VNU Journal of Science: Earth and Environmental Sciences, Vol. 35, No. 4 (2019) 12-21 12 Original Article Climate Analog Locations of Cities and Disappearing Climate in Viet Nam Nguyen Thi Tuyet 1,* , Ngo Duc Thanh 2 , Phan Van Tan 3 1 Department of Infrastructure and Urban Development Strategy, Vietnam Institute for Development Strategies, Ministry of Planning and Investment, 65 Van Mieu, Dong Da, Hanoi, Vietnam 2 REMOSAT laboratory, University of Science and Technology of Ha Noi, Vietnam Academy of Science and Technology, A21 Building, 18 Hoang Quoc Viet, Cau Giay, Hanoi, Vietnam 3 Department of Meteorology and Climate Change, VNU University of Science, 334 Nguyen Trai, Hanoi, Vietnam Received 15 June 2019 Revised 18 September 2019; Accepted 05 October 2019 Abstract: The study defined climate analog locations of cities and disappearing climate in Viet Nam at the end of the 21st century under the Representative Concentration Pathways 4.5 (RCP4.5) and 8.5 (RCP8.5) scenarios. Outputs from six regional climate experiments conducted under the Southeast Asia Regional Climate Downscaling/Coordinated Regional Climate Downscaling Experiment – Southeast Asia (SEACLID/CORDEX-SEA) were used, covering the domain of 15S - 27N, 89.5E - 146.5E. Results showed the general southward tendency of climate analog locations from the original sites. The climate distances between the reference cities and their analog locations were greater under the RCP8.5 than those under the RCP4.5. The analog locations of Ha Noi, Hai Phong and Da Nang were closer to the original cities than those of Ho Chi Minh and Can Tho. Under the RCP8.5, 2.39% of land in Viet Nam, mainly located in some small parts of the Central Highlands and Southern Viet Nam, was projected by the ensemble (ENS) experiment to experience disappearing climate at the end of the 21st century. Keywords: Climate analog, disappearing climate, regional climate model, Viet Nam. ______ Corresponding author. E-mail address: [email protected] https://doi.org/10.25073/2588-1094/vnuees.4409

Welcome message from author
This document is posted to help you gain knowledge. Please leave a comment to let me know what you think about it! Share it to your friends and learn new things together.
Transcript

VNU Journal of Science: Earth and Environmental Sciences, Vol. 35, No. 4 (2019) 12-21
12
Original Article
Climate Analog Locations of Cities and Disappearing Climate
in Viet Nam
Nguyen Thi Tuyet1,*, Ngo Duc Thanh2, Phan Van Tan3
1Department of Infrastructure and Urban Development Strategy, Vietnam Institute for Development Strategies, Ministry of Planning and Investment, 65 Van Mieu, Dong Da, Hanoi, Vietnam
2REMOSAT laboratory, University of Science and Technology of Ha Noi, Vietnam Academy of Science and Technology, A21 Building, 18 Hoang Quoc Viet, Cau Giay, Hanoi, Vietnam
3Department of Meteorology and Climate Change, VNU University of Science,
334 Nguyen Trai, Hanoi, Vietnam
Received 15 June 2019
Revised 18 September 2019; Accepted 05 October 2019
Abstract: The study defined climate analog locations of cities and disappearing climate in Viet Nam
at the end of the 21st century under the Representative Concentration Pathways 4.5 (RCP4.5) and
8.5 (RCP8.5) scenarios. Outputs from six regional climate experiments conducted under the
Southeast Asia Regional Climate Downscaling/Coordinated Regional Climate Downscaling
Experiment – Southeast Asia (SEACLID/CORDEX-SEA) were used, covering the domain of 15S -
27N, 89.5E - 146.5E. Results showed the general southward tendency of climate analog locations
from the original sites. The climate distances between the reference cities and their analog locations
were greater under the RCP8.5 than those under the RCP4.5. The analog locations of Ha Noi, Hai
Phong and Da Nang were closer to the original cities than those of Ho Chi Minh and Can Tho. Under
the RCP8.5, 2.39% of land in Viet Nam, mainly located in some small parts of the Central Highlands
and Southern Viet Nam, was projected by the ensemble (ENS) experiment to experience
disappearing climate at the end of the 21st century.
Keywords: Climate analog, disappearing climate, regional climate model, Viet Nam.
______ Corresponding author.
E-mail address: [email protected]
https://doi.org/10.25073/2588-1094/vnuees.4409

N. T. Tuyet et al. / VNU Journal of Science: Earth and Environmental Sciences, Vol. 35, No. 4 (2019) 12-21 13
1. Introduction
The notion of climate analog was well
introduced in previous studies [e.g. Hallegatte et
al., 2007; Ishizaki et al., 2012; Bos et al., 2015;
Hibino et al., 2015] [1-4]. Briefly, a climate
analog location of a reference site A is the place
where its present climate being similar to the
projected future climate in A. The reference site
A is considered to experience disappearing
climate if its present climate is found at nowhere
within the study area in the future. Williams et
al. [2007] [5] showed that disappearing climates
generally located in tropical mountainous
regions and the poleward areas of continents.
The percentage of global terrestrial surface that
might experience disappearing climate was
projected to be 10 – 48% and 4 – 20% for the
high (A2) and low (B1) emission scenarios by
2100, respectively. Besides, disappearing
climates could occur in the northern high-
latitudes, Andes, Central America, sub-Saharan
Africa and South-East Asia (SEA) [Fabienne et
al., 2017] [6]. They showed that the projected
disappearing land fraction was about 14%, 20%,
and almost 40% at the 1.5°C, 2°C, and 4°C
global warming levels, respectively.
In Viet Nam, a number of researches on
climate and climate change have been conducted
[e.g. Nguyen Duc Ngu and Nguyen Trong Hieu,
1991; 2004; Nguyen Viet Lanh, 2007; Tran Viet
Lien et al., 2007; Nguyen Duc Ngu, 2008; Phan-
Van et al., 2009; Ho et al., 2011; Mai Van et al.,
2014, Nguyen et al., 2014; Ngo-Duc et al., 2014;
2016; Ngo-Thanh et al., 2017; Trinh-Tuan et al.,
2019] ([7-19]). In 2009, the Ministry of Natural
Resources and Environment (MONRE)
published the report on Climate Change and Sea
Level Rise Scenarios for Viet Nam [MONRE,
2009] [20]. This report was updated in 2012 and
2016 [MONRE, 2012; 2016] [21-22] and has
been considered as a reference document for
supplying the basis for climate change-related
studies in various sectors. It is worth noting that
no research on climate analog has been
published in Viet Nam to date.
The present study identifies for the first time
the best analog locations of cities in Viet Nam
within the SEA domain by using the outputs of
six regional climate experiments resulted from
the Southeast Asia Regional Climate
Downscaling/Coordinated Regional Climate
Downscaling Experiment – Southeast Asia
(SEACLID/CORDEX-SEA) project [Ngo-Duc
et al. 2017, Juneng et al. 2016, Cruz et al. 2017,
Tangang et al. 2018] ([17], [23-25]). Projected
disappearing climate in the future in Viet Nam is
also analyzed in the study.
2. Data and methodology
Two climate variables used for the analysis in this study are monthly 2m-temperature and precipitation of the reference period 1986 - 2005 and the future period 2080 - 2099 under the Representative Concentration Pathways 4.5 (RCP4.5) and 8.5 (RCP8.5) scenarios. The data were obtained from the outputs of six regional downscaling experiments of the SEACLID/CORDEX-SEA project and from their ensemble average (ENS). The Regional Climate Model version 4.3 (RegCM4.3) [Giorgi et al. 2012] [26] was used to dynamically downscale six global climate models (GCMs) of the Coupled Model Intercomparison Project Phase 5 (CMIP5) to 25 km horizontal resolution over the SEA domain of 15S - 27N, 89.5E - 146.5E. The downscaled experiments are respectively called 1) CNRM, 2) CSIRO, 3) ECEA, 4) GFDL, 5) HADG and 6) MPI, following the names of the six driving GCMs.
In order to identify climate analog locations,
a formulation to estimate the climate distance d
from a location B to a target point A was
proposed as follows:
d = 1
2× (dT + dP) (Eq.1)
where dT and dP are the distances of temperature
and precipitation, respectively.
dT =1
β×
1
12∑ √
(Tf,n − Tp,n )2
σTf,n2+ σTp,n
2n=12n=1 (Eq.2)
dP = α × 1
β×
1
12∑ √
(Pf,n − Pp,n )2
σPf,n2+ σPp,n
2n=12n=1 (Eq.3)

14 N. T. Tuyet et al. / VNU Journal of Science: Earth and Environmental Sciences, Vol. 35, No. 4 (2019) 12-21
where T (P) is the 20-year monthly mean
temperature (precipitation) in the future (f) in A
or at the present period (p) in B for month n
(from January to December); σT (σP) is the
standard deviation of the monthly temperature
(precipitation) values; β is an ENS weighting
factor, equals to 1 if an individual experiment is
considered and equals to 2.0 (1.8) under RCP4.5
(RCP8.5) for the ENS values; α is a scaling
factor related to the ratio between the variability
of precipitation and temperature within the SEA
domain. α varies from 3.5 to 4.9, depending on
the experiments and scenarios. It should be noted
that the climate distance from B to A could be
different with that from A to B.
The best analog location of the target point
A is the point located within the SEA land region
at which the climate distance to A is the
minimum. Based on this, the best analog
locations of 78 cities in Viet Nam (Figure 1,
Table 1) are identified. For illustrative purposes,
analyses for five central cities including Ha Noi,
Hai Phong, Da Nang, Ho Chi Minh and Can Tho
are conducted in Section 3.1. When the climate
distance to A from the best analog location is
smaller than or equal to 1 (or 1< d ≤2), A is
considered as a good-analog (or poor-analog)
point. When the climate distance from A to each
location within the SEA land region is greater
than the arbitrary threshold of 2, i.e. there is no
location within SEA at which the future climate
is similar to the present climate in A, the point A
is considered to experience disappearing
climate in the future.
Figure 1. Locations of 78 cities in Viet Nam (displayed with red circles and numbered
from 1 to 78 according to the respective order of cities in the Table 1) analyzed in this study.
0
1
2
3
4
5
6
7
8
9
10
11
12
13
1415
16
17
18
19
20
21
22
23
2425
26
27
2829
30
31
32
33
34
35
36
37
38
39
40
41
42
43
44
45
46
47
48
49
50
51
52
5354
55
56
57
58
59
60
62
63
64
65
66
67
68
69
70
71
72
73
74
75
76
77
TRUONG SA
HOANG SA
102˚ 105˚ 108˚ 111˚ 114˚
9˚
12˚
15˚
18˚
21˚
24˚
N. T. Tuyet et al. / VNU Journal of Science: Earth and Environmental Sciences, Vol. 35, No. 4 (2019) 12-21 15
A ranking method based on the central root mean square difference was implemented and showed the superior performances of ENS, CNRM and the poorest one of ECEA compared to the remaining experiments (not shown). Thus, to illustrate the results clearly and less confusing, the present study only carries out the analysis for the ENS, CNRM and ECEA experiments.
3. Results and discussions
3.1. Climatic relocation of five central cities in
Viet Nam
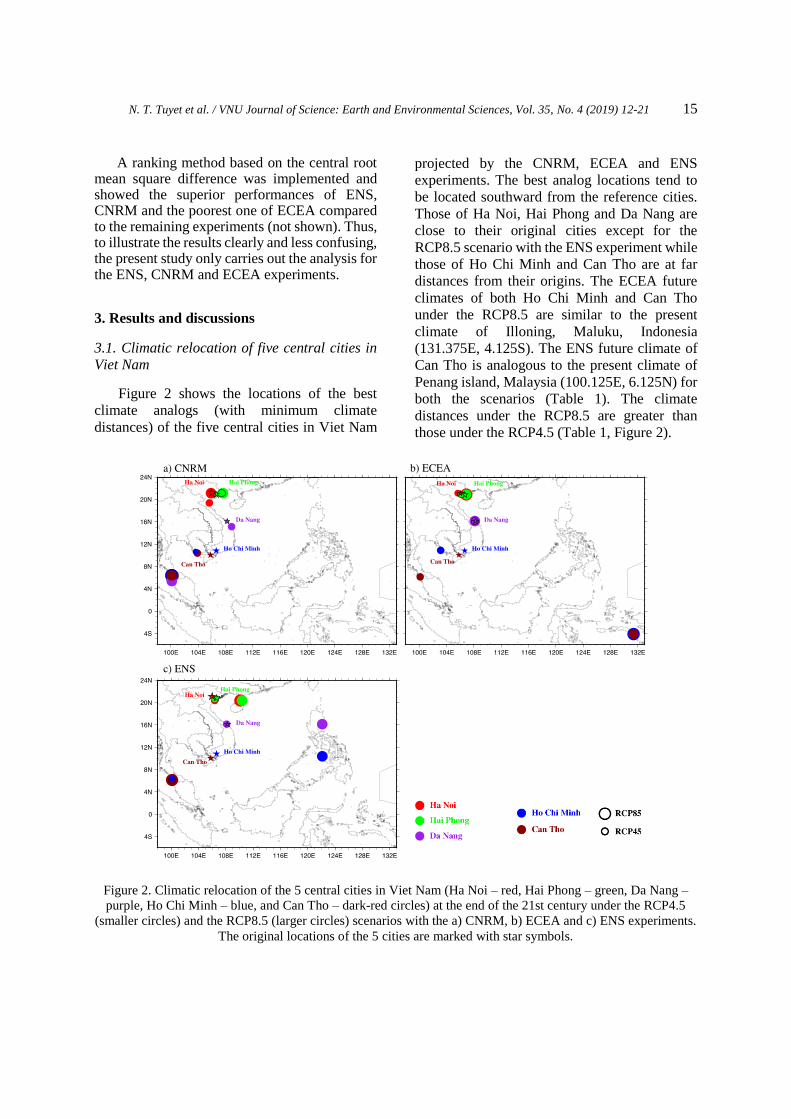
Figure 2 shows the locations of the best
climate analogs (with minimum climate
distances) of the five central cities in Viet Nam
projected by the CNRM, ECEA and ENS
experiments. The best analog locations tend to
be located southward from the reference cities.
Those of Ha Noi, Hai Phong and Da Nang are
close to their original cities except for the
RCP8.5 scenario with the ENS experiment while
those of Ho Chi Minh and Can Tho are at far
distances from their origins. The ECEA future
climates of both Ho Chi Minh and Can Tho
under the RCP8.5 are similar to the present
climate of Illoning, Maluku, Indonesia
(131.375E, 4.125S). The ENS future climate of
Can Tho is analogous to the present climate of
Penang island, Malaysia (100.125E, 6.125N) for
both the scenarios (Table 1). The climate
distances under the RCP8.5 are greater than
those under the RCP4.5 (Table 1, Figure 2).
Figure 2. Climatic relocation of the 5 central cities in Viet Nam (Ha Noi – red, Hai Phong – green, Da Nang –
purple, Ho Chi Minh – blue, and Can Tho – dark-red circles) at the end of the 21st century under the RCP4.5
(smaller circles) and the RCP8.5 (larger circles) scenarios with the a) CNRM, b) ECEA and c) ENS experiments.
The original locations of the 5 cities are marked with star symbols.
16 N. T. Tuyet et al. / VNU Journal of Science: Earth and Environmental Sciences, Vol. 35, No. 4 (2019) 12-21
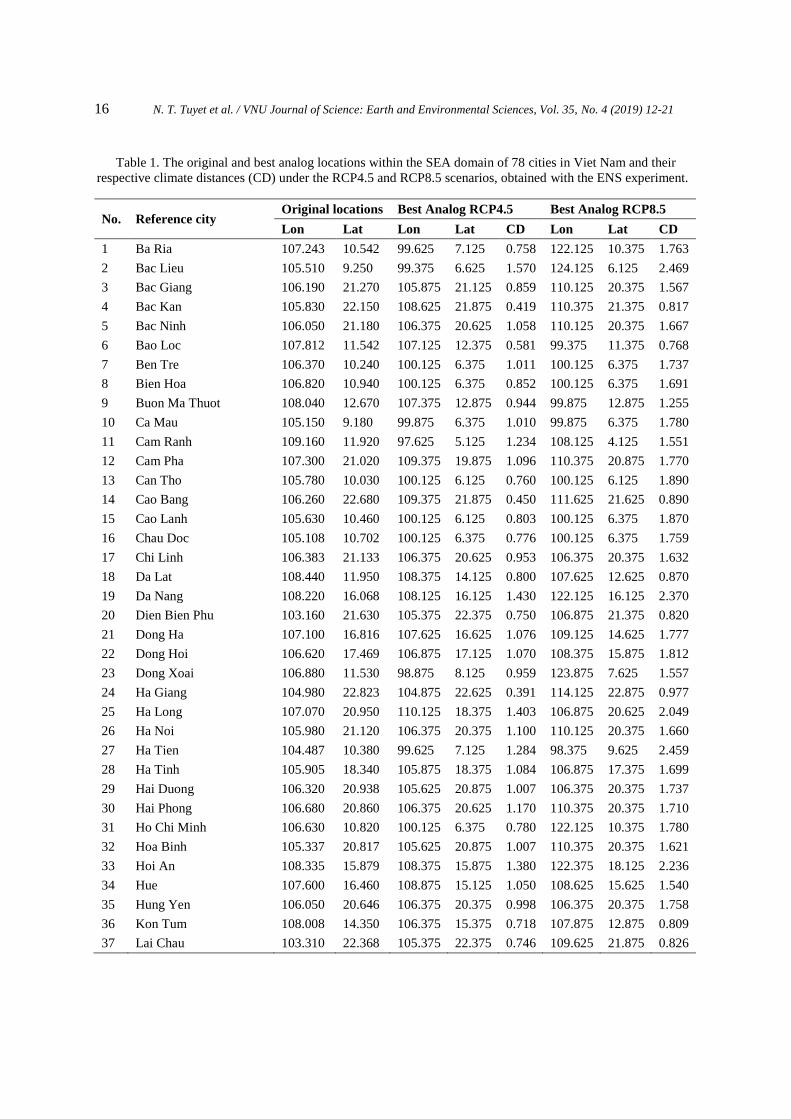
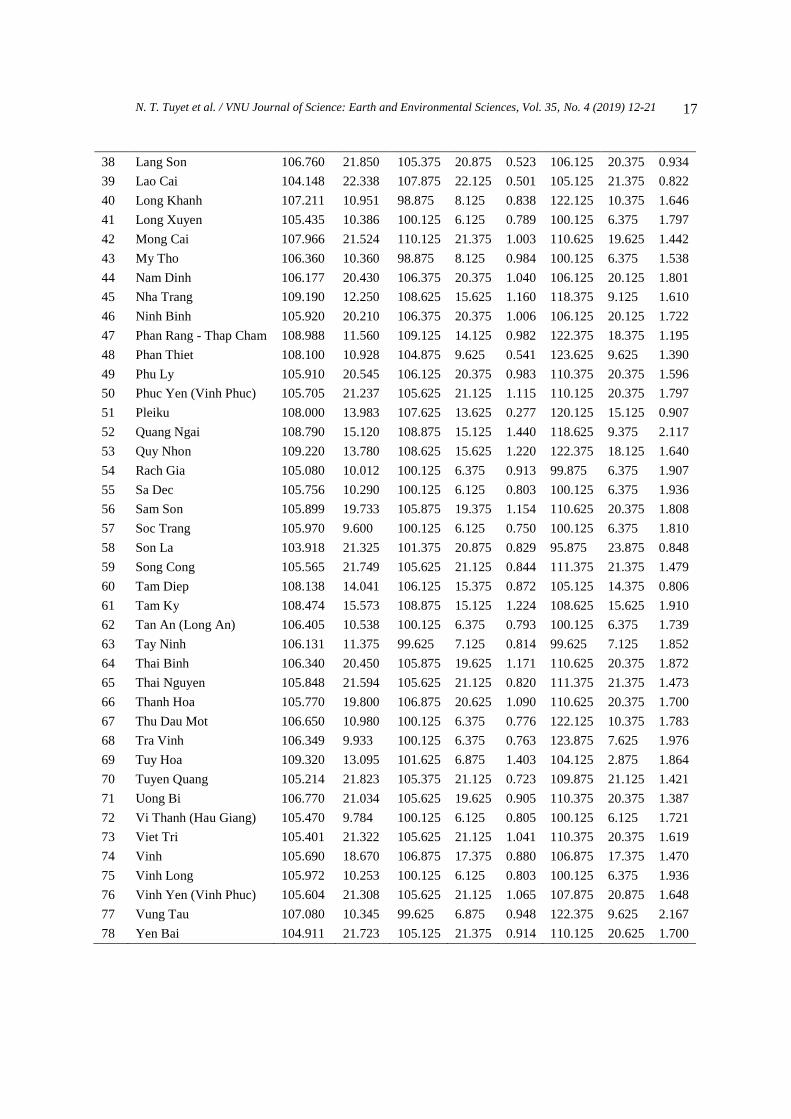
Table 1. The original and best analog locations within the SEA domain of 78 cities in Viet Nam and their
respective climate distances (CD) under the RCP4.5 and RCP8.5 scenarios, obtained with the ENS experiment.
No. Reference city Original locations Best Analog RCP4.5 Best Analog RCP8.5
Lon Lat Lon Lat CD Lon Lat CD
1 Ba Ria 107.243 10.542 99.625 7.125 0.758 122.125 10.375 1.763
2 Bac Lieu 105.510 9.250 99.375 6.625 1.570 124.125 6.125 2.469
3 Bac Giang 106.190 21.270 105.875 21.125 0.859 110.125 20.375 1.567
4 Bac Kan 105.830 22.150 108.625 21.875 0.419 110.375 21.375 0.817
5 Bac Ninh 106.050 21.180 106.375 20.625 1.058 110.125 20.375 1.667
6 Bao Loc 107.812 11.542 107.125 12.375 0.581 99.375 11.375 0.768
7 Ben Tre 106.370 10.240 100.125 6.375 1.011 100.125 6.375 1.737
8 Bien Hoa 106.820 10.940 100.125 6.375 0.852 100.125 6.375 1.691
9 Buon Ma Thuot 108.040 12.670 107.375 12.875 0.944 99.875 12.875 1.255
10 Ca Mau 105.150 9.180 99.875 6.375 1.010 99.875 6.375 1.780
11 Cam Ranh 109.160 11.920 97.625 5.125 1.234 108.125 4.125 1.551
12 Cam Pha 107.300 21.020 109.375 19.875 1.096 110.375 20.875 1.770
13 Can Tho 105.780 10.030 100.125 6.125 0.760 100.125 6.125 1.890
14 Cao Bang 106.260 22.680 109.375 21.875 0.450 111.625 21.625 0.890
15 Cao Lanh 105.630 10.460 100.125 6.125 0.803 100.125 6.375 1.870
16 Chau Doc 105.108 10.702 100.125 6.375 0.776 100.125 6.375 1.759
17 Chi Linh 106.383 21.133 106.375 20.625 0.953 106.375 20.375 1.632
18 Da Lat 108.440 11.950 108.375 14.125 0.800 107.625 12.625 0.870
19 Da Nang 108.220 16.068 108.125 16.125 1.430 122.125 16.125 2.370
20 Dien Bien Phu 103.160 21.630 105.375 22.375 0.750 106.875 21.375 0.820
21 Dong Ha 107.100 16.816 107.625 16.625 1.076 109.125 14.625 1.777
22 Dong Hoi 106.620 17.469 106.875 17.125 1.070 108.375 15.875 1.812
23 Dong Xoai 106.880 11.530 98.875 8.125 0.959 123.875 7.625 1.557
24 Ha Giang 104.980 22.823 104.875 22.625 0.391 114.125 22.875 0.977
25 Ha Long 107.070 20.950 110.125 18.375 1.403 106.875 20.625 2.049
26 Ha Noi 105.980 21.120 106.375 20.375 1.100 110.125 20.375 1.660
27 Ha Tien 104.487 10.380 99.625 7.125 1.284 98.375 9.625 2.459
28 Ha Tinh 105.905 18.340 105.875 18.375 1.084 106.875 17.375 1.699
29 Hai Duong 106.320 20.938 105.625 20.875 1.007 106.375 20.375 1.737
30 Hai Phong 106.680 20.860 106.375 20.625 1.170 110.375 20.375 1.710
31 Ho Chi Minh 106.630 10.820 100.125 6.375 0.780 122.125 10.375 1.780
32 Hoa Binh 105.337 20.817 105.625 20.875 1.007 110.375 20.375 1.621
33 Hoi An 108.335 15.879 108.375 15.875 1.380 122.375 18.125 2.236
34 Hue 107.600 16.460 108.875 15.125 1.050 108.625 15.625 1.540
35 Hung Yen 106.050 20.646 106.375 20.375 0.998 106.375 20.375 1.758
36 Kon Tum 108.008 14.350 106.375 15.375 0.718 107.875 12.875 0.809
37 Lai Chau 103.310 22.368 105.375 22.375 0.746 109.625 21.875 0.826
N. T. Tuyet et al. / VNU Journal of Science: Earth and Environmental Sciences, Vol. 35, No. 4 (2019) 12-21 17
38 Lang Son 106.760 21.850 105.375 20.875 0.523 106.125 20.375 0.934
39 Lao Cai 104.148 22.338 107.875 22.125 0.501 105.125 21.375 0.822
40 Long Khanh 107.211 10.951 98.875 8.125 0.838 122.125 10.375 1.646
41 Long Xuyen 105.435 10.386 100.125 6.125 0.789 100.125 6.375 1.797
42 Mong Cai 107.966 21.524 110.125 21.375 1.003 110.625 19.625 1.442
43 My Tho 106.360 10.360 98.875 8.125 0.984 100.125 6.375 1.538
44 Nam Dinh 106.177 20.430 106.375 20.375 1.040 106.125 20.125 1.801
45 Nha Trang 109.190 12.250 108.625 15.625 1.160 118.375 9.125 1.610
46 Ninh Binh 105.920 20.210 106.375 20.375 1.006 106.125 20.125 1.722
47 Phan Rang - Thap Cham 108.988 11.560 109.125 14.125 0.982 122.375 18.375 1.195
48 Phan Thiet 108.100 10.928 104.875 9.625 0.541 123.625 9.625 1.390
49 Phu Ly 105.910 20.545 106.125 20.375 0.983 110.375 20.375 1.596
50 Phuc Yen (Vinh Phuc) 105.705 21.237 105.625 21.125 1.115 110.125 20.375 1.797
51 Pleiku 108.000 13.983 107.625 13.625 0.277 120.125 15.125 0.907
52 Quang Ngai 108.790 15.120 108.875 15.125 1.440 118.625 9.375 2.117
53 Quy Nhon 109.220 13.780 108.625 15.625 1.220 122.375 18.125 1.640
54 Rach Gia 105.080 10.012 100.125 6.375 0.913 99.875 6.375 1.907
55 Sa Dec 105.756 10.290 100.125 6.125 0.803 100.125 6.375 1.936
56 Sam Son 105.899 19.733 105.875 19.375 1.154 110.625 20.375 1.808
57 Soc Trang 105.970 9.600 100.125 6.125 0.750 100.125 6.375 1.810
58 Son La 103.918 21.325 101.375 20.875 0.829 95.875 23.875 0.848
59 Song Cong 105.565 21.749 105.625 21.125 0.844 111.375 21.375 1.479
60 Tam Diep 108.138 14.041 106.125 15.375 0.872 105.125 14.375 0.806
61 Tam Ky 108.474 15.573 108.875 15.125 1.224 108.625 15.625 1.910
62 Tan An (Long An) 106.405 10.538 100.125 6.375 0.793 100.125 6.375 1.739
63 Tay Ninh 106.131 11.375 99.625 7.125 0.814 99.625 7.125 1.852
64 Thai Binh 106.340 20.450 105.875 19.625 1.171 110.625 20.375 1.872
65 Thai Nguyen 105.848 21.594 105.625 21.125 0.820 111.375 21.375 1.473
66 Thanh Hoa 105.770 19.800 106.875 20.625 1.090 110.625 20.375 1.700
67 Thu Dau Mot 106.650 10.980 100.125 6.375 0.776 122.125 10.375 1.783
68 Tra Vinh 106.349 9.933 100.125 6.375 0.763 123.875 7.625 1.976
69 Tuy Hoa 109.320 13.095 101.625 6.875 1.403 104.125 2.875 1.864
70 Tuyen Quang 105.214 21.823 105.375 21.125 0.723 109.875 21.125 1.421
71 Uong Bi 106.770 21.034 105.625 19.625 0.905 110.375 20.375 1.387
72 Vi Thanh (Hau Giang) 105.470 9.784 100.125 6.125 0.805 100.125 6.125 1.721
73 Viet Tri 105.401 21.322 105.625 21.125 1.041 110.375 20.375 1.619
74 Vinh 105.690 18.670 106.875 17.375 0.880 106.875 17.375 1.470
75 Vinh Long 105.972 10.253 100.125 6.125 0.803 100.125 6.375 1.936
76 Vinh Yen (Vinh Phuc) 105.604 21.308 105.625 21.125 1.065 107.875 20.875 1.648
77 Vung Tau 107.080 10.345 99.625 6.875 0.948 122.375 9.625 2.167
78 Yen Bai 104.911 21.723 105.125 21.375 0.914 110.125 20.625 1.700

N. T. Tuyet et al. / VNU Journal of Science: Earth and Environmental Sciences, Vol. 35, No. 4 (2019) 12-21 18
Figure 3. Seasonal cycles of temperature and precipitation of the five central cities (Ha Noi, Hai Phong, Da Nang,
Ho Chi Minh and Can Tho) in Viet Nam. Blue and black lines show the present and future projected cycles of a
reference site, respectively. Red lines represent the present cycles of the respective best analog location with the
ENS experiment. Grey shading displays the value range of the 6 RCMs at the best analog location.
Figure 3 describes the future seasonal cycles
of temperature and precipitation of the five
central cities (black lines), which generally fit
well with the present cycles of the analog
locations (red lines). There is a better similarity
for temperature than precipitation, and for the
RCP4.5 than the RCP8.5. The future
precipitation in Ho Chi Minh and Can Tho is not
in good agreement with the present one at the
analog locations under both the scenarios. This
is also appropriate for Da Nang under the
RCP8.5 (Figure 3). The results shown in Figure
3 are in line with those shown in Figure 2c, i.e.
the distances between Ho Chi Minh and Can Tho
and their analog locations are large for both the
RCP4.5 and the RCP8.5.
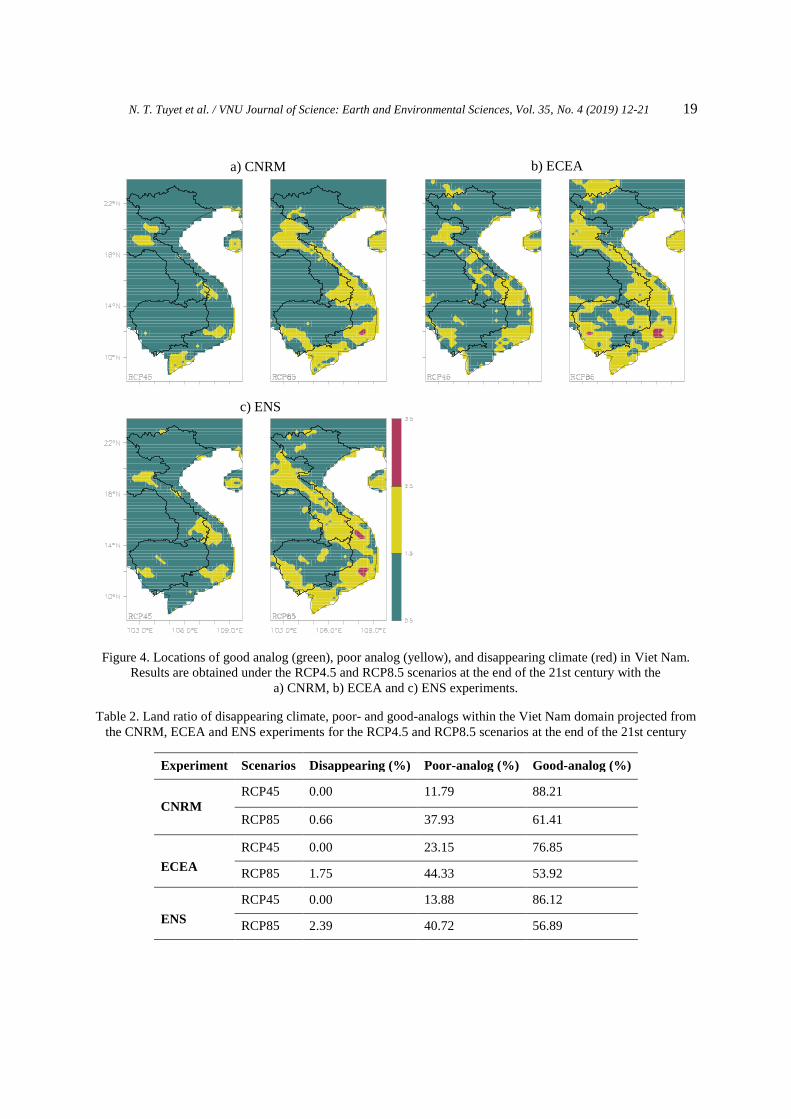
3.2. Disappearing climate in Viet Nam
The land fractions of disappearing climate in
Viet Nam are 0.66%, 1.75% and 2.39% for the
CNRM, ECEA and ENS experiments under the
RCP8.5, respectively. This means that we can
almost find a location within the SEA region at
which its projected future climate is close to the
present climate of a given place in Viet Nam.
The present climate in only a few small parts in
the Southern Viet Nam and the Central
Highlands of Viet Nam (red parts in Figure 4) is
projected to disappear in SEA in the future. This
agrees with the results of Williams et al. [2007]
[5], which showed that disappearing climate
located in the mountainous tropical areas. The
good-analog percentage is high (~80% - 90%)
under the RCP4.5 and lower (~53% - 62%)
under the RCP8.5. The poor-analog percentage
accounts for 37% - 44% of the Viet Nam land
under the RCP8.5, which mainly lies in the
Central and the Southern Viet Nam (Figure 4).
This indicates that the warmer regions at present
tend to be poor analog or disappearing climate
locations in the future while the cooler ones (e.g.
the Northern Viet Nam) show the good-analog
characteristic.
12
15
18
21
24
27
30
33
de
gC
1 2 3 4 5 6 7 8 9 10 11 12
Ha Noi Hai Phong Da Nang Ho Chi Minh Can Tho
9
12
15
18
21
24
27
30
33
deg
C1 2 3 4 5 6 7 8 9 10 11 12
RCP4.5
9
12
15
18
21
24
27
30
33
deg
C
1 2 3 4 5 6 7 8 9 10 11 12
9
12
15
18
21
24
27
30
33
de
gC
1 2 3 4 5 6 7 8 9 10 11 12
9
12
15
18
21
24
27
30
33
de
gC
1 2 3 4 5 6 7 8 9 10 11 12
Temperature (deg. C)
Rainfall (mm/day)
0
5
10
15
20
25
30
35
mm
/day
1 2 3 4 5 6 7 8 9 10 11 12
RCM, RCP45 − Hanoi
0
5
10
15
20
25
30
35
mm
/da
y
1 2 3 4 5 6 7 8 9 10 11 12
0
5
10
15
20
25
30
35
mm
/da
y
1 2 3 4 5 6 7 8 9 10 11 12
0
5
10
15
20
25
30
35
mm
/da
y
1 2 3 4 5 6 7 8 9 10 11 12
0
5
10
15
20
25
30
35
mm
/day
1 2 3 4 5 6 7 8 9 10 11 12
RCP8.5Temperature (deg. C)
12
15
18
21
24
27
30
33
deg
C
1 2 3 4 5 6 7 8 9 10 11 12
RCM, RCP85 − Hanoi
9
12
15
18
21
24
27
30
33
de
gC
1 2 3 4 5 6 7 8 9 10 11 12
9
12
15
18
21
24
27
30
33d
eg
C
1 2 3 4 5 6 7 8 9 10 11 12
9
12
15
18
21
24
27
30
33
deg
C
1 2 3 4 5 6 7 8 9 10 11 12
9
12
15
18
21
24
27
30
33
deg
C
1 2 3 4 5 6 7 8 9 10 11 12
Rainfall (mm/day)
0
5
10
15
20
25
30
35
mm
/day
1 2 3 4 5 6 7 8 9 10 11 12
RCM, RCP85 − Hanoi
0
5
10
15
20
25
30
35
mm
/da
y
1 2 3 4 5 6 7 8 9 10 11 12
0
5
10
15
20
25
30
35
mm
/da
y
1 2 3 4 5 6 7 8 9 10 11 12
0
5
10
15
20
25
30
35
mm
/da
y
1 2 3 4 5 6 7 8 9 10 11 12
0
5
10
15
20
25
30
35
mm
/da
y
1 2 3 4 5 6 7 8 9 10 11 12
ENS analog ENS future ENS present
N. T. Tuyet et al. / VNU Journal of Science: Earth and Environmental Sciences, Vol. 35, No. 4 (2019) 12-21 19
Figure 4. Locations of good analog (green), poor analog (yellow), and disappearing climate (red) in Viet Nam.
Results are obtained under the RCP4.5 and RCP8.5 scenarios at the end of the 21st century with the
a) CNRM, b) ECEA and c) ENS experiments.
Table 2. Land ratio of disappearing climate, poor- and good-analogs within the Viet Nam domain projected from
the CNRM, ECEA and ENS experiments for the RCP4.5 and RCP8.5 scenarios at the end of the 21st century
Experiment Scenarios Disappearing (%) Poor-analog (%) Good-analog (%)
CNRM
RCP45 0.00 11.79 88.21
RCP85 0.66 37.93 61.41
ECEA
RCP45 0.00 23.15 76.85
RCP85 1.75 44.33 53.92
ENS
RCP45 0.00 13.88 86.12
RCP85 2.39 40.72 56.89
a) CNRM b) ECEA
c) ENS
N. T. Tuyet et al. / VNU Journal of Science: Earth and Environmental Sciences, Vol. 35, No. 4 (2019) 12-21 20
4. Conclusion
The study used the model data from six
downscaled climate experiments and their
ensemble product, which were conducted under
the framework of the SEACLID/CORDEX-SEA
project. The results showed the climatic
relocations of 78 cities in Viet Nam in the future
under the RCP4.5 and RCP8.5 scenarios, which
generally exhibited a southward tendency. The
climate distance under the RCP8.5 was larger
than that under the RCP4.5. The climate analog
locations of Ha Noi, Hai Phong and Da Nang
were closer to their original cities than those of
Ho Chi Minh and Can Tho. In the future, about
2.39% of Viet Nam land, mainly located in the
Central Highlands and Southern Viet Nam, was
projected to experience disappearing climate by
the ENS experiment under the RCP8.5. The
poor-analog locations are prominent in the
Central and Southern Viet Nam while the good-
analog areas are mainly in the Northern Viet
Nam. The results of the present study would
provide worthwhile inputs for further climate
change impact assessment and adaptation
research.
Acknowledgements
This study is supported by the Viet Nam
National Foundation for Science and
Technology Development (NAFOSTED) under
Grant 105.06-2018.05. We acknowledge the
SEACLID/CORDEX-SEA members for
producing and making their model outputs
available.
Reference
[1] S. Hallegatte, J.C. Hourcade, P. Ambrosi, Using
climate analogues for assessing climate change
economic impacts in urban areas, Climatic
Change 82(1) (2007) 47-60. https://doi.org/10.
1007/s10584-006-9161-z.
[2] N.N. Ishizaki, H. Shiogama, K. Takahashi, S.
Emori, K. Dairaku, H. Kusaka, T. Nakaegawa, I.
Takayabu, An Attempt to Estimate of
Probabilistic Regional Climate Analogue in a
Warmer Japan, Journal of the Meteorological
Society of Japan. Ser. II, 90B (2012) 65-74.
https://doi.org/10.2151/jmsj. 2012-B05.
[3] S.P.M. Bos, T. Pagella, R. Kindt, A.J.M. Russell,
E. Luedeling, Climate analogs for agricultural
impact projection and adaptation - a reliability
test, Frontiers in Environmental Science 3(65)
(2015). https://doi.org/10.3389/ fenvs.2015.00065.
[4] K. Hibino, I. Takayabu, T. Nakaegawa, Objective
estimate of future climate analogues projected by
an ensemble AGCM experiment under the SRES
A1B scenario, Climatic Change 131(4) (2015),
677-689. https://doi.org/10.1007/s10584-015-1396-0.
[5] S.T.J. Williams, J.E. Kutzbach, Projected
distributions of novel and disappearing climates
by 2100 AD, Proceedings of the National
Academy of Sciences 104(14) (2007), 5738-5742.
https://doi.org/10.1073/ pnas.0606292104.
[6] D. Fabienne, M.F. Erich, K. Reto, Future local
climate unlike currently observed anywhere,
Environmental Research Letters 12(8) (2017),
084004.https://doi.org/10.1088/1748-9326/aa75d7.
[7] N.D. Ngu, N.T. Hieu, Climate Change and its
impact in Viet Nam in the past 100 years, Nature
and People, Reality Publishing, Ha Noi, 1991 (in
Vietnamese).
[8] N.D. Ngu, N.T. Hieu, Climate and Vietnamese
climate resources, Agriculture Publishing, Ha
Noi, 2004 (in Vietnamese).
[9] N.V. Lanh, Some results on climate change in
Viet Nam, Journal of Meteorology Hydrology
560, 33 (2007) (in Vietnamese).
[10] T.V. Lien, H.D. Cuong, T.A. Son, Climate
scenario building in climatic regions in Viet Nam
for the period 2010 – 2100, Journal of
Meteorology Hydrology (2007) (in Vietnamese).
[11] N.D. Ngu, Climate Change, Science and
Technique Publishing, Ha Noi, 2008 (in
Vietnamese).
[12] T. Phan-Van, T. Ngo-Duc, T.M.H. Ho, Seasonal
and interannual variations of surface climate
elements over Viet Nam, Climate Research 40(1)
(2009) 49-60. https://doi.org/ 10.3354/cr00824.
[13] T. M. H. Ho, V. T. Phan, N. Q. Le, and Q.
Nguyen, Extreme climatic events over Viet Nam
from observational data and RegCM3
projections, Climate Research 49(2) (2011) 87-
100. https://doi.org/10.3354/cr01021.
[14] K. Mai-Van, M.G. Redmond, C. McSweeney, T.
Thuc, Evaluation of dynamically downscaled
ensemble climate simulations for Viet Nam,
International Journal of Climatology 34(7) (2014)
2450-2463. https:// doi.org/10.1002/joc.3851.
N. T. Tuyet et al. / VNU Journal of Science: Earth and Environmental Sciences, Vol. 35, No. 4 (2019) 12-21 21
[15] D.Q. Nguyen, J. Renwick, J. McGregor,
Variations of surface temperature and rainfall in
Viet Nam from 1971 to 2010, International
Journal of Climatology 34(1) (2014) 249-264.
https://doi.org/10.1002/joc.3684.
[16] T. Ngo-Duc, C. Kieu, M. Thatcher, D. Nguyen-
Le, T. Phan-Van, Climate projections for Viet
Nam based on regional climate models, Climate
Research 60(3) (2014) 199-213. https://doi.org/
10.3354/cr01234.
[17] T. Ngo-Duc, T.T. Fredolin, S. Jerasorn, C. Faye et
al., Performance evaluation of RegCM4 in
simulating extreme rainfall and temperature
indices over the CORDEX-Southeast Asia region,
International Journal of Climatology 37(3) (2017)
1634-1647. https://doi.org/10.1002/joc.4803.
[18] H. Ngo-Thanh, T. Ngo-Duc, H. Nguyen-Hong, P.
Baker, T. Phan-Van, A distinction between
summer rainy season and summer monsoon
season over the Central Highlands of Viet Nam,
Theoretical and Applied Climatology (2017).
https://doi.org/10.1007/s00704-017-2178-6.
[19] L. Trinh-Tuan, J. Matsumoto, F.T. Tangang, L.
Juneng, F. Cruz, G. Narisma et al., Application of
Quantile Mapping Bias Correction for Mid-Future
Precipitation Projections over Viet Nam, SOLA
15 (2019) 1-6. https://doi.org/10. 2151/sola. 2019-
001.
[20] T. Thuc, N.V. Thang, H.T.L. Huong, M.V.
Khiem, N.X. Hien, D.H. Phong, Climate change
and sea level rise scenarios for Viet Nam,
Ministry of Natural Resources and Environment
(MONRE), Ha Noi, 2009.
[21] T. Thuc, N.V. Thang, H.T.L. Huong, M.V.
Khiem, N.X. Hien, D.H. Phong, Climate change
and sea level rise scenarios for Viet Nam,
Ministry of Natural Resources and Environment
(MONRE), Ha Noi, 2012.
[22] T. Thuc, N.V. Thang, H.T.L. Huong, M.V.
Khiem, N.X. Hien, D.H. Phong, Climate change
and sea level rise scenarios for Viet Nam,
Ministry of Natural Resources and Environment
(MONRE), Ha Noi, 2016.
[23] L. Juneng, et al., Sensitivity of Southeast Asia
rainfall simulations to cumulus and air-sea flux
parameterizations in RegCM4, Climate Research,
69(1) (2016) 59-77.
[24] F.T. Cruz, G.T. Narisma, J.B. Dado, Singhruck P,
Tangang F et al., Sensitivity of temperature to
physical parameterization schemes of RegCM4
over the CORDEX-Southeast Asia region.
International Journal of Climatology 37(15)
(2017) 5139-5153.
[25] F. Tangang, S. Supari, J.X. Chung, F. Cruz, E.
Salimun, S.T. Ngai et al., Future changes in
annual precipitation extremes over Southeast Asia
under global warming of 2°C. APN Science
Bulletin, 8(1) (2018).
[26] F. Giorgi, et al., RegCM4: model description and
preliminary tests over multiple CORDEX
domains, Climate Research, 52 (2012) 7-29.
Related Documents