Addressing Non-economic Losses and Damages Associated with Climate Change: Learning from the Recent Past Extreme Climatic Events for Future Planning Yohei Chiba and S.V.R.K. Prabhakar

Welcome message from author
This document is posted to help you gain knowledge. Please leave a comment to let me know what you think about it! Share it to your friends and learn new things together.
Transcript
Addressing Non-economic
Losses and Damages
Associated with Climate
Change: Learning from the
Recent Past Extreme
Climatic Events for Future
Planning
Yohei Chiba and S.V.R.K. Prabhakar

Addressing Non-economic Losses
and Damages Associated with
Climate Change: Learning from the
Recent Past Extreme Climatic Events
for Future Planning
Edited by:
Yohei Chiba and S.V.R.K. Prabhakar
Contact [email protected]
Institute for Global Environmental Strategies (IGES), Hayama, Japan
APN website: http://www.apn-gcr.org/resources/items/show/1943
IGES website: https://www.iges.or.jp/en/natural-resource/ad/landd.html
Suggested Citation Chiba, Y. and S.V.R.K. Prabhakar (Eds.). 2017. Addressing Non-economic Losses and
Damages Associated with Climate Change: Learning from the Recent Past Extreme Climatic
Events for Future Planning. Kobe, Japan: Asia-Pacific Network for Global Change Research
(APN) and Institute for Global Environmental Strategies (IGES).
Copyright © 2017 Asia-Pacific Network for Global Change Research
APN seeks to maximise discoverability and use of its knowledge and information. All publications
are made available through its online repository “APN E-Lib” (www.apn-gcr.org/resources/).
Unless otherwise indicated, APN publications may be copied, downloaded and printed for private
study, research and teaching purposes, or for use in non-commercial products or services.
Appropriate acknowledgement of APN as the source and copyright holder must be given, while
APN’s endorsement of users’ views, products or services must not be implied in any way. For
reuse requests: http://www.apn-gcr.org/?p=10807

Final Report: CAF2015-RR08-CMY-Chiba i
Table of Content
List of Contributors ........................................................................................................ iii
Acknowledgments ......................................................................................................... iii
Abbreviations ................................................................................................................iv
Summary ...................................................................................................................... v
Non-Economic Loss and Damages in Japan: A Case Study of Nachikatsuura Town .... 1
1. Introduction ............................................................................................................... 1
2. Methodology ............................................................................................................. 2
3. Results ...................................................................................................................... 8
4. Discussion .............................................................................................................. 11
5. Conclusions ............................................................................................................ 13
6. Future Directions .................................................................................................... 14
7. References ............................................................................................................. 14
Non-Economic Loss and Damages in Bangladesh: A Case Study of Koyra Upazila ... 17
1. Introduction ............................................................................................................. 17
2. Methodology ........................................................................................................... 18
3. Results .................................................................................................................... 29
4. Discussion .............................................................................................................. 34
5. Conclusions ............................................................................................................ 38
6. Future Directions .................................................................................................... 39
7. References ............................................................................................................. 39
Non-Economic Loss and Damages in India: Issues and Way Forward ....................... 43
1. Introduction ............................................................................................................. 43
2. Past Extreme events: Assessment of Damage and Loss ........................................ 45
3. Policy and Institutional Responses .......................................................................... 48
4. Conclusions and Way Forward ............................................................................... 49
5. References ............................................................................................................. 50
Economic and Non-Economic Loss and Damage from Droughts in Western India: The
Role of Adaptation Measures ...................................................................................... 53
1. Introduction ............................................................................................................. 53
2. Methodology ........................................................................................................... 55
Final Report: CAF2015-RR08-CMY-Chiba ii
3. Results and Discussion ........................................................................................... 62
4. Conclusions ............................................................................................................ 69
5. References ............................................................................................................. 71
6. Appendix ................................................................................................................. 74
Non-Economic Loss and Damage in Philippines: A Case Study of Super Typhoon
Yolanda ...................................................................................................................... 75
1. Introduction ............................................................................................................. 75
2. Methodology ........................................................................................................... 79
3. Results and Discussion ........................................................................................... 85
4. Conclusions .......................................................................................................... 100
5. Recommendation .................................................................................................. 101
6. References ........................................................................................................... 102
Non-Economic Loss and Damages in Thailand: A Case Study of Floods in Pathumthani
Province.................................................................................................................... 103
1. Introduction ........................................................................................................... 103
2. Methodology ......................................................................................................... 104
3. Results and Discussion ......................................................................................... 109
4. Conclusions .......................................................................................................... 114
5. References ........................................................................................................... 114
6. Appendix ............................................................................................................... 115
Final Report: CAF2015-RR08-CMY-Chiba iii
List of Contributors
The following are the contributors to this work, in alphabetical order:
1. Antonio P. Abamo Associate Professor and Dean, Visayas State University, Philippines
2. Md. Atikul Islam
Professor, Khulna University, Bangladesh 3. Chandra Sekhar Bahinipati
Assistant Professor, Gujarat Institute of Development Research, India 4. Sangam Shrestha
Associate Professor, Asian Institute of Technology
5. S.V.R.K. Prabhakar Senior Policy Researcher and Task Manager, IGES, Japan
6. Yohei Chiba
Policy Researcher, IGES, Japan
Acknowledgments We gratefully acknowledge several researchers, government officials, non-governmental
organizations and community members who participated in this project directly and
indirectly by providing valuable time, experiences and expertise, including being part of
the workshops, consultations and surveys conducted in this project.
Authors
Final Report: CAF2015-RR08-CMY-Chiba iv
Abbreviations AHP Analytic Hierarchy Process
BBS Bangladesh Bureau of Statistics
BDT Bangladeshi Taka
CCA Climate Change Adaptation
COP 16 Sixteenth Session of the Conference of the Parties
CR Consistency Ratio
D form Disaster form
DC Deputy Commissioner
DM Disaster Management
DRM Disaster Risk Management
DRR Disaster Risk Reduction
DRRO Disaster Relief and Rehabilitation Officer
ELDs Economic Loss and Damages
FGDs Focus Group Discussions
GDP Gross Domestic Product
GoB Government of Bangladesh
JPY Japanese Yen
KI Key Informant
L&Ds Loss and Damages
LGU Local Government Unit
M&V Measurability and Verifiability
NDRRMC National Disaster Risk Reduction and Management Council
NEDA National Economic and Development Authority
NELDs Non-Economic Loss and Damages
NGOs Non Government Organizations
NRDP National Disaster Response Plan
OCD Office of Civil Defense
ODK Open Data Kit
P or Php Philippine peso
PAG-ASA Philippine Atmospheric Geophysical and Astronomical Services
Administration
PAR Philippine Area of Responsibility
PDNA Post Disaster Needs Assessment
PIOs Project Implementation Officers
PTSD Post-Traumatic Stress Disorder
ST Super Typhoon
UNDP United Nations Development Programme
UNESCO United Nations Educational, Scientific and Cultural Organization
UNFCCC United Nations Framework Convention on Climate Change
UNISDR United Nations International Strategy for Disaster Reduction
UNO Upazila Nirbahi Officer
UP Union Parishad
Final Report: CAF2015-RR08-CMY-Chiba v
Summary
The non-economic loss and damages (NELDs) caused by climate-related disasters have
not been often considered in most disaster risk assessments and not been reported in
most post-disaster reports and databases to the extent they deserve the attention;
despite these losses could constitute major proportion of the total loss and damages
(L&Ds) of any disaster events. Issues such as lack of proper recognition among the
stakeholders engaged in disaster risk reduction (DRR) and climate change adaptation
(CCA) for value that society attaches to NELDs are compounded to a certain extent by
the lack of simple methods to identify, prioritize and measure NELDs constitute crucial
barriers in considering them in decision making at all levels. Keeping these in view, this
project aimed to develop an assessment framework to identify, prioritize and measure
NELDs in key vulnerable sectors and to make policy recommendations for addressing
NELDs targeting the key policy makers and the practitioners.
Keywords: Non-economic loss and damage, disaster risk reduction, climate change
adaptation, climate-related disasters, community
Key facts/figures
The project has trained 27 young researchers who are early into the research career which enabled them to: understand the subject of NELDs; and provide intellectual contribution to the project.
The project has sensitized more than 100 professionals, policy makers and researchers on the subject of NELDs in the context of DRR and CCA through participation in five project-organized workshops and presentations in various conferences, seminars and forum.
The project implemented approximately 900 household surveys (Japan: 175; Bangladesh: 247; India: 186; Philippines: 199; and Thailand: 100) to collect relevant information about key NELDs.
The project has quantified key NELDs in terms of monetary values to estimate and measure the NELD impacts. In case of Japan, the findings show that the economic loss and damages (ELDs) were 141 times higher than the NELDs of ‘mental diseases’ caused by Typhoon No.12 in 2011.
In case of Bangladesh, the findings demonstrates that the NELDs of ‘inaccessible to sanitation’, ‘waterborne diseases’ and ‘psychosocial disorder’ were 1.3 times higher than the ELDs caused by cyclone Aila in 2009.
In case of Philippines, the findings illustrate that the NELDs on ‘value of human life’ and ‘ecosystem services’ were much greater than the ELDs (including costs of infrastructure, agricultural crops, livestock and fishery) caused by Typhoon Yolanda (Haiyan) in 2013.
Final Report: CAF2015-RR08-CMY-Chiba vi
In case of Thailand, the findings suggest that the NELDs which incurred in two thematic areas of ‘human life and health’ and ‘water and sanitation’ were 74 times higher than the ELDs during the 2011 flood.
In case of India, the findings reveals that the average total economic value of a drought was INR 8,035, and the mean of NELD costs were INR 4,597, and that irrigation reduces the potential impact, while crop-insurance failed to mitigate L&Ds, particularly the NELDs.
Potential for further work
The project has helped identifying, prioritizing and measuring major NELDs caused by
climate-related disasters in the context of the study locations in order to integrate these
NELDs into decision-making on DRR and CCA efforts. One potential area for further
work is to enhance the valuation framework to quantify key NELD indicators in a way
that can be easily used by the governments and other stakeholders and not just the
academic community. This can contribute to more precisely quantifying the actual total
L&Ds, including both economic and non-economic aspects. In addition, the nature of
NELDs can be different, depending on local, regional and socioeconomic characteristics.
Thus, it is essential to build capacities of local governments for assessing NELDs with
the assessment framework developed through this project. Furthermore, it is necessary
to raise awareness of policymakers and practitioners about NELDs to invest in risk
mitigation.
Key Publications
1. Chiba, Y. and Prabhakar, S. (2017). Priority Practices for Addressing Non-economic Loss and Damage caused by Typhoons in Japan : Case Study of Nachikatsuura Town. IGES Research Report. Kanagawa, Japan: Institute for Global Environmental Strategies (IGES).
2. Chiba, Y. and Prabhakar, S. (2015). Addressing Non-Economic Loss and Damage Associated with Climate Change: Learning from Recent Past Extreme Climatic Events for Future Planning. APN Science Bulletin Issue 5 (March 2015), pp. 97.
3. Chiba, Y. and Prabhakar, S. (2014). Challenges in Assessing Non-Economic Loss and Damages of Climatic Disasters [PowerPoint slides]. Asia-Pacific Climate Change Adaptation Forum 2014, Kuala Lumpur, Malaysia, October 1-3.
4. Chiba, Y., Shaw, R. and Prabhakar, S. (2017). Climate change-related non-economic loss and damage in Bangladesh and Japan. International Journal of Climate Change Strategies and Management, 9(2), pp. 166–183.
5. Bahinipati, C. S. (2017). Can planned adaptation measures reduce loss and damage from droughts in western India [PowerPoint slides]. The INSEE Panel on ‘Climate Variability, Environmental Changes and Rural Livelihood’ in 5th Annual Conference the Network of Rural Agrarian Studies, Nabakrushna Choudhury Centre for Development Studies, Bhubaneswar, India, October 27-29.
6. Bahinipati, C. S. (2017). Economic and non-economic loss and damage from droughts in western India: Role of crop-insurance and irrigation [PowerPoint slides]. The 8th Annual Conference on Climate Change, titled ‘Climate Action: Mitigation and
Final Report: CAF2015-RR08-CMY-Chiba vii
Adaptation in a post Paris World’, Tata Institute of Social Sciences (TISS), Mumbai, India, August 4-5.
7. Bahinipati, C.S. (2017). Loss and damage from droughts in Western India: estimation and the role of adaptation measures. GIDR Working Paper, Gujarat Institute of Development Research (GIDR), Ahmedabad, India (forthcoming).
8. Bahinipati, C. S. (2015). Loss and damage associated with climatic extremes in India: Identification and methodological challenges [PowerPoint slides]. The International Conference on ‘Meeting equity in Climate Change: Paris and the Post-2015 Agenda’, organized by and held at Tata Institute of Social Sciences (TISS), Mumbai, India, July 31 - August 1.
9. Institute for Global Environmental Strategies (IGES) (2015). The Paris Climate Agreement and Beyond: Linking Short-term Climate Actions to Long-term Goals. Kanagawa, Japan: IGES.
10. Nishat, A. (2014). Challenges in assessing non-economic L&D of salinity in Bangladesh [PowerPoint slides]. Asia-Pacific Climate Change Adaptation Forum 2014, Kuala Lumpur, Malaysia, October 1-3.
11. Prabhakar, S. (2016). Addressing non-economic losses and damages associated with climate change: Learning from recent past extreme climatic events for future planning [PowerPoint slides]. The session on ‘SC 6.6 Linking climate change adaptation, disaster risk reduction, and loss & damage: lessons toward resilient Asia-Pacific region’ in Adaptation Futures 2016, Rotterdam, The Netherlands, May 10-13.
12. Prabhakar, S. Kamat, K. Hakimov, A, Chiba, Y. and Nakata, M. (2015). Loss and Damage Associated with Climate Change: What and Why, Stakeholder Perspectives, and a Way Forward. In The Paris Climate Agreement and Beyond: Linking Short-term Climate Actions to Long-term Goals (pp. 105-128).
13. Prabhakar, S., Kojima, S. Chiba, Y. and Endo, I. (2015). Addressing Non-economic Loss and Damage: Toward resilient society to climate change and natural disasters. In Climate Updates, IGES Climate. Kanagawa, Japan: Institute for Global Environmental Strategies (IGES).
14. Shrestha, M. and Shrestha, S. (2016). Identifying and Addressing Economic and Non-Economic Loss and Damages Associated with Climate Events in Thailand [Poster]. We actually had one poster presentation from this study. The Conference on ‘Decision Support System for Water and Environment Management: Improving the Understanding and Minimizing the Socioeconomic, Health and Environmental Impacts’, Hanoi, Vietnam, May 19.
1.1. Pull quotes
“We found the project to be invaluable for countries to prepare disaster loss and damage
information on non-economic aspect to achieve their sustainable development, climate
change adaptation, and disaster risk reduction.”
Mr. Yohei Chiba, IGES, Japan
Final Report: CAF2015-RR08-CMY-Chiba viii
“Non-economic loss and damages account for the significant proportion of total loss and
damages incurred through climatic events and this study provides clear evidence for it.
The project was an invaluable opportunity for us to take this subject forward addressing
the practical issues leading to improved understanding of risks faced by societies in the
changing climate”
Dr. S.V.R.K. Prabhakar, IGES, Japan
“A new frontier of knowledge and professionally exciting challenge in being able to
contribute to climate change science and technology research.”
Dr. Antonio P. Abamo, Visayas State University, Philippines
“The project identified the importance of non-economic loss and damages (NELDs)
related to cyclone hazard in Bangladesh which is often neglected in disaster
management policy of the country. So the project outcome will be valuable for
sustainable disaster management policy in Bangladesh.”
Prof. Md. Atikul Islam, Khulna University, Bangladesh
“I am indeed grateful to both APN and IGES for giving me an opportunity to work on non-
economic loss and damage from climate extremes. While doing this project, I have really
learned lot from the filed as well as project collaborators.”
Dr. Chandra Sekhar Bahinipati, GIDR, India
“The non-economic loss & damages in human life & health and water & sanitation sector
in flood affected areas of Thailand is estimated to be much higher than the economic
loss & damages.”
Dr. Sangam Shrestha, AIT, Thailand
Final Report: CAF2015-RR08-CMY-Chiba 1
Non-Economic Loss and Damages in Japan: A Case Study
of Nachikatsuura Town
Yohei Chiba and S.V.R.K. Prabhakar Institute for Global Environmental Strategies (IGES), Hayama,
Japan
1. Introduction Loss and damages (L&Ds) caused by climate-related disasters are one of the most
crucial challenges in the context of climate change. Particularly, the non-economic loss
and damages (NELDs), such as losses of human functions, social and cultural assets,
and environmental assets, have not been well considered in climate change adaptation
(CCA). In 2010, the sixteenth session of the Conference of the Parties (COP 16) under
United Nations Framework Convention on Climate Change (UNFCCC) recognized that
it was necessary to reduce the L&D (Decision 1/CP.16). The COP 19 in 2013 established
the Warsaw International Mechanism to tackle the L&Ds (Decision 2/CP.19). The Paris
Agreement of COP 21 in 2015 further reiterated the importance of addressing L&Ds
(Decision /CP.21). Despite of the positive advancement to the L&Ds, the
countermeasures to NELDs are still backward. This is because a common definition of
the NELDs has not been universally agreed yet, and it is difficult to adequately
understand, identify and estimate the NELDs since the variety of the NELDs directly and
indirectly incur through various pathways on individuals, society and environment
(UNFCCC, 2013).
Addressing NELDs is important in the context of CCA since inadequate addressing of
NELDs will be a major impediment to adaptation as most of the underlying communities’
vulnerabilities lie in the non-economic aspects, including dependency on social capital
and natural capital. This is especially the case with the rural communities of Japan
(Yoshitake & Deguchi, 2008; Tsutsumi, 2017). By not considering the impacts of NELDs,
the effectiveness of any adaptation interventions would be significantly reduced.
In Japan, climate-related disasters, such as Super Typhoons and the accompanying
record-breaking heavy rainfalls, have increasingly incurred in recent years. Looking at
the past few years, there were several significant typhoons. In particular, the Typhoon
No. 12 in 2011 caused severe L&D to the country. The record-breaking heavy rainfall by
the Typhoon No.12 caused landslides, inundation and river flooding and resulted in
significant damages and human casualties. Wakayama Prefecture, located in Kii
Peninsula, one of the most typhoon and rainfall prone areas in the country, recorded the
highest deaths of 56, out of total 82 deaths in all the prefectures in the country in 2011
(FDMA, 2012).
Final Report: CAF2015-RR08-CMY-Chiba 2
Learning the lessons from the past extreme typhoons, Japan has enhanced its
countermeasures on disaster risk reduction (DRR) and CCA. However, the
countermeasures are more likely to address clearer physical damages, such as
damages to houses and infrastructures. NELDs which are more likely to occur a little
later after the disaster, such as mental diseases and community disruption, have not
been sufficiently addressed in the existing countermeasures in the recovery phase.
Keeping the above in view, this study intends to:
1. Understand non-economic loss and damages (NELDs) caused by recent past major
climate-related disasters (i.e., Typhoon No.12 in 2011);
2. Develop an assessment framework where structured questionnaire surveys with key
indicators can be implemented in a participatory manner to identify, prioritize and
measure NELDs from climatic disasters, as well as expert consultations, focused
group discussions and associated quantitative analytical techniques; and
3. Make policy recommendations to strengthen the DRR and CCA plans and policies
at national and sub-national levels for mainstreaming and addressing the NELDs.
2. Methodology The study is based on sequential study workflows: 1) comprehensive literature review;
2) pre-survey on site; 3) expert consultation; 4) community consultation; 5) questionnaire
survey; and 6) data analysis by using the analytic hierarchy process (AHP) and
quantification methods. Comprehensive literature review on NELDs in context of DRR
and CCA was conducted to understand NELDs caused by climate-related disasters in
Japan. The pre-survey was also implemented in Wakayama to have a first-hand
experience of L&Ds caused by the typhoons. The AHP was used to prioritize key NELDs
caused by the 2011 Typhoon No. 12 in Nachikatsuura Town. Elements of AHP analysis
for NELDs consisted of decision criteria, indicators and risk reduction practices. These
elements were examined through comprehensive literature review, expert consultation,
and focus group discussion (FGD) in the affected community. Consequently, a
household questionnaire survey was conducted to prioritize key NELD-related elements
from the perspectives of the affected local communities and the local government
officials. The key NELD indicators identified through the questionnaire survey were
quantified in terms of monetary values to estimate and measure the NELD impacts.
2.1 Study location
Nachikatsuura Town, Wakayama Prefecture, was chosen as the study site for
reasons, including: severity of loss and damages from the Typhoon No. 12;
vulnerability to climatic disasters as rural small municipality; and abundance of
social, cultural and environmental assets, which can be impacted by NELDs.
Final Report: CAF2015-RR08-CMY-Chiba 3
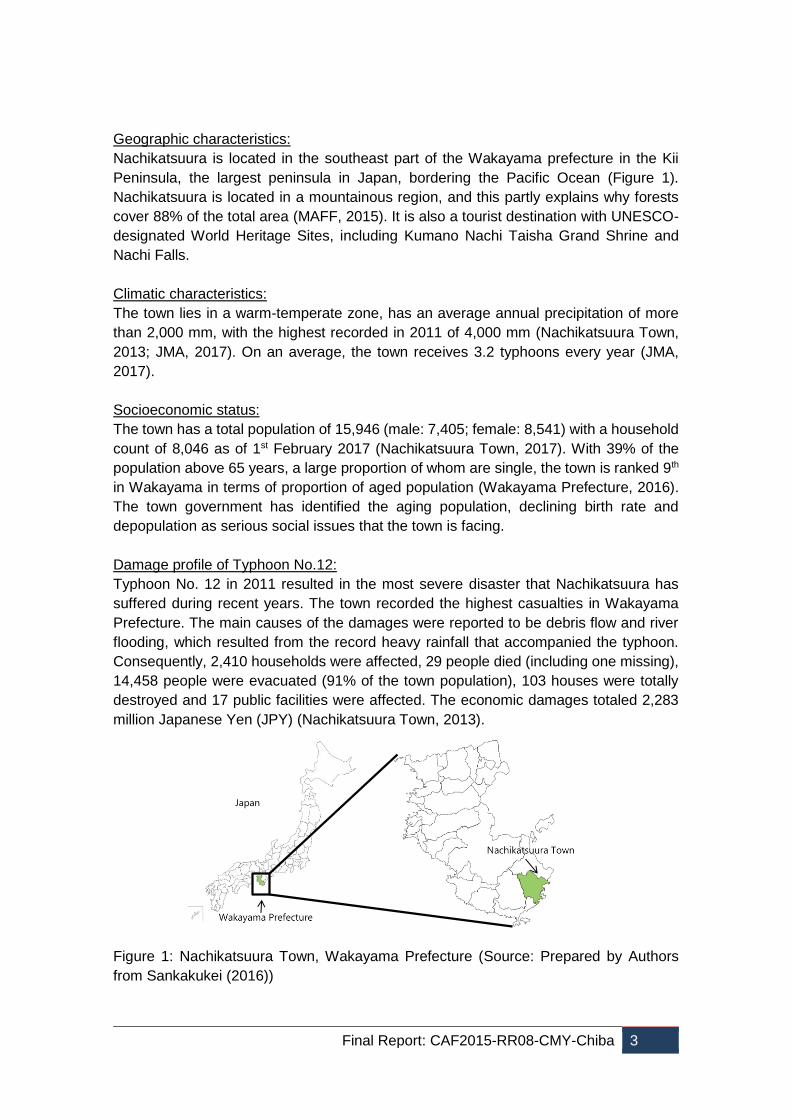
Geographic characteristics:
Nachikatsuura is located in the southeast part of the Wakayama prefecture in the Kii
Peninsula, the largest peninsula in Japan, bordering the Pacific Ocean (Figure 1).
Nachikatsuura is located in a mountainous region, and this partly explains why forests
cover 88% of the total area (MAFF, 2015). It is also a tourist destination with UNESCO-
designated World Heritage Sites, including Kumano Nachi Taisha Grand Shrine and
Nachi Falls.
Climatic characteristics:
The town lies in a warm-temperate zone, has an average annual precipitation of more
than 2,000 mm, with the highest recorded in 2011 of 4,000 mm (Nachikatsuura Town,
2013; JMA, 2017). On an average, the town receives 3.2 typhoons every year (JMA,
2017).
Socioeconomic status:
The town has a total population of 15,946 (male: 7,405; female: 8,541) with a household
count of 8,046 as of 1st February 2017 (Nachikatsuura Town, 2017). With 39% of the
population above 65 years, a large proportion of whom are single, the town is ranked 9th
in Wakayama in terms of proportion of aged population (Wakayama Prefecture, 2016).
The town government has identified the aging population, declining birth rate and
depopulation as serious social issues that the town is facing.
Damage profile of Typhoon No.12:
Typhoon No. 12 in 2011 resulted in the most severe disaster that Nachikatsuura has
suffered during recent years. The town recorded the highest casualties in Wakayama
Prefecture. The main causes of the damages were reported to be debris flow and river
flooding, which resulted from the record heavy rainfall that accompanied the typhoon.
Consequently, 2,410 households were affected, 29 people died (including one missing),
14,458 people were evacuated (91% of the town population), 103 houses were totally
destroyed and 17 public facilities were affected. The economic damages totaled 2,283
million Japanese Yen (JPY) (Nachikatsuura Town, 2013).
Figure 1: Nachikatsuura Town, Wakayama Prefecture (Source: Prepared by Authors
from Sankakukei (2016))
Japan
Final Report: CAF2015-RR08-CMY-Chiba 4
2.2 Literature review & pre-survey at field on NELDs
Japan has suffered countless earthquake, typhoons and other types of disasters due to
its geographical and geological characteristics (JICA, 2015). In particular, typhoons and
accompanying wind and flood related disasters have occurred year after year. They are
expected to increase in their frequency and intensity due to climate change impacts
(MOEJ, 2015). During the past few years, there are several major typhoons, and the
Typhoon No.12 in 2011 especially caused significant L&Ds to Japan and has contributed
significant lessons for improving the disaster risk management (DRM) in the country. In
particular, Wakayama prefecture suffered serious L&Ds from the typhoon. Literature
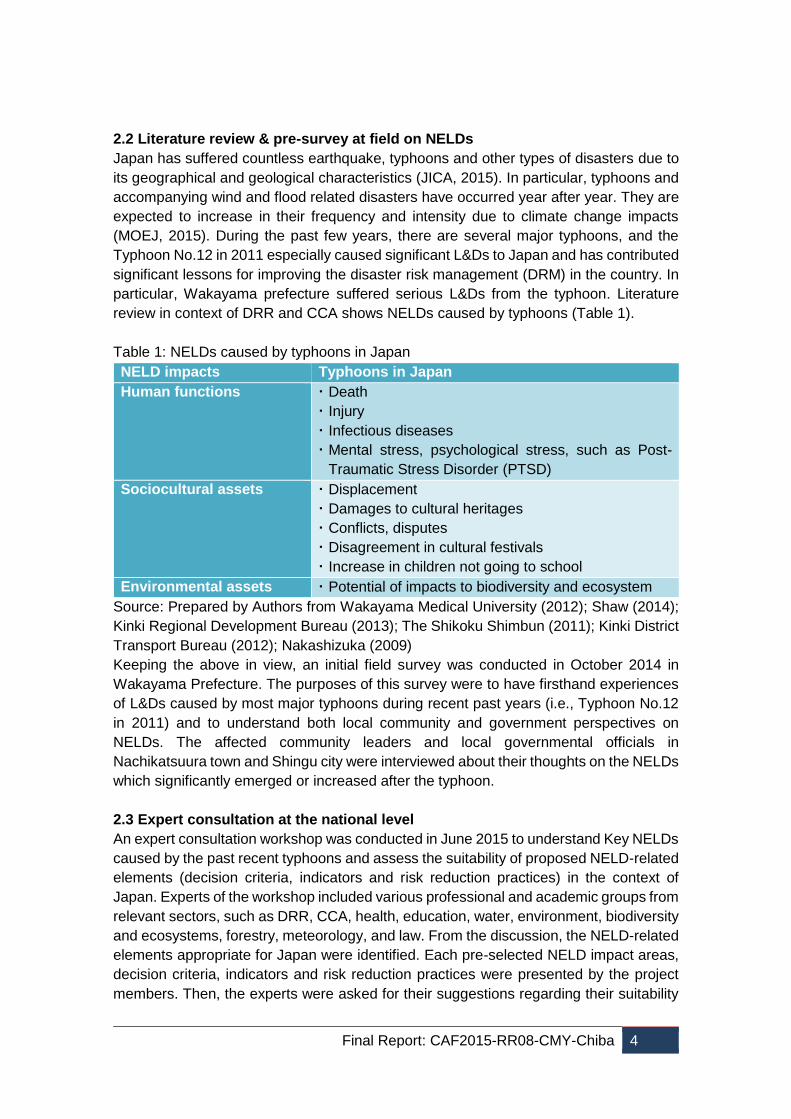
review in context of DRR and CCA shows NELDs caused by typhoons (Table 1).
Table 1: NELDs caused by typhoons in Japan
NELD impacts Typhoons in Japan
Human functions Death
Injury
Infectious diseases
Mental stress, psychological stress, such as Post-
Traumatic Stress Disorder (PTSD)
Sociocultural assets Displacement
Damages to cultural heritages
Conflicts, disputes
Disagreement in cultural festivals
Increase in children not going to school
Environmental assets Potential of impacts to biodiversity and ecosystem
Source: Prepared by Authors from Wakayama Medical University (2012); Shaw (2014);
Kinki Regional Development Bureau (2013); The Shikoku Shimbun (2011); Kinki District
Transport Bureau (2012); Nakashizuka (2009)
Keeping the above in view, an initial field survey was conducted in October 2014 in
Wakayama Prefecture. The purposes of this survey were to have firsthand experiences
of L&Ds caused by most major typhoons during recent past years (i.e., Typhoon No.12
in 2011) and to understand both local community and government perspectives on
NELDs. The affected community leaders and local governmental officials in
Nachikatsuura town and Shingu city were interviewed about their thoughts on the NELDs
which significantly emerged or increased after the typhoon.
2.3 Expert consultation at the national level
An expert consultation workshop was conducted in June 2015 to understand Key NELDs
caused by the past recent typhoons and assess the suitability of proposed NELD-related
elements (decision criteria, indicators and risk reduction practices) in the context of
Japan. Experts of the workshop included various professional and academic groups from
relevant sectors, such as DRR, CCA, health, education, water, environment, biodiversity
and ecosystems, forestry, meteorology, and law. From the discussion, the NELD-related
elements appropriate for Japan were identified. Each pre-selected NELD impact areas,
decision criteria, indicators and risk reduction practices were presented by the project
members. Then, the experts were asked for their suggestions regarding their suitability
Final Report: CAF2015-RR08-CMY-Chiba 5
and priority in terms of typhoons in Japan. Through discussion with the experts, some of
the areas, criteria, indicators and practices were excluded and included in the context of
Japan.
2.4 Community consultation
After the expert consultation, a community consultation through focus group discussion
(FGD) was conducted in June 2016 to evaluate the key NELD-related elements (decision
criteria, indicators and risk reduction practices) from the community perspective. Iseki
District in Nachikatsuura was selected as the site since it was one of the most severely
affected districts in the town. The NELD-related elements vetted by the experts were
presented by the project members, and then 9 community members of the district were
asked to identify three most important NELD-related elements.
2.5 AHP-based survey
2.5.1 Analytic hierarchy process (AHP)
This study used the AHP to prioritize key NELDs caused by the Typhoon No.12 in Nachikatsuura. Table 2 shows Saaty’s fundamental judgement scales for pairwise comparison used in this study. The AHP is suitable for this study as it helps solving problems that are hierarchical in nature and helps in reconciling opinions of multiple stakeholders in deriving a common agreement. Microsoft Excel was used for the AHP analysis. The aggregation of individual priorities was done by geometric mean of individual priorities (Forman & Peniwati, 1998).
Table 2: Fundamental judgement scales for pairwise comparisons
Scale Description
1 Equal importance of both options
3 Moderate importance of one over another
5 Strong importance for one over another
7 Very strong importance for one over another
9 Extreme importance for one over another
Source: Prepared by Authors from Saaty (1990) The elements of AHP analysis for NELDs included three components: 1) relevant decision-making criteria, 2) indicators; and 3) risk reduction practices. The NELD elements were identified, examined and narrowed down through comprehensive literature review, expert consultation and FGD in the affected community (See Section 2.2, 2.3 and 2.4).
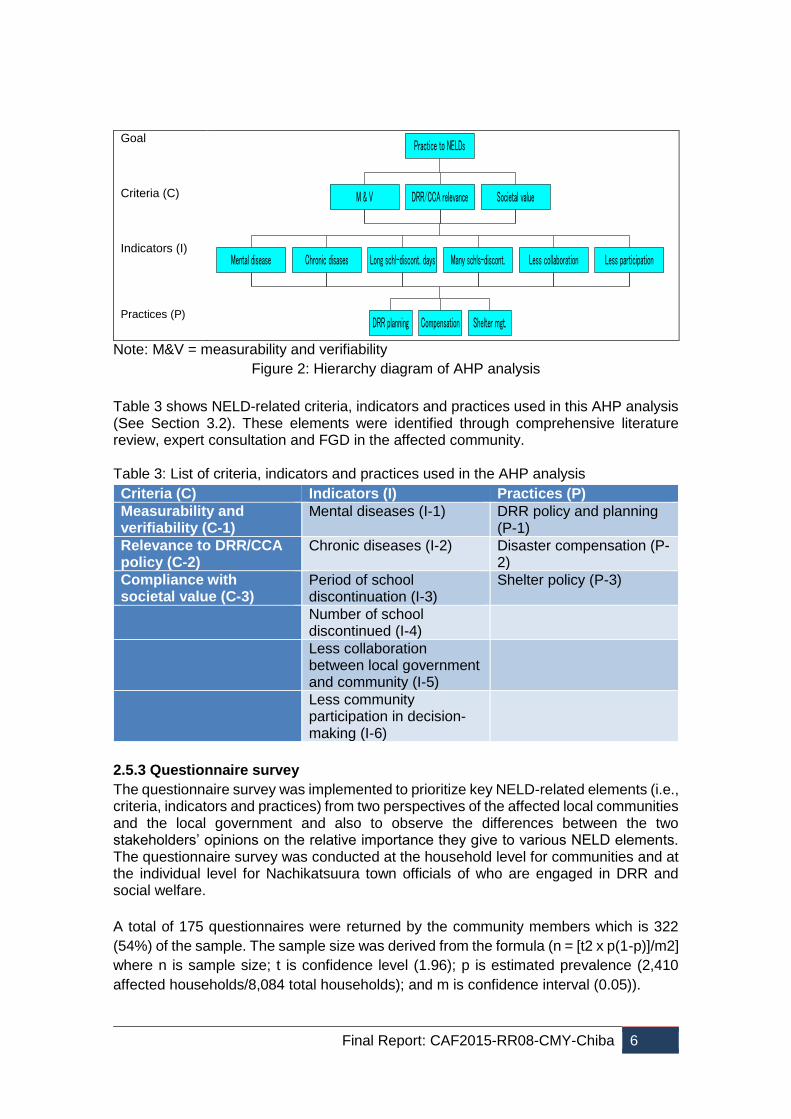
2.5.2 Structure of the decision hierarchy
Figure 2 presents the hierarchy diagram of the AHP which reflected the identified key NELD-related elements (criteria, indicators and risk reduction practices) in Nachikatsuura. The goal of this AHP was set as ‘selection of best risk reduction practices for addressing NELDs caused by the Typhoon No.12’. It assumes that the NELDs should be addressed for better post-disaster recovery.
Final Report: CAF2015-RR08-CMY-Chiba 6
Goal Criteria (C) Indicators (I) Practices (P)
M & V DRR/CCA relevance Societal value
Mental disease Chronic disases Long schl-discont. days Many schls-discont. Less collaboration Less participation
DRR planning Compensation Shelter mgt.
Practice to NELDs
Note: M&V = measurability and verifiability
Figure 2: Hierarchy diagram of AHP analysis
Table 3 shows NELD-related criteria, indicators and practices used in this AHP analysis (See Section 3.2). These elements were identified through comprehensive literature review, expert consultation and FGD in the affected community. Table 3: List of criteria, indicators and practices used in the AHP analysis
Criteria (C) Indicators (I) Practices (P)
Measurability and verifiability (C-1)
Mental diseases (I-1) DRR policy and planning (P-1)
Relevance to DRR/CCA policy (C-2)
Chronic diseases (I-2) Disaster compensation (P-2)
Compliance with societal value (C-3)
Period of school discontinuation (I-3)
Shelter policy (P-3)
Number of school discontinued (I-4)
Less collaboration between local government and community (I-5)
Less community participation in decision-making (I-6)
2.5.3 Questionnaire survey
The questionnaire survey was implemented to prioritize key NELD-related elements (i.e., criteria, indicators and practices) from two perspectives of the affected local communities and the local government and also to observe the differences between the two stakeholders’ opinions on the relative importance they give to various NELD elements. The questionnaire survey was conducted at the household level for communities and at the individual level for Nachikatsuura town officials of who are engaged in DRR and social welfare.
A total of 175 questionnaires were returned by the community members which is 322
(54%) of the sample. The sample size was derived from the formula (n = [t2 x p(1-p)]/m2]
where n is sample size; t is confidence level (1.96); p is estimated prevalence (2,410
affected households/8,084 total households); and m is confidence interval (0.05)).
Final Report: CAF2015-RR08-CMY-Chiba 7
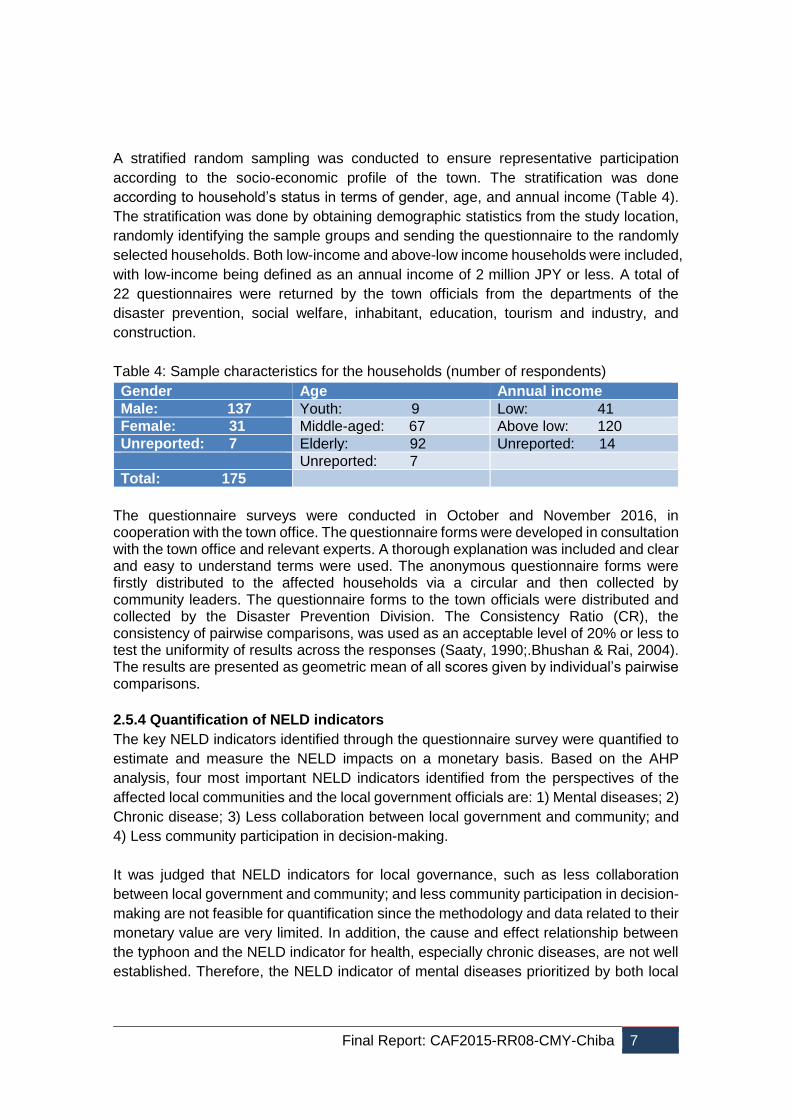
A stratified random sampling was conducted to ensure representative participation
according to the socio-economic profile of the town. The stratification was done
according to household’s status in terms of gender, age, and annual income (Table 4).
The stratification was done by obtaining demographic statistics from the study location,
randomly identifying the sample groups and sending the questionnaire to the randomly
selected households. Both low-income and above-low income households were included,
with low-income being defined as an annual income of 2 million JPY or less. A total of
22 questionnaires were returned by the town officials from the departments of the
disaster prevention, social welfare, inhabitant, education, tourism and industry, and
construction.
Table 4: Sample characteristics for the households (number of respondents)
Gender Age Annual income
Male: 137 Youth: 9 Low: 41
Female: 31 Middle-aged: 67 Above low: 120
Unreported: 7 Elderly: 92 Unreported: 14
Unreported: 7
Total: 175
The questionnaire surveys were conducted in October and November 2016, in cooperation with the town office. The questionnaire forms were developed in consultation with the town office and relevant experts. A thorough explanation was included and clear and easy to understand terms were used. The anonymous questionnaire forms were firstly distributed to the affected households via a circular and then collected by community leaders. The questionnaire forms to the town officials were distributed and collected by the Disaster Prevention Division. The Consistency Ratio (CR), the consistency of pairwise comparisons, was used as an acceptable level of 20% or less to test the uniformity of results across the responses (Saaty, 1990;.Bhushan & Rai, 2004). The results are presented as geometric mean of all scores given by individual’s pairwise comparisons.
2.5.4 Quantification of NELD indicators
The key NELD indicators identified through the questionnaire survey were quantified to
estimate and measure the NELD impacts on a monetary basis. Based on the AHP
analysis, four most important NELD indicators identified from the perspectives of the
affected local communities and the local government officials are: 1) Mental diseases; 2)
Chronic disease; 3) Less collaboration between local government and community; and
4) Less community participation in decision-making.
It was judged that NELD indicators for local governance, such as less collaboration
between local government and community; and less community participation in decision-
making are not feasible for quantification since the methodology and data related to their
monetary value are very limited. In addition, the cause and effect relationship between
the typhoon and the NELD indicator for health, especially chronic diseases, are not well
established. Therefore, the NELD indicator of mental diseases prioritized by both local
Final Report: CAF2015-RR08-CMY-Chiba 8
communities and local government officials was considered for the quantification, as a
trial.
For simplicity, the monetary value was defined as the following formula:
Monetary value = [Number of people affected] x [Average costs associated with
parameters under the NELD indicator]
The parameters selected for ‘mental diseases’ are:
1. Medical cost
2. Transportation cost
Hence, the monetary value for ‘mental diseases’ is:
Monetary value = [Number of people affected] x [Average medical cost + Average
transportation cost]
The information on number of people affected by mental diseases; medical fee; and
transportation cost were not collected by the town office as disaster data collection format
does not require the collection of such information (FDMA, 2001). Besides that, the
questionnaire survey could not obtain valid information about the above formula from
sample households.
Therefore, estimated values of each parameter substitute in available literature and the
questionnaire survey were used to quantify:
Number of people affected by mental diseases = Number of affected households by
the typhoon (Nachikatsuura Town, 2013) x Average number of a household x
Percentage of households affected by mental diseases
(Note: the information about average number of a household and percentage of
households affected by mental diseases was collected by the questionnaire survey.)
Average medical cost = Medical cost of mental diseases per person (Japan JHIA,
2013)
Average transportation cost = Taxi minimum fare (one way) of Nachikatsuura x 2
(Note: the information about taxi minimum fare was obtained from websites of local
taxi companies.)
3. Results
3.1 Pre-survey at field
The major findings from the interview with community leaders and local governmental
officials in Nachikatsuura town and Shingu city are shown as the follows:
Community leaders’ perspectives on the NELDs:
Impacts on health: physical illness, trauma, mental stress
Impacts on social/cultural capitals: displacement, troubles between men and women
or among affected people, deterioration of interpersonal relations
Impacts on education: children not attending school
Final Report: CAF2015-RR08-CMY-Chiba 9
Impacts on environment: never-seen-before grasses, outbreak of mold
Local governmental officials’ perspectives on the NELDs:
Impacts on health: mental stress, PTSD, fear (many of the voices raised from
evacuees)
Impacts on social/cultural capitals: displacement, decrease in tourists to cultural
heritages
Impacts on education: schools discontinued
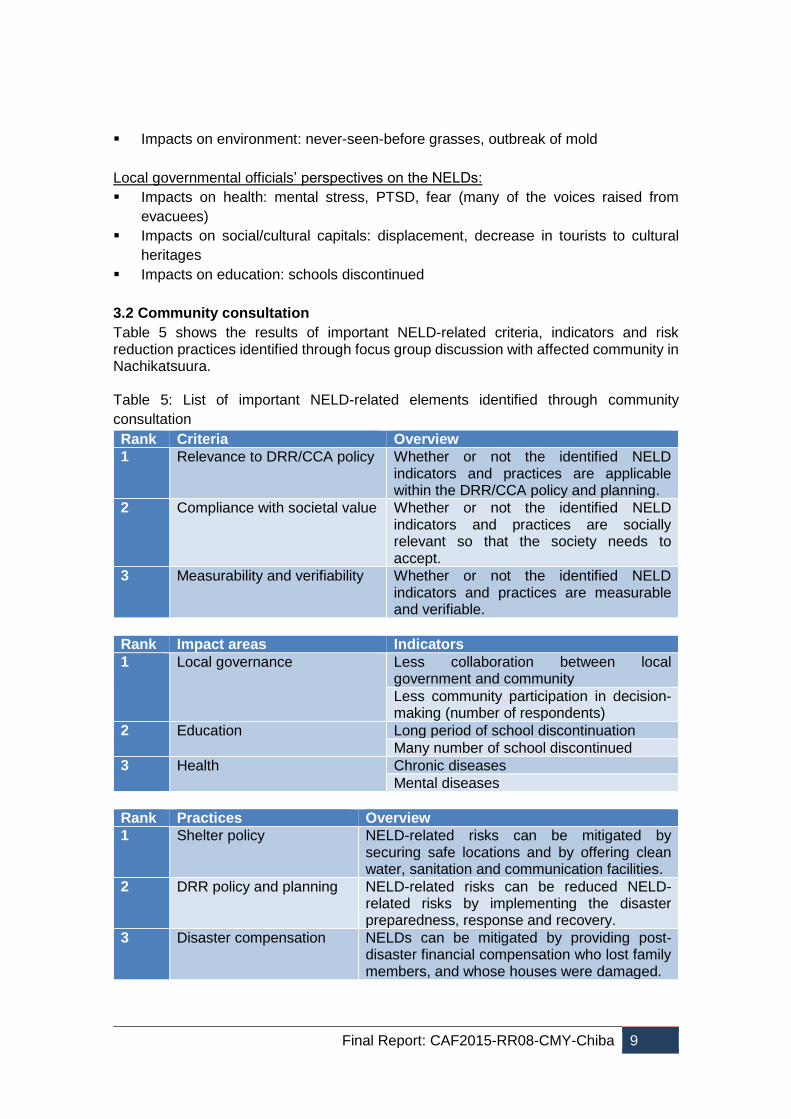
3.2 Community consultation
Table 5 shows the results of important NELD-related criteria, indicators and risk reduction practices identified through focus group discussion with affected community in Nachikatsuura. Table 5: List of important NELD-related elements identified through community
consultation
Rank Criteria Overview
1 Relevance to DRR/CCA policy Whether or not the identified NELD indicators and practices are applicable within the DRR/CCA policy and planning.
2 Compliance with societal value Whether or not the identified NELD indicators and practices are socially relevant so that the society needs to accept.
3 Measurability and verifiability Whether or not the identified NELD indicators and practices are measurable and verifiable.
Rank Impact areas Indicators
1 Local governance Less collaboration between local government and community
Less community participation in decision-making (number of respondents)
2 Education Long period of school discontinuation
Many number of school discontinued
3 Health Chronic diseases
Mental diseases
Rank Practices Overview
1 Shelter policy NELD-related risks can be mitigated by securing safe locations and by offering clean water, sanitation and communication facilities.
2 DRR policy and planning NELD-related risks can be reduced NELD-related risks by implementing the disaster preparedness, response and recovery.
3 Disaster compensation NELDs can be mitigated by providing post-disaster financial compensation who lost family members, and whose houses were damaged.
Final Report: CAF2015-RR08-CMY-Chiba 10
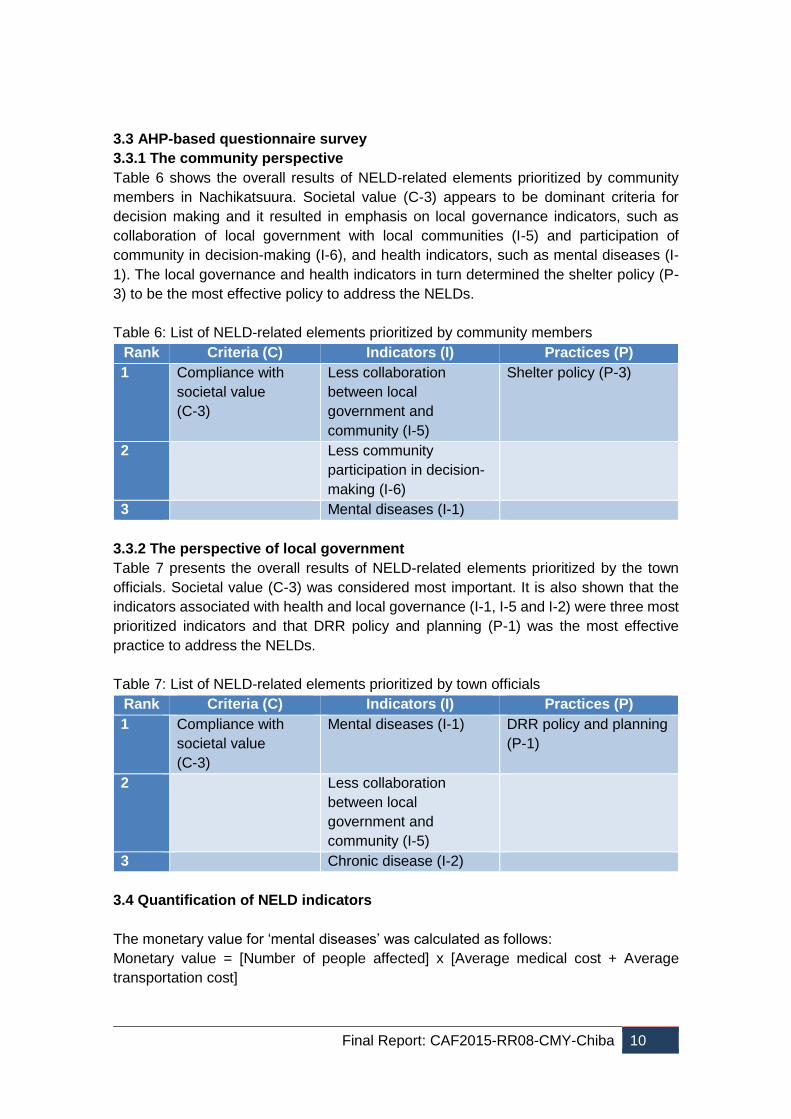
3.3 AHP-based questionnaire survey
3.3.1 The community perspective
Table 6 shows the overall results of NELD-related elements prioritized by community
members in Nachikatsuura. Societal value (C-3) appears to be dominant criteria for
decision making and it resulted in emphasis on local governance indicators, such as
collaboration of local government with local communities (I-5) and participation of
community in decision-making (I-6), and health indicators, such as mental diseases (I-
1). The local governance and health indicators in turn determined the shelter policy (P-
3) to be the most effective policy to address the NELDs.
Table 6: List of NELD-related elements prioritized by community members
Rank Criteria (C) Indicators (I) Practices (P)
1 Compliance with
societal value
(C-3)
Less collaboration
between local
government and
community (I-5)
Shelter policy (P-3)
2 Less community
participation in decision-
making (I-6)
3 Mental diseases (I-1)
3.3.2 The perspective of local government
Table 7 presents the overall results of NELD-related elements prioritized by the town
officials. Societal value (C-3) was considered most important. It is also shown that the
indicators associated with health and local governance (I-1, I-5 and I-2) were three most
prioritized indicators and that DRR policy and planning (P-1) was the most effective
practice to address the NELDs.
Table 7: List of NELD-related elements prioritized by town officials
Rank Criteria (C) Indicators (I) Practices (P)
1 Compliance with
societal value
(C-3)
Mental diseases (I-1) DRR policy and planning
(P-1)
2 Less collaboration
between local
government and
community (I-5)
3 Chronic disease (I-2)
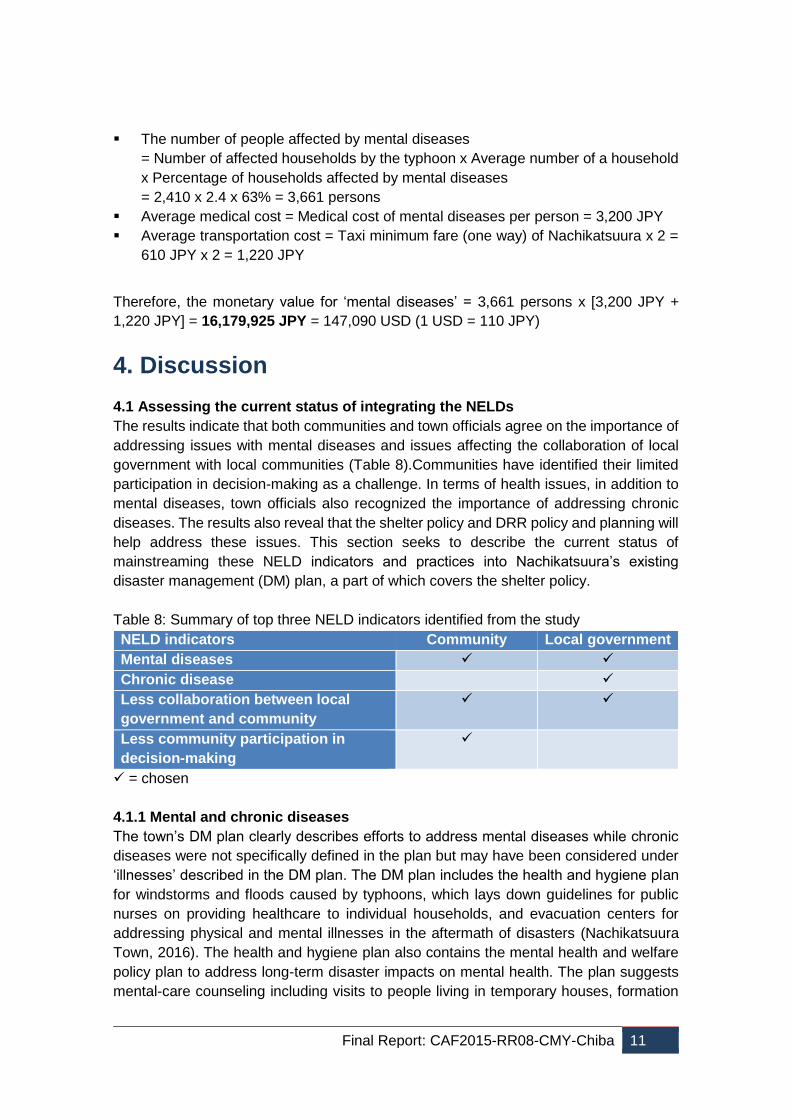
3.4 Quantification of NELD indicators
The monetary value for ‘mental diseases’ was calculated as follows:
Monetary value = [Number of people affected] x [Average medical cost + Average
transportation cost]
Final Report: CAF2015-RR08-CMY-Chiba 11
The number of people affected by mental diseases
= Number of affected households by the typhoon x Average number of a household
x Percentage of households affected by mental diseases
= 2,410 x 2.4 x 63% = 3,661 persons
Average medical cost = Medical cost of mental diseases per person = 3,200 JPY
Average transportation cost = Taxi minimum fare (one way) of Nachikatsuura x 2 =
610 JPY x 2 = 1,220 JPY
Therefore, the monetary value for ‘mental diseases’ = 3,661 persons x [3,200 JPY +
1,220 JPY] = 16,179,925 JPY = 147,090 USD (1 USD = 110 JPY)
4. Discussion
4.1 Assessing the current status of integrating the NELDs
The results indicate that both communities and town officials agree on the importance of
addressing issues with mental diseases and issues affecting the collaboration of local
government with local communities (Table 8).Communities have identified their limited
participation in decision-making as a challenge. In terms of health issues, in addition to
mental diseases, town officials also recognized the importance of addressing chronic
diseases. The results also reveal that the shelter policy and DRR policy and planning will
help address these issues. This section seeks to describe the current status of
mainstreaming these NELD indicators and practices into Nachikatsuura’s existing
disaster management (DM) plan, a part of which covers the shelter policy.
Table 8: Summary of top three NELD indicators identified from the study
NELD indicators Community Local government
Mental diseases
Chronic disease
Less collaboration between local
government and community
Less community participation in
decision-making
= chosen
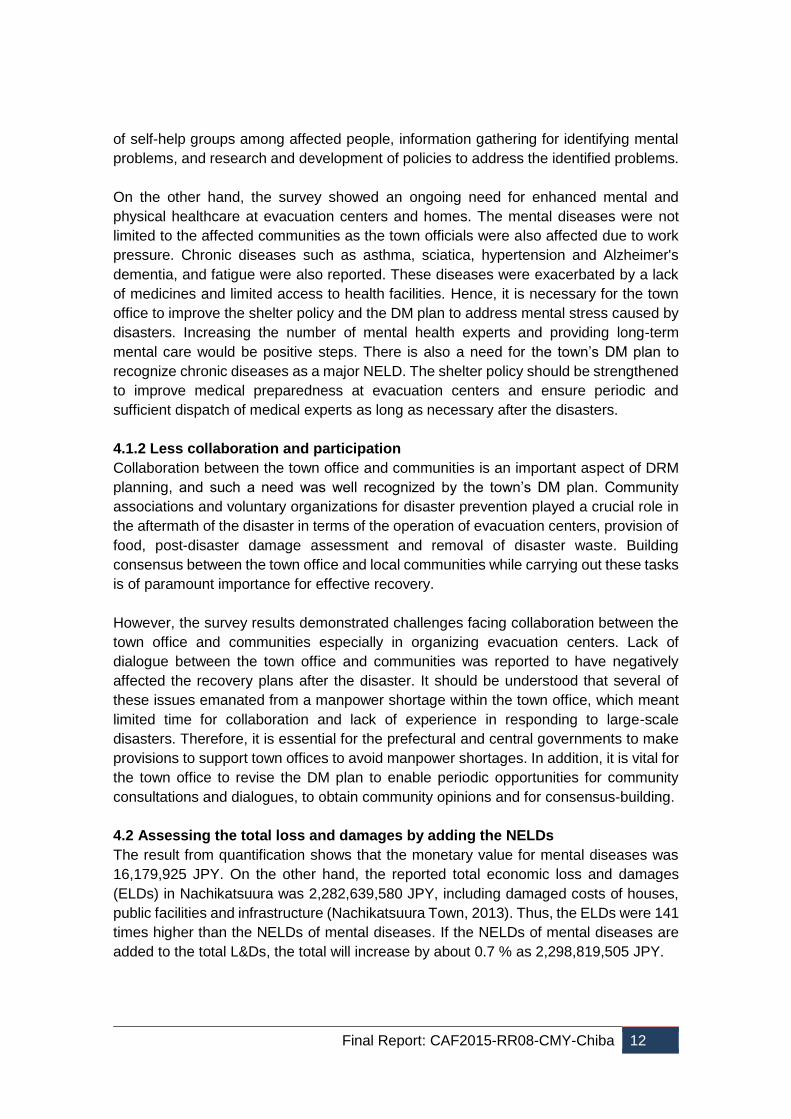
4.1.1 Mental and chronic diseases
The town’s DM plan clearly describes efforts to address mental diseases while chronic
diseases were not specifically defined in the plan but may have been considered under
‘illnesses’ described in the DM plan. The DM plan includes the health and hygiene plan
for windstorms and floods caused by typhoons, which lays down guidelines for public
nurses on providing healthcare to individual households, and evacuation centers for
addressing physical and mental illnesses in the aftermath of disasters (Nachikatsuura
Town, 2016). The health and hygiene plan also contains the mental health and welfare
policy plan to address long-term disaster impacts on mental health. The plan suggests
mental-care counseling including visits to people living in temporary houses, formation
Final Report: CAF2015-RR08-CMY-Chiba 12
of self-help groups among affected people, information gathering for identifying mental
problems, and research and development of policies to address the identified problems.
On the other hand, the survey showed an ongoing need for enhanced mental and
physical healthcare at evacuation centers and homes. The mental diseases were not
limited to the affected communities as the town officials were also affected due to work
pressure. Chronic diseases such as asthma, sciatica, hypertension and Alzheimer's
dementia, and fatigue were also reported. These diseases were exacerbated by a lack
of medicines and limited access to health facilities. Hence, it is necessary for the town
office to improve the shelter policy and the DM plan to address mental stress caused by
disasters. Increasing the number of mental health experts and providing long-term
mental care would be positive steps. There is also a need for the town’s DM plan to
recognize chronic diseases as a major NELD. The shelter policy should be strengthened
to improve medical preparedness at evacuation centers and ensure periodic and
sufficient dispatch of medical experts as long as necessary after the disasters.
4.1.2 Less collaboration and participation
Collaboration between the town office and communities is an important aspect of DRM
planning, and such a need was well recognized by the town’s DM plan. Community
associations and voluntary organizations for disaster prevention played a crucial role in
the aftermath of the disaster in terms of the operation of evacuation centers, provision of
food, post-disaster damage assessment and removal of disaster waste. Building
consensus between the town office and local communities while carrying out these tasks
is of paramount importance for effective recovery.
However, the survey results demonstrated challenges facing collaboration between the
town office and communities especially in organizing evacuation centers. Lack of
dialogue between the town office and communities was reported to have negatively
affected the recovery plans after the disaster. It should be understood that several of
these issues emanated from a manpower shortage within the town office, which meant
limited time for collaboration and lack of experience in responding to large-scale
disasters. Therefore, it is essential for the prefectural and central governments to make
provisions to support town offices to avoid manpower shortages. In addition, it is vital for
the town office to revise the DM plan to enable periodic opportunities for community
consultations and dialogues, to obtain community opinions and for consensus-building.
4.2 Assessing the total loss and damages by adding the NELDs
The result from quantification shows that the monetary value for mental diseases was
16,179,925 JPY. On the other hand, the reported total economic loss and damages
(ELDs) in Nachikatsuura was 2,282,639,580 JPY, including damaged costs of houses,
public facilities and infrastructure (Nachikatsuura Town, 2013). Thus, the ELDs were 141
times higher than the NELDs of mental diseases. If the NELDs of mental diseases are
added to the total L&Ds, the total will increase by about 0.7 % as 2,298,819,505 JPY.
Final Report: CAF2015-RR08-CMY-Chiba 13
This study sought to only quantify mental diseases by using limited number of
parameters associated with the costs of mental diseases, such as medical cost and
transportation cost. If the other relevant parameters are considered and also other key
NELDs could be quantified, the total L&Ds will significantly increase. This indicates that
the low attention paid to NELDs can result in significant underestimation of the actual
disaster L&Ds, and this can induce insufficient investments in post-disaster recovery and
limited decision-making on DRR and CCA efforts, and lead to decrease in community
resilience to climatic disasters (Morrissey and Oliver-Smith, 2013; IPCC, 2014).
Therefore, the measurement and reporting frameworks for key NELDs identified, such
as mental and chronic diseases, collaboration between local government and community,
and community participation in decision-making, are essential to collect adequate
information for aid decision-making. These indicators should be included in the data
formats to ensure L&Ds are fully reported.
5. Conclusions The study aimed to understand NELDs caused by Typhoon No.12 in 2011, develop an
assessment framework to identify, prioritize and measure the NELDs, and strengthen
the DRR and CCA plans and policies for addressing the NELDs. The study location was
Nachikatsuura Town, Wakayama Prefecture in Japan. The study conducted
comprehensive literature review on NELDs in context of DRR and CCA and then
implemented the pre-survey in Wakayama to have a first-hand experience of L&Ds
caused by the typhoons. The study applied the AHP analysis to prioritize key NELD-
related criteria, indicators and practices, which were in order examined through:
comprehensive literature review; expert consultation; and FGD in the affected
community. Questionnaire surveys were conducted to prioritize the key NELD-related
elements, targeting the affected communities and local government officials. The key
NELD indicators identified through the questionnaire survey were quantified in terms of
monetary values to estimate and measure the NELD impacts.
The study identified relevance to DRR/CCA policy, compliance with societal value and
measurability and verifiability as important criteria, through expert and community
consultations. It also specified less collaboration between local government and
community, less community participation in decision-making, long period of school
discontinuation, many number of school discontinued, chronic diseases and mental
diseases as important NELD indicators. In addition, it found shelter policy, DRR policy
and planning and disaster compensation as important practices to address NELDs.
It then identified several similarities and differences between the preferences of the
affected communities and town officials. The affected communities identified social value,
collaboration of local government with local communities and shelter policy as the most
important criterion, indicator and practice for each. The results were similar to those of
the town officials, except on practice, where DRR policy and planning was prioritized
instead of shelter policy.
Final Report: CAF2015-RR08-CMY-Chiba 14
It showed that mental diseases and shelter management are closely related. This raises
a need to support vulnerable people by mobilizing more mental health experts and
providing long-term mental care. In addition, providing mental-care to the town officials
is necessary as they face significant mental pressure in the aftermath of the disaster.
There is also a need to recognize and address chronic diseases as a major NELD in the
town’s DM plan and strengthen the shelter policy in terms of medical preparedness at
evacuation centers and periodic dispatch of medical experts. Moreover, it is essential for
the town office to improve the shelter policy and related DM plan in ways that strengthen
collaboration between the town office and local communities. It is imperative for the town
office to improve the DM plan by establishing communication channels to seek opinions
and for consensus-building with communities. The prefectural and central governments
should make provisions for supporting town offices to avoid manpower shortages and
strengthen their human resources and technical capacity to prepare for, cope with and
recover from disasters.
Another concern is that the total L&Ds will significantly increase if key NELDs could be
quantified. The result shows if the NELDs of mental diseases are added on the reported
economic L&Ds, the total L&D costs will increase by about 0.7 %. Thus, the
measurement and reporting frameworks for key NELDs identified, such as mental and
chronic diseases, collaboration between local government and community, and
community participation in decision-making, are necessary. These indicators should be
included in the data formats to ensure L&Ds are fully reported.
6. Future Directions This study identified and prioritized key NELDs in the context of the study location and
identified important practices that could address these impacts. It then quantified only
the NELD indicator for mental diseases on a monetary basis by using limited number of
parameters associated with the costs of mental diseases. As a further study scope, it is
important to enhance the valuation framework to consider other relevant parameters for
mental diseases and to quantify other key NELD indicators in order to more precisely
figure out the actual total L&Ds which are more likely to significantly increase if they are
added.
7. References Bhushan, N. and Rai, K. (2004). Strategic decision making : applying the analytic
hierarchy process. Berlin, Germany: Springer-Verlag London Limited. Fire and Disaster Management Agency (FDMA) (2001). Guideline of the disaster
report. Tokyo, Japan: FDMA. Fire and Disaster Management Agency (FDMA) (2012). 20th Report: Status of
Typhoon No.12 in 2011 and Activities of FDMA (As of 28 September 2012). Tokyo, Japan: FDMA.
Forman, E. and Peniwati, K. (1998). Aggregating individual judgments and priorities with the analytic hierarchy process. European Journal of Operational Research, 108(1), 165–169.
Final Report: CAF2015-RR08-CMY-Chiba 15
IPCC (2014). Climate Change 2014: Impacts, Adaptation, and Vulnerability. Part A: Global and Sectoral Aspects. Contribution of Working Group II to the Fifth Assessment Report of the Intergovernmental Panel on Climate Change. Cambridge, United Kingdom and New York, NY, USA: Cambridge University Press.
Japan Health Insurance Association (JHIA) (2013). Statistical Information of Medical Cost in FY2013. Retrieved June 13, 2017, from https://www.kyoukaikenpo.or.jp/~/media/Files/wakayama/toukeizyouhou/h25toukei.pdf
Japan International Cooperation Agency (JICA) (2015). BOSAI. Tokyo, Japan: JICA. Japan Meteorological Agency (JMA). (2017a). Annual precipitation in Irokawa.
Retrieved April 4, 2017, from http://www.data.jma.go.jp/obd/stats/etrn/view/annually_a.php?prec_no=65&block_no=1172&year=2011&month=&day=&view=
Japan Meteorological Agency (JMA) (2017b). Average numbers of typhoons. Retrieved April 4, 2017, from http://www.data.jma.go.jp/fcd/yoho/typhoon/statistics/average/average.html
Ministry of Agriculture, Forestry and Fisheries (MAFF) (2015). Nachikatsuura Town, Wakayama. Retrieved February 9, 2017, from http://www.machimura.maff.go.jp/machi/contents/30/421/details.html
Ministry of the Environment (MOEJ) (2015). National Adaptation Plan to Climate Change Impacts (Draft). Tokyo, Japan: MOEJ.
MLIT (2012). Report on reputational damage to tourism from Typhoon No.12 (Wakayama Prefecture). Osaka, Japan: MLIT.
MLIT (2013). 2011 Kii Peninsula Flood Disaster (Typhoon No.12, Typhoon No.15). Osaka, Japan: MLIT.
Morrissey, J. and Oliver-Smith, A. (2013). Perspectives on Non-Economic Loss and Damage: Understanding values at risk from climate change. (K. Warner & S. Kreft, Eds.). Bonn: Loss and Damage in Vulnerable Countries Initiative, United Nations University.
Nachikatsuura Town (2013). Kii Peninsula Flood Disaster. Wakayama, Japan: Nachikatsuura Town.
Nachikatsuura Town (2016). Nachikatsuura Town Local Disaster Management Plan. Wakayama, Japan: Nachikatsuura Town.
Nachikatsuura Town (2017). Nachikatsuura Town. Retrieved February 9, 2017, from https://www.town.nachikatsuura.wakayama.jp/forms/top/top.aspx
Nakashizuka, T. (2009). Effects of global warming on biological diversity and ecosystems. Global Environmental Research, 14(2), 183–188.
Saaty, T. L. (1990). How to make a decision: the analytic hierarchy process. European Journal of Operational Research, 48(1), 9–26.
Sankakukei (2016). Blank Map. Retrieved February 8, 2017, from http://www.freemap.jp/
Shaw, R. (2014). Community Practices for Disaster Risk Reduction in Japan. Tokyo, Japan: Springer Japan.
The Shikoku Shimbun (2011). The Agency for Cultural Affairs of Japan reported 36 cultural heritages were damaged in 8 prefectures by Typhoon No.12. Retrieved April 20, 2015, from http://www.shikoku-np.co.jp/national/culture_entertainment/20110907000564
Tsutsumi, K. (2017). Social Capital. In The International Encyclopedia of Geography (pp. 1–6). Oxford, UK: John Wiley & Sons, Ltd.
Final Report: CAF2015-RR08-CMY-Chiba 16
UNFCCC (2013). Non-economic losses in the context of the work programme on loss and damage. Bonn, Germany: UNFCCC, United Nations.
Wakayama Medical University (2012). Medical Support Activity Report on the Great East Japan Earthquake and Typhoon No.12. Wakayama, Japan: Wakayama Medical University.
Wakayama Prefecture (2011). Progress report for relief and recovery in Wakayama Prefecture. Wakayama, Japan: Wakayama Prefecture.
Wakayama Prefecture (2016). The status of aging population in Wakayama Prefecture. Wakayama, Japan: Wakayama Prefecture.
Yoshitake, T. and Deguchi, C. (2008). Social Capital Development in a Rural Community Based on Exchange Management with Outsiders: The Case of Akimoto, a Small Mountainous Settlement in Japan. The Town Planning Review, 79(4), 427–462.
Final Report: CAF2015-RR08-NMY-Chiba 17
Non-Economic Loss and Damages in Bangladesh: A Case Study of
Koyra Upazila
Yohei Chiba and S.V.R.K. Prabhakar Institute for Global Environmental Strategies (IGES), Hayama, Japan;
Md. Atikul Islam and Md. Ali Akber, Khulna University, Khulna, Bangladesh
1. Introduction Bangladesh, one of the most vulnerable countries to climate change (Maplecroft, 2010;
Harmeling and Eckstein, 2012), experienced a total of 247 extreme events between 1991 and
2011. The average annual death toll was 824, equivalent to 0.6 people per 100,000 inhabitants
(Harmeling and Eckstein, 2012). In addition to the loss of life, the annual average financial
loss from extreme events is estimated at nearly USD 1.7 billion, equivalent to 1.18 percent of
annual GDP in Bangladesh.
This country is situated in the wide Ganges delta plain with a coastline about 700 kilometers
long and with most of the country sitting at less than 12 meters above sea level, Bangladesh
is extremely exposed to natural hazards. Floods, tropical cyclones, drought, and storm surges
occur frequently. These, together with other negative environmental impacts such as
deforestation, soil degradation, erosion, salinization as well as social vulnerability due to
extreme poverty, high population density, and a lack of safety nets make Bangladesh
extremely susceptible to climate change (Akter, 2012). A study by Unnikrishnan et al. (2006)
predicted an increase in both the frequency and magnitude of tropical cyclones in the Bay of
Bengal by 2050, resulting in heavy precipitation in the region. Shamsuddoha et al. (2013)
assessed the impacts of two relatively recent cyclones, cyclone Sidr in 2007 and cyclone Aila
in 2009. In both cases, several million households were affected and in Sidr’s case, more than
2.3 million households lost their homes. The loss and damage on croplands was severe in
both cases.
Almost two-fifths' of the total impacts of storm surges in the world occurs in Bangladesh.
Between 1877 and 1995, Bangladesh was hit by 154 cyclones, including 43 severe cyclones
(Dasgupta et al., 2011). On average, a severe cyclone hits the country every three years (GoB,
2009), and the frequency of 7 m height cyclonic surge occurs once every five years (Dasgupta
et al., 2011). In fact, 60 percent of the cyclone related deaths that occurred worldwide between
1980 and 2000 were in Bangladesh (Nicholls et al., 2007). On average, 6000 people die each
year in floods from storms and cyclones (Schiermeier, 2014). A cyclone in 1970 resulted in
the death of around 300,000 people, and another in 1991 caused 138,000 deaths (World Bank,
2000). In November 2007, the coastal region of Bangladesh was affected by tropical cyclone
Sidr and 3406 people died with economic losses estimated at US$1.67 billion (GoB, 2008). In
recent years, cyclone Nargis (May 2008), cyclone Bijli (April 2009), cyclone Aila (May 2009),
and cyclone Mahasen (May 2013) devastated coastal life in Bangladesh.
Final Report: CAF2015-RR08-NMY-Chiba 18
According to UNFCCC (2012), the economic losses are regarded as the loss of resources,
goods and services that are commonly traded in markets and that market price can be used
to value economic losses. Non-economic losses are interpreted as the loss of those that are
not commonly traded in markets (UNFCCC, 2013). Non-economic losses in the context of
climate change incorporates losses of, inter alia, life, health, displacement and human mobility,
territory, cultural heritage, indigenous/local knowledge, biodiversity and ecosystem services.
However, non-economic loss can occur in three distinct areas: private individuals, society and
the environment (UNFCCC, 2013). In general, non-economic damages have often not been
taken into consideration in most risk assessments of both climatic and non-climatic in nature
and in designing insurance and compensation mechanisms (UNISDR, 2010; Hoffmaister and
Stabinsky, 2012) and the non-economic losses have often not been reported in the most post-
disaster reports and databases (Swiss Re, 2012).
In Bangladesh, non-economic loss and damages (NELDs) of natural disasters hardly draws
attention of the people and the government. However, the NELDs indirectly influence the
impact of the disaster events. UNFCCC, 2013 report stated that in many developing countries,
NELDs might be more significant than economic loss and damages (ELDs), and recognizing
and managing the risk of NELDs should therefore be a central aspect of climate change policy.
The NELDs associated with climate events have not been often considered in most risk
assessment in Bangladesh. There exists a research gap in the context of addressing NELDs
of climatic condition of Bangladesh.
Keeping the above in view, this study aims to:
1. understand NELDs caused by recent past major climate-related disasters (i.e., cyclone
Aila in 2009);
2. develop an assessment framework where structured questionnaire surveys with key
indicators can be implemented in a participatory manner to identify, prioritize and measure
NELDs from climatic disasters, as well as expert consultations, focused group discussions
and associated quantitative analytical techniques; and
3. make policy recommendations to strengthen the DRR and CCA plans and policies at
national and sub-national levels for mainstreaming and addressing the NELDs.
The major challenge of this study was the unawareness regarding NELDs. Although
Bangladesh has a very effective disaster management policy and a role model of disaster
management; still NELDs are not considered in the national policy. Existing damage
assessment form (D form) also does not include NELDs categories directly. Therefore, data
regarding NELDs of cyclones are not available. Furthermore, local people of the study area
are not familiar with NELDs. Therefore, it was difficult to collect relevant primary data from the
respondents.
2. Methodology The study is based on sequential steps: 1) comprehensive literature review; 2) pre-survey on
site; 3) expert consultation; 4) community consultation; 5) questionnaire survey; and 6) data
analysis by using the analytic hierarchy process (AHP) and quantification methods.
Comprehensive literature review on NELDs in context of DRR and CCA was conducted to
understand NELDs caused by climate-related disasters in Bangladesh. The pre-survey was
Final Report: CAF2015-RR08-NMY-Chiba 19
also implemented in Khulna to have a firsthand experience of L&Ds caused by the cyclones.
The AHP was used to prioritize key NELDs caused by cyclone Aila in Koyra upazila. Elements
of AHP analysis for NELDs consisted of decision criteria, indicators and risk reduction
practices. These elements were examined through comprehensive literature review, expert
consultation, and focus group discussions (FGDs) in the affected communities. Consequently,
a household questionnaire survey was conducted to prioritize key NELD-related elements
from the perspectives of the affected local communities and the local government officials.
The key NELD indicators identified through the questionnaire survey were quantified in terms
of monetary values in order to compare the portion of NELDs to the total loss and damage
including the ELDs.
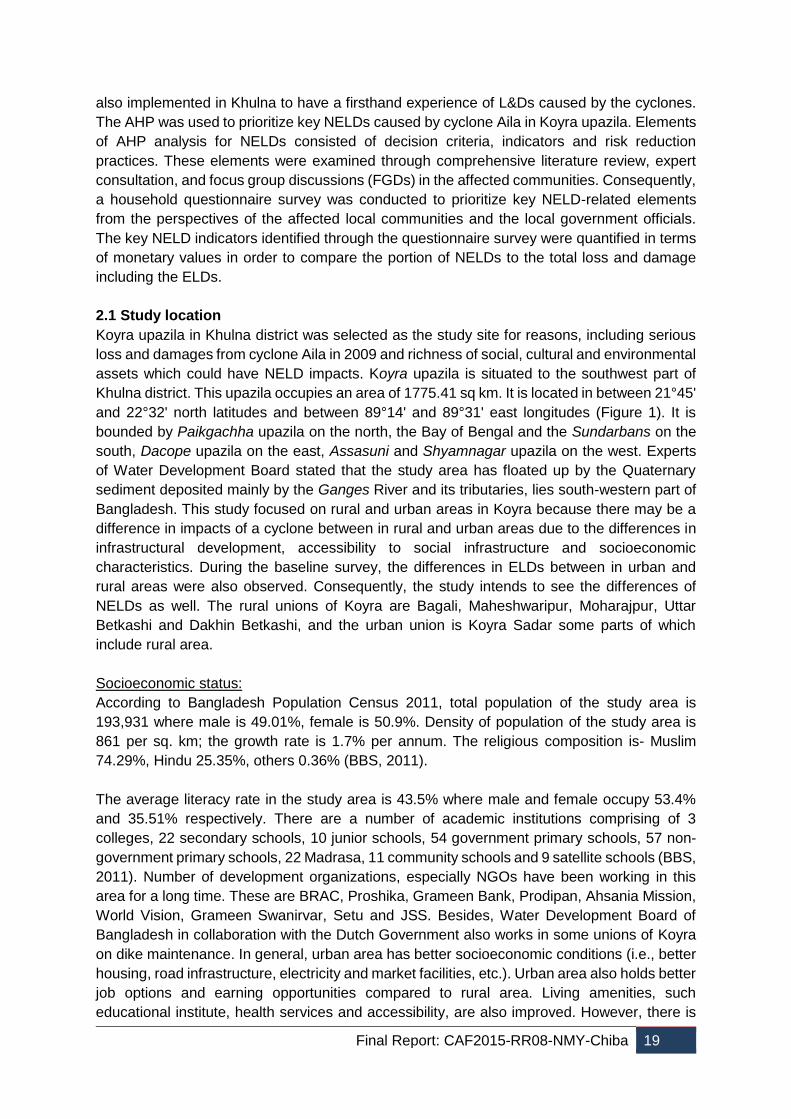
2.1 Study location
Koyra upazila in Khulna district was selected as the study site for reasons, including serious
loss and damages from cyclone Aila in 2009 and richness of social, cultural and environmental
assets which could have NELD impacts. Koyra upazila is situated to the southwest part of
Khulna district. This upazila occupies an area of 1775.41 sq km. It is located in between 21°45'
and 22°32' north latitudes and between 89°14' and 89°31' east longitudes (Figure 1). It is
bounded by Paikgachha upazila on the north, the Bay of Bengal and the Sundarbans on the
south, Dacope upazila on the east, Assasuni and Shyamnagar upazila on the west. Experts
of Water Development Board stated that the study area has floated up by the Quaternary
sediment deposited mainly by the Ganges River and its tributaries, lies south-western part of
Bangladesh. This study focused on rural and urban areas in Koyra because there may be a
difference in impacts of a cyclone between in rural and urban areas due to the differences in
infrastructural development, accessibility to social infrastructure and socioeconomic
characteristics. During the baseline survey, the differences in ELDs between in urban and
rural areas were also observed. Consequently, the study intends to see the differences of
NELDs as well. The rural unions of Koyra are Bagali, Maheshwaripur, Moharajpur, Uttar
Betkashi and Dakhin Betkashi, and the urban union is Koyra Sadar some parts of which
include rural area.
Socioeconomic status:
According to Bangladesh Population Census 2011, total population of the study area is
193,931 where male is 49.01%, female is 50.9%. Density of population of the study area is
861 per sq. km; the growth rate is 1.7% per annum. The religious composition is- Muslim
74.29%, Hindu 25.35%, others 0.36% (BBS, 2011).
The average literacy rate in the study area is 43.5% where male and female occupy 53.4%
and 35.51% respectively. There are a number of academic institutions comprising of 3
colleges, 22 secondary schools, 10 junior schools, 54 government primary schools, 57 non-
government primary schools, 22 Madrasa, 11 community schools and 9 satellite schools (BBS,
2011). Number of development organizations, especially NGOs have been working in this
area for a long time. These are BRAC, Proshika, Grameen Bank, Prodipan, Ahsania Mission,
World Vision, Grameen Swanirvar, Setu and JSS. Besides, Water Development Board of
Bangladesh in collaboration with the Dutch Government also works in some unions of Koyra
on dike maintenance. In general, urban area has better socioeconomic conditions (i.e., better
housing, road infrastructure, electricity and market facilities, etc.). Urban area also holds better
job options and earning opportunities compared to rural area. Living amenities, such
educational institute, health services and accessibility, are also improved. However, there is
Final Report: CAF2015-RR08-NMY-Chiba 20
no information on difference in socioeconomic conditions of rural and urban areas of Koyra
upazila since only part of Koyra Sadar union is considered as urban areas according to the
Bangladesh Bureau of Statistics report (BBS, 2012).
Figure 1: Map Koyra upazila
Climatic characteristics:
This area has a humid climate with three distinct seasons: pre-monsoon (March to June),
monsoon (July to October), post-monsoon (November to February). The annual rainfall ranges
from 1500 mm to 2000 mm, where about 70% of the rainfall occurs in the monsoon season
(Sultana et al. 2015). Temperature trend of this area for last 61 years shows that since 1990s
the yearly average temperature is gradually escalating. It is shown in Figure 2 where the yellow
line indicates the trend of yearly average temperature (in oC). This average has gone up to
more than 31 oC, which indicates possible anomaly in climatic condition.
Final Report: CAF2015-RR08-NMY-Chiba 21
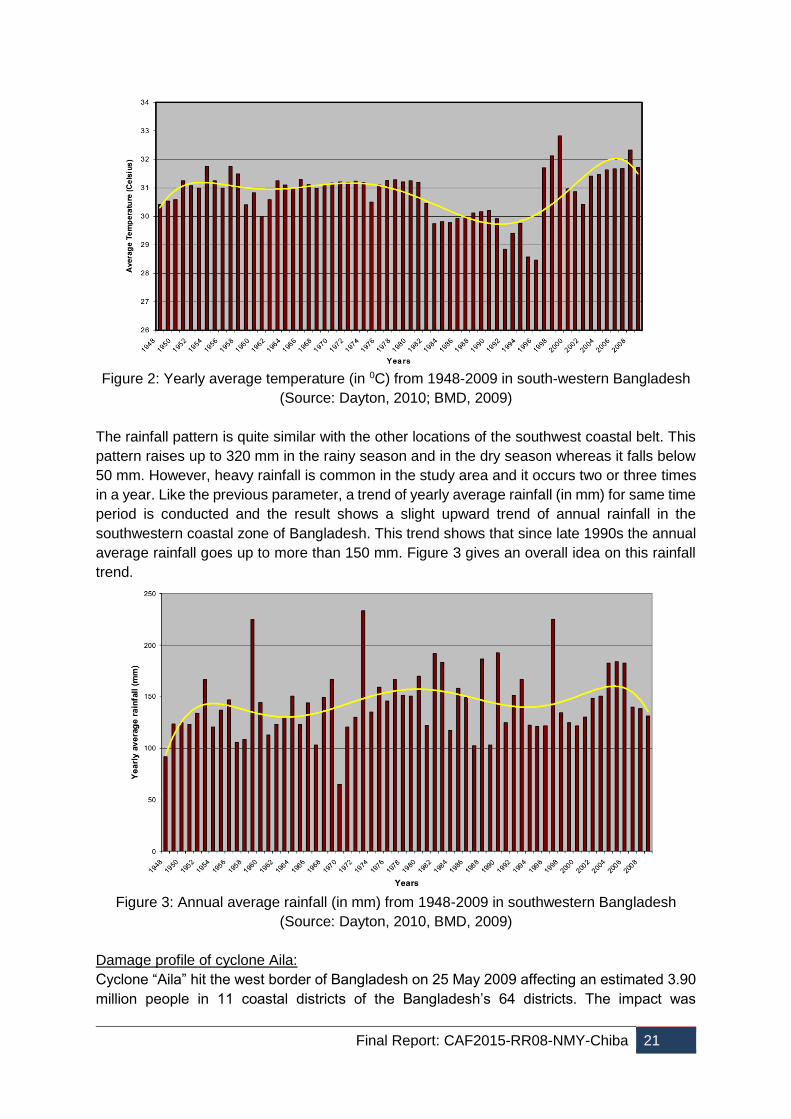
Figure 2: Yearly average temperature (in 0C) from 1948-2009 in south-western Bangladesh
(Source: Dayton, 2010; BMD, 2009)
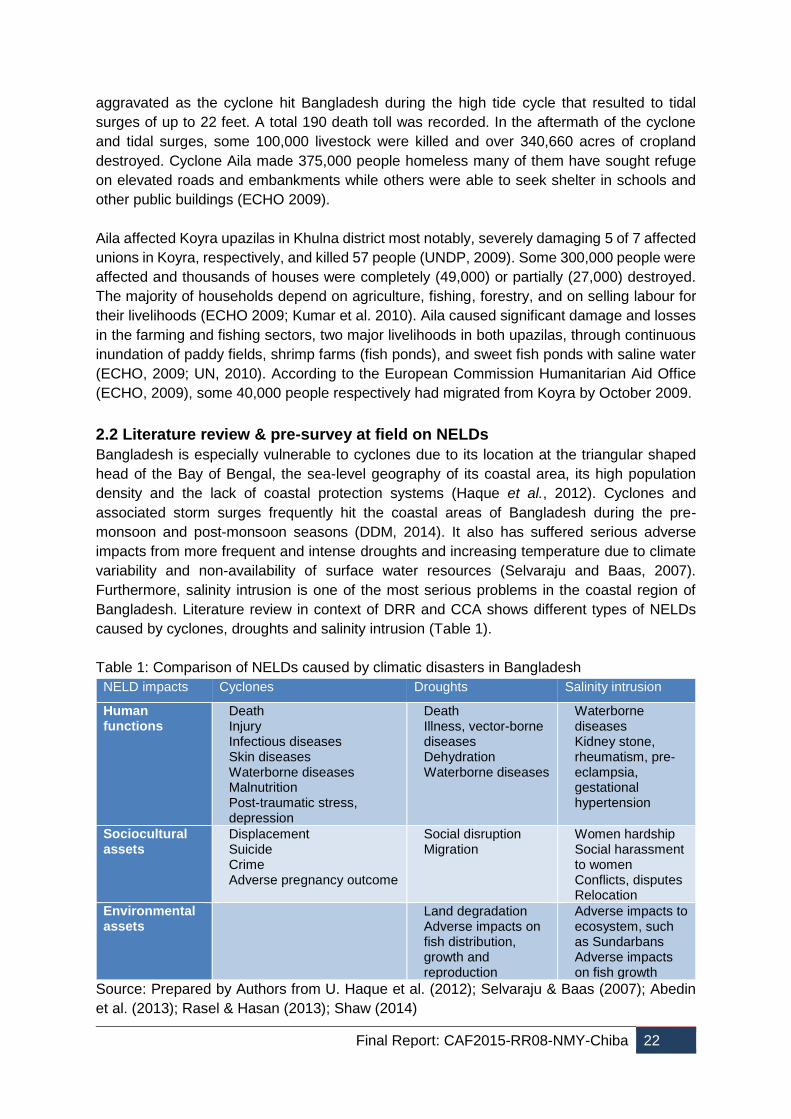
The rainfall pattern is quite similar with the other locations of the southwest coastal belt. This
pattern raises up to 320 mm in the rainy season and in the dry season whereas it falls below
50 mm. However, heavy rainfall is common in the study area and it occurs two or three times
in a year. Like the previous parameter, a trend of yearly average rainfall (in mm) for same time
period is conducted and the result shows a slight upward trend of annual rainfall in the
southwestern coastal zone of Bangladesh. This trend shows that since late 1990s the annual
average rainfall goes up to more than 150 mm. Figure 3 gives an overall idea on this rainfall
trend.
Figure 3: Annual average rainfall (in mm) from 1948-2009 in southwestern Bangladesh
(Source: Dayton, 2010, BMD, 2009)
Damage profile of cyclone Aila:
Cyclone “Aila” hit the west border of Bangladesh on 25 May 2009 affecting an estimated 3.90
million people in 11 coastal districts of the Bangladesh’s 64 districts. The impact was
Final Report: CAF2015-RR08-NMY-Chiba 22
aggravated as the cyclone hit Bangladesh during the high tide cycle that resulted to tidal
surges of up to 22 feet. A total 190 death toll was recorded. In the aftermath of the cyclone
and tidal surges, some 100,000 livestock were killed and over 340,660 acres of cropland
destroyed. Cyclone Aila made 375,000 people homeless many of them have sought refuge
on elevated roads and embankments while others were able to seek shelter in schools and
other public buildings (ECHO 2009).
Aila affected Koyra upazilas in Khulna district most notably, severely damaging 5 of 7 affected
unions in Koyra, respectively, and killed 57 people (UNDP, 2009). Some 300,000 people were
affected and thousands of houses were completely (49,000) or partially (27,000) destroyed.
The majority of households depend on agriculture, fishing, forestry, and on selling labour for
their livelihoods (ECHO 2009; Kumar et al. 2010). Aila caused significant damage and losses
in the farming and fishing sectors, two major livelihoods in both upazilas, through continuous
inundation of paddy fields, shrimp farms (fish ponds), and sweet fish ponds with saline water
(ECHO, 2009; UN, 2010). According to the European Commission Humanitarian Aid Office
(ECHO, 2009), some 40,000 people respectively had migrated from Koyra by October 2009.
2.2 Literature review & pre-survey at field on NELDs
Bangladesh is especially vulnerable to cyclones due to its location at the triangular shaped
head of the Bay of Bengal, the sea-level geography of its coastal area, its high population
density and the lack of coastal protection systems (Haque et al., 2012). Cyclones and
associated storm surges frequently hit the coastal areas of Bangladesh during the pre-
monsoon and post-monsoon seasons (DDM, 2014). It also has suffered serious adverse
impacts from more frequent and intense droughts and increasing temperature due to climate
variability and non-availability of surface water resources (Selvaraju and Baas, 2007).
Furthermore, salinity intrusion is one of the most serious problems in the coastal region of
Bangladesh. Literature review in context of DRR and CCA shows different types of NELDs
caused by cyclones, droughts and salinity intrusion (Table 1).
Table 1: Comparison of NELDs caused by climatic disasters in Bangladesh
NELD impacts Cyclones Droughts Salinity intrusion
Human functions
Death Injury Infectious diseases Skin diseases Waterborne diseases Malnutrition Post-traumatic stress,
depression
Death Illness, vector-borne
diseases Dehydration Waterborne diseases
Waterborne diseases
Kidney stone, rheumatism, pre-eclampsia, gestational hypertension
Sociocultural assets
Displacement Suicide Crime Adverse pregnancy outcome
Social disruption Migration
Women hardship Social harassment
to women Conflicts, disputes Relocation
Environmental assets
Land degradation Adverse impacts on
fish distribution, growth and reproduction
Adverse impacts to ecosystem, such as Sundarbans
Adverse impacts on fish growth
Source: Prepared by Authors from U. Haque et al. (2012); Selvaraju & Baas (2007); Abedin
et al. (2013); Rasel & Hasan (2013); Shaw (2014)
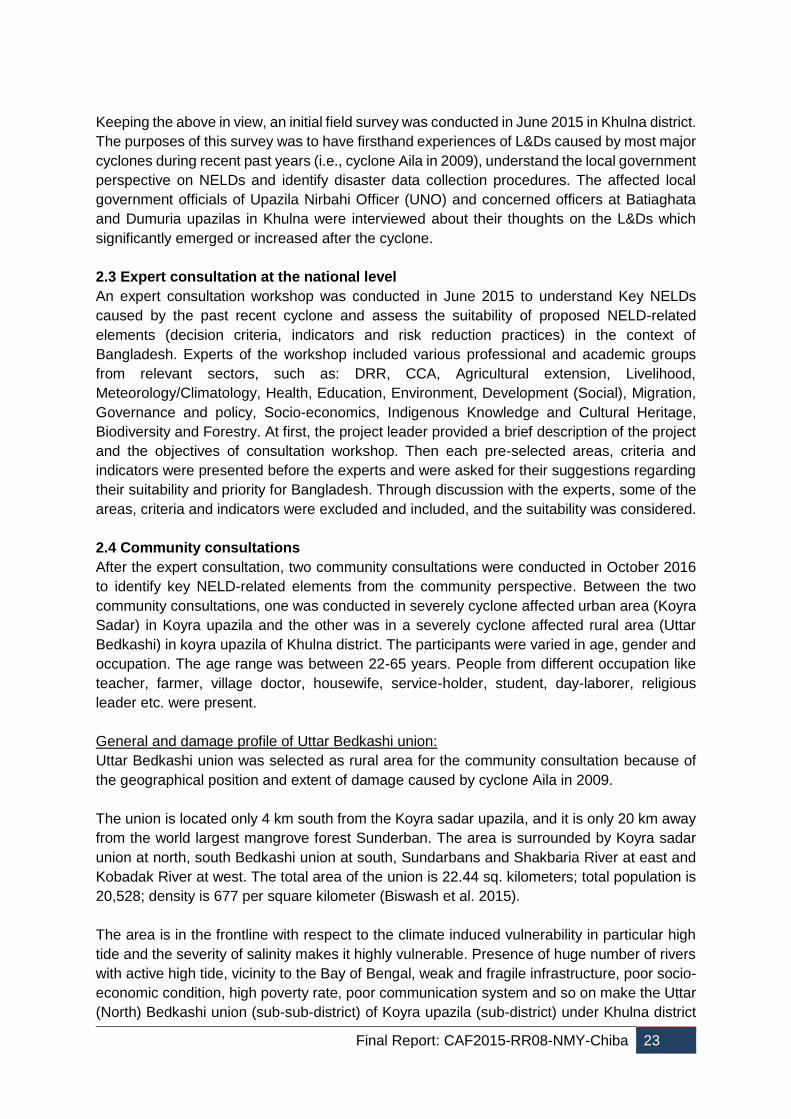
Final Report: CAF2015-RR08-NMY-Chiba 23
Keeping the above in view, an initial field survey was conducted in June 2015 in Khulna district.
The purposes of this survey was to have firsthand experiences of L&Ds caused by most major
cyclones during recent past years (i.e., cyclone Aila in 2009), understand the local government
perspective on NELDs and identify disaster data collection procedures. The affected local
government officials of Upazila Nirbahi Officer (UNO) and concerned officers at Batiaghata
and Dumuria upazilas in Khulna were interviewed about their thoughts on the L&Ds which
significantly emerged or increased after the cyclone.
2.3 Expert consultation at the national level
An expert consultation workshop was conducted in June 2015 to understand Key NELDs
caused by the past recent cyclone and assess the suitability of proposed NELD-related
elements (decision criteria, indicators and risk reduction practices) in the context of
Bangladesh. Experts of the workshop included various professional and academic groups
from relevant sectors, such as: DRR, CCA, Agricultural extension, Livelihood,
Meteorology/Climatology, Health, Education, Environment, Development (Social), Migration,
Governance and policy, Socio-economics, Indigenous Knowledge and Cultural Heritage,
Biodiversity and Forestry. At first, the project leader provided a brief description of the project
and the objectives of consultation workshop. Then each pre-selected areas, criteria and
indicators were presented before the experts and were asked for their suggestions regarding
their suitability and priority for Bangladesh. Through discussion with the experts, some of the
areas, criteria and indicators were excluded and included, and the suitability was considered.
2.4 Community consultations
After the expert consultation, two community consultations were conducted in October 2016
to identify key NELD-related elements from the community perspective. Between the two
community consultations, one was conducted in severely cyclone affected urban area (Koyra
Sadar) in Koyra upazila and the other was in a severely cyclone affected rural area (Uttar
Bedkashi) in koyra upazila of Khulna district. The participants were varied in age, gender and
occupation. The age range was between 22-65 years. People from different occupation like
teacher, farmer, village doctor, housewife, service-holder, student, day-laborer, religious
leader etc. were present.
General and damage profile of Uttar Bedkashi union:
Uttar Bedkashi union was selected as rural area for the community consultation because of
the geographical position and extent of damage caused by cyclone Aila in 2009.
The union is located only 4 km south from the Koyra sadar upazila, and it is only 20 km away
from the world largest mangrove forest Sunderban. The area is surrounded by Koyra sadar
union at north, south Bedkashi union at south, Sundarbans and Shakbaria River at east and
Kobadak River at west. The total area of the union is 22.44 sq. kilometers; total population is
20,528; density is 677 per square kilometer (Biswash et al. 2015).
The area is in the frontline with respect to the climate induced vulnerability in particular high
tide and the severity of salinity makes it highly vulnerable. Presence of huge number of rivers
with active high tide, vicinity to the Bay of Bengal, weak and fragile infrastructure, poor socio-
economic condition, high poverty rate, poor communication system and so on make the Uttar
(North) Bedkashi union (sub-sub-district) of Koyra upazila (sub-district) under Khulna district

Final Report: CAF2015-RR08-NMY-Chiba 24
much more fragile and vulnerable to disasters than other unions of the upazila. The unique
geophysical location and setting make the area very much vulnerable to different natural
disasters like cyclone, storm surges, river bank erosion, tidal surges, tidal floods, saline water
intrusion, fresh water scarcity, and so on. The area was severely affected by the super cyclone
Sidr and cyclone Aila in 2007 and 2009 respectively (Biswash et al. 2015).
Cyclone Aila was the most devastating disaster the area faced during the last thirty years
(Biswash et al. 2015). The cyclone caused the death of one person and injury to about 200
people. Moreover, about 23,000 people of this union were affected by cyclone Aila, and among
them 8,000 people were severely affected. About 1520 families were severely affected and
2300 households were completely destroyed (Source: Koyra upazila office cyclone damage
data record (D form)). Many children and women were affected by diarrhea as the post
disaster epidemic; 90% of the household were affected; 95% crops and trees were severely
damaged. Moreover, different local infrastructure like school, mosques, culvert, bridge,
embankment and many more were highly damaged (Biswash et al. 2015).
General and damage profile of Koyra Sadar union:
Madinabad area of Koyra Sadar union was selected for community consultation of urban area
due to the geographical position and extent of damage caused by cyclone Aila in 2009. The
union is divided into six administrative units or wards. The total area of the union is 3,339 ha;
total population is 32,499; density is 973 per square kilometer (Azam and Sarkar 2012). The
cyclone caused death of 5 people and injury to 150 people in the Koyra Sadar union. During
the Aila about 25,000 people and 6,504 families were severely affected. More than 4,700
households were completely damaged and about 4,600 households were partially damaged
(source: Koyra upazila office cyclone damage data record (D form)).
2.5 AHP-based survey
2.5.1 Analytic hierarchy process (AHP)
This study used the AHP to prioritize key NELDs caused by cyclone Aila in Koyra. Table 2
shows Saaty’s fundamental judgement scales for pairwise comparison used in this study. The
AHP is suitable for this study as it helps solving problems that are hierarchical in nature and
helps in reconciling opinions of multiple stakeholders in deriving a common agreement.
Microsoft Excel was used for the AHP analysis. The aggregation of individual priorities was
done by geometric mean of individual priorities (Forman and Peniwati, 1998).
Table 2: Fundamental judgement scales for pairwise comparisons
Scale Description
1 Equal importance of both options
3 Moderate importance of one over another
5 Strong importance for one over another
7 Very strong importance for one over another
9 Extreme importance for one over another
Source: Prepared by Authors from Saaty (1990)
The elements of AHP analysis for NELDs included three components: 1) relevant decision-
making criteria, 2) indicators; and 3) risk reduction practices. The NELD elements were
identified, examined and narrowed down through comprehensive literature review, expert
consultation and FGD in the affected community (see section 2.2, 2.3 and 2.4).
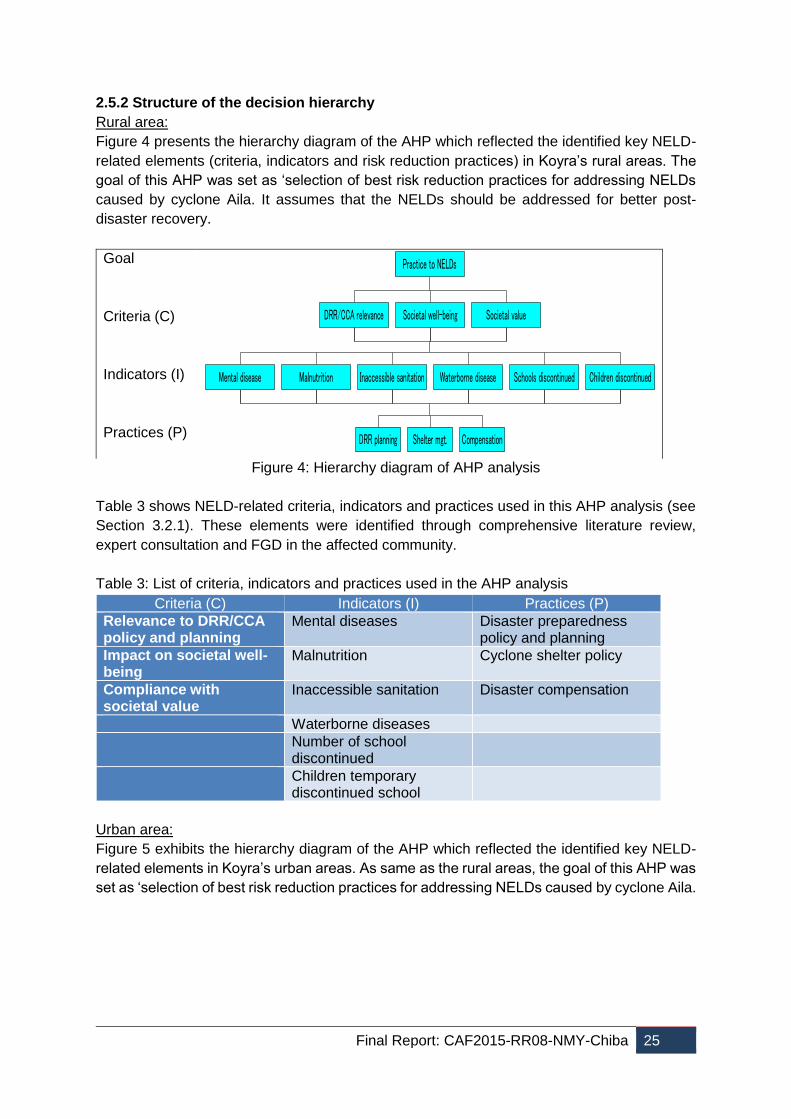
Final Report: CAF2015-RR08-NMY-Chiba 25
2.5.2 Structure of the decision hierarchy
Rural area:
Figure 4 presents the hierarchy diagram of the AHP which reflected the identified key NELD-
related elements (criteria, indicators and risk reduction practices) in Koyra’s rural areas. The
goal of this AHP was set as ‘selection of best risk reduction practices for addressing NELDs
caused by cyclone Aila. It assumes that the NELDs should be addressed for better post-
disaster recovery.
Goal
Criteria (C)
Indicators (I)
Practices (P)
DRR/CCA relevance Societal well-being Societal value
Mental disease Malnutrition Inaccessible sanitation Waterborne disease Schools discontinued Children discontinued
DRR planning Shelter mgt. Compensation
Practice to NELDs
Figure 4: Hierarchy diagram of AHP analysis
Table 3 shows NELD-related criteria, indicators and practices used in this AHP analysis (see
Section 3.2.1). These elements were identified through comprehensive literature review,
expert consultation and FGD in the affected community.
Table 3: List of criteria, indicators and practices used in the AHP analysis
Criteria (C) Indicators (I) Practices (P)
Relevance to DRR/CCA policy and planning
Mental diseases Disaster preparedness policy and planning
Impact on societal well-being
Malnutrition Cyclone shelter policy
Compliance with societal value
Inaccessible sanitation Disaster compensation
Waterborne diseases
Number of school discontinued
Children temporary discontinued school
Urban area:
Figure 5 exhibits the hierarchy diagram of the AHP which reflected the identified key NELD-
related elements in Koyra’s urban areas. As same as the rural areas, the goal of this AHP was
set as ‘selection of best risk reduction practices for addressing NELDs caused by cyclone Aila.
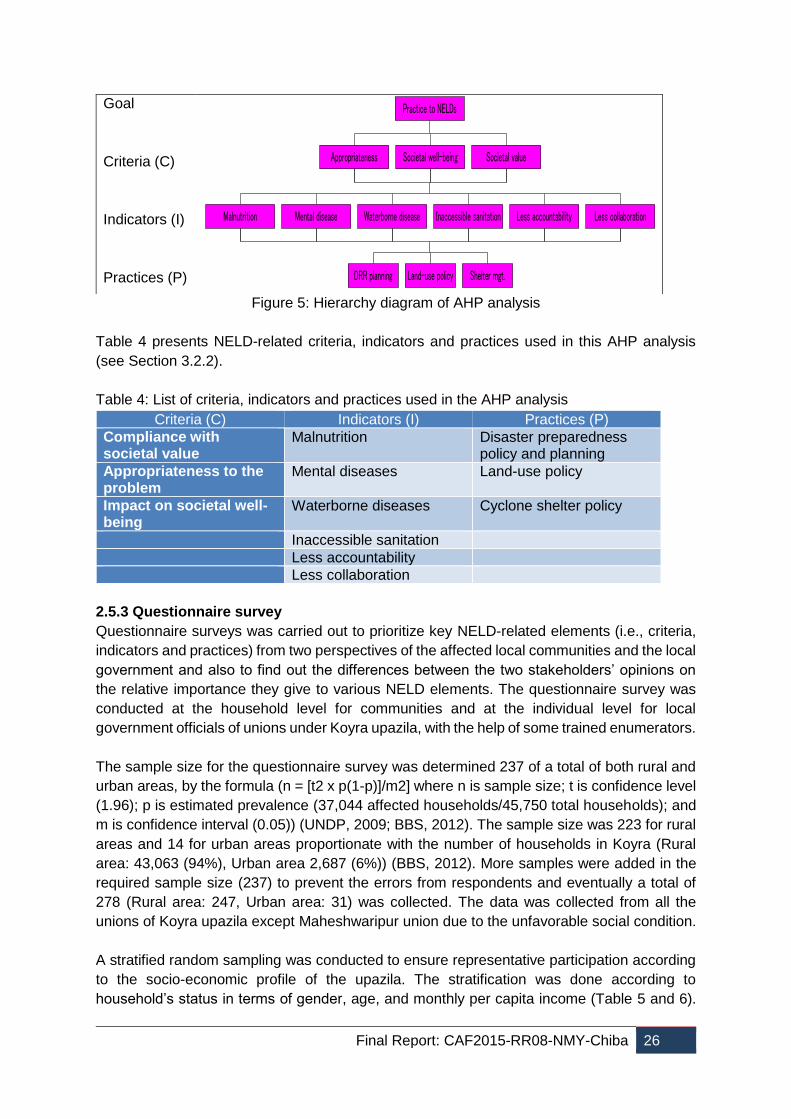
Final Report: CAF2015-RR08-NMY-Chiba 26
Goal
Criteria (C)
Indicators (I)
Practices (P)
Appropriateness Societal well-being Societal value
Malnutrition Mental disease Waterborne disease Inaccessible sanitation Less accountability Less collaboration
DRR planning Land-use policy Shelter mgt.
Practice to NELDs
Figure 5: Hierarchy diagram of AHP analysis
Table 4 presents NELD-related criteria, indicators and practices used in this AHP analysis
(see Section 3.2.2).
Table 4: List of criteria, indicators and practices used in the AHP analysis
Criteria (C) Indicators (I) Practices (P)
Compliance with societal value
Malnutrition Disaster preparedness policy and planning
Appropriateness to the problem
Mental diseases Land-use policy
Impact on societal well-being
Waterborne diseases Cyclone shelter policy
Inaccessible sanitation
Less accountability
Less collaboration
2.5.3 Questionnaire survey
Questionnaire surveys was carried out to prioritize key NELD-related elements (i.e., criteria,
indicators and practices) from two perspectives of the affected local communities and the local
government and also to find out the differences between the two stakeholders’ opinions on
the relative importance they give to various NELD elements. The questionnaire survey was
conducted at the household level for communities and at the individual level for local
government officials of unions under Koyra upazila, with the help of some trained enumerators.
The sample size for the questionnaire survey was determined 237 of a total of both rural and
urban areas, by the formula (n = [t2 x p(1-p)]/m2] where n is sample size; t is confidence level
(1.96); p is estimated prevalence (37,044 affected households/45,750 total households); and
m is confidence interval (0.05)) (UNDP, 2009; BBS, 2012). The sample size was 223 for rural
areas and 14 for urban areas proportionate with the number of households in Koyra (Rural
area: 43,063 (94%), Urban area 2,687 (6%)) (BBS, 2012). More samples were added in the
required sample size (237) to prevent the errors from respondents and eventually a total of
278 (Rural area: 247, Urban area: 31) was collected. The data was collected from all the
unions of Koyra upazila except Maheshwaripur union due to the unfavorable social condition.
A stratified random sampling was conducted to ensure representative participation according
to the socio-economic profile of the upazila. The stratification was done according to
household’s status in terms of gender, age, and monthly per capita income (Table 5 and 6).
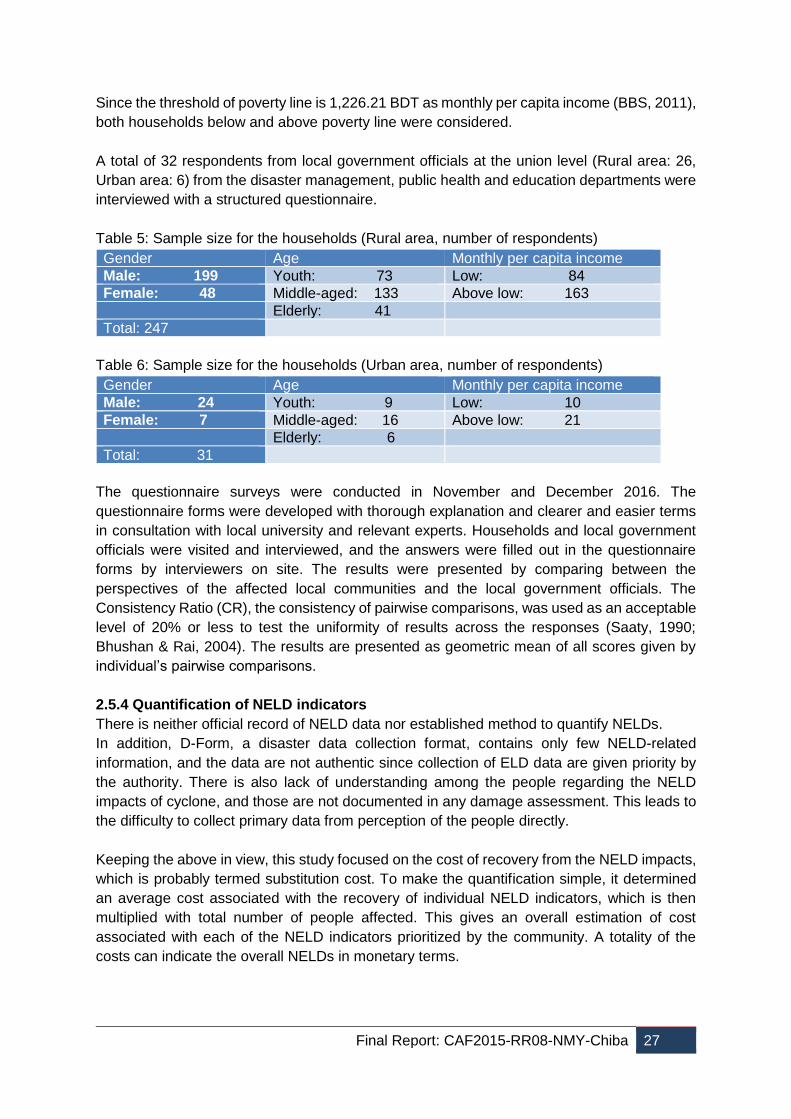
Final Report: CAF2015-RR08-NMY-Chiba 27
Since the threshold of poverty line is 1,226.21 BDT as monthly per capita income (BBS, 2011),
both households below and above poverty line were considered.
A total of 32 respondents from local government officials at the union level (Rural area: 26,
Urban area: 6) from the disaster management, public health and education departments were
interviewed with a structured questionnaire.
Table 5: Sample size for the households (Rural area, number of respondents)
Gender Age Monthly per capita income
Male: 199 Youth: 73 Low: 84
Female: 48 Middle-aged: 133 Above low: 163
Elderly: 41
Total: 247
Table 6: Sample size for the households (Urban area, number of respondents)
Gender Age Monthly per capita income
Male: 24 Youth: 9 Low: 10
Female: 7 Middle-aged: 16 Above low: 21
Elderly: 6
Total: 31
The questionnaire surveys were conducted in November and December 2016. The
questionnaire forms were developed with thorough explanation and clearer and easier terms
in consultation with local university and relevant experts. Households and local government
officials were visited and interviewed, and the answers were filled out in the questionnaire
forms by interviewers on site. The results were presented by comparing between the
perspectives of the affected local communities and the local government officials. The
Consistency Ratio (CR), the consistency of pairwise comparisons, was used as an acceptable
level of 20% or less to test the uniformity of results across the responses (Saaty, 1990;
Bhushan & Rai, 2004). The results are presented as geometric mean of all scores given by
individual’s pairwise comparisons.
2.5.4 Quantification of NELD indicators
There is neither official record of NELD data nor established method to quantify NELDs.
In addition, D-Form, a disaster data collection format, contains only few NELD-related
information, and the data are not authentic since collection of ELD data are given priority by
the authority. There is also lack of understanding among the people regarding the NELD
impacts of cyclone, and those are not documented in any damage assessment. This leads to
the difficulty to collect primary data from perception of the people directly.
Keeping the above in view, this study focused on the cost of recovery from the NELD impacts,
which is probably termed substitution cost. To make the quantification simple, it determined
an average cost associated with the recovery of individual NELD indicators, which is then
multiplied with total number of people affected. This gives an overall estimation of cost
associated with each of the NELD indicators prioritized by the community. A totality of the
costs can indicate the overall NELDs in monetary terms.
Final Report: CAF2015-RR08-NMY-Chiba 28
For quantification of the selected NELD indicators, firstly, relevant indicator parameters were
selected. Then monetary value for the NELD indicators was calculated using the following
formulae:
Monetary Value = [Number of people affected] x [average costs associates with NELD
indicator parameters]
Based on the AHP analysis, the three most important NELD indicators for both rural and urban
areas are: 1) inaccessible to sanitation; 2) waterborne diseases; and 3) psycho social disorder.
Therefore, these indicators were considered for the quantification.
Inaccessible to sanitation:
The parameters selected for the indicator “inaccessible to sanitation” are:
1. Cost of broken infrastructures (sewerages, pipelines, toilets, etc.)
2. Repairing cost of broken infrastructures
Therefore, the monetary value for the indicator “inaccessible to sanitation” is:
Monetary value = [Number of households affected] x [average cost of broken infrastructures
+ average repairing cost of broken infrastructures]
Waterborne diseases:
The parameters selected for the indicator “waterborne diseases” are:
1. Medical fee
2. Transportation cost
Hence, the monetary value for the indicator “waterborne diseases” is:
Monetary value = [Number of people affected] x [average medical fee + average transportation
cost]
Psycho-social disorder:
The parameters selected for the indicator “psycho-social disorder” are:
1. Medical fee
2. Transportation cost
Thus, the monetary value for the indicator “psycho-social disorder” is:
Monetary value = [Number of people affected] x [average medical fee + average transportation
cost]
Similarly, all the other indicators were converted into monetary terms.
The data of number of people affected and parameters for NELD indicators was collected from
the experts in each union. The experts included head of the local government (Chairman),
union secretary, union disaster management committee member, educated local people
(school teacher) and government officers.
The data regarding number of people affected and parameters for NELD indicators were not
recorded in any officially written database. Therefore, we had to rely on the memory of the
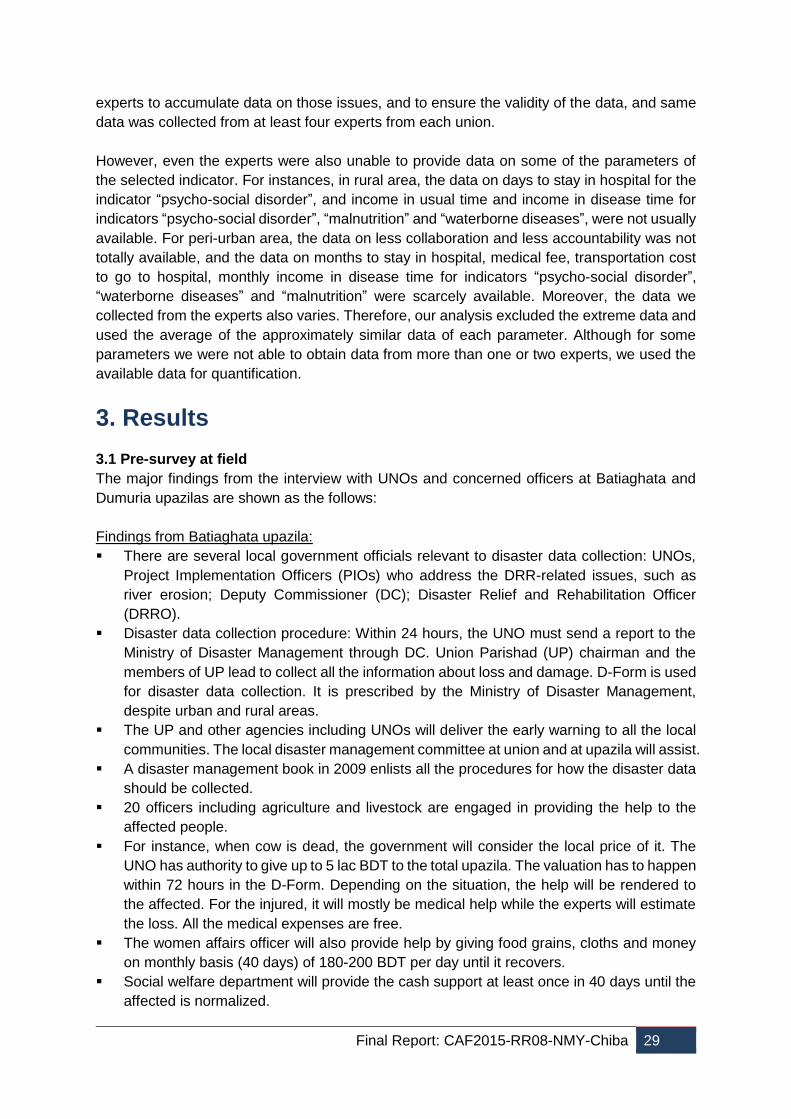
Final Report: CAF2015-RR08-NMY-Chiba 29
experts to accumulate data on those issues, and to ensure the validity of the data, and same
data was collected from at least four experts from each union.
However, even the experts were also unable to provide data on some of the parameters of
the selected indicator. For instances, in rural area, the data on days to stay in hospital for the
indicator “psycho-social disorder”, and income in usual time and income in disease time for
indicators “psycho-social disorder”, “malnutrition” and “waterborne diseases”, were not usually
available. For peri-urban area, the data on less collaboration and less accountability was not
totally available, and the data on months to stay in hospital, medical fee, transportation cost
to go to hospital, monthly income in disease time for indicators “psycho-social disorder”,
“waterborne diseases” and “malnutrition” were scarcely available. Moreover, the data we
collected from the experts also varies. Therefore, our analysis excluded the extreme data and
used the average of the approximately similar data of each parameter. Although for some
parameters we were not able to obtain data from more than one or two experts, we used the
available data for quantification.
3. Results
3.1 Pre-survey at field
The major findings from the interview with UNOs and concerned officers at Batiaghata and
Dumuria upazilas are shown as the follows:
Findings from Batiaghata upazila:
There are several local government officials relevant to disaster data collection: UNOs,
Project Implementation Officers (PIOs) who address the DRR-related issues, such as
river erosion; Deputy Commissioner (DC); Disaster Relief and Rehabilitation Officer
(DRRO).
Disaster data collection procedure: Within 24 hours, the UNO must send a report to the
Ministry of Disaster Management through DC. Union Parishad (UP) chairman and the
members of UP lead to collect all the information about loss and damage. D-Form is used
for disaster data collection. It is prescribed by the Ministry of Disaster Management,
despite urban and rural areas.
The UP and other agencies including UNOs will deliver the early warning to all the local
communities. The local disaster management committee at union and at upazila will assist.
A disaster management book in 2009 enlists all the procedures for how the disaster data
should be collected.
20 officers including agriculture and livestock are engaged in providing the help to the
affected people.
For instance, when cow is dead, the government will consider the local price of it. The
UNO has authority to give up to 5 lac BDT to the total upazila. The valuation has to happen
within 72 hours in the D-Form. Depending on the situation, the help will be rendered to
the affected. For the injured, it will mostly be medical help while the experts will estimate
the loss. All the medical expenses are free.
The women affairs officer will also provide help by giving food grains, cloths and money
on monthly basis (40 days) of 180-200 BDT per day until it recovers.
Social welfare department will provide the cash support at least once in 40 days until the
affected is normalized.
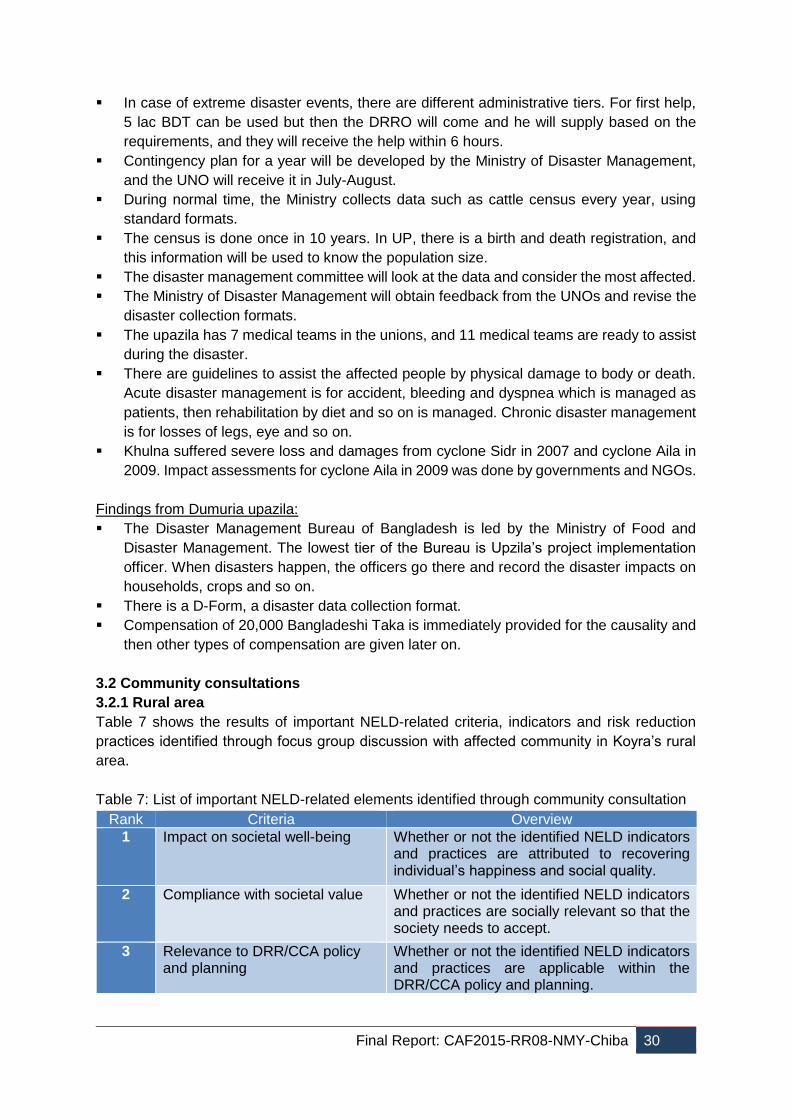
Final Report: CAF2015-RR08-NMY-Chiba 30
In case of extreme disaster events, there are different administrative tiers. For first help,
5 lac BDT can be used but then the DRRO will come and he will supply based on the
requirements, and they will receive the help within 6 hours.
Contingency plan for a year will be developed by the Ministry of Disaster Management,
and the UNO will receive it in July-August.
During normal time, the Ministry collects data such as cattle census every year, using
standard formats.
The census is done once in 10 years. In UP, there is a birth and death registration, and
this information will be used to know the population size.
The disaster management committee will look at the data and consider the most affected.
The Ministry of Disaster Management will obtain feedback from the UNOs and revise the
disaster collection formats.
The upazila has 7 medical teams in the unions, and 11 medical teams are ready to assist
during the disaster.
There are guidelines to assist the affected people by physical damage to body or death.
Acute disaster management is for accident, bleeding and dyspnea which is managed as
patients, then rehabilitation by diet and so on is managed. Chronic disaster management
is for losses of legs, eye and so on.
Khulna suffered severe loss and damages from cyclone Sidr in 2007 and cyclone Aila in
2009. Impact assessments for cyclone Aila in 2009 was done by governments and NGOs.
Findings from Dumuria upazila:
The Disaster Management Bureau of Bangladesh is led by the Ministry of Food and
Disaster Management. The lowest tier of the Bureau is Upzila’s project implementation
officer. When disasters happen, the officers go there and record the disaster impacts on
households, crops and so on.
There is a D-Form, a disaster data collection format.
Compensation of 20,000 Bangladeshi Taka is immediately provided for the causality and
then other types of compensation are given later on.
3.2 Community consultations
3.2.1 Rural area
Table 7 shows the results of important NELD-related criteria, indicators and risk reduction
practices identified through focus group discussion with affected community in Koyra’s rural
area.
Table 7: List of important NELD-related elements identified through community consultation
Rank Criteria Overview
1 Impact on societal well-being Whether or not the identified NELD indicators and practices are attributed to recovering individual’s happiness and social quality.
2 Compliance with societal value Whether or not the identified NELD indicators and practices are socially relevant so that the society needs to accept.
3 Relevance to DRR/CCA policy and planning
Whether or not the identified NELD indicators and practices are applicable within the DRR/CCA policy and planning.
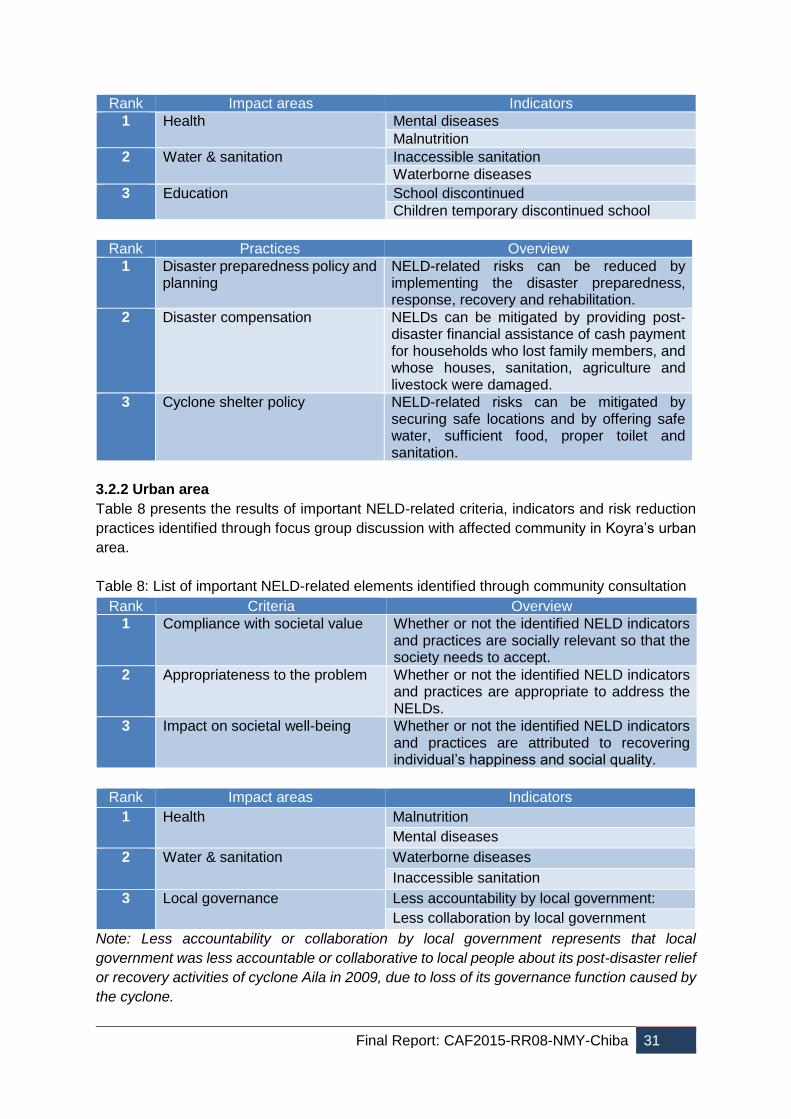
Final Report: CAF2015-RR08-NMY-Chiba 31
Rank Impact areas Indicators
1 Health Mental diseases
Malnutrition
2 Water & sanitation Inaccessible sanitation
Waterborne diseases
3 Education School discontinued
Children temporary discontinued school
Rank Practices Overview
1 Disaster preparedness policy and planning
NELD-related risks can be reduced by implementing the disaster preparedness, response, recovery and rehabilitation.
2 Disaster compensation NELDs can be mitigated by providing post-disaster financial assistance of cash payment for households who lost family members, and whose houses, sanitation, agriculture and livestock were damaged.
3 Cyclone shelter policy NELD-related risks can be mitigated by securing safe locations and by offering safe water, sufficient food, proper toilet and sanitation.
3.2.2 Urban area
Table 8 presents the results of important NELD-related criteria, indicators and risk reduction
practices identified through focus group discussion with affected community in Koyra’s urban
area.
Table 8: List of important NELD-related elements identified through community consultation
Rank Criteria Overview
1 Compliance with societal value Whether or not the identified NELD indicators and practices are socially relevant so that the society needs to accept.
2 Appropriateness to the problem Whether or not the identified NELD indicators and practices are appropriate to address the NELDs.
3 Impact on societal well-being Whether or not the identified NELD indicators and practices are attributed to recovering individual’s happiness and social quality.
Rank Impact areas Indicators
1 Health Malnutrition
Mental diseases
2 Water & sanitation Waterborne diseases
Inaccessible sanitation
3 Local governance Less accountability by local government:
Less collaboration by local government
Note: Less accountability or collaboration by local government represents that local
government was less accountable or collaborative to local people about its post-disaster relief
or recovery activities of cyclone Aila in 2009, due to loss of its governance function caused by
the cyclone.
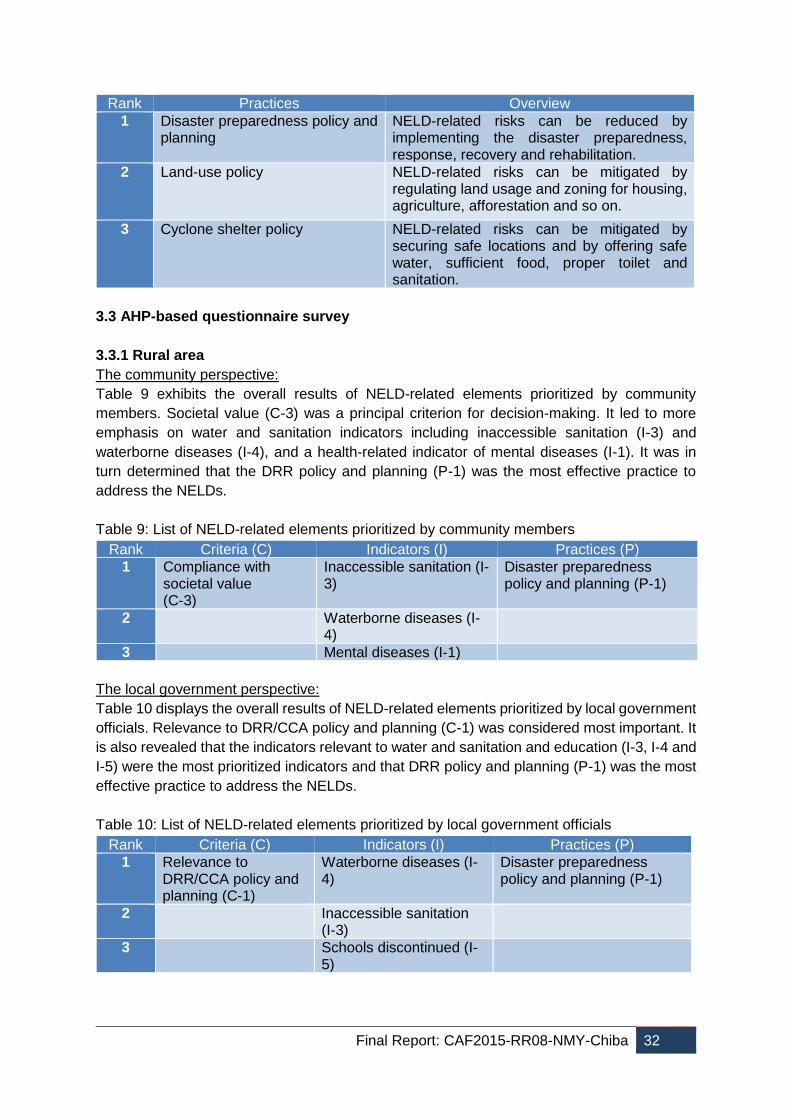
Final Report: CAF2015-RR08-NMY-Chiba 32
Rank Practices Overview
1 Disaster preparedness policy and planning
NELD-related risks can be reduced by implementing the disaster preparedness, response, recovery and rehabilitation.
2 Land-use policy NELD-related risks can be mitigated by regulating land usage and zoning for housing, agriculture, afforestation and so on.
3 Cyclone shelter policy NELD-related risks can be mitigated by securing safe locations and by offering safe water, sufficient food, proper toilet and sanitation.
3.3 AHP-based questionnaire survey
3.3.1 Rural area
The community perspective:
Table 9 exhibits the overall results of NELD-related elements prioritized by community
members. Societal value (C-3) was a principal criterion for decision-making. It led to more
emphasis on water and sanitation indicators including inaccessible sanitation (I-3) and
waterborne diseases (I-4), and a health-related indicator of mental diseases (I-1). It was in
turn determined that the DRR policy and planning (P-1) was the most effective practice to
address the NELDs.
Table 9: List of NELD-related elements prioritized by community members
Rank Criteria (C) Indicators (I) Practices (P)
1 Compliance with societal value (C-3)
Inaccessible sanitation (I-3)
Disaster preparedness policy and planning (P-1)
2 Waterborne diseases (I-4)
3 Mental diseases (I-1)
The local government perspective:
Table 10 displays the overall results of NELD-related elements prioritized by local government
officials. Relevance to DRR/CCA policy and planning (C-1) was considered most important. It
is also revealed that the indicators relevant to water and sanitation and education (I-3, I-4 and
I-5) were the most prioritized indicators and that DRR policy and planning (P-1) was the most
effective practice to address the NELDs.
Table 10: List of NELD-related elements prioritized by local government officials
Rank Criteria (C) Indicators (I) Practices (P)
1 Relevance to DRR/CCA policy and planning (C-1)
Waterborne diseases (I-4)
Disaster preparedness policy and planning (P-1)
2 Inaccessible sanitation (I-3)
3 Schools discontinued (I-5)
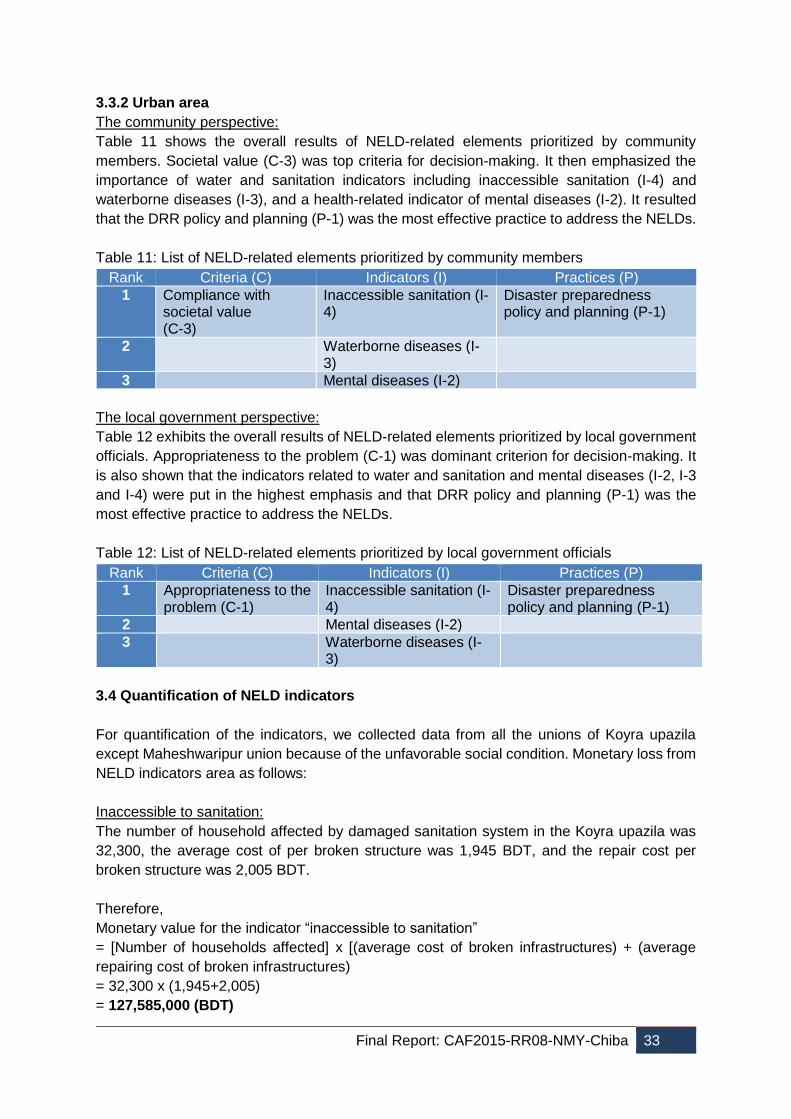
Final Report: CAF2015-RR08-NMY-Chiba 33
3.3.2 Urban area
The community perspective:
Table 11 shows the overall results of NELD-related elements prioritized by community
members. Societal value (C-3) was top criteria for decision-making. It then emphasized the
importance of water and sanitation indicators including inaccessible sanitation (I-4) and
waterborne diseases (I-3), and a health-related indicator of mental diseases (I-2). It resulted
that the DRR policy and planning (P-1) was the most effective practice to address the NELDs.
Table 11: List of NELD-related elements prioritized by community members
Rank Criteria (C) Indicators (I) Practices (P)
1 Compliance with societal value (C-3)
Inaccessible sanitation (I-4)
Disaster preparedness policy and planning (P-1)
2 Waterborne diseases (I-3)
3 Mental diseases (I-2)
The local government perspective:
Table 12 exhibits the overall results of NELD-related elements prioritized by local government
officials. Appropriateness to the problem (C-1) was dominant criterion for decision-making. It
is also shown that the indicators related to water and sanitation and mental diseases (I-2, I-3
and I-4) were put in the highest emphasis and that DRR policy and planning (P-1) was the
most effective practice to address the NELDs.
Table 12: List of NELD-related elements prioritized by local government officials
Rank Criteria (C) Indicators (I) Practices (P)
1 Appropriateness to the problem (C-1)
Inaccessible sanitation (I-4)
Disaster preparedness policy and planning (P-1)
2 Mental diseases (I-2)
3 Waterborne diseases (I-3)
3.4 Quantification of NELD indicators
For quantification of the indicators, we collected data from all the unions of Koyra upazila
except Maheshwaripur union because of the unfavorable social condition. Monetary loss from
NELD indicators area as follows:
Inaccessible to sanitation:
The number of household affected by damaged sanitation system in the Koyra upazila was
32,300, the average cost of per broken structure was 1,945 BDT, and the repair cost per
broken structure was 2,005 BDT.
Therefore,
Monetary value for the indicator “inaccessible to sanitation”
= [Number of households affected] x [(average cost of broken infrastructures) + (average
repairing cost of broken infrastructures)
= 32,300 x (1,945+2,005)
= 127,585,000 (BDT)
Final Report: CAF2015-RR08-NMY-Chiba 34
= 1,635,705 (USD)
(1 USD= 78 BDT)
For quantification of inaccessible to sanitation, we excluded the parameter cost of sanitation
until recovery as generally the affected people used the sanitation facilities provided by the
government, NGO or neighbors, so they didn’t pay for the sanitation facilities.
Waterborne diseases:
The number of people affected by waterborne diseases in the Koyra upazila was 73,033,
average medical fee for per person was 914.70 BDT, and average transportation cost was
217.69 BDT.
Therefore,
Monetary value for the indicator “waterborne diseases”
= [Number of people affected] x [(average medical fee) + (average transportation cost)]
= 73,033 x (914.70+217.69)
= 82,920,987 (BDT)
= 1,063,088 (USD)
For quantification of waterborne diseases, we excluded the parameter period to stay in
hospital as treatment facilities were available to them in their local area since they only stay at
hospital if the condition is severe.
Psycho-social disorder:
The number of people affected by psycho-social disorder in the Koyra upazila was 120,627,
average medical fee for per person was 608.33 BDT, and average transportation cost was
188.33 BDT.
Therefore,
Monetary value for the indicator “psycho-social disorder”
= [Number of people affected] x [(average medical fee) + (average transportation cost)]
= 120,627 x (608.33+188.33)
= 96,098,705 (BDT)
= 1,232,034 (USD)
For quantification of psycho-social disorder, we excluded the parameter period to stay in
hospital as very few people in the area went to the hospital for mental or psycho-social
disorder.
4. Discussion
4.1 Assessing the current status of integrating the NELDs
The results from the questionnaire surveys indicate that both rural and urban communities in
Koyra agree on the importance of addressing issues with inaccessible sanitation, waterborne
diseases and mental diseases (Table 13). In addition, local government officials in rural areas
have identified schools discontinued. This section seeks to the current status of incorporating
these NELD indicators into existing Bangladesh’s national DRR plan and policy that Koyra’s
local authorities follow.
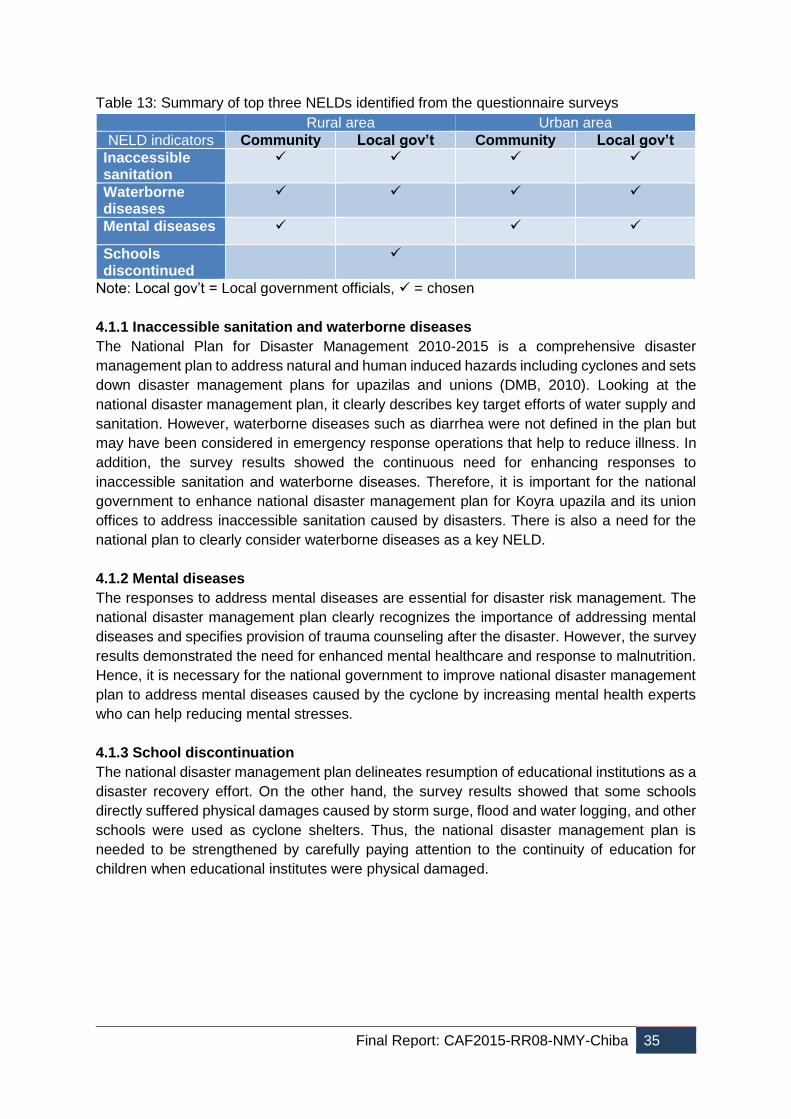
Final Report: CAF2015-RR08-NMY-Chiba 35
Table 13: Summary of top three NELDs identified from the questionnaire surveys
Rural area Urban area
NELD indicators Community Local gov’t Community Local gov’t
Inaccessible sanitation
Waterborne diseases
Mental diseases
Schools discontinued
Note: Local gov’t = Local government officials, = chosen
4.1.1 Inaccessible sanitation and waterborne diseases
The National Plan for Disaster Management 2010-2015 is a comprehensive disaster
management plan to address natural and human induced hazards including cyclones and sets
down disaster management plans for upazilas and unions (DMB, 2010). Looking at the
national disaster management plan, it clearly describes key target efforts of water supply and
sanitation. However, waterborne diseases such as diarrhea were not defined in the plan but
may have been considered in emergency response operations that help to reduce illness. In
addition, the survey results showed the continuous need for enhancing responses to
inaccessible sanitation and waterborne diseases. Therefore, it is important for the national
government to enhance national disaster management plan for Koyra upazila and its union
offices to address inaccessible sanitation caused by disasters. There is also a need for the
national plan to clearly consider waterborne diseases as a key NELD.
4.1.2 Mental diseases
The responses to address mental diseases are essential for disaster risk management. The
national disaster management plan clearly recognizes the importance of addressing mental
diseases and specifies provision of trauma counseling after the disaster. However, the survey
results demonstrated the need for enhanced mental healthcare and response to malnutrition.
Hence, it is necessary for the national government to improve national disaster management
plan to address mental diseases caused by the cyclone by increasing mental health experts
who can help reducing mental stresses.
4.1.3 School discontinuation
The national disaster management plan delineates resumption of educational institutions as a
disaster recovery effort. On the other hand, the survey results showed that some schools
directly suffered physical damages caused by storm surge, flood and water logging, and other
schools were used as cyclone shelters. Thus, the national disaster management plan is
needed to be strengthened by carefully paying attention to the continuity of education for
children when educational institutes were physical damaged.
Final Report: CAF2015-RR08-NMY-Chiba 36
4.2 Assessing the total loss and damages by adding the NELDs
4.2.1 Reporting status of the disaster loss and damages in Bangladesh
The data on the L&Ds after any disaster in Bangladesh is collected through D-Form. The D-
Form is the government-prescribed form for collecting data on L&Ds of a disaster. This form
has several sections to collect data on both ELDs and NELDs. At the union level, the local
government personnel are responsible to collect the data of L&Ds from their respective unions.
It includes the information on the following L&D issues about a disaster on a union level:
Number of people completely and partially affected, died, or injured.
Number of household completely and partially affected.
Number of houses completely or partially destroyed
Number of livestock damaged and monetary loss
Number of poultry damaged and monetary loss
Area of crop field partially or completely damaged and monetary loss
Area of salt field damaged and monetary loss
Area of shrimp or prawn ghers damaged and monetary loss
Number of educational institutions completely and partially damaged.
Number of religious institutions (mosque, temple) damaged.
Area of road partially or completely damaged
Area of polder or embankment completely and partially damaged
Area of forest damaged
Damage to the electricity supply in monetary value
Damage to telecommunication system in monetary value
Damage to the industry
Number of fish farm damaged and monetary loss
Number of deep, shallow, and manual tube-well damaged
Number of pond damaged
Number of water vessels (boat, trawler) damaged and monetary loss
Number of fishing nets damaged and monetary loss
Number of handlooms damaged and monetary loss
The data of the union level is compiled into the upazila level to get an overall picture of the
disaster L&Ds of the upazila. The valuation of the L&Ds completes within 72 hours, and the
UNO offices coordinate the work.
4.2.2 Economic loss and damage of ‘Aila’ in Koyra
The data of the ELDs collected through the D-Form after Aila were: loss of livestock, loss of
poultry, loss of crop yield, loss of shrimp or prawn, damage to the electricity supply, damage
to the fish ponds, damage to the water vessels, and damage to fishing nets.
Therefore, the total monetary loss in Koyra upazila is:
= loss of livestock + loss of poultry + loss of crop yield + loss of shrimp or prawn + damage to
the electricity supply + damage to the fish ponds + damage to the water vessels + damage to
fishing nets
= 15,620,000 + 5,700,000 + 20,000 + 200,000,000 + 55,000 + 6,500,000 + 6,975,000 +
3,150,000
= 238,020,000 (BDT)
Final Report: CAF2015-RR08-NMY-Chiba 37
= 3,051,538 (USD)
(1 USD = 78 BDT)
The highest monetary loss was found in the damage to the shrimp and prawn farms, and it
was approximately 200,000,000 BDT. The second highest monetary loss was recorded in the
loss of livestock, and which was around 15,620,000 BDT. Conversely, the least monetary loss
was recorded in the loss of crop yield.
4.2.3 Comparison of ELDs and NELDs and the total L&Ds of ‘Aila’ in Koyra
The total NELDs of Aila in Koyra upazila are the summation of the L&D values of the three
major NELD indicators, namely inaccessible to sanitation, waterborne diseases, and psycho-
social disorder.
Therefore, the total value of NELDs of Aila in Koyra upazila is:
= inaccessible to sanitation + waterborne diseases + psycho-social disorder
= 127,585,000 + 82,920,987 + 96,098,705
= 306,604,692 (BDT)
= 3,930,829 (USD)
(1 USD = 78 BDT)
The total estimated value of the NELDs of cyclone Aila in Koyra was 306,604,692 BDT
(3,930,829 USD).While the total estimated ELDs were 238,020,000 BDT (3,051,538 USD).
Hence, the NELDs were 68,584,692 BDT (1.3 times) more, compared to the ELDs.
The total L&Ds are the summation of the total NELDs and the ELDs. Therefore:
Total L&Ds
= total NELDs + total ELDs
= 306.604,692 + 238,020,000
= 544, 624,692 (BDT)
= 6,982,367 (USD)
(1 USD = 78 BDT)
The total estimated L&Ds of Aila in Koyra were 544, 624,692 BDT (6,982,367 USD).
4.2.4 Importance of inclusion of NELDs
The existing disaster L&D reporting structure of Bangladesh addresses a number of NELDs,
such as human health (number of people died, injured), number of educational institution
damaged, sanitation (water source: i.e., tube-well damaged) and ecosystem (pond affected).
However, the existing disaster L&D data collection form (D-Form) does not address many
other NELDs for example migration, social capital, governance, etc. Moreover, detailed
information on the indicators of the areas (for instances in sanitation- damage to sanitary
facilities) should be reported to get the actual scenario of L&Ds of a disaster since the NELDs
can be more dominant than the ELDs.
Final Report: CAF2015-RR08-NMY-Chiba 38
5. Conclusions The study intended to understand NELDs caused by cyclone Aila in 2009, develop an
assessment framework to identify, prioritize and measure the NELDs, and strengthen the DRR
and CCA plans and policies for addressing the NELDs and practices to address the NELDs
for effective DRR and CCA. The study location was Koyra upazila, Khulna district in
Bangladesh. The study made comprehensive literature review on NELDs in context of DRR
and CCA and then carried out the pre-survey in Khulna to have a firsthand experience of L&Ds
caused by the cyclones. The study applied the AHP analysis to prioritize key NELD-related
criteria, indicators and practices, which were examined through: comprehensive literature
review; expert consultation; and FGD in the affected community. Questionnaire surveys were
conducted to prioritize the key NELD-related elements, targeting the affected communities
and local government officials. The key NELD indicators identified through the questionnaire
survey were quantified in terms of monetary values to estimate and measure the NELD
impacts.
For rural area of Koyra, the study identified impact on societal well-being, compliance with
societal value, and relevance to DRR/CCA policy as important criteria, through expert and
community consultations. As important NELD indicators, it specified mental diseases,
malnutrition, inaccessible sanitation, waterborne diseases, school discontinued, and children
temporary discontinued school. In addition, it found disaster preparedness policy and planning,
disaster compensation and cyclone shelter policy as important risk reduction practices to
address the NELDs. Similarly, for urban area of Koyra, the study figured out compliance with
societal value, appropriateness to the problem, and impact on societal well-being as important
criteria. Furthermore, as important NELD indicators, it detected malnutrition, mental diseases,
waterborne diseases, inaccessible sanitation, less accountability by local government, and
less collaboration by local government. It also identified disaster preparedness policy and
planning, land-use policy, and cyclone shelter policy as important risk reduction practices to
address the NELDs. The study then identified the preferences between the affected
communities and local government officials, and also between those of rural and urban areas
of Koyra. The results indicate that both rural and urban communities in Koyra agreed on the
importance of addressing issues with inaccessible sanitation, waterborne diseases, and
mental diseases.
The study showed that inaccessible sanitation and DRR policy and planning are closely linked.
This raises a need to enhance national disaster management plan for Koyra upazila and its
union offices to address inaccessible sanitation caused by the cyclone. There is also a need
to recognize and address waterborne diseases as a major NELD in the national plan. In
addition, it is important for the national government to improve the national disaster
management plan to strengthen the efforts against mental diseases by mobilizing more mental
health experts. Moreover, it is essential to enhance the national disaster management plan to
ensure the continuity of education for children when schools are unable to function due to the
cyclone.
Another challenge is that the total L&Ds will significantly increase if key NELDs could be
quantified. The result showed that the estimated monetary value of NELDs based on key
NELD indicators (i.e., inaccessible sanitation, waterborne diseases, and mental diseases)
were more dominant than the ELDs calculated based on D-Form. Thus, the measurement and
Final Report: CAF2015-RR08-NMY-Chiba 39
reporting frameworks for other key NELDs which were identified but not quantified, such as
malnutrition, less accountability by local government, and less collaboration between local
government and community, are essential. These indicators should be included in the data
collection format of D-Form to ensure L&Ds are fully reported.
6. Future Directions This study identified and prioritized key NELDs in the context of the study location and
identified important practices that could address these impacts. It then quantified only the
NELD indicators for inaccessible sanitation, waterborne diseases, and mental diseases on a
monetary basis, by using limited number of parameters associated with the costs of recovery
from the NELD impacts. Some of the parameters would both economic and non-economic
aspects which are inseparable to apply only for NELDs. As a further study scope, it is important
to enhance the valuation framework for improving relevancy, quality and verifiability of the
parameters used for the three NELD indicators and for quantifying other key NELD indicators,
in order to more precisely figure out the actual total L&Ds which are more likely to further
increase if those are added.
7. References Abedin, M. A., Habiba, U., Shaw, R. and Hassan, A. W. R. (2013). Water Insecurity: A Social
Dilemma, Community, Environment and Disaster Risk Management, 13(2013), pp. 287–
303.
Akter, S. (2012). The Role of Micro Insurance as a Safety Net against Environmental Risks in
Bangladesh. The Journal of Environment and Development, 21(2): 263‐380.
Azam, M. and Sarker, T. (2009). Adaptation strategies for safe drinking water supply in the
low lying coastal regions in Bangladesh.
BBS (2010-11). Statistical Year Book of Bangladesh. Bangladesh Bureau of Statistics, Dhaka,
Bangladesh.
Bangladesh Bureau of Statistics (BBS), Statistics Division, Ministry of Planning, Government
of the People’s Republic of Bangladesh (2011). Report of Household Income and
Expenditure Survey 2010.
Bangladesh Bureau of Statistics (BBS), Statistics and Informatics Division (SID), Ministry of
Planning (2012). Community Report Khulna Zila: Population and Housing Census 2011.
Biswas, A. A. A., Sattar, M. A., Hossain, M. A., Faisal, M., and Islam, M. R. (2015). An Internal
Environmental Displacement and Livelihood Security in Uttar Bedkashi Union of
Bangladesh. Applied Ecology and Environmental Sciences, 3(6), 163-175.
Bhushan, N. and Rai, K. (2004). Strategic decision making : applying the analytic hierarchy
process. Berlin, Germany: Springer-Verlag London Limited.
Dasgupta, S., Huq, M., Khan, Z.H., Ahmed, M.M.Z., Mukherjee, N., Khan, M.F. and Pandey,
K. (2011). Cyclones in a Changing Climate: the Case of Bangladesh. Department for
Environment, Food and Rural Affairs, London.
DAYTON, U. O. (2010). Temperature database of Bangladesh. Global Temperature. Ohio,
Department of Mechanical and Aerospace Engineering.
DAYTON, U. O. (2010) Rainfall database for Bangladesh. Ohio, Department of Mechanical
and Aerospace Engineering.
Department of Disaster Management, Ministry of Disaster Management and Relief,
Government of the People’s Republic of Bangladesh (DDM) (2014). Disaster Report 2013.
Dhaka, Bangladesh.
Final Report: CAF2015-RR08-NMY-Chiba 40
Disaster Management Bureau, Disaster Management & Relief Division, Ministry of Food and
Disaster Management (DMB) (2010). National Plan for Disaster Management 2010-2015.
Dhaka, Bangladesh.
ECHO (European Commission Humanitarian Aid Offce) (2009). In-depth Recovery Needs
Assessment of Cyclone Aila Affected Areas. 25–31 October. Conducted by international
agencies (ActionAid, Concern Worldwide, DanChurchAid, MuslimAid, Islamic Relief,
Oxfam-GB and Save the Children-UK) and funded by ECHO.
Forman, E. and Peniwati, K. (1998). Aggregating individual judgments and priorities with the
analytic hierarchy process, European Journal of Operational Research, 108(1), pp. 165–
169.
GoB (2009). Bangladesh Climate Change Strategy and Action Plan 2009. Government of the
People's Republic of Bangladesh, Dhaka, Bangladesh.
Harmeling, S. and Eckstein, D. (2012). Global Climate Risk Index 2012: Who suffers most
from extreme weather events.
Haque, U., Hashizume, M., Kolivras, K. N., Overgaard, H. J., Das, B. and Yamamoto, T. (2012).
Reduced death rates from cyclones in Bangladesh: What more needs to be done?,
Bulletin of the World Health Organization, 90(2), pp. 150–156.
Hoffmaister, J.P. and D. Stabinsky (2012). Loss and damage: Some key issues and
considerations for SIDS expert meeting. Briefing Paper on Loss and Damage: 4. SIDS
Expert Meeting, 9-11 October, Bridgetown, Barbados.
Kumar, U., M.A. Baten, A.A. Masud, K.S. Osman, and M.M. Rahman (2010). Cyclone Aila:
One Year On; Natural Disaster to Human Sufferings.
Maplecroft (2010). Big economies of the future ‐ Bangladesh, India, Philippines, Vietnam and
Pakistan ‐ most at risk from climate change [online]. Available at:
<http://maplecroft.com/about/news/ccvi.html> [Accessed 25 May 2017].
Nicholls, R.J., P.P. Wong, V.R. Burkett, J.O. Codignotto, J.E. Hay, R.F. McLean, S.
Ragoonaden and C.D. Woodroffe (2007). Coastal systems and low‐lying areas. In: M.L.
Parry, O.F. Canziani, J.P. Palutikof, P.J. van der Linden and C.E. Hanson (eds). Climate
Change 2007: Impacts, Adaptation and Vulnerability. Contribution of Working Group II to
the Fourth Assessment Report of the Intergovernmental Panel on Climate Change.
Cambridge: Cambridge University Press.
Rasel, H. M., Hasan, M. R., Ahmed, B. and Miah, M. S. U. (2013). Investigation of soil and
water salinity, its effect on crop production and adaptation strategy, International Journal
of Water Resources and Environmental Engineering, 5(8), pp. 475–481.
Saaty, T. L. (1990). How to make a decision: the analytic hierarchy process, European Journal
of Operational Research, 48(1), pp. 9–26.
Schiermeier, Q. (2014). Holding back the tide. Nature, 508, 164-166.
Selvaraju, R. and Baas, S. (2007). Climate Variability and Change: Adaptation to Drought in
Bangladesh : A Resource Book and Training Guide. Rome: Asian Disaster Preparedness
Center, Food and Agriculture Organization of the United Nations.
Shamsuddoha, M., Roberts, E., Hasemann, A., and S. Roddick (2013). Establishing Links
between Disaster Risk Reduction and Climate Change Adaptation in the Context of Loss
and Damage: Policies and Approaches in Bangladesh. Dhaka: International Centre for
Climate Change and Development.
Shaw, R. (2014). Community Practices for Disaster Risk Reduction in Japan. Tokyo, Japan:
Springer Japan.
Final Report: CAF2015-RR08-NMY-Chiba 41
Sultana, S., Ahmed, K. M., Mahtab-Ul-Alam, S. M., Hasan, M., Tuinhof, A. S., Ghosh, S. K.,
Rahman, M. S., Ravenscroft, P. and Zheng, Y. (2015). Low-Cost Aquifer Storage and
Recovery: Implications for Improving Drinking Water Access for Rural Communities in
Coastal Bangladesh. J. Hydrol. Eng. 20(3): B5014007.
Swiss Re (2012). Natural catastrophes and man-made disasters in 2012: An year of extreme
weather events in the US. Switzerland.
UNDP (United Nations Development Programme) (2009). Field Visit Report on Selected Aila
affected areas. http://cccm.iom.org.bd/fle/pdf/34.pdf (last accessed on 29 May 2017).
UNFCCC (2013). Non-economic losses in the context of the work programme on loss and
damage. Technical paper.
UNFCCC (2013). Report of the Conference of the Parties on its eighteenth session, held in
Doha from 26 November to 8 December 2012; Addendum: Part Two: Action taken by the
Conference of the Parties at its eighteenth session. FCCC/CP/2012/8/Add.1
UNFCCC (2012). A Literature Review on the Topics in the Context of Thematic Area 2 of the
Work Programme on Loss and Damage: A Range of Approaches to Address Loss and
Damage Associated with the Adverse Effects of Climate Change. United Nations
Framework Convention on Climate Change (UNFCCC). FCCC/SBI/2012/INF.14.
UNISDR (2010). Disaster risk reduction tools and methods for climate change adaptation.
Inter-Agency Task Force on Climate Change and Disaster Risk Reduction. Geneva,
Switzerland: UNISDR.
Unnikrishnan, A.S., Kumar, K.R., Fernandes, S.E., Michael, G.S. and Patwadhan, S.K. (2006).
Sea level changes along the Indian Coast. Current Science, 90(3): 362‐368.
World Bank (2000). Bangladesh: Climate Change and Sustainable Development. Report No.
21,104-BD. The World Bank, Dhaka.

Final Report: CAF2015-RR08-NMY-Chiba 42
Final Report: CAF2015-RR08-NMY-Chiba 43
Non-Economic Loss and Damages in India: Issues and Way Forward
Ajinder Walia National Institute of Disaster Management, Ministry of Home Affairs,
Indraprastha Estate, New Delhi – 110 002, India
1. Introduction India is highly prone to various extreme climatic events which are aggravated by human
interventions. The primary responsibility of management of a disaster in the country rests with
the state government. The central government plays a supplementary role in the process as
and when the state government falls short of its capacity to deal with the event. In the
immediate aftermath of disaster, the state government, the defence services, National
Disaster Response force, local as well as national and international NGOs all work together
in search and rescue activities and in providing immediate relief to the disaster survivors as in
the case of a major floods or a cyclone. In case of a major disaster event, the state government
responds to the disaster using finances from the State Disaster Response Fund (SDRF). If
this fund is also not able to meet the requirement of the state government then the state
government submits a memorandum on the loss and damage in the affected area to the
central government asking for its assistance An Inter-ministerial central team visits the affected
area to conduct an on the spot review of the loss and damage claimed by the state government
and submits its report. The report is then submitted to an Inter-ministerial group (IMG) for
approval. On the basis of the recommendations of IMG, the state government receives
necessary financial aid from the central government’s National Disaster Response Fund
(NDRF) to provide immediate relief to the disaster survivors.
In the block year of 2010-2015, a sum of Rs 33,580.33 crores has been allocated towards
State Disaster Response fund. It may be noted that the funds from SDRF and NDRF are used
with the aim to provide immediate relief to the disaster survivors and not with the purpose of
recovery. The manual on administration of SDRF and NDRF clearly highlights the difference
between immediate relief and compensation as,
“Relief means assistance to reduce the level of suffering and to mitigate the distress as to
bring out the affected people from the shock and trauma of losing their means of livelihood.
On the other hand, compensation would mean replacement of all damages in financial terms.
Compensation is a part of contractual agreement whereby unnatural dispossession of wealth
and property is to be compensated for.”
The memorandum of loss and damage submitted by the state to the central government
includes sector wise damage on the basis of items listed out by the central government. Some
of the broad categories of loss and damage includes loss of lives, disability, injury, loss of
household goods, damage to houses, roads damaged, agricultural land affected, loss of crops,
damage to handicrafts or handlooms, damage to fisheries sector, damage to drinking supply,
damage to irrigation and power sector, loss of livestock, loss of fishing boats and accessories,
damage to primary schools, hospitals, primary health centres and community assets owned
Final Report: CAF2015-RR08-NMY-Chiba 44
by Panchyats etc. The list does not even cover all economic damage. Only few livelihood
activities are included in the list while commercial establishments have been left out. It is
surprising that the list of items in the memorandum does not even detail out the damage and
loss of environment inspite of the fact that the Disaster Management law, 2005 of the country
defines disaster as:
“catastrophe, mishap, calamity or a grave occurrence in any area arising out of natural or
manmade causes, or by accident or negligence, which results in substantial loss of life and
human suffering or damage to, or destruction of, or degradation of environment, and is of
such a nature, or magnitude as to be beyond, the coping capacity of the affected community
of the affected area”.
We need to understand that the impact of such events on human populace is not only
restricted to loss of life and damage to infrastructure alone but is more widespread permeating
to social and psychological areas as well. Extreme events also result in injuries, disability,
maternity complications, migration, mental health problems, loss of education, loss of
secondary sources of livelihood, loss of social security, aggravation of poverty and many such
impacts which do not have a direct economic value. The impact in one area of human life
cannot be isolated from other areas as impact in one will also impact others. For example:
When a disaster survivor becomes disabled he/she will feel sad and depressed about it.
He/she will also experience loss of livelihood. His/her family will experience a loss in living
standards and may also become poor. Hence, in the above mentioned case there is a causal
relationship between physical impact of the disaster survivor to psychological impact which
affected the social standard of the family and finally had an economic impact not only on the
disaster survivor if extrapolated, then also on the economy of the country. However, the
structured damage and loss assessment processes do not take the indirect economic impact
or non-economic impact into account while compiling and computing data in a post disaster
scenario.
The process of inclusion of non-economic damage and loss in the assessment techniques
faces many challenges. More often than not, these damages cannot be quantified directly and
need an analysis to be considered as economic value. The damage and loss assessment
techniques try to capture the damages as they are visible on the ground and can be quantified
directly. However, loss of life, although considered a non-economic loss, is an exception in
such cases. Loss of life is the first loss which is reported and compensated in the post disaster
scenario as it is directly visible and can be computed. This is done on the basis that human
beings are seen as having economically productive value on the basis of which they contribute
to the gross domestic product of the country. Even the aged persons are compensated on the
ground that given an opportunity they would also have contributed to the economy of the
country. In fact loss of human life is the only noneconomic loss which is reported and
compensated according to norms in the aftermath of a disaster.
In the above mentioned context we can clearly see that disasters tend to have an economic
as well as non-economic impact on the lives of the community. However, our damage and
loss assessment techniques capture some of the economic damages with loss of lives being
an exception. The non-economic loss which is equally significant does not form a part of
funding mechanism required for immediate relief to the community. India does not have a
standard format or a template for identifying and addressing the non-economic damages and
loss during a disaster. The immediate relief is provided by primarily targeting the economic
Final Report: CAF2015-RR08-NMY-Chiba 45
sector not withstanding that the non-economic sector is also an offshoot of the economic
sector and vice versa. Both the sectors are interrelated and interdependent upon each other
with strong linkages. In case of major disasters, reconstruction and recovery needs which also
include non-economic needs are essentially met through planned budget of the government
of India and soft loans from international financial institutions like World Bank and Asian
Development Bank. The state government does not have any specific funds for recovery.
Moreover, often there is no clear framework for post disaster recovery and reconstruction. In
the absence of a framework for capturing the non-economic along with the economic damage
and loss, a holistic approach towards managing the event remains incomplete. Therefore, it
becomes imperative to have a framework for identifying and assessing the non-economic
damage and losses as well.
2. Past Extreme events: Assessment of Damage and Loss
India has experienced an increase in the frequency of extreme climatic events in the past few
years. In this section the damage and loss which was reported for major climatic events since
2011 has been analysed. This window of this time period is sufficient to throw light on the
current pattern of reporting of damage and loss by the respective state governments,
Institutions and international organizations and subsequently draw a conclusion on the gaps
in the reporting mechanism.
In the year 2011, three major extreme climatic events namely; Floods in Odisha, Drought in
Karnataka and cyclone ‘Thane’ in Tamil Nadu and Puducherry occurred in India. Although the
floods in Odisha resulted in the death of 45 lives, it actually affected over 3.5 million people
and caused massive damage to crops and infrastructure. The estimated damage to houses
was about 116706 crores. About 179387.38 hectares of Kharif crop sustained crop-loss, in
which more than 50% was due to floods. Agricultural land of 803.4 hectares was sand cast,
14.67 lakh livestock were affected and 280320 people were evacuated to safer places and
kept in temporary shelters during the floods. (Government of Odisha, 2011).
This was followed by a late season drought in the state of Karnataka in the month of
September. The memorandum submitted by the state government mainly focuses on the
technical aspects of rainfall in the area. The estimated Agriculture Crop loss was Rs 4245.84
crores and estimated horticulture Crop loss was Rs 299.cores (Government of Karnataka,
2011).
The year 2011 ended with another hydro-meteorological disaster in the form of a Cyclone
‘Thane’, which affected India's south-eastern coastline severely affecting the Tamil Nadu
district of Cuddalore, south of the city of Chennai on December 30 with winds gusting at almost
90 miles per hour at its peak. The cyclone resulted in death of over 53 people and caused
severe damage to infrastructure and environment. About 21 deaths of men and 20 deaths of
women were reported in Cuddalore district of Tamil Nadu. The cyclone resulted in the death
of 343 cows, bullock, buffaloes and their calves and 59423 poultry. About 73292 houses were
fully damaged, 196385 were partially damaged and 96205 houses were severely damaged.
The damage to agriculture sector was also massive. About 87473 hectares of area was
damaged which constituted about 54.49 % of the total cultivated area. A total length of 1583.50
km of road was also damaged. Almost 100 percent of the electricity board’s infrastructure
suffered damage. A total of 65.44 percent of the total horticulture crops were damaged in
Final Report: CAF2015-RR08-NMY-Chiba 46
various stages (Government of Tamil Nadu, 2012). It is interesting to note that in case of
Cyclone ‘Thane’ the state government presented a gender segregated data in terms of lives
lost which was not done in earlier disasters in this year. The damage and loss assessment do
not indicate any significant reporting of non-economic damages in the 2011.
In the subsequent year 2012, three major extreme climatic events were reported namely floods
in Assam, heavy rains in Uttarkashi and cyclone Nilam in Andhra Pradesh. The state of Assam
witnessed massive floods in June and September 2012. Apart from loss of lives the damage
caused to infrastructure was enormous. An overview of the damage caused by floods is
outlined below in Table1.
About 812 Hectare Sericulture Plantation was affected, about 10, 00,000 nurseries were
damaged and 1580 rearing house were also damaged. Further, a total of 5000 Km of village
internal roads, 500 Km of Irrigation Channel/Marginal Bund, 425 Drinking Water units d and
50 Panchayat houses were also damaged (Assam State Disaster Management Authority,
2012).
The state of Uttrakhand also witnessed cloud burst leading to flash floods and number of
landslides in the month of August. Table 2 shows the losses incurred due to flash floods. It is
interesting to note that number of persons with grievous injuries finds a mention in the
memorandum. The injury is basically looked at from a physical point of view. No reference has
been made from a mental/ psychological health perspective.
The year also witnessed cyclone ‘Nilam’ on 31st October, 2012 which resulted in death of 61
human lives. It affected 19 districts, 8707 villages and a population of 20.42 lakhs. About 8.91
lakh hectares of total cropped area was affected and 29687 houses were damaged. The loss
of big and small animals was about 1858 with 98757 deaths of poultry birds. 6108.63
kilometres of road surface was damaged. The details also include damage and loss to various
sectors like fisheries, sericulture, animal husbandry, irrigation, water supply etc. Interestingly,
the memorandum states that 123 trees were removed for clearing traffic and debris as well as
for diversion of overflows which is indicative of the environment loss caused by the cyclone.
(Government of Andhra Pradesh, 2012).
In 2013, flash floods in Uttrakhand captured national as well as international attention. Heavy
rains coupled with probable collapse of the Chorabari Lake caused flooding and landslides in
the region. Unfortunately, the timing of the disaster coincided with the peak tourist and
pilgrimage season, which led to a massive increase in the number of deaths and affecting the
rescue and relief operations as well. As on 9th May, 2014 about 169 lives were lost and over
4,021 people were reported to be missing (presumed to be dead).The government of
Uttrakhand along with the World Bank and Asian Development Bank conducted a joint rapid
damage and needs assessment. The team could not undertake an independent mission due
to rough weather, heavy rains, flooding and landslides. They relied essentially on the data
collected by the government officers from the field. The report captures damage and loss in
ten sectors and identifies the specific needs for recovery and reconstruction. It was estimated
that the disaster caused damage to 3,077 rural and urban houses,995 public buildings, 2,174
roads, 85 motor bridges &140 bridle bridges, 50 raw water intake stations and tube wells, 40
km of pipelines, about 2,703 piped water schemes,3338 household toilets,495 km of canal
work,74 km of flood protection works,20,401 hectares of cultivable land,42 fish ponds,17,700
livestock,8000 small and micro enterprises, number of tourism linked livelihoods, 2010
Final Report: CAF2015-RR08-NMY-Chiba 47
hectares of crop area and 15,537 hectares of horticulture crop area. About 80 hectares of
forest area was lost along the river course (World Bank, 2013). Since the economy of
Uttrakhand is heavily dependent upon tourism, the damage and loss in the livelihood sector
includes loss of government and private infrastructure, direct loss to stakeholders of tourism,
loss of livelihood along the path of pilgrimage as well as those involved in adventure sports,
revenue and tax losses and loss of reputation of the state in the area of tourism. This report
marks a departure from earlier such report mentioned above. The issue of gender has been
raised in the context of housing as well as the livelihood sector. The report states that there
were a number of women survivors who would now be heading households. The report
advocates for gender sensitive cash for transfer programmes. It report also identifies the need
for counselling services for those who have lost their family members.
The Tata Institute of Social Sciences, Mumbai also conducted an immediate needs
assessment in 90 villages across 6 affected districts in the state of Uttrakhand. The villages
were assessed for livelihood recovery, housing education, health, public infrastructure, women,
children, mental health, disability and relief and compensation. The priority areas of
intervention were decided on the basis of these parameters. However, the report does not
capture any detailed analysis of the priority areas. For example It says that there are four
villages namely; Chelound, Semi, Bhaisari, Kalimath & Chaumasi in Rudraprayag district
where women should be given utmost priority attention with no further explanation on the
aspect. The same was the case for all other human and social factors like children, mental
health, disability etc. Furthermore, there was no follow-up study for assessing the detailed
damage and loss assessments by the Institute.
The second major disaster in 2013 was Cyclone Phailin which made landfall in Odisha on 12th
October, 2013 with wind speeds of over 200 km/hour. Over one million people were evacuated.
It resulted in loss of 44 lives in Odisha and one life in the state of Andhra Pradesh. 23 people
sustained serious injuries while 53 people sustained minor injuries. The World Bank conducted
a Rapid Damage Needs Assessment (RDNA) in the State of Odisha. Eight sectors including
Housing, Public Buildings, Roads, Urban and Rural Infrastructure, Agriculture and Livestock,
Livelihood (Fisheries, MSME, Handicraft and Handloom), Energy/Power, and Forest and
Plantations were included in damage and loss assessments. It can be seen that environmental
damage was also an integral part of this assessment. The World Bank also relied on the
information detailed out in the memorandum submitted by the State Government. About
256,633 houses were fully or partially damaged in the cyclone. The estimation of
reconstruction cost included Rs 29,600 million for housing sector, Rs 6,620 million for public
buildings, Rs 7000 million for roads, Rs 4700 million for urban and rural infrastructure, Rs
26,500 million for agriculture, livestock, irrigation and horticulture, Rs 3, 96065 million for
livelihood, Rs .10, 480 million for energy and power and finally 160 million for forests and
plantations. It was estimated that Rs 89, 0201,450 million was needed for recovery and
reconstruction in the State. The human recovery needs assessment included housing, public
buildings, heritage buildings, roads, urban &rural infrastructure, agriculture, livelihoods, energy,
forests and plantations and finally social vulnerability (World Bank, 2013).
In the year 2014, the extreme climatic event which captured national attention was floods in
Jammu and Kashmir. Due to heavy rains from 1st to 6th September, the state of Jammu and
Kashmir experienced floods, flash floods and landslides. Almost 20 districts of the state were
affected and it resulted in the loss of 282 lives. Around 5794 villages were affected out of
Final Report: CAF2015-RR08-NMY-Chiba 48
which 741 villages were submerged. There was huge loss to crops as 6.48 lakh hectares of
land for agriculture and horticulture purposes were affected. A total of 3.44 lakhs of residential
houses were fully, partially or severely damaged. The state government submitted a
memorandum to the Central government for assistance but with a request to relax the norms
under SDRF. A request was made to the central government to provide funds for permanent
restoration of damaged infrastructure rather than focusing only on temporary restoration. It
also demanded for reimbursement of rent for one year for those families whose houses were
fully damaged. The memorandum also observed that huge chunks of land were either washed
away or land was completely eroded and was consequently rendered unfit for agricultural
purposes. An amount of Rs 75 crore has been proposed for the revival of washed away and
eroded land. The state government has also asked the central government to provide
compensation to business communities and commercial establishments along with deferment
of loans and providing additional loan facilities. The state government has laid emphasis on
rehabilitation and reconstruction rather than focusing on immediate relief. This demand is not
a normal procedure followed by the states. The central government has yet to take a final
decision on the requests made. Nevertheless, an initiative has been undertaken to link
damage and loss assessment with recovery (Government of Jammu and Kashmir, 2014).
3. Policy and Institutional Responses The government of India provides funds from NDRF with the aim for providing immediate relief
to the disaster survivors so that they can pull themselves up and start their lives again. It is
not considered to be any kind of compensation. SDRF and NDRF form a part of non planned
budget for disaster management in the country. For long term recovery, the state government
has to approach the planning commission of the country with their needs and assessment for
recovery and reconstruction under planned budget. The planning commission responds to the
recovery and reconstruction needs of the state via three pronged strategy. Firstly, the planning
commission has about 66 central sector schemes. According to the recent directions from the
government of India, 10 percent of the money under all the schemes can be used for disaster
mitigation and restoration essentially meaning recovery. For example Sarv Skisha Abhiyaan
is a centrally sponsored scheme of the government of India which aims at providing
elementary education to all children below 14 years of age. 10 percent of the money under
this scheme can be used for building disaster resilient schools, developing capacity of the
teachers and principals for disaster risk reduction, development of schools safety plans,
conducting of mock drills, awareness generation for environmental education, etc. As per the
second strategy, the planning commission can send the request to Department of Economic
Affairs, Ministry of External Affairs who can approach International Funding Institutions (IFI)
agencies like World Bank and Asian development Bank for assisting the state in recovery via
loans. These agencies conduct rapid damage and loss assessment by focusing on two
elements namely; physical infrastructure and economic damages and human recovery needs
assessment. In the recent Uttrakhand Disaster, the World Bank pitched in with a credit of $ 250
million to build 2500 resilient houses and 3600 km of roads under the Uttrakhand Disaster
recovery project. The project would also help in reconstruction of early warning infrastructure
apart from building the capacity of State Disaster Management Authority and State Disaster
Response Force., The aim of the project is to build resilient infrastructure for the state as well
as the communities so that it can safeguard them from future disasters. Importantly, the needs
assessment of the joint rapid damage and needs assessment report, 2013 of the World Bank
report has raised the issue of women headed households and the need for giving making cash
Final Report: CAF2015-RR08-NMY-Chiba 49
transfer in any form gender sensitive delivery programmes. It falls short of mainstreaming
gender in all sectors. The report also identifies the need for counselling services for those who
have lost the family members. This report has relied upon the government reporting
mechanisms. It has referred to only few social issues in the wake of Uttrakhand tragedy. In
case of Cyclone Phailin, the government of Odisha decided to give a month’s additional
pension to older women under the Madhubabu Pension Scheme and also made provisions
for giving half a quintal of rice and Rs 500 to them. The World Bank is already running National
Cyclone Risk Mitigation Project in the states of Odisha and Andhra Pradesh. The project
focuses on improving the early warning system and connecting it to the community level,
construction of building cyclone resistant infrastructure, multi-purpose cyclone shelters,
evacuation roads and strengthening embankments in the coastal areas. It is a pre disaster
intervention rather than a post disaster intervention. Thirdly, the planning commission has a
budget referred to as “Special Planned Assistance” under which they can provide funds to
States for addressing non-economic needs in the recovery processes. Additionally, the State
government can also write to respective central Ministries for seeking assistance for respective
sectors under the planned budgets. For example In the recent Jammu and Kashmir floods in
2014, the State government had written to the Ministry of Health for providing psychosocial
counselling services to the disaster survivors. The Ministry of health responded to this non-
economic need by tying up with agencies working in the area. However, this non-economic
need was addressed in an adhoc manner when the requisition was sent by the state
government. It needs to be understood though that there is no standard framework to capture
both economic as well as non-economic damage and loss. The non-economic damage and
loss is addressed as and when it is demanded and on a case to case basis.
4. Conclusions and Way Forward In India, the damage and loss assessments mechanisms only capture economic and not the
non-economic damage. At present, the aim of these assessments is neither linked to
compensation nor at providing assistance to the community to get back to their normal lives.
The funding provisions for providing immediate relief to the disaster survivors are done through
National Disaster Response Fund and State Disaster Response Fund. In order to get funding,
certain specific items have been listed by the central government. The state government tries
to provide information based on the listed items to ensure financing for immediate relief. The
list of items includes loss of life, disability, damage to physical infrastructure, and damage to
certain sectors of livelihood like agriculture, fisheries, handicrafts etc. They do not even
capture all economic damages leave alone non-economic damage and loss. The damage and
loss assessments are thus guided by the funding mechanism and hence have engrained its
limitations. An initiative has been undertaken by the State Government of Kashmir where they
have requested the central government to release funds beyond norms for rehabilitation and
recovery rather than focusing only on immediate relief. There are certain mechanisms for
addressing non-economic damages, but it is done on a case to case basis depending upon
the specific need. While gliding from relief to reconstruction and recovery, the role of
International Funding Institutions (IFIs) like the World Bank and Asian Development Bank
comes into light. The IFI’s conduct Rapid Damage and Needs Assessment according to their
framework. It includes physical damage and economic losses along with identification of
human recovery needs.
In India, although a holistic and integrated approach to disaster risk management is advocated,
the desk research and discussions with government officials shows, that addressal of non-
Final Report: CAF2015-RR08-NMY-Chiba 50
economic damage and loss has not received adequate attention at the level of policy, financial
allocations and programmes. An integrated framework for capturing and funding economic
and non-economic damages is not present in the country. It i due to the fact that the damage
and loss assessment techniques focus only on immediate relief and not on effective recovery
of the community. Although the principle advocated in the country is “build back better” but the
linkage of national level damage and loss assessment mechanisms with the recovery of the
community is not established. Again, this may be due to the fact that the impact of non-
economic damage is generally not visible in the immediate aftermath of a disaster but starts
becoming visible as and when the community goes through the processes of recovering.
Hence, there is a lack of long term vision for building and taking the physical, social and
economic resilience of the community to next level is lacking. The need to address the non-
economic damages is passed over to IFI’s like the World Bank and Asian development bank
who capture the economic as well as non-economic damages including culture heritage,
environmental loss and social vulnerability including women and children needs in their
assessments. There is a need for developing a framework not only for capturing non-economic
impacts of disasters along with the economic impacts snot only at the national and state levels
but also to establish the link between impacts of disasters and recovery processes of the
community.
5. References Disaster Management Division (2013). Manual on Administration of State Disaster Response
Fund and National Disaster Response Fund, Retrieved from Ministry of Home Affairs,
Government of India. Retrieved from http://www.ndmindia.nic.in/
United Nations Development Programme & International Recovery Platform. (2007.) Review of
Post disaster Recovery Needs Assessment and Methodologies. Retrieved from
www.saludydesastres.info/index.php?option=com_docman
Tata Institute of social Sciences. (2013). The Uttrakhand Disaster: Impact Assessment and
Selection of Affected Villages, Based on Perceptual Ranking and Qualitative Narratives.
Unpublished Report.
World Bank, Asian Development Bank & Government of Uttrakhand. (2013). Joint Rapid
Damage and Needs Assessment. Retrieved from www.adb.org/sites/default/files/linked-
documents/47229-001-sd-01.pdf
World Bank, Asian Development Bank & Government of Odisha. (2013). Rapid Damage and
Needs Assessment, India Cyclone Phailin in Odisha.
https://openknowledge.worldbank.org/handle/10986/1760
Department of Revenue and Disaster Management. (2011). Memorandum: Floods 2011.
Government of Odisha.
Department of Revenue, Relief and Rehabilitation. (2014). Memorandum: Special package for
rehabilitation of flood victims of 2014. Government of Jammu and Kashmir
Government of Karnataka. (2011). Memorandum submitted to Governments of India seeking
Central Assistance for Drought Relief measures in Karnataka State.
Department of Revenue. (2012). Memorandum submitted to Central Team: District Cuddalore.
Government of Tamil Nadu.
Assam State Disaster Management Authority. (2013). Towards a Disaster Resilient Assam:
Floods in Assam 2012. Government of Assam. Retrieved from http://sdmassam.nic.in/
Department of Disaster Management. (2012). Disaster Relief Memorandum for Central
Assistance. Government of Uttrakhand.
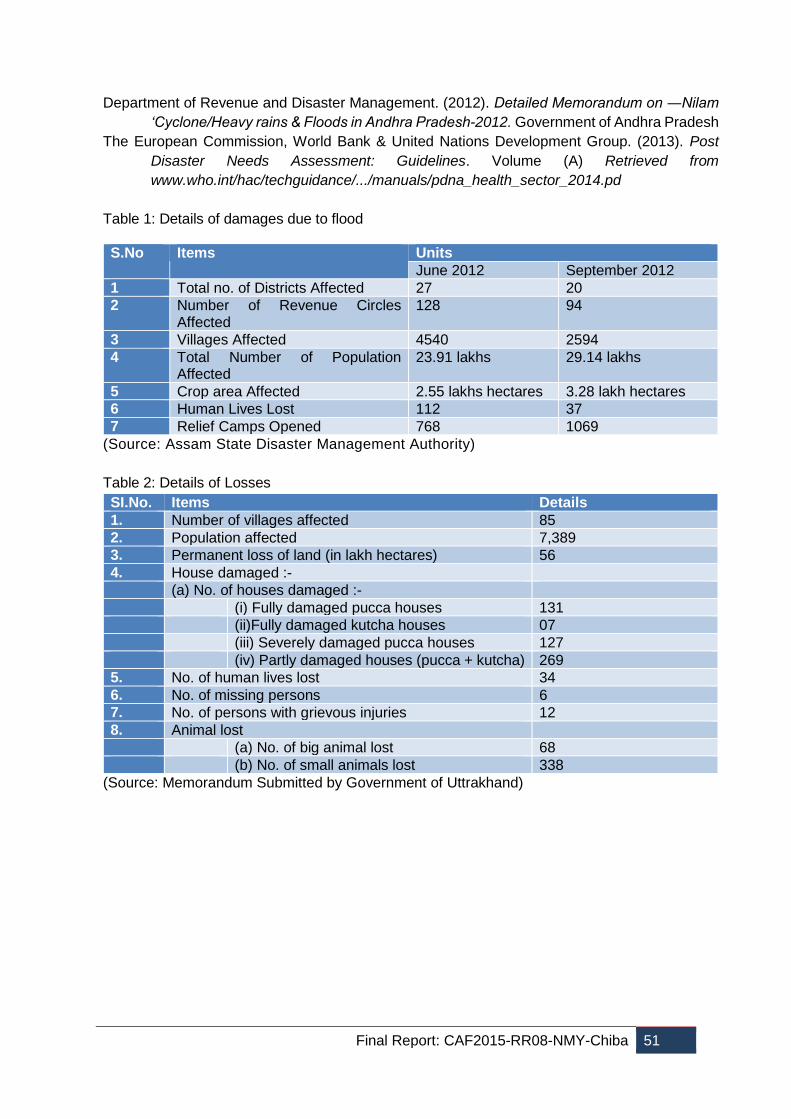
Final Report: CAF2015-RR08-NMY-Chiba 51
Department of Revenue and Disaster Management. (2012). Detailed Memorandum on ―Nilam
‘Cyclone/Heavy rains & Floods in Andhra Pradesh-2012. Government of Andhra Pradesh
The European Commission, World Bank & United Nations Development Group. (2013). Post
Disaster Needs Assessment: Guidelines. Volume (A) Retrieved from
www.who.int/hac/techguidance/.../manuals/pdna_health_sector_2014.pd
Table 1: Details of damages due to flood
(Source: Assam State Disaster Management Authority)
Table 2: Details of Losses
SI.No. Items Details
1. Number of villages affected 85
2. Population affected 7,389
3. Permanent loss of land (in lakh hectares) 56
4. House damaged :-
(a) No. of houses damaged :-
(i) Fully damaged pucca houses 131
(ii)Fully damaged kutcha houses 07
(iii) Severely damaged pucca houses 127
(iv) Partly damaged houses (pucca + kutcha) 269
5. No. of human lives lost 34
6. No. of missing persons 6
7. No. of persons with grievous injuries 12
8. Animal lost
(a) No. of big animal lost 68
(b) No. of small animals lost 338
(Source: Memorandum Submitted by Government of Uttrakhand)
S.No Items Units
June 2012 September 2012
1 Total no. of Districts Affected 27 20
2 Number of Revenue Circles Affected
128 94
3 Villages Affected 4540 2594
4 Total Number of Population Affected
23.91 lakhs 29.14 lakhs
5 Crop area Affected 2.55 lakhs hectares 3.28 lakh hectares
6 Human Lives Lost 112 37
7 Relief Camps Opened 768 1069

Final Report: CAF2015-RR08-NMY-Chiba 52
Final Report: CAF2015-RR08-NMY-Chiba 53
Economic and Non-Economic Loss and Damage from Droughts in
Western India: The Role of Adaptation Measures
Chandra Sekhar Bahinipati Indian Institute of Technology Tirupati, India
1. Introduction Climate change is likely to increase frequency and intensity of rapid- and slow-onset
disasters, e.g., cyclonic storms, floods, droughts, etc, all over the world, particularly in the
developing nations (IPCC, 2012). While the small island and developing countries are already
vulnerable to such events (Stern, 2007; Hallegatte, 2014), there could be a significant
devastation of tangible and intangible assets from these events in the foreseeable future
(IPCC, 2012). With reference to India, according to the International Emergency Events
Database (EM-DAT) of disasters, the total economic damage costs from a range of natural
disasters were US$ 2.92 billion during 1970s and increased to US$ 5.92 billion, US$ 18.41
billion and US$ 23.74 billion in the subsequent decades, respectively (Bahinipati et al., 2016).
The Paris agreement (i.e., Conference of Parties, hereafter, CoP 21, held in 2015) has,
therefore, recognized the importance of minimizing and addressing loss and damage (L&D)1
associated with these events. Before drafting a disaster mitigation action plan, it is prerequisite
to estimate total economic value (TEV) of a disaster, i.e., how much do a disaster cost to an
entity (Ladds et al., 2017). Such assessment could be carried out both at ex-post and ex-ante
levels. It should be noted about the impossibility to define ‘the cost’ of a disaster, as it mainly
depends on the purpose of the assessment (Hallegatte, 2014).
In general, the society incurs two types of costs because of a disaster: (i) economic (i.e.,
impact on goods and services those are traded in the market), and (ii) non-economic (i.e.,
affected goods and services for which market does not exist); it is again classified into direct
and indirect2 (Hallegatte, 2014). Over the years, L&D assessments have been carried out by
the government agencies and the individual research studies. The former around the world
calculate ex-post L&D figure to seek financial assistance from the central government and
various donor agencies (Bahinipati et al., 2015). Likewise, the respective state governments
in India do a post-disaster impact assessment report, which is prepared by either the revenue
and disaster management department or the state disaster management authority. Since a
‘work programme on L&D’ instituted in Cancun (i.e., CoP 16 held in 2010), a few research
studies are being emerged to estimate L&D (both ex-ante and ex-post) of different sectors as
1 It refers to the impacts that are beyond the limits of adaptation
(https://collections.unu.edu/eserv/UNU:5855/Loss_and_damage_Policy_Brief_10.pdf; accessed on February 7, 2017). 2 While direct L&D are the immediate consequences of the disaster (e.g. crop loss, depletion of groundwater, damage to
ecosystem services, etc.), indirect L&D are provoked by the consequences of the disaster, e.g., loss of jobs in agriculture sector,
impact on health on consumption, psychological trauma, etc (see Hallegatte, 2014).
Final Report: CAF2015-RR08-NMY-Chiba 54
well as entities from various natural disasters3 (see Warner and van der Geest, 2013); Indian
case studies are: Ranger et al. (2011), Bahinipati et al. (2015), and Patankar and Patwardhan
(2016). Although these reports and studies have reported several L&D components4, non-
economic loss and damage (NELD) indicators are most often vaguely reported (Prabhakar et
al., 2015). After all, there is still a controversy in the definition and assessment methodology
for assessing L&D (Birkmann and Welle, 2015). In fact, L&D calculations are based on
different methods and approaches, and thus, the results are quite different across them
(Hallegatte, 2014; Ladds et al., 2017).
With referring to various L&D reports across Indian states, it is noticed that direct economic
L&D (ELD) indicators (e.g., loss of agricultural crops, and damage to private and public
properties) are mostly reported (Bahinipati et al., 2015). Further, a few NELD indicators are
also accounted in these reports, e.g., human casualties, people affected and number of
suicides (Prabhakar et al., 2015). In the case of drought which is focus of the present study,
mostly two L&D variables are reported: number of people affected and total crop area (in ha)
experienced more than 50% crop loss. NELD costs in the developing nations could be more
significant, as the stock of non-economic goods and services are relatively higher than that of
economic in these nations (UNFCCC, 2013; Fankhauser et al., 2014). NELD consists of items
those are neither traded in the formal market nor accounted for, e.g., loss of human lives,
cultural heritage and ecosystem services, and hence, poses a serious challenge for
conceptualization, accounting and monetization of these particulars (UNFCCC, 2013;
Morrissey and Oliver-Smith, 2013; Fankhauser et al., 2014; Serdeczny et al., 2016). There are
two major issues while accounting and monetizing NELD: (i) knowledge about stock of various
non-economic goods and services, and (ii) appropriate methods to monetize NELD indicators
(Serdeczny et al., 2016). Some NELD indicators are indirect and also long-term in nature, e.g.,
drop-out of children from school, impact on health, malnutrition, poverty, etc (see Dercon,
2008). Hoddinott and Kinsey (2001), for instance, find that children (aged between 12 and 24
months) remain shorter four years after the failures of rain in 1994/95 than the identically aged
children who has not experienced this drought in Zimbabwe. Whatever the method we adopt,
it is, thus, quite impossible to account all the costs associated with a disaster.
NELD indicators are mostly unnoticed or unaddressed by policy (Morrissey and Oliver-Smith,
2013). While there is a limited knowledge about relationship between disaster and NELD, a
few studies explicitly assess NELD from several extreme events (e.g., Morrissey and Oliver-
Smith, 2013; Andrei et al., 2014; Serdeczny et al., 2016; see Fankhauser et al., 2014);
however, none of them has estimated the cost of NELD. The failure to adequately account
NELD has the serious consequences in terms of not only under-estimating total L&D figure
but also undermining community’s resilience (Morrissey and Oliver-Smith, 2013). Recently,
NELD is also part of an ongoing L&D debate under the UNFCCC (Serdeczny et al., 2016). It
is imperative to estimate both scale and value of NELD in order to undertake adaptation
measures (Serdeczny et al., 2016). Various autonomous and planned adaptation strategies
have been undertaken to smoothing income and consumption, e.g., drought prone areas
programme, desert development programme, watershed approach, irrigation, crop-insurance,
etc (Prabhakar and Shaw, 2008; Mwinjaka et al., 2010). There is also a paucity of studies to
3 It should be noted that there are a bulk of studies which look into entity’s (e.g., individual, household, region, country, etc.)
vulnerability from several disasters. 4 For example, number of people affected, loss of lives, damage to agricultural crops, damage to public property and house, etc.
Final Report: CAF2015-RR08-NMY-Chiba 55
look into the relationship between existing adaptation measures and L&D, particularly NELD.
With taking a case study from Gujarat state, prone to frequent droughts, in western India (see
Figure 1), there are two specific objectives of this study: (i) to estimate average TEV, ELD and
NELD costs from the recent past droughts, and (ii) to examine the role of adaptation options
like crop-insurance and irrigation in determining ELD and NELD intensity.
This paper is structured as follows: the first section outlines study area; while the second
section describes empirical methods for cost estimation and determinants of ELD and NELD
impact and specification of model variables, the third section discusses the empirical results;
and the final section concludes with some policy suggestions.
2. Methodology
2.1 Study Area
The state of Gujarat, consisting of seven agro-climatic zones, in western India (see Figure 1)
is mostly covered by arid and semi-arid regions, where agriculture is the basic source of
livelihoods for a majority of rural households; for example, around 50% of the total labour force
depends on agriculture as of 2011 census. While the state receives rainfall in a range of
minimum 18 days (north-west arid: Kutch district) to maximum 63 days (southern hills) in a
year, almost 90% of the total rainfall occurs during the monsoon season (Mehta, 2013). The
average rainfall widely varies between 250 mm and 1500 mm among the agro-climatic zones.
A high variability in temperature and rainfall is also observed in the state as well as across the
agro-climatic regions (Mehta, 2013). In addition, the state has been experienced recurrent
droughts in the past several decades (Roy and Hirway, 2007; Mwinjaka et al., 2010; Hiremath
and Shiyani, 2013). In between 1978 and 2008, the state had received 12 drought years
(Hiremath and Shiyani, 2013), and three in the current decade, i.e., 2012, 2014 and 2016 – it
seems drought occurs once in three years. In the context of spatial impact, most of the times
more than 50% of state’s total area is affected (Roy and Hirway, 2007). In 2016, the state
receives 24% less rainfall, and around 18 districts have been facing deficit rainfall ranging
from 20% to 56%. The state government has, therefore, declared 527 villages as partially
affected and 623 villages as drought affected5. On the other hand, Mall et al. (2006) reported
that the likelihood of occurring drought in the state is 21%, with around 23% in Saurashtra and
Kutch region. Across the agro-climatic zones, the rainfall variability is relatively high in the
Kutch region (Mehta, 2013).
Previous studies pointed out that climate variability and extreme events could significantly
affect the major crops across the state (Pandey and Patel, 2010; Patel et al., 2015; Mondal et
al., 2015). Pandey and Patel (2010) outline that increase in temperature is likely to reduce
wheat production in Gujarat. Estimating impact of climate change on different crops (wheat,
maize, pearl millet, paddy and groundnut) in the state, Patel et al. (2015) found an adverse
impact of climate change on these crops; while maximum yield reduction is noticed in the case
of wheat, the lowest impact could be on pearl millet. Taking a case study from the Gujarat
state, Mondal et al. (2015) report that projected precipitation changes may have positive
impact on crop cover, while temperature rise could reduce crop cover and productivity. Climate
variability and extreme events like drought have been negatively impacted households across
5 http://www.dailypioneer.com/nation/gujarat-government-declares-623-villages-drought-affected.html; accessed on January 31,
2017.
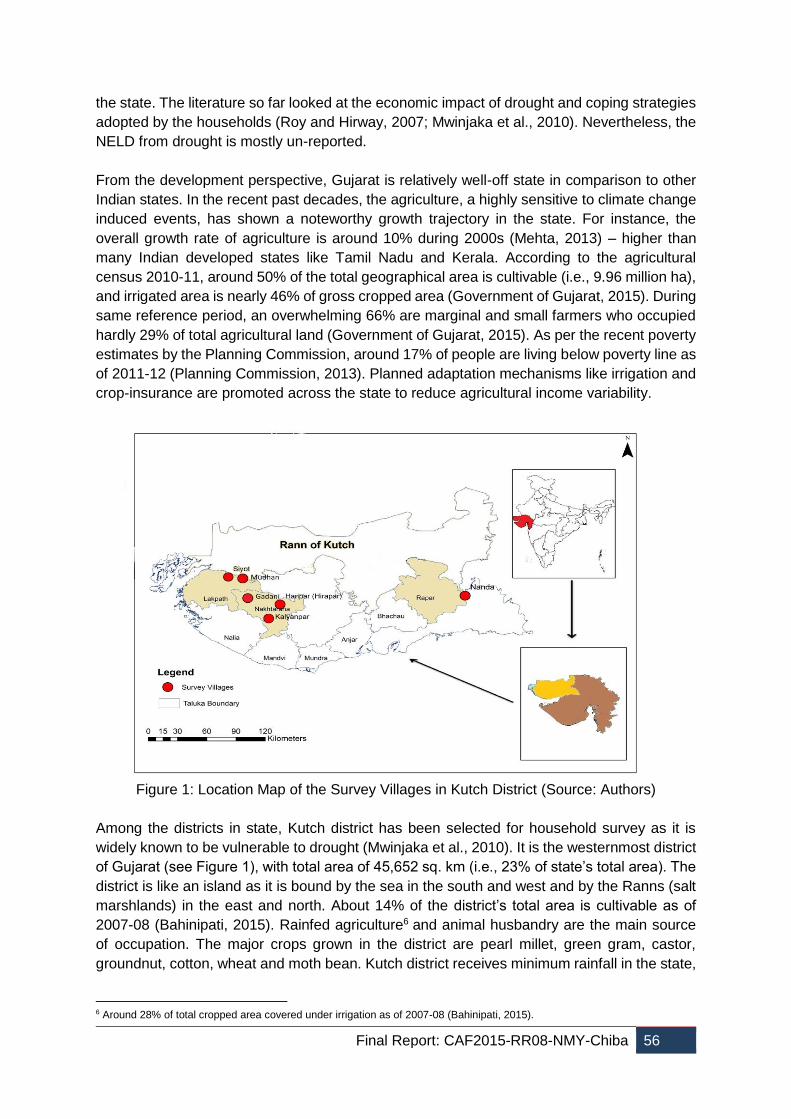
Final Report: CAF2015-RR08-NMY-Chiba 56
the state. The literature so far looked at the economic impact of drought and coping strategies
adopted by the households (Roy and Hirway, 2007; Mwinjaka et al., 2010). Nevertheless, the
NELD from drought is mostly un-reported.
From the development perspective, Gujarat is relatively well-off state in comparison to other
Indian states. In the recent past decades, the agriculture, a highly sensitive to climate change
induced events, has shown a noteworthy growth trajectory in the state. For instance, the
overall growth rate of agriculture is around 10% during 2000s (Mehta, 2013) – higher than
many Indian developed states like Tamil Nadu and Kerala. According to the agricultural
census 2010-11, around 50% of the total geographical area is cultivable (i.e., 9.96 million ha),
and irrigated area is nearly 46% of gross cropped area (Government of Gujarat, 2015). During
same reference period, an overwhelming 66% are marginal and small farmers who occupied
hardly 29% of total agricultural land (Government of Gujarat, 2015). As per the recent poverty
estimates by the Planning Commission, around 17% of people are living below poverty line as
of 2011-12 (Planning Commission, 2013). Planned adaptation mechanisms like irrigation and
crop-insurance are promoted across the state to reduce agricultural income variability.
Figure 1: Location Map of the Survey Villages in Kutch District (Source: Authors)
Among the districts in state, Kutch district has been selected for household survey as it is
widely known to be vulnerable to drought (Mwinjaka et al., 2010). It is the westernmost district
of Gujarat (see Figure 1), with total area of 45,652 sq. km (i.e., 23% of state’s total area). The
district is like an island as it is bound by the sea in the south and west and by the Ranns (salt
marshlands) in the east and north. About 14% of the district’s total area is cultivable as of
2007-08 (Bahinipati, 2015). Rainfed agriculture6 and animal husbandry are the main source
of occupation. The major crops grown in the district are pearl millet, green gram, castor,
groundnut, cotton, wheat and moth bean. Kutch district receives minimum rainfall in the state,
6 Around 28% of total cropped area covered under irrigation as of 2007-08 (Bahinipati, 2015).
Final Report: CAF2015-RR08-NMY-Chiba 57
i.e., 340 mm, with coefficient of variation around 60% (Bahinipati, 2015), and because of
erratic rainfall, the groundwater level is rapidly declining7. Previous studies established that a
higher percentage of households are increasingly vulnerable to the growing number of
droughts and consequent famines (Mwinjaka et al., 2010). The study villages were selected
based on the two categories: (i) without adaptation, i.e., villages do not have any irrigation
facility, (ii) with adaptation, i.e., to some extent households have access to irrigation. In sum,
six villages were chosen for household survey such as Siyot, Nanda, Haripar, Gadani, Mudhan
and Kalyanpar (see Figure 1 and Appendix 1). Among them, households in two villages (Siyot
and Mudhan) were having fully rainfed agriculture (i.e., no irrigation facility), while irrigation
sources are available in the remaining villages; groundwater is the main irrigation source in all
the villages. Such type of selection was purposefully done to look into the impact of adaptation
on NELD costs – one of the objectives of this study.
A stratified random sampling method was adopted to select households with an aim to cover
all land ownership categories. Following a simple random sampling approach, around 20-40
households per village were selected for survey. Before the survey, it was planned to interview
40 households in each village, and however, we end up with selecting 20 households in some
of the villages due to large migration followed by a drought occurred in 2016. In sum, 186 farm
households were surveyed. To answer the research questions, information was elicited
through structured interview schedule that include questions related to household
characteristics, agriculture, impact as well as L&D from drought (both economic and non-
economic), coping strategies and willingness to pay (WTP) for drought mitigation measures.
The household survey was conducted during November-December 2016.
2.2 Methods
2.2.1 Economic and Non-Economic Loss and Damage from Drought
In this study, the ‘total economic value (TEV)’ of a drought comprises of costs associated with
both ELD and NELD. When ELD includes goods and services for which market exist, NELD
consists of both use and non-use values; sometimes, it is difficult to distinguish between ELD
and NELD8. Therefore, we can directly estimate ELD costs from a disaster, but not the NELD
costs. Use values refer to a household forgone utility because of L&D occurred to non-
economic goods and services which are directly used by them (Logar and van den Bergh,
2011; Fankhauser et al., 2014). Non use values consist of: (a) option value (WTP for protecting
watershed, dams and community ponds for directly use by them in terms accessing water for
irrigation and drinking purposes, and indirect benefits occurred through groundwater recharge),
(b) altruistic value (WTP to protect these services, so that others could use it), and (c)
existence value (WTP for existence of such resources to enhance overall societal wellbeing,
even though s/he may not use these services) (see Logar and van den Bergh, 2011;
Fankhauser et al., 2014). In the literature, stated preference methods, e.g., contingent
valuation (CV) method and choice modeling, are adopted to value the non-market goods and
services. In fact, limited studies so far have used these methods to calculate NELD from a
disaster, particularly in India. Previous NELD studies have mostly employed qualitative
methods to access it (Morrissey and Oliver-Smith, 2013; Andrei et al., 2014). This study has
been adopted CV method to estimate TEV and NELD from droughts in rural India. Although
7 Over-extraction of groundwater is also another major causal factor for this rapid depletion in the arid and semi-arid regions of
the state. 8 In general, damage to ecosystem services is mainly part of NELD, however ecosystem also provides food and fibre which are
part of the market economy (Fankhauser et al., 2014).
Final Report: CAF2015-RR08-NMY-Chiba 58
choice modeling approach has the advantage over CV, this is beyond the scope of present
study as it requires a large survey which may not possible given the time constraint of the
project. Two major challenges are there while doing NELD cost estimation:
incommensurability and context-dependent9 (Serdeczny et al., 2016). Indeed, it should be
noted that there are some costs which society has to be paid years after the event occurred
(see Dercon, 2008), and thus, it is unlikely to do a complete cost assessment – we may still
under-estimate the impact, even after accounting costs associated with NELD (Logar and van
den Bergh, 2011). Nevertheless, it is imperative to estimate NELD costs, particularly in the
developing nation context.
The study districts have been experienced drought for three years in the current decade (e.g.,
2012, 2014 and 2016), and therefore, farm households were specifically asked to report both
ELD and NELD from droughts occurred in 2014 and 2016; this was not asked for 2012 drought
to avoid the possibility of recall bias. A few focus group discussions were conducted to identify
the indicators of ELD and NELD. The major indicators of ELD are: loss of agricultural crops,
land desertification, loss of small and big ruminants, damage to assets and amenities and
additional expenditure for irrigation. Psycho-social stress due to L&D, psychological impact of
migration of family members, drop-out of children, intra- and inter-village conflict for water
(both irrigation and drinking) and depletion of groundwater are representing NELD. In the case
of ELD, the respondents were asked to directly report value (in Indian rupee) for all the L&D
indicators. Since this is not possible in the NELD context, CV method has been adopted to
estimate both TEV and NELD (see Pattanayak and Kramer, 2001). In addition, households
were also asked to convey intensity of ELD and NELD in likert scale, and these information
were employed to do comparison among them in terms of impact.
To estimate ELD costs, all the reported values for each indicator were summed. The ELD cost
from drought occurred in 2016 is calculated as:
Where, 2016ELD refers to ELD from drought occurred in 2016, 2016LAG means value of loss
of agricultural crops, 2016LLstock represents value of loss of small and big ruminants,
2016LAgWage exemplifies value of loss of agricultural wages, and 2016CosLIrri t cites
additional expenditure on irrigation during 2016. Following the similar approach, ELD costs for
2014 drought were also computed.
Similar to ELD, households cannot directly assign any monetary value to NELD indicators. As
mentioned above, CV method has been followed in the present study to put monetary value
for the NELD indicators. From a policy perspective, it would not be justifiable to develop
hypothetical market for each indicator separately, and then compute value for it. Therefore,
the farm households were asked about their preference for drought mitigation measures, e.g.,
land and water management, and insurance and compensation. Drought mitigation is
described in the survey as drought control service, and this could decline the potential crop
damage due to drought. The farmers were first briefed about the hypothetical market and its
9 The former refers to the absence of common unit to measure the non-economic goods and services on the same scale, and
the later means values are different from person-to-person (Serdeczny et al., 2016).
2016 2016 2016 2016 2016Cos 1ELD LAG LLstock LAgWage LIrri t
Final Report: CAF2015-RR08-NMY-Chiba 59
potential benefits in terms of reducing L&D, and then, they were asked to state their WTP for
the proposed service. The underlying assumption of the CV method is that households are
the best judges in assessing the economic values of the benefits those they likely to get from
drought mitigation options. The surveyed households are assumed to know exactly the
consumer surplus (i.e., Hicksian compensating variation) which they derive from the mitigation
measures.
During the focus group discussions, two major drought mitigation mechanisms were largely
stated by the farmers: (i) land and water management, and (ii) insurance and compensation.
Whereas the former reduce both ELD and NELD, the latter mostly address NELD. Therefore,
the values stated for first one is considered as TEV of a drought, and similarly, the second one
is classified as proxy for NELD costs. Hence, this study has been developed three scenarios
(see Appendix 2: detail description about the scenarios). Based on this, it has computed
average TEV and NELD from droughts for households in western India.
2.2.2 Determinants of Economic and Non-economic Loss and Damage from Drought
The second objective is to identify the determinants of ELD and NELD impacts. In doing so,
the role of adaptation measures (e.g., crop-insurance and irrigation) in reducing L&D was
investigated; according to the surveyed farmers, both are the major adaptation options to
mitigate drought impact. As pointed out above, farmers were asked to report intensity of ELD
and NELD in likert scale. A binary variable is constructed based on this information, i.e., impact
of ELD and NELD is 1 if it is reported as very high, high and moderate, otherwise 0 (for low
and no impact). The specific onus is to look into the role of crop insurance and irrigation in
mitigating L&D impact. In doing so, a discrete choice model was utilized as the dependent
variables are binary in choice. Either probit or logit model could be applied in the present study
context. The former is widely employed because of the normality assumption (Wooldridge,
2002), and therefore, this study has adopted probit model to do the empirical analysis. Probit
model can be derived from an underlying latent variable model (Wooldridge, 2002):
* *1 0 2y x e y y
Where, *y is the unobserved latent variable, x denotes a set of explanatory variable,
represents the vector of parameters to be estimated and e is the error term. Outcome of a
disaster (i.e., ELD and NELD) depends on hazard and risks, sensitivity and adaptive capacity
(Bahinipati and Patnaik, 2015). In this study, the explanatory variables include a set of hazard
and risk, socio-economic characteristics of the household and household head (HH),
adaptation practices and access to formal institutions. Except hazard and risk, the remaining
variables capture both sensitivity and adaptive capacity of a household. Proxy variable which
captures hazard and risk is number of droughts a farmer comes across in the last five years.
The rational for the hypothesis of how the explanatory variables influence ELD and NELD
impacts is presented below. To explain the effects of confounding variables directly, the
marginal effects of both continuous and discrete explanatory variables are estimated.
The marginal impact of each numerical and continuous independent variable on dependent
variable is given by (Wooldridge, 2002):
Final Report: CAF2015-RR08-NMY-Chiba 60
1|3j
p y xg x
x
In addition, the marginal effect for a dummy variable, say kx , is measured as (Wooldridge,
2002):
1 2 2 1 1
1 2 2 1 1
1|
4
k k k
k
k k
p y xG x x
x
G x x
In general, the cross-section econometric analysis encounters the problem of multicollinearity
and heteroskedasticity. While a variance inflation factor (VIF) for each independent variable
was computed to check multicollinearity, a robust standard error was calculated to address
the possibility of heteroskedasticity. The VIF value for all the independent variables is below
10 (between 1.20 and 2.73), negating the absence of multicollinearity. Table 1 presents
descriptive statistics of variables used in the empirical analysis.
Variable like number of droughts in the last five years capture exposure of a household, and
a positive relationship is, therefore, expected with respect to L&D. Earlier studies find a
positive coefficient with statistically significant (Bahinipati and Patnaik, 2015). The variables
representing socio-economic characteristics of household and household head (HH) are: size
of household, age of HH, years of schooling of HH, agriculture dependency ratio, small and
marginal farmer category, value of asset and BPL category. Household size hypothesized as
either positive or negative relationship with L&D costs, depending on the dependency ratio.
Previous studies ascertain that it enhances the level of vulnerability (Christiaensen et al., 2007;
Bahinipati, 2016). A positive or negative relationship is anticipated between age of the HH and
L&D impact. Based on the previous studies, one can hypothesize that a household is likely to
be less vulnerable if the HH is literate (Dercon et al., 2005). Education, in particular, assists
farmers to access information on various risk reduction measures which a household can
undertake to reduce L&D costs (Wamsler et al., 2012). In fact, Sharma et al. (2013), and
Bahinipati and Patnaik (2015) find a positive relationship between literacy rate and L&D. There
is a direct causal association between agriculture dependency ratio and L&D, since drought
directly affects the agricultural crops. The remaining three variables, e.g., small and marginal,
BPL and value of asset, represent economic status of the household. While one could expect
a positive relationship for the first two variables with L&D costs (i.e., small and marginal and
BPL), the last one (value of asset) is likely to reduce vulnerability. In general, small and
marginal farmers and BPL households have less adaptive capacity, and therefore, the
intensity of L&D is expected to high on them. On the other hand, the rich dwellers can deplete
their existing resources to mitigate potential impact from droughts.
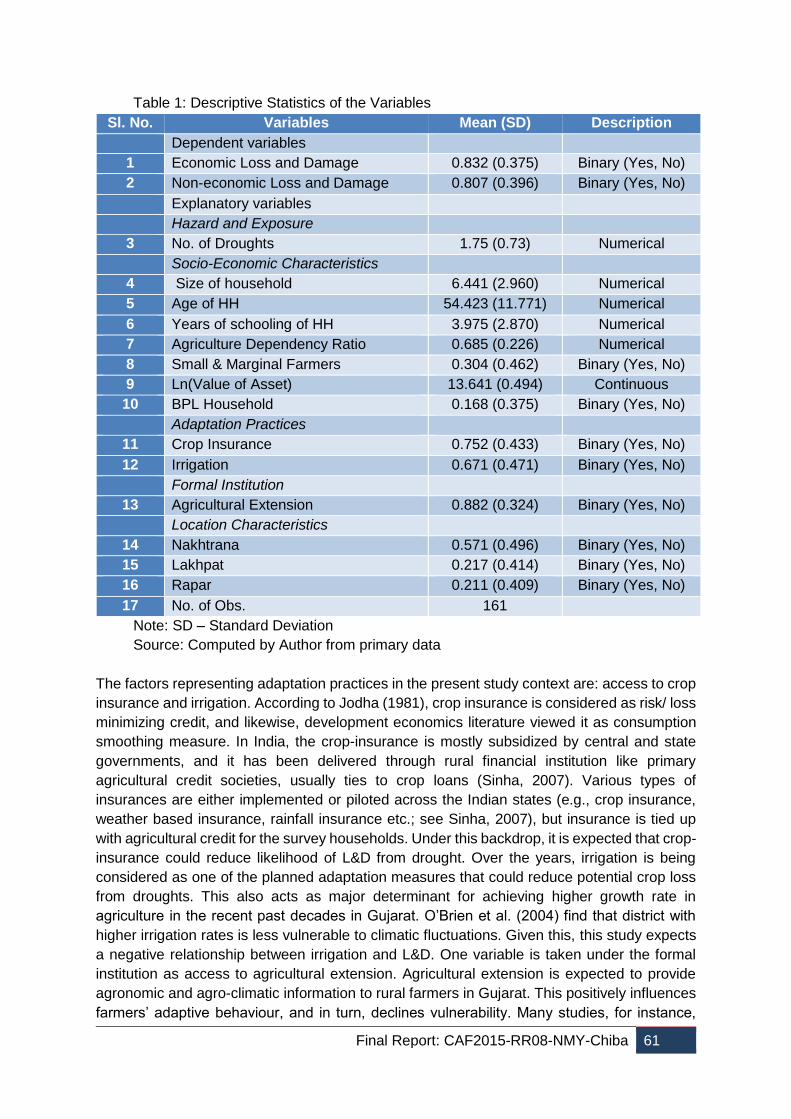
Final Report: CAF2015-RR08-NMY-Chiba 61
Table 1: Descriptive Statistics of the Variables
Sl. No. Variables Mean (SD) Description
Dependent variables
1 Economic Loss and Damage 0.832 (0.375) Binary (Yes, No)
2 Non-economic Loss and Damage 0.807 (0.396) Binary (Yes, No)
Explanatory variables
Hazard and Exposure
3 No. of Droughts 1.75 (0.73) Numerical
Socio-Economic Characteristics
4 Size of household 6.441 (2.960) Numerical
5 Age of HH 54.423 (11.771) Numerical
6 Years of schooling of HH 3.975 (2.870) Numerical
7 Agriculture Dependency Ratio 0.685 (0.226) Numerical
8 Small & Marginal Farmers 0.304 (0.462) Binary (Yes, No)
9 Ln(Value of Asset) 13.641 (0.494) Continuous
10 BPL Household 0.168 (0.375) Binary (Yes, No)
Adaptation Practices
11 Crop Insurance 0.752 (0.433) Binary (Yes, No)
12 Irrigation 0.671 (0.471) Binary (Yes, No)
Formal Institution
13 Agricultural Extension 0.882 (0.324) Binary (Yes, No)
Location Characteristics
14 Nakhtrana 0.571 (0.496) Binary (Yes, No)
15 Lakhpat 0.217 (0.414) Binary (Yes, No)
16 Rapar 0.211 (0.409) Binary (Yes, No)
17 No. of Obs. 161
Note: SD – Standard Deviation
Source: Computed by Author from primary data
The factors representing adaptation practices in the present study context are: access to crop
insurance and irrigation. According to Jodha (1981), crop insurance is considered as risk/ loss
minimizing credit, and likewise, development economics literature viewed it as consumption
smoothing measure. In India, the crop-insurance is mostly subsidized by central and state
governments, and it has been delivered through rural financial institution like primary
agricultural credit societies, usually ties to crop loans (Sinha, 2007). Various types of
insurances are either implemented or piloted across the Indian states (e.g., crop insurance,
weather based insurance, rainfall insurance etc.; see Sinha, 2007), but insurance is tied up
with agricultural credit for the survey households. Under this backdrop, it is expected that crop-
insurance could reduce likelihood of L&D from drought. Over the years, irrigation is being
considered as one of the planned adaptation measures that could reduce potential crop loss
from droughts. This also acts as major determinant for achieving higher growth rate in
agriculture in the recent past decades in Gujarat. O’Brien et al. (2004) find that district with
higher irrigation rates is less vulnerable to climatic fluctuations. Given this, this study expects
a negative relationship between irrigation and L&D. One variable is taken under the formal
institution as access to agricultural extension. Agricultural extension is expected to provide
agronomic and agro-climatic information to rural farmers in Gujarat. This positively influences
farmers’ adaptive behaviour, and in turn, declines vulnerability. Many studies, for instance,
Final Report: CAF2015-RR08-NMY-Chiba 62
outline that this directly governs farm households’ adaptation decision (Patt et al., 2005; Wood
et al., 2014; Bahinipati and Venkatachalam, 2015). Taluka-level dummy variables were
considered in the model to capture location specific unobserved heterogeneity.
3. Results and Discussion
3.1 Socio-Economic Features of the Farm Households
The important characteristics of the surveyed households are described in Table 2. Among
the sample households, the family size was around 7 with an average age of household head
(HH) was 54. In contrast to various rural household surveys in India, around 73% of farm
households had literate HH, and BPL households were only 15% of the total households. With
respect to land ownership category, 31% of farmers belong to marginal and small category,
while 64% in medium and 5% in large farmer categories. A majority of households live in pucca
house in the study villages, i.e., 72% of the total families. The value of a household’s assets
and amenities on an average was INR 0.94 million at the time of survey with standard deviation
of 0.61; out of them, about 61% of the total assets related to agriculture. The per-capita income
per month was reported as INR 3,886.16, and per-capita food consumption expenditure per
month was found as INR 1,329.04; a higher standard deviation was found in the case of
income.
Based on the information reported in Table 2, a large percentage of households have access
to various formal institutions, except agro-meteorological information and soil health card; both
are prerequisite for improving agricultural production in the arid region. The former is positively
influenced farmers’ adaptive behaviour (Patt et al., 2005). Although Pradhan Mantri Fasal
Bima Yojona (PMFBY) has been launched recently, it is surprising to see that around 59% of
the total farmers have opted. Around 73% of total households have regularly purchased crop-
insurance, and this could be significantly higher in comparison to other drought prone regions
of India (see Panda et al., 2013). While 84% of total farmers have access to agricultural
extension, 68% households access information from Krushi Mahostav (agrarian festival)10.
Both are the main source of providing information related to agronomic, agro-climatic and
various agricultural technologies to the farmers.
3.2 Impact of Droughts on Farm Households
Households in the developing nations are exposed to various risk and shocks, which are either
idiosyncratic or covariate, and negatively affect their wellbeing. Many studies have established
that households, particularly in the developing and small island nations, do not have perfect
insurance mechanism, and hence, there are both short- and long-term impact of several
shocks on their livelihood (Dercon, 2008). In this context, Table 3 outlines details on frequency,
intensity and impact of drought on households. Farmers were specifically asked to express
their perception about frequency and intensity of drought and its impact on their livelihoods.
While all the surveyed households experienced change in frequency and intensity of droughts
over the years, more than 95% of the total households reported about increase in frequency
and intensity of drought. This finding reveals that frequency and intensity of drought have been
raised in the study villages.
10 It was launched in 2005 the bridge the distance between technology and farmers, and the main aim is to reduce the gestation
period for diffusion of technology among the farmers in different parts of the state (Pattnaik et al., 2012).
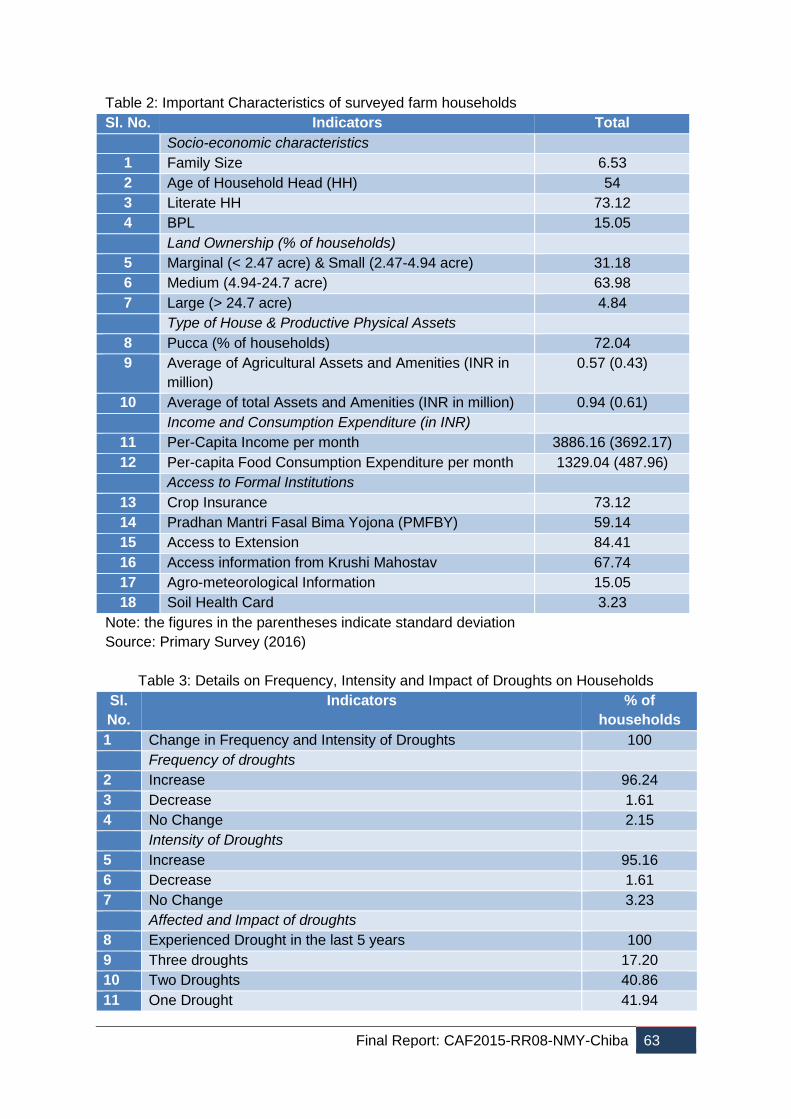
Final Report: CAF2015-RR08-NMY-Chiba 63
Table 2: Important Characteristics of surveyed farm households
Sl. No. Indicators Total Socio-economic characteristics
1 Family Size 6.53
2 Age of Household Head (HH) 54
3 Literate HH 73.12
4 BPL 15.05 Land Ownership (% of households)
5 Marginal (< 2.47 acre) & Small (2.47-4.94 acre) 31.18
6 Medium (4.94-24.7 acre) 63.98
7 Large (> 24.7 acre) 4.84 Type of House & Productive Physical Assets
8 Pucca (% of households) 72.04
9 Average of Agricultural Assets and Amenities (INR in
million)
0.57 (0.43)
10 Average of total Assets and Amenities (INR in million) 0.94 (0.61) Income and Consumption Expenditure (in INR)
11 Per-Capita Income per month 3886.16 (3692.17)
12 Per-capita Food Consumption Expenditure per month 1329.04 (487.96) Access to Formal Institutions
13 Crop Insurance 73.12
14 Pradhan Mantri Fasal Bima Yojona (PMFBY) 59.14
15 Access to Extension 84.41
16 Access information from Krushi Mahostav 67.74
17 Agro-meteorological Information 15.05
18 Soil Health Card 3.23
Note: the figures in the parentheses indicate standard deviation
Source: Primary Survey (2016)
Table 3: Details on Frequency, Intensity and Impact of Droughts on Households
Sl.
No.
Indicators % of
households
1 Change in Frequency and Intensity of Droughts 100
Frequency of droughts
2 Increase 96.24
3 Decrease 1.61
4 No Change 2.15
Intensity of Droughts
5 Increase 95.16
6 Decrease 1.61
7 No Change 3.23
Affected and Impact of droughts
8 Experienced Drought in the last 5 years 100
9 Three droughts 17.20
10 Two Droughts 40.86
11 One Drought 41.94
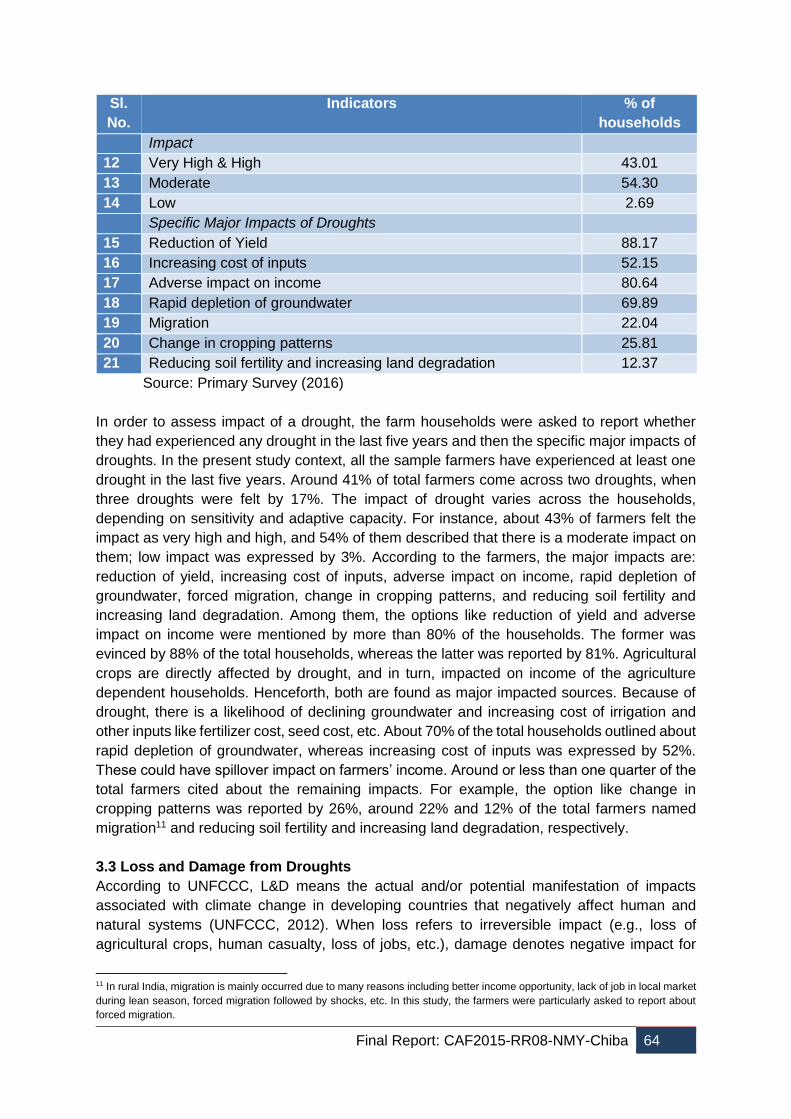
Final Report: CAF2015-RR08-NMY-Chiba 64
Sl.
No.
Indicators % of
households Impact
12 Very High & High 43.01
13 Moderate 54.30
14 Low 2.69
Specific Major Impacts of Droughts
15 Reduction of Yield 88.17
16 Increasing cost of inputs 52.15
17 Adverse impact on income 80.64
18 Rapid depletion of groundwater 69.89
19 Migration 22.04
20 Change in cropping patterns 25.81
21 Reducing soil fertility and increasing land degradation 12.37
Source: Primary Survey (2016)
In order to assess impact of a drought, the farm households were asked to report whether
they had experienced any drought in the last five years and then the specific major impacts of
droughts. In the present study context, all the sample farmers have experienced at least one
drought in the last five years. Around 41% of total farmers come across two droughts, when
three droughts were felt by 17%. The impact of drought varies across the households,
depending on sensitivity and adaptive capacity. For instance, about 43% of farmers felt the
impact as very high and high, and 54% of them described that there is a moderate impact on
them; low impact was expressed by 3%. According to the farmers, the major impacts are:
reduction of yield, increasing cost of inputs, adverse impact on income, rapid depletion of
groundwater, forced migration, change in cropping patterns, and reducing soil fertility and
increasing land degradation. Among them, the options like reduction of yield and adverse
impact on income were mentioned by more than 80% of the households. The former was
evinced by 88% of the total households, whereas the latter was reported by 81%. Agricultural
crops are directly affected by drought, and in turn, impacted on income of the agriculture
dependent households. Henceforth, both are found as major impacted sources. Because of
drought, there is a likelihood of declining groundwater and increasing cost of irrigation and
other inputs like fertilizer cost, seed cost, etc. About 70% of the total households outlined about
rapid depletion of groundwater, whereas increasing cost of inputs was expressed by 52%.
These could have spillover impact on farmers’ income. Around or less than one quarter of the
total farmers cited about the remaining impacts. For example, the option like change in
cropping patterns was reported by 26%, around 22% and 12% of the total farmers named
migration11 and reducing soil fertility and increasing land degradation, respectively.
3.3 Loss and Damage from Droughts
According to UNFCCC, L&D means the actual and/or potential manifestation of impacts
associated with climate change in developing countries that negatively affect human and
natural systems (UNFCCC, 2012). When loss refers to irreversible impact (e.g., loss of
agricultural crops, human casualty, loss of jobs, etc.), damage denotes negative impact for
11 In rural India, migration is mainly occurred due to many reasons including better income opportunity, lack of job in local market
during lean season, forced migration followed by shocks, etc. In this study, the farmers were particularly asked to report about
forced migration.
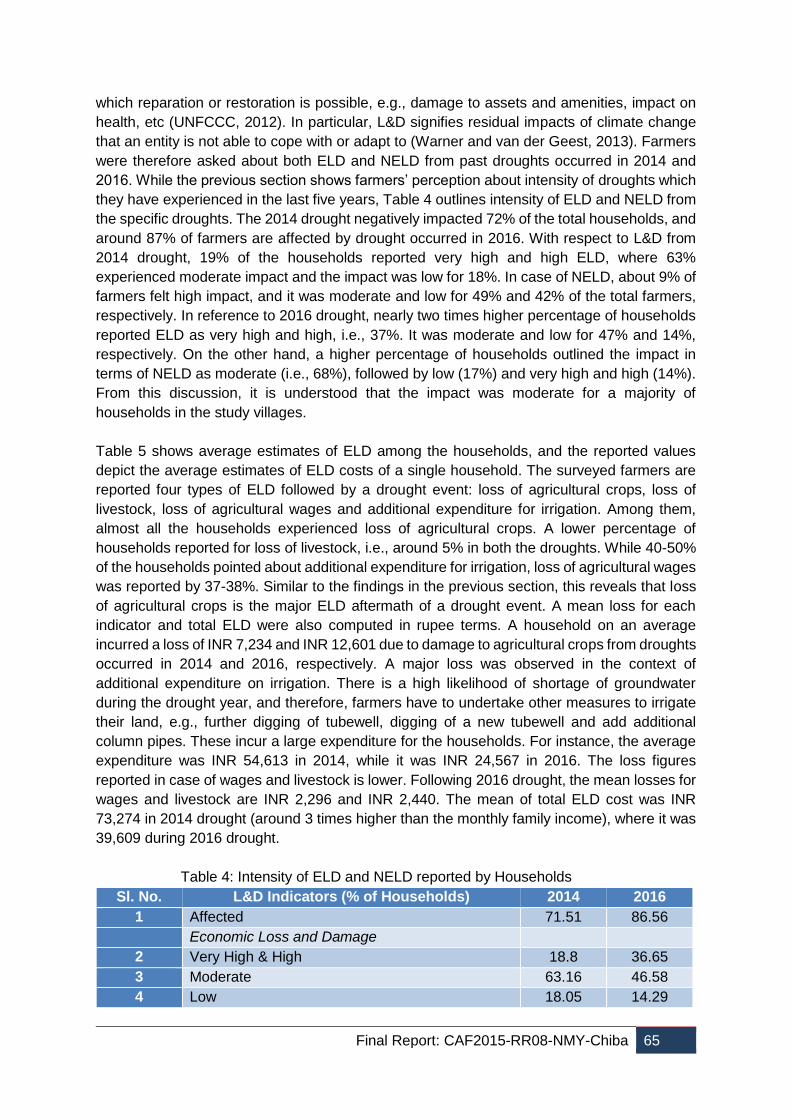
Final Report: CAF2015-RR08-NMY-Chiba 65
which reparation or restoration is possible, e.g., damage to assets and amenities, impact on
health, etc (UNFCCC, 2012). In particular, L&D signifies residual impacts of climate change
that an entity is not able to cope with or adapt to (Warner and van der Geest, 2013). Farmers
were therefore asked about both ELD and NELD from past droughts occurred in 2014 and
2016. While the previous section shows farmers’ perception about intensity of droughts which
they have experienced in the last five years, Table 4 outlines intensity of ELD and NELD from
the specific droughts. The 2014 drought negatively impacted 72% of the total households, and
around 87% of farmers are affected by drought occurred in 2016. With respect to L&D from
2014 drought, 19% of the households reported very high and high ELD, where 63%
experienced moderate impact and the impact was low for 18%. In case of NELD, about 9% of
farmers felt high impact, and it was moderate and low for 49% and 42% of the total farmers,
respectively. In reference to 2016 drought, nearly two times higher percentage of households
reported ELD as very high and high, i.e., 37%. It was moderate and low for 47% and 14%,
respectively. On the other hand, a higher percentage of households outlined the impact in
terms of NELD as moderate (i.e., 68%), followed by low (17%) and very high and high (14%).
From this discussion, it is understood that the impact was moderate for a majority of
households in the study villages.
Table 5 shows average estimates of ELD among the households, and the reported values
depict the average estimates of ELD costs of a single household. The surveyed farmers are
reported four types of ELD followed by a drought event: loss of agricultural crops, loss of
livestock, loss of agricultural wages and additional expenditure for irrigation. Among them,
almost all the households experienced loss of agricultural crops. A lower percentage of
households reported for loss of livestock, i.e., around 5% in both the droughts. While 40-50%
of the households pointed about additional expenditure for irrigation, loss of agricultural wages
was reported by 37-38%. Similar to the findings in the previous section, this reveals that loss
of agricultural crops is the major ELD aftermath of a drought event. A mean loss for each
indicator and total ELD were also computed in rupee terms. A household on an average
incurred a loss of INR 7,234 and INR 12,601 due to damage to agricultural crops from droughts
occurred in 2014 and 2016, respectively. A major loss was observed in the context of
additional expenditure on irrigation. There is a high likelihood of shortage of groundwater
during the drought year, and therefore, farmers have to undertake other measures to irrigate
their land, e.g., further digging of tubewell, digging of a new tubewell and add additional
column pipes. These incur a large expenditure for the households. For instance, the average
expenditure was INR 54,613 in 2014, while it was INR 24,567 in 2016. The loss figures
reported in case of wages and livestock is lower. Following 2016 drought, the mean losses for
wages and livestock are INR 2,296 and INR 2,440. The mean of total ELD cost was INR
73,274 in 2014 drought (around 3 times higher than the monthly family income), where it was
39,609 during 2016 drought.
Table 4: Intensity of ELD and NELD reported by Households
Sl. No. L&D Indicators (% of Households) 2014 2016
1 Affected 71.51 86.56 Economic Loss and Damage
2 Very High & High 18.8 36.65
3 Moderate 63.16 46.58
4 Low 18.05 14.29
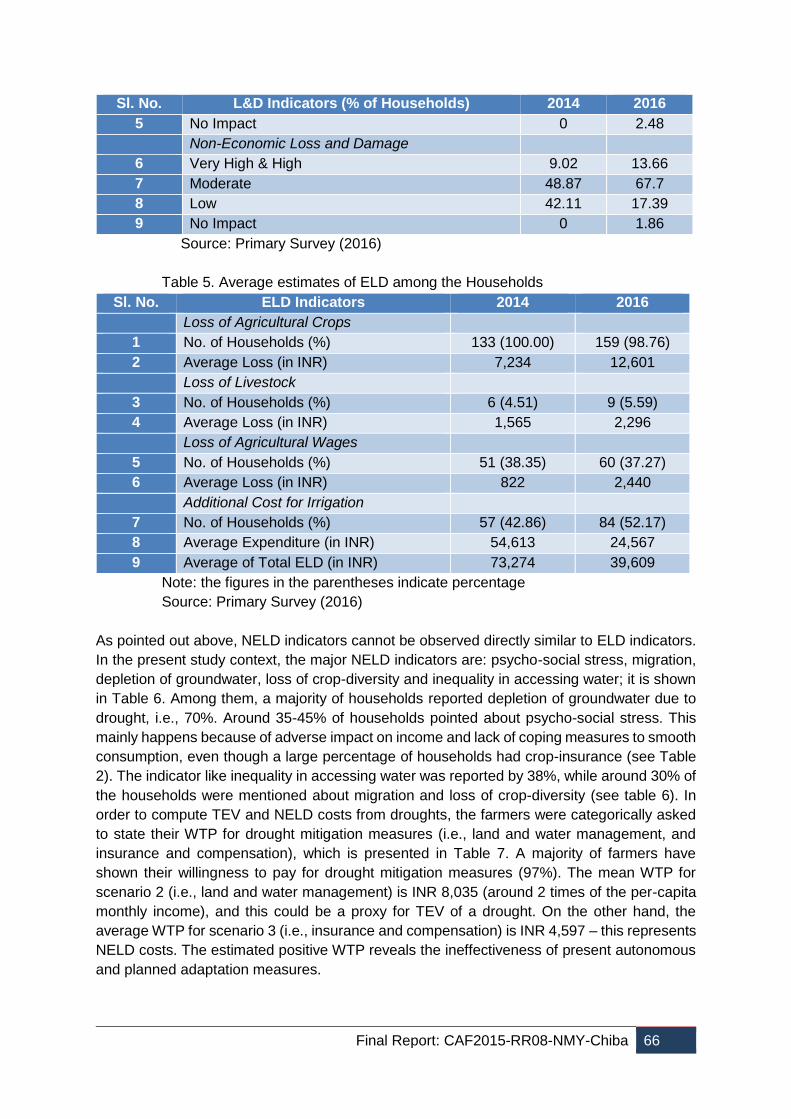
Final Report: CAF2015-RR08-NMY-Chiba 66
Sl. No. L&D Indicators (% of Households) 2014 2016
5 No Impact 0 2.48 Non-Economic Loss and Damage
6 Very High & High 9.02 13.66
7 Moderate 48.87 67.7
8 Low 42.11 17.39
9 No Impact 0 1.86
Source: Primary Survey (2016)
Table 5. Average estimates of ELD among the Households
Sl. No. ELD Indicators 2014 2016 Loss of Agricultural Crops
1 No. of Households (%) 133 (100.00) 159 (98.76)
2 Average Loss (in INR) 7,234 12,601 Loss of Livestock
3 No. of Households (%) 6 (4.51) 9 (5.59)
4 Average Loss (in INR) 1,565 2,296 Loss of Agricultural Wages
5 No. of Households (%) 51 (38.35) 60 (37.27)
6 Average Loss (in INR) 822 2,440 Additional Cost for Irrigation
7 No. of Households (%) 57 (42.86) 84 (52.17)
8 Average Expenditure (in INR) 54,613 24,567
9 Average of Total ELD (in INR) 73,274 39,609
Note: the figures in the parentheses indicate percentage
Source: Primary Survey (2016)
As pointed out above, NELD indicators cannot be observed directly similar to ELD indicators.
In the present study context, the major NELD indicators are: psycho-social stress, migration,
depletion of groundwater, loss of crop-diversity and inequality in accessing water; it is shown
in Table 6. Among them, a majority of households reported depletion of groundwater due to
drought, i.e., 70%. Around 35-45% of households pointed about psycho-social stress. This
mainly happens because of adverse impact on income and lack of coping measures to smooth
consumption, even though a large percentage of households had crop-insurance (see Table
2). The indicator like inequality in accessing water was reported by 38%, while around 30% of
the households were mentioned about migration and loss of crop-diversity (see table 6). In
order to compute TEV and NELD costs from droughts, the farmers were categorically asked
to state their WTP for drought mitigation measures (i.e., land and water management, and
insurance and compensation), which is presented in Table 7. A majority of farmers have
shown their willingness to pay for drought mitigation measures (97%). The mean WTP for
scenario 2 (i.e., land and water management) is INR 8,035 (around 2 times of the per-capita
monthly income), and this could be a proxy for TEV of a drought. On the other hand, the
average WTP for scenario 3 (i.e., insurance and compensation) is INR 4,597 – this represents
NELD costs. The estimated positive WTP reveals the ineffectiveness of present autonomous
and planned adaptation measures.
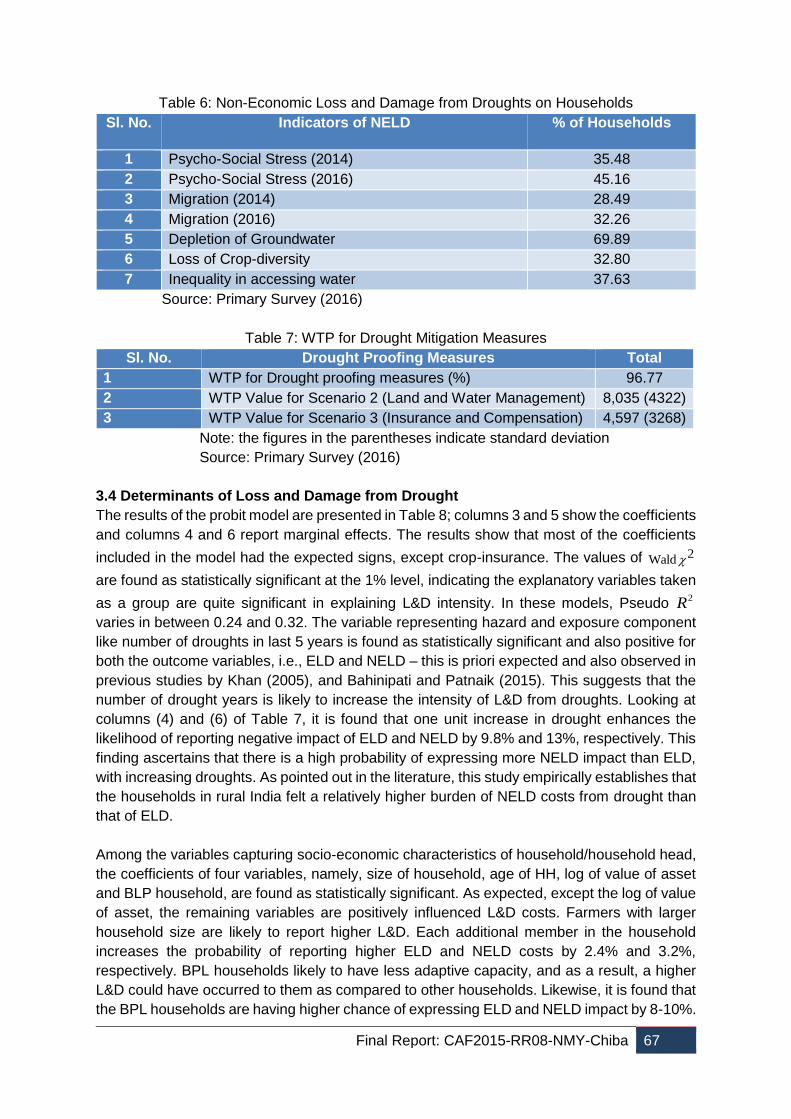
Final Report: CAF2015-RR08-NMY-Chiba 67
Table 6: Non-Economic Loss and Damage from Droughts on Households
Sl. No. Indicators of NELD % of Households
1 Psycho-Social Stress (2014) 35.48
2 Psycho-Social Stress (2016) 45.16
3 Migration (2014) 28.49
4 Migration (2016) 32.26
5 Depletion of Groundwater 69.89
6 Loss of Crop-diversity 32.80
7 Inequality in accessing water 37.63
Source: Primary Survey (2016)
Table 7: WTP for Drought Mitigation Measures
Sl. No. Drought Proofing Measures Total
1 WTP for Drought proofing measures (%) 96.77
2 WTP Value for Scenario 2 (Land and Water Management) 8,035 (4322)
3 WTP Value for Scenario 3 (Insurance and Compensation) 4,597 (3268)
Note: the figures in the parentheses indicate standard deviation
Source: Primary Survey (2016)
3.4 Determinants of Loss and Damage from Drought
The results of the probit model are presented in Table 8; columns 3 and 5 show the coefficients
and columns 4 and 6 report marginal effects. The results show that most of the coefficients
included in the model had the expected signs, except crop-insurance. The values of 2Wald
are found as statistically significant at the 1% level, indicating the explanatory variables taken
as a group are quite significant in explaining L&D intensity. In these models, Pseudo 2R
varies in between 0.24 and 0.32. The variable representing hazard and exposure component
like number of droughts in last 5 years is found as statistically significant and also positive for
both the outcome variables, i.e., ELD and NELD – this is priori expected and also observed in
previous studies by Khan (2005), and Bahinipati and Patnaik (2015). This suggests that the
number of drought years is likely to increase the intensity of L&D from droughts. Looking at
columns (4) and (6) of Table 7, it is found that one unit increase in drought enhances the
likelihood of reporting negative impact of ELD and NELD by 9.8% and 13%, respectively. This
finding ascertains that there is a high probability of expressing more NELD impact than ELD,
with increasing droughts. As pointed out in the literature, this study empirically establishes that
the households in rural India felt a relatively higher burden of NELD costs from drought than
that of ELD.
Among the variables capturing socio-economic characteristics of household/household head,
the coefficients of four variables, namely, size of household, age of HH, log of value of asset
and BLP household, are found as statistically significant. As expected, except the log of value
of asset, the remaining variables are positively influenced L&D costs. Farmers with larger
household size are likely to report higher L&D. Each additional member in the household
increases the probability of reporting higher ELD and NELD costs by 2.4% and 3.2%,
respectively. BPL households likely to have less adaptive capacity, and as a result, a higher
L&D could have occurred to them as compared to other households. Likewise, it is found that
the BPL households are having higher chance of expressing ELD and NELD impact by 8-10%.
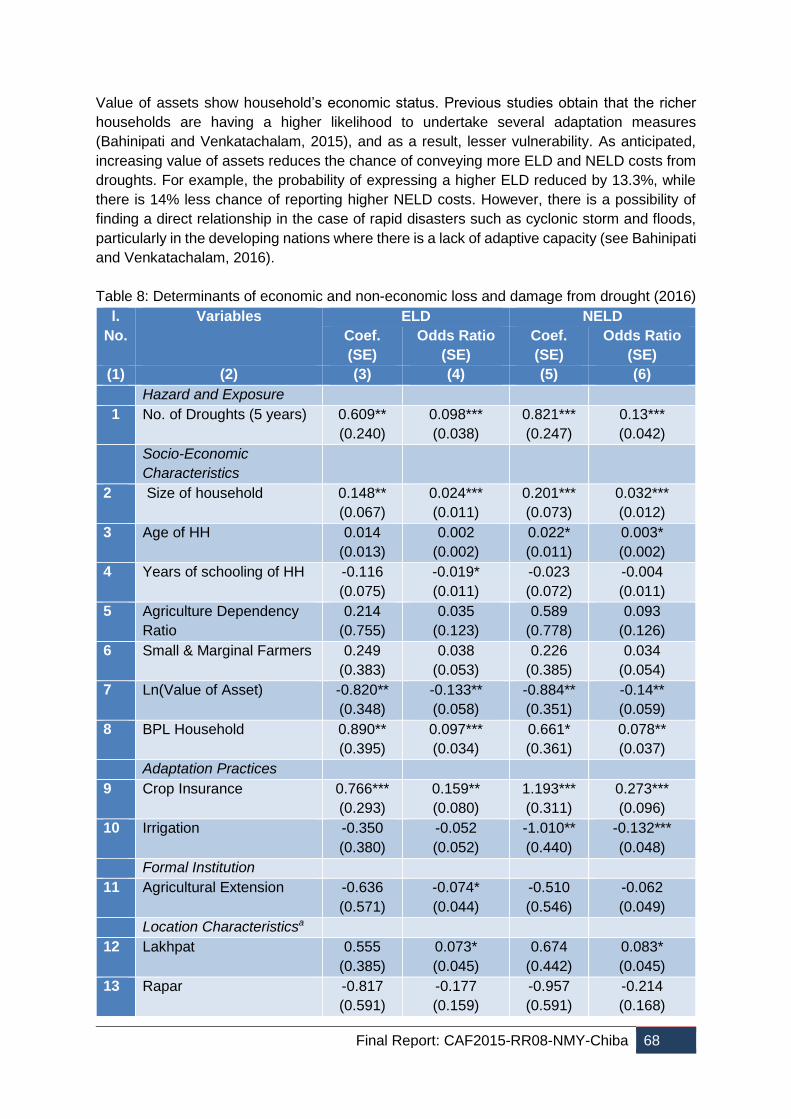
Final Report: CAF2015-RR08-NMY-Chiba 68
Value of assets show household’s economic status. Previous studies obtain that the richer
households are having a higher likelihood to undertake several adaptation measures
(Bahinipati and Venkatachalam, 2015), and as a result, lesser vulnerability. As anticipated,
increasing value of assets reduces the chance of conveying more ELD and NELD costs from
droughts. For example, the probability of expressing a higher ELD reduced by 13.3%, while
there is 14% less chance of reporting higher NELD costs. However, there is a possibility of
finding a direct relationship in the case of rapid disasters such as cyclonic storm and floods,
particularly in the developing nations where there is a lack of adaptive capacity (see Bahinipati
and Venkatachalam, 2016).
Table 8: Determinants of economic and non-economic loss and damage from drought (2016)
l.
No.
Variables ELD NELD
Coef.
(SE)
Odds Ratio
(SE)
Coef.
(SE)
Odds Ratio
(SE)
(1) (2) (3) (4) (5) (6)
Hazard and Exposure
1 No. of Droughts (5 years) 0.609**
(0.240)
0.098***
(0.038)
0.821***
(0.247)
0.13***
(0.042)
Socio-Economic
Characteristics
2 Size of household 0.148**
(0.067)
0.024***
(0.011)
0.201***
(0.073)
0.032***
(0.012)
3 Age of HH 0.014
(0.013)
0.002
(0.002)
0.022*
(0.011)
0.003*
(0.002)
4 Years of schooling of HH -0.116
(0.075)
-0.019*
(0.011)
-0.023
(0.072)
-0.004
(0.011)
5 Agriculture Dependency
Ratio
0.214
(0.755)
0.035
(0.123)
0.589
(0.778)
0.093
(0.126)
6 Small & Marginal Farmers 0.249
(0.383)
0.038
(0.053)
0.226
(0.385)
0.034
(0.054)
7 Ln(Value of Asset) -0.820**
(0.348)
-0.133**
(0.058)
-0.884**
(0.351)
-0.14**
(0.059)
8 BPL Household 0.890**
(0.395)
0.097***
(0.034)
0.661*
(0.361)
0.078**
(0.037)
Adaptation Practices
9 Crop Insurance 0.766***
(0.293)
0.159**
(0.080)
1.193***
(0.311)
0.273***
(0.096)
10 Irrigation -0.350
(0.380)
-0.052
(0.052)
-1.010**
(0.440)
-0.132***
(0.048)
Formal Institution
11 Agricultural Extension -0.636
(0.571)
-0.074*
(0.044)
-0.510
(0.546)
-0.062
(0.049)
Location Characteristicsa
12 Lakhpat 0.555
(0.385)
0.073*
(0.045)
0.674
(0.442)
0.083*
(0.045)
13 Rapar -0.817
(0.591)
-0.177
(0.159)
-0.957
(0.591)
-0.214
(0.168)
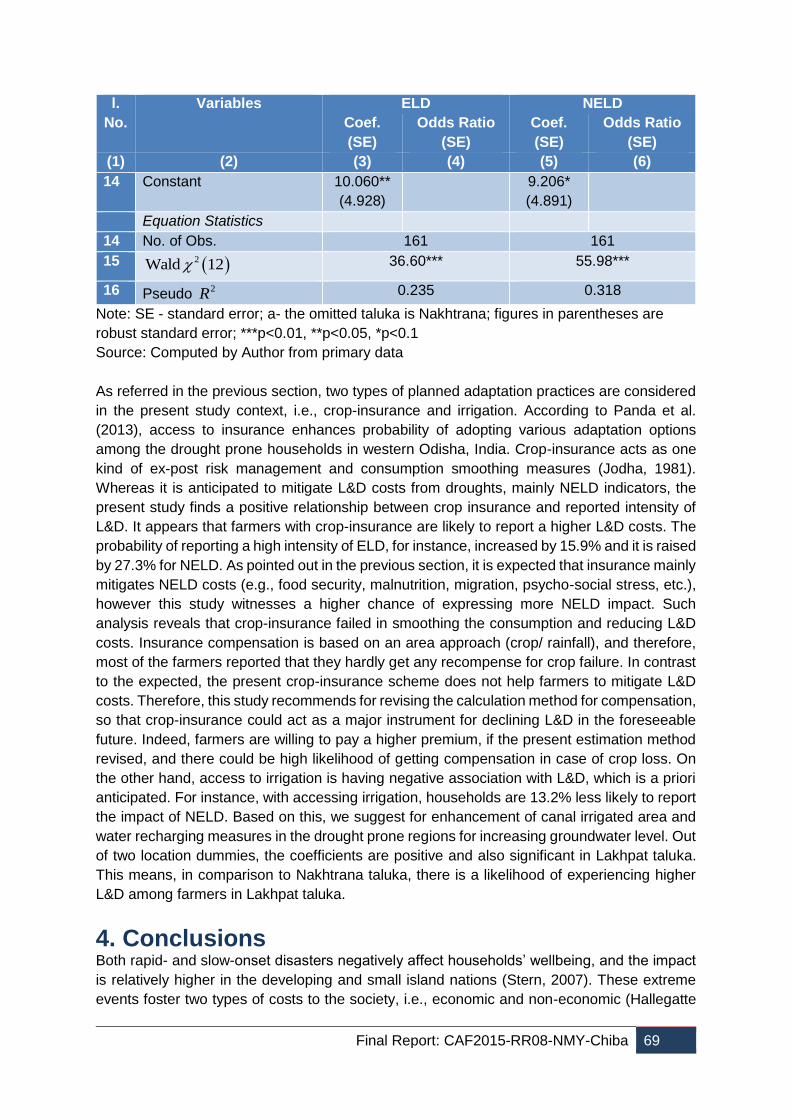
Final Report: CAF2015-RR08-NMY-Chiba 69
l.
No.
Variables ELD NELD
Coef.
(SE)
Odds Ratio
(SE)
Coef.
(SE)
Odds Ratio
(SE)
(1) (2) (3) (4) (5) (6)
14 Constant 10.060**
(4.928)
9.206*
(4.891)
Equation Statistics
14 No. of Obs. 161 161
15 2Wald 12 36.60*** 55.98***
16 Pseudo 2R 0.235 0.318
Note: SE - standard error; a- the omitted taluka is Nakhtrana; figures in parentheses are
robust standard error; ***p<0.01, **p<0.05, *p<0.1
Source: Computed by Author from primary data
As referred in the previous section, two types of planned adaptation practices are considered
in the present study context, i.e., crop-insurance and irrigation. According to Panda et al.
(2013), access to insurance enhances probability of adopting various adaptation options
among the drought prone households in western Odisha, India. Crop-insurance acts as one
kind of ex-post risk management and consumption smoothing measures (Jodha, 1981).
Whereas it is anticipated to mitigate L&D costs from droughts, mainly NELD indicators, the
present study finds a positive relationship between crop insurance and reported intensity of
L&D. It appears that farmers with crop-insurance are likely to report a higher L&D costs. The
probability of reporting a high intensity of ELD, for instance, increased by 15.9% and it is raised
by 27.3% for NELD. As pointed out in the previous section, it is expected that insurance mainly
mitigates NELD costs (e.g., food security, malnutrition, migration, psycho-social stress, etc.),
however this study witnesses a higher chance of expressing more NELD impact. Such
analysis reveals that crop-insurance failed in smoothing the consumption and reducing L&D
costs. Insurance compensation is based on an area approach (crop/ rainfall), and therefore,
most of the farmers reported that they hardly get any recompense for crop failure. In contrast
to the expected, the present crop-insurance scheme does not help farmers to mitigate L&D
costs. Therefore, this study recommends for revising the calculation method for compensation,
so that crop-insurance could act as a major instrument for declining L&D in the foreseeable
future. Indeed, farmers are willing to pay a higher premium, if the present estimation method
revised, and there could be high likelihood of getting compensation in case of crop loss. On
the other hand, access to irrigation is having negative association with L&D, which is a priori
anticipated. For instance, with accessing irrigation, households are 13.2% less likely to report
the impact of NELD. Based on this, we suggest for enhancement of canal irrigated area and
water recharging measures in the drought prone regions for increasing groundwater level. Out
of two location dummies, the coefficients are positive and also significant in Lakhpat taluka.
This means, in comparison to Nakhtrana taluka, there is a likelihood of experiencing higher
L&D among farmers in Lakhpat taluka.
4. Conclusions Both rapid- and slow-onset disasters negatively affect households’ wellbeing, and the impact
is relatively higher in the developing and small island nations (Stern, 2007). These extreme
events foster two types of costs to the society, i.e., economic and non-economic (Hallegatte
Final Report: CAF2015-RR08-NMY-Chiba 70
and Przyluski, 2010; Hallegatte, 2014). While the government agencies and several research
studies have carried out ex-post L&D assessment reports (Bahinipati et al., 2015), various
NELD indicators are mostly not accounted in these reports (Prabhakar et al., 2015). Indeed,
it is much more relevant, particularly in the developing nations as they are likely to lost non-
economic goods and services to a greater extent (UNFCCC, 2013; Fankhauser et al., 2014).
Since there is no market existing for them, serious challenges occur in terms of
conceptualization, accounting and monetization of these items. Nevertheless, it is imperative
to estimate both scale and value of NELD (Serdeczny et al., 2016). In the mean time, various
adaptation measures have been taken up to reduce potential L&D. However, there is a dearth
of studies to estimate NELD costs, and analyzing the role of adaptation in L&D costs,
particularly NELD. Therefore, the present study estimated TEV, ELD- and NELD costs, and
assessed the impact of adaptation on L&D costs. For empirical assessment, around 186 farm
households were interviewed in the Kutch district of Gujarat state – prone to recurrent droughts.
Households were directly report value of ELD during recent past droughts, and a CV method
was adopted to compute TEV and NELD costs. On the other hand, probit model was employed
to assess impact of adaptation options on L&D intensity, with controlling the influence of
hazard and risk and socio-economic characteristics; the measures like crop-insurance and
irrigation are reported as major adaptation options to cope with droughts.
The following salient points emerged from the analysis of this study. All the households
experienced at least one drought in the last five years, and around 95% of them felt about
increasing trend in frequency and intensity of drought. In terms of impact, a majority of
households reported that droughts moderately affect their livelihood. While everybody lost
agricultural crops followed by a drought, a major loss was observed in the case of additional
expenditure on irrigation. On an average, a household incurred a loss of INR 7,234 and INR
12,601 due to damage to agricultural crops from droughts occurred in 2014 and 2016, and at
the same time, the mean expenditure on additional irrigation was INR 54,613 and INR 24,567.
The mean of total ELD cost was INR 73,274 in 2014 drought (around 3 times higher than the
monthly family income), where it was 39,609 during 2016 drought. On the other hand, the
major NELD indicators are groundwater depletion and psycho-social stress. The average TEV
of a drought was INR 8,035 (about 2 times higher than per-capita monthly income), and the
mean NELD costs were INR 4,597. The estimated positive WTP reveals the ineffectiveness
of present risk management strategies. Analyzing the role of adaptation based on probit model,
it is found that irrigation reduces the potential impact from drought, while crop-insurance is
failed to mitigate L&D, especially NELD. It seems, in contrast to the expected, the present
crop-insurance scheme does not help farmers to mitigate L&D costs. The other major
determinants of reporting L&D are: number of droughts, size of household, age of HH, value
of asset and BPL household.
From the policy perspective, this study recommends for calculation of NELD costs as it is
much relevant in a developing country context and mostly unnoticed and unaddressed by
policy. In many instances, loss of ecosystem services also negatively affects food production,
health and water supply, and in turn, impacted on people’s lives and livelihoods. It is also
important to revise the existing crop-insurance policy, so that it can mitigate potential L&D
costs. Cautions are required while interpreting findings of this study. First, it is with empirical
study design. The sample size of this study is small, and therefore, we cannot generalize the
findings for entire rural India. The second one has to do with validity checks of CV method.
Final Report: CAF2015-RR08-NMY-Chiba 71
5. References Andrei, S., G. Rabbani, and Khan, H.I. (2014). Non-economic loss and damage caused by
climatic stressors in selected coastal districts of Bangladesh. Bangladesh Centre for
Advance Studies.
Bahinipati, C. S. and Patnaik, U. (2015). The damages from climatic extremes in India: do
disaster specific and generic adaptation measures matter?. Environmental Economics
and Policy Studies, 17(1): 157-177.
Bahinipati, C.S. and Venkatachalam, L. (2015). What drives farmers to adopt farm-level
adaptation practices to climate extremes: empirical evidence from Odisha, India.
International Journal of Disaster Risk Reduction. 14(4), 347-356.
Bahinipati, C.S., and Venkatachalam, L. (2016). Role of climatic risks and socio-economic
factors in influencing the economic impact of climatic extremes: A normalisation study
in the context of Odisha, India. Regional Environmental Change (Springer), 16(1): 177-
188.
Bahinipati, C. S., Rajasekar, U., Acharya, A. and Patel, M. (2015). Flood-induced economic
loss and damage to the textile industry in Surat city, India. Asian Cities Climate
Resilience Working Paper Series 26, International Institute of Environment and
Development (IIED), London, U.K.
Bahinipati, C.S., Patnaik, U. and Viswanathan, P.K. (2016). What causes economics losses
from natural disasters in India?. In Dinda, S. (Eds.), Handbook of research on climate
change impact on health and environmental sustainability, IGI Global Publisher, U.S.A.,
pp. 157-175.
Bahinipati, C. S. (2015). District-level estimation of development indicators for the state,
Gujarat, research report submitted to Indian Council of Social Science Research
(ICSSR), New Delhi, India.
Bahinipati, C. S. (2016). Consumption smoothing and climate extremes: Evidence from a farm
household survey in eastern coastal India. Social Change and Development, 13: 1-18.
Birkmann, J. and Welle, T. (2015). Assessing the risk of loss and damage: exposure,
vulnerability and risk to climate related hazards for different country classifications.
International Journal of Global Warming, 8(2), 191-212.
Christiaensen, L., Hoffmann, V. and Sarris, A. (2007). Gauging the welfare effects of shocks
in rural Tanzania. World Bank Policy Research Working Paper 4406, World Bank,
Washington D.C.
Dercon, S., Hoddinott, J. and Woldehanna, T. (2005). Shocks and Consumption in 15
Ethiopian Villages, 1999-2004. Journal of African Economies, 14(4), 559-585.
Dercon, S. (2008). Fate and fear: risks and its consequences in Africa. Journal of African
Economies, 17: ii97-ii127.
Fankhauser, S., Dietz, S. and Gradwell, P. (2014). Non-economic losses in the context of the
UNFCCC work programme on loss and damage. Policy Paper, Centre for Climate
Change Economics and Policy, Grantham Research Institute on Climate Change and
the Environment, U.K.
Government of Gujarat (2015). Report on task force to derive suggestions to increase
agriculture development in Gujarat, Department of Agriculture and Cooperation,
Government of Gujarat, Gandhinagar.
Hallegatte, S. (2014). Natural disasters and climate change: an economic perspective.
Published by Springer International Publishing, Switzerland.
Final Report: CAF2015-RR08-NMY-Chiba 72
Hiremath, D. B. and Shiyani, R. L. (2013). Analysis of vulnerability indices in various Agro-
climatic zones of Gujarat. Indian Journal of Agricultural Economics, 68(1): 122-137.
Hoddinott, J. and Kinsey, B. (2001). Child growth in the time of drought. Oxford Bulletin of
Economics and Statistics, 63(4): 409-436.
IPCC (2012). Summary for policymakers. In: Field, C.B., Barros, V., Stocker, T.F., Qin, D.,
Dokken, D.J., Ebi, K.L., Mastrandrea, M.D., Mach, K.J., Plattner, G.K., Allen, S.K.,
Tignor, M. and Midgley, P.M. (eds) Managing the risks of extreme events and disasters
to advance climate change adaptation: a special report of Working Groups I and II of the
Intergovernmental Panel on Climate Change. Cambridge University Press, Cambridge,
3–21. See: http://ipcc-wg2.gov/SREX/
Jodha, N.S. (1981). Role of credit in farmers’ adjustment against risk in Arid and Semi-Arid
tropical areas of India. Economic and Political Weekly. 26 (42–43), 1696–1709.
Kahn, M. (2005). The death toll from natural disasters: The role of income, geography and
institutions. Review of Economics and Statistics, 87(2): 271-284.
Ladds, M., Keating, A., Handmer, J. and Magee, L. (2017). How much do disaster cost? A
comparison of disaster cost estimates in Australia. International Journal of Disaster Risk
Reduction, doi:10.1016/j.ijdrr.2017.01.004.
Logar, I., C.J.M., J. and van den Bergh (2011). Method for assessment of the costs of droughts.
Mall, R. K., Singh, R., Gupta, A., Srinivasan, G. and Rathore, L. S. (2006). Impact of climate
change on Indian agriculture: A review. Climatic Change, 78(2-4): 445-478.
Mehta, N. (2013). An investigation into growth, instability and role of weather in Gujarat
Agriculture: 1981-2011. Agricultural Economics Research Review, 26: 43-55.
Mondal, P., Jain, M., DeFries, R. S., Galford, G. L. and Small, C. (2015). Sensitivity of crop
cover to climate variability: Insights from two Indian agro-eco regions. Journal of
Environmental Management, 148: 21-30.
Morrissey, J., and Oliver-Smith, A. (2013). Perspectives on non-economic loss and damage:
understanding values at risk from climate change.
Mwinjaka, O., Gupta, J. and Bresser, T. (2010). Adaptation strategies of the poorest farmers
in drought-prone Gujarat. Climate and Development, 2(4): 346-363.
O’Brien, K. L., Leichenko, R., Kelkar, U., Venema, H., Aandahl, G., Tompkins, H., Javed, A.,
Bhadwal, S., Barg, S., Nygaard, L. and West, J. (2004). Mapping vulnerability to multiple
stressors: Climate change and globalisation in India. Global Environmental Change,
14(4): 303-313.
Pandey, V. and Patel, H.R. (2010). Climate change and agriculture over Gujarat. In G.S.L.H.V.
Prasad Rao, G.G.S.N. Rao and V.U.M. Rao (Eds.), Climate Change and agriculture over
India (pp.1-12). New Delhi: PHI Learning private limited.
Patankar, A. and Patwardhan, A. (2016). Estimating the uninsured losses due to extreme
weather events and implications for informal sector vulnerability: a case study of Mumbai,
India. Natural Hazards, 80(1): 285-310.
Patel, H.R., Lunagaria, M.M., Karande, B.I., Yadav, S.B., Shah, A.V., Sood, V.K. and Pandey,
V. (2015). Climate change and its impact on major crops in Gujarat. Journal of Agro-
meteorology, 17(2): 190-193.
Patt, A., Suarez, P. and Gwata, C. (2005). Effects of seasonal climate forecasts and
participatory workshops among subsistence farmers in Zimbabwe. Proceedings of
National Academy of Science, 102(35), 12623-12628.
Pattanayak, S. and Kramer, R.A. (2001). Pricing ecological services: willingness to pay for
drought mitigation from watershed protection in eastern Indonesia. Water Resources
Research, 37(3): 771-778.
Final Report: CAF2015-RR08-NMY-Chiba 73
Pattnaik, I., Shah, T., Koppa, G. and Shah, A. (2012). Agricultural extension service through
Krishi Mahotsav in Gujarat: a preliminary assessment. GIDR Occasional Paper Series
No. 2, Gujarat Institute of Development Research, Ahmedabad, India.
Planning Commission (2013). Press Note on Poverty Estimates, 2011-12. Government of
India, New Delhi, India. http://planningcommission.nic.in/news/pre_pov2307.pdf;
accessed on 6th January 2014.
Prabhakar, S.V.R.K. and Shaw, R. (2008). Climate change adaptation implications for drought
risk mitigation: a perspective for India. Climatic Change, 88:113-130.
Prabhakar, S.V.R.K., Chiba, Y., Abamo, A., Bahinipati, C.S. and Shrestha, S. (2015).
Addressing non-economic loss and damage associated with climatic events in Asia:
experiences, issues and way forward. IGES Research Report, Institute for Global
Environmental Strategies, Japan.
Ranger, N., Hallegatte, S., Bhattacharya, S., Bachu, M., Priya, S., Dhore, K., Rafique, F.,
Mathur, P., Naville, N., Henriet, F., Herweijer, C., Pohit, S. and Corfee-Morlot, J. (2011).
An assessment of potential impact of climate change on flood risk in Mumbai. Climatic
Change, 104: 139-167.
Roy, A., and Hirway, I. (2007). Multiple impacts of droughts and assessment of drought policy
in major drought prone states in India. Project report submitted to The Planning
Commission, Government of India, New Delhi.
Serdeczny, O., Waters, E. and Chan, S. (2016). Non-economic loss and damage in the context
of climate change. Discussion Paper 3, German Development Institute, Bonn, Germany.
Sharma U, Patwardhan A, and Patt, A. G. (2013). Education as a determinant of response to
cyclone warnings: Evidence from coastal zones of India. Ecology and Society, 18(2).
Sinha, S. (2007). Agricultural insurance in India. Centre for Insurance and Risk Management
Working Paper Series, Institute for Financial Management and Research, Chennai, India.
Stern, N. (2007). Stern review: the economics of climate change. Cambridge University Press
UNFCCC (2012). A literature review on the topics in the context of Thematic Area 2 of the
work programme on loss and damage: a range of approaches to address loss and
damage associated with the adverse effects of climate change.
UNFCCC (2013). Non-economic losses in the context of the work programme on loss and
damage. Technical Paper, 1–22.
Wamsler, C., Brink, E. and Rentala, O. (2012). Climate change, adaptation and formal
education: The role of schooling for increasing societies’ adaptive capacities in EI
Salvador and Brazil. Ecology and Society, 17(2).
Warner, K. and van der Geest, K. (2013). Loss and damage from climate change: local-level
evidence from nine vulnerable countries. International Journal of Global Warming, 5(4),
367–386.
Wood, S. A., Jina, A. S., Jain, M., Kristjanson, P. and DeFries, R. S. (2014). Smallholder
farmer cropping decision related to climate variability across multiple regions. Global
Environmental Change (in press), http://dx.doi.org/10.1016/j.gloenvcha.2013.12.011.
Wooldridge, J. M. (2002). Econometric analysis of cross section and panel data. The MIT
Press, Cambridge.
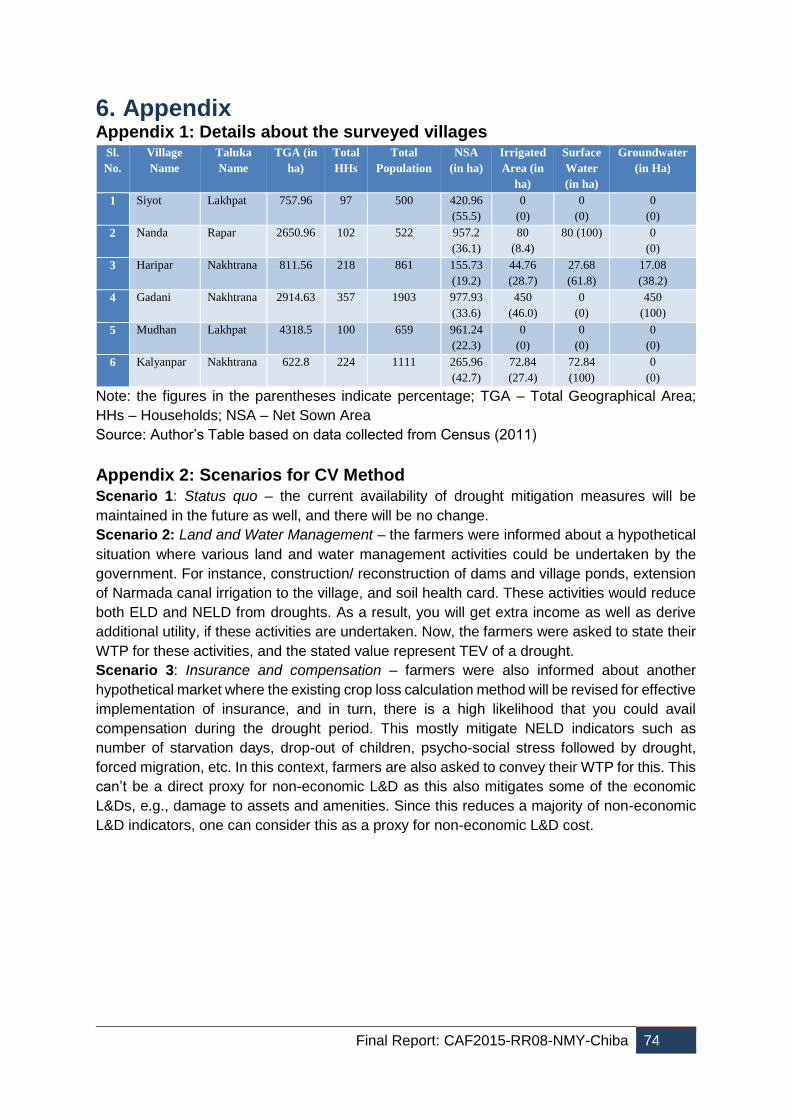
Final Report: CAF2015-RR08-NMY-Chiba 74
6. Appendix Appendix 1: Details about the surveyed villages
Sl.
No.
Village
Name
Taluka
Name
TGA (in
ha)
Total
HHs
Total
Population
NSA
(in ha)
Irrigated
Area (in
ha)
Surface
Water
(in ha)
Groundwater
(in Ha)
1 Siyot Lakhpat 757.96 97 500 420.96
(55.5)
0
(0)
0
(0)
0
(0)
2 Nanda Rapar 2650.96 102 522 957.2
(36.1)
80
(8.4)
80 (100) 0
(0)
3 Haripar Nakhtrana 811.56 218 861 155.73
(19.2)
44.76
(28.7)
27.68
(61.8)
17.08
(38.2)
4 Gadani Nakhtrana 2914.63 357 1903 977.93
(33.6)
450
(46.0)
0
(0)
450
(100)
5 Mudhan Lakhpat 4318.5 100 659 961.24
(22.3)
0
(0)
0
(0)
0
(0)
6 Kalyanpar Nakhtrana 622.8 224 1111 265.96
(42.7)
72.84
(27.4)
72.84
(100)
0
(0)
Note: the figures in the parentheses indicate percentage; TGA – Total Geographical Area;
HHs – Households; NSA – Net Sown Area
Source: Author’s Table based on data collected from Census (2011)
Appendix 2: Scenarios for CV Method
Scenario 1: Status quo – the current availability of drought mitigation measures will be
maintained in the future as well, and there will be no change.
Scenario 2: Land and Water Management – the farmers were informed about a hypothetical
situation where various land and water management activities could be undertaken by the
government. For instance, construction/ reconstruction of dams and village ponds, extension
of Narmada canal irrigation to the village, and soil health card. These activities would reduce
both ELD and NELD from droughts. As a result, you will get extra income as well as derive
additional utility, if these activities are undertaken. Now, the farmers were asked to state their
WTP for these activities, and the stated value represent TEV of a drought.
Scenario 3: Insurance and compensation – farmers were also informed about another
hypothetical market where the existing crop loss calculation method will be revised for effective
implementation of insurance, and in turn, there is a high likelihood that you could avail
compensation during the drought period. This mostly mitigate NELD indicators such as
number of starvation days, drop-out of children, psycho-social stress followed by drought,
forced migration, etc. In this context, farmers are also asked to convey their WTP for this. This
can’t be a direct proxy for non-economic L&D as this also mitigates some of the economic
L&Ds, e.g., damage to assets and amenities. Since this reduces a majority of non-economic
L&D indicators, one can consider this as a proxy for non-economic L&D cost.
Final Report: CAF2015-RR08-NMY-Chiba 75
Non-Economic Loss and Damage in Philippines: A Case Study of Super
Typhoon Yolanda
Antonio P. Abamo, Ma. Salome B. Bulayog and Ian Dave B. Custodio
Visayas State University, Philippines
1. Introduction Climate change is the single biggest environmental and humanitarian crisis of our time (NDRC
2014). The earth’s climate is changing across time and climate scientists are in consensus in
attributing climate change to the rising concentrations of greenhouse gases particularly carbon
emission in the atmosphere causing changes in the temperature. The temperatures are rising,
snow and rainfall patterns are shifting, and more extreme climatic events—like heavy
rainstorms and records of high temperatures are already taking place. Extreme climatic
disasters and calamities are now occurring worldwide causing economic disturbances across
countries which barred economic progress. Disasters are situations or events which
overwhelms local capacity, necessitating a request to a national or international level for
external assistance; an unforeseen and often sudden event that causes great damage,
destruction and human suffering (CRED 2013).
According to the Annual Disaster Statistical Review by the Centre for Research on the
Epidemiology of Disasters (CRED), in the year 2013, there were 330 naturally triggered
disasters were registered and killed a significant number of people of about 21,610 and 96.5
million people became victims worldwide. At a more detailed level, it appears that, in 2013,
the number of people killed by floods (recording up to 9,819 and a damage accounting to
US$ 53.2 billion) was the highest of the decade and the number of those killed by storms
(8,583) was the second highest. Deaths from floods had the largest share of natural disaster
fatalities in 2013, representing 45.4% of global disaster mortality, while deaths from storms
accounted for 39.7% which by the whole year, an estimated of US$ 118.6 billion economic
losses were recorded from natural disasters. Hence, addressing both economic and non-
economic losses and damages plays a vital role in assessing climate related costs and
damages in order to deliver efficient and adequate to the needs of the affected people
especially on the vulnerable developing countries.
1.1 Objectives
In general, the research aimed to develop an assessment framework in identifying and
measuring non-economic loss and damages (NELD) associated with climatic disasters:
Specifically, it aimed to:
1. Understand non-economic loss and damages (NELDs) caused by recent past major
climate-related disasters (i.e., ST Haiyan in 2013);
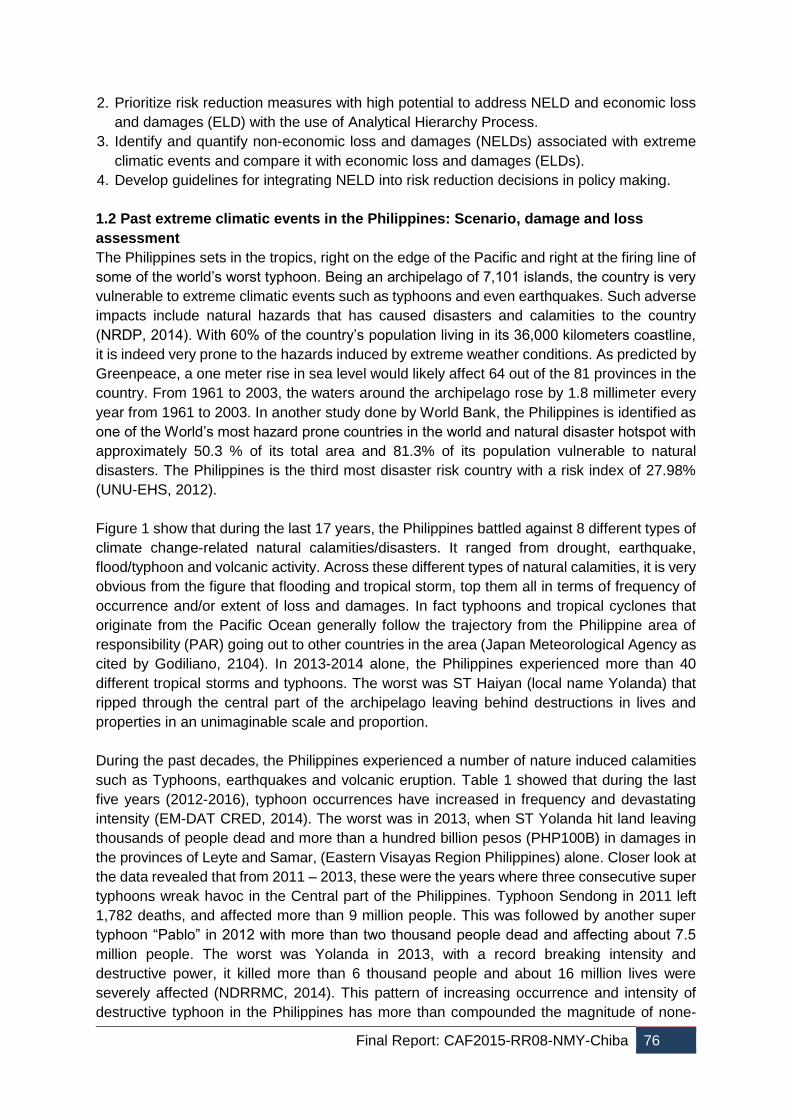
Final Report: CAF2015-RR08-NMY-Chiba 76
2. Prioritize risk reduction measures with high potential to address NELD and economic loss
and damages (ELD) with the use of Analytical Hierarchy Process.
3. Identify and quantify non-economic loss and damages (NELDs) associated with extreme
climatic events and compare it with economic loss and damages (ELDs).
4. Develop guidelines for integrating NELD into risk reduction decisions in policy making.
1.2 Past extreme climatic events in the Philippines: Scenario, damage and loss
assessment
The Philippines sets in the tropics, right on the edge of the Pacific and right at the firing line of
some of the world’s worst typhoon. Being an archipelago of 7,101 islands, the country is very
vulnerable to extreme climatic events such as typhoons and even earthquakes. Such adverse
impacts include natural hazards that has caused disasters and calamities to the country
(NRDP, 2014). With 60% of the country’s population living in its 36,000 kilometers coastline,
it is indeed very prone to the hazards induced by extreme weather conditions. As predicted by
Greenpeace, a one meter rise in sea level would likely affect 64 out of the 81 provinces in the
country. From 1961 to 2003, the waters around the archipelago rose by 1.8 millimeter every
year from 1961 to 2003. In another study done by World Bank, the Philippines is identified as
one of the World’s most hazard prone countries in the world and natural disaster hotspot with
approximately 50.3 % of its total area and 81.3% of its population vulnerable to natural
disasters. The Philippines is the third most disaster risk country with a risk index of 27.98%
(UNU-EHS, 2012).
Figure 1 show that during the last 17 years, the Philippines battled against 8 different types of
climate change-related natural calamities/disasters. It ranged from drought, earthquake,
flood/typhoon and volcanic activity. Across these different types of natural calamities, it is very
obvious from the figure that flooding and tropical storm, top them all in terms of frequency of
occurrence and/or extent of loss and damages. In fact typhoons and tropical cyclones that
originate from the Pacific Ocean generally follow the trajectory from the Philippine area of
responsibility (PAR) going out to other countries in the area (Japan Meteorological Agency as
cited by Godiliano, 2104). In 2013-2014 alone, the Philippines experienced more than 40
different tropical storms and typhoons. The worst was ST Haiyan (local name Yolanda) that
ripped through the central part of the archipelago leaving behind destructions in lives and
properties in an unimaginable scale and proportion.
During the past decades, the Philippines experienced a number of nature induced calamities
such as Typhoons, earthquakes and volcanic eruption. Table 1 showed that during the last
five years (2012-2016), typhoon occurrences have increased in frequency and devastating
intensity (EM-DAT CRED, 2014). The worst was in 2013, when ST Yolanda hit land leaving
thousands of people dead and more than a hundred billion pesos (PHP100B) in damages in
the provinces of Leyte and Samar, (Eastern Visayas Region Philippines) alone. Closer look at
the data revealed that from 2011 – 2013, these were the years where three consecutive super
typhoons wreak havoc in the Central part of the Philippines. Typhoon Sendong in 2011 left
1,782 deaths, and affected more than 9 million people. This was followed by another super
typhoon “Pablo” in 2012 with more than two thousand people dead and affecting about 7.5
million people. The worst was Yolanda in 2013, with a record breaking intensity and
destructive power, it killed more than 6 thousand people and about 16 million lives were
severely affected (NDRRMC, 2014). This pattern of increasing occurrence and intensity of
destructive typhoon in the Philippines has more than compounded the magnitude of none-
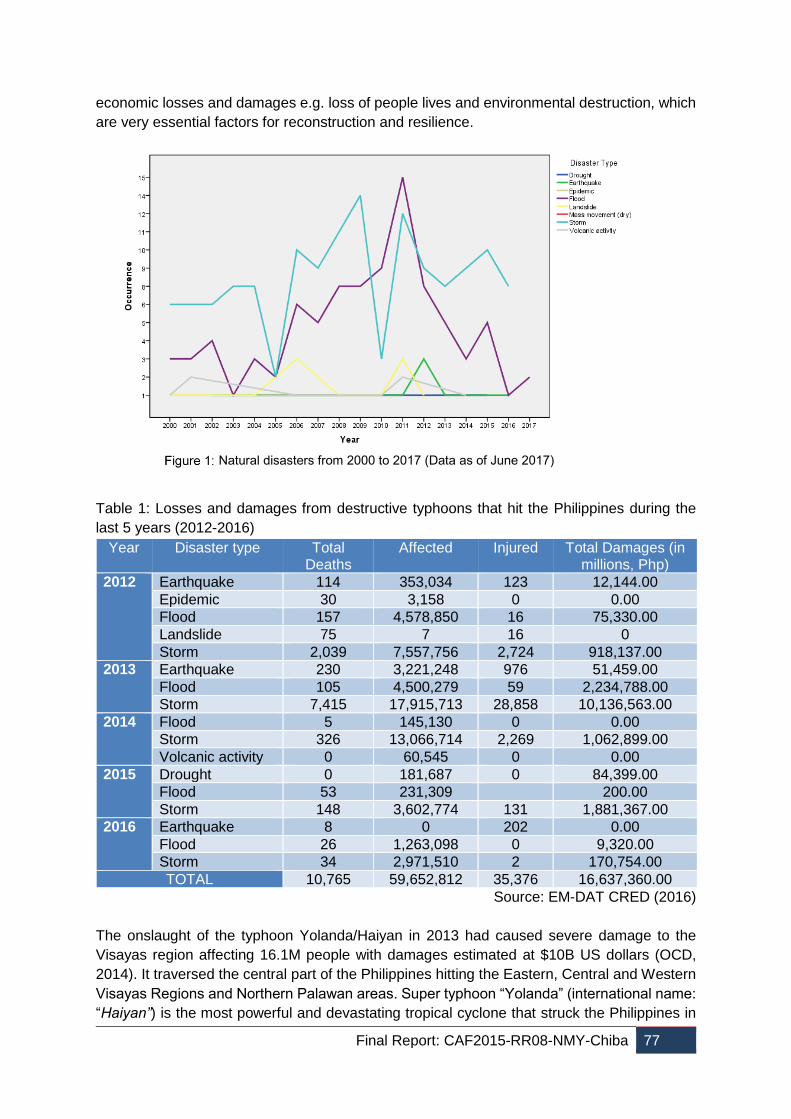
Final Report: CAF2015-RR08-NMY-Chiba 77
economic losses and damages e.g. loss of people lives and environmental destruction, which
are very essential factors for reconstruction and resilience.
Table 1: Losses and damages from destructive typhoons that hit the Philippines during the
last 5 years (2012-2016)
Year Disaster type Total Deaths
Affected Injured Total Damages (in millions, Php)
2012
Earthquake 114 353,034 123 12,144.00
Epidemic 30 3,158 0 0.00
Flood 157 4,578,850 16 75,330.00
Landslide 75 7 16 0
Storm 2,039 7,557,756 2,724 918,137.00
2013
Earthquake 230 3,221,248 976 51,459.00
Flood 105 4,500,279 59 2,234,788.00
Storm 7,415 17,915,713 28,858 10,136,563.00
2014 Flood 5 145,130 0 0.00
Storm 326 13,066,714 2,269 1,062,899.00
Volcanic activity 0 60,545 0 0.00
2015
Drought 0 181,687 0 84,399.00
Flood 53 231,309 200.00
Storm 148 3,602,774 131 1,881,367.00
2016
Earthquake 8 0 202 0.00
Flood 26 1,263,098 0 9,320.00
Storm 34 2,971,510 2 170,754.00
TOTAL 10,765 59,652,812 35,376 16,637,360.00
Source: EM-DAT CRED (2016)
The onslaught of the typhoon Yolanda/Haiyan in 2013 had caused severe damage to the
Visayas region affecting 16.1M people with damages estimated at $10B US dollars (OCD,
2014). It traversed the central part of the Philippines hitting the Eastern, Central and Western
Visayas Regions and Northern Palawan areas. Super typhoon “Yolanda” (international name:
“Haiyan”) is the most powerful and devastating tropical cyclone that struck the Philippines in
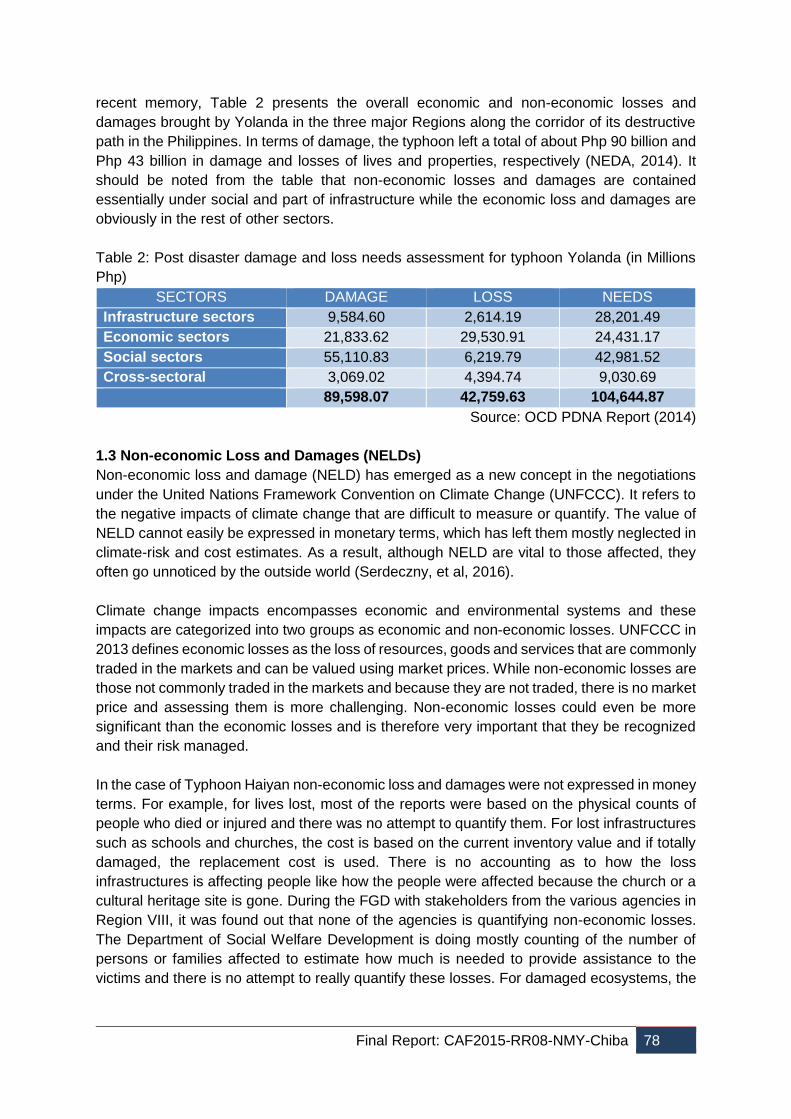
Final Report: CAF2015-RR08-NMY-Chiba 78
recent memory, Table 2 presents the overall economic and non-economic losses and
damages brought by Yolanda in the three major Regions along the corridor of its destructive
path in the Philippines. In terms of damage, the typhoon left a total of about Php 90 billion and
Php 43 billion in damage and losses of lives and properties, respectively (NEDA, 2014). It
should be noted from the table that non-economic losses and damages are contained
essentially under social and part of infrastructure while the economic loss and damages are
obviously in the rest of other sectors.
Table 2: Post disaster damage and loss needs assessment for typhoon Yolanda (in Millions
Php)
SECTORS DAMAGE LOSS NEEDS
Infrastructure sectors 9,584.60 2,614.19 28,201.49
Economic sectors 21,833.62 29,530.91 24,431.17
Social sectors 55,110.83 6,219.79 42,981.52
Cross-sectoral 3,069.02 4,394.74 9,030.69
89,598.07 42,759.63 104,644.87
Source: OCD PDNA Report (2014)
1.3 Non-economic Loss and Damages (NELDs)
Non-economic loss and damage (NELD) has emerged as a new concept in the negotiations
under the United Nations Framework Convention on Climate Change (UNFCCC). It refers to
the negative impacts of climate change that are difficult to measure or quantify. The value of
NELD cannot easily be expressed in monetary terms, which has left them mostly neglected in
climate-risk and cost estimates. As a result, although NELD are vital to those affected, they
often go unnoticed by the outside world (Serdeczny, et al, 2016).
Climate change impacts encompasses economic and environmental systems and these
impacts are categorized into two groups as economic and non-economic losses. UNFCCC in
2013 defines economic losses as the loss of resources, goods and services that are commonly
traded in the markets and can be valued using market prices. While non-economic losses are
those not commonly traded in the markets and because they are not traded, there is no market
price and assessing them is more challenging. Non-economic losses could even be more
significant than the economic losses and is therefore very important that they be recognized
and their risk managed.
In the case of Typhoon Haiyan non-economic loss and damages were not expressed in money
terms. For example, for lives lost, most of the reports were based on the physical counts of
people who died or injured and there was no attempt to quantify them. For lost infrastructures
such as schools and churches, the cost is based on the current inventory value and if totally
damaged, the replacement cost is used. There is no accounting as to how the loss
infrastructures is affecting people like how the people were affected because the church or a
cultural heritage site is gone. During the FGD with stakeholders from the various agencies in
Region VIII, it was found out that none of the agencies is quantifying non-economic losses.
The Department of Social Welfare Development is doing mostly counting of the number of
persons or families affected to estimate how much is needed to provide assistance to the
victims and there is no attempt to really quantify these losses. For damaged ecosystems, the
Final Report: CAF2015-RR08-NMY-Chiba 79
DENR estimates only the loss incurred by tree plantations and not the damage of natural
forests.
1.4 Scientific Framework of the Study
Quantifying and identifying of non-economic values is a challenging task. One of the main
difficulties in accessing non-economic losses, is due to the lack of market price. Goods that
are essential for human-natural systems (e.g. eco-system services) are not valued in the
markets (Morrissey and Smith, 2013). Nevertheless, these non-economic values are of
upmost importance when assessing the total cost of losses and damages. The traditional way
of accounting the economic losses and damages alone undervalue the real cost of climate
change impacts. Non-economic losses may be more significant than economic losses in many
developing countries (UNFCCC, 2013). Figure 2 shows the methodology framework for
quantifying NELD in terms of monetary values so as the proportion of NELD can be compared
with the economic damages and in terms total loss and damage can be calculated.
2. Methodology
2.1 Location of the Study
There were two sets of study area where the study was conducted with distinct purposes for
each. The first set was in the town of Tolosa, Leyte, particularly on Brgy Imelda and Brgy.
Telegrafo which both lies within the shoreline. The pairwise comparison of the identified
parameters of the AHP diagram (see Figure 4 on section 2.6 below) was conducted with
gender specific participants – male and female of the various sectors (senior citizens, PWD’s,
farmers and fisher folks organization and others). This aimed to give perspectives on what are
the prioritization of the risk-reduction practices that was identified beforehand by the
stakeholders from the various government sectors, which will then be useful in determining
the most prioritized practice/s among all those identified, at the community level.
On the other hand, the second set of the study locations aimed for the quantification of the
non-economic losses and damages, which was conducted from the two distinct provinces that
are both within the path of the Super typhoon Yolanda (“Haiyan”). One is from the province of
Samar, Brgy. Carmen from the municipality of Hernani, and the other one was on Brgy. San
Jose from the City of Tacloban, province of Leyte. Both of the study areas were chosen based
on the characteristic that the study also wants to look into – the significance or effect of
mangroves as a live storm surge barrier or as a protection to a disaster, such as the barbaric
super typhoon. Both of the areas lies within the shoreline, facing the Pacific Ocean. Brgy.
Carmen of Hernani, Eastern Samar was the one of the two barangays that has the presence
of mangroves along the shoreline while Brgy. San Jose from the City of Tacloban doesn’t have.
Brgy. Carmen is just a single unit of barangay and is not divided into any sub barangays or
zones (“purok” or “sityo” in local term) which has a total population of 1,021 while Brgy. San
Jose is nested with 11 separate sub barangays named by numbers from Brgy. 80 to Brgy 89
(Brgy. 83 is subdivided into three, 83-A, 83-B and 83-C) which totals to about 6000 households.
Given with a very big population, time and budget constrained the study, that’s why purposive
sampling was done and only a total of 163 household were interviewed using paperless survey
instrument through the ODK platform.

Final Report: CAF2015-RR08-NMY-Chiba 80
2.2 Expert consultation at the national/regional level
The stakeholder’s consultation forum was organized to gather the information needed for the
study, specifically in determining what are the non-economic losses and damages brought by
a calamity/disasters, particularly after the devastation of Typhoon Yolanda (Haiyan) which has
been a very tremendous disaster in the Philippine history. The focus group discussion also
aimed the identification of the criteria in planning or policy making, the indicators which serves
as the measures of effectiveness of such criterion, and practices being done by the
government, especially the government’s regional offices concerned together with the Local
Government Unit (LGU) on how to prevent or minimize NELD as an immediate effect of a
calamity or disaster. The stakeholders represents the different government’s regional offices
and the selected LGU’s of the province. They were also the participants of the AHP multi
Source: Google Maps 2017
Figure 3: The map of the study areas in the Province of Leyte and Samar
Leyte
Samar
Tacloban
Hernani
Tolosa
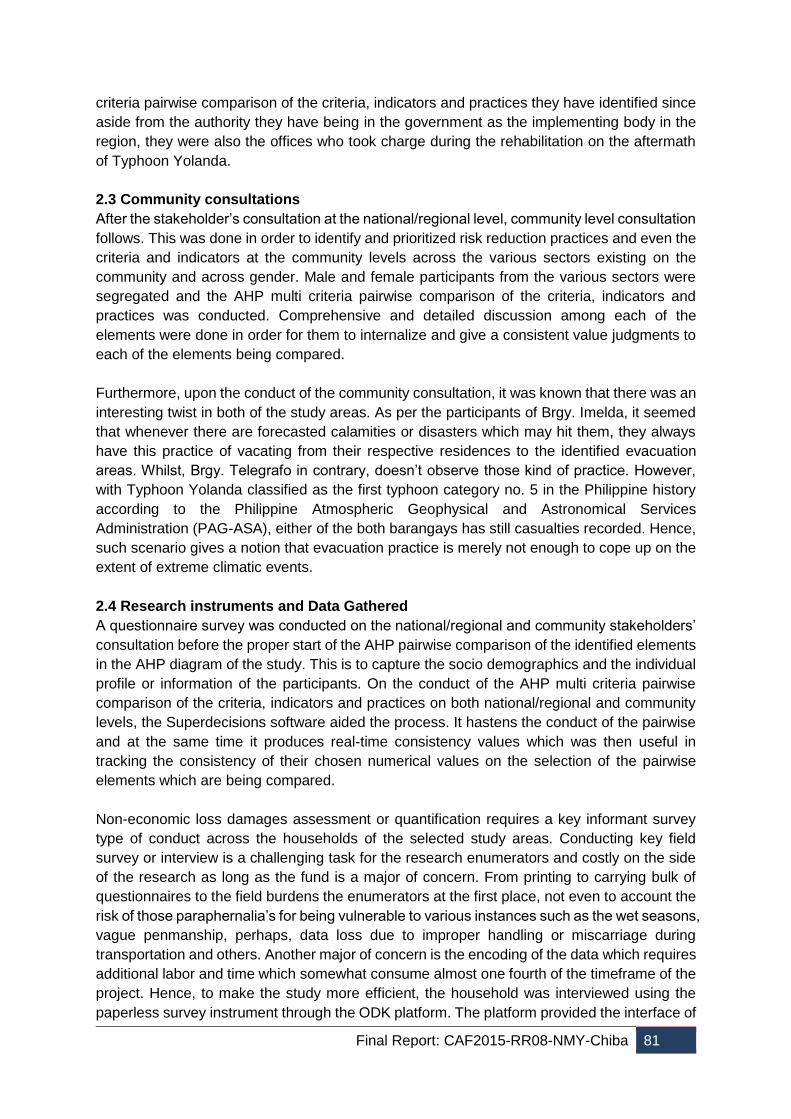
Final Report: CAF2015-RR08-NMY-Chiba 81
criteria pairwise comparison of the criteria, indicators and practices they have identified since
aside from the authority they have being in the government as the implementing body in the
region, they were also the offices who took charge during the rehabilitation on the aftermath
of Typhoon Yolanda.
2.3 Community consultations
After the stakeholder’s consultation at the national/regional level, community level consultation
follows. This was done in order to identify and prioritized risk reduction practices and even the
criteria and indicators at the community levels across the various sectors existing on the
community and across gender. Male and female participants from the various sectors were
segregated and the AHP multi criteria pairwise comparison of the criteria, indicators and
practices was conducted. Comprehensive and detailed discussion among each of the
elements were done in order for them to internalize and give a consistent value judgments to
each of the elements being compared.
Furthermore, upon the conduct of the community consultation, it was known that there was an
interesting twist in both of the study areas. As per the participants of Brgy. Imelda, it seemed
that whenever there are forecasted calamities or disasters which may hit them, they always
have this practice of vacating from their respective residences to the identified evacuation
areas. Whilst, Brgy. Telegrafo in contrary, doesn’t observe those kind of practice. However,
with Typhoon Yolanda classified as the first typhoon category no. 5 in the Philippine history
according to the Philippine Atmospheric Geophysical and Astronomical Services
Administration (PAG-ASA), either of the both barangays has still casualties recorded. Hence,
such scenario gives a notion that evacuation practice is merely not enough to cope up on the
extent of extreme climatic events.
2.4 Research instruments and Data Gathered
A questionnaire survey was conducted on the national/regional and community stakeholders’
consultation before the proper start of the AHP pairwise comparison of the identified elements
in the AHP diagram of the study. This is to capture the socio demographics and the individual
profile or information of the participants. On the conduct of the AHP multi criteria pairwise
comparison of the criteria, indicators and practices on both national/regional and community
levels, the Superdecisions software aided the process. It hastens the conduct of the pairwise
and at the same time it produces real-time consistency values which was then useful in
tracking the consistency of their chosen numerical values on the selection of the pairwise
elements which are being compared.
Non-economic loss damages assessment or quantification requires a key informant survey
type of conduct across the households of the selected study areas. Conducting key field
survey or interview is a challenging task for the research enumerators and costly on the side
of the research as long as the fund is a major of concern. From printing to carrying bulk of
questionnaires to the field burdens the enumerators at the first place, not even to account the
risk of those paraphernalia’s for being vulnerable to various instances such as the wet seasons,
vague penmanship, perhaps, data loss due to improper handling or miscarriage during
transportation and others. Another major of concern is the encoding of the data which requires
additional labor and time which somewhat consume almost one fourth of the timeframe of the
project. Hence, to make the study more efficient, the household was interviewed using the
paperless survey instrument through the ODK platform. The platform provided the interface of
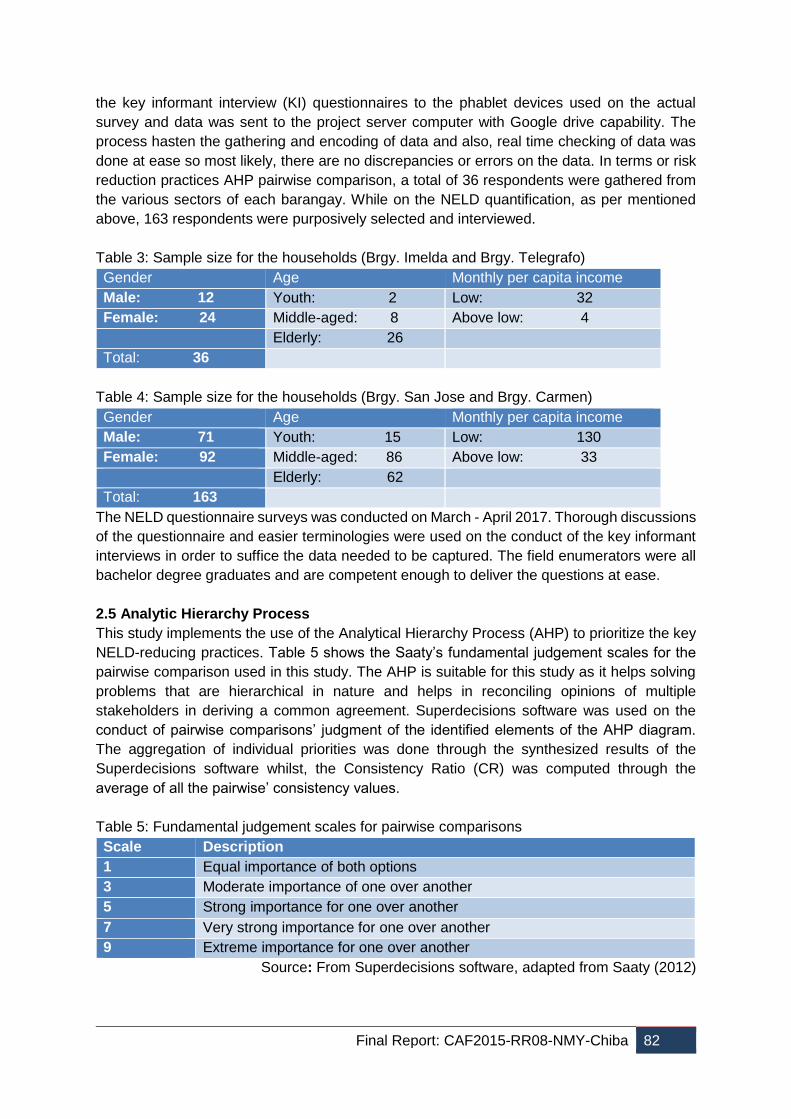
Final Report: CAF2015-RR08-NMY-Chiba 82
the key informant interview (KI) questionnaires to the phablet devices used on the actual
survey and data was sent to the project server computer with Google drive capability. The
process hasten the gathering and encoding of data and also, real time checking of data was
done at ease so most likely, there are no discrepancies or errors on the data. In terms or risk
reduction practices AHP pairwise comparison, a total of 36 respondents were gathered from
the various sectors of each barangay. While on the NELD quantification, as per mentioned
above, 163 respondents were purposively selected and interviewed.
Table 3: Sample size for the households (Brgy. Imelda and Brgy. Telegrafo)
Gender Age Monthly per capita income
Male: 12 Youth: 2 Low: 32
Female: 24 Middle-aged: 8 Above low: 4
Elderly: 26
Total: 36
Table 4: Sample size for the households (Brgy. San Jose and Brgy. Carmen)
Gender Age Monthly per capita income
Male: 71 Youth: 15 Low: 130
Female: 92 Middle-aged: 86 Above low: 33
Elderly: 62
Total: 163
The NELD questionnaire surveys was conducted on March - April 2017. Thorough discussions
of the questionnaire and easier terminologies were used on the conduct of the key informant
interviews in order to suffice the data needed to be captured. The field enumerators were all
bachelor degree graduates and are competent enough to deliver the questions at ease.
2.5 Analytic Hierarchy Process
This study implements the use of the Analytical Hierarchy Process (AHP) to prioritize the key
NELD-reducing practices. Table 5 shows the Saaty’s fundamental judgement scales for the
pairwise comparison used in this study. The AHP is suitable for this study as it helps solving
problems that are hierarchical in nature and helps in reconciling opinions of multiple
stakeholders in deriving a common agreement. Superdecisions software was used on the
conduct of pairwise comparisons’ judgment of the identified elements of the AHP diagram.
The aggregation of individual priorities was done through the synthesized results of the
Superdecisions software whilst, the Consistency Ratio (CR) was computed through the
average of all the pairwise’ consistency values.
Table 5: Fundamental judgement scales for pairwise comparisons
Scale Description
1 Equal importance of both options
3 Moderate importance of one over another
5 Strong importance for one over another
7 Very strong importance for one over another
9 Extreme importance for one over another
Source: From Superdecisions software, adapted from Saaty (2012)
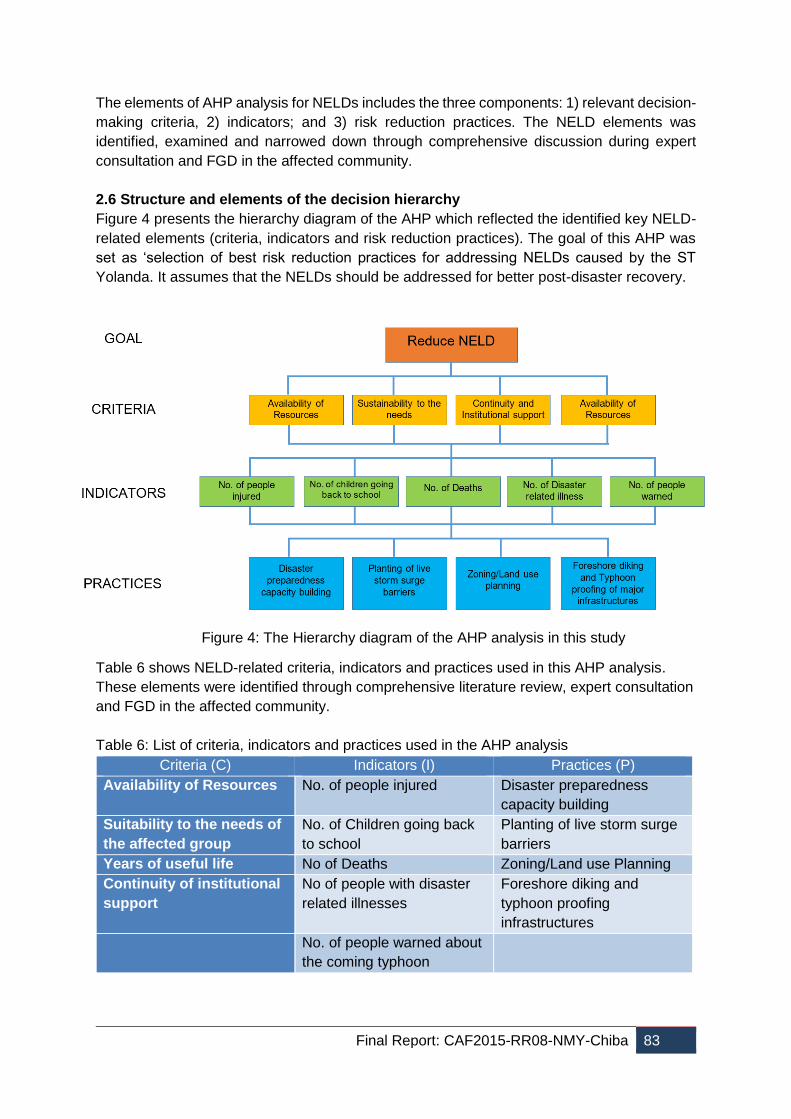
Final Report: CAF2015-RR08-NMY-Chiba 83
The elements of AHP analysis for NELDs includes the three components: 1) relevant decision-
making criteria, 2) indicators; and 3) risk reduction practices. The NELD elements was
identified, examined and narrowed down through comprehensive discussion during expert
consultation and FGD in the affected community.
2.6 Structure and elements of the decision hierarchy
Figure 4 presents the hierarchy diagram of the AHP which reflected the identified key NELD-
related elements (criteria, indicators and risk reduction practices). The goal of this AHP was
set as ‘selection of best risk reduction practices for addressing NELDs caused by the ST
Yolanda. It assumes that the NELDs should be addressed for better post-disaster recovery.
Table 6 shows NELD-related criteria, indicators and practices used in this AHP analysis.
These elements were identified through comprehensive literature review, expert consultation
and FGD in the affected community.
Table 6: List of criteria, indicators and practices used in the AHP analysis
Criteria (C) Indicators (I) Practices (P)
Availability of Resources No. of people injured Disaster preparedness
capacity building
Suitability to the needs of
the affected group
No. of Children going back
to school
Planting of live storm surge
barriers
Years of useful life No of Deaths Zoning/Land use Planning
Continuity of institutional
support
No of people with disaster
related illnesses
Foreshore diking and
typhoon proofing
infrastructures
No. of people warned about
the coming typhoon
Figure 4: The Hierarchy diagram of the AHP analysis in this study
Final Report: CAF2015-RR08-NMY-Chiba 84
2.6.1 Criteria
2.6.1.1 Availability of Resources. An important consideration that contributes to resiliency
of the affected areas. This includes financial, manpower and physical resources that are
available.
2.6.1.2 Suitability to the needs of the affected group. A choice of the practice to mitigate
climate change impacts, it could be the suitability of the intervention to the needs of the
affected groups and its urgency.
2.6.1.3 Years of useful life. The longevity of the investment. Applicable for infrastructures like
school buildings, sea walls/dykes, etc. This includes the infrastructures that require huge
budgets are more durable and would last longer and cost per unit would be cheaper in the
long-run.
2.6.1.4 Continuity of Institutional support. Life of the project depends on the political life of
that elected official supporting the project and therefore lacks continuity. Political term of
elected office is 3 years, so if the support is not institutionalized, chances are that every time
a new person is elected, the old project will be scrapped and therefore there is no continuity.
2.6.2 Indicators
2.6.2.1 No. of people injured. This includes those people suffered from minor or serious
injuries that seeks or requires immediate medical attention on the aftermath of a disaster.
2.6.2.2 No. children going back to school. Children are much vulnerable of all the members
of the society. This indicators includes those children who were going to school before the
disaster and dropped out or opted not to continue schooling after the calamity or a disaster.
2.6.2.3 No. of deaths. The number of people who are missing are also included in this
indicator. Identified fatalities are the main scope of this indicator.
2.6.2.4 No. of people with disaster related illness. This includes those people who suffered
from any types of diseases or illnesses caused by various instances on the aftermath of a
calamity or disaster such as water contamination leading to water-borne diseases, diarrhea
among others.
2.6.2.5 No. of people warned about the coming typhoon. Information dissemination plays
a vital role in disaster management. Failure of these aspects could lead to serious fatalities
and may incur significant losses and damages to infrastructures, agriculture and others. Use
of words matters. Technical jargons terminologies was one of the main reasons why people
didn’t mind much not until Typhoon Yolanda came.
2.6.3 Practices
2.6.3.1 Disaster preparedness capacity building. Includes preparation for the coming
typhoons and activities such as storm signals warning to everybody who will be affected by a
coming calamity, preparing logistics such as food, medicines, water, and flashlights among
others.
2.6.3.2 Planting of live storm surge barriers. Foreshore reforestation is done to provide
storm surge barriers using mangrove and other tree species proven effective.
2.6.3.3 Zoning/Land use Planning. Through zoning, hazardous places are identified where
it is not allowed to be used as residential areas. Land use planning will allocate the available
land area in the community based on their purpose
2.6.3.4 Foreshore diking and typhoon proofing infrastructures. Includes the construction
of sea walls, river dykes and river control and other physical barriers. Strengthening the
existing infrastructures such as bridges, school buildings, churches, public markets airports
and others.
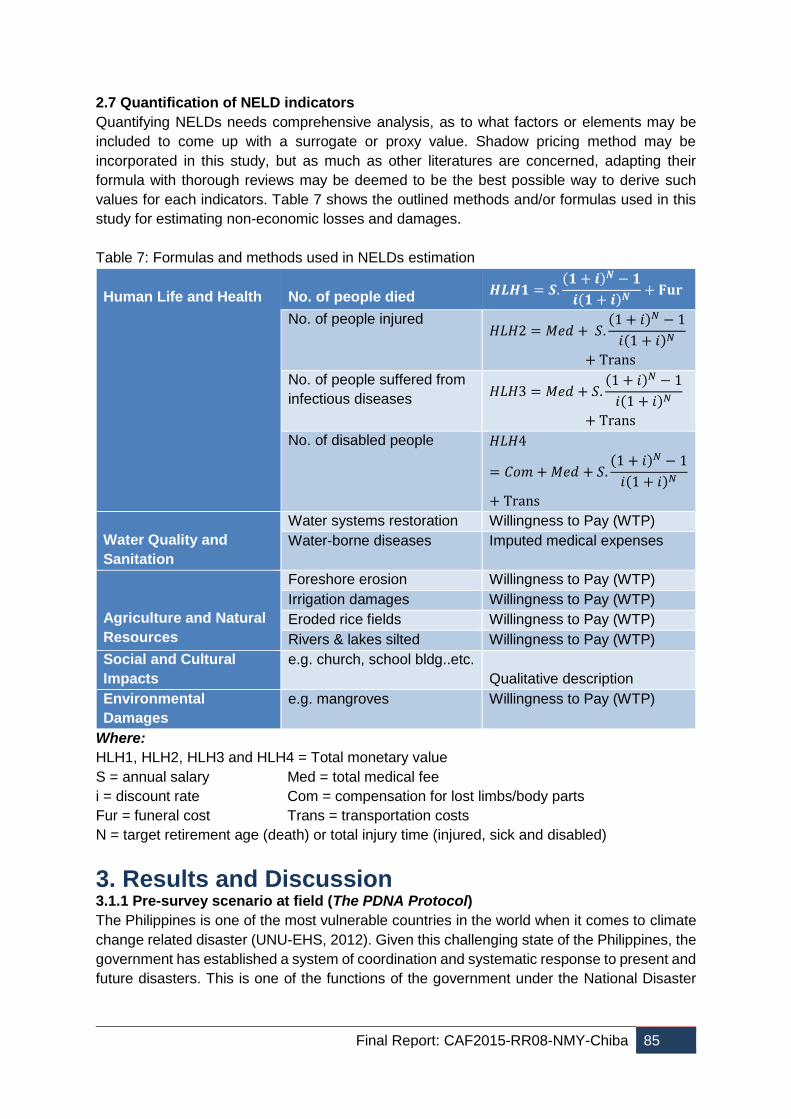
Final Report: CAF2015-RR08-NMY-Chiba 85
2.7 Quantification of NELD indicators
Quantifying NELDs needs comprehensive analysis, as to what factors or elements may be
included to come up with a surrogate or proxy value. Shadow pricing method may be
incorporated in this study, but as much as other literatures are concerned, adapting their
formula with thorough reviews may be deemed to be the best possible way to derive such
values for each indicators. Table 7 shows the outlined methods and/or formulas used in this
study for estimating non-economic losses and damages.
Table 7: Formulas and methods used in NELDs estimation
Human Life and Health
No. of people died 𝑯𝑳𝑯𝟏 = 𝑺.
(𝟏 + 𝒊)𝑵 − 𝟏
𝒊(𝟏 + 𝒊)𝑵+ 𝐅𝐮𝐫
No. of people injured 𝐻𝐿𝐻2 = 𝑀𝑒𝑑 + 𝑆.
(1 + 𝑖)𝑁 − 1
𝑖(1 + 𝑖)𝑁
+ Trans
No. of people suffered from
infectious diseases 𝐻𝐿𝐻3 = 𝑀𝑒𝑑 + 𝑆.
(1 + 𝑖)𝑁 − 1
𝑖(1 + 𝑖)𝑁
+ Trans
No. of disabled people 𝐻𝐿𝐻4
= 𝐶𝑜𝑚 + 𝑀𝑒𝑑 + 𝑆.(1 + 𝑖)𝑁 − 1
𝑖(1 + 𝑖)𝑁
+ Trans
Water Quality and
Sanitation
Water systems restoration Willingness to Pay (WTP)
Water-borne diseases Imputed medical expenses
Agriculture and Natural
Resources
Foreshore erosion Willingness to Pay (WTP)
Irrigation damages Willingness to Pay (WTP)
Eroded rice fields Willingness to Pay (WTP)
Rivers & lakes silted Willingness to Pay (WTP)
Social and Cultural
Impacts
e.g. church, school bldg..etc.
Qualitative description
Environmental
Damages
e.g. mangroves Willingness to Pay (WTP)
Where:
HLH1, HLH2, HLH3 and HLH4 = Total monetary value
S = annual salary Med = total medical fee
i = discount rate Com = compensation for lost limbs/body parts
Fur = funeral cost Trans = transportation costs
N = target retirement age (death) or total injury time (injured, sick and disabled)
3. Results and Discussion 3.1.1 Pre-survey scenario at field (The PDNA Protocol)
The Philippines is one of the most vulnerable countries in the world when it comes to climate
change related disaster (UNU-EHS, 2012). Given this challenging state of the Philippines, the
government has established a system of coordination and systematic response to present and
future disasters. This is one of the functions of the government under the National Disaster
Final Report: CAF2015-RR08-NMY-Chiba 86
and Risk Reduction Management Council (NDRRMC). This is under the Office of the President
chaired by the Secretary of National Defense.
At the regional and provincial level, systematic response to disaster is coordinated by the
Office of Civil Defense (OCD) thru a standardized procedure known as the Post Disaster
Needs Assessment (PDNA). The PDNA is a newly crafted manual of operation of the
government for an effective response to disaster particularly loss and damage assessment.
Even before the PDNA was crafted by the OCD, each government department unit have their
own procedures in responding and assessing needs after every disaster and calamities. The
harmonized and final version of the PDNA from OCD is yet to be released for coordinated
implementation, so that during the conduct of this study and in the absence of the harmonized
version of the PDNA from OCD, these are the individual post disaster loss and damage
assessment from various departments of the government;
Department of Agriculture (DA), Department of Science and Technology (DOST) and
Department of Environment and Natural Resources (DENR) – disaster loss and damage
assessment is based on a derived estimation of the value of services or productivity. But actual
quantification is based on the intuitive judgement of the focal person in the department doing
the loss and damage assessment. In the case of DENR, assessment for environmental loss
and damages has yet to include in its procedure the value of ecosystems services into its
estimation of loss and damage assessment.
Department of Public Works and Highways (DPWH) - base their assessment on disaster
loss and damage from replacement cost of facilities and infrastructures.
Department of Health (DOH) and Department of Social Services and Development
(DSWD) – Needs assessment is done thru physical count of those who are dead, sick and
injured. In the case of injured/sick, DOH will use these to estimate the value of medicines
needed to handle the hospitalization and treatment. The number of deaths and those with
disaster-related illnesses, these are needed by the DSWD in order to come up with relief
goods needed to cope with the effect of disaster.
The National Economic and Development Authority (NEDA) – makes the integrated
assessment of loss and damage across all sectors of government after receiving all individual
submission of loss and damage assessment report from various agencies of the government.
In all these methods and approaches used by the regional and local government in responding
to disasters, the fact remains that in the absence of the final version duly ratified and
harmonized PDNA from OCD, disaster needs assessment (loss and damages) are done
individually and still relying on the wisdom and power of visual and/or physical observation of
the focal person in each department unit. Also damage and loss assessment across all units
of government are essentially focusing more on ELD and relatively muted in as far as
systematically accounting for NELDs
Final Report: CAF2015-RR08-NMY-Chiba 87
3.1.2 AHP Prioritization of Risk Reduction Practices
3.1.2.1 Regional and/or national expert opinion
Figure 5 shows the results of important NELD-related criteria, indicators and risk reduction
practices identified through AHP-guided focus group consultation/discussion (FGD) with
national/regional experts from various agencies of government. The results showed that, from
among the four NELD-reducing practices identified by the experts at the national/regional level,
the top 3 were; (P1 = 0.54) disaster preparedness and capacity building, (P2 = 0.12) planting
of live storm surge barriers and (P4=0.12) foreshore diking and typhoon proofing
infrastructures. This prioritization of practices stems from the commonly acknowledge
deficiency in disaster preparedness; that is inability of the people to fully comprehend what is
meant by “storm surge”? Many of those who died during the disaster, were actually both those
who evacuated and those that did not. For those who did not evacuate, the consequence is
obvious! But for those who evacuated, same fate happened because they evacuated to a
wrong/deficient facility! Due to the extreme nature of a disaster event, everybody was ill-
prepared for such a calamity. Hence, both the information dissemination of the evacuation
service providers and the evacuees were deficient and considered not enough. This explains
the reason why disaster preparedness and capacity building was high in their priority of NELD-
reducing practices.
Following closely in terms priority practice to reduce NELD across affected areas in the study
sites is the planting of live storm surge barriers (P2). This actually involved the
planting/establishment of live storm surge barrier such as mangrove in coastal areas. When
asked about the reason, during the survey, why they put higher priority on live storm surge
barrier, respondents said that mangrove forest stand along the coastline, is perceived as
barrier that slows down the velocity of tidal surge as it enters the populated coastline and is
relatively cheaper to put up. The foreshore dyking solution which is third in the order of priority
practice because of the cost involved. As an engineering solution it is effective albiet,
prohibitively expensive, hence, it is given relatively lower priority among experts and
stakeholders.
High in the list of priority criteria for selecting the best NELD-reducing practice was actually
sustainability to the needs of affected communities (C2 = 0.70), followed by years of useful life
(C3 = 0.14). In terms of indicators of effectiveness of a NELD-reducing practice given the
prioritized criteria, the most important indicator prioritized by the experts and stakeholders,
number of people effectively warned (I5 = 0.48), number of disaster –related illnesses (I5 =
0.20) and number of deaths (I3 = 0.12). These prioritization of criteria and indicators of
effectiveness of a NELD-reducing practice, conceptually corroborates the selected priority
practice to reduce NELD among experts and stakeholders. Given a consistency ratio (CR)
ranging from 0.05 to 0.07 across decision elements, it can be deduced that experts’ decision
to select the best NELD-reducing practice is reliably based on scientific logic and informed
choice.
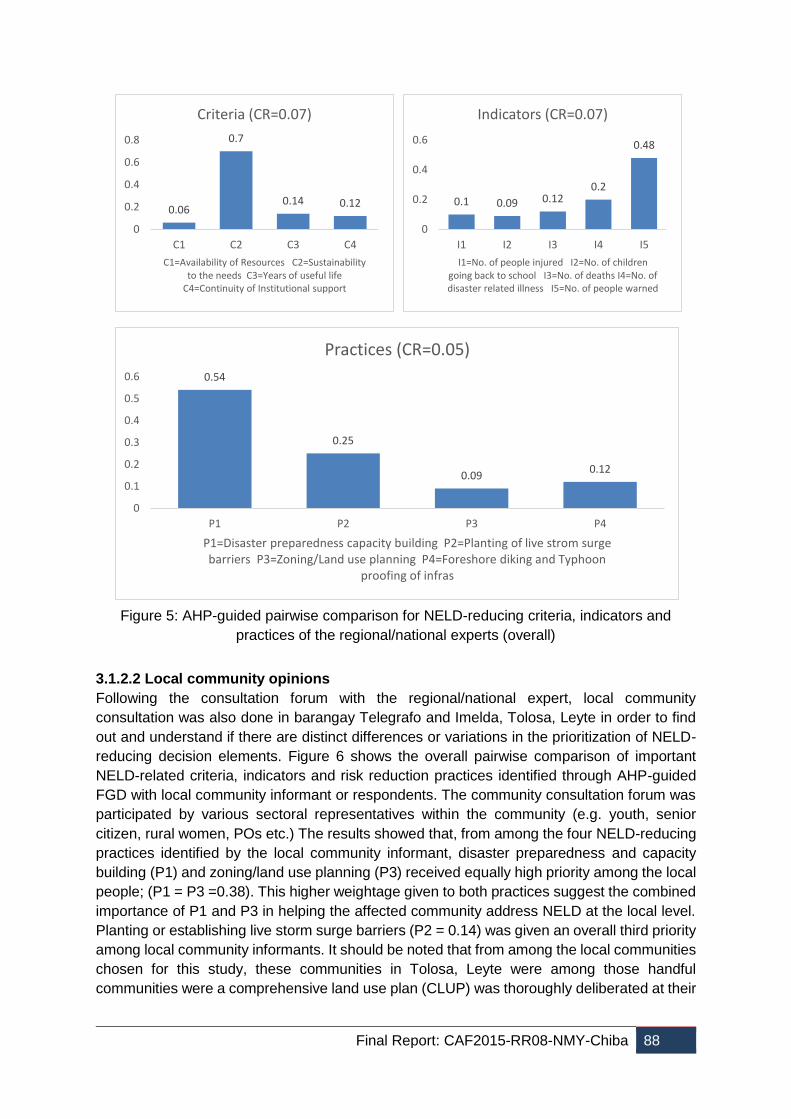
Final Report: CAF2015-RR08-NMY-Chiba 88
3.1.2.2 Local community opinions
Following the consultation forum with the regional/national expert, local community
consultation was also done in barangay Telegrafo and Imelda, Tolosa, Leyte in order to find
out and understand if there are distinct differences or variations in the prioritization of NELD-
reducing decision elements. Figure 6 shows the overall pairwise comparison of important
NELD-related criteria, indicators and risk reduction practices identified through AHP-guided
FGD with local community informant or respondents. The community consultation forum was
participated by various sectoral representatives within the community (e.g. youth, senior
citizen, rural women, POs etc.) The results showed that, from among the four NELD-reducing
practices identified by the local community informant, disaster preparedness and capacity
building (P1) and zoning/land use planning (P3) received equally high priority among the local
people; (P1 = P3 =0.38). This higher weightage given to both practices suggest the combined
importance of P1 and P3 in helping the affected community address NELD at the local level.
Planting or establishing live storm surge barriers (P2 = 0.14) was given an overall third priority
among local community informants. It should be noted that from among the local communities
chosen for this study, these communities in Tolosa, Leyte were among those handful
communities were a comprehensive land use plan (CLUP) was thoroughly deliberated at their
0.06
0.7
0.14 0.12
0
0.2
0.4
0.6
0.8
C1 C2 C3 C4
C1=Availability of Resources C2=Sustainability to the needs C3=Years of useful life
C4=Continuity of Institutional support
Criteria (CR=0.07)
0.54
0.25
0.090.12
0
0.1
0.2
0.3
0.4
0.5
0.6
P1 P2 P3 P4
P1=Disaster preparedness capacity building P2=Planting of live strom surge barriers P3=Zoning/Land use planning P4=Foreshore diking and Typhoon
proofing of infras
Practices (CR=0.05)
0.1 0.09 0.120.2
0.48
0
0.2
0.4
0.6
I1 I2 I3 I4 I5
I1=No. of people injured I2=No. of children going back to school I3=No. of deaths I4=No. of disaster related illness I5=No. of people warned
Indicators (CR=0.07)
Figure 5: AHP-guided pairwise comparison for NELD-reducing criteria, indicators and
practices of the regional/national experts (overall)
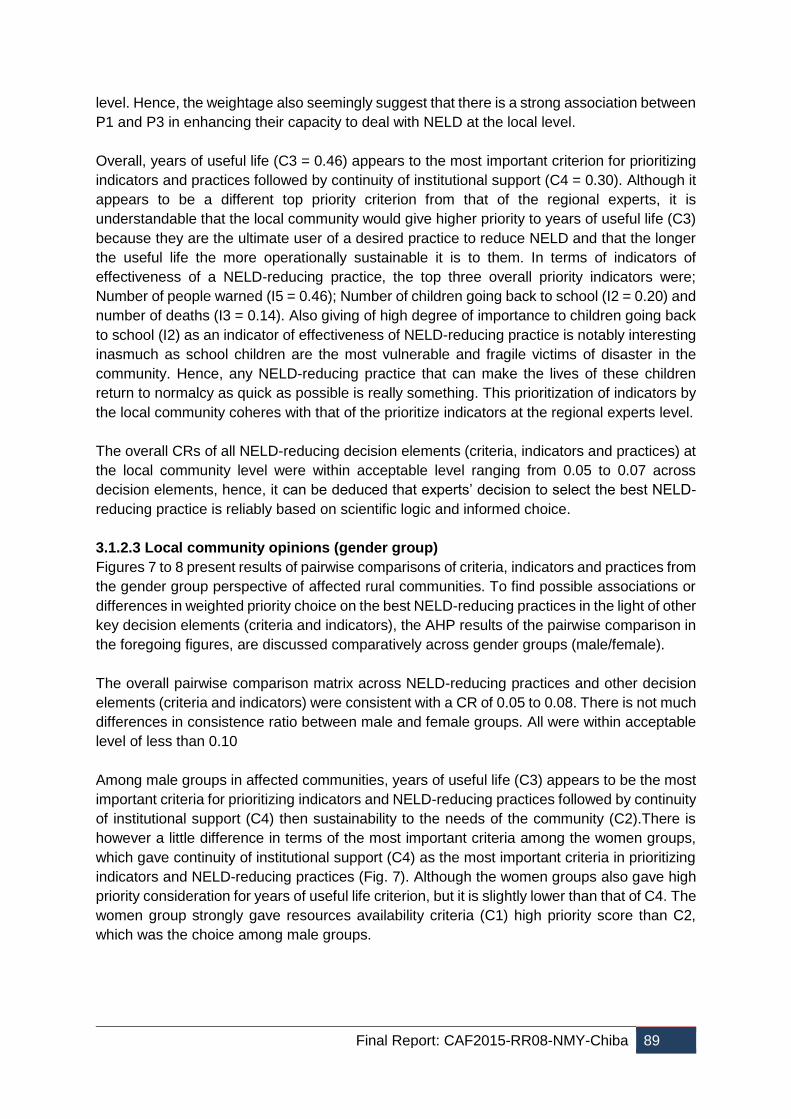
Final Report: CAF2015-RR08-NMY-Chiba 89
level. Hence, the weightage also seemingly suggest that there is a strong association between
P1 and P3 in enhancing their capacity to deal with NELD at the local level.
Overall, years of useful life (C3 = 0.46) appears to the most important criterion for prioritizing
indicators and practices followed by continuity of institutional support (C4 = 0.30). Although it
appears to be a different top priority criterion from that of the regional experts, it is
understandable that the local community would give higher priority to years of useful life (C3)
because they are the ultimate user of a desired practice to reduce NELD and that the longer
the useful life the more operationally sustainable it is to them. In terms of indicators of
effectiveness of a NELD-reducing practice, the top three overall priority indicators were;
Number of people warned (I5 = 0.46); Number of children going back to school (I2 = 0.20) and
number of deaths (I3 = 0.14). Also giving of high degree of importance to children going back
to school (I2) as an indicator of effectiveness of NELD-reducing practice is notably interesting
inasmuch as school children are the most vulnerable and fragile victims of disaster in the
community. Hence, any NELD-reducing practice that can make the lives of these children
return to normalcy as quick as possible is really something. This prioritization of indicators by
the local community coheres with that of the prioritize indicators at the regional experts level.
The overall CRs of all NELD-reducing decision elements (criteria, indicators and practices) at
the local community level were within acceptable level ranging from 0.05 to 0.07 across
decision elements, hence, it can be deduced that experts’ decision to select the best NELD-
reducing practice is reliably based on scientific logic and informed choice.
3.1.2.3 Local community opinions (gender group)
Figures 7 to 8 present results of pairwise comparisons of criteria, indicators and practices from
the gender group perspective of affected rural communities. To find possible associations or
differences in weighted priority choice on the best NELD-reducing practices in the light of other
key decision elements (criteria and indicators), the AHP results of the pairwise comparison in
the foregoing figures, are discussed comparatively across gender groups (male/female).
The overall pairwise comparison matrix across NELD-reducing practices and other decision
elements (criteria and indicators) were consistent with a CR of 0.05 to 0.08. There is not much
differences in consistence ratio between male and female groups. All were within acceptable
level of less than 0.10
Among male groups in affected communities, years of useful life (C3) appears to be the most
important criteria for prioritizing indicators and NELD-reducing practices followed by continuity
of institutional support (C4) then sustainability to the needs of the community (C2).There is
however a little difference in terms of the most important criteria among the women groups,
which gave continuity of institutional support (C4) as the most important criteria in prioritizing
indicators and NELD-reducing practices (Fig. 7). Although the women groups also gave high
priority consideration for years of useful life criterion, but it is slightly lower than that of C4. The
women group strongly gave resources availability criteria (C1) high priority score than C2,
which was the choice among male groups.
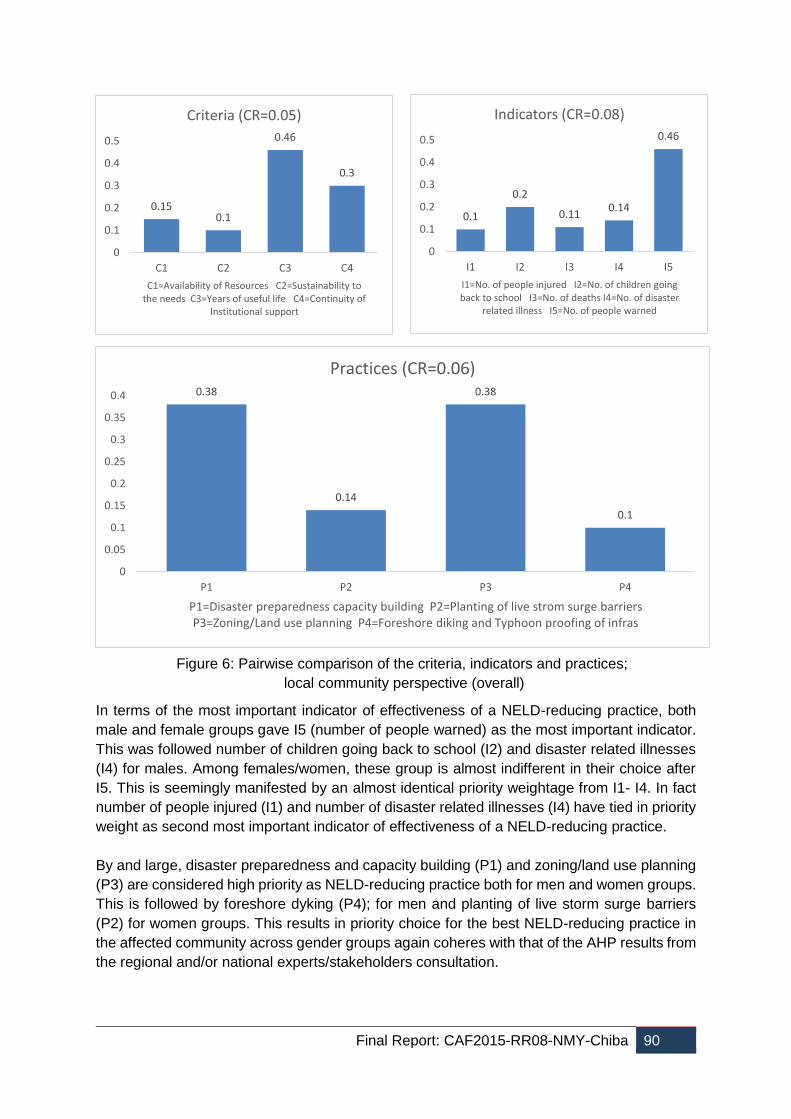
Final Report: CAF2015-RR08-NMY-Chiba 90
In terms of the most important indicator of effectiveness of a NELD-reducing practice, both
male and female groups gave I5 (number of people warned) as the most important indicator.
This was followed number of children going back to school (I2) and disaster related illnesses
(I4) for males. Among females/women, these group is almost indifferent in their choice after
I5. This is seemingly manifested by an almost identical priority weightage from I1- I4. In fact
number of people injured (I1) and number of disaster related illnesses (I4) have tied in priority
weight as second most important indicator of effectiveness of a NELD-reducing practice.
By and large, disaster preparedness and capacity building (P1) and zoning/land use planning
(P3) are considered high priority as NELD-reducing practice both for men and women groups.
This is followed by foreshore dyking (P4); for men and planting of live storm surge barriers
(P2) for women groups. This results in priority choice for the best NELD-reducing practice in
the affected community across gender groups again coheres with that of the AHP results from
the regional and/or national experts/stakeholders consultation.
Figure 6: Pairwise comparison of the criteria, indicators and practices;
local community perspective (overall)
0.150.1
0.46
0.3
0
0.1
0.2
0.3
0.4
0.5
C1 C2 C3 C4
C1=Availability of Resources C2=Sustainability to the needs C3=Years of useful life C4=Continuity of
Institutional support
Criteria (CR=0.05)
0.38
0.14
0.38
0.1
0
0.05
0.1
0.15
0.2
0.25
0.3
0.35
0.4
P1 P2 P3 P4
P1=Disaster preparedness capacity building P2=Planting of live strom surge barriers P3=Zoning/Land use planning P4=Foreshore diking and Typhoon proofing of infras
Practices (CR=0.06)
0.1
0.2
0.110.14
0.46
0
0.1
0.2
0.3
0.4
0.5
I1 I2 I3 I4 I5
I1=No. of people injured I2=No. of children going back to school I3=No. of deaths I4=No. of disaster
related illness I5=No. of people warned
Indicators (CR=0.08)
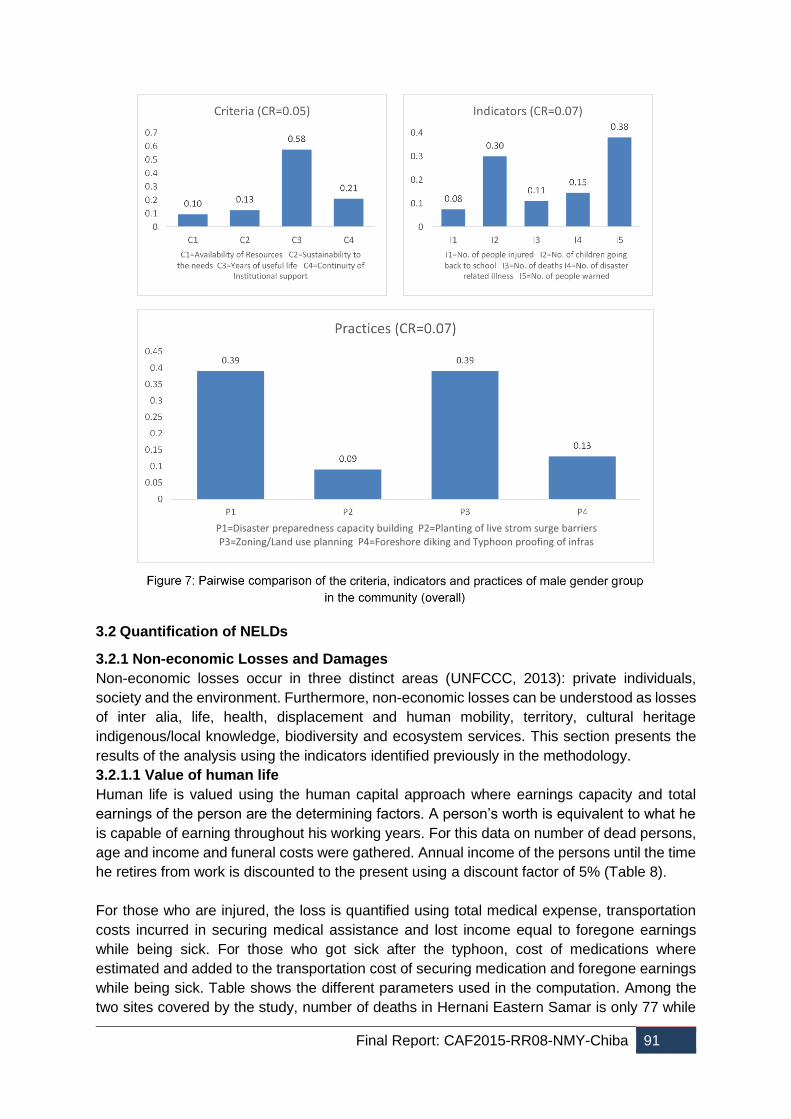
Final Report: CAF2015-RR08-NMY-Chiba 91
3.2 Quantification of NELDs
3.2.1 Non-economic Losses and Damages
Non-economic losses occur in three distinct areas (UNFCCC, 2013): private individuals,
society and the environment. Furthermore, non-economic losses can be understood as losses
of inter alia, life, health, displacement and human mobility, territory, cultural heritage
indigenous/local knowledge, biodiversity and ecosystem services. This section presents the
results of the analysis using the indicators identified previously in the methodology.
3.2.1.1 Value of human life
Human life is valued using the human capital approach where earnings capacity and total
earnings of the person are the determining factors. A person’s worth is equivalent to what he
is capable of earning throughout his working years. For this data on number of dead persons,
age and income and funeral costs were gathered. Annual income of the persons until the time
he retires from work is discounted to the present using a discount factor of 5% (Table 8).
For those who are injured, the loss is quantified using total medical expense, transportation
costs incurred in securing medical assistance and lost income equal to foregone earnings
while being sick. For those who got sick after the typhoon, cost of medications where
estimated and added to the transportation cost of securing medication and foregone earnings
while being sick. Table shows the different parameters used in the computation. Among the
two sites covered by the study, number of deaths in Hernani Eastern Samar is only 77 while
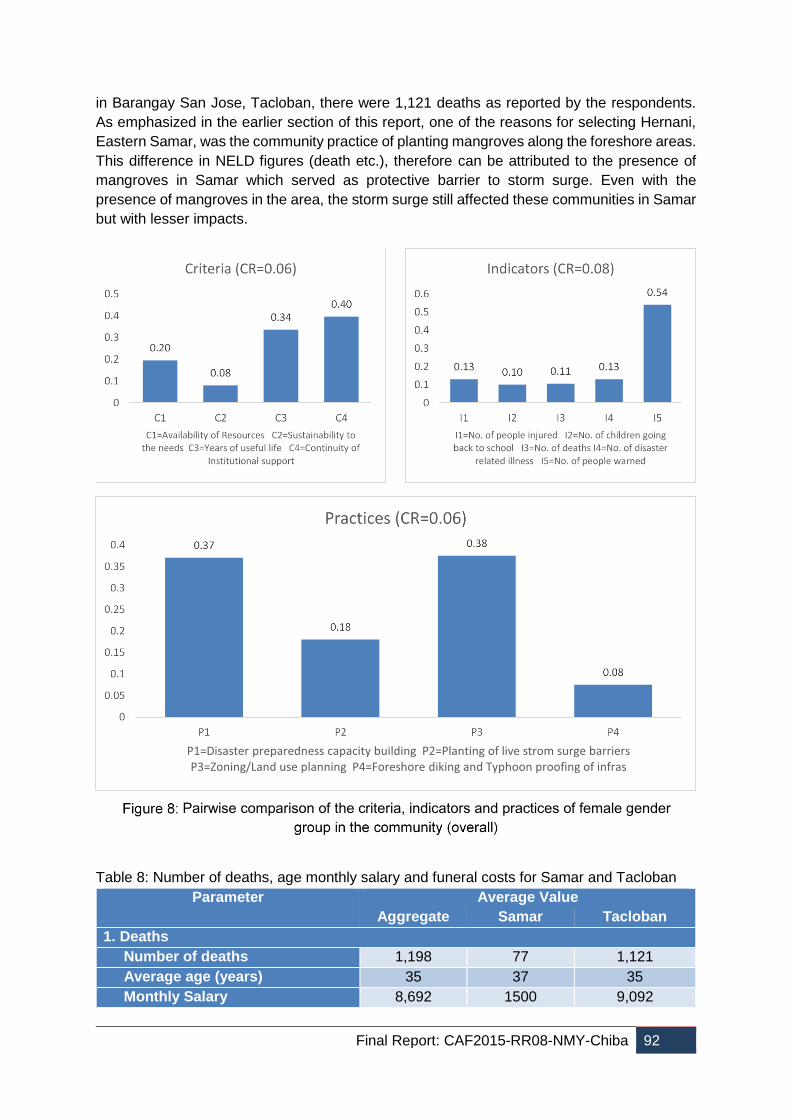
Final Report: CAF2015-RR08-NMY-Chiba 92
in Barangay San Jose, Tacloban, there were 1,121 deaths as reported by the respondents.
As emphasized in the earlier section of this report, one of the reasons for selecting Hernani,
Eastern Samar, was the community practice of planting mangroves along the foreshore areas.
This difference in NELD figures (death etc.), therefore can be attributed to the presence of
mangroves in Samar which served as protective barrier to storm surge. Even with the
presence of mangroves in the area, the storm surge still affected these communities in Samar
but with lesser impacts.
Table 8: Number of deaths, age monthly salary and funeral costs for Samar and Tacloban
Parameter Average Value
Aggregate Samar Tacloban
1. Deaths
Number of deaths 1,198 77 1,121
Average age (years) 35 37 35
Monthly Salary 8,692 1500 9,092
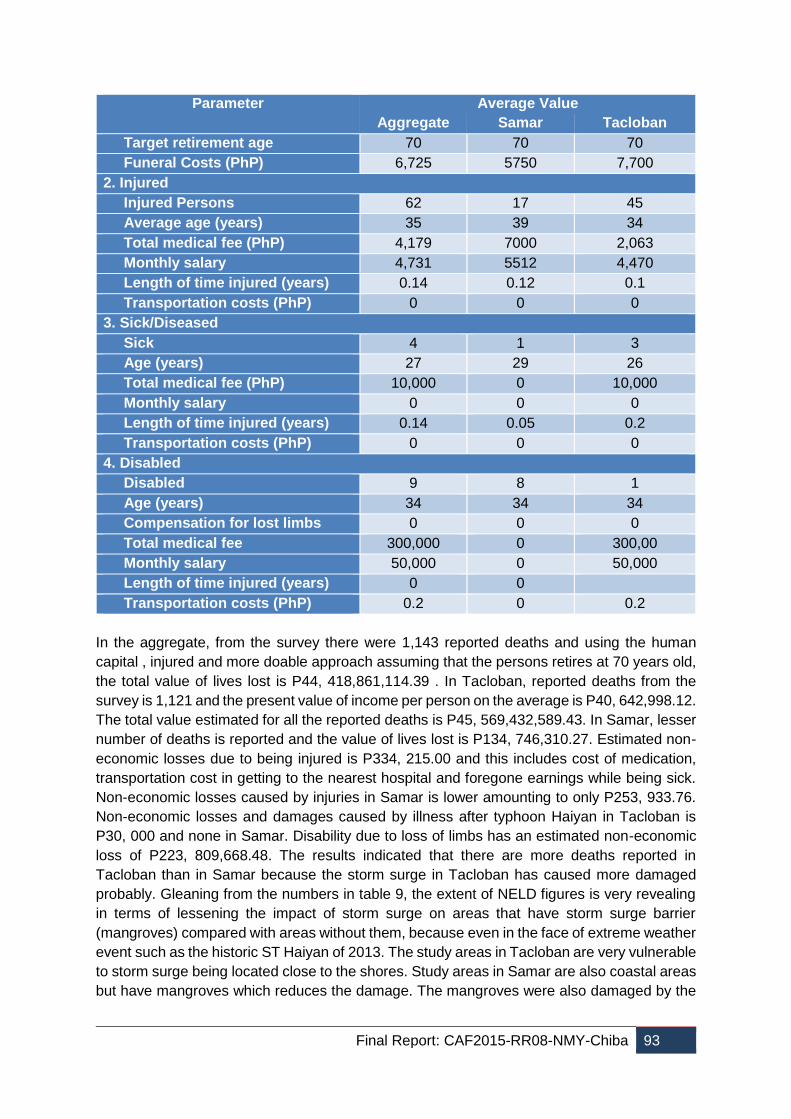
Final Report: CAF2015-RR08-NMY-Chiba 93
Parameter Average Value
Aggregate Samar Tacloban
Target retirement age 70 70 70
Funeral Costs (PhP) 6,725 5750 7,700
2. Injured
Injured Persons 62 17 45
Average age (years) 35 39 34
Total medical fee (PhP) 4,179 7000 2,063
Monthly salary 4,731 5512 4,470
Length of time injured (years) 0.14 0.12 0.1
Transportation costs (PhP) 0 0 0
3. Sick/Diseased
Sick 4 1 3
Age (years) 27 29 26
Total medical fee (PhP) 10,000 0 10,000
Monthly salary 0 0 0
Length of time injured (years) 0.14 0.05 0.2
Transportation costs (PhP) 0 0 0
4. Disabled
Disabled 9 8 1
Age (years) 34 34 34
Compensation for lost limbs 0 0 0
Total medical fee 300,000 0 300,00
Monthly salary 50,000 0 50,000
Length of time injured (years) 0 0
Transportation costs (PhP) 0.2 0 0.2
In the aggregate, from the survey there were 1,143 reported deaths and using the human
capital , injured and more doable approach assuming that the persons retires at 70 years old,
the total value of lives lost is P44, 418,861,114.39 . In Tacloban, reported deaths from the
survey is 1,121 and the present value of income per person on the average is P40, 642,998.12.
The total value estimated for all the reported deaths is P45, 569,432,589.43. In Samar, lesser
number of deaths is reported and the value of lives lost is P134, 746,310.27. Estimated non-
economic losses due to being injured is P334, 215.00 and this includes cost of medication,
transportation cost in getting to the nearest hospital and foregone earnings while being sick.
Non-economic losses caused by injuries in Samar is lower amounting to only P253, 933.76.
Non-economic losses and damages caused by illness after typhoon Haiyan in Tacloban is
P30, 000 and none in Samar. Disability due to loss of limbs has an estimated non-economic
loss of P223, 809,668.48. The results indicated that there are more deaths reported in
Tacloban than in Samar because the storm surge in Tacloban has caused more damaged
probably. Gleaning from the numbers in table 9, the extent of NELD figures is very revealing
in terms of lessening the impact of storm surge on areas that have storm surge barrier
(mangroves) compared with areas without them, because even in the face of extreme weather
event such as the historic ST Haiyan of 2013. The study areas in Tacloban are very vulnerable
to storm surge being located close to the shores. Study areas in Samar are also coastal areas
but have mangroves which reduces the damage. The mangroves were also damaged by the
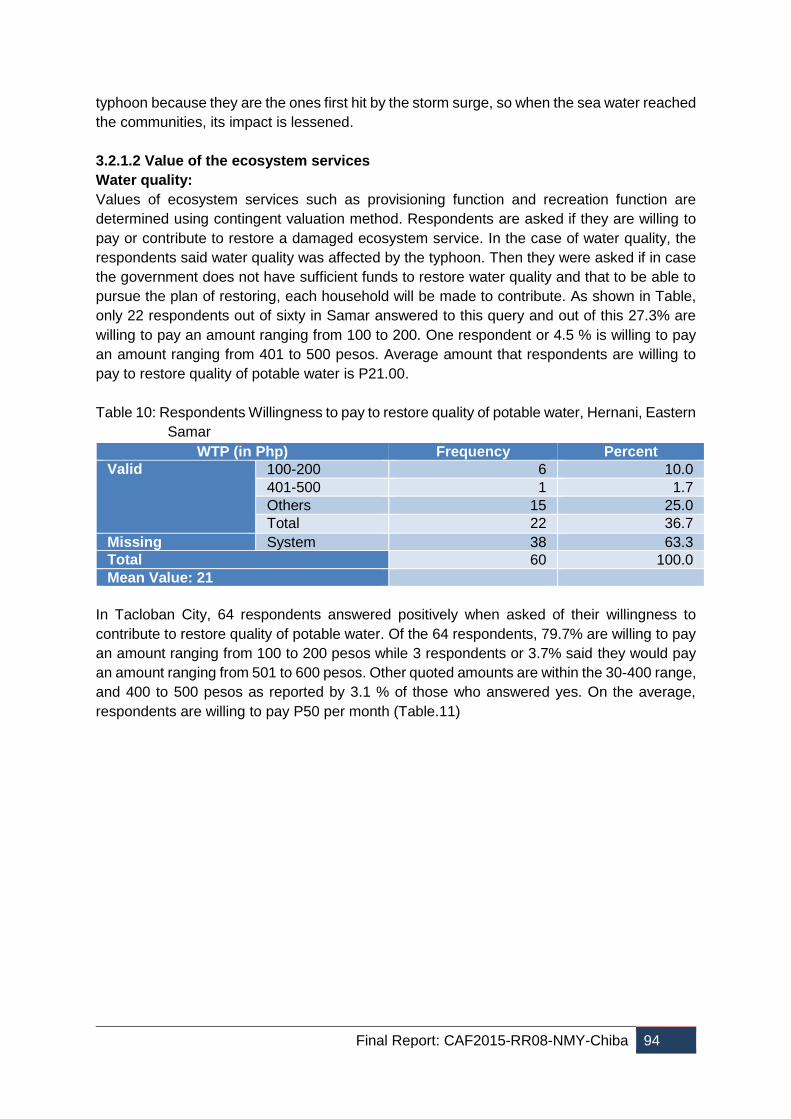
Final Report: CAF2015-RR08-NMY-Chiba 94
typhoon because they are the ones first hit by the storm surge, so when the sea water reached
the communities, its impact is lessened.
3.2.1.2 Value of the ecosystem services
Water quality:
Values of ecosystem services such as provisioning function and recreation function are
determined using contingent valuation method. Respondents are asked if they are willing to
pay or contribute to restore a damaged ecosystem service. In the case of water quality, the
respondents said water quality was affected by the typhoon. Then they were asked if in case
the government does not have sufficient funds to restore water quality and that to be able to
pursue the plan of restoring, each household will be made to contribute. As shown in Table,
only 22 respondents out of sixty in Samar answered to this query and out of this 27.3% are
willing to pay an amount ranging from 100 to 200. One respondent or 4.5 % is willing to pay
an amount ranging from 401 to 500 pesos. Average amount that respondents are willing to
pay to restore quality of potable water is P21.00.
Table 10: Respondents Willingness to pay to restore quality of potable water, Hernani, Eastern
Samar
WTP (in Php) Frequency Percent
Valid 100-200 6 10.0
401-500 1 1.7
Others 15 25.0
Total 22 36.7
Missing System 38 63.3
Total 60 100.0
Mean Value: 21
In Tacloban City, 64 respondents answered positively when asked of their willingness to
contribute to restore quality of potable water. Of the 64 respondents, 79.7% are willing to pay
an amount ranging from 100 to 200 pesos while 3 respondents or 3.7% said they would pay
an amount ranging from 501 to 600 pesos. Other quoted amounts are within the 30-400 range,
and 400 to 500 pesos as reported by 3.1 % of those who answered yes. On the average,
respondents are willing to pay P50 per month (Table.11)
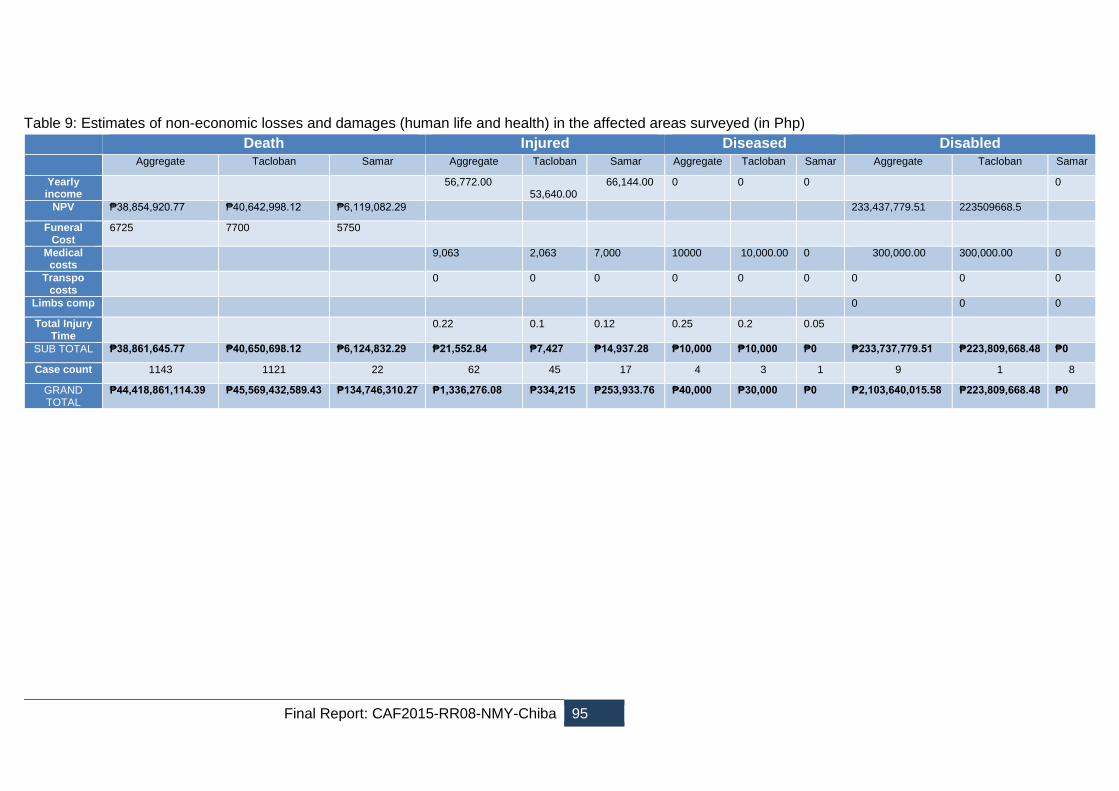
Final Report: CAF2015-RR08-NMY-Chiba 95
Table 9: Estimates of non-economic losses and damages (human life and health) in the affected areas surveyed (in Php) Death Injured Diseased Disabled
Aggregate Tacloban Samar Aggregate Tacloban Samar Aggregate Tacloban Samar Aggregate Tacloban Samar
Yearly income
56,772.00
53,640.00 66,144.00 0 0 0
0
NPV ₱38,854,920.77 ₱40,642,998.12 ₱6,119,082.29
233,437,779.51 223509668.5
Funeral Cost
6725 7700 5750
Medical costs
9,063 2,063 7,000 10000 10,000.00 0 300,000.00 300,000.00 0
Transpo costs
0 0 0 0 0 0 0 0 0
Limbs comp
0 0 0
Total Injury Time
0.22 0.1 0.12 0.25 0.2 0.05
SUB TOTAL ₱38,861,645.77 ₱40,650,698.12 ₱6,124,832.29 ₱21,552.84 ₱7,427 ₱14,937.28 ₱10,000 ₱10,000 ₱0 ₱233,737,779.51 ₱223,809,668.48 ₱0
Case count 1143 1121 22 62 45 17 4 3 1 9 1 8
GRAND TOTAL
₱44,418,861,114.39 ₱45,569,432,589.43 ₱134,746,310.27 ₱1,336,276.08 ₱334,215 ₱253,933.76 ₱40,000 ₱30,000 ₱0 ₱2,103,640,015.58 ₱223,809,668.48 ₱0
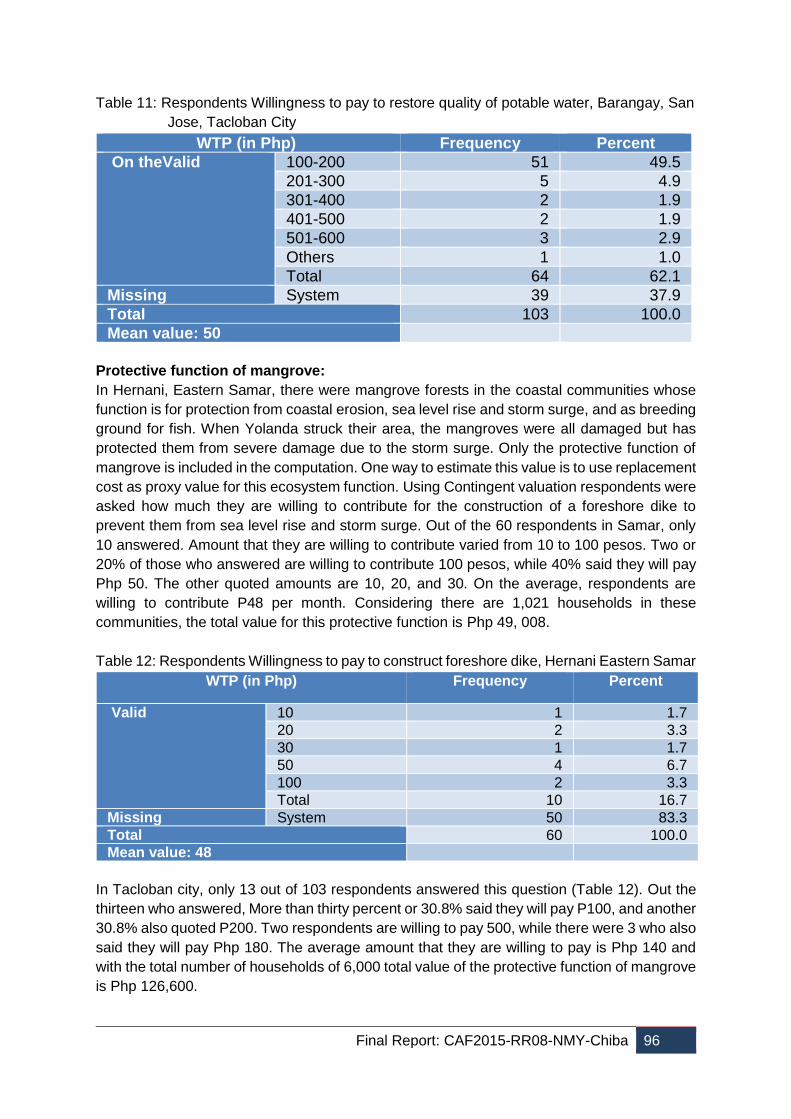
Final Report: CAF2015-RR08-NMY-Chiba 96
Table 11: Respondents Willingness to pay to restore quality of potable water, Barangay, San
Jose, Tacloban City
WTP (in Php) Frequency Percent
On theValid 100-200 51 49.5
201-300 5 4.9
301-400 2 1.9
401-500 2 1.9
501-600 3 2.9
Others 1 1.0
Total 64 62.1
Missing System 39 37.9
Total 103 100.0
Mean value: 50
Protective function of mangrove:
In Hernani, Eastern Samar, there were mangrove forests in the coastal communities whose
function is for protection from coastal erosion, sea level rise and storm surge, and as breeding
ground for fish. When Yolanda struck their area, the mangroves were all damaged but has
protected them from severe damage due to the storm surge. Only the protective function of
mangrove is included in the computation. One way to estimate this value is to use replacement
cost as proxy value for this ecosystem function. Using Contingent valuation respondents were
asked how much they are willing to contribute for the construction of a foreshore dike to
prevent them from sea level rise and storm surge. Out of the 60 respondents in Samar, only
10 answered. Amount that they are willing to contribute varied from 10 to 100 pesos. Two or
20% of those who answered are willing to contribute 100 pesos, while 40% said they will pay
Php 50. The other quoted amounts are 10, 20, and 30. On the average, respondents are
willing to contribute P48 per month. Considering there are 1,021 households in these
communities, the total value for this protective function is Php 49, 008.
Table 12: Respondents Willingness to pay to construct foreshore dike, Hernani Eastern Samar
WTP (in Php) Frequency Percent
Valid 10 1 1.7
20 2 3.3
30 1 1.7
50 4 6.7
100 2 3.3
Total 10 16.7
Missing System 50 83.3
Total 60 100.0
Mean value: 48
In Tacloban city, only 13 out of 103 respondents answered this question (Table 12). Out the
thirteen who answered, More than thirty percent or 30.8% said they will pay P100, and another
30.8% also quoted P200. Two respondents are willing to pay 500, while there were 3 who also
said they will pay Php 180. The average amount that they are willing to pay is Php 140 and
with the total number of households of 6,000 total value of the protective function of mangrove
is Php 126,600.
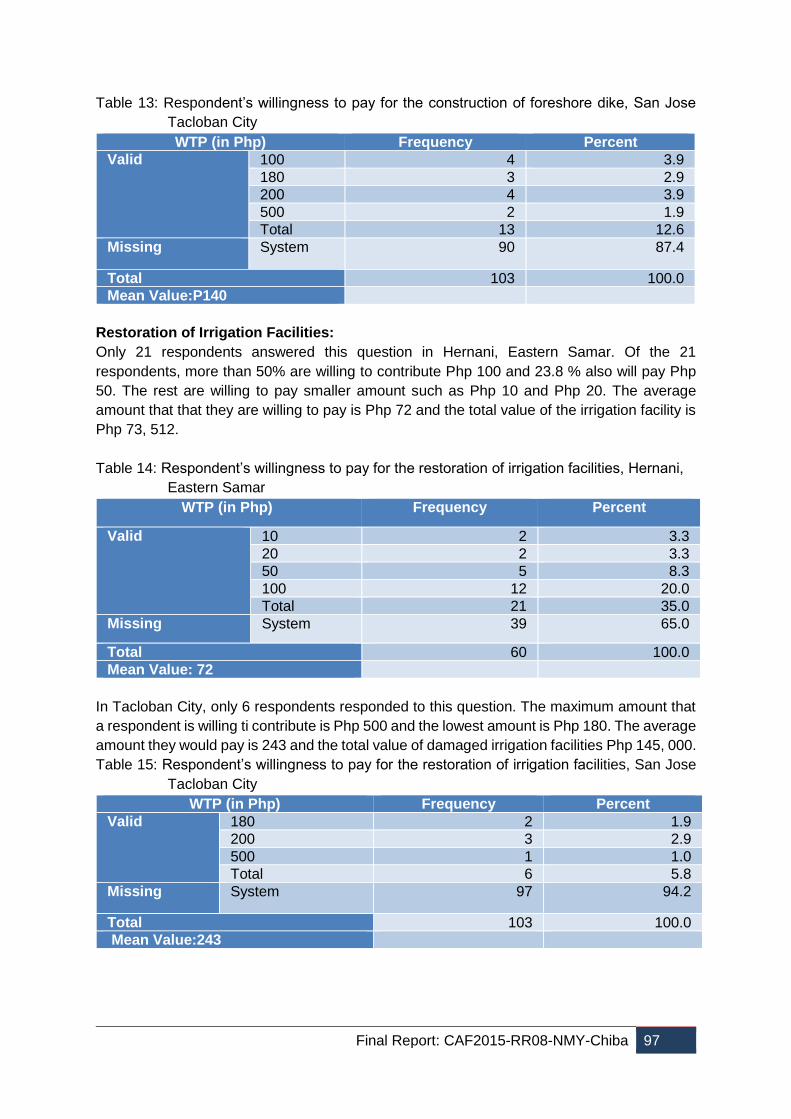
Final Report: CAF2015-RR08-NMY-Chiba 97
Table 13: Respondent’s willingness to pay for the construction of foreshore dike, San Jose
Tacloban City
WTP (in Php) Frequency Percent
Valid 100 4 3.9
180 3 2.9
200 4 3.9
500 2 1.9
Total 13 12.6
Missing System 90 87.4
Total 103 100.0
Mean Value:P140
Restoration of Irrigation Facilities:
Only 21 respondents answered this question in Hernani, Eastern Samar. Of the 21
respondents, more than 50% are willing to contribute Php 100 and 23.8 % also will pay Php
50. The rest are willing to pay smaller amount such as Php 10 and Php 20. The average
amount that that they are willing to pay is Php 72 and the total value of the irrigation facility is
Php 73, 512.
Table 14: Respondent’s willingness to pay for the restoration of irrigation facilities, Hernani,
Eastern Samar
WTP (in Php) Frequency Percent
Valid 10 2 3.3
20 2 3.3
50 5 8.3
100 12 20.0
Total 21 35.0
Missing System 39 65.0
Total 60 100.0
Mean Value: 72
In Tacloban City, only 6 respondents responded to this question. The maximum amount that
a respondent is willing ti contribute is Php 500 and the lowest amount is Php 180. The average
amount they would pay is 243 and the total value of damaged irrigation facilities Php 145, 000.
Table 15: Respondent’s willingness to pay for the restoration of irrigation facilities, San Jose
Tacloban City
WTP (in Php) Frequency Percent
Valid 180 2 1.9
200 3 2.9
500 1 1.0
Total 6 5.8
Missing System 97 94.2
Total 103 100.0
Mean Value:243
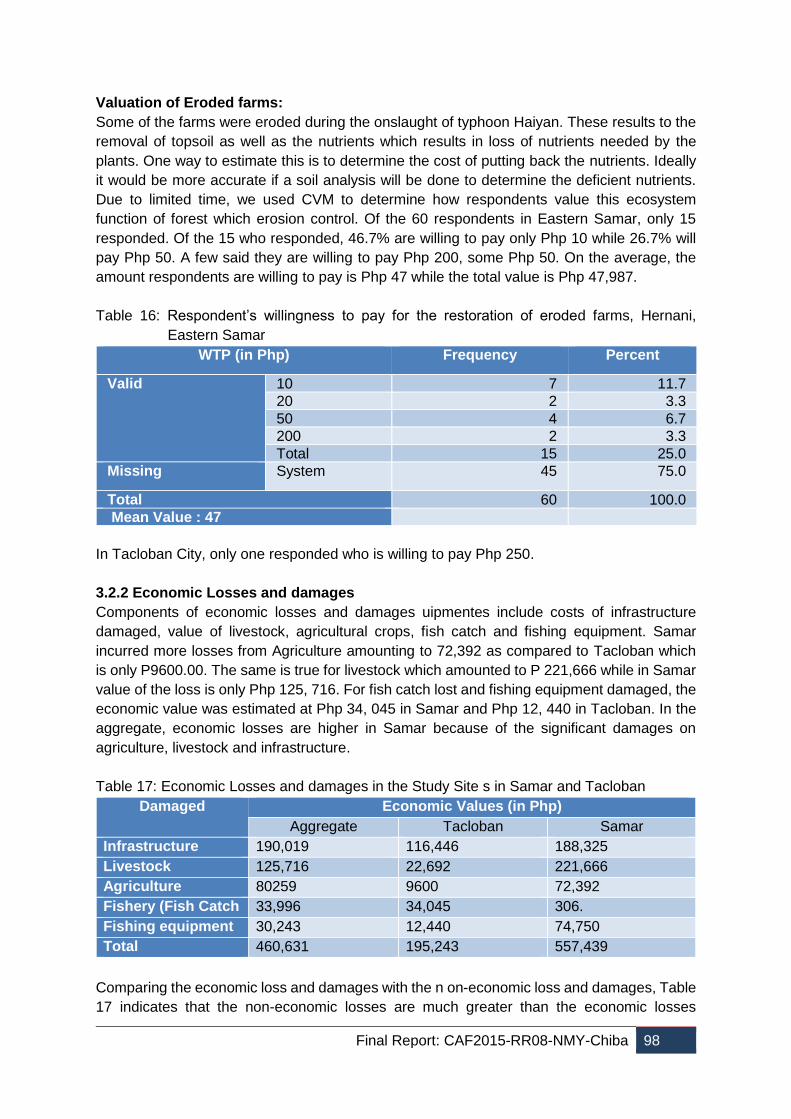
Final Report: CAF2015-RR08-NMY-Chiba 98
Valuation of Eroded farms:
Some of the farms were eroded during the onslaught of typhoon Haiyan. These results to the
removal of topsoil as well as the nutrients which results in loss of nutrients needed by the
plants. One way to estimate this is to determine the cost of putting back the nutrients. Ideally
it would be more accurate if a soil analysis will be done to determine the deficient nutrients.
Due to limited time, we used CVM to determine how respondents value this ecosystem
function of forest which erosion control. Of the 60 respondents in Eastern Samar, only 15
responded. Of the 15 who responded, 46.7% are willing to pay only Php 10 while 26.7% will
pay Php 50. A few said they are willing to pay Php 200, some Php 50. On the average, the
amount respondents are willing to pay is Php 47 while the total value is Php 47,987.
Table 16: Respondent’s willingness to pay for the restoration of eroded farms, Hernani,
Eastern Samar
WTP (in Php) Frequency Percent
Valid 10 7 11.7
20 2 3.3
50 4 6.7
200 2 3.3
Total 15 25.0
Missing System 45 75.0
Total 60 100.0
Mean Value : 47
In Tacloban City, only one responded who is willing to pay Php 250.
3.2.2 Economic Losses and damages
Components of economic losses and damages uipmentes include costs of infrastructure
damaged, value of livestock, agricultural crops, fish catch and fishing equipment. Samar
incurred more losses from Agriculture amounting to 72,392 as compared to Tacloban which
is only P9600.00. The same is true for livestock which amounted to P 221,666 while in Samar
value of the loss is only Php 125, 716. For fish catch lost and fishing equipment damaged, the
economic value was estimated at Php 34, 045 in Samar and Php 12, 440 in Tacloban. In the
aggregate, economic losses are higher in Samar because of the significant damages on
agriculture, livestock and infrastructure.
Table 17: Economic Losses and damages in the Study Site s in Samar and Tacloban
Damaged Economic Values (in Php)
Aggregate Tacloban Samar
Infrastructure 190,019 116,446 188,325
Livestock 125,716 22,692 221,666
Agriculture 80259 9600 72,392
Fishery (Fish Catch 33,996 34,045 306.
Fishing equipment 30,243 12,440 74,750
Total 460,631 195,243 557,439
Comparing the economic loss and damages with the n on-economic loss and damages, Table
17 indicates that the non-economic losses are much greater than the economic losses
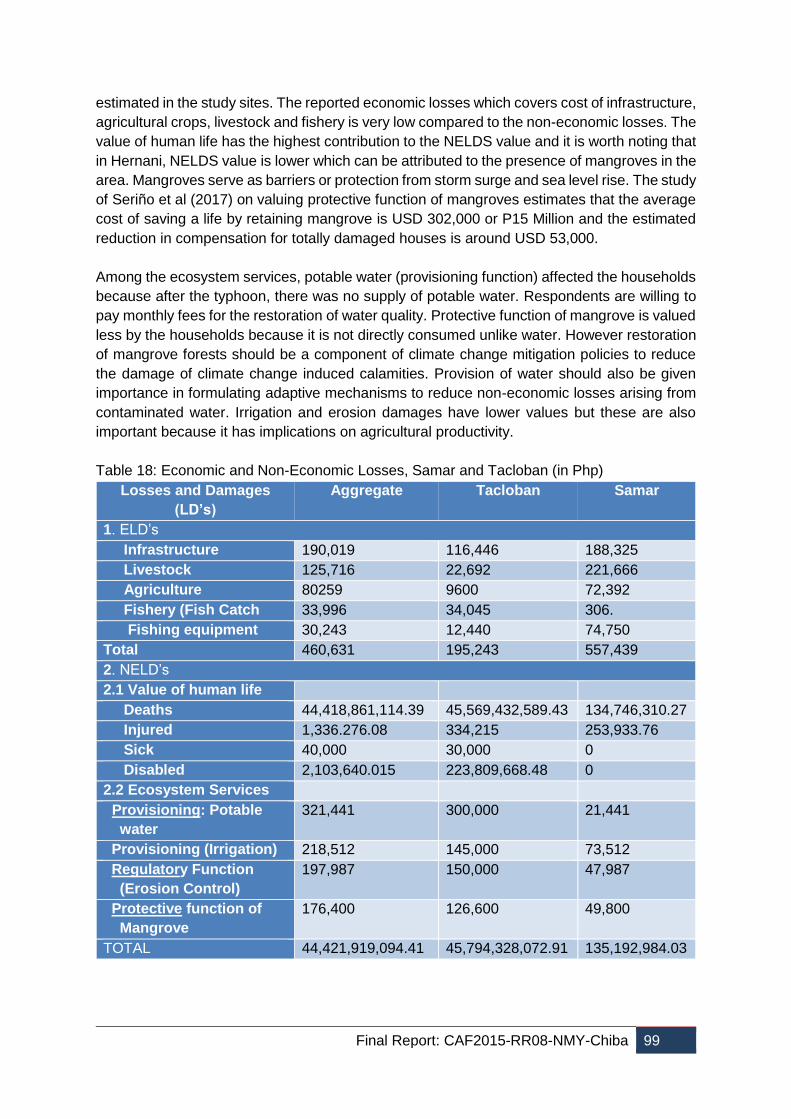
Final Report: CAF2015-RR08-NMY-Chiba 99
estimated in the study sites. The reported economic losses which covers cost of infrastructure,
agricultural crops, livestock and fishery is very low compared to the non-economic losses. The
value of human life has the highest contribution to the NELDS value and it is worth noting that
in Hernani, NELDS value is lower which can be attributed to the presence of mangroves in the
area. Mangroves serve as barriers or protection from storm surge and sea level rise. The study
of Seriño et al (2017) on valuing protective function of mangroves estimates that the average
cost of saving a life by retaining mangrove is USD 302,000 or P15 Million and the estimated
reduction in compensation for totally damaged houses is around USD 53,000.
Among the ecosystem services, potable water (provisioning function) affected the households
because after the typhoon, there was no supply of potable water. Respondents are willing to
pay monthly fees for the restoration of water quality. Protective function of mangrove is valued
less by the households because it is not directly consumed unlike water. However restoration
of mangrove forests should be a component of climate change mitigation policies to reduce
the damage of climate change induced calamities. Provision of water should also be given
importance in formulating adaptive mechanisms to reduce non-economic losses arising from
contaminated water. Irrigation and erosion damages have lower values but these are also
important because it has implications on agricultural productivity.
Table 18: Economic and Non-Economic Losses, Samar and Tacloban (in Php)
Losses and Damages
(LD’s)
Aggregate Tacloban Samar
1. ELD’s
Infrastructure 190,019 116,446 188,325
Livestock 125,716 22,692 221,666
Agriculture 80259 9600 72,392
Fishery (Fish Catch 33,996 34,045 306.
Fishing equipment 30,243 12,440 74,750
Total 460,631 195,243 557,439
2. NELD’s
2.1 Value of human life
Deaths 44,418,861,114.39 45,569,432,589.43 134,746,310.27
Injured 1,336.276.08 334,215 253,933.76
Sick 40,000 30,000 0
Disabled 2,103,640.015 223,809,668.48 0
2.2 Ecosystem Services
Provisioning: Potable
water
321,441 300,000 21,441
Provisioning (Irrigation) 218,512 145,000 73,512
Regulatory Function
(Erosion Control)
197,987 150,000 47,987
Protective function of
Mangrove
176,400 126,600 49,800
TOTAL 44,421,919,094.41 45,794,328,072.91 135,192,984.03
Final Report: CAF2015-RR08-NMY-Chiba 100
4. Conclusions The storm surge disaster in Tacloban City Philippines, brought about by ST Yolanda (Haiyan)
of 2013 reminded the Philippines of how vulnerable it will be to extreme weather events and
other climate-related calamities. This study was undertaken to develop an assessment
framework in identifying and measuring non-economic loss and damages (NELD) associated
with climatic disasters.
The shear inadequacy of literatures and standard methodologies in identifying, let alone,
assessing and measuring the extent and value of NELD in every post disaster analysis, has
compounded the analytical challenge of this research. From a survey data of 250 respondents,
an Analytical Hierarchy Process (AHP) – guided instrument was used first; to identify the
various types of NELD observed/experienced during the onslaught of ST Yolanda and
prioritize the practices/strategies in reducing if not mitigating NELDs in the affected areas.
Then, the study attempted to quantify NELD using standard valuation tools and how it can be
used to sharpen the assessment of damage both economic and non-economic in nature.
Results of the individual household survey revealed that there are five sources of NELD
identified in this study; these are; human life & health, water quality sanitation; agriculture and
natural resources; social-cultural impacts, environmental damage. Pre-survey information
from various government agencies (DA, DOST, DENR, DOH, DSWD, DPWH and OCD)
revealed that inclusion of all these NELD items into their post disaster needs assessment were
only limited to physical counts. Although the Department of Environment has considered the
application of standard valuation techniques for environmental damage from disaster, but this
has not been formally embedded into the official PDNA operations manual, which is yet to be
harmonized by OCD. Up until this report, each government department use its own individual
L&D assessment method, which essentially captures only the economic L&D.
An AHP-guided NELD consultation forum with national/regional experts and key informant (KI)
participants from affected communities in the study sites expressed agreements on the
necessity to improve in the way NELD is factored into the official post disaster assessment.
Pairwise comparison of NELD-reducing practices from regional experts and KIs from affected
communities showed coherence in terms of giving high priority to disaster
preparedness/capacity building and planting/establishment of live storm surge barrier. The
second most important NELD-reducing practice identified during the two separate consultation
forums were foreshore concrete diking from among the regional experts and zoning and LU
planning from the affected community informants. The priority weightage from regional experts
was more of an engineering solution while that of the community KIs was expressing more on
the importance of social preparedness for disaster management, which incidentally the
affected communities in these particular study sites have been doing.
Finer examination on the pairwise comparison of NELD-reducing practices at the community
level, a gender segregated AHP-guided consultation was done. Result showed that, disaster
preparedness and capacity building and zoning/land use planning are considered high in the
priority as NELD-reducing practice both for men and women groups. This is followed by
foreshore diking; for men and planting/establishment of live storm surge barriers (mangroves)
for women groups. These results in priority choices for the best NELD-reducing practice in the
affected community across gender groups again coheres with that of the AHP-guided results
Final Report: CAF2015-RR08-NMY-Chiba 101
from the overall community and regional and/or national experts/stakeholders consultation
forum.
Finally, from the results of NELD sources identified in the study sites, it indicated that the
estimated non-economic losses & damage (NELDs) are much greater than the economic
losses & damage (ELDs). The reported economic losses which covers cost of infrastructure,
agricultural crops, livestock and fishery is very low compared to the non-economic losses. The
value of human life has the highest contribution to the NELDs value and it is worth noting that
in one study site (Hernani, Eastern Samar), NELDs value is lower which can be attributed to
the presence of established mangroves in the area. Mangroves serve as barriers or protection
from storm surge and sea level rise. This supports the findings of Seriño et al (2017) on valuing
protective function of mangroves estimates that the average cost of saving a life by retaining
mangrove is USD 302,000 or P15 Million and the estimated reduction in compensation for
totally damaged houses is around USD 53,000. The findings in this study including that of
other corroborating results, could give us the estimate as to the magnitude of logical
compensation or degree of understatement if we exclude NELD in the post disaster needs
assessment from extreme weather events due to climate change.
5. Recommendation Revisit PDNA plan and policy for addressing the NELDs: It almost four years after the
onslaught of the ST Haiyan in the Philippines and the final version of a harmonized PDNA
manual of operation from OCD has not come out of the press or better yet, released for
ratification by all branches of concerned government departments. Since Haiyan up until this
report, each government department is still using their individual procedure for disaster needs
assessment. After the consultation forum and validation of results with stakeholders and
affected communities, there was a unified expression of urgency that systematic identification
and assessment of NELD be included in the harmonized PDNA that is yet to come out from
OCD. Hence, one of the doable action that the research team can do is to include in the
expanded NELD project in other Regions, an official policy brief that will influence the final
version of the of the harmonized PDNA to have at least the flavour of systematic NELD item
inclusions. This will be a starting point for a long term institutionalization of action.
Structural and environmental approach as priority NELD-reducing practice: The second
best NELD-reducing practice prioritize by stakeholders and affected communities are the
planting of live storm surge barrier along coastal communities and the criteria that best support
this direction is sustainability not only to the needs of the affected communities but also
sustainability of institutional support even after the project. Hence, lobbying/legworking the
result of this study to LGU and other local officials will indeed enhance the operational
sustainability of the NELD-reducing practice at the same time protect our environment
Expanding the coverage/scope zoning and LU planning: From the result of the AHP-
guided consultation both at the regional and local level, disaster preparedness & capacity
building and Zoning/Land Use Planning were consistently rated in high priority and importance
as the best NELD-reducing practices. Hence it is recommended that the current
comprehensive land use planning (CLUP) undertaken or crafted by almost all municipalities
and cities around the province of Leyte, should include a more elaborate DRRM sections or
component that will heighten disaster preparedness specially in climate change vulnerable
areas/communities. Since VSU is also mostly requested/commissioned to provide this service
Final Report: CAF2015-RR08-NMY-Chiba 102
to develop a site –specific CLUP for most municipalities in the Province of Leyte, then the
research team can make an official representation to the CLUP Team of VSU to include this
module in there services with the local officials.
Pursue an expanded and target-specific planting and/or establishment of mangrove
plantations among households along coastal communities: It has been intimated from
the result of this study and duly corroborated by the findings of other studies, that an
established mangrove stand is able to save lives and shelter of people considerably. Hence
to encourage autonomous household adaptation, it is recommended that households
particularly the along the vulnerable coastal areas, be required to undertake training or attend
seminar on DRRM (JKB Arias,et.al., 2016). This measure should be legislated together with
the conduct of CLUP in the municipality so that autonomous adaptation of this practice be
institutionalized.
The research team also thru the expanded NELD project in other regions, will work with DENR
to incentivise support for community-wide action for the rehabilitation and establishment of
mangrove plantation in key vulnerable coastal communities. Presenting the result of this study
to the RRDC (Regional Research and Development Council) is a starting point to drum up
support from the regional and local stakeholders.
6. References Arias, J.K.B., J.J.P. Mediodia and K.J.R. Lino (2016). Impacts of and Adaptation to Extreme
Weather Events: An Intra-household Perspective. EEPSEA Report No. 2016-RR2.
Economy and Evironment Program for Southeast Asia. Laguna, Philippines
Centre for Research on the Epidemiology of Disasters (CRED) (2013). Annual Disaster
Statistical Review. http://cred.be/sites/default/files/ADSR_2013.pdf Retrieved May 1,
2015.
Morrissey, J and Anthony Oliver, S. A. (2013). Perspectives on non-economic loss and
damage understanding values at risk from climate change.
Moises Neil Seriño, Julie Carl Ureta, Jayson Baldesco, Karl John Galvez, Canesio Predo, and
Eunice Kenee Seriño (2017). Valuing the protection service provided by mangroves in
typhoon-hit areas in the Philippines. EEPSEA Research Report No. 2017-RR19.
Economy and Environment Program for Southeast Asia, Laguna, Philippines.
National Development and Reform Commission (NDRC) (2014). Retrieved from:
http://www.nrdc.org/about/staff/climate-change-experts.asp Accessed May 17, 2015.
National Disaster Response Plan (NDRP) (2014). http://www.ndrrmc.gov.ph/attachments
/article/1334/NDRP_Hydro_Meteorological_Hazrds_as_of_2014.pdf Retrieved May 2,
2015.
Serdeczny, O., Waters, E., Chan, S. (2016). Non-economic Loss and Damage: Addressing
the Forgotten Side of Climate Change Impacts.
UNFCCC (2013). Non-economic losses in the context of the work programme on loss and
damage. Technical paper.
Final Report: CAF2015-RR08-NMY-Chiba 103
Non-Economic Loss and Damages in Thailand: A Case Study of
Floods in Pathumthani Province
Sangam Shrestha and Manish Shrestha Asian Institute of Technology, Thailand
1. Introduction Confidence has increased that some extreme events will become more frequent, more
widespread and/or more intense during the 21st century (IPCC, 2007). Human beings are
releasing greenhouse gases (GHG) at an alarming rate than that it would occur naturally. Over
30 billion tons of carbon dioxide alone is being emitted per year (ADB 2013). If the trend of
GHGs emission continues, in the worst case, the global mean temperature will increase up to
4.9°C by the end of 21st century (Van Vuuren et. al 2011). The change in temperature will also
have an adverse effect on the rainfall.
Even though, precipitation is a local phenomenon, it highly varies both spatially and temporally
(ADB, 2013). Significant changes have been observed in number of heavy precipitation events
in some region, particularly in the second half of the 21st century. Numerous studies reported
the chances of increase in flooding due to climate change (Jean et al, 2014; Babel et al. 2013;
Xu et al. 2013; UNEP, 2012).
The Kingdom of Thailand is no stranger to natural disasters. Thailand ranks as the 7th most
flood-prone county in the world and is flooded approximately 10 times per year (World Bank,
2012). Flooding occurs almost every year in the Chao Phraya River Basin and has a long
history of flood events in the past. The flood of 2011 was the worst in the history of Thailand
that inundated 9% of the country’s total land. The World Bank ranked the Thailand flood of
2011 as the world’s fourth costliest disaster as of 2011 with the total damage of USD 45.7
billion. With a changing climate, the extreme events can be frequent and more intense in the
coming future.
Climate change will affect a wide range of social, economic and environmental system
(UNFCCC, 2013). The impact will have an adverse effect on both economic and non-economic
sectors. Example of economic losses due to climate change impact are the losses of
resources, goods and services that are traded in market. On a contrary, non-economic losses
are those which cannot be traded in the markets. Examples of non-economic losses are loss
of life, destruction of cultural and natural sites, destruction of eco-system and biodiversity etc.
Along with these, intangible damages like pain, physical and emotional distress, social tension,
impaired health quality etc. are also classified as non-economic losses.
Non-economic losses caused by extreme events may be more significant than economic
losses in many developing countries (UNFCCC, 2013). But, identifying and quantifying of non-
economic values is a challenging task. One of the main difficulties in assessing non-economic
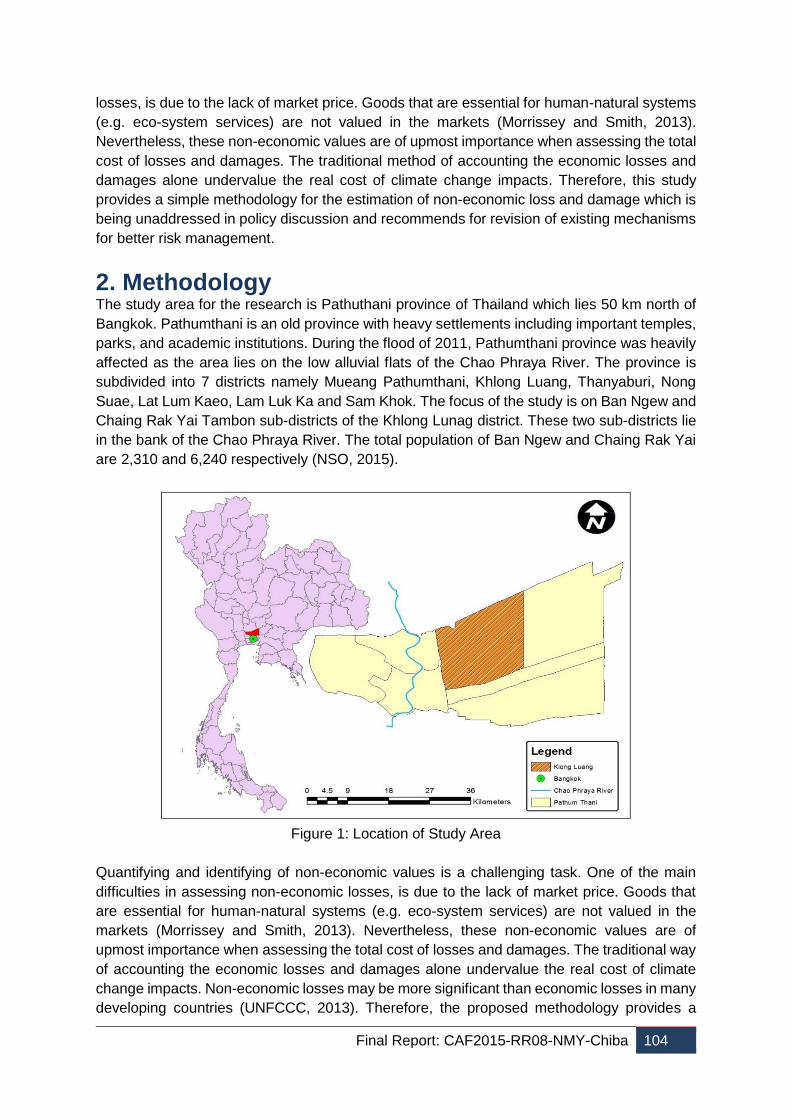
Final Report: CAF2015-RR08-NMY-Chiba 104
losses, is due to the lack of market price. Goods that are essential for human-natural systems
(e.g. eco-system services) are not valued in the markets (Morrissey and Smith, 2013).
Nevertheless, these non-economic values are of upmost importance when assessing the total
cost of losses and damages. The traditional method of accounting the economic losses and
damages alone undervalue the real cost of climate change impacts. Therefore, this study
provides a simple methodology for the estimation of non-economic loss and damage which is
being unaddressed in policy discussion and recommends for revision of existing mechanisms
for better risk management.
2. Methodology The study area for the research is Pathuthani province of Thailand which lies 50 km north of
Bangkok. Pathumthani is an old province with heavy settlements including important temples,
parks, and academic institutions. During the flood of 2011, Pathumthani province was heavily
affected as the area lies on the low alluvial flats of the Chao Phraya River. The province is
subdivided into 7 districts namely Mueang Pathumthani, Khlong Luang, Thanyaburi, Nong
Suae, Lat Lum Kaeo, Lam Luk Ka and Sam Khok. The focus of the study is on Ban Ngew and
Chaing Rak Yai Tambon sub-districts of the Khlong Lunag district. These two sub-districts lie
in the bank of the Chao Phraya River. The total population of Ban Ngew and Chaing Rak Yai
are 2,310 and 6,240 respectively (NSO, 2015).
Figure 1: Location of Study Area
Quantifying and identifying of non-economic values is a challenging task. One of the main
difficulties in assessing non-economic losses, is due to the lack of market price. Goods that
are essential for human-natural systems (e.g. eco-system services) are not valued in the
markets (Morrissey and Smith, 2013). Nevertheless, these non-economic values are of
upmost importance when assessing the total cost of losses and damages. The traditional way
of accounting the economic losses and damages alone undervalue the real cost of climate
change impacts. Non-economic losses may be more significant than economic losses in many
developing countries (UNFCCC, 2013). Therefore, the proposed methodology provides a
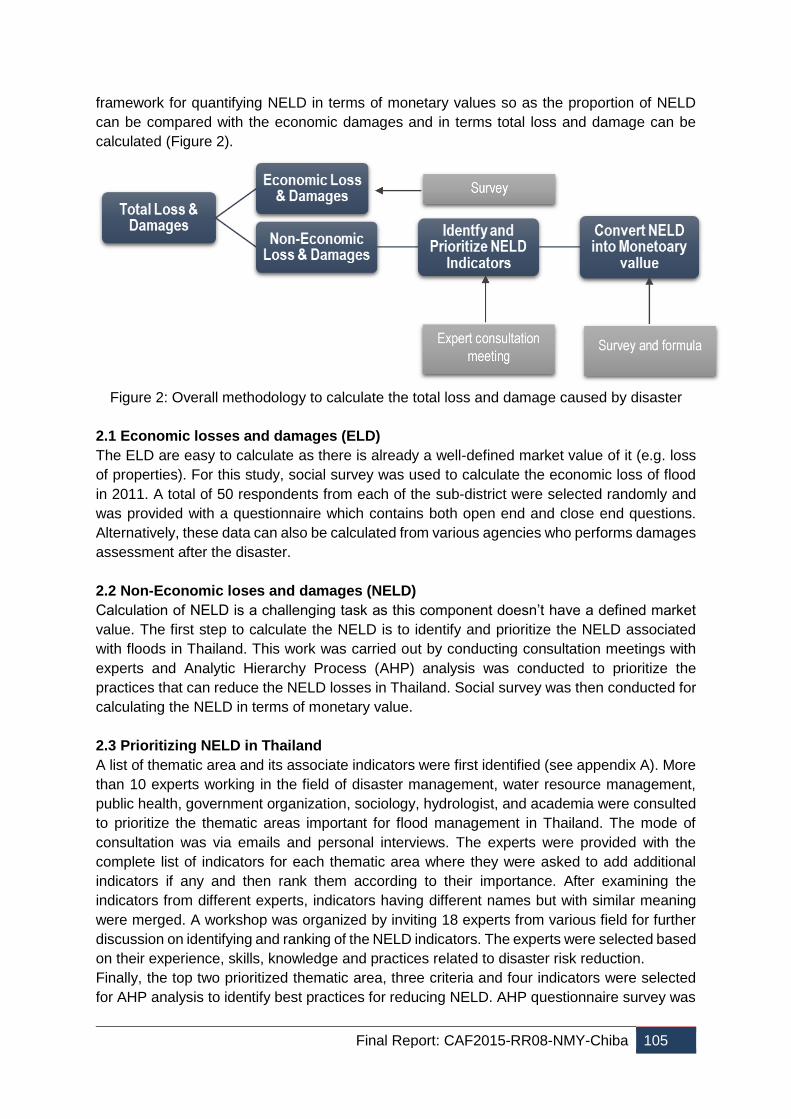
Final Report: CAF2015-RR08-NMY-Chiba 105
framework for quantifying NELD in terms of monetary values so as the proportion of NELD
can be compared with the economic damages and in terms total loss and damage can be
calculated (Figure 2).
Figure 2: Overall methodology to calculate the total loss and damage caused by disaster
2.1 Economic losses and damages (ELD)
The ELD are easy to calculate as there is already a well-defined market value of it (e.g. loss
of properties). For this study, social survey was used to calculate the economic loss of flood
in 2011. A total of 50 respondents from each of the sub-district were selected randomly and
was provided with a questionnaire which contains both open end and close end questions.
Alternatively, these data can also be calculated from various agencies who performs damages
assessment after the disaster.
2.2 Non-Economic loses and damages (NELD)
Calculation of NELD is a challenging task as this component doesn’t have a defined market
value. The first step to calculate the NELD is to identify and prioritize the NELD associated
with floods in Thailand. This work was carried out by conducting consultation meetings with
experts and Analytic Hierarchy Process (AHP) analysis was conducted to prioritize the
practices that can reduce the NELD losses in Thailand. Social survey was then conducted for
calculating the NELD in terms of monetary value.
2.3 Prioritizing NELD in Thailand
A list of thematic area and its associate indicators were first identified (see appendix A). More
than 10 experts working in the field of disaster management, water resource management,
public health, government organization, sociology, hydrologist, and academia were consulted
to prioritize the thematic areas important for flood management in Thailand. The mode of
consultation was via emails and personal interviews. The experts were provided with the
complete list of indicators for each thematic area where they were asked to add additional
indicators if any and then rank them according to their importance. After examining the
indicators from different experts, indicators having different names but with similar meaning
were merged. A workshop was organized by inviting 18 experts from various field for further
discussion on identifying and ranking of the NELD indicators. The experts were selected based
on their experience, skills, knowledge and practices related to disaster risk reduction.
Finally, the top two prioritized thematic area, three criteria and four indicators were selected
for AHP analysis to identify best practices for reducing NELD. AHP questionnaire survey was
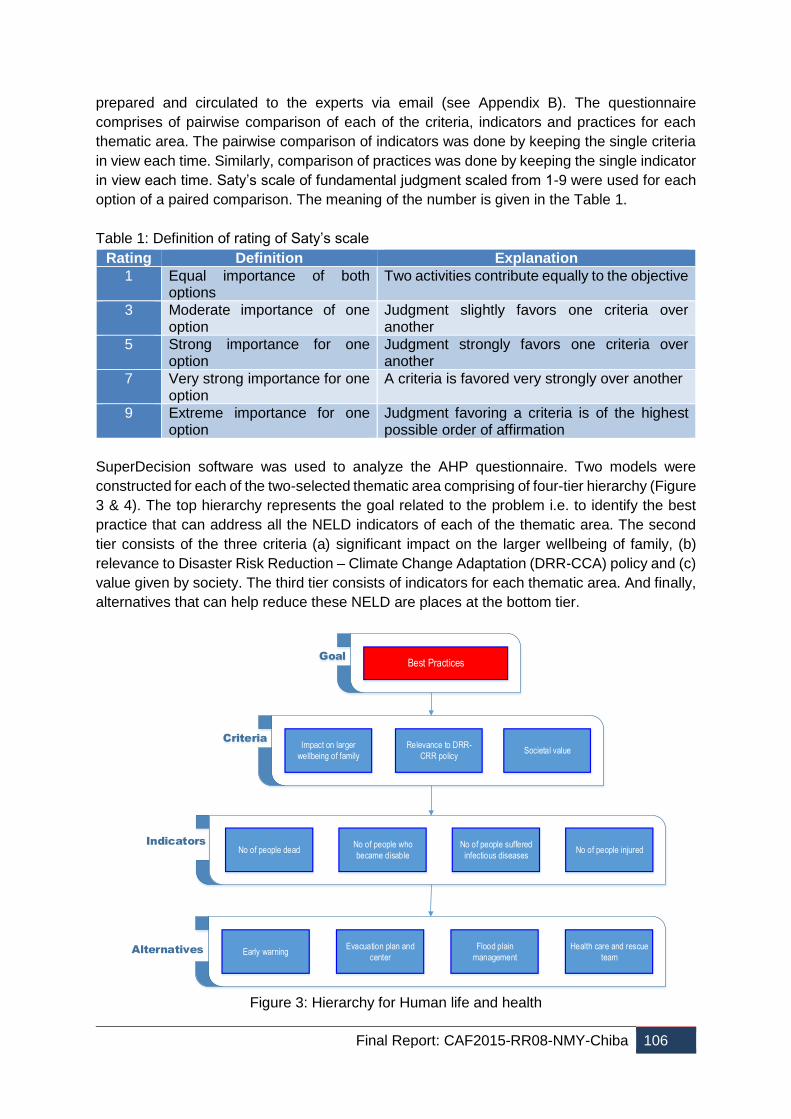
Final Report: CAF2015-RR08-NMY-Chiba 106
prepared and circulated to the experts via email (see Appendix B). The questionnaire
comprises of pairwise comparison of each of the criteria, indicators and practices for each
thematic area. The pairwise comparison of indicators was done by keeping the single criteria
in view each time. Similarly, comparison of practices was done by keeping the single indicator
in view each time. Saty’s scale of fundamental judgment scaled from 1-9 were used for each
option of a paired comparison. The meaning of the number is given in the Table 1.
Table 1: Definition of rating of Saty’s scale
Rating Definition Explanation
1 Equal importance of both options
Two activities contribute equally to the objective
3 Moderate importance of one option
Judgment slightly favors one criteria over another
5 Strong importance for one option
Judgment strongly favors one criteria over another
7 Very strong importance for one option
A criteria is favored very strongly over another
9 Extreme importance for one option
Judgment favoring a criteria is of the highest possible order of affirmation
SuperDecision software was used to analyze the AHP questionnaire. Two models were
constructed for each of the two-selected thematic area comprising of four-tier hierarchy (Figure
3 & 4). The top hierarchy represents the goal related to the problem i.e. to identify the best
practice that can address all the NELD indicators of each of the thematic area. The second
tier consists of the three criteria (a) significant impact on the larger wellbeing of family, (b)
relevance to Disaster Risk Reduction – Climate Change Adaptation (DRR-CCA) policy and (c)
value given by society. The third tier consists of indicators for each thematic area. And finally,
alternatives that can help reduce these NELD are places at the bottom tier.
Goal
Criteria
Best Practices
Impact on larger
wellbeing of family
Relevance to DRR-
CRR policy Societal value
No of people deadNo of people suffered
infectious diseases
No of people who
became disableNo of people injured
Flood plain
management
Health care and rescue
team
Evacuation plan and
centerEarly warning
Indicators
Alternatives
Figure 3: Hierarchy for Human life and health
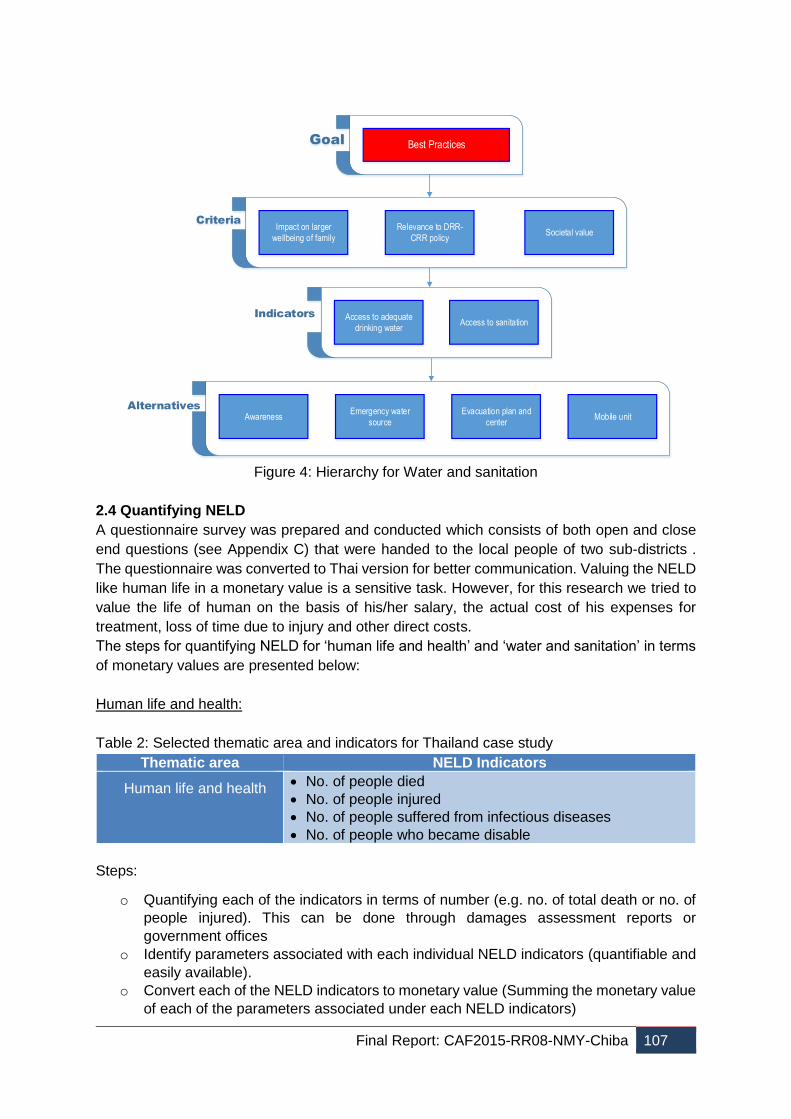
Final Report: CAF2015-RR08-NMY-Chiba 107
Goal
Criteria
Best Practices
Impact on larger
wellbeing of family
Relevance to DRR-
CRR policy Societal value
Access to sanitationAccess to adequate
drinking water
Evacuation plan and
centerMobile unit
Emergency water
sourceAwareness
Indicators
Alternatives
Figure 4: Hierarchy for Water and sanitation
2.4 Quantifying NELD
A questionnaire survey was prepared and conducted which consists of both open and close
end questions (see Appendix C) that were handed to the local people of two sub-districts .
The questionnaire was converted to Thai version for better communication. Valuing the NELD
like human life in a monetary value is a sensitive task. However, for this research we tried to
value the life of human on the basis of his/her salary, the actual cost of his expenses for
treatment, loss of time due to injury and other direct costs.
The steps for quantifying NELD for ‘human life and health’ and ‘water and sanitation’ in terms
of monetary values are presented below:
Human life and health:
Table 2: Selected thematic area and indicators for Thailand case study
Thematic area NELD Indicators
Human life and health No. of people died
No. of people injured
No. of people suffered from infectious diseases
No. of people who became disable
Steps:
o Quantifying each of the indicators in terms of number (e.g. no. of total death or no. of
people injured). This can be done through damages assessment reports or
government offices
o Identify parameters associated with each individual NELD indicators (quantifiable and
easily available).
o Convert each of the NELD indicators to monetary value (Summing the monetary value
of each of the parameters associated under each NELD indicators)
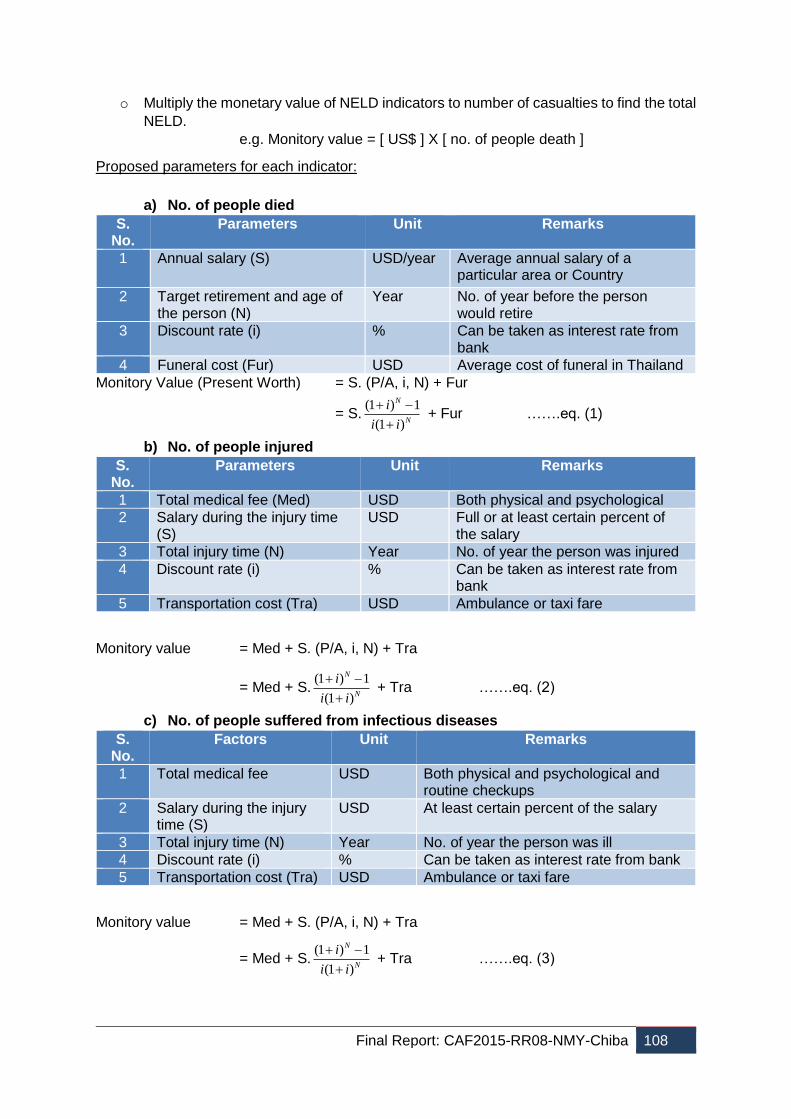
Final Report: CAF2015-RR08-NMY-Chiba 108
o Multiply the monetary value of NELD indicators to number of casualties to find the total
NELD.
e.g. Monitory value = [ US$ ] X [ no. of people death ]
Proposed parameters for each indicator:
a) No. of people died
S. No.
Parameters Unit Remarks
1 Annual salary (S) USD/year Average annual salary of a particular area or Country
2 Target retirement and age of the person (N)
Year No. of year before the person would retire
3 Discount rate (i) % Can be taken as interest rate from bank
4 Funeral cost (Fur) USD Average cost of funeral in Thailand
Monitory Value (Present Worth) = S. (P/A, i, N) + Fur
= S.(1 ) 1
(1 )
N
N
i
i i
+ Fur …….eq. (1)
b) No. of people injured
S. No.
Parameters Unit Remarks
1 Total medical fee (Med) USD Both physical and psychological
2 Salary during the injury time (S)
USD Full or at least certain percent of the salary
3 Total injury time (N) Year No. of year the person was injured
4 Discount rate (i) % Can be taken as interest rate from bank
5 Transportation cost (Tra) USD Ambulance or taxi fare
Monitory value = Med + S. (P/A, i, N) + Tra
= Med + S.(1 ) 1
(1 )
N
N
i
i i
+ Tra …….eq. (2)
c) No. of people suffered from infectious diseases
S. No.
Factors Unit Remarks
1 Total medical fee USD Both physical and psychological and routine checkups
2 Salary during the injury time (S)
USD At least certain percent of the salary
3 Total injury time (N) Year No. of year the person was ill
4 Discount rate (i) % Can be taken as interest rate from bank
5 Transportation cost (Tra) USD Ambulance or taxi fare
Monitory value = Med + S. (P/A, i, N) + Tra
= Med + S.(1 ) 1
(1 )
N
N
i
i i
+ Tra …….eq. (3)
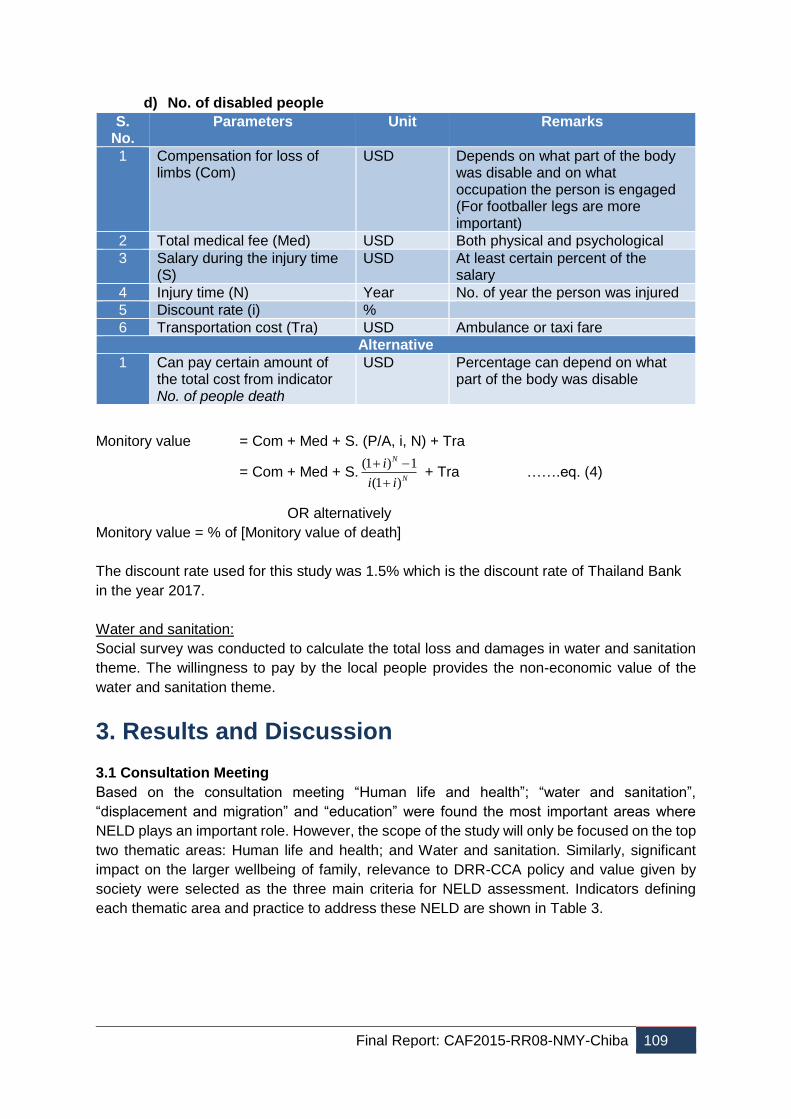
Final Report: CAF2015-RR08-NMY-Chiba 109
d) No. of disabled people
S. No.
Parameters Unit Remarks
1 Compensation for loss of limbs (Com)
USD Depends on what part of the body was disable and on what occupation the person is engaged (For footballer legs are more important)
2 Total medical fee (Med) USD Both physical and psychological
3 Salary during the injury time (S)
USD At least certain percent of the salary
4 Injury time (N) Year No. of year the person was injured
5 Discount rate (i) %
6 Transportation cost (Tra) USD Ambulance or taxi fare
Alternative
1 Can pay certain amount of the total cost from indicator No. of people death
USD Percentage can depend on what part of the body was disable
Monitory value = Com + Med + S. (P/A, i, N) + Tra
= Com + Med + S.(1 ) 1
(1 )
N
N
i
i i
+ Tra …….eq. (4)
OR alternatively
Monitory value = % of [Monitory value of death]
The discount rate used for this study was 1.5% which is the discount rate of Thailand Bank
in the year 2017.
Water and sanitation:
Social survey was conducted to calculate the total loss and damages in water and sanitation
theme. The willingness to pay by the local people provides the non-economic value of the
water and sanitation theme.
3. Results and Discussion
3.1 Consultation Meeting
Based on the consultation meeting “Human life and health”; “water and sanitation”,
“displacement and migration” and “education” were found the most important areas where
NELD plays an important role. However, the scope of the study will only be focused on the top
two thematic areas: Human life and health; and Water and sanitation. Similarly, significant
impact on the larger wellbeing of family, relevance to DRR-CCA policy and value given by
society were selected as the three main criteria for NELD assessment. Indicators defining
each thematic area and practice to address these NELD are shown in Table 3.
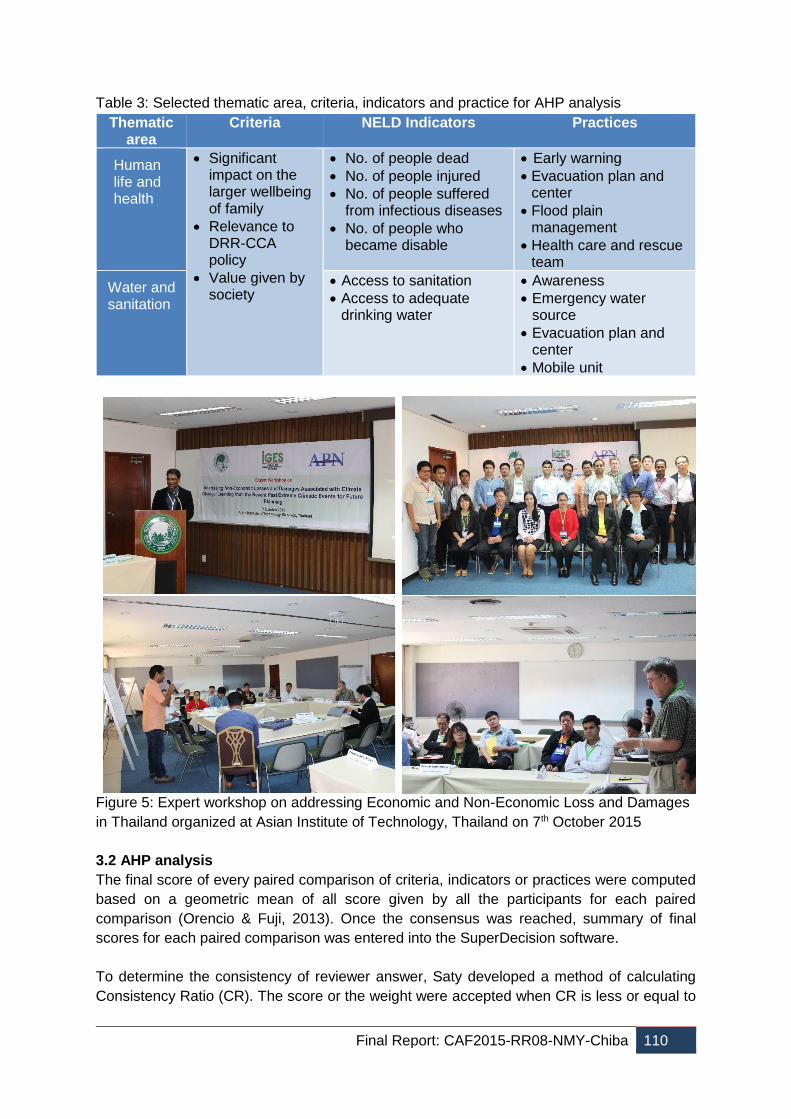
Final Report: CAF2015-RR08-NMY-Chiba 110
Table 3: Selected thematic area, criteria, indicators and practice for AHP analysis
Thematic area
Criteria NELD Indicators Practices
Human life and health
Significant impact on the larger wellbeing of family
Relevance to DRR-CCA policy
Value given by society
No. of people dead
No. of people injured
No. of people suffered from infectious diseases
No. of people who became disable
Early warning
Evacuation plan and center
Flood plain management
Health care and rescue team
Water and sanitation
Access to sanitation
Access to adequate drinking water
Awareness
Emergency water source
Evacuation plan and center
Mobile unit
Figure 5: Expert workshop on addressing Economic and Non-Economic Loss and Damages
in Thailand organized at Asian Institute of Technology, Thailand on 7th October 2015
3.2 AHP analysis
The final score of every paired comparison of criteria, indicators or practices were computed
based on a geometric mean of all score given by all the participants for each paired
comparison (Orencio & Fuji, 2013). Once the consensus was reached, summary of final
scores for each paired comparison was entered into the SuperDecision software.
To determine the consistency of reviewer answer, Saty developed a method of calculating
Consistency Ratio (CR). The score or the weight were accepted when CR is less or equal to
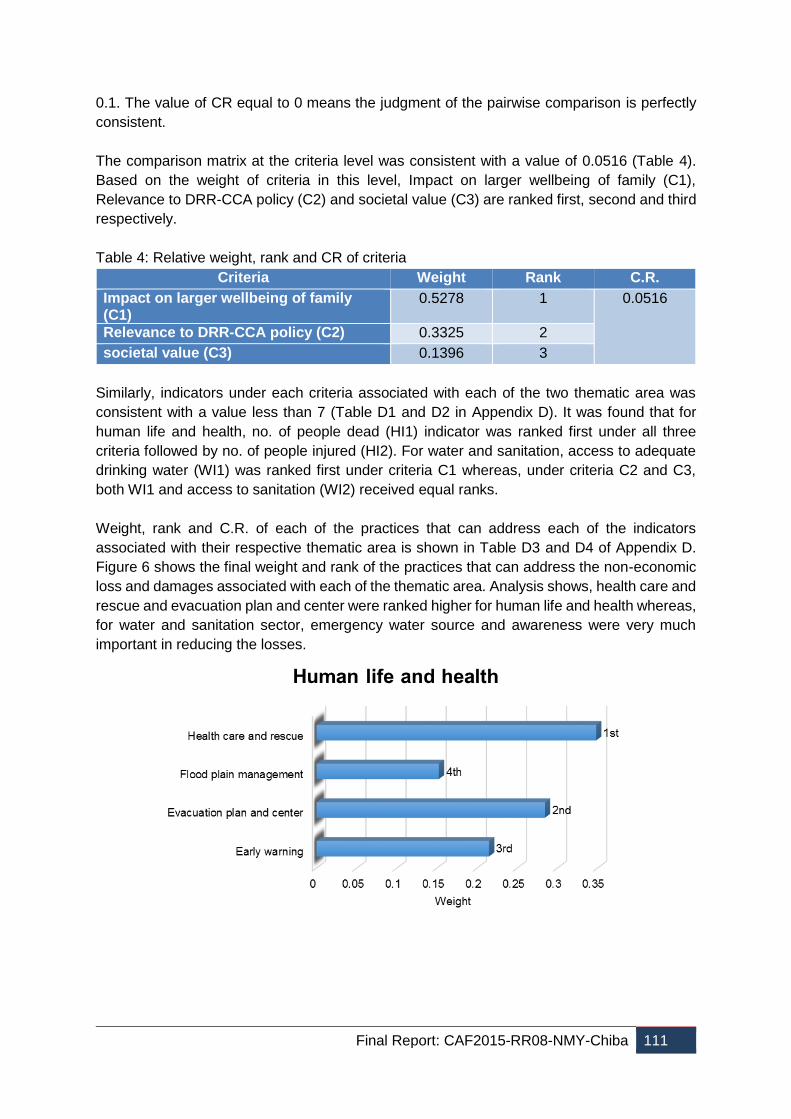
Final Report: CAF2015-RR08-NMY-Chiba 111
0.1. The value of CR equal to 0 means the judgment of the pairwise comparison is perfectly
consistent.
The comparison matrix at the criteria level was consistent with a value of 0.0516 (Table 4).
Based on the weight of criteria in this level, Impact on larger wellbeing of family (C1),
Relevance to DRR-CCA policy (C2) and societal value (C3) are ranked first, second and third
respectively.
Table 4: Relative weight, rank and CR of criteria
Criteria Weight Rank C.R.
Impact on larger wellbeing of family (C1)
0.5278 1 0.0516
Relevance to DRR-CCA policy (C2) 0.3325 2
societal value (C3) 0.1396 3
Similarly, indicators under each criteria associated with each of the two thematic area was
consistent with a value less than 7 (Table D1 and D2 in Appendix D). It was found that for
human life and health, no. of people dead (HI1) indicator was ranked first under all three
criteria followed by no. of people injured (HI2). For water and sanitation, access to adequate
drinking water (WI1) was ranked first under criteria C1 whereas, under criteria C2 and C3,
both WI1 and access to sanitation (WI2) received equal ranks.
Weight, rank and C.R. of each of the practices that can address each of the indicators
associated with their respective thematic area is shown in Table D3 and D4 of Appendix D.
Figure 6 shows the final weight and rank of the practices that can address the non-economic
loss and damages associated with each of the thematic area. Analysis shows, health care and
rescue and evacuation plan and center were ranked higher for human life and health whereas,
for water and sanitation sector, emergency water source and awareness were very much
important in reducing the losses.
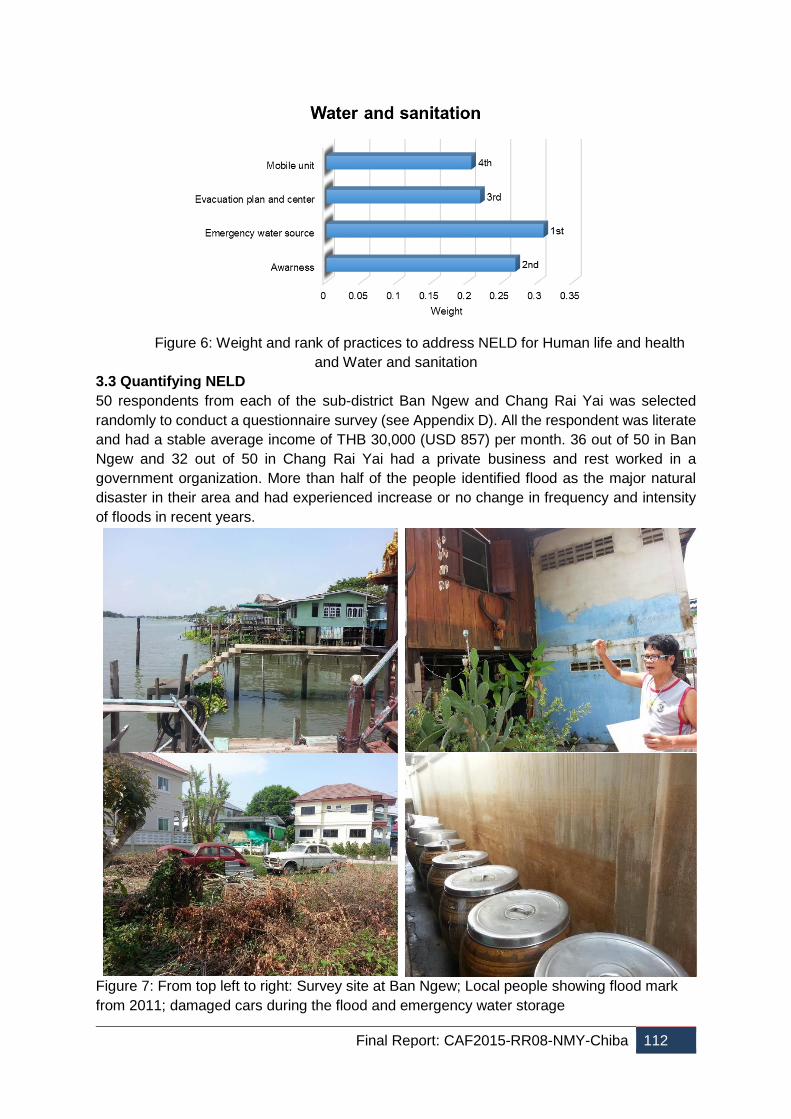
Final Report: CAF2015-RR08-NMY-Chiba 112
Figure 6: Weight and rank of practices to address NELD for Human life and health
and Water and sanitation
3.3 Quantifying NELD
50 respondents from each of the sub-district Ban Ngew and Chang Rai Yai was selected
randomly to conduct a questionnaire survey (see Appendix D). All the respondent was literate
and had a stable average income of THB 30,000 (USD 857) per month. 36 out of 50 in Ban
Ngew and 32 out of 50 in Chang Rai Yai had a private business and rest worked in a
government organization. More than half of the people identified flood as the major natural
disaster in their area and had experienced increase or no change in frequency and intensity
of floods in recent years.
Figure 7: From top left to right: Survey site at Ban Ngew; Local people showing flood mark
from 2011; damaged cars during the flood and emergency water storage
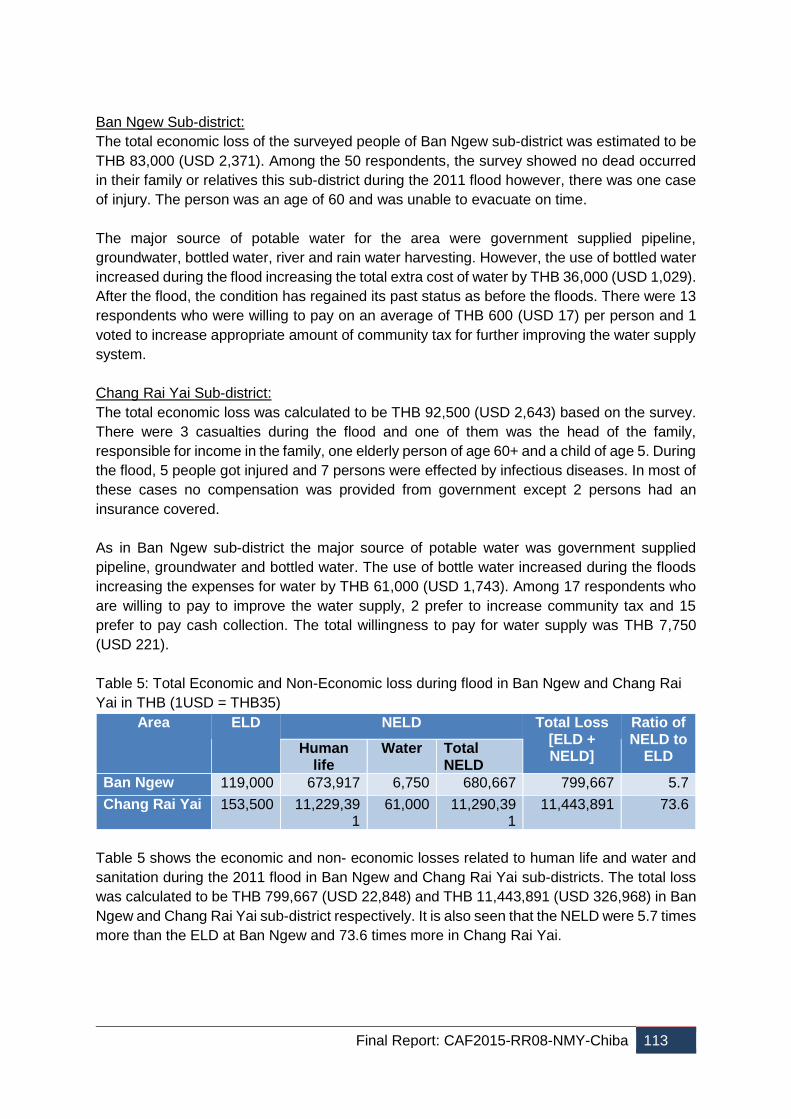
Final Report: CAF2015-RR08-NMY-Chiba 113
Ban Ngew Sub-district:
The total economic loss of the surveyed people of Ban Ngew sub-district was estimated to be
THB 83,000 (USD 2,371). Among the 50 respondents, the survey showed no dead occurred
in their family or relatives this sub-district during the 2011 flood however, there was one case
of injury. The person was an age of 60 and was unable to evacuate on time.
The major source of potable water for the area were government supplied pipeline,
groundwater, bottled water, river and rain water harvesting. However, the use of bottled water
increased during the flood increasing the total extra cost of water by THB 36,000 (USD 1,029).
After the flood, the condition has regained its past status as before the floods. There were 13
respondents who were willing to pay on an average of THB 600 (USD 17) per person and 1
voted to increase appropriate amount of community tax for further improving the water supply
system.
Chang Rai Yai Sub-district:
The total economic loss was calculated to be THB 92,500 (USD 2,643) based on the survey.
There were 3 casualties during the flood and one of them was the head of the family,
responsible for income in the family, one elderly person of age 60+ and a child of age 5. During
the flood, 5 people got injured and 7 persons were effected by infectious diseases. In most of
these cases no compensation was provided from government except 2 persons had an
insurance covered.
As in Ban Ngew sub-district the major source of potable water was government supplied
pipeline, groundwater and bottled water. The use of bottle water increased during the floods
increasing the expenses for water by THB 61,000 (USD 1,743). Among 17 respondents who
are willing to pay to improve the water supply, 2 prefer to increase community tax and 15
prefer to pay cash collection. The total willingness to pay for water supply was THB 7,750
(USD 221).
Table 5: Total Economic and Non-Economic loss during flood in Ban Ngew and Chang Rai
Yai in THB (1USD = THB35)
Area ELD NELD Total Loss [ELD + NELD]
Ratio of NELD to
ELD Human
life Water Total
NELD
Ban Ngew 119,000 673,917 6,750 680,667 799,667 5.7
Chang Rai Yai 153,500 11,229,391
61,000 11,290,391
11,443,891 73.6
Table 5 shows the economic and non- economic losses related to human life and water and
sanitation during the 2011 flood in Ban Ngew and Chang Rai Yai sub-districts. The total loss
was calculated to be THB 799,667 (USD 22,848) and THB 11,443,891 (USD 326,968) in Ban
Ngew and Chang Rai Yai sub-district respectively. It is also seen that the NELD were 5.7 times
more than the ELD at Ban Ngew and 73.6 times more in Chang Rai Yai.
Final Report: CAF2015-RR08-NMY-Chiba 114
4. Conclusions Meteorological and hydrological extreme events are natural phenomenon; however, the
frequency and intensity of these events are increasing rapidly during recent years as a result
of climate change. These events will have two types of losses and damages in the society,
the economic and the non-economic. The economic losses and damages are usually given
more priority during the assessment and the NELD are often ignored due to the lack of market
value. These NELD are of significant importance and should also be equally or even should
be highly prioritized during the L& D assessment.
This study provides a simple method to estimating the total L&D including both the ELD and
NELD. The method consists of consultation meeting with experts as well as social survey to
estimate the ELD and NELD during the 2011 flood of Thailand in terms of monetary value.
More than 25 experts were approached to help in prioritizing the NELD indicators. The output
of the consultation meeting shows that Human life and Health and Water and Sanitation are
the two most important NELD. In addition, AHP analysis was carried out to prioritize the
adaptation options to address these NELD. Health care and rescue and evacuation plan and
center were identified best for human life and health whereas, for water and sanitation sector,
emergency water source and awareness were identified the best adaptation option in reducing
the losses.
Two sub-districts Ban Ngew and Chang Rai Yai of Pathumthani province of Thailand were
used as a case study and 50 respondents from each sub-district was selected randomly for
questionnaire. The survey was carried out to acquire data on the total loss during the 2011
flood. Evaluating the human life in monetary value is a very sensitive issue. In this study, the
NELD value were calculated solely based on the income and injury expenses of the victims.
In reality, the value of human life is much more valuable and cannot be quantified or evaluated
in the monetary value. The result of this study shows that the NELD were much higher than
the ELD. In Ban Ngew sub-district the NELD was nearly 6 times higher than ELD and 74 time
higher in Chang Rai Yai sub-district. Only two thematic area Human life and health and Water
and Sanitation were selected for this study. In reality, the total NELD can be much higher than
if all the component of NELD are evaluated. Therefore, it is recommended that the NELD cost
should be given equal priority during the L&D assessment which are mostly unaddressed.
During the survey, it was also found that none of the victims received any form of
compensation from the government during the floods.
5. References ADB (2013). Climate-related disasters in Asia and the pacific. ADB economics working paper
series, Asian development bank. ISSN 1655-5252, publication stock no. wps135852.
Babel, M.S., Bhusal, S.P., Wahid, S.M. and Agarwal, A. (2013). Climate change and water
resources in the Bagmati River Basin, Nepal. Theoretical and Applied Climatology.
112:3-4.
IPCC (2007). Climate Change 2007: Synthesis Report. Intergovernmental Panel on Climate
Change, Switzerland.
Jena, P.P., Chatterjee, C., Pradhan. G. and Mishra, A. (2014). Are recent frequent high floods
in Mahanadi basin in eastern India due to increase in extreme rainfalls?. Journal of
Hydrology, 517 (2014) 847–862.
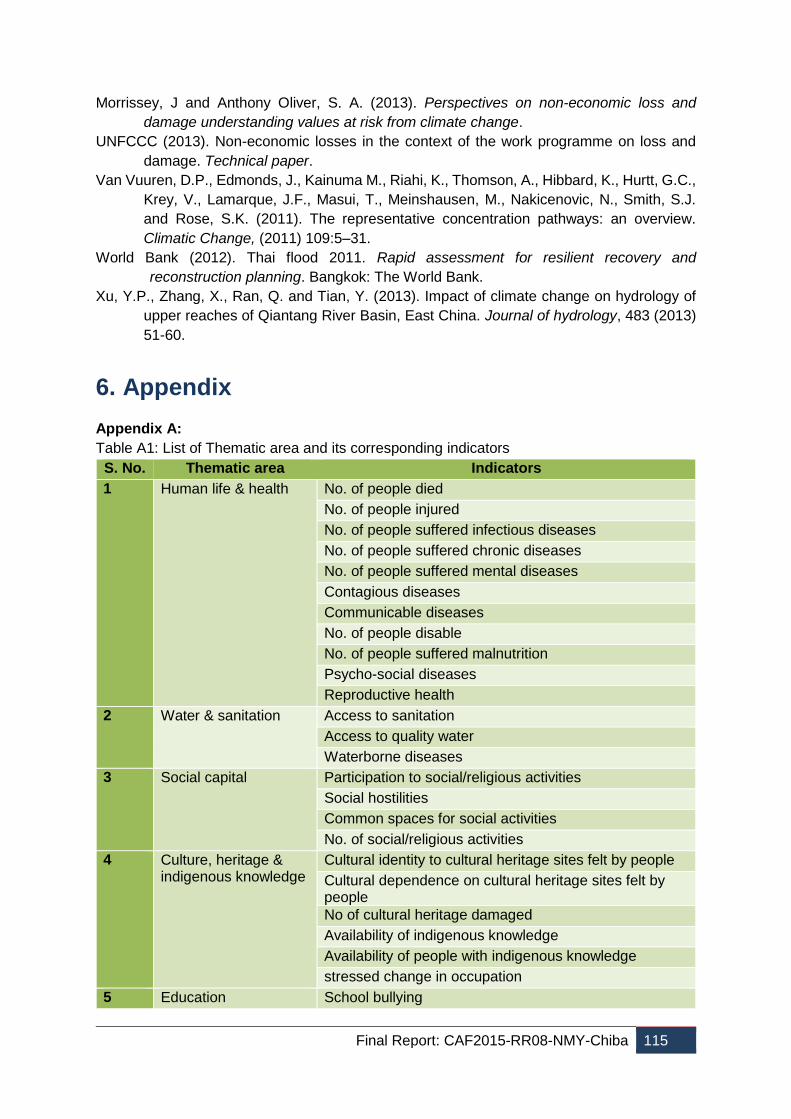
Final Report: CAF2015-RR08-NMY-Chiba 115
Morrissey, J and Anthony Oliver, S. A. (2013). Perspectives on non-economic loss and
damage understanding values at risk from climate change.
UNFCCC (2013). Non-economic losses in the context of the work programme on loss and
damage. Technical paper.
Van Vuuren, D.P., Edmonds, J., Kainuma M., Riahi, K., Thomson, A., Hibbard, K., Hurtt, G.C.,
Krey, V., Lamarque, J.F., Masui, T., Meinshausen, M., Nakicenovic, N., Smith, S.J.
and Rose, S.K. (2011). The representative concentration pathways: an overview.
Climatic Change, (2011) 109:5–31.
World Bank (2012). Thai flood 2011. Rapid assessment for resilient recovery and
reconstruction planning. Bangkok: The World Bank.
Xu, Y.P., Zhang, X., Ran, Q. and Tian, Y. (2013). Impact of climate change on hydrology of
upper reaches of Qiantang River Basin, East China. Journal of hydrology, 483 (2013)
51-60.
6. Appendix
Appendix A:
Table A1: List of Thematic area and its corresponding indicators
S. No. Thematic area Indicators
1 Human life & health No. of people died
No. of people injured
No. of people suffered infectious diseases
No. of people suffered chronic diseases
No. of people suffered mental diseases
Contagious diseases
Communicable diseases
No. of people disable
No. of people suffered malnutrition
Psycho-social diseases
Reproductive health
2 Water & sanitation Access to sanitation
Access to quality water
Waterborne diseases
3 Social capital Participation to social/religious activities
Social hostilities
Common spaces for social activities
No. of social/religious activities
4 Culture, heritage & indigenous knowledge
Cultural identity to cultural heritage sites felt by people
Cultural dependence on cultural heritage sites felt by people
No of cultural heritage damaged
Availability of indigenous knowledge
Availability of people with indigenous knowledge
stressed change in occupation
5 Education School bullying
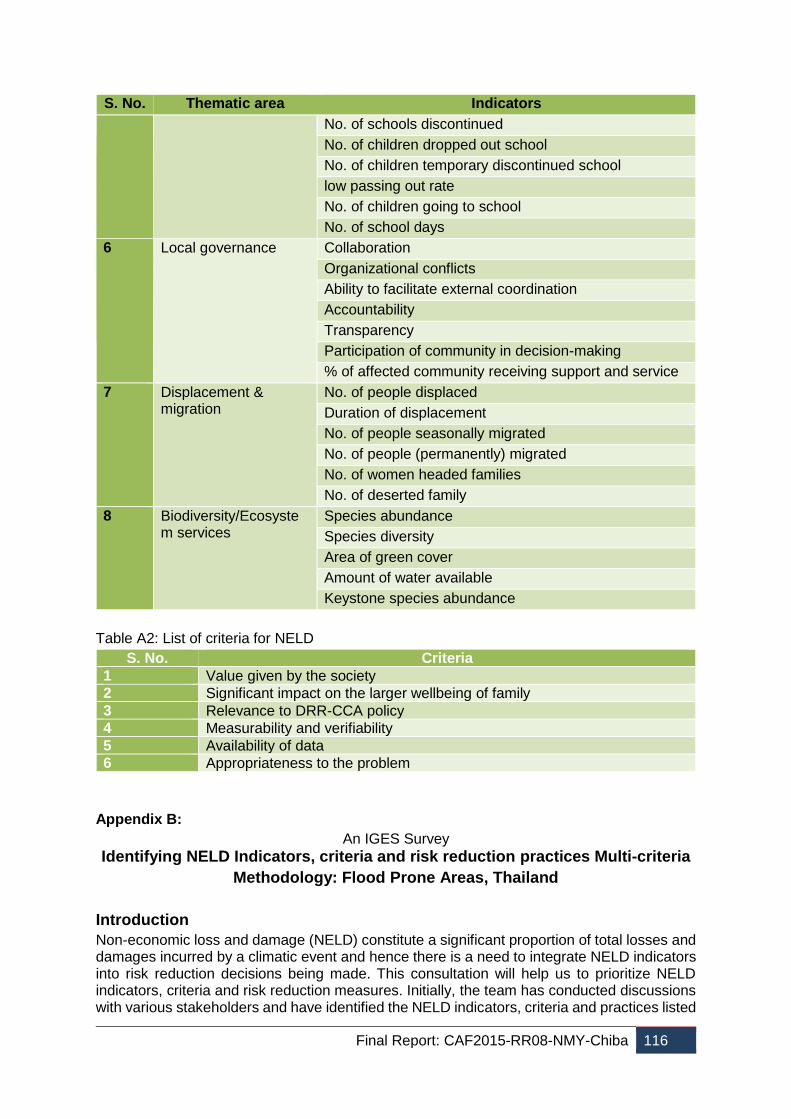
Final Report: CAF2015-RR08-NMY-Chiba 116
S. No. Thematic area Indicators
No. of schools discontinued
No. of children dropped out school
No. of children temporary discontinued school
low passing out rate
No. of children going to school
No. of school days
6 Local governance Collaboration
Organizational conflicts
Ability to facilitate external coordination
Accountability
Transparency
Participation of community in decision-making
% of affected community receiving support and service
7 Displacement & migration
No. of people displaced
Duration of displacement
No. of people seasonally migrated
No. of people (permanently) migrated
No. of women headed families
No. of deserted family
8 Biodiversity/Ecosystem services
Species abundance
Species diversity
Area of green cover
Amount of water available
Keystone species abundance
Table A2: List of criteria for NELD
S. No. Criteria
1 Value given by the society
2 Significant impact on the larger wellbeing of family
3 Relevance to DRR-CCA policy
4 Measurability and verifiability
5 Availability of data
6 Appropriateness to the problem
Appendix B:
An IGES Survey
Identifying NELD Indicators, criteria and risk reduction practices Multi-criteria
Methodology: Flood Prone Areas, Thailand
Introduction
Non-economic loss and damage (NELD) constitute a significant proportion of total losses and damages incurred by a climatic event and hence there is a need to integrate NELD indicators into risk reduction decisions being made. This consultation will help us to prioritize NELD indicators, criteria and risk reduction measures. Initially, the team has conducted discussions with various stakeholders and have identified the NELD indicators, criteria and practices listed
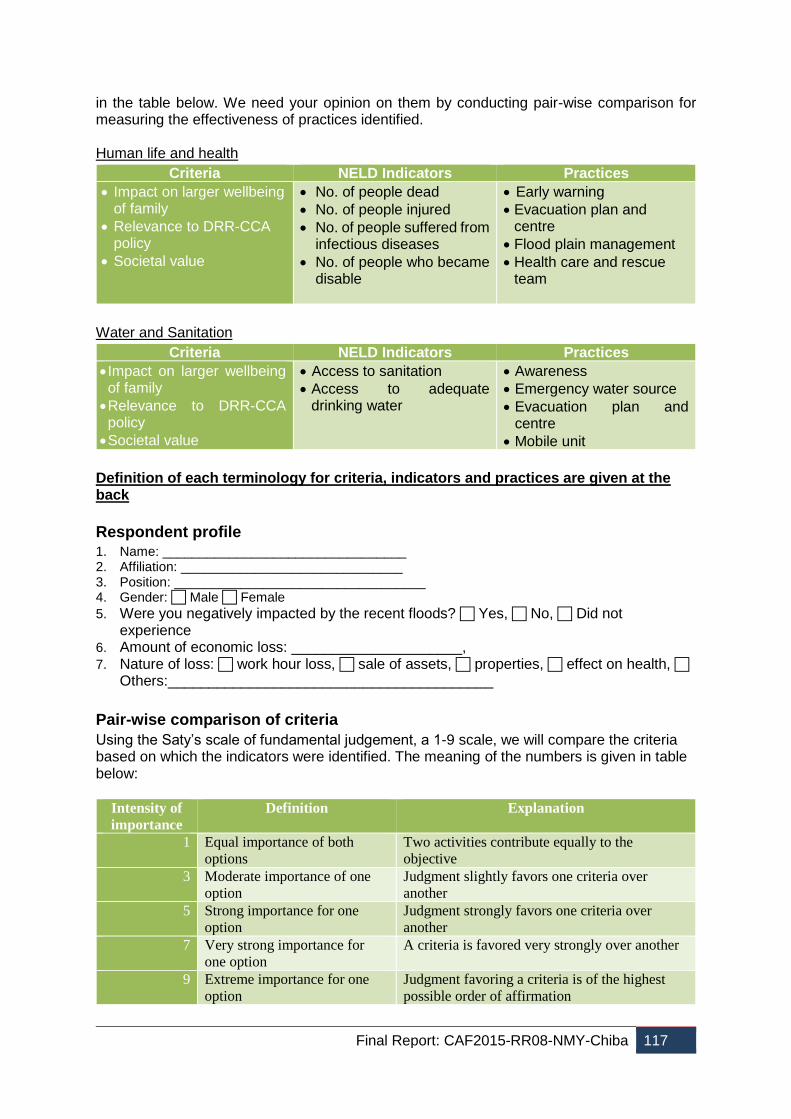
Final Report: CAF2015-RR08-NMY-Chiba 117
in the table below. We need your opinion on them by conducting pair-wise comparison for measuring the effectiveness of practices identified. Human life and health
Criteria NELD Indicators Practices
Impact on larger wellbeing of family
Relevance to DRR-CCA policy
Societal value
No. of people dead
No. of people injured
No. of people suffered from infectious diseases
No. of people who became disable
Early warning
Evacuation plan and centre
Flood plain management
Health care and rescue team
Water and Sanitation
Criteria NELD Indicators Practices
Impact on larger wellbeing of family
Relevance to DRR-CCA policy
Societal value
Access to sanitation
Access to adequate drinking water
Awareness
Emergency water source
Evacuation plan and centre
Mobile unit
Definition of each terminology for criteria, indicators and practices are given at the back
Respondent profile 1. Name: _________________________________ 2. Affiliation: ______________________________ 3. Position: __________________________________ 4. Gender: Male Female
5. Were you negatively impacted by the recent floods? Yes, No, Did not experience
6. Amount of economic loss: _____________________, 7. Nature of loss: work hour loss, sale of assets, properties, effect on health,
Others:________________________________________
Pair-wise comparison of criteria
Using the Saty’s scale of fundamental judgement, a 1-9 scale, we will compare the criteria based on which the indicators were identified. The meaning of the numbers is given in table below:
Intensity of
importance
Definition Explanation
1 Equal importance of both
options
Two activities contribute equally to the
objective
3 Moderate importance of one
option
Judgment slightly favors one criteria over
another
5 Strong importance for one
option
Judgment strongly favors one criteria over
another
7 Very strong importance for
one option
A criteria is favored very strongly over another
9 Extreme importance for one
option
Judgment favoring a criteria is of the highest
possible order of affirmation

Final Report: CAF2015-RR08-NMY-Chiba 118
Pairwise comparison of criteria It is important that the indicators prioritized should be able to satisfy a set of criteria that underpins the need for including NELD into risk management decisions. In other words, these criteria addresses the why aspect of including the NELD into information based on which risk management decisions are being made.
You can copy this tick mark ( ) to your desire scale
Impact on larger wellbeing of family
Relevance to DRR-CCA policy 9 7 5 3 1 3 5 7 9
Impact on larger wellbeing of family
Societal value
9 7 5 3 1 3 5 7 9
Relevance to DRR-CCA policy
Societal value
9 7 5 3 1 3 5 7 9
Human life and health
Pairwise comparison of indicators by each criteria
Please compare each indicator by keeping single criteria in view each time. We have three criteria at hand and we will compare each indicators applying these three criteria.
Pairwise comparison of indicators by the criteria of ‘Impact on larger wellbeing of family’
Example
Comparison between indicator no. of people dead and no. of people who became disable based on different criteria
Impact on larger wellbeing of family Death of family member can be much more significant than the family member getting disable. So the scale can be upto 9 for no. of dead.
No. of people dead No. of people who
became disable 9 7 5 3 1 3 5 7 9
Societal value
In the prospective of societal value, death of a person might be less significant than no. of people who became disable compared to impact on larger wellbeing of family. Therefore, the scale can be 7 or 5 for no. of people dead.
No. of people dead No. of people who
became disable 9 7 5 3 1 3 5 7 9
Relevance to DRR-CCA policy
However, in the prospective of DRR-CCA policy, both can have equal significant. So the scale can
be 1.
No. of people dead No. of people who
became disable 9 7 5 3 1 3 5 7 9
Note: This is just an example the indicator and its scale can be different based on view of respondent.
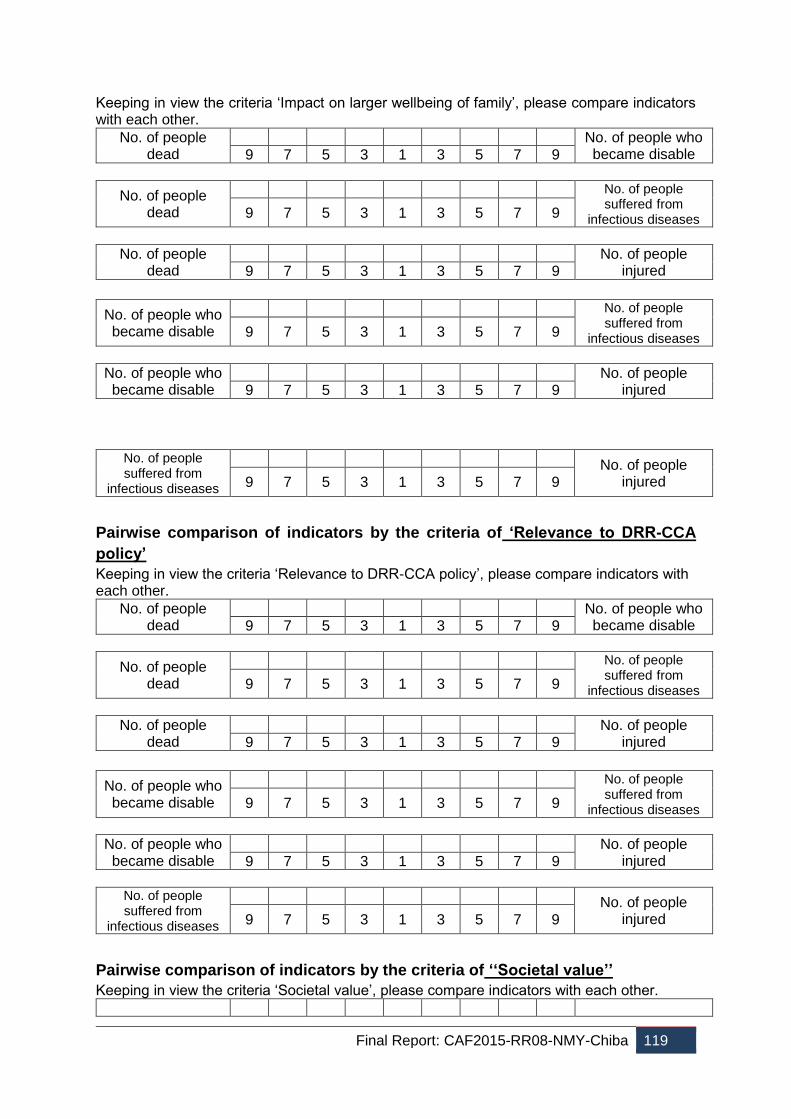
Final Report: CAF2015-RR08-NMY-Chiba 119
Keeping in view the criteria ‘Impact on larger wellbeing of family’, please compare indicators with each other.
No. of people dead
No. of people who became disable 9 7 5 3 1 3 5 7 9
No. of people dead
No. of people suffered from
infectious diseases 9 7 5 3 1 3 5 7 9
No. of people dead
No. of people injured 9 7 5 3 1 3 5 7 9
No. of people who became disable
No. of people suffered from
infectious diseases 9 7 5 3 1 3 5 7 9
No. of people who became disable
No. of people injured 9 7 5 3 1 3 5 7 9
No. of people suffered from
infectious diseases
No. of people injured 9 7 5 3 1 3 5 7 9
Pairwise comparison of indicators by the criteria of ‘Relevance to DRR-CCA
policy’
Keeping in view the criteria ‘Relevance to DRR-CCA policy’, please compare indicators with each other.
No. of people dead
No. of people who became disable 9 7 5 3 1 3 5 7 9
No. of people dead
No. of people suffered from
infectious diseases 9 7 5 3 1 3 5 7 9
No. of people dead
No. of people injured 9 7 5 3 1 3 5 7 9
No. of people who became disable
No. of people suffered from
infectious diseases 9 7 5 3 1 3 5 7 9
No. of people who became disable
No. of people injured 9 7 5 3 1 3 5 7 9
No. of people suffered from
infectious diseases
No. of people injured 9 7 5 3 1 3 5 7 9
Pairwise comparison of indicators by the criteria of ‘‘Societal value’’
Keeping in view the criteria ‘Societal value’, please compare indicators with each other.
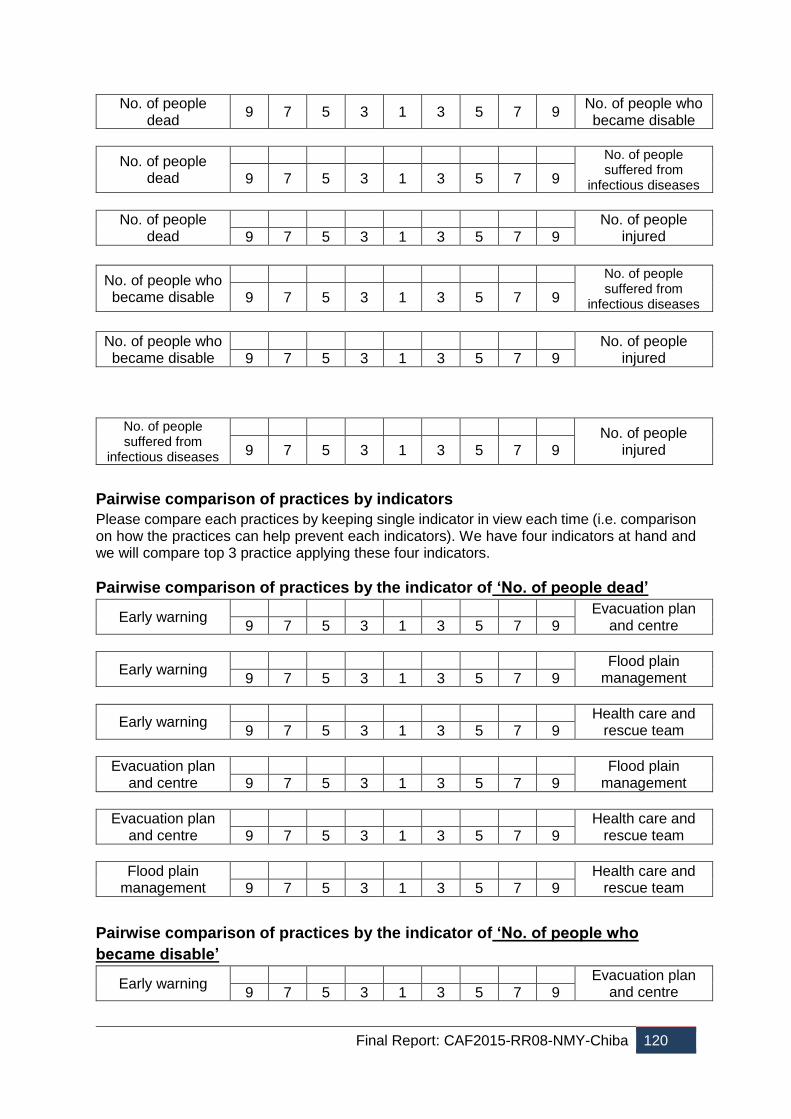
Final Report: CAF2015-RR08-NMY-Chiba 120
No. of people dead
9 7 5 3 1 3 5 7 9 No. of people who became disable
No. of people dead
No. of people suffered from
infectious diseases 9 7 5 3 1 3 5 7 9
No. of people dead
No. of people injured 9 7 5 3 1 3 5 7 9
No. of people who became disable
No. of people suffered from
infectious diseases 9 7 5 3 1 3 5 7 9
No. of people who became disable
No. of people injured 9 7 5 3 1 3 5 7 9
No. of people suffered from
infectious diseases
No. of people injured 9 7 5 3 1 3 5 7 9
Pairwise comparison of practices by indicators
Please compare each practices by keeping single indicator in view each time (i.e. comparison on how the practices can help prevent each indicators). We have four indicators at hand and we will compare top 3 practice applying these four indicators.
Pairwise comparison of practices by the indicator of ‘No. of people dead’
Early warning Evacuation plan
and centre 9 7 5 3 1 3 5 7 9
Early warning Flood plain
management 9 7 5 3 1 3 5 7 9
Early warning Health care and
rescue team 9 7 5 3 1 3 5 7 9
Evacuation plan and centre
Flood plain management 9 7 5 3 1 3 5 7 9
Evacuation plan and centre
Health care and rescue team 9 7 5 3 1 3 5 7 9
Flood plain management
Health care and rescue team 9 7 5 3 1 3 5 7 9
Pairwise comparison of practices by the indicator of ‘No. of people who
became disable’
Early warning Evacuation plan
and centre 9 7 5 3 1 3 5 7 9
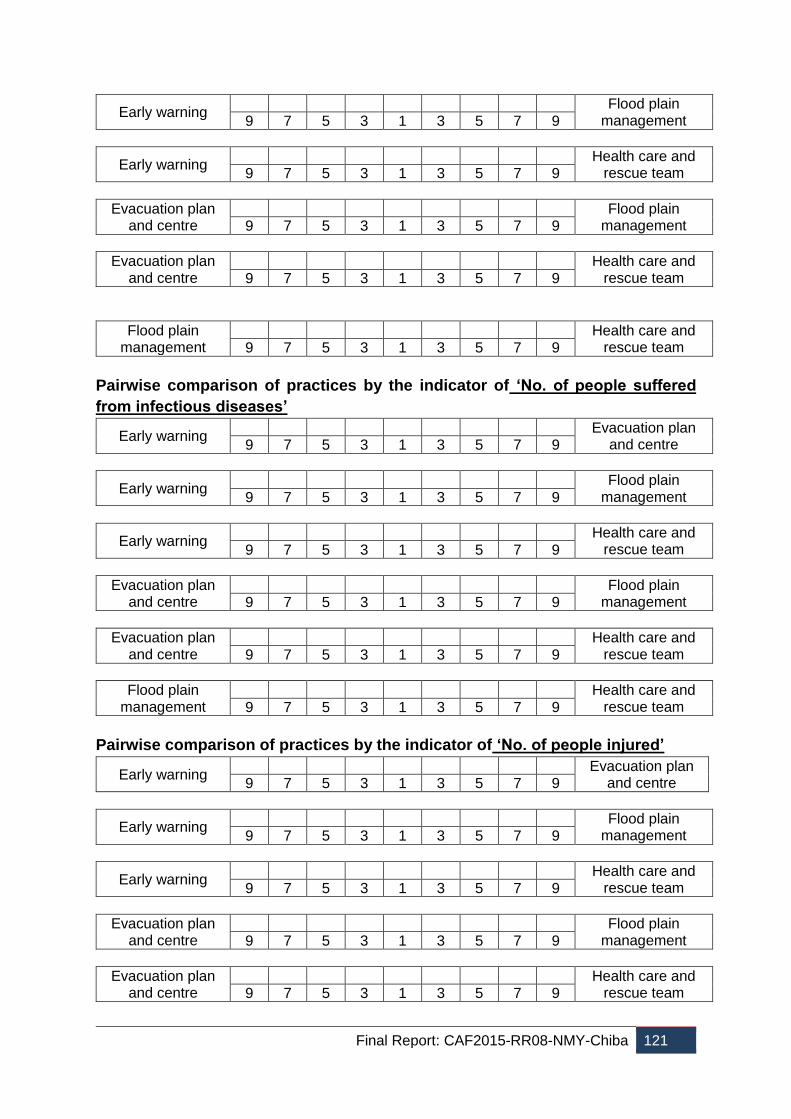
Final Report: CAF2015-RR08-NMY-Chiba 121
Early warning Flood plain
management 9 7 5 3 1 3 5 7 9
Early warning Health care and
rescue team 9 7 5 3 1 3 5 7 9
Evacuation plan and centre
Flood plain management 9 7 5 3 1 3 5 7 9
Evacuation plan and centre
Health care and rescue team 9 7 5 3 1 3 5 7 9
Flood plain management
Health care and rescue team 9 7 5 3 1 3 5 7 9
Pairwise comparison of practices by the indicator of ‘No. of people suffered
from infectious diseases’
Early warning Evacuation plan
and centre 9 7 5 3 1 3 5 7 9
Early warning Flood plain
management 9 7 5 3 1 3 5 7 9
Early warning Health care and
rescue team 9 7 5 3 1 3 5 7 9
Evacuation plan and centre
Flood plain management 9 7 5 3 1 3 5 7 9
Evacuation plan and centre
Health care and rescue team 9 7 5 3 1 3 5 7 9
Flood plain management
Health care and rescue team 9 7 5 3 1 3 5 7 9
Pairwise comparison of practices by the indicator of ‘No. of people injured’
Early warning Evacuation plan
and centre 9 7 5 3 1 3 5 7 9
Early warning Flood plain
management 9 7 5 3 1 3 5 7 9
Early warning Health care and
rescue team 9 7 5 3 1 3 5 7 9
Evacuation plan and centre
Flood plain management 9 7 5 3 1 3 5 7 9
Evacuation plan and centre
Health care and rescue team 9 7 5 3 1 3 5 7 9

Final Report: CAF2015-RR08-NMY-Chiba 122
Flood plain management
Health care and rescue team 9 7 5 3 1 3 5 7 9
Water and Sanitation
Pairwise comparison of indicators by each criteria
Please compare each indicator by keeping single criteria in view each time. We have three criteria at hand and we will compare each indicators applying these three criteria.
Pairwise comparison of indicators by the criteria of ‘Impact on larger wellbeing of family’ (family scale) Keeping in view the criteria ‘Impact on larger wellbeing of family’, please compare indicators with each other.
Access to adequate drinking
Water
Access to Sanitation 9 7 5 3 1 3 5 7 9
Pairwise comparison of indicators by the criteria of ‘‘Societal value’’ (Society
scale)
Keeping in view the criteria ‘Societal value’, please compare indicators with each other.
Access to adequate drinking
Water
Access to Sanitation 9 7 5 3 1 3 5 7 9
Pairwise comparison of indicators by the criteria of ‘Relevance to DRR-CCA
policy’ (in view of insurance and compensation scheme)
Keeping in view the criteria ‘Relevance to DRR-CCA policy’, please compare indicators with each other.
Access to adequate drinking
Water
Access to Sanitation 9 7 5 3 1 3 5 7 9
Pairwise comparison of practices by indicators
Please compare each practices by keeping single indicator in view each time (i.e. comparison on how the practices can help prevent each indicators). We have two indicators at hand and we will compare top 3 practice applying these two indicators.
Pairwise comparison of practices by the indicator of ‘Access to quality water’
Awareness Emergency water
source 9 7 5 3 1 3 5 7 9
Awareness Evacuation plan
and centre 9 7 5 3 1 3 5 7 9
Awareness
Mobile unit 9 7 5 3 1 3 5 7 9
Emergency water source
Evacuation plan and centre 9 7 5 3 1 3 5 7 9
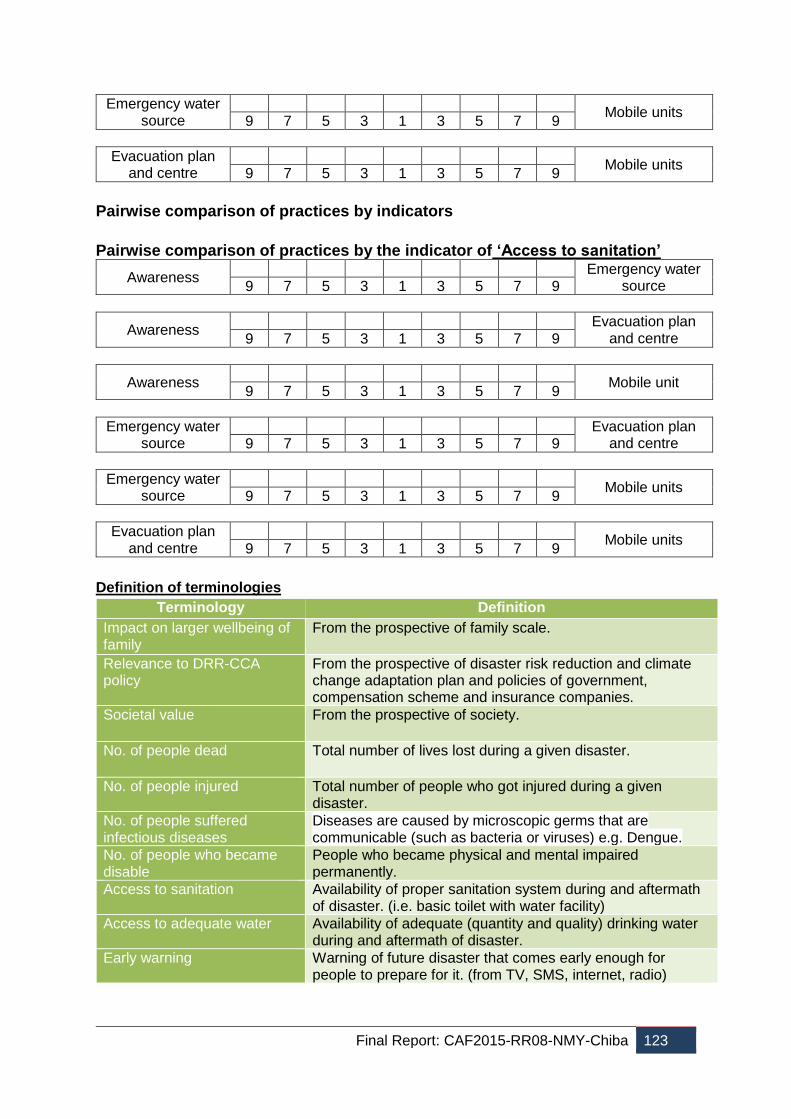
Final Report: CAF2015-RR08-NMY-Chiba 123
Emergency water source
Mobile units
9 7 5 3 1 3 5 7 9
Evacuation plan and centre
Mobile units
9 7 5 3 1 3 5 7 9
Pairwise comparison of practices by indicators
Pairwise comparison of practices by the indicator of ‘Access to sanitation’
Awareness Emergency water
source 9 7 5 3 1 3 5 7 9
Awareness Evacuation plan
and centre 9 7 5 3 1 3 5 7 9
Awareness
Mobile unit 9 7 5 3 1 3 5 7 9
Emergency water source
Evacuation plan and centre 9 7 5 3 1 3 5 7 9
Emergency water source
Mobile units
9 7 5 3 1 3 5 7 9
Evacuation plan and centre
Mobile units
9 7 5 3 1 3 5 7 9
Definition of terminologies
Terminology Definition
Impact on larger wellbeing of family
From the prospective of family scale.
Relevance to DRR-CCA policy
From the prospective of disaster risk reduction and climate change adaptation plan and policies of government, compensation scheme and insurance companies.
Societal value From the prospective of society.
No. of people dead Total number of lives lost during a given disaster.
No. of people injured Total number of people who got injured during a given disaster.
No. of people suffered infectious diseases
Diseases are caused by microscopic germs that are communicable (such as bacteria or viruses) e.g. Dengue.
No. of people who became disable
People who became physical and mental impaired permanently.
Access to sanitation Availability of proper sanitation system during and aftermath of disaster. (i.e. basic toilet with water facility)
Access to adequate water Availability of adequate (quantity and quality) drinking water during and aftermath of disaster.
Early warning Warning of future disaster that comes early enough for people to prepare for it. (from TV, SMS, internet, radio)
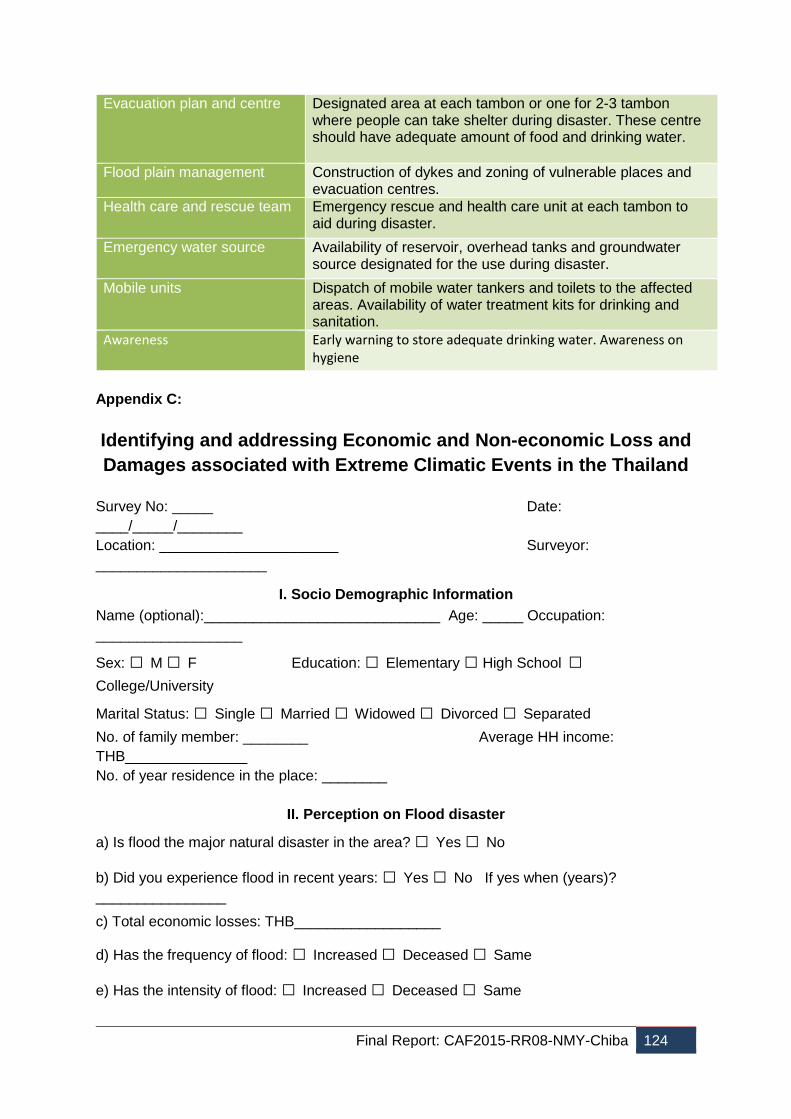
Final Report: CAF2015-RR08-NMY-Chiba 124
Evacuation plan and centre Designated area at each tambon or one for 2-3 tambon where people can take shelter during disaster. These centre should have adequate amount of food and drinking water.
Flood plain management Construction of dykes and zoning of vulnerable places and evacuation centres.
Health care and rescue team Emergency rescue and health care unit at each tambon to aid during disaster.
Emergency water source Availability of reservoir, overhead tanks and groundwater source designated for the use during disaster.
Mobile units Dispatch of mobile water tankers and toilets to the affected areas. Availability of water treatment kits for drinking and sanitation.
Awareness Early warning to store adequate drinking water. Awareness on hygiene
Appendix C:
Identifying and addressing Economic and Non-economic Loss and
Damages associated with Extreme Climatic Events in the Thailand
Survey No: _____ Date:
____/_____/________
Location: ______________________ Surveyor:
_____________________
I. Socio Demographic Information
Name (optional):_____________________________ Age: _____ Occupation:
__________________
Sex: □ M □ F Education: □ Elementary □ High School □ College/University
Marital Status: □ Single □ Married □ Widowed □ Divorced □ Separated
No. of family member: ________ Average HH income:
THB_______________
No. of year residence in the place: ________
II. Perception on Flood disaster
a) Is flood the major natural disaster in the area? □ Yes □ No
b) Did you experience flood in recent years: □ Yes □ No If yes when (years)?
________________
c) Total economic losses: THB__________________
d) Has the frequency of flood: □ Increased □ Deceased □ Same
e) Has the intensity of flood: □ Increased □ Deceased □ Same
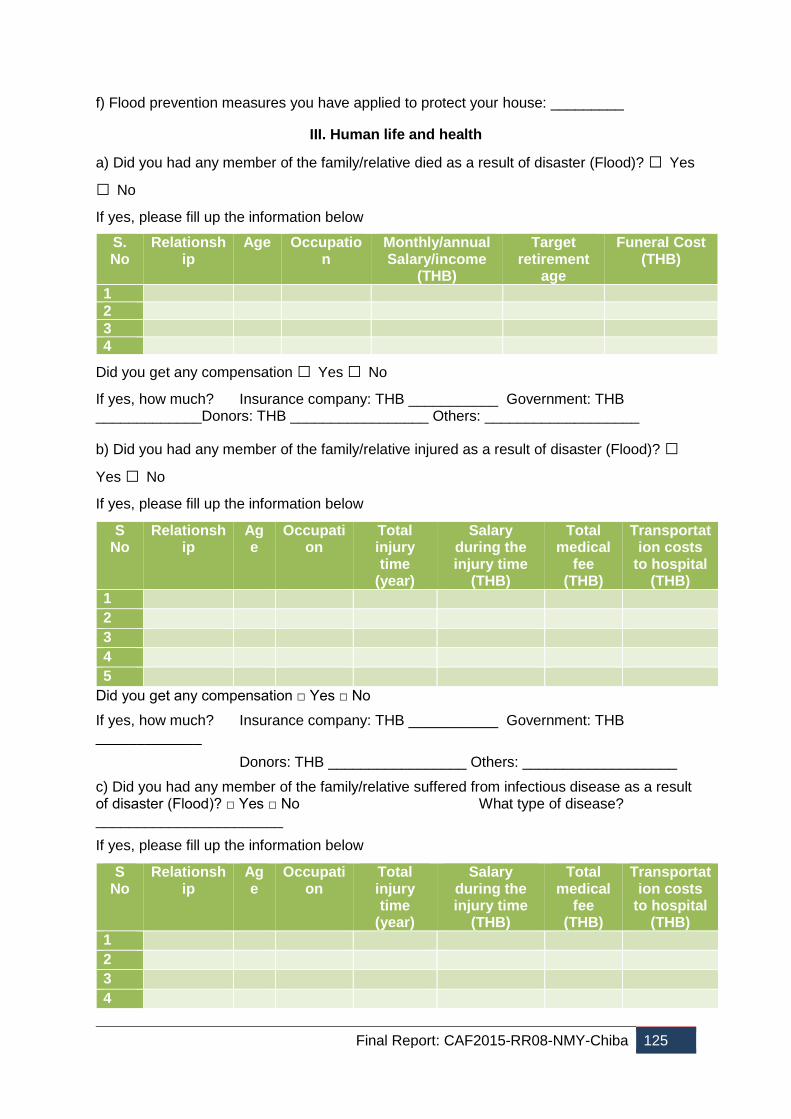
Final Report: CAF2015-RR08-NMY-Chiba 125
f) Flood prevention measures you have applied to protect your house: _________
III. Human life and health
a) Did you had any member of the family/relative died as a result of disaster (Flood)? □ Yes
□ No
If yes, please fill up the information below
S. No
Relationship
Age Occupation
Monthly/annual Salary/income
(THB)
Target retirement
age
Funeral Cost (THB)
1
2
3
4
Did you get any compensation □ Yes □ No
If yes, how much? Insurance company: THB ___________ Government: THB _____________Donors: THB _________________ Others: ___________________
b) Did you had any member of the family/relative injured as a result of disaster (Flood)? □ Yes □ No
If yes, please fill up the information below
Did you get any compensation □ Yes □ No
If yes, how much? Insurance company: THB ___________ Government: THB _____________
Donors: THB _________________ Others: ___________________
c) Did you had any member of the family/relative suffered from infectious disease as a result of disaster (Flood)? □ Yes □ No What type of disease? _______________________
If yes, please fill up the information below
S No
Relationship
Age
Occupation
Total injury time
(year)
Salary during the injury time
(THB)
Total medical
fee (THB)
Transportation costs
to hospital (THB)
1
2
3
4
5
S No
Relationship
Age
Occupation
Total injury time
(year)
Salary during the injury time
(THB)
Total medical
fee (THB)
Transportation costs
to hospital (THB)
1
2
3
4
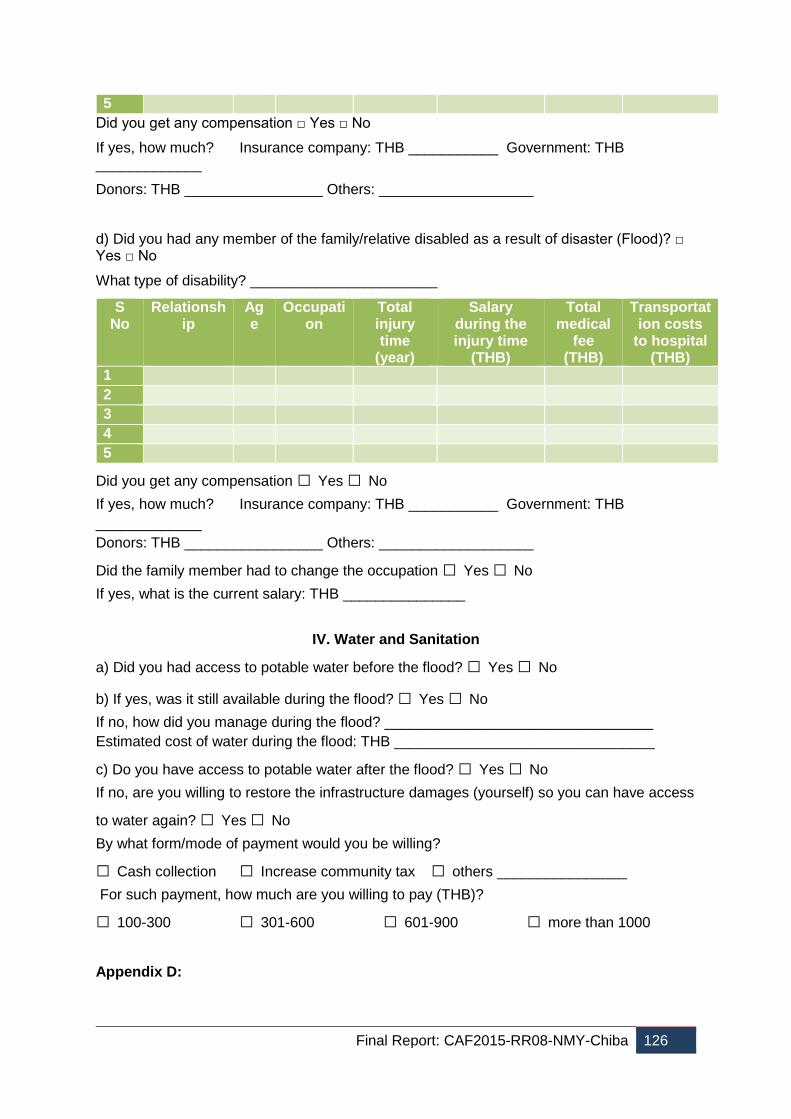
Final Report: CAF2015-RR08-NMY-Chiba 126
Did you get any compensation □ Yes □ No
If yes, how much? Insurance company: THB ___________ Government: THB _____________
Donors: THB _________________ Others: ___________________
d) Did you had any member of the family/relative disabled as a result of disaster (Flood)? □ Yes □ No
What type of disability? _______________________
Did you get any compensation □ Yes □ No
If yes, how much? Insurance company: THB ___________ Government: THB
_____________
Donors: THB _________________ Others: ___________________
Did the family member had to change the occupation □ Yes □ No
If yes, what is the current salary: THB _______________
IV. Water and Sanitation
a) Did you had access to potable water before the flood? □ Yes □ No
b) If yes, was it still available during the flood? □ Yes □ No
If no, how did you manage during the flood? _________________________________
Estimated cost of water during the flood: THB ________________________________
c) Do you have access to potable water after the flood? □ Yes □ No
If no, are you willing to restore the infrastructure damages (yourself) so you can have access
to water again? □ Yes □ No
By what form/mode of payment would you be willing?
□ Cash collection □ Increase community tax □ others ________________
For such payment, how much are you willing to pay (THB)?
□ 100-300 □ 301-600 □ 601-900 □ more than 1000
Appendix D:
5
S No
Relationship
Age
Occupation
Total injury time
(year)
Salary during the injury time
(THB)
Total medical
fee (THB)
Transportation costs
to hospital (THB)
1
2
3
4
5
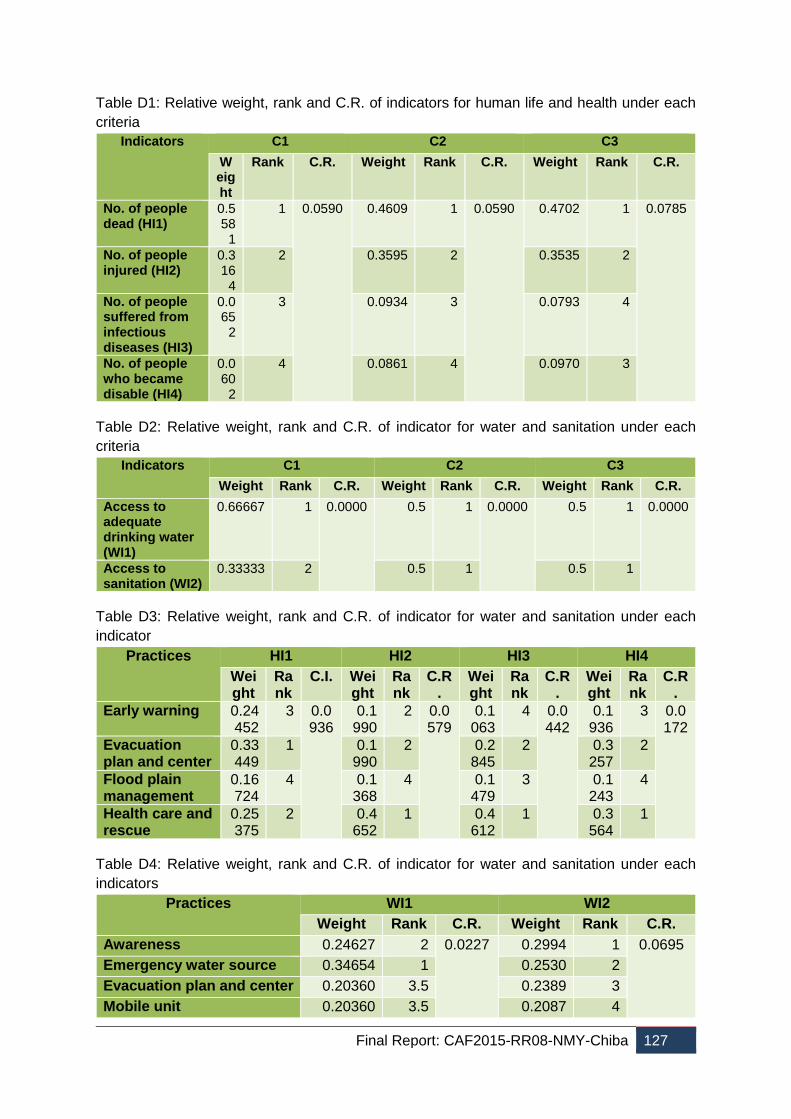
Final Report: CAF2015-RR08-NMY-Chiba 127
Table D1: Relative weight, rank and C.R. of indicators for human life and health under each
criteria
Indicators C1 C2 C3
Weight
Rank C.R. Weight Rank C.R. Weight Rank C.R.
No. of people dead (HI1)
0.558
1
1 0.0590 0.4609 1 0.0590 0.4702 1 0.0785
No. of people injured (HI2)
0.316
4
2 0.3595 2 0.3535 2
No. of people suffered from infectious diseases (HI3)
0.065
2
3 0.0934 3 0.0793 4
No. of people who became disable (HI4)
0.060
2
4 0.0861 4 0.0970 3
Table D2: Relative weight, rank and C.R. of indicator for water and sanitation under each
criteria
Indicators C1 C2 C3
Weight Rank C.R. Weight Rank C.R. Weight Rank C.R.
Access to adequate drinking water (WI1)
0.66667 1 0.0000 0.5 1 0.0000 0.5 1 0.0000
Access to sanitation (WI2)
0.33333 2 0.5 1 0.5 1
Table D3: Relative weight, rank and C.R. of indicator for water and sanitation under each
indicator
Practices HI1 HI2 HI3 HI4
Weight
Rank
C.I. Weight
Rank
C.R.
Weight
Rank
C.R.
Weight
Rank
C.R.
Early warning 0.24452
3 0.0936
0.1990
2 0.0579
0.1063
4 0.0442
0.1936
3 0.0172
Evacuation plan and center
0.33449
1 0.1990
2 0.2845
2 0.3257
2
Flood plain management
0.16724
4 0.1368
4 0.1479
3 0.1243
4
Health care and rescue
0.25375
2 0.4652
1 0.4612
1 0.3564
1
Table D4: Relative weight, rank and C.R. of indicator for water and sanitation under each
indicators
Practices WI1 WI2
Weight Rank C.R. Weight Rank C.R.
Awareness 0.24627 2 0.0227 0.2994 1 0.0695
Emergency water source 0.34654 1 0.2530 2
Evacuation plan and center 0.20360 3.5 0.2389 3
Mobile unit 0.20360 3.5 0.2087 4

Final Report: CAF2015-RR08-NMY-Chiba 128

Contact
Institute for Global Environmental Strategies (IGES), Hayama, Japan
APN website: http://www.apn-gcr.org/resources/items/show/1943
IGES website: https://www.iges.or.jp/en/natural-resource/ad/landd.html
Related Documents