Click on the button to go to the problem © 2013 Pearson © 2013 Pearson

Click on the button to go to the problem © 2013 Pearson.
Dec 14, 2015
Welcome message from author
This document is posted to help you gain knowledge. Please leave a comment to let me know what you think about it! Share it to your friends and learn new things together.
Transcript

Click on the button to go to the problem
© 2013 Pearson© 2013 Pearson
© 2013 Pearson
Aggregate Supply and Aggregate Demand
29CHECKPOINTS
Click on the button to go to the problem
© 2013 Pearson
Problem 2Problem 2
Problem 3Problem 3
Problem 1Problem 1
Problem 2Problem 2
Problem 1Problem 1
Checkpoint 29.1 Checkpoint 29.2 Checkpoint 29.3
Problem 1Problem 1 Clickerversion
Clickerversion
Clickerversion
Clickerversion
Clickerversion
Clickerversion
Clickerversion
ClickerversionIn the newsIn the news
In the newsIn the news
In the newsIn the news

© 2013 Pearson
Practice Problem 1 Explain the influence of each of events on the quantity of real GDP supplied and aggregate supply in India and use a graph to illustrate.
• Fuel prices rise.
• U.S. firms move their IT and data functions to India.
• Wal-Mart and Starbucks open in India.
• Universities in India increase the number of engineering graduates.
• The money wage rate in India rises.
• The price level in India rises.
CHECKPOINT 29.1

© 2013 Pearson
SolutionAs fuel prices rise, the quantity of real GDP supplied at the current price level decreases.
The AS curve shifts leftward.
CHECKPOINT 29.1
© 2013 Pearson
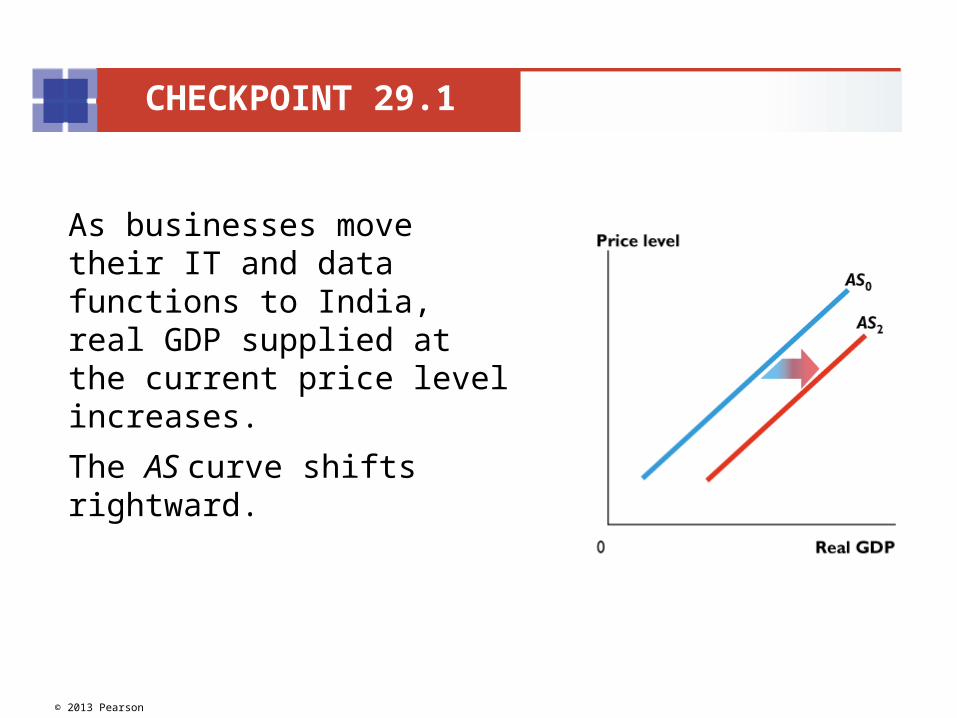
As businesses move their IT and data functions to India, real GDP supplied at the current price level increases.
The AS curve shifts rightward.
CHECKPOINT 29.1
© 2013 Pearson
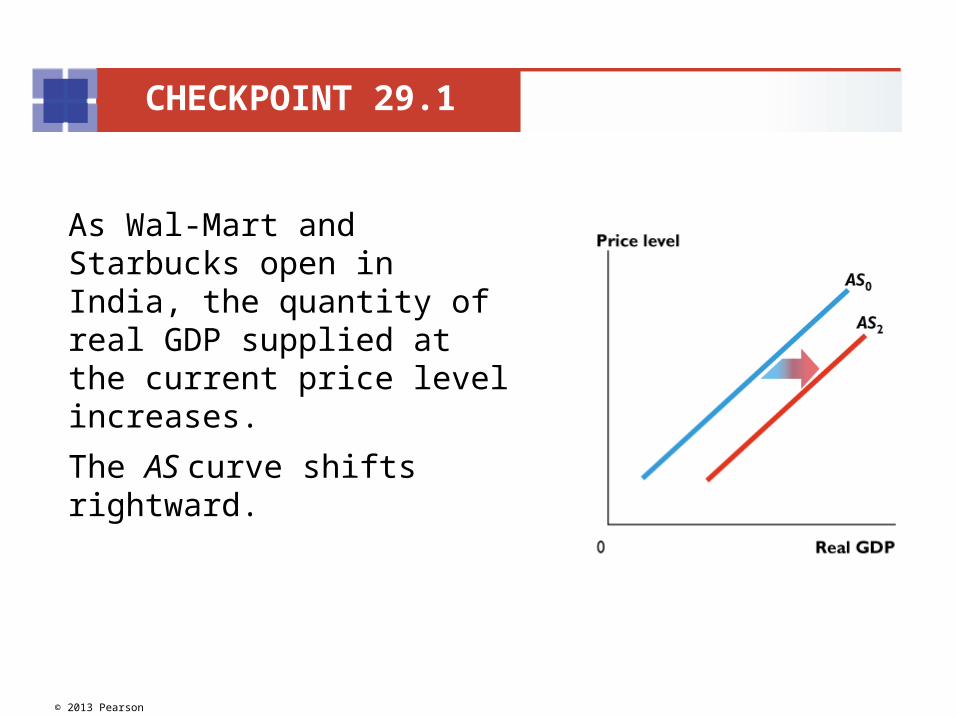
As Wal-Mart and Starbucks open in India, the quantity of real GDP supplied at the current price level increases.
The AS curve shifts rightward.
CHECKPOINT 29.1

© 2013 Pearson
With more engineering graduates, the number of skilled workers increases, and production increases at the current price level.
The AS curve shifts rightward.
CHECKPOINT 29.1
© 2013 Pearson
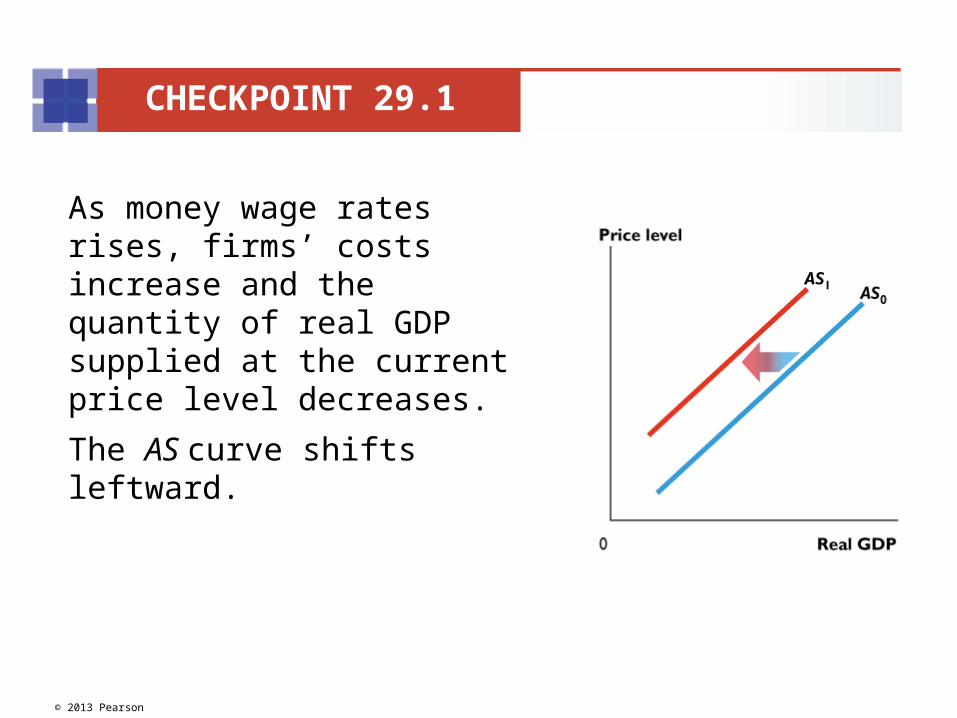
As money wage rates rises, firms’ costs increase and the quantity of real GDP supplied at the current price level decreases.
The AS curve shifts leftward.
CHECKPOINT 29.1
© 2013 Pearson
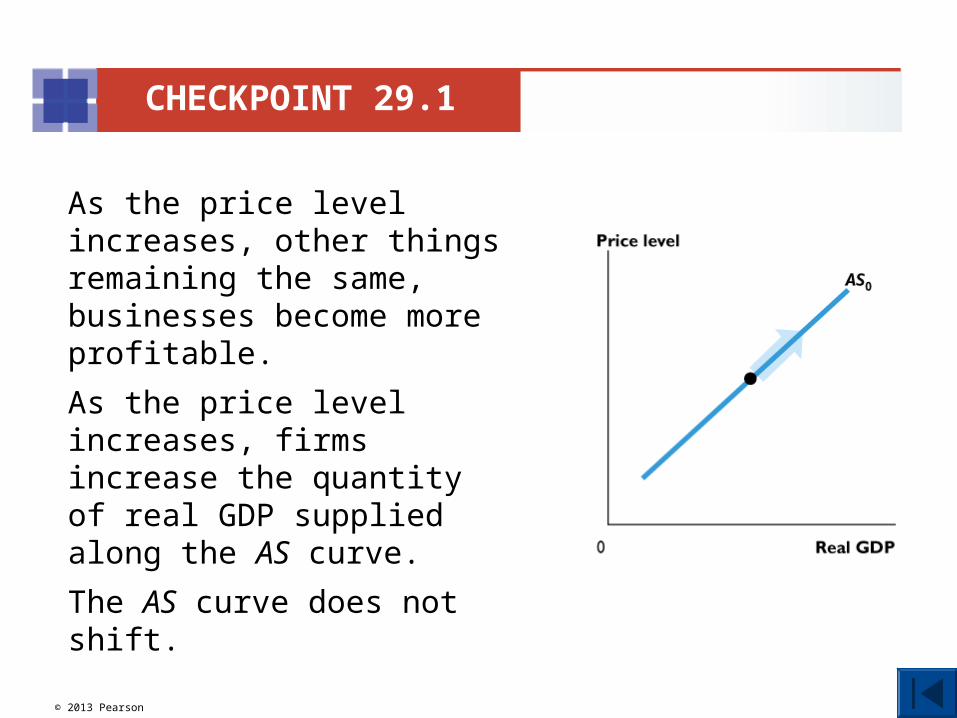
As the price level increases, other things remaining the same, businesses become more profitable.
As the price level increases, firms increase the quantity of real GDP supplied along the AS curve.
The AS curve does not shift.
CHECKPOINT 29.1

© 2013 Pearson
Study Plan ProblemU.S. firms move their IT and data functions to India. In the short run, India’s aggregate supply _________.
CHECKPOINT 29.1
A. increases
B. doesn’t change, but U.S. aggregate supply increases
C. decreases because more of India’s workers are now employed by U.S. firms
D. doesn’t change, but a higher price level brings an increase in the quantity of real GDP supplied
© 2013 Pearson
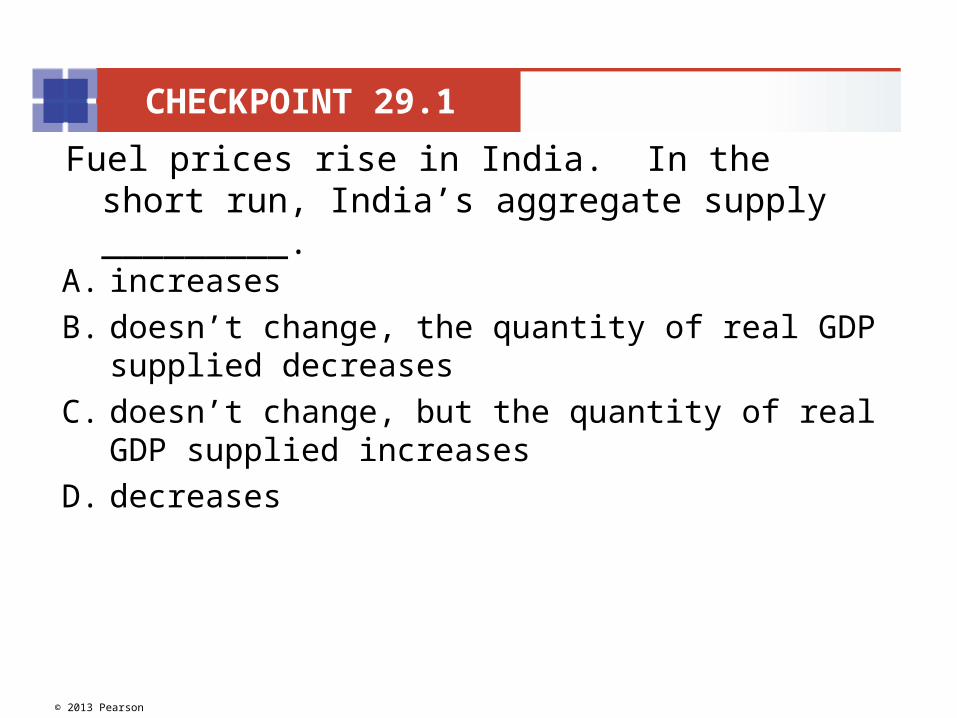
Fuel prices rise in India. In the short run, India’s aggregate supply _________.
CHECKPOINT 29.1
A. increases
B. doesn’t change, the quantity of real GDP supplied decreases
C. doesn’t change, but the quantity of real GDP supplied increases
D. decreases
© 2013 Pearson
Wal-Mart and Starbucks open in India. In the short run, India’s aggregate supply _______.
CHECKPOINT 29.1
A. increases
B. doesn’t change, the quantity of real GDP supplied decreases
C. doesn’t change, but the quantity of real GDP supplied increases
D. decreases

© 2013 Pearson
Universities in India increase the number of engineering graduates. In the short run, India’s aggregate supply _______.
CHECKPOINT 29.1
A. doesn’t change, the quantity of real GDP supplied decreases
B. increases
C. doesn’t change, but the quantity of real GDP supplied increases
D. decreases

© 2013 Pearson
The money wage rate in India rises. In the short run, India’s aggregate supply _______.
CHECKPOINT 29.1
A. doesn’t change, but the price level rises and the quantity of real GDP supplied increases
B. increases
C. doesn’t change, but the price level falls and the quantity of real GDP supplied decreases
D. decreases
© 2013 Pearson
The price level in India rises. In the short run, India’s aggregate supply _______.
CHECKPOINT 29.1
A. doesn’t change, but the quantity of real GDP supplied decreases
B. increases
C. doesn’t change, but the quantity of real GDP supplied increases
D. decreases
© 2013 Pearson
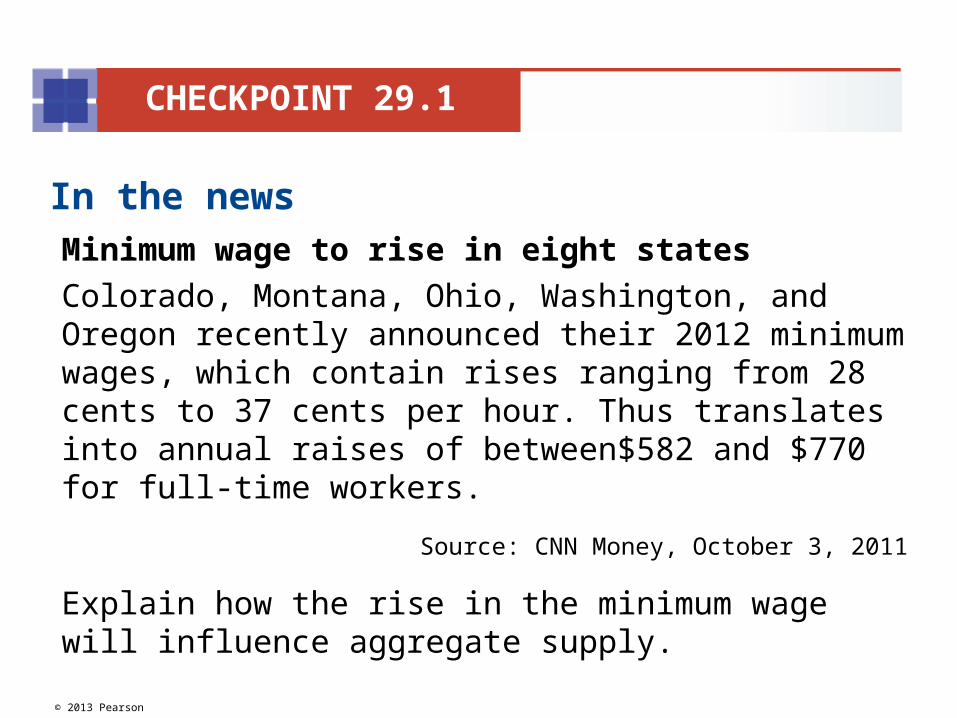
In the newsMinimum wage to rise in eight states
Colorado, Montana, Ohio, Washington, and Oregon recently announced their 2012 minimum wages, which contain rises ranging from 28 cents to 37 cents per hour. Thus translates into annual raises of between$582 and $770 for full-time workers.
Source: CNN Money, October 3, 2011
Explain how the rise in the minimum wage will influence aggregate supply.
CHECKPOINT 29.1
© 2013 Pearson
Solution
The rise in the minimum wage at the current price level increases the real wage rate and decreases aggregate supply.
If the rise in the minimum wage rate increases the natural unemployment rate, potential GDP decreases and aggregate supply decreases farther.
CHECKPOINT 29.1
© 2013 Pearson
Practice Problem 1Mexico trades with the United States.
Explain the effect of each of the following events on Mexico’s aggregate demand.
• The government of Mexico cuts income taxes.
•The United States experiences strong economicgrowth.
•Mexico sets new environmental standards that require factories to upgrade their production facilities.
CHECKPOINT 29.2
© 2013 Pearson
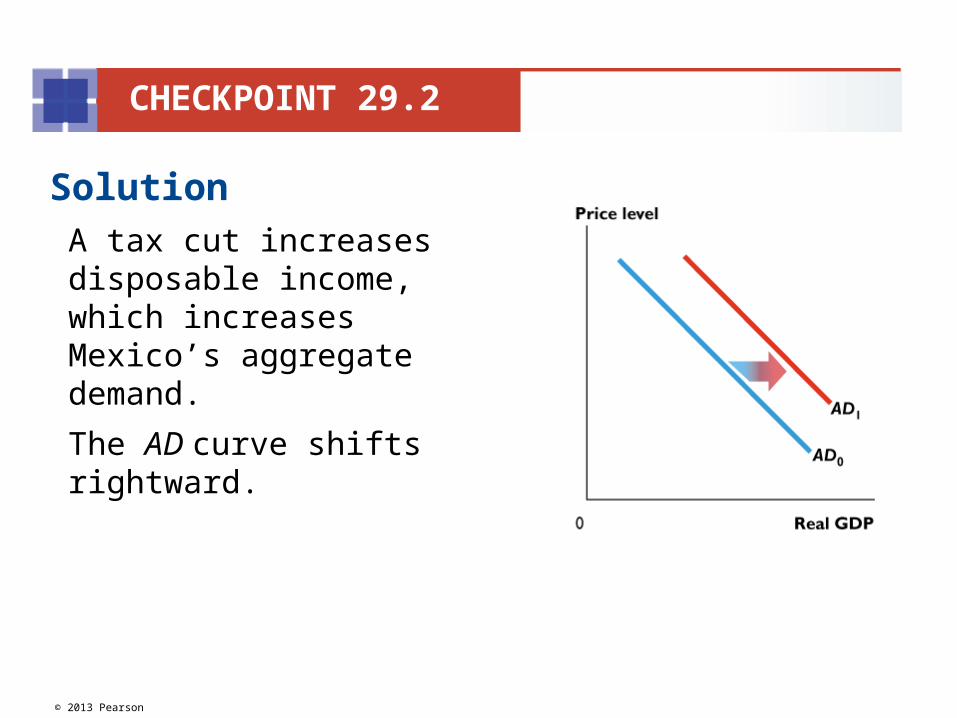
SolutionA tax cut increases disposable income, which increases Mexico’s aggregate demand.
The AD curve shifts rightward.
CHECKPOINT 29.2

© 2013 Pearson
Strong U.S. growth increases the demand for Mexican-produced goods and increases Mexico’s aggregate demand.
The AD curve shifts rightward.
CHECKPOINT 29.2
© 2013 Pearson
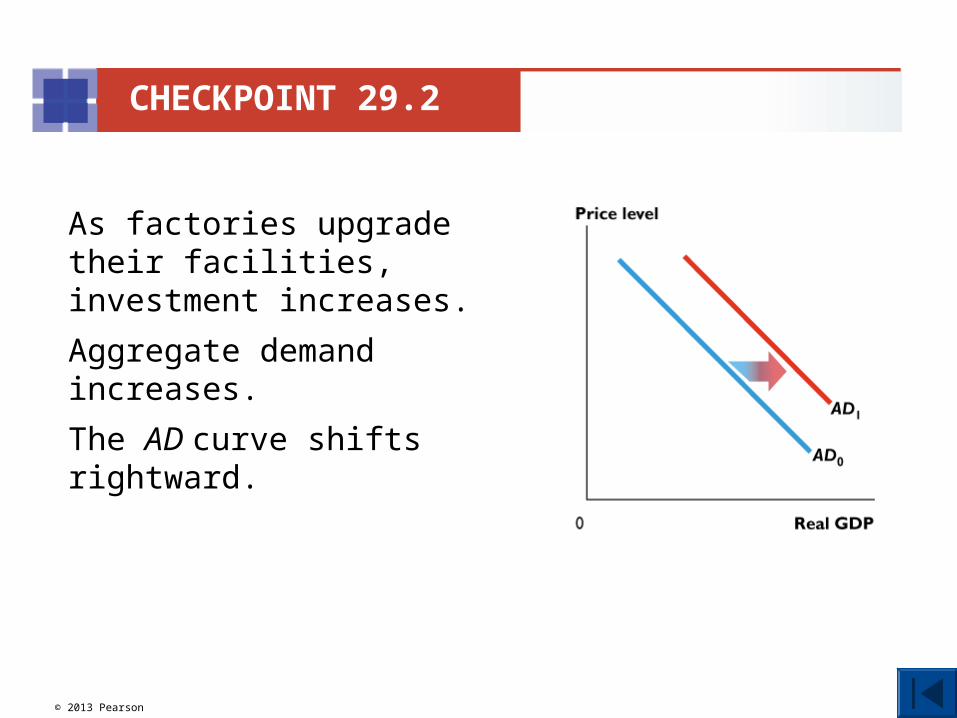
As factories upgrade their facilities, investment increases.
Aggregate demand increases.
The AD curve shifts rightward.
CHECKPOINT 29.2

© 2013 Pearson
Study Plan ProblemIf the government of Mexico cuts income taxes,Mexico’s aggregate demand _________.
CHECKPOINT 29.2
A. decreases, and the AD curve shifts leftward
B. increases, and the AD curve shifts rightward
C. is unchanged because it just increases the amount that taxpayers transfer to the government
D. is unchanged, but the price level rises and the quantity of real GDP demanded decreases
© 2013 Pearson
Mexico trades with the United States. If the United States experiences strong economic growth, Mexico’s aggregate demand _________.
CHECKPOINT 29.2
A. decreases and the AD curve shifts leftward
B. is unchanged, but the quantity of real GDP demanded increases
C. is unchanged, but U.S. aggregate demand increases
D. increases because its exports to the United States increases
© 2013 Pearson
When Mexico sets new environmental standards that require factories to upgrade their production facilities. Mexico’s aggregate demand _________.
CHECKPOINT 29.2
A. increases because investment increases
B. is unchanged, but the quantity of real GDP demanded increases
C. is unchanged, but the quantity of real GDP demanded decreases
D. decreases
© 2013 Pearson
Practice Problem 2Explain the effect of each of the following events on Mexico’s aggregate demand.
•Europe trades with Mexico and Europe goes into recession.
•The price level in Mexico rises.
•Mexico increases the quantity of money.
CHECKPOINT 29.2
© 2013 Pearson
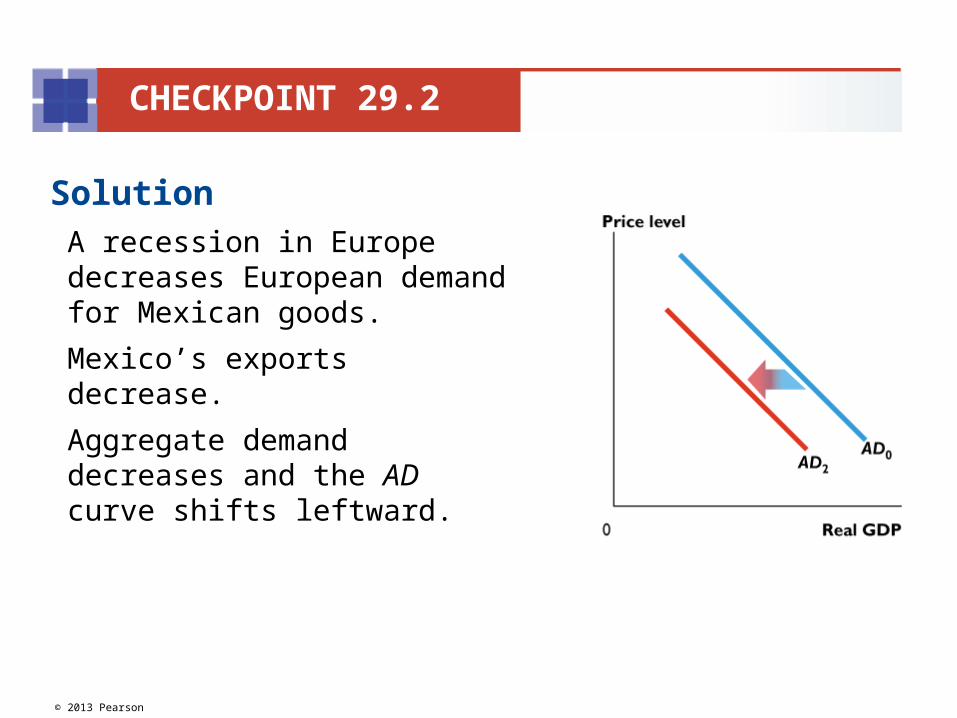
SolutionA recession in Europe decreases European demand for Mexican goods.
Mexico’s exports decrease.
Aggregate demand decreases and the AD curve shifts leftward.
CHECKPOINT 29.2
© 2013 Pearson
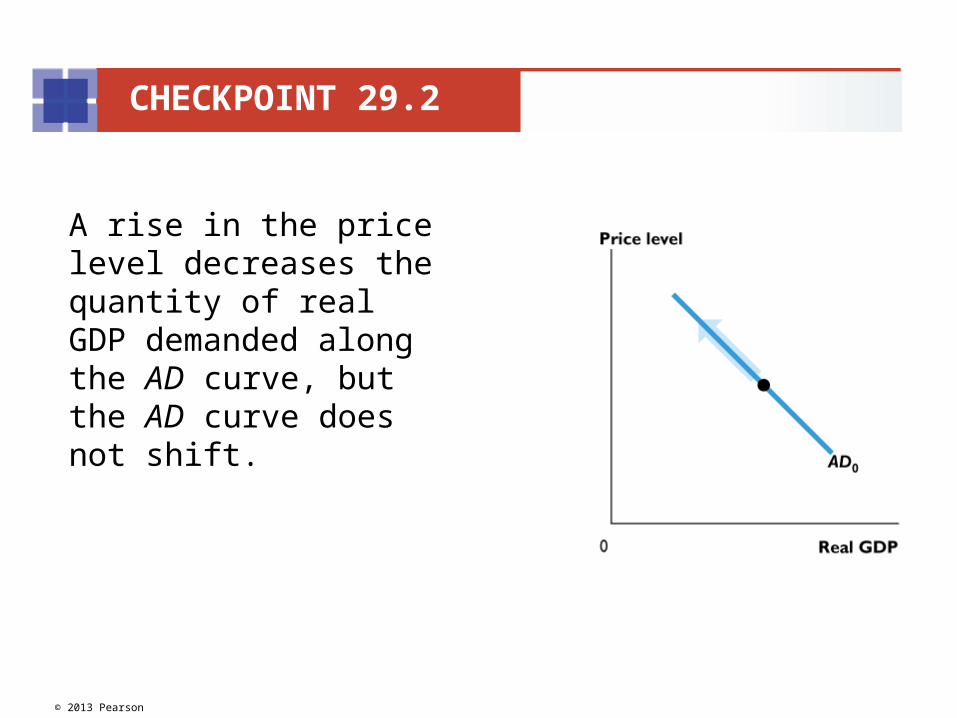
A rise in the price level decreases the quantity of real GDP demanded along the AD curve, but the AD curve does not shift.
CHECKPOINT 29.2
© 2013 Pearson
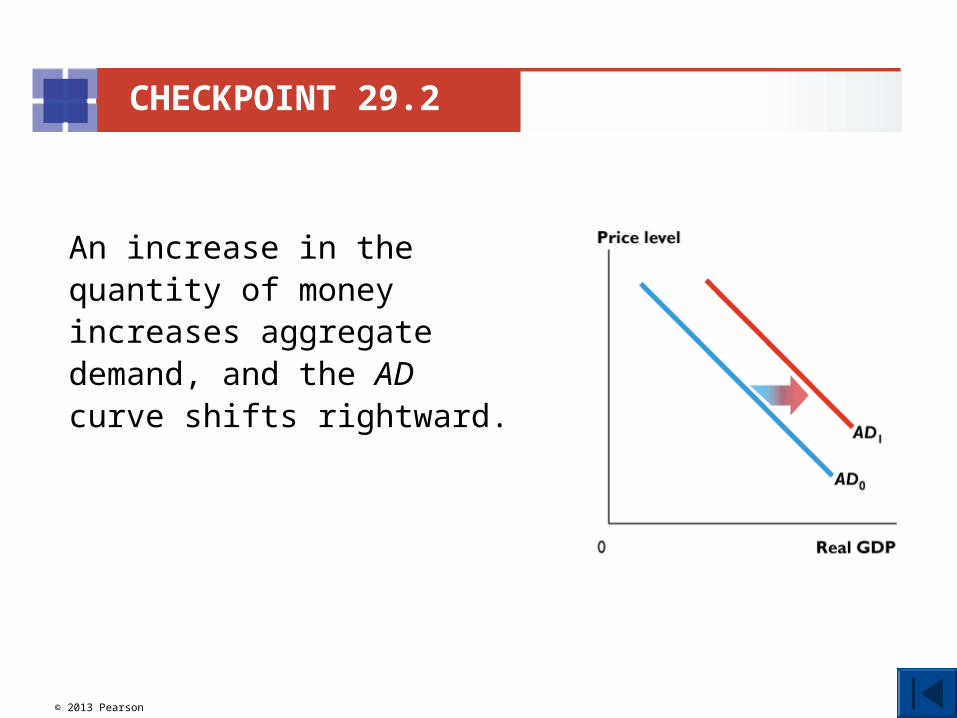
An increase in the quantity of money increases aggregate demand, and the AD curve shifts rightward.
CHECKPOINT 29.2

© 2013 Pearson
In the news
Durable goods orders fall, new-homes sales pick up
The BEA announced that demand for durable goods fell 5.3%, while new-home sales rose 4.2% in the second quarter of 2011. U.S. exports increased 3.6%.
Source: BEA, September 29, 2011
Explain how the items in the news clip influence U.S. aggregate demand.
CHECKPOINT 29.2
© 2013 Pearson
SolutionThe purchase of durable goods and new homes is investment.
A decrease in durable goods sales decreases aggregate demand, while the increase in new home sales increased aggregate demand.
The rise in U.S. exports is an increase in the demand for U.S.-produced goods and services, so the rise in U.S. exports increased U.S. aggregate demand.
CHECKPOINT 29.2

© 2013 Pearson
Practice Problem 1The U.S. economy is at full employment when the following events occur:
• A deep recession hits the world economy.
• The world oil price rises by a large amount.
• U.S. businesses expect future profits to fall.
Explain the effect of each event separately on aggregate demand and aggregate supply.
How will real GDP and price level change in the short run?
CHECKPOINT 29.3

© 2013 Pearson
SolutionA deep recession in the world economy decreases U.S. aggregate demand.
The AD curve shifts leftward.
In the short run, U.S. real GDP decreases and the price level falls.
CHECKPOINT 29.3
© 2013 Pearson
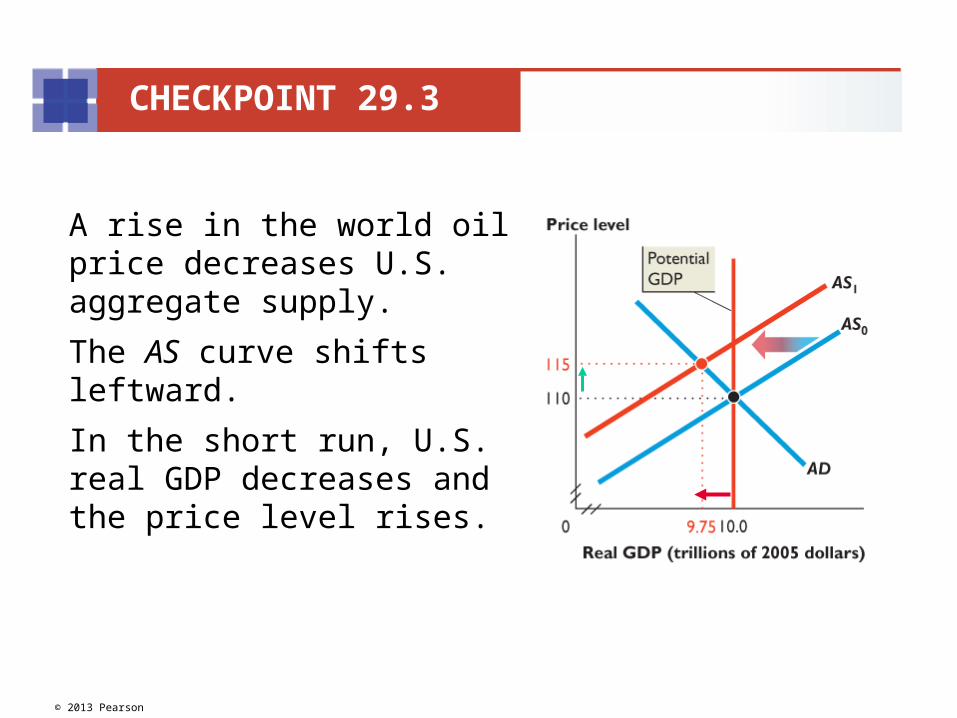
A rise in the world oil price decreases U.S. aggregate supply.
The AS curve shifts leftward.
In the short run, U.S. real GDP decreases and the price level rises.
CHECKPOINT 29.3

© 2013 Pearson
A fall in expected future profits decreases U.S. aggregate demand.
The AD curve shifts leftward.
In the short run, U.S. real GDP decreases and the price level falls.
CHECKPOINT 29.3
© 2013 Pearson
Practice Problem 2The U.S. economy is at full employment when the following events occur:
• A deep recession hits the world economy.
• The world oil price rises by a large amount.
• U.S. businesses expect future profits to fall.
Explain the combined effect of these events on real GDP and price level.
CHECKPOINT 29.3
© 2013 Pearson
Solution
All three events decrease U.S. real GDP.
The deep world recession and the fall in expected future profits decrease the price level.
The rise in the world oil price increases the price level.
So the combined effect on the price level is ambiguous.
CHECKPOINT 29.3
© 2013 Pearson
Study Plan ProblemThe U.S. economy is at full employment when a deep recession hits the world economy, the world oil price rises by a large amount, and U.S. businesses expect future profits to fall.
CHECKPOINT 29.2
A. The U.S. price level rises and real GDP decreases
B. The U.S. price level falls and real GDP decreases
C. U.S. real GDP decreases, but the price level might rise or fall.
D. U.S. real GDP increases, but the price level might rise or fall.
© 2013 Pearson
Practice Problem 3The U.S. economy is at full employment when the following events occur:
• A deep recession hits the world economy.
• The world oil price rises by a large amount.
• U.S. businesses expect future profits to fall.
Which event, if any, brings stagflation?
CHECKPOINT 29.3

© 2013 Pearson
SolutionStagflation occurs when the price level rises and real GDP decreases at the same time.
The rise in the world oil price brings stagflation because it decreases aggregate supply, decreases real GDP, and raises the price level.
CHECKPOINT 29.3
© 2013 Pearson
Study Plan ProblemThe U.S. economy is at full employment. Stagflation occurs, if ______.
CHECKPOINT 29.2
A. a deep recession hits the world economy
B. the world oil price rises by a large amount
C. U.S. businesses expect future profits to fall.
D. A, or B, or C occur.
© 2013 Pearson
In the news
U.S. incomes fall for the first time in 2 years
Consumer spending rose 0.2 percent, down from 0.7 percent in July. Incomes fell 0.1 percent—the first decline since October 2009. Consumer spending accounts for 70 percent of economic activity.
Source: Associated Press, September 30, 2011
Explain the combined effect of these events in terms of the AS-AD model.
CHECKPOINT 29.3
© 2013 Pearson
Solution
The news clip gives no information about aggregate supply.
Consumption expenditure is 70 percent of aggregate demand, so an increase in consumption expenditure would increase aggregate demand, GDP, and aggregate incomes.
CHECKPOINT 29.3
© 2013 Pearson
But incomes fell, so the other components of aggregate demand (investment, government expenditure, net exports) must have decreased, ….
moving the economy down along the AS curve.
Or aggregate supply must have decreased, moving the economy up along the AD curve.
CHECKPOINT 29.3
Related Documents