Cleveland Clinic Transforming Healthcare

Cleveland Clinic Transforming Healthcare Cleveland Clinic Transforming Healthcare.
Dec 16, 2015
Welcome message from author
This document is posted to help you gain knowledge. Please leave a comment to let me know what you think about it! Share it to your friends and learn new things together.
Transcript
Cleveland ClinicTransforming
Healthcare
Cleveland ClinicTransforming
Healthcare

Age > 65Age > 65
#Millions
#Millions
19001900
90
70
50
30
10
90
70
50
30
10
19201920 19401940 19601960 20002000 20202020 2040204019801980
Se-ries1

The total amount of knowledge doubles every 2 1/2 years
The total amount of knowledge doubles every 2 1/2 years
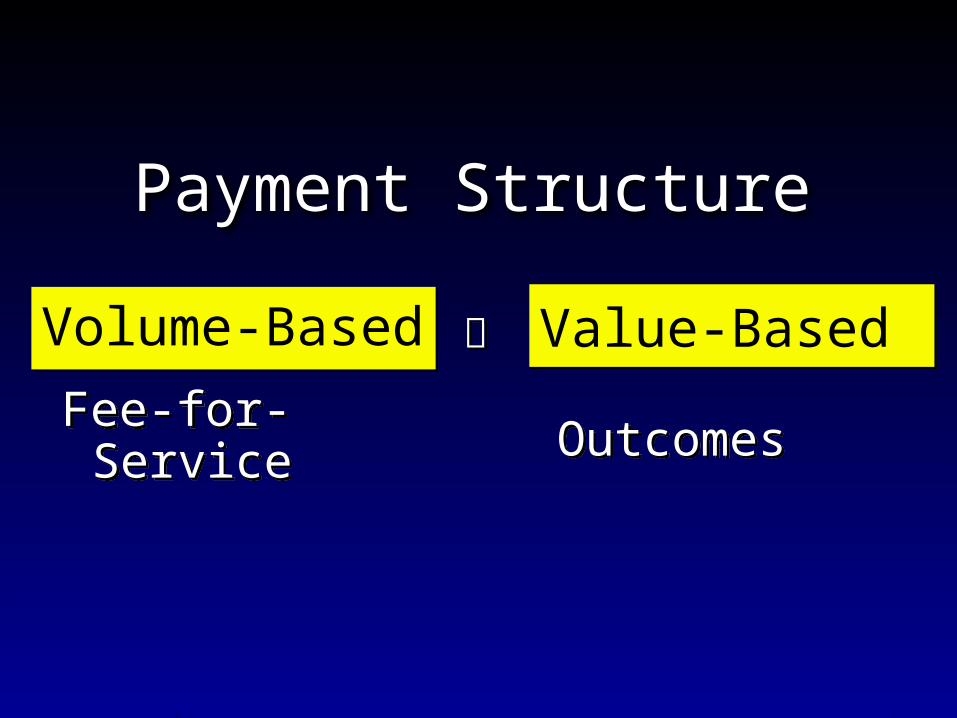
Volume-BasedVolume-Based Value-BasedValue-Based
Fee-for-ServiceFee-for-Service OutcomesOutcomes
Payment Structure
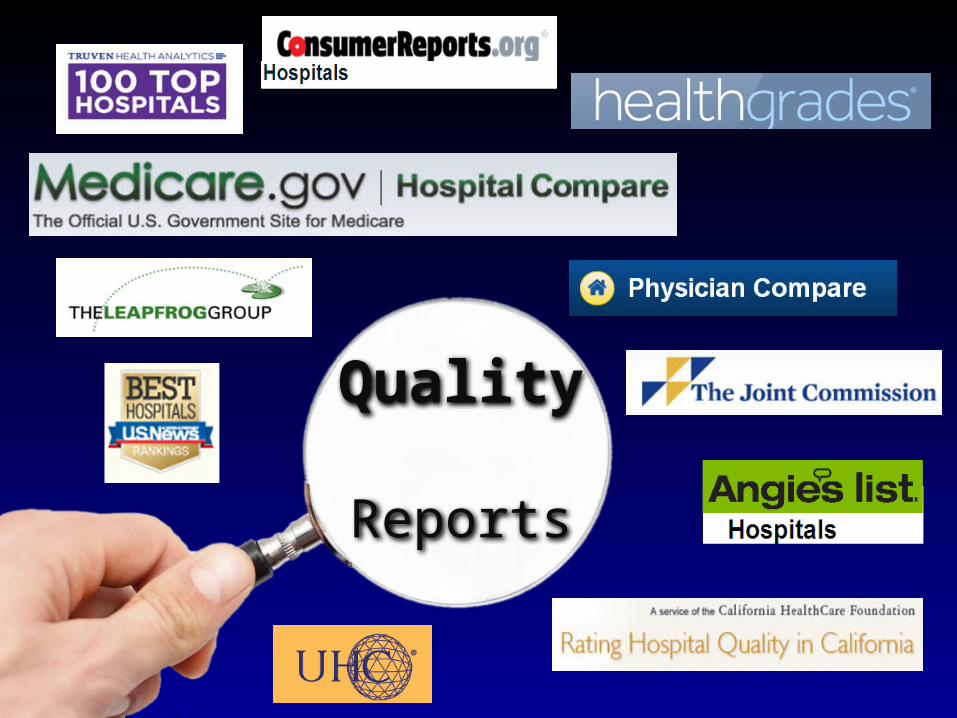
Quality Reports

Cost Transparency Companies

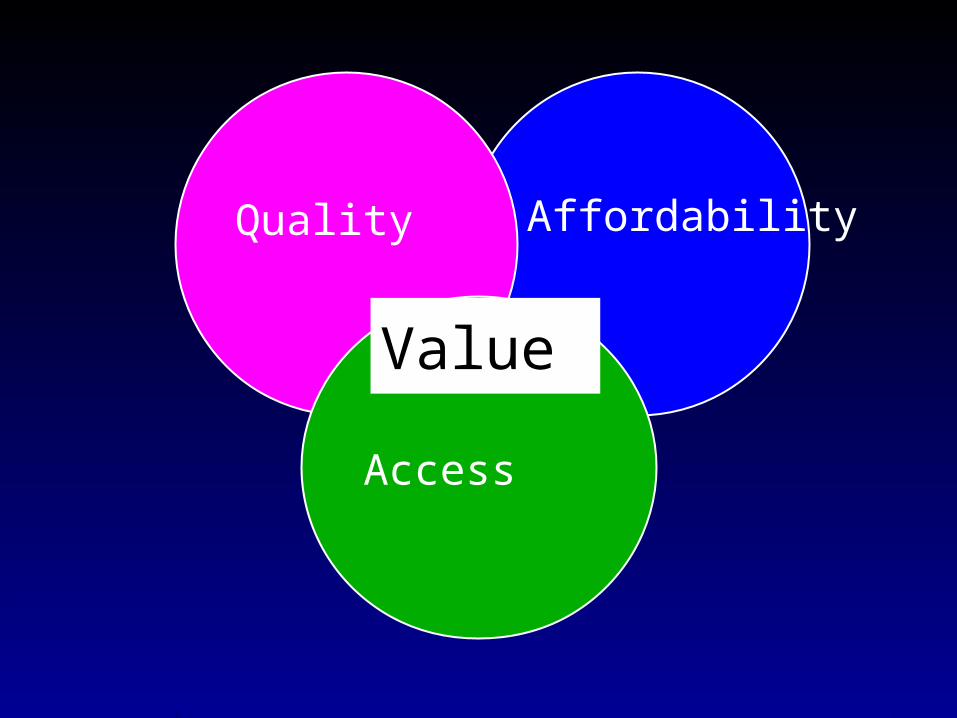
AffordabilityQuality
Access
Value

Access
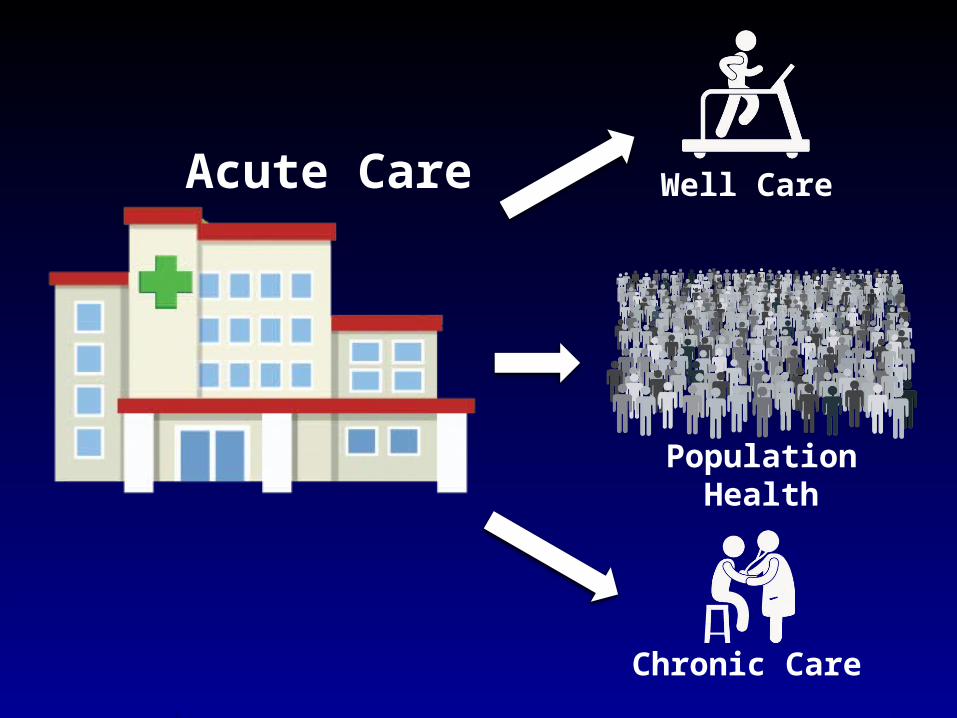
Acute Care Well Care
Population Health
Chronic Care
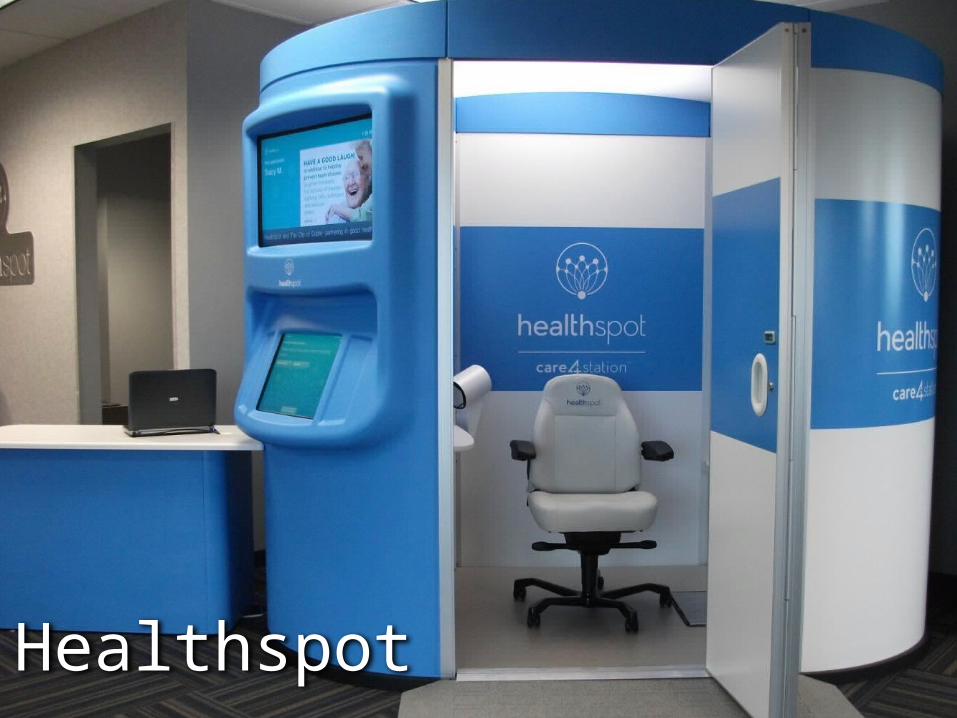
Healthspot
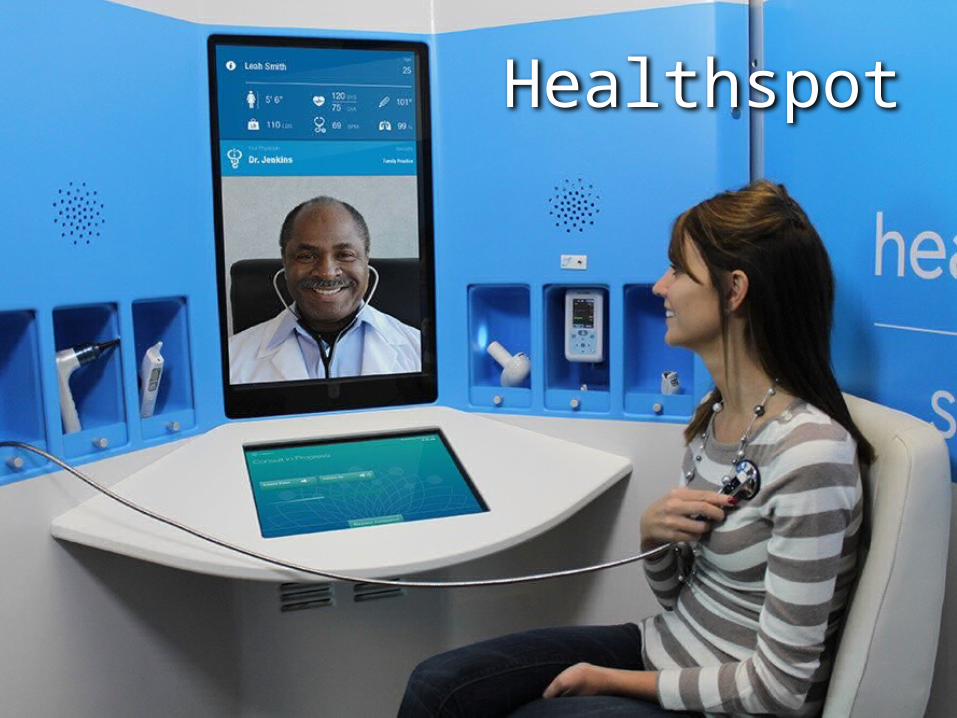
Healthspot

CCHS ED Wait Time
2011 2012 2013 2014
46minutes
2010
13minutes
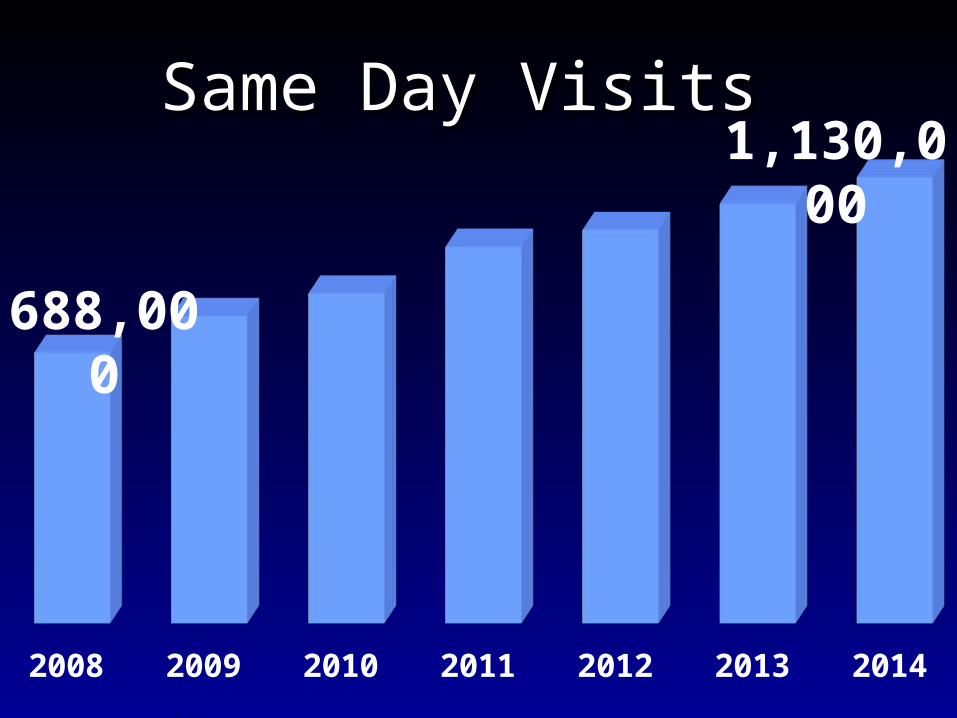
2008 2009 2010 2011 2012 2013 2014
Same Day Visits
688,000
1,130,000
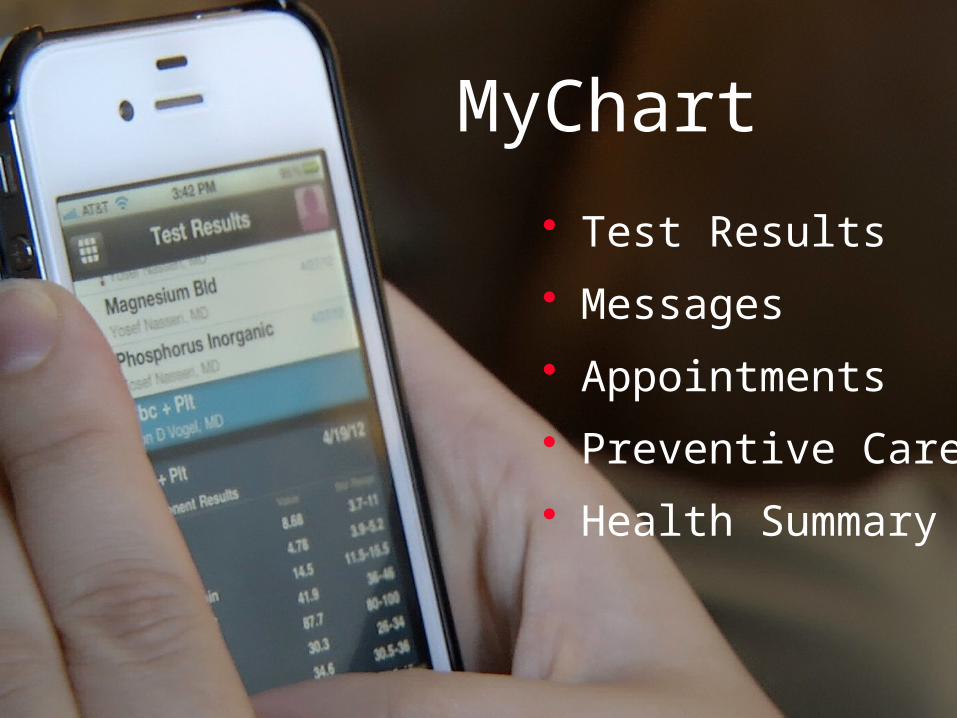
• Test Results
• Messages
• Appointments
• Preventive Care
• Health Summary
MyChart

Quality

40 million lives
50 Million

Watson Goes to Medical School

UHC ConsortiumQuality Ranking
UHC ConsortiumQuality Ranking
1 5 9 13 17 21 25
Rank28 33 37 41 45 49 53 57 61 65 69 73 77 81 85 89 93 97
80th
2010
♦ ♦ ♦ ♦ ♦ ♦ ♦ ♦ ♦ ♦ ♦ ♦ ♦ ♦ ♦ ♦ ♦ ♦ ♦ ♦ ♦ ♦ ♦ ♦ ♦ ♦ ♦ ♦ ♦ ♦ ♦ ♦ ♦ ♦ ♦ ♦ ♦ ♦ ♦ ♦ ♦ ♦ ♦ ♦ ♦ ♦ ♦ ♦ ♦ ♦ ♦ ♦ ♦ ♦ ♦ ♦ ♦ ♦ ♦ ♦ ♦ ♦ ♦ ♦ ♦ ♦ ♦ ♦ ♦ ♦ ♦ ♦ ♦ ♦ ♦ ♦ ♦ ♦ ♦ ♦ ♦ ♦ ♦ ♦ ♦
♦ ♦ ♦ ♦ ♦ ♦ ♦ ♦ ♦
49th
2011
20th
2012
14th
2013
10th
2014

Patient Safety Indicators
2012 20132011
National Mean .61
.41
.94

Patient Satisfaction
75th
%ile
29th
%ile

Affordability
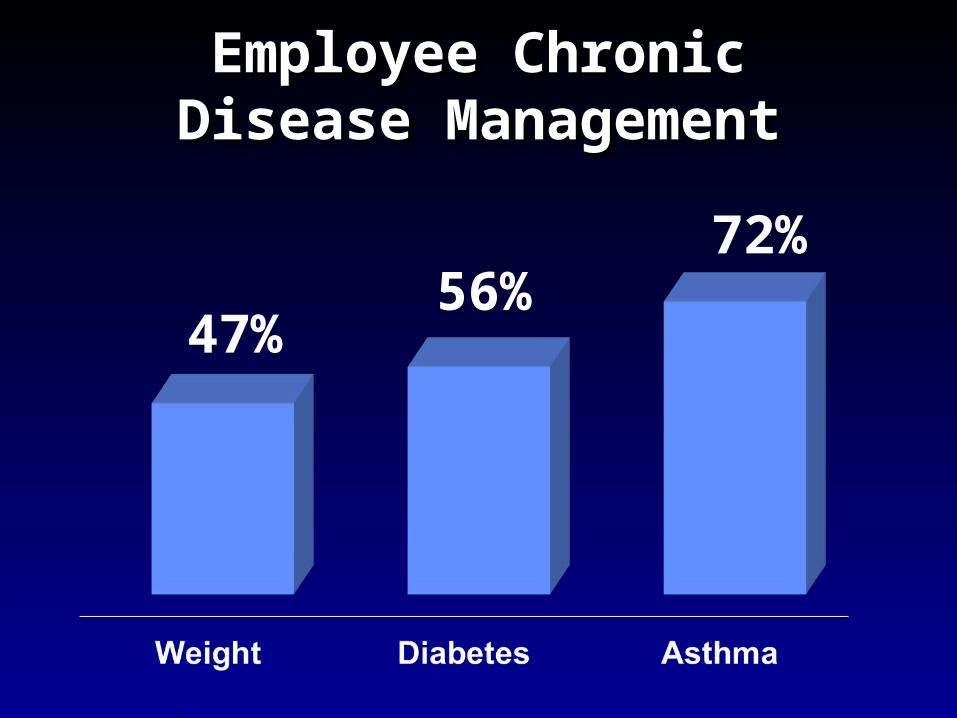
Employee Chronic Disease Management
72%
47%56%

Employee Health Plan PMPM Costs
220
260
300
340
380
420
$
2004 2014
2004-20097.5% 2010-2Q2014
3.6%
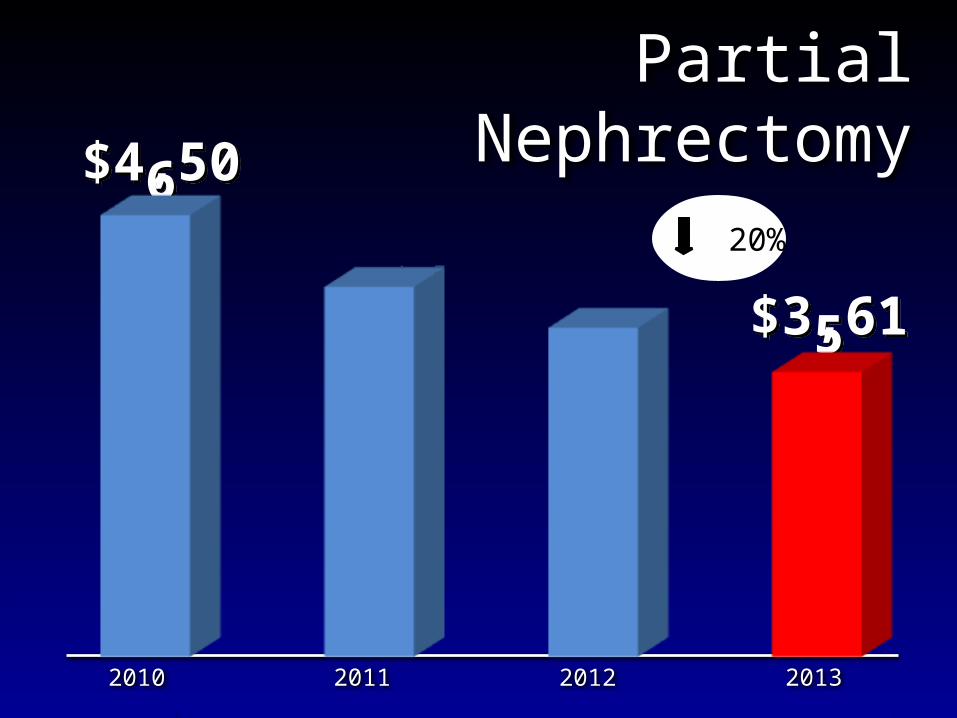
Partial Nephrectomy
20%
201220112010 2013
$4,506$4,506
$3,615$3,615

PotentialPre Post
$554$554
$237$237
$136$136
Low Back PainCost / Case
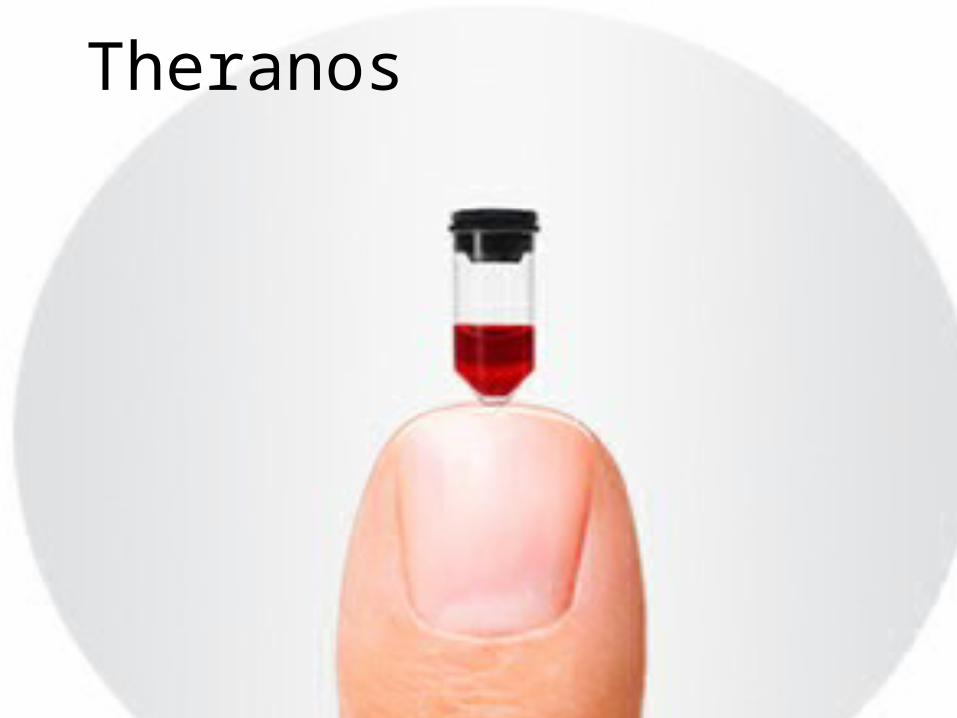
Theranos

AffordabilityQuality
Access
Value
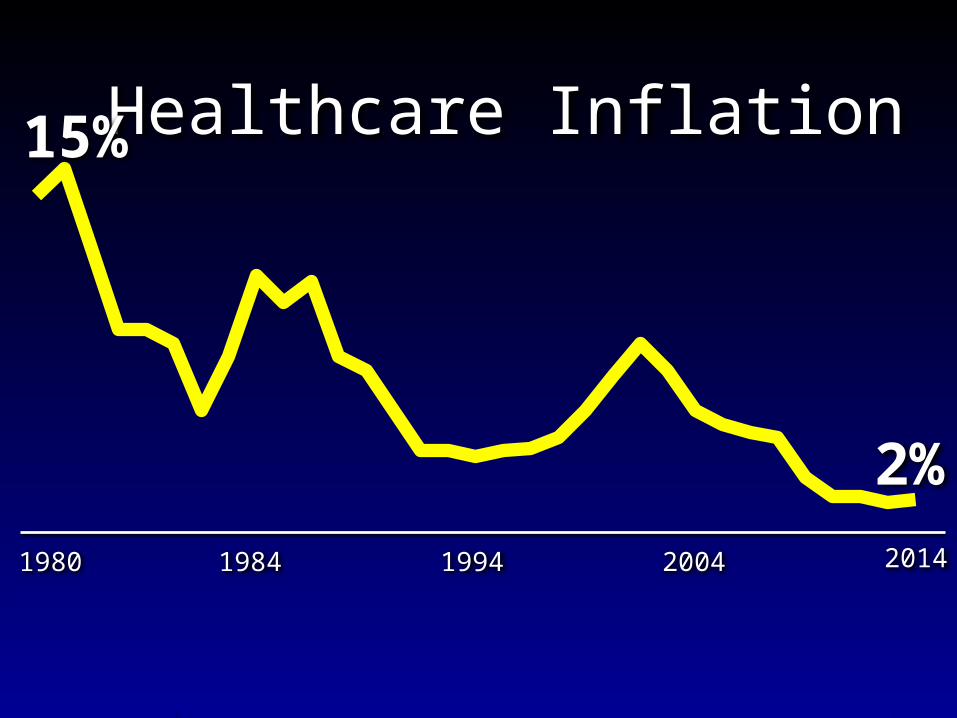
Healthcare Inflation
1980 20141994 20041984
15%
2%

Related Documents


