CLERMONT COUNTY WATER RESOURCES DEPARTMENT WASTEWATER MASTER PLAN UPDATE TABLE OF CONTENTS CLERMONT COUNTY WWMPU - FINAL CH2M HILL, INC II Table of Contents 1.0 EXECUTIVE SUMMARY ............................................................................................... 1-1 1.1 Mission ..................................................................................................................... 1-1 1.2 Project Goals ............................................................................................................ 1-2 1.3 Key Findings and Recommendations .................................................................. 1-4 2.0 INTRODUCTION .............................................................................................................. 2-1 2.1 Objectives of the Wastewater Master Plan Update ........................................... 2-1 2.2 Previous Reports and Planning Documents ....................................................... 2-1 2.2.1 1995 Wastewater Master Plan (Harza) ................................................... 2-3 2.2.2 2003 Revised Executive Summary Update (Quest) .............................. 2-4 2.2.3 Economic Development Strategic Plan 2010-2013 ................................ 2-7 2.2.4 Clermont County Industry Report 2010 ................................................ 2-8 2.2.5 Eastern Corridor Project ........................................................................... 2-8 2.2.6 Union Township Comprehensive Land Use Plan 20/20 ................... 2-10 2.2.7 Miami Township Comprehensive Plan – 2005.................................... 2-10 2.2.8 Batavia Township Growth Management Plan Update 2004 ............. 2-11 2.2.9 Goshen Township Growth Management Plan – 2000 ........................ 2-12 2.2.10 Stonelick Township Growth Management Plan – 2002 ..................... 2-13 2.2.11 Pierce Township Land Use Plan ........................................................... 2-14 2.2.12 Jackson Township Land Use Plan, 2008 ............................................... 2-14 2.2.13 Washington Township/Moscow Village Wastewater Study, 2002 .......................................................................................... 2-14 2.3 Current Legislation, Planning and Regulatory Matters.................................. 2-15 2.3.1 Area-Wide 208 Planning......................................................................... 2-15 2.3.2 Recent Legislation ................................................................................... 2-16 2.3.2.1 Household Sewage Treatment Systems ............................... 2-16 2.3.3 Regulatory Matters.................................................................................. 2-18 2.3.3.1 Total Maximum Daily Load .................................................. 2-18 2.3.3.2 Nutrient Control Initiatives ................................................... 2-19 2.3.3.3 Water Quality Criteria for Bacteria ....................................... 2-20 2.4 Service Area Delineation ..................................................................................... 2-21 2.4.1 Facility Planning Areas........................................................................... 2-21 2.4.2 Political Jurisdictions .............................................................................. 2-22 2.4.3 Unsewered Priority Areas ...................................................................... 2-23 3.0 FACILITY PLANNING AREAS – 2010 STATE OF THE SYSTEM .......................... 3-1 3.1 Loveland/Horner’s Run/Branch Hill ................................................................. 3-1 3.1.1 Existing Conditions ................................................................................... 3-1

Clermont 2 WWMPU Report
Nov 30, 2015
Clermont County Wastewater Management Plan
Welcome message from author
This document is posted to help you gain knowledge. Please leave a comment to let me know what you think about it! Share it to your friends and learn new things together.
Transcript

CLERMONT COUNTY WATER RESOURCES DEPARTMENT
WASTEWATER MASTER PLAN UPDATE
TABLE OF CONTENTS
CLERMONT COUNTY WWMPU - FINAL CH2M HILL, INC II
Table of Contents 1.0 EXECUTIVE SUMMARY ............................................................................................... 1-1
1.1 Mission ..................................................................................................................... 1-1 1.2 Project Goals ............................................................................................................ 1-2 1.3 Key Findings and Recommendations .................................................................. 1-4
2.0 INTRODUCTION .............................................................................................................. 2-1
2.1 Objectives of the Wastewater Master Plan Update ........................................... 2-1 2.2 Previous Reports and Planning Documents ....................................................... 2-1
2.2.1 1995 Wastewater Master Plan (Harza) ................................................... 2-3 2.2.2 2003 Revised Executive Summary Update (Quest) .............................. 2-4 2.2.3 Economic Development Strategic Plan 2010-2013 ................................ 2-7 2.2.4 Clermont County Industry Report 2010 ................................................ 2-8 2.2.5 Eastern Corridor Project ........................................................................... 2-8 2.2.6 Union Township Comprehensive Land Use Plan 20/20 ................... 2-10 2.2.7 Miami Township Comprehensive Plan – 2005 .................................... 2-10 2.2.8 Batavia Township Growth Management Plan Update 2004 ............. 2-11 2.2.9 Goshen Township Growth Management Plan – 2000 ........................ 2-12 2.2.10 Stonelick Township Growth Management Plan – 2002 ..................... 2-13 2.2.11 Pierce Township Land Use Plan ........................................................... 2-14 2.2.12 Jackson Township Land Use Plan, 2008 ............................................... 2-14 2.2.13 Washington Township/Moscow Village Wastewater
Study, 2002 .......................................................................................... 2-14 2.3 Current Legislation, Planning and Regulatory Matters .................................. 2-15
2.3.1 Area-Wide 208 Planning......................................................................... 2-15 2.3.2 Recent Legislation ................................................................................... 2-16
2.3.2.1 Household Sewage Treatment Systems ............................... 2-16 2.3.3 Regulatory Matters .................................................................................. 2-18
2.3.3.1 Total Maximum Daily Load .................................................. 2-18 2.3.3.2 Nutrient Control Initiatives ................................................... 2-19 2.3.3.3 Water Quality Criteria for Bacteria ....................................... 2-20
2.4 Service Area Delineation ..................................................................................... 2-21 2.4.1 Facility Planning Areas ........................................................................... 2-21 2.4.2 Political Jurisdictions .............................................................................. 2-22 2.4.3 Unsewered Priority Areas ...................................................................... 2-23
3.0 FACILITY PLANNING AREAS – 2010 STATE OF THE SYSTEM .......................... 3-1 3.1 Loveland/Horner’s Run/Branch Hill ................................................................. 3-1
3.1.1 Existing Conditions ................................................................................... 3-1

CLERMONT COUNTY WATER RESOURCES DEPARTMENT
WASTEWATER MASTER PLAN UPDATE
TABLE OF CONTENTS
CLERMONT COUNTY WWMPU - FINAL CH2M HILL, INC III
3.1.1.1 Land Use and Zoning Trends .................................................. 3-1 3.1.1.2 Population .................................................................................. 3-2 3.1.1.3 Current Wastewater Production ............................................. 3-2 3.1.1.4 Collection/Conveyance and Treatment Facilities ................ 3-3 3.1.1.5 Delineation of Unsewered Areas ............................................ 3-3
3.1.2 Wastewater Management Challenges .................................................... 3-3 3.2 O’Bannon Creek ...................................................................................................... 3-4
3.2.1 Existing Conditions ................................................................................... 3-4 3.2.1.1 Land Use and Zoning Trends .................................................. 3-4 3.2.1.2 Population .................................................................................. 3-4 3.2.1.3 Current Wastewater Production ............................................. 3-5 3.2.1.4 Collection/Conveyance and Treatment Facilities ................ 3-5 3.2.1.5 Delineation of Unsewered Areas ............................................ 3-5
3.2.2 Wastewater Management Challenges .................................................... 3-6 3.3 Stonelick Creek ....................................................................................................... 3-6
3.3.1 Existing Conditions ................................................................................... 3-6 3.3.1.1 Land Use and Zoning Trends .................................................. 3-6 3.3.1.2 Population .................................................................................. 3-7 3.3.1.3 Current Wastewater Production ............................................. 3-7 3.3.1.4 Collection, Conveyance and Treatment Facilities ................ 3-8 3.3.1.5 Delineation of Unsewered Areas ........................................... .3-8
3.3.2 Wastewater Management Challenges .................................................... 3-9 3.4 Upper East Fork .................................................................................................... 3-10
3.4.1 Existing Conditions ................................................................................. 3-10 3.4.1.1 Land Use and Zoning Trends ................................................ 3-10 3.4.1.2 Population ................................................................................ 3-11 3.4.1.3 Current Wastewater Production ........................................... 3-11 3.4.1.4 Collection, Conveyance and Treatment Facilities .............. 3-11 3.4.1.5 Delineation of Unsewered Areas .......................................... 3-12
3.4.2 Wastewater Management Challenges .................................................. 3-12 3.5 Lower East Fork .................................................................................................... 3-13
3.5.1 Existing Conditions ................................................................................. 3-13 3.5.1.1 Land Use and Zoning Trends ................................................ 3-13 3.5.1.2 Population ................................................................................ 3-14 3.5.1.3 Current Wastewater Production ........................................... 3-14 3.5.1.4 Collection/Conveyance and Treatment Facilities .............. 3-14 3.5.1.5 Delineation of Unsewered Areas .......................................... 3-15
3.5.2 Wastewater Management Challenges .................................................. 3-15 3.6 Middle East Fork .................................................................................................. 3-15
3.6.1 Existing Conditions ................................................................................. 3-15 3.6.1.1 Land Use and Zoning Trends ................................................ 3-16 3.6.1.2 Population ................................................................................ 3-16 3.6.1.3 Current Wastewater Production ........................................... 3-16

CLERMONT COUNTY WATER RESOURCES DEPARTMENT
WASTEWATER MASTER PLAN UPDATE
TABLE OF CONTENTS
CLERMONT COUNTY WWMPU - FINAL CH2M HILL, INC IV
3.6.1.4 Collection/Conveyance and Treatment Facilities .............. 3-17 3.6.1.5 Delineation of Unsewered Areas .......................................... 3-17
3.6.2 Wastewater Management Challenges .................................................. 3-17 3.7 Nine Mile ............................................................................................................... 3-18
3.7.1 Existing Conditions ................................................................................. 3-18 3.7.1.1 Land Use and Zoning Trends ................................................ 3-18 3.7.1.2 Population ................................................................................ 3-19 3.7.1.3 Current Wastewater Production ........................................... 3-19 3.7.1.4 Collection/Conveyance and Treatment Facilities .............. 3-19 3.7.1.5 Delineation of Unsewered Areas .......................................... 3-20
3.7.2 Wastewater Management Challenges .................................................. 3-20 3.8 New Richmond ..................................................................................................... 3-20
3.8.1 Existing Conditions ................................................................................. 3-21 3.8.1.1 Land Use and Zoning Trends ................................................ 3-21 3.8.1.2 Population ................................................................................ 3-21 3.8.1.3 Wastewater Production .......................................................... 3-22 3.8.1.4 Collection, Conveyance and Treatment Facilities .............. 3-22 3.8.1.5 Delineation of Unsewered Areas .......................................... 3-23
3.8.2 Wastewater Management Challenges .................................................. 3-23 3.9 Felicity .................................................................................................................... 3-24
3.9.1 Existing Conditions ................................................................................. 3-24 3.9.1.1 Land Use and Zoning Trends ................................................ 3-24 3.9.1.2 Population ................................................................................ 3-24 3.9.1.3 Wastewater Production .......................................................... 3-25 3.9.1.4 Collection, Conveyance and Treatment Facilities .............. 3-25 3.9.1.5 Delineation of Unsewered Areas .......................................... 3-26
3.9.2 Wastewater Management Challenges .................................................. 3-26
4.0 FUTURE POPULATION AND FLOW PROJECTIONS ............................................. 4-1 4.1 Data Used for Developing Projections ................................................................ 4-1 4.2 Population Forecast ................................................................................................ 4-3 4.3 Population Allocation ............................................................................................ 4-4 4.4 Future Wastewater Production ............................................................................ 4-5
5.0 NEEDS ASSESSMENT FOR SUSTAINABILITY ........................................................ 5-1 5.1 Collection and Conveyance .................................................................................. 5-1
5.1.1 Loveland/Horner’s Run/Branch Hill .................................................... 5-7 5.1.2 O’Bannon Creek ......................................................................................... 5-7 5.1.3 Stonelick Creek .......................................................................................... 5-8 5.1.4 Upper East Fork ......................................................................................... 5-9 5.1.5 Lower East Fork ....................................................................................... 5-10 5.1.6 Middle East Fork ..................................................................................... 5-10 5.1.7 Nine Mile .................................................................................................. 5-13

CLERMONT COUNTY WATER RESOURCES DEPARTMENT
WASTEWATER MASTER PLAN UPDATE
TABLE OF CONTENTS
CLERMONT COUNTY WWMPU - FINAL CH2M HILL, INC V
5.1.8 New Richmond ........................................................................................ 5-13 5.1.9 Felicity ....................................................................................................... 5-14
5.2 Wastewater Treatment Facilities ........................................................................ 5-15 5.2.1 Loveland/Horner’s Run/Branch Hill .................................................. 5-15
5.2.1.1 Loveland/Horner’s Run/Branch Hill Treatment Needs Assessment ............................................................................ 5-20
5.2.2 O’Bannon Creek ....................................................................................... 5-22 5.2.2.1 O’Bannon Creek Treatment Needs Assessment ................. 5-23
5.2.3 Lower East Fork ....................................................................................... 5-24 5.2.3.1 Lower East Fork Treatment Needs Assessment ................. 5-26
5.2.4 Middle East Fork ..................................................................................... 5-27 5.2.4.1 Middle East Fork Treatment Needs Assessment ................ 5-28
5.2.5 Nine Mile .................................................................................................. 5-29 5.2.5.1 Nine Mile Treatment Needs Assessment ............................ 5-30
5.2.6 Felicity ....................................................................................................... 5-30 5.2.6.1 Felicity Treatment Needs Assessment ................................. 5-32
5.2.7 Stonelick Creek ........................................................................................ 5-33 5.2.8 New Richmond ........................................................................................ 5-33 5.2.9 Upper East Fork ....................................................................................... 5-34
6.0 ALTERNATIVES EVALUATION FOR CAPACITY NEEDS .................................... 6-1 6.1 Evaluation of Alternatives .................................................................................... 6-1
6.1.1 Collection and Conveyance ..................................................................... 6-1 6.1.1.1 Unsewered Areas ...................................................................... 6-1 6.1.1.2 Capacity Constraints ................................................................ 6-7
6.1.2 Wastewater Treatment .............................................................................. 6-8 6.1.2.1 Near Term Improvements ....................................................... 6-8 6.1.2.2 Mid-Term Improvements ...................................................... 6-10 6.1.2.3 Long-Term Improvements ..................................................... 6-12
6.2 Project Prioritization ............................................................................................ 6-12 6.2.1 Collection, Conveyance and Treatment ............................................... 6-12
6.2.1.1 Near-Term (Priority 1) ............................................................ 6-13 6.2.1.2 Intermediate Term (Priority 2) .............................................. 6-13 6.2.1.3 Longer Term (Priority 3) ........................................................ 6-14
6.2.2 Wastewater Treatment ............................................................................ 6-14 6.2.2.1 Peak Wet Weather Flow Considerations ............................. 6-14 6.2.2.2 Regulatory Initiative Factors ................................................. 6-15 6.2.2.3 Consolidation and Regionalization Measures .................... 6-17 6.2.2.4 Expansion of Existing Treatment Facilities ......................... 6-17
7.0 SUMMARY OF RECOMMENDED PLAN .................................................................... 7-1 7.1 Near-Term Capital Improvements....................................................................... 7-1 7.2 Intermediate Term Capital Improvements ......................................................... 7-6

CLERMONT COUNTY WATER RESOURCES DEPARTMENT
WASTEWATER MASTER PLAN UPDATE
TABLE OF CONTENTS
CLERMONT COUNTY WWMPU - FINAL CH2M HILL, INC VI
7.3 Longer Term Capital Improvements ................................................................... 7-9 7.4 Infiltration and Inflow Reduction ...................................................................... 7-17
APPENDICES A CIP Project Prioritization: Data Collection for Candidate Projects B Prioritization Data: Evaluation Criteria Scores EXHIBITS 1.1 Summary of Proposed Short Term Capital Improvements ....................................... 1-7 1.2 Summary of Proposed Intermediate Capital Improvements ..................................... 1-9 1.3 Summary of Proposed Long Term Capital Improvements ...................................... 1-11 2.1 Clermont County Political Jurisdictions ..................................................................... 2-22 2.2 Unsewered Areas Recommended for Sewer Extension (Clermont County Health District) ......................................................................... 2-25 3.1 Loveland/Horner’s Run/Branch Hill 2010 State of the System ................................ 3-3 3.2 Map – Loveland/Homer’s Run/Branch Hill ............................................................. 3-28 3.3 O’Bannon 2010 State of the System................................................................................ 3-5 3.4 Map – O’Bannon Creek ................................................................................................. 3-29 3.5 Stonelick 2010 State of the System ................................................................................. 3-8 3.6 Map – Stonelick Creek ................................................................................................... 3-30 3.7 Upper East Fork 2010 State of the System .................................................................. 3-12 3.8 Map – Upper East Fork ................................................................................................. 3-31 3.9 Lower East Fork 2010 State of the System .................................................................. 3-14 3.10 Map – Lower East Fork ................................................................................................. 3-32 3.11 Middle East Fork 2010 State of the System ................................................................. 3-17 3.12 Map – Middle East Fork ................................................................................................ 3-33 3.13 Nine Mile/Ten Mile Creek 2010 State of the System ................................................ 3-19 3.14 Map – Nine Mile/Ten Mile Creek ............................................................................... 3-34 3.15 New Richmond 2010 State of the System ................................................................... 3-23 3.16 Map – New Richmond ................................................................................................... 3-35 3.17 Felicity 2010 State of the System .................................................................................. 3-26 3.18 Map – Felicity .................................................................................................................. 3-36 4.1 TAZ 1253 in the Nine/Ten Mile FPA ............................................................................ 4-3 4.2 Population Projections 2020 and 2030 ........................................................................... 4-4 4.3 Process of Allocating Population Changes Projected for the Future ........................ 4-6 4.4 Map – Loveland/Horner’s Run/Branch Hill ............................................................... 4-7 4.5 Map – O’Bannon Creek ................................................................................................... 4-8 4.6A&B Map – Lower East Fork Creek ........................................................................................ 4-9 4.7A&B Map – Middle East Fork Creek ..................................................................................... 4-11 4.8 Map – Nine Mile/Ten Mile Creek ............................................................................... 4-13 5.1 Problems Identified .......................................................................................................... 5-3

CLERMONT COUNTY WATER RESOURCES DEPARTMENT
WASTEWATER MASTER PLAN UPDATE
TABLE OF CONTENTS
CLERMONT COUNTY WWMPU - FINAL CH2M HILL, INC VII
EXHIBITS 5.2 Map – Loveland/Horner’s Run/Branch Hill Problem Areas.................................. 5-35 5.3 Map – O-Bannon Creek Problem Areas ...................................................................... 5-36 5.4A&B Map – Lower East Fork Problem Areas ...................................................................... 5-37 5.5A&B Map – Middle East Fork Problem Areas ..................................................................... 5-39 5.6 Map – Nine Mile/Ten Mile Creek Problem Areas .................................................... 5-41 5.7 Wards Corner Regional WWTP ................................................................................... 5-17 5.8 Miami Trails WWTP ...................................................................................................... 5-18 5.9 Arrowhead Park WWTP ............................................................................................... 5-19 5.10 Indian Lookout WWTP ................................................................................................. 5-20 5.11 O’Bannon Creek Regional WWTP ............................................................................... 5-23 5.12 Lower East Fork Regional WWTP ............................................................................... 5-25 5.13 Middle East Fork Regional WWTP .............................................................................. 5-28 5.14 Nine Mile WWTP ........................................................................................................... 5-30 5.15 Felicity WWTP ................................................................................................................ 5-32 6.1 CCWRD Scoring Criteria .............................................................................................. 6-12 6.2 Map – Loveland/Horner’s Run/Branch Hill Recommended Alternatives........... 6-18 6.3 Map – O’Bannon Creek Recommended Alternatives ............................................... 6-19 6.4 Map – Stonelick Creek Recommended Alternatives ................................................. 6-20 6.5A&B Map – Lower East Fork Creek Recommended Alternatives .................................... 6-21 6.6A&B Map – Middle East Fork Creek Recommended Alternatives .................................. 6-23 6.7 Map – Nine Mile/Ten Mile Creek Recommended Alternatives ............................. 6-25 6.8 Map – New Richmond Recommended Alternatives ................................................ 6-26 6.9 Peak Wet Weather Flow to WWTPs ............................................................................ 6-15 7.1 Summary of Proposed Projects Short Term Capital Improvements ......................... 7-4 7.2 Summary of Proposed Projects Intermediate Capital Improvements ...................... 7-7 7.3 Summary of Proposed Projects Long Term Capital Improvements ....................... 7-10 7.4 Benefit Score by Criteria Weight Compositions for Short Term Capital Improvements (P1) ...................................................................................... 7-12 7.5 Benefit Score by Criteria Weight Compositions for Intermediate Term Capital Improvements (P2) ...................................................................................... 7-13 7.6 Benefit Score by Criteria Weight Composition for Long Term Capital Improvements (P3) ...................................................................................... 7-14 7.7 Benefit Score by Criteria Weight Composition – Top 50 Projects ........................... 7-15 7.8 Cumulative Project Costs Ordered by Project Total Benefit Score – Top 50 Projects ........................................................................................................... 7-16 7.9 I/I Reduction Program .................................................................................................. 7-19

CLERMONT COUNTY WATER RESOURCES DEPARTMENT
WASTEWATER MASTER PLAN UPDATE
SECTION 1.0
EXECUTIVE SUMMARY
CLERMONT COUNTY WWMPU - FINAL CH2M HILL, INC 1-1
1.0 EXECUTIVE SUMMARY 1.1 Mission
Clermont County is recognized as one of the faster growing counties in Ohio based on
population data released by the Ohio Department of Development with 18.5 percent
population growth from 1990 to 2000 and more recently 10.9 percent growth from year 2000
to 2010. The County owns and operates wastewater collection and treatment systems that
serve approximately two-thirds of its current population, an estimated 197,363 people (2010
U.S. Census Bureau). While serving this estimated population, centralized conveyance and
treatment systems accommodate approximately 25 percent of the land area of the County.
Like many other public utilities, Clermont County is faced with financial restraint amid
increasingly stringent regulatory requirements and the recurring need for resources to
replace and maintain existing wastewater assets that are aging or undersized. These
drivers, along with increased stakeholder interest and the County’s desire that financial
resources be applied to projects that contribute the most value, support the mission of this
updated plan:
To provide for protection of public health (an estimated 34 percent of the County is
served by 21,000+ existing home sewage treatment systems);
To provide and sustain area growth and development;
To address current and future conveyance/treatment capacity limitations caused by
excessive infiltration and inflow;
To provide detailed planning for addressing needs in unsewered areas such that
wastewater utilities associated with new development can evolve consistent with
integrated and comprehensive planning;

CLERMONT COUNTY WATER RESOURCES DEPARTMENT
WASTEWATER MASTER PLAN UPDATE
SECTION 1.0
EXECUTIVE SUMMARY
CLERMONT COUNTY WWMPU - FINAL CH2M HILL, INC 1-2
To provide townships, municipalities and other stakeholders with a forum in which
the County can educate and solicit input on the social, environmental and economic
implications of a centralized sewer system.
1.2 Project Goals
Previous master planning efforts placed emphasis on the achievement of water quality goals
and objectives. While these objectives are an inherent part of wastewater master planning,
the Master Plan Update focuses on effective planning and implementation to maintain and
improve existing service levels. In addition to meeting these needs, the future demands on
the collection, conveyance, and treatment facilities are also addressed. The primary goals of
the Wastewater Master Plan Update are:
Identification of wastewater peak flows throughout the system, including
interpretation of existing records and documentation, compilation of future growth
projections, and updated modeling of the collection system;
Development and evaluation of cost-effective solutions to system limitations,
including infiltration/inflow control, use of regional excess flow holding basins, sub-
regional wastewater treatment facilities, and recommended improvements to
Clermont County’s conveyance system;
Prioritization of recommended improvements to produce the greatest benefit based
on environmental, social and economic criteria that reflect Clermont County Water
Resources Department’s goals and objectives, thus enabling Clermont County to
maintain the desired service level to its rate payers;
Identification and scheduling of proposed capital improvement projects consistent
with affordability, regulatory compliance and sustainable growth in the best interest
of the ratepayers of Clermont County;
Identification of new regulatory requirements and their associated impacts on the
County’s existing treatment systems;

CLERMONT COUNTY WATER RESOURCES DEPARTMENT
WASTEWATER MASTER PLAN UPDATE
SECTION 1.0
EXECUTIVE SUMMARY
CLERMONT COUNTY WWMPU - FINAL CH2M HILL, INC 1-3
Development of a strategy for sustainable infrastructure through effective,
predictive, preventative and routine maintenance.
The Wastewater Master Plan Update provides Clermont County with a comprehensive plan
for the development of its wastewater infrastructure to meet both the short-term and long-
term growth of the County through the 2030 time horizon.
A major objective of this updated wastewater master plan is to establish a plan for
conveyance of wastewater to the County’s wastewater treatment facilities. Of the eight
existing wastewater treatment facilities managed by the Clermont County Water Resources
Department: Lower East Fork Regional, Middle East Fork Regional, O’Bannon Creek
Regional, Ward’s Corner Regional, Nine Mile, Felicity, Miami Trails and Arrowhead, the
latter two facilities are proposed for elimination to consolidate resources.
A second objective of this Wastewater Master Plan Update is the identification of peak
wastewater flows associated with the County’s design storm and the evaluation of the
capacity of the existing collection and conveyance system to convey these peak flows
without excessive surcharging and without sanitary sewer overflows. Modeling of five key
planning areas, including the Lower East Fork, Middle East Fork, O’Bannon Creek, Nine
Mile and Loveland/Horner’s Run/Branch Hill planning areas provides the required
information to identify capacity limitations within each planning area. The models used in
this analysis, except for the new Loveland/Horner’s Run/Branch Hill model, were built
using the County’s existing calibrated models and projecting the base flows, groundwater
infiltration and inflow/infiltration responses. Field measured flow data representative of
the existing collection system were not available and thus not used for this analysis.
Different versions of the updated existing models and the new Loveland/Horner’s Run
model were developed to represent flows for the years 2010, 2020, and 2030. The 2010 flows
are based on additional populations resulting from growth within the County between the
time when the original models were built and calibrated (in 2000) to the time of the most
recent GIS data provided by the County. From the modeling outcome, improvements to the

CLERMONT COUNTY WATER RESOURCES DEPARTMENT
WASTEWATER MASTER PLAN UPDATE
SECTION 1.0
EXECUTIVE SUMMARY
CLERMONT COUNTY WWMPU - FINAL CH2M HILL, INC 1-4
wastewater collection and treatment system infrastructure are recommended. Planning, for
both infrastructure replacement and system maintenance, is critical to the long-term
sustainability of the County’s system.
Finally, this updated wastewater master plan provides the County with recommendations
for capital improvements that are necessary to achieve the goals identified above. The
capital improvement recommendations are categorized into three priority levels: near-term
2010 needs, intermediate-term, or 2020 needs and long-term 2030 needs which are intended
to serve and guide development of the County’s five-year revolving capital improvement
plan.
1.3 Key Findings and Recommendations
The Wastewater Master Plan Update prescribes capital improvements and measures to
improve wastewater management in sewered and unsewered areas through the year 2030.
Key areas of the updated wastewater master plan include proposed improvements to
address:
Existing problems in the County’s sanitary service areas; including inadequate
collection and pumping facilities that address excessive surcharging, water-in-
basements, sanitary sewer overflows and modifications to existing wastewater
treatment facilities to increase peak wet weather flow treatment;
Existing problems in unsewered areas; including new wastewater management
facilities and sewer extensions to unsewered problem areas;
Growth and economic development; including upgrading of existing collection,
conveyance and treatment infrastructure;
Consolidation of infrastructure to promote regionalization of wastewater
management

CLERMONT COUNTY WATER RESOURCES DEPARTMENT
WASTEWATER MASTER PLAN UPDATE
SECTION 1.0
EXECUTIVE SUMMARY
CLERMONT COUNTY WWMPU - FINAL CH2M HILL, INC 1-5
The 20-year Wastewater Master Plan Update includes a total of $291.2 million in capital
improvements covering 85 proposed projects located throughout the County’s service area.
The recommended projects have been divided into three project priority levels, reflecting
near-term, intermediate and long-term areas of need, described as follows:
Priority 1(P1) Level – presence of excessive sewer surcharging or known water-in-
basement issues, sanitary sewer or manhole overflows resulting from existing (2010)
modeled areas;
Priority 2(P2) Level – presence of excessive sewer surcharging or known water-in-
basement issues, sanitary sewer or manhole overflows resulting from future (2020)
modeled areas;
Priority 3(P3) Level – presence of excessive sewer surcharging or known water-in-
basement issues, sanitary sewer or manhole overflows resulting from future (2030)
modeled areas;
An objective decision analysis approach was employed to prioritize the projects for each
priority level, utilizing weighted decision criteria developed by the Clermont County Water
Resources Department to measure benefit for its rate payers. The prioritized listing of the
recommended projects and their estimated (May 2010) costs is included in Exhibits 1.1
through 1.3. The costs presented include major trunk sewer improvements, pumping
improvements and treatment modifications. Costs for local sewers and community
treatment systems have not been included. The recommended projects are assigned an
alpha-numeric code which identifies the facility planning area, priority level and project
number. Each project is located on a facility planning map for reference.
The total cost of recommended improvements for each of these areas is as follows:
Priority 1: $128.5 million ( 33 near-term areas of need projects);
Priority 2: $124.1 million (42 intermediate-term areas of need projects);

CLERMONT COUNTY WATER RESOURCES DEPARTMENT
WASTEWATER MASTER PLAN UPDATE
SECTION 1.0
EXECUTIVE SUMMARY
CLERMONT COUNTY WWMPU - FINAL CH2M HILL, INC 1-6
Priority 3: $38.6 million (10 long-term areas of need projects).
The project compilation is intended to provide a basis for project consideration and timing
of capital investment. Prior to proceeding with the design of the proposed capital
improvement projects as outlined herein, the County should undertake a detailed, project-
level flow monitoring campaign for each project to refine and update model output and
thereby confirm project magnitude and concept.
In closing, with the current economic climate characterized by financial restraint,
increasingly stringent regulatory requirements and the recurring need for resources to
replace and maintain existing wastewater infrastructure assets, the County must focus on
capital improvements that contribute the most value to its rate payers while supporting its
mission for growth, economic development and quality of life. The Wastewater Master Plan
Update, as presented herein, seeks to achieve that goal, reflecting the concerns of its rate
payers while addressing wastewater management challenges over the next 20 years.

CLERMONT COUNTY WATER RESOURCES DEPARTMENT
WASTEWATER MASTER PLAN UPDATE
SECTION 1.0
EXECUTIVE SUMMARY
CLERMONT COUNTY WWMPU - FINAL CH2M HILL, INC 1-7
EXHIBIT 1.1 Summary of Proposed Near Term Capital Improvements
Project Number Project Description Conveyance Storage L.S. Upgrade Details
Total Benefit Score
Project Capital Costs
OBN‐P1‐06 Obannon Creek Sewer Upgrade (MH 5351 ‐ OBNWW) 4,800 LF Involves laying 4,837' of open cut sewers ranging from 27"‐54". 63.7 $2,501,000MEF‐P1‐01 Bethel Collection Improvements I (MH 100493 ‐ MH 2552) 4,900 LF Involves laying 4,931' of open cut sewers ranging from 10"‐15". 60.1 $2,440,000MEF‐P1‐02 Bethel Collection Improvements II (MH 2689 ‐ MH BETHELPS) 11,000 LF Involves laying 10,997' of open cut sewers ranging from 21"‐30". 60.1 $5,211,000OBN‐P1‐02 Creek Sewer Upgrade (MH 5935 ‐ MH 5783) 15,600 LF Involves laying 15,997' of open cut sewers ranging from 12"‐21". 60.1 $6,181,000OBN‐P1‐04 Paxtonwoods Sewer Upgrade (MH 5133 ‐ MH 5208) 3,000 LF Involves laying 555' of 10" open cut sewers and 2,421' of 12" open cut sewers. 60.1 $1,155,000OBN‐P1‐05 Redbird Road Sewer Upgrade I (MH 5350 ‐ MH 5351) 1,800 LF Involves laying 1,760' of 27" open cut sewers. 60.1 $888,000LEF‐P1‐01 Shayler Run Upstream Sewer Upgrade (MH 9840 ‐ MH 9159_branches to MH
777/MH 419)4,900 LF 3 MG Involves laying 4,826' of open cut sewers ranging from 10"‐24" and providing
3 MG of storage.55.3 $10,295,000
LEF‐P1‐03 Hall Run Sewer Replacment and EQ Expansion 14,500 LF 2 MG Involves laying 14,460' of open cut sewers ranging from 8"‐21" and providing 2 MG of storage.
55.3 $15,672,000
LEF‐P1‐04 Wolf Pen‐Pleasant Hill Road Sewer Upgrades (MH 8235‐MH8144) 4,500 LF 3.6 MG 7 MGD Involves laying 4,402' of open cut sewers ranging from 10"‐30", providing 3.6 MG of storage and upgrading list staion to 7 MGD.
55.3 $13,724,000
LEF‐P1‐05 Cook Road Sewer Upgrade (MH 5033 ‐ MH 10050) 3,500 LF 6.5 MGD Involves laying 3,159' of 12" open cut sewers and 266' of 18" open cut sewers and upgrading lift stations to 6.5 MGD.
55.3 $3,416,000
LEF‐P1‐07 Mt. Caramel‐Tobasco Sewer Upgrade (MH 8491‐MH 9659) 3,200 LF Involves laying 3,184' of open cut sewers ranging from 10"‐18". 55.3 $1,803,000LEF‐P1‐08 Clough Pike Sewer Upgrade ( MH 226‐ MH 9646) 2,800 LF Involves laying 453' of 10" open cut sewers and 2,297' of 12" open cut sewers. 55.3 $1,051,000OBN‐P1‐T1 OBN Regional WWTP Modifications Phase 1 (augment wet weather flow
treatment capacity to 11 mgd)OBN Regional WWTP Modifications Phase 1 (augment wet weather flow treat 53.8 $8,340,000
MEF‐P1‐T1 MEF Regional WWTP Modifications Phase 1 (augment wet weather flow treatment capacity to 18 mgd)
MEF Regional WWTP Modifications Phase 1 (augment wet weather flow treatm 53.8 $4,183,000
LEF‐P1‐06 Elick Lane Sewer Upgrade (MH1843‐MH 2002) 1,300 LF Involves laying 1,244' of 10" open cut sewers. 50.5 $584,000SLC‐P1‐T1 Village of Newtonsville WWTP (will address to address existing on‐site issues) Village of Newtonsville WWTP (will address to address existing on‐site issues 44.7 $2,800,000NML‐P1‐T1 NML WWTP Modifications Phase 1 (provide 0.75MG EQ capacity) NML WWTP Modifications Phase 1 (provide 0.75MG EQ capacity) 42.6 $8,423,000LEF‐P1‐09 Arcadia Lane Sewer Upgrade (MH 1546‐1653) 700 LF Involves laying 640' of 10" open cut sewers. 41.4 $281,000NML‐P1‐01 Nine Mile‐Tabasco Road Sewer Upgrade I (MH 6544 ‐ WWTP) 6,000 LF Involves laying 5,650' of 24" open cut sewers and 299' of 21" open cut sewers. 38.5 $2,734,000LEF‐P1‐15 Orchard Lift Station Upgrade 2.2 MGD Involves upgrading lift station to 2.2 MGD. 38.5 $1,282,000LEF‐P1‐16 Shepherd Lift Station Upgrade 2.5 MGD Involves upgrading lift station to 2.5 MGD. 38.5 $1,305,000MEF‐P1‐03 Locust Lake LS/FM Upgrade 2,600 LF (F.M.) 1 MGD Involves laying 2,628' of 8" force main and upgrading lift station to 1 MGD. 35.8 $2,189,000

CLERMONT COUNTY WATER RESOURCES DEPARTMENT
WASTEWATER MASTER PLAN UPDATE
SECTION 1.0
EXECUTIVE SUMMARY
CLERMONT COUNTY WWMPU - FINAL CH2M HILL, INC 1-8
EXHIBIT 1.1 Summary of Proposed Near Term Capital Improvements (continued)
Project Number Project Description Conveyance Storage L.S. Upgrade Details
Total Benefit Score
Project Capital Costs
OBN‐P1‐03 O'Bannon Trunk Sewer Improvements (MH 5787 ‐ MH 5439) 15,000 LF Involves laying 14,994' of open cut sewers ranging from 12"‐54". 28.2 $9,667,000LEF‐P1‐10 SR 28 Sewer Upgrade (MH 8139‐ MH 4207) 3,300 LF Involves laying 3,291' of 15" open cut sewers. 27.3 $1,917,000LHR‐P1‐01 Miami Trails Sewer Upgrade (MH 7503 ‐ Miami Trails WWTP) 4,500 LF Involves laying 4,485' of open cut sewers ranging from 10"‐15". 24.7 $2,925,000NML‐P1‐02 Nine Mile‐Tabasco Road Sewer Upgrade II (MH 6625‐6615) 1,800 LF Involves laying 1,161' of 21" open cut sewers and 610' of 24" open cut sewers. 24.6 $1,051,000LEF‐P1‐11 SR 131 Lift Station Upgrade 1,400 LF 3 MGD Involves laying 1,381' of 15" open cut sewers and 19' of 35" open cut sewers
and upgrading lift station to 3 MGD.24.6 $1,938,000
LEF‐P1‐12 Happy Hollow Lift Station Upgrade 140 LF 4 MGD Involves laying 131' of 18" open cut sewers and upgrading lift staton to 4 24.6 $1,516,000LEF‐P1‐13 Viking Village Lift Station Upgrade 1.1 MGD Involves upgrading lift station to 1.1 MGD. 24.6 $1,198,000LEF‐P1‐14 State Route 28 Lift Station Upgrade 3 MGD Involves upgrading lift station to 3 MGD. 24.6 $1,347,000MEF‐P1‐04 Lucy Run Sewer Upgrade (Phase I) (MH 3264 ‐ MH 3239) 7,100 LF Involves laying 7,146' of 42" open cut sewers. 24.6 $4,862,000OBN‐P1‐01 Deerfield Road Collection Improvements (MH 4757 ‐ MH 5567) 8,800 LF Involves laying 8,761' of 12" open cut sewers. 24.6 $4,977,000LEF‐P1‐02 Eastgate North Drive Sewer Upgrade (MH 7547‐9968) 1,500 LF Involves laying 397' of 12" open cut sewers and 1,102' of 15" open cut sewers. 18.3 $631,000The costs listed are project capital costs that include construction costs, administration costs, engineering costs, contingencies, and other soft costs. These costs are escalated to represent costs for Cincinnati, Ohio for May 2010 using an ENRCCI = 7837.

CLERMONT COUNTY WATER RESOURCES DEPARTMENT
WASTEWATER MASTER PLAN UPDATE
SECTION 1.0
EXECUTIVE SUMMARY
CLERMONT COUNTY WWMPU - FINAL CH2M HILL, INC 1-9
EXHIBIT 1.2 Summary of Proposed Intermediate Term Capital Improvements
Project Number Project Description Conveyance Storage L.S. Upgrade Details
Total Benefit Score
Project Capital Costs
OBN‐P2‐08 SR 132 Sewer upgrade (MH 6097 ‐ MH 6076) 18,700 LF Involves laying 18,654' of open cut sewers ranging from 18"‐30". 63.7 $9,909,000OBN‐P2‐09 Goshen Sewer Upgrade (MH 6227 ‐ MH 5755) 18,100 LF Involves laying 18,148' of open cut sewers ranging from 15"‐42". 60.1 $9,991,000OBN‐P2‐12 Deerfield Road Storage 2 MG Involves providing 2 MG of storage. 60.1 $6,443,000OBN‐P2‐13 Fay Road Sewer Upgrade (MH 5765 ‐ MH 5787) 5,000 LF Involves laying 4,981' of 12" open cut sewers. 60.1 $1,857,000OBN‐P2‐10 SR 48 Sewer Upgrade (MH 5410 ‐ MH 5351) 2,000 LF Involves laying 1,414' of 10" open cut sewers and 627' of 12" open cut sewers. 57.4 $866,000MEF‐P2‐08 Bethel Lift Station Storage 1.5 MG Involved providing 1.5 MG of storage. 46.9 $4,685,000LEF‐P2‐T1 LEF Regional WWTP Modifications (nutrient removal facilities) LEF Regional WWTP Modifications (nutrient removal facilities) 45.6 $3,950,000OBN‐P2‐T2 OBN Regional WWTP Modifications Phase 2 (nutrient control facilities) OBN Regional WWTP Modifications Phase 2 (nutrient control facilities) 45.6 $1,850,000MEF‐P2‐T2 MEF Regional WWTP Modifications Phase 2 (nutrient removal facilities) MEF Regional WWTP Modifications Phase 2 (nutrient removal facilities) 45.6 $3,150,000LHR‐P2‐T2 Miami Trails WWTP Elimination 19,000 LF,
5,000 LF (F.M)2 MG Miami Trails WWTP Elimination. Involves laying 19,000' of open cut sewers
ranging 8"‐15", 5,000' of 4" force mains and upgrading lift stations to 2 MG.35.7 $13,757,000
OBN‐P2‐T3 OBN Regional WWTP Modifications Phase 2 (augment EQ capacity) OBN Regional WWTP Modifications Phase 2 (augment EQ capacity) 42.6 $9,000,000MEF‐P2‐13 Owensville P.S. and F.M. Upgrade (STLOUSFM ‐ MH 3220) 6,100 LF (F.M.) 4 MGD Involves laying 6,142' of 15" force mains and upgrading lift station to 4 MGD. 42.1 $3,954,000LEF‐P2‐21 Meadow Drive Sewer Upgrade (MH 4648‐ MH 10070/Longfield PS) 1,890LF 3 MGD Involves laying 1,890' of 12" open cut sewers and upgrading lift station to 3 38.5 $2,066,000
LHR‐P2‐T4 Arrowhead Park WWTP Elimination (flow to be directed to Wards Corner Regional WWTP)
2,500 LF Arrowhead Park WWTP Elimination (flow to be directed to Wards Corner Regional WWTP). Involves new lift station and laying 5,000' of force main.
35.7 $1,906,000
NML‐P2‐04 Legendary Run Sewer Upgrade (MH 9563 MH 9488) 1,500 LF Involves laying 1,483' of 12" open cut sewers. 33.7 $662,000NML‐P2‐06 Oakland Farm Drive Sewer I (MH 9480 MH 455) 1,200 LF Involves laying 1,116' of 10" open cut sewers. 33.7 $442,000NML‐P2‐05 Pierce Lift Station Upgrade 1.5 MGD Involves upgrading lift station to 1.5 MGD. 33.7 $1,225,000MEF‐P2‐05 Bethel Collection Improvements III (MH 9465 ‐ MH 9468) 1,800 LF Involves laying 1,821' of open cut sewers ranging from 12"‐15". 33.7 $1,001,000MEF‐P2‐06 Bethel Collection Improvements IV (MH 9437 ‐ MH 2689) 6,300 LF Involves laying 2,188' of 15" open cut sewers and 4091' of 18" open cut
sewers.33.7 $3,025,000
MEF‐P2‐07 Bethel Collection Improvements V (MH 2606 ‐ MH 2689) 1,300 LF Involves laying 1,305' of 10" open cut sewers. 33.7 $648,000MEF‐P2‐11 Owensville Collection Improvements I (MH 3148 ‐ MH 3119) 3,100 LF Involves laying 1,037' of 12" open cut sewers and 2,054' of 15"open cut
sewers.33.7 $1,694,000
MEF‐P2‐12 Owensville Collection Improvements II (MH 3116 ‐ MH 3100) 300 LF Involves laying 318' of 12" open cut sewers. 33.7 $192,000MEF‐P2‐19 Huntsman Trace Sewer Upgrade (MH 2952 ‐ MH 3490) 8,300 LF Involves laying 7,146' of 12" open cut sewers and 1,198' of 15" open cut
sewers.33.7 $3,452,000
MEF‐P2‐20 Chapel Sewer Upgrade (MH 2895 ‐ MH 2364) 3,500 LF Involves laying 2,362' of 12" open cut sewers and 1,138' of 15" open cut sewers.
33.7 $1,570,000

CLERMONT COUNTY WATER RESOURCES DEPARTMENT
WASTEWATER MASTER PLAN UPDATE
SECTION 1.0
EXECUTIVE SUMMARY
CLERMONT COUNTY WWMPU - FINAL CH2M HILL, INC 1-10
EXHIBIT 1.2 Summary of Proposed Intermediate Term Capital Improvements (continued)
Project Number Project Description Conveyance Storage L.S. Upgrade Details
Total Benefit Score
Project Capital Costs
OBN‐P2‐11 Redbird Road Sewer Upgrade II (MH 7756 ‐ MH 5350) 5,000 LF Involves laying 4,981' of 18" open cut sewers. 33.7 $2,092,000MEF‐P2‐18 Rose Lane Sewer Upgrade (MH 3016 ‐ MH 3018) 800 LF Involves laying 830' of 10" open cut sewers. 31 $324,000MEF‐P2‐23 Locust Lake Sewer Upgrade (MH 2869 ‐ LOCUSTPS) 200 LF Involves laying 171' of 12" open cut sewers. 31 $94,000OBN‐P2‐07 Twin Oak Sewer Upgrade (MH 7741 ‐ MH 7753) 1,900 LF Involves laying 1,919' of 10" open cut sewers. 31 $1,004,000MEF‐P2‐16 Haskell Sewer Upgrade (MH 3427 ‐ MEFWW) 4,600 LF Involves laying 794' of 24" open cut sewers and 3,796' of 42" open cut sewers. 30.9 $2,834,000
NML‐P2‐03 Nine Mile‐Tabasco Road Sewer Upgrade III (MH 6714 ‐ MH6721 ) 3,700 LF Involves laying 3,625' of 21" open cut sewers. 27.3 $1,523,000LEF‐P2‐17 Founders Boulevard Sewer Upgrade (MH 2101‐ MH 2130) 1,200 LF Involves laying 1,168' of 21" open cut sewers. 27.3 $518,000LEF‐P2‐18 Old SR 74 Sewer Upgrade (MH 2214‐ MH 2251 ) 800 LF Involves laying 742' of 12" open cut sewers. 27.3 $401,000LEF‐P2‐19 Olive Branch‐Stonelick Road Sewer Upgrade (MH 9850‐ MH 9843) 2,500 LF Involves laying 2,438' of 21" open cut sewers. 27.3 $1,029,000MEF‐P2‐09 Lucy Run Sewer Upgrade (Phase II) (MH 8133 ‐ MH 3264) 8,400 LF Involves laying 6,030' of 27" open cut sewers and 2,323' of 36" open cut 27.3 $4,131,000MEF‐P2‐10 Lucy Run Sewer Upgrade (Phase III) (MH 3239 ‐ MEFWW) 6,000 LF Involves laying 5,981' of 42" open cut sewers. 27.3 $4,105,000MEF‐P2‐14 Hartman Lane Sewer Upgrade (MH 9395 ‐ MH 3427) 7,700 LF Involves laying 7,652' of 24" open cut sewers. 27.3 $3,360,000MEF‐P2‐15 Winemiller Sewer Upgrade (MH 3317 ‐ MH 9393) 3,900 LF Involves laying 3,934' of 21" open cut sewers. 27.3 $1,802,000MEF‐P2‐17 SR 132 @ Elmwood Road Sewer Upgrade (MH 3214 ‐ MH 3205) 3,600 LF Involves laying 3,645' of 21" open cut sewers. 27.3 $1,591,000MEF‐P2‐21 Foozer FM/Sewer Upgrade (MH 9354 ‐ FOOZERPS; FOOZERFM ‐ MH 12901) 700 LF/8,000 LF
(F.M.)Involves laying 656' of 15" open cut sewers, 20' of 12" open cut sewers and 8,005' of 15" force mains.
27.3 $5,450,000
MEF‐P2‐22 Upper Lucy Run Sewer Upgrade (MH 3488 ‐ MH 8133) 6,000 LF Involves laying 3,389' of 21" open cut sewers and 2,618' of 24" open cut sewers.
27.3 $2,716,000
MEF‐P2‐24 SR 132 @ SR 125 Sewer Upgrade (MH 12901 ‐ MH 3490) 7,100 LF Involves laying 7,080' of 24" open cut sewers. 24.6 $3,838,000The costs listed are project capital costs that include construction costs, administration costs, engineering costs, contingencies, and other soft costs. These costs are escalated to represent costs for Cincinnati, Ohio for May 2010 using an ENRCCI = 7837.

CLERMONT COUNTY WATER RESOURCES DEPARTMENT
WASTEWATER MASTER PLAN UPDATE
SECTION 1.0
EXECUTIVE SUMMARY
CLERMONT COUNTY WWMPU - FINAL CH2M HILL, INC 1-11
EXHIBIT 1.3 Summary of Proposed Long Term Capital Improvements
Project Number Project Description Conveyance Storage L.S. Upgrade Details
Total Benefit Score
Project Capital Costs
NML‐P3‐T2 NML WWTP Modifications Phase 2 (augment EQ capacity) NML WWTP Modifications Phase 2 (augment EQ capacity) 42.6 $2,300,000MEF‐P3‐T3 MEF Regional WWTP Modifications Phase 3 (augment EQ capacity) MEF Regional WWTP Modifications Phase 3 (augment EQ capacity) 42.6 $10,175,000LEF‐P3‐20 Ferguson Drive and Aicholtz Road Sewer Upgrade (MH 356‐ MH 11962) 4,200 LF Involves laying 226' of 10" open cut sewers and 3,885' of 12" open cut sewers.
41.2 $2,029,000LEF‐P3‐22 Nature Run Upgrade 0.6 MGD Involves upgrading lift station to 0.6 MGD. 38.5 $1,119,000LEF‐P3‐T2 LEF Regional WWTP Design Flow Expansion (ADF = 14 mgd) LEF Regional WWTP Design Flow Expansion (ADF = 14 mgd) 35.7 $15,000,000NML‐P3‐07 Oakland Farm Drive Sewer II (MH 6875 ‐ MH 6721) 2,100 LF Involves laying 2,047' of 15" open cut sewers. 33.7 $826,000NML‐P3‐08 Pierce F.M Upgrade (MH Pierce Pump Station‐MH 9484) 1,200 LF Involves laying 1,129' of 12" open cut sewers and 56' of 10" force mains. 33.7 $522,000
NRH‐P3‐01Sewer Extensions immediately adjacent to the New Richmond sewered area to serve homes currently served by onsight systems.
3,000 LF Involves laying 3,000' of 8" open cut sewers.21
$1,642,000
NML‐P3‐09Sewer Extensions along Fulton Grove Road to serve homes currently served by onsight systems
3,000 LF Involves laying 3,000' of 8" open cut sewers.21
$1,622,000
SLC‐P3‐01Sewer Extensions in the Owensville area to serve homes currently served by onsight systems. Owensville‐Belfast Road north of Ownsville.
7,000 LF Involves laying 7,000' of 8" open cut sewers.16.2
$1,830,000
SLC‐P3‐02Sewer Extensions in the Owensville area to serve homes currently served by onsight systems. SR 50 east to the Clermont Northeastern Local School treatment facility.
6,000 LF Involves laying 6,000' of 8" open cut sewers.
16.2
$1,571,000
The costs listed are project capital costs that include construction costs, administration costs, engineering costs, contingencies, and other soft costs. These costs are escalated to represent costs for Cincinnati, Ohio for May 2010 using an ENRCCI = 7837.

CLERMONT COUNTY WATER RESOURCES DEPARTMENT
WASTEWATER MASTER PLAN UPDATE
SECTION 2.0
INTRODUCTION
CLERMONT COUNTY WWMPU - FINAL CH2M HILL, INC 2-1
2.0 INTRODUCTION 2.1 Objectives of the Wastewater Master Plan Update Clermont County owns and operates wastewater collection and treatment systems that
serve an estimated two-thirds of its current population of 197,363 (2010 U.S. Census
Bureau). Since Clermont County is recognized as one of the ten fastest growing counties in
Ohio and the second fastest growing county in southwestern Ohio, this Wastewater Master
Plan Update effort is necessary to:
Protect public health. This includes plans to address the estimated 34 percent of the
County served by 21,000+ existing home sewage treatment systems as well as
numerous semi-public systems (i.e. any facility not owned and operated by County,
State or Federal government, such as mobile home parks and schools).
Sustain area growth and development.
Identify current and future conveyance/treatment capacity limitations caused by
excessive infiltration and inflow.
Provide detailed planning for servicing currently unsewered areas such that
wastewater utilities associated with new development can evolve consistent with
integrated and comprehensive planning.
Provide a forum for townships, municipalities and other stakeholders in which the
County can educate and solicit input on the social, environmental and economic
implications of a centralized sewer system
2.2 Previous Reports and Planning Documents
Preparation of this document is based on available data and published resources from
various departments within Clermont County, local townships, villages and other
governmental agencies whose function is relevant to the preparation of this Wastewater

CLERMONT COUNTY WATER RESOURCES DEPARTMENT
WASTEWATER MASTER PLAN UPDATE
SECTION 2.0
INTRODUCTION
CLERMONT COUNTY WWMPU - FINAL CH2M HILL, INC 2-2
Master Plan Update. The main sources and methodologies for compiling information used
in the document are as follows:
Facility Planning Areas – The facility planning areas used in this report are derived from
the Regional Water Quality Management Plan (OKI, 1977), the Status of Wastewater Treatment
Facilities and Facility Planning Areas (OKI, 1998; revised 1999) except as recently amended to
include updated FPA boundaries within Clermont County (City of Milford, Amendment 29,
2004) and a new FPA (Village of Williamsburg, Amendment 32, 2009).
Population Trends - The facility planning areas’ population estimates and projections were
derived from the traffic analysis zone (TAZ) database maintained by OKI. This database
includes population figures, both current and projected. A total of 128 traffic zones span the
facility planning areas analyzed in this report, making the traffic zones useful building
blocks for projecting populations in the facility planning areas which often encompass
segments of multiple political jurisdictions.
Development Trends – Development trends within each FPA were inferred from a host of
comprehensive land use, growth management and zoning plans prepared at the township
level, regional economic development, industry, transportation and corridor studies.
Sewer Service Areas – Sewered areas within the planning area boundaries were obtained
from the jurisdictions providing the service, including Clermont County, Village of New
Richmond, Village of Williamsburg, Village of Moscow, City of Milford, Village of Batavia
and the City of Loveland (Metropolitan Sewer District of Greater Cincinnati).
Wastewater Treatment – Data pertaining to the permitted discharge of treated wastewater
from publicly and privately owned and operated facilities were obtained from the Ohio
EPA, Division of Surface Water, Southwest District office files and additional data furnished
by the Clermont County Water Resources Department (CCWRD).

CLERMONT COUNTY WATER RESOURCES DEPARTMENT
WASTEWATER MASTER PLAN UPDATE
SECTION 2.0
INTRODUCTION
CLERMONT COUNTY WWMPU - FINAL CH2M HILL, INC 2-3
Home (On-site) Sewage Treatment Systems – On-site wastewater treatment system
locations in each FPA were identified using a Geographical Information System (GIS) data
layer provided by the Clermont County General Health District which maintains this
database for the entire County and regularly conducts inspections of these facilities.
Notable key documents relevant to this study are summarized below.
2.2.1 1995 Wastewater Master Plan (Harza)
Harza Environmental Services developed a Wastewater Master Plan, in concert with the
Clermont County Sewer District (forerunner of the Clermont County Water Resources
Department) and the Technical Advisory Committee appointed by the Board of County
Commissioners. The plan developed planning methods and introduced concepts and
guidance to solutions dealing with water quality management issues. The objective of the
master plan was to provide the County with the direction and resources needed to:
Address existing wastewater management and related water quality problems
Begin taking a coordinated, pro-active approach to planning, implementation,
operation and maintenance, and monitoring of wastewater management activities
Establish sound, technically-based policies to complement a long-term plan for
wastewater service that supports continued economic growth and development
while protecting the natural environment of the County; and
Define a management strategy that is well-suited to supporting the effective
implementation and administration of the wastewater master plan
The report identified wastewater management issues in Clermont County, wastewater
management needs and solutions for each facility planning area, evaluation of sludge
management options, and a recommended wastewater management master plan. The
major elements of the recommended wastewater master plan included:

CLERMONT COUNTY WATER RESOURCES DEPARTMENT
WASTEWATER MASTER PLAN UPDATE
SECTION 2.0
INTRODUCTION
CLERMONT COUNTY WWMPU - FINAL CH2M HILL, INC 2-4
Basic policies related to environmental preservation and wastewater management
Recommendations for implementation of specific physical facility improvements
Proposed operation and maintenance improvements
Recommendations for adoption of specific policies related to wastewater
management, and
Suggestions for structuring of the management units required to implement and
maintain the master plan
The plan also included estimated costs, financing options, and plan for implementation of
recommendations.
2.2.2 2003 Revised Executive Summary Update (Quest)
Since the development of the Wastewater Master Plan by Harza in 1995, Clermont County
refocused its priorities, necessitating an update to the Wastewater Master Plan in 2003 that
revisited the philosophy and principals of the plan and provided updates as necessary. A
new executive summary was developed by Quest to include all relevant information
verbatim from the existing Executive Summary that remained accurate and supplemented
with updated data, tables and attachments where applicable. The executive summary
provided recommendations for the following:
1. Approach to Wastewater Management:
Response to Critical Existing Problems
Development of Countywide Wastewater Policies and Management Structure
Improvement Plan to Support Future Growth

CLERMONT COUNTY WATER RESOURCES DEPARTMENT
WASTEWATER MASTER PLAN UPDATE
SECTION 2.0
INTRODUCTION
CLERMONT COUNTY WWMPU - FINAL CH2M HILL, INC 2-5
2. Wastewater Management Improvements:
Corrective Action: Centralized and non-Centralized Problem Areas
Capital Improvements: Non-Centralized Areas and Growth Related
3. Policy/Management Structure Improvements:
Creation of a central entity responsible for countywide management of water
quality issues
Improved inventory and management of data related to location and
performance of semi-public and on-site systems
Improved inventory and management of water quality data
Regional planning of sewer extension projects to maximize benefits and
minimize costs per connection
Detailed, coordinated, technical review of development and wastewater
management plans for unsewered areas
Regional consideration of non-wastewater related impacts on water quality and
the natural environment
4. Stormwater Initiatives:
Establish an Interim Dedicated Account for Stormwater Management
Program Development Strategy
Form a Citizens Advisory Task Force
Begin Preparations for NPDES Phase II Permitting
Develop a Stormwater Management GIS Needs Assessment
Develop a Watershed Capital Improvement Planning Strategy

CLERMONT COUNTY WATER RESOURCES DEPARTMENT
WASTEWATER MASTER PLAN UPDATE
SECTION 2.0
INTRODUCTION
CLERMONT COUNTY WWMPU - FINAL CH2M HILL, INC 2-6
Preparation and Assessment of Cooperative Opportunities
5. Master Plan Policy and Management Structure:
Adoption of the Environmental Protection Policy
Improved Policies for Management of On-Site Systems
Formation of a Countywide Office of Environmental Quality (OEQ)
Master Plan Financing Options
6. Plan for Implementation:
Establishing a County commitment to plan implementation
Promotion of public awareness of wastewater management issues and consensus
building
Development of technically sound, implementable policies related to wastewater
planning, permitting and management of semi-public and on-site systems,
improved management of point and nonpoint threats to water quality, and
project financing.
Development of the organizational and procedural elements needed to support
collaborative planning, design, and implementation of projects by entities in the
County.
Initiation of focused efforts aimed at addressing critical on-going problems and
defining in greater detail the manner in which recommended improvements are
successfully implemented.
The report recommended that Clermont County continue its policy of continually revising
the prioritizations of the 5-year capital improvement plan, as a means of proceeding with
final planning and design of recommended master plan capital improvements. It provided
CLERMONT COUNTY WATER RESOURCES DEPARTMENT
WASTEWATER MASTER PLAN UPDATE
SECTION 2.0
INTRODUCTION
CLERMONT COUNTY WWMPU - FINAL CH2M HILL, INC 2-7
a general basis for considerations of projects and estimating the timing of expenditures that
have been significantly altered over the planning years that have passed since the original
implementation of the master plan. The report recommended that the revised plan must be
implemented in the form of new policies, management structures, and facility
improvements as summarized above.
2.2.3 Economic Development Strategic Plan 2010-2013
One of the key initiatives emphasized in the Economic Development Strategic Plan (June 2010)
is to improve the coordination of various local governments responsible for land use,
utilities, zoning and transportation. This will be accomplished through a master plan of
development prepared by the County that is intended to provide a common basis of
understanding and useful guidance for townships, villages and cities as development
strategies are formulated and implemented. The vision and desire is to obtain a high degree
of collaboration between governmental entities so that coordinated capital improvement
planning can be accomplished that transcends jurisdictional boundaries.
With over $19 million budgeted by the County in 2010 for wastewater projects, these capital
improvements influence the location and type of development and re-development that will
occur throughout the County. Accordingly, the Economic Development Strategic Plan (June
2010) recommends the following for these projects:
Timing the funding of infrastructure projects to coincide with state and federal
funding opportunities so that maximum financial leverage can be obtained;
Aligning planned capital improvement with the priorities of local communities to
the extent possible;
Engaging public sector partners in a collaborative effort with planning for
infrastructure improvements which often include acquisition of real estate for new
sewers, easements and rights-of-way.

CLERMONT COUNTY WATER RESOURCES DEPARTMENT
WASTEWATER MASTER PLAN UPDATE
SECTION 2.0
INTRODUCTION
CLERMONT COUNTY WWMPU - FINAL CH2M HILL, INC 2-8
2.2.4 Clermont County Industry Report 2010
Recent industry data compiled and evaluated for the third quarter 2010 and forecasted to
2015 in Clermont County indicates the following:
The job outlook for various selected industries suggests a 13.1 percent increase over
the five year period. Among those industries examined include construction,
manufacturing, retail and wholesale trade, real estate, utilities, finance and insurance,
transportation and warehousing;
The projected change in job growth over the 2010 to 2015 period is higher than the
projected state growth rate (5%) and national growth rate (8%);
The largest job gains are in the areas of retail trade, construction and finance and
insurance;
The location quotient is a way of quantifying how concentrated an occupation or
industry is in a region compared to the nation (i.e. an LQ=1.0 indicates an average
share of jobs compared to the nation as a whole).The location quotient (LQ) computed
for each selected industry suggests that retail trade (LQ=1.42), construction (LQ=1.45)
and finance and insurance (LQ=1.31) are expected to remain as pillars of the local
economy with a larger than average share of total jobs.
The five-year forecast from economic indicators suggests an upward trend in the local
economy lies ahead. This upward trend will lead to development and re-development in
established commercial and industrial corridors and new development in adjoining areas.
2.2.5 Eastern Corridor Project
The initial tier of the “Eastern Corridor Project” in Hamilton and Clermont Counties
developed a feasible multi-modal plan for an area extending from downtown Cincinnati to
the Eastgate Mall area located in Union Township. SR 32 in western Clermont County is a
developed, predominantly commercial/retail corridor that experiences a high volume of

CLERMONT COUNTY WATER RESOURCES DEPARTMENT
WASTEWATER MASTER PLAN UPDATE
SECTION 2.0
INTRODUCTION
CLERMONT COUNTY WWMPU - FINAL CH2M HILL, INC 2-9
commuter, business/freight and local residential traffic. During the initial studies, a
number of alternatives were considered in the Eastgate area including various I 275/SR 32
interchange options to improve capacity and safety. The main improvements considered
include the following:
Modification of the existing I 275/SR 32 and Eastgate Boulevard interchanges;
Removal of existing Old SR 74/SR 32 intersection west of I 275 and extending Old SR
74 west to intersect with Mt. Carmel-Tobasco Road;
Widening SR 32 to Gleneste-Withamsville Road and creating a new intersection at
relocated Old SR 74/SR 32;
Coordination with locally planned roadways.
The multi-modal plan is planned for construction in three phases and is being coordinated
with other local projects in the area programmed by Clermont County. Clermont County
Transportation Improvement District (CCTID), in cooperation with the Clermont County
Engineers Office, Ohio Department of Transportation (ODOT) and Union Township, is
beginning planning for a local roadway network improvement between Mount Carmel-
Tobasco Road and Eastgate Boulevard, referred to as the Aicholtz Road Connector.
The improvement corridor follows Old SR 74 and Aicholtz Road, with a new connection
under I-275. Total length is about 1.3 miles. The Aicholtz Connector is being coordinated
with ODOT’s planned improvement of the I-275 / SR 32 interchange and planned multi-
modal improvements associated with the Eastern Corridor project and will offer residential
and commercial growth opportunities in addition to improving travel efficiency, safety and
access to the Eastgate area.
Additionally, CCTID currently has more than thirty projects, mainly in Miami and Union
Township that are in the planning and design stage. Two roadway projects began
construction in southern Miami Township in 2010.

CLERMONT COUNTY WATER RESOURCES DEPARTMENT
WASTEWATER MASTER PLAN UPDATE
SECTION 2.0
INTRODUCTION
CLERMONT COUNTY WWMPU - FINAL CH2M HILL, INC 2-10
2.2.6 Union Township Comprehensive Land Use Plan 20/20
The Union Township Comprehensive Land Use Plan 20/20 plans to promote sustainable
development in nine focus areas that were identified within the township. According to the
Plan, there is a disproportionate level of apartments, townhouses, and condominiums
located throughout the township as compared to other areas. Accordingly, to obtain more
balance and to retain a diversity of land uses, the Plan recommended future residential
development should consist of large lot single-family homes since ample small lot single-
family structures and sufficient areas currently zoned for small lot residential development
are available. Sanitary service is in place for the majority of the township.
The Ivy Pointe Commerce Park, a 100-acre Class A office park at the southeast corner of the
intersection of SR 32 and I 275, was completed in 2009. In addition to interstate frontage
and convenient access to I-275, Ivy Pointe will be enhanced by significant road
improvements to Ferguson Drive between Aicholtz Road and Clough Pike.
2.2.7 Miami Township Comprehensive Plan – 2005
The Miami Township Comprehensive Plan – 2005 contains a capacity analysis which concluded
that future development pressure is likely to continue due to the projected increase in
population. Future pressure was predicted by comparing the projected population to the
amount of developable land available.
Ten key concept areas were identified and analyzed as to their potential for growth and
development. The capacity analysis concluded that the estimated 2,200 acres of developable
land for residential units under existing zoning regulations will likely be built out by 2025 in
Miami Township. This, in turn, will challenge CCWRD to continue to maintain adequate
sanitary service to the township as this growth is realized.

CLERMONT COUNTY WATER RESOURCES DEPARTMENT
WASTEWATER MASTER PLAN UPDATE
SECTION 2.0
INTRODUCTION
CLERMONT COUNTY WWMPU - FINAL CH2M HILL, INC 2-11
2.2.8 Batavia Township Growth Management Plan Update 2004
The Batavia Growth Management Plan was prepared in 1997 and updated in 2004. The Plan
stresses the importance of encouraging development to occur that is generally contiguous to
existing developed areas and that can be served with public utilities and services. CCWRD
provides sanitary service to Batavia Township but not the Village of Batavia. The Village of
Batavia has recently agreed to a proposal from the County that would enable the County to
operate and maintain the Village’s collection and treatment systems for a limited time
period of three years, after which time a decision would be considered to merge the
Village’s water and wastewater service with the County’s systems.
The 1997 Growth Management Plan recommended that Batavia Township assume a 2.5%
annual growth rate, resulting in a 2020 population of approximately 26,000 residents. The
Plan Update 2004 projections indicate that Batavia Township's population by 2020 will be
between 26,350 and 28,375 residents. This means that the Township can anticipate
approximately 9,550 new residents by 2020.
Accordingly, residential development will be controlled consistent with the densities of
existing neighborhoods in the planning area; generally 2 to 3 dwelling units per acre for
single family detached development and 5 to 7 dwelling units per acre for multiple family
or attached single family development.
Future residential development will be encouraged at densities between 1 and 2 dwellings
per acre; however, in rural areas, residential development will be encouraged in 3 acre
minimum lot sizes.
The “UC East” project has been a boon to the township, the local economy and to the
educational aspirations of Clermont County residents. The 230 acre Ford plant in eastern
Batavia Township has been vacant since 2008, and was recently acquired by Industrial
Realty Group LLC in 2010.

CLERMONT COUNTY WATER RESOURCES DEPARTMENT
WASTEWATER MASTER PLAN UPDATE
SECTION 2.0
INTRODUCTION
CLERMONT COUNTY WWMPU - FINAL CH2M HILL, INC 2-12
The Batavia Township trustees approved zoning plans for the University of Cincinnati to
use an 18-acre portion of the 230-acre Ford site for educational purposes. The University of
Cincinnati signed a lease for approximately 81,000 square feet of space which was renovated
in time for classes to open in the fall of 2010.
2.2.9 Goshen Township Growth Management Plan – 2000
Approximately half of Goshen Township is served by sanitary sewers under the jurisdiction
of CCWRD. This service extends and covers most of the western portion of the township
where the majority of high density development exists. As part of the Plan, a capacity
analysis of residentially and agriculturally zoned land was evaluated at its full potential,
that is, the number of units that could be developed regardless of the existence of sewer and
water or the presence of development constraints.
There are approximately 14,000 acres of land that have a potential for subdivision and
development. Of this total, approximately 10,700 acres are zoned for agricultural uses while
another 3,330 acres are zoned for residential or planned development districts. Based on
permitted densities within each of these agricultural and residential districts, there is
enough undeveloped land to accommodate another 14,393 housing units. This number of
housing units is far in excess of the anticipated demand. If the Township is fully built out
according to existing zoning, the total population of Goshen Township could exceed 58,000
people. Projections for the year 2020 indicate a demand for 2,300 new housing units in the
township.
The majority of new residential development has located in areas around SR 48 due to
amenities and features not available in other parts of the township. This area, designated
for moderate density suburban residential, will continue to be developed for single-family
uses with a maximum density of 2 units per acre.

CLERMONT COUNTY WATER RESOURCES DEPARTMENT
WASTEWATER MASTER PLAN UPDATE
SECTION 2.0
INTRODUCTION
CLERMONT COUNTY WWMPU - FINAL CH2M HILL, INC 2-13
Commercial development will likely continue along SR 28 in conjunction with pending SR
28 corridor improvements planned for construction in 2011 along this primary
thoroughfare.
2.2.10 Stonelick Township Growth Management Plan – 2002
The current land use distribution indicates approximately 87 percent (approximately 17,800
acres) of the Township's total land area serves agricultural or woodland use. The remainder
of the land is primarily residential, totaling about 11 percent (2,340 acres) of the Township.
This development is scattered throughout the township, with some concentration along SR
131 in the north and US 50 in the south. Nearly all of the local commercial and office
development has occurred within or near the Village of Owensville.
Sanitary sewer service provided by Clermont County is confined to the Village of
Owensville and along State Route 132 in the immediate vicinity of Owensville. As a
practical matter, development with substantial density cannot occur without sanitary sewer
service. For this reason, residential development does occur in rural areas using on-site
systems for wastewater treatment.
The available land in Stonelick Township can easily accommodate the range of growth that
may occur over the next twenty years, if the current zoning regulations remain unchanged.
The range of future population as determined in the Plan and the projected demand for new
homes would only consume about 12 percent of the land capacity in Stonelick Township.
The extent of sanitary service suggests that most of the township will maintain a semi-rural
level of development within the next ten to twenty years. Growth pressure will likely come
from the south through the SR 32 corridor and the growth that has been confined to Union
and Batavia Townships will begin to move north into the southern portion of Stonelick
Township.

CLERMONT COUNTY WATER RESOURCES DEPARTMENT
WASTEWATER MASTER PLAN UPDATE
SECTION 2.0
INTRODUCTION
CLERMONT COUNTY WWMPU - FINAL CH2M HILL, INC 2-14
2.2.11 Pierce Township Land Use Plan
According to the Plan, township growth is somewhat constrained by the lack of sanitary
sewer service and steep slopes. However, there is a significant amount of land that has
potential for new growth with 41 percent of this land area classified as either
undeveloped or in agriculture. If the township continues to experience an average
annual growth rate of 2.15 percent or more, a population of over 20,000 residents by
2025 could result. With the recent provision for higher density housing around Amelia,
this rate may increase if the proposed density attracts a significant number of new
developments.
Low density residential areas (where sanitary service is unavailable) is recommended to
be 1 dwelling per 2 acres; in areas where sanitary service is available, these areas can
continue to develop at a density of 1 dwelling per 0.5 acre.
2.2.12 Jackson Township Land Use Plan, 2008
The type of development that will take place in Jackson Township in the future will be
determined by the availability of sanitary sewers. Currently sewer service is not provided
within Jackson Township. Growth pressure will likely come from the south and migrate
north from SR 32 although population growth has and will continue to be slow in this area.
Jackson Township has the largest area of contiguous undeveloped land in Clermont
County. The future development of the 1,000 acre “White Farm” tract located in the
southern part of the township bordering SR 276 and Jackson Pike will introduce
development potential to Jackson Township although no timetable has been set for this
project and sewer service to this area.
2.2.13 Washington Township/Moscow Village Wastewater Study, 2002
The purpose of this study was to develop a plan to provide treatment and collection
alternatives to serve the future needs of unsewered areas within Washington Township.

CLERMONT COUNTY WATER RESOURCES DEPARTMENT
WASTEWATER MASTER PLAN UPDATE
SECTION 2.0
INTRODUCTION
CLERMONT COUNTY WWMPU - FINAL CH2M HILL, INC 2-15
The study investigated the possibility of directing some of the township wastewater
production to the treatment facility owned and operated by the Village of Moscow. At
the time the study was undertaken, the Clermont County Health District reported that
25 percent of the existing on-site treatment systems in the study area were failing.
The study advocated the continued use of on-site systems for the near term if slow
population growth is forecast for Washington Township. The report also concluded
that conveyance of wastewater flow to the Village of Moscow’s facultative pond
treatment system is not desirable for several reasons: 1) limited capacity exists to accept
additional flow, 2) the treatment system is located in the Ohio River floodplain and 3)
two of the three facultative ponds have water surface elevations that are below the 25-
year flood elevation which does not comply with “Ten States Standards” which requires
treatment systems to be fully operational and accessible during a 25-year flood.
2.3 Current Legislation, Planning and Regulatory Matters
Current legislation, planning and regulatory matters have been identified that impact
wastewater planning in Clermont County. These include work presently being undertaken
by the Ohio-Kentucky-Indiana Regional Council of Governments to update area-wide 208 Plans,
legislation relating to household sewage treatment systems, nutrient discharge control and
the total maximum daily load program.
2.3.1 Area-Wide 208 Planning
The Ohio-Kentucky-Indiana Regional Council of Governments (OKI) serves as the lead planning
agency for the development of a regional water quality management plan (208 plan) for the
43 facility planning areas (FPAs) located in Butler, Clermont, Hamilton and Warren
Counties. OKI recently received three grants for work related to the 208 Plan for southwest
Ohio. Some of this grant-funded work relates to on-going consistency reviews, dataset
analysis and compilation, amendments adopted by OKI and incorporation of OEPA’s 2010
Integrated Water Quality Monitoring and Assessment Report into the planning process. A key

CLERMONT COUNTY WATER RESOURCES DEPARTMENT
WASTEWATER MASTER PLAN UPDATE
SECTION 2.0
INTRODUCTION
CLERMONT COUNTY WWMPU - FINAL CH2M HILL, INC 2-16
task slated for completion by the end of June 2011 is the development of an updated,
electronically-accessible 208 Plan that will include current profiles, trends and data analyses
for 20 of the 43 FPAs.
2.3.2 Recent Legislation
2.3.2.1 Household Sewage Treatment Systems
There are thousands of household sewage treatment systems scattered throughout
Clermont County. In fact, the Clermont County Health District maintains an
electronic filing system of approximately 21,400 on-site systems. Of this total,
approximately 18,500 of these systems have undergone inspection by County staff.
The aggregate wastewater production from these systems is significant, accounting
for the total production in some planning areas.
A household sewage treatment system (HSTS) is a system, or a part of such a system,
that receives sewage from a single-family, two-family, or three-family dwelling. The
Ohio Department of Health (ODH) regulates sewage treatment systems across the
state through statutory authority established under Ohio Revised Code (ORC)
Chapter 3718 and Ohio Administrative Code Chapter 3701-29. The Public Health
Council within the ODH is empowered to adopt, amend and rescind rules
pertaining to public health and establishes state minimum rules for siting,
permitting, installing, altering, operating, and abandoning sewage treatment and
disposal systems. Local boards of health are tasked with the associated permitting,
inspecting, and enforcing the rules.
It is important to note that the current version of the Ohio Administrative Code
(OAC) Chapter 3701-29 has not changed and will remain in effect until new rules are
adopted sometime after January 1, 2012. In addition, more stringent local health
district rules that have been adopted since the state rule change in July 2007also

CLERMONT COUNTY WATER RESOURCES DEPARTMENT
WASTEWATER MASTER PLAN UPDATE
SECTION 2.0
INTRODUCTION
CLERMONT COUNTY WWMPU - FINAL CH2M HILL, INC 2-17
remain in effect until new state rules are adopted after January 1, 2012. All existing
sewage treatment system approvals and special device approvals authorized by the
Director of Health remain approved until new rules are adopted.
Senate Bill (SB) 110 was passed and signed into law in June 2010. This bill became
effective in mid-September 2010 and amended many of the Household and Small
Flow On-Site Sewage Treatment System statutes that were suspended by prior
legislation. Under SB 110, the Public Health Council has 18 months (but no sooner
than January 1, 2012) working with local health districts, to create statewide
standards for household sewage treatment systems (HSTSs), while allowing local
boards of health some flexibility to set more stringent standards where nessecitated
by unique local conditions. Other provisions of this bill:
Define “public health nuisance” to allow a determination based on evidence of
observed mechanical failure or system malfunction evidenced by ponding,
seepage, discharge of wastewater into surface water resulting in noncompliance
with applicable water quality standards, etc;
Require discharging systems to comply with terms of the National Pollutant
Elimination System (NPDES);
Require local boards of health to inspect an HSTS within 12 months (reduced
from 18 months) of installation;
Authoize standards for inspection of septage haulers;
Require the Ohio Department of Health to develop educational programs to
assist owners of HSTSs in the proper operation and management of their
systems;
CLERMONT COUNTY WATER RESOURCES DEPARTMENT
WASTEWATER MASTER PLAN UPDATE
SECTION 2.0
INTRODUCTION
CLERMONT COUNTY WWMPU - FINAL CH2M HILL, INC 2-18
Authorize the Public Health council to establish fees to support enforcement of
Ohio law regulating HSTSs and to fund the installation and evaluation of new
HSTS technology pilot projects.
The net effect of SB 110 on the County will not be fully known until the Public
Health Council releases draft rules sometime in 2012.
2.3.3 Regulatory Matters
2.3.3.1 Total Maximum Daily Load
The Clean Water Act requires watersheds that do not meet water quality goals to be
“cleaned-up” in some approved manner. The “cleanup plan” is referred to as a total
maximum daily load (TMDL) report which recommends specific actions and
prescribes the pollutant loading reduction necessary from various sources to achieve
water quality goals. The Ohio EPA measures the health of its streams by examining
the number and types of fish and aquatic insects in the water. As well, the level of
chemicals and bacteria are measured to determine the suitability of streams for use
as a water supply and for recreation.
The Little Miami River which drains 1,756 square miles in southwestern Ohio and
which drains a large portion of Clermont County is a state and national scenic river.
In 2007, the Ohio EPA collected biological, chemical and physical data from the
Lower Little Miami River Watershed and issued a TMDL Report that was approved
by USEPA in March 2011. O’Bannon Creek located in Goshen Township was made
part of the study and was included in the TMDL Report (Note: this was the only
stream located in Clermont County that was included in the Lower Little Miami
River TMDL Report that had monitoring sites). Based on the outcome of the study,
O’Bannon Creek was judged as impaired but not needing a TMDL. Impairment was
due to natural causes related to flow and habitat, mainly in headwater regions,
upstream of the O’Bannon Creek Regional WWTP.

CLERMONT COUNTY WATER RESOURCES DEPARTMENT
WASTEWATER MASTER PLAN UPDATE
SECTION 2.0
INTRODUCTION
CLERMONT COUNTY WWMPU - FINAL CH2M HILL, INC 2-19
According to OEPA’s 2010 Integrated Water Quality Monitoring and Assessment Report,
Stonelick Creek and the East Fork of the Little Miami River are planned to be
monitored in 2012 with a subsequent TMDL report prepared in 2015. Ohio River
tributaries located in the southern portion of Clermont County (i.e. Nine Mile, Ten
Mile, Twelve Mile Creek and others) are planned for monitoring in 2016 with TMDL
work scheduled for completion in 2019.
2.3.3.2 Nutrient Control Initiatives
Much of the recently completed TMDL work has and will translate into more
restrictive nutrient control initiatives for NPDES permit holders. Clermont County
can expect issuance of nutrient control limitations for total phosphorus in the
ensuing NPDES permit cycle for those WWTPs discharging to the Little Miami River
Basin. The NPDES Permit in effect for the Wards Corner Regional WWTP presently
requires compliance with a monthly average total phosphorus concentration of 1.0
milligram per liter. Total nitrogen control initiatives in the range of 3 to 10
milligrams per liter in plant discharges are anticipated in the future as 2020 is
approached.
The establishment of in-stream numeric targets is a significant component of the
TMDL process. The numeric targets serve as a measure of comparison between
observed in-stream conditions and the conditions that are expected to restore the
designated uses of a stream segment. The TMDL identifies the load reductions and
other actions that are necessary to meet the target, with the intent of applicable water
quality standards compliance and ultimately attainment of designated aquatic life
uses.
Numeric targets are generally derived directly or indirectly from state narrative or
numeric water quality standards; however, Ohio EPA does not have statewide
numeric criteria for nutrients such as phosphorus and nitrogen. Targets are derived
by analyzing the effects of nutrients on the aquatic life assemblages of Ohio streams

CLERMONT COUNTY WATER RESOURCES DEPARTMENT
WASTEWATER MASTER PLAN UPDATE
SECTION 2.0
INTRODUCTION
CLERMONT COUNTY WWMPU - FINAL CH2M HILL, INC 2-20
and rivers and inferences are drawn between the health of biologic communities and
the concentrations of nutrients they are exposed to at reference sites (Ref. Association
Between Nutrients, Habitat and Aquatic Biota in Ohio rivers and Streams, OEPA, 1999).
In effect, statistical association is used to link nutrient concentrations with biological
index scores, thus providing threshold values (i.e. in-stream targets) for phosphorus
and nitrogen that correspond to designated aquatic life uses. However, in this type
of linkage analysis there can be a large variation between causal and response
variables resulting in ill-defined relationships. Accordingly, in-stream nutrient
targets derived in a TMDL analysis and upon which effluent limits are based, should
be fully understood by the County before a compliance commitment is entered into.
Nutrient targets are not codified in Ohio’s water quality standards; therefore, some
flexibility exists as to how they can be used in a TMDL study.
2.3.3.3 Water Quality Criteria for Bacteria
Ohio EPA adopted new rules in December 2009 which included new water quality
criteria for bacteria. Criteria for the bacteria E. coli have replaced standards for F. coli
(fecal coliform), as E. coli has been shown to be a better predictor of the potential for
impacts to human health from exposure to wastewater effluent and surface waters
which contain wastewater effluent. The standard recreation season when
monitoring for bacteria is required has been changed to May 1st through October
31st. The new rules also grant authority to the Director of Ohio EPA to extend
effluent disinfection requirements beyond the May 1st through October 31st
recreation season if necessary. These new rules became effective on March 15, 2010.
Clermont County can expect E. coli discharge requirements to replace F.coli limits as
each NPDES permit is renewed. Existing permits that are modified for reasons other
than cyclic renewal will include the new E. coli limits. The numerical limits for E.coli
are dependent on the use designation of the receiving stream. For a Class A
(frequent recreational activity) stream, typical in Clermont County, the numerical

CLERMONT COUNTY WATER RESOURCES DEPARTMENT
WASTEWATER MASTER PLAN UPDATE
SECTION 2.0
INTRODUCTION
CLERMONT COUNTY WWMPU - FINAL CH2M HILL, INC 2-21
limits are 126 colony counts per 100 milliliters (30-day average) and 284 colony
counts per 100 milliliters (7-day average). In general, wastewater treatment plant
effluent disinfection facilities that have been designed for F. coli requirements of
1,000 colony counts per 100 milliliters (30-day average) will likely be adequate in E.
coli limit compliance.
NPDES permits for WWTPs that discharge directly to the Ohio River will continue to
include fecal coliform limits and monitoring requirements as pollution control
standards for these streams are set by the Ohio River Sanitation Commission
(ORSANCO).
2.4 Service Area Delineation
2.4.1 Facility Planning Areas
The Ohio-Kentucky-Indiana Regional Council of Governments (OKI) in their Status of
Wastewater Treatment Facilities and Facility Planning Areas, 1999 has divided the Ohio
portion of the OKI regions into 42 sub-regions. Of these 42 sub-regions (i.e. facility planning
areas), 11 are located in Clermont County. The boundary of each facility planning area
(FPA) generally follows watershed drainage areas but in most cases is modified to account
for political boundaries. Some of the FPAs have become outdated and have been revised or
newly created. For instance, the Village of Williamsburg has extended sanitary sewer
service in several directions and expanded its wastewater treatment facility. A new (12th)
FPA has been established for the Williamsburg area. Similarly, the Milford FPA boundary
was revised recently to reflect current conditions within the City of Milford.
Conclusions drawn from OKI’s most recent study indicate that of the eleven FPAs located in
Clermont County, seven (Loveland, Horner’s Run/Branch Hill, Middle East Fork, Nine-Ten
Mile, Stonelick, Lower East Fork and O’Bannon Creek) are regarded as being in significant
or in definite need of expanding or improving centralized wastewater treatment facilities.

CLERMONT COUNTY WATER RESOURCES DEPARTMENT
WASTEWATER MASTER PLAN UPDATE
SECTION 2.0
INTRODUCTION
CLERMONT COUNTY WWMPU - FINAL CH2M HILL, INC 2-22
2.4.2. Political Jurisdictions
Political jurisdictions that are provided wastewater collection and treatment service by
Clermont County are summarized in Exhibit 2.1.
EXHIBIT 2.1 Clermont County Political Jurisdictions
Political Jurisdiction Facility Planning AreaServed By Clermont County
(Y/N)TownshipsBATAVIA Middle East Fork, Lower East Fork* YFRANKLIN Felicity NGOSHEN O'Bannon, Stonelick* YJACKSON Upper East Fork, Stonelick, Middle East Fork NMIAMI Horner Run Branch Hill, Loveland, Lower East Fork, O'Bannon YMONROE New Richmond, Felicity, Middle East Fork* NOHIO New Richmond, Nine Ten Mile NPIERCE Nine Ten Mile, New Richmond, Middle East Fork* YSTONELICK Stonelick, Middle East Fork, O'Bannon* NTATE Middle East Fork, Felicity, New Richmond* NUNION Lower East Fork, Nine Ten Mile, Middle East Fork* YWASHINGTON Felicity NWAYNE Stonelick, O'Bannon, Upper East Fork* NWILLIAMSBURG Middle East Fork, Upper East Fork Y
City and Village CITY OF MILFORD Milford NCITY OF LOVELAND Loveland NAMELIA Nine Ten Mile, Middle East Fork YBATAVIA Middle East Fork, Lower East Fork* NBETHEL Middle East Fork YCHILO Felicity NFELICITY Felicity YMOSCOW Felicity NNEVILLE Felicity NNEW RICHMOND New Richmond NNEWTONSVILLE Stonelick NOWENSVILLE Stonelick YWILLIAMSBURG Williamsburg N
* The village/city/township marginally lies within this FPAThere are a few sewers in the Franklin, Tate and Stonelick townships that drain to the villages of Felicity, Bethel and Owensville respectively.

CLERMONT COUNTY WATER RESOURCES DEPARTMENT
WASTEWATER MASTER PLAN UPDATE
SECTION 2.0
INTRODUCTION
CLERMONT COUNTY WWMPU - FINAL CH2M HILL, INC 2-23
2.4.3 Unsewered Priority Areas
A total of 12 public (8 owned and operated by Clermont County) and 23 semi-public
wastewater management systems are estimated to serve less than a third of the area within
Clermont County. Development in the remaining unsewered area of the County is served
by home sewage treatment systems, commonly referred to as “on-site” systems. These on-
site systems are not confined to any given planning area but are common in all planning
areas, generally scattered, but concentrated in some areas.
The Clermont County Health District has electronic records of 21,394 on-site systems in the
County. Of this total, approximately 80 percent have data from inspections conducted over
the last ten years; however, no accurate records are kept to verify occupancy or vacancy
because of the time interval between inspections. On-site system data is linked as a layer in
the County’s GIS system and is used in this report. From this information, an estimated
upper bound population of 57,800 is served by on-site systems.
Areas recommended by the Clermont County Health District to be in need of sewer service
include those areas summarized in Exhibit 2.2. Some of these areas have small lot sizes and
are not located adjacent to a sewered area, posing significant challenge to service. Areas
that are shaded have a large number of older discharging systems and are considered
priority areas.
The need to expand the wastewater management services into unsewered areas is driven
by: 1) the County’s gradual transition from a predominantly rural region to a region that
includes moderate to high density urban development, 2) public health nuisances and 3)
impacts detrimental to water quality. The population distribution and corresponding
wastewater production will continue to change as development patterns, reacting to
economic conditions, gradually push eastward and southward.

CLERMONT COUNTY WATER RESOURCES DEPARTMENT
WASTEWATER MASTER PLAN UPDATE
SECTION 2.0
INTRODUCTION
CLERMONT COUNTY WWMPU - FINAL CH2M HILL, INC 2-24
In areas where there are problems associated with inadequate or failing on-site systems,
corrective action is necessary where maximum benefit can be obtained for the capital
investment. The approach taken should focus on:
Correction (i.e. address existing problems in unsewered areas where health, safety
and environmental protection is a concern and where stakeholder support is
expressed – notably the Village of Newtonsville in the Stonelick Creek planning
area);
Prevention (i.e. prevent the return of existing problems through effective
management and appropriate and beneficial capital investment);
Projection (i.e. meet future needs to sustain growth and economic vitality consistent
with county-wide objectives).
Identification of future needs is challenged by the economic downturn that began in 2008
and whose effects continue to impact the local economy, especially the housing market.
Given this circumstance and the pace of recovery, the County should move forward with a
reactive, yet integrated approach to wastewater management in unsewered areas. Reactive
in the sense that need-based projects such as public health nuisances located adjacent to a
nearby sewer, can be resolved cost effectively for maximum benefit. The second part of this
approach would achieve sustainable growth through integrated consideration of land use,
development and on-site issues wherein capital investment is planned and prioritized to
align with development patterns and projected areas of wastewater infrastructure need.

CLERMONT COUNTY WATER RESOURCES DEPARTMENT
WASTEWATER MASTER PLAN UPDATE
SECTION 2.0
INTRODUCTION
CLERMONT COUNTY WWMPU - FINAL CH2M HILL, INC 2-25
EXHIBIT 2.2 Unsewered Areas Recommended for Sewer Extension Clermont County Health District (November 2009)
Township Road/Subdivision/Village Miami Arborcrest Lane
Bonnie lane Bramblewood Drive Branch Hill-Miamiville Road Indianview Drive Apache Trail Tarkington Lane Cynthia Drive Wiltsee Avenue Timber Trail Subdivision Hickory Ridge Drive Pine Bluff Drive Thorn Tree Court Day Drive Eagle Ridge Subdivision Valley Forge Road Heritage Lane Brandywine Lane Bunker Hill Road Eagle Creek Trail Liberty Court Epworth Road (portion) Fox Run Road (portion) Indian Oaks Subdivision Blackhawk Trail Pheasant Run Pawnee Ridge Kickapoo Circle Jannie Lane Lewis Road (north end) Louanne Lane Oskamp Drive South Garrett Drive Valley View Drive Wardwood Subdivision Woodsway Drive Westward Drive Northward Drive Windfield Hills Subdivision

CLERMONT COUNTY WATER RESOURCES DEPARTMENT
WASTEWATER MASTER PLAN UPDATE
SECTION 2.0
INTRODUCTION
CLERMONT COUNTY WWMPU - FINAL CH2M HILL, INC 2-26
EXHIBIT 2.2 Unsewered Areas Recommended for Sewer Extension (continued) Clermont County Health District (November 2009)
Township Road/Subdivision/Village Miami East Knollwood Court
West Knollwood Court Windfield Court Winding Woods Subdivision Covey Court Quail Run Court
Union Fulton Grove Road Pepper Ridge Subdivision Caraway Drive Cinnamon Court Chicory Lane Sesame Street Oregano Drive Nutmeg Knoll Street Quail Run Sleepy Hollow Lane Woodland View Drive Sanro Drive
Pierce West Concord Road East Concord Road
Monroe Rolling Hills Drive Lindale-Mt Holly Road Fair Oak Road Christine Lane Norman Lane Village of Laurel (community system)
Goshen Woodville Pike (Goshen and Miami segments) Wayne Village of Newtonsville (community system)
Stonelick Sutton Lane Wilshire Circle Freda Lane Anna Court Goshen Road (southern end)
Ohio Petri Lane Notes: 1. Aeas in bold have a large number of discharging systems and are
considered priority areas. 2. Implementation of projects in these areas will be subject to affordability
and regulatory initiatives pertaining to home sewage treatment systems.

CLERMONT COUNTY WATER RESOURCES DEPARTMENT
WASTEWATER MASTER PLAN UPDATE
SECTION 3.0
FACILITY PLANNING AREAS – 2010 STATE OF THE SYSTEM
CLERMONT COUNTY WWMPU - FINAL CH2M HILL, INC 3-1
3.0 FACILITY PLANNING AREAS 2010 STATE OF THE SYSTEM
There are 12 facility planning areas designated by OKI that are located within Clermont
County. These include: Felicity, Horner’s Run/Branch Hill, Loveland, Lower East Fork,
Middle East Fork, Milford, New Richmond, Nine-Ten Mile, O’Bannon Creek, Stonelick,
Upper East Fork and Williamsburg. These planning areas are becoming outdated due to
sewer extensions reaching beyond facility planning envelopes and boundaries that do not
align with natural drainage boundaries. Yet, these planning area boundaries continue to be
utilized by regulatory agencies for the organization of information and the discernment of
wastewater management priorities.
This section describes the current (2010) state of each facility planning area in Clermont
County and the wastewater challenges present in each. For purposes of this report, the
Loveland and Horner’s Run/Branch Hill facility planning areas have been combined into a
single planning area.
3.1 Loveland/Horner’s Run/Branch Hill
3.1.1 Existing Conditions
The drainage area of Loveland/Horner’s Run/Branch Hill is approximately 15,500 acres, all
of which lies in Miami Township. Of this area, approximately 1,180 acres is sewered and
flow drains to the Miami Trails, Wards Corner Regional, Indian Lookout (being eliminated
and therefore not considered) and Arrowhead Park WWTPs.
3.1.1.1 Land Use and Zoning Trends
The majority of Loveland/Horner’s Run/Branch Hill is zoned residential with
vacant land and agriculture accounting for an estimated 25 percent of the area.
Concentrated areas of residential development exist in the southeastern sector of the
City of Loveland, the Village of Miamiville and along local routes of transportation,
including Branch Hill-Guinea Pike, Branch Hill-Miamiville Road, Ward’s Corner

CLERMONT COUNTY WATER RESOURCES DEPARTMENT
WASTEWATER MASTER PLAN UPDATE
SECTION 3.0
FACILITY PLANNING AREAS – 2010 STATE OF THE SYSTEM
CLERMONT COUNTY WWMPU - FINAL CH2M HILL, INC 3-2
Road and Loveland-Miamiville Road. The highest densities are located in the
Oasis/Miami Trails and the Wood Creek and Paxton developments. Commercial
development exists mainly along Ward’s Corner near the I-275 interchange and
along SR-126 with other non-residential development scattered throughout the area.
Trends in zoning suggest that a pattern of moderate density residential development
will continue to be the primary land use in the area, particularly in the Ward’s
Corner area, north and south of I-275.
3.1.1.2 Population
The current population within the Loveland/Horner’s Run/Branch Hill area is
estimated to be 20,900 (Refer to Section 4.0). The rapid growth that occurred during
the last 20 years in this area, however, has moderated since the economic slowdown
in 2008 that impacted the local housing market; yet, the population in Miami
Township as a whole has increased 11.5 percent from year 2000-2010 (U.S. Census).
The large quantity of developable land in the area, coupled with a forecast for
sustained growth will stimulate single family home development at existing
residential densities.
3.1.1.3 Current Wastewater Production
The total number of home sewage treatment systems (HSTSs) within the
Loveland/Horner’s Run/Branch Hill planning area is estimated to be 2,600, of
which 660 are located in Loveland. Based on this information, the estimated sanitary
wastewater production is 0.93 mgd which includes the estimated production of the
HSTSs (basis: all active) and the current production of 0.4 mgd from the four
permitted point sources described in Exhibit 3.1.
A dry weather flow model run was developed to estimate the average dry weather
flow. The wet weather peak flow rate was determined by evaluating the modeled
system using a 5 year 6 hour design storm.

CLERMONT COUNTY WATER RESOURCES DEPARTMENT
WASTEWATER MASTER PLAN UPDATE
SECTION 3.0
FACILITY PLANNING AREAS – 2010 STATE OF THE SYSTEM
CLERMONT COUNTY WWMPU - FINAL CH2M HILL, INC 3-3
3.1.1.4 Collection/Conveyance and Treatment Facilities
The collection system inventory and treatment facilities are listed in the Exhibit 3.1.
EXHIBIT 3.1 Loveland/Horner’s Run/Branch Hill 2010 State of the System
3.1.1.5 Delineation of Unsewered Areas
The unsewered areas in this basin are served by on-site systems. Exhibit 3.2 shows
the extent of sewered and unsewered areas, treatment facilities, sewers, pump
stations and the boundary for Loveland/Horner's Run/Branch Hill FPA
3.1.2 Wastewater Management Challenges
With the projection for continued area growth and quantity of land that is presently
available for development, plans for wastewater management improvements must address
the following challenges:
Continued consolidation and regionalization of wastewater collection and treatment
facilities, particularly in the northern portion of the planning area and specifically the
smaller treatment facilities such as Arrowhead, Indian Lookout (planned for
elimination) and Miami Trails;
Provision for sustained residential growth and development in Miami Township,
notably the areas north and south of the Ward’s Corner/I-275 interchange;
Addressing existing public health nuisances associated with HSTSs, notably those cited
in Exhibit 2.2.
BasinSewered Area
(acres)Total Area (acres)
Length of Sewer (miles)
Range of Pipe Sizes (inches)
Pump Stations Pumping to this FPA
Wastewater Treatment Plant
WWTP Design Capacity (mgd)
Miami Trails WWTP 0.4
Arrowhead Park WWTP 0.14
Wards Corner Regional WWTP 2Indian Lookout
WWTP 0.045Total 2.585
9Loveland/Horner's Run/Branch Hill 1,179 15,457 22.0 4" to 12"

CLERMONT COUNTY WATER RESOURCES DEPARTMENT
WASTEWATER MASTER PLAN UPDATE
SECTION 3.0
FACILITY PLANNING AREAS – 2010 STATE OF THE SYSTEM
CLERMONT COUNTY WWMPU - FINAL CH2M HILL, INC 3-4
3.2 O’Bannon Creek
3.2.1 Existing Conditions
The O’Bannon Creek planning area consists of approximately 27,000 acres located in north-
central Clermont Couty. It includes most of Goshen Township and portions of Miami,
Wayne and Stonelick Townships. Of this area, approximately 4,800 acres are sewered with
flow draining to the O’Bannon Creek Regional Wastewater Treatment Plant. Although
approximately 12 square miles located in Warren County drain southward into O’Bannon
Creek, for purposes of this master plan update, the O’Bannon Creek planning area is
assumed to include only those areas located in Clermont County
3.2.1.1 Land Use and Zoning Trends
Land use consists primarily of lower density residential development in the west
and central portions of the planning area with several large mobile parks also
present. Agriculture is the dominant land use in the east. Commercial development
is mainly concentrated west of Goshen along SR-28. Planning projections suggest
that moderate density suburban residential development will likely occur in the area
between Smith Road and the Cincinnati Nature Preserve, north of SR-28, with
continued commercial and industrial development along SR-28, both west and east
of Goshen.
3.2.1.2 Population
The current (2010) population in the O’Bannon Creek planning area is estimated to
be 23,100 (Refer to Section 4.0). As with other areas in the County that experienced
moderate to significant growth during the last 20 years, this trend has moderated
recently since the economic turndown that began in 2008; yet, the population of
Goshen Township as a whole increased 13.5 percent from year 2000 to 2010

CLERMONT COUNTY WATER RESOURCES DEPARTMENT
WASTEWATER MASTER PLAN UPDATE
SECTION 3.0
FACILITY PLANNING AREAS – 2010 STATE OF THE SYSTEM
CLERMONT COUNTY WWMPU - FINAL CH2M HILL, INC 3-5
(U.S. Census). The availability of developable land will drive the forecast for
continued commercial development and suburban residential growth in the area at
moderate densities of two units per acre.
3.2.1.3 Current Wastewater Production
The total number of HSTSs in the O’Bannon Creek planning area is estimated to be
2,400 which are scattered throughout the area but primarily to the east and north.
The estimated sanitary production is 2.25 mgd which includes the estimated HSTS
production (basis: all active) and the O’Bannon Creek Regional WWTP which
currently discharges an annual average flow of 1.67 mgd.
The updated hydraulic model was used to calculate the current wastewater
production. A dry weather flow model run was developed to estimate the average
dry weather flow. The wet weather peak flow rate was determined by evaluating the
modeled system using a 5 year 6 hour design storm.
3.2.1.4 Collection/Conveyance and Treatment Facilities
The collection system inventory and treatment facilities are listed in the Exhibit 3.3.
EXHIBIT 3.3 O’Bannon 2010 State of the System
3.2.1.5 Delineation of Unsewered Areas
The unsewered areas in this basin are served by on-site systems. This area has
promising development potential in the existing agricultural areas as well as in areas
that adjoin existing suburban development. Exhibit 3.4 shows the sewered and
unsewered areas, treatment facilities, sewers, pump stations and the boundary for
the O’Bannon Creek FPA.
Sewered Area (acres)
Total Area (acres)
Length of Sewer (miles)
Range of Pipe Sizes (inches)
Pump Stations Pumping to this FPA
Wastewater Treatment Plant
WWTP Design Capacity (mgd)
4,772 26,747 110.9 15" to 36" 5O'Bannon Creek
WWTP 4.4

CLERMONT COUNTY WATER RESOURCES DEPARTMENT
WASTEWATER MASTER PLAN UPDATE
SECTION 3.0
FACILITY PLANNING AREAS – 2010 STATE OF THE SYSTEM
CLERMONT COUNTY WWMPU - FINAL CH2M HILL, INC 3-6
3.2.2 Wastewater Management Challenges
The forecast for continued growth in the area suggests that wastewater management focus
on the following challenges:
Hydraulic improvements at the O’Bannon Creek Regional WWTP to enable
increased treatment of peak wet weathers flows;
Control of infiltration and inflow, particularly those portions of the trunk sewer that
have been installed in, near or across creek beds where access is a challenge;
Addressing public health nuisances associated with HSTSs, notably along Woodville
Pike (CR-133);
Plan for effective wastewater management in developing areas that lie outside the
existing service area.
3.3 Stonelick Creek
The Stonelick Creek FPA includes approximately 43,700 acres, located in the northeast
portion of Clermont County. This FPA includes most of Stonelick and Wayne Townships
and portions of Union, Goshen and Jackson Townships. Incorporated municipalities in the
planning area include the villages of Owensville and Newtonsville. There are various
unincorporated towns and villages scattered through the area, notably Edenton and Belfast.
The entire planning area drains to Stonelick Creek, the area’s major water course, which
flows in a southwesterly direction and is tributary to the East Fork of the Little Miami River.
The 181 acre Stonelick Lake, a man-made reservoir which is surrounded by a state park, is
located in the upper portion of the planning area.
3.3.1 Existing Conditions
3.3.1.1 Land Use and Zoning Trends
The current land use distribution suggests that approximately 87 percent of the
FPA’s land area is devoted to agricultural or woodland use, both of which are

CLERMONT COUNTY WATER RESOURCES DEPARTMENT
WASTEWATER MASTER PLAN UPDATE
SECTION 3.0
FACILITY PLANNING AREAS – 2010 STATE OF THE SYSTEM
CLERMONT COUNTY WWMPU - FINAL CH2M HILL, INC 3-7
available for development under existing zoning regulations. Residential
development is generally low-density and scattered around the planning area, with
some concentration in the north along SR 131 and in the south along US 50. Most of
the commercial development has occurred within or near the Village of Owensville
and to a lesser degree in the Edenton and Belfast communities.
Physical limitations to the development of land in the area are steep slopes and
floodplain areas. These two constraints are characteristic of the Stonelick Creek
valley which is the most prominent physical feature of the area and its most valuable
natural asset.
3.3.1.2 Population
The planning area’s 2010 population is estimated at 13,700. Based on the 2010 U.S.
Census figures, the combined populations of Stonelick and Wayne Townships,
which make up the majority of land area in the FPA, declined slightly. The Village of
Newtonsville which is currently unsewered grew from a population of 427 in 1990 to
492 in the year 2000 but lost an estimated 20 percent of its population from year 2000
to 2010. According to the 2010 U.S. Census, the current population of Newtonsville
is 392. As well, the Village of Owensville declined in population during this same
period from 1,019 in 1990 to 794 in 2010, resulting in a net population loss of 22.1
percent during the last 20 years.
3.3.1.3 Current Wastewater Production
The majority of wastewater generated within the planning area originates from
individual on-site systems. The total number of on-site systems within the Stonelick
Creek planning area is estimated to be 3,600 units which are scattered throughout
the area. The Clermont County Health District has indicated that it does not know
with certainty the number of these on-site systems that are active. Based on this
information, it is estimated that the sanitary wastewater production within the

CLERMONT COUNTY WATER RESOURCES DEPARTMENT
WASTEWATER MASTER PLAN UPDATE
SECTION 3.0
FACILITY PLANNING AREAS – 2010 STATE OF THE SYSTEM
CLERMONT COUNTY WWMPU - FINAL CH2M HILL, INC 3-8
Stonelick Creek planning area is 0.78 mgd which includes the estimated production
of the on-site systems (basis: all active) and the two localized point source
discharges described below:
Clermont Northeastern Local School, located in Stonelick Township near US
50 east of Owensville, which has a permitted flow of 40,000 gpd to Patterson
Run (current flow of 21,000 gpd).
Stonelick State Park Campgrounds, located in Wayne Township which has a
permitted flow of 30,000 gpd to Stonelick Lake (estimated current flow of
12,000).
3.3.1.4 Collection, Conveyance and Treatment Facilities
Sanitary sewer service is provided to the Village of Owensville with service
extending north and south along SR 132, and the Owensville North extension along
Belfast-Owensville Road. Sanitary wastewater is conveyed southward to the Middle
East Fork Basin and receives treatment at the Middle East Fork WWTP located in
Batavia. The collection system inventory and treatment facilities are listed in the
Exhibit 3.5.
EXHIBIT 3.5 Stonelick 2010 State of the System (Sewered and conveyed to Middle East Fork FPA)
3.3.1.5 Delineation of Unsewered Areas
Exhibit 3.6 contains a map of the Stonelick Creek planning area showing the extent
of sewered areas and unsewered areas presently served by on-site systems. The vast
majority of the planning area is unsewered. Clermont County has extended sanitary
service into the planning area’s western and southern boundaries, as noted
previously, increasing the potential of continued expansion of sanitary service into
this area.
Sewered Area (acres)
Total Area (acres)
Length of Sewer (miles)
Range of Pipe Sizes (inches)
Pump Stations Pumping to this FPA
Wastewater Treatment Plant
WWTP Design Capacity (mgd)
340 43,698 5.5 8" to 18" ‐ ‐ ‐

CLERMONT COUNTY WATER RESOURCES DEPARTMENT
WASTEWATER MASTER PLAN UPDATE
SECTION 3.0
FACILITY PLANNING AREAS – 2010 STATE OF THE SYSTEM
CLERMONT COUNTY WWMPU - FINAL CH2M HILL, INC 3-9
3.3.2 Wastewater Management Challenges
With the preponderance of on-site systems located within the Stonelick Creek planning
area, the identified challenges to wastewater management include:
Planning for the anticipated growth that is forecast to enter the planning area from
the south, from the SR 32 corridor passing through Batavia Township and to a lesser
extent from the east along SR 131.
Addressing the concentration of small lot development located within established
communities or along major roadways.
Maintaining vigilance over the proper construction and adequate maintenance of on-
site systems to prevent a public health nuisance.
Supporting reasonable levels of growth and development through wastewater
management improvement projects that are capable of providing maximum benefit
to targeted areas.
One such target area is the Village of Newtonsville located in southern Wayne Township
along SR 131. The residents of this community have indicated their desire for the
elimination of on-site systems in favor of centralized collection and treatment to the
Clermont County Water Resources Department (CCWRD).
In 1999, CCWRD responded to this local concern by commissioning a study to examine
viable treatment alternatives to serve Newtonsville. For the general area bounded by
Cedarville Road and Newtonsville Road, an area that includes approximately 200 housing
units, a natural form of treatment system was recommended. In addition to eliminating the
on-site systems, the natural treatment system would serve to augment the flow to Stonelick
Creek. The estimated cost of the collection system and 0.2 mgd treatment system was

CLERMONT COUNTY WATER RESOURCES DEPARTMENT
WASTEWATER MASTER PLAN UPDATE
SECTION 3.0
FACILITY PLANNING AREAS – 2010 STATE OF THE SYSTEM
CLERMONT COUNTY WWMPU - FINAL CH2M HILL, INC 3-10
approximately $4 million (1999 basis). Due to the excessive cost of construction, the
unfamiliarity of operating a natural treatment system and the strict compliance criteria for
discharge to Stonelick Creek, this alternative was not considered further.
Future planning by CCWRD to provide sanitary collection and wastewater treatment to the
Village of Newtonsville is being considered in response to local support of these facilities.
3.4 Upper East Fork
The Upper East Fork FPA includes approximately 15,400 acres, located in eastern Clermont
County, bordering Brown County. This FPA includes most of Jackson Township and
portions of Wayne and Williamsburg Townships. Prior planning studies commissioned by
the County have incorporated this area into the Middle East Fork FPA, although the current
Regional Water Quality Management Plan, Revised December 1999 (i.e. 208 Plan) regards the
Upper East Fork as a separate FPA.
The Upper East Fork area is bisected by SR 50 which runs east-west and by SR 133 running
north-south. There are no incorporated municipalities in the planning area but sparsely
populated, unincorporated communities are scattered through this area, including
Marathon and Monterey. The planning area drains to the East Fork of the Little Miami
River, the area’s major water course, and its tributaries which flow in a southwesterly
direction to East Fork Lake.
3.4.1 Existing Conditions
3.4.1.1 Land Use and Zoning Trends
The current land use distribution indicates that agriculture and woodlands dominate
the area, both of which are available for development under existing zoning
regulations. Steep slopes exist along the East Fork and its tributaries. The balance of
the terrain has slopes generally less than 5 percent which are conducive to growth
and development.

CLERMONT COUNTY WATER RESOURCES DEPARTMENT
WASTEWATER MASTER PLAN UPDATE
SECTION 3.0
FACILITY PLANNING AREAS – 2010 STATE OF THE SYSTEM
CLERMONT COUNTY WWMPU - FINAL CH2M HILL, INC 3-11
Residential development is generally low-density and scattered around the planning
area, with the largest concentrations located in Marathon and Monterey. There is no
major industry or employer in the area. Isolated commercial development exists
along SR 50 and SR 133, primarily in the Marathon and Monterey communities.
A 207 acre hazardous waste landfill is centrally located in Jackson Township and is
owned by CECOS, an international waste disposal company. This landfill ceased
operation and eventually closed in the mid-1980s.
3.4.1.2 Population
The planning area’s 2010 population is estimated at 2,270. The population has
grown moderately in recent years (approximately 1% per year) and is anticipated to
follow this same trend into the future, possibly leveling off due to the sparse
development pattern and lack of transportation route expansion through the area.
3.4.1.3 Current Wastewater Production
The majority of wastewater generated within the planning area originates from
individual on-site systems. The total number of on-site systems within the Upper
East Fork planning area is estimated to be 990 units which are generally scattered
throughout the area. The largest concentration of on-site systems is located within
Marathon. Based on this information, it is estimated that the sanitary wastewater
production within the Upper East Fork planning area is 0.2 mgd which includes only
the estimated production of the on-site systems (basis: all active).
3.4.1.4 Collection, Conveyance and Treatment Facilities
The planning area is without centralized sanitary service. The nearest public sewer
under the jurisdiction of Clermont County is located north of SR 32 and extends
from Bauer Road to Half Acre Road. The Village of Williamsburg, located south of
the planning area, has expanded its sewer service westward along Old SR 32.

CLERMONT COUNTY WATER RESOURCES DEPARTMENT
WASTEWATER MASTER PLAN UPDATE
SECTION 3.0
FACILITY PLANNING AREAS – 2010 STATE OF THE SYSTEM
CLERMONT COUNTY WWMPU - FINAL CH2M HILL, INC 3-12
The Village of Williamsburg was originally a part of the Middle East Fork and Upper
East Fork FPAs. Recently, an amendment (Amendment 32 to OKI’s Regional Water
Quality Management Plan) to update the boundaries for facility planning areas in
eastern Clermont County and to identify the boundaries of a new facility planning
area for the Village of Williamsburg was granted by OKI in August 2009. This action
designates responsibility to the Village of Williamsburg for the construction,
maintenance and operation of wastewater collection and treatment facilities for the
new Williamsburg FPA and re-designates CCWRD for the construction,
maintenance and operation of wastewater collection and treatment facilities for the
updated Middle East Fork and Upper East Fork FPAs. A small northern segment of
the Williamsburg FPA extends into the Upper East Fork FPA, primarily between
McKeever Road and SR 133. The collection system inventory and treatment facilities
are listed in the Exhibit 3.7.
EXHIBIT 3.7 Upper East Fork 2010 State of the System
3.4.1.5 Delineation of Unsewered Areas
Exhibit 3.8 contains a map of the Upper East Fork planning area showing the extent
of unsewered areas presently served by on-site systems. Clermont County has not
extended sanitary sewer service into the planning area although public water service
is provided in the southern portion of the FPA.
3.4.2 Wastewater Management Challenges
The area with the greatest potential to experience growth and conceivably be served with a
public sewer system is the southwestern portion of the planning area, generally located
south of Jackson Pike in Jackson Township. This part of the planning area is in close
proximity to SR 32, one of the main transportation routes into and out of Clermont County.
Sewered Area (acres)
Total Area (acres)
Length of Sewer (miles)
Range of Pipe Sizes (inches)
Pump Stations Pumping to this FPA
Wastewater Treatment Plant
WWTP Design Capacity (mgd)
‐ 15,353 ‐ ‐ ‐ ‐ ‐

CLERMONT COUNTY WATER RESOURCES DEPARTMENT
WASTEWATER MASTER PLAN UPDATE
SECTION 3.0
FACILITY PLANNING AREAS – 2010 STATE OF THE SYSTEM
CLERMONT COUNTY WWMPU - FINAL CH2M HILL, INC 3-13
As with other areas having a preponderance of on-site systems, the identified challenges to
wastewater management in the Upper East Fork planning area include:
Planning for the possible growth that is likely to enter the Upper East Fork area from
the south, via the SR 32 corridor that passes through Batavia Township.
Continuing vigilance over the proper construction and adequate maintenance of on-
site systems whose operation best fits the current and future vision for growth
within the planning area.
3.5 Lower East Fork
3.5.1 Existing Conditions
The Lower East Fork planning area includes 21,500 acres which are located in Union and
portions of Miami and Batavia townships. Of this area, 16,500 acres are sewered with flow
draining to the Lower East Fork Wastewater Treatment Plant. Wastewater is also pumped
into the Lower East Fork drainage area through 49 pump stations.
3.5.1.1 Land Use and Zoning Trends
Single family residences constructed at suburban densities constitute the majority of
existing development in the area, covering the most of the planning area. There are
no incorporated communities in the planning area, yet significant commercial and
industrial development exists, particularly in the Eastgate area located at the
intersection of I-275 and SR-32. This area is a boon to the local economy which will
continue into the future with planned transportation improvements such as the re-
design of the I-275/SR-32 interchange and the 100 acre Class A office park complex
located south of this intersection. Land use planning indicates that the availability of
developable land will continue to drive moderate to low-density (2 houses per acre)
single family home construction; however, the goal is to achieve an appropriate
balance of residential, commercial and industrial development in the area.

CLERMONT COUNTY WATER RESOURCES DEPARTMENT
WASTEWATER MASTER PLAN UPDATE
SECTION 3.0
FACILITY PLANNING AREAS – 2010 STATE OF THE SYSTEM
CLERMONT COUNTY WWMPU - FINAL CH2M HILL, INC 3-14
3.5.1.2 Population
The existing population within the Lower East Fork planning area is estimated to be
51,900 (Refer to Section 4.0). This has resulted from sustained growth rates over the
last 20 years which is forecast to continue into the foreseeable future. The townships
of Batavia, Union and Miami all showed a pattern of strong growth from year 2000
to 2010 with Union Township registering an estimated 9.6 percent growth over this
period.
3.5.1.3 Current Wastewater Production
There are approximately 560 HSTSs located in the Lower East Fork area. These are
located primarily north and south of SR-50 east of I-275 and in a pocket area south of
Milford. The sewered area produces an average of 6.9 mgd of sanitary flow. The
existing on-site system production (basis: all active) adds another 0.12 mgd.
The updated hydraulic model was used to calculate the current wastewater
production. A dry weather flow model run was developed to estimate the average
dry weather flow. The wet weather peak flow rate was determined by evaluating the
modeled system using a 5 year 6 hour design storm.
3.5.1.4 Collection/Conveyance and Treatment Facilities
The collection system inventory and treatment facilities are listed in the Exhibit 3.9.
EXHIBIT 3.9 Lower East Fork 2010 State of the System
Sewered Area (acres)
Total Area (acres)
Length of Sewer (miles)
Range of Pipe Sizes (inches)
Pump Stations Pumping to this FPA
Wastewater Treatment Plant
WWTP Design Capacity (mgd)
16,485 21,500 286.2 2" to 42" 49Lower East Fork
WWTP 9

CLERMONT COUNTY WATER RESOURCES DEPARTMENT
WASTEWATER MASTER PLAN UPDATE
SECTION 3.0
FACILITY PLANNING AREAS – 2010 STATE OF THE SYSTEM
CLERMONT COUNTY WWMPU - FINAL CH2M HILL, INC 3-15
3.5.1.5 Delineation of Unsewered Areas
The unsewered areas in this basin are served by on-site systems. There are areas to
the east in the Stonelick FPA that when developed could drain to the Lower East
Fork drainage area. Exhibit 3.10 shows the extent of sewered and unsewered areas,
treatment facilities, sewers, pump stations and the boundary for the Lower East Fork
FPA.
3.5.2 Wastewater Management Challenges
The Lower East Fork planning area is the most populous and heavily developed area in the
County. As such, wastewater management challenges relate to a greater extent to the
maintenance and sustainability of existing service. Wastewater management challenges in
this planning area include the following:
Collection system improvements aimed at providing adequate capacity to collect,
convey and treat existing and projected flows, including the elimination of
surcharging and overflows;
Expansion of the Lower East Fork WWTP to augment treatment capacity of excess
wet weather flows and to provide for future growth in the area;
Address the public health nuisances associated with on-site treatment systems,
notably in the Pepper Ridge subdivision and Woodland View Drive areas.
3.6 Middle East Fork
3.6.1 Existing Conditions
The Middle East Fork planning area consisting of 71,446 acres is located in central Clermont
County and includes nearly all of Batavia and Williamsburg townships and extends into
Tate, Jackson, Pierce, Monroe, Stonelick and Union townships. Incorporated municipalities
include Batavia, Bethel, Williamsburg and Amelia (Note: Areas tributary to the East Fork
Little Miami River that lie outside Clermont County are not considered herein for planning

CLERMONT COUNTY WATER RESOURCES DEPARTMENT
WASTEWATER MASTER PLAN UPDATE
SECTION 3.0
FACILITY PLANNING AREAS – 2010 STATE OF THE SYSTEM
CLERMONT COUNTY WWMPU - FINAL CH2M HILL, INC 3-16
purposes). The planning area is bisected by the East Fork Little Miami River. Of the total
Middle East Fork area, approximately 7,143 acres (10 percent) is currently sewered and
drains to the Middle East Fork WWTP.
3.6.1.1 Land Use and Zoning Trends
The majority of existing development is located in the incorporated municipalities
and along major thoroughfares and consists of single family residences, although
there are multi-family developments and mobile home parks located along or near
SR-32 and SR-125. The land use in the eastern segment of the planning area is
devoted to agriculture and warm weather recreation at East Fork Lake.
3.6.1.2 Population
The current (2010) population within the Middle East Fork planning area is
estimated to be 39,200 (Refer to Section 4.0). Between the census years 2000 and
2010, the Batavia Township population grew an estimated 31.2 percent. The adjacent
township of Williamsburg to the east experienced an estimated population increase
of 14.8 percent. The future population within the planning area is forecast to grow at
an annual rate between 2-2.5 percent.
3.6.1.3 Current Wastewater Production
The majority of wastewater currently produced within the planning area is
generated from the County’s sewer system. A daily production of 3.6 mgd
originates from the sewered areas. The number of on-site systems is estimated to be
4,370. These are located mainly in the east and central sectors of the planning area
and contribute an additional 0.94 mgd (basis: all active) for a combined sanitary
production of 4.54 mgd.

CLERMONT COUNTY WATER RESOURCES DEPARTMENT
WASTEWATER MASTER PLAN UPDATE
SECTION 3.0
FACILITY PLANNING AREAS – 2010 STATE OF THE SYSTEM
CLERMONT COUNTY WWMPU - FINAL CH2M HILL, INC 3-17
The updated hydraulic model was used to calculate the current wastewater
production. A dry weather flow model run was developed to estimate the average
dry weather flow. The wet weather peak flow rate was determined by evaluating the
modeled system using a 5 year 6 hour design storm.
3.6.1.4 Collection/Conveyance and Treatment Facilities
The collection system inventory and treatment facilities are listed in the Exhibit 3.11.
EXHIBIT 3.11 Middle East Fork 2010 State of the System
3.6.1.5 Delineation of Unsewered Areas
The vast unsewered areas located to the east and central portions of the planning
area are served by on-site systems. These mainly agricultural areas have significant
development potential. Planning forecasts suggest that residential growth is
anticipated in areas north of SR-32 between Olive Branch-Stonelick Road eastward to
Herold Road and south of the Village of Batavia, generally along SR-222 with
continued commercial development along SR-32.
Exhibit 3.12 shows the sewered and unsewered area, WWTPs, sewers, pump stations
and boundary for Middle East Fork FPA
3.6.2 Wastewater Management Challenges
The Middle East Fork planning area is the second most populous area in the County, second
only to the Lower East Fork region. Continued development pressure will create the
following wastewater challenges within this planning area:
Sewered Area (acres)
Total Area (acres)
Length of Sewer (miles)
Range of Pipe Sizes (inches)
Pump Stations Pumping to this FPA
Wastewater Treatment Plant
WWTP Design Capacity (mgd)
7,143 71,446 166.9 1.5" to 36" 35Middle East Fork WWTP 7.2
CLERMONT COUNTY WATER RESOURCES DEPARTMENT
WASTEWATER MASTER PLAN UPDATE
SECTION 3.0
FACILITY PLANNING AREAS – 2010 STATE OF THE SYSTEM
CLERMONT COUNTY WWMPU - FINAL CH2M HILL, INC 3-18
Collection system improvements aimed at providing adequate capacity to collect,
convey and treat existing and projected flows, including the elimination of excessive
surcharging and overflows;
Address public health nuisances associated with on-site treatment systems;
Augment treatment capacity for excess wet weather flows at the Middle East Fork
WWTP and provide for future growth;
3.7 Nine Mile
3.7.1 Existing Conditions
The Nine Mile planning area consists of approximately 14,400 acres located in west-central
Clermont County and includes most of Pierce Township and portions of Ohio and Union
townships. This area is deeply incised by Nine Mile and Ten Mile Creek which flow
westward into the Ohio River. There are no incorporated municipalities in the Nine Mile
FPA other than a portion of Amelia that extends into the planning boundary. Of the total
area noted, approximately 2,800 acres is served by the County’s collection system and
drains to the Nine Mile WWTP.
3.7.1.1 Land Use and Zoning Trends
Single family residential properties constitute the majority of the existing
development which is located mainly in the northwest quadrant of the planning area
along the SR-125 corridor and adjacent to I-275. There are some multi-family units
scattered about the area and commercial developments located along SR-125 as well.
Concentrated development in other areas, particularly the southern half of the
planning area, is lacking due to steep topography. Planning forecasts suggest low
density residential development (1 unit per 2 acres) will continue to characterize the
southern half of the area, while more conventional residential development (2-4
units per acre) is anticipated along and south of SR-125 where minimal slope
constraints exist.

CLERMONT COUNTY WATER RESOURCES DEPARTMENT
WASTEWATER MASTER PLAN UPDATE
SECTION 3.0
FACILITY PLANNING AREAS – 2010 STATE OF THE SYSTEM
CLERMONT COUNTY WWMPU - FINAL CH2M HILL, INC 3-19
3.7.1.2 Population
The current (2010) population within the Nine Mile planning area is estimated at
20,280 (Refer to Section 4.0). The population of Pierce Township where the Nine
Mile FPA is mainly located grew at an average rate of 1.74 percent per year from
year 2000 to 2010. The forecasted annual growth rate for Pierce Township of
2.1 percent will impact and likely produce a similar population increase within the
planning area, thus creating a continued demand for residential housing and
wastewater services.
3.7.1.3 Current Wastewater Production
There are an estimated 1,400 HSTSs located in the Nine Mile planning area. The
estimated production from this source is 0.3 mgd (basis: all active). These units are
located mainly in the southern region of the planning area. An average daily
production of 1.47 mgd originates from the sewered area for a combined total of
1.77 mgd.
The updated hydraulic model was used to calculate the current wastewater
production. A dry weather flow model run was developed to estimate the average
dry weather flow. The wet weather peak flow rate was determined by evaluating the
modeled system using a 5 year 6 hour design storm.
3.7.1.4 Collection/Conveyance and Treatment Facilities
The collection system inventory and treatment facilities are listed in the Exhibit 3.13.
EXHIBIT 3.13 Nine Mile/Ten Mile Creek 2010 State of the System
Sewered Area (acres)
Total Area (acres)
Length of Sewer (miles)
Range of Pipe Sizes (inches)
Pump Stations Pumping to this FPA
Wastewater Treatment Plant
WWTP Design Capacity (mgd)
2,825 14,363 66.6 2" to 24" 13Nine Mile WWTP 3

CLERMONT COUNTY WATER RESOURCES DEPARTMENT
WASTEWATER MASTER PLAN UPDATE
SECTION 3.0
FACILITY PLANNING AREAS – 2010 STATE OF THE SYSTEM
CLERMONT COUNTY WWMPU - FINAL CH2M HILL, INC 3-20
3.7.1.5 Delineation of Unsewered Areas
Unsewered areas mainly located in the southern half of the planning area are served
by on-site systems. This area contains extensive wooded hillsides with steep slopes.
Planning forecasts indicate there may be demand for development in these areas
with hillside development limited to a maximum of 1 unit per 2.5 acres. Low
density development (1 unit per 2 acres) will be encouraged on terrain near valley
floors and on hillsides where slope is less than 25 percent. Conventional density
development will be permitted where there are no slope constraints.
Exhibit 3.14 shows the extent of sewered and unsewered areas, treatment facilities,
sewers, pump stations and the boundary for the Nine /Ten Mile FPA
3.7.2 Wastewater Management Challenges
Wastewater management challenges in the Nine/Ten Mile planning area include the
following:
Collection system improvements aimed at providing adequate capacity to collect,
convey and treat existing and projected flows, including the elimination of
surcharging and overflows;
Effective management of wastewater in areas generally located to the south of the
existing service area within the Ten Mile drainage divide;
Provision for excess flow equalization at the Nine Mile WWTP;
3.8 New Richmond
The New Richmond FPA includes approximately 21, 700 acres, located in the southwest
portion of Clermont County, bordering on the Ohio River. This FPA includes most of Ohio
Township and portions of Pierce, Monroe and Tate Townships. New Richmond, situated on
the Ohio River is the planning area’s lone incorporated municipality.

CLERMONT COUNTY WATER RESOURCES DEPARTMENT
WASTEWATER MASTER PLAN UPDATE
SECTION 3.0
FACILITY PLANNING AREAS – 2010 STATE OF THE SYSTEM
CLERMONT COUNTY WWMPU - FINAL CH2M HILL, INC 3-21
Ten Mile Creek and Twelve Mile Creek are the two major watercourses that drain the area,
flowing westward to the Ohio River.
3.8.1 Existing Conditions
3.8.1.1 Land Use and Zoning Trends
Land use within the New Richmond FPA consists of widely scattered, low density
residential development throughout the eastern portion of the planning area
(Monroe Township), transitioning to moderate and high density urban development
in and around the Village of New Richmond. Most of the commercial development
has occurred along SR 52 which is aligned with and follows the Ohio River.
Physical limitations to the development of land in the area are steep slopes (>25
percent) found along the valley walls of the Ohio River and tributary streams and
lowland flooding. These two constraints are characteristic of the Ohio River valley
and its tributaries, the most prominent physical feature of the area and its most
valuable natural asset.
A dominant feature adjacent to the Ohio River along SR 52 is the coal-fired Beckjord
Generating Station located on the north end of New Richmond.
3.8.1.2 Population
The planning area’s 2010 population is estimated at 10,080. Ohio Township where
most of the FPA is located showed a slight (1 percent) decline in population from
2000 to 2010 while Monroe Township registered an estimated 5 percent decline in
population over the same period. The Village of New Richmond in Ohio Township
has grown from a population of 2,210 in the year 2000 to an estimated population in
2010 of 2,582, a 16.8 percent gain in population over the last ten year period.

CLERMONT COUNTY WATER RESOURCES DEPARTMENT
WASTEWATER MASTER PLAN UPDATE
SECTION 3.0
FACILITY PLANNING AREAS – 2010 STATE OF THE SYSTEM
CLERMONT COUNTY WWMPU - FINAL CH2M HILL, INC 3-22
3.8.1.3 Wastewater Production
Approximately 40 percent of wastewater generated within the planning area
originates from individual on-site systems. The total number of on-site systems
within the New Richmond planning area is estimated to be 2,560 units which are
scattered throughout the eastern and central portions of the planning area. Based on
this information, it is estimated that the sanitary wastewater production within the
New Richmond planning area is 0.84 mgd which includes the estimated production
of the on-site systems (all active basis) and the four permitted point sources
described below:
New Richmond WWTP, located in Ohio Township along US 52, which has a
permitted flow of 550,000 gpd to Patterson Run (current flow of 270,000 gpd);
Chestnut Mobile Home Park WWTP located in New Richmond, which has a
permitted flow of 3,900 gpd to an unnamed tributary of Fagin Run.
Hilltop Estates Mobile Home Park WWTP located in New Richmond along
SR 132, which has a permitted flow of 75,000 gpd to an unnamed tributary of
Fagin Run.
Hi-View Estates Mobile Home Park WWTP located in Bethel along SR 222,
which has a permitted flow of 37,800 gpd to an unnamed tributary of Twelve
Mile Creek.
3.8.1.4 Collection, Conveyance and Treatment Facilities
The Village of New Richmond has expanded its service area to the north along (old)
SR 52 to service the River Bluffs area and to the east along Bethel-New Richmond
Road just past the corporate boundary. The collection system inventory and
treatment facilities are listed in the Exhibit 3.15.

CLERMONT COUNTY WATER RESOURCES DEPARTMENT
WASTEWATER MASTER PLAN UPDATE
SECTION 3.0
FACILITY PLANNING AREAS – 2010 STATE OF THE SYSTEM
CLERMONT COUNTY WWMPU - FINAL CH2M HILL, INC 3-23
EXHIBIT 3.15 New Richmond 2010 State of the System (Unsewered)*
* table lists only sewers owned by the CCWRD
3.8.1.5 Delineation of Unsewered Areas
Exhibit 3.16 contains a map of the New Richmond planning area showing the extent
of unsewered areas presently served by on-site systems.
3.8.2 Wastewater Management Challenges
With the large number of on-site systems in the New Richmond planning area and limited
sanitary sewer service, the identified challenges to wastewater management include:
Addressing the preponderance of roadside residential properties on small lots
located along rural roads throughout the east and central portion of the planning
area.
Continuing vigilance over the proper construction and adequate maintenance of on-
site systems whose operation best fits the current and future vision for growth
within the planning area, recognizing that much of the unsewered areas are
generally unsuitable for soil-based on-site systems.
Supporting reasonable levels of growth and development through wastewater
management improvement projects that are capable of providing maximum benefit
to target areas.
Target areas include: 1) providing limited sewer extensions to serve areas that are
located adjacent to New Richmond and that are known to create a public health
nuisance and 2) planning for the installation of trunk sewers that extend into the
eastern portion of the service area such as along Bethel-New Richmond Road in
anticipation of a regional solution to wastewater management in the southwestern
reach of the County.
Sewered Area (acres)
Total Area (acres)
Length of Sewer (miles)
Range of Pipe Sizes (inches)
Pump Stations Pumping to this FPA
Wastewater Treatment Plant
WWTP Design Capacity (mgd)
‐ 21,659 ‐ ‐ ‐ ‐ ‐

CLERMONT COUNTY WATER RESOURCES DEPARTMENT
WASTEWATER MASTER PLAN UPDATE
SECTION 3.0
FACILITY PLANNING AREAS – 2010 STATE OF THE SYSTEM
CLERMONT COUNTY WWMPU - FINAL CH2M HILL, INC 3-24
3.9 Felicity
The Felicity FPA includes a large area of approximately 64,200 acres, located in extreme
southern Clermont County and situated between the New Richmond and Middle East Fork
FPAs. This FPA includes all of Washington and Franklin Townships and the southern
portions of Monroe and Tate Townships. Incorporated municipalities in the planning area
include the Village of Felicity and the Ohio River towns of Chilo, Moscow and Neville.
There are various small unincorporated towns and villages scattered through the area.
The entire planning area drains to the Ohio River, mainly through Bullskin, Big Indian and
Bear Creek.
3.9.1 Existing Conditions
3.9.1.1 Land Use and Zoning Trends
Agriculture is the dominant land use throughout the entire planning area and is
available for development. With the notable exception of some concentrated
development along SR 52 which winds along the Ohio River through Chilo, Felicity,
Moscow and Neville, low density, single family rural residences characterize the
majority of area development. Most of the commercial development has occurred
within or near the incorporated villages noted previously.
Physical limitations to the development of land in the area are steep slopes mainly
along the western and southern portions of the planning area and lowland areas
subject to flooding. Washington Township has no zoning requirements that would
limit development in this portion of the planning area.
3.9.1.2 Population
The planning area’s 2010 population is estimated at 10,820 (Refer to Section 4.0). The
unsewered communities of Chilo (est. pop. 63) and Neville (est. pop. 100) each
experienced double-digit population declines during the last ten years (2000 to 2010).
The sewered Village of Felicity (est. pop. 818) registered an 11.3 percent decline in

CLERMONT COUNTY WATER RESOURCES DEPARTMENT
WASTEWATER MASTER PLAN UPDATE
SECTION 3.0
FACILITY PLANNING AREAS – 2010 STATE OF THE SYSTEM
CLERMONT COUNTY WWMPU - FINAL CH2M HILL, INC 3-25
population over this same period. The Village of Moscow with a current
population of 185, also a sewered community, lost 24 percent of its population
between year 2000 and 2010. The townships of Washington and Franklin showed
similar although smaller population declines in the range of 3-4 percent for this
period.
3.9.1.3 Wastewater Production
The majority of wastewater generated within the planning area originates from
individual on-site systems. The total number of on-site systems within the Felicity
planning area is estimated to be 2,980 units which are scattered throughout the area.
It is estimated that the sanitary wastewater production within the Felicity planning
area is 0.82 mgd which includes the estimated production of the on-site systems
(basis: all active) and the two localized point source discharges described below:
Felicity Regional WWTP, located in the Village of Felicity in Franklin
Township on SR 133 which has a permitted flow of 250,000 gpd to Bullskin
Creek (current average flow of 160,000 gpd).
Village of Moscow WWTP located in Moscow in Washington Township
which has a permitted flow of 24,000 gpd to the Ohio River (current average
flow of 18,000 gpd).
3.9.1.4 Collection, Conveyance and Treatment Facilities
Wastewater collection and treatment facilities operate in the Village of Felicity
(CCWRD) and the Village of Moscow. CCWRD commissioned a wastewater
management study of the Washington Township/Village of Moscow area that was
completed in 2002. The goal of the study was to assess the needs of the area and
determine the best method of providing wastewater treatment. The study cited the

CLERMONT COUNTY WATER RESOURCES DEPARTMENT
WASTEWATER MASTER PLAN UPDATE
SECTION 3.0
FACILITY PLANNING AREAS – 2010 STATE OF THE SYSTEM
CLERMONT COUNTY WWMPU - FINAL CH2M HILL, INC 3-26
presence of failed on-site systems as a driving force to direct wastewater from
Washington Township to the wastewater treatment facility located in the Village of
Moscow.
The Village of Moscow WWTP includes a pumping station, bar screen and
facultative lagoon treatment system consisting of three ponds in series. Two of the
facultative ponds have been installed below the 25-year flood plain elevation which
would not allow operability and accessibility as required by the Recommended
Standards for the Wastewater Facilities (i.e. “Ten States Standards”), during a 25-year
flood event. Additionally, the treatment facility is nearing design capacity. For
these reasons, the study did not advocate directing sanitary wastewater generated
within Washington Township to the Village of Moscow for treatment, but
recommended continued use of on-site systems due to the forecast for continued
slow area growth. The collection system inventory and treatment facilities are listed
in the Exhibit 3.17.
EXHIBIT 3.17 Felicity 2010 State of the System
3.9.1.5 Delineation of Unsewered Areas
Exhibit 3.18 contains a map of the Felicity planning area showing the extent of
unsewered areas presently served by on-site systems. Clermont County provides
sanitary service only to the Village of Felicity within the planning area.
3.9.2 Wastewater Management Challenges
With the preponderance of on-site systems located within the Felicity planning area and the
desire to envision a southern regional wastewater management strategy, the identified
challenges to wastewater management include:
Sewered Area (acres)
Total Area (acres)
Length of Sewer (miles)
Range of Pipe Sizes (inches)
Pump Stations Pumping to this FPA
Wastewater Treatment Plant
WWTP Design Capacity (mgd)
802 64,174 7.8 4" to 12" 2 Felicity WWTP 0.25

CLERMONT COUNTY WATER RESOURCES DEPARTMENT
WASTEWATER MASTER PLAN UPDATE
SECTION 3.0
FACILITY PLANNING AREAS – 2010 STATE OF THE SYSTEM
CLERMONT COUNTY WWMPU - FINAL CH2M HILL, INC 3-27
Continue the vigilance over proper construction and adequate maintenance of on-
site systems whose operation best fits the current and future vision for growth
within the planning area.
Define the role of the Felicity FPA in serving local needs in the Village of Felicity and
the Village of Moscow as well as the southern regional needs of the County. A
potential southern regional treatment facility located at or near Point Pleasant along
SR 52 in the Big Indian Creek Basin would be advantageous in terms of existing
zoning and favorable wasteload allocation since the discharge would be to the Ohio
River and could possibly serve existing infrastructure in adjacent planning areas.

CLERMONT COUNTY WATER RESOURCES DEPARTMENT
WASTEWATER MASTER PLAN UPDATE
SECTION 3.0
FACILITY PLANNING AREAS – 2010 STATE OF THE SYSTEM
CLERMONT COUNTY WWMPU - FINAL CH2M HILL, INC 3-28
Insert Maps
3.2
3.4
3.6
3.8
3.10
3.12
3.14
3.16
3.18

CLERMONT COUNTY WATER RESOURCES DEPARTMENT
WASTEWATER MASTER PLAN UPDATE
SECTION 4.0
FUTURE POPULATION AND FLOW PROJECTIONS
CLERMONT COUNTY WWMPU - FINAL CH2M HILL, INC 4-1
4.0 FUTURE POPULATION AND FLOW PROJECTIONS
The population estimates for 2010 and projections to 2020 and 2030 were derived from the
traffic zone database maintained by the Ohio, Indiana and Kentucky Council of
Governments (OKI). This database includes population figures, both current and projected,
and the area of each traffic zone. Individual properties in the traffic zones were considered
developable if they met certain criteria specified by the County (refer to details in
Section 4.3). Future flows were developed from projected population and developable
acreage that will drain to the existing wastewater treatment plants. The details of the
process for projecting the population, acreage and flows are explained in the following sub-
sections.
4.1 Data Used for Developing Projections
The Master Plan Update utilized flows projected to 2020 and 2030 for the analysis of
potential projects. The future flows were developed from projected population and acreage
that is anticipated to drain to existing wastewater treatment facilities.
The data used to estimate the future populations for Clermont County include:
Traffic Analysis Zone (TAZ) data: A total of 128 traffic zones cover the nine facility
planning areas analyzed in this report, making the traffic zones useful building
blocks for projecting populations in the facility planning areas which often
encompass segments of multiple political jurisdictions. As an example, Exhibit 4.1
shows the location of TAZ 1253 within the Nine/Ten Mile planning area.

CLERMONT COUNTY WATER RESOURCES DEPARTMENT
WASTEWATER MASTER PLAN UPDATE
SECTION 4.0
FUTURE POPULATION AND FLOW PROJECTIONS
CLERMONT COUNTY WWMPU - FINAL CH2M HILL, INC 4-2
Township Future Land Use Plans: The purpose of a land use plan is to outline the
future growth areas and development of the community. The plan serves as a
blueprint for the community to refer to as development occurs and changes are
observed. Future land use plans for the township, which has jurisdiction over a
given TAZ, were consulted and incorporated during population allocations.
GIS Maps containing the following information:
Orthographic photos
Property lines
Properties containing an HSTS
Existing subcatchments
Sewers
Manholes
Traffic Analysis Zones (TAZ)
Contours
Water bodies

CLERMONT COUNTY WATER RESOURCES DEPARTMENT
WASTEWATER MASTER PLAN UPDATE
SECTION 4.0
FUTURE POPULATION AND FLOW PROJECTIONS
CLERMONT COUNTY WWMPU - FINAL CH2M HILL, INC 4-3
EXHIBIT 4.1 TAZ 1253 in the Nine/Ten Mile FPA
4.2 Population Forecast
Population changes projected between 2010 and 2020 and between 2010 and 2030 were
established for each TAZ using the following methodology:
Total population change (POPtot) was counted using a 1:1 ratio
Employee population change (POPemp) was counted using a 1:5 ratio
Equivalent population change was calculated: POPeq = POPtot + 1/5 * POPemp
The population projections for each exhibit are listed in Exhibit 4.2.

CLERMONT COUNTY WATER RESOURCES DEPARTMENT
WASTEWATER MASTER PLAN UPDATE
SECTION 4.0
FUTURE POPULATION AND FLOW PROJECTIONS
CLERMONT COUNTY WWMPU - FINAL CH2M HILL, INC 4-4
EXHIBIT 4.2 Population Projections 2020 and 2030
4.3 Population Allocation
GIS maps were used to evaluate properties where new development could take place within
each TAZ. All properties currently undeveloped in TAZs were potentially developable if
they met the following criteria:
Size is greater than 10 acres with septic tanks
Properties were not parks, institutions, water bodies or golf courses
Topography has a slope that is less than 20%
This exercise was undertaken for each of the potentially developable properties in all of the
TAZs. If the total area of the developable properties in a TAZ was more than 20% of the
TAZ area, new subcatchments were created by combining these properties. Population
changes projected for the TAZ areas for year 2020 and 2030 (from 2010) were allocated to
these new sub-catchments comprised of developable properties on an area weighted basis.
Based on engineering judgment, it was assumed that the projected population growth
would occur in these developable areas until 2020 as well as 2030 (i.e. the new developable
Facility Planning Area 2010 Area (acres)2010 Equivalent
Population2020 Equivalent
Population2030 Equivalent
PopulationLoveland 3,219 6,822 7,219 7,365Horner's Run Branch Hill 7,279 14,128 14,319 14,230O'Bannon 26,753 23,126 27,014 29,163Stonelick 43,529 13,698 15,932 17,159Lower East Fork 22,114 51,964 60,298 64,930Upper East Fork 15,348 2,270 3,033 3,492Middle East Fork 71,272 39,259 48,833 54,465New Richmond 21,657 10,075 14,145 16,626Nine Ten Mile 14,041 20,278 24,741 27,312Williamsburg 2,423 1,989 2,423 2,674Felicity 64,175 10,816 11,719 12,127
where Equivalent Population = Residential Population + 1/5 * Employment Population

CLERMONT COUNTY WATER RESOURCES DEPARTMENT
WASTEWATER MASTER PLAN UPDATE
SECTION 4.0
FUTURE POPULATION AND FLOW PROJECTIONS
CLERMONT COUNTY WWMPU - FINAL CH2M HILL, INC 4-5
area will remain unchanged from 2020 to 2030). If however, the developable area was less
than 20% of the TAZ area, population changes were allocated to existing sub-catchments in
the TAZ on a current population weighted basis.
In either case, future land use plans for the township, which has jurisdiction over a given
TAZ, were consulted and incorporated during the allocation. Exhibit 4.3 shows the overall
approach adopted for allocating the TAZ population changes projected for the future time
horizons of 2020 and 2030.
4.4 Future Wastewater Production
Future flows were developed in the InfoWorks models by utilizing the area, population,
rainfall-derived infiltration and inflow (RDII) factors, groundwater factors and a wastewater
profile. The area and population were obtained using the process discussed. The other
factors were developed using the following process:
RDII factors used a 0.5% R1 factor for inflow and a 0.5% R3 factor for infiltration. No R2 factor was used.
Groundwater was allocated at 30 gal/capita/day
Wastewater profile was 100 gal/capita/day
Exhibits 4.4 through 4.8 show the forecasted planning areas for the modeled FPAs based on
the approach discussed in this section.

CLERMONT COUNTY WATER RESOURCES DEPARTMENT
WASTEWATER MASTER PLAN UPDATE
SECTION 4.0
FUTURE POPULATION AND FLOW PROJECTIONS
CLERMONT COUNTY WWMPU - FINAL CH2M HILL, INC 4-6
EXHIBIT 4.3 Process of Allocating Population Changes Projected for the Future
Yes
No
Identify Developable Parcels for each TAZ
Is Developable Area > 20% of
TAZ area
Allocate population change to Developable Areas only on an area weighted basis and land use plans –
Create New Subcatchments
Township Land Use Plans
Parcels that do not meet criteria: -Existing Subcatchments -Septic parcels < 10 acres -Parks -Institutions -Water Bodies -Golf Courses -Slope > 20%
Area and population contributed by existing
subcatchments were reconciled with TAZ data
Determine fractions of Subcatchments in the TAZ and their contributions to TAZ area
and population
Subcatchment fractions spread over TAZs should
add up to 1
Determine existing Subcatchments contained in a
given TAZ boundary
QC
Calculate Equivalent Population Change
POPeq = POPtot + 1/5 * POPemp
Allocate population change to existing Subcatchments only based on current
population distribution and land use plans – Update Existing Sub-catchments

CLERMONT COUNTY WATER RESOURCES DEPARTMENT
WASTEWATER MASTER PLAN UPDATE
SECTION 4.0
FUTURE POPULATION AND FLOW PROJECTIONS
CLERMONT COUNTY WWMPU - FINAL CH2M HILL, INC 4-7
Exhibit 4.4: MAP – showing planning areas for Loveland/Horner’s Run/Branch Hill FPA Exhibit 4.5: MAP – showing planning area for O’Bannon Creek FPA Exhibit 4.6A&B: MAP – showing planning area for Lower East Fork Creek FPA Exhibit 4.7A&B: MAP – showing planning area for Middle East Fork Creek FPA Exhibit 4.8: MAP – showing planning area for Nine Mile/Ten Mile Creek FPA

CLERMONT COUNTY WATER RESOURCES DEPARTMENT
WASTEWATER MASTER PLAN UPDATE
SECTION 5.0
NEEDS ASSESSMENT FOR SUSTAINABILITY
CLERMONT COUNTY WWMPU - FINAL CH2M HILL, INC 5-1
5.0 NEEDS ASSESSMENT FOR SUSTAINABILITY 5.1 Collection and Conveyance
Capacity problem locations were identified in each of the five basin models for each of the
three flow regimes considered (i.e. 2010, 2020 and 2030). A needs assessment determination
was also conducted in unsewered areas. Different versions of the updated existing models
and the new Loveland/Horner’s Run model were developed to reflect flows for the year
2010 and projected flows for 2020, and 2030. The 2010 flows were based on updated
populations resulting from growth within the County between the time when the original
model was built and calibrated (2000) through the 2006 GIS data files furnished by the
County. The 2020 and 2030 flows were based on population projections provided by Traffic
Analysis Zone (TAZ) data supplied by OKI and available township land use and planning
documents. The three modeled versions of each basin were analyzed using the 5 year 6 hour
design storm provided by the County to identify the locations of system capacity issues.
The criteria for identifying problem areas are as follows:
Any overflowing manhole in the sewer system,
Over-utilized pipes that surcharge more than three feet above the crown of the pipe,
and
Over-utilized pipes in areas with known water-in-basement complaints
The Problems identified using these criteria are listed in Exhibit 5.1. The problems have
been divided into three priority levels as follows:
Priority 1(P1) Level – presence of excessive surcharging or known water-in-
basement issues, sanitary sewer or manhole overflows resulting from existing (2010)
modeled areas;

CLERMONT COUNTY WATER RESOURCES DEPARTMENT
WASTEWATER MASTER PLAN UPDATE
SECTION 5.0
NEEDS ASSESSMENT FOR SUSTAINABILITY
CLERMONT COUNTY WWMPU - FINAL CH2M HILL, INC 5-2
Priority 2(P2) Level – presence of excessive surcharging or known water-in-
basement issues, sanitary sewer or manhole overflows resulting from future (2020)
modeled areas;
Priority 3(P3) Level – presence of excessive surcharging or known water-in-
basement issues, sanitary sewer or manhole overflows resulting from future (2030)
modeled areas;
The models used in this analysis except for the Loveland/Horner’s Run/Branch Hill model
were built using the County’s calibrated models and projecting the base flows, groundwater
infiltration and inflow and infiltration responses.
Special Note: Field measured flow data were not available for this analysis.

CLERMONT COUNTY WATER RESOURCES DEPARTMENT
WASTEWATER MASTER PLAN UPDATE
SECTION 5.0
NEEDS ASSESSMENT FOR SUSTAINABILITY
CLERMONT COUNTY WWMPU - FINAL CH2M HILL, INC 5-3
EXHIBIT 5.1 Problems Identified
Modeled AreaProblem Number Description of Problem P1 P2 P3
Nine Mile 1 Nine Mile‐Tabasco Road Sewer Capacity Problems I XNine Mile 2 Nine Mile‐Tabasco Road Sewer Capacity Problems II XNine Mile 3 Legendary Run Sewer Capacity Problems XNine Mile 4 Oakland Farm Drive Sewer Capacity Problems XNine Mile 5 Pierce Lift Station Capacity Problems X
Lower East Fork 1 Shayler Run Upstream Sewer Capacity Problems XLower East Fork 2 Eastgate North Drive Sewer Capacity Problems XLower East Fork 3 Hall Run Sewer Capacity Problems XLower East Fork 4 Round Bottom Road SewerCapacity Problems XLower East Fork 5 Wolf Pen ‐ Pleasant Hill Road Sewer Capacity Problems XLower East Fork 6 Cook Road Near Lift Station Capacity Problems XLower East Fork 7 Elick Lane Sewer Capacity Problems XLower East Fork 8 Mt. Caramel‐Tobasco Road Sewer Capacity Problems XLower East Fork 9 Clough Pike Sewer Capacity Problems XLower East Fork 10 Arcadia Lane Sewer Capacity Problems XLower East Fork 11 Founders Boulevard Sewer Capacity Problems XLower East Fork 12 Old SR 74 Sewer Capacity Problems XLower East Fork 13 Olive Branch‐Stonelick Road Sewer Capacity Problems XLower East Fork 14 Binning Road Sewer Capacity Problems X
Priority Level
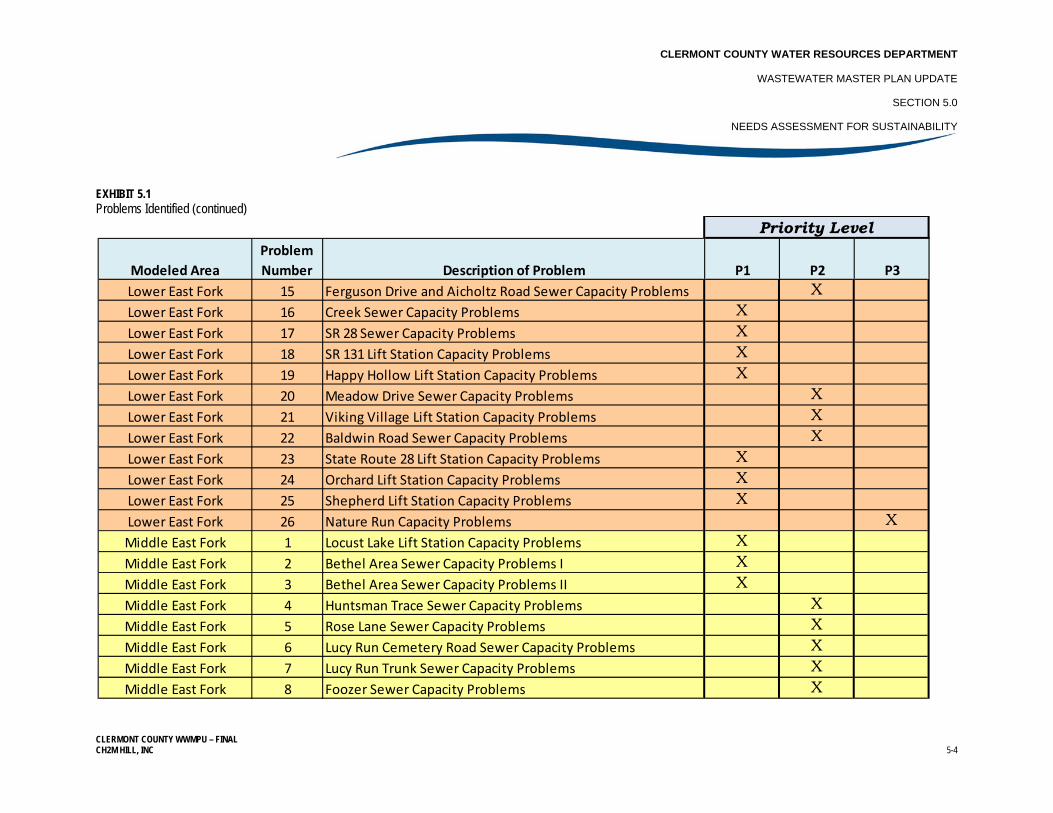
CLERMONT COUNTY WATER RESOURCES DEPARTMENT
WASTEWATER MASTER PLAN UPDATE
SECTION 5.0
NEEDS ASSESSMENT FOR SUSTAINABILITY
CLERMONT COUNTY WWMPU – FINAL CH2M HILL, INC 5-4
EXHIBIT 5.1 Problems Identified (continued)
Modeled AreaProblem Number Description of Problem P1 P2 P3
Lower East Fork 15 Ferguson Drive and Aicholtz Road Sewer Capacity Problems XLower East Fork 16 Creek Sewer Capacity Problems XLower East Fork 17 SR 28 Sewer Capacity Problems XLower East Fork 18 SR 131 Lift Station Capacity Problems XLower East Fork 19 Happy Hollow Lift Station Capacity Problems XLower East Fork 20 Meadow Drive Sewer Capacity Problems XLower East Fork 21 Viking Village Lift Station Capacity Problems XLower East Fork 22 Baldwin Road Sewer Capacity Problems XLower East Fork 23 State Route 28 Lift Station Capacity Problems XLower East Fork 24 Orchard Lift Station Capacity Problems XLower East Fork 25 Shepherd Lift Station Capacity Problems XLower East Fork 26 Nature Run Capacity Problems XMiddle East Fork 1 Locust Lake Lift Station Capacity Problems XMiddle East Fork 2 Bethel Area Sewer Capacity Problems I XMiddle East Fork 3 Bethel Area Sewer Capacity Problems II XMiddle East Fork 4 Huntsman Trace Sewer Capacity Problems XMiddle East Fork 5 Rose Lane Sewer Capacity Problems XMiddle East Fork 6 Lucy Run Cemetery Road Sewer Capacity Problems XMiddle East Fork 7 Lucy Run Trunk Sewer Capacity Problems XMiddle East Fork 8 Foozer Sewer Capacity Problems X
Priority Level

CLERMONT COUNTY WATER RESOURCES DEPARTMENT
WASTEWATER MASTER PLAN UPDATE
SECTION 5.0
NEEDS ASSESSMENT FOR SUSTAINABILITY
CLERMONT COUNTY WWMPU – FINAL CH2M HILL, INC 5-5
EXHIBIT 5.1 Problems Identified (continued)
Modeled AreaProblem Number Description of Problem P1 P2 P3
Middle East Fork 9 Bethel Area Sewer Capacity Problems III XMiddle East Fork 10 Bethel Area Sewer Capacity Problems IV XMiddle East Fork 11 Bethel Area Sewer Capacity Problems V XMiddle East Fork 12 Haskell Road Sewer Capacity Problems XMiddle East Fork 13 Hartman Lane Sewer Capacity Problems XMiddle East Fork 14 Winemiller Sewer Capacity Problems XMiddle East Fork 15 Owensville Area Sewer Capacity Problems I XMiddle East Fork 16 Owensville Area Sewer Capacity Problems II XMiddle East Fork 17 Huntsman Trace Sewer Capacity Problems XMiddle East Fork 18 Stable Trails Sewer Capacity Problems XMiddle East Fork 19 Hartman Lane Sewer Capacity Problems X
O'Bannon 1 Twin Oaks Sewer Capacity Problems XO'Bannon 2 Redbird Road Sewer Capacity Problems XO'Bannon 3 O'Bannon South Trunk Sewer Capacity Problems XO'Bannon 4 Deerfield Sewer Capacity Problems XO'Bannon 5 Upper Creek Sewer Capacity Problems XO'Bannon 6 Middle Creek Sewer Capacity Problems XO'Bannon 7 Deerfield Sewer Capacity Problems XO'Bannon 8 Barre Lane Sewer Capacity Problems X
Priority Level

CLERMONT COUNTY WATER RESOURCES DEPARTMENT
WASTEWATER MASTER PLAN UPDATE
SECTION 5.0
NEEDS ASSESSMENT FOR SUSTAINABILITY
CLERMONT COUNTY WWMPU – FINAL CH2M HILL, INC 5-6
EXHIBIT 5.1 Problems Identified (continued)
Modeled AreaProblem Number Description of Problem P1 P2 P3
O'Bannon 9 Upper Creek Sewer Capacity Problems XO'Bannon 10 Middle Creek Sewer Capacity Problems XO'Bannon 11 Gibson Road Sewer Capacity Problems XO'Bannon 12 SR 132 Sewer Capacity Problems XO'Bannon 13 Main Street Sewer Capacity Problems XO'Bannon 14 Upper Creek Sewer Capacity Problems XO'Bannon 15 Twin Oak Sewer Capacity Problems XO'Bannon 16 SR 48 Sewer Capacity Problems XO'Bannon 17 Upper Creek Sewer Capacity Problems XO'Bannon 18 SR 132 Sewer Capacity Problems X
Loveand/Horner's Run 1 Miami Trails Sewer Capacity Problems X
P1 ‐ Near Term (2010)P2 ‐ Intermediate Term (2020)P3 ‐ Long Term (2030)
Priority Level

CLERMONT COUNTY WATER RESOURCES DEPARTMENT
WASTEWATER MASTER PLAN UPDATE
SECTION 5.0
NEEDS ASSESSMENT FOR SUSTAINABILITY
CLERMONT COUNTY WWMPU - FINAL CH2M HILL, INC 5-7
5.1.1 Loveland/Horner’s Run/Branch Hill
Exhibit 5.2 illustrates and identifies capacity problems in Loveland/Horner’s Run/Branch
Hill planning area for 2010, 2020 and 2030 flows.
The analysis using the 2010 (existing condition) model shows some limited surcharging
along Trailridge Court, in the area tributary to the Miami Trails WWTP. No surcharging or
surface failure occurred in the areas tributary to the Wards Corner or Arrowhead WWTPs.
The 2020 (intermediate term) model analysis shows progressive surcharging along
Trailridge Court, in the area tributary to the Miami Trails WWTP. No surcharging or surface
failure occurred in the areas tributary to the Wards Corner or Arrowhead WWTP.
The 2030 (future) model analysis shows very little change to the surcharging along
Trailridge Court, in the area tributary to the Miami Trails WWTP compared to the 2020
model outcome. No surcharging or surface failure occurred in the areas tributary to the
Wards Corner or Arrowhead WWTP.
5.1.2 O’Bannon Creek
Exhibit 5.3 illustrates and identifies the problems in the O’Bannon Creek planning area for
2010, 2020 and 2030 flows.
The analysis using the 2010 (existing condition) model shows surcharging along Deerfield
Road and sections that extend along creeks in the western portion of the basin and near the
WWTP, conveying flows toward the O’Bannon Creek Regional WWTP.
The 2020 (intermediate term) model shows progressive surcharging along Deerfield Road,
and in the western portion of the basin. There is new surcharging in the trunk sewers
conveying flow to the WWTP from the west in the 2020 model outcome.

CLERMONT COUNTY WATER RESOURCES DEPARTMENT
WASTEWATER MASTER PLAN UPDATE
SECTION 5.0
NEEDS ASSESSMENT FOR SUSTAINABILITY
CLERMONT COUNTY WWMPU - FINAL CH2M HILL, INC 5-8
The analysis using the 2030 (future) model showed progressive surcharging in the western
portion of the basin.
5.1.3 Stonelick Creek
The County has extended sanitary sewer service into the planning area’s western and
southern extremities, but the vast majority of the area is without sewer service.
Accordingly, the Stonelick FPA has not been modeled. Wastewater management challenges
in the Stonelick Creek planning area include the following:
Planning for the anticipated growth that is forecast to enter the planning area from
the south, from the SR 32 corridor passing through Batavia Township and to a lesser
extent from the east along SR 131.
Addressing the concentration of small lot development located within established
communities or along major roadways.
Maintaining vigilance over the proper construction and adequate maintenance of on-
site systems to prevent a public health nuisance, given that there are an estimated
3,600 on-site system in the planning area.
Supporting reasonable levels of growth and development through wastewater
management improvements that are capable of providing maximum benefit to
targeted areas.
Due to the steep terrain and concern over water quality and use attainment goals in the
Stonelick Creek, broad expansion of collection and conveyance infrastructure is not
recommended at the present time. However, a practical initial stage of wastewater
management in this area is to focus on and meet near-term needs in limited sectors of the
planning area where needs have been expressed to address existing problems or to support
moderate levels of growth. One such sector is the Newtonsville, Edenton, Belfast and
Owensville quadrangle.

CLERMONT COUNTY WATER RESOURCES DEPARTMENT
WASTEWATER MASTER PLAN UPDATE
SECTION 5.0
NEEDS ASSESSMENT FOR SUSTAINABILITY
CLERMONT COUNTY WWMPU - FINAL CH2M HILL, INC 5-9
Location of the planned wastewater treatment facility in the Village of Newtonsville would
meet an immediate need expressed by local residents, As well, this would provide the
opportunity in the future to provide local sewers to the Village of Belfast that have known
on-site problems, with flow conveyed to Newtonsville via pump station for treatment. On-
site problem areas include Sutton Lane, Wilshire Circle and Goshen Road (southernmost
reach of CR-57).
The unsewered area between Belfast and Owensville, including known on-site problem
areas, is proposed to be served via the Owensville North extension along Belfast-Owensville
Road. A local sewer extending east of Owensville along SR 50 is proposed to facilitate
development east of Owensville and eliminate the Clermont Northeastern Local School
treatment facility. Flows from these areas are proposed to be conveyed to the Middle East
Fork Basin via the pump station located in Owensville.
5.1.4 Upper East Fork
The Upper East Fork planning area is without centralized sanitary service and has not been
modeled. The need for collection and conveyance infrastructure in this planning area is
limited by its small population, sparse development and proximity to existing sanitary
sewers. As with other areas having a preponderance of on-site systems, the identified
challenges to wastewater management in the Upper East Fork planning area include:
Planning for possible growth that is likely to enter the Upper East Fork area from the
south, via the SR 32 corridor that passes through Batavia Township.
Continuing vigilance over the proper construction and adequate maintenance of on-
site systems whose operation best fits the current and future vision for growth
within the planning area, given that there are an estimated 990 on-site systems in the
planning area with the largest concentration in the Village of Marathon.

CLERMONT COUNTY WATER RESOURCES DEPARTMENT
WASTEWATER MASTER PLAN UPDATE
SECTION 5.0
NEEDS ASSESSMENT FOR SUSTAINABILITY
CLERMONT COUNTY WWMPU - FINAL CH2M HILL, INC 5-10
Due to the general lack of growth and development in the area and growth projections that
support continuance of this trend, installation of sewer service to this area is not practical or
feasible at the present time. Over the next 20 years, wastewater management decisions
should continue to be based on providing maximum benefit to targeted areas on an as-
needed basis, driven by area development.
According to Jackson Township (personal communication with township zoning inspector),
the area bounded by Hawley Road and Jackson Pike may develop to create mixed
residential housing, although a timetable has not been put forth. Should development
eventually occur, this area could be served from the existing sewer north of SR 32 that
extends from Bauer Road to Half Acre Road.
5.1.5 Lower East Fork
Exhibit 5.4 shows a map identifying the problems in Lower East Fork for 2010, 2020 and
2030 flows.
The 2010 (existing condition) modeled analysis found problem areas with surcharging and
overflowing manholes in the area of Hall Run, Shayler Run, upstream of the WWTP and in
the upper part of the basin around and including the Cook and Highview Lift Stations.
The 2020 (intermediate future) modeled analysis found the 2010 problem areas to be
projected to experience surcharging and overflowing manholes and in addition to these
areas the trunk sewer draining to the WWTP from the east.
The 2030 (future) modeled analysis found more surcharging upstream of Hall Run and
Shayler Run.
5.1.6 Middle East Fork
Exhibit 5.5 shows a map identifying the problems in Middle East Fork for 2010, 2020 and
2030 flows.

CLERMONT COUNTY WATER RESOURCES DEPARTMENT
WASTEWATER MASTER PLAN UPDATE
SECTION 5.0
NEEDS ASSESSMENT FOR SUSTAINABILITY
CLERMONT COUNTY WWMPU - FINAL CH2M HILL, INC 5-11
The analysis using the 2010 (existing condition) model showed surcharging in Bethel and
capacity problems at the Locust Lake Lift Station.
The analysis using the 2020 (intermediate term) model showed additional surcharging in
Bethel, surcharging along State Route 32, surcharging in Owensville, surcharging along
Lucy Run, and some miscellaneous surcharging in a couple of other areas near State Route
125.
The analysis using the 2030 (future) model showed additional surcharging near State Route
32 and State Route 125.
The flows from the Village of Bethel are pumped via 10-inch force main, approximately
29,000 feet long, and discharge to the Middle East Fork FPA upstream of the Lucy Run
Sewer, just north of State Route 125. Re-routing flows from Bethel was considered during
the needs assessment that was performed for the Middle East Fork FPA. The two primary
considerations that were investigated included the benefit to the Middle East Fork system in
regard to conveyance and treatment and the best alternative for managing the flows from
the Bethel Pump Station.
The resulting investigation indicated that re-routing of the Bethel flows would reduce the
2030 peak flow experienced in the Lucy Run Trunk Sewer but not significantly enough to
eliminate the required improvements. Without the Bethel flows, the problem along Lucy
Run would still require replacement of the entire stretch of sewer; however the size would
be reduced by one pipe size in some locations. This scenario produces scant cost savings
considering the cost of redirecting the Bethel flows elsewhere.
Alternatives for redirecting up to 2.4 MGD of flow from the Bethel Pump Station are
somewhat limited. Three concepts were considered, including: conveyance of the flows to
a neighboring jurisdiction (i.e. New Richmond or Williamsburg), conveyance of flows to a
proposed southern regional treatment facility located in the Felicity FPA and conveyance of
flow to a proposed treatment facility in the Bethel area.

CLERMONT COUNTY WATER RESOURCES DEPARTMENT
WASTEWATER MASTER PLAN UPDATE
SECTION 5.0
NEEDS ASSESSMENT FOR SUSTAINABILITY
CLERMONT COUNTY WWMPU - FINAL CH2M HILL, INC 5-12
Conveyance of wastewater flows westward into New Richmond would require construction
of a force main to convey the flow into the New Richmond FPA, a long gravity sewer
extending from the east end of the New Richmond FPA to the existing WWTP, and a
substantial upgrade of the existing New Richmond WWTP whose current design flow is
0.55 MGD. This concept plan would also require a multi-jurisdictional agreement between
the County and the Village of New Richmond to manage and treat these flows. Similarly,
conveyance of flows from Bethel to the Village of Williamsburg would require costly
conveyance, substantial expansion of the Williamsburg WWTP whose design flow is 0.5
MGD and a multi-jurisdictional agreement between both parties. The cost to accomplish
either of these options is excessive and lacks merit.
Conveyance of the Bethel flows to a proposed southern regional WWTP, discharging to the
Ohio River in the Felicity FPA was investigated. As with the other concepts, this plan
would require construction of a new force main and long gravity sewer to convey the flows
from Bethel to the proposed plant which would be sized to accommodate flows from both
Felicity and Moscow (requiring additional sewer construction). Due to the scattered, sparse
population and lack of projected population growth in the southern part of the County, this
concept is not practical.
Siting and construction of a proposed treatment facility in the vicinity of Bethel and
discharging to East Fork of the Little Miami River Lake would also be a costly proposition.
The plant would be required to comply with Best Available Demonstrated Control
Technology (BADCT) criteria, likely requiring enhanced nutrient controls and tertiary
treatment facilities. Although this plant could serve as mid-southern regional treatment
facility sized for the surrounding area; the cost would be prohibitive.
Therefore, based on the evaluation discussed above, proposed re-routing of the flows from
the Village of Bethel away from the Middle East Fork basin to eliminate surcharging and
capacity issues was eliminated from consideration.

CLERMONT COUNTY WATER RESOURCES DEPARTMENT
WASTEWATER MASTER PLAN UPDATE
SECTION 5.0
NEEDS ASSESSMENT FOR SUSTAINABILITY
CLERMONT COUNTY WWMPU - FINAL CH2M HILL, INC 5-13
5.1.7 Nine Mile
The 2010 (existing condition) modeled analysis found problem with surcharging and
overflowing manholes in the area upstream of the WWTP.
The 2020 (intermediate term) modeled analysis found the 2010 problem areas to be
projected to experience surcharging and overflowing manholes and in addition to these
areas Pierce Lift Station.
The 2030 (future) modeled analysis projected more excessive surcharging of the 2010 areas.
Exhibit 5.6 shows a map identifying the problems in Nine Mile for 2010, 2020 and 2030
flows.
5.1.8 New Richmond
The County has extended sanitary sewer service into the planning area’s eastern fringe and
the Village of New Richmond is serving its population to the west, but approximately half
of the area is without sewer service. With the large number of on-site systems in the
planning area and limited sanitary sewer service, the collection system has not been
modeled. Identified challenges to wastewater management include:
Addressing the preponderance of roadside residential properties on small lots
located along rural roads throughout the east and central portion of the planning
area.
Continuing vigilance over the proper construction and adequate maintenance of on-
site systems, estimated at 2,560 units, to prevent public nuisances, recognizing that
much of the unsewered areas are generally unsuitable for soil-based on-site systems.
Supporting reasonable levels of growth and development through wastewater
management improvements that are capable of providing maximum benefit to target
areas.

CLERMONT COUNTY WATER RESOURCES DEPARTMENT
WASTEWATER MASTER PLAN UPDATE
SECTION 5.0
NEEDS ASSESSMENT FOR SUSTAINABILITY
CLERMONT COUNTY WWMPU - FINAL CH2M HILL, INC 5-14
As-needed target areas include: 1) providing limited sewer extensions to serve areas that
are located adjacent to and east of the New Richmond service area and that are known to
create a public health nuisance and 2) planning for the installation of trunk sewers that
extend into the eastern portion of the service area such as along Bethel-New Richmond
Road in anticipation of a regional solution to wastewater management in the southwestern
reach of the County.
5.1.9 Felicity
Alternatives to provide a broad-reaching collection and conveyance network to serve the
Felicity planning area cannot be justified by the pattern of slow growth that will likely
continue into the foreseeable future. Yet, there are areas of need in existing unsewered areas
that have on-site system concentrations, notably Point Pleasant, Laurel and Point Isabel.
With the preponderance of on-site systems located within the Felicity planning area and the
desire to envision a southern regional wastewater management strategy, the identified
challenges to wastewater management include:
Continue the vigilance over proper construction and adequate maintenance of on-
site systems, estimated at 2,980 units, whose operation best fits the current and
future vision for growth within the planning area.
Define the role of the Felicity FPA in serving local needs in the Village of Felicity and
the Village of Moscow as well as the southern regional needs of the County.
A potential southern regional treatment facility located in the Big Indian Creek Basin would
be advantageous in terms of existing zoning, favorable wasteload allocation since the
discharge would be to the Ohio River and could possibly serve existing infrastructure in
adjacent planning areas. One such scenario would consist of planning for a southern
regional treatment facility between Moscow and Point Pleasant that would serve Felicity,
Moscow, unsewered areas in northern Washington Township (i.e. up to Point Isabel),

CLERMONT COUNTY WATER RESOURCES DEPARTMENT
WASTEWATER MASTER PLAN UPDATE
SECTION 5.0
NEEDS ASSESSMENT FOR SUSTAINABILITY
CLERMONT COUNTY WWMPU - FINAL CH2M HILL, INC 5-15
unsewered areas in southern Monroe Township (i.e. up to Laurel), the Ohio River towns of
Chilo and Neville. A detailed study of a proposed Clermont County Southern Regional
Conveyance and Collection System plan is recommended to accomplish this objective.
In the intervening period, it is proposed that community treatment systems be considered at
the following locations: Point Isabel, Point Pleasant, Laurel, Chilo and Neville. This
alternative is an effective option for groups of four to 100 residences. Cluster collection and
treatment systems represent an attractive and affordable sewage service option that would
meet the needs of a dispersed or slowly growing population and support and maintain the
rural character of these communities. While adverse topography encourages this approach,
so do unsuitable soils that demand more than a conventional on-site system.
5.2 Wastewater Treatment Facilities
CCWRD currently owns and operates a total of nine wastewater treatment facilities that
serve designated areas and which are governed under the National Pollutant Discharge
Elimination System (NPDES). Four of these plants are located in the Loveland/Horner’s
Run/Branch Hill FPA, and one each in O’Bannon, Lower East Fork, Middle East Fork, Nine
Mile and Felicity. Each is individually discussed below.
5.2.1 Loveland/Horner’s Run/Branch Hill
There are four existing wastewater treatment facilities and 9 pump stations within the
Loveland/Horner’s Run/Branch Hill FPA. These include the Wards Corner Regional,
Miami Trails, Arrowhead Park and Indian Lookout WWTPs. The Bramblewood WWTP that
formerly served the Bramblewood Subdivision has recently been de-commissioned with its
flow routed to the Wards Corner Regional facility via the recently completed Bramblewood
trunk sewer.
Wastewater that is generated within the Clermont County side of the City of Loveland is
collected, conveyed and treated at the Polk Run WWTP which is owned and operated by the
Metropolitan Sewer District of Greater Cincinnati.

CLERMONT COUNTY WATER RESOURCES DEPARTMENT
WASTEWATER MASTER PLAN UPDATE
SECTION 5.0
NEEDS ASSESSMENT FOR SUSTAINABILITY
CLERMONT COUNTY WWMPU - FINAL CH2M HILL, INC 5-16
Satellite Photo of Wards Corner Regional WWTP
Wards Corner Regional WWTP. The
Wards Corner Regional WWTP was placed
into service in 2009 and replaced the
former Wards Corner WWTP located on
Loveland-Miamiville Road. This facility is
served by a separate sanitary sewer system
and discharges to a small stream that is
tributary to the Little Miami River. This
plant is the only CCWRD operated facility
that is currently required to comply with
an effluent total phosphorus limit of 1.0
mg/L. The plant has been designed to treat
an average flow of 2.0 MGD and a peak flow of 6.0 MGD but currently treats less than
100,000 GPD. Wet stream processes include the following:
flow equalization
fine screening
activated sludge (two oxidation ditches)
secondary clarification
tertiary sand filtration
ultraviolet light disinfection
post aeration
The plant is in compliance with the terms and conditions of its governing NPDES permit.
Based on the Biological and Water Quality Study of the Lower Little Miami River and Selected
Tributaries study performed by Ohio EPA in 2007 and published in October 2009, the Little

CLERMONT COUNTY WATER RESOURCES DEPARTMENT
WASTEWATER MASTER PLAN UPDATE
SECTION 5.0
NEEDS ASSESSMENT FOR SUSTAINABILITY
CLERMONT COUNTY WWMPU - FINAL CH2M HILL, INC 5-17
Satellite Photo of Miami Trails
Miami River is in full attainment with its use designation downstream of the Wards Corner
Regional WWTP discharge. Monthly operating data from the Wards Corner Regional
WWTP for the period (2009-10) are summarized in Exhibit 5.7.
EXHIBIT 5.7 Wards Corner Regional WWTP Effluent Quality 2009-10 (through October)
Parameter Units
NPDES Limits
50th Pct 95th Pct Range 30-day 7-day
Flow MGD --- --- 0.062 0.16 0.011-0.27 cBOD5 mg/L 10 15 3.3 8.2 2.0-9.7 TSS mg/L 12 18 2.7 7.8 1.0-9.0 NH4-N (S) mg/L 0.4 0.6
0.14 0.62 0.1-0.66 NH4-N (W) mg/L 3.0 4.5 TP mg/L 1.0 1.5 1.4 5.8 0.1-7.8
Miami Trails WWTP. The Miami Trails
WWTP serves residents in the Belle Meade
and Miami Trails subdivisions. The plant
was originally built in 1989 and has been
expanded three times due to rapid and
sustained development in the area. This
facility discharges to a small stream that is
tributary to the Little Miami River and has
been designed to treat an average flow of 0.4
MGD. Wet stream processes include the
following:
coarse screening
activated sludge (extended aeration)
secondary clarification
tertiary filtration

CLERMONT COUNTY WATER RESOURCES DEPARTMENT
WASTEWATER MASTER PLAN UPDATE
SECTION 5.0
NEEDS ASSESSMENT FOR SUSTAINABILITY
CLERMONT COUNTY WWMPU - FINAL CH2M HILL, INC 5-18
Satellite Photo of Arrowhead Park
chlorine disinfection
The plant is in compliance with the terms and conditions of its governing NPDES permit.
Based on the Biological and Water Quality Study of the Lower Little Miami River and Selected
Tributaries study performed by Ohio EPA in 2007 and published in October 2009, the Little
Miami River is in full attainment with its use designation downstream of the Miami Trails
WWTP discharge. Monthly operating data from the Miami Trails WWTP for the period
(2007-10) are summarized in Exhibit 5.8.
EXHIBIT 5.8 Miami Trails WWTP Effluent Quality 2007-10 (through October)
Parameter Units
NPDES Limits
50th Pct 95th Pct Range 30-day 7-day Flow MGD --- --- 0.29 0.48 0.08-0.71 cBOD5 mg/L 10 15 3.7 7.5 2.0-10.2 TSS mg/L 12 18 3.3 9.0 1.0-12.9 NH4-N (S) mg/L 1.3 2.0
0.15 0.75 0.1-3.3 NH4-N (W) mg/L 3.7 5.6
Arrowhead Park WWTP. The Arrowhead
Park WWTP serves the 360-unit
Arrowhead Park Apartments complex
and residents located on Hollow Lane.
The plant was placed into service in 1976
and is located off Branch Hill-Guinea Pike,
adjacent to the Little Miami Bike Trail.
This facility discharges to a small stream
that is tributary to the Little Miami River
and has been designed to treat an average
flow of 0.14 MGD. Wet stream processes
include the following:

CLERMONT COUNTY WATER RESOURCES DEPARTMENT
WASTEWATER MASTER PLAN UPDATE
SECTION 5.0
NEEDS ASSESSMENT FOR SUSTAINABILITY
CLERMONT COUNTY WWMPU - FINAL CH2M HILL, INC 5-19
Satellite Photo of Indian Lookout WWTP
coarse screening
2-stage activated sludge with intermediate and final clarifiers
chlorine disinfection
The plant produces an effluent that complies with the terms and conditions of its governing
NPDES permit. Based on the Biological and Water Quality Study of the Lower Little Miami River
and Selected Tributaries study performed by Ohio EPA in 2007 and published in October
2009, the Little Miami River is in full attainment with its use designation downstream of the
Arrowhead Park WWTP discharge. Monthly operating data from the period (2007-10) are
summarized in Exhibit 5.9.
EXHIBIT 5.9 Arrowhead Park WWTP Effluent Quality 2007-10 (through October)
Parameter Units
NPDES Limits
50th Pct 95th Pct Range 30-day 7-day Flow MGD --- --- 0.054 0.121 0.02-0.18 cBOD5 (S) mg/L 15 23
4.6 11.5 2.0-12.9 cBOD5 (W) mg/L 25 40 TSS mg/L 15 23 3.8 7.5 1.0-27.8 NH4-N (S) mg/L 16 24
0.45 6.9 0.1-12.0 NH4-N (W) mg/L --- ---
Indian Lookout WWTP. The Indian
Lookout WWTP serves approximately
200 homes in several local subdivisions
off Branch Hill-Miamiville Road. The
facility was placed into service in 1977
and was later expanded in 1988. The
facility has a permitted flow of 0.045
mgd. Wet stream processes include the
following:

CLERMONT COUNTY WATER RESOURCES DEPARTMENT
WASTEWATER MASTER PLAN UPDATE
SECTION 5.0
NEEDS ASSESSMENT FOR SUSTAINABILITY
CLERMONT COUNTY WWMPU - FINAL CH2M HILL, INC 5-20
coarse screening
activated sludge (extended aeration)
final clarification
chlorine disinfection
The Indian Lookout WWTP is planned for decommissioning in the near future with its flow
directed to the Wards Corner Regional facility via the proposed Indian Lookout trunk sewer
and lift station improvements.
The plant produces an effluent that complies with the terms and conditions of its governing
NPDES permit. Based on the Biological and Water Quality Study of the Lower Little Miami River
and Selected Tributaries study performed by Ohio EPA in 2007 and published in October
2009, the Little Miami River is in full attainment with its use designation downstream of the
Indian Lookout WWTP discharge. Monthly operating data from the period (2007-10) are
summarized in Exhibit 5.10.
EXHIBIT 5.10 Indian Lookout WWTP Effluent Quality 2007-10 (through October)
Parameter Units
NPDES Limits
50th Pct 95th Pct Range 30-day 7-day Flow MGD --- --- 0.042 0.135 0.011-0.3 cBOD5 mg/L 10 15 7 16 2-14 TSS mg/L 12 18 8 12 2-27 NH4-N (S) mg/L 1.5 2.3
0.3 1.2 0.1-5.2 NH4-N (W) mg/L 2.5 3.8
5.2.1.1 Loveland/Horner’s Run/Branch Hill Treatment Needs Assessment
Growth within the Loveland/Horner’s Run/Brach Hill FPA, particularly the
housing market, has been slow to recover from the economic downturn that began in
2008, a trend that will likely continue into the foreseeable future. Given these
CLERMONT COUNTY WATER RESOURCES DEPARTMENT
WASTEWATER MASTER PLAN UPDATE
SECTION 5.0
NEEDS ASSESSMENT FOR SUSTAINABILITY
CLERMONT COUNTY WWMPU - FINAL CH2M HILL, INC 5-21
circumstances, it is prudent to direct efforts toward near-term needs that are clearly
visible and produce the most benefit.
The average flow discharged by the Miami Trails WWTP during the last three years
is 75 percent of the design flow, signaling a need to consider re-rating the plant
capacity after a comprehensive evaluation is completed to determine and defend a
new design capacity. Regulatory initiatives to limit the discharge of phosphorus will
likely not be imposed until the next permit cycle in 2014. It would be beneficial and
advantageous to invest capital to decommission this treatment facility and direct the
wastewater to the Ward’s Corner Regional WWTP in the longer term as the plant
flow continues to approach the design capacity.
The Arrowhead Park WWTP (NPDES Permit 1PH00014*ID) has a favorable
wasteload allocation to the Little Miami River and includes a total phosphorus
monitoring requirement. This permit will expire at the end of 2011 and likely
contain more rigorous effluent criteria in the next permit cycle since the Biological and
Water Quality Study of the Lower Little Miami River and Selected Tributaries study has
been completed and published by Ohio EPA in October 2009. Additional capital
investment in this facility would be required to enable the plant to comply with
stringent effluent requirements. It would be beneficial and advantageous to invest
in capital improvements that would eliminate the Arrowhead Park WWTP and
direct the flow to the Wards Corner Regional WWTP.
The Wards Corner Regional WWTP has been designed for nutrient control but is
under-loaded hydraulically. Efforts are underway and should be continued to
consolidate infrastructure and direct tributary flows to this location, including
planned improvements that decommission the Indian Lookout WWTP.

CLERMONT COUNTY WATER RESOURCES DEPARTMENT
WASTEWATER MASTER PLAN UPDATE
SECTION 5.0
NEEDS ASSESSMENT FOR SUSTAINABILITY
CLERMONT COUNTY WWMPU - FINAL CH2M HILL, INC 5-22
Aerial Photo of O’Bannon Creek Regional WWTP
5.2.2 O’Bannon Creek
The O’Bannon Creek Regional
Wastewater Treatment serves most of
Goshen Township and portions of
Miami and Stonelick Township and
discharges to O’Bannon Creek. The
plant is served by a separate sanitary
sewer system and includes seven
pump stations. This facility was
placed into service in 1984 and later
modified in 1992 and 2001. The
current design average flow is 4.4
MGD. Wet stream processes include the following:
flow equalization
coarse screening
grit removal
2-stage activated sludge with intermediate and final clarifiers
tertiary sand filters
ultraviolet light disinfection
The facilities added in 2001 included the following:
oxidation ditch
final clarifier
augmented tertiary sand filtration

CLERMONT COUNTY WATER RESOURCES DEPARTMENT
WASTEWATER MASTER PLAN UPDATE
SECTION 5.0
NEEDS ASSESSMENT FOR SUSTAINABILITY
CLERMONT COUNTY WWMPU - FINAL CH2M HILL, INC 5-23
augmented ultraviolet light disinfection
The plant is in compliance with the terms and conditions of its governing NPDES permit.
Based on the Biological and Water Quality Study of the Lower Little Miami River and Selected
Tributaries study performed by Ohio EPA in 2007 and published in October 2009, O’Bannon
Creek is in full attainment with its use designation downstream of the O’Bannon Creek
Regional WWTP. Monthly operating data from the O’Bannon Creek Regional WWTP for
the five year period (2004-9) are summarized in Exhibit 5.11.
EXHIBIT 5.11 O’Bannon Creek Regional WWTP Effluent Quality 2004-9
Parameter Units
NPDES Limits
50th Pct 95th Pct Range 30-day 7-day Flow MGD --- --- 1.55 2.67 0.62 – 6.6 cBOD5 mg/L 8 12 2.5 5.0 0 – 13.7 TSS mg/L 12 18 3.3 7.8 0 – 28.3 NH4-N (S) mg/L 0.5 0.8 0.1 0.5 0 – 14.2 NH4-N (W) mg/L 2.0 3.0 0.1 0.7 0 – 2.6 TP mg/L --- --- 2.5 4.8 0.4 – 6.3
5.2.2.1 O’Bannon Creek Treatment Needs Assessment
Treatment needs for sustainability within this FPA should focus on the treatment of
peak wet weather flows at the O’Bannon Creek Regional WWTP and regulatory
initiatives to limit total phosphorus discharge. Regulatory initiatives to limit the
discharge of phosphorus will likely not be imposed until the next permit cycle in
2015.
The O’Bannon Creek Regional WWTP has limited peak flow treatment capacity.
This plant should be equipped to manage and treat flows equal to 2.5 times the
design average flow, or 11 mgd. Currently, the peak sustainable flow is
approximately 5.5 mgd. It is recommended that a plant hydraulic evaluation be
conducted to identify hydraulic bottlenecks and unit operations that limit hydraulic
throughput and invest in necessary plant modifications to augment peak flow

CLERMONT COUNTY WATER RESOURCES DEPARTMENT
WASTEWATER MASTER PLAN UPDATE
SECTION 5.0
NEEDS ASSESSMENT FOR SUSTAINABILITY
CLERMONT COUNTY WWMPU - FINAL CH2M HILL, INC 5-24
Aerial Photo of Lower East Fork
treatment. Planning for additional equalization volume should be considered after
plant hydraulic improvements and proposed collection system improvements are
completed.
Efforts are currently underway to extend and provide sanitary service to an area
lying outside the County’s jurisdictional boundary. This area, located in Harlan
Township in Warren County, will include the expanded pet products manufacturing
operation of Hartz Mountain Corporation and approximately 20 Warren County
residences located nearby along SR 132. The combined flow of approximately 15,000
gpd will be conveyed to the O’Bannon Creek Regional WWTP via a proposed new
sewer to be built along SR 132, north of Shiloh Road to the County line. In addition
to contributing additional flow and load to the O’Bannon Creek Regional WWTP,
this new sewer will open the area along SR 132 to further development.
5.2.3 Lower East Fork
The Lower East Fork Regional WWTP
is the County’s largest wastewater
treatment facility and serves Miami
and Union Townships. The plant is
served by a separate sanitary system
that includes 49 pump stations. The
plant was placed into service in 1979
and modified in 1993 and in 2006. The
design average flow is currently 9.0
MGD with a peak sustainable flow of
15.5 mgd. The plant discharges to a small
stream tributary to the East Fork Little Miami River.

CLERMONT COUNTY WATER RESOURCES DEPARTMENT
WASTEWATER MASTER PLAN UPDATE
SECTION 5.0
NEEDS ASSESSMENT FOR SUSTAINABILITY
CLERMONT COUNTY WWMPU - FINAL CH2M HILL, INC 5-25
The plant is currently under construction to augment the peak flow treatment capacity.
These plant improvements are slated for completion in 2012. Wet stream processes include
the following:
fine screening
grit removal
flow equalization
activated sludge (oxidation ditches)
final clarification
tertiary filtration
ultraviolet light disinfection
post aeration
The plant is in compliance with the terms and conditions of its governing NPDES permit.
The East Fork Little Miami River watershed was not part of the intensive stream survey of
the Lower little Miami River conducted by Ohio EPA in 2007. Accordingly, no conclusions
that reflect the current biological health and water quality of the East Fork Little Miami
River are available; however, a total maximum daily load (TMDL) study is scheduled for the
East Fork Little Miami River in 2015. Monthly operating data from the Lower East Fork
WWTP for the five year period (2004-9) are summarized in Exhibit 5.12.
EXHIBIT 5.12 Lower East Fork Regional WWTP Effluent Quality 2004-9
Parameter Units
NPDES Limits
50th Pct 95th Pct Range 30-day 7-day Flow MGD --- --- 5.07 9.67 2.54-15.4 cBOD5 mg/L 10 15 2.0 7.55 2.0-14.3 TSS mg/L 12 18 1.0 4.1 1.0-52 NH4-N (S) mg/L 1.0 1.5 0.1 0.25 0.1-1.5 NH4-N (W) mg/L 3.0 4.5 0.1 1.17 0.1-10.7

CLERMONT COUNTY WATER RESOURCES DEPARTMENT
WASTEWATER MASTER PLAN UPDATE
SECTION 5.0
NEEDS ASSESSMENT FOR SUSTAINABILITY
CLERMONT COUNTY WWMPU - FINAL CH2M HILL, INC 5-26
5.2.3.1 Lower East Fork Treatment Needs Assessment
Treatment needs for sustainability within the Lower East Fork FPA should focus on
the continued treatment of peak wet weather flows at the Lower East Fork Regional
WWTP. Regulatory initiatives to limit the discharge of phosphorus will likely not be
imposed until the TMDL study slated for 2015 is completed or the plant is expanded,
resulting in an increase in loading. The effective NPDES Permit for this facility
(1PK00009*LD) contains a monitoring only instruction for total phosphorus and will
expire in 2015.
The plant is currently under construction to effectively manage the treatment of
excess flows which reach the plant during wet weather events. When completed in
2012, the plant will be capable of treating a peak wet weather flow rate of 21 mgd.
This treatment rate in association with the available 10MG of equalization capacity
will mitigate the risk of plant overflows.
During the most recent five year period (2006-2010) the annual average plant flow of
6.6 mgd is essentially unchanged from the previous five year period (2001-2005).
Plant expansion is unwarranted in the near term, although a longer-range vision to
expand the Lower East Fork WWTP to a design average flow of 14 mgd with a peak
treatment rate of 28 mgd should be considered in the future. Based on growth
projections for this sewershed presented previously, planning for the Lower East
Fork WWTP design flow expansion should be initiated as 2020 is approached. The
annual average plant flow is projected to be consistently in the 7.6 mgd range (85%
of design flow) at that time.

CLERMONT COUNTY WATER RESOURCES DEPARTMENT
WASTEWATER MASTER PLAN UPDATE
SECTION 5.0
NEEDS ASSESSMENT FOR SUSTAINABILITY
CLERMONT COUNTY WWMPU - FINAL CH2M HILL, INC 5-27
Aerial Photo of Middle East Fork WWTP
5.2.4 Middle East Fork
The Middle East Fork Regional WWTP
serves an area that includes portions of
Stonelick, Batavia, Monroe, Tate and
Williamsburg Townships. The plant is
served by a separate sanitary sewer
system which includes 35 pump
stations. The plant has an average
design flow of 7.2 MGD and discharges
to the East Fork Little Miami River. Wet
stream processes include the following:
fine screening
grit removal
flow equalization
activated sludge aeration
final clarification
post aeration
ultraviolet disinfection
The plant is in compliance with the terms and conditions of its governing NPDES permit.
The East Fork Little Miami River watershed was not part of the intensive stream survey of
the Lower little Miami River conducted by Ohio EPA in 2007. Accordingly, no conclusions
that reflect the current biological health and water quality of the East Fork Little Miami
River are available; however, a total maximum daily load (TMDL) study is scheduled for the
East Fork Little Miami River in 2015. Monthly operating data from the Middle East Fork
WWTP for the five year period (2004-9) are summarized in Exhibit 5.13.

CLERMONT COUNTY WATER RESOURCES DEPARTMENT
WASTEWATER MASTER PLAN UPDATE
SECTION 5.0
NEEDS ASSESSMENT FOR SUSTAINABILITY
CLERMONT COUNTY WWMPU - FINAL CH2M HILL, INC 5-28
EXHIBIT 5.13 Middle East Fork Regional WWTP Effluent Quality 2004-9
Parameter Units
NPDES Limits
50th Pct 95th Pct Range 30-day 7-day Flow MGD --- --- 3.04 6.44 1.24-18.4 cBOD5 (S) mg/L 12.8 19.5 3.6 7.4 0-21.3 cBOD5 (W) mg/L 18.5 29 3.2 8.5 0-17.6 TSS (S) mg/L 17 25
4.0 12.8 0-44.3 TSS (W) mg/L 22 33 NH4-N (S) mg/L 1.57 2.35 0 1.0 0-11.5 NH4-N (W) mg/L 5.83 8.75 0 2.3 0-8.93
5.2.4.1 Middle East Fork Treatment Needs Assessment
Treatment needs for sustainability within this FPA should focus on the treatment of
peak wet weather flows at the Middle East Fork Regional WWTP and regulatory
initiatives to limit total phosphorus discharge. Regulatory initiatives to limit the
discharge of phosphorus will likely not be imposed until the next permit cycle in
2015 unless the plant is expanded, resulting in an increase in loading.
The Middle East Fork Regional WWTP has limited peak flow treatment capacity.
This plant should be equipped to manage and treat flows equal to 2.5 times the
design average flow, or 18 mgd. Currently, the peak sustainable flow is
approximately 8.5 mgd. It is recommended that a plant hydraulic evaluation be
conducted to identity hydraulic bottlenecks and unit operations that limit hydraulic
throughput and invest in necessary plant modifications to augment peak flow
treatment capacity. Planning for additional equalization volume should be
considered after plant hydraulic improvements and proposed collection system
improvements are completed.

CLERMONT COUNTY WATER RESOURCES DEPARTMENT
WASTEWATER MASTER PLAN UPDATE
SECTION 5.0
NEEDS ASSESSMENT FOR SUSTAINABILITY
CLERMONT COUNTY WWMPU - FINAL CH2M HILL, INC 5-29
Aerial Photo of Nine Mile WWTP
5.2.5 Nine Mile
Although the Nine Mile Wastewater
Treatment Plant discharges to Nine
Mile Creek, it is modeled as a direct
discharge to the Ohio River. This
facility was constructed in 1984 and
later modified in 2002 and is served by
a separate sanitary sewer system. The
current design average flow is 3.0
MGD. Wet stream processes include
the following:
coarse screening
fine screening
activated sludge (oxidation ditches)
final clarification
ultraviolet light disinfection
The coarse screen installation was completed in 2010. On average, the plant runs a single
oxidation ditch and clarifier and is in compliance with the terms and conditions of its
governing NPDES permit.
In 2010, the Ohio River Sanitation Commission (ORSANCO) compiled a Biennial Assessment
of Ohio River Water Quality Conditions for 2005-2009. The Nine Mile FPA is included in the
pool located between the Markland and Mehldahl Dams. No consensus agreement
between the states was reached on the interpretation of the data sets presented, so the
aquatic life use was not assessed in the referenced report.

CLERMONT COUNTY WATER RESOURCES DEPARTMENT
WASTEWATER MASTER PLAN UPDATE
SECTION 5.0
NEEDS ASSESSMENT FOR SUSTAINABILITY
CLERMONT COUNTY WWMPU - FINAL CH2M HILL, INC 5-30
Monthly operating data from the five year period (2004-9) for the Nine Mile WWTP are
summarized in Exhibit 5.14.
EXHIBIT 5.14 Nine Mile WWTP Effluent Quality 2004-9
Parameter Units
NPDES Limits
50th Pct 95th Pct Range 30-day 7-day Flow MGD --- --- 1.28 2.53 0.75 – 5.2 cBOD5 mg/L 19 30 3.3 6.2 0 – 15.4 TSS mg/L 22.8 34.2 5.0 13.8 0 – 304 NH4-N (S) mg/L 9.4 14.1 0.1 0.6 0 – 15.4 NH4-N (W) mg/L 10.2 15.3 0.2 1.0 0 – 11.4 TP mg/L --- --- --- --- ---
5.2.5.1 Nine Mile Treatment Needs Assessment
The current average wastewater flow is approximately 50 percent of the design
average flow, thus plant expansion is not warranted for the foreseeable future.
Containment and treatment of excess wet weather flows should be a priority at the
WWTP sincethe flow produced by the 5-year, 6 hour design storm over a 24-hour
period exceeds the peak sustainable plant flow by 0.3 million gallons currently. In
addition, completion of the proposed 2020 collection system improvements will
increase the peak hourly flow by 66 percent to 11.22 mgd which will continue to
challenge the plant’s ability to manage peak flows. A 750,000 gallon flow
equalization basin is proposed at the WWTP for the intermediate term to retain
excess wet weather flows. For the near term, excess flows can be equalized using the
standby oxidation ditch.
5.2.6 Felicity
The Village of Felicity WWTP is owned and operated by the CCWRD and serves
approximately 370 homes in the Village of Felicity. The only other wastewater treatment
facility in this FPA is located in the Village of Moscow and is owned and operated by the
Village.

CLERMONT COUNTY WATER RESOURCES DEPARTMENT
WASTEWATER MASTER PLAN UPDATE
SECTION 5.0
NEEDS ASSESSMENT FOR SUSTAINABILITY
CLERMONT COUNTY WWMPU - FINAL CH2M HILL, INC 5-31
Aerial Photo of Felicity WWTP
The Felicity WWTP has a permitted flow of
0.25 mgd and discharges to an unnamed
tributary of Bear Creek which discharges to
the Ohio River. Wet stream processes
include the following:
coarse screening
activated sludge
final clarification
chlorine disinfection
The plant is in compliance with the terms and
conditions of its governing NPDES permit.
In 2010, the Ohio River Sanitation Commission (ORSANCO) compiled a Biennial Assessment
of Ohio River Water Quality Conditions for 2005-2009. The Felicity FPA is included in the pool
located between the Greenup and Mehldahl Dams. No consensus agreement between the
ORSANCO states was reached on the interpretation of the data sets presented, so the
aquatic life use was not assessed in this report.
Monthly operating data from the period (2007-10) for the Village of Felicity WWTP are
summarized in Exhibit 5.15.

CLERMONT COUNTY WATER RESOURCES DEPARTMENT
WASTEWATER MASTER PLAN UPDATE
SECTION 5.0
NEEDS ASSESSMENT FOR SUSTAINABILITY
CLERMONT COUNTY WWMPU - FINAL CH2M HILL, INC 5-32
EXHIBIT 5.15 Felicity WWTP Effluent Quality 2007-10 (through October)
Parameter Units
NPDES Limits
50th Pct 95th Pct Range 30-day 7-day Flow MGD --- --- 0.18 0.53 0.10-1.01 cBOD5 (S) mg/L 10 15
4.0 9.6 2.0-10.4 cBOD5 (W) mg/L 15 23 TSS (S) mg/L 15 23
3.0 7.8 1.0-8.8 TSS (W) mg/L 20 30 NH4-N (S) mg/L 1.5 2.3
0.15 5.2 0.1-7.83 NH4-N (W) mg/L 2.3 3.5
5.2.6.1 Felicity Treatment Needs Assessment
The current average wastewater flow is approximately 70 percent of the design
average flow, thus plant expansion is not warranted for the foreseeable future as
growth in this facility planning area is slow. The peak daily to average daily flow
registered at the WWTP is consistently in the range of 5:1. Adequate flow
equalization volume has been provided at the WWTP to contain a peak flow up to 3
times design average flow.
Alternatives for the development of an expanded collection and treatment system
cannot easily be supported by the slow growth anticipated for the area at the present
time, yet a regional solution to wastewater management in the southwestern reach of
the County should be contemplated. One such scenario would consist of planning
for a regional treatment facility between Moscow and Point Pleasant that would
serve Felicity, the sewered Village of Moscow, and unsewered areas of Franklin and
Washington Townships, particularly the Ohio River towns of Chilo and Neville. A
detailed study of a proposed Southern Regional Treatment Facility is recommended.

CLERMONT COUNTY WATER RESOURCES DEPARTMENT
WASTEWATER MASTER PLAN UPDATE
SECTION 5.0
NEEDS ASSESSMENT FOR SUSTAINABILITY
CLERMONT COUNTY WWMPU - FINAL CH2M HILL, INC 5-33
5.2.7 Stonelick Creek
Centralized wastewater collection and treatment facilities do not presently exist within the
Stonelick planning area; however, CCWRD is planning for an initial stage of proposed
improvements to address existing home sewage treatment system problems in and around
the Village- of Newtonsville. Location of a proposed treatment facility in the Village of
Newtonsville that will initially serve local residents and, in the future, potentially serve the
Village of Edenton via pump station, may result in stringent requirements, including
phosphorus limitations, if discharge to Stonelick Creek is planned. Stonelick Creek is
seasonally dry and obtaining an NPDES permit for this new discharge may be a challenge
unless flow is directed to the Middle East Fork Basin by way of the Owensville interceptor.
It is recommended that these improvements move forward immediately to address existing
on-site problems and meet local community support of centralized sanitary service.
5.2.8 New Richmond
Centralized wastewater treatment facilities in the New Richmond planning area consist of
the New Richmond WWTP which began service in 1996 and three other small privately
owned and operated “package” treatment systems serving mobile home parks.
Approximately one-half of the planning area’s unsewered land is unsuitable for on-site
systems, yet there are an estimated 2,560 units which are scattered throughout the eastern
and central portions of the planning area.
The projected land use for the planning area does not suggest dense areas of development
will occur. This, in turn, does not make a strong case for the planning and development of a
centralized wastewater collection and treatment system for this area beyond that which
presently exists in New Richmond.

CLERMONT COUNTY WATER RESOURCES DEPARTMENT
WASTEWATER MASTER PLAN UPDATE
SECTION 5.0
NEEDS ASSESSMENT FOR SUSTAINABILITY
CLERMONT COUNTY WWMPU - FINAL CH2M HILL, INC 5-34
5.2.9 Upper East Fork
There are no wastewater treatment facilities that are governed by NPDES permits in the
Upper East Fork planning area. An existing onsite system concentration is located in the
unincorporated community of Marathon. The Upper East Fork planning area’s need for a
centralized, publically-owned and operated collection and treatment system is diminished
by a small population, sparse development and proximity to an existing centralized system.
The Village of Williamsburg located in the newly created Williamsburg FPA owns and
operates the nearest collection system.
For these reasons, it is recommended that limited action be taken in planning for centralized
treatment facilities in the Upper East Fork area.

CLERMONT COUNTY WATER RESOURCES DEPARTMENT
WASTEWATER MASTER PLAN UPDATE
SECTION 5.0
NEEDS ASSESSMENT FOR SUSTAINABILITY
CLERMONT COUNTY WWMPU - FINAL CH2M HILL, INC 5-35
Insert Maps:
5.2
5.3
5.4A&B
5.5A&B
5.6
CLERMONT COUNTY WATER RESOURCES DEPARTMENT
WASTEWATER MASTER PLAN UPDATE
SECTION 6.0
ALTERNATIVES EVALUATION FOR CAPACITY NEEDS
CLERMONT COUNTY WWMPU - FINAL CH2M HILL, INC 6-1
6.0 ALTERNATIVES EVALUATION FOR CAPACITY NEEDS
6.1 Evaluation of Alternatives
The approach to alternatives development is based on the growth and flow projections
presented in previous sections. Alternatives were developed and evaluated to meet the
collection system needs of Clermont County through consideration of future growth, I/I
conditions, capacity enhancement, and storage within the collection and treatment systems.
The approach included the following steps:
Assessment of the 2010, 2020 and 2030 modeled pipes to determine where the peak
flow exceeded the capacity of the sewer;
I/I reduction analysis to determine if this alternative alone would resolve capacity
issues;
Upsizing the pipes to carry the peak flow rate for the year 2030 condition without
surcharging;
Development of conveyance alternatives sized to the 2030 condition without
excessive surcharge;
Select storage sites where flow containment could eliminate upsizing of long
stretches of sewer.
Assessment of treatment needs based on the projected flows and anticipated
regulatory initiatives
6.1.1 Collection and Conveyance
6.1.1.1 Unsewered Areas
Alternatives for providing wastewater collection and conveyance infrastructure to
unsewered areas within the County were explored and are summarized below. For
purposes of this study, it is assumed that the City of Milford, located in the Milford
FPA, the Village of Williamsburg, located in the Williamsburg FPA, the Village of

CLERMONT COUNTY WATER RESOURCES DEPARTMENT
WASTEWATER MASTER PLAN UPDATE
SECTION 6.0
ALTERNATIVES EVALUATION FOR CAPACITY NEEDS
CLERMONT COUNTY WWMPU - FINAL CH2M HILL, INC 6-2
Batavia located in the Middle East Fork FPA and the Village of New Richmond
located in the New Richmond FPA will continue to manage and operate their
respective wastewater collection, conveyance and treatment facilities. However, for
existing on-site problem areas and extension of sewer service to unsewered areas
susceptible to potential future on-site problems, it is recommended that these
matters be resolved, provided that County objectives for growth and economic
development are met.
Loveland/Horner’s Run/Branch Hill – Given the continued suburban density
development that is characteristic of the area, alternatives to address the number of
on-site systems in existing unsewered areas should focus on areas that have on-site
problems adjacent to existing sewered areas and pocket areas where capital
investment can be prioritized to align with development. The recent regionalization
of wastewater collection, conveyance and treatment facilities to serve this planning
area provides a wastewater management system that serves current developments in
the area and future suburban growth. Accordingly, this regionalized service is
judged to be the most cost effective means of addressing the area’s on-site systems in
existing unsewered areas.
The initial stage of this regionalization is in-place with construction of the Wards
Corner Regional WWTP with consolidation of other wastewater infrastructure in
progress or in planning. This wastewater management system will also address on-
site system concerns within the Miami-Goshen-Stonelick well field adjacent to the
Village of Miamiville.
Pocket areas where sanitary service should be considered include the land adjacent
to and south of the Belle Meade subdivision (east of I 275), the Todd farm property
west of I 275 along Ward’s Corner Road, the Huber property along Loveland-
Miamiville Road and areas bounded by the Little Miami River and

CLERMONT COUNTY WATER RESOURCES DEPARTMENT
WASTEWATER MASTER PLAN UPDATE
SECTION 6.0
ALTERNATIVES EVALUATION FOR CAPACITY NEEDS
CLERMONT COUNTY WWMPU - FINAL CH2M HILL, INC 6-3
Loveland-Miamiville Road just west of Miamiville. This approach to unsewered
areas would focus capital investment and sustain economic vitality consistent with
County-wide wastewater management objectives in the planning area.
O’Bannon Creek – Alternatives that range from limited to extensive expansion of the
sanitary service to address on-site systems in existing unsewered areas were
examined in the O’Bannon Creek planning area. The recommended approach is to
expand sanitary service to: 1) areas experiencing on-site problems or areas that pose
a public nuisance through sewer extension, notably areas that are adjacent to an
existing sewer and 2) targeted areas through integrated consideration of land use,
development and on-site problem issues where capital investment is prioritized to
align with development patterns and projected areas of wastewater infrastructure
need. The latter would include the opportunity for extending the existing service
area into neighboring jurisdictions, where desirable, to sustain area growth and
economic vitality consistent with County-wide objectives. The planned SR 132
sewer extension north of Shiloh Road in Goshen Township will serve the Hartz
Mountain pet products manufacturing facility in Warren County and limited
adjacent residences. While this approach to unsewered areas would limit capital
investment compared to other alternatives, such as extensive expansion of sanitary
service, it is more in-line with prevailing economic conditions and would achieve
wastewater management objectives in the planning area.
Stonelick Creek – Alternatives framed around moderate to extensive expansion of
sanitary service are not practical for the Stonelick Creek planning area due to the
predominance of sparsely populated areas and generally steep topography. For this
reason, basin-wide wastewater management alternatives were not evaluated. The
recommended approach for this planning area is to focus on and invest in target

CLERMONT COUNTY WATER RESOURCES DEPARTMENT
WASTEWATER MASTER PLAN UPDATE
SECTION 6.0
ALTERNATIVES EVALUATION FOR CAPACITY NEEDS
CLERMONT COUNTY WWMPU - FINAL CH2M HILL, INC 6-4
areas that meet critical needs within the planning area, notably the Newtonsville-
Owensville-Belfast-Edenton quadrangle where on-site problems exist and
community support has been expressed for centralized sanitary service.
A proposed treatment facility located in Newtonsville would align with community
support for centralized service in this area and could potentially serve the Village of
Edenton. Areas in and around Owensville, notably east on SR 50 and north along
SR 132 would be served by local sewers with conveyance to the Middle East Fork
Basin via the Owensville pump station. Wastewater management in non-critical
unsewered areas is recommended to consist of on-site systems using best practices
for design, construction and operation.
Lower East Fork – The Lower East Fork planning area is a densely developed area,
the vast majority of which is served by the County’s sanitary system. With this level
of service in-place, continued extension of the collection system is the preferred
means by which effective and reliable wastewater management can be provided to
unsewered areas. As a result, alternatives for the entire basin should be limited to
specific improvement projects in known development areas where on-site problems
exist, such as Klondyke Road and Wolfpen-Pleasant Hill Road areas that are located
adjacent to existing sewered areas and undeveloped areas that are likely to
experience development in the foreseeable future, such as planned commercial
development in the southern portion of the planning area along Aicholtz Road in
Union Township.
Middle East Fork – The recommended approach in the Middle East Fork planning
area is to address critical on-site problems areas and provide effective wastewater
management in the unsewered areas through logical expansion of sanitary service.
With the extension of sanitary service to the Owensville area, resolution of existing
unsewered areas in the southern portion of Stonelick Creek FPA is being addressed
by the County. This service affords the elimination of significant concentrations of

CLERMONT COUNTY WATER RESOURCES DEPARTMENT
WASTEWATER MASTER PLAN UPDATE
SECTION 6.0
ALTERNATIVES EVALUATION FOR CAPACITY NEEDS
CLERMONT COUNTY WWMPU - FINAL CH2M HILL, INC 6-5
on-site systems and provides the basic infrastructure necessary to support moderate
growth along the SR 50 and SR 132 corridors. Continuance of this approach of
gradual sewer extension is recommended to serve unsewered areas in this location
in combination with proposed modifications to the Owensville pump station and
conveyance capacity improvements downstream of the pump station.
In the southern portion of the planning area, unsewered areas generally bounded by
SR 132, SR 125 and Lindale-Mt. Holly Road located in Pierce and Monroe Townships
should be addressed via sewer extension to eliminate existing on-site problems.
Nine Mile/Ten Mile – The recommended wastewater management approach in the
Nine Mile planning area should focus on areas that have on-site problems adjacent
to existing sewered areas and pocket areas where capital investment can be
prioritized to align with development. Expansion of sanitary service especially to
areas located in the eastern rim of the FPA is not practical and was not considered.
Proposed improvements include construction of a local sewer to serve on-site
problem areas located on Fulton Grove Road (southern Union Township). As
development moves eastward, on-site problem areas on East and West Concord
Road in Pierce Township should be addressed along with the elimination of the
package treatment system that serves the mobile home park located between Lindale
and Amelia along SR 132, however this is not a proposed project at this time.
New Richmond – The development and projected land use patterns for the New
Richmond planning area east of the Village of New Richmond do not support
significant expansion of sanitary service. Accordingly, the practical alternative to
effective wastewater management in unsewered areas consists of limited sewer
extensions that serve on-site problem areas that are adjacent to the New Richmond
service area, including areas along Bethel-New Richmond Road.

CLERMONT COUNTY WATER RESOURCES DEPARTMENT
WASTEWATER MASTER PLAN UPDATE
SECTION 6.0
ALTERNATIVES EVALUATION FOR CAPACITY NEEDS
CLERMONT COUNTY WWMPU - FINAL CH2M HILL, INC 6-6
Problem areas immediately adjacent to the service area boundary of New Richmond
are recommended to be resolved provided that County objectives for growth and
economic development are met.
Felicity – The Felicity planning area has a strong rural character with scattered and
sparsely populated development, primarily along or near the Ohio River. As such,
practical alternatives for providing effective and reliable wastewater management
plans are limited as in other regions of the County.
Alternatives for the development of an expanded collection and treatment system
cannot easily be supported by the slow growth anticipated for the area at the present
time, yet a regional solution to wastewater management in the southwestern reach of
the County should be contemplated. One such scenario would consist of planning
for a regional treatment facility between Moscow and Point Pleasant that would
serve Felicity, Moscow, unsewered areas in northern Washington Township (i.e. up
to Point Isabel), unsewered areas of southern Monroe Township (i.e. up to Laurel),
the Ohio River towns of Chilo and Neville. A feasibility study of a proposed
Clermont County Southwest Regional Treatment Facility is recommended for this
far-reaching plan.
In the near term, community treatment centers are recommended in areas that have
concentrations of on-site systems. These include the Ohio River towns of Point
Pleasant, Chilo and Neville and to a lesser extent, the Villages of Laurel and Point
Isabel. Community treatment centers are environmentally sound, financially
responsible solutions for small community wastewater problems where
conventional, centralized systems are not practical or affordable and where
individual on-site systems are inappropriate because of unacceptable soil conditions.
Each community treatment system would collect wastewater from each home via
small diameter gravity sewer. These sewers would use septic tanks to remove most
of the wastewater solids and convey the effluent from the tanks to a central location

CLERMONT COUNTY WATER RESOURCES DEPARTMENT
WASTEWATER MASTER PLAN UPDATE
SECTION 6.0
ALTERNATIVES EVALUATION FOR CAPACITY NEEDS
CLERMONT COUNTY WWMPU - FINAL CH2M HILL, INC 6-7
for treatment and disinfection. Treatment is proposed to consist of re-circulating
media filtration to aerate and treat the incoming wastewater and enhance nitrogen
removal. Prior to adopting this approach, it is advisable to proceed in step-wise
fashion in accordance with the following plan:
Hold public meeting;
Discuss the possibility of the project with local organizations and residents;
Assess history of local problems and level of resident interest
Identify funding sources for project;
Perform an income survey to determine grant assistance qualification;
Apply for grant or other assistance;
Perform study to determine the most practical means of conveyance and
treatment and evaluate site options for the community.
As the need for a centralized southern regional treatment facility becomes more of a
practical solution to effective and reliable wastewater treatment for unsewered areas
in this planning area, these community treatment systems would be converted to
pumping stations or desirably be replaced by gravity sewers.
6.1.1.2 Capacity Constraints
The problems identified in the sewered (modeled) areas were evaluated using the
Infoworks model and alternatives were selected that balanced the storage in the
collection system versus storage or upgrades that would be necessary at the
wastewater treatment plants. If existing storage is available, such as with the
equalization basins in the Lower East Fork basin, then preference was given to
additional storage. Storage was also recommended when a storage tank could
eliminate the need to upsize a long reach of pipe.
CLERMONT COUNTY WATER RESOURCES DEPARTMENT
WASTEWATER MASTER PLAN UPDATE
SECTION 6.0
ALTERNATIVES EVALUATION FOR CAPACITY NEEDS
CLERMONT COUNTY WWMPU - FINAL CH2M HILL, INC 6-8
6.1.2 Wastewater Treatment
Clermont County is faced with near, intermediate and long-term wastewater treatment
challenges. In the near-term, the County must implement measures to increase the
treatment of peak flow rates induced by wet weather events either through expanded peak
flow treatment facilities, on-site storage or a combination of both. In the mid-term, the
County must focus on nutrient control initiatives, particularly phosphorus reduction in
treated plant effluent, to comply with water quality and use attainability requirements for
the Little Miami River Basin. For the two plants located on the East Fork of the Little Miami
River, the nutrient limitations will be derived from a total maximum daily load (TMDL)
study scheduled for 2015. Longer term, the County must plan for plant expansion, guided
by growth and development in the planning areas which will result in continually
increasing volumes of wastewater being generated, both as a result of growth and the
gradual but progressive elimination of unsewered areas. The balance of this chapter
summarizes the short, mid and long term improvements recommended to address these
challenges.
6.1.2.1 Near-Term Improvements
In the near-term, the County must address peak wet weather flow treatment issues
at the O’Bannon Creek Regional, Middle East Fork Regional and Nine Mile Creek
WWTPs. Based on the performance of the majority of these plants over a five year
period and the alternatives considered, the near-term improvements are
recommended as follows:
O’Bannon Creek Regional WWTP - The peak sustainable flow (i.e. the flow rate that
can be sustained for at least 24 hours, while producing an effluent that complies with
NPDES requirements) at the O’Bannon Creek Regional WWTP is 5.0 mgd. The
County should implement the following strategy to increase the treatment of peak
wet weather flows at the O’Bannon Creek Regional WWTP:

CLERMONT COUNTY WATER RESOURCES DEPARTMENT
WASTEWATER MASTER PLAN UPDATE
SECTION 6.0
ALTERNATIVES EVALUATION FOR CAPACITY NEEDS
CLERMONT COUNTY WWMPU - FINAL CH2M HILL, INC 6-9
Perform a plant-wide hydraulic evaluation to identify bottlenecking in pipes,
structures and unit operations that limit hydraulic throughput;
Complete plant modifications to augment peak flow treatment to a minimum
rate equal to 2.5 times the design average flow of 4.4 mgd, or 11 mgd – this
improvement in combination with the existing 2.5 million gallons of
equalization volume will enable the WWTP to contain and treat flows
associated with the design storm under existing conditions (Note: the
peaking factor of 2.5 is conservative in relation to the design storm modeling
outcome in the O’Bannon Creek sewershed where the peak hour to average
day ratio varies from 1.8 to 2.1; generally accepted engineering practices
typically utilize peaking factors in the range of 2.0-3.0 unless site conditions
indicate otherwise);
Middle East Fork Regional WWTP – The peak sustainable flow (i.e. the flow rate
that can be sustained for at least 24 hours, while producing an effluent that complies
with NPDES requirements) at the Middle East Fork Regional WWTP is 8.5 mgd. The
County should implement the following strategy to increase the treatment of peak
wet weather flows at the Middle East Fork Regional WWTP:
Perform a plant-wide hydraulic evaluation to identify bottlenecking and
structures and unit operations that limit hydraulic throughput;
Complete plant modifications to augment peak flow treatment to a minimum rate
equal to 2.5 times the design average flow of 7.2 mgd, or 18 mgd – this improvement
in combination with the existing 3.0 million gallons of equalization volume will
enable the WWTP to contain and treat the flows associated with the design storm
under existing conditions (Note: the peaking factor of 2.5 is conservative in relation
to the design storm modeling outcome in the Middle East Fork sewershed where the

CLERMONT COUNTY WATER RESOURCES DEPARTMENT
WASTEWATER MASTER PLAN UPDATE
SECTION 6.0
ALTERNATIVES EVALUATION FOR CAPACITY NEEDS
CLERMONT COUNTY WWMPU - FINAL CH2M HILL, INC 6-10
peak hour to average day ratio varies from 1.5 to 2.7; generally accepted engineering
practices typically utilize peaking factors in the range of 2.0-3.0 unless site conditions
indicate otherwise);
6.1.2.2 Mid-Term Improvements
Facilities Discharging to the Little Miami River Basin - In the mid-term, the County
must plan to address treatment plant expansion and nutrient control initiatives that
will likely be developed to control the discharge of total phosphorus and perhaps
total nitrogen in the Little Miami Basin. The Biological and Water Quality Study of the
Lower Little Miami River and Selected Tributaries study, which excluded the East Fork
of the Little Miami River, has been completed and published by Ohio EPA in
October 2009. The study, which included field work completed in 2007, noted that
the overall higher quality discharge from the wastewater treatment facilities is
responsible for significant restoration of the biological integrity of the Little Miami
River.
However, the report maintains that the Little Miami River is over-enriched,
especially in the lower segment of the river where populations are highest and most
of the larger wastewater treatment facilities exist, suggesting that in-stream
phosphorus targets are not being met in the Little Miami River. As a result of their
findings, Ohio EPA recommends that the highest standard of wastewater treatment,
including total phosphorus removal, be employed by all NPDES facilities
discharging into the Little Miami River watershed. This study formed the basis for
the TMDL Report which was finalized and approved in March 2011.
Monitoring of the East Fork of the Little Miami River, which drains a large portion of
Clermont County, is scheduled to begin in 2012 with the TMDL Report scheduled
for completed in 2015.

CLERMONT COUNTY WATER RESOURCES DEPARTMENT
WASTEWATER MASTER PLAN UPDATE
SECTION 6.0
ALTERNATIVES EVALUATION FOR CAPACITY NEEDS
CLERMONT COUNTY WWMPU - FINAL CH2M HILL, INC 6-11
Based on the regulatory initiatives and findings of recent water quality and
biological assessments on the Little Miami River, the County should plan to control
the discharge of total phosphorus at the O’Bannon Creek Regional, Lower East Fork
Regional, Middle East Fork Regional and Miami Trails WWTPs at the mid-term
level. Options to consider include chemical precipitation, biological phosphorus
removal or a combination of both.
The Lower East Fork Regional plant has an oxidation ditch system that can and
should be modified to remove phosphorus biologically through construction of
staged anaerobic and anoxic zones preceding the existing aerated basins.
The O’Bannon Creek facility has split-flow treatment that utilizes an oxidation ditch
and a two-stage activated sludge system followed by tertiary filtration. Both of these
treatment trains are recommended to be modified to remove phosphorus
biologically.
It is recommended that the Middle East Fork Regional WWTP utilize and convert
existing tankage to provide anaerobic zones and perform modifications to the
aeration tanks, including internal sludge recycling to accomplish biological
phosphorus removal.
Phosphorus limits imposed on the Miami Trails WWTP should be met with low-cost
chemical precipitation, as this plant is planned for elimination with flow conveyance
to the Wards Corner Regional WWTP via new interceptor sewer along Branch Hill-
Miamiville Road, pump station and force main.
Treatment plant expansion of 14 mgd is recommended at the Lower East Fork
Regional WWTP as discussed previously in Section 5.2.3.

CLERMONT COUNTY WATER RESOURCES DEPARTMENT
WASTEWATER MASTER PLAN UPDATE
SECTION 6.0
ALTERNATIVES EVALUATION FOR CAPACITY NEEDS
CLERMONT COUNTY WWMPU - FINAL CH2M HILL, INC 6-12
Nine Mile WWTP – The peak sustainable flow (i.e. the flow rate that can be
sustained for at least 24 hours, while producing an effluent that complies with
NPDES requirements) at the Nine Mile WWTP is 5.5 mgd. The County should
implement the following strategy to address the treatment of peak wet weather
flows at the Nine Mile WWTP:
Construct 0.75 million gallons of off-line equalization storage capacity at the
WWTP to contain and treat the flows associated with the design storm under
existing conditions.
6.1.2.3 Long-Term Improvements
Beyond 2020, the long term management of excess flows derived from peak wet
weather events will be necessary at the O’Bannon Creek Regional, Middle East Fork
Regional and Nine Mile Creek WWTPs after the impact of proposed project
completion both at the plant and collection system is assessed.
6.2 Project Prioritization
6.2.1 Collection, Conveyance and Treatment
Project prioritization is based upon scoring criteria developed by CCWRD. These criteria are
listed in Exhibit 6.1.
EXHIBIT 6.1 CCWRD SCORING CRITERIA
CCWRD Criteria Description Weight Regulatory Requirement Project is required by mandate or order to achieve
or maintain regulatory compliance or reduce risk of non-compliance.
21%
Capacity Need Project is necessary to address near future (<5 years) or far future (>5 years) capacity restrictions.
12%
Operational Improvement (Maintenance/Sustainability)
Project will decrease required maintenance costs/effort or improve ability to operate/maintain infrastructure while prolonging or renewing the useful life of the asset.
16%
Safety, Public Health and Customer Service
Project will improve safety, health and general welfare of the public and may also contribute to maintaining or reducing service rates.
12%

CLERMONT COUNTY WATER RESOURCES DEPARTMENT
WASTEWATER MASTER PLAN UPDATE
SECTION 6.0
ALTERNATIVES EVALUATION FOR CAPACITY NEEDS
CLERMONT COUNTY WWMPU - FINAL CH2M HILL, INC 6-13
EXHIBIT 6.1 CCWRD SCORING CRITERIA
CCWRD Criteria Description Weight System Reliability/Risk Reduction
Project enhances the reliability of service and reduces risk (i.e. loss of service, reduced service, overflows and backups).
12%
Economic Development Project supports/maintains existing economic development, supports development initiatives or encourages new development.
9%
Conform with Master Plan Project is identified in or in conformance with Water or Wastewater Master Plan.
OMITTED
Stakeholder Confidence Project enhances the confidence of ratepayers, regulators, elected officials and/or the general public by demonstrating that a quality product is being delivered, quality of life is being improved and/or environmental impacts are being reduced.
9%
Cost Containment/Revenue Enhancement
Project will result in increased revenues or reduced operational and maintenance costs or reduced future capital expenditures.
9%
100.0%
Each project (i.e. collection, conveyance and treatment) was scored individually based upon
the criteria contained in Exhibit 6.1 and prioritized for each time horizon: 2010, 2020 and
2030.
6.2.1.1 Near-Term (Priority 1)
Excessive surcharging (defined as > 3 feet above pipe crown) or presence of known
water-in-basement (WIB), sanitary sewer overflow (SSO), or manhole (MH)
overflows resulting from existing (2010) modeled areas.
6.2.1.2 Intermediate Term (Priority 2)
Excessive surcharging (defined as > 3 feet above pipe crown) or presence of known
water-in-basement (WIB), sanitary sewer overflow (SSO) or manhole (MH)
overflows resulting from future (2020) modeled areas.

CLERMONT COUNTY WATER RESOURCES DEPARTMENT
WASTEWATER MASTER PLAN UPDATE
SECTION 6.0
ALTERNATIVES EVALUATION FOR CAPACITY NEEDS
CLERMONT COUNTY WWMPU - FINAL CH2M HILL, INC 6-14
6.2.1.3 Longer Term (Priority 3)
Excessive surcharging (defined as > 3 feet above pipe crown) or presence of known
water-in-basement (WIB), sanitary sewer overflow (SSO) or manhole (MH)
overflows resulting from future (2030) modeled areas.
The recommended alternatives for the modeled FPAs are shown in Exhibits 6.2
through 6.8.
6.2.2 Wastewater Treatment
Segregation of the thirteen proposed treatment projects into near term (Priority 1),
intermediate term (Priority 2) and longer term (Priority 3) has been based on engineering
judgment guided by current treatment plant capacity, proposed collection and conveyance
projects presented previously and impending regulatory requirements.
6.2.2.1 Peak Wet Weather Flow Considerations
The prioritization of proposed wastewater treatment projects is based upon scoring
criteria developed by CCWRD (listed previously in Exhibit 6.1) and peak wastewater
flows associated with the design storm (Refer to Exhibit 6.9). The most critical near-
term areas of need include the following:
Hydraulic limitations that impact the effective treatment capacity of peak wet
weather flows at the O’Bannon Creek Regional and Middle East Fork
Regional WWTPs;
Insufficient excess flow equalization capacity at the O’Bannon Creek WWTP.

CLERMONT COUNTY WATER RESOURCES DEPARTMENT
WASTEWATER MASTER PLAN UPDATE
SECTION 6.0
ALTERNATIVES EVALUATION FOR CAPACITY NEEDS
CLERMONT COUNTY WWMPU - FINAL CH2M HILL, INC 6-15
EXHIBIT 6.9 Peak Wet Weather Flows to WWTPs
Modeled Area
Wastewater Treatment
Facility
Existing Peak WWTP Treatment Capacity(mgd) 1
2010 Peak Daily
Flow (with collection
system projects
completion - mgd)
2020 Peak Daily
Flow (with collection
system projects
completion - mgd)
2030 Peak Daily
Flow (with collection
system projects
completion - mgd)
Lower East Fork LEF Regional WWTP
21.0 2 20.2 22.0 25.0
Middle East Fork MEF Regional WWTP
8.5 9.5 21.1 22.0
O’Bannon Creek O’Bannon Creek Regional WWTP
5.0 13.4 23.1 23.8
Nine Mile Nine Mile WWTP
5.5 3.8 5.5 5.6
Felicity Felicity WWTP 0.6 --- --- --- Loveland/Horner’s Run/Branch Hill
Miami Trails WWWTP
0.7 1.4 1.9 1.9
Arrowhead Park WWTP
0.2 .06 0.1 0.1
Wards Corner Regional WWTP
6.0 0.7 3.7 3.7
1 Bramblewood and Indian Lookout WWTPs have not been included due to recent or planned elimination 2 Based on completion of LEF WWTP Improvement Project No. 6402-60044, currently under construction.
6.2.2.2 Regulatory Initiative Impacts
In-stream total phosphorus concentrations have been a significant concern in the
Little Miami River watershed, particularly along the main stem of the Little Miami
River. Several waste water treatment facilities have expanded treatment capacity and
improved effluent quality which has likely contributed to healthier aquatic life
communities that are now being observed (Refer to Biological and Water Quality Study
of the Lower Little Miami River and Selected Tributaries, 2009). This study formed the
basis for the TMDL Report for the Lower Little Miami River which was finalized
and approved in March 2011.
CLERMONT COUNTY WATER RESOURCES DEPARTMENT
WASTEWATER MASTER PLAN UPDATE
SECTION 6.0
ALTERNATIVES EVALUATION FOR CAPACITY NEEDS
CLERMONT COUNTY WWMPU - FINAL CH2M HILL, INC 6-16
Despite the improved biological performance, statistical analysis has shown that the
total phosphorus concentrations in the main stem of the river have not changed
significantly based on the last three Ohio EPA surveys on this part of the river which
occurred in 1993, 1998, and 2007. However, stream flow conditions were
considerably different between these surveys and perhaps with higher stream flow
in 2007 the nutrient concentrations would have been lower. The confounding factor
in determining if in-stream improvements in total phosphorus concentrations have
in fact occurred is that there are two major differences between 1993 and 1998
surveys and the 2007 survey. Specifically, waste water treatment improved, but also
the stream flows were low for 2007. Additional surveys are needed, when in-stream
flows are comparable, to derive meaningful conclusions on the improvement of in-
stream phosphorus levels. Ohio EPA continues to recommend that the highest
standard of wastewater treatment, including total phosphorus removal, be
employed by all NPDES facilities discharging into the Little Miami River
watershed.
Biological and water quality monitoring of the East Fork of the Little Miami
River is scheduled to begin in 2012 with the TMDL Report targeted for
completion in 2015. The findings of this future study and TMDL Report will
have a greater impact on the County than the Lower Little Miami River TMDL
since its larger wastewater treatment facilities discharge to the East Fork Little
Miami River. Based on the findings of recent water quality and biological
assessments on the Little Miami River and the Lower Little Miami River TMDL, the
most critical areas of need related to regulatory initiatives for treatment include the
following:
Nutrient (i.e. total phosphorus) control measures at the O’Bannon Creek
Regional, Lower East Fork Regional and Middle East Fork Regional WWTPs.

CLERMONT COUNTY WATER RESOURCES DEPARTMENT
WASTEWATER MASTER PLAN UPDATE
SECTION 6.0
ALTERNATIVES EVALUATION FOR CAPACITY NEEDS
CLERMONT COUNTY WWMPU - FINAL CH2M HILL, INC 6-17
6.2.2.3 Consolidation and Regionalization Measures
With the completion of the Wards Corner Regional WWTP in 2009, the foundation is
in-place for effective consolidation and regionalization of wastewater collection,
conveyance and treatment in the northwest sector of the County. The Wards Corner
Regional facility has a design flow of 2 mgd but currently treats less than 0.1 mgd.
Continuation of this process of consolidation and regionalization is recommended to
consist of the following:
Elimination of the Arrowhead Park WWTP with flow directed to the Wards
Corner Regional WWTP via pump station, force main and interceptor sewer
(Refer to Exhibit 6.2);
Elimination of the Miami Trails WWTPs with flow directed to the Wards
Corner Regional WWTP via pump station, force main and interceptor sewer
(Refer to Exhibit 6.2).
Elimination of these plants will immediately contribute 0.4 mgd of additional flow to
the Wards Corner Regional WWTP.
6.2.2.4 Expansion of Existing Treatment Facilities
The planned expansion of the Lower East Fork Regional Plant to 14 mgd will
facilitate future growth and development in this planning area.

CLERMONT COUNTY WATER RESOURCES DEPARTMENT
WASTEWATER MASTER PLAN UPDATE
SECTION 6.0
ALTERNATIVES EVALUATION FOR CAPACITY NEEDS
CLERMONT COUNTY WWMPU - FINAL CH2M HILL, INC 6-18
Insert Maps:
6.2
6.3
6.4
6.5
6.6
6.7
6.8
CLERMONT COUNTY WATER RESOURCES DEPARTMENT
WASTEWATER MASTER PLAN UPDATE
SECTION 7.0
SUMMARY OF RECOMMENDED PLAN
CLERMONT COUNTY WWMPU - FINAL CH2M HILL, INC 7-1
7.0 SUMMARY OF RECOMMENDED PLAN 7.1 Near-Term Capital Improvements
The data collected to prioritize the candidate projects and to score individual projects are
summarized in Appendices A and B respectively. A multi-attribute utility prioritization
analysis of the proposed projects was performed and the projects were ranked based on
their total benefit scores. The cost estimates prepared for this document are indexed to May
2010. A parametric costing tool developed for estimating project construction and capital
costs for various facilities was utilized to prepare the estimates.
Resources used in development of the costing tool include:
R.S. Means
Richardson Process Plant Estimating Standards
Mechanical Contractors Association - Labor Manual
National Electrical Contractors Association - Labor Unit Manual (NECA)
United States Environmental Protection Agency References and Standards
Various Municipalities Facility Construction Data
CH2M HILL Historical Data
Vendor Quotes on Equipment and Materials where appropriate.
The estimates are based on the assumption the work will be done on a competitively bid
basis and the contractors will have a reasonable amount of time to complete the work.
These cost estimates are considered a Class 4 - Planning Level estimate as defined by the
American Association of Cost Engineering (AACE) and as designated in ASTM E 2516-06. It
is considered accurate to +50% to -30% based up to a 15% complete project definition.
CLERMONT COUNTY WATER RESOURCES DEPARTMENT
WASTEWATER MASTER PLAN UPDATE
SECTION 7.0
SUMMARY OF RECOMMENDED PLAN
CLERMONT COUNTY WWMPU - FINAL CH2M HILL, INC 7-2
The agreed-to assumptions for cost estimate derivation for sewer construction are as
follows:
Average depth of pipe (12 feet)
Street width impact (10 feet)
Service lateral connections determined by property count
Water services replaced (1 per 2,000 feet)
Manhole impact (1 per 300 feet)
Dewatering included if construction is in or along waterway
Traffic maintenance required if on-road
Clearing and grubbing required if off-road
Sewage flow maintained
No rock excavation
The costs listed are project capital costs that include construction, administration,
engineering, contingencies, and other “soft” costs based on the following assumptions:
Construction contingencies:
30% for construction costs (CC) < $350K
25% for $350K < CC < $1,100K
20% for CC > $1,100K
Engineering and Construction Administration (9% CC)
Land Acquisition and Rights of Way (6% CC)
Planning and Preliminary Design (5% CC ) – includes flow monitoring for model
calibration by CCWRD

CLERMONT COUNTY WATER RESOURCES DEPARTMENT
WASTEWATER MASTER PLAN UPDATE
SECTION 7.0
SUMMARY OF RECOMMENDED PLAN
CLERMONT COUNTY WWMPU - FINAL CH2M HILL, INC 7-3
Miscellaneous (2% CC) – includes permits, inspections and geotechnical
The total CC multiplier is in the range of 1.42 to 1.52.
A list of the proposed projects prioritized by their total benefit score for short term capital
improvements is shown in Exhibit 7.1.
CLERMONT COUNTY WATER RESOURCES DEPARTMENT
WASTEWATER MASTER PLAN UPDATE
SECTION 7.0
SUMMARY OF RECOMMENDED PLAN
CLERMONT COUNTY WWMPU - FINAL CH2M HILL, INC 7-4
EXHIBIT 7.1 Summary of Proposed Projects for Near Term Capital Improvements Note: Some of the identified projects may not require implementation as a result of CCWRD’s efforts to reduce infiltration and inflow.
Project Number Project Description Conveyance Storage L.S. Upgrade Details
Total Benefit Score
Project Capital Costs
OBN‐P1‐06 Obannon Creek Sewer Upgrade (MH 5351 ‐ OBNWW) 4,800 LF Involves laying 4,837' of open cut sewers ranging from 27"‐54". 63.7 $2,501,000MEF‐P1‐01 Bethel Collection Improvements I (MH 100493 ‐ MH 2552) 4,900 LF Involves laying 4,931' of open cut sewers ranging from 10"‐15". 60.1 $2,440,000MEF‐P1‐02 Bethel Collection Improvements II (MH 2689 ‐ MH BETHELPS) 11,000 LF Involves laying 10,997' of open cut sewers ranging from 21"‐30". 60.1 $5,211,000OBN‐P1‐02 Creek Sewer Upgrade (MH 5935 ‐ MH 5783) 15,600 LF Involves laying 15,997' of open cut sewers ranging from 12"‐21". 60.1 $6,181,000OBN‐P1‐04 Paxtonwoods Sewer Upgrade (MH 5133 ‐ MH 5208) 3,000 LF Involves laying 555' of 10" open cut sewers and 2,421' of 12" open cut sewers. 60.1 $1,155,000OBN‐P1‐05 Redbird Road Sewer Upgrade I (MH 5350 ‐ MH 5351) 1,800 LF Involves laying 1,760' of 27" open cut sewers. 60.1 $888,000LEF‐P1‐01 Shayler Run Upstream Sewer Upgrade (MH 9840 ‐ MH 9159_branches to MH
777/MH 419)4,900 LF 3 MG Involves laying 4,826' of open cut sewers ranging from 10"‐24" and providing
3 MG of storage.55.3 $10,295,000
LEF‐P1‐03 Hall Run Sewer Replacment and EQ Expansion 14,500 LF 2 MG Involves laying 14,460' of open cut sewers ranging from 8"‐21" and providing 2 MG of storage.
55.3 $15,672,000
LEF‐P1‐04 Wolf Pen‐Pleasant Hill Road Sewer Upgrades (MH 8235‐MH8144) 4,500 LF 3.6 MG 7 MGD Involves laying 4,402' of open cut sewers ranging from 10"‐30", providing 3.6 MG of storage and upgrading list staion to 7 MGD.
55.3 $13,724,000
LEF‐P1‐05 Cook Road Sewer Upgrade (MH 5033 ‐ MH 10050) 3,500 LF 6.5 MGD Involves laying 3,159' of 12" open cut sewers and 266' of 18" open cut sewers and upgrading lift stations to 6.5 MGD.
55.3 $3,416,000
LEF‐P1‐07 Mt. Caramel‐Tobasco Sewer Upgrade (MH 8491‐MH 9659) 3,200 LF Involves laying 3,184' of open cut sewers ranging from 10"‐18". 55.3 $1,803,000LEF‐P1‐08 Clough Pike Sewer Upgrade ( MH 226‐ MH 9646) 2,800 LF Involves laying 453' of 10" open cut sewers and 2,297' of 12" open cut sewers. 55.3 $1,051,000OBN‐P1‐T1 OBN Regional WWTP Modifications Phase 1 (augment wet weather flow
treatment capacity to 11 mgd)OBN Regional WWTP Modifications Phase 1 (augment wet weather flow treat 53.8 $8,340,000
MEF‐P1‐T1 MEF Regional WWTP Modifications Phase 1 (augment wet weather flow treatment capacity to 18 mgd)
MEF Regional WWTP Modifications Phase 1 (augment wet weather flow treatm 53.8 $4,183,000
LEF‐P1‐06 Elick Lane Sewer Upgrade (MH1843‐MH 2002) 1,300 LF Involves laying 1,244' of 10" open cut sewers. 50.5 $584,000SLC‐P1‐T1 Village of Newtonsville WWTP (will address to address existing on‐site issues) Village of Newtonsville WWTP (will address to address existing on‐site issues 44.7 $2,800,000NML‐P1‐T1 NML WWTP Modifications Phase 1 (provide 0.75MG EQ capacity) NML WWTP Modifications Phase 1 (provide 0.75MG EQ capacity) 42.6 $8,423,000LEF‐P1‐09 Arcadia Lane Sewer Upgrade (MH 1546‐1653) 700 LF Involves laying 640' of 10" open cut sewers. 41.4 $281,000NML‐P1‐01 Nine Mile‐Tabasco Road Sewer Upgrade I (MH 6544 ‐ WWTP) 6,000 LF Involves laying 5,650' of 24" open cut sewers and 299' of 21" open cut sewers. 38.5 $2,734,000LEF‐P1‐15 Orchard Lift Station Upgrade 2.2 MGD Involves upgrading lift station to 2.2 MGD. 38.5 $1,282,000LEF‐P1‐16 Shepherd Lift Station Upgrade 2.5 MGD Involves upgrading lift station to 2.5 MGD. 38.5 $1,305,000MEF‐P1‐03 Locust Lake LS/FM Upgrade 2,600 LF (F.M.) 1 MGD Involves laying 2,628' of 8" force main and upgrading lift station to 1 MGD. 35.8 $2,189,000OBN‐P1‐03 O'Bannon Trunk Sewer Improvements (MH 5787 ‐ MH 5439) 15,000 LF Involves laying 14,994' of open cut sewers ranging from 12"‐54". 28.2 $9,667,000LEF‐P1‐10 SR 28 Sewer Upgrade (MH 8139‐ MH 4207) 3,300 LF Involves laying 3,291' of 15" open cut sewers. 27.3 $1,917,000

CLERMONT COUNTY WATER RESOURCES DEPARTMENT
WASTEWATER MASTER PLAN UPDATE
SECTION 7.0
SUMMARY OF RECOMMENDED PLAN
CLERMONT COUNTY WWMPU - FINAL CH2M HILL, INC 7-5
EXHIBIT 7.1 Summary of Proposed Projects for Near Term Capital Improvements (continued) Note: Some of the identified projects may not require implementation as a result of CCWRD’s efforts to reduce infiltration and inflow.
Project Number Project Description Conveyance Storage L.S. Upgrade Details
Total Benefit Score
Project Capital Costs
LHR‐P1‐01 Miami Trails Sewer Upgrade (MH 7503 ‐ Miami Trails WWTP) 4,500 LF Involves laying 4,485' of open cut sewers ranging from 10"‐15". 24.7 $2,925,000NML‐P1‐02 Nine Mile‐Tabasco Road Sewer Upgrade II (MH 6625‐6615) 1,800 LF Involves laying 1,161' of 21" open cut sewers and 610' of 24" open cut sewers. 24.6 $1,051,000LEF‐P1‐11 SR 131 Lift Station Upgrade 1,400 LF 3 MGD Involves laying 1,381' of 15" open cut sewers and 19' of 35" open cut sewers
and upgrading lift station to 3 MGD.24.6 $1,938,000
LEF‐P1‐12 Happy Hollow Lift Station Upgrade 140 LF 4 MGD Involves laying 131' of 18" open cut sewers and upgrading lift staton to 4 24.6 $1,516,000LEF‐P1‐13 Viking Village Lift Station Upgrade 1.1 MGD Involves upgrading lift station to 1.1 MGD. 24.6 $1,198,000LEF‐P1‐14 State Route 28 Lift Station Upgrade 3 MGD Involves upgrading lift station to 3 MGD. 24.6 $1,347,000MEF‐P1‐04 Lucy Run Sewer Upgrade (Phase I) (MH 3264 ‐ MH 3239) 7,100 LF Involves laying 7,146' of 42" open cut sewers. 24.6 $4,862,000OBN‐P1‐01 Deerfield Road Collection Improvements (MH 4757 ‐ MH 5567) 8,800 LF Involves laying 8,761' of 12" open cut sewers. 24.6 $4,977,000LEF‐P1‐02 Eastgate North Drive Sewer Upgrade (MH 7547‐9968) 1,500 LF Involves laying 397' of 12" open cut sewers and 1,102' of 15" open cut sewers. 18.3 $631,000The costs listed are project capital costs that include construction costs, administration costs, engineering costs, contingencies, and other soft costs. These costs are escalated to represent costs for Cincinnati, Ohio for May 2010 using an ENRCCI = 7837.

CLERMONT COUNTY WATER RESOURCES DEPARTMENT
WASTEWATER MASTER PLAN UPDATE
SECTION 7.0
SUMMARY OF RECOMMENDED PLAN
CLERMONT COUNTY WWMPU - FINAL CH2M HILL, INC 7-6
7.2 Intermediate Term Capital Improvements
A list of the proposed projects prioritized by their total benefit score for intermediate term
capital improvements is shown in Exhibit 7.2.

CLERMONT COUNTY WATER RESOURCES DEPARTMENT
WASTEWATER MASTER PLAN UPDATE
SECTION 7.0
SUMMARY OF RECOMMENDED PLAN
CLERMONT COUNTY WWMPU - FINAL CH2M HILL, INC 7-7
EXHIBIT 7.2 Summary of Proposed Projects for Intermediate Capital Improvements Note: Some of the identified projects may not be required as a result of CCWRD’s efforts to reduce infiltration and inflow.
Project Number Project Description Conveyance Storage L.S. Upgrade Details
Total Benefit Score
Project Capital Costs
OBN‐P2‐08 SR 132 Sewer upgrade (MH 6097 ‐ MH 6076) 18,700 LF Involves laying 18,654' of open cut sewers ranging from 18"‐30". 63.7 $9,909,000OBN‐P2‐09 Goshen Sewer Upgrade (MH 6227 ‐ MH 5755) 18,100 LF Involves laying 18,148' of open cut sewers ranging from 15"‐42". 60.1 $9,991,000OBN‐P2‐12 Deerfield Road Storage 2 MG Involves providing 2 MG of storage. 60.1 $6,443,000OBN‐P2‐13 Fay Road Sewer Upgrade (MH 5765 ‐ MH 5787) 5,000 LF Involves laying 4,981' of 12" open cut sewers. 60.1 $1,857,000OBN‐P2‐10 SR 48 Sewer Upgrade (MH 5410 ‐ MH 5351) 2,000 LF Involves laying 1,414' of 10" open cut sewers and 627' of 12" open cut sewers. 57.4 $866,000MEF‐P2‐08 Bethel Lift Station Storage 1.5 MG Involved providing 1.5 MG of storage. 46.9 $4,685,000LEF‐P2‐T1 LEF Regional WWTP Modifications (nutrient removal facilities) LEF Regional WWTP Modifications (nutrient removal facilities) 45.6 $3,950,000OBN‐P2‐T2 OBN Regional WWTP Modifications Phase 2 (nutrient control facilities) OBN Regional WWTP Modifications Phase 2 (nutrient control facilities) 45.6 $1,850,000MEF‐P2‐T2 MEF Regional WWTP Modifications Phase 2 (nutrient removal facilities) MEF Regional WWTP Modifications Phase 2 (nutrient removal facilities) 45.6 $3,150,000LHR‐P2‐T2 Miami Trails WWTP Elimination 19,000 LF,
5,000 LF (F.M)2 MG Miami Trails WWTP Elimination. Involves laying 19,000' of open cut sewers
ranging 8"‐15", 5,000' of 4" force mains and upgrading lift stations to 2 MG.35.7 $13,757,000
OBN‐P2‐T3 OBN Regional WWTP Modifications Phase 2 (augment EQ capacity) OBN Regional WWTP Modifications Phase 2 (augment EQ capacity) 42.6 $9,000,000MEF‐P2‐13 Owensville P.S. and F.M. Upgrade (STLOUSFM ‐ MH 3220) 6,100 LF (F.M.) 4 MGD Involves laying 6,142' of 15" force mains and upgrading lift station to 4 MGD. 42.1 $3,954,000LEF‐P2‐21 Meadow Drive Sewer Upgrade (MH 4648‐ MH 10070/Longfield PS) 1,890LF 3 MGD Involves laying 1,890' of 12" open cut sewers and upgrading lift station to 3 38.5 $2,066,000
LHR‐P2‐T4 Arrowhead Park WWTP Elimination (flow to be directed to Wards Corner Regional WWTP)
2,500 LF Arrowhead Park WWTP Elimination (flow to be directed to Wards Corner Regional WWTP). Involves new lift station and laying 5,000' of force main.
35.7 $1,906,000
NML‐P2‐04 Legendary Run Sewer Upgrade (MH 9563 MH 9488) 1,500 LF Involves laying 1,483' of 12" open cut sewers. 33.7 $662,000NML‐P2‐06 Oakland Farm Drive Sewer I (MH 9480 MH 455) 1,200 LF Involves laying 1,116' of 10" open cut sewers. 33.7 $442,000NML‐P2‐05 Pierce Lift Station Upgrade 1.5 MGD Involves upgrading lift station to 1.5 MGD. 33.7 $1,225,000MEF‐P2‐05 Bethel Collection Improvements III (MH 9465 ‐ MH 9468) 1,800 LF Involves laying 1,821' of open cut sewers ranging from 12"‐15". 33.7 $1,001,000MEF‐P2‐06 Bethel Collection Improvements IV (MH 9437 ‐ MH 2689) 6,300 LF Involves laying 2,188' of 15" open cut sewers and 4091' of 18" open cut
sewers.33.7 $3,025,000
MEF‐P2‐07 Bethel Collection Improvements V (MH 2606 ‐ MH 2689) 1,300 LF Involves laying 1,305' of 10" open cut sewers. 33.7 $648,000MEF‐P2‐11 Owensville Collection Improvements I (MH 3148 ‐ MH 3119) 3,100 LF Involves laying 1,037' of 12" open cut sewers and 2,054' of 15"open cut
sewers.33.7 $1,694,000
MEF‐P2‐12 Owensville Collection Improvements II (MH 3116 ‐ MH 3100) 300 LF Involves laying 318' of 12" open cut sewers. 33.7 $192,000MEF‐P2‐19 Huntsman Trace Sewer Upgrade (MH 2952 ‐ MH 3490) 8,300 LF Involves laying 7,146' of 12" open cut sewers and 1,198' of 15" open cut
sewers.33.7 $3,452,000
MEF‐P2‐20 Chapel Sewer Upgrade (MH 2895 ‐ MH 2364) 3,500 LF Involves laying 2,362' of 12" open cut sewers and 1,138' of 15" open cut sewers.
33.7 $1,570,000

CLERMONT COUNTY WATER RESOURCES DEPARTMENT
WASTEWATER MASTER PLAN UPDATE
SECTION 7.0
SUMMARY OF RECOMMENDED PLAN
CLERMONT COUNTY WWMPU - FINAL CH2M HILL, INC 7-8
EXHIBIT 7.2 Summary of Proposed Projects for Intermediate Capital Improvements (continued) Note: Some of the identified projects may not require implementation as a result of CCWRD’s efforts to reduce infiltration and inflow.
Project Number Project Description Conveyance Storage L.S. Upgrade Details
Total Benefit Score
Project Capital Costs
OBN‐P2‐11 Redbird Road Sewer Upgrade II (MH 7756 ‐ MH 5350) 5,000 LF Involves laying 4,981' of 18" open cut sewers. 33.7 $2,092,000MEF‐P2‐18 Rose Lane Sewer Upgrade (MH 3016 ‐ MH 3018) 800 LF Involves laying 830' of 10" open cut sewers. 31 $324,000MEF‐P2‐23 Locust Lake Sewer Upgrade (MH 2869 ‐ LOCUSTPS) 200 LF Involves laying 171' of 12" open cut sewers. 31 $94,000OBN‐P2‐07 Twin Oak Sewer Upgrade (MH 7741 ‐ MH 7753) 1,900 LF Involves laying 1,919' of 10" open cut sewers. 31 $1,004,000MEF‐P2‐16 Haskell Sewer Upgrade (MH 3427 ‐ MEFWW) 4,600 LF Involves laying 794' of 24" open cut sewers and 3,796' of 42" open cut sewers. 30.9 $2,834,000
NML‐P2‐03 Nine Mile‐Tabasco Road Sewer Upgrade III (MH 6714 ‐ MH6721 ) 3,700 LF Involves laying 3,625' of 21" open cut sewers. 27.3 $1,523,000LEF‐P2‐17 Founders Boulevard Sewer Upgrade (MH 2101‐ MH 2130) 1,200 LF Involves laying 1,168' of 21" open cut sewers. 27.3 $518,000LEF‐P2‐18 Old SR 74 Sewer Upgrade (MH 2214‐ MH 2251 ) 800 LF Involves laying 742' of 12" open cut sewers. 27.3 $401,000LEF‐P2‐19 Olive Branch‐Stonelick Road Sewer Upgrade (MH 9850‐ MH 9843) 2,500 LF Involves laying 2,438' of 21" open cut sewers. 27.3 $1,029,000MEF‐P2‐09 Lucy Run Sewer Upgrade (Phase II) (MH 8133 ‐ MH 3264) 8,400 LF Involves laying 6,030' of 27" open cut sewers and 2,323' of 36" open cut 27.3 $4,131,000MEF‐P2‐10 Lucy Run Sewer Upgrade (Phase III) (MH 3239 ‐ MEFWW) 6,000 LF Involves laying 5,981' of 42" open cut sewers. 27.3 $4,105,000MEF‐P2‐14 Hartman Lane Sewer Upgrade (MH 9395 ‐ MH 3427) 7,700 LF Involves laying 7,652' of 24" open cut sewers. 27.3 $3,360,000MEF‐P2‐15 Winemiller Sewer Upgrade (MH 3317 ‐ MH 9393) 3,900 LF Involves laying 3,934' of 21" open cut sewers. 27.3 $1,802,000MEF‐P2‐17 SR 132 @ Elmwood Road Sewer Upgrade (MH 3214 ‐ MH 3205) 3,600 LF Involves laying 3,645' of 21" open cut sewers. 27.3 $1,591,000MEF‐P2‐21 Foozer FM/Sewer Upgrade (MH 9354 ‐ FOOZERPS; FOOZERFM ‐ MH 12901) 700 LF/8,000 LF
(F.M.)Involves laying 656' of 15" open cut sewers, 20' of 12" open cut sewers and 8,005' of 15" force mains.
27.3 $5,450,000
MEF‐P2‐22 Upper Lucy Run Sewer Upgrade (MH 3488 ‐ MH 8133) 6,000 LF Involves laying 3,389' of 21" open cut sewers and 2,618' of 24" open cut sewers.
27.3 $2,716,000
MEF‐P2‐24 SR 132 @ SR 125 Sewer Upgrade (MH 12901 ‐ MH 3490) 7,100 LF Involves laying 7,080' of 24" open cut sewers. 24.6 $3,838,000The costs listed are project capital costs that include construction costs, administration costs, engineering costs, contingencies, and other soft costs. These costs are escalated to represent costs for Cincinnati, Ohio for May 2010 using an ENRCCI = 7837.

CLERMONT COUNTY WATER RESOURCES DEPARTMENT
WASTEWATER MASTER PLAN UPDATE
SECTION 7.0
SUMMARY OF RECOMMENDED PLAN
CLERMONT COUNTY WWMPU - FINAL CH2M HILL, INC 7-9
7.3 Longer Term Capital Improvements A list of the proposed projects prioritized by their total benefit score for long term capital
improvements is shown in Exhibit 7.3.

CLERMONT COUNTY WATER RESOURCES DEPARTMENT
WASTEWATER MASTER PLAN UPDATE
SECTION 7.0
SUMMARY OF RECOMMENDED PLAN
CLERMONT COUNTY WWMPU - FINAL CH2M HILL, INC 7-10
EXHIBIT 7.3 Summary of Proposed Projects for Long Term Capital Improvements Note: Some of the identified projects may not require implementation as a result of CCWRD’s efforts to reduce infiltration and inflow.
Project Number Project Description Conveyance Storage L.S. Upgrade Details
Total Benefit Score
Project Capital Costs
NML‐P3‐T2 NML WWTP Modifications Phase 2 (augment EQ capacity) NML WWTP Modifications Phase 2 (augment EQ capacity) 42.6 $2,300,000MEF‐P3‐T3 MEF Regional WWTP Modifications Phase 3 (augment EQ capacity) MEF Regional WWTP Modifications Phase 3 (augment EQ capacity) 42.6 $10,175,000LEF‐P3‐20 Ferguson Drive and Aicholtz Road Sewer Upgrade (MH 356‐ MH 11962) 4,200 LF Involves laying 226' of 10" open cut sewers and 3,885' of 12" open cut sewers.
41.2 $2,029,000LEF‐P3‐22 Nature Run Upgrade 0.6 MGD Involves upgrading lift station to 0.6 MGD. 38.5 $1,119,000LEF‐P3‐T2 LEF Regional WWTP Design Flow Expansion (ADF = 14 mgd) LEF Regional WWTP Design Flow Expansion (ADF = 14 mgd) 35.7 $15,000,000NML‐P3‐07 Oakland Farm Drive Sewer II (MH 6875 ‐ MH 6721) 2,100 LF Involves laying 2,047' of 15" open cut sewers. 33.7 $826,000NML‐P3‐08 Pierce F.M Upgrade (MH Pierce Pump Station‐MH 9484) 1,200 LF Involves laying 1,129' of 12" open cut sewers and 56' of 10" force mains. 33.7 $522,000
NRH‐P3‐01Sewer Extensions immediately adjacent to the New Richmond sewered area to serve homes currently served by onsight systems.
3,000 LF Involves laying 3,000' of 8" open cut sewers.21
$1,642,000
NML‐P3‐09Sewer Extensions along Fulton Grove Road to serve homes currently served by onsight systems
3,000 LF Involves laying 3,000' of 8" open cut sewers.21
$1,622,000
SLC‐P3‐01Sewer Extensions in the Owensville area to serve homes currently served by onsight systems. Owensville‐Belfast Road north of Ownsville.
7,000 LF Involves laying 7,000' of 8" open cut sewers.16.2
$1,830,000
SLC‐P3‐02Sewer Extensions in the Owensville area to serve homes currently served by onsight systems. SR 50 east to the Clermont Northeastern Local School treatment facility.
6,000 LF Involves laying 6,000' of 8" open cut sewers.
16.2
$1,571,000
The costs listed are project capital costs that include construction costs, administration costs, engineering costs, contingencies, and other soft costs. These costs are escalated to represent costs for Cincinnati, Ohio for May 2010 using an ENRCCI = 7837.

CLERMONT COUNTY WATER RESOURCES DEPARTMENT
WASTEWATER MASTER PLAN UPDATE
SECTION 7.0
SUMMARY OF RECOMMENDED PLAN
CLERMONT COUNTY WWMPU - FINAL CH2M HILL, INC 7-11
The results from the multi-attribute utility prioritization analysis of the proposed projects
are shown in a graphical form for the short, intermediate and long term capital
improvements in Exhibits 7.4, 7.5 and 7.6 respectively. Exhibit 7.7 shows the benefit score by
criteria weight composition of 50 projects with highest priority among all the projects
evaluated and Exhibit 7.8 shows the cumulative project costs corresponding to these
projects. (Note: Not all projects listed in prior exhibits may be required based on the
successful efforts of CCWRD to remove inflow via separation of foundation drains from the
sanitary sewer system (Ref. Article 3.6.7 of Clermont County Water Resources Department’s
Standards and Provisions) and to remove infiltration from the sanitary system via other
means).

CLERMONT COUNTY WATER RESOURCES DEPARTMENT
WASTEWATER MASTER PLAN UPDATE
SECTION 7.0
SUMMARY OF RECOMMENDED PLAN
CLERMONT COUNTY WWMPU - FINAL CH2M HILL, INC 7-12
EXHIBIT 7.4 Benefit Score by Criteria Weight Composition for Near Term Capital Improvements (P1)

CLERMONT COUNTY WATER RESOURCES DEPARTMENT
WASTEWATER MASTER PLAN UPDATE
SECTION 7.0
SUMMARY OF RECOMMENDED PLAN
CLERMONT COUNTY WWMPU - FINAL CH2M HILL, INC 7-13
EXHIBIT 7.5 Benefit Score by Criteria Weight Composition for Intermediate Term Capital Improvements (P2)
0
10
20
30
40
50
60
70
OBN
‐P2‐08
OBN
‐P2‐09
OBN
‐P2‐12
OBN
‐P2‐13
OBN
‐P2‐10
MEF‐P2‐08
LEF‐P2
‐T1
OBN
‐P2‐T2
MEF‐P2‐T2
OBN
‐P2‐T3
MEF‐P2‐13
LEF‐P2
‐21
LHR‐P2
‐T2
LHR‐P2
‐T4
MEF‐P2‐05
MEF‐P2‐06
MEF‐P2‐07
MEF‐P2‐11
MEF‐P2‐12
MEF‐P2‐19
MEF‐P2‐20
NML‐P2
‐04
NML‐P2
‐05
NML‐P2
‐06
OBN
‐P2‐11
MEF‐P2‐18
MEF‐P2‐23
OBN
‐P2‐07
MEF‐P2‐16
LEF‐P2
‐17
LEF‐P2
‐18
LEF‐P2
‐19
MEF‐P2‐09
MEF‐P2‐10
MEF‐P2‐14
MEF‐P2‐15
MEF‐P2‐17
MEF‐P2‐21
MEF‐P2‐22
NML‐P2
‐03
MEF‐ P2‐24
Bene
fit Score
Alternative
Cost Containment & Revenue Enhancement
Stakeholder Confidence
Economic Development
System Reliability & Risk Reduction
Safety, Public Health & Customer Service
Operational Improvement (Maintenance & Sustainability)
Capacity Need
Regulatory Requirement

CLERMONT COUNTY WATER RESOURCES DEPARTMENT
WASTEWATER MASTER PLAN UPDATE
SECTION 7.0
SUMMARY OF RECOMMENDED PLAN
CLERMONT COUNTY WWMPU - FINAL CH2M HILL, INC 7-14
EXHIBIT 7.6 Benefit Score by Criteria Weight Composition for Long Term Capital Improvements (P3)
0
10
20
30
40
50
60
70
NML‐P3
‐T2
MEF‐P3‐T3
LEF‐P3
‐20
LEF‐P3
‐22
LEF‐P3
‐T2
NML‐P3
‐07
NML‐P3
‐08
NRH‐P3
‐01
NML‐P3
‐09
STL‐P3
‐01
STL‐P3
‐02
Bene
fit Score
Alternative
Cost Containment & Revenue Enhancement
Stakeholder Confidence
Economic Development
System Reliability & Risk Reduction
Safety, Public Health & Customer Service
Operational Improvement (Maintenance & Sustainability)
Capacity Need
Regulatory Requirement
CLERMONT COUNTY WATER RESOURCES DEPARTMENT
WASTEWATER MASTER PLAN UPDATE
SECTION 7.0
SUMMARY OF RECOMMENDED PLAN
CLERMONT COUNTY WWMPU - FINAL CH2M HILL, INC 7-15
EXHIBIT 7.7 Benefit Score by Criteria Weight Composition - Top 50 Projects
0
10
20
30
40
50
60
70
OBN
‐P1‐06
OBN
‐P2‐08
MEF‐P1‐01
MEF‐P1‐02
OBN
‐P1‐02
OBN
‐P1‐04
OBN
‐P1‐05
OBN
‐P2‐09
OBN
‐P2‐12
OBN
‐P2‐13
OBN
‐P2‐10
LEF‐P1
‐01
LEF‐P1
‐03
LEF‐P1
‐04
LEF‐P1
‐05
LEF‐P1
‐07
LEF‐P1
‐08
MEF‐P1‐T1
OBN
‐P1‐T1
LEF‐P1
‐06
MEF‐P2‐08
LEF‐P2
‐T1
MEF‐P2‐T2
OBN
‐P2‐T2
SLC‐P1
‐T1
NML‐P1
‐T1
OBN
‐P2‐T3
MEF‐P3‐T3
NML‐P3
‐T2
MEF‐P2‐13
LEF‐P1
‐09
LEF‐P3
‐20
LEF‐P1
‐15
LEF‐P1
‐16
NML‐P1
‐01
LEF‐P2
‐21
LEF‐P3
‐22
MEF‐P1‐03
LHR‐P2
‐T2
LHR‐P2
‐T4
LEF‐P3
‐T2
MEF‐P2‐05
MEF‐P2‐06
MEF‐P2‐07
MEF‐P2‐11
MEF‐P2‐12
MEF‐P2‐19
MEF‐P2‐20
NML‐P2
‐04
NML‐P2
‐05
Bene
fit Score
Alternative
Cost Containment & Revenue Enhancement
Stakeholder Confidence
Economic Development
System Reliability & Risk Reduction
Safety, Public Health & Customer Service
Operational Improvement (Maintenance & Sustainability)
Capacity Need
Regulatory Requirement

CLERMONT COUNTY WATER RESOURCES DEPARTMENT
WASTEWATER MASTER PLAN UPDATE
SECTION 7.0
SUMMARY OF RECOMMENDED PLAN
CLERMONT COUNTY WWMPU - FINAL CH2M HILL, INC 7-16
EXHIBIT 7.8 Cumulative Project Costs Ordered by Project Total Benefit Score – Top 50 Projects
$0
$50,000,000
$100,000,000
$150,000,000
$200,000,000
OBN
‐P1‐06
OBN
‐P2‐08
MEF‐P1‐01
MEF‐P1‐02
OBN
‐P1‐02
OBN
‐P1‐04
OBN
‐P1‐05
OBN
‐P2‐09
OBN
‐P2‐12
OBN
‐P2‐13
OBN
‐P2‐10
LEF‐P1
‐01
LEF‐P1
‐03
LEF‐P1
‐04
LEF‐P1
‐05
LEF‐P1
‐07
LEF‐P1
‐08
MEF‐P1‐T1
OBN
‐P1‐T1
LEF‐P1
‐06
MEF‐P2‐08
LEF‐P2
‐T1
MEF‐P2‐T2
OBN
‐P2‐T2
SLC‐P1
‐T1
NML‐P1
‐T1
OBN
‐P2‐T3
MEF‐P3‐T3
NML‐P3
‐T2
MEF‐P2‐13
LEF‐P1
‐09
LEF‐P3
‐20
LEF‐P1
‐15
LEF‐P1
‐16
NML‐P1
‐01
LEF‐P2
‐21
LEF‐P3
‐22
MEF‐P1‐03
LHR‐P2
‐T2
LHR‐P2
‐T4
LEF‐P3
‐T2
MEF‐P2‐05
MEF‐P2‐06
MEF‐P2‐07
MEF‐P2‐11
MEF‐P2‐12
MEF‐P2‐19
MEF‐P2‐20
NML‐P2
‐04
NML‐P2
‐05
Cumulative Co
sts
Alternative

CLERMONT COUNTY WATER RESOURCES DEPARTMENT
WASTEWATER MASTER PLAN UPDATE
SECTION 7.0
SUMMARY OF RECOMMENDED PLAN
CLERMONT COUNTY WWMPU - FINAL CH2M HILL, INC 7-17
7.4 Infiltration and Inflow Reduction
Modeling of the County’s sewered areas has revealed the presence of infiltration and inflow
(I/I) in the sanitary sewer system. I/I can enter the wastewater conveyance system through
sewers and manholes and consumes pipe and treatment capacity. A significant number of
I/I sources may be located on private property. Without an aggressive, enforceable program
to locate and repair these private property defects, often at homeowner expense, a
significant portion of I/I sources remain. CCWRD has recently updated its Standards and
Provisions (September 2010) to include funding for eligible homeowners to remove the
connection of foundation drains from the public sewer system
A program for managing and reducing I/I throughout the County’s collection system helps
to sustain the operation of existing infrastructure through operation, maintenance, and
management of the collection system. The traditional methodology for I/I control involves
locating the sources of I/I, then removing or sealing out the unwanted water. Flow
monitoring and maintenance programs are often employed to identify sub-basins with
relatively high I/I followed by allocation of source detection resources to identify and
pinpoint I/I sources. Based on I/I severity and type of defects found, the challenge is to
determine the appropriate level of I/I reduction that can be cost effectively implemented.
After the updated collection system models were developed, an evaluation of I/I reduction
was performed on the Nine/Ten Mile Basin. This was accomplished to determine whether
I/I reduction could be used as a method to eliminate the capacity problems that the
modeling was showing throughout the County. For the evaluation it was assumed that an
I/I reduction program could eliminate 10% of the I/I from the system. This is a conservative
assumption based on I/I removal programs in other municipalities. The results of this
evaluation showed that although the peak flows were lowered by I/I reduction, this
reduction in flow did not address the significant capacity constraints in the system.
Therefore, I/I reduction is not considered a means to resolve capacity problems identified

CLERMONT COUNTY WATER RESOURCES DEPARTMENT
WASTEWATER MASTER PLAN UPDATE
SECTION 7.0
SUMMARY OF RECOMMENDED PLAN
CLERMONT COUNTY WWMPU - FINAL CH2M HILL, INC 7-18
through modeling. However, the County should continue with preventative maintenance
and I/I reduction programs that help relieve capacity constraints and extend the useful life
of the sewers.
The County recognizes the need to exclude extraneous water from its collection system and
has a staff devoted to I/I investigation activities; however, I/I control is a significant
challenge. Since the sources of I/I were never intended to exist, they are not located in any
“designed” or “standard” location. Each source must be located before it can be addressed,
and finding the source requires a site-specific investigation. Consequently, removal of I/I is
a continuous and repetitive process of identification, evaluation and repair.
The County should sustain its program of I/I evaluation and rehabilitation to protect sewer
capacity and WWTP peak flow treatment capability. Since previous flow monitoring has
shown I/I intrusion into the sanitary sewer system, the flow monitoring basins should be
prioritized and investigated more fully to determine sources.
Exhibit 7.9 summarizes the structure of the proposed I/I program. Red checks show tasks
the County has initiated or is in the process of initiating. System mapping should be
updated on a regular basis. Flow monitoring should occur regularly and be repeated
throughout the collection system as needed about every five years. Program elements such
as smoke and dye tests should occur as needed. Manhole and sewer rehabilitation will
result from the CCTV inspections.

CLERMONT COUNTY WATER RESOURCES DEPARTMENT
WASTEWATER MASTER PLAN UPDATE
SECTION 7.0
SUMMARY OF RECOMMENDED PLAN
CLERMONT COUNTY WWMPU - FINAL CH2M HILL, INC 7-19
EXHIBIT 7.9 I/I Reduction Program
I/I identification and removal is an ongoing effort. As the County sewer system ages and
more flow enters the system, the need to research, test, develop, and implement effective
means of I/I reduction in order to minimize sewer system capacity problems continues. This
effort is essential to achieving a sustainable, cost-effective, and long-term program for
addressing capacity constraints in the collection system.
System Mapping
Prioritize Areas
Flow Monitoring
Analyze Data Develop & Update GIS of Collection System
Purpose: Focus the Effort
Collection System Understanding (Flows, I/I, Rainfall Response)
CCTV Sewers
Dye Tests
Smoke Tests
I/I Evaluation
Identify I/I Sources
Manhole Inspections
CCTV Laterals
Purpose: Identify I/I Sources
Develop & Update GIS Database of all Inspection & Findings
Develop & Update GIS Database of all Rehabilitation
I/I Rehabilitation
Develop Upgrade Plan
Identify Structural Deficiency
Laterals Sewers Manholes
Purpose: Stop Inflow Sources
Related Documents