Clementine ® 8.0 User’s Guide

Welcome message from author
This document is posted to help you gain knowledge. Please leave a comment to let me know what you think about it! Share it to your friends and learn new things together.
Transcript

Clementine® 8.0 User’s Guide

For more information about SPSS® software products, please visit our Web site athttp://www.spss.com or contact
SPSS Inc.233 South Wacker Drive, 11th FloorChicago, IL 60606-6412Tel: (312) 651-3000Fax: (312) 651-3668
SPSS is a registered trademark and the other product names are the trademarksof SPSS Inc. for its proprietary computer software. No material describing suchsoftware may be produced or distributed without the written permission of theowners of the trademark and license rights in the software and the copyrights inthe published materials.
The SOFTWARE and documentation are provided with RESTRICTED RIGHTS.Use, duplication, or disclosure by the Government is subject to restrictions as set forthin subdivision (c) (1) (ii) of The Rights in Technical Data and Computer Softwareclause at 52.227-7013. Contractor/manufacturer is SPSS Inc., 233 South WackerDrive, 11th Floor, Chicago, IL 60606-6412.
General notice: Other product names mentioned herein are used for identificationpurposes only and may be trademarks of their respective companies.
This product includes software developed by the Apache Software Foundation(http://www.apache.org).This product includes software developed by Eric Young ([email protected]).Copyright © 1995–1997 by Eric Young. All rights reserved.This product contains IBM Runtime Environment for AIX®, Java™ 2 TechnologyEdition Runtime Modules. Copyright © 1999, 2000 by IBM Corporation.Windows is a registered trademark of Microsoft Corporation.UNIX is a registered trademark of The Open Group.DataDirect, INTERSOLV, SequeLink, and DataDirect Connect are registeredtrademarks of DataDirect Technologies.
Clementine® 8.0 User's GuideCopyright © 2003 by Integral Solutions Limited.All rights reserved.Printed in the United States of America.
No part of this publication may be reproduced, stored in a retrieval system, ortransmitted, in any form or by any means, electronic, mechanical, photocopying,recording, or otherwise, without the prior written permission of the publisher.
1 2 3 4 5 6 7 8 9 0 06 05 04 03
ISBN 1-56827-333-9

Preface
Clementine is the SPSS enterprise-strength data mining workbench. Clementinehelps organizations improve customer and citizen relationships through an in-depthunderstanding of data. Organizations use the insight gained from Clementine to retainprofitable customers, identify cross-selling opportunities, attract new customers,detect fraud, reduce risk, and improve government service delivery.
Clementine’s visual interface invites users’ specific business expertise, whichleads to more powerful predictive models and shortens time-to-solution. Clementineoffers many modeling techniques, such as prediction, classification, segmentation,and association detection algorithms. Once models are created, Clementine SolutionPublisher enables their delivery enterprise-wide to decision makers or to a database.
Compatibility
Clementine is designed to operate on computer systems running Windows Me,Windows XP, Windows 2000, Windows NT 4.0 with Service Pack 6 or higher.
Serial Numbers
Your serial number is your identification number with SPSS Inc. You will needthis serial number when you contact SPSS Inc. for information regarding support,payment, or an upgraded system. The serial number was provided with yourClementine system.
iii

Customer Service
If you have any questions concerning your shipment or account, contact your localoffice, listed on the SPSS Web site at http://www.spss.com/worldwide/. Please haveyour serial number ready for identification.
Training Seminars
SPSS Inc. provides both public and onsite training seminars. All seminars featurehands-on workshops. Seminars will be offered in major cities on a regular basis. Formore information on these seminars, contact your local office, listed on the SPSSWeb site at http://www.spss.com/worldwide/.
Technical Support
The services of SPSS Technical Support are available to registered customers. StudentVersion customers can obtain technical support only for installation and environmentalissues. Customers may contact Technical Support for assistance in using Clementineproducts or for installation help for one of the supported hardware environments. Toreach Technical Support, see the SPSS Web site at http://www.spss.com, or contactyour local office, listed on the SPSS Web site at http://www.spss.com/worldwide/. Beprepared to identify yourself, your organization, and the serial number of your system.
Tell Us Your Thoughts
Your comments are important. Please let us know about your experiences with SPSSproducts. We especially like to hear about new and interesting applications usingClementine. Please send e-mail to [email protected] or write to SPSS Inc., Attn.:Director of Product Planning, 233 South Wacker Drive, 11th Floor, Chicago, IL60606-6412.
Contacting SPSS
If you would like to be on our mailing list, contact one of our offices, listed on ourWeb site at http://www.spss.com/worldwide/.
iv
Contents
1 What's New in Clementine 8.0? 1
Welcome to Clementine 8.0. . . . . . . . . . . . . . . . . . . . . . . . . . . . . . . . . . . . . . 1New Features . . . . . . . . . . . . . . . . . . . . . . . . . . . . . . . . . . . . . . . . . . . . . . . . 1Changes Since Clementine 7.0 . . . . . . . . . . . . . . . . . . . . . . . . . . . . . . . . . . 12
2 Clementine Overview 17
Getting Started . . . . . . . . . . . . . . . . . . . . . . . . . . . . . . . . . . . . . . . . . . . . . . 17Clementine at a Glance. . . . . . . . . . . . . . . . . . . . . . . . . . . . . . . . . . . . . . . . 24Setting Clementine Options. . . . . . . . . . . . . . . . . . . . . . . . . . . . . . . . . . . . . 31Automating Clementine. . . . . . . . . . . . . . . . . . . . . . . . . . . . . . . . . . . . . . . . 39
3 Understanding Data Mining 41
Data Mining Overview . . . . . . . . . . . . . . . . . . . . . . . . . . . . . . . . . . . . . . . . 41Machine-Learning Techniques . . . . . . . . . . . . . . . . . . . . . . . . . . . . . . . . . . 42Assessing Potential Data Mining Applications . . . . . . . . . . . . . . . . . . . . . . 50A Strategy for Data Mining . . . . . . . . . . . . . . . . . . . . . . . . . . . . . . . . . . . . . 52Tips . . . . . . . . . . . . . . . . . . . . . . . . . . . . . . . . . . . . . . . . . . . . . . . . . . . . . . 55
4 Building Streams 57
Stream-Building Overview . . . . . . . . . . . . . . . . . . . . . . . . . . . . . . . . . . . . . 57Building Data Streams . . . . . . . . . . . . . . . . . . . . . . . . . . . . . . . . . . . . . . . . 58
v
5 Source Nodes 97
Overview . . . . . . . . . . . . . . . . . . . . . . . . . . . . . . . . . . . . . . . . . . . . . . . . . . 97Variable File Node . . . . . . . . . . . . . . . . . . . . . . . . . . . . . . . . . . . . . . . . . . . 98Fixed File Node . . . . . . . . . . . . . . . . . . . . . . . . . . . . . . . . . . . . . . . . . . . . . 101Setting Data Storage for Text Fields . . . . . . . . . . . . . . . . . . . . . . . . . . . . . 104Database Node. . . . . . . . . . . . . . . . . . . . . . . . . . . . . . . . . . . . . . . . . . . . . 106SPSS Import Node . . . . . . . . . . . . . . . . . . . . . . . . . . . . . . . . . . . . . . . . . . 111SAS Import Node . . . . . . . . . . . . . . . . . . . . . . . . . . . . . . . . . . . . . . . . . . . 113User Input Node . . . . . . . . . . . . . . . . . . . . . . . . . . . . . . . . . . . . . . . . . . . . 114Common Source Node Tabs . . . . . . . . . . . . . . . . . . . . . . . . . . . . . . . . . . . 119
6 Record Operations Nodes 125
Overview of Record Operations . . . . . . . . . . . . . . . . . . . . . . . . . . . . . . . . 125Select Node . . . . . . . . . . . . . . . . . . . . . . . . . . . . . . . . . . . . . . . . . . . . . . . 126Sample Node . . . . . . . . . . . . . . . . . . . . . . . . . . . . . . . . . . . . . . . . . . . . . . 127Balance Node. . . . . . . . . . . . . . . . . . . . . . . . . . . . . . . . . . . . . . . . . . . . . . 129Aggregate Node . . . . . . . . . . . . . . . . . . . . . . . . . . . . . . . . . . . . . . . . . . . . 131Sort Node . . . . . . . . . . . . . . . . . . . . . . . . . . . . . . . . . . . . . . . . . . . . . . . . . 134Merge Node . . . . . . . . . . . . . . . . . . . . . . . . . . . . . . . . . . . . . . . . . . . . . . . 135Append Node . . . . . . . . . . . . . . . . . . . . . . . . . . . . . . . . . . . . . . . . . . . . . . 143Distinct Node . . . . . . . . . . . . . . . . . . . . . . . . . . . . . . . . . . . . . . . . . . . . . . 145
7 Field Operations Nodes 147
Field Operations Overview . . . . . . . . . . . . . . . . . . . . . . . . . . . . . . . . . . . . 147Type Node . . . . . . . . . . . . . . . . . . . . . . . . . . . . . . . . . . . . . . . . . . . . . . . . 148
vi

Filter Node . . . . . . . . . . . . . . . . . . . . . . . . . . . . . . . . . . . . . . . . . . . . . . . . 164Derive Node . . . . . . . . . . . . . . . . . . . . . . . . . . . . . . . . . . . . . . . . . . . . . . . 167Filler Node . . . . . . . . . . . . . . . . . . . . . . . . . . . . . . . . . . . . . . . . . . . . . . . . 181Reclassify Node . . . . . . . . . . . . . . . . . . . . . . . . . . . . . . . . . . . . . . . . . . . . 184Binning Node . . . . . . . . . . . . . . . . . . . . . . . . . . . . . . . . . . . . . . . . . . . . . . 188Set to Flag Node . . . . . . . . . . . . . . . . . . . . . . . . . . . . . . . . . . . . . . . . . . . . 197History Node . . . . . . . . . . . . . . . . . . . . . . . . . . . . . . . . . . . . . . . . . . . . . . 199Field Reorder Node. . . . . . . . . . . . . . . . . . . . . . . . . . . . . . . . . . . . . . . . . . 201
8 Building CLEM Expressions 205
What Is CLEM? . . . . . . . . . . . . . . . . . . . . . . . . . . . . . . . . . . . . . . . . . . . . . 205Using the Expression Builder . . . . . . . . . . . . . . . . . . . . . . . . . . . . . . . . . . 210Types of CLEM Functions . . . . . . . . . . . . . . . . . . . . . . . . . . . . . . . . . . . . . 216Common Uses of CLEM. . . . . . . . . . . . . . . . . . . . . . . . . . . . . . . . . . . . . . . 217
9 Handling Missing Values 223
Overview of Missing Values . . . . . . . . . . . . . . . . . . . . . . . . . . . . . . . . . . . 223Specifying Missing Values . . . . . . . . . . . . . . . . . . . . . . . . . . . . . . . . . . . . 224Treating Missing Values . . . . . . . . . . . . . . . . . . . . . . . . . . . . . . . . . . . . . . 225CLEM Functions for Missing Values . . . . . . . . . . . . . . . . . . . . . . . . . . . . . 228
10 Graph Nodes 231
Graph Nodes Overview. . . . . . . . . . . . . . . . . . . . . . . . . . . . . . . . . . . . . . . 231Building Graphs . . . . . . . . . . . . . . . . . . . . . . . . . . . . . . . . . . . . . . . . . . . . 236
vii
Using Graphs . . . . . . . . . . . . . . . . . . . . . . . . . . . . . . . . . . . . . . . . . . . . . . 240Plot Node . . . . . . . . . . . . . . . . . . . . . . . . . . . . . . . . . . . . . . . . . . . . . . . . . 243Multiplot Node . . . . . . . . . . . . . . . . . . . . . . . . . . . . . . . . . . . . . . . . . . . . . 256Distribution Node . . . . . . . . . . . . . . . . . . . . . . . . . . . . . . . . . . . . . . . . . . . 259Histogram Node . . . . . . . . . . . . . . . . . . . . . . . . . . . . . . . . . . . . . . . . . . . . 264Collection Node . . . . . . . . . . . . . . . . . . . . . . . . . . . . . . . . . . . . . . . . . . . . 272Web Node . . . . . . . . . . . . . . . . . . . . . . . . . . . . . . . . . . . . . . . . . . . . . . . . 276Evaluation Chart Node . . . . . . . . . . . . . . . . . . . . . . . . . . . . . . . . . . . . . . . 290
11 Modeling Nodes 307
Overview of Modeling Nodes . . . . . . . . . . . . . . . . . . . . . . . . . . . . . . . . . . 307Neural Net Node . . . . . . . . . . . . . . . . . . . . . . . . . . . . . . . . . . . . . . . . . . . 311Kohonen Node . . . . . . . . . . . . . . . . . . . . . . . . . . . . . . . . . . . . . . . . . . . . . 324C5.0 Node . . . . . . . . . . . . . . . . . . . . . . . . . . . . . . . . . . . . . . . . . . . . . . . . . 329Linear Regression Node . . . . . . . . . . . . . . . . . . . . . . . . . . . . . . . . . . . . . . 334GRI Node . . . . . . . . . . . . . . . . . . . . . . . . . . . . . . . . . . . . . . . . . . . . . . . . . 339Apriori Node. . . . . . . . . . . . . . . . . . . . . . . . . . . . . . . . . . . . . . . . . . . . . . . 341K-Means Node . . . . . . . . . . . . . . . . . . . . . . . . . . . . . . . . . . . . . . . . . . . . . 345Logistic Regression Node . . . . . . . . . . . . . . . . . . . . . . . . . . . . . . . . . . . . . 348Factor Analysis/PCA Node . . . . . . . . . . . . . . . . . . . . . . . . . . . . . . . . . . . . 359TwoStep Cluster Node . . . . . . . . . . . . . . . . . . . . . . . . . . . . . . . . . . . . . . . 364C&R Tree Node. . . . . . . . . . . . . . . . . . . . . . . . . . . . . . . . . . . . . . . . . . . . . 367Sequence Node . . . . . . . . . . . . . . . . . . . . . . . . . . . . . . . . . . . . . . . . . . . . 373
viii
12 Generated Models 381
Overview of Generated Models. . . . . . . . . . . . . . . . . . . . . . . . . . . . . . . . . 381Working with Generated Models in the Generated Models Palette . . . . . . 382Using Generated Models in Streams. . . . . . . . . . . . . . . . . . . . . . . . . . . . . 385Using the Generated Model Browsers . . . . . . . . . . . . . . . . . . . . . . . . . . . 386Generated Net Node. . . . . . . . . . . . . . . . . . . . . . . . . . . . . . . . . . . . . . . . . 388Logistic Regression Equation Node. . . . . . . . . . . . . . . . . . . . . . . . . . . . . . 392Linear Regression Equation Node . . . . . . . . . . . . . . . . . . . . . . . . . . . . . . . 398Factor Equation Node . . . . . . . . . . . . . . . . . . . . . . . . . . . . . . . . . . . . . . . . 403Unrefined Rule Model . . . . . . . . . . . . . . . . . . . . . . . . . . . . . . . . . . . . . . . . 407Generated Ruleset Node. . . . . . . . . . . . . . . . . . . . . . . . . . . . . . . . . . . . . . 412Generated Decision Tree Node . . . . . . . . . . . . . . . . . . . . . . . . . . . . . . . . . 418Generated Cluster Models . . . . . . . . . . . . . . . . . . . . . . . . . . . . . . . . . . . . 428Generated Sequence Rules Node . . . . . . . . . . . . . . . . . . . . . . . . . . . . . . . 454
13 Exporting Models 463
Exporting Overview. . . . . . . . . . . . . . . . . . . . . . . . . . . . . . . . . . . . . . . . . . 463PMML Export . . . . . . . . . . . . . . . . . . . . . . . . . . . . . . . . . . . . . . . . . . . . . . 465C Code Export . . . . . . . . . . . . . . . . . . . . . . . . . . . . . . . . . . . . . . . . . . . . . . 465Exporting to PredictiveMarketing . . . . . . . . . . . . . . . . . . . . . . . . . . . . . . . 481Exporting to Cleo . . . . . . . . . . . . . . . . . . . . . . . . . . . . . . . . . . . . . . . . . . . 484
14 Output Nodes 487
Overview of Output Nodes . . . . . . . . . . . . . . . . . . . . . . . . . . . . . . . . . . . . 487Working with Output . . . . . . . . . . . . . . . . . . . . . . . . . . . . . . . . . . . . . . . . . 488
ix
Output Browser Menus. . . . . . . . . . . . . . . . . . . . . . . . . . . . . . . . . . . . . . . 489Output Node Output Tab . . . . . . . . . . . . . . . . . . . . . . . . . . . . . . . . . . . . . . 491Table Node . . . . . . . . . . . . . . . . . . . . . . . . . . . . . . . . . . . . . . . . . . . . . . . . 493Matrix Node . . . . . . . . . . . . . . . . . . . . . . . . . . . . . . . . . . . . . . . . . . . . . . . 498Analysis Node . . . . . . . . . . . . . . . . . . . . . . . . . . . . . . . . . . . . . . . . . . . . . 504Data Audit Node . . . . . . . . . . . . . . . . . . . . . . . . . . . . . . . . . . . . . . . . . . . . 510Statistics Node . . . . . . . . . . . . . . . . . . . . . . . . . . . . . . . . . . . . . . . . . . . . . 518Quality Node. . . . . . . . . . . . . . . . . . . . . . . . . . . . . . . . . . . . . . . . . . . . . . . 522Report Node . . . . . . . . . . . . . . . . . . . . . . . . . . . . . . . . . . . . . . . . . . . . . . . 527Set Globals Node . . . . . . . . . . . . . . . . . . . . . . . . . . . . . . . . . . . . . . . . . . . 529Solution Publisher Node . . . . . . . . . . . . . . . . . . . . . . . . . . . . . . . . . . . . . . 531Database Output Node . . . . . . . . . . . . . . . . . . . . . . . . . . . . . . . . . . . . . . . 533Flat File Node . . . . . . . . . . . . . . . . . . . . . . . . . . . . . . . . . . . . . . . . . . . . . . 539SPSS Export Node . . . . . . . . . . . . . . . . . . . . . . . . . . . . . . . . . . . . . . . . . . 540SAS Export Node . . . . . . . . . . . . . . . . . . . . . . . . . . . . . . . . . . . . . . . . . . . 544Excel Node . . . . . . . . . . . . . . . . . . . . . . . . . . . . . . . . . . . . . . . . . . . . . . . . 545SPSS Procedure Node . . . . . . . . . . . . . . . . . . . . . . . . . . . . . . . . . . . . . . . 546Helper Applications . . . . . . . . . . . . . . . . . . . . . . . . . . . . . . . . . . . . . . . . . 550
15 SuperNodes 553
SuperNode Overview . . . . . . . . . . . . . . . . . . . . . . . . . . . . . . . . . . . . . . . . 553Types of SuperNodes . . . . . . . . . . . . . . . . . . . . . . . . . . . . . . . . . . . . . . . . 554Creating SuperNodes . . . . . . . . . . . . . . . . . . . . . . . . . . . . . . . . . . . . . . . . 557Editing SuperNodes . . . . . . . . . . . . . . . . . . . . . . . . . . . . . . . . . . . . . . . . . 564Saving and Loading SuperNodes . . . . . . . . . . . . . . . . . . . . . . . . . . . . . . . 573
x

16 Projects and Reports 575
Introduction to Projects . . . . . . . . . . . . . . . . . . . . . . . . . . . . . . . . . . . . . . 575Building a Project . . . . . . . . . . . . . . . . . . . . . . . . . . . . . . . . . . . . . . . . . . . 579Building a Report . . . . . . . . . . . . . . . . . . . . . . . . . . . . . . . . . . . . . . . . . . . 586
17 Batch Mode Execution 591
Introduction to Batch Mode . . . . . . . . . . . . . . . . . . . . . . . . . . . . . . . . . . . 591Working in Batch Mode . . . . . . . . . . . . . . . . . . . . . . . . . . . . . . . . . . . . . . 592
18 Scripting in Clementine 597
Introduction to Scripting . . . . . . . . . . . . . . . . . . . . . . . . . . . . . . . . . . . . . . 597Scripting in the User Interface . . . . . . . . . . . . . . . . . . . . . . . . . . . . . . . . . 599Scripting in Batch Mode . . . . . . . . . . . . . . . . . . . . . . . . . . . . . . . . . . . . . . 606
19 Clementine External Module Interface 607
Introduction to the Clementine External Module Interface. . . . . . . . . . . . . 607How CEMI Works . . . . . . . . . . . . . . . . . . . . . . . . . . . . . . . . . . . . . . . . . . . 607System Architecture . . . . . . . . . . . . . . . . . . . . . . . . . . . . . . . . . . . . . . . . . 608Specification File . . . . . . . . . . . . . . . . . . . . . . . . . . . . . . . . . . . . . . . . . . . 609Restrictions . . . . . . . . . . . . . . . . . . . . . . . . . . . . . . . . . . . . . . . . . . . . . . . 615Example Specification File . . . . . . . . . . . . . . . . . . . . . . . . . . . . . . . . . . . . 616CEMI Node Management . . . . . . . . . . . . . . . . . . . . . . . . . . . . . . . . . . . . . 624Tips for Writing External Programs . . . . . . . . . . . . . . . . . . . . . . . . . . . . . . 630
xi
20 Application Examples 631
Overview . . . . . . . . . . . . . . . . . . . . . . . . . . . . . . . . . . . . . . . . . . . . . . . . . 631Condition Monitoring Example . . . . . . . . . . . . . . . . . . . . . . . . . . . . . . . . . 631Fraud Detection Example . . . . . . . . . . . . . . . . . . . . . . . . . . . . . . . . . . . . . 638Retail Example . . . . . . . . . . . . . . . . . . . . . . . . . . . . . . . . . . . . . . . . . . . . . 647Market Basket Analysis Example . . . . . . . . . . . . . . . . . . . . . . . . . . . . . . . 652
Appendices
A CLEM Language Reference 663
CLEM Reference Overview . . . . . . . . . . . . . . . . . . . . . . . . . . . . . . . . . . . . 663CLEM Datatypes . . . . . . . . . . . . . . . . . . . . . . . . . . . . . . . . . . . . . . . . . . . . 663Operator Precedence . . . . . . . . . . . . . . . . . . . . . . . . . . . . . . . . . . . . . . . . 668Parameters. . . . . . . . . . . . . . . . . . . . . . . . . . . . . . . . . . . . . . . . . . . . . . . . 669Functions Reference. . . . . . . . . . . . . . . . . . . . . . . . . . . . . . . . . . . . . . . . . 670Obsolete Features and Functions . . . . . . . . . . . . . . . . . . . . . . . . . . . . . . . 696
B Scripting Language Reference 697
Scripting Reference Overview . . . . . . . . . . . . . . . . . . . . . . . . . . . . . . . . . 697Scripting Syntax . . . . . . . . . . . . . . . . . . . . . . . . . . . . . . . . . . . . . . . . . . . . 697Setting Properties and Parameters . . . . . . . . . . . . . . . . . . . . . . . . . . . . . . 700Parameters in Scripting . . . . . . . . . . . . . . . . . . . . . . . . . . . . . . . . . . . . . . 701Using CLEM in Scripts. . . . . . . . . . . . . . . . . . . . . . . . . . . . . . . . . . . . . . . . 704Creating Nodes and Streams . . . . . . . . . . . . . . . . . . . . . . . . . . . . . . . . . . 704
xii

Manipulating Streams . . . . . . . . . . . . . . . . . . . . . . . . . . . . . . . . . . . . . . . 711Node Manipulation . . . . . . . . . . . . . . . . . . . . . . . . . . . . . . . . . . . . . . . . . . 713Manipulating the Generated Models Palette . . . . . . . . . . . . . . . . . . . . . . . 722Manipulating SuperNodes . . . . . . . . . . . . . . . . . . . . . . . . . . . . . . . . . . . . 724Results Manipulation . . . . . . . . . . . . . . . . . . . . . . . . . . . . . . . . . . . . . . . . 725File Output . . . . . . . . . . . . . . . . . . . . . . . . . . . . . . . . . . . . . . . . . . . . . . . . 726Exit Commands . . . . . . . . . . . . . . . . . . . . . . . . . . . . . . . . . . . . . . . . . . . . . 727Controlling Script Execution . . . . . . . . . . . . . . . . . . . . . . . . . . . . . . . . . . . 727Executing and Interrupting Scripts . . . . . . . . . . . . . . . . . . . . . . . . . . . . . . 729
C Command Line Arguments 731
Invoking the Software. . . . . . . . . . . . . . . . . . . . . . . . . . . . . . . . . . . . . . . . 731Command Line Arguments . . . . . . . . . . . . . . . . . . . . . . . . . . . . . . . . . . . . 731
D Node and Stream Properties 737
Properties Reference Overview . . . . . . . . . . . . . . . . . . . . . . . . . . . . . . . . 737Syntax for Node and Stream Properties . . . . . . . . . . . . . . . . . . . . . . . . . . 738Node and Stream Property Examples . . . . . . . . . . . . . . . . . . . . . . . . . . . . 740Node Properties . . . . . . . . . . . . . . . . . . . . . . . . . . . . . . . . . . . . . . . . . . . . 741SuperNode Properties . . . . . . . . . . . . . . . . . . . . . . . . . . . . . . . . . . . . . . . 794Stream Properties . . . . . . . . . . . . . . . . . . . . . . . . . . . . . . . . . . . . . . . . . . 796
xiii

E CEMI Specification File Reference 799
Specification File Overview. . . . . . . . . . . . . . . . . . . . . . . . . . . . . . . . . . . . 799Notation . . . . . . . . . . . . . . . . . . . . . . . . . . . . . . . . . . . . . . . . . . . . . . . . . . 800Node Specification . . . . . . . . . . . . . . . . . . . . . . . . . . . . . . . . . . . . . . . . . . 800Core Specification . . . . . . . . . . . . . . . . . . . . . . . . . . . . . . . . . . . . . . . . . . 804
Glossary 841
Index 855
xiv
Chapter
1What's New in Clementine 8.0?
Welcome to Clementine 8.0
Welcome to release 8.0 of the Clementine data mining workbench. This releaseexpands the functionality of the toolkit to include new data preparation tasks, such asfield recoding, field reordering, and new join functionality. Back-end improvementsinclude the ability to load data in bulk to a database, the ability to work directlybetween Clementine Server and SPSS Server, and additional support for SQLgeneration. The implementation of a graphical view for cluster models provides acounterpart to the Tree Viewer incorporated in release 7.0 for tree models.
Read on for information regarding the specific changes in this release. If you are anold friend of Clementine, please see the section “Changes Since Clementine 7.0” formore information on taking advantage of the enhanced functionality in this release.
New Features
This release includes new features and enhancements designed to expand datatransformation, streamline your work, and support your efforts to conduct thorough,insightful data mining.
New Nodes
The following new nodes are included on the Field Ops and Output node palettes:
Data Audit node, for a comprehensive first look at your data.
Reclassify node, used to regroup or collapse categories for numeric or string setfields.
1
2
Chapter 1
Binning node, used to automatically recode numeric range fields.
Reorder node, used to customize the natural order of fields downstream.
These new nodes are introduced in the topics that follow.
New Functionality
In this release, you can:
Visualize cluster model results using the Viewer tab for generated Kohonen,K-Means, and TwoStep cluster models.
Generate encoded passwords for use in scripting and command-line arguments.
Specify a custom bulk loader program for exporting to a database.
Generate SQL for decision tree models and rulesets.
Learn more about the algorithms used in Clementine. See the ClementineAlgorithms Guide available on the product CD.
Keep data analysis on the server when transferring between server versionsof SPSS and Clementine. For more information, see “Helper Applications”in Chapter 14 on page 550.
Specify several custom conditions and rules for evaluation charts.
Perform partial outer joins and anti-joins using new Merge node functionality.
Filter or rename fields directly from SPSS Procedure, Export, and Publishernodes. For more information, see “Renaming or Filtering Fields for Export”in Chapter 14 on page 542.
Many of these new features are discussed in the topics that follow.
New Tools for Data Preparation and Exploration
This release expands the range of tools available for data preparation and explorationby adding a number of new nodes and enhancements.
3
What's New in Clementine 8.0?
New Data Audit Node
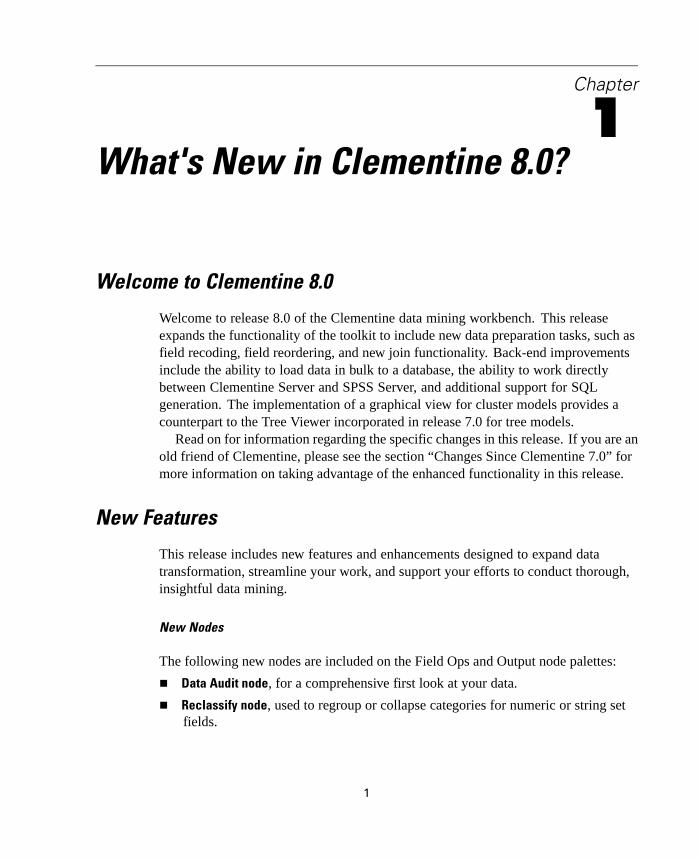
The Data Audit node provides a comprehensive first look at the data you bring intoClementine. Often used during the initial data exploration, the Data Audit reportshows summary statistics as well as histograms and distribution graphs for each datafield. The results are displayed in an easy-to-read matrix that can be sorted and usedto generate full-size graphs and data preparation nodes.
Figure 1-1Data Audit report in the output browser
The Data Audit node is available from the Output nodes palette. For moreinformation, see “Data Audit Node” in Chapter 14 on page 510.
New Binning Node
The Binning node enables you to automatically create new set fields based on thevalues of one or more existing numeric range fields. For example, you can transforma scale income field into a new categorical field containing groups of income asdeviations from the mean. In SPSS, this is also known as Automatic Recode. Onceyou have created bins for the new field, you can generate a Derive node based onthe cut points.
4
Chapter 1
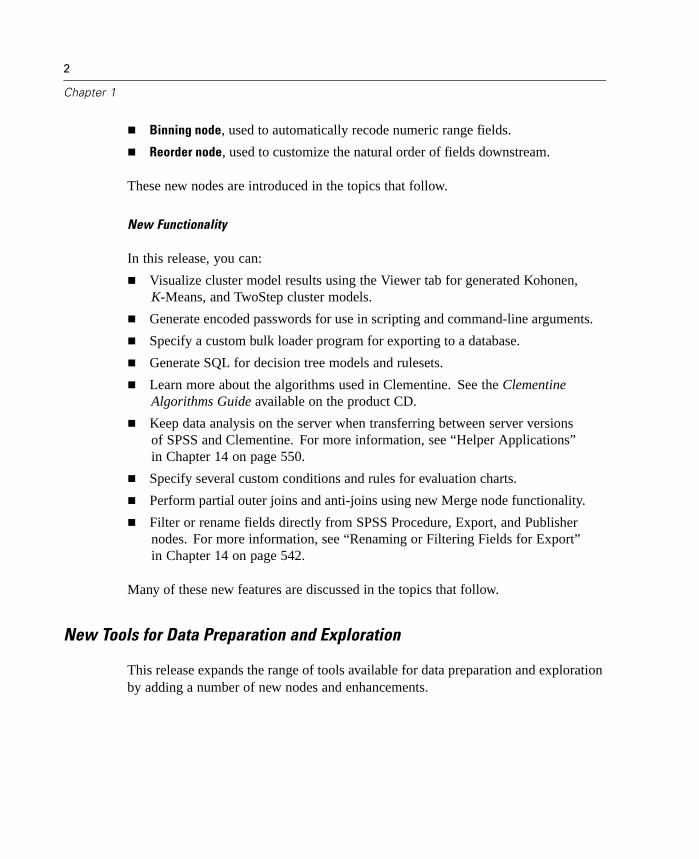
The Settings tab provides options for available techniques. The View tab displayscut points established for data previously run through the node.
Figure 1-2Binning node dialog box: Settings tab
Using the Binning node, you can automatically generate bins (categories) using thefollowing techniques:
Fixed-width binning
Tiles (equal counts)
Mean and standard deviation
Ranks
The Binning node is available from the Field Ops palette. For more information, see“Binning Node” in Chapter 7 on page 188.
5
What's New in Clementine 8.0?
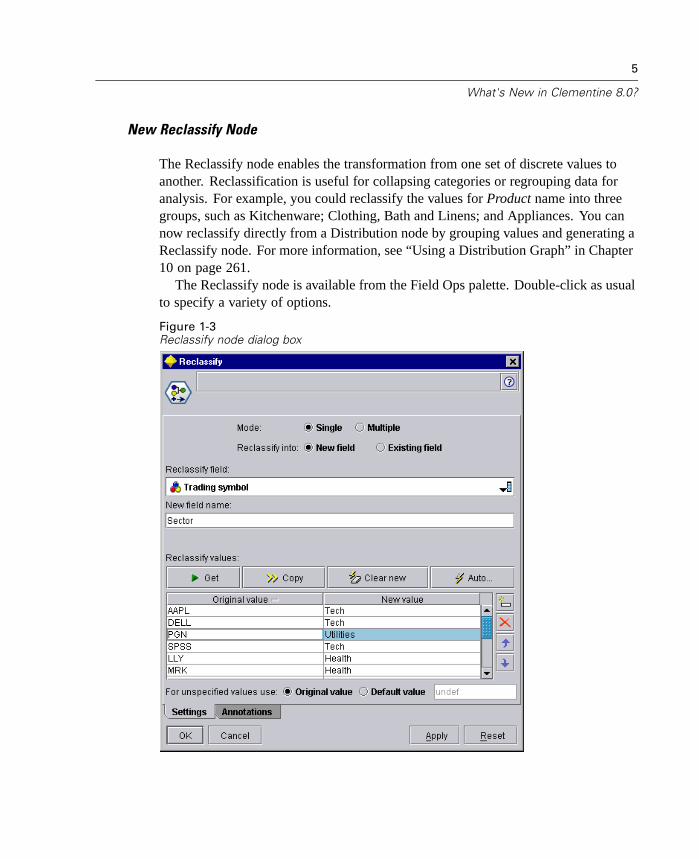
New Reclassify Node
The Reclassify node enables the transformation from one set of discrete values toanother. Reclassification is useful for collapsing categories or regrouping data foranalysis. For example, you could reclassify the values for Product name into threegroups, such as Kitchenware; Clothing, Bath and Linens; and Appliances. You cannow reclassify directly from a Distribution node by grouping values and generating aReclassify node. For more information, see “Using a Distribution Graph” in Chapter10 on page 261.
The Reclassify node is available from the Field Ops palette. Double-click as usualto specify a variety of options.
Figure 1-3Reclassify node dialog box
6
Chapter 1
For more information, see “Reclassify Node” in Chapter 7 on page 184.
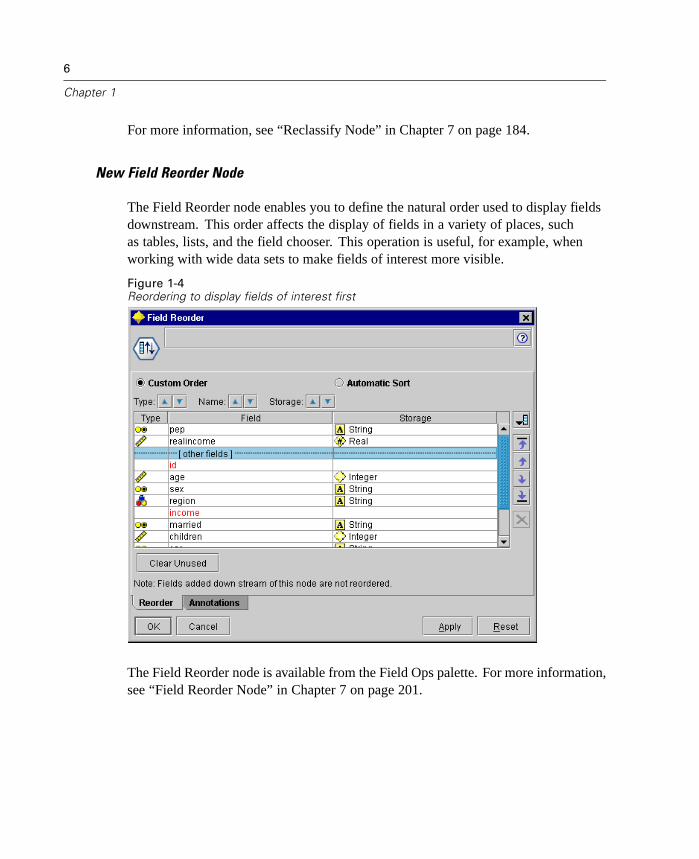
New Field Reorder Node
The Field Reorder node enables you to define the natural order used to display fieldsdownstream. This order affects the display of fields in a variety of places, suchas tables, lists, and the field chooser. This operation is useful, for example, whenworking with wide data sets to make fields of interest more visible.
Figure 1-4Reordering to display fields of interest first
The Field Reorder node is available from the Field Ops palette. For more information,see “Field Reorder Node” in Chapter 7 on page 201.

7
What's New in Clementine 8.0?
Enhanced Data Merging
This release includes more sophisticated Merge node capabilities. You can nowmerge records using the following types of joins:
Inner join
Full outer join
Partial outer join, both left and right joins
Anti-join, the opposite of an inner join
The Merge node is available on the Record Ops palette. For more information, see“Merge Node” in Chapter 6 on page 135.
Modeling Enhancements
Understanding the results of data modeling has never been easier. This releaseexpands support for visualization and exploration of generated models by adding arich graphical representation of cluster models as well as more flexible evaluationcharts.
You will also see even more efficient use of in-database mining in this releasewith the ability to generate SQL for scoring operations. For more information, see“In-Database Scoring” on page 12.
The product CD also includes published information on the algorithms included inClementine. You can download the Clementine Algorithms Guide from the productCD.
New Graphical Viewer for Cluster Models
In this release, you can now view a graphical representation of cluster results on theViewer tab for the following models:
Generated Kohonen net node
Generated K-Means node
Generated TwoStep Cluster node

8
Chapter 1
The Cluster Viewer displays summary statistics and distributions for fields betweenclusters.
Figure 1-5Sample Cluster Viewer tab with cluster display
For more information, see “Cluster Viewer Tab” in Chapter 12 on page 428.

9
What's New in Clementine 8.0?
Note: Some models created before Clementine 8.0 may not display full informationon the Viewer tab.
Lift Calculated for Apriori and GRI
Lift is now calculated for each rule in an association model. Lift statistics aredisplayed for each rule as an extra column in the rule browser. Minimum andmaximum lift values are calculated and displayed as part of the Analysis section ofthe model summary. For more information, see “ Unrefined Rule Summary Tab” inChapter 12 on page 409.
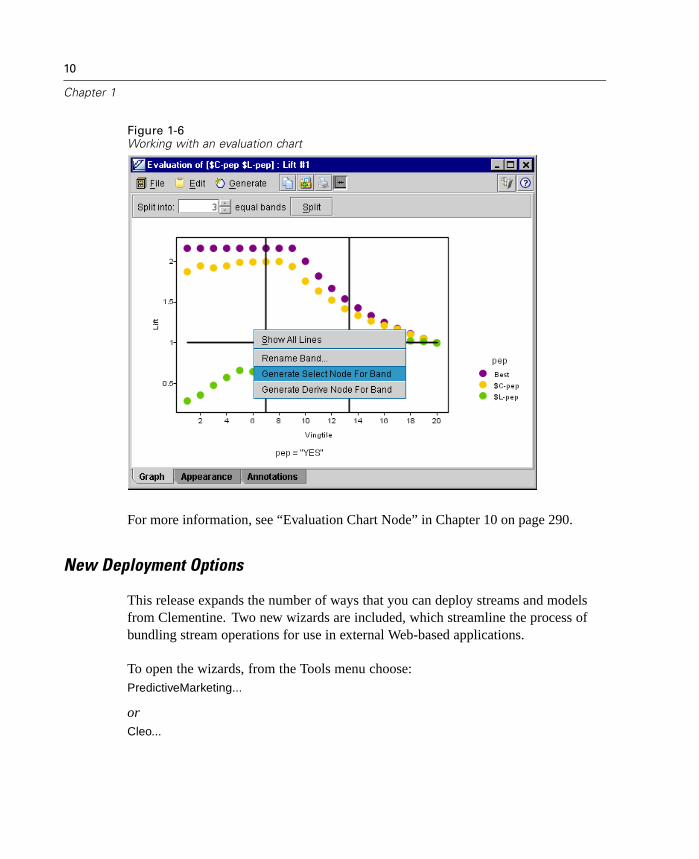
Improved Evaluation Charts
Evaluation charts now include functionality enabling you to define hit conditions andscoring expressions used in the chart. You can also specify a business rule conditionused for display. Lines are now clearly marked in the output, and you can use themouse to separate the x-axis into bands for generating a variety of nodes.
10
Chapter 1
Figure 1-6Working with an evaluation chart
For more information, see “Evaluation Chart Node” in Chapter 10 on page 290.
New Deployment Options
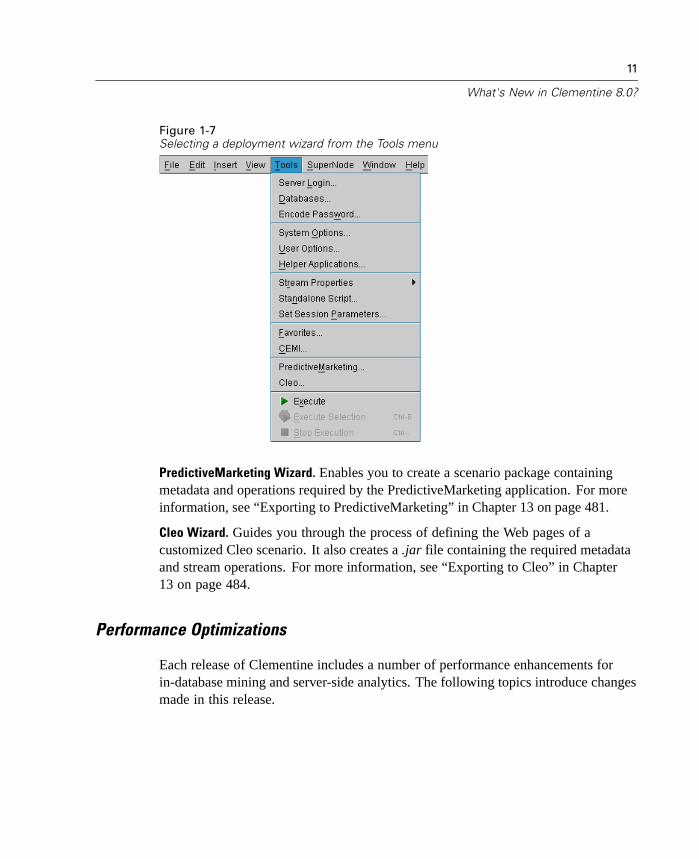
This release expands the number of ways that you can deploy streams and modelsfrom Clementine. Two new wizards are included, which streamline the process ofbundling stream operations for use in external Web-based applications.
To open the wizards, from the Tools menu choose:PredictiveMarketing...
orCleo...
11
What's New in Clementine 8.0?
Figure 1-7Selecting a deployment wizard from the Tools menu
PredictiveMarketing Wizard. Enables you to create a scenario package containingmetadata and operations required by the PredictiveMarketing application. For moreinformation, see “Exporting to PredictiveMarketing” in Chapter 13 on page 481.
Cleo Wizard. Guides you through the process of defining the Web pages of acustomized Cleo scenario. It also creates a .jar file containing the required metadataand stream operations. For more information, see “Exporting to Cleo” in Chapter13 on page 484.
Performance Optimizations
Each release of Clementine includes a number of performance enhancements forin-database mining and server-side analytics. The following topics introduce changesmade in this release.
12
Chapter 1
Bulk Loading
To increase performance during data export, you can now use a custom bulk loaderprogram specific to your database. Options are available using the Advanced buttonon Database and Publisher output nodes.
Using this dialog box, you can also fine-tune a number of options, such as row-sizeor column-wise binding for loading via ODBC and batch size settings for batchcommits to the database. For more information, see “Database Output AdvancedOptions” in Chapter 14 on page 536.
In-Database Scoring
Clementine continues to expand its support for in-database mining. In this release,you can now generate SQL from decision trees and rulesets (in addition to linearregression and factor generated models). This allows scoring to be conducted in thedatabase, reducing costly data transfer and calculations on the client.
Specify SQL optimization options in the User Options dialog box. Then specifySQL generation options on the Settings tab for generated ruleset models. For moreinformation, see “ Generated Ruleset Settings Tab” in Chapter 12 on page 417. Onceyou've enabled SQL generation, look for nodes and selected generated models on thecanvas to turn purple during execution, indicating the operation is being performedin-database.
For more information on in-database mining and SQL generation, contactTechnical Support for a copy of the whitepaper, SQL Optimization in Clementine.
Changes Since Clementine 7.0
For users who are familiar with Clementine, this release includes several changesthat you should note. All changes are covered in the online Help and in the manual,but the most significant are listed here.

13
What's New in Clementine 8.0?
CEMI Changes
For those using the Clementine External Module Interface (CEMI) to incorporate theirown functionality into Clementine, you can now create and include custom CEMIicons for the node palettes and generated model palettes. For more information, see“Creating CEMI Node Icons” in Chapter 19 on page 627.
Scripting Changes
This release includes several changes to scripting as part of an ongoing effort toexpose the full Clementine functionality through the scripting interface in a consistentfashion. Enhancements for this release are discussed in the topics that follow.
Scripting and Batch Mode Changes
Encoded Password Generator
A tool is available through the user interface to generate encoded passwords.Once encoded, you can copy and store the password to script files andcommand-line arguments. The node property epassword used for databasenode anddatabaseexportnode stores the encoded password.
To generate an encoded password, from the Tools menu choose:Encode Password
For more information, see “Generating an Encoded Password” in Appendix D onpage 746.
Launch Using a Command File
Command-line launch of Clementine and Clementine Batch has been simplified withthe use of the @ argument. To shorten or simplify the clemb or clementine invocationcommand, you can use a file that contains one command per line as an alternative topassing all of the commands via the command line. Specify the name of the commandfile, preceded by the @ symbol. For more information, see “Combining MultipleArguments” in Appendix C on page 732.
14
Chapter 1
Execute Script Selection
You can now execute selected lines from a stream, SuperNode, or standalone scriptusing a new icon on the toolbar.
Figure 1-8Toolbar icon used to execute selected lines of a script
Changes to Node Properties
Following are new node properties (also called slot parameters) for this release aswell as changes to existing ones.
New Stream Properties
parameters enables you to update stream parameters from within a stand-alonescript.
refresh_source_nodes is used to refresh Source nodes automatically upon streamexecution.
New Node Properties
Several new nodes are available in this release. Their properties are available throughscripting and are documented in the online Help and manual.
For the Binning node, new in release 8.0, the complete functionality is availablethrough scripting. For more information, see “Field Operations Nodes” inAppendix D on page 751.
For the Reclassify node, new in release 8.0, the complete functionality isavailable through scripting. For more information, see “Field Operations Nodes”in Appendix D on page 751.
For the Reorder node, new in release 8.0, the complete functionality is availablethrough scripting. For more information, see “Field Operations Nodes” inAppendix D on page 751.
15
What's New in Clementine 8.0?
For the Data Audit node, new in release 8.0, the complete functionality isavailable through scripting. For more information, see “Output Nodes” inAppendix D on page 781.
New Properties
For the Database Export and Publisher nodes, there are several new properties forthe ability to bulk load data to a database. For more information, see “OutputNodes” in Appendix D on page 781.
For the Variable File and Fixed File source nodes, there are two new properties(invalid_char_mode and invalid_char_replacement) used to remove or replaceinvalid characters. For more information, see “Source Nodes” in AppendixD on page 742.
Deprecated Node Properties
full_out_join for the Merge node has been replaced by join where the type of joincan be set to one of the following: Inner, FullOuter, PartialOuter, or Anti.

Chapter
2Clementine Overview
Getting Started
As a data mining tool that combines advanced modeling technology with ease of use,Clementine helps you discover and predict interesting and valuable relationshipswithin your data. You can use Clementine for decision-support activities, such as:
Creating customer profiles and determining customer lifetime value.
Detecting and predicting fraud in your organization.
Determining and predicting valuable sequences in Web-site data.
Predicting future trends in sales and growth.
Profiling for direct mailing response and credit risk.
Performing churn prediction, classification, and segmentation.
Sifting through vast quantities of data from automation and discovering usefulpatterns.
These are just a sampling of the many ways that you can use Clementine to extractvaluable information from your data. Essentially, if you have the data and yourdata contain the right information, Clementine will help you find answers to yourquestions.
17
18
Chapter 2
Installing Clementine
When you purchased Clementine, you received an installation package containing acombination of the following CD-ROMs, depending on which version of Clementinethat you purchased:
Clementine Standalone/Client. This CD installs the Clementine Standalone/Clientversion.
SPSS Data Access Pack. This CD contains the SPSS Data Access Pack, whichinstalls a set of data access drivers used to access various types of databases.
Clementine Server. This CD installs the Clementine Server version.
Clementine Batch (Optional). This CD installs the batch version for ClementineServer and standalone Clementine Batch.
Clementine Solution Publisher Runtime (Optional). This add-on component installsan environment that allows you to run the Clementine Solution Publisher.Clementine Solution Publisher Runtime will be included only if you havepurchased this option.
Clementine Application Templates (Optional). This CD provides vertical markettemplates, including data, streams, and documentation.
Clementine Application Templates for Security (Optional). This add-on productoffers stream templates, documentation, and sample data that give you a headstart in selected security applications.
To install Clementine, insert the product CD into your CD-ROM drive. From theAutoPlay menu, choose Install Clementine. The instructions will guide you throughthe installation process. For more information about installing Clementine Client,Clementine Server, Clementine Batch, SPSS Data Access Pack, and ClementineSolution Publisher Runtime, see the installation documents included on the applicableCD-ROMs.
System Requirements
The system requirements for installing the Clementine Client version are:
Hardware. Pentium-compatible processor or higher and a monitor with 1024x 768 resolution or higher (support for 65,536 colors is recommended). ACD-ROM drive for installation is also required.

19
Clementine Overview
Software. Installing Clementine installs the Java Virtual Machine: Sun JavaRuntime Environment 1.4.1_02. In order to run the online Help system, youshould have Internet Explorer version 5.x or Netscape 6.
Operating System. Windows Me, Windows XP Home and Professional, Windows2000, Windows 2003, or Windows NT 4.0 with Service Pack 6.
Minimum free disk space. 320MB.
Minimum RAM. 256MB are recommended. 512MB are recommended when usingClementine Application Templates (CATs) or other large data sets.
Installation Procedure
These installation instructions apply to the client version of Clementine for Windows,including Clementine Server or Standalone clients. To install Clementine onWindows NT or Windows 2000, you must be logged in to your computer withadministrator privileges.
To install Clementine:
E Insert the CD into the CD-ROM drive.
E From the AutoPlay menu that appears, choose Install Clementine 8.0.
E Follow the instructions that appear on the screen.
When installing Clementine, you will be prompted for a license code, which shouldbe included in your Clementine kit. If you cannot find your license code, call yoursales representative.
After you have entered your serial number and license code, you will be promptedto select which Clementine add-on components you want to install.

20
Chapter 2
Figure 2-1Selecting Clementine components for installation
Once you have completed the installation procedure, a new program item—Clementine
8.0—will be added to the Start menu. This item includes Clementine and a demosfolder. Note: Installing Clementine 8.0 does not automatically overwrite earlierinstallations of Clementine 7.0 or 7.5. You will need to uninstall these using theWindows Control Panel.
After installing Clementine, you may have additional questions regarding databaseaccess and connections to the server.
Contact your system administrator for information about available servers, userIDs, and passwords. You can also refer to the Clementine Server Administrator'sGuide, included on the Server CD-ROM.
For questions about the SPSS Data Access technology, see the Getting Startedwith SPSS Data Access Technology on the SPSS Data Access Pack CD-ROM.Additional DataDirect documentation is included on the CD-ROM.
21
Clementine Overview
Uninstalling Clementine
To remove or modify the current installation of Clementine:
E In the Windows Control Panel, select Add/Remove Programs.
E From the list, select Clementine.
E Click Add/Remove.
E The InstallShield Wizard will automatically appear, with options for modifyingor removing the installation.
Note: For Windows NT or Windows 2000, you must be logged in to your computerwith administrator privileges to uninstall program files.
Starting Clementine
Once you have installed Clementine, you can get started by launching the application.
To run Clementine:
E From the Start menu choose:Programs
ClementineClementine
E If you have installed Clementine properly, the main Clementine window will appearafter a few seconds.
Launching from the Command Line
Using the command line of your operating system, you can launch the Clementineuser interface. From both client and server computers, you can launch Clementineusing the following steps:
E Open a DOS window or command prompt window.

22
Chapter 2
E Type the command clementine as well as any arguments (flags) used to load streams,execute scripts, and connect to a server.
Note: Clementine can also be launched in batch mode from the command line. Formore information, see “Introduction to Batch Mode” in Chapter 17 on page 591.
Connecting to a Server
Clementine is a client-server application and can be run against the local computeror a server of your specification. The current connection status is displayed at thebottom left of the Clementine window.
To connect to a server:
E Double-click the connection status area of the Clementine window.
or
E From the Tools menu, select Server Login.
E Using the dialog box, specify options to connect to a server or switch to the localhost computer.
Figure 2-2Server Login dialog box
23
Clementine Overview
Connection. Choose Local to launch a local execution server (clemlocal). In thismode, the server isn't public and is used only by the current session of Clementine.Choose Network to view a list of servers available on the network and activate theoptions below.
Server. Specify an available server or select one from the drop-down list.
Port. Lists the default server port number for the current release. If the default portis not accessible, you should contact your system administrator for an updated portnumber for the installation of Clementine Server.
User name. Enter the user name with which to log in to the server.
Password. Enter the password associated with the specified user name.
Domain. Specify the domain used to log in to the server.
Default data path. Specify a path used for data on the server computer. Click theellipsis button (...) to browse to the desired location.
Set as default server. Select to use the current settings as the default server.
Changing the Temp Directory
Some operations performed by Clementine may require temporary files to be created.By default, Clementine uses the system temporary directory to create temp files. Youcan alter the location of the temporary directory using the following steps.
E Create a new directory called clem and subdirectory called servertemp.
E Edit options.cfg, located in the /config directory of your Clementine installation.Edit the temp_directory parameter in this file to read: temp_directory,"C:/clem/servertemp".
E After doing this, you must restart the Clementine Server service. You can do this byclicking the Services tab on your Windows Control Panel. Just stop the service andthen start it to activate the changes you made. Restarting the machine will alsorestart the service.
All temp files will now be written to this new directory.
24
Chapter 2
Note: The most common error when attempting to do this is to use the wrong type ofslashes. Because of Clementine's UNIX history, we employ forward slashes.
Clementine at a Glance
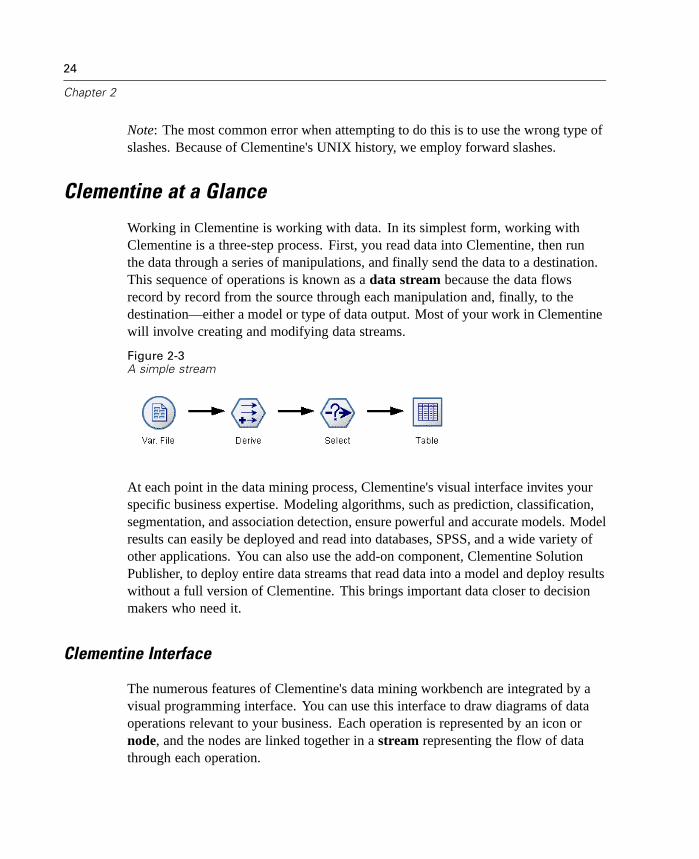
Working in Clementine is working with data. In its simplest form, working withClementine is a three-step process. First, you read data into Clementine, then runthe data through a series of manipulations, and finally send the data to a destination.This sequence of operations is known as a data stream because the data flowsrecord by record from the source through each manipulation and, finally, to thedestination—either a model or type of data output. Most of your work in Clementinewill involve creating and modifying data streams.
Figure 2-3A simple stream
At each point in the data mining process, Clementine's visual interface invites yourspecific business expertise. Modeling algorithms, such as prediction, classification,segmentation, and association detection, ensure powerful and accurate models. Modelresults can easily be deployed and read into databases, SPSS, and a wide variety ofother applications. You can also use the add-on component, Clementine SolutionPublisher, to deploy entire data streams that read data into a model and deploy resultswithout a full version of Clementine. This brings important data closer to decisionmakers who need it.
Clementine Interface
The numerous features of Clementine's data mining workbench are integrated by avisual programming interface. You can use this interface to draw diagrams of dataoperations relevant to your business. Each operation is represented by an icon ornode, and the nodes are linked together in a stream representing the flow of datathrough each operation.
25
Clementine Overview
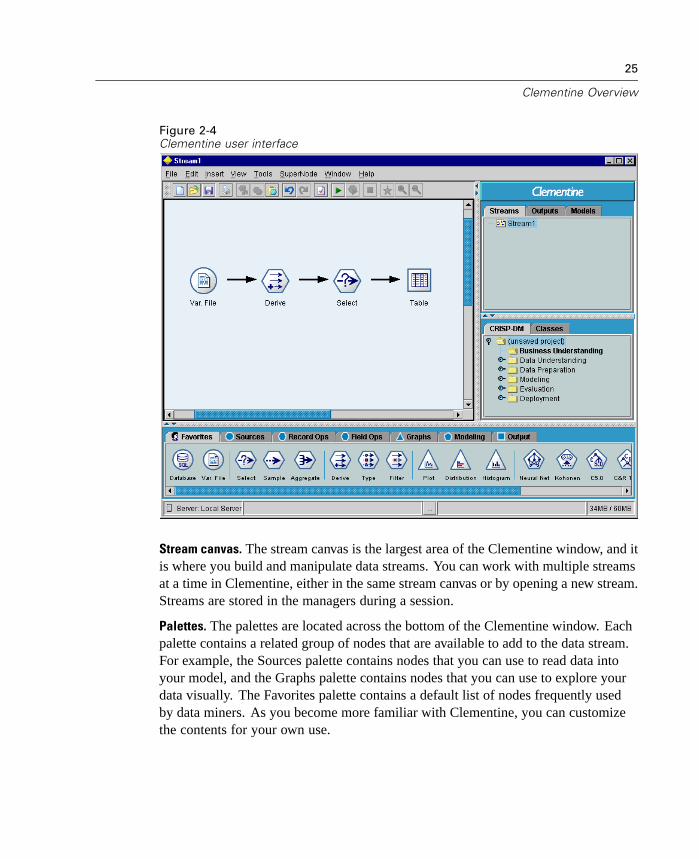
Figure 2-4Clementine user interface
Stream canvas. The stream canvas is the largest area of the Clementine window, and itis where you build and manipulate data streams. You can work with multiple streamsat a time in Clementine, either in the same stream canvas or by opening a new stream.Streams are stored in the managers during a session.
Palettes. The palettes are located across the bottom of the Clementine window. Eachpalette contains a related group of nodes that are available to add to the data stream.For example, the Sources palette contains nodes that you can use to read data intoyour model, and the Graphs palette contains nodes that you can use to explore yourdata visually. The Favorites palette contains a default list of nodes frequently usedby data miners. As you become more familiar with Clementine, you can customizethe contents for your own use.
26
Chapter 2
Managers. At the upper right of the Clementine window are three types of managers.Each tab—Streams, Outputs, and Models—is used to view and manage thecorresponding types of objects. You can use the Streams tab to open, rename, save,and delete the streams created in a session. Clementine output, such as graphs andtables, is stored in the Outputs tab. You can save output objects directly from thismanager. The Models tab is the most powerful of the manager tabs and contains theresults of machine learning and modeling conducted in Clementine. These modelscan be browsed directly from the Models tab or added to the stream in the canvas.
Projects. The Projects window is located at the lower right of the Clementine windowand offers a useful way of organizing your data mining efforts in Clementine. Formore information, see “Introduction to Projects” in Chapter 16 on page 575.
Report window. Located below the palettes, the Report window provides feedbackon the progress of various operations, such as when data are being read into thedata stream.
Status window. Also located below the palettes, the Status window providesinformation on what the application is currently doing, as well as indications whenuser feedback is required.
Clementine Toolbars
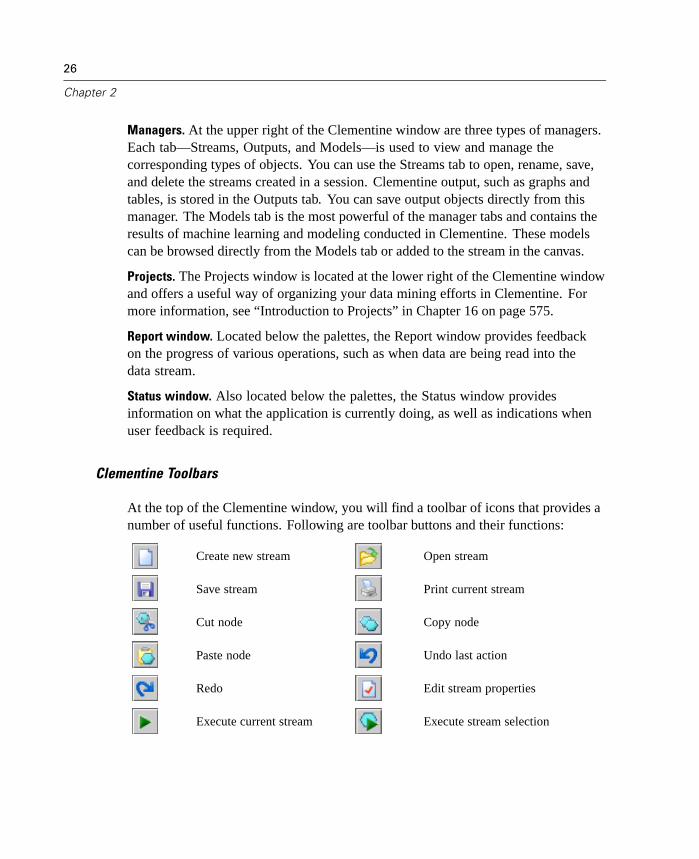
At the top of the Clementine window, you will find a toolbar of icons that provides anumber of useful functions. Following are toolbar buttons and their functions:
Create new stream Open stream
Save stream Print current stream
Cut node Copy node
Paste node Undo last action
Redo Edit stream properties
Execute current stream Execute stream selection
27
Clementine Overview
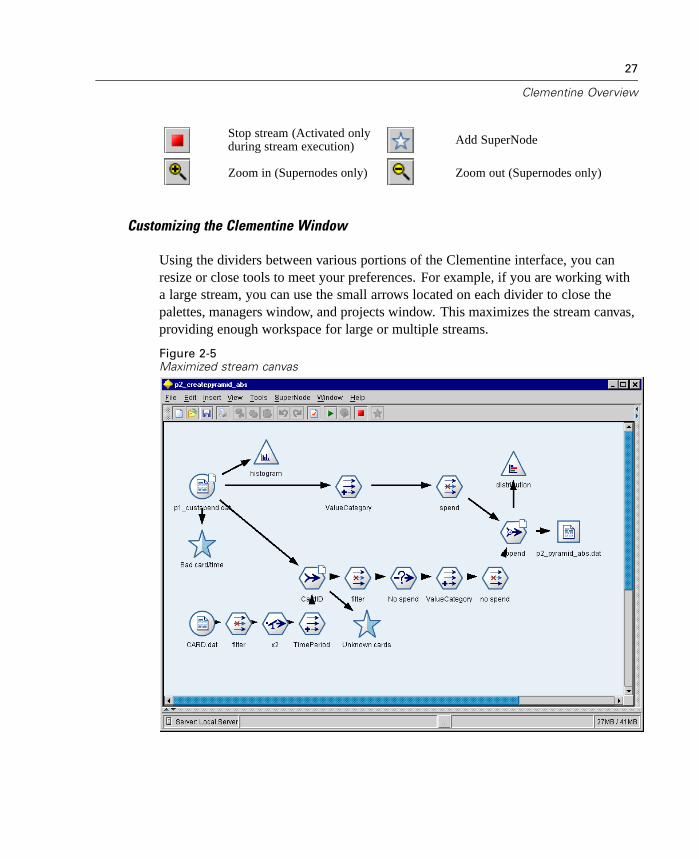
Stop stream (Activated onlyduring stream execution) Add SuperNode
Zoom in (Supernodes only) Zoom out (Supernodes only)
Customizing the Clementine Window
Using the dividers between various portions of the Clementine interface, you canresize or close tools to meet your preferences. For example, if you are working witha large stream, you can use the small arrows located on each divider to close thepalettes, managers window, and projects window. This maximizes the stream canvas,providing enough workspace for large or multiple streams.
Figure 2-5Maximized stream canvas

28
Chapter 2
As an alternative to closing the nodes palette and manager and project windows, youcan use the stream canvas as a scrollable page by moving vertically and horizontallywith the blue scrollbars at the side and bottom of the Clementine window.
Using the Mouse in Clementine
Some of the operations in the Clementine main window require that your mouse havea third button or wheel. The third button is most often used to click and drag whenconnecting nodes. If you do not have a three-button mouse, you can simulate thisfeature by pressing the Alt key while clicking and dragging the mouse.
The most common uses of the mouse in Clementine include the following:
Single-click. Use either the right or left mouse button to select options frommenus, open context-sensitive menus, and access various other standard controlsand options. Click and hold the button to move and drag nodes.
Double-click. Double-click using the left mouse button to place nodes on thestream canvas and edit existing nodes.
Middle-click. Click the middle mouse button and drag the cursor to connect nodeson the stream canvas. Double-click the middle mouse button to disconnect anode. If you do not have a three-button mouse, you can simulate this feature bypressing the Alt key while clicking and dragging the mouse.
Using Shortcut Keys
Many visual programming operations in Clementine have shortcut keys associatedwith them. For example, you can delete a node by clicking the node and pressing theDelete key on your keyboard. Likewise, you can quickly save a stream by pressingthe S key while holding down the Ctrl key. Control commands like this one areindicated by a combination of Ctrl- and another key—for example, Ctrl-S.
There are a number of shortcut keys used in standard Windows operations, such asCtrl-X to cut. These shortcuts are supported in Clementine along with the followingapplication-specific shortcuts. Select an object in the stream canvas and press thespecified keys.
29
Clementine Overview
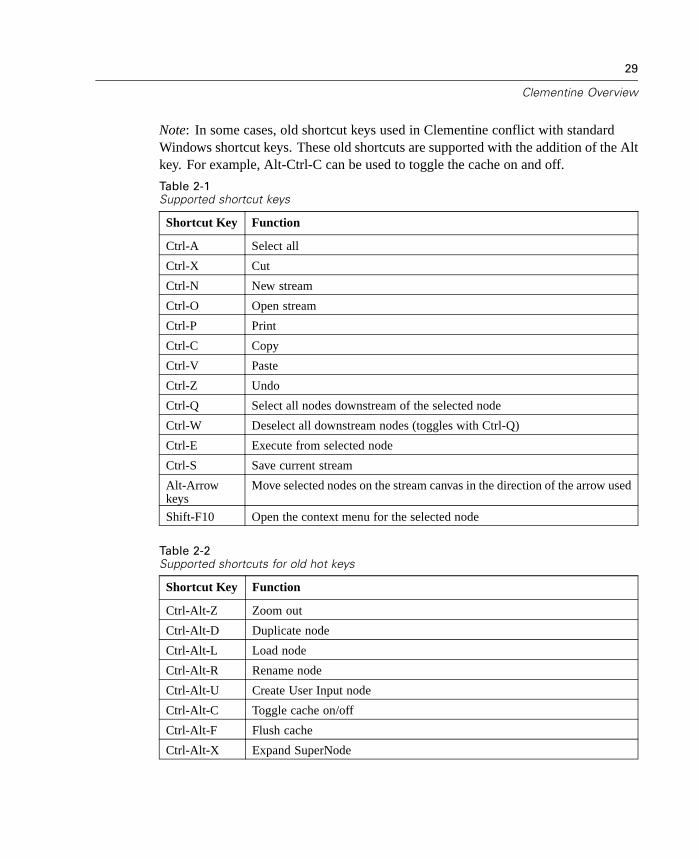
Note: In some cases, old shortcut keys used in Clementine conflict with standardWindows shortcut keys. These old shortcuts are supported with the addition of the Altkey. For example, Alt-Ctrl-C can be used to toggle the cache on and off.
Table 2-1Supported shortcut keys
Shortcut Key Function
Ctrl-A Select all
Ctrl-X Cut
Ctrl-N New stream
Ctrl-O Open stream
Ctrl-P Print
Ctrl-C Copy
Ctrl-V Paste
Ctrl-Z Undo
Ctrl-Q Select all nodes downstream of the selected node
Ctrl-W Deselect all downstream nodes (toggles with Ctrl-Q)
Ctrl-E Execute from selected node
Ctrl-S Save current stream
Alt-Arrowkeys
Move selected nodes on the stream canvas in the direction of the arrow used
Shift-F10 Open the context menu for the selected node
Table 2-2Supported shortcuts for old hot keys
Shortcut Key Function
Ctrl-Alt-Z Zoom out
Ctrl-Alt-D Duplicate node
Ctrl-Alt-L Load node
Ctrl-Alt-R Rename node
Ctrl-Alt-U Create User Input node
Ctrl-Alt-C Toggle cache on/off
Ctrl-Alt-F Flush cache
Ctrl-Alt-X Expand SuperNode

30
Chapter 2
Shortcut Key Function
Ctrl-Alt-Z Zoom in/zoom out
Delete Delete node or connection
Backspace Delete node or connection
Getting Help in Clementine
There are several ways to access the various kinds of help in Clementine:
Context-sensitive help. Click the Help button or icon in most dialog boxes toaccess a Help topic specifically for the controls in that dialog box.
What's This help. To access general help on nodes and toolbar items, select What'sThis from the Help menu in Clementine. The cursor changes to a question mark,which you can use to click on any item in the stream canvas or palettes. A Helpwindow will open with information on the selected item.
Help on CRISP-DM. Clementine includes a Help system designed to support theCross Industry Standard Process for Data Mining. To access this help, selectCRISP Help from the Help menu or use the context menu options from theCRISP-DM projects tool to select Help for a particular phase of data mining.
Accessibility help. To view help topics discussing Clementine's accessibilityfeatures, select Accessibility Help from the Help menu.
Tutorial. For a “quick start” guide to using Clementine, you can access the onlinetutorial by selecting Tutorial from the Help menu.
Help table of contents. You can access the entire online Help system by selectingHelp Topics from the Help menu. The system includes information on Clementineand data mining as well as all other Help topics.
PDF files on the Clementine CDs. There are numerous PDF files on the productCDs, covering installation, administration, and troubleshooting. Clementinemanuals are also included in PDF format on the CDs.
If you cannot find what you are looking for or need additional assistance,please contact SPSS Technical Support at SPSS Technical Support(http://www.spss.com/tech/).
31
Clementine Overview
Setting Clementine Options
There are several ways to customize and set options for Clementine:
Set system options, such as memory usage and locale, by selecting SystemOptions from the Tools menu.
Set user options, such as fonts, warnings, and optimizations, by selecting UserOptions from the Tools menu.
Specify the location of applications that work with Clementine by selectingHelper Applications from the Tools menu.
Specify the default directories used in Clementine by selecting Set Directory orSet Server Directory from the File menu.
System Options
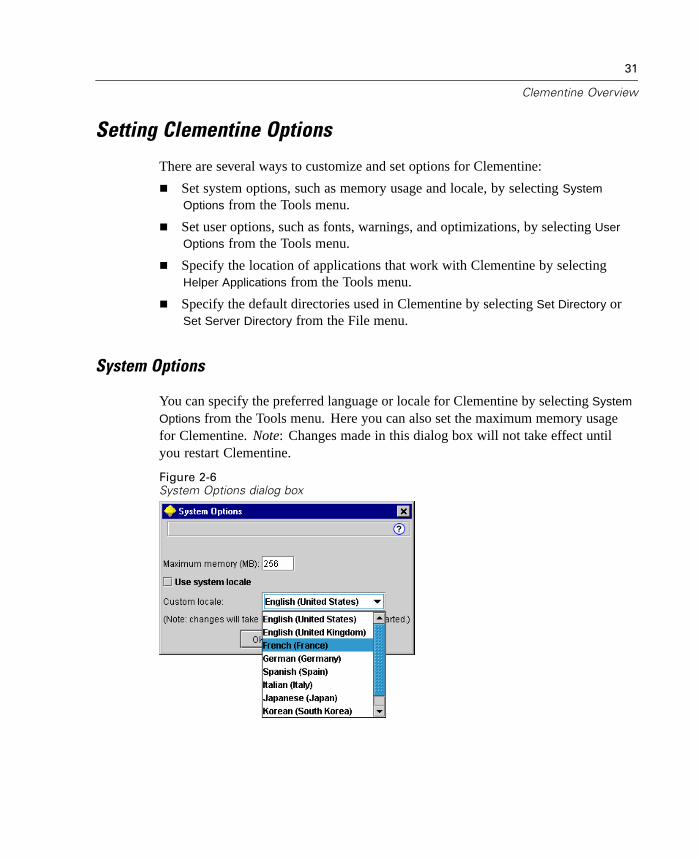
You can specify the preferred language or locale for Clementine by selecting System
Options from the Tools menu. Here you can also set the maximum memory usagefor Clementine. Note: Changes made in this dialog box will not take effect untilyou restart Clementine.
Figure 2-6System Options dialog box
32
Chapter 2
Maximum memory. Select to impose a limit in megabytes on Clementine's memoryusage. On some platforms, Clementine limits its process size to reduce the toll oncomputers with limited resources or heavy loads. If you are dealing with largeamounts of data, this may cause an “out of memory” error. You can ease memoryload by specifying a new threshold.
Use system locale. This option is selected by default and set to English (UnitedStates). Deselect to specify another language from the drop-down list of availablelanguages and locales.
Managing Memory
In addition to the Maximum memory setting specified in the System Options dialogbox, there are several ways you can optimize memory usage:
Set up a cache on any nonterminal node so that the data are read from the cacherather than retrieved from the data source when you execute the data stream. Thiswill help decrease the memory load for large data sets. For more information, see“Caching Options for Nodes” in Chapter 4 on page 68.
Adjust the Maximum set size option in the Stream Properties dialog box. Thisoption specifies a maximum number of members for set fields after which thetype of the field becomes typeless. For more information, see “Setting Optionsfor Streams” in Chapter 4 on page 73.
Force Clementine to free up memory by clicking in the lower right corner of theClementine window where the memory that Clementine is using and the amountallocated are displayed (xxMB/xxIIMB). Clicking this region turns it a darkershade, after which memory allocation figures will drop. Once the region returnsto its regular color, Clementine has freed up all the memory possible.
Setting Default Directories
You can specify the default directory used for file browsers and output by selectingSet Directory or Set Server Directory from the File menu.
Set Directory. You can use this option to set the working directory. The defaultworking directory is based on the installation path of your version of Clementine,or from the command line path used to launch Clementine. In local mode, the

33
Clementine Overview
working directory is the path used for all client-side operations and output files(if they are referenced with relative paths).
Set Server Directory. The Set Server Directory option on the File menu is enabledwhenever there is a remote server connection. Use this option to specify thedefault directory for all server files and data files specified for input or output.The default server directory is $CLEO/data, where $CLEO is the directory inwhich the Server version of Clementine is installed. Using the command line,you can also override this default by using the -server_directory flag with theclementine command line argument.
Setting User Options
You can set general options for Clementine by selecting User Options from the Toolsmenu. These options apply to all streams used in Clementine.
The following types of options can be set by clicking the corresponding tab:
Display options, such as graph and background colors.
Notification options, such as model overwriting and error messages.
Optimization options, such as SQL generation and stream rewriting.
To set stream-specific options, such as decimal separators, time and data formats,and stream scripts, use the Stream Properties dialog box, available from the Fileand Tools menus.
Setting Notification Options
Using the Notifications tab of the User Options dialog box, you can set variousoptions regarding the occurrence and type of warnings and confirmation windows inClementine. You can also specify the behavior of the Outputs and Models tab in themanagers window when new output and models are generated.
34
Chapter 2
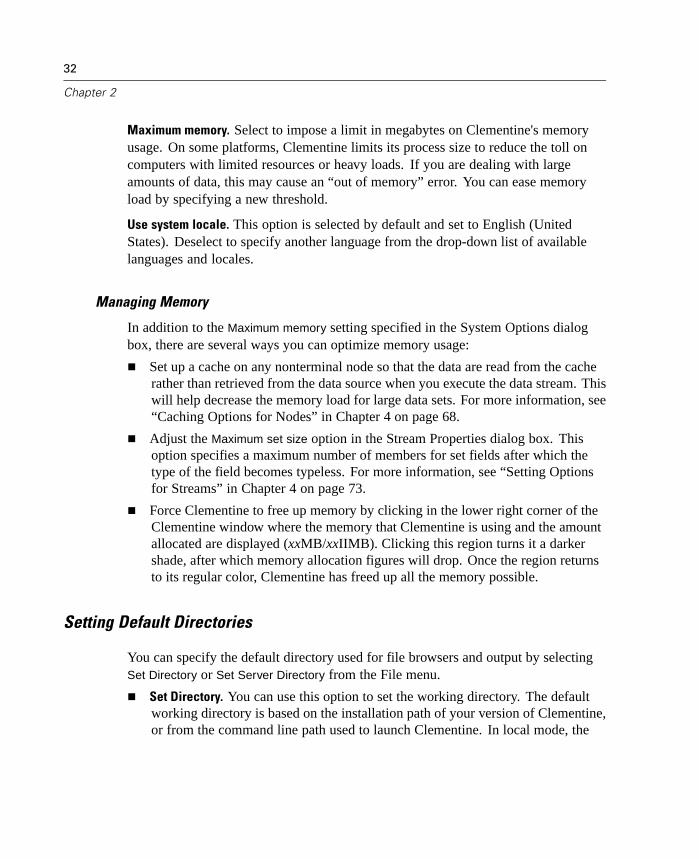
Figure 2-7Setting notification options
Warn when a node overwrites a file. Select to warn with an error message whennode operations overwrite an existing file.
Warn when a node overwrites a database table. Select to warn with an error messagewhen node operations overwrite an existing database table.
Sound Events. Use the list below to specify whether sounds are used to notify youwhen an event or error occurs. There are a number of sounds available. Use theellipsis button (...) to browse for and select a sound. Note: The .wav files usedto create sounds in Clementine are stored in the /media/sounds directory of yourClementine installation.
Mute all sounds. Select to turn off sound notification for all events.

35
Clementine Overview
New Output / New Model. The options on the right side of this dialog box are used tospecify the behavior of the Outputs and Models managers tabs when new items aregenerated. Select New Output or New Model from the drop-down list to specify thebehavior of the corresponding tab. The following options are available:
Select tab. Choose whether to switch to the Outputs or Models tab when thecorresponding object is generated during stream execution.
Select Always to switch to the corresponding tab in the managers window.
Select If generated by current stream to switch only tabs for objects generated bythe stream currently visible in the canvas.
Select Never to restrict the software from switching tabs to notify you of generatedoutput or models.
Flash tab. Select whether to flash the Output or Models tab in the managers windowwhen new output or models have been generated.
Select If not selected to flash the corresponding tab (if not already selected)whenever new objects are generated in the managers window.
Select Never to restrict the software from flashing tabs to notify you of generatedobjects.
Open window (New Output only). For new output objects, select whether toautomatically open an output window upon generation.
Select Always to always open a new output window.
Select If generated by current stream to open a new window for output generatedby the stream currently visible in the canvas.
Select Never to restrict the software from automatically opening new windowsfor generated output.
Scroll palette to make visible (New Model only). Select whether to automatically scrollthe Models tab in the managers window to make the most recent model visible.
Select Always to enable scrolling.
Select If generated by current stream to scroll only for objects generated by thestream currently visible in the canvas.
Select Never to restrict the software from automatically scrolling the Models tab.
Replace previous model (New Model only). Select to overwrite previous iterations ofthe same model.

36
Chapter 2
Click Default Values to revert to the system default settings for this tab.
Setting Display Options
Using the Display tab of the User Options dialog box, you can set options for thedisplay of fonts and colors in Clementine.
Figure 2-8Setting display options
Standard Fonts and Colors. Options in this control box are used to specify the colorscheme of Clementine and the size of fonts displayed. Options selected here are notapplied until you close and restart the software.
Use Clementine defaults. Select to use the default blue-themed Clementineinterface.
37
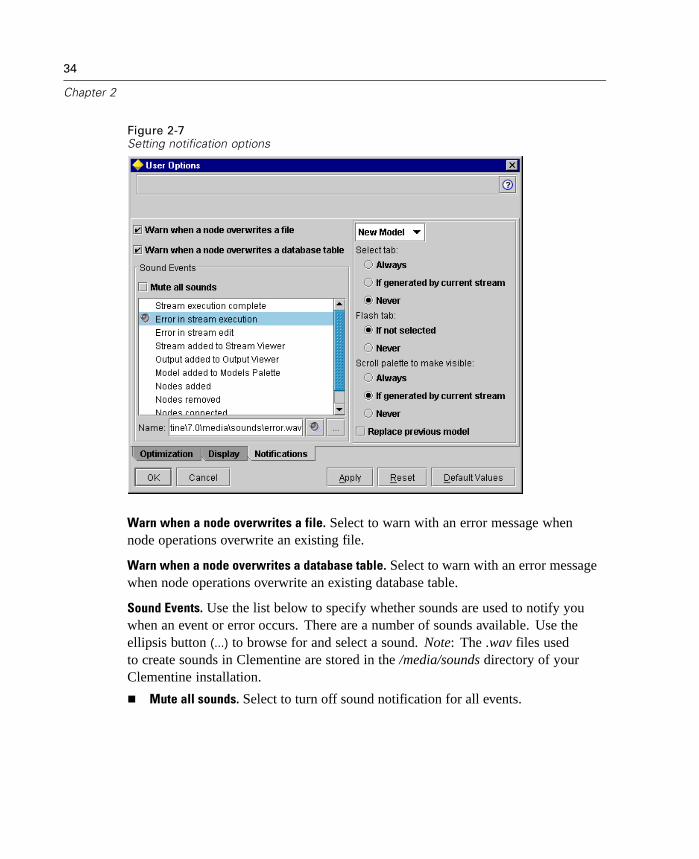
Clementine Overview
Use Windows settings. Select to use the Windows display settings on yourcomputer. This may be useful for increased contrast in the stream canvas andpalettes.
Small node font size. Specify a font size to be used in the node palettes and whensmall nodes are displayed in the stream canvas.
Large node font size. Specify a font size to be used when large (standard) nodesare displayed in the stream canvas.
Note: Node size for a stream can be specified on the Layout tab of the StreamProperties dialog box.
Custom Colors. For each of the items listed in the table, select a color from thedrop-down list. To specify a custom color, scroll to the bottom of the color drop-downlist and select Color.
Chart Category Color Order. This table lists the currently selected colors used fordisplay in newly created graphs. The order of the colors reflects the order in whichthey will be used in the chart. For example, if a set field used as a color overlaycontains four unique values, then only the first four colors listed here will be used.You can specify different colors using the drop-down list for each color number. Tospecify a custom color, scroll to the bottom of the drop-down list and select Color.Changes made here do not affect previously created graphs.
Click Default Values to revert to the system default settings for this tab.
Setting Optimization Options
Using the Optimizations tab of the User Options dialog box, you can optimizeClementine performance during stream execution. Note that Server optimizationsettings in options.cfg override any settings in the Client version.
38
Chapter 2
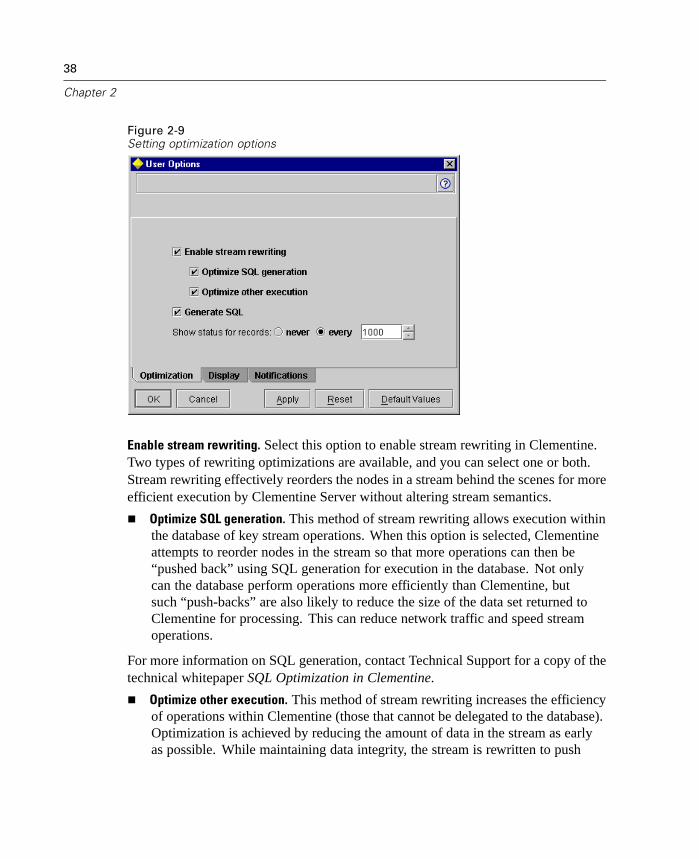
Figure 2-9Setting optimization options
Enable stream rewriting. Select this option to enable stream rewriting in Clementine.Two types of rewriting optimizations are available, and you can select one or both.Stream rewriting effectively reorders the nodes in a stream behind the scenes for moreefficient execution by Clementine Server without altering stream semantics.
Optimize SQL generation. This method of stream rewriting allows execution withinthe database of key stream operations. When this option is selected, Clementineattempts to reorder nodes in the stream so that more operations can then be“pushed back” using SQL generation for execution in the database. Not onlycan the database perform operations more efficiently than Clementine, butsuch “push-backs” are also likely to reduce the size of the data set returned toClementine for processing. This can reduce network traffic and speed streamoperations.
For more information on SQL generation, contact Technical Support for a copy of thetechnical whitepaper SQL Optimization in Clementine.
Optimize other execution. This method of stream rewriting increases the efficiencyof operations within Clementine (those that cannot be delegated to the database).Optimization is achieved by reducing the amount of data in the stream as earlyas possible. While maintaining data integrity, the stream is rewritten to push

39
Clementine Overview
operations closer to the data source, thus reducing data downstream for costlyoperations, such as joins.
Generate SQL. Specify to perform some processing of a stream with an ODBC sourcein the database using SQL code to generate execution processes in sequential order.When Optimize SQL Generation is also selected, the order of stream operations maybe shifted behind the scenes (stream rewriting) to optimize operation “push-backs.”These options are unavailable when running Clementine in local mode. Whenoperations for a node have been passed back to the database, the node will behighlighted in purple.
Show status for records. Select whether Clementine reports records as they arrive atterminal nodes. Specify a number used for updating the status every N records.
Click Default Values to revert to the system default settings for this tab.
Automating Clementine
Since advanced data mining can be a complex and sometimes lengthy process,Clementine includes several types of coding and automation support.
Clementine Language for Expression Manipulation (CLEM) is a language foranalyzing and manipulating the data that flows along Clementine streams. Dataminers use CLEM extensively in stream operations to perform tasks as simpleas deriving profit from cost and revenue data or as complex as transformingWeb-log data into a set of fields and records with usable information. For moreinformation, see “What Is CLEM?” in Chapter 8 on page 205.
Scripting is a powerful tool for automating tedious processes in the user interfaceand working with objects in batch mode. Scripts can perform the same kindsof actions that users perform with a mouse or a keyboard. You can set optionsfor nodes and perform derivations using a subset of CLEM. You can alsospecify output and manipulate generated models. For more information, see“Introduction to Scripting” in Chapter 18 on page 597.
Batch mode enables you to use Clementine in a noninteractive manner by runningClementine with no visible user interface. Using scripts, you can specify streamand node operations as well as modeling parameters and deployment options. Formore information, see “Introduction to Batch Mode” in Chapter 17 on page 591.


Chapter
3Understanding Data Mining
Data Mining Overview
Through a variety of techniques, data mining identifies nuggets of information inbodies of data. Data mining extracts information in such a way that it can be used inareas such as decision support, prediction, forecasts, and estimation. Data is oftenvoluminous but of low value and with little direct usefulness in its raw form. It is thehidden information in the data that has value.
Terms. The terms attribute, field, and variable refer to a single data item common toall cases under consideration. A collection of attribute values that refers to a specificcase is called a record, an example, or a case.
Technologies and techniques. In data mining, success comes from combining your (oryour expert's) knowledge of the data with advanced, active analysis techniques inwhich the computer identifies the underlying relationships and features in the data.The process of data mining generates models from historical data that are later usedfor predictions, pattern detection, and more. The techniques for building these modelsare called machine learning, or modeling.
Clementine includes a number of machine-learning and modeling technologies,including rule induction, neural networks, association rule discovery, sequencedetection, and clustering. It also includes many facilities that let you apply yourexpertise to the data:
Data manipulation. Constructs new data items derived from existing ones andbreaks down the data into meaningful subsets. Data from a variety of sourcescan be merged and filtered.
Browsing and visualization. Displays aspects of the data using the Data Auditnode to perform and initial audit including graphs and statistics. For moreinformation, see “Data Audit Node” in Chapter 14 on page 510. Advanced
41
42
Chapter 3
visualization includes interactive graphics, which can be exported for inclusion inproject reports.
Statistics. Confirms suspected relationships between variables in the data.Statistics from SPSS can also be used within Clementine.
Hypothesis testing. Constructs models of how the data behaves and verifies thesemodels.
Typically, you will use these facilities to identify a promising set of attributes in thedata. These attributes can then be fed to the modeling techniques, which will attemptto identify underlying rules and relationships.
Machine-Learning Techniques
Clementine offers a wide variety of machine-learning techniques. These techniquesare summarized below.
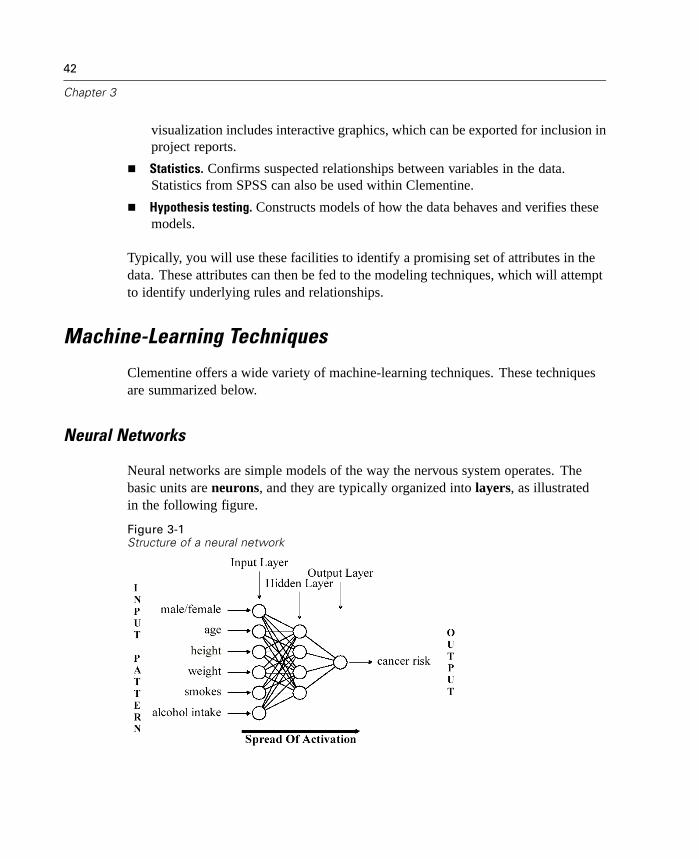
Neural Networks
Neural networks are simple models of the way the nervous system operates. Thebasic units are neurons, and they are typically organized into layers, as illustratedin the following figure.
Figure 3-1Structure of a neural network
43
Understanding Data Mining
Input data is presented to the first layer, and values are propagated from each neuronto every neuron in the next layer. The values are modified during transmission byweights. Eventually, a result is delivered from the output layer.
Initially, all weights are random, and the answers that come out of the net areprobably nonsensical. The network learns through training. Examples for which theoutput is known are repeatedly presented to the network, and the answers it gives arecompared to the known outcomes. Information from this comparison is passed backthrough the network, gradually changing the weights. As training progresses, thenetwork becomes increasingly accurate in replicating the known outcomes. Oncetrained, the network can be applied to future cases where the outcome is unknown.
Rule Induction
One of the problems with neural networks is that the way a trained network makesits decision is opaque. Because the information encoded by the network is simplya collection of numbers, it is very difficult to work out the reasoning that goes intoits decision-making process. Neural networks are sometimes referred to as blackboxes because of this problem.
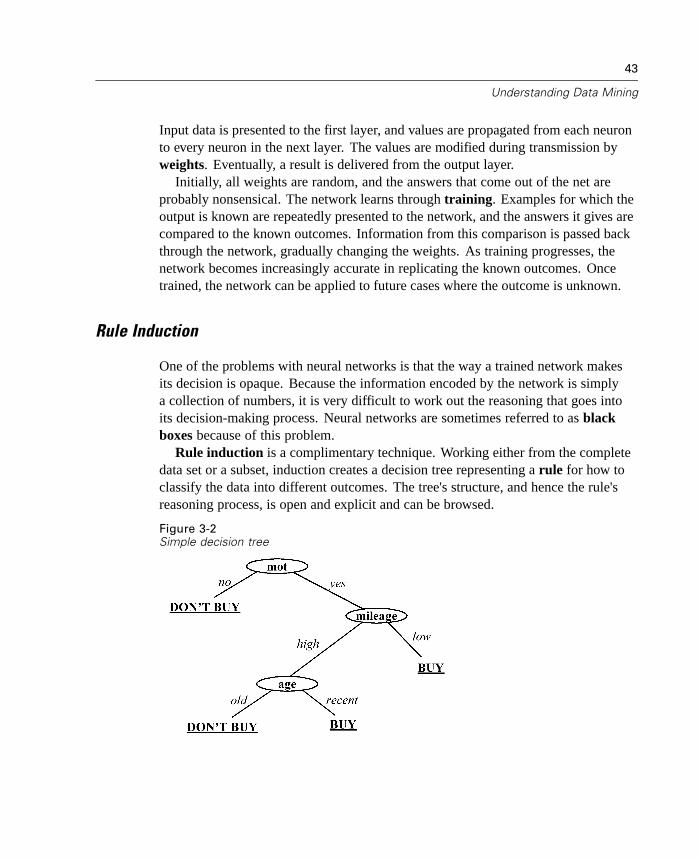
Rule induction is a complimentary technique. Working either from the completedata set or a subset, induction creates a decision tree representing a rule for how toclassify the data into different outcomes. The tree's structure, and hence the rule'sreasoning process, is open and explicit and can be browsed.
Figure 3-2Simple decision tree

44
Chapter 3
Another strength of induction is that the process will automatically include in itsrule only the attributes that really matter in making a decision. Attributes that donot contribute to the accuracy of the tree are ignored. This can yield very usefulinformation about the data and can be used in Clementine to reduce the data to onlyrelevant fields before training another learning technique, such as a neural net.
Decision trees such as the one above can be converted into a collection of if-thenrules (a ruleset), which in many cases show the information in a more comprehensibleform. The decision tree presentation is useful when you want to see how attributes inthe data can split or partition the population into subsets relevant to the problem.The ruleset presentation is useful if you want to see how particular groups of itemsrelate to a specific conclusion. For example, the following rule gives us a profilefor a group of cars that is worth buying:
IF mot = 'yes'
AND mileage = 'low'
THEN -> 'BUY'.
Kohonen Networks
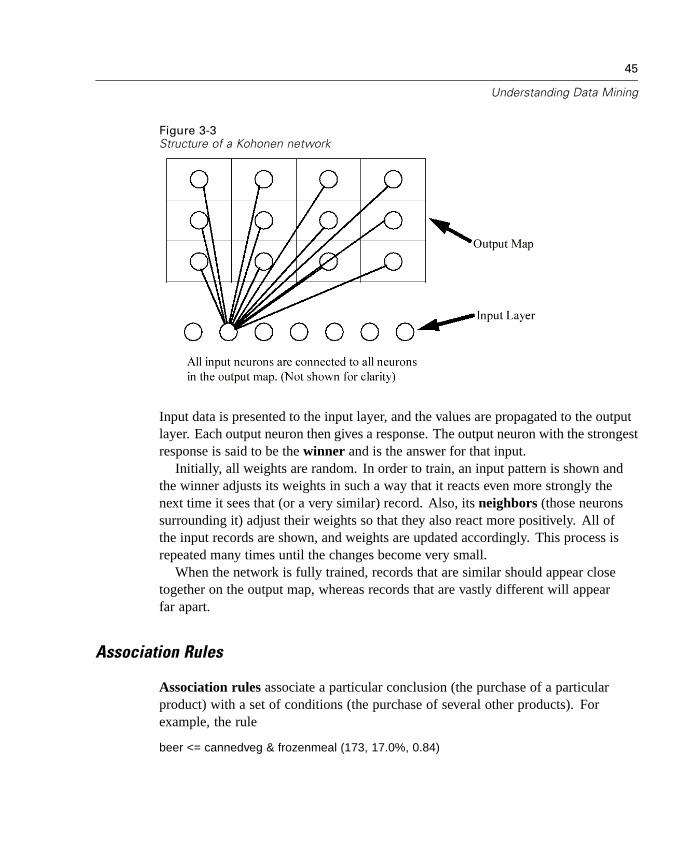
Kohonen networks are a type of neural network that perform clustering. The basicunits are neurons, and they are organized into two layers: the input layer and theoutput layer (also called the output map). All of the input neurons are connectedto all of the output neurons, and these connections have strengths, or weights,associated with them.
The output map is a two-dimensional grid of neurons, with no connections betweenthe units. Shown below is a 3 × 4 map, although typically maps are larger than this.
45
Understanding Data Mining
Figure 3-3Structure of a Kohonen network
Input data is presented to the input layer, and the values are propagated to the outputlayer. Each output neuron then gives a response. The output neuron with the strongestresponse is said to be the winner and is the answer for that input.
Initially, all weights are random. In order to train, an input pattern is shown andthe winner adjusts its weights in such a way that it reacts even more strongly thenext time it sees that (or a very similar) record. Also, its neighbors (those neuronssurrounding it) adjust their weights so that they also react more positively. All ofthe input records are shown, and weights are updated accordingly. This process isrepeated many times until the changes become very small.
When the network is fully trained, records that are similar should appear closetogether on the output map, whereas records that are vastly different will appearfar apart.
Association Rules
Association rules associate a particular conclusion (the purchase of a particularproduct) with a set of conditions (the purchase of several other products). Forexample, the rule
beer <= cannedveg & frozenmeal (173, 17.0%, 0.84)

46
Chapter 3
states that beer often occurs when cannedveg and frozenmeal occur together. Therule is 84% reliable and applies to 17% of the data, or 173 records. Association rulealgorithms automatically find the associations that you could find manually usingvisualization techniques, such as the Web node.
Figure 3-4Web node showing associations between market basket items
The advantage of association rule algorithms over the more standard decision treealgorithms (C5.0 and C&R Trees) is that associations can exist between any of theattributes. A decision tree algorithm will build rules with only a single conclusion,whereas association algorithms attempt to find many rules, each of which may havea different conclusion.
The disadvantage of association algorithms is that they are trying to find patternswithin a potentially very large search space and, hence, can require much more timeto run than a decision tree algorithm. The algorithms use a generate and test methodfor finding rules—simple rules are generated initially, and these are validated againstthe data set. The good rules are stored and all rules, subject to various constraints, are
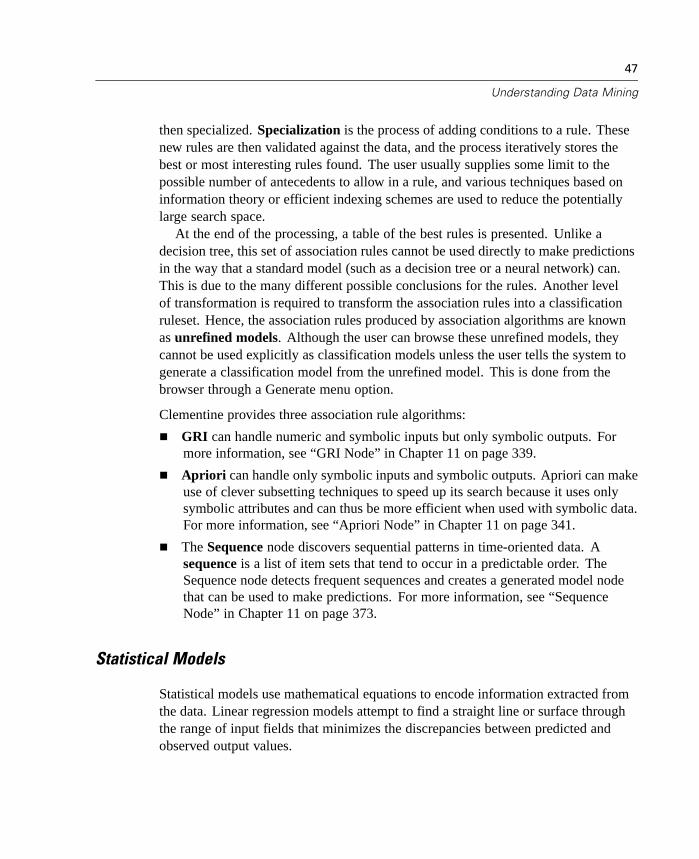
47
Understanding Data Mining
then specialized. Specialization is the process of adding conditions to a rule. Thesenew rules are then validated against the data, and the process iteratively stores thebest or most interesting rules found. The user usually supplies some limit to thepossible number of antecedents to allow in a rule, and various techniques based oninformation theory or efficient indexing schemes are used to reduce the potentiallylarge search space.
At the end of the processing, a table of the best rules is presented. Unlike adecision tree, this set of association rules cannot be used directly to make predictionsin the way that a standard model (such as a decision tree or a neural network) can.This is due to the many different possible conclusions for the rules. Another levelof transformation is required to transform the association rules into a classificationruleset. Hence, the association rules produced by association algorithms are knownas unrefined models. Although the user can browse these unrefined models, theycannot be used explicitly as classification models unless the user tells the system togenerate a classification model from the unrefined model. This is done from thebrowser through a Generate menu option.
Clementine provides three association rule algorithms:
GRI can handle numeric and symbolic inputs but only symbolic outputs. Formore information, see “GRI Node” in Chapter 11 on page 339.
Apriori can handle only symbolic inputs and symbolic outputs. Apriori can makeuse of clever subsetting techniques to speed up its search because it uses onlysymbolic attributes and can thus be more efficient when used with symbolic data.For more information, see “Apriori Node” in Chapter 11 on page 341.
The Sequence node discovers sequential patterns in time-oriented data. Asequence is a list of item sets that tend to occur in a predictable order. TheSequence node detects frequent sequences and creates a generated model nodethat can be used to make predictions. For more information, see “SequenceNode” in Chapter 11 on page 373.
Statistical Models
Statistical models use mathematical equations to encode information extracted fromthe data. Linear regression models attempt to find a straight line or surface throughthe range of input fields that minimizes the discrepancies between predicted andobserved output values.
48
Chapter 3
Figure 3-5Simple linear regression equation
Logistic regression models are somewhat more complicated but use a similar strategyto generate equations for predicting probabilities associated with each possible valueof a symbolic output field.
Statistical models have been around for some time and are relatively wellunderstood mathematically. They represent basic models that assume fairly simplekinds of relationships in the data. In some cases, they can give you adequatemodels very quickly. Even for problems in which more flexible machine-learningtechniques (such as neural networks) can ultimately give better results, you canuse statistical models as baseline predictive models to judge the performance ofadvanced techniques.
Clustering Models
Clustering models focus on identifying groups of similar records and labeling therecords according to the group to which they belong. This is done without the benefitof prior knowledge about the groups and their characteristics. In fact, you may noteven know exactly how many groups to look for. This is what distinguishes clusteringmodels from the other machine-learning techniques available in Clementine—there is

49
Understanding Data Mining
no predefined output or target field for the model to predict. These models are oftenreferred to as unsupervised learning models, since there is no external standardby which to judge the model's classification performance. There are no right orwrong answers for these models. Their value is determined by their ability to captureinteresting groupings in the data and provide useful descriptions of those groupings.
Clustering methods are based on measuring distances between records andbetween clusters. Records are assigned to clusters in a way that tends to minimize thedistance between records belonging to the same cluster.
Figure 3-6Simple clustering model
Clementine includes three methods for clustering. You have already seen howKohonen networks can be used for clustering. For more information, see “KohonenNetworks” on page 44. K-Means clustering works by defining a fixed number ofclusters and iteratively assigning records to clusters and adjusting the cluster centers.This process of reassignment and cluster center adjustment continues until furtherrefinement can no longer improve the model appreciably. TwoStep clustering worksby first compressing the data into a manageable number of small subclusters, thenusing a statistical clustering method to progressively merge the subclusters intoclusters, then merging the clusters into larger clusters, and so on, until the minimum
50
Chapter 3
desired number of clusters is reached. TwoStep clustering has the advantage ofautomatically estimating the optimal number of clusters for the training data.
Clustering models are often used to create clusters or segments that are then usedas inputs in subsequent analyses. A common example of this is the market segmentsused by marketers to partition their overall market into homogeneous subgroups.Each segment has special characteristics that affect the success of marketing effortstargeted toward it. If you are using data mining to optimize your marketing strategy,you can usually improve your model significantly by identifying the appropriatesegments and using that segment information in your predictive models.
Assessing Potential Data Mining Applications
Data mining isn't likely to be fruitful unless the data that you want to use meetscertain criteria. The following sections present some of the aspects of the data andapplication that you should consider.
Is the Data Available?
This may seem like an obvious question, but be aware that although data might beavailable, it may not be in a form that can be used easily. Clementine can importdata from databases (via ODBC) or from files. The data, however, might be held insome other form on a machine that cannot be directly accessed. It will need to bedownloaded or dumped in a suitable form before it can be used. It might be scatteredamong different databases and sources and need to be pulled together. It may noteven be online. If it exists only on paper, a data entry phase will be required beforeyou can begin data mining.
Does the Data Cover the Relevant Attributes?
The object of data mining is to identify relevant attributes, so this may seem likean odd question. It is very useful, however, to look at what data is available andtry to identify likely relevant factors that are not recorded. In trying to predict icecream sales, for example, you may have a lot of information on retail outlets or saleshistories, but you may not have weather and temperature information that is likely to
51
Understanding Data Mining
play a significant role. Missing attributes don't necessarily mean that data mining willnot produce useful results, but they can limit the accuracy of resulting predictions.
A quick way of assessing the situation is to perform a comprehensive audit of yourdata. Before moving on, consider attaching a Data Audit node to your data source andexecuting to generate a full report. For more information, see “Data Audit Node” inChapter 14 on page 510.
Is the Data Noisy?
Data often contains errors or may contain subjective, and therefore variable,judgments. These phenomena are collectively referred to as noise. Sometimes,noise in data is normal. There may well be underlying rules, but they may not holdfor 100% of the cases.
Typically, the more noise there is in data, the more difficult it is to get accurateresults. However, Clementine's machine-learning methods are able to handle noisydata and have been used successfully on data sets containing up to almost 50% noise.
Is There Enough Data?
This is a difficult question to answer. In data mining, it is not necessarily the size of adata set that is important. The representativeness of the data set is far more significant,together with its coverage of possible outcomes and combinations of variables.
Typically, the more attributes that are considered, the more records that will beneeded to give representative coverage.
If the data is representative and there are general underlying rules, it may well bethat a data sample of a few thousand (or even a few hundred) records will give equallygood results as a million—and you will get the results more quickly.
Is Expertise on the Data Available?
In many cases, you will be working on your own data and will therefore be highlyfamiliar with its content and meaning. However, if you are working on data, say, foranother department of your organization or for a client, it is highly desirable that youhave access to experts who know the data. They can guide you in the identification ofrelevant attributes and can help to interpret the results of data mining, distinguishing

52
Chapter 3
the true nuggets of information from “fool's gold,” or artifacts caused by anomalies inthe data sets.
A Strategy for Data Mining
As with most business endeavors, data mining is much more effective if done ina planned, systematic way. Even with cutting edge data mining tools, such asClementine, the majority of the work in data mining requires a knowledgeablebusiness analyst to keep the process on track. To guide your planning, answer thefollowing questions:
What substantive problem do you want to solve?
What data sources are available, and what parts of the data are relevant to thecurrent problem?
What kind of preprocessing and data cleaning do you need to do before youstart mining the data?
What data mining technique(s) will you use?
How will you evaluate the results of the data mining analysis?
How will you get the most out of the information that you obtained from datamining?
The typical data mining process can become complicated very quickly. There is a lotto keep track of—complex business problems, multiple data sources, varying dataquality across data sources, an array of data mining techniques, different ways ofmeasuring data mining success, and so on.
To stay on track, it helps to have an explicitly defined process model for datamining. The process model guides you through the critical issues outlined above andmakes sure that the important points are addressed. It serves as a data mining roadmap so that you won't lose your way as you dig into the complexities of your data.
The data mining process model recommended for use with Clementine is theCross-Industry Standard Process for Data Mining (CRISP-DM). As you can tell fromthe name, this model is designed as a general model that can be applied to a widevariety of industries and business problems.

53
Understanding Data Mining
The CRISP-DM Process Model
The general CRISP-DM process model includes six phases that address the mainissues in data mining. The six phases fit together in a cyclical process, illustratedin the following figure.
Figure 3-7CRISP-DM process model
These six phases cover the full data mining process, including how to incorporatedata mining into your larger business practices. The six phases include:
Business understanding. This is perhaps the most important phase of data mining.Business understanding includes determining business objectives, assessing thesituation, determining data mining goals, and producing a project plan.
Data understanding. Data provides the “raw materials” of data mining. Thisphase addresses the need to understand what your data resources are and thecharacteristics of those resources. It includes collecting initial data, describingdata, exploring data, and verifying data quality. The Data Audit node availablefrom the Output nodes palette is an indispensable tool for data understanding.For more information, see “Data Audit Node” in Chapter 14 on page 510.
Data preparation. After cataloging your data resources, you will need to prepareyour data for mining. Preparations include selecting, cleaning, constructing,integrating, and formatting data.
54
Chapter 3
Modeling. This is, of course, the flashy part of data mining, where sophisticatedanalysis methods are used to extract information from the data. This phaseinvolves selecting modeling techniques, generating test designs, and buildingand assessing models.
Evaluation. Once you have chosen your models, you are ready to evaluate how thedata mining results can help you to achieve your business objectives. Elementsof this phase include evaluating results, reviewing the data mining process, anddetermining the next steps.
Deployment. Now that you've invested all of this effort, it's time to reap thebenefits. This phase focuses on integrating your new knowledge into youreveryday business processes to solve your original business problem. This phaseincludes plan deployment, monitoring and maintenance, producing a final report,and reviewing the project.
There are some key points in this process model. First, while there is a generaltendency for the process to flow through the steps in the order outlined above, thereare also a number of places where the phases influence each other in a nonlinearway. For example, data preparation usually precedes modeling. However, decisionsmade and information gathered during the modeling phase can often lead you torethink parts of the data preparation phase, which can then present new modelingissues, and so on. The two phases feed back on each other until both phases havebeen resolved adequately. Similarly, the evaluation phase can lead you to reevaluateyour original business understanding, and you may decide that you've been trying toanswer the wrong question. At this point, you can revise your business understandingand proceed through the rest of the process again with a better target in mind.
The second key point is embodied by the outer cyclical arrow surrounding theprocess, indicating the iterative nature of data mining. You will rarely, if ever, simplyplan a data mining project, execute it, and then pack up your data and go home.Using data mining to address your customers' demands is an ongoing endeavor. Theknowledge gained from one cycle of data mining will almost invariably lead to newquestions, new issues, and new opportunities to identify and meet your customers'needs. Those new questions, issues, and opportunities can usually be addressedby mining your data once again. This process of mining and identifying newopportunities should become part of the way you think about your business and acornerstone of your overall business strategy.
55
Understanding Data Mining
This introduction gives only a brief overview of the CRISP-DM process model.For complete details on using the model, consult any of the following resources:
Choose Help on CRISP-DM from the Help menu in Clementine to access theCRISP-DM help system.
The CRISP-DM Guide included with your Clementine materials.
Data Mining with Confidence, published by SPSS Inc. This guide is availablefrom the SPSS online bookstore.
Tips
Following are some tips for dealing with issues that commonly come up duringdata mining.
Induction, Neural Net, or Statistical Models?
If you're not sure which attributes are important, it often makes sense to use inductionfirst to produce a rule. The rule browser will then let you generate a filter that cuts thedata down to only the fields that induction found to be important. This can be used toselect a good subset of fields before training a net or statistical model. Alternativeapproaches include training a network and using the Sensitivity Analysis feature torank the different fields by their relevance to the outcome or using a linear regressionmodel to perform stepwise, forwards, or backwards field selection.
Statistical methods are usually very quick and relatively uncomplicated. Therefore,they can often be used as baseline models, giving you a target to beat with the moretime-consuming machine-learning techniques. Typically, though by no meansuniversally true, neural nets will work better on cases with a numeric outcome, whileinduction will do better on symbolic decisions.
Is the Data Balanced?
Suppose you have two outcomes: low or high. Ninety percent of cases are low, andonly 10% are high. Neural networks will respond badly to such biased data. Theywill learn only the low outcomes and tend to ignore the high ones. Their chance oflearning to make accurate predictions is greatly increased if there are roughly equal
56
Chapter 3
numbers of each output value. One way of balancing the data in this example wouldbe to use only one-ninth of the low cases and all of the high cases for training.
Sampling
When starting to work on large data sets, initially take smaller samples. This will letyou get through more simple experiments more quickly. Once you have a feel forhow the data behaves, you can test your hypotheses on the entire set.
Collecting Exceptions
When testing models, look closely at the cases where they make the wrong decisions(such cases are called exceptions). Applying Clementine's data analysis facilitiesto these exceptions can give indications of weaknesses in the original training data,which you can then redress, or clues about how to improve the model.

Chapter
4Building Streams
Stream-Building Overview
Data mining using Clementine focuses on the process of running data through a seriesof nodes, referred to as a stream. This series of nodes represents operations to beperformed on the data, while links between the nodes indicate the direction of dataflow. Typically, you use a data stream to read data into Clementine, run it througha series of manipulations, and then send it to a destination, such as an SPSS fileor the Clementine Solution Publisher.
For example, suppose that you want to open a data source, add a new field, selectrecords based on values in the new field, and then display the results in a table. Inthis case, your data stream would consist of four nodes:
A Variable File node, which you set up to read the data from the data source.
A Derive node, which you use to add the new, calculated field to the data set.
A Select node, which you use to set up selection criteria to exclude recordsfrom the data stream.
A Table node, which you use to display the results of your manipulationsonscreen.
57
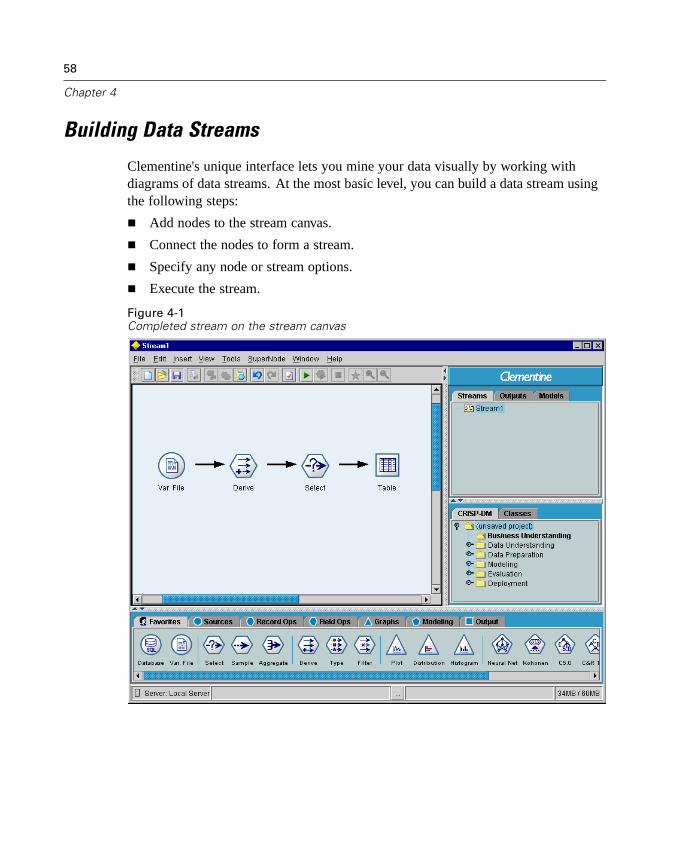
58
Chapter 4
Building Data Streams
Clementine's unique interface lets you mine your data visually by working withdiagrams of data streams. At the most basic level, you can build a data stream usingthe following steps:
Add nodes to the stream canvas.
Connect the nodes to form a stream.
Specify any node or stream options.
Execute the stream.
Figure 4-1Completed stream on the stream canvas
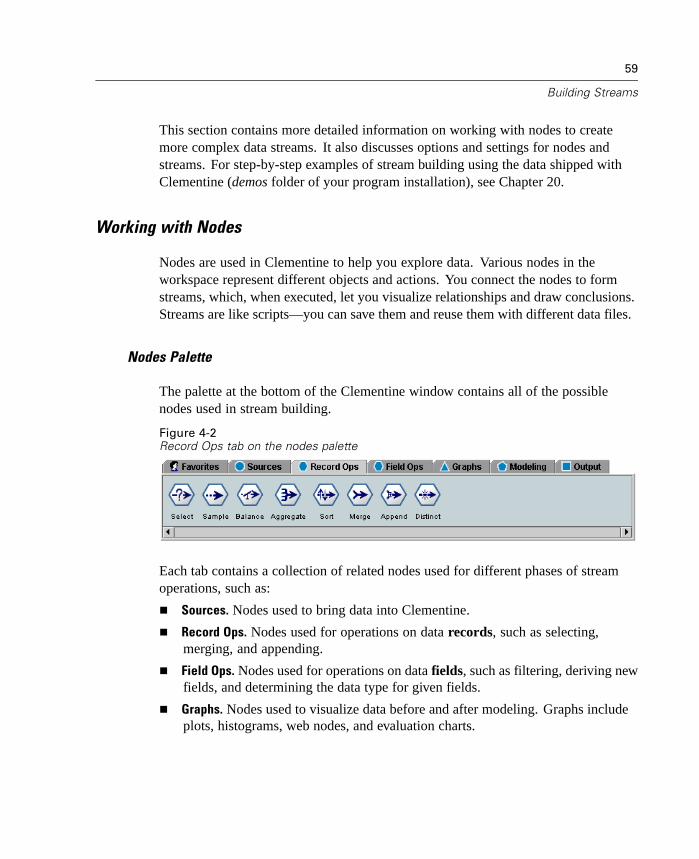
59
Building Streams
This section contains more detailed information on working with nodes to createmore complex data streams. It also discusses options and settings for nodes andstreams. For step-by-step examples of stream building using the data shipped withClementine (demos folder of your program installation), see Chapter 20.
Working with Nodes
Nodes are used in Clementine to help you explore data. Various nodes in theworkspace represent different objects and actions. You connect the nodes to formstreams, which, when executed, let you visualize relationships and draw conclusions.Streams are like scripts—you can save them and reuse them with different data files.
Nodes Palette
The palette at the bottom of the Clementine window contains all of the possiblenodes used in stream building.
Figure 4-2Record Ops tab on the nodes palette
Each tab contains a collection of related nodes used for different phases of streamoperations, such as:
Sources. Nodes used to bring data into Clementine.
Record Ops. Nodes used for operations on data records, such as selecting,merging, and appending.
Field Ops. Nodes used for operations on data fields, such as filtering, deriving newfields, and determining the data type for given fields.
Graphs. Nodes used to visualize data before and after modeling. Graphs includeplots, histograms, web nodes, and evaluation charts.

60
Chapter 4
Modeling. Nodes representing the powerful modeling algorithms available inClementine, such as neural nets, decision trees, clustering algorithms, and datasequencing.
Output. Nodes used to produce a variety of output for Clementine data, charts, andmodel results. Output can be viewed within Clementine for many output nodes orsent directly to another application, such as SPSS or Excel.
Customizing the Favorites Tab
The Favorites tab on the nodes palette can be customized to accommodate yourusage of Clementine. For example, if you frequently analyze time-series data froma database, you might want to be sure that both the Database source node and theSequence modeling node are available from the Favorites tab. The Palette Managerenables you to easily make these adjustments. To access the Palette Manager:
E From the Tools menu, select Favorites.
Figure 4-3Selecting nodes to add to the Favorites tab
Display “Favorites” tab. Selected by default, this option controls whether a Favoritestab is displayed on the nodes palette.
Using the check boxes in the Shown? column, select whether to include each node onthe Favorites tab.
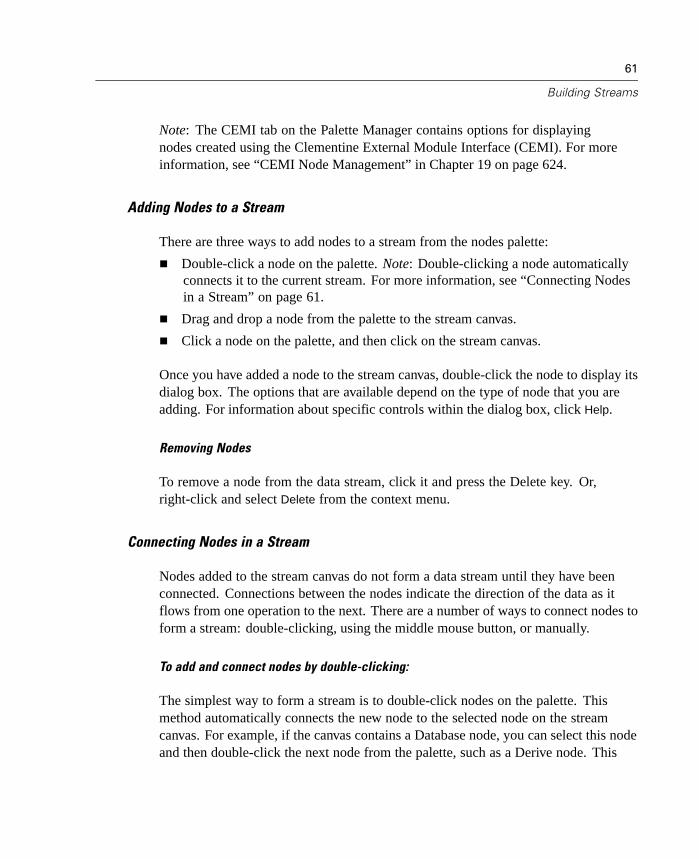
61
Building Streams
Note: The CEMI tab on the Palette Manager contains options for displayingnodes created using the Clementine External Module Interface (CEMI). For moreinformation, see “CEMI Node Management” in Chapter 19 on page 624.
Adding Nodes to a Stream
There are three ways to add nodes to a stream from the nodes palette:
Double-click a node on the palette. Note: Double-clicking a node automaticallyconnects it to the current stream. For more information, see “Connecting Nodesin a Stream” on page 61.
Drag and drop a node from the palette to the stream canvas.
Click a node on the palette, and then click on the stream canvas.
Once you have added a node to the stream canvas, double-click the node to display itsdialog box. The options that are available depend on the type of node that you areadding. For information about specific controls within the dialog box, click Help.
Removing Nodes
To remove a node from the data stream, click it and press the Delete key. Or,right-click and select Delete from the context menu.
Connecting Nodes in a Stream
Nodes added to the stream canvas do not form a data stream until they have beenconnected. Connections between the nodes indicate the direction of the data as itflows from one operation to the next. There are a number of ways to connect nodes toform a stream: double-clicking, using the middle mouse button, or manually.
To add and connect nodes by double-clicking:
The simplest way to form a stream is to double-click nodes on the palette. Thismethod automatically connects the new node to the selected node on the streamcanvas. For example, if the canvas contains a Database node, you can select this nodeand then double-click the next node from the palette, such as a Derive node. This
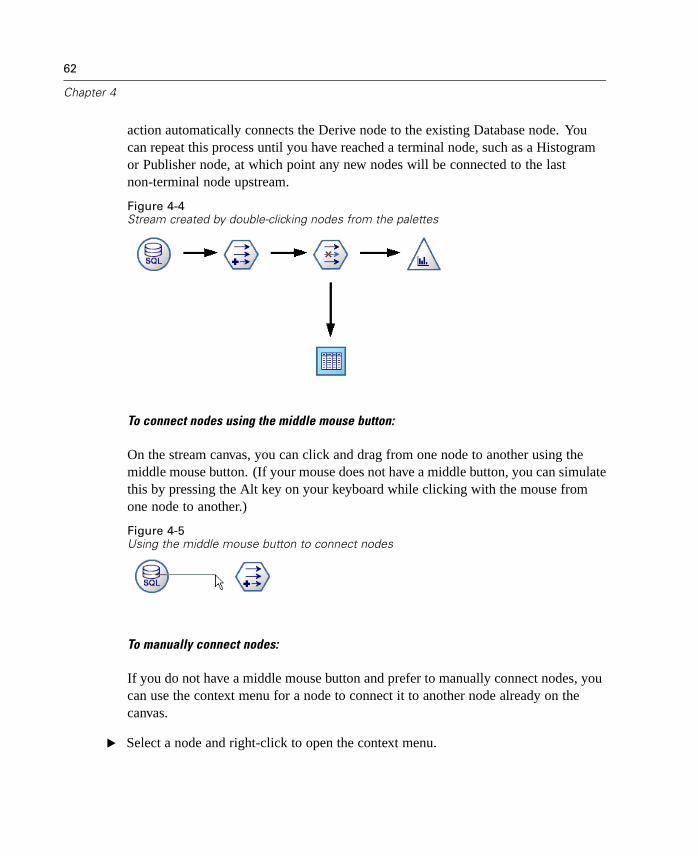
62
Chapter 4
action automatically connects the Derive node to the existing Database node. Youcan repeat this process until you have reached a terminal node, such as a Histogramor Publisher node, at which point any new nodes will be connected to the lastnon-terminal node upstream.
Figure 4-4Stream created by double-clicking nodes from the palettes
To connect nodes using the middle mouse button:
On the stream canvas, you can click and drag from one node to another using themiddle mouse button. (If your mouse does not have a middle button, you can simulatethis by pressing the Alt key on your keyboard while clicking with the mouse fromone node to another.)
Figure 4-5Using the middle mouse button to connect nodes
To manually connect nodes:
If you do not have a middle mouse button and prefer to manually connect nodes, youcan use the context menu for a node to connect it to another node already on thecanvas.
E Select a node and right-click to open the context menu.

63
Building Streams
E From the menu, select Connect.
E A connection icon will appear both on the start node and the cursor. Click on a secondnode on the canvas to connect the two nodes.
Figure 4-6Connecting nodes using the Connect option from the context menu
Figure 4-7Connected nodes
When connecting nodes, there are several guidelines to follow. You will receive anerror message if you attempt to make any of the following types of connections:
A connection leading to a source node
A connection leading from a terminal node
A node having more than its maximum number of input connections
Connecting two nodes that are already connected
Circularity (data returns to a node from which it has already flowed)
Bypassing Nodes in a Stream
When you bypass a node in the data stream, all of its input and output connections arereplaced by connections that lead directly from its input nodes to its output nodes. Ifthe node does not have both input and output connections, then all of its connectionsare deleted rather than rerouted.
For example, you might have a stream that derives a new field, filters fields, andthen explores the results in a histogram and table. If you want to also view the samegraph and table for data before fields are filtered, you can add either new Histogramand Table nodes to the stream or you can bypass the Filter node. When you bypass

64
Chapter 4
the Filter node, the connections to the graph and table pass directly from the Derivenode. The Filter node is disconnected from the stream.
Figure 4-8Bypassing a previously connected Filter node
To bypass a node:
E On the stream canvas, use the middle mouse button to double-click the node that youwant to bypass. Alternatively, you can use Alt-double-click.
Note: You can undo this action using the Undo option on the Edit menu or bypressing Ctrl-Z.
Adding Nodes in Existing Connections
When you want to add a node between two connected nodes, you can replace theoriginal connection with two new connections—an input connection that leads to thenew node and an output connection that leads from it.
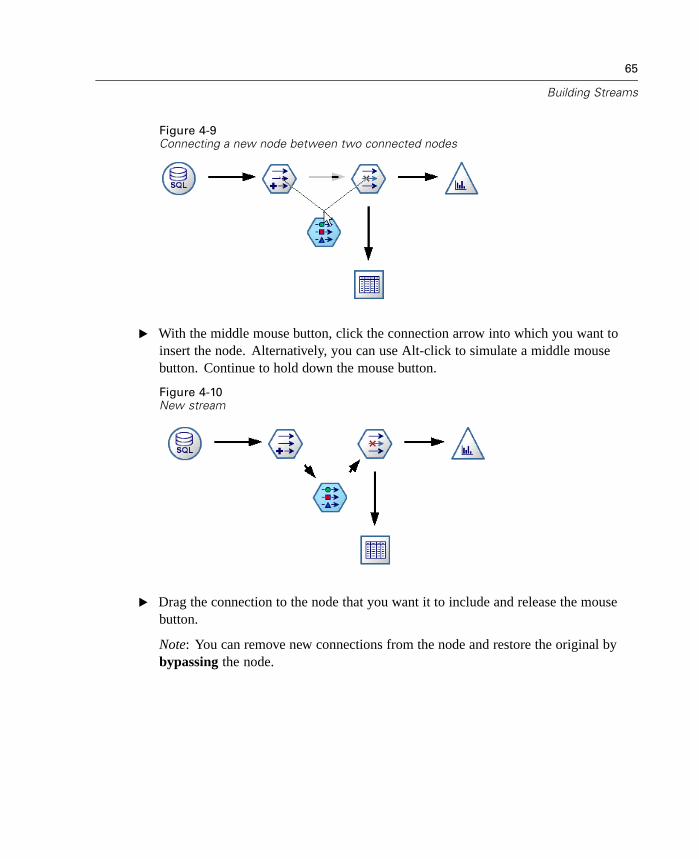
65
Building Streams
Figure 4-9Connecting a new node between two connected nodes
E With the middle mouse button, click the connection arrow into which you want toinsert the node. Alternatively, you can use Alt-click to simulate a middle mousebutton. Continue to hold down the mouse button.
Figure 4-10New stream
E Drag the connection to the node that you want it to include and release the mousebutton.
Note: You can remove new connections from the node and restore the original bybypassing the node.

66
Chapter 4
Deleting Connections between Nodes
You can delete the connection between nodes using two methods:
E Press and hold down the right mouse button on the connection arrow head.
E From the context menu, select Delete Connection.
Figure 4-11Deleting the connection between nodes in a stream
Or you can delete a connection as follows:
E Select a node and press F3 on your keyboard to delete all connections.
E Select a node, and from the main menus choose:Edit
NodeDisconnect
Setting Options for Nodes
Once you have created and connected nodes, there are several options for customizingnodes. Right-click on a node and select one of the menu options.

67
Building Streams
Figure 4-12Context menu options for nodes
Select Edit to open the dialog box for the selected node.
Select Connect to manually connect one node to another.
Select Disconnect to delete all links to and from the node.
Select Rename and Annotate to open the Edit dialog box to the Annotations tab.
Select Copy to make a copy of the node with no connections. This can be addedto a new or existing stream.
Select Cut or Delete to remove the selected node(s) from the stream canvas. Note:Selecting Cut allows you to paste nodes, while Delete does not.
Select Load Node to open a previously saved node and load its options into thecurrently selected node. Note: The nodes must be of identical type.
Select Save Node to save the node's details in a file. You can load node detailsonly into another node of the same type.
Select Cache to expand the menu, with options for caching the selected node.
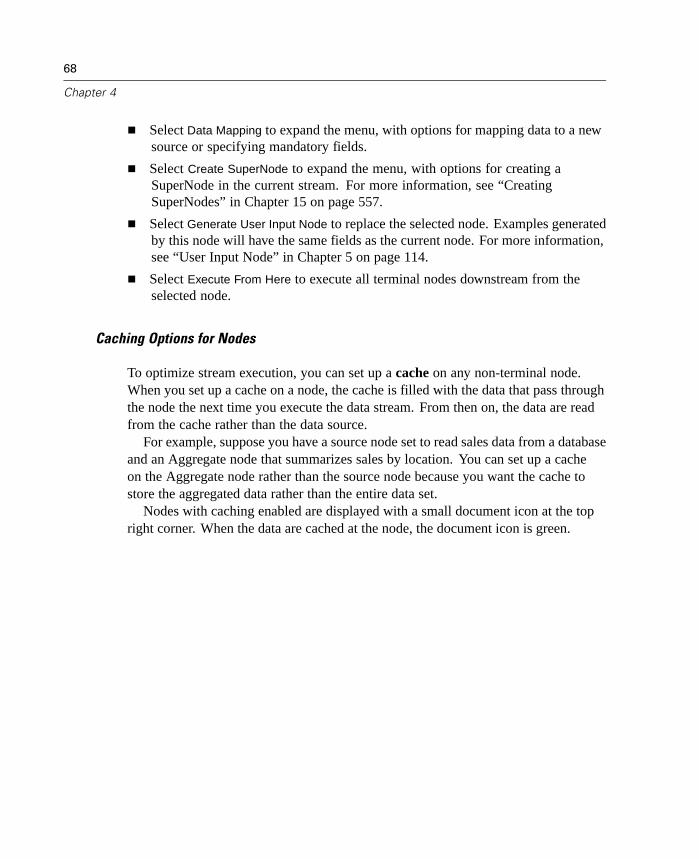
68
Chapter 4
Select Data Mapping to expand the menu, with options for mapping data to a newsource or specifying mandatory fields.
Select Create SuperNode to expand the menu, with options for creating aSuperNode in the current stream. For more information, see “CreatingSuperNodes” in Chapter 15 on page 557.
Select Generate User Input Node to replace the selected node. Examples generatedby this node will have the same fields as the current node. For more information,see “User Input Node” in Chapter 5 on page 114.
Select Execute From Here to execute all terminal nodes downstream from theselected node.
Caching Options for Nodes
To optimize stream execution, you can set up a cache on any non-terminal node.When you set up a cache on a node, the cache is filled with the data that pass throughthe node the next time you execute the data stream. From then on, the data are readfrom the cache rather than the data source.
For example, suppose you have a source node set to read sales data from a databaseand an Aggregate node that summarizes sales by location. You can set up a cacheon the Aggregate node rather than the source node because you want the cache tostore the aggregated data rather than the entire data set.
Nodes with caching enabled are displayed with a small document icon at the topright corner. When the data are cached at the node, the document icon is green.
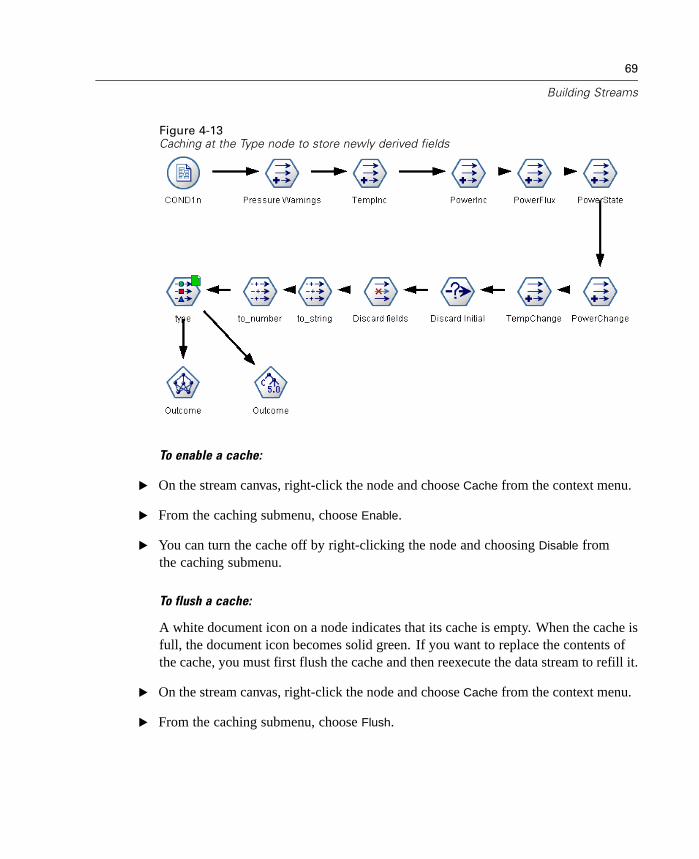
69
Building Streams
Figure 4-13Caching at the Type node to store newly derived fields
To enable a cache:
E On the stream canvas, right-click the node and choose Cache from the context menu.
E From the caching submenu, choose Enable.
E You can turn the cache off by right-clicking the node and choosing Disable fromthe caching submenu.
To flush a cache:
A white document icon on a node indicates that its cache is empty. When the cache isfull, the document icon becomes solid green. If you want to replace the contents ofthe cache, you must first flush the cache and then reexecute the data stream to refill it.
E On the stream canvas, right-click the node and choose Cache from the context menu.
E From the caching submenu, choose Flush.

70
Chapter 4
To save a cache:
You can save the contents of a cache as a SPSS data file (*.sav). You can then eitherreload the file as a cache, or you can set up a node that uses the cache file as its datasource. You can also load a cache that you saved from another project.
E On the stream canvas, right-click the node and choose Cache from the context menu.
E From the caching submenu, choose Save Cache.
E In the Save Cache dialog box, browse to the location where you want to save thecache file.
E Enter a name in the File Name text box.
E Be sure that *.sav is selected in the Files of Type drop-down list, and click Save.
To load a cache:
If you have saved a cache file before removing it from the node, you can reload it.
E On the stream canvas, right-click the node and choose Cache from the context menu.
E From the caching submenu, choose Load Cache.
E In the Load Cache dialog box, browse to the location of the cache file, select it,and click Load.
Annotating Nodes
All nodes in Clementine can be annotated in a number of ways. You can annotate anode to provide additional description about that node. For example, you may wantto include annotations that provide more information about fields within a node ordescribe a node's role in a stream. You may also want to add tooltip text for lengthystreams with a number of similar graphs or Derive nodes, for example. This will helpyou distinguish between nodes on the stream canvas.
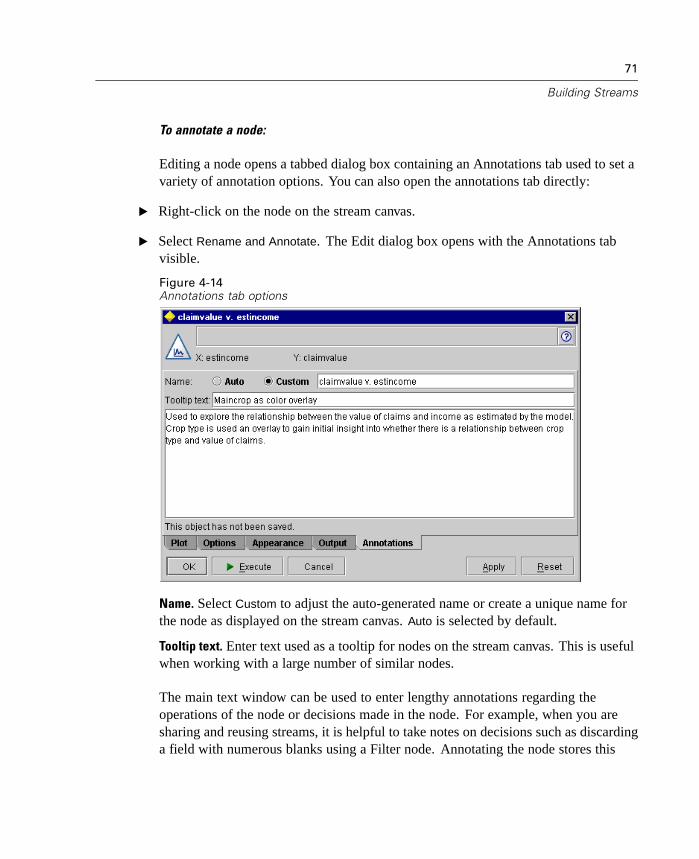
71
Building Streams
To annotate a node:
Editing a node opens a tabbed dialog box containing an Annotations tab used to set avariety of annotation options. You can also open the annotations tab directly:
E Right-click on the node on the stream canvas.
E Select Rename and Annotate. The Edit dialog box opens with the Annotations tabvisible.
Figure 4-14Annotations tab options
Name. Select Custom to adjust the auto-generated name or create a unique name forthe node as displayed on the stream canvas. Auto is selected by default.
Tooltip text. Enter text used as a tooltip for nodes on the stream canvas. This is usefulwhen working with a large number of similar nodes.
The main text window can be used to enter lengthy annotations regarding theoperations of the node or decisions made in the node. For example, when you aresharing and reusing streams, it is helpful to take notes on decisions such as discardinga field with numerous blanks using a Filter node. Annotating the node stores this
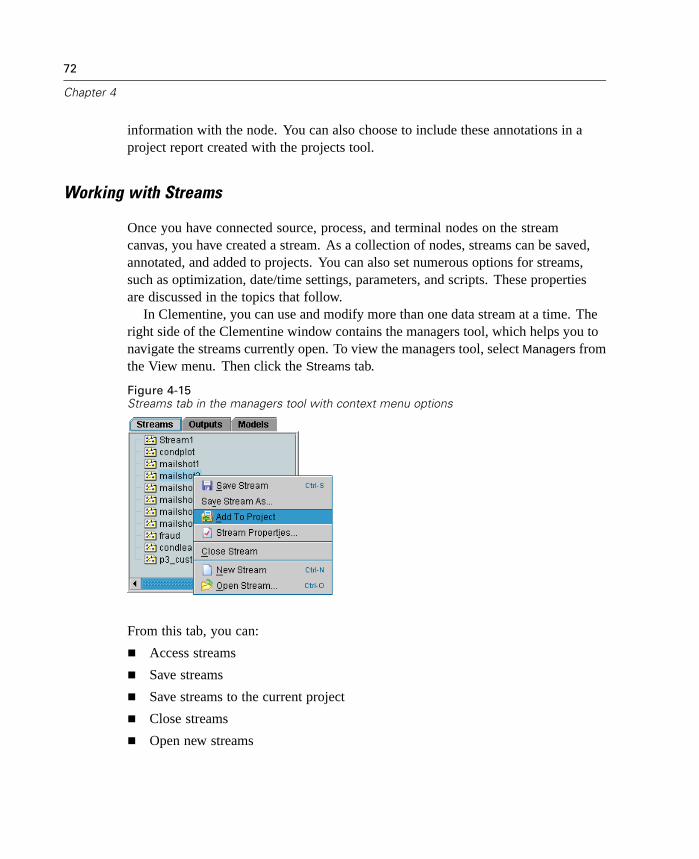
72
Chapter 4
information with the node. You can also choose to include these annotations in aproject report created with the projects tool.
Working with Streams
Once you have connected source, process, and terminal nodes on the streamcanvas, you have created a stream. As a collection of nodes, streams can be saved,annotated, and added to projects. You can also set numerous options for streams,such as optimization, date/time settings, parameters, and scripts. These propertiesare discussed in the topics that follow.
In Clementine, you can use and modify more than one data stream at a time. Theright side of the Clementine window contains the managers tool, which helps you tonavigate the streams currently open. To view the managers tool, select Managers fromthe View menu. Then click the Streams tab.
Figure 4-15Streams tab in the managers tool with context menu options
From this tab, you can:
Access streams
Save streams
Save streams to the current project
Close streams
Open new streams

73
Building Streams
Right-click on a stream on the Streams tab to access these options.
Setting Options for Streams
For the current stream, you can specify a number of options, many of which applyto CLEM expressions.
To set stream options:
E From the File menu, select Stream Properties. Alternatively, you can use the contextmenu on the Streams tab in the managers tool.
E Click the Options tab.
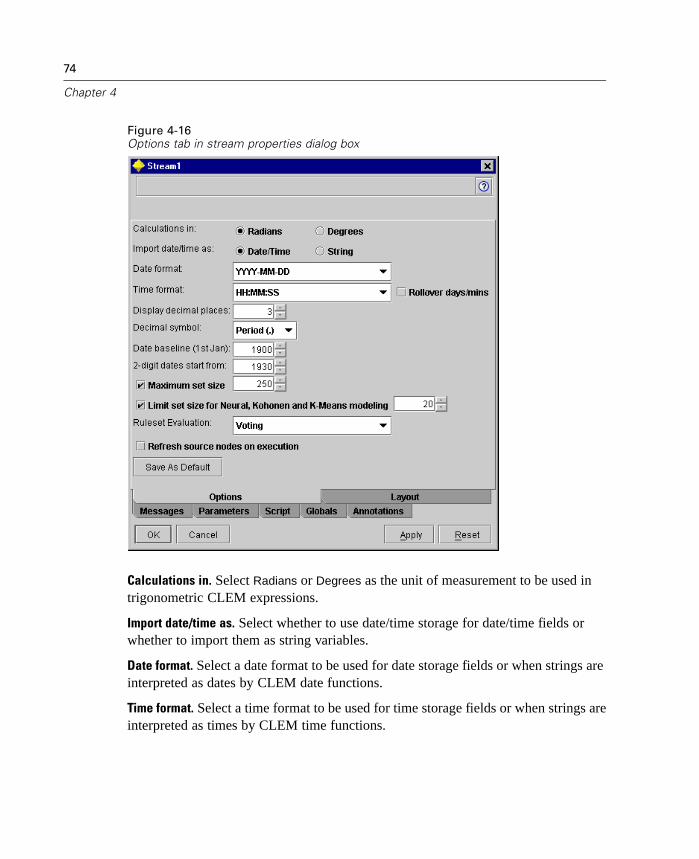
74
Chapter 4
Figure 4-16Options tab in stream properties dialog box
Calculations in. Select Radians or Degrees as the unit of measurement to be used intrigonometric CLEM expressions.
Import date/time as. Select whether to use date/time storage for date/time fields orwhether to import them as string variables.
Date format. Select a date format to be used for date storage fields or when strings areinterpreted as dates by CLEM date functions.
Time format. Select a time format to be used for time storage fields or when strings areinterpreted as times by CLEM time functions.

75
Building Streams
Display decimal places. Set a number of decimal places to be used for displaying andprinting real numbers in Clementine.
Decimal symbol. From the drop-down list, select either a comma (,) or period (.)as a decimal separator.
Rollover days/mins. Select whether negative time differences should be interpreted asreferring to the previous day or hour.
Date baseline (1st Jan). Select the baseline years (always 1st January) to be used byCLEM date functions that work with a single date.
2-digit dates start from. Specify the cutoff year to add century digits for years denotedwith only two digits. For example, specifying 1930 as the cutoff year will roll over05/11/02 to the year 2002. The same setting will use the 19th century for dates after30, such as 05/11/73.
Maximum set size. Select to specify a maximum number of members for set fieldsafter which the type of the field becomes typeless. This option is disabled by default,but it is useful when working with large set fields. Note: The direction of fieldsset to typeless is automatically set to none. This means the fields are not availablefor modeling.
Limit set size for Neural, Kohonen, and K-Means modeling. Select to specify a maximumnumber of members for set fields used in Neural nets, Kohonen nets, and K-Meansmodeling. The default set size is 20, after which the field is ignored and a warning israised, providing information on the field in question.
Ruleset evaluation. Determine how rulesets are evaluated. By default, rulesets useVoting to combine predictions from individual rules and determine the final prediction.To ensure that rulesets use the first hit rule by default, select First Hit. For moreinformation, see “Generated Ruleset Node” in Chapter 12 on page 412.
Refresh source nodes on execution. Select to automatically refresh all source nodeswhen executing the current stream. This action is analogous to clicking the Refreshbutton on a source node, except that this option automatically refreshes all sourcenodes (except User Input nodes) automatically for the current stream.
Note: Selecting this option flushes the caches of downstream nodes even if the datahasn't changed. Flushing occurs only once per execution, though, which means thatyou can still use downstream caches as temporary storage for a single execution. Forexample, say that you've set a cache midstream after a complex derive operation and
76
Chapter 4
that you have several graphs and reports attached downstream of this Derive node.When executing, the cache at the Derive node will be flushed and refilled but onlyfor the first graph or report. Subsequent terminal nodes will read data from theDerive node cache.
The options specified above apply only to the current stream. To set these options asthe default for all streams in Clementine, click Save As Default.
Setting Options for Stream Layout
Using the Layout tab in the stream properties dialog box, you can specify a number ofoptions regarding the display and usage of the stream canvas.
To set layout options:
E From the File menu, choose Stream Properties. Alternatively, from the Tools menu,choose:Stream Properties
Layout
E Click the Layout tab in the stream properties dialog box.
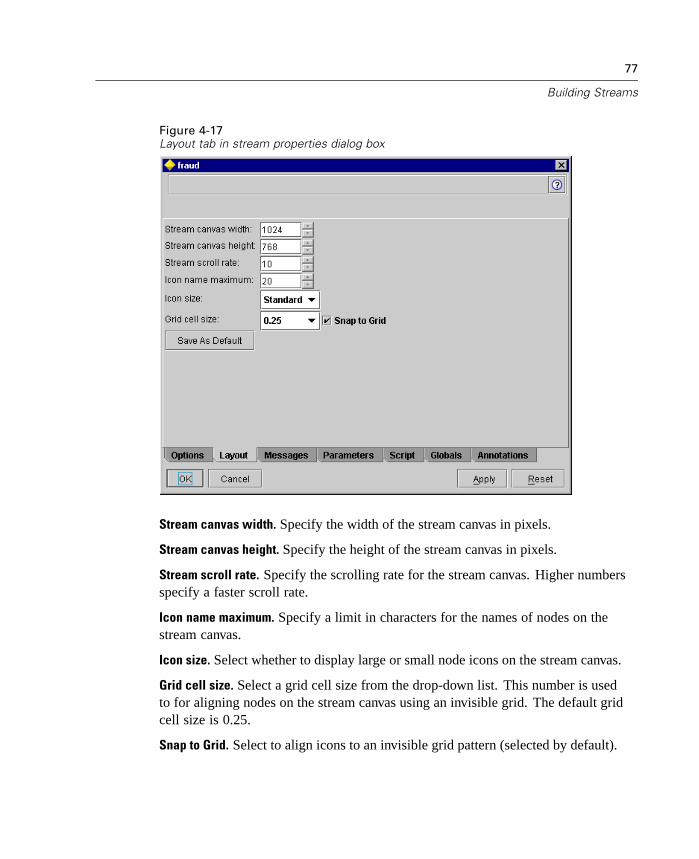
77
Building Streams
Figure 4-17Layout tab in stream properties dialog box
Stream canvas width. Specify the width of the stream canvas in pixels.
Stream canvas height. Specify the height of the stream canvas in pixels.
Stream scroll rate. Specify the scrolling rate for the stream canvas. Higher numbersspecify a faster scroll rate.
Icon name maximum. Specify a limit in characters for the names of nodes on thestream canvas.
Icon size. Select whether to display large or small node icons on the stream canvas.
Grid cell size. Select a grid cell size from the drop-down list. This number is usedto for aligning nodes on the stream canvas using an invisible grid. The default gridcell size is 0.25.
Snap to Grid. Select to align icons to an invisible grid pattern (selected by default).

78
Chapter 4
The options specified above apply only to the current stream. To set these options asthe default for all streams in Clementine, click Save As Default.
Viewing Stream Execution Messages
Messages regarding stream operations such as execution, time elapsed for modelbuilding, and optimization can be easily viewed using the Messages tab in the streamproperties dialog box. Error messages are also reported in this table.
To view stream messages:
E From the File menu, choose Stream Properties. Alternatively, from the Tools menu,choose:Stream
Messages
E Click the Messages tab in the stream properties dialog box.
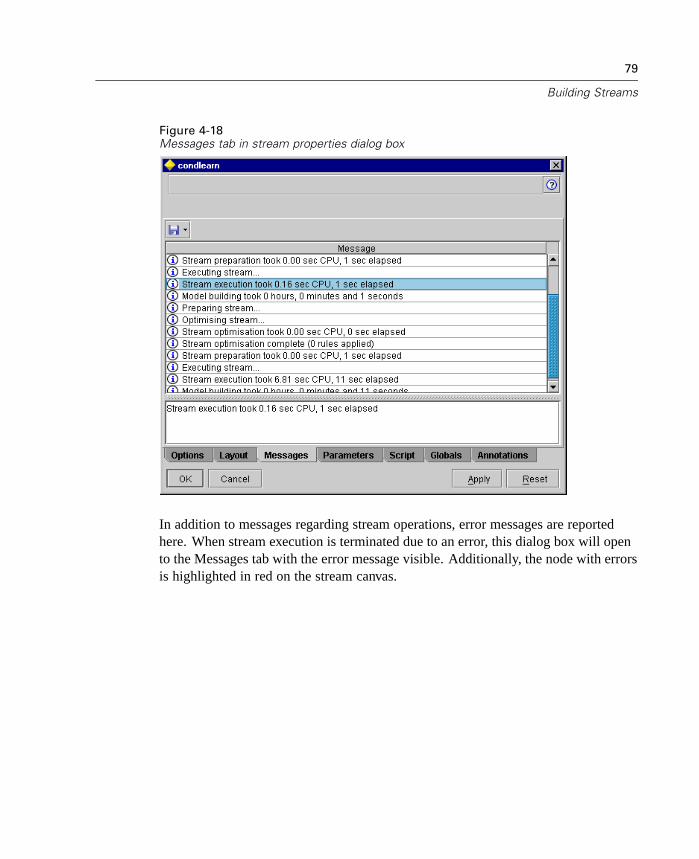
79
Building Streams
Figure 4-18Messages tab in stream properties dialog box
In addition to messages regarding stream operations, error messages are reportedhere. When stream execution is terminated due to an error, this dialog box will opento the Messages tab with the error message visible. Additionally, the node with errorsis highlighted in red on the stream canvas.

80
Chapter 4
Figure 4-19Stream execution with errors reported
You can save messages reported here for a stream by selecting Save Messages fromthe save button drop-down list on the Messages tab. You can also clear all messagesfor a given stream by selecting Clear All Messages from the save button drop-down list.
Viewing and Setting Stream Parameters
For each stream in Clementine, you have the ability to set user-defined variables,such as Minvalue, whose values can be specified when used in scripting or CLEMexpressions. These variables are called parameters. You can set parameters forstreams, sessions, and SuperNodes. Stream parameters are saved and loaded with thestream diagrams.
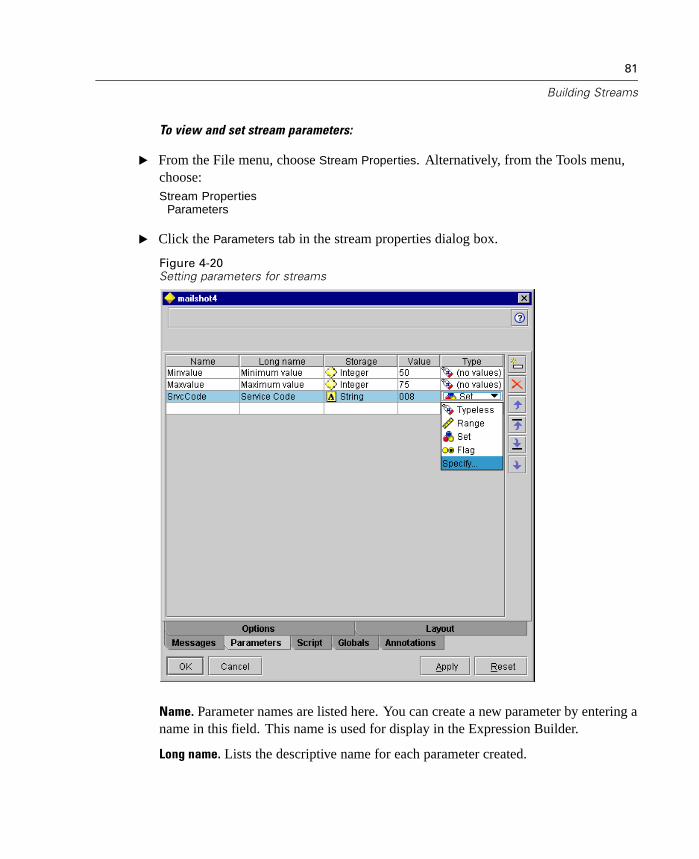
81
Building Streams
To view and set stream parameters:
E From the File menu, choose Stream Properties. Alternatively, from the Tools menu,choose:Stream Properties
Parameters
E Click the Parameters tab in the stream properties dialog box.
Figure 4-20Setting parameters for streams
Name. Parameter names are listed here. You can create a new parameter by entering aname in this field. This name is used for display in the Expression Builder.
Long name. Lists the descriptive name for each parameter created.
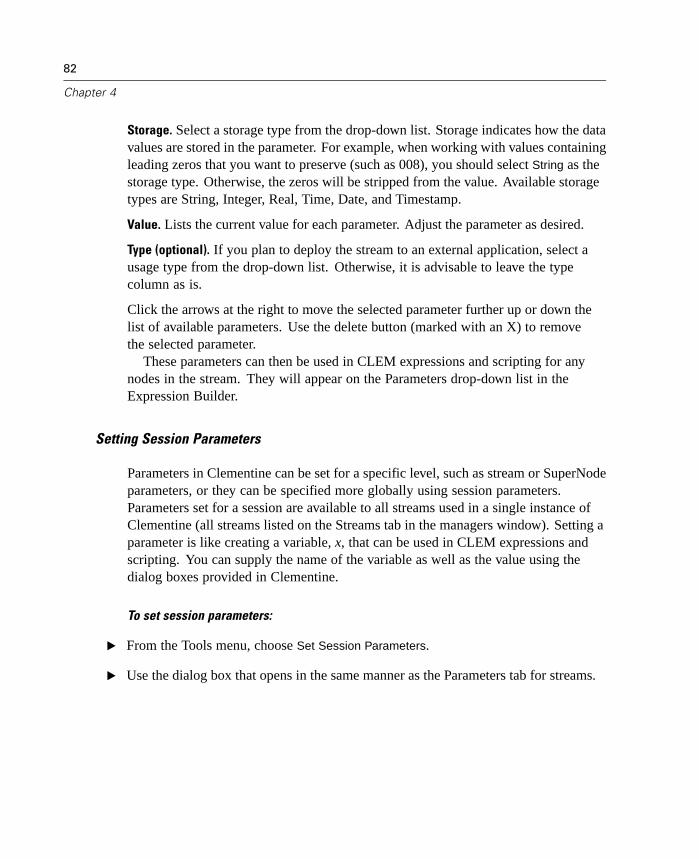
82
Chapter 4
Storage. Select a storage type from the drop-down list. Storage indicates how the datavalues are stored in the parameter. For example, when working with values containingleading zeros that you want to preserve (such as 008), you should select String as thestorage type. Otherwise, the zeros will be stripped from the value. Available storagetypes are String, Integer, Real, Time, Date, and Timestamp.
Value. Lists the current value for each parameter. Adjust the parameter as desired.
Type (optional). If you plan to deploy the stream to an external application, select ausage type from the drop-down list. Otherwise, it is advisable to leave the typecolumn as is.
Click the arrows at the right to move the selected parameter further up or down thelist of available parameters. Use the delete button (marked with an X) to removethe selected parameter.
These parameters can then be used in CLEM expressions and scripting for anynodes in the stream. They will appear on the Parameters drop-down list in theExpression Builder.
Setting Session Parameters
Parameters in Clementine can be set for a specific level, such as stream or SuperNodeparameters, or they can be specified more globally using session parameters.Parameters set for a session are available to all streams used in a single instance ofClementine (all streams listed on the Streams tab in the managers window). Setting aparameter is like creating a variable, x, that can be used in CLEM expressions andscripting. You can supply the name of the variable as well as the value using thedialog boxes provided in Clementine.
To set session parameters:
E From the Tools menu, choose Set Session Parameters.
E Use the dialog box that opens in the same manner as the Parameters tab for streams.
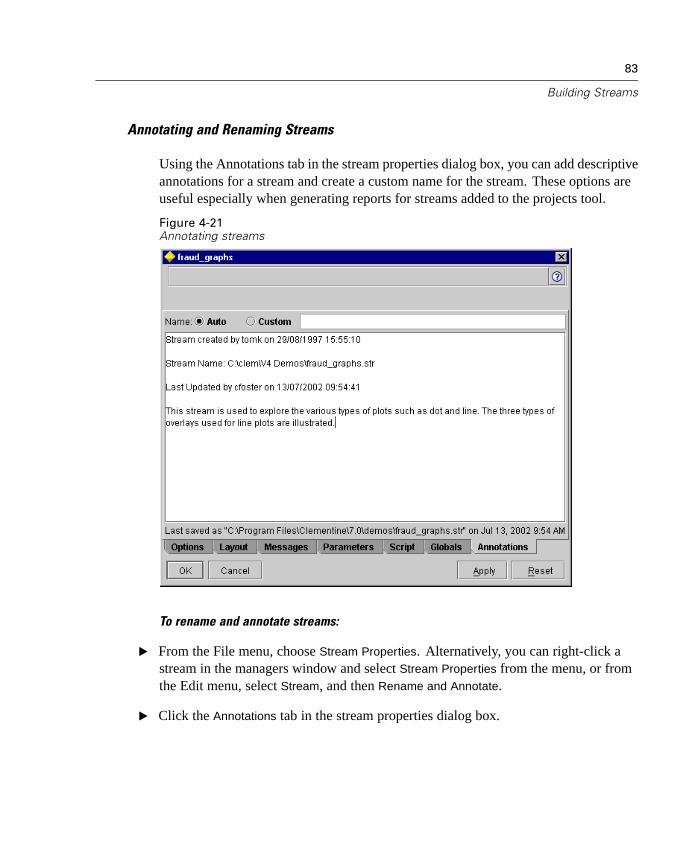
83
Building Streams
Annotating and Renaming Streams
Using the Annotations tab in the stream properties dialog box, you can add descriptiveannotations for a stream and create a custom name for the stream. These options areuseful especially when generating reports for streams added to the projects tool.
Figure 4-21Annotating streams
To rename and annotate streams:
E From the File menu, choose Stream Properties. Alternatively, you can right-click astream in the managers window and select Stream Properties from the menu, or fromthe Edit menu, select Stream, and then Rename and Annotate.
E Click the Annotations tab in the stream properties dialog box.

84
Chapter 4
E Select whether to use the auto-generated stream name, such as Stream1, Stream2,etc., or create a custom name using the text box.
E In the main text window, enter any descriptions and click OK or Apply.
Viewing Global Values for Streams
Using the Globals tab in the stream properties dialog box, you can view the globalvalues set for the current stream. Global values are created using a Set Globals nodeto determine statistics such as mean, sum, or standard deviation for selected fields.Once the Set Globals node is executed, these values are then available for a varietyof uses in stream operations.
To set global values for a stream:
E From the File menu, choose Stream Properties. Alternatively, from the Tools menu,choose:Stream Properties
Globals
E Click the Globals tab in the stream properties dialog box.
85
Building Streams
Figure 4-22Viewing global values available for the stream
Globals available. Available globals are listed in this table. You cannot edit globalvalues here, but you can clear all global values for a stream using the clear all valuesbutton to the right of the table.
Executing Streams
Once you have specified the desired options for streams and connected the desirednodes, you can execute the stream by running the data through nodes in the stream.There are several ways to execute a stream within Clementine:
You can select Execute from the Tools menu.
You can also execute your data streams by clicking one of the execute buttonson the toolbar. These buttons allow you to execute the entire stream or simplythe selected terminal node. For more information, see “Clementine Toolbars” inChapter 2 on page 26.
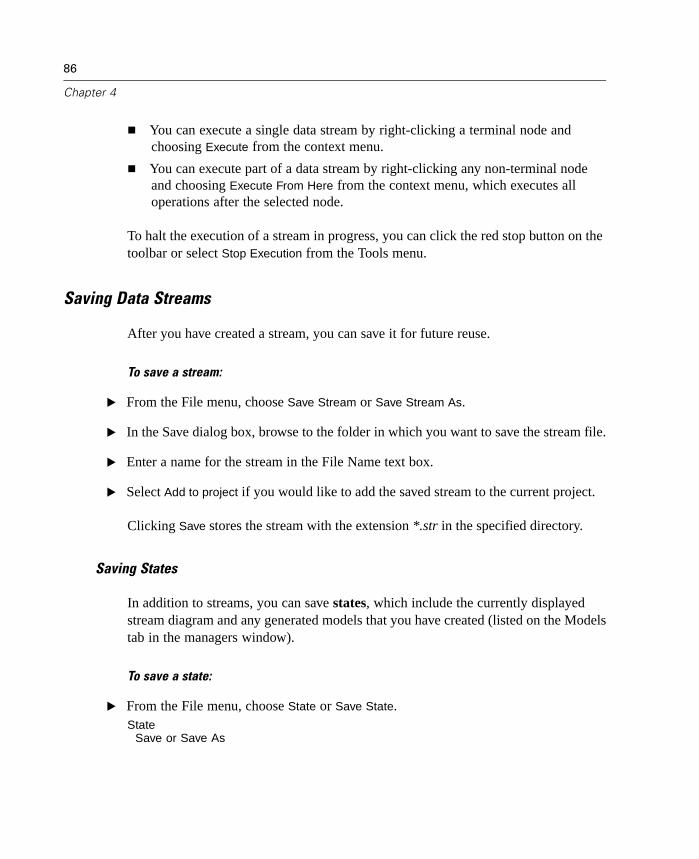
86
Chapter 4
You can execute a single data stream by right-clicking a terminal node andchoosing Execute from the context menu.
You can execute part of a data stream by right-clicking any non-terminal nodeand choosing Execute From Here from the context menu, which executes alloperations after the selected node.
To halt the execution of a stream in progress, you can click the red stop button on thetoolbar or select Stop Execution from the Tools menu.
Saving Data Streams
After you have created a stream, you can save it for future reuse.
To save a stream:
E From the File menu, choose Save Stream or Save Stream As.
E In the Save dialog box, browse to the folder in which you want to save the stream file.
E Enter a name for the stream in the File Name text box.
E Select Add to project if you would like to add the saved stream to the current project.
Clicking Save stores the stream with the extension *.str in the specified directory.
Saving States
In addition to streams, you can save states, which include the currently displayedstream diagram and any generated models that you have created (listed on the Modelstab in the managers window).
To save a state:
E From the File menu, choose State or Save State.State
Save or Save As
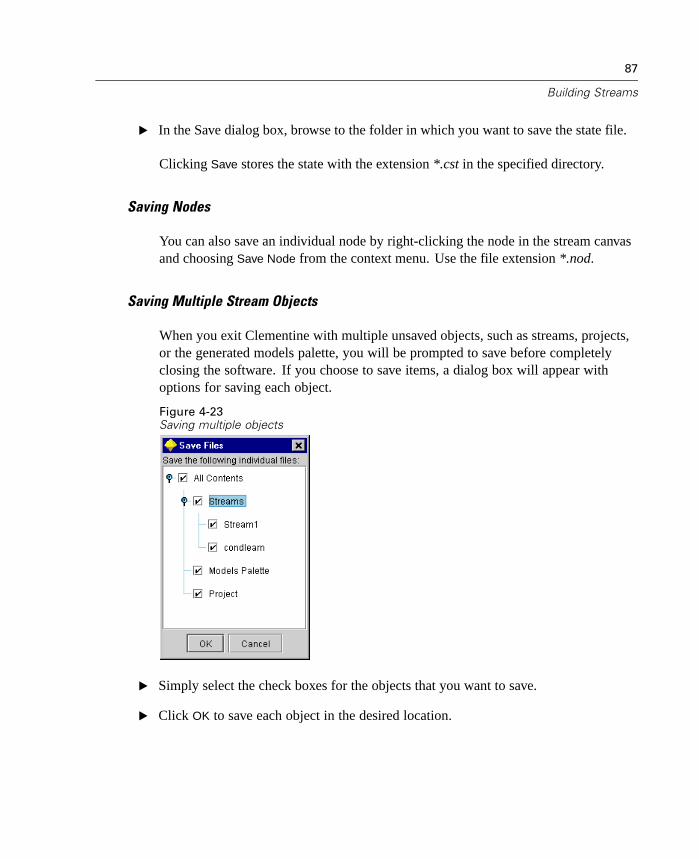
87
Building Streams
E In the Save dialog box, browse to the folder in which you want to save the state file.
Clicking Save stores the state with the extension *.cst in the specified directory.
Saving Nodes
You can also save an individual node by right-clicking the node in the stream canvasand choosing Save Node from the context menu. Use the file extension *.nod.
Saving Multiple Stream Objects
When you exit Clementine with multiple unsaved objects, such as streams, projects,or the generated models palette, you will be prompted to save before completelyclosing the software. If you choose to save items, a dialog box will appear withoptions for saving each object.
Figure 4-23Saving multiple objects
E Simply select the check boxes for the objects that you want to save.
E Click OK to save each object in the desired location.

88
Chapter 4
You will then be prompted with a standard Save dialog box for each object. After youhave finished saving, the application will close as originally instructed.
Loading Files
You can reload a number of saved objects in Clementine.
Streams (.str)
States (.cst)
Models (.gm)
Models palette (.gen)
Nodes (.nod)
Output (.cou)
Projects (.cpj)
Opening New Files
Streams can be loaded directly from the File menu:
E From the File menu, choose Open Stream.
All other file types can be opened using the submenu items available from the Filemenu. For example, to load a model, from the File menu, choose:Models
Open Model or Load Models Palette
When loading streams created with earlier versions of Clementine, some nodes maybe out of date. In some cases, the nodes will be automatically updated, and in othersyou will need to convert them using a utility.
The Cache File node has been replaced by the SPSS Import node. Any streamsthat you load containing Cache File nodes will be replaced by SPSS Import nodes.
The Build Rule node has been replaced by the C&R Tree node. Any streams thatyou load containing Build Rule nodes will be replaced by C&R Tree nodes.
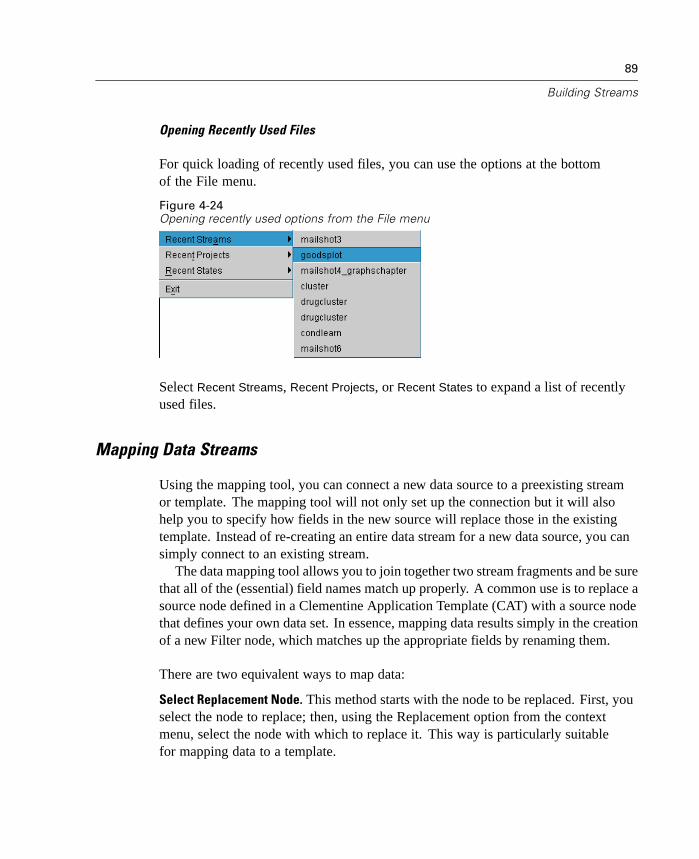
89
Building Streams
Opening Recently Used Files
For quick loading of recently used files, you can use the options at the bottomof the File menu.
Figure 4-24Opening recently used options from the File menu
Select Recent Streams, Recent Projects, or Recent States to expand a list of recentlyused files.
Mapping Data Streams
Using the mapping tool, you can connect a new data source to a preexisting streamor template. The mapping tool will not only set up the connection but it will alsohelp you to specify how fields in the new source will replace those in the existingtemplate. Instead of re-creating an entire data stream for a new data source, you cansimply connect to an existing stream.
The data mapping tool allows you to join together two stream fragments and be surethat all of the (essential) field names match up properly. A common use is to replace asource node defined in a Clementine Application Template (CAT) with a source nodethat defines your own data set. In essence, mapping data results simply in the creationof a new Filter node, which matches up the appropriate fields by renaming them.
There are two equivalent ways to map data:
Select Replacement Node. This method starts with the node to be replaced. First, youselect the node to replace; then, using the Replacement option from the contextmenu, select the node with which to replace it. This way is particularly suitablefor mapping data to a template.

90
Chapter 4
Map to. This method starts with the node to be introduced to the stream. First, selectthe node to introduce; then, using the Map option from the context menu, select thenode to which it should join. This way is particularly useful for mapping to a terminalnode. Note: You cannot map to Merge or Append nodes. Instead, you should simplyconnect the stream to the Merge node in the normal manner.
Figure 4-25Selecting data mapping options
In contrast to earlier versions of Clementine, data mapping is now tightly integratedinto stream building, and if you try to connect to a node that already has a connection,you will be offered the option of replacing the connection or mapping to that node.
Mapping Data to a Template
To replace the data source for a template stream with a new source node bringingyour own data into Clementine, you should use the Select Replacement Node optionfrom the Data Mapping context menu option. This option is available for all nodesexcept Merge, Aggregate, and all terminal nodes. Using the data mapping tool toperform this action helps ensure that fields are matched properly between the existingstream operations and the new data source. The following steps provide an overviewof the data mapping process.

91
Building Streams
Step 1: Specify Essential Fields in the original source node. In order for streamoperations to execute properly, essential fields should be specified. In most cases,this step is completed by the template author. For more information, see “SpecifyingEssential Fields” on page 93.
Step 2: Add new data source to the stream canvas. Using one of Clementine's sourcenodes, bring in the new replacement data.
Step 3: Replace the template source node. Using the Data Mapping options on thecontext menu for the template source node, choose Select Replacement Node. Thenselect the source node for the replacement data.
Figure 4-26Selecting a replacement source node
Step 4: Check mapped fields. In the dialog box that opens, check that the softwareis mapping fields properly from the replacement data source to the stream. Anyunmapped essential fields are displayed in red. These fields are used in streamoperations and must be replaced with a similar field in the new data source in order fordownstream operations to function properly. For more information, see “ExaminingMapped Fields” on page 94.
After using the dialog box to ensure that all essential fields are properly mapped,the old data source is disconnected and the new data source is connected to thetemplate stream using a Filter node called Map. This Filter node directs the actualmapping of fields in the stream. An Unmap Filter node is also included on the streamcanvas. The Unmap Filter node can be used to reverse field name mapping by addingit to the stream. It will undo the mapped fields, but note that you will have to edit anydownstream terminal nodes to reselect the fields and overlays.
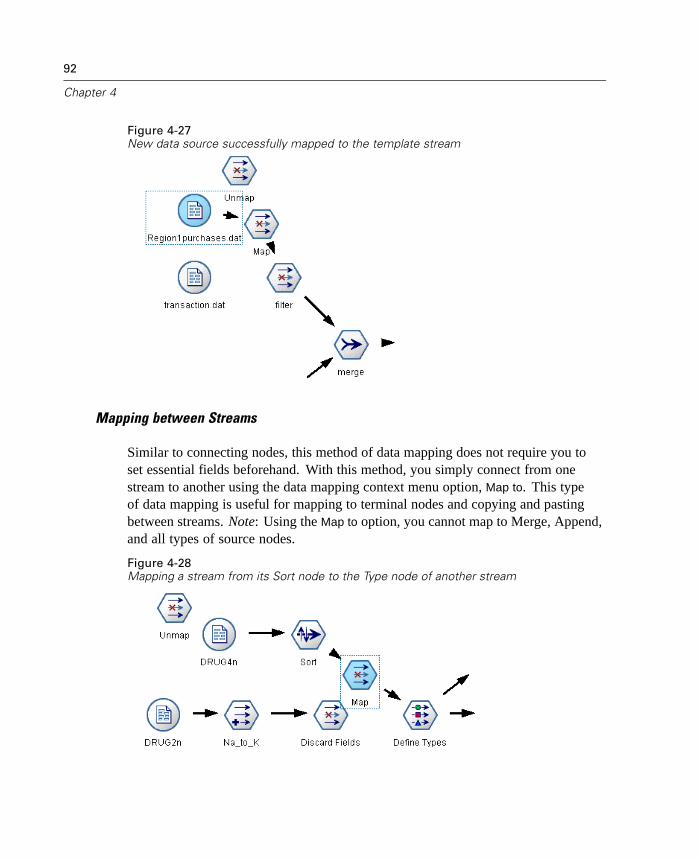
92
Chapter 4
Figure 4-27New data source successfully mapped to the template stream
Mapping between Streams
Similar to connecting nodes, this method of data mapping does not require you toset essential fields beforehand. With this method, you simply connect from onestream to another using the data mapping context menu option, Map to. This typeof data mapping is useful for mapping to terminal nodes and copying and pastingbetween streams. Note: Using the Map to option, you cannot map to Merge, Append,and all types of source nodes.
Figure 4-28Mapping a stream from its Sort node to the Type node of another stream
93
Building Streams
To map data between streams:
E Right-click the node that you want to use for connecting to the new stream.
E From the context menu, select:Data mapping
Map to
E Use the cursor to select a destination node on the target stream.
E In the dialog box that opens, ensure that fields are properly matched and click OK.
Specifying Essential Fields
When mapping to a template, essential fields will typically be specified by thetemplate author. These essential fields indicate whether a particular field is used indownstream operations. For example, the existing stream may build a model that usesa field called Churn. In this stream, Churn is an essential field because you could notbuild the model without it. Likewise, fields used in manipulation nodes, such as aDerive node, are necessary to derive the new field. Explicitly setting such fields asessential helps to ensure that the proper fields in the new source node are mapped tothem. If mandatory fields are not mapped, you will receive an error message. If youdecide that certain manipulations or output nodes are unnecessary, you can delete thenodes from the stream and remove the appropriate fields from the Essential Fields list.
Note: In general, template streams in the Solutions Template Library already haveessential fields specified.
To set essential fields:
E Right-click on the source node of the template stream that will be replaced.
E From the context menu, select Specify Essential Fields.

94
Chapter 4
Figure 4-29Specifying Essential Fields dialog box
E Using the Field Chooser, you can add or remove fields from the list. To open the FieldChooser, click the icon to the right of the fields list.
Examining Mapped Fields
Once you have selected the point at which one data stream or data source will bemapped to another, a dialog box opens for you to select fields for mapping or toensure that the system default mapping is correct. If essential fields have been set forthe stream or data source and they are unmatched, these fields are displayed in red.Any unmapped fields from the data source will pass through the Filter node unaltered,but note that you can map non-essential fields as well.
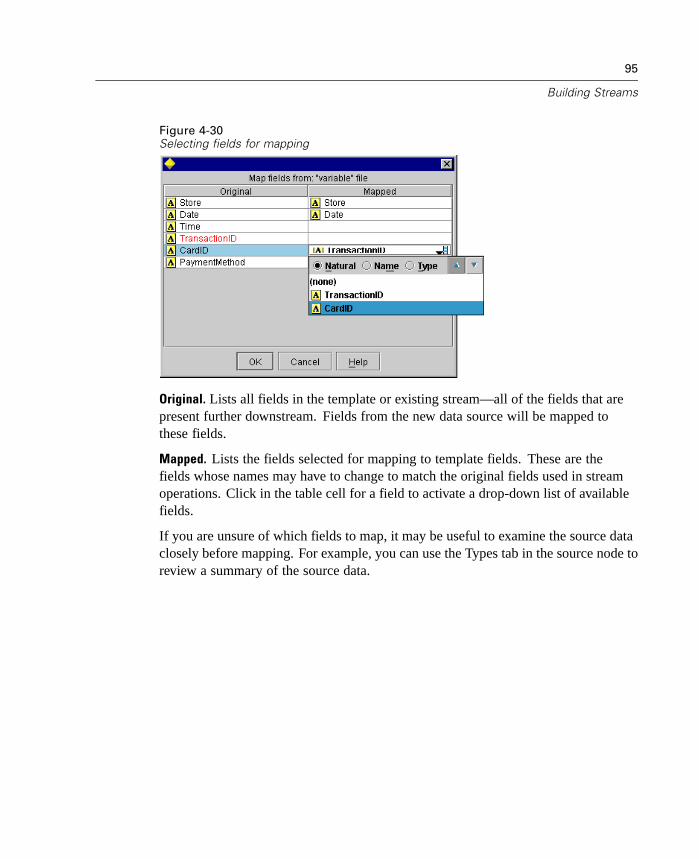
95
Building Streams
Figure 4-30Selecting fields for mapping
Original. Lists all fields in the template or existing stream—all of the fields that arepresent further downstream. Fields from the new data source will be mapped tothese fields.
Mapped. Lists the fields selected for mapping to template fields. These are thefields whose names may have to change to match the original fields used in streamoperations. Click in the table cell for a field to activate a drop-down list of availablefields.
If you are unsure of which fields to map, it may be useful to examine the source dataclosely before mapping. For example, you can use the Types tab in the source node toreview a summary of the source data.

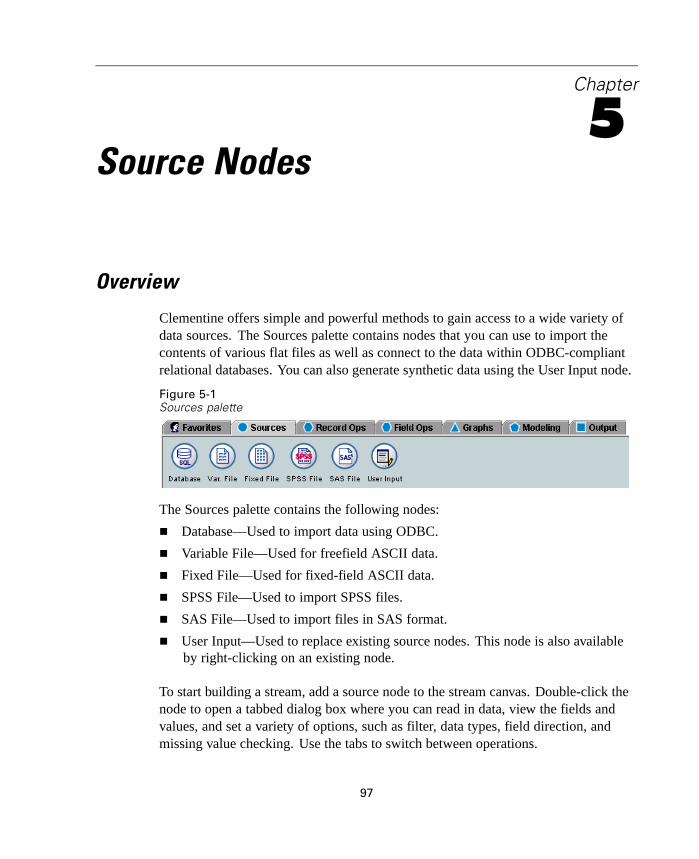
Chapter
5Source Nodes
Overview
Clementine offers simple and powerful methods to gain access to a wide variety ofdata sources. The Sources palette contains nodes that you can use to import thecontents of various flat files as well as connect to the data within ODBC-compliantrelational databases. You can also generate synthetic data using the User Input node.
Figure 5-1Sources palette
The Sources palette contains the following nodes:
Database—Used to import data using ODBC.
Variable File—Used for freefield ASCII data.
Fixed File—Used for fixed-field ASCII data.
SPSS File—Used to import SPSS files.
SAS File—Used to import files in SAS format.
User Input—Used to replace existing source nodes. This node is also availableby right-clicking on an existing node.
To start building a stream, add a source node to the stream canvas. Double-click thenode to open a tabbed dialog box where you can read in data, view the fields andvalues, and set a variety of options, such as filter, data types, field direction, andmissing value checking. Use the tabs to switch between operations.
97
98
Chapter 5
On the File tab, each type of source node has unique options for accessing data.These options are discussed in the topics below. Additional tabs, such as Data, Filter,Type, and Annotations, are common to all source nodes and are discussed towardthe end of this chapter. For more information, see “Common Source Node Tabs”on page 119.
Variable File Node
You can use Variable File nodes to read data from freefield text files (files whoserecords contain a constant number of fields but a varied number of characters). Thistype of node is also useful for files with fixed-length header text and certain types ofannotations.
During the execution of a stream, the Variable File node first tries to read the file.If the file does not exist or you do not have permission to read it, an error will occurand the execution will end. If there are no problems opening the file, records will beread one at a time and passed through the stream until the entire file is read.
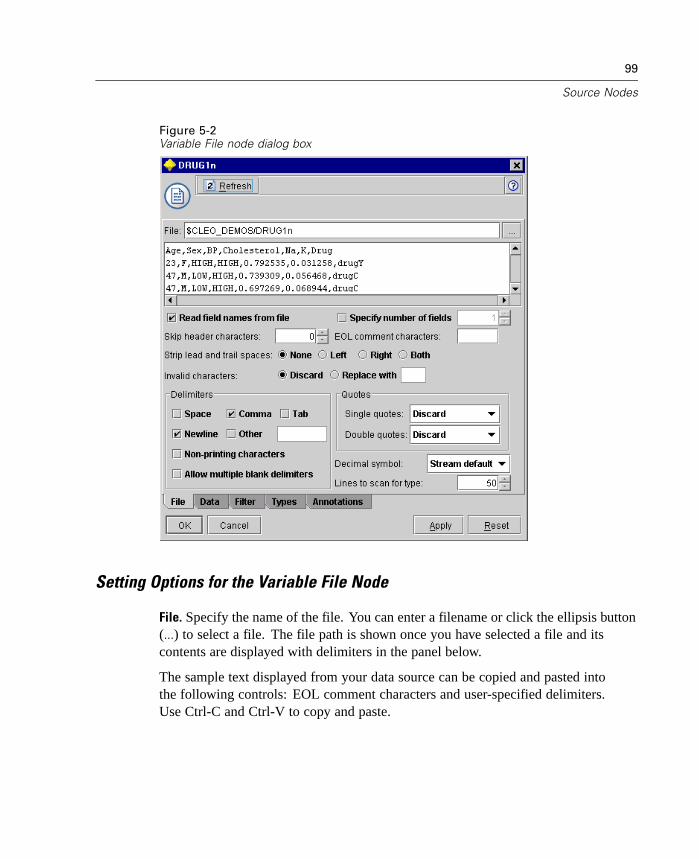
99
Source Nodes
Figure 5-2Variable File node dialog box
Setting Options for the Variable File Node
File. Specify the name of the file. You can enter a filename or click the ellipsis button(...) to select a file. The file path is shown once you have selected a file and itscontents are displayed with delimiters in the panel below.
The sample text displayed from your data source can be copied and pasted intothe following controls: EOL comment characters and user-specified delimiters.Use Ctrl-C and Ctrl-V to copy and paste.
100
Chapter 5
Read field names from file. Selected by default, this option treats the first row inthe data file as labels for the column. If your first row is not a header, deselect toautomatically give each field a generic name, such as Field1, Field2, for the numberof fields in the data set.
Specify number of fields. Specify the number of fields in each record. Clementinecan detect the number of fields automatically as long as the records are new-lineterminated. You can also set a number manually.
Skip header characters. Specify how many characters you want to ignore at thebeginning of the first record.
EOL comment characters. Specify characters, such as # or !, to indicate annotations inthe data. Wherever one of these characters appears in the data file, everything up tobut not including the next new-line character will be ignored.
Strip lead and trail spaces. Select options for discarding leading and trailing spaces instrings on import.
Invalid characters. Select Discard to remove invalid characters from the data input.Select Replace with to replace invalid characters with the specified symbol (onecharacter only). Invalid characters are null (0) characters or any character that doesnot exist in the server's encoding.
Delimiters. Using the check boxes listed for this control, you can specify whichcharacters, such as the comma (,), define field boundaries in the file. You can alsospecify more than one delimiter, such as “, |” for records that use multiple delimiters.The default delimiter is the comma.
Select Allow multiple blank delimiters to treat multiple adjacent blank delimitercharacters as a single delimiter. For example, if one data value is followed byfour spaces and then another data value, this group would be treated as two fieldsrather than five.
Quotes. Using the drop-down lists for this control, you can specify how single anddouble quotation marks are treated on import. You can choose to Discard all quotationmarks, Include as text by including them in the field value, or Pair and discard to matchpairs of quotation marks and remove them. If a quotation mark is unmatched, youwill receive an error message. Both Discard and Pair and discard store the field value(without quotation marks) as a string.
101
Source Nodes
Decimal symbol. Select the type of decimal separator used in your data source. TheStream default is the character selected from the Options tab of the stream propertiesdialog box. Otherwise, select either Period(.) or Comma(,) to read all data in this dialogbox using the chosen character as the decimal separator.
Lines to scan for type. Specify how many lines to scan for specified data types.
At any point when working in this dialog box, click Refresh to reload fields from thedata source. This is useful when altering data connections to the source node or whenworking between tabs on the dialog box.
Fixed File Node
You can use Fixed File nodes to import data from fixed-field text files (files whosefields are not delimited but start at the same position and are of a fixed length).Machine-generated or legacy data is frequently stored in fixed-field format. Usingthe File tab of the Fixed File node, you can easily specify the position and length ofcolumns in your data.
Setting Options for the Fixed File Node
The File tab of the Fixed File node allows you to bring data into Clementine andspecify the position of columns and length of records. Using the data preview pane inthe center of the dialog box, you can click to add arrows specifying the breakpointsbetween fields.

102
Chapter 5
Figure 5-3Specifying columns in fixed-field data
File. Specify the name of the file. You can enter a filename or click the ellipsis button(...) to select a file. The file path is shown once you have selected a file and itscontents are displayed with delimiters in the panel below.
The data preview pane can be used to specify column position and length. The rulerat the top of the preview window helps measure the length of variables and specifythe breakpoint between them. You can specify breakpoint lines by clicking in theruler area above the fields. Breakpoints can be moved by dragging and discardedby dragging them outside of the data preview region.
103
Source Nodes
Each breakpoint line automatically adds a new field to the fields table below.
Start positions indicated by the arrows are automatically added to the Startcolumn in the table below.
Line oriented. Select if you want to skip the new-line character at the end of eachrecord.
Skip header lines. Specify how many lines you want to ignore at the beginning of thefirst record. This is useful for ignoring column headers.
Record length. Specify the number of characters in each record.
Decimal symbol. Select the type of decimal separator used in your data source. TheStream default is the character selected from the Options tab of the stream propertiesdialog box. Otherwise, select either Period(.) or Comma(,) to read all data in this dialogbox using the chosen character as the decimal separator.
Field. All fields you have defined for this data file are listed here. There are twoways to define fields:
Specify fields interactively using the data preview pane above.
Specify fields manually by adding empty field rows to the table below. Click thebutton to the right of the fields pane to add new fields. Then, in the empty field,enter a Field name, a Start position and a Length. These options will automaticallyadd arrows to the data preview pane, which can be easily adjusted.
To remove a previously defined field, select the field in the list and click the reddelete button.
Start. Specify the position of the first character in the field. For example, if thesecond field of a record begins on the sixteenth character, you would enter 16 asthe starting point.
Length. Specify how many characters are in the longest value for each field. Thisdetermines the cutoff point for the next field.
Strip lead and trail spaces. Select to discard leading and trailing spaces in strings onimport.
Invalid characters. Select Discard to remove invalid characters from the data input.Select Replace with to replace invalid characters with the specified symbol (onecharacter only). Invalid characters are null (0) characters or any character that doesnot exist in the server's encoding.

104
Chapter 5
Lines to scan for type. Specify how many lines to scan for specified data types.
At any point while working in this dialog box, click Refresh to reload fields from thedata source. This is useful when altering data connections to the source node or whenworking between tabs on the dialog box.
Setting Data Storage for Text Fields
The options on the Data tab, common to both Fixed File and Variable File sourcenodes, allow you to change the storage type for the data fields read into Clementine.In earlier versions of Clementine, data storage was editable only by manipulating thedata type. In this release, you can manipulate data storage and data type separately.
Data storage describes the way data is stored in a field. For example, a fieldwith values 1 and 0 is an integer. Other storage types used in Clementine areReal, String, Time, Date, and Timestamp. The Data tab allows you to changethe data storage type. You can also convert storage for a field using a variety ofconversion functions, such as to_string and to_integer, in a Filler node. Thesefunctions are also available from the Derive node for temporary conversionduring a derive calculation.
Data type is a way of describing the intended use of the data in a given field. Itis frequently referred to as usage type. For example, you may want to set thetype for an integer field with values 1 and 0 to a flag. This usually indicates that1=True and 0=False. When preparing and modeling data, it is often criticalthat you know the data type for fields of interest. The Types tab in all sourcenodes allows you to alter the data type. For more information, see “Setting DataTypes in the Source Node” on page 119.
Using the Data Storage Table
Using the table available on the Data tab, you can perform the following tasksrelated to data storage.
Use the Fields column to view fields for the current data set.
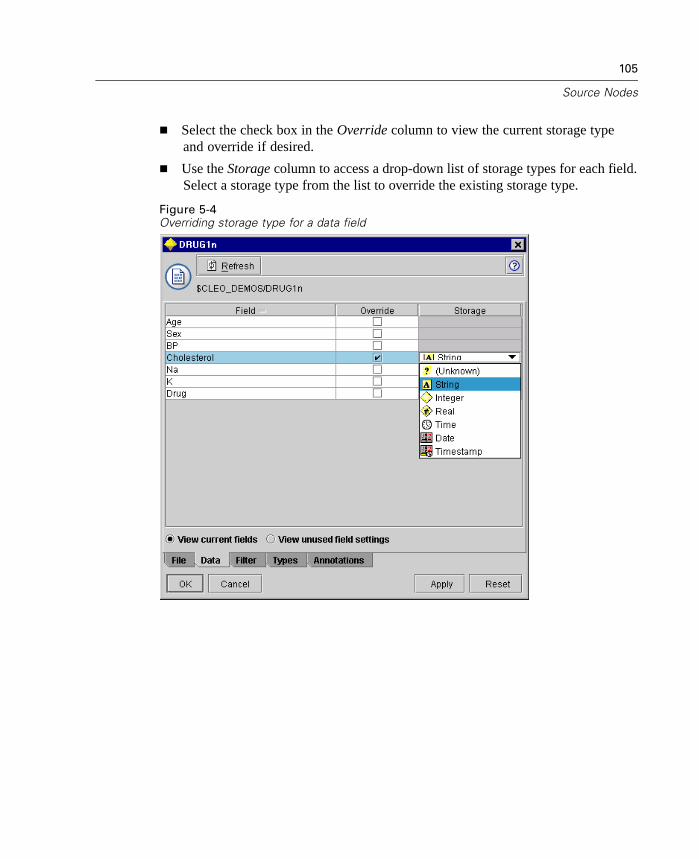
105
Source Nodes
Select the check box in the Override column to view the current storage typeand override if desired.
Use the Storage column to access a drop-down list of storage types for each field.Select a storage type from the list to override the existing storage type.
Figure 5-4Overriding storage type for a data field
106
Chapter 5
Additional Options
Several other options can be specified using the Data tab:
To view storage settings for data that is no longer connected through the currentnode (train data, for example), select View unused field settings. You can clearthe legacy fields by clicking Clear.
At any point while working in this dialog box, click Refresh to reload fields fromthe data source. This is useful when altering data connections to the source nodeor when working between tabs on the dialog box.
Database Node
If you have ODBC (Open Database Connectivity), you can import data from a varietyof other packages, including Excel, MS Access, dBASE, SAS (NT version only),Oracle, and Sybase, using the ODBC source node. For information about installingODBC drivers, see the documentation included on the Clementine CD-ROM. Youshould begin by reading Getting Started with SPSS Data Access Technology.pdfin the Installation Documents folder.
Use the following general steps to access data from a database:
E In the Database node dialog box, connect to a database using Table mode or SQLQuery mode.
E Select a table from the database.
E Using the tabs in the Database node dialog box, you can alter usage types andfilter data fields.
These steps are described in more detail in the next several topics.
Setting Database Node Options
You can use the options on the Data tab of the Database node dialog box to gainaccess to a database and read data from the selected table.

107
Source Nodes
Figure 5-5Loading data by selecting a table
Mode. Select Table to connect to a table using the dialog box controls. Select SQL
Query to query the database selected below using SQL.
Data source. For both Table and SQL Query modes, you can enter a name in the Datasource field or select Add new database connection from the drop-down list.
The following options are used to connect to a database and select a table using thedialog box:
Table name. If you know the name of the table you would like to access, enter it inthe Table name field. Otherwise, click the Select button to open a dialog box listingavailable tables.
Strip lead and trail spaces. Select options for discarding leading and trailing spaces instrings.
Quote table and column names. Specify whether you want table and column names tobe enclosed in quotation marks when queries are sent to the database (if, for example,they contain spaces or punctuation).
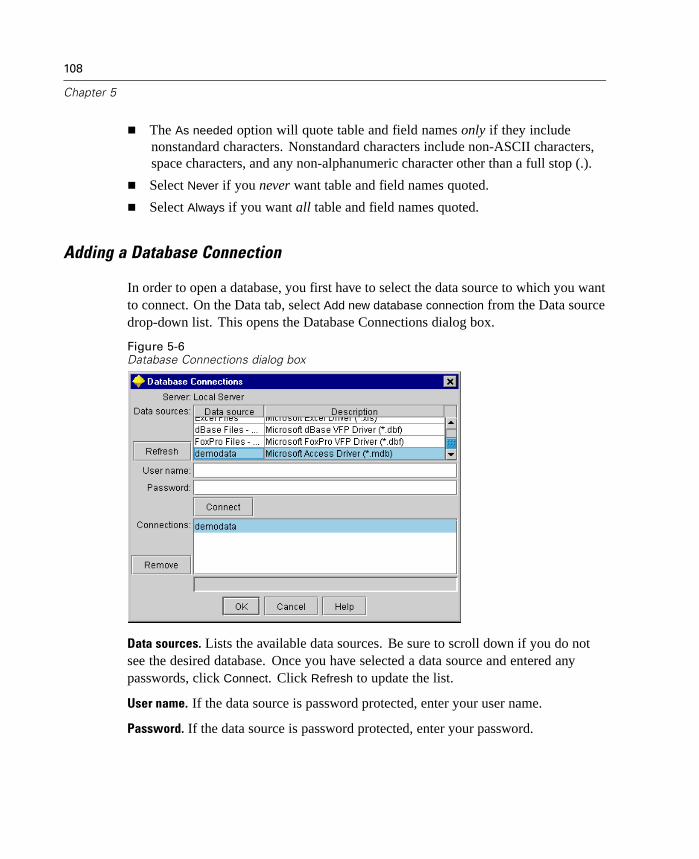
108
Chapter 5
The As needed option will quote table and field names only if they includenonstandard characters. Nonstandard characters include non-ASCII characters,space characters, and any non-alphanumeric character other than a full stop (.).
Select Never if you never want table and field names quoted.
Select Always if you want all table and field names quoted.
Adding a Database Connection
In order to open a database, you first have to select the data source to which you wantto connect. On the Data tab, select Add new database connection from the Data sourcedrop-down list. This opens the Database Connections dialog box.
Figure 5-6Database Connections dialog box
Data sources. Lists the available data sources. Be sure to scroll down if you do notsee the desired database. Once you have selected a data source and entered anypasswords, click Connect. Click Refresh to update the list.
User name. If the data source is password protected, enter your user name.
Password. If the data source is password protected, enter your password.

109
Source Nodes
Connections. Shows currently connected databases. To remove connections, selectone from the list and click Remove.
Once you have completed your selections, click OK to return to the main dialog boxand select a table from the currently connected database.
Selecting a Database Table
After you have connected to a data source, you can choose to import fields from aspecific table or view. From the Data tab of the Database dialog box, you can eitherenter the name of a table in the Table name field or click Select to open a dialog boxlisting the available tables and views.
Figure 5-7Selecting a table from the currently connected database
Show table owner. Select if a data source requires that the owner of a table must bespecified before you can access the table. Deselect this option for data sources thatdo not have this requirement.
Note: SAS and Oracle databases usually require you to show the table owner.
Tables/Views. Select the table or view to import.
110
Chapter 5
Show. Lists the columns in the data source to which you are currently connected.Click one of the following options to customize your view of the available tables:
Click User Tables to view ordinary database tables created by database users.
Click System Tables to view database tables owned by the system (such as tablesthat provide information about the database, like details of indexes). This optionis necessary to view the tabs used in Excel databases.
Click Views to view virtual tables based on a query involving one or moreordinary tables.
Click Synonyms to view synonyms created in the database for any existing tables.
Querying the Database
Once you have connected to a data source, you can choose to import fields using anSQL query. From the main dialog box, select SQL Query as the connection mode.This adds a query editor window in the dialog box. Using the query editor, you cancreate or load an SQL query whose result set will be read into the data stream. Tocancel and close the query editor window, select Table as the connection mode.
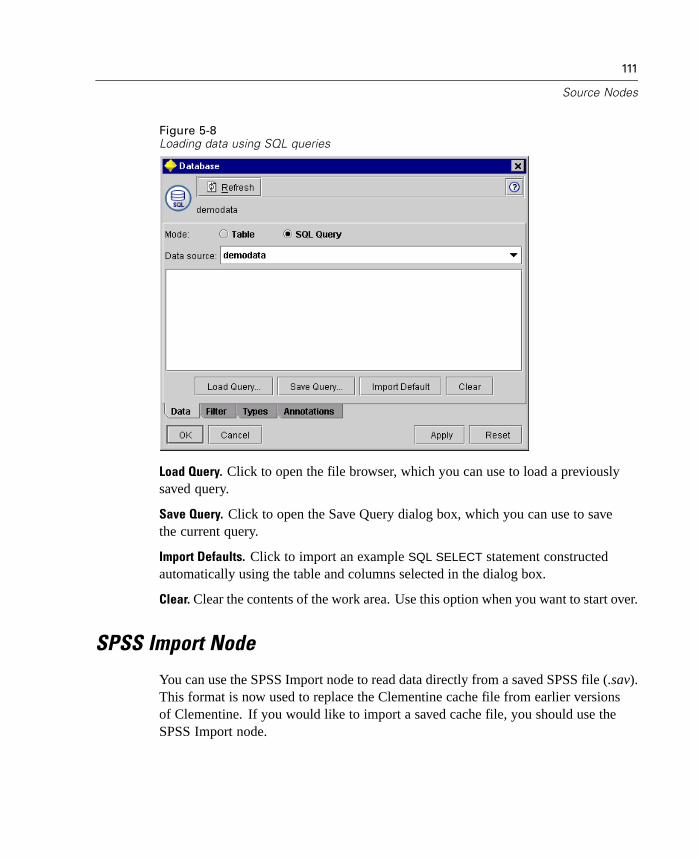
111
Source Nodes
Figure 5-8Loading data using SQL queries
Load Query. Click to open the file browser, which you can use to load a previouslysaved query.
Save Query. Click to open the Save Query dialog box, which you can use to savethe current query.
Import Defaults. Click to import an example SQL SELECT statement constructedautomatically using the table and columns selected in the dialog box.
Clear. Clear the contents of the work area. Use this option when you want to start over.
SPSS Import Node
You can use the SPSS Import node to read data directly from a saved SPSS file (.sav).This format is now used to replace the Clementine cache file from earlier versionsof Clementine. If you would like to import a saved cache file, you should use theSPSS Import node.
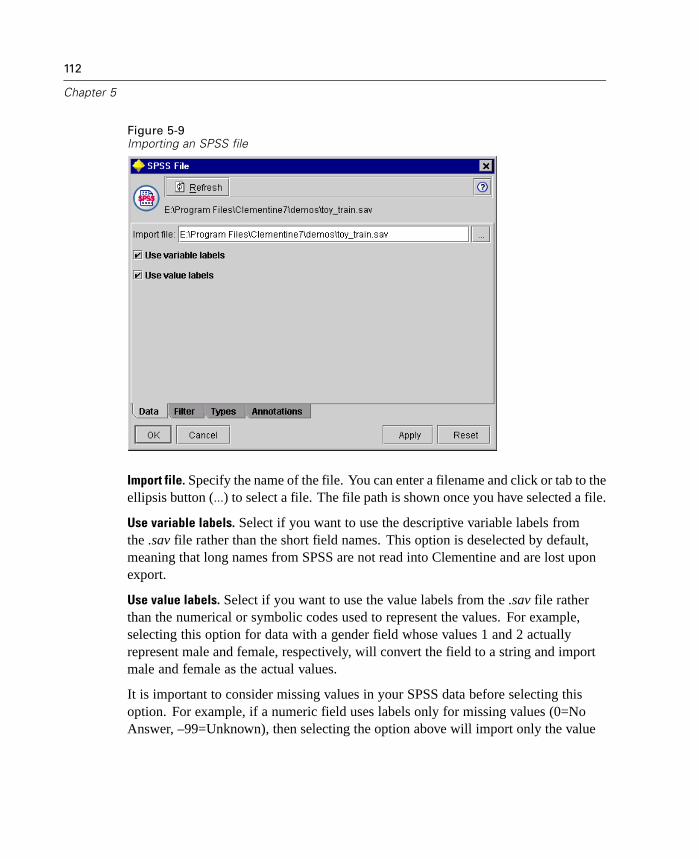
112
Chapter 5
Figure 5-9Importing an SPSS file
Import file. Specify the name of the file. You can enter a filename and click or tab to theellipsis button (...) to select a file. The file path is shown once you have selected a file.
Use variable labels. Select if you want to use the descriptive variable labels fromthe .sav file rather than the short field names. This option is deselected by default,meaning that long names from SPSS are not read into Clementine and are lost uponexport.
Use value labels. Select if you want to use the value labels from the .sav file ratherthan the numerical or symbolic codes used to represent the values. For example,selecting this option for data with a gender field whose values 1 and 2 actuallyrepresent male and female, respectively, will convert the field to a string and importmale and female as the actual values.
It is important to consider missing values in your SPSS data before selecting thisoption. For example, if a numeric field uses labels only for missing values (0=NoAnswer, –99=Unknown), then selecting the option above will import only the value

113
Source Nodes
labels No Answer and Unknown and will convert the field to a string. In such cases,you should import the values themselves and set missing values in a Type node.
SAS Import Node
The SAS Import node allows you to bring SAS data into your data mining session.You can import four types of files:
SAS for Windows/OS2 (.sd2)
SAS for UNIX (.ssd)
SAS Transport File (.tpt)
SAS version 7/8 (.sas7bdat)
When the data are imported, all variables are kept and no variable types are changed.All cases are selected.
Figure 5-10Importing a SAS file
114
Chapter 5
Setting Options for the SAS Import Node
Import. Select which type of SAS file to transport. You can choose SAS for
Windows/OS2 (.sd2), SAS for UNIX (.SSD), SAS Transport File (.tpt), or SAS Version 7/8
(.sas7bdat).
Import file. Specify the name of the file. You can enter a filename or click the ellipsisbutton (...) to browse to the file's location.
Member. Select a member to import from the SAS transport file selected above. Youcan enter a member name or click Select to browse through all members in the file.
Read user formats from a SAS data file. Select to read user formats. SAS files store dataand data formats (such as variable labels) in different files. Most often, you will wantto import the formats as well. If you have a large data set, however, you may wantto deselect this option to save memory.
Format file. If a format file is required, this text box is activated. You can enter afilename or click the ellipsis button (...) to browse to the file's location.
Use variable label headings. Select to use the descriptive variable labels from the SASformat file rather than the short field names. This option is deselected by default.
User Input Node
The User Input node provides an easy way for you to create synthetic data—eitherfrom scratch or by altering existing data. This is useful, for example, when you wantto create a test data set for modeling.
Creating Data from Scratch
The User Input node is available from the Sources node palette and can be addeddirectly to the stream canvas.
E Click the Sources tab of the nodes palette.
E Drag and drop or double-click to add the User Input node to the stream canvas.
E Double-click to open its dialog box and specify fields and values.

115
Source Nodes
Note: User Input nodes that are selected from the Sources palette will be completelyblank, with no fields and no data information. This enables you to create syntheticdata entirely from scratch.
Generating Data from an Existing Data Source
You can also generate a User Input node from any non-terminal node in the stream:
E Decide at which point in the stream you want to replace a node.
E Right-click on the node that will feed its data into the User Input node and selectGenerate User Input Node from the menu.
E The User Input node appears with all downstream processes attached to it, replacingthe existing node at that point in your data stream. When generated, the node inheritsall of the data structure and field type information (if available) from the metadata.
Note: If data have not been run through all nodes in the stream, then the nodes arenot fully instantiated, meaning that storage and data values may not be availablewhen replacing with a User Input node.
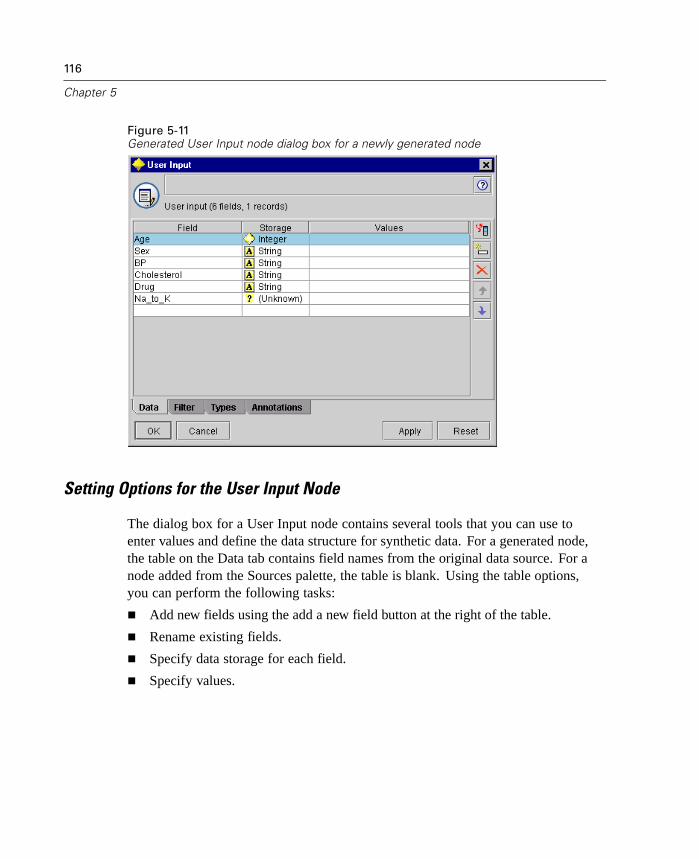
116
Chapter 5
Figure 5-11Generated User Input node dialog box for a newly generated node
Setting Options for the User Input Node
The dialog box for a User Input node contains several tools that you can use toenter values and define the data structure for synthetic data. For a generated node,the table on the Data tab contains field names from the original data source. For anode added from the Sources palette, the table is blank. Using the table options,you can perform the following tasks:
Add new fields using the add a new field button at the right of the table.
Rename existing fields.
Specify data storage for each field.
Specify values.
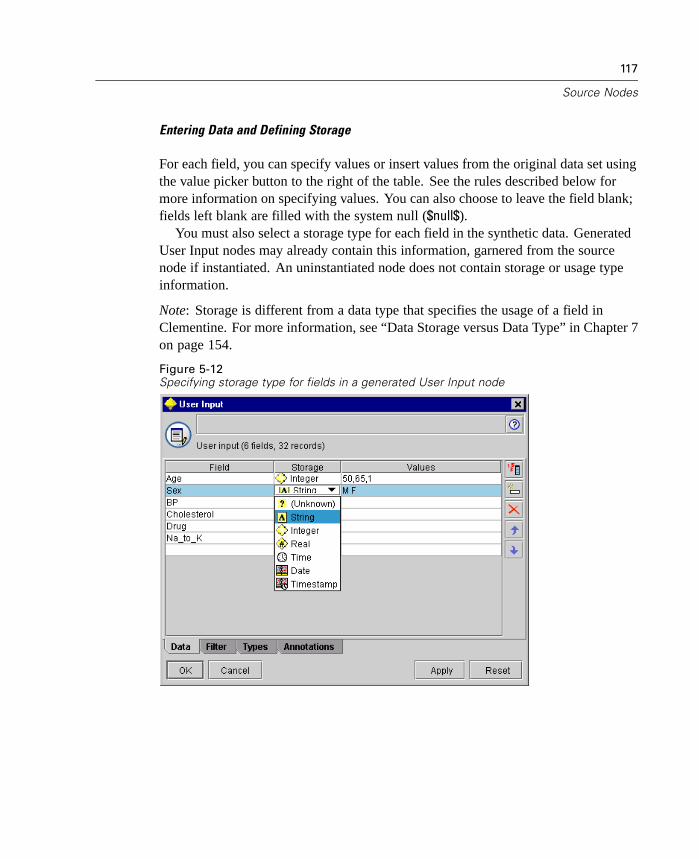
117
Source Nodes
Entering Data and Defining Storage
For each field, you can specify values or insert values from the original data set usingthe value picker button to the right of the table. See the rules described below formore information on specifying values. You can also choose to leave the field blank;fields left blank are filled with the system null ($null$).
You must also select a storage type for each field in the synthetic data. GeneratedUser Input nodes may already contain this information, garnered from the sourcenode if instantiated. An uninstantiated node does not contain storage or usage typeinformation.
Note: Storage is different from a data type that specifies the usage of a field inClementine. For more information, see “Data Storage versus Data Type” in Chapter 7on page 154.
Figure 5-12Specifying storage type for fields in a generated User Input node
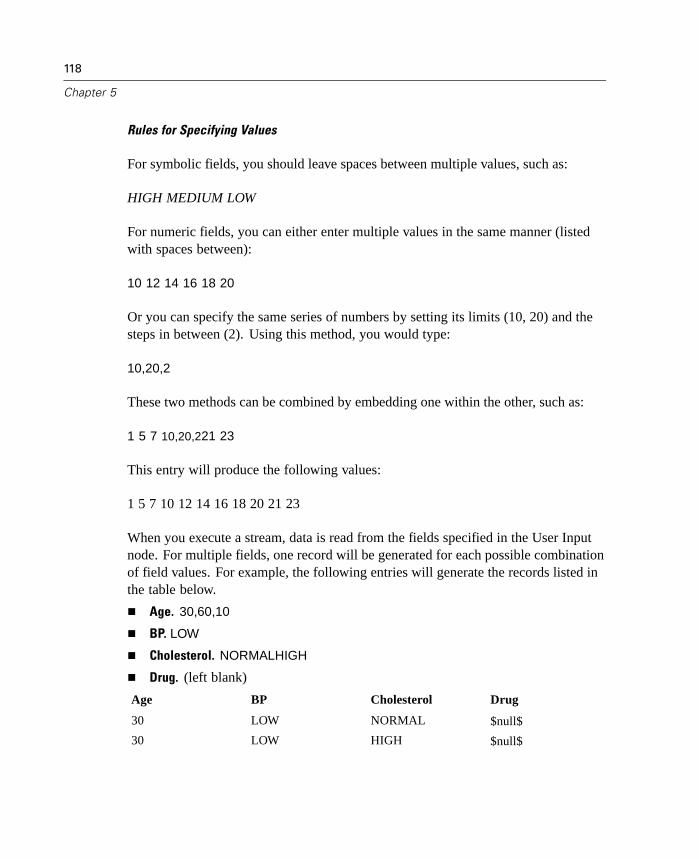
118
Chapter 5
Rules for Specifying Values
For symbolic fields, you should leave spaces between multiple values, such as:
HIGH MEDIUM LOW
For numeric fields, you can either enter multiple values in the same manner (listedwith spaces between):
10 12 14 16 18 20
Or you can specify the same series of numbers by setting its limits (10, 20) and thesteps in between (2). Using this method, you would type:
10,20,2
These two methods can be combined by embedding one within the other, such as:
1 5 7 10,20,221 23
This entry will produce the following values:
1 5 7 10 12 14 16 18 20 21 23
When you execute a stream, data is read from the fields specified in the User Inputnode. For multiple fields, one record will be generated for each possible combinationof field values. For example, the following entries will generate the records listed inthe table below.
Age. 30,60,10
BP. LOW
Cholesterol. NORMALHIGH
Drug. (left blank)
Age BP Cholesterol Drug
30 LOW NORMAL $null$
30 LOW HIGH $null$
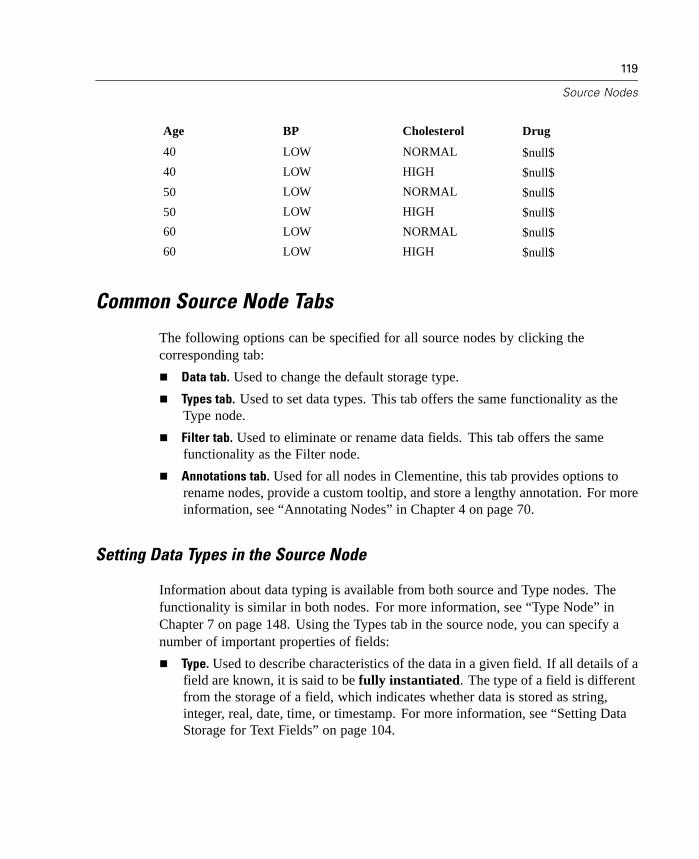
119
Source Nodes
Age BP Cholesterol Drug
40 LOW NORMAL $null$
40 LOW HIGH $null$
50 LOW NORMAL $null$
50 LOW HIGH $null$
60 LOW NORMAL $null$
60 LOW HIGH $null$
Common Source Node Tabs
The following options can be specified for all source nodes by clicking thecorresponding tab:
Data tab. Used to change the default storage type.
Types tab. Used to set data types. This tab offers the same functionality as theType node.
Filter tab. Used to eliminate or rename data fields. This tab offers the samefunctionality as the Filter node.
Annotations tab. Used for all nodes in Clementine, this tab provides options torename nodes, provide a custom tooltip, and store a lengthy annotation. For moreinformation, see “Annotating Nodes” in Chapter 4 on page 70.
Setting Data Types in the Source Node
Information about data typing is available from both source and Type nodes. Thefunctionality is similar in both nodes. For more information, see “Type Node” inChapter 7 on page 148. Using the Types tab in the source node, you can specify anumber of important properties of fields:
Type. Used to describe characteristics of the data in a given field. If all details of afield are known, it is said to be fully instantiated. The type of a field is differentfrom the storage of a field, which indicates whether data is stored as string,integer, real, date, time, or timestamp. For more information, see “Setting DataStorage for Text Fields” on page 104.
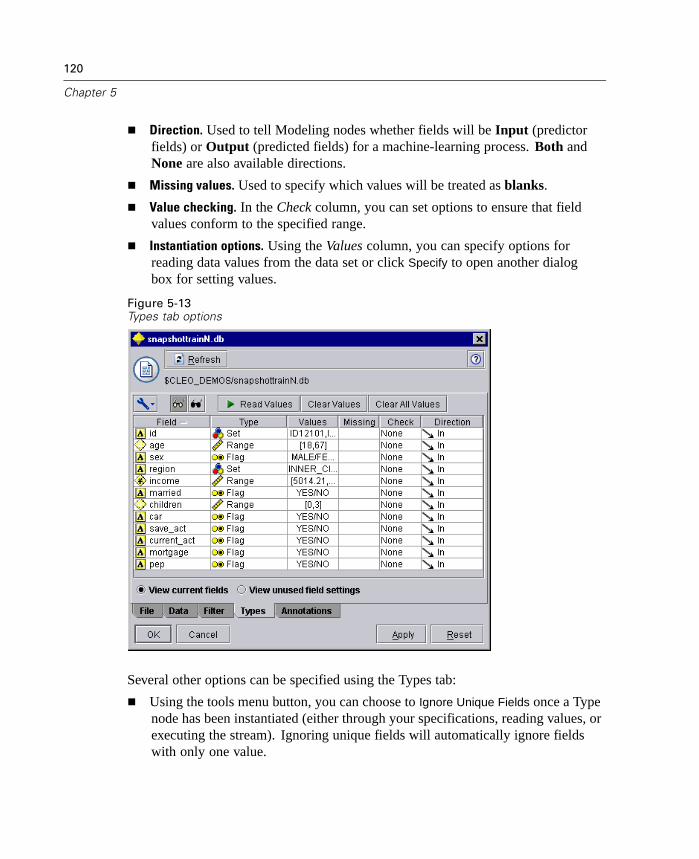
120
Chapter 5
Direction. Used to tell Modeling nodes whether fields will be Input (predictorfields) or Output (predicted fields) for a machine-learning process. Both andNone are also available directions.
Missing values. Used to specify which values will be treated as blanks.
Value checking. In the Check column, you can set options to ensure that fieldvalues conform to the specified range.
Instantiation options. Using the Values column, you can specify options forreading data values from the data set or click Specify to open another dialogbox for setting values.
Figure 5-13Types tab options
Several other options can be specified using the Types tab:
Using the tools menu button, you can choose to Ignore Unique Fields once a Typenode has been instantiated (either through your specifications, reading values, orexecuting the stream). Ignoring unique fields will automatically ignore fieldswith only one value.

121
Source Nodes
Using the tools menu button, you can choose to Ignore Large Sets once a Typenode has been instantiated. Ignoring large sets will automatically ignore sets witha large number of members.
Using the tools menu button, you can generate a Filter node to discard selectedfields.
Using the sunglasses toggle buttons, you can set the default for all fields to Reador Pass. The Types tab in the source node passes fields by default, while theType node itself reads fields by default.
Using the context menu, you can choose to Copy attributes from one field toanother. For more information, see “Copying Type Attributes” in Chapter7 on page 163.
Using the View unused field settings option, you can view type settings for fieldsthat are no longer present in the data or were once connected to this Type node.This is useful when reusing a Type node for train and test data sets.
Using the Clear Values button, you can clear changes to field values made in thisnode and reread values from the data source. If you have made no alterationsin this source node, then pressing Clear Values will make no field changes,effectively setting the Values column options to Pass.
Using the Clear All Values button, you can reset values for all fields read into thenode. This option effectively sets the Values column to Read for all fields.
For more information, see “Setting Data Types in the Type Node” in Chapter 7on page 151.
When to Instantiate at the Source Node
There are two ways you can learn about the data storage and values of your fields.This instantiation can occur at either the source node, when you first bring data intoClementine, or by inserting a Type node into the data stream.
Instantiating at the source node is useful when:
The data set is small.
You plan to derive new fields using the Expression Builder (instantiating makesfield values available from the E-Builder).
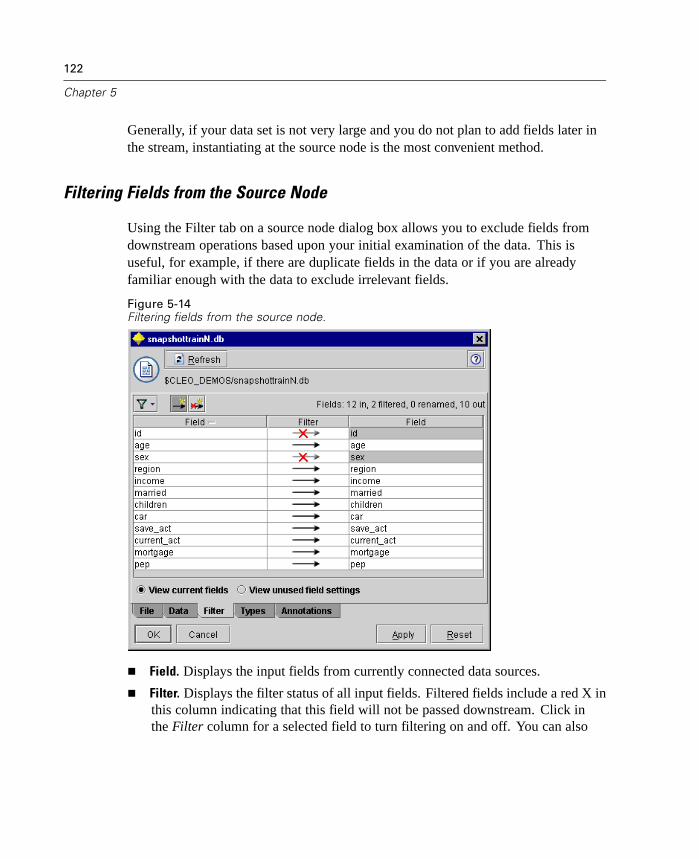
122
Chapter 5
Generally, if your data set is not very large and you do not plan to add fields later inthe stream, instantiating at the source node is the most convenient method.
Filtering Fields from the Source Node
Using the Filter tab on a source node dialog box allows you to exclude fields fromdownstream operations based upon your initial examination of the data. This isuseful, for example, if there are duplicate fields in the data or if you are alreadyfamiliar enough with the data to exclude irrelevant fields.
Figure 5-14Filtering fields from the source node.
Field. Displays the input fields from currently connected data sources.
Filter. Displays the filter status of all input fields. Filtered fields include a red X inthis column indicating that this field will not be passed downstream. Click inthe Filter column for a selected field to turn filtering on and off. You can also

123
Source Nodes
select options for multiple fields simultaneously using the Shift-click methodof selection.
Field. Displays the fields as they leave the Filter node. Duplicate names aredisplayed in red. You can edit field names by clicking in this column and enteringa new name. Or you can remove fields by clicking in the Filter column to disableduplicate fields.
All columns in the table above can be sorted by clicking on the column header.
View current fields. Select to view fields for data sets actively connected to the Filternode. This option is selected by default and is the most common method of usingFilter nodes.
View unused field settings. Select to view fields for data sets that were once (but areno longer) connected to the Filter node. This option is useful when copying Filternodes from one stream to another or saving and reloading Filter nodes.
The Filter menu at the top of this dialog box (available from the filter button) helpsyou to perform operations on multiple fields simultaneously. You can choose to:
Remove all fields.
Include all fields.
Toggle all fields.
Remove duplicates.
Truncate field names.
Use input field names.
Set the default filter state.
You can also use the arrow toggle buttons to include all fields or discard all fieldsat once. This is useful for large data sets where only a few fields are to be includeddownstream.


Chapter
6Record Operations Nodes
Overview of Record Operations
Record operations nodes are used to make changes to the data set at the recordlevel. These operations are important during the Data Understanding and DataPreparation phases of data mining because they allow you to tailor the data toyour particular business need.
For example, based on the results of the data audit conducted using the Data Auditnode from the Output palette, you might decide that you'd like customer purchaserecords for the past three months to be merged. Using a Merge node from the RecordOps palette, you can merge records based on the values of a key field, such asCustomer ID. In contrast, for example, you may discover that a database containinginformation about Web-site hits is unmanageable with over one million records.Using Sample nodes, you can select a subset of data for use in modeling.
Figure 6-1Record Ops palette
The Record Ops palette contains the following nodes:
Select
Sample
Balance
Aggregate
Sort
125
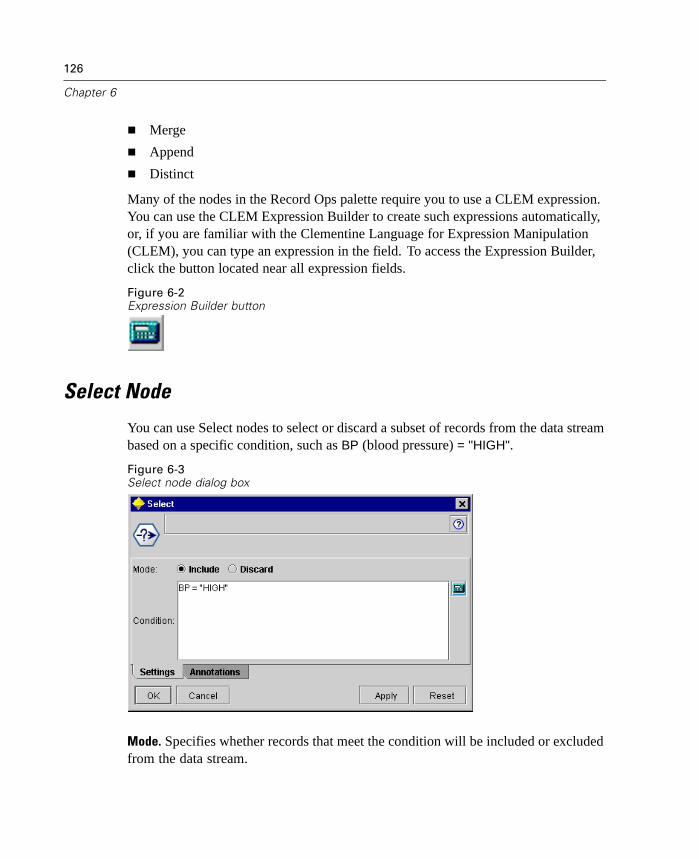
126
Chapter 6
Merge
Append
Distinct
Many of the nodes in the Record Ops palette require you to use a CLEM expression.You can use the CLEM Expression Builder to create such expressions automatically,or, if you are familiar with the Clementine Language for Expression Manipulation(CLEM), you can type an expression in the field. To access the Expression Builder,click the button located near all expression fields.
Figure 6-2Expression Builder button
Select Node
You can use Select nodes to select or discard a subset of records from the data streambased on a specific condition, such as BP (blood pressure) = "HIGH".
Figure 6-3Select node dialog box
Mode. Specifies whether records that meet the condition will be included or excludedfrom the data stream.
127
Record Operations Nodes
Include. Select to include records that meet the selection condition.
Discard. Select to exclude records that meet the selection condition.
Condition. Displays the selection condition that will be used to test each record, whichyou specify using a CLEM expression. Either enter an expression in the window oruse the Expression Builder by clicking the calculator (Expression Builder) button tothe right of the window.
Select nodes are also used to choose a proportion of records. Typically, you woulduse a different node, the Sample node, for this operation. However, if the conditionthat you want to specify is more complex than the parameters provided, you cancreate your own condition using the Select node. For example, you can create acondition such as:
BP = "HIGH" and random(10) <= 4
This will select approximately 40% of the records showing high blood pressure andpass those records downstream for further analysis.
Sample Node
You can use Sample nodes to specify a limit on the number of records passed to thedata stream or to specify a proportion of records to discard. You may want to samplethe original data for a variety of reasons, such as:
Increasing the performance of the data mining tool.
Paring down a large data set, such as one with millions of records. Using Samplenodes, you can pass a random sample to generate a model that is usually asaccurate as one derived from the full data set.
Training a neural network. You should reserve a sample for training and a samplefor testing.

128
Chapter 6
Setting Options for the Sample NodeFigure 6-4Sample node dialog box
Mode. Select whether to pass (include) or discard (exclude) records for the followingmodes:
Pass sample. Select to include in the data stream the sample that you specifybelow. For example, if you set the mode to Pass sample and set the 1-in-noption to 5, then every fifth record will be included in the data stream up tothe maximum sample size.
Discard sample. Select to exclude the sample that you specify from the datastream. For example, if you set the mode to Discard sample and set the 1-in-noption to 5, then every fifth record will be discarded (excluded) from the datastream.
Sample. Select the method of sampling from the following options:
First. Select to use contiguous data sampling. For example, if the maximumsample size is set to 10000, then the first 10,000 records will either be passedon to the data stream (if the mode is Pass sample) or discarded (if the mode isDiscard sample).
129
Record Operations Nodes
1-in-n. Select to sample data by passing or discarding every nth record. Forexample, if n is set to 5, then every fifth record will either be passed to the datastream or discarded, depending on the mode selected above.
Random %. Select to sample a random percentage of the data. For example, ifyou set the percentage to 20, then 20% of the data will either be passed to thedata stream or discarded, depending on the mode selected above. Use the field tospecify a sampling percentage. You can also specify a seed value using the Setrandom seed control below.
Maximum sample size. Specify the largest sample to be included or discarded fromthe data stream. This option is redundant and therefore disabled when First andInclude are selected above.
Set random seed. When Random % is selected above, you can use this control to set arandom seed and specify the seed value. Specifying a seed value allows you toreproduce the same list of randomly selected records if needed. Click the Generate
button to automatically generate a random seed.
Balance Node
You can use Balance nodes to correct imbalances in data sets so that they conform tospecified test criteria. For example, suppose that a data set has only two values—lowor high—and that 90% of the cases are low while only 10% of the cases are high.Many modeling techniques have trouble with such biased data because they will tendto learn only the low outcome and ignore the high one, since it is more rare. If thedata are well-balanced with approximately equal numbers of low and high outcomes,models will have a better chance of finding patterns that distinguish the two groups.In this case, a Balance node is useful for creating a balancing directive that reducescases with a low outcome.
Balancing is carried out by duplicating and then discarding records based on theconditions that you specify. Records for which no condition holds are always passedthrough. Because this process works by duplicating and/or discarding records, theoriginal sequence of your data is lost in downstream operations. Be sure to derive anysequence-related values before adding a Balance node to the data stream.
Note: Balance nodes can be generated automatically from distribution charts andhistograms.
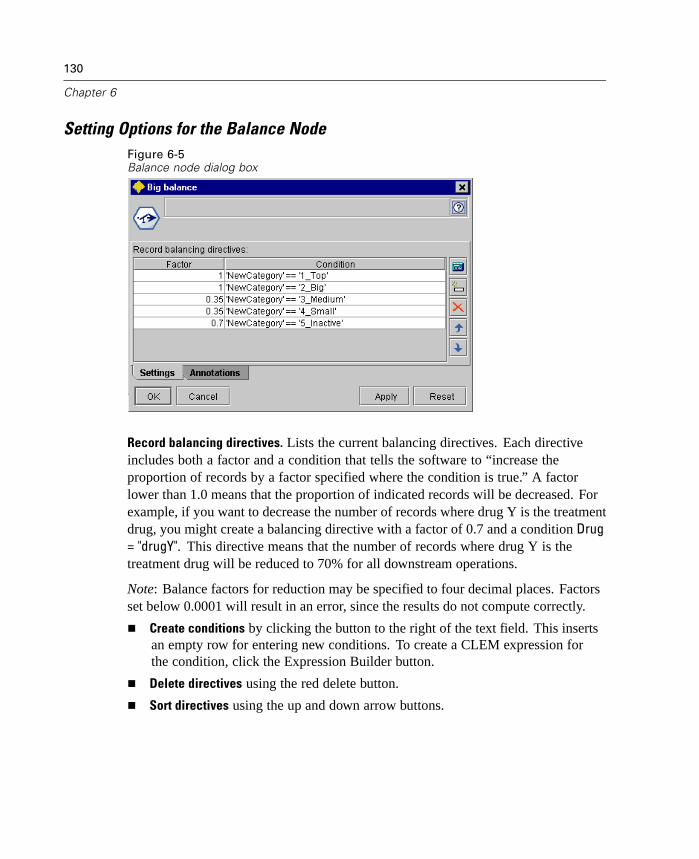
130
Chapter 6
Setting Options for the Balance NodeFigure 6-5Balance node dialog box
Record balancing directives. Lists the current balancing directives. Each directiveincludes both a factor and a condition that tells the software to “increase theproportion of records by a factor specified where the condition is true.” A factorlower than 1.0 means that the proportion of indicated records will be decreased. Forexample, if you want to decrease the number of records where drug Y is the treatmentdrug, you might create a balancing directive with a factor of 0.7 and a condition Drug= "drugY". This directive means that the number of records where drug Y is thetreatment drug will be reduced to 70% for all downstream operations.
Note: Balance factors for reduction may be specified to four decimal places. Factorsset below 0.0001 will result in an error, since the results do not compute correctly.
Create conditions by clicking the button to the right of the text field. This insertsan empty row for entering new conditions. To create a CLEM expression forthe condition, click the Expression Builder button.
Delete directives using the red delete button.
Sort directives using the up and down arrow buttons.
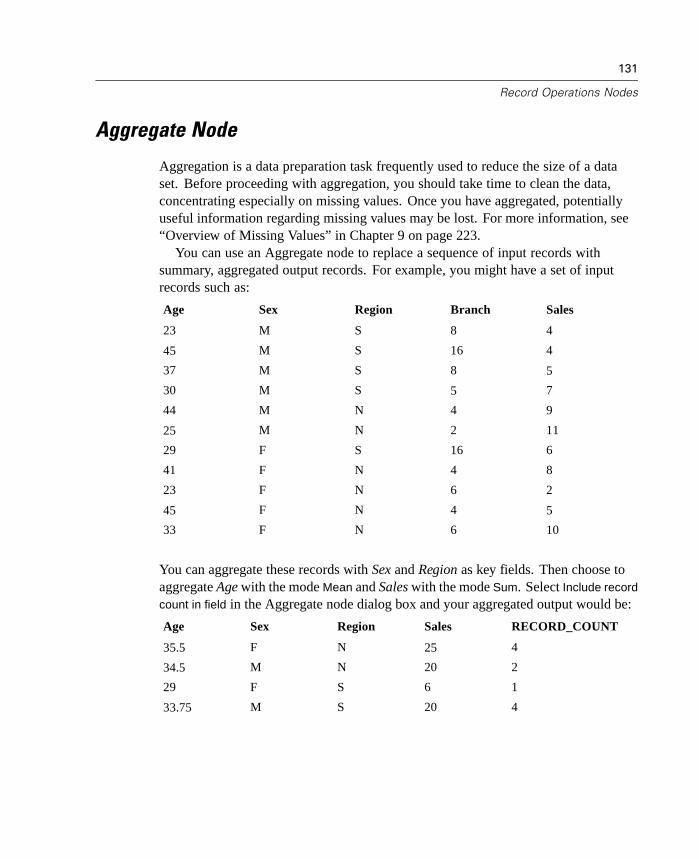
131
Record Operations Nodes
Aggregate Node
Aggregation is a data preparation task frequently used to reduce the size of a dataset. Before proceeding with aggregation, you should take time to clean the data,concentrating especially on missing values. Once you have aggregated, potentiallyuseful information regarding missing values may be lost. For more information, see“Overview of Missing Values” in Chapter 9 on page 223.
You can use an Aggregate node to replace a sequence of input records withsummary, aggregated output records. For example, you might have a set of inputrecords such as:
Age Sex Region Branch Sales
23 M S 8 4
45 M S 16 4
37 M S 8 5
30 M S 5 7
44 M N 4 9
25 M N 2 11
29 F S 16 6
41 F N 4 8
23 F N 6 2
45 F N 4 5
33 F N 6 10
You can aggregate these records with Sex and Region as key fields. Then choose toaggregate Age with the mode Mean and Sales with the mode Sum. Select Include record
count in field in the Aggregate node dialog box and your aggregated output would be:
Age Sex Region Sales RECORD_COUNT
35.5 F N 25 4
34.5 M N 20 2
29 F S 6 1
33.75 M S 20 4
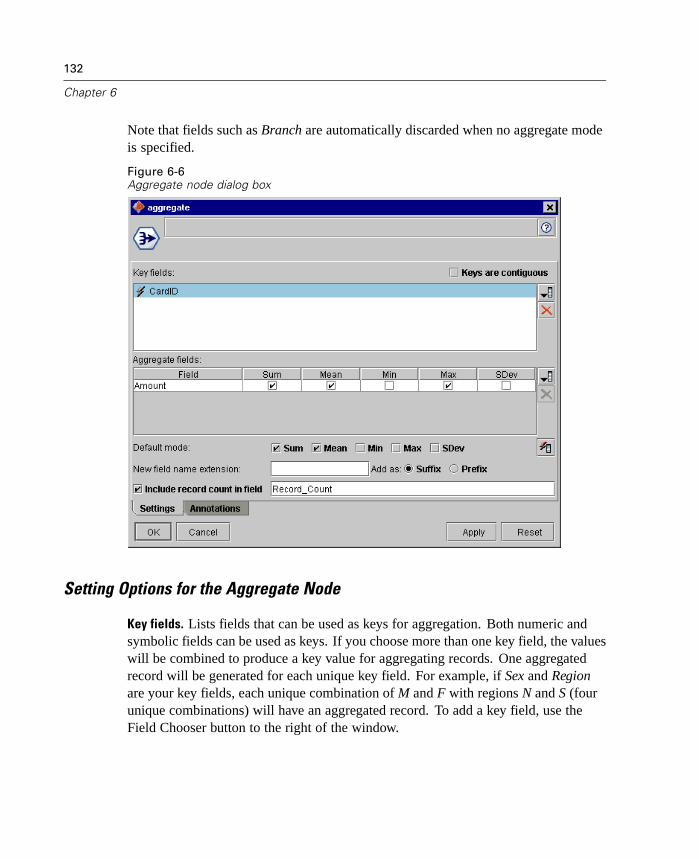
132
Chapter 6
Note that fields such as Branch are automatically discarded when no aggregate modeis specified.
Figure 6-6Aggregate node dialog box
Setting Options for the Aggregate Node
Key fields. Lists fields that can be used as keys for aggregation. Both numeric andsymbolic fields can be used as keys. If you choose more than one key field, the valueswill be combined to produce a key value for aggregating records. One aggregatedrecord will be generated for each unique key field. For example, if Sex and Regionare your key fields, each unique combination of M and F with regions N and S (fourunique combinations) will have an aggregated record. To add a key field, use theField Chooser button to the right of the window.

133
Record Operations Nodes
Keys are contiguous. Select to treat the values for the key fields as equal if they occurin adjacent records.
Aggregate fields. Lists the numeric fields whose values will be aggregated as well asthe selected modes of aggregation. To add fields to this list, use the Field Chooserbutton on the right.
Default mode. Specify the default aggregation mode to be used for newly added fields.If you frequently use the same aggregation, select one or more modes here and usethe Apply to All button on the right to apply the selected modes to all fields listedabove. The following aggregation modes are available in Clementine:
Sum. Select to return summed values for each key field combination.
Mean. Select to return the mean values for each key field combination.
Min. Select to return minimum values for each key field combination.
Max. Select to return maximum values for each key field combination.
SDev. Select to return the standard deviation for each key field combination.
New field name extension. Select to add a suffix or prefix, such as “1” or “new,” toduplicate aggregated fields. For example, the result of a minimum values aggregationon the field Age will produce a field name called Age_Min_1 if you have selectedthe suffix option and specified “1” as the extension. Note: Aggregation extensionssuch as _Min or Max_ are automatically added to the new field, indicating the type ofaggregation performed. Select Suffix or Prefix to indicate your preferred extensionstyle.
Include record count in field. Select to include an extra field in each output recordcalled Record_Count, by default. This field indicates how many input records wereaggregated to form each aggregate record. Create a custom name for this field bytyping in the edit field.
Note: System null values are excluded when aggregates are computed, but they areincluded in the record count. Blank values, on the other hand, are included in bothaggregation and record count. To exclude blank values, you can use a Filler node toreplace blanks with null values. You can also remove blanks using a Select node.

134
Chapter 6
Sort Node
You can use Sort nodes to sort records into ascending or descending order based onthe values of one or more fields. For example, Sort nodes are frequently used to viewand select records with the most common data values. Typically, you would firstaggregate the data using the Aggregate node and then use the Sort node to sort theaggregated data into descending order of record counts. Displaying these results in atable will allow you to explore the data and to make decisions, such as selecting therecords of the top-10 best customers.
Figure 6-7Sort node dialog box
Sort by. All fields selected to use as sort keys are displayed in a table. A key fieldworks best for sorting when it is numeric.
Add fields to this list using the Field Chooser button on the right.
Select an order by clicking the Ascending or Descending arrow in the table'sOrder column.
Delete fields using the red delete button.
Sort directives using the up and down arrow buttons.
Default sort order. Select either Ascending or Descending to use as the default sortorder when new fields are added above.
135
Record Operations Nodes
Merge Node
The function of a Merge node is to take multiple input records and create a singleoutput record containing all or some of the input fields. This is a useful operationwhen you want to merge data from different sources, such as internal customer dataand purchased demographic data. There are two ways to merge data in Clementine:
Merge by order concatenates corresponding records from all sources in the orderof input until the smallest data source is exhausted. It is important if using thisoption that you have sorted your data using a Sort node.
Merge using a key field, such as Customer ID, to specify how to match recordsfrom one data source with records from the other(s). Several types of joins arepossible in Clementine, including inner join, full outer join, partial outer join, andanti-join. For more information, see “Types of Joins” on page 135.
Types of Joins
When using a key field for data merging, it is useful to spend some time thinkingabout which records will be excluded and which will be included. Clementine offersa variety of joins, which are discussed in detail below.
The two basic types of joins are referred to as inner and outer joins. These methodsare frequently used to merge tables from related data sets based on common values ofa key field, such as Customer ID. Inner joins allow for clean merging and an outputdata set that includes only complete records. Outer joins also include completerecords from the merged data, but they also allow you to include unique data fromone or more input tables.
The types of joins allowed in Clementine are described in greater detail below.
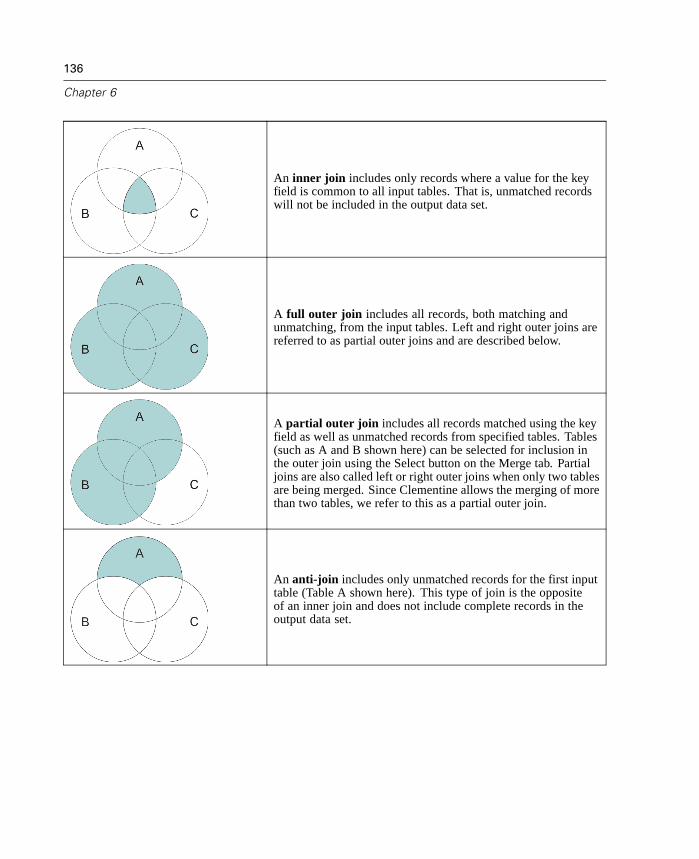
136
Chapter 6
An inner join includes only records where a value for the keyfield is common to all input tables. That is, unmatched recordswill not be included in the output data set.
A full outer join includes all records, both matching andunmatching, from the input tables. Left and right outer joins arereferred to as partial outer joins and are described below.
A partial outer join includes all records matched using the keyfield as well as unmatched records from specified tables. Tables(such as A and B shown here) can be selected for inclusion inthe outer join using the Select button on the Merge tab. Partialjoins are also called left or right outer joins when only two tablesare being merged. Since Clementine allows the merging of morethan two tables, we refer to this as a partial outer join.
An anti-join includes only unmatched records for the first inputtable (Table A shown here). This type of join is the oppositeof an inner join and does not include complete records in theoutput data set.

137
Record Operations Nodes
Specifying a Merge Method and KeysFigure 6-8Using the Merge tab to set merge method options
Merge Method. Select either Order or Keys to specify the method of merging records.Selecting Keys activates the bottom half of the dialog box.
Order. Merges records by order such that the nth record from each input is mergedto produce the nth output record. When any record runs out of a matching inputrecord, no more output records are produced. This means that the number ofrecords created is the number of records in the smallest data set.
Keys. Uses a key field, such as Transaction ID, to merge records with the samevalue in the key field. This is equivalent to a database “equi-join.” If a key valueoccurs more than once, all possible combinations are returned. For example,if records with the same key field value A contain differing values B, C, and
138
Chapter 6
D in other fields, the merged fields will produce a separate record for eachcombination of A with value B, A with value C, and A with value D.
Note: Null values are not considered identical in the merge-by-key method andwill not join.
Possible keys. Lists all fields found in all input data sources. Select a field fromthis list and use the arrow button to add it as a key field used for merging records.More than one key field may be used.
Keys for merge. Lists all fields used to merge records from all input data sources basedon values of the key fields. To remove a key from the list, select one and use thearrow button to return it to the Possible keys list. When more than one key field isselected, the option below is enabled.
Combine duplicate key fields. When more than one key field is selected above, thisoption ensures that there is only one output field of that name. This option is enabledby default except in the case when streams have been imported from earlier versionsof Clementine. When this option is disabled, duplicate key fields must be renamed orexcluded using the Filter tab in the Merge node dialog box.
Include only matching records (inner join). Select to merge only complete records.
Include matching and nonmatching records (full outer join). Select to perform a “fullouter join.” This means that if values for the key field are not present in all inputtables, the incomplete records are still retained. The undefined value ($null$) is addedto the key field and included in the output record.
Include matching and selected nonmatching records (partial outer join). Select toperform a “partial outer join” of the tables you select in a subdialog box. Click Select
to specify tables for which incomplete records will be retained in the merge.
Include records in the first data set not matching any others (anti-join). Select to performa type of “anti-join” where only nonmatching records from the first data set arepassed downstream. You can specify the order of input data sets using arrows on theInputs tab. This type of join does not include complete records in the output data set.
For more information, see “Types of Joins” on page 135.

139
Record Operations Nodes
Selecting Data for Partial Joins
For a partial outer join, you must select the table(s) for which incomplete records willbe retained. For example, you may want to retain all records from a Customer tablewhile retaining only matched records from the Mortgage Loan table.
Figure 6-9Selecting data for a partial or outer join
Outer Join column. In the Outer Join column, select data sets to include in their entirety.For a partial join, overlapping records will be retained as well as incomplete recordsfor data sets selected here. For more information, see “Types of Joins” on page 135.
Filtering Fields from the Merge Node
Merge nodes include a convenient way of filtering or renaming duplicate fields as aresult of merging multiple data sources. Click the Filter tab in the dialog box toselect filtering options.
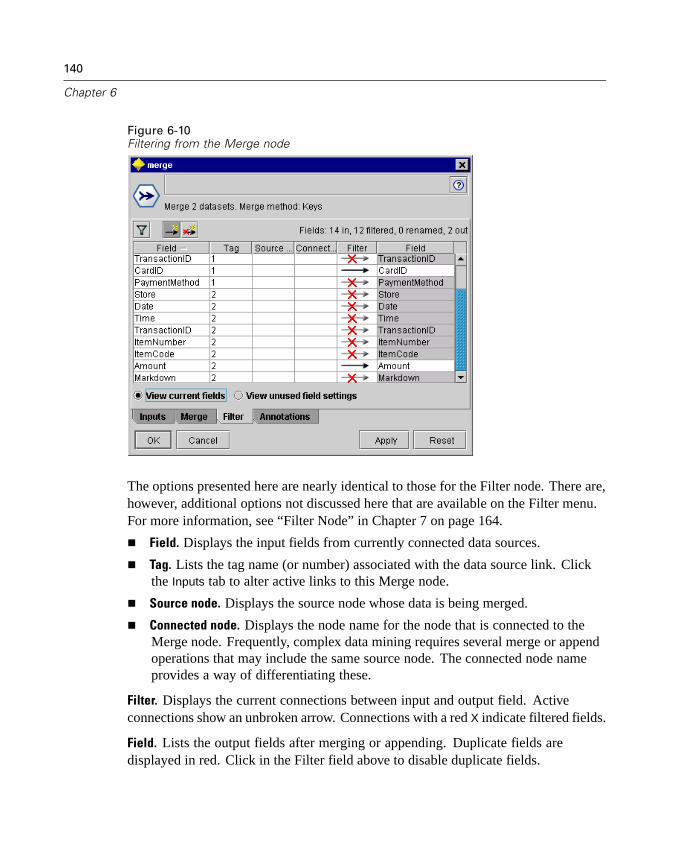
140
Chapter 6
Figure 6-10Filtering from the Merge node
The options presented here are nearly identical to those for the Filter node. There are,however, additional options not discussed here that are available on the Filter menu.For more information, see “Filter Node” in Chapter 7 on page 164.
Field. Displays the input fields from currently connected data sources.
Tag. Lists the tag name (or number) associated with the data source link. Clickthe Inputs tab to alter active links to this Merge node.
Source node. Displays the source node whose data is being merged.
Connected node. Displays the node name for the node that is connected to theMerge node. Frequently, complex data mining requires several merge or appendoperations that may include the same source node. The connected node nameprovides a way of differentiating these.
Filter. Displays the current connections between input and output field. Activeconnections show an unbroken arrow. Connections with a red X indicate filtered fields.
Field. Lists the output fields after merging or appending. Duplicate fields aredisplayed in red. Click in the Filter field above to disable duplicate fields.
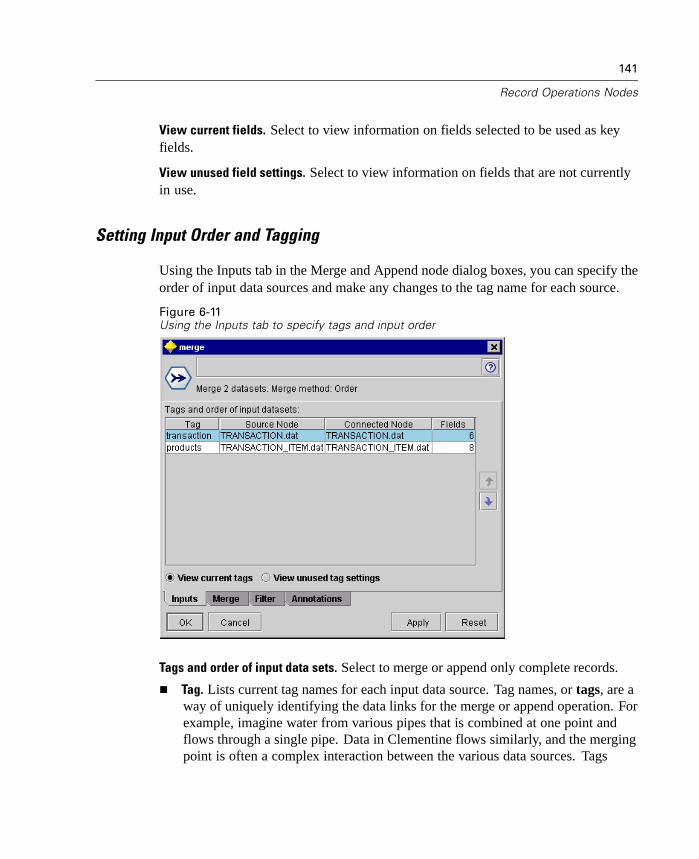
141
Record Operations Nodes
View current fields. Select to view information on fields selected to be used as keyfields.
View unused field settings. Select to view information on fields that are not currentlyin use.
Setting Input Order and Tagging
Using the Inputs tab in the Merge and Append node dialog boxes, you can specify theorder of input data sources and make any changes to the tag name for each source.
Figure 6-11Using the Inputs tab to specify tags and input order
Tags and order of input data sets. Select to merge or append only complete records.
Tag. Lists current tag names for each input data source. Tag names, or tags, are away of uniquely identifying the data links for the merge or append operation. Forexample, imagine water from various pipes that is combined at one point andflows through a single pipe. Data in Clementine flows similarly, and the mergingpoint is often a complex interaction between the various data sources. Tags
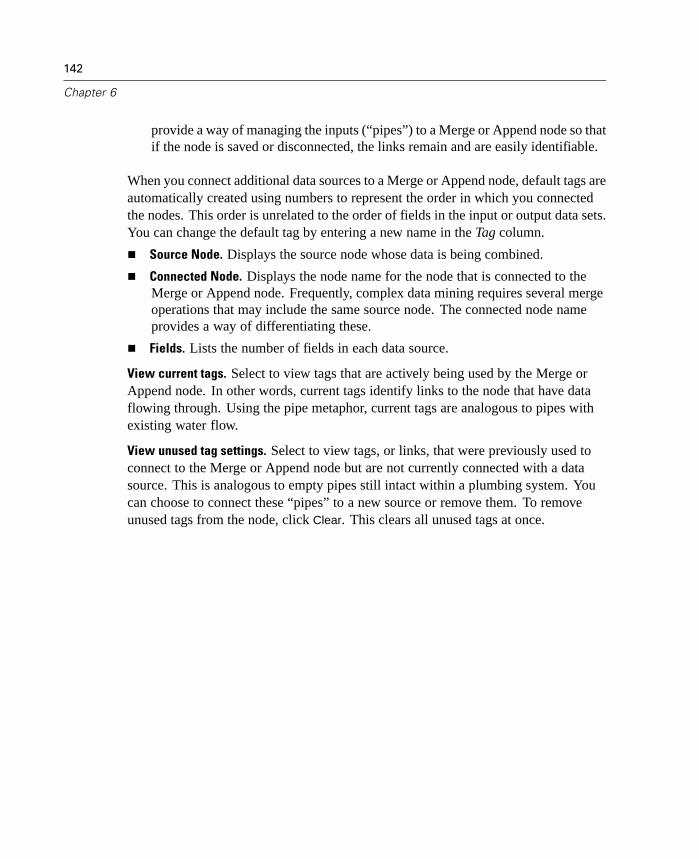
142
Chapter 6
provide a way of managing the inputs (“pipes”) to a Merge or Append node so thatif the node is saved or disconnected, the links remain and are easily identifiable.
When you connect additional data sources to a Merge or Append node, default tags areautomatically created using numbers to represent the order in which you connectedthe nodes. This order is unrelated to the order of fields in the input or output data sets.You can change the default tag by entering a new name in the Tag column.
Source Node. Displays the source node whose data is being combined.
Connected Node. Displays the node name for the node that is connected to theMerge or Append node. Frequently, complex data mining requires several mergeoperations that may include the same source node. The connected node nameprovides a way of differentiating these.
Fields. Lists the number of fields in each data source.
View current tags. Select to view tags that are actively being used by the Merge orAppend node. In other words, current tags identify links to the node that have dataflowing through. Using the pipe metaphor, current tags are analogous to pipes withexisting water flow.
View unused tag settings. Select to view tags, or links, that were previously used toconnect to the Merge or Append node but are not currently connected with a datasource. This is analogous to empty pipes still intact within a plumbing system. Youcan choose to connect these “pipes” to a new source or remove them. To removeunused tags from the node, click Clear. This clears all unused tags at once.
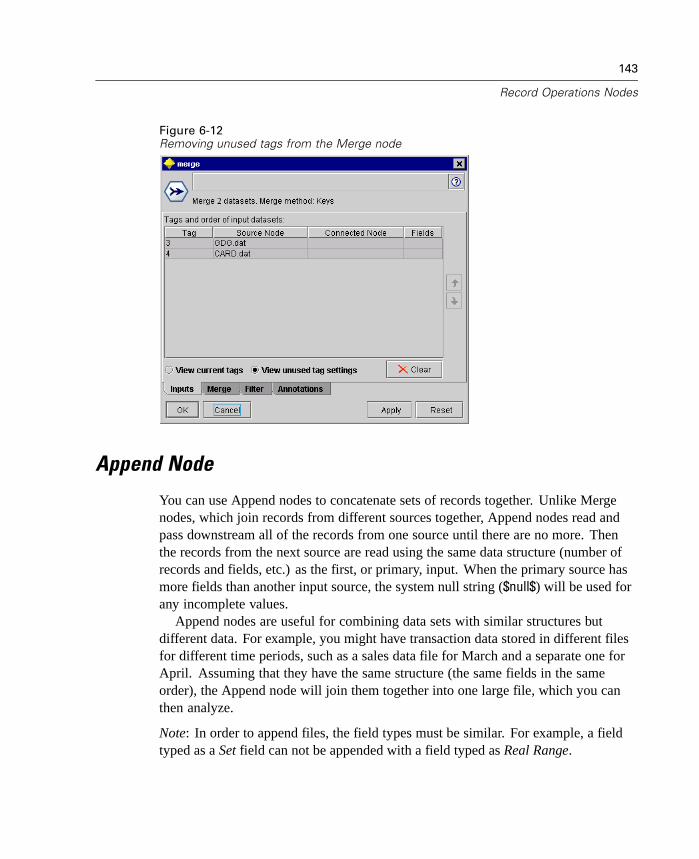
143
Record Operations Nodes
Figure 6-12Removing unused tags from the Merge node
Append Node
You can use Append nodes to concatenate sets of records together. Unlike Mergenodes, which join records from different sources together, Append nodes read andpass downstream all of the records from one source until there are no more. Thenthe records from the next source are read using the same data structure (number ofrecords and fields, etc.) as the first, or primary, input. When the primary source hasmore fields than another input source, the system null string ($null$) will be used forany incomplete values.
Append nodes are useful for combining data sets with similar structures butdifferent data. For example, you might have transaction data stored in different filesfor different time periods, such as a sales data file for March and a separate one forApril. Assuming that they have the same structure (the same fields in the sameorder), the Append node will join them together into one large file, which you canthen analyze.
Note: In order to append files, the field types must be similar. For example, a fieldtyped as a Set field can not be appended with a field typed as Real Range.
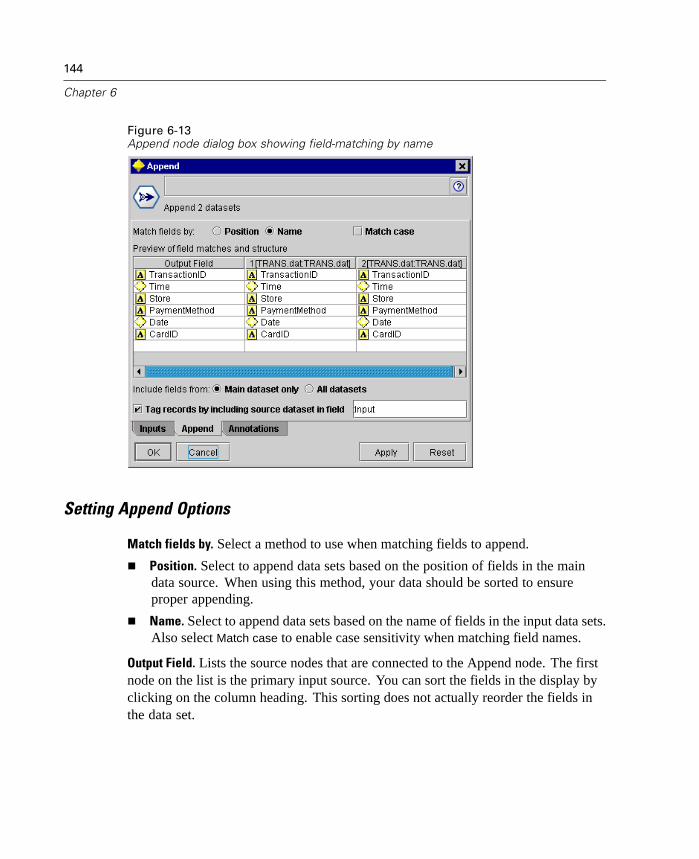
144
Chapter 6
Figure 6-13Append node dialog box showing field-matching by name
Setting Append Options
Match fields by. Select a method to use when matching fields to append.
Position. Select to append data sets based on the position of fields in the maindata source. When using this method, your data should be sorted to ensureproper appending.
Name. Select to append data sets based on the name of fields in the input data sets.Also select Match case to enable case sensitivity when matching field names.
Output Field. Lists the source nodes that are connected to the Append node. The firstnode on the list is the primary input source. You can sort the fields in the display byclicking on the column heading. This sorting does not actually reorder the fields inthe data set.

145
Record Operations Nodes
Include fields from. Select Main data set only to produce output fields based on thefields in the main data set. The main data set is the first input, specified on the Inputstab. Select All data sets to produce output fields for all fields in all data sets regardlessof whether there is a matching field across all input data sets.
Tag records by including source data set in field. Select to add an additional field tothe output file whose values indicate the source data set for each record. Specify aname in the text field. The default field name is Input.
Distinct Node
You can use Distinct nodes to remove duplicate records either by passing the firstdistinct record to the data stream or by discarding the first record and passing anyduplicates to the data stream instead. This operation is useful when you want to havea single record for each item in the data, such as customers, accounts, or products.For example, Distinct nodes can be helpful in finding duplicate records in a customerdatabase or in getting an index of all of the product IDs in your database.
Figure 6-14Distinct node dialog box
Mode. Specify whether to include or exclude (discard) the first record.

146
Chapter 6
Include. Select to include the first distinct record in the data stream.
Discard. Select to discard the first distinct record found and pass any duplicaterecords to the data stream instead. This option is useful for finding duplicates inyour data so that you can examine them later in the stream.
Fields. Lists fields used to determine whether records are identical.
Add fields to this list using the Field Chooser button on the right.
Delete fields using the red delete button.
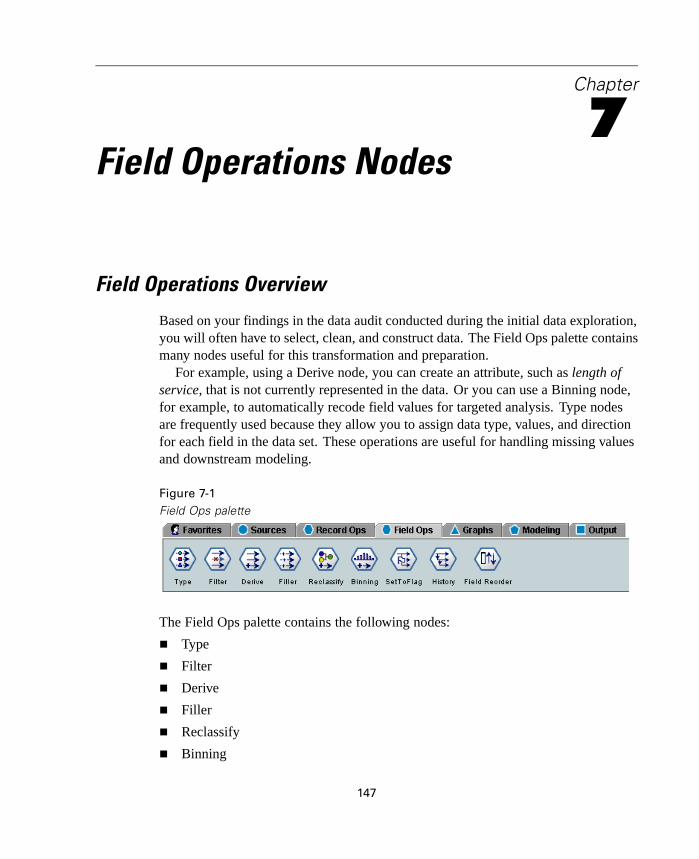
Chapter
7Field Operations Nodes
Field Operations Overview
Based on your findings in the data audit conducted during the initial data exploration,you will often have to select, clean, and construct data. The Field Ops palette containsmany nodes useful for this transformation and preparation.
For example, using a Derive node, you can create an attribute, such as length ofservice, that is not currently represented in the data. Or you can use a Binning node,for example, to automatically recode field values for targeted analysis. Type nodesare frequently used because they allow you to assign data type, values, and directionfor each field in the data set. These operations are useful for handling missing valuesand downstream modeling.
Figure 7-1Field Ops palette
The Field Ops palette contains the following nodes:
Type
Filter
Derive
Filler
Reclassify
Binning
147

148
Chapter 7
Set to Flag
History
Field Reorder
Several of these nodes can be generated directly from the audit report created by aData Audit node. For more information, see “Generating Graphs and Nodes fromthe Audit” in Chapter 14 on page 516.
Type Node
Using Type nodes, you can specify a number of important properties of fields:
Type. Used to describe characteristics of the data in a given field. If all of thedetails of a field are known, it is called fully instantiated. The type of a field isdifferent from the storage of a field, which indicates whether data are stored asstrings, integers, real numbers, dates, times, or timestamps.
Direction. Used to tell Modeling nodes whether fields will be Input (predictorfields) or Output (predicted fields) for a machine learning process. Both andNone are also available directions.
Missing values. Used to specify which values will be treated as blanks.
Value checking. In the Check column, you can set options to ensure that fieldvalues conform to the specified range.
Instantiation options. Using the Values column, you can specify options for readingdata values from the data set, or use the Specify option to open another dialog boxfor setting values. You can also choose to pass fields without reading their values.
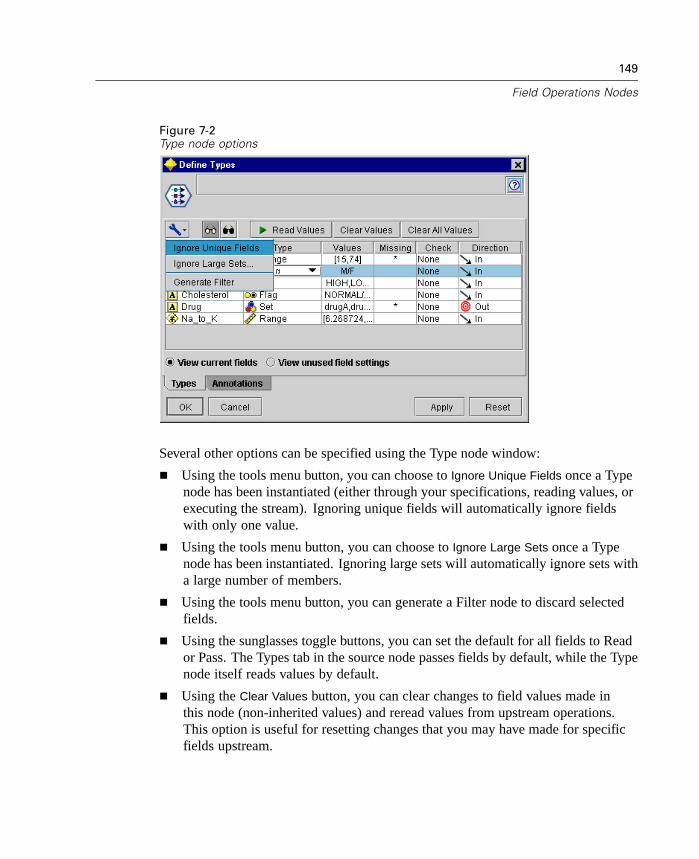
149
Field Operations Nodes
Figure 7-2Type node options
Several other options can be specified using the Type node window:
Using the tools menu button, you can choose to Ignore Unique Fields once a Typenode has been instantiated (either through your specifications, reading values, orexecuting the stream). Ignoring unique fields will automatically ignore fieldswith only one value.
Using the tools menu button, you can choose to Ignore Large Sets once a Typenode has been instantiated. Ignoring large sets will automatically ignore sets witha large number of members.
Using the tools menu button, you can generate a Filter node to discard selectedfields.
Using the sunglasses toggle buttons, you can set the default for all fields to Reador Pass. The Types tab in the source node passes fields by default, while the Typenode itself reads values by default.
Using the Clear Values button, you can clear changes to field values made inthis node (non-inherited values) and reread values from upstream operations.This option is useful for resetting changes that you may have made for specificfields upstream.

150
Chapter 7
Using the Clear All Values button, you can reset values for all fields read into thenode. This option effectively sets the Values column to Read for all fields. Thisoption is useful to reset values for all fields and reread values and types fromupstream operations.
Using the context menu, you can choose to Copy attributes from one field toanother. For more information, see “Copying Type Attributes” on page 163.
Using the View unused field settings option, you can view type settings for fieldsthat are no longer present in the data or were once connected to this Type node.This is useful when reusing a Type node for data sets that have changed.
Data Types
The following types describe the way data is used in Clementine:
Range. Used to describe numeric values, such as a range of 0–100 or 0.75–1.25.A range value may be an integer, real number, or date/time.
Discrete. Used for string values when an exact number of distinct values isunknown. This is an uninstantiated data type, meaning that all possibleinformation about the storage and usage of the data is not yet known. Once datahas been read, the type will be flag, set, or typeless, depending on the maximumset size specified in the stream properties dialog box.
Flag. Used for data with two distinct values, such as Yes/No or 1, 2. Data may berepresented as text, integer, real number, or date/time. Note: Date/time refersto three types of storage: time, date, or timestamp.
Set. Used to describe data with multiple distinct values, each treated as a memberof a set, such as small/medium/large. In this version of Clementine, a set canhave any storage—numeric, string, or date/time. Note that setting a type to Setdoes not automatically change the values to string.
Typeless. Used for data that does not conform to any of the above types or forset types with too many members. It is useful for cases in which the type wouldotherwise be a set with many members (such as an account number). When youselect Typeless for a field, the direction is automatically set to None. The defaultmaximum size for sets is 250 unique values. This number can be adjusted ordisabled in the stream properties dialog box.
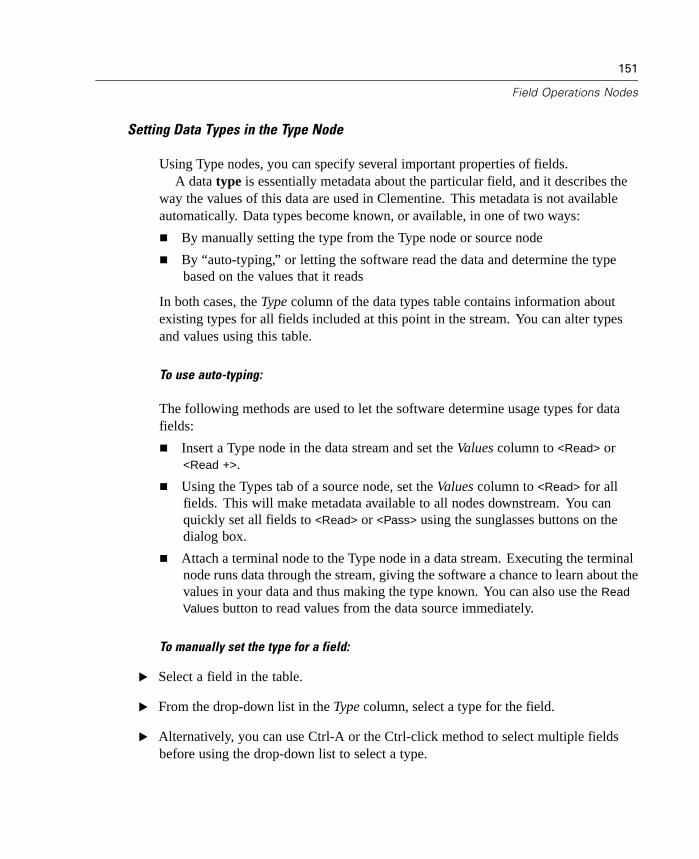
151
Field Operations Nodes
Setting Data Types in the Type Node
Using Type nodes, you can specify several important properties of fields.A data type is essentially metadata about the particular field, and it describes the
way the values of this data are used in Clementine. This metadata is not availableautomatically. Data types become known, or available, in one of two ways:
By manually setting the type from the Type node or source node
By “auto-typing,” or letting the software read the data and determine the typebased on the values that it reads
In both cases, the Type column of the data types table contains information aboutexisting types for all fields included at this point in the stream. You can alter typesand values using this table.
To use auto-typing:
The following methods are used to let the software determine usage types for datafields:
Insert a Type node in the data stream and set the Values column to <Read> or<Read +>.
Using the Types tab of a source node, set the Values column to <Read> for allfields. This will make metadata available to all nodes downstream. You canquickly set all fields to <Read> or <Pass> using the sunglasses buttons on thedialog box.
Attach a terminal node to the Type node in a data stream. Executing the terminalnode runs data through the stream, giving the software a chance to learn about thevalues in your data and thus making the type known. You can also use the ReadValues button to read values from the data source immediately.
To manually set the type for a field:
E Select a field in the table.
E From the drop-down list in the Type column, select a type for the field.
E Alternatively, you can use Ctrl-A or the Ctrl-click method to select multiple fieldsbefore using the drop-down list to select a type.

152
Chapter 7
Note: Selecting a type will not affect the data storage used for this field. You can alterdata storage using the Data tab in the Variable File and Fixed File node dialog boxesor using the conversion functions available from the Filler node.
Figure 7-3Manually setting types
What Is Instantiation?
Instantiation is the process of reading or specifying information, such as storagetype and values for a data field. In order to optimize system resources, instantiatingin Clementine is a user-directed process—you tell the software to read values byspecifying options on the Types tab in a source node or by running data througha Type node.
Data with unknown types are also referred to as uninstantiated. Data whosestorage type and values are unknown are displayed in the Type column of theTypes tab as <Default>.
153
Field Operations Nodes
When you have some information about a field's storage, such as string ornumeric, the data is called partially instantiated. Discrete or Range are partiallyinstantiated types. For example, Discrete specifies that the field is symbolic, butyou don't know whether it is a set or a flag type.
When all of the details about a type are known, including the values, a fullyinstantiated type—set, flag, range—is displayed in this column. Note: Therange type is used for both partially instantiated and fully instantiated data fields.Ranges can be either integers or real numbers.
During the execution of a data stream with a Type node, uninstantiated typesimmediately become partially instantiated, based on the initial data values. Once allof the data have passed through the node, all data become fully instantiated unlessvalues were set to <Pass>. If execution is interrupted, the data will remain partiallyinstantiated. Once the Types tab has been instantiated, the values of a field are staticat that point in the stream. This means that any upstream changes will not affect thevalues of a particular field, even if you reexecute the stream. To change or update thevalues based on new data or added manipulations, you need to edit them in the Typestab itself or set the value for a field to <Read> or <Read +>.
When to Instantiate at the Type Node
There are two ways you can learn about the storage type and values of your datafields. This instantiation can occur at either the source node when you first bringdata into Clementine or by inserting a Type node into the data stream.
Instantiating at the Type node is useful when:
The data set is large, and the stream filters a subset prior to the Type node.
Data have been filtered in the stream.
Data have been merged or appended in the stream.
New data fields are derived during processing.
Generally, if your data set is not very large and you do not plan to add fields laterin the stream, instantiating at the source node is the most convenient method. TheType node provides additional flexibility for large data sets and compatibility withearlier versions of Clementine.
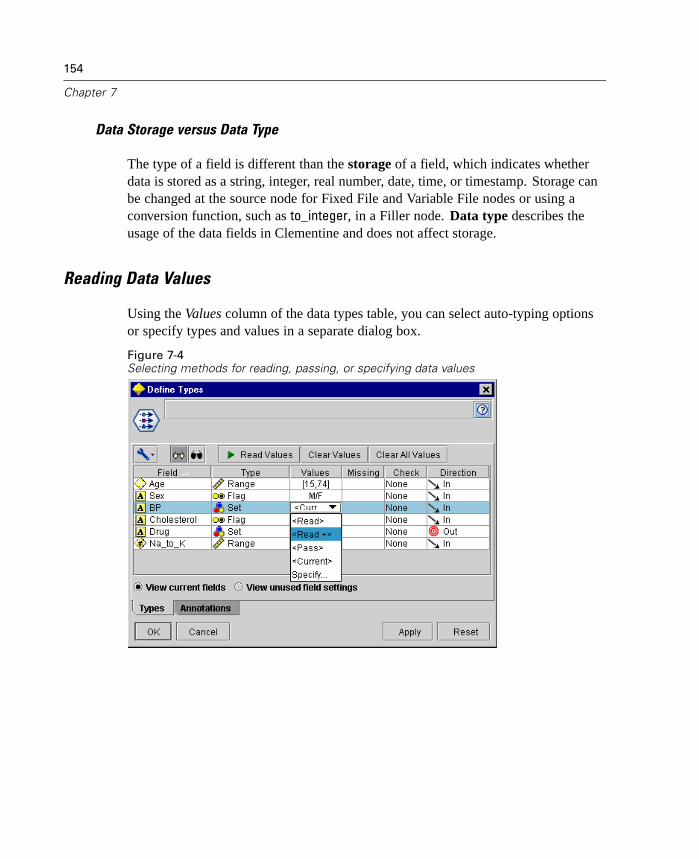
154
Chapter 7
Data Storage versus Data Type
The type of a field is different than the storage of a field, which indicates whetherdata is stored as a string, integer, real number, date, time, or timestamp. Storage canbe changed at the source node for Fixed File and Variable File nodes or using aconversion function, such as to_integer, in a Filler node. Data type describes theusage of the data fields in Clementine and does not affect storage.
Reading Data Values
Using the Values column of the data types table, you can select auto-typing optionsor specify types and values in a separate dialog box.
Figure 7-4Selecting methods for reading, passing, or specifying data values

155
Field Operations Nodes
The options available from this drop-down list provide the following instructionsfor auto-typing:
Option Function
<Read> Data will be read when the node is executed.
<Read+> Data will be read and appended to the current data (if any exists).
<Pass> No data is read.
<Current> Keep current data values.
Specify... A separate dialog box is launched for you to specify values and typeoptions.
Executing a Type node or clicking Read Values will auto-type and read values fromyour data source based on your selection. These values can also be specified manuallyusing the Specify option or by double-clicking a cell in the Field column.
Once you have made changes for fields in the Type node, you can reset valueinformation using the following buttons on the dialog box toolbar:
Using the Clear Values button, you can clear changes to field values made inthis node (non-inherited values) and reread values from upstream operations.This option is useful for resetting changes that you may have made for specificfields upstream.
Using the Clear All Values button, you can reset values for all fields read into thenode. This option effectively sets the Values column to Read for all fields. Thisoption is useful to reset values for all fields and reread values and types fromupstream operations.
Using the Values Dialog Box
This dialog box contains several options for reading, specifying, and handling valuesfor the selected field. Many of the controls are common to all types of data. Thesecommon controls are discussed here.
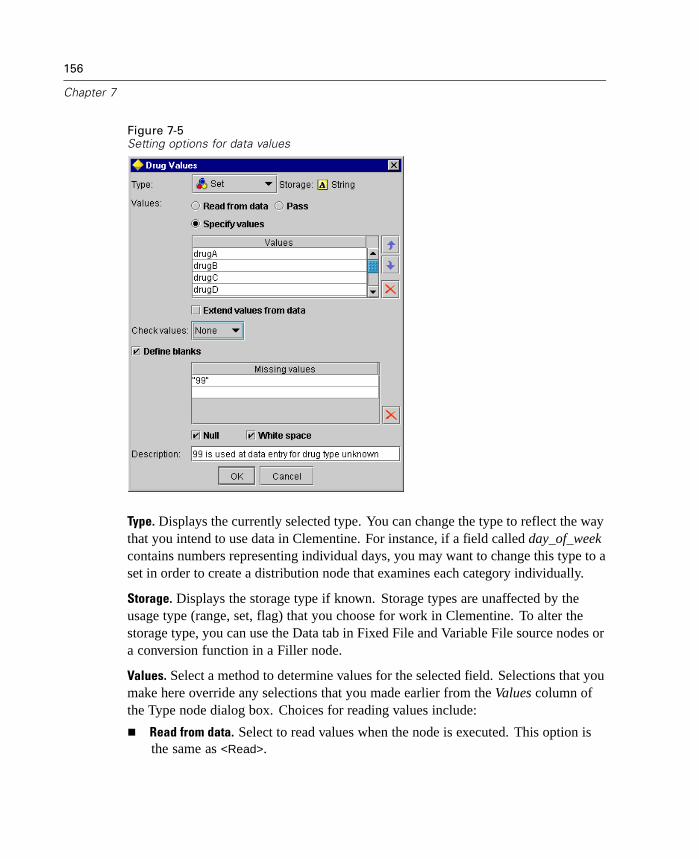
156
Chapter 7
Figure 7-5Setting options for data values
Type. Displays the currently selected type. You can change the type to reflect the waythat you intend to use data in Clementine. For instance, if a field called day_of_weekcontains numbers representing individual days, you may want to change this type to aset in order to create a distribution node that examines each category individually.
Storage. Displays the storage type if known. Storage types are unaffected by theusage type (range, set, flag) that you choose for work in Clementine. To alter thestorage type, you can use the Data tab in Fixed File and Variable File source nodes ora conversion function in a Filler node.
Values. Select a method to determine values for the selected field. Selections that youmake here override any selections that you made earlier from the Values column ofthe Type node dialog box. Choices for reading values include:
Read from data. Select to read values when the node is executed. This option isthe same as <Read>.
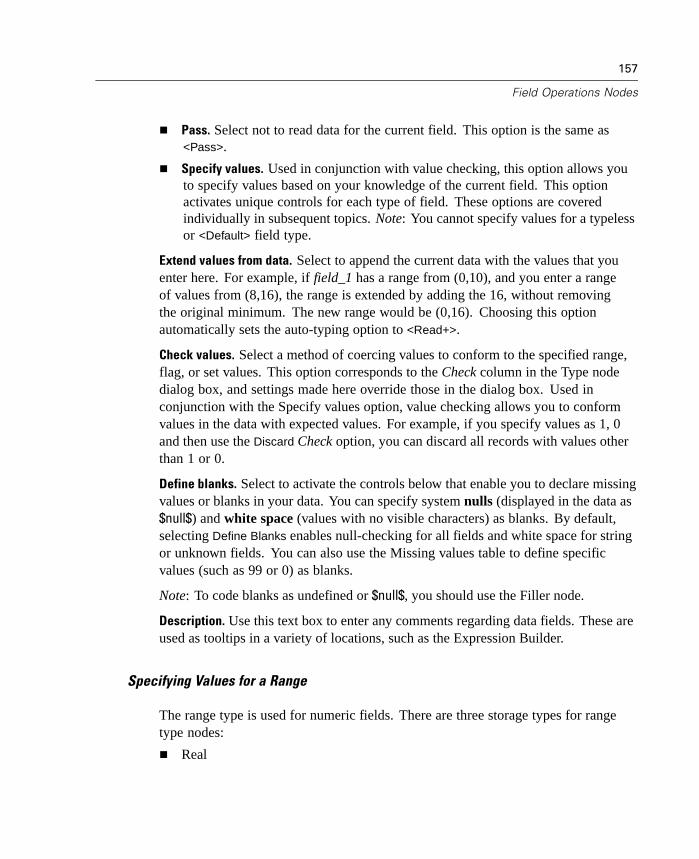
157
Field Operations Nodes
Pass. Select not to read data for the current field. This option is the same as<Pass>.
Specify values. Used in conjunction with value checking, this option allows youto specify values based on your knowledge of the current field. This optionactivates unique controls for each type of field. These options are coveredindividually in subsequent topics. Note: You cannot specify values for a typelessor <Default> field type.
Extend values from data. Select to append the current data with the values that youenter here. For example, if field_1 has a range from (0,10), and you enter a rangeof values from (8,16), the range is extended by adding the 16, without removingthe original minimum. The new range would be (0,16). Choosing this optionautomatically sets the auto-typing option to <Read+>.
Check values. Select a method of coercing values to conform to the specified range,flag, or set values. This option corresponds to the Check column in the Type nodedialog box, and settings made here override those in the dialog box. Used inconjunction with the Specify values option, value checking allows you to conformvalues in the data with expected values. For example, if you specify values as 1, 0and then use the Discard Check option, you can discard all records with values otherthan 1 or 0.
Define blanks. Select to activate the controls below that enable you to declare missingvalues or blanks in your data. You can specify system nulls (displayed in the data as$null$) and white space (values with no visible characters) as blanks. By default,selecting Define Blanks enables null-checking for all fields and white space for stringor unknown fields. You can also use the Missing values table to define specificvalues (such as 99 or 0) as blanks.
Note: To code blanks as undefined or $null$, you should use the Filler node.
Description. Use this text box to enter any comments regarding data fields. These areused as tooltips in a variety of locations, such as the Expression Builder.
Specifying Values for a Range
The range type is used for numeric fields. There are three storage types for rangetype nodes:
Real

158
Chapter 7
Integer
Date/Time
The same dialog box is used to edit all types of range nodes; however, the differentstorage types are displayed as reference.
Figure 7-6Options for specifying a range of values
Lower. Specify a lower limit for the range field values.
Upper. Specify an upper limit for the range field values.
Specifying Values for a Set
Set field types indicate that the data values are used discretely as a member of the set.The storage types for a set can be string, integer, real number, or date/time.

159
Field Operations Nodes
Figure 7-7Options for specifying set values
Values. Used in conjunction with value checking, this option allows you to specifyvalues based on your knowledge of the current field. Using this table, you can enterexpected values for the field and check the data set's conformity to these values usingthe Check values drop-down list. Using the arrow and delete buttons, you can modifyexisting values as well as reorder or delete values.
Specifying Values for a Flag
Flag fields are used to display data that have two distinct values. The storage typesfor flags can be string, integer, real number, or date/time.
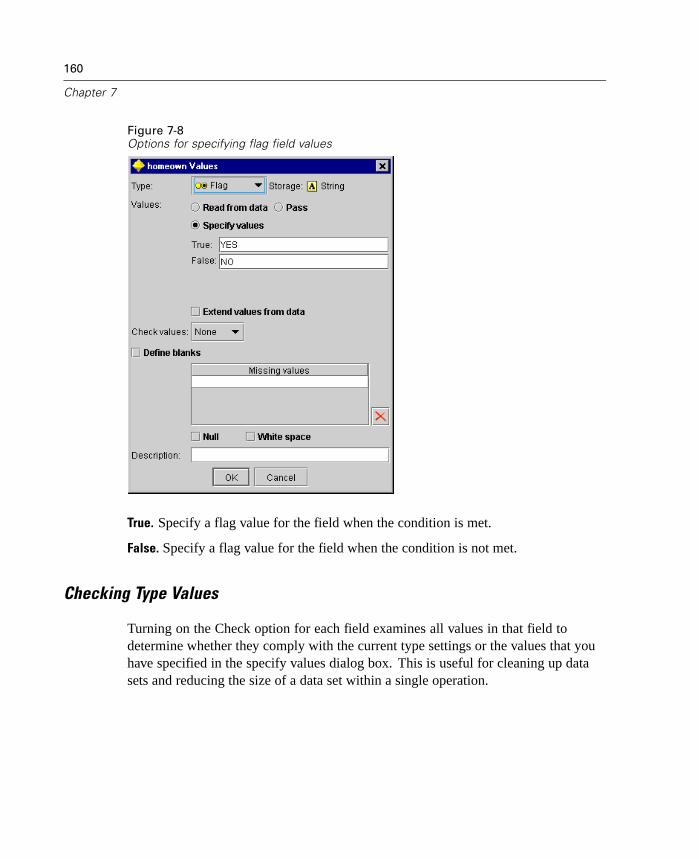
160
Chapter 7
Figure 7-8Options for specifying flag field values
True. Specify a flag value for the field when the condition is met.
False. Specify a flag value for the field when the condition is not met.
Checking Type Values
Turning on the Check option for each field examines all values in that field todetermine whether they comply with the current type settings or the values that youhave specified in the specify values dialog box. This is useful for cleaning up datasets and reducing the size of a data set within a single operation.

161
Field Operations Nodes
Figure 7-9Selecting Check options for the selected field
The setting of the Check column in the Type node dialog box determines whathappens when a value outside of the type limits is discovered. To change the Checksettings for a field, use the drop-down list for that field in the Check column. To setthe Check settings for all fields, click in the Field column and press Ctrl-A. Then usethe drop-down list for any field in the Check column.
The following Check settings are available:
None. Values will be passed through without checking. This is the default setting.
Nullify. Change values outside of the limits to the system null ($null$).
Coerce. Fields whose types are fully instantiated will be checked for values that falloutside the specified ranges. Unspecified values will be converted to a legal valuefor that type using the following rules:
For flags, any value other than the true and false value is converted to the falsevalue.
For sets, any unknown value is converted to the first member of the set's values.
Numbers greater than the upper limit of a range are replaced by the upper limit.

162
Chapter 7
Numbers less than the lower limit of a range are replaced by the lower limit.
Null values in a range are given the midpoint value for that range.
Discard. When illegal values are found, the entire record is discarded.
Warn. The number of illegal items is counted and reported in the stream propertiesdialog box when all of the data have been read.
Abort. The first illegal value encountered terminates the execution of the stream. Theerror is reported in the stream properties dialog box.
Setting Field Direction
Specifying the direction of a field provides useful information for Modeling nodesbecause they tell the model engine in which direction fields will be used. You can seta direction by clicking in the Direction column for a particular field.
Figure 7-10Setting Direction options for the Type node
Directions can be set as:
In. The field will be used as an input to machine learning (a predictor field).
163
Field Operations Nodes
Out. The field will be used as an output or target for machine learning (one of thefields that the model will try to predict).
Both. The field will be used as both an input and an output by the GRI and Apriorinodes. All other modeling nodes will ignore the field.
None. The field will be ignored by machine learning. Fields that have been set toTypeless are automatically set to None in the Direction column.
Copying Type Attributes
You can easily copy the attributes of a type, such as values, checking options, andmissing values from one field to another:
E Right-click on the field whose attributes you want to copy.
E From the context menu, choose Copy.
E Right-click on the field(s) whose attributes you want to change.
E From the context menu, choose Paste Special. Note: You can select multiple fieldsusing the Ctrl-click method or by using the Select Fields option from the context menu.
A new dialog box opens, from which you can select the specific attributes that youwant to paste. If you are pasting into multiple fields, the options that you select herewill apply to all target fields.
Paste the following attributes. Select from the list below to paste attributes from onefield to another.
Type. Select to paste the type.
Values. Select to paste the field values.
Missing. Select to paste missing value settings.
Check. Select to paste value checking options.
Direction. Select to paste the direction of a field.
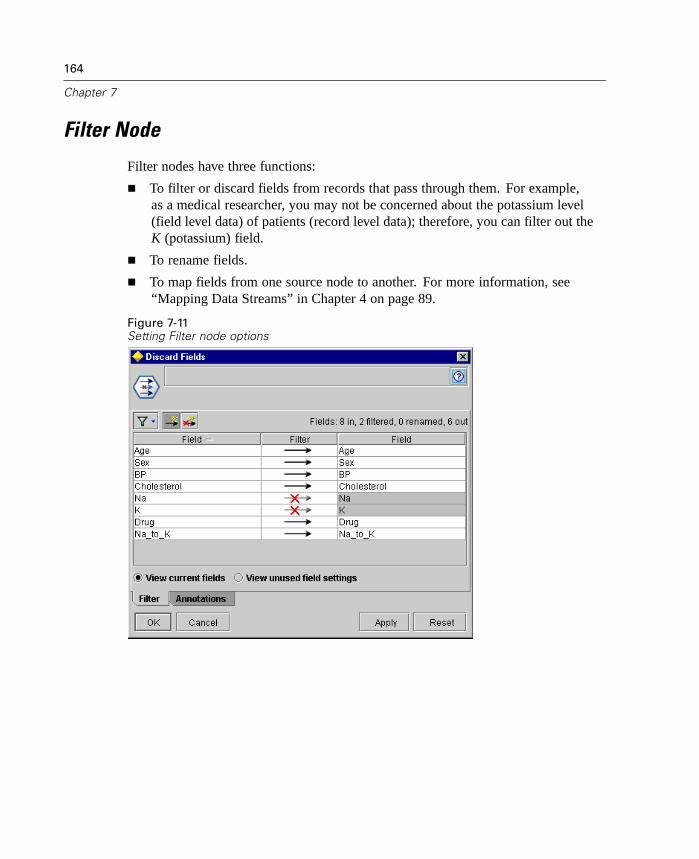
164
Chapter 7
Filter Node
Filter nodes have three functions:
To filter or discard fields from records that pass through them. For example,as a medical researcher, you may not be concerned about the potassium level(field level data) of patients (record level data); therefore, you can filter out theK (potassium) field.
To rename fields.
To map fields from one source node to another. For more information, see“Mapping Data Streams” in Chapter 4 on page 89.
Figure 7-11Setting Filter node options
165
Field Operations Nodes
Setting Filtering Options
The table used in the Filter tab shows the name of each field as it comes into the nodeas well as the name of each field as it leaves. You can use the options in this tableto rename or filter out fields that are duplicates or are unnecessary for downstreamoperations.
Field. Displays the input fields from currently connected data sources.
Filter. Displays the filter status of all input fields. Filtered fields include a redX in this column, indicating that this field will not be passed downstream.Click in the Filter column for a selected field to turn filtering on and off. Youcan also select options for multiple fields simultaneously using the Shift-clickmethod of selection.
Field. Displays the fields as they leave the Filter node. Duplicate names aredisplayed in red. You can edit field names by clicking in this column andentering a new name. Or, remove fields by clicking in the Filter column todisable duplicate fields.
All columns in the table can be sorted by clicking on the column header.
View current fields. Select to view fields for data sets actively connected to the Filternode. This option is selected by default and is the most common method of usingFilter nodes.
View unused field settings. Select to view fields for data sets that were once but are nolonger connected to the Filter node. This option is useful when copying Filter nodesfrom one stream to another or when saving and reloading Filter nodes.
The filter menu at the top of this dialog box (available from the filter button) helpsyou to perform operations on multiple fields simultaneously.

166
Chapter 7
Figure 7-12Filter menu options
You can choose to:
Remove all fields.
Include all fields.
Toggle all fields.
Remove duplicates. Note: Selecting this option removes all occurrences of theduplicate name, including the first one.
Truncate field names.
Use input field names.
Set the default filter state.
You can also use the arrow toggle buttons at the top of the dialog box to include allfields or discard all fields at the same time. This is useful for large data sets whereonly a few fields are to be included downstream.
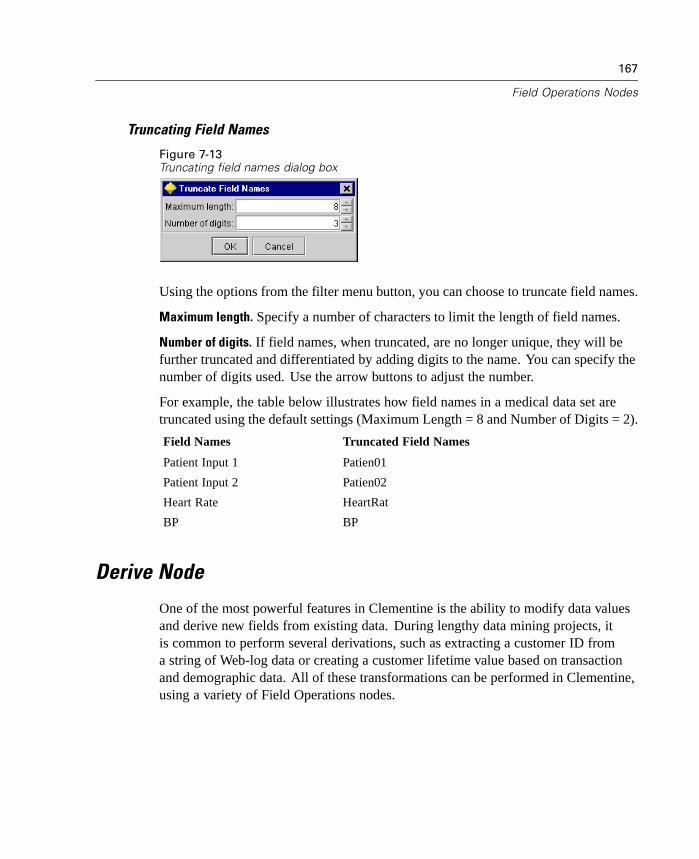
167
Field Operations Nodes
Truncating Field Names
Figure 7-13Truncating field names dialog box
Using the options from the filter menu button, you can choose to truncate field names.
Maximum length. Specify a number of characters to limit the length of field names.
Number of digits. If field names, when truncated, are no longer unique, they will befurther truncated and differentiated by adding digits to the name. You can specify thenumber of digits used. Use the arrow buttons to adjust the number.
For example, the table below illustrates how field names in a medical data set aretruncated using the default settings (Maximum Length = 8 and Number of Digits = 2).
Field Names Truncated Field Names
Patient Input 1 Patien01
Patient Input 2 Patien02
Heart Rate HeartRat
BP BP
Derive Node
One of the most powerful features in Clementine is the ability to modify data valuesand derive new fields from existing data. During lengthy data mining projects, itis common to perform several derivations, such as extracting a customer ID froma string of Web-log data or creating a customer lifetime value based on transactionand demographic data. All of these transformations can be performed in Clementine,using a variety of Field Operations nodes.
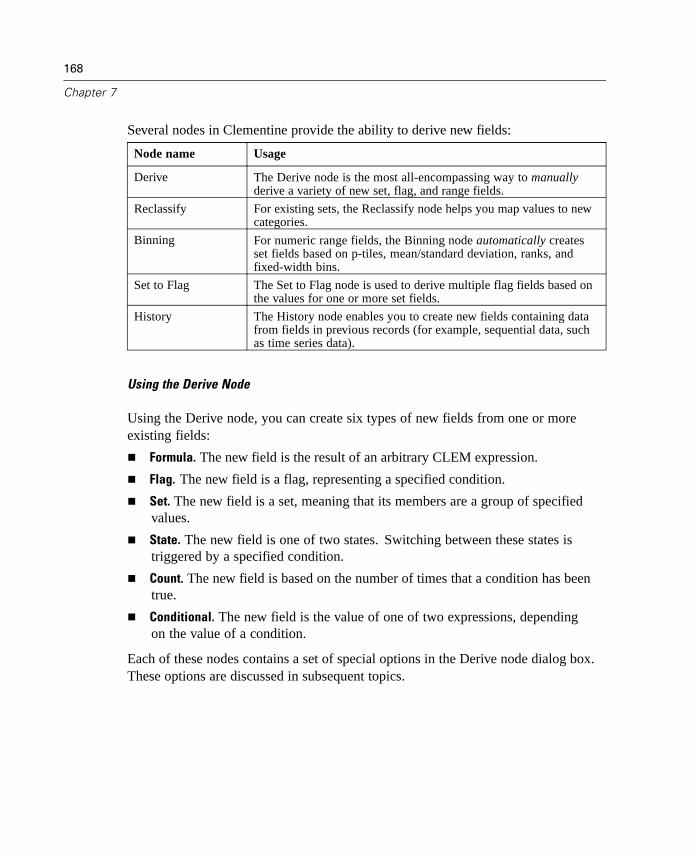
168
Chapter 7
Several nodes in Clementine provide the ability to derive new fields:
Node name Usage
Derive The Derive node is the most all-encompassing way to manuallyderive a variety of new set, flag, and range fields.
Reclassify For existing sets, the Reclassify node helps you map values to newcategories.
Binning For numeric range fields, the Binning node automatically createsset fields based on p-tiles, mean/standard deviation, ranks, andfixed-width bins.
Set to Flag The Set to Flag node is used to derive multiple flag fields based onthe values for one or more set fields.
History The History node enables you to create new fields containing datafrom fields in previous records (for example, sequential data, suchas time series data).
Using the Derive Node
Using the Derive node, you can create six types of new fields from one or moreexisting fields:
Formula. The new field is the result of an arbitrary CLEM expression.
Flag. The new field is a flag, representing a specified condition.
Set. The new field is a set, meaning that its members are a group of specifiedvalues.
State. The new field is one of two states. Switching between these states istriggered by a specified condition.
Count. The new field is based on the number of times that a condition has beentrue.
Conditional. The new field is the value of one of two expressions, dependingon the value of a condition.
Each of these nodes contains a set of special options in the Derive node dialog box.These options are discussed in subsequent topics.

169
Field Operations Nodes
Setting Basic Options for the Derive Node
At the top of the dialog box for Derive nodes are a number of options for selectingthe type of Derive node that you need.
Figure 7-14Derive node dialog box
Mode. Select Single or Multiple, depending on whether you want to derive multiplefields. When Multiple is selected, the dialog box changes to include options formultiple Derive fields.
Derive field. For simple Derive nodes, specify the name of the field that you want toderive and add to each record. The default name is DeriveN, where N is the number ofDerive nodes that you have created thus far during the current session.
Derive as. Select a type of Derive node, such as Formula or Set, from the drop-downlist. For each type, a new field is created based on the conditions that you specify inthe type-specific dialog box.
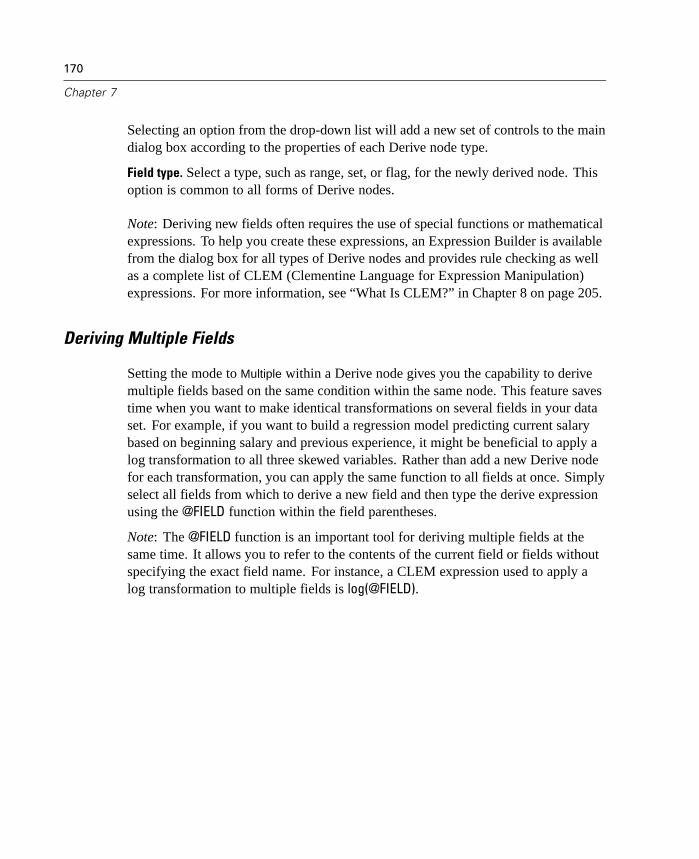
170
Chapter 7
Selecting an option from the drop-down list will add a new set of controls to the maindialog box according to the properties of each Derive node type.
Field type. Select a type, such as range, set, or flag, for the newly derived node. Thisoption is common to all forms of Derive nodes.
Note: Deriving new fields often requires the use of special functions or mathematicalexpressions. To help you create these expressions, an Expression Builder is availablefrom the dialog box for all types of Derive nodes and provides rule checking as wellas a complete list of CLEM (Clementine Language for Expression Manipulation)expressions. For more information, see “What Is CLEM?” in Chapter 8 on page 205.
Deriving Multiple Fields
Setting the mode to Multiple within a Derive node gives you the capability to derivemultiple fields based on the same condition within the same node. This feature savestime when you want to make identical transformations on several fields in your dataset. For example, if you want to build a regression model predicting current salarybased on beginning salary and previous experience, it might be beneficial to apply alog transformation to all three skewed variables. Rather than add a new Derive nodefor each transformation, you can apply the same function to all fields at once. Simplyselect all fields from which to derive a new field and then type the derive expressionusing the @FIELD function within the field parentheses.
Note: The @FIELD function is an important tool for deriving multiple fields at thesame time. It allows you to refer to the contents of the current field or fields withoutspecifying the exact field name. For instance, a CLEM expression used to apply alog transformation to multiple fields is log(@FIELD).

171
Field Operations Nodes
Figure 7-15Deriving multiple fields
The following options are added to the dialog box when you select Multiple mode:
Derive from. Use the Field Chooser to select fields from which to derive new fields.One output field will be generated for each selected field. Note: Selected fieldsdo not need to be the same storage type; however, the Derive operation will fail ifthe condition is not valid for all fields.
File name extension. Type the extension that you would like added to the new fieldname(s). For example, for a new field containing the log of Current Salary, you couldadd the extension log_ to the field name, producing log_Current Salary. Use the radiobuttons to choose whether to add the extension as a prefix (at the beginning) or as asuffix (at the end) of the field name. The default name is DeriveN, where N is thenumber of Derive nodes that you have created thus far during the current session.

172
Chapter 7
As in the single-mode Derive node, you now need to create an expression to use forderiving a new field. Depending on the type of Derive operation selected, there are anumber of options to create a condition. These options are discussed in subsequenttopics. To create an expression, you can simply type in the formula field(s) or use theExpression Builder by clicking the calculator button. Remember to use the @FIELDfunction when referring to manipulations on multiple fields.
Selecting Multiple Fields
For all nodes that perform operations on multiple input fields, such as Derive(multiple mode), Aggregate, Sort, and Multiplot, you can easily select multiplefields using the following dialog box.
Figure 7-16Selecting multiple fields
Sort by. You can sort available fields for viewing by selecting one of the followingoptions:
Natural. View the order of fields as they have been passed down the data streaminto the current node.
Name. Use alphabetical order to sort fields for viewing.
Type. View fields sorted by their type. This option is useful when selectingfields by type.
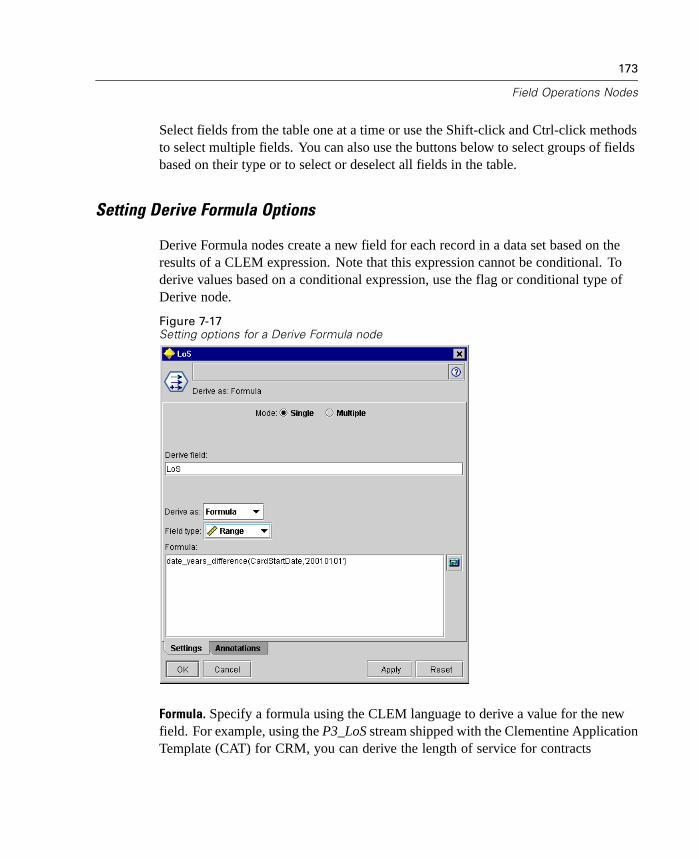
173
Field Operations Nodes
Select fields from the table one at a time or use the Shift-click and Ctrl-click methodsto select multiple fields. You can also use the buttons below to select groups of fieldsbased on their type or to select or deselect all fields in the table.
Setting Derive Formula Options
Derive Formula nodes create a new field for each record in a data set based on theresults of a CLEM expression. Note that this expression cannot be conditional. Toderive values based on a conditional expression, use the flag or conditional type ofDerive node.
Figure 7-17Setting options for a Derive Formula node
Formula. Specify a formula using the CLEM language to derive a value for the newfield. For example, using the P3_LoS stream shipped with the Clementine ApplicationTemplate (CAT) for CRM, you can derive the length of service for contracts

174
Chapter 7
pertaining to all customers in the database. The new field is called LoS and using theExpression Builder, you can create the following expression in the Formula field:
date_years_difference(CardStartDate,'20010101')
Upon execution, the new LoS field will be created for each record and will contain thevalue of the difference between the value for CardStartDate and the reference date(2001/01/01) for each record.
Setting Derive Flag Options
Derive Flag nodes are used to indicate a specific condition, such as high bloodpressure or customer account inactivity. A flag field is created for each record, andwhen the true condition is met, the flag value for true is added in the field.
Figure 7-18Deriving a flag field to indicate inactive accounts

175
Field Operations Nodes
True value. Specify a value to include in the flag field for records that match thecondition specified below. The default is T.
False value. Specify a value to include in the flag field for records that do not matchthe condition specified below. The default is F.
True when. Specify a CLEM condition to evaluate certain values of each record andgive the record a True value or a False value (defined above). Note that the true valuewill be given to records in the case of non-false numeric values.
Note: To return an empty string, you should type opening and closing quotes withnothing between them, such as “ ”. Empty strings are often used, for example, asthe false value in order to enable true values to stand out more clearly in a table.Similarly, quotes should be used if you want a string value that would otherwisebe treated as a number
Setting Derive Set Options
Derive Set nodes are used to execute a set of CLEM conditions in order to determinewhich condition each record satisfies. As a condition is met for each record, a value(indicating which set of conditions was met) will be added to the new, derived field.

176
Chapter 7
Figure 7-19Setting customer value categories using a Derive Set node
Default value. Specify a value to be used in the new field if none of the conditionsare met.
Set field to. Specify a value to enter in the new field when a particular conditionis met. Each value in the list has an associated condition that you specify in theadjacent column.
If this condition is true. Specify a condition for each member in the set field to list. Usethe Expression Builder to select from available functions and fields. You can use thearrow and delete buttons to reorder or remove conditions.
A condition works by testing the values of a particular field in the data set. As eachcondition is tested, the values specified above will be assigned to the new field toindicate which, if any, condition was met. If none of the conditions are met, thedefault value is used.
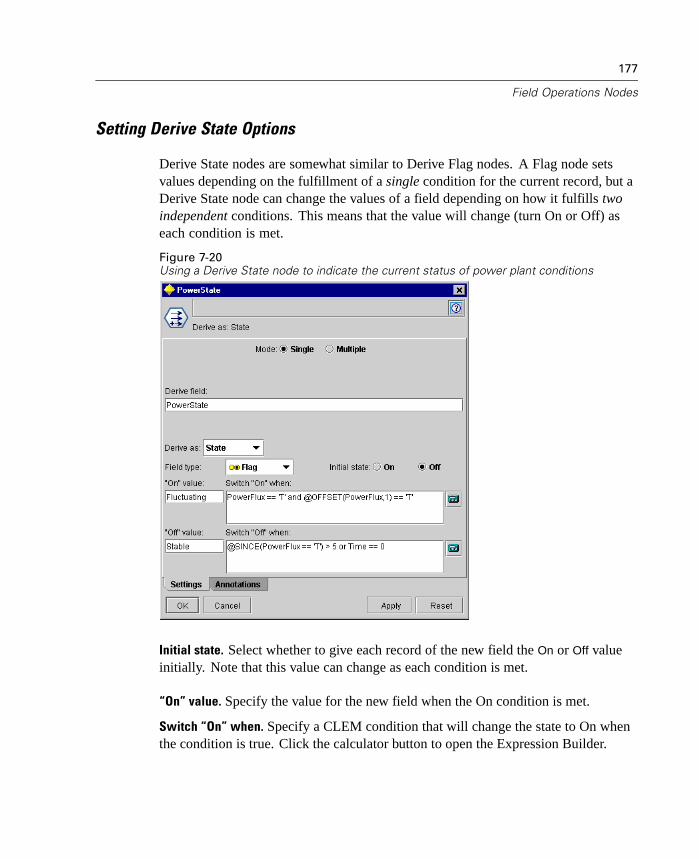
177
Field Operations Nodes
Setting Derive State Options
Derive State nodes are somewhat similar to Derive Flag nodes. A Flag node setsvalues depending on the fulfillment of a single condition for the current record, but aDerive State node can change the values of a field depending on how it fulfills twoindependent conditions. This means that the value will change (turn On or Off) aseach condition is met.
Figure 7-20Using a Derive State node to indicate the current status of power plant conditions
Initial state. Select whether to give each record of the new field the On or Off valueinitially. Note that this value can change as each condition is met.
“On” value. Specify the value for the new field when the On condition is met.
Switch “On” when. Specify a CLEM condition that will change the state to On whenthe condition is true. Click the calculator button to open the Expression Builder.
178
Chapter 7
“Off” value. Specify the value for the new field when the Off condition is met.
Switch “Off” when. Specify a CLEM condition that will change the state to Off whenthe condition is false. Click the calculator button to open the Expression Builder.
Note: To specify an empty string, you should type opening and closing quotes withnothing between them, such as “ ”. Similarly, quotes should be used if you want astring value that would otherwise be treated as a number.
Setting Derive Count Options
A Derive Count node is used to apply a series of conditions to the values of a numericfield in the data set. As each condition is met, the value of the derived count field isincreased by a set increment. This type of Derive node is useful for time series data.
Figure 7-21Count options in the Derive node dialog box

179
Field Operations Nodes
Initial value. Sets a value used on execution for the new field. The initial value mustbe a numeric constant. Use the arrow buttons to increase or decrease the value.
Increment when. Specify the CLEM condition that, when met, will change the derivedvalue based on the number specified in Increment by. Click the calculator button toopen the Expression Builder.
Increment by. Set the value used to increment the count. You can use either a numericconstant or the result of a CLEM expression.
Reset when. Specify a condition that, when met, will reset the derived value to theinitial value. Click the calculator button to open the Expression Builder.
Setting Derive Conditional Options
Derive Conditional nodes use a series of If, Then, Else statements to derive thevalue of the new field.
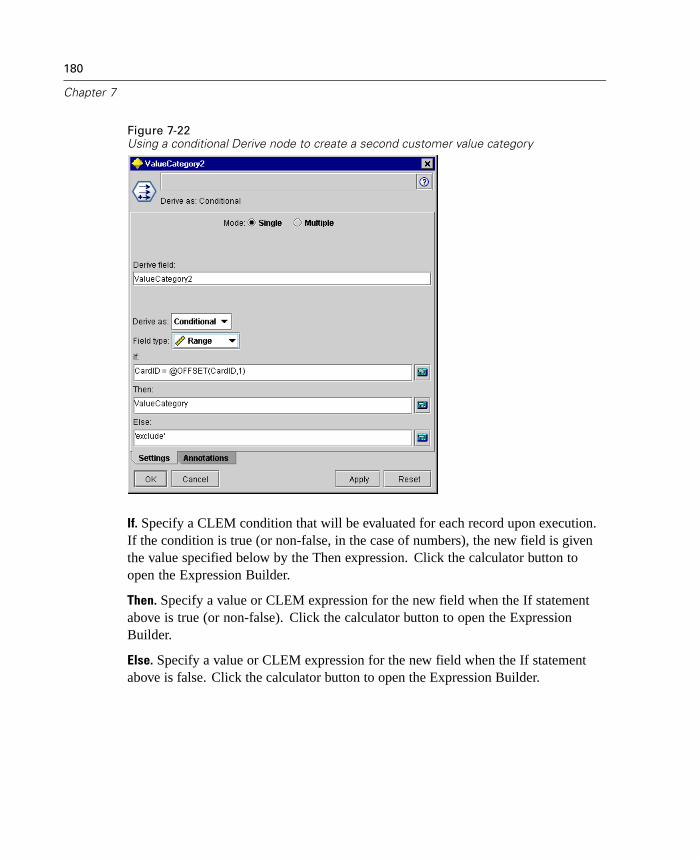
180
Chapter 7
Figure 7-22Using a conditional Derive node to create a second customer value category
If. Specify a CLEM condition that will be evaluated for each record upon execution.If the condition is true (or non-false, in the case of numbers), the new field is giventhe value specified below by the Then expression. Click the calculator button toopen the Expression Builder.
Then. Specify a value or CLEM expression for the new field when the If statementabove is true (or non-false). Click the calculator button to open the ExpressionBuilder.
Else. Specify a value or CLEM expression for the new field when the If statementabove is false. Click the calculator button to open the Expression Builder.
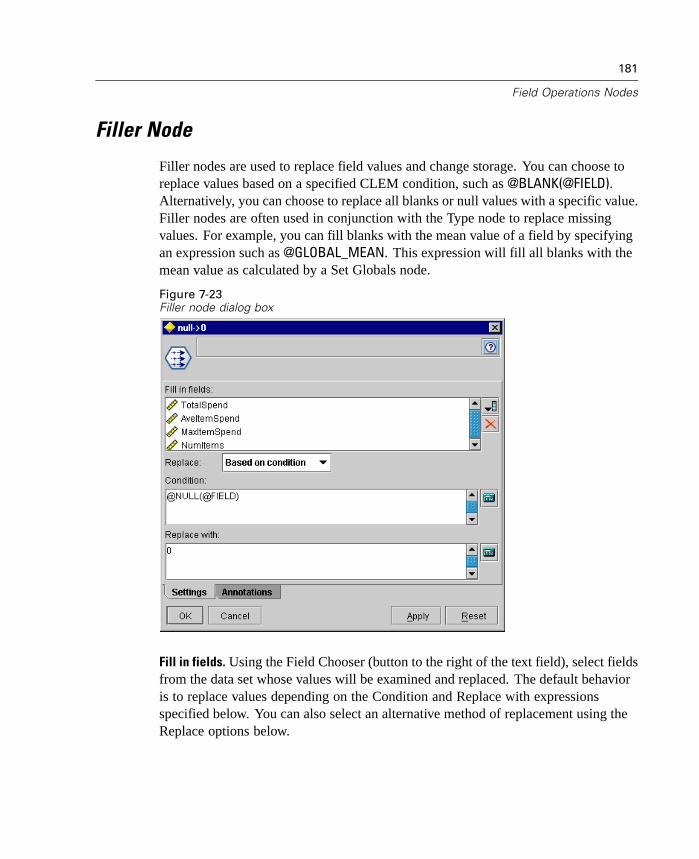
181
Field Operations Nodes
Filler Node
Filler nodes are used to replace field values and change storage. You can choose toreplace values based on a specified CLEM condition, such as @BLANK(@FIELD).Alternatively, you can choose to replace all blanks or null values with a specific value.Filler nodes are often used in conjunction with the Type node to replace missingvalues. For example, you can fill blanks with the mean value of a field by specifyingan expression such as @GLOBAL_MEAN. This expression will fill all blanks with themean value as calculated by a Set Globals node.
Figure 7-23Filler node dialog box
Fill in fields. Using the Field Chooser (button to the right of the text field), select fieldsfrom the data set whose values will be examined and replaced. The default behavioris to replace values depending on the Condition and Replace with expressionsspecified below. You can also select an alternative method of replacement using theReplace options below.
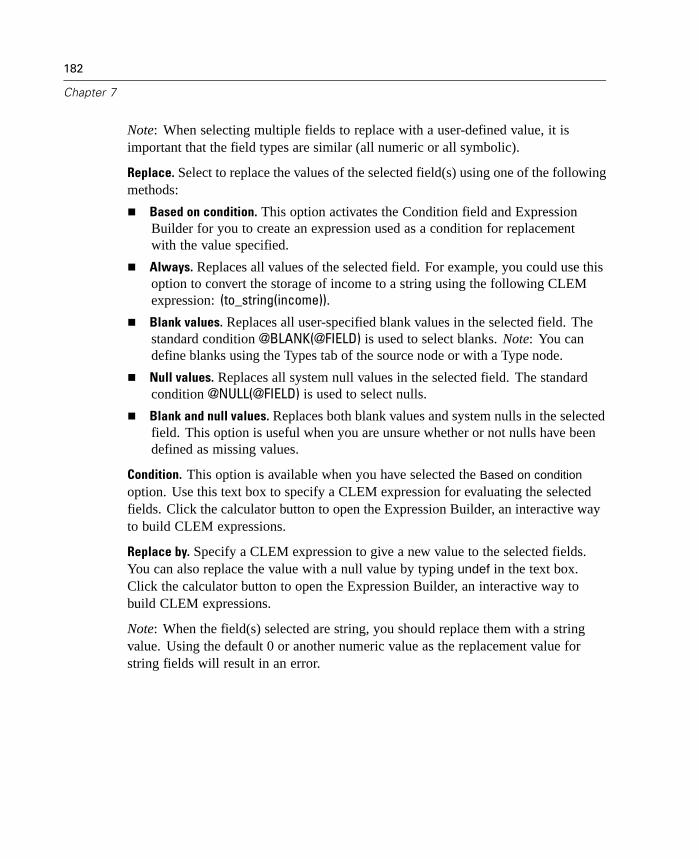
182
Chapter 7
Note: When selecting multiple fields to replace with a user-defined value, it isimportant that the field types are similar (all numeric or all symbolic).
Replace. Select to replace the values of the selected field(s) using one of the followingmethods:
Based on condition. This option activates the Condition field and ExpressionBuilder for you to create an expression used as a condition for replacementwith the value specified.
Always. Replaces all values of the selected field. For example, you could use thisoption to convert the storage of income to a string using the following CLEMexpression: (to_string(income)).
Blank values. Replaces all user-specified blank values in the selected field. Thestandard condition @BLANK(@FIELD) is used to select blanks. Note: You candefine blanks using the Types tab of the source node or with a Type node.
Null values. Replaces all system null values in the selected field. The standardcondition @NULL(@FIELD) is used to select nulls.
Blank and null values. Replaces both blank values and system nulls in the selectedfield. This option is useful when you are unsure whether or not nulls have beendefined as missing values.
Condition. This option is available when you have selected the Based on condition
option. Use this text box to specify a CLEM expression for evaluating the selectedfields. Click the calculator button to open the Expression Builder, an interactive wayto build CLEM expressions.
Replace by. Specify a CLEM expression to give a new value to the selected fields.You can also replace the value with a null value by typing undef in the text box.Click the calculator button to open the Expression Builder, an interactive way tobuild CLEM expressions.
Note: When the field(s) selected are string, you should replace them with a stringvalue. Using the default 0 or another numeric value as the replacement value forstring fields will result in an error.
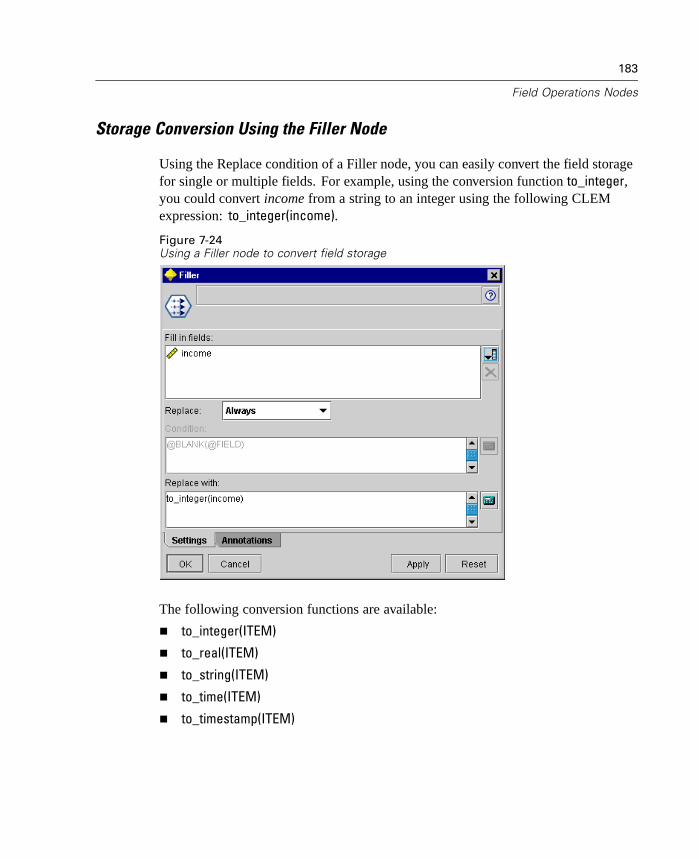
183
Field Operations Nodes
Storage Conversion Using the Filler Node
Using the Replace condition of a Filler node, you can easily convert the field storagefor single or multiple fields. For example, using the conversion function to_integer,you could convert income from a string to an integer using the following CLEMexpression: to_integer(income).
Figure 7-24Using a Filler node to convert field storage
The following conversion functions are available:
to_integer(ITEM)
to_real(ITEM)
to_string(ITEM)
to_time(ITEM)
to_timestamp(ITEM)
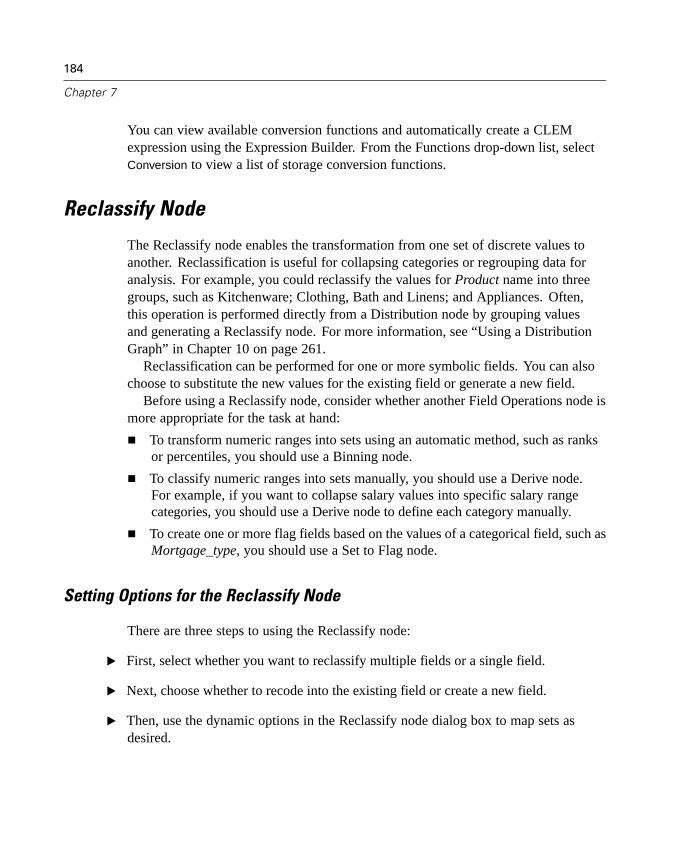
184
Chapter 7
You can view available conversion functions and automatically create a CLEMexpression using the Expression Builder. From the Functions drop-down list, selectConversion to view a list of storage conversion functions.
Reclassify Node
The Reclassify node enables the transformation from one set of discrete values toanother. Reclassification is useful for collapsing categories or regrouping data foranalysis. For example, you could reclassify the values for Product name into threegroups, such as Kitchenware; Clothing, Bath and Linens; and Appliances. Often,this operation is performed directly from a Distribution node by grouping valuesand generating a Reclassify node. For more information, see “Using a DistributionGraph” in Chapter 10 on page 261.
Reclassification can be performed for one or more symbolic fields. You can alsochoose to substitute the new values for the existing field or generate a new field.
Before using a Reclassify node, consider whether another Field Operations node ismore appropriate for the task at hand:
To transform numeric ranges into sets using an automatic method, such as ranksor percentiles, you should use a Binning node.
To classify numeric ranges into sets manually, you should use a Derive node.For example, if you want to collapse salary values into specific salary rangecategories, you should use a Derive node to define each category manually.
To create one or more flag fields based on the values of a categorical field, such asMortgage_type, you should use a Set to Flag node.
Setting Options for the Reclassify Node
There are three steps to using the Reclassify node:
E First, select whether you want to reclassify multiple fields or a single field.
E Next, choose whether to recode into the existing field or create a new field.
E Then, use the dynamic options in the Reclassify node dialog box to map sets asdesired.
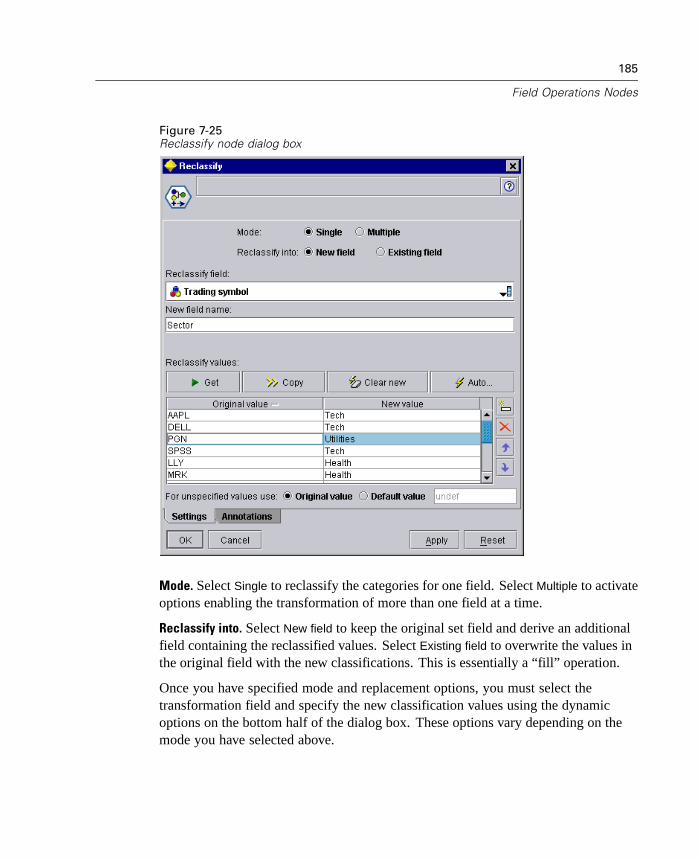
185
Field Operations Nodes
Figure 7-25Reclassify node dialog box
Mode. Select Single to reclassify the categories for one field. Select Multiple to activateoptions enabling the transformation of more than one field at a time.
Reclassify into. Select New field to keep the original set field and derive an additionalfield containing the reclassified values. Select Existing field to overwrite the values inthe original field with the new classifications. This is essentially a “fill” operation.
Once you have specified mode and replacement options, you must select thetransformation field and specify the new classification values using the dynamicoptions on the bottom half of the dialog box. These options vary depending on themode you have selected above.
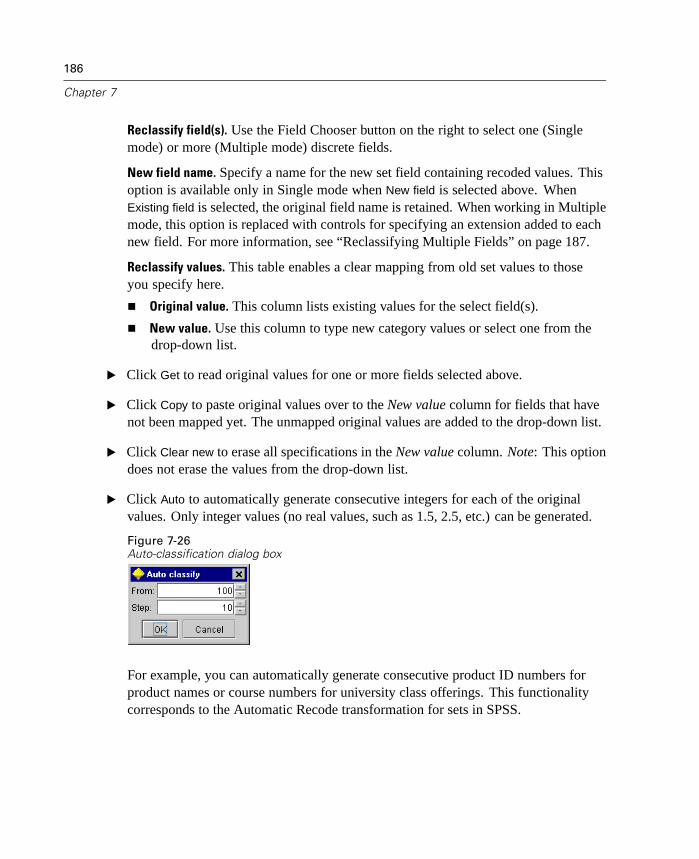
186
Chapter 7
Reclassify field(s). Use the Field Chooser button on the right to select one (Singlemode) or more (Multiple mode) discrete fields.
New field name. Specify a name for the new set field containing recoded values. Thisoption is available only in Single mode when New field is selected above. WhenExisting field is selected, the original field name is retained. When working in Multiplemode, this option is replaced with controls for specifying an extension added to eachnew field. For more information, see “Reclassifying Multiple Fields” on page 187.
Reclassify values. This table enables a clear mapping from old set values to thoseyou specify here.
Original value. This column lists existing values for the select field(s).
New value. Use this column to type new category values or select one from thedrop-down list.
E Click Get to read original values for one or more fields selected above.
E Click Copy to paste original values over to the New value column for fields that havenot been mapped yet. The unmapped original values are added to the drop-down list.
E Click Clear new to erase all specifications in the New value column. Note: This optiondoes not erase the values from the drop-down list.
E Click Auto to automatically generate consecutive integers for each of the originalvalues. Only integer values (no real values, such as 1.5, 2.5, etc.) can be generated.
Figure 7-26Auto-classification dialog box
For example, you can automatically generate consecutive product ID numbers forproduct names or course numbers for university class offerings. This functionalitycorresponds to the Automatic Recode transformation for sets in SPSS.
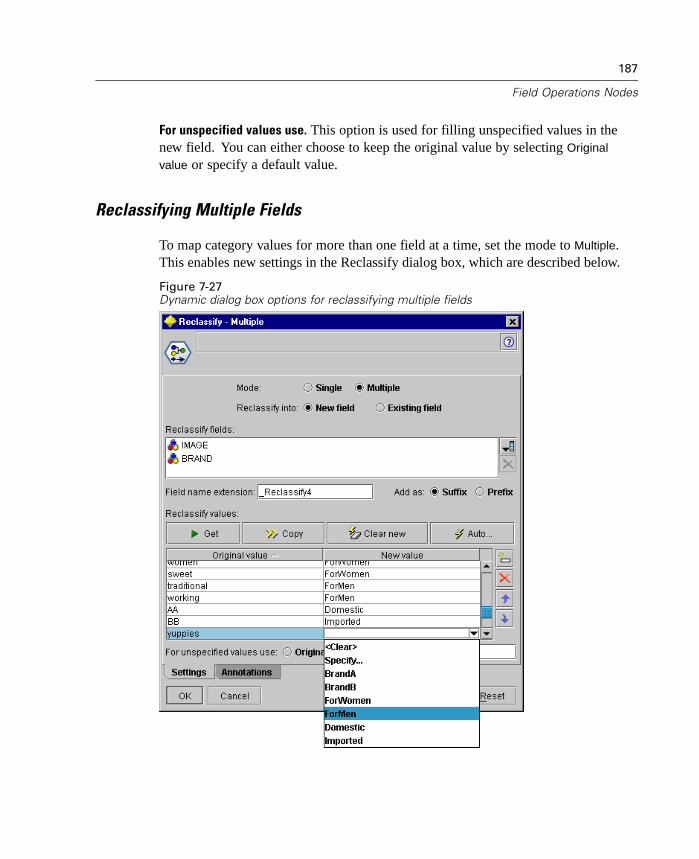
187
Field Operations Nodes
For unspecified values use. This option is used for filling unspecified values in thenew field. You can either choose to keep the original value by selecting Original
value or specify a default value.
Reclassifying Multiple Fields
To map category values for more than one field at a time, set the mode to Multiple.This enables new settings in the Reclassify dialog box, which are described below.
Figure 7-27Dynamic dialog box options for reclassifying multiple fields
188
Chapter 7
Reclassify fields. Use the Field Chooser button on the right to select the fields thatyou want to transform. Using the Field Chooser, you can select all fields at once orfields of a similar type, such as set or flag.
Field name extension. When recoding multiple fields simultaneously, it is moreefficient to specify a common extension added to all new fields rather than individualfield names. Specify an extension such as _recode and select whether to append orprepend this extension to the original field names.
Storage and Type for Reclassified Fields
The Reclassify node always creates a Set type field from the recode operation.In some cases, this may change the type of the field when using the Existing field
reclassification mode.
The new field's storage (how data is stored rather than how it is used) is calculatedbased on the following Settings tab options:
If unspecified values are set to use a default value, the storage type is determinedby examining both the new values as well as the default value and determiningthe appropriate storage. For example, if all values can be parsed as integers, thefield will have the integer storage type.
If unspecified values are set to use the original values, the storage type is basedon the storage of the original field. If all of the values can be parsed as thestorage of the original field, then that storage is preserved; otherwise, the storageis determined by finding the most appropriate storage type encompassing bothold and new values.
Note: If the original type was uninstantiated, the new type will be also beuninstantiated.
Binning Node
The Binning node enables you to automatically create new set fields based on thevalues of one or more existing numeric range fields. For example, you can transforma scale income field into a new categorical field containing groups of income asdeviations from the mean. In SPSS, this is also known as Automatic Recode. Once
189
Field Operations Nodes
you have created bins for the new field, you can generate a Derive node based onthe cut points.
Before using a Binning node, consider whether another Field Operations node ismore appropriate for the task at hand:
To manually specify cut points for categories, such as specific predefined salaryranges, use a Derive node.
To create new categories for existing sets, use a Reclassify node.
Missing Value Handling
The Binning node handles missing values in the following ways:
User-specified blanks. Missing values specified as blanks are included during thetransformation. For example, if you designated –99 to indicate a blank valueusing the Type node, this value will be included in the binning process. To ignoreblanks during binning, you should use a Filler node to replace the blank valueswith the system null value.
System-missing values ($null$). Null values are ignored during the binningtransformation and remain nulls after the transformation.
The Settings tab provides options for available techniques. The View tab displays cutpoints established for data previously run through the node.
Setting Options for the Binning Node
Using the Binning node, you can automatically generate bins (categories) using thefollowing techniques:
Fixed-width binning
Tiles (equal counts)
Mean and standard deviation
Ranks
The bottom half of the dialog box changes dynamically depending on the binningmethod you select.

190
Chapter 7
Figure 7-28Binning node dialog box: Settings tab
Bin fields. Numeric range fields pending transformation are displayed here. TheBinning node enables you to bin multiple fields simultaneously. Add or remove fieldsusing the buttons on the right.
Binning method. Select the method used to determine cut points for new field bins(categories).
The following topics discuss options for the available methods of binning.
Fixed-Width Bins
When you choose Fixed-width as the binning method, a new set of options is displayedin the dialog box.

191
Field Operations Nodes
Figure 7-29Binning node dialog box: Settings tab with options for fixed-width bins
Name extension. Specify an extension to use for the generated field(s). _BIN isthe default extension. You may also specify whether the extension is added to thestart (Prefix) or end (Suffix) of the field name. For example, you could generate anew field called income_BIN.
Bin width. Specify a value (integer or real) used to calculate the “width” of the bin.For example, you can use the default value, 10, to bin the field Age. Since Age has arange from 18–65, the generated bins would be the following:
Table 7-1Bins for Age with range 18–65
Bin 1 Bin 2 Bin 3 Bin 4 Bin 5 Bin 6
>=13 to <23 >=23 to <33 >=33 to <43 >=43 to <53 >=53 to <63 >=63 to <73
The start of bin intervals is calculated using the lowest scanned value minus half thebin width (as specified). For example, in the bins shown above, 13 is used to startthe intervals according to the following calculation: 18 [lowest data value] – 5[0.5 × (Bin width of 10)] = 13.
No. of bins. Use this option to specify an integer used to determine the number offixed-width bins (categories) for the new field(s).
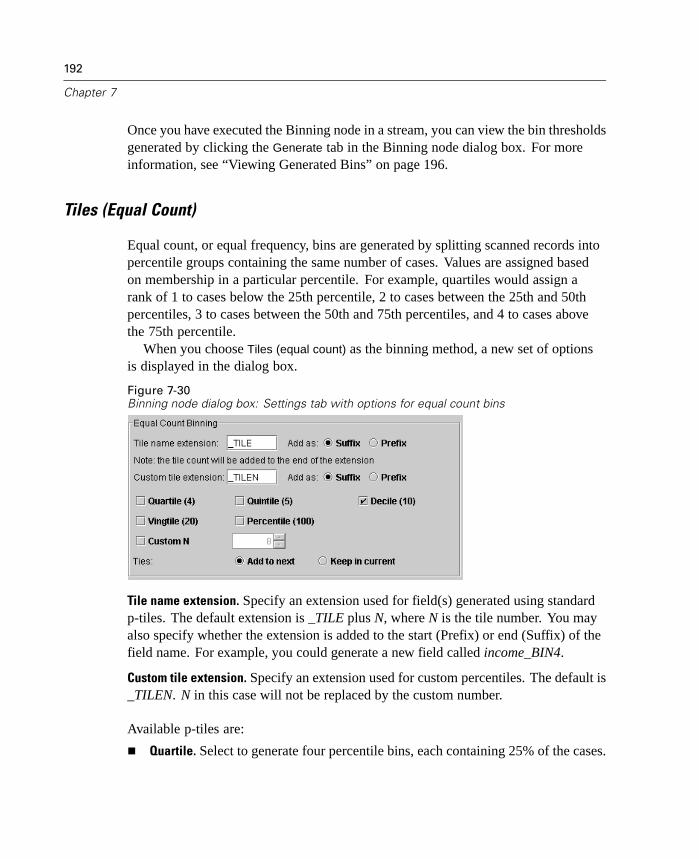
192
Chapter 7
Once you have executed the Binning node in a stream, you can view the bin thresholdsgenerated by clicking the Generate tab in the Binning node dialog box. For moreinformation, see “Viewing Generated Bins” on page 196.
Tiles (Equal Count)
Equal count, or equal frequency, bins are generated by splitting scanned records intopercentile groups containing the same number of cases. Values are assigned basedon membership in a particular percentile. For example, quartiles would assign arank of 1 to cases below the 25th percentile, 2 to cases between the 25th and 50thpercentiles, 3 to cases between the 50th and 75th percentiles, and 4 to cases abovethe 75th percentile.
When you choose Tiles (equal count) as the binning method, a new set of optionsis displayed in the dialog box.
Figure 7-30Binning node dialog box: Settings tab with options for equal count bins
Tile name extension. Specify an extension used for field(s) generated using standardp-tiles. The default extension is _TILE plus N, where N is the tile number. You mayalso specify whether the extension is added to the start (Prefix) or end (Suffix) of thefield name. For example, you could generate a new field called income_BIN4.
Custom tile extension. Specify an extension used for custom percentiles. The default is_TILEN. N in this case will not be replaced by the custom number.
Available p-tiles are:
Quartile. Select to generate four percentile bins, each containing 25% of the cases.
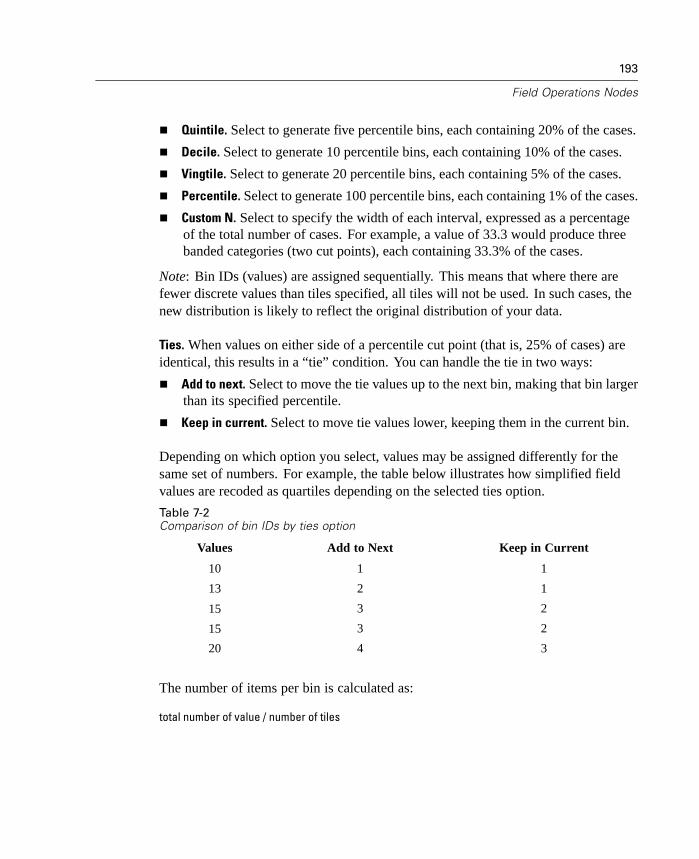
193
Field Operations Nodes
Quintile. Select to generate five percentile bins, each containing 20% of the cases.
Decile. Select to generate 10 percentile bins, each containing 10% of the cases.
Vingtile. Select to generate 20 percentile bins, each containing 5% of the cases.
Percentile. Select to generate 100 percentile bins, each containing 1% of the cases.
Custom N. Select to specify the width of each interval, expressed as a percentageof the total number of cases. For example, a value of 33.3 would produce threebanded categories (two cut points), each containing 33.3% of the cases.
Note: Bin IDs (values) are assigned sequentially. This means that where there arefewer discrete values than tiles specified, all tiles will not be used. In such cases, thenew distribution is likely to reflect the original distribution of your data.
Ties. When values on either side of a percentile cut point (that is, 25% of cases) areidentical, this results in a “tie” condition. You can handle the tie in two ways:
Add to next. Select to move the tie values up to the next bin, making that bin largerthan its specified percentile.
Keep in current. Select to move tie values lower, keeping them in the current bin.
Depending on which option you select, values may be assigned differently for thesame set of numbers. For example, the table below illustrates how simplified fieldvalues are recoded as quartiles depending on the selected ties option.
Table 7-2Comparison of bin IDs by ties option
Values Add to Next Keep in Current
10 1 1
13 2 1
15 3 2
15 3 2
20 4 3
The number of items per bin is calculated as:
total number of value / number of tiles

194
Chapter 7
In the simplified example above, the desired number of items per bin is 1.25 (5 values/ 4 quartiles). The value 13 (being value number 2) straddles the 1.25 desired countthreshold and is therefore treated differently depending on the selected ties option. InAdd to Next mode, it is added into bin 2. In Keep in Current mode, it is left in bin 1,pushing the range of values for bin 4 outside that of existing data values.
Rank Cases
When you choose Ranks as the binning method, a new set of options is displayedin the dialog box.
Figure 7-31Binning node dialog box: Settings tab with options for ranks
Ranking creates new fields containing ranks, fractional ranks, and percentile valuesfor numeric fields depending on the options specified below.
Rank order. Select Ascending (lowest value is marked 1) or Descending (highest valueis marked 1).
Rank. Select to rank cases in ascending or descending order as specified above. Therange of values in the new field will be 1–N, where N is the number of discrete valuesin the original field. Tied values are given the average of their rank.
Fractional rank. Select to rank cases where the value of the new field equals rankdivided by the sum of the weights of the nonmissing cases. Fractional ranks fall inthe range of 0–1.
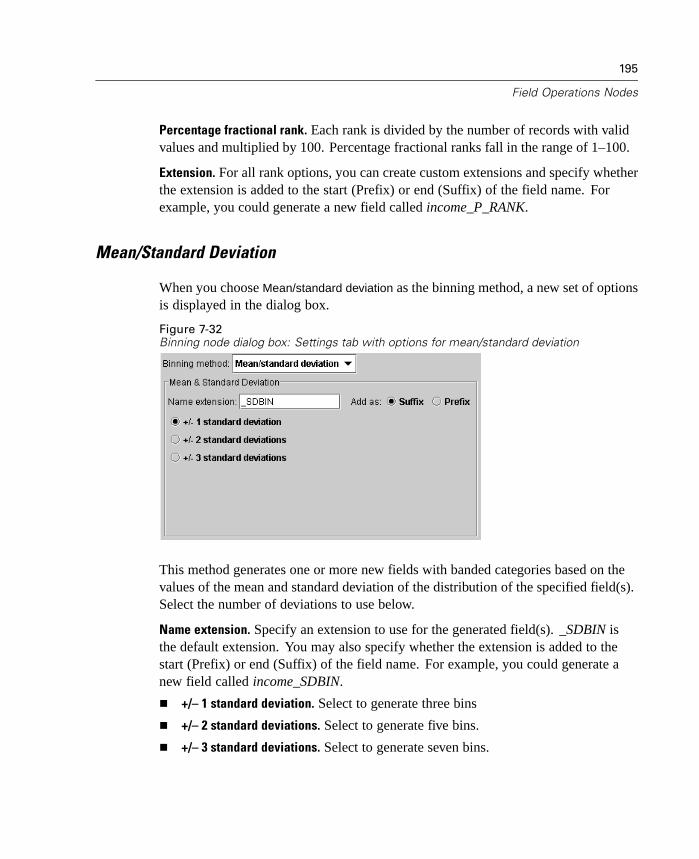
195
Field Operations Nodes
Percentage fractional rank. Each rank is divided by the number of records with validvalues and multiplied by 100. Percentage fractional ranks fall in the range of 1–100.
Extension. For all rank options, you can create custom extensions and specify whetherthe extension is added to the start (Prefix) or end (Suffix) of the field name. Forexample, you could generate a new field called income_P_RANK.
Mean/Standard Deviation
When you choose Mean/standard deviation as the binning method, a new set of optionsis displayed in the dialog box.
Figure 7-32Binning node dialog box: Settings tab with options for mean/standard deviation
This method generates one or more new fields with banded categories based on thevalues of the mean and standard deviation of the distribution of the specified field(s).Select the number of deviations to use below.
Name extension. Specify an extension to use for the generated field(s). _SDBIN isthe default extension. You may also specify whether the extension is added to thestart (Prefix) or end (Suffix) of the field name. For example, you could generate anew field called income_SDBIN.
+/– 1 standard deviation. Select to generate three bins
+/– 2 standard deviations. Select to generate five bins.
+/– 3 standard deviations. Select to generate seven bins.
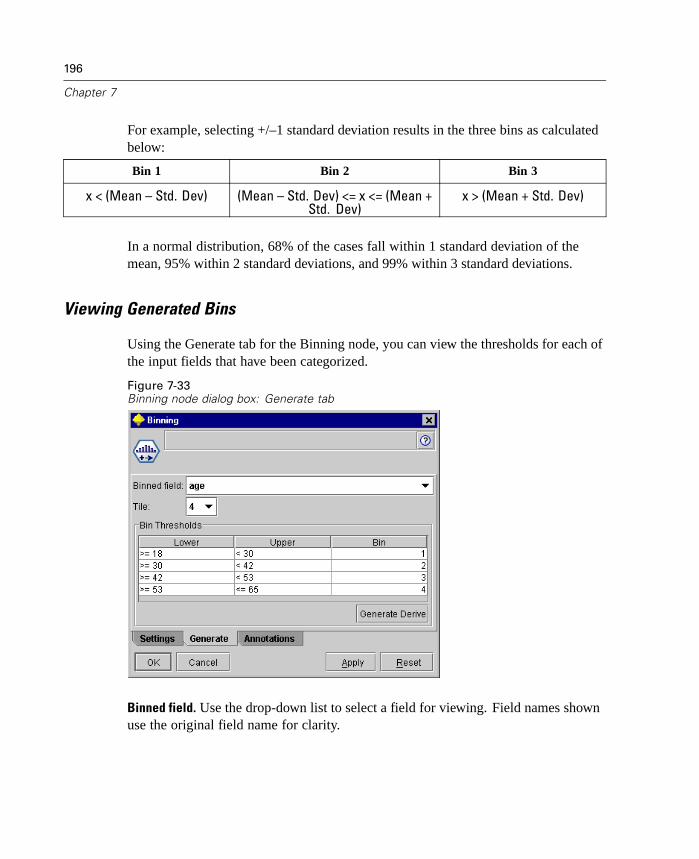
196
Chapter 7
For example, selecting +/–1 standard deviation results in the three bins as calculatedbelow:
Bin 1 Bin 2 Bin 3
x < (Mean – Std. Dev) (Mean – Std. Dev) <= x <= (Mean +Std. Dev)
x > (Mean + Std. Dev)
In a normal distribution, 68% of the cases fall within 1 standard deviation of themean, 95% within 2 standard deviations, and 99% within 3 standard deviations.
Viewing Generated Bins
Using the Generate tab for the Binning node, you can view the thresholds for each ofthe input fields that have been categorized.
Figure 7-33Binning node dialog box: Generate tab
Binned field. Use the drop-down list to select a field for viewing. Field names shownuse the original field name for clarity.

197
Field Operations Nodes
Tile. Use the drop-down list to select a tile, such as 10 or 100, for viewing. This optionis available only when bins have been generated using the equal counts method.
Bin Thresholds. Threshold values are shown here for each generated bin. You cannotchange the values shown here, but you can click the Generate Derive button to create aDerive node with the current values in an editable form.
Thresholds are available only after you have run data through the node (thatis, “executed” the stream).
Thresholds will be overwritten when new data is run through the stream.
Generate Derive. Generating a Derive node is useful for applying established binthresholds from one set of data to another. Furthermore, once these split points areknown, a Derive operation is more efficient than a Binning operation when workingwith large datasets.
Set to Flag Node
The Set to Flag node is used to derive multiple flag fields based on the symbolicvalues defined for one or more set fields. For example, you may have purchased dataon several products that can be bought in several different departments within a store.Currently, your data consist of one product per purchase and lists the product codeand the department code (a set) as two attributes. For easier data manipulation, youcan create a flag field for each department, which will indicate whether or not theproduct was purchased in that department.

198
Chapter 7
Figure 7-34Creating a flag field for high blood pressure using the drug demo data
Setting Options for the Set to Flag Node
Set to Flag nodes require fully instantiated types (data whose type attributes andvalues are known). Therefore, you must have a Type node upstream from a Set toFlag node that specifies one or more fields as set types. After all options have beenspecified in the Set to Flag node, you can detach the Type node, if desired, since it isno longer needed for information on types.
Set fields. Lists all fields in the data whose types are set. Select one from the list todisplay the values in the set. You can choose from these values to create a flag field.

199
Field Operations Nodes
Field name extension. Select to enable controls for specifying an extension that willbe added as a suffix or prefix to the new flag field. By default, new field names areautomatically created by combining the original field name with the field value intoa label, such as Fieldname_fieldvalue.
Available set values. Values in the set selected above are displayed here. Select one ormore values for which you want to generate flags. For example, if the values in afield called blood_pressure are High, Medium, and Low, you can select High andadd it to the list on the right. This will create a field with a flag for records with avalue indicating high blood pressure.
Create flag fields. The newly created flag fields are listed here. You can specifyoptions for naming the new field using the field name extension controls.
True value. Specify the true value used by the node when setting a flag. By default,this value is T.
False value. Specify the false value used by the node when setting a flag. By default,this value is F.
Aggregate keys. Select to group records together based on key fields specified below.When Aggregate keys is selected, all flag fields in a group will be “turned on” ifany record was set to true. Use the Field Chooser to specify which key fields willbe used to aggregate records.
History Node
History nodes are most often used for sequential data, such as time series data. Theyare used to create new fields containing data from fields in previous records. Whenusing a History node, you may want to have data that is presorted by a particularfield. You can use a Sort node to do this.

200
Chapter 7
Setting Options for the History NodeFigure 7-35History node dialog box
Selected fields. Using the Field Chooser (button to the right of the text box), select thefields for which you want a history. Each selected field is used to create new fieldsfor all records in the data set.
Offset. Specify the latest record prior to the current record from which you want toextract historical field values. For example, if Offset is set to 3, as each record passesthrough this node, the field values for the third record previous will be included inthe current record. Use the Span settings to specify how far back records will beextracted from. Use the arrows to adjust the offset value.
Span. Specify how many prior records from which you want to extract values. Forexample, if Offset is set to 3 and Span is set to 5, each record that passes through thenode will have five fields added to it for each field specified in the Selected fields list.This means that when the node is processing record 10, fields will be added fromrecord 7 through record 3. Use the arrows to adjust the span value.
201
Field Operations Nodes
Where history is unavailable. Select one of the following three options for handlingrecords that have no history values. This usually refers to the first several records atthe top of the data set, for which there are no previous records to use as a history.
Discard records. Select to discard records where no history value is availablefor the field selected.
Leave history undefined. Select to keep records where no history value is available.The history field will be filled with an undefined value, displayed as $null$.
Fill values with. Specify a value or string to be used for records where no historyvalue is available. The default replacement value is undef, the system null. Nullvalues are displayed in Clementine using the string $null$. When selecting areplacement value, keep in mind the following rules in order for proper executionto occur:
Selected fields should be of the same storage type.
If all the selected fields have numeric storage, the replacement value must beparsed as an integer.
If all the selected fields have real storage, the replacement value must be parsed asa real.
If all the selected fields have symbolic storage, the replacement value must beparsed as a string.
If all the selected fields have date/time storage, the replacement value must beparsed as a date/time field.
If none of the above conditions are met, you will receive an error when executingthe History node.
Field Reorder Node
The Field Reorder node enables you to define the natural order used to display fieldsdownstream. This order affects the display of fields in a variety of places, such astables, lists, and the Field Chooser. This operation is useful, for example, whenworking with wide data sets to make fields of interest more visible.
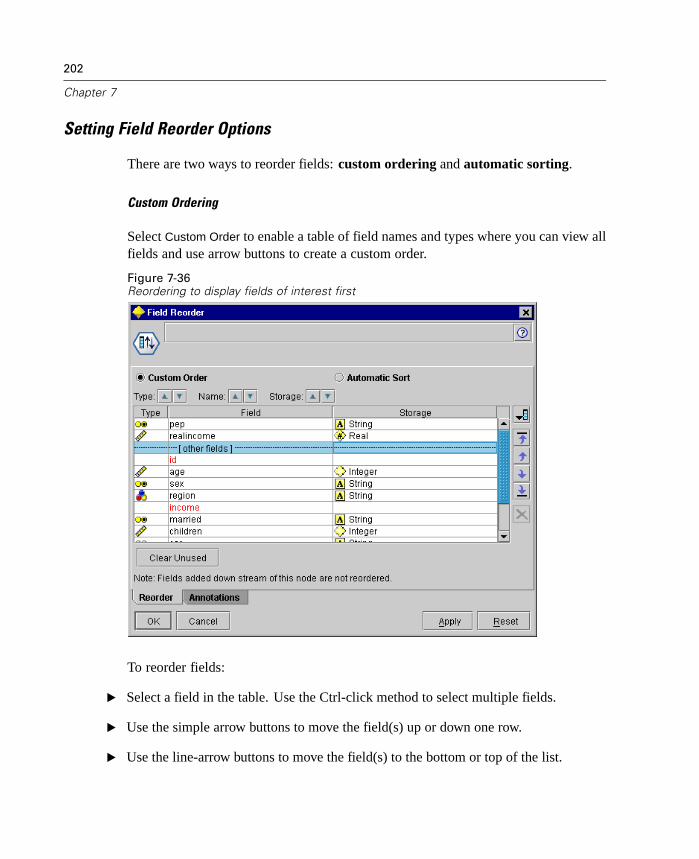
202
Chapter 7
Setting Field Reorder Options
There are two ways to reorder fields: custom ordering and automatic sorting.
Custom Ordering
Select Custom Order to enable a table of field names and types where you can view allfields and use arrow buttons to create a custom order.
Figure 7-36Reordering to display fields of interest first
To reorder fields:
E Select a field in the table. Use the Ctrl-click method to select multiple fields.
E Use the simple arrow buttons to move the field(s) up or down one row.
E Use the line-arrow buttons to move the field(s) to the bottom or top of the list.
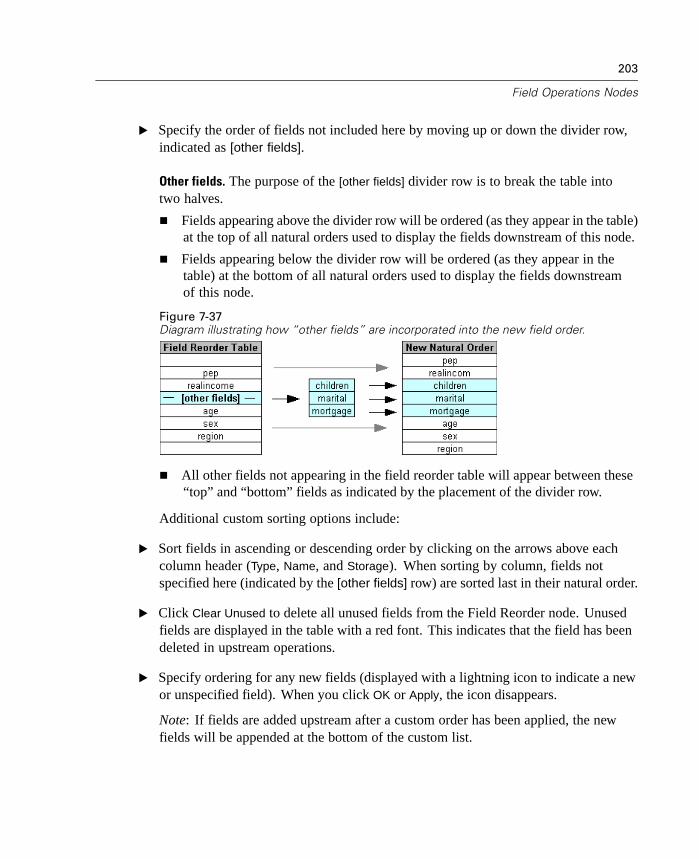
203
Field Operations Nodes
E Specify the order of fields not included here by moving up or down the divider row,indicated as [other fields].
Other fields. The purpose of the [other fields] divider row is to break the table intotwo halves.
Fields appearing above the divider row will be ordered (as they appear in the table)at the top of all natural orders used to display the fields downstream of this node.
Fields appearing below the divider row will be ordered (as they appear in thetable) at the bottom of all natural orders used to display the fields downstreamof this node.
Figure 7-37Diagram illustrating how “other fields” are incorporated into the new field order.
All other fields not appearing in the field reorder table will appear between these“top” and “bottom” fields as indicated by the placement of the divider row.
Additional custom sorting options include:
E Sort fields in ascending or descending order by clicking on the arrows above eachcolumn header (Type, Name, and Storage). When sorting by column, fields notspecified here (indicated by the [other fields] row) are sorted last in their natural order.
E Click Clear Unused to delete all unused fields from the Field Reorder node. Unusedfields are displayed in the table with a red font. This indicates that the field has beendeleted in upstream operations.
E Specify ordering for any new fields (displayed with a lightning icon to indicate a newor unspecified field). When you click OK or Apply, the icon disappears.
Note: If fields are added upstream after a custom order has been applied, the newfields will be appended at the bottom of the custom list.
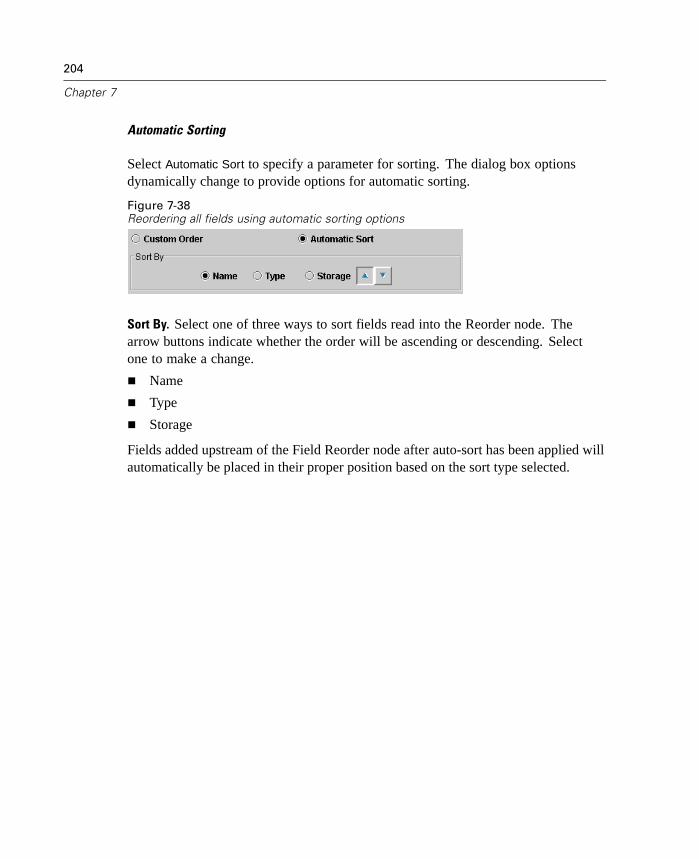
204
Chapter 7
Automatic Sorting
Select Automatic Sort to specify a parameter for sorting. The dialog box optionsdynamically change to provide options for automatic sorting.
Figure 7-38Reordering all fields using automatic sorting options
Sort By. Select one of three ways to sort fields read into the Reorder node. Thearrow buttons indicate whether the order will be ascending or descending. Selectone to make a change.
Name
Type
Storage
Fields added upstream of the Field Reorder node after auto-sort has been applied willautomatically be placed in their proper position based on the sort type selected.

Chapter
8Building CLEM Expressions
What Is CLEM?
The Clementine Language for Expression Manipulation (CLEM) is a powerfullanguage for analyzing and manipulating the data that flows along Clementinestreams. Data miners use CLEM extensively in stream operations to perform tasks assimple as deriving profit from cost and revenue data or as complex as transformingWeb-log data into a set of fields and records with usable information.
CLEM is used within Clementine to:
Compare and evaluate conditions on record fields.
Derive values for new fields.
Derive new values for existing fields.
Reason about the sequence of records.
Insert data from records into reports.
A subset of the CLEM language can be used when scripting either in the user interfaceor batch mode. This allows you to perform many of the same data manipulationsin an automated fashion. For more information, see “Introduction to Scripting” inChapter 18 on page 597.
205

206
Chapter 8
Values and Data Types
CLEM expressions are similar to formulas constructed from values, field names,operators, and functions. The simplest valid CLEM expression is a value or a fieldname. Examples of valid values are:
31.79'banana'
Examples of field names are:
Product_ID'$P-NextField'
Where Product is the name of a field from a market basket data set, '$P-NextField' isthe name of a parameter, and the value of the expression is the value of the namedfield. Typically, field names start with a letter and may also contain digits andunderscores (_). You can use names that do not follow these rules if you place thename within quotation marks. CLEM values can be any of the following:
Strings—for example, "c1", "Type 2", "a piece of free text"
Integers—for example, 12, 0, –189
Real numbers—for example, 12.34, 0.0, –0.0045
Date/time fields—for example, 05/12/2002, 12/05/2002, 12/05/02
It is also possible to use the following elements:
Character codes—for example, ‘a‘ or 3
Lists of items—for example, [1 2 3], ['Type 1' 'Type 2']
Character codes and lists do not usually occur as field values. Typically, they areused as arguments of CLEM functions.
Quoting Rules
Although the software is flexible when determining the fields, values, parameters,and strings used in a CLEM expression, the following general rules provide a listof “best practices” to use when creating expressions.

207
Building CLEM Expressions
Strings—Always use double quotes when writing strings ("Type 2" or “value”).Single quotes may be used instead but at the risk of confusion with quoted fields.
Characters—Always use single back-slash quotes like this ‘ . For example,note the character d in the following function: stripchar(‘d‘,"drugA"). Theonly exception to this is when using an integer to refer to a specific characterin a string. For example, note the character 5 in the following function:lowertoupper(“druga”(5)) —> “A”. Note: On a standard UK and US keyboard,the key for the backquote character (grave accent, unicode 0060) can be foundjust below the Escape key.
Fields—Fields are typically unquoted when used in CLEM expressions(subscr(2,arrayID)) —> CHAR). You may use single quotes when necessary toenclose spaces or other special characters ('Order Number'). Fields that arequoted but undefined in the data set will be misread as strings.
Parameters—Always use single quotes ('$P-threshold').
Expressions and Conditions
CLEM expressions can return a result (used when deriving new values)—for example:
Weight * 2.2Age + 1sqrt(Signal-Echo)
Or, they can evaluate true or false (used when selecting on a condition)—for example:
Drug = "drugA"Age < 16not(PowerFlux) and Power > 2000
You can combine operators and functions arbitrarily in CLEM expressions—forexample:
sqrt(abs(Signal)) * max(T1, T2) + Baseline
Brackets and operator precedence determine the order in which the expression isevaluated. In this example, the order of evaluation is:
abs(Signal) is evaluated, and sqrt is applied to its result.
208
Chapter 8
max(T1, T2) is evaluated.
The two results are multiplied: x has higher precedence than +.
Finally, Baseline is added to the result.
The descending order of precedence (that is, operations that are executed first tooperations that are executed last) is as follows:
Function arguments
Function calls
xx
x / mod div rem
+ -
> < >= <= /== == = /=
If you want to override precedence, or if you are in any doubt of the order ofevaluation, you can use parentheses to make it explicit—for example,
sqrt(abs(Signal)) * (max(T1, T2) + Baseline)
CLEM Examples
To illustrate correct syntax as well as the types of expressions possible with CLEM,example expressions follow.
Simple Expressions
Formulas can be as simple as this one, which derives a new field based on the valuesof fields After and Before:
(After - Before) / Before * 100.0
Notice that field names are unquoted when referring to the values of the field.
Similarly, the following expression simply returns the log of each value for the fieldsalary.
log(salary)
209
Building CLEM Expressions
Complex Expressions
Expressions can also be lengthy and more complex. The following expression returnsTrue if the value of two fields ($KX-Kohonen and $KY-Kohonen) fall within thespecified ranges. Notice that here the field names are single quoted because thefield names contain special characters:
('$KX-Kohonen' >= -0.2635771036148072 and '$KX-Kohonen' <= 0.3146203637123107and '$KY-Kohonen' >= -0.18975617885589602 and'$KY-Kohonen' <= 0.17674794197082522) -> T
Several functions, such as string functions, require you to enter several parametersusing correct syntax. For example, the function subscrs is used below to return thefirst character of a produce_ID field, indicating whether an item is organic, geneticallymodified, or conventional. The results of an expression are described by “-> Result”:
subscrs(1,produce_ID) -> ‘c‘
Similarly, the following expression is
stripchar(‘3‘,"123") -> "12"
It is important to note that characters are always encapsulated within singlebackquotes.
Combining Functions in an Expression
Frequently CLEM expressions consist of a combination of functions. The functionbelow combines subscr and lowertoupper to return the first character of produce_IDand convert it to upper case.
lowertoupper(subscr(1,produce_ID)) -> ‘C‘
This same expression can be written in shorthand as:
lowertoupper(produce_ID(1)) -> ‘C‘
Another commonly used combination of functions is shown below.
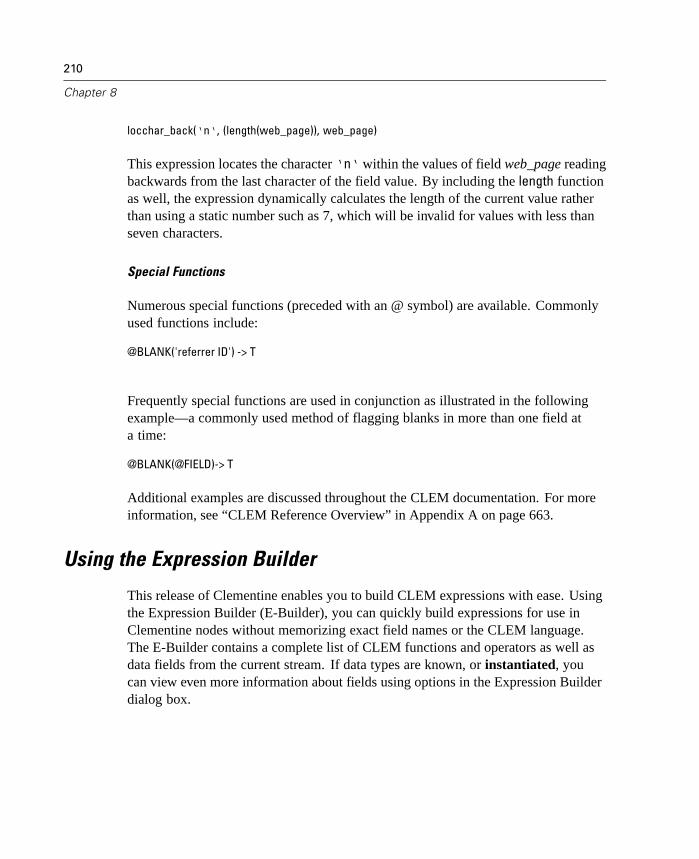
210
Chapter 8
locchar_back(‘n‘, (length(web_page)), web_page)
This expression locates the character ‘n‘ within the values of field web_page readingbackwards from the last character of the field value. By including the length functionas well, the expression dynamically calculates the length of the current value ratherthan using a static number such as 7, which will be invalid for values with less thanseven characters.
Special Functions
Numerous special functions (preceded with an @ symbol) are available. Commonlyused functions include:
@BLANK('referrer ID') -> T
Frequently special functions are used in conjunction as illustrated in the followingexample—a commonly used method of flagging blanks in more than one field ata time:
@BLANK(@FIELD)-> T
Additional examples are discussed throughout the CLEM documentation. For moreinformation, see “CLEM Reference Overview” in Appendix A on page 663.
Using the Expression Builder
This release of Clementine enables you to build CLEM expressions with ease. Usingthe Expression Builder (E-Builder), you can quickly build expressions for use inClementine nodes without memorizing exact field names or the CLEM language.The E-Builder contains a complete list of CLEM functions and operators as well asdata fields from the current stream. If data types are known, or instantiated, youcan view even more information about fields using options in the Expression Builderdialog box.
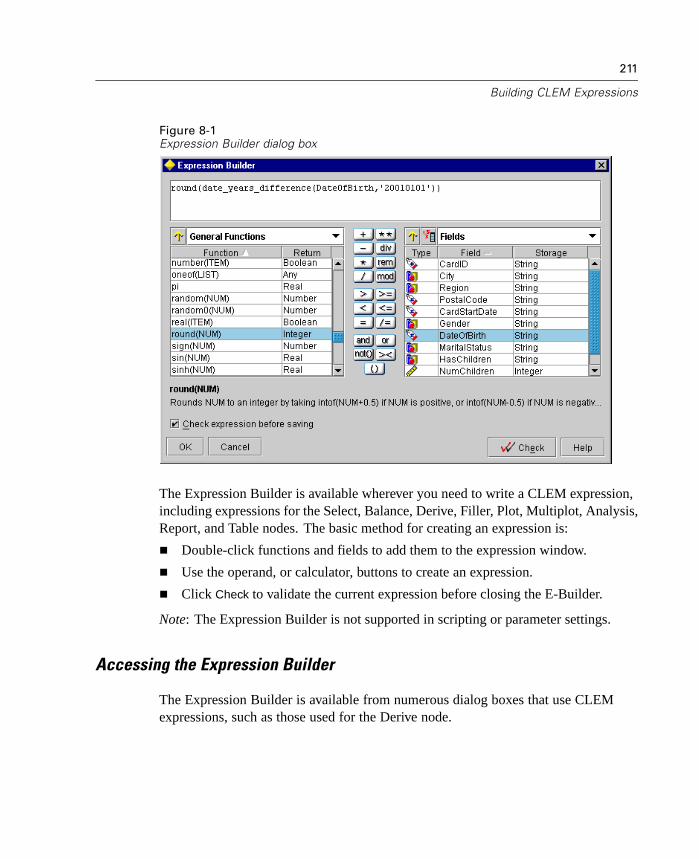
211
Building CLEM Expressions
Figure 8-1Expression Builder dialog box
The Expression Builder is available wherever you need to write a CLEM expression,including expressions for the Select, Balance, Derive, Filler, Plot, Multiplot, Analysis,Report, and Table nodes. The basic method for creating an expression is:
Double-click functions and fields to add them to the expression window.
Use the operand, or calculator, buttons to create an expression.
Click Check to validate the current expression before closing the E-Builder.
Note: The Expression Builder is not supported in scripting or parameter settings.
Accessing the Expression Builder
The Expression Builder is available from numerous dialog boxes that use CLEMexpressions, such as those used for the Derive node.
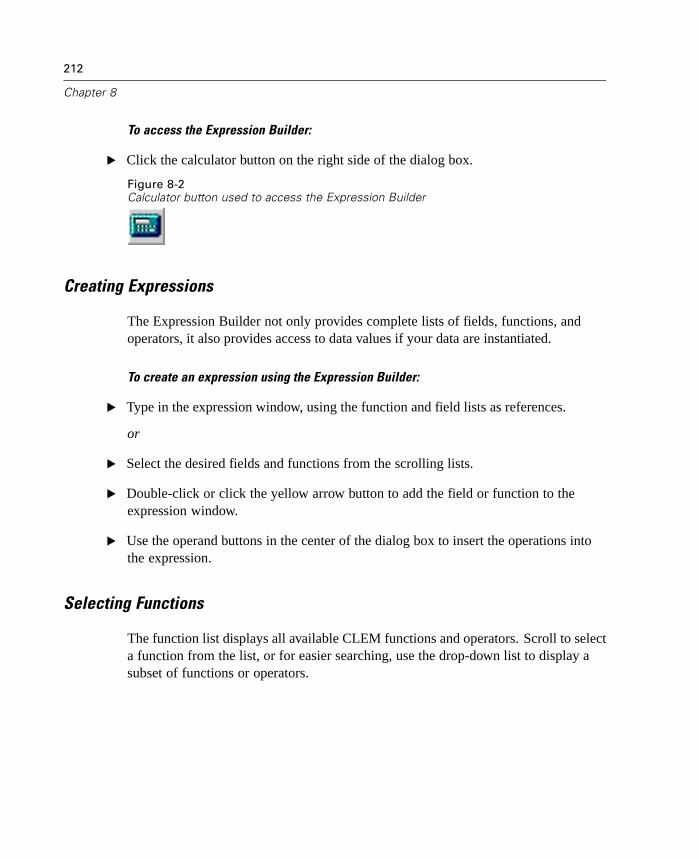
212
Chapter 8
To access the Expression Builder:
E Click the calculator button on the right side of the dialog box.
Figure 8-2Calculator button used to access the Expression Builder
Creating Expressions
The Expression Builder not only provides complete lists of fields, functions, andoperators, it also provides access to data values if your data are instantiated.
To create an expression using the Expression Builder:
E Type in the expression window, using the function and field lists as references.
or
E Select the desired fields and functions from the scrolling lists.
E Double-click or click the yellow arrow button to add the field or function to theexpression window.
E Use the operand buttons in the center of the dialog box to insert the operations intothe expression.
Selecting Functions
The function list displays all available CLEM functions and operators. Scroll to selecta function from the list, or for easier searching, use the drop-down list to display asubset of functions or operators.
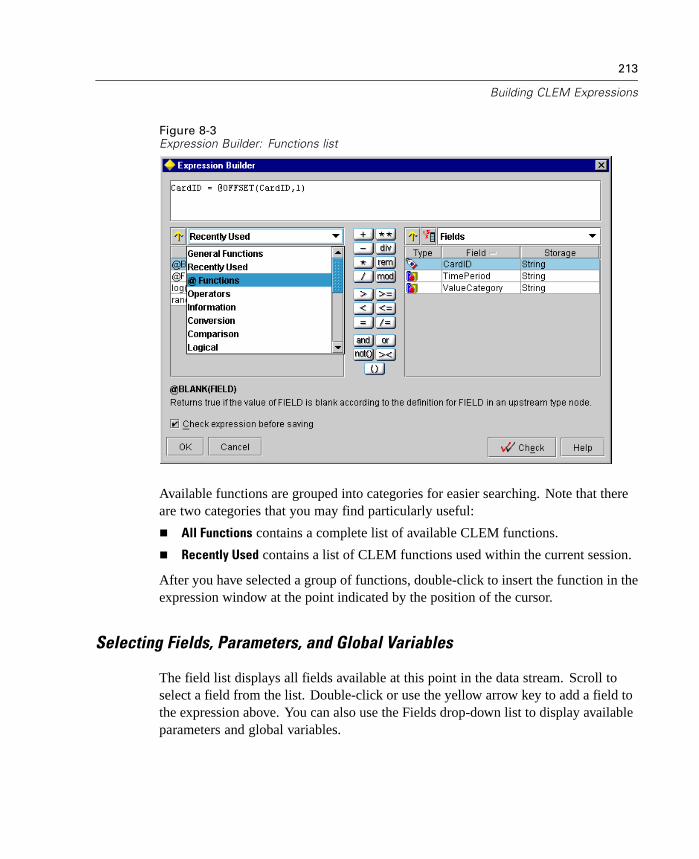
213
Building CLEM Expressions
Figure 8-3Expression Builder: Functions list
Available functions are grouped into categories for easier searching. Note that thereare two categories that you may find particularly useful:
All Functions contains a complete list of available CLEM functions.
Recently Used contains a list of CLEM functions used within the current session.
After you have selected a group of functions, double-click to insert the function in theexpression window at the point indicated by the position of the cursor.
Selecting Fields, Parameters, and Global Variables
The field list displays all fields available at this point in the data stream. Scroll toselect a field from the list. Double-click or use the yellow arrow key to add a field tothe expression above. You can also use the Fields drop-down list to display availableparameters and global variables.
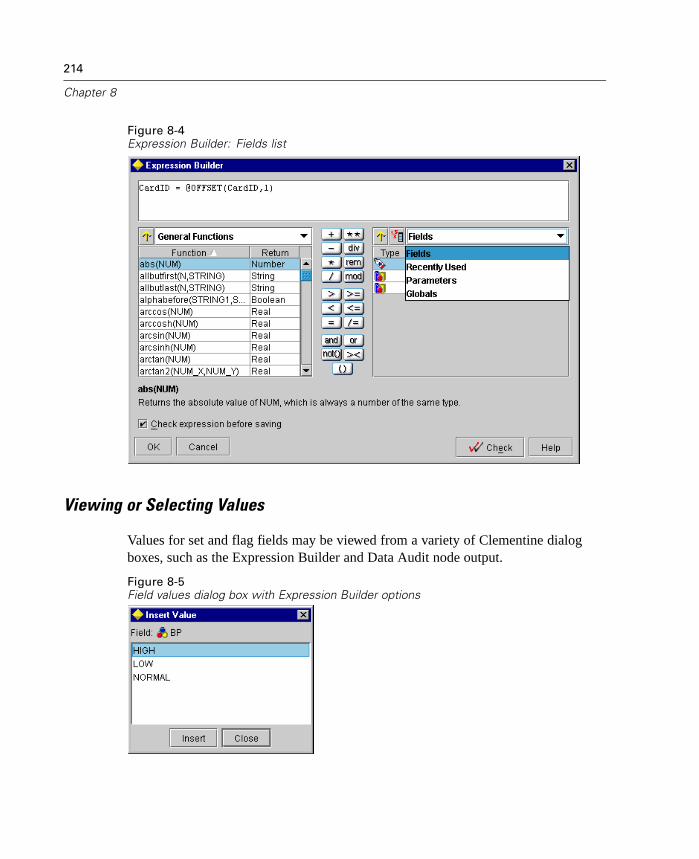
214
Chapter 8
Figure 8-4Expression Builder: Fields list
Viewing or Selecting Values
Values for set and flag fields may be viewed from a variety of Clementine dialogboxes, such as the Expression Builder and Data Audit node output.
Figure 8-5Field values dialog box with Expression Builder options

215
Building CLEM Expressions
Selecting Values for the Expression Builder
If the data are fully instantiated, meaning that storage, types, and values are known,you can also use this dialog box to add values to an expression in the ExpressionBuilder.
To select and add a value:
E Select a field from the Fields list.
E Click the Value picker button to open a dialog box listing values for the selected field.
Figure 8-6Value picker button
E Select a value from the list.
E Click Insert to add it to the CLEM expression at the cursor position.
Checking CLEM Expressions
Before closing the Expression Builder, take a moment to check the function thatyou created. Unchecked expressions are displayed in red. Click Check to validatethe expression, checking the following:
Proper quoting of values and field names
Proper usage of parameters and global variables
Valid usage of operators
Existence of referenced fields
Existence and definition of referenced globals
If errors are found, an alert is raised, and the offending string is highlighted in theexpression window.
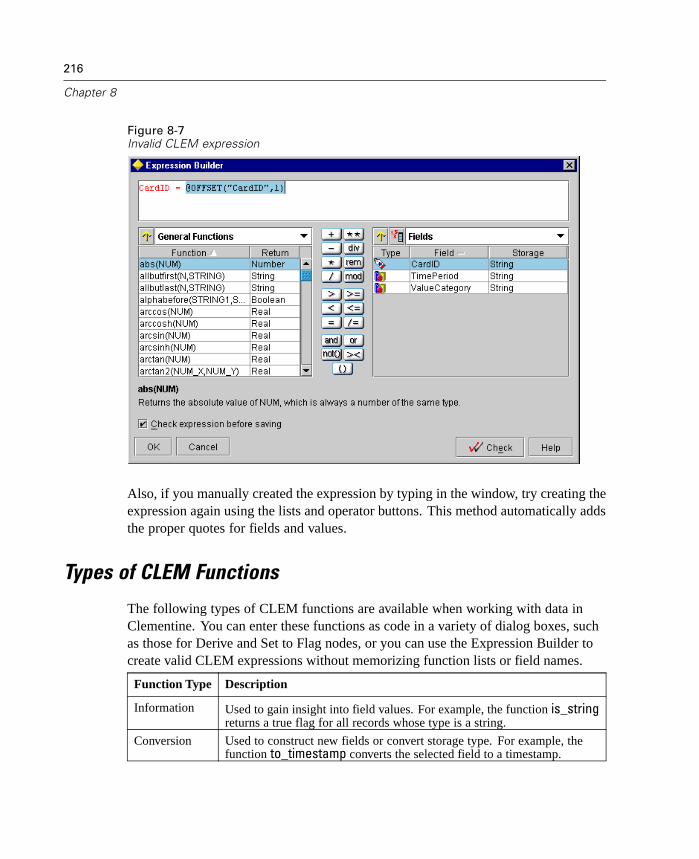
216
Chapter 8
Figure 8-7Invalid CLEM expression
Also, if you manually created the expression by typing in the window, try creating theexpression again using the lists and operator buttons. This method automatically addsthe proper quotes for fields and values.
Types of CLEM Functions
The following types of CLEM functions are available when working with data inClementine. You can enter these functions as code in a variety of dialog boxes, suchas those for Derive and Set to Flag nodes, or you can use the Expression Builder tocreate valid CLEM expressions without memorizing function lists or field names.
Function Type Description
Information Used to gain insight into field values. For example, the function is_stringreturns a true flag for all records whose type is a string.
Conversion Used to construct new fields or convert storage type. For example, thefunction to_timestamp converts the selected field to a timestamp.

217
Building CLEM Expressions
Function Type Description
Comparison Used to compare field values to each other or to a specified string. Forexample, <= is used to compare whether the values of two fields arelesser or equal.
Logical Used to perform logical operations, such as if, then, else operations.
Numeric Used to perform numeric calculations, such as the natural log of fieldvalues.
Trigonometric Used to perform trigonometric calculations, such as the arccosine of aspecified angle.
Bitwise Used to manipulate integers as bit patterns.
Random Used to randomly select items or generate numbers.
String Used to perform a wide variety of operations on strings, such as stripchar,which allows you to remove a specified character.
Date and Time Used to perform a variety of operations on date/time fields.
Sequence Used to gain insight into the record sequence of a data set or performoperations based on that sequence.
Global Used to access global values created by a Set Globals node. For example,@MEAN is used to refer to the mean average of all values for a fieldacross the entire data set.
Blanks andNull
Used to access, flag, and frequently to fill user-specified blanks orsystem-missing values. For example, @BLANK(FIELD) is used to raise atrue flag for records where blanks are present.
Special Fields Used to denote the specific fields under examination. For example,@FIELD is used when deriving multiple fields.
Common Uses of CLEM
There are a number of operations possible using CLEM. See the following topics fora general introduction to the most common operations.
Working with Strings
There are a number of operations available for strings, including:
Converting a string to uppercase or lowercase—uppertolower(CHAR).
Removing specified characters, such as 'ID_' or '$' from a stringvariable—stripchar(CHAR,STRING).

218
Chapter 8
Determining the length (number of characters) for a stringvariable—length(STRING).
Checking the alphabetical ordering of string values—alphabefore(STRING1,STRING2).
For more information, see “String Functions” in Appendix A on page 679.
Handling Blanks and Missing Values
Replacing blanks or missing values is a common data preparation task for dataminers. CLEM provides you with a number of tools to automate blank handling. TheFiller node is the most common place to work with blanks; however, the followingfunctions can be used in any node that accepts CLEM expressions:
@BLANK(FIELD) can be used to determine records whose values are blank for aparticular field, such as Age.
@NULL(FIELD) can be used to determine records whose values are system-missingfor the specified field(s). In Clementine, system-missing values are displayedas $null$ values.
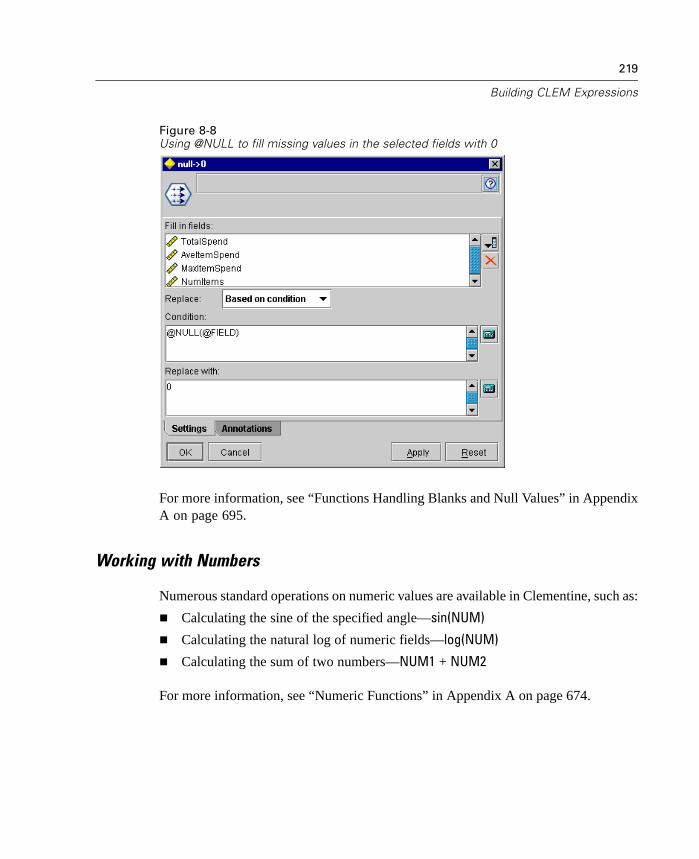
219
Building CLEM Expressions
Figure 8-8Using @NULL to fill missing values in the selected fields with 0
For more information, see “Functions Handling Blanks and Null Values” in AppendixA on page 695.
Working with Numbers
Numerous standard operations on numeric values are available in Clementine, such as:
Calculating the sine of the specified angle—sin(NUM)
Calculating the natural log of numeric fields—log(NUM)
Calculating the sum of two numbers—NUM1 + NUM2
For more information, see “Numeric Functions” in Appendix A on page 674.

220
Chapter 8
Working with Times and Dates
Time and date formats may vary depending on your data source and locale. Theformats of date and time are specific to each stream and are set in the streamproperties dialog box. The following examples are commonly used functions forworking with date/time fields.
Calculating Time Passed
You can easily calculate the time passed from a baseline date using a family offunctions similar to the one below. This function returns the time in months from thebaseline date to the date represented by date string DATE, as a real number. This isan approximate figure, based on a month of 30.0 days.
date_in_months(Date)
Comparing Date/Time Values
Values of date/time fields can be compared across records using functions similar tothe one below. This function returns a value of true if date string DATE1 represents adate prior to that represented by date string DATE2. Otherwise, this function returnsa value of 0.
date_before(Date1, Date2)
Calculating Differences
You can also calculate the difference between two times and two dates usingfunctions, such as:
date_weeks_difference(Date1, Date2)
This function returns the time in weeks from the date represented by the date stringDATE1 to the date represented by date string DATE2, as a real number. This is based ona week of 7.0 days. If DATE2 is prior to DATE1, this function returns a negative number.

221
Building CLEM Expressions
Today's Date
The current date can be added to the data set using the function @TODAY. Today'sdate is added as a string to the specified field or new field using the date formatselected in the stream properties dialog box. For more information, see “Date andTime Functions” in Appendix A on page 684.

Chapter
9Handling Missing Values
Overview of Missing Values
During the Data Preparation phase of data mining, you will often want to replacemissing values in the data. Missing values are values in the data set that are unknown,uncollected, or incorrectly entered. Usually such values are invalid for their fields.For example, a field such as Sex should contain values such as M and F. If youdiscover the values Y or Z in the field, you can safely assume that such valuesare invalid and should therefore be interpreted as blanks. Likewise, a negativevalue for the field Age is meaningless and should also be interpreted as a blank.Frequently, such obviously wrong values are purposely entered or left blank during aquestionnaire to indicate a nonresponse. At times you may want to examine theseblanks more closely to determine whether a nonresponse, such as the refusal to giveone's age, is a factor in predicting a specific outcome.
Some modeling techniques handle missing data better than others. For example,GRI, C5.0, and Apriori cope well with values that are explicitly declared as “missing”in a Type node. Other modeling techniques have trouble dealing with missing valuesand experience longer training times and result in less accurate models.
There are two types of missing values in Clementine:
System-missing values. Also called nulls, these are values left blank in thedatabase, and they have not been specifically set as “missing” in the Type node.System-missing values are displayed as $null$ in Clementine.
User-defined missing values. Also called blanks, these are values, such as“unknown,” 99, or –1, that are explicitly defined in the Type node as missing.Data values specified as blanks are flagged for special treatment and are excludedfrom most calculations.
223
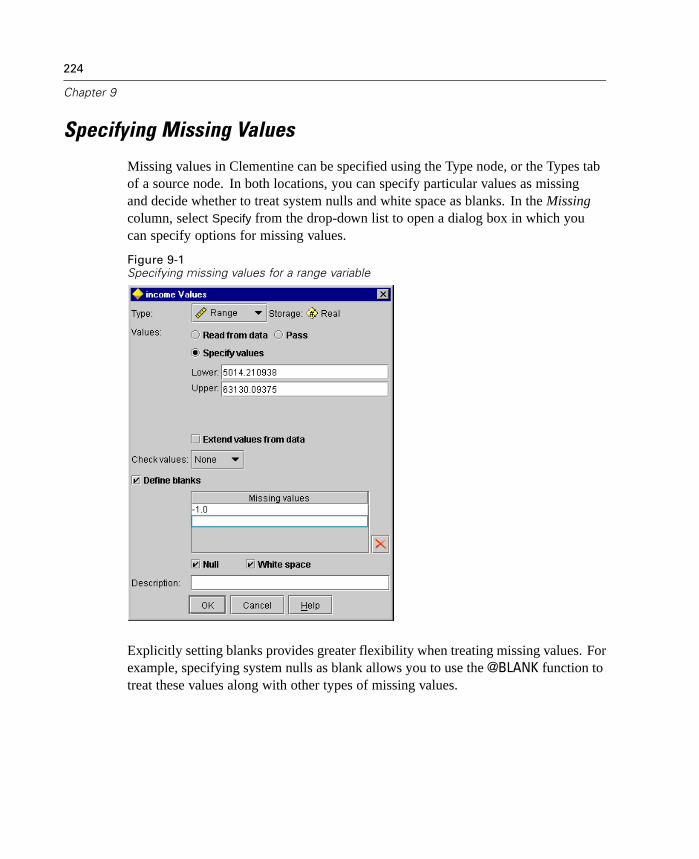
224
Chapter 9
Specifying Missing Values
Missing values in Clementine can be specified using the Type node, or the Types tabof a source node. In both locations, you can specify particular values as missingand decide whether to treat system nulls and white space as blanks. In the Missingcolumn, select Specify from the drop-down list to open a dialog box in which youcan specify options for missing values.
Figure 9-1Specifying missing values for a range variable
Explicitly setting blanks provides greater flexibility when treating missing values. Forexample, specifying system nulls as blank allows you to use the @BLANK function totreat these values along with other types of missing values.

225
Handling Missing Values
Treating Missing Values
You should decide how to treat missing values in light of your business or domainknowledge. In order to ease training time and increase accuracy, you may want toremove blanks from your data set. On the other hand, the presence of blank valuesmay lead to new business opportunities or additional insight.
There are several techniques used in Clementine for eliminating missing values.You can determine the best technique by addressing the following characteristicsof your data:
Size of the data set
Number of fields containing blanks
Amount of missing information
Once you have analyzed these factors, there are a couple of ways to treat missingvalues. These options revolve around removing fields and records or finding anadequate method of imputing values:
Omitting the fields with missing values
Omitting the records with missing values
Filling in missing values with default values
Filling in missing values with a value derived from a model
In determining which method to use, you should also consider the type of the fieldwith missing values.
Range types. For numeric field types, such as range, you should always eliminate anynon-numeric values before building a model because many models will not functionif blanks are included in numeric fields.
Discrete types. For symbolic field types, such as set and flag, altering missing valuesis not necessary but will increase the accuracy of the model. For example, a modelthat uses the field Sex will still function with meaningless values, such as Y and Z, butremoving all values other than M and F will increase the accuracy of the model.
Before making any final decisions, you can generate a data quality report of missingdata using a Quality node. Once you have examined the report, you can use this nodeto automate the selection and filtering of records and fields with missing values.
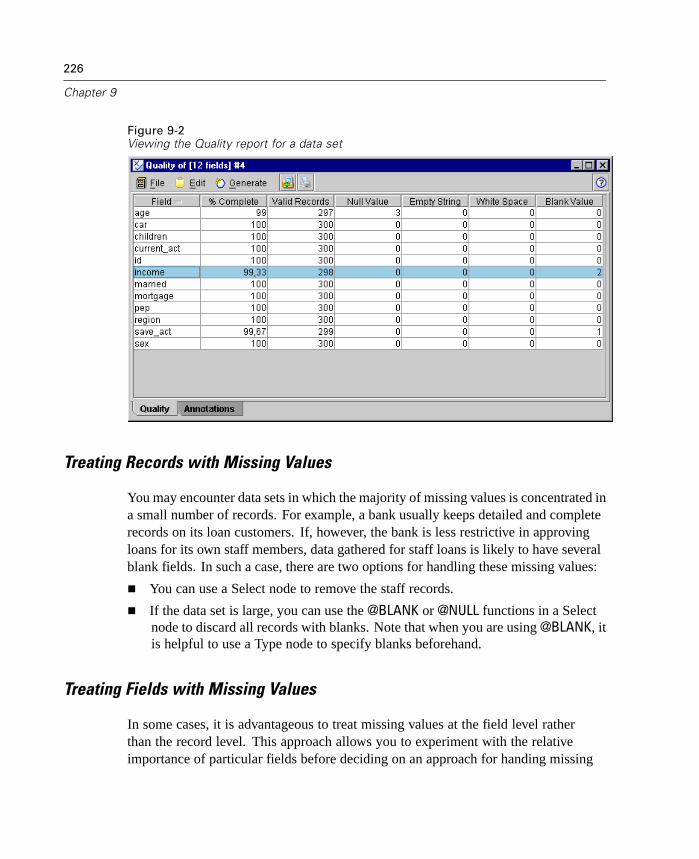
226
Chapter 9
Figure 9-2Viewing the Quality report for a data set
Treating Records with Missing Values
You may encounter data sets in which the majority of missing values is concentrated ina small number of records. For example, a bank usually keeps detailed and completerecords on its loan customers. If, however, the bank is less restrictive in approvingloans for its own staff members, data gathered for staff loans is likely to have severalblank fields. In such a case, there are two options for handling these missing values:
You can use a Select node to remove the staff records.
If the data set is large, you can use the @BLANK or @NULL functions in a Selectnode to discard all records with blanks. Note that when you are using @BLANK, itis helpful to use a Type node to specify blanks beforehand.
Treating Fields with Missing Values
In some cases, it is advantageous to treat missing values at the field level ratherthan the record level. This approach allows you to experiment with the relativeimportance of particular fields before deciding on an approach for handing missing

227
Handling Missing Values
values. Typically, the method used is based on the number of missing values in aparticular attribute as well as the attribute's importance.
Fields with Many Missing Values
In some data sets, the majority of missing values is concentrated in a small numberof fields. For example, a market research company may collect data from a generalquestionnaire containing 50 questions. Two of the questions address age and politicalpersuasion, information that many people are reluctant to give. In this case, Age andPolitical_persuasion have many missing values. To handle these types of fields withmany missing values, you have several options:
You can use a Filter node to filter out the fields determined to have numerousmissing values.
Instead of removing the fields, you can use a Type node to set the fields' directionto None. This will keep the fields in the data set but leave them out of modelingprocesses.
You can also choose to keep the fields and fill in missing values with sensibledefaults, such as mean globals. This option is discussed further in the next topic.
Fields with a Few Missing Values
In many data sets, omissions and mistakes are made during data capture and dataentry. For example, if inexperienced staff are processing numerous orders each dayand entering the information into databases, the data set may contain some errantor missing values. In cases where there are only a few missing values, it is usefulto insert values to replace the blanks. There are four methods commonly used fordetermining the replacement value.
You can use a Type node to ensure that the field types cover only legal valuesand then set the Check column to Coerce for the fields whose blank values needreplacing. For more information, see “Type Node” in Chapter 7 on page 148.
You can use a Filler node to select the fields with missing values based on aspecific condition. You can set the condition to test for those values and replacethem using a specific value or a global variable created by the Set Globals node.For more information, see “Filler Node” in Chapter 7 on page 181.

228
Chapter 9
Using both Type and Filler nodes, you can define blanks and replace them. First,use a Type node to specify information on what constitutes a missing value. Thenuse a Filler node to select fields whose values need replacing. For example, ifthe field Age is a range between 18 and 65 but also includes some spaces andnegative values, select the White space option in the Specify Values dialog boxof the Type node and add the negative values to the list of missing values. Inthe Filler node, select the field Age, set the condition to @BLANK(@FIELD), andchange the Replace with expression to –1 (or some other numeric value).
The most ambitious option is to learn which values will optimally replacemissing values by training neural nets and building models to generate the bestreplacement values. You can then use a Filler node to replace blanks with thisvalue. Note that at least one model is required for each field whose values willbe replaced and values should be replaced only from models with sufficientaccuracy. This option is time consuming, but if the replacement values for eachfield are good, it will improve the overall modeling.
CLEM Functions for Missing Values
There are several CLEM functions used to handle missing values. The followingfunctions are often used in Select and Filler nodes to discard or fill missing values:
@BLANK(FIELD)
@NULL(FIELD)
undef
The @ functions can be used in conjunction with the @FIELD function to identify thepresence of blank or null values in one or more fields. The fields can simply beflagged when blank or null values are present, or they can be filled with replacementvalues or used in a variety of other operations.
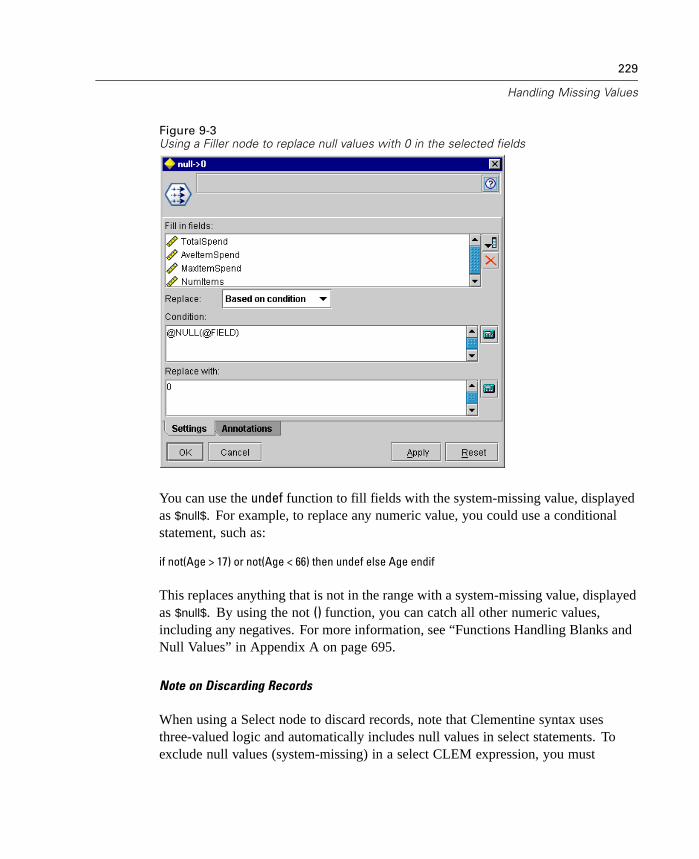
229
Handling Missing Values
Figure 9-3Using a Filler node to replace null values with 0 in the selected fields
You can use the undef function to fill fields with the system-missing value, displayedas $null$. For example, to replace any numeric value, you could use a conditionalstatement, such as:
if not(Age > 17) or not(Age < 66) then undef else Age endif
This replaces anything that is not in the range with a system-missing value, displayedas $null$. By using the not () function, you can catch all other numeric values,including any negatives. For more information, see “Functions Handling Blanks andNull Values” in Appendix A on page 695.
Note on Discarding Records
When using a Select node to discard records, note that Clementine syntax usesthree-valued logic and automatically includes null values in select statements. Toexclude null values (system-missing) in a select CLEM expression, you must

230
Chapter 9
explicitly specify this using and not in the expression. For example, to select andinclude all records where the type of prescription drug is Drug C, you would usethe following select statement:
Drug = 'drugC' and not(@NULL(Drug))
Earlier versions of Clementine excluded null values in such situations.

Chapter
10Graph Nodes
Graph Nodes Overview
Several phases of the data mining process use graphs and charts to explore databrought into Clementine. For example, you can connect a Plot or Distributionnode to a data source to gain insight into data types and distributions. You canthen perform record and field manipulations to prepare the data for downstreammodeling operations. Another common use of graphs is to check the distribution andrelationships between newly derived fields.
Figure 10-1Graphs palette
The Graphs palette contains the following nodes:
Plot
Multiplot
Distribution
Histogram
Collection
Web
Evaluation
231
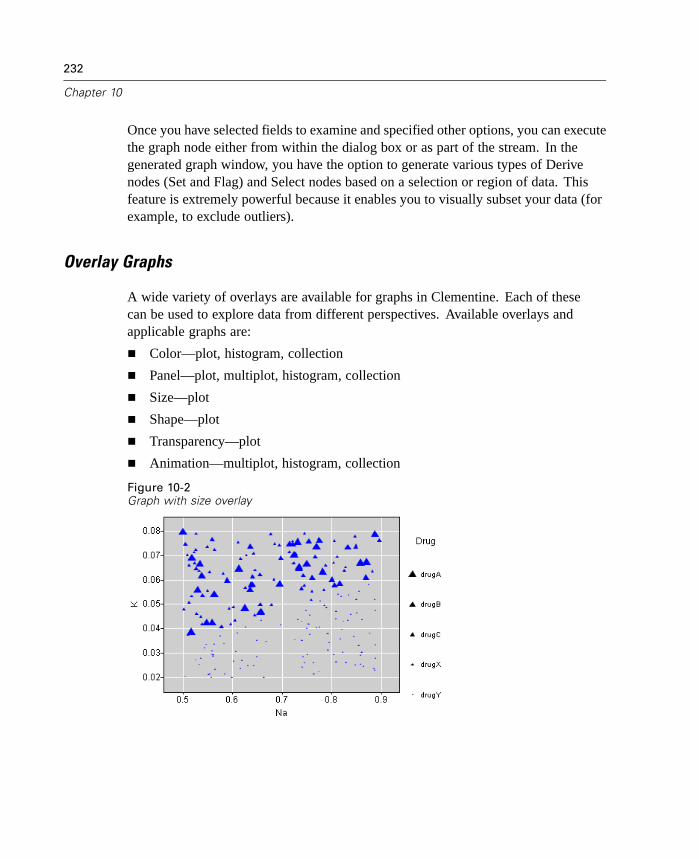
232
Chapter 10
Once you have selected fields to examine and specified other options, you can executethe graph node either from within the dialog box or as part of the stream. In thegenerated graph window, you have the option to generate various types of Derivenodes (Set and Flag) and Select nodes based on a selection or region of data. Thisfeature is extremely powerful because it enables you to visually subset your data (forexample, to exclude outliers).
Overlay Graphs
A wide variety of overlays are available for graphs in Clementine. Each of thesecan be used to explore data from different perspectives. Available overlays andapplicable graphs are:
Color—plot, histogram, collection
Panel—plot, multiplot, histogram, collection
Size—plot
Shape—plot
Transparency—plot
Animation—multiplot, histogram, collection
Figure 10-2Graph with size overlay
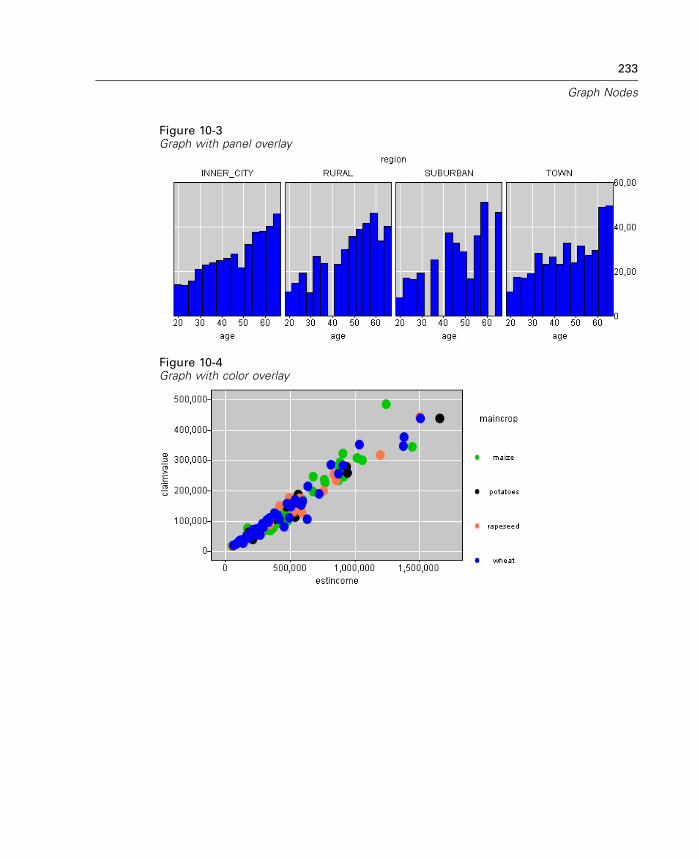
233
Graph Nodes
Figure 10-3Graph with panel overlay
Figure 10-4Graph with color overlay
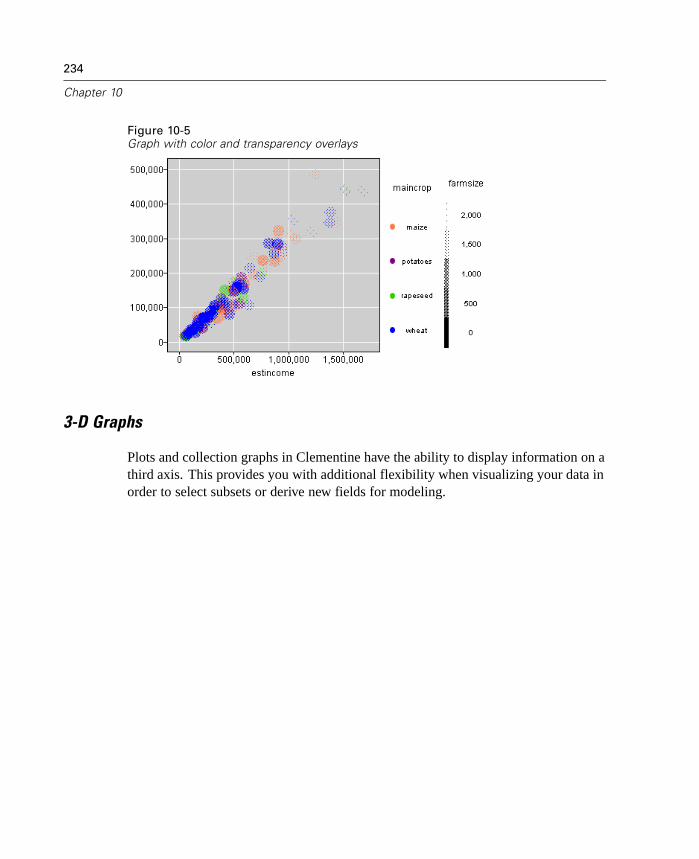
234
Chapter 10
Figure 10-5Graph with color and transparency overlays
3-D Graphs
Plots and collection graphs in Clementine have the ability to display information on athird axis. This provides you with additional flexibility when visualizing your data inorder to select subsets or derive new fields for modeling.
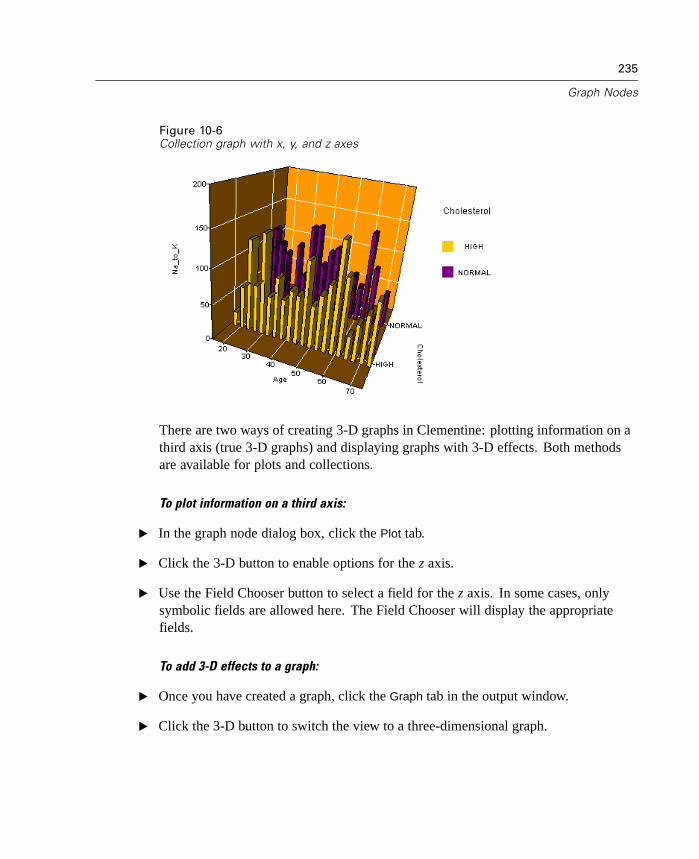
235
Graph Nodes
Figure 10-6Collection graph with x, y, and z axes
There are two ways of creating 3-D graphs in Clementine: plotting information on athird axis (true 3-D graphs) and displaying graphs with 3-D effects. Both methodsare available for plots and collections.
To plot information on a third axis:
E In the graph node dialog box, click the Plot tab.
E Click the 3-D button to enable options for the z axis.
E Use the Field Chooser button to select a field for the z axis. In some cases, onlysymbolic fields are allowed here. The Field Chooser will display the appropriatefields.
To add 3-D effects to a graph:
E Once you have created a graph, click the Graph tab in the output window.
E Click the 3-D button to switch the view to a three-dimensional graph.

236
Chapter 10
Animation
Plots, multiplots, and histograms can be “animated” in Clementine. An animationgraph works like a movie clip—click the play button to flip through charts for allcategories. An animation variable with many categories works especially well, sincethe animation “flips through” all of the graphs for you. Keeping the number of distinctcategories reasonable (such as 15) will ensure normal performance of the software.
Figure 10-7Animated plot using a variable with three categories
Once you have generated an animated chart, you can use the animation tools in anumber of ways:
Pause the animation at any point.
Use the slider to view the animation at the desired point (category).
Building Graphs
Once added to a stream, each graph node can be double-clicked to open a tabbeddialog box for specifying options. Most graphs contain a number of unique optionspresented on one or more tabs. There are also several tab options common to allgraphs. The following topics contain more information about these common options.
Setting Output Options for Graphs
For all graph types, you can specify the following options for the filename and displayof generated graphs. Note: For distributions, the file types are different and reflectthe distribution's similarity to tables. For more information, see “Output Optionsfor the Distribution Node” on page 261.
237
Graph Nodes
Output to screen. Select to generate and display the graph in a Clementine window.
Output to file. Select to save the generated graph as a file of the type specified inthe File type drop-down list.
File type. Available file types are:
Bitmap (.bmp)
JPEG (.jpg)
PNG (.png)
HTML document (.html)
Note: The above file types are not available for distributions. For more information,see “Output Options for the Distribution Node” on page 261.
Filename. Specify a filename used for the generated graph. Use the ellipsis button (...)
to specify a file and location.
Setting Appearance Options for Graphs
For all graphs except distributions, you can specify appearance options either beforegraph creation or while exploring the already generated graph.
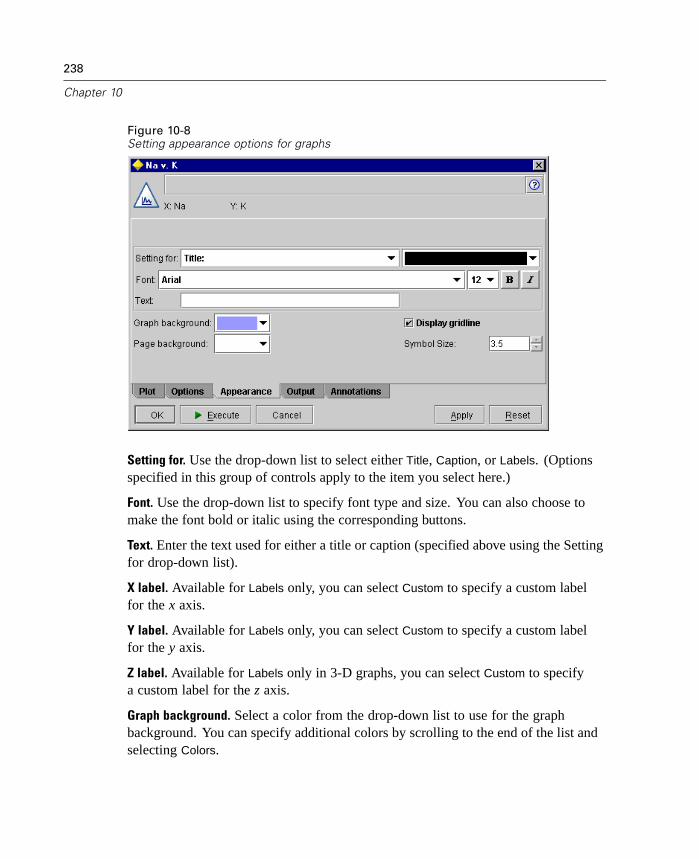
238
Chapter 10
Figure 10-8Setting appearance options for graphs
Setting for. Use the drop-down list to select either Title, Caption, or Labels. (Optionsspecified in this group of controls apply to the item you select here.)
Font. Use the drop-down list to specify font type and size. You can also choose tomake the font bold or italic using the corresponding buttons.
Text. Enter the text used for either a title or caption (specified above using the Settingfor drop-down list).
X label. Available for Labels only, you can select Custom to specify a custom labelfor the x axis.
Y label. Available for Labels only, you can select Custom to specify a custom labelfor the y axis.
Z label. Available for Labels only in 3-D graphs, you can select Custom to specifya custom label for the z axis.
Graph background. Select a color from the drop-down list to use for the graphbackground. You can specify additional colors by scrolling to the end of the list andselecting Colors.

239
Graph Nodes
Page background. Select a color from the drop-down list to use for the backgroundof the entire graph window (as opposed to the plot or graph area). You can specifyadditional colors by scrolling to the end of the list and selecting Colors.
Figure 10-9Specifying a custom color for backgrounds
Display gridline. Selected by default, this option displays a gridline behind the plotor graph that enables you to more easily determine region and band cutoff points.Gridlines are always displayed in white unless the graph background is white; in thiscase, they are displayed in gray.
Symbol Size. Enter a point size used for display symbols or use the arrows to adjustthe default size.
Color settings used for points and bars are specified in the User Options dialog box.
E To access this dialog box, from the Clementine window menus, choose:Tools
User Options...
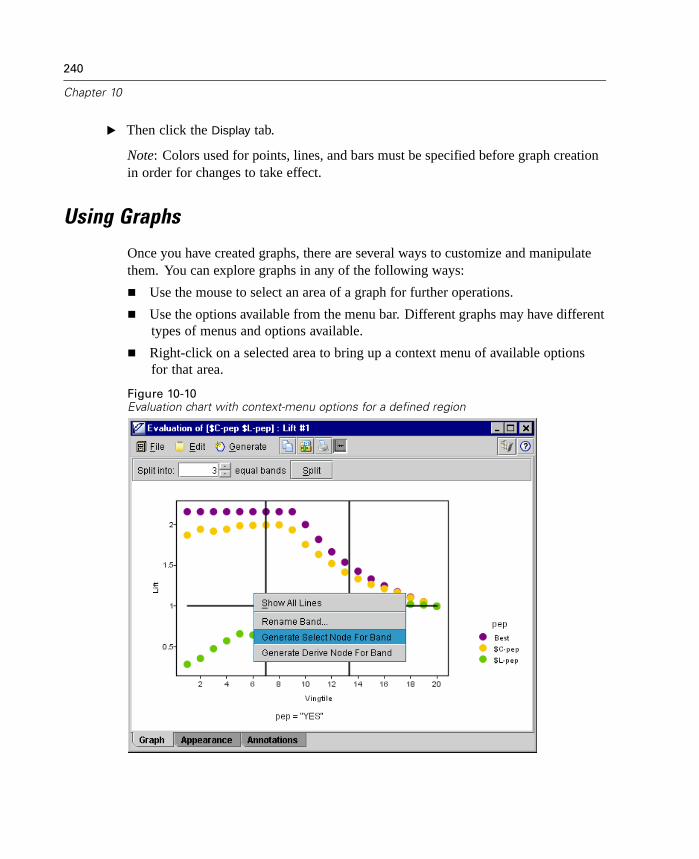
240
Chapter 10
E Then click the Display tab.
Note: Colors used for points, lines, and bars must be specified before graph creationin order for changes to take effect.
Using Graphs
Once you have created graphs, there are several ways to customize and manipulatethem. You can explore graphs in any of the following ways:
Use the mouse to select an area of a graph for further operations.
Use the options available from the menu bar. Different graphs may have differenttypes of menus and options available.
Right-click on a selected area to bring up a context menu of available optionsfor that area.
Figure 10-10Evaluation chart with context-menu options for a defined region

241
Graph Nodes
Using these methods, you can perform the following operations, depending on thetype of graph created:
Highlight data regions on plot graphs using the mouse to specify a rectangulararea.
Highlight data bands on histograms and collection graphs by clicking in thegraph area.
Identify and label subsets of your data.
Generate manipulation nodes based on selected areas of the graph.
Figure 10-11Exploring a plot using a variety of methods

242
Chapter 10
General Graph Window Options
Each graph has a number of options, such as exporting, printing, adding to projects,and publishing to the Web. Some of these options are available from the File menuand others from the toolbar.
Figure 10-12File menu and toolbar for graph windows
File Menu Options
From the file menu of a graph window, you can perform the following operations:
Save the graph as a file. Using the Save dialog box, you can also add the file tothe currently open project.
Close the graph window/file.
Close the graph and delete it from the Output tab.
Print the graph and set up printing options, including headers and footers.
243
Graph Nodes
Export the graph in a number of formats—graphic formats and table or dataformats, where applicable.
Publish the graph as an image file to the repository used by SPSS WebDeployment Framework. This makes the graph available to all applicationsusing the framework.
Export the graph as HTML to the desired location.
Toolbar Options
Using the toolbar buttons in the graph window, you can perform the followingoperations:
Copy the graph to the clipboard for pasting into another application.
Add the graph file to the current project. Note: You will be prompted to save thegraph if it is unsaved.
Print the graph to the default printer without opening any printing dialog boxes.
The remainder of this chapter focuses on the specific options for creating graphsand using them in their output windows.
Plot Node
Plot nodes show the relationship between numeric fields. You can create a plot usingpoints (also known as a scatterplot) or you can use lines. You can create three types ofline plots by specifying an X Mode in the dialog box.
X Mode = Sort
Setting X Mode to Sort causes data to be sorted by values for the field plotted on thex axis. This produces a single line running from left to right on the graph. Using aset variable as an overlay produces multiple lines of different hues running from leftto right on the graph.

244
Chapter 10
Figure 10-13Line plot with X Mode set to Sort
X Mode = Overlay
Setting X Mode to Overlay creates multiple line plots on the same graph. Data are notsorted for an overlay plot; as long as the values on the x axis increase, data will beplotted on a single line. If the values decrease, a new line begins. For example, as xmoves from 0 to 100, the y values will be plotted on a single line. When x falls below100, a new line will be plotted in addition to the first one. The finished plot mighthave numerous plots useful for comparing several series of y values. This type ofplot is useful for data with a periodic time component, such as electricity demandover successive 24-hour periods.
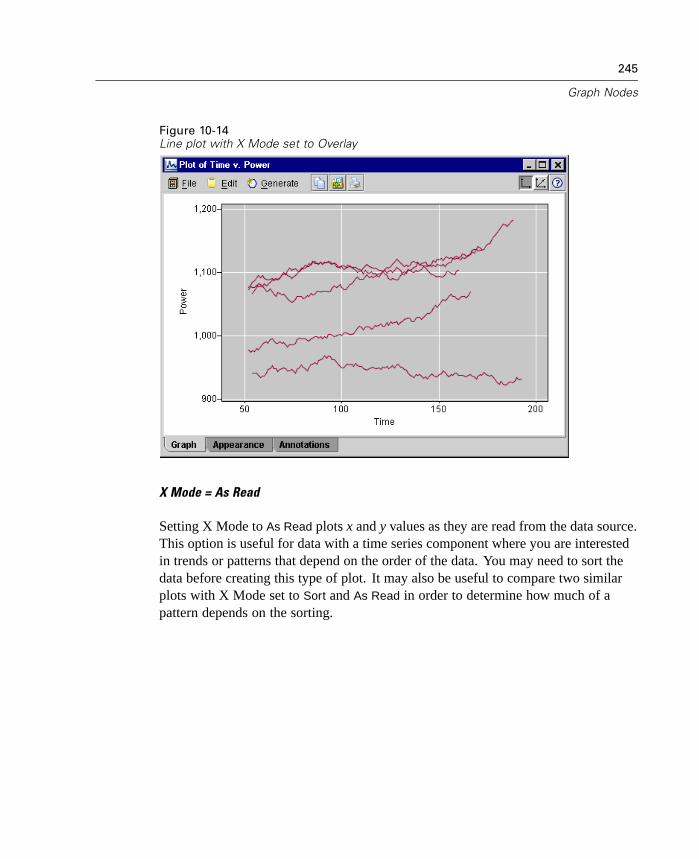
245
Graph Nodes
Figure 10-14Line plot with X Mode set to Overlay
X Mode = As Read
Setting X Mode to As Read plots x and y values as they are read from the data source.This option is useful for data with a time series component where you are interestedin trends or patterns that depend on the order of the data. You may need to sort thedata before creating this type of plot. It may also be useful to compare two similarplots with X Mode set to Sort and As Read in order to determine how much of apattern depends on the sorting.
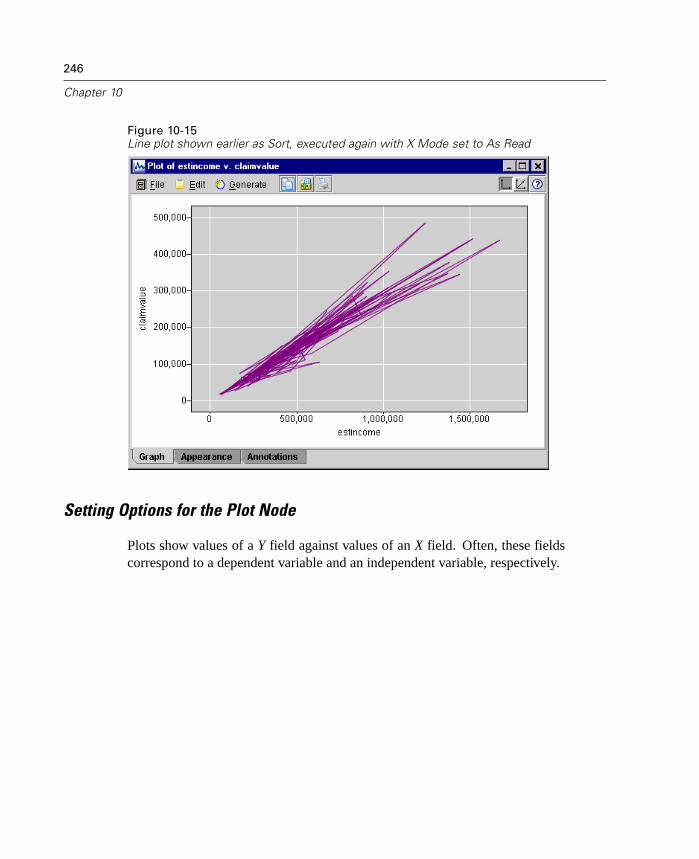
246
Chapter 10
Figure 10-15Line plot shown earlier as Sort, executed again with X Mode set to As Read
Setting Options for the Plot Node
Plots show values of a Y field against values of an X field. Often, these fieldscorrespond to a dependent variable and an independent variable, respectively.
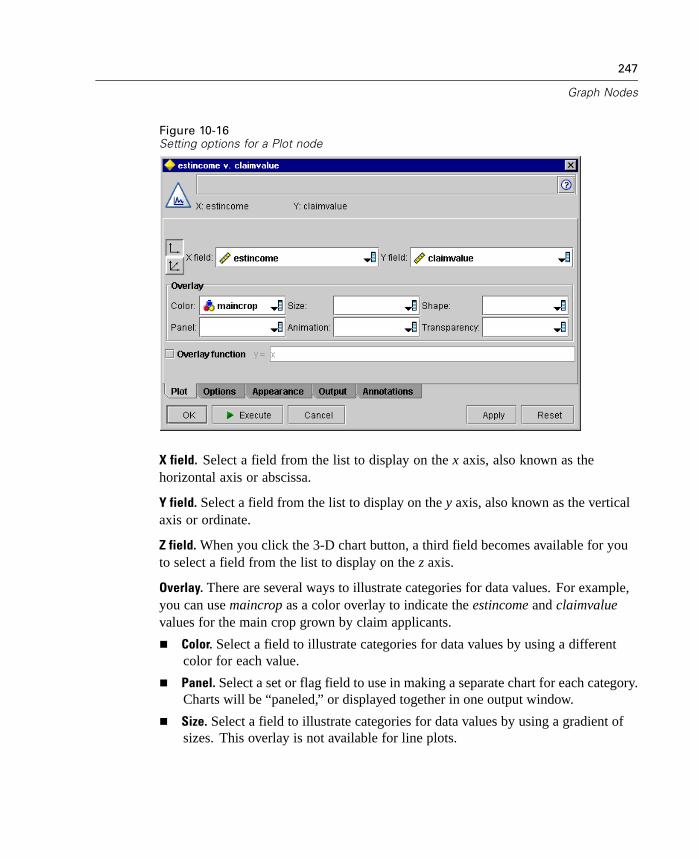
247
Graph Nodes
Figure 10-16Setting options for a Plot node
X field. Select a field from the list to display on the x axis, also known as thehorizontal axis or abscissa.
Y field. Select a field from the list to display on the y axis, also known as the verticalaxis or ordinate.
Z field. When you click the 3-D chart button, a third field becomes available for youto select a field from the list to display on the z axis.
Overlay. There are several ways to illustrate categories for data values. For example,you can use maincrop as a color overlay to indicate the estincome and claimvaluevalues for the main crop grown by claim applicants.
Color. Select a field to illustrate categories for data values by using a differentcolor for each value.
Panel. Select a set or flag field to use in making a separate chart for each category.Charts will be “paneled,” or displayed together in one output window.
Size. Select a field to illustrate categories for data values by using a gradient ofsizes. This overlay is not available for line plots.

248
Chapter 10
Animation. Select a set or flag field to illustrate categories for data values bycreating a series of charts displayed in sequence using animation.
Shape. Select a set or flag field to illustrate categories for data values by using adifferent point shape for each category. This overlay is not available for line plots.
Transparency. Select a field to illustrate categories for data values by using adifferent level of transparency for each category. This overlay is not availablefor line plots.
When using a range field as an overlay for color, size, and transparency, the legenduses a continuous scale rather than discrete categories.
Overlay function. Select to specify a known function to compare to actual values. Forexample, to compare actual versus predicted values, you can plot the function y =x as an overlay. Specify a function for y = in the text box. The default function isy = x, but you can specify any sort of function, such as a quadratic function or anarbitrary expression, in terms of x. If you have specified a 3-D graph, you can alsospecify an overlay function for z. Note: Overlay functions are not available for apanel or animation graph.
Once you have set options for a plot, you can execute the plot directly from the dialogbox by clicking Execute. You may, however, want to use the Options tab for additionalspecifications, such as binning, X Mode, and style.
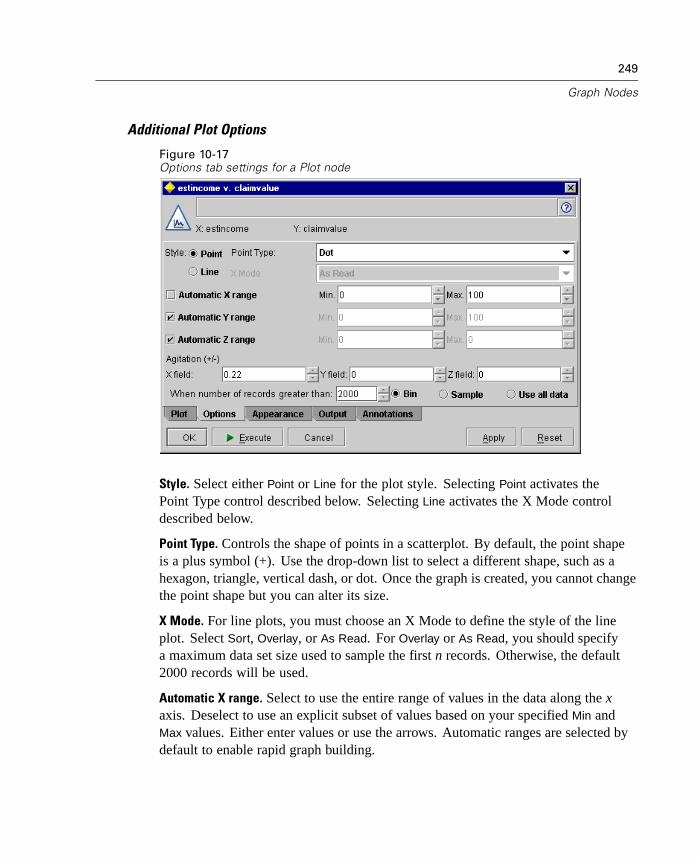
249
Graph Nodes
Additional Plot Options
Figure 10-17Options tab settings for a Plot node
Style. Select either Point or Line for the plot style. Selecting Point activates thePoint Type control described below. Selecting Line activates the X Mode controldescribed below.
Point Type. Controls the shape of points in a scatterplot. By default, the point shapeis a plus symbol (+). Use the drop-down list to select a different shape, such as ahexagon, triangle, vertical dash, or dot. Once the graph is created, you cannot changethe point shape but you can alter its size.
X Mode. For line plots, you must choose an X Mode to define the style of the lineplot. Select Sort, Overlay, or As Read. For Overlay or As Read, you should specifya maximum data set size used to sample the first n records. Otherwise, the default2000 records will be used.
Automatic X range. Select to use the entire range of values in the data along the xaxis. Deselect to use an explicit subset of values based on your specified Min andMax values. Either enter values or use the arrows. Automatic ranges are selected bydefault to enable rapid graph building.

250
Chapter 10
Automatic Y range. Select to use the entire range of values in the data along the yaxis. Deselect to use an explicit subset of values based on your specified Min andMax values. Either enter values or use the arrows. Automatic ranges are selected bydefault to enable rapid graph building.
Automatic Z range. When a 3-D graph is specified on the Plot tab, you can select thisoption to use the entire range of values in the data along the z axis. Deselect to usean explicit subset of values based on your specified Min and Max values. Eitherenter values or use the arrows. Automatic ranges are selected by default to enablerapid graph building.
Agitation (+/–). Also known as jittering, agitation is useful for point plots of a data setin which many values are repeated. In order to see a clearer distribution of values,you can distribute the points randomly around the actual value. Set the agitation valueto add random error that will jitter the points in axis coordinates. Each point will bejittered by jitterFactor x (randomVal –0.5), where randomVal >= 0 and <= 1. A value of0.2 (corresponding to a maximum of 10% of the frame real estate) works well here.
Note to users of earlier versions of Clementine: The agitation value specified in a plotuses a different metric in this release of Clementine. In earlier versions, the valuewas an actual number, but it is now a proportion of the frame size. This means thatagitation values in old streams are likely to be too large. For this release, any nonzeroagitation values will be converted to the value 0.2.
When number of records greater than. Specify a method for plotting large datasets. You can specify a maximum data set size or use the default 2000 records.Performance is enhanced for large data sets when you select the Bin or Sample
options. Alternatively, you can choose to plot all data points by selecting Use all
data, but you should note that this may dramatically decrease the performance ofthe software. Note: When X Mode is set to Overlay or As Read, these options aredisabled and only the first n records are used.
Bin. Select to enable binning when the data set contains more than the specifiednumber of records. Binning divides the graph into fine grids before actuallyplotting and counts the number of points that would appear in each of the gridcells. In the final graph, one point is plotted per cell at the bin centroid (averageof all point locations in the bin). The size of the plotted symbols indicates thenumber of points in that region (unless you have used size as an overlay). Usingthe centroid and size to represent the number of points makes the binned plota superior way to represent large data sets because it prevents overplotting in

251
Graph Nodes
dense regions (undifferentiated masses of color) and reduces symbol artifacts(artificial patterns of density). Symbol artifacts occur when certain symbols(particularly the plus symbol [+]) collide in a way that produces dense areasnot present in the raw data.
Sample. Select to randomly sample the data to the number of records entered inthe text field. 2000 records is the default.
Using a Plot Graph
Plots, multiplots, and evaluation charts are essentially plots of X against Y. Forexample, if you are exploring potential fraud in agricultural grant applications (asillustrated in fraud.str in the demos folder of your Clementine installation), you mightwant to plot the income claimed on the application versus the income estimated bya neural net. Using an overlay, such as crop type, will illustrate whether there is arelationship between claims (value or number) and type of crop.
Figure 10-18Plot of the relationship between estimated income and claim value with main crop typeas an overlay

252
Chapter 10
Since plots, multiplots, and evaluation charts are two-dimensional displays of Yagainst X, it is easy to interact with them by selecting regions with the mouse. Aregion is an area of the graph described by its minimum and maximum X and Yvalues. Note: Regions cannot be defined in 3-D or animated plots.
To define a region:
You can either use the mouse to interact with the graph, or you can use the EditGraph Regions dialog box to specify region boundaries and related options. Formore information, see “Editing Graph Regions” on page 256. To use the mousefor defining a region:
E Click the left mouse button somewhere in the plot to define a corner of the region.
E Drag the mouse to the position desired for the opposite corner of the region. Theresulting rectangle cannot exceed the boundaries of the axes.
E Release the mouse button to create a permanent rectangle for the region. By default,the new region is called Region<N>, where N corresponds to the number of regionsalready created in the Clementine session.

253
Graph Nodes
Figure 10-19Defining a region of high claim values
Once you have a defined a region, there are numerous ways to delve deeper into theselected area of the graph. Use the mouse in the following ways to produce feedbackin the graph window:
Hover over data points to provide point-specific information.
Right-click and hold the mouse button in a region to provide information aboutboundaries of that region.
Simply right-click in a region to bring up a context menu with additional options,such as generating process nodes.

254
Chapter 10
Figure 10-20Exploring the region of high claim values
To rename a region:
E Right-click anywhere in the defined region.
E From the context menu, choose Rename Region.
E Enter a new name and click OK.
Note: You can also rename the default region by right-clicking anywhere outside theregion and choosing Rename Default Region.
To delete a region:
E Right-click anywhere in the defined region.

255
Graph Nodes
E From the context menu, choose Delete Region.
Once you have defined regions, you can select subsets of records on the basis of theirinclusion in a particular region or in one of several regions. You can also incorporateregion information for a record by producing a Derive node to flag records basedon their inclusion in a region.
To select or flag records in a single region:
E Right-click in the region. Note that when you hold the right mouse button, the detailsfor the region are displayed in the feedback panel below the plot.
E From the context menu, choose Generate Select Node for Region or Generate Derive
Node for Region.
A Select node or Derive node is automatically added to the stream canvas with theappropriate options and conditions specified. The Select node selects all records inthe region. The Derive node generates a flag for records whose values fall within theregion. The flag field name corresponds to the region name, with the flags set to Tfor records inside the region and F for records outside.
To select, flag, or derive a set for records in all regions:
E From the Generate menu in the graph window, choose Derive Node (Set), Derive Node
(Flag), or Select Node.
E For all selections, a new node appears on the stream canvas with the followingcharacteristics, depending on your selection:
Derive Set. Produces a new field called region for each record. The value of thatfield is the name of the region into which the records fall. Records falling outsideall regions receive the name of the default region. (Right-click outside all regionsand choose Rename Default Region to change the name of the default region.)
Derive Flag. Creates a flag field called in_region with the flags set to T for recordsinside any region and F for records outside all regions.
Select Node. Generates a new node that tests for inclusion in any region. Thisnode selects records in any region for downstream processing.

256
Chapter 10
Editing Graph Regions
For plots, multiplots, and evaluation charts, you can edit the properties of regionsdefined on the graph. To open this dialog box, from graph window menus, choose:Edit
Graph Regions...
Figure 10-21Specifying properties for the defined regions
Region Name. Enter adjustments to the defined region names.
You can manually specify the boundaries of the region by adjusting the Minand Max values for X and Y.
Add new regions by specifying the name and boundaries. Then press the Enterkey to begin a new row.
Delete regions by selecting one in the table and clicking the delete button.
Multiplot Node
A multiplot is a special type of plot that displays multiple Y fields over a single Xfield. The Y fields are plotted as colored lines and each is equivalent to a Plot nodewith Style set to Line and X Mode set to Sort. Multiplots are useful when you havetime sequence data and want to explore the fluctuation of several variables over time.
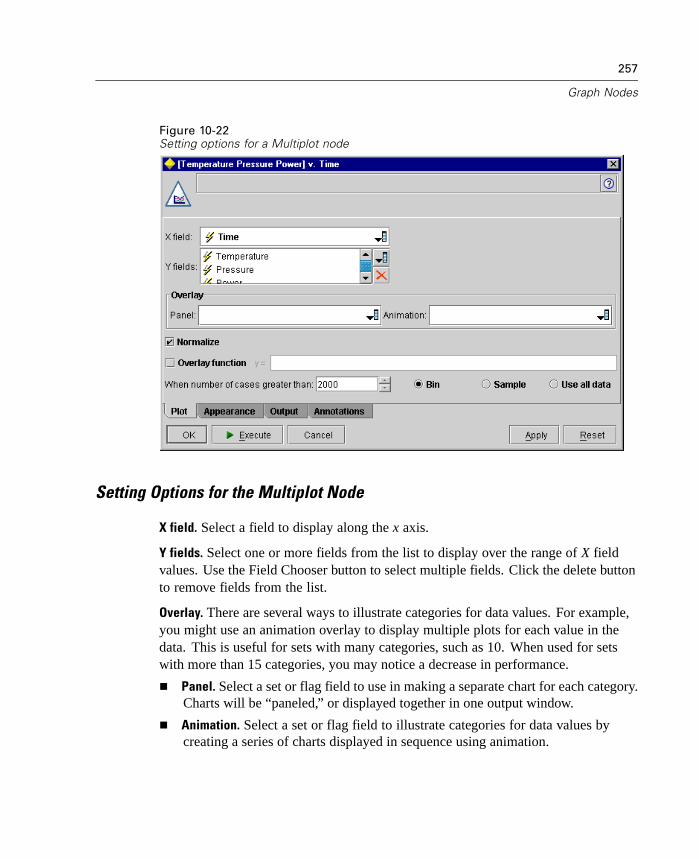
257
Graph Nodes
Figure 10-22Setting options for a Multiplot node
Setting Options for the Multiplot Node
X field. Select a field to display along the x axis.
Y fields. Select one or more fields from the list to display over the range of X fieldvalues. Use the Field Chooser button to select multiple fields. Click the delete buttonto remove fields from the list.
Overlay. There are several ways to illustrate categories for data values. For example,you might use an animation overlay to display multiple plots for each value in thedata. This is useful for sets with many categories, such as 10. When used for setswith more than 15 categories, you may notice a decrease in performance.
Panel. Select a set or flag field to use in making a separate chart for each category.Charts will be “paneled,” or displayed together in one output window.
Animation. Select a set or flag field to illustrate categories for data values bycreating a series of charts displayed in sequence using animation.

258
Chapter 10
Normalize. Select to scale all Y values to the range 0–1 for display on the graph.Normalizing helps you explore the relationship between lines that might otherwise beobscured in the graph.
Figure 10-23Standard multiplot showing power-plant fluctuation over time (note that withoutnormalizing, the plot for Pressure is impossible to see)
Figure 10-24Normalized multiplot showing a plot for Pressure
259
Graph Nodes
Overlay function. Select to specify a known function to compare to actual values. Forexample, to compare actual versus predicted values, you can plot the function y = xas an overlay. Specify a function in the y = text box. The default function is y = x,but you can specify any sort of function, such as a quadratic function or an arbitraryexpression, in terms of x.
When number of records greater than. Specify a method for plotting large datasets. You can specify a maximum data set size or use the default 2000 points.Performance is enhanced for large data sets when you select the Bin or Sample
options. Alternatively, you can choose to plot all data points by selecting Use all
data, but you should note that this may dramatically decrease the performance ofthe software. Note: When X Mode is set to Overlay or As Read, these options aredisabled and only the first n records are used.
Bin. Select to enable binning when the data set contains more than the specifiednumber of records. Binning divides the graph into fine grids before actuallyplotting and counts the number of connections that would appear in each of thegrid cells. In the final graph, one connection is used per cell at the bin centroid(average of all connection points in the bin).
Sample. Select to randomly sample the data to the specified number of records.
Using a Multiplot Graph
Plots and multiplots are two-dimensional displays of Y against X, making it easy tointeract with them by selecting regions with the mouse. A region is an area of thegraph described by its minimum and maximum X and Y values.
Since multiplots are essentially a type of plot, the graph window displays thesame options as those for the Plot node. For more information, see “Using a PlotGraph” on page 251.
Distribution Node
A distribution graph shows the occurrence of symbolic (non-numeric) values, suchas mortgage type or gender, in a data set. A typical use of the Distribution node isto show imbalances in the data that can be rectified by using a Balance node beforecreating a model. You can automatically generate a Balance node using the Generatemenu in a distribution graph window.

260
Chapter 10
Note: To show the occurrence of numeric values, you should use a Histogram node.
Figure 10-25Setting options for a Distribution node
Setting Options for the Distribution Node
Plot. Select the type of distribution. Select Selected fields to show the distribution ofthe selected field. Select All flags (true values) to show the distribution of true valuesfor flag fields in the data set.
Field. Select a set or flag field for which to show the distribution of values. Only fieldsthat have not been explicitly set as numeric appear on the list.
Overlay. Select a set or flag field to use as a color overlay, illustrating the distributionof its values within each value of the field selected above. For example, you can usemarketing campaign response (pep) as an overlay for number of children (children) toillustrate responsiveness by family size.
Normalize by color. Select to scale bars such that all bars take up the full width of thegraph. The overlay values equal a proportion of each bar, making comparisonsacross categories easier.
261
Graph Nodes
Sort. Select the method used to display values in the distribution graph. SelectAlphabetic to use alphabetical order or By count to list values in decreasing order ofoccurrence.
Proportional scale. Select to scale the distribution of values such that the value withthe largest count fills the full width of the plot. All other bars are scaled against thisvalue. Deselecting this option scales bars according to the total counts of each value.
Output Options for the Distribution Node
Options displayed on the Output tab for distributions are slightly different than forother graphs.
Output to screen. Select to generate and display the graph in a Clementine window.
Output to file. Select to save the generated graph as a file of the type specified inthe File type drop-down list.
Filename. Specify a filename used for the generated graph. Use the ellipses button (...)
to specify a specific file and location.
File type. Available file types are:
Formatted (.tab)
Data (comma delimited) (.dat)
HTML document (.html)
Lines per page. When saving output as HTML, this option is enabled to allow you todetermine the length of each HTML page. The default setting is 400.
Using a Distribution Graph
Distribution nodes are used to show the distribution of symbolic values in a dataset. They are frequently used before manipulation nodes to explore the data andcorrect any imbalances. For example, if instances of respondents without childrenoccur much more frequently than other types of respondents, you might want toreduce these instances so that a more useful rule can be generated in later data miningoperations. A Distribution node will help you to examine and make decisions aboutsuch imbalances.

262
Chapter 10
Figure 10-26Distribution graph showing the proportion of numbers of children with response to amarketing campaign
Once you have created a distribution graph and examined the results, you can useoptions from the menus to group values, copy values, and generate a number ofnodes for data preparation.
Edit Menu Options
You can use options on the Edit menu to group, select, and copy values in thedistribution table.
To select and copy values from a distribution:
E Click and hold the mouse button while dragging it to select a set of values. You canuse the Edit menu to Select All values.
E From the Edit menu, choose Copy or Copy (Inc. field names).
E Paste to the clipboard or into the desired application.
Note: The bars do not get copied directly. Instead, the table values are copied. Thismeans that overlaid values will not be displayed in the copied table.
To group values from a distribution:
E Select values for grouping using the Ctrl-click method.
E From the Edit menu, choose Group.

263
Graph Nodes
You can also:
Ungroup values by selecting the group name in the distribution list and choosingUngroup from the Edit menu.
Edit groups by selecting the group name in the distribution list and choosing Editgroup from the Edit menu. This opens a dialog box where values can be shifted toand from the group.
Figure 10-27Edit group dialog box
Generate Menu Options
You can use options on the Generate menu to select a subset of data, derive aflag field, regroup values, or balance the data. These operations generate a datapreparation node and place it on the stream canvas. To use the generated node,connect it to an existing stream.
Select Node. Select any cell from the graph to generate a Select node for thatcategory. You can select multiple categories using Ctrl-click in the distributiontable.
Derive Node. Select any cell from the graph to generate a Derive flag nodefor that category. You can select multiple categories using Ctrl-click in thedistribution table.
Balance Node (boost). Use this option to generate a Balance node that booststhe size of smaller subsets.
Balance Node (reduce). Use this option to generate a Balance node that reducesthe size of larger subsets.
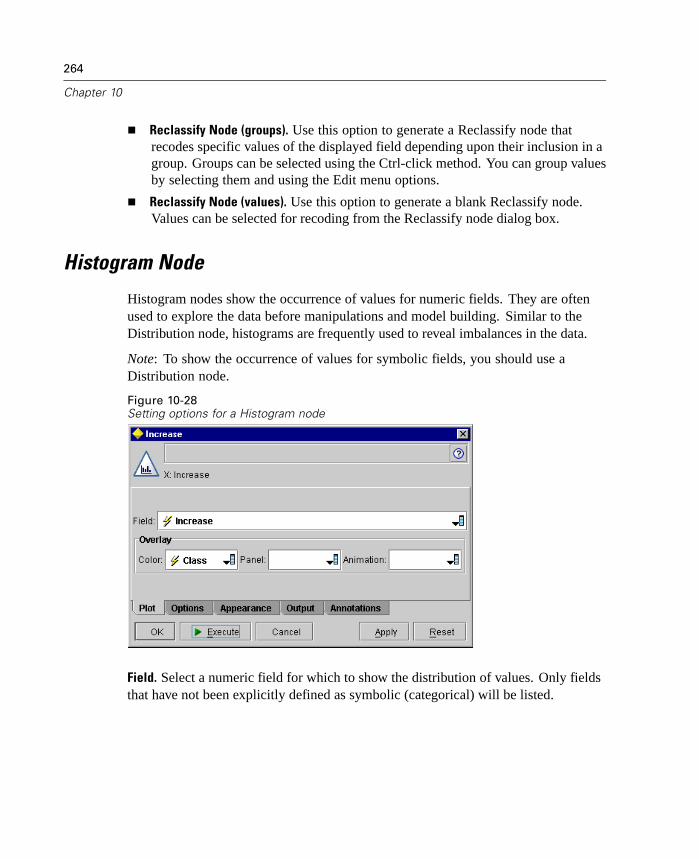
264
Chapter 10
Reclassify Node (groups). Use this option to generate a Reclassify node thatrecodes specific values of the displayed field depending upon their inclusion in agroup. Groups can be selected using the Ctrl-click method. You can group valuesby selecting them and using the Edit menu options.
Reclassify Node (values). Use this option to generate a blank Reclassify node.Values can be selected for recoding from the Reclassify node dialog box.
Histogram Node
Histogram nodes show the occurrence of values for numeric fields. They are oftenused to explore the data before manipulations and model building. Similar to theDistribution node, histograms are frequently used to reveal imbalances in the data.
Note: To show the occurrence of values for symbolic fields, you should use aDistribution node.
Figure 10-28Setting options for a Histogram node
Field. Select a numeric field for which to show the distribution of values. Only fieldsthat have not been explicitly defined as symbolic (categorical) will be listed.
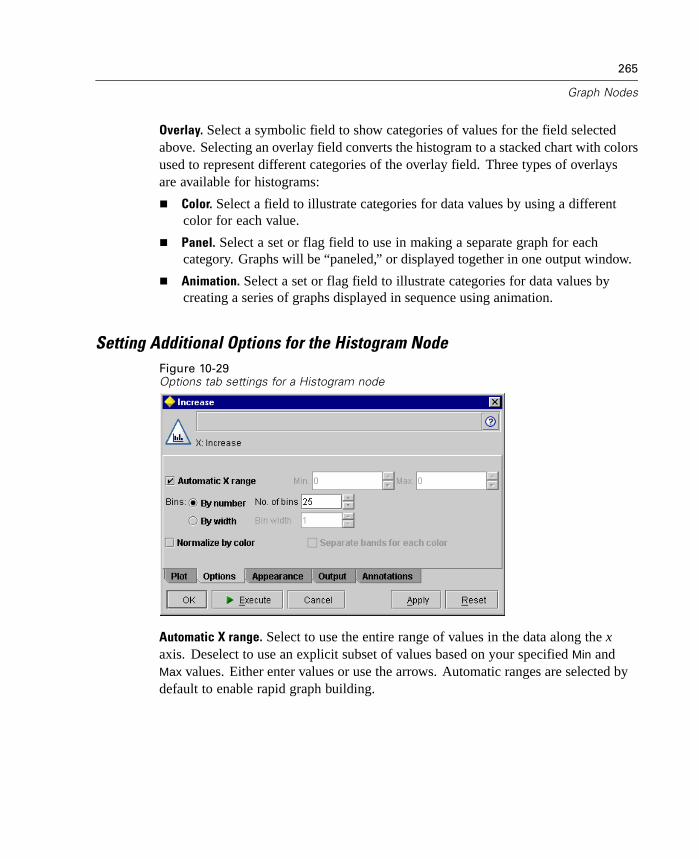
265
Graph Nodes
Overlay. Select a symbolic field to show categories of values for the field selectedabove. Selecting an overlay field converts the histogram to a stacked chart with colorsused to represent different categories of the overlay field. Three types of overlaysare available for histograms:
Color. Select a field to illustrate categories for data values by using a differentcolor for each value.
Panel. Select a set or flag field to use in making a separate graph for eachcategory. Graphs will be “paneled,” or displayed together in one output window.
Animation. Select a set or flag field to illustrate categories for data values bycreating a series of graphs displayed in sequence using animation.
Setting Additional Options for the Histogram NodeFigure 10-29Options tab settings for a Histogram node
Automatic X range. Select to use the entire range of values in the data along the xaxis. Deselect to use an explicit subset of values based on your specified Min andMax values. Either enter values or use the arrows. Automatic ranges are selected bydefault to enable rapid graph building.

266
Chapter 10
Bins. Select By number to display a fixed number of histogram bars whose widthdepends on the range specified above and the number of buckets specified below.Select By width to create a histogram with bars of a fixed width (specified below). Thenumber of bars depends on the specified width and the range of values.
No. of bins. Specify the number of buckets (bars) to be used in the histogram. Use thearrows to adjust the number.
Bin width. Specify the width of histogram bars.
Normalize by color. Select to adjust all bars to the same height, displaying overlaidvalues as a percentage of the total cases in each bar.
Separate bands for each color. Select to display each overlaid value as a separateband on the graph.
Using Histograms and Collections
Histograms and collections offer a similar window into your data before modeling.
Histograms show the distribution of values in a numeric field whose valuesrange along the x axis.
Collections show the distribution of values for one numeric field relative to thevalues of another, rather than the occurrence of values for a single field.
Both types of charts are frequently used before manipulation nodes to explore thedata and correct any imbalances by generating a Balance node from the outputwindow. You can also generate a Derive Flag node to add a field showing whichband each record falls into or a Select node to select all records within a particularset or range of values. Such operations help you to focus on a particular subsetof data for further exploration.

267
Graph Nodes
Figure 10-30Histogram showing the distribution of increased purchases by category due to promotion
Several options are available in the histogram window. These options apply for bothhistograms and collections. For example, you can:
Split the range of values on the x axis into bands.
Generate a Select or Derive Flag node based on inclusion in a particular band'srange of values.
Generate a Derive Set node to indicate the band into which a record's values fall.
Generate a Balance node to correct imbalances in the data.
View the graph in 3-D (available for collections only).
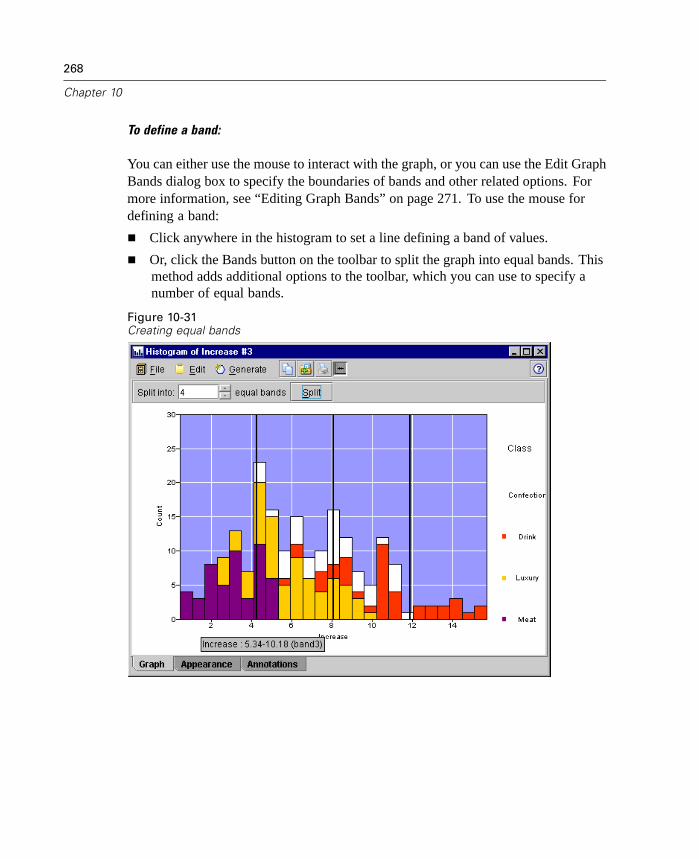
268
Chapter 10
To define a band:
You can either use the mouse to interact with the graph, or you can use the Edit GraphBands dialog box to specify the boundaries of bands and other related options. Formore information, see “Editing Graph Bands” on page 271. To use the mouse fordefining a band:
Click anywhere in the histogram to set a line defining a band of values.
Or, click the Bands button on the toolbar to split the graph into equal bands. Thismethod adds additional options to the toolbar, which you can use to specify anumber of equal bands.
Figure 10-31Creating equal bands

269
Graph Nodes
Once you have a defined a band, there are numerous ways to delve deeper into theselected area of the graph. Use the mouse in the following ways to produce feedbackin the graph window:
Hover over bars to provide bar-specific information.
Check the range of values for a band by right-clicking inside a band and readingthe feedback panel at the bottom of the window.
Simply right-click in a band to bring up a context menu with additional options,such as generating process nodes.
Rename bands by right-clicking in a band and selecting Rename Band. Bydefault, bands are named bandN, where N equals the number of bands from leftto right on the x axis.
Move the boundaries of a band by selecting a band line with your mouse andmoving it to the desired location on the x axis.
Delete bands by right-clicking on a line and selecting Delete Band.
Once you have created a histogram, defined bands, and examined the results, you canuse options on the Generate menu and the context menu to create Balance, Select,or Derive nodes.
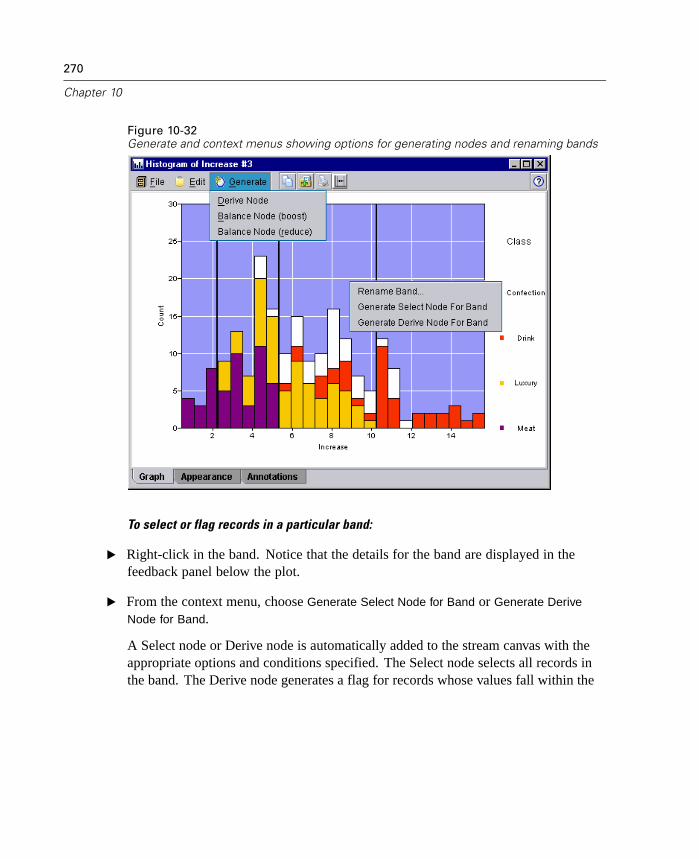
270
Chapter 10
Figure 10-32Generate and context menus showing options for generating nodes and renaming bands
To select or flag records in a particular band:
E Right-click in the band. Notice that the details for the band are displayed in thefeedback panel below the plot.
E From the context menu, choose Generate Select Node for Band or Generate Derive
Node for Band.
A Select node or Derive node is automatically added to the stream canvas with theappropriate options and conditions specified. The Select node selects all records inthe band. The Derive node generates a flag for records whose values fall within the

271
Graph Nodes
band. The flag field name corresponds to the band name, with flags set to T forrecords inside the band and F for records outside.
To derive a set for records in all regions:
E From the Generate menu in the graph window, choose Derive Node.
E A new Derive Set node appears on the stream canvas with options set to create a newfield called band for each record. The value of that field equals the name of theband that each record falls into.
To create a Balance node for imbalanced data:
E From the Generate menu in the graph window, choose one of the two Balancenode types:
Balance Node (boost). Generates a Balance node to boost the occurrence ofinfrequent values.
Balance Node (reduce). Generates a Balance node to reduce the frequency ofcommon values.
The generated node will be placed on the stream canvas. To use the node, connect itto an existing stream.
Editing Graph Bands
For histograms, collections, and evaluation charts, you can edit the properties of bandsdefined on the graph. To open this dialog box, from graph window menus, choose:Edit
Graph Bands...

272
Chapter 10
Figure 10-33Specifying properties for graph bands
Band Name. Enter adjustments to the defined band names.
You can manually specify the boundaries of the band by adjusting the Min andMax values for X and Y.
Add new bands by specifying the name and boundaries. Then press the Enter keyto begin a new row.
Delete bands by selecting one in the table and clicking the delete button.
Collection Node
Collections are similar to histograms except that collections show the distributionof values for one numeric field relative to the values of another, rather than theoccurrence of values for a single field. A collection is useful for illustrating a variableor field whose values change over time. Using 3-D graphing, you can also includea symbolic axis displaying distributions by category.
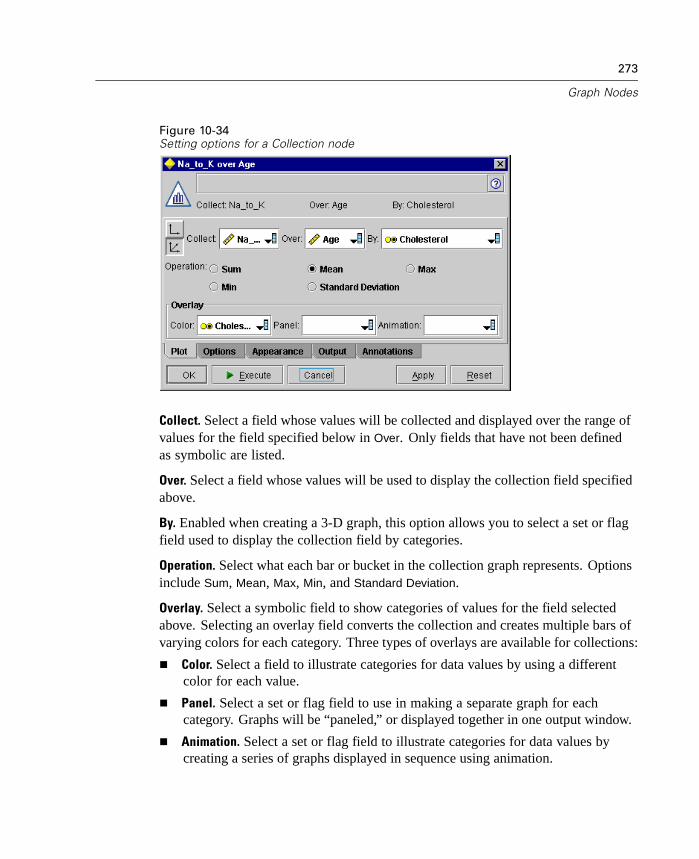
273
Graph Nodes
Figure 10-34Setting options for a Collection node
Collect. Select a field whose values will be collected and displayed over the range ofvalues for the field specified below in Over. Only fields that have not been definedas symbolic are listed.
Over. Select a field whose values will be used to display the collection field specifiedabove.
By. Enabled when creating a 3-D graph, this option allows you to select a set or flagfield used to display the collection field by categories.
Operation. Select what each bar or bucket in the collection graph represents. Optionsinclude Sum, Mean, Max, Min, and Standard Deviation.
Overlay. Select a symbolic field to show categories of values for the field selectedabove. Selecting an overlay field converts the collection and creates multiple bars ofvarying colors for each category. Three types of overlays are available for collections:
Color. Select a field to illustrate categories for data values by using a differentcolor for each value.
Panel. Select a set or flag field to use in making a separate graph for eachcategory. Graphs will be “paneled,” or displayed together in one output window.
Animation. Select a set or flag field to illustrate categories for data values bycreating a series of graphs displayed in sequence using animation.

274
Chapter 10
Setting Additional Options for the Collection Node
Automatic X range. Select to use the entire range of values in the data along the xaxis. Deselect to use an explicit subset of values based on your specified Min andMax values. Either enter values or use the arrows. Automatic ranges are selected bydefault to enable rapid graph building.
Bins. Select By number to display a fixed number of collection bars whose widthdepends on the range specified above and the number of buckets specified below.Select By width to create a collection with bars of a fixed width (specified below). Thenumber of bars depends on the specified width and the range of values.
No. of bins. Specify the number of buckets (bars) to be used in the collection. Use thearrows to adjust the number.
Bin width. Specify the width of collection bars.
Using a Collection Graph
Collection nodes show the distribution of values in a numeric field whose valuesrange along the x axis. They are frequently used before manipulation nodes to explorethe data and correct any imbalances by generating a Balance node from the graphwindow. You can also generate a Derive Flag node to add a field showing whichrange (band) each record falls into or a Select node to select all records within aparticular range of values. Such operations help you to focus on a particular subsetof data for further exploration.
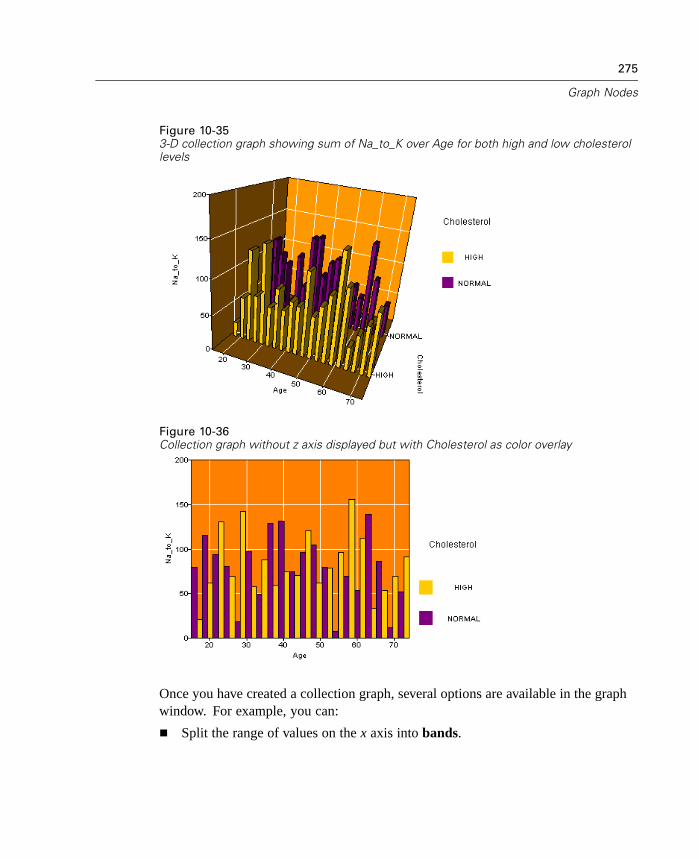
275
Graph Nodes
Figure 10-353-D collection graph showing sum of Na_to_K over Age for both high and low cholesterollevels
Figure 10-36Collection graph without z axis displayed but with Cholesterol as color overlay
Once you have created a collection graph, several options are available in the graphwindow. For example, you can:
Split the range of values on the x axis into bands.
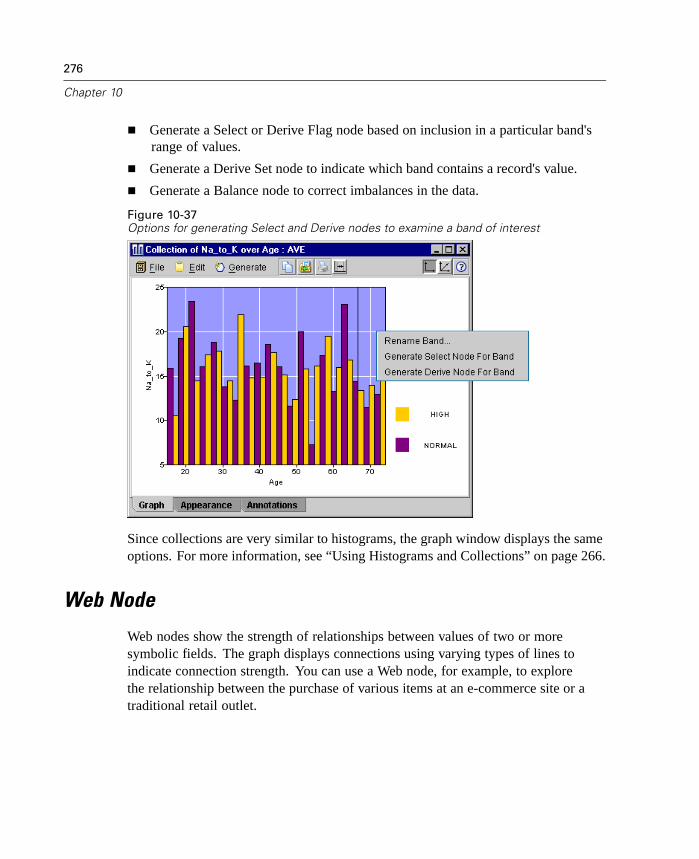
276
Chapter 10
Generate a Select or Derive Flag node based on inclusion in a particular band'srange of values.
Generate a Derive Set node to indicate which band contains a record's value.
Generate a Balance node to correct imbalances in the data.
Figure 10-37Options for generating Select and Derive nodes to examine a band of interest
Since collections are very similar to histograms, the graph window displays the sameoptions. For more information, see “Using Histograms and Collections” on page 266.
Web Node
Web nodes show the strength of relationships between values of two or moresymbolic fields. The graph displays connections using varying types of lines toindicate connection strength. You can use a Web node, for example, to explorethe relationship between the purchase of various items at an e-commerce site or atraditional retail outlet.
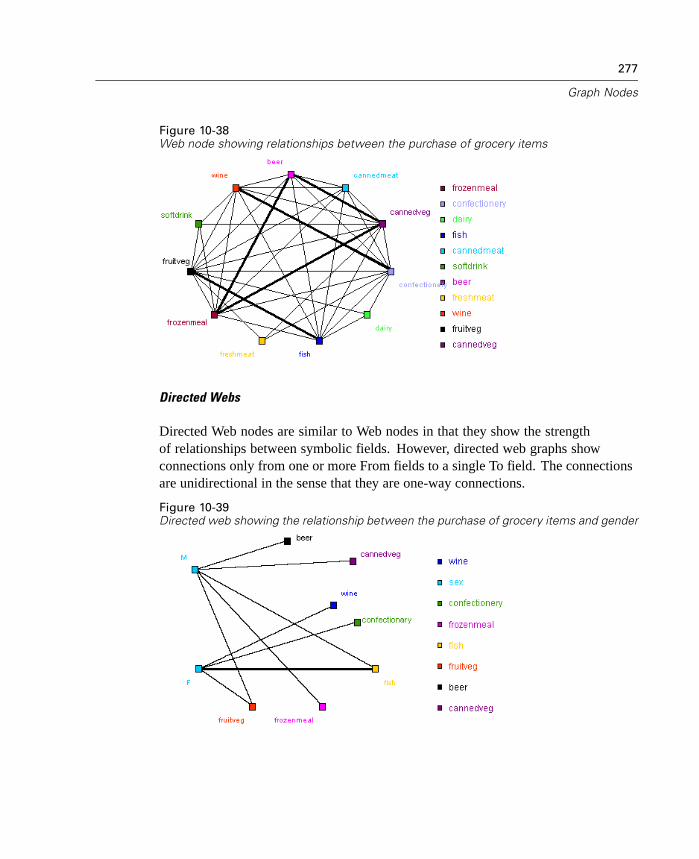
277
Graph Nodes
Figure 10-38Web node showing relationships between the purchase of grocery items
Directed Webs
Directed Web nodes are similar to Web nodes in that they show the strengthof relationships between symbolic fields. However, directed web graphs showconnections only from one or more From fields to a single To field. The connectionsare unidirectional in the sense that they are one-way connections.
Figure 10-39Directed web showing the relationship between the purchase of grocery items and gender

278
Chapter 10
Like Web nodes, the graph displays connections using varying types of lines toindicate connection strength. You can use a Directed Web node, for example, toexplore the relationship between gender and a proclivity for certain purchase items.
Setting Options for the Web NodeFigure 10-40Setting options for a Web node
Web. Select to create a web graph illustrating the strength of relationships betweenall specified fields.
Directed web. Select to create a directional web graph illustrating the strength ofrelationships between multiple fields and the values of one field, such as gender orreligion. When this option is selected, a To Field is activated and the Fields controlbelow is renamed From Fields for additional clarity.
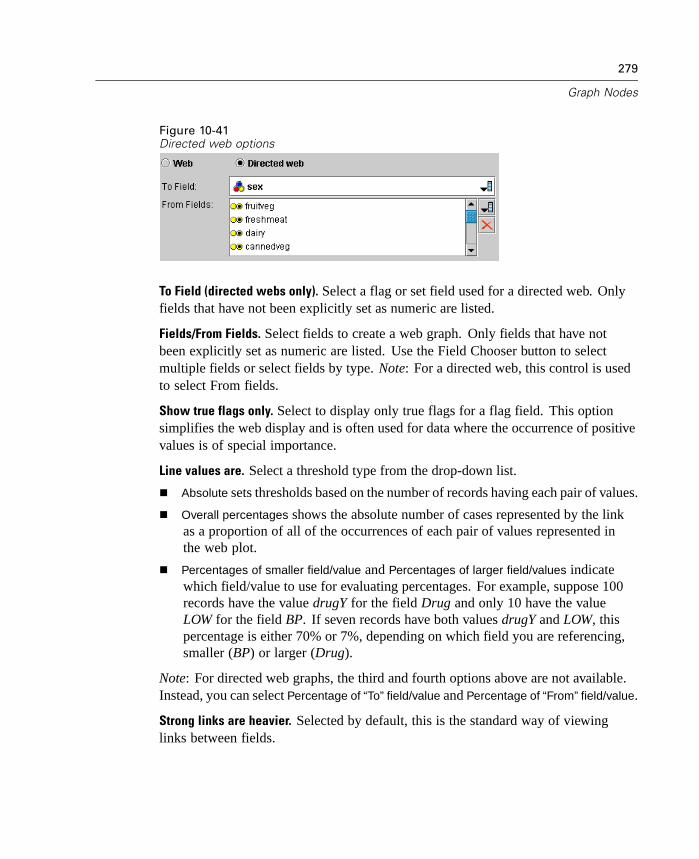
279
Graph Nodes
Figure 10-41Directed web options
To Field (directed webs only). Select a flag or set field used for a directed web. Onlyfields that have not been explicitly set as numeric are listed.
Fields/From Fields. Select fields to create a web graph. Only fields that have notbeen explicitly set as numeric are listed. Use the Field Chooser button to selectmultiple fields or select fields by type. Note: For a directed web, this control is usedto select From fields.
Show true flags only. Select to display only true flags for a flag field. This optionsimplifies the web display and is often used for data where the occurrence of positivevalues is of special importance.
Line values are. Select a threshold type from the drop-down list.
Absolute sets thresholds based on the number of records having each pair of values.
Overall percentages shows the absolute number of cases represented by the linkas a proportion of all of the occurrences of each pair of values represented inthe web plot.
Percentages of smaller field/value and Percentages of larger field/values indicatewhich field/value to use for evaluating percentages. For example, suppose 100records have the value drugY for the field Drug and only 10 have the valueLOW for the field BP. If seven records have both values drugY and LOW, thispercentage is either 70% or 7%, depending on which field you are referencing,smaller (BP) or larger (Drug).
Note: For directed web graphs, the third and fourth options above are not available.Instead, you can select Percentage of “To” field/value and Percentage of “From” field/value.
Strong links are heavier. Selected by default, this is the standard way of viewinglinks between fields.

280
Chapter 10
Weak links are heavier. Select to reverse the meaning of links displayed in bold lines.This option is frequently used for fraud detection or examination of outliers.
Setting Additional Options for the Web Node
The Options tab for Web nodes contains a number of additional options to customizethe output graph.
Figure 10-42Options tab settings for a Web node
Number of Links. The following controls are used to control the number of linksdisplayed in the output graph. Some of these options, such as Weak links above andStrong links above, are also available in the output graph window. You can also use aslider control in the final graph to adjust the number of links displayed.
Maximum number of links to display. Specify a number indicating the maximumnumber of links to show on the output graph. Use the arrows to adjust the value.

281
Graph Nodes
Show only links above. Specify a number indicating the minimum value for whichto show a connection in the web. Use the arrows to adjust the value.
Show all links. Specify to display all links regardless of minimum or maximumvalues. Selecting this option may increase processing time if there are a largenumber of fields.
Discard if very few records. Select to ignore connections that are supported by too fewrecords. Set the threshold for this option by entering a number in Min. records/line.
Discard if very many records. Select to ignore strongly supported connections. Enter anumber in Max. records/line.
Strong links above. Specify a threshold for strong connections (heavy lines) andregular connections (normal lines). All connections above this value are consideredstrong.
Weak links below. Specify a number indicating the threshold for weak connections(dotted lines) and regular connections (normal lines). All connections below thisvalue are considered weak.
Link Size. Specify options for controlling the size of links:
Link size varies continuously. Select to display a range of link sizes reflecting thevariation in connection strengths based on actual data values.
Link size shows strong/normal/weak categories. Select to display three strengths ofconnections—strong, normal, and weak. The cut-off points for these categoriescan be specified above as well as in the final graph.
Web Display. Select a type of web display:
Circle. Select to use the standard web display.
Network layout. Select to use an algorithm to group together the strongest links.This is intended to highlight strong links using spatial differentiation as well asweighted lines.

282
Chapter 10
Figure 10-43Network display showing strong connections from frozenmeal and cannedveg to othergrocery items
Appearance Options for the Web Plot
The Appearance tab for web plots contains a subset of options available for othertypes of graphs.
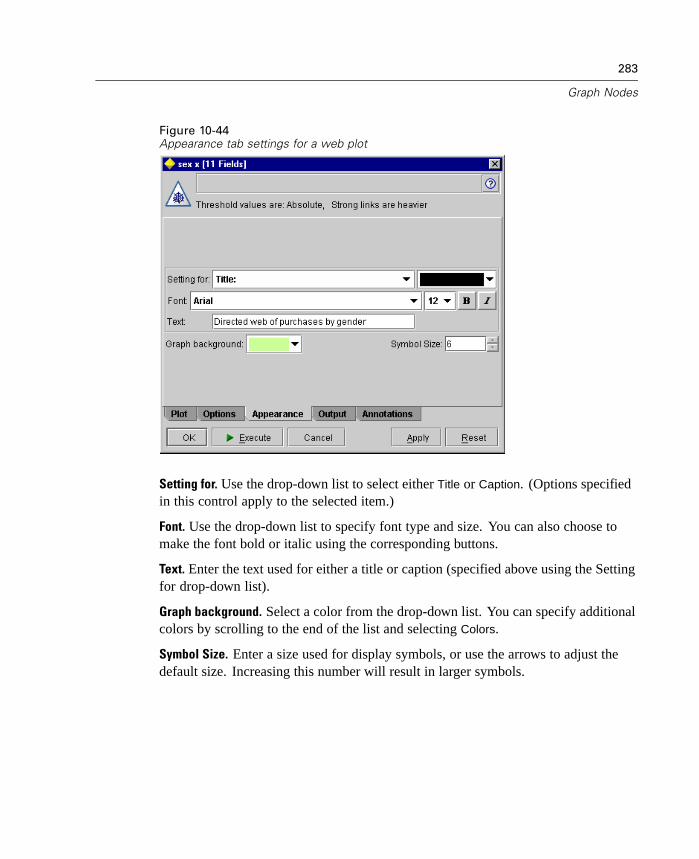
283
Graph Nodes
Figure 10-44Appearance tab settings for a web plot
Setting for. Use the drop-down list to select either Title or Caption. (Options specifiedin this control apply to the selected item.)
Font. Use the drop-down list to specify font type and size. You can also choose tomake the font bold or italic using the corresponding buttons.
Text. Enter the text used for either a title or caption (specified above using the Settingfor drop-down list).
Graph background. Select a color from the drop-down list. You can specify additionalcolors by scrolling to the end of the list and selecting Colors.
Symbol Size. Enter a size used for display symbols, or use the arrows to adjust thedefault size. Increasing this number will result in larger symbols.
284
Chapter 10
Using a Web Graph
Web nodes are used to show the strength of relationships between values of two ormore symbolic fields. Connections are displayed in a graph with varying types oflines to indicate connections of increasing strength. You can use a Web node, forexample, to explore the relationship between cholesterol levels, blood pressure, andthe drug that was effective in treating the patient's illness.
Strong connections are shown with a heavy line. This indicates that the twovalues are strongly related and should be further explored.
Medium connections are shown with a line of normal weight.
Weak connections are shown with a dotted line.
If no line is shown between two values, this means either that the two values neveroccur in the same record or that this combination occurs in a number of recordsbelow the threshold specified in the Web node dialog box.
Once you have created a Web node, there are several options for adjusting the graphdisplay and generating nodes for further analysis.

285
Graph Nodes
Figure 10-45Web graph indicating a number of strong relationships, such as normal blood pressurewith DrugX and high cholesterol with DrugY
For both Web nodes and Directed Web nodes, you can:
Change the layout of the web display.
Hide points to simplify the display.
Change the thresholds controlling line styles.
Highlight lines between values to indicate a “selected” relationship.
Generate a Select node for one or more “selected” records or a Derive Flag nodeassociated with one or more relationships in the web.
To adjust points:
Move points by clicking the mouse on a point and dragging it to the new location.The web will be redrawn to reflect the new location.

286
Chapter 10
Hide points by right-clicking on a point in the web and choosing Hide or Hide andReplan from the context menu. Hide simply hides the selected point and any linesassociated with it. Hide and Replan redraws the web, adjusting for any changesyou have made. Any manual moves are undone.
Show all hidden points by choosing Reveal All or Reveal All and Replan from theWeb menu in the graph window. Selecting Reveal All and Replan redraws the web,adjusting to include all previously hidden points and their connections.
To select, or “highlight,” lines:
E Left-click to select a line and highlight it in red.
E Continue to select additional lines by repeating this process.
You can deselect lines by choosing Clear Selection from the Web menu in the graphwindow.
To view the web using a network layout:
E From the Web menu, choose Network.
E To return to circle layout, select Circle from the same menu.
To select or flag records for a single relationship:
E Right-click on the line representing the relationship of interest.
E From the context menu, choose Generate Select Node For Link or Generate Derive
Node For Link.
A Select node or Derive node is automatically added to the stream canvas with theappropriate options and conditions specified:
The Select node selects all records in the given relationship.
The Derive node generates a flag indicating whether the selected relationshipholds true for records in the entire data set. The flag field is named by joiningthe two values in the relationship with an underscore, such as LOW_drugCor drugC_LOW.
287
Graph Nodes
To select or flag records for a group of relationships:
E Select the line(s) in the web display representing relationships of interest.
E From the Generate menu in the graph window, choose Select Node (“And”), Select
Node (“Or”), Derive Node (“And”), or Derive Node (“Or”).
The “Or” nodes give the disjunction of conditions. This means that the node willapply to records for which any of the selected relationships hold.
The “And” nodes give the conjunction of conditions. This means that the nodewill apply only to records for which all selected relationships hold. An erroroccurs if any of the selected relationships are mutually exclusive.
After you have completed your selection, a Select node or Derive node isautomatically added to the stream canvas with the appropriate options and conditionsspecified.
Adjusting Web Thresholds
After you have created a web graph, you can adjust the thresholds controlling linestyles using the toolbar slider to change the minimum visible line. You can alsoview additional threshold options by clicking the yellow double-arrow button onthe toolbar to expand the web graph window. Then click the Controls tab to viewadditional options.

288
Chapter 10
Figure 10-46Expanded window featuring display and threshold options
Threshold values are. Shows the type of threshold selected during creation in theWeb node dialog box.
Strong links are heavier. Selected by default, this is the standard way of viewinglinks between fields.
Weak links are heavier. Select to reverse the meaning of links displayed in bold lines.This option is frequently used for fraud detection or examination of outliers.
Web Display. Specify options for controlling the size of links in the output graph:
Size varies continuously. Select to display a range of link sizes reflecting thevariation in connection strengths based on actual data values.
Size shows strong/normal/weak categories. Select to display three strengths ofconnections—strong, normal, and weak. The cutoff points for these categoriescan be specified above as well as in the final graph.
Strong links above. Specify a threshold for strong connections (heavy lines) andregular connections (normal lines). All connections above this value are consideredstrong. Use the slider to adjust the value or enter a number in the field.
289
Graph Nodes
Weak links below. Specify a number indicating the threshold for weak connections(dotted lines) and regular connections (normal lines). All connections below this valueare considered weak. Use the slider to adjust the value or enter a number in the field.
After you have adjusted the thresholds for a web, you can replan, or redraw, the webdisplay with the new threshold values by clicking the black replan button on the webgraph toolbar. Once you have found settings that reveal the most meaningful patterns,you can update the original settings in the Web node (also called the Parent Webnode) by choosing Update Parent Node from the Web menu in the graph window.
Creating a Web Summary
You can create a web summary document that lists strong, medium, and weak linksby clicking the yellow double-arrow button on the toolbar to expand the web graphwindow. Then click the Summary tab to view tables for each type of link. Tables canbe expanded and collapsed using the toggle buttons for each.

290
Chapter 10
Figure 10-47Web summary listing connections between blood pressure, cholesterol, and drug type
Evaluation Chart Node
The Evaluation Chart node offers an easy way to evaluate and compare predictivemodels to choose the best model for your application. Evaluation charts show howmodels perform in predicting particular outcomes. They work by sorting recordsbased on the predicted value and confidence of the prediction, splitting the recordsinto groups of equal size (quantiles), and then plotting the value of the businesscriterion for each quantile, from highest to lowest. Multiple models are shown asseparate lines in the plot.

291
Graph Nodes
Outcomes are handled by defining a specific value or range of values as a hit. Hitsusually indicate success of some sort (such as a sale to a customer) or an event ofinterest (such as a specific medical diagnosis). You can define hit criteria on theOptions tab of the dialog box. Or, you can use the default hit criteria as follows:
Flag output fields are straightforward; hits correspond to true values.
For Set output fields, the first value in the set defines a hit.
For Range output fields, hits equal values greater than the midpoint of the field'srange.
There are five types of evaluation charts, each of which emphasizes a differentevaluation criterion.
Gains Charts
Gains are defined as the proportion of total hits that occurs in each quantile. Gains arecomputed as (number of hits in quantile / total number of hits) × 100%.
Figure 10-48Gains chart (cumulative) with baseline, best line and business rule displayed
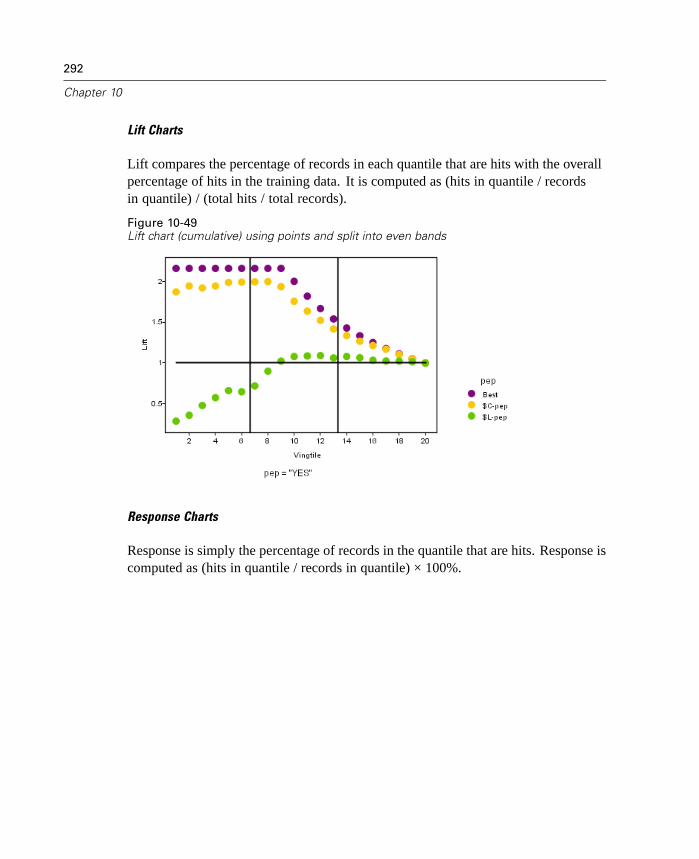
292
Chapter 10
Lift Charts
Lift compares the percentage of records in each quantile that are hits with the overallpercentage of hits in the training data. It is computed as (hits in quantile / recordsin quantile) / (total hits / total records).
Figure 10-49Lift chart (cumulative) using points and split into even bands
Response Charts
Response is simply the percentage of records in the quantile that are hits. Response iscomputed as (hits in quantile / records in quantile) × 100%.

293
Graph Nodes
Figure 10-50Response chart (cumulative) with best line and baseline
Profit Charts
Profit equals the revenue for each record minus the cost for the record. Profits for aquantile are simply the sum of profits for all records in the quantile. Profits areassumed to apply only to hits, but costs apply to all records. Profits and costs can befixed or can be defined by fields in the data. Profits are computed as (sum of revenuefor records in quantile – sum of costs for records in quantile).
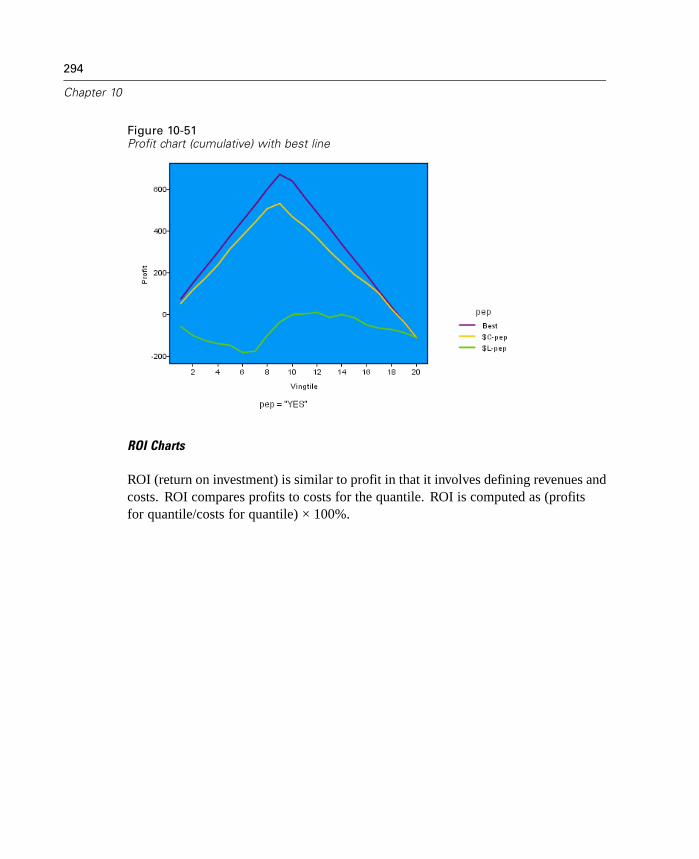
294
Chapter 10
Figure 10-51Profit chart (cumulative) with best line
ROI Charts
ROI (return on investment) is similar to profit in that it involves defining revenues andcosts. ROI compares profits to costs for the quantile. ROI is computed as (profitsfor quantile/costs for quantile) × 100%.

295
Graph Nodes
Figure 10-52ROI chart (cumulative) with best line
Evaluation charts can be also be cumulative, so that each point equals the value for thecorresponding quantile plus all higher quantiles. Cumulative charts usually conveythe overall performance of models better, whereas non-cumulative charts often excelat indicating particular problem areas for models.
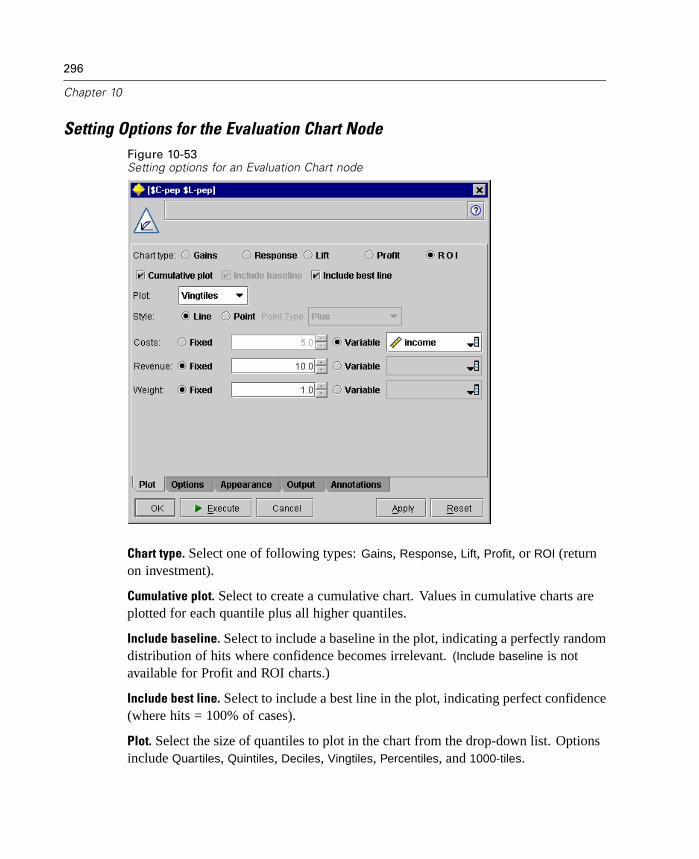
296
Chapter 10
Setting Options for the Evaluation Chart NodeFigure 10-53Setting options for an Evaluation Chart node
Chart type. Select one of following types: Gains, Response, Lift, Profit, or ROI (returnon investment).
Cumulative plot. Select to create a cumulative chart. Values in cumulative charts areplotted for each quantile plus all higher quantiles.
Include baseline. Select to include a baseline in the plot, indicating a perfectly randomdistribution of hits where confidence becomes irrelevant. (Include baseline is notavailable for Profit and ROI charts.)
Include best line. Select to include a best line in the plot, indicating perfect confidence(where hits = 100% of cases).
Plot. Select the size of quantiles to plot in the chart from the drop-down list. Optionsinclude Quartiles, Quintiles, Deciles, Vingtiles, Percentiles, and 1000-tiles.

297
Graph Nodes
Style. Select Line or Point. Specify a point type by selecting one from the drop-downlist. Options include Dot, Rectangle, Plus, Triangle, Hexagon, Horizontal dash, andVertical dash.
For Profit and ROI charts, additional controls allow you to specify costs, revenue,and weights.
Costs. Specify the cost associated with each record. You can select Fixed orVariable costs. For fixed costs, specify the cost value. For variable costs, click theField Chooser button to select a field as the cost field.
Revenue. Specify the revenue associated with each record that represents a hit.You can select Fixed or Variable costs. For fixed revenue, specify the revenuevalue. For variable revenue, click the Field Chooser button to select a fieldas the revenue field.
Weight. If the records in your data represent more than one unit, you can usefrequency weights to adjust the results. Specify the weight associated with eachrecord, using Fixed or Variable weights. For fixed weights, specify the weightvalue (the number of units per record). For variable weights, click the FieldChooser button to select a field as the weight field.
Setting Additional Options for Evaluation Charts
The Options tab for evaluation charts provides flexibility in defining hits, scoringcriteria, and business rules displayed in the chart. You can also set options forexporting the results of the model evaluation.
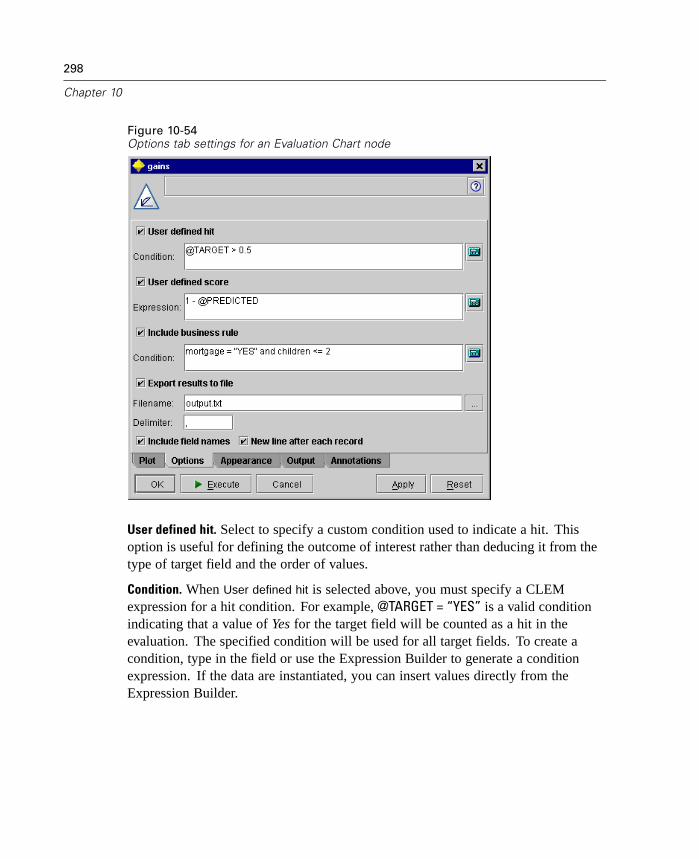
298
Chapter 10
Figure 10-54Options tab settings for an Evaluation Chart node
User defined hit. Select to specify a custom condition used to indicate a hit. Thisoption is useful for defining the outcome of interest rather than deducing it from thetype of target field and the order of values.
Condition. When User defined hit is selected above, you must specify a CLEMexpression for a hit condition. For example, @TARGET = “YES” is a valid conditionindicating that a value of Yes for the target field will be counted as a hit in theevaluation. The specified condition will be used for all target fields. To create acondition, type in the field or use the Expression Builder to generate a conditionexpression. If the data are instantiated, you can insert values directly from theExpression Builder.
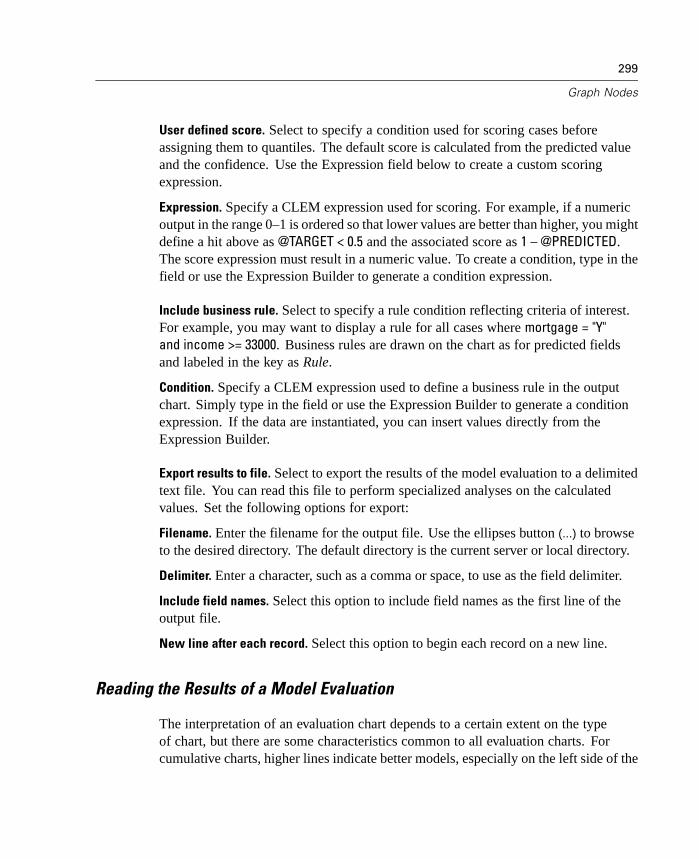
299
Graph Nodes
User defined score. Select to specify a condition used for scoring cases beforeassigning them to quantiles. The default score is calculated from the predicted valueand the confidence. Use the Expression field below to create a custom scoringexpression.
Expression. Specify a CLEM expression used for scoring. For example, if a numericoutput in the range 0–1 is ordered so that lower values are better than higher, you mightdefine a hit above as @TARGET < 0.5 and the associated score as 1 – @PREDICTED.The score expression must result in a numeric value. To create a condition, type in thefield or use the Expression Builder to generate a condition expression.
Include business rule. Select to specify a rule condition reflecting criteria of interest.For example, you may want to display a rule for all cases where mortgage = "Y"and income >= 33000. Business rules are drawn on the chart as for predicted fieldsand labeled in the key as Rule.
Condition. Specify a CLEM expression used to define a business rule in the outputchart. Simply type in the field or use the Expression Builder to generate a conditionexpression. If the data are instantiated, you can insert values directly from theExpression Builder.
Export results to file. Select to export the results of the model evaluation to a delimitedtext file. You can read this file to perform specialized analyses on the calculatedvalues. Set the following options for export:
Filename. Enter the filename for the output file. Use the ellipses button (...) to browseto the desired directory. The default directory is the current server or local directory.
Delimiter. Enter a character, such as a comma or space, to use as the field delimiter.
Include field names. Select this option to include field names as the first line of theoutput file.
New line after each record. Select this option to begin each record on a new line.
Reading the Results of a Model Evaluation
The interpretation of an evaluation chart depends to a certain extent on the typeof chart, but there are some characteristics common to all evaluation charts. Forcumulative charts, higher lines indicate better models, especially on the left side of the

300
Chapter 10
chart. In many cases, when comparing multiple models the lines will cross, so that onemodel will be higher in one part of the chart and another will be higher in a differentpart of the chart. In this case, you need to consider what portion of the sample youwant (which defines a point on the x axis) when deciding which model to choose.
Most of the non-cumulative charts will be very similar. For good models,non-cumulative charts should be high toward the left side of the chart and low towardthe right side of the chart. (If a non-cumulative chart shows a sawtooth pattern, youcan smooth it out by reducing the number of quantiles to plot and reexecuting thegraph.) Dips on the left side of the chart or spikes on the right side can indicate areaswhere the model is predicting poorly. A flat line across the whole graph indicates amodel that essentially provides no information.
Gains charts. Cumulative gains charts always start at 0% and end at 100% as you gofrom left to right. For a good model, the gains chart will rise steeply toward 100%and then level off. A model that provides no information will follow the diagonalfrom lower left to upper right (shown in the chart if Include baseline is selected).
Lift charts. Cumulative lift charts tend to start above 1.0 and gradually descend untilthey reach 1.0 as you go from left to right. The right edge of the chart represents theentire data set, so the ratio of hits in cumulative quantiles to hits in data is 1.0. For agood model, lift should start well above 1.0 on the left, remain on a high plateau asyou move to the right, and then trail off sharply toward 1.0 on the right side of thechart. For a model that provides no information, the line will hover around 1.0 forthe entire graph. (If Include baseline is selected, a horizontal line at 1.0 is shown inthe chart for reference.)
Response charts. Cumulative response charts tend to be very similar to lift chartsexcept for the scaling. Response charts usually start near 100% and graduallydescend until they reach the overall response rate (total hits / total records) on theright edge of the chart. For a good model, the line will start near or at 100% on theleft, remain on a high plateau as you move to the right, and then trail off sharplytoward the overall response rate on the right side of the chart. For a model thatprovides no information, the line will hover around the overall response rate for theentire graph. (If Include baseline is selected, a horizontal line at the overall responserate is shown in the chart for reference.)
Profit charts. Cumulative profit charts show the sum of profits as you increase thesize of the selected sample, moving from left to right. Profit charts usually start nearzero, increase steadily as you move to the right until they reach a peak or plateau in
301
Graph Nodes
the middle, and then decrease toward the right edge of the chart. For a good model,profits will show a well-defined peak somewhere in the middle of the chart. For amodel that provides no information, the line will be relatively straight and may beincreasing, decreasing, or level depending on the cost/revenue structure that applies.
ROI charts. Cumulative ROI (return on investment) charts tend to be similar toresponse charts and lift charts except for the scaling. ROI charts usually start above0% and gradually descend until they reach the overall ROI for the entire data set(which can be negative). For a good model, the line should start well above 0%,remain on a high plateau as you move to the right, and then trail off rather sharplytoward the overall ROI on the right side of the chart. For a model that provides noinformation, the line should hover around the overall ROI value.
Using an Evaluation Chart
Using the mouse to explore an evaluation chart is similar to using a histogram orcollection graph.

302
Chapter 10
Figure 10-55Working with an evaluation chart
The x axis represents model scores across the specified quantiles, such as vingtiles ordeciles. You can partition the x axis into bands just as you would for a histogram byclicking with the mouse or using the splitter icon to display options for automaticallysplitting the axis into equal bands.
Figure 10-56Splitter icon used to expand the toolbar with options for splitting into bands
You can manually edit the boundaries of bands by selecting Graph Bands from theEdit menu. For more information, see “Editing Graph Bands” on page 271.
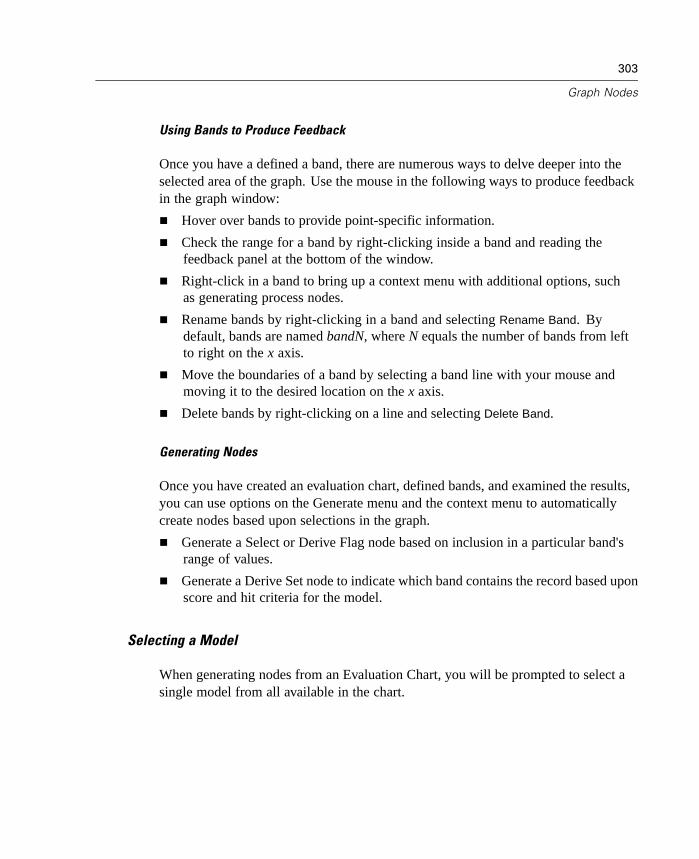
303
Graph Nodes
Using Bands to Produce Feedback
Once you have a defined a band, there are numerous ways to delve deeper into theselected area of the graph. Use the mouse in the following ways to produce feedbackin the graph window:
Hover over bands to provide point-specific information.
Check the range for a band by right-clicking inside a band and reading thefeedback panel at the bottom of the window.
Right-click in a band to bring up a context menu with additional options, suchas generating process nodes.
Rename bands by right-clicking in a band and selecting Rename Band. Bydefault, bands are named bandN, where N equals the number of bands from leftto right on the x axis.
Move the boundaries of a band by selecting a band line with your mouse andmoving it to the desired location on the x axis.
Delete bands by right-clicking on a line and selecting Delete Band.
Generating Nodes
Once you have created an evaluation chart, defined bands, and examined the results,you can use options on the Generate menu and the context menu to automaticallycreate nodes based upon selections in the graph.
Generate a Select or Derive Flag node based on inclusion in a particular band'srange of values.
Generate a Derive Set node to indicate which band contains the record based uponscore and hit criteria for the model.
Selecting a Model
When generating nodes from an Evaluation Chart, you will be prompted to select asingle model from all available in the chart.
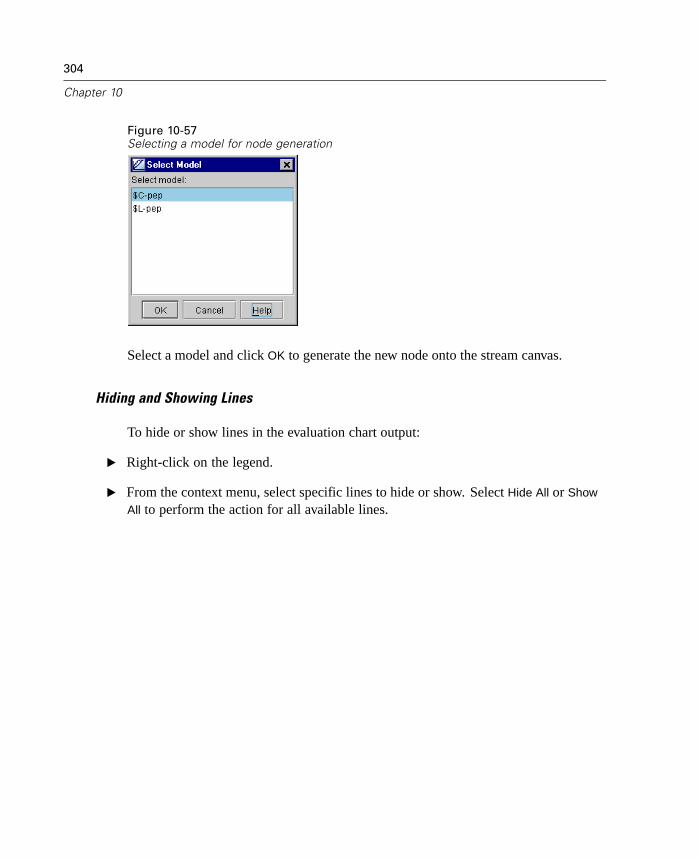
304
Chapter 10
Figure 10-57Selecting a model for node generation
Select a model and click OK to generate the new node onto the stream canvas.
Hiding and Showing Lines
To hide or show lines in the evaluation chart output:
E Right-click on the legend.
E From the context menu, select specific lines to hide or show. Select Hide All or Show
All to perform the action for all available lines.
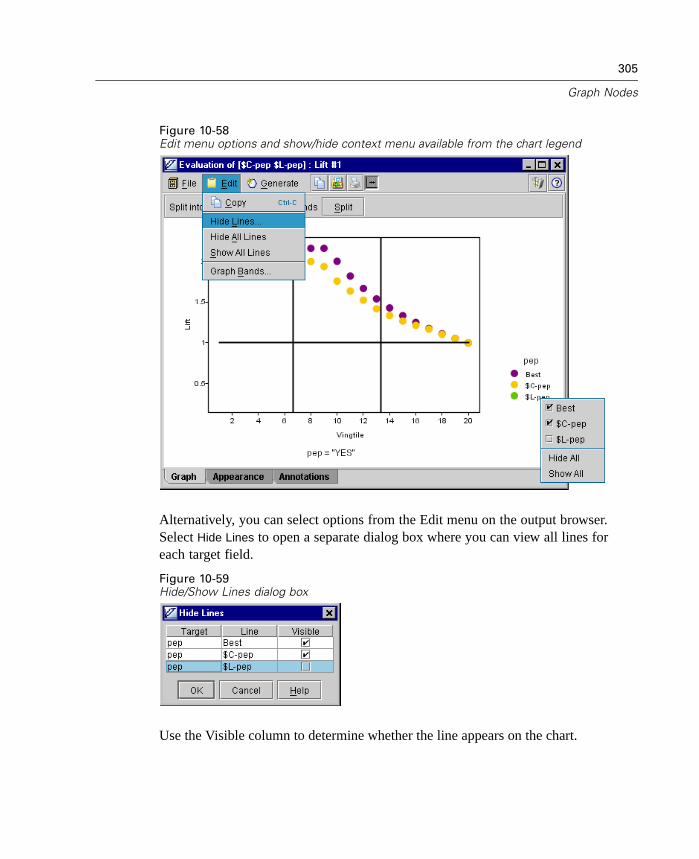
305
Graph Nodes
Figure 10-58Edit menu options and show/hide context menu available from the chart legend
Alternatively, you can select options from the Edit menu on the output browser.Select Hide Lines to open a separate dialog box where you can view all lines foreach target field.
Figure 10-59Hide/Show Lines dialog box
Use the Visible column to determine whether the line appears on the chart.


Chapter
11Modeling Nodes
Overview of Modeling Nodes
Modeling nodes are the heart of the data mining process. The methods availablein these nodes allow you to derive new information from your data and developpredictive models. Clementine offers a variety of modeling methods taken frommachine learning, artificial intelligence, and statistics. Each method has certainstrengths and is best suited for particular types of problems.
Figure 11-1Modeling palette
The Modeling palette contains the following nodes:
Neural Net
C5.0
Kohonen
Linear Regression
Generalized Rule Induction (GRI)
Apriori
K-Means
Logistic Regression
Factor Analysis/PCA
TwoStep Cluster
307
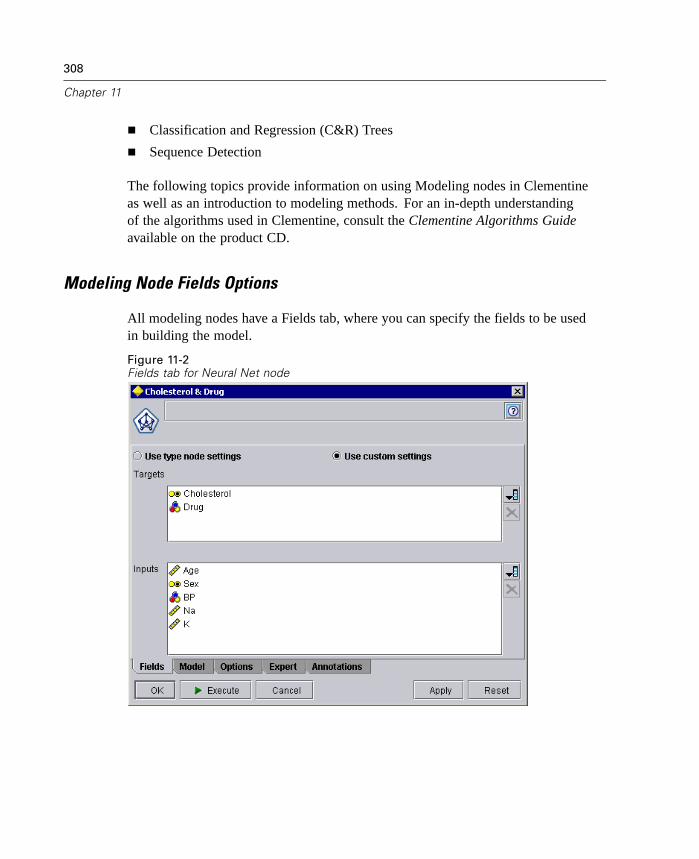
308
Chapter 11
Classification and Regression (C&R) Trees
Sequence Detection
The following topics provide information on using Modeling nodes in Clementineas well as an introduction to modeling methods. For an in-depth understandingof the algorithms used in Clementine, consult the Clementine Algorithms Guideavailable on the product CD.
Modeling Node Fields Options
All modeling nodes have a Fields tab, where you can specify the fields to be usedin building the model.
Figure 11-2Fields tab for Neural Net node
309
Modeling Nodes
Before you can build a model, you need to specify which fields you want to use astargets and as inputs. By default, all modeling nodes except the Sequence node willuse field information from an upstream Type node. If you are using a Type node toselect input and target fields, you don't need to change anything on this tab. ForSequence models, you must specify the field settings on the Fields tab of the modelingnode. For more information, see “Sequence Node Field Options” on page 374.
Use Type node settings. This option tells the node to use field information from anupstream type node. This is the default.
Use custom settings. This option tells the node to use field information specified hereinstead of that given in any upstream Type node(s). After selecting this option,specify fields below.
Target(s). For models that require one or more target fields, select the targetfield(s). This is similar to setting a field's direction to Out in a Type node.
Inputs. Select the input field(s). This is similar to setting a field's direction to Inin a Type node.
Use frequency field. This option allows you to select a field as a frequencyweight. Use this if the records in your training data represent more than one uniteach—for example, if you are using aggregated data. The field values shouldbe the number of units represented by each record. Values for a frequency fieldshould be positive integers. Frequency weights affect calculation of branchinstances for C&RT models. Records with negative or zero frequency weightare excluded from the analysis. Non-integer frequency weights are roundedto the nearest integer.
Use weight field. This option allows you to select a field as a case weight. Caseweights are used to account for differences in variance across levels of the outputfield. These weights are used in model estimation but do not affect calculationof branch instances for C&RT models. Case weight values should be positivebut need not be integer values. Records with negative or zero case weight areexcluded from the analysis.
310
Chapter 11
Consequents. For rule induction nodes (Apriori and GRI), select the fields to beused as consequents in the resulting ruleset. (This corresponds to fields with typeOut or Both in a Type node.)
Antecedents. For rule induction nodes (Apriori and GRI), select the fields to beused as antecedents in the resulting ruleset. (This corresponds to fields with typeIn or Both in a Type node.)
Transactional data format (Apriori node only). Apriori can handle data in either of twoformats. Transactional data has two fields: one for an ID and one for content. Eachrecord represents a single item, and associated items are linked by having the same ID.
Here is an example of data in Transactional format:
Customer Purchase
1 jam
2 milk
3 jam
3 bread
4 jam
4 bread
4 milk
Tabular data format (Apriori node only). Tabular data has items represented by separateflags, and each record represents a complete set of associated items.
Here is an example of Tabular data:
Customer jam bread milk
1 T F F
2 F F T
3 T T F
4 T T T

311
Modeling Nodes
Neural Net Node
The Neural Net node (formerly called “Train Net”) is used to create and train aneural network. A neural network, sometimes called a multi-layer perceptron, isbasically a simplified model of the way the human brain processes information. Itworks by simulating a large number of interconnected simple processing units thatresemble abstract versions of neurons.
The processing units are arranged in layers. There are typically three parts in aneural network: an input layer with units representing the input fields, one or morehidden layers, and an output layer with a unit or units representing the outputfield(s). The units are connected with varying connection strengths or weights.
The network learns by examining individual records, generating a prediction foreach record, and making adjustments to the weights whenever it makes an incorrectprediction. This process is repeated many times, and the network continues toimprove its predictions until one or more of the stopping criteria have been met.
Requirements. There are no restrictions on field types. Neural Net nodes can handlenumeric, symbolic, or flag inputs and outputs. The Neural Net node expects one ormore fields with direction In and one or more fields with direction Out. Fields setto Both or None are ignored. Field types must be fully instantiated when the nodeis executed.
Strengths. Neural networks are powerful general function estimators. They usuallyperform prediction tasks at least as well as other techniques and sometimes performsignificantly better. They also require minimal statistical or mathematical knowledgeto train or apply. Clementine incorporates several features to avoid some of thecommon pitfalls of neural networks, including sensitivity analysis to aid ininterpretation of the network, pruning and validation to prevent overtraining, anddynamic networks to automatically find an appropriate network architecture.

312
Chapter 11
Neural Net Node Model OptionsFigure 11-3Neural Net node model options
Editing the Neural Net node allows you to set the parameters for the node. You canset the following parameters:
Model name. Specify the name of the network to be produced.
Auto. With this option selected, the model name will be generated automatically,based on the target field name(s). This is the default.
Custom. Select this option to specify your own name for the generated model thatwill be created by this node.
Method. Clementine provides six training methods for building neural networkmodels:
Quick. This method uses rules of thumb and characteristics of the data to choosean appropriate shape (topology) for the network. Note that the method forcalculating default size of the hidden layer has changed from previous versions of
313
Modeling Nodes
Clementine. The new method will generally produce smaller hidden layers thatare faster to train and that generalize better. If you find that you get poor accuracywith the default size, try increasing the size of the hidden layer on the Expert tabor try an alternate training method.
Dynamic. This method creates an initial topology, but modifies the topology byadding and/or removing hidden units as training progresses.
Multiple. This method creates several networks of different topologies (the exactnumber depends on the training data). These networks are then trained in apseudo-parallel fashion. At the end of training, the model with the lowest RMSerror is presented as the final model.
Prune. This method starts with a large network and removes (prunes) the weakestunits in the hidden and input layers as training proceeds. This method is usuallyslow, but it often yields better results than other methods.
RBFN. The radial basis function network (RBFN) uses a technique similar tok-means clustering to partition the data based on values of the target field.
Exhaustive prune. This method is related to the Prune method. It starts with a largenetwork and prunes the weakest units in the hidden and input layers as trainingproceeds. With Exhaustive Prune, network training parameters are chosen toensure a very thorough search of the space of possible models to find the bestone. This method is usually the slowest, but it often yields the best results. Notethat this method can take a long time to train, especially with large data sets.
Prevent overtraining. When selected, this option splits the data randomly into trainingand validation sets. The network is trained on the training set, and accuracy isestimated based on the validation set. You can specify the proportion of the data tobe used for training in the Sample % box. (The remainder of the data is used forvalidation.)
Set random seed. If no random seed is set, the sequence of random values used toinitialize the network weights will be different every time the node is executed. Thiscan cause the node to create different models on different runs, even if the networksettings and data values are exactly the same. By selecting this option, you can set therandom seed to a specific value so that the resulting model is exactly reproducible. Aspecific random seed always generates the same sequence of random values, in whichcase executing the node always yields the same generated model.

314
Chapter 11
Stop on. You can select one of the following stoppng criteria:
Default. With this setting, the network will stop training when the network appearsto have reached its optimally trained state. If the default setting is used with theMultiple training method, the networks that fail to train well are discarded astraining progresses.
Accuracy (%). With this option, training will continue until the specified accuracyis attained. This may never happen, but you can interrupt training at any pointand save the net with the best accuracy achieved so far.
Cycles. With this option, training will continue for the specified number of cycles(passes through the data).
Time (mins). With this option, training will continue for the specified amount oftime (in minutes). Note that training may go a bit beyond the specified time limitin order to complete the current cycle.
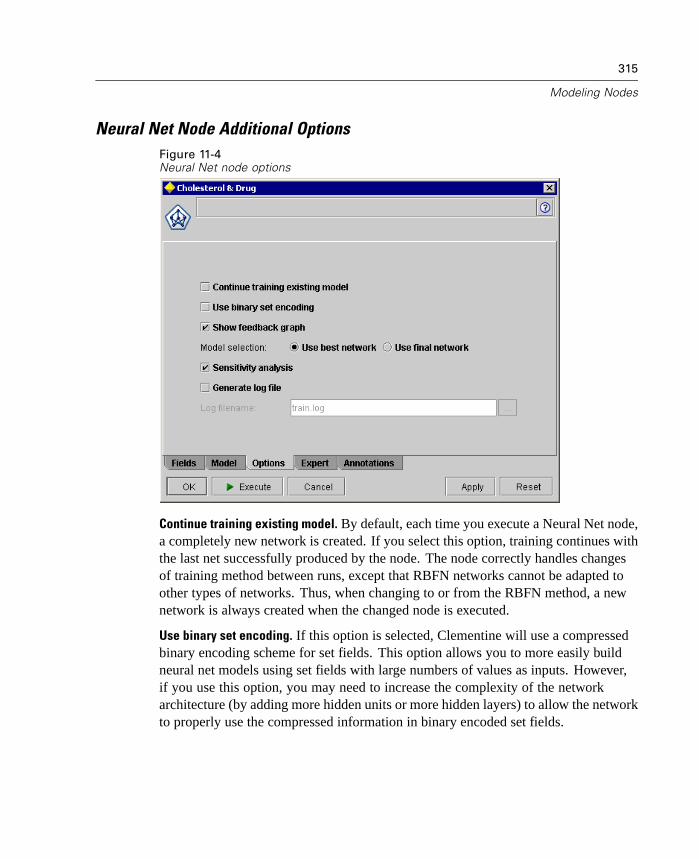
315
Modeling Nodes
Neural Net Node Additional OptionsFigure 11-4Neural Net node options
Continue training existing model. By default, each time you execute a Neural Net node,a completely new network is created. If you select this option, training continues withthe last net successfully produced by the node. The node correctly handles changesof training method between runs, except that RBFN networks cannot be adapted toother types of networks. Thus, when changing to or from the RBFN method, a newnetwork is always created when the changed node is executed.
Use binary set encoding. If this option is selected, Clementine will use a compressedbinary encoding scheme for set fields. This option allows you to more easily buildneural net models using set fields with large numbers of values as inputs. However,if you use this option, you may need to increase the complexity of the networkarchitecture (by adding more hidden units or more hidden layers) to allow the networkto properly use the compressed information in binary encoded set fields.
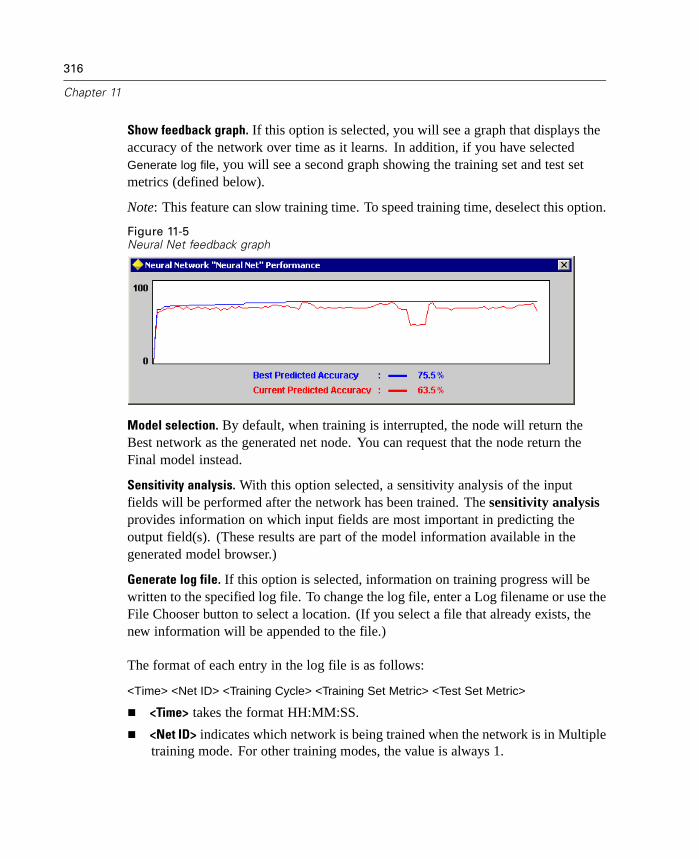
316
Chapter 11
Show feedback graph. If this option is selected, you will see a graph that displays theaccuracy of the network over time as it learns. In addition, if you have selectedGenerate log file, you will see a second graph showing the training set and test setmetrics (defined below).
Note: This feature can slow training time. To speed training time, deselect this option.
Figure 11-5Neural Net feedback graph
Model selection. By default, when training is interrupted, the node will return theBest network as the generated net node. You can request that the node return theFinal model instead.
Sensitivity analysis. With this option selected, a sensitivity analysis of the inputfields will be performed after the network has been trained. The sensitivity analysisprovides information on which input fields are most important in predicting theoutput field(s). (These results are part of the model information available in thegenerated model browser.)
Generate log file. If this option is selected, information on training progress will bewritten to the specified log file. To change the log file, enter a Log filename or use theFile Chooser button to select a location. (If you select a file that already exists, thenew information will be appended to the file.)
The format of each entry in the log file is as follows:
<Time> <Net ID> <Training Cycle> <Training Set Metric> <Test Set Metric>
<Time> takes the format HH:MM:SS.
<Net ID> indicates which network is being trained when the network is in Multipletraining mode. For other training modes, the value is always 1.

317
Modeling Nodes
<Training Cycle> is an integer, incrementing from 0 on each training run.
<Training Set Metric> and <Test Set Metric> are measures of network performanceon the training data and test data, respectively. (These values are identical whenPrevent overtraining is deselected.) They are calculated as the squared correlationbetween predicted and actual values divided by the mean squared error (MSE).If both Generate log file and Show feedback graph are selected, these metrics aredisplayed in the feedback graph in addition to the usual accuracy values.
Neural Net Node Expert Options—Quick MethodFigure 11-6Quick method expert options
Hidden layers. Select the number of hidden layers for the neural network. Morehidden layers can help neural networks learn more complex relationships, but theyalso increase training time.
318
Chapter 11
Layer 1, 2, 3. For each layer, specify the number of hidden units to include. Morehidden units per layer can also help in learning complex tasks, but as with additionalhidden layers, they also increase training time.
Persistence. Specify the number of cycles for which the network will continue to trainif no improvement is seen. Higher values can help networks escape local minima, butthey also increase training time.
Alpha and Eta. These parameters control the training of the network. For moreinformation, see “Neural Net Node Learning Rates” on page 323.
Neural Net Node Expert Options—Dynamic Method
There are no expert options for the dynamic method in the Neural Net node.

319
Modeling Nodes
Neural Net Node Expert Options - Multiple MethodFigure 11-7Multiple method expert options
Topologies. Specify the topologies of the networks to be trained. A topology is givenby specifying the number of hidden units in each layer, separated by commas.Topologies can specify one, two, or three hidden layers by using the appropriatenumber of parameters. For example, a network with one hidden layer of 10 unitswould be specified as 10; a network with three hidden layers of 10, 12, and 15 unitswould be specified as10, 12, 15.
You can also specify a range of numbers for hidden units in a layer by providingtwo or three numbers separated by spaces. If two numbers are given, separatenetworks are created with a number of hidden units equal to each integer between thefirst and second number (inclusive). For example, to generate networks having 10,11, 12, 13, and 14 hidden units in a single layer, specify 10 14. To generate networkswith two hidden layers where the first layer varies from 10 to 14 and the second layervaries from 8 to 12, specify 10 14, 8 12. In this case, networks are generated thatcontain all possible combinations of values. If a third value is given, it is used as an

320
Chapter 11
increment for counting from the first value to the second. For example, to generatenetworks with 10, 12, 14, and 16 hidden units, specify 10 16 2.
Finally, you can provide multiple network topologies, separated by semicolons.For example, to generate networks with one hidden layer of 10, 12, 14, and 16 hiddenunits, and networks having two hidden layers of 10 hidden units and 7 to 10 hiddenunits, respectively, specify 10 16 2; 10, 7 10.
Discard non-pyramids. Pyramids are networks where each layer contains the samenumber or fewer hidden units than the preceding layer. Such networks usuallytrain better than non-pyramidal networks. Selecting this option discards networksthat are not pyramids.
Persistence. Specify the number of cycles for which the network will continue totrain if no improvement is seen.
Alpha and Eta. These parameters control the training of the network. For moreinformation, see “Neural Net Node Learning Rates” on page 323.

321
Modeling Nodes
Neural Net Node Expert Options—Prune MethodFigure 11-8Prune method expert options
Hidden layers. Select the number of hidden layers for the initial network (beforepruning).
Layer 1, 2, 3. For each layer, specify the number of hidden units to include in theinitial network (before pruning). The initial layers should be slightly larger than youwould use with another training method.
Hidden rate. Specify the number of hidden units to be removed in a single hiddenunit pruning.
Hidden persistence. Specify the number of hidden unit pruning operations to performif no improvement is seen.
Input rate. Specify the number of input units to be removed in a single input pruning.

322
Chapter 11
Input persistence. Specify the number of input pruning operations to be performed ifno improvement is seen.
Persistence. Specify the number of cycles for which the network will train beforeattempting to prune if no improvement is seen.
Overall persistence. Specify the number of times to go through the hidden unitprune/input prune loop if no improvement is seen. Applies when using the Defaultstopping model. For more information, see “Neural Net Node Model Options” onpage 312.
Alpha and Eta. These parameters control the training of the network. For moreinformation, see “Neural Net Node Learning Rates” on page 323.
Neural Net Node Expert Options—RBFN MethodFigure 11-9RBFN method expert options

323
Modeling Nodes
RBF clusters. Specify the number of radial basis functions or clusters to use. Thiscorresponds to the size of the hidden layer.
Persistence. Specify the number of cycles for which the network will continue totrain if no improvement is seen.
Eta. For RBFNs, eta remains constant. By default, eta will be computed automatically,based on the first two cycles. To specify the value for eta, deselect Compute Eta
automatically and enter the desired value. For more information, see “Neural Net NodeLearning Rates” on page 323.
Alpha. A momentum term used in updating the weights during training. For moreinformation, see “Neural Net Node Learning Rates” on page 323.
RBF overlapping. The hidden units in an RBFN represent radial basis functions thatdefine clusters or regions in the data. This parameter allows you to control how muchthose regions or clusters overlap. Normally during training, records affect only thecluster(s) to which they are closest. By increasing this parameter, you increase thesize of the region associated with each hidden unit, allowing records to affect moredistant clusters. Specify a positive real value.
Neural Net Node Expert Options—Exhaustive Prune Method
There are no expert options for the Exhaustive Prune method in the Neural Net node.
Neural Net Node Learning Rates
Neural net training is controlled by several parameters. These parameters can be setusing the Expert tab of the Neural Net node dialog box.
Alpha. A momentum term used in updating the weights during training. Momentumtends to keep the weight changes moving in a consistent direction. Specify a valuebetween 0 and 1. Higher values of alpha can help the network escape from localminima.
Eta. The learning rate, which controls how much the weights are adjusted at eachupdate. Eta changes as training proceeds for all training methods except RBFN,where eta remains constant. Initial Eta is the starting value of Eta. During training,Eta starts at Initial Eta, decreases to Low Eta, then is reset to High Eta and decreases
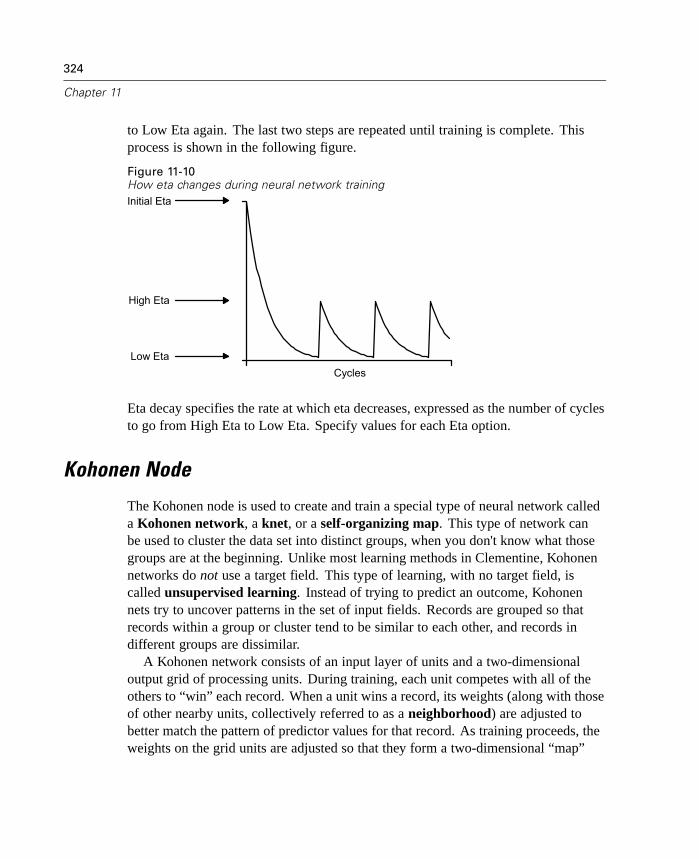
324
Chapter 11
to Low Eta again. The last two steps are repeated until training is complete. Thisprocess is shown in the following figure.
Figure 11-10How eta changes during neural network training
Cycles
Initial Eta
High Eta
Low Eta
Eta decay specifies the rate at which eta decreases, expressed as the number of cyclesto go from High Eta to Low Eta. Specify values for each Eta option.
Kohonen Node
The Kohonen node is used to create and train a special type of neural network calleda Kohonen network, a knet, or a self-organizing map. This type of network canbe used to cluster the data set into distinct groups, when you don't know what thosegroups are at the beginning. Unlike most learning methods in Clementine, Kohonennetworks do not use a target field. This type of learning, with no target field, iscalled unsupervised learning. Instead of trying to predict an outcome, Kohonennets try to uncover patterns in the set of input fields. Records are grouped so thatrecords within a group or cluster tend to be similar to each other, and records indifferent groups are dissimilar.
A Kohonen network consists of an input layer of units and a two-dimensionaloutput grid of processing units. During training, each unit competes with all of theothers to “win” each record. When a unit wins a record, its weights (along with thoseof other nearby units, collectively referred to as a neighborhood) are adjusted tobetter match the pattern of predictor values for that record. As training proceeds, theweights on the grid units are adjusted so that they form a two-dimensional “map”

325
Modeling Nodes
of the clusters. (Hence the term self-organizing map.) Usually, a Kohonen netwill end up with a few units that summarize many observations (strong units), andseveral units that don't really correspond to any of the observations (weak units).The strong units (and sometimes other units adjacent to them in the grid) representprobable cluster centers.
Another use of Kohonen networks is in dimension reduction. The spatialcharacteristic of the two-dimensional grid provides a mapping from the k originalpredictors to two derived features that preserve the similarity relationships in theoriginal predictors. In some cases, this can give you the same kind of benefit asfactor analysis or PCA.
Note that the method for calculating default size of the output grid has changedfrom previous versions of Clementine. The new method will generally producesmaller output layers that are faster to train and generalize better. If you find that youget poor results with the default size, try increasing the size of the output grid on theExpert tab. For more information, see “Kohonen Node Expert Options” on page 328.
Requirements. To train a Kohonen net, you need one or more In fields. Fields set asOut, Both, or None are ignored.
Strengths. You do not need to have data on group membership to build a Kohonennetwork model. You don't even need to know the number of groups to look for.Kohonen networks start with a large number of units, and as training progresses, theunits gravitate toward the natural clusters in the data. You can look at the number ofobservations captured by each unit in the generated model to identify the strong units,which can give you a sense of the appropriate number of clusters.

326
Chapter 11
Kohonen Node Model OptionsFigure 11-11Kohonen node model options
Model name. Specify the name of the network to be produced.
Auto. With this option selected, the model name will be “Kohonen.” This isthe default.
Custom. Select this option to specify your own name for the generated model thatwill be created by this node.
Continue training existing model. By default, each time you execute a Kohonen node, acompletely new network is created. If you select this option, training continues withthe last net successfully produced by the node.
Show feedback graph. If this option is selected, a visual representation of thetwo-dimensional array is displayed during training. The strength of each node isrepresented by color. Red denotes a unit that is winning many records (a strong unit),and white denotes a unit that is winning few or no records (a weak unit). Note thatthis feature can slow training time. To speed up training time, deselect this option.
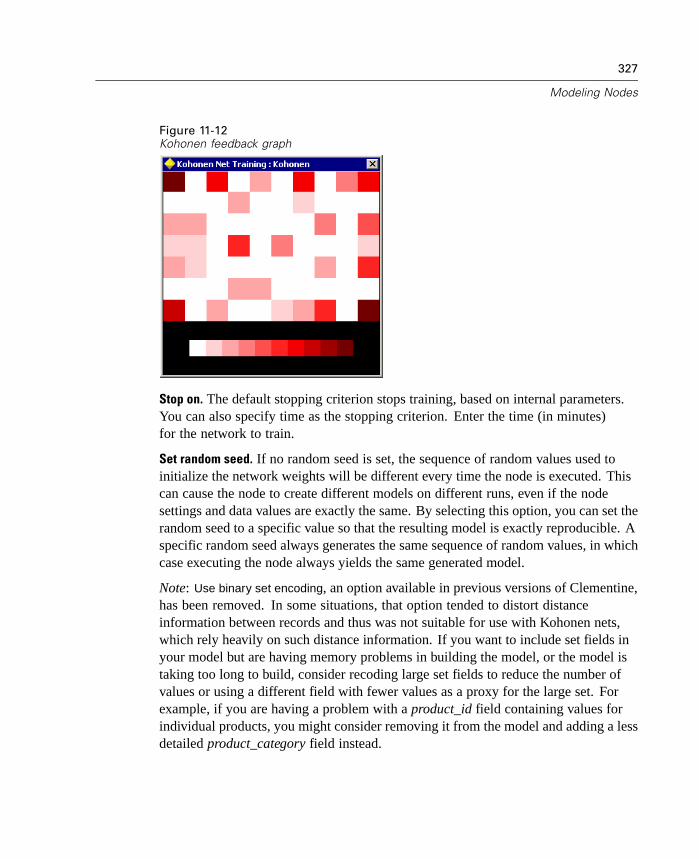
327
Modeling Nodes
Figure 11-12Kohonen feedback graph
Stop on. The default stopping criterion stops training, based on internal parameters.You can also specify time as the stopping criterion. Enter the time (in minutes)for the network to train.
Set random seed. If no random seed is set, the sequence of random values used toinitialize the network weights will be different every time the node is executed. Thiscan cause the node to create different models on different runs, even if the nodesettings and data values are exactly the same. By selecting this option, you can set therandom seed to a specific value so that the resulting model is exactly reproducible. Aspecific random seed always generates the same sequence of random values, in whichcase executing the node always yields the same generated model.
Note: Use binary set encoding, an option available in previous versions of Clementine,has been removed. In some situations, that option tended to distort distanceinformation between records and thus was not suitable for use with Kohonen nets,which rely heavily on such distance information. If you want to include set fields inyour model but are having memory problems in building the model, or the model istaking too long to build, consider recoding large set fields to reduce the number ofvalues or using a different field with fewer values as a proxy for the large set. Forexample, if you are having a problem with a product_id field containing values forindividual products, you might consider removing it from the model and adding a lessdetailed product_category field instead.
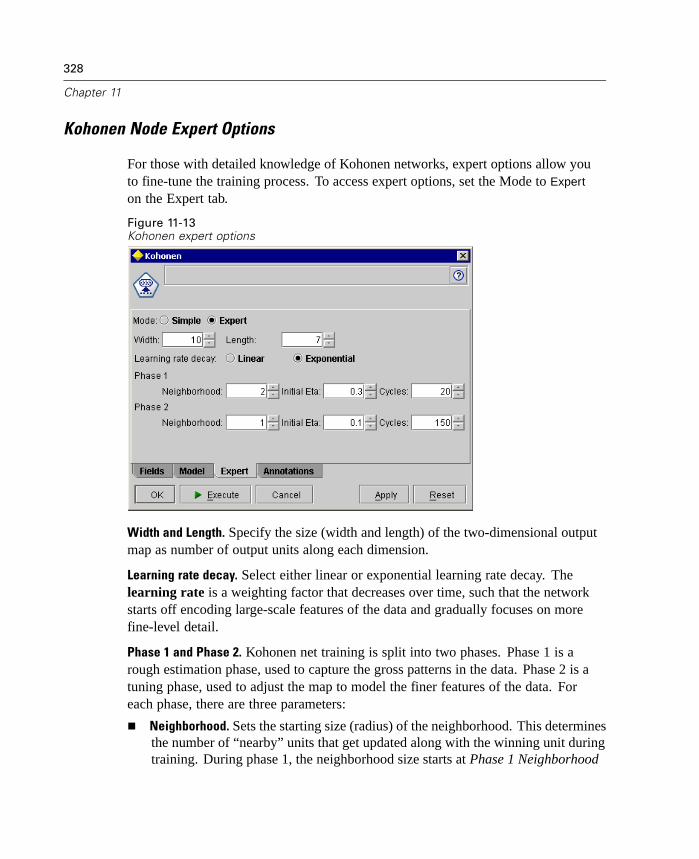
328
Chapter 11
Kohonen Node Expert Options
For those with detailed knowledge of Kohonen networks, expert options allow youto fine-tune the training process. To access expert options, set the Mode to Expert
on the Expert tab.
Figure 11-13Kohonen expert options
Width and Length. Specify the size (width and length) of the two-dimensional outputmap as number of output units along each dimension.
Learning rate decay. Select either linear or exponential learning rate decay. Thelearning rate is a weighting factor that decreases over time, such that the networkstarts off encoding large-scale features of the data and gradually focuses on morefine-level detail.
Phase 1 and Phase 2. Kohonen net training is split into two phases. Phase 1 is arough estimation phase, used to capture the gross patterns in the data. Phase 2 is atuning phase, used to adjust the map to model the finer features of the data. Foreach phase, there are three parameters:
Neighborhood. Sets the starting size (radius) of the neighborhood. This determinesthe number of “nearby” units that get updated along with the winning unit duringtraining. During phase 1, the neighborhood size starts at Phase 1 Neighborhood

329
Modeling Nodes
and decreases to (Phase 2 Neighborhood + 1). During phase 2, neighborhoodsize starts at Phase 2 Neighborhood and decreases to 1.0. Phase 1 Neighborhoodshould be larger than Phase 2 Neighborhood.
Initial Eta. Sets the starting value for learning rate eta. During phase 1, eta startsat Phase 1 Initial Eta and decreases to Phase 2 Initial Eta. During phase 2, etastarts at Phase 2 Initial Eta and decreases to 0. Phase 1 Initial Eta should belarger than Phase 2 Initial Eta.
Cycles. Sets the number of cycles for each phase of training. Each phase continuesfor the specified number of passes through the data.
C5.0 Node
This node uses the C5.0 algorithm to build either a decision tree or a ruleset. A C5.0model works by splitting the sample based on the field that provides the maximuminformation gain. Each subsample defined by the first split is then split again,usually based on a different field, and the process repeats until the subsamples cannotbe split any further. Finally, the lowest level splits are reexamined, and those that donot contribute significantly to the value of the model are removed or pruned.
C5.0 can produce two kinds of models. A decision tree is a straightforwarddescription of the splits found by the algorithm. Each terminal, or “leaf,” nodedescribes a particular subset of the training data, and each case in the training databelongs to exactly one terminal node in the tree. In other words, exactly oneprediction is possible for any particular data record presented to a decision tree.
In contrast, a ruleset is a set of rules that tries to make predictions for individualrecords. Rulesets are derived from decision trees and, in a way, represent a simplifiedor distilled version of the information found in the decision tree. Rulesets canoften retain most of the important information from a full decision tree but with aless complex model. Because of the way rulesets work, they do not have the sameproperties as decision trees. The most important difference is that with a ruleset,more than one rule may apply for any particular record, or no rules at all may apply.If multiple rules apply, each rule gets a weighted “vote” based on the confidenceassociated with that rule, and the final prediction is decided by combining theweighted votes of all of the rules that apply to the record in question. If no ruleapplies, a default prediction is assigned to the record.

330
Chapter 11
Requirements. To train a C5.0 model, you need one or more In fields and one or moresymbolic Out field(s). Fields set to Both or None are ignored. Fields used in themodel must have their types fully instantiated.
Strengths. C5.0 models are quite robust in the presence of problems such as missingdata and large numbers of input fields. They usually do not require long trainingtimes to estimate. In addition, C5.0 models tend to be easier to understand than someother model types, since the rules derived from the model have a very straightforwardinterpretation. C5.0 also offers the powerful boosting method to increase accuracyof classification.
C5.0 Node Model OptionsFigure 11-14C5.0 node options
Model name. Specify the name of the model to be produced.
Auto. With this option selected, the model name will be generated automatically,based on the target field name(s). This is the default.
Custom. Select this option to specify your own name for the generated model thatwill be created by this node.

331
Modeling Nodes
Output type. Specify here whether you want the resulting generated model to be aDecision tree or a Ruleset.
Group symbolics. If this option is selected, C5.0 will attempt to combine symbolicvalues that have similar patterns with respect to the output field. If this option is notselected, C5.0 will create a child node for every value of the symbolic field used tosplit the parent node. For example, if C5.0 splits on a COLOR field (with values RED,GREEN, and BLUE), it will create a three-way split by default. However, if thisoption is selected, and the records where COLOR = RED are very similar to recordswhere COLOR = BLUE, it will create a two-way split, with the GREENs in one groupand the BLUEs and REDs together in the other.
Use boosting. The C5.0 algorithm has a special method for improving its accuracyrate, called boosting. It works by building multiple models in a sequence. The firstmodel is built in the usual way. Then, a second model is built such in such a waythat it focuses especially on the records that were misclassified by the first model.Then a third model is built to focus on the second model's errors, and so on. Finally,cases are classified by applying the whole set of models to them, using a weightedvoting procedure to combine the separate predictions into one overall prediction.Boosting can significantly improve the accuracy of a C5.0 model, but it also requireslonger training. The Number of trials option allows you to control how many modelsare used for the boosted model. This feature is based on the research of Freund &Schapire, with some proprietary improvements to handle noisy data better.
Cross-validate. If this option is selected, C5.0 will use a set of models built on subsetsof the training data to estimate the accuracy of a model built on the full data set. This isuseful if your data set is too small to split into traditional training and testing sets. Thecross-validation models are discarded after the accuracy estimate is calculated. Youcan specify the number of folds, or the number of models used for cross-validation.Note that in previous versions of Clementine, building the model and cross-validatingit were two separate operations. In the current version, no separate model-buildingstep is required. Model building and cross-validation are performed at the same time.
Mode. For Simple training, most of the C5.0 parameters are set automatically. Experttraining allows more direct control over the training parameters.
332
Chapter 11
Simple Mode Options
Favor. By default, C5.0 will try to produce the most accurate tree possible. In someinstances, this can lead to overfitting, which can result in poor performance whenthe model is applied to new data. Select Generality to use algorithm settings that areless susceptible to this problem.
Note: Models built with the Generality option selected are not guaranteed togeneralize better than other models. When generality is a critical issue, alwaysvalidate your model against a held-out test sample.
Expected noise (%). Specify the expected proportion of noisy or erroneous data in thetraining set.
Expert Mode Options
Pruning severity. Determines the extent to which the generated decision tree or rulesetwill be pruned. Increase this value to obtain a smaller, more concise tree. Decreaseit to obtain a more accurate tree. This setting affects local pruning only (see “Useglobal pruning” below).
Minimum records per child branch. The size of subgroups can be used to limit thenumber of splits in any branch of the tree. A branch of the tree will be split only iftwo or more of the resulting subbranches would contain at least this many recordsfrom the training set. The default value is 2. Increase this value to help preventovertraining with noisy data.
Use global pruning. Trees are pruned in two stages: First a local pruning stage whichexamines subtrees and collapses branches to increase the accuracy of the model.Second, a global pruning stage considers the tree as a whole, and weak subtrees maybe collapsed. Global pruning is performed by default. To omit the global pruningstage, deselect this option.
Winnow attributes. If this option is selected, C5.0 will examine the usefulness of thepredictors before starting to build the model. Predictors that are found to be irrelevantare then excluded from the model-building process. This option can be helpful formodels with many predictor fields, and can help prevent overfitting.

333
Modeling Nodes
Misclassification Cost OptionsIn some contexts, certain kinds of errors are more costly than others. For example,it may be more costly to classify a high-risk credit applicant as low risk (one kindof error) than it is to classify a low-risk applicant as high risk (a different kind).Misclassification costs allow you to specify the relative importance of differentkinds of prediction errors.
Figure 11-15Specifying misclassification costs
The misclassification cost matrix shows the cost for each possible combination ofpredicted category and actual category. By default, all misclassification costs areset to 1.0. To enter custom cost values, select Use misclassification costs and enteryour custom values into the cost matrix.
To change a misclassification cost, select the cell corresponding to the desiredcombination of predicted and actual values, delete the existing contents of the cell,and enter the desired cost for the cell.
Remember that customized misclassification costs are not automaticallysymmetric. For example, if you set the cost of misclassifying A as B to be 2.0, thecost of misclassifying B as A will still have the default value of 1.0 unless youexplicitly change it as well.
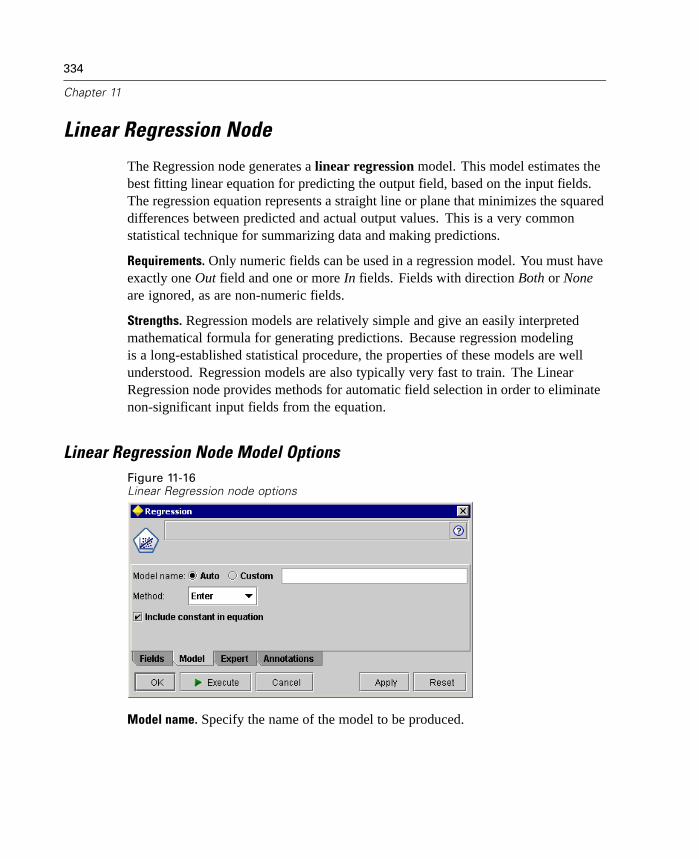
334
Chapter 11
Linear Regression Node
The Regression node generates a linear regression model. This model estimates thebest fitting linear equation for predicting the output field, based on the input fields.The regression equation represents a straight line or plane that minimizes the squareddifferences between predicted and actual output values. This is a very commonstatistical technique for summarizing data and making predictions.
Requirements. Only numeric fields can be used in a regression model. You must haveexactly one Out field and one or more In fields. Fields with direction Both or Noneare ignored, as are non-numeric fields.
Strengths. Regression models are relatively simple and give an easily interpretedmathematical formula for generating predictions. Because regression modelingis a long-established statistical procedure, the properties of these models are wellunderstood. Regression models are also typically very fast to train. The LinearRegression node provides methods for automatic field selection in order to eliminatenon-significant input fields from the equation.
Linear Regression Node Model OptionsFigure 11-16Linear Regression node options
Model name. Specify the name of the model to be produced.
335
Modeling Nodes
Auto. With this option selected, the model name will be generated automatically,based on the target field name. This is the default.
Custom. Select this option to specify your own name for the generated model thatwill be created by this node.
Method. Specify the method to be used in building the regression model.
Enter. This is the default method, which enters all the In fields into the equationdirectly. No field selection is performed in building the model.
Stepwise. The Stepwise method of field selection builds the equation in steps, asthe name implies. The initial model is the simplest model possible, with no inputfields in the equation. At each step, input fields that have not yet been added tothe model are evaluated, and if the best of those input fields adds significantly tothe predictive power of the model, it is added. In addition, input fields that arecurrently in the model are reevaluated to determine if any of them can be removedwithout significantly detracting from the model. If so, they are removed. Thenthe process repeats, and other fields are added and/or removed. When no morefields can be added to improve the model, and no more can be removed withoutdetracting from the model, the final model is generated.
Backwards. The Backwards method of field selection is similar to the Stepwisemethod in that the model is built in steps. However, with this method, theinitial model contains all of the input fields as predictors, and fields can onlybe removed from the model. Input fields that contribute little to the model areremoved one by one until no more fields can be removed without significantlyworsening the model, yielding the final model.
Forwards. The Forwards method is essentially the opposite of the Backwardsmethod. With this method, the initial model is the simplest model with no inputfields, and fields can only be added to the model. At each step, input fields notyet in the model are tested based on how much they would improve the model,and the best of those is added to the model. When no more fields can be addedor the best candidate field does not produce a large enough improvement in themodel, the final model is generated.
Note: The automatic methods (including Stepwise, Forwards, and Backwards arehighly adaptable learning methods and have a strong tendency to overfit the trainingdata. When using these methods, it is especially important to verify the validity of theresulting model with a hold-out test sample or new data.

336
Chapter 11
Include constant in equation. This option determines whether the resulting equationwill include a constant term. In most situations, you should leave this selected.This option can be useful if you have prior knowledge that the output field equals 0whenever the predictor field or fields equal 0.
Linear Regression Node Expert Options
For those with detailed knowledge of Linear Regression models, expert optionsallow you to fine-tune the model-building process. To access expert options, setthe Mode to Expert on the Expert tab.
Figure 11-17Linear Regression expert options
Missing values. By default, the Linear Regression node will use only records thathave valid values for all fields used in the model. (This is sometimes called listwisedeletion of missing values). If you have a lot of missing data, you may find that thisapproach eliminates too many records, leaving you without enough data to generate agood model. In such cases, you can deselect the Only use complete records option.Clementine will then attempt to use as much information as possible to estimatethe Regression model, including records where some of the fields have missingvalues. (This is sometimes called pairwise deletion of missing values.) However, insome situations, using incomplete records in this manner can lead to computationalproblems in estimating the regression equation.
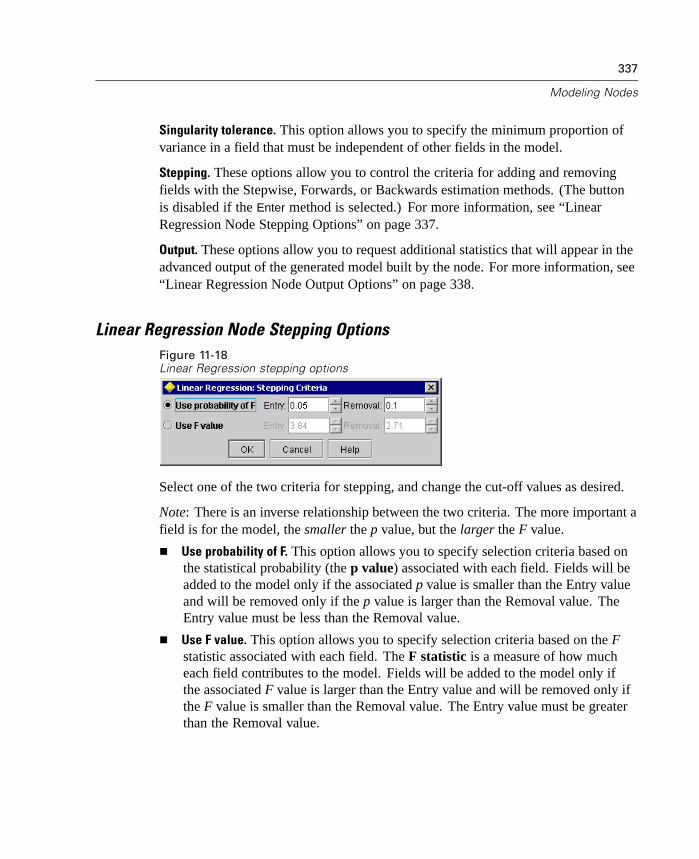
337
Modeling Nodes
Singularity tolerance. This option allows you to specify the minimum proportion ofvariance in a field that must be independent of other fields in the model.
Stepping. These options allow you to control the criteria for adding and removingfields with the Stepwise, Forwards, or Backwards estimation methods. (The buttonis disabled if the Enter method is selected.) For more information, see “LinearRegression Node Stepping Options” on page 337.
Output. These options allow you to request additional statistics that will appear in theadvanced output of the generated model built by the node. For more information, see“Linear Regression Node Output Options” on page 338.
Linear Regression Node Stepping OptionsFigure 11-18Linear Regression stepping options
Select one of the two criteria for stepping, and change the cut-off values as desired.
Note: There is an inverse relationship between the two criteria. The more important afield is for the model, the smaller the p value, but the larger the F value.
Use probability of F. This option allows you to specify selection criteria based onthe statistical probability (the p value) associated with each field. Fields will beadded to the model only if the associated p value is smaller than the Entry valueand will be removed only if the p value is larger than the Removal value. TheEntry value must be less than the Removal value.
Use F value. This option allows you to specify selection criteria based on the Fstatistic associated with each field. The F statistic is a measure of how mucheach field contributes to the model. Fields will be added to the model only ifthe associated F value is larger than the Entry value and will be removed only ifthe F value is smaller than the Removal value. The Entry value must be greaterthan the Removal value.

338
Chapter 11
Linear Regression Node Output Options
Select the optional output you want to display in the advanced output of the generatedlinear regression model. To view the advanced output, browse the generated modeland click the Advanced tab. For more information, see “Linear Regression EquationAdvanced Output” in Chapter 12 on page 401.
Figure 11-19Linear Regression advanced output options
Model fit. Summary of model fit, including R-square. This represents the proportionof variance in the output field that can be explained by the input fields.
R squared change. The change in R-square at each step for Stepwise, Forwards, andBackwards estimation methods.
Selection criteria. Statistics estimating the information content of the model foreach step of the model, to help evaluate model improvement. Statistics include theAkaike Information Criterion, Amemiya Prediction Criterion, Mallows' PredictionCriterion, and Schwarz Bayesian Criterion.
Descriptives. Basic descriptive statistics about the input and output fields.
Part and partial correlations. Statistics that help to determine importance and uniquecontributions of individual input fields to the model.
Collinearity diagnostics. Statistics that help to identify problems with redundantinput fields.
339
Modeling Nodes
Regression coefficients. Statistics for the regression coefficients:
Confidence interval. The 95% confidence interval for each coefficient in theequation.
Covariance matrix. The covariance matrix of the input fields.
Residuals. Statistics for the residuals, or the differences between predicted valuesand actual values.
Durbin-Watson. The Durbin-Watson test of autocorrelation. This test detectseffects of record order that can invalidate the regression model.
GRI Node
The Generalized Rule Induction (GRI) node discovers association rules in the data.Association rules are statements in the form
if antecedent(s) then consequent(s)
For example, if a customer purchases a razor and after-shave lotion, then thatcustomer will purchase shaving cream with 80% confidence. GRI extracts a setof rules from the data, pulling out the rules with the highest information content.Information content is measured using an index that takes both the generality(support) and accuracy (confidence) of rules into account.
Requirements. To create a GRI ruleset, you need one or more In fields and one ormore Out fields. Output fields (those with direction Out or Both) must be symbolic.Fields with direction None are ignored. Fields types must be fully instantiated beforeexecuting the node.
Strengths. Rulesets are usually fairly easy to interpret, in contrast to other methodssuch as neural networks. Rules in a ruleset can overlap such that some records maytrigger more than one rule. This allows the ruleset to make rules more general than ispossible with a decision tree. The GRI node can also handle multiple output fields. Incontrast to Apriori, GRI can handle numeric as well as symbolic input fields.

340
Chapter 11
GRI Node Model OptionsFigure 11-20GRI node options
Model name. Specify the name of the model to be produced.
Auto. With this option selected, the model name will be generated automatically,based on the target or consequent field name(s). This is the default.
Custom. Select this option to specify your own name for the generated model thatwill be created by this node.
Minimum rule support. You can also specify a support criterion (as a percentage).Support refers to the percentage of records in the training data for which theantecedents (the “if” part of the rule) are true. (Note that this definition of supportdiffers from that used in the Sequence node. For more information, see “SequenceNode Model Options” on page 376.) If you are getting rules that apply to very smallsubsets of the data, try increasing this setting.
Minimum rule confidence. You can specify an accuracy criterion (as a percentage)for keeping rules in the ruleset. Rules with lower confidence than the specifiedcriterion are discarded. If you are getting too many rules or uninteresting rules,try increasing this setting. If you are getting too few rules (or no rules at all), trydecreasing this setting.
341
Modeling Nodes
Maximum number of antecedents. You can specify the maximum number ofantecedents for any rule. This is a way to limit the complexity of the rules. If therules are too complex or too specific, try decreasing this setting. This setting alsohas a large influence on training time. If your ruleset is taking too long to train,try reducing this setting.
Maximum number of rules. This option determines the number of rules retained in theruleset. Rules are retained in descending order of interest (as calculated by the GRIalgorithm). Note that the ruleset may contain fewer rules than the number specified,especially if you use a stringent confidence or support criterion.
Only true values for flags. If this option is selected, only true values will appear in theresulting rules. This can help make rules easier to understand.
Apriori Node
The Apriori node also discovers association rules in the data. Apriori offers fivedifferent methods of selecting rules and uses a sophisticated indexing scheme toefficiently process large data sets.
Requirements. To create an Apriori ruleset, you need one or more In fields and one ormore Out fields. Input and output fields (those with direction In, Out or Both) mustbe symbolic. Fields with direction None are ignored. Fields types must be fullyinstantiated before executing the node.
Strengths. For large problems, Apriori is generally faster to train than GRI. It also hasno arbitrary limit on the number of rules that can be retained and can handle ruleswith up to 32 preconditions. Apriori offers five different training methods, allowingmore flexibility in matching the data mining method to the problem at hand.
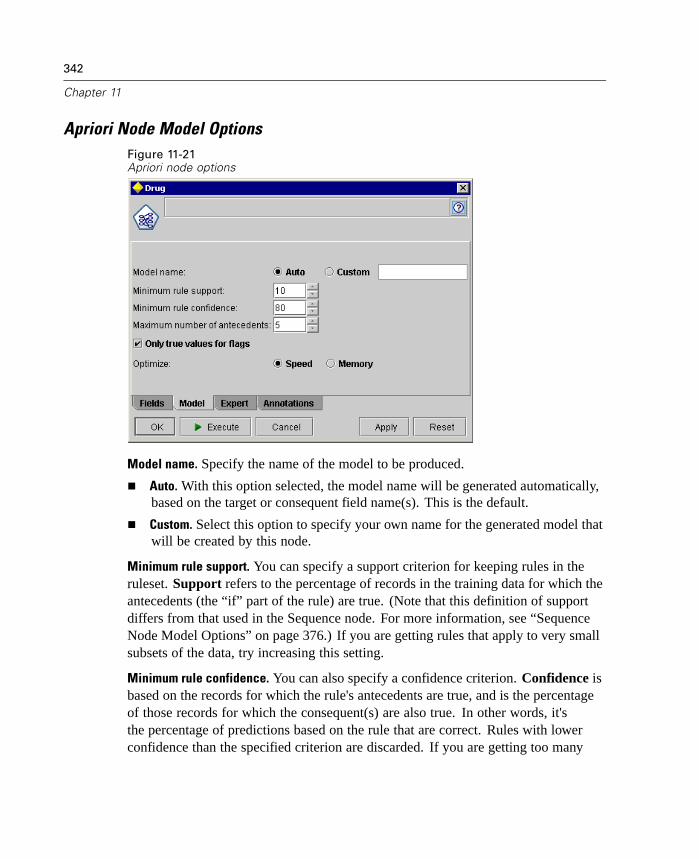
342
Chapter 11
Apriori Node Model OptionsFigure 11-21Apriori node options
Model name. Specify the name of the model to be produced.
Auto. With this option selected, the model name will be generated automatically,based on the target or consequent field name(s). This is the default.
Custom. Select this option to specify your own name for the generated model thatwill be created by this node.
Minimum rule support. You can specify a support criterion for keeping rules in theruleset. Support refers to the percentage of records in the training data for which theantecedents (the “if” part of the rule) are true. (Note that this definition of supportdiffers from that used in the Sequence node. For more information, see “SequenceNode Model Options” on page 376.) If you are getting rules that apply to very smallsubsets of the data, try increasing this setting.
Minimum rule confidence. You can also specify a confidence criterion. Confidence isbased on the records for which the rule's antecedents are true, and is the percentageof those records for which the consequent(s) are also true. In other words, it'sthe percentage of predictions based on the rule that are correct. Rules with lowerconfidence than the specified criterion are discarded. If you are getting too many
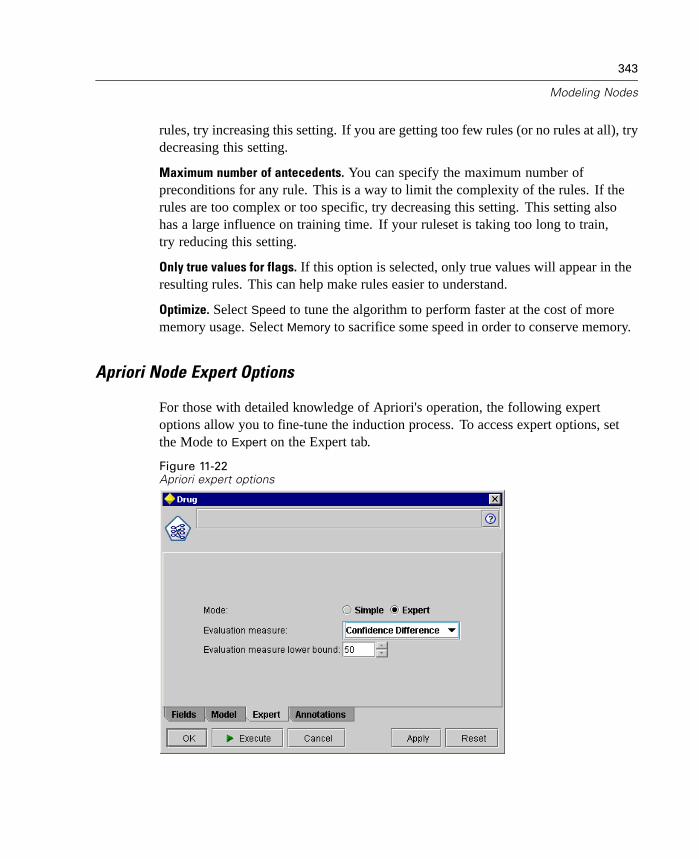
343
Modeling Nodes
rules, try increasing this setting. If you are getting too few rules (or no rules at all), trydecreasing this setting.
Maximum number of antecedents. You can specify the maximum number ofpreconditions for any rule. This is a way to limit the complexity of the rules. If therules are too complex or too specific, try decreasing this setting. This setting alsohas a large influence on training time. If your ruleset is taking too long to train,try reducing this setting.
Only true values for flags. If this option is selected, only true values will appear in theresulting rules. This can help make rules easier to understand.
Optimize. Select Speed to tune the algorithm to perform faster at the cost of morememory usage. Select Memory to sacrifice some speed in order to conserve memory.
Apriori Node Expert Options
For those with detailed knowledge of Apriori's operation, the following expertoptions allow you to fine-tune the induction process. To access expert options, setthe Mode to Expert on the Expert tab.
Figure 11-22Apriori expert options

344
Chapter 11
Evaluation measure. Apriori supports five methods of evaluating potential rules.
Rule Confidence. The default method uses the confidence (or accuracy) of the ruleto evaluate rules. For this measure, the Evaluation measure lower bound is disabled,since it is redundant with the Minimum rule confidence option on the Model tab.For more information, see “Apriori Node Model Options” on page 342.
Confidence Difference. (Also called absolute confidence difference to prior.)This evaluation measure is the absolute difference between the rule's confidenceand its prior confidence. This option prevents bias where the outcomes arenot evenly distributed. This helps prevent “obvious” rules from being kept.For example, it may be the case that 80% of customers buy your most popularproduct. A rule that predicts buying that popular product with 85% accuracydoesn't add much to your knowledge, even though 85% accuracy may seemquite good on an absolute scale. Set the evaluation measure lower bound to theminimum difference in confidence for which you want rules to be kept.
Confidence Ratio. (Also called difference of confidence quotient to 1.) Thisevaluation measure is the ratio of rule confidence to prior confidence (or, if theratio is greater than one, its reciprocal) subtracted from 1. Like ConfidenceDifference, this method takes uneven distributions into account. It is especiallygood at finding rules that predict rare events. For example, suppose that there isa rare medical condition that occurs in only 1% of patients. A rule that is ableto predict this condition 10% of the time is a great improvement over randomguessing, even though on an absolute scale, 10% accuracy might not seem veryimpressive. Set the evaluation measure lower bound to the difference for whichyou want rules to be kept.
Information Difference. (Also called information difference to prior.) Thismeasure is based on the information gain measure. If the probability of aparticular consequent is considered as a logical value (a bit), then the informationgain is the proportion of that bit that can be determined, based on the antecedents.The information difference is the difference between the information gain, giventhe antecedents, and the information gain, given only the prior confidence of theconsequent. An important feature of this method is that it takes support intoaccount so that rules that cover more records are preferred for a given level ofconfidence. Set the evaluation measure lower bound to the information differencefor which you want rules to be kept.

345
Modeling Nodes
Note: Because the scale for this measure is somewhat less intuitive than the otherscales, you may need to experiment with different lower bounds to get a satisfactoryruleset.
Normalized Chi-square. (Also called normalized chi-squared measure.) Thismeasure is a statistical index of association between antecedents and consequents.The measure is normalized to take values between 0 and 1. This measure is evenmore strongly dependent on support than the information difference measure. Setthe evaluation measure lower bound to the information difference for which youwant rules to be kept.
Note: As with the information difference measure, the scale for this measure issomewhat less intuitive than the other scales, so you may need to experiment withdifferent lower bounds to get a satisfactory ruleset.
K-Means Node
The K-Means node provides a method of cluster analysis. It can be used to clusterthe data set into distinct groups when you don't know what those groups are at thebeginning. Unlike most learning methods in Clementine, K-Means models do notuse a target field. This type of learning, with no target field, is called unsupervisedlearning. Instead of trying to predict an outcome, K-Means tries to uncover patternsin the set of input fields. Records are grouped so that records within a group or clustertend to be similar to each other, but records in different groups are dissimilar.
K-Means works by defining a set of starting cluster centers derived from data.It then assigns each record to the cluster to which it is most similar, based on therecord's input field values. After all cases have been assigned, the cluster centers areupdated to reflect the new set of records assigned to each cluster. The records are thenchecked again to see whether they should be reassigned to a different cluster, andthe record assignment/cluster iteration process continues until either the maximumnumber of iterations is reached, or the change between one iteration and the next failsto exceed a specified threshold.
Note: The resulting model depends to a certain extent on the order of the trainingdata. Reordering the data and rebuilding the model may lead to a different finalcluster model.
Requirements. To train a K-Means model, you need one or more In fields. Fields withdirection Out, Both, or None are ignored.

346
Chapter 11
Strengths. You do not need to have data on group membership to build a K-Meansmodel. The K-Means model is often the fastest method of clustering for large datasets.
K-Means Node Model OptionsFigure 11-23K-Means node options
Model name. Specify the name of the model to be produced.
Auto. With this option selected, the model name will be “Kmeans.” This is thedefault.
Custom. Select this option to specify your own name for the generated model thatwill be created by this node.
Specified number of clusters. Specify the number of clusters to generate. The defaultis 5.
Generate distance field. If this option is selected, the generated model will include afield containing the distance of each record from the center of its assigned cluster.
Show cluster proximity. Select this option to include information about distancesbetween cluster centers in the generated model output.
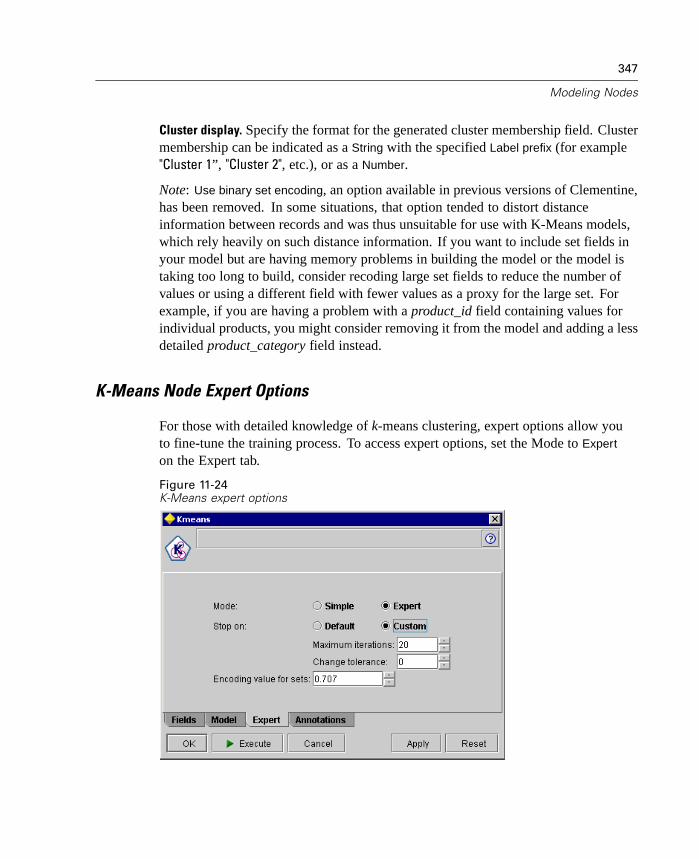
347
Modeling Nodes
Cluster display. Specify the format for the generated cluster membership field. Clustermembership can be indicated as a String with the specified Label prefix (for example"Cluster 1”, "Cluster 2", etc.), or as a Number.
Note: Use binary set encoding, an option available in previous versions of Clementine,has been removed. In some situations, that option tended to distort distanceinformation between records and was thus unsuitable for use with K-Means models,which rely heavily on such distance information. If you want to include set fields inyour model but are having memory problems in building the model or the model istaking too long to build, consider recoding large set fields to reduce the number ofvalues or using a different field with fewer values as a proxy for the large set. Forexample, if you are having a problem with a product_id field containing values forindividual products, you might consider removing it from the model and adding a lessdetailed product_category field instead.
K-Means Node Expert Options
For those with detailed knowledge of k-means clustering, expert options allow youto fine-tune the training process. To access expert options, set the Mode to Expert
on the Expert tab.
Figure 11-24K-Means expert options
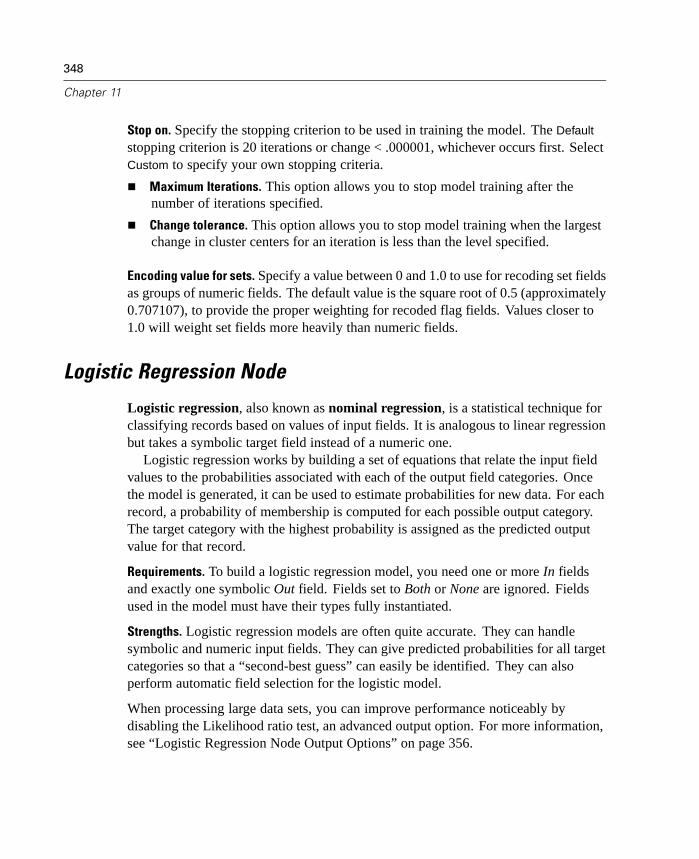
348
Chapter 11
Stop on. Specify the stopping criterion to be used in training the model. The Default
stopping criterion is 20 iterations or change < .000001, whichever occurs first. SelectCustom to specify your own stopping criteria.
Maximum Iterations. This option allows you to stop model training after thenumber of iterations specified.
Change tolerance. This option allows you to stop model training when the largestchange in cluster centers for an iteration is less than the level specified.
Encoding value for sets. Specify a value between 0 and 1.0 to use for recoding set fieldsas groups of numeric fields. The default value is the square root of 0.5 (approximately0.707107), to provide the proper weighting for recoded flag fields. Values closer to1.0 will weight set fields more heavily than numeric fields.
Logistic Regression Node
Logistic regression, also known as nominal regression, is a statistical technique forclassifying records based on values of input fields. It is analogous to linear regressionbut takes a symbolic target field instead of a numeric one.
Logistic regression works by building a set of equations that relate the input fieldvalues to the probabilities associated with each of the output field categories. Oncethe model is generated, it can be used to estimate probabilities for new data. For eachrecord, a probability of membership is computed for each possible output category.The target category with the highest probability is assigned as the predicted outputvalue for that record.
Requirements. To build a logistic regression model, you need one or more In fieldsand exactly one symbolic Out field. Fields set to Both or None are ignored. Fieldsused in the model must have their types fully instantiated.
Strengths. Logistic regression models are often quite accurate. They can handlesymbolic and numeric input fields. They can give predicted probabilities for all targetcategories so that a “second-best guess” can easily be identified. They can alsoperform automatic field selection for the logistic model.
When processing large data sets, you can improve performance noticeably bydisabling the Likelihood ratio test, an advanced output option. For more information,see “Logistic Regression Node Output Options” on page 356.

349
Modeling Nodes
Logistic Regression Node Model OptionsFigure 11-25Logistic Regression node options
Model name. Specify the name of the model to be produced.
Auto. With this option selected, the model name will be generated automatically,based on the target field name. This is the default.
Custom. Select this option to specify your own name for the generated model thatwill be created by this node.
Method. Specify the method to be used in building the logistic regression model.
Enter. This is the default method, which enters all of the terms into the equationdirectly. No field selection is performed in building the model.
Stepwise. The Stepwise method of field selection builds the equation in steps,as the name implies. The initial model is the simplest model possible, with nomodel terms (except the constant) in the equation. At each step, terms that havenot yet been added to the model are evaluated, and if the best of those terms adds

350
Chapter 11
significantly to the predictive power of the model, it is added. In addition, termsthat are currently in the model are reevaluated to determine if any of them can beremoved without significantly detracting from the model. If so, they are removed.Then the process repeats, and other terms are added and/or removed. Whenno more terms can be added to improve the model and no more terms can beremoved without detracting from the model, the final model is generated.
Forwards. The Forwards method of field selection is similar to the Stepwisemethod in that the model is built in steps. However, with this method, the initialmodel is the simplest model, and only the constant and terms can be added to themodel. At each step, terms not yet in the model are tested based on how muchthey would improve the model, and the best of those is added to the model. Whenno more terms can be added or the best candidate term does not produce a largeenough improvement in the model, the final model is generated.
Backwards. The Backwards method is essentially the opposite of the Forwardsmethod. With this method, the initial model contains all of the terms aspredictors, and terms can only be removed from the model. Model terms thatcontribute little to the model are removed one by one until no more terms can beremoved without significantly worsening the model, yielding the final model.
Backwards Stepwise. The Backwards Stepwise method is essentially the oppositeof the Stepwise method. With this method, the initial model contains all of theterms as predictors. At each step, terms in the model are evaluated, and anyterms that can be removed without significantly detracting from the model areremoved. In addition, previously removed terms are reevaluated to determine ifthe best of those terms adds significantly to the predictive power of the model.If so, it is added back into the model. When no more terms can be removedwithout significantly detracting from the model and no more terms can be addedto improve the model, the final model is generated.
Note: The automatic methods, including Stepwise, Forwards, and Backwards, arehighly adaptable learning methods and have a strong tendency to overfit the trainingdata. When using these methods, it is especially important to verify the validity of theresulting model with a hold-out test sample or new data.
Model type. There are three options for defining the terms in the model. MainEffects models include only the input fields individually and do not test interactions(multiplicative effects) between input fields. Full Factorial models include allinteractions as well as the input field main effects. Full factorial models are betterable to capture complex relationships but are also much more difficult to interpret and
351
Modeling Nodes
are more likely to suffer from overfitting. Because of the potentially large number ofpossible combinations, automatic field selection methods (methods other than Enter)are disabled for full factorial models. Custom models include only the terms (maineffects and interactions) that you specify. When selecting this option, use the ModelTerms list to add or remove terms in the model.
Model Terms. When building a Custom model, you will need to explicitly specify theterms in the model. The list shows the current set of terms for the model. The buttonson the right side of the Model Terms list allow you to add and remove model terms.
E To add terms to the model, click the Add new model terms button.
E To delete terms, select the desired terms and click the Delete selected model termsbutton.
Include constant in equation. This option determines whether the resulting equationswill include a constant term. In most situations, you should leave this option selected.
Adding Terms to a Logistic Regression Model
When requesting a custom logistic regression model, you can add terms to the modelby clicking the Add new model terms button on the Logistic Regression Model tab. Anew dialog box opens in which you can specify terms.
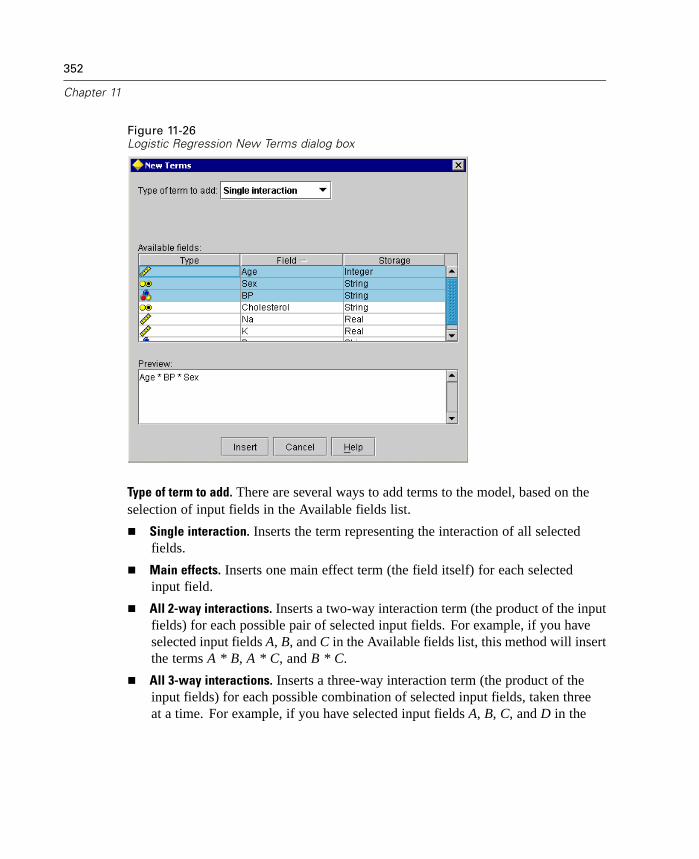
352
Chapter 11
Figure 11-26Logistic Regression New Terms dialog box
Type of term to add. There are several ways to add terms to the model, based on theselection of input fields in the Available fields list.
Single interaction. Inserts the term representing the interaction of all selectedfields.
Main effects. Inserts one main effect term (the field itself) for each selectedinput field.
All 2-way interactions. Inserts a two-way interaction term (the product of the inputfields) for each possible pair of selected input fields. For example, if you haveselected input fields A, B, and C in the Available fields list, this method will insertthe terms A * B, A * C, and B * C.
All 3-way interactions. Inserts a three-way interaction term (the product of theinput fields) for each possible combination of selected input fields, taken threeat a time. For example, if you have selected input fields A, B, C, and D in the
353
Modeling Nodes
Available fields list, this method will insert the terms A * B * C, A * B * D,A * C * D, and B * C * D.
All 4-way interactions. Inserts a four-way interaction term (the product of the inputfields) for each possible combination of selected input fields, taken four at a time.For example, if you have selected input fields A, B, C, D, and E in the Availablefields list, this method will insert the terms A * B * C * D, A * B * C * E, A * B *D * E, A * C * D * E, and B * C * D * E.
Available fields. Lists the available input fields to be used in constructing model terms.
Preview. Shows the terms that will be added to the model if you click Insert, based onthe selected fields and the term type selected above.
Insert. Inserts terms in the model based on the current selection of fields and termtype and closes the dialog box.
Logistic Regression Node Expert Options
For those with detailed knowledge of logistic regression, expert options allow youto fine-tune the training process. To access expert options, set the Mode to Expert
on the Expert tab.
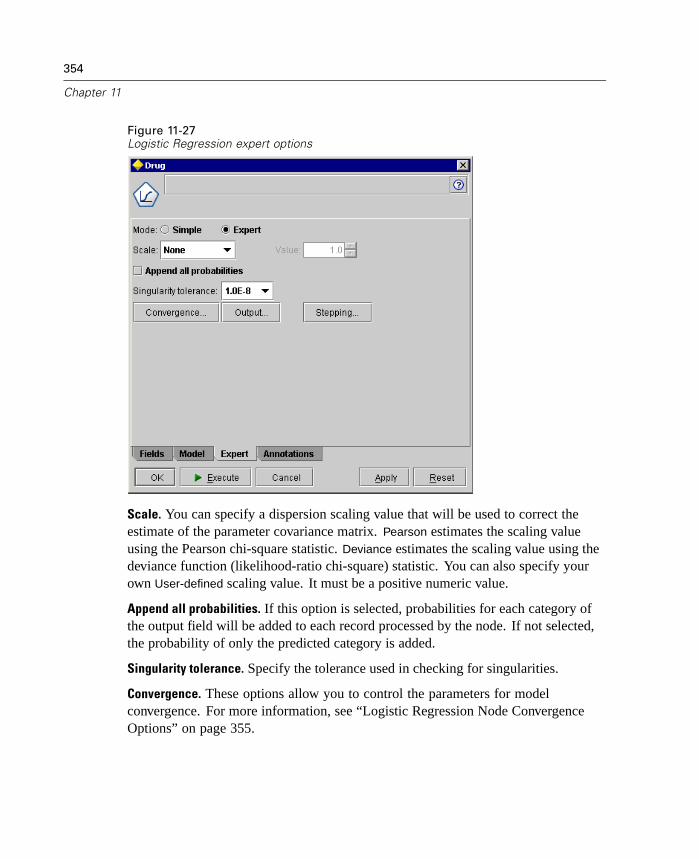
354
Chapter 11
Figure 11-27Logistic Regression expert options
Scale. You can specify a dispersion scaling value that will be used to correct theestimate of the parameter covariance matrix. Pearson estimates the scaling valueusing the Pearson chi-square statistic. Deviance estimates the scaling value using thedeviance function (likelihood-ratio chi-square) statistic. You can also specify yourown User-defined scaling value. It must be a positive numeric value.
Append all probabilities. If this option is selected, probabilities for each category ofthe output field will be added to each record processed by the node. If not selected,the probability of only the predicted category is added.
Singularity tolerance. Specify the tolerance used in checking for singularities.
Convergence. These options allow you to control the parameters for modelconvergence. For more information, see “Logistic Regression Node ConvergenceOptions” on page 355.
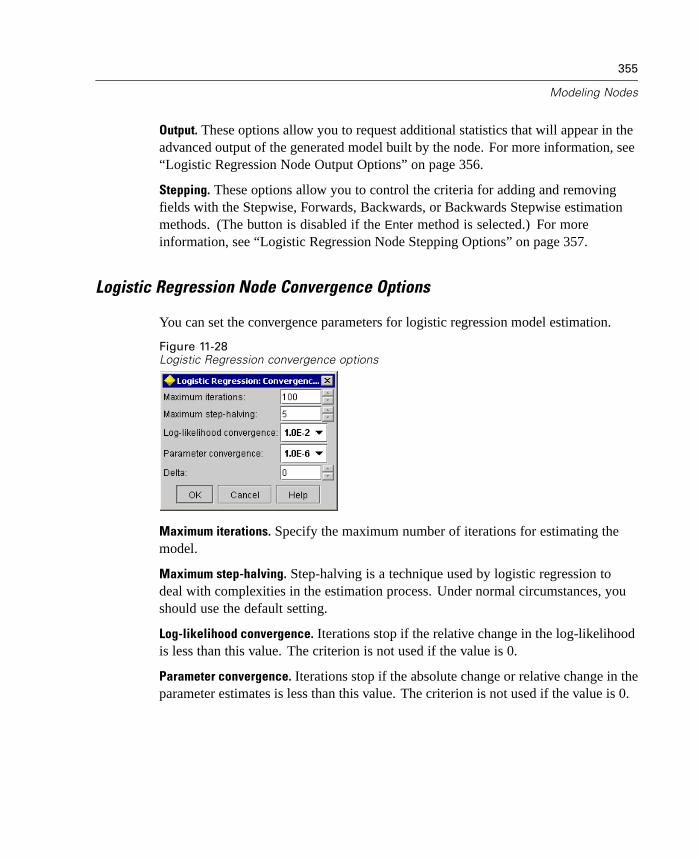
355
Modeling Nodes
Output. These options allow you to request additional statistics that will appear in theadvanced output of the generated model built by the node. For more information, see“Logistic Regression Node Output Options” on page 356.
Stepping. These options allow you to control the criteria for adding and removingfields with the Stepwise, Forwards, Backwards, or Backwards Stepwise estimationmethods. (The button is disabled if the Enter method is selected.) For moreinformation, see “Logistic Regression Node Stepping Options” on page 357.
Logistic Regression Node Convergence Options
You can set the convergence parameters for logistic regression model estimation.
Figure 11-28Logistic Regression convergence options
Maximum iterations. Specify the maximum number of iterations for estimating themodel.
Maximum step-halving. Step-halving is a technique used by logistic regression todeal with complexities in the estimation process. Under normal circumstances, youshould use the default setting.
Log-likelihood convergence. Iterations stop if the relative change in the log-likelihoodis less than this value. The criterion is not used if the value is 0.
Parameter convergence. Iterations stop if the absolute change or relative change in theparameter estimates is less than this value. The criterion is not used if the value is 0.

356
Chapter 11
Delta. You can specify a value between 0 and 1 to be added to each empty cell(combination of input field and output field values). This can help the estimationalgorithm deal with data where there are many possible combinations of field valuesrelative to the number of records in the data. The default is 0.
Logistic Regression Node Output OptionsFigure 11-29Logistic Regression output options
Select the optional output you want to display in the advanced output of the generatedlogistic regression model. To view the advanced output, browse the generatedmodel and select the Advanced tab. For more information, see “Logistic RegressionAdvanced Output” in Chapter 12 on page 397.
Summary statistics. The Cox and Snell, Nagelkerke, and McFadden R-squaremeasures of model fit. These statistics are in some ways analogous to the R-squarestatistic in linear regression.
Likelihood ratio test. Tests of whether the coefficients of the model effects arestatistically different from 0. Significant input fields are those with very smallsignificance levels in the output (labeled Sig.).
Note: This option greatly increases the processing time required to build a logisticregression model. If your model is taking too long to build, consider disabling thisoption.
Asymptotic correlation. The estimated correlation matrix of the coefficient estimates.
Goodness-of-fit chi-square statistics. Pearson's and likelihood-ratio chi-squarestatistics. These statistics test the overall fit of the model to the training data.

357
Modeling Nodes
Iteration history. Specify the interval for printing iteration status in the advancedoutput.
Parameter estimates. Estimates of the equation coefficients.
Confidence interval. The confidence intervals for coefficients in the equations.Specify the level of the confidence interval (the default is 95%).
Asymptotic covariance. The estimated covariance matrix of the parameter estimates.
Classification table. Table of the observed versus predicted responses.
Logistic Regression Node Stepping OptionsFigure 11-30Linear Regression stepping options
Number of terms in model. You can specify the minimum number of terms in themodel for Backwards and Backwards Stepwise models and the maximum number ofterms for Forwards and Stepwise models. If you specify a minimum value greaterthan 0, the model will include that many terms, even if some of the terms wouldhave been removed based on statistical criteria. The minimum setting is ignored forForwards, Stepwise, and Enter models. If you specify a maximum, some termsmay be omitted from the model, even though they would have been selected based
358
Chapter 11
on statistical criteria. The Maximum setting is ignored for Backwards, BackwardsStepwise, and Enter models.
Significance thresholds for LR criteria. This option allows you to specify selectioncriteria based on the statistical probability (the p value) associated with each field.Fields will be added to the model only if the associated p value is smaller than theEntry value and will be removed only if the p value is larger than the Removal value.The Entry value must be smaller than the Removal value.
Requirements for entry or removal. For some applications, it doesn't make mathematicalsense to add interaction terms to the model unless the model also contains thelower-order terms for the fields involved in the interaction term. For example, it maynot make sense to include A * B in the model unless A and B also appear in themodel. These options let you determine how such dependencies are handled duringstepwise term selection.
Hierarchy for discrete effects. Higher-order effects (interactions involving more fields)will enter the model only if all lower-order effects (main effects or interactionsinvolving fewer fields) for the relevant fields are already in the model, and lower-ordereffects will not be removed if higher-order effects involving the same fields are in themodel. Applies only to discrete fields. For more information, see “Data Types” inChapter 7 on page 150.
Hierarchy for all effects. As described above, except applies to all input fieldsfields.
Containment for all effects. Effects can appear in the model only if all of theeffects contained in the effect also appear in the model. This option is similarto the Hierarchy for all effects option except that range fields are treatedsomewhat differently. For an effect to contain another effect, the contained(lower-order) effect must include all of the range fields involved in the containing(higher-order) effect, and the contained effect's discrete fields must be a subset ofthose in the containing effect. For example, if A and B are discrete fields and X isa range field, then the term A * B * X contains the terms A * X and B * X.
None. No relationships are enforced; terms are added to and removed from themodel independently.
359
Modeling Nodes
Factor Analysis/PCA Node
The Factor/PCA node provides powerful data reduction techniques to reduce thecomplexity of your data. Two similar but distinct approaches are provided.
Principal components analysis (PCA) finds linear combinations of the inputfields that do the best job of capturing the variance in the entire set of fields,where the components are orthogonal (perpendicular) to each other. PCA focuseson all variance, including both shared and unique variance.
Factor analysis attempts to identify underlying concepts, or factors, that explainthe pattern of correlations within a set of observed fields. Factor analysisfocuses on shared variance only. Variance that is unique to specific fields isnot considered in estimating the model. Several methods of factor analysisare provided by the Factor/PCA node.
For both approaches, the goal is to find a small number of derived fields thateffectively summarize the information in the original set of fields.
Requirements. Only numeric fields can be used in a Factor/PCA model. To estimate afactor analysis or PCA, you need one or more In fields. Fields with direction Out,Both, or None are ignored, as are non-numeric fields.
Strengths. Factor analysis and PCA can effectively reduce the complexity of yourdata without sacrificing much of the information content. These techniques can helpyou build more robust models that execute more quickly than would be possiblewith the raw input fields.
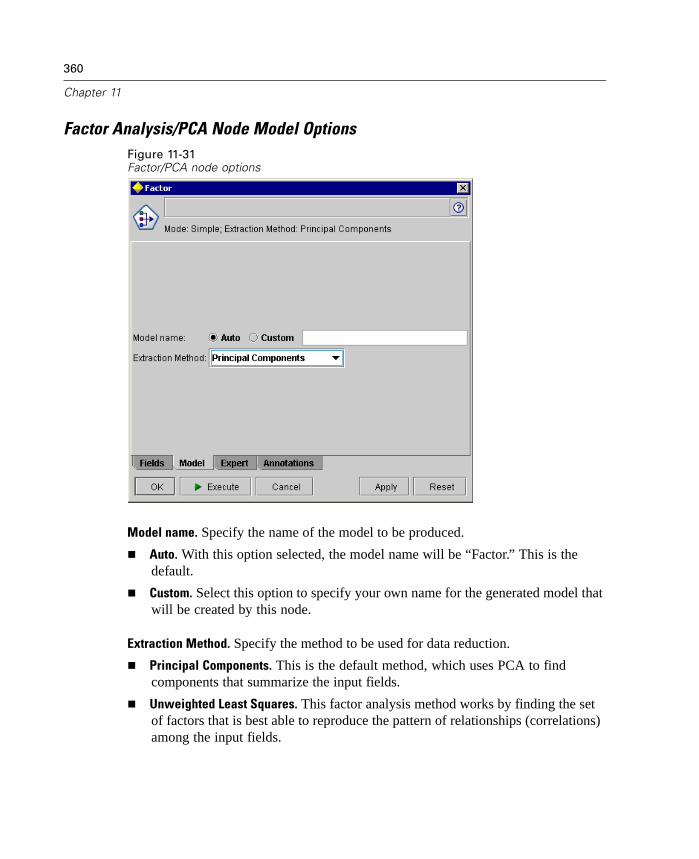
360
Chapter 11
Factor Analysis/PCA Node Model OptionsFigure 11-31Factor/PCA node options
Model name. Specify the name of the model to be produced.
Auto. With this option selected, the model name will be “Factor.” This is thedefault.
Custom. Select this option to specify your own name for the generated model thatwill be created by this node.
Extraction Method. Specify the method to be used for data reduction.
Principal Components. This is the default method, which uses PCA to findcomponents that summarize the input fields.
Unweighted Least Squares. This factor analysis method works by finding the setof factors that is best able to reproduce the pattern of relationships (correlations)among the input fields.
361
Modeling Nodes
Generalized Least Squares. This factor analysis method is similar to unweightedleast squares, except that it uses weighting to de-emphasize fields with a lot ofunique (unshared) variance.
Maximum Likelihood. This factor analysis method produces factor equationsthat are most likely to have produced the observed pattern of relationships(correlations) in the input fields, based on assumptions about the form of thoserelationships. Specifically, the method assumes that the training data follow amultivariate normal distribution.
Principal Axis Factoring. This factor analysis method is very similar to theprincipal components method, except that it focuses on shared variance only.
Alpha Factoring. This factor analysis method considers the fields in the analysisto be a sample from the universe of potential input fields. It maximizes thestatistical reliability of the factors.
Image Factoring. This factor analysis method uses data estimation to isolate thecommon variance and find factors that describe it.
Factor Analysis/PCA Node Expert Options
For those with detailed knowledge of factor analysis and PCA, expert options allowyou to fine-tune the training process. To access expert options, set the Mode toExpert on the Expert tab.
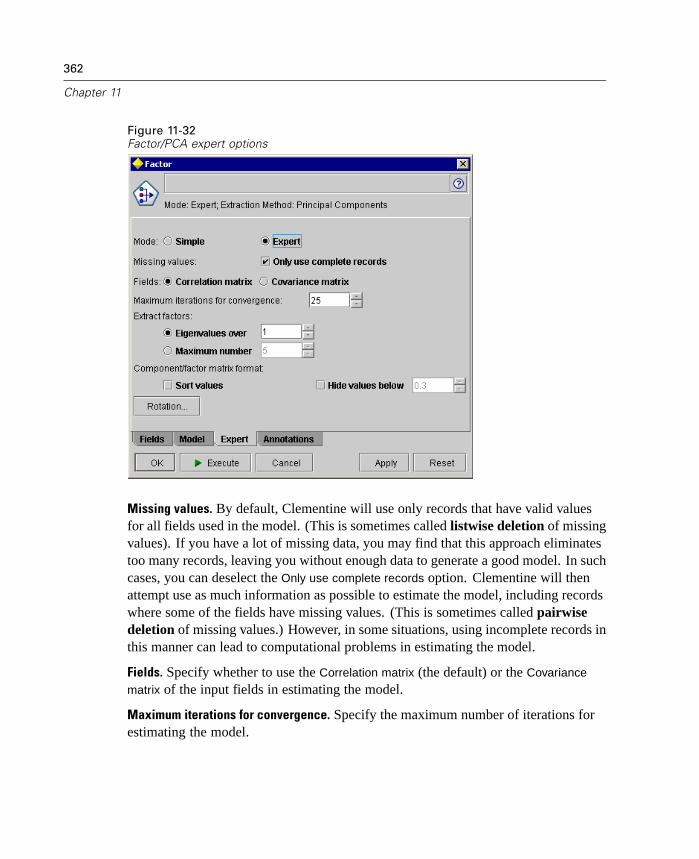
362
Chapter 11
Figure 11-32Factor/PCA expert options
Missing values. By default, Clementine will use only records that have valid valuesfor all fields used in the model. (This is sometimes called listwise deletion of missingvalues). If you have a lot of missing data, you may find that this approach eliminatestoo many records, leaving you without enough data to generate a good model. In suchcases, you can deselect the Only use complete records option. Clementine will thenattempt use as much information as possible to estimate the model, including recordswhere some of the fields have missing values. (This is sometimes called pairwisedeletion of missing values.) However, in some situations, using incomplete records inthis manner can lead to computational problems in estimating the model.
Fields. Specify whether to use the Correlation matrix (the default) or the Covariance
matrix of the input fields in estimating the model.
Maximum iterations for convergence. Specify the maximum number of iterations forestimating the model.
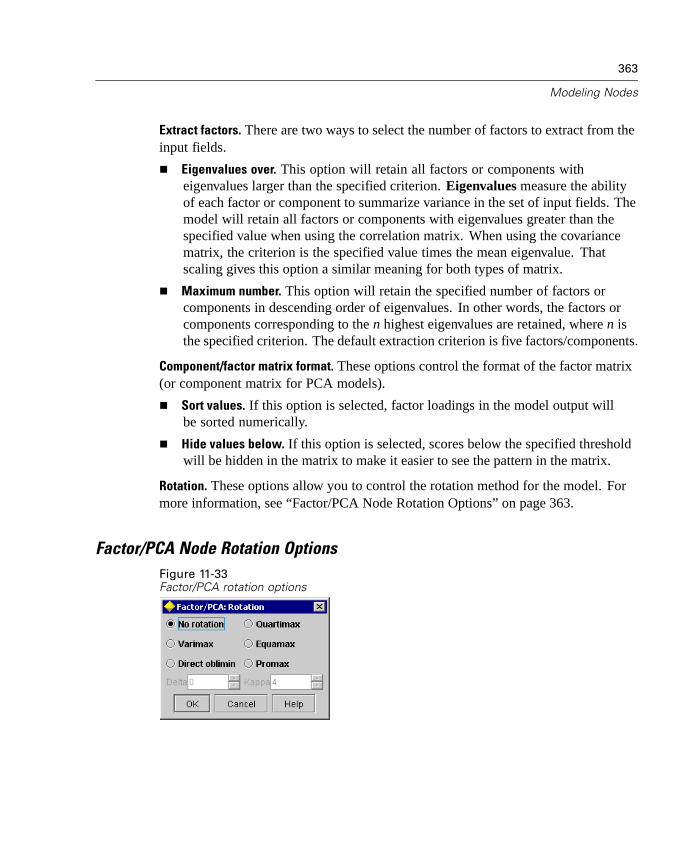
363
Modeling Nodes
Extract factors. There are two ways to select the number of factors to extract from theinput fields.
Eigenvalues over. This option will retain all factors or components witheigenvalues larger than the specified criterion. Eigenvalues measure the abilityof each factor or component to summarize variance in the set of input fields. Themodel will retain all factors or components with eigenvalues greater than thespecified value when using the correlation matrix. When using the covariancematrix, the criterion is the specified value times the mean eigenvalue. Thatscaling gives this option a similar meaning for both types of matrix.
Maximum number. This option will retain the specified number of factors orcomponents in descending order of eigenvalues. In other words, the factors orcomponents corresponding to the n highest eigenvalues are retained, where n isthe specified criterion. The default extraction criterion is five factors/components.
Component/factor matrix format. These options control the format of the factor matrix(or component matrix for PCA models).
Sort values. If this option is selected, factor loadings in the model output willbe sorted numerically.
Hide values below. If this option is selected, scores below the specified thresholdwill be hidden in the matrix to make it easier to see the pattern in the matrix.
Rotation. These options allow you to control the rotation method for the model. Formore information, see “Factor/PCA Node Rotation Options” on page 363.
Factor/PCA Node Rotation OptionsFigure 11-33Factor/PCA rotation options

364
Chapter 11
In many cases, mathematically rotating the set of retained factors can increase theirusefulness and especially their interpretability. Select a rotation method:
None. The default option. No rotation is used.
Varimax. An orthogonal rotation method that minimizes the number of fields withhigh loadings on each factor. It simplifies the interpretation of the factors.
Direct oblimin. A method for oblique (nonorthogonal) rotation. When Delta equals0 (the default), solutions are oblique. As delta becomes more negative, the factorsbecome less oblique. To override the default delta of 0, enter a number lessthan or equal to 0.8.
Quartimax. An orthogonal method that minimizes the number of factors needed toexplain each field. It simplifies the interpretation of the observed fields.
Equamax. A rotation method that is a combination of the Varimax method, whichsimplifies the factors, and the Quartimax method, which simplifies the fields.The number of fields that load highly on a factor and the number of factorsneeded to explain a field are minimized.
Promax. An oblique rotation, which allows factors to be correlated. It can becalculated more quickly than a Direct Oblimin rotation, so it can be useful for largedata sets. Kappa controls the obliqueness (the extent to which factors can becorrelated) of the solution.
TwoStep Cluster Node
The TwoStep Cluster node provides a form of cluster analysis. It can be used tocluster the data set into distinct groups when you don't know what those groups areat the beginning. As with Kohonen nodes and K-Means nodes, TwoStep Clustermodels do not use a target field. Instead of trying to predict an outcome, TwoStepCluster tries to uncover patterns in the set of input fields. Records are grouped sothat records within a group or cluster tend to be similar to each other, but records indifferent groups are dissimilar.
TwoStep Cluster is a two-step clustering method. The first step makes a single passthrough the data, during which it compresses the raw input data into a manageable setof subclusters. The second step uses a hierarchical clustering method to progressivelymerge the subclusters into larger and larger clusters, without requiring anotherpass through the data. Hierarchical clustering has the advantage of not requiringthe number of clusters to be selected ahead of time. Many hierarchical clustering

365
Modeling Nodes
methods start with individual records as starting clusters, and merge them recursivelyto produce ever larger clusters. Though such approaches often break down with largeamounts of data, TwoStep's initial preclustering makes hierarchical clustering fasteven for large data sets.
Note: The resulting model depends to a certain extent on the order of the trainingdata. Reordering the data and rebuilding the model may lead to a different finalcluster model.
Requirements. To train a TwoStep Cluster model, you need one or more In fields.Fields with direction Out, Both, or None are ignored. The TwoStep Cluster algorithmdoes not handle missing values. Records with blanks for any of the input fields willbe ignored when building the model.
Strengths. TwoStep Cluster can handle mixed field types and is able to handle largedata sets efficiently. It also has the ability to test several cluster solutions and choosethe best, so you don't need to know how many clusters to ask for at the outset.TwoStep Cluster can be set to automatically exclude outliers, or extremely unusualcases that can contaminate your results.
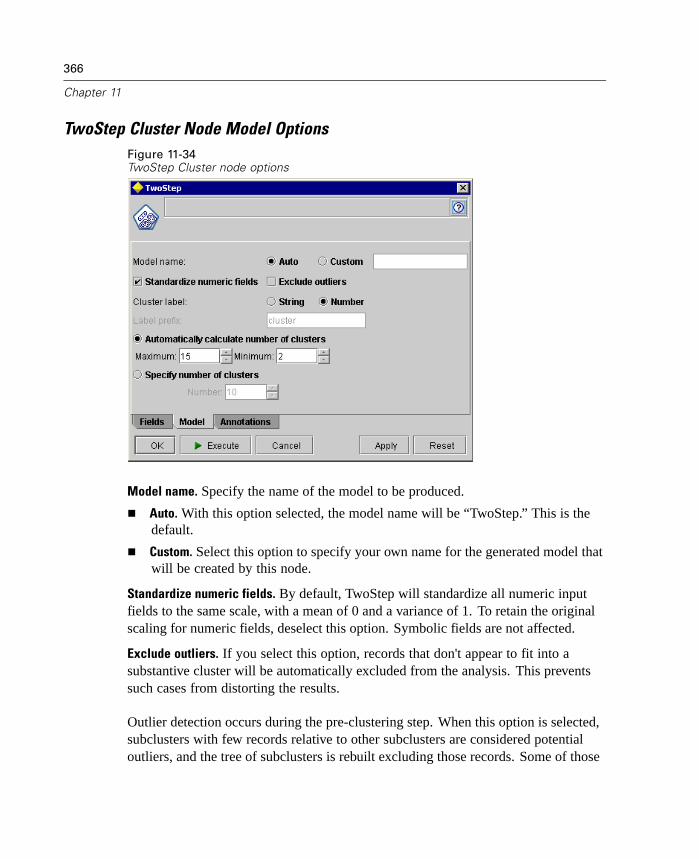
366
Chapter 11
TwoStep Cluster Node Model OptionsFigure 11-34TwoStep Cluster node options
Model name. Specify the name of the model to be produced.
Auto. With this option selected, the model name will be “TwoStep.” This is thedefault.
Custom. Select this option to specify your own name for the generated model thatwill be created by this node.
Standardize numeric fields. By default, TwoStep will standardize all numeric inputfields to the same scale, with a mean of 0 and a variance of 1. To retain the originalscaling for numeric fields, deselect this option. Symbolic fields are not affected.
Exclude outliers. If you select this option, records that don't appear to fit into asubstantive cluster will be automatically excluded from the analysis. This preventssuch cases from distorting the results.
Outlier detection occurs during the pre-clustering step. When this option is selected,subclusters with few records relative to other subclusters are considered potentialoutliers, and the tree of subclusters is rebuilt excluding those records. Some of those
367
Modeling Nodes
potential outlier records may be added to the rebuilt subclusters, if they are similarenough to any of the new subcluster profiles. The rest of the potential outliers thatcannot be merged are considered outliers, and are added to a “noise” cluster andexcluded from the hierarchical clustering step.
When scoring data with a TwoStep model that uses outlier handling, new casesthat are more than a certain threshold distance (based on the log-likelihood) fromthe nearest substantive cluster are considered outliers and are assigned to the “noise”cluster.
Cluster label. Specify the format for the generated cluster membership field. Clustermembership can be indicated as a String with the specified Label prefix (for example"Cluster 1", "Cluster 2", etc.), or as a Number.
Automatically calculate number of clusters. TwoStep cluster can very rapidly analyzea large number of cluster solutions to choose the optimal number of clusters forthe training data. Specify a range of solutions to try by setting the Maximum andthe Minimum number of clusters. TwoStep uses a two-stage process to determinethe optimal number of clusters. In the first stage, an upper bound on the numberof clusters in the model is selected based on the change in the Bayes InformationCriterion (BIC) as more clusters are added. In the second stage, the change in theminimum distance between clusters is found for all models with fewer clusters thanthe minimum-BIC solution. The largest change in distance is used to identify thefinal cluster model.
Specify number of clusters. If you know how many clusters to include in your model,select this option and enter the number of clusters.
C&R Tree Node
The Classification and Regression (C&R) Tree node is a tree-based classificationand prediction method. Similar to C5.0, this method uses recursive partitioning tosplit the training records into segments with similar output field values. C&R Treestarts by examining the input fields to find the best split, measured by the reduction inan impurity index that results from the split. The split defines two subgroups, eachof which is subsequently split into two more subgroups, and so on, until one of thestopping criteria is triggered.

368
Chapter 11
Note: The C&R Tree node replaces the Build Rule node from earlier versions ofClementine. If you load a file containing a Build Rule node, it will be replacedwith a C&R Tree node, as the Build Rule node is no longer supported. Generatedmodels created by Build Rule, however, will continue to operate in the usual wayand will not be replaced.
Requirements. To train a C&R Tree model, you need one or more In fields and exactlyone Out field. The output field can be numeric or symbolic. Fields set to Bothor None are ignored. Fields used in the model must have their types fully instantiated.
Strengths. C&R Tree models are quite robust in the presence of problems such asmissing data and large numbers of fields. They usually do not require long trainingtimes to estimate. In addition, C&R Tree models tend to be easier to understandthan some other model types—the rules derived from the model have a verystraightforward interpretation. Unlike C5.0, C&R Tree can accommodate numeric aswell as symbolic output fields.
C&R Tree Node Model OptionsFigure 11-35C&R Tree node options
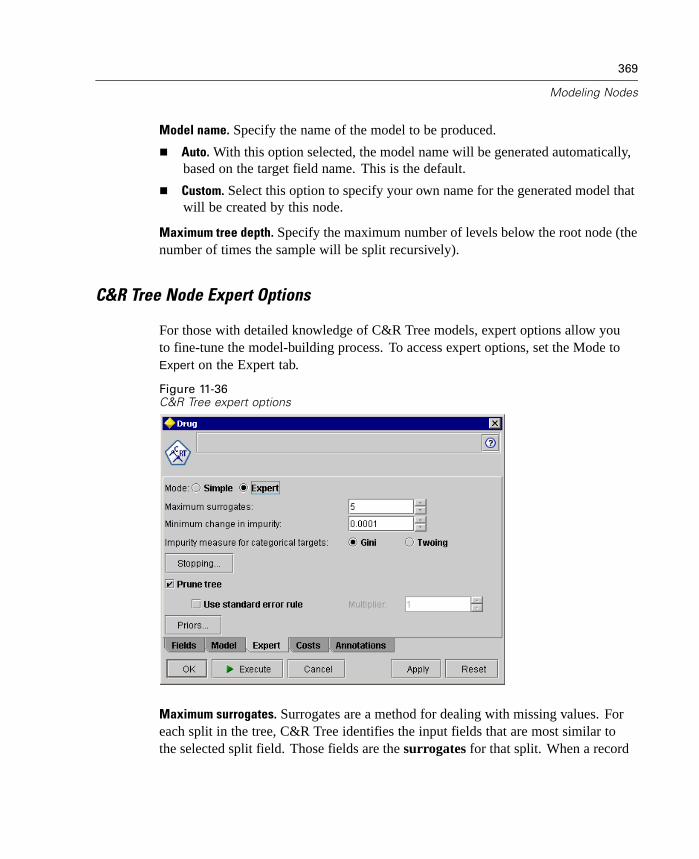
369
Modeling Nodes
Model name. Specify the name of the model to be produced.
Auto. With this option selected, the model name will be generated automatically,based on the target field name. This is the default.
Custom. Select this option to specify your own name for the generated model thatwill be created by this node.
Maximum tree depth. Specify the maximum number of levels below the root node (thenumber of times the sample will be split recursively).
C&R Tree Node Expert Options
For those with detailed knowledge of C&R Tree models, expert options allow youto fine-tune the model-building process. To access expert options, set the Mode toExpert on the Expert tab.
Figure 11-36C&R Tree expert options
Maximum surrogates. Surrogates are a method for dealing with missing values. Foreach split in the tree, C&R Tree identifies the input fields that are most similar tothe selected split field. Those fields are the surrogates for that split. When a record
370
Chapter 11
must be classified but has a missing value for a split field, its value on a surrogatefield can be used to make the split. Increasing this setting will allow more flexibilityto handle missing values, but may also lead to increased memory usage and longertraining times.
Minimum change in impurity. Specify the minimum change in impurity to create a newsplit in the tree. If the best split for a branch reduces the impurity of the tree by lessthan the specified amount, the split will not be made.
Impurity measure for categorical targets. These options allow you to select the methodused to measure the impurity of the tree. Impurity refers to the extent to whichsubgroups defined by the tree have a wide range of output field values within eachgroup. The goal of the tree is to create subgroups such that each subgroup tends tohave the same or similar output values—in other words, to minimize the impurityof the tree. Gini is a general impurity measure based on probabilities of categorymembership for the branch. Twoing is an impurity measure that emphasizes the binarysplit and is more likely to lead to approximately equal-sized branches from a split.This option only affects symbolic target fields; numeric target fields always use theleast squared deviation impurity measure.
Stopping. These options allow you to control the criteria for deciding when to stopsplitting nodes in the tree. For more information, see “C&R Tree Node StoppingOptions” on page 371.
Prune tree. Pruning consists of removing bottom-level splits that do not contributesignificantly to the accuracy of the tree. Pruning can help simplify the tree, making iteasier to interpret and, in some cases, improving generalization. If you want the fulltree without pruning, deselect this option.
Use standard error rule. Allows you to specify a more liberal pruning rule. Thestandard error rule allows C&R Tree to select the simplest tree whose riskestimate is close to (but possibly greater than) that of the subtree with the smallestrisk. The multiplier indicates the size of the allowable difference in the riskestimate between the pruned tree and the tree with the smallest risk in terms ofthe risk estimate. For example, if you specify “2,” a tree whose risk estimate is (2× standard error) larger than that of the full tree could be selected.
Priors. These options allow you to set prior probabilities for target categories. Formore information, see “C&R Tree Node Prior Probability Options” on page 372.
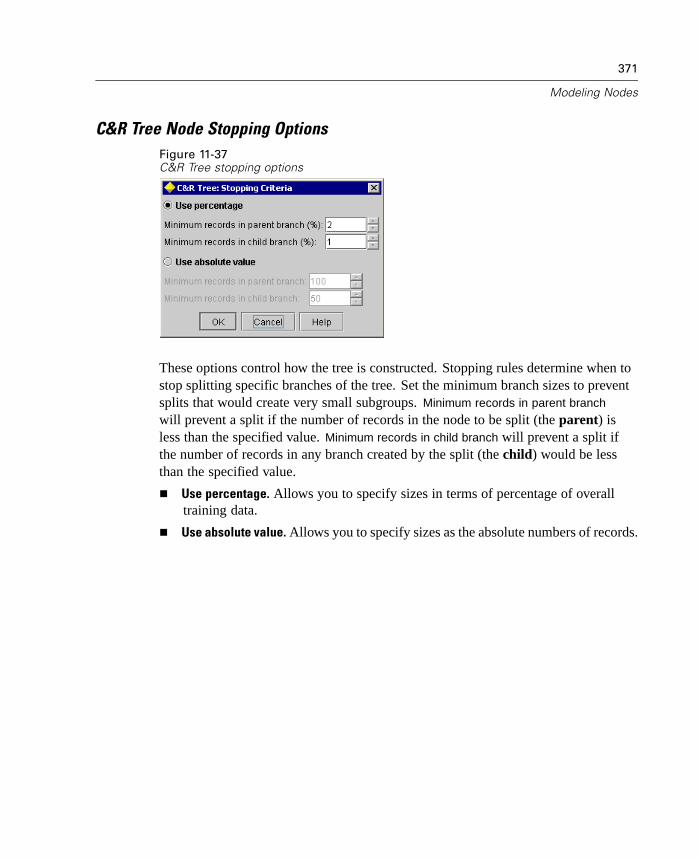
371
Modeling Nodes
C&R Tree Node Stopping OptionsFigure 11-37C&R Tree stopping options
These options control how the tree is constructed. Stopping rules determine when tostop splitting specific branches of the tree. Set the minimum branch sizes to preventsplits that would create very small subgroups. Minimum records in parent branch
will prevent a split if the number of records in the node to be split (the parent) isless than the specified value. Minimum records in child branch will prevent a split ifthe number of records in any branch created by the split (the child) would be lessthan the specified value.
Use percentage. Allows you to specify sizes in terms of percentage of overalltraining data.
Use absolute value. Allows you to specify sizes as the absolute numbers of records.
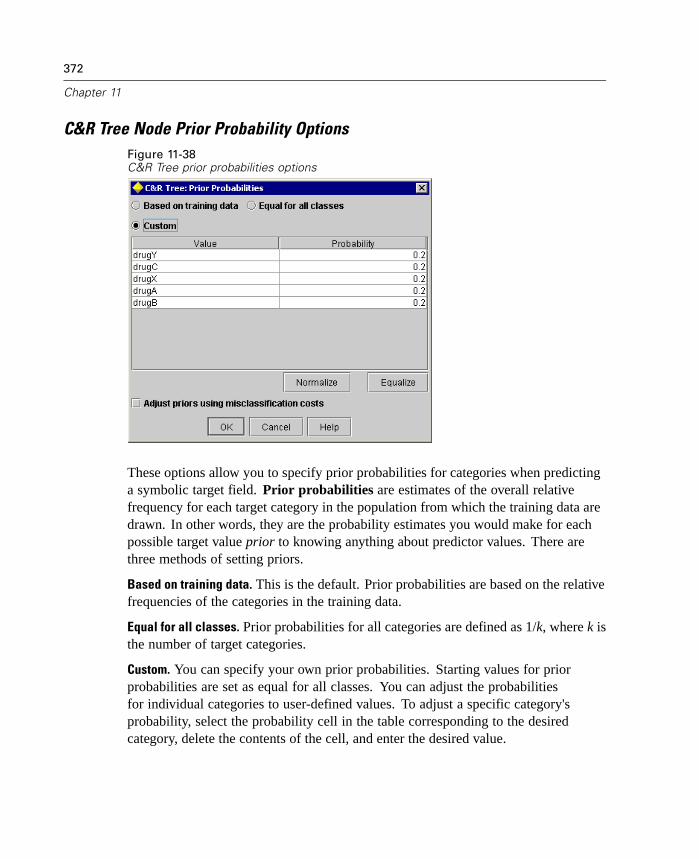
372
Chapter 11
C&R Tree Node Prior Probability OptionsFigure 11-38C&R Tree prior probabilities options
These options allow you to specify prior probabilities for categories when predictinga symbolic target field. Prior probabilities are estimates of the overall relativefrequency for each target category in the population from which the training data aredrawn. In other words, they are the probability estimates you would make for eachpossible target value prior to knowing anything about predictor values. There arethree methods of setting priors.
Based on training data. This is the default. Prior probabilities are based on the relativefrequencies of the categories in the training data.
Equal for all classes. Prior probabilities for all categories are defined as 1/k, where k isthe number of target categories.
Custom. You can specify your own prior probabilities. Starting values for priorprobabilities are set as equal for all classes. You can adjust the probabilitiesfor individual categories to user-defined values. To adjust a specific category'sprobability, select the probability cell in the table corresponding to the desiredcategory, delete the contents of the cell, and enter the desired value.
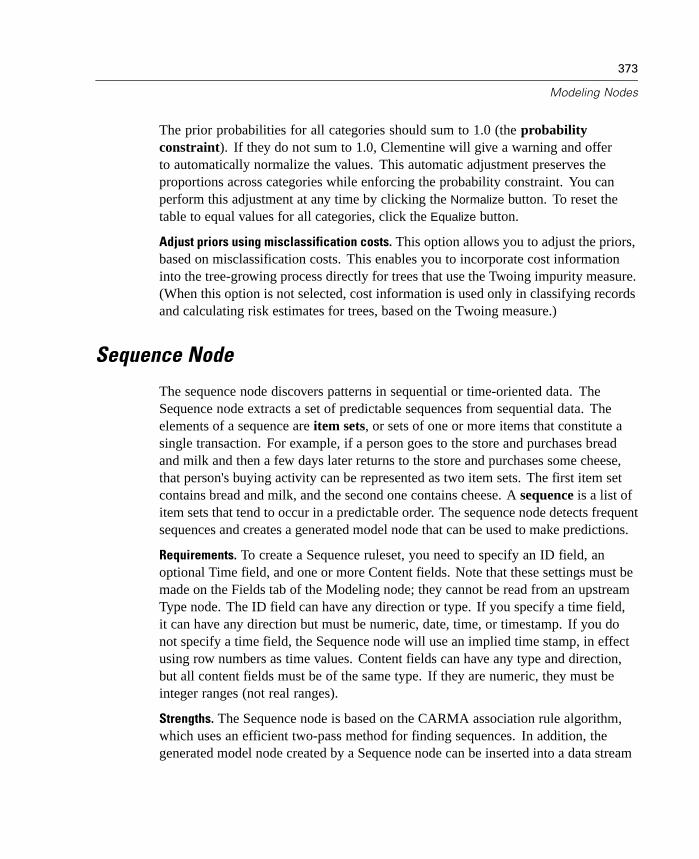
373
Modeling Nodes
The prior probabilities for all categories should sum to 1.0 (the probabilityconstraint). If they do not sum to 1.0, Clementine will give a warning and offerto automatically normalize the values. This automatic adjustment preserves theproportions across categories while enforcing the probability constraint. You canperform this adjustment at any time by clicking the Normalize button. To reset thetable to equal values for all categories, click the Equalize button.
Adjust priors using misclassification costs. This option allows you to adjust the priors,based on misclassification costs. This enables you to incorporate cost informationinto the tree-growing process directly for trees that use the Twoing impurity measure.(When this option is not selected, cost information is used only in classifying recordsand calculating risk estimates for trees, based on the Twoing measure.)
Sequence Node
The sequence node discovers patterns in sequential or time-oriented data. TheSequence node extracts a set of predictable sequences from sequential data. Theelements of a sequence are item sets, or sets of one or more items that constitute asingle transaction. For example, if a person goes to the store and purchases breadand milk and then a few days later returns to the store and purchases some cheese,that person's buying activity can be represented as two item sets. The first item setcontains bread and milk, and the second one contains cheese. A sequence is a list ofitem sets that tend to occur in a predictable order. The sequence node detects frequentsequences and creates a generated model node that can be used to make predictions.
Requirements. To create a Sequence ruleset, you need to specify an ID field, anoptional Time field, and one or more Content fields. Note that these settings must bemade on the Fields tab of the Modeling node; they cannot be read from an upstreamType node. The ID field can have any direction or type. If you specify a time field,it can have any direction but must be numeric, date, time, or timestamp. If you donot specify a time field, the Sequence node will use an implied time stamp, in effectusing row numbers as time values. Content fields can have any type and direction,but all content fields must be of the same type. If they are numeric, they must beinteger ranges (not real ranges).
Strengths. The Sequence node is based on the CARMA association rule algorithm,which uses an efficient two-pass method for finding sequences. In addition, thegenerated model node created by a Sequence node can be inserted into a data stream
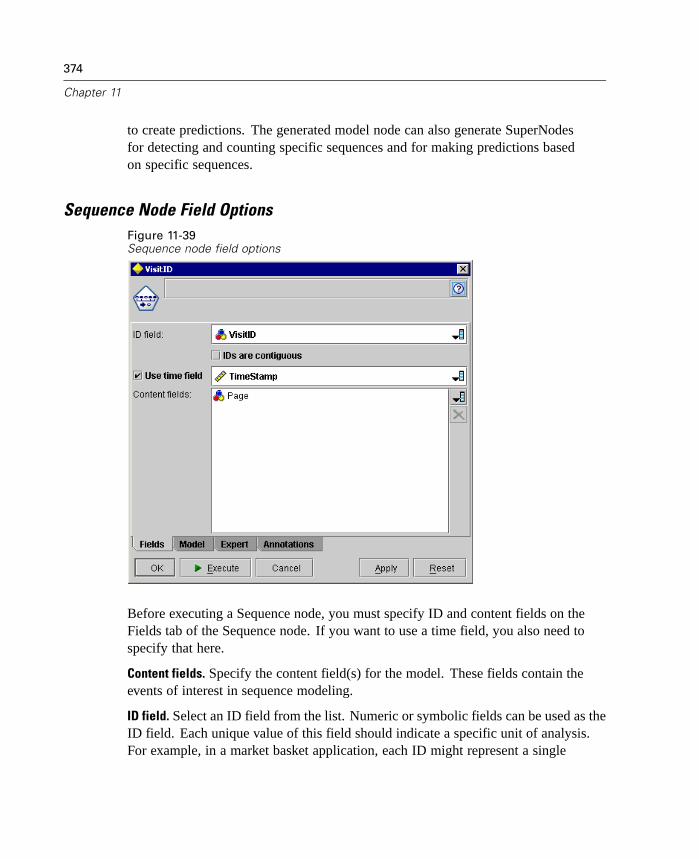
374
Chapter 11
to create predictions. The generated model node can also generate SuperNodesfor detecting and counting specific sequences and for making predictions basedon specific sequences.
Sequence Node Field OptionsFigure 11-39Sequence node field options
Before executing a Sequence node, you must specify ID and content fields on theFields tab of the Sequence node. If you want to use a time field, you also need tospecify that here.
Content fields. Specify the content field(s) for the model. These fields contain theevents of interest in sequence modeling.
ID field. Select an ID field from the list. Numeric or symbolic fields can be used as theID field. Each unique value of this field should indicate a specific unit of analysis.For example, in a market basket application, each ID might represent a single

375
Modeling Nodes
customer. For a Web log analysis application, each ID might represent a computer(by IP address) or a user (by login data).
IDs are contiguous. If your data are presorted so that all records with the same IDappear together in the data stream, select this option to speed up processing. Ifyour data are not presorted (or you are not sure), leave this option unselected, andthe Sequence node will sort the data automatically.
Note: If your data are not sorted and you select this option, you may get invalidresults in your Sequence model.
Time field. If you want to use a field in the data to indicate event times, select Use
time field and specify the field to be used. The time field must be numeric, date, time,or timestamp. If no time field is specified, records are assumed to arrive from thedata source in sequential order, and record numbers are used as time values (the firstrecord occurs at time "1"; the second, at time "2"; etc.).
Content fields. Specify the content field(s) for the model. These fields contain theevents of interest in sequence modeling.
The Sequence node can handle data in either of two formats:
Tabular data has items represented by separate flag fields, where each flag fieldrepresents the presence or absence of a specific item.
Transactional data has one or more content fields for items.
The content field(s) contain values indicating which items belong to the transaction.These can be numeric or symbolic. If you use multiple fields with transactional data,the items specified in these fields for a particular record are assumed to representitems found in a single transaction with a single time stamp.
Following is an example of Tabular data:
Customer jam bread milk
1 T F F
1 F F T
2 T T F
3 T T T
376
Chapter 11
Here are the same data shown in Transactional format:
Customer Time Purchase
1 1 jam
1 2 milk
2 3 jam
2 3 bread
3 4 jam
3 4 bread
3 4 milk
Sequence Node Model OptionsFigure 11-40Sequence node options
Model name. Specify the name of the model to be produced.
Auto. With this option selected, the model name will be “Sequence.” This isthe default.
Custom. Select this option to specify your own name for the generated model thatwill be created by this node.
377
Modeling Nodes
Minimum rule support (%). You can specify a support criterion. Support refers to theproportion of IDs in the training data that contain the entire sequence. (Note that thisdefinition of support differs from that used in the GRI and Apriori nodes.) If youwant to focus on more common sequences, increase this setting.
Minimum rule confidence (%). You can specify a confidence criterion for keepingsequences in the sequence set. Confidence refers to the percentage of the IDs where acorrect prediction is made, out of all the IDs for which the rule makes a prediction. Itis calculated as the number of IDs for which the entire sequence is found divided bythe number of IDs for which the antecedents are found, based on the training data.Sequences with lower confidence than the specified criterion are discarded. If you aregetting too many sequences or uninteresting sequences, try increasing this setting. Ifyou are getting too few sequences, try decreasing this setting.
Maximum sequence size. You can set the maximum number of distinct item sets (asopposed to items) in a sequence. If the sequences of interest are relatively short, youcan decrease this setting to speed up building the sequence set.
Predictions to add to stream. Specify the number of predictions to be added to thestream by the resulting generated Model node. For more information, see “GeneratedSequence Rules Node” in Chapter 12 on page 454.
Sequence Node Expert Options
For those with detailed knowledge of the Sequence node's operation, the followingexpert options allow you to fine-tune the model-building process. To access expertoptions, set the Mode to Expert on the Expert tab.

378
Chapter 11
Figure 11-41Sequence node expert options
Set maximum duration. If selected, sequences will be limited to those with a duration(the time between the first and last item set) less than or equal to the value specified.If you haven't specified a time field, the duration is expressed in terms of rows(records) in the raw data. If the Time field used is a time, date or timestamp field, theduration is expressed in seconds. For numeric fields, the duration is expressed in thesame units as the field itself.
Set pruning value. The CARMA algorithm used in the Sequence node periodicallyremoves (prunes) infrequent item sets from its list of potential item sets duringprocessing to conserve memory. Select this option to adjust the frequency of pruning.The number specified determines the frequency of pruning. Enter a smaller valueto decrease the memory requirements of the algorithm (but potentially increase thetraining time required), or enter a larger value to speed up training (but potentiallyincrease memory requirements).
Set maximum sequences in memory. If selected, the CARMA algorithm will limitits memory store of candidate sequences during model building to the number ofsequences specified. Select this option if Clementine is using too much memoryduring the building of Sequence models. Note that the maximum sequences valueyou specify here is the number of candidate sequences tracked internally as the
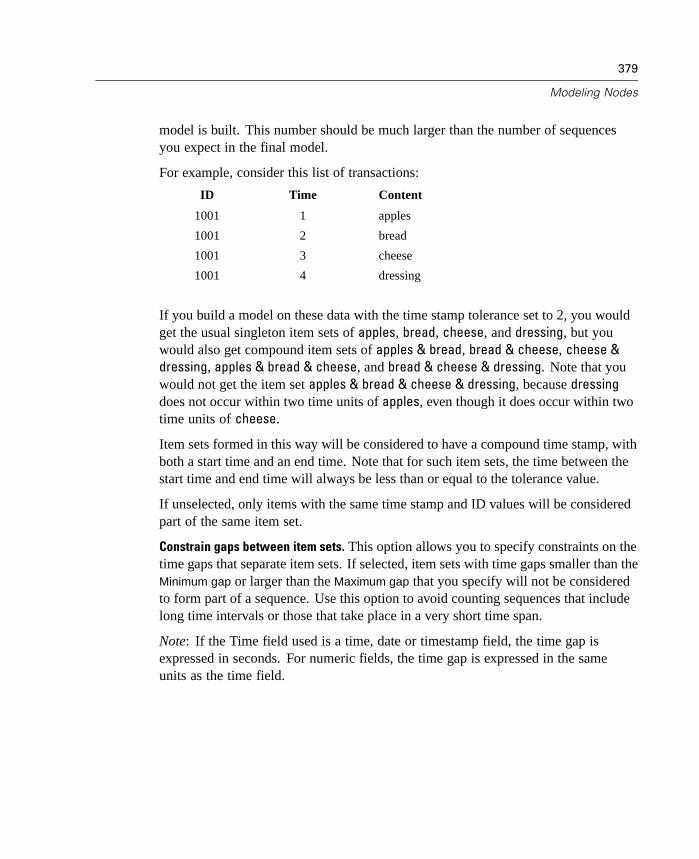
379
Modeling Nodes
model is built. This number should be much larger than the number of sequencesyou expect in the final model.
For example, consider this list of transactions:
ID Time Content
1001 1 apples
1001 2 bread
1001 3 cheese
1001 4 dressing
If you build a model on these data with the time stamp tolerance set to 2, you wouldget the usual singleton item sets of apples, bread, cheese, and dressing, but youwould also get compound item sets of apples & bread, bread & cheese, cheese &dressing, apples & bread & cheese, and bread & cheese & dressing. Note that youwould not get the item set apples & bread & cheese & dressing, because dressingdoes not occur within two time units of apples, even though it does occur within twotime units of cheese.
Item sets formed in this way will be considered to have a compound time stamp, withboth a start time and an end time. Note that for such item sets, the time between thestart time and end time will always be less than or equal to the tolerance value.
If unselected, only items with the same time stamp and ID values will be consideredpart of the same item set.
Constrain gaps between item sets. This option allows you to specify constraints on thetime gaps that separate item sets. If selected, item sets with time gaps smaller than theMinimum gap or larger than the Maximum gap that you specify will not be consideredto form part of a sequence. Use this option to avoid counting sequences that includelong time intervals or those that take place in a very short time span.
Note: If the Time field used is a time, date or timestamp field, the time gap isexpressed in seconds. For numeric fields, the time gap is expressed in the sameunits as the time field.
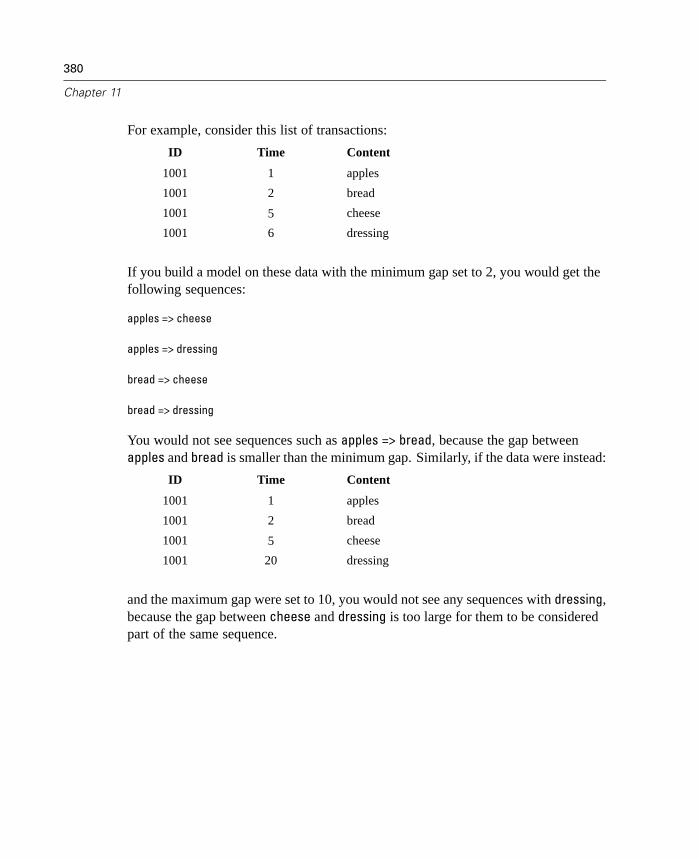
380
Chapter 11
For example, consider this list of transactions:
ID Time Content
1001 1 apples
1001 2 bread
1001 5 cheese
1001 6 dressing
If you build a model on these data with the minimum gap set to 2, you would get thefollowing sequences:
apples => cheese
apples => dressing
bread => cheese
bread => dressing
You would not see sequences such as apples => bread, because the gap betweenapples and bread is smaller than the minimum gap. Similarly, if the data were instead:
ID Time Content
1001 1 apples
1001 2 bread
1001 5 cheese
1001 20 dressing
and the maximum gap were set to 10, you would not see any sequences with dressing,because the gap between cheese and dressing is too large for them to be consideredpart of the same sequence.

Chapter
12Generated Models
Overview of Generated Models
Generated models are the fruits of your data modeling labor. A generated model nodeis created whenever you successfully execute a modeling node. Generated modelscontain information about the model created and provide a mechanism for using thatmodel to generate predictions and facilitate further data mining.
Generated models are placed in the generated models palette (located on theModels tab in the managers window in the upper right corner of the Clementinewindow) when they are created. From there they can be selected and browsed to viewdetails of the model. Generated models other than unrefined rule models can be placedinto the stream to generate predictions or to allow further analysis of their properties.
You can identify the type of a generated model node from its icon:
Icon Node type Icon Node type
Neural Network Kohonen Net
C5.0 Tree model Linear Regression Equation
Ruleset K-Means model
Logistic RegressionEquation
C&R Tree model
381

382
Chapter 12
Icon Node type Icon Node type
Factor/PCA Equation Sequence set
Unrefined associationrules (generated modelspalette only)
The following topics provide information on using generated models in Clementine.For an in-depth understanding of the algorithms used in Clementine, consult theClementine Algorithms Guide available on the product CD.
Working with Generated Models in the Generated ModelsPalette
The generated models palette (on the Models tab in the managers window) allows youto use, examine, and modify generated model nodes in various ways. Two contextmenus provide access to these features.
Figure 12-1Generated model context menu
Right-clicking directly on a generated model node in the generated models paletteopens a context menu with the following options for modifying the node:
Add to Stream. Adds the generated model node to the currently active stream. Ifthere is a selected node in the stream, the generated model node will be connectedto the selected node when such a connection is possible.
Browse. Opens the model browser for the node.

383
Generated Models
Rename and Annotate. Allows you to rename the generated model node and/ormodify the annotation for the node.
Save. Saves the node to an external file.
Export PMML. Exports the model as predictive model markup language (PMML),which can be used with SPSS SmartScore for scoring new data outside ofClementine. Export PMML is available for all generated model nodes, exceptthose created by CEMI modeling nodes. For more information, see “ExportingModels” in Chapter 13 on page 464.
Export C code. Exports the model as C code that can be used to score new dataoutside of Clementine. This option is available for generated Net, C5.0 Tree,generated Kohonen, and generated K-Means nodes. For more information, see“Exporting Models” in Chapter 13 on page 464.
Add to Project. Saves the generated model and adds it to the current project. Onthe Classes tab, the node will be added to the Generated Models folder. On theCRISP-DM tab, it will be added to the default project phase. (See Setting theDefault Project Phase for information on how to change the default project phase.)
Delete. Deletes the node from the palette.
Figure 12-2Generated models palette context menu
Right-clicking on an unoccupied area in the generated models palette opens a contextmenu with the following options:
Open Model. Loads a generated model previously created in Clementine.
Load Palette. Loads a saved palette from an external file.
Save Palette. Saves the entire contents of the generated models palette to anexternal file.
Clear Palette. Deletes all nodes from the palette.
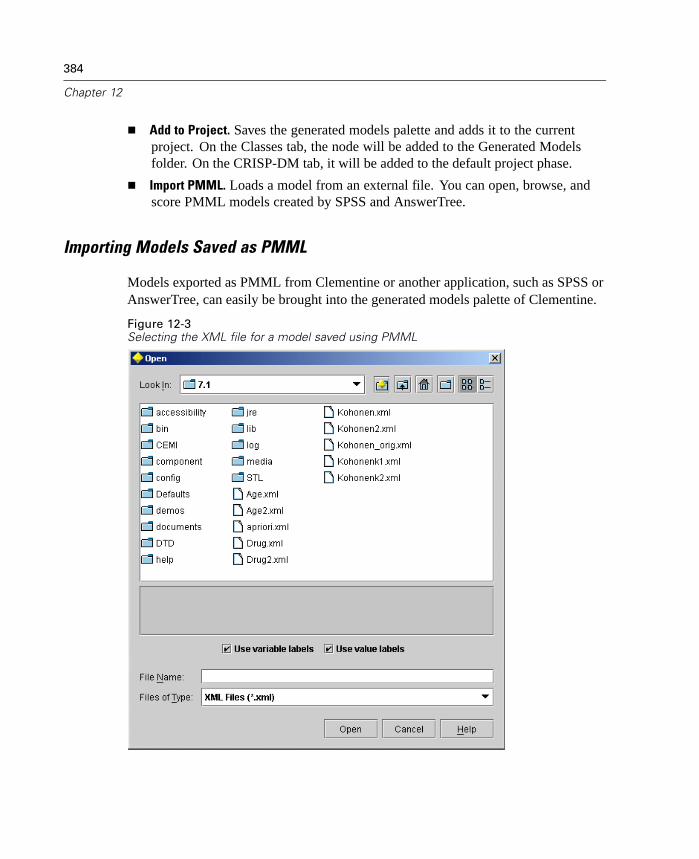
384
Chapter 12
Add to Project. Saves the generated models palette and adds it to the currentproject. On the Classes tab, the node will be added to the Generated Modelsfolder. On the CRISP-DM tab, it will be added to the default project phase.
Import PMML. Loads a model from an external file. You can open, browse, andscore PMML models created by SPSS and AnswerTree.
Importing Models Saved as PMML
Models exported as PMML from Clementine or another application, such as SPSS orAnswerTree, can easily be brought into the generated models palette of Clementine.
Figure 12-3Selecting the XML file for a model saved using PMML

385
Generated Models
Use variable labels. The PMML may specify both variable names and variable labels(such as Referrer ID for RefID) for variables in the data dictionary. Select this optionto use variable labels, if they are present in the originally exported PMML.
Use value labels. The PMML may specify both values and value labels (such as Malefor M or Female for F) for a variable. Select this option to use the value labels, ifthey are present in the PMML.
If you have selected the above label options but there are no variable or value labelsin the PMML, then the variable names and literal values are used as normal. Bydefault, both options are selected.
Supported Model Types
The following PMML models can be browsed and scored in Clementine:
CHAID
Exhaustive CHAID
C&RT
QUEST
Logistic regression (multinomial and conditional logistic)
TwoStep cluster
Using Generated Models in Streams
The generated models can be placed in streams to score new data and generate newnodes. Scoring data allows you to use the information gained from model building tocreate predictions for new records. For some models, generated model nodes can alsogive you additional information about the quality of the prediction, such as confidencevalues or distances from cluster centers. Generating new nodes allows you to easilycreate new nodes based on the structure of the generated model. For example, mostmodels that perform input field selection allow you to generate Filter nodes that willpass only input fields that the model identified as important.
To use a generated model node for scoring data:
E Select the desired model by clicking it in the generated models palette.

386
Chapter 12
E Add the model to the stream by clicking the desired location in the stream canvas.
E Connect the generated model node to a data source or stream that will pass data to it.
E Add or connect one or more processing or output nodes (such as a Table node) to thegenerated model node.
E Execute one of the nodes downstream from the generated model node.
Note that you cannot use Unrefined Rule nodes for scoring data. To score data basedon an association rule model, use the Unrefined Rule node to generate a Rulesetnode, and use the Ruleset node for scoring. For more information, see “Generating aRuleset” on page 411.
To use a generated model node for generating processing nodes:
E Browse (on the palette) or edit (on the stream canvas) the model.
E Select the desired node type from the Generate menu of the generated model browserwindow. The options available will vary depending on the type of generated modelnode. See the specific generated model type for details about what you can generatefrom a particular model.
Using the Generated Model Browsers
The generated model browsers allow you to examine and use the results of yourmodels. From the browser, you can save, print, or export the generated model,examine the model summary, and view or edit annotations for the model. For sometypes of generated models, you can also generate new nodes, such as Filter nodes orRuleset nodes. For some models, you can also view model parameters, such as rulesor cluster centers. For some types of models (tree-based models and cluster models),you can view a graphical representation of the structure of the model. Controls forusing the generated model browsers are described below.
387
Generated Models
Menus
File Menu. All generated models have a File menu, containing the following options:
Save Node. Saves the generated model node to a file.
Close. Closes the current generated model browser.
Header and Footer. Allows you to edit the page header and footer for printingfrom the node.
Page Setup. Allows you to change the page setup for printing from the node.
Print Preview. Displays a preview of how the node will look when printed. Selectthe information you want to preview from the submenu.
Print. Prints the contents of the node. Select the information you want to printfrom the submenu.
Export Text. Exports the contents of the node to a text file. Select the informationyou want to export from the submenu.
Export HTML. Exports the contents of the node to an HTML file. Select theinformation you want to export from the submenu.
Export PMML. Exports the model as predictive model markup language (PMML),which can be used with other PMML-compatible software.
Export C code. Exports the model as C code, which can be compiled and usedwith other applications.
Generate menu. Most generated models also have a Generate menu, allowing you togenerate new nodes based on the generated model. The options available from thismenu will depend on the type of model you are browsing. See the specific generatedmodel type for details about what you can generate from a particular model.
Tabs
Generated models information appears on several tabs, to make the information moremanageable. The set of tabs available varies depending on the type of generatedmodel.
Model. This tab contains basic model information, such as cluster centers (forcluster models) or rules (for rulesets).
388
Chapter 12
Viewer. For tree-based models (C5.0 and C&R Tree) and cluster models (K-Meansand Two Step), the Viewer tab provides a graphical representation model results.For trees, the Viewer tab shows split criteria and the distribution of target valuesin each branch of the tree. For clusters, the Viewer tab shows the mean anddistribution of values for each cluster, enabling you to visually compare clusters.
Advanced. For linear regression, logistic regression, and factor/PCA models, theAdvanced tab displays detailed statistical analysis of the model.
Summary. The Summary tab contains information about model performance,fields used, build settings, and training summary.
Annotations. The Annotations tab contains annotations about the generated model.For more information, see “Annotating Nodes” in Chapter 4 on page 70.
Generated Net Node
Generated Net nodes represent the neural networks created by Neural Net nodes. Theycontain all of the information captured by the trained network, as well as informationabout the neural network's characteristics, such as accuracy and architecture.
To see information about the neural network model, right-click the generated Netnode and select Browse from the context menu (or Edit for nodes in a stream).
You can add the network model to your stream by selecting the icon in thegenerated models palette and then clicking the stream canvas where you want to placethe node, or by right-clicking the icon and selecting Add to Stream from the contextmenu. Then connect your stream to the node, and you are ready to pass data to thenetwork model to generate predictions. The data coming into the generated modelnode must contain the same input fields, with the same types, as the training data usedto create the model. (If fields are missing or field types are mismatched, you willsee an error message when you execute the stream.)
When you execute a stream containing a generated Net node, the Net node adds anew field for each output field from the original training data. The new field containsthe network's prediction for the corresponding output field. The name of each newprediction field is the name of the output field being predicted, with $N- added to thebeginning. For example, for an output field named profit, the predicted values wouldappear in a new field called $N-profit. For symbolic output fields, a second new fieldis also added, containing the confidence for the prediction. The confidence field isnamed in a similar manner, with $NC- added to the beginning of the original outputfield name. In a stream with multiple generated Net nodes in a series predicting the

389
Generated Models
same output field(s), the new predicted and confidence field names will includenumbers to distinguish them from each other. The first Net node in the stream willuse the usual names, the second node will use names starting with $N1- and $NC1-,the third node will use names starting with $N2- and $NC2-, and so on.
Confidence for neural networks. Confidence values for neural networks are providedfor symbolic output fields and are computed as follows:
Flag data. Confidence is computed as abs(0.5 – Raw Output) * 2. Values areconverted into a scale of 0 to 1. If the output unit value is below 0.5, it ispredicted as 0 (false), and if it is 0.5 or above, it is predicted as 1 (true). Forexample, if the Neural Net prediction value is 0.72, then this is displayed as“true” and the confidence will be (0.5 – 0.72) * 2 = 0.64.
Set data. Set output fields are internally converted to flags for neural networks, sothere is a separate raw output value for each category of the output field. Valuesare converted into a scale of 0 to 1. Confidence is computed as (Highest RawOutput — Second Highest Raw Output). The highest scaled value defines whichpredicted set value is chosen, and the difference between the highest scaled valueand the second highest scaled value is the confidence. For example, if there arefour set values (red, blue, white, black) and the scaled values produced by NeuralNet are red = 0.32, blue = 0.85, white = 0.04, and black = 0.27, then the predictedset value would be blue, and the confidence would be 0.85 – 0.32 = 0.53.
Generating a Filter node. The Generate menu allows you to create a new Filter nodeto pass input fields based on the results of the model. For more information, see“Generating a Filter Node from a Neural Network” on page 392.
Generated Neural Network Summary Tab
On the generated Net node Summary tab, you will see information about the networkitself (Analysis), fields used in the network (Fields), settings used when buildingthe model (Build Settings), and model training (Training Summary). You can alsoperform file operations, including printing, saving, and exporting, from the File menu,and you can generate new Filter nodes from the Generate menu.
When you first browse a generated Net node, the Summary tab results may becollapsed. To see the results of interest, use the expander control to the left of the itemto show the results, or use the Expand All button to show all results. To hide results

390
Chapter 12
when finished viewing them, use the expander control to collapse the specific resultsyou want to hide, or use the Collapse All button to collapse all results.
Figure 12-4Sample generated Net node Summary tab
Analysis. The analysis section displays information about the estimated accuracy ofthe network, the architecture or topology of the network, and the relative importanceof fields, as determined by sensitivity analysis (if you requested it). If you haveexecuted an Analysis node attached to this modeling node, information from thatanalysis will also appear in this section. For more information, see “Analysis Node”in Chapter 14 on page 504.
Estimated accuracy. This is an index of the accuracy of the predictions. Forsymbolic outputs, this is simply the percentage of records for which the predictedvalue is correct. For numeric targets, the calculation is based on the differencesbetween the predicted values and the actual values in the training data. Theformula for finding the accuracy for numeric fields is

391
Generated Models
(1.0-abs(Actual-Predicted)/(Range of Output Field))*100.0
where Actual is the actual value of the output field, Predicted is the value predictedby the network, and Range of Output Field is the range of values for the output field(the highest value for the field minus the lowest value). This accuracy is calculatedfor each record, and the overall accuracy is the average of the values for all records inthe training data.
Because these estimates are based on the training data, they are likely to be somewhatoptimistic. The accuracy of the model on new data will usually be somewhat lowerthan this.
Architecture. For each layer in the network, the number of units in that layer islisted.
Relative Importance of Inputs. This section contains the results of the sensitivityanalysis if you requested one. The input fields are listed in order of importance,from most important to least important. The value listed for each input is ameasure of its relative importance, varying between 0 (a field that has no effecton the prediction) and 1.0 (a field that completely determines the prediction).
Fields. This section lists the fields used as target(s) and inputs in building the model.
Build Settings. This section contains information on the settings used in building themodel.
Training Summary. This section shows the type of the model, the stream used to createit, the user who created it, when it was built, and the elapsed time for building themodel.
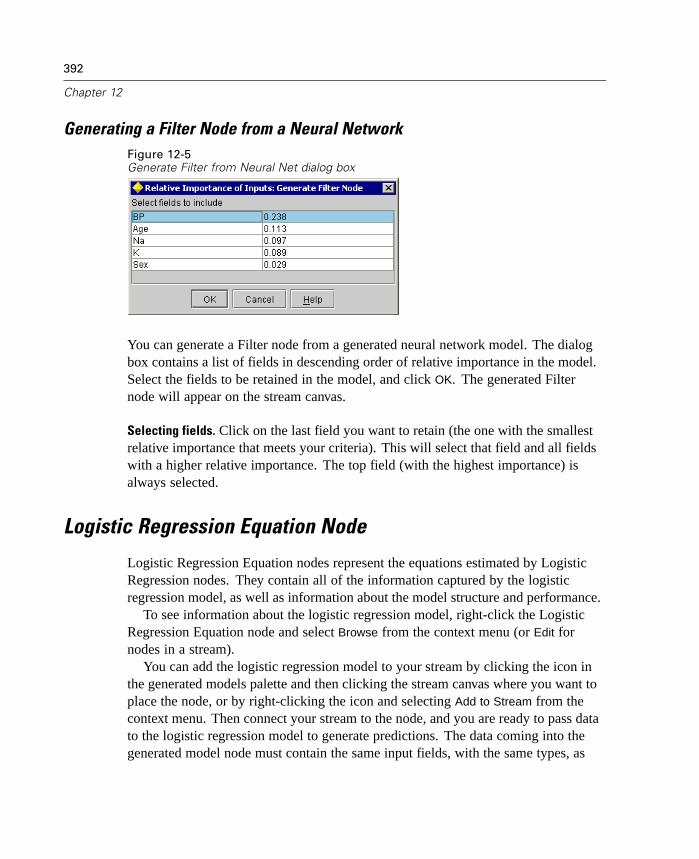
392
Chapter 12
Generating a Filter Node from a Neural NetworkFigure 12-5Generate Filter from Neural Net dialog box
You can generate a Filter node from a generated neural network model. The dialogbox contains a list of fields in descending order of relative importance in the model.Select the fields to be retained in the model, and click OK. The generated Filternode will appear on the stream canvas.
Selecting fields. Click on the last field you want to retain (the one with the smallestrelative importance that meets your criteria). This will select that field and all fieldswith a higher relative importance. The top field (with the highest importance) isalways selected.
Logistic Regression Equation Node
Logistic Regression Equation nodes represent the equations estimated by LogisticRegression nodes. They contain all of the information captured by the logisticregression model, as well as information about the model structure and performance.
To see information about the logistic regression model, right-click the LogisticRegression Equation node and select Browse from the context menu (or Edit fornodes in a stream).
You can add the logistic regression model to your stream by clicking the icon inthe generated models palette and then clicking the stream canvas where you want toplace the node, or by right-clicking the icon and selecting Add to Stream from thecontext menu. Then connect your stream to the node, and you are ready to pass datato the logistic regression model to generate predictions. The data coming into thegenerated model node must contain the same input fields, with the same types, as
393
Generated Models
the training data used to create the model. (If fields are missing or field types aremismatched, you will see an error message when you execute the stream.)
When you execute a stream containing a Logistic Regression Equation node,the node adds two new fields containing the model's prediction and the associatedprobability. The names of the new fields are derived from the name of the outputfield being predicted, prefixed with $L- for the predicted category and $LP- for theassociated probability. For example, for an output field named colorpref, the newfields would be named $L-colorpref and $LP-colorpref. In addition, if you haveselected the Append all probabilities expert option in the Logistic Regression node,an additional field will be added for each category of the output field, containingthe probability belonging to the corresponding category for each record. Theseadditional fields are named based on the values of the output field, prefixed by $LP-.For example, if the legal values of colorpref are Red, Green, and Blue, three newfields will be added: $LP-Red, $LP-Green, and $LP-Blue. In a stream with multipleLogistic Regression Equation nodes in a series predicting the same output field, thenew predicted and confidence field names will include numbers to distinguish themfrom each other. The first Logistic Regression Equation node in the stream will usethe usual names, the second node will use names starting with $L1- and $LP1-, thethird node will use names starting with $L2- and $LP2-, and so on.
Generating a Filter node. The Generate menu allows you to create a new Filter nodeto pass input fields based on the results of the model. Fields that are dropped fromthe model due to multicollinearity will be filtered by the generated node, as well asfields not used in the model.
Logistic Regression Equation Model Tab
On the Logistic Regression Equation node Model tab, you will see the actual equationsestimated by the Logistic Regression node; one equation for each category in thetarget field except the baseline category. The equations are displayed in a tree format.
When you first browse a Logistic Regression Equation node, the Model tab resultsstart out collapsed. To see the results of interest, use the expander control to the left ofthe item to show the results, or click the Expand All button to show all results. To hideresults when finished viewing them, use the expander control to collapse the specificresults you want to hide, or click the Collapse All button to collapse all results.
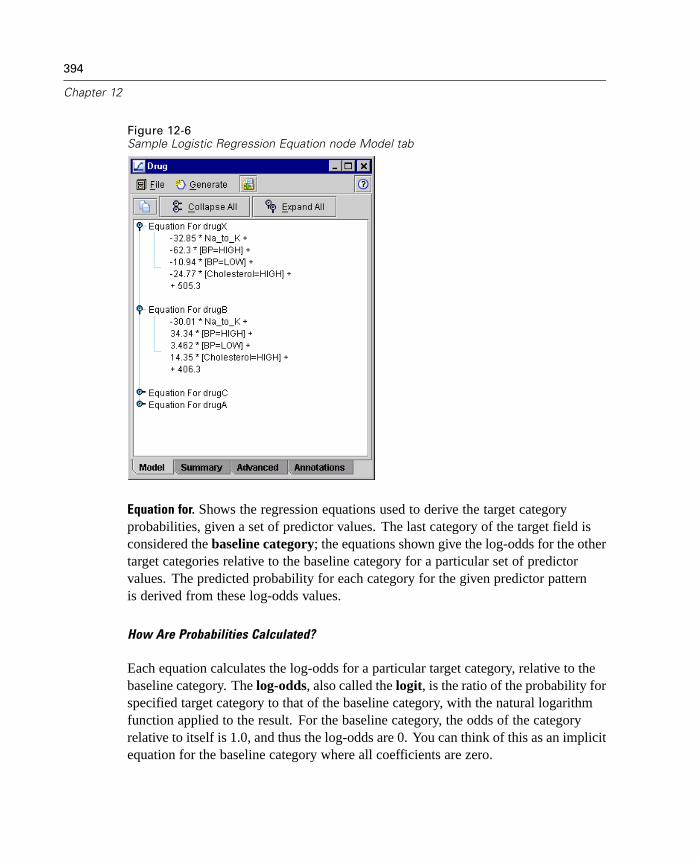
394
Chapter 12
Figure 12-6Sample Logistic Regression Equation node Model tab
Equation for. Shows the regression equations used to derive the target categoryprobabilities, given a set of predictor values. The last category of the target field isconsidered the baseline category; the equations shown give the log-odds for the othertarget categories relative to the baseline category for a particular set of predictorvalues. The predicted probability for each category for the given predictor patternis derived from these log-odds values.
How Are Probabilities Calculated?
Each equation calculates the log-odds for a particular target category, relative to thebaseline category. The log-odds, also called the logit, is the ratio of the probability forspecified target category to that of the baseline category, with the natural logarithmfunction applied to the result. For the baseline category, the odds of the categoryrelative to itself is 1.0, and thus the log-odds are 0. You can think of this as an implicitequation for the baseline category where all coefficients are zero.
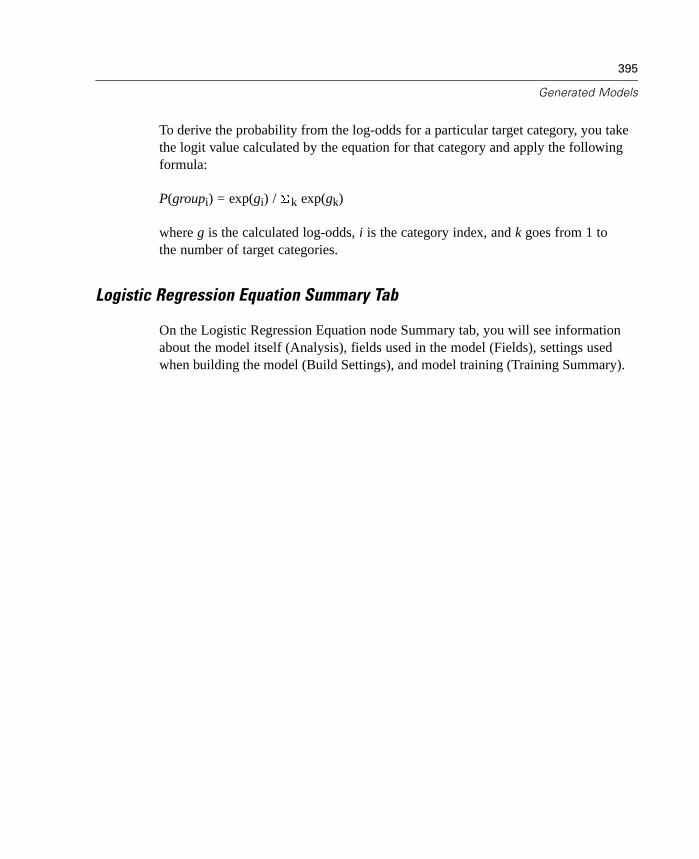
395
Generated Models
To derive the probability from the log-odds for a particular target category, you takethe logit value calculated by the equation for that category and apply the followingformula:
P(groupi) = exp(gi) / k exp(gk)
where g is the calculated log-odds, i is the category index, and k goes from 1 tothe number of target categories.
Logistic Regression Equation Summary Tab
On the Logistic Regression Equation node Summary tab, you will see informationabout the model itself (Analysis), fields used in the model (Fields), settings usedwhen building the model (Build Settings), and model training (Training Summary).
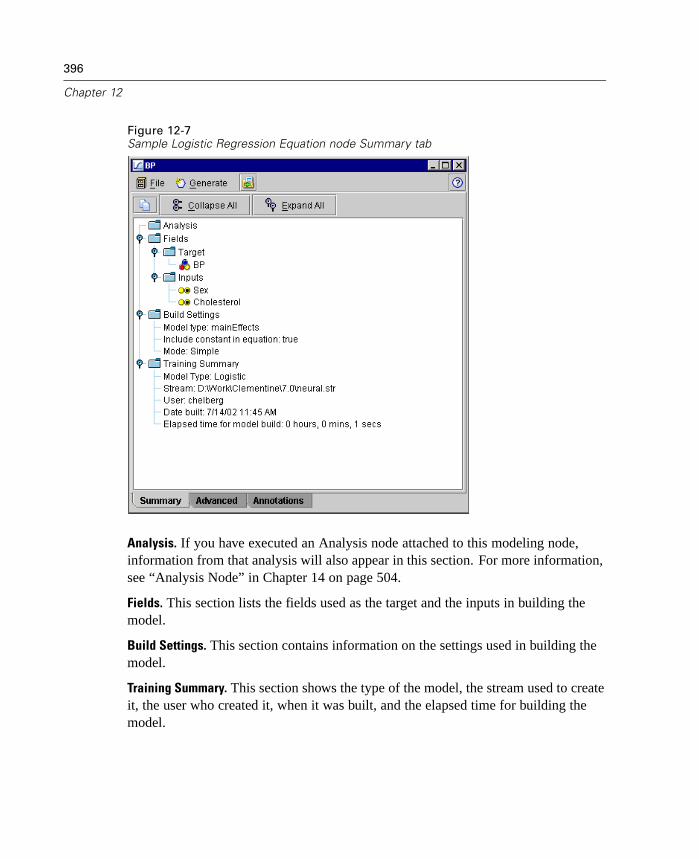
396
Chapter 12
Figure 12-7Sample Logistic Regression Equation node Summary tab
Analysis. If you have executed an Analysis node attached to this modeling node,information from that analysis will also appear in this section. For more information,see “Analysis Node” in Chapter 14 on page 504.
Fields. This section lists the fields used as the target and the inputs in building themodel.
Build Settings. This section contains information on the settings used in building themodel.
Training Summary. This section shows the type of the model, the stream used to createit, the user who created it, when it was built, and the elapsed time for building themodel.
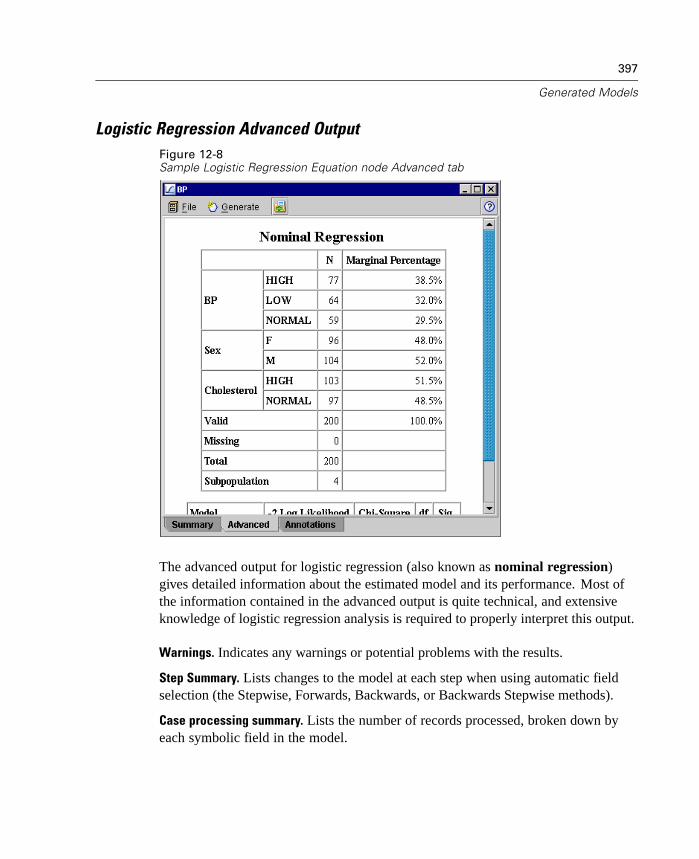
397
Generated Models
Logistic Regression Advanced OutputFigure 12-8Sample Logistic Regression Equation node Advanced tab
The advanced output for logistic regression (also known as nominal regression)gives detailed information about the estimated model and its performance. Most ofthe information contained in the advanced output is quite technical, and extensiveknowledge of logistic regression analysis is required to properly interpret this output.
Warnings. Indicates any warnings or potential problems with the results.
Step Summary. Lists changes to the model at each step when using automatic fieldselection (the Stepwise, Forwards, Backwards, or Backwards Stepwise methods).
Case processing summary. Lists the number of records processed, broken down byeach symbolic field in the model.

398
Chapter 12
Model fitting information. Shows the likelihood ratio test of your model (Final) againstone in which all of the parameter coefficients are 0 (Intercept Only).
Goodness-of-fit chi-square statistics (optional). Shows Pearson's and likelihood-ratiochi-square statistics. These statistics test the overall fit of the model to the trainingdata.
Pseudo R-square (optional). Shows the Cox and Snell, Nagelkerke, and McFaddenR-square measures of model fit.
Likelihood ratio tests (optional). Shows statistics testing whether the coefficients of themodel effects are statistically different from 0.
Parameter estimates (optional). Shows estimates of the equation coefficients, tests ofthose coefficients, odds ratios derived from the coefficients (labeled Exp(B)), andconfidence intervals for the odds ratios.
Asymptotic covariance/correlation matrix (optional). Shows the asymptotic covariancesand/or correlations of the parameter estimates.
Classification (optional). Shows the matrix of predicted and actual output field valueswith percentages.
Observed and predicted frequencies (optional). For each covariate pattern, shows theobserved and predicted frequencies for each output field value. This table can be quitelarge, especially for models with numeric input fields. If the resulting table would betoo large to be practical, it is omitted, and a warning appears.
Linear Regression Equation Node
Linear Regression Equation nodes represent the equations estimated by LinearRegression nodes. They contain all of the information captured by the linearregression model, as well as information about the model structure and performance.
To see information about the logistic regression model, right-click the LinearRegression Equation node and select Browse from the context menu (or Edit fornodes in a stream).
You can add the linear regression model to your stream by clicking the icon in thegenerated models palette and then clicking the stream canvas where you want to placethe node, or by right-clicking the icon and selecting Add to Stream from the contextmenu. Then connect your stream to the node, and you are ready to pass data to the
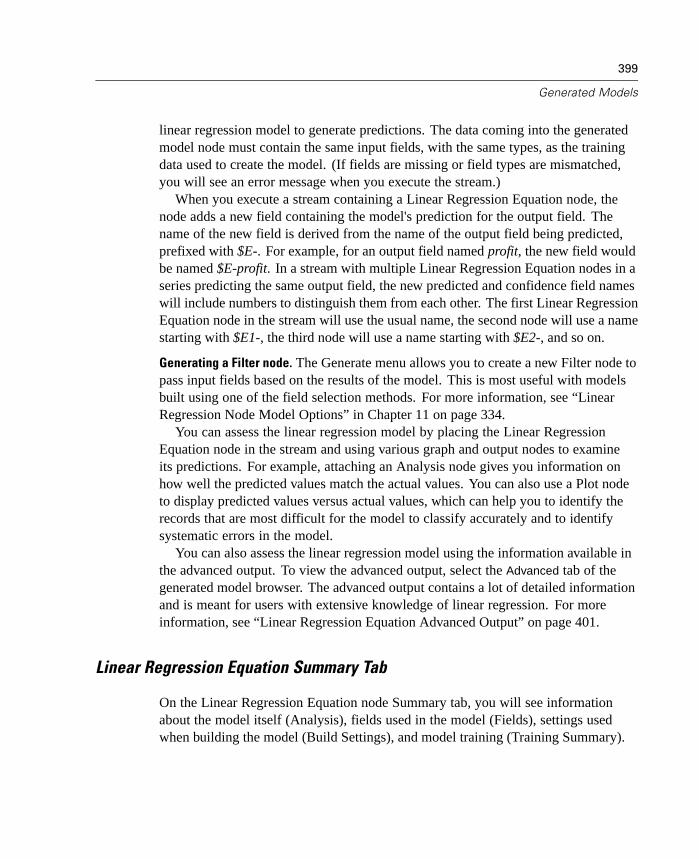
399
Generated Models
linear regression model to generate predictions. The data coming into the generatedmodel node must contain the same input fields, with the same types, as the trainingdata used to create the model. (If fields are missing or field types are mismatched,you will see an error message when you execute the stream.)
When you execute a stream containing a Linear Regression Equation node, thenode adds a new field containing the model's prediction for the output field. Thename of the new field is derived from the name of the output field being predicted,prefixed with $E-. For example, for an output field named profit, the new field wouldbe named $E-profit. In a stream with multiple Linear Regression Equation nodes in aseries predicting the same output field, the new predicted and confidence field nameswill include numbers to distinguish them from each other. The first Linear RegressionEquation node in the stream will use the usual name, the second node will use a namestarting with $E1-, the third node will use a name starting with $E2-, and so on.
Generating a Filter node. The Generate menu allows you to create a new Filter node topass input fields based on the results of the model. This is most useful with modelsbuilt using one of the field selection methods. For more information, see “LinearRegression Node Model Options” in Chapter 11 on page 334.
You can assess the linear regression model by placing the Linear RegressionEquation node in the stream and using various graph and output nodes to examineits predictions. For example, attaching an Analysis node gives you information onhow well the predicted values match the actual values. You can also use a Plot nodeto display predicted values versus actual values, which can help you to identify therecords that are most difficult for the model to classify accurately and to identifysystematic errors in the model.
You can also assess the linear regression model using the information available inthe advanced output. To view the advanced output, select the Advanced tab of thegenerated model browser. The advanced output contains a lot of detailed informationand is meant for users with extensive knowledge of linear regression. For moreinformation, see “Linear Regression Equation Advanced Output” on page 401.
Linear Regression Equation Summary Tab
On the Linear Regression Equation node Summary tab, you will see informationabout the model itself (Analysis), fields used in the model (Fields), settings usedwhen building the model (Build Settings), and model training (Training Summary).
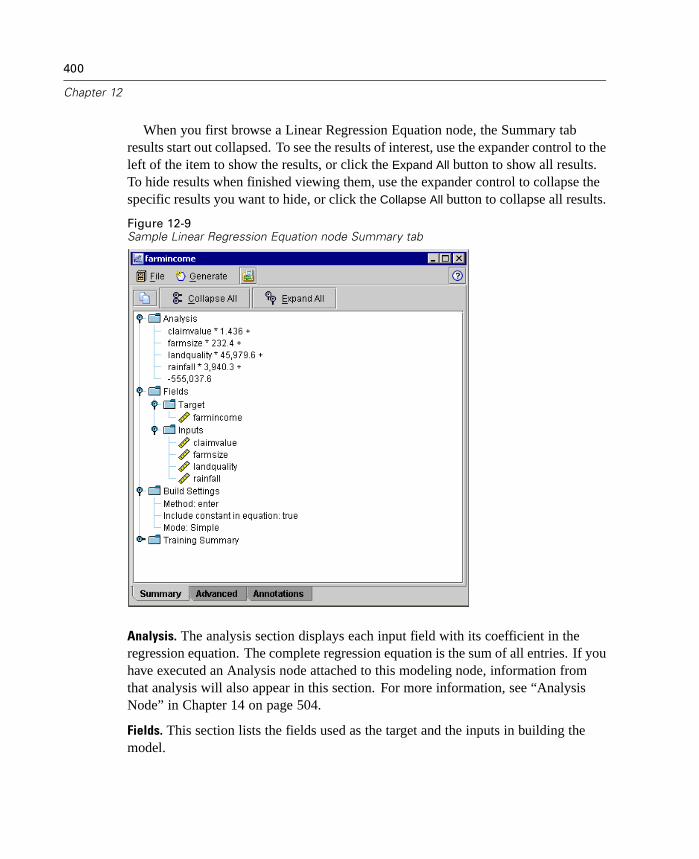
400
Chapter 12
When you first browse a Linear Regression Equation node, the Summary tabresults start out collapsed. To see the results of interest, use the expander control to theleft of the item to show the results, or click the Expand All button to show all results.To hide results when finished viewing them, use the expander control to collapse thespecific results you want to hide, or click the Collapse All button to collapse all results.
Figure 12-9Sample Linear Regression Equation node Summary tab
Analysis. The analysis section displays each input field with its coefficient in theregression equation. The complete regression equation is the sum of all entries. If youhave executed an Analysis node attached to this modeling node, information fromthat analysis will also appear in this section. For more information, see “AnalysisNode” in Chapter 14 on page 504.
Fields. This section lists the fields used as the target and the inputs in building themodel.
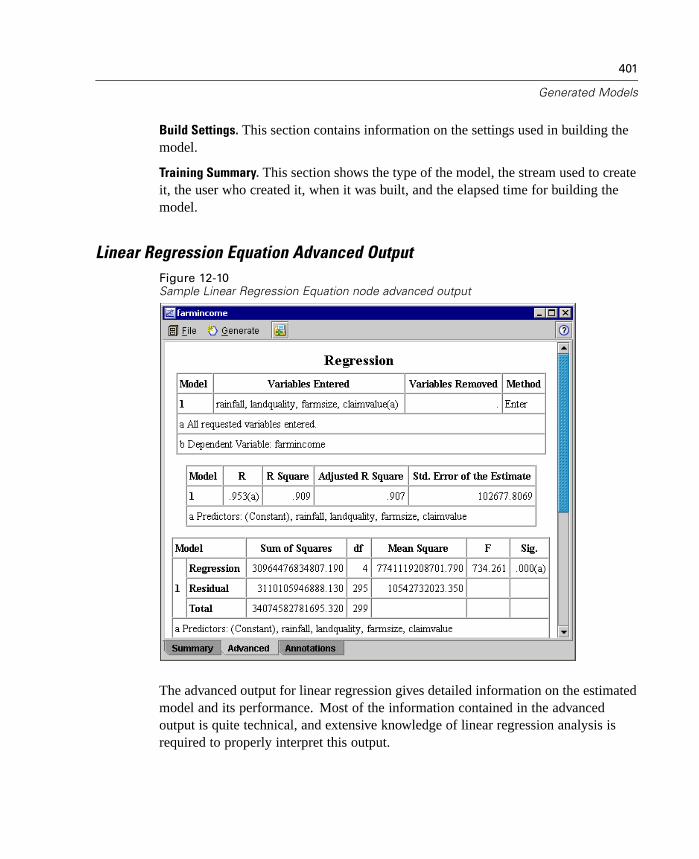
401
Generated Models
Build Settings. This section contains information on the settings used in building themodel.
Training Summary. This section shows the type of the model, the stream used to createit, the user who created it, when it was built, and the elapsed time for building themodel.
Linear Regression Equation Advanced OutputFigure 12-10Sample Linear Regression Equation node advanced output
The advanced output for linear regression gives detailed information on the estimatedmodel and its performance. Most of the information contained in the advancedoutput is quite technical, and extensive knowledge of linear regression analysis isrequired to properly interpret this output.
402
Chapter 12
Warnings. Indicates any warnings or potential problems with the results.
Descriptive statistics (optional). Shows the number of valid records (cases), the mean,and the standard deviation for each field in the analysis.
Correlations (optional). Shows the correlation matrix of input and output fields.One-tailed significance and the number of records (cases) for each correlation arealso displayed.
Variables entered/removed. Shows fields added to or removed from the model at eachstep for Stepwise, Forwards, and Backwards regression methods. For the Entermethod, only one row is shown entering all fields immediately.
Model summary. Shows various summaries of model fit. If the R-Squared Change
option is selected in the Linear Regression node, change in model fit is reported ateach step for Stepwise, Forwards, and Backwards methods. If the Selection Criteria
option is selected in the Linear Regression node, additional model fit statistics arereported at each step, including Akaike Information Criterion, Amemiya PredictionCriterion, Mallows' Prediction Criterion, and Schwarz Bayesian Criterion.
ANOVA. Shows the analysis of variance (ANOVA) table for the model.
Coefficients. Shows the coefficients of the model and statistical tests of thosecoefficients. If the Confidence interval option is selected in the Linear Regressionnode, 95% confidence intervals are also reported in this table. If the Part and partial
correlations option is selected, part and partial correlations are also reported in thistable. Finally, if the Collinearity Diagnostics option is selected, collinearity statistics forinput fields are reported in this table.
Coefficient correlations (optional). Shows correlations among coefficient estimates.
Collinearity diagnostics (optional). Shows collinearity diagnostics for identifyingsituations in which the input fields form a linearly dependent set.
Casewise diagnostics (optional). Shows the records with the largest prediction errors.
Residuals statistics (optional). Shows summary statistics describing the distribution ofprediction errors.
403
Generated Models
Factor Equation Node
Factor Equation nodes represent the factor analysis and principal component analysis(PCA) models created by Factor/PCA nodes. They contain all of the informationcaptured by the trained model, as well as information about the model's performanceand characteristics.
To see information about the factor/PCA model, right-click the Factor Equationnode and select Browse from the context menu (or Edit for nodes in a stream).
You can add the Factor Equation node to your stream by clicking the icon in thegenerated models palette and then clicking the stream canvas where you want to placethe node, or by right-clicking the icon and selecting Add to Stream from the contextmenu. Then connect your stream to the node, and you are ready to pass data to thefactor model to compute factor or component scores. The data coming into thegenerated model node must contain the same input fields, with the same types, asthe training data used to create the model. (If fields are missing or field types aremismatched, you will see an error message when you execute the stream.)
When you execute a stream containing a Factor Equation node, the FactorEquation node adds a new field for each factor or component in the model. The newfield names are derived from the model name, prefixed by $F- and suffixed by -n,where n is the number of the factor or component. For example, if your model isnamed Factor and contains three factors, the new fields would be named $F-Factor-1,$F-Factor-2, and $F-Factor-3. In a stream with multiple Factor Equation nodes in aseries predicting the same output field(s), the new field names will include numbersin the prefix to distinguish them from each other. The first Factor Equation node inthe stream will use the usual names, the second node will use names starting with$F1-, the third node will use names starting with $F2-, and so on.
To get a better sense of what the factor model has encoded, you can do some moredownstream analysis. A useful way to view the result of the factor model is to viewthe correlations between factors and input fields using a Statistics node. This showsyou which input fields load heavily on which factors and can help you discover ifyour factors have any underlying meaning or interpretation. For more information,see “Statistics Node” in Chapter 14 on page 518.
You can also assess the factor model using the information available in theadvanced output. To view the advanced output, select the Advanced tab of thegenerated model browser. The advanced output contains a lot of detailed informationand is meant for users with extensive knowledge of factor analysis or PCA. For moreinformation, see “Factor Equation Advanced Output” on page 406.

404
Chapter 12
Factor Equation Model Tab
On the Factor Equation node Model tab, you will see information about how thescores are calculated.
Figure 12-11Sample Factor Equation node Model tab
Equation for. Shows the factor score equation for each factor. Factor or componentscores are calculated by multiplying each input field value by its coefficient andsumming the results.

405
Generated Models
Factor Equation Summary Tab
On the Factor Equation node Summary tab, you will see information about the modelitself (Analysis), fields used in the model (Fields), settings used when building themodel (Build Settings), and model training (Training Summary).
When you first browse a Factor Equation node, the Summary tab results start outcollapsed. To see the results of interest, use the expander control to the left of the itemto show the results, or click the Expand All button to show all results. To hide resultswhen finished viewing them, use the expander control to collapse the specific resultsyou want to hide, or click the Collapse All button to collapse all results.
Figure 12-12Sample Factor Equation node Summary tab
Analysis. The analysis section displays the number of factors retained in thefactor/PCA model.
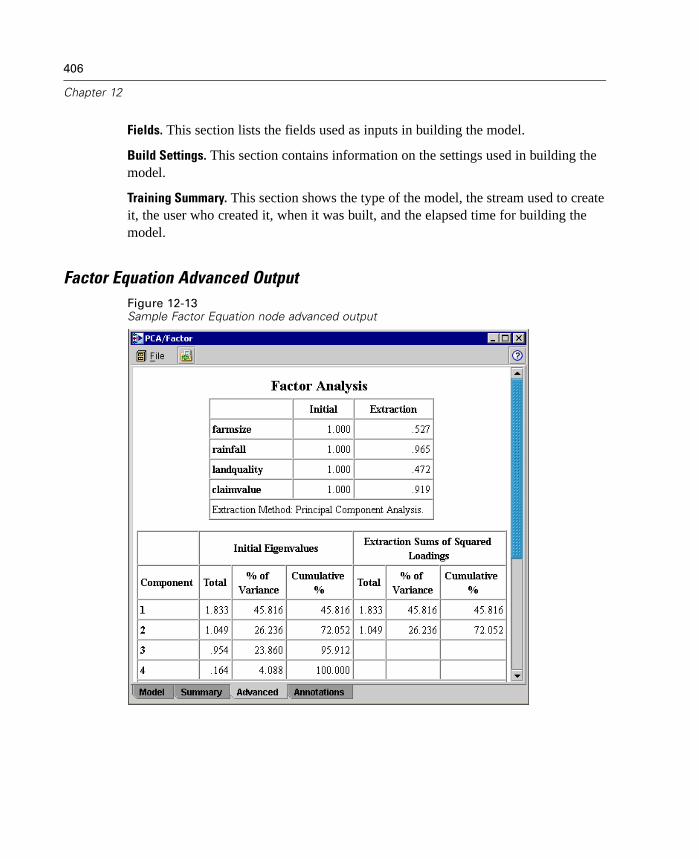
406
Chapter 12
Fields. This section lists the fields used as inputs in building the model.
Build Settings. This section contains information on the settings used in building themodel.
Training Summary. This section shows the type of the model, the stream used to createit, the user who created it, when it was built, and the elapsed time for building themodel.
Factor Equation Advanced OutputFigure 12-13Sample Factor Equation node advanced output
407
Generated Models
The advanced output for factor analysis gives detailed information on the estimatedmodel and its performance. Most of the information contained in the advancedoutput is quite technical, and extensive knowledge of factor analysis is required toproperly interpret this output.
Warnings. Indicates any warnings or potential problems with the results.
Communalities. Shows the proportion of each field's variance that is accounted for bythe factors or components. Initial gives the initial communalities with the full set offactors (the model starts with as many factors as input fields), and Extraction givesthe communalities based on the retained set of factors.
Total variance explained. Shows the total variance explained by the factors in themodel. Initial Eigenvalues shows the variance explained by the full set of initialfactors. Extraction Sums of Squared Loadings shows the variance explained byfactors retained in the model. Rotation Sums of Squared Loadings shows the varianceexplained by the rotated factors. Note that for oblique rotations, Rotation Sums ofSquared Loadings shows only the sums of squared loadings and does not showvariance percentages.
Factor (or component) matrix. Shows correlations between input fields and unrotatedfactors.
Rotated factor (or component) matrix. Shows correlations between input fields androtated factors for orthogonal rotations.
Pattern matrix. Shows the partial correlations between input fields and rotated factorsfor oblique rotations.
Structure matrix. Shows the simple correlations between input fields and rotatedfactors for oblique rotations.
Factor correlation matrix. Shows correlations among factors for oblique rotations.
Unrefined Rule Model
Unrefined Rule models represent the rules discovered by one of the association rulemodeling nodes (Apriori or GRI). These models contain information about the rulesextracted from the data. Unrefined Rule models are not designed for generatingpredictions directly, and they cannot be added to streams.
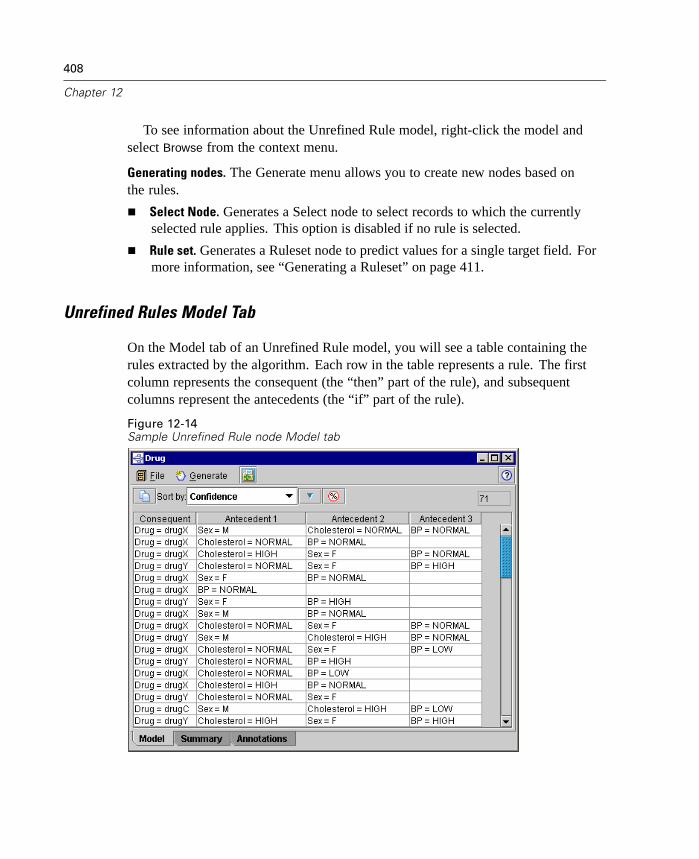
408
Chapter 12
To see information about the Unrefined Rule model, right-click the model andselect Browse from the context menu.
Generating nodes. The Generate menu allows you to create new nodes based onthe rules.
Select Node. Generates a Select node to select records to which the currentlyselected rule applies. This option is disabled if no rule is selected.
Rule set. Generates a Ruleset node to predict values for a single target field. Formore information, see “Generating a Ruleset” on page 411.
Unrefined Rules Model Tab
On the Model tab of an Unrefined Rule model, you will see a table containing therules extracted by the algorithm. Each row in the table represents a rule. The firstcolumn represents the consequent (the “then” part of the rule), and subsequentcolumns represent the antecedents (the “if” part of the rule).
Figure 12-14Sample Unrefined Rule node Model tab
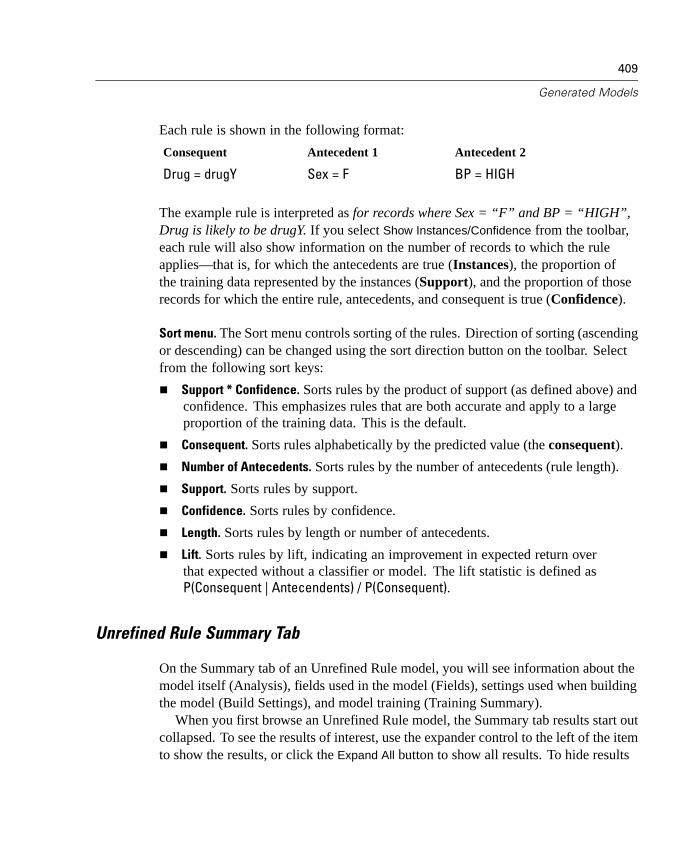
409
Generated Models
Each rule is shown in the following format:
Consequent Antecedent 1 Antecedent 2
Drug = drugY Sex = F BP = HIGH
The example rule is interpreted as for records where Sex = “F” and BP = “HIGH”,Drug is likely to be drugY. If you select Show Instances/Confidence from the toolbar,each rule will also show information on the number of records to which the ruleapplies—that is, for which the antecedents are true (Instances), the proportion ofthe training data represented by the instances (Support), and the proportion of thoserecords for which the entire rule, antecedents, and consequent is true (Confidence).
Sort menu. The Sort menu controls sorting of the rules. Direction of sorting (ascendingor descending) can be changed using the sort direction button on the toolbar. Selectfrom the following sort keys:
Support * Confidence. Sorts rules by the product of support (as defined above) andconfidence. This emphasizes rules that are both accurate and apply to a largeproportion of the training data. This is the default.
Consequent. Sorts rules alphabetically by the predicted value (the consequent).
Number of Antecedents. Sorts rules by the number of antecedents (rule length).
Support. Sorts rules by support.
Confidence. Sorts rules by confidence.
Length. Sorts rules by length or number of antecedents.
Lift. Sorts rules by lift, indicating an improvement in expected return overthat expected without a classifier or model. The lift statistic is defined asP(Consequent | Antecendents) / P(Consequent).
Unrefined Rule Summary Tab
On the Summary tab of an Unrefined Rule model, you will see information about themodel itself (Analysis), fields used in the model (Fields), settings used when buildingthe model (Build Settings), and model training (Training Summary).
When you first browse an Unrefined Rule model, the Summary tab results start outcollapsed. To see the results of interest, use the expander control to the left of the itemto show the results, or click the Expand All button to show all results. To hide results
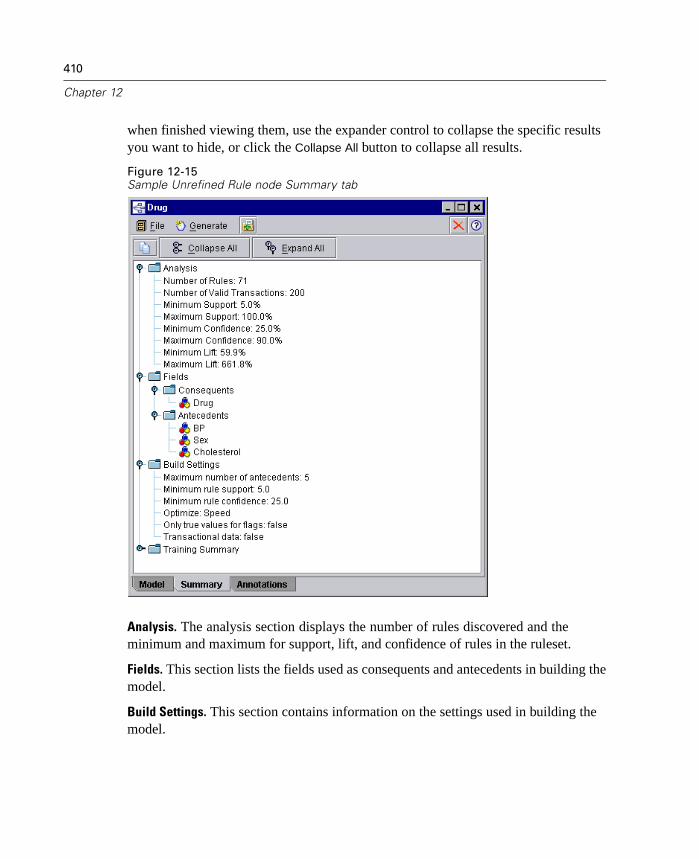
410
Chapter 12
when finished viewing them, use the expander control to collapse the specific resultsyou want to hide, or click the Collapse All button to collapse all results.
Figure 12-15Sample Unrefined Rule node Summary tab
Analysis. The analysis section displays the number of rules discovered and theminimum and maximum for support, lift, and confidence of rules in the ruleset.
Fields. This section lists the fields used as consequents and antecedents in building themodel.
Build Settings. This section contains information on the settings used in building themodel.
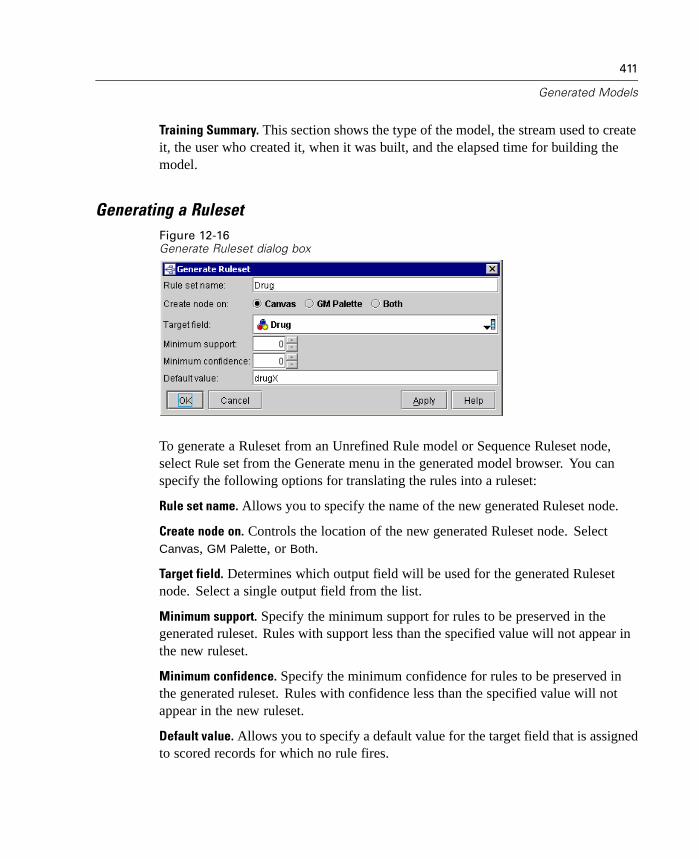
411
Generated Models
Training Summary. This section shows the type of the model, the stream used to createit, the user who created it, when it was built, and the elapsed time for building themodel.
Generating a RulesetFigure 12-16Generate Ruleset dialog box
To generate a Ruleset from an Unrefined Rule model or Sequence Ruleset node,select Rule set from the Generate menu in the generated model browser. You canspecify the following options for translating the rules into a ruleset:
Rule set name. Allows you to specify the name of the new generated Ruleset node.
Create node on. Controls the location of the new generated Ruleset node. SelectCanvas, GM Palette, or Both.
Target field. Determines which output field will be used for the generated Rulesetnode. Select a single output field from the list.
Minimum support. Specify the minimum support for rules to be preserved in thegenerated ruleset. Rules with support less than the specified value will not appear inthe new ruleset.
Minimum confidence. Specify the minimum confidence for rules to be preserved inthe generated ruleset. Rules with confidence less than the specified value will notappear in the new ruleset.
Default value. Allows you to specify a default value for the target field that is assignedto scored records for which no rule fires.
412
Chapter 12
Generated Ruleset Node
Generated Ruleset nodes represent the rules for predicting a particular output fielddiscovered by one of the association rule modeling nodes (Apriori or GRI), by theBuild C5.0 node, or by the C&R Tree node. For association rules, the generatedRuleset node must be generated from an Unrefined Rule node. For C&R Tree models,the generated Ruleset node must be generated from the C&R Tree model node. Agenerated Ruleset node can be created directly by C5.0 using the ruleset option andcan also be generated from a C5.0 decision tree model. Unlike Unrefined Rule nodes,generated Ruleset nodes can be placed in streams to generate predictions.
You can add the generated Ruleset node to your stream by clicking the icon inthe generated models palette and then clicking the stream canvas where you want toplace the node, or by right-clicking the icon and selecting Add to Stream from thecontext menu. Then connect your stream to the node, and you are ready to pass datato the Ruleset to generate predictions. The data coming into the generated modelnode must contain the same input fields, with the same types, as the training data usedto create the model. (If fields are missing or field types are mismatched, you willsee an error message when you execute the stream.)
To see information about the ruleset, right-click the Ruleset node and select Browse
from the context menu (or Edit for nodes in a stream).When you execute a stream containing a Ruleset node, the Ruleset node adds two
new fields containing the predicted value and the confidence for each record to thedata. The new field names are derived from the model name by adding prefixes.For association rulesets, the prefixes are $A- for the prediction field and $AC- forthe confidence field. For C5.0 rulesets, the prefixes are $C- for the prediction fieldand $CC- for the confidence field. For C&R Tree rulesets, the prefixes are $R- forthe prediction field and $RC- for the confidence field. In a stream with multipleRuleset nodes in a series predicting the same output field(s), the new field nameswill include numbers in the prefix to distinguish them from each other. The firstAssociation Ruleset node in the stream will use the usual names, the second nodewill use names starting with $A1- and $AC1-, the third node will use names startingwith $A2- and $AC2-, and so on.
413
Generated Models
How rules are applied. Rulesets are unlike other generated model nodes becausefor any particular record, more than one prediction may be generated, and thosepredictions may not all agree. There are two methods for generating predictionsfrom rulesets:
Voting. This method attempts to combine the predictions of all of the rules thatapply to the record. For each record, all rules are examined and each rulethat applies to the record is used to generate a prediction and an associatedconfidence. The sum of confidence figures for each output value is computed,and the value with the greatest confidence sum is chosen as the final prediction.The confidence for the final prediction is the confidence sum for that valuedivided by the number of rules that fired for that record.
First hit. This method simply tests the rules in order, and the first rule that appliesto the record is the one used to generate the prediction.
The method used can be controlled in the stream options. For more information, see“Setting Options for Streams” in Chapter 4 on page 73.
Generating nodes. The generate menu allows you to create new nodes based on theruleset.
Filter Node. Creates a new Filter node to filter fields that are not used by rules inthe ruleset.
Select Node. Creates a new Select node to select records to which the selectedrule applies. The generated node will select records for which all antecedents ofthe rule are true. This option requires a rule to be selected.
Rule Trace Node. Creates a new SuperNode that will compute a field indicatingwhich rule was used to make the prediction for each record. When a ruleset isevaluated using the first hit method, this is simply a symbol indicating the firstrule that would fire. When the ruleset is evaluated using the voting method, thisis a more complex string showing the input to the voting mechanism.
Single Decision Tree(Canvas)/Single Decision Tree(GM Palette). Creates a newsingle Ruleset derived from the currently selected rule. Only available for boostedC5.0 models. For more information, see “Boosted C5.0 Models” on page 427.
Model to Palette. Returns the model to the generated models palette. This isuseful in situations where a colleague may have sent you a stream containingthe model and not the model itself.
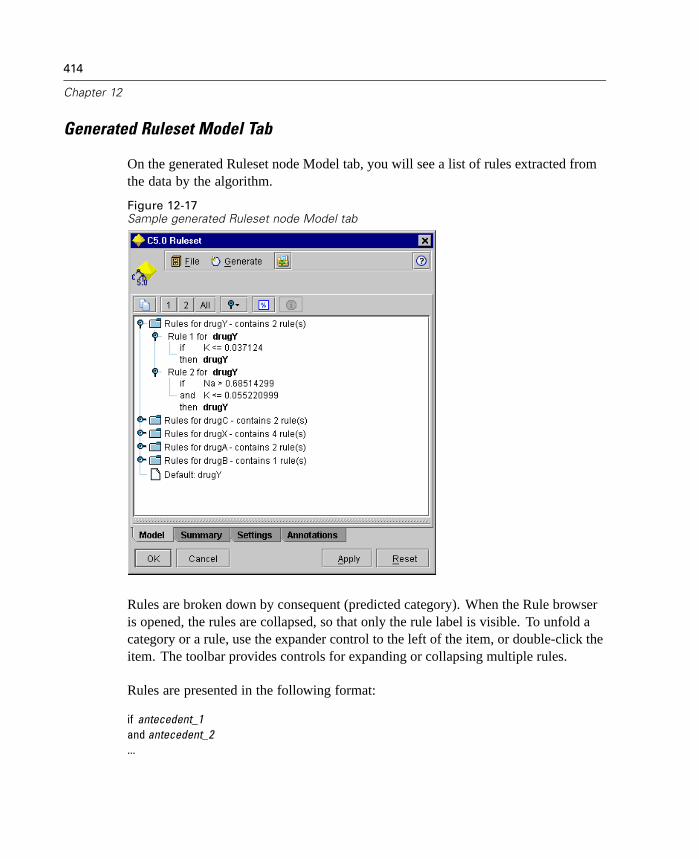
414
Chapter 12
Generated Ruleset Model Tab
On the generated Ruleset node Model tab, you will see a list of rules extracted fromthe data by the algorithm.
Figure 12-17Sample generated Ruleset node Model tab
Rules are broken down by consequent (predicted category). When the Rule browseris opened, the rules are collapsed, so that only the rule label is visible. To unfold acategory or a rule, use the expander control to the left of the item, or double-click theitem. The toolbar provides controls for expanding or collapsing multiple rules.
Rules are presented in the following format:
if antecedent_1and antecedent_2...
415
Generated Models
and antecedent_nthen predicted value
where consequent and antecedent_1 through antecedent_n are all conditions. Therule is interpreted as “for records where antecedent_1 through antecedent_n are alltrue, consequent is also likely to be true.” If you click the Show Instances/Confidence
button on the toolbar, each rule will also show information on the number of recordsto which the rule applies—that is, for which the antecedents are true (Instances), andthe proportion of those records for which the entire rule is true (Confidence).
Note that confidence is calculated somewhat differently for C5.0 rulesets. C5.0 usesthe following formula for calculating the confidence of a rule:
(1 + number of records where rule is correct) / (2 + number of records forwhich the rule's antecedents are true)
This calculation of the confidence estimate adjusts for the process of generalizingrules from a decision tree (which is what C5.0 does when it creates a ruleset).
Generated Ruleset Summary Tab
On the Summary tab of a generated Ruleset node, you will see information about themodel itself (Analysis), fields used in the model (Fields), settings used when buildingthe model (Build Settings), and model training (Training Summary).
When you first browse a generated Ruleset node, the Summary tab results start outcollapsed. To see the results of interest, use the expander control to the left of the itemto show the results, or click the Expand All button to show all results. To hide resultswhen finished viewing them, use the expander control to collapse the specific resultsyou want to hide, or click the Collapse All button to collapse all results.

416
Chapter 12
Figure 12-18Sample generated Ruleset node Summary tab
Analysis. The analysis section displays the tree depth. If you have executed anAnalysis node attached to this modeling node, information from that analysis willalso appear in this section. For more information, see “Analysis Node” in Chapter14 on page 504.
Fields. This section lists the fields used as the target and the inputs in building themodel.
Build Settings. This section contains information on the settings used in building themodel.
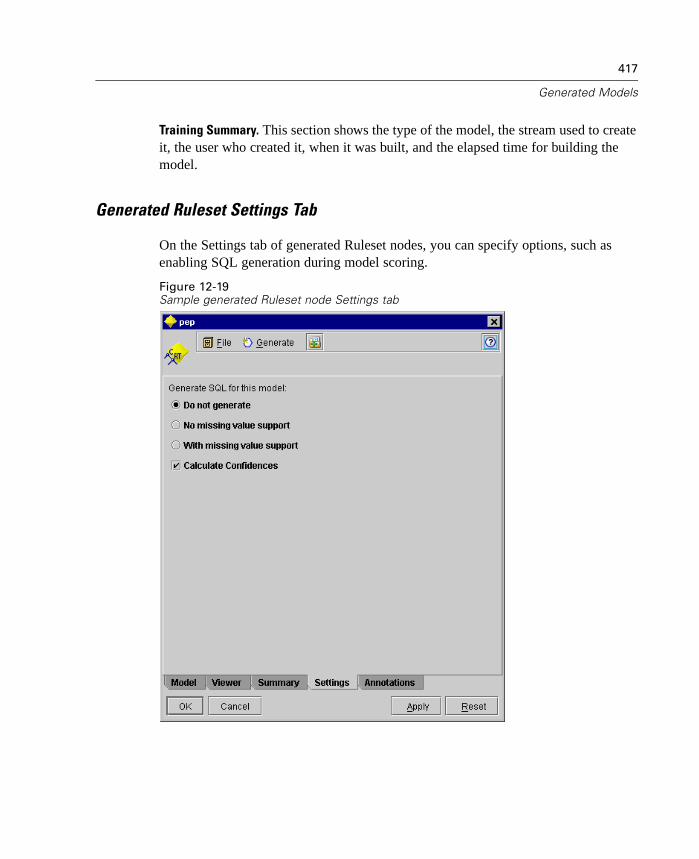
417
Generated Models
Training Summary. This section shows the type of the model, the stream used to createit, the user who created it, when it was built, and the elapsed time for building themodel.
Generated Ruleset Settings Tab
On the Settings tab of generated Ruleset nodes, you can specify options, such asenabling SQL generation during model scoring.
Figure 12-19Sample generated Ruleset node Settings tab

418
Chapter 12
Generate SQL. Select one of the options below to enable or disable SQL generation forthe model in order to take advantage of in-database mining. The settings specifiedhere apply only when operating with a database.
Do not generate. Select to disable SQL generation for the model.
No missing value support. Select to enable SQL generation without the overheadof handling missing values. This option simply sets the prediction to null ($null$)when a missing value is encountered while scoring a case. Note: This option isavailable only for decision trees and is the recommended selection for C5.0 treesor when the data has already been treated for missing values.
With missing value support. Select to enable SQL generation with full missingvalue support. This means that SQL is generated so that missing values arehandled as specified in the model. For example, C&RT trees use surrogate rulesand biggest child fallback. Note: SQL generation does not provide efficientsupport for C5.0's treatment of missing values; therefore, this option is notenabled for C5.0 trees. No missing value support is recommended if you stillwant to generate SQL for C5.0 trees.
Calculate Confidences. Select to include confidences in scoring operations pushedback to the database. Control over confidences allows you to generate more efficientSQL.
Generated Decision Tree Node
Generated Decision Tree nodes represent the tree structures for predicting a particularoutput field discovered by one of the decision tree modeling nodes (C5.0, C&RTree, or Build Rule from previous versions of Clementine). Note that although theBuild Rule node has been replaced by the C&R Tree node in version 6.0 or higher,Decision Tree nodes in existing streams that were originally created using a BuildRule node will still function properly.
To see information about the decision tree model, right-click the Decision Treenode and select Browse from the context menu (or Edit for nodes in a stream).
You can add the Decision Tree node to your stream by clicking the icon in thegenerated models palette and then clicking the stream canvas where you want to placethe node, or by right-clicking the icon and selecting Add to Stream from the contextmenu. Then connect your stream to the node, and you are ready to pass data to thedecision tree model to generate predictions. The data coming into the generated

419
Generated Models
model node must contain the same input fields, with the same types, as the trainingdata used to create the model. (If fields are missing or field types are mismatched,you will see an error message when you execute the stream.)
When you execute a stream containing a Decision Tree node, the Decision Treenode adds two new fields containing the predicted value and the confidence for eachrecord to the data. The new field names are derived from the model name by addingprefixes. For C&R and Build Rule trees, the prefixes are $R- for the predictionfield and $RC- for the confidence field. For C5.0 trees, the prefixes are $C- for theprediction field and $CC- for the confidence field. In a stream with multiple DecisionTree nodes in a series predicting the same output field(s), the new field names willinclude numbers in the prefix to distinguish them from each other. For example, thefirst C&R Tree node in the stream will use the usual names, the second node willuse names starting with $R1- and $RC1-, the third node will use names startingwith $R2- and $RC2-, and so on.
Generating nodes. The generate menu allows you to create new nodes based on thetree model.
Filter Node. Creates a new Filter node to filter fields that are not used by the treemodel. If there is a Type node upstream from this Decision Tree node, any fieldswith direction OUT are passed on by the generated Filter node.
Select Node. Creates a new Select node to select records assigned to the currentlyselected branch of the tree. This option requires a tree branch to be selected.
Rule set. Creates a new Ruleset node containing the tree structure as a set of rulesdefining the terminal branches of the tree. This option is not available whenbrowsing a regression tree (a decision tree with a numeric output field.)
Single Decision Tree(Canvas)/Single Decision Tree(GM Palette). Creates a newsingle Ruleset derived from the currently selected rule. Only available for boostedC5.0 models. For more information, see “Boosted C5.0 Models” on page 427.
Model to Palette. Returns the model to the generated models palette. This isuseful in situations where a colleague may have sent you a stream containingthe model and not the model itself.
Decision Tree Model Tab
The Decision Tree node Model tab displays a list of conditions defining thepartitioning of data discovered by the algorithm.

420
Chapter 12
Figure 12-20Sample Decision Tree node Model tab
When the Rule browser is opened, the rules are collapsed, so that only the rule labelis visible. To unfold a category or a rule, use the expander control to the left ofthe item, or double-click the item. The toolbar provides controls for expanding orcollapsing multiple rules.
Decision trees work by recursively partitioning the data based on input field values.The data partitions are called branches. The initial branch (sometimes called theroot) encompasses all data records. The root is split into subsets or child branches,based on the value of a particular input field. Each child branch may be furthersplit into sub-branches, which may in turn be split again, and so on. At the lowest
421
Generated Models
level of the tree are branches that have no more splits. Such branches are known asterminal branches, or leaves.
The Decision Tree browser shows the input values that define each partition orbranch and a summary of output field values for the records in that split. For splitsbased on numeric fields, the branch is shown by a line of the form:
fieldname relation value [summary]
where relation is a numeric relation. For example, a branch defined by values greaterthan 100 for the revenue field would appear as
revenue > 100 [summary]
For splits based on symbolic fields, the branch is shown by a line of the form:
fieldname = value [summary] or fieldname in [values] [summary]
where values are the field values that define the branch. For example, a branchthat includes records where the value of region can be any of North, West, or Southwould be represented as
region in ["North" "West" "South"] [summary]
For terminal branches, a prediction is also given adding an arrow and the predictedvalue to the end of the rule condition. For example, a leaf defined by revenue > 100that predicts a value of high for the output field, the Tree browser would display
revenue > 100 [Mode: high] high
The summary for the branch is defined differently for symbolic and numeric outputfields. For trees with numeric output fields, the summary is the average value forthe branch, and the effect of the branch is the difference between the average for thebranch and the average of its parent branch. For trees with symbolic output fields, thesummary is the mode, or the most frequent value, for records in the branch.
To fully describe a branch, you need to include the condition that defines thebranch, plus the conditions that define the splits further up the tree. For example, inthe tree
revenue > 100region = "North"region in ["South" "East" "West"]

422
Chapter 12
revenue <= 200
the branch represented by the second line is defined by the conditions revenue > 100and region = “North”.
If you select Show Instances/Confidence from the toolbar, each rule will also showinformation on the number of records to which the rule applies (Instances) and theproportion of those records for which the rule is true (Confidence).
If you select Show Additional Information Panel from the toolbar, you will see a panelcontaining detailed information for the selected rule at the bottom of the window. Theinformation panel contains three tabs.
Figure 12-21Information panel
History. This tab traces the split conditions from the root node down to theselected node. This provides a list of conditions that determines when a recordis assigned to the selected node. Records for which all the conditions are truewill be assigned to this node.
Frequencies. For models with symbolic target fields, this tab shows for eachpossible target value the number of records assigned to this node (in the trainingdata) that have that target value. The frequency figure, expressed as a percentage(shown to a maximum of 3 decimal places) is also displayed. For models withnumeric targets, this tab is empty.
Surrogates. For C&R Tree models, the primary split and any surrogate splits forthe selected node are shown. This tells you how records with missing values forthe primary split field will be classified at that split. For other decision treemodels, this tab is empty.

423
Generated Models
Decision Tree Viewer Tab
The Viewer tab shows a graphical display of the structure of the tree in detail. In mostcases, because of the size of the overall tree, only a portion of the tree is visible inthe Tree view. You can scroll the window to view other parts of the tree or use thetree map window to select a different region of the tree to view. To show the treemap window, click the tree map button on the toolbar.
Figure 12-22Sample Decision Tree Viewer tab with tree map window
You can display each node in the tree as a table of values, a graph of values, orboth. You can control the node display using the toolbar buttons. You can alsochange the orientation of the tree display (top-down, left-to-right, or right-to-left)using the toolbar controls.
424
Chapter 12
You can expand and collapse the branches in the tree for display purposes. Bydefault, all branches in the tree are expanded. Click the minus sign (–) next to aparent node to hide all of its child nodes. Click the plus sign (+) next to a parentnode to display its child nodes.
You can select a node in the Viewer tab for generating a Ruleset or a Select nodefrom the Generate menu. To select a node, simply click on it.
Node statistics. For a symbolic target field, the table shows the number and percentageof records in each category and the percentage of the entire sample that the noderepresents. For a range (numeric) target field, the table shows the mean, standarddeviation, number of records, and predicted value of the target field.
Node graphs. For a symbolic target field, the graph is a bar chart of percentages ineach category of the target field. Preceding each row in the table is a color swatchthat corresponds to the color that represents each of the target field categories in thegraphs for the node. For a range (numeric) target field, the graph shows a histogramof the target field for records in the node.
Decision Tree Summary Tab
On the Summary tab of a Decision Tree node, you will see information about themodel itself (Analysis), fields used in the model (Fields), settings used when buildingthe model (Build Settings), and model training (Training Summary).
When you first browse a Decision Tree node, the Summary tab results start outcollapsed. To see the results of interest, use the expander control to the left of the itemto show the results, or click the Expand All button to show all results. To hide resultswhen finished viewing them, use the expander control to collapse the specific resultsyou want to hide, or click the Collapse All button to collapse all results.
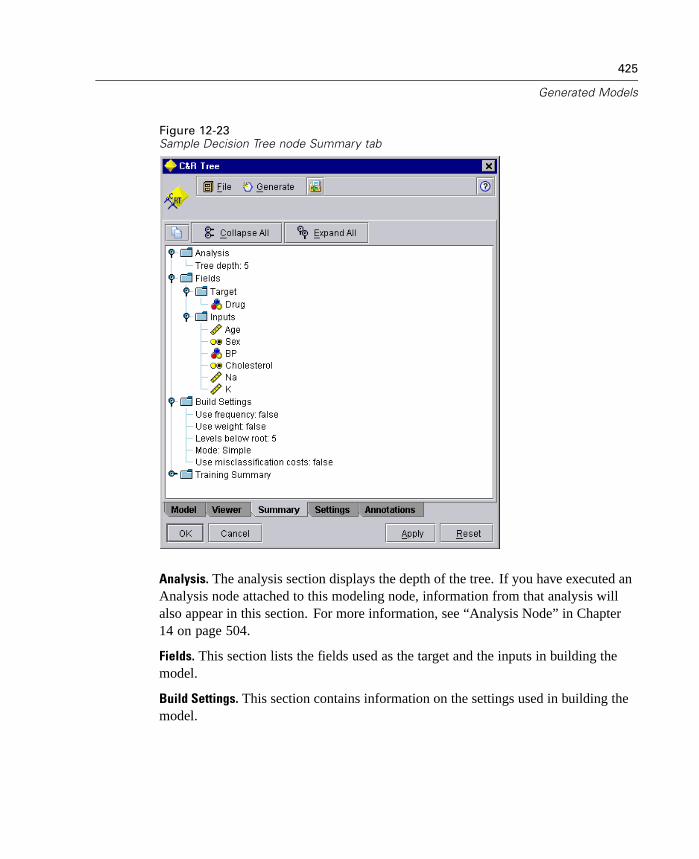
425
Generated Models
Figure 12-23Sample Decision Tree node Summary tab
Analysis. The analysis section displays the depth of the tree. If you have executed anAnalysis node attached to this modeling node, information from that analysis willalso appear in this section. For more information, see “Analysis Node” in Chapter14 on page 504.
Fields. This section lists the fields used as the target and the inputs in building themodel.
Build Settings. This section contains information on the settings used in building themodel.
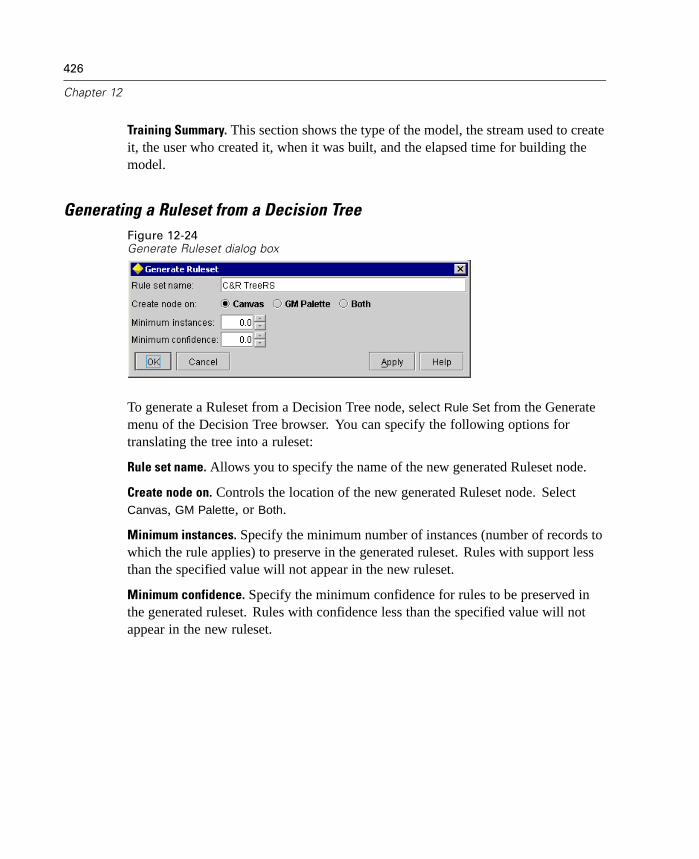
426
Chapter 12
Training Summary. This section shows the type of the model, the stream used to createit, the user who created it, when it was built, and the elapsed time for building themodel.
Generating a Ruleset from a Decision TreeFigure 12-24Generate Ruleset dialog box
To generate a Ruleset from a Decision Tree node, select Rule Set from the Generatemenu of the Decision Tree browser. You can specify the following options fortranslating the tree into a ruleset:
Rule set name. Allows you to specify the name of the new generated Ruleset node.
Create node on. Controls the location of the new generated Ruleset node. SelectCanvas, GM Palette, or Both.
Minimum instances. Specify the minimum number of instances (number of records towhich the rule applies) to preserve in the generated ruleset. Rules with support lessthan the specified value will not appear in the new ruleset.
Minimum confidence. Specify the minimum confidence for rules to be preserved inthe generated ruleset. Rules with confidence less than the specified value will notappear in the new ruleset.
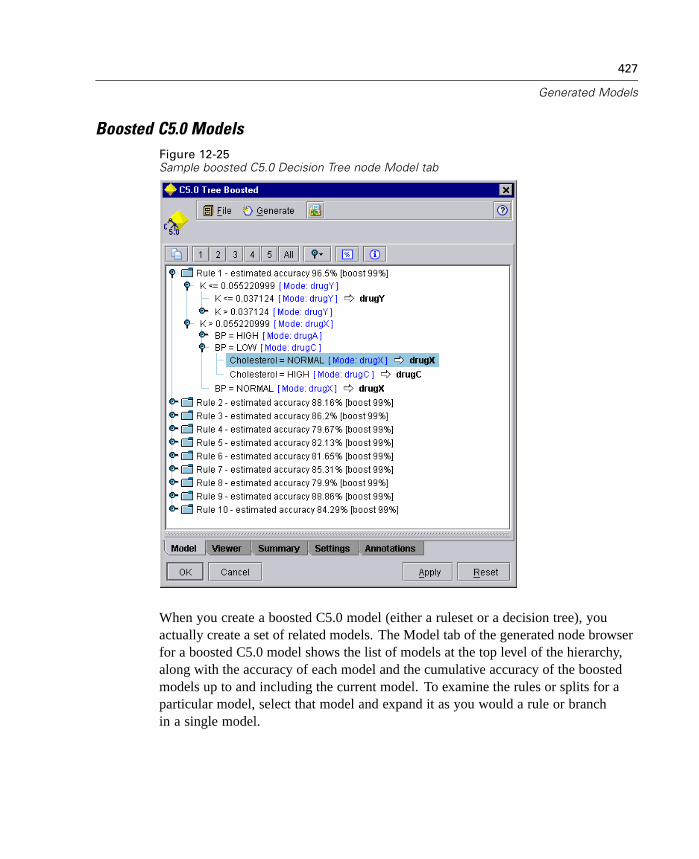
427
Generated Models
Boosted C5.0 ModelsFigure 12-25Sample boosted C5.0 Decision Tree node Model tab
When you create a boosted C5.0 model (either a ruleset or a decision tree), youactually create a set of related models. The Model tab of the generated node browserfor a boosted C5.0 model shows the list of models at the top level of the hierarchy,along with the accuracy of each model and the cumulative accuracy of the boostedmodels up to and including the current model. To examine the rules or splits for aparticular model, select that model and expand it as you would a rule or branchin a single model.
428
Chapter 12
You can also extract a particular model from the set of boosted models and create anew generated Ruleset node containing just that model. To create a new ruleset froma boosted C5.0 model, select the ruleset or tree of interest and choose either Single
Decision Tree (GM Palette) or Single Decision Tree (Canvas) from the Generate menu.
Generated Cluster Models
Cluster models are typically used to find groups (or clusters) of similar recordsbased on the variables examined, where the similarity between members of the samegroup is high and the similarity between members of different groups is low. Theresults can be used to identify associations that would otherwise not be apparent. Forexample, through cluster analysis of customer preferences, income level, and buyinghabits, it may be possible to identify the types of customers that are more likely torespond to a particular marketing campaign.
The following cluster models are generated in Clementine:
Generated Kohonen net node
Generated K-Means node
Generated TwoStep cluster node
To see information about the generated cluster models, right-click the model node andselect Browse from the context menu (or Edit for nodes in a stream).
Cluster Viewer Tab
The Viewer tab for cluster models shows a graphical display of summary statisticsand distributions for fields between clusters.

429
Generated Models
Figure 12-26Sample Cluster Viewer tab with cluster display
By default, the clusters are displayed on the x axis and the fields on the y axis. If thecluster matrix is large, it is automatically paginated for faster display on the screen.The expanded dialog contains options for viewing all clusters and fields at once. Thetoolbar contains buttons used for navigating through paginated results. For moreinformation, see “Navigating the Cluster View” on page 435.
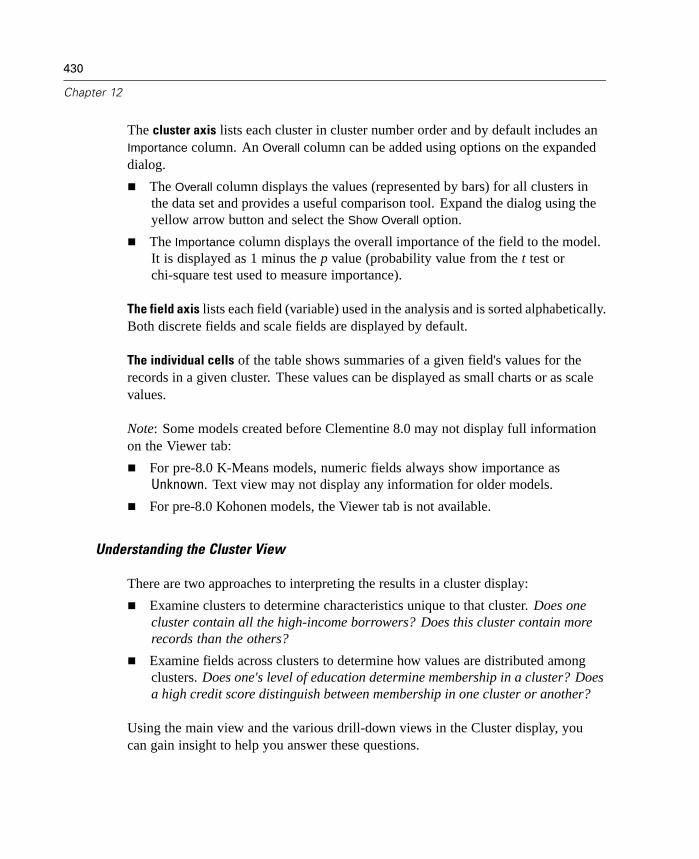
430
Chapter 12
The cluster axis lists each cluster in cluster number order and by default includes anImportance column. An Overall column can be added using options on the expandeddialog.
The Overall column displays the values (represented by bars) for all clusters inthe data set and provides a useful comparison tool. Expand the dialog using theyellow arrow button and select the Show Overall option.
The Importance column displays the overall importance of the field to the model.It is displayed as 1 minus the p value (probability value from the t test orchi-square test used to measure importance).
The field axis lists each field (variable) used in the analysis and is sorted alphabetically.Both discrete fields and scale fields are displayed by default.
The individual cells of the table shows summaries of a given field's values for therecords in a given cluster. These values can be displayed as small charts or as scalevalues.
Note: Some models created before Clementine 8.0 may not display full informationon the Viewer tab:
For pre-8.0 K-Means models, numeric fields always show importance asUnknown. Text view may not display any information for older models.
For pre-8.0 Kohonen models, the Viewer tab is not available.
Understanding the Cluster View
There are two approaches to interpreting the results in a cluster display:
Examine clusters to determine characteristics unique to that cluster. Does onecluster contain all the high-income borrowers? Does this cluster contain morerecords than the others?
Examine fields across clusters to determine how values are distributed amongclusters. Does one's level of education determine membership in a cluster? Doesa high credit score distinguish between membership in one cluster or another?
Using the main view and the various drill-down views in the Cluster display, youcan gain insight to help you answer these questions.
431
Generated Models
Figure 12-27Sub-section of Top View display for clusters
As you read across the row for a field, take note of how the category frequency(for discrete fields) and the mean-value distribution (for range fields) varies amongclusters. For example, in the image above, notice that Clusters 2 and 5 contain entirelydifferent values for the BP (blood pressure) field. This information, combined withthe importance level indicated in the column on the right, tells you that blood pressureis an important determinant of membership in a cluster. These clusters and the BPfield are worth examining in greater detail. Using the display, you can double-clickthe field for a more detailed view, displaying actual values and statistics.
The following tips provide more information on interpreting the detailed viewfor fields and clusters.
What Is Importance?
For both range (numeric) and discrete fields, the higher the importance measure, theless likely the variation for a field between clusters is due to chance and more likelydue to some underlying difference. In other words, fields with a higher importancelevel are those to explore further.
Importance is calculated as 1 minus the p value, where probability value is takenfrom t tests (for range fields) and chi-square tests (for discrete fields).

432
Chapter 12
Reading the Display for Discrete Fields
For discrete fields, or sets, the Top View (the default cluster comparison view)displays distribution charts indicating the category counts of the field for each cluster.Drill-down (by double-clicking or using the expanded tab options) to view actualcounts for each value within a cluster. These counts indicate the number of recordswith the given value that fall into a specific cluster.
Figure 12-28Drill-down view for a discrete field
To view both counts and percentages, view the display as text. For more information,see “Viewing Clusters as Text” on page 441. At any time, you can click the Top Viewbutton on the toolbar to return to the main Viewer display for all fields and clusters.Use the arrow buttons to flip through recent views.
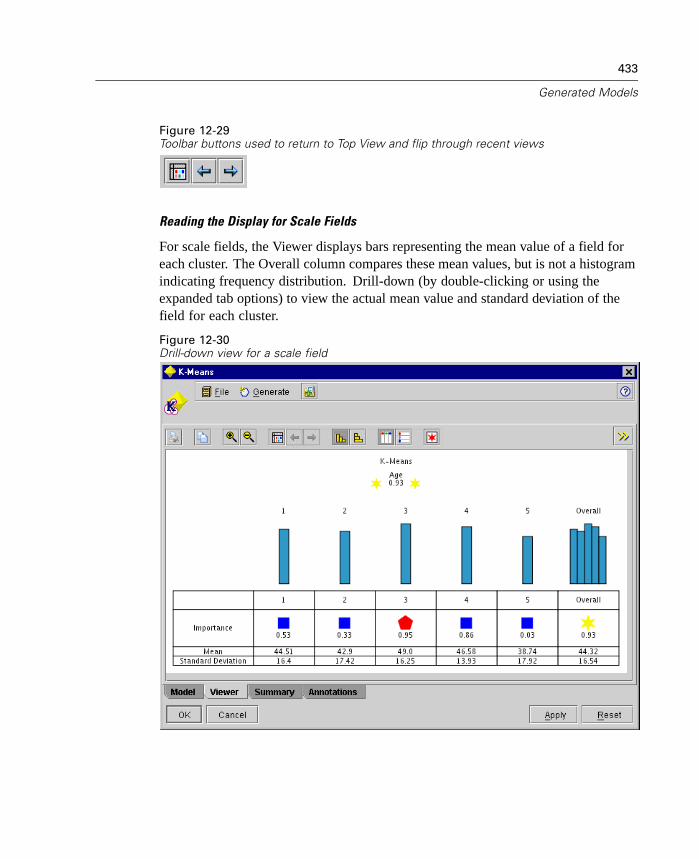
433
Generated Models
Figure 12-29Toolbar buttons used to return to Top View and flip through recent views
Reading the Display for Scale Fields
For scale fields, the Viewer displays bars representing the mean value of a field foreach cluster. The Overall column compares these mean values, but is not a histogramindicating frequency distribution. Drill-down (by double-clicking or using theexpanded tab options) to view the actual mean value and standard deviation of thefield for each cluster.
Figure 12-30Drill-down view for a scale field

434
Chapter 12
Reading Cluster Details
You can view detailed information about a single cluster by drilling-down intothe display. This is an effective way to quickly examine a cluster of interest anddetermine which field(s) might contribute to the cluster's uniqueness. Compare theCluster and Overall charts by field and use the importance levels to determine fieldsthat provide separation or commonality between clusters.
Figure 12-31Drill-down view for a single cluster
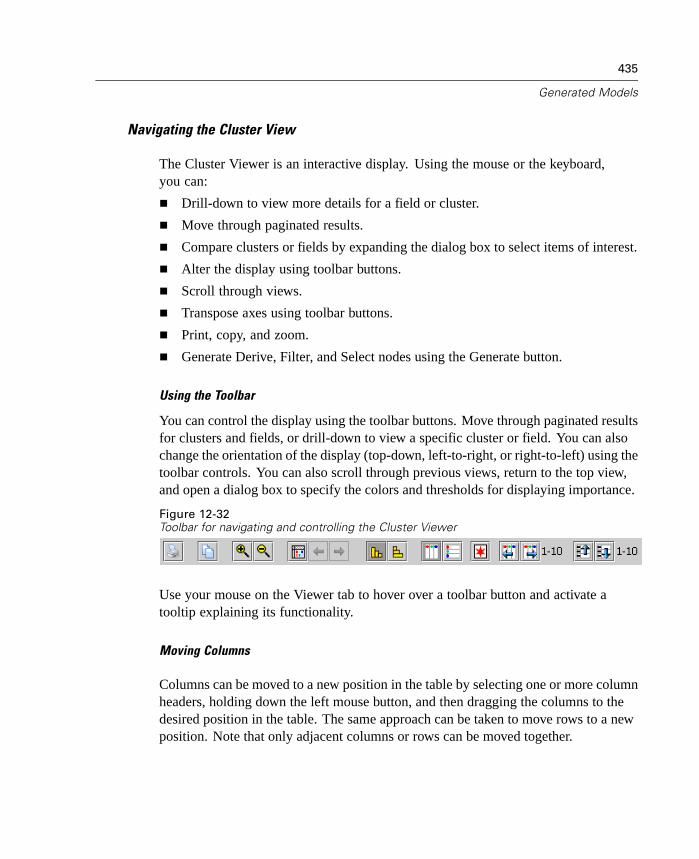
435
Generated Models
Navigating the Cluster View
The Cluster Viewer is an interactive display. Using the mouse or the keyboard,you can:
Drill-down to view more details for a field or cluster.
Move through paginated results.
Compare clusters or fields by expanding the dialog box to select items of interest.
Alter the display using toolbar buttons.
Scroll through views.
Transpose axes using toolbar buttons.
Print, copy, and zoom.
Generate Derive, Filter, and Select nodes using the Generate button.
Using the Toolbar
You can control the display using the toolbar buttons. Move through paginated resultsfor clusters and fields, or drill-down to view a specific cluster or field. You can alsochange the orientation of the display (top-down, left-to-right, or right-to-left) using thetoolbar controls. You can also scroll through previous views, return to the top view,and open a dialog box to specify the colors and thresholds for displaying importance.
Figure 12-32Toolbar for navigating and controlling the Cluster Viewer
Use your mouse on the Viewer tab to hover over a toolbar button and activate atooltip explaining its functionality.
Moving Columns
Columns can be moved to a new position in the table by selecting one or more columnheaders, holding down the left mouse button, and then dragging the columns to thedesired position in the table. The same approach can be taken to move rows to a newposition. Note that only adjacent columns or rows can be moved together.
436
Chapter 12
Generating Nodes from Cluster Models
The Generate menu allows you to create new nodes based on the cluster model.This option is available from the Model and Cluster tabs of the generated model.The generated nodes are placed unconnected on the canvas. Connect and make anydesired edits before execution.
Filter Node. Creates a new Filter node to filter fields that are not used by thecluster model. Make specifications by editing the Filter node generated on thestream canvas. If there is a Type node upstream from this Cluster node, any fieldswith direction OUT are discarded by the generated Filter node.
Filter Node (from selection). Creates a new Filter node to filter fields based uponselections in the Viewer. Select multiple fields using the Ctrl-click method.Fields selected in the Viewer are discarded downstream, but you may change thisbehavior by editing the Filter node before execution.
Select Node. Creates a new Select node to select fields based upon theirmembership in a each cluster. A select condition is automatically generated.
Select Node (from selection). Creates a new Select node to select fields basedupon membership in clusters selected in the Viewer. Select multiple clustersusing the Ctrl-click method.
Derive Node. Creates a new Derive node, which derives a field based uponmembership in all visible clusters. A derive condition is automatically generated.
Derive Node (from selection). Creates a new Derive node, which derives a fieldbased upon membership in clusters selected in the Viewer. Select multipleclusters using the Ctrl-click method.
Selecting Clusters for Display
You can specify clusters for display by selecting a cluster column in the viewerand double-clicking. Multiple adjacent cells, rows, or columns can be selected byholding down the Shift key on the keyboard while making a selection. Multiplenonadjacent cells, rows, or columns can be selected by holding down the Ctrl keywhile making a selection.

437
Generated Models
Alternatively, you can select clusters for display using a dialog box available fromthe expanded Cluster Viewer. To open the dialog box:
E Click the yellow arrow at the top of the Viewer to expand for more options.
Figure 12-33Expanded Viewer tab with Show and Sort options
E From the Cluster drop-down list, select one of several options for display.
Select Display All to show all clusters in the matrix.
Select a cluster number to display details for only that cluster.
Select Clusters Larger than, to set a threshold for display clusters. This enablesthe Records options, which allows you to specify the minimum numbers ofrecords in a cluster for it to be displayed.

438
Chapter 12
Select Clusters Smaller than, to set a threshold for displaying clusters. Thisenables the Records options, which allows you to specify the maximum numbersof records in a cluster for it to be displayed.
Select Custom to hand-select clusters for display. To the right of the drop-downlist, click the ellipsis (...) button to open a dialog box where you can selectavailable clusters.
Custom Selection of Clusters
In the Show Selected Clusters dialog box, cluster names are listed in the column onthe right. Individual clusters may be selected for display using the column on the left.
Click Select All to select and view all clusters.
Click Clear to deselect all clusters in the dialog box.
Selecting Fields for Display
You can specify fields for display by selecting a field row in the viewer anddouble-clicking.
Alternatively, you can select fields using a dialog available from the expanded ClusterViewer. To open the dialog box:
E Click the yellow arrow at the top of the Viewer to expand for more options.
E From the Field drop-down list, select one of several options for display.
Select Display All to show all fields in the matrix.
Select a field name to display details for only that field.
Select All Ranges, to display all range (numeric) fields.
Select All Discrete, to display all discrete (categorical) fields.
Select Conditional, to display fields that meet a certain level of importance. Youcan specify the importance condition using the Show drop-down list.
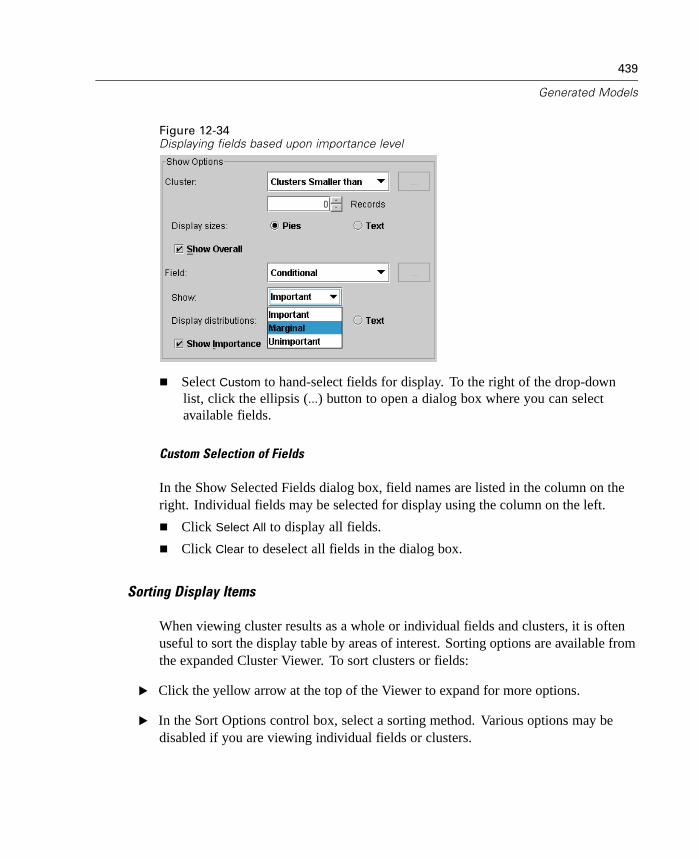
439
Generated Models
Figure 12-34Displaying fields based upon importance level
Select Custom to hand-select fields for display. To the right of the drop-downlist, click the ellipsis (...) button to open a dialog box where you can selectavailable fields.
Custom Selection of Fields
In the Show Selected Fields dialog box, field names are listed in the column on theright. Individual fields may be selected for display using the column on the left.
Click Select All to display all fields.
Click Clear to deselect all fields in the dialog box.
Sorting Display Items
When viewing cluster results as a whole or individual fields and clusters, it is oftenuseful to sort the display table by areas of interest. Sorting options are available fromthe expanded Cluster Viewer. To sort clusters or fields:
E Click the yellow arrow at the top of the Viewer to expand for more options.
E In the Sort Options control box, select a sorting method. Various options may bedisabled if you are viewing individual fields or clusters.
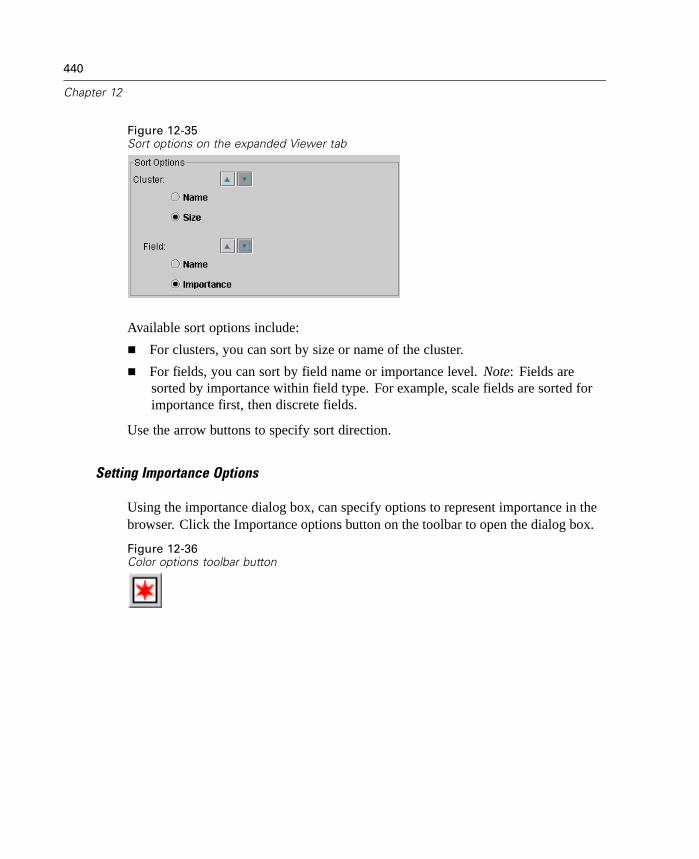
440
Chapter 12
Figure 12-35Sort options on the expanded Viewer tab
Available sort options include:
For clusters, you can sort by size or name of the cluster.
For fields, you can sort by field name or importance level. Note: Fields aresorted by importance within field type. For example, scale fields are sorted forimportance first, then discrete fields.
Use the arrow buttons to specify sort direction.
Setting Importance Options
Using the importance dialog box, can specify options to represent importance in thebrowser. Click the Importance options button on the toolbar to open the dialog box.
Figure 12-36Color options toolbar button
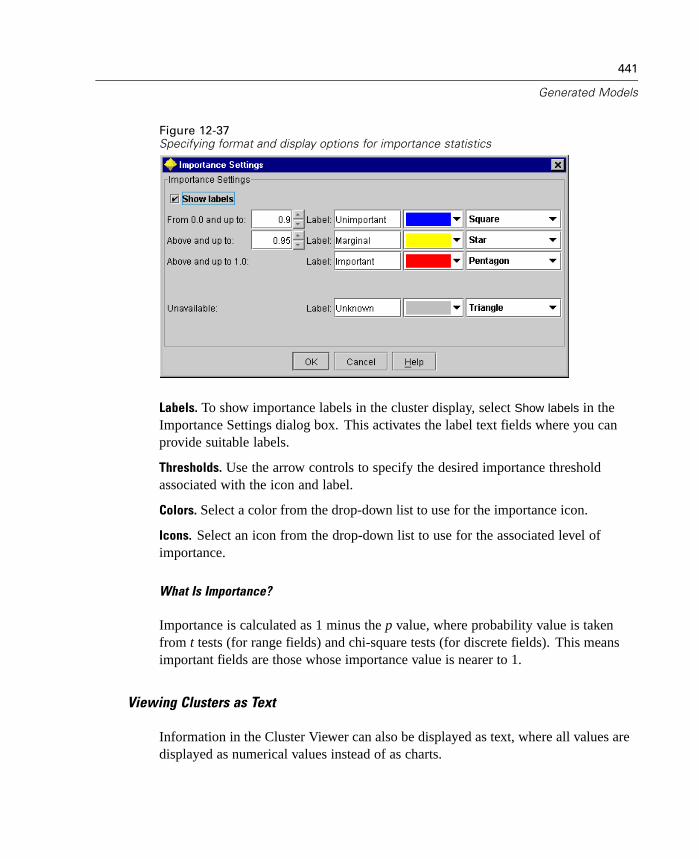
441
Generated Models
Figure 12-37Specifying format and display options for importance statistics
Labels. To show importance labels in the cluster display, select Show labels in theImportance Settings dialog box. This activates the label text fields where you canprovide suitable labels.
Thresholds. Use the arrow controls to specify the desired importance thresholdassociated with the icon and label.
Colors. Select a color from the drop-down list to use for the importance icon.
Icons. Select an icon from the drop-down list to use for the associated level ofimportance.
What Is Importance?
Importance is calculated as 1 minus the p value, where probability value is takenfrom t tests (for range fields) and chi-square tests (for discrete fields). This meansimportant fields are those whose importance value is nearer to 1.
Viewing Clusters as Text
Information in the Cluster Viewer can also be displayed as text, where all values aredisplayed as numerical values instead of as charts.
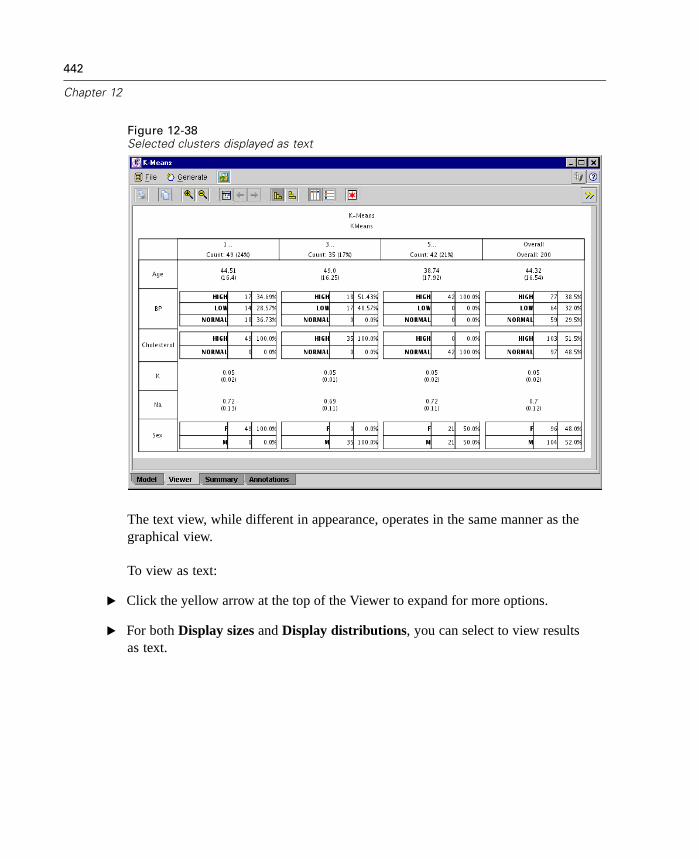
442
Chapter 12
Figure 12-38Selected clusters displayed as text
The text view, while different in appearance, operates in the same manner as thegraphical view.
To view as text:
E Click the yellow arrow at the top of the Viewer to expand for more options.
E For both Display sizes and Display distributions, you can select to view resultsas text.

443
Generated Models
Generated Kohonen Node
Generated Kohonen nodes represent the Kohonen networks created by Kohonennodes. They contain all of the information captured by the trained network, as well asinformation about the Kohonen network's architecture.
To see information about the Kohonen network model, right-click the generatedKohonen node and select Browse from the context menu (or Edit for nodes in a stream).
You can add the Kohonen model to your stream by clicking the icon in thegenerated models palette and then clicking the stream canvas where you want to placethe node, or by right-clicking the icon and selecting Add to Stream from the contextmenu. Then connect your stream to the node, and you are ready to pass data to theKohonen model to generate predictions. The data coming into the generated modelnode must contain the same input fields, with the same types, as the training data usedto create the model. (If fields are missing or field types are mismatched, you willsee an error message when you execute the stream.)
When you execute a stream containing a generated Kohonen node, the Kohonennode adds two new fields containing the X and Y coordinates of the unit in theKohonen output grid that responded most strongly to that record. The new fieldnames are derived from the model name, prefixed by $KX- and $KY-. For example,if your model is named Kohonen, the new fields would be named $KX-Kohonenand $KY-Kohonen. In a stream with multiple generated Kohonen nodes in a seriespredicting the same output field(s), the new field names will include numbers todistinguish them from each other. The first Net node in the stream will use the usualnames, the second node will use names starting with $KX1- and $KY1-, the third nodewill use names starting with $KX2- and $KY2-, and so on.
To get a better sense of what the Kohonen net has encoded, click the Viewer tab onthe generated model browser. This displays the Cluster Viewer, providing a graphicalrepresentation of clusters, fields, and importance levels. For more information, see“Cluster Viewer Tab” on page 428.
If you prefer to visualize the clusters as a grid, you can view the result of theKohonen net by plotting the $KX- and $KY- fields using a Plot node. (You shouldselect X-Agitation and Y-Agitation in the Plot node to prevent each unit's records fromall being plotted on top of each other.) In the plot, you can also overlay a symbolicfield to investigate how the Kohonen net has clustered the data.
Another powerful technique for gaining insight into the Kohonen network is to userule induction to discover the characteristics that distinguish the clusters found by thenetwork. For more information, see “C5.0 Node” in Chapter 11 on page 329.
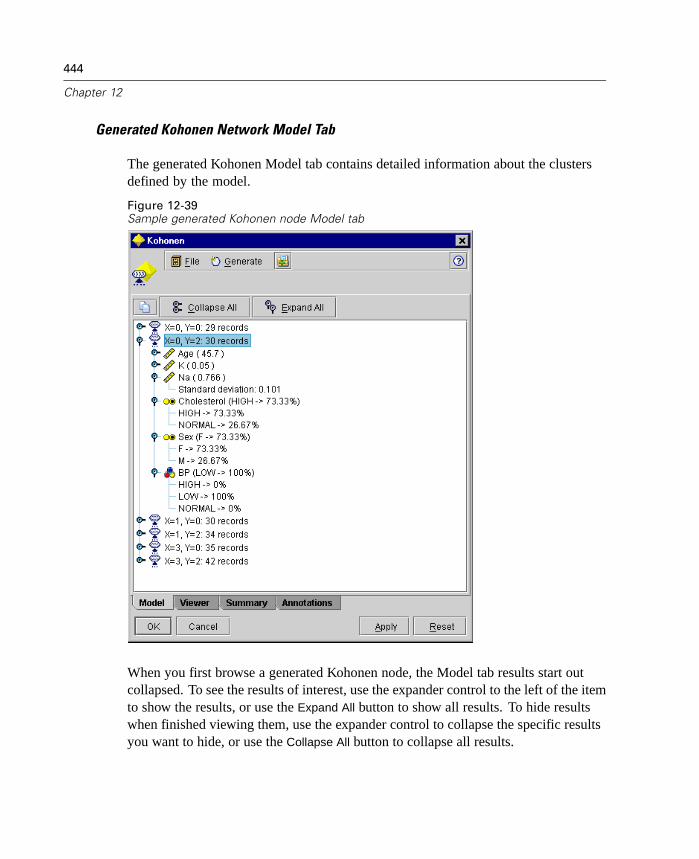
444
Chapter 12
Generated Kohonen Network Model Tab
The generated Kohonen Model tab contains detailed information about the clustersdefined by the model.
Figure 12-39Sample generated Kohonen node Model tab
When you first browse a generated Kohonen node, the Model tab results start outcollapsed. To see the results of interest, use the expander control to the left of the itemto show the results, or use the Expand All button to show all results. To hide resultswhen finished viewing them, use the expander control to collapse the specific resultsyou want to hide, or use the Collapse All button to collapse all results.

445
Generated Models
Clusters. Kohonen networks, also commonly called clusters, are labeled and thenumber of records assigned to each cluster is shown. Each cluster is described byits center, which can be thought of as the prototype for the cluster. For scale fields,the mean value and standard deviation for training records assigned to the cluster isgiven; for symbolic fields, the proportion for each distinct value is reported (exceptfor values that do not occur for any records in the cluster, which are omitted).
Generated Kohonen Network Summary Tab
On the Summary tab of a generated Kohonen node, you will see information aboutthe network itself (Analysis), fields used in the network (Fields), settings used whenbuilding the model (Build Settings), and model training (Training Summary).
When you first browse a generated Kohonen node, the Summary tab results startout collapsed. To see the results of interest, use the expander control to the left ofthe item to show the results, or use the Expand All button to show all results. To hideresults when finished viewing them, use the expander control to collapse the specificresults you want to hide, or use the Collapse All button to collapse all results.

446
Chapter 12
Figure 12-40Sample generated Kohonen node Summary tab
Analysis. The analysis section displays information about the architecture or topologyof the network. The length and width of the two-dimensional Kohonen feature map(the output layer) are shown as $KX-model_name and $KY-model_name. For the inputand output layers, the number of units in that layer is listed.
Fields. This section lists the fields used as inputs in building the model.
Build Settings. This section contains information on the settings used in building themodel.
Training Summary. This section shows the type of the model, the stream used to createit, the user who created it, when it was built, and the elapsed time for building themodel.
447
Generated Models
Generated K-Means Node
Generated K-Means nodes represent the clustering models created by Train K-Meansnodes. They contain all of the information captured by the clustering model, as wellas information about the training data and the estimation process.
To see information about the K-Means model, right-click the generated K-Meansnode and select Browse from the context menu (or Edit for nodes in a stream).
You can add the model to your stream by clicking the icon in the generated modelspalette and then clicking the stream canvas where you want to place the node, or byright-clicking the icon and selecting Add to Stream from the context menu. Thenconnect your stream to the node, and you are ready to pass data to the K-Means modelto assign cluster memberships. The data coming into the generated model node mustcontain the same input fields, with the same types, as the training data used to createthe model. (If fields are missing or field types are mismatched, you will see an errormessage when you execute the stream.)
When you execute a stream containing a generated K-Means node, the K-Meansnode adds two new fields containing the cluster membership and distance fromthe assigned cluster center for that record. The new field names are derived fromthe model name, prefixed by $KM- for the cluster membership and $KMD- for thedistance from the cluster center. For example, if your model is named Kmeans, thenew fields would be named $KM-Kmeans and $KMD-Kmeans. In a stream withmultiple generated K-Means nodes in a series predicting the same output field(s), thenew field names will include numbers to distinguish them from each other. The firstgenerated K-Means node in the stream will use the usual names, the second node willuse names starting with $KM1- and $KMD1-, the third node will use names startingwith $KM2- and $KMD2-, and so on.
A powerful technique for gaining insight into the K-Means model is to use ruleinduction to discover the characteristics that distinguish the clusters found by themodel. For more information, see “C5.0 Node” in Chapter 11 on page 329. You canalso click the Viewer tab on the generated model browser to display the ClusterViewer, providing a graphical representation of clusters, fields, and importance levels.For more information, see “Cluster Viewer Tab” on page 428.
Generated K-Means Model Tab
The generated K-Means Model tab contains detailed information about the clustersdefined by the model.

448
Chapter 12
Figure 12-41Sample generated K-Means node Model tab
When you first browse a generated K-Means node, the Model tab results start outcollapsed. To see the results of interest, use the expander control to the left of the itemto show the results, or use the Expand All button to show all results. To hide resultswhen finished viewing them, use the expander control to collapse the specific resultsyou want to hide, or use the Collapse All button to collapse all results.
Clusters. Clusters are labeled and the number of records assigned to each clusteris shown. Each cluster is described by its center, which can be thought of as theprototype for the cluster. For scale fields, the mean value for training recordsassigned to the cluster is given; for symbolic fields, the proportion for each distinctvalue is reported (except for values that do not occur for any records in the cluster,
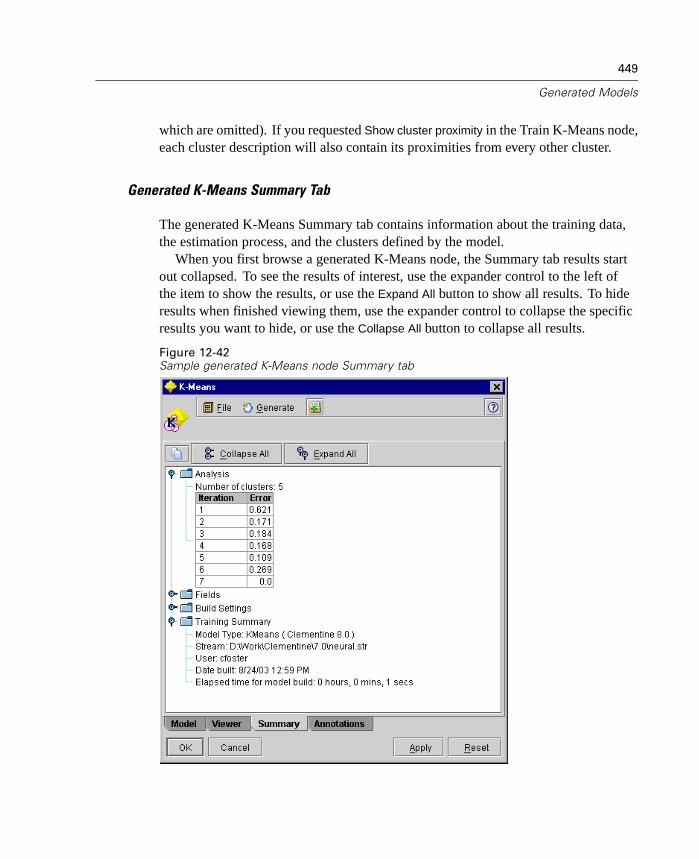
449
Generated Models
which are omitted). If you requested Show cluster proximity in the Train K-Means node,each cluster description will also contain its proximities from every other cluster.
Generated K-Means Summary Tab
The generated K-Means Summary tab contains information about the training data,the estimation process, and the clusters defined by the model.
When you first browse a generated K-Means node, the Summary tab results startout collapsed. To see the results of interest, use the expander control to the left ofthe item to show the results, or use the Expand All button to show all results. To hideresults when finished viewing them, use the expander control to collapse the specificresults you want to hide, or use the Collapse All button to collapse all results.
Figure 12-42Sample generated K-Means node Summary tab

450
Chapter 12
Analysis. The analysis section displays information about the cluster solution foundby the model. The number of clusters is shown, as well as the iteration history. If youhave executed an Analysis node attached to this modeling node, information fromthat analysis will also appear in this section. For more information, see “AnalysisNode” in Chapter 14 on page 504.
Fields. This section lists the fields used as inputs in building the model.
Build Settings. This section contains information on the settings used in building themodel.
Training Summary. This section shows the type of the model, the stream used to createit, the user who created it, when it was built, and the elapsed time for building themodel.
Generated TwoStep Cluster Node
Generated TwoStep Cluster nodes represent the clustering models created by TwoStepCluster nodes. They contain all of the information captured by the clustering model,as well as information about the training data and the estimation process.
To see information about the TwoStep cluster model, right-click the generatedTwoStep node and select Browse from the context menu (or Edit for nodes in a stream).
You can add the model to your stream by clicking the icon in the generated modelspalette and then clicking the stream canvas where you want to place the node, or byright-clicking the icon and selecting Add to Stream from the context menu. Thenconnect your stream to the node, and you are ready to pass data to the TwoStepCluster model to assign cluster memberships. The data coming into the generatedmodel node must contain the same input fields, with the same types, as the trainingdata used to create the model. (If fields are missing or field types are mismatched,you will see an error message when you execute the stream.)
When you execute a stream containing a generated TwoStep Cluster node, thenode adds a new field containing the cluster membership for that record. The newfield name is derived from the model name, prefixed by $T-. For example, if yourmodel is named TwoStep, the new field would be named $T-TwoStep. In a streamwith multiple generated TwoStep Cluster nodes in series, the new field names willinclude numbers to distinguish them from each other. The first TwoStep node in thestream will use the usual name, the second node will use a name starting with $T1-,the third node will use a name starting with $T2-, and so on.

451
Generated Models
A powerful technique for gaining insight into the TwoStep model is to use ruleinduction to discover the characteristics that distinguish the clusters found by themodel. For more information, see “C5.0 Node” in Chapter 11 on page 329. You canalso click the Viewer tab on the generated model browser to display the ClusterViewer, providing a graphical representation of clusters, fields, and importance levels.For more information, see “Cluster Viewer Tab” on page 428.
Generated TwoStep Model Tab
The generated TwoStep Model tab contains detailed information about the clustersdefined by the model.
When you first browse a generated TwoStep node, the Model tab results start outcollapsed. To see the results of interest, use the expander control to the left of the itemto show the results, or use the Expand All button to show all results. To hide resultswhen finished viewing them, use the expander control to collapse the specific resultsyou want to hide, or use the Collapse All button to collapse all results.

452
Chapter 12
Figure 12-43Sample generated TwoStep node Model tab
Clusters. Clusters are labeled, and the number of records assigned to each clusteris shown. Each cluster is described by its center, which can be thought of as theprototype for the cluster. For scale fields, the average value and standard deviationfor training records assigned to the cluster is given; for symbolic fields, the proportionfor each distinct value is reported (except for values that do not occur for any recordsin the cluster, which are omitted).
Generated TwoStep Summary Tab
The generated TwoStep Summary tab contains information about the training data,the estimation process, and the clusters defined by the model.

453
Generated Models
When you first browse a generated TwoStep node, the Summary tab results startout collapsed. To see the results of interest, use the expander control to the left ofthe item to show the results, or use the Expand All button to show all results. To hideresults when finished viewing them, use the expander control to collapse the specificresults you want to hide, or use the Collapse All button to collapse all results.
Figure 12-44Sample generated TwoStep node Summary tab
Analysis. The analysis section displays the number of clusters found.
Fields. This section lists the fields used as inputs in building the model.
Build Settings. This section contains information on the settings used in building themodel.
454
Chapter 12
Training Summary. This section shows the type of the model, the stream used to createit, the user who created it, when it was built, and the elapsed time for building themodel.
Generated Sequence Rules Node
Generated Sequence Rules nodes represent the sequences found for a particularoutput field discovered by the Sequence node. Unlike Unrefined Rule nodes createdby association rule nodes like Apriori and GRI, generated Sequence Rules nodes canbe placed in streams to generate predictions.
To see information about the sequence model, right-click the Sequence Rules nodeand select Browse from the context menu (or Edit for nodes in a stream).
You can also add a Sequence Rules node to a data stream to generate predictions.The data format must match the format used when building the sequence model.When you execute a stream containing a Sequence Rules node, the Sequence Rulesnode adds a pair of fields containing predictions and associated confidence valuesfor each prediction from the sequence model to the data. By default, three pairs offields containing the top three predictions (and their associated confidence values)are added. You can change the number of predictions generated when you buildthe model by setting the Sequence node model options at build time. For moreinformation, see “Sequence Node Model Options” in Chapter 11 on page 376.
The new field names are derived from the model name. The field names are$S-sequence-n for the prediction field (where n indicates the nth prediction) and$SC-sequence-n for the confidence field. In a stream with multiple Sequence Rulesnodes in a series, the new field names will include numbers in the prefix to distinguishthem from each other. The first Sequence Set node in the stream will use the usualnames, the second node will use names starting with $S1- and $SC1-, the third nodewill use names starting with $S2- and $SC2-, and so on. Predictions appear inorder by confidence, so that $S-sequence-1 contains the prediction with the highestconfidence, $S-sequence-2 contains the prediction with the next highest confidence,and so on. For records where the number of available predictions is smaller than thenumber of predictions requested, remaining predictions contain the value $null$. Forexample, if only two predictions can be made for a particular record, the values of$S-sequence-3 and $SC-sequence-3 will be $null$.
455
Generated Models
Predictions made by the generated Sequence Model node are not tied to the timestamp of the record to which they are added. They simply refer to the most likelyitems to appear at some point in the future, given the history of transactions for thecurrent ID up to the current record. For more information, see “Predictions fromSequence Rules” on page 455.
Note: When scoring data using a generated Sequence Set node in a stream, anytolerance or gap settings that you selected in building the model are ignored forscoring purposes.
Generating nodes. The Generate menu allows you to create new SuperNodes basedon the sequence model.
Rule SuperNode. Generates a SuperNode that can detect and count occurrencesof sequences in scored data. This option is disabled if no rule is selected. Formore information, see “Generating a Rule SuperNode from a Sequence RulesNode” on page 460.
Model to Palette. Returns the model to the generated models palette. This isuseful in situations where a colleague may have sent you a stream containingthe model and not the model itself.
Predictions from Sequence Rules
When you pass data records into a Sequence Rules node, the node handles therecords in a time-dependent manner (or order-dependent, if no timestamp field wasused to build the model). Records should be sorted by the ID field and timestampfield (if present).
For each record, the rules in the model are compared to the set of transactionsprocessed for the current ID so far, including the current record and any previousrecords with the same ID and earlier timestamp. The k rules with the highestconfidence values that apply to this set of transactions are used to generate the kpredictions for the record, where k is the number of predictions specified when themodel was built. (If multiple rules predict the same outcome for the transaction set,only the rule with the highest confidence is used.)
Note that the predictions for each record do not necessarily depend on that record'stransactions. If the current record's transactions do not trigger a specific rule, ruleswill be selected based on the previous transactions for the current ID. In other words,if the current record doesn't add any useful predictive information to the sequence,
456
Chapter 12
the prediction from the last useful transaction for this ID is carried forward to thecurrent record.
For example, suppose you have a Sequence Rule model with the single rule
Jam -> Bread (0.66)
and you pass it the following records:
ID Purchase Prediction
001 jam bread001 milk bread
Notice that the first record generates a prediction of bread, as you would expect. Thesecond record also contains a prediction of bread, because there's no rule for jamfollowed by milk; therefore the milk transaction doesn't add any useful information,and the rule Jam -> Bread still applies.
Sequence Rules Model Tab
On the Model tab of a Sequence Rules node, you will see a table containing the rulesextracted by the algorithm. Each row in the table represents a rule. The first columnrepresents the consequent (the “then” part of the rule), and subsequent columnsrepresent the antecedents (the “if” part of the rule). Each antecedent representsone itemset in the sequence, and the itemsets are shown in the order in which theyappear in the sequence.

457
Generated Models
Figure 12-45Sample Sequence Rules node Model tab
Each rule is shown in the following format:
Consequent Antecedent 1 Antecedent 2
frozenmeal frozenmeal beercannedveg frozenmeal and beer
The first example rule is interpreted as for IDs that had “frozenmeal” in onetransaction and then “beer” in another, there is likely a subsequent occurrenceof “frozenmeal.” The second example rule is interpreted as for IDs that had“frozenmeal” and “beer” in the same transaction, there is likely a subsequentoccurrence of “cannedveg.” There is an important difference between the two rules:in the first rule, frozenmeal and beer are purchased at different times, but in thesecond rule they are purchased at the same time.
458
Chapter 12
If you select Show Instances/Confidence from the toolbar, each rule will also showinformation on the number of IDs for which the sequence appears (Instances), theproportion of the training data IDs represented by the instances (Support), andthe proportion of those IDs for which the rule is true (Confidence). Note that theproportions are based on valid transactions (transactions with at least one observeditem or true value) rather than total transactions. Invalid transactions—those with noitems or true values—are discarded for these calculations.
Sort menu. The Sort menu controls sorting of the rules. Direction of sorting (ascendingor descending) can be changed using the sort direction button on the toolbar. Selectfrom the following sort keys:
Support. Sorts rules by support.
Confidence. Sorts rules by confidence. This is the default.
Support * Confidence. Sorts rules by the product of support and confidence. Thisemphasizes rules that are both accurate and apply to a large proportion of thetraining data.
Consequent. Sorts rules alphabetically by the predicted value (the consequent).
First Antecedent. Sorts rules by the first item of the first antecedent itemset.
Last Antecedent. Sorts rules by the first item of the last antecedent itemset.
Number of Items. Sorts rules by the number of items, counting individual itemsacross all itemsets in the rule.
For example, the following table is sorted in ascending order by number of items:
Consequent Antecedent 1 Antecedent 2
cannedveg cannedveg frozenmealfrozenmeal cannedveg and
frozenmeal and beer
The first rule has two antecedents (itemsets) and two items. The second rule has onlyone antecedent itemset, but that itemset contains three items, so this rule comesafter the first rule.

459
Generated Models
Sequence Set Summary Tab
On the Summary tab of a Sequence Rules node, you will see information about themodel itself (Analysis), fields used in the model (Fields), settings used when buildingthe model (Build Settings), and model training (Training Summary).
When you first browse a Sequence Rules node, the Summary tab results start outcollapsed. To see the results of interest, use the expander control to the left of the itemto show the results, or click the Expand All button to show all results. To hide resultswhen finished viewing them, use the expander control to collapse the specific resultsyou want to hide, or click the Collapse All button to collapse all results.
Figure 12-46Sample Sequence Rules node Summary tab
Analysis. The analysis section displays the number of rules discovered and theminimum and maximum for support and confidence of rules in the rules. If youhave executed an Analysis node attached to this modeling node, information fromthat analysis will also appear in this section. For more information, see “AnalysisNode” in Chapter 14 on page 504.
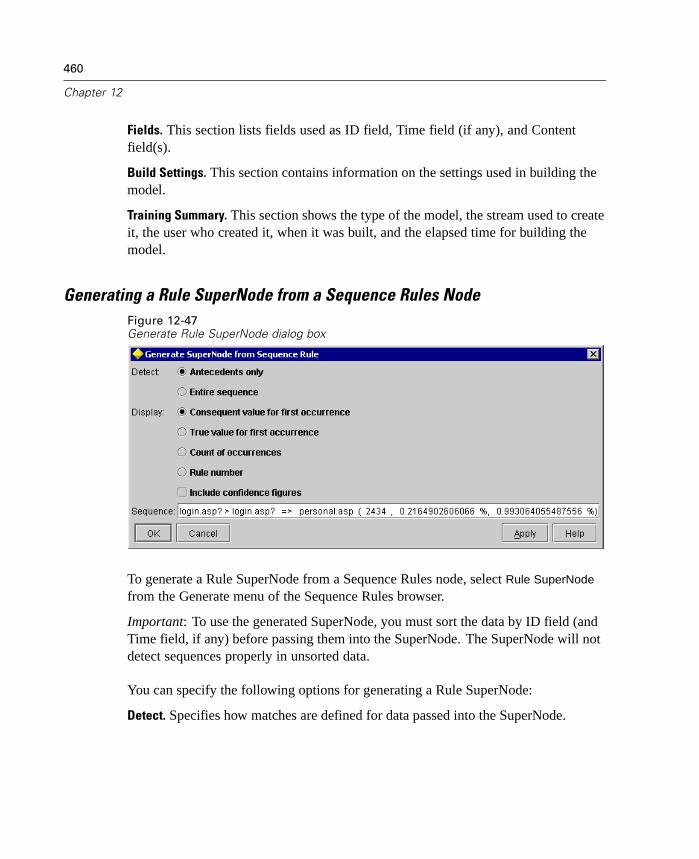
460
Chapter 12
Fields. This section lists fields used as ID field, Time field (if any), and Contentfield(s).
Build Settings. This section contains information on the settings used in building themodel.
Training Summary. This section shows the type of the model, the stream used to createit, the user who created it, when it was built, and the elapsed time for building themodel.
Generating a Rule SuperNode from a Sequence Rules NodeFigure 12-47Generate Rule SuperNode dialog box
To generate a Rule SuperNode from a Sequence Rules node, select Rule SuperNode
from the Generate menu of the Sequence Rules browser.
Important: To use the generated SuperNode, you must sort the data by ID field (andTime field, if any) before passing them into the SuperNode. The SuperNode will notdetect sequences properly in unsorted data.
You can specify the following options for generating a Rule SuperNode:
Detect. Specifies how matches are defined for data passed into the SuperNode.

461
Generated Models
Antecedents only. The SuperNode will identify a match any time it finds theantecedents for the selected rule in the correct order within a set of recordshaving the same ID, regardless of whether the consequent is also found. Notethat this does not take into account timestamp tolerance or item gap constraintsettings from the original Sequence modeling node. When the last antecedentitemset is detected in the stream (and all other antecedents have been foundin the proper order), all subsequent records with the current ID will containthe summary selected below.
Entire sequence. The SuperNode will identify a match any time it finds theantecedents and the consequent for the selected rule in the correct order within aset of records having the same ID. This does not take into account timestamptolerance or item gap constraint settings from the original Sequence modelingnode. When the consequent is detected in the stream (and all antecedents havealso been found in the correct order), the current record and all subsequentrecords with the current ID will contain the summary selected below.
Display. Controls how match summaries are added to the data in the Rule SuperNodeoutput.
Consequent value for first occurrence. The value added to the data is theconsequent value predicted based on the first occurrence of the match. Valuesare added as a new field named rule_n_consequent, where n is the rule number(based on the order of creation of Rule SuperNodes in the stream).
True value for first occurrence. The value added to the data is true if there is atleast one match for the ID and false if there is no match. Values are added as anew field named rule_n_flag.
Count of occurrences. The value added to the data is the number of matches forthe ID. Values are added as a new field named rule_n_count.
Rule number. The value added is the rule number for the selected rule. Rulenumbers are assigned based on the order in which the SuperNode was addedto the stream. For example, the first Rule SuperNode is considered rule 1, thesecond Rule SuperNode is considered rule 2, etc. This option is most usefulwhen you will be including multiple Rule SuperNodes in your stream. Values areadded as a new field named rule_n_number.
Include confidence figures. If selected, this option will add the rule confidence tothe data stream as well as the other summary selected above. Values are added asa new field named rule_n_confidence.

Chapter
13Exporting Models
Exporting Overview
There are several ways to export models built in Clementine. This section discussestwo methods:
Exporting the model and stream together
Exporting only the model as C code or PMML
Exporting Models and Streams
Many data mining applications offer support for exporting models, but few offersupport for the complete deployment of data preparation, manipulation, and modeling.Clementine provides several ways for you to export the entire data mining process toan application such as PredictiveMarketing or your own application using ClementineSolution Publisher. Essentially, the work you do in Clementine to prepare data andbuild models can be used to your advantage outside of Clementine.
You can export an entire stream and model in the following ways:
Use a Publisher node to export the stream and model for later use with theClementine Solution Publisher Runtime. For more information, see “SolutionPublisher Node” in Chapter 14 on page 531.
Use a wizard in Clementine to package the stream components for export tothe PredictiveMarketing application.
463

464
Chapter 13
Exporting Models
Most models generated in Clementine can be exported individually in either C codeor as XML model files encoded as predictive model markup language (PMML).
Table 13-1Models and available types of export
Model Type Supported Export Type
Neural Net C code, PMML
Build C5.0 C code, PMML
Kohonen C code, PMML
Linear Regression PMML
Generalized Rule Induction (GRI) PMML
Apriori PMML
K-Means C code, PMML
Logistic Regression PMML
TwoStep Cluster PMML
Classification and Regression (C&R) Trees PMML
Sequence Detection PMML
Factor Analysis/PCA none
To export a model:
Once you have generated a model, you can export it as C code or encoded as PMMLusing the following steps:
E Right-click a model on the Models tab in the managers window.
E From the context menu, chooseExport PMML or Export C code.

465
Exporting Models
Figure 13-1Exporting a generated model
E In the Export dialog box, specify a target directory and a unique name for the model.
PMML Export
All models in Clementine, except Factor/PCA models, can be exported as PMML.Exporting a model using the Export PMML option produces an XML file containing aPMML 2.1 description of the model.
For PMML model export, you should choose the name of the XML file to becreated or overwritten.
For more details about PMML, see the data mining group Web site athttp://www.dmg.org.
C Code Export
Four models in Clementine can be exported as C code—Neural Net, Kohonen, C5.0,and K-Means. When exporting as C code, choose the name of the C source file, suchas mysource.c. A header file is also exported with the same name but with an .hextension (for example, mysource.h). Depending on the model type, a data file namedmysource.san or mysource.sak may also be exported.
Note: Because the code includes field names and data values, exported C code formodels built using some languages, particularly those that involve double-bytecharacter sets, may require additional modification before compiling.

466
Chapter 13
Exporting C5.0 Decision Trees and Rulesets
Rule export creates two files: a header file and a source file. The names of these filescorrespond to the name of the OUT field predicted by the rule. For example, if thename of the OUT field is NAME, exporting generates the files NAME.h and NAME.c.
Rule Header File
The header file defines constants to represent symbolic (set and flag) field values.Names for these constants have the following form:
FIELD_VALUE
For example, if field BP has a value of high, this will be represented asBP_high.In addition, the header file defines a struct to represent an example. The name of
this struct is exNAME, where NAME corresponds to the OUT field. The struct handlesinteger fields as int and real fields asfloat.
Rule Source File
The source file contains C code used to make predictions for the associated model.This code begins by including the corresponding header file. The remainder of thesource file defines the function for prediction. The name of this function correspondsto the OUT field. The example structure defined in the header file serves as anargument to the function.
For example, if the OUT field is NAME, the function has the following structure:
int NAME(struct exNAME example, double *confidence) { .... }
For decision trees, the function body { .... } consists of “cascaded” IF and SWITCH
statements. Rulesets translate to single-level conditionals. Boosted models generateone “static” (file local) function per model.
The value returned by the function depends on the OUT field type:
A real OUT field yields a float.
An integer OUT field returns an int.
467
Exporting Models
A symbolic OUT field yields an integer corresponding to one of the constantsdefined for the field's values in the header file.
An “unclassifiable” example returns a 0 (defined by the constant unknown).
The function automatically sets the confidence to the value associated with theclassification.
Exporting Nets
Net export creates three files:
Wrapper header file
File of wrapper routines
Network definition file (*.san)
The wrapper routines utilize functions found in other files that do not depend onyour model. These functions use the network definition file to reproduce the neuralnetwork.
The names of the files depend on the name of the neural network. For example,for a network named DRUG, exporting creates files named DRUG.h, DRUG.c, andDRUG.san.
Neural Net Wrapper Header File
The exported neural net wrapper header file declares two structs and two functions,with names derived from the network name. For example, for a network namedDrug, the header file contains:
Drug_inputs, a struct for inputs
Drug_outputs, a struct for outputs
Two functions for handling input and output
The first function:
void neural_Drug_CLEARSETS ()
468
Chapter 13
clears the input sets data. The other function:
struct Drug_outputs *neural_Drug( struct Drug_inputs *ins,struct Drug_outputs *outs )
takes an input structure and returns the results from the network in an output structure.
Neural Net Wrapper Routines
The source file contains the code for the two functions defined in theheader file. Thiscode contains calls to functions found inneurals.c.
The value returned by the wrapper routines depends on theOUT field:
A set returns a *char.
A flag yields an int (1 for true, 0 for false).
A real returns a double.
An integer yields an int.
Other Files for Neural Net Export
In order to use a network, additional files must be included duringcompilation. Thesefiles are found in the LIB/sann subdirectory of your Clementine installation and arenamed forprop.h, forprop.c, neurals.h, and neurals.c.
The file neurals.c provides five functions for network processing:
int neural_init(char *filename)
Opens a network whose definition corresponds to thenamed file (normally a *.sanfile).
int neural_set(char *netname, char*varnam, ...)
Sets the variable varnam in the network netname to the third argument, whose typedepends onthe variable being set.
int neural_propagate(char *netname)
469
Exporting Models
Forward-propagates the values on the inputs throughthe network netname to theoutput.
int neural_result( char *netname,char *varname, struct neural_r_u *results)
Puts the result from the output variablevarname in the network netname into theunion results (results.c for sets, results.d for real ranges, or results.i for integers andflags). See struct neural_r_u in the neurals.h header file.
int neural_close(char *netname)
Closes the network named netname.
Neural Net Export Example
The following is an example of the code that should be written to get results fromthe network. This file is called, arbitrarily, find_drug.c.
#include "neurals.h"#include "Drug.h"
int main( int argc, char **argv ){
struct Drug_inputs ins;struct Drug_outputs outs;
neural_init("Drug.san");ins.Age = 39;ins.Sex = 1;ins.BP = "NORMAL";ins.Cholesterol = 0;ins.Na_to_K = 13.1457;
neural_Drug(&ins, &outs);
printf("\nResult is %s with confidence %f\n\n",outs.Drug, outs.Drug_confidence);
neural_close("Drug");return 0;
}
In the above example, flag fields (symbolic fields witha maximum of two possiblevalues) equal 1 or 0 (for true and false, respectively); use a Type node in the streamfrom which the code was generated to ascertain these values.
470
Chapter 13
This example can be compiled (with an ANSI C compiler) with a command such as:
cc find_drug.c Drug.c neurals.c forprop.c -lm
Consult your C manual for compiler-specific details.
Without using the wrapper routine, the code would be as follows. The file is called,arbitrarily, find_drug_no_wrapper.c.
#include "neurals.h"
int main(int argc, char **argv ){
struct neural_r_u res;
neural_init("Drug.san");neural_set("Drug","BP","CLEARSET");neural_set("Drug","Age",39);neural_set("Drug","Sex",1);neural_set("Drug","BP","NORMAL");neural_set("Drug","Cholestrol",0);neural_set("Drug","Na_to_K",13.1457);neural_propagate("Drug");
neural_result("Drug","Drug",&res);
printf("\nResult is %s with confidence %f\n\n",res.c, res.confidence);
neural_close("Drug");}
To compile this (with an ANSI C compiler), the command would be something like:
cc find_drug_no_wrapper.c neurals.c forprop.c -lm
Exporting Radial Basis Function (RBF) Nets
As with other neural networks, RBF export creates three files:
Wrapper header file
File of wrapper routines
Network definition file (*.san)

471
Exporting Models
The wrapper routines utilize functions found in neurals_rbf.c. These functions usethe network definition file to reproduce the network.
RBF net export is based on the name of the RBF network. For example, for anRBF network named Drug, three files are written: Drug.h, Drug.c, and Drug.san.
RBF Net Wrapper Header File
The exported RBF net wrapper header file declares two structs and two functions,with names derived from the network name. For example, a network named Drugyields a header file containing:
Drug_inputs, a struct for inputs
Drug_outputs, a struct for outputs
Two functions for handling input and output
The first function:
void neural_Drug_CLEARSETS ()
clears the input sets data. The second function:
struct Drug_outputs *neural_Drug( struct Drug_inputs *ins,struct Drug_outputs *outs )
takes an input structure and returns the results from the RBF network in an outputstructure.
RBF Net Wrapper Routines
The source file contains the code for the two functions defined in the correspondingheader file. This code contains calls to functions found in neurals_rbf.c.
The value returned by the wrapper routines depends on the OUT field:
A set yields *char.
A flag returns an int (1 for true, 0 for false).
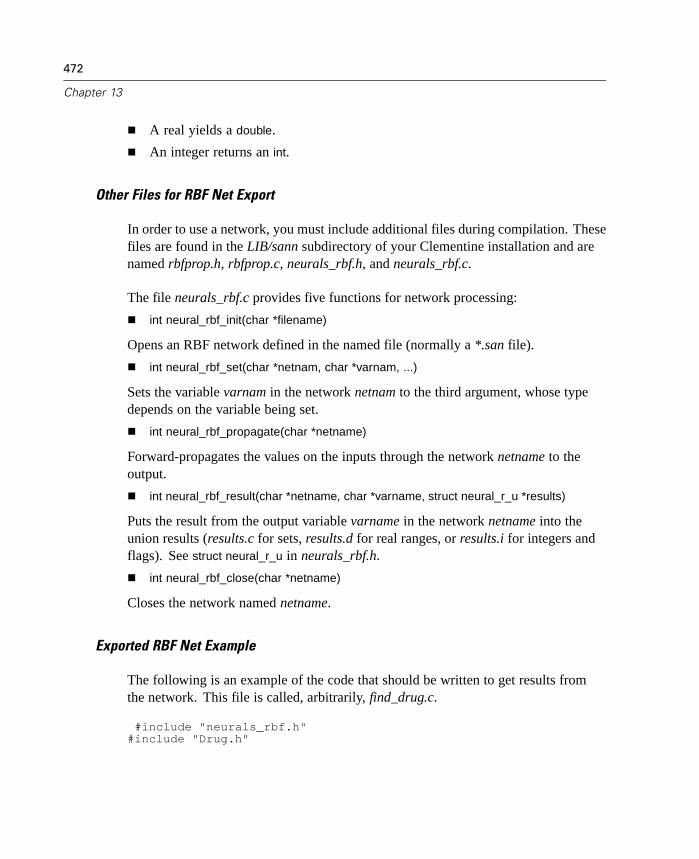
472
Chapter 13
A real yields a double.
An integer returns an int.
Other Files for RBF Net Export
In order to use a network, you must include additional files during compilation. Thesefiles are found in the LIB/sann subdirectory of your Clementine installation and arenamed rbfprop.h, rbfprop.c, neurals_rbf.h, and neurals_rbf.c.
The file neurals_rbf.c provides five functions for network processing:
int neural_rbf_init(char *filename)
Opens an RBF network defined in the named file (normally a *.san file).
int neural_rbf_set(char *netnam, char *varnam, ...)
Sets the variable varnam in the network netnam to the third argument, whose typedepends on the variable being set.
int neural_rbf_propagate(char *netname)
Forward-propagates the values on the inputs through the network netname to theoutput.
int neural_rbf_result(char *netname, char *varname, struct neural_r_u *results)
Puts the result from the output variable varname in the network netname into theunion results (results.c for sets, results.d for real ranges, or results.i for integers andflags). See struct neural_r_u in neurals_rbf.h.
int neural_rbf_close(char *netname)
Closes the network named netname.
Exported RBF Net Example
The following is an example of the code that should be written to get results fromthe network. This file is called, arbitrarily, find_drug.c.
#include "neurals_rbf.h"#include "Drug.h"
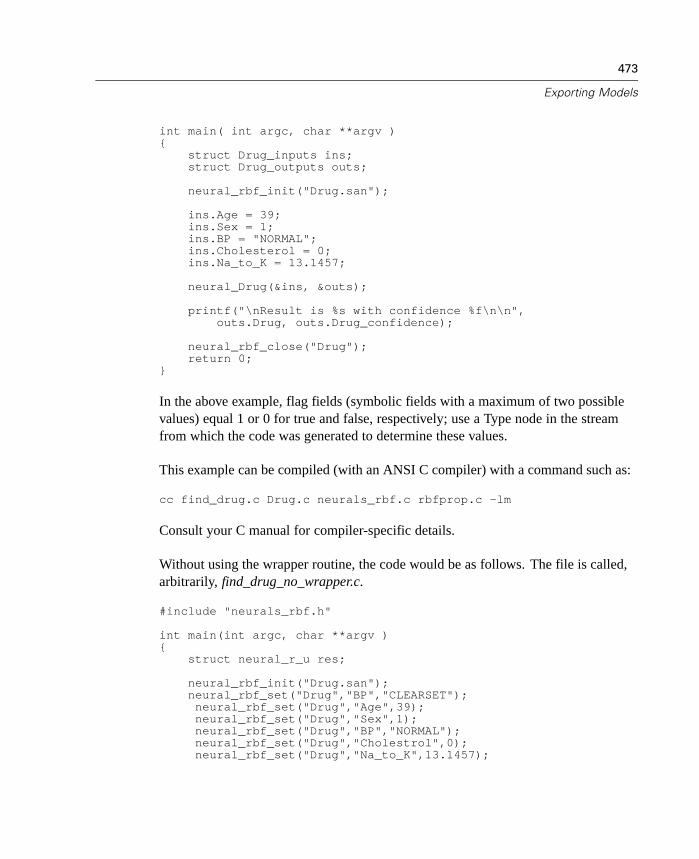
473
Exporting Models
int main( int argc, char **argv ){
struct Drug_inputs ins;struct Drug_outputs outs;
neural_rbf_init("Drug.san");
ins.Age = 39;ins.Sex = 1;ins.BP = "NORMAL";ins.Cholesterol = 0;ins.Na_to_K = 13.1457;
neural_Drug(&ins, &outs);
printf("\nResult is %s with confidence %f\n\n",outs.Drug, outs.Drug_confidence);
neural_rbf_close("Drug");return 0;
}
In the above example, flag fields (symbolic fields with a maximum of two possiblevalues) equal 1 or 0 for true and false, respectively; use a Type node in the streamfrom which the code was generated to determine these values.
This example can be compiled (with an ANSI C compiler) with a command such as:
cc find_drug.c Drug.c neurals_rbf.c rbfprop.c -lm
Consult your C manual for compiler-specific details.
Without using the wrapper routine, the code would be as follows. The file is called,arbitrarily, find_drug_no_wrapper.c.
#include "neurals_rbf.h"
int main(int argc, char **argv ){
struct neural_r_u res;
neural_rbf_init("Drug.san");neural_rbf_set("Drug","BP","CLEARSET");neural_rbf_set("Drug","Age",39);neural_rbf_set("Drug","Sex",1);neural_rbf_set("Drug","BP","NORMAL");neural_rbf_set("Drug","Cholestrol",0);neural_rbf_set("Drug","Na_to_K",13.1457);

474
Chapter 13
neural_rbf_propagate("Drug");neural_rbf_result("Drug","Drug",&res);
printf("\nResult is %s with confidence %f\n\n",res.c, res.confidence);
neural_rbf_close("Drug");return 0;
}
To compile this (with an ANSI C compiler), the command would be something like:
cc find_drug_no_wrapper.c neurals_rbf.c rbfprop.c -lm
Exporting Kohonen Nets
Kohonen net export creates three files:
Wrapper header file
File of wrapper routines
Network definition file (*.san)
The wrapper routines utilize functions found in koh_net.c. These functions use thenetwork definition file to reproduce the network.
Kohonen net export is based on the name of the Kohonen network. For example,for a network named Cluster_Drug, three files are written: Cluster_Drug.h,Cluster_Drug.c, and Cluster_Drug.san.
Kohonen Net Wrapper Header File
The exported Kohonen net wrapper header file declares two structs and two functions,with names derived from the network name. For a network named Cluster_Drug,the header file contains:
Cluster_Drug_inputs, a struct for inputs
Cluster_Drug_outputs, a struct for outputs from the topology map
Two functions for handling input and output
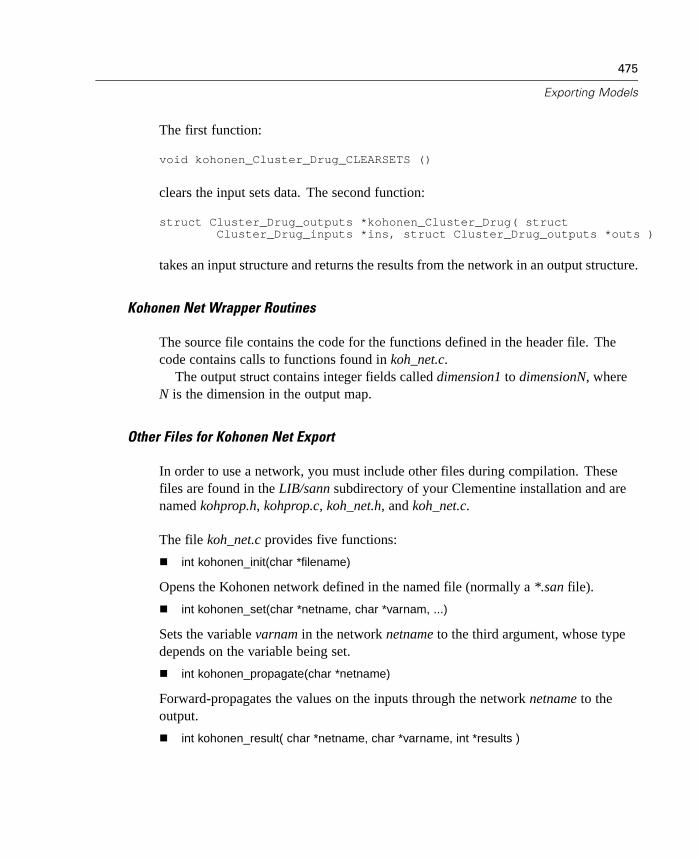
475
Exporting Models
The first function:
void kohonen_Cluster_Drug_CLEARSETS ()
clears the input sets data. The second function:
struct Cluster_Drug_outputs *kohonen_Cluster_Drug( structCluster_Drug_inputs *ins, struct Cluster_Drug_outputs *outs )
takes an input structure and returns the results from the network in an output structure.
Kohonen Net Wrapper Routines
The source file contains the code for the functions defined in the header file. Thecode contains calls to functions found in koh_net.c.
The output struct contains integer fields called dimension1 to dimensionN, whereN is the dimension in the output map.
Other Files for Kohonen Net Export
In order to use a network, you must include other files during compilation. Thesefiles are found in the LIB/sann subdirectory of your Clementine installation and arenamed kohprop.h, kohprop.c, koh_net.h, and koh_net.c.
The file koh_net.c provides five functions:
int kohonen_init(char *filename)
Opens the Kohonen network defined in the named file (normally a *.san file).
int kohonen_set(char *netname, char *varnam, ...)
Sets the variable varnam in the network netname to the third argument, whose typedepends on the variable being set.
int kohonen_propagate(char *netname)
Forward-propagates the values on the inputs through the network netname to theoutput.
int kohonen_result( char *netname, char *varname, int *results )
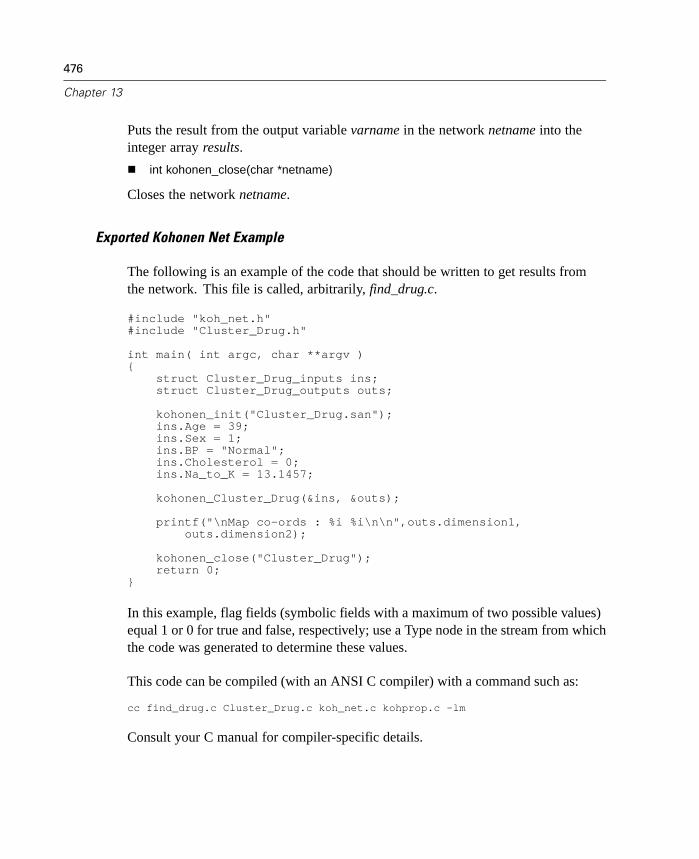
476
Chapter 13
Puts the result from the output variable varname in the network netname into theinteger array results.
int kohonen_close(char *netname)
Closes the network netname.
Exported Kohonen Net Example
The following is an example of the code that should be written to get results fromthe network. This file is called, arbitrarily, find_drug.c.
#include "koh_net.h"#include "Cluster_Drug.h"
int main( int argc, char **argv ){
struct Cluster_Drug_inputs ins;struct Cluster_Drug_outputs outs;
kohonen_init("Cluster_Drug.san");ins.Age = 39;ins.Sex = 1;ins.BP = "Normal";ins.Cholesterol = 0;ins.Na_to_K = 13.1457;
kohonen_Cluster_Drug(&ins, &outs);
printf("\nMap co-ords : %i %i\n\n",outs.dimension1,outs.dimension2);
kohonen_close("Cluster_Drug");return 0;
}
In this example, flag fields (symbolic fields with a maximum of two possible values)equal 1 or 0 for true and false, respectively; use a Type node in the stream from whichthe code was generated to determine these values.
This code can be compiled (with an ANSI C compiler) with a command such as:
cc find_drug.c Cluster_Drug.c koh_net.c kohprop.c -lm
Consult your C manual for compiler-specific details.
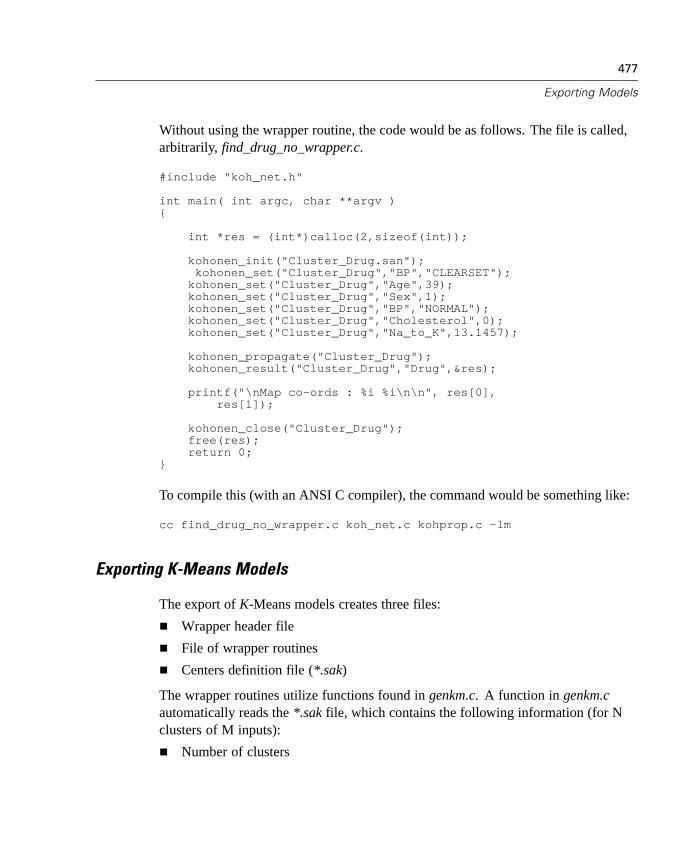
477
Exporting Models
Without using the wrapper routine, the code would be as follows. The file is called,arbitrarily, find_drug_no_wrapper.c.
#include "koh_net.h"
int main( int argc, char **argv ){
int *res = (int*)calloc(2,sizeof(int));
kohonen_init("Cluster_Drug.san");kohonen_set("Cluster_Drug","BP","CLEARSET");
kohonen_set("Cluster_Drug","Age",39);kohonen_set("Cluster_Drug","Sex",1);kohonen_set("Cluster_Drug","BP","NORMAL");kohonen_set("Cluster_Drug","Cholesterol",0);kohonen_set("Cluster_Drug","Na_to_K",13.1457);
kohonen_propagate("Cluster_Drug");kohonen_result("Cluster_Drug","Drug",&res);
printf("\nMap co-ords : %i %i\n\n", res[0],res[1]);
kohonen_close("Cluster_Drug");free(res);return 0;
}
To compile this (with an ANSI C compiler), the command would be something like:
cc find_drug_no_wrapper.c koh_net.c kohprop.c -lm
Exporting K-Means Models
The export of K-Means models creates three files:
Wrapper header file
File of wrapper routines
Centers definition file (*.sak)
The wrapper routines utilize functions found in genkm.c. A function in genkm.cautomatically reads the *.sak file, which contains the following information (for Nclusters of M inputs):
Number of clusters

478
Chapter 13
Number of inputs
Cluster 1 coordinates for inputs 1 through M
Cluster 2 coordinates for inputs 1 through M
Cluster N coordinates for inputs 1 through M
K-Means model export is based on the name of the model. For example, for a modelnamed Drug, three files are written: KM_Drug.h, KM_Drug.c, and KM_Drug.sak.
K-Means Model Wrapper Header File
The header file defines constants to represent symbolic (set and flag) field values.Names for these constants have the following form:
FIELD_VALUE
For example, if field BP has the value high, this will be represented as BP_high.In addition, the header file defines a struct to represent an example. The name of
this struct is exNAME, where NAME corresponds to the name of the model. The struct
handles integer fields as int and real fields as double.
K-Means Model Wrapper Routines
This file contains the code for two functions, which contain calls to the functionsfound in genkm.c. The first function:
void encode_Drug ( struct kmDrug example, double *ex )
encodes an example using values between 0 and 1, and puts the result in a doublearray ex. The second function:
int calc_Drug( struct kmDrug example, struct Kmeans km,double *distance)
uses an example and an array of centers (contained in the struct Kmeans) to computethe distance between the example and each center, returning the minimum distancefound and the corresponding cluster number.
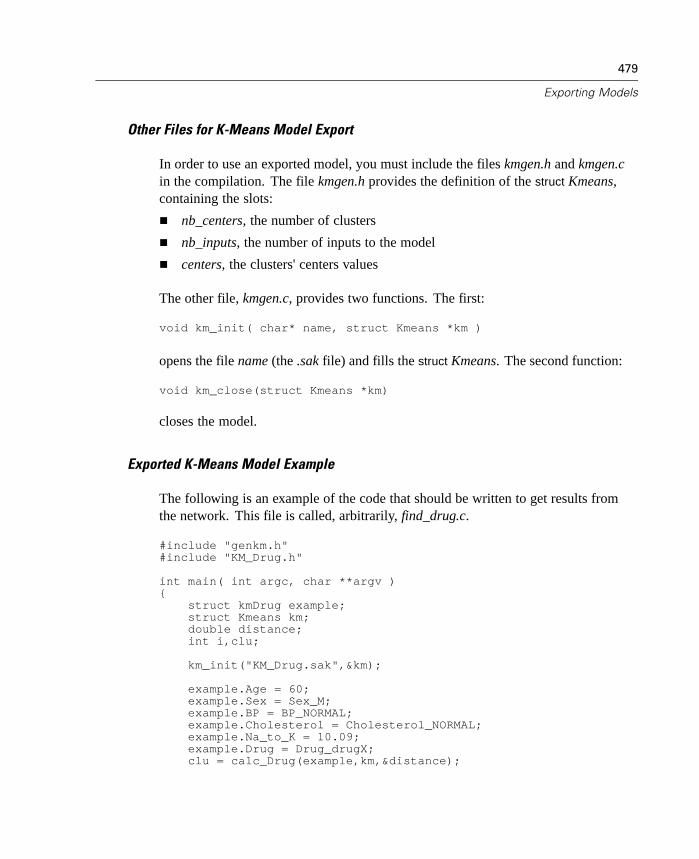
479
Exporting Models
Other Files for K-Means Model Export
In order to use an exported model, you must include the files kmgen.h and kmgen.cin the compilation. The file kmgen.h provides the definition of the struct Kmeans,containing the slots:
nb_centers, the number of clusters
nb_inputs, the number of inputs to the model
centers, the clusters' centers values
The other file, kmgen.c, provides two functions. The first:
void km_init( char* name, struct Kmeans *km )
opens the file name (the .sak file) and fills the struct Kmeans. The second function:
void km_close(struct Kmeans *km)
closes the model.
Exported K-Means Model Example
The following is an example of the code that should be written to get results fromthe network. This file is called, arbitrarily, find_drug.c.
#include "genkm.h"#include "KM_Drug.h"
int main( int argc, char **argv ){
struct kmDrug example;struct Kmeans km;double distance;int i,clu;
km_init("KM_Drug.sak",&km);
example.Age = 60;example.Sex = Sex_M;example.BP = BP_NORMAL;example.Cholesterol = Cholesterol_NORMAL;example.Na_to_K = 10.09;example.Drug = Drug_drugX;clu = calc_Drug(example,km,&distance);

480
Chapter 13
printf("Cluster_%d, distance =%lf\n",clu,distance);
km_close(&km);return 0;
}
This can be compiled (with an ANSI C compiler) with a command such as:
cc genkm.c KM_Drug.c find_drug.c -lm
Consult your C manual for compiler-specific details.
Field Names
Whenever possible, the code contained in exported models uses the field namesfound in the model. However, in order to produce valid C code, some names maybe modified as follows:
Names of set fields that begin with a number, such as 12_inch, receive anunderscore prefix, _12_inch.
Non-alphanumeric characters in field names become underscore charactersin the exported code. For example, Barcelona->Diagonal becomesBarcelona__Diagonal.
Notice that these modifications may result in undesired redundancies in the fieldnames. For example, the two fields 1_myfield and -1_myfield both receive new namesof _1_myfield. To avoid these naming conflicts, use field names that begin with aletter and contain alphanumeric characters only, or use a Filter node to assign a newname to any field that would otherwise be changed.
Error Codes for Model ExportExported code for neural nets, RBF nets, and Kohonen nets use functions externalto the particular network being exported. If difficulties arise during subsequentcompilation or execution, these functions return the following error codes:
0: OK
1: FILE NOT FOUND

481
Exporting Models
2: INVALID NETWORK NAME
3: NOT ENOUGH AVAILABLE MEMORY
4: NO SUCH VARIABLE IN THE NETWORK
5: WRONG DIRECTION FOR VARIABLE
6: INPUT VARIABLE ASSIGNMENT INCORRECT
7: UNKNOWN GENERIC TYPE (PROBABLY A FILE FAULT)
8: NETWORK ALREADY IN MEMORY
9: NO MORE RESULTS AVAILABLE FROM AN OUTPUT SET
Exporting to PredictiveMarketing
Using options within Clementine, you can easily publish streams for use with thePredictiveMarketing system, a Web-enabled predictive analytics solution from SPSS.All of the data manipulation and modeling work done in Clementine can quicklybe packaged as a scoring solution and saved directly into the PredictiveMarketingproduct.
To help you package streams, the PredictiveMarketing Wizard has been added toClementine. To access the Wizard, from the menus choose:Tools
PredictiveMarketing
This opens the PredictiveMarketing Wizard, which walks you through the steps ofspecifying fields and other import information needed by PredictiveMarketing.
PredictiveMarketing Wizard Overview
Before getting started with the PredictiveMarketing Wizard, there are a couple ofconcepts you should be familiar with. The following terms are used when referring tothe modeling stream and published modeling scenario.
482
Chapter 13
What is a scenario?
A scenario is a collection of tools that provides you with the analytical capabilitiesto address a particular business issue. For example, suppose you want to determinewhich customers are likely to respond to a summer sale campaign. You can use ascenario to obtain data from your database, create a predictive model, score themodel, view reports, and explore the model.
A scenario encompasses the following components:
Dataset. The data set contains metadata information that is the bridge between thedata in your database and the information required to build the model.
Model. The model is the heart of the scenario. The model processes your data usinga specific algorithm and creates a framework for analysis of new data. This is thescenario component built using Clementine.
Reports. Reports viewed in PredictiveMarketing provide an analysis of the modelresults. However, reports are not available for imported Clementine and importedPMML models.
Exploration. The Model Explorer allows you to differentiate customers by modifyingthe criteria for a customer profile. For C&RT models, the system returns a score forthe customer profile. For Association Rules models, the system describes which rulesapply to the customer profile.
What is a scenario template?
The framework for a PredictiveMarketing scenario, called the scenario template,is what you are creating using the PredictiveMarketing Wizard in Clementine. Thescenario template determines the basic characteristics of a scenario. For example, thescenario template dictates the data set, model type, and the fields that appear on thePredictiveMarketing Scenario Explorer page.
All of these components are packaged as a .jar file using the Wizard. Now you needto describe the application of the target template as well as a couple of parameters.
After the scenario template is generated from Clementine, it is published toPredictiveMarketing, where various parameters can be edited with a tool calledthe Scenario Explorer. Here users create new scenarios, choosing from any ofthe available scenario templates that have been deployed. The new scenario uses
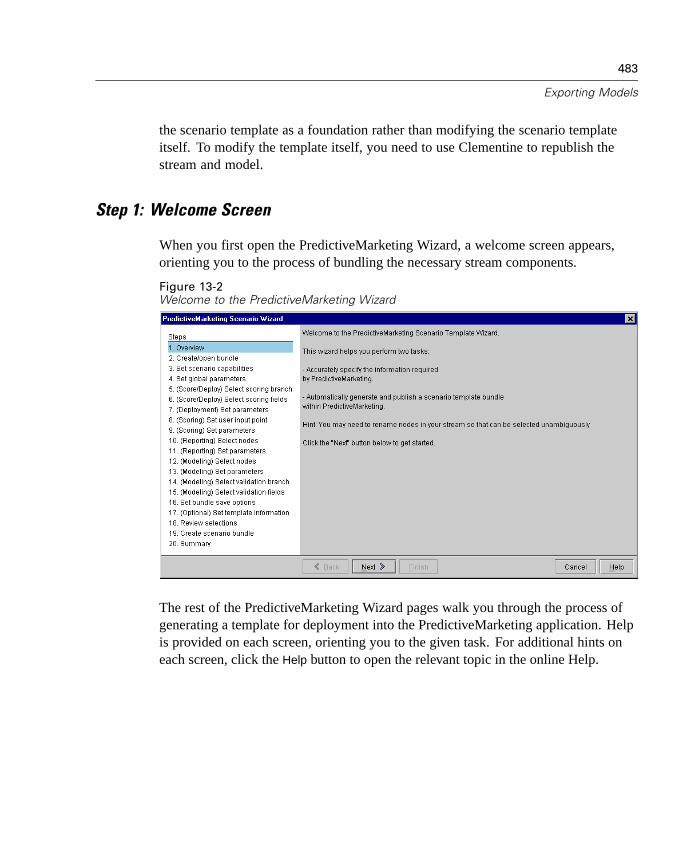
483
Exporting Models
the scenario template as a foundation rather than modifying the scenario templateitself. To modify the template itself, you need to use Clementine to republish thestream and model.
Step 1: Welcome Screen
When you first open the PredictiveMarketing Wizard, a welcome screen appears,orienting you to the process of bundling the necessary stream components.
Figure 13-2Welcome to the PredictiveMarketing Wizard
The rest of the PredictiveMarketing Wizard pages walk you through the process ofgenerating a template for deployment into the PredictiveMarketing application. Helpis provided on each screen, orienting you to the given task. For additional hints oneach screen, click the Help button to open the relevant topic in the online Help.
484
Chapter 13
Exporting to Cleo
Using options within Clementine, you can easily publish streams for use with Cleo, acustomizeable solution that allows you to extend the power of predictive analytics to aWeb-based audience. The Cleo interface can be completely customized for your targetapplication and operates seamlessly within the SPSS Web Deployment Framework.
To help you package streams, the Cleo Wizard has been added to Clementine. Toaccess the Wizard, from the menus choose:Tools
Cleo
This opens the Cleo Wizard, which walks you through the steps of specifying fieldsand other import information needed by Cleo.
Cleo Wizard Overview
Before getting started with the Cleo Wizard, there are a couple of concepts youshould be familiar with. The following terms are used when referring to the modelingstream and published modeling scenario.
What is a Cleo scenario?
A Cleo scenario is a collection of tools that provides you with the analyticalcapabilities to address a particular business issue, such as real-time churn predictionor credit scoring. You can use a Cleo scenario to obtain data from your database or toenter a single record for analysis. Then, you can score the data on real-time, usinga model created in Clementine––all without purchasing or distributing Clementineto the target user.
The interface for a Cleo scenario is entirely customizeable, depending on thesettings you specify in the Cleo Wizard and the options described in the CleoImplementation Guide, available with the Cleo product.
What is a scenario bundle?
The framework for a scenario, called the scenario bundle, is what you arecreating using the Cleo Wizard in Clementine. The scenario bundle determines thecomponents of a scenario as well as an XML definition of its Web interface. For

485
Exporting Models
example, the scenario bundle dictates requirements such as the type of data input andany required fields. It also contains a blueprint for the look of the Cleo Web pages,specifying items such as whether the input Web page will contain a drop-down list offield values or a radio button control.
All of these components are packaged as a .jar file using the Wizard. Now youneed to provide metadata describing how the stream and fields will be used as well asa couple of formatting options for the output HTML.
After the scenario bundle is generated from Clementine, it is published to Cleowithin the SPSS Web Deployment Framework. Using a Web browser, users canrequest scores or predictions based on individual records or data files that they specify.
Modifying an Existing Bundle
To modify a scenario bundle, you can open the bundle using the Cleo Wizard andmake any changes on the Wizard pages. To apply your new specifications, republishor save the bundle.
Cleo Stream Prerequisites
To optimize use of the Cleo Wizard and ensure that your stream is prepared fordeployment, consider the following recommendations before proceeding with theWizard:
Instantiate the data by clicking Read Values on the Type tab in each of the Sourcenodes. This optimizes the Wizard by making values available to you whenspecifying metadata.
Terminate the stream with a Publisher node and perform a test execute to ensurethat the stream is fully functional.
Step 1: Cleo Wizard Overview Screen
When you first open the Cleo Wizard, a welcome screen appears orienting you to theprocess of bundling the necessary stream components.
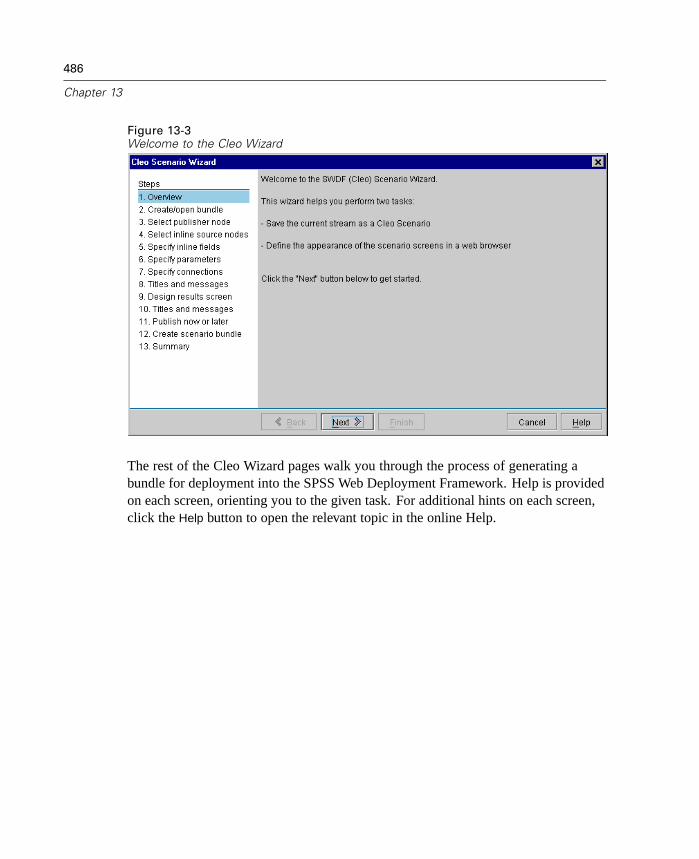
486
Chapter 13
Figure 13-3Welcome to the Cleo Wizard
The rest of the Cleo Wizard pages walk you through the process of generating abundle for deployment into the SPSS Web Deployment Framework. Help is providedon each screen, orienting you to the given task. For additional hints on each screen,click the Help button to open the relevant topic in the online Help.
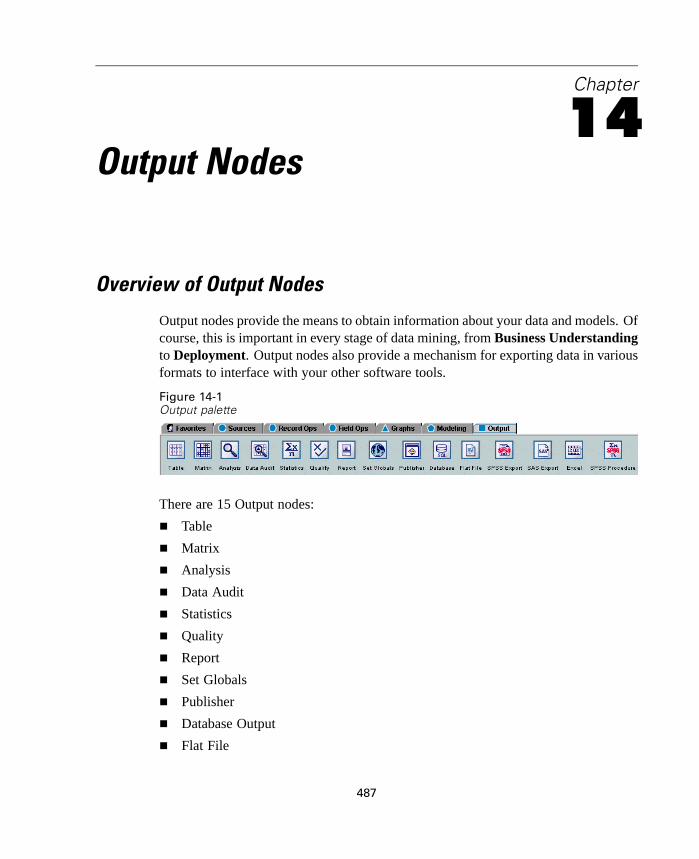
Chapter
14Output Nodes
Overview of Output Nodes
Output nodes provide the means to obtain information about your data and models. Ofcourse, this is important in every stage of data mining, from Business Understandingto Deployment. Output nodes also provide a mechanism for exporting data in variousformats to interface with your other software tools.
Figure 14-1Output palette
There are 15 Output nodes:
Table
Matrix
Analysis
Data Audit
Statistics
Quality
Report
Set Globals
Publisher
Database Output
Flat File
487

488
Chapter 14
SPSS Export
SAS Export
Excel
SPSS Procedure
Working with Output
You can easily retrieve and manage charts, graphs, and tables generated inClementine. The right side of the Clementine window contains the managers tool thathelps you navigate the current output objects.
To view the managers tool, select Managers from the View menu. Then click theOutputs tab.
Figure 14-2Outputs tab of the managers tool
From this window, you can:
Open existing output objects, such as histograms, evaluation charts, and tables.
Save output objects.
Add output files to the current project.
Delete unsaved output objects from the current session.
Rename output objects.
Right-click anywhere on the Outputs tab to access these options.

489
Output Nodes
Output Browser Menus
Output browsers are used to display the results of output. The following menusare available in most output browsers.
File menu. The File menu contains file- and print-related operations.
Save. Saves the results as a Clementine output object (*.cou). If the output hasnot been previously saved, you will be prompted for a filename and location.
Save As. Saves the results as a Clementine output object with a new name.
Close. Closes the browser window.
Close and Delete. Closes the browser window and permanently deletes the outputfrom the Outputs tab. You can also click the wastebasket icon at the corner of abrowser window to close and delete.
Header and Footer. Allows you to change the page headers and footers for printing.
Page Setup. Allows you to change the page settings for printing output.
Print Preview. Displays a preview of the output as it will appear when printed.
Print. Opens the Print dialog box to print the output.
Export. Exports the output as if the output settings file type were set to thecorresponding file type. For more information, see “Output Node Output Tab”on page 491.
Publish to Web. Publishes the output to the SPSS Web Deployment Framework(SWDF). For more information, see “Publish to Web” on page 490.
Export HTML. Exports the output as HTML to the specified file.
Edit menu. The Edit menu contains editing operations.
Copy. Copies the selected output to the clipboard.
Copy All. Copies all output to the clipboard.
Copy (inc. field names). For tabular output, such as tables and matrices, copies theselected cells and the associated column and row headings to the clipboard.
Select All. Selects all content in the browser window.
Clear selection. Deselects all content.

490
Chapter 14
Generate menu. The Generate menu allows you to generate new nodes based on thecontents of the output browser. Generate options will vary depending on the typeof output you are browsing. See the documentation for the specific output type youare browsing for details of node-generating options.
Publish to Web
By selecting Publish to Web, you can publish your output to the SPSS WebDeployment Framework (SWDF).
Figure 14-3Publish to Web dialog box
Enter the authentication information and URL required to access the SWDF server.By default, Save username and server URL to options is selected, so your settingswill be saved, and will be automatically used the next time you use the Publish toWeb feature. If you do not want to save the information you enter, deselect thisoption. For more information on publishing to the SWDF, see the SWDF help filesor contact your SWDF administrator.
Note: If you want to export simple HTML files for use with a standard Web server,use the Export HTML option instead.
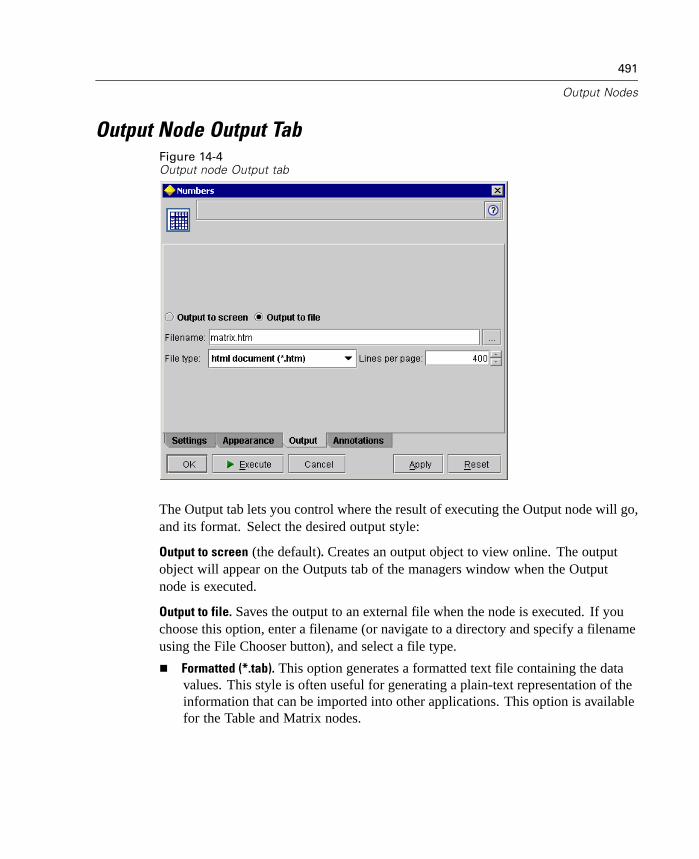
491
Output Nodes
Output Node Output TabFigure 14-4Output node Output tab
The Output tab lets you control where the result of executing the Output node will go,and its format. Select the desired output style:
Output to screen (the default). Creates an output object to view online. The outputobject will appear on the Outputs tab of the managers window when the Outputnode is executed.
Output to file. Saves the output to an external file when the node is executed. If youchoose this option, enter a filename (or navigate to a directory and specify a filenameusing the File Chooser button), and select a file type.
Formatted (*.tab). This option generates a formatted text file containing the datavalues. This style is often useful for generating a plain-text representation of theinformation that can be imported into other applications. This option is availablefor the Table and Matrix nodes.
492
Chapter 14
Data (comma delimited) (*.dat). This option generates a comma-delimited textfile containing the data values. This style is often useful as a quick way togenerate a data file that can be imported into spreadsheets or other data analysisapplications. This option is available for the Table and Matrix nodes.
Transposed (*.dat). This option generates a comma-delimited text file similar tothe Data (comma delimited) option, except that this option writes out a transposedversion of the data. In the transposed data, the rows represent fields and thecolumns represent records. This option is available for the Table and Matrixnodes.
Note: For large tables, the above options can be somewhat inefficient, especially whenworking with a remote server. In such cases, using a File Output node will providemuch better performance. For more information, see “Flat File Node” on page 539.
HTML (*.html). This option writes HTML-formatted output to a file or files. Fortabular output (from the Table or Matrix nodes), a set of HTML files contains acontents panel listing field names, and the data in an HTML table. The table maybe split over multiple HTML files if the number of rows in the table exceeds theLines per page specification. In this case, the contents panel contains links to alltable pages and provides a means of navigating the table. For nontabular output,a single HTML file is created containing the results of the node.
Note: If the HTML output contains only formatting for the first page, adjust theLines per page specification to include all output on a single page. Or, if the outputtemplate for nodes such as the Report node contains custom HTML tags, be sure youhave specified Custom as the format type.
Text File (*.txt). This option generates a text file containing the output. This style isoften useful for generating output that can be imported into other applications,such as word processors or presentation software.
Format. For the Report node, you can choose whether output is automaticallyformatted or formatted using HTML included in the template. Select Custom toallow HTML formatting in the template.
Title. For the Report node, you can specify optional title text that will appear at thetop of the report output.
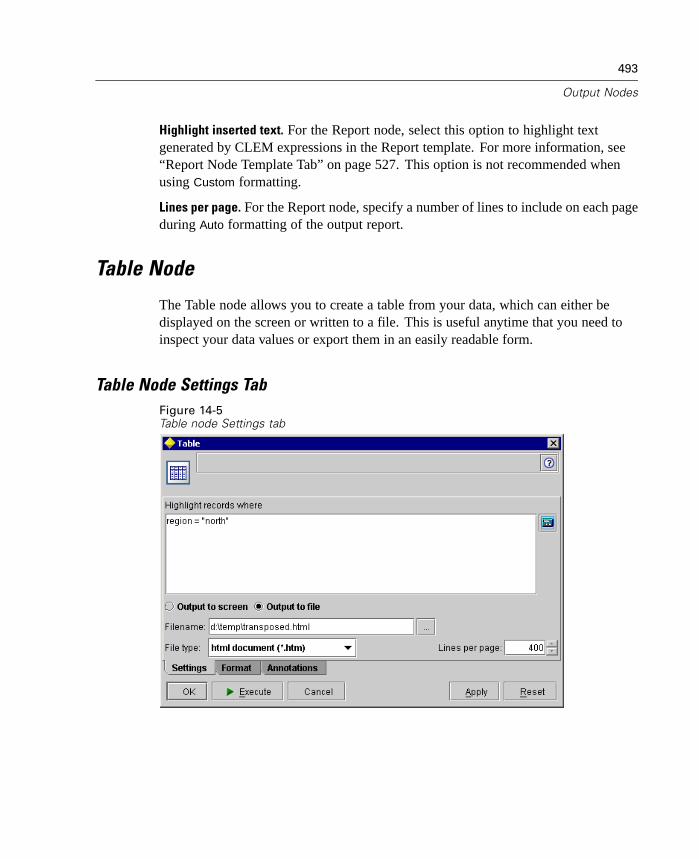
493
Output Nodes
Highlight inserted text. For the Report node, select this option to highlight textgenerated by CLEM expressions in the Report template. For more information, see“Report Node Template Tab” on page 527. This option is not recommended whenusing Custom formatting.
Lines per page. For the Report node, specify a number of lines to include on each pageduring Auto formatting of the output report.
Table Node
The Table node allows you to create a table from your data, which can either bedisplayed on the screen or written to a file. This is useful anytime that you need toinspect your data values or export them in an easily readable form.
Table Node Settings TabFigure 14-5Table node Settings tab

494
Chapter 14
Highlight records where. You can highlight records in the table by entering a CLEMexpression that is true for the records to be highlighted. This option is enabled onlywhen Output to screen is selected.
Output. Output options can be set here, similar to the settings found on the commonOutput node Output tab. For more information, see “Output Node Output Tab”on page 491.
Table Node Format TabFigure 14-6Table node Format Tab
The Format tab shows the list of fields and formatting options for each field.
Field. This shows the name of the selected field.
Justify. Specifies how the values should be justified within the table column. Thedefault setting is Auto, which left-justifies symbolic values and right-justifies numericvalues. You can override the default by selecting left, right, or center.

495
Output Nodes
Width. By default, column widths are automatically calculated based on the values ofthe field. To override the automatic width calculation, deselect the Auto Width optionfor the desired field(s) and enter a Manual Width in the next column.
View current fields. By default, the dialog box shows the list of currently active fields.To view the list of unused fields, select View unused fields settings instead.
Context menu. The context menu for this tab provides various selection and settingupdate options.
Select All. Selects all fields.
Select None. Clears the selection.
Select Fields. Selects fields based on type or storage characteristics. Options areSelect Discrete, Select Range (numeric), Select Typeless, Select Strings, SelectNumbers, or Select Date/Time. For more information, see “Data Types” inChapter 7 on page 150.
Set Justify. Sets the justification for the selected field(s). Options are Auto,Center, Left, or Right.
Set Auto Width. Sets the use of automatic width calculation for the selected fields.Options are On or Off.
Set Manual Width. Sets the manual field width for the selected field(s) (anddisables Auto Width for those fields if necessary). Options include multiples of5, up to 30. To set a manual width that is not a multiple of 5, edit the valuedirectly in the table.
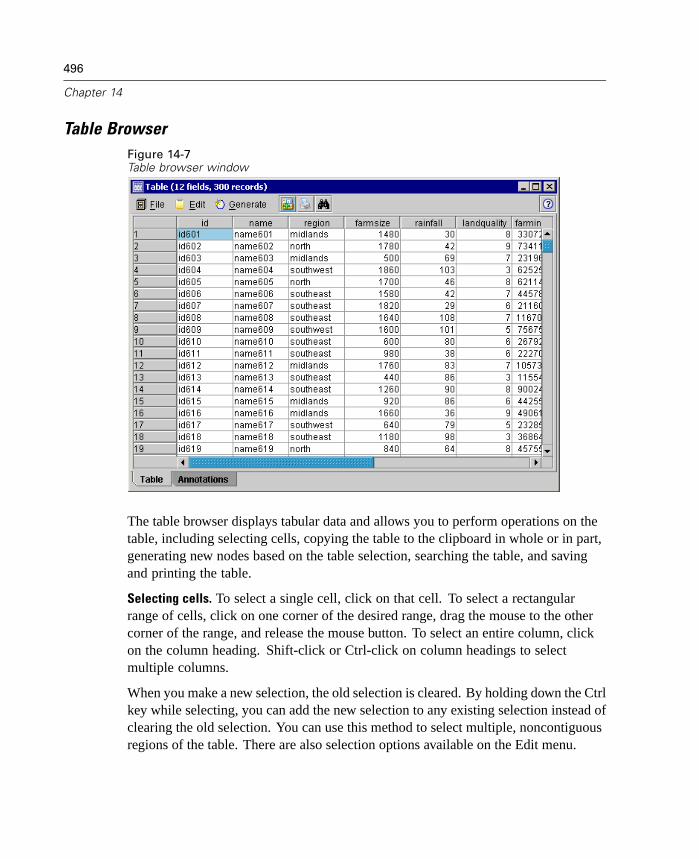
496
Chapter 14
Table BrowserFigure 14-7Table browser window
The table browser displays tabular data and allows you to perform operations on thetable, including selecting cells, copying the table to the clipboard in whole or in part,generating new nodes based on the table selection, searching the table, and savingand printing the table.
Selecting cells. To select a single cell, click on that cell. To select a rectangularrange of cells, click on one corner of the desired range, drag the mouse to the othercorner of the range, and release the mouse button. To select an entire column, clickon the column heading. Shift-click or Ctrl-click on column headings to selectmultiple columns.
When you make a new selection, the old selection is cleared. By holding down the Ctrlkey while selecting, you can add the new selection to any existing selection instead ofclearing the old selection. You can use this method to select multiple, noncontiguousregions of the table. There are also selection options available on the Edit menu.
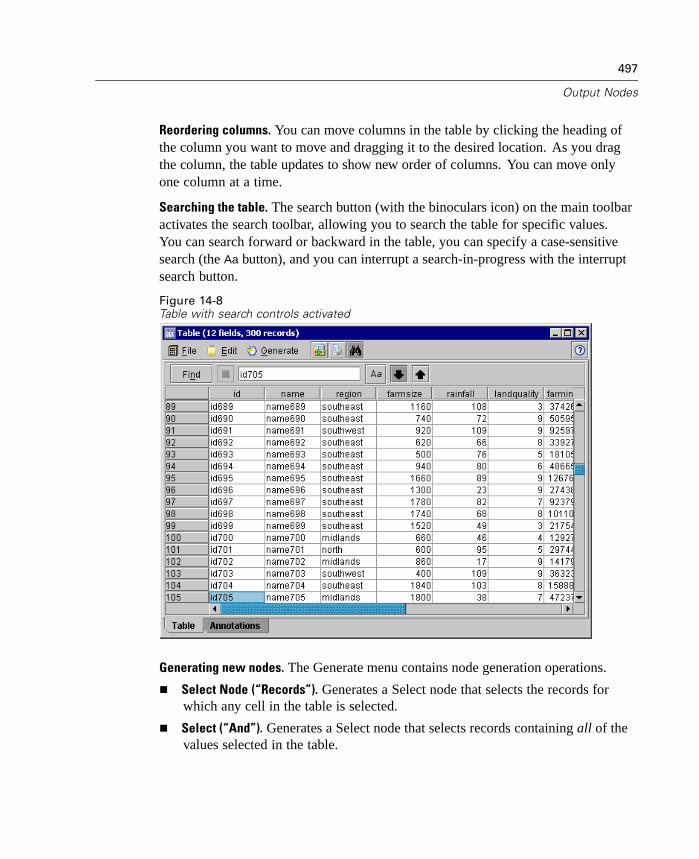
497
Output Nodes
Reordering columns. You can move columns in the table by clicking the heading ofthe column you want to move and dragging it to the desired location. As you dragthe column, the table updates to show new order of columns. You can move onlyone column at a time.
Searching the table. The search button (with the binoculars icon) on the main toolbaractivates the search toolbar, allowing you to search the table for specific values.You can search forward or backward in the table, you can specify a case-sensitivesearch (the Aa button), and you can interrupt a search-in-progress with the interruptsearch button.
Figure 14-8Table with search controls activated
Generating new nodes. The Generate menu contains node generation operations.
Select Node (“Records”). Generates a Select node that selects the records forwhich any cell in the table is selected.
Select (“And”). Generates a Select node that selects records containing all of thevalues selected in the table.
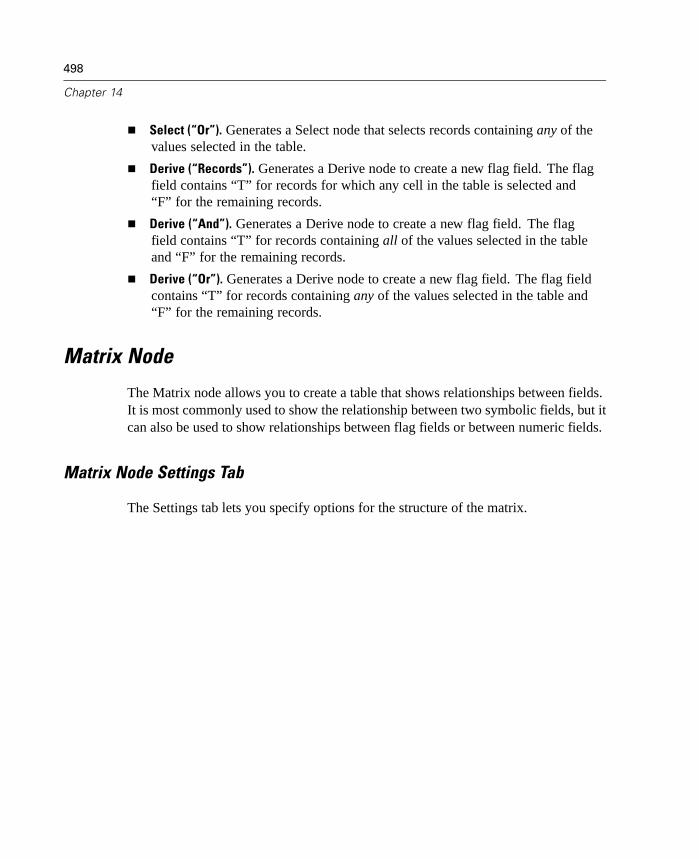
498
Chapter 14
Select (“Or”). Generates a Select node that selects records containing any of thevalues selected in the table.
Derive (“Records”). Generates a Derive node to create a new flag field. The flagfield contains “T” for records for which any cell in the table is selected and“F” for the remaining records.
Derive (“And”). Generates a Derive node to create a new flag field. The flagfield contains “T” for records containing all of the values selected in the tableand “F” for the remaining records.
Derive (“Or”). Generates a Derive node to create a new flag field. The flag fieldcontains “T” for records containing any of the values selected in the table and“F” for the remaining records.
Matrix Node
The Matrix node allows you to create a table that shows relationships between fields.It is most commonly used to show the relationship between two symbolic fields, but itcan also be used to show relationships between flag fields or between numeric fields.
Matrix Node Settings Tab
The Settings tab lets you specify options for the structure of the matrix.
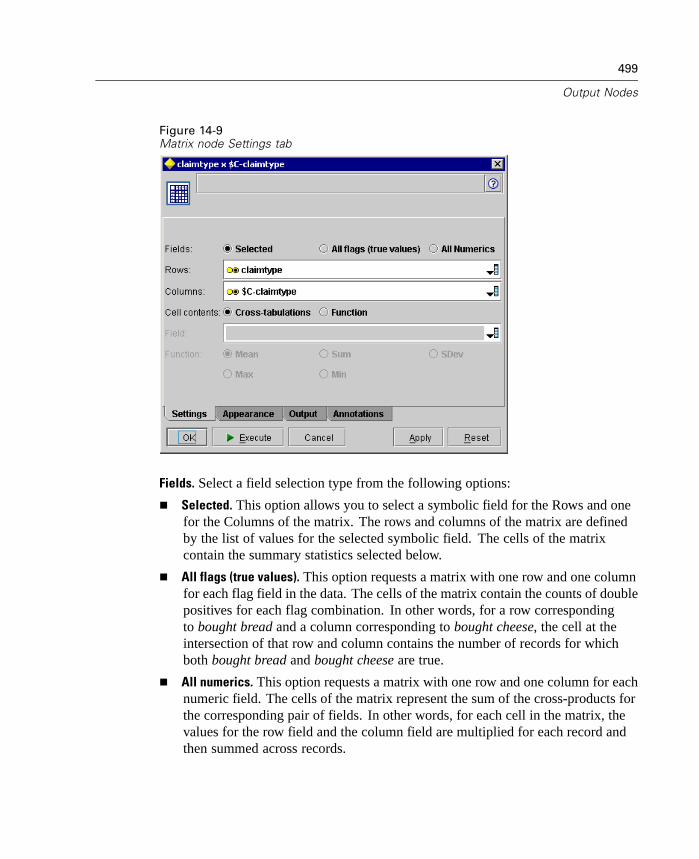
499
Output Nodes
Figure 14-9Matrix node Settings tab
Fields. Select a field selection type from the following options:
Selected. This option allows you to select a symbolic field for the Rows and onefor the Columns of the matrix. The rows and columns of the matrix are definedby the list of values for the selected symbolic field. The cells of the matrixcontain the summary statistics selected below.
All flags (true values). This option requests a matrix with one row and one columnfor each flag field in the data. The cells of the matrix contain the counts of doublepositives for each flag combination. In other words, for a row correspondingto bought bread and a column corresponding to bought cheese, the cell at theintersection of that row and column contains the number of records for whichboth bought bread and bought cheese are true.
All numerics. This option requests a matrix with one row and one column for eachnumeric field. The cells of the matrix represent the sum of the cross-products forthe corresponding pair of fields. In other words, for each cell in the matrix, thevalues for the row field and the column field are multiplied for each record andthen summed across records.

500
Chapter 14
Cell contents. If you have chosen Selected fields above, you can specify the statisticto be used in the cells of the matrix. Select a count-based statistic, or select anoverlay field to summarize values of a numeric field based on the values of therow and column fields.
Cross-tabulations. Cell values are counts and/or percentages of how manyrecords have the corresponding combination of values. You can specify whichcross-tabulation summaries you want using the options on the Appearance tab.For more information, see “Matrix Node Appearance Tab” on page 500.
Function. If you select a summary function, cell values are a function of theselected overlay field values for cases having the appropriate row and columnvalues. For example, if the row field is Region, the column field is Product, andthe overlay field is Revenue, then the cell in the Northeast row and the Widgetcolumn will contain the sum (or average, minimum, or maximum) of revenue forwidgets sold in the northeast region. The default summary function is Mean. Youcan select another function for summarizing the function field. Options includeMean, Sum, SDev (standard deviation), Max (maximum), or Min (minimum).
Matrix Node Appearance Tab
The Appearance tab allows you to control sorting and highlighting options for thematrix, as well as statistics presented for cross-tabulation matrices.
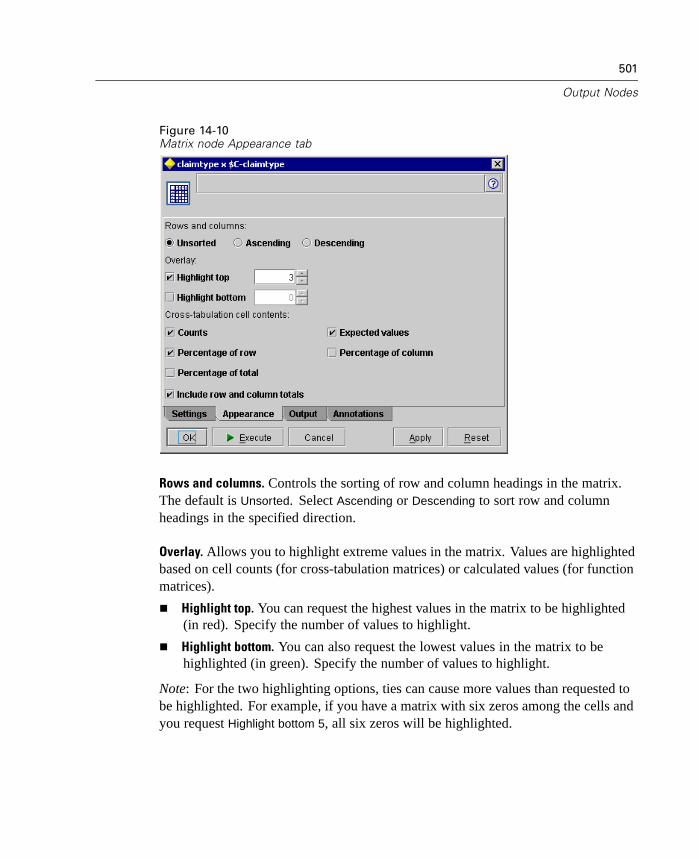
501
Output Nodes
Figure 14-10Matrix node Appearance tab
Rows and columns. Controls the sorting of row and column headings in the matrix.The default is Unsorted. Select Ascending or Descending to sort row and columnheadings in the specified direction.
Overlay. Allows you to highlight extreme values in the matrix. Values are highlightedbased on cell counts (for cross-tabulation matrices) or calculated values (for functionmatrices).
Highlight top. You can request the highest values in the matrix to be highlighted(in red). Specify the number of values to highlight.
Highlight bottom. You can also request the lowest values in the matrix to behighlighted (in green). Specify the number of values to highlight.
Note: For the two highlighting options, ties can cause more values than requested tobe highlighted. For example, if you have a matrix with six zeros among the cells andyou request Highlight bottom 5, all six zeros will be highlighted.

502
Chapter 14
Cross-tabulation cell contents. You can specify the summary statistics contained inthe matrix for cross-tabulation matrices. This option is not available when using All
flags (true values) of All Numerics.
Counts. Cells include the number of records with the row value that have thecorresponding column value. This is only default cell content.
Expected values. Cells include the expected value for number of records in thecell, assuming that there is no relationship between the rows and columns.Expected values are based on the following formula:
p(row value) * p(column value) * total number of records
Percentage of row. Cells include the percentage of all records with the row valuethat have the corresponding column value. Percentages sum to 100 within rows.
Percentage of column. Cells include the percentage of all records with thecolumn value that have the corresponding row value. Percentages sum to 100within columns.
Percentage of total. Cells include the percentage of all records having thecombination of column value and row value. Percentages sum to 100 over thewhole matrix.
Include row and column totals. Adds a row and a column to the matrix for columnand row totals.
Matrix Output Browser
The matrix browser displays cross-tabulated data and allows you to performoperations on the matrix, including selecting cells, copying the matrix to the clipboardin whole or in part, generating new nodes based on the matrix selection, and savingand printing the matrix.
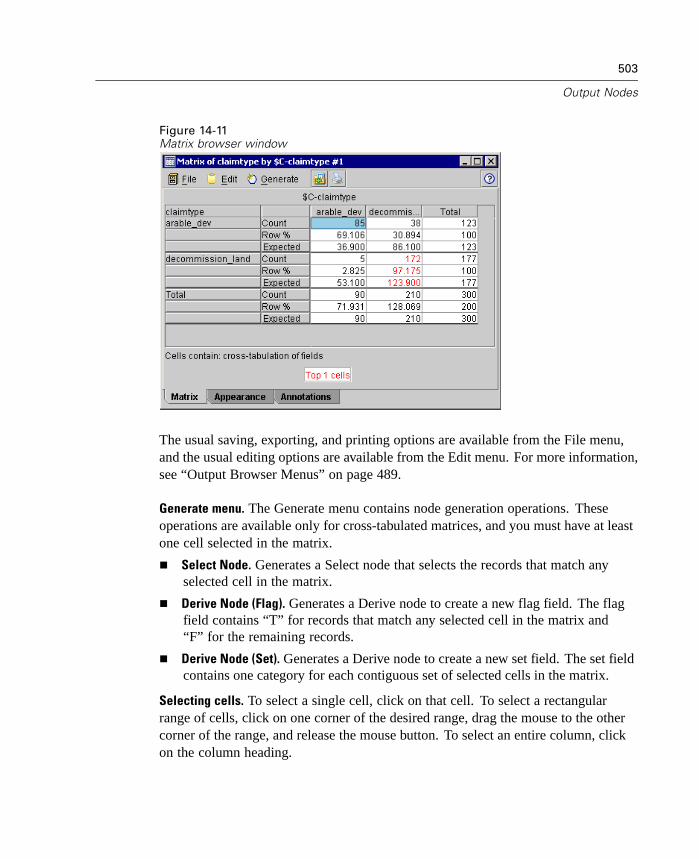
503
Output Nodes
Figure 14-11Matrix browser window
The usual saving, exporting, and printing options are available from the File menu,and the usual editing options are available from the Edit menu. For more information,see “Output Browser Menus” on page 489.
Generate menu. The Generate menu contains node generation operations. Theseoperations are available only for cross-tabulated matrices, and you must have at leastone cell selected in the matrix.
Select Node. Generates a Select node that selects the records that match anyselected cell in the matrix.
Derive Node (Flag). Generates a Derive node to create a new flag field. The flagfield contains “T” for records that match any selected cell in the matrix and“F” for the remaining records.
Derive Node (Set). Generates a Derive node to create a new set field. The set fieldcontains one category for each contiguous set of selected cells in the matrix.
Selecting cells. To select a single cell, click on that cell. To select a rectangularrange of cells, click on one corner of the desired range, drag the mouse to the othercorner of the range, and release the mouse button. To select an entire column, clickon the column heading.

504
Chapter 14
When you make a new selection, the old selection is cleared. By holding down theCtrl key while selecting, you can add the new selection to any existing selectioninstead of clearing the old selection. You can use this method to select multiple,noncontiguous regions of the matrix. You can add contiguous regions to yourselection by holding down the Shift key while selecting. Selection options are alsoavailable on the Edit menu.
Analysis Node
The Analysis node allows you to analyze predictive models to evaluate their ability togenerate accurate predictions. Analysis nodes perform various comparisons betweenpredicted values and actual values for one or more generated model nodes. Analysisnodes can also be used to compare predictive models to other predictive models.
When you execute an Analysis node, a summary of the analysis results isautomatically added to the Analysis section on the Summary tab for each generatedmodel node in the executed stream. The detailed analysis results appear on theOutputs tab of the managers window or can be written directly to a file.
Analysis Node Analysis Tab
The Analysis tab allows you to specify the details of the analysis.

505
Output Nodes
Figure 14-12Analysis node Analysis tab
Coincidence matrices (for symbolic targets). Shows the pattern of matches betweeneach generated (predicted) field and its target field for symbolic targets. A table isdisplayed with rows defined by actual values and columns defined by predictedvalues, with the number of records having that pattern in each cell. This is useful foridentifying systematic errors in prediction. If there is more than one generated fieldrelated to the same output field but produced by different models, the cases wherethese fields agree and disagree are counted and the totals are displayed. For the caseswhere they agree, another set of correct/wrong statistics is displayed.
Performance evaluation. Shows performance evaluation statistics for models withsymbolic outputs. This statistic, reported for each category of the output field(s), isa measure of the average information content (in bits) of the model for predictingrecords belonging to that category. It takes the difficulty of the classificationproblem into account, so accurate predictions for rare categories will earn a higherperformance evaluation index than accurate predictions for common categories. Ifthe model does no better than guessing for a category, the performance evaluationindex for that category will be 0.
506
Chapter 14
Confidence figures (if available). For models that generate a confidence field, thisoption reports statistics on the confidence values and their relationship to predictions.There are two settings for this option:
Threshold for. Reports the confidence level above which the accuracy will be thespecified percentage.
Improve accuracy. Reports the confidence level above which the accuracy isimproved by the specified factor. For example, if the overall accuracy is 90%and this option is set to 2.0, the reported value will be the confidence requiredfor 95% accuracy.
User defined analysis. You can specify your own analysis calculation to be usedin evaluating your model(s). Use CLEM expressions to specify what should becomputed for each record and how to combine the record-level scores into an overallscore. Use the functions @TARGET and @PREDICTED to refer to the target (actualoutput) value and the predicted value, respectively.
If. Specify a conditional expression if you need to use different calculationsdepending on some condition.
Then. Specify the calculation if the If condition is true.
Else. Specify the calculation if the If condition is false.
Use. Select a statistic to compute an overall score from the individual scores.
Break down analysis by fields. Shows the symbolic fields available for breaking downthe analysis. In addition to the overall analysis, a separate analysis will be reportedfor each category of each breakdown field.
Analysis Output Browser
The analysis output browser lets you see the results of executing the Analysis node.The usual saving, exporting, and printing options are available from the File menu.For more information, see “Output Browser Menus” on page 489.

507
Output Nodes
Figure 14-13Analysis output browser
When you first browse Analysis output, the results are expanded. To hide results afterviewing them, use the expander control to the left of the item to collapse the specificresults you want to hide, or click the Collapse All button to collapse all results. To seeresults again after collapsing them, use the expander control to the left of the item toshow the results, or click the Expand All button to show all results.
Results for output field. The Analysis output contains a section for each output field forwhich there is a corresponding prediction field created by a generated model.
508
Chapter 14
Comparing. Within the output field section is a subsection for each prediction fieldassociated with that output field. For symbolic output fields, the top level of thissection contains a table showing the number and percentage of correct and incorrectpredictions and the total number of records in the stream. For numeric output fields,this section shows the following information:
Minimum Error. Shows the minimum error (difference between observed andpredicted values).
Maximum Error. Shows the maximum error.
Mean Error. Shows the average (mean) of errors across all records. This indicateswhether there is a systematic bias (a stronger tendency to overestimate than tounderestimate, or vice versa) in the model.
Mean Absolute Error. Shows the average of the absolute values of the errors acrossall records. Indicates the average magnitude of error, independent of the direction.
Standard Deviation. Shows the standard deviation of the errors.
Linear Correlation. Shows the linear correlation between the predicted and actualvalues. This statistic varies between –1.0 and 1.0. Values close to +1.0 indicatea strong positive association, such that high predicted values are associatedwith high actual values and low predicted values are associated with low actualvalues. Values close to –1.0 indicate a strong negative association, such that highpredicted values are associated with low actual values, and vice versa. Valuesclose to 0.0 indicate a weak association, such that predicted values are moreor less independent of actual values.
Occurrences. Shows the number of records used in the analysis.
Coincidence Matrix. For symbolic output fields, if you requested a coincidence matrixin the analysis options, a subsection appears here containing the matrix. The rowsrepresent actual observed values, and the columns represent predicted values. Thecell in the table indicates the number of records for each combination of predictedand actual values.
Performance Evaluation. For symbolic output fields, if you requested performanceevaluation statistics in the analysis options, the performance evaluation results appearhere. Each output category is listed with its performance evaluation statistic.

509
Output Nodes
Confidence Values Report. For symbolic output fields, if you requested confidencevalues in the analysis options, the values appear here. The following statistics arereported for model confidence values:
Range. Shows the range (smallest and largest values) of confidence values forrecords in the stream data.
Mean Correct. Shows the average confidence for records that are classifiedcorrectly.
Mean Incorrect. Shows the average confidence for records that are classifiedincorrectly.
Always Correct Above. Shows the confidence threshold above which predictionsare always correct and the percentage of cases meeting this criterion.
Always Incorrect Below. Shows the confidence threshold below which predictionsare always incorrect and the percentage of cases meeting this criterion.
X% Accuracy Above. Shows the confidence level at which accuracy is X%. X isapproximately the value specified for Threshold for in the Analysis options. Forsome models and data sets, it is not possible to choose a confidence value thatgives the exact threshold specified in the options (usually due to clusters ofsimilar cases with the same confidence value near the threshold). The thresholdreported is the closest value to the specified accuracy criterion that can beobtained with a single confidence value threshold.
X Fold Correct Above. Shows the confidence value at which accuracy is X timesbetter than it is for the overall data set. X is the value specified for Improveaccuracy in the Analysis options.
Agreement between. If two or more generated models that predict the same outputfield are included in the stream, you will also see statistics on the agreement betweenpredictions generated by the models. This includes the number and percentage ofrecords for which the predictions agree (for symbolic output fields) or error summarystatistics (for numeric output fields). For symbolic fields, it includes an analysis ofpredictions compared to actual values for the subset of records on which the modelsagree (generate the same predicted value).
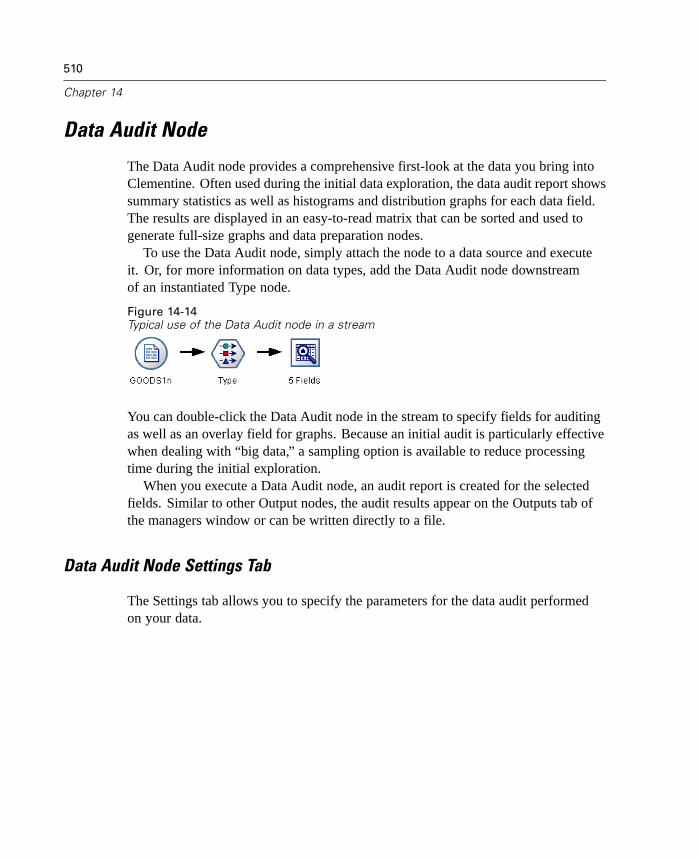
510
Chapter 14
Data Audit Node
The Data Audit node provides a comprehensive first-look at the data you bring intoClementine. Often used during the initial data exploration, the data audit report showssummary statistics as well as histograms and distribution graphs for each data field.The results are displayed in an easy-to-read matrix that can be sorted and used togenerate full-size graphs and data preparation nodes.
To use the Data Audit node, simply attach the node to a data source and executeit. Or, for more information on data types, add the Data Audit node downstreamof an instantiated Type node.
Figure 14-14Typical use of the Data Audit node in a stream
You can double-click the Data Audit node in the stream to specify fields for auditingas well as an overlay field for graphs. Because an initial audit is particularly effectivewhen dealing with “big data,” a sampling option is available to reduce processingtime during the initial exploration.
When you execute a Data Audit node, an audit report is created for the selectedfields. Similar to other Output nodes, the audit results appear on the Outputs tab ofthe managers window or can be written directly to a file.
Data Audit Node Settings Tab
The Settings tab allows you to specify the parameters for the data audit performedon your data.

511
Output Nodes
Figure 14-15Data Audit node Settings tab
Selecting Fields
Default. By default, the Data Audit node creates a report for all fields based uponsettings in the Type node. This enables quick usage of the Data Audit node. Forexample, you can simply attach the node to your stream and click Execute to generatean audit report for all fields. The default behavior is as follows:
If there are no Type node settings, all fields are included in the report.
If there are Type settings (regardless of whether or not they are instantiated) allIN, OUT, and BOTH fields are included in the display. If there is a single OUTfield use it as the Overlay field. If there is more than one OUT field specified, adefault overlay not specified.
Use custom fields. Select this option to manually specify fields for inclusion in theaudit. Use the field chooser button on the right to select fields individually or by type.
512
Chapter 14
Fields. This box contains all fields manually selected for inclusion in the audit.Remove fields using the X button to the right of the field list box.
Overlay. To customize the audit report, you can manually select a field to use asan overlay for thumbnail graphs. By default, an overlay is selected based uponsettings in the Type node as specified above.
Setting Display Options
Using options in the Display section of the Settings tab, you can select statistics andgraphs for inclusion in the data audit report. To exclude statistics from the report,deselect Basic Statistics and Median and Mode. This produces a matrix containingonly field name and thumbnail graphs.
Graphs. Select this option to view the graphs for fields selected on the Settings tab.
Basic statistics. Select this option to view the following statistics for fields selected onthe Settings tab.
Table 14-1Basic statistics available for each field type
Statistic Availability by Type
Correlation Coefficient Range fields (when range overlay)
Min All numeric fields
Max All numeric fields
Mean Range fields
Standard Deviation Range fields
Skewness Range fields
Unique Set, Flag fields
Valid All fields
Median and mode. Select this option to view Median, Mode, Unique, and Validcolumns for fields selected on the Settings tab.
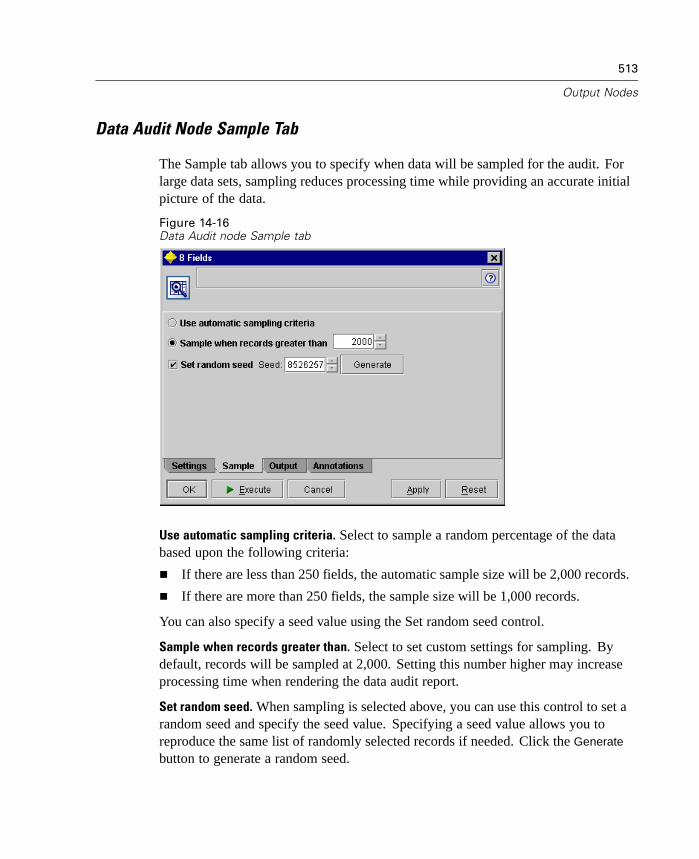
513
Output Nodes
Data Audit Node Sample Tab
The Sample tab allows you to specify when data will be sampled for the audit. Forlarge data sets, sampling reduces processing time while providing an accurate initialpicture of the data.
Figure 14-16Data Audit node Sample tab
Use automatic sampling criteria. Select to sample a random percentage of the databased upon the following criteria:
If there are less than 250 fields, the automatic sample size will be 2,000 records.
If there are more than 250 fields, the sample size will be 1,000 records.
You can also specify a seed value using the Set random seed control.
Sample when records greater than. Select to set custom settings for sampling. Bydefault, records will be sampled at 2,000. Setting this number higher may increaseprocessing time when rendering the data audit report.
Set random seed. When sampling is selected above, you can use this control to set arandom seed and specify the seed value. Specifying a seed value allows you toreproduce the same list of randomly selected records if needed. Click the Generate
button to generate a random seed.

514
Chapter 14
Note: Random sampling will automatically occur for all output when you requeststatistics that are based on sorting (for example, the median). Data that have beensampled for the audit will labeled “Sample” in the output.
Data Audit Output Browser
The output browser lets you see the results of executing the Data Audit node. Theusual saving, exporting, and printing options are available from the File menu. Formore information, see “Output Browser Menus” on page 489.
Figure 14-17Data audit report in the output browser
The Data Audit report window is a powerful tool that enables you to compare fieldsquickly using thumbnail graphs and view a variety of statistics for all fields. Usingyour mouse to explore the graph and toolbar options, you can also:
View values and ranges for fields by double-clicking a field in the Type orUnique columns.
Sort columns by clicking on the column header to activate an arrow indicatingsort order. This option is available for all columns in the report.

515
Output Nodes
View graph labels for set fields by hovering with the mouse over a bar to displayits label in a tooltip.
Generate full-size graphs from the thumbnail graph in the report. For moreinformation, see “Generating Graphs and Nodes from the Audit” on page 516.
Generate various nodes used in transforming and preparing data for analysis.For more information, see “Generating Graphs and Nodes from the Audit”on page 516.
Export the report in HTML. For more information, see “Output Browser Menus”on page 489.
Types of Results
The audit results vary depending upon the type and presence of an overlay field.Overlay fields are automatically set based upon options in an upstream Type node orcustom options specified in the Data Audit node dialog box.
If no overlay is selected, all charts are either bar charts (set or flag) or histograms(range). Note that typeless fields are not displayed.
Figure 14-18Excerpt of audit results without an overlay field
For a set or flag field overlay, the graphs are colored by the values of the overlay.
Figure 14-19Excerpt of audit results with a set field overlay
Note: If an overlay set has more than 100 values, a warning is raised and the overlayis not included.
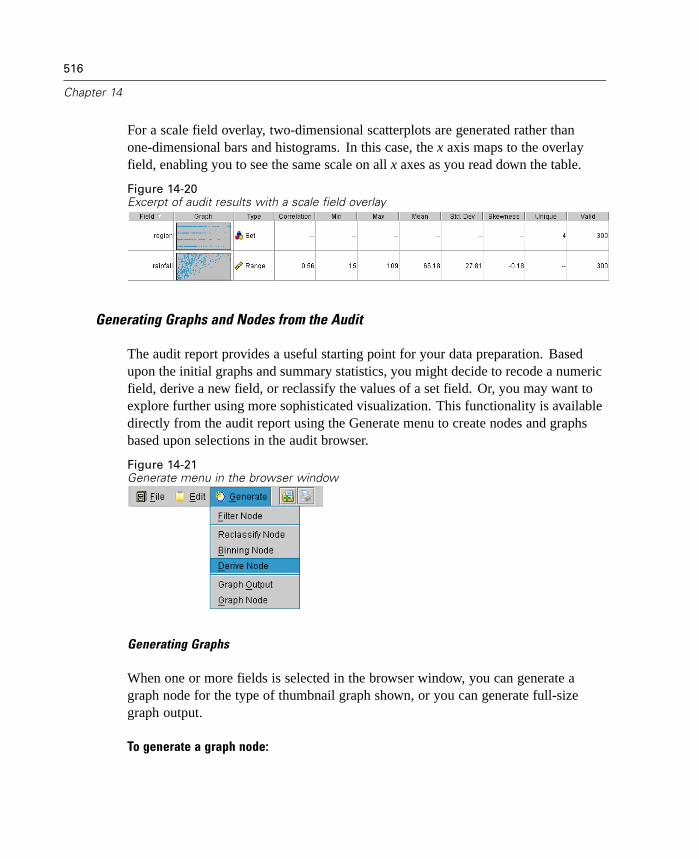
516
Chapter 14
For a scale field overlay, two-dimensional scatterplots are generated rather thanone-dimensional bars and histograms. In this case, the x axis maps to the overlayfield, enabling you to see the same scale on all x axes as you read down the table.
Figure 14-20Excerpt of audit results with a scale field overlay
Generating Graphs and Nodes from the Audit
The audit report provides a useful starting point for your data preparation. Basedupon the initial graphs and summary statistics, you might decide to recode a numericfield, derive a new field, or reclassify the values of a set field. Or, you may want toexplore further using more sophisticated visualization. This functionality is availabledirectly from the audit report using the Generate menu to create nodes and graphsbased upon selections in the audit browser.
Figure 14-21Generate menu in the browser window
Generating Graphs
When one or more fields is selected in the browser window, you can generate agraph node for the type of thumbnail graph shown, or you can generate full-sizegraph output.
To generate a graph node:
517
Output Nodes
E Select one or more fields in the browser.
E From the Generate menu, select Graph node.
E Open the graph node added to stream canvas to specify chart options and customoverlays.
To generate a graph (output window only):
E Double-click a graph in the browser.
or
E Select a single field in the browser.
E From the Generate menu, select Graph output.
For range fields, a histogram is added to the Outputs tab of the managers windowand opened for viewing. For discrete fields, a distribution is added to the Outputs taband opened for viewing.
Note: If a thumbnail graph was based upon sampled data, the generated graph willcontain all cases if the original data stream is still open.
Generating Nodes for Data Preparation
A variety of nodes used in data preparation can be generated directly from the auditreport browser. For example:
You can derive a new field based upon the values of claimvalue and farmincomeby selecting both in the audit report and choosing Derive from the Generate menu.The new node is added to the stream canvas.
Similarly, you may determine, based upon audit results, that recoding farmincomeinto percentile-based bins provides more focused analysis. To generate a Binningnode, select the field row in the display and choose Binning from the Generatemenu.
The following Field Operation nodes may be generated:
Filter
Derive
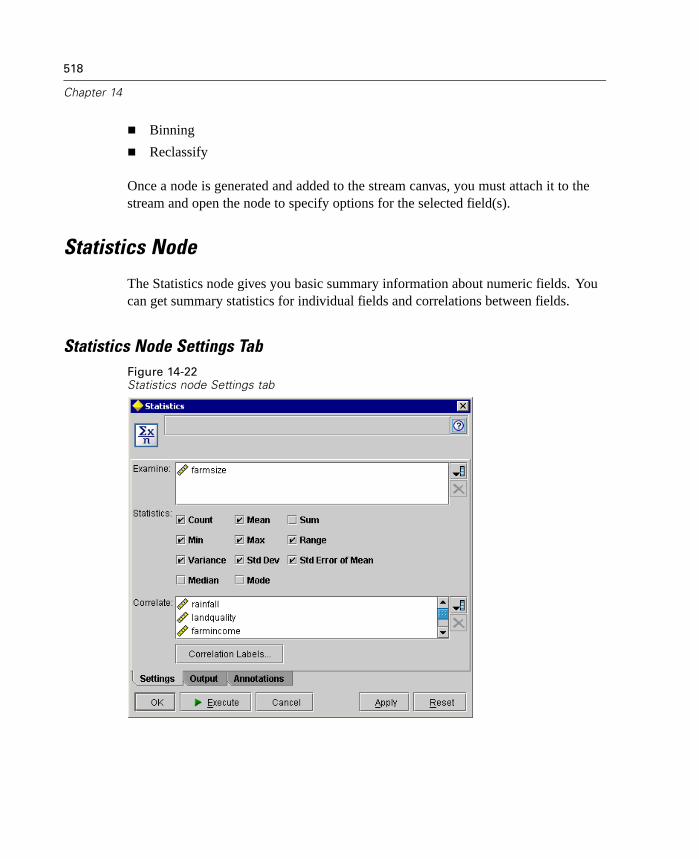
518
Chapter 14
Binning
Reclassify
Once a node is generated and added to the stream canvas, you must attach it to thestream and open the node to specify options for the selected field(s).
Statistics Node
The Statistics node gives you basic summary information about numeric fields. Youcan get summary statistics for individual fields and correlations between fields.
Statistics Node Settings TabFigure 14-22Statistics node Settings tab
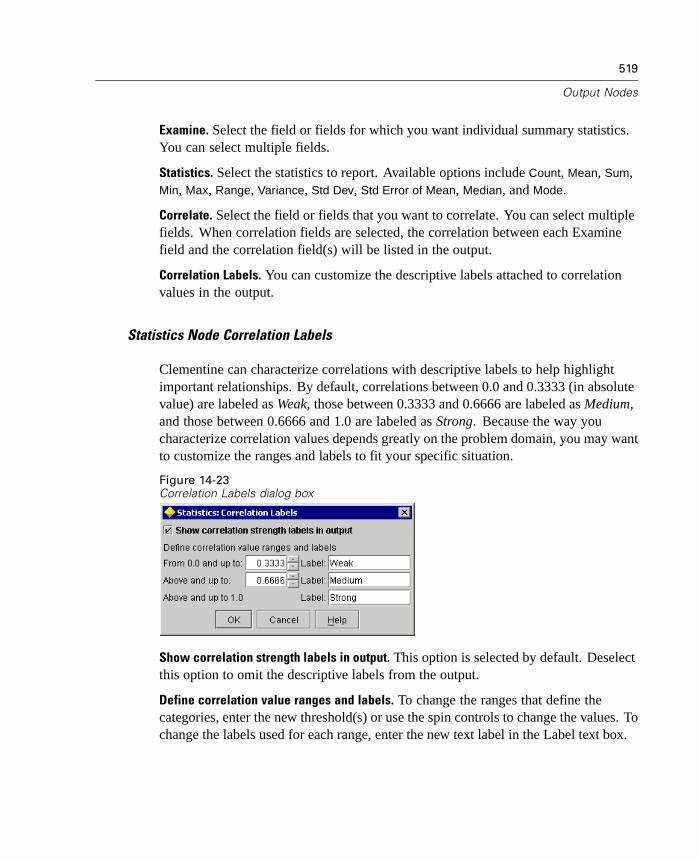
519
Output Nodes
Examine. Select the field or fields for which you want individual summary statistics.You can select multiple fields.
Statistics. Select the statistics to report. Available options include Count, Mean, Sum,Min, Max, Range, Variance, Std Dev, Std Error of Mean, Median, and Mode.
Correlate. Select the field or fields that you want to correlate. You can select multiplefields. When correlation fields are selected, the correlation between each Examinefield and the correlation field(s) will be listed in the output.
Correlation Labels. You can customize the descriptive labels attached to correlationvalues in the output.
Statistics Node Correlation Labels
Clementine can characterize correlations with descriptive labels to help highlightimportant relationships. By default, correlations between 0.0 and 0.3333 (in absolutevalue) are labeled as Weak, those between 0.3333 and 0.6666 are labeled as Medium,and those between 0.6666 and 1.0 are labeled as Strong. Because the way youcharacterize correlation values depends greatly on the problem domain, you may wantto customize the ranges and labels to fit your specific situation.
Figure 14-23Correlation Labels dialog box
Show correlation strength labels in output. This option is selected by default. Deselectthis option to omit the descriptive labels from the output.
Define correlation value ranges and labels. To change the ranges that define thecategories, enter the new threshold(s) or use the spin controls to change the values. Tochange the labels used for each range, enter the new text label in the Label text box.

520
Chapter 14
Statistics Output Browser
The statistics output browser displays the results of the statistical analysis and allowsyou to perform operations, including selecting fields, generating new nodes basedon the selection, and saving and printing the results. The usual saving, exporting,and printing options are available from the File menu, and the usual editing optionsare available from the Edit menu. For more information, see “Output BrowserMenus” on page 489.
When you first browse Statistics output, the results are expanded. To hide resultsafter viewing them, use the expander control to the left of the item to collapse thespecific results you want to hide, or click the Collapse All button to collapse all results.To see results again after collapsing them, use the expander control to the left of theitem to show the results, or click the Expand All button to show all results.
Figure 14-24Statistics output browser
The output contains a section for each Examine field, containing a table of therequested statistics.

521
Output Nodes
Count. The number of records with valid values for the field.
Mean. The average (mean) value for the field across all records.
Sum. The sum of values for the field across all records.
Min. The minimum value for the field.
Max. The maximum value for the field.
Range. The difference between the minimum and maximum values.
Variance. A measure of the variability in the values of a field. It is calculated bytaking the difference between each value and the overall mean, squaring it,summing across all of the values, and dividing by the number of records.
Standard Deviation. Another measure of variability in the values of a field,calculated as the square root of the variance.
Standard Error of Mean. A measure of the uncertainty in the estimate of the field'smean if the mean is assumed to apply to new data.
Median. The “middle” value for the field; that is, the value that divides the upperhalf of the data from the lower half of the data (based on values of the field).
Mode. The most common single value in the data.
If you specified correlate fields, the output also contains a section listing thePearson correlation between the Examine field and each correlate field, and optionaldescriptive labels for the correlation values. The correlation measures the strengthof relationship between two numeric fields. It takes values between –1.0 and 1.0.Values close to +1.0 indicate a strong positive association, such that high values onone field are associated with high values on the other, and low values are associatedwith low values. Values close to –1.0 indicate a strong negative association, so thathigh values for one field are associated with low values for the other, and vice versa.Values close to 0.0 indicate a weak association, so that values for the two fieldsare more or less independent.
Generate menu. The Generate menu contains node generation operations.
Filter. Generates a Filter node to filter out fields that are uncorrelated or weaklycorrelated with other fields.

522
Chapter 14
Generating a Filter Node from Statistics
Figure 14-25Generate Filter from Statistics dialog box
The Filter node generated from a Statistics output browser will filter fields based ontheir correlations with other fields. It works by sorting the correlations in order ofabsolute value, taking the largest correlations (according to the criterion set in thedialog box), and creating a filter that passes all fields that appear in any of thoselarge correlations.
Mode. Decide how to select correlations. Include causes fields appearing in thespecified correlations to be retained. Exclude causes the fields to be filtered.
Include/Exclude fields appearing in. Define the criterion for selecting correlations.
Top number of correlations. Selects the specified number of correlations andincludes/excludes fields that appear in any of those correlations.
Top percentage of correlations (%). Selects the specified percentage (n%) ofcorrelations and includes/excludes fields that appear in any of those correlations.
Correlations greater than. Selects correlations greater in absolute value than thespecified threshold.
Quality Node
The Quality node reports on the quality of your data by checking for missing valuesor blanks. The node can take Clementine blank definitions into account or deal withempty or white space values. From the Quality output browser you can generateSelect or Filter nodes based on various data quality characteristics.

523
Output Nodes
Quality Node Quality TabFigure 14-26Quality node Quality tab
To analyze the quality of all of your data, select Evaluate all fields. To analyze onlycertain fields, select Evaluate selected fields and select the fields of interest.
Treat as invalid values. Select the data features that you want to consider as invalidvalues.
Null (undefined) value. Considers system ($null$) values as invalid.
Empty string. Consider empty strings as invalid.
White space. Consider values that contain only white space (spaces, tabs, ornew lines) as invalid.
Blank values. Consider blank values as defined by an upstream Type node orSource node as invalid. For more information, see “Specifying Missing Values”in Chapter 9 on page 224.
Calculate. Select calculation options for the quality report.

524
Chapter 14
Count of records with valid values. Select this option to show the number ofrecords with valid values for each evaluated field.
Breakdown counts of records with invalid values. Select this option to show thenumber of records with each type of invalid value for each field.
Quality Node Output BrowserFigure 14-27Quality browser window
The quality browser displays the results of the data quality analysis and allows you toperform operations, including selecting fields, generating new nodes based on theselection, and saving and printing the results.
Quality results. The data quality report lists the fields in descending order ofcompleteness. The fields with the highest data quality (the lowest proportion ofinvalid values as defined in the options) are listed at the top, and those with the lowestdata quality (the highest proportion of invalid values) are listed at the bottom.
Selecting fields. You can select fields by clicking directly on them in the list. Multiplefields can be selected by holding down the Shift key (to add contiguous fields) or theCtrl key (to add noncontiguous fields) while clicking. You can deselect a selected fieldby clicking it while pressing the Ctrl key or by simply selecting another field. Youcan also use the options on the Edit menu to select all fields or to clear the selection.
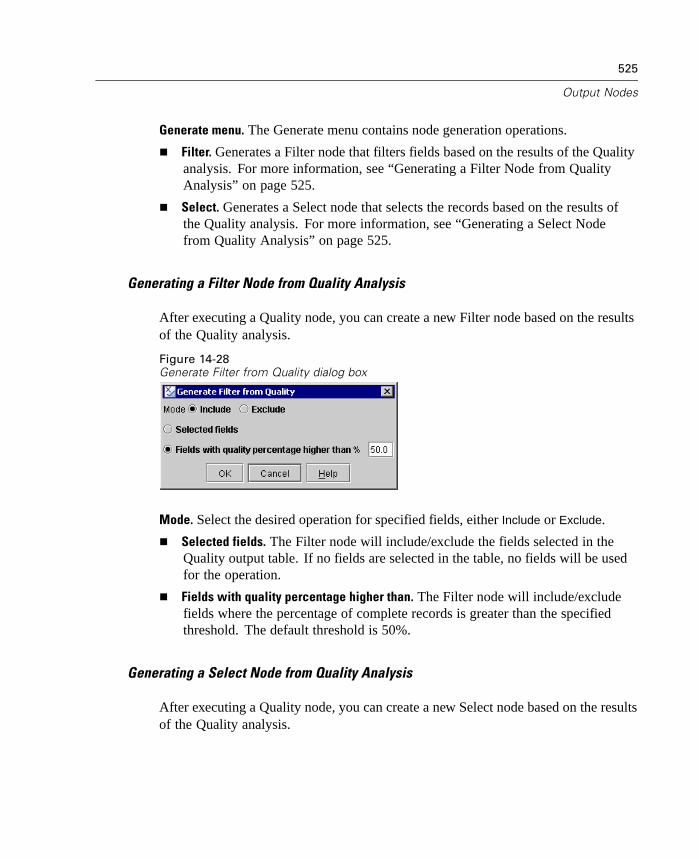
525
Output Nodes
Generate menu. The Generate menu contains node generation operations.
Filter. Generates a Filter node that filters fields based on the results of the Qualityanalysis. For more information, see “Generating a Filter Node from QualityAnalysis” on page 525.
Select. Generates a Select node that selects the records based on the results ofthe Quality analysis. For more information, see “Generating a Select Nodefrom Quality Analysis” on page 525.
Generating a Filter Node from Quality Analysis
After executing a Quality node, you can create a new Filter node based on the resultsof the Quality analysis.
Figure 14-28Generate Filter from Quality dialog box
Mode. Select the desired operation for specified fields, either Include or Exclude.
Selected fields. The Filter node will include/exclude the fields selected in theQuality output table. If no fields are selected in the table, no fields will be usedfor the operation.
Fields with quality percentage higher than. The Filter node will include/excludefields where the percentage of complete records is greater than the specifiedthreshold. The default threshold is 50%.
Generating a Select Node from Quality Analysis
After executing a Quality node, you can create a new Select node based on the resultsof the Quality analysis.
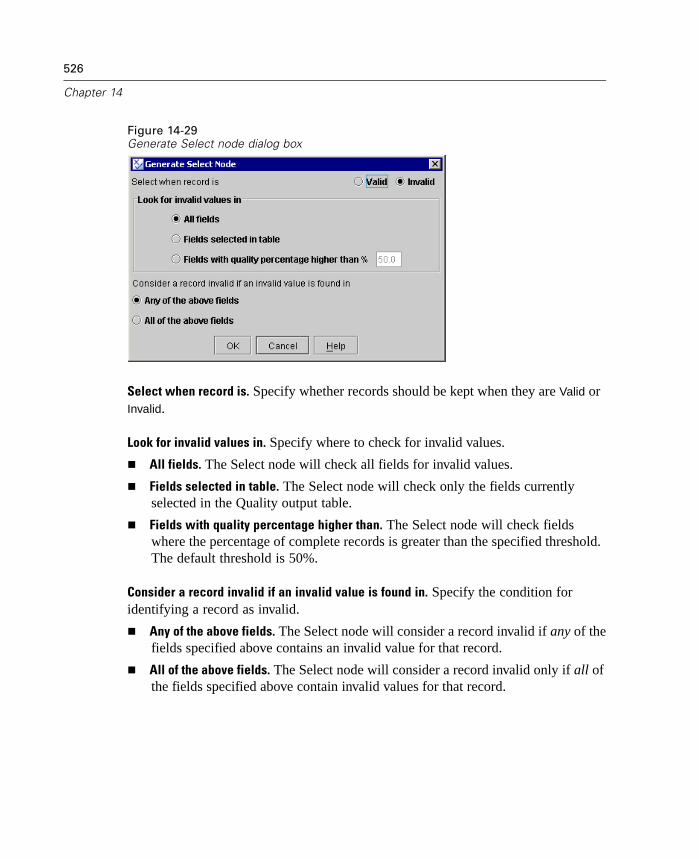
526
Chapter 14
Figure 14-29Generate Select node dialog box
Select when record is. Specify whether records should be kept when they are Valid orInvalid.
Look for invalid values in. Specify where to check for invalid values.
All fields. The Select node will check all fields for invalid values.
Fields selected in table. The Select node will check only the fields currentlyselected in the Quality output table.
Fields with quality percentage higher than. The Select node will check fieldswhere the percentage of complete records is greater than the specified threshold.The default threshold is 50%.
Consider a record invalid if an invalid value is found in. Specify the condition foridentifying a record as invalid.
Any of the above fields. The Select node will consider a record invalid if any of thefields specified above contains an invalid value for that record.
All of the above fields. The Select node will consider a record invalid only if all ofthe fields specified above contain invalid values for that record.

527
Output Nodes
Report Node
The Report node allows you to create formatted reports containing fixed text aswell as data and other expressions derived from the data. You specify the formatof the report by using text templates to define the fixed text and the data outputconstructions. You can provide custom text formatting using HTML tags in thetemplate and by setting options on the Output tab. Data values and other conditionaloutput are included in the report using CLEM expressions in the template.
Report Node Template TabFigure 14-30Report node Template tab
Creating a template. To define the contents of the report, you create a template on theReport node Template tab. The template consists of lines of text, each of whichspecifies something about the contents of the report, and some special tag linesused to indicate the scope of the content lines. Within each content line, CLEM
528
Chapter 14
expressions enclosed in square brackets ([]) are evaluated before the line is sent to thereport. There are three possible scopes for a line in the template:
Fixed. Lines that are not marked otherwise are considered fixed. Fixed linesare copied into the report only once, after any expressions that they containare evaluated. For example, the line
This is my report, printed on [@TODAY]
would copy a single line to the report, containing the text and the current date.
Global (iterate ALL). Lines contained between the special tags #ALL and # arecopied to the report once for each record of input data. CLEM expressions(enclosed in brackets) are evaluated based on the current record for each outputline. For example, the lines
#ALLFor record [@INDEX], the value of AGE is [AGE]#
would include one line for each record indicating the record number and age.
Conditional (iterate WHERE). Lines contained between the special tags #WHERE<condition> and # are copied to the report once for each record where thespecified condition is true. The condition is a CLEM expression. (In the WHEREcondition, the brackets are optional.) For example, the lines
#WHERE [SEX = 'M']Male at record no. [@INDEX] has age [AGE].#
will write one line to the file for each record with a value of “M” for sex.
The complete report will contain the fixed, global, and conditional lines defined byapplying the template to the input data.
You can specify options for displaying or saving results using the Output tab,common to various types of Output nodes. For more information, see “Output NodeOutput Tab” on page 491.
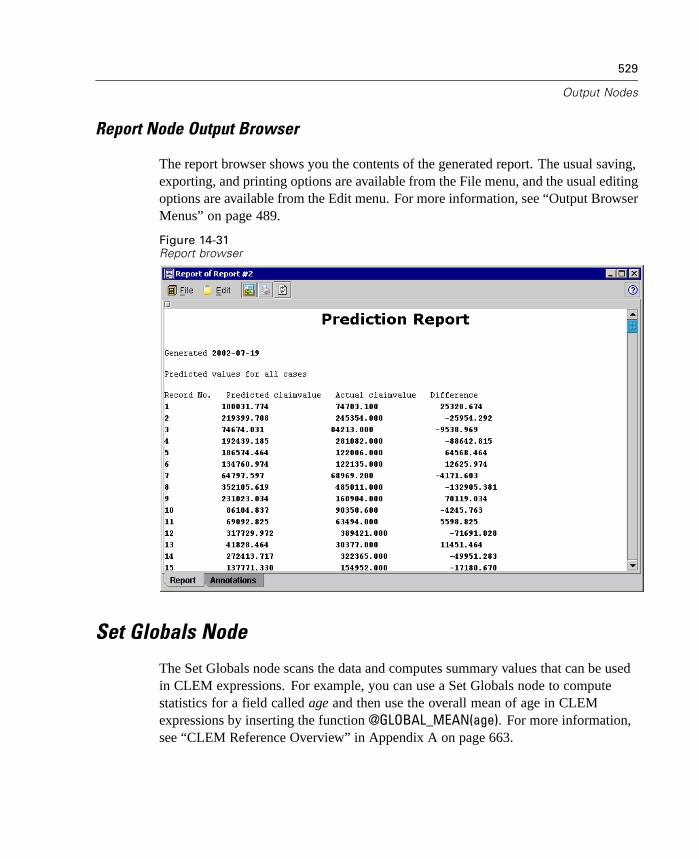
529
Output Nodes
Report Node Output Browser
The report browser shows you the contents of the generated report. The usual saving,exporting, and printing options are available from the File menu, and the usual editingoptions are available from the Edit menu. For more information, see “Output BrowserMenus” on page 489.
Figure 14-31Report browser
Set Globals Node
The Set Globals node scans the data and computes summary values that can be usedin CLEM expressions. For example, you can use a Set Globals node to computestatistics for a field called age and then use the overall mean of age in CLEMexpressions by inserting the function @GLOBAL_MEAN(age). For more information,see “CLEM Reference Overview” in Appendix A on page 663.
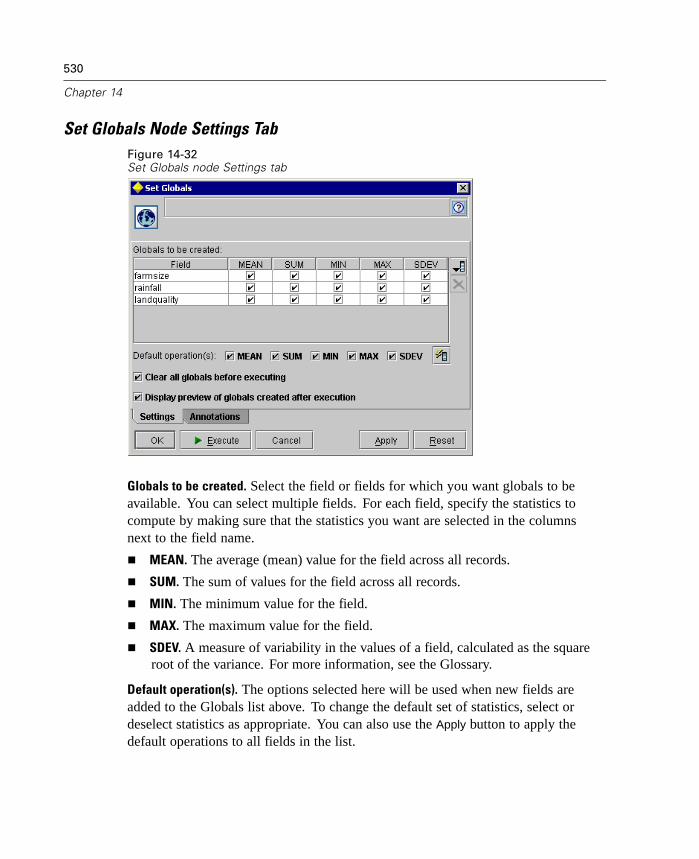
530
Chapter 14
Set Globals Node Settings TabFigure 14-32Set Globals node Settings tab
Globals to be created. Select the field or fields for which you want globals to beavailable. You can select multiple fields. For each field, specify the statistics tocompute by making sure that the statistics you want are selected in the columnsnext to the field name.
MEAN. The average (mean) value for the field across all records.
SUM. The sum of values for the field across all records.
MIN. The minimum value for the field.
MAX. The maximum value for the field.
SDEV. A measure of variability in the values of a field, calculated as the squareroot of the variance. For more information, see the Glossary.
Default operation(s). The options selected here will be used when new fields areadded to the Globals list above. To change the default set of statistics, select ordeselect statistics as appropriate. You can also use the Apply button to apply thedefault operations to all fields in the list.

531
Output Nodes
Clear all globals before executing. Select this option to remove all global values beforecalculating new values. If this option is not selected, newly calculated values replaceolder values, but globals that are not recalculated remain available as well.
Display preview of globals created after execution. If you select this option, theGlobals tab of the stream properties dialog box will appear after execution to displaythe calculated global values. For more information, see “Viewing Global Valuesfor Streams” in Chapter 4 on page 84.
Solution Publisher Node
Clementine Solution Publisher is an add-on product that allows you to export entireClementine streams in order to embed the streams in your own external applications.This allows you to interactively create your data mining process until you have a datamodeling stream that serves your needs and then to use that stream in a productionenvironment. Solution Publisher provides a more powerful deployment mechanismthan exporting generated models because it publishes the entire stream, including datapreprocessing done by the stream as well as the actual model used with the data.
Streams are exported as a published image file and an associated parameter filethat can be executed using the Clementine Runtime. This removes much of thecomplexity associated with compilation of C code into an executable file.
Note: Solution Publisher is not part of the base Clementine program. To use SolutionPublisher, you must have a license for it. If Solution Publisher is not enabled on yoursystem, check with your system administrator to make sure all license codes havebeen activated, or contact SPSS about purchasing a Solution Publisher license.
For full details on how to use Solution Publisher, see the Solution Publisher User'sGuide.pdf on the Clementine CD.

532
Chapter 14
Setting Options for the Solution Publisher NodeFigure 14-33Solution Publisher node edit dialog box
Published name. Specify the name for the files to be published. Enter a filename orclick the File Chooser button to browse to the file's location.
Export data. You can export records in several formats. Each format has its ownassociated options.
Database Export Options. This option writes records to a database table. Databaseexport options are the same as those for the Database Output node. For moreinformation, see “Database Node Export Tab” on page 534.
533
Output Nodes
Flat file. This option writes records to a delimited text file. File Export Optionsare the same as those for the Flat File Output node. For more information, see“Flat File Export Tab” on page 539.
SPSS file. This option writes records to an SPSS data file. SPSS file exportoptions are the same as those for the SPSS Export node, except that theapplication-launching options are not available in the Publisher node. For moreinformation, see “SPSS Export Node Export Tab” on page 541.
SAS file. This option writes records to a SAS data file. SAS file export options arethe same as those for the SAS Export node. For more information, see “SASExport Node Export Tab” on page 544.
When publishing to external applications, consider filtering extraneous fields orrenaming fields to conform with input requirements. Both can be accomplishedusing the Filter tab in the Publisher dialog box. For more information, see “SPSSImport Node” in Chapter 5 on page 111.
Database Output Node
You can use Database nodes to write data to ODBC-compliant relational data sources.
Note: To write to an ODBC data source, the data source must exist, and you musthave write permission for that data source. Contact your database administrator if youhave questions about creating or setting permissions for ODBC data sources.
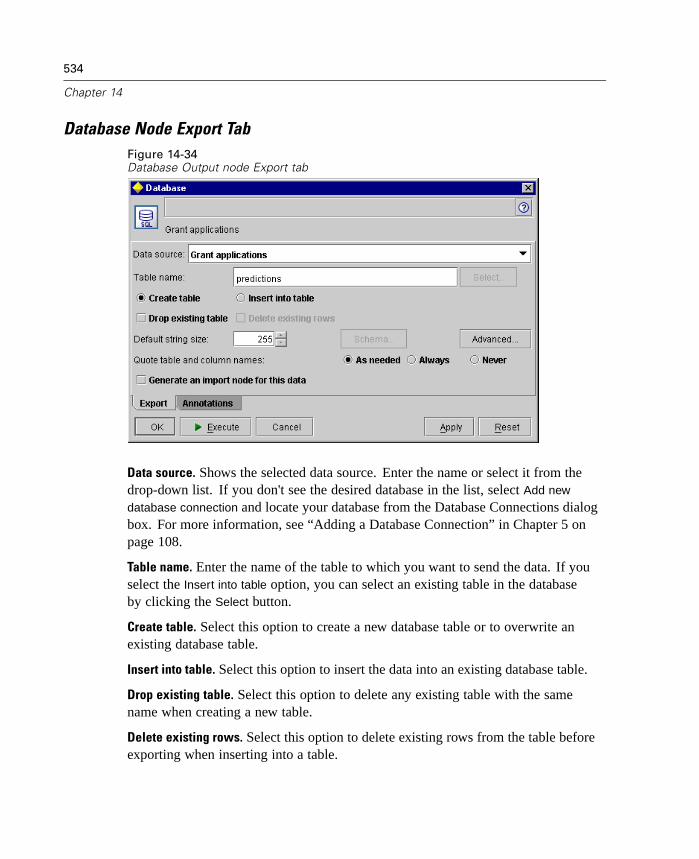
534
Chapter 14
Database Node Export TabFigure 14-34Database Output node Export tab
Data source. Shows the selected data source. Enter the name or select it from thedrop-down list. If you don't see the desired database in the list, select Add new
database connection and locate your database from the Database Connections dialogbox. For more information, see “Adding a Database Connection” in Chapter 5 onpage 108.
Table name. Enter the name of the table to which you want to send the data. If youselect the Insert into table option, you can select an existing table in the databaseby clicking the Select button.
Create table. Select this option to create a new database table or to overwrite anexisting database table.
Insert into table. Select this option to insert the data into an existing database table.
Drop existing table. Select this option to delete any existing table with the samename when creating a new table.
Delete existing rows. Select this option to delete existing rows from the table beforeexporting when inserting into a table.
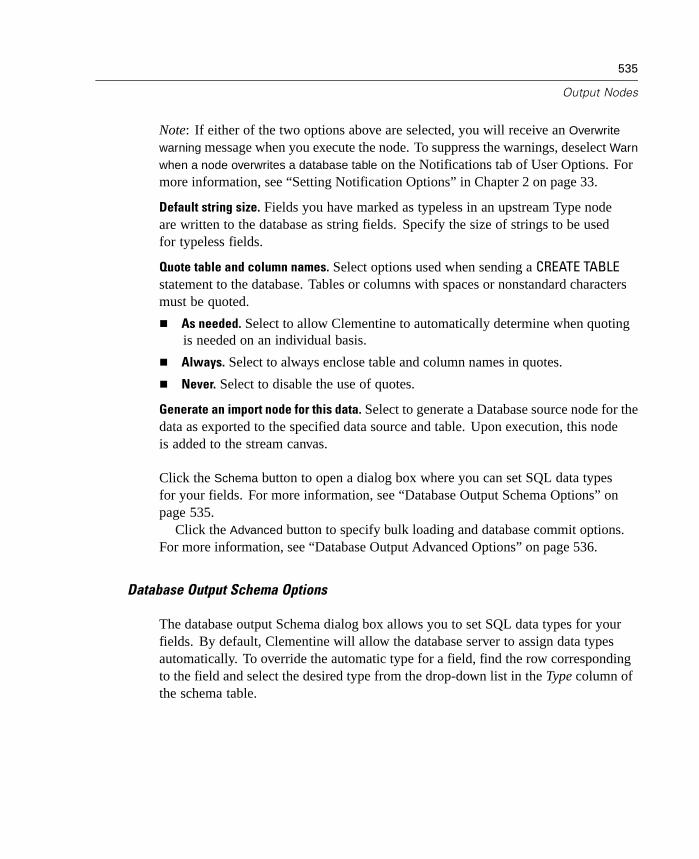
535
Output Nodes
Note: If either of the two options above are selected, you will receive an Overwrite
warning message when you execute the node. To suppress the warnings, deselect Warn
when a node overwrites a database table on the Notifications tab of User Options. Formore information, see “Setting Notification Options” in Chapter 2 on page 33.
Default string size. Fields you have marked as typeless in an upstream Type nodeare written to the database as string fields. Specify the size of strings to be usedfor typeless fields.
Quote table and column names. Select options used when sending a CREATE TABLEstatement to the database. Tables or columns with spaces or nonstandard charactersmust be quoted.
As needed. Select to allow Clementine to automatically determine when quotingis needed on an individual basis.
Always. Select to always enclose table and column names in quotes.
Never. Select to disable the use of quotes.
Generate an import node for this data. Select to generate a Database source node for thedata as exported to the specified data source and table. Upon execution, this nodeis added to the stream canvas.
Click the Schema button to open a dialog box where you can set SQL data typesfor your fields. For more information, see “Database Output Schema Options” onpage 535.
Click the Advanced button to specify bulk loading and database commit options.For more information, see “Database Output Advanced Options” on page 536.
Database Output Schema Options
The database output Schema dialog box allows you to set SQL data types for yourfields. By default, Clementine will allow the database server to assign data typesautomatically. To override the automatic type for a field, find the row correspondingto the field and select the desired type from the drop-down list in the Type column ofthe schema table.
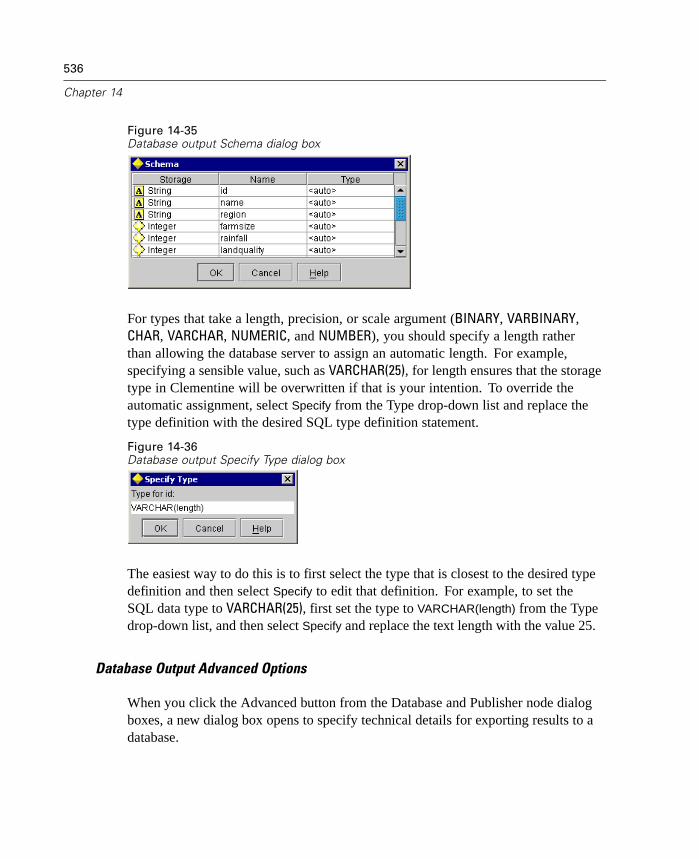
536
Chapter 14
Figure 14-35Database output Schema dialog box
For types that take a length, precision, or scale argument (BINARY, VARBINARY,CHAR, VARCHAR, NUMERIC, and NUMBER), you should specify a length ratherthan allowing the database server to assign an automatic length. For example,specifying a sensible value, such as VARCHAR(25), for length ensures that the storagetype in Clementine will be overwritten if that is your intention. To override theautomatic assignment, select Specify from the Type drop-down list and replace thetype definition with the desired SQL type definition statement.
Figure 14-36Database output Specify Type dialog box
The easiest way to do this is to first select the type that is closest to the desired typedefinition and then select Specify to edit that definition. For example, to set theSQL data type to VARCHAR(25), first set the type to VARCHAR(length) from the Typedrop-down list, and then select Specify and replace the text length with the value 25.
Database Output Advanced Options
When you click the Advanced button from the Database and Publisher node dialogboxes, a new dialog box opens to specify technical details for exporting results to adatabase.
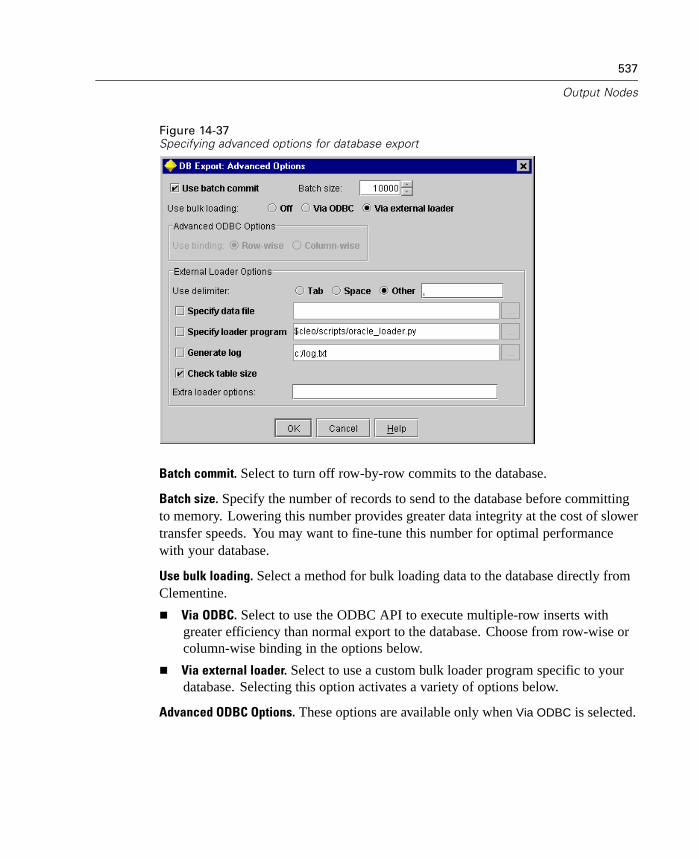
537
Output Nodes
Figure 14-37Specifying advanced options for database export
Batch commit. Select to turn off row-by-row commits to the database.
Batch size. Specify the number of records to send to the database before committingto memory. Lowering this number provides greater data integrity at the cost of slowertransfer speeds. You may want to fine-tune this number for optimal performancewith your database.
Use bulk loading. Select a method for bulk loading data to the database directly fromClementine.
Via ODBC. Select to use the ODBC API to execute multiple-row inserts withgreater efficiency than normal export to the database. Choose from row-wise orcolumn-wise binding in the options below.
Via external loader. Select to use a custom bulk loader program specific to yourdatabase. Selecting this option activates a variety of options below.
Advanced ODBC Options. These options are available only when Via ODBC is selected.

538
Chapter 14
Row-wise. Select row-wise binding to use the SQLBulkOperations call for loadingdata into the database. Row-wise binding typically improves speed compared tothe use of parameterized inserts that insert data on a record-by-record basis.
Column-wise. Select to use column-wise binding for loading data into thedatabase. Column-wise binding improves performance by binding each databasecolumn (in a parameterized INSERT statement) to an array of N values. Executingthe INSERT once causes N rows to be inserted into the database. This method candramatically increase performance.
External Loader Options. When Via external loader is specified, a variety of options aredisplayed for exporting the dataset to a file and specifying and executing a customloader program to load the data from that file into the database.
Use delimiter. Specify which delimiter character should be used in the exportedfile. Select Tab to delimit with tab and Space to delimit with spaces. Select Otherto specify another character, such as the comma (,).
Specify data file. Select to enter the path to use for the data file written during bulkloading. By default, a temporary file is created in the temp directory on the server.
Specify loader program. Select to specify a bulk loading program. By default, thesoftware searches the /scripts subdirectory of the Clementine (client, server,and Solution Publisher) installation for a python script to execute for a givendatabase. Several scripts have been included with the software. Check the /scriptssubdirectory for available scripts and technical documentation.
Generate log. Select to generate a log file to the specified directory. The log filecontains error information and is useful if the bulk load operation fails.
Check table size. Select to perform table checking that ensures that the increase intable size corresponds to the number of rows exported from Clementine.
Extra loader options. Specify additional arguments to the loader program. Usedouble-quotes for arguments containing spaces.
Double-quotes are included in optional arguments by escaping with a backslash. Forexample, the option specified as -comment “This is a \”comment\"" includes both the-comment flag and the comment itself rendered as This is a “comment”.
A single backslash can be included by escaping with another back-slash. Forexample, the option specified as -specialdir “C:\\Test Scripts\\” includes the flag-specialdir and the directory rendered as C:\Test Scripts\.
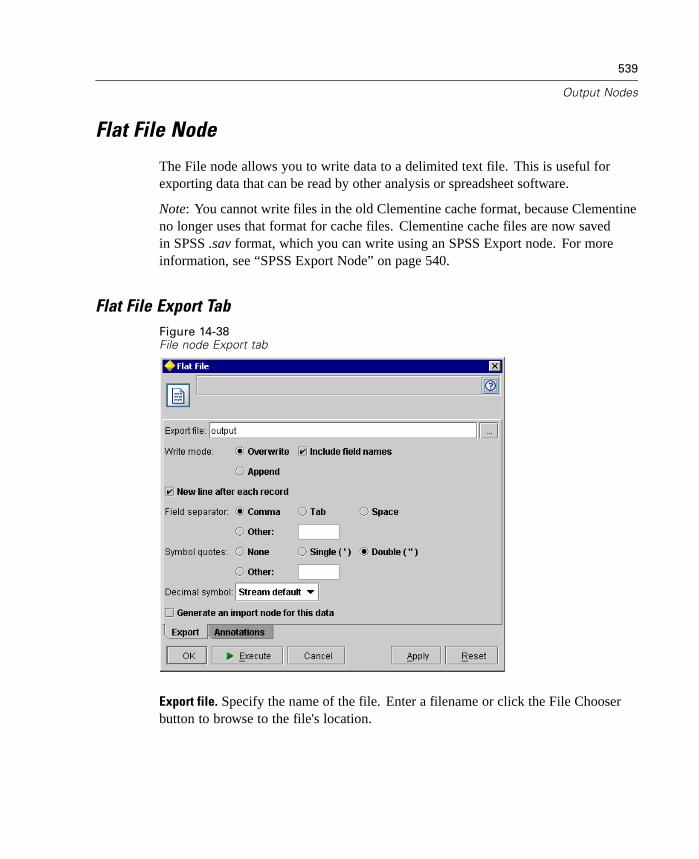
539
Output Nodes
Flat File Node
The File node allows you to write data to a delimited text file. This is useful forexporting data that can be read by other analysis or spreadsheet software.
Note: You cannot write files in the old Clementine cache format, because Clementineno longer uses that format for cache files. Clementine cache files are now savedin SPSS .sav format, which you can write using an SPSS Export node. For moreinformation, see “SPSS Export Node” on page 540.
Flat File Export TabFigure 14-38File node Export tab
Export file. Specify the name of the file. Enter a filename or click the File Chooserbutton to browse to the file's location.
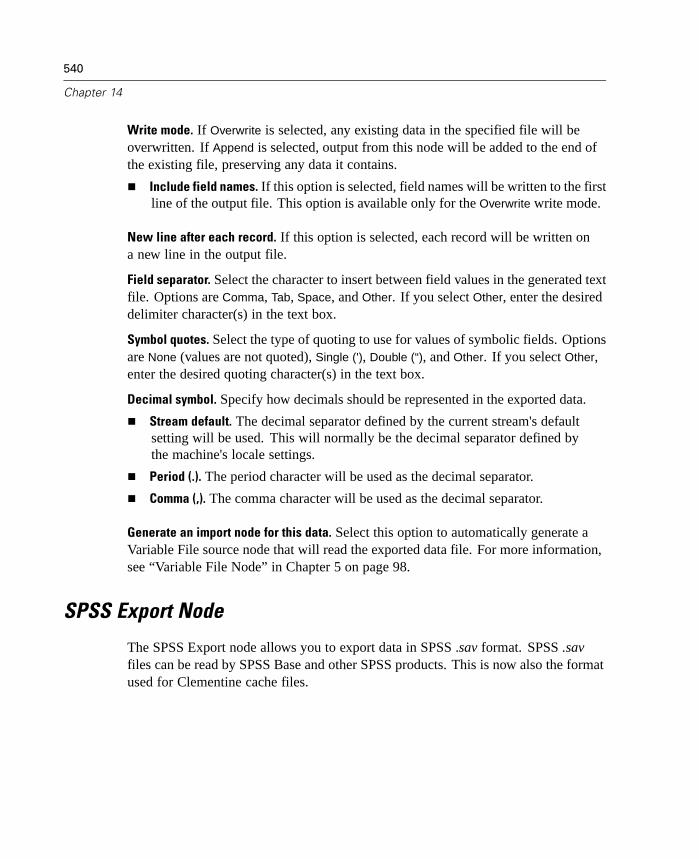
540
Chapter 14
Write mode. If Overwrite is selected, any existing data in the specified file will beoverwritten. If Append is selected, output from this node will be added to the end ofthe existing file, preserving any data it contains.
Include field names. If this option is selected, field names will be written to the firstline of the output file. This option is available only for the Overwrite write mode.
New line after each record. If this option is selected, each record will be written ona new line in the output file.
Field separator. Select the character to insert between field values in the generated textfile. Options are Comma, Tab, Space, and Other. If you select Other, enter the desireddelimiter character(s) in the text box.
Symbol quotes. Select the type of quoting to use for values of symbolic fields. Optionsare None (values are not quoted), Single ('), Double (“), and Other. If you select Other,enter the desired quoting character(s) in the text box.
Decimal symbol. Specify how decimals should be represented in the exported data.
Stream default. The decimal separator defined by the current stream's defaultsetting will be used. This will normally be the decimal separator defined bythe machine's locale settings.
Period (.). The period character will be used as the decimal separator.
Comma (,). The comma character will be used as the decimal separator.
Generate an import node for this data. Select this option to automatically generate aVariable File source node that will read the exported data file. For more information,see “Variable File Node” in Chapter 5 on page 98.
SPSS Export Node
The SPSS Export node allows you to export data in SPSS .sav format. SPSS .savfiles can be read by SPSS Base and other SPSS products. This is now also the formatused for Clementine cache files.
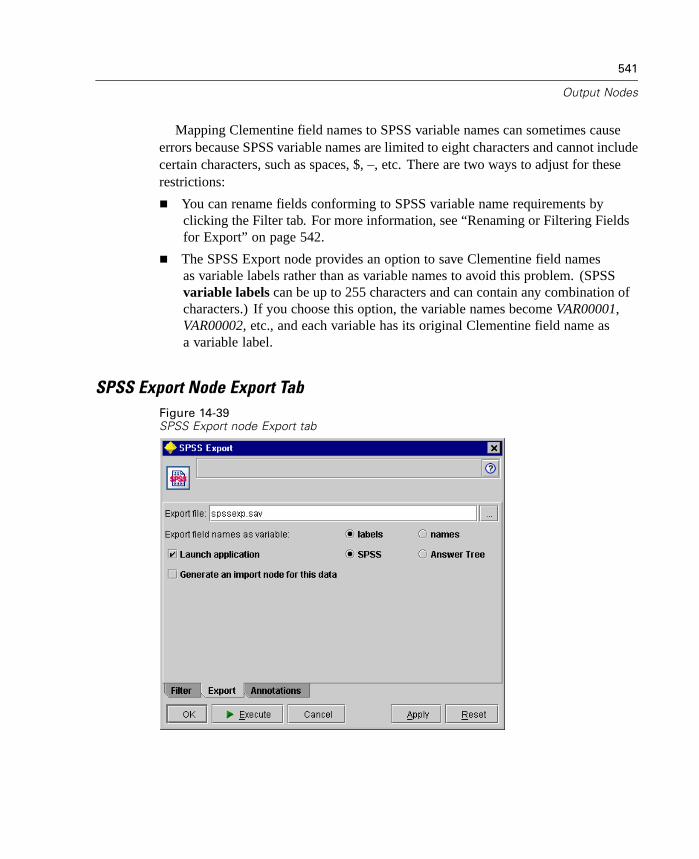
541
Output Nodes
Mapping Clementine field names to SPSS variable names can sometimes causeerrors because SPSS variable names are limited to eight characters and cannot includecertain characters, such as spaces, $, –, etc. There are two ways to adjust for theserestrictions:
You can rename fields conforming to SPSS variable name requirements byclicking the Filter tab. For more information, see “Renaming or Filtering Fieldsfor Export” on page 542.
The SPSS Export node provides an option to save Clementine field namesas variable labels rather than as variable names to avoid this problem. (SPSSvariable labels can be up to 255 characters and can contain any combination ofcharacters.) If you choose this option, the variable names become VAR00001,VAR00002, etc., and each variable has its original Clementine field name asa variable label.
SPSS Export Node Export TabFigure 14-39SPSS Export node Export tab

542
Chapter 14
Export file. Specify the name of the file. Enter a file name or click the file chooserbutton to browse to the file's location.
Export field names as variable. To use the Clementine field names as variable names,select names. Clementine allows characters in field names that are illegal in SPSSvariable names. To prevent possibly creating illegal SPSS names, select labels instead.
Launch application. If SPSS or AnswerTree is installed on your computer, you caninvoke them directly on the saved data file. Select the program to open. If you havethe applications installed but are having problems launching them, check your helperapplications settings. For more information, see “Helper Applications” on page 550.
To simply create an SPSS .sav file without opening an external program, deselectthis option.
Generate an import node for this data. Select this option to automatically generate anSPSS File node that will read the exported data file. For more information, see “SPSSImport Node” in Chapter 5 on page 111.
Renaming or Filtering Fields for Export
Before exporting or deploying data from Clementine to external applications such asSPSS, it may be necessary to rename or truncate field names. The SPSS Procedure,SPSS Export, and Publisher node dialog boxes contain a Filter tab to facilitate thisprocess.
A basic description of Filter functionality is discussed elsewhere. For moreinformation, see “Setting Filtering Options” in Chapter 7 on page 165. This topicprovides tips for reading data into SPSS.
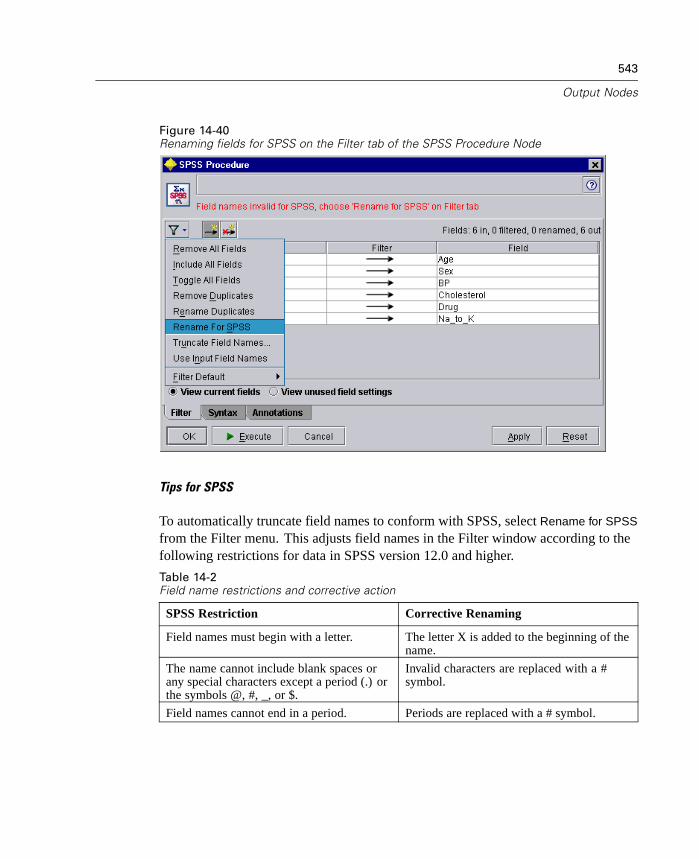
543
Output Nodes
Figure 14-40Renaming fields for SPSS on the Filter tab of the SPSS Procedure Node
Tips for SPSS
To automatically truncate field names to conform with SPSS, select Rename for SPSS
from the Filter menu. This adjusts field names in the Filter window according to thefollowing restrictions for data in SPSS version 12.0 and higher.
Table 14-2Field name restrictions and corrective action
SPSS Restriction Corrective Renaming
Field names must begin with a letter. The letter X is added to the beginning of thename.
The name cannot include blank spaces orany special characters except a period (.) orthe symbols @, #, _, or $.
Invalid characters are replaced with a #symbol.
Field names cannot end in a period. Periods are replaced with a # symbol.

544
Chapter 14
SPSS Restriction Corrective Renaming
Length of field names cannot exceed 64characters.
Long names are truncated to 64 characters,according to standards for SPSS 12.0 andhigher.
Field names must be unique. Note: Namesin SPSS are not case sensitive.
Duplicate names are truncated to 5 charactersand then appended with an index ensuringuniqueness.
Reserved keywords are: ALL, NE, EQ, TO,LE, LT, BY, OR, GT, AND, NOT, GE, WITH
Fields names matching a reserved word areappended with the # symbol.For example, WITH becomes WITH#.
SAS Export Node
The SAS Export node allows you to write data in SAS format to be read into SAS or aSAS-compatible software package. You can export in three SAS file formats: SASfor Windows/OS2, SAS for UNIX, or SAS Version 7/8.
SAS Export Node Export TabFigure 14-41SAS Export node Export tab
Export file. Specify the name of the file. Enter a filename or click the File Chooserbutton to browse to the file's location.
545
Output Nodes
Export. Specify the export file format. Options are SAS for Windows/OS2, SAS
for UNIX, or SAS Version 7/8.
Export field names as variable. To use the Clementine field names as variable names,select names. Clementine allows characters in field names that are illegal in SASvariable names. To prevent possibly creating illegal SAS names, select labels instead.
Generate an import node for this data. Select this option to automatically generate aSAS File node that will read the exported data file. For more information, see “SASImport Node” in Chapter 5 on page 113.
Excel Node
The Excel node exports the data and opens it in Microsoft Excel as a spreadsheet.(If Excel is not installed, executing this node will report an error and save the file ina format readable by Excel).
If you have Excel installed but are having problems launching it, check your helperapplications settings. For more information, see “Helper Applications” on page 550.
Excel Node Export TabFigure 14-42Excel node Export Tab

546
Chapter 14
Create file. Indicate where you want the export file to be created.
In temporary directory. This option will create the file in the temporary directory,with an automatically generated filename.
With specified file name. This option will save the file to the filename specified.
File name. If you select With specified file name above, specify the name of the fileto be exported. Enter a filename or click the File Chooser button to browse to thefile's location.
File type. Select the format for the exported file. Options are CSV (Comma delimited)
or Text (tab delimited).
Decimal symbol. Specify how decimals should be represented in the exported data.
Locale default. The decimal separator defined by the machine's locale settingwill be used.
Period (.). The period character will be used as the decimal separator.
Comma (,). The comma character will be used as the decimal separator.
SPSS Procedure Node
If you have SPSS installed on your machine, the SPSS Procedure node allows you tocall an SPSS procedure to analyze your Clementine data. You can view the results ina browser window or save results in the SPSS output file format. A wide variety ofSPSS analytical procedures is accessible from Clementine.
For details on specific SPSS procedures, consult the documentation that camewith your copy of SPSS. You can also click the SPSS Syntax Help button, availablefrom the dialog box. This will provide syntax charts for the command that you arecurrently typing.
If you have trouble running SPSS Procedure nodes, consider the following tips:
If field names used in Clementine are longer than eight characters (for versionsprior to SPSS 12) or contain invalid characters, it is necessary to rename ortruncate before reading into SPSS. For more information, see “Renaming orFiltering Fields for Export” on page 542.
If SPSS was installed after Clementine, you may need to specify the SPSSinstallation directory in the Clementine Helper Applications dialog box.

547
Output Nodes
If SPSS windows are not opening properly, check options in SPSS to be sure thatthe program names and locations are set properly.
Graphs generated with the Clementine option will still be displayed using theSPSS Viewer; however, the title of the graph itself will appear on the Outputstab in the managers window.
SPSS Procedure Node Syntax Tab
Use this dialog box to create syntax code for SPSS procedures. Syntax is composed oftwo parts: a statement and associated options. The statement specifies the analysisor operation to be performed and the fields to be used. The options specify everythingelse, including which statistics to display, derived fields to save, and so on.
If you have previously created syntax files, you can use them here by selectingOpen from the File menu. Selecting an .sps file will paste the contents into theProcedure node dialog box.
To insert previously saved syntax without replacing the current contents, selectInsert from the File menu. This will paste the contents of an .sps file at thepoint specified by the cursor.
If you are unfamiliar with SPSS syntax, the simplest way to create syntax code inClementine is to first run the command in SPSS, copy the syntax into the SPSSProcedure node in Clementine, and execute the stream.
Once you have created syntax for a frequently used procedure, you can save thesyntax by selecting Save or Save As from the File menu.

548
Chapter 14
Options for viewing and saving the output from the SPSS Procedure node areavailable below the syntax edit box:
Figure 14-43SPSS Procedure node dialog box
Store. Select the types of files you want to save from the SPSS Procedure node. Youcan save the following types of SPSS file formats:
Data. The data read into the node will be saved as a .sav file in the directoryspecified.
SPSS Syntax. The syntax used to run the SPSS procedure can be saved for laterre-use. Syntax files are saved with an .sps extension.
SPSS Results. The results created with the SPSS Procedure node can be saved asa .spo file in the directory specified.
Path. Specify a location for the output files selected.
Output Mode. Select SPSS to display the results in an SPSS window (launched fromthe SPSS application installed on your machine). Select Clementine to use the defaultClementine browser window. Only basic reports (frequencies, crosstabs, etc.) can bedisplayed in Clementine output mode.
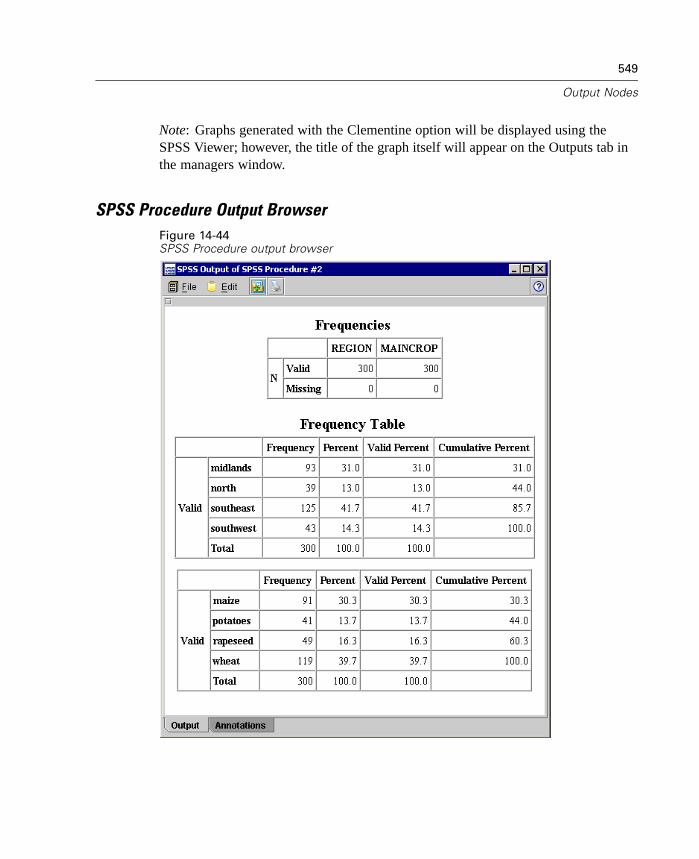
549
Output Nodes
Note: Graphs generated with the Clementine option will be displayed using theSPSS Viewer; however, the title of the graph itself will appear on the Outputs tab inthe managers window.
SPSS Procedure Output BrowserFigure 14-44SPSS Procedure output browser
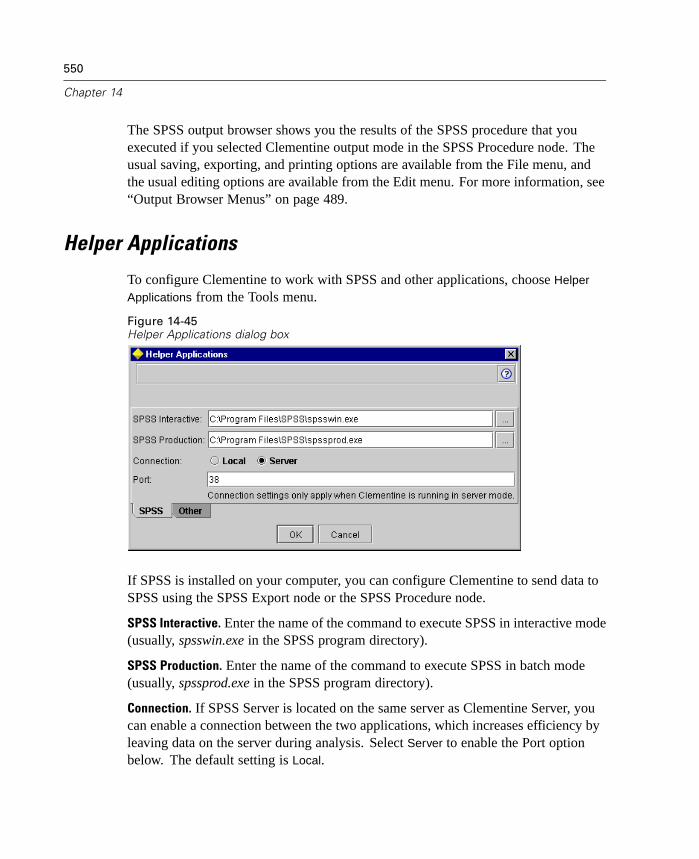
550
Chapter 14
The SPSS output browser shows you the results of the SPSS procedure that youexecuted if you selected Clementine output mode in the SPSS Procedure node. Theusual saving, exporting, and printing options are available from the File menu, andthe usual editing options are available from the Edit menu. For more information, see“Output Browser Menus” on page 489.
Helper Applications
To configure Clementine to work with SPSS and other applications, choose Helper
Applications from the Tools menu.
Figure 14-45Helper Applications dialog box
If SPSS is installed on your computer, you can configure Clementine to send data toSPSS using the SPSS Export node or the SPSS Procedure node.
SPSS Interactive. Enter the name of the command to execute SPSS in interactive mode(usually, spsswin.exe in the SPSS program directory).
SPSS Production. Enter the name of the command to execute SPSS in batch mode(usually, spssprod.exe in the SPSS program directory).
Connection. If SPSS Server is located on the same server as Clementine Server, youcan enable a connection between the two applications, which increases efficiency byleaving data on the server during analysis. Select Server to enable the Port optionbelow. The default setting is Local.

551
Output Nodes
Port. Specify the server port for SPSS Server.
Other Helper Applications
On the Other tab of the Helper Applications dialog box, you can specify the locationof applications, such as AnswerTree and Excel, to work interactively with data fromClementine.
Figure 14-46Helper Applications dialog box: Other tab
AnswerTree Interactive. Enter the name of the command to execute AnswerTree(normally atree.exe in the AnswerTree program directory).
Excel(tm) Interactive. Enter the name of the command to execute Excel (normallyexcel.exe in the Excel program directory).
Publish to Web URL. Enter the URL for your SPSS Web Deployment Framework(SWDF) server for the Publish to Web option.

Chapter
15SuperNodes
SuperNode Overview
One of the reasons that Clementine's visual programming interface is so easy to learnis that each node has a clearly defined function. This means, though, that for complexprocessing, a long sequence of nodes may be necessary. Eventually, this may clutterthe stream canvas and make it difficult to follow stream diagrams. There are twoways to avoid the clutter of a long and complex stream:
You can split a processing sequence into several streams that feed one into theother. The first stream, for example, creates a data file that the second uses asinput. The second creates a file that the third uses as input, and so on. Youcan manage these multiple streams by saving them in a project. A projectprovides organization for multiple streams and their output. However, a projectfile contains only a reference to the objects it contains, and you will still havemultiple stream files to manage.
A more streamlined alternative when working with complex stream processes isto create a SuperNode.
SuperNodes group multiple nodes into a single node by encapsulating sections of adata stream. This provides numerous benefits to the data miner:
Streams are neater and more manageable.
Nodes can be combined into a business-specific SuperNode.
SuperNodes can be exported to libraries for reuse in multiple data mining projects.
553
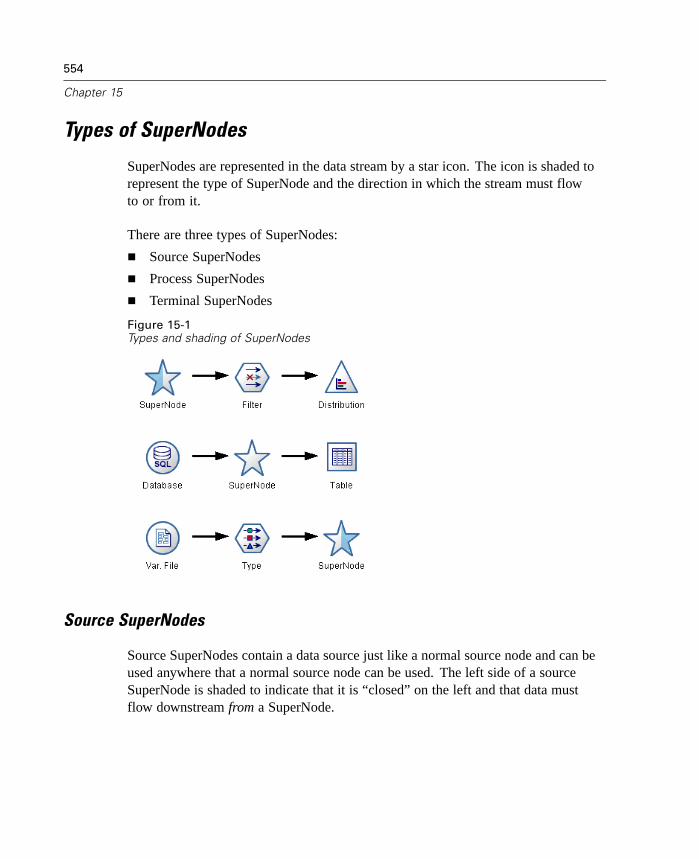
554
Chapter 15
Types of SuperNodes
SuperNodes are represented in the data stream by a star icon. The icon is shaded torepresent the type of SuperNode and the direction in which the stream must flowto or from it.
There are three types of SuperNodes:
Source SuperNodes
Process SuperNodes
Terminal SuperNodes
Figure 15-1Types and shading of SuperNodes
Source SuperNodes
Source SuperNodes contain a data source just like a normal source node and can beused anywhere that a normal source node can be used. The left side of a sourceSuperNode is shaded to indicate that it is “closed” on the left and that data mustflow downstream from a SuperNode.
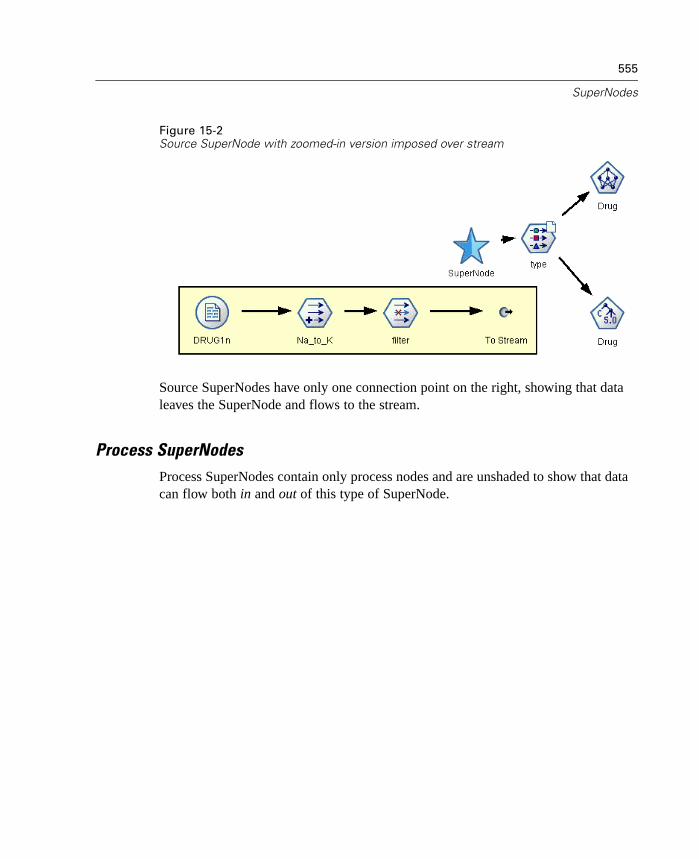
555
SuperNodes
Figure 15-2Source SuperNode with zoomed-in version imposed over stream
Source SuperNodes have only one connection point on the right, showing that dataleaves the SuperNode and flows to the stream.
Process SuperNodesProcess SuperNodes contain only process nodes and are unshaded to show that datacan flow both in and out of this type of SuperNode.

556
Chapter 15
Figure 15-3Process SuperNode with zoomed-in version imposed over stream
Process SuperNodes have connection points on both the left and right, showingthat data enters the SuperNode and leaves to flow back to the stream. AlthoughSuperNodes can contain additional stream fragments and even extra streams, bothconnection points must flow through a single path connecting the From Streamand To Stream points.
Note: Process SuperNodes are also sometimes referred to as “ManipulationSuperNodes.”
Terminal SuperNodes
Terminal SuperNodes contain one or more terminal nodes (plot, table, etc.) and canbe used in the same manner as a terminal node. A terminal SuperNode is shaded onthe right side to indicate that it is “closed” on the right and that data can flow onlyinto a terminal SuperNode.

557
SuperNodes
Figure 15-4Terminal SuperNode with zoomed-in version imposed over stream
Terminal SuperNodes have only one connection point on the left, showing that dataenters the SuperNode from the stream and terminates inside the SuperNode.
Terminal SuperNodes can also contain scripts that are used to specify the order ofexecution for all terminal nodes inside the SuperNode. For more information, see“SuperNodes and Scripting” on page 572.
Creating SuperNodes
Creating a SuperNode “shrinks” the data stream by encapsulating several nodes intoone node. Once you have created or loaded a stream on the canvas, there are severalways to create a SuperNode.
Multiple Selection
The simplest way to create a SuperNode is by selecting all of the nodes that youwant to encapsulate:
E Use the mouse to select multiple nodes on the stream canvas. You can also useShift-click to select a stream or section of a stream. Note: Nodes that you select

558
Chapter 15
must be from a continuous or forked stream. You cannot select nodes that are notadjacent or connected in some way.
E Then, using one of the following three methods, encapsulate the selected nodes:
Click the SuperNode icon (shaped like a star) on the toolbar.
Right-click on the SuperNode, and from the context menu choose:Create SuperNode
From Selection
From the SuperNode menu, choose:Create SuperNode
From Selection
Figure 15-5Creating a SuperNode using multiple selection
All three of these options encapsulate the nodes into a SuperNode shaded to reflect itstype—source, process, or terminal—based on its contents.
Single Selection
You can also create a SuperNode by selecting a single node and using menu optionsto determine the start and end of the SuperNode or encapsulating everythingdownstream of the selected node.
E Click the node that determines the start of encapsulation.
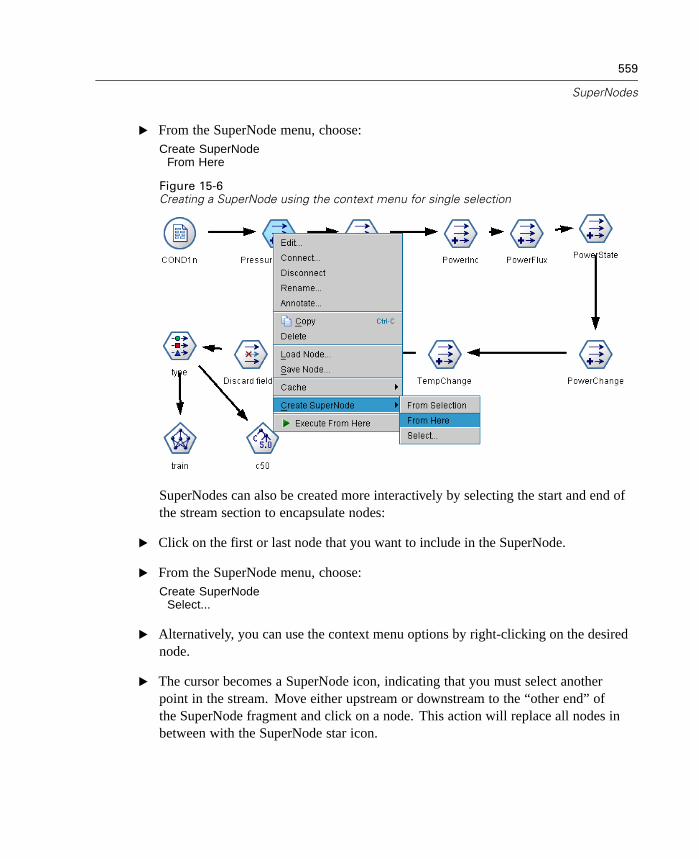
559
SuperNodes
E From the SuperNode menu, choose:Create SuperNode
From Here
Figure 15-6Creating a SuperNode using the context menu for single selection
SuperNodes can also be created more interactively by selecting the start and end ofthe stream section to encapsulate nodes:
E Click on the first or last node that you want to include in the SuperNode.
E From the SuperNode menu, choose:Create SuperNode
Select...
E Alternatively, you can use the context menu options by right-clicking on the desirednode.
E The cursor becomes a SuperNode icon, indicating that you must select anotherpoint in the stream. Move either upstream or downstream to the “other end” ofthe SuperNode fragment and click on a node. This action will replace all nodes inbetween with the SuperNode star icon.

560
Chapter 15
Note: Nodes that you select must be from a continuous or forked stream. You cannotselect nodes that are not adjacent or connected in some way.
Nesting SuperNodes
SuperNodes can be nested within other SuperNodes. The same rules for each type ofSuperNode (source, process, and terminal) apply to nested SuperNodes. For example,a process SuperNode with nesting must have a continuous data flow through allnested SuperNodes in order for it to remain a process SuperNode. If one of the nestedSuperNodes is terminal, then data would no longer flow through the hierarchy.
Figure 15-7Process SuperNode nested within another process SuperNode
Terminal and source SuperNodes can contain other types of nested SuperNodes, butthe same basic rules for creating SuperNodes apply.
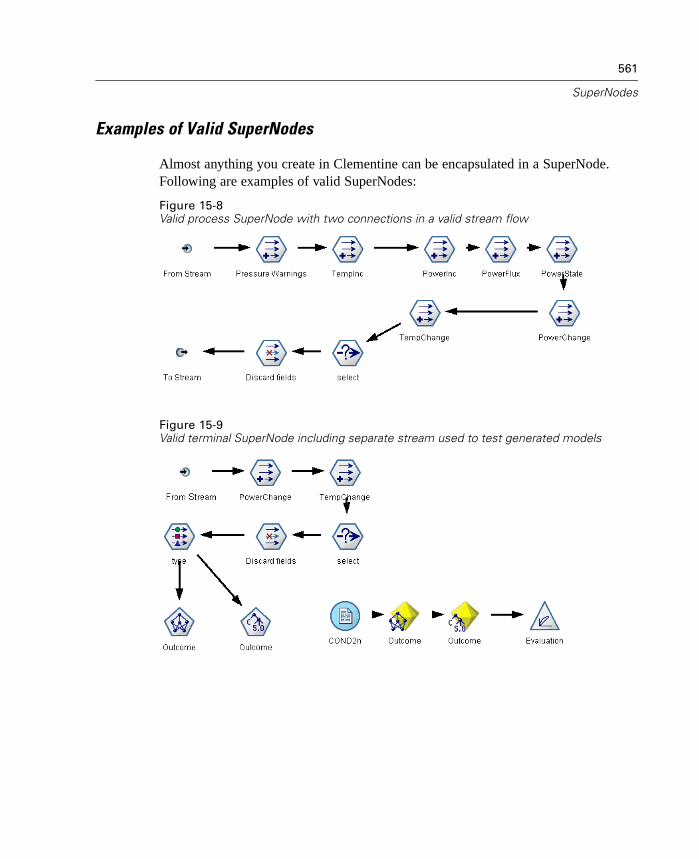
561
SuperNodes
Examples of Valid SuperNodes
Almost anything you create in Clementine can be encapsulated in a SuperNode.Following are examples of valid SuperNodes:
Figure 15-8Valid process SuperNode with two connections in a valid stream flow
Figure 15-9Valid terminal SuperNode including separate stream used to test generated models

562
Chapter 15
Figure 15-10Valid process SuperNode containing a nested SuperNode
Examples of Invalid SuperNodes
The most important aspect of creating valid SuperNodes is to ensure that data flowslinearly through the SuperNode connections. If there are two connections (a processSuperNode), then data must flow in a stream from the beginning connector to theending connector. Similarly, a source SuperNode must allow data to flow from thesource node to the single connector that brings data back to the zoomed-out stream.
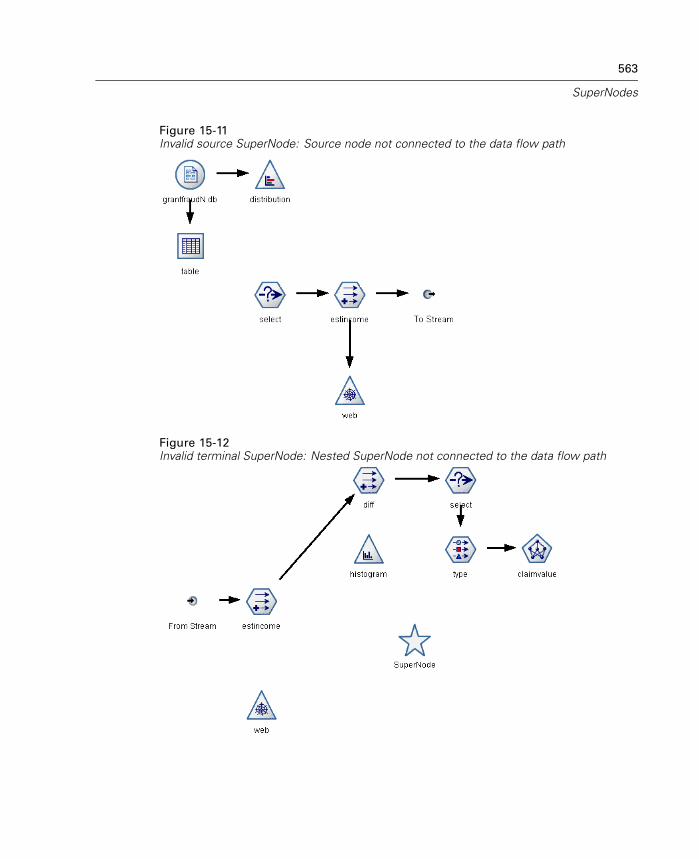
563
SuperNodes
Figure 15-11Invalid source SuperNode: Source node not connected to the data flow path
Figure 15-12Invalid terminal SuperNode: Nested SuperNode not connected to the data flow path

564
Chapter 15
Editing SuperNodes
Once you have created a SuperNode, you can examine it more closely by zooming into it. To view the contents of a SuperNode, you can use the zoom-in icon from theClementine toolbar, or the following method:
E Right-click on a SuperNode.
E From the context menu, choose Zoom In.
The contents of the selected SuperNode will be displayed in a slightly differentClementine environment, with connectors showing the flow of data through thestream or stream fragment. At this level on the stream canvas, there are severaltasks that you that can perform:
Modify the SuperNode type—source, process, or terminal.
Create parameters or edit the values of a parameter. Parameters are used inscripting and CLEM expressions.
Specify caching options for the SuperNode and its subnodes.
Create or modify a SuperNode script (terminal SuperNodes only).
Modifying SuperNode Types
In some circumstances, it is useful to alter the type of a SuperNode. This option isavailable only when you are zoomed in to a SuperNode, and it applies only to theSuperNode at that level. The three types of SuperNodes and their connectors are:
Source SuperNode One connection going out
Process SuperNode Two connections: one coming in and onegoing out
Terminal SuperNode One connection coming in
To change the type of a SuperNode:
E Be sure that you are zoomed in to the SuperNode.
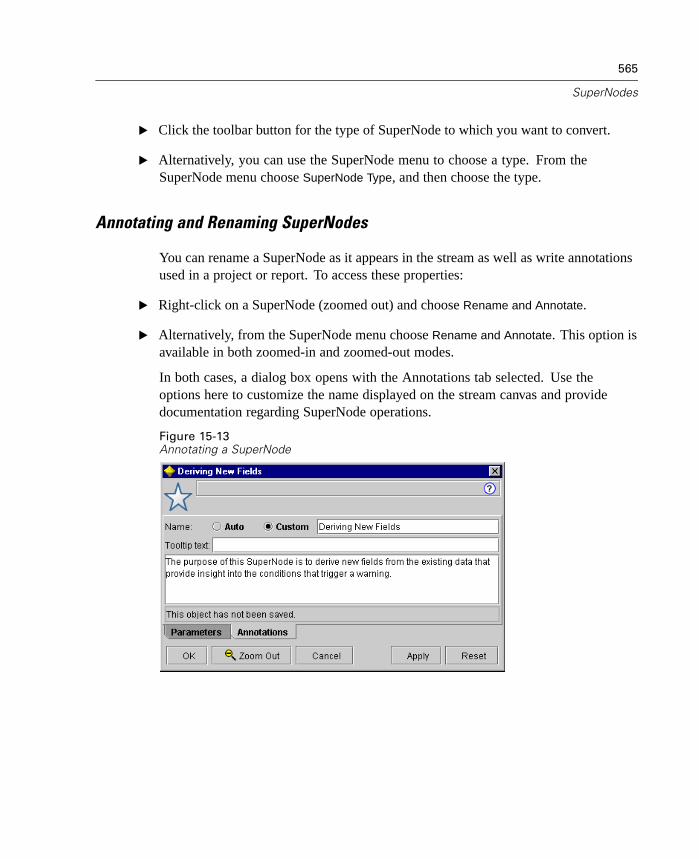
565
SuperNodes
E Click the toolbar button for the type of SuperNode to which you want to convert.
E Alternatively, you can use the SuperNode menu to choose a type. From theSuperNode menu choose SuperNode Type, and then choose the type.
Annotating and Renaming SuperNodes
You can rename a SuperNode as it appears in the stream as well as write annotationsused in a project or report. To access these properties:
E Right-click on a SuperNode (zoomed out) and choose Rename and Annotate.
E Alternatively, from the SuperNode menu choose Rename and Annotate. This option isavailable in both zoomed-in and zoomed-out modes.
In both cases, a dialog box opens with the Annotations tab selected. Use theoptions here to customize the name displayed on the stream canvas and providedocumentation regarding SuperNode operations.
Figure 15-13Annotating a SuperNode

566
Chapter 15
SuperNode Parameters
In Clementine, you have the ability to set user-defined variables, such as Minvalue,whose values can be specified when used in scripting or CLEM expressions. Thesevariables are called parameters. You can set parameters for streams, sessions, andSuperNodes. Any parameters set for a SuperNode are available when buildingCLEM expressions in that SuperNode or any nested nodes. Parameters set for nestedSuperNodes are not available to their parent SuperNode.
There are two steps to creating and setting parameters for SuperNodes:
Define parameters for the SuperNode.
Then, specify the value for each parameter of the SuperNode.
These parameters can then be used in CLEM expressions for any encapsulated nodes.
Defining SuperNode Parameters
Parameters for a SuperNode can be defined in both zoomed-out and zoomed-inmodes. The parameters defined apply to all encapsulated nodes. To define theparameters of a SuperNode, you first need to access the Parameters tab of theSuperNode dialog box. Use one of the following methods to open the dialog box:
Double-click a SuperNode in the stream.
From the SuperNode menu, choose Set Parameters.
Alternatively, when zoomed in to a SuperNode, choose Set Parameters fromthe context menu.
Once you have opened the dialog box, the Parameters tab is visible with anypreviously defined parameters.
To define a new parameter:
E Click the Define Parameters button to open the dialog box.

567
SuperNodes
Figure 15-14Defining parameters for a SuperNode
Name. Enter the name of the parameter in the field. Do not include the $P- prefix thatdenotes a parameter in CLEM expressions. For example, to create a parameter forthe minimum temperature, you could type minvalue.
Long name. Enter a long name, such as Minimum value, for the parameter. This isthe user-friendly name that will be used in the SuperNode dialog box for specifyingparameters.
Storage. Select a storage type from the drop-down list. Storage indicates how the datavalues are stored in the parameter. For example, when working with values containingleading zeros that you want to preserve (such as 008), you should select String as thestorage type. Otherwise these zeros will be stripped from the value. Available storagetypes are String, Integer, Real, Time, Date, and Timestamp.
Value. Set a default value for when the SuperNode parameters have not been specified.
Type (Optional). If you plan to deploy the stream to an external application, select ausage type from the drop-down list. Otherwise, it is advisable to leave the typecolumn as is.
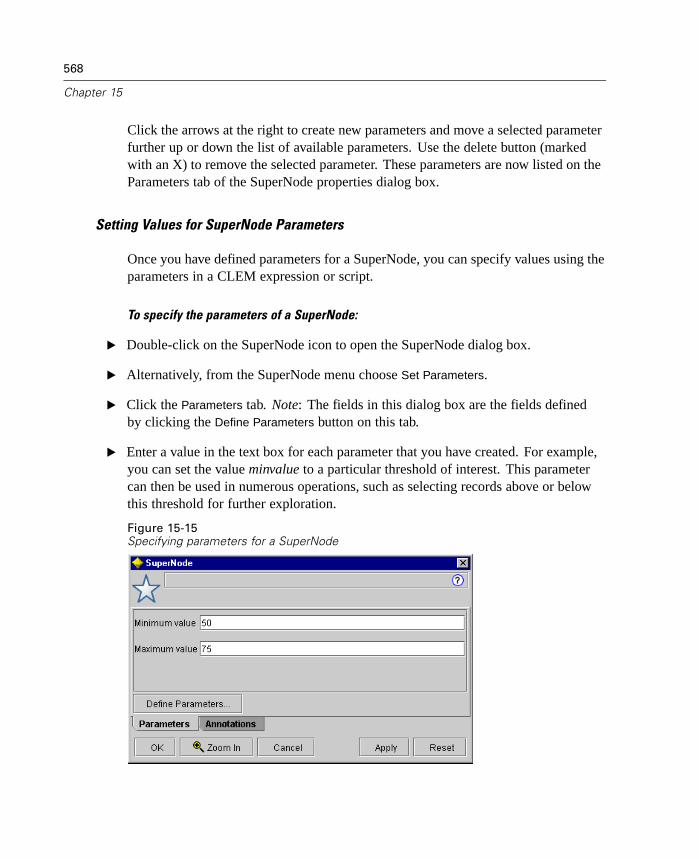
568
Chapter 15
Click the arrows at the right to create new parameters and move a selected parameterfurther up or down the list of available parameters. Use the delete button (markedwith an X) to remove the selected parameter. These parameters are now listed on theParameters tab of the SuperNode properties dialog box.
Setting Values for SuperNode Parameters
Once you have defined parameters for a SuperNode, you can specify values using theparameters in a CLEM expression or script.
To specify the parameters of a SuperNode:
E Double-click on the SuperNode icon to open the SuperNode dialog box.
E Alternatively, from the SuperNode menu choose Set Parameters.
E Click the Parameters tab. Note: The fields in this dialog box are the fields definedby clicking the Define Parameters button on this tab.
E Enter a value in the text box for each parameter that you have created. For example,you can set the value minvalue to a particular threshold of interest. This parametercan then be used in numerous operations, such as selecting records above or belowthis threshold for further exploration.
Figure 15-15Specifying parameters for a SuperNode
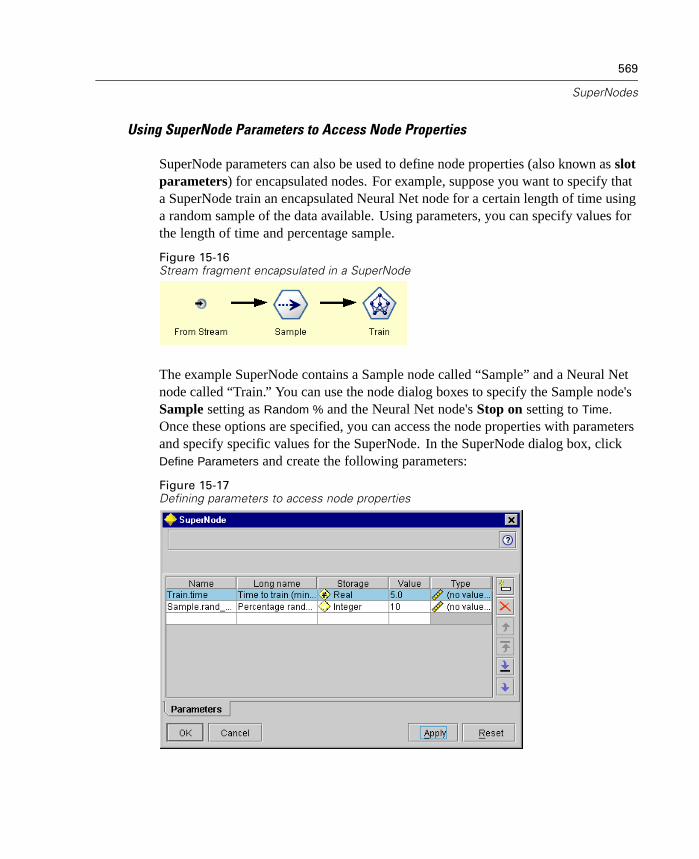
569
SuperNodes
Using SuperNode Parameters to Access Node Properties
SuperNode parameters can also be used to define node properties (also known as slotparameters) for encapsulated nodes. For example, suppose you want to specify thata SuperNode train an encapsulated Neural Net node for a certain length of time usinga random sample of the data available. Using parameters, you can specify values forthe length of time and percentage sample.
Figure 15-16Stream fragment encapsulated in a SuperNode
The example SuperNode contains a Sample node called “Sample” and a Neural Netnode called “Train.” You can use the node dialog boxes to specify the Sample node'sSample setting as Random % and the Neural Net node's Stop on setting to Time.Once these options are specified, you can access the node properties with parametersand specify specific values for the SuperNode. In the SuperNode dialog box, clickDefine Parameters and create the following parameters:
Figure 15-17Defining parameters to access node properties

570
Chapter 15
Note: The parameter names, such as Sample.rand_pct, use correct syntax for referringto node properties, where Sample represents the name of the node and rand_pctis a node property. For more information, see “Properties Reference Overview”in Appendix D on page 737.
Once you have defined these parameters, you can easily modify values for the twoSample and Neural Net node properties without reopening each dialog box. Instead,simply select Set Parameters from the SuperNode menu to access the Parameters tabof the SuperNode dialog box, where you can specify new values for Random %and Time. This is particularly useful when exploring the data during numerousiterations of model building.
Figure 15-18Specifying values for node properties on the Parameters tab in the SuperNode dialog box
SuperNodes and Caching
From within a SuperNode, all nodes except terminal nodes can be cached. Caching iscontrolled by right-clicking on a node and choosing one of several options from theCache context menu. This menu option is available both from outside a SuperNodeand for the nodes encapsulated within a SuperNode.
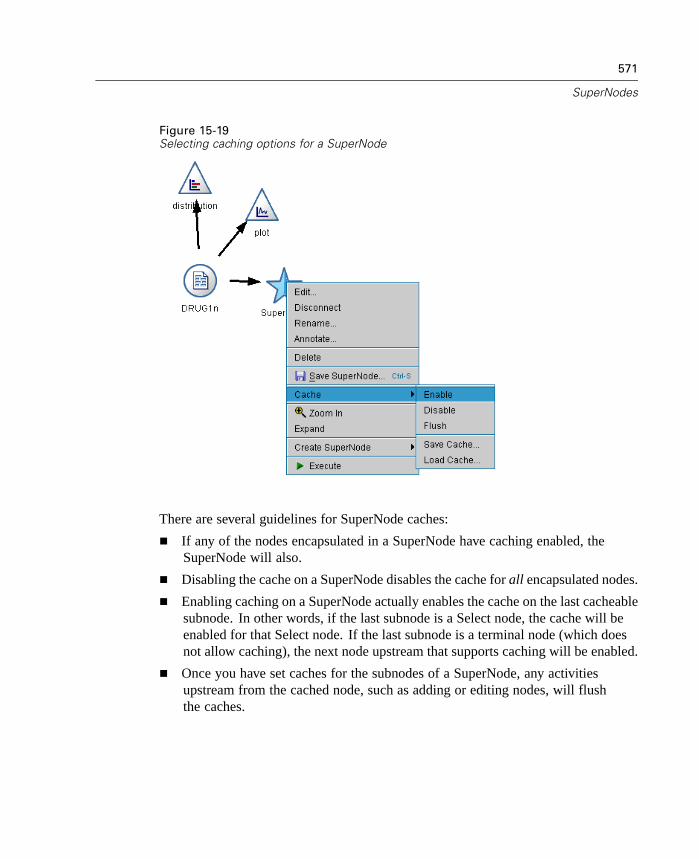
571
SuperNodes
Figure 15-19Selecting caching options for a SuperNode
There are several guidelines for SuperNode caches:
If any of the nodes encapsulated in a SuperNode have caching enabled, theSuperNode will also.
Disabling the cache on a SuperNode disables the cache for all encapsulated nodes.
Enabling caching on a SuperNode actually enables the cache on the last cacheablesubnode. In other words, if the last subnode is a Select node, the cache will beenabled for that Select node. If the last subnode is a terminal node (which doesnot allow caching), the next node upstream that supports caching will be enabled.
Once you have set caches for the subnodes of a SuperNode, any activitiesupstream from the cached node, such as adding or editing nodes, will flushthe caches.

572
Chapter 15
SuperNodes and Scripting
You can use the Clementine scripting language to write simple programs thatmanipulate and execute the contents of a terminal SuperNode. For instance, youmight want to specify the order of execution for a complex stream. As an example,if a SuperNode contains a Set Globals node that needs to be executed before aPlot node, you can create a script that executes the Set Globals node first. Valuescalculated by this node, such as the average or standard deviation, can then be usedwhen the Plot node is executed.
The Script tab of the SuperNode dialog box is available only for terminalSuperNodes.
To open the scripting dialog box for a terminal SuperNode:
E Right-click on the SuperNode canvas and choose SuperNode Script.
E Alternatively, in both zoomed-in and zoomed-out modes, you can choose SuperNode
Script from the SuperNode menu.
Note: SuperNode scripts are executed only with the stream and SuperNode when youhave selected Run this script in the dialog box.

573
SuperNodes
Figure 15-20Creating a script for a SuperNode
Specific options for scripting and its use within Clementine are discussed elsewherein this guide. For more information, see “Introduction to Scripting” in Chapter 18on page 597.
Saving and Loading SuperNodes
One of the advantages of SuperNodes is that they can be saved and reused in otherstreams. When saving and loading SuperNodes, note that they use an .slb extension.
To save a SuperNode:
E Zoom in on the SuperNode.
E From the SuperNode menu, choose Save SuperNode.
E Specify a filename and directory in the dialog box.

574
Chapter 15
E Select whether to add the saved SuperNode to the current project.
E Click Save.
To load a SuperNode:
E From the Insert menu in the Clementine window, choose SuperNode.
E Select a SuperNode file (.slb) from the current directory or browse to a different one.
E Click Load.
Note: Imported SuperNodes have the default values for all of their parameters. Tochange the parameters, double-click on a SuperNode on the stream canvas.

Chapter
16Projects and Reports
Introduction to Projects
A project is a group of files related to a data mining task. Projects include datastreams, graphs, generated models, reports, and anything else that you have created inClementine. At first glance, it may seem that Clementine projects are simply a way toorganize output, but they are actually capable of much more. Using projects, you can:
Annotate each object in the project file.
Use the CRISP-DM methodology to guide your data mining efforts. Projects alsocontain a CRISP-DM Help system that provides details and real-world exampleson data mining with CRISP-DM.
Add non-Clementine objects to the project, such as a PowerPoint slide showused to present your data mining goals or white papers on the algorithms thatyou plan to use.
Produce both comprehensive and simple update reports based on yourannotations. These reports can be generated in HTML for easy publishing onyour organization's intranet.
The projects tool is visible by default, but it can also be accessed by selectingProject from the View menu. Objects that you add to a project can be viewed in twoways: Classes view and CRISP-DM view. Anything that you add to a project isadded to both views, and you can toggle between views to create the organizationthat works best.
575
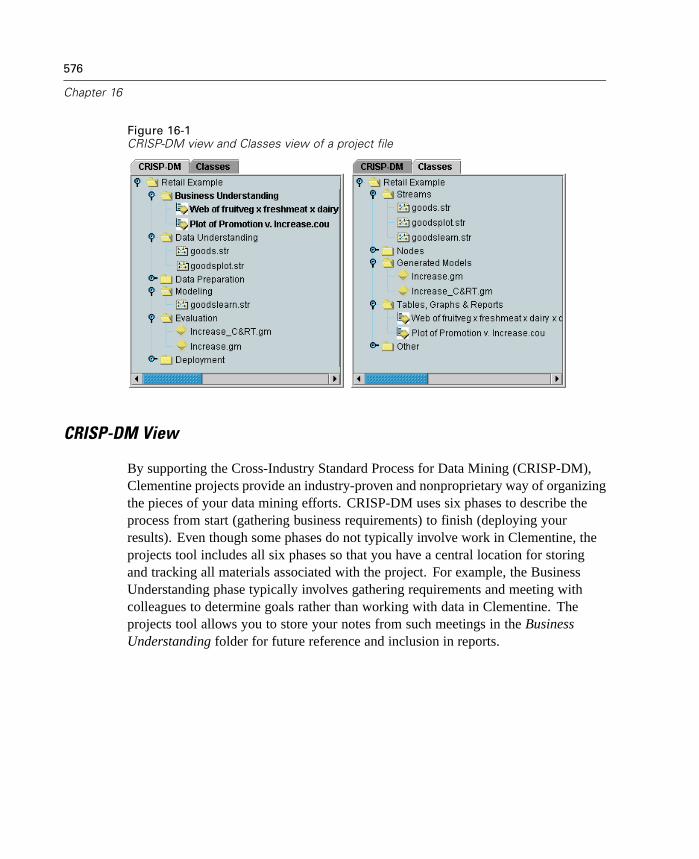
576
Chapter 16
Figure 16-1CRISP-DM view and Classes view of a project file
CRISP-DM View
By supporting the Cross-Industry Standard Process for Data Mining (CRISP-DM),Clementine projects provide an industry-proven and nonproprietary way of organizingthe pieces of your data mining efforts. CRISP-DM uses six phases to describe theprocess from start (gathering business requirements) to finish (deploying yourresults). Even though some phases do not typically involve work in Clementine, theprojects tool includes all six phases so that you have a central location for storingand tracking all materials associated with the project. For example, the BusinessUnderstanding phase typically involves gathering requirements and meeting withcolleagues to determine goals rather than working with data in Clementine. Theprojects tool allows you to store your notes from such meetings in the BusinessUnderstanding folder for future reference and inclusion in reports.
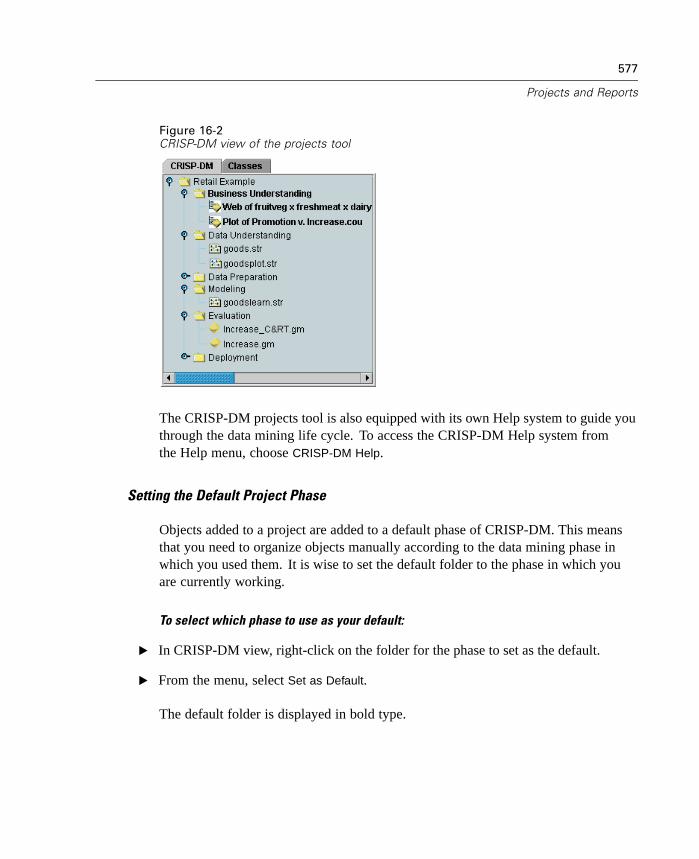
577
Projects and Reports
Figure 16-2CRISP-DM view of the projects tool
The CRISP-DM projects tool is also equipped with its own Help system to guide youthrough the data mining life cycle. To access the CRISP-DM Help system fromthe Help menu, choose CRISP-DM Help.
Setting the Default Project Phase
Objects added to a project are added to a default phase of CRISP-DM. This meansthat you need to organize objects manually according to the data mining phase inwhich you used them. It is wise to set the default folder to the phase in which youare currently working.
To select which phase to use as your default:
E In CRISP-DM view, right-click on the folder for the phase to set as the default.
E From the menu, select Set as Default.
The default folder is displayed in bold type.

578
Chapter 16
Classes View
The Classes view in the projects tool organizes your work in Clementine categoricallyby the type of objects created. Saved objects can be added to any of the followingcategories:
Streams
Nodes
Models
Tables, graphs, reports
Other (non-Clementine files, such as slide shows or white papers relevant toyour data mining work)
Figure 16-3Classes view in the projects tool
Adding objects to the Classes view also adds them to the default phase folder inthe CRISP-DM view.

579
Projects and Reports
Building a Project
A project is essentially a file containing references to all of the files that you associatewith the project. This means that project items are saved both individually and asa reference in the project file (.cpj). Because of this referential structure, note thefollowing:
Project items must first be saved individually before being added to a project.If an item is unsaved, you will be prompted to save it before adding it to thecurrent project.
Objects that are updated individually, such as streams, are also updated in theproject file.
Manually moving or deleting objects (such as streams and nodes) from the filesystem will render links in the project file invalid.
Creating a New Project
New projects are easy to create in the Clementine window. You can either startbuilding one, if none is already open, or you can close an existing project and startfrom scratch.
E From the stream canvas menus, choose:File
ProjectNew Project...
Adding to a Project
Once you have created or opened a project, you can add objects, such as data streams,nodes, and reports, using several methods.
Adding Objects from the Managers
Using the managers in the upper right corner of the Clementine window, you canadd streams or output.
E Select an object, such as a table or a stream, from one of the managers tabs.
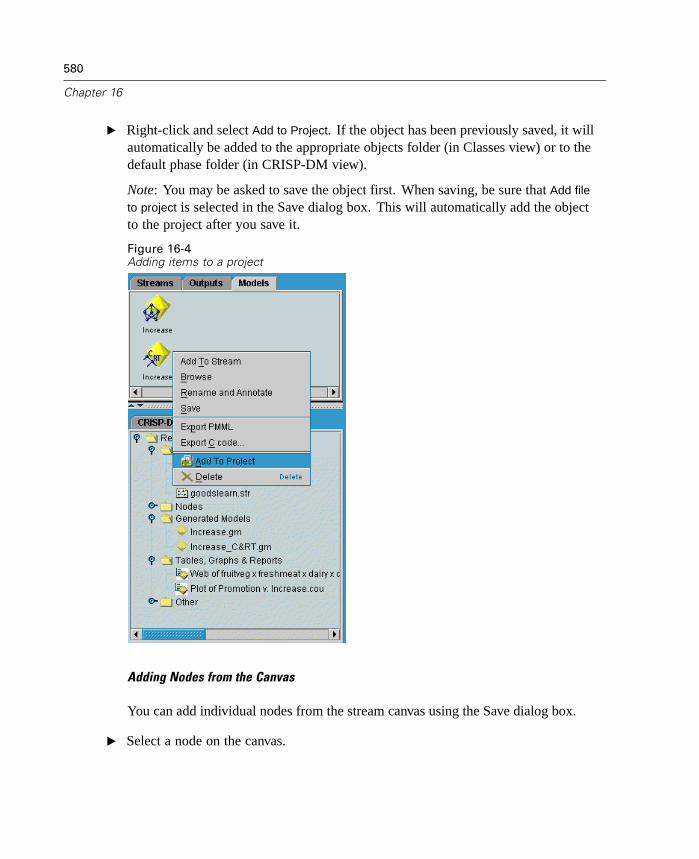
580
Chapter 16
E Right-click and select Add to Project. If the object has been previously saved, it willautomatically be added to the appropriate objects folder (in Classes view) or to thedefault phase folder (in CRISP-DM view).
Note: You may be asked to save the object first. When saving, be sure that Add file
to project is selected in the Save dialog box. This will automatically add the objectto the project after you save it.
Figure 16-4Adding items to a project
Adding Nodes from the Canvas
You can add individual nodes from the stream canvas using the Save dialog box.
E Select a node on the canvas.

581
Projects and Reports
E Right-click and select Save Node. Alternatively, from the menus, you can choose:Edit
NodeSave Node...
E In the Save dialog box, select Add file to project.
E Create a name for the node and click Save. This saves the file and adds it to the project.
Nodes are added to the Nodes folder in Classes view and to the default phase folder inCRISP-DM view.
Adding External Files
You can add a wide variety of non-Clementine objects to a project. This is usefulwhen managing the entire data mining process within Clementine. For example, youcan store links to data, notes, presentations, and graphics in a project. In CRISP-DMview, external files can be added to the folder of your choice. In Classes view,external files can be saved only to the Other folder.
To add external files to a project:
E Drag files from the desktop to the project.
or
E Right-click on the target folder in CRISP-DM or Classes view.
E From the menu, select Add to Folder.
E Select a file from the dialog box and click Open.
E This will add a reference to the selected object inside Clementine projects.
Setting Project Properties
You can customize a project's contents and documentation using the project propertiesdialog box. To access project properties:
E Right-click an object or folder in the projects tool and select Project Properties.

582
Chapter 16
E Click the Project tab to specify basic project information.
Figure 16-5Setting project properties
Author. The default author name is detected from user settings on your computer.Make any adjustments for this project.
Created. The project's creation date is displayed in an uneditable field.
Summary. Create a summary for your data mining project that will be displayed inthe project report.
Contents. This uneditable table contains a list of the type and number of objectsreferenced by the project file.
Update file references when loading project. Select this option to update the project'sreferences to its components. Note: The files added to a project are not saved in theproject file itself. Rather, a reference to the files is stored in the project. This meansthat moving or deleting a file will remove that object from the project.
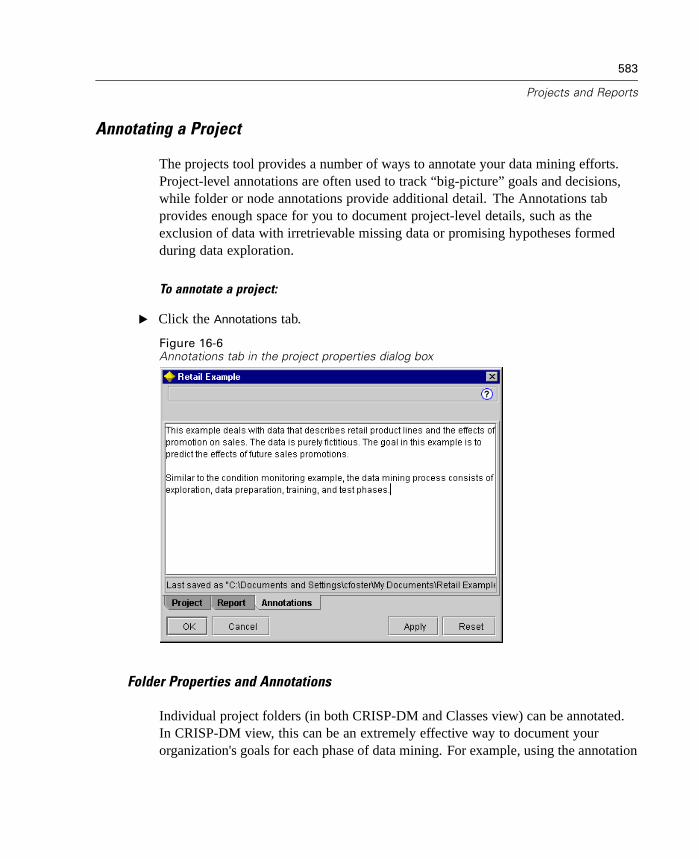
583
Projects and Reports
Annotating a Project
The projects tool provides a number of ways to annotate your data mining efforts.Project-level annotations are often used to track “big-picture” goals and decisions,while folder or node annotations provide additional detail. The Annotations tabprovides enough space for you to document project-level details, such as theexclusion of data with irretrievable missing data or promising hypotheses formedduring data exploration.
To annotate a project:
E Click the Annotations tab.
Figure 16-6Annotations tab in the project properties dialog box
Folder Properties and Annotations
Individual project folders (in both CRISP-DM and Classes view) can be annotated.In CRISP-DM view, this can be an extremely effective way to document yourorganization's goals for each phase of data mining. For example, using the annotation

584
Chapter 16
tool for the Business Understanding folder, you can include documentation suchas “The business objective for this study is to reduce churn among high-valuecustomers.” This text could then be automatically included in the project reportby selecting the Include in report option.
To annotate a folder:
E Select a folder in the projects tool.
E Right-click the folder and select Folder Properties.
In CRISP-DM view, folders are annotated with a summary of the purpose of eachphase as well as guidance on completing the relevant data mining tasks. You canremove or edit any of these annotations.
Figure 16-7Project folder with CRISP-DM annotation
Name. Displays the name of the selected field.
Tooltip text. Create custom tooltips that will be displayed when you hover the mouseover a project folder. This is useful in CRISP-DM view, for example, to provide aquick overview of each phase's goals or to mark the status of a phase, such as “Inprogress” or “Complete.”
Annotation field. Use this field for more lengthy annotations that can be collated in theproject report. The CRISP-DM view includes a description of each data mining phasein the annotation, but you should feel free to customize this for your own project.
Include in report. To include the annotation in reports, select Include in report.

585
Projects and Reports
Object Properties
You can view object properties and choose whether to include individual objects inthe project report. To access object properties:
E Right-click an object in the project window.
E From the menu, choose Object Properties.
Figure 16-8Object properties dialog box
Name. Lists the name of the saved object.
Path. Lists the location of the saved object.
Include in report. Select to include the object details in a generated report.
Closing a Project
When you exit Clementine or open a new project, the existing project is closed,including all associated files. Alternatively, you can choose to close the project fileitself and leave all associated files open. To close a project file:
E From the File menu, choose Close Project.
E You may be prompted to close or leave open all files associated with the project.Select Leave Open to close the project file (.cpj) itself but to leave open all associatedfiles, such as streams, nodes, or graphs.
If you modify and save any associated files after the close of a project, these updatedversions will be included in the project the next time you open it. To prevent thisbehavior, remove the file from the project or save it under a different filename.
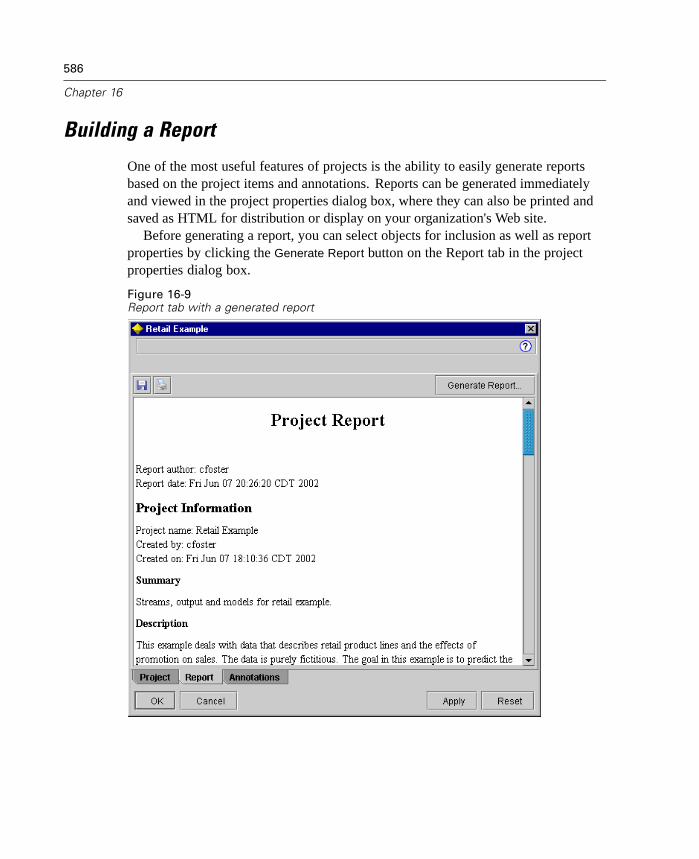
586
Chapter 16
Building a Report
One of the most useful features of projects is the ability to easily generate reportsbased on the project items and annotations. Reports can be generated immediatelyand viewed in the project properties dialog box, where they can also be printed andsaved as HTML for distribution or display on your organization's Web site.
Before generating a report, you can select objects for inclusion as well as reportproperties by clicking the Generate Report button on the Report tab in the projectproperties dialog box.
Figure 16-9Report tab with a generated report
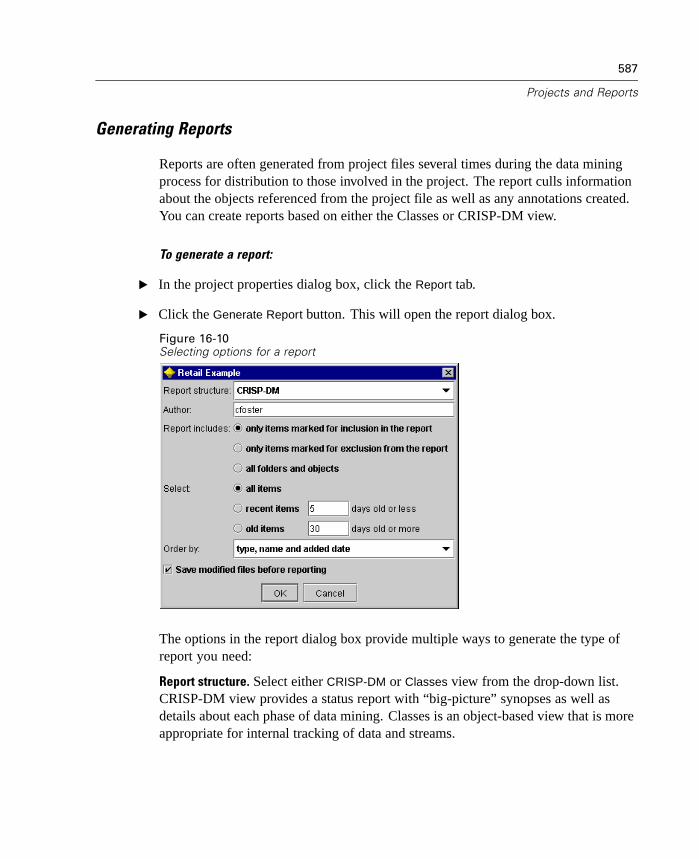
587
Projects and Reports
Generating Reports
Reports are often generated from project files several times during the data miningprocess for distribution to those involved in the project. The report culls informationabout the objects referenced from the project file as well as any annotations created.You can create reports based on either the Classes or CRISP-DM view.
To generate a report:
E In the project properties dialog box, click the Report tab.
E Click the Generate Report button. This will open the report dialog box.
Figure 16-10Selecting options for a report
The options in the report dialog box provide multiple ways to generate the type ofreport you need:
Report structure. Select either CRISP-DM or Classes view from the drop-down list.CRISP-DM view provides a status report with “big-picture” synopses as well asdetails about each phase of data mining. Classes is an object-based view that is moreappropriate for internal tracking of data and streams.
588
Chapter 16
Author. The default user name is displayed, but you can easily make changes forinclusion in the report.
Report includes. Use the radio buttons to select a method for including objects in thereport. Select all folders and objects to include all items added to the project file. Youcan also include items based on whether Include in Report is selected in the objectproperties. Alternatively, to check on unreported items, you can choose to includeonly items marked for exclusion (where Include in Report is deselected).
Select. This option allows you to easily provide project updates by selecting onlyrecent items in the report. Alternatively, you can track older and perhaps unresolvedissues by setting parameters for old items. Select all items to dismiss time as aparameter for the report.
Order by. Using the drop-down list, you can select a combination of the followingobject characteristics to order them within a folder or phase:
Type. Group objects by type within a phase.
Name. Organize objects using alphabetical order.
Added date. Sort objects using the date added to the project.
Save modified files before reporting. Select to save any objects within the projectthat have been modified.
Saving and Exporting Reports
The generated report is displayed as HTML in the project properties dialog box. Youcan save and print the report using the controls on the Annotations tab.

589
Projects and Reports
Figure 16-11Generated report window
Use the buttons at the top of the HTML window to:
Print the report using the Print button.
Save the report as HTML by clicking the Save button to specify a report nameand location. The HTML file can then be exported for use on the Web.
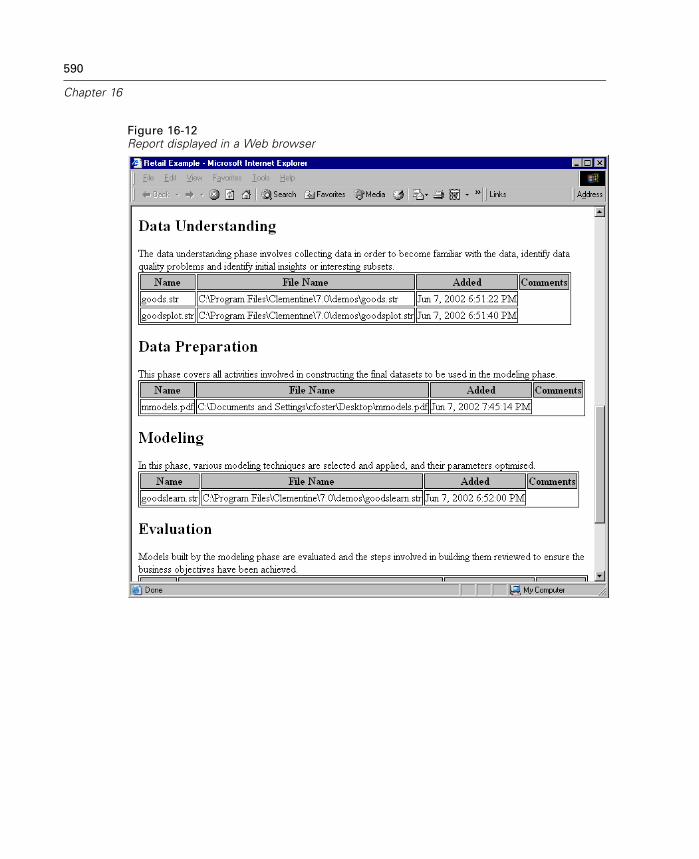
590
Chapter 16
Figure 16-12Report displayed in a Web browser
Chapter
17Batch Mode Execution
Introduction to Batch Mode
Data mining is usually an interactive process—you interact with data and with modelsto improve your understanding of the data and the domain it represents. However,Clementine streams can also be used to process data and perform data mining tasksin a batch, or non-interactive, manner by running Clementine with no visible userinterface. This facility is called batch mode.
To perform a long-running or repetitive task without your intervention and withoutthe presence of the user interface on the screen, use batch mode. Examples of suchtasks include:
Running a time-consuming modeling exercise in the background.
Running a stream at a scheduled time (for example, overnight, when the resultantload on the computer will not be inconvenient).
Running a data preprocessing stream on a large volume of data (for example,in the background and/or overnight).
Regularly scheduled tasks, such as producing monthly reports.
Running a stream as an embedded part of another process, such as a scoringengine facility.
Note: Clementine operations can be scheduled in batch mode using the appropriateoperating system commands or utilities (for example, the at command underWindows NT).
591
592
Chapter 17
Working in Batch Mode
Working in batch mode typically involves:
E Invoking Clementine in batch mode using the clemb command.
E Connecting to a server or running in local mode.
E Loading an existing stream or script file.
E Executing the stream or script.
Once execution is complete, you can then consult the log file produced by defaultin batch mode and view the results of graphs, output nodes, and models. For moreinformation on these steps, see the following topics.
Invoking the Software
Using the command line of your operating system, you can launch Clementine inbatch mode. From both client and server machines, you can launch Clementine inbatch mode using the following steps:
E Open a DOS window or command prompt window.
E Type the command clemb as well as any arguments (flags) used to load streams,execute scripts, and connect to a server.
Using Command Line Arguments
In order for Clementine to open and execute files, such as streams and scripts, in batchmode, you need to alter the initial command (clemb) that launches the software. Thereare a number of command line arguments, also referred to as flags, that you can use to:
Connect to a server.
Load streams, scripts, states, projects, and output files.
Specify log file options.
Set default directories for use in Clementine.
593
Batch Mode Execution
All of the above operations require the use of flags appended to the clemb command.Flags follow the form -flag, where the dash precedes the argument itself. For example,using the flag -server in conjunction with the initial argument clemb will connect tothe server specified using other flag options.
You can combine the clemb command with a number of other startup flags, suchas -stream and -execute, in order to load and execute streams in batch mode. Thefollowing command loads and executes the stream report.str without invoking theuser interface:
clemb -stream report.str -execute
A complete list of command line arguments can be found in Appendix C.
Clementine states and scripts are also executed in this manner, using the -stateand -script flags, respectively. Multiple states and streams can be loaded byspecifying the relevant flag for each item.
Multiple arguments can be combined into a single command file and specified atstartup using the @ symbol. For more information, see “Combining MultipleArguments” in Appendix C on page 732.
Batch Mode Log Files
Running in batch mode produces a log file. By default, the name of this log file isclem_batch.log, but you can specify an alternative name using the -log flag. Forexample, the following command executes report.str in batch mode and sends thelogging information to report.log:
clemb -stream report.str -execute -log report.log
Normally, the log file overwrites any existing file of the same name, but you canmake Clementine append to the log file instead by using the -appendlog flag. Loggingcan also be suppressed altogether by using the -nolog flag. For more information,see “Log File Arguments” in Appendix C on page 735.
Note: Logging arguments are available only when running in batch mode.
594
Chapter 17
Scripting in Batch Mode
In its simplest form, batch mode execution of Clementine streams is performed one ata time using the command line arguments discussed earlier in this guide. A givenstream is executed without significantly altering its node parameters. While thismay work well for automated production of monthly churn reports or predictions, itcannot handle the sophisticated processes that many advanced data miners wouldlike to automate.
For example, a financial institution may want to construct a number of modelsusing different data or modeling parameters, test the models on another set ofdata, and produce a report on the results. Because this process requires repetitivemodifications to a stream and the creation and deletion of nodes, automating itrequires the use of scripting. Scripting allows complex processes that wouldotherwise require user intervention to be automated and executed in batch mode. Formore information, see “Introduction to Scripting” in Chapter 18 on page 597.
To execute a script in batch mode:
E Append the clemb command with the -script flag, specifying the name of the scriptyou want to execute.
E Also use the -execute flag with the above arguments to execute the specified script.This will run the stand-alone script in its entirety.
For example, to load and execute a script that runs a model producing churn scores thatare stored as output for the data warehouse, you would use the following command:
clemb -script clemscript.txt -execute
Using Parameters in Batch Mode
You can modify the effect of executing a stream in batch mode by supplyingparameters to the command line launch of Clementine. These might be simpleparameters, used directly in CLEM expressions, or they might be node properties,also called slot parameters, which are used to modify the settings of nodes in thestream.
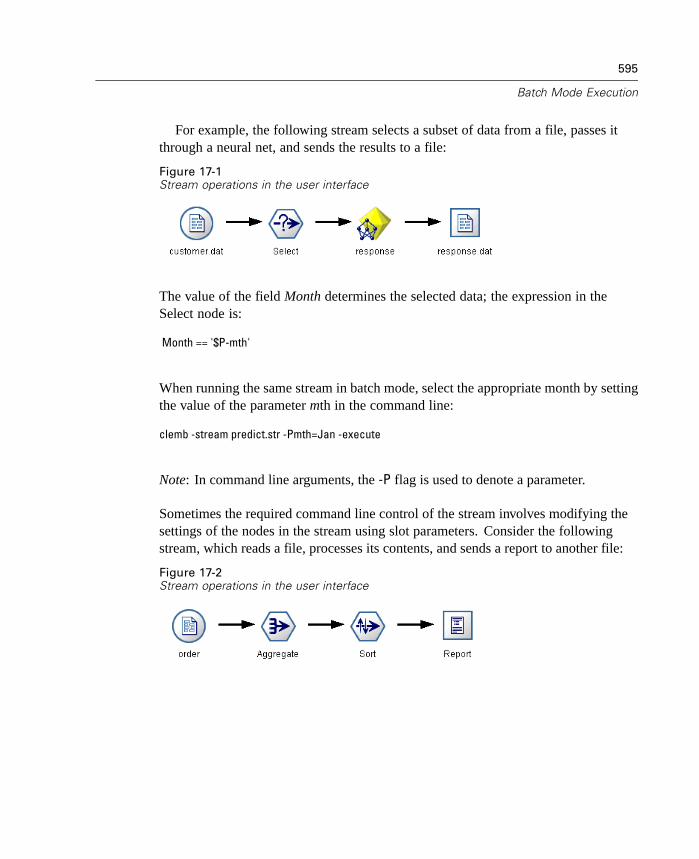
595
Batch Mode Execution
For example, the following stream selects a subset of data from a file, passes itthrough a neural net, and sends the results to a file:
Figure 17-1Stream operations in the user interface
The value of the field Month determines the selected data; the expression in theSelect node is:
Month == '$P-mth'
When running the same stream in batch mode, select the appropriate month by settingthe value of the parameter mth in the command line:
clemb -stream predict.str -Pmth=Jan -execute
Note: In command line arguments, the -P flag is used to denote a parameter.
Sometimes the required command line control of the stream involves modifying thesettings of the nodes in the stream using slot parameters. Consider the followingstream, which reads a file, processes its contents, and sends a report to another file:
Figure 17-2Stream operations in the user interface
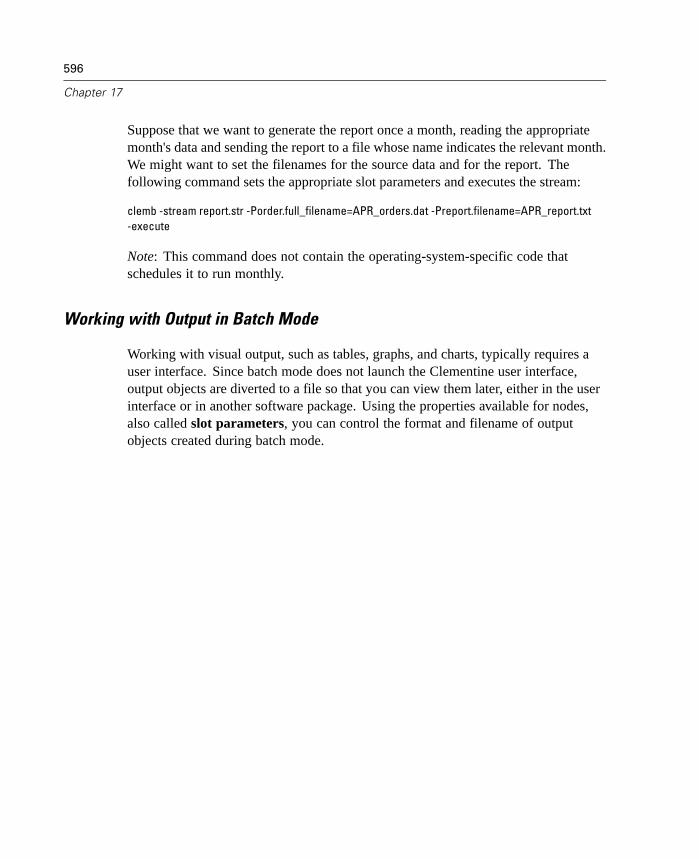
596
Chapter 17
Suppose that we want to generate the report once a month, reading the appropriatemonth's data and sending the report to a file whose name indicates the relevant month.We might want to set the filenames for the source data and for the report. Thefollowing command sets the appropriate slot parameters and executes the stream:
clemb -stream report.str -Porder.full_filename=APR_orders.dat -Preport.filename=APR_report.txt-execute
Note: This command does not contain the operating-system-specific code thatschedules it to run monthly.
Working with Output in Batch Mode
Working with visual output, such as tables, graphs, and charts, typically requires auser interface. Since batch mode does not launch the Clementine user interface,output objects are diverted to a file so that you can view them later, either in the userinterface or in another software package. Using the properties available for nodes,also called slot parameters, you can control the format and filename of outputobjects created during batch mode.

Chapter
18Scripting in Clementine
Introduction to Scripting
Scripting is a powerful tool used to automate tedious processes in the user interfaceand work with objects in batch mode. Scripts can perform the same kinds of actionsthat you perform with a mouse or a keyboard. You can set options for nodes andperform derivations using a subset of CLEM (Clementine Language for ExpressionManipulation).
Typically, scripts automate tasks that would otherwise have to be performed bythe user. These tasks might be highly repetitive or time consuming for the user toperform manually. Using scripts, you can:
Gain control of the order of execution of a stream.
Specify an automatic sequence of actions that normally involves userinteraction—for example, you can build a model and then test it.
Set up complex processes that require substantial user interaction—for example,cross-validation procedures that require repeated model generation and testing.
Set up processes that manipulate streams—for example, you can take a modeltraining stream, run it, and produce the corresponding model testing streamautomatically.
Automate Clementine processes from other applications or scheduling systems byinvoking Clementine in batch mode to execute a script.
The following sections describe how to use scripts in greater detail.
597
598
Chapter 18
Types of Scripts
There are three types of scripting used in Clementine:
You can associate scripts with a particular stream and use them exclusively inconjunction with that stream. These scripts are saved and loaded with the streamto which they are attached and are called stream scripts. You can designatea stream script as the default method of using that stream. Thus, executingthe stream means executing the script.
Scripts can also be used in terminal SuperNodes to control the execution of theSuperNode contents. These are referred to as SuperNode scripts.
Other scripts are not associated with any particular stream—for example, scriptsthat manipulate multiple streams cannot be associated with an individual stream.These scripts are stored in text files and are called standalone scripts.
Example Clementine Script
A stream can be used to train a neural network model when executed. Normally, totest the model, you would insert the model manually near the end of the stream, makethe appropriate connections, and execute the Analysis node.
Using a Clementine script, you can automate the process of testing the model afteryou have created it. For, example, you might use a script like this:
execute Drug:neuralnetnodecreate analysisnode at 700 200set DRUG1n:varfilenode.full_filename = "$CLEO_DEMOS\DRUG2n"insert model Drug connected between :typenode and :analysisnodeexecute :analysisnode
This script executes the Neural Net node called Drug and then creates an Analysisnode and switches the data source to read a test data set, Drug2n. The generatedmodel is inserted between the test data source and the Analysis node (with theappropriate connections), and the Analysis node is executed.
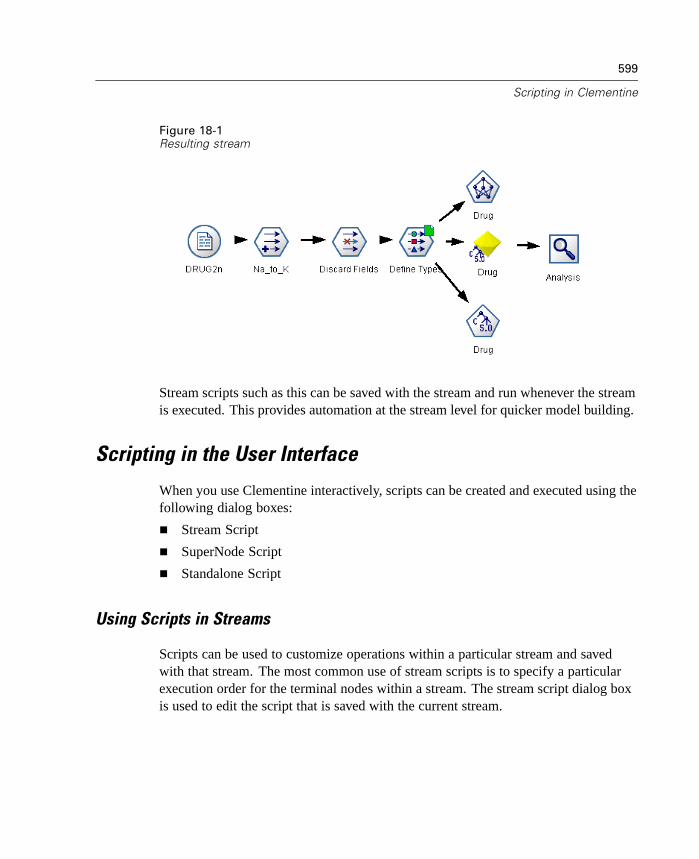
599
Scripting in Clementine
Figure 18-1Resulting stream
Stream scripts such as this can be saved with the stream and run whenever the streamis executed. This provides automation at the stream level for quicker model building.
Scripting in the User Interface
When you use Clementine interactively, scripts can be created and executed using thefollowing dialog boxes:
Stream Script
SuperNode Script
Standalone Script
Using Scripts in Streams
Scripts can be used to customize operations within a particular stream and savedwith that stream. The most common use of stream scripts is to specify a particularexecution order for the terminal nodes within a stream. The stream script dialog boxis used to edit the script that is saved with the current stream.

600
Chapter 18
To access the stream script dialog box:
E From the File or Tools menus, choose:Stream Properties
E Click the Script tab to work with scripts for the current stream.
Figure 18-2Stream script dialog box
The toolbar icons in this dialog box enable you to perform the following operations:
Import scripts from text files.
Save scripts to text files.
Execute the current script.
Execute selected lines from a script.
Check the syntax of the current script.
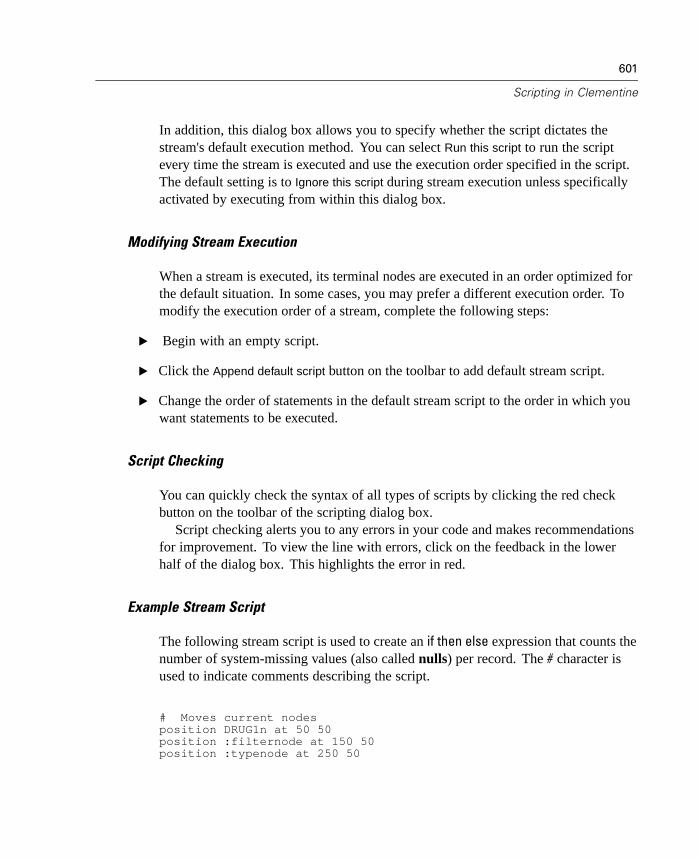
601
Scripting in Clementine
In addition, this dialog box allows you to specify whether the script dictates thestream's default execution method. You can select Run this script to run the scriptevery time the stream is executed and use the execution order specified in the script.The default setting is to Ignore this script during stream execution unless specificallyactivated by executing from within this dialog box.
Modifying Stream Execution
When a stream is executed, its terminal nodes are executed in an order optimized forthe default situation. In some cases, you may prefer a different execution order. Tomodify the execution order of a stream, complete the following steps:
E Begin with an empty script.
E Click the Append default script button on the toolbar to add default stream script.
E Change the order of statements in the default stream script to the order in which youwant statements to be executed.
Script Checking
You can quickly check the syntax of all types of scripts by clicking the red checkbutton on the toolbar of the scripting dialog box.
Script checking alerts you to any errors in your code and makes recommendationsfor improvement. To view the line with errors, click on the feedback in the lowerhalf of the dialog box. This highlights the error in red.
Example Stream Script
The following stream script is used to create an if then else expression that counts thenumber of system-missing values (also called nulls) per record. The # character isused to indicate comments describing the script.
# Moves current nodesposition DRUG1n at 50 50position :filternode at 150 50position :typenode at 250 50
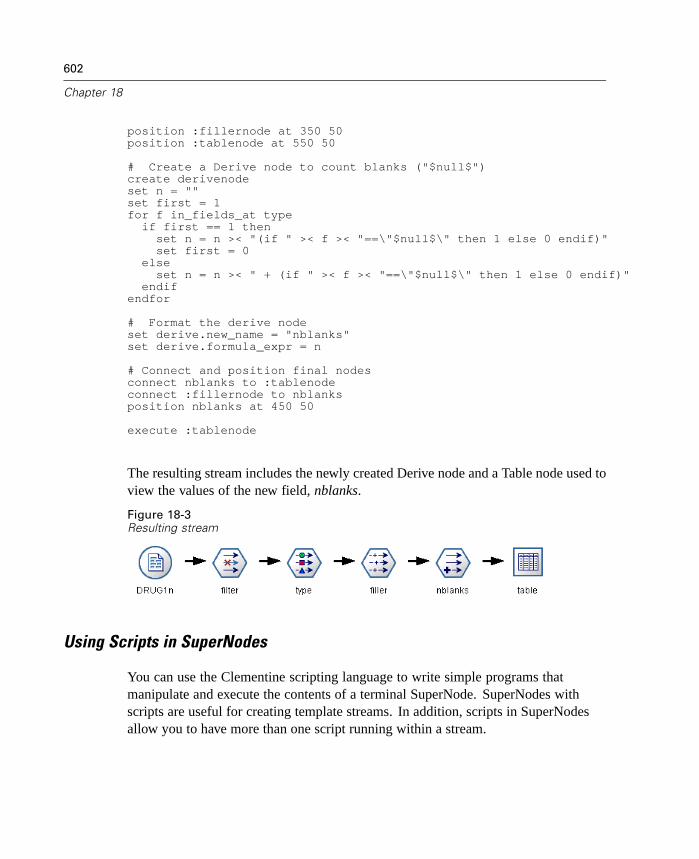
602
Chapter 18
position :fillernode at 350 50position :tablenode at 550 50
# Create a Derive node to count blanks ("$null$")create derivenodeset n = ""set first = 1for f in_fields_at type
if first == 1 thenset n = n >< "(if " >< f >< "==\"$null$\" then 1 else 0 endif)"set first = 0
elseset n = n >< " + (if " >< f >< "==\"$null$\" then 1 else 0 endif)"
endifendfor
# Format the derive nodeset derive.new_name = "nblanks"set derive.formula_expr = n
# Connect and position final nodesconnect nblanks to :tablenodeconnect :fillernode to nblanksposition nblanks at 450 50
execute :tablenode
The resulting stream includes the newly created Derive node and a Table node used toview the values of the new field, nblanks.
Figure 18-3Resulting stream
Using Scripts in SuperNodes
You can use the Clementine scripting language to write simple programs thatmanipulate and execute the contents of a terminal SuperNode. SuperNodes withscripts are useful for creating template streams. In addition, scripts in SuperNodesallow you to have more than one script running within a stream.

603
Scripting in Clementine
For example, you might want to specify the order of execution for a complexstream. If a SuperNode contains a Set Globals node that needs to be executed beforederiving a new field used in a Plot node, you can create a script that executes the SetGlobals node first. Values calculated by this node, such as the average or standarddeviation, can then be used when the Plot node is executed.
When using scripts in SuperNodes, it is important to keep the following guidelinesin mind:
Only terminal SuperNodes can execute scripts. Therefore, the Scripts tab of theSuperNode dialog box is available only for terminal SuperNodes.
Nodes within SuperNodes can access SuperNode, stream, and global parameters.However, nodes outside SuperNodes can access only stream and globalparameters.
You can also specify node properties within a SuperNode.
To open the scripting dialog box for a terminal SuperNode:
E Right-click on the SuperNode canvas, and from the context menu choose SuperNode
Script.
E Alternatively, in both zoomed-in and zoomed-out modes, you can choose SuperNode
Script from the SuperNode menu.
For more information, see “SuperNodes and Scripting” in Chapter 15 on page 572.
Example SuperNode Script
The following SuperNode script is used to specify the order of execution for terminalnodes inside the SuperNode.
execute 'Set Globals'execute 'gains'execute 'profit'execute 'age v. $CC-pep'execute 'Table'

604
Chapter 18
Reordering operations within the SuperNode allows access to the globals createdusing a Set Globals node.
Using Standalone Scripts
The Standalone Script dialog box is used to create or edit a text file containing ascript. It displays the name of the file and provides facilities for loading, saving,importing, and executing scripts. To access the Standalone Script dialog box, fromthe Tools menu, choose Standalone Script.
Figure 18-4Standalone Script dialog box
The same toolbar and script-checking options are available for standalone scriptsas for stream scripts. A useful feature for all types of scripts is the ability to viewfeedback on scripting errors in the feedback panel at the bottom of the dialog box.
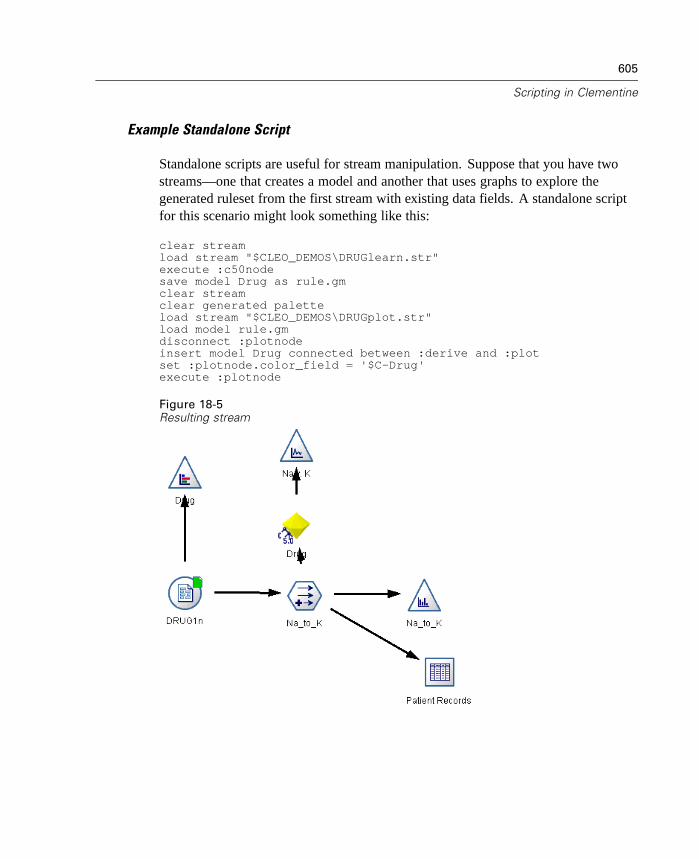
605
Scripting in Clementine
Example Standalone Script
Standalone scripts are useful for stream manipulation. Suppose that you have twostreams—one that creates a model and another that uses graphs to explore thegenerated ruleset from the first stream with existing data fields. A standalone scriptfor this scenario might look something like this:
clear streamload stream "$CLEO_DEMOS\DRUGlearn.str"execute :c50nodesave model Drug as rule.gmclear streamclear generated paletteload stream "$CLEO_DEMOS\DRUGplot.str"load model rule.gmdisconnect :plotnodeinsert model Drug connected between :derive and :plotset :plotnode.color_field = '$C-Drug'execute :plotnode
Figure 18-5Resulting stream

606
Chapter 18
Scripting in Batch Mode
Scripting enables you to run operations typically performed in the user interface.Simply specify and execute a standalone stream at the command line when launchingClementine in batch mode. For example:
clemb -script scores.txt -execute
The -script flag loads the specified script, while the -execute flag executes allcommands in the script file. For more information, see “Working in Batch Mode” inChapter 17 on page 592.
Chapter
19Clementine External ModuleInterface
Introduction to the Clementine External Module Interface
The Clementine External Module Interface (CEMI) is a mechanism that allows theaddition of other programs—for example, data processing routines or modelingalgorithms—to Clementine as new nodes.
To do this, Clementine requires details about the external program, such as whatit is called, what command parameters should be passed to the program, howClementine should present options to the program and results to the user, and so forth.A text file called a specification file provides this information. Clementine translatesthe information in this file into a new node definition.
How CEMI Works
The CEMI specification file is a text file containing structured specificationsdescribing the behavior of the new node. When it is executed, it launches an externalapplication. The CEMI specification file describes what kind of data will be readinto the node from Clementine and what sort of data will be received back fromthe node once execution is complete.
One of the most important characteristics to define is the type of node to create,which is determined largely by the sort of application that it accesses.
Source nodes generate new data for Clementine.
Process nodes take data from Clementine, modify it, and return the modifieddata to Clementine.
607

608
Chapter 19
Terminal nodes take data from Clementine and do something with it (display it,save it to a file, etc.).
Modeling nodes take data from Clementine and create a model that can bebrowsed to learn something about the data.
After creating the CEMI specification file, load the new node into Clementine usingthe Palette Manager. This adds the new node to the appropriate palette and makesthe node ready for use.
System Architecture
The use of external modules within the Clementine data mining system results in adefault system architecture as shown below.
Figure 19-1External module system architecture
ExternalProcess
Node
Input Data
PreviousNode
NextNode
Mapping File(optional)
Output Data
ExternalExecutable
Your Stream
Behind theScenes
Input Data
PreviousNode
Mapping File(optional)
ExternalExecutable
Your Stream
Behind theScenes
ExternalTerminal
NodeNextNode
Output Data
ExternalExecutable
Your Stream
Behind theScenes
ExternalSource Node
CEMI Source Node CEMI Terminal Node
CEMI Process Node

609
Clementine External Module Interface
When the stream encounters an external module, it writes the data to a temporary datafile. The external module uses this data file as input along with any necessary datamapping. The external module then executes, typically generating an output data filethat is read back into Clementine and passed to the next node.
This architecture forms the basis for external module processing in Clementine,and the CEMI specification file provides the guidelines for how this is done.
Specification File
Within a specification file, the main sections are introduced with their headings. Therelevant subsections for the node type are then listed. At most, the file containsthree sections.
The NODE section is the introductory section, or header, of the CEMI specificationfile and identifies the following:
Name of the node
Type of node
Palette containing the node
Custom icon used for node
The CORE section specifies the main body of the CEMI specification file and isconstructed from subsections covering the following areas:
Parameters. Specifies parameters (similar to variables) used throughout aspecification file.
Execution. Identifies the location of the external executable program.
Options. Lists arguments to be passed to the program.
Appearance. Defines the controls for the node's editing dialog box.
Inputs. Specifies the data and the data model that flow from Clementine to theexternal module.
Outputs. Specifies the data and the data model that flow from the external moduleback to Clementine.
Metafiles. Provides information about the fields used by the program.

610
Chapter 19
Results. Specifies what happens to the final stream results.
Return codes. Associates text messages with values returned by the program.
The MODEL section has a structure similar to the CORE section but defines how thenode for a model that is generated from the CEMI node behaves. Custom nodes arespecified using an ICON subsection identical to that used in the NODE section. Onlymodeling nodes require a MODEL section. For more information, see “SpecificationFile Overview” in Appendix E on page 799.
Parameters
Parameters are the attributes associated with the new node. They store specificinformation about each node, which can be used to control the functioning of the nodeand can be passed to the external module. For example, a parameter can store thecurrent mode of operation for an algorithm with three possible modes. You can alsoadd a user interface to your node to allow users to set or select values of parameters.In addition, parameters can reference input and output files. Define parameters inthe PARAMETERS subsection.
External Program
Define the location of the external program either by explicitly entering the full pathto the file or by referencing a parameter in the node. If the user has control over wherethe executable program resides, the second approach may be helpful because it allowsthe user to define the location in the editing dialog box. The EXECUTE subsectiondefines the location of the executable program(s) associated with the external module.
Command Line Options
Options define which parameters are passed as command arguments to the externalprogram and how they should be passed. Each option consists of an expressionusually composed of a parameter name concatenated with a string. Options can bepassed to the program either unconditionally or conditionally. Define the options onthe command line in the OPTIONS subsection of the specification file.

611
Clementine External Module Interface
Editing Dialog Box
The editing dialog box provides an interface that enables the user to modify executionsettings. The appearance of this dialog box is very important; it is where the nodebehavior is altered and modified. The interface must contain all of the necessaryinformation and also must be easy to use.
Settings Tab
By default, controls occur on the Settings tab of a CEMI editing dialog box. You candefine the controls for the node's editing dialog box in the CONTROLS subsection ofthe specification file. The dialog box may include a variety of controls, includingoption buttons, check boxes, text boxes, and menus. The type of parameter modifiedby the control determines which control appears in the dialog box, with some typesproviding alternate controls. You may group options on new tabs using the TAB
option in the CONTROLS subsection. For more information, see “Tabs” in AppendixE on page 818.
Figure 19-2Settings tab for a text-mining CEMI

612
Chapter 19
When defining the controls, consider the following guidelines:
Use the correct label as a descriptor for the control. It should be reasonablyconcise while conveying the correct information.
Use the right parameter for a control. For example, a parameter that takes onlytwo values does not necessarily require a check box. The Clementine C5.0editing dialog box offers the option of selecting the output type as one of twovalues—Decision tree or Rule set. This setting could be represented as an optionlabeled Decision tree. When selected, the output type is decision tree; whendeselected, the output is a ruleset. Although the outcome would be the same,using option buttons makes it easier for the user to understand.
Controls for filenames are generally positioned at the top.
Controls that form the focus of the node are positioned high in the dialog box. Forexample, graph nodes display fields from the data. Selecting those fields is themain function of the editing dialog box, so field parameters are placed at the top.
Check boxes or option buttons often allow the user to select an option that needsfurther information. For example, selecting Use boosting in the C5.0 editingdialog box requires that the analysis include a number indicating Number oftrials. The extra information is always placed after the option selection, either atthe right side or directly beneath it.
The editing dialog boxes produced for the CEMI use Clementine's commit editing;the values displayed in the dialog boxes are not copied to the node until the userclicks OK, Apply, or in the case of terminal nodes, Execute. Similarly, the informationdisplayed by the dialog box is not updated (for example, when the input fields to thenode have changed as a result of operating upstream of the current node) until theuser cancels and redisplays the dialog box or clicks the Refresh button.
Specification Tab
The CEMI specification that was used to create a CEMI node is stored as part of thenode itself, visible on the Specification tab of the editing dialog box.

613
Clementine External Module Interface
Figure 19-3Specification tab for a text-mining CEMI
This enables you to open streams containing CEMI nodes without having the CEMInode loaded in your version of Clementine. You cannot run the node, however. Note:Streams created prior to release 7.0 require that you load the CEMI specificationbeforehand, however, since previous versions didn’t save the specification as partof the node.
Once you have loaded a CEMI node into a stream, note that there is no way tochange the specification of that node. Instead, replacing the specification of a loadedCEMI will only replace the specification used to create new nodes. Existing nodeswill use the specification they were created with.
Input and Output Fields
The data model represents the structure of the data flowing through the stream.Describing the data at that point in the stream, the model corresponds to theinformation in the Type node. It lists the names of existing fields (not including thosethat have been filtered out) and describes their type.

614
Chapter 19
When adding any node to Clementine, consider how the data model passed intothe node affects the behavior of that node. For example, a process node, such as aDerive node, takes an input data model, adds a new field to it, and produces an outputdata model that is passed to the next node in the Clementine stream. In contrast, aterminal node, such as a Graph node, takes an input data model and produces nooutput data model because the data is not passed to any more nodes. Clementine mustknow what will happen to the data model so that subsequent nodes can present thecorrect information about which fields are available. The data model information inthe specification file gives Clementine the information necessary to keep the datamodel consistent across the entire stream.
Depending on whether data flows into, out of, or through the node, the specificationfile must describe the data model for input, output, or both. The external programcan affect the data model either by adding new fields to whatever fields pass into thenode or by replacing the fields coming into the node with new fields generated bythe program itself. The INPUT_FIELDS and OUTPUT_FIELDS subsections of thespecification file describe the effects of the CEMI node on the data model.
Input and Output Files
The data file created by Clementine and used as input to the external program, aswell as any data file returned by the program, contain the data in a particular format.For example, it uses a specific character to separate data values, such as a comma.Furthermore, the file may or may not contain field names. The INPUT_DATA andOUTPUT_DATA subsections describe the format of these files, ensuring compatibilitybetween Clementine and the external program with respect to data transfer.
Metafiles
Metafiles contain extra information about the data being passed to the program. Thismay be type information, or it may describe how each field will be transformed by theexternal program. Because metafiles can take a wide variety of formats, specifyingthem can be complex. The MAPPING_FILE subsection defines the structure of themetafile created by the CEMI node.

615
Clementine External Module Interface
Results
In addition to output data files, the external program may generate results, such as agraphical display or a simple text report. The RESULTS subsection determines howto handle these results. The output can be viewed in text or HTML browsers ordisplayed using a specified external viewer.
Return Codes
Most programs perform some sort of error checking and display any necessarymessages to the user. The programs typically return integers to indicate successfulcompletion or other status. The RETURN_CODE subsection enables the handling ofthese integers by associating them with message text. The messages can be used tonotify the user of an incorrect input value or a possible problem in the program.
Restrictions
When designing a CEMI node, some CEMI restrictions may influence how tostructure the specification file:
Generated model nodes produced by external programs cannot be exported.
CEMI nodes that make any selections based on type require a Type node directlyupstream. Such CEMI nodes automatically instantiate the data if a Type nodeis present.
CEMI process nodes that extend the data model are more efficient if they includeall fields than if they select a subset of the fields. Also, external modules thatextend the data model must include the original input fields with their outputfields.
Restricting which fields are passed to the program applies only to terminal nodes.Process nodes and generated model nodes that extend the data model must beable to handle all of the fields that are passed into the node and return theoriginal values in each record. This is in addition to handling any extra fieldsadded by the node.
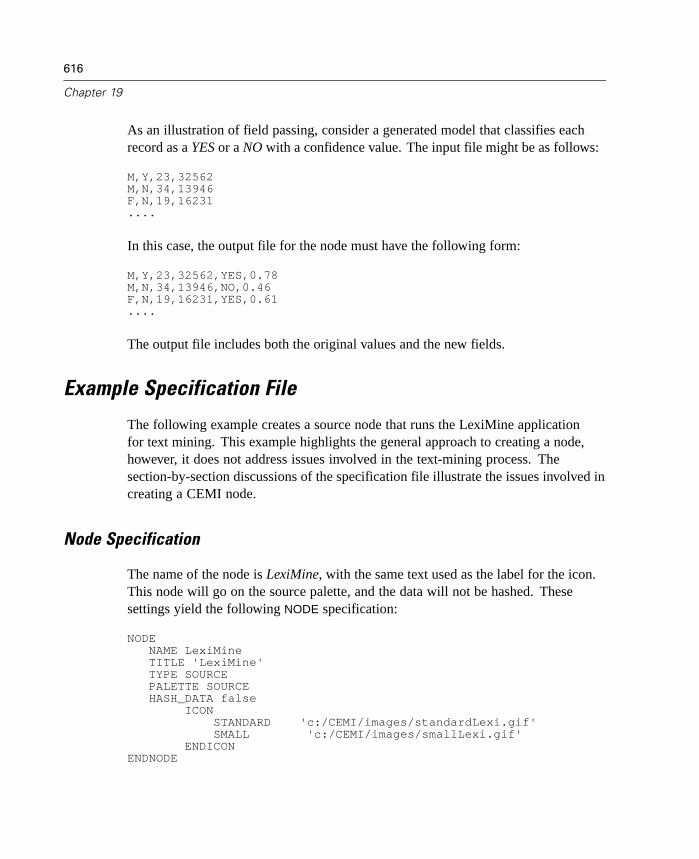
616
Chapter 19
As an illustration of field passing, consider a generated model that classifies eachrecord as a YES or a NO with a confidence value. The input file might be as follows:
M,Y,23,32562M,N,34,13946F,N,19,16231....
In this case, the output file for the node must have the following form:
M,Y,23,32562,YES,0.78M,N,34,13946,NO,0.46F,N,19,16231,YES,0.61....
The output file includes both the original values and the new fields.
Example Specification File
The following example creates a source node that runs the LexiMine applicationfor text mining. This example highlights the general approach to creating a node,however, it does not address issues involved in the text-mining process. Thesection-by-section discussions of the specification file illustrate the issues involved increating a CEMI node.
Node Specification
The name of the node is LexiMine, with the same text used as the label for the icon.This node will go on the source palette, and the data will not be hashed. Thesesettings yield the following NODE specification:
NODENAME LexiMineTITLE 'LexiMine'TYPE SOURCEPALETTE SOURCEHASH_DATA false
ICONSTANDARD 'c:/CEMI/images/standardLexi.gif'SMALL 'c:/CEMI/images/smallLexi.gif'
ENDICONENDNODE
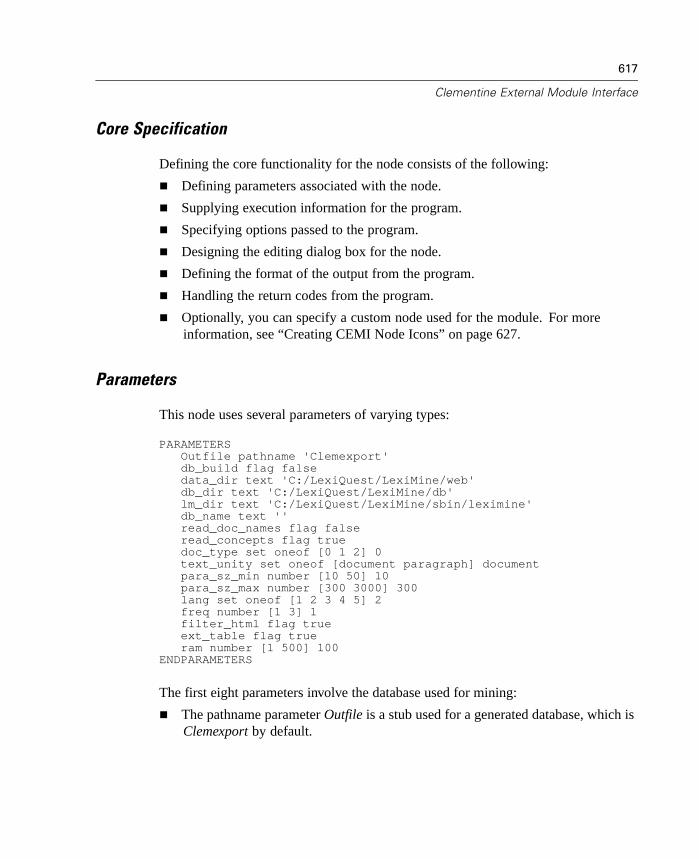
617
Clementine External Module Interface
Core Specification
Defining the core functionality for the node consists of the following:
Defining parameters associated with the node.
Supplying execution information for the program.
Specifying options passed to the program.
Designing the editing dialog box for the node.
Defining the format of the output from the program.
Handling the return codes from the program.
Optionally, you can specify a custom node used for the module. For moreinformation, see “Creating CEMI Node Icons” on page 627.
Parameters
This node uses several parameters of varying types:
PARAMETERSOutfile pathname 'Clemexport'db_build flag falsedata_dir text 'C:/LexiQuest/LexiMine/web'db_dir text 'C:/LexiQuest/LexiMine/db'lm_dir text 'C:/LexiQuest/LexiMine/sbin/leximine'db_name text ''read_doc_names flag falseread_concepts flag truedoc_type set oneof [0 1 2] 0text_unity set oneof [document paragraph] documentpara_sz_min number [10 50] 10para_sz_max number [300 3000] 300lang set oneof [1 2 3 4 5] 2freq number [1 3] 1filter_html flag trueext_table flag trueram number [1 500] 100
ENDPARAMETERS
The first eight parameters involve the database used for mining:
The pathname parameter Outfile is a stub used for a generated database, which isClemexport by default.
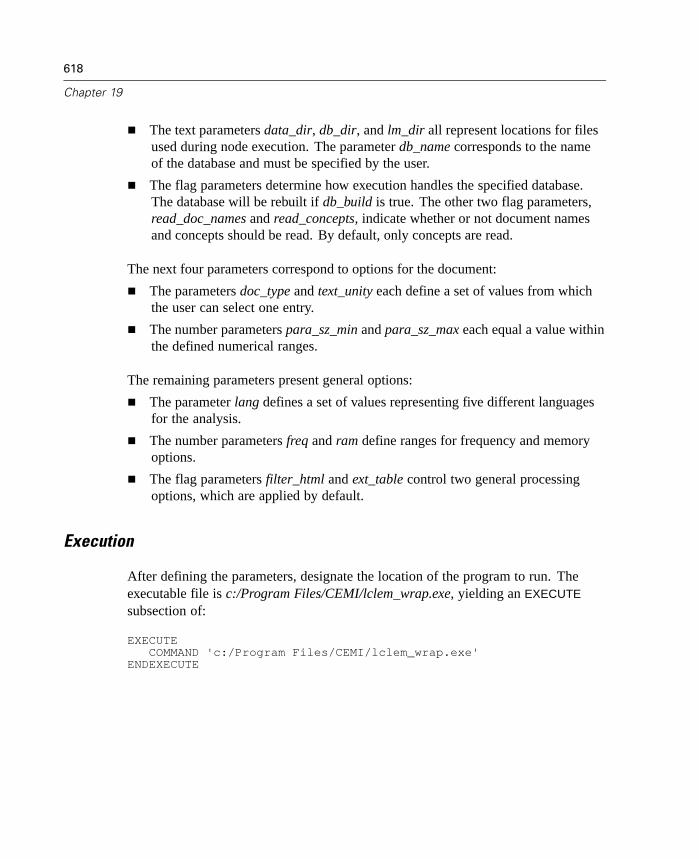
618
Chapter 19
The text parameters data_dir, db_dir, and lm_dir all represent locations for filesused during node execution. The parameter db_name corresponds to the nameof the database and must be specified by the user.
The flag parameters determine how execution handles the specified database.The database will be rebuilt if db_build is true. The other two flag parameters,read_doc_names and read_concepts, indicate whether or not document namesand concepts should be read. By default, only concepts are read.
The next four parameters correspond to options for the document:
The parameters doc_type and text_unity each define a set of values from whichthe user can select one entry.
The number parameters para_sz_min and para_sz_max each equal a value withinthe defined numerical ranges.
The remaining parameters present general options:
The parameter lang defines a set of values representing five different languagesfor the analysis.
The number parameters freq and ram define ranges for frequency and memoryoptions.
The flag parameters filter_html and ext_table control two general processingoptions, which are applied by default.
Execution
After defining the parameters, designate the location of the program to run. Theexecutable file is c:/Program Files/CEMI/lclem_wrap.exe, yielding an EXECUTE
subsection of:
EXECUTECOMMAND 'c:/Program Files/CEMI/lclem_wrap.exe'
ENDEXECUTE
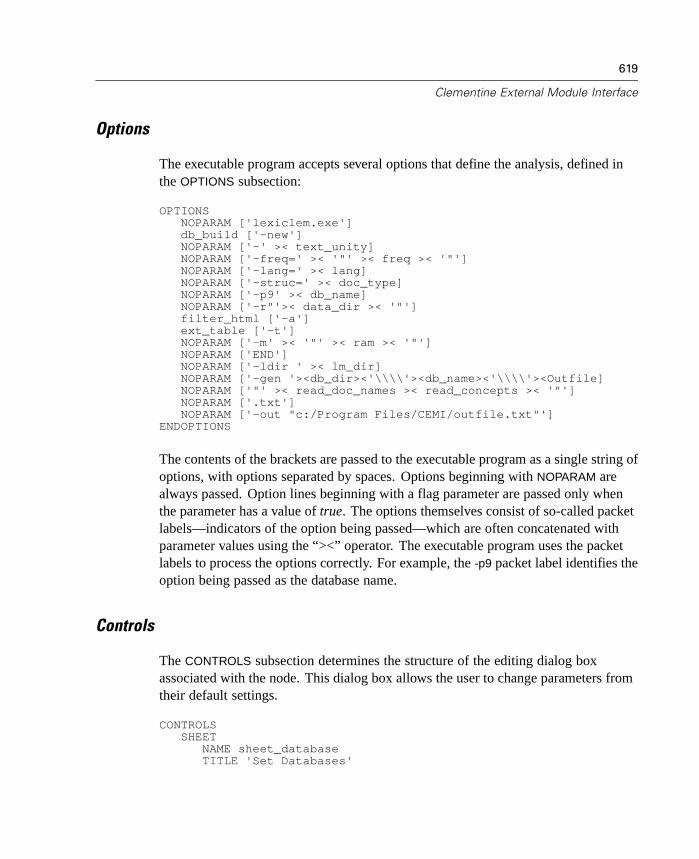
619
Clementine External Module Interface
Options
The executable program accepts several options that define the analysis, defined inthe OPTIONS subsection:
OPTIONSNOPARAM ['lexiclem.exe']db_build ['-new']NOPARAM ['-' >< text_unity]NOPARAM ['-freq=' >< '"' >< freq >< '"']NOPARAM ['-lang=' >< lang]NOPARAM ['-struc=' >< doc_type]NOPARAM ['-p9' >< db_name]NOPARAM ['-r"'>< data_dir >< '"']filter_html ['-a']ext_table ['-t']NOPARAM ['-m' >< '"' >< ram >< '"']NOPARAM ['END']NOPARAM ['-ldir ' >< lm_dir]NOPARAM ['-gen '><db_dir><'\\\\'><db_name><'\\\\'><Outfile]NOPARAM ['"' >< read_doc_names >< read_concepts >< '"']NOPARAM ['.txt']NOPARAM ['-out "c:/Program Files/CEMI/outfile.txt"']
ENDOPTIONS
The contents of the brackets are passed to the executable program as a single string ofoptions, with options separated by spaces. Options beginning with NOPARAM arealways passed. Option lines beginning with a flag parameter are passed only whenthe parameter has a value of true. The options themselves consist of so-called packetlabels—indicators of the option being passed—which are often concatenated withparameter values using the “><” operator. The executable program uses the packetlabels to process the options correctly. For example, the -p9 packet label identifies theoption being passed as the database name.
Controls
The CONTROLS subsection determines the structure of the editing dialog boxassociated with the node. This dialog box allows the user to change parameters fromtheir default settings.
CONTROLSSHEET
NAME sheet_databaseTITLE 'Set Databases'
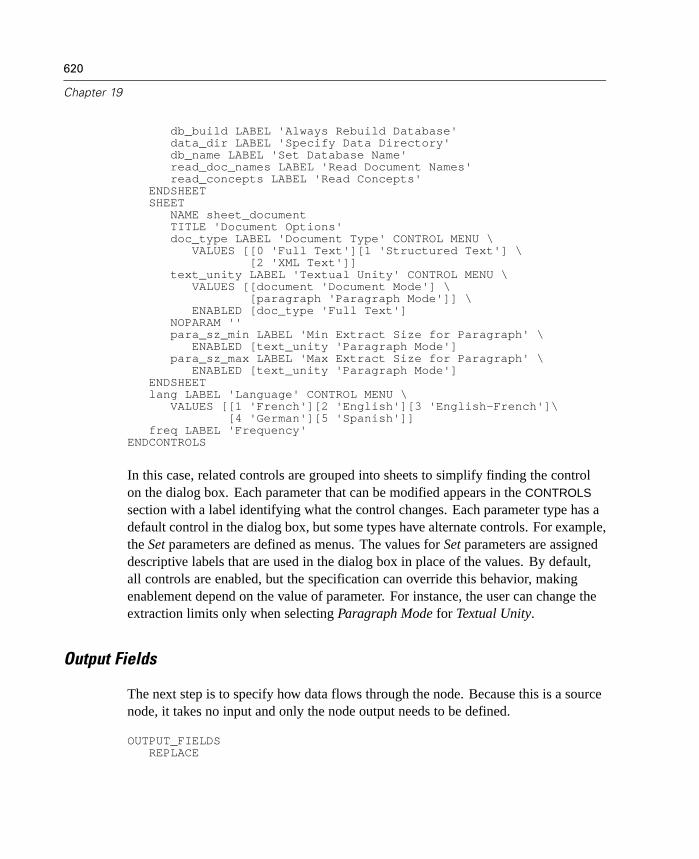
620
Chapter 19
db_build LABEL 'Always Rebuild Database'data_dir LABEL 'Specify Data Directory'db_name LABEL 'Set Database Name'read_doc_names LABEL 'Read Document Names'read_concepts LABEL 'Read Concepts'
ENDSHEETSHEET
NAME sheet_documentTITLE 'Document Options'doc_type LABEL 'Document Type' CONTROL MENU \
VALUES [[0 'Full Text'][1 'Structured Text'] \[2 'XML Text']]
text_unity LABEL 'Textual Unity' CONTROL MENU \VALUES [[document 'Document Mode'] \
[paragraph 'Paragraph Mode']] \ENABLED [doc_type 'Full Text']
NOPARAM ''para_sz_min LABEL 'Min Extract Size for Paragraph' \
ENABLED [text_unity 'Paragraph Mode']para_sz_max LABEL 'Max Extract Size for Paragraph' \
ENABLED [text_unity 'Paragraph Mode']ENDSHEETlang LABEL 'Language' CONTROL MENU \
VALUES [[1 'French'][2 'English'][3 'English-French']\[4 'German'][5 'Spanish']]
freq LABEL 'Frequency'ENDCONTROLS
In this case, related controls are grouped into sheets to simplify finding the controlon the dialog box. Each parameter that can be modified appears in the CONTROLS
section with a label identifying what the control changes. Each parameter type has adefault control in the dialog box, but some types have alternate controls. For example,the Set parameters are defined as menus. The values for Set parameters are assigneddescriptive labels that are used in the dialog box in place of the values. By default,all controls are enabled, but the specification can override this behavior, makingenablement depend on the value of parameter. For instance, the user can change theextraction limits only when selecting Paragraph Mode for Textual Unity.
Output Fields
The next step is to specify how data flows through the node. Because this is a sourcenode, it takes no input and only the node output needs to be defined.
OUTPUT_FIELDSREPLACE

621
Clementine External Module Interface
CREATE_IF [read_doc_names] NAME ['Document'] TYPE [AUTO]CREATE NAME ['DocID'] TYPE [AUTO]CREATE_IF [read_concepts] NAME ['Concept'] TYPE [AUTOSYMBOL]CREATE_IF [read_concepts] NAME ['Data'] TYPE [AUTONUMBER]CREATE_IF [read_concepts] NAME ['Type'] TYPE [AUTOSYMBOL]
ENDOUTPUT_FIELDS
The node always creates a field named DocID. The creation of other fields dependson the values of flag parameters. When reading document names, the node creates afield name Document. When reading concepts, three new fields are created. Inaddition to names for the fields, specify their types too.
Output Data
The format of the input and output data must be defined. Source nodes do not acceptinput, so only the latter is required.
OUTPUT_DATAFILE_NAME ['c:/Program Files/CEMI/outfile.txt']SEPARATOR ';'INC_FIELDS false
ENDOUTPUT_DATA
The name of the file containing the data generated by the executable file is c:/ProgramFiles/CEMI/outfile.txt, and it does not contain field names. Records in this file areseparated by semicolons. This information allows the node to pass the generated datato the next node in the stream.
Return Codes
The program returns one of three values reporting on the status of the execution.The RETURN_CODE subsection assigns text to integers returned by the executableprogram.
RETURN_CODESUCCESS_VALUE 01 'Illegal option'2 'Must select either Read Document Names or Read Concepts'
ENDRETURN_CODE

622
Chapter 19
Complete Specification File
The complete specification file is as follows:
SPECFILENODE
NAME LexiMineTITLE 'LexiMine'TYPE SOURCEPALETTE SOURCEHASH_DATA false
ICONSTANDARD '$CLEO\CEMI\images\lg_cemi_icon.gif'SMALL '$CLEO\CEMI\images\sm_cemi_icon.gif'
ENDICONENDNODE
COREPARAMETERS
# FilesOutfile pathname 'Clemexport'
# Database Sheetdb_build flag falsedata_dir text 'C:/LexiQuest/LexiMine/web'db_dir text 'C:/LexiQuest/LexiMine/db'lm_dir text 'C:/LexiQuest/LexiMine/sbin/leximine'db_name text ''read_doc_names flag falseread_concepts flag true
# Document Optionsdoc_type set oneof [0 1 2] 0text_unity set oneof [document paragraph] documentpara_sz_min number [10 50] 10para_sz_max number [300 3000] 300
# Language Optionslang set oneof [1 2 3 4 5] 2freq number [1 3] 1
# Otherfilter_html flag trueext_table flag trueram number [1 500] 100
ENDPARAMETERS
EXECUTECOMMAND 'c:/Program Files/CEMI/lclem_wrap.exe'
ENDEXECUTE
OPTIONSNOPARAM ['lexiclem.exe']db_build ['-new']NOPARAM ['-' >< text_unity]NOPARAM ['-freq=' >< '"' >< freq >< '"']

623
Clementine External Module Interface
NOPARAM ['-lang=' >< lang]NOPARAM ['-struc=' >< doc_type]NOPARAM ['-p9' >< db_name]NOPARAM ['-r"'>< data_dir >< '"']filter_html ['-a']ext_table ['-t']NOPARAM ['-m' >< '"' >< ram >< '"']NOPARAM ['END']NOPARAM ['-ldir ' >< lm_dir]NOPARAM ['-gen '><db_dir><'\\\\'><db_name><'\\\\'><Outfile]NOPARAM ['"' >< read_doc_names >< read_concepts >< '"']NOPARAM ['.txt']NOPARAM ['-out "c:/Program Files/CEMI/outfile.txt"']
ENDOPTIONS
CONTROLSSHEET
NAME sheet_databaseTITLE 'Set Databases'db_build LABEL 'Always Rebuild Database'data_dir LABEL 'Specify Data Directory'db_name LABEL 'Set Database Name'read_doc_names LABEL 'Read Document Names'read_concepts LABEL 'Read Concepts'
ENDSHEETSHEET
NAME sheet_documentTITLE 'Document Options'doc_type LABEL 'Document Type' CONTROL MENU \
VALUES [[0 'Full Text'][1 'Structured Text'] \[2 'XML Text']]
text_unity LABEL 'Textual Unity' CONTROL MENU \VALUES [[document 'Document Mode'] \
[paragraph 'Paragraph Mode']] \ENABLED [doc_type 'Full Text']
NOPARAM ''para_sz_min LABEL 'Min Extract Size for Paragraph' \
ENABLED [text_unity 'Paragraph Mode']para_sz_max LABEL 'Max Extract Size for Paragraph' \
ENABLED [text_unity 'Paragraph Mode']ENDSHEETlang LABEL 'Language' CONTROL MENU \
VALUES [[1 'French'][2 'English'][3 'English-French']\[4 'German'][5 'Spanish']]
freq LABEL 'Frequency'ENDCONTROLS
OUTPUT_FIELDSREPLACECREATE_IF [read_doc_names] NAME ['Document'] TYPE [AUTO]CREATE NAME ['DocID'] TYPE [AUTO]CREATE_IF [read_concepts] NAME ['Concept'] \
TYPE [AUTOSYMBOL]

624
Chapter 19
CREATE_IF [read_concepts] NAME ['Data'] TYPE [AUTONUMBER]CREATE_IF [read_concepts] NAME ['Type'] TYPE [AUTOSYMBOL]
ENDOUTPUT_FIELDS
OUTPUT_DATAFILE_NAME ['c:/Program Files/CEMI/outfile.txt']SEPARATOR ';'INC_FIELDS false
ENDOUTPUT_DATA
RETURN_CODESUCCESS_VALUE 01 'Illegal option'2 'Must select either Read Document Names or Read Concepts'
ENDRETURN_CODEENDCORE
ENDSPECFILE
CEMI Node Management
After creating a specification file, load the new node into Clementine using theCEMI tab of the Palette Manager.
Figure 19-4Palette Manager
The CEMI tab contains a selectable list of any previously loaded CEMI nodes alongwith Add and Remove buttons.

625
Clementine External Module Interface
The Add button loads a new node (custom or default) corresponding to aspecification file into the palette defined in the file. If the node loads successfully,the CEMI Specifications list updates to include the name of the added node.Clementine reports any errors occurring during loading with context informationfor the error, including the line number in the specification file where the problemarises. After loading, the CEMI node will be available to all users of the client.
The Remove button eliminates a CEMI node from the palette. Nodes of theremoved type that appear in existing streams are not removed from the streamsand will continue to function as before.
Adding a CEMI Node
Using a dialog box in Clementine, you can load specification files, one at a time,while the software is running.
E From the Tools menu of the stream canvas, choose CEMI.
E In the Palette Manager, click Add.
E In the Open dialog box, select the specification file for the node to be added. Bydefault, the manager opens to the CEMI subdirectory of your Clementine installation.
E Click Open.
The new node appears on the palette designated in the specification file, and thename of the node appears in the list of CEMI specifications in the Palette Manager.Click OK to close the Palette Manager.
Installing from the Command Line
You can also add a CEMI node using the following command line argument:
-install_cemi <file>
For example:
clemb -install_cemi 'c:\cemi\test.spc'

626
Chapter 19
To install multiple specification files, repeat the argument.
If an identical CEMI node exists, it will be replaced by the new one.
When this argument is specified, all other options are ignored and Clementinewill not be invoked.
Removing a CEMI Node
E From the Tools menu on the stream canvas, select CEMI.
E In the Palette Manager, select the node to be removed from the list of CEMIspecifications.
E Click Remove.
E Click OK to close the Palette Manager.
Uninstalling from the Command Line
You can also remove a CEMI node using the following command line argument:
-uninstall_cemi <file>
For example:
clemb -uninstall_cemi 'c:\cemi\test.spc'
To remove multiple specification files, repeat the argument.
When this argument is specified, all other options are ignored and Clementinewill not be invoked.

627
Clementine External Module Interface
Creating CEMI Node Icons
For each CEMI node and any associated generated models, you can create customicons. There are two parts to creating and implementing custom icons:
Create icons conforming to Clementine requirements using a graphics package.
Specify the icons in the CEMI specification file. For more information, see“ICON Subsection” in Appendix E on page 803.
This topic provides guidelines for creating icons that display well in Clementine.
Graphics Requirements
Custom CEMI nodes should conform to the following standards:
CEMI nodes require both small and standard icons in order to conform withstream layout settings for icon size.
Standard-sized icons (used to display nodes on the stream canvas) are 48 pixelswide by 48 pixels high.
Small-sized icons (used to display nodes in the palette) are 36 pixels wide by36 pixels high.
Color depth should be 16 colors or higher. Most application icons are 4-bit16 color images.
Example CEMI icons are included in the cemi/icons/ directory of your Clementineinstallation.
Icon Layers
Node icons are composed of overlapping layers—the glyph layer and thebackground layer. You may work with them as a layered image or separately if yourgraphics package does not support layers.
Glyph layer. The glyph layer is the customizeable part of a node icon.
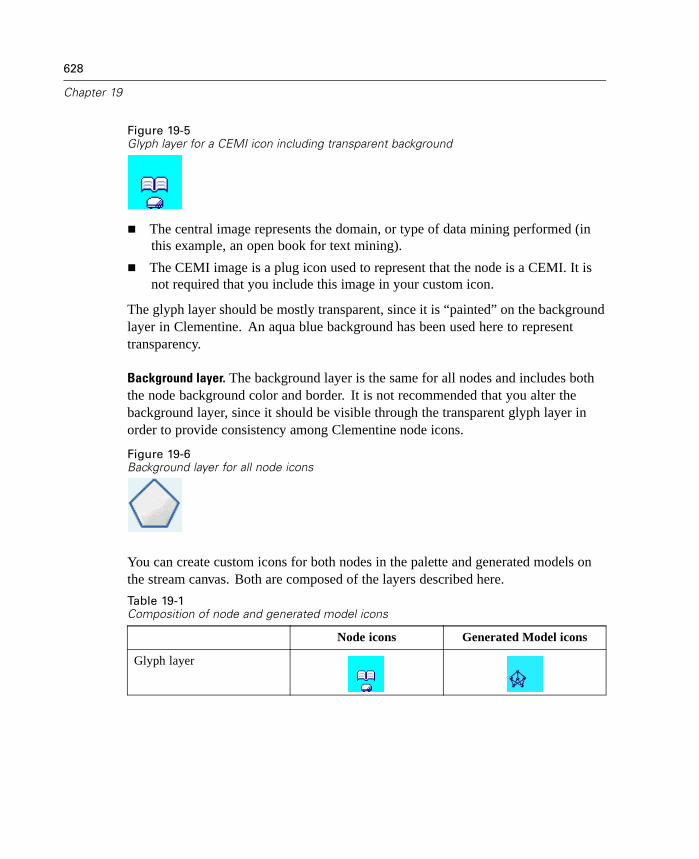
628
Chapter 19
Figure 19-5Glyph layer for a CEMI icon including transparent background
The central image represents the domain, or type of data mining performed (inthis example, an open book for text mining).
The CEMI image is a plug icon used to represent that the node is a CEMI. It isnot required that you include this image in your custom icon.
The glyph layer should be mostly transparent, since it is “painted” on the backgroundlayer in Clementine. An aqua blue background has been used here to representtransparency.
Background layer. The background layer is the same for all nodes and includes boththe node background color and border. It is not recommended that you alter thebackground layer, since it should be visible through the transparent glyph layer inorder to provide consistency among Clementine node icons.
Figure 19-6Background layer for all node icons
You can create custom icons for both nodes in the palette and generated models onthe stream canvas. Both are composed of the layers described here.
Table 19-1Composition of node and generated model icons
Node icons Generated Model icons
Glyph layer

629
Clementine External Module Interface
Node icons Generated Model icons
Background layer
Image as displayed inClementine
Creating a Custom Icon
The following instructions pertain to the creation of a standard-sized icon. For smallicons, use sample files from CEMI/images/ that are labeled with the suffix _sm. Forexample, glyph_node_sm.gif is the glyph layer for a small node icon.
E In a graphics package that supports transparency, open the example CEMI icon calledglyph_node_lg.gif from the CEMIi/images/ directory of your Clementine installation.This is the glyph layer, used for a standard-sized icon.
E Using a color depth of 16 or more colors, create an icon that conveys the domain yourCEMI addresses (such as text mining, micro-array analysis, etc.).
E Check the image size. Images larger than 48 pixels by 48 pixels (or 36 by 36 for smallicons) will be trimmed for display in the application.
E Set the image background to transparent. In most graphics packages, transparenciesare achieved by nominating a transparency color and then “painting” the imagebackground with this color.
E If your graphics package supports layers, open a background layer from the sampledirectory, such as bg_process_lg.gif. Bring the layer into the current image.
E Check whether your custom image obscures the node background or border.
E If the layers overlap correctly, close only the background layer without saving it.
E Save the transparent glyph layer as a new .gif file. Note that the original exampleicon is read-only.

630
Chapter 19
E Open the CEMI specification file, and include parameters for the custom node.You should include an ICON subsection in the NODE specification (and MODEL
specification if the custom icon represents a generated model node). For moreinformation, see “ICON Subsection” in Appendix E on page 803.
Note: If your graphics package does not support layered images, individually openthe glyph and background layers anyway to help visualize the correct size andplacement of your custom icon.
Generated Model Icons
To create generated model icons for your CEMI application, repeat the steps aboveusing the following glyph and background layers:
For the glyph layer, use glyph_genmod_lg.gif for standard-sized icons.
For testing with the background layer, use bg_refmod_lg.gif for refined modelsand bg_unrefmod_lg.gif for unrefined models.
Tips for Writing External Programs
Whether writing new programs or adapting existing programs to be called from CEMInodes, seamless integration and ease of use should be your two main goals. With thisin mind, consider the following points as you undertake the programming task:
Programs should be able to read both symbolic and numeric data, even if thealgorithms themselves can process only one type of data or more than one type ofdata. If this is not the case, the user of the external program will need to ensurethat all field types are fully instantiated before running the program or otherwiserisk invalid data getting passed to the program. The CEMI can auto-instantiatefield types as long as there is a Type node upstream from the CEMI node.
The limit on memory usage that can be set for Clementine does not apply toexternal programs. When writing programs, consider both the memory and speedimplications of any algorithm used.
Chapter
20Application Examples
Overview
The data mining tools in Clementine can help solve a wide variety of business andorganizational problems. The following examples are a small subset of the issues forwhich Clementine can provide insight.
You can use each example as a road map for the types of operations typicallyperformed by data miners. To begin, you should load the data file(s) referenced foreach application and follow the steps, learning both Clementine's visual programminginterface as well as data mining methods. The data files are available from the demosdirectory of your installation of Clementine.
The data sets used here are much smaller than the enormous data stores managedby some data miners, but this will enable you to focus on data mining operationsrather than problems with the data itself. Handling the complexities of enormous datasets and data of poor quality are discussed elsewhere in this guide. Consulting theClementine Application Templates (CATs), available on a separate CD from yourSPSS representative, will also provide a step-by-step guide to complex data miningapplications.
Condition Monitoring Example
This example concerns monitoring status information from a machine and theproblem of recognizing and predicting fault states. The data consist of a number ofconcatenated time series. Each record is a “snapshot” report on the machine interms of the following:
Time. An integer.
Power. An integer.
Temperature. An integer.
631
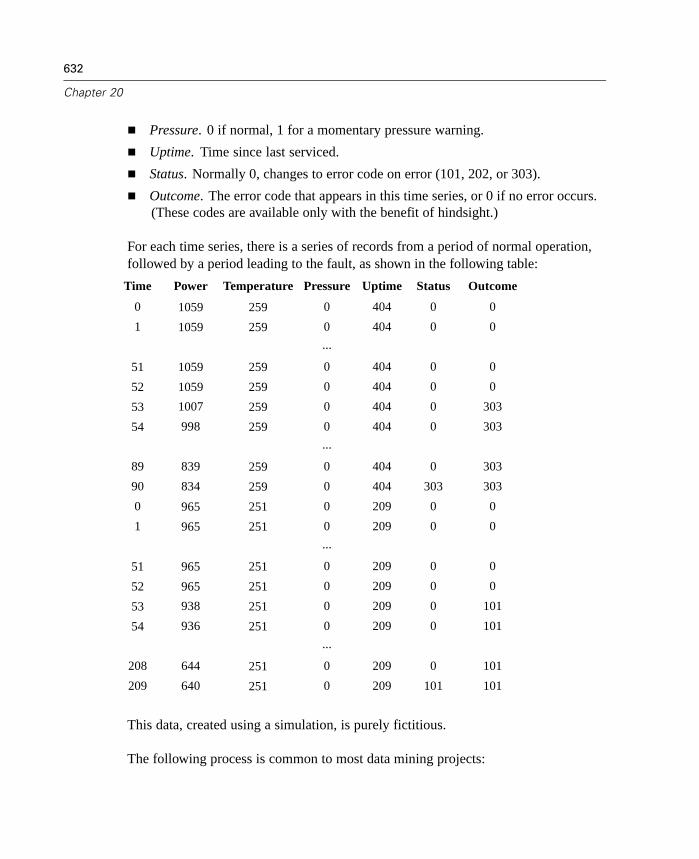
632
Chapter 20
Pressure. 0 if normal, 1 for a momentary pressure warning.
Uptime. Time since last serviced.
Status. Normally 0, changes to error code on error (101, 202, or 303).
Outcome. The error code that appears in this time series, or 0 if no error occurs.(These codes are available only with the benefit of hindsight.)
For each time series, there is a series of records from a period of normal operation,followed by a period leading to the fault, as shown in the following table:
Time Power Temperature Pressure Uptime Status Outcome
0 1059 259 0 404 0 0
1 1059 259 0 404 0 0
...
51 1059 259 0 404 0 0
52 1059 259 0 404 0 0
53 1007 259 0 404 0 303
54 998 259 0 404 0 303
...
89 839 259 0 404 0 303
90 834 259 0 404 303 303
0 965 251 0 209 0 0
1 965 251 0 209 0 0
...
51 965 251 0 209 0 0
52 965 251 0 209 0 0
53 938 251 0 209 0 101
54 936 251 0 209 0 101
...
208 644 251 0 209 0 101
209 640 251 0 209 101 101
This data, created using a simulation, is purely fictitious.
The following process is common to most data mining projects:

633
Application Examples
Examine the data to determine which attributes may be relevant to the predictionor recognition of the states of interest.
Retain those attributes (if already present), or derive and add them to the data,if necessary.
Use the resultant data to train rules and neural nets.
Test the trained systems using independent test data.
Examining the Data
The file condplot.str illustrates the first part of the process. It contains the streamshown below, which plots a number of graphs. If the time series of temperature orpower contains patterns that are visible to the eye, you could differentiate betweenimpending error conditions or possibly predict their occurrence. For both temperatureand power, the stream below plots the time series associated with the three differenterror codes on separate graphs, yielding six graphs. Select nodes separate the dataassociated with the different error codes.
Figure 20-1condplot stream
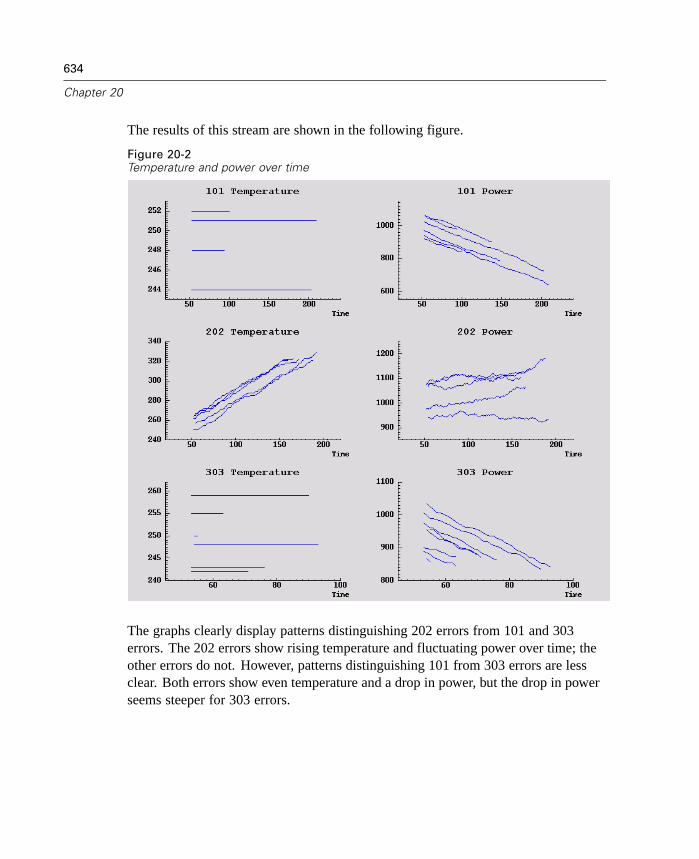
634
Chapter 20
The results of this stream are shown in the following figure.
Figure 20-2Temperature and power over time
The graphs clearly display patterns distinguishing 202 errors from 101 and 303errors. The 202 errors show rising temperature and fluctuating power over time; theother errors do not. However, patterns distinguishing 101 from 303 errors are lessclear. Both errors show even temperature and a drop in power, but the drop in powerseems steeper for 303 errors.

635
Application Examples
Based on these graphs, it appears that the presence and rate of change for bothtemperature and power, as well as the presence and degree of fluctuation, are relevantto predicting and distinguishing faults. These attributes should therefore be added tothe data before applying the learning systems.
Data Preparation
Based on the results of exploring the data, the stream condlearn.str derives therelevant data and learns to predict faults.
Figure 20-3condlearn stream
The sequence of nodes is as follows:
Variable File node. Reads data file COND1n.
Derive Pressure Warnings. Counts the number of momentary pressure warnings.Reset when time returns to 0.
Derive TempInc. Calculates momentary rate of temperature change using @DIFF1.
Derive PowerInc. Calculates momentary rate of power change using @DIFF1.
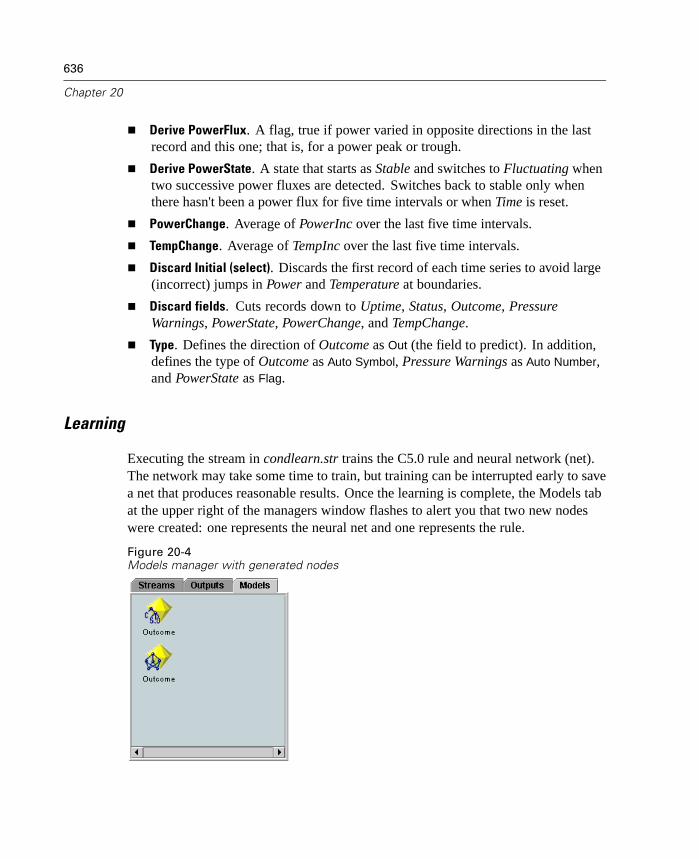
636
Chapter 20
Derive PowerFlux. A flag, true if power varied in opposite directions in the lastrecord and this one; that is, for a power peak or trough.
Derive PowerState. A state that starts as Stable and switches to Fluctuating whentwo successive power fluxes are detected. Switches back to stable only whenthere hasn't been a power flux for five time intervals or when Time is reset.
PowerChange. Average of PowerInc over the last five time intervals.
TempChange. Average of TempInc over the last five time intervals.
Discard Initial (select). Discards the first record of each time series to avoid large(incorrect) jumps in Power and Temperature at boundaries.
Discard fields. Cuts records down to Uptime, Status, Outcome, PressureWarnings, PowerState, PowerChange, and TempChange.
Type. Defines the direction of Outcome as Out (the field to predict). In addition,defines the type of Outcome as Auto Symbol, Pressure Warnings as Auto Number,and PowerState as Flag.
Learning
Executing the stream in condlearn.str trains the C5.0 rule and neural network (net).The network may take some time to train, but training can be interrupted early to savea net that produces reasonable results. Once the learning is complete, the Models tabat the upper right of the managers window flashes to alert you that two new nodeswere created: one represents the neural net and one represents the rule.
Figure 20-4Models manager with generated nodes
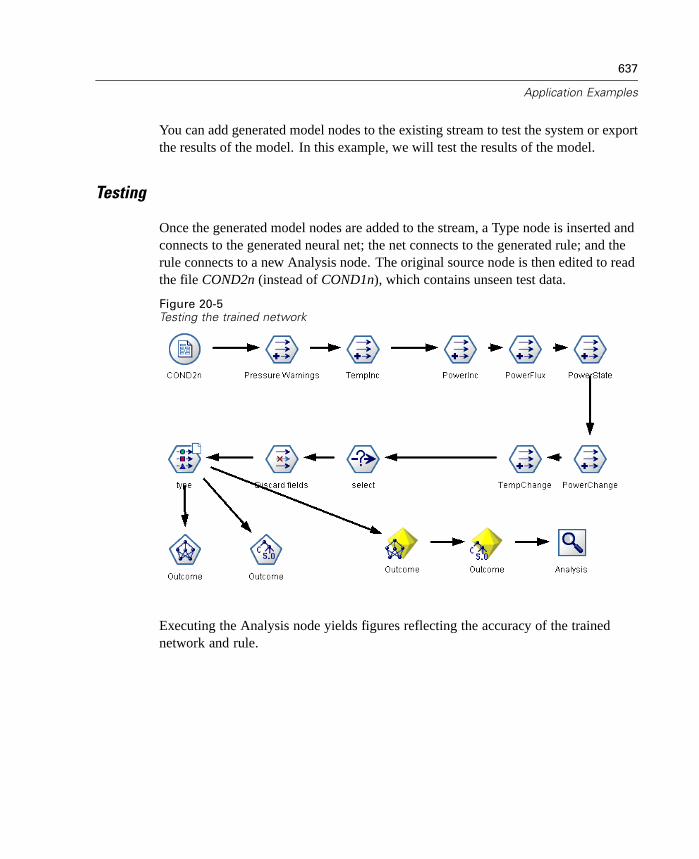
637
Application Examples
You can add generated model nodes to the existing stream to test the system or exportthe results of the model. In this example, we will test the results of the model.
Testing
Once the generated model nodes are added to the stream, a Type node is inserted andconnects to the generated neural net; the net connects to the generated rule; and therule connects to a new Analysis node. The original source node is then edited to readthe file COND2n (instead of COND1n), which contains unseen test data.
Figure 20-5Testing the trained network
Executing the Analysis node yields figures reflecting the accuracy of the trainednetwork and rule.
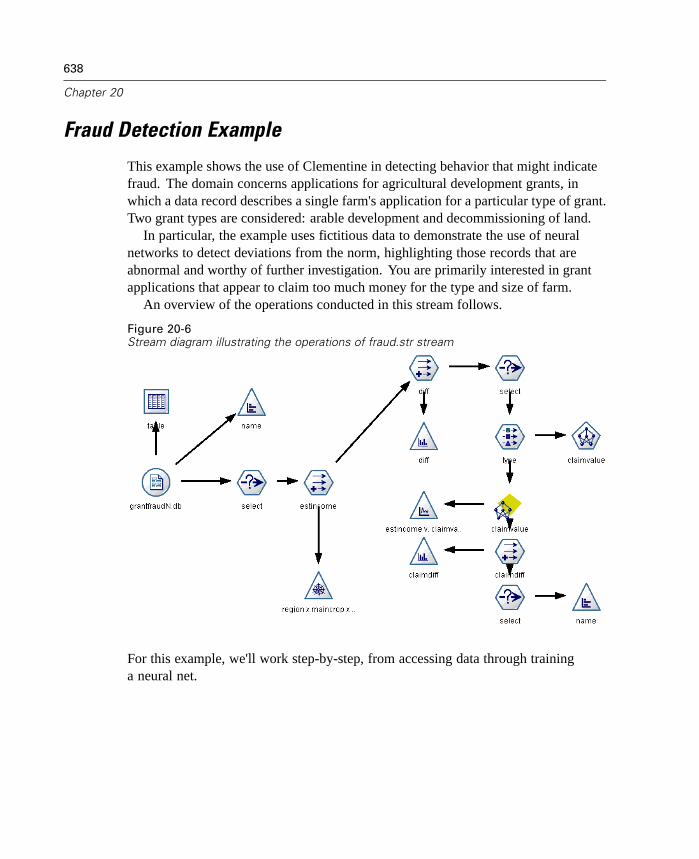
638
Chapter 20
Fraud Detection Example
This example shows the use of Clementine in detecting behavior that might indicatefraud. The domain concerns applications for agricultural development grants, inwhich a data record describes a single farm's application for a particular type of grant.Two grant types are considered: arable development and decommissioning of land.
In particular, the example uses fictitious data to demonstrate the use of neuralnetworks to detect deviations from the norm, highlighting those records that areabnormal and worthy of further investigation. You are primarily interested in grantapplications that appear to claim too much money for the type and size of farm.
An overview of the operations conducted in this stream follows.
Figure 20-6Stream diagram illustrating the operations of fraud.str stream
For this example, we'll work step-by-step, from accessing data through traininga neural net.

639
Application Examples
Accessing the Data
The first step is to connect to the data set grantfraudN.db using a Variable File node.Since the data set contains field names, we can add a Table node to the stream andexecute it in order to inspect its form. Alternatively, you can also gain some initialinsight into the data by clicking the Types tab of the Source node and reading in thevalues.
The data contain nine fields:
id. A unique identification number.
name. Name of the claimant.
region. Geographic location (midlands/north/southwest/southeast).
landquality. Integer scale—farmer's declaration of land quality.
rainfall. Integer scale—annual rainfall over farm.
farmincome. Real range—declared annual income of farm.
maincrop. Primary crop (maize/wheat/potatoes/rapeseed).
claimtype. Type of grant applied for (decommission_land/arable_dev).
claimvalue. Real range—the value of the grant applied for.
Data Investigation
At this point, it's a good idea to investigate the data using exploratory graphics.This helps you to form hypotheses that can be useful in modeling. To begin with,consider the possible types of fraud in the data. One such possibility is multiplegrant aid applications from a single farm. Assuming that the data set contains oneunique identification number per farm, it is a simple matter to show the number ofoccurrences of this supposedly unique number.
Connect a Distribution node to the data set and select the name field. The tablebelow shows that a few farms have made multiple claims.
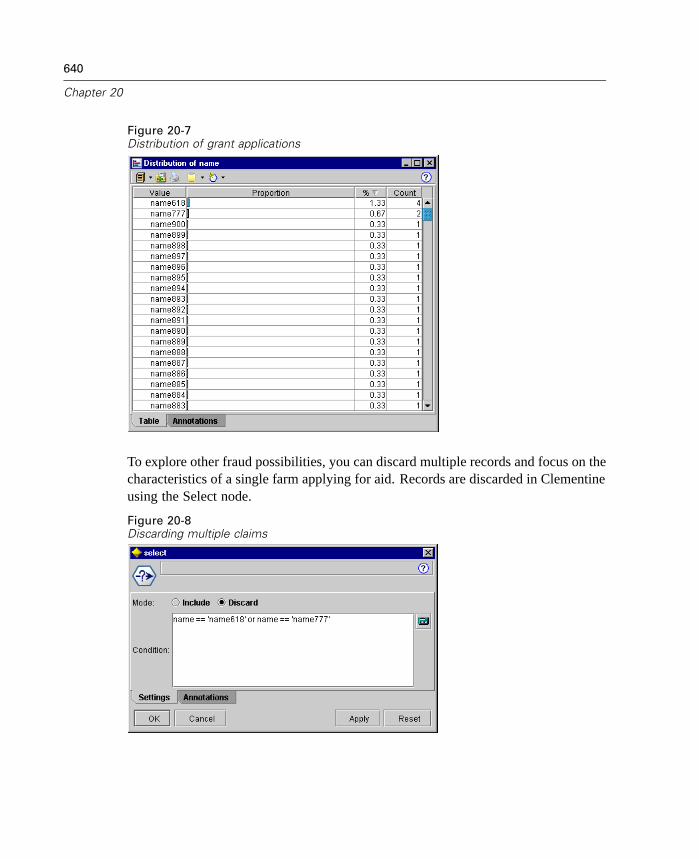
640
Chapter 20
Figure 20-7Distribution of grant applications
To explore other fraud possibilities, you can discard multiple records and focus on thecharacteristics of a single farm applying for aid. Records are discarded in Clementineusing the Select node.
Figure 20-8Discarding multiple claims
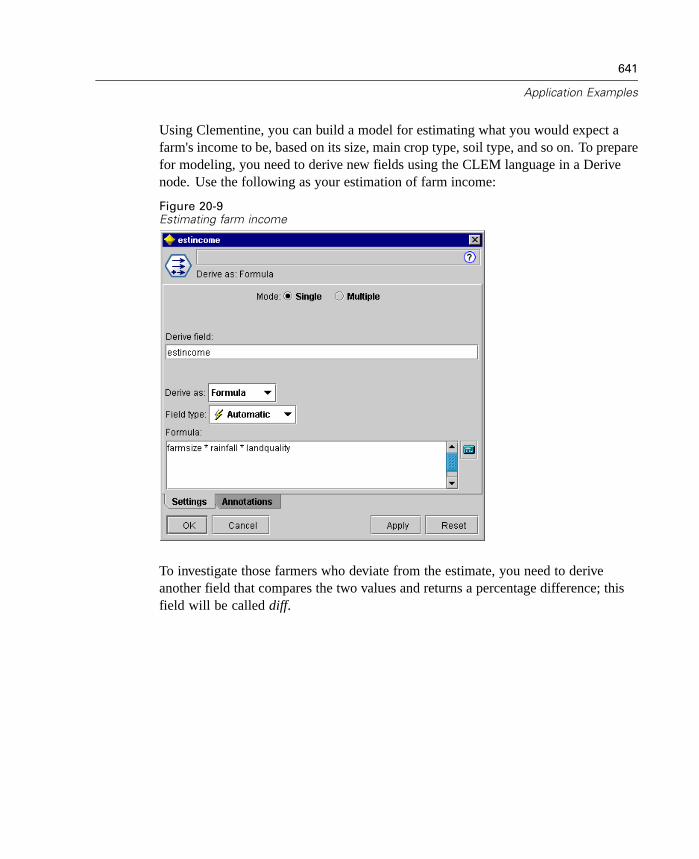
641
Application Examples
Using Clementine, you can build a model for estimating what you would expect afarm's income to be, based on its size, main crop type, soil type, and so on. To preparefor modeling, you need to derive new fields using the CLEM language in a Derivenode. Use the following as your estimation of farm income:
Figure 20-9Estimating farm income
To investigate those farmers who deviate from the estimate, you need to deriveanother field that compares the two values and returns a percentage difference; thisfield will be called diff.

642
Chapter 20
Figure 20-10Comparing income differences
To explore the deviations, it is helpful to plot a histogram of diff. It is interesting tooverlay claimtype to see if this has any influence on distance from the estimatedincome.
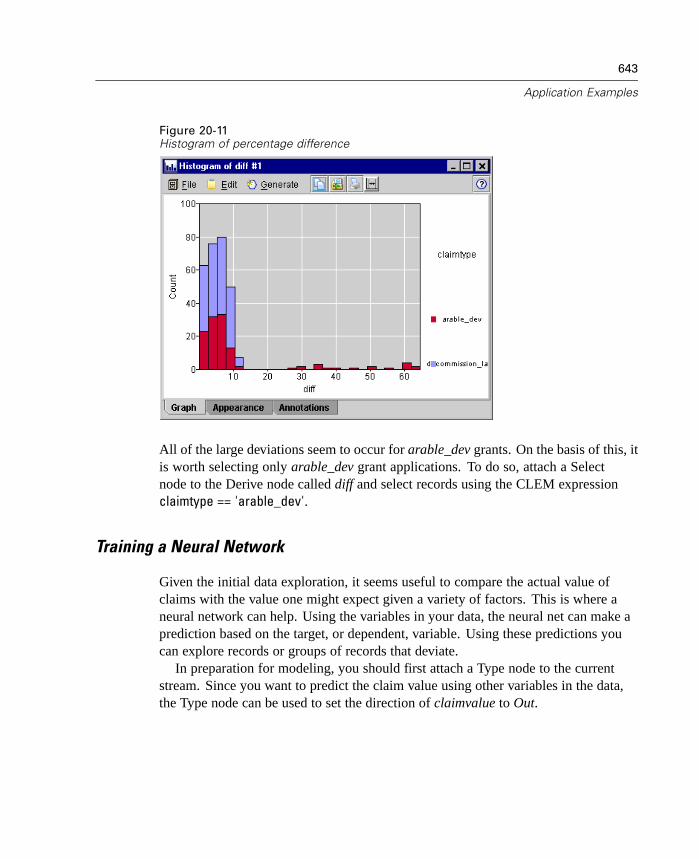
643
Application Examples
Figure 20-11Histogram of percentage difference
All of the large deviations seem to occur for arable_dev grants. On the basis of this, itis worth selecting only arable_dev grant applications. To do so, attach a Selectnode to the Derive node called diff and select records using the CLEM expressionclaimtype == 'arable_dev'.
Training a Neural Network
Given the initial data exploration, it seems useful to compare the actual value ofclaims with the value one might expect given a variety of factors. This is where aneural network can help. Using the variables in your data, the neural net can make aprediction based on the target, or dependent, variable. Using these predictions youcan explore records or groups of records that deviate.
In preparation for modeling, you should first attach a Type node to the currentstream. Since you want to predict the claim value using other variables in the data,the Type node can be used to set the direction of claimvalue to Out.
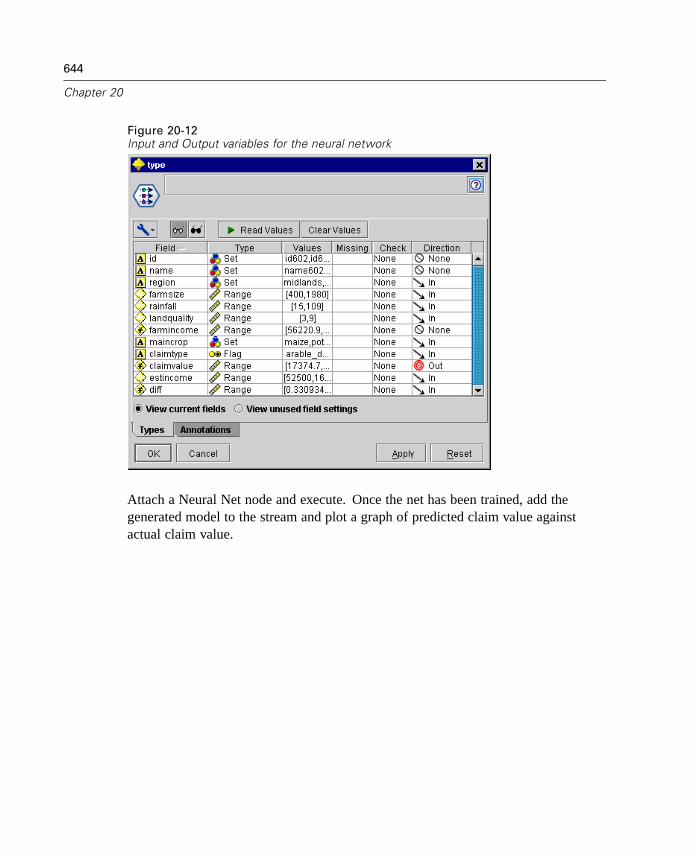
644
Chapter 20
Figure 20-12Input and Output variables for the neural network
Attach a Neural Net node and execute. Once the net has been trained, add thegenerated model to the stream and plot a graph of predicted claim value againstactual claim value.

645
Application Examples
Figure 20-13Comparing predicted and actual claim values
The fit appears to be good for the majority of cases. Derive another claimdiff field,similar to the “income differences” field derived earlier. This Derive node usesthe CLEM expression
(abs(claimvalue - '$N-claimvalue') / 'claimvalue') * 100
In order to interpret the difference between actual and estimated claim values, usea histogram of claimdiff. You are primarily interested in those who appear to beclaiming more than you would expect (as judged by the neural net).

646
Chapter 20
Figure 20-14Selecting a subset of data from the histogram
By adding a band to the histogram, you can right-click in the banded area andgenerate a Select node to further investigate those with a relatively large claimdiff,such as greater than 50%. These claims warrant further investigation.
Summary
This example created a model and compared the model predictions to values existingin the data set (for farm incomes). From this, you found deviations mainly in one typeof grant application (arable development) and selected these for further investigation.You trained a neural network model to generalize the relations between claim valueand farm size, estimated income, main crop, etc. The claims that differed by a largeamount from the network model (more than 50%) were identified as worth furtherinvestigation. Of course, it may turn out that all of these claims are valid, but the factthat they are different from the norm is of interest.
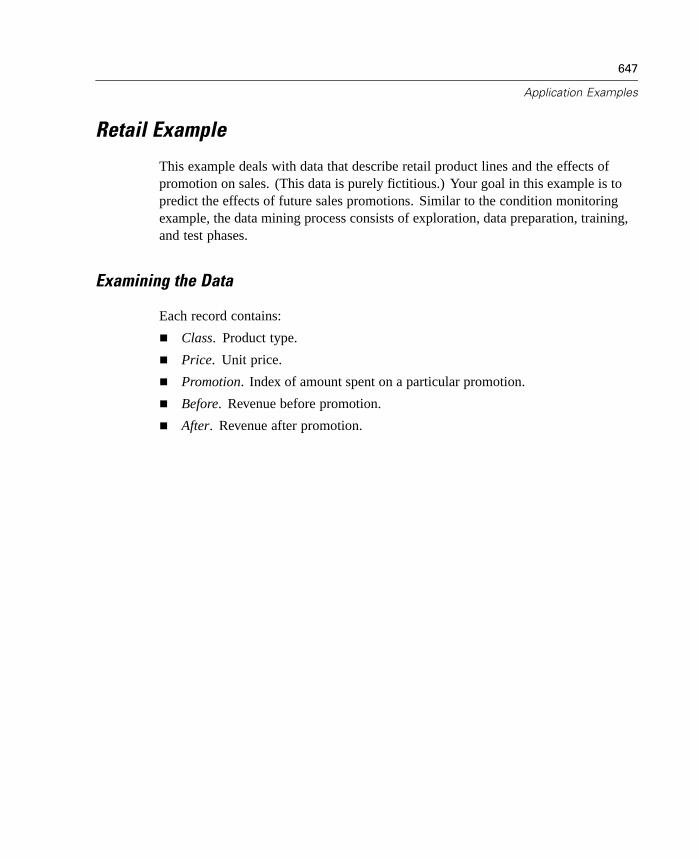
647
Application Examples
Retail Example
This example deals with data that describe retail product lines and the effects ofpromotion on sales. (This data is purely fictitious.) Your goal in this example is topredict the effects of future sales promotions. Similar to the condition monitoringexample, the data mining process consists of exploration, data preparation, training,and test phases.
Examining the Data
Each record contains:
Class. Product type.
Price. Unit price.
Promotion. Index of amount spent on a particular promotion.
Before. Revenue before promotion.
After. Revenue after promotion.
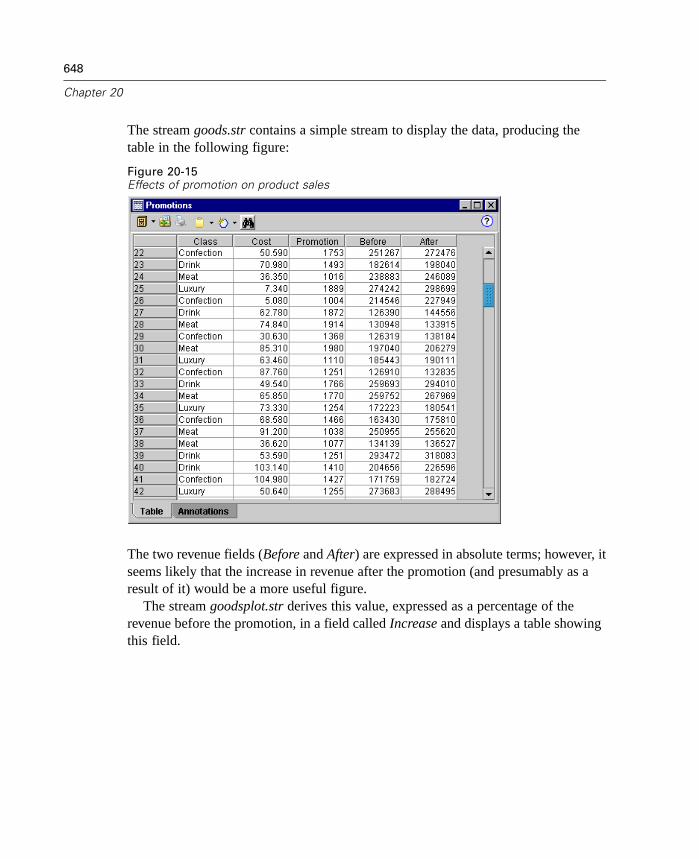
648
Chapter 20
The stream goods.str contains a simple stream to display the data, producing thetable in the following figure:
Figure 20-15Effects of promotion on product sales
The two revenue fields (Before and After) are expressed in absolute terms; however, itseems likely that the increase in revenue after the promotion (and presumably as aresult of it) would be a more useful figure.
The stream goodsplot.str derives this value, expressed as a percentage of therevenue before the promotion, in a field called Increase and displays a table showingthis field.
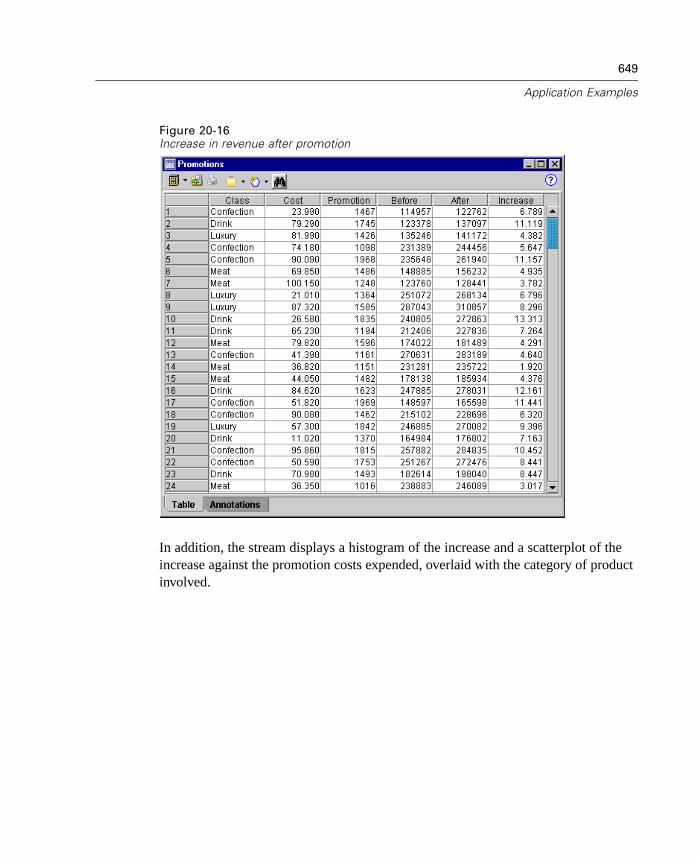
649
Application Examples
Figure 20-16Increase in revenue after promotion
In addition, the stream displays a histogram of the increase and a scatterplot of theincrease against the promotion costs expended, overlaid with the category of productinvolved.
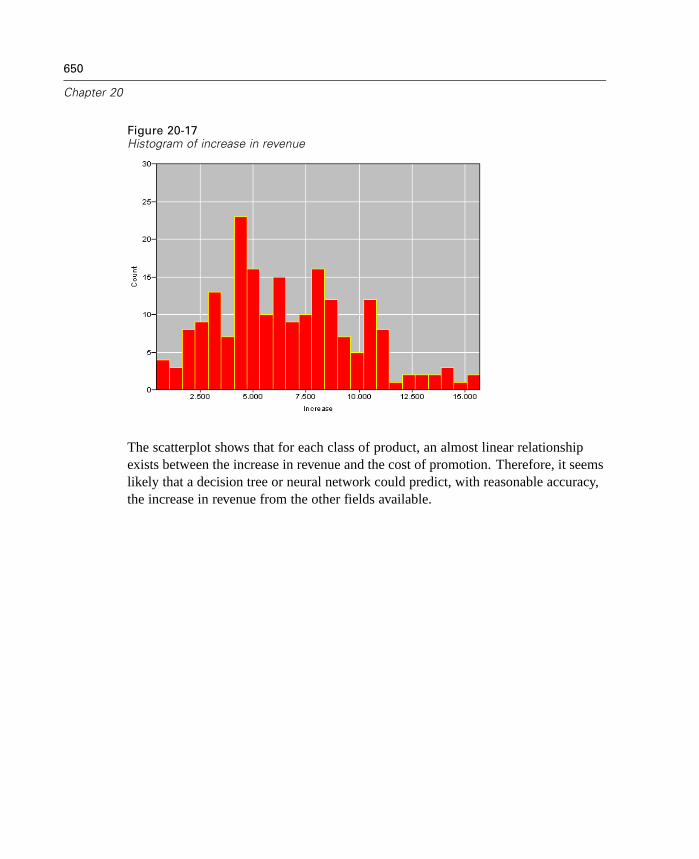
650
Chapter 20
Figure 20-17Histogram of increase in revenue
The scatterplot shows that for each class of product, an almost linear relationshipexists between the increase in revenue and the cost of promotion. Therefore, it seemslikely that a decision tree or neural network could predict, with reasonable accuracy,the increase in revenue from the other fields available.

651
Application Examples
Figure 20-18Revenue increase versus promotional expenditure
Learning and Testing
The stream goodslearn.str trains a neural network and a decision tree to make thisprediction of revenue increase.
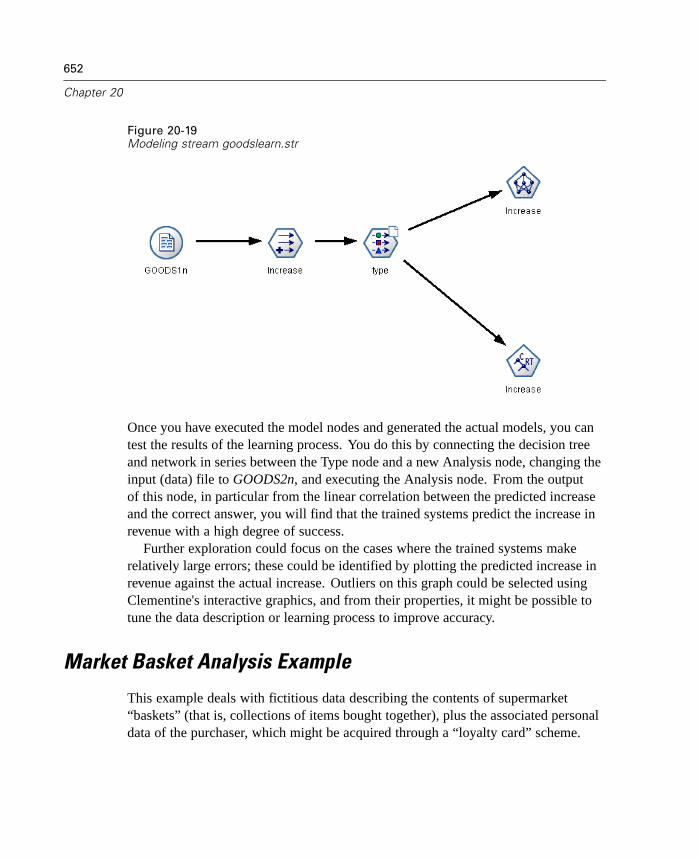
652
Chapter 20
Figure 20-19Modeling stream goodslearn.str
Once you have executed the model nodes and generated the actual models, you cantest the results of the learning process. You do this by connecting the decision treeand network in series between the Type node and a new Analysis node, changing theinput (data) file to GOODS2n, and executing the Analysis node. From the outputof this node, in particular from the linear correlation between the predicted increaseand the correct answer, you will find that the trained systems predict the increase inrevenue with a high degree of success.
Further exploration could focus on the cases where the trained systems makerelatively large errors; these could be identified by plotting the predicted increase inrevenue against the actual increase. Outliers on this graph could be selected usingClementine's interactive graphics, and from their properties, it might be possible totune the data description or learning process to improve accuracy.
Market Basket Analysis Example
This example deals with fictitious data describing the contents of supermarket“baskets” (that is, collections of items bought together), plus the associated personaldata of the purchaser, which might be acquired through a “loyalty card” scheme.
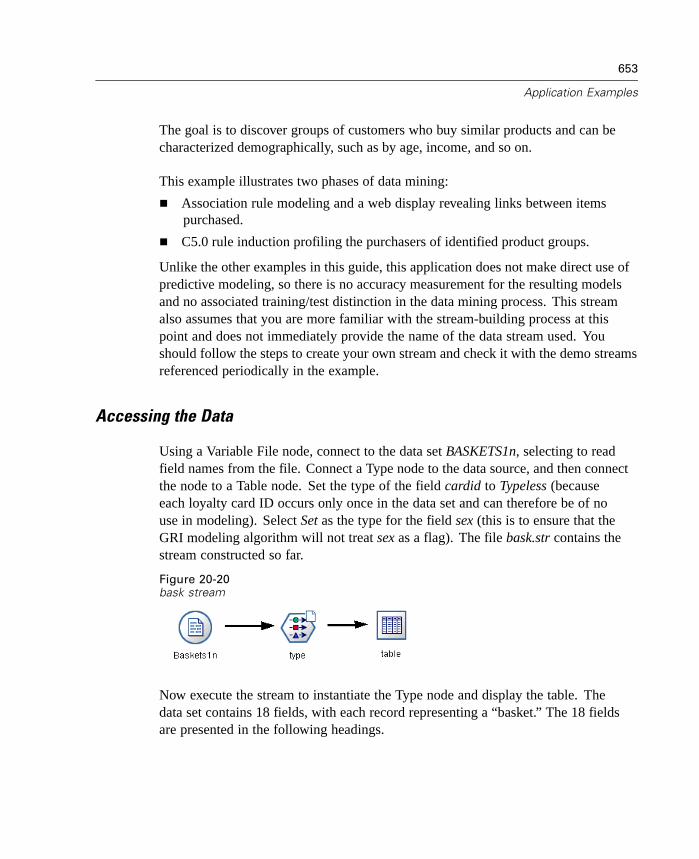
653
Application Examples
The goal is to discover groups of customers who buy similar products and can becharacterized demographically, such as by age, income, and so on.
This example illustrates two phases of data mining:
Association rule modeling and a web display revealing links between itemspurchased.
C5.0 rule induction profiling the purchasers of identified product groups.
Unlike the other examples in this guide, this application does not make direct use ofpredictive modeling, so there is no accuracy measurement for the resulting modelsand no associated training/test distinction in the data mining process. This streamalso assumes that you are more familiar with the stream-building process at thispoint and does not immediately provide the name of the data stream used. Youshould follow the steps to create your own stream and check it with the demo streamsreferenced periodically in the example.
Accessing the Data
Using a Variable File node, connect to the data set BASKETS1n, selecting to readfield names from the file. Connect a Type node to the data source, and then connectthe node to a Table node. Set the type of the field cardid to Typeless (becauseeach loyalty card ID occurs only once in the data set and can therefore be of nouse in modeling). Select Set as the type for the field sex (this is to ensure that theGRI modeling algorithm will not treat sex as a flag). The file bask.str contains thestream constructed so far.
Figure 20-20bask stream
Now execute the stream to instantiate the Type node and display the table. Thedata set contains 18 fields, with each record representing a “basket.” The 18 fieldsare presented in the following headings.

654
Chapter 20
Basket summary:
cardid. Loyalty card identifier for customer purchasing this basket.
value. Total purchase price of basket.
pmethod. Method of payment for basket.
Personal details of cardholder:
sex
homeown. Whether or not cardholder is a homeowner.
income
age
Basket contents—flags for presence of product categories:
fruitveg
freshmeat
dairy
cannedveg
cannedmeat
frozenmeal
beer
wine
softdrink
fish
confectionery
Discovering Affinities in Basket Contents
First, you need to acquire an overall picture of affinities (associations) in the basketcontents using Generalized Rule Induction (GRI) to produce association rules. Selectthe fields to be used in this modeling process by editing the Type node and setting thedirections of all of the product categories to Both and setting all other directions toNone. (Both means that the field can be either an input or an output of the resultantmodel.)

655
Application Examples
Note: You can set options for multiple fields using Shift-click to select the fieldsbefore specifying an option from the columns.
Figure 20-21Selecting fields for modeling
Once you have specified fields for modeling, attach a GRI node to the Type node,edit it, select the option Only true values for flags, and execute the GRI node. Theresult, an unrefined model on the Models tab at the upper right of the managerswindow, contains association rules that you can view using the context menu andselecting Browse.

656
Chapter 20
Figure 20-22Association rules
These rules show a variety of associations between frozen meals, canned vegetables,and beer; wine and confectionery are also associated. The presence of two-wayassociation rules, such as:
frozenmeal <= beerbeer <= frozenmeal
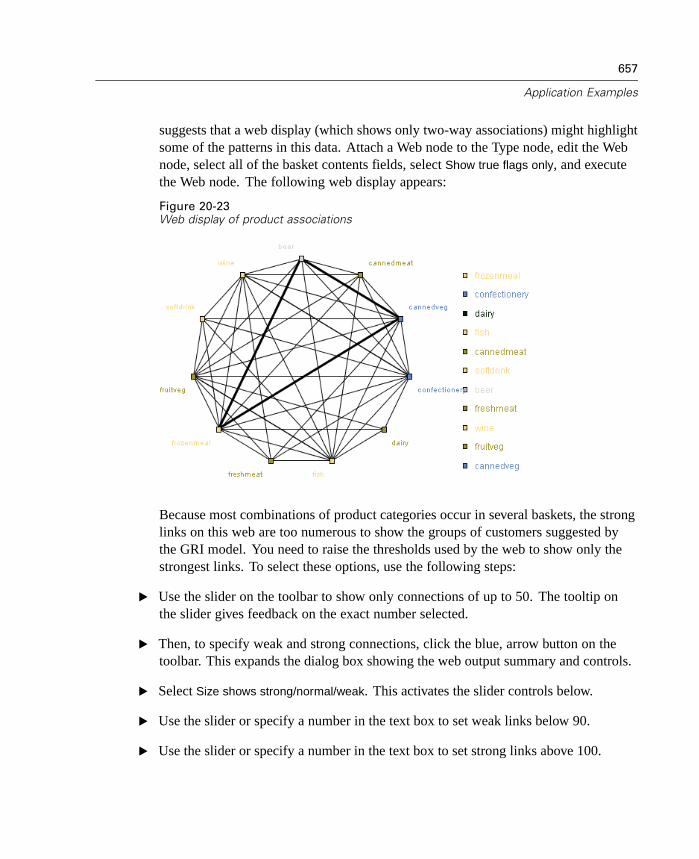
657
Application Examples
suggests that a web display (which shows only two-way associations) might highlightsome of the patterns in this data. Attach a Web node to the Type node, edit the Webnode, select all of the basket contents fields, select Show true flags only, and executethe Web node. The following web display appears:
Figure 20-23Web display of product associations
Because most combinations of product categories occur in several baskets, the stronglinks on this web are too numerous to show the groups of customers suggested bythe GRI model. You need to raise the thresholds used by the web to show only thestrongest links. To select these options, use the following steps:
E Use the slider on the toolbar to show only connections of up to 50. The tooltip onthe slider gives feedback on the exact number selected.
E Then, to specify weak and strong connections, click the blue, arrow button on thetoolbar. This expands the dialog box showing the web output summary and controls.
E Select Size shows strong/normal/weak. This activates the slider controls below.
E Use the slider or specify a number in the text box to set weak links below 90.
E Use the slider or specify a number in the text box to set strong links above 100.

658
Chapter 20
Applying these changes results in the following web display:
Figure 20-24Restricted web display
In the display, three groups of customers stand out:
Those who buy fish and fruits and vegetables, who might be called “healthyeaters”
Those who buy wine and confectionery
Those who buy beer, frozen meals, and canned vegetables (“beer, beans, andpizza”)
Note that GRI identified only the last two of these groups; the healthy eaters did notform a strong enough pattern for GRI to find it.
The file basklinks.str contains the stream constructed so far.
Profiling the Customer Groups
You have now identified three groups of customers based on the types of productsthey buy, but you would also like to know who these customers are—that is, theirdemographic profile. This can be achieved by “tagging” each customer with a flag for
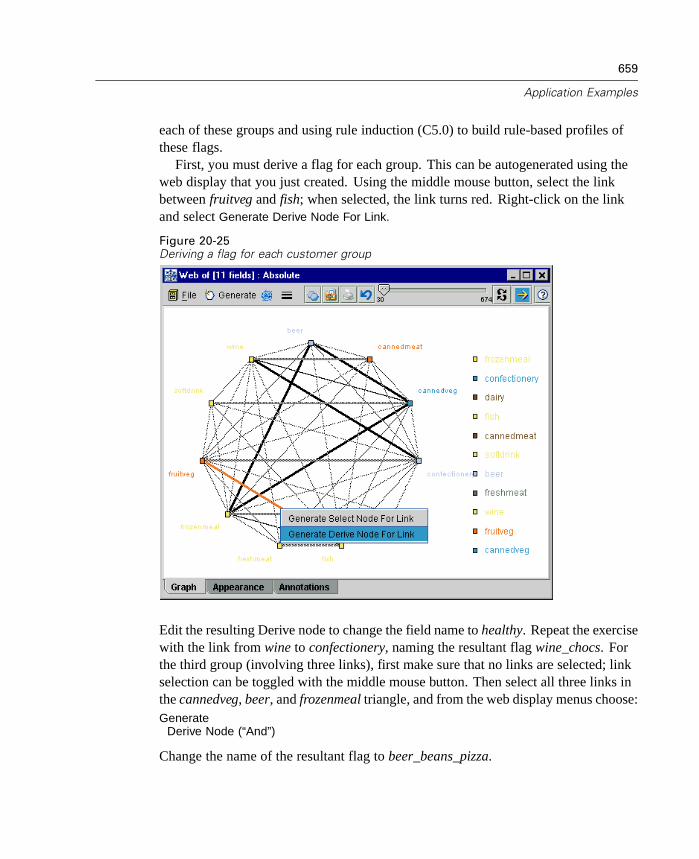
659
Application Examples
each of these groups and using rule induction (C5.0) to build rule-based profiles ofthese flags.
First, you must derive a flag for each group. This can be autogenerated using theweb display that you just created. Using the middle mouse button, select the linkbetween fruitveg and fish; when selected, the link turns red. Right-click on the linkand select Generate Derive Node For Link.
Figure 20-25Deriving a flag for each customer group
Edit the resulting Derive node to change the field name to healthy. Repeat the exercisewith the link from wine to confectionery, naming the resultant flag wine_chocs. Forthe third group (involving three links), first make sure that no links are selected; linkselection can be toggled with the middle mouse button. Then select all three links inthe cannedveg, beer, and frozenmeal triangle, and from the web display menus choose:Generate
Derive Node (“And”)
Change the name of the resultant flag to beer_beans_pizza.
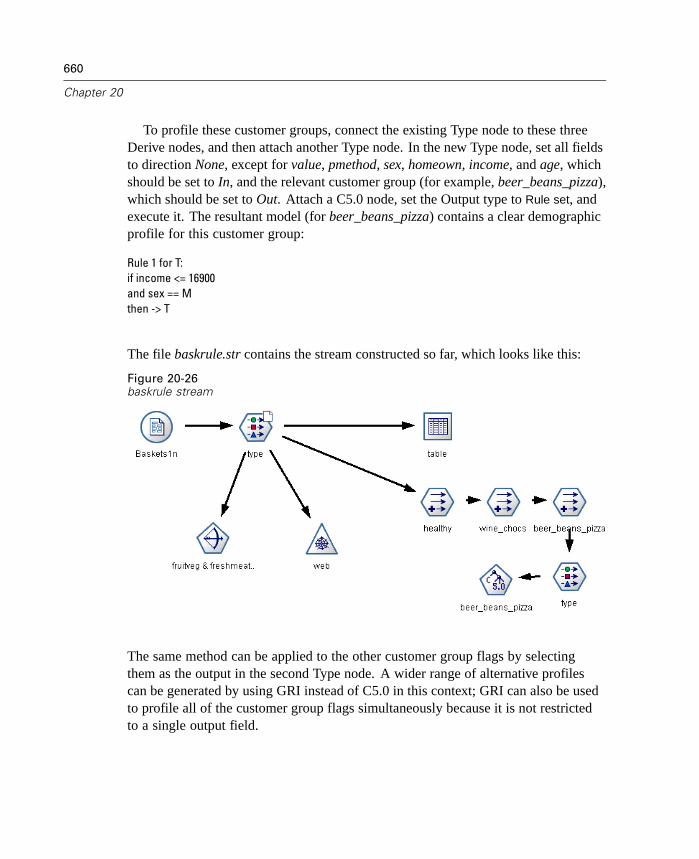
660
Chapter 20
To profile these customer groups, connect the existing Type node to these threeDerive nodes, and then attach another Type node. In the new Type node, set all fieldsto direction None, except for value, pmethod, sex, homeown, income, and age, whichshould be set to In, and the relevant customer group (for example, beer_beans_pizza),which should be set to Out. Attach a C5.0 node, set the Output type to Rule set, andexecute it. The resultant model (for beer_beans_pizza) contains a clear demographicprofile for this customer group:
Rule 1 for T:if income <= 16900and sex == Mthen -> T
The file baskrule.str contains the stream constructed so far, which looks like this:
Figure 20-26baskrule stream
The same method can be applied to the other customer group flags by selectingthem as the output in the second Type node. A wider range of alternative profilescan be generated by using GRI instead of C5.0 in this context; GRI can also be usedto profile all of the customer group flags simultaneously because it is not restrictedto a single output field.

661
Application Examples
Summary
This example reveals how Clementine can be used to discover affinities, or links, in adatabase, both by modeling (using GRI) and by visualization (using a web display).These links correspond to groupings of cases in the data, and these groups can beinvestigated in detail and profiled by modeling (using C5.0 rulesets).
In the retail domain, such customer groupings might, for example, be used to targetspecial offers to improve the response rates to direct mailings or to customize therange of products stocked by a branch to match the demands of its demographic base.


Appendix
ACLEM Language Reference
CLEM Reference Overview
This section describes the Clementine Language for Expression Manipulation(CLEM), which is a powerful tool used to analyze and manipulate the data used inClementine streams. You can use CLEM within nodes to perform the following tasks:
Compare and evaluate conditions on record fields.
Derive values for new fields.
Derive new values for existing fields.
Reason about the sequence of records.
Insert data from records into reports.
CLEM expressions consist of values, field names, operators, and functions. Usingcorrect syntax, you can create a wide variety of powerful data operations. For moreinformation, see “CLEM Examples” in Chapter 8 on page 208.
CLEM Datatypes
CLEM datatypes may be made up of any of the following:
Integers
Reals
Characters
Strings
Lists
Fields
Date/Time
663

664
Appendix A
Rules for Quoting
Although Clementine is flexible when determining the fields, values, parameters,and strings used in a CLEM expression, the following general rules provide a listof “good practices” to use when creating expressions.
Strings—Always use double quotes when writing strings, such as "Type 2". Singlequotes may be used instead but at the risk of confusion with quoted fields.
Fields—Use single quotes only where necessary to enclose spaces or other specialcharacters, such as 'Order Number'. Fields that are quoted but undefined inthe data set will be misread as strings.
Parameters—Always use single quotes when using parameters, such as'$P-threshold'.
Characters must use single backquotes (‘), such as stripchar(‘d‘, "drugA").
For more information, see “Values and Data Types” in Chapter 8 on page 206.Additionally, these rules are covered in more detail in the following topics.
Integers
Integers are represented as a sequence of decimal digits. Optionally, you can place aminus sign (–) before the integer to denote a negative number—for example, 1234,999, –77.
The CLEM language handles integers of arbitrary precision. The maximum integersize depends on your platform. If the values are too large to be displayed in an integerfield, changing the field type to Real usually restores the value.
Reals
Real refers to a floating-point number. Reals are represented by one or more digits,followed by a decimal point, followed by one or more digits. CLEM reals are held indouble precision.
Optionally, you can place a minus sign (–) before the real to denote a negativenumber––for example, 1.234, 0.999, –77.001. Use the form <number> e <exponent>to express a real number in exponential notation—for example, 1234.0e5, 1.7e–2.When the Clementine application reads number strings from files and converts them
665
CLEM Language Reference
automatically to numbers, numbers with no leading digit before the decimal point orwith no digit after the point are accepted––for example, 999. or .11. However, theseforms are illegal in CLEM expressions.
Characters
Characters (usually shown as CHAR) are typically used within a CLEM expressionto perform tests on strings. For example, you can use the function isuppercode todetermine whether the first character of a string is uppercase. The following CLEMexpression uses a character to indicate that the test should be performed on the firstcharacter of the string:
isuppercode(subscrs(1, "MyString"))
To express the code (in contrast to the location) of a particular character in a CLEMexpression, use single backquotes of the form ‘<character>‘––for example, ‘A‘,‘Z‘.
Note: There is no CHAR storage type for a field, so if a field is derived or filled withan expression that results in a CHAR, then that result will be converted to a string.
Strings
Generally, you should enclose strings in double quotation marks. Examples of stringsare "c35product2", "referrerID". To indicate special characters in a string, use abackslash––for example, "\$65443". You can use single quotes around a string, but theresult is indistinguishable from a quoted field ('referrerID').
Lists
A list is an ordered sequence of elements, which may be of mixed type. Lists areenclosed in square brackets ([]). Examples of lists are [1 2 4 16], ["abc" "def"]. Lists arenot used as the value of Clementine fields. They are used to provide arguments tofunctions, such as member and oneof.
666
Appendix A
Fields
Names in CLEM expressions that are not names of functions are assumed to be fieldnames. You can write these simply as Power, val27, state_flag, etc., but if the namebegins with a digit or includes non-alphabetic characters, such as spaces (with theexception of the underscore '_'), place the name within single quotation marks––forexample, 'Power Increase', '2nd answer', '#101', '$P-NextField'.
Note: Fields that are quoted but undefined in the data set will be misread as strings.
Dates
The CLEM language supports the following date formats:
Format Examples
DDMMYY 150163MMDDYY 011563YYMMDD 630115YYYYMMDD 19630115DD/MM/YY 15/01/63DD/MM/YYYY 15/01/1963MM/DD/YY 01/15/63MM/DD/YYYY 01/15/1963DD-MM-YY 15-01-63DD-MM-YYYY 15-01-1963MM-DD-YY 01-15-63MM-DD-YYYY 01-15-1963DD.MM.YY 15.01.63DD.MM.YYYY 15.01.1963MM.DD.YY 01.15.63MM.DD.YYYY 01.15.1963DD-MON-YY 15-JAN-63, 15-jan-63, 01-Jan-63DD/MON/YY 15/JAN/63, 15/jan/63, 01/Jan/63DD.MON.YY 15.JAN.63, 15.jan.63, 01.Jan.63

667
CLEM Language Reference
Format Examples
DD-MON-YYYY 15-JAN-1963, 15-jan-1963, 01-Jan-1963DD/MON/YYYY 15/JAN/1963, 15/jan/1963, 01/Jan/1963DD.MON.YYYY 15.JAN.1963, 15.jan.1963, 01.Jan.1963
Date calculations are based on a “baseline” date, which is specified in the streamproperties dialog box. The default baseline date is January 1, 1900.
Time
The CLEM language supports the following time formats:
Format Examples
HHMMSS 120112, 010101, 221212HHMM 1223, 0745, 2207MMSS 5558, 0100HH:MM:SS 12:01:12, 01:01:01, 22:12:12HH:MM 12:23, 07:45, 22:07MM:SS 55:58, 01:00(H)H:(M)M:(S)S 12:1:12, 1:1:1, 22:12:12(H)H:(M)M 12:23, 7:45, 22:7(M)M:(S)S 55:58, 1:0HH.MM.SS 12.01.12, 01.01.01, 22.12.12HH.MM 12.23, 07.45, 22.07MM.SS 55.58, 01.00(H)H.(M)M.(S)S 12.1.12, 1.1.1, 22.12.12(H)H.(M)M 12.23, 7.45, 22.7(M)M.(S)S 55.58, 1.0
668
Appendix A
Operator Precedence
Precedences determine the parsing of complex expressions, especially unbracketedexpressions with more than one infix operator. For example,
3 + 4 * 5
parses as 3 + (4 * 5) rather than (3 + 4) * 5 because the relative precedences dictate that* is to be parsed before +. Every operator in the CLEM language has a precedencevalue associated with it; the lower this value, the more important it is on the parsinglist, meaning that it will be processed sooner than other operators with lowerprecedence values.
Precedence values are as follows:
Operation Precedence
or 10
and 9
= 7
== 7
/= 7
/== 7
> 6
>= 6
< 6
<= 6
&&=_0 6
&&/=_0 6
+ 5
>< 5
- 5
* 4
&& 4
&&~~ 4
|| 4
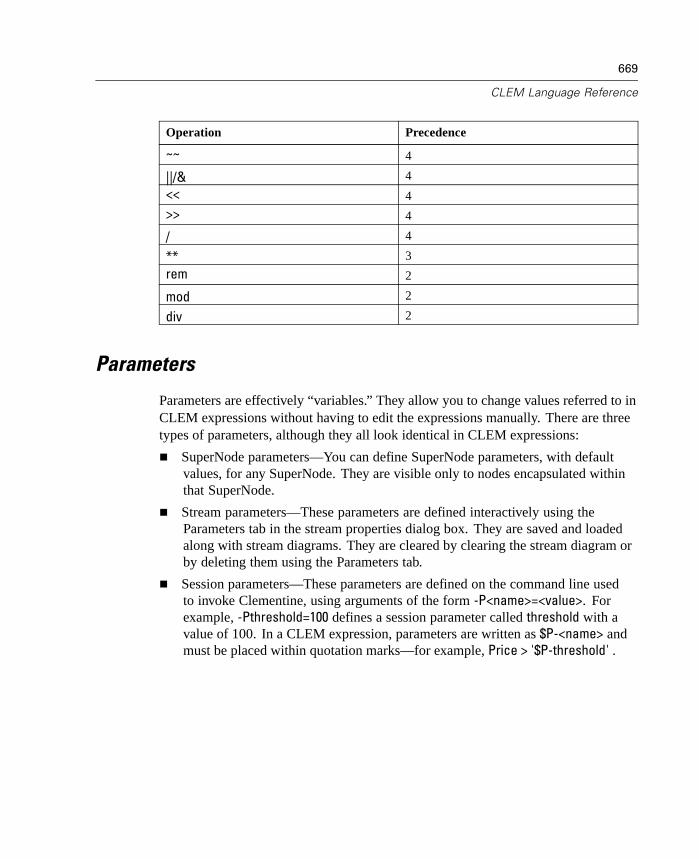
669
CLEM Language Reference
Operation Precedence
~~ 4
||/& 4
<< 4
>> 4
/ 4
** 3
rem 2
mod 2
div 2
Parameters
Parameters are effectively “variables.” They allow you to change values referred to inCLEM expressions without having to edit the expressions manually. There are threetypes of parameters, although they all look identical in CLEM expressions:
SuperNode parameters—You can define SuperNode parameters, with defaultvalues, for any SuperNode. They are visible only to nodes encapsulated withinthat SuperNode.
Stream parameters—These parameters are defined interactively using theParameters tab in the stream properties dialog box. They are saved and loadedalong with stream diagrams. They are cleared by clearing the stream diagram orby deleting them using the Parameters tab.
Session parameters—These parameters are defined on the command line usedto invoke Clementine, using arguments of the form -P<name>=<value>. Forexample, -Pthreshold=100 defines a session parameter called threshold with avalue of 100. In a CLEM expression, parameters are written as $P-<name> andmust be placed within quotation marks—for example, Price > '$P-threshold' .

670
Appendix A
Using Parameters in CLEM Expressions
Parameters set for SuperNodes, streams, and sessions can be accessed in CLEM.Parameters are represented in expressions by $P-pname, where pname is the name ofthe parameter. When used in CLEM expressions, parameters must be placed withinsingle quotes––for example, '$P-scale'.
Available parameters are easily viewed using the Expression Builder. To viewcurrent parameters:
E In any dialog box accepting CLEM expressions, click the Expression Builder button.
E From the Fields drop-down list, select Parameters.
You can select parameters from the list for insertion into the CLEM expression.
Functions Reference
The following CLEM functions are available when working with data in Clementine.You can enter these functions as code in a variety of dialog boxes, such as Deriveand Set To Flag nodes, or you can use the Expression Builder to create valid CLEMexpressions without memorizing function lists or field names.
Function Type Description
Information Used to gain insight into field values. For example, the functionis_string returns true for all records whose type is a string.
ConversionUsed to construct new fields or convert storage type. For example,the function to_timestamp converts the selected field to atimestamp.
ComparisonUsed to compare field values to each other or to a specified string.For example, <= is used to compare whether the values of twofields are lesser or equal.
Logical Used to perform logical operations, such as if, then, elseoperations.
Numeric Used to perform numeric calculations, such as the natural log offield values.
Trigonometric Used to perform trigonometric calculations, such as the arccosineof a specified angle.
Bitwise Used to manipulate integers as bit patterns.
Random Used to randomly select items or generate numbers.
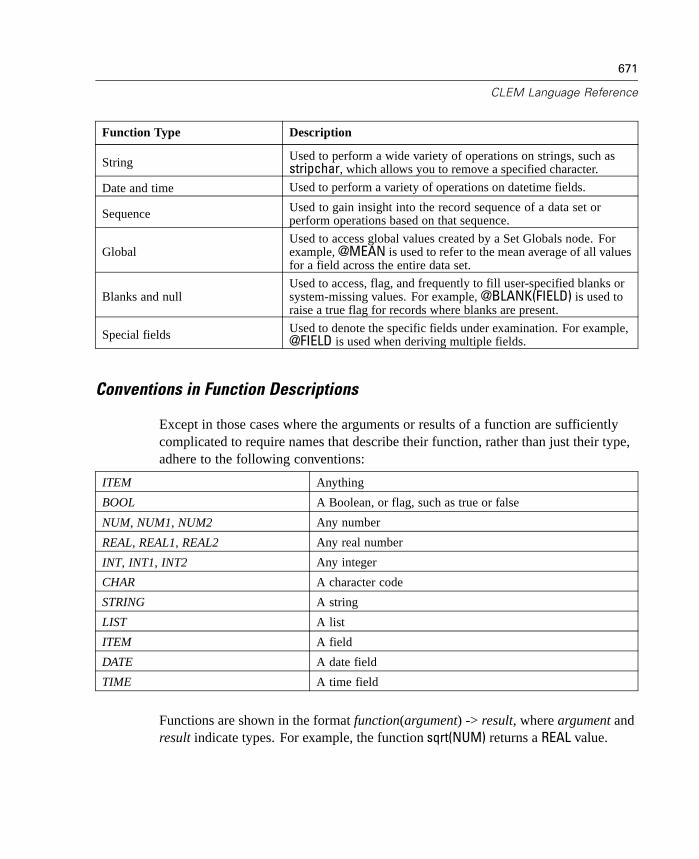
671
CLEM Language Reference
Function Type Description
String Used to perform a wide variety of operations on strings, such asstripchar, which allows you to remove a specified character.
Date and time Used to perform a variety of operations on datetime fields.
Sequence Used to gain insight into the record sequence of a data set orperform operations based on that sequence.
GlobalUsed to access global values created by a Set Globals node. Forexample, @MEAN is used to refer to the mean average of all valuesfor a field across the entire data set.
Blanks and nullUsed to access, flag, and frequently to fill user-specified blanks orsystem-missing values. For example, @BLANK(FIELD) is used toraise a true flag for records where blanks are present.
Special fields Used to denote the specific fields under examination. For example,@FIELD is used when deriving multiple fields.
Conventions in Function Descriptions
Except in those cases where the arguments or results of a function are sufficientlycomplicated to require names that describe their function, rather than just their type,adhere to the following conventions:
ITEM Anything
BOOL A Boolean, or flag, such as true or false
NUM, NUM1, NUM2 Any number
REAL, REAL1, REAL2 Any real number
INT, INT1, INT2 Any integer
CHAR A character code
STRING A string
LIST A list
ITEM A field
DATE A date field
TIME A time field
Functions are shown in the format function(argument) -> result, where argument andresult indicate types. For example, the function sqrt(NUM) returns a REAL value.
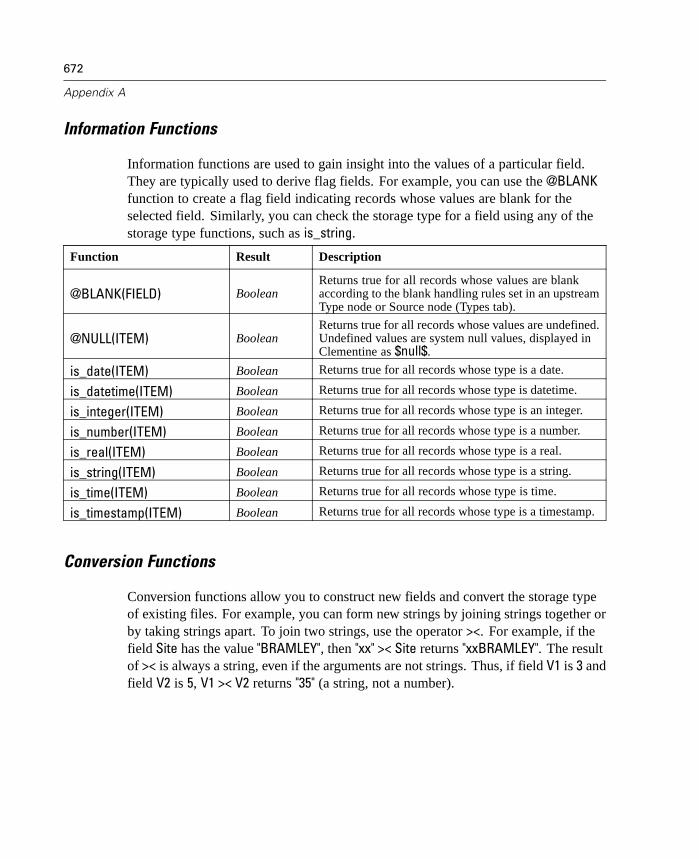
672
Appendix A
Information Functions
Information functions are used to gain insight into the values of a particular field.They are typically used to derive flag fields. For example, you can use the @BLANKfunction to create a flag field indicating records whose values are blank for theselected field. Similarly, you can check the storage type for a field using any of thestorage type functions, such as is_string.
Function Result Description
@BLANK(FIELD) BooleanReturns true for all records whose values are blankaccording to the blank handling rules set in an upstreamType node or Source node (Types tab).
@NULL(ITEM) BooleanReturns true for all records whose values are undefined.Undefined values are system null values, displayed inClementine as $null$.
is_date(ITEM) Boolean Returns true for all records whose type is a date.
is_datetime(ITEM) Boolean Returns true for all records whose type is datetime.
is_integer(ITEM) Boolean Returns true for all records whose type is an integer.
is_number(ITEM) Boolean Returns true for all records whose type is a number.
is_real(ITEM) Boolean Returns true for all records whose type is a real.
is_string(ITEM) Boolean Returns true for all records whose type is a string.
is_time(ITEM) Boolean Returns true for all records whose type is time.
is_timestamp(ITEM) Boolean Returns true for all records whose type is a timestamp.
Conversion Functions
Conversion functions allow you to construct new fields and convert the storage typeof existing files. For example, you can form new strings by joining strings together orby taking strings apart. To join two strings, use the operator ><. For example, if thefield Site has the value "BRAMLEY", then "xx" >< Site returns "xxBRAMLEY". The resultof >< is always a string, even if the arguments are not strings. Thus, if field V1 is 3 andfield V2 is 5, V1 >< V2 returns "35" (a string, not a number).
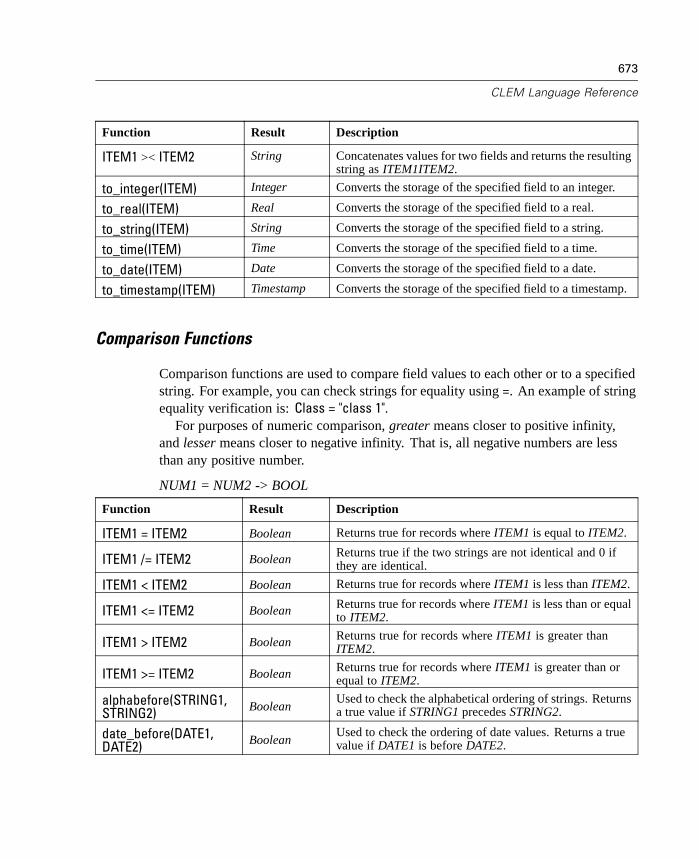
673
CLEM Language Reference
Function Result Description
ITEM1 >< ITEM2 String Concatenates values for two fields and returns the resultingstring as ITEM1ITEM2.
to_integer(ITEM) Integer Converts the storage of the specified field to an integer.
to_real(ITEM) Real Converts the storage of the specified field to a real.
to_string(ITEM) String Converts the storage of the specified field to a string.
to_time(ITEM) Time Converts the storage of the specified field to a time.
to_date(ITEM) Date Converts the storage of the specified field to a date.
to_timestamp(ITEM) Timestamp Converts the storage of the specified field to a timestamp.
Comparison Functions
Comparison functions are used to compare field values to each other or to a specifiedstring. For example, you can check strings for equality using =. An example of stringequality verification is: Class = "class 1".
For purposes of numeric comparison, greater means closer to positive infinity,and lesser means closer to negative infinity. That is, all negative numbers are lessthan any positive number.
NUM1 = NUM2 -> BOOL
Function Result Description
ITEM1 = ITEM2 Boolean Returns true for records where ITEM1 is equal to ITEM2.
ITEM1 /= ITEM2 Boolean Returns true if the two strings are not identical and 0 ifthey are identical.
ITEM1 < ITEM2 Boolean Returns true for records where ITEM1 is less than ITEM2.
ITEM1 <= ITEM2 Boolean Returns true for records where ITEM1 is less than or equalto ITEM2.
ITEM1 > ITEM2 Boolean Returns true for records where ITEM1 is greater thanITEM2.
ITEM1 >= ITEM2 Boolean Returns true for records where ITEM1 is greater than orequal to ITEM2.
alphabefore(STRING1,STRING2) Boolean
Used to check the alphabetical ordering of strings. Returnsa true value if STRING1 precedes STRING2.
date_before(DATE1,DATE2) Boolean
Used to check the ordering of date values. Returns a truevalue if DATE1 is before DATE2.
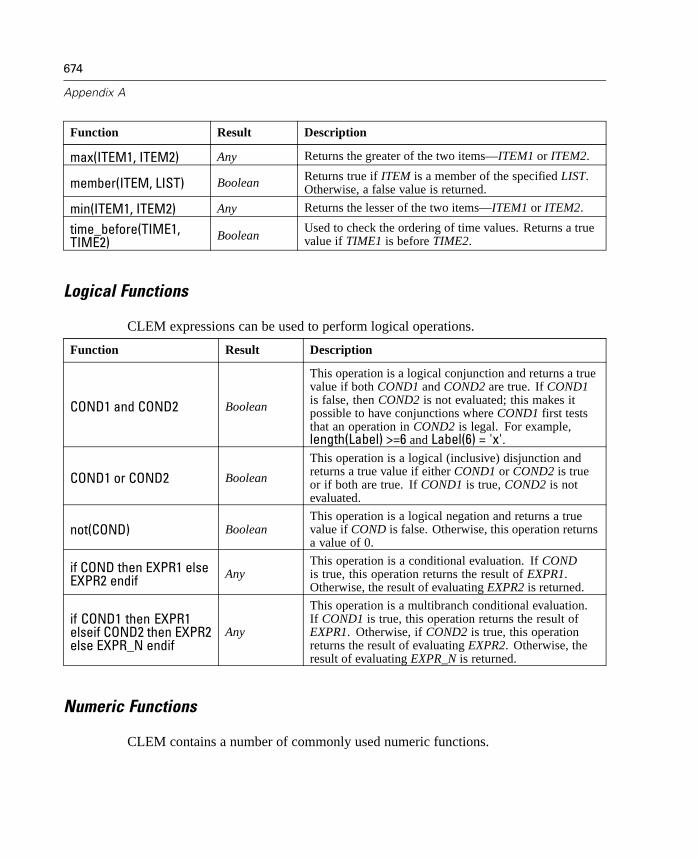
674
Appendix A
Function Result Description
max(ITEM1, ITEM2) Any Returns the greater of the two items—ITEM1 or ITEM2.
member(ITEM, LIST) Boolean Returns true if ITEM is a member of the specified LIST.Otherwise, a false value is returned.
min(ITEM1, ITEM2) Any Returns the lesser of the two items—ITEM1 or ITEM2.
time_before(TIME1,TIME2) Boolean
Used to check the ordering of time values. Returns a truevalue if TIME1 is before TIME2.
Logical Functions
CLEM expressions can be used to perform logical operations.
Function Result Description
COND1 and COND2 Boolean
This operation is a logical conjunction and returns a truevalue if both COND1 and COND2 are true. If COND1is false, then COND2 is not evaluated; this makes itpossible to have conjunctions where COND1 first teststhat an operation in COND2 is legal. For example,length(Label) >=6 and Label(6) = 'x'.
COND1 or COND2 Boolean
This operation is a logical (inclusive) disjunction andreturns a true value if either COND1 or COND2 is trueor if both are true. If COND1 is true, COND2 is notevaluated.
not(COND) BooleanThis operation is a logical negation and returns a truevalue if COND is false. Otherwise, this operation returnsa value of 0.
if COND then EXPR1 elseEXPR2 endif Any
This operation is a conditional evaluation. If CONDis true, this operation returns the result of EXPR1.Otherwise, the result of evaluating EXPR2 is returned.
if COND1 then EXPR1elseif COND2 then EXPR2else EXPR_N endif
Any
This operation is a multibranch conditional evaluation.If COND1 is true, this operation returns the result ofEXPR1. Otherwise, if COND2 is true, this operationreturns the result of evaluating EXPR2. Otherwise, theresult of evaluating EXPR_N is returned.
Numeric Functions
CLEM contains a number of commonly used numeric functions.
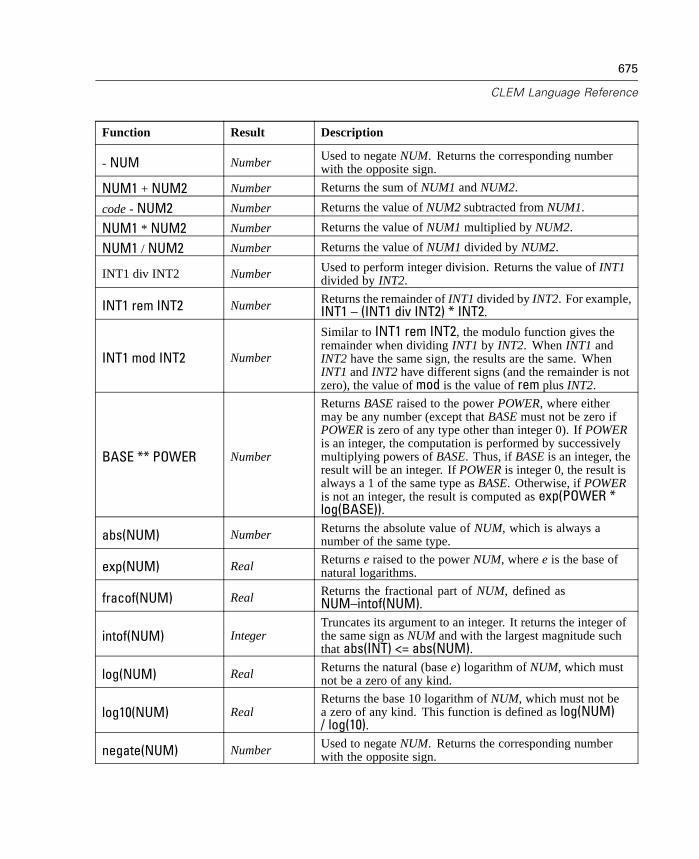
675
CLEM Language Reference
Function Result Description
- NUM Number Used to negate NUM. Returns the corresponding numberwith the opposite sign.
NUM1 + NUM2 Number Returns the sum of NUM1 and NUM2.
code - NUM2 Number Returns the value of NUM2 subtracted from NUM1.
NUM1 * NUM2 Number Returns the value of NUM1 multiplied by NUM2.
NUM1 / NUM2 Number Returns the value of NUM1 divided by NUM2.
INT1 div INT2 Number Used to perform integer division. Returns the value of INT1divided by INT2.
INT1 rem INT2 Number Returns the remainder of INT1 divided by INT2. For example,INT1 – (INT1 div INT2) * INT2.
INT1 mod INT2 Number
Similar to INT1 rem INT2, the modulo function gives theremainder when dividing INT1 by INT2. When INT1 andINT2 have the same sign, the results are the same. WhenINT1 and INT2 have different signs (and the remainder is notzero), the value of mod is the value of rem plus INT2.
BASE ** POWER Number
Returns BASE raised to the power POWER, where eithermay be any number (except that BASE must not be zero ifPOWER is zero of any type other than integer 0). If POWERis an integer, the computation is performed by successivelymultiplying powers of BASE. Thus, if BASE is an integer, theresult will be an integer. If POWER is integer 0, the result isalways a 1 of the same type as BASE. Otherwise, if POWERis not an integer, the result is computed as exp(POWER *log(BASE)).
abs(NUM) Number Returns the absolute value of NUM, which is always anumber of the same type.
exp(NUM) Real Returns e raised to the power NUM, where e is the base ofnatural logarithms.
fracof(NUM) Real Returns the fractional part of NUM, defined asNUM–intof(NUM).
intof(NUM) IntegerTruncates its argument to an integer. It returns the integer ofthe same sign as NUM and with the largest magnitude suchthat abs(INT) <= abs(NUM).
log(NUM) Real Returns the natural (base e) logarithm of NUM, which mustnot be a zero of any kind.
log10(NUM) RealReturns the base 10 logarithm of NUM, which must not bea zero of any kind. This function is defined as log(NUM)/ log(10).
negate(NUM) Number Used to negate NUM. Returns the corresponding numberwith the opposite sign.
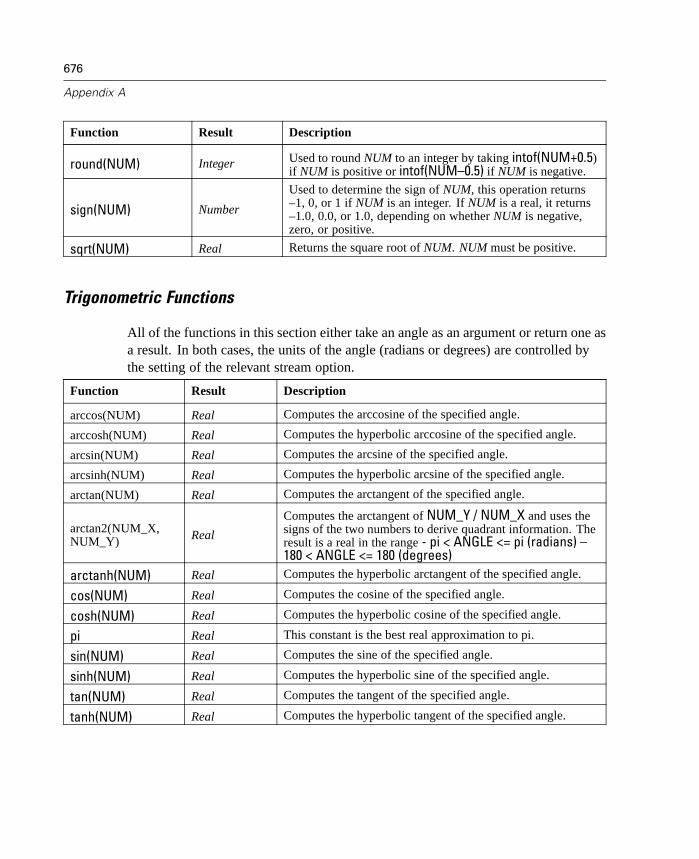
676
Appendix A
Function Result Description
round(NUM) Integer Used to round NUM to an integer by taking intof(NUM+0.5)if NUM is positive or intof(NUM–0.5) if NUM is negative.
sign(NUM) Number
Used to determine the sign of NUM, this operation returns–1, 0, or 1 if NUM is an integer. If NUM is a real, it returns–1.0, 0.0, or 1.0, depending on whether NUM is negative,zero, or positive.
sqrt(NUM) Real Returns the square root of NUM. NUM must be positive.
Trigonometric Functions
All of the functions in this section either take an angle as an argument or return one asa result. In both cases, the units of the angle (radians or degrees) are controlled bythe setting of the relevant stream option.
Function Result Description
arccos(NUM) Real Computes the arccosine of the specified angle.
arccosh(NUM) Real Computes the hyperbolic arccosine of the specified angle.
arcsin(NUM) Real Computes the arcsine of the specified angle.
arcsinh(NUM) Real Computes the hyperbolic arcsine of the specified angle.
arctan(NUM) Real Computes the arctangent of the specified angle.
arctan2(NUM_X,NUM_Y) Real
Computes the arctangent of NUM_Y / NUM_X and uses thesigns of the two numbers to derive quadrant information. Theresult is a real in the range - pi < ANGLE <= pi (radians) –180 < ANGLE <= 180 (degrees)
arctanh(NUM) Real Computes the hyperbolic arctangent of the specified angle.
cos(NUM) Real Computes the cosine of the specified angle.
cosh(NUM) Real Computes the hyperbolic cosine of the specified angle.
pi Real This constant is the best real approximation to pi.
sin(NUM) Real Computes the sine of the specified angle.
sinh(NUM) Real Computes the hyperbolic sine of the specified angle.
tan(NUM) Real Computes the tangent of the specified angle.
tanh(NUM) Real Computes the hyperbolic tangent of the specified angle.
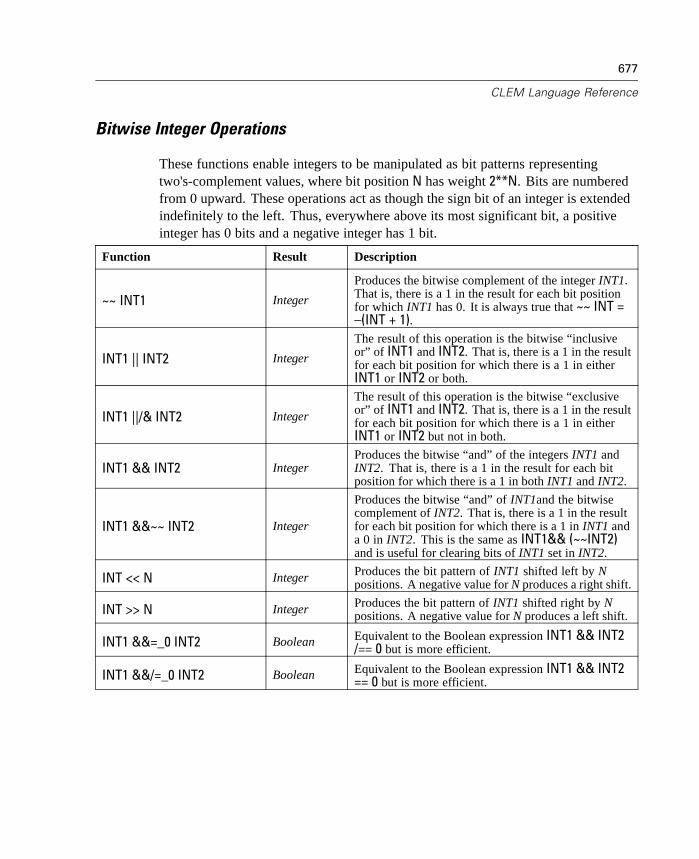
677
CLEM Language Reference
Bitwise Integer Operations
These functions enable integers to be manipulated as bit patterns representingtwo's-complement values, where bit position N has weight 2**N. Bits are numberedfrom 0 upward. These operations act as though the sign bit of an integer is extendedindefinitely to the left. Thus, everywhere above its most significant bit, a positiveinteger has 0 bits and a negative integer has 1 bit.
Function Result Description
~~ INT1 Integer
Produces the bitwise complement of the integer INT1.That is, there is a 1 in the result for each bit positionfor which INT1 has 0. It is always true that ~~ INT =–(INT + 1).
INT1 || INT2 Integer
The result of this operation is the bitwise “inclusiveor” of INT1 and INT2. That is, there is a 1 in the resultfor each bit position for which there is a 1 in eitherINT1 or INT2 or both.
INT1 ||/& INT2 Integer
The result of this operation is the bitwise “exclusiveor” of INT1 and INT2. That is, there is a 1 in the resultfor each bit position for which there is a 1 in eitherINT1 or INT2 but not in both.
INT1 && INT2 IntegerProduces the bitwise “and” of the integers INT1 andINT2. That is, there is a 1 in the result for each bitposition for which there is a 1 in both INT1 and INT2.
INT1 &&~~ INT2 Integer
Produces the bitwise “and” of INT1and the bitwisecomplement of INT2. That is, there is a 1 in the resultfor each bit position for which there is a 1 in INT1 anda 0 in INT2. This is the same as INT1&& (~~INT2)and is useful for clearing bits of INT1 set in INT2.
INT << N Integer Produces the bit pattern of INT1 shifted left by Npositions. A negative value for N produces a right shift.
INT >> N Integer Produces the bit pattern of INT1 shifted right by Npositions. A negative value for N produces a left shift.
INT1 &&=_0 INT2 Boolean Equivalent to the Boolean expression INT1 && INT2/== 0 but is more efficient.
INT1 &&/=_0 INT2 Boolean Equivalent to the Boolean expression INT1 && INT2== 0 but is more efficient.

678
Appendix A
Function Result Description
integer_bitcount(INT) Integer
Counts the number of 1 or 0 bits in thetwo's-complement representation of INT. If INT isnon-negative, N is the number of 1 bits. If INT isnegative, it is the number of 0 bits. Owing to the signextension, there are an infinite number of 0 bits ina non-negative integer or 1 bits in a negative integer.It is always the case that integer_bitcount(INT) =integer_bitcount(-(INT+1)).
integer_leastbit(INT) IntegerReturns the bit position N of the least-significant bitset in the integer INT. N is the highest power of 2 bywhich INT divides exactly.
integer_length(INT) Integer
Returns the length in bits of INT as a two's-complementinteger. That is, N is the smallest integer such that INT< (1 << N) if INT >= 0 INT >= (–1 << N) if INT < 0.If INT is non-negative, then the representation of INTas an unsigned integer requires a field of at least N bit.Alternatively, a minimum of N+1 bits is required torepresent INT as a signed integer, regardless of its sign.
testbit(INT, N) BooleanTests the bit at position N in the integer INT and returnsthe state of bit N as a Boolean value, which is true for1 and false for 0.
Random Functions
The following functions are used to randomly select items or randomly generatenumbers.
Function Result Description
oneof(LIST) Any Returns a randomly chosen element of LIST. List items shouldbe entered as [ITEM1,ITEM2,...ITEM_N].
random(NUM) Number
Returns a uniformly distributed random number of the same type(INT or REAL), starting from 1 to NUM. If you use an integer,then only integers are returned. If you use a real (decimal)number, then real numbers are returned (decimal precisiondetermined by the stream options). The largest random numberreturned by the function could equal NUM.
random0(NUM) NumberThis has the same properties as random(NUM), but startingfrom 0. The largest random number returned by the functionwill never equal X.
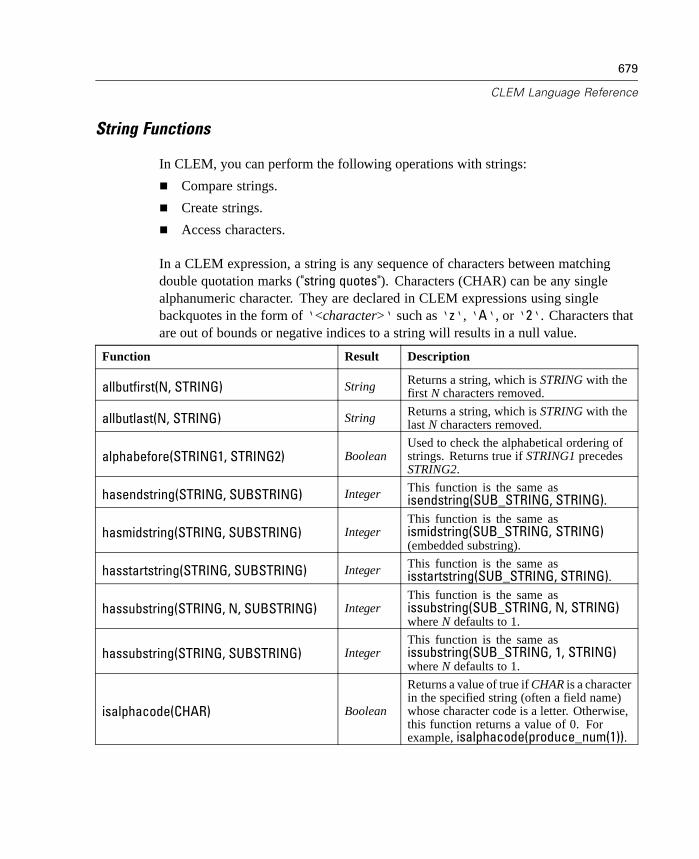
679
CLEM Language Reference
String Functions
In CLEM, you can perform the following operations with strings:
Compare strings.
Create strings.
Access characters.
In a CLEM expression, a string is any sequence of characters between matchingdouble quotation marks ("string quotes"). Characters (CHAR) can be any singlealphanumeric character. They are declared in CLEM expressions using singlebackquotes in the form of ‘<character>‘ such as ‘z‘, ‘A‘, or ‘2‘. Characters thatare out of bounds or negative indices to a string will results in a null value.
Function Result Description
allbutfirst(N, STRING) String Returns a string, which is STRING with thefirst N characters removed.
allbutlast(N, STRING) String Returns a string, which is STRING with thelast N characters removed.
alphabefore(STRING1, STRING2) BooleanUsed to check the alphabetical ordering ofstrings. Returns true if STRING1 precedesSTRING2.
hasendstring(STRING, SUBSTRING) Integer This function is the same asisendstring(SUB_STRING, STRING).
hasmidstring(STRING, SUBSTRING) IntegerThis function is the same asismidstring(SUB_STRING, STRING)(embedded substring).
hasstartstring(STRING, SUBSTRING) Integer This function is the same asisstartstring(SUB_STRING, STRING).
hassubstring(STRING, N, SUBSTRING) IntegerThis function is the same asissubstring(SUB_STRING, N, STRING)where N defaults to 1.
hassubstring(STRING, SUBSTRING) IntegerThis function is the same asissubstring(SUB_STRING, 1, STRING)where N defaults to 1.
isalphacode(CHAR) Boolean
Returns a value of true if CHAR is a characterin the specified string (often a field name)whose character code is a letter. Otherwise,this function returns a value of 0. Forexample, isalphacode(produce_num(1)).
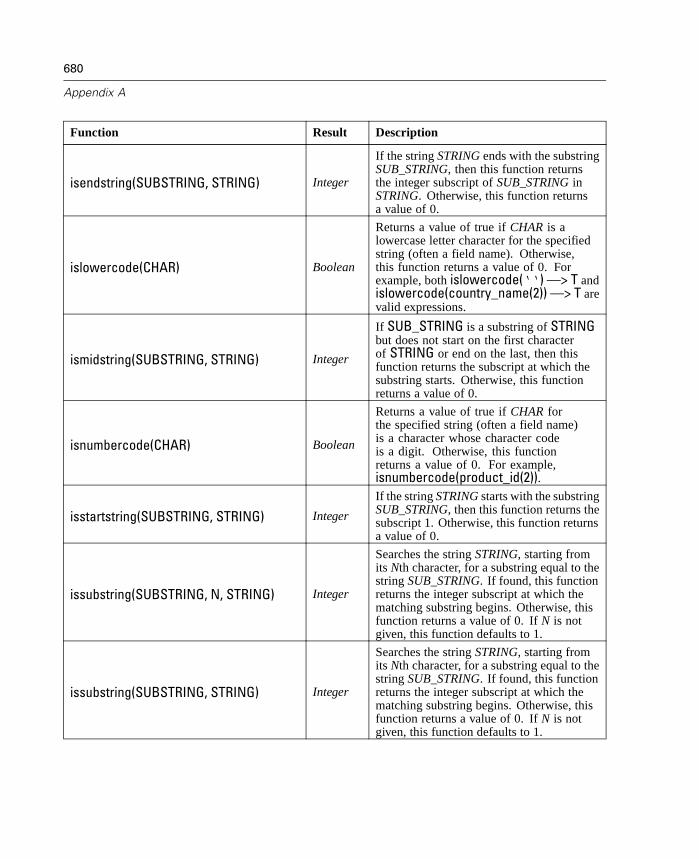
680
Appendix A
Function Result Description
isendstring(SUBSTRING, STRING) Integer
If the string STRING ends with the substringSUB_STRING, then this function returnsthe integer subscript of SUB_STRING inSTRING. Otherwise, this function returnsa value of 0.
islowercode(CHAR) Boolean
Returns a value of true if CHAR is alowercase letter character for the specifiedstring (often a field name). Otherwise,this function returns a value of 0. Forexample, both islowercode(‘‘) —> T andislowercode(country_name(2)) —> T arevalid expressions.
ismidstring(SUBSTRING, STRING) Integer
If SUB_STRING is a substring of STRINGbut does not start on the first characterof STRING or end on the last, then thisfunction returns the subscript at which thesubstring starts. Otherwise, this functionreturns a value of 0.
isnumbercode(CHAR) Boolean
Returns a value of true if CHAR forthe specified string (often a field name)is a character whose character codeis a digit. Otherwise, this functionreturns a value of 0. For example,isnumbercode(product_id(2)).
isstartstring(SUBSTRING, STRING) Integer
If the string STRING starts with the substringSUB_STRING, then this function returns thesubscript 1. Otherwise, this function returnsa value of 0.
issubstring(SUBSTRING, N, STRING) Integer
Searches the string STRING, starting fromits Nth character, for a substring equal to thestring SUB_STRING. If found, this functionreturns the integer subscript at which thematching substring begins. Otherwise, thisfunction returns a value of 0. If N is notgiven, this function defaults to 1.
issubstring(SUBSTRING, STRING) Integer
Searches the string STRING, starting fromits Nth character, for a substring equal to thestring SUB_STRING. If found, this functionreturns the integer subscript at which thematching substring begins. Otherwise, thisfunction returns a value of 0. If N is notgiven, this function defaults to 1.
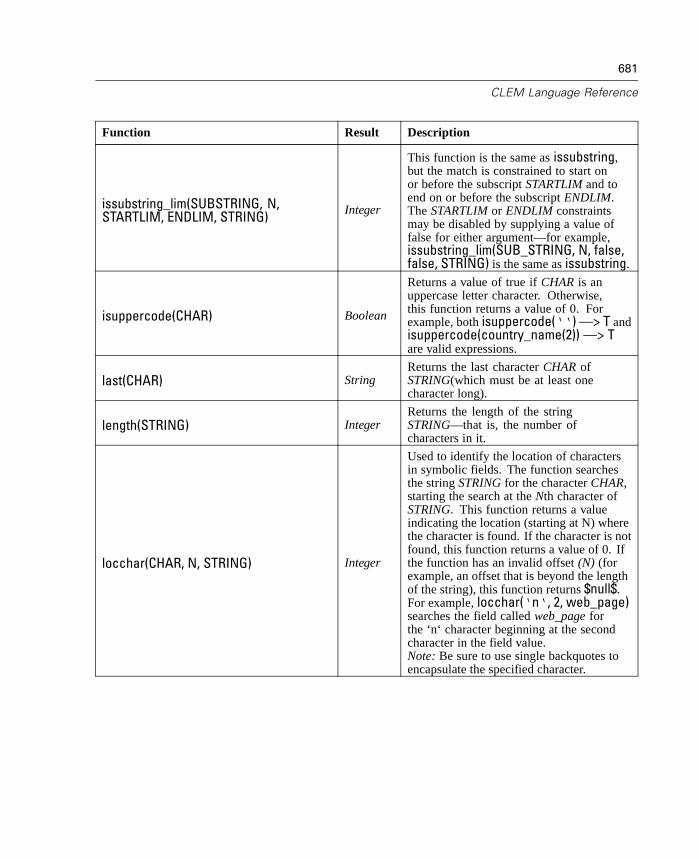
681
CLEM Language Reference
Function Result Description
issubstring_lim(SUBSTRING, N,STARTLIM, ENDLIM, STRING) Integer
This function is the same as issubstring,but the match is constrained to start onor before the subscript STARTLIM and toend on or before the subscript ENDLIM.The STARTLIM or ENDLIM constraintsmay be disabled by supplying a value offalse for either argument—for example,issubstring_lim(SUB_STRING, N, false,false, STRING) is the same as issubstring.
isuppercode(CHAR) Boolean
Returns a value of true if CHAR is anuppercase letter character. Otherwise,this function returns a value of 0. Forexample, both isuppercode(‘‘) —> T andisuppercode(country_name(2)) —> Tare valid expressions.
last(CHAR) StringReturns the last character CHAR ofSTRING(which must be at least onecharacter long).
length(STRING) IntegerReturns the length of the stringSTRING—that is, the number ofcharacters in it.
locchar(CHAR, N, STRING) Integer
Used to identify the location of charactersin symbolic fields. The function searchesthe string STRING for the character CHAR,starting the search at the Nth character ofSTRING. This function returns a valueindicating the location (starting at N) wherethe character is found. If the character is notfound, this function returns a value of 0. Ifthe function has an invalid offset (N) (forexample, an offset that is beyond the lengthof the string), this function returns $null$.For example, locchar(‘n‘, 2, web_page)searches the field called web_page forthe ‘n‘ character beginning at the secondcharacter in the field value.Note: Be sure to use single backquotes toencapsulate the specified character.

682
Appendix A
Function Result Description
locchar_back(CHAR, N, STRING) Integer
Similar to locchar, except that the search isperformed backward, starting from the Nthcharacter.For example, locchar_back(‘n‘, 9,web_page) searches the field web_pagestarting from the ninth character and movingbackwards towards the start of the string.If the function has an invalid offset (forexample, an offset that is beyond the lengthof the string), this function returns $null$.Ideally, you should use locchar_backin conjunction with the functionlength(<field>) to dynamically usethe length of the current value of thefield. For example, locchar_back(‘n‘,(length(web_page)), web_page).
stripchar(CHAR,STRING) String
Enables you to remove specified charactersfrom a string or field. You can use thisfunction, for example, to remove extrasymbols, such as currency notations,from data to achieve a simple numberor name. For example, using the syntaxstripchar(‘$‘, 'Cost') returns a new fieldwith the dollar sign removed from all values.Note: Be sure to use single backquotes toencapsulate the specified character.
skipchar(CHAR, N, STRING) Integer
Searches the string STRING for anycharacter other than CHAR, starting at theNth character. This function returns aninteger substring indicating the point atwhich one is found or 0 if every characterfrom the Nth onward is a CHAR. If thefunction has an invalid offset (for example,an offset that is beyond the length of thestring), this function returns $null$.locchar is often used in conjunctionwith theskipchar functions to determinethe value of N (the point at which tostart searching the string. For example,skipchar(‘s‘, (locchar(‘s‘, 1,"MyString")), "MyString").
skipchar_back(CHAR, N, STRING) IntegerSimilar to skipchar, except that the searchis performed backward, starting from theNth character.
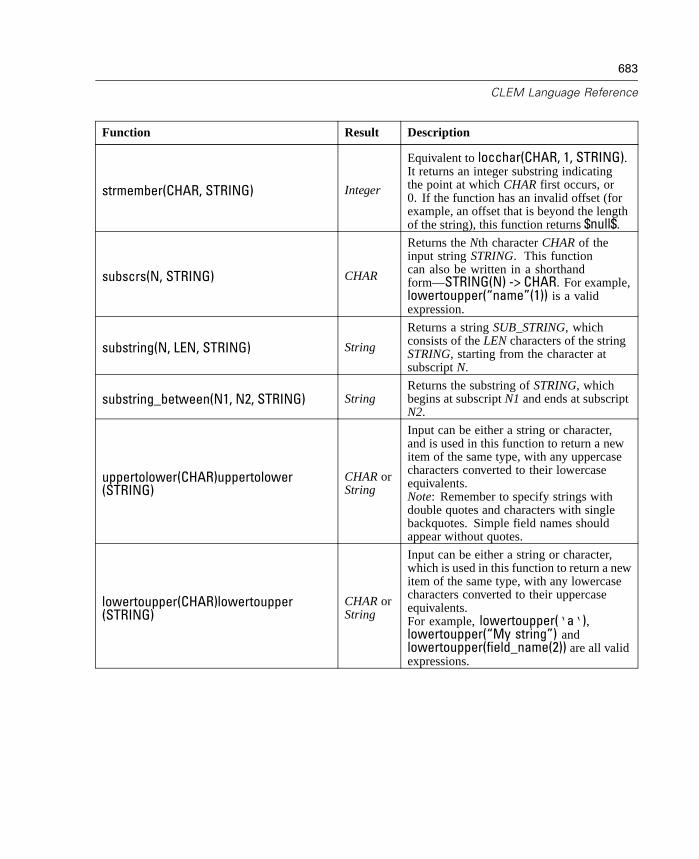
683
CLEM Language Reference
Function Result Description
strmember(CHAR, STRING) Integer
Equivalent to locchar(CHAR, 1, STRING).It returns an integer substring indicatingthe point at which CHAR first occurs, or0. If the function has an invalid offset (forexample, an offset that is beyond the lengthof the string), this function returns $null$.
subscrs(N, STRING) CHAR
Returns the Nth character CHAR of theinput string STRING. This functioncan also be written in a shorthandform—STRING(N) -> CHAR. For example,lowertoupper(“name”(1)) is a validexpression.
substring(N, LEN, STRING) String
Returns a string SUB_STRING, whichconsists of the LEN characters of the stringSTRING, starting from the character atsubscript N.
substring_between(N1, N2, STRING) StringReturns the substring of STRING, whichbegins at subscript N1 and ends at subscriptN2.
uppertolower(CHAR)uppertolower(STRING)
CHAR orString
Input can be either a string or character,and is used in this function to return a newitem of the same type, with any uppercasecharacters converted to their lowercaseequivalents.Note: Remember to specify strings withdouble quotes and characters with singlebackquotes. Simple field names shouldappear without quotes.
lowertoupper(CHAR)lowertoupper(STRING)
CHAR orString
Input can be either a string or character,which is used in this function to return a newitem of the same type, with any lowercasecharacters converted to their uppercaseequivalents.For example, lowertoupper(‘a‘),lowertoupper(“My string”) andlowertoupper(field_name(2)) are all validexpressions.
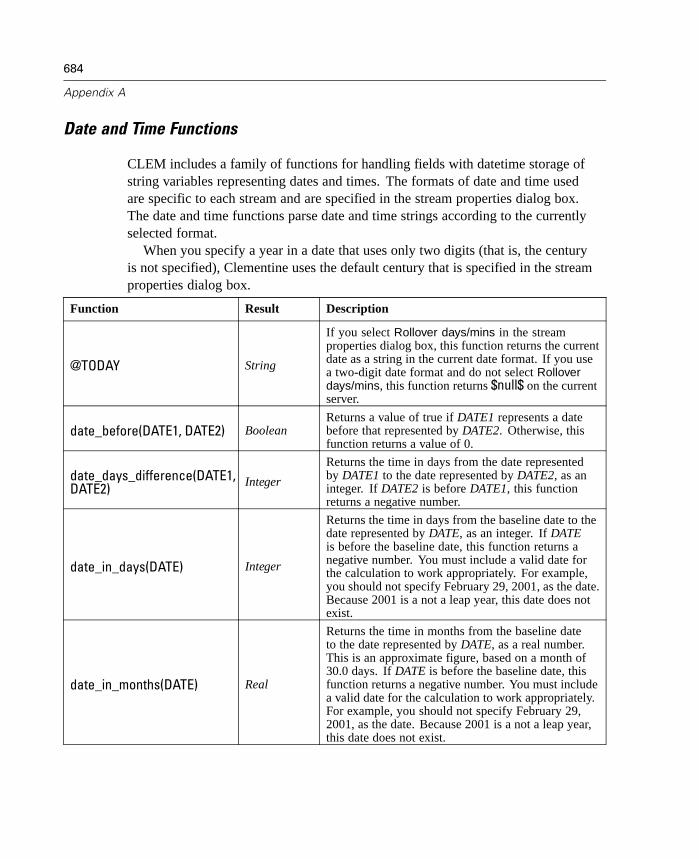
684
Appendix A
Date and Time Functions
CLEM includes a family of functions for handling fields with datetime storage ofstring variables representing dates and times. The formats of date and time usedare specific to each stream and are specified in the stream properties dialog box.The date and time functions parse date and time strings according to the currentlyselected format.
When you specify a year in a date that uses only two digits (that is, the centuryis not specified), Clementine uses the default century that is specified in the streamproperties dialog box.
Function Result Description
@TODAY String
If you select Rollover days/mins in the streamproperties dialog box, this function returns the currentdate as a string in the current date format. If you usea two-digit date format and do not select Rolloverdays/mins, this function returns $null$ on the currentserver.
date_before(DATE1, DATE2) BooleanReturns a value of true if DATE1 represents a datebefore that represented by DATE2. Otherwise, thisfunction returns a value of 0.
date_days_difference(DATE1,DATE2) Integer
Returns the time in days from the date representedby DATE1 to the date represented by DATE2, as aninteger. If DATE2 is before DATE1, this functionreturns a negative number.
date_in_days(DATE) Integer
Returns the time in days from the baseline date to thedate represented by DATE, as an integer. If DATEis before the baseline date, this function returns anegative number. You must include a valid date forthe calculation to work appropriately. For example,you should not specify February 29, 2001, as the date.Because 2001 is a not a leap year, this date does notexist.
date_in_months(DATE) Real
Returns the time in months from the baseline dateto the date represented by DATE, as a real number.This is an approximate figure, based on a month of30.0 days. If DATE is before the baseline date, thisfunction returns a negative number. You must includea valid date for the calculation to work appropriately.For example, you should not specify February 29,2001, as the date. Because 2001 is a not a leap year,this date does not exist.
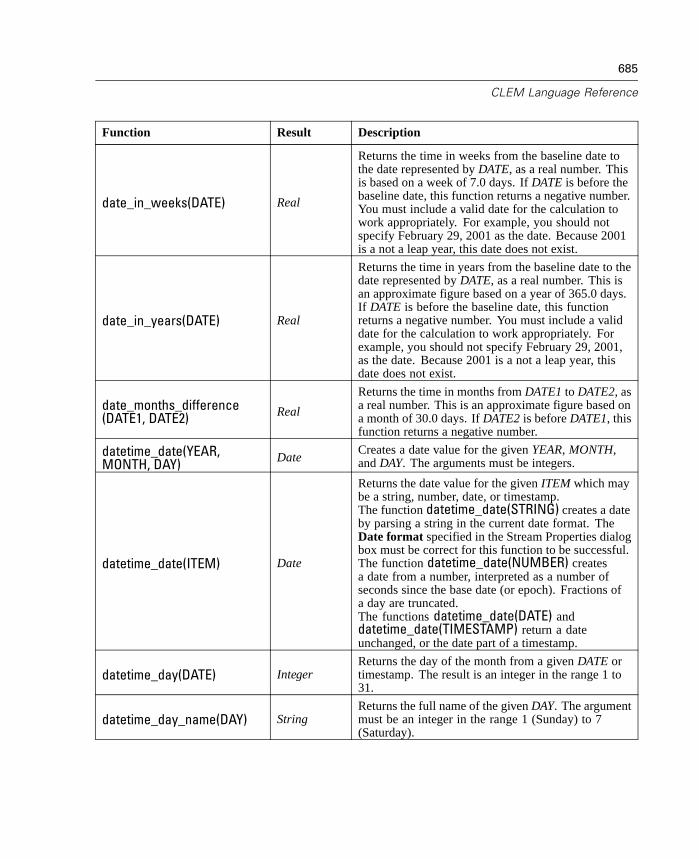
685
CLEM Language Reference
Function Result Description
date_in_weeks(DATE) Real
Returns the time in weeks from the baseline date tothe date represented by DATE, as a real number. Thisis based on a week of 7.0 days. If DATE is before thebaseline date, this function returns a negative number.You must include a valid date for the calculation towork appropriately. For example, you should notspecify February 29, 2001 as the date. Because 2001is a not a leap year, this date does not exist.
date_in_years(DATE) Real
Returns the time in years from the baseline date to thedate represented by DATE, as a real number. This isan approximate figure based on a year of 365.0 days.If DATE is before the baseline date, this functionreturns a negative number. You must include a validdate for the calculation to work appropriately. Forexample, you should not specify February 29, 2001,as the date. Because 2001 is a not a leap year, thisdate does not exist.
date_months_difference(DATE1, DATE2) Real
Returns the time in months from DATE1 to DATE2, asa real number. This is an approximate figure based ona month of 30.0 days. If DATE2 is before DATE1, thisfunction returns a negative number.
datetime_date(YEAR,MONTH, DAY) Date
Creates a date value for the given YEAR, MONTH,and DAY. The arguments must be integers.
datetime_date(ITEM) Date
Returns the date value for the given ITEM which maybe a string, number, date, or timestamp.The function datetime_date(STRING) creates a dateby parsing a string in the current date format. TheDate format specified in the Stream Properties dialogbox must be correct for this function to be successful.The function datetime_date(NUMBER) createsa date from a number, interpreted as a number ofseconds since the base date (or epoch). Fractions ofa day are truncated.The functions datetime_date(DATE) anddatetime_date(TIMESTAMP) return a dateunchanged, or the date part of a timestamp.
datetime_day(DATE) IntegerReturns the day of the month from a given DATE ortimestamp. The result is an integer in the range 1 to31.
datetime_day_name(DAY) StringReturns the full name of the given DAY. The argumentmust be an integer in the range 1 (Sunday) to 7(Saturday).

686
Appendix A
Function Result Description
datetime_hour(TIME) Integer Returns the hour from a TIME or timestamp. Theresult is an integer in the range 1 to 23.
datetime_in_seconds(DATETIME) Real
Returns the number of seconds in a DATETIME.
datetime_minute(TIME) Integer Returns the minute from a TIME or timestamp. Theresult is an integer in the range 0 to 59
datetime_month(DATE) Integer Returns the month from a DATE or timestamp. Theresult is an integer in the range 1 to 12.
datetime_month_name(MONTH) String
Returns the full name of the given MONTH. Theargument must be an integer in the range 1 to 12.
datetime_now Timestamp Returns the current time as a timestamp.
datetime_second(TIME) Integer Returns the second from a TIME or timestamp. Theresult is an integer in the range 0 to 59.
datetime_day_short_name(DAY) String
Returns the abbreviated name of the given DAY. Theargument must be an integer in the range 1 (Sunday)to 7 (Saturday).
datetime_month_short_name(MONTH) String
Returns the abbreviated name of the given MONTH.The argument must be an integer in the range 1 to 12.
datetime_time(HOUR,MINUTE, SECOND) Time
Returns the time value for the specified HOUR,MINUTE, and SECOND. The arguments must beintegers.
datetime_time(ITEM) Time Returns the time value of the given ITEM.
datetime_timestamp(YEAR,MONTH, DAY, HOUR,MINUTE, SECOND)
TimestampReturns the timestamp value for the given YEAR,MONTH, DAY, HOUR, MINUTE, and SECOND.
datetime_timestamp(DATE,TIME) Timestamp
Returns the timestamp value for the given DATE andTIME.
datetime_timestamp(NUMBER) Timestamp
Returns the timestamp value of the given number ofseconds.
datetime_weekday(DATE) Integer Returns the day of the week from the given DATEor timestamp.
datetime_year(DATE) Integer Returns the year from a DATE or timestamp. Theresult is an integer such as 2002.
date_weeks_difference(DATE1, DATE2) Real
Returns the time in weeks from the date representedby DATE1 to the date represented by DATE2, as areal number. This is based on a week of 7.0 days.If DATE2 is before DATE1, this function returns anegative number.
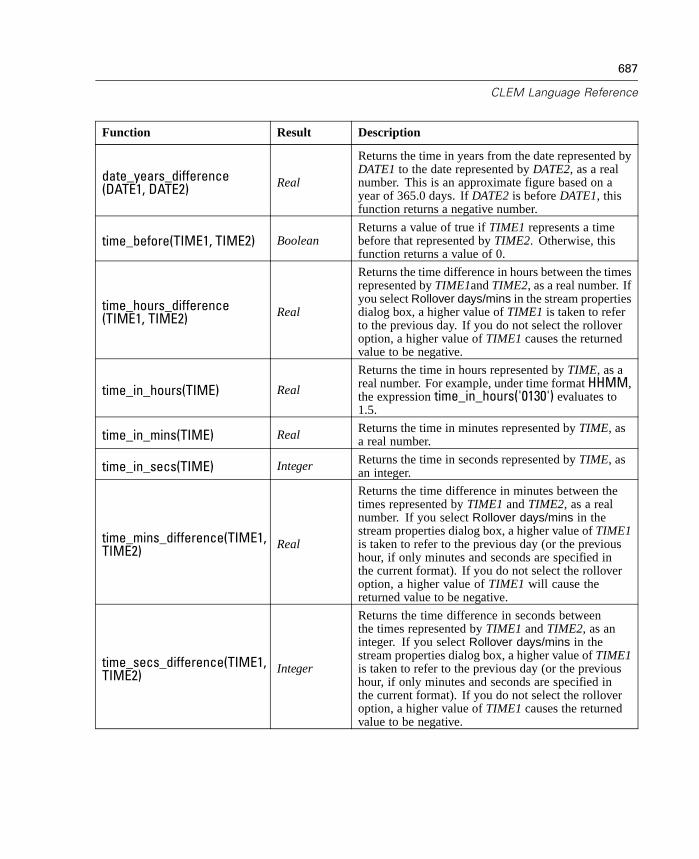
687
CLEM Language Reference
Function Result Description
date_years_difference(DATE1, DATE2) Real
Returns the time in years from the date represented byDATE1 to the date represented by DATE2, as a realnumber. This is an approximate figure based on ayear of 365.0 days. If DATE2 is before DATE1, thisfunction returns a negative number.
time_before(TIME1, TIME2) BooleanReturns a value of true if TIME1 represents a timebefore that represented by TIME2. Otherwise, thisfunction returns a value of 0.
time_hours_difference(TIME1, TIME2) Real
Returns the time difference in hours between the timesrepresented by TIME1and TIME2, as a real number. Ifyou select Rollover days/mins in the stream propertiesdialog box, a higher value of TIME1 is taken to referto the previous day. If you do not select the rolloveroption, a higher value of TIME1 causes the returnedvalue to be negative.
time_in_hours(TIME) Real
Returns the time in hours represented by TIME, as areal number. For example, under time format HHMM,the expression time_in_hours('0130') evaluates to1.5.
time_in_mins(TIME) Real Returns the time in minutes represented by TIME, asa real number.
time_in_secs(TIME) Integer Returns the time in seconds represented by TIME, asan integer.
time_mins_difference(TIME1,TIME2) Real
Returns the time difference in minutes between thetimes represented by TIME1 and TIME2, as a realnumber. If you select Rollover days/mins in thestream properties dialog box, a higher value of TIME1is taken to refer to the previous day (or the previoushour, if only minutes and seconds are specified inthe current format). If you do not select the rolloveroption, a higher value of TIME1 will cause thereturned value to be negative.
time_secs_difference(TIME1,TIME2) Integer
Returns the time difference in seconds betweenthe times represented by TIME1 and TIME2, as aninteger. If you select Rollover days/mins in thestream properties dialog box, a higher value of TIME1is taken to refer to the previous day (or the previoushour, if only minutes and seconds are specified inthe current format). If you do not select the rolloveroption, a higher value of TIME1 causes the returnedvalue to be negative.
688
Appendix A
Sequence Functions
For some operations, the sequence of events is important. The Clementine applicationallows you to work with the following record sequences:
Sequences and time series
Sequence functions
Record indexing
Averaging, summing, and comparing values
Monitoring change—differentiation
@SINCE
Offset values
Additional sequence facilities
For many applications, each record passing through a stream can be considered as anindividual case, independent of all others. In such situations, the order of recordsis usually unimportant.
For some classes of problems, however, the record sequence is very important.These are typically time series situations, in which the sequence of records representsan ordered sequence of events or occurrences. Each record represents a snapshotat a particular instant in time; much of the richest information, however, mightbe contained not in instantaneous values but in the way in which such values arechanging and behaving over time.
Of course, the relevant parameter may be something other than time. For example,the records could represent analyses performed at distances along a line, but thesame principles would apply.
Sequence and special functions are immediately recognizable by the followingcharacteristics:
They are all prefixed by @.
Their names are given in uppercase.
Sequence functions can refer to the record currently being processed by a node, therecords that have already passed through a node, and even, in one case, recordsthat have yet to pass through a node. Sequence functions can be mixed freely withother components of CLEM expressions, although some have restrictions on whatcan be used as their arguments.

689
CLEM Language Reference
Examples
You may find it useful to know how long it has been since a certain event occurred ora condition was true. Use the function @SINCE to do this—for example:
@SINCE(Income > Outgoings)
This function returns the offset of the last record where this condition was true—thatis, the number of records before this one in which the condition was true. If thecondition has never been true, @SINCE returns @INDEX +.
Sometimes you may want to refer to a value of the current record in the expressionused by @SINCE. You can do this using the function @THIS, which specifies that afield name always applies to the current record. To find the offset of the last recordthat had a Concentration field value more than twice that of the current record, youcould use:
@SINCE(Concentration > 2 * @THIS(Concentration))
In some cases the condition given to @SINCE is true of the current record bydefinition—for example:
@SINCE(ID == @THIS(ID))
For this reason, @SINCE does not evaluate its condition for the current record. Usea similar function, @SINCE0, if you want to evaluate the condition for the currentrecord as well as previous ones; if the condition is true in the current record, @SINCE0returns 0.
Available Sequence Functions
Function Result Description
@MEAN(FIELD) Real Returns the mean average of values for the specifiedFIELD or FIELDS.
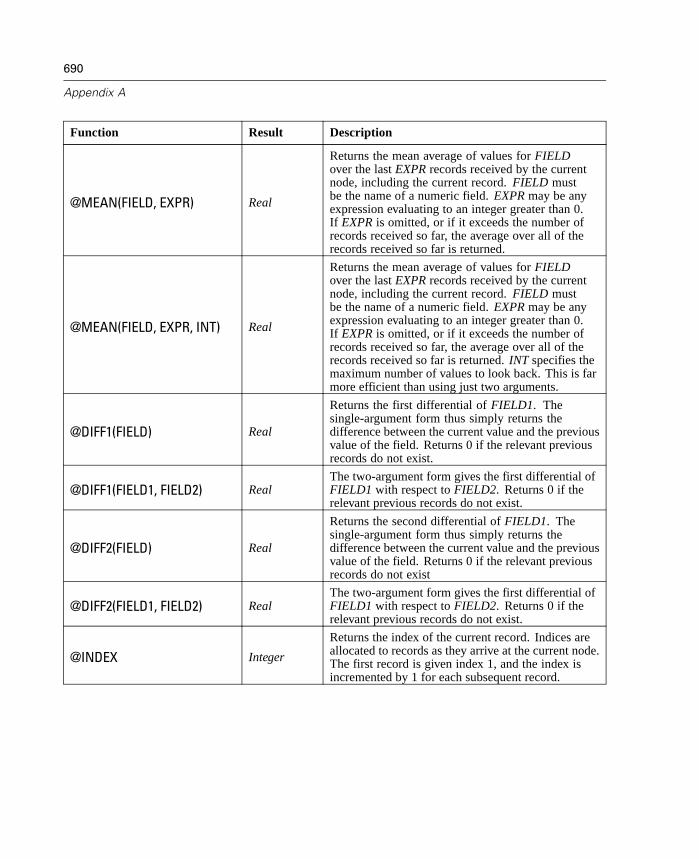
690
Appendix A
Function Result Description
@MEAN(FIELD, EXPR) Real
Returns the mean average of values for FIELDover the last EXPR records received by the currentnode, including the current record. FIELD mustbe the name of a numeric field. EXPR may be anyexpression evaluating to an integer greater than 0.If EXPR is omitted, or if it exceeds the number ofrecords received so far, the average over all of therecords received so far is returned.
@MEAN(FIELD, EXPR, INT) Real
Returns the mean average of values for FIELDover the last EXPR records received by the currentnode, including the current record. FIELD mustbe the name of a numeric field. EXPR may be anyexpression evaluating to an integer greater than 0.If EXPR is omitted, or if it exceeds the number ofrecords received so far, the average over all of therecords received so far is returned. INT specifies themaximum number of values to look back. This is farmore efficient than using just two arguments.
@DIFF1(FIELD) Real
Returns the first differential of FIELD1. Thesingle-argument form thus simply returns thedifference between the current value and the previousvalue of the field. Returns 0 if the relevant previousrecords do not exist.
@DIFF1(FIELD1, FIELD2) RealThe two-argument form gives the first differential ofFIELD1 with respect to FIELD2. Returns 0 if therelevant previous records do not exist.
@DIFF2(FIELD) Real
Returns the second differential of FIELD1. Thesingle-argument form thus simply returns thedifference between the current value and the previousvalue of the field. Returns 0 if the relevant previousrecords do not exist
@DIFF2(FIELD1, FIELD2) RealThe two-argument form gives the first differential ofFIELD1 with respect to FIELD2. Returns 0 if therelevant previous records do not exist.
@INDEX Integer
Returns the index of the current record. Indices areallocated to records as they arrive at the current node.The first record is given index 1, and the index isincremented by 1 for each subsequent record.

691
CLEM Language Reference
Function Result Description
@LAST_NON_BLANK(FIELD) Any
Returns the last value for FIELD that was not blank,according to any blank definition for FIELD in a Typenode upstream of the current node, or satisfying theBlank If value of the current node, if this is a Fillernode. If there are no nonblank values for FIELD inthe records read so far, $null$ is returned.
@MAX(FIELD) Number Returns the maximum value for the specified italic.
@MAX(FIELD, EXPR) Number
Returns the maximum value for FIELD over the lastEXPR records received so far, including the currentrecord. FIELD must be the name of a numeric field.EXPR may be any expression evaluating to an integergreater than 0.
@MAX(FIELD, EXPR, INT) Number
Returns the maximum value for FIELD over the lastEXPR records received so far, including the currentrecord. FIELD must be the name of a numericfield. EXPR may be any expression evaluating to aninteger greater than 0. If EXPR is omitted, or if itexceeds the number of records received so far, themaximum value over all of the records received so faris returned. INT specifies the maximum number ofvalues to look back. This is far more efficient thanusing just two arguments.
@MIN(FIELD) Number Returns the minimum value for the specified FIELD.
@MIN(FIELD, EXPR) Number
Returns the minimum value for FIELD over the lastEXPR records received so far, including the currentrecord. FIELD must be the name of a numeric field.EXPR may be any expression evaluating to an integergreater than 0.
@MIN(FIELD, EXPR, INT) Number
Returns the minimum value for FIELD over the lastEXPR records received so far, including the currentrecord. FIELD must be the name of a numericfield. EXPR may be any expression evaluating to aninteger greater than 0. If EXPR is omitted, or if itexceeds the number of records received so far, theminimum value over all of the records received so faris returned. INT specifies the maximum number ofvalues to look back. This is far more efficient thanusing just two arguments.
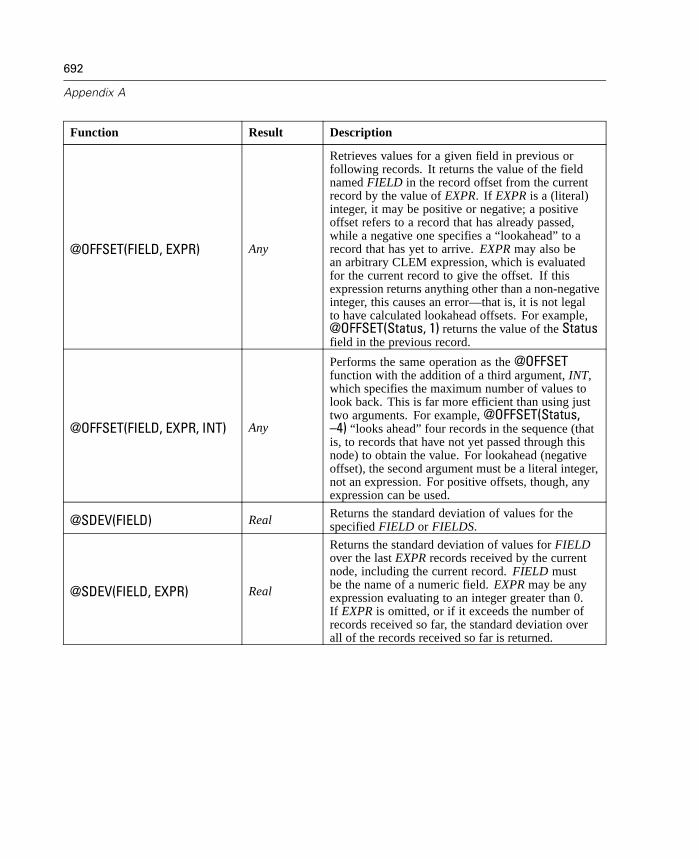
692
Appendix A
Function Result Description
@OFFSET(FIELD, EXPR) Any
Retrieves values for a given field in previous orfollowing records. It returns the value of the fieldnamed FIELD in the record offset from the currentrecord by the value of EXPR. If EXPR is a (literal)integer, it may be positive or negative; a positiveoffset refers to a record that has already passed,while a negative one specifies a “lookahead” to arecord that has yet to arrive. EXPR may also bean arbitrary CLEM expression, which is evaluatedfor the current record to give the offset. If thisexpression returns anything other than a non-negativeinteger, this causes an error—that is, it is not legalto have calculated lookahead offsets. For example,@OFFSET(Status, 1) returns the value of the Statusfield in the previous record.
@OFFSET(FIELD, EXPR, INT) Any
Performs the same operation as the @OFFSETfunction with the addition of a third argument, INT,which specifies the maximum number of values tolook back. This is far more efficient than using justtwo arguments. For example, @OFFSET(Status,–4) “looks ahead” four records in the sequence (thatis, to records that have not yet passed through thisnode) to obtain the value. For lookahead (negativeoffset), the second argument must be a literal integer,not an expression. For positive offsets, though, anyexpression can be used.
@SDEV(FIELD) Real Returns the standard deviation of values for thespecified FIELD or FIELDS.
@SDEV(FIELD, EXPR) Real
Returns the standard deviation of values for FIELDover the last EXPR records received by the currentnode, including the current record. FIELD mustbe the name of a numeric field. EXPR may be anyexpression evaluating to an integer greater than 0.If EXPR is omitted, or if it exceeds the number ofrecords received so far, the standard deviation overall of the records received so far is returned.

693
CLEM Language Reference
Function Result Description
@SDEV(FIELD, EXPR, INT) Real
Returns the standard deviation of values for FIELDover the last EXPR records received by the currentnode, including the current record. FIELD mustbe the name of a numeric field. EXPR may be anyexpression evaluating to an integer greater than 0.If EXPR is omitted, or if it exceeds the number ofrecords received so far, the standard deviation overall of the records received so far is returned. INTspecifies the maximum number of values to lookback. This is far more efficient than using just twoarguments.
@SINCE(EXPR) Any Returns the number of records that have passed sinceEXPR, an arbitrary CLEM expression, was true
@SINCE(EXPR, INT) Any dding the second argument, INT specifies themaximum number of records to look back.
@SINCE0(EXPR) Any
Considers the current record, while @SINCE doesnot; @SINCE0 returns 0 if EXPR is true for thecurrent record. If EXPR has never been true, INT is@INDEX+1
@SINCE0(EXPR, INT) Any Adding the second argument, INT specifies themaximum number of records to look back.
@SUM(FIELD) Number Returns the sum of values for the specified FIELDor FIELDS.
@SUM(FIELD, EXPR) Number
Returns the sum of values for FIELD over the lastEXPR records received by the current node, includingthe current record. FIELD must be the name ofa numeric field. EXPR may be any expressionevaluating to an integer greater than 0. If EXPRis omitted, or if it exceeds the number of recordsreceived so far, the sum over all of the recordsreceived so far is returned.
@SUM(FIELD, EXPR, INT) Number
Returns the sum of values for FIELD over thelast EXPR records received by the current node,including the current record. FIELD must bethe name of a numeric field. EXPR may be anyexpression evaluating to an integer greater than 0.If EXPR is omitted, or if it exceeds the numberof records received so far, the sum over all of therecords received so far is returned. INT specifies themaximum number of values to look back. This is farmore efficient than using just two arguments.
@THIS(FIELD) Any Returns the value of the field named FIELD in thecurrent record. Used only in @SINCE expressions.

694
Appendix A
Global Functions
The functions @MEAN,@SUM, @MIN, @MAX, and @SDEV work on, at most, all of therecords read up to and including the current one. In some cases, however, it is usefulto be able to work out how values in the current record compare with values seen inthe entire data set. Using a Set Globals node to generate values across the entire dataset, you can access these values in a CLEM expression using the global functions.
For example:
@GLOBAL_MAX(Age)
returns the highest value of Age in the data set, while the expression
(Value - @GLOBAL_MEAN(Value)) / @GLOBAL_SDEV(Value)
expresses the difference between this record's Value and the global mean as a numberof standard deviations. You can use global values only after they have been calculatedby a Set Globals node. All current global values can be canceled by clicking the Clear
Global Values button on the Globals tab in the Stream Properties dialog box.
Function Result Description
@GLOBAL_MAX(FIELD) Number
Returns the maximum value for FIELD over the wholedata set, as previously generated by a Set Globals node.FIELD must be the name of a numeric field. If thecorresponding global value has not been set, an erroroccurs.
@GLOBAL_MIN(FIELD) Number
Returns the minimum value for FIELD over the wholedata set, as previously generated by a Set Globals node.FIELD must be the name of a numeric field. If thecorresponding global value has not been set, an erroroccurs.
@GLOBAL_SDEV(FIELD) Number
Returns the standard deviation of values for FIELD overthe whole data set, as previously generated by a SetGlobals node. FIELD must be the name of a numericfield. If the corresponding global value has not been set,an error occurs.

695
CLEM Language Reference
Function Result Description
@GLOBAL_MEAN(FIELD) Number
Returns the mean average of values for FIELD over thewhole data set, as previously generated by a Set Globalsnode. FIELD must be the name of a numeric field. If thecorresponding global value has not been set, an erroroccurs.
@GLOBAL_SUM(FIELD) Number
Returns the sum of values for FIELD over the wholedata set, as previously generated by a Set Globals node.FIELD must be the name of a numeric field. If thecorresponding global value has not been set, an erroroccurs.
Functions Handling Blanks and Null Values
Using CLEM, you can specify that certain values in a field are to be regarded as“blanks,” or missing values. The following functions work with blanks:
Function Result Description
@BLANK(FIELD) BooleanReturns true for all records whose values are blankaccording to the blank handling rules set in anupstream Type node or Source node (Types tab).
@LAST_NON_BLANK(FIELD) Any
Returns the last value for FIELD that was notblank, according to any blank definition for FIELDin a Type node upstream of the current node, orsatisfying the Blank If value of the current node,if this is a Filler node. If there are no nonblankvalues for FIELD in the records read so far, $null$is returned.
@NULL(FIELD) Boolean
Returns true if the value of FIELD is thesystem-missing $null$. Returns false forall other values, including user-definedblanks. If you want to check for both, use@BLANK(FIELD)and @NULL(FIELD).
undef AnyUsed generally in CLEM to enter a $null$value—for example, to fill blank values with nullsin the Filler node.
Blank fields may be “filled in” with the Filler node. In both Filler and Derive nodes(multiple mode only), the special CLEM function @FIELD refers to the current field(s)being examined.
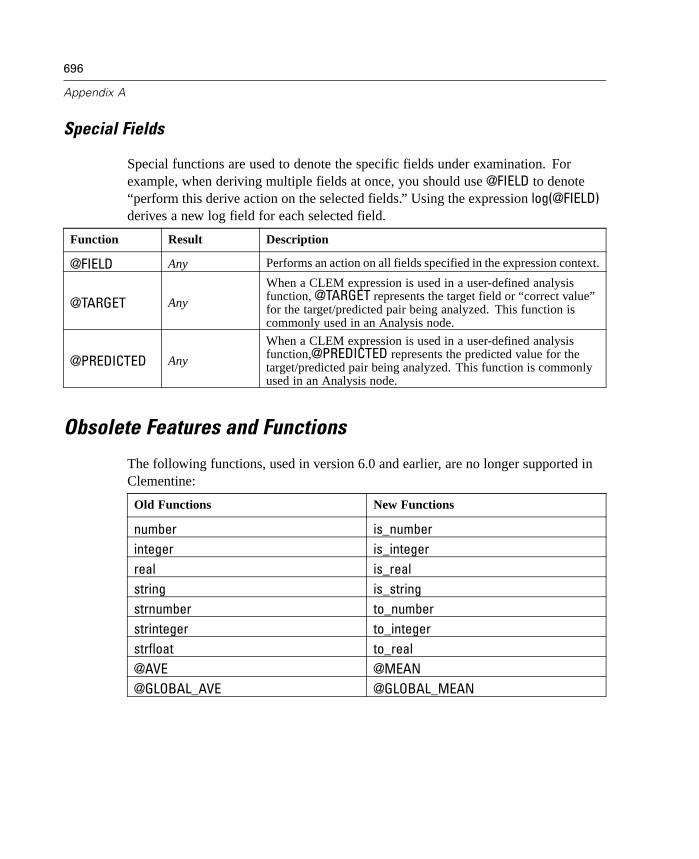
696
Appendix A
Special Fields
Special functions are used to denote the specific fields under examination. Forexample, when deriving multiple fields at once, you should use @FIELD to denote“perform this derive action on the selected fields.” Using the expression log(@FIELD)derives a new log field for each selected field.
Function Result Description
@FIELD Any Performs an action on all fields specified in the expression context.
@TARGET Any
When a CLEM expression is used in a user-defined analysisfunction, @TARGET represents the target field or “correct value”for the target/predicted pair being analyzed. This function iscommonly used in an Analysis node.
@PREDICTED Any
When a CLEM expression is used in a user-defined analysisfunction,@PREDICTED represents the predicted value for thetarget/predicted pair being analyzed. This function is commonlyused in an Analysis node.
Obsolete Features and Functions
The following functions, used in version 6.0 and earlier, are no longer supported inClementine:
Old Functions New Functions
number is_numberinteger is_integerreal is_realstring is_stringstrnumber to_numberstrinteger to_integerstrfloat to_real@AVE @MEAN@GLOBAL_AVE @GLOBAL_MEAN
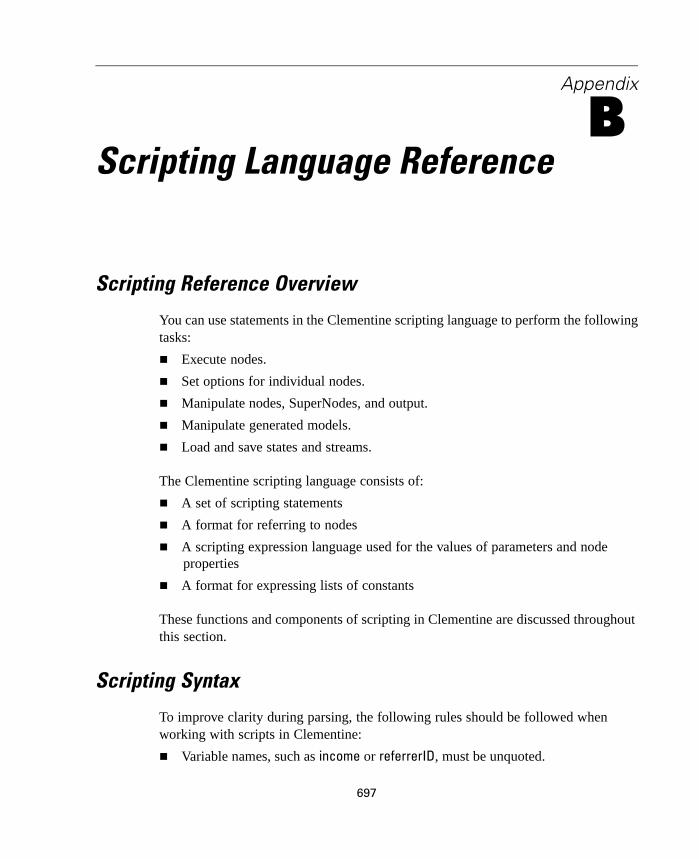
Appendix
BScripting Language Reference
Scripting Reference Overview
You can use statements in the Clementine scripting language to perform the followingtasks:
Execute nodes.
Set options for individual nodes.
Manipulate nodes, SuperNodes, and output.
Manipulate generated models.
Load and save states and streams.
The Clementine scripting language consists of:
A set of scripting statements
A format for referring to nodes
A scripting expression language used for the values of parameters and nodeproperties
A format for expressing lists of constants
These functions and components of scripting in Clementine are discussed throughoutthis section.
Scripting Syntax
To improve clarity during parsing, the following rules should be followed whenworking with scripts in Clementine:
Variable names, such as income or referrerID, must be unquoted.
697

698
Appendix B
Global parameter references, such as '$P-Maxvalue', should be single-quoted.
File names, such as “druglearn.str”, should be double-quoted.
Parameter references, such as ^mystream, should be preceded with a ^ symbol.
Node names, such as databasenode or Na_to_K, can be unquoted orsingle-quoted. Note: Names must be quoted if they include spaces or specialcharacters. You cannot, however, use a node name in a script if the name startswith a number, such as '2a_referrerID'.
String literals, such as "Web graph of BP and Drug" or "High", should bedouble-quoted or single-quoted if the context prohibits the use of objectreferences.
CLEM expressions, such as "Age >= 55", should be double-quoted.
If you use quotation marks within a CLEM expression, make sure that eachquotation mark is preceded by a backslash (\)—for example:
set :node.parameter=" BP=\"HIGH\"".
Note: Scripts written for previous versions of Clementine will continue to work asthey did before; however, it is recommended that you use the above guidelines forimproved clarity. The script checker available in all scripting dialog boxes willflag ambiguous syntax.
Inserting Comments and Continuations
The following characters are used in scripting to denote comments and continuations.
Character Usage Example
# The hash sign is a comment. The restof the line is ignored.
#This is a single-line comment.
/ A line ending with a slash indicatesthat the statement continues on the nextline.
See example below.
/* The sequence /* indicates the beginningof a comment. Everything is ignoreduntil a */ end comment marker is found.
See example below.
Following are examples of multiline comments and continuations:
/* This is a
699
Scripting Language Reference
multi linecomment*/
set :fixedfilenode.fields = [{"Age" 1 3}/{"Sex" 5 7} {"BP" 9 10} {"Cholesterol" 12 22}/
{"Na" 24 25} {"K" 27 27} {"Drug" 29 32}]
Operators in Scripts
In addition to the usual CLEM operators, you can manipulate list-type local or slotparameters in scripts using the “+” and “–” operators. The “+” adds an element to thelist, and the “–” operator removes an item. Here is an example:
var z # create a new local parameterset z = [1 2 3] # set it to the list containing 1, 2, and 3set z = z + 4 # add an element; z now equals [1 2 3 4]
These operators cannot be used with Stream, SuperNode, or Session parameters, noroutside of scripts in general CLEM expressions (such as a formula in a Derive node).
Guidelines for Referring to Nodes in Scripts
There are several node-specific guidelines to follow for correct scripting syntax.
You can specify nodes by name—for example, DRUG1n. You can qualify thename by type—for example, Drug:neuralnetnode refers to a Neural Net nodecalled Drug and not to any other kind of node.
You can specify nodes by type only. For example, :neuralnetnode refers to allNeural Net nodes. This statement is not restricted to nodes of any particular name.
Node types are words—for example, samplenode, neuralnetnode, andkmeansnode. Although you can omit the suffix node, it is recommended that youinclude it because it makes identifying errors in scripts easier.
You can supply node names and types as the values of parameters by using the ^syntax. For example, where a node name is required, ^n means the node whosename is stored in the parameter n, and Drug:^t means the node called Drug,whose type is stored in the parameter t.
700
Appendix B
The same rules apply to generated model nodes. You can use the name of the node onthe generated models palette in the managers window when specifying a generatedmodel in scripting. For more information, see “Manipulating the Generated ModelsPalette” on page 722.
Setting Properties and Parameters
Using scripting, you can specify the value of node properties as well as expressionsfor local and global parameters. The following command is used to set the value ofthe parameter (or node property, also referred to as a slot parameter):
set PARAMETER = EXPRESSION
PARAMETER can be:
A global parameter or variable, such as x
A local parameter or variable, such as my_node
A special variable, such as stream where stream is the current stream
A node property, such as Na_to_K:derivenode.formula_expr
A script command, such as save stream
EXPRESSION can be:
A CLEM expression valid in scripting, such as "Age >= 55"
A script command that returns a value, such as load, create, or get
A literal value, such as 1 or Include
Examples
Following are examples of set expressions used to specify parameter values, nodeproperties, and CLEM expressions used in node properties:
set p = 1set minvalue = 21set :derivenode.new_name = "Ratio of Na to K"set :derivenode.formula_expr = "Na / K"set my_node = get node :plotnode
701
Scripting Language Reference
Multiple Expressions
You can assign multiple expressions to properties for nodes (also called slotparameters) in a single operation. It is used when multiple changes need to be madeto a node before the data model is determined. The format used to set multipleproperties is:
set NODE {NODEPROPERTY1 = EXPRESSION1NODEPROPERTY2 = EXPRESSION2
}
For example, suppose you want to set multiple properties for a Sample node. To doso, you could use the following multiset command:
set :samplenode {max_size = 200mode = "Include"sample_type = "First"}
Parameters in Scripting
The scripting language often uses parameters to refer to variables in the current scriptor at a variety of levels within Clementine.
Local parameters refer to variables set for the current script using the varcommand.
Global parameters refer to Clementine parameters set for streams, SuperNodes,and sessions.
These types of parameters are discussed further in the following topics.
Local Parameters
Local parameters are parameters set locally for access to objects and values ofany type by the current script only. Local parameters are also referred to as localvariables and are declared with the var command. Using the var command for local

702
Appendix B
parameters helps maintain the distinction between local parameters (variables) andglobal parameters, which can be set for a session, stream, or SuperNode and cancontain strings or numbers only.
When referring to local parameters in scripting statements, be sure to use the ^symbol preceding the parameter name. For example, the following script is used toset a local parameter and then refers to that parameter:
var my_nodeset my_node = create distributionnoderename ^my_node as "Distribution of Flag"
When resolving variable references, the local parameter list is searched before theglobal parameter list. For example, if a variable x existed as a local parameter and aglobal parameter, using the syntax '$P-X' in a scripting statement would ensure thatthe global parameter variable is used rather than the local one.
Global Parameters
When you use ordinary parameters such as stream, session, or SuperNode parametersin a script, these parameters are called global parameters. Global parameters areoften used in scripting as part of a CLEM expression in which the parameter value isspecified in the script.
Setting Parameters
You can set parameters using the set command and the following syntax:
set foodtype = pizza
If there are no nodes or existing parameters named foodtype, this command creates aparameter called foodtype with a default value of pizza.
The parameter is created for a stream if the command is part of a stream script,or a SuperNode if the script is a SuperNode script.
If the command is used as a startup flag on the command line or a standalonescript, the parameter becomes a session parameter.

703
Scripting Language Reference
Referring to Parameters
You can refer to previously created parameters by encapsulating them in singlequotes, prefaced with the string $P—for example, '$P-minvalue'. You can also refersimply to the parameter name, such as minvalue. The value for a global parameter isalways a string or number. For example, you can refer to the foodtype parameter andset a new value using the following syntax:
set foodtype = beer
You can also refer to parameters within the context of a CLEM expression used in ascript. As an example, the following script sets the properties for a Select node toinclude records where the value for Age is greater than that specified by the streamparameter called cutoff. The parameter is used in a CLEM expression with the propersyntax for CLEM—'$P-cutoff':
set :selectnode {mode = "Include"condition = "Age >= '$P-cutoff'"}
The script above uses the default value for the stream parameter called cutoff. Youcan specify a new parameter value by adding the following line to the script abovethe Select node specifications:
set cutoff = 50
The resulting script selects all records where the value of Age is greater than 50.
For more information, see “Parameters” in Appendix A on page 669.
704
Appendix B
Using CLEM in Scripts
You can use CLEM expressions, functions, and operators within scripts used inClementine; however, your scripting expression cannot contain calls to any @functions, date/time functions, and bitwise operations. Additionally, the followingrules apply to CLEM expressions in scripting:
Parameters must be specified in single quotes and with the $P- prefix.
CLEM expressions must be encased in quotes. If the CLEM expression itselfcontains quoted strings or quoted field names, the embedded quotes must bepreceded by a backslash( \). For more information, see “Scripting Syntax” onpage 697.
You can use global values such as GLOBAL_MEAN(Age) in scripting, however you cannot use the @GLOBAL function itself within the scripting environment.
Examples of CLEM expressions used in scripting are:
set :balancenode.directives = [{1.3 "Age > 60"}]set :fillernode.condition = "(Age > 60) and (BP = \"High\")"set :derivenode.formula_expr = "substring(5, 1, Drug)"set Flag:derivenode.flag_expr = "Drug = X"set :selectnode.condition = "Age >= '$P-cutoff'"set :derivenode.formula_expr = "Age - GLOBAL_MEAN(Age)"
Creating Nodes and Streams
The commands below are used to create a node or stream of the given specificationand modifiers. The modifiers are specific to the type of object being created.
Node Creation
create NODE NODE_POSITION
In addition to specifying the creation of a node, you can also specify position andconnection options, as follows:
NODE_POSITION

705
Scripting Language Reference
at X Ybetween NODE1 and NODE2connected between NODE1 and NODE2
You can also create a node using variables to avoid ambiguity. For instance, in theexample below, a Type node is created and the reference variable x is set to containa reference to that Type node. You can then use the variable x to return the objectreferenced by x (in this case, the Type node) and perform additional operations, suchas renaming, positioning, or connecting the new node.
var xset x = create typenoderename ^x as "mytypenode"position ^x at 200 200var yset y = create varfilenoderename ^y as "mydatasource"position ^y at 100 200connect ^y to ^x
The above example creates two nodes, renames each, positions them, and finallyconnects them on the stream canvas.
Figure B-1Nodes created using variables
You can also use the reserved word—node—as a special variable in circumstancessimilar to the one above. For instance, you might use a script, such as the followingwhen creating a stream:
set node = create typenoderename ^node as "mytypenode"position ^node at 200 200set node = create varfilenoderename ^node as "mydatasource"position ^node at 100 200

706
Appendix B
connect mydatasource to mytypenode
The script above is a good illustration of how to avoid ambiguity in scripting. Thevariable node is used to refer to specific objects and rename them unambiguously.At the end of the example script above, the unambiguous node names are used toconnect the nodes on the stream canvas.
Note: Special variables, such as node, can be re-used to reference multiple nodes.Simply use the set command to reset the object referenced by the variable. For moreinformation, see “ Setting the Current Object” on page 709.
Stream Creation
create STREAM DEFAULT_FILENAME
This creates a new stream with either the default stream name or a name of yourchoice. The newly created stream is returned as an object.
X-Y Positioning
Positioning nodes on the stream canvas uses an invisible x-y grid. You can use theimage below as a reference for the x-y grid coordinates.
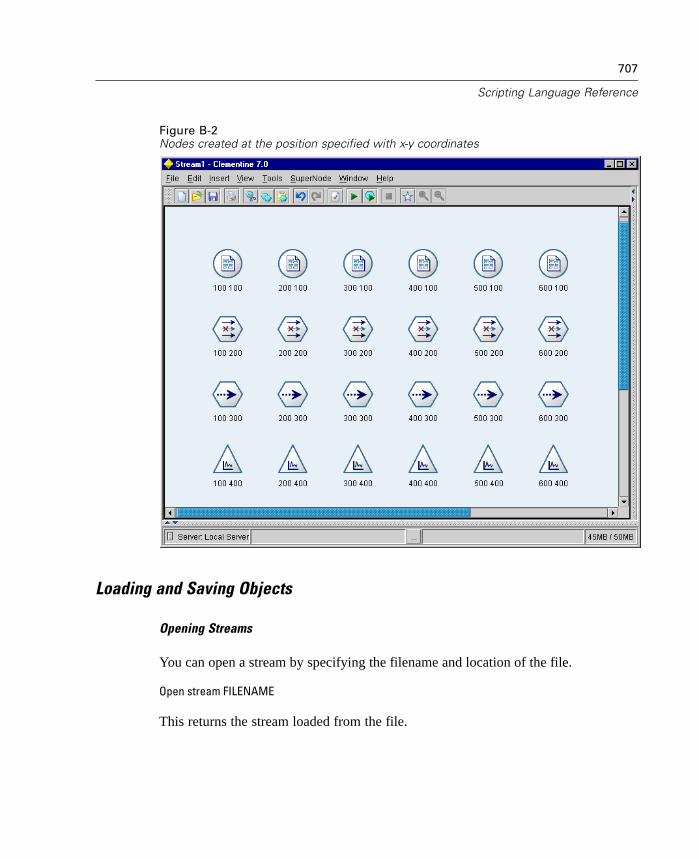
707
Scripting Language Reference
Figure B-2Nodes created at the position specified with x-y coordinates
Loading and Saving Objects
Opening Streams
You can open a stream by specifying the filename and location of the file.
Open stream FILENAME
This returns the stream loaded from the file.
708
Appendix B
Loading Objects
To open a variety of objects, use the following command:
load OBJECT_TYPE FILENAME
This returns the object loaded from the file.
Object types are:
stream
project
node
model
generated palette
state
Saving Objects
You can also save an object to a file. The first format is valid for streams and projectsonly, and uses the object's default name if there is one or generates an error if there isnot.
save OBJECTsave OBJECT as FILENAME
Objects are:
An object reference, such as node NODE model MODEL
A variable containing an object that can be saved
Special variables such as stream (the current stream) or generated palette (thegenerated models tab/palette)

709
Scripting Language Reference
Retrieving Objects
The following commands retrieve an existing object of the given type. For generalobjects, retrieval is on the basis of the object name. For nodes, retrieval is on the basisof a node description. An error is raised if the specified object cannot be found.
get OBJECT_TYPE NAMEget node NODE
This returns the object retrieved.
Object types are:
stream
node
Setting the Current Object
You can refer to the “current” object in scripting using predefined, special variables.The words listed below are reserved in Clementine scripting to indicate the “current”object and are called special variables:
node—the current node
stream—the current stream
model—the current model
generated palette—the generated models palette on the Models tab of themanagers window
output—the current output
project—the current project
Each of these special variables can be used in a scripting statement by assigning avariable of the correct type. For example, in the following statement, stream is aspecial variable referring to the current stream:
save stream as "C:/My Streams/Churn.str"

710
Appendix B
Note: Throughout this guide, the presence of “current” objects, such as streams ornodes is noted for each scripting statement that returns an object as the “current”object. For example, when opening and loading a stream, the stream specifiedbecomes the current stream.
Using Special Variables
An arbitrary object, such as a stream, can be made the current object by assigning thatobject to the corresponding special variable. For example, making a stream the currentstream can be done by assigning a stream to the special variable stream—for example:
set stream = my_stream
Assigning a value of the wrong type to a special variable causes a run-time error. Incases where the special variable can be used, any variable can also be used. Forexample, saving the current stream can be carried out with:
save stream as 'C:/My Streams/Churn.str'
It is also valid to say:
save my_stream as 'C:/My Streams/Churn.str'
where my_stream has previously been assigned a stream value.
Closing and Deleting Objects
Once you have created or loaded an object, you can use several commands to closeor delete it.
Closing Streams
close STREAM
The above command closes the specified STREAM, but does not close Clementineor any other streams.
711
Scripting Language Reference
Deleting Nodes
delete NODE
The above command deletes the specified node from the current stream in the streamcanvas. NODE can be a standard node or a generated model node in the stream canvas.
Manipulating Streams
In addition to the properties common to all objects, streams include a number ofproperties that can be used to change the behavior of the stream through scripting.
Stream Properties
Using scripting, you can specify a number of properties for streams. For example,using the special stream variable, ^stream, you can set the following types ofproperties.
set ^stream.execute_method = "Script"set ^stream.date_format = "MM/DD/YY"
Stream Execution
You can execute streams using the following statements.
execute NODE
The above command executes the section of the current stream that includes thespecified node. If the node is a terminal node, then this executes the stream sectionterminated by the node. If the node is not a terminal node, then execution is equivalentto the Execute From Here pop-up menu option.
execute NODE N
The above command executes the section of the current stream that includes thespecified node. The search for the node begins at the Nth node. Different values of Nare guaranteed to execute different nodes.
712
Appendix B
execute_all
The above command executes all terminal nodes in the current stream.
execute_script
The above command executes the stream script associated with the current stream.
Note: Scripts associated with different streams can be executed by setting the streamas the current stream or by using the with command.
Reassigning the Current Stream
with stream STREAMSTATEMENT(s)endwith
This syntax is used to temporarily reassign the current stream to be the specifiedSTREAM—for example:
with stream STREAMcreate typenodeexecute_script
endwith
The above statements execute the create action and execute the stream's script withthe specified STREAM set as the current stream. The original current stream isrestored once each statement has been executed.
Conditional statements and loop constructs can also be included—for example:
with stream STREAMfor I from 1 to 5
set :selectnode.expression = 'field > ' >< (I * 10)executeendforendwith

713
Scripting Language Reference
This will set the current stream to STREAM for all expressions within the loop andrestore the original value when the loop has completed.
Closing Streams
close STREAM
The above syntax closes the specified STREAM.
Node Manipulation
In addition to the standard properties for objects such as creating, saving, and loading,there are numerous node-specific properties that can be used to change the behaviorof the node. These properties, as well as general guidelines for manipulating andreferring to nodes in scripts are discussed in the following topics.
Node Names in Scripting
Once created, nodes in scripts should be referred to using the form:
NAME:TYPE
NAME is the name of a node, and type is its type. At a minimum, you must includeeither NAME or TYPE. You may omit one, but you may not omit both. For example,the following command creates a new Derive node (new nodes do not use the colon )between an existing Variable File node called drug1n and an existing Plot node.
create derivenode connected between drug1n and :plotnode
You can also precede either NAME or TYPE by a ^ symbol to indicate the presenceof a parameter. For example, ^PARAMETER means that the relevant component (thename or type of the node) is the value of the parameter PARAMETER. This ^ notationmay also be used when supplying generated model names and node property (slotparameter) names or types—for example:
Drug:^t

714
Appendix B
means a node named Drug where t is a parameter for the type of node with a valueof c50node. Essentially, the above reference can be translated as:
Drug:c50node
Similarly, a parameter can be used for the node name. For example, the followingnode references:
^n:derivenode^n
can both be used in a context where a node name is required, and where n has thevalue Na_to_K. This refers to the node named Na_to_K.
The node type specifies the type of the node and can be any of the nodes describedin the following table or the name of any node defined by the Clementine ExternalModule Interface. The suffix node may be omitted. Although you may omit the suffixnode, it is recommended that you include it because it makes identifying errors inscripts easier. Where the node name or name/type combination is ambiguous—thatis, where it could refer to more than one node—an error is raised.
Node Names Reference
The following table contains a complete list of node names used for scripting.
Table B-1Node names for scripting
Node Type Node Name in User Interface Scripting Syntax
Var. File variablefilenode
Fixed File fixedfilenode
Database databasenode
SAS Import sasimportnode
SPSS Import spssimportnode
Sources
User Input userinputnode
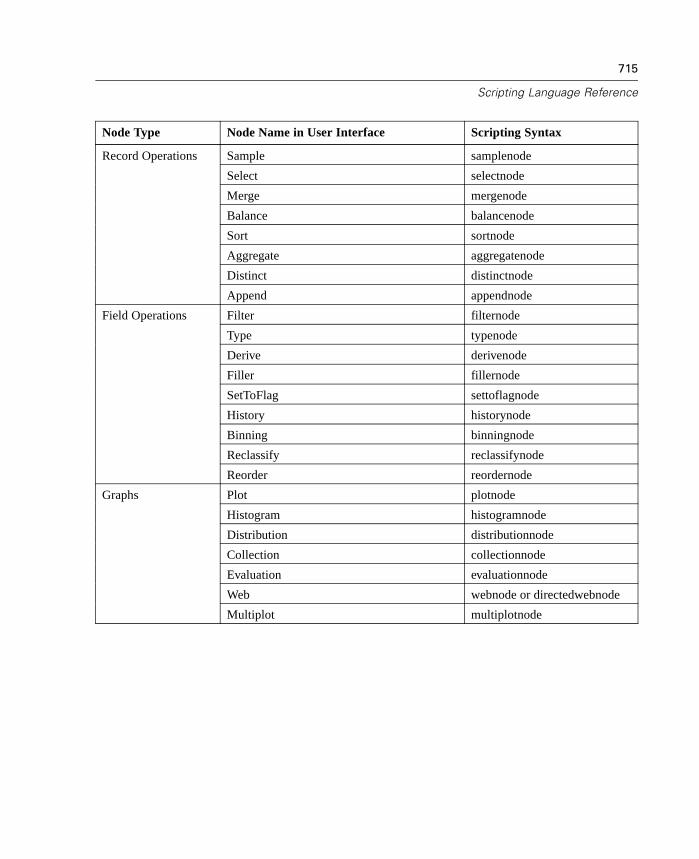
715
Scripting Language Reference
Node Type Node Name in User Interface Scripting Syntax
Sample samplenode
Select selectnode
Merge mergenode
Balance balancenode
Sort sortnode
Aggregate aggregatenode
Distinct distinctnode
Record Operations
Append appendnode
Filter filternode
Type typenode
Derive derivenode
Filler fillernode
SetToFlag settoflagnode
History historynode
Binning binningnode
Reclassify reclassifynode
Field Operations
Reorder reordernode
Plot plotnode
Histogram histogramnode
Distribution distributionnode
Collection collectionnode
Evaluation evaluationnode
Web webnode or directedwebnode
Graphs
Multiplot multiplotnode

716
Appendix B
Node Type Node Name in User Interface Scripting Syntax
Neural Net neuralnetnode
Build C5.0 c50node
Kohonen kohonennode
Linear Reg. regressionnode
Logistic Reg. logregnode
C&R Tree cartnode
Factor/PCA factornode
TwoStep twostepnode
GRI grinode
Apriori apriorinode
Kmeans kmeansnode
Modeling
Sequence sequencenode
Neural Net applyneuralnetnode
Build C5.0 applyc50node
Kohonen applykohonennode
Linear Reg. applyregressionnode
Logistic Reg. applylogregnode
C&R Tree applycartnode
Factor/PCA applyfactornode
TwoStep applytwostepnode
GRI applygrinode
Apriori applyapriorinode
Kmeans applykmeansnode
Sequence applysequencenode
Generated Models
Generated Rulesets applyrulenode
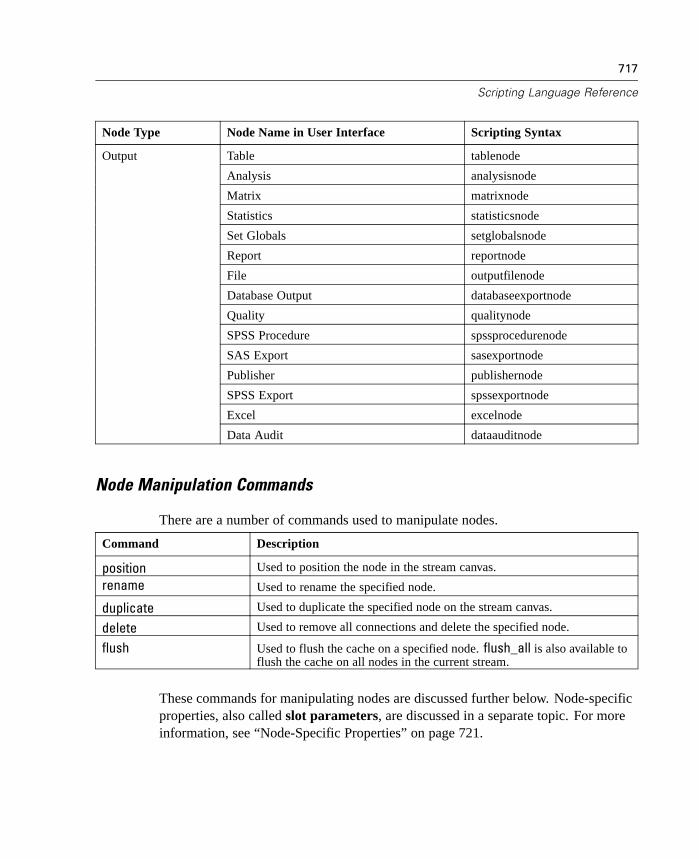
717
Scripting Language Reference
Node Type Node Name in User Interface Scripting Syntax
Table tablenode
Analysis analysisnode
Matrix matrixnode
Statistics statisticsnode
Set Globals setglobalsnode
Report reportnode
File outputfilenode
Database Output databaseexportnode
Quality qualitynode
SPSS Procedure spssprocedurenode
SAS Export sasexportnode
Publisher publishernode
SPSS Export spssexportnode
Excel excelnode
Output
Data Audit dataauditnode
Node Manipulation Commands
There are a number of commands used to manipulate nodes.
Command Description
position Used to position the node in the stream canvas.
rename Used to rename the specified node.
duplicate Used to duplicate the specified node on the stream canvas.
delete Used to remove all connections and delete the specified node.
flush Used to flush the cache on a specified node. flush_all is also available toflush the cache on all nodes in the current stream.
These commands for manipulating nodes are discussed further below. Node-specificproperties, also called slot parameters, are discussed in a separate topic. For moreinformation, see “Node-Specific Properties” on page 721.

718
Appendix B
Positioning Nodes
There are a number of methods used to position nodes and models in the streamcanvas.
position NODE NODE_POSITION
The above statement moves the specified node to the node position. This may alsoinclude a connection specification. NODE_POSITION can be specified using thefollowing position/connection modifiers:
at X Y
between NODE1 and NODE2
connected between NODE1 and NODE2
For example, to position an already created node, you can use any of the followingmethods:
position Drug:net at 100 100
This statement positions the neural net model called Drug at coordinates 100, 100.
position Drug:net between DRUG2n and analysis
This statement positions the net as precisely as possible between the two nodes namedDRUG2n and analysis, ignoring any snap-to-grid settings.
position Drug:net connected between DRUG2n and analysis
This statement positions the net model between Drug2n and makes connections fromDrug2n to the net and from the net to analysis, respectively.
Renaming Nodes
Once you have created a node, you can rename it using the following syntax:
rename NODE as NEWNAME

719
Scripting Language Reference
The above statement renames the specified node to the supplied name. For example,to rename a source node reflecting a new data source, you could use a commandsimilar to the following:
rename :varfilenode as "testdata"
Duplicating Nodes
duplicate NODE as NEWNAMEduplicate NODE as NEWNAME NODE_POSITION
The statements above duplicates the specified node giving it the name provided. Thesecond statement also allows the node to be positioned using the positional modifiersdiscussed above. This returns the newly created node.
Flushing the Cache for a Node
flush NODE
The above statement flushes the data cache of a node. If the cache is not enabled or isnot full, this operation does nothing. Disabling the cache also flushes the cache.
flush_all
The above statement flushes the data caches of all nodes in the current stream.
Deleting Nodes
You can delete nodes using either of the following methods.
delete NODE
This statement deletes the specified node from the current stream. For this statementto function, the specified node must already exist—for example:
delete Na_to_K:derivenode
This statement deletes the Na_to_K node.
delete last model
720
Appendix B
This statement deletes the last model inserted with the insert model statement. Forthis statement to function, both of the following conditions must be satisfied:
The insert model statement must have been executed at least once within thecurrent script execution.
The node that the insert model statement created must still exist.
Connecting and Disconnecting Nodes
The following statements are used to connect and disconnect nodes in the streamcanvas. For example, using object create properties in conjunction with connectionstatements, you can create a new Type node positioned between the two specifiednodes:
create typenode connected between :databasenode and :filternode
Available Commands
connect NODE1 to NODE2
The above statement creates a connection from node 1 to node 2. For example,connect :net to Analysis will make a connection from the neural net model to anode called Analysis.
connect NODE1 between NODE2 and NODE3
The above statement creates a connection from node 2 to node 1 and from node 1 tonode 3. This is a commonly used statement for quick stream building. For example,create derivenode between drug1n and :selectnode will add a Derive node and createconnections between all three nodes if they are not already present.
disconnect NODE
The above statement deletes all connections to and from the node.
disconnect NODE1 from NODE2
The above statement deletes the connection from node 1 to node 2.
disconnect NODE1 between NODE2 and NODE3

721
Scripting Language Reference
The above statement deletes the connection from node 2 to node 1 and from node1 to node 3.
Node-Specific Properties
There are many node-specific properties used to set options found in the user-interfacedialog boxes for each node. These node properties are also referred to as slotparameters. For example, to create a stream and specify options for each node, youwould use a script similar to this one:
create varfilenode at 100 100set :varfilenode {full_filename = "demos/drug1n"read_field_names = "True"}create tablenode at 400 100create samplenode connected between :varfilenode and :tablenodeset :samplenode {max_size = 200mode = "Include"sample_type = "First"}create plotnode at 300 300create derivenode connected between drug1n and :plotnodeset :derivenode {new_name = "Ratio of Na to K"formula_expr = "'Na' / 'K'"}set :plotnode {x_field = 'Ratio of Na to K'y_field = 'Age'color_field = 'BP'}
The above script uses a combination of general and specific node properties to createa functional data stream. The multiset commands (contained within {}) are used tospecify node-specific properties such as reading data files, CLEM expressions, andcolor overlay fields. For more information, see “Properties Reference Overview”in Appendix D on page 737.
722
Appendix B
Manipulating the Generated Models Palette
In addition to the standard properties used to manipulate objects in Clementine, thereare a number of model-specific properties that you can use to work with the models inthe generated models palette (also called the Models tab in the manager window).
This statement loads the complete contents of the specified generated models palette:
export generated MODEL in DIRECTORY
The next statement exports the specified model in the named directory. This statementexports C code for those nodes that support C code export. For any other exports, thisstatement generates an error. For this statement to work, the specified model must bepresent on the generated models palette and must be the only model with that name;also, the named directory must exist.
export_xml generated MODEL in DIRECTORY
Duplicate Model Names
When using scripts to manipulate generated models, you should be aware thatallowing duplicate model names can result in script ambiguity. It's a good idea torequire unique names for generated models when scripting.
To set options for duplicate model names:
E From the menus, choose:Tools
User Options
E Click the Notifications tab.
E Select Replace previous model to restrict duplicate naming for generated models.
Adding Models to a Stream
There are several ways to add generated models to the current stream.

723
Scripting Language Reference
insert model MODELinsert model MODEL NODE_POSITION
Both statements are used to insert the specified model from the generated modelstab/palette into the stream. The second statement includes a positional specification.
For reference, NODE_POSITION modifiers for nodes are:
at X Y
between NODE1 and NODE2
connected between NODE1 and NODE2
This returns the model added to the stream.
Deleting Models
delete last model
Deletes the last model inserted into the stream with the insert model statement.The insert model statement must have been executed at least once for the streamwithin the current script, and the node that was created must exist.
delete model MODEL
This deletes the named model from the generated models palette.
clear generated palette
This clears the generated models palette.
Exporting Models
Models can be exported to a specific directory with a specific filename using thefollowing syntax:
export model MODEL in DIRECTORY format FORMATexport model MODEL as FILENAME format FORMAT

724
Appendix B
The following formats are supported:
pmmlc_codemodeltextmodelhtml
The options modelhtml and modeltext export the model tab of a generated modelin either HTML or plain text. For example, if you have generated a model calledassocapriori, you could export the model using the following command:
export model 'assocapriori' as 'C:\temp\assoc_apriori' format modelhtml
This creates an HTML file with the model tab results displayed in table format.
Figure B-3Association model tab exported as HTML
Manipulating SuperNodes
SuperNodes include a number of properties that can be used to change the behaviorof the SuperNode.

725
Scripting Language Reference
Property Value Description
parameters Provides access to the parameters specified withina SuperNode.
default_execute SCRIPT or NORMAL (Terminal SuperNodes only.) This propertydefines whether executing the terminal SuperNodesimply executes each subterminal node or executesthe SuperNode script.
For more information, see “ SuperNode Properties” in Appendix D on page 794.
Results Manipulation
Terminal nodes include a read-only parameter called output that can be used toaccess the most recently generated object. This release includes properties to allowscript access to the attributes and values in the data that was generated in a Tablenode—for example:
set num_rows = :tablenode.output.row_countset num_cols = :tablenode.output.column_count
Attempting to access the value of a generated object slot where the object has notbeen created will generate an error. The values within the data set underlying aparticular generated object are accessible using the value command:
set table_data = :tablenode.outputset last_value = value table_data at num_rows num_cols
Indexing is from 1.
The following properties are common to all result objects:
Property Description
row_count Returns the number of rows in the data.
column_count Returns the number of columns in the data.
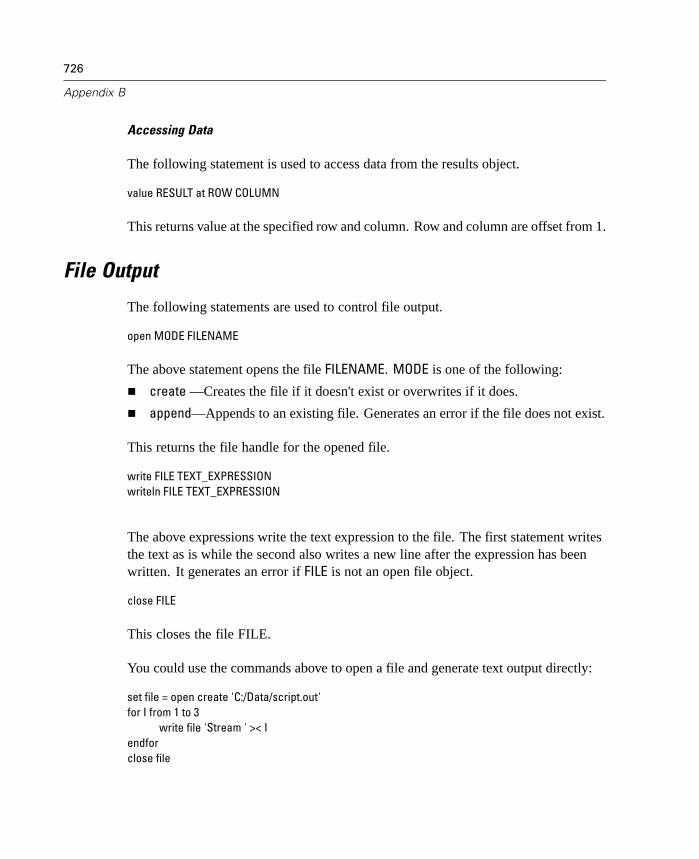
726
Appendix B
Accessing Data
The following statement is used to access data from the results object.
value RESULT at ROW COLUMN
This returns value at the specified row and column. Row and column are offset from 1.
File Output
The following statements are used to control file output.
open MODE FILENAME
The above statement opens the file FILENAME. MODE is one of the following:
create —Creates the file if it doesn't exist or overwrites if it does.
append—Appends to an existing file. Generates an error if the file does not exist.
This returns the file handle for the opened file.
write FILE TEXT_EXPRESSIONwriteln FILE TEXT_EXPRESSION
The above expressions write the text expression to the file. The first statement writesthe text as is while the second also writes a new line after the expression has beenwritten. It generates an error if FILE is not an open file object.
close FILE
This closes the file FILE.
You could use the commands above to open a file and generate text output directly:
set file = open create 'C:/Data/script.out'for I from 1 to 3
write file 'Stream ' >< Iendforclose file
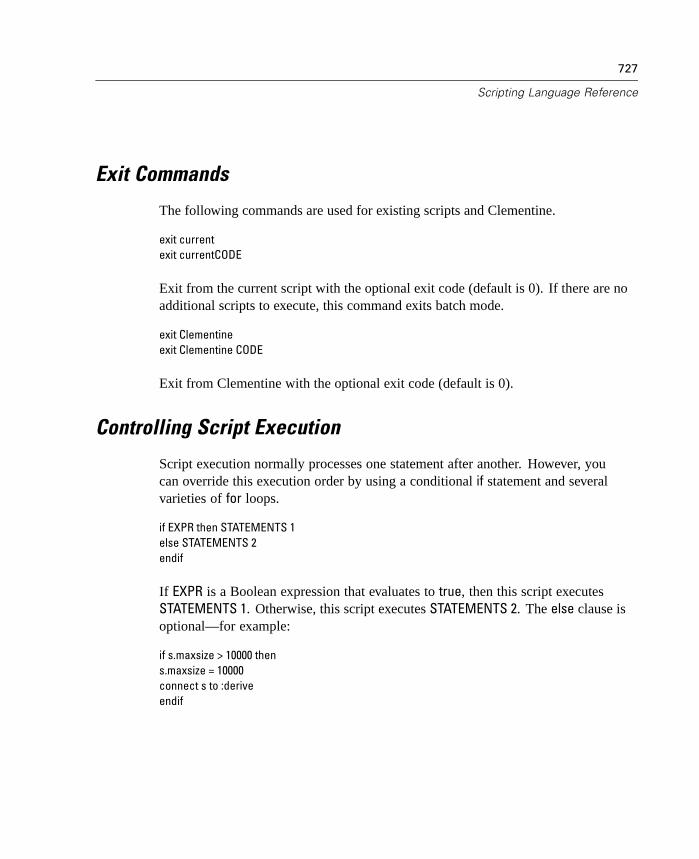
727
Scripting Language Reference
Exit Commands
The following commands are used for existing scripts and Clementine.
exit currentexit currentCODE
Exit from the current script with the optional exit code (default is 0). If there are noadditional scripts to execute, this command exits batch mode.
exit Clementineexit Clementine CODE
Exit from Clementine with the optional exit code (default is 0).
Controlling Script Execution
Script execution normally processes one statement after another. However, youcan override this execution order by using a conditional if statement and severalvarieties of for loops.
if EXPR then STATEMENTS 1else STATEMENTS 2endif
If EXPR is a Boolean expression that evaluates to true, then this script executesSTATEMENTS 1. Otherwise, this script executes STATEMENTS 2. The else clause isoptional—for example:
if s.maxsize > 10000 thens.maxsize = 10000connect s to :deriveendif
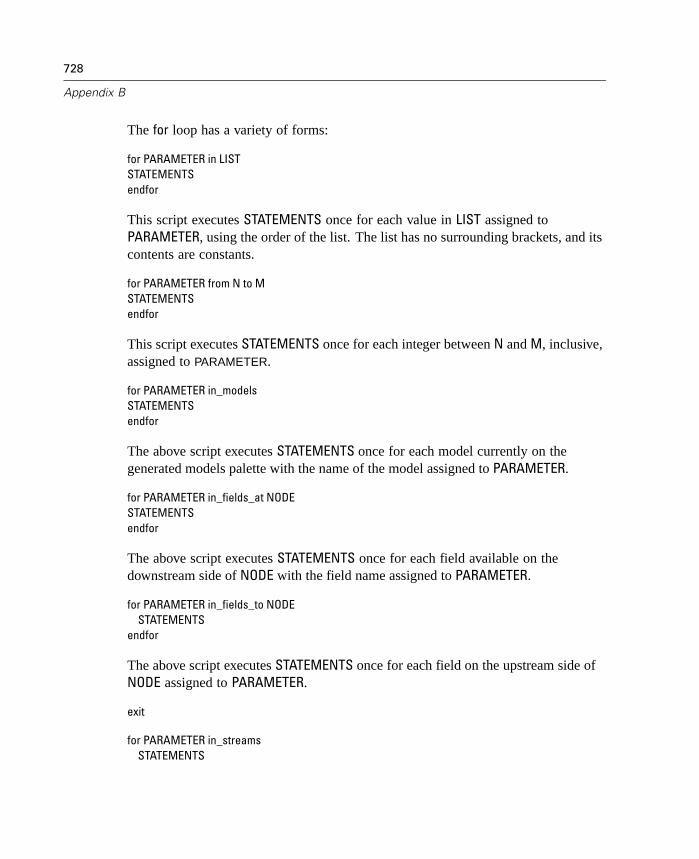
728
Appendix B
The for loop has a variety of forms:
for PARAMETER in LISTSTATEMENTSendfor
This script executes STATEMENTS once for each value in LIST assigned toPARAMETER, using the order of the list. The list has no surrounding brackets, and itscontents are constants.
for PARAMETER from N to MSTATEMENTSendfor
This script executes STATEMENTS once for each integer between N and M, inclusive,assigned to PARAMETER.
for PARAMETER in_modelsSTATEMENTSendfor
The above script executes STATEMENTS once for each model currently on thegenerated models palette with the name of the model assigned to PARAMETER.
for PARAMETER in_fields_at NODESTATEMENTSendfor
The above script executes STATEMENTS once for each field available on thedownstream side of NODE with the field name assigned to PARAMETER.
for PARAMETER in_fields_to NODESTATEMENTS
endfor
The above script executes STATEMENTS once for each field on the upstream side ofNODE assigned to PARAMETER.
exit
for PARAMETER in_streamsSTATEMENTS

729
Scripting Language Reference
endfor
The above script executes STATEMENTS once for each loaded stream palette assignedto PARAMETER. If PARAMETER is the special variable stream then the current streamis set for STATEMENTS in the loop. The original value of stream is restored when theloop terminates.
The above command exits from the current script. If there are no additional scriptsto execute, this command exits batch mode.
exit Clementine
The above command exits the Clementine application.
Executing and Interrupting Scripts
In Clementine, you can execute and interrupt scripts. You can execute a script usingany of the following methods:
Click the Execute button (marked with a green arrow) within a scripting dialogbox.
Execute a stream where Run this script is set as the default execution method.
Use the -execute flag on startup, either in normal or batch mode.
Note: A SuperNode script is executed when the SuperNode is executed as long as youhave selected Run this script within the SuperNode script dialog box.
When you are not in batch mode, during script execution the red Stop button isactivated in the Scripting dialog box toolbar. Using this button, you can abandon theexecution of the script and any current stream.

Appendix
CCommand Line Arguments
Invoking the Software
Using the command line of your operating system, you can launch either theClementine user interface (client machine only) or Clementine in batch mode (clientor server machines). To launch Clementine or Clementine Batch:
E Open a DOS window or command prompt window.
E Type the command clemb or clementine as well as any arguments (flags) used to loadstreams, execute scripts, and connect to a server.
Command Line Arguments
There are a number of command line arguments, also referred to as flags, that youcan use to alter the invocation of Clementine or Clementine Batch. These flags aresimply appended to the initial command clementine or clemb.
For example, you can combine the clemb command with other startup flags,such as -stream and -execute, in order to load and execute streams in batch mode.The following command loads and executes the stream report.str without invokingthe user interface:
clemb -stream report.str -execute
You can also execute Clementine states and scripts in this manner, using the -stateand -script flags, respectively.
731
732
Appendix C
Combining Multiple Arguments
Multiple arguments can be combined in a single command file specified atinvocation using the @ symbol followed by the filename. This enables you toshorten the clementine or clemb invocation and overcome any operating systemlimitations on command length. For example, the following startup command startsClementine Batch using all of the arguments specified in the file referenced by<commandFileName>.
clemb @<commandFileName>
A command file can contain all arguments previously specified individually at startup.For example, the command line invocation
clemb -stream report.str -Porder.full_filename=APR_orders.dat -Preport.filename=APR_report.txt -execute
may be replaced by a command file with one argument per line as follows:
-stream report.str-Porder.full_filename=APR_orders.dat-Preport.filename=APR_report.txt-execute
When writing and referencing command files, be sure to follow these constraints:
Use only one command per line.
A command file cannot contain an embedded @CommandFile argument.
Enclose the filename and path in quotes if spaces are required—for example,clementine @”c:/Program Files/clementine/scripts/my command file.txt”.
Server Connection Arguments
In order to complete execution requests, Clementine (in both user interface and batchmodes) connects to a server. If you have not specified a server using the argumentslisted below, the application will connect to a default server. The -local and -serverflags are used to override the default server connection from the command line.

733
Command Line Arguments
The -server flag tells Clementine that it should connect to a public server, andthe flags -hostname, -port, -username, -password, and -domain are used to tellClementine how to connect to the public server.
The -local flag tells Clementine to launch its own local execution server(clemlocal). In this mode, the server isn't public and is used only by the currentsession of Clementine.
For more information on arguments used to run in local or server mode, consult thefollowing table.
Argument Behavior
-local Overrides saved settings and runs Clementine in local mode,using its own local execution server (clemlocal). If -serveris also specified, the application will fail and a warning willbe raised.
-server Overrides saved settings and runs Clementine in server mode,connecting to a public server using the flags -hostname, -port,-username, -password, and -domain. If -client is alsospecified, the application will fail and a warning will be raised.
-hostname <name> The host name of the server machine. Available in servermode only.
-port <number> The port number of the specified server. Available in servermode only.
-username <name> The user name with which to log in to the server. Available inserver mode only.
-password <password> The password with which to log in to the server. Available inserver mode only. Note: If the -password argument is notused, you will be prompted for a password.
-epassword<encodedpasswordstring>
The encoded password with which to log in to the server.Available in server mode only. Note: An encoded passwordcan be generated from the Tools menu of the Clementineapplication.
-domain <name> The domain used to log in to the server. Available in servermode only.
-P <name>=<value> Used to set a startup parameter. Can also be used to set nodeproperties, or slot parameters.
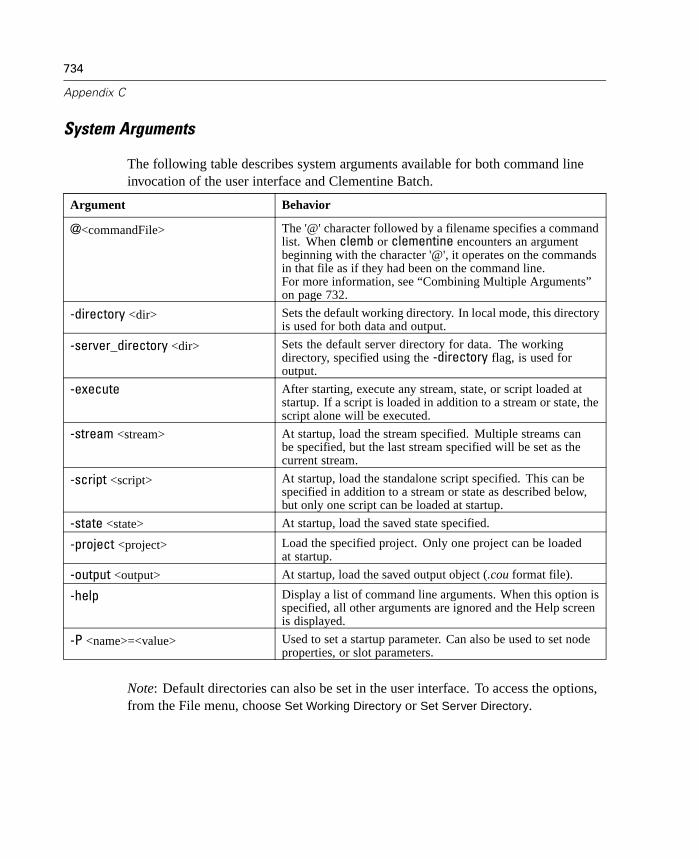
734
Appendix C
System Arguments
The following table describes system arguments available for both command lineinvocation of the user interface and Clementine Batch.
Argument Behavior
@<commandFile> The '@' character followed by a filename specifies a commandlist. When clemb or clementine encounters an argumentbeginning with the character '@', it operates on the commandsin that file as if they had been on the command line.For more information, see “Combining Multiple Arguments”on page 732.
-directory <dir> Sets the default working directory. In local mode, this directoryis used for both data and output.
-server_directory <dir> Sets the default server directory for data. The workingdirectory, specified using the -directory flag, is used foroutput.
-execute After starting, execute any stream, state, or script loaded atstartup. If a script is loaded in addition to a stream or state, thescript alone will be executed.
-stream <stream> At startup, load the stream specified. Multiple streams canbe specified, but the last stream specified will be set as thecurrent stream.
-script <script> At startup, load the standalone script specified. This can bespecified in addition to a stream or state as described below,but only one script can be loaded at startup.
-state <state> At startup, load the saved state specified.
-project <project> Load the specified project. Only one project can be loadedat startup.
-output <output> At startup, load the saved output object (.cou format file).
-help Display a list of command line arguments. When this option isspecified, all other arguments are ignored and the Help screenis displayed.
-P <name>=<value> Used to set a startup parameter. Can also be used to set nodeproperties, or slot parameters.
Note: Default directories can also be set in the user interface. To access the options,from the File menu, choose Set Working Directory or Set Server Directory.

735
Command Line Arguments
Loading Multiple Files
From the command line, you can easily load multiple streams, states, and outputs atstartup. To do so, you should repeat the relevant argument for each object loaded. Forexample, to load and execute two streams called report.str and train.str, you woulduse the following command line arguments:
clemb -stream report.str -stream train.str -execute
Log File Arguments
Running Clementine in batch mode produces a log file. By default, the name of thislog file is clem_batch.log, but you can specify an alternative name using the -log flag.For example, the following command executes report.str in batch mode and sendsthe logging information to report.log:
clemb -stream report.str -execute -log report.log
Normally, the log file overwrites any existing file of the same name, but you can makeClementine append to the log file instead by using the -appendlog flag. Logging canalso be suppressed altogether by using the -nolog flag.
Note: Logging arguments are available only when running in batch mode.
Argument Behavior
-appendlog Append to an existing log file instead of creating a new one (batchmode only).
-log <logfile> Specify a log file for batch mode logging information instead ofthe default clem_batch.log. Note: Specifying stdout will causelogging to the console.
-nolog Produce no logging information in batch mode.
Parameter Arguments
Parameters can be used as flags during command line execution of Clementine orClementine Batch mode. In command line arguments, the -P flag is used to denote aparameter of the form -P<name>=<value>.

736
Appendix C
Parameters can be any of the following:
Simple parameters, or parameters used directly in CLEM expressions.
Slot parameters, also referred to as node properties. These parameters are usedto modify the settings of nodes in the stream.
Command line parameters, which are parameters used to alter the invocationof Clementine or Clementine Batch.
For example, you can supply data source user names and passwords as command lineflags, such as the following:
clementine -stream response.str -P:databasenode.username=george -P:databasenode.password=jetson
For more information, see “Using Parameters in Batch Mode” in Chapter 17 onpage 594.

Appendix
DNode and Stream Properties
Properties Reference Overview
Node and stream properties allow you to specify options for a variety of nodes, suchas Filter, Multiplot, Neural Net, and Evaluation. Other types of properties referto high-level stream operations, such as caching or SuperNode behavior. Using acombination of scripting commands, parameters, and node and stream properties, youcan automate a number of operations and run Clementine in batch mode.
Node properties can be used in SuperNode parameters. For more information,see “Using SuperNode Parameters to Access Node Properties” in Chapter 15on page 569.
Node properties can also be used as part of a command line option (using the -Pflag) when starting Clementine. For more information, see “Using Parameters inBatch Mode” in Chapter 17 on page 594.
This section describes the node settings that you can control using properties and howyou can reference these properties, including:
Properties syntax
Examples of node and stream properties
Structured node properties
In the context of scripting within Clementine, node and stream properties are oftencalled slot parameters. In this guide, they are referred to as node or stream properties.
737
738
Appendix D
Syntax for Node and Stream Properties
Properties must use the following syntax structure:
NAME:TYPE.PROPERTY
where NAME is the name of a node, and the TYPE is its type, such as multiplotnodeor derivenode. You can omit either NAME or TYPE, but you must include at leastone of them. PROPERTY is the name of the node or stream parameter that yourexpression refers to. For example, the following syntax is used to filter the Agefield from downstream data:
set mynode:filternode.include.Age = false
To use a custom value for any of the parameters (NAME, TYPE, or PROPERTY), firstset the value in a statement, such as set derive.newname = mynewfield. From thatpoint on, you can use the value, mynewfieldname, as the parameter by preceding itwith the ^ symbol. For example, you can set the type for the Derive node namedabove using the following syntax:
set ^mynewfield.result_type = "Conditional"
All nodes used in Clementine can be specified in the TYPE parameter of the syntaxNAME:TYPE.PROPERTY. Additionally, any node defined by the Clementine ExternalModule Interface can also be controlled using scripting parameters.
Structured Properties
There are two ways in which scripting uses structured properties for increasedclarity when parsing:
To give structure to the names of properties for complex nodes, such as Type,Filter, or Balance nodes.
To provide a format for specifying multiple properties at once.
739
Node and Stream Properties
Structuring for Complex Interfaces
The scripts for nodes with tables and other complex interfaces, such as the Type,Filter, and Balance nodes, must follow a particular structure in order to parsecorrectly. These structured properties need a name that is more complex than thename for a single identifier. For example, within a Filter node, each available field(on its upstream side) is switched either on or off. In order to refer to this information,the Filter node stores one item of information per field (whether each field is true orfalse), and these multiple items are accessed and updated by a single property calledfield. This may have (or be given) the value true or false. Suppose that a Filter nodenamed mynode has (on its upstream side) a field called Age. To switch this off, set theproperty mynode.include.Age to the value false, as follows:
set mynode.include.Age = false
Structuring to Set Multiple Properties
For many nodes, you can assign more than one node or stream property at a time.This is referred to as the multiset command or set block. For more information, see“Setting Properties and Parameters” in Appendix B on page 700.
In some cases, a structured property can be quite complex. The backslash (\)character can be used as line continuation character to help you line up the argumentsfor clarity. For example:
mynode:sortnode.keys = [{ 'K' Descending} \{ 'Age' Ascending}\{ 'Na' Descending }]
Another advantage of structured properties is the ability to set several properties ona node before the node is stable. By default, a multiset sets all properties in theblock before taking any action based on an individual property setting. For example,when defining a Fixed File node, using two steps to set field properties would resultin errors because the node is not consistent until both settings are valid. Definingproperties as a multiset circumvents this problem by setting both properties beforeupdating the data model.

740
Appendix D
Abbreviations
Standard abbreviations are used throughout the syntax for node properties. Learningthe abbreviations may help you in constructing scripts.
Abbreviation Meaning
abs absolute value
len length
min minimum
max maximum
correl correlation
covar covariance
num number or numeric
pct percent or percentage
transp transparency
xval cross-validation
var variance or variable (in Source nodes)
Node and Stream Property Examples
Node and stream properties can be used in a variety of ways with Clementine. Theyare most commonly used as part of a script, either a standalone script, used toautomate multiple streams or operations, or a stream script, used to automateprocesses within a single stream. SuperNode parameters can also be specified usingthe properties for nodes within the SuperNode. At the most basic level, propertiescan also be used as a command line option for starting Clementine. Using the -pargument as part of command line invocation, you can change a setting in the streamusing a stream property.
s.max_size Refers to the property max_size of the nodenamed s.
s:samplenode.max_size Refers to the property max_size of the nodenamed s, which must be a sample node.
:samplenode.max_sizeRefers to the property max_size of theSample node in the current stream (theremust be only one Sample node).

741
Node and Stream Properties
s:sample.max_size Refers to the property max_size of the nodenamed s, which must be a Sample node.
t.direction.Age Refers to the direction of the field Age in theType node t.
:.max_size *** NOT LEGAL *** You must specifyeither the node name or the node type.
The example s:sample.max_size illustrates that you do not need to spell out nodetypes in full.
The example t.direction.Age illustrates that some slot names can themselves bestructured—in cases where the attributes of a node are more complex than simplyindividual slots with individual values. Such slots are called structured or complexproperties.
Node Properties
Each type of node has its own set of legal properties. Each property has a type;this may be a general type—number, flag, or string—in which case, settings forthe property are coerced to the correct type, or an error is raised if they cannot becoerced. Alternatively, the property reference may specify the range of legal valuessuch as Discard, PairAndDiscard, and IncludeAsText, in which case an error israised if any other value is used. Flag properties can be set to false using any of thefollowing values: Off, OFF, off, No, NO, no, n, N, f, F, false, False, FALSE, or 0. Allother values are regarded as true. In the reference tables found in this guide, thestructured properties are indicated as such in the Property Description column, andtheir usage formats are given.
Note: Nodes created by the Clementine External Module Interface also haveproperties created for them automatically.
Common Node Properties
A number of properties are common to all nodes (including SuperNodes) inClementine.
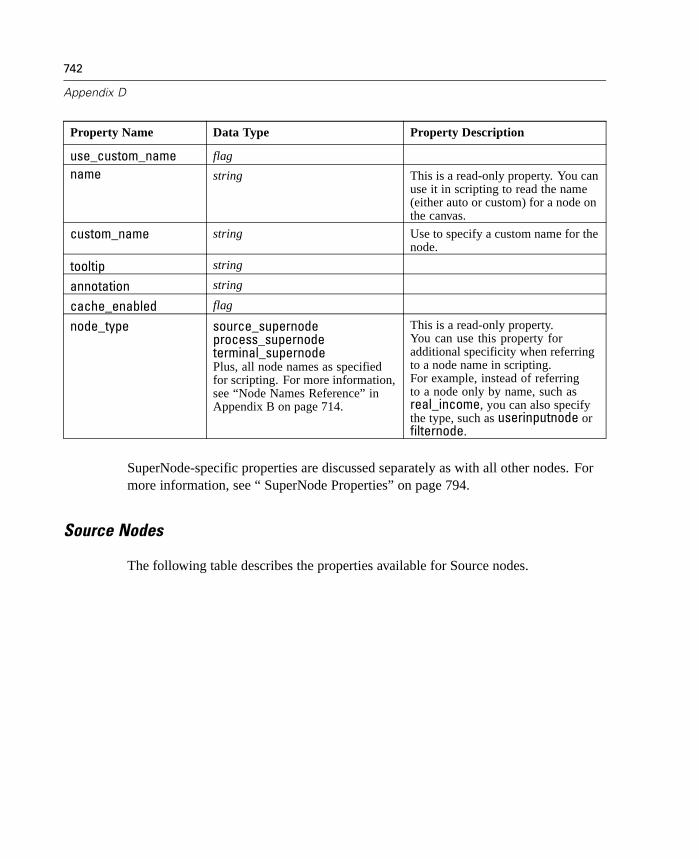
742
Appendix D
Property Name Data Type Property Description
use_custom_name flag
name string This is a read-only property. You canuse it in scripting to read the name(either auto or custom) for a node onthe canvas.
custom_name string Use to specify a custom name for thenode.
tooltip string
annotation string
cache_enabled flag
node_type source_supernodeprocess_supernodeterminal_supernodePlus, all node names as specifiedfor scripting. For more information,see “Node Names Reference” inAppendix B on page 714.
This is a read-only property.You can use this property foradditional specificity when referringto a node name in scripting.For example, instead of referringto a node only by name, such asreal_income, you can also specifythe type, such as userinputnode orfilternode.
SuperNode-specific properties are discussed separately as with all other nodes. Formore information, see “ SuperNode Properties” on page 794.
Source Nodes
The following table describes the properties available for Source nodes.

743
Node and Stream Properties
Node Property Name Data Type Property Description
skip_header number
num_fields_auto flag
num_fields number
delimit_space flag
delimit_tab flag
delimit_new_line flag
delimit_non_printing flag
delimit_comma flag
delimit_other flag
other string
decimal_symbol DefaultCommaPeriod
multi_blank flag
read_field_names flag
strip_spaces NoneLeftRightBoth
invalid_char_mode DiscardReplace
invalid_char_replacement string
lines_to_scan number
quotes_1 DiscardPairAndDiscardIncludeAsText
quotes_2 DiscardPairAndDiscardIncludeAsText
variablefilenode
full_filename string Full name of file to beread, including directory.
fixedfilenode record_len number
line_oriented flag
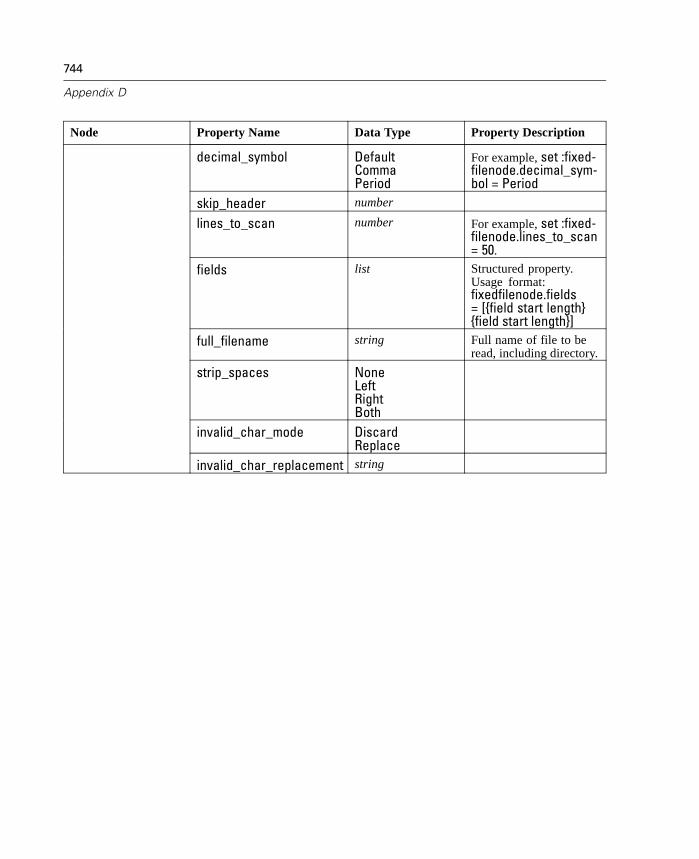
744
Appendix D
Node Property Name Data Type Property Description
decimal_symbol DefaultCommaPeriod
For example, set :fixed-filenode.decimal_sym-bol = Period
skip_header number
lines_to_scan number For example, set :fixed-filenode.lines_to_scan= 50.
fields list Structured property.Usage format:fixedfilenode.fields= [{field start length}{field start length}]
full_filename string Full name of file to beread, including directory.
strip_spaces NoneLeftRightBoth
invalid_char_mode DiscardReplace
invalid_char_replacement string
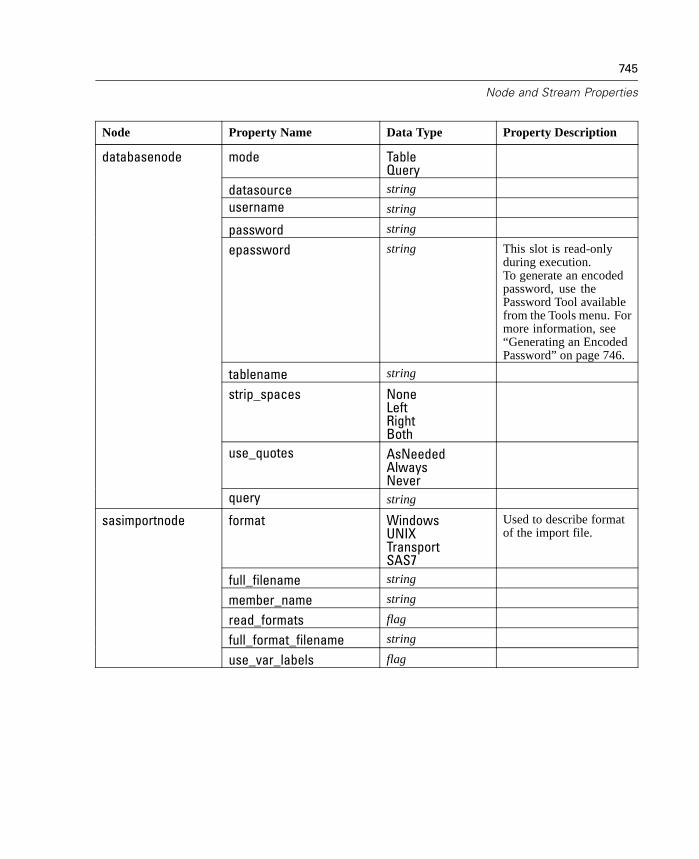
745
Node and Stream Properties
Node Property Name Data Type Property Description
mode TableQuery
datasource string
username string
password string
epassword string This slot is read-onlyduring execution.To generate an encodedpassword, use thePassword Tool availablefrom the Tools menu. Formore information, see“Generating an EncodedPassword” on page 746.
tablename string
strip_spaces NoneLeftRightBoth
use_quotes AsNeededAlwaysNever
databasenode
query string
format WindowsUNIXTransportSAS7
Used to describe formatof the import file.
full_filename string
member_name string
read_formats flag
full_format_filename string
sasimportnode
use_var_labels flag

746
Appendix D
Node Property Name Data Type Property Description
full_filename string
use_var_labels flag
spssimportnode orspssnode
use_value_labels flag
userinputnode values Structured property ofthe form: set :userin-putnode.values.Age ='10,70,5'. Note: Settingvalues for a field that isn'tpresent creates that field.Additionally, setting thevalues for a field to anempty string (" ") removesthe specified field.
Generating an Encoded Password
A tool is available through the user interface to generate encoded passwords basedon the Blowfish algorithm (see http://www.counterpane.com/blowfish.html for moredetails). Once encoded, you can copy and store the password to script files andcommand line arguments. The node property epassword used for databasenode anddatabaseexportnode stores the encoded password.
E To generate an encoded password, from the Tools menu choose:Encode Password
Figure D-1Encode Password Tool
E Specify a password in the Password textbox.
E Click Encode to generate a random encoding of your password.

747
Node and Stream Properties
E Click the Copy icon to copy the encoded password to the clipboard.
E Paste the password to the desired script or parameter.
Encoded passwords can be used in:
Node properties for Database Source and Output nodes.
Command line arguments for logging into the server.
Database connection properties stored in a .par file, the parameter file generatedby a Publisher node.
Record Operations Nodes
The following table describes the properties available for Record Operations nodes.
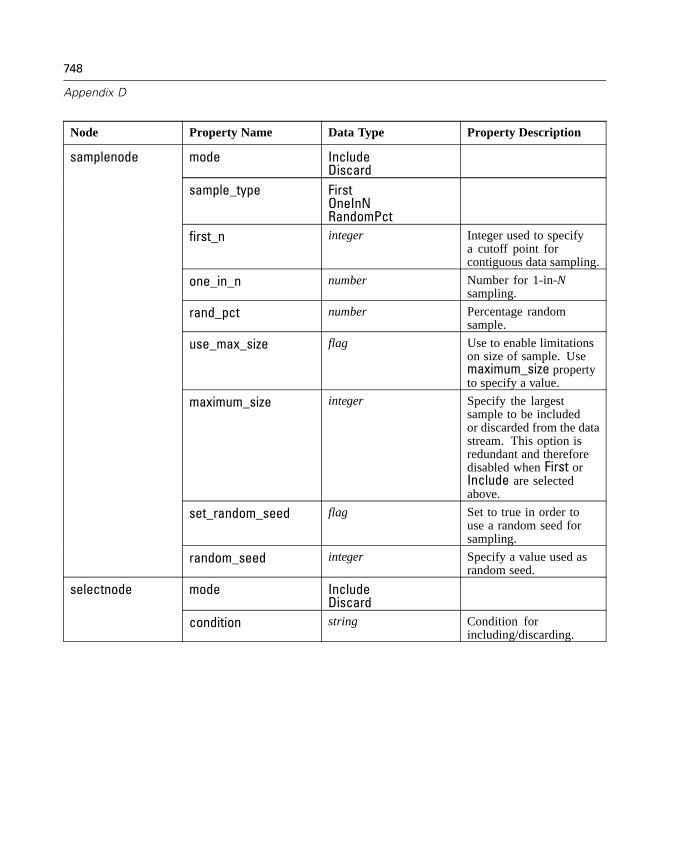
748
Appendix D
Node Property Name Data Type Property Description
mode IncludeDiscard
sample_type FirstOneInNRandomPct
first_n integer Integer used to specifya cutoff point forcontiguous data sampling.
one_in_n number Number for 1-in-Nsampling.
rand_pct number Percentage randomsample.
use_max_size flag Use to enable limitationson size of sample. Usemaximum_size propertyto specify a value.
maximum_size integer Specify the largestsample to be includedor discarded from the datastream. This option isredundant and thereforedisabled when First orInclude are selectedabove.
set_random_seed flag Set to true in order touse a random seed forsampling.
samplenode
random_seed integer Specify a value used asrandom seed.
mode IncludeDiscard
selectnode
condition string Condition forincluding/discarding.
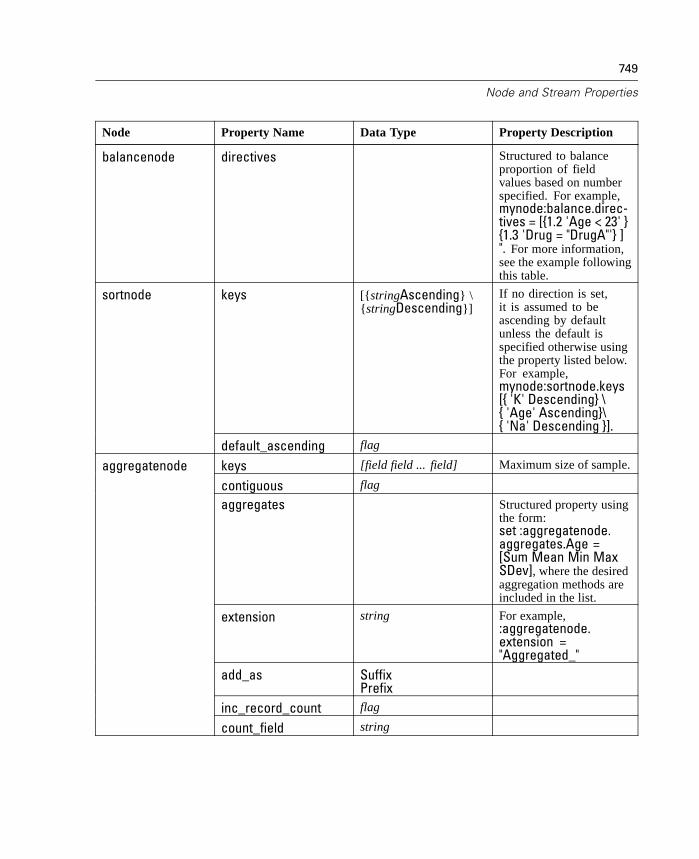
749
Node and Stream Properties
Node Property Name Data Type Property Description
balancenode directives Structured to balanceproportion of fieldvalues based on numberspecified. For example,mynode:balance.direc-tives = [{1.2 'Age < 23' }{1.3 'Drug = "DrugA"'} ]". For more information,see the example followingthis table.
keys [{stringAscending} \{stringDescending}]
If no direction is set,it is assumed to beascending by defaultunless the default isspecified otherwise usingthe property listed below.For example,mynode:sortnode.keys[{ 'K' Descending} \{ 'Age' Ascending}\{ 'Na' Descending }].
sortnode
default_ascending flag
keys [field field ... field] Maximum size of sample.
contiguous flag
aggregates Structured property usingthe form:set :aggregatenode.aggregates.Age =[Sum Mean Min MaxSDev], where the desiredaggregation methods areincluded in the list.
extension string For example,:aggregatenode.extension ="Aggregated_"
add_as SuffixPrefix
inc_record_count flag
aggregatenode
count_field string
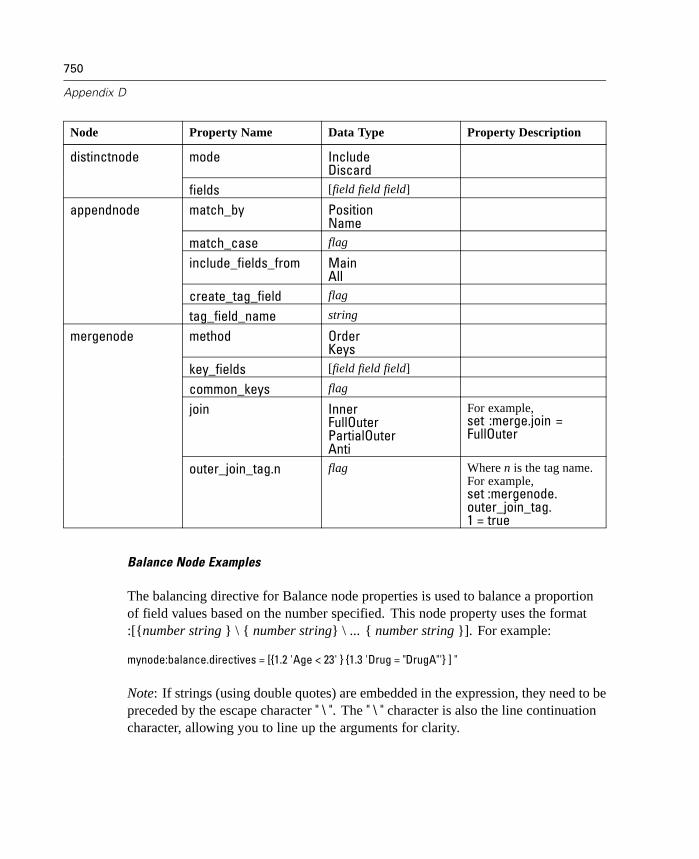
750
Appendix D
Node Property Name Data Type Property Description
mode IncludeDiscard
distinctnode
fields [field field field]
match_by PositionName
match_case flag
include_fields_from MainAll
create_tag_field flag
appendnode
tag_field_name string
method OrderKeys
key_fields [field field field]
common_keys flag
join InnerFullOuterPartialOuterAnti
For example,set :merge.join =FullOuter
mergenode
outer_join_tag.n flag Where n is the tag name.For example,set :mergenode.outer_join_tag.1 = true
Balance Node Examples
The balancing directive for Balance node properties is used to balance a proportionof field values based on the number specified. This node property uses the format:[{number string } \ { number string} \ ... { number string }]. For example:
mynode:balance.directives = [{1.2 'Age < 23' } {1.3 'Drug = "DrugA"'} ] "
Note: If strings (using double quotes) are embedded in the expression, they need to bepreceded by the escape character " \ ". The " \ " character is also the line continuationcharacter, allowing you to line up the arguments for clarity.
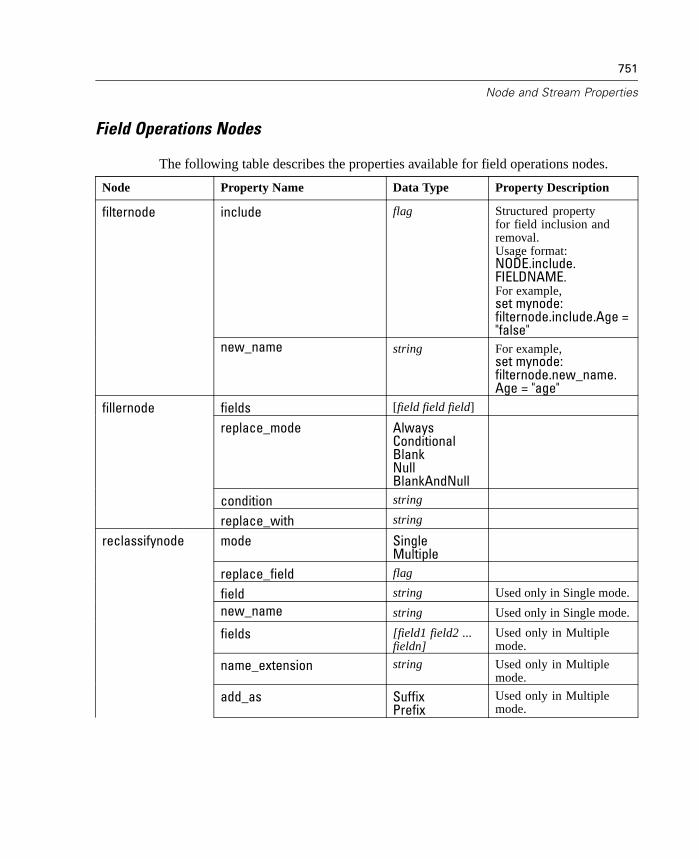
751
Node and Stream Properties
Field Operations Nodes
The following table describes the properties available for field operations nodes.
Node Property Name Data Type Property Description
include flag Structured propertyfor field inclusion andremoval.Usage format:NODE.include.FIELDNAME.For example,set mynode:filternode.include.Age ="false"
filternode
new_name string For example,set mynode:filternode.new_name.Age = "age"
fields [field field field]
replace_mode AlwaysConditionalBlankNullBlankAndNull
condition string
fillernode
replace_with string
reclassifynode mode SingleMultiple
replace_field flag
field string Used only in Single mode.
new_name string Used only in Single mode.
fields [field1 field2 ...fieldn]
Used only in Multiplemode.
name_extension string Used only in Multiplemode.
add_as SuffixPrefix
Used only in Multiplemode.
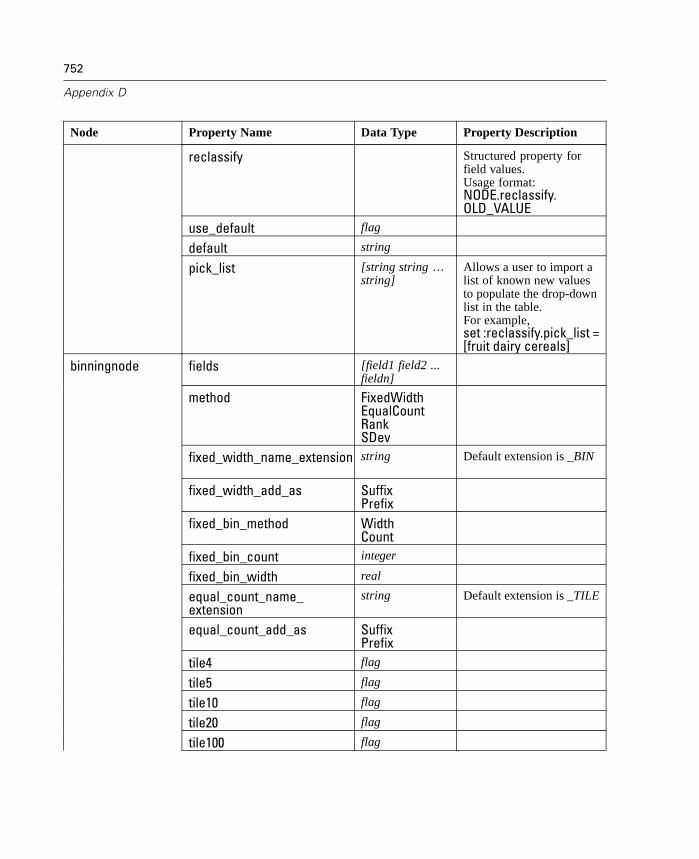
752
Appendix D
Node Property Name Data Type Property Description
reclassify Structured property forfield values.Usage format:NODE.reclassify.OLD_VALUE
use_default flag
default string
pick_list [string string …string]
Allows a user to import alist of known new valuesto populate the drop-downlist in the table.For example,set :reclassify.pick_list =[fruit dairy cereals]
binningnode fields [field1 field2 ...fieldn]
method FixedWidthEqualCountRankSDev
fixed_width_name_extension string Default extension is _BIN
fixed_width_add_as SuffixPrefix
fixed_bin_method WidthCount
fixed_bin_count integer
fixed_bin_width real
equal_count_name_extension
string Default extension is _TILE
equal_count_add_as SuffixPrefix
tile4 flag
tile5 flag
tile10 flag
tile20 flag
tile100 flag
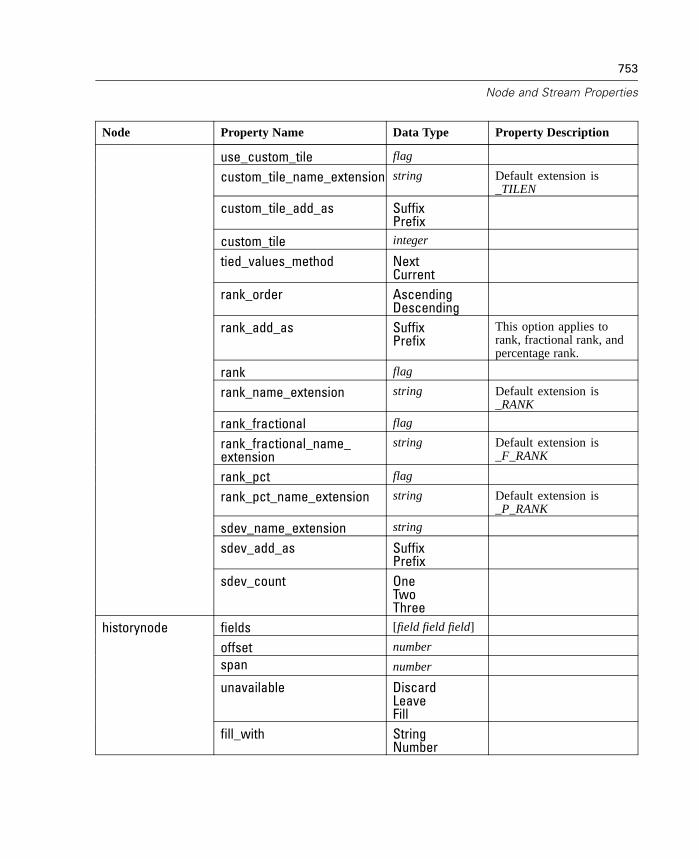
753
Node and Stream Properties
Node Property Name Data Type Property Description
use_custom_tile flag
custom_tile_name_extension string Default extension is_TILEN
custom_tile_add_as SuffixPrefix
custom_tile integer
tied_values_method NextCurrent
rank_order AscendingDescending
rank_add_as SuffixPrefix
This option applies torank, fractional rank, andpercentage rank.
rank flag
rank_name_extension string Default extension is_RANK
rank_fractional flag
rank_fractional_name_extension
string Default extension is_F_RANK
rank_pct flag
rank_pct_name_extension string Default extension is_P_RANK
sdev_name_extension string
sdev_add_as SuffixPrefix
sdev_count OneTwoThree
fields [field field field]
offset number
span number
unavailable DiscardLeaveFill
historynode
fill_with StringNumber

754
Appendix D
Node Property Name Data Type Property Description
fields_from [field field field] For example,set :settoflagn-ode.fields_from.Drug= [drugA drugB]creates flag fieldscalled Drug_drugAand Drug_drugB.
true_value string
false_value string
use_extension flag
extension string
add_as SuffixPrefix
aggregate flag
settoflagnode
keys [field field field]
typenode direction InOutBothNone
Structured property forfield directions.Usage format:NODE.direction.FIELDNAME
type RangeFlagSetTypelessDiscreteDefault
Type of field. Setting typeto Default will clear anyvalues parameter setting,and if value_mode hasthe value Specify, it willbe reset to Read. Ifvalue_mode is set to Passor Read, setting type willnot affect value_mode.Usage format:NODE.type.FIELDNAME
storage UnknownStringIntegerRealTimeDateTimestamp
Read-only structuredproperty for field storagetype.Usage format:NODE.storage.FIELDNAME
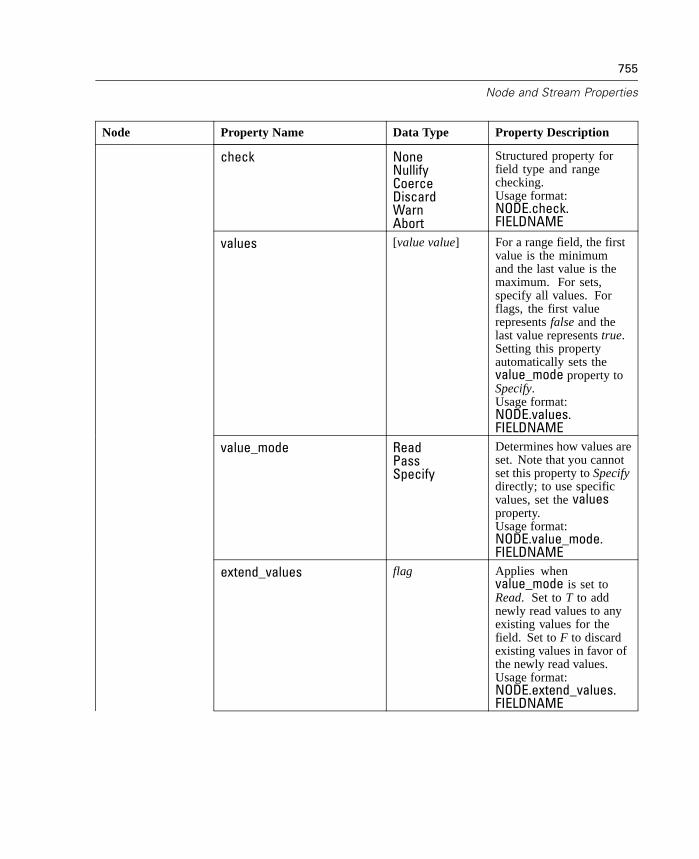
755
Node and Stream Properties
Node Property Name Data Type Property Description
check NoneNullifyCoerceDiscardWarnAbort
Structured property forfield type and rangechecking.Usage format:NODE.check.FIELDNAME
values [value value] For a range field, the firstvalue is the minimumand the last value is themaximum. For sets,specify all values. Forflags, the first valuerepresents false and thelast value represents true.Setting this propertyautomatically sets thevalue_mode property toSpecify.Usage format:NODE.values.FIELDNAME
value_mode ReadPassSpecify
Determines how values areset. Note that you cannotset this property to Specifydirectly; to use specificvalues, set the valuesproperty.Usage format:NODE.value_mode.FIELDNAME
extend_values flag Applies whenvalue_mode is set toRead. Set to T to addnewly read values to anyexisting values for thefield. Set to F to discardexisting values in favor ofthe newly read values.Usage format:NODE.extend_values.FIELDNAME
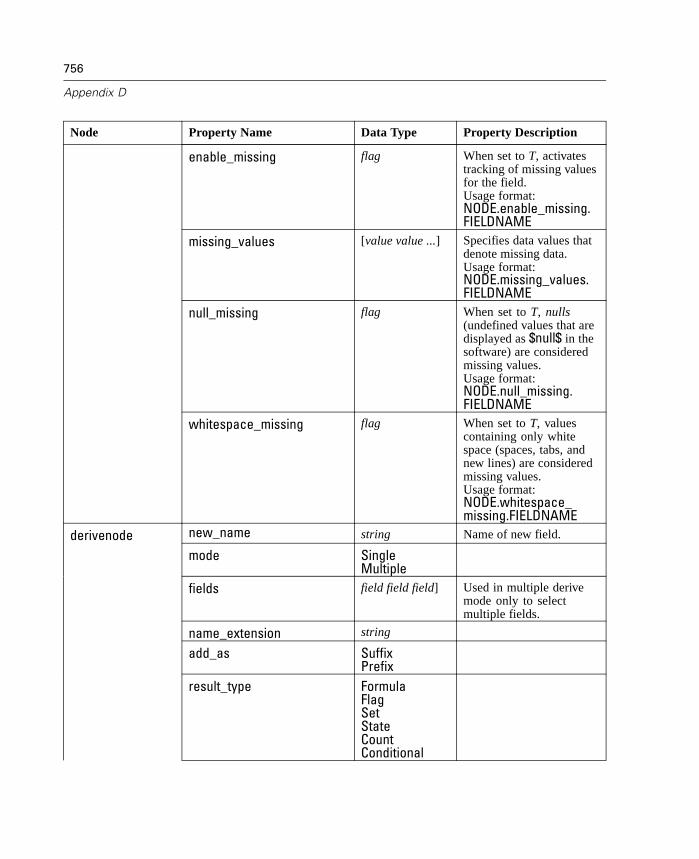
756
Appendix D
Node Property Name Data Type Property Description
enable_missing flag When set to T, activatestracking of missing valuesfor the field.Usage format:NODE.enable_missing.FIELDNAME
missing_values [value value ...] Specifies data values thatdenote missing data.Usage format:NODE.missing_values.FIELDNAME
null_missing flag When set to T, nulls(undefined values that aredisplayed as $null$ in thesoftware) are consideredmissing values.Usage format:NODE.null_missing.FIELDNAME
whitespace_missing flag When set to T, valuescontaining only whitespace (spaces, tabs, andnew lines) are consideredmissing values.Usage format:NODE.whitespace_missing.FIELDNAME
derivenode new_name string Name of new field.
mode SingleMultiple
fields field field field] Used in multiple derivemode only to selectmultiple fields.
name_extension string
add_as SuffixPrefix
result_type FormulaFlagSetStateCountConditional

757
Node and Stream Properties
Node Property Name Data Type Property Description
formula_expr string Expression for calculatinga new field value in aDerive Any node.
flag_expr string
flag_true string
flag_false string
set_default string
set_value_cond string Structured to supply thecondition associated witha given value.Usage format:set :derivenode.set_value_cond.Retired = 'age > 65'
state_on_val string
state_off_val string
state_on_expression string
state_off_expression string
state_initial OnOff
count_initial_val string
count_inc_condition string
count_inc_expression string
count_reset_condition string
cond_if_cond string
cond_then_expr string
cond_else_expr string
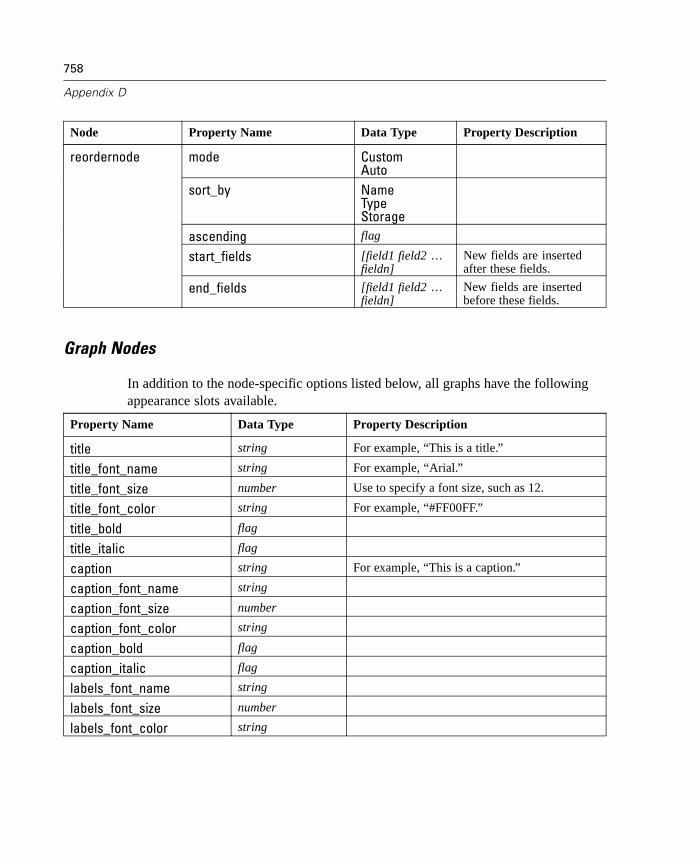
758
Appendix D
Node Property Name Data Type Property Description
mode CustomAuto
sort_by NameTypeStorage
ascending flag
start_fields [field1 field2 …fieldn]
New fields are insertedafter these fields.
reordernode
end_fields [field1 field2 …fieldn]
New fields are insertedbefore these fields.
Graph Nodes
In addition to the node-specific options listed below, all graphs have the followingappearance slots available.
Property Name Data Type Property Description
title string For example, “This is a title.”
title_font_name string For example, “Arial.”
title_font_size number Use to specify a font size, such as 12.
title_font_color string For example, “#FF00FF.”
title_bold flag
title_italic flag
caption string For example, “This is a caption.”
caption_font_name string
caption_font_size number
caption_font_color string
caption_bold flag
caption_italic flag
labels_font_name string
labels_font_size number
labels_font_color string

759
Node and Stream Properties
Property Name Data Type Property Description
labels_bold flag
labels_italic flag
Notes
Turning off optional fields. Optional fields, such as an overlay field for plots, can beturned off by setting the property value to " " (empty string). For example:
set :plotnode.color_field = ""
Specifying colors. The colors for titles, captions, backgrounds, and labels can bespecified using the hexadecimal strings starting with the hash (#) symbol. Forexample, to set the graph background to sky blue, you would use the followingstatement:
set mygraph.graph_background="#87CEEB"
Here, the first two digits, 87, specify the red content; the middle two digits, CE,specify the green content; and the last two digits, EB, specify the blue content. Eachdigit can take a value in the range 0–9 or A–F. Together these values can specify ared-green-blue, or RGB, color. Note: When specifying colors in RGB, you can usethe Field Chooser in the user interface to determine the correct color code. Simplyhover over the color to activate a tooltip with the desired information.
When specifying colors in RGB, you can use the Field Chooser in the userinterface to determine the correct color code. Simply hover over the color to activatea tooltip with the desired information.
The following table describes the specific properties available for individualGraph nodes.
Node Property Name Data Type Property Description
plotnode x_field field
y_field field
three_D flag
z_field field
color_field field Overlay field
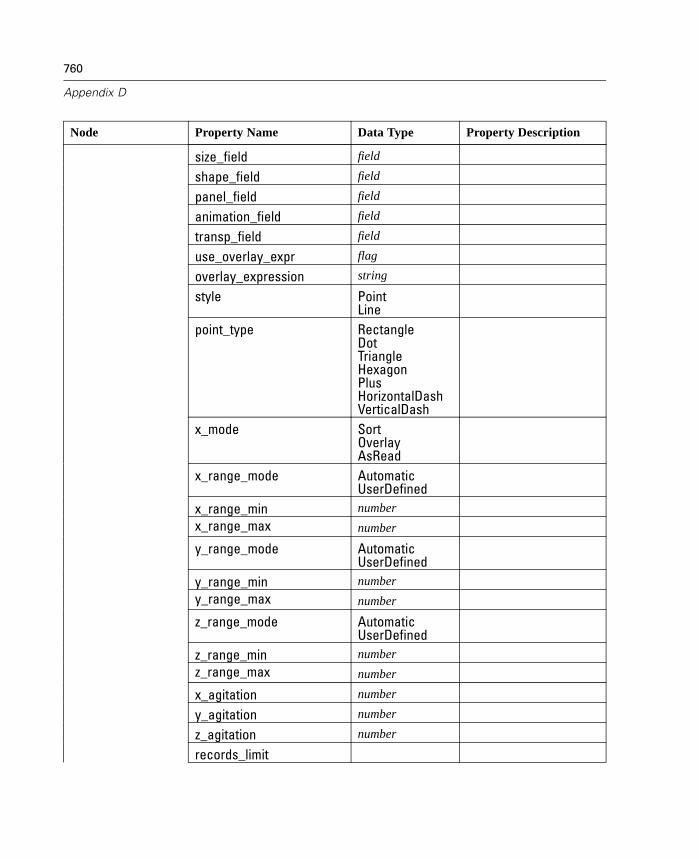
760
Appendix D
Node Property Name Data Type Property Description
size_field field
shape_field field
panel_field field
animation_field field
transp_field field
use_overlay_expr flag
overlay_expression string
style PointLine
point_type RectangleDotTriangleHexagonPlusHorizontalDashVerticalDash
x_mode SortOverlayAsRead
x_range_mode AutomaticUserDefined
x_range_min number
x_range_max number
y_range_mode AutomaticUserDefined
y_range_min number
y_range_max number
z_range_mode AutomaticUserDefined
z_range_min number
z_range_max number
x_agitation number
y_agitation number
z_agitation number
records_limit

761
Node and Stream Properties
Node Property Name Data Type Property Description
if_over_limit PlotBinsPlotSamplePlotAll
title string
caption string
x_label_auto flag
x_label string
y_label_auto flagr
y_label string
z_label_auto flag
z_label string
use_grid flag
graph_background color There are standard graphcolors described at thebeginning of this section.
page_background color There are standard graphcolors described at thebeginning of this section.
output_to ScreenBMPJPEGPNGHTML
full_filename string
histogramnode field field
color_field field
panel_field field
animation_field field
range_mode AutomaticUserDefined
range_min number
range_max number
bins ByNumberByWidth
num_bins number

762
Appendix D
Node Property Name Data Type Property Description
bin_width number
normalize flag
separate_bands flag
title string
caption string
x_label_auto flag
x_label string
y_label_auto flag
y_label string
use_grid flag
graph_background color There are standard graphcolors described at thebeginning of this section.
page_background color There are standard graphcolors described at thebeginning of this section.
output_to ScreenBMPJPEGPNGHTML
full_filename string
x_field field
color_field field Overlay field
normalize flag
plot SpecifiedFlags
use_proportional_scale flag
output_to ScreenFormattedDataHTML
distributionnode
full_filename string
webnode ordirectedwebnode
use_directed_web flag Use this parameter tocreate a directed web.

763
Node and Stream Properties
Node Property Name Data Type Property Description
fields [field field field]
to_field field
from_fields [field field field]
true_flags_only flag
line_values AbsoluteOverallPctPctLargerPctSmaller
strong_links_heavier flag
num_links ShowMaximumShowLinksAboveShowAll
max_num_links number
links_above number
discard_links_min flag
links_min_records number
discard_links_max flag
links_max_records number
weak_below number
strong_above number
link_size_continuous flag
web_display CircularNetwork
title string
caption string
graph_background color There are standard graphcolors described at thebeginning of this section.
symbol_size number Used to specify a symbolsize.For example,set :webnode.symbol_size = 5.5 createsa symbol size larger thanthe default.
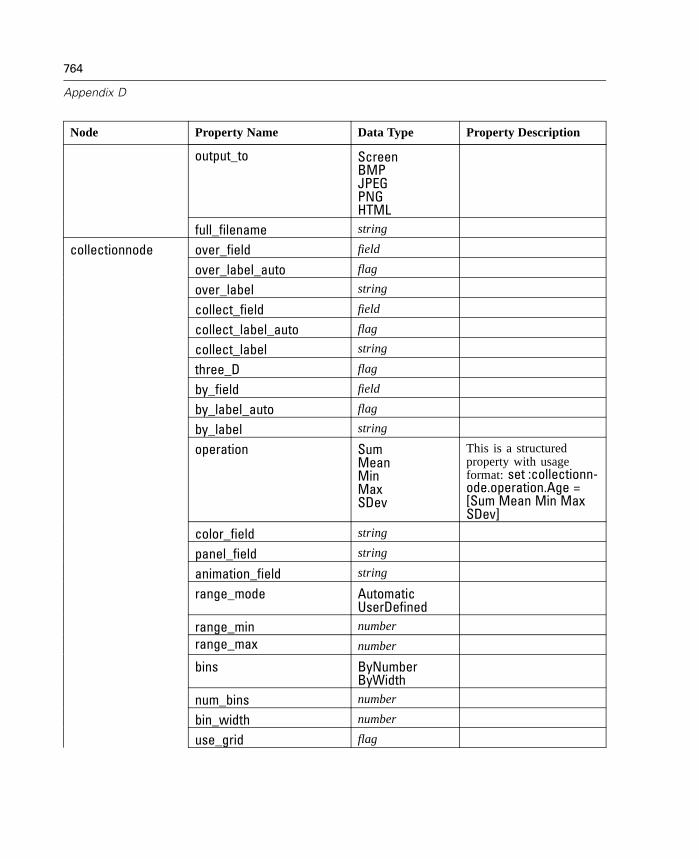
764
Appendix D
Node Property Name Data Type Property Description
output_to ScreenBMPJPEGPNGHTML
full_filename string
collectionnode over_field field
over_label_auto flag
over_label string
collect_field field
collect_label_auto flag
collect_label string
three_D flag
by_field field
by_label_auto flag
by_label string
operation SumMeanMinMaxSDev
This is a structuredproperty with usageformat: set :collectionn-ode.operation.Age =[Sum Mean Min MaxSDev]
color_field string
panel_field string
animation_field string
range_mode AutomaticUserDefined
range_min number
range_max number
bins ByNumberByWidth
num_bins number
bin_width number
use_grid flag
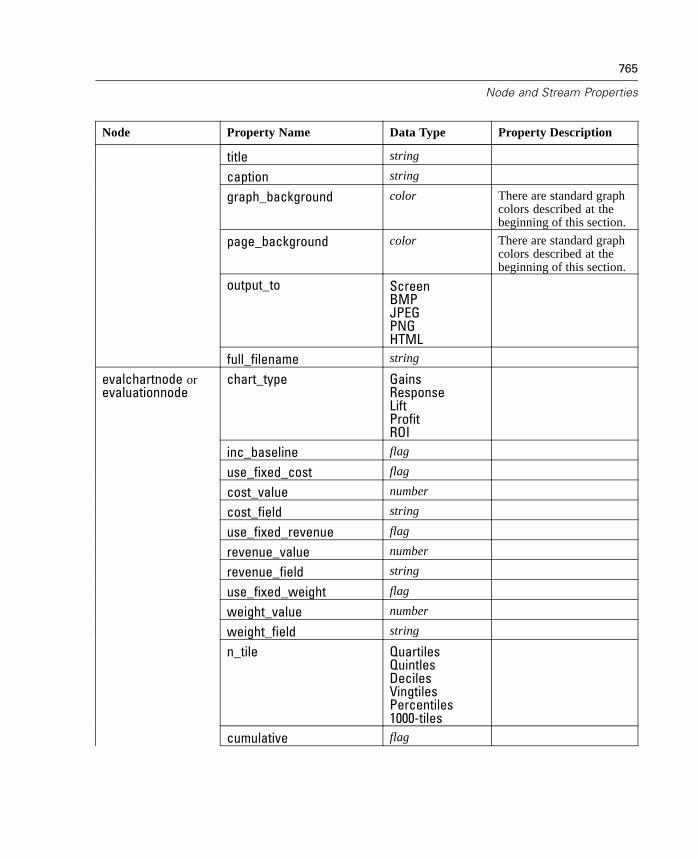
765
Node and Stream Properties
Node Property Name Data Type Property Description
title string
caption string
graph_background color There are standard graphcolors described at thebeginning of this section.
page_background color There are standard graphcolors described at thebeginning of this section.
output_to ScreenBMPJPEGPNGHTML
full_filename string
evalchartnode orevaluationnode
chart_type GainsResponseLiftProfitROI
inc_baseline flag
use_fixed_cost flag
cost_value number
cost_field string
use_fixed_revenue flag
revenue_value number
revenue_field string
use_fixed_weight flag
weight_value number
weight_field string
n_tile QuartilesQuintlesDecilesVingtilesPercentiles1000-tiles
cumulative flag

766
Appendix D
Node Property Name Data Type Property Description
style LinePoint
point_type RectangleDotTriangleHexagonPlusHorizontalDashVerticalDash
export_data flag
data_filename string
delimiter string
new_line flag
inc_field_names flag
inc_best_line flag
inc_business_rule flag
business_rule_expression string
use_hit_condition flag
hit_condition string
use_score_expression flag
score_expression string
caption_auto flag
output_to ScreenBMPJPEGPNGHTML
full_filename string
multiplotnode x_field field
y_fields [field field field]
panel_field field
animation_field field
normalize flag
use_overlay_expr flag
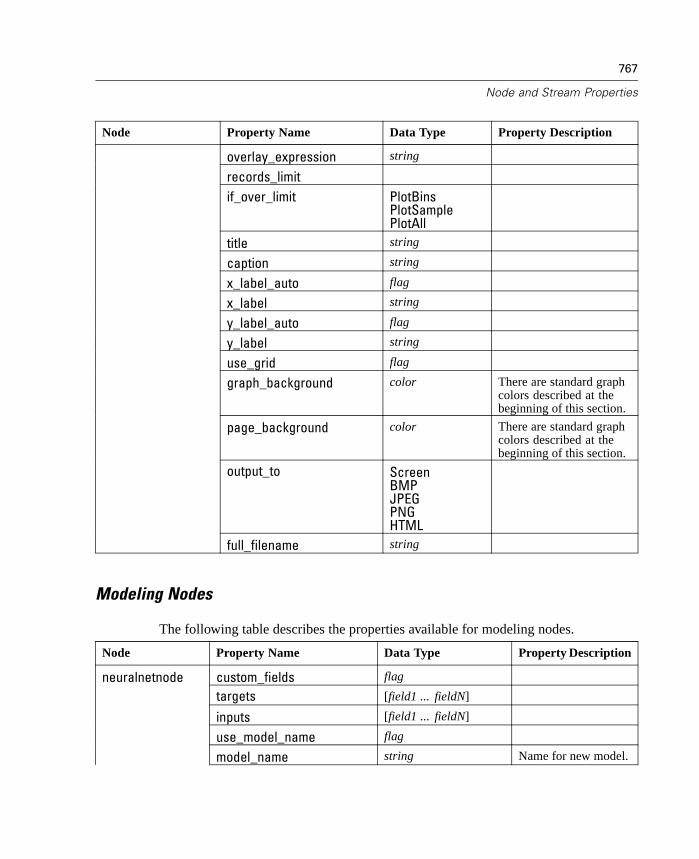
767
Node and Stream Properties
Node Property Name Data Type Property Description
overlay_expression string
records_limitif_over_limit PlotBins
PlotSamplePlotAll
title string
caption string
x_label_auto flag
x_label string
y_label_auto flag
y_label string
use_grid flag
graph_background color There are standard graphcolors described at thebeginning of this section.
page_background color There are standard graphcolors described at thebeginning of this section.
output_to ScreenBMPJPEGPNGHTML
full_filename string
Modeling Nodes
The following table describes the properties available for modeling nodes.
Node Property Name Data Type Property Description
neuralnetnode custom_fields flag
targets [field1 ... fieldN]
inputs [field1 ... fieldN]
use_model_name flag
model_name string Name for new model.
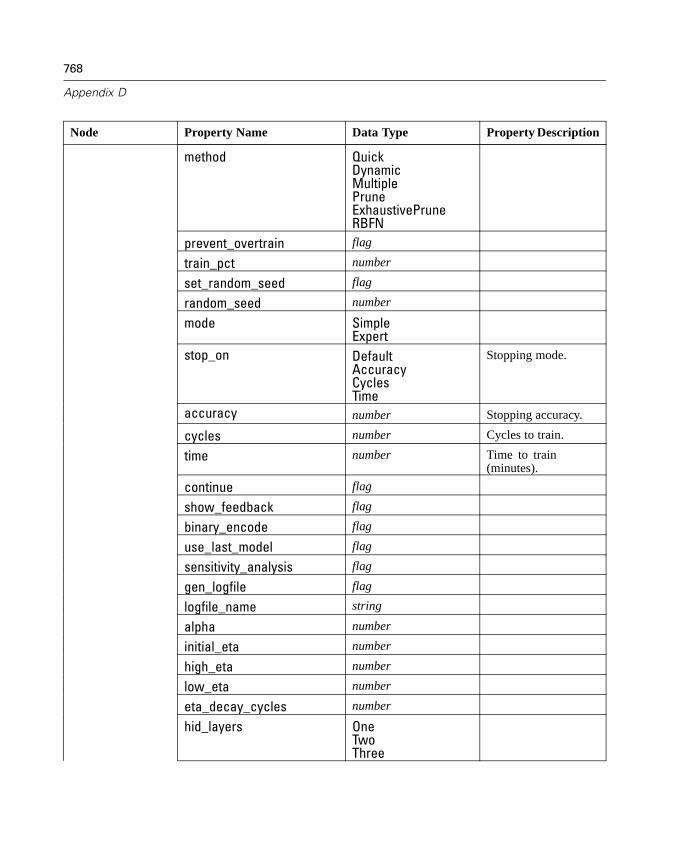
768
Appendix D
Node Property Name Data Type Property Description
method QuickDynamicMultiplePruneExhaustivePruneRBFN
prevent_overtrain flag
train_pct number
set_random_seed flag
random_seed number
mode SimpleExpert
stop_on DefaultAccuracyCyclesTime
Stopping mode.
accuracy number Stopping accuracy.
cycles number Cycles to train.
time number Time to train(minutes).
continue flag
show_feedback flag
binary_encode flag
use_last_model flag
sensitivity_analysis flag
gen_logfile flag
logfile_name string
alpha number
initial_eta number
high_eta number
low_eta number
eta_decay_cycles number
hid_layers OneTwoThree

769
Node and Stream Properties
Node Property Name Data Type Property Description
hl_units_one number
hl_units_two number
hl_units_three number
persistence number
m_topologies string
m_non_pyramids flag
m_persistence number
p_hid_layers OneTwoThree
p_hl_units_one number
p_hl_units_two number
p_hl_units_three number
p_persistence number
p_hid_rate number
p_hid_pers number
p_inp_rate number
p_inp_pers number
p_overall_pers number
r_persistence number
r_num_clusters number
r_eta_auto flag
r_alpha number
r_eta number
c50node custom_fields flag
target field
inputs [field1 ... field2]
use_model_name field
model_name string Name for new model.
output_type DecisionTreeRuleSet
group_symbolics flag

770
Appendix D
Node Property Name Data Type Property Description
use_boost flag
boost_num_trials number
use_xval flag
xval_num_folds number
mode SimpleExpert
favor AccuracyGenerality
Favor accuracy orgenerality.
expected_noise number
min_child_records number
pruning_severity number
use_costs flag
costs Structured property inthe form of:[{drugA drugB 1.5}{drugA drugC 2.1}],where the argumentsin {} are actualpredicted costs.
use_winnowing flag
use_global_pruning flag On (true) by default.
kohonennode custom_fields flag
inputs [field1 ... fieldN]
use_model_name flag
model_name string Custom name for newmodel.
continue flag
show_feedback flag
mode SimpleExpert
stop_on DefaultTime
time number
length number
width number

771
Node and Stream Properties
Node Property Name Data Type Property Description
decay_style LinearExponential
phase1_neighborhood number
phase1_eta number
phase1_cycles number
phase2_neighborhood number
phase2_eta number
phase2_cycles number
regressionnode custom_fields flag
inputs [field1 ... field2]
target field
use_model_name flag
model_name string
method EnterStepwiseBackwardsForwards
include_constant flag
use_weight flag
weight_field flag
mode SimpleExpert
complete_records flag
tolerance 1.0E-11.0E-21.0E-31.0E-41.0E-51.0E-61.0E-71.0E-81.0E-91.0E-101.0E-111.0E-12
Use double quotes forarguments.

772
Appendix D
Node Property Name Data Type Property Description
stepping_method ProbabilityFvalue
probability_entry number
probability_removal number
F_value_entry number
F_value_removal number
selection_criteria flag
confidence_interval flag
covariance_matrix flag
collinearity_diagnostics flag
durbin_watson flag
model_fit flag
r_squared_change flag
p_correlations flag
descriptives flag
logregnode custom_fields flag
inputs [field1 ... field2]
target field
use_model_name flag
model_name string
include_constant flag
mode SimpleExpert
method EnterStepwiseForwardsBackwardsBackwardsStepwise
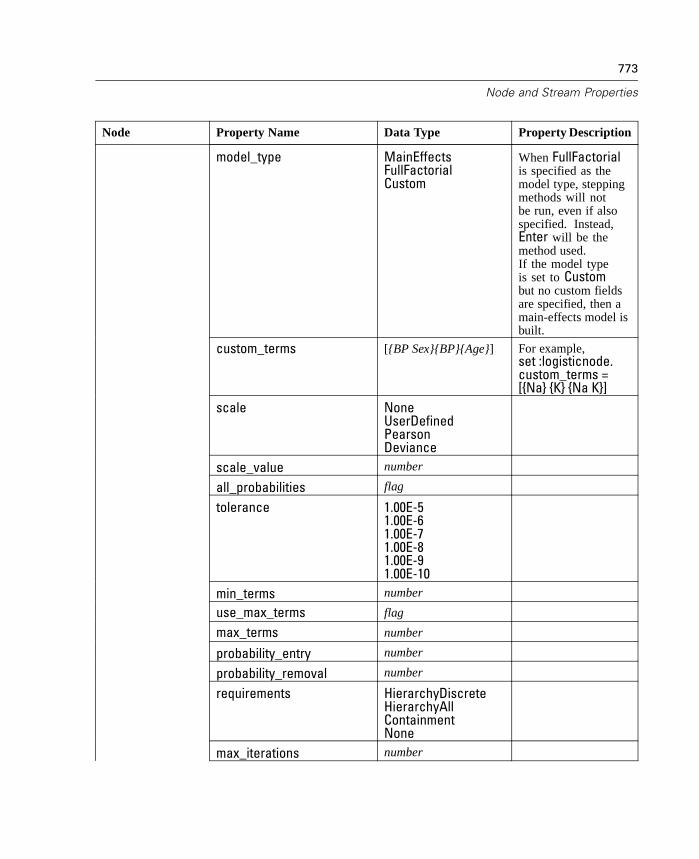
773
Node and Stream Properties
Node Property Name Data Type Property Description
model_type MainEffectsFullFactorialCustom
When FullFactorialis specified as themodel type, steppingmethods will notbe run, even if alsospecified. Instead,Enter will be themethod used.If the model typeis set to Custombut no custom fieldsare specified, then amain-effects model isbuilt.
custom_terms [{BP Sex}{BP}{Age}] For example,set :logisticnode.custom_terms =[{Na} {K} {Na K}]
scale NoneUserDefinedPearsonDeviance
scale_value number
all_probabilities flag
tolerance 1.00E-51.00E-61.00E-71.00E-81.00E-91.00E-10
min_terms number
use_max_terms flag
max_terms number
probability_entry number
probability_removal number
requirements HierarchyDiscreteHierarchyAllContainmentNone
max_iterations number
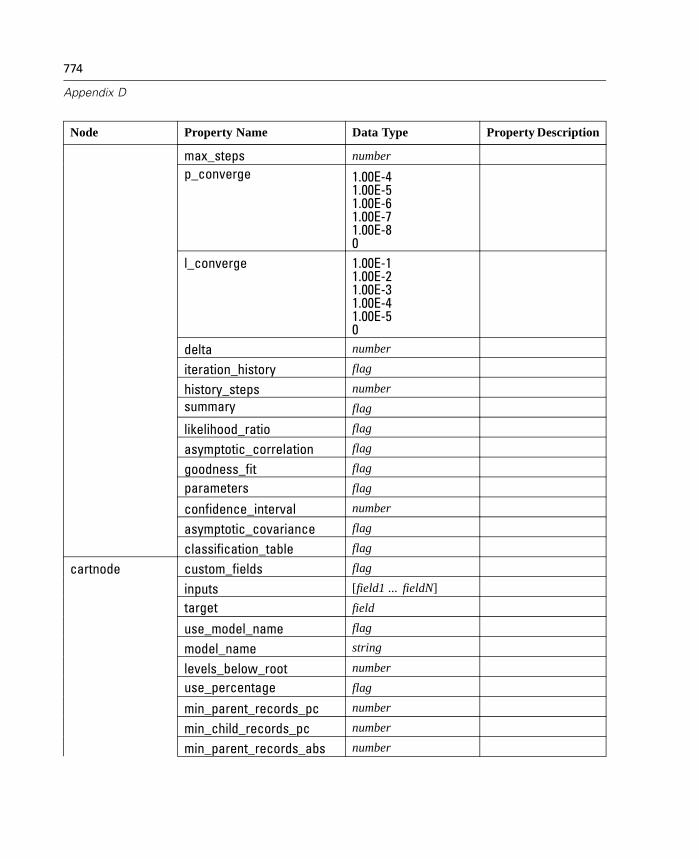
774
Appendix D
Node Property Name Data Type Property Description
max_steps number
p_converge 1.00E-41.00E-51.00E-61.00E-71.00E-80
l_converge 1.00E-11.00E-21.00E-31.00E-41.00E-50
delta number
iteration_history flag
history_steps number
summary flag
likelihood_ratio flag
asymptotic_correlation flag
goodness_fit flag
parameters flag
confidence_interval number
asymptotic_covariance flag
classification_table flag
cartnode custom_fields flag
inputs [field1 ... fieldN]
target field
use_model_name flag
model_name string
levels_below_root number
use_percentage flag
min_parent_records_pc number
min_child_records_pc number
min_parent_records_abs number
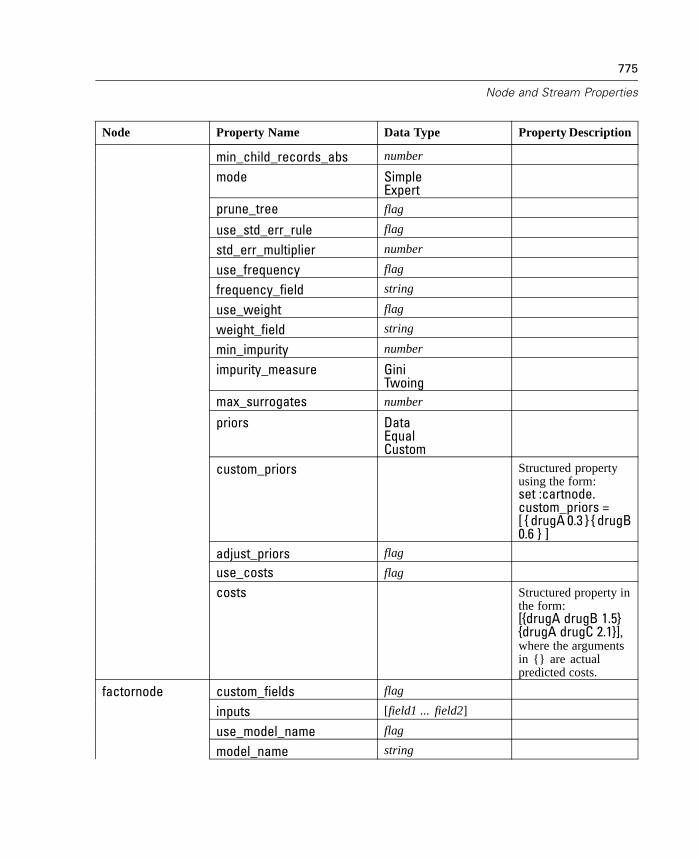
775
Node and Stream Properties
Node Property Name Data Type Property Description
min_child_records_abs number
mode SimpleExpert
prune_tree flag
use_std_err_rule flag
std_err_multiplier number
use_frequency flag
frequency_field string
use_weight flag
weight_field string
min_impurity number
impurity_measure GiniTwoing
max_surrogates number
priors DataEqualCustom
custom_priors Structured propertyusing the form:set :cartnode.custom_priors =[ { drugA 0.3 } { drugB0.6 } ]
adjust_priors flag
use_costs flag
costs Structured property inthe form:[{drugA drugB 1.5}{drugA drugC 2.1}],where the argumentsin {} are actualpredicted costs.
factornode custom_fields flag
inputs [field1 ... field2]
use_model_name flag
model_name string
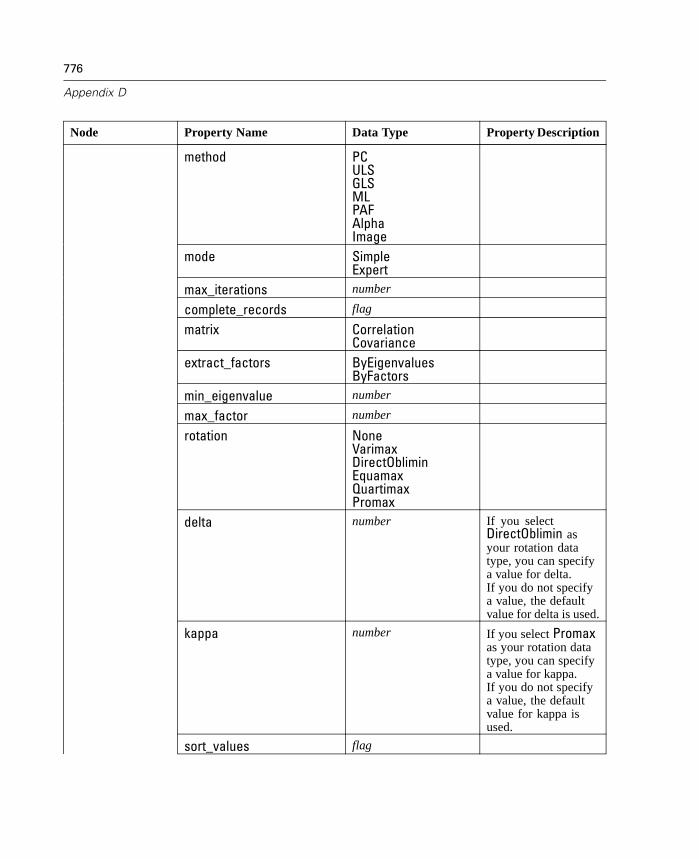
776
Appendix D
Node Property Name Data Type Property Description
method PCULSGLSMLPAFAlphaImage
mode SimpleExpert
max_iterations number
complete_records flag
matrix CorrelationCovariance
extract_factors ByEigenvaluesByFactors
min_eigenvalue number
max_factor number
rotation NoneVarimaxDirectObliminEquamaxQuartimaxPromax
delta number If you selectDirectOblimin asyour rotation datatype, you can specifya value for delta.If you do not specifya value, the defaultvalue for delta is used.
kappa number If you select Promaxas your rotation datatype, you can specifya value for kappa.If you do not specifya value, the defaultvalue for kappa isused.
sort_values flag

777
Node and Stream Properties
Node Property Name Data Type Property Description
hide_values flag
hide_below number
custom_fields flag
inputs [field1 ... fieldN]
use_model_name flag
model_name string
standardize flag
exclude_outliers flag
cluster_num_auto flag
min_num_clusters number
max_num_clusters number
num_clusters number
cluster_label StringNumber
twostepnode
label_prefix string
custom_fields flag
consequents field
antecedents [field1 ... fieldN]
use_model_name flag
model_name string
min_supp number
min_conf number
max_num_rules number
max_antecedents number
grinode
true_flags flag

778
Appendix D
Node Property Name Data Type Property Description
custom_fields flag
consequents field
antecedents [field1 ... fieldN]
use_model_name flag
model_name string
min_supp number
min_conf number
max_antecedents number
true_flags flag
optimize SpeedMemory
use_transactional_data flag
contiguous flag
id_field string
content_field string
mode SimpleExpert
evalution RuleConfidenceDifferenceToPriorConfidenceRatioInformationDifferenceNormalizedChiSquare
apriorinode
lower_bound number
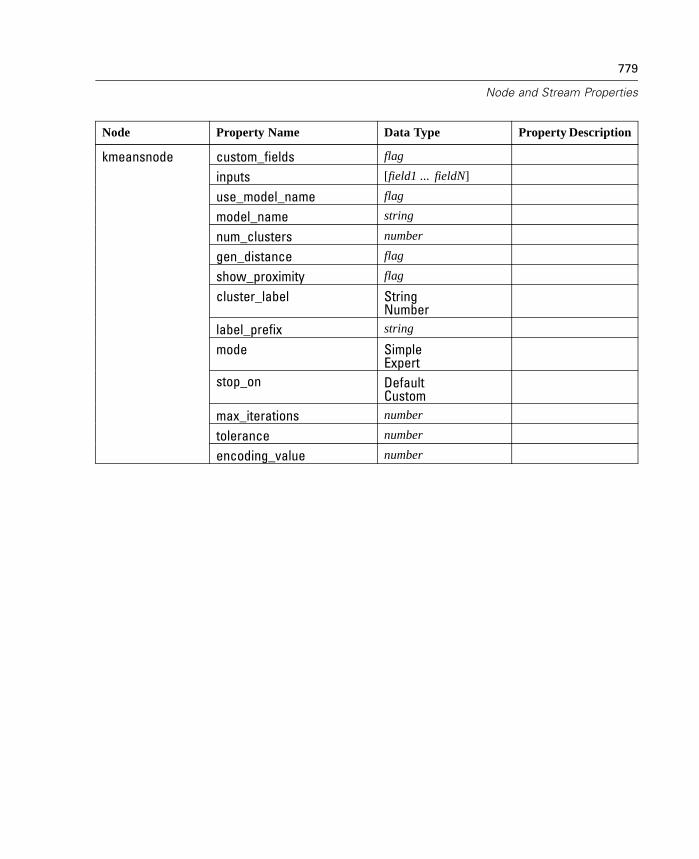
779
Node and Stream Properties
Node Property Name Data Type Property Description
custom_fields flag
inputs [field1 ... fieldN]
use_model_name flag
model_name string
num_clusters number
gen_distance flag
show_proximity flag
cluster_label StringNumber
label_prefix string
mode SimpleExpert
stop_on DefaultCustom
max_iterations number
tolerance number
kmeansnode
encoding_value number
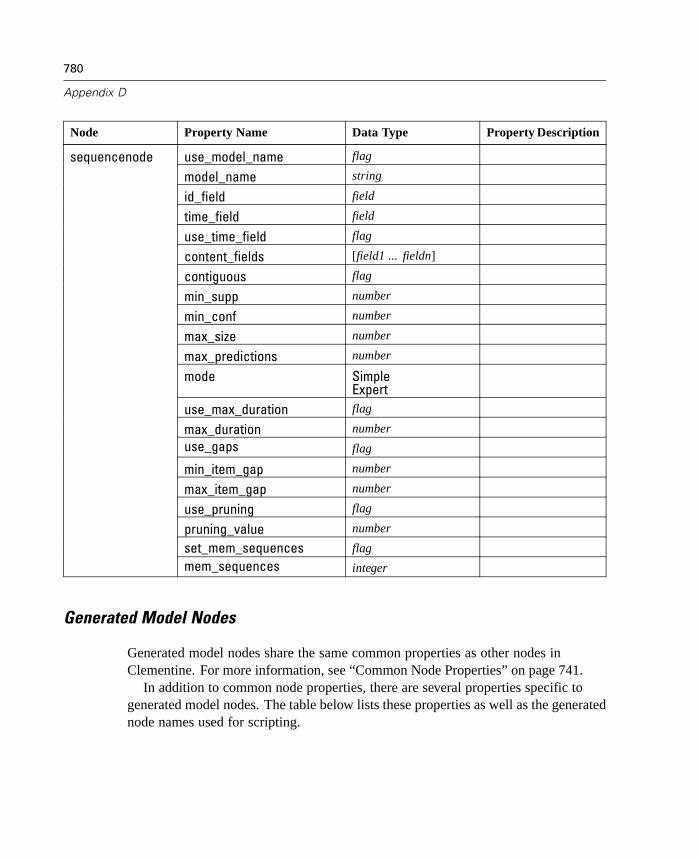
780
Appendix D
Node Property Name Data Type Property Description
use_model_name flag
model_name string
id_field field
time_field field
use_time_field flag
content_fields [field1 ... fieldn]
contiguous flag
min_supp number
min_conf number
max_size number
max_predictions number
mode SimpleExpert
use_max_duration flag
max_duration number
use_gaps flag
min_item_gap number
max_item_gap number
use_pruning flag
pruning_value number
set_mem_sequences flag
sequencenode
mem_sequences integer
Generated Model Nodes
Generated model nodes share the same common properties as other nodes inClementine. For more information, see “Common Node Properties” on page 741.
In addition to common node properties, there are several properties specific togenerated model nodes. The table below lists these properties as well as the generatednode names used for scripting.

781
Node and Stream Properties
GeneratedModel
Node name forscripting
Property Name Data Type Description
Neural Net applyneuralnetnodeBuild C5.0 applyc50nodeKohonen applykohonennodeLinear Reg. applyregressionnodeLogistic Reg. applylogregnode
sql_generate NeverMissingValuesNoMissingValues
Used to setSQL generationoptions duringruleset execution.
C&R Tree applycartnode
calculate_conf flag Available whenSQL generationis enabled, thisproperty includesconfidencecalculations inthe generatedtree.
Factor/PCA applyfactornodeTwoStep applytwostepnodeGRI applygrinodeApriori applyapriorinodeKmeans applykmeansnodeSequence applysequencenodeGeneratedRulesets
applyrulenode
Output Nodes
Output node properties are slightly different from other types of node properties.Rather than referring to a particular node options, output node properties store areference to the output object. This is useful, for example, in taking a value from atable and then setting it as a stream parameter.
The following table describes the scripting properties available for output nodes.

782
Appendix D
Node Property Name Data TypePropertyDescription
full_filename string If disk, data, orHTML output, thename of the outputfile.
output_to ScreenFormattedDataHTMLTransposed
Specifies locationand type of output.
highlight_expr string
lines_per_page number
tablenode
output string A read-onlyproperty that holdsa reference to thelast table built bythe node.
output_to ScreenTXTHTML
by_fields [field fieldfield]
full_filename string If disk, data, orHTML output, thename of the outputfile.
coincidence flag
performance flag
confidence flag
threshold number
improve_accuracy number
inc_user_measure flag
user_if expr
user_then expr
user_else expr
analysisnode
user_compute [Mean SumMin MaxSDev]
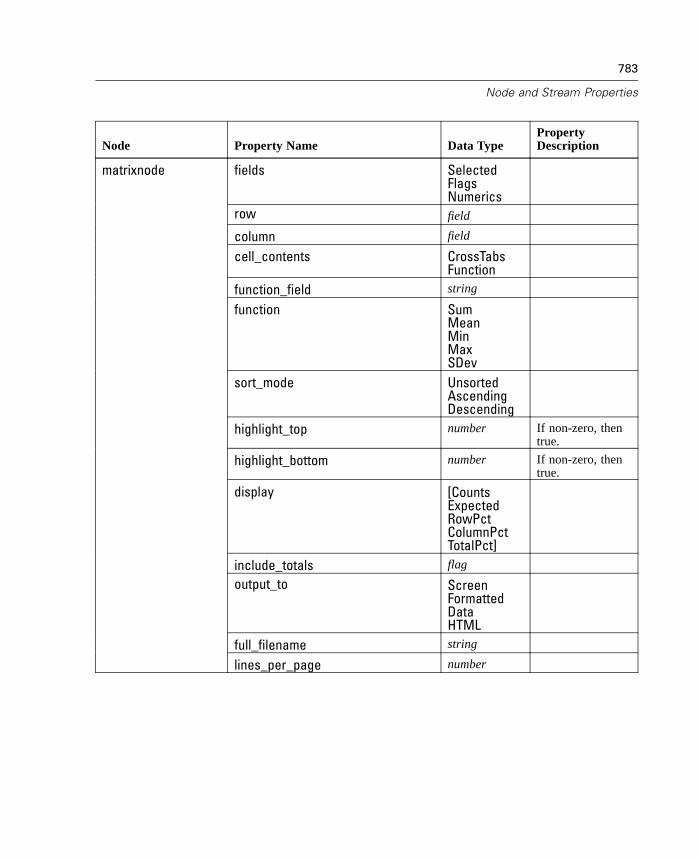
783
Node and Stream Properties
Node Property Name Data TypePropertyDescription
fields SelectedFlagsNumerics
row field
column field
cell_contents CrossTabsFunction
function_field string
function SumMeanMinMaxSDev
sort_mode UnsortedAscendingDescending
highlight_top number If non-zero, thentrue.
highlight_bottom number If non-zero, thentrue.
display [CountsExpectedRowPctColumnPctTotalPct]
include_totals flag
output_to ScreenFormattedDataHTML
full_filename string
matrixnode
lines_per_page number
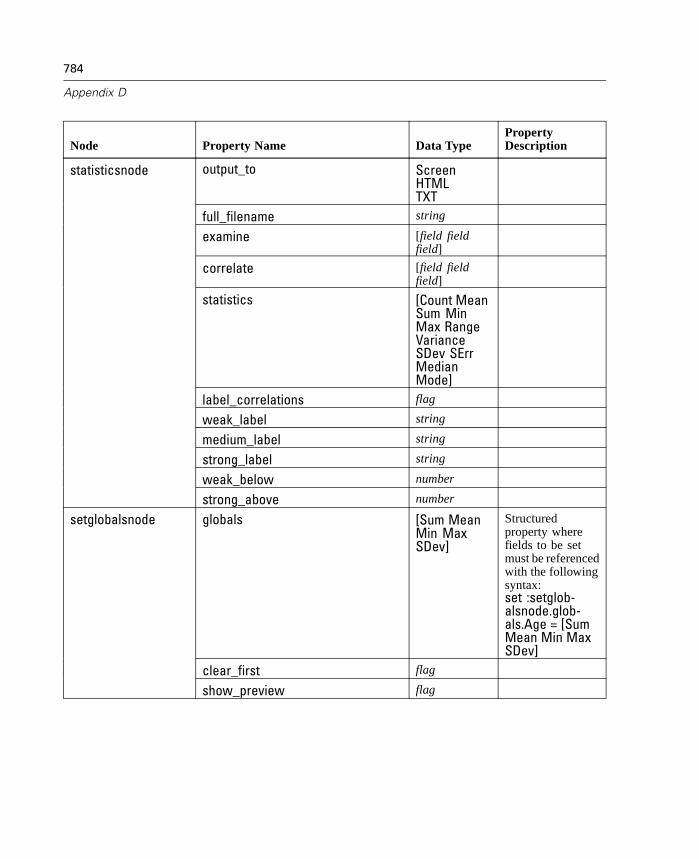
784
Appendix D
Node Property Name Data TypePropertyDescription
output_to ScreenHTMLTXT
full_filename string
examine [field fieldfield]
correlate [field fieldfield]
statistics [Count MeanSum MinMax RangeVarianceSDev SErrMedianMode]
label_correlations flag
weak_label string
medium_label string
strong_label string
weak_below number
statisticsnode
strong_above number
globals [Sum MeanMin MaxSDev]
Structuredproperty wherefields to be setmust be referencedwith the followingsyntax:set :setglob-alsnode.glob-als.Age = [SumMean Min MaxSDev]
clear_first flag
setglobalsnode
show_preview flag
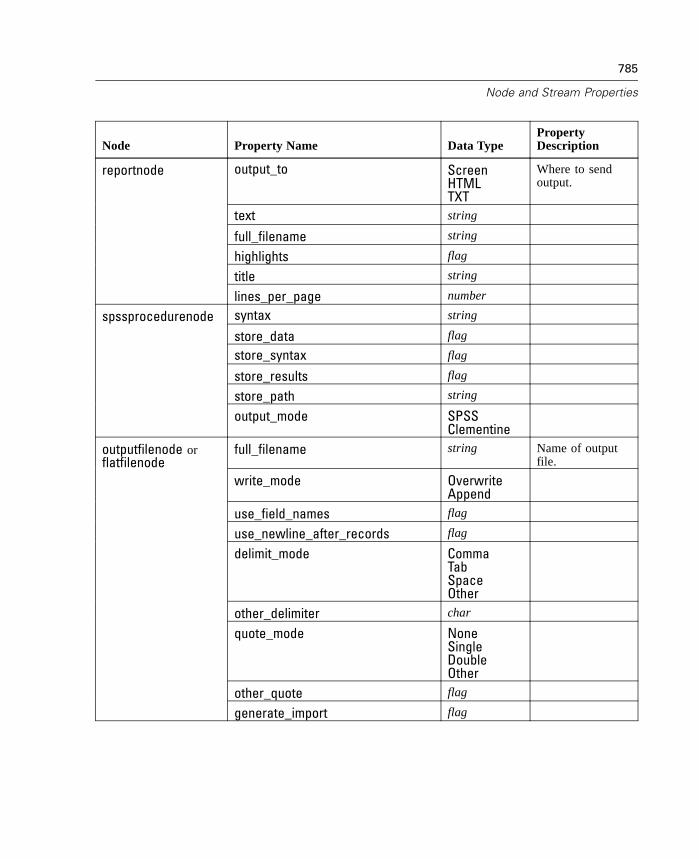
785
Node and Stream Properties
Node Property Name Data TypePropertyDescription
output_to ScreenHTMLTXT
Where to sendoutput.
text string
full_filename string
highlights flag
title string
reportnode
lines_per_page number
syntax string
store_data flag
store_syntax flag
store_results flag
store_path string
spssprocedurenode
output_mode SPSSClementine
full_filename string Name of outputfile.
write_mode OverwriteAppend
use_field_names flag
use_newline_after_records flag
delimit_mode CommaTabSpaceOther
other_delimiter char
quote_mode NoneSingleDoubleOther
other_quote flag
outputfilenode orflatfilenode
generate_import flag
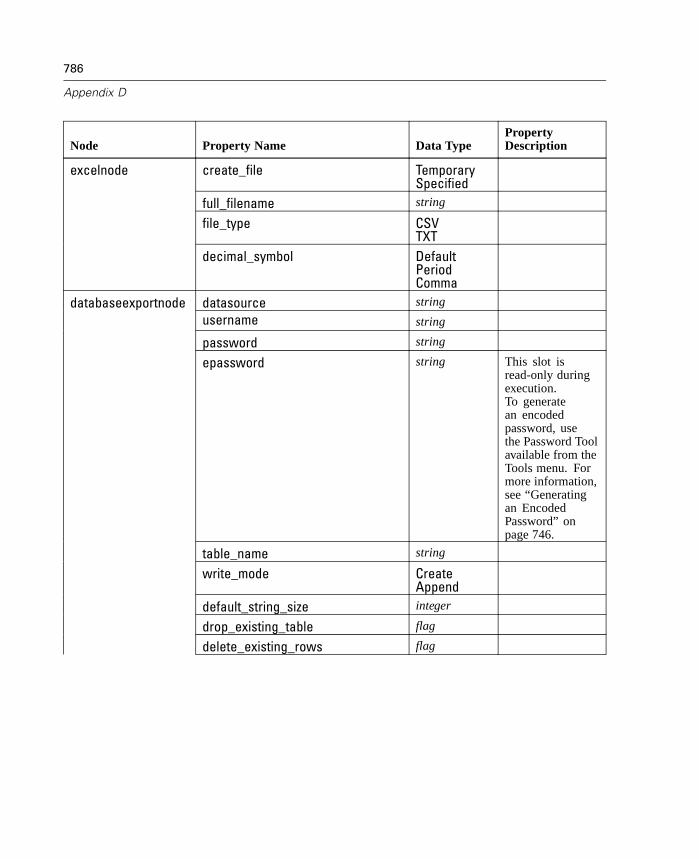
786
Appendix D
Node Property Name Data TypePropertyDescription
create_file TemporarySpecified
full_filename string
file_type CSVTXT
excelnode
decimal_symbol DefaultPeriodComma
databaseexportnode datasource string
username string
password string
epassword string This slot isread-only duringexecution.To generatean encodedpassword, usethe Password Toolavailable from theTools menu. Formore information,see “Generatingan EncodedPassword” onpage 746.
table_name string
write_mode CreateAppend
default_string_size integer
drop_existing_table flag
delete_existing_rows flag
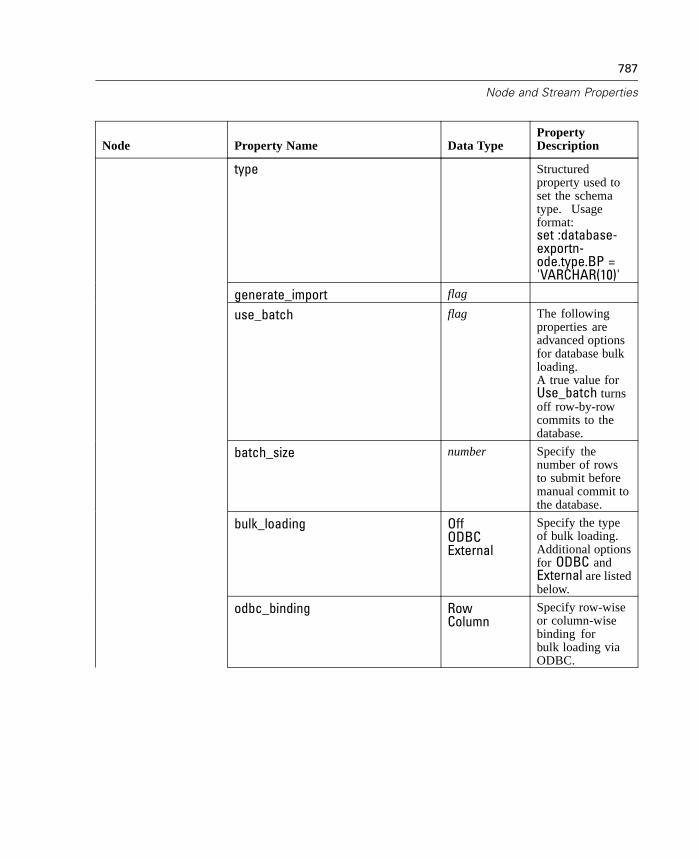
787
Node and Stream Properties
Node Property Name Data TypePropertyDescription
type Structuredproperty used toset the schematype. Usageformat:set :database-exportn-ode.type.BP ='VARCHAR(10)'
generate_import flag
use_batch flag The followingproperties areadvanced optionsfor database bulkloading.A true value forUse_batch turnsoff row-by-rowcommits to thedatabase.
batch_size number Specify thenumber of rowsto submit beforemanual commit tothe database.
bulk_loading OffODBCExternal
Specify the typeof bulk loading.Additional optionsfor ODBC andExternal are listedbelow.
odbc_binding RowColumn
Specify row-wiseor column-wisebinding forbulk loading viaODBC.

788
Appendix D
Node Property Name Data TypePropertyDescription
loader_delimit_mode TabSpaceOther
For bulk-loadingvia an externalprogram, specifytype of delimiter.Select Other inconjunction withloader_other_delimiter propertyto specifydelimiters, suchas the comma (,).
loader_other_delimiter string
specify_data_file flag A true flagactivates thedata_file propertybelow, where youcan specify thefilename and pathto write to whenbulk loading to thedatabase.
data_file string
specify_loader_program flag A true flagactivates theloader_programproperty below,where you canspecify the nameand location ofan external loaderscript or program.
loader_program string
gen_logfile flag A true flagactivates thelogfile_namebelow, where youcan specify thename of a fileon the server togenerate an errorlog.
logfile_name string

789
Node and Stream Properties
Node Property Name Data TypePropertyDescription
check_table_size flag A true flag allowstable checkingto ensure thatthe increase indatabase table sizecorresponds to thenumber of rowsexported fromClementine.
loader_options string Specify additionalarguments, suchas -comment and-specialdir, to theloader program.
mode AllSelected
fields [field1 ...fieldn]
invalid [Null EmptySpace Blank]
calculate [CountBreakdown]
output_to ScreenHTMLTXT
Where to sendoutput.
qualitynode
full_filename string
full_filename string
launch_application flag
application SPSSAnswerTree
field_names LabelsNames
spssexportnode
generate_import flag

790
Appendix D
Node Property Name Data TypePropertyDescription
format WindowsUNIXSAS7SAS8
Variant propertylabel fields.
full_filename string
field_names NamesHeadings
sasexportnode
generate_import flag
publishernode published_name string
export_data FlatFileDatabaseSPSSFileSASFile
export_file_full_filename string
export_file_delimit_mode CommaTabSpaceOther
export_file_other_delimiter string
export_file_add_newline flag
export_file_write_mode OverwriteAppend
export_file_inc_fieldnames flag
export_file_quote_mode NoneSingleDoubleOther
export_file_other_quote string
export_file_decimal_symbol DefaultPeriodComma
export_db_datasource string
export_db_username string
export_db_tablename string
export_db_default_string_size number

791
Node and Stream Properties
Node Property Name Data TypePropertyDescription
export_db_write_mode CreateAppend
export_db_delete_existing_rows flag
export_db_drop_existing_table flag
export_db_type Structuredproperty used toset the schematype. Usageformat::databaseexport.types.BP ='VARCHAR(10)'
export_spss_full_filename string
export_spss_field_names NamesLabels
export_sas_full_filenames string
export_sas_format WindowsUNIXSAS7SAS8
export_sas_field_names LabelsNames
use_batch flag The followingproperties areadvanced optionsfor database bulkloading.A true value forUse_batch turnsoff row-by-rowcommits to thedatabase.
batch_size number Specify thenumber of rowsto submit beforemanual commit tothe database.
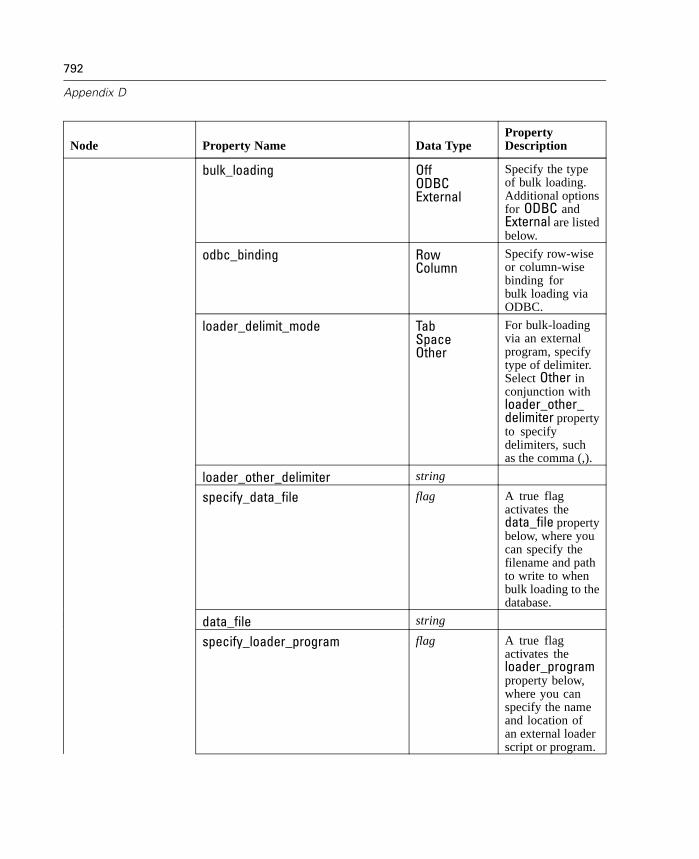
792
Appendix D
Node Property Name Data TypePropertyDescription
bulk_loading OffODBCExternal
Specify the typeof bulk loading.Additional optionsfor ODBC andExternal are listedbelow.
odbc_binding RowColumn
Specify row-wiseor column-wisebinding forbulk loading viaODBC.
loader_delimit_mode TabSpaceOther
For bulk-loadingvia an externalprogram, specifytype of delimiter.Select Other inconjunction withloader_other_delimiter propertyto specifydelimiters, suchas the comma (,).
loader_other_delimiter string
specify_data_file flag A true flagactivates thedata_file propertybelow, where youcan specify thefilename and pathto write to whenbulk loading to thedatabase.
data_file string
specify_loader_program flag A true flagactivates theloader_programproperty below,where you canspecify the nameand location ofan external loaderscript or program.
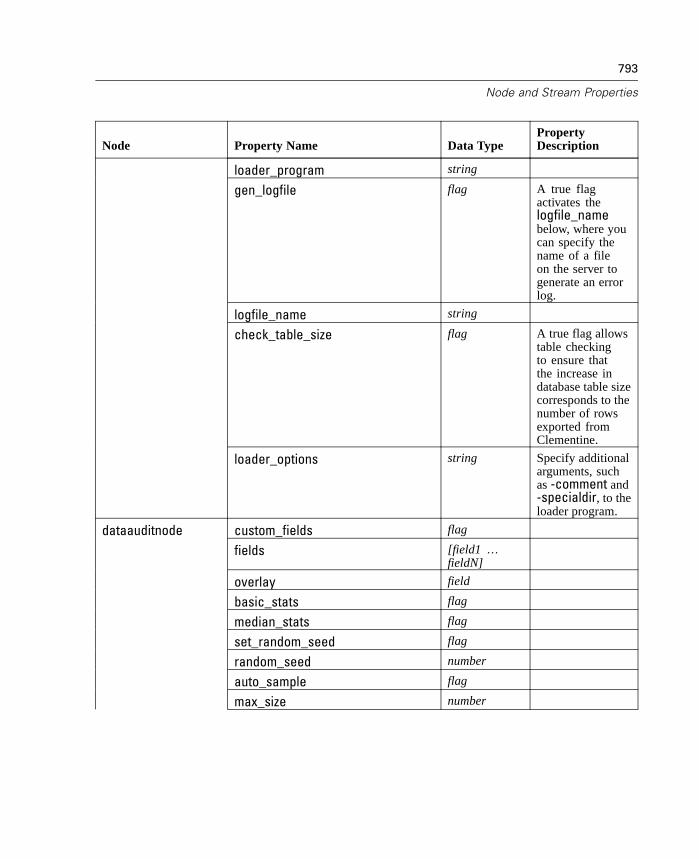
793
Node and Stream Properties
Node Property Name Data TypePropertyDescription
loader_program string
gen_logfile flag A true flagactivates thelogfile_namebelow, where youcan specify thename of a fileon the server togenerate an errorlog.
logfile_name string
check_table_size flag A true flag allowstable checkingto ensure thatthe increase indatabase table sizecorresponds to thenumber of rowsexported fromClementine.
loader_options string Specify additionalarguments, suchas -comment and-specialdir, to theloader program.
dataauditnode custom_fields flag
fields [field1 …fieldN]
overlay field
basic_stats flag
median_stats flag
set_random_seed flag
random_seed number
auto_sample flag
max_size number
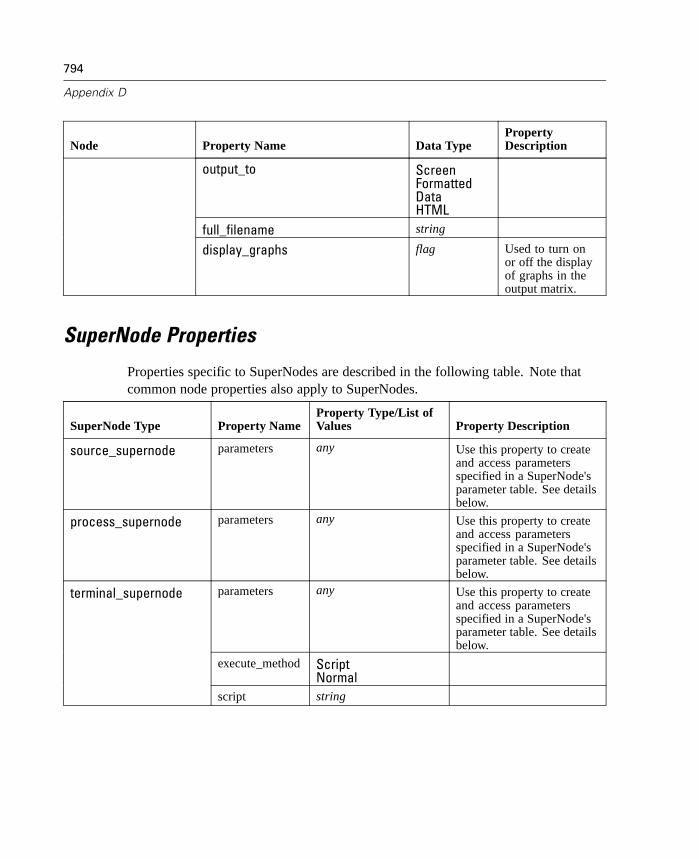
794
Appendix D
Node Property Name Data TypePropertyDescription
output_to ScreenFormattedDataHTML
full_filename string
display_graphs flag Used to turn onor off the displayof graphs in theoutput matrix.
SuperNode Properties
Properties specific to SuperNodes are described in the following table. Note thatcommon node properties also apply to SuperNodes.
SuperNode Type Property NameProperty Type/List ofValues Property Description
source_supernode parameters any Use this property to createand access parametersspecified in a SuperNode'sparameter table. See detailsbelow.
process_supernode parameters any Use this property to createand access parametersspecified in a SuperNode'sparameter table. See detailsbelow.
parameters any Use this property to createand access parametersspecified in a SuperNode'sparameter table. See detailsbelow.
execute_method ScriptNormal
terminal_supernode
script string
795
Node and Stream Properties
SuperNode Parameters
Using scripts, you can access two kinds of parameters for SuperNodes:
Parameters, or user-defined variables, such as Minvalue, set for the contentsof a SuperNode.
Node properties (also called slot parameters) for nodes encapsulated within theSuperNode. For example, 'Sample.rand_pct' is the parameter that accesses therandom percent control for an encapsulated Sample node.
Both types must be specified in the parameter table for a SuperNode before readingor updating. For more information, see “SuperNode Parameters” in Chapter 15on page 566.
To create or set a SuperNode parameter, use the form:
set mySuperNode.parameters.minvalue = 30orset :process_supernode.parameters.minvalue = 30orset :process_supernode.parameters.minvalue = "<expression>"
You can be even more explicit, including both name and type in the script command.For example:
set mySuperNode:process_supernode.parameters.minvalue = 30
To access properties such as rand_pct for encapsulated nodes within the SuperNode,be sure to include the literal name of the parameter within single quotes. For example:
set mySuperNode.parameters.'Data_subset:samplenode.rand_pct' = 50orset :source_supernode.parameters.'Data_subset:samplenode.rand_pct'= 50
Note: When you define parameters in SuperNodes, you must refer to parameters bytheir short parameter names because these are guaranteed to be unique.

796
Appendix D
Stream Properties
A variety of stream properties can be controlled by scripting. To reference streamproperties, you must use a special stream variable, denoted with a ^ preceding thestream
set ^stream.execute_method = Script
Stream properties are described in the following table.
Property Name Data Type Property Description
execute_method NormalScript
date_format "DDMMYY""MMDDYY""YYMMDD""YYYYMMDD""DD/MM/YY""DD/MM/YYYY""MM/DD/YY""MM/DD/YYYY"“DD-MM-YY""DD-MM-YYYY""MM-DD-YY""MM-DD-YYYY""DD.MM.YY""DD.MM.YYYY""MM.DD.YY""MM.DD.YYYY""DD-MON-YY""DD/MON/YY""DD.MON.YY""DD-MON-YYYY""DD/MON/YYYY""DD.MON.YYYY""YYYY-MM-DD"
date_baseline number
date_2digit_baseline number
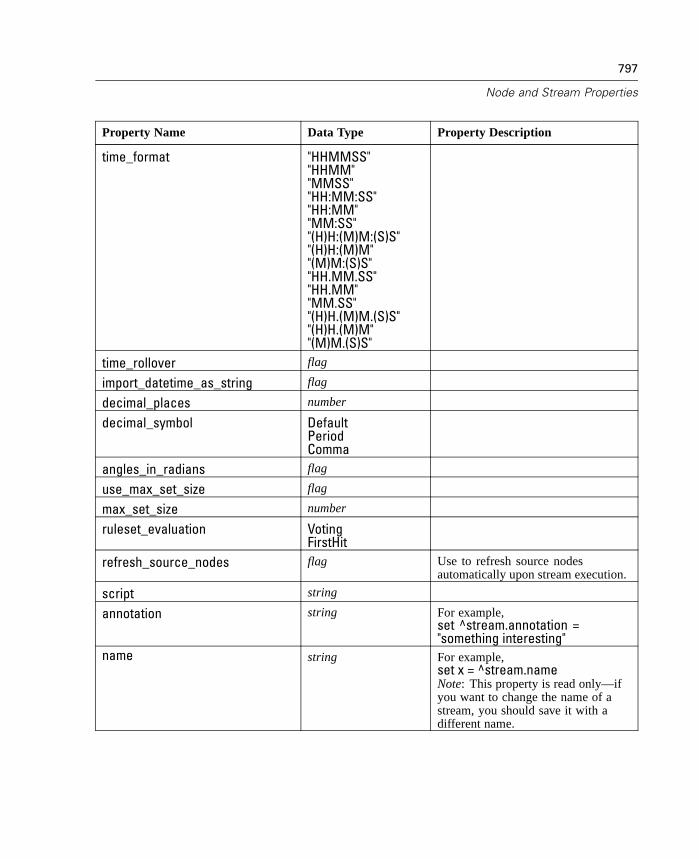
797
Node and Stream Properties
Property Name Data Type Property Description
time_format "HHMMSS""HHMM""MMSS""HH:MM:SS""HH:MM""MM:SS""(H)H:(M)M:(S)S""(H)H:(M)M""(M)M:(S)S""HH.MM.SS""HH.MM""MM.SS""(H)H.(M)M.(S)S""(H)H.(M)M""(M)M.(S)S"
time_rollover flag
import_datetime_as_string flag
decimal_places number
decimal_symbol DefaultPeriodComma
angles_in_radians flag
use_max_set_size flag
max_set_size number
ruleset_evaluation VotingFirstHit
refresh_source_nodes flag Use to refresh source nodesautomatically upon stream execution.
script string
annotation string For example,set ^stream.annotation ="something interesting"
name string For example,set x = ^stream.nameNote: This property is read only—ifyou want to change the name of astream, you should save it with adifferent name.

798
Appendix D
Property Name Data Type Property Description
parameters Use to update stream parameters fromwithin a standalone script.For example,set ^stream.parameters.height =23
nodes See detailed information below.
The nodes property is used to refer to the nodes in current stream. The followingstream script provides an example:
var listofnodesvar thenodeset listofnodes = ^stream.nodes
set ^stream.annotation = ^stream.annotation >< "\n\nThis stream is called \"" >< ^stream.name >< "\" and contains the follow
for thenode in listofnodesset ^stream.annotation = ^stream.annotation >< "\n" >< ^thenode.node_typeendfor
The above example uses the nodes property to create a list of all nodes in the streamand write that list in the stream annotations. The annotation produced looks like this:
This stream is called "druglearn" and contains the following nodes
derivenodeneuralnetnodevariablefilenodetypenodec50nodefilternode

Appendix
ECEMI Specification File Reference
Specification File Overview
The Clementine External Module Interface (CEMI) provides the ability to addexternal programs into the Clementine data mining system as new nodes. An externalprogram corresponds to any program that can be run from a command line ona supported operating system.
CEMI allows the definition of what the new node looks like, what type of node it is(for example, record operations or graph node), and how Clementine must interfacewith the external module. All of this is done via a specification file—a text filehaving a prescribed structure that is interpretable by CEMI. This file begins withthe word SPECFILE, ends with the word ENDSPECFILE, and contains up to threespecification sections in its body.
SPECFILE<node-specification><core-specification><model-specification>+
ENDSPECFILE
The specification file is line-oriented. In order to allow long lines to continue overmultiple lines, the backslash character (\) serves as a line concatenator throughout thefile. Furthermore, blank lines are ignored, and lines starting with a hash character (#)correspond to comments and are ignored. Indentation of sections is optional but isrecommended to improve readability.
799

800
Appendix E
Notation
The notational scheme used to describe the structure of the specification file includesthe following rules:
“|” means “or.”
“{” and “}” enclose the members of the set of options for an “or” group. One ormore of the members should be selected.
“+” means “zero or one instance of” (optional).
“*” means “zero or more instances of” (multiple).
“<” and “>” surround an identifier of a non-terminal symbol. The text betweenthese symbols will be replaced by keywords and other specifications.
Other text appearing in the definitions of specification file sections are keywords orterminal symbols. Keywords should be specified as presented. Terminal symbolsshould be replaced as follows:
<string> represents a single-quoted string.
<word> represents an unquoted alphanumeric string.
<integer> corresponds to an integer literal.
<real> represents a real number literal.
<boolean> corresponds to either “true” or “false.”
Node Specification
This section of the specification file defines what type of node CEMI should createand how it will appear in Clementine.
NODENAME <word>TITLE <string>TYPE {SOURCE |
PROCESS |TERMINAL |MODELLING UNREFINED+ <word> }
PALETTE {SOURCE |FIELD |RECORD |GRAPH |
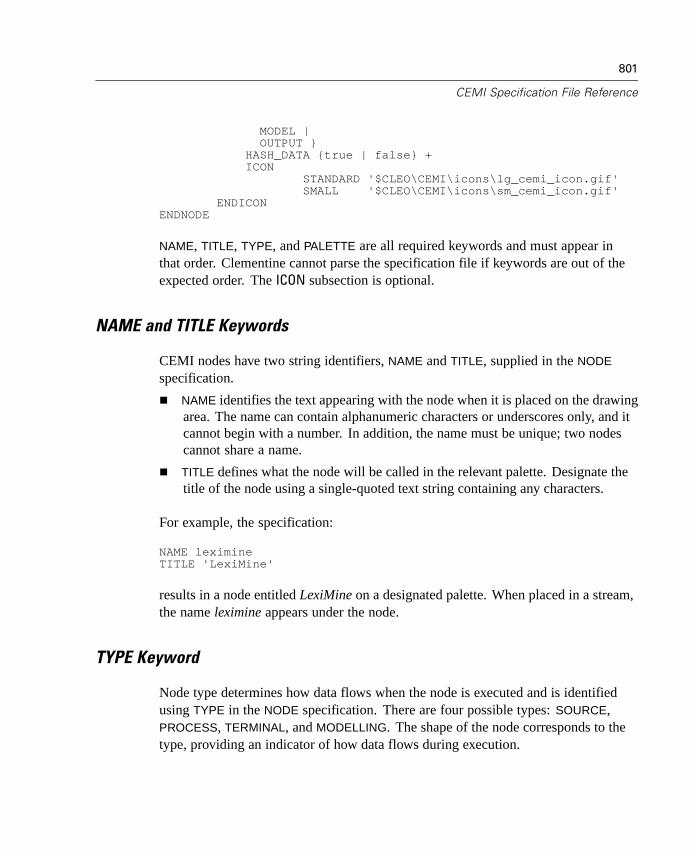
801
CEMI Specification File Reference
MODEL |OUTPUT }
HASH_DATA {true | false} +ICON
STANDARD '$CLEO\CEMI\icons\lg_cemi_icon.gif'SMALL '$CLEO\CEMI\icons\sm_cemi_icon.gif'
ENDICONENDNODE
NAME, TITLE, TYPE, and PALETTE are all required keywords and must appear inthat order. Clementine cannot parse the specification file if keywords are out of theexpected order. The ICON subsection is optional.
NAME and TITLE Keywords
CEMI nodes have two string identifiers, NAME and TITLE, supplied in the NODE
specification.
NAME identifies the text appearing with the node when it is placed on the drawingarea. The name can contain alphanumeric characters or underscores only, and itcannot begin with a number. In addition, the name must be unique; two nodescannot share a name.
TITLE defines what the node will be called in the relevant palette. Designate thetitle of the node using a single-quoted text string containing any characters.
For example, the specification:
NAME leximineTITLE 'LexiMine'
results in a node entitled LexiMine on a designated palette. When placed in a stream,the name leximine appears under the node.
TYPE Keyword
Node type determines how data flows when the node is executed and is identifiedusing TYPE in the NODE specification. There are four possible types: SOURCE,PROCESS, TERMINAL, and MODELLING. The shape of the node corresponds to thetype, providing an indicator of how data flows during execution.

802
Appendix E
Source nodes provide input to a stream. CEMI source nodes import types of datathat the built-in Clementine source nodes cannot handle, extending the range ofsupported data formats. For example, a CEMI source node could be createdto read in Web log data, which contains a specific number of fields but needsa set of preprocessing steps.
Process nodes receive input from one node and send output to one or more nodes.CEMI process nodes perform new data manipulation tasks. For example, a CEMIprocess node could be used to incorporate new data cleaning techniques.
Terminal nodes produce output. CEMI terminal nodes create reporting tools,store data in a new way, or launch software that displays results. For example,a CEMI terminal node could be used to send data from Clementine into anExcel spreadsheet.
Modeling nodes produce either refined or unrefined models for the data athand. Refined models can be browsed and placed in streams to process data.In contrast, unrefined models can be browsed only on the Models tab in themanagers window; they cannot be used directly to process data. CEMI modelingnodes will be used for incorporating new modeling techniques. Use REFINEDor UNREFINED to indicate the model type and supply a name for the new nodegenerated on the Models tab.
PALETTE Keyword
Palettes provide a method for organizing nodes by functionality. Use PALETTE in theNODE specification to define the palette on which to place the CEMI node (either thedefault CEMI icon or a custom icon specified in the ICON subsection). The selectionof a palette for the node is closely related to the node type.
SOURCE corresponds to the Sources palette, which typically contains sourcenodes.
RECORD yields a node on the Record Ops palette. This palette usually containsprocess nodes.
FIELD places the node on the Field Ops palette, which commonly holds processnodes.
GRAPH corresponds to the Graphs palette, which typically contains terminalnodes because they pass no data to subsequent nodes.
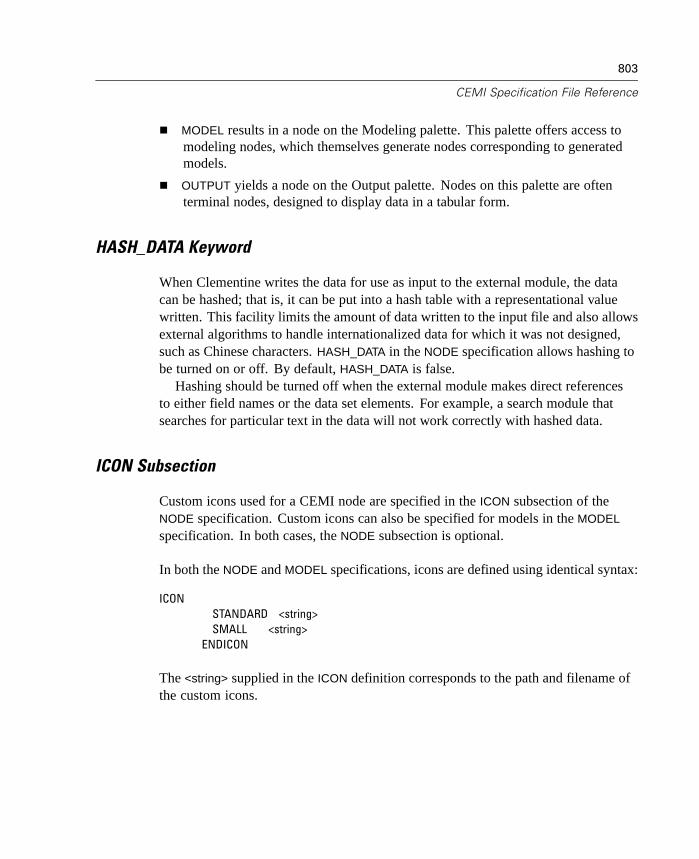
803
CEMI Specification File Reference
MODEL results in a node on the Modeling palette. This palette offers access tomodeling nodes, which themselves generate nodes corresponding to generatedmodels.
OUTPUT yields a node on the Output palette. Nodes on this palette are oftenterminal nodes, designed to display data in a tabular form.
HASH_DATA Keyword
When Clementine writes the data for use as input to the external module, the datacan be hashed; that is, it can be put into a hash table with a representational valuewritten. This facility limits the amount of data written to the input file and also allowsexternal algorithms to handle internationalized data for which it was not designed,such as Chinese characters. HASH_DATA in the NODE specification allows hashing tobe turned on or off. By default, HASH_DATA is false.
Hashing should be turned off when the external module makes direct referencesto either field names or the data set elements. For example, a search module thatsearches for particular text in the data will not work correctly with hashed data.
ICON Subsection
Custom icons used for a CEMI node are specified in the ICON subsection of theNODE specification. Custom icons can also be specified for models in the MODEL
specification. In both cases, the NODE subsection is optional.
In both the NODE and MODEL specifications, icons are defined using identical syntax:
ICONSTANDARD <string>SMALL <string>
ENDICON
The <string> supplied in the ICON definition corresponds to the path and filename ofthe custom icons.

804
Appendix E
This string must be enclosed in single quotes and use a slash character (/) asthe directory separator.
Environment variables can be used in the filename. The example below uses$CLEO to represent the Clementine installation directory.
ICONSTANDARD 'c:/ProgramFiles/Clementine/CEMI/images/lg_cem i_icon.gif'SMALL '$CLEO /C EMI/images/sm _cemi_icon.gif'
ENDICON
A node in Clementine contains both a standard and small icon (as specified on theLayout tab of the Stream Properties dialog box). When specifying a custom node, besure to include custom icons for both sizes.
The ICON subsection will not parse correctly unless both icons are supplied.
If either icon specified cannot be found or is not a valid image file (.gif or .jpg), ablank CEMI node icon will be displayed on the palette.
Image size is not validated during parsing. If the icon is too large, only a portionof the image will be displayed.
Note: It is advised that custom icons adhere to a set of guidelines designed forseamless display in Clementine. For more information, see “Creating CEMI NodeIcons” in Chapter 19 on page 627.
Core Specification
The main structure of the specification file is contained in the CORE section. Thissection defines details such as input data models and return values.
CORE{ <parameters-subsection>
<execute-subsection><options-subsection>+<controls-subsection><input-fields-subsection>+<output-fields-subsection>+<input-data-subsection>+<output-data-subsection>+<mapping-file-subsection>*<return-code-subsection>+

805
CEMI Specification File Reference
<results-subsection>+<model-files-subsection>+ }
ENDCORE
Subsections for parameters, execution, options, controls, and return codes should beincluded for all CEMI nodes. The remaining subsections depend on the node type:
Source nodes include subsections for output fields and output data.
Process nodes include subsections for input fields, output fields, input data,output data, and mapping files.
Terminal nodes include subsections for input fields, input data, mapping files,and results.
Modeling nodes include subsections for input fields, input data, mapping files,results, and model results.
PARAMETERS Subsection
Parameters are defined in the PARAMETERS subsection of CORE or MODEL.
PARAMETERS{ <name> <parameter-definition> | FROM <name> }*
ENDPARAMETERS
After each parameter name, supply a definition of the parameter. The definitionincludes a parameter type and a default value. The parameter type gives somesemantic information about what type of value is stored by the parameter. Thedefault value appears when the editing dialog box is first opened. Any number ofparameters can be defined in PARAMETERS; however, the format for the parameterdefinition depends on the type. Available types include: flag, text, number, field,set, pathname, tempfile, and id.
The FROM keyword should be used only in the PARAMETERS subsection of theMODEL specification. FROM identifies parameters defined in CORE that MODEL
should inherit. Follow FROM with the name of the parameter to be included inMODEL.
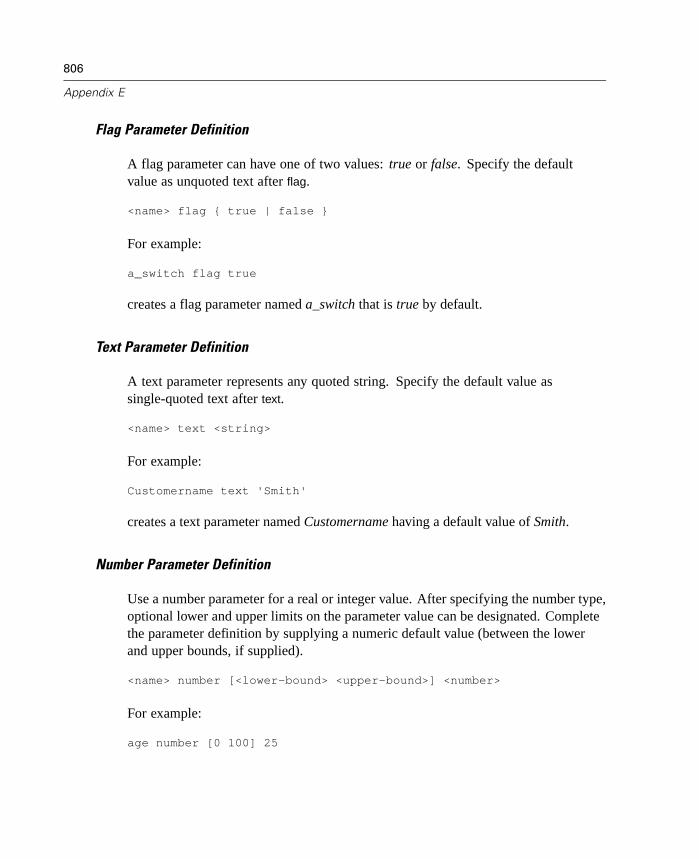
806
Appendix E
Flag Parameter Definition
A flag parameter can have one of two values: true or false. Specify the defaultvalue as unquoted text after flag.
<name> flag { true | false }
For example:
a_switch flag true
creates a flag parameter named a_switch that is true by default.
Text Parameter Definition
A text parameter represents any quoted string. Specify the default value assingle-quoted text after text.
<name> text <string>
For example:
Customername text 'Smith'
creates a text parameter named Customername having a default value of Smith.
Number Parameter Definition
Use a number parameter for a real or integer value. After specifying the number type,optional lower and upper limits on the parameter value can be designated. Completethe parameter definition by supplying a numeric default value (between the lowerand upper bounds, if supplied).
<name> number [<lower-bound> <upper-bound>] <number>
For example:
age number [0 100] 25
807
CEMI Specification File Reference
yields a number parameter named age that can range from 0 to 100. By default,this parameter equals 25.
If the parameter needs only a lower or upper bound, use a “–” character in place ofthe other bound. For example:
age number [0 -] 25
indicates that age cannot be smaller than 0 but has no upper bound.
Number parameters are handled internally as either real numbers or integer numbersdependent on the minimum, maximum and default values for the parameter. If anumber parameter has an integer min, max and default then the parameter will bedefined as an integer parameter and the values will be stored and treated as an integer(its control on the edit dialog will only accept integers). All other values will createa real parameter.
Field Parameter Definition
A field parameter contains one or more field names from the data set.
<name> field oneof { all | numeric | symbolic }<name> field someof { all | numeric | symbolic }
Follow the field designation with a keyword that indicates whether the parameter willcontain one field name or multiple field names:
oneof. Contains one field from the input data model.
someof. Contains one or more fields from the input data model.
The definition of a field parameter concludes with a keyword designating the typeof fields that the parameter references:
all. The name of any field in the input data set may appear in the parameter.
numeric. Restricts the available names to those for numeric fields.
symbolic. Restricts the available names to those for symbolic fields.
For example:
inputfield1 field oneof all
808
Appendix E
creates a parameter named inputfield1 that contains one field name for fields of anytype in the input data set. In contrast:
inputfield2 field someof symbolic
yields a parameter named inputfield2 that contains one or more field names forsymbolic fields in the input data set.
The field names themselves are not specified when defining the parameter. Theuser identifies the field names using the editing dialog box for the node.
Set Parameter Definition
A set parameter contains one or more values from a specified set.
<name> set oneof [ <set-members>* ] <default-value><name> set someof [ <set-members>*] <default-value>+
<set-members> == { <name> | <string> | <number> }<default-value> == { <name> | <string> | <number> }
After the set designation, provide a keyword indicating whether the parameter willcontain one value or multiple values:
oneof. Contains one value from the set.
someof. Contains one or more values from the set. Include the CONTROL TOGGLEkeyword for the someof parameter to create a multiple check box control.
Follow the oneof or someof keyword with a bracketed, space-delimited set of possiblevalues for the parameter. This set may contain unquoted alphanumeric strings,single-quoted strings, or numbers. The definition of a set parameter concludes byspecifying the default value for the parameter selected from the set of possiblevalues. For example:
payment_method set oneof [check cash credit] cash
creates a parameter named payment_method that contains one value from the set{check, cash, credit}. By default, this parameter has a value of cash.

809
CEMI Specification File Reference
Pathname Parameter Definition
Pathname parameters refer to file names.
<name> pathname <string>
This parameter allows the user to specify an existing file to edit, or to specify a newfile to which to write. The default value, specified after the pathname designation,should include the path to the file as well as the file name. Use a slash (/) as thedirectory separator in paths.
Since a specification file is saved with the CEMI node, it is advisable to useenvironment variables when pointing to pathnames. For example, you can define anenvironment variable MYAPP_PATH and use that variable in a pathname specificationsuch as ‘$MYAPP_PATH/bin/myapp.exe’.
Use ‘$’ to refer to environment variables in CEMI specifications.
You may also use the special variable $CLEO to point to the Clementineinstallation directory.
Pathname parameters are fully expanded to their absolute pathnames before they areused in the execution of a CEMI node. This includes expansion of environmentvariables. CEMI specifications which expect relative pathnames or manipulatethe contents of pathname parameters in string expressions may need to be alteredto conform with this behavior.
Tempfile Parameter Definition
A tempfile parameter specifies the name of a temporary file.
<name> tempfile <string>
Supply the name for the temporary file as a single-quoted string after the tempfile
designation. Typically, names for temporary files do not include a file suffix, allowingthe name to be used as a stem for both temporary input and output files specified inthe INPUT_DATA and OUTPUT_DATA subsections. For example:
myfile tempfile 'temp'
810
Appendix E
creates a parameter named myfile that contains the root name temp, which will beused for temporary files.
Id Parameter Definition
An id parameter identifies the root used as a stem for the generation of temporary IDs.
<name> id <string>
A parameter of this type serves as a unique reference when needed, such as whenmodeling.
EXECUTE Subsection
In the specification file, the EXECUTE subsection defines the external executableprogram:
EXECUTE{ COMMAND <string> |
COMMAND_IF <command-condition> <string> |COMMAND_UNLESS <command-condition> <string> }*
ENDEXECUTE
<command-condition> =={ SERVER | <parameter-condition> }
<parameter-condition> =={ <word> | \
[ <word> { <word> | <string> | <number> } ] }
The string supplied in the EXECUTE subsection corresponds to the path and filenameof the file to be executed by the node. This string must be enclosed in single quotesand use a slash character (/) as the directory separator. For example, a node thatexecutes the file C:\Program Files\Clementine\mycemi.exe would have the followingEXECUTE subsection:
EXECUTECOMMAND 'c:/Program Files/Clementine/mycemi.exe'
ENDEXECUTE

811
CEMI Specification File Reference
Alternatively, the string could correspond to a text parameter defined in thePARAMETERS subsection. However, in this situation, the CEMI parser requirestwo slashes as the directory separator. For example, to specify mycemi.exe usinga parameter:
PARAMETERSmyfile text 'c://Program Files//Clementine//mycemi.exe'
ENDPARAMETERS
EXECUTECOMMAND myfile
ENDEXECUTE
EXECUTE can include any number of execution commands. CEMI executes thespecified programs in the order specified in the specification file.
Typically, the external executable program processes command line arguments inthe specification file. All of the extra information to be included on the MS-DOScommand line is listed in the OPTIONS subsection of the specification.
Conditional Execution
COMMAND_IF and COMMAND_UNLESS permit a single CEMI node to run differentexecutable programs. These directives include a condition and the name of theexecutable program to be run. If a COMMAND_IF condition is true, the node runs thespecified executable program. In contrast, a COMMAND_UNLESS condition must befalse for the corresponding executable program to be run.
For example, a C5.0 CEMI node may have one executable program for producingrulesets and another for producing decision trees. A flag parameter defined in thePARAMETERS subsection can be referenced in the EXECUTE subsection to determinewhich executable program to run.
PARAMETERSgen_ruleset flag true
ENDPARAMETERS
EXECUTECOMMAND_IF [gen_ruleset] 'C:/Clementine/ruleset.exe'COMMAND_UNLESS [gen_ruleset] 'C:/Clementine/dec_trees.exe';
ENDEXECUTE
In this case, the node runs ruleset.exe when gen_ruleset is true and runs dec_trees.exewhen gen_ruleset is false.

812
Appendix E
If a CEMI node needs to provide access to more than two executable programs,multiple COMMAND_IF statements could access a set parameter to determine whichexecutable program to run. For example, a neural network CEMI node may haveexecutable programs for five training methods: Quick, Dynamic, Multiple, Prune, orRBFN. The following specification uses the parameter training to define the method.The value of training determines which executable program to run.
PARAMETERStraining set oneof [quick dynam mult prune rbfn] quick
ENDPARAMETERS
EXECUTECOMMAND_IF [training quick] 'C:/Clementine/t_quick.exe'COMMAND_IF [training dynam] 'C:/Clementine/t_dynam.exe'COMMAND_IF [training mult] 'C:/Clementine/t_mult.exe'COMMAND_IF [training prune] 'C:/Clementine/t_prune.exe'COMMAND_IF [training rbfn] 'C:/Clementine/t_rbfn.exe'
ENDEXECUTE
The executable program to run may depend on whether Clementine is running inclient or server mode. When running in server mode, the executable program must becalled from the server. Although it is possible to load two slightly different CEMIspecification files with differently named nodes and paths of execution, this is timeconsuming and it produces two nodes that are practically identical.
The keyword SERVER tests whether Clementine is running in server mode.This condition returns true, allowing you to specify different executableprogram commands for client and server execution using COMMAND_IF andCOMMAND_UNLESS. For example:
EXECUTECOMMAND_IF SERVER 'C:/Clementine/externs/cemi_server.exe'COMMAND_UNLESS SERVER 'C:/Clementine/externs/cemi_client.exe'
ENDEXECUTE
OPTIONS Subsection
Executable programs usually take in a list of values as input that modifies theirbehavior. This list typically follows the name of the executable program wheninvoking it from the command line. CEMI provides this functionality by passingparameter values as command line arguments.
813
CEMI Specification File Reference
The OPTIONS subsection is used to specify the command line arguments to bepassed to the external module. The order in which the options are listed in thespecification file is the order in which they will be passed to the external module.CEMI inserts spaces between the options when constructing the command line.
OPTIONS{ <parameter-name> | NOPARAM } [ <string-expression> ]*
ENDOPTIONS
<string-expression> =={ <string> | <word> | FIELD.NAME } \{ >< { <string-expression> }*
Begin each option definition with either an existing parameter name or the NOPARAM
keyword. A parameter name corresponds to a conditional option; if the parameter is aflag that is true or if the parameter is of any other type, the corresponding option getspassed to the executable program. In contrast, NOPARAM designates unconditionaloptions. These options are always passed to the executable program.
The option itself is a string expression enclosed in brackets that contains any textor parameter names, provided they are joined by the “><” operator. CEMI inserts thecurrent value for the parameter in the command line. For set someof and field someof
parameters, the selected items appear separated by spaces and enclosed in brackets.The values for parameters are usually set by the user in the node's editing dialog box.For example, consider the following subsections of CORE:
PARAMETERSmy_text text 'ALL'my_set field someof allmy_flag flag truecond_option set oneof [low med high] low
ENDPARAMETERSEXECUTE
COMMAND mycemi.exeENDEXECUTEOPTIONS
NOPARAM ['reset=' >< my_text]NOPARAM [my_set]my_flag [cond_option]
ENDOPTIONS
The executable program mycemi.exe receives at most three command line arguments:
The value of my_text appended to the text “reset=”, reset=ALL.
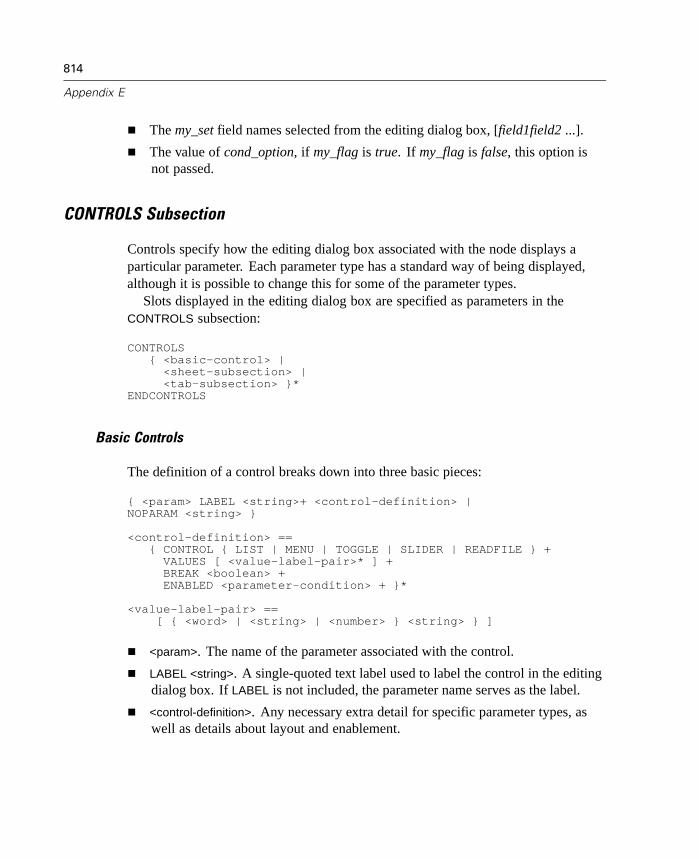
814
Appendix E
The my_set field names selected from the editing dialog box, [field1field2 ...].
The value of cond_option, if my_flag is true. If my_flag is false, this option isnot passed.
CONTROLS Subsection
Controls specify how the editing dialog box associated with the node displays aparticular parameter. Each parameter type has a standard way of being displayed,although it is possible to change this for some of the parameter types.
Slots displayed in the editing dialog box are specified as parameters in theCONTROLS subsection:
CONTROLS{ <basic-control> |
<sheet-subsection> |<tab-subsection> }*
ENDCONTROLS
Basic Controls
The definition of a control breaks down into three basic pieces:
{ <param> LABEL <string>+ <control-definition> |NOPARAM <string> }
<control-definition> =={ CONTROL { LIST | MENU | TOGGLE | SLIDER | READFILE } +
VALUES [ <value-label-pair>* ] +BREAK <boolean> +ENABLED <parameter-condition> + }*
<value-label-pair> ==[ { <word> | <string> | <number> } <string> } ]
<param>. The name of the parameter associated with the control.
LABEL <string>. A single-quoted text label used to label the control in the editingdialog box. If LABEL is not included, the parameter name serves as the label.
<control-definition>. Any necessary extra detail for specific parameter types, aswell as details about layout and enablement.

815
CEMI Specification File Reference
Graphical elements are mapped to previously defined parameters; different parametershave different visual representations in the editing dialog box.
A pathname parameter is represented by a text box for the directory and filename.It also includes a button that presents a file selection dialog box. Use CONTROLREADFILE to make the file selection dialog box read-only. In this case, theexternal module is prevented from modifying or creating the selected file. Theread-only dialog box does not allow selection of a new nonexistent file and doesnot allow overwriting of an existing file.
A flag parameter is represented by a check box. If the check box is switched“on,” the corresponding parameter receives a value of true; otherwise falsewill be returned.
A text parameter is represented by a text box.
A number parameter is represented by a text box with arrows or a slider to adjustthe value. To use the slider control, specify CONTROL SLIDER in the controldefinition.
A field parameter is represented by a list box or menu.
A set oneof parameter can be displayed in a list box (CONTROL LIST), a menu(CONTROL MENU), or a set of toggle buttons (CONTROL TOGGLE). For setsomeof parameters, the control is limited to a vertical set of check boxes;CONTROL TOGGLE changes the orientation to horizontal. The control definitionalso includes a list of value-label pairs in brackets. For each value in the set,specify a single-quoted label to be displayed in the control. Enclose the individualpairs and the entire list in brackets.
Control Layout
By default, each control appears on a new line in the editing dialog box in the ordercorresponding to its definitions in the specification file. To display two controls onthe same line, specify BREAK false in the definition of the second parameter.
Note: The ALIGNED keyword, available in previous releases, is no longer supported.Controls will be aligned on the edit dialog automatically, based upon the controltype and settings.
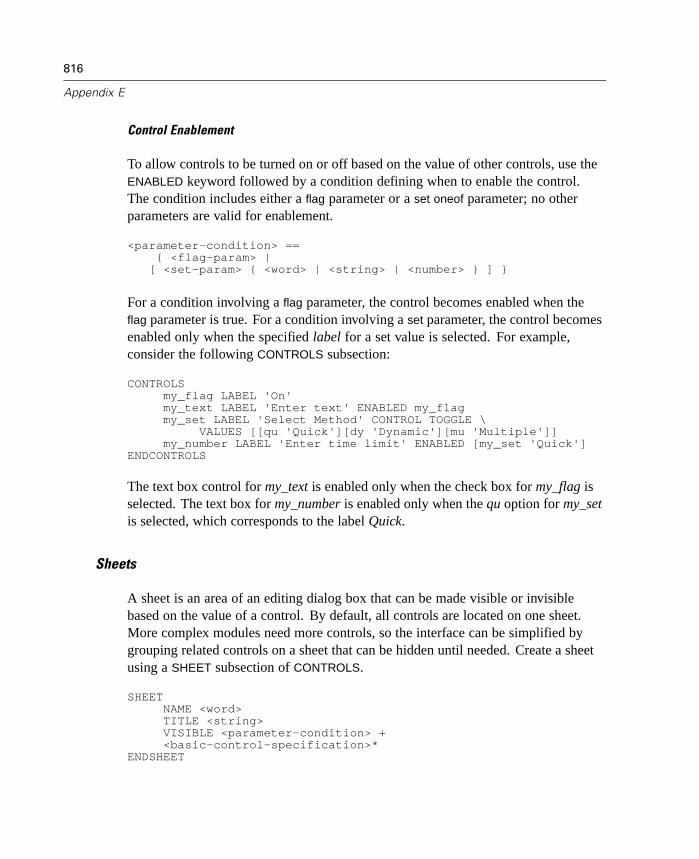
816
Appendix E
Control Enablement
To allow controls to be turned on or off based on the value of other controls, use theENABLED keyword followed by a condition defining when to enable the control.The condition includes either a flag parameter or a set oneof parameter; no otherparameters are valid for enablement.
<parameter-condition> =={ <flag-param> |
[ <set-param> { <word> | <string> | <number> } ] }
For a condition involving a flag parameter, the control becomes enabled when theflag parameter is true. For a condition involving a set parameter, the control becomesenabled only when the specified label for a set value is selected. For example,consider the following CONTROLS subsection:
CONTROLSmy_flag LABEL 'On'my_text LABEL 'Enter text' ENABLED my_flagmy_set LABEL 'Select Method' CONTROL TOGGLE \
VALUES [[qu 'Quick'][dy 'Dynamic'][mu 'Multiple']]my_number LABEL 'Enter time limit' ENABLED [my_set 'Quick']
ENDCONTROLS
The text box control for my_text is enabled only when the check box for my_flag isselected. The text box for my_number is enabled only when the qu option for my_setis selected, which corresponds to the label Quick.
Sheets
A sheet is an area of an editing dialog box that can be made visible or invisiblebased on the value of a control. By default, all controls are located on one sheet.More complex modules need more controls, so the interface can be simplified bygrouping related controls on a sheet that can be hidden until needed. Create a sheetusing a SHEET subsection of CONTROLS.
SHEETNAME <word>TITLE <string>VISIBLE <parameter-condition> +<basic-control-specification>*
ENDSHEET

817
CEMI Specification File Reference
<parameter-condition> =={ <flag-parameter> |
[ <set-param> { <word> | <string> | <number> } ] }
The NAME value is a non-quoted string used to reference a particular sheet. TITLE
defines a single-quoted string that appears at the top of the sheet in the editingdialog box.
VISIBLE defines when the sheet is available to the user. Follow this keyword with acondition involving a flag or set oneof parameter. A flag parameter typically hides apanel of expert options that certain types of users do not need to see. In contrast, acondition involving a set parameter sorts controls into groups, providing access to agroup when a value from the corresponding set is selected. Controls common to allvalues of the set should be placed in the main editing dialog box.
The definition of a sheet concludes with lines defining the controls to appear onthe sheet. The basic control definition for a sheet is identical to the definition of acontrol in the main editing dialog box, including all layout and enablement options.The following CONTROLS subsection defines two controls on a sheet that is visibleonly when a flag parameter is true.
CONTROLSmy_dep LABEL 'Dependent variable'my_indep LABEL 'Independent variable(s)'my_flag LABEL 'Expert Options'SHEET
NAME expert_sheetTITLE 'Expert Options'VISIBLE my_flagres_flag LABEL 'Residual plot'out_flag 'Outlier analysis'
ENDSHEETENDCONTROLS
The residual plot and outlier analysis can be selected only if the user requests expertoptions.
Sheets cannot be nested within another sheet. Each sheet can be made visible orinvisible only by using a condition involving a control in the main editing dialog box.For example, the CONTROLS subsection above cannot be specified as:
CONTROLSmy_dep LABEL 'Dependent variable'my_indep LABEL 'Independent variable(s)'my_flag LABEL 'Expert Options'
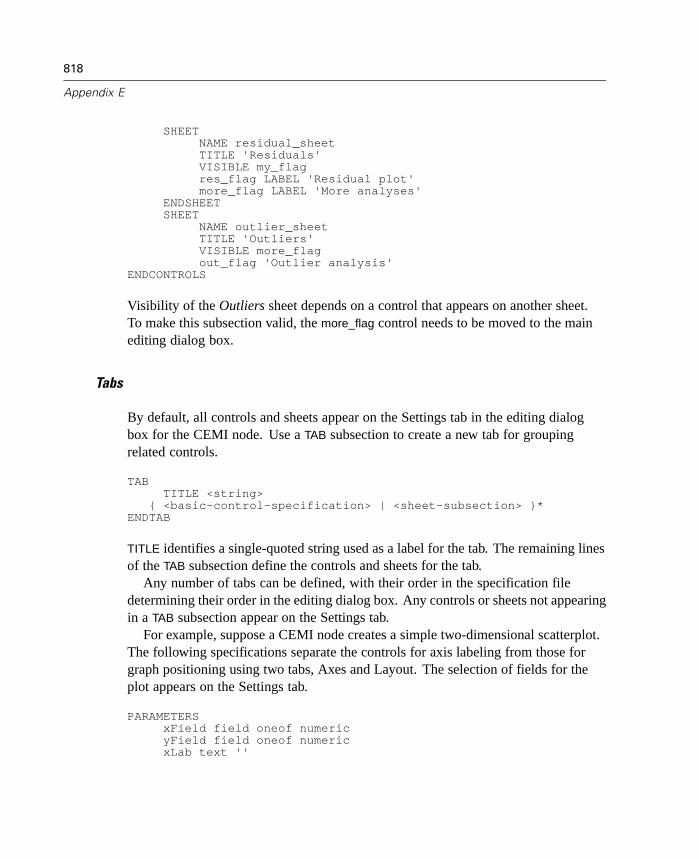
818
Appendix E
SHEETNAME residual_sheetTITLE 'Residuals'VISIBLE my_flagres_flag LABEL 'Residual plot'more_flag LABEL 'More analyses'
ENDSHEETSHEET
NAME outlier_sheetTITLE 'Outliers'VISIBLE more_flagout_flag 'Outlier analysis'
ENDCONTROLS
Visibility of the Outliers sheet depends on a control that appears on another sheet.To make this subsection valid, the more_flag control needs to be moved to the mainediting dialog box.
Tabs
By default, all controls and sheets appear on the Settings tab in the editing dialogbox for the CEMI node. Use a TAB subsection to create a new tab for groupingrelated controls.
TABTITLE <string>
{ <basic-control-specification> | <sheet-subsection> }*ENDTAB
TITLE identifies a single-quoted string used as a label for the tab. The remaining linesof the TAB subsection define the controls and sheets for the tab.
Any number of tabs can be defined, with their order in the specification filedetermining their order in the editing dialog box. Any controls or sheets not appearingin a TAB subsection appear on the Settings tab.
For example, suppose a CEMI node creates a simple two-dimensional scatterplot.The following specifications separate the controls for axis labeling from those forgraph positioning using two tabs, Axes and Layout. The selection of fields for theplot appears on the Settings tab.
PARAMETERSxField field oneof numericyField field oneof numericxLab text ''

819
CEMI Specification File Reference
yLab text ''xPos number [0 8] 1yPos number [0 11] 1
ENDPARAMETERSCONTROLS
xField LABEL 'Field for the x-axis'yField LABEL 'Field for the y-axis'TAB
TITLE 'Axes'xLab LABEL 'Label for the x-axis'yLab LABEL 'Label for the y-axis'
ENDTABTAB
TITLE 'Layout'xPos LABEL 'Horizontal location'yPos LABEL 'Vertical location'
ENDTABENDCONTROLS
INPUT_FIELDS Subsection
The INPUT_FIELDS subsection specifies which fields from the data will be used asinput to the external module. Fields can be included based on their direction and/ortype from the most recent Type node in the Clementine stream or based on the valuesheld by a field type parameter. The number of fields passed can also be defined.
INPUT_FIELDS{ INCLUDE | DISCARD } \
<selection-criteria> <constraint-criteria+>ENDINPUT_FIELDS
Specifying field selection involves:
Defining whether to include or discard the selected fields
Identifying the criteria used to select fields
Imposing limits on the number of fields selected, if desired
The choice between INCLUDE and DISCARD depends on whether or not the selectedfields should be passed to the external program. INCLUDE passes only the selectedfields; DISCARD passes all but the selected fields. Use the latter approach if it is easierto specify the fields that should not be copied to the temporary file.
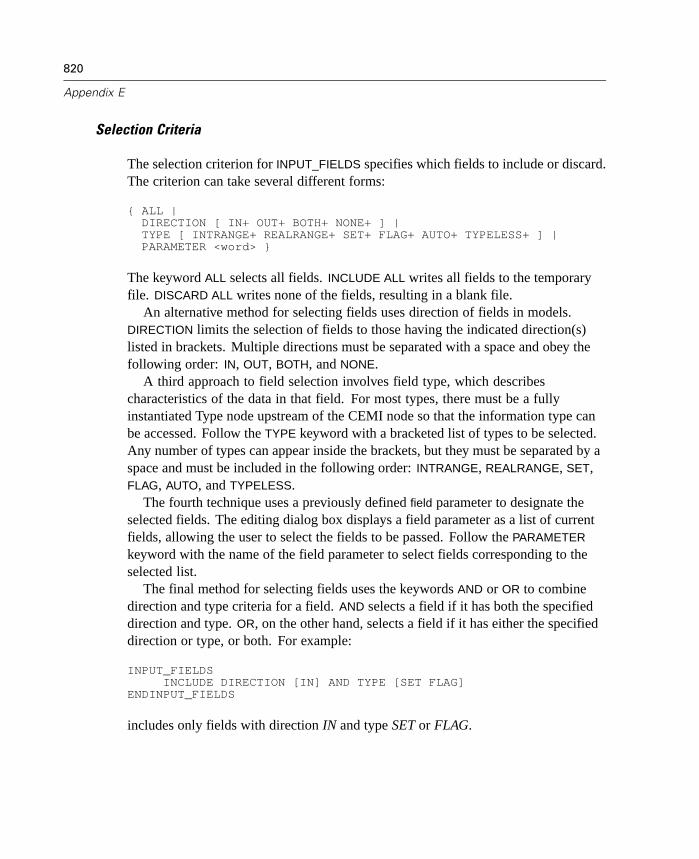
820
Appendix E
Selection Criteria
The selection criterion for INPUT_FIELDS specifies which fields to include or discard.The criterion can take several different forms:
{ ALL |DIRECTION [ IN+ OUT+ BOTH+ NONE+ ] |TYPE [ INTRANGE+ REALRANGE+ SET+ FLAG+ AUTO+ TYPELESS+ ] |PARAMETER <word> }
The keyword ALL selects all fields. INCLUDE ALL writes all fields to the temporaryfile. DISCARD ALL writes none of the fields, resulting in a blank file.
An alternative method for selecting fields uses direction of fields in models.DIRECTION limits the selection of fields to those having the indicated direction(s)listed in brackets. Multiple directions must be separated with a space and obey thefollowing order: IN, OUT, BOTH, and NONE.
A third approach to field selection involves field type, which describescharacteristics of the data in that field. For most types, there must be a fullyinstantiated Type node upstream of the CEMI node so that the information type canbe accessed. Follow the TYPE keyword with a bracketed list of types to be selected.Any number of types can appear inside the brackets, but they must be separated by aspace and must be included in the following order: INTRANGE, REALRANGE, SET,FLAG, AUTO, and TYPELESS.
The fourth technique uses a previously defined field parameter to designate theselected fields. The editing dialog box displays a field parameter as a list of currentfields, allowing the user to select the fields to be passed. Follow the PARAMETER
keyword with the name of the field parameter to select fields corresponding to theselected list.
The final method for selecting fields uses the keywords AND or OR to combinedirection and type criteria for a field. AND selects a field if it has both the specifieddirection and type. OR, on the other hand, selects a field if it has either the specifieddirection or type, or both. For example:
INPUT_FIELDSINCLUDE DIRECTION [IN] AND TYPE [SET FLAG]
ENDINPUT_FIELDS
includes only fields with direction IN and type SET or FLAG.
821
CEMI Specification File Reference
Constraint Criteria
To impose limits on the number of fields passed to the external program throughCEMI, use the keyword CHECK after the selection criteria in the INPUT_FIELDS
subsection of the specification file.
CHECK { MIN <integer> + | MAX <integer> + } +
Use MIN and MAX to denote the minimum and maximum number of fields to pass.For example:
INPUT_FIELDSINCLUDE DIRECTION [OUT] CHECK MAX 1
ENDINPUT_FIELDS
writes at most one field having direction OUT to the temporary file passed to theexternal program. If multiple OUT fields exist, the first encountered appears in thetemporary file. If no OUT fields occur, the file contains no fields. Alternatively:
INPUT_FIELDSINCLUDE TYPE [REALRANGE] CHECK MIN 1 MAX 5
ENDINPUT_FIELDS
writes at least one and no more than five fields of type REALRANGE to the temporaryfile.
OUTPUT_FIELDS Subsection
An external module may return extra new fields, remove fields, or return a completelynew set of fields. Clementine needs to know what to expect in the new data modelin order to check the consistency of the data on its return. The OUTPUT_FIELDS
subsection relates information about the new data model. This subsection describesonly the data model; the actual data must be returned to Clementine in a filereferenced in the OUTPUT_DATA subsection.
OUTPUT_FIELDS{ REPLACE | EXTEND }{ <field-operation> | <process-foreach-loop> }*
ENDOUTPUT_FIELDS
822
Appendix E
In order to describe changes in the original data model, define the new data modelusing the EXTEND or REPLACE keywords.
EXTEND adds zero or more new fields to the original data model and preservesthe number of records, as well as the field and record order.
REPLACE replaces the original data model. Use this keyword when EXTEND isnot appropriate, such as when fields are removed from the original data model orwhen the data model is replaced entirely with new fields.
In either mode, the OUTPUT_FIELDS subsection should describe the fields that arecreated by the module. When using EXTEND, these are the new fields only; whenusing REPLACE, these are all of the fields output from the node.
New fields are described by their name and type; the field names specified in theOUTPUT_FIELDS subsection will be used in subsequent Clementine nodes, so if fieldnames exist in the data, they are treated as data values.
Field Operations
Field operations consist of three parts: a creation expression, a name assignment,and a type specification.
<creation-exp> NAME [ <string-exp> | <param-name> ] \TYPE [ <type-exp> ]
<creation-exp> =={ CREATE | { CREATE_IF | CREATE_UNLESS } \
<parameter-condition> }
<type-exp> ={ AUTO |
AUTOSYMBOL |AUTONUMBER |AUTOSET |AUTOFLAG |REALRANGE <real-low> <real-high> |INTRANGE <integer-low> <integer-high> |FLAG <true-string> <false-string> |SET [ <string>* ] |FIELD.TYPE }
The creation expression determines whether the field is always generated orconditionally generated and takes one of three forms:
CREATE yields unconditional field generation.

823
CEMI Specification File Reference
CREATE_IF generates a field only if a parameter condition is true.
CREATE_UNLESS generates a field only if a parameter condition is false.
For conditional creation, the parameter condition can contain either a flag parameteror a set parameter. For flag parameters, simply supply the parameter name. For set
parameters, however, include the single-quoted label of the set value that should resultin a true parameter condition.
After the creation expression, define the new field. NAME identifies the name forthe field being created. Follow the keyword with brackets containing the desiredname in one of the following forms:
A single-quoted string, such as ['new_field'].
A text parameter defined in the PARAMETERS subsection, such as [newField].Defining a control for the parameter allows the user to specify the name for thenew field using the editing dialog box.
The keyword FIELD.NAME, which inserts the name of the current field. InFOREACH loops, the current field is the one matching the selection criteria.
A string expression containing any combination of the above forms, concatenatedusing the “><” operator, such as ['$C-' >< FIELD.NAME].
TYPE defines the type for the new field. Follow the keyword with brackets containingthe desired type, plus any type-specific details.
INTRANGE and REALRANGE fields require the specification of the low andhigh values.
FLAG fields require the values representing true and false to be specified.
SET fields require a space-separated list of single-quoted members of the set.
Alternatively, use the keyword FIELD.TYPE to insert the type of the current field. InFOREACH loops, the current field is the one matching the selection criteria.
To illustrate different approaches to field creation, consider the followingsubsection:
OUTPUT_FIELDSEXTENDCREATE NAME [uncond] TYPE [AUTO]CREATE_IF [my_flag] NAME [cond1] TYPE [SET 'Low' 'Med' 'High']CREATE_UNLESS [my_set 'Type1'] NAME [cond2] \
TYPE [FLAG 'Pos' 'Neg']ENDOUTPUT_FIELDS
824
Appendix E
CREATE yields a field named uncond having a type of automatic. The filereturned from the external program will always contain this field.
If my_flag is true, the returned file contains a field named cond1, which is a setfield containing values of Low, Med, and High. If my_flag has a control inthe editing dialog box, the user can define whether or not the file contains thisnew field.
If my_set has any value other than Type1, the returned file contains a fieldnamed cond2, a flag field in which Pos represents a true value. If my_set has acontrol in the editing dialog box, the file contains cond2 when the user selectsany value but Type1.
If the program generates a fixed number of fields and the names and types of thenew fields are independent of other fields, the specification file needs only onefield operation line for each new field. If dependencies between fields exist, use aFOREACH loop for field creation.
For Each Loops
FOREACH loops provide a method of creating fields for situations in which:
The external program creates a fixed number of fields, but the names or types ofthe new fields depend on other fields.
The data model is replaced by the external program, either by adding a variablenumber of new fields to the original fields or by returning only new fields.
A FOREACH loop has two general structures, depending on the boundaries of the loop.
FOREACH <loop-bounds><field-operation>*
ENDFOREACH
<loop-bounds> =={ FIELD { INCLUDE | DISCARD } <selection-criteria> |
FROM { <integer> | <word> } TO { <integer> | <word> } }
The first approach creates new fields using selection criteria. In this case, add theFIELD keyword to the loop, followed by INCLUDE or DISCARD. The FOREACH
loop loops through fields in the original data model, comparing each to theselection criterion, which is defined in the same way as the selection criterion forINPUT_FIELDS. INCLUDE results in the loop body being executed when a field

825
CEMI Specification File Reference
satisfies the selection criteria; DISCARD executes the loop for each original field thatdoes not satisfy the selection criteria.
For example, the C5.0 model adds two fields to the data model, one for thepredicted value and one for the confidence value. Each of these new fields needs aname that reflects the OUT field for the model. Consider the following specification:
OUTPUT_FIELDSEXTENDFOREACH INCLUDE DIRECTION [OUT]
CREATE NAME ['$C-' >< FIELD.NAME] TYPE [FIELD.TYPE]CREATE NAME ['$CC-' >< FIELD.NAME] TYPE [INTRANGE 0 1]
ENDFOREACHENDOUTPUT_FIELDS
For the OUT field, the loop body gets executed, creating two new fields. One fieldreceives a name corresponding to “$C–” appended to the name of the OUT field. Thisfield has the same type as the OUT field and corresponds to the predicted value.The other new field has a name resulting from appending “$CC–” to the OUT fieldname and is an INTRANGE field.
If the data model is being replaced, all of the fields in the new data model mustbe described. Clementine does not know what the number of fields must be, so youmust specify this using the second structure for FOREACH loops. This techniquerequires the specification of the initial and final values for the loop. Specify thesebounds as either integers:
FOREACH FROM 0 TO 10
or as parameters:
PARAMETERSstart_num number [0 10] 0end_num number [10 20] 10
ENDPARAMETERS...OUTPUT_FIELDS
FOREACH FROM start_num TO end_num...ENDOUTPUT_FIELDS
The data model being described is completely new, so no information from existingfields can be used to specify the name or the types of the fields. For example:
OUTPUT_FIELDS
826
Appendix E
REPLACEFOREACH FROM 1 TO 3
CREATE NAME ['field-' >< FIELD.TYPE] TYPE [AUTO]ENDFOREACH
ENDOUTPUT_FIELDS
creates five new AUTO fields, with names field-1, field-2, and field-3. In this case,FIELD.TYPE inserts the current number of the field.
Fields created using a FOREACH loop of this type are limited to the AUTO,AUTOSYMBOL, AUTONUMBER, AUTOSET, and AUTOFLAG types.
INPUT_DATA and OUTPUT_DATA Subsections
When Clementine runs an external module, it creates a file to send data to the externalmodule and/or reads a file to receive data from the external module. The INPUT_DATA
and OUTPUT_DATA subsections describe the data files used by CEMI. INPUT_DATA
contains information about the data sent from Clementine to the external program.Clementine creates a temporary file and copies the contents of the file referenced inthis subsection to the temporary file. In contrast, OUTPUT_DATA contains informationabout the data sent from the external program to Clementine.
INPUT_DATAFILE_NAME { [ <param-name> | <string-expression> ] }
{ SEPARATOR {<string> | 'TAB' } |EOL <string> |INC_FIELDS <boolean> | }*
ENDINPUT_DATA
Any combination of SEPARATOR, EOL, and INC_FIELDS can be specified, but theymust occur in that order. For output data files, change INPUT_DATA to OUTPUT_DATA
and ENDINPUT_DATA to ENDOUTPUT_DATA.FILE_NAME identifies the location and name of the data file. A pathname or
tempfile parameter often supplies this information.
PARAMETERSinputfile tempfile 'C:\cemi files\infiles\temp_indata.txt'
ENDPARAMETERSINPUT_DATA
FILE_NAME [inputfile]ENDINPUT_DATA

827
CEMI Specification File Reference
Alternatively, FILE_NAME can reference a single-quoted string, such as:
INPUT_DATAFILE_NAME ['C:\cemi files\infiles\temp_input_data.txt']
ENDINPUT_DATA
To specify a common location for multiple files, use a string appended to a tempfile orpathname parameter using the >< operator. For example:
PARAMETERSfilestem pathname 'C:\cemi files\prm_infiles\'
ENDPARAMETERSINPUT_DATA
FILE_NAME [filestem >< 'in_data.txt']ENDINPUT_DATAOUTPUT_DATA
FILE_NAME [filestem >< 'out_data.txt']ENDOUTPUT_DATA
If the file location is not explicitly specified, Clementine allocates the filesdynamically. However, the data source is typically used as a command option for theexternal module. Setting the file location allows you to ensure that the file you pass tothe external module matches the name of the file created by Clementine.
The INPUT_DATA and OUTPUT_DATA subsections also describe the format ofthe data in the file. Controlling the format ensures that the external program andClementine can process the data passed between them. Three keywords provideformat information:
SEPARATOR defines the character used to separate the field values. Supply thecharacter within single quotes after the keyword. The default is a comma, whichis used if no separator is specified. Use of the special keyword TAB separatesfields in the file with a tab character.
EOL identifies the character used to define the end of a record line. Denotethe character using a single-quoted string after the keyword. The default isa new line character.
INC_FIELDS specifies whether or not the file created contains field names on thefirst line. Follow the keyword with true to include field names or with false toomit them.
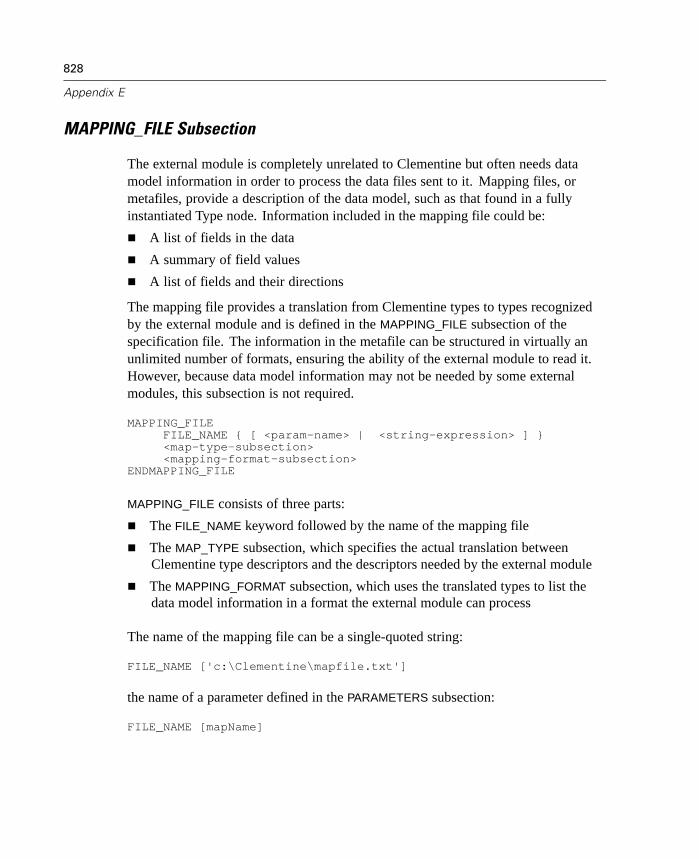
828
Appendix E
MAPPING_FILE Subsection
The external module is completely unrelated to Clementine but often needs datamodel information in order to process the data files sent to it. Mapping files, ormetafiles, provide a description of the data model, such as that found in a fullyinstantiated Type node. Information included in the mapping file could be:
A list of fields in the data
A summary of field values
A list of fields and their directions
The mapping file provides a translation from Clementine types to types recognizedby the external module and is defined in the MAPPING_FILE subsection of thespecification file. The information in the metafile can be structured in virtually anunlimited number of formats, ensuring the ability of the external module to read it.However, because data model information may not be needed by some externalmodules, this subsection is not required.
MAPPING_FILEFILE_NAME { [ <param-name> | <string-expression> ] }<map-type-subsection><mapping-format-subsection>
ENDMAPPING_FILE
MAPPING_FILE consists of three parts:
The FILE_NAME keyword followed by the name of the mapping file
The MAP_TYPE subsection, which specifies the actual translation betweenClementine type descriptors and the descriptors needed by the external module
The MAPPING_FORMAT subsection, which uses the translated types to list thedata model information in a format the external module can process
The name of the mapping file can be a single-quoted string:
FILE_NAME ['c:\Clementine\mapfile.txt']
the name of a parameter defined in the PARAMETERS subsection:
FILE_NAME [mapName]
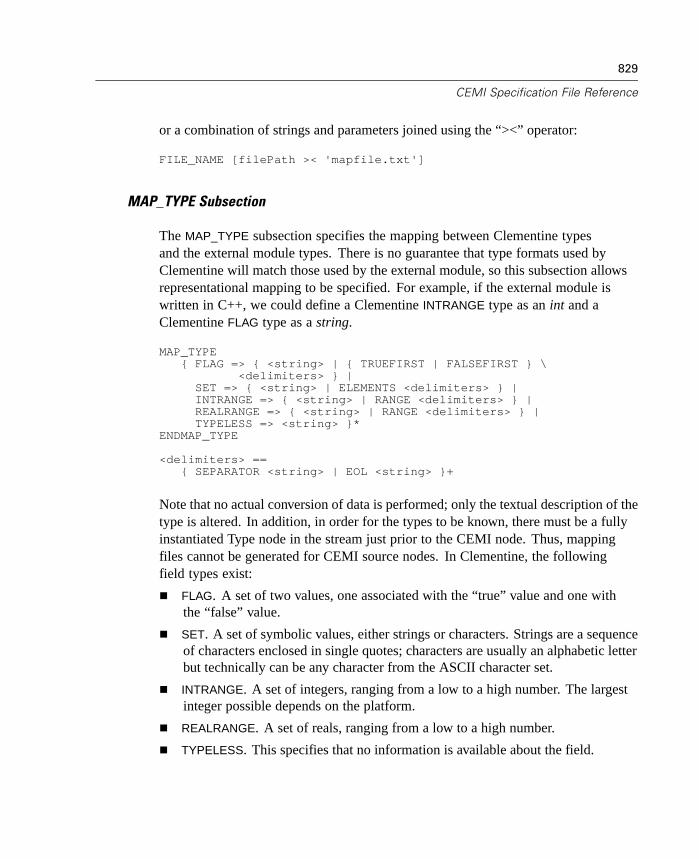
829
CEMI Specification File Reference
or a combination of strings and parameters joined using the “><” operator:
FILE_NAME [filePath >< 'mapfile.txt']
MAP_TYPE Subsection
The MAP_TYPE subsection specifies the mapping between Clementine typesand the external module types. There is no guarantee that type formats used byClementine will match those used by the external module, so this subsection allowsrepresentational mapping to be specified. For example, if the external module iswritten in C++, we could define a Clementine INTRANGE type as an int and aClementine FLAG type as a string.
MAP_TYPE{ FLAG => { <string> | { TRUEFIRST | FALSEFIRST } \
<delimiters> } |SET => { <string> | ELEMENTS <delimiters> } |INTRANGE => { <string> | RANGE <delimiters> } |REALRANGE => { <string> | RANGE <delimiters> } |TYPELESS => <string> }*
ENDMAP_TYPE
<delimiters> =={ SEPARATOR <string> | EOL <string> }+
Note that no actual conversion of data is performed; only the textual description of thetype is altered. In addition, in order for the types to be known, there must be a fullyinstantiated Type node in the stream just prior to the CEMI node. Thus, mappingfiles cannot be generated for CEMI source nodes. In Clementine, the followingfield types exist:
FLAG. A set of two values, one associated with the “true” value and one withthe “false” value.
SET. A set of symbolic values, either strings or characters. Strings are a sequenceof characters enclosed in single quotes; characters are usually an alphabetic letterbut technically can be any character from the ASCII character set.
INTRANGE. A set of integers, ranging from a low to a high number. The largestinteger possible depends on the platform.
REALRANGE. A set of reals, ranging from a low to a high number.
TYPELESS. This specifies that no information is available about the field.

830
Appendix E
To map Clementine types, indicate the type to be mapped followed by the “=>”operator and either a single-quoted string or a keyword. Use of a string describes afield in terms of actual data types, such as:
MAP_TYPESET => 'Varchar'FLAG => 'Varchar'INTRANGE => 'Long'REALRANGE => 'Double'
ENDMAP_TYPE
In this case, fields of type INTRANGE are described as Long in the mapping file.Using a keyword instead of a string lists actual data values for each field. Each
field type has its own keyword:
For set fields, ELEMENTS lists every member of the set in alphabetical order,separated by commas.
For flag fields, TRUEFIRST lists the true and false values, in that order, separatedby a comma. To reverse the order, use FALSEFIRST.
For intrange and realrange fields, RANGE lists the lowest and highest valuesseparated by “..”.
Each line ends with a period.
To change the value separator or end of line character for a type, add the SEPARATOR
or EOL keywords to the mapping definition, following each with the character tobe used in single quotes. For example:
MAP_TYPESET => ELEMENTS SEPARATOR ';' EOL '!'INTRANGE => RANGE SEPARATOR '-' EOL '?'
ENDMAP_TYPE
separates the values for set fields using a semicolon and ends the line with anexclamation point. The low and high values for intrange fields are separated by adash, with their lines ending with a question mark.
Any types encountered that are described in the MAP_TYPE subsection are mappedto their Clementine types. For instance, if set fields are not defined in MAP_TYPE,they are mapped to SET.

831
CEMI Specification File Reference
MAPPING_FORMAT Subsection
The MAPPING_FORMAT subsection generates the actual content of the mappingfile. It allows the definition of a wide variety of formats in order to be as widelycompatible as possible for parsing by the external module.
MAPPING_FORMAT{ <map-exp> |
<map-foreach-loop> }*ENDMAPPING_FORMAT
<map-exp> =={ TEXT( <map-exp>+ ) | <map-exp-element> } { >< <map-exp> }*
<map-exp-element> =={ <word> | <string> | <number> | FIELD.TYPE | FIELD.NAME }
<map-foreach-loop> ==FOREACH FIELD { INCLUDE | DISCARD } <selection-criteria>
{ <map-exp> }*ENDFOREACH
Each map-expression line corresponds to a line of generated text. If field informationis accessed, fields are referred to in order of occurrence. For example, if onemap-expression line is specified, then only one line will appear in the mappingfile and it will contain information from the first occurring field in the data set. Togenerate a line of text for each field, multiple map-expression lines are needed.Alternatively, a FOREACH FIELD loop could be used.
Construct map-expression lines using text, parameter values, or a combinationor both. For example:
MAPPING_FORMATTEXT('#CEMI Mapping File')TEXT('')TEXT(infile)TEXT('Output File: ') >< outfile
ENDMAPPING_FORMAT
creates a mapping file containing four lines. The first two contain the text “#CEMIMapping File” followed by a blank line. The third line identifies the input file byprinting the value of the infile parameter. The final line appends the text “Output File:”to the name of the output file, which corresponds to the value of the parameter outfile.
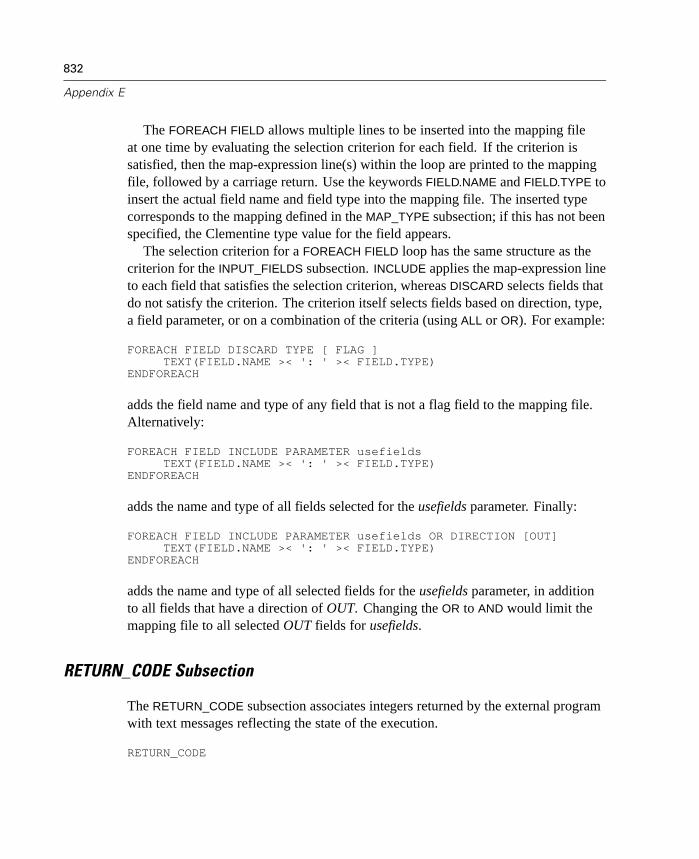
832
Appendix E
The FOREACH FIELD allows multiple lines to be inserted into the mapping fileat one time by evaluating the selection criterion for each field. If the criterion issatisfied, then the map-expression line(s) within the loop are printed to the mappingfile, followed by a carriage return. Use the keywords FIELD.NAME and FIELD.TYPE toinsert the actual field name and field type into the mapping file. The inserted typecorresponds to the mapping defined in the MAP_TYPE subsection; if this has not beenspecified, the Clementine type value for the field appears.
The selection criterion for a FOREACH FIELD loop has the same structure as thecriterion for the INPUT_FIELDS subsection. INCLUDE applies the map-expression lineto each field that satisfies the selection criterion, whereas DISCARD selects fields thatdo not satisfy the criterion. The criterion itself selects fields based on direction, type,a field parameter, or on a combination of the criteria (using ALL or OR). For example:
FOREACH FIELD DISCARD TYPE [ FLAG ]TEXT(FIELD.NAME >< ': ' >< FIELD.TYPE)
ENDFOREACH
adds the field name and type of any field that is not a flag field to the mapping file.Alternatively:
FOREACH FIELD INCLUDE PARAMETER usefieldsTEXT(FIELD.NAME >< ': ' >< FIELD.TYPE)
ENDFOREACH
adds the name and type of all fields selected for the usefields parameter. Finally:
FOREACH FIELD INCLUDE PARAMETER usefields OR DIRECTION [OUT]TEXT(FIELD.NAME >< ': ' >< FIELD.TYPE)
ENDFOREACH
adds the name and type of all selected fields for the usefields parameter, in additionto all fields that have a direction of OUT. Changing the OR to AND would limit themapping file to all selected OUT fields for usefields.
RETURN_CODE Subsection
The RETURN_CODE subsection associates integers returned by the external programwith text messages reflecting the state of the execution.
RETURN_CODE

833
CEMI Specification File Reference
SUCCESS_VALUE <integer>{ <integer> <string> }*
ENDRETURN_CODE
This subsection of the specification file is optional. No expectations are made on theexternal executable program to return numeric values, but the majority of executableprograms do. If the RETURN_CODE subsection is included, however, it must specifya success value using the keyword SUCCESS_VALUE followed by an integer. Whenthe program executes successfully, it returns this value. Any integer can be used toindicate successful completion, but typically a program returns a 0 to indicate success.
Each numeric value returned by an executable program has a meaning. Anexplanation of what the return code means is more useful to the Clementine user thana number. Therefore, the concept of a code table is used. Each numeric code hasan associated textual description, which is what will be displayed in Clementine oncompletion of the executable program. Define the text assigned with each possiblereturn value by specifying the returned integer followed by a single-quoted string todisplay. For example:
RETURN_CODESUCCESS_VALUE 01 'No value has been entered for Start Field'2 'No value has been entered for End Field'
ENDRETURN_CODE
RESULTS Subsection
Terminal and modeling nodes do not return data back to the stream for furtherprocessing, so the OUTPUT_FIELDS and OUTPUT_DATA subsections of thespecification file are not needed. Instead, the RESULTS subsection determines how tohandle the results from the external program. This subsection defines the locationand representation of the CEMI node results. For example, it specifies whether theresults are a graphical display, such as a bar chart, or whether they are returnedas a file, such as a text report.
RESULTSRESULT_TYPE { FILE_NAME [ <string-expression> ] |
STD_OUT |EXTERN }
{ RESULT_FORMAT <result-format> |RESULT_FORMAT
<conditional-result> }+
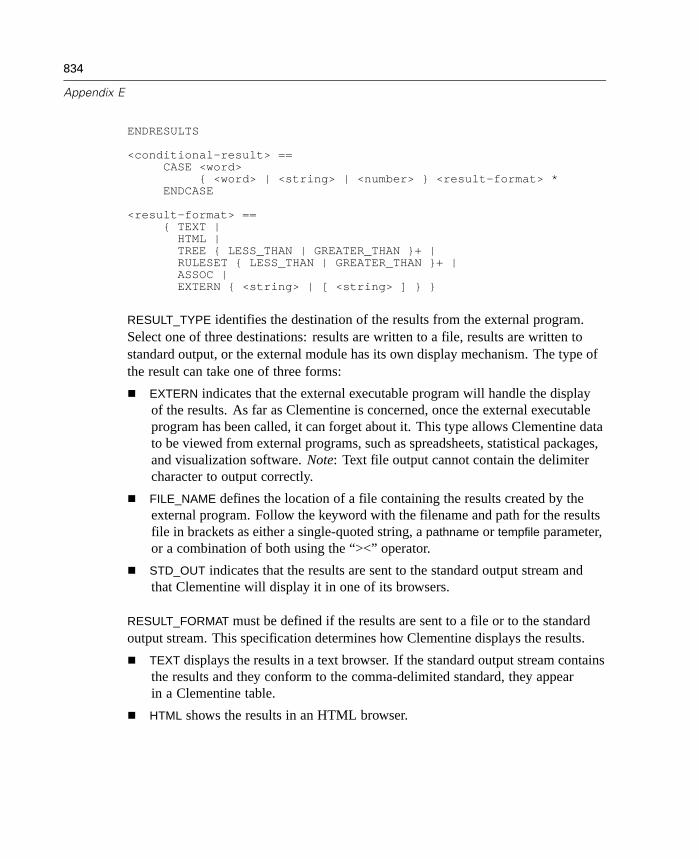
834
Appendix E
ENDRESULTS
<conditional-result> ==CASE <word>
{ <word> | <string> | <number> } <result-format> *ENDCASE
<result-format> =={ TEXT |
HTML |TREE { LESS_THAN | GREATER_THAN }+ |RULESET { LESS_THAN | GREATER_THAN }+ |ASSOC |EXTERN { <string> | [ <string> ] } }
RESULT_TYPE identifies the destination of the results from the external program.Select one of three destinations: results are written to a file, results are written tostandard output, or the external module has its own display mechanism. The type ofthe result can take one of three forms:
EXTERN indicates that the external executable program will handle the displayof the results. As far as Clementine is concerned, once the external executableprogram has been called, it can forget about it. This type allows Clementine datato be viewed from external programs, such as spreadsheets, statistical packages,and visualization software. Note: Text file output cannot contain the delimitercharacter to output correctly.
FILE_NAME defines the location of a file containing the results created by theexternal program. Follow the keyword with the filename and path for the resultsfile in brackets as either a single-quoted string, a pathname or tempfile parameter,or a combination of both using the “><” operator.
STD_OUT indicates that the results are sent to the standard output stream andthat Clementine will display it in one of its browsers.
RESULT_FORMAT must be defined if the results are sent to a file or to the standardoutput stream. This specification determines how Clementine displays the results.
TEXT displays the results in a text browser. If the standard output stream containsthe results and they conform to the comma-delimited standard, they appearin a Clementine table.
HTML shows the results in an HTML browser.

835
CEMI Specification File Reference
TREE corresponds to the type of output produced by C5.0 (in DecisionTreemode) and by C&R Tree. Model output must adhere to PMML standards to beread properly in Clementine.
RULESET corresponds to the type of output produced by C5.0 in Ruleset modeand by the Generate Ruleset option of an Association Rules node. Model outputmust adhere to PMML standards to be read properly in Clementine.
ASSOC corresponds to the type of output produced by the association algorithms(such as Apriori). Model output must adhere to PMML standards to be readproperly in Clementine.
EXTERN specifies an external browser executable program. Follow the keywordwith a single-quoted string expression containing the full path of the executableprogram.
When a numeric field is encountered in a tree or ruleset, it is split by using {>= and<} or {> and <=}. The options GREATER_THAN and LESS_THAN define which sign(> or <) receives the equals sign for the splits.
External programs that provide results in PMML format for TREE, RULESET, orASSOC models have full compatibility with the Clementine model browser, includingthe ability to save models and generate new nodes automatically. However, thegenerated model represented by the results may be executed by Clementine internally.In some cases, this may not be desirable. You can override internal execution byadding an EXECUTE subsection to the MODEL specification of the specification file.The model can still be browsed in Clementine's browser.
Note: Results in the TREE, RULESET, or ASSOC formats must adhere to the PMML2.1 standard. Earlier formats are no longer supported.
MODEL_FILES Subsection
External modeling modules often save generated model information in a file. CEMIcan store the contents of this generated model file with the generated model nodeitself. This eliminates the need to maintain these external files separately becauseall of the necessary information to use the generated model is contained in thegenerated model node.
MODEL_FILESFILE_NAME { <word> | [ <string-expression> ] }*
ENDMODEL_FILES

836
Appendix E
Specify each model file using the FILE_NAME keyword, followed by the nameand path of the file as either a single-quoted string, a parameter defined in thePARAMETERS subsection, or a combination of both using the “><” operator.
When the model-building node is executed, the files specified in the MODEL_FILES
block are read and stored in the generated model. When the generated model isexecuted, the files are written back out prior to execution of the generated modelexecutable program. Any parameters used in the MODEL_FILES subsection must beinherited by the generated model using the FROM keyword in the PARAMETERS
subsection of the MODEL specification.
Model Specification
The MODEL specification describes the behavior of generated models created by theexternal executable program through a CEMI node of type MODELLING. In essence, agenerated model is a process node, and the MODEL specification defines how thisgenerated model communicates with Clementine.
MODEL contains the same subsections as the CORE specification but omits theCONTROLS subsection because generated models do not have an editing dialog box.Furthermore, most of the MODEL subsections are optional, whereas most CORE
subsections are required. The content of the specification file for MODELLING nodesdepends on whether CEMI creates an unrefined or refined model.
When executed as part of a stream, refined and unrefined modeling nodes producemodels on the Models tab in the managers window. Both model types can bebrowsed, but only the refined generated model can be placed on the drawing area. Theunrefined generated model cannot be executed and cannot be moved from the Modelstab. This is because the model is not really a model, but a textual representation of theresults. In contrast, the refined generated model also shows a textual representationof the results when browsed, but the format of the results allows them to generateextra modeling information when added to a stream.
In a modeling node specification file, both unrefined and refined models containa MODEL specification. However, the unrefined model includes the MODEL
specification in name only; it does not contain any information.
837
CEMI Specification File Reference
Unrefined Models Specification
An unrefined model cannot be executed, so very little needs to be added to thespecification file for these models. The MODEL specification has the followingstructure:
MODELPARAMETERSENDPARAMETERS
ENDMODEL
The PARAMETERS subsection is empty because any specified parameters wouldbe redundant.
The results for unrefined models are similar to the results for terminal nodes.Usually, an unrefined model contains machine-readable text. This can be browsedas TEXT or HTML, using either Clementine's internal browsers or by specifyingan external browser. Define the method for handling the results in the RESULTS
subsection of CORE.
Refined Models Specification
The MODEL specification deals with the execution of the generated model, whichoccurs when it has been placed in a stream on the drawing area. As the data flowsthrough the generated model, execution of the external module happens for a secondtime unless the EXECUTE subsection of MODEL specifies a different executableprogram.
For a refined model, MODEL may contain the following subsections, which havethe same structure as the identically named subsections of CORE:
PARAMETERS. Contains any new parameters needed for execution of theprogram. Parameters from the CORE section can be referenced here by usingthe FROM keyword; they will contain the same values. Any tempfile parameters,however, will have lost their values after the CORE execution because thoseparameters are temporary. Otherwise, the input file will retain the “train” datainstead of replacing it with the “test” data.
EXECUTE. Specifies the executable program that executes the generated model.This may be the same executable program defined in CORE.

838
Appendix E
OPTIONS. Identifies command line arguments to pass to the external programdefined in the EXECUTE subsection.
INPUT_FIELDS. Specifies the fields sent to the generated model. These fields“test” the model.
INPUT_DATA. Specifies the file containing the input data.
OUTPUT_FIELDS. Defines the fields returned by the generated model.
OUTPUT_DATA. Specifies the comma-delimited file containing the output dataread into Clementine.
MAPPING_FILE. Generates a file containing type node information.
RETURN_CODE. Specifies error messages for the execution of the generatedmodel.
MODEL_FILES. Lists files generated during CORE execution that are needed bythe generated model during MODEL execution.
Externally Executed Generated Models
An externally executable generated model produces a file containing data, usuallyin the default comma-delimited format, when executed. Clementine reads this fileback into the node that follows the refined model node in the stream.
CEMI nodes that produce these models require the PARAMETERS, EXECUTE,OPTIONS, INPUT_FIELDS, INPUT_DATA, OUTPUT_FIELDS, and OUTPUT_DATA
subsections in the MODEL specification.
Internally Executed Generated Models
An internally executable generated model uses Clementine's internal mechanismfor execution when placed in a stream. These models create rules and rulesets in aformat that Clementine can use to execute them internally. Executing the generatedmodel produces a file containing data in one of three specific result formats (TREE,RULESET, or ASSOC).
If the generated descriptive results use one of Clementine's predefined resultformats, they can be displayed using Clementine model browsers. As a result, theresults can generate derive nodes, select nodes, and rulesets. The predefined result

839
CEMI Specification File Reference
formats provide complete compatibility, including the ability to save models andgenerate new nodes automatically.
CEMI nodes that produce models of this type require only three of the MODEL
subsections: PARAMETERS, INPUT_FIELDS, and OUTPUT_FIELDS. All otherbehavior is determined by the model type rather than the CEMI specification.
The “internal” model formats (used in CEMI modeling nodes withRESULT_FORMAT TREE, RULESET, and ASSOC) now require the result output of themodel builder node to use the PMML 2.0 standard XML instead of the previouslysupported model formats.

Glossary
This glossary defines terms used in Clementine and data mining in general.
aggregate. To combine data across groups. Aggregation is used to create summaries.
annotation. Comments associated with a node, model, or stream. These can be addedby the user or generated automatically.
antecedent. Part of an association rule that specifies a pre-condition for the rule.This is a condition that must be present in a record for the rule to apply to it. Theantecedents taken together form the “if” part of the rule. For example, in the rule
milk & cheese => bread
“milk” is an antecedent, and so is “cheese.” See also consequent.
Apriori. Association rule algorithm, capable of producing rules that describeassociations (affinities) between symbolic attributes.
association. The extent to which values of one field depend on or are predicted byvalues of another field.
balance. To level the distribution of an attribute (normally symbolic) in a data set bydiscarding records with common values or duplicating records with rare values.
batch mode. The facility to run Clementine without the user interface, so that streamscan be run “in the background” or embedded in other applications.
blanks. Missing values or values used to indicate missing data.
Boolean field. A field that can take only two values, true or false (often encoded as1 and 0, respectively). See also flag.
boosting. A technique used by the Build C5.0 node to increase the accuracy of themodel. The technique uses multiple models built sequentially. The first model is builtnormally. The data are then weighted to emphasize the records for which the firstmodel generated errors and the second model is built. The data are then weightedagain based on the second model's errors and another model is built, and so on, until
841
842
Glossary
the specified number of models has been built. The boosted model consists of theentire set of models, with final predictions determined by combining the individualmodel predictions.
business understanding. A phase in the CRISP-DM process model. This phaseinvolves determining business objectives, assessing the situation, determining datamining goals, and producing a project plan.
C&R Trees. A decision tree algorithm based on minimizing an impurity measure. C&RTrees can handle both symbolic and numeric output fields.
C5.0. Rule induction algorithm, capable of producing compact decision trees andrulesets. (The previous version was called C4.5).
cache. A store of data associated with a Clementine node.
case. A single object or element of interest in the data set. Cases might representcustomers, transactions, manufactured parts, or other basic units of analysis. Withdenormalized data, cases are represented as records in the data set.
cell. In a display table, the intersection of one row and one column.
CEMI (Clementine External Module Interface). A facility to define Clementine nodesthat execute programs external to Clementine.
chi-square. A test statistic used to evaluate the association between categoricalvariables. It is based on differences between predicted frequencies and observedfrequencies in a crosstabulation.
classification. A process of identifying the group to which an object belongs byexamining characteristics of the object. In classification, the groups are defined bysome external criterion (contrast with clustering).
classification and regression trees (C&R Trees). An algorithm for creating a decisiontree based on minimization of impurity measures. Also known as CART.
classification tree. A type of decision tree in which the goal of the tree isclassification—in other words, a decision tree with a symbolic output field.
CLEM (Clementine Language for Expression Manipulation). Language used to testconditions and derive new values in Clementine.
clustering. The process of grouping records together based on similarity. In clustering,there is no external criterion for groups (contrast with classification).

843
Glossary
confidence. An estimate of the accuracy of a prediction. For most models, it is definedas the number of training records for which the model or submodel (such as a specificrule or decision tree branch) makes a correct prediction divided by the number oftraining records for which the model or submodel makes any prediction.
connection. A link between two nodes, along which data records “flow.”
consequent. Part of an association rule that specifies the predicted outcome. Theconsequent forms the “then” part of the rule. For example, in the rule
milk & cheese => bread
“bread” is the consequent. See also antecedent.
correlation. A statistical measure of the association between two numeric fields.Values range from –1 to +1. A correlation of 0 means that there is no relationshipbetween the two fields.
CRISP-DM (Cross-Industry Standard Process for Data Mining). A general process modelfor data mining. See the CRISP-DM manual or CRISP Help for complete informationon this process model.
cross-tabulation. A table showing counts based on categories of two or more symbolicfields. Each cell of the table indicates how many cases have a specific combinationof values for the fields.
cross-validation. A technique for testing the generalizability of a model in the absenceof a hold-out test sample. Cross-validation works by dividing the training datainto n subsets and then building n models with each subset held out in turn. Eachof those models is tested on the hold-out sample, and the average accuracy of themodels on those hold-out samples is used as an estimate of the accuracy of the modelon new data.
data cleaning. The process of checking data for errors and correcting those errorswhenever possible.
data mining. A process for extracting information from large data sets to solvebusiness problems.
data preparation. A phase in the CRISP-DM process model. This phase involvesselecting, cleaning, constructing, integrating, and formatting data.

844
Glossary
data quality. The extent to which data have been accurately coded and stored in thedatabase. Factors that adversely affect data quality include missing data, data entryerrors, program bugs, etc.
data set. A set of data that has been prepared for analysis, usually by denormalizingthe data and importing it as a flat file.
data understanding. A phase in the CRISP-DM process model. This phase involvescollecting initial data, describing data, exploring data, and verifying data quality.
data visualization. A process of examining data patterns graphically. Includes use oftraditional plots as well as advanced interactive graphics. In many cases, visualizationallows you to easily spot patterns that would be difficult to find using other methods.
data warehouse. A large database created specifically for decision support throughoutthe enterprise. It usually consists of data extracted from other company databases.These data have been cleaned and organized for easy access. Often includes ametadata store as well.
decile. A division of data into ten ordered groups of equal size. The first decilecontains 10% (one-tenth) of the records with the highest values of the orderingattribute.
decision tree. A class of data mining models that classifies records based on variousfield values. The entire sample of cases is split according to a field value, and theneach subgroup is split again. The process repeats until further splits cease to improveclassification accuracy or until other stopping criteria are met. See also C5.0, C&RTrees, classification tree, and regression tree.
delimiter. A character or sequence of characters that appears between fields and/orrecords in a data file.
denormalized data. Data that have been extracted from a relational database (that is,normalized data) and converted to a single table in which each row represents onerecord and each column represents one field. A file containing denormalized data iscalled a flat file. This is the type of data typically used in data mining.
dependent variable. A variable (field) whose value is assumed to depend on the valuesof other variables (fields). Also known as an output field or variable.

845
Glossary
deployment. A phase in the CRISP-DM process model. This phase involves plandeployment, monitoring and maintenance, producing a final report, and reviewingthe project.
derived field. A field that is calculated or inferred from other fields. For example, ifyou have share price and earnings per share for stocks in your database, you coulddivide the former by the latter to get the P/E ratio, a derived field.
diagram. The current contents of the stream canvas. May contain zero or one ormore valid streams.
directed web. A display used for examining the relations between symbolic datafields and a target symbolic data field.
direction. Whether a field will be used as an input, output, or both or will be ignoredby modeling algorithms.
distribution. A characteristic of a field defined by the pattern of values observed inthe data for that field.
domain knowledge. Knowledge and expertise that you possess related to thesubstantive business problem under consideration, as distinguished from knowledgeof data mining techniques.
downstream. The direction in which data is flowing; the part of the stream afterthe current node.
equation. Numeric model based on linear regression, produced by a regression node.
evaluation. A phase in the CRISP-DM process model. This phase involves evaluatingresults, reviewing the data mining process, and determining the next steps.
factor analysis. A method of data reduction that works by summarizing the commonvariance in a large number of related fields using a small number of derived fields thatcapture the structure in the original fields. See also PCA.
feature. An attribute of a case or record. In database terms, it is synonymous withfield. See also field, variable.
field. A datum associated with a record in a database. A measured characteristic ofthe object represented by the record. See also feature, variable.
filler. Operation to replace values in a record, often used to fill blanks with a specifiedvalue.

846
Glossary
filter. Discard fields from a record.
fixed file. A file whose records are of constant length (number of characters). Fieldsare defined by their starting position in the record and their length.
flag. A symbolic field with exactly two valid values, usually some variation of trueand false.
flat file. A data set represented by a single table with a row for each record and acolumn for each field. Composed of denormalized data.
generated model. An icon on the Models tab in the managers window, representing amodel generated by a modeling node.
global values. Values associated with a whole data set rather than with individualrecords.
GRI (generalized rule induction). An association rule algorithm capable of producingrules that describe associations (affinities) between attributes of a symbolic target.
histogram. A graphical display of the distribution of values for a numeric field. Itis created by dividing the range of possible values into subranges, or bins, andplotting a bar for each bin indicating the number of cases having a value within therange of the bin.
history. Operation to integrate values from a sequence of previous records into thecurrent record.
impurity. An index of how much variability exists in a subgroup or segment of data.A low impurity index indicates a homogeneous group, where most members of thegroup have similar values for the criterion or target field.
input field. A field used to predict the values of one or more output fields by a machinelearning technique. See also predictor.
instantiate. To specify the valid values of a field. Fields can be partially instantiated.For example, a field can be defined as a set field, but the specific members of the setthat define valid values may be left undefined. Fields can also be fully instantiated,where all the necessary information is defined for the field. Instantiation is typicallyperformed automatically by passing the data through a Type node, but you can alsodefine or edit instantiation information manually in the Type node.
integer. A number with no decimal point or fractional part.

847
Glossary
interaction. In a statistical model, an interaction is a type of effect involving two ormore fields (variables) in which the effect of one field in predicting the output fielddepends on the level of the other input field(s). For example, if you are predictingresponse to a marketing campaign, you may find that high price leads to decreasedresponse for low-income people but increased response for high-income people.
iterative. Involving repeated applications of a step or a series of steps. Counting is asimple iterative procedure, which works by taking the step “add one to the previousvalue” and applying it repeatedly. An iteration is a single pass through the stepsof an iterative process.
k-means. An approach to clustering that defines k clusters and iteratively assignsrecords to clusters based on distances from the mean of each cluster until a stablesolution is found.
Kohonen network. A type of neural network used for clustering. Also known as aself-organizing map (SOM).
lift. Improvement in expected return caused by the use of a classifier or model overthat expected with no classification or prediction. The higher the lift, the betterthe classifier or model.
linear regression. A mathematical technique for estimating a linear model for acontinuous output field.
logistic regression. A special type of regression model used when the output fieldis symbolic.
machine learning. A set of methods for allowing a computer to learn a specifictask—usually decision making, estimation, classification, prediction, etc.—withouthaving to be (manually) programmed to do so. Also, the process of applying suchmethods to data.
main effect. In a statistical model, a main effect is the direct effect of an input field(predictor) on the output field (target), independent of the values of other input fields.Contrast with interaction.
market basket analysis. An application of association-based models that attempts todescribe pairs or clusters of items that tend to be purchased by the same customerat the same time.
matrix. A matrix-style or cross-tabulation display format.

848
Glossary
mean. The average value for a field (variable). The mean is a measure of the center ofthe distribution for a field. Compare with median and mode.
median. The value for a field below which 50% of the observed values fall; the valuethat splits the data into an upper half and a lower half. The median is a measure of thecenter of the distribution for a field. Compare with mean and mode.
merge. To combine multiple tables into a single table by joining pairs (or n-pairs) ofrecords together.
metadata. Literally, data about data. Metadata is information about the data in yourdata store. It typically contains descriptions of fields, records, and relationshipsbetween fields, as well as information about how the data store was assembled andhow it is maintained.
misclassification matrix. A crosstabulation of predicted values versus observed valuesfor a given classification model. Shows the different types of errors made by themodel. Sometimes called a confusion matrix.
mode. The most frequently observed value for a field. The mode is useful forsummarizing symbolic fields. Compare with mean and median.
model. A mathematical equation that describes the relationship among a set of fields.Models are usually based on statistical methods and involve assumptions about thedistributions of the fields used in the model, as well as the mathematical form ofthe relationship.
modeling. A phase in the CRISP-DM process model. This phase involves selectingmodeling techniques, generating test designs, and building and assessing models.
multilayer perceptron (MLP). A common type of neural network, used for classificationor prediction. Also called a back propagation network.
multiplot. A graph on which several fields are plotted at once.
neural network. A mathematical model for predicting or classifying cases using acomplex mathematical scheme that simulates an abstract version of brain cells. Aneural network is trained by presenting it with a large number of observed cases, oneat a time, and allowing it to update itself repeatedly until it learns the task.
node. A processing operation in Clementine's visual programming environment.Data flows from, into, or through a node.
849
Glossary
nominal regression. See logistic regression.
normalized data. Data that have been broken into logical pieces that are storedseparately to minimize redundancy. For example, information about specific productsmay be separated from order information. By doing this, the details of each productappear only once, in a products table, instead of being repeated for each transactioninvolving that product. Normalized data are usually stored in a relational database,with relations defining how records in different tables refer to one another. Contrastwith denormalized data.
ODBC (open database connectivity). ODBC is a data exchange interface, allowingprograms of various types to exchange data with each other. For example, if yourdatabase system is ODBC-compliant, the task of transferring data to and from thedatabase is made much simpler.
outlier. A record with extreme values for one or more fields. Various technicaldefinitions are used for determining which specific cases are outliers. The mostcommon criterion is that any case with a value greater than three standard deviationsfrom the mean (in either direction) is considered an outlier.
output field. A field to be predicted by a machine-learning technique. See also targetand dependent variable.
overfitting. A potential problem with model estimation in which the model isinfluenced by some quirks of the data sample. Ideally, the model encodes only the truepatterns of interest. However, sometimes data mining methods can learn details of thetraining data that are not part of a general pattern, which leads to models that don'tgeneralize well. Cross-validation is a method for detecting overfitting in a model.
palette. A collection of node icons from which new components can be selected.
parameter. A value used like a variable for modifying the behavior of a stream withoutediting it by hand.
PCA (principal components analysis). A method of data reduction that works bysummarizing the total variance in a large number of related fields using a smallnumber of derived fields. See also factor analysis.
prediction. An estimate of the value of some output field for an unknown case, basedon a model and the values of other fields for that case.

850
Glossary
predictor. A field in the data set that is used in a model or classifier to predict the valueof some other field (the output field). See also input field.
probability. A measure of the likelihood that an event will occur. Probability valuesrange from 0 to 1; 0 implies that the event never occurs, and 1 implies that the eventalways occurs. A probability of 0.5 indicates that the event has an even chanceof occurring or not occurring.
project tool. Clementine's facility for organizing and managing the materialsassociated with a data mining project (streams, graphs, and documents). Includes theReport manager.
pruning. Reducing the size of a model to improve its generalizability and, in somecases, its accuracy. With rule induction, this is achieved by removing the lesssignificant parts of the decision tree. With neural networks, underused neuronsare removed.
quantile. Division of data into ordered groups of equal size. Examples of quantiles arequartiles, quintiles, and deciles.
quartile. A division of data into four ordered groups of equal size. The first quartilecontains 25% (one-fourth) of records with the highest values of the ordering attribute.
query. A formal specification of data to be extracted from a database, data warehouse,or data mart. Queries are often expressed in structured query language (SQL). Forexample, to analyze records for only your male customers, you would make a queryon the database for all records in which customer's gender has the value male, andthen analyze the resulting subset of the data.
quintile. A division of data into five ordered groups of equal size. The first quintilecontains 20% (one-fifth) of the records, with the highest values of the orderingattribute.
RBFN (radial basis function network). A type of neural network used for predictivemodelling but internally based on clustering.
real number. A number with a decimal point.
record. A row in a database; for denormalized data, synonymous with case.
refined model. A model that is executable and can be placed in streams and used togenerate predictions. Most modeling nodes produce refined models. Exceptions areGRI and Apriori, which produce unrefined models.
851
Glossary
regression tree. A tree-based algorithm that splits a sample of cases repeatedly toderive homogeneous subsets, based on values of a numeric output field.
relational database. A data store designed for normalized data. A relational databaseusually consists of a set of tables and a set of relations that define how records fromone table are related to records from other tables. For example, a product ID may beused to link records in a transaction table with records in a product detail table.
Report Manager. Clementine's facility for automatically producing draft projectreports. The Report Manager is part of the projects window.
rough diamond. See unrefined model.
row. A record, or case, in a database.
rule induction. The process of automatically deriving decision-making rules fromexample cases.
ruleset. A decision tree expressed as a set of independent rules.
sample. A subset of cases selected from a larger set of possible cases (called thepopulation). The data you analyze are based on a sample; the conclusions you draware usually applied to the larger population. Also, to select such a subset of cases.
scatterplot. A data graph that plots two (or sometimes three) numeric fields againsteach other for a set of records. Each point in the scatterplot represents one record.Relationships between fields can often be readily seen in an appropriate scatterplot.
scoring. The process of producing a classification or prediction for a new, untestedcase. An example is credit scoring, where a credit application is rated for risk basedon various aspects of the applicant and the loan in question.
script. In Clementine, a series of statements or commands that manipulate a stream.Scripts are used to control stream execution and automate data mining tasks.
segment. A group or subgroup having some set of properties in common. Usuallyused in a marketing context to describe homogeneous subsets of the populationof potential customers.
segmentation. A process of identifying groups of records with similar values fora target field. The process takes the whole set of records and divides them intosubgroups, or segments, based on characteristics of the records.
select. Extract a subset of data records based on a test condition.
852
Glossary
sensitivity analysis. A technique for judging the relevance of data fields to a neuralnetwork by examining how changes in input affect the output.
sequence. The ordering of records.
set field. A symbolic field with more than two valid values.
significance (statistical). A statement regarding the probability that an observeddifference is attributable to random fluctuations (that is, attributable to chance).The smaller this probability is, the more confident you can be that the differencerepresents a true difference.
slot parameter. A setting in a Clementine node that can be treated like a parameter andset in a script, using a parameter-setting dialog box or the Clementine command line.Also called node or stream properties.
SQL (structured query language). A specialized language for selecting data from adatabase. This is the standard way of expressing data queries for most databasemanagement systems.
standard deviation. A measure of the variability in the values of a field. It is calculatedby taking the difference between each value and the overall mean, squaring it,summing across all of the values, dividing by the number of records (or sometimesby the number of records minus one), and then taking the square root. The standarddeviation is equal to the square root of the variance.
statistics. Generally, a set of methods used to derive general information fromspecific data. The term is also used to describe the computed values derived fromthese methods.
stream. A path of connected nodes along which data flows.
string. A piece of text made up of a sequence of characters—fred, Class 2, or 1234,for example.
supervised learning. A learning task where there is an output field with observed datathat can be used to train a learning algorithm. The algorithm attempts to build amodel that produces predictions that match the observed output values as closely aspossible. This external criterion of observed output values is said to supervise thelearning process. Compare to unsupervised learning.
853
Glossary
support. For an association or sequence rule, a measure of the rule's prevalence inthe training data or the proportion of the training data to which the rule applies. It isdefined differently for association rules and for sequences. For association rules, itis the proportion of training records for which the antecedents of the rule are true(sometimes expressed as a percentage). For sequences, it is the proportion of trainingIDs that contain at least one instance of the entire sequence, including the consequent.
symbolic field. A field whose values are restricted to a particular list of valid values,usually representing categories. Symbolic field values are not treated as mathematicalnumbers, even when coded with numeric values. For example, you cannot multiply ordivide symbolic field values. Flags and set fields are examples of symbolic fields.
target. The field that you want to predict, whose value is assumed to be related to thevalues of other fields (the predictors). Also known as an output field or dependentvariable.
time series analysis. Data analysis techniques in which measurements are taken on thesame unit at several points in time. Also, the application of these techniques.
transformation. A formula applied to values of a field to alter the distribution ofvalues. Some statistical methods require that fields have a particular distribution.When a field's distribution differs from what is required, a transformation (such astaking logarithms of values) can often remedy the problem.
two-step clustering. A clustering method that involves preclustering the records into alarge number of subclusters and then applying a hierarchical clustering technique tothose subclusters to define the final clusters.
type. Definition of the valid values that a field can have.
unrefined model. A model that is not executable but that could potentially betransformed into a useful executable model. The GRI and Apriori nodes both producethese.
unsupervised learning. A learning task lacking an external criterion for testing outputvalues. The learning algorithm must impose its own structure on the problem toderive a solution. Clustering models are examples of unsupervised learning. Compareto supervised learning.
upstream. The direction from which data has come; the part of the stream precedingthe current node.
854
Glossary
user input. Interactive specification of a data set by the user—for example, forpurposes of testing a model.
variable. In general, any measured characteristic that can vary across records.Variables are represented as fields in a database; for most purposes, variable, attribute,and field are synonymous.
variable file. A file whose records are of different lengths (number of characters) buthave a constant number of fields that are separated by delimiters.
variance. A measure of the variability in the values of a field. It is calculated by takingthe difference between each value and the overall mean, squaring it, summing acrossall of the values, and dividing by the number of records (or sometimes by the numberof records minus one). The variance is equal to the square of the standard deviation.
vingtile. A division of data into 20 ordered groups of equal size. The first vingtilecontains 5% (one-twentieth) of the records, with the highest values of the orderingattribute.
visual programming. Specifying how to manipulate and process a sequence of datarecords by positioning and editing graphical objects.
web. A display used for examining the relations between symbolic data fields.

Index1-in-n sampling, 128
3-D graphs, 234
abs, 674absolute confidence difference to prior (apriori
evaluation measure), 344adding
records, 131to a project, 579
additional information paneldecision tree node, 422
advanced outputfactor/PCA node, 403, 406linear regression node, 338, 401logistic regression node, 356, 397
aggregate nodeoverview, 131setting options, 132
aggregating data, 841aggregating records, 198Akaike Information Criterion
linear regression, 338algorithms, 7, 382allbutfirst, 679allbutlast, 679alpha
neural net node, 323alphabefore, 673, 679Amemiya Prediction Criterion
linear regression, 338analysis browser
edit menu, 489file menu, 489interpreting, 506
analysis node, 504analysis tab, 504output tab, 491
animation, 232, 236annotating, 841
nodes, 70streams, 83
annotationsfolder, 583project, 583
AnswerTreelaunching from Clementine, 541, 551
antecedent, 841anti-join, 135append node
field matching, 144overview, 143setting options, 144tagging fields, 141
applications of data mining, 50Apriori, 841apriori node, 341, 342, 343
evaluation measures, 343expert options, 343options, 342tabular vs. transactional data, 310
arccos, 676arccosh, 676arcsin, 676arcsinh, 676arctan, 676arctan2, 676arctanh, 676arguments
command file, 732server connection, 732system, 734
ascending order, 134assigning data types, 147, 148association, 841association plots, 276, 278association rules, 45, 339, 341, 407, 408, 409, 411,
412, 414, 415, 417, 454, 455, 456, 459for sequences, 373
asymptotic correlationslogistic regression, 356, 397
asymptotic covariancelogistic regression, 356
attribute, 41audit
data audit node, 510initial data audit, 510
automatic recode, 184, 184, 188automation, 205
855
856
Index
auto-typing, 151, 154
balance, 841balance factors, 130balance node
generating, 261, 266, 274overview, 129setting options, 130
baselineevaluation chart options, 296
batch mode, 39, 205, 597, 729, 841invoking software, 592, 731log, 593log files, 735output, 596parameters, 594scheduling streams, 591scripting, 594, 606using arguments, 592, 731
best lineevaluation chart options, 296
biased data, 129binning node
count-based bins, 192fixed-width bins, 190mean/standard deviation bins, 195overview, 188ranks, 194setting options, 189viewing bins, 196
bitwise functions, 677blank handling, 148, 155
binning node, 189CLEM functions, 695filling values, 181
blanks, 218, 223, 224, 225, 522, 841blank values
quality node, 523Boolean field, 841boosting, 330, 427, 841build rule node, 367, 418
loading, 88bulk loading, 536business rule
evaluation chart options, 297business understanding, 841
C&R tree node, 367, 368, 369, 418, 419case weights, 309frequency weights, 309impurity measures, 369misclassification costs, 333prior probabilities, 369, 372pruning, 369stopping criteria, 369stopping options, 371surrogates, 369tree depth, 368
C&R trees, 384, 424, 841C5.0, 412, 414, 415, 417, 418, 419, 424, 427, 841
boosting, 427C5.0 node, 329, 330
boosting, 330misclassification costs, 330, 333options, 330pruning, 330
cache, 841enabling, 32, 68flushing, 68, 73options for nodes, 68saving, 68setting up a cache, 66supernodes, 570
cache file node, 111loading, 88
cache statements, 717case, 41, 841C code, 464, 465, 480cell, 841CEMI, 607, 841
custom node icons, 627, 629examples, 616loading new nodes, 624, 625removing nodes, 624, 626restrictions, 615specification file, 607, 609, 799system architecture, 608writing programs, 630
CHAID, 384characters, 663, 665checking CLEM expressions, 215checking types, 160classes, 575, 578

857
Index
classification, 841classification and regression trees, 841classification table
logistic regression, 356classification trees, 329, 367, 841clear values, 119CLEM, 1, 210, 217, 704, 841
building expressions, 212checking expressions, 215datatypes, 664, 664, 665, 665, 665, 666examples, 208expressions, 207, 663, 669function categories, 216functions, 212introduction, 39, 205language, 663missing values, 228scripting, 597, 697
Clementine, 24features at a glance, 24getting started, 21installing, 18, 19options, 31overview, 1, 17running from command line, 592, 592, 731, 731uninstalling, 21
Clementine Application Templates (CATs)data mapping tool, 89
Clementine Batch, 731Clementine Solution Publisher, 531CLEM expressions, 125CLEM functions
bitwise, 677blanks and nulls, 695comparison, 673conversion, 672datetime, 684global, 694information, 672list of available, 670logical, 674numeric, 674random, 678sequence, 688special functions, 696
string, 679trigonometric, 676
Cleo, 10stream prerequisites, 485wizard, 484, 485
clientdefault directory, 32
close statement, 713cluster analysis
number of clusters, 366clustering, 48, 324, 345, 364, 428, 447, 447, 449,
451, 452, 841overall display, 428viewing clusters, 428
cluster viewerdisplay options, 436, 438, 439importance, 440interpreting results, 430overview, 428text view, 441using, 435view all, 436, 438
coercing values, 160coincidence matrix
analysis node, 504collection node
creating, 274graph window, 274overview, 272
collinearity diagnosticslinear regression, 338, 401
colorssetting, 36
column ordertable browser, 496
column widthtable node, 494
column-wise binding, 536combining data, 143combining data from multiple files, 135comma, 73command line, 21
list of arguments, 732, 734, 735multiple arguments, 732parameters, 735running Clementine, 592, 592, 731, 731
858
Index
comment charactersin variable files, 99
comments, 698commit size, 536comparison functions, 673concatenating records, 143condition monitoring, 631conditions, 207
specifying a series, 178confidence, 841
apriori node, 342decision tree node, 422for sequences, 456GRI node, 340neural networks, 388sequence node, 376
confidence difference (apriori evaluation measure),344
confidence intervalslinear regression, 338, 401logistic regression, 356
confidence ratio (apriori evaluation measure), 344connecting nodes
scripting, 720connections, 841
database, 108server, 22
connect statement, 720consequent, 841content field(s)
sequence node, 374contiguous data sampling, 128contiguous keys, 132continuations, 698CONTROLS subsection, 619, 814
guidelines, 611SHEET subsection, 816TAB subsection, 818
conventions, 671convergence options
logistic regression node, 355conversion functions, 672converting sets to flags, 197copy, 26copying type attributes, 163
CORE specification, 609, 617, 804CONTROLS subsection, 611, 619, 814EXECUTE subsection, 610, 618, 810INPUT_DATA subsection, 614, 826INPUT_FIELDS subsection, 613, 819MAPPING_FILE subsection, 614, 828MODEL_FILES subsection, 835OPTIONS subsection, 610, 619, 812OUTPUT_DATA subsection, 614, 621, 826OUTPUT_FIELDS subsection, 613, 620, 821PARAMETERS subsection, 610, 617, 805RESULTS subsection, 615, 833RETURN_CODE subsection, 615, 621, 832
correlations, 518, 841descriptive labels, 519statistics output, 520
cos, 676cosh, 676counts, 192
statistics output, 520covariance matrix
linear regression, 338, 401creating
new fields, 167, 169synthetic data, 114
CRISP-DM, 1, 575data understanding, 97projects view, 576
CRISP-DM process model, 52, 53, 841data preparation, 147
cross-tabulation, 841matrix node, 498, 500
cross-validation, 841cut, 26cut points
binning node, 188
dataaggregating, 131audit, 510availability, 50balancing, 55coverage, 50expertise, 51exploring, 510size of, 51
859
Index
storage, 104, 154, 181storage type, 155
data access pack, 18data audit browser
edit menu, 514file menu, 514generating graphs, 516generating nodes, 516
data audit node, 510sample tab, 513settings tab, 510use in data mining , 50use in exploration, 41
databasebulk loading, 536connecting to data, 108reading data from, 106, 106selecting a table, 109
database nodequery editor, 110
database output node, 533data source, 534export tab, 534schema, 535table name, 534
data cleaning, 843data mapping tool, 89, 90data mining, 41, 843
choosing a modeling method, 55strategy, 52tips, 55
data preparation, 125, 843data quality, 522, 843data reduction, 359data set, 843data storage, 183data streams
building, 57, 58data types, 101, 147, 148, 206
instantiation, 152data understanding, 125, 843data visualization, 843data warehouse, 843date_before, 673date/time, 150, 220date formats, 666, 667
date functions, 666, 667@TODAY , 684date_before, 684date_days_difference, 684date_in_days, 684date_in_months, 684date_in_weeks, 684date_in_years, 684date_months_difference, 684date_weeks_difference, 684date_years_difference, 684
dates, 217setting formats, 73
datetime functionsdatetime_date, 684, 684datetime_day, 684datetime_day_name, 684datetime_day_short_name, 684datetime_hour, 684datetime_in_seconds, 684datetime_minute, 684datetime_month, 684datetime_month_name, 684datetime_month_short_name, 684datetime_now datetime_second , 684datetime_time , 684, 684datetime_time, 684, 684datetime_timestamp, 684, 684, 684datetime_weekday , 684datetime_year, 684
decile, 843decimal, 73decimal symbol, 99
Excel node, 545flat file output node, 539
decision tree node, 418, 419, 423, 424, 426additional information panel, 422rule frequencies, 422surrogates, 422
decision trees, 43, 329, 367, 418, 419, 424, 843decreasing data, 126, 127default
project phase, 577delete statements, 717deleting
output objects, 488

860
Index
delimiters, 99, 536, 843denormalized data, 843dependent variable, 843deployment, 531, 843derived field, 843derive node
conditional, 179count, 178flag, 174formula, 173generating, 251, 261, 266, 274, 284generating from a binning node, 196generating from bins, 188multiple derive, 170overview, 167set, 175setting options, 169state, 177
descending order, 134descriptives
linear regression, 338, 401diagram, 843difference of confidence quotient to 1 (apriori
evaluation measure), 344dimension reduction, 324directed web, 843directed web node
overview, 276, 278direction of fields, 148, 162, 843directives, 130direct oblimin rotation
factor/PCA node, 363directory
default, 32discarding fields, 164discarding samples, 128disconnect statement, 720distinct node
overview, 145distribution, 264, 843distribution node
creating, 260, 261overview, 259using the graph, 261
DTD, 465dummy coding, 197
duplicate fields, 135, 165duplicate records, 145duplicate statements, 717Durbin-Watson test
linear regression, 338, 401
editing dialog box, 611enabling controls, 816layout, 815sheets, 816tabs, 818
eigenvaluesfactor/PCA node, 363
empty stringsquality node, 523
encapsulating nodes, 557endif statements, 727EOL characters, 99equal counts, 192equamax rotation
factor/PCA node, 363equation, 843error codes, 480error messages, 78essential fields, 89, 93eta
neural net node, 323evaluating models, 504evaluation, 843evaluation chart node
business rule, 297creating, 296, 297hiding lines, 304hit condition, 297overview, 290reading results, 299score expression, 297using the graph, 301
evaluation measuresapriori node, 343
examplescondition monitoring, 631fraud detection, 638market basket analysis, 652overview, 631retail analysis, 647

861
Index
Excel, 106, 545launching from Clementine, 551
Excel node, 545exceptions, 56execute statement, 711EXECUTE subsection, 610, 618, 810
command line arguments, 812conditional execution, 811server mode, 812
executing scripts, 727, 729execution
for streams, 85specifying the order of, 572
exhaustive pruningneural net node, 312
exit, 727exit commands, 727exp, 674expert options
apriori node, 343C&R tree node, 369factor/PCA node, 361k-means node, 347Kohonen node, 328logistic regression node, 353neural net node, 318, 319, 321, 322, 323sequence node, 377
expert outputfactor/PCA node, 362linear regression node, 337, 338logistic regression node, 356
exploring datadata audit node, 510
exportingC code, 465error codes, 480field names, 480generated models, 382k-means models, 477, 478, 478, 479, 479Kohonen nets, 474, 474, 475, 475, 476models, 464, 480neural nets, 467, 467, 468, 468, 469output, 489PMML, 465radial basis function nets, 470, 471, 471, 472,472
rules, 466, 466, 466supernodes, 573to Cleo, 484to PredictiveMarketing, 481
exporting dataflat file format, 539SAS format, 544to a database, 533to AnswerTree, 540to Excel, 545, 545to SPSS, 540
export statements, 722Expression Builder, 1, 125
accessing, 211overview, 210using, 212
expressions, 663extension
derived field, 170
factor/PCA node, 359, 360, 361eigenvalues, 363estimation methods, 360expert options, 361expert output, 362factor scores, 361iterations, 361missing value handling, 361number of factors, 361rotation options, 363
factor analysis, 359, 403, 404, 406, 843factor equation node, 403, 404, 406false values, 159feature, 843feedback graph
neural net node, 315field, 843field attributes, 163field derivation formula, 173field names, 167
data export, 533, 539, 541, 544exporting, 480
field operations nodes, 147binning node, 188derive node, 167field reorder node, 201
862
Index
filler node, 181filter node, 164generating from a data audit, 516history node, 199reclassify node, 184scripting properties, 751type node, 148
field ops palette, 802field options
modeling nodes, 308field parameters, 807, 815field reorder node, 201
automatic sorting, 204custom ordering, 202setting options, 202
fields, 41, 663, 666deriving multiple fields, 170in CLEM expressions, 213reordering, 201selecting multiple, 172turning off in scripting, 758viewing values, 214
field selectionlinear regression node, 334
field types, 148filler node, 843
missing values, 227overview, 181
filtering fields, 139, 164, 843for SPSS, 542
filter nodegenerating from neural network model, 392overview, 164setting options, 165
fixed-field text data, 101fixed file node
overview, 101setting options, 101
fixed files, 843flag parameters, 806, 815flags, 843
combining multiple flags, 732command line arguments, 592, 731
flag type, 150, 151, 159flat file, 843
flat file output node, 539export tab, 539
fonts, 36format files, 114fracof, 674fractional ranks, 194fraud detection, 638freefield text data, 98frequencies, 192
decision tree node, 422functions, 666, 667, 671
@AVE, 696@BLANK, 227, 228, 672, 695@DIFF, 688@FIELD, 210, 210, 228, 696@GLOBAL_AVE, 696@GLOBAL_MAX, 694@GLOBAL_MEAN, 694@GLOBAL_MIN, 694@GLOBAL_SDEV, 694@GLOBAL_SUM, 694@INDEX , 688@LAST_NON_BLANK , 688, 695@LAST_NON_BLANK, 688, 695@MAX, 688@MEAN, 688@MIN , 688@NULL, 228, 672, 695@OFFSET , 688@PREDICTED, 210, 210, 696@SDEV , 688@SINCE, 688@SUM, 688@TARGET, 210, 210, 696@THIS , 688@TODAY, 684examples, 208in CLEM expressions, 212
gains charts, 290, 299generated k-means node, 447, 447, 449generated Kohonen node, 443, 444, 445generated models, 381, 385, 388, 389, 392, 393,
395, 397, 398, 399, 401, 403, 404, 405, 406,407, 408, 409, 412, 414, 415, 417, 418, 419,
863
Index
424, 427, 443, 444, 445, 447, 447, 449, 450,451, 452, 454, 455, 456, 459, 846
exporting, 382, 386generating processing nodes from, 385menus, 386node propertes, 780printing, 386saving, 386saving and loading, 382scoring data with, 385tabs, 386using in streams, 385
generated models palette, 381, 722saving and loading, 382
generated net node, 388, 389generated sequence ruleset, 411generated sequence rules node, 454, 455, 456, 459generated TwoStep cluster node, 450, 451, 452generating flags, 198global functions, 694global parameters, 701, 702global values, 529, 846goodness-of-fit chi-square statistics
logistic regression, 356, 397graph nodes, 231, 240
scripting properties, 758graphs
3-D, 234adding to projects, 578animation, 232appearance options, 237collections, 272color overlay, 232distributions, 259editing regions, 256evaluation charts, 290exporting, 242generating from a data audit, 516histograms, 264multiplot, 256output, 236panel overlay, 232plots, 243printing, 242saving, 242shape overlay, 232
size overlay, 232transparency, 232webs, 276, 278with animation, 236
graphs palette, 802GRI node, 339, 340, 846
options, 340grouping
values, 261
handling missing values, 147hasendstring, 679HASH_DATA keyword, 803hasmidstring, 679hasstartstring, 679hassubstring, 679, 679help
accessing, 30types of, 30
helper applications, 550histogram, 846histogram node
creating, 265overview, 264using the graph, 266
history, 846decision tree node, 422
history node, 200overview, 199
hitsevaluation chart options, 297
hot keys, 28HTML
report node, 492
iconssetting options, 76
ICON subsection, 803ID field
sequence node, 374id parameters, 810if, then, else functions, 674if, then, else statements, 179if statements, 727imbalanced data, 129importance
in the cluster viewer, 440
864
Index
importingPMML models, 382supernodes, 573
impurity, 846incomplete records, 137increasing performance, 127information difference (apriori evaluation measure),
344information functions, 672inner join, 135INPUT_DATA subsection, 614, 826INPUT_FIELDS subsection, 613, 819input field, 846insert statements, 722installation, 18
CEMI nodes, 625instances
decision tree node, 422instantiation, 148, 150, 151, 152, 154, 846
source node, 121type node, 153
integer_bitcount, 677integer_leastbit, 677integer_length, 677integer functions, 696integer ranges, 157integers, 663, 664, 846interaction, 846interrupting scripts, 729intof, 674introduction, 663
Clementine, 1, 17invalid values, 522is_ functions
is_date, 672is_datetime, 672is_integer, 672is_number , 672is_real, 672is_string, 672is_time, 672is_timestamp, 672
isalphacode, 679isendstring, 679islowercode, 679ismidstring, 679
isnumbercode, 679isstartstring, 679issubstring, 679, 679issubstring_lim, 679isuppercode, 679iteration history
logistic regression, 356iterative, 846
jittering, 249joining data sets, 143joins, 135, 135, 137
partial outer, 139justification
table node, 494
key fields, 132, 198key method, 135key value for aggregation, 132k-means clustering, 48, 345, 447, 449, 847k-means generated models, 447k-means models
exporting, 477, 478, 478, 479, 479k-means node, 345, 346, 347
distance field, 346encoding value for sets, 347expert options, 347large sets, 73stopping criteria, 347
knowledge discovery, 41Kohonen generated models, 443Kohonen nets
exporting, 474, 474, 475, 475, 476Kohonen networks, 44, 48, 847Kohonen node, 324, 326, 328
binary set encoding option (removed), 326expert options, 328feedback graph, 326learning rate, 328neighborhood, 324, 328stopping criteria, 326
labelsvalue, 384variable, 384
865
Index
lagged data, 199language
options, 31large databases, 125
performing a data audit, 510learning rate
neural net node, 323length, 679lift, 408, 847lift charts, 290, 299likelihood ratio test
logistic regression, 356, 397linear regression, 47, 334, 399, 401, 405, 847linear regression equation node, 399, 401, 405linear regression node, 334, 334, 336
advanced (expert) output, 338backwards estimation method, 334expert options, 336expert output, 336field selection, 334forwards estimation method, 334missing value handling, 336stepping criteria (field selection), 336, 337stepwise estimation method, 334weighted least squares, 309
line plots, 231, 243, 256links
web node, 280list parameters
modifying in scripts, 699lists, 663, 665loading
generated models, 382nodes, 88states, 88
localeoptions, 31
local variables, 701, 701locchar, 679locchar_back, 679log, 674log10, 674log files, 593
arguments, 735logical functions, 674logistic regression, 47, 348, 384, 393, 395, 397, 847
logistic regression equation node, 392, 395, 397equations, 393model tab, 393
logistic regression node, 348, 349, 353advanced (expert) output, 356convergence criteria, 353convergence options, 355expert options, 353expert output, 353model form, 349stepping criteria (field selection), 357
log-odds, 393lowertoupper, 679
machine learning, 41, 42, 847main data set, 144main effect, 847Mallows' Prediction Criterion
linear regression, 338managers
models tab, 382outputs tab, 488
mandatory fields, 94MAPPING_FILE subsection, 614, 828
MAP_TYPE subsection, 829MAPPING_FORMAT subsection, 831
mapping data, 93mapping fields, 89market basket analysis, 652, 847matrix, 847matrix browser
edit menu, 489file menu, 489generate menu, 502
matrix node, 498appearance tab, 500column percentages, 500cross-tabulation, 500highlighting, 500output browser, 502output tab, 491row percentages, 500settings tab, 498sorting rows and columns, 500
max, 673
866
Index
maximumset globals node, 530statistics output, 520
maximum value for aggregation, 132mean, 847
binning node, 195set globals node, 530statistics output, 520
mean/standard deviationused to bin fields, 195
mean value for aggregation, 132mean value for records, 131median, 847
statistics output, 520member, 673member (SAS import)
setting, 114memory
managing, 31, 32merge node
filtering fields, 139overview, 135setting options, 137tagging fields, 141
merging records, 847metadata, 51, 847middle mouse button
simulating, 28, 61min, 673minimizing, 27minimum
set globals node, 530statistics output, 520
minimum value for aggregation, 132misclassification costs, 333
C5.0 node, 330misclassification matrix, 847missing values, 147, 155, 218, 224, 225, 227, 522
CLEM expressions, 228filling, 223handling, 223in Aggregate nodes, 131in fields, 226in records, 226
mode, 847statistics output, 520
MODEL_FILES subsection, 835model evaluation, 290model fit
linear regression, 338, 401model fitting information
logistic regression, 397modeling, 847modeling nodes, 307, 311, 324, 329, 334, 339, 341,
345, 348, 359, 364, 367, 373, 608, 802, 803,805
scripting properties, 767modeling palette, 803models
adding to projects, 578duplicate names, 722exporting, 464, 480importing, 382scripting, 722, 722, 723, 723
MODEL specification, 610, 836for refined models, 837for unrefined models, 837
models tabsaving and loading, 382
modifying data values, 167momentum
neural net node, 323mouse
using in Clementine, 28, 61multi-layer perceptrons, 311, 847multiple derive, 170multiple fields
selecting, 172multiple inputs, 135multiple regression, 334multiplot node, 847
creating, 257overview, 256using the graph, 259
multiset command, 738
NAME keyword, 801natural order
altering, 201negate, 674network
web graph, 280
867
Index
neural net node, 311, 312, 317, 318, 319, 321, 322,323
alpha, 323dynamic training method, 312, 318eta, 323exhaustive prune training method, 312, 323expert options, 317, 318, 319, 321, 322, 323feedback graph, 315field options, 308large sets, 73learning rate (eta), 323momentum (alpha), 323multiple training method, 312, 319persistence, 317, 319, 321, 322prune training method, 312, 321quick training method, 312, 317radial basis function network (RBFN) trainingmethod, 312, 322sensitivity analysis, 315stopping criteria, 312training log, 315
neural netsexporting, 467, 467, 468, 468, 469
neural network modelsgenerating filter nodes, 392
neural networks, 42, 311, 324, 388, 389, 444, 445,848
confidence, 388new features, 1node, 848node reference, 697nodes, 21, 697
adding, 61, 64adding to projects, 578, 579annotating, 70bypassing in a stream, 63connecting in a stream, 61deleting, 61deleting connections, 66duplicating, 66editing, 66introduction, 59loading, 88names, 699, 713, 714positioning, 706saving, 86
scripting, 699, 704, 707, 709, 710, 713, 713,714, 717, 720setting options, 66
NODE specification, 609, 616HASH_DATA keyword, 800, 803ICON subsection, 803NAME keyword, 800, 801PALETTE keyword, 800, 802TITLE keyword, 800, 801TYPE keyword, 800TYPE keyword, 801
noisy data, 51nominal regression, 348normalized chi-square (apriori evaluation measure),
345normalized data, 848notifications
setting options, 33nulls, 155, 218, 223null values
quality node, 523number function, 696number parameters, 806, 815numbers, 219, 664, 664numeric functions, 674
objectsproperties, 585
ODBC, 106, 848bulk loading via ODBC, 536
ODBC output node. See database output node, 533oneof, 678opening
models, 88nodes, 88output, 88output objects, 488projects, 579states, 88streams, 88
operator precedence, 668optimization, 1
options, 37options, 31
AnswerTree, 551display, 36
868
Index
Excel, 551for Clementine, 31optimization, 37SPSS, 550stream properties, 73, 76, 78, 80user, 33
OPTIONS subsection, 610, 619, 812Oracle, 106order
of input data, 141ordering data, 134, 202order merging, 135order of execution
specifying, 572outer join, 135outlier, 848output
scripting, 726working with, 488
OUTPUT_DATA subsection, 614, 621, 826OUTPUT_FIELDS subsection, 613, 620, 821output browsers
menus, 489output field, 848output formats, 491output manager, 488output nodes, 487, 488, 493, 493, 494, 498, 504,
510, 518, 522, 527, 529, 531, 533, 539, 540,544, 545, 546
output tab, 491publish to web, 490scripting properties, 781
output palette, 803overfitting, 848overlays, 246
data audit browser, 515for graphs, 232
overwriting database tables, 534
PALETTE keyword, 802palette manager
CEMI, 624palettes, 848
overview, 24panel, 232
parameter estimateslogistic regression, 397
parameters, 602, 669, 697, 701, 701, 702, 704, 713,714, 738, 738, 740, 794, 796, 848
for streams, 80, 82node properties, 569scripting, 697, 699setting for supernodes, 566, 566, 568slot parameters, 569
PARAMETERS subsection, 610, 617, 805field parameters, 807flag parameters, 806id parameters, 810number parameters, 806pathname parameters, 809set parameters, 808tempfile parameters, 809text parameters, 806
part and partial correlationslinear regression, 338, 401
partial joins, 135, 139passing samples, 128passwords
database connections, 108encoded, 732, 746
paste, 26pathname parameters, 809, 815PCA, 359, 848percentages, 128performance evaluation statistic, 504period, 73persistence
neural net node, 317, 319, 321, 322pi, 676plot node, 231
creating, 243, 246using the graph, 251
plotting associations, 276, 278PMML, 464, 465, 833PMML models
exporting, 382importing, 382, 384
point plots, 231, 243, 256positioning nodes, 717PowerPoint files, 578precedence, 668
869
Index
prediction, 848PredictiveMarketing, 10, 481predictor, 848principal components analysis (PCA), 359, 403,
404, 406printing
output, 489streams, 66
prior probabilitiesC&R tree node, 372
probabilitiesin logistic regression, 393
probability, 848process nodes, 607, 802, 802, 805profit charts, 290, 299projects, 575
adding objects, 579annotating, 583building, 579classes view, 578closing, 585creating new projects, 579CRISP-DM view, 576folder properties, 583generating reports, 586object properties, 585setting a default folder, 577setting properties, 581
project tool, 848promax rotation
factor/PCA node, 363properties
common scripting, 741filter nodes, 738for data streams, 73for scripting, 737node, 569project folder, 583report phases, 587scripting, 700, 738, 738, 740, 741, 780, 794stream, 796
pruning, 848pseudo R-square
logistic regression, 397publisher node, 531
publish to web, 490URL setting, 551
purple nodes, 37python
bulk loading scripts, 536
quality browseredit menu, 489file menu, 489generate menu, 524generating filter nodes, 525generating select nodes, 525interpreting results, 524
quality node, 522invalid value criteria, 523output tab, 491quality tab, 523
quantile, 848quartile, 848quartimax rotation
factor/PCA node, 363query, 106, 106, 848query editor, 110QUEST, 384quintile, 848quotes
for database export, 534
radial basis function netsexporting, 470, 471, 471, 472, 472
radial basis function network (RBFN), 312, 322,850
random functionsoneof , 678random0, 678
random samples, 127range
statistics output, 520range field type, 157ranges, 150, 150, 151, 151rank cases, 194real functions, 696real ranges, 157reals, 663, 664, 850reclassify node, 184, 187
generating from a distribution, 261overview, 184, 188
870
Index
recode, 184, 184, 188record counts, 132record length, 101record operations nodes, 125
aggregate node, 131append node, 143balance node, 129distinct node, 145merge node, 135sample node, 127scripting properties, 747select node, 126sort node, 134
record ops palette, 802records, 41, 850
merging, 135missing values, 226
refined models, 837, 850externally executable, 838internally executable, 838
refreshsource nodes, 73
regression, 334, 398regression equation node, 398regression trees, 367, 850relational database, 850
rename statements, 717renaming
output objects, 488streams, 83
replacing field values, 181report browser, 529
edit menu, 489file menu, 489
report manager, 850report node, 527
HTML, 492output tab, 491template tab, 527
reportsadding to projects, 578generating, 586setting properties, 587
resizing, 27response charts, 290, 299
RESULTS subsection, 615, 833retail analysis, 647RETURN_CODE subsection, 615, 621, 832ROI charts, 290, 299rotation
of factors/components, 363rough diamond, 850round, 674row, 850row-wise binding, 536R-squared change
linear regression, 338, 401rule induction, 43, 329, 339, 341, 367, 850rules
exporting, 466, 466, 466ruleset node, 411, 412, 414, 415, 417, 426rulesets, 850
evaluating, 73rule supernode
generating from sequence rules, 460
sample nodeoverview, 127setting options, 128
sampling, 56, 127, 850sampling percentages, 128SAS
import node, 113setting import options, 114transport files, 113types of import files, 113
SAS data, 544SAS export node, 544, 544sav files, 111saving
generated models, 382multiple objects, 87nodes, 86output, 489output objects, 488states, 86, 87streams, 86
scale factors, 130scatterplots, 231, 243, 256, 850

871
Index
scenario, 481, 484schema
database output node, 535Schwarz Bayesian Criterion
linear regression, 338scoring, 850
evaluation chart options, 297scoring data, 385scripting, 39, 205, 714, 727, 850
abbreviations used, 740batch mode, 606checking, 601CLEM expressions, 704closing streams, 710common properties, 741creating nodes, 704creating streams, 704current object, 709, 710deleting nodes, 710examples, 598, 601, 603, 605executing, 729exit commands, 727field operations nodes, 751file output, 726generated models, 722get object, 709graph nodes, 758in batch mode, 594interrupting, 729language reference, 697manipulating results, 725modeling nodes, 767models, 722, 723, 723node commands, 717node properties, 721nodes, 713, 713opening nodes, 707operators, 699output nodes, 781overview, 597, 697parameters, 701record operations nodes, 747saving streams, 707setting parameters, 700setting properties, 700
source nodes, 742standalone scripts, 598streams, 598, 711supernodes, 572, 602, 724supernode scripts, 598syntax, 697, 698, 699, 699user interface, 599, 599, 602, 604
scrollingsetting options, 76
sd2 (SAS) files, 113searching
table browser, 496security
encoded passwords, 732, 746seed
random seed, 128segmentation, 850select, 850selecting rows (cases), 126selection criteria
linear regression, 338, 401select node
generating, 251, 261, 266, 274, 284overview, 126
self-organizing maps, 44, 324sensitivity analysis, 850
neural net node, 315neural networks, 389
sequence browser, 459sequence detection, 45, 373sequence functions, 688sequence node, 373, 377
content field(s), 374data formats, 374expert options, 377field options, 374generated sequence rules, 454, 455ID field, 374options, 376predictions, 455tabular versus transactional data, 377time field, 374
sequence rules nodegenerating a rule supernode, 460
872
Index
sequences, 850generated sequence rules, 456, 459sequence browser, 459sorting, 459
servercommand line arguments, 732default directory, 32
server mode, 22session
parameters, 82set field type, 850set globals node, 529
settings tab, 530set parameters, 808, 815sets, 73
transforming, 184, 187set to flag node, 197, 198set type, 150, 151, 158SHEET subsection, 816shortcut keys, 28sign, 674significance (statistical), 850sin, 676sinh, 676skipchar, 679skipchar_back, 679slb files, 573slot parameters, 569, 602, 699, 700, 713, 721, 737,
741, 850solution publisher node, 531, 532solutions template library, 89sorting
fields, 201records, 134
sort nodeoverview, 134
source nodes, 607, 802, 802, 805database node, 106data mapping, 90fixed file node, 101instantiating types, 121overview, 97refreshing, 73SAS import node, 113scripting properties, 742
SPSS file node, 111user input node, 114, 116variable file node, 98
sources palette, 802SPECFILE, 799
CORE specification, 804MODEL specification, 836NODE specification, 800
special functions, 696special variables, 709, 710specification file, 607, 609
backslashes, 799comments, 799notation, 800
SPSSlaunching from Clementine, 541, 546, 550valid field names, 542
SPSS export node, 540export tab, 541
SPSS file nodeoverview, 111
SPSS output browser, 549SPSS procedure node, 546, 547SPSS Web Deployment Framework (SWDF)
publishing output, 490SQL, 106, 106, 110, 850
generating from rulesets, 417SQL generation, 37sqrt, 674ssd (SAS) files, 113standalone scripts, 598, 599, 604standard deviation, 850
binning node, 195set globals node, 530statistics output, 520
standard deviation for aggregation, 132standard error of mean
statistics output, 520states
loading, 88saving, 86, 87
statistical models, 47statistics, 850
data audit node, 510matrix node, 498
873
Index
statistics browseredit menu, 489file menu, 489generate menu, 520generating filter nodes, 522interpreting, 520
statistics node, 518correlation labels, 519correlations, 518output tab, 491settings tab, 518statistics, 518
status window, 24stop execution, 26stopping options
C&R tree node, 371storage, 104, 154, 155
converting, 181, 183stream canvas
overview, 24settings, 76
streams, 21, 850adding nodes, 61, 64adding to projects, 578, 579annotating, 83building, 57, 58bypassing nodes, 63connecting nodes, 61execution, 85loading, 88multiset command, 737options, 73properties, 713, 796saving, 86scheduling, 591scripting, 597, 598, 599, 599, 601, 704, 707,709, 710, 711, 711, 712scripting properties, 711setting parameters, 80
strfloat, 696string functions, 679, 696strings, 217, 663, 665, 850
scripting, 699strinteger, 696stripchar, 679strmember, 679
strnumber, 696structured properties, 738subscrs, 679substringsubstring_between, 679sum
set globals node, 530statistics output, 520
summary data, 131summary statistics
data audit node, 510summed values, 132supernodes, 553, 598, 729, 737, 794
creating, 557creating caches for, 570editing, 564loading, 573nesting, 560process supernodes, 555saving, 573scripting, 572, 599, 603, 697, 724setting parameters, 566, 566, 568source supernodes, 554terminal supernodes, 556types of, 554zooming in, 564
supervised learning, 850support, 850
apriori node, 342for sequences, 456GRI node, 340sequence node, 376
surrogatesdecision tree node, 422
Sybase, 106symbolic field, 850syntax
for scripting, 697, 698, 699, 699syntax tab
SPSS procedure node, 547synthetic data, 114system
command line arguments, 734options, 31requirements, 18
system-missing values, 223
874
Index
tablereading from a database, 109
table browseredit menu, 489file menu, 489generate menu, 496reordering columns, 496searching, 496selecting cells, 496
table node, 493column justification, 494column width, 494format tab, 494output settings, 493settings tab, 493
table owner, 109tables
adding to projects, 578joining, 135
TAB subsection, 818tabular data
apriori node, 310sequence node, 374
tags, 135, 141tan, 676tanh, 676target, 853temp directory, 23tempfile parameters, 809template fields, 94templates, 89, 90, 481, 484
report node, 527terminal nodes, 608, 802, 803, 805testbit, 677test metric
neural net node, 315text data, 98, 101text files, 98text parameters, 806, 815thresholds
viewing bin thresholds, 196throughput reporting, 37ties, 192tiles, 192time
setting formats, 73
time_before, 673time and date functions, 666, 667time field
sequence node, 374time formats, 666, 667time functions, 666, 667
time_before, 684time_hours_difference, 684time_in_hours, 684time_in_mins, 684time_in_secs, 684time_mins_difference, 684time_secs_difference, 684
times, 217time series, 199, 853timestamp, 150to_ functions
to_date, 672to_integer, 672to_real, 672to_string, 672to_time, 672to_timestamp, 672
toolbar, 26tpt (SAS) files, 113training data sets, 127train metric
neural net node, 315train net node
See neural net node, 311transactional data
apriori node, 310sequence node, 374
transformations, 853reclassify, 184, 188recode, 184, 188
transparency, 232tree map
decision tree node, 423tree viewer, 423trigonometric functions, 676true values, 159truncating field names, 165, 167TwoStep clustering, 48, 451, 452, 853

875
Index
TwoStep cluster node, 364, 366, 450number of clusters, 366options, 366outlier handling, 366standardization of fields, 366
type, 104, 853type attributes, 163TYPE keyword, 801type node, 224
blank handling, 155clearing values, 119copying types, 163flag field type, 159instantiating, 153missing values, 227overview, 148range field type, 157set field type, 158setting direction, 162setting options, 150, 151
unbiased data, 129undef, 228, 695undefined values, 137undo, 26uninstalling
CEMI nodes, 626, 627Clementine, 21
unique records, 145unmapping fields, 89unrefined models, 45, 837, 853unrefined rule node, 407, 408, 409, 411unsupervised learning, 48, 853unsupervised models, 324uppertolower, 679upstream, 853usage type, 104user input node, 853
overview, 114setting options, 116
user-missing values, 223user options, 33
value labels, 111values, 206
adding to CLEM expressions, 214reading, 154
specifying, 155viewing from a data audit, 214
variable file node, 98, 853setting options, 99
variable labels, 111SPSS export node, 540
variable namesdata export, 533, 539, 541, 544
variables, 41, 704, 853scripting, 709, 710
variance, 853statistics output, 520
varimax rotationfactor/PCA node, 363
viewer tabdecision tree node, 423
views, 109vingtile, 853visual programming, 24, 853
warnings, 78setting options, 33
web node, 853adjusting thresholds, 287, 289appearance options, 282creating, 280overview, 276, 278using the graph, 284
weighted least squares, 309weight fields, 309what's new, 1
algorithms information, 7binning node, 3bulk loading, 12CEMI changes, 13cluster viewer, 7data audit node, 3deployment options, 10encoded password generator, 13evaluation chart improvements, 9field reorder node, 6in-database scoring, 12lift statistic, 9merge node enhancements, 7modeling enhancements, 7node properties, 13, 14
876
Index
reclassify node, 5scripting, 13
white spacequality node, 523
wizardaccessing, 481, 484overview, 481, 484
XMLexporting, 722
x-y grid coordinates, 706
zooming, 26, 564
Related Documents