City University of New York (CUNY) City University of New York (CUNY) CUNY Academic Works CUNY Academic Works Open Educational Resources Queensborough Community College 2020 Clear-Sighted Statistics: Module 6: Index Numbers (slides) Clear-Sighted Statistics: Module 6: Index Numbers (slides) Edward Volchok CUNY Queensborough Community College How does access to this work benefit you? Let us know! More information about this work at: https://academicworks.cuny.edu/qb_oers/149 Discover additional works at: https://academicworks.cuny.edu This work is made publicly available by the City University of New York (CUNY). Contact: [email protected]

Welcome message from author
This document is posted to help you gain knowledge. Please leave a comment to let me know what you think about it! Share it to your friends and learn new things together.
Transcript
City University of New York (CUNY) City University of New York (CUNY)
CUNY Academic Works CUNY Academic Works
Open Educational Resources Queensborough Community College
2020
Clear-Sighted Statistics: Module 6: Index Numbers (slides) Clear-Sighted Statistics: Module 6: Index Numbers (slides)
Edward Volchok CUNY Queensborough Community College
How does access to this work benefit you? Let us know!
More information about this work at: https://academicworks.cuny.edu/qb_oers/149
Discover additional works at: https://academicworks.cuny.edu
This work is made publicly available by the City University of New York (CUNY). Contact: [email protected]
1
Clear-Sighted Statistics
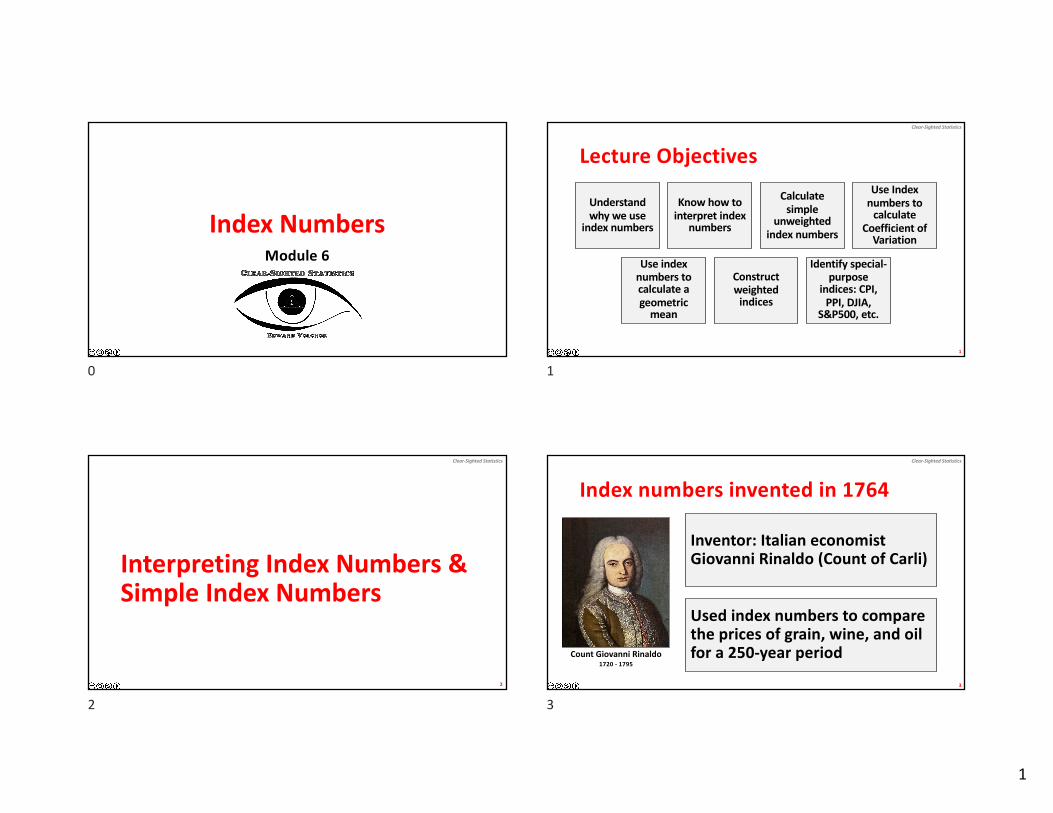
Index NumbersModule 6
0
Clear-Sighted Statistics
Lecture Objectives
1
Understand why we use
index numbers
Know how to interpret index
numbers
Calculate simple
unweighted index numbers
Use Index numbers to
calculate Coefficient of
Variation
Use index numbers to calculate a geometric
mean
Construct weighted
indices
Identify special-purpose
indices: CPI, PPI, DJIA,
S&P500, etc.
1
Clear-Sighted Statistics
Interpreting Index Numbers & Simple Index Numbers
2
2
Clear-Sighted Statistics
Index numbers invented in 1764
Inventor: Italian economist Giovanni Rinaldo (Count of Carli)
Used index numbers to compare the prices of grain, wine, and oil for a 250-year period
3
Count Giovanni Rinaldo1720 - 1795
3
2
Clear-Sighted Statistics
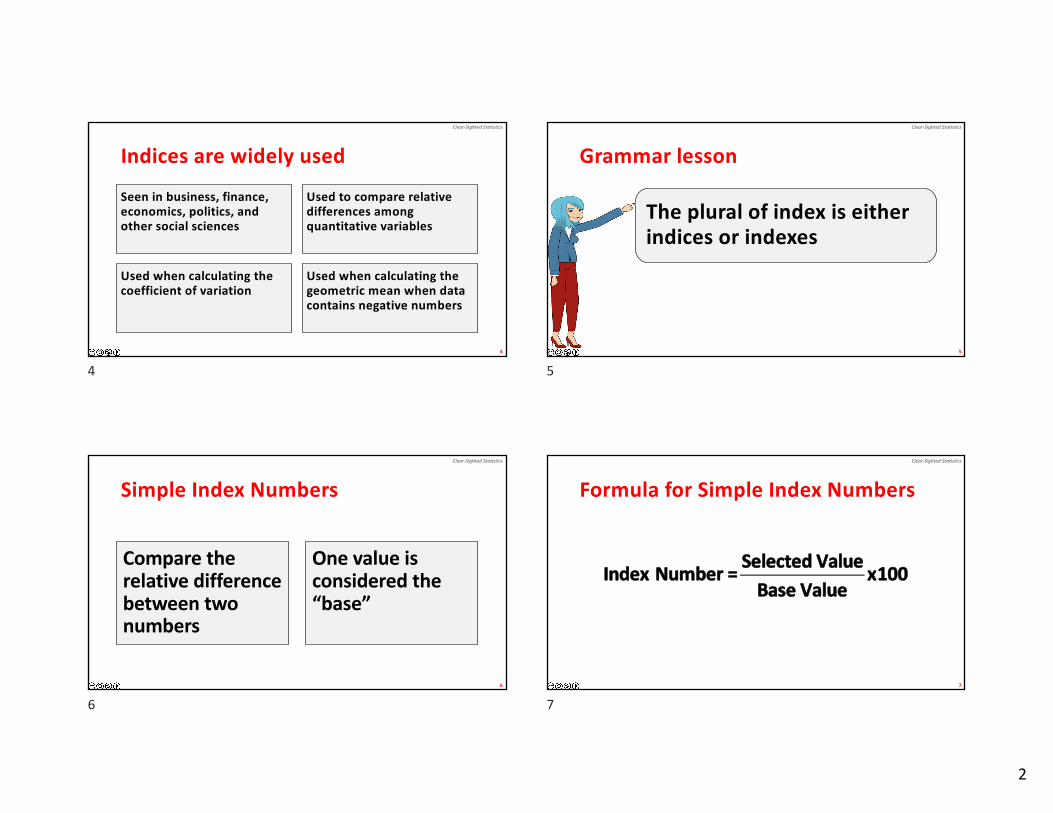
Indices are widely used
Seen in business, finance, economics, politics, and other social sciences
Used to compare relative differences among quantitative variables
Used when calculating the coefficient of variation
Used when calculating the geometric mean when data contains negative numbers
4
4
Clear-Sighted Statistics
Grammar lesson
The plural of index is either indices or indexes
5
5
Clear-Sighted Statistics
Simple Index Numbers
Compare the relative difference between two numbers
One value is considered the “base”
6
6
Clear-Sighted Statistics
Formula for Simple Index Numbers
7
IndexNumber= SelectedValueBaseValue
x100
7
3
Clear-Sighted Statistics
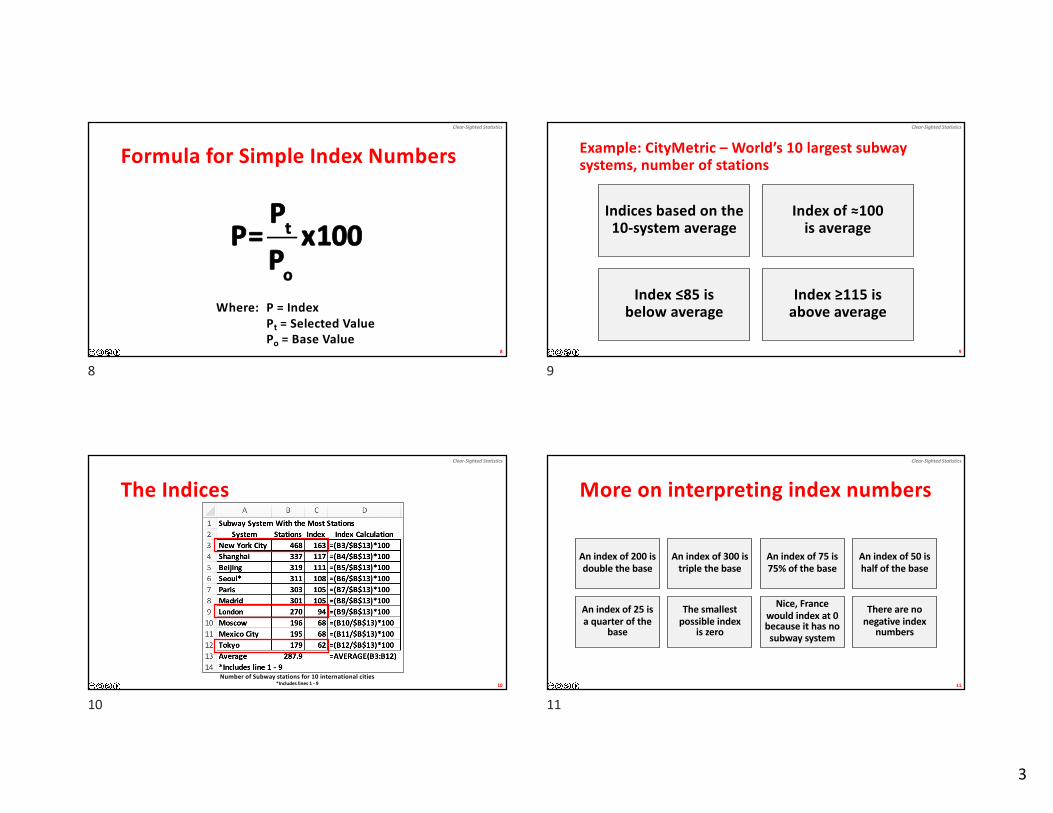
Formula for Simple Index Numbers
8
P=Pt
Pox100
Where: P = IndexPt = Selected ValuePo = Base Value
8
Clear-Sighted Statistics
Example: CityMetric – World’s 10 largest subway systems, number of stations
Indices based on the 10-system average
Index of ≈100 is average
Index ≤85 is below average
Index ≥115 is above average
9
9
Clear-Sighted Statistics
The Indices
10Number of Subway stations for 10 international cities
*Includes lines 1 - 9
10
Clear-Sighted Statistics
More on interpreting index numbers
An index of 200 is double the base
An index of 300 is triple the base
An index of 75 is 75% of the base
An index of 50 is half of the base
An index of 25 is a quarter of the
base
The smallest possible index
is zero
Nice, France would index at 0 because it has no subway system
There are no negative index
numbers
11
11
4
Clear-Sighted Statistics
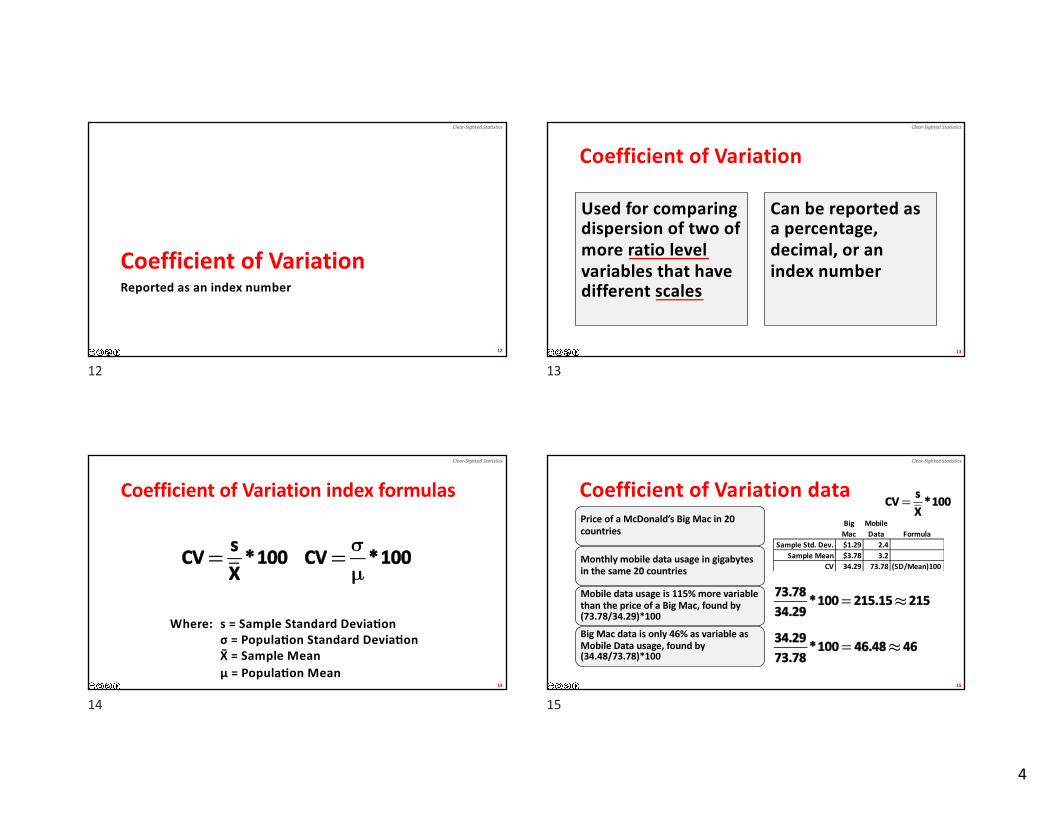
Coefficient of VariationReported as an index number
12
12
Clear-Sighted Statistics
Coefficient of Variation
Used for comparing dispersion of two of more ratio level variables that have different scales
Can be reported as a percentage, decimal, or an index number
13
13
Clear-Sighted Statistics
Coefficient of Variation index formulas
14
CV= σµ*100CV= s
X*100
Where: s = Sample Standard DeviaDonσ = PopulaDon Standard DeviaDonXG = Sample Meanμ = PopulaDon Mean
14
Clear-Sighted Statistics
Coefficient of Variation dataPrice of a McDonald’s Big Mac in 20 countries
Monthly mobile data usage in gigabytes in the same 20 countries
Mobile data usage is 115% more variable than the price of a Big Mac, found by (73.78/34.29)*100
Big Mac data is only 46% as variable as Mobile Data usage, found by (34.48/73.78)*100
15
Big Mac
Mobile Data Formula
Sample Std. Dev. $1.29 2.4Sample Mean $3.78 3.2
CV 34.29 73.78 (SD/Mean)100
73.7834.29
*100= 215.15≈215
34.2973.78
*100= 46.48≈ 46
CV= sX*100
15
5
Clear-Sighted Statistics
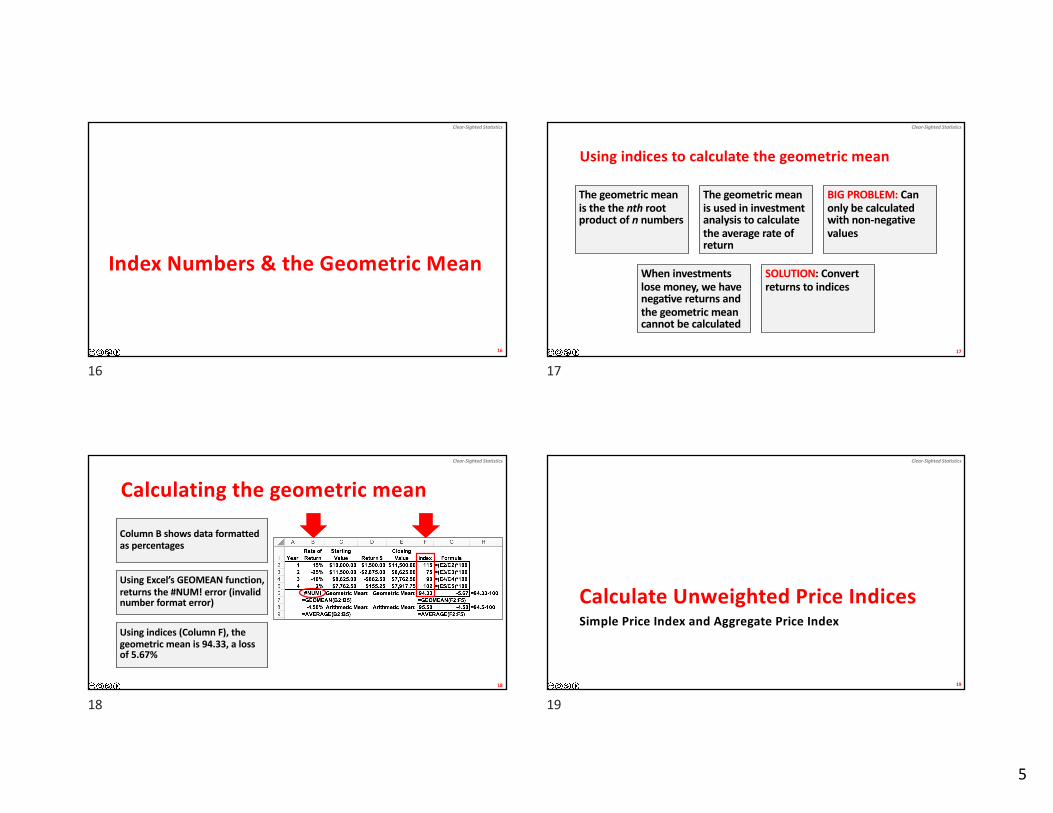
Index Numbers & the Geometric Mean
16
16
Clear-Sighted Statistics
Using indices to calculate the geometric mean
The geometric mean is the the nth root product of n numbers
The geometric mean is used in investment analysis to calculate the average rate of return
BIG PROBLEM: Can only be calculated with non-negative values
When investments lose money, we have negaRve returns and the geometric mean cannot be calculated
SOLUTION: Convert returns to indices
17
17
Clear-Sighted Statistics
Calculating the geometric mean
18
Column B shows data formatted as percentages
Using Excel’s GEOMEAN function, returns the #NUM! error (invalid number format error)
Using indices (Column F), the geometric mean is 94.33, a loss of 5.67%
18
Clear-Sighted Statistics
Calculate Unweighted Price IndicesSimple Price Index and Aggregate Price Index
19
19
6
Clear-Sighted Statistics
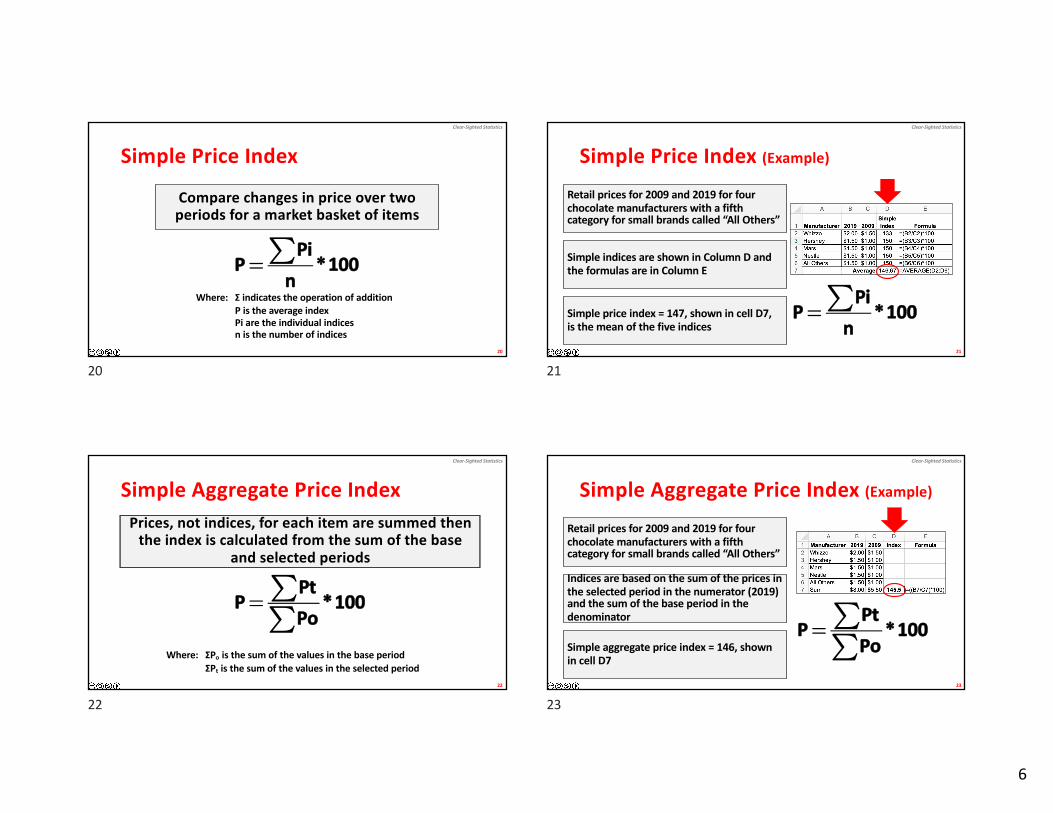
Simple Price Index
Compare changes in price over two periods for a market basket of items
20
P=Pi∑
n*100
Where: Σ indicates the operation of additionP is the average index Pi are the individual indicesn is the number of indices
20
Clear-Sighted Statistics
Simple Price Index (Example)
Retail prices for 2009 and 2019 for four chocolate manufacturers with a fifth category for small brands called “All Others”
Simple indices are shown in Column D and the formulas are in Column E
Simple price index = 147, shown in cell D7, is the mean of the five indices
21
P=Pi∑
n*100
21
Clear-Sighted Statistics
Simple Aggregate Price IndexPrices, not indices, for each item are summed then
the index is calculated from the sum of the base and selected periods
22
P=Pt∑Po∑
*100
Where: ΣPo is the sum of the values in the base periodΣPt is the sum of the values in the selected period
22
Clear-Sighted Statistics
Simple Aggregate Price Index (Example)
Retail prices for 2009 and 2019 for four chocolate manufacturers with a fifth category for small brands called “All Others”
Indices are based on the sum of the prices in the selected period in the numerator (2019) and the sum of the base period in the denominator
Simple aggregate price index = 146, shown in cell D7
23
P=Pt∑Po∑
*100
23
7
Clear-Sighted Statistics
Weighted IndicesLespeyres, Paasche, Fisher Ideal, and Value Indices
24
24
Clear-Sighted Statistics
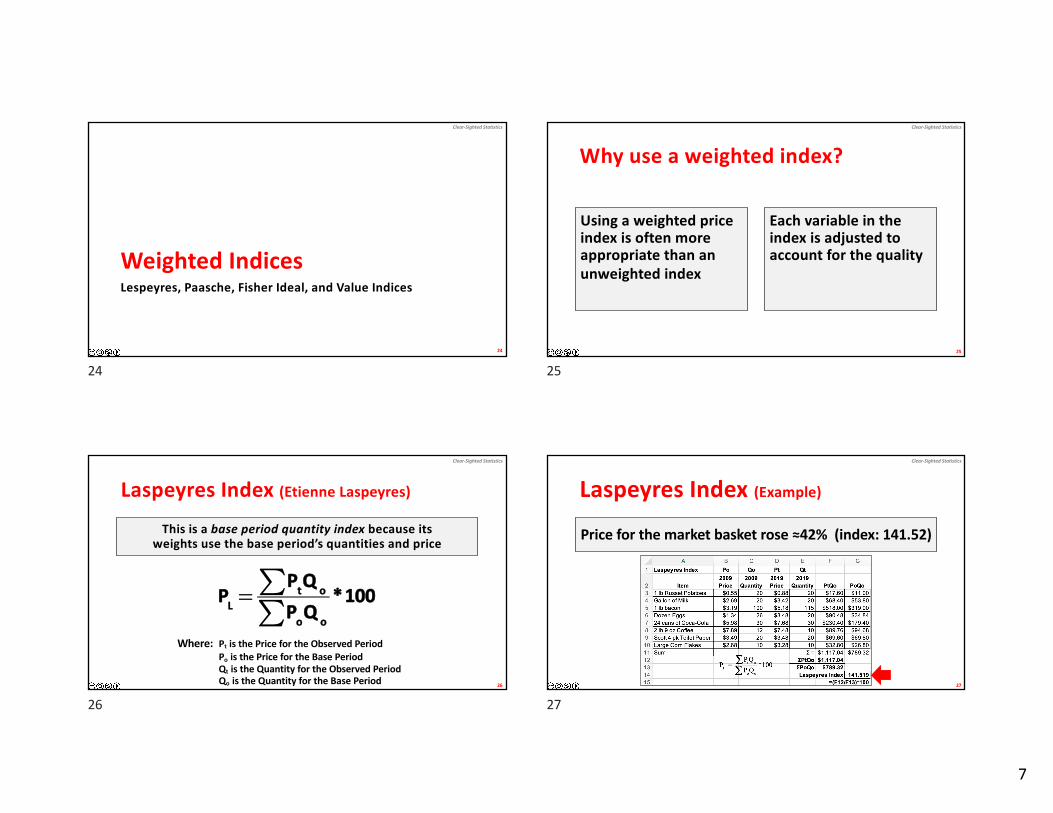
Why use a weighted index?
Using a weighted price index is often more appropriate than an unweighted index
Each variable in the index is adjusted to account for the quality
25
25
Clear-Sighted Statistics
Laspeyres Index (Etienne Laspeyres)
This is a base period quantity index because its weights use the base period’s quantities and price
26
Where: Pt is the Price for the Observed PeriodPo is the Price for the Base PeriodQt is the Quantity for the Observed PeriodQo is the Quantity for the Base Period
PL =PtQ o∑PoQ o∑
*100
26
Clear-Sighted Statistics
Laspeyres Index (Example)
Price for the market basket rose ≈42% (index: 141.52)
27
27
8
Clear-Sighted Statistics
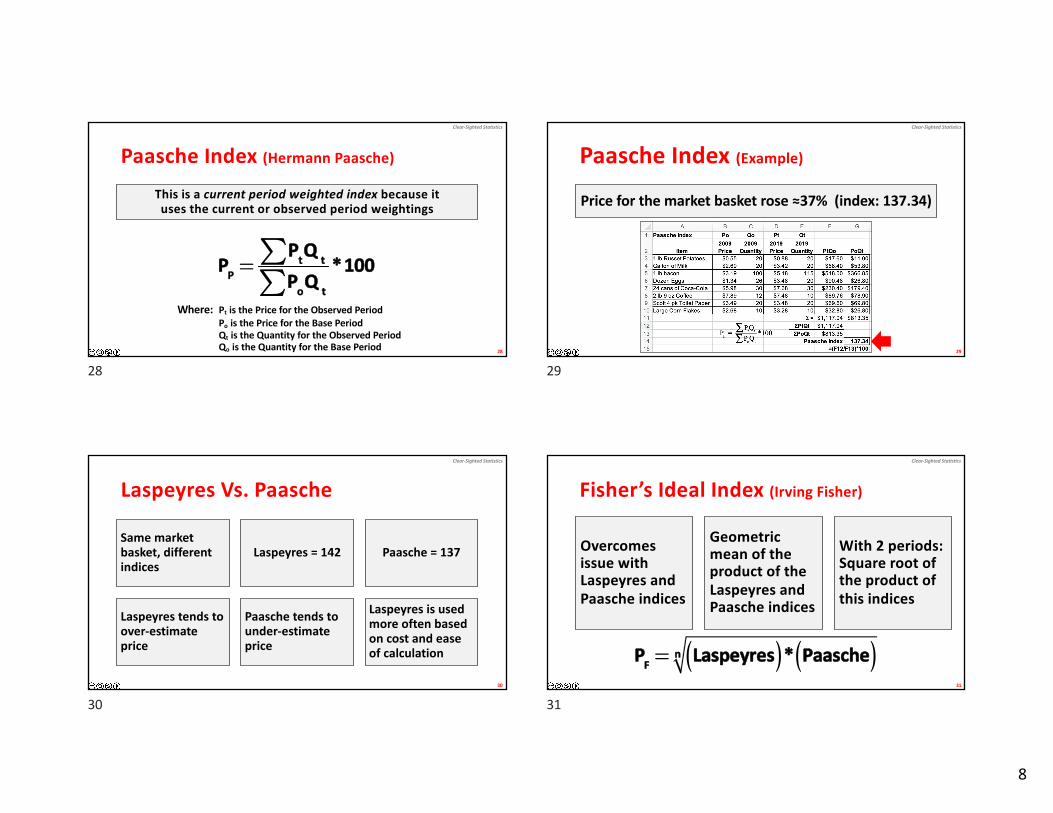
PP =PtQ t∑PoQ t∑
*100
Paasche Index (Hermann Paasche)
This is a current period weighted index because it uses the current or observed period weightings
28
Where: Pt is the Price for the Observed PeriodPo is the Price for the Base PeriodQt is the Quantity for the Observed PeriodQo is the Quantity for the Base Period
28
Clear-Sighted Statistics
Paasche Index (Example)
Price for the market basket rose ≈37% (index: 137.34)
29
29
Clear-Sighted Statistics
Laspeyres Vs. Paasche
Same market basket, different indices
Laspeyres = 142 Paasche = 137
Laspeyres tends to over-estimate price
Paasche tends to under-estimate price
Laspeyres is used more often based on cost and ease of calculation
30
30
Clear-Sighted Sta0s0cs
Fisher’s Ideal Index (Irving Fisher)
Overcomes issue with Laspeyres and Paasche indices
Geometric mean of the product of the Laspeyres and Paasche indices
With 2 periods: Square root of the product of this indices
31
PF= Laspeyres( )* Paasche( )n
31
9
Clear-Sighted Statistics
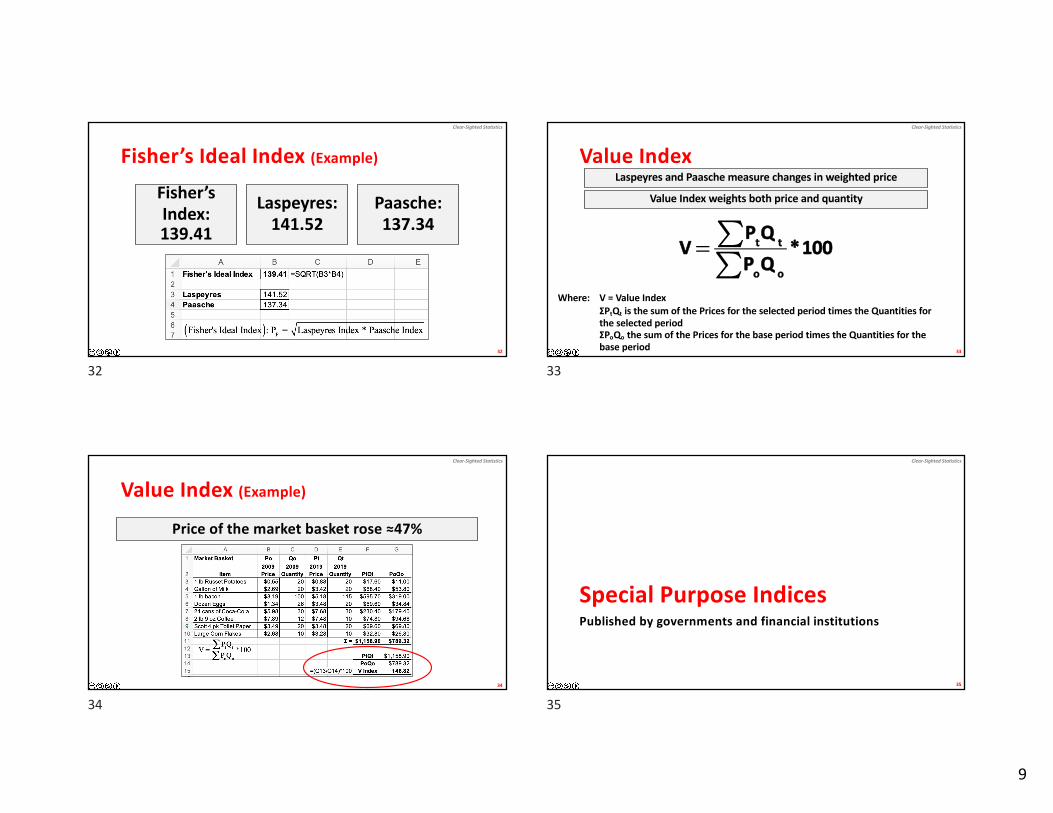
Fisher’s Ideal Index (Example)
Fisher’s Index: 139.41
Laspeyres: 141.52
Paasche: 137.34
32
32
Clear-Sighted Statistics
Value IndexLaspeyres and Paasche measure changes in weighted price
Value Index weights both price and quantity
33
Where: V = Value IndexΣPtQt is the sum of the Prices for the selected period times the Quantities for the selected periodΣPoQo the sum of the Prices for the base period times the Quantities for the base period
V=PtQ t∑PoQ o∑
*100
33
Clear-Sighted Statistics
Value Index (Example)
Price of the market basket rose ≈47%
34
34
Clear-Sighted Statistics
Special Purpose IndicesPublished by governments and financial institutions
35
35
10
Clear-Sighted Statistics
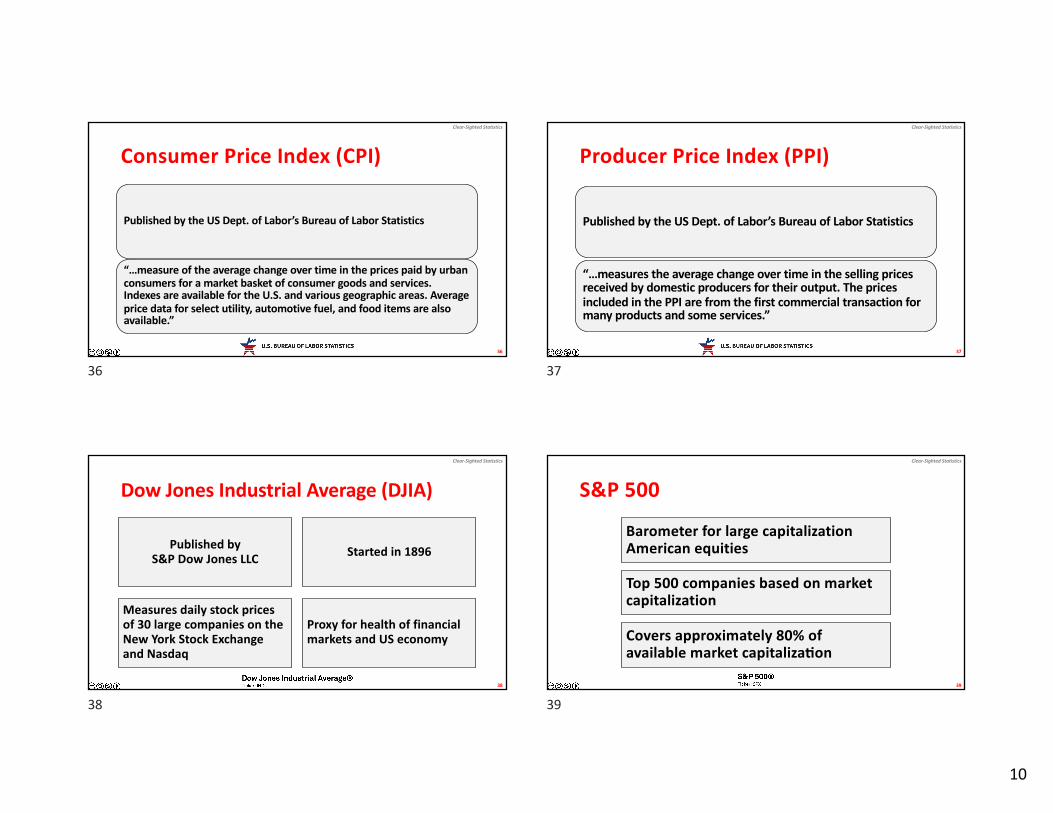
Consumer Price Index (CPI)
Published by the US Dept. of Labor’s Bureau of Labor Statistics
“…measure of the average change over time in the prices paid by urban consumers for a market basket of consumer goods and services. Indexes are available for the U.S. and various geographic areas. Average price data for select utility, automotive fuel, and food items are also available.”
36
36
Clear-Sighted Statistics
Producer Price Index (PPI)
Published by the US Dept. of Labor’s Bureau of Labor Statistics
“…measures the average change over time in the selling prices received by domestic producers for their output. The prices included in the PPI are from the first commercial transaction for many products and some services.”
37
37
Clear-Sighted Statistics
Dow Jones Industrial Average (DJIA)
Published by S&P Dow Jones LLC Started in 1896
Measures daily stock prices of 30 large companies on the New York Stock Exchange and Nasdaq
Proxy for health of financial markets and US economy
38
38
Clear-Sighted Statistics
S&P 500
Barometer for large capitalization American equities
Top 500 companies based on market capitalization
Covers approximately 80% of available market capitalizaaon
39
39
11
Clear-Sighted Statistics
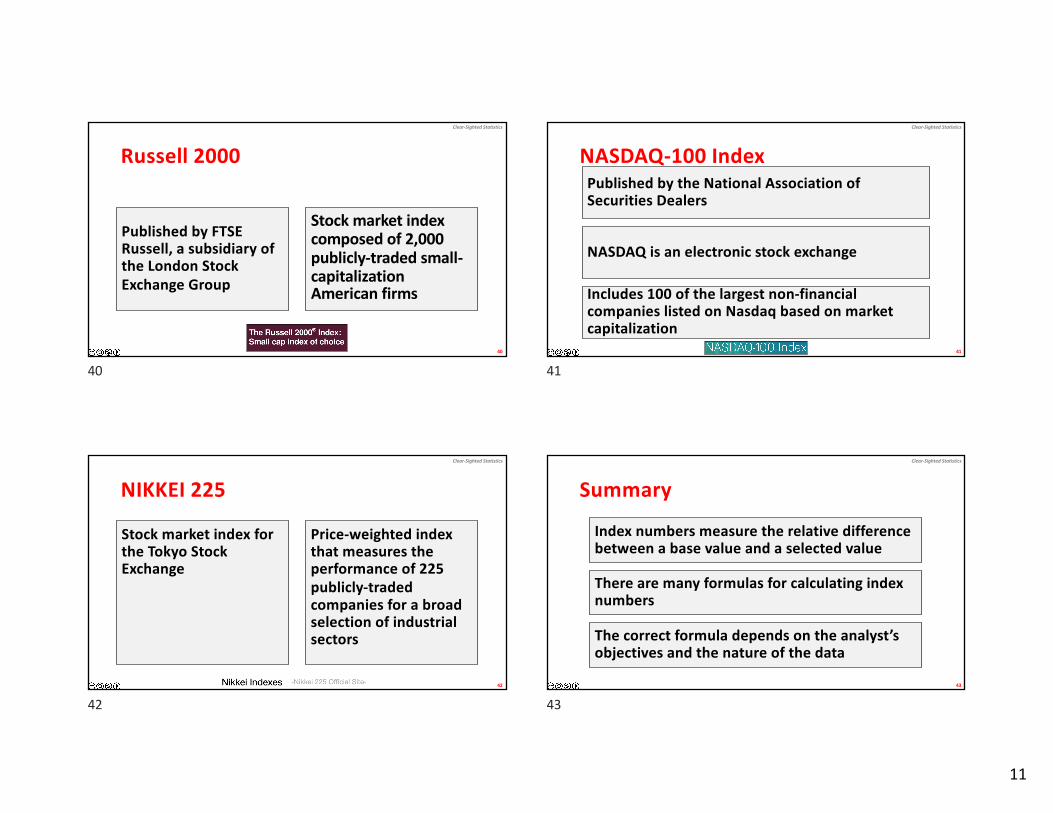
Russell 2000
Published by FTSE Russell, a subsidiary of the London Stock Exchange Group
Stock market index composed of 2,000 publicly-traded small-capitalization American firms
40
40
Clear-Sighted Statistics
NASDAQ-100 IndexPublished by the National Association of Securities Dealers
NASDAQ is an electronic stock exchange
Includes 100 of the largest non-financial companies listed on Nasdaq based on market capitalization
41
41
Clear-Sighted Statistics
NIKKEI 225
Stock market index for the Tokyo Stock Exchange
Price-weighted index that measures the performance of 225 publicly-traded companies for a broad selection of industrial sectors
42
42
Clear-Sighted Statistics
Summary
Index numbers measure the relative difference between a base value and a selected value
There are many formulas for calculating index numbers
The correct formula depends on the analyst’s objectives and the nature of the data
43
43

12
Clear-Sighted Statistics
44
44
Clear-Sighted Statistics
45
Except where otherwise noted Clear-Sighted Statistics is licensed under
a Creative Commons License. You are free to share derivatives of this work
for non-commercial purposes only. Please attribute this work to Edward Volchok.
45
Related Documents