RESEARCH ARTICLE Cleaning of raw peptide MS/MS spectra: Improved protein identification following deconvolution of multiply charged peaks, isotope clusters, and removal of background noise Nedim Mujezinovic 1 , Günther Raidl 2 , James R. A. Hutchins 1 , Jan-Michael Peters 1 , Karl Mechtler 1 * and Frank Eisenhaber 1* 1 Research Institute of Molecular Pathology, Vienna, Austria 2 Institute of Computer Graphics and Algorithms, Vienna University of Technology, Vienna, Austria The dominant ions in MS/MS spectra of peptides, which have been fragmented by low-energy CID, are often b-, y-ions and their derivatives resulting from the cleavage of the peptide bonds. However, MS/MS spectra typically contain many more peaks. These can result not only from isotope variants and multiply charged replicates of the peptide fragmentation products but also from unknown fragmentation pathways, sample-specific or systematic chemical contaminations or from noise generated by the electronic detection system. The presence of this background complicates spectrum interpretation. Besides dramatically prolonged computation time, it can lead to incorrect protein identification, especially in the case of de novo sequencing algorithms. Here, we present an algorithm for detection and transformation of multiply charged peaks into singly charged monoisotopic peaks, removal of heavy isotope replicates, and random noise. A quantitative criterion for the recognition of some noninterpretable spectra has been derived as a byproduct. The approach is based on numerical spectral analysis and signal detection methods. The algorithm has been implemented in a stand-alone computer program called MS Cleaner that can be obtained from the authors upon request. Received: December 23, 2005 Revised: June 8, 2006 Accepted: June 12, 2006 Keywords: Charge deconvolution / Deisotoping / Noise reduction / Raw mass spectrum proces- sing Proteomics 2006, 6, 5117–5131 5117 1 Introduction Developments in modern MS have made the large-scale analysis of cellular proteomes possible [1–3]. LC coupled with MS/MS (LC-MS/MS) is the standard technique used for the analysis of complex protein mixtures [4, 5]. Since modern mass spectrometers can generate large datasets with high- throughput, computational analysis of thousands of spectra has become the major bottleneck. Both the accuracy of the computer-generated interpretations (the identity of the pro- teins and their PTMs) as well as the time and the storage requirements for their computation are a matter of concern. In many cases, but not always, b- and y-ions and their derivatives resulting from cleavage at peptide bonds are the most dominant signals in MS/MS spectra of peptides after their fragmentation by low energy CID [5–12]. However, MS/MS spectra typically contain many more peaks than can Correspondence: Dr. Frank Eisenhaber, Research Institute of Mo- lecular Pathology, Dr. Bohr-Gasse 7, A-1030 Vienna, Austria E-mail: [email protected] Fax: 143-1-7987-153 Abbreviations: ADH, alcohol dehydrogenase; IIR, infinite impulse response; LC-MS/MS, LC coupled with MS/MS; SMC, structural maintenance of chromosome; TRF , transferrin * These authors contributed equally to this work. DOI 10.1002/pmic.200500928 © 2006 WILEY-VCH Verlag GmbH & Co. KGaA, Weinheim www.proteomics-journal.com

Welcome message from author
This document is posted to help you gain knowledge. Please leave a comment to let me know what you think about it! Share it to your friends and learn new things together.
Transcript
RESEARCH ARTICLE
Cleaning of raw peptide MS/MS spectra: Improved
protein identification following deconvolution of
multiply charged peaks, isotope clusters, and removal of
background noise
Nedim Mujezinovic1, Günther Raidl2, James R. A. Hutchins1, Jan-Michael Peters1,Karl Mechtler1* and Frank Eisenhaber1*
1 Research Institute of Molecular Pathology, Vienna, Austria2 Institute of Computer Graphics and Algorithms, Vienna University of Technology, Vienna, Austria
The dominant ions in MS/MS spectra of peptides, which have been fragmented by low-energyCID, are often b-, y-ions and their derivatives resulting from the cleavage of the peptide bonds.However, MS/MS spectra typically contain many more peaks. These can result not only fromisotope variants and multiply charged replicates of the peptide fragmentation products but alsofrom unknown fragmentation pathways, sample-specific or systematic chemical contaminationsor from noise generated by the electronic detection system. The presence of this backgroundcomplicates spectrum interpretation. Besides dramatically prolonged computation time, it canlead to incorrect protein identification, especially in the case of de novo sequencing algorithms.Here, we present an algorithm for detection and transformation of multiply charged peaks intosingly charged monoisotopic peaks, removal of heavy isotope replicates, and random noise. Aquantitative criterion for the recognition of some noninterpretable spectra has been derived as abyproduct. The approach is based on numerical spectral analysis and signal detection methods.The algorithm has been implemented in a stand-alone computer program called MS Cleanerthat can be obtained from the authors upon request.
Received: December 23, 2005Revised: June 8, 2006
Accepted: June 12, 2006
Keywords:
Charge deconvolution / Deisotoping / Noise reduction / Raw mass spectrum proces-sing
Proteomics 2006, 6, 5117–5131 5117
1 Introduction
Developments in modern MS have made the large-scaleanalysis of cellular proteomes possible [1–3]. LC coupled withMS/MS (LC-MS/MS) is the standard technique used for the
analysis of complex protein mixtures [4, 5]. Since modernmass spectrometers can generate large datasets with high-throughput, computational analysis of thousands of spectrahas become the major bottleneck. Both the accuracy of thecomputer-generated interpretations (the identity of the pro-teins and their PTMs) as well as the time and the storagerequirements for their computation are a matter of concern.
In many cases, but not always, b- and y-ions and theirderivatives resulting from cleavage at peptide bonds are themost dominant signals in MS/MS spectra of peptides aftertheir fragmentation by low energy CID [5–12]. However,MS/MS spectra typically contain many more peaks than can
Correspondence: Dr. Frank Eisenhaber, Research Institute of Mo-lecular Pathology, Dr. Bohr-Gasse 7, A-1030 Vienna, AustriaE-mail: [email protected]: 143-1-7987-153
Abbreviations: ADH, alcohol dehydrogenase; IIR, infinite impulseresponse; LC-MS/MS, LC coupled with MS/MS; SMC, structuralmaintenance of chromosome; TRF, transferrin * These authors contributed equally to this work.
DOI 10.1002/pmic.200500928
© 2006 WILEY-VCH Verlag GmbH & Co. KGaA, Weinheim www.proteomics-journal.com
5118 N. Mujezinovic et al. Proteomics 2006, 6, 5117–5131
be expected from this fragmentation scheme. Some of themare repeated shifted signals due to the natural isotope dis-tribution [13]. The heavy isotope variants and the mono-isotope peak form isotope peak clusters that can be detectedwith high-resolution instruments. ESI allows measuring themasses of large molecules by producing multiply chargedions, thereby decreasing the m/z into detectable ranges [14–18]. If a fragment ion comprises several functional groupscapable of acting as a charge carrier, the same isotope peakcluster can be repeated with a different charge state at dif-ferent m/z values in the spectrum. Other signals originatefrom unknown fragmentation pathways, sample-specific orsystematic chemical contaminations, and random noiseproduced by the electronic detection system.
It is hardly possible to derive any benefit from the above-mentioned additional background peaks that can composethe majority of the spectrum as long as the theoreticalunderstanding of the mechanism of their genesis is scarce.The presence of these peaks not only complicates computer-based spectrum interpretation by increasing the computa-tion time, but also, more critically, false interpretation ofhigh-intensity signals as potential b- or y-related ions canlead in some cases to incorrect sequence interpretations ofproteins or false identification of their PTMs. Particularly,the de novo sequencing approach [19–25] is affected by thisproblem, where each peak is part of a sequence puzzle to besolved, and therefore has initially to be considered as apotential b- or y-ion. In the case of algorithms based on pro-tein sequence database searches [26–32], the danger of mis-interpretation is not so dramatic, especially for protein tar-gets without PTMs, since the space of naturally occurringprotein sequences is much smaller than the set of sequencesthat can be theoretically generated. Usually, a few dominat-ing peaks of the major fragmentation row in the spectrumare sufficient to unambiguously determine the register of apeptide fragment within the original protein sequence. Butwhen the nature of possible PTMs is a priori unknown (and,therefore, the mass changes to be anticipated vary widely) orwhen the database contains many proteins with similar pep-tides, the background can lead database search methodsdown a wrong path and result in incorrect protein identifi-cation.
Background processing of raw MS/MS spectra fromprotein samples has not been in the center of interest amongthe community for a long time, partly due to limitations ofmeasurement accuracy. For example, resolution of isotopeclusters requires very precise instruments, which havebecome available on a broad scale only recently (e.g., theThermo Finnigan LCQ with close to ,0.5 Da resolution and,0.3 Da accuracy of mass measurement or the newer LTQwith ,0.3 Da resolution and ,0.2 Da mass determinationaccuracy). Therefore, some spectrum interpretation algo-rithms foresee simplified exclusion rules for heavy ion peaksin their scoring or spectra preprocessing schemes [26].Similarly, deconvolution of multiply charged peaks and de-isotoping with procedures described in the literature [33–41]
are possible only with very accurate data and resolved isotopeclusters. The results are reliable only in the cases of suffi-ciently large peptide fragments where an isotope peak clusterof the higher charge state is confirmed by respective clustersat the lowest charge state or when the distances betweenpeaks in a cluster accurately match the expected mass differ-ences.
Sometimes, it might be rather advisable to refrain fromautomatically interpreting very noisy MS/MS spectra insteadof generating interpretations that are not justified by thedata. The task of unselecting noninterpretable spectra isrelated to but different from the question of cleaning spectrafrom noise. Xu et al. [42] and Bern et al. [43] propose empiri-cal criteria for unselecting bad spectra; i.e., spectra with onlyfew significant peaks over a dense background. For thesemethods, the relatively high number of false positivelyunselected (i.e., nevertheless interpretable) spectra remains aproblem.
Previous work on raw protein MS/MS spectrum proces-sing has not led to satisfying solutions and, therefore, manycurrently available MS/MS spectrum analysis packages lar-gely ignore the presence of additional background signals.Most commercial spectrum interpretation software suitescontain some noise reduction but the algorithms imple-mented are not publicly documented. At present, there isonly one available program isolatedly dedicated to spectralcleaning, the MASCOT Distiller (see www.matrixscience.com), a commercial software package that optimizes peaklocation and intensities, given the ideal isotopic distributionof elements contained in peptides. However, the algorithmsused in this software are not published and the correctness ofpeak removal/inclusion has not been evaluated in transpar-ent large-scale tests. In addition, low computation speed andrun-time stability issues may create problems in practicallaboratory work.
It should be emphasized that, given the incompleteunderstanding of the chemical process of fragmentation, noautomated procedure will match the performance of theexperienced eye and the intuition of an MS specialist in theforeseeable future. Nevertheless, the number of mass spec-tra to be processed in proteomics laboratories is so largethat there is no alternative to automated interpretation, maybe, augmented by manual inspection of a few selectedcases. In this article, we propose fast algorithms for back-ground processing of peptide MS/MS spectra based onnumerical spectral analysis and signal recognition ap-proaches. They (i) detect multiply charged replicates andtransform them into singly charged monoisotopic peaks, (ii)reduce isotope peak clusters to a single signal, (iii) removehigh-frequency and periodic background noise. Finally, as abyproduct, we derive (iv) a spectral criterion for the deter-mination of certain noninterpretable spectra with a very lowfalse-positive rate. The approaches used are robust to mildinaccuracies in the data. We have implemented the algo-rithms in a software package called MS Cleaner, a programwritten in the C/C11 language, which can be obtained
© 2006 WILEY-VCH Verlag GmbH & Co. KGaA, Weinheim www.proteomics-journal.com
Proteomics 2006, 6, 5117–5131 Bioinformatics 5119
from the authors upon request. Tests show that noisyMS/MS spectra benefit from the treatment with the back-ground removal procedure.
2 Materials and methods
2.1 Sample preparation
Purified antihuman Smc2 rabbit polyclonal antibody(200 mg) [44], crosslinked to Affi-Gel Protein A beads (100 mLbed-volume, BioRad), was used to immunoprecipitate thecondensin complexes from 10 mg of clarified interphaseHeLa cell extract. Following extensive washing, immuno-precipitated protein complexes were acid-eluted from thebeads, and 10% of the total eluate was analyzed by SDS-PAGE and silver staining. After reduction and acetylation ofcysteine residues using DTTand iodoacetamide, respectively,the condensin sample was proteolytically digested usingTrypsin Gold (Promega), and the digestion stopped with tet-rafluoroacetic acid.
2.2 MS
Tryptic peptides from condensin samples were separated bynano-HPLC [45] on an UltiMate HPLC system and PepMapC18 column (LC Packings, Amsterdam, The Netherlands),with a gradient of 5–75% ACN, in 0.1% formic acid [45, 46].Eluting peptides were introduced by ESI into an LTQ linear ITmass spectrometer (Thermo Finnigan), where full MS andMS/MS spectra were recorded. In another experiment, a mix-ture of tryptic peptides from standard, commercially acquiredBSA, yeast alcohol dehydrogenase (ADH) or human transfer-rin (TRF) was used for system optimization and testing. Eachprotein (100 fmol) was injected into a nano-HPLC device (LCPackings) and MS/MS spectra were acquired using a 3D ITmass spectrometer, model DecaXP (Thermo Finnigan).
2.3 File processing
The MS/MS output, in the form of an Xcalibur raw-file, wasconverted into dta files using BioWorks software (ThermoElectron, 53 944 spectra in the case of the condensin sample,2679 for BSA, 2325 for ADH, and 2608 for TRF). The re-spective dta files were merged to generate a single mgf file(MASCOT generic format) using the merge.pl program(Matrix Science). This original mgf file was then processedusing the MS Cleaner program, using the default internalparameters, generating two new mgf files with cleaned andbad spectra, respectively.
2.4 MS/MS data analysis
All three mgf files were used to perform MASCOT MS/MS IonSearches (Matrix Science). In the case of BSA, ADH, and TRF,the nonredundant protein sequence database was used (as of
15 December, 2005). In the case of the condensin sample, theidentification of post-translational phosphorylations was theoriginal task. Therefore, the search was initially performedagainst a small curated protein database (146 sequences and68 753 residues), which includes components of the con-densin, cohesin, and kinetochore complexes, as well as somecommon contaminants and trypsin, in the case of the con-densin sample. Additionally, we carried out searches againstall human as well as against all proteins in the nonredundantdatabase. It should be noted that the MASCOT score for re-covering the original proteins tend to be the higher, the smallerthe database due to reduced sequence background; thus, thesearch with the small database of 146 sequences is the morestringent condition compared with searches in the non-redundant database. The MASCOT search parameters werethe same in all runs (enzyme: trypsin; fixed modifications:carbamidomethyl (Cys); variable modifications: oxidation(Met); peptide charges: 11, 21, and 31; mass values: mono-isotopic; protein mass: unrestricted; peptide mass tolerance:62 Da; fragment mass tolerance: 60.8 Da; max. missed clea-vages: 1). The MASCOT search results output html-file wasformatted with standard scoring, a significance threshold ofp,0.05, and an ion score cut-off for each peptide of 30.
3 Results and discussion
For a given raw (but centroided, peak-list transformed) pep-tide MS/MS spectrum, we propose the application of fourseparate independent procedures: (i) for detection of multi-ply charged peaks, (ii) for the removal of latent periodic noiseincluding deisotoping, (iii) for the removal of high-frequencyrandom noise, and (iv) for the detection of noninterpretablespectra. Each algorithm is applied on the same originalMS/MS spectrum. First, we describe some illustrative casesto motivate the application of spectral criteria for backgroundremoval. After the following description of the four algo-rithms, we focus on results of testing the MS Cleaner inlarge-scale application tests.
3.1 Motivation for the application of spectral criteria
for background removal
Albeit comprehending the exact mechanism of the genesis ofbackground peaks would allow the construction of an algo-rithm for their removal, this knowledge is not available andmore phenomenological approaches appear necessary. Theanalogy with electrical signal processing is one possibility;i.e., the series of peaks in the mass spectrogram can be con-sidered as a signal compounded with noise after transfer viaan information channel, from which the original signal hasto be recovered. At the associated website http://mendel.imp.univie.ac.at/mass-spectrometry/ANALYSIS/, we pre-sent some case studies with partially designed MS/MS spec-tra for illustration (see the series of Supplementary Figs. 1–12at the associated website).
© 2006 WILEY-VCH Verlag GmbH & Co. KGaA, Weinheim www.proteomics-journal.com
5120 N. Mujezinovic et al. Proteomics 2006, 6, 5117–5131
For example, isotope clusters are characterized by equi-distant groups of peaks. It should be expected that suchclusters are the source of latent periodicity in the signal thatshould be visible in the form of maxima in the frequencyspectrum of the signal. This is indeed the case. From anoriginal peptide MS/MS spectrum (Supplementary Fig. 1),we extracted all peaks relevant for interpretation by MASCOT(Supplementary Fig. 2). A third MS/MS spectrum was createdwith all MASCOT-interpreted peaks and complemented withartificial isotope clusters (Supplementary Fig. 5). The originalMS/MS spectrum exhibits latent periodicity in their Fouriertransforms (Supplementary Figs. 3, 4). There is no obviousperiodic component in the spectrum with only interpretablepeaks (Supplementary Figs. 6, 7). The periodic componentreappears in the MS/MS spectrum consisting of MASCOT-interpreted peaks complemented with isotope clusters (Sup-plementary Figs. 8, 9). Thus, disappearance of isotope clus-ters correlates with dampening of the prominent periodicspectral component in the Fourier transform.
Similarly, noisy spectra are characterized by large num-bers of low intensity peaks. We added artificial random noiseto the MS/MS spectrum of MASCOT-interpreted peaks(Supplementary Fig. 10). Application of just a low-pass filter(suppression of the high-frequency part of the frequencyspectrum of the signal) leads to the suppression, mainly, ofartificially added noise peaks (Supplementary Figs. 11, 12).
Whereas these exemplary cases do not represent a proofof the efficiency for background removal with methodsknown in numerical signal processing, they show theirpotential in reasonably modified application settings. Fur-ther, it should be said that such procedures can identify truechemical or electronic background but do not aim to iden-tify derivatives of b- or y-ions. The latter requires algo-rithmic analysis of chemical decay processes which is notthe goal of this work. In the following, we describe thealgorithms used in detail. For the convenience of the reader,Supplementary data to this text (dta and mgf files ofexemplary mass spectra, additional Supplementary tablesand figures) are available at the URL http://mendel.imp.univie.ac.at/mass-spectrometry/.
3.2 Deconvolution of multiply charged peaks
Although ionization techniques such as ESI have the advan-tage of shifting heavy ions into lower, detectable m/z rangesby generating multiply charged fragment ions [33], they canpollute the spectrum by causing replicates of otherwiseidentical ions at different charge states. In general, thesemultiply charged signals occur as isotope clusters. For thepurpose of spectrum interpretation, peak replicates originat-ing from different charge states have to be unified.
The relative spectral intensities of isotope-variant peaksin a cluster are determined by the natural isotope distribu-tions of carbon, hydrogen, oxygen, nitrogen, and sulfur, thepredominant chemical elements in peptide fragments. Weuse this a priori known form of the intensity pattern from
multiply charged replicates for searching its reoccurrence inthe measured spectrum by correlational analysis. Our algo-rithm is quite robust relative to inaccuracies in the experi-mental resolution of isotope clusters due to two artifices inprocessing the mass spectrum: (i) the removal of small peaksvery close to major intensities and (ii) the procedure ofinterpolated peak densification in the mass range of com-parison with the predefined pattern.
The algorithm includes several steps (see also Fig. 1).Prior to spectrum analysis, the general form (the etalon) ofisotope cluster patterns is precomputed for double- and tri-ple-charged fragments. The intensity patterns in isotopeclusters become complicated with large fragment masses butstill can be exactly calculated [47–51]. Given the large num-ber of potential peptide fragment sizes and sequence possi-bilities, the computational time for taking into account theexact isotopic patterns is too high for a background analysisprogram. We rely on Wehofsky’s polymomial approximation[38, 39], a computational shortcut for the target signal wherethe relative intensity of the nth isotope variant peak (in apattern of N � 7 peaks; k ¼ 6, the order of expansion) is
I n;Mð Þ ¼ A nð Þ þXk
j¼1
Bj nð ÞMj (1)
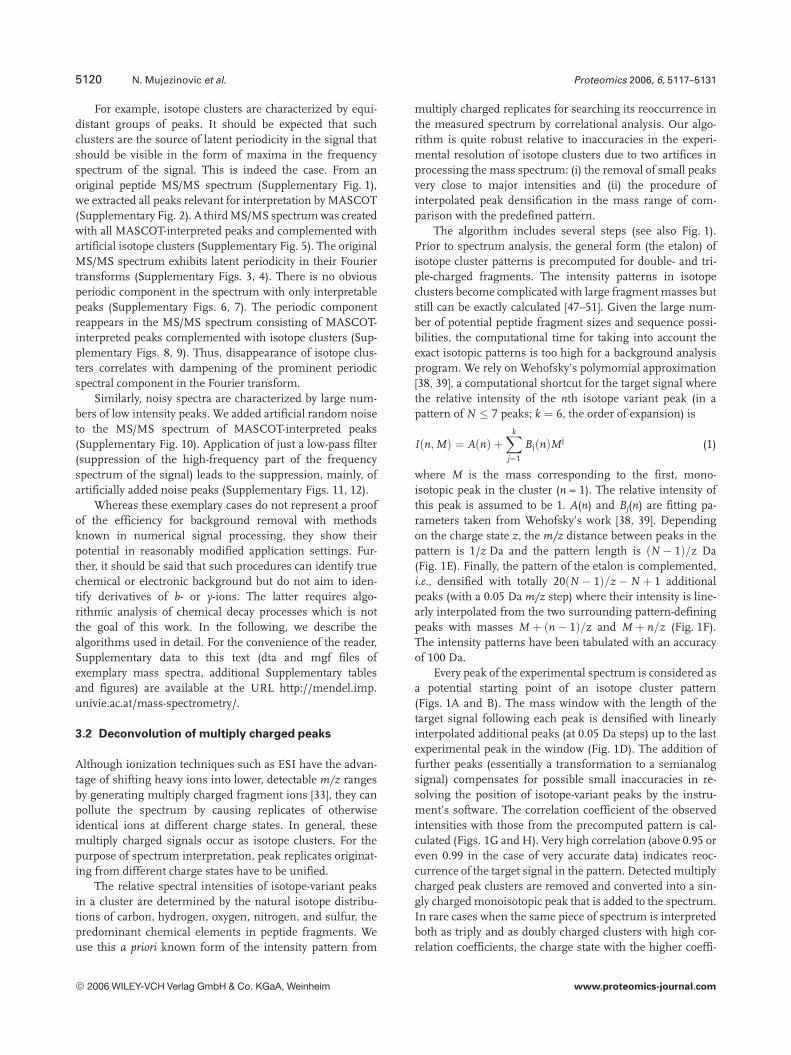
where M is the mass corresponding to the first, mono-isotopic peak in the cluster (n = 1). The relative intensity ofthis peak is assumed to be 1. A(n) and Bj(n) are fitting pa-rameters taken from Wehofsky’s work [38, 39]. Dependingon the charge state z, the m/z distance between peaks in thepattern is 1/z Da and the pattern length is N � 1ð Þ=z Da(Fig. 1E). Finally, the pattern of the etalon is complemented,i.e., densified with totally 20 N � 1ð Þ=z� N þ 1 additionalpeaks (with a 0.05 Da m/z step) where their intensity is line-arly interpolated from the two surrounding pattern-definingpeaks with masses M þ n� 1ð Þ=z and M þ n=z (Fig. 1F).The intensity patterns have been tabulated with an accuracyof 100 Da.
Every peak of the experimental spectrum is considered asa potential starting point of an isotope cluster pattern(Figs. 1A and B). The mass window with the length of thetarget signal following each peak is densified with linearlyinterpolated additional peaks (at 0.05 Da steps) up to the lastexperimental peak in the window (Fig. 1D). The addition offurther peaks (essentially a transformation to a semianalogsignal) compensates for possible small inaccuracies in re-solving the position of isotope-variant peaks by the instru-ment’s software. The correlation coefficient of the observedintensities with those from the precomputed pattern is cal-culated (Figs. 1G and H). Very high correlation (above 0.95 oreven 0.99 in the case of very accurate data) indicates reoc-currence of the target signal in the pattern. Detected multiplycharged peak clusters are removed and converted into a sin-gly charged monoisotopic peak that is added to the spectrum.In rare cases when the same piece of spectrum is interpretedboth as triply and as doubly charged clusters with high cor-relation coefficients, the charge state with the higher coeffi-
© 2006 WILEY-VCH Verlag GmbH & Co. KGaA, Weinheim www.proteomics-journal.com
Proteomics 2006, 6, 5117–5131 Bioinformatics 5121
Figure 1. Determination of multiply charged replicates with correlation analysis. This series of diagrams illustrates the process of remov-ing multiply charged replicates. The abscissa represents the m/z (the signal count in 0.1 Da/charge unit in E and F); the ordinate axis showspeak intensity in relative units. To the order of diagrams: (A), (B) are in the first row, (C), (D) in the second, etc. (A) Piece of raw MS/MSspectrum. (B) Peak cluster from raw spectrum at greater magnification. (C) The same peak cluster after removal of small peaks. (D) Thesame peak cluster after densification. (E) Precomputed pattern of isotope peak cluster. Here and in (F), only the relative abscissa value isimportant (with an undefined additive constant). (F) The same pattern after densification. (G) Peak cluster from raw spectrum together withcoefficients of correlation with the precomputed pattern (in the lower part of the graph, multiplied by 100%; the horizontal line corre-sponding to 95% is shown). (H) The same but for the whole piece of raw spectrum.
© 2006 WILEY-VCH Verlag GmbH & Co. KGaA, Weinheim www.proteomics-journal.com
5122 N. Mujezinovic et al. Proteomics 2006, 6, 5117–5131
cient is taken. It should be noted that our algorithm does notlook after correlations between the occurrences of singly andmultiply charged ions from the same chemical species.
This procedure works adequately as long as no very low-intensity peaks close to major intensities of an isotope clusterinterfere (distance below ,0.25 Da, a user-defined measurebelow the machine accuracy). These peaks are typically arti-facts that can arise from random noise or from the transfor-mation of the continuous MS/MS spectrum into the centroidform as a discrete signal. Prior to spectrum densification, thesmall interfering peaks between the main isotope clusterpeaks have to be merged with the closest main peak in thecluster; i.e., this is essentially a procedure of reversal of smallpeak creation. For the peak-merging algorithm, a weight di-rected graph G(V, E) is constructed. The set of vertices (V) isthe set of all m/z values in the window. A directed edge eI,j [Eis added between two vertices vi, vj [V if the distance d be-tween peaks vi, vj is less than the user-defined accuracy value.The direction of the edge is defined to be from vi to vj ifintensity (vi) , intensity (vj). The weight wi of an edge ei,j isdefined as the distance between two vertices vi and vj (in0.01 Da units). If a vertex vi giving origin to the edge ei,j isactively removed from the graph (and its intensity is added tothe vertex vj), then edges to other vertices can also vanish. Viasystematic enumeration (for example with topologicalordering), an edge-free subgraph can be computed withoutlarge computational cost that fulfills the condition that thesum of weights of actively removed edges is minimal.
It should be noted that, with the procedure for findingmultiply charged isotope clusters that uses the criterion ofhigh correlation with an etalon, not all such clusters willprobably be detected. Most importantly, our algorithm relieson the resolution of isotope clusters for multiply chargedreplicates. For the typical mode of an MS/MS device withoutFourier-transformation capability, the fast scanning pre-cludes the detection of isotope clusters in many instancesand the respective multiply charged ions will not be detected.It also possible that sections of MS/MS spectra with verydense noise let our algorithm believe the existence of a clus-ter; thus, the removal of the original noise cluster will lead tothe creation of a single noise peak with higher m/z. It is alsonot excluded that, in some other instances, our algorithmmight generate a few false-positive predictions. Especially,problems will appear in the following cases: (i) aggressivebaseline suppression used in some instruments will affectthe relative intensities of peaks of an isotope cluster andmight reduce the correlation with the predefined etalon. Thisproblem can be addressed during spectrum recording. (ii)True interfering peaks overlaying an isotope cluster willeither result in low correlation and prevent the detection ofthe multiply charged cluster (if they are of high intensity andlead to a low correlation coefficient) or disappear in the peak-merging algorithm (if they are of low intensity). (iii) Someinterpretable ions are very close (e.g., y-NH3 and y-H2O differonly by 1 Da) and might create the false impression of anisotope cluster if their relative intensities are commensurate
with the etalon. The results of real-life applications (seebelow) show that the cases listed are rare in real applications.
3.3 Removal of latent periodic noise including
deisotoping of the spectrum
Correlation of the measured MS/MS spectrum with pre-calculated isotopic intensity distributions is efficient only formultiply charged peak clusters since the probability of find-ing additional, unrelated peaks in the spectrum with dis-tance of 1 Da is high. Therefore, correlation analysis withpredefined patterns is not really useful for deisotoping. But ifwe treat an MS/MS spectrum as a set of signals in the timedomain where the m/z axis is the analog of time and theintensity of each peak in the MS/MS spectrum as the inten-sity of a signal at a certain time, we can consider the single-charged peak signals as a periodical function (with periodi-city of ,1 Da for singly charged peaks). This periodicalfunction in the time domain results in a power spectrum inthe frequency domain where the reoccurring elements canbe more easily recognized.
Besides isotope variants, there can be other sources ofspectral contamination with latent periodicity, for examplefrom the electronic detection system or from the accom-panying chemical polymer contaminants such as silanes,etc. Reoccurring signals at quasi-constant mass shifts can beseen in the frequency domain, i.e., as characteristic reoc-currences of high amplitudes at multiples of a base fre-quency fB in the Fourier transform of the tandem massspectrum. Yet another Fourier transformation applied at thefrequency domain level can be used to determine this basefrequency fB. As we have seen above, suppression of peri-odically reoccurring intensity maxima in the power spec-trum can effectively remove latent periodical noise includ-ing minor isotope variant peaks (Fig. 2). When writing thismanuscript, we noticed that periodicity analysis has beenpreviously proposed for the detection of chemical back-ground in MS fingerprints of small organic or inorganiccompounds [52].
Converting to the frequency domain, the discrete Fouriertransform Y of the MS/MS spectrum (S) is found by takingthe N-point fast Fourier transform Y – FFT(S,N). The valueN is calculated as N = 2n11, where n is the smallest integerlarger than log2 xmax � xminð Þ=0:05½ �. The values xmax andxmin are the largest and the smallest m/z values in the spec-trum, respectively. The power spectrum, a measurement ofthe power at various frequencies, is PS = Y ? Y*/N (seeexample in Fig. 2A, called PS-graph below). Typically, thepower spectrum of a good MS/MS spectrum is quasi-period-ic. The length of this period (the base frequency fB) is deter-mined with another Fourier-transformation, where we con-sider the power spectrum as a signal in the time domain(Fig. 2B, called PSPS graph below). In order to remove thereoccurring elements from the power spectrum, a multibandreject filter has to be introduced for each MS/MS spectrum.The filter is created by the Yulewalk method of auto
© 2006 WILEY-VCH Verlag GmbH & Co. KGaA, Weinheim www.proteomics-journal.com
Proteomics 2006, 6, 5117–5131 Bioinformatics 5123
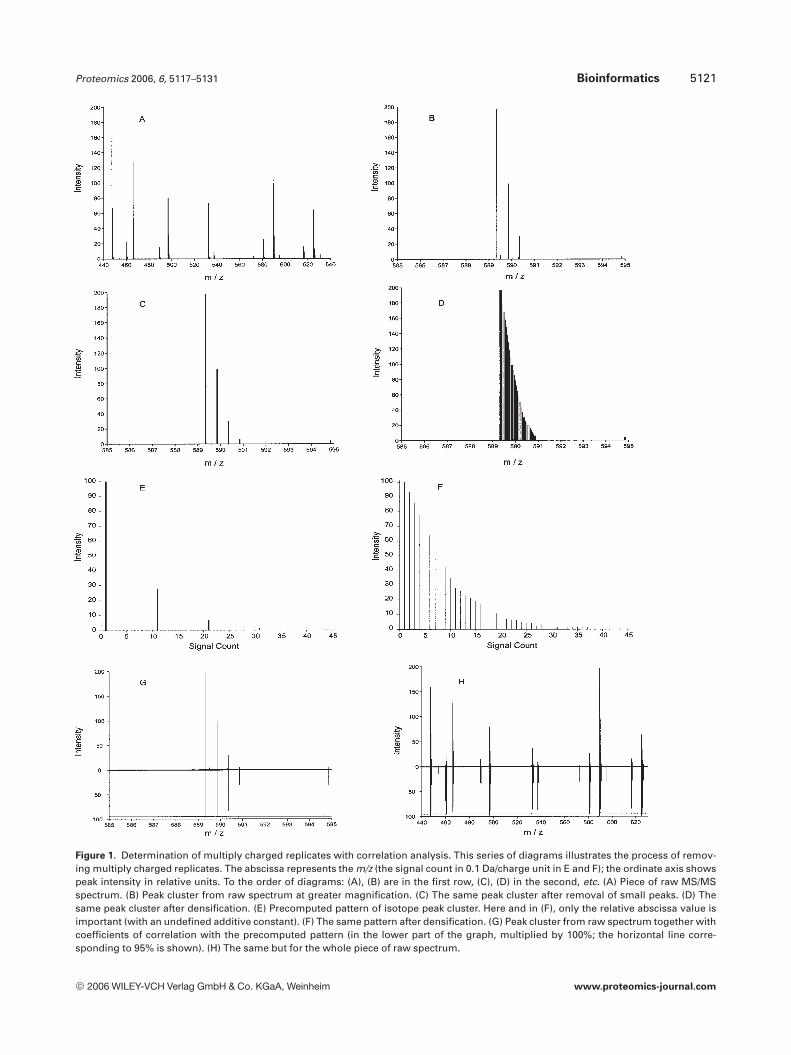
Figure 2. Deisotoping with removal of latent periodic back-ground. This series of diagrams illustrates the procedure ofremoving latent periodical background. (A) First power spectrumof an MS/MS spectrum. The amplitude in relative units is shownat the ordinate. At the abscissa, the frequency ranges from zeroup to and including the double Nyquist frequency. Therefore, thegraph is symmetric relative to a line perpendicular to the abscissaof about 33 000. (B) Power spectrum of the power spectrumunder (A). The major peak is at abscissa 21, the number of quasi-repeats in (A). It should be noted that, typically for interpretableMS/MS spectra, the second power spectrum is also quasi-peri-odical (peaks at 21, 42, etc.). (C) Raw MS/MS spectrum (upperpart of the diagram) and spectrum after removal of periodicbackground (lower part of the diagram). Arrows indicate cases ofisotope variant identification. The axes show the m/z and therelative intensity, respectively.
regressive moving average (ARMA) spectral estimation [53].Yulewalk designs recursive infinite impulse response (IIR)digital filters using a least-squares fit to a specified frequencyresponse. Frequencies required by the Yulewalk method arecalculated by applying a median filter to the power spectrum(over 300–500 discrete data points) and by computing a sec-ond power spectrum (PSPS-graph) in order to obtain themost prominent frequency of the first power spectrum (PS-graph). The created IIR filter is used to filter the MS/MSspectrum in the time domain [54]. After filtering, the recov-ered MS/MS spectrum might contain some signals withnegative intensity or some new signals with positive inten-sity. Additionally, some signals occurring with positiveintensities both in the original raw spectrum and the recov-ered spectrum have lost considerable intensity in the latter(threshold of 95%; this number should be higher for veryclean and regular spectra). All three types of signals are cor-rected to zero in a final step. Examination of exemplaryspectra has shown that suppression of latent periodicities in
the MS/MS spectrum effectively also removes low-intensitypeaks originating from higher mass isotopes in isotopeclusters (Fig. 2C).
In some cases, PS-graphs of dta files display several,overlaying modes of periodicities. The respective PSPS-graphs have several maxima with similar intensities. If thenumerically largest maximum is at very low base frequenciesfB (e.g., there are only a few maxima in the PS-graph), theapplication of the periodical multiband filter with this fB canlead to severe damage of the MS/MS spectrum. To avoid thisproblem, we routinely set intensities in the PSPS-graph tozero for low frequencies (up to and including the thresholdfBT = 14 abscissa units).
3.4 Removal of high-frequency random noise
Noisy MS/MS spectra suffer from many superfluous peaksdensely distributed over the whole m/z range. Assuming thatthe random noise in an MS/MS spectrum exists as signals of
© 2006 WILEY-VCH Verlag GmbH & Co. KGaA, Weinheim www.proteomics-journal.com
5124 N. Mujezinovic et al. Proteomics 2006, 6, 5117–5131
high frequency of occurrence, a Butterworth IIR low-passfilter [55] is applied to the spectrum in the time domain. Thenormalized stop frequency of the filter is in the range from0.5 to 0.9 (the best result was obtained with stop frequency0.8). An empirical threshold of 99.99% is applied to removeall signals, which have lost intensity above this threshold,from the raw spectrum.
3.5 Recognition of noninterpretable spectra
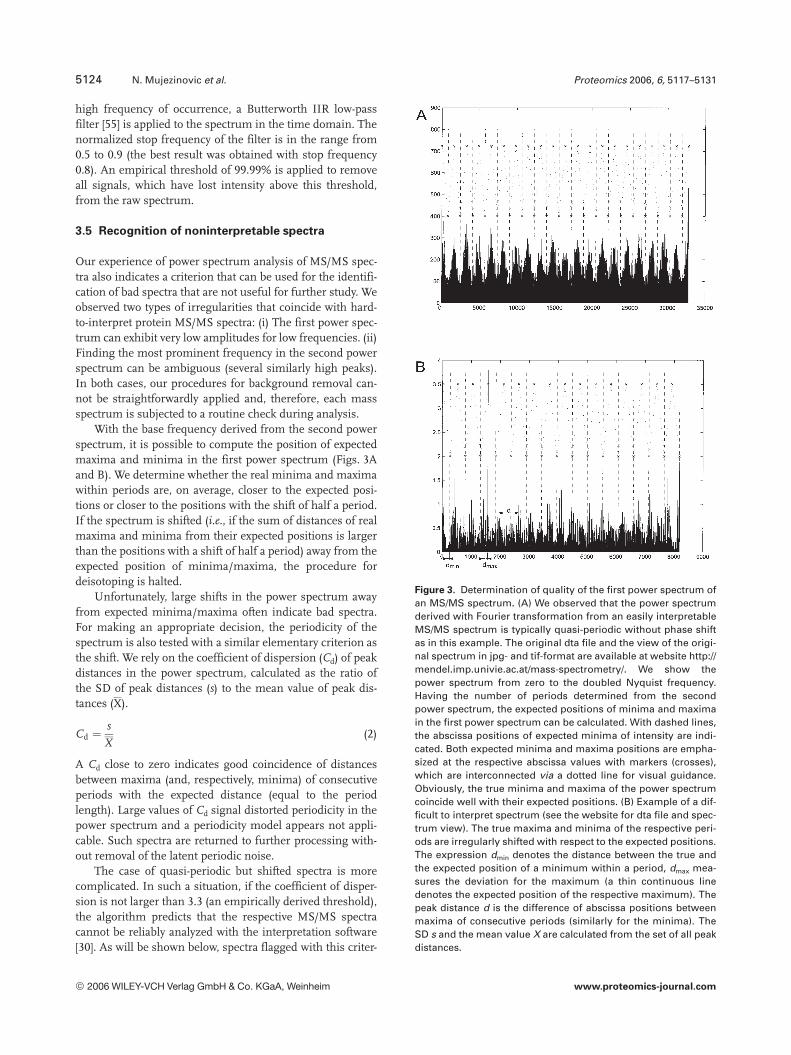
Our experience of power spectrum analysis of MS/MS spec-tra also indicates a criterion that can be used for the identifi-cation of bad spectra that are not useful for further study. Weobserved two types of irregularities that coincide with hard-to-interpret protein MS/MS spectra: (i) The first power spec-trum can exhibit very low amplitudes for low frequencies. (ii)Finding the most prominent frequency in the second powerspectrum can be ambiguous (several similarly high peaks).In both cases, our procedures for background removal can-not be straightforwardly applied and, therefore, each massspectrum is subjected to a routine check during analysis.
With the base frequency derived from the second powerspectrum, it is possible to compute the position of expectedmaxima and minima in the first power spectrum (Figs. 3Aand B). We determine whether the real minima and maximawithin periods are, on average, closer to the expected posi-tions or closer to the positions with the shift of half a period.If the spectrum is shifted (i.e., if the sum of distances of realmaxima and minima from their expected positions is largerthan the positions with a shift of half a period) away from theexpected position of minima/maxima, the procedure fordeisotoping is halted.
Unfortunately, large shifts in the power spectrum awayfrom expected minima/maxima often indicate bad spectra.For making an appropriate decision, the periodicity of thespectrum is also tested with a similar elementary criterion asthe shift. We rely on the coefficient of dispersion (Cd) of peakdistances in the power spectrum, calculated as the ratio ofthe SD of peak distances (s) to the mean value of peak dis-tances (X).
Cd ¼s
X(2)
A Cd close to zero indicates good coincidence of distancesbetween maxima (and, respectively, minima) of consecutiveperiods with the expected distance (equal to the periodlength). Large values of Cd signal distorted periodicity in thepower spectrum and a periodicity model appears not appli-cable. Such spectra are returned to further processing with-out removal of the latent periodic noise.
The case of quasi-periodic but shifted spectra is morecomplicated. In such a situation, if the coefficient of disper-sion is not larger than 3.3 (an empirically derived threshold),the algorithm predicts that the respective MS/MS spectracannot be reliably analyzed with the interpretation software[30]. As will be shown below, spectra flagged with this criter-
Figure 3. Determination of quality of the first power spectrum ofan MS/MS spectrum. (A) We observed that the power spectrumderived with Fourier transformation from an easily interpretableMS/MS spectrum is typically quasi-periodic without phase shiftas in this example. The original dta file and the view of the origi-nal spectrum in jpg- and tif-format are available at website http://mendel.imp.univie.ac.at/mass-spectrometry/. We show thepower spectrum from zero to the doubled Nyquist frequency.Having the number of periods determined from the secondpower spectrum, the expected positions of minima and maximain the first power spectrum can be calculated. With dashed lines,the abscissa positions of expected minima of intensity are indi-cated. Both expected minima and maxima positions are empha-sized at the respective abscissa values with markers (crosses),which are interconnected via a dotted line for visual guidance.Obviously, the true minima and maxima of the power spectrumcoincide well with their expected positions. (B) Example of a dif-ficult to interpret spectrum (see the website for dta file and spec-trum view). The true maxima and minima of the respective peri-ods are irregularly shifted with respect to the expected positions.The expression dmin denotes the distance between the true andthe expected position of a minimum within a period, dmax mea-sures the deviation for the maximum (a thin continuous linedenotes the expected position of the respective maximum). Thepeak distance d is the difference of abscissa positions betweenmaxima of consecutive periods (similarly for the minima). TheSD s and the mean value X are calculated from the set of all peakdistances.
© 2006 WILEY-VCH Verlag GmbH & Co. KGaA, Weinheim www.proteomics-journal.com
Proteomics 2006, 6, 5117–5131 Bioinformatics 5125
ion are indeed not well interpretable even with databasesearch-based software (i.e., no protein hits are found or onlyhits with very low reliability).
In rare cases, the suppression of very low frequencies inthe PSPS-graph leads to incorrect base frequency determi-nation (to fB that is too high) and, consequently, to apparentlyshifted spectra. These few spectra marked as non-interpretable are false-positively rejected and represent partof the price for automatically cleaning large-scale MS/MSmeasurements from background with spectral methods asdescribed here.
3.6 General considerations for testing procedures for
background removal in tandem mass spectra
In the ideal world, background removal algorithms would beparametrized and tested against a large library of MS/MSspectra where the different types of all noise (e.g., multiplycharged peaks, isotope clusters, random noise, etc.) areexplicitly annotated in electronically readable form and therates of true- and false-positive detection of various noisetypes can be directly computed. Unfortunately, such a librarywas not available to us during this work and its creation isbeyond the scope of our effort. We validated our backgroundremoval algorithm implicitly. The automated interpretationof MS/MS spectra with MASCOT has become a virtualstandard in proteomics laboratories; therefore, we comparedthe MASCOT-generated interpretations both for the originalMS/MS spectra and the spectrum versions after the applica-tion of our background removal procedure. Discrepanciesbetween both interpretations can be automatically detectedin large-scale tests of real datasets and summarized by com-puter programs. We used this approach also for parametriz-ing the MS Cleaner. The parameters described above havebeen selected to achieve a minimum of cases of accidentalremoval of peaks that are relevant for interpretation byMASCOT in large-scale tests. Finally, we tested the MASCOTDistiller in the same setting.
We wish to emphasize, to the best of our knowledge, thatpossibly existing internal procedures for background mask-ing in MASCOT have not been described in the public liter-ature. If there are any, they are the same in all test applica-tions in this work and the results are independent of them.
3.7 Results of background removal in MS/MS spectra
obtained with 100 fmol BSA, ADH, and TRF
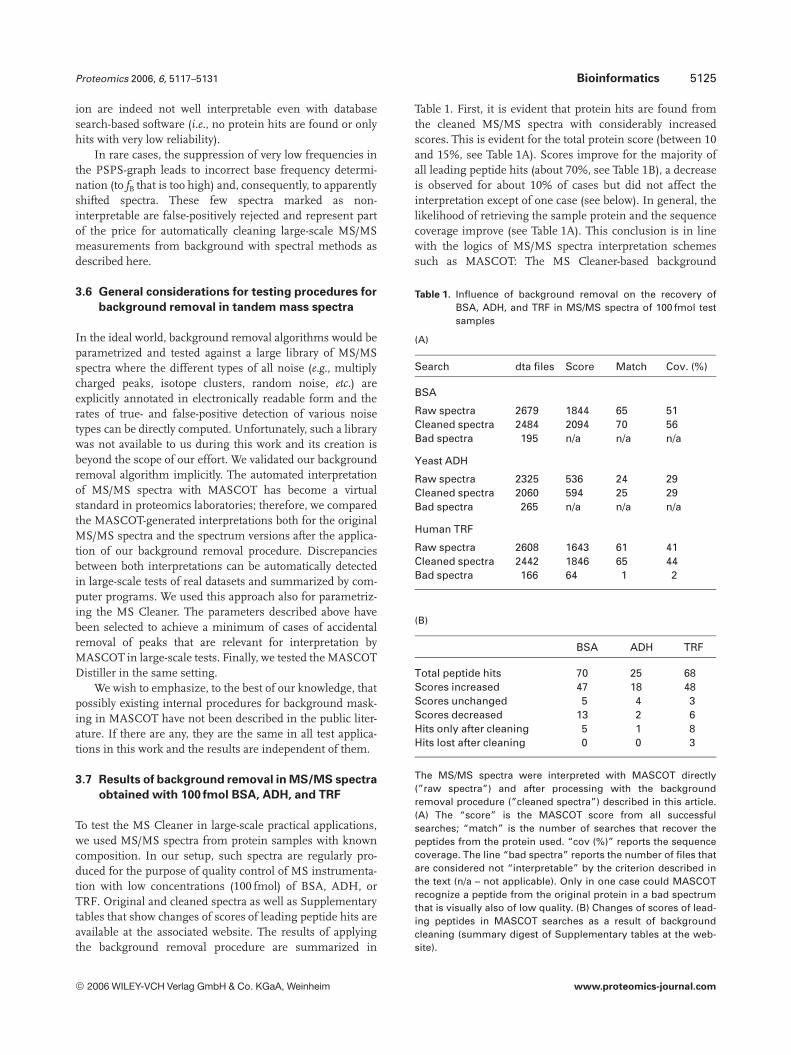
To test the MS Cleaner in large-scale practical applications,we used MS/MS spectra from protein samples with knowncomposition. In our setup, such spectra are regularly pro-duced for the purpose of quality control of MS instrumenta-tion with low concentrations (100 fmol) of BSA, ADH, orTRF. Original and cleaned spectra as well as Supplementarytables that show changes of scores of leading peptide hits areavailable at the associated website. The results of applyingthe background removal procedure are summarized in
Table 1. First, it is evident that protein hits are found fromthe cleaned MS/MS spectra with considerably increasedscores. This is evident for the total protein score (between 10and 15%, see Table 1A). Scores improve for the majority ofall leading peptide hits (about 70%, see Table 1B), a decreaseis observed for about 10% of cases but did not affect theinterpretation except of one case (see below). In general, thelikelihood of retrieving the sample protein and the sequencecoverage improve (see Table 1A). This conclusion is in linewith the logics of MS/MS spectra interpretation schemessuch as MASCOT: The MS Cleaner-based background
Table 1. Influence of background removal on the recovery ofBSA, ADH, and TRF in MS/MS spectra of 100 fmol testsamples
(A)
Search dta files Score Match Cov. (%)
BSA
Raw spectra 2679 1844 65 51Cleaned spectra 2484 2094 70 56Bad spectra 195 n/a n/a n/a
Yeast ADH
Raw spectra 2325 536 24 29Cleaned spectra 2060 594 25 29Bad spectra 265 n/a n/a n/a
Human TRF
Raw spectra 2608 1643 61 41Cleaned spectra 2442 1846 65 44Bad spectra 166 64 1 2
(B)
BSA ADH TRF
Total peptide hits 70 25 68Scores increased 47 18 48Scores unchanged 5 4 3Scores decreased 13 2 6Hits only after cleaning 5 1 8Hits lost after cleaning 0 0 3
The MS/MS spectra were interpreted with MASCOT directly(”raw spectra”) and after processing with the backgroundremoval procedure (”cleaned spectra”) described in this article.(A) The “score” is the MASCOT score from all successfulsearches; “match” is the number of searches that recover thepeptides from the protein used. “cov (%)” reports the sequencecoverage. The line “bad spectra” reports the number of files thatare considered not “interpretable” by the criterion described inthe text (n/a – not applicable). Only in one case could MASCOTrecognize a peptide from the original protein in a bad spectrumthat is visually also of low quality. (B) Changes of scores of lead-ing peptides in MASCOT searches as a result of backgroundcleaning (summary digest of Supplementary tables at the web-site).
© 2006 WILEY-VCH Verlag GmbH & Co. KGaA, Weinheim www.proteomics-journal.com
5126 N. Mujezinovic et al. Proteomics 2006, 6, 5117–5131
removal decreases the number of peaks considerably. There-fore, the number of alternative (including false-positively hit)protein sequences that might fit a given spectrum reducesand the scores of the top hits against the alternatives natu-rally improve.
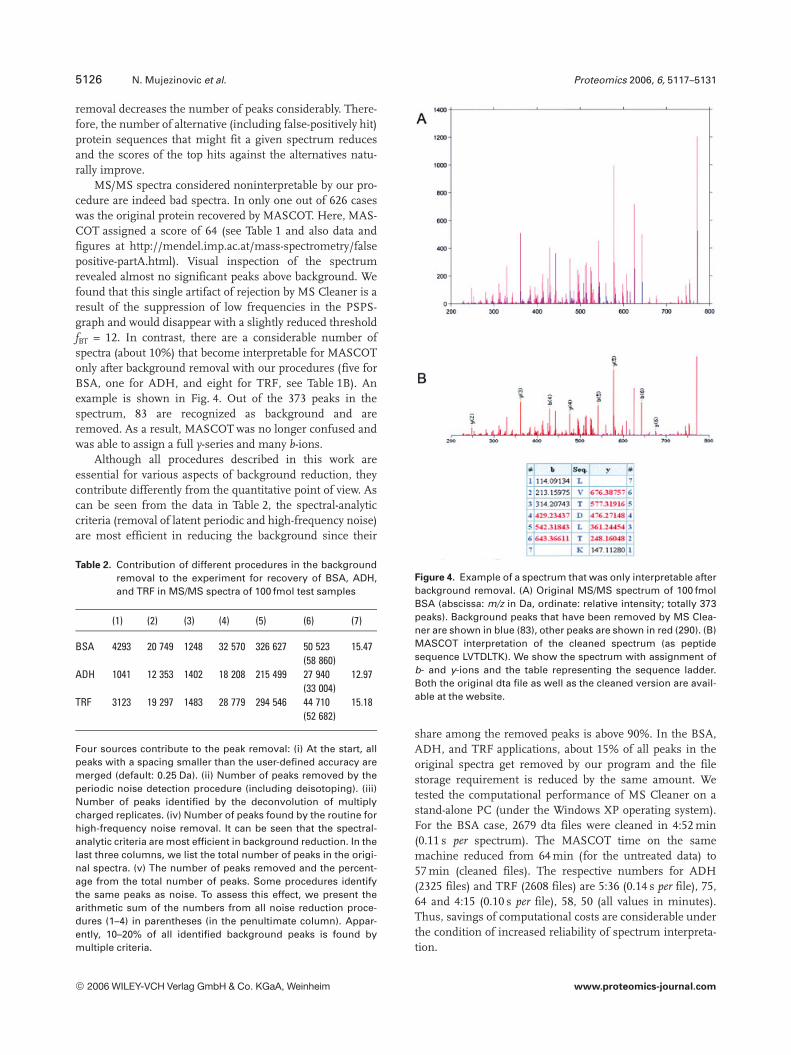
MS/MS spectra considered noninterpretable by our pro-cedure are indeed bad spectra. In only one out of 626 caseswas the original protein recovered by MASCOT. Here, MAS-COT assigned a score of 64 (see Table 1 and also data andfigures at http://mendel.imp.ac.at/mass-spectrometry/falsepositive-partA.html). Visual inspection of the spectrumrevealed almost no significant peaks above background. Wefound that this single artifact of rejection by MS Cleaner is aresult of the suppression of low frequencies in the PSPS-graph and would disappear with a slightly reduced thresholdfBT = 12. In contrast, there are a considerable number ofspectra (about 10%) that become interpretable for MASCOTonly after background removal with our procedures (five forBSA, one for ADH, and eight for TRF, see Table 1B). Anexample is shown in Fig. 4. Out of the 373 peaks in thespectrum, 83 are recognized as background and areremoved. As a result, MASCOT was no longer confused andwas able to assign a full y-series and many b-ions.
Although all procedures described in this work areessential for various aspects of background reduction, theycontribute differently from the quantitative point of view. Ascan be seen from the data in Table 2, the spectral-analyticcriteria (removal of latent periodic and high-frequency noise)are most efficient in reducing the background since their
Table 2. Contribution of different procedures in the backgroundremoval to the experiment for recovery of BSA, ADH,and TRF in MS/MS spectra of 100 fmol test samples
(1) (2) (3) (4) (5) (6) (7)
BSA 4293 20 749 1248 32 570 326 627 50 523(58 860)
15.47
ADH 1041 12 353 1402 18 208 215 499 27 940(33 004)
12.97
TRF 3123 19 297 1483 28 779 294 546 44 710(52 682)
15.18
Four sources contribute to the peak removal: (i) At the start, allpeaks with a spacing smaller than the user-defined accuracy aremerged (default: 0.25 Da). (ii) Number of peaks removed by theperiodic noise detection procedure (including deisotoping). (iii)Number of peaks identified by the deconvolution of multiplycharged replicates. (iv) Number of peaks found by the routine forhigh-frequency noise removal. It can be seen that the spectral-analytic criteria are most efficient in background reduction. In thelast three columns, we list the total number of peaks in the origi-nal spectra. (v) The number of peaks removed and the percent-age from the total number of peaks. Some procedures identifythe same peaks as noise. To assess this effect, we present thearithmetic sum of the numbers from all noise reduction proce-dures (1–4) in parentheses (in the penultimate column). Appar-ently, 10–20% of all identified background peaks is found bymultiple criteria.
Figure 4. Example of a spectrum that was only interpretable afterbackground removal. (A) Original MS/MS spectrum of 100 fmolBSA (abscissa: m/z in Da, ordinate: relative intensity; totally 373peaks). Background peaks that have been removed by MS Clea-ner are shown in blue (83), other peaks are shown in red (290). (B)MASCOT interpretation of the cleaned spectrum (as peptidesequence LVTDLTK). We show the spectrum with assignment ofb- and y-ions and the table representing the sequence ladder.Both the original dta file as well as the cleaned version are avail-able at the website.
share among the removed peaks is above 90%. In the BSA,ADH, and TRF applications, about 15% of all peaks in theoriginal spectra get removed by our program and the filestorage requirement is reduced by the same amount. Wetested the computational performance of MS Cleaner on astand-alone PC (under the Windows XP operating system).For the BSA case, 2679 dta files were cleaned in 4:52 min(0.11 s per spectrum). The MASCOT time on the samemachine reduced from 64 min (for the untreated data) to57 min (cleaned files). The respective numbers for ADH(2325 files) and TRF (2608 files) are 5:36 (0.14 s per file), 75,64 and 4:15 (0.10 s per file), 58, 50 (all values in minutes).Thus, savings of computational costs are considerable underthe condition of increased reliability of spectrum interpreta-tion.
© 2006 WILEY-VCH Verlag GmbH & Co. KGaA, Weinheim www.proteomics-journal.com
Proteomics 2006, 6, 5117–5131 Bioinformatics 5127
3.8 Detailed analysis of MS Cleaner’s removal of
multiply charged peaks in the dta files of the BSA
set
We attempted to check whether the multiply charged peaksassigned by MASCOT are detected by our program MScleaner. After having manually analyzed the whole BSAdataset, we found only two peaks interpreted as doublycharged by MASCOT that had also a remnant isotope clus-ter (in the dta file 369.369.2, see Supplementary data athttp://mendel.imp.ac.at/mass-spectrometry/beforeafterBSA.htm). For this spectrum, MS Cleaner revealed seven doublycharged clusters. Two of them (at m/z = 315.70 and 320.30)include the two doubly charged peaks found by MASCOT.The other five are composed of noise peaks. It should benoted that spectral procedures (as a rule, the algorithm forhigh-frequency noise removal) mark many low intensitypeak clusters (comparable with the five latter ones) as noise,too. As discussed above, MS/MS measurement accuracyand scanning speed on many instruments prevent thedetection of isotope clusters in many cases. We think thatthe algorithm for detecting multiply charged clusters willwork the better, the more accurate the spectra are recorded(as in the new generation of Fourier-transformation instru-ments) and the more complete isotope clusters are repre-sented in the data.
3.9 Application of the background removal to the
condensin dataset
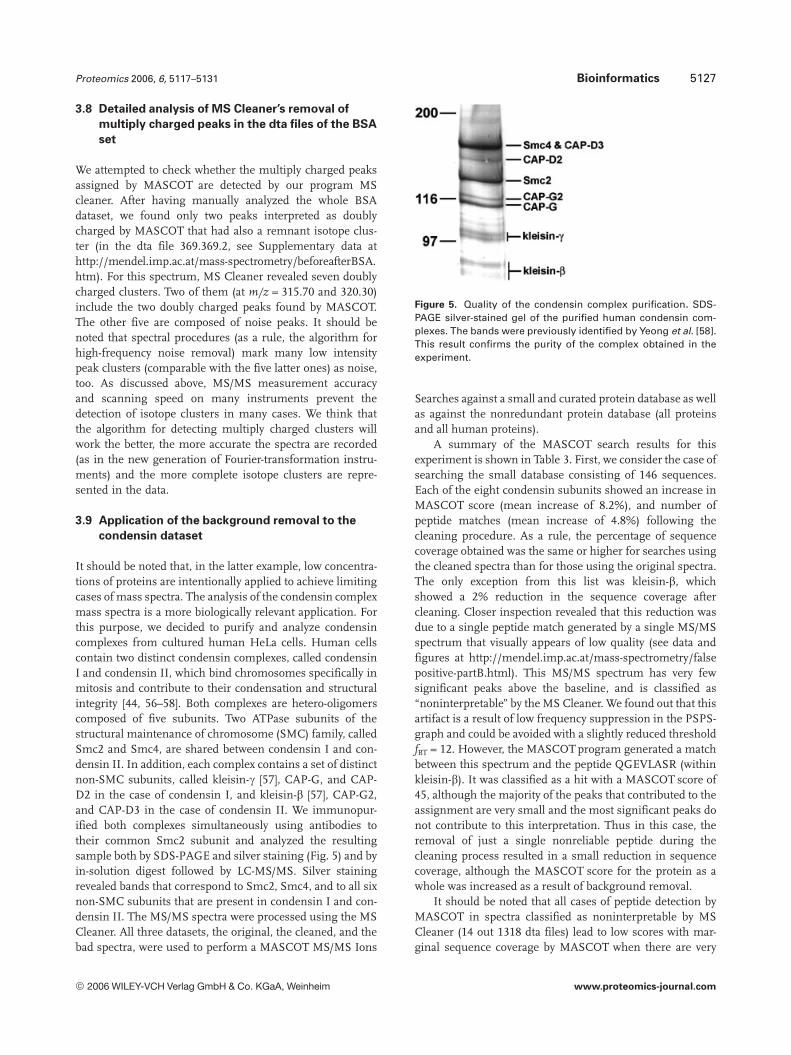
It should be noted that, in the latter example, low concentra-tions of proteins are intentionally applied to achieve limitingcases of mass spectra. The analysis of the condensin complexmass spectra is a more biologically relevant application. Forthis purpose, we decided to purify and analyze condensincomplexes from cultured human HeLa cells. Human cellscontain two distinct condensin complexes, called condensinI and condensin II, which bind chromosomes specifically inmitosis and contribute to their condensation and structuralintegrity [44, 56–58]. Both complexes are hetero-oligomerscomposed of five subunits. Two ATPase subunits of thestructural maintenance of chromosome (SMC) family, calledSmc2 and Smc4, are shared between condensin I and con-densin II. In addition, each complex contains a set of distinctnon-SMC subunits, called kleisin-g [57], CAP-G, and CAP-D2 in the case of condensin I, and kleisin-b [57], CAP-G2,and CAP-D3 in the case of condensin II. We immunopur-ified both complexes simultaneously using antibodies totheir common Smc2 subunit and analyzed the resultingsample both by SDS-PAGE and silver staining (Fig. 5) and byin-solution digest followed by LC-MS/MS. Silver stainingrevealed bands that correspond to Smc2, Smc4, and to all sixnon-SMC subunits that are present in condensin I and con-densin II. The MS/MS spectra were processed using the MSCleaner. All three datasets, the original, the cleaned, and thebad spectra, were used to perform a MASCOT MS/MS Ions
Figure 5. Quality of the condensin complex purification. SDS-PAGE silver-stained gel of the purified human condensin com-plexes. The bands were previously identified by Yeong et al. [58].This result confirms the purity of the complex obtained in theexperiment.
Searches against a small and curated protein database as wellas against the nonredundant protein database (all proteinsand all human proteins).
A summary of the MASCOT search results for thisexperiment is shown in Table 3. First, we consider the case ofsearching the small database consisting of 146 sequences.Each of the eight condensin subunits showed an increase inMASCOT score (mean increase of 8.2%), and number ofpeptide matches (mean increase of 4.8%) following thecleaning procedure. As a rule, the percentage of sequencecoverage obtained was the same or higher for searches usingthe cleaned spectra than for those using the original spectra.The only exception from this list was kleisin-b, whichshowed a 2% reduction in the sequence coverage aftercleaning. Closer inspection revealed that this reduction wasdue to a single peptide match generated by a single MS/MSspectrum that visually appears of low quality (see data andfigures at http://mendel.imp.ac.at/mass-spectrometry/falsepositive-partB.html). This MS/MS spectrum has very fewsignificant peaks above the baseline, and is classified as“noninterpretable” by the MS Cleaner. We found out that thisartifact is a result of low frequency suppression in the PSPS-graph and could be avoided with a slightly reduced thresholdfBT = 12. However, the MASCOT program generated a matchbetween this spectrum and the peptide QGEVLASR (withinkleisin-b). It was classified as a hit with a MASCOT score of45, although the majority of the peaks that contributed to theassignment are very small and the most significant peaks donot contribute to this interpretation. Thus in this case, theremoval of just a single nonreliable peptide during thecleaning process resulted in a small reduction in sequencecoverage, although the MASCOT score for the protein as awhole was increased as a result of background removal.
It should be noted that all cases of peptide detection byMASCOT in spectra classified as noninterpretable by MSCleaner (14 out 1318 dta files) lead to low scores with mar-ginal sequence coverage by MASCOT when there are very
© 2006 WILEY-VCH Verlag GmbH & Co. KGaA, Weinheim www.proteomics-journal.com
5128 N. Mujezinovic et al. Proteomics 2006, 6, 5117–5131
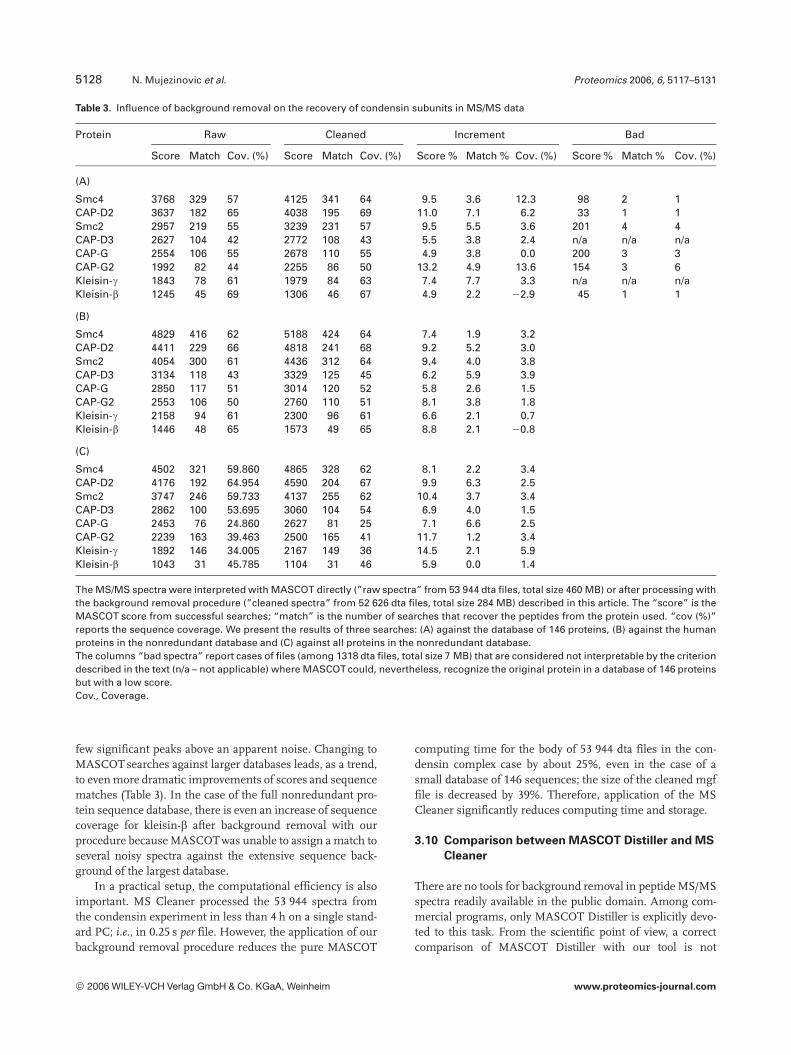
Table 3. Influence of background removal on the recovery of condensin subunits in MS/MS data
Protein Raw Cleaned Increment Bad
Score Match Cov. (%) Score Match Cov. (%) Score % Match % Cov. (%) Score % Match % Cov. (%)
(A)
Smc4 3768 329 57 4125 341 64 9.5 3.6 12.3 98 2 1CAP-D2 3637 182 65 4038 195 69 11.0 7.1 6.2 33 1 1Smc2 2957 219 55 3239 231 57 9.5 5.5 3.6 201 4 4CAP-D3 2627 104 42 2772 108 43 5.5 3.8 2.4 n/a n/a n/aCAP-G 2554 106 55 2678 110 55 4.9 3.8 0.0 200 3 3CAP-G2 1992 82 44 2255 86 50 13.2 4.9 13.6 154 3 6Kleisin-g 1843 78 61 1979 84 63 7.4 7.7 3.3 n/a n/a n/aKleisin-b 1245 45 69 1306 46 67 4.9 2.2 22.9 45 1 1
(B)
Smc4 4829 416 62 5188 424 64 7.4 1.9 3.2CAP-D2 4411 229 66 4818 241 68 9.2 5.2 3.0Smc2 4054 300 61 4436 312 64 9.4 4.0 3.8CAP-D3 3134 118 43 3329 125 45 6.2 5.9 3.9CAP-G 2850 117 51 3014 120 52 5.8 2.6 1.5CAP-G2 2553 106 50 2760 110 51 8.1 3.8 1.8Kleisin-g 2158 94 61 2300 96 61 6.6 2.1 0.7Kleisin-b 1446 48 65 1573 49 65 8.8 2.1 20.8
(C)
Smc4 4502 321 59.860 4865 328 62 8.1 2.2 3.4CAP-D2 4176 192 64.954 4590 204 67 9.9 6.3 2.5Smc2 3747 246 59.733 4137 255 62 10.4 3.7 3.4CAP-D3 2862 100 53.695 3060 104 54 6.9 4.0 1.5CAP-G 2453 76 24.860 2627 81 25 7.1 6.6 2.5CAP-G2 2239 163 39.463 2500 165 41 11.7 1.2 3.4Kleisin-g 1892 146 34.005 2167 149 36 14.5 2.1 5.9Kleisin-b 1043 31 45.785 1104 31 46 5.9 0.0 1.4
The MS/MS spectra were interpreted with MASCOT directly (”raw spectra” from 53 944 dta files, total size 460 MB) or after processing withthe background removal procedure (”cleaned spectra” from 52 626 dta files, total size 284 MB) described in this article. The “score” is theMASCOT score from successful searches; “match” is the number of searches that recover the peptides from the protein used. “cov (%)”reports the sequence coverage. We present the results of three searches: (A) against the database of 146 proteins, (B) against the humanproteins in the nonredundant database and (C) against all proteins in the nonredundant database.The columns “bad spectra” report cases of files (among 1318 dta files, total size 7 MB) that are considered not interpretable by the criteriondescribed in the text (n/a – not applicable) where MASCOT could, nevertheless, recognize the original protein in a database of 146 proteinsbut with a low score.Cov., Coverage.
few significant peaks above an apparent noise. Changing toMASCOT searches against larger databases leads, as a trend,to even more dramatic improvements of scores and sequencematches (Table 3). In the case of the full nonredundant pro-tein sequence database, there is even an increase of sequencecoverage for kleisin-b after background removal with ourprocedure because MASCOT was unable to assign a match toseveral noisy spectra against the extensive sequence back-ground of the largest database.
In a practical setup, the computational efficiency is alsoimportant. MS Cleaner processed the 53 944 spectra fromthe condensin experiment in less than 4 h on a single stand-ard PC; i.e., in 0.25 s per file. However, the application of ourbackground removal procedure reduces the pure MASCOT
computing time for the body of 53 944 dta files in the con-densin complex case by about 25%, even in the case of asmall database of 146 sequences; the size of the cleaned mgffile is decreased by 39%. Therefore, application of the MSCleaner significantly reduces computing time and storage.
3.10 Comparison between MASCOT Distiller and MS
Cleaner
There are no tools for background removal in peptide MS/MSspectra readily available in the public domain. Among com-mercial programs, only MASCOT Distiller is explicitly devo-ted to this task. From the scientific point of view, a correctcomparison of MASCOT Distiller with our tool is not
© 2006 WILEY-VCH Verlag GmbH & Co. KGaA, Weinheim www.proteomics-journal.com
Proteomics 2006, 6, 5117–5131 Bioinformatics 5129
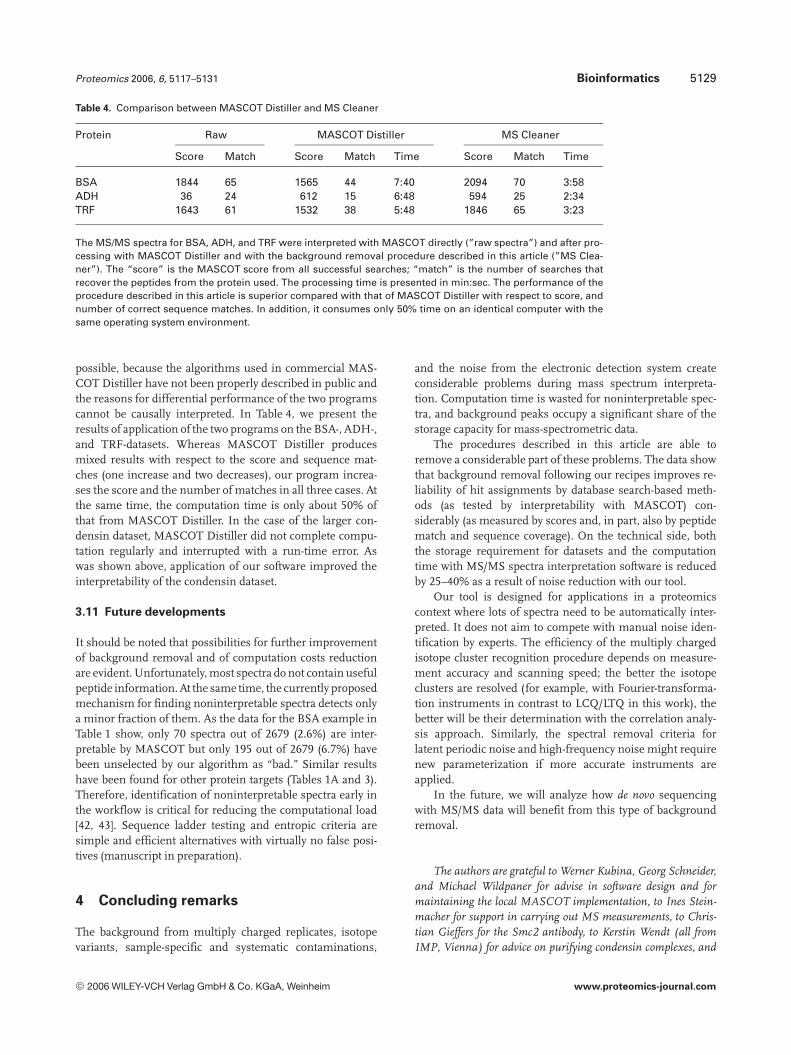
Table 4. Comparison between MASCOT Distiller and MS Cleaner
Protein Raw MASCOT Distiller MS Cleaner
Score Match Score Match Time Score Match Time
BSA 1844 65 1565 44 7:40 2094 70 3:58ADH 36 24 612 15 6:48 594 25 2:34TRF 1643 61 1532 38 5:48 1846 65 3:23
The MS/MS spectra for BSA, ADH, and TRF were interpreted with MASCOT directly (”raw spectra”) and after pro-cessing with MASCOT Distiller and with the background removal procedure described in this article (”MS Clea-ner”). The “score” is the MASCOT score from all successful searches; “match” is the number of searches thatrecover the peptides from the protein used. The processing time is presented in min:sec. The performance of theprocedure described in this article is superior compared with that of MASCOT Distiller with respect to score, andnumber of correct sequence matches. In addition, it consumes only 50% time on an identical computer with thesame operating system environment.
possible, because the algorithms used in commercial MAS-COT Distiller have not been properly described in public andthe reasons for differential performance of the two programscannot be causally interpreted. In Table 4, we present theresults of application of the two programs on the BSA-, ADH-,and TRF-datasets. Whereas MASCOT Distiller producesmixed results with respect to the score and sequence mat-ches (one increase and two decreases), our program increa-ses the score and the number of matches in all three cases. Atthe same time, the computation time is only about 50% ofthat from MASCOT Distiller. In the case of the larger con-densin dataset, MASCOT Distiller did not complete compu-tation regularly and interrupted with a run-time error. Aswas shown above, application of our software improved theinterpretability of the condensin dataset.
3.11 Future developments
It should be noted that possibilities for further improvementof background removal and of computation costs reductionare evident. Unfortunately, most spectra do not contain usefulpeptide information. At the same time, the currently proposedmechanism for finding noninterpretable spectra detects onlya minor fraction of them. As the data for the BSA example inTable 1 show, only 70 spectra out of 2679 (2.6%) are inter-pretable by MASCOT but only 195 out of 2679 (6.7%) havebeen unselected by our algorithm as “bad.” Similar resultshave been found for other protein targets (Tables 1A and 3).Therefore, identification of noninterpretable spectra early inthe workflow is critical for reducing the computational load[42, 43]. Sequence ladder testing and entropic criteria aresimple and efficient alternatives with virtually no false posi-tives (manuscript in preparation).
4 Concluding remarks
The background from multiply charged replicates, isotopevariants, sample-specific and systematic contaminations,
and the noise from the electronic detection system createconsiderable problems during mass spectrum interpreta-tion. Computation time is wasted for noninterpretable spec-tra, and background peaks occupy a significant share of thestorage capacity for mass-spectrometric data.
The procedures described in this article are able toremove a considerable part of these problems. The data showthat background removal following our recipes improves re-liability of hit assignments by database search-based meth-ods (as tested by interpretability with MASCOT) con-siderably (as measured by scores and, in part, also by peptidematch and sequence coverage). On the technical side, boththe storage requirement for datasets and the computationtime with MS/MS spectra interpretation software is reducedby 25–40% as a result of noise reduction with our tool.
Our tool is designed for applications in a proteomicscontext where lots of spectra need to be automatically inter-preted. It does not aim to compete with manual noise iden-tification by experts. The efficiency of the multiply chargedisotope cluster recognition procedure depends on measure-ment accuracy and scanning speed; the better the isotopeclusters are resolved (for example, with Fourier-transforma-tion instruments in contrast to LCQ/LTQ in this work), thebetter will be their determination with the correlation analy-sis approach. Similarly, the spectral removal criteria forlatent periodic noise and high-frequency noise might requirenew parameterization if more accurate instruments areapplied.
In the future, we will analyze how de novo sequencingwith MS/MS data will benefit from this type of backgroundremoval.
The authors are grateful to Werner Kubina, Georg Schneider,and Michael Wildpaner for advise in software design and formaintaining the local MASCOT implementation, to Ines Stein-macher for support in carrying out MS measurements, to Chris-tian Gieffers for the Smc2 antibody, to Kerstin Wendt (all fromIMP, Vienna) for advice on purifying condensin complexes, and
© 2006 WILEY-VCH Verlag GmbH & Co. KGaA, Weinheim www.proteomics-journal.com
5130 N. Mujezinovic et al. Proteomics 2006, 6, 5117–5131
to Kurt Varmuza (Technical University, Vienna) for advise. Thiswork has been supported by Boehringer Ingelheim, Gen-AU BIN(to F. E.), Gen-AU APP (to K. M.), and the European Com-mission FP6 Integrated Project “MitoCheck” (to J.-M. P.).
5 References
[1] Shevchenko, A., Jensen, O. N., Podtelejnikov, A. V.,Sagliocco, F. et al., Proc. Natl. Acad. Sci. USA 1996, 93,14440–14445.
[2] Pandey, A., Mann, M., Nature 2000, 405, 837–846.
[3] McCormack, A. L., Schieltz, D. M., Goode, B., Yang, S. et al.,Anal. Chem. 1997, 69, 767–776.
[4] Washburn, M. P., Wolters, D., Yates, J. R., Nat. Biotechnol.2001, 19, 242–247.
[5] Wysocki, V. H., Tsaprailis, G., Smith, L. L., Breci, L. A., J. MassSpectrom. 2000, 35, 1399–1406.
[6] Hunt, D. F., Yates, R., Shabanowitz, J., Winston, S., Hauer, C.R., Proc. Natl. Acad. Sci. USA 1986, 83, 6233–6237.
[7] Poulter, L., Tylor, L. C., Int. J. Mass Spectrom. Ion Process.1989, 91, 183–197.
[8] Alexander, A. J., Thibault, P., Boyd, R. K., Curtis, J. M., Rine-hart, K. L., Int. J. Mass Spectrom. Ion Process. 1990, 98, 107–134.
[9] Somogyi, A., Wysocki, V. H., Mayer, I., J. Am. Soc. MassSpectrom. 1994, 5, 704–717.
[10] Papayannopoulos, I. A., Mass Spectrom. Rev. 1995, 14, 49–73.
[11] Cox, K. A., Gaskell, S. J., Morris, M., Whiting, A., J. Am. Soc.Mass Spectrom. 1996, 7, 522–531.
[12] Dongre, A. R., Jones, J. L., Somogyi, A., Wysocki, V. H., J.Am. Soc. Mass Spectrom. 1996, 118, 8365–8374.
[13] Yergey, J., Heller, D., Hansen, G., Cotter, R. J., Fenselau, C.,Anal. Chem. 1983, 55, 353–356.
[14] Fenn, J. B., Mann, M., Meng, C. K., Wong, S. F., Whitehouse,C. M., Science 1989, 246, 64–71.
[15] Mann, M., Org. Mass Spectrom. 1990, 25, 575–587.
[16] Smith, R. D., Loo, J. A., Ogorzalek Loo, R. R., Busman, M.,Udseth, H. R., Mass Spectrom. Rev. 1991, 10, 359–451.
[17] Kebarle, P., Tang, L., Anal. Chem. 1993, 65, 972A–986A.
[18] McLafferty, F. W., Acc. Chem. Res. 1994, 27, 379–386.
[19] Scoble, H. A., Biller, J. E., Biemann, K., Fresenius Z. Anal.Chem. 1987, 327, 239–245.
[20] Bartels, C., Biomed. Environ. Mass Spectrom. 1990, 19, 363–368.
[21] Johnson, R. S., Taylor, J. A., Mol. Biotechnol. 2002, 22, 301–315.
[22] Dancik, V., Addona, T. A., Clauser, K. R., Vath, J. E., Pevzner,P. A., J. Comput. Biol. 1999, 6, 327–342.
[23] Zhang, Z., McElvain, J. S., Anal. Chem. 2000, 72, 2337–2350.
[24] Horn, D. M., Zubarev, R. A., McLafferty, F. W., PNAS 1994, 97,10313–10317.
[25] Taylor, J. A., Johnson, R. S., Anal. Chem. 2001, 73, 2594–2604.
[26] Eng, J. K., McCormack, A. L., Yates, J. R., J. Am. Soc. MassSpectrom. 1994, 5, 976–989.
[27] Yates, J. R., Eng, J., McCormack, A. L., Schieltz, D. M., Anal.Chem. 1995, 67, 1426–1436.
[28] Yates, J. R. III, McCormack, A. L., Eng, J., Anal. Chem. 1996,68, 534A–540A.
[29] Yates, J. R. III, Eng, J. K., McCormack, A. L., Anal. Chem.1995, 67, 3202–3210.
[30] Perkins, D. N., Pappin, D. J., Creasy, D. M., Cottrell, J. S.,Electrophoresis 1999, 20, 3551–3567.
[31] Sadygov, R. G., Eng, J., Durr, E., Saraf, A. et al., J. Proteome.Res. 2002, 1, 211–215.
[32] Zhang, N., Aebersold, R., Schwikowski, B., Proteomics 2002,2, 1406–1412.
[33] Mann, M., Meng, C. K., Fenn, J. B., Anal. Chem. 1989, 61,1702–1708.
[34] Ferrige, A. G., Seddon, M. J., Rapid Commun. Mass Spec-trom. 1991, 5, 374–379.
[35] Reinhold, B. B., Reinhold, V. N., J. Am. Soc. Mass Spectrom.1992, 3, 207–215.
[36] Zhang, Z., Marshall, A., J. Am. Soc. Mass Spectrom. 1998, 9,225–233.
[37] Gentzel, M., Kocher, T., Ponnusamy, S., Wilm, M., Proteom-ics 2003, 3, 1597–1610.
[38] Wehofsky, M., Thesis, Justus-Liebig-Universität Giessen,Germany, 2001.
[39] Wehofsky, M., Hoffmann, R., J. Mass Spectrom. 2002, 37,223–229.
[40] Jaitly, D., Page-Belanger, R., Faubert, D., Thibault, P.,Kebarle, P., MSMS Peak Identification and its Applications,ISMB/ECCB 2004, 2004, http,//www.ismb.org/ismbeccb2004/accepted_papers (Communication 46), 1–3.
[41] Horn, D. M., Zubarev, R. A., McLafferty, F. W., J. Am. Soc.Mass Spectrom. 2000, 11, 320–332.
[42] Xu, M., Geer, L. Y., Bryant, S. H., Roth, J. S. et al., J. Pro-teome. Res. 2005, 4, 300–305.
[43] Bern, M., Goldberg, D., McDonald, W. H., Yates, J. R. III,Bioinformatics 2004, 20, I49–I54.
[44] Hirota, T., Gerlich, D., Koch, B., Ellenberg, J., Peters, J. M., J.Cell Sci. 2004, 117, 6435–6445.
[45] Mitulovic, G., Smoluch, M., Chervet, J. P., Steinmacher, I. etal., Anal. Bioanal. Chem. 2003, 376, 946–951.
[46] Mitulovic, G., Stingl, C., Smoluch, M., Swart, R. et al., Prote-omics 2004, 4, 2545–2557.
[47] Blom, K. F., Org. Mass Spectrom. 1988, 23, 194–203.
[48] She, J., McKinney, M., Petreas, M., Stephens, R., Organoha-logen Compd. 1995, 23, 171–174.
[49] Rockwood, A. L., Rapid Commun. Mass Spectrom. 1995, 9,103–105.
[50] Rockwood, A. L., VanOrden, S. L., Anal. Chem. 1996, 68,2027–2030.
[51] Rockwood, A. L., VanOrden, S. L., Smith, R. D., Rapid Com-mun. Mass Spectrom. 1996, 10, 54–59.
[52] Baranov, V., US Patent 6590 204, 2003.
© 2006 WILEY-VCH Verlag GmbH & Co. KGaA, Weinheim www.proteomics-journal.com
Proteomics 2006, 6, 5117–5131 Bioinformatics 5131
[53] Friedlander, B., Porat, B., IEEE Trans. Aerosp. Electron. Syst.1984, AES-20, 158–173.
[54] Oppenheim, A. V., Schafer, R. W., Discrete-Time Signal Pro-cessing, Englewood Cliffs, Prentice-Hall, NJ 1989.
[55] Parks, T. W., Burrus, C. S., Digital Filter Design, John Wiley &Sons, New York 1987.
[56] Ono, T., Losada, A., Hirano, M., Myers, M. P. et al., Cell 2003,115, 109–121.
[57] Schleiffer, A., Kaitna, S., Maurer-Stroh, S., Glotzer, M. et al.,Mol. Cell 2003, 11, 571–575.
[58] Yeong, F. M., Hombauer, H., Wendt, K. S., Hirota, T. et al.,Curr. Biol. 2003, 13, 2058–2064.
6 Addendum: Web supplement
At the website http://mendel.imp.univie.ac.at/mass-spectrometry/, supplementary resources are available: (i) the web-page with illustrative examples that motivate the applicationof frequency-spectral criteria for background removal inMS/MS spectra at the link http://mendel.imp.univie.ac.at/mass-spectrometry/ANALYSIS/; (ii) the raw MS/MS data(mgf format) and the respective background-cleaned versionfor the BSA, ADH, and TRF samples together with Supple-mentary tables showing the changes of scores of leadingpeptide hits; (iii) views of the original spectra used in Fig. 3;(iv) the dta files and MS/MS-spectral views of the data used inFig. 4; (v) details about the single false-positively rejectedspectrum from the TRF dataset (http://mendel.imp.ac.at/mass-spectrometry/falsepositive-partA.html); (vi) result list-ings for the condensin dataset of the MASCOT searchagainst the nonredundant protein sequence database bothwith restriction to human proteins and without any taxo-nomic restriction; (vii) details about a false-positively rejectedspectrum from the condensin dataset (http://mendel.imp.ac.at/mass-spectrometry/falsepositive-partB.html), and (viii)a demonstration version of the MS Cleaner with user manual(Windows XP edition).
© 2006 WILEY-VCH Verlag GmbH & Co. KGaA, Weinheim www.proteomics-journal.com
Related Documents