- 1 - Monday 5 th July 2021 This document is for private circulation, and must be read in conjunction with the disclaimer on the last page. SUBSCRIBE Issue Details Clean Science & Technology Ltd (CSTL), established in 2003, is one of the leading companies engaged in the manufacturing of functionally critical specialty chemicals such as Monomethyl Ether of Hydroquinone – MEHQ, Butylated Hydroxy Anisole – BHA, and Ascorbyl Palmitate (Performance Chemicals), Guaiacol and Dicyclohexyl Carbodimide – DCC (Pharmaceutical Intermediates), and Methoxy Acetophenone – 4MAP and Anisole (FMCG Chemicals). For the products MEHQ and BHA, CSTL is the top global producer, while it ranks 3 rd globally for Guaiacol. For the other products that it manufactures, namely Ascorbic Palmitate, DCC, 4-MAP and Anisole, it is India’s largest producer. To cater to the increasing demand requirements for all the above products, the company is undertaking a capex of ~INR 150 cr, which should be operational by early FY23. Accordingly, we expect CSTL to sustain its revenue growth rates of 20.4% to INR 894 cr over the period of FY21-24E. Exports contribute over 65-70% of CSTL’s total business, while the rest comes from the domestic market. EBITDA and net profit over the same period are set to grow at a CAGR of 17.7% to INR 422 cr and 17.1% to INR 318 cr, respectively. EBITDA and net margin are expected to deteriorate by 330bps (to 47.2%) and 312bps (to 35.6%), respectively, since the operationalization of the new facilities would lead to an increase in overhead costs. As a result, return ratios RoE and RoIC are expected to be at 26.8% (-994bps) and 62.0% (-166bps), respectively, by FY24. Phenol and hydrogen peroxide are the key raw materials used, along with Acetone, Cyclohexylamine, Methanol, Tertiery Butyl Alcohol and Acetic Anhydride. The company procures all the raw materials on spot contracts, and passes-on the prices to its clients. CSTL’s customers include manufacturers and distributors in India, China, Europe, the US, Taiwan, Korea and Japan. Listing BSE & NSE Open Date 7 th July 2021 Close Date 9 th July 2021 Price Band INR 880-900 Market Lot 16 shares Minimum Lot 1 Lot Issue Structure Offer for sale 100% Fresh Issue 0% Issue Size INR 1,547 cr Total no of shares 106,218,960 QIB share (%) ≥ 50% Non Inst share (%) ≤ 15% Retail share (%) ≤ 35% Shareholding Pattern Pre (%) Post (%) Promoters 94.7 78.5 Institutional 5.3 13.4 Public 0.0 8.1 Clean Science & Technology Ltd. IPO NOTE Sales EBITDA Net Profit EBITDA (%) Net Profit (%) EPS ₹ BV ₹ RoE (%) RoIC (%) P/E (x) P/BV (x) EV/EBITDA (x) FY20 419 185 140 44.2 33.3 13.1 32.2 40.8 63.3 68.5 27.9 50.8 FY21 512 259 198 50.5 38.7 18.7 50.8 36.8 63.6 48.2 17.7 36.0 FY22E 652 322 236 49.4 36.2 22.2 69.7 31.9 62.3 40.5 12.9 28.5 FY23E 778 378 280 48.5 36.0 26.3 90.7 29.0 61.7 34.2 9.9 23.9 FY24E 894 422 318 47.2 35.6 30.0 111.7 26.8 62.0 30.0 8.1 20.9 Key Financials (in ₹ crores)

Welcome message from author
This document is posted to help you gain knowledge. Please leave a comment to let me know what you think about it! Share it to your friends and learn new things together.
Transcript
- 1 - Monday 5th July 2021
This document is for private circulation, and must be read in conjunction with the disclaimer on the last page.
SUBSCRIBE
Issue Details Clean Science & Technology Ltd (CSTL), established in 2003, is one of the
leading companies engaged in the manufacturing of functionally critical
specialty chemicals such as Monomethyl Ether of Hydroquinone – MEHQ,
Butylated Hydroxy Anisole – BHA, and Ascorbyl Palmitate (Performance
Chemicals), Guaiacol and Dicyclohexyl Carbodimide – DCC (Pharmaceutical
Intermediates), and Methoxy Acetophenone – 4MAP and Anisole (FMCG
Chemicals). For the products MEHQ and BHA, CSTL is the top global
producer, while it ranks 3rd globally for Guaiacol. For the other products that
it manufactures, namely Ascorbic Palmitate, DCC, 4-MAP and Anisole, it is
India’s largest producer.
To cater to the increasing demand requirements for all the above products,
the company is undertaking a capex of ~INR 150 cr, which should be
operational by early FY23. Accordingly, we expect CSTL to sustain its
revenue growth rates of 20.4% to INR 894 cr over the period of FY21-24E.
Exports contribute over 65-70% of CSTL’s total business, while the rest
comes from the domestic market.
EBITDA and net profit over the same period are set to grow at a CAGR of
17.7% to INR 422 cr and 17.1% to INR 318 cr, respectively. EBITDA and net
margin are expected to deteriorate by 330bps (to 47.2%) and 312bps (to
35.6%), respectively, since the operationalization of the new facilities would
lead to an increase in overhead costs. As a result, return ratios RoE and
RoIC are expected to be at 26.8% (-994bps) and 62.0% (-166bps),
respectively, by FY24.
Phenol and hydrogen peroxide are the key raw materials used, along with
Acetone, Cyclohexylamine, Methanol, Tertiery Butyl Alcohol and Acetic
Anhydride. The company procures all the raw materials on spot contracts,
and passes-on the prices to its clients. CSTL’s customers include
manufacturers and distributors in India, China, Europe, the US, Taiwan,
Korea and Japan.
Listing BSE & NSE
Open Date 7th July 2021
Close Date 9th July 2021
Price Band INR 880-900
Market Lot 16 shares
Minimum Lot 1 Lot
Issue Structure
Offer for sale 100%
Fresh Issue 0%
Issue Size INR 1,547 cr
Total no of shares 106,218,960
QIB share (%) ≥ 50%
Non Inst share (%) ≤ 15%
Retail share (%) ≤ 35%
Shareholding Pattern
Pre (%) Post (%)
Promoters 94.7 78.5
Institutional 5.3 13.4
Public 0.0 8.1
Clean Science & Technology Ltd.
IPO
NO
TE
Sales EBITDA Net
Profit EBITDA
(%)
Net Profit
(%)
EPS ₹
BV ₹
RoE (%)
RoIC (%)
P/E (x)
P/BV (x)
EV/EBITDA (x)
FY20 419 185 140 44.2 33.3 13.1 32.2 40.8 63.3 68.5 27.9 50.8
FY21 512 259 198 50.5 38.7 18.7 50.8 36.8 63.6 48.2 17.7 36.0
FY22E 652 322 236 49.4 36.2 22.2 69.7 31.9 62.3 40.5 12.9 28.5
FY23E 778 378 280 48.5 36.0 26.3 90.7 29.0 61.7 34.2 9.9 23.9
FY24E 894 422 318 47.2 35.6 30.0 111.7 26.8 62.0 30.0 8.1 20.9
Key Financials (in ₹ crores)
- 2 - Monday 5th July 2021
This document is for private circulation, and must be read in conjunction with the disclaimer on the last page.
The company operates two manufacturing facilities in Kurkumbh (Maharashtra) with an aggregate installed capacity of 29,900 metric tonnes (MT), which is split across its three verticals
• Performance chemicals – capacity of 9,640 MT (~74% utilization in FY21)
• Pharmaceutical intermediaries – capacity of 4,060 MT (~64% utilization in FY21)
• FMCG chemicals – capacity of 16,200 MT (~73% utilization in FY21) The ongoing capex (3rd facility) is coming up at the same location with the 4th facility (planning stage) expected to come up over the next couple of years. We initiate coverage with a BUY and recommend a SUBSCRIBE for long term investment. At the offer for sale price of INR 900, the stock is valued at 30X FY24 earnings. The high valuations are justified given the
• high growth potential
• dominant producer status
• best in class profitability, and
• sustainable high return ratios
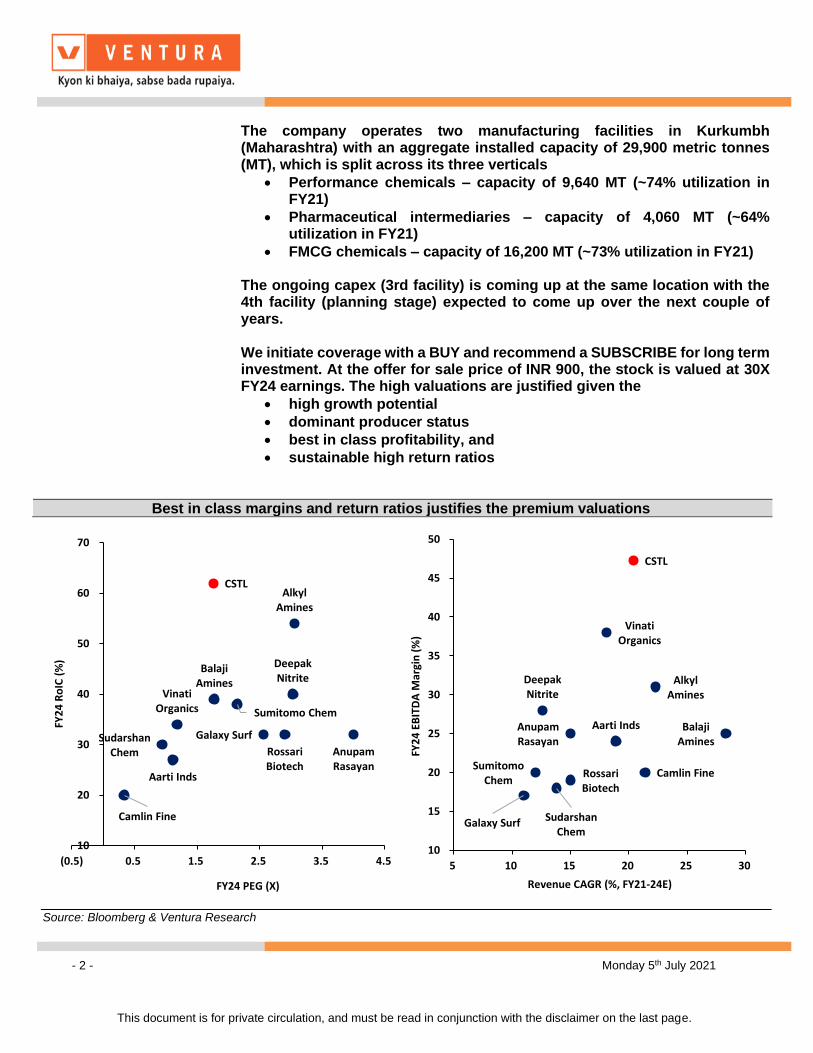
Best in class margins and return ratios justifies the premium valuations
Source: Bloomberg & Ventura Research
CSTL
Rossari Biotech
Balaji Amines
Deepak Nitrite
Sumitomo Chem
Anupam Rasayan
Galaxy Surf
Aarti Inds
Alkyl Amines
Vinati Organics
Sudarshan Chem
Camlin Fine
10
20
30
40
50
60
70
(0.5) 0.5 1.5 2.5 3.5 4.5
FY2
4 R
oIC
(%
)
FY24 PEG (X)
CSTL
Rossari Biotech
Balaji Amines
Deepak Nitrite
Sumitomo Chem
Anupam Rasayan
Galaxy Surf
Aarti Inds
Alkyl Amines
Vinati Organics
Sudarshan Chem
Camlin Fine
10
15
20
25
30
35
40
45
50
5 10 15 20 25 30
FY2
4 E
BIT
DA
Mar
gin
(%
)
Revenue CAGR (%, FY21-24E)
- 3 - Monday 5th July 2021
This document is for private circulation, and must be read in conjunction with the disclaimer on the last page.
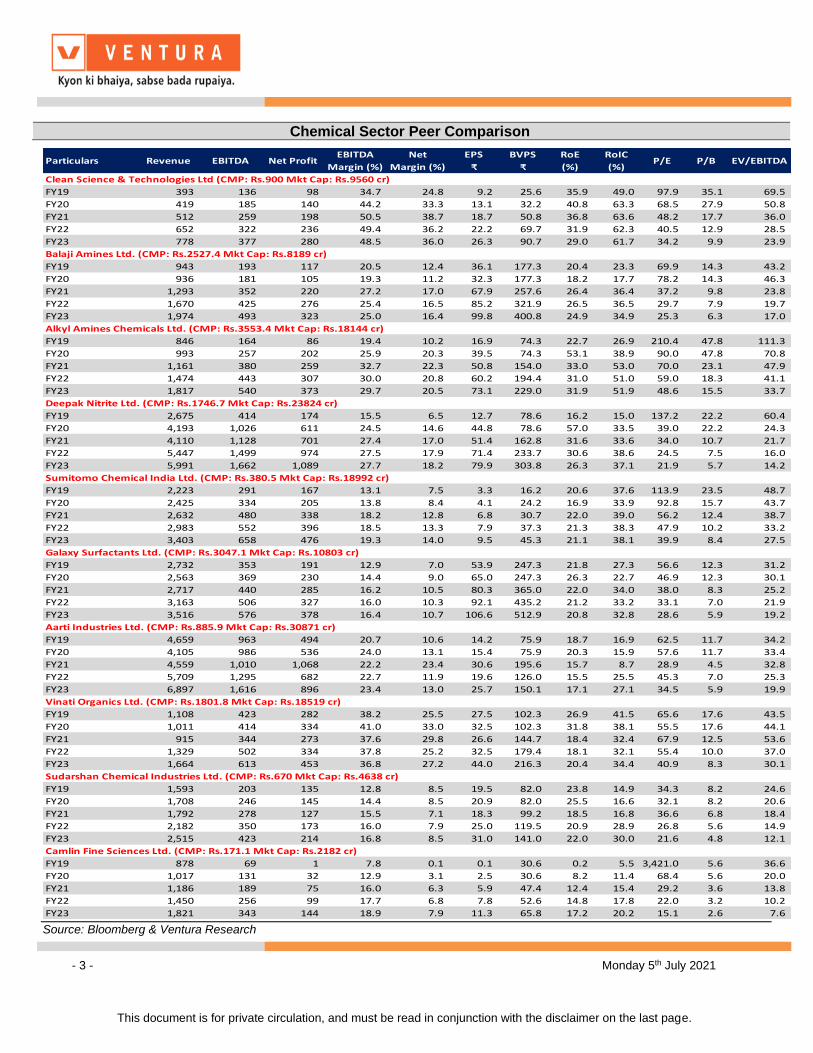
Chemical Sector Peer Comparison
Source: Bloomberg & Ventura Research
Particulars Revenue EBITDA Net ProfitEBITDA
Margin (%)
Net
Margin (%)
EPS
₹
BVPS
₹
RoE
(%)
RoIC
(%)P/E P/B EV/EBITDA
Clean Science & Technologies Ltd (CMP: Rs.900 Mkt Cap: Rs.9560 cr)
FY19 393 136 98 34.7 24.8 9.2 25.6 35.9 49.0 97.9 35.1 69.5
FY20 419 185 140 44.2 33.3 13.1 32.2 40.8 63.3 68.5 27.9 50.8
FY21 512 259 198 50.5 38.7 18.7 50.8 36.8 63.6 48.2 17.7 36.0
FY22 652 322 236 49.4 36.2 22.2 69.7 31.9 62.3 40.5 12.9 28.5
FY23 778 377 280 48.5 36.0 26.3 90.7 29.0 61.7 34.2 9.9 23.9
Balaji Amines Ltd. (CMP: Rs.2527.4 Mkt Cap: Rs.8189 cr)
FY19 943 193 117 20.5 12.4 36.1 177.3 20.4 23.3 69.9 14.3 43.2
FY20 936 181 105 19.3 11.2 32.3 177.3 18.2 17.7 78.2 14.3 46.3
FY21 1,293 352 220 27.2 17.0 67.9 257.6 26.4 36.4 37.2 9.8 23.8
FY22 1,670 425 276 25.4 16.5 85.2 321.9 26.5 36.5 29.7 7.9 19.7
FY23 1,974 493 323 25.0 16.4 99.8 400.8 24.9 34.9 25.3 6.3 17.0
Alkyl Amines Chemicals Ltd. (CMP: Rs.3553.4 Mkt Cap: Rs.18144 cr)
FY19 846 164 86 19.4 10.2 16.9 74.3 22.7 26.9 210.4 47.8 111.3
FY20 993 257 202 25.9 20.3 39.5 74.3 53.1 38.9 90.0 47.8 70.8
FY21 1,161 380 259 32.7 22.3 50.8 154.0 33.0 53.0 70.0 23.1 47.9
FY22 1,474 443 307 30.0 20.8 60.2 194.4 31.0 51.0 59.0 18.3 41.1
FY23 1,817 540 373 29.7 20.5 73.1 229.0 31.9 51.9 48.6 15.5 33.7
Deepak Nitrite Ltd. (CMP: Rs.1746.7 Mkt Cap: Rs.23824 cr)
FY19 2,675 414 174 15.5 6.5 12.7 78.6 16.2 15.0 137.2 22.2 60.4
FY20 4,193 1,026 611 24.5 14.6 44.8 78.6 57.0 33.5 39.0 22.2 24.3
FY21 4,110 1,128 701 27.4 17.0 51.4 162.8 31.6 33.6 34.0 10.7 21.7
FY22 5,447 1,499 974 27.5 17.9 71.4 233.7 30.6 38.6 24.5 7.5 16.0
FY23 5,991 1,662 1,089 27.7 18.2 79.9 303.8 26.3 37.1 21.9 5.7 14.2
Sumitomo Chemical India Ltd. (CMP: Rs.380.5 Mkt Cap: Rs.18992 cr)
FY19 2,223 291 167 13.1 7.5 3.3 16.2 20.6 37.6 113.9 23.5 48.7
FY20 2,425 334 205 13.8 8.4 4.1 24.2 16.9 33.9 92.8 15.7 43.7
FY21 2,632 480 338 18.2 12.8 6.8 30.7 22.0 39.0 56.2 12.4 38.7
FY22 2,983 552 396 18.5 13.3 7.9 37.3 21.3 38.3 47.9 10.2 33.2
FY23 3,403 658 476 19.3 14.0 9.5 45.3 21.1 38.1 39.9 8.4 27.5
Galaxy Surfactants Ltd. (CMP: Rs.3047.1 Mkt Cap: Rs.10803 cr)
FY19 2,732 353 191 12.9 7.0 53.9 247.3 21.8 27.3 56.6 12.3 31.2
FY20 2,563 369 230 14.4 9.0 65.0 247.3 26.3 22.7 46.9 12.3 30.1
FY21 2,717 440 285 16.2 10.5 80.3 365.0 22.0 34.0 38.0 8.3 25.2
FY22 3,163 506 327 16.0 10.3 92.1 435.2 21.2 33.2 33.1 7.0 21.9
FY23 3,516 576 378 16.4 10.7 106.6 512.9 20.8 32.8 28.6 5.9 19.2
Aarti Industries Ltd. (CMP: Rs.885.9 Mkt Cap: Rs.30871 cr)
FY19 4,659 963 494 20.7 10.6 14.2 75.9 18.7 16.9 62.5 11.7 34.2
FY20 4,105 986 536 24.0 13.1 15.4 75.9 20.3 15.9 57.6 11.7 33.4
FY21 4,559 1,010 1,068 22.2 23.4 30.6 195.6 15.7 8.7 28.9 4.5 32.8
FY22 5,709 1,295 682 22.7 11.9 19.6 126.0 15.5 25.5 45.3 7.0 25.3
FY23 6,897 1,616 896 23.4 13.0 25.7 150.1 17.1 27.1 34.5 5.9 19.9
Vinati Organics Ltd. (CMP: Rs.1801.8 Mkt Cap: Rs.18519 cr)
FY19 1,108 423 282 38.2 25.5 27.5 102.3 26.9 41.5 65.6 17.6 43.5
FY20 1,011 414 334 41.0 33.0 32.5 102.3 31.8 38.1 55.5 17.6 44.1
FY21 915 344 273 37.6 29.8 26.6 144.7 18.4 32.4 67.9 12.5 53.6
FY22 1,329 502 334 37.8 25.2 32.5 179.4 18.1 32.1 55.4 10.0 37.0
FY23 1,664 613 453 36.8 27.2 44.0 216.3 20.4 34.4 40.9 8.3 30.1
Sudarshan Chemical Industries Ltd. (CMP: Rs.670 Mkt Cap: Rs.4638 cr)
FY19 1,593 203 135 12.8 8.5 19.5 82.0 23.8 14.9 34.3 8.2 24.6
FY20 1,708 246 145 14.4 8.5 20.9 82.0 25.5 16.6 32.1 8.2 20.6
FY21 1,792 278 127 15.5 7.1 18.3 99.2 18.5 16.8 36.6 6.8 18.4
FY22 2,182 350 173 16.0 7.9 25.0 119.5 20.9 28.9 26.8 5.6 14.9
FY23 2,515 423 214 16.8 8.5 31.0 141.0 22.0 30.0 21.6 4.8 12.1
Camlin Fine Sciences Ltd. (CMP: Rs.171.1 Mkt Cap: Rs.2182 cr)
FY19 878 69 1 7.8 0.1 0.1 30.6 0.2 5.5 3,421.0 5.6 36.6
FY20 1,017 131 32 12.9 3.1 2.5 30.6 8.2 11.4 68.4 5.6 20.0
FY21 1,186 189 75 16.0 6.3 5.9 47.4 12.4 15.4 29.2 3.6 13.8
FY22 1,450 256 99 17.7 6.8 7.8 52.6 14.8 17.8 22.0 3.2 10.2
FY23 1,821 343 144 18.9 7.9 11.3 65.8 17.2 20.2 15.1 2.6 7.6
- 4 - Monday 5th July 2021
This document is for private circulation, and must be read in conjunction with the disclaimer on the last page.
Source: Company Reports and Ventura Research
0
10
20
30
0
500
1,000
1,500
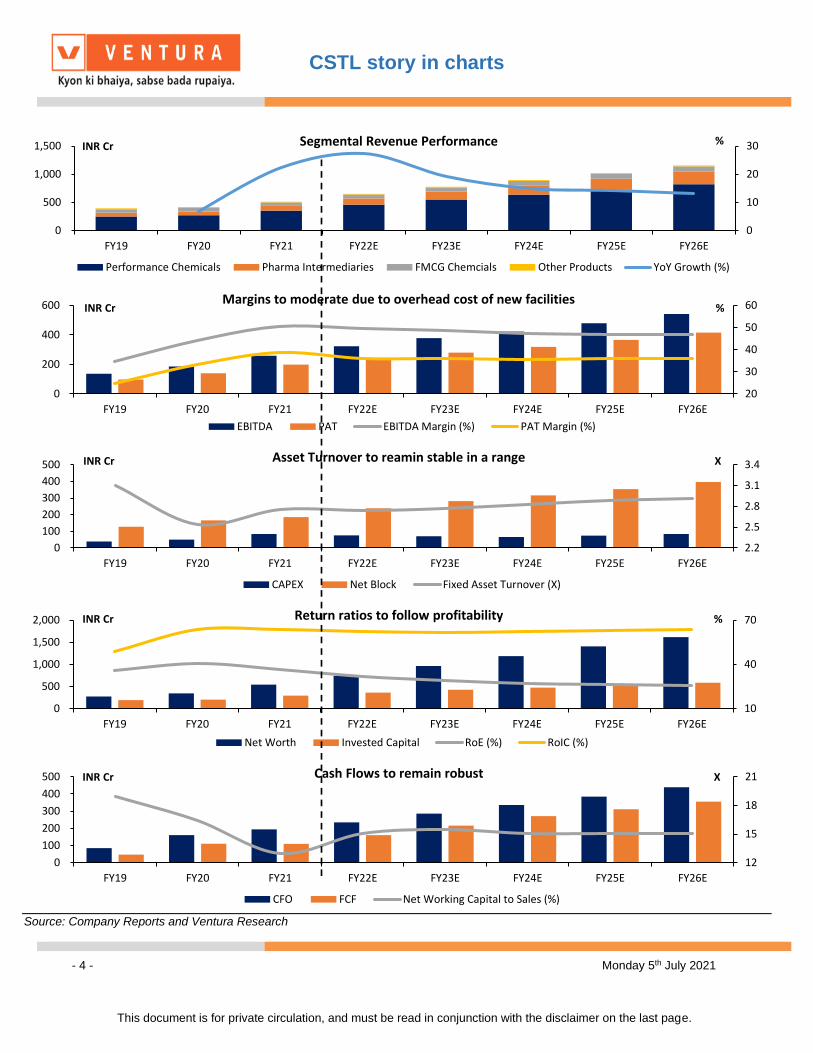
FY19 FY20 FY21 FY22E FY23E FY24E FY25E FY26E
Segmental Revenue Performance
Performance Chemicals Pharma Intermediaries FMCG Chemcials Other Products YoY Growth (%)
INR Cr %
20
30
40
50
60
0
200
400
600
FY19 FY20 FY21 FY22E FY23E FY24E FY25E FY26E
Margins to moderate due to overhead cost of new facilities
EBITDA PAT EBITDA Margin (%) PAT Margin (%)
INR Cr %
2.2
2.5
2.8
3.1
3.4
0
100
200
300
400
500
FY19 FY20 FY21 FY22E FY23E FY24E FY25E FY26E
Asset Turnover to reamin stable in a range
CAPEX Net Block Fixed Asset Turnover (X)
INR Cr X
10
40
70
0
500
1,000
1,500
2,000
FY19 FY20 FY21 FY22E FY23E FY24E FY25E FY26E
Return ratios to follow profitability
Net Worth Invested Capital RoE (%) RoIC (%)
INR Cr %
12
15
18
21
0
100
200
300
400
500
FY19 FY20 FY21 FY22E FY23E FY24E FY25E FY26E
Cash Flows to remain robust
CFO FCF Net Working Capital to Sales (%)
INR Cr X
CSTL story in charts
- 5 - Monday 5th July 2021
This document is for private circulation, and must be read in conjunction with the disclaimer on the last page.
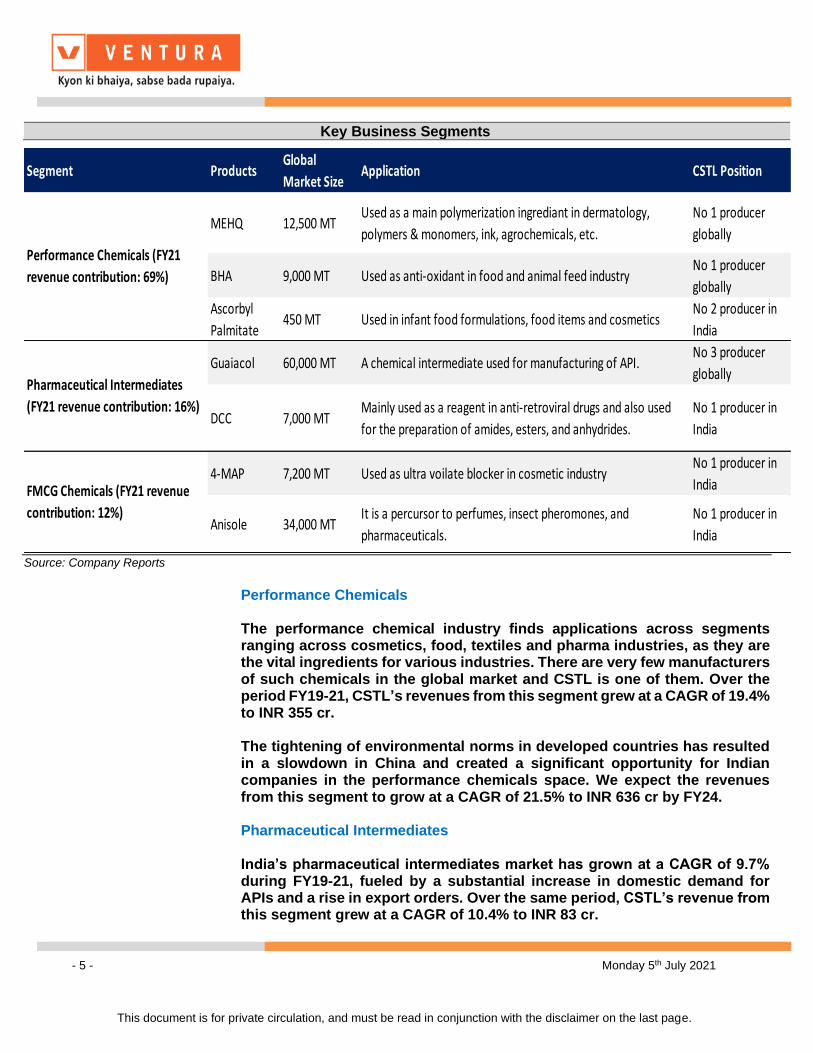
Key Business Segments
Source: Company Reports
Performance Chemicals The performance chemical industry finds applications across segments ranging across cosmetics, food, textiles and pharma industries, as they are the vital ingredients for various industries. There are very few manufacturers of such chemicals in the global market and CSTL is one of them. Over the period FY19-21, CSTL’s revenues from this segment grew at a CAGR of 19.4% to INR 355 cr. The tightening of environmental norms in developed countries has resulted in a slowdown in China and created a significant opportunity for Indian companies in the performance chemicals space. We expect the revenues from this segment to grow at a CAGR of 21.5% to INR 636 cr by FY24. Pharmaceutical Intermediates India’s pharmaceutical intermediates market has grown at a CAGR of 9.7% during FY19-21, fueled by a substantial increase in domestic demand for APIs and a rise in export orders. Over the same period, CSTL’s revenue from this segment grew at a CAGR of 10.4% to INR 83 cr.
Segment ProductsGlobal
Market SizeApplication CSTL Position
MEHQ 12,500 MTUsed as a main polymerization ingrediant in dermatology,
polymers & monomers, ink, agrochemicals, etc.
No 1 producer
globally
BHA 9,000 MT Used as anti-oxidant in food and animal feed industryNo 1 producer
globally
Ascorbyl
Palmitate450 MT Used in infant food formulations, food items and cosmetics
No 2 producer in
India
Guaiacol 60,000 MT A chemical intermediate used for manufacturing of API.No 3 producer
globally
DCC 7,000 MTMainly used as a reagent in anti-retroviral drugs and also used
for the preparation of amides, esters, and anhydrides.
No 1 producer in
India
4-MAP 7,200 MT Used as ultra voilate blocker in cosmetic industryNo 1 producer in
India
Anisole 34,000 MTIt is a percursor to perfumes, insect pheromones, and
pharmaceuticals.
No 1 producer in
India
Performance Chemicals (FY21
revenue contribution: 69%)
Pharmaceutical Intermediates
(FY21 revenue contribution: 16%)
FMCG Chemicals (FY21 revenue
contribution: 12%)
- 6 - Monday 5th July 2021
This document is for private circulation, and must be read in conjunction with the disclaimer on the last page.
The government is taking various initiatives to boost the industry, such as allocating land in different states to develop API Mega Parks, increasing investment in R&D, etc., which could improve the consumption for pharma intermediates at a CAGR of over 15% over the period of FY21-24E. CSTL is India’s largest producer of DCC and 3rd largest globally for Guaiacol. We expect the revenues from this segment to grow at a CAGR of 25.6% to INR 164 cr by FY24. FMCG Chemicals 4-MAP is the key ingredient in CSTL’s FMCG chemical segment, which is an aromatic chemical compound used in spices, cosmetics, medicines, etc. Globally, the 4-MAP market clocked a CAGR of 3.6% to USD 35 mn during FY19-21. Over the period, CSTL’s revenue from this segment grew at a CAGR of 1.6% to INR 63 cr. CSTL underperformed the global growth due to slower than expected growth in the domestic premium FMCG industry. With the rapid urbanization and rising income levels, we are expecting a gradual increase in demand for premium FMCG products in the Indian market. We expect the revenues from this segment to grow at a CAGR of 8.0% to INR 80 cr by FY24.
- 7 - Monday 5th July 2021
This document is for private circulation, and must be read in conjunction with the disclaimer on the last page.
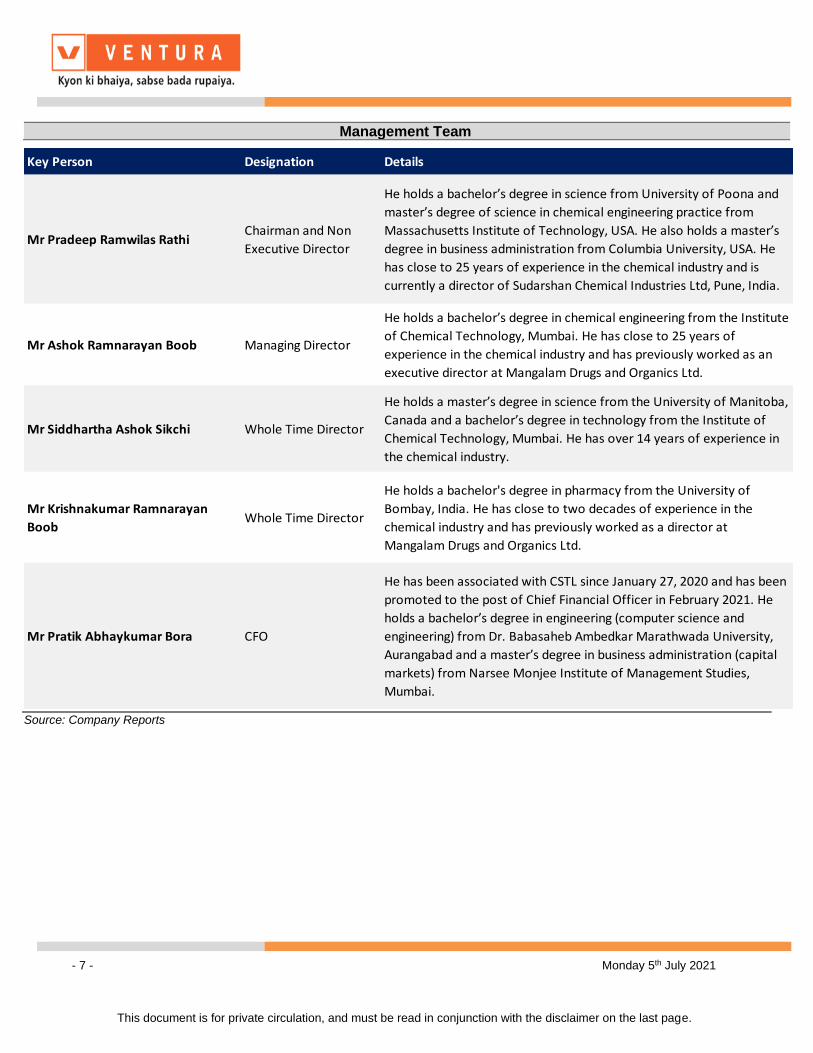
Management Team
Source: Company Reports
Key Person Designation Details
Mr Pradeep Ramwilas RathiChairman and Non
Executive Director
He holds a bachelor’s degree in science from University of Poona and
master’s degree of science in chemical engineering practice from
Massachusetts Institute of Technology, USA. He also holds a master’s
degree in business administration from Columbia University, USA. He
has close to 25 years of experience in the chemical industry and is
currently a director of Sudarshan Chemical Industries Ltd, Pune, India.
Mr Ashok Ramnarayan Boob Managing Director
He holds a bachelor’s degree in chemical engineering from the Institute
of Chemical Technology, Mumbai. He has close to 25 years of
experience in the chemical industry and has previously worked as an
executive director at Mangalam Drugs and Organics Ltd.
Mr Siddhartha Ashok Sikchi Whole Time Director
He holds a master’s degree in science from the University of Manitoba,
Canada and a bachelor’s degree in technology from the Institute of
Chemical Technology, Mumbai. He has over 14 years of experience in
the chemical industry.
Mr Krishnakumar Ramnarayan
BoobWhole Time Director
He holds a bachelor's degree in pharmacy from the University of
Bombay, India. He has close to two decades of experience in the
chemical industry and has previously worked as a director at
Mangalam Drugs and Organics Ltd.
Mr Pratik Abhaykumar Bora CFO
He has been associated with CSTL since January 27, 2020 and has been
promoted to the post of Chief Financial Officer in February 2021. He
holds a bachelor’s degree in engineering (computer science and
engineering) from Dr. Babasaheb Ambedkar Marathwada University,
Aurangabad and a master’s degree in business administration (capital
markets) from Narsee Monjee Institute of Management Studies,
Mumbai.
- 8 - Monday 5th July 2021
This document is for private circulation, and must be read in conjunction with the disclaimer on the last page.
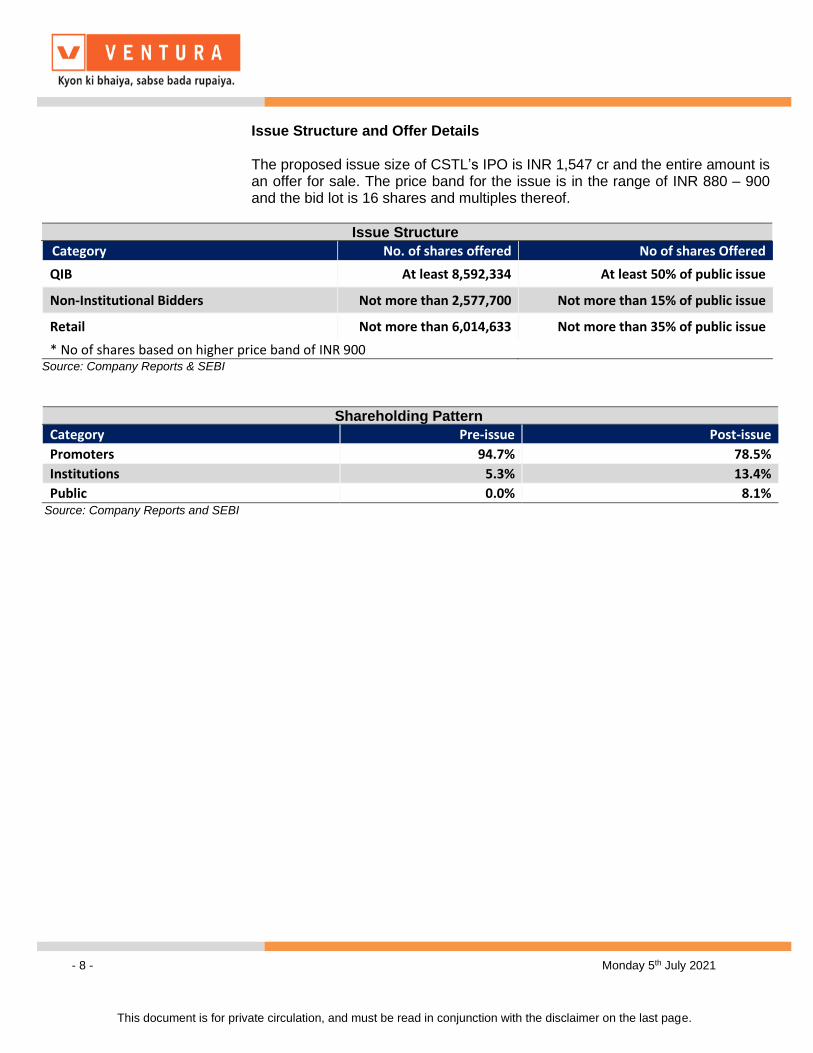
Issue Structure and Offer Details The proposed issue size of CSTL’s IPO is INR 1,547 cr and the entire amount is an offer for sale. The price band for the issue is in the range of INR 880 – 900 and the bid lot is 16 shares and multiples thereof.
Issue Structure
Category No. of shares offered No of shares Offered
QIB At least 8,592,334 At least 50% of public issue
Non-Institutional Bidders Not more than 2,577,700 Not more than 15% of public issue
Retail Not more than 6,014,633 Not more than 35% of public issue
* No of shares based on higher price band of INR 900 Source: Company Reports & SEBI
Shareholding Pattern
Category Pre-issue Post-issue
Promoters 94.7% 78.5%
Institutions 5.3% 13.4%
Public 0.0% 8.1% Source: Company Reports and SEBI
- 9 - Monday 5th July 2021
This document is for private circulation, and must be read in conjunction with the disclaimer on the last page.
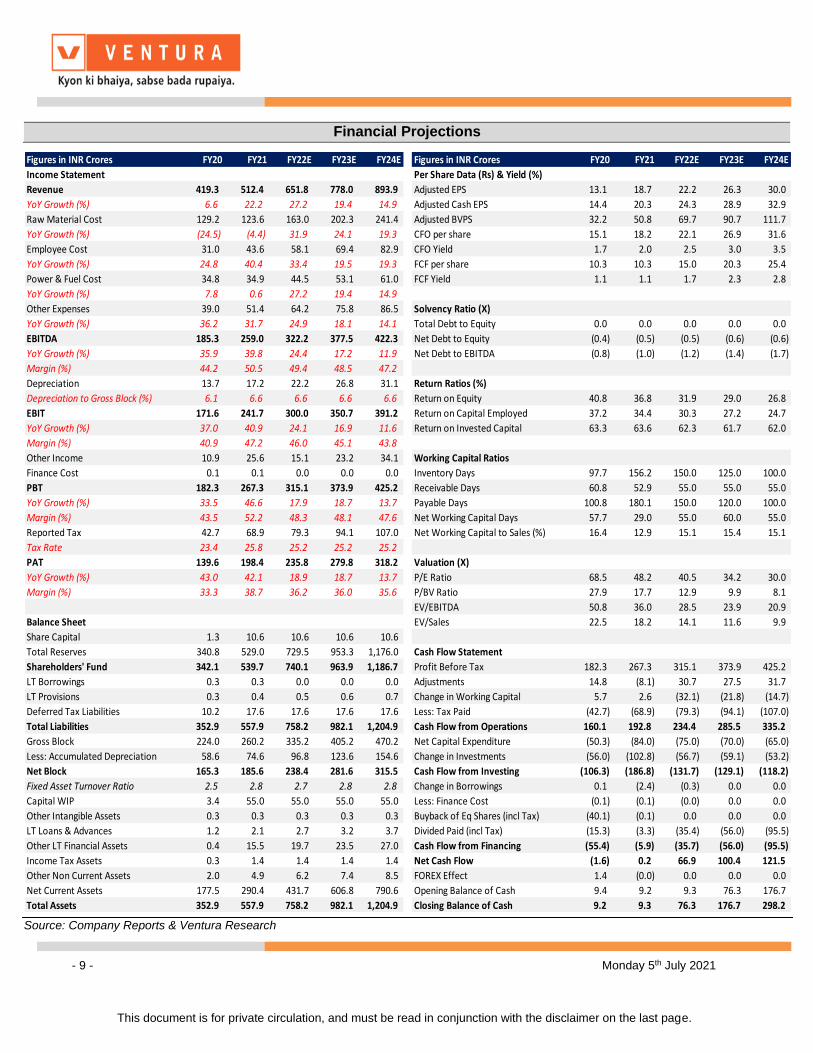
Financial Projections
Source: Company Reports & Ventura Research
Figures in INR Crores FY20 FY21 FY22E FY23E FY24E Figures in INR Crores FY20 FY21 FY22E FY23E FY24E
Income Statement Per Share Data (Rs) & Yield (%)
Revenue 419.3 512.4 651.8 778.0 893.9 Adjusted EPS 13.1 18.7 22.2 26.3 30.0
YoY Growth (%) 6.6 22.2 27.2 19.4 14.9 Adjusted Cash EPS 14.4 20.3 24.3 28.9 32.9
Raw Material Cost 129.2 123.6 163.0 202.3 241.4 Adjusted BVPS 32.2 50.8 69.7 90.7 111.7
YoY Growth (%) (24.5) (4.4) 31.9 24.1 19.3 CFO per share 15.1 18.2 22.1 26.9 31.6
Employee Cost 31.0 43.6 58.1 69.4 82.9 CFO Yield 1.7 2.0 2.5 3.0 3.5
YoY Growth (%) 24.8 40.4 33.4 19.5 19.3 FCF per share 10.3 10.3 15.0 20.3 25.4
Power & Fuel Cost 34.8 34.9 44.5 53.1 61.0 FCF Yield 1.1 1.1 1.7 2.3 2.8
YoY Growth (%) 7.8 0.6 27.2 19.4 14.9
Other Expenses 39.0 51.4 64.2 75.8 86.5 Solvency Ratio (X)
YoY Growth (%) 36.2 31.7 24.9 18.1 14.1 Total Debt to Equity 0.0 0.0 0.0 0.0 0.0
EBITDA 185.3 259.0 322.2 377.5 422.3 Net Debt to Equity (0.4) (0.5) (0.5) (0.6) (0.6)
YoY Growth (%) 35.9 39.8 24.4 17.2 11.9 Net Debt to EBITDA (0.8) (1.0) (1.2) (1.4) (1.7)
Margin (%) 44.2 50.5 49.4 48.5 47.2
Depreciation 13.7 17.2 22.2 26.8 31.1 Return Ratios (%)
Depreciation to Gross Block (%) 6.1 6.6 6.6 6.6 6.6 Return on Equity 40.8 36.8 31.9 29.0 26.8
EBIT 171.6 241.7 300.0 350.7 391.2 Return on Capital Employed 37.2 34.4 30.3 27.2 24.7
YoY Growth (%) 37.0 40.9 24.1 16.9 11.6 Return on Invested Capital 63.3 63.6 62.3 61.7 62.0
Margin (%) 40.9 47.2 46.0 45.1 43.8
Other Income 10.9 25.6 15.1 23.2 34.1 Working Capital Ratios
Finance Cost 0.1 0.1 0.0 0.0 0.0 Inventory Days 97.7 156.2 150.0 125.0 100.0
PBT 182.3 267.3 315.1 373.9 425.2 Receivable Days 60.8 52.9 55.0 55.0 55.0
YoY Growth (%) 33.5 46.6 17.9 18.7 13.7 Payable Days 100.8 180.1 150.0 120.0 100.0
Margin (%) 43.5 52.2 48.3 48.1 47.6 Net Working Capital Days 57.7 29.0 55.0 60.0 55.0
Reported Tax 42.7 68.9 79.3 94.1 107.0 Net Working Capital to Sales (%) 16.4 12.9 15.1 15.4 15.1
Tax Rate 23.4 25.8 25.2 25.2 25.2
PAT 139.6 198.4 235.8 279.8 318.2 Valuation (X)
YoY Growth (%) 43.0 42.1 18.9 18.7 13.7 P/E Ratio 68.5 48.2 40.5 34.2 30.0
Margin (%) 33.3 38.7 36.2 36.0 35.6 P/BV Ratio 27.9 17.7 12.9 9.9 8.1
EV/EBITDA 50.8 36.0 28.5 23.9 20.9
Balance Sheet EV/Sales 22.5 18.2 14.1 11.6 9.9
Share Capital 1.3 10.6 10.6 10.6 10.6
Total Reserves 340.8 529.0 729.5 953.3 1,176.0 Cash Flow Statement
Shareholders' Fund 342.1 539.7 740.1 963.9 1,186.7 Profit Before Tax 182.3 267.3 315.1 373.9 425.2
LT Borrowings 0.3 0.3 0.0 0.0 0.0 Adjustments 14.8 (8.1) 30.7 27.5 31.7
LT Provisions 0.3 0.4 0.5 0.6 0.7 Change in Working Capital 5.7 2.6 (32.1) (21.8) (14.7)
Deferred Tax Liabilities 10.2 17.6 17.6 17.6 17.6 Less: Tax Paid (42.7) (68.9) (79.3) (94.1) (107.0)
Total Liabilities 352.9 557.9 758.2 982.1 1,204.9 Cash Flow from Operations 160.1 192.8 234.4 285.5 335.2
Gross Block 224.0 260.2 335.2 405.2 470.2 Net Capital Expenditure (50.3) (84.0) (75.0) (70.0) (65.0)
Less: Accumulated Depreciation 58.6 74.6 96.8 123.6 154.6 Change in Investments (56.0) (102.8) (56.7) (59.1) (53.2)
Net Block 165.3 185.6 238.4 281.6 315.5 Cash Flow from Investing (106.3) (186.8) (131.7) (129.1) (118.2)
Fixed Asset Turnover Ratio 2.5 2.8 2.7 2.8 2.8 Change in Borrowings 0.1 (2.4) (0.3) 0.0 0.0
Capital WIP 3.4 55.0 55.0 55.0 55.0 Less: Finance Cost (0.1) (0.1) (0.0) 0.0 0.0
Other Intangible Assets 0.3 0.3 0.3 0.3 0.3 Buyback of Eq Shares (incl Tax) (40.1) (0.1) 0.0 0.0 0.0
LT Loans & Advances 1.2 2.1 2.7 3.2 3.7 Divided Paid (incl Tax) (15.3) (3.3) (35.4) (56.0) (95.5)
Other LT Financial Assets 0.4 15.5 19.7 23.5 27.0 Cash Flow from Financing (55.4) (5.9) (35.7) (56.0) (95.5)
Income Tax Assets 0.3 1.4 1.4 1.4 1.4 Net Cash Flow (1.6) 0.2 66.9 100.4 121.5
Other Non Current Assets 2.0 4.9 6.2 7.4 8.5 FOREX Effect 1.4 (0.0) 0.0 0.0 0.0
Net Current Assets 177.5 290.4 431.7 606.8 790.6 Opening Balance of Cash 9.4 9.2 9.3 76.3 176.7
Total Assets 352.9 557.9 758.2 982.1 1,204.9 Closing Balance of Cash 9.2 9.3 76.3 176.7 298.2
- 10 - Monday 5th July 2021
This document is for private circulation, and must be read in conjunction with the disclaimer on the last page.
Disclosures and Disclaimer
Ventura Securities Limited (VSL) is a SEBI registered intermediary offering broking, depository and portfolio management services to clients. VSL is member of BSE, NSE and MCX-SX. VSL is a depository participant of NSDL. VSL states that no disciplinary action whatsoever has been taken by SEBI against it in last five years except administrative warning issued in connection with technical and venial lapses observed while inspection of books of accounts and records. Ventura Commodities Limited, Ventura Guaranty Limited, Ventura Insurance Brokers Limited and Ventura Allied Services Private Limited are associates of VSL. Research Analyst (RA) involved in the preparation of this research report and VSL disclose that neither RA nor VSL nor its associates (i) have any financial interest in the company which is the subject matter of this research report (ii) holds ownership of one percent or more in the securities of subject company (iii) have any material conflict of interest at the time of publication of this research report (iv) have received any compensation from the subject company in the past twelve months (v) have managed or co-managed public offering of securities for the subject company in past twelve months (vi) have received any compensation for investment banking merchant banking or brokerage services from the subject company in the past twelve months (vii) have received any compensation for product or services from the subject company in the past twelve months (viii) have received any compensation or other benefits from the subject company or third party in connection with the research report. RA involved in the preparation of this research report discloses that he / she has not served as an officer, director or employee of the subject company. RA involved in the preparation of this research report and VSL discloses that they have not been engaged in the market making activity for the subject company. Our sales people, dealers, traders and other professionals may provide oral or written market commentary or trading strategies to our clients that reflect opinions that are contrary to the opinions expressed herein. We may have earlier issued or may issue in future reports on the companies covered herein with recommendations/ information inconsistent or different those made in this report. In reviewing this document, you should be aware that any or all of the foregoing, among other things, may give rise to or potential conflicts of interest. We may rely on information barriers, such as "Chinese Walls" to control the flow of information contained in one or more areas within us, or other areas, units, groups or affiliates of VSL. This report is for information purposes only and this document/material should not be construed as an offer to sell or the solicitation of an offer to buy, purchase or subscribe to any securities, and neither this document nor anything contained herein shall form the basis of or be relied upon in connection with any contract or commitment whatsoever. This document does not solicit any action based on the material contained herein. It is for the general information of the clients / prospective clients of VSL. VSL will not treat recipients as clients by virtue of their receiving this report. It does not constitute a personal recommendation or take into account the particular investment objectives, financial situations, or needs of clients / prospective clients. Similarly, this document does not have regard to the specific investment objectives, financial situation/circumstances and the particular needs of any specific person who may receive this document. The securities discussed in this report may not be suitable for all investors. The appropriateness of a particular investment or strategy will depend on an investor's individual circumstances and objectives. Persons who may receive this document should consider and independently evaluate whether it is suitable for his/ her/their particular circumstances and, if necessary, seek professional/financial advice. And such person shall be responsible for conducting his/her/their own investigation and analysis of the information contained or referred to in this document and of evaluating the merits and risks involved in the securities forming the subject matter of this document. The projections and forecasts described in this report were based upon a number of estimates and assumptions and are inherently subject to significant uncertainties and contingencies. Projections and forecasts are necessarily speculative in nature, and it can be expected that one or more of the estimates on which the projections and forecasts were based will not materialize or will vary significantly from actual results, and such variances will likely increase over time. All projections and forecasts described in this report have been prepared solely by the authors of this report independently of the Company. These projections and forecasts were not prepared with a view toward compliance with published guidelines or generally accepted accounting principles. No independent accountants have expressed an opinion or any other form of assurance on these projections or forecasts. You should not regard the inclusion of the projections and forecasts described herein as a representation or warranty by VSL, its associates, the authors of this report or any other person that these projections or forecasts or their underlying assumptions will be achieved. For these reasons, you should only consider the projections and forecasts described in this report after carefully evaluating all of the information in this report, including the assumptions underlying such projections and forecasts. The price and value of the investments referred to in this document/material and the income from them may go down as well as up, and investors may realize losses on any investments. Past performance is not a guide for future performance. Future returns are not guaranteed and a loss of original capital may occur. Actual results may differ materially from those set forth in projections. Forward-looking statements are not predictions and may be subject to change without notice. We do not provide tax advice to our clients, and all investors are strongly advised to consult regarding any potential investment. VSL, the RA involved in the preparation of this research report and its associates accept no liabilities for any loss or damage of any kind arising out of the use of this report. This report/document has been prepared by VSL, based upon information available to the public and sources, believed to be reliable. No representation or warranty, express or implied is made that it is accurate or complete. VSL has reviewed the report and, in so far as it includes current or historical information, it is believed to be reliable, although its accuracy and completeness cannot be guaranteed. The opinions expressed in this document/material are subject to change without notice and have no obligation to tell you when opinions or information in this report change. This report or recommendations or information contained herein do/does not constitute or purport to constitute investment advice in publicly accessible media and should not be reproduced, transmitted or published by the recipient. The report is for the use and consumption of the recipient only. This publication may not be distributed to the public used by the public media without the express written consent of VSL. This report or any portion hereof may not be printed, sold or distributed without the written consent of VSL. This document does not constitute an offer or invitation to subscribe for or purchase or deal in any securities and neither this document nor anything contained herein shall form the basis of any contract or commitment whatsoever. This document is strictly confidential and is being furnished to you solely for your information, may not be distributed to the press or other media and may not be reproduced or redistributed to any other person. The opinions and projections expressed herein are entirely those of the author and are given as part of the normal research activity of VSL and are given as of this date and are subject to change without notice. Any opinion estimate or projection herein constitutes a view as of the date of this report and there can be no assurance that future results or events will be consistent with any such opinions, estimate or projection. This document has not been prepared by or in conjunction with or on behalf of or at the instigation of, or by arrangement with the company or any of its directors or any other person. Information in this document must not be relied upon as having been authorized or approved by the company or its directors or any other person. Any opinions and projections contained herein are entirely those of the authors. None of the company or its directors or any other person accepts any liability whatsoever for any loss arising from any use of this document or its contents or otherwise arising in connection therewith. The information contained herein is not intended for publication or distribution or circulation in any manner whatsoever and any unauthorized reading, dissemination, distribution or copying of this communication is prohibited unless otherwise expressly authorized. Please ensure that you have read “Risk Disclosure Document for Capital Market and Derivatives Segments” as prescribed by Securities and Exchange Board of India before investing in Securities Market.
Ventura Securities Limited - SEBI Registration No.: INH000001634
Corporate Office: I-Think Techno Campus, 8th Floor, ‘B’ Wing, Off Pokhran Road No 2, Eastern Express Highway, Thane (W) – 400608
Related Documents