CDM-SSC-PDD (version 02) CDM – Executive Board page 1 CLEAN DEVELOPMENT MECHANISM SIMPLIFIED PROJECT DESIGN DOCUMENT FOR SMALL-SCALE PROJECT ACTIVITIES (SSC-CDM-PDD) Version 02 CONTENTS A. General description of the small-scale project activity B. Baseline methodology C. Duration of the project activity / Crediting period D. Monitoring methodology and plan E. Calculation of GHG emission reductions by sources F. Environmental impacts G. Stakeholders comments Annexes Annex 1: Information on participants in the project activity Annex 2: Information regarding public funding Annex 3: Emission factor calculation

Welcome message from author
This document is posted to help you gain knowledge. Please leave a comment to let me know what you think about it! Share it to your friends and learn new things together.
Transcript

CDM-SSC-PDD (version 02) CDM – Executive Board page 1
CLEAN DEVELOPMENT MECHANISM
SIMPLIFIED PROJECT DESIGN DOCUMENT FOR SMALL-SCALE PROJECT ACTIVITIES (SSC-CDM-PDD)
Version 02
CONTENTS
A. General description of the small-scale project activity B. Baseline methodology C. Duration of the project activity / Crediting period D. Monitoring methodology and plan E. Calculation of GHG emission reductions by sources F. Environmental impacts G. Stakeholders comments Annexes Annex 1: Information on participants in the project activity Annex 2: Information regarding public funding Annex 3: Emission factor calculation
CDM-SSC-PDD (version 02) CDM – Executive Board page 2
Revision history of this document
Version Number
Date Description and reason of revision
01 21 January 2003
Initial adoption
02 8 July 2005 • The Board agreed to revise the CDM SSC PDD to reflect guidance and clarifications provided by the Board since version 01 of this document.
• As a consequence, the guidelines for completing CDM SSC PDD have been revised accordingly to version 2. The latest version can be found at <http://cdm.unfccc.int/Reference/Documents>.

CDM-SSC-PDD (version 02) CDM – Executive Board page 3 SECTION A. General description of the small-scale project activity A.1. Title of the small-scale project activity: >> “Methane recovery from waste water generated from wheat straw wash at Paper manufacturing unit of
Shreyan Industries Limited (SIL)” Ahmedgarh, District Sangrur, Punjab. Version 01, April 04, 2006
A.2. Description of the small-scale project activity: >> Purpose of the Project Activity
The project activity is the installation of a high rate Upflow anaerobic sludge blanket (UASB) digester
which captures methane and burns it for generating steam in boilers. SIL’s paper manufacturing unit at
Ahmedgarh has an annual installed capacity of 33,000 Metric Tonnes (MT) of paper per annum. Paper
manufacturing being a water intensive process produces large quantity of waste water with high percentage
of chemical oxygen demand (COD). Waste stream from raw wheat straw wash which is having following
characteristics is treated in existing anaerobic lagoons followed by aerobic treatment.
Source of Waste Water Volume (m3/day) COD (mg/lit) Treatment
Wheat straw wash 2000 7000 Anaerobic
Treatment in anaerobic lagoon is open to atmosphere and releases methane. Installation of UASB digester
in project activity would capture methane produced due to anaerobic reactions and flare/burn it. The
effluent from digester would then be treated aerobically so as to reduce the COD further to meet the
statutory requirement of effluent discharge.
Project’s Contribution to Sustainable Development
The project activity construction and commissioning of a UASB digester and associated units will give
employment opportunities to labours during construction in vicinity of plant.
The existing open lagoon emanates large quantity of methane into the atmosphere which is a potent GHG.
Introduction of UASB digester in project activity would capture methane thereby mitigating emissions of
GHG.
The stench which emanates from open lagoon due to anaerobic decomposition of carbonaceous material
would get reduced after UASB digesters will be commissioned.
The project activity would supply biogas produced to boilers for generating heat and electricity thereby
reducing rice husk requirement in the manufacturing unit which is presently being used as fuel in boilers.

CDM-SSC-PDD (version 02) CDM – Executive Board page 4 Reduction in rice husk quantity to be procured would reduce operational cost of the boilers and prove
economical for manufacturing facility.
A.3. Project participants: >> Name of Party
involved
(host indicates a host
Private and/or public entity(ies)
project participants (as applicable)
Kindly indicate if the Party
involved wishes to be
considered as project
India (Host) Shreyan Industries Limited (SIL)
No
A.4. Technical description of the small-scale project activity: >> A.4.1. Location of the small-scale project activity: >> A.4.1.1. Host Party(ies): >> India A.4.1.2. Region/State/Province etc.: >> Punjab A.4.1.3. City/Town/Community etc: >> Ahmedgarh, Sangrur District A.4.1.4. Detail of physical location, including information allowing the unique identification of this small-scale project activity(ies): >> The project activity is located within premises of paper manufacturing unit of SIL at Ahmedgarh in
Sangrur district in Punjab. The nearest airport is located at Ludhiana which is about 35 Km from the plant
site. The nearest railway station at Ahmedgarh is about 3 Km from the plant. The geographic location of
the plant is depicted in the following map.

CDM-SSC-PDD (version 02) CDM – Executive Board page 5
A.4.2. Type and category(ies) and technology of the small-scale project activity: >> This project activity falls under Type –III “ other project activities” and category H “ Methane recovery “
as specified in indicative simplified baseline and monitoring methodologies for selected small scale CDM
project activity categories.
The project activity, installation of high rate UASB reactor reduces both emissions by sources by
recovering methane and directly emits less than 15 kilo tons of carbon di oxide equivalent per year and
thus qualify under the above mentioned project type and category.
The project activity would capture methane in UASB reactor and stores it in gas holders. In absence of the
project activity the methane generated in anaerobic lagoon would have been emitted into the atmosphere.
Direct emissions attributed due to the project activity include following
Ø CO2 emissions related to the power used by the project activity facilities.
Project Location

CDM-SSC-PDD (version 02) CDM – Executive Board page 6
(Emission factors for grid electricity has been calculated as described in category I.D)
Ø Methane emissions through inefficiency of the wastewater treatment and presence of degradable
organic carbon in treated wastewater.
Ø Methane emissions from the decay of the final sludge generated by the treatment systems.
Ø Methane fugitive emissions through inefficiencies in capture and flare systems.
Estimation of the project and baseline emissions has been done using “Methane recovery in waste water
treatment” Methodology Type-III.H. Version 01, 03 March 2006. Table given below depicts the results
Crediting Year Project Emissions tCO2 e
2006-2007 9,045
2007-2008 9,045
2008-2009 9,045
2009-2010 9,045
2010-2011 9,045
2011-2012 9,045
2012-2013 9,045
2013-2014 9,045 2014-2015 9,045
2015-2016 9,045
It is evident from table that project emissions over 10 year crediting period do not exceed 15 kilo
tons/annum, hence project activity qualify as a small scale activity under Type-III activities.
SIL after considering various technology for treating low and medium strength wastewater with high
volumetric loading rates decided to deploy Up Flow anaerobic sludge blanket reactor (UASB) for treating
their wheat straw wash stream.
Description
The wheat straw wash wastewater from wet cleaning plant will be sent through a filter to clarifier unit to
remove the inert materials. The clarified effluent shall then enter buffer tank (BT) to maintain pH of the
digester, temperature control, and constant feed to the digester. The digester which is a large Reinforced
Cement Concrete (RCC) tank is provided with a Gas, sludge and effluent separator. The effluent
distribution network is placed at the bottom of the digester for ensuring proper intermingling of the influent
with sludge and recycled effluent. Methane generated would be separated by gas separator and pass
through a foam trap to gas holder.
CDM-SSC-PDD (version 02) CDM – Executive Board page 7 A.4.3. Brief explanation of how the anthropogenic emissions of anthropogenic greenhouse gas (GHGs) by sources are to be reduced by the proposed small-scale project activity, including why the emission reductions would not occur in the absence of the proposed small-scale project activity, taking into account national and/or sectoral policies and circumstances: >> The project activity captures methane generated from anaerobic decomposition of wheat straw wash
effluent in UASB reactor that would otherwise be released into the atmosphere from open lagoons.
Although ministry of environment and forest, Government of India has stipulated standards for discharging
waste water, deploying advanced technologies like UASB is not mandatory by law to achieve standards. In
absence of project activity SIL would have continued treating its waste stream in existing anaerobic
lagoons
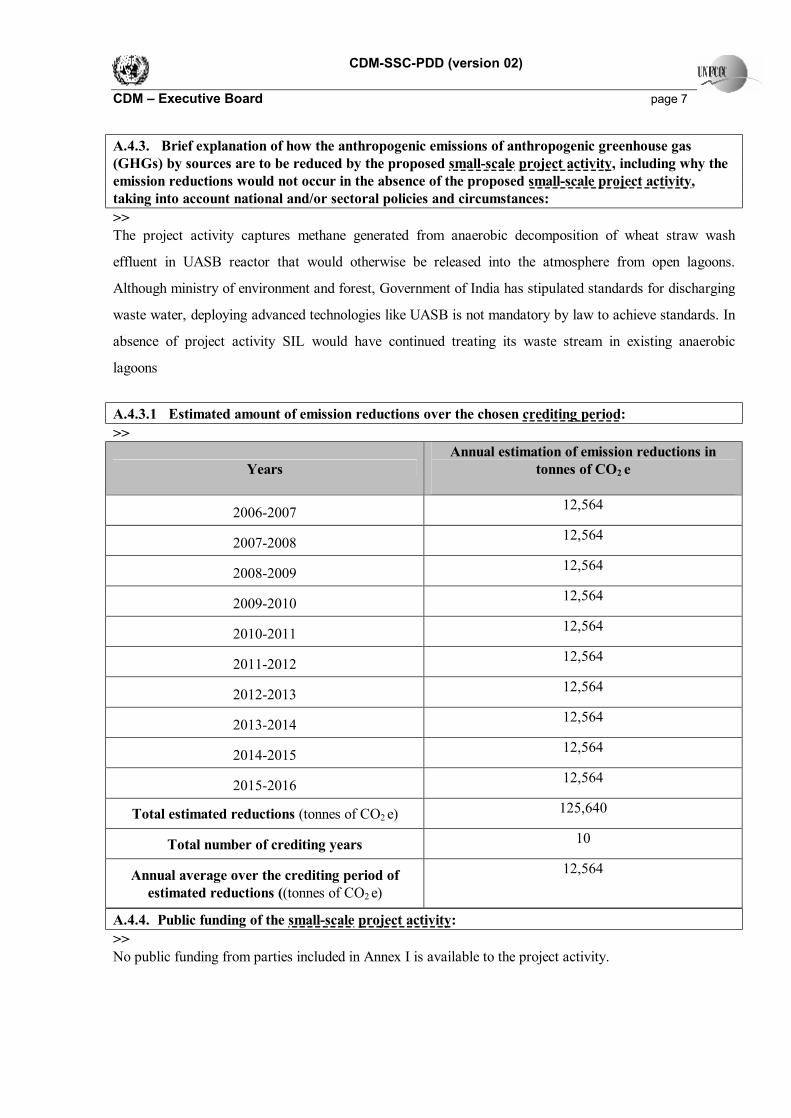
A.4.3.1 Estimated amount of emission reductions over the chosen crediting period: >>
Years Annual estimation of emission reductions in
tonnes of CO2 e
2006-2007 12,564
2007-2008 12,564
2008-2009 12,564
2009-2010 12,564
2010-2011 12,564
2011-2012 12,564
2012-2013 12,564
2013-2014 12,564
2014-2015 12,564
2015-2016 12,564
Total estimated reductions (tonnes of CO2 e) 125,640
Total number of crediting years 10
Annual average over the crediting period of estimated reductions ((tonnes of CO2 e)
12,564
A.4.4. Public funding of the small-scale project activity: >> No public funding from parties included in Annex I is available to the project activity.

CDM-SSC-PDD (version 02) CDM – Executive Board page 8 A.4.5. Confirmation that the small-scale project activity is not a debundled component of a larger project activity: >> As per appendix –c of the indicative simplified modalities and procedure for small scale CDM project
activity. A project activity is considered to be a debundled component of large project activity if there is a
registered small scale CDM project or request for registration by another small scale project activity
• By the same project participants;
• In the same project category and technology/measure; and
• Registered within the previous 2 years; and
• Whose project boundary is within 1 km of the project boundary of the proposed small-scale
activity at the closest point.
Since above points are not applicable in case of SIL project activity, it can be said that the small scale
project activity of SIL is not a debundled component of a large project activity, hence eligible to use
simplified baseline and monitoring methodology.
CDM-SSC-PDD (version 02) CDM – Executive Board page 9 SECTION B. Application of a baseline methodology: B.1. Title and reference of the approved baseline methodology applied to the small-scale project activity: >> Title: “Methane recovery in waste water treatment” Methodology Type-III.H. Version 01, 03 March 2006
Indicative simplified baseline and monitoring methodologies for selected small-scale CDM project activity categories. B.2 Project category applicable to the small-scale project activity: >> As per indicative simplified modalities and procedures for small-scale CDM project activities, project
activity of SIL falls under Type–III.H. “other project activities” and category “Methane recovery”. Project
activity fulfils applicability criteria illustrated in section A.4.2. above, and eligible to use methodology
Type-III.H. “Methane recovery in Waste Water”.
Baseline scenario for the project activity is existing anaerobic treatment system with out methane recovery
and combustion. Baseline emission scenario for the project activity consists of the methane generation
potential of the untreated wastewater and or sludge
BEy = MEy,ww,untreated + MEy,s,untreated
Where
MEy,ww,untreated methane emission potential of the untreated wastewater in the year “y” (tonnes)
MEy,ww,untreated = Qy,ww * CODy,ww,untreated * Bo,ww * MCFww,untreated
B.3. Description of how the anthropogenic emissions of GHG by sources are reduced below those that would have occurred in the absence of the registered small-scale CDM project activity: >> The project activity which would have estimated annual direct anthropogenic emissions of less than 15,000
tons of CO2 equivalent and would not be a debundled component of a large CDM project activity can use
Type III.H. simplified baseline and monitoring methodology listed in indicative simplified modalities and
procedures for small scale CDM project activity.
In absence of the project activity there would be continued emissions of methane into the atmosphere from
open lagoon. Although the project activity faces barriers illustrated in paragraphs below, SIL has been
implementing the project activity considering benefits that may accrue as a result of registration of the
project activity as CDM project.

CDM-SSC-PDD (version 02) CDM – Executive Board page 10 Barriers to the project activity
Technological Barrier
Methane generation in the UASB digester is dependent on the quantum of raw COD and subjected to
ambient and wastewater temperature and their variations. The anaerobic bacterial culture in the digester
gets adversely affected with even 3-50C fluctuation in the reactor. Performance of UASB digester is highly
dependent upon the growth of bacterial film in the reactor. In a country like India where high seasonal
temperature variation persist installation of a temperature sensitive technology may prove risky. Biogas
generated in digesters mainly consist of methane, presence of hydrogen sulphide in the biogas which gets
generated in anaerobic conditions makes biogas corrosive. Desulphurisation is required to remove corrosive
hydrogen sulphide from biogas which would otherwise corrode digester, gasholders and boilers. Installation
of a desulphurisation unit incurs additional expenses which eventually reduces viability of a UASB
technology.
Barrier due to prevailing Practice
The UASB technology was introduced in India in late eighties for treating waste water of high COD
content. Disadvantages enumerated below associated with its operations have prevented its widespread use
in Industry in India.
Ø Requirement of secondary treatment to bring down the COD of waste to stipulated discharge
standards.
Ø The effluent from UASB is highly Anoxic and it exerts high immediate oxygen demand (IOD) on
the receiving water body or land.
The project activity is first of its kind in India wherein waste water from wheat straw wash would be
treated in a UASB digester and gas liberated would be recovered and burnt. No paper unit in the state has
commissioned high rate UASB digesters so far.
Other Barrier
Resource barrier
SIL’s main activity is paper manufacturing and it has considerable experience and repute in this field in the
region. Employees of SIL are experienced and skilled in paper manufacturing and do not have experience in
waste water treatment technologies like UASB. Commissioning of UASB digester at paper manufacturing
unit for effluent treatment requires training to be imparted to SIL employee for operating UASB digester.
Since, UASB technology is not a widespread technology in India there is lack of trained manpower for
manning digester. Lack of trained manpower may prove a barrier in implementing the project activity.
CDM-SSC-PDD (version 02) CDM – Executive Board page 11 B.4. Description of how the definition of the project boundary related to the baseline methodology selected is applied to the small-scale project activity: >> The project boundary for SIL activity include physical and geographical site of Effluent stream, UASB
digester, Gas holders and boiler where the gas will burn. Anthropogenic baseline emissions included in the
project boundary are emission from anaerobic lagoon which would have been there in absence of the
project activity. Project emissions included in the project boundary are as follows:
(i) CO2 emissions related to the power used by the project activity facilities.
Emission factors for grid electricity or diesel fuel use as the case may be shall be calculated as described in
category I.D.
(ii) Methane emissions through inefficiency of the wastewater treatment and presence of degradable organic
carbon in treated wastewater.
(iii) Methane emissions from the decay of the final sludge generated by the treatment systems.
(iv) Methane fugitive emissions through inefficiencies in capture and flare systems.
(v) Methane emissions resulting from dissolved methane in the treated wastewater effluent.
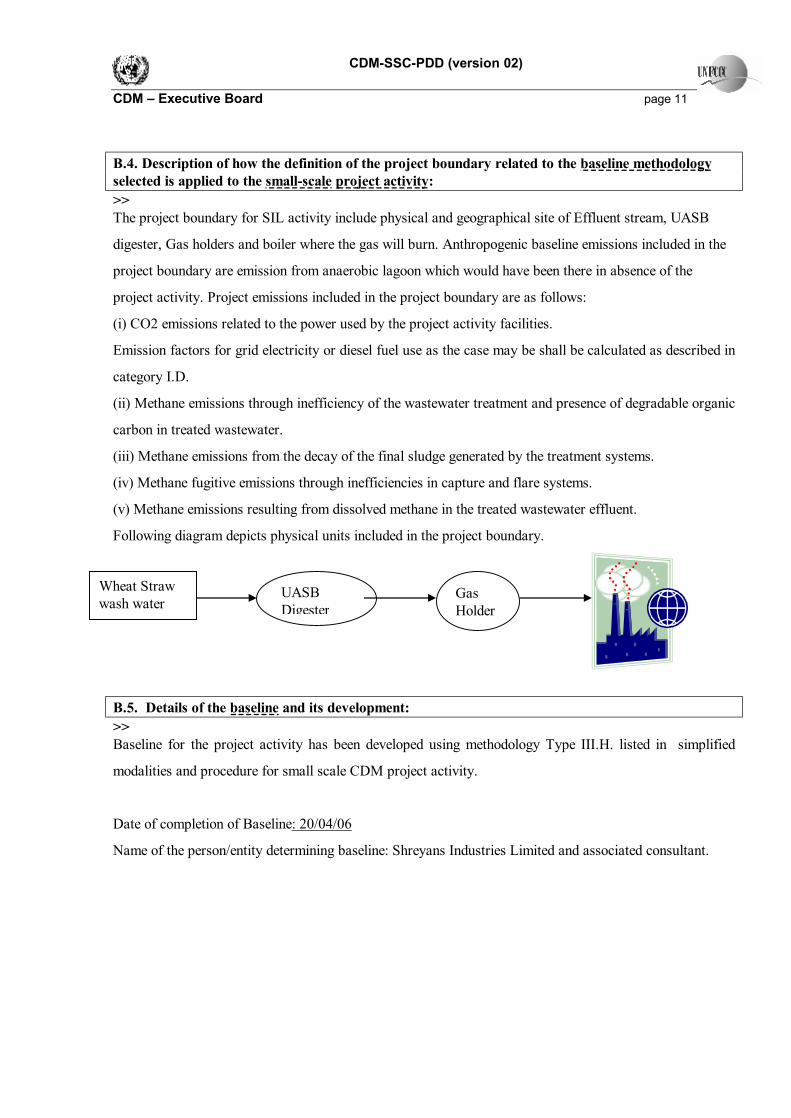
Following diagram depicts physical units included in the project boundary.
B.5. Details of the baseline and its development: >> Baseline for the project activity has been developed using methodology Type III.H. listed in simplified
modalities and procedure for small scale CDM project activity.
Date of completion of Baseline: 20/04/06
Name of the person/entity determining baseline: Shreyans Industries Limited and associated consultant.
UASB Digester
Wheat Straw wash water
Gas Holder

CDM-SSC-PDD (version 02) CDM – Executive Board page 12 SECTION C. Duration of the project activity / Crediting period: C.1. Duration of the small-scale project activity: >> C.1.1. Starting date of the small-scale project activity: >> November 2005 C.1.2. Expected operational lifetime of the small-scale project activity: >> 25 Years C.2. Choice of crediting period and related information: >> The project activity will use the fixed crediting period. C.2.1. Renewable crediting period: >> Not selected C.2.1.1. Starting date of the first crediting period: >> Not selected C.2.1.2. Length of the first crediting period: >> Not selected C.2.2. Fixed crediting period: >> 10 years C.2.2.1. Starting date: >> 01/09/2006 C.2.2.2. Length: >> 10 years

CDM-SSC-PDD (version 02) CDM – Executive Board page 13 SECTION D. Application of a monitoring methodology and plan: >> D.1. Name and reference of approved monitoring methodology applied to the small-scale project activity: >> Title: “Monitoring Methodology for Methane Recovery from Waste Water” Type. III.H.
Reference: Monitoring plan for the project activity has been prepared according to the guidelines given in
paragraph 8, 9, 10 and 11 of Type.III.H. simplified baseline and monitoring methodology.
Monitoring plan for the project activity includes flow of waste water entering digester, inlet COD, Outlet
COD and methane recovered fuelled/flared in the project activity.
D.2. Justification of the choice of the methodology and why it is applicable to the small-scale project activity: >> This project activity falls under Type –III “ other project activities” and category H “ Methane recovery “
as specified in indicative simplified baseline and monitoring methodologies for selected small scale CDM
project activity categories.
The project activity, installation of high rate UASB reactor reduces both emissions by sources by
recovering methane and directly emits less than 15 kilo tons of carbon di oxide equivalent per year. It is
also proved above in section A.4.5.that project activity of SIL is not a debundled component of large
project activity thus qualify under the above mentioned project type and category.
D.3 Data to be monitored: >> Data to be monitored for calculating project and Baseline emissions Sl.No. Data Variable Data unit Source
of data Measured (m), calculated © or estimated (e)
Recording frequency
How will the data be archived? (electronic/ paper)
Comment
D.3.1 Flow Rate M3/day Plant M Daily CP+2Yr. Paper
Baseline emission calculation
D.3.2 COD (inlet) Mg/litre Lab M Daily CP+2Yr. Paper
Baseline emission calculation
D.3.3 COD (outlet) Mg/litre Lab M Daily CP+2Yr. Paper
Baseline emission calculation
D.3.4 Electricity MU Plant M Daily CP+2Yr. Baseline emission

CDM-SSC-PDD (version 02) CDM – Executive Board page 14
consumption Paper calculation D.3.5 Temperature
of gas 0C Plant M Daily CP+2Yr.
Paper Baseline emission calculation
D.3.6 Pressure of gas kg/Cm2 Plant M Daily CP+2Yr. Paper
Baseline emission calculation
D.3.7 Volume of gas M3 Plant M Daily CP+2Yr. Paper
Baseline emission calculation
D.3.8 Quantity of Gas
Tons Plant C Daily CP+2Yr. Paper
Baseline emission calculation
D.3.9 Methane Quantity generated
Tons Plant C Daily CP+2Yr. Paper
Baseline emission calculation
D.3.10 Biogas fuelled/ flared
Tons Plant M Daily CP+2Yr. Paper
Baseline emission calculation
D.4. Qualitative explanation of how quality control (QC) and quality assurance (QA) procedures are undertaken: >> Quality control (QC) and quality assurance (QA) procedures would be undertaken for data to be monitored. (data items in tables contained in section D.3 (a to b) above, as applicable)
Data
Uncertainty level of data (High/Medium/Low)
Are QA/QC procedures planned for these data?
Explain QA/QC procedures planned for these data, or why such procedures are not necessary.
D.3.1 Low Yes Flow rate measurement is essential for calculation of both baseline and project emissions. Flow meters complying with standards should be used for monitoring.
D.3.2 Medium Yes COD (Inlet) is a measure of methane generation potential of untreated waste water and is essential for calculating both baseline and project emissions. Analysis will be done in laboratory for measurement. Standard procedures would be used for measurement.
D.3.3 Medium Yes COD (outlet) is a measure of methane generation potential of treated waste water from digester and is essential for calculating project emissions. Analysis will be done in laboratory for measurement. Standard procedures would be used for measurement.
D.3.4 Low Yes Electricity consumption would be measured by meters provided at plant.
D.3.5 Low Yes Temperature of gas is to be monitored for calculating the weight of biogas produced.
D.3.6 Low Yes Pressure of gas is to be monitored for calculating the weight of biogas produced.
D.3.7 Low Yes Pressure of gas is to be monitored for calculating the weight of biogas produced.
D.3.8 Medium No Quantity of gas produced is computed from its volume, temperature and pressure condition.

CDM-SSC-PDD (version 02) CDM – Executive Board page 15 Data
Uncertainty level of data (High/Medium/Low)
Are QA/QC procedures planned for these data?
Explain QA/QC procedures planned for these data, or why such procedures are not necessary.
D.3.9 Medium Yes Methane quantity is computed from the fraction of methane present in Biogas. Methane fraction is to be calculated in laboratory.
D.3.10 Low No Quantity of Biogas fuelled or flared gives an estimate of methane quantity flared.
D.5. Please describe briefly the operational and management structure that the project participant(s) will implement in order to monitor emission reductions and any leakage effects generated by the project activity: >> SIL has planned an operation and management structure for the project activity with roles and
responsibilities of individuals defined. The management would be responsible for monitoring and reporting
of the parameters involved. All parameters would be monitored and reported in a transparent manner so
that they can be easily verified by DOE.
SIL constituted a CDM monitoring team which would be responsible for the overall monitoring and
management of the projects. CDM team comprises of monitoring supervisors having responsibility of
operating and monitoring the plant. Parameters involved in the project activity at Digester, Lab and
Cogeneration. Supervisor at cogeneration unit would be responsible for monitoring parameters related to
co-generation”, whereas supervisors at lab and digesters would take care of monitoring at lab and digesters
respectively.
Daily report of the parameters monitored would be reported to CDM controller for verification. Chairman
CDM monitoring committee would be the in charge of CDM cell and report to ED & CEO who would
review the reports on monthly basis and subsequently send reports to the Managing Director. Management
structure for monitoring and reporting is presented in following block diagram.
Managing Director
ED & CEO
Chairman CDM monitoring committee
CDM controller
Monitoring Team

CDM-SSC-PDD (version 02) CDM – Executive Board page 16
D.6. Name of person/entity determining the monitoring methodology: >> The monitoring methodology was prepared by Shreyans Industries Limited whose contact information is
given in annexure-1. SIL is the project participant for this project activity.

CDM-SSC-PDD (version 02) CDM – Executive Board page 17 SECTION E.: Estimation of GHG emissions by sources: E.1. Formulae used: >> E.1.1 Selected formulae as provided in appendix B: >> GHG emission reduction for the project activity has been calculated using following formula
ERy = BEy – PEy – Leakages
Where
ERy = emission reductions in year ‘y’
BEy = Baseline emissions PEy = Emissions due to project activity in year ‘y’
E.1.2 Description of formulae when not provided in appendix B: >> E.1.2.1 Describe the formulae used to estimate anthropogenic emissions by sources of GHGs due to the project activity within the project boundary: >> GHG emissions due to the project activity within the project boundary include direct emissions from the
following sources.
(i) CO2 emissions related to the power used by the project activity facilities.
Emission factors for grid electricity or diesel fuel use as the case may be shall be calculated as described in
category I.D.
(ii) Methane emissions through inefficiency of the wastewater treatment and presence of degradable organic
carbon in treated wastewater.
(iii) Methane emissions from the decay of the final sludge generated by the treatment systems.
(iv) Methane fugitive emissions through inefficiencies in capture and flare systems.
(v) Methane emissions resulting from dissolved methane in the treated wastewater effluent. PEy = PEy, power + PEy,ww,treated + PEy,s,final + PEy,fugitive + PEy,dissolved
where:
PEy: project activity emissions in the year “y” (tonnes of CO2 equivalent)
PEy,power :emissions through electricity or diesel consumption in the year “y”
PEy,ww,treated :emissions through degradable organic carbon in treated wastewater in year “y”

CDM-SSC-PDD (version 02) CDM – Executive Board page 18 PEy,s,final: emissions through anaerobic decay of the final sludge produced in the year “y”. If the sludge is
controlled combusted, disposed in a landfill with methane recovery, or used for soil application, this term can be
neglected, and the destiny of the final sludge will be monitored during the crediting period.
PEy,fugitive: emissions through methane release in capture and flare systems in year “y”.
PEy,dissolved: emissions through dissolved methane in treated wastewater in year “y”
PEy, power = EF*EC
Where:
EF1 = Emission factor calculated tons of CO2/GwH
EC = Electricity consumed per year in Million unit
PEy,ww,treated = Qy,ww * CODy,ww,treated * Bo,ww * MCFww * GWP_CH4
where:
Qy,ww: volume of wastewater treated in the year “y” (m3)
CODy,ww,treated: chemical oxygen demand of the treated wastewater in the year “y” (tonnes/m3)
Bo,ww: methane generation capacity of the treated wastewater (IPCC default value of 0.25 kg
CH4/kg.COD)
MCFww,treated: methane conversion factor for the anaerobic decay of wastewater. (default value of 0.5 is
suggested)2
GWP_CH4 Global Warming Potential for CH4 (value of 21 is used)
PEy,s,final = Sy,final * DOCy,s,final * DOCF * F * 16/12 * GWP_CH4
where:
PEy,s,final : Methane emissions from the anaerobic decay of the final sludge generated in the wastewater system in
the year “y” (tonnes of CO2 equivalent)
Sy,final : Amount of final sludge generated by the wastewater treatment in the year y (tonnes).
DOCy,s,final : Degradable organic content of the final sludge generated by the wastewater treatment in the year y
(mass fraction). It can be measured by sampling and analysis of the sludge produced, or the IPCC default value
for solid wastes of 0.3 is used.
1 Refer Baseline information provided in Annexure-3 for emission factor calculation. 2 IPCC default values are 1.0 for anaerobic, and zero for aerobic systems. Here it is assumed that after the discharge
PEy, power = 957 X 0.235 = 225 tons
PEy,ww,treated = 700000 X 0.0026 X 0.25 X 0.5 X 21 = 4778 tons

CDM-SSC-PDD (version 02) CDM – Executive Board page 19 DOCF: Fraction of DOC dissimilated to biogas (IPCC default value is 0.77).
F: Fraction of CH4 in landfill gas (IPCC default is 0.5).
PEy,fugitive = PEy,fugitive,ww + PEy,fugitive,s
where:
PEy,fugitive,ww Fugitive emissions through capture and flare inefficiencies in the anaerobic wastewater treatment in
the year “y” (tonnes of CO2 equivalent)
PEy,fugitive,s Fugitive emissions through capture and flare inefficiencies in the anaerobic sludge treatment in the
year “y” (tonnes of CO2 equivalent)
PEy,fugitive,ww = (1 – CFEww) * MEy,ww,untreated * GWP_CH4
where:
CFEww capture and flare efficiency of the methane recovery and combustion equipment in the wastewater
treatment (a default value of 0.9 shall be used, given no other appropriate value)
MEy,ww,untreated methane emission potential of the untreated wastewater in the year “y” (tonnes)
MEy,ww,untreated = Qy,ww * CODy,ww,untreated * Bo,ww * MCFww,untreated
where:
CODy,ww,untreated Chemical oxygen demand of the wastewater entering the anaerobic treatment reactor/system with
methane capture in the year “y” (tonnes/m3)
MCFww,untreated methane conversion factor for the anaerobic decay of the untreated wastewater (IPCC default
value of 1.0 for anaerobic systems. If the untreated wastewater is discharged to the environment, the default
value of 0.5 is suggested).
PEy,dissolved = Qy,ww * [CH4]y,ww,treated * GWP_CH4
where:
of the wastewater to a river, lake, sea, etc., half of the degradable organic carbon will decay anaerobically.
PEy,s,final = 0 tons
MEy,ww,untreated = 700000 X 0.007 X 0.25 X 1 = 1225 tons
PEy,fugitive,ww = (1-0.9) X 1225 X 21 = 2573 tons

CDM-SSC-PDD (version 02) CDM – Executive Board page 20 [CH4]y,ww,treated dissolved methane content in the treated wastewater (tonnes/m3). In aerobic wastewater treatment
default value is zero, in anaerobic treatment it can be measured, or a default value of 10e-4 tonnes/m3 can be
used.
E.1.2.2 Describe the formulae used to estimate leakage due to the project activity, where required, for the applicable project category in appendix B of the simplified modalities and procedures for small-scale CDM project activities >> There is no transfer of equipments involved in SIL project activity hence leakages are not considered. E.1.2.3 The sum of E.1.2.1 and E.1.2.2 represents the small-scale project activity emissions: >> Project activity emissions3 = 9045 tons of CO2e equivalent per annum E.1.2.4 Describe the formulae used to estimate the anthropogenic emissions by sources of GHGs in the baseline using the baseline methodology for the applicable project category in appendix B of the simplified modalities and procedures for small-scale CDM project activities: >> Baseline emissions for the project activity include methane generation emission potential of untreated
wastewater and or sludge.
BEy = MEy,ww,untreated + MEy,s,untreated
Where:
BEy = Baseline emissions in year ‘y’
MEy,ww,untreated : Methane generation potential of untreated wastewater ‘y’
MEy,s,untreated : Methane generation potential of untreated sludge ‘y’
MEy,ww,untreated = Qy,ww * CODy,ww,untreated * Bo,ww * MCFww,untreated * GWP-CH4
where:
CODy,ww,untreated : Chemical oxygen demand of the wastewater entering the anaerobic treatment reactor/system
with methane capture in the year “y” (tonnes/m3)
MCFww,untreated : methane conversion factor for the anaerobic decay of the untreated wastewater (IPCC default
value of 1.0 for anaerobic systems. If the untreated wastewater is discharged to the environment, the default
value of 0.5 is suggested).
PEy,dissolved = 700000 X 10e-4 X 21 = 1470 tons
MEy,ww,untreated = 700000 X 0.007 X 0.21 X 1 X 21 = 21609 tons
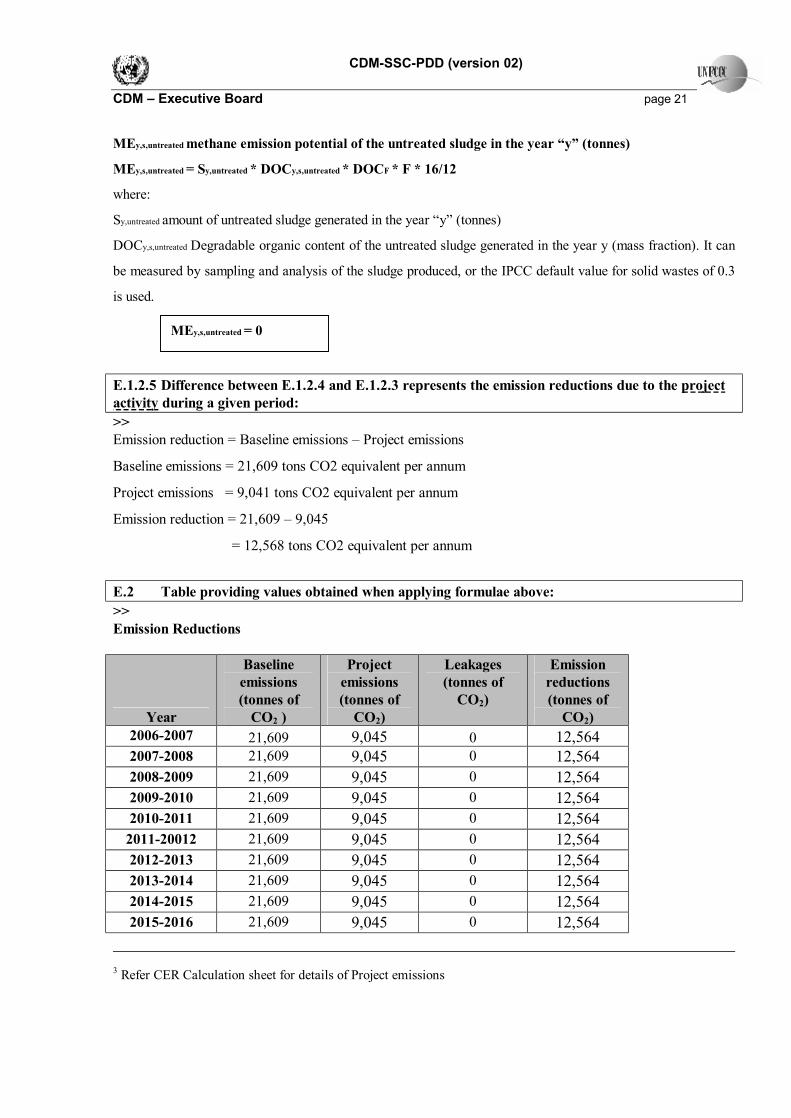
CDM-SSC-PDD (version 02) CDM – Executive Board page 21 MEy,s,untreated methane emission potential of the untreated sludge in the year “y” (tonnes)
MEy,s,untreated = Sy,untreated * DOCy,s,untreated * DOCF * F * 16/12
where:
Sy,untreated amount of untreated sludge generated in the year “y” (tonnes)
DOCy,s,untreated Degradable organic content of the untreated sludge generated in the year y (mass fraction). It can
be measured by sampling and analysis of the sludge produced, or the IPCC default value for solid wastes of 0.3
is used.
E.1.2.5 Difference between E.1.2.4 and E.1.2.3 represents the emission reductions due to the project activity during a given period: >> Emission reduction = Baseline emissions – Project emissions
Baseline emissions = 21,609 tons CO2 equivalent per annum
Project emissions = 9,041 tons CO2 equivalent per annum
Emission reduction = 21,609 – 9,045
= 12,568 tons CO2 equivalent per annum
E.2 Table providing values obtained when applying formulae above: >> Emission Reductions
Year
Baseline emissions (tonnes of
CO2 )
Project emissions (tonnes of
CO2)
Leakages (tonnes of
CO2)
Emission reductions (tonnes of
CO2) 2006-2007 21,609 9,045 0 12,564 2007-2008 21,609 9,045 0 12,564 2008-2009 21,609 9,045 0 12,564 2009-2010 21,609 9,045 0 12,564 2010-2011 21,609 9,045 0 12,564
2011-20012 21,609 9,045 0 12,564 2012-2013 21,609 9,045 0 12,564 2013-2014 21,609 9,045 0 12,564 2014-2015 21,609 9,045 0 12,564 2015-2016 21,609 9,045 0 12,564
3 Refer CER Calculation sheet for details of Project emissions
MEy,s,untreated = 0
CDM-SSC-PDD (version 02) CDM – Executive Board page 22
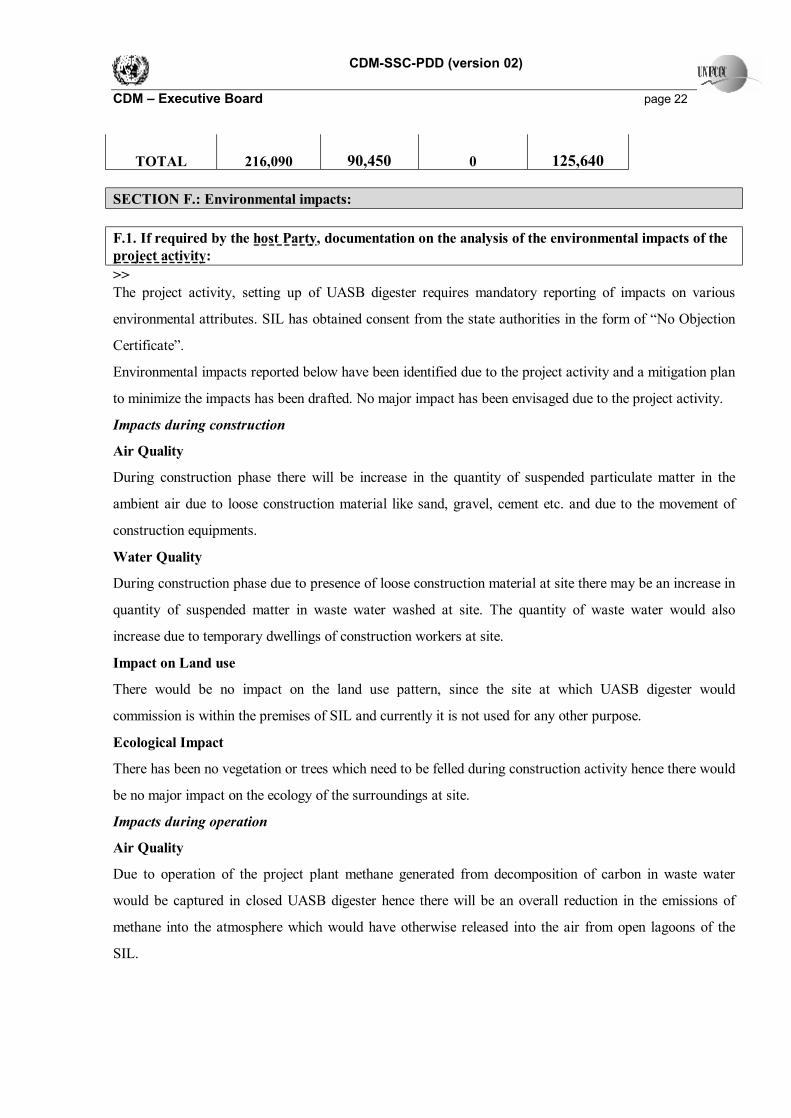
TOTAL 216,090 90,450 0 125,640
SECTION F.: Environmental impacts: F.1. If required by the host Party, documentation on the analysis of the environmental impacts of the project activity: >> The project activity, setting up of UASB digester requires mandatory reporting of impacts on various
environmental attributes. SIL has obtained consent from the state authorities in the form of “No Objection
Certificate”.
Environmental impacts reported below have been identified due to the project activity and a mitigation plan
to minimize the impacts has been drafted. No major impact has been envisaged due to the project activity.
Impacts during construction
Air Quality
During construction phase there will be increase in the quantity of suspended particulate matter in the
ambient air due to loose construction material like sand, gravel, cement etc. and due to the movement of
construction equipments.
Water Quality
During construction phase due to presence of loose construction material at site there may be an increase in
quantity of suspended matter in waste water washed at site. The quantity of waste water would also
increase due to temporary dwellings of construction workers at site.
Impact on Land use
There would be no impact on the land use pattern, since the site at which UASB digester would
commission is within the premises of SIL and currently it is not used for any other purpose.
Ecological Impact
There has been no vegetation or trees which need to be felled during construction activity hence there would
be no major impact on the ecology of the surroundings at site.
Impacts during operation
Air Quality
Due to operation of the project plant methane generated from decomposition of carbon in waste water
would be captured in closed UASB digester hence there will be an overall reduction in the emissions of
methane into the atmosphere which would have otherwise released into the air from open lagoons of the
SIL.
CDM-SSC-PDD (version 02) CDM – Executive Board page 23 Water Quality
Due to operation of UASB digester there will be reduction in Biological Oxygen Demand (BOD) and COD
of final effluent in comparison to what it would be, had the treatment of waste water been done in open
lagoon.
Impact on Land use
There would be no impact on land use at site due to operation of UASB digester.
Ecological Impact
There would be no impact on the ecology due to operation of the UASB digester. Environmental Management Plan Although no major environmental impact has been envisaged due to the project activity following plan has
been made to mitigate the minor impacts.
Ø Construction Phase impacts are temporary and limited during construction period only.
Ø Temporary dwellings for construction worker at site should be provided with temporary lavatories
so that waste water from site can be treated along with other waste water.
Ø During operation phase regular monitoring of BOD and COD of effluent should be done so as to
ensure that final effluent confirms with discharge standards stipulated by state pollution control
board.
Ø Plantation would be done along the premises of Industrial unit.

CDM-SSC-PDD (version 02) CDM – Executive Board page 24 SECTION G. Stakeholders’ comments: G.1. Brief description of how comments by local stakeholders have been invited and compiled: >> Stakeholder identified for the project activity include following:
Ø Local residents
Ø Employees of SIL
Ø Local municipality
SIL organised a meeting at its premises to brief local stakeholders identified above about the project
activity. Local language was used to communicate with stakeholders and project activity was briefed by
SIL officials such that they can understand the activity and its associated impacts simply.
G.2. Summary of the comments received: >> SIL briefed stakeholders identified above, about the project activity in a meeting organized at its premises
in Ahmedgarh, Sangrur. List of participants attended the meeting and minutes of the meeting is available
with SIL for verification by DOE.
G.3. Report on how due account was taken of any comments received: >> There were no major comments received from stakeholders on the project activity. Minutes of meeting were
compiled and copy of it has been sent to human resource, R&D and other concerned departments of SIL.
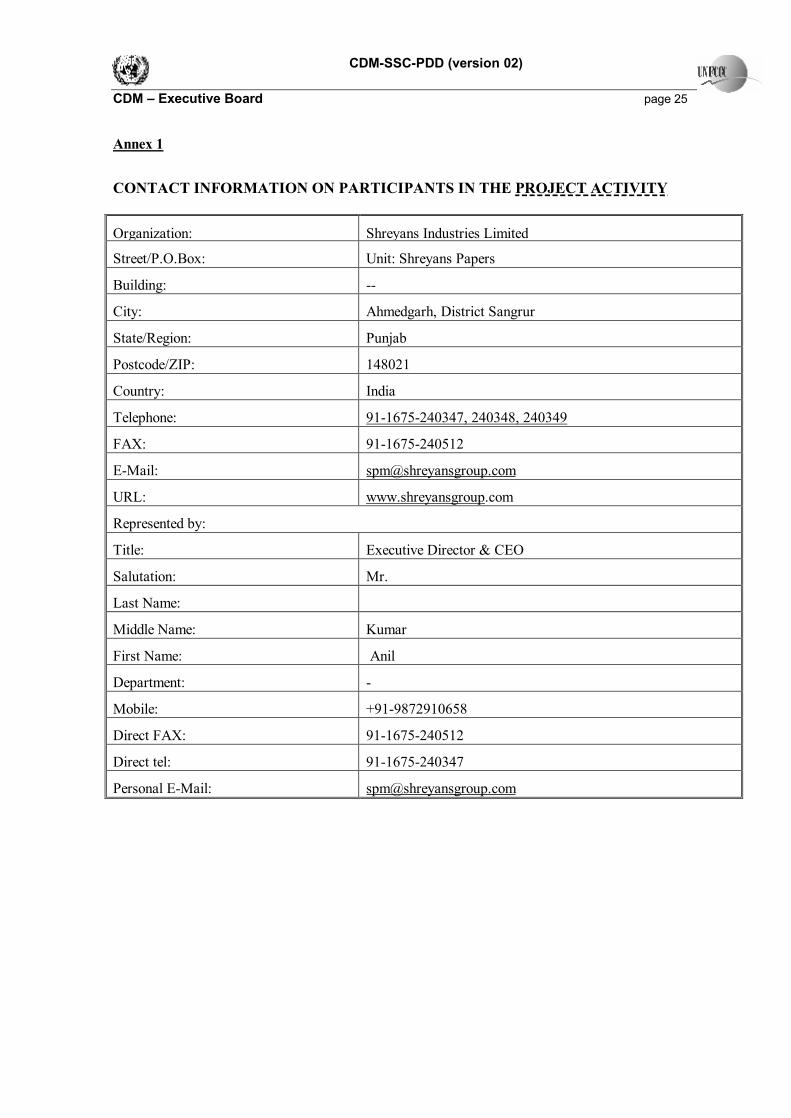
CDM-SSC-PDD (version 02) CDM – Executive Board page 25 Annex 1
CONTACT INFORMATION ON PARTICIPANTS IN THE PROJECT ACTIVITY
Organization: Shreyans Industries Limited
Street/P.O.Box: Unit: Shreyans Papers
Building: --
City: Ahmedgarh, District Sangrur
State/Region: Punjab
Postcode/ZIP: 148021
Country: India
Telephone: 91-1675-240347, 240348, 240349
FAX: 91-1675-240512
E-Mail: [email protected]
URL: www.shreyansgroup.com
Represented by:
Title: Executive Director & CEO
Salutation: Mr.
Last Name:
Middle Name: Kumar
First Name: Anil
Department: -
Mobile: +91-9872910658
Direct FAX: 91-1675-240512
Direct tel: 91-1675-240347
Personal E-Mail: [email protected]

CDM-SSC-PDD (version 02) CDM – Executive Board page 26 Annex 2 INFORMATION REGARDING PUBLIC FUNDING
No public funding from Annexure-I country has been involved in the project activity.
CDM-SSC-PDD (version 02) CDM – Executive Board page 27 Annexure-3 Emission Factor Calculations
Baseline data
Carbon emission factor of grid
The emission coefficient for the electricity displaced is calculated in accordance with provisions of
paragraph 9 of Type I Category D of ‘Indicative simplified baseline and monitoring methodologies for
selected small-scale CDM project activity categories - version 08 - 03 march 2006’. Northern region’s
present generation mix, thermal efficiency, and emission co-efficient are used to estimate the net carbon
intensity/baseline factor of the chosen grid.
The emission coefficient (measured in kg CO2equ/kWh) is calculated in a transparent and conservative
manner as:
(a) The average of the “approximate operating margin” and the “build margin” (or combined
margin)
OR
(b) The weighted average emissions (in kg CO2equ/kWh) of the current generation mix.
Complete analysis of the electricity generation has been carried out for the calculation of the emission
coefficient as per paragraph 9 (a) given above.
Combined Margin
The baseline methodology suggests that the project activity will have an effect on both the operating margin (i.e. the present power generation sources of the grid, weighted according to the actual participation in the grid mix) and the build margin (i.e. weighted average emissions of recent capacity additions) of the selected grid and the baseline emission factor would therefore incorporate an average of both these elements.
Operating Margin
The “approximate operating margin” is defined as the weighted average emissions (in kg CO2equ/kWh)
of all generating sources serving the system, excluding hydro, geothermal, wind, low-cost biomass,
nuclear and solar generation;
The project activity would have some effect on the operating margin of the Northern region grid. The
carbon emission factor as per the operating margin takes into consideration the power generation mix of

CDM-SSC-PDD (version 02) CDM – Executive Board page 28 2002-2003, 2003-2004 and 2004-2005 excluding hydro, geothermal, wind, low-cost biomass, nuclear and
solar generation of the selected grid, and the default value of emission factors of the fuel used for power
generation.
Average efficiency of gas/combustion turbine (peak load) works out to be 30 % and that for gas
turbines in combined cycle works out to be 42 %. On conservative basis average efficiency for base line
calculations is considered as 45%. Standard emission factors given in IPCC for coal and gas (thermal
generation) are applied over the expected generation mix and net emission factor is determined. Carbon
Emission Factor of grid as per operating margin is 1.159 kg CO2/kWh electricity generation.
Build Margin
The “build margin” emission factor is calculated by taking the weighted average emissions (in kg
CO2equ/kWh) of recent capacity additions to the system, which capacity additions are defined as the
greater (in MWh) of most recent 20% of existing plants or the 5 most recent plants.
The project activity will have some effect on the build margin of the Northern region grid. The baseline
factor as per the build margin takes into consideration the delay effect on the future projects and
assumes that the past trend will continue in the future. Capacity additions of most recent 20 % of
existing plants is greater than (in MWh) 5 most recent plants hence, for our build margin calculation we
have taken into consideration 20 % of most recent plants built in Northern region given below. The key
parameters for calculating build margin have been assumed same as that for calculating operating
margin. Carbon Emission Factor of grid as per build margin is 0.755 kg CO2/kWh electricity
generation.
Net Carbon Emission Factor of Grid as per combined margin = (OM + BM)/2 = 0.957 kg of CO2 / kWh
generation.
Key elements to determine baseline for the project activity
The key elements such as variables, parameters and data sources used to determine the baseline for the
project activity are tabulated below:
S No. Key Parameters Data Sources Reference
1 Generation of power of all the
plants for the year 2002-03,
2003-04 and 2004-05
Annual reports of Northern
region Electricity Board
(NREB)
http://nreb.nic.in/Reports/In
dex.htm
2 Coal consumption of each coal Annual Performance review www.cea.nic.in

CDM-SSC-PDD (version 02) CDM – Executive Board page 29
fired power plant for the year
2002-03, 2003-04 and 2004-05
of Thermal power plant
(CEA)
3 Calorific value of coal Revised 1996 IPCC
Guidelines for National Green
house Gas Inventories:
Reference Manual
4 Calorific value of gas Revised 1996 IPCC
Guidelines for National Green
house Gas Inventories:
Reference Manual
5 Oxidation factors Revised 1996 IPCC
Guidelines for National Green
house Gas Inventories:
Reference Manual
6 Efficiency of gas based power
plants supplying power to grid
Annexure 2a as given by
"Baselines for Renewable
Energy Projects under Clean
Development Mechanism" by
The Ministry of Non-
Conventional Energy
Sources, Govt. of India.
http://mnes.nic.in/baselinerpt.
htm
7 Emission factor of natural gas Revised 1996 IPCC
Guidelines for National Green
house Gas Inventories:
Reference Manual
8 Emission factor of coal Revised 1996 IPCC
Guidelines for National Green
house Gas Inventories:
Reference Manual
Note:

CDM-SSC-PDD (version 02) CDM – Executive Board page 30 The value of emission factors are given in terms of carbon unit in Revised 1996 IPCC Guidelines for
National Green house Gas Inventories: Reference Manual. It is converted in terms of CO2 as shown below:
Fuel Emission factor given in
IPCC manual
Emission factor
tC/TJ tCO2/TJ
Natural gas 15.3 56.1 ( 15.3 x 44/12)
Coal 25.8 94.6 ( 25.8 x 44/12)
Generation details
The power generation of power plants falls under Northern grid region for the past three years is given
below:
Name Type Fuel Generation (2002-03) (MkWh)
Generation (2003-04) (MkWh)
Generation (2004-05) (MkWh)
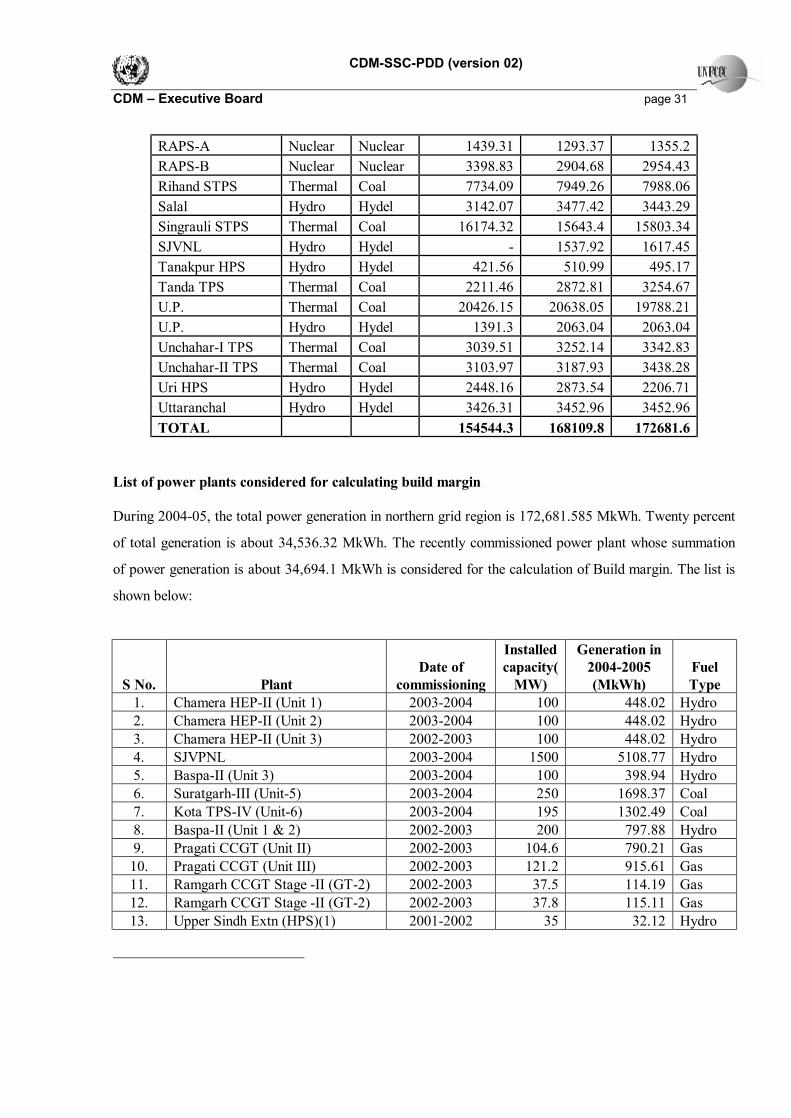
Anta GPS Thermal Gas 2757.73 2775.92 2595.77 Auriya GPS Thermal Gas 4268.68 4247.41 4119.47 Badarpur TPS Thermal Coal 5267.22 5428.96 5462.78 Bairasiul Hydro Hydel 671.67 687.79 689.67 Bhakra Complex Hydro Hydel 6531.01 6956.9 4546.01 Chamera HPS Hydro Hydel 2253.53 2648.32 3452.25 Dadri GPS Thermal Gas 5211.55 5058.66 5527.71 Dadri NCTPS Thermal Coal 6041.46 6181.12 6842.52 Dehar Hydro Hydel 3253.1 3299.29 3150.52 Delhi Thermal Coal 1455.83 1164.11 5203.8 Delhi Thermal Gas 2035.15 5159.77 4091.37 Faridabad GPS Thermal Gas 2702.02 2792.58 3172.01 H.P. Hydro Hydel 1598.25 3666.39 3666.39 Haryana Thermal Coal 5867.03 6849.26 7192.41 Haryana Hydro Hydel 245.75 251.73 251.73 J&K Hydro Hydel 407.09 851.03 851.03 J&K Thermal Gas 67.36 15.41 23.51 NAPS Nuclear Nuclear 3580.38 2959.44 2760.01 Pong Hydro Hydel 763.85 1178.93 882.57 Punjab Thermal Coal 13576.98 14118.96 14390.42 Punjab Hydro Hydel 3525.55 4420.43 4420.43 Rajasthan Thermal Coal 13826.4 15044.48 17330.79 Rajasthan Thermal Gas 218.92 201.37 360.7 Rajasthan Hydro Hydel 60.78 494.07 494.07
CDM-SSC-PDD (version 02) CDM – Executive Board page 31
RAPS-A Nuclear Nuclear 1439.31 1293.37 1355.2 RAPS-B Nuclear Nuclear 3398.83 2904.68 2954.43 Rihand STPS Thermal Coal 7734.09 7949.26 7988.06 Salal Hydro Hydel 3142.07 3477.42 3443.29 Singrauli STPS Thermal Coal 16174.32 15643.4 15803.34 SJVNL Hydro Hydel - 1537.92 1617.45 Tanakpur HPS Hydro Hydel 421.56 510.99 495.17 Tanda TPS Thermal Coal 2211.46 2872.81 3254.67 U.P. Thermal Coal 20426.15 20638.05 19788.21 U.P. Hydro Hydel 1391.3 2063.04 2063.04 Unchahar-I TPS Thermal Coal 3039.51 3252.14 3342.83 Unchahar-II TPS Thermal Coal 3103.97 3187.93 3438.28 Uri HPS Hydro Hydel 2448.16 2873.54 2206.71 Uttaranchal Hydro Hydel 3426.31 3452.96 3452.96 TOTAL 154544.3 168109.8 172681.6
List of power plants considered for calculating build margin
During 2004-05, the total power generation in northern grid region is 172,681.585 MkWh. Twenty percent
of total generation is about 34,536.32 MkWh. The recently commissioned power plant whose summation
of power generation is about 34,694.1 MkWh is considered for the calculation of Build margin. The list is
shown below:
S No. Plant Date of
commissioning
Installed capacity(
MW)
Generation in 2004-2005 (MkWh)
Fuel Type
1. Chamera HEP-II (Unit 1) 2003-2004 100 448.02 Hydro 2. Chamera HEP-II (Unit 2) 2003-2004 100 448.02 Hydro 3. Chamera HEP-II (Unit 3) 2002-2003 100 448.02 Hydro 4. SJVPNL 2003-2004 1500 5108.77 Hydro 5. Baspa-II (Unit 3) 2003-2004 100 398.94 Hydro 6. Suratgarh-III (Unit-5) 2003-2004 250 1698.37 Coal 7. Kota TPS-IV (Unit-6) 2003-2004 195 1302.49 Coal 8. Baspa-II (Unit 1 & 2) 2002-2003 200 797.88 Hydro 9. Pragati CCGT (Unit II) 2002-2003 104.6 790.21 Gas 10. Pragati CCGT (Unit III) 2002-2003 121.2 915.61 Gas 11. Ramgarh CCGT Stage -II (GT-2) 2002-2003 37.5 114.19 Gas 12. Ramgarh CCGT Stage -II (GT-2) 2002-2003 37.8 115.11 Gas 13. Upper Sindh Extn (HPS)(1) 2001-2002 35 32.12 Hydro

CDM-SSC-PDD (version 02) CDM – Executive Board page 32
14. Suratgarh stage-II (3 & 4) 2001-2002 500 3396.74 Coal 15. Upper Sindh Stage II (2) 2001-2002 35 32.12 Hydro 16. Malana-1 & 2 2001-2002 86 266.08 Hydro 17. Panipat TPS Stage 4 (Unit-6) 2000-2001 210 1269.31 Coal 18. Chenani Stage III (1,2,3) 2000-2001 7.5 19.1 Hydro 19. Ghanvi HPS (2) 2000-2001 22.5 74.06 Hydro 20. RAPP (Unit-4) 2000-2001 220 1309.7 Nuclear 21. Ranjit Sagar (Unit-1,2,3,4) 2000-2001 600 1131.37 Hydro 22. Gumma HPS 2000-2001 3 4.35 Hydro 23. Faridabad CCGT (Unit 1) (NTPC) 2000-2001 144 1030.59 Gas 24. Suratgarh TPS 2 1999-2000 250 1698.37 Coal 25. RAPS-B (2) 1999-2000 220 1309.7 Nuclear 26. Uppersindh-2 HPS #1 1999-2000 35 32.12 Hydro 27. Faridabad GPS 1 & 2 (NTPC) 1999-2000 286 2046.86 Gas 28. Unchahar-II TPS #2 1999-2000 210 1559.75 Coal 29. Unchahar-II TPS #1 1998-1999 210 1559.75 Coal 30. Suratgarh TPS #1 1998-1999 250 1698.37 Coal 31. GHGTPLM (Unit 1) 1998-1999 210 1453.23 Coal 32. GHGTPLM (Unit 2) 1997-1998 210 1453.23 Coal 33. Tanda TPS (Unit-4) 1997-1998 110 731.54 Coal
The baseline emissions are the annual kWh generated by the project activity times emission coefficient of
0.957 kg CO2/kWh.

CDM-SSC-PDD (version 02) CDM – Executive Board page 33 Appendix A Abbreviations
UASB Up flow Anaerobic Sludge Blanket
CO2 Carbon dioxide
GHG Green House Gases
INR Indian National Rupee
IPCC Inter Governmental Panel on Climate Change
kg Kilogram
km Kilometre
kW Kilowatt
kWh Kilowatt - hour
MW Mega Watt
PDD Project design document
SIL Shreyans Industries Limited
tph Tonnes per hour
UNFCCC United Nations Framework Convention on Climate Change
DOE Designated Operational Entity
Related Documents