CDM-SSC-PDD (version 02) CDM – Executive Board page 1 CLEAN DEVELOPMENT MECHANISM SIMPLIFIED PROJECT DESIGN DOCUMENT FOR SMALL-SCALE PROJECT ACTIVITIES (SSC-CDM-PDD) Version 02 CONTENTS A. General description of the small-scale project activity B. Baseline methodology C. Duration of the project activity / Crediting period D. Monitoring methodology and plan E. Calculation of GHG emission reductions by sources F. Environmental impacts G. Stakeholders comments Annexes Annex 1: Information on participants in the project activity Annex 2: Information regarding public funding

Welcome message from author
This document is posted to help you gain knowledge. Please leave a comment to let me know what you think about it! Share it to your friends and learn new things together.
Transcript
CDM-SSC-PDD (version 02) CDM – Executive Board page 1
CLEAN DEVELOPMENT MECHANISM
SIMPLIFIED PROJECT DESIGN DOCUMENT FOR SMALL-SCALE PROJECT ACTIVITIES (SSC-CDM-PDD)
Version 02
CONTENTS
A. General description of the small-scale project activity B. Baseline methodology C. Duration of the project activity / Crediting period D. Monitoring methodology and plan E. Calculation of GHG emission reductions by sources F. Environmental impacts G. Stakeholders comments Annexes Annex 1: Information on participants in the project activity Annex 2: Information regarding public funding
CDM-SSC-PDD (version 02) CDM – Executive Board page 2
Revision history of this document
Version Number
Date Description and reason of revision
01 21 January 2003
Initial adoption
02 8 July 2005 • The Board agreed to revise the CDM SSC PDD to reflect guidance and clarifications provided by the Board since version 01 of this document.
• As a consequence, the guidelines for completing CDM SSC PDD have been revised accordingly to version 2. The latest version can be found at <http://cdm.unfccc.int/Reference/Documents>.

CDM-SSC-PDD (version 02) CDM – Executive Board page 3 SECTION A. General description of the small-scale project activity A.1. Title of the small-scale project activity: >>10 MW Biomass (Rice Husk) Based Power Generation Unit of M/s Rukmani Power and Steel Ltd... (RPSL). A.2. Description of the small-scale project activity: >> Purpose The purpose of the project activity is to develop a 10MW (gross) rice-husk based power plant at Gram Kunkuni, Dist. Raigarh in the State of Chhattisgarh, India, based on the rice husk from rice mills within a 5 km radius. Depending on price and other factors, the plant may possibly also use other agro-residues available locally, as the detailed biomass survey shows an abundance of other agro-residues also available in Kharsia District. Rukmani Power and Steel Ltd. is promoted by Mr. S. Agrawal and Mr. B. Agrawal. The family is in the business of rice milling, tobacco, and industrial development. The power generated will be sold to Chhattisgarh Electricity Board, but the price will not allow the promoters to break-even in their operations. For this reason, the project is conceived as a CDM project with the income from CERs ensuring the viability of the plant. Since the project uses only biomass materials (rice husk) for power generation, which otherwise would have been coal, the project does not lead to GHG emissions. Combustion of rice husk in the project results in GHG emission of CO2, CH4 and NOx. The major constituent of GHG emissions is CO2 which accounts for about 98%, whereas CH4 and NOx constitute the remaining 2%. This can well be evidenced from the typical ultimate analysis of biomass materials, which indicates the Nitrogen content is within 1 to 2%, therefore CH4 emission is negligible. Hence, the CO2 is considered as the only GHG emissions from the rice husk combustion. Since the rice husk is formed by fixing the atmospheric CO2 by the action of photosynthesis in the presence of sunlight, the CO2 released due to combustion of rice husk is assumed to be equal to the CO2 fixed by the photosynthesis. Again the CO2 released during the combustion will be consumed by the paddy for its growth. In view of the above, rice husk combustion and release can be treated as cyclic process resulting in no net increase of CO2 in the atmosphere, Hence, the project will not lead to GHG emissions. Provision of co-firing option will take care of possible short fall of rice husk fuel supply. In this case the GHG emissions from the coal burning will be a source of GHG emissions which will be taken into account in the monitoring and the emission reduction quantification. Contribution to sustainable development � Reduction of GHGs � Biomass power plants contribute to sustainable development because they offer a decentralised
power supply using locally available fuel sources. � Decentralised power generation reduces transmission and distribution losses. � Decentralised power generation provides jobs in rural areas without the kind of extensive local
environmental damage associated with coal mines. � Biomass power plants encourage farmers to think of biomass as a fuel source. � Biomass fuel is a new kind of rural agro-product which farmers can be encouraged to grow or
supply in a manner suited to the needs of the biomass power industry.

CDM-SSC-PDD (version 02) CDM – Executive Board page 4 � Reasonable fuel prices can be paid by the plant promoters to the farmers for their agro-residues,
or to the mill owners who supply the rice-husk, and this transaction will ensure that farming is a viable economic activity in the face of constant and unremitting down-ward pressure on agricultural product prices of all types.
� The project will also help reduce the ever increasing gap of supply and demand of electricity in the State of Chhattisgarh.
� To the extent that the power plant will use agro-residues, the project also helps landless labourers in the area by giving them employment. Agro-residues are available between the months of February to May during which season agricultural labourers do not have enough employment. The project thus reduces stress migration by providing employment in the summer months. The labourers load the tractors which collect the fuel and deliver it to the plant.
� To the extent that the project will use agro-residues, the plant will also provide additional revenue for the farmers who use their tractors to transport the fuel. In other words, the plant is generating commercial value for agro-residues locally by enabling the farmers to sell their agro-residues to a local buyer and thus augment their income.
� The total net biomass available for power production in the District is 1 million tonnes. This is enough for around 170 MW of biomass-based power generation.
The main conclusion in the planning phase was thus that the plant will contribute to sustainable development in a social, environmental, economic and technological sense. The project thus meets the guidelines for CDM projects stipulated by the Government of India, and the Government of India has issues its Letter of Approval for this project confirming that the project contributes to sustainable development. A.3. Project participants: >> Name of Party involved ((host) indicates a host Party)
Private and/or public entity(ies) project participants (as applicable)
Kindly indicate if the Party involved wishes to be considered as project participant (Yes/No)
India (host) Rukmani Power and Steel Ltd. Agrawal Gudakhu Factory Campus Ganesh Nagar Bilaspur (C.G.) Pin Code - 495004 Phone : 07752-505522 Fax : 07752-257352 email : [email protected] Contact Person : Sanjay Kumar Agrawal Mobile : 9893057352 email : [email protected]
Yes
CDM-SSC-PDD (version 02) CDM – Executive Board page 5 A.4. Technical description of the small-scale project activity: >> The project activity is a 10 MW (gross) capacity grid connected biomass (rice husk) based renewable energy power plant with high-pressure steam turbine configuration. On an annual average basis, the project will generate around 71.28 GWh and export around 63 GWh to the Chhattisgarh grid by considering auxiliary power consumption of 11.5%. The plant will operate at an annual average plant load factor of 90% after a 2 year stabilisation period during which the PLF is assumed to be 70% in the first year and 80% in the second. Though as per MNES guidelines and Chhattisgarh Pollution Control Board consent, the project can operate with coal as a fuel up to a maximum of 30% on an annual basis, the project will not use coal. The power plant has one condensing steam turbo generator unit manufactured by Messrs Thermodyne Technologies, Chennai, with a matching atmospheric fluidised bed boiler capable of firing multi fuels. All necessary auxiliary facilities of the power plant are provided. The boiler is sized to produce a maximum of 45 tonnes per hour of steam. The steam turbine is a straight condensing type machine with two bleed off, one to deaerator and one to High Pressure (HP) heater, presently blanked. The steam conditions at the boiler heat outlet are at a pressure of 67kg/cm2/485 + 5°C. Full technical details: Type of steam generator: condensing steam turbo generator Fuel: Rice Husk, agro-residue. Fuel firing rate: 12-18 TPH Coal-handling design capacity: 7.5 TPH Ash-handling design capacity: 5 TPH Main steam flow rate: 42.5 TPH Main steam pressure: 64 kg/cm2 Main steam temperature: 485°C Power generation capability: 10 MW Condenser vacuum: 0.108 kg/cm2 Feed water inlet temperature: 130o C Cooling water temperature: 32°C Dust collection equipment: Electrostatic Precipitator Outlet dust concentration: 100 mg/Nm3 @ 15%O2 The gross rating of the plant is 10 MW. It is situated on 20 acres. The plant has raw water consumption of 55 cubic metres per hour for cooling tower makeup, and 5 cubic metres per hour for power plant cycle makeup. The chimney of 57 metres in height is designed for a minimum flue gas velocity of 15 m / s. and the power evacuation is through a 33 KV line located approximately 3 km from the plant. Additional environmental and technical information:
1. The emission of Nox is negligible as the temperature in the furnace is lower than 1000 0 C.
2. The sulphur content in biomass is 0.13% maximum (0.08% for rice husk). 3. The detrimental effect of SO2 and Nox is partially mitigated by a greenbelt around the
boundary of the plant. The plantation also helps to replenish oxygen. 4. The particulate emissions from the plant are controlled by the use of high efficiency
(99%) Electrostatic Precipitators (ESP).

CDM-SSC-PDD (version 02) CDM – Executive Board page 6
5. There is some contribution to thermal pollution of the atmosphere through the discharge of hot flue gases. The effect at ground level is minimal as the heat is dissipated to the higher levels of the atmosphere through the chimney.
6. Solid wastes include ash generated by the plant. This is drenched with water to avoid dust hazard, and is transported in closed containers in trucks to brick manufacturing units. The ash percentage is only 3% if agro-residues are used; when rice husk is used the ash will be 18-20%, which will be used as fertiliser in nearby fields.
7. Liquid wastes from the power plant will result mainly from the boiler blow down and demineralised plant. These liquid wastes are used for the greenbelt inside the plant.
8. Noise pollution is relatively low, and wherever the noise level exceeds the acceptable limits such as around the turbine etc, acoustic shields are provided.
9. Forested hills on either side of the power plant shield the surrounding area from noise and pollution.
A.4.1. Location of the small-scale project activity: >> Location and address of plant: WorksRukmani Power And Steel Ltd. Gram Kunkuni, P.O. Kharsia, Dist. Raigarh (C.G.) Phone : 07762-273051 Fax : 07762-272745 email : [email protected] Works office: Rukmani Power and Steel Ltd. Musaddilal Mansaram Rice Mill Campus Gram Thusikela P.O. Kharsia Dist. Raigarh (C.G.) Contact Person : Bajranglal Agrawal Mobile : 9826702015 Language : Only Hindi A.4.1.1. Host Party(ies): >> India A.4.1.2. Region/State/Province etc.: >> Chhattisgarh A.4.1.3. City/Town/Community etc: >> Gram Kunkuni, Dist. Raigarh

CDM-SSC-PDD (version 02) CDM – Executive Board page 7 A.4.1.4. Detail of physical location, including information allowing the unique identification of this small-scale project activity(ies): >>The plant is located at Gram Kunkuni, Dist. Raigarh, Chhattisgarh. The site is well connected by roads. The site is generally plain and solid is of black cotton type. Borewell water is being used to meet the plant water requirement. Power generated from the plant is being evacuated to State of Chhattisgarh Electricity Board through their 33 kV station which is 3 km from the plant. The bearings of the project location at Kharsia, District Raigarh are: Latitude: 21 deg – 58 N Longitude: 83 deg – 07 E LOCATION OF RAIGARH DISTRICT IN CHHATTISGARH
A.4.2. Type and category(ies) and technology of the small-scale project activity: >> The relevant project type and category is: Type I. RENEWABLE ENERGY PROJECTS, Category I.D. - Renewable electricity generation for a grid (according to: Appendix B of the simplified baseline and monitoring methodologies for selected small-scale CDM project activity categories)1
1 Note: In this SCCPDD all reference to the Simplified Small-scale Methodology I.C. refer to the version 05, 25 February 2005.

CDM-SSC-PDD (version 02) CDM – Executive Board page 8 Justification how the proposed activity conforms with the project type from Appendix B: Type I.D. Renewable electricity generation for a grid 1. This category comprises renewable energy generation units, such as photovoltaics, hydro,
tidal/wave, wind, geothermal, and biomass, that supply electricity to an electricity distribution system that is or would have been supplied by at least one fossil fuel or non-renewable biomass fired generating unit.
2. If the unit added has both renewable and non-renewable components (e.g.. a wind/diesel unit),
the eligibility limit of 15MW for a small-scale CDM project activity applies only to the renewable component.
1. RPSL is a biomass renewable energy generation unit. RPSL supplies electricity to an electricity distribution system that is or would have been supplied by at least one fossil fuel or non-renewable biomass fired generating unit. The plant is 100% biomass based, but coal could technically also be fired and so coal consumption will also be monitored. 2. RPSL is a 10 MW capacity plant and is thus below the 15 MW eligibility limit for a small-scale CDM project activity. The generating capacity of RPSL will remain at 10 MW throughout the crediting period. The state-of - the -art technology being used in this project is already available in India - no environmentally safe and sound technology and know-how is thus being transferred to the host party. A.4.3. Brief explanation of how the anthropogenic emissions of anthropogenic greenhouse gas (GHGs) by sources are to be reduced by the proposed small-scale project activity, including why the emission reductions would not occur in the absence of the proposed small-scale project activity, taking into account national and/or sectoral policies and circumstances: >> The power plant uses environmentally sound sustainably grown biomass. The GHG emissions of the combustion process, mainly CO2, is consumed by plant species during growth, representing a cyclic process. Since, the biomass contains only negligible quantities of other elements lime Nitrogen, Sulphur etc. release of other GHG are considered as negligible. The biomass fuel is thus CO2 neutral and thus environmentally benign as it limits the greenhouse effect. Conventional energy generation equivalent of around 71.28 GWh per annum from the third year onwards for a first crediting period of 7 years would be replaced by generating power in the 10 MW non-conventional renewable sources biomass based power plant thereby resulting in CO2 emission reduction of 74 367 tonnes. In the absence of the proposed activity, the same energy generation would have been taken-up by thermal power plants and emission of CO2 would have occurred due to combustion of conventional fuels like coal / gas. A.4.3.1 Estimated amount of emission reductions over the chosen crediting period: >>

CDM-SSC-PDD (version 02) CDM – Executive Board page 9
Operating year Certified Emission Reductions (tonnes of CO2)
2006-2007 28920 2007-2008 66104 2008-2009 74367 2009-2010 74367 2010-2011 74367 2011-2012 74367 2012-2013 74367
TOTAL estimated reductions (tonnes of CO2 e) 466 859 Total number of crediting years 7 Annual average over the crediting period of estimated reductions (tonnes of CO2 e)
66694
A.4.4. Public funding of the small-scale project activity: >> No public funding involved A.4.5. Confirmation that the small-scale project activity is not a debundled component of a larger project activity: >> The small-scale project activity is not a debundled component of a large project activity since there is no registered small-scale CDM project activity or an application to register another small-scale CDM project activity:
• With the same project participants; • In the same project category or technology; and
• Registered within the previous two years; and
• Whose project boundary is within 1 km of the project boundary of the proposed small-scale
activity at the closest point. SECTION B. Application of a baseline methodology: B.1. Title and reference of the approved baseline methodology applied to the small-scale project activity: >> Small-scale CDM Project, Type I – RENEWABLE ENERGY PROJECTS, I.D. Renewable electricity generation for a grid (according to: Annex B of simplified baseline and monitoring methodologies for selected small-scale CDM project activity categories)

CDM-SSC-PDD (version 02) CDM – Executive Board page 10 B.2 Project category applicable to the small-scale project activity: >> A) This methodology is applicable as per definition in the Annex B of the simplified methodologies for
selected small-scale CDM project activity categories, Type I.D Renewable energy generation for a grid:
1. This category comprises renewable energy generation units, such as photovoltaics, hydro, tidal/wave, wind, geothermal, and biomass, that supply electricity to an electricity distribution system that is or would have been supplied by at least one fossil fuel or non-renewable biomass fired generating unit. B) Qualification under small-scale CDM according to: Para 2.: …. The eligibility limit of 15MW for a small-scale CDM project activity applies…. C) The baseline is applied in accordance with Paragraph 7 of the definitions: 7. ……….. the baseline is the kWh produced by the renewable generating unit multiplied by an emission coefficient (measured in kg CO2equ/kWh) calculated in a transparent and conservative manner as: (b) The weighted average emissions (in kg CO2equ/kWh) of the current generation mix. The current generation mix of the State of Chhattisgarh has been chosen for calculating the weighted average emissions. Details of this baseline are given in section B.3 and B.5. Currently there are some discussions in India regarding choice of suitable grid system comprising “current generation mix”. India has a national grid, divided into 5 regional grids, and further divided into State grids into which generation from with the state and sometimes from outside the state is fed. In the case of Chhattisgarh the state grid is fed by generation from within the state boundary. The system is managed by the State Electricity Board, and the generation is done predominantly by the Central owned National Thermal Power Corporation and by some private operators. After discussion with validators a suitable baseline is chosen. The state grid is a suitable system boundary for calculating the weighted average emissions of the current generation mix because the state is aiming at 100% electricity self-sufficiency. There is thus no need to look beyond the state boundaries for generation sources. Para 7 of the Annex B of the simplified methodologies for selected small-scale CDM project activity categories, Type I.D Renewable energy generation for a grid says that ….: 7. For all other systems, the baseline is the kWh produced by the renewable generating unit multiplied by an emission coefficient (measured in kg CO2equ/kWh) calculated in a transparent and conservative manner as:
(a) The average of the “approximate operating margin” and the “build margin”, where: (i) The “approximate operating margin” is the weighted average emissions (in kg CO2equ/kWh) of all generating sources serving the system, excluding hydro, geothermal, wind, low-cost biomass, nuclear and solar generation;

CDM-SSC-PDD (version 02) CDM – Executive Board page 11
(ii) The “build margin” is the weighted average emissions (in kg CO2equ/kWh) of recent capacity additions to the system, which capacity additions are defined as the greater (in MWh) of most recent4 20%5 of existing plants or the 5 most recent plants.”;
OR, (b) The weighted average emissions (in kg CO2equ/kWh) of the current generation mix. 4 Generation data available for the most recent year. 5 If 20% falls on part capacity of a plant, that plant is included in the calculation. Both options were considered in previous published SSC_PDDs using Chhattisgarh baseline2. Here we refer to this previous published PDD, and choose the more conservative option (b). The justification for choosing (b) the weighted average emissions, is that the methodology is conservative and transparent, and the data is available. The basic baseline methodology is that the current generation mix of the Chhattisgarh grid is tabulated giving the GWh of electricity generated for each power plant. The emission factor for each type of fuel is calculated based on IPCC default values and Central Electricity Authority power plant efficiency values, and the GWh is multiplied by the emission factor for that plant to give the tonnes of CO2equ for that plant in that year. The total amount of CO2 emissions from the generating sources are divided by the total number of GWh of electricity generated by the sources, to give an average emission factor for the grid. This weighted average emission factor in tonnes CO2equ/GWh of the current generation mix is then multiplied by the number of GWh generated by RPSL to derive the total tonnes CO2equ saved by the project activity compared to the baseline. In case the plant consumes coal, the CO2equ from coal firing is subtracted from this value to give the net emissions. This scenario is not likely in this project activity, but because the plant is technically capable of firing coal such a precaution should be built into the monitoring plan. The tonnes CO2equ from coal consumption is calculated by taking the calorific value of the coal, and multiplying it by the tonnes of coal consumed, and then multiplying the MJ of energy by the IPCC default value emission factor for sub-bituminous coal such as would be used in RPSL, to get the tonnes CO2equ from coal consumption. In this project activity this number is most likely to be nil. B.3. Description of how the anthropogenic emissions of GHG by sources are reduced below those that would have occurred in the absence of the registered small-scale CDM project activity: >> Reduction of GHG Emission by Sources The anthropogenic GHG emissions by sources are reduced below what would have occurred in the absence of the proposed CDM project because if it were not for this project the users of electricity who are drawing power in Kharsia and surrounding area from this plant, would otherwise be drawing this power from the generation mix in the grid in the State of Chhattisgarh . In Chhattisgarh, Hydro and other renewable together account for only 6% of total generation. Thus by substituting the power from the current generation mix with biomass power, the emissions associated with fossil fuels are avoided to the extent of the generation of power by RPSL multiplied by the emission factor of the current generation 2 VVL-PDD-210405

CDM-SSC-PDD (version 02) CDM – Executive Board page 12 mix in the State of Chhattisgarh . Direct on-site emissions that arise from the burning of biomass in the boiler include CO2. However, the CO2 released equals the amount of CO2 taken up by the biomass during growing, therefore no net emission occur.
Chhattisgarh is a new State which was carved out of Madhya Pradesh on the 1st November, 2000. It is one of the very few states in the country, which has a robust power sector since its very inception. The power position of the State is comfortable as there is abundant coal in the state. The Chhattisgarh State Electricity Board (CSEB), which was constituted almost immediately after the State came into being, in a position more or less to meet the electricity requirement of the new State and is in good financial health. In Chhattisgarh, NTPC has an installed thermal capacity of 2100 MW while CSEB's units have a thermal capacity of 1240 MW and hydel capacity of 130 MW. Apart from NTPC and CSEB, there are a number of private generation units of large and small capacity. The state Govt. has pursued a liberal policy with regard to captive generation which has resulted in a number of private players coming up. As per a study made by the Power Finance Corporation Ltd. New Delhi, the state has potential of 61000 MW of additional thermal power in terms of availability of coal for more than 100 years and more than 2500 MW hydel capacity. To tap this vast potential, substantial addition to the existing generation capacity is already under way. CSEB is setting up thermal plant of two units each of 250 MW capacity at Korba and plans to have another 2 units, each of 250-300 MW at Korba West as Extension Stage-III. NTPC is setting up a thermal power project at Seepat, with 3x660 MW capacity in Phase I and 2x500 MW in Phase II. Bhilai Steel Plant, which has a captive power plant of 110 MW, is setting up 270 MW power plant for their own use. Balco, Korba already has captive plant of 270 MW and they are already on way to commission another plant of 540 MW capacity. M/s Jindal Steel and Power Ltd., has a power plant of 150 MW and are adding 79 MW capacity to this plant. They have entered into an MOU with the Chhattisgarh Govt. for IPP of 1000 MW. M/s. Jaiswal Neco Ltd. and M/s. Monnet Power Ltd., Raipur have also planned for setting up Captive power plants of 200 MW and 55 MW respectively. Thus an additional capacity of 6125 MW of thermal power is planned in the State of which 2980 MW shall be in the Central Sector. Most of these plants are in various stages of implementation. Apart from these major power producers, there are a number of small captive power units which also are adding their capacity. However, the reform process has been slow in the state for a variety of reason. Although a number of steps have been taken by the CSEB, the main provider of electricity in the state, for internal reforms, primarily aimed at improving efficiency, structural reforms have been delayed due to various factors of which non-finalization of division of assets and liabilities of the erstwhile Madhya Pradesh Electricity Board is the most important. The State government has recently taken steps to carry forward the reform process in terms of the provisions of Electricity Act, 2003. The first significant step is the setting up of the ERC. The present project activity is not only justified due to the shortage of power availability and energy but also due to eco-friendly power generation. All the planned plants in the State of Chhattisgarh detailed above are in the conventional coal fired thermal sector. Thus through the present project activity, GHG emissions by sources are reduced below those that would have occurred in the absence of the proposed CDM project activity. Details of the underlying assumptions and calculation of the baseline and the emission reductions are provided in section B and E of this SSCPDD. Barriers and Additionality The relevant barrier for RPSL as per Appendix B Attachment A are: a) Investment barrier: a financially more viable alternative to the project activity would have led to higher emissions.

CDM-SSC-PDD (version 02) CDM – Executive Board page 13 The report of the Expert committee for fuels for power generation of the Central Electricity Authority Planning Wing published in February 2004 gives the following costs of generation for fossil-fuels in India at 80% PLF and distance in km for coal transportation of 2000 km ( the highest cost level in the table): domestic coal PH Rs 1.92/kWh, domestic coal LC Rs 2.36/kWh imported coal 2.52 Rs/kWh, imported coal LC 2.69 Rs/kWh, Lignite at PH 2.48 Rs/kWh, Lignite at Port 2.51 Rs/kWh, Naphta at port 4.68 Rs/kWh, Naphta at LC 4.66 Rs/kWh, Gas along pipeline 1.49 Rs/kWh, Diesel at LC 5.69 Rs/kWh. A recent study3 of the costs at NTPC's Dadri project which is like the Korba West project in Chhattisgarh estimates the cost of generation at this 4 x 210 MW coal fired plant at 1.82 Rs/kWh for 2001. Thus all the fossil fuel options which the RPSL plant is replacing are cheaper.
The generation cost at RPSL is 2.57 Rs/kWh, but the tariff being paid is only 2.25 Rs/kWh. Clearly RPSL needs CDM money to succeed. The financially more attractive alternative to RPSL are fossil-fuel based power plants as given in the description of State of Chhattisgarh power plants. The thermal plants implemented in Chhattisgarh are cheaper but they lead to higher emissions. They are preferred as the tariffs that State Electricity Boards must pay for fossil power are lower compared to the tariffs being paid to RPSL . The average cost of generation in Chhattisgarh is 1.04 Rs/kWh.4. RPSL cannot match this and without CERs RPSL will not be built. Role of CER income: The CER income will provide a second revenue stream to the project in order for the project to cover the cost differential between the income from the sale of power to the State of Chhattisgarh under the Power Purchase Agreement signed on 23rd November 2004, and the actual cost of generation. The CER income is an indispensable component of the project financing, and was considered as a mina income stream before the decision to go ahead with RPSL was taken. The cost of agricultural residue and rice husk per tonne is only 500 Rs in today’s market. In the case of agro-residues this one tonne consists of leaves (20%), mud (15%) and moisture around (40%). Therefore, only 50 % of agricultural residue procured will be available for use. The processing cost of agricultural residue is almost 250 – 300 Rs/tonne. The calorific value is approximately 3500 kcal/kg. The ash from agricultural residues has high potassium chlorides, which leads to super heater corrosion. Due to the above reasons the cost of using agricultural residue fuel and/or rice husk is estimated conservatively at 1.1 Rs/unit in 2005 with 10% escalation every year. In the first year of operation the price level thus is expected to be at 1.29 Rs/ tonne. The combination of these fuel price trends and the tariff level in Chhattisgarh renders this project non-viable without CDM money. Assuming 38 Euros per CER and fuel prices as above, the expected financials of the company with and without CER income, with CER income coming as an income stream annually over 10 years, is 8.66 % and -25.13 % respectively. Thus it is clear that without CER income at a level commensurate with international emission reduction costs, the plant will not be viable. This discussion proves that there is an investment barrier to the proposed project activity, and CDM funds are needed to overcome this investment barrier. 3 COST ANALYSIS OF POWER PROJECTS : A STUDY OF NTPC DADRI PROJECT by Dr. A P Dash, Mr. R Mukherjee, Mr. Atul Prasad *Sr.Faculty & Professor, Power Management Inst.,NTPC, NOIDA, data 2001/2.
4 Generation cost, Chhattisgarh Electricity Board Annual report 2005.
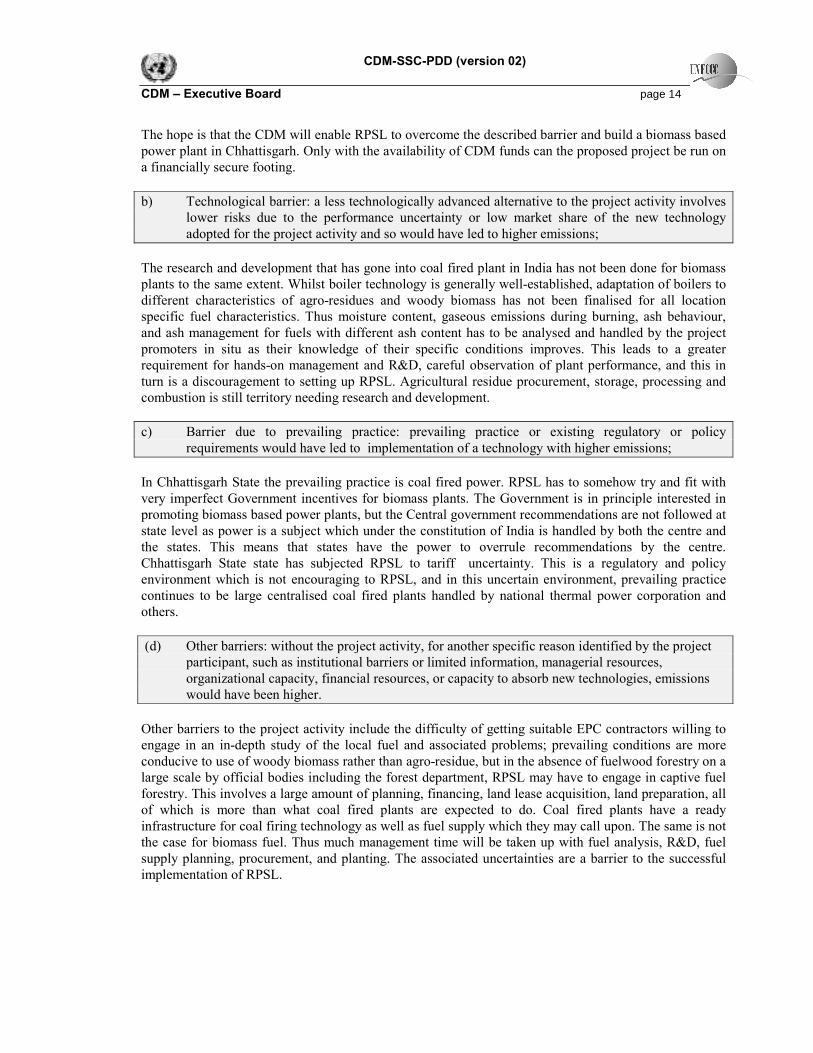
CDM-SSC-PDD (version 02) CDM – Executive Board page 14 The hope is that the CDM will enable RPSL to overcome the described barrier and build a biomass based power plant in Chhattisgarh. Only with the availability of CDM funds can the proposed project be run on a financially secure footing.
b) Technological barrier: a less technologically advanced alternative to the project activity involves
lower risks due to the performance uncertainty or low market share of the new technology adopted for the project activity and so would have led to higher emissions;
The research and development that has gone into coal fired plant in India has not been done for biomass plants to the same extent. Whilst boiler technology is generally well-established, adaptation of boilers to different characteristics of agro-residues and woody biomass has not been finalised for all location specific fuel characteristics. Thus moisture content, gaseous emissions during burning, ash behaviour, and ash management for fuels with different ash content has to be analysed and handled by the project promoters in situ as their knowledge of their specific conditions improves. This leads to a greater requirement for hands-on management and R&D, careful observation of plant performance, and this in turn is a discouragement to setting up RPSL. Agricultural residue procurement, storage, processing and combustion is still territory needing research and development. c) Barrier due to prevailing practice: prevailing practice or existing regulatory or policy
requirements would have led to implementation of a technology with higher emissions; In Chhattisgarh State the prevailing practice is coal fired power. RPSL has to somehow try and fit with very imperfect Government incentives for biomass plants. The Government is in principle interested in promoting biomass based power plants, but the Central government recommendations are not followed at state level as power is a subject which under the constitution of India is handled by both the centre and the states. This means that states have the power to overrule recommendations by the centre. Chhattisgarh State state has subjected RPSL to tariff uncertainty. This is a regulatory and policy environment which is not encouraging to RPSL, and in this uncertain environment, prevailing practice continues to be large centralised coal fired plants handled by national thermal power corporation and others.
(d) Other barriers: without the project activity, for another specific reason identified by the project
participant, such as institutional barriers or limited information, managerial resources, organizational capacity, financial resources, or capacity to absorb new technologies, emissions would have been higher.
Other barriers to the project activity include the difficulty of getting suitable EPC contractors willing to engage in an in-depth study of the local fuel and associated problems; prevailing conditions are more conducive to use of woody biomass rather than agro-residue, but in the absence of fuelwood forestry on a large scale by official bodies including the forest department, RPSL may have to engage in captive fuel forestry. This involves a large amount of planning, financing, land lease acquisition, land preparation, all of which is more than what coal fired plants are expected to do. Coal fired plants have a ready infrastructure for coal firing technology as well as fuel supply which they may call upon. The same is not the case for biomass fuel. Thus much management time will be taken up with fuel analysis, R&D, fuel supply planning, procurement, and planting. The associated uncertainties are a barrier to the successful implementation of RPSL.

CDM-SSC-PDD (version 02) CDM – Executive Board page 15 The hope is that the CDM will enable the project activity to overcome the described barriers. Only if CDM funds are available can the proposed project use 100% percentage of agricultural residue which benefits the local farmers, local labourers, reduces the risk associated with fuel price increase, and repay the loans.
As seen even though the PPA is binding there is tremendous influence by the government on the PPA which is the biggest risk that RPSL face and one of the reasons why the company needs CER money. The State Government does not honour the MNES guidelines. The described project activity is thus additional because a) the baseline is reasonable, and represents the project scenario in the absence of the project activity, and b) the various barriers faced by the project prove that the emission reduction which is achieved by the project is additional to what would have occurred in the absence of the project. B.4. Description of how the definition of the project boundary related to the baseline methodology selected is applied to the small-scale project activity: >> As per Paragraph 4 of the small-scale baseline methodology I.D. Renewable electricity generation for a grid The project boundary encompasses the physical, geographical site of the renewable generation source. The project boundary covers the point of fuel supply to the point of power export to the grid where the project proponent has a full control. The project thus covers fuel storage and processing, boiler, Steam Turbine generator (STG) and all other power generating equipments, and consumption units within the power plant site.

CDM-SSC-PDD (version 02) CDM – Executive Board page 16 Boundary:
B.5. Details of the baseline and its development: >> The following methodology will be applied: I.D. Renewable electricity generation for a grid. The baseline is applied in accordance with Paragraph 7 of the definitions: 7. ……….. the baseline is the kWh produced by the renewable generating unit multiplied by an emission coefficient (measured in kg CO2equ/kWh) calculated in a transparent and conservative manner as: (b) The weighted average emissions (in kg CO2equ/kWh) of the current generation mix. Since the project activity is generating power in the State of Chhattisgarh and feeding it into the Chhattisgarh state electricity grid, the baseline for this project activity is the function of the generation mix in Chhattisgarh State. Using the methodology available for small-scale project activities as

CDM-SSC-PDD (version 02) CDM – Executive Board page 17 discussed in section B2 above, the weighted average emission (in kg CO2equ/kWh) of current generation mix in the State of Chhattisgarh 5 is used for the calculation of baseline. It is observed that, in the State of Chhattisgarh generation mix, coal and gas based power projects are responsible for GHG emissions. Since there is a gap between demand and supply in Chhattisgarh grid, the generation of power from the project activity will replace or get absorbed to partially fulfil the State of Chhattisgarh ’s power requirement. If the coal and hydro based power generation mix generated the same amount of electricity, it would be causing the emissions that are now being avoided by the project activity. Hence, the baseline calculated using the method indicated represents the realistic anthropogenic emission amount by sources that would occur in the absence of the project activity. Details on the emission coefficient Year 2004-2005 is considered the base year. Chhattisgarh State Electricity Board generation data for power plants located in the State of Chhattisgarh as tabulated below is used to derive the installed State of Chhattisgarh gross power generation for 2004-2005, and the GHG emissions from sources. In order to arrive at the detailed break up of the power generation mix in the State of Chhattisgarh, data was compiled from the THE STATE ELECTRICITY BOARD OF CHHATTISGARH website. Actual generation figures are available for 2004-2005.
5 http://www.cseb-powerhub.com/index.htm

CDM-SSC-PDD (version 02) CDM – Executive Board page 18
Table 1 Detailed break up of Installed capacity and generation in Chhattisgarh 2004-2005, and emission factor
BASELINE INFORMATION FOR CHHATTISGARH (2005)
Installed capacity
Emission Factor IPCC
Power station Unit MW Fuel Generation
GWh tCO2/GWh Emissions
tCO2 Korba East Unit 1 80 Coal 511.584 1079.518 552264.4 Unit 2 80 Coal 511.584 1079.518 552264.4 Unit 3 120 Coal 767.376 1079.518 828396.5 Unit 4 120 Coal 767.376 1079.518 828396.5Korba West Unit 1 210 Coal 1342.908 1079.518 1449694 Unit 2 210 Coal 1342.908 1079.518 1449694 Unit 3 210 Coal 1342.908 1079.518 1449694 Unit 4 210 Coal 1342.908 1079.518 1449694Other Captive Coal 130 Coal 831.324 1079.518 897429.6Korba NTPC (share) 682 Coal 4362.48 1079.518 4709378Bango Hydel 120 Hydro 420.48 0 0Gangrel 10 Hydro 35.04 0 0
Total 13578.876 14166905Carbon Emission Factor for Chhattisgarh
Fuel
Generation GWh (2005)
Emissions tCO2 %
Hydro 455.52 0 3.35 Nuclear 0 0 0.00 Coal 13123.356 14166904.8 96.65 Diesel 0 0 0.00 NG 0 0 0.00 Lignite 0 0 0.00 Total 13578.876 14166904.8 100.00
Average ∑ EFbaseline 1043.30 tCO2/GWh source: http://www.cseb-powerhub.com/index.htm The general procedure is described in B.2. above. The emission factor in tonnes CO2e / GWh for the fossil-fuel used in Chhattisgarh viz. sub-bituminous coal, is calculated using the following formula. Coal: 2730 * 4.18 * 25.8 * (44/12) / 1000

CDM-SSC-PDD (version 02) CDM – Executive Board page 19 The numbers in the formula represent the following calculation: 2730 = kcal/kWh which is the average power plant efficiency as given by Central Electricity
Authority, India *4.18 = kJ/kcal *25.8 = Carbon Emission Factor (f) (tC/TJ) for Other Bit. Coal
default value from IPCC 1996, 1.13 Table 1-1. *44/12 = (CO2/C) /1000 thus EF Coal = 1079.518 tCO2e / GWh The average ∑ EFbaseline is calculated as ∑emissions from all generation / ∑electricity generation, to get average ∑ EFbaseline = 1043.39 tCO2e / GWh
Table 2 : Emission Reductions from the Project Activity
Operating year Baseline Emissions
(tonnes of CO2) Project Emissions (tonnes of CO2)
Certified Emission Reductions (tonnes of CO2)
2006-2007 28920 0 28920 2007-2008 66104 0 66104 2008-2009 74367 0 74367 2009-2010 74367 0 74367 2010-2011 74367 0 74367 2011-2012 74367 0 74367 2012-2013 74367 0 74367
Therefore, a conventional energy equivalent of 71.28 GWh generated annually in Chhattisgarh would be saved by generating power from the 10 MW Biomass based power plant which in turn will reduce 74 367 tonnes of CO2 emissions per annum from the 3rd year onwards. Date of completion: 29/08/2005 Contact information: Rukmani Power and Steel Ltd. The entity is also the project participant listed in Annex 1. SECTION C. Duration of the project activity / Crediting period: C.1. Duration of the small-scale project activity: >>21 years C.1.1. Starting date of the small-scale project activity: >>01/09/2006 C.1.2. Expected operational lifetime of the small-scale project activity: >>

CDM-SSC-PDD (version 02) CDM – Executive Board page 20 25-y-0-m C.2. Choice of crediting period and related information: >>Renewable crediting period C.2.1. Renewable crediting period: >>3 x 7-y C.2.1.1. Starting date of the first crediting period: >>01/09/2006 C.2.1.2. Length of the first crediting period: >>7-y-0-m C.2.2. Fixed crediting period: >>N/A C.2.2.1. Starting date: >> N/A C.2.2.2. Length: >> N/A SECTION D. Application of a monitoring methodology and plan: >> The Monitoring and Verification procedures define a project specific standard against which the project’s performance (i.e. GHG emissions) and conformance with all relevant criteria will be monitored and verified. It includes developing suitable data collection methods including a computerised data capture system, and techniques for data interpretation for monitoring and verifying GHG emissions with specific focus on technical/efficiency/performance parameters. It also allows scope for review, scrutiny and benchmarking against established norms for monitoring and verification. The M&V protocol provides a range of data estimation, measurement and collection options and techniques, in each case indicating preferred options consistent with good practice to allow project managers, and operational staff, auditors and verifiers to apply the most practical and cost effective measurement approaches to the project. The aim is to enable this project to have clear, credible and accurate monitoring, evaluation and verification procedures. The purpose of the procedures is to direct and support continuous monitoring of project performance and project indicators, to determine project outcomes and GHG reductions. D.1. Name and reference of approved monitoring methodology applied to the small-scale project activity:

CDM-SSC-PDD (version 02) CDM – Executive Board page 21 >> The monitoring methodology from the corresponding baseline methodology Type I.D. Renewable electricity generation for a grid is used. Para 9 states: 9. Monitoring shall consist of metering the electricity generated by the renewable technology. In the case of co-fired plants, the amount of biomass and fossil fuel input shall be monitored. D.2. Justification of the choice of the methodology and why it is applicable to the small-scale project activity: >> The project activity meets the eligibility criteria to use simplified modalities and procedure for small-scale CDM project activities as set out in paragraph 6 (c) of decision 17/CP.7. Details of approved methodology for baseline calculations for CDM projects of capacity less than 15 MW are available in the “Appendix B of the simplified modalities and procedure for small scale CDM project activities”. As the power plant is of 10 MW capacity, the indicative simplified baseline and monitoring methodologies for selected small scale (CDM projects less than 15 MW) project activity categories is applied. In this methodology there is no need to monitor the baseline for the duration of the first crediting period. D.3 Data to be monitored: >> ID number
Data type Data variable
Data unit Measured (m), calculated (c) or estimated (e)
Recording frequency
Proportion of data to be monitored
How will the data be archived? (electronic/ paper)
For how long is archived data to be kept?
Comment
D.3.1. Power Total electricity generated
KWh Measured continuous 100% Electronic and Paper
Crediting period plus 2 years
Measured on plant premises and monitored and recorded continuously through DCS. Manufacturers of the system should be reputable.
D.3.2 Power Power Export
KWh Measured continuous 100% Electronic and Paper
Crediting period plus 2 years
Meter is Calibrated and Regularly inspected by The State Electricity Board of Chhattisgarh
D.3.4. Power Auxiliary consumption
kWh Measured continuous 100% Electronic and Paper
Crediting period plus 2 years
D.3.5 Fuel quantity
Biomass used
MT Measured Daily >95% Electronic and Paper
Crediting period plus 2 years
To be monitored at purchase and usage
D.3.6 Fuel quality
Calorific value of Biomass
Kcal/kg Actual sample testing
Monthly Grab Sample
Electronic and Paper
Crediting period plus 2 years
Sample testing
D.3.7. Fuel quantity
Coal used MT Measured Daily >95% Electronic and Paper
Crediting period
Coal is not likely to be

CDM-SSC-PDD (version 02) CDM – Executive Board page 22
plus 2 years
used but as the plant is designed to fire up to 30% coal, monitor-ing should be done.
D.3.8 Fuel quality
Calorific value of Coal
Kcal/kg Actual sample testing
Monthly Sample Electronic and Paper
Crediting period plus 2 years
Sample testing
D.3.9 Fuel quality
Carbon content of coal
% Actual sample testing
Monthly Sample Electronic and Paper
Crediting period plus 2 years
Sample testing
D.3.10. Equipment operation specific
Efficiency of power generation activity
% Calc continuous 100% Electronic and Paper
Crediting period plus 2 years
D.3.11. Operation specific
Plant heat rate
Kcal/kWh
Calc continuous 100% Electronic and Paper
Crediting period plus 2 years
D.4. Qualitative explanation of how quality control (QC) and quality assurance (QA) procedures are undertaken: >> ID number
Uncertainly level of data (High/medium/low)
Are QA/QC procedures planned for these data?
Outline explanation of why QA/QC procedures are/are not being planned.
D.3.1. Low Yes This data will be used to calculate the emission reductions by project activity
D.3.2 Low Yes This data will be used as supporting information for calculation of emission reduction by project activity
D.3.3 Low Yes This data will be used as supporting information for calculation of emission reduction by project activity
D.3.4 Low Yes This data will be used to calculate emission reductions by project activity
D.3.5. Low Yes This data will be used as supporting information for calculation of emission reduction by project activity
D.3.6 Low Yes This data will be used as supporting information for calculation of emission reduction by project activity
D.3.7 Low Yes This data will be used to calculate the emission reductions by project activity if necessary
D.3.8. Low Yes This data will be used to calculate the emission reductions by project activity if necessary
D.3.9. Low Yes This data will be used to calculate the emission reductions by project activity if necessary
D.3.10. Low Yes This data will not be used to calculate the emission reductions by project activity but is an important
parameter for plant performance D.3.11. Low Yes This data will not be used to calculate the emission
reductions by project activity but is an important parameter for plant performance
CDM-SSC-PDD (version 02) CDM – Executive Board page 23 D.5. Please describe briefly the operational and management structure that the project participant(s) will implement in order to monitor emission reductions and any leakage effects generated by the project activity: >> As this is not a co-fired plant, there is technically no need to monitor the amount of biomass and fossil fuel input. However, because the plant is designed to fire up to 30% coal, the amount of coal as well as the amount of biomass used will be monitored. The amount of biomass purchased will be based on invoices from the farmers and a weighbridge slip. These invoices and slips are also checked by auditors once a year. A consultant is hired to conduct calorific value tests for the biomass fuels and check the emissions on a monthly basis. The same will be done for coal in case coal is used. For purposes of calculating the emission reductions, the present project activity will not subtract internal auxiliary power consumption from total plant electricity generation. There a total of three meters at the plant. One is a generation meter which is in the control room. The other two are an export meter and a back-up export meter which are at the sub-station. Both these meters are inspected by The State Electricity Board of Chhattisgarh (govt) on monthly basis. The emission reductions are calculated by taking the generation figures. This is justified because no auxiliary consumption or transmission loss savings or any other losses are taken into account in the baseline generation case. This approach is justified because:
a) it is simple and transparent b) for baseline purposes the project proponents have also taken power generated in the grid. This
means that auxiliary power and other losses are not considered in the baseline case. The same is therefore done in the project case.
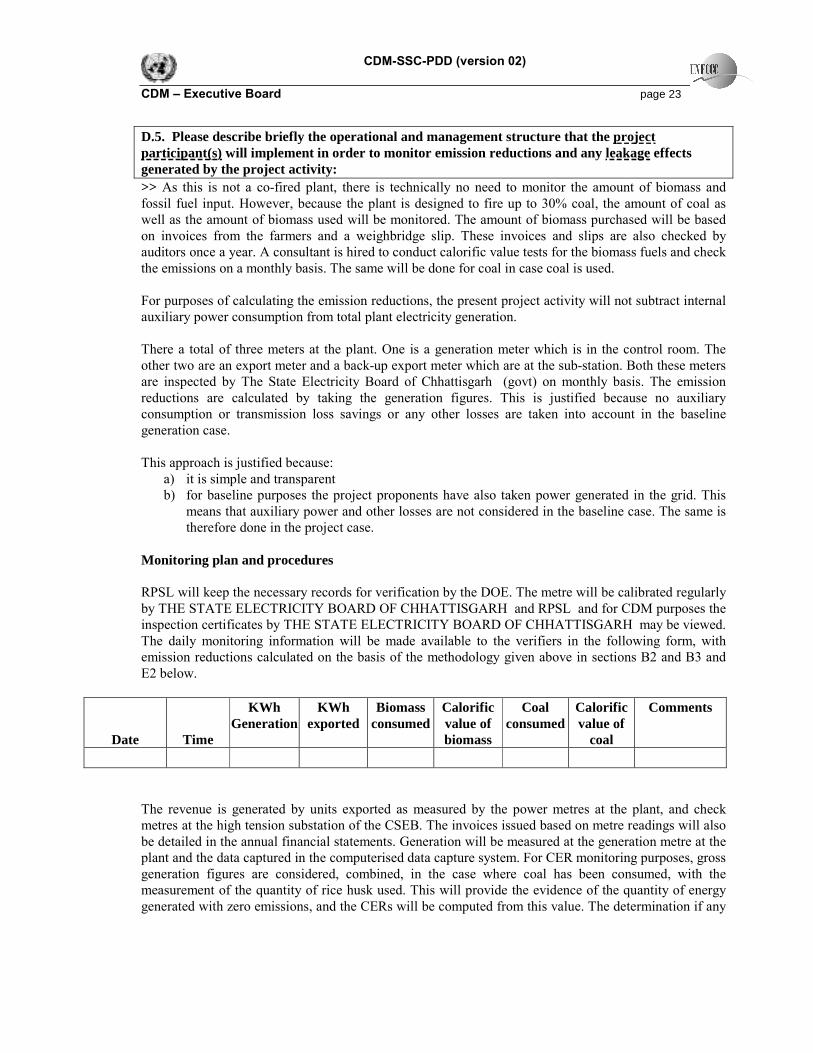
Monitoring plan and procedures RPSL will keep the necessary records for verification by the DOE. The metre will be calibrated regularly by THE STATE ELECTRICITY BOARD OF CHHATTISGARH and RPSL and for CDM purposes the inspection certificates by THE STATE ELECTRICITY BOARD OF CHHATTISGARH may be viewed. The daily monitoring information will be made available to the verifiers in the following form, with emission reductions calculated on the basis of the methodology given above in sections B2 and B3 and E2 below.
Date Time
KWh Generation
KWh exported
Biomass consumed
Calorific value of biomass
Coal consumed
Calorific value of
coal
Comments
The revenue is generated by units exported as measured by the power metres at the plant, and check metres at the high tension substation of the CSEB. The invoices issued based on metre readings will also be detailed in the annual financial statements. Generation will be measured at the generation metre at the plant and the data captured in the computerised data capture system. For CER monitoring purposes, gross generation figures are considered, combined, in the case where coal has been consumed, with the measurement of the quantity of rice husk used. This will provide the evidence of the quantity of energy generated with zero emissions, and the CERs will be computed from this value. The determination if any

CDM-SSC-PDD (version 02) CDM – Executive Board page 24 of the quality and quantity of coal fired will also help us determine the project emissions due to this in terms of mass of CO2. The project employs a digital control system (DCS) that will measure, record, report, monitor and continuously control various key parameters. These will include quantity and quality of rice husk, quantity and quality of coal used, total power generated, power exported, etc (details in the table below). All monitoring and control functions will be done as per the internal standards and norms of RPSL. The instrumentation systems for the project are mainly micro processor based instruments with a desired level of accuracy. All instruments will be calibrated and marked at regular intervals so that the accuracy of measurement can be ensured at all times. The quantity of emission reductions claimed by the project will only be a fraction of the total generated emissions from the grid, which depends on the actual generation mix of the grid in a particular year. CSEB publishes yearly reports regarding performance of all the power generation units (including private sector units). Hence authentic data related to measurement, recording, monitoring and control of the generation mix of the CSEB is ensured. The reports contain all information regarding type of generation like hydro, thermal, nuclear, renewable, installed capacity, de-rated capacity, performance of generation unit, actual generation, capacity additions during the year etc., which can be used for verification of the generation mix and emissions factors for baseline calculations for a particular year. On-site emissions Direct on-site emissions after the implementation of the project arise from burning rice husk in the boiler. The emissions are mainly CO2. However, the CO2 released equals the amount of CO2 taken up by the equivalent paddy plantation / biomass during growing. Therefore no net emissions occur. The other direct on-site emission source is combustion of coal in the boiler, if at all. The CO2 generation from coal combustion is calculated as a project emission and deducted from the emission reduction that would have occurred if 100% rice husk had been used. The methodology includes monitoring the quantity and quality of coal and the % of coal usage. The rice husk availability varies seasonally. Paddy is cultivated in 2 seasons, February to May and June to October. Adequate storage is required from November to June. Methane emissions may only occur during anaerobic conditions in such storage. This is not expected to contribute any significant GHGs even under anaerobic conditions. In principle nitrous oxide N2O emissions could also arise from such storage. However, no data from emission on storage is available. We assume the amount of CH4 and nitrous oxide emissions formed due to rice husk storage (which will take place in the open air) to be comparable to the amount of CH4 and N2O arising from rice husk when left on the field. As a consequence CH4 and N2O will not be influenced by the project and will not be taken into account during monitoring. Direct off site emissions These arise from the transportation of rice husk. However, in the baseline, fuel transport has also not been taken into account. On average the distance the fuel has to be transported for coal-fired plants is more than for rice husk plants. RPSL will have no more than 5 km distances to cover. The figures are calculated but are not taken into account for project emission calculations. As the plant uses existing rice husk from existing paddy, no additional biomass is grown on account of the project. Thus no additional uptake by sinks occurs. Indirect on site emissions

CDM-SSC-PDD (version 02) CDM – Executive Board page 25 These arise during the construction of the power plant. Considering the emission that will be avoided by the power plant during its life time, these are considered too small to need to be quantified and are thus not taken into account for monitoring purposes. Fuel requirement, availability and utilisation Quantity of rice husk used in the boiler as fuel: After the conveyor, an approximate measure of the shift wise usage of rice husk is done at this point by scaling the bunker. The same record is maintained manually in the register. Control of fuel feeding to the FBC boiler is done by controlling the rpm of the motors of the feeder system. The amount of rice husk used can be further verified by checking invoices and receipts from farmers and suppliers. A similar system has to be in place to check the amount of coal fired. Quality of rice husk: this will have to be checked in order to ensure smooth performance of the plant, though it will not affect emission reductions. A monitoring of the quality of coal similar to that for rice husk will be maintained if appropriate. Total power generated: this will be continuously monitored through the DCS. If the interpretation of data is done correctly, various interpretations can be made. For example, lower utilisation of feeders will indicate possible use of coal even if not reported in the fuel log, etc. This is the figure that will be used for calculating the total emission reductions. Power consumed by auxiliaries: this will be continuously monitored through the DCS. All instruments carry tag plates to indicate date of calibration. This number will be monitored to check for any reduction in auxiliary consumption, which may indicate a surreptitious switch to coal. Power exported to the grid: all instruments will be calibrated. Efficiency of the power generation activity: quantity and major quality parameters of steam at the inlet to the turbine will be measured through the DCS on-line. Base don measured input and output parameters, the system efficiency will be calculated and monitored by the DCS. All the above parameters will demonstrate the performance of the project at any given time. Leakage Appendix B of the Simplified Methodologies for Small-scale CDM Project Activities states in Section A Paragraph 8: In the case of the project activities using biomass, leakage shall be considered. The activity identified, which contributes for GHG emission outside the project boundary is transportation of biomass from biomass collection centres to biomass power project site. Calculation of leakage has been carried –out as under: � Biomass to be procured 100000 MT (dry weight) � Wet weight (60% extra) 170000 MT (wet weight) � Average Distance between project 5 km (10 km round trip)
Site and biomass collection centers � Biomass load per truck 6 MT

CDM-SSC-PDD (version 02) CDM – Executive Board page 26 � Number of trips 28333 � Consumption of Diesel per trip 12.5 (4 km/litre) � Total Diesel consumption 70833 litres � CO2 emission factor for Diesel 2.68 kg/l
(as per IPCC) � CO2 emission per annum 190 tonnes The CO2 emission occurs during the transportation of fuel from the source to the power plants. However, the distance between the coal mines and the thermal power plants is higher as compared to the transportation distance between biomass collection centres to biomass power project site and hence the CO2 emissions are higher. To be on conservative side and for sake of transparency, the emission due to coal transportation has not been added while calculating the baseline of generation in the State of Chhattisgarh. Hence the emission due to transportation of biomass has also been neglected from the calculations and estimations of emission reductions in the project case. Thus no leakage will be considered as taking place. As far as demand side leakage or market induced leakage is concerned, the biomass survey shows a surplus of biomass in the region to the extent that at least 20 such plants could come up utilising existing unutilised biomass in this and the adjoining District without impacting any other users. Thus there is no demand side or market induced leakage in this project activity. D.6. Name of person/entity determining the monitoring methodology: >> Rukmani Power and Steel Ltd. The person/entity is also the project participant and is the designated official contact for this project activity. SECTION E.: Estimation of GHG emissions by sources: E.1. Formulae used: >> E.1.1 Selected formulae as provided in appendix B: >> Since the project emissions come from a renewable source, the emission reductions are equal to the baseline emissions, which are calculated as: …………… the baseline is the kWh produced by the renewable generating unit multiplied by an emission coefficient (measured in kg CO2equ/kWh) calculated in a transparent and conservative manner as: (b) The weighted average emissions (in kg CO2equ/kWh) of the current generation mix. The following formula and values are used to obtain to total yearly emission reduction of the project activity: CERy = kWhy x EF where: CERy : yearly Certified Emission Reductions kWhy : kWh generated in year y measured at the energy meter

CDM-SSC-PDD (version 02) CDM – Executive Board page 27 EF = 1.043.30 kg CO2e / kWh EF is calculated as follows: ∑emissions from all generation / ∑electricity generation The formula used to calculate the emissions from all generation for coal is: 2730 * 4.18 * 25.8 * (44/12) / 1000 The numbers in the formula represent the following values: 2730 = kcal/kWh – average power plant efficiency as given by Central Electricity Authority, India *4.18 = kJ/kcal *25.8 = Carbon Emission Factor (f) (t C/TJ)
Other Bit. Coal , default value from IPCC 1996, 1.13 Table 1-1. *44/12 = (CO2/C) /1000 = to get tCO2e / GWh With the following generation figures assumed: Operating year Generation (kWh)
2006-2007 27720000 2007-2008 63360000 2008-2009 71280000 2009-2010 71280000 2010-2011 71280000 2011-2012 71280000 2012-2013 71280000
In case monitoring reveals use of coal, the formula will be: CERy = kWhy x EF – tCO2C
where: CERy : yearly Certified Emission Reductions kWhy : kWh generated in year y measured at the energy meter EF = 1.043.30 kg CO2e / kWh tCO2C : tonnes CO2 from coal combustion as project emissions Formula for tCO2C: Kg coal – as measured Calorific value of coal in MJ/kg coal = 15.7 EF: for sub-bituminous coal in tonnes CO2/MJ = 0.00009469 Kg coal x MJ/kg = MJ energy from coal combustion MJ x EF = tonnes CO2 from coal combustion E.1.2 Description of formulae when not provided in appendix B: >>N/A E.1.2.1 Describe the formulae used to estimate anthropogenic emissions by sources of GHGs due to the project activity within the project boundary:

CDM-SSC-PDD (version 02) CDM – Executive Board page 28 >>N/A E.1.2.2 Describe the formulae used to estimate leakage due to the project activity, where required, for the applicable project category in appendix B of the simplified modalities and procedures for small-scale CDM project activities >>N/A E.1.2.3 The sum of E.1.2.1 and E.1.2.2 represents the small-scale project activity emissions: >> N/A E.1.2.4 Describe the formulae used to estimate the anthropogenic emissions by sources of GHGs in the baseline using the baseline methodology for the applicable project category in appendix B of the simplified modalities and procedures for small-scale CDM project activities: >> N/A E.1.2.5 Difference between E.1.2.4 and E.1.2.3 represents the emission reductions due to the project activity during a given period: >> N/A E.2 Table providing values obtained when applying formulae above: >> Operating year Baseline Emissions
(tonnes of CO2) Project Emissions (tonnes of CO2)
Certified Emission Reductions (tonnes of CO2)
2006-2007 28920 0 28920 2007-2008 66104 0 66104 2008-2009 74367 0 74367 2009-2010 74367 0 74367 2010-2011 74367 0 74367 2011-2012 74367 0 74367 2012-2013 74367 0 74367
Total 466859 SECTION F.: Environmental impacts: F.1. If required by the host Party, documentation on the analysis of the environmental impacts of the project activity: >> As per the government of India notification dated June 13, 2002 based on environment protection rule 1986, public hearing and EIA is required for those industries / projects which are listed in the predefined list of Ministry of Environment and Forests. First Environmental Impact Assessment of the project activity prior to inception of project has been done at the request of Chhattisgarh Pollution Control Board, beginning with an assessment of the baseline parametres.

CDM-SSC-PDD (version 02) CDM – Executive Board page 29 RPSL has taken all the care to follow the rules and regulations for conservation of the environment prescribed by the licensing authority CPCB. “The Care” Environmental Impact Assessment of 12 July 2005 and subsequent dates, measured:
• noise monitoring inside the premises at 5 locations, viz. identified plant site and 4 villages • ambient air sampling at 6 locations, viz. site of RPSL in wind direction, against wind direction,
and 4 villages • water sample at 6 locations, RPSL pond, borewell, reservoir near site, pond in village near
site, open well in village near site, pond in village, borewell in village. These measurements will be continuously recorded by this external monitoring body, and reports provided to RPSL for action as appropriate. Agricultural residues contain a maximum of 3 % ash, though rice husk ash contains up to 20% ash; 90 % of this ash is converted to fly ash. The air emissions are kept below 115 mg/Nm3 due to the electrostatic precipitator that is used by the power plant. Both the bottom ash and the fly ash are used by brick manufacturers or in the case of rice husk ash it can be used for the production of high quality silicon. Currently RPSL is looking into this process industry and may set up such a plant for conversion of rice husk ash into high quality silicon. Total waste water from the plant is used in maintaining the green belt. SECTION G. Stakeholders’ comments: G.1. Brief description of how comments by local stakeholders have been invited and compiled: >> The local stakeholders are basically the farmers and agricultural labourers around the plant. They are the most important stakeholders who will benefit from the agricultural residue collection and sale activities for providing fuel to the power plant. They are very keen for the plant to run on agricultural residues and are ready to provide all the inputs required. Other stakeholders are the regulatory authorities, the purchasers of the power and other stakeholders. These are:
� The customer (THE STATE ELECTRICITY BOARD OF CHHATTISGARH ) � Licensing and regulatory authorities like � Non-Conventional Energy Development Corporation of Chhattisgarh � Chhattisgarh Pollution Control Board � Chhattisgarh Irrigation Department � MoEF (Govt of India) � MNES (Govt. of India)
RPSL has been constantly in touch with other identified stakeholders like licensing and regulatory authorities. Their views are reflected in the form of permission granted for the project. In this aspect, the permission by Non-Conventional Energy Development Corporation of Chhattisgarh, MoEF, CPCB and MNES are indication of favourable impression for the project. RPSL completed the necessary consultation with local stakeholders especially the suppliers of biomass. There was no real need to involve others as there was full support for the project at all levels. The project

CDM-SSC-PDD (version 02) CDM – Executive Board page 30 does not require displacement of any local population. In addition, the local population is also an indirect consumer of the power that is supplied from the power plants. The distance between the electrical substation for power evacuation and the plant is very small so the installation of transmission lines does not create any inconvenience to the local population. Chhattisgarh Pollution Control Board (CPPCB) has prescribed standards of environmental compliance and monitors the adherence to the standards. The project has already received No Objection Certification (NOC) from CPCB to start the plant. Non-Conventional Energy Development Agency of Chhattisgarh implements policies in respect of non-conventional renewable power projects in the state of Chhattisgarh and has accorded approval to the project. As a buyer of the power, the State Electricity Board of Chhattisgarh is a major stakeholder in the project. They hold the key to the commercial success of the project, and the State Electricity Board of Chhattisgarh has already cleared the project and RPSL has already signed Power Purchase Agreement (PPA) with the State Electricity Board of Chhattisgarh and is supplying power. Designated National Authority under Ministry of Environment and Forest has provided host county approval to the project. The Government of India, through Ministry of Non-conventional Energy Sources (MNES), has been promoting energy conservation, demand side management and viable renewable energy projects including wind, small hydro and bagasse cogeneration / bio-mass power. The project meets their requirements. G.2. Summary of the comments received: >> As mentioned above, RPSL has already received all the required approvals and clearances for their project. Farmers and landless labourers expressed their happiness about project implementation by RPSL in this area, which has provided them an opportunity of small business and employment. It is also helping to improve the general level of economic activity in the region. G.3. Report on how due account was taken of any comments received: >> The plant is set up in response to the need for local employment and off-farm opportunities in a very poor locality. To this extent the project itself is in response to stakeholder comments – viz. that they need jobs. Further, the document will be published on UNFCCC/Validator’s website for public comments.
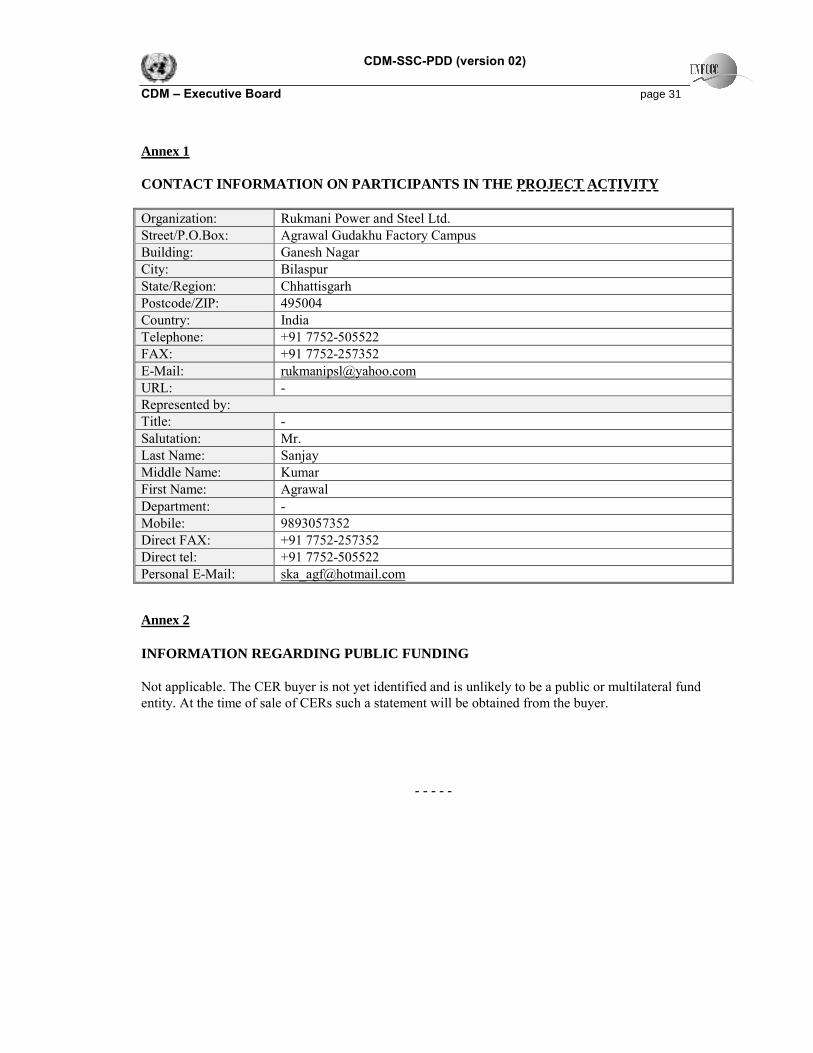
CDM-SSC-PDD (version 02) CDM – Executive Board page 31 Annex 1 CONTACT INFORMATION ON PARTICIPANTS IN THE PROJECT ACTIVITY Organization: Rukmani Power and Steel Ltd.Street/P.O.Box: Agrawal Gudakhu Factory CampusBuilding: Ganesh NagarCity: Bilaspur State/Region: Chhattisgarh Postcode/ZIP: 495004Country: India Telephone: +91 7752-505522FAX: +91 7752-257352E-Mail: [email protected]: - Represented by: Title: - Salutation: Mr. Last Name: Sanjay Middle Name: Kumar First Name: Agrawal Department: - Mobile: 9893057352 Direct FAX: +91 7752-257352 Direct tel: +91 7752-505522 Personal E-Mail: [email protected]
Annex 2 INFORMATION REGARDING PUBLIC FUNDING Not applicable. The CER buyer is not yet identified and is unlikely to be a public or multilateral fund entity. At the time of sale of CERs such a statement will be obtained from the buyer.
- - - - -
Related Documents