PROJECT DESIGN DOCUMENT FORM (CDM PDD) - Version 03 CDM – Executive Board page 1 CLEAN DEVELOPMENT MECHANISM PROJECT DESIGN DOCUMENT FORM (CDM-PDD) Version 03 - in effect as of: 28 July 2006 CONTENTS A. General description of project activity B. Application of a baseline and monitoring methodology C. Duration of the project activity / crediting period D. Environmental impacts E. Stakeholders’ comments Annexes Annex 1: Contact information on participants in the project activity Annex 2: Information regarding public funding Annex 3: Baseline information Annex 4: Monitoring plan

Welcome message from author
This document is posted to help you gain knowledge. Please leave a comment to let me know what you think about it! Share it to your friends and learn new things together.
Transcript

PROJECT DESIGN DOCUMENT FORM (CDM PDD) - Version 03
CDM – Executive Board
page 1
CLEAN DEVELOPMENT MECHANISM
PROJECT DESIGN DOCUMENT FORM (CDM-PDD)
Version 03 - in effect as of: 28 July 2006
CONTENTS
A. General description of project activity
B. Application of a baseline and monitoring methodology
C. Duration of the project activity / crediting period
D. Environmental impacts
E. Stakeholders’ comments
Annexes
Annex 1: Contact information on participants in the project activity
Annex 2: Information regarding public funding
Annex 3: Baseline information
Annex 4: Monitoring plan

PROJECT DESIGN DOCUMENT FORM (CDM PDD) - Version 03
CDM – Executive Board
page 2
SECTION A. General description of project activity
A.1. Title of the project activity:
Project title: Market Coke Waste Heat Recovery Project
Version number: V01.1
Date: 25 January 2012 (V01)
18 May 2012 (V01.1 – updated in line with Designated Operational Entities’ (DOE)
recommendations)
A.2. Description of the project activity:
Exxaro Resources Limited (Exxaro) plans to construct the Market Coke Plant (the project facility) at their
Grootegeluk Coal Mine in the Limpopo Province of South Africa. The Bankable Feasibility Study (BFS)
for the project facility has been completed and the potential to generate electricity from waste heat
recovered in the Market Coke Waste Heat Recovery Plant (the project activity) is being investigated
through the completion of a Pre-feasibility Study (PFS) 1. The project activity and the project facility will
independently seek approval from Exxaro’s Board of Directors due to the need for carbon revenue for the
project activity (see section B.5. below) 1.
The project activity will utilise waste heat recovered from the coke oven flue gas (waste gas, off-gas)
after tertiary combustion, produced as part of the coking pyrolysis process in the project facility to
produce electricity.
During the coking pyrolysis process, coal from the Grootegeluk Coal Mine is heated in coke ovens in the
absence of oxygen (air), driving off volatile matter in the coal to produce market coke. Large volumes of
hot coke oven flue gases are produced in the coking pyrolysis process and these hot waste gases contain
energy in the form of waste heat which can be recovered. In the project activity, steam is produced in
waste heat recovery boilers (WHRB) using the waste heat recovered from the hot coke oven flue gas after
tertiary combustion. The steam is expanded through turbines to produce mechanical energy used to drive
alternators to produce electricity.
The project activity is expected to have a gross installed capacity of 60MW and the objective of the
project activity is to supply the electricity produced, 462 000 MWh/yr, to the internal grid of the
Grootegeluk Coal Mine thereby displacing more carbon intensive electricity from the South African
national grid operated by Eskom (the baseline) and therefore also lessening the burden on the national
grid. Additionally, the project activity is expected to result in greenhouse gas (GHG) emissions
reductions of approximately 450 912 tCO2e/yr. The baseline or business as usual practice would be to
combust the hot coke oven flue gases in flue gas ducts (tertiary combustion) and vent the waste heat to
atmosphere.
The project activity and project facility will be located at the Grootegeluk Coal Mine on the farm Daarby
458 LQ, approximately 25km west of the town of Lephalale (formerly Ellisras), in the Limpopo Province
of South Africa.
1 Exxaro, 2012a.

PROJECT DESIGN DOCUMENT FORM (CDM PDD) - Version 03
CDM – Executive Board
page 3
The project facility and the project activity make important and noteworthy contributions to the
sustainable development of South Africa2. The project activity displaces the carbon intensive electricity
of the national grid and is expected to result in GHG emissions reductions of approximately
450 912.00tCO2e/yr.
Located within the existing Grootegeluk Coal Mine, the project activity will not affect local or regional
biodiversity. The proposed site is located on an area currently utilised as a construction lay-down area
within the mine, and as such will not affect “greenfields” sites on the mine further mitigating the
disturbance of ecosystems and biodiversity.
Approximately 275 direct jobs will be created during the operational lifetime of the project facility and
the project activity, with more jobs expected to be created during the construction phase3.
Additionally, as described in sections D.1. and D.2. below, the scoping phase of the environmental impact
assessment (EIA) process has identified potential environmental impacts and has outlined the plan of
study for the EIA. Moreover, the project’s environmental impacts will be assessed and appropriate
mitigation measures will be identified and implemented in the project’s design and operation3.
A.3. Project participants:
Table 1 below provides a list of the project participants:
Table1: Project participants
Name of Party involved (*) (host)
indicates a Host Party)
Private and/or public entity(ies)
project participants (*) (as
applicable)
Kindly indicate if the Party
involved wishes to be considered
as project participant (Yes/No)
Republic of South Africa (host) Exxaro Resources Limited No
(*) In accordance with the CDM modalities and procedures, at the time of making the
CDM-PDD public at the stage of validation, a Party involved may or may not have provided its
approval. At the time of requesting registration, the approval by the Party(ies) involved is
required.
Note: When the PDD is filled in support of a proposed new methodology (form CDM-NM), at least
the Host Party(ies) and any known project participant (e.g. those proposing a new methodology) shall
be identified.
A.4. Technical description of the project activity:
A.4.1. Location of the project activity:
>>
A.4.1.1. Host Party(ies):
2 Department of Energy (DOE), 2011. Designated National Authority (DNA) Letter Of No Objection (LONO).
3 Synergistics, 2012. Market Coke Plant and Co-generation Plant - Draft Environmental Scoping Report.

PROJECT DESIGN DOCUMENT FORM (CDM PDD) - Version 03
CDM – Executive Board
page 4
Country: Republic of South Africa.
A.4.1.2. Region/State/Province etc.:
Province: Limpopo Province.
A.4.1.3. City/Town/Community etc.:
Town/ City: Lephalale (formerly Ellisras).
Municipality: Lephalale Local Municipality, within the Waterberg District Municipality.
A.4.1.4. Details of physical location, including information allowing the
unique identification of this project activity (maximum one page):
The project activity will be located at the Grootegeluk Coal Mine on the farm Daarby 458 LQ,
approximately 25km west of the town of Lephalale (formerly Ellisras), in the Limpopo Province of South
Africa. The coordinates for the project are: 23.6453° South and 27.5544° East and refer to point R9 of
Figure 3 below.
Figure 1 below provides the location of the Grootegeluk Coal Mine, where the project activity will be
located, while Figure 2 provides the location of the project activity within the boundaries of the
Grootegeluk Coal Mine. Also, a preliminary site layout diagram is provided in Figure 3.

PROJECT DESIGN DOCUMENT FORM (CDM PDD) - Version 03
CDM – Executive Board
page 5
Figure 1: Location of the Grootegeluk Coal Mine in the Limpopo Province of South Africa (Source: Synergistics
Environmental Services3).

PROJECT DESIGN DOCUMENT FORM (CDM PDD) - Version 03
CDM – Executive Board
page 6
Figure 2: Location of the Market Coke Waste Heat Recovery Plant within the Grootegeluk Coal Mine (Source:
Synergistics Environmental Services3).

PROJECT DESIGN DOCUMENT FORM (CDM PDD) - Version 03
CDM – Executive Board
page 7
Figure 3: Preliminary site layout diagram (Exxaro Grootegeluk Coal Mine
4).
A.4.2. Category(ies) of project activity:
The project falls within Sectoral Scope 01 Energy industries (renewable - / non-renewable sources) and
Sectoral Scope 04 Manufacturing industries.
A.4.3. Technology to be employed by the project activity:
The project activity will use standard technology and equipment to recover the hot waste gas and energy
incorporating the gas system, waste heat boilers, a standard steam system with turbines, generators,
switchgear and control systems. A simplified process flow diagram for the project activity is provided in
Figure 4 below.
4 Exxaro 2012b.

PROJECT DESIGN DOCUMENT FORM (CDM PDD) - Version 03
CDM – Executive Board
page 8
Figure 4: Simplified process flow diagram for the Market Coke Waste Heat Recovery Plant
As can be seen from Figure 4 above, waste heat from the tertiary combustion of the coke oven flue gas
from the project facility enters the project activity at the WHRB where it is used to raise steam for use in
the steam turbine. The steam is expanded through the turbine driving a shaft connected to the generator
producing approximately 462 000 MWh/yr electricity. The project activity’s expected plant load factor is
96%5.
The technology employed is mature and the equipment is available from a large number of manufacturers
and is to a large extent interchangeable. The only deviation from the standard is that the project activity
will utilize dry (air) cooling technology as opposed to a conventional wet cooling technology and system,
as a result of the general water shortage in the region thereby enhancing its sustainable development and
environmental benefits (even though the wet cooling technology and system would be cheaper and would
also allow the generation of more power). However, although the technology utilised is considered to be
standard and mature technology, the use of this technology in the coke manufacturing process is
considered to be first of its kind in South Africa, as demonstrated in section B.5. below.
The project boundary includes the proposed Market Coke Plant as the project facility, containing the coke
ovens where the waste heat is generated after tertiary combustion of the coke oven flue gas and the
associated and co-located Market Coke Waste Heat Recovery Plant (the project activity) containing the
5 Engineering and Projects Company (E&PC), 2011.Exxaro Energy Coke Waste Heat Recovery Project: Process
Design Criteria.
Waste Heat Waste Heat
Recovery Boiler Stack
Steam Turbine
High Pressure Steam ~
60 MW Electricity (Gross)
Low Pressure Steam
Generator
Boiler Feed Water Condenser
Cooling Tower - Dry Cooling
Cooling Air

PROJECT DESIGN DOCUMENT FORM (CDM PDD) - Version 03
CDM – Executive Board
page 9
gas system, WHRB, steam system with turbines, generators (alternators), switchgear, control systems and
ancillary equipment. The South African national electricity grid operated by Eskom which currently
supplies electricity to the Grootegeluk Coal Mine prior to the project activity, shall also form part of the
project boundary for the purposes of determining the baseline. Emissions which fall outside of the project
boundary, include the ongoing mining operations at the Grootegeluk Coal Mine as well as the operation
of the project facility. The project activity will result in the displacement of GHG intensive electricity
supplied from the South African national grid and will therefore target carbon dioxide (CO2) reductions.
Figure 5 below provides a detailed process flow diagram delineating the project activity.
The baseline (see section B.4 below) is the continuation of the status quo whereby the Grootegeluk Coal
Mine’s electricity is supplied from the South African national grid and the usual practice for the project
facility would be to combust and vent the coke oven flue gas emitted from the coke ovens.
PROJECT DESIGN DOCUMENT FORM (CDM PDD) - Version 03
CDM – Executive Board page 10
Figure 5: Detailed process flow diagram delineating the project activity
60% Yield COFG
Eff. 22 %
Tertiary
Combustion
Steam Turbine
Compaction
Waste Heat
Recovery Boiler
(WHRB)
Coking Oven Battery
Combustion
Secondary Combustion
Primary
Coke Oven Cross-Section
Schematic
Current SSCC plus GG6 II
Coke 500 ktpa 552 ktpa Coke Cutting & Screening
Coke Quenching
Quench Water H
2O
Off-Gas Stack
Air
Crushing &
Sizing
Electricity 72 MWe Generator
Feedstock 920 ktpa
Compaction Process
H2O
HP Steam
Dry Condensing
Air Steam
Make-up H
2O
Tertiary Combustion
8-10% Fines
Bypass around Energy Recovery
Plant
Project Activity

PROJECT DESIGN DOCUMENT FORM (CDM PDD) - Version 03
CDM – Executive Board
page 11
Project facility process description
Semi-soft coking coal (SSCC) is conveyed from coal stockpiles within the existing Grootegeluk Coal
Mine and stored in concrete silos and coal storage bins (hoppers). The SSCC is crushed and sized before
compaction, where it is loaded from a hopper into a compacting box. Hydraulic compaction will be used
which involves the compression of the SSCC layers from the top by a hydraulically activated
compression plate. Water is added during compaction to increase the strength of the resulting coal cake.
The shaped and compacted coal cake is then loaded onto charging / pushing cars and is “charged” (fed)
into the coke ovens. Once in the coke oven, the pyrolysis process begins through the combustion of the
volatile gases which are released from the coal cake during heating. This is where the coke ovens make
available the waste heat after tertiary combustion of the hot coke oven flue gases for utilisation in the
project activity. As can be seen from the figure below, from the ducts below the coke oven floor, the hot
coke oven gases are drawn into the flues that run across the length of the coke oven battery. Tertiary
combustion of the hot coke oven flue gases takes place within the flues as air is fed in. The waste heat is
transported along the flues, before the waste heat is recovered in the waste heat recovery boilers for use in
the project activity.
Figure 6: Schematic example of coke ovens and coking pyrolysis process
Coal cake charged into coke ovens
Coke ovens
Tertiary combustion of the hot coke oven flue gases

PROJECT DESIGN DOCUMENT FORM (CDM PDD) - Version 03
CDM – Executive Board
page 12
Project activity process description
As mentioned previously and as can be seen from Figure 4 above, the battery limit between the project
facility and the project activity is the point at which the hot coke oven flue gases, after tertiary
combustion, enters the waste heat recovery boilers. The expected thermodynamic conditions, including
temperature and flow rate, of the waste heat is given in the table below.
Table 2: Waste heat conditions at WHRB inlet
6
Description Value Unit
Flow rate 583 139 Nm3/hr
Temperature 1 230 °C
Energy Available 274 MW
The thermodynamic cycle for the project activity is the “Rankine cycle”. The cycle is the basis for
conventional power generating stations and consists of a steam source such as the WHRB which utilise
the waste heat from the tertiary combustion of the hot coke oven flue gas at an approximate temperature
of 1 230°C to convert water to high-pressure steam. In the steam cycle, water is first pumped into the
WHRB at medium to high pressure. It is then heated utilising the waste heat to the boiling temperature in
the range of 480°C to 540°C, depending on the pressure.
The pressurised steam is then expanded through a multi-stage turbine to a lower steam pressure and
exhausted to a condenser at vacuum conditions. An extraction condensing turbine will be utilised. The
rotational energy generated, is transferred by the turbine output shaft to the generator which generates
electricity. The condensate from the condenser returns to the feed water pumps for further use and
continuation of the cycle. The anticipated technical parameters for major equipment utilised in the
project activity are provided in the table below.
Table 3: Anticipated technical parameters of major equipment
6
Waste Heat Recovery Boilers
(WHRBs)
Turbine and generator units
Units: 4 Units: 2
Boiler thermal efficiency
(estimated): 85% (to be confirmed
(tbc))
Steam temperature at turbine inlet
(estimated): 480˚C (tbc)
Blowdown (estimated): 3% (tbc) Steam pressure at turbine inlet
(estimated): 65 Bar (tbc)
Steaming capacity per boiler
(estimated): 286 t/hr (to be
confirmed (tbc))
Specific steam consumption
(overall) (estimated): 4.76kg/kW
Feedwater temperature (estimated):
110˚C (tbc)
Turbine capacity (estimated):
30MWe (tbc)
Feedwater Pressure (a) (estimated):
81 Bar(a) (tbc)
Boiler outlet steam temperature
(estimated): 485˚C (tbc)
6 E&PC, 2011. Exxaro Energy Coke Waste Heat Recovery Project: Energy and Material Balance.

PROJECT DESIGN DOCUMENT FORM (CDM PDD) - Version 03
CDM – Executive Board
page 13
The steam system includes the waste heat recovery boilers and turbines, ducting, pumps, piping, cladding
and civil work but also associated equipment like piping, valves, electrical equipment, automation,
instrumentation, de-aerators, fans, stacks, condensers, cooling towers and the water treatment plants.
A.4.4. Estimated amount of emission reductions over the chosen crediting period:
A fixed, ten (10) year crediting period for the project activity will be utilised. The project activity will
result in the displacement of GHG intensive electricity supplied from the South African national grid and
will therefore target CO2 reductions.
The estimated emissions reductions of the project activity over the 10 year crediting period are
summarized in the table below:
Table 4: Estimated emissions reductions
Year Annual estimation of emission reductions
in tonnes of CO2e
2015 (01/08/2015 - 31/12/2015) 189 383
2016 450 912
2017 450 912
2018 450 912
2019 450 912
2020 450 912
2021 450 912
2022 450 912
2023 450 912
2024 450 912
2025 (01/01/2025 - 31/07/2025) 261 529
Total estimated reductions (tonnes of CO2e) 4 509 120
Total number of crediting years 10
Annual average over the crediting period
of estimated reductions (tonnes of CO2e)
450 912
A.4.5. Public funding of the project activity:
Official Development Assistance (ODA) or public funding has not and will not be used in the
development and implementation of the project7.
7 Exxaro, 2012c.

PROJECT DESIGN DOCUMENT FORM (CDM PDD) - Version 03
CDM – Executive Board
page 14
SECTION B. Application of a baseline and monitoring methodology
B.1. Title and reference of the approved baseline and monitoring methodology applied to the
project activity:
The approved baseline and monitoring methodology to be employed for the project activity is:
“ACM0012: Consolidated baseline methodology for GHG emission reductions from waste energy
recovery projects (ACM0012 / Version 04.0.0, Sectoral Scopes: 01 and 04, EB 60)”
Relevant methodological tools utilised include:
“Tool to calculate the emission factor for an electricity system (Version 2.2.1, EB 63, Annex
19)”8;
“Tool for the demonstration and assessment of additionality (Version 6.0.0, EB 65, Annex 21)”8;
The relevant scope and applicability criteria of the tools are assessed and demonstrated for use in the
tables below.
Table 5: Scope and applicability criteria analysis of the Tool to calculate the emission factor for an electricity system
Tool scope and applicability criteria Applicability of tool for use in the project activity
This methodological tool determines the CO2 emission
factor for the displacement of electricity generated by
power plants in an electricity system, by calculating the
“combined margin” emission factor (CM) of the
electricity system. The CM is the result of a weighted
average of two emission factors pertaining to the
electricity system: the “operating margin” (OM) and the
“build margin” (BM). The operating margin is the
emission factor that refers to the group of existing power
plants whose current electricity generation would be
affected by the proposed CDM project activity. The
build margin is the emission factor that refers to the
group of prospective power plants whose construction
and future operation would be affected by the proposed
CDM project activity.
The project activity results in the displacement of
electricity generated by power plants in the South
African national grid (the electricity system) owned and
operated by Eskom. As such, the tool is utilised to
calculate the combined margin (CM) emissions factor of
the grid. The project activity and the application of the
tool thus complies with the criterion and is suitable for
use.
This tool may be applied to estimate the OM, BM and/or
CM when calculating baseline emissions for a project
activity that substitutes grid electricity, i.e. where a
project activity supplies electricity to a grid or a project
activity that results in savings of electricity that would
have been provided by the grid (e.g. demand-side energy
efficiency projects).
The tool is utilised to estimate the OM, BM and CM of
the grid for the purposes of determining the baseline
emissions. The project activity substitutes grid
electricity that would have otherwise supplied the
recipient facility, the Grootegeluk Coal Mine. The
criterion is satisfied and the tool is applicable for use.
Under this tool, the emission factor for the project
electricity system can be calculated either for grid power
plants only or, as an option, can include off-grid power
plants. In the latter case, the conditions specified in
As can be seen from section B.6.1. below, although this
step of the tool is optional, only grid power plants are
included in the calculation. As such there is no
requirement to meet the conditions specified in Annex 2
8 Available online at http://cdm.unfccc.int/Reference/tools/index.html

PROJECT DESIGN DOCUMENT FORM (CDM PDD) - Version 03
CDM – Executive Board
page 15
Tool scope and applicability criteria Applicability of tool for use in the project activity
“Annex 2 - Procedures related to off-grid power
generation” should be met. Namely, the total capacity of
off-grid power plants (in MW) should be at least 10% of
the total capacity of grid power plants in the electricity
system; or the total electricity generation by off-grid
power plants (in MWh) should be at least 10% of the
total electricity generation by grid power plants in the
electricity system; and that factors which negatively
affect the reliability and stability of the grid are
primarily due to constraints in generation and not to
other aspects such as transmission capacity.
of the tool. The criterion is therefore satisfied and the
use of the tool is applicable.
Note that this tool is also referred to in the “Tool to
calculate project emissions from electricity
consumption” for the purpose of calculating project and
leakage emissions in case where a project activity
consumes electricity from the grid or results in increase
of consumption of electricity from the grid outside the
project boundary.
Project and leakage emissions are calculated according
to ACM0012 as described in section B.6.1. below. The
project activity does not consumer electricity from the
grid and does not result in an increase of electricity from
the grid outside of the project boundary. The criterion is
fulfilled and the tool is applicable for use.
In case of CDM projects the tool is not applicable if the
project electricity system is located partially or totally in
an Annex I country.
The project electricity system comprises the South
African national grid owned and operated by Eskom and
is neither partially or totally located in an Annex I
country. The tool is therefore applicable for use in the
project activity.
Table 6: Scope and applicability criteria analysis of the Tool for the demonstration and assessment of additionality
Tool scope and applicability criteria Applicability of tool for use in the project activity
This tool provides for a step-wise approach to
demonstrate and assess additionality. These Steps
include:
(a) Identification of alternatives to the project activity;
(b) Investment analysis to determine that the proposed
project activity is either: 1) not the most economically or
financially attractive, or 2) not economically or
financially feasible;
(c) Barriers analysis; and
(d) Common practice analysis.
The steps provided in the tool are applied and
furthermore are considered to have been applied
correctly, according to the requirements of the tool. The
tool is therefore applicable for use since the criterion is
satisfied.
Based on the information about activities similar to the
proposed project activity, the common practice analysis
is to complement and reinforce the investment and/or
barriers analysis. The Steps are summarized in the flow-
chart on page 2 of this document.
As can be seen in section B.5. below, the common
practice analysis is utilised to complement the
investment analysis. Furthermore the Stepss are applied
in accordance with the requirements of the tool and the
criterion is satisfied, thereby the tool is applicable for
use.
The document provides a general framework for
demonstrating and assessing additionality and is
applicable to a wide range of project types. Some project
types may require adjustments to this general
framework.
ACM0012 requires that the assessment and
demonstration of additionality be carried out according
to the latest version of the Tool for the demonstration
and assessment of additionality, as such the tool is
applied as is and no adjustments have been made to the
general framework. The tool is therefore applicable for
use.
This tool does not replace the need for the baseline The baseline scenario has been determined in

PROJECT DESIGN DOCUMENT FORM (CDM PDD) - Version 03
CDM – Executive Board
page 16
Tool scope and applicability criteria Applicability of tool for use in the project activity
methodology to provide a step-wise approach to identify
the baseline scenario. Project participants that propose
new baseline methodologies shall ensure consistency
between the determination of additionality of a project
activity and the determination of a baseline scenario.
Project participants can also use the “Combined tool to
identify the baseline scenario and demonstrate
additionality”, which provides a procedure for baseline
scenario identification as well as additionality
demonstration.
accordance with ACM0012, where realistic and credible
alternatives have been identified in a step wise approach
for the most plausible baseline scenario. The tool has
therefore not replaced the need for the baseline
methodology to provide a step-wise approach to identify
the baseline scenario and is therefore applicable for use.
Guideline documents utilised include:
“Guidelines on the assessment of investment analysis (Version 05, EB 62, Annex 5)”
“Guidelines on additionality of first-of-its-kind project activities (Version 01.0, EB 63, Annex
11)”
“Guidelines on common practice (Version 01.0, EB 63, Annex 12)”
B.2. Justification of the choice of the methodology and why it is applicable to the project
activity:
Provided in the table below is an applicability analysis of the project activity against the criteria set out in
ACM0012:
Table 7: Applicability analysis of ACM0012 against the project activity
ACM0012 Applicability Criteria Project Activity
The consolidated methodology is applicable to project
activities implemented in an existing or Greenfield
facility converting waste energy carried in identified
WECM stream(s) into useful energy. The WECM
stream may be an energy source for:
• Generation of electricity;
• Cogeneration;
• Direct use as process heat source;
• Generation of heat in element process;
• Generation of mechanical energy; or
• Supply of heat of reaction with or without process
heating.
The project activity is the construction and operation of
the new (Greenfield) Market Coke Waste Heat Recovery
Plant5. The project activity utilises waste heat carried in
the coke oven flue gas after tertiary combustion (the
identified waste energy carrying medium (WECM))
produced in the greenfield Market Coke Plant (the
project facility) as part of the coking pyrolysis process to
generate 462 000 MWh/yr net electricity6. The project
activity subscribes to the criterion and ACM0012 is
therefore suitable for use.
In the absence of the project activity, the WECM stream:
(a) Would not be recovered and therefore would be
flared, released to atmosphere, or remain unutilized in
the absence of the project activity at the existing or
Greenfield project facility; or
(b) Would be partially recovered, and the unrecovered
portion of WECM stream would be flared, vented or
remained unutilised at the existing or Greenfield project
facility.
In the absence of the project activity, the WECM would
not be recovered and would be combusted and vented to
atmosphere10, 11
. Thus, the criterion is applicable to the
project activity, and ACM0012 is suitable for use.

PROJECT DESIGN DOCUMENT FORM (CDM PDD) - Version 03
CDM – Executive Board
page 17
ACM0012 Applicability Criteria Project Activity
Project activities improving the WECM recovery may
(i) capture and utilise a larger quantity of WECM stream
as compared to the historical situation in existing
facility, or capture and utilise a larger quantity of
WECM stream as compared to a “reference waste
energy generating facility”; and/or (ii) apply more
energy efficient equipment to replace/modify/expand
waste energy recovery equipment, or implement a more
energy efficient equipment than the “reference waste
energy generating facility”.
For project activities which recover waste pressure, the
methodology is applicable where waste pressure is used
to generate electricity only and the electricity generated
from waste pressure is measurable.
Although the project activity produces electricity only,
no waste pressure is recovered and therefore ACM0012
is applicable to the project activity5, 6
.
Regulations do not require the project facility to recover
and/or utilize the waste energy prior to the
implementation of the project activity.
Current regulations require that the coke oven flue gas to
be combusted before being vented to atmosphere in
order to comply with environmental air quality
regulations9. However, no South African regulations
require the use of the waste energy. The project activity
subscribes to this criterion and ACM0012 is therefore
suitable for use.
The methodology is applicable to both Greenfield and
existing waste energy generation facilities. If the
production capacity of the project facility is expanded as
a result of the project activity, the added production
capacity must be treated as a Greenfield facility.
Both the project activity and project facility are
Greenfield facilities and will therefore be treated as such
for further analysis in this document5. ACM0012 is
therefore suitable for use.
Waste energy that is released under abnormal operation
(for example, emergencies, shut down) of the project
facility shall not be included in the emission reduction
calculations.
Under abnormal conditions (emergencies, plant shut
down etc.) of either the project facility or project
activity, waste energy released will not form part of the
emissions reductions calculations and therefore
ACM0012 is suitable for use.
If multiple waste gas streams are available in the project
facility and can be used interchangeably for various
applications as part of the energy sources in the facility,
the recovery of any waste gas stream, which would be
totally or partially recovered in the absence of the
project activity, shall not be reduced due to the
implementation of CDM project activity. For such
situations, the guidance provided in Annex 3 shall be
followed.
The only identified WECM for the project activity is the
waste heat contained in the hot coke oven flue gas after
tertiary combustion produced as part of the coking
pyrolysis process in the project facility6. Multiple waste
gas streams are therefore not utilised in the project
activity and therefore ACM0012 is suitable for use.
The methodology is not applicable to the cases where a
WECM stream is partially recovered in the absence of
the CDM project activity to supply the heat of reaction,
and the recovery of this WECM stream is increased
under the project activity to replace fossil fuels used for
In the absence of the project activity, the WECM would
be combusted and vented in full, and would not be
partially recovered10, 11
. Additionally, the project
activity utilises the WECM to generate electricity as the
only output of the project activity and does not utilise

PROJECT DESIGN DOCUMENT FORM (CDM PDD) - Version 03
CDM – Executive Board
page 18
ACM0012 Applicability Criteria Project Activity
the purpose of supplying heat of reaction.
the WECM for heat of reaction6. Thus, ACM0012 is
suitable for use.
This methodology is also not applicable to project
activities where the waste gas/heat recovery project is
implemented in a single-cycle power plant (e.g. gas
turbine or diesel generator) to generate power.
However, the projects recovering waste energy from
single cycle and/or combined cycle power plants for the
purpose of generation of heat only can apply this
methodology.
The project activity recovers waste heat contained in the
coke oven flue gas after tertiary combustion produced as
part of the coking pyrolysis process in the project
facility and does not recover waste energy from a single
and or combined cycle power plant5. Furthermore, the
project activity is a Greenfield plant producing power
(electricity) only and is not a cogeneration plant and is
therefore applicable to ACM0012.
The emission reduction credits can be claimed up to the
end of the lifetime of the waste energy generation
equipment. The remaining lifetime of the equipment
should be determined using the latest version of the
“Tool to determine the remaining lifetime of
equipment”.
The project activity is a Greenfield plant and will
therefore employ a technical lifetime for equipment that
is equal to the technically designed operational lifetime
for equipment from its first commissioning. ACM0012
is thus suitable for use.
The extent of use of waste energy from the waste energy
generation facilities in the absence of the CDM project
activity will be determined in accordance with the
procedures provided in Annex 1 (for Greenfield project
facilities) and in Annex 2 (for existing project facilities)
to this methodology.
As can be seen from section B.5. below, there are no
waste energy generation facilities within South Africa
that use waste energy, therefore Annex 1 and Annex 2 of
the methodology are not applicable. ACM0012 is
suitable for use.
In addition, the applicability conditions included in the
tools referred to above apply.
The project activity complies with the applicability
conditions stated in the relevant tools as demonstrated in
section B.1., tables 5 and 6, thus ACM0012 is suitable
for use.
As can be seen from the above table, the project activity fulfils the required applicability criteria for
ACM0012 and therefore ACM0012 is an appropriate methodology for the project activity.
B.3. Description of the sources and gases included in the project boundary:
The project boundary includes the proposed project facility, containing the coke ovens where the coke
oven flue gas is generated and the associated and co-located project activity containing the gas system,
waste heat recovery boilers, steam system with turbines, generators, switchgear, control systems and
ancillary equipment (refer to Figure 5 above for a diagram delineating the project boundary). The South
African national electricity grid operated by Eskom which supplies the electricity to the Grootegeluk Coal
Mine, shall also form part of the project boundary for the purposes of determining the baseline and grid
emissions factor (GEF).
Provided in the table below are the emission sources and gases that are included in the project boundary
for the purpose of calculating baseline emissions and project emissions:

PROJECT DESIGN DOCUMENT FORM (CDM PDD) - Version 03
CDM – Executive Board
page 19
Table 8: Summary of the emission sources and gases that are included or excluded in the project boundary
Source Gas Included? Justification /
Explanation
Bas
elin
e
Electricity
generation, grid or
captive source
CO2 Included Main emission
source.
CH4
Excluded Excluded for
simplification. This
is conservative.
N2O Excluded Excluded for
simplification. This
is conservative.
Pro
ject
Act
ivit
y
Supplemental fossil
fuel consumption at
the project plant
CO2 Included Main emission
source.
CH4 Excluded Excluded for
simplification.
N2O Excluded Excluded for
simplification.
Supplemental
electricity
consumption
CO2 Included Main emission
source.
CH4 Excluded Excluded for
simplification.
N2O Excluded Excluded for
simplification.
B.4. Description of how the baseline scenario is identified and description of the identified
baseline scenario:
In accordance with ACM0012 realistic and credible alternatives have been identified in a step wise
approach for the most plausible baseline scenario. Realistic and credible alternatives have been
determined for:
• Waste energy use in the absence of the project activity; and
• Power generation in the absence of the project activity for each recipient facility if the project activity
involves electricity generation for that recipient facility.
Since the project activity does not generate heat (process heat and/or heat of reaction) or mechanical
energy as outputs, realistic and credible alternatives have not been identified for these.
Step 1: Define the most plausible baseline scenario for the generation of heat, electricity and
mechanical energy using the following baseline options and combinations
As per ACM0012, “the baseline scenario is identified as the most plausible baseline scenario among all
realistic and credible alternative(s)”.

PROJECT DESIGN DOCUMENT FORM (CDM PDD) - Version 03
CDM – Executive Board
page 20
Furthermore, ACM0012 states that “therefore any alternative identified for the project activity should
provide the same amount of heat, power or mechanical energy that is provided by the project activity…”.
Table 9 below provides an analysis of realistic and credible alternatives for the use of waste energy in the
absence of the project activity:
Table 9: Realistic and credible alternative analysis for waste energy Alternative Realistic and credible
alternative? (Yes / No)
Justification / Explanation
W1 WECM is directly vented
to the atmosphere without
incineration
No The WECM for the project activity is the
waste heat contained in the coke oven
flue gas after tertiary combustion5. In
terms of South African air quality
regulations the project facility is required
to comply with the relevant regulations
and thus directly venting the WECM (the
coke oven flue gas to the atmosphere
without incineration) is not considered to
be a realistic and credible alternative9.
W1 is therefore not a realistic and
credible alternative.
W2 WECM is released to the
atmosphere (for example
after incineration) or waste
heat is released (or vented)
to the atmosphere or waste
pressure energy is not
utilized
Yes As mentioned for W1 above, combustion
(incineration) of the coke oven flue gas is
required in order for the project facility
to comply with South African air quality
regulations. As such, after tertiary
combustion of the coke oven flue gas, the
waste heat would be released to the
atmosphere, W2 is therefore a realistic
and credible alternative.
W3 Waste energy is sold as an
energy source
No None of the existing operations at the
Grootegeluk Coal Mine, regardless of
their proximity to the project activity,
have the potential to utilise the waste
heat generated by the project facility10,11
.
The waste energy (the waste heat) would
remain utilised and therefore there does
not exist the opportunity to sell the waste
energy as an energy source. W3 is thus
not considered to be a realistic and
credible alternative.
W4 Waste energy is used for
meeting energy demand at
the recipient facility(ies)
No As above for W3, none of the existing
operations at the Grootegeluk Coal Mine
(the recipient facility) have the potential
to utilise the waste energy for meeting
9 Department of Environmental Affairs (DEA), 2010. National Environmental Management: Air Quality Act, 2004
(Act No. 39 of 2004) (NEMAQA) – Government Notice No. 248 (GN 248 of 31 March 2010).
10 Exxaro, 2012d.
11 Exxaro, 2012e.

PROJECT DESIGN DOCUMENT FORM (CDM PDD) - Version 03
CDM – Executive Board
page 21
Alternative Realistic and credible
alternative? (Yes / No)
Justification / Explanation
their energy demand, therefore W4 is not
a realistic and credible alternative.
W5 A portion of the quantity
or energy of WECM is
recovered for generation of
heat and/or electricity
and/or mechanical energy,
while the rest of the waste
energy produced at the
project facility is
flared/released to
atmosphere/ unutilised
No According to the Pre-feasibility Study
(PFS), the total heat available from the
coke oven flue gas produced in the
project facility after tertiary combustion
and ducting losses is 275MW12
. As such
this whole amount was utilised in the
energy optimisation model developed to
quantify the process design criteria for
the project activity, in order for the
project activity to produce the required
level of power for use at the recipient
facility. Therefore recovering only a
portion of the energy of the WECM is
not considered feasible since the power
produced would not be sufficient to
satisfy the needs of the recipient facility,
W5 is thus excluded as a realistic and
credible alternative.
W6 All the waste energy
produced at the facility is
captured and used for
export electricity
generation or steam
No As above for W3 and W4, none of the
existing operations at the Grootegeluk
Coal Mine, regardless of their proximity
to the project facility, have the potential
to utilise the waste energy generated by
the project facility10, 11
. Additionally, the
use of the waste energy for export
electricity generation would require a
project similar to the proposed project
activity, and is therefore not considered
to be a realistic and credible alternative
for the use of waste energy in the absence
of the project activity. W6 is thus
excluded as a realistic and credible
alternative to the project activity
As can be seen from Table 9 above, W2 is the only realistic and credible alternative for the use of waste
energy in the absence of the project activity.
For power generation, realistic and credible alternatives have been analysed Table 10 below:
Table 10: Realistic and credible alternative analysis for power generation Alternative Realistic and credible
alternative? (Yes / No)
Justification / Explanation
P1 Proposed project activity
not undertaken as a CDM
project activity
No. The revenues generated from the sale of
CERs generated from the project activity
are key to the project activity’s
12 E&PC, 2011.Exxaro Energy Coke Waste Heat Recovery Project: Process Concept Design.

PROJECT DESIGN DOCUMENT FORM (CDM PDD) - Version 03
CDM – Executive Board
page 22
Alternative Realistic and credible
alternative? (Yes / No)
Justification / Explanation
feasibility, as assessed and demonstrated
in section B.5. below. Without revenues
from the sale of CERs, the project will
not go ahead and therefore, P1 is not a
realistic and credible alternative.
P2 On-site or off-site existing
fossil fuel fired
cogeneration plant
No. The project activity produces power
(electricity) only and therefore a fossil
fuel fired cogeneration plant, on-site or
off-site, is not a realistic and credible
alternative and P2 is excluded5, 6
.
Additionally, there is no existing on-site
or off-site fossil fuel fired cogeneration
plant10, 11
.
P3 On-site or off-site
Greenfield fossil fuel fired
cogeneration plant
No. As above for P2 – the project activity
produces power only and therefore a
Greenfield fossil fuel fired cogeneration
plant, located either on-site or off-site, is
not considered to be a realistic and
credible alternative and P3 is therefore
excluded.
P4 On-site or off-site existing
renewable energy based
cogeneration plant
No. As above for P2 – the project activity
produces power only and therefore an
existing renewable energy based
cogeneration plant, located either on-site
or off-site, is not considered to be a
realistic and credible alternative and P4
is therefore excluded.
P5 On-site or off-site
Greenfield renewable
energy based cogeneration
plant
No. As above for P2 – the project activity
produces power only and therefore a
Greenfield renewable energy based
cogeneration plant, located either on-site
or off-site, is not considered to be a
realistic and credible alternative and P5
is therefore excluded.
P6 On-site or off-site existing
fossil fuel based existing
identified captive power
plant
No. Power is currently obtained from the
national grid and while the grid is
supplied from predominantly fossil fuel
fired power stations, the Grootegeluk
Coal Mine is not supplied with electricity
directly from an existing identified
captive power plant13
. Therefore P6 is
not considered to be a realistic and
credible alternative and is excluded.
13 Exxaro, 2012f.

PROJECT DESIGN DOCUMENT FORM (CDM PDD) - Version 03
CDM – Executive Board
page 23
Alternative Realistic and credible
alternative? (Yes / No)
Justification / Explanation
P7 On-site or off-site existing
identified renewable
energy or other waste
energy based captive
power plant
No. As above for P6 – power is currently
supplied from the national grid and not
from existing identified renewable
energy or other waste energy based
captive power plants. P7 is therefore not
a realistic and credible alternative and is
excluded.
P8 On-site or off-site
Greenfield fossil fuel
based captive plant
No. As can be seen from section B.6.1.
below, the annual average power
generation from the five most recently
constructed coal-fired power stations in
South Africa is 23 796 369MWh/yr. The
construction and operation of an on-site
or off-site greenfield fossil fuel based
captive plant is therefore not considered
to be a realistic and credible alternative
to the project activity since this would
not provide the same amount of power
that is provided by the project activity
(462 000 MWh/yr). P8 is therefore
excluded as a realistic and credible
alternative.
P9 On-site or off-site
Greenfield renewable
energy or other waste
energy based captive plant
No. As above for P8 and as can be seen from
section B.6.1. below, with approximately
92% of electricity supply in South Africa
from coal-fired power stations, the
construction and operation of an on-site
or off-site greenfield renewable energy
or other waste energy based captive plant
is not considered to be a realistic and
credible alternative to the project
activity. P9 is therefore excluded as a
realistic and credible alternative.
P10 Sourced from grid-
connected power plants
Yes. This is the status quo and current
situation and is therefore P10 included as
a realistic and credible alternative.
P11 Existing captive electricity
generation using waste
energy (if the project
activity is captive
generation using waste
energy, this scenario
represents captive
generation with lower
efficiency or lower
recovery than the project
activity)
No. There is no existing use of waste energy
and the project activity is a Greenfield
plant and does not represent an efficiency
improvement10, 11
. P11 is therefore not
considered to be a realistic and credible
alternative and is excluded.
P12 Existing cogeneration
using waste energy, but at
a lower efficiency or
No. As above for P2 and P11– the project
activity is a Greenfield plant and does
not represent an efficiency or recovery

PROJECT DESIGN DOCUMENT FORM (CDM PDD) - Version 03
CDM – Executive Board
page 24
Alternative Realistic and credible
alternative? (Yes / No)
Justification / Explanation
lower recovery improvement. Also, the project activity
is not a cogeneration plant and produces
only power. P12 is not considered to be
a realistic and credible alternative.
Based on Table 10 above, the only realistic and credible alternative for power generation is P10.
Therefore, the outcome of Step 1 is a scenario of W2 and P10, as summarised and described in Table 11
below:
Table 11: Realistic and credible baseline scenario matrix
Scenario Baseline alternative/ option Scenario description
Waste energy Power
1 W2 P10 Waste energy would be combusted and vented and power would be
supplied from the national grid.
Step 2: Step 2 and/or Step 3 of the latest approved version of the “Tool for the demonstration and
assessment of additionality” shall be used to identify the most plausible baseline scenarios by
eliminating non-feasible options (e.g. alternatives where barriers are prohibitive or which are clearly
economically unattractive).
Step 2 has been undertaken in section B.5. below and is therefore not repeated here for simplification.
Step 3: If more than one credible and plausible alternative scenario remain, the alternative
with the lowest baseline emissions shall be considered as the baseline scenario.
As can be seen from Step 1 above and section B.5. below, Scenario 1 is the only remaining realistic and
credible alternative, thus Step 3 is not required.
B.5. Description of how the anthropogenic emissions of GHG by sources are reduced below
those that would have occurred in the absence of the registered CDM project activity (assessment
and demonstration of additionality):
The table below provides the timeline for the proposed project activity and illustrates that the potential for
carbon revenue from the project activity was a key determinant to proceed with the project.
Table 12: Timeline of key milestones associated with the development of the proposed project activity
Description / Milestone Date
Project initiated as PFS. 06/2010
PFS complete. 01/02/20115
Tender issued for CDM consulting services 28/02/201114
14 Exxaro, 2012g.

PROJECT DESIGN DOCUMENT FORM (CDM PDD) - Version 03
CDM – Executive Board
page 25
Description / Milestone Date
Environmental impact assessment (EIA) consultant
appointed.
04/201115
Camco appointed as CDM consultant. 09/06/201116
Prior Consideration Notice submitted to the CDM
Executive Board (EB) and the South African Designated
National Authority (DNA).
27/06/201117
Confirmation of receipt of the Prior Consideration
Notice received from the South African DNA.
28/06/2011
Project Identification Note (PIN) submitted to the South
African DNA.
06/09/201118
Letter of No Objection (LONO) received from the South
African DNA.
28/09/201119
Expected construction start date. 08/2013
Expected date of project commissioning. 08/2015
ACM0012 requires that the assessment and demonstration of additionality be carried out according to the
latest version of the “Tool for the demonstration and assessment of additionality”, which at the time of
writing this document is Version 6.0.0, EB 65, Annex 21. As such and in line with the tool, the step-wise
approach to demonstrate and assess additionality has been carried out below:
Step 1: Identification of alternatives to the project activity consistent with current laws and regulations
Sub-step 1a: Define alternatives to the project activity:
From section B.4. above, Step 1 and Step 2 result in there being only one realistic and credible alternative
scenario to the project activity, namely Scenario 1 which is the business as usual practice and
continuation of the current situation (the baseline). This is in line with and in accordance with the “Tool
for the demonstration and assessment of additionality” (Version 6.0.0, EB 65, Annex 21), which states
that “realistic and credible alternative(s) available to the project participants or similar project
developers that provide outputs or services comparable with the proposed CDM project activity” and
includes alternative “g”, which is selected here since it is considered to be the same as Scenario 1, where:
“(g) If applicable, continuation of the current situation (no project activity or other alternatives
undertaken).”
Outcome of Sub-step 1a:
15 Exxaro, 2012h.
16 Exxaro, 2012i.
17 Prior Consideration Notice, 2011.
18 Project Identification Note (PIN), 2011.
19 Letter of No Objection (LONO), 2011.

PROJECT DESIGN DOCUMENT FORM (CDM PDD) - Version 03
CDM – Executive Board
page 26
The outcome of Sub-step 1a is therefore that the identified realistic and credible alternative scenario to the
project activity is Scenario 1.
Sub-step 1b: Consistency with mandatory laws and regulations:
Scenario 1 as described in Table 11 above is in compliance with all mandatory laws and regulations. As
mentioned previously, waste gas would need to be combusted and vented in accordance with relevant
health, safety and environmental legislation. The legislation is however not prescriptive in the manner or
method of combustion and is aimed rather at ensuring emissions are within certain health, safety and
environmental standards for air quality. Furthermore, no legislation in South Africa requires that the
waste heat produced as a result of combustion be recovered or utilised in any way.
Outcome of Sub-step 1b:
Scenario 1 is therefore identified as a realistic and credible alternative scenario to the project activity
since it is in compliance with mandatory legislation and regulations. Step 2 is therefore undertaken
below.
Step 2: Investment analysis
Step 2 is undertaken to demonstrate that the proposed project activity is not economically or financially
feasible, without the revenue from the sale of certified emission reductions (CERs).
Sub-step 2a: Determine appropriate analysis method
Version 6.0.0 of the “Tool for the demonstration and assessment of additionality” provides three options
available as appropriate analysis methods, namely:
Option I. Simple cost analysis
Option II. Investment comparison analysis
Option III. Benchmark analysis
Since Option I. is appropriate to project activities and alternative scenarios that generate no financial or
economic benefits other than CDM related income, it is deemed not to be an appropriate analysis method
because the project activity is expected to generate revenues from the sale of CERs as well as electricity
to the recipient facility. Additionally, Option II is not considered to be an appropriate analysis method
since the only realistic and credible alternative, Scenario 1, does not require investment and is not a
similar investment project. Therefore, the project activity will utilise Option III. Benchmark analysis is
the appropriate analysis method.
Sub-step 2b: Option III. Benchmark analysis method
The Internal Rate of Return (IRR) is used as the financial indicator for the project. More specifically, the
post-tax equity IRR is used as it is considered to be an appropriate IRR in order to allow comparison to

PROJECT DESIGN DOCUMENT FORM (CDM PDD) - Version 03
CDM – Executive Board
page 27
the NERSA (2011)20
published return on equity, which is a post-tax benchmark. Therefore, in order to
assess whether the project activity is financially attractive, this equity IRR is compared to the NERSA
benchmark equity IRR, a post-tax return on equity figure of 17%.
Sub-step 2c: Calculation and comparison of financial indicators (only applicable to Options II and III)
Major parameters and inputs used in the calculation of the equity IRR are listed in Table 13 below:
Table 13: Parameters and inputs to the IRR
Parameter/ Input Amount/ Value Unit Source / Reference
Technical (General)
Capacity (Net) 60.00 MWe Pre-feasibility Study
(PFS)12
Capacity factor 0.96 PFS5
Electrical output (Net) 462 000 .00 MWh/yr Calculated
Project lifetime 20.00 yrs PFS
Capital Expenditure (CAPEX)
Hard CAPEX (plant and
equipment)
1 063 310 191 ZAR PFS21
Soft CAPEX
(development and non-
financing costs)
558 950 256 ZAR PFS21
Operational Expenditure (OPEX)
Fixed OPEX 71 880 000 ZAR PFS
Variable OPEX (Yrs 1 - 3)
8 709 120 ZAR PFS
Variable OPEX (Yrs 4 -
20)
10 342 080 ZAR PFS
Financial Structure
Debt 0 % PFS
Equity 100 % PFS
Revenues
Electricity tariff 557.70 ZAR/MWh Calculated
Carbon revenue 29 408 481.00 ZAR/yr Calculated
Other financial parameters / inputs
Company income tax rate
28.00 % South African Revenue
Services (SARS)
Value added tax (VAT) 14.00 % SARS
Suitability of parameters / inputs to IRR calculation
Parameters and inputs to the return on equity calculation have been sourced from the PFS compiled by the
engineering, procurement and construction (EPC) contractor, Engineering and Projects Company
(E&PC), an independent engineering consulting company. The PFS utilised CAPEX figures based on
20 NERSA, 2011. NERSA Consultation Paper: Cogeneration Regulatory Rules and Feed-In Tariffs, 19 January
2011. Page 17 of 23.
21 E&PC, 2011. Exxaro Energy Coke Waste Heat Recovery Project: Steam and Power Generation - 2x30MWe
Genset.

PROJECT DESIGN DOCUMENT FORM (CDM PDD) - Version 03
CDM – Executive Board
page 28
quotations received from equipment manufacturers as well as the experience of E&PC in building similar
projects.
CAPEX and OPEX
The PFS compiled by E&PC provided expected CAPEX and OPEX figures based on quotations received
from equipment manufacturers as well as the experience of E&PC in building similar projects.
Revenues
The tariff utilised to calculate revenues from electricity is considered to be an appropriate figure since it is
based on the actual tariff charged to the Grootegeluk Coal Mine for the period October 2010 to November
2011 and escalated according to NERSA approved electricity tariff increases22
and thus reflects the
savings accrued to Exxaro as an income.
IRR calculation
Table 10 shows the real equity IRR with and without the income from CER revenue compared to the
benchmark IRR. As can be seen from Annex 3-1, and based upon the above parameters and inputs, the
equity IRR without CER revenue is 6.5%, which is well below the benchmark return on equity of 17%.
Table 14: IRR results summary
Description Without CER revenues Benchmark
Equity IRR 6.5% 17%
Therefore, as can be seen from above, the project’s equity IRR suggests that it is not financially attractive
when compared to the benchmark real return on equity and is therefore financially additional.
Sub-step 2d: Sensitivity analysis (only applicable to Options II and III):
A sensitivity analysis was conducted to show that the conclusion regarding the financial attractiveness is
sufficiently robust to reasonable variations in the parameters and inputs to the return on equity. In other
words, that the investment analysis could consistently support the conclusion that the project activity
undertaken without the CDM, will not be financially attractive. Accordingly, IRR sensitivity to CER
price is not included in the following analysis. The sensitivity analysis was carried out using the range of
+10% and –10%.
The following variables were included in the sensitivity analysis:
Hard and Soft CAPEX (Total CAPEX)
Fixed and Variable OPEX (Total OPEX)
Electricity tariff
Electrical output
The results of the sensitivity are shown in Table 15 below:
Table 15: Sensitivity for materially significant parameters / inputs
Variable -10% 0% +10%
Total CAPEX 8.0% 6.5% 5.2%
22 NERSA MYPD 2011.

PROJECT DESIGN DOCUMENT FORM (CDM PDD) - Version 03
CDM – Executive Board
page 29
Total OPEX 7.0% 6.5% 6.0%
Electricity tariff 4.6% 6.5% 8.2%
Electrical output 4.7% 6.5% 8.2%
Benchmark 17% 6.5% 17%
Provided in Figure 7 below is a graph illustrating the sensitivity analysis carried out.
Figure 7: Sensitivity analysis graph
It can be observed that despite variation in the key parameters and inputs, the equity IRR remains below
the benchmark. The investment analysis provides a valid argument in favour of additionality as this
analysis consistently supports the conclusion that the project activity is not economically or financially
attractive.
Outcome of Step 2:
The proposed CDM project activity is not financially or economically attractive. The revenue from the
sale of CERs improves the financial attractiveness of the project activity’s real equity IRR.
Table 16 below shows the required variation of the materially significant financial parameters to make the
equity IRR reach the benchmark of 17%.
Table 16: Variation of parameters / inputs to reach benchmark
Total CAPEX -50%
Electricity tariff +75%
Electrical output +75%
From Table 16 above, it can be seen that should the Total CAPEX decrease by 50%, or the Electricity
tariff and the Electrical output increase by 75%, the project activity will reach the equity benchmark of
1.0%2.0%3.0%4.0%5.0%6.0%7.0%8.0%9.0%
10.0%11.0%12.0%13.0%14.0%15.0%16.0%17.0%18.0%19.0%20.0%
(-10%) Base case (+10%)
Equ
ity
IRR
Sensitivity analysis
Total CAPEX
Total OPEX
Electricity tariff
Electrical output
Benchmark

PROJECT DESIGN DOCUMENT FORM (CDM PDD) - Version 03
CDM – Executive Board
page 30
17%. However, it is unlikely that these parameters will vary to such a high degree and therefore these
variations reflect an unrealistic scenario. Moreover, it is not likely that the Total CAPEX will decrease by
as much as 50% since the CAPEX was calculated based on quotations received from equipment
manufacturers as well as the experience of E&PC in building similar projects. Thus the Total CAPEX is
more likely to increase.
Additionally, the Electricity tariff is based upon the actual electricity tariff for the Grootegeluk Coal Mine
for the period October 2010 to November 2011 which has been escalated in line with NERSA22
approved
tariff increases. The Electrical output of the project activity is already based on a 96% plant load factor
and therefore is not possible to increase the electrical output by 75%.
Step 3: Barrier analysis
Since the barrier analysis is an optional step within the “Tool for the demonstration and assessment of
additionality”, it has not been undertaken here.
Step 4: Common practice analysis
Sub-step 4a: Analyze other activities similar to the proposed project activity:
As the default and in line with the “Guidelines on common practice (Version 01.0, EB 63, Annex 12)”, the
applicable geographic area is that of the geo-political boundaries of South Africa. Currently in South
Africa, there are only 3 coke manufacturing plants23
. These include plants located at:
Vanderbijlpark – 6 coke batteries with gas cleaning and by-product recovery;
Pretoria – 1 coke battery with gas cleaning and by-product recovery; and
Newcastle – 3 coke batteries with gas cleaning and by-product recovery.
As such and as can be seen from the above mentioned coke manufacturing plants, there are no coke
batteries either of the non-recovery type or the heat recovery type in operation in South Africa.
Sub-step 4b: Discuss any similar Options that are occurring:
From Sub-step 4a above, it can be seen that no similar activities are located within the applicable
geographic area. In line with version 6.0.0 of the “Tool for the Demonstration and Assessment of
Additionality”, the following steps have been carried out in order to evaluate any similar options that are
occurring:
Step 1: Calculate applicable output range as +/-50% of the design output or capacity of the proposed
project activity.
Step 2: In the applicable geographical area, identify all plants that deliver the same output or capacity,
within the applicable output range calculated in Step 1, as the proposed project activity and have started
commercial operation before the start date of the project. Note their number Nall. Registered CDM project
activities and projects activities undergoing validation shall not be included in this step;
Step 3: Within plants identified in Step 2, identify those that apply technologies different that the
technology applied in the proposed project activity. Note their number Ndiff.
23 CNI Technologies, 2012. Coke Making Facilities in South Africa.

PROJECT DESIGN DOCUMENT FORM (CDM PDD) - Version 03
CDM – Executive Board
page 31
Step 4: Calculate factor F=1-Ndiff /Nall representing the share of plants using technology similar to the
technology used in the proposed project activity in all plants that deliver the same output or capacity as
the proposed project activity.
Thus:
Step 1: The applicable output range of the project activity is 27.5MW (-50%) to 82.5MW (+50%).
Step 2: As can be seen in Sub-step 4a above, while there are currently no plants that deliver the same
output or capacity in the applicable geographic area within the applicable output range of the proposed
project activity as calculated in Step 1, the 3 coke manufacturing plants identified in Sub-step 4a are
included here for . Therefore, Nall = 0.
Step 3: Since, as identified in Sub-step 4a above, there are no plants that apply technologies different than
the technology applied, Ndiff = 0.
Step 4: The factor is calculated as:
F = 1-Ndiff /Nall
Where:
Ndiff = 0;
Nall = 0
Thus, F = 1-0/0; = 1. Also, Nall – Ndiff = 0 – 0 = 0, which is less than 3. As such, since F = 1 and is
greater than 0.2 and Nall – Ndiff =0 which is less than 3, the project activity is not common practice and
satisfies Sub-step 4a and Sub-step 4b.
In conclusion, it is only through the inclusion of CDM revenues that the project activity becomes
financially more attractive. Also, the intention to register the project activity under the CDM was a key
determinant to proceed with the project. The project activity is therefore additional.
B.6. Emission reductions:
B.6.1. Explanation of methodological choices:
Baseline emissions calculation
As per ACM0012, baseline emissions for the year y, are determined using equation “1”:
yflstyEny BEBEBE ,,
Where:
BEy = The total baseline emissions during the year y in tCO2
BEEn,y = The baseline emissions from energy generated by the project activity during the year y in
tCO2
PROJECT DESIGN DOCUMENT FORM (CDM PDD) - Version 03
CDM – Executive Board
page 32
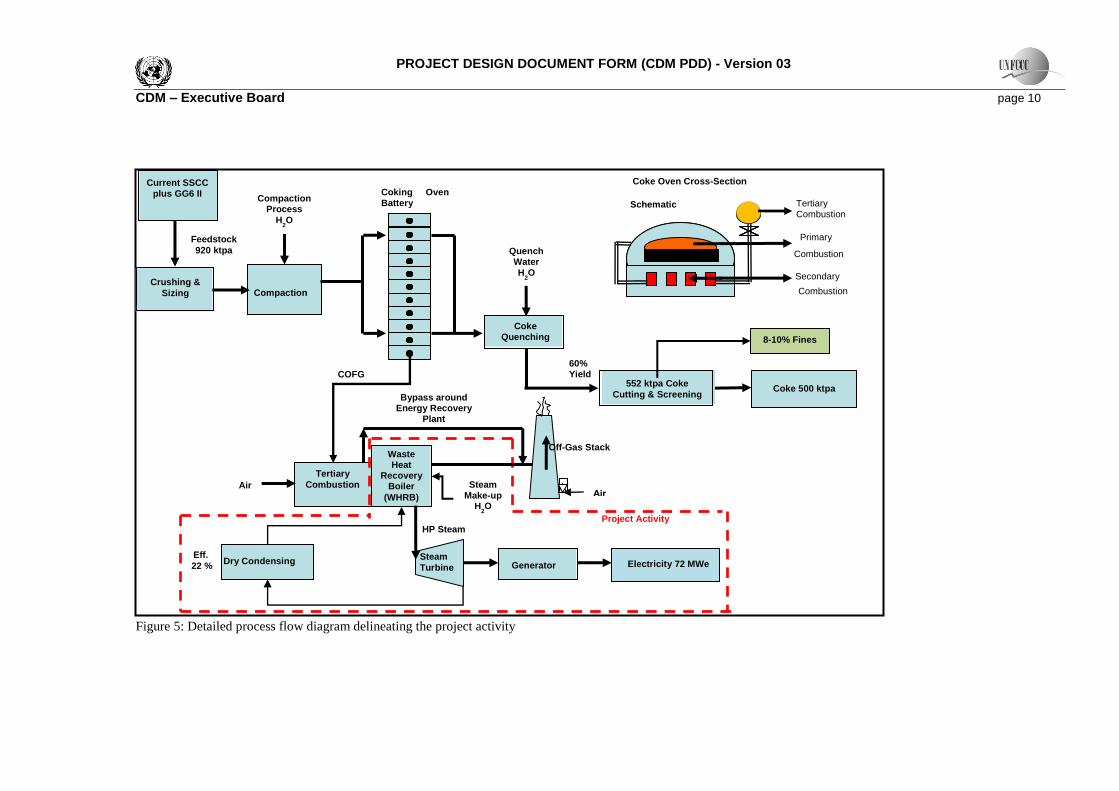
BEflst,y = Baseline emissions from fossil fuel combustion, if any, either directly for flaring of waste
gas or for steam generation that would have been used for flaring the waste gas in the
absence of the project activity (tCO2), calculated as per equation 26. This is relevant for
those project activities where in the baseline steam is used to flare the waste gas
Since the project activity does not combust fossil fuels either directly for flaring of waste gas or for steam
generation that would have been used for flaring the waste gas in the absence of the project activity and
would not in the baseline utilise steam to flare the waste gas, BEflst,y = 0 and equation “1” simplifies to:
BEy = BEEn,y
Section B.4 above describes the only realistic and credible alternative to the project activity, which is a
scenario comprising W2 and P10 where waste energy would be flared and power would be supplied from
the national grid. This scenario conforms to “Scenarios 1 and 2” as defined in ACM0012, as such
equation “2” is used to calculate BEEn,y:
yTheryElecyEn BEBEBE ,,,
Where:
BEElec,y = Baseline emissions from electricity during the year y in tCO2
BETher,y = Baseline emissions from thermal energy (due to heat generation by elemental processes)
during the year y (tCO2)
The project activity produces electricity only, therefore BETher,y = 0 and equation “2” simplifies to:
BEEn,y = BEElec,y
Baseline emissions from electricity (BEElec,y) generation are calculated according to “Case 1” and using
equation “3” of ACM0012:
j i
yjiElecyjiwcmcapyElec EFEGffBE )*(** ,,,,,,
Where:
BEelec,y = Baseline emissions due to displacement of electricity during the year y (tCO2)
EGi,j,y = The quantity of electricity supplied to the recipient j by generator, which in the absence of
the project activity would have been sourced from source i (the grid or an identified source)
during the year y in MWh
EFelec,i,j,y = The CO2 emission factor for the electricity source i (gr for the grid, and is for an identified
source), displaced due to the project activity, during the year y (tCO2/MWh)

PROJECT DESIGN DOCUMENT FORM (CDM PDD) - Version 03
CDM – Executive Board
page 33
fwcm = Fraction of total electricity generated by the project activity using waste energy. This
fraction is 1 if the electricity generation is purely from use of waste energy. Depending
upon the situation, this factor is estimated using the equations in section 3.1
Note: For a project activity using waste pressure to generate electricity, the electricity
generated from waste pressure should be measurable and this fraction is 1
fcap = Factor that determines the energy that would have been produced in project year y using
waste energy generated at a historical level, expressed as a fraction of the total energy
produced using waste source in year y. The ratio is 1 if the waste energy generated in
project year y is the same or less than that generated at a historical level. The value is
estimated using the equations in section 3.2. For Greenfield facilities, fcap is 1. If the
procedure in Annex 1 concludes that the waste energy would have been partially utilised in
the “reference waste energy generating facilities” this fact will be captured in the factor
fpractice (refer to equations 22, 23, 24 and 25 for the use of factor fpractice)
The recipient, j, of the electricity in this instance is the Grootegeluk Coal Mine and the electricity source,
i, is the South African national grid.
All the waste energy is utilised in the project activity to generate electricity, thus fwcm = 1, while fcap = 1
also, since the project activity is a Greenfield facility. Equation “3” is consequently simplified to:
BEelec,y = 1 * 1 * ∑j ∑i (EGi,j,y * EFelec,i,j,y)
EFelec,i,j,y is the grid emissions factor (GEF) for the South African grid, which is calculated utilising V2.2.1
of the “Tool to calculate the emission factor for an electricity system” (Version 2.2.1, EB 63, Annex 19).
Thus, the following six (6) steps of the baseline methodology procedure of the tool are utilised, namely:
STEP 1. Identify the relevant electricity systems;
STEP 2. Choose whether to include off-grid power plants in the project electricity system (optional);
STEP 3. Select a method to determine the operating margin (OM);
STEP 4. Calculate the operating margin emission factor according to the selected method;
STEP 5. Calculate the build margin (BM) emission factor;
STEP 6. Calculate the combined margin (CM) emissions factor.
Step 1: Identify the relevant electricity systems
As South Africa’s national utility, Eskom is responsible for the supply of approximately 95% of the
country’s electricity, with approximately 92% supplied from large-scale coal-fired power stations24
, 25
.
As above for B.3, the relevant electricity system is the South African National grid, which comprises the
following plants and types:
Table 17: Power plants comprising the South African national grid
26.
24 Department of Energy (DOE), 2010. South African Energy Synopsis 2010. Directorate: Energy Information
Management, Process Design and Publications.
25 Eskom, 2011. Integrated Report 2011.

PROJECT DESIGN DOCUMENT FORM (CDM PDD) - Version 03
CDM – Executive Board
page 34
Plant no. Power station Installed capacity
(MW)
Generation
technology
Energy source /
Fuel type
1 Arnot 1 980 Coal Subcritical Other Bituminous
Coal
2 Duvha 3 450 Coal Subcritical Other Bituminous
Coal
3 Hendrina 1 895 Coal Subcritical Other Bituminous
Coal
4 Kendal 3 840 Coal Subcritical Other Bituminous
Coal
5 Kriel 2 850
Coal Subcritical Other Bituminous
Coal
6 Lethabo
3 558
Coal Subcritical Other Bituminous
Coal
7 Matimba
3 690
Coal Subcritical Other Bituminous
Coal
8 Majuba
3 843
Coal Subcritical Other Bituminous
Coal
9 Matla
3 450
Coal Subcritical Other Bituminous
Coal
10 Tutuka
3 510
Coal Subcritical Other Bituminous
Coal
11 Koeberg 1 800 Nuclear Nuclear
12 Camden 1 600
Coal Subcritical Other Bituminous
Coal
13 Grootvlei 1 200
Coal Subcritical Other Bituminous
Coal
14 Komati 1 000
Coal Subcritical Other Bituminous
Coal
15 Imports Not available (N/a) N/a N/a
Step 2: Choose whether to include off-grid power plants in the project electricity system (optional)
Although this step is optional, Option I: Only grid power plants are included in the calculation, is selected
here.
Step 3: Select a method to determine the operating margin (OM)
V2.2.0 of the “Tool to calculate the emission factor for an electricity system” provides one of the
following methods for calculation the operating margin emission factor (EFgrid,OM,y):
(a) Simple OM; or
(b) Simple adjusted OM; or
(c) Dispatch data analysis OM; or
(d) Average OM.
Since Option (b) Simple adjusted OM as well as Option (c) Dispatch data analysis both require data
which is not publicly available in South Africa, namely load duration data and detailed running dispatch
26 Accessed online at http://www.eskom.co.za/c/article/236/cdm-calculations/ and
http://www.eskom.co.za/content/calculationTable.htm

PROJECT DESIGN DOCUMENT FORM (CDM PDD) - Version 03
CDM – Executive Board
page 35
data respectively, they are deemed not feasible for use to calculate the operating margin of the electricity
system. Moreover, while an ex ante method (discussed in more detail below) has been chosen, (c)
requires an ex post method to calculate the operating margin of the electricity system which is not
applicable to historical data and also requires annual monitoring. Therefore, Options (b) and (c) are not
feasible for use.
Additionally, Option (d) Average OM is suitable only for electricity systems where low cost/must run
power plants generate more than 50% of the electricity supplied to the grid, which as demonstrated
below, is not the case in South Africa and therefore Option (d) is not feasible for use. This leaves Option
(a) Simple OM as the appropriate method to determine the operating margin.
Option (a) can only be used if low-cost/must-run resources constitute less than 50% of total grid
generation. Low-cost/must-run resources are defined as power plants with low marginal generation costs
or power plants that are dispatched independently of the daily or seasonal load of the grid and typically
include hydro, geothermal, wind, low-cost biomass, nuclear and solar generation. Based on an average of
the five most recent years for which data is available, the annual average electricity generation in South
Africa was approximately 240 154 551MWh, of which low cost/must run resources contributed
approximately 9 478 800MWh or approximately 4% (see the table below for the calculation of the
figures).
Table 18: Net electricity calculation26
.
Plant
no.
Power
station
Generatio
n
technolog
y
Low
cost/mus
t run
(Yes /
No)
Net electricity generation (EGm,y) (MWh)
2006 2007 2008 2009 2010
1 Arnot Coal
Subcritical
No 11 495 036 15 938 102 11 905 060 11 987 281 13 227 864
2 Duvha Coal
Subcritical
No 24 479 488 31 550 562 23 622 732 21 769 489 22 581 228
3 Hendrina Coal
Subcritical
No 12 410 151 16 083 288 13 756 351 12 296 687 12 143 292
4 Kendal Coal
Subcritical
No 26 461 793 34 164 855 26 517 420 23 841 401 23 307 031
5 Kriel Coal
Subcritical
No 20 510 202 22 468 695 17 762 398 18 156 686 15 906 816
6 Lethabo
Coal
Subcritical
No 22 498 940 32 052 833 25 701 723 23 580 232 25 522 698
7 Matimba
Coal
Subcritical
No 28 401 085 34 983 880 29 021 742 26 256 068 27 964 141
8 Majuba
Coal
Subcritical
No 17 620 119 22 828 565 23 680 971 22 676 924 22 340 081
9 Matla
Coal
Subcritical
No 23 782 480 30 864 194 24 549 833 21 863 400 21 954 536
10 Tutuka
Coal
Subcritical
No 16 500 638 23 389 829 20 980 242 21 504 122 19 847 894
11 Koeberg Nuclear Yes 11 293 000 11 780 000 11 317 000 13 004 000
12 Camden Coal No 756 540 2 815 982 5 171 057 6 509 079 7 472 070

PROJECT DESIGN DOCUMENT FORM (CDM PDD) - Version 03
CDM – Executive Board
page 36
Plant
no.
Power
station
Generatio
n
technolog
y
Low
cost/mus
t run
(Yes /
No)
Net electricity generation (EGm,y) (MWh)
2006 2007 2008 2009 2010
Subcritical
13 Grootvlei Coal
Subcritical
No - - 237 138 1 249 556 2 656 230
14 Komati Coal
Subcritical
No - - - - 1 016 023
15 Imports N/a N/a - - 10 624 000 10 998 000 9 162 000
Total electricity generation 204 916 472 278 433 785 245 310 667 234 005 925 238 105 904
Average annual generation 240 154 551
Low cost/must run generation - 11 293 000 11 780 000 11 317 000 13 004 000
Average annual low cost/must run
generation
9 478 800
% of low cost/must run 3.95%
As can be seen from the table above, low cost/must run resources constituted approximately 4% of
average annual generation for the grid for the last five (5) years. Thus, Option (a) Simple OM is
appropriate for use.
Step 4: Calculate the operating margin emission factor according to the selected method
The Simple OM is calculated ex ante, using a 3-year generation-weighted average based on the most
recent data available at the time of submission of the CDM-PDD to the DOE for validation. Furthermore,
Option A: Based on the net electricity generation and a CO2 emission factor of each power unit of the
Simple OM method is utilised. Under this option, the simple OM emission factor is calculated based on
the net electricity generation of each power unit and an emission factor for each power unit, as follows:
Where:
EFgrid,OMsimple,y = Simple operating margin CO2 emission factor in year y (tCO2/MWh)
EGm,y = Net quantity of electricity generated and delivered to the grid by power unit m
in year y (MWh)
EFEL,m,y = CO2 emission factor of power unit m in year y (tCO2/MWh)
m = All power units serving the grid in year y except low-cost / must-run power
units
y = The relevant year as per the data vintage chosen in Step 3
Determination of EFEL,m,y
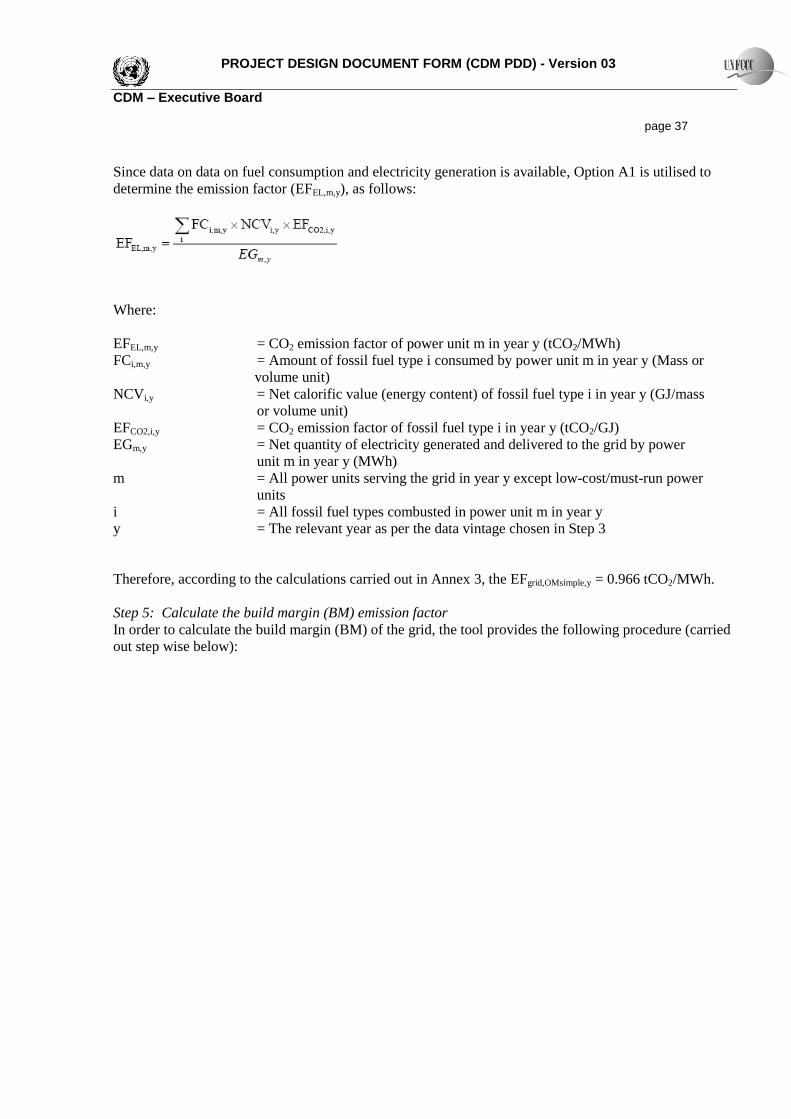
PROJECT DESIGN DOCUMENT FORM (CDM PDD) - Version 03
CDM – Executive Board
page 37
Since data on data on fuel consumption and electricity generation is available, Option A1 is utilised to
determine the emission factor (EFEL,m,y), as follows:
Where:
EFEL,m,y = CO2 emission factor of power unit m in year y (tCO2/MWh)
FCi,m,y = Amount of fossil fuel type i consumed by power unit m in year y (Mass or
volume unit)
NCVi,y = Net calorific value (energy content) of fossil fuel type i in year y (GJ/mass
or volume unit)
EFCO2,i,y = CO2 emission factor of fossil fuel type i in year y (tCO2/GJ)
EGm,y = Net quantity of electricity generated and delivered to the grid by power
unit m in year y (MWh)
m = All power units serving the grid in year y except low-cost/must-run power
units
i = All fossil fuel types combusted in power unit m in year y
y = The relevant year as per the data vintage chosen in Step 3
Therefore, according to the calculations carried out in Annex 3, the EFgrid,OMsimple,y = 0.966 tCO2/MWh.
Step 5: Calculate the build margin (BM) emission factor
In order to calculate the build margin (BM) of the grid, the tool provides the following procedure (carried
out step wise below):

PROJECT DESIGN DOCUMENT FORM (CDM PDD) - Version 03
CDM – Executive Board
page 38
Identify the 5 most recent power units, excluding CDM (SET5-units)
The 5 units that started to supply electricity most recently to the grid include:
Table 19: Five most recent power plants.
Commissioning
order
Plant No. Power
Station
Commisioning
date
CDM Electricity
generation (EGm,y)
1 8 Majuba 01/04/1996 No 22 340 081
2 4 Kendal 01/10/1988 No 23 307 031
3 7 Matimba 04/12/1987 No 27 964 141
4 6 Lethabo 22/12/1985 No 25 522 698
5 10 Tutuka 01/06/1985 No 19 847 894
Annual electricity generation (AEGSET-5-units) 118 981 845
Identify the units that comprise at least 20% of the system generation, excluding CDM (SET≥20%)
The annual electricity generation of the grid in 2010 (AEGtotal) was 238 105 904MWh, with 20% of the
generation equal to 47 621 181MWh. Of the above 5 units, SET5-units, that started to supply electricity
most recently to the grid, Majuba, Kendal and Matimba comprise SET≥20%, with 73 611 253MWh.

PROJECT DESIGN DOCUMENT FORM (CDM PDD) - Version 03
CDM – Executive Board
page 39
Select the set of power units that comprises the larger annual generation
Of SET5-units and SET≥20%, the set of power units that comprises the larger annual electricity generation is
SET5-units with 118 981 845MWh.
Is there at least one power unit older than 10 years in the set?
Yes - since all the power units in SET5-units are older than 10 years, the procedure is further carried out
below.
Exclude power units older than 10 years and include power units registered in the CDM
No power units are registered under the CDM and the next step is carried out below.
Does the set comprise at least 20% of generation?
No – there are no power units registered with the CDM that can be included as per the step above.
Include power units older than 10 years until the set comprises 20% of generation
In a step-wise approach, power units older than ten years are added to the sample until the sample
comprises 20% of generation. As such, the SET≥20% including Majuba, Kendal and Matimba with
73 611 253MWh comprise the SETsample and SET≥20% are used to calculate the build margin below
utilising equation “13” of the tool.
Where:
EFgrid,BM,y = Build margin CO2 emission factor in year y (tCO2/MWh)
EGm,y = Net quantity of electricity generated and delivered to the grid by power unit m
in year y (MWh)
EFEL,m,y = CO2 emission factor of power unit m in year y (tCO2/MWh)
m = Power units included in the build margin
y = Most recent historical year for which power generation data is available
Therefore, according to the calculations carried out in Annex 3, the EFgrid,BM,y = 0.986tCO2/MWh.
Step 6: Calculate the combined margin emissions factor
The combined margin (CM) emissions factor (EFgrid,CM,y) is calculated using the Weighted average CM
method, Option A and equation “14” of the tool, as follows:
Where:
EFgrid,CM,y = Combined margin (CM) emissions factor in year y (tCO2/MWh)
EFgrid,BM,y = Build margin CO2 emission factor in year y (tCO2/MWh)
EFgrid,OM,y = Operating margin CO2 emission factor in year y (tCO2/MWh)
wOM = Weighting of operating margin emissions factor (%)

PROJECT DESIGN DOCUMENT FORM (CDM PDD) - Version 03
CDM – Executive Board
page 40
wBM = Weighting of build margin emissions factor (%)
Since the project activity is not a wind and solar power generation project activity, the default values for
according to the tool of wOM = 0.5 and wBM = 0.5 are utilised. Therefore according to the calculations
carried out in Annex 3, the EFgrid,CM,y = 0.976tCO2/MWh.
Project emissions calculation
Project emissions include emissions due to (1) combustion of auxiliary fuel to supplement waste gas/heat
and (2) electricity emissions due to consumption of electricity for cleaning of gas before being used for
generation of energy or other supplementary electricity consumption. Project emissions are calculated
according to equation “41” of the methodology:
yELyAFy PEPEPE ,,
Where:
yPE = Project emissions due to the project activity (tCO2)
yAFPE , = Project activity emissions from on-site consumption of fossil fuels by the unit
process(es) and/or co-generation plant(s) if they are used as supplementary fuels due to
non-availability of waste energy to the project activity or due to any other reason
(tCO2)
yELPE , = Project activity emissions from on-site consumption of electricity for gas cleaning
equipment or other supplementary electricity consumption (tCO2) (as per Table 1:
Summary of gases and sources included in the project boundary)
According to ACM0012: “Note: If the electricity was consumed in gas cleaning equipment in the
baseline as well, project emissions due to electricity consumption for gas cleaning can be ignored.”
The above statement is taken to be the same for other supplementary electricity consumption. The project
activity will supply electricity to the Grootegeluk Coal Mine, the recipient facility which includes the
proposed project facility and project activity, and supplementary electricity consumption is thus
calculated as part of the baseline and is accordingly ignored here and PEEL,y = 0.
Since the project activity does not consume fossil fuels in the unit process (the project facility), or due to
non-availability of waste energy to the project activity or due to any other reason, PEAF,y = 0. Moreover,
the non-availability of waste energy for the project activity have been calculated as part of the baseline,
where EGi,j,y (MWh) is calculated taking into account the planned / designed electrical output of the
project activity taking into account planned and unplanned outages. Thus, PEy = 0.
Leakage emissions calculation
No leakage is applicable under ACM0012.
Emission reductions calculation
Emission reductions due to the project activity during the year y are calculated according to equation “42”
of ACM0012:
yyy PEBEER

PROJECT DESIGN DOCUMENT FORM (CDM PDD) - Version 03
CDM – Executive Board
page 41
Where:
yER = Total emissions reductions during the year y in tons of CO2
yPE = Emissions from the project activity during the year y in tons of CO2
yBE = Baseline emissions for the project activity during the year y in tons of CO2, applicable
to Scenario 2
As indicated above, PEy = 0, thus equation “42” simplifies to ERy = BEy.
B.6.2. Data and parameters that are available at validation:
Data and parameters available at validation include:
Data / Parameter: EFelec,i,j,y
Data unit: tCO2/MWh
Description: The CO2 emission factor for the electricity source i (gr for the grid, and is for an
identified source), displaced due to the project activity, during the year y (tCO2/MWh)
Source of data used: Calculated utilising V2.2.1 of the “Tool to calculate the emission factor for an
electricity system”.
Value applied: 0.976
Justification of the choice
of data or description of
measurement methods
and procedures actually
applied :
As per applied tool, this value has been calculated ex-ante. The calculations for the tool
will be made available during validation.
Any comment:
Data / Parameter: EFgrid,OMsimple,y
Data unit: tCO2/MWh
Description: Simple operating margin CO2 emission factor in year y.
Source of data used: Calculated utilising V2.2.1 of the “Tool to calculate the emission factor for an
electricity system”.
Value applied: 0.966
Justification of the choice
of data or description of
measurement methods
and procedures actually
applied :
As per applied tool, this value has been calculated ex-ante. The calculations for the tool
will be made available during validation.
Any comment:
Data / Parameter: EFEL,m,y
Data unit: tCO2/MWh
Description: CO2 emission factor of power unit m in year y.
Source of data used: Calculated utilising V2.2.1 of the “Tool to calculate the emission factor for an
electricity system”.
Value applied: 0.973

PROJECT DESIGN DOCUMENT FORM (CDM PDD) - Version 03
CDM – Executive Board
page 42
Justification of the choice
of data or description of
measurement methods
and procedures actually
applied :
As per applied tool, this value has been calculated ex-ante. The calculations for the tool
will be made available during validation.
Any comment:
B.6.3. Ex-ante calculation of emission reductions:
>>
Baseline emissions calculation
From section B.6.1 above, BEy = BEEn,y and BEEn,y = BEElec,y.
Also, BEelec,y = 1 * 1 * ∑j ∑i (EGi,j,y * EFelec,i,j,y), where EGi,j,y = 462 000 .00MWh (according to
the PFS) and EFelec,i,j,y = 0.976tCO2/MWh. Thus:
BEelec,y = 1 * 1 * ∑j ∑i (462 000 .00MWh * 0.976tCO2/MWh) = 450 912.00 tCO2
Project emissions calculation
From section B.6.1 above, PEEL,y = 0 and PEAF,y = 0, thus, PEy = 0 + 0 = 0 tCO2.
Leakage emissions calculation
No leakage is applicable under ACM0012.
Emission reductions calculation
From section B.6.1 above, ERy = BEy. Thus, ERy =450 912.00 tCO2.
B.6.4 Summary of the ex-ante estimation of emission reductions:
Year Annual estimation of emission reductions
in tonnes of CO2e
2015 (01/08/2015 - 31/12/2015) 206 600
2016 450 912
2017 450 912
2018 450 912
2019 450 912
2020 450 912
2021 450 912
2022 450 912
2023 450 912
2024 450 912
2025 (01/01/2025 - 31/07/2025) 285 304
Total estimated reductions (tonnes of CO2e) 4 919 040
Total number of crediting years 10
Annual average over the crediting period
of estimated reductions (tonnes of CO2e)
450 912

PROJECT DESIGN DOCUMENT FORM (CDM PDD) - Version 03
CDM – Executive Board
page 43
B.7. Application of the monitoring methodology and description of the monitoring plan:
Data / Parameter: EGi,,j,y
Data unit: MWh
Description: Quantity of electricity supplied to the recipient j by the generator, which in the absence of
the project activity would have sourced from ith
source (i can be either grid or identified
source) during the year y in MWh
Source of data: Recipient facility(ies) and generation plant measurement records
Measurement
procedures (if any):
The quantity of electricity supplied to the recipient will be measured continuously using
electricity meters. The meter readings will be aggregated monthly for use in the
monitoring report.
Monitoring frequency: Monthly
QA/QC procedures: The information will be saved onto Exxaro’s Supervisory Control and Data Acquisition
(SCADA) system. Meters will be calibrated and maintained according to the
manufacturer’s specifications.
Any comment:
Data / Parameter: Abnormal operation of the project facility including emergencies and shut down
Data unit: Hours
Description: The hours of abnormal operation of parts of project facility that can have an impact on
waste energy generation and recovery
Source of data: Operation of project facility
Measurement procedures
(if any):
Monitoring frequency: Daily, aggregated annually
QA/QC procedures:
Any comment: This parameter has to be monitored to demonstrate that no emission reduction is claimed
for the hours during the abnormal operation of the part of project facility which have
impact on waste energy generation and recovery. The abnormality can be in terms of
violation of operational parameters, poor quality product, emergencies or shutdown
B.7.2. Description of the monitoring plan:
The monitoring plan will ensure that emission reductions are accurately monitored, recorded, and
reported.
Overall project management
Exxaro has a clear and well defined management and organisational structure. This is illustrated in the
operation organogram below:

PROJECT DESIGN DOCUMENT FORM (CDM PDD) - Version 03
CDM – Executive Board
page 44
Figure 8: Operational organogram
Monitoring equipment
Electricity meters will measure the quantity of electricity supplied to the recipient facility. The meters are
likely to be 4-quadrant billable class meters that are bi-directional – this means that they subtract any
electricity used by the project activity during start up, or when the project activity is not producing
electricity. Electricity meters will be installed on the feeds to the recipient facility. A metering diagram
is provided below.
Exxaro Resources
Service Level Agreements
Equipment Providers
External Service
Providers Plant
Manager
Senior
operators
Admin Clerks
Cleaners
• IT
• HR
• Finance
• CDM
verification
• Security
• Technical
services
Exxaro
Service Level Agreements
Equipment Providers
External Service
Providers Plant
Manager
Junior
operators

PROJECT DESIGN DOCUMENT FORM (CDM PDD) - Version 03
CDM – Executive Board
page 45
Figure 9: Metering diagram
Monitoring accuracy
The electricity meters will be fitted with a telemetry system, and the data will be fed into the plant
SCADA system on a daily basis. The main and check meters will be reconciled monthly to check if their
readings are within a pre-defined accuracy band. If there are discrepancies, a notification will be sent to
the control room to advise the operator to attend to the problem.
Data collection and storage
On a monthly basis, the project activity plant manager (or other designated employee) and a
representative from Grootegeluk Coal Mine will read electricity meters to determine the quantity of
electricity produced by the project activity. The electricity readings will be logged electronically for the
purposes of calculating emission reductions.
The information will be saved onto the Exxaro’s SCADA system, as well as Exxaro’s on-site financial
systems. Backups will be kept both on- and off-site, and all of the data will be available for CDM
verification. As per ACM0012, all data collected as part of the monitoring plan will be archived
electronically, and will be kept for a minimum of two years at the end of the crediting period.
B.8. Date of completion of the application of the baseline study and monitoring methodology and
the name of the responsible person(s)/entity(ies):
>>
Completion date:
18/05/2012
Contact information of responsible person(s)/entity(ies):
Person:
Mr. Glen Louwrens

PROJECT DESIGN DOCUMENT FORM (CDM PDD) - Version 03
CDM – Executive Board
page 46
Entity:
Carbon Asset Management Company Pty Ltd (Camco)
Postal address:
P.O Box 70,
Woodlands Office Park,
Woodmead 2080, South Africa
Physical address:
Building 18
Woodlands Office Park
Western Service Road
Woodmead Johannesburg
2080 South Africa
Tel: +27 11 253 3400
Fax: +27 11 804 1038
Email: [email protected]
SECTION C. Duration of the project activity / crediting period
C.1. Duration of the project activity:
C.1.1. Starting date of the project activity:
>>
The starting date of the project activity is the expected construction contract signing date, which is quarter
2 (Q2) of 2013.
C.1.2. Expected operational lifetime of the project activity:
Twenty (20) years.
C.2. Choice of the crediting period and related information:
C.2.1. Renewable crediting period:
C.2.1.1. Starting date of the first crediting period:
Not applicable (N/a).
C.2.1.2. Length of the first crediting period:

PROJECT DESIGN DOCUMENT FORM (CDM PDD) - Version 03
CDM – Executive Board
page 47
N/a.
C.2.2. Fixed crediting period:
C.2.2.1. Starting date:
A single ten (10) year crediting period has been chosen for the project activity. The starting date of the
first crediting period is the start date of project commissioning, which is expected 2015/08/01.
C.2.2.2. Length:
10 years.
SECTION D. Environmental impacts
>>
D.1. Documentation on the analysis of the environmental impacts, including transboundary
impacts:
The project facility and the project activity make important and noteworthy contributions to the
sustainable development of South Africa. The scoping phase of the environmental impact assessment
(EIA) process has identified potential environmental impacts and has outlined the plan of study for the
EIA. Synergistics Environmental Services (Pty) Ltd (Synergistics) has been appointed by Exxaro as the
independent environmental consultant to undertake the Scoping EIA and EIA.
D.2. If environmental impacts are considered significant by the project participants or the host
Party, please provide conclusions and all references to support documentation of an environmental
impact assessment undertaken in accordance with the procedures as required by the host Party:
The impacts which may be significant for the project activity include: air quality, surface and ground
water quality, social and economic impacts. As such, specialist input and studies will be conducted for
the following environmental components:
Air Quality Assessment.
Traffic Impact Assessment.
Surface Water Assessment.
Groundwater Assessment.
The key legislation applicable to the proposed project activity includes:
The National Environmental Management Act (No. 107 of 1998) (NEMA);
The Mineral and Petroleum Resources Development Act (No. 28 of 2002) (MPRDA);
The National Water Act (No. 36 of 1998) (NWA); and
The National Environmental Management: Air Quality Act (No. 39 of 2004) (NEMAQA).

PROJECT DESIGN DOCUMENT FORM (CDM PDD) - Version 03
CDM – Executive Board
page 48
The Scoping EIA and EIA will be conducted in line with the above mentioned legislation, additionally,
the EIA process has been developed to ensure that it complies with GNR 543 Sections 26 to 33 and the
associated guidelines as well as the requirements of the MPRDA. Synergistics, as the independent EIA
consultant, has deemed that the environmental process followed to date meets the requirements of the
legislation to ensure that the regulatory authorities receive sufficient information to enable them to make
an informed decision to accept the scoping report and approve the plan of study for EIA.
SECTION E. Stakeholders’ comments
>>
E.1. Brief description how comments by local stakeholders have been invited and compiled:
Comments by local stakeholders were invited and compiled through a local stakeholders meeting which
was held on Tuesday 13 December 2011. Invitation to the meeting was advertised in the local newspaper
the Mogol Pos and was supplemented by posters which were on display in a number of locations around
Lephalale.
The purpose of the meeting was to introduce stakeholders and interested parties to the project activity and
to provide a platform from which comments could be gathered. The agenda of the consultation meeting
included an introduction and attendance register sign in, a presentation of the project, a questions and
answers section, followed by a summary and next steps of the consultation to conclude.
E.2. Summary of the comments received:
A number of general and technical questions were raised throughout the stakeholder consultation. A
sample of these questions is listed below:
Q: Would the project go ahead if the project is not registered as a CDM project?
A: The project would not go ahead since the revenue from the sale of CERs is a key determinant for the
project to proceed.
Q: At what stage in the CDM registration cycle is the project at currently?
A: The project is currently entering the Validation stage.
Q: Does the project produce any by-products, such as tar or phenols?
A: The project does not produce any by-products such as tar or phenols since all of the volatiles are fully
combusted in the flue ducts and tertiary combustion chamber.
Q: Will the project facility, the Coke Plant, be run 24hrs?
A: Yes. The project facility operates as a batch process where batteries of coke ovens will be operational
over a 24hr period.
Q: Has the technology been utilised overseas?
A: The technology has to a large extent been utilised overseas, however it is considered to be the first
application of this technology in South Africa.
Q: Will the electricity produced be utilised on site or exported to the grid?
A: The electricity produced will be utilised on site.

PROJECT DESIGN DOCUMENT FORM (CDM PDD) - Version 03
CDM – Executive Board
page 49
E.3. Report on how due account was taken of any comments received:
The stakeholder consultation was well attended by local representatives who showed a keen interest in the
proposed project. A number of interesting questions were raised and answered. No objections to the
project were made.
Due account of any comments received is included in the EIA process explained in sections D.1. and D.2.
above.

PROJECT DESIGN DOCUMENT FORM (CDM PDD) - Version 03
CDM – Executive Board
page 50
Annex 1
CONTACT INFORMATION ON PARTICIPANTS IN THE PROJECT ACTIVITY
Organization: Exxaro Resources Limited
Street/P.O.Box: Roger Dyason Road
Building:
City: Pretoria West
State/Region: Gauteng
Postcode/ZIP: 0183
Country: South Africa
Telephone: +27 (0)12 307 5000
FAX: +27 (0)12 323 3400
E-Mail: [email protected]
URL: www.exxaro.com
Represented by: Project Manager
Title: Project Manager
Salutation: Mr.
Last name: Steinmann
Middle name:
First name: Ludwig
Department:
Mobile:
Direct FAX:
Direct tel:
Personal e-mail:

PROJECT DESIGN DOCUMENT FORM (CDM PDD) - Version 03
CDM – Executive Board
page 51
Annex 2
INFORMATION REGARDING PUBLIC FUNDING
Refer to Exxaro, 2012c.

PROJECT DESIGN DOCUMENT FORM (CDM PDD) - Version 03
CDM – Executive Board page 52
Annex 3
BASELINE INFORMATION

PROJECT DESIGN DOCUMENT FORM (CDM PDD) - Version 03
CDM – Executive Board page 53

PROJECT DESIGN DOCUMENT FORM (CDM PDD) - Version 03
CDM – Executive Board page 54

PROJECT DESIGN DOCUMENT FORM (CDM PDD) - Version 03
CDM – Executive Board page 55

PROJECT DESIGN DOCUMENT FORM (CDM PDD) - Version 03
CDM – Executive Board
page 56
Annex 4
MONITORING INFORMATION
- - - - -
Related Documents