Ethanol Propane Biodiesel Natural Gas CLEAN CITIES Alternative Fuel Price Report October 2016

Welcome message from author
This document is posted to help you gain knowledge. Please leave a comment to let me know what you think about it! Share it to your friends and learn new things together.
Transcript
Ethanol Propane BiodieselNatural Gas
CLEAN CITIES
Alternative Fuel Price Report
October 2016
CLEAN CITIES ALTERNATIVE FUEL PRICE REPORT OCTOBER 2016
2
Welcome to the October 2016 issue!The Clean Cities Alternative Fuel Price Report is a quarterly report designed to keep Clean Cities coalitions and other interested parties up to date on the prices of alternative and conventional fuels in the United States. This issue summarizes prices that were submitted between October 1, 2016 and October 15, 2016 by Clean Cities coordinators, fuel providers, and other Clean Cities stakeholders.
What’s New in This Issue:We have made some minor adjustments to the Historical Prices charts (Figures 3, 5, 7, 9, 11, 13 and 15). Previously, there were slight differences in the price ranges for each chart. For example, for Figure 9, Historical Ethanol (E85) Prices Versus Gasoline, the prices on the Y axis previously ranged from $1.75 to $4.00 per gallon, while for Figure 15, Historical B99/B100 Prices Versus Diesel, the prices on the Y axis ranged from $2.00 to $5.00 per gallon. We have modified the scales so that the prices on the Y axes range from $1.25 to $5.00 for each of the charts.
Looking AheadWe will continue to improve the Alternative Fuel Price Report, based on user feedback. We look forward to hearing from you as we implement these upgrades.

3
CLEAN CITIES ALTERNATIVE FUEL PRICE REPORT OCTOBER 2016
Methodology• This report’s prices represent retail, at-the-pump sales
prices for each fuel, including federal and state motor fuel taxes.1
• Clean Cities coordinators, fuel providers, and other key stakeholders provide prices for fuels in their areas on a voluntary basis.
• Prices were submitted for all major alternative fuels currently in widespread use, i.e. natural gas, propane, biodiesel, and ethanol.
• Prices were submitted for conventional fuels from stations that also sell alternative fuels, or from nearby stations.
• Prices from public and private refueling stations are included.2
• Prices were averaged to determine regional price trends by fuel and variability in fuel price within and among regions.3
• Some states charge a flat annual fee, in lieu of collecting motor fuel taxes at the pump, usually for large trucks using gaseous fuels like compressed natural gas (CNG) and liquefied petroleum gas (LPG or propane). These flat fees are not included in the prices reported in these pages.
• Consistent with the U.S. Energy Information Administration (EIA) fuel price reporting format, prices are grouped by the Petroleum Administration for Defense Districts (PADD). The PADD districts are illustrated in the map below.
FIGURE 1 PETROLEUM ADMINSTRATION FOR DEFENSE DISTRICTS (PADD)Source: U.S. Energy Information Administration
Number of Data Points Submitted
Region Gasoline Diesel CNG LNG Ethanol Propane B20 B99/B100
New England 45 31 28 1 7 27 9 4
Central Atlantic 83 78 97 0 94 51 30 2
Lower Atlantic 69 61 66 1 74 119 15 16
Midwest 264 140 121 5 240 81 28 0
Gulf Coast 102 80 63 6 129 126 11 3
Rocky Mountain 99 87 106 10 62 76 8 1
West Coast 119 140 127 16 69 134 32 22
TOTAL 781 617 608 39 675 614 133 48
1 In some cases, prices were submitted by government refueling facilities, and motor fuel taxes were not included in the prices reported to Clean Cities. In these instances, the appropriate federal and state motor fuel taxes have been added to the reported prices to provide a more representative basis for comparison. 2 Public refueling stations are open to the public, while private fueling stations are privately-owned or available only to selected fleets. 3 Fuel price averages for this report are determined by simply averaging the individual data points received. A comparison of average fuel prices for private and for public stations by region can be found on pages 22-23.
TABLE 1
CLEAN CITIES ALTERNATIVE FUEL PRICE REPORT OCTOBER 2016
4
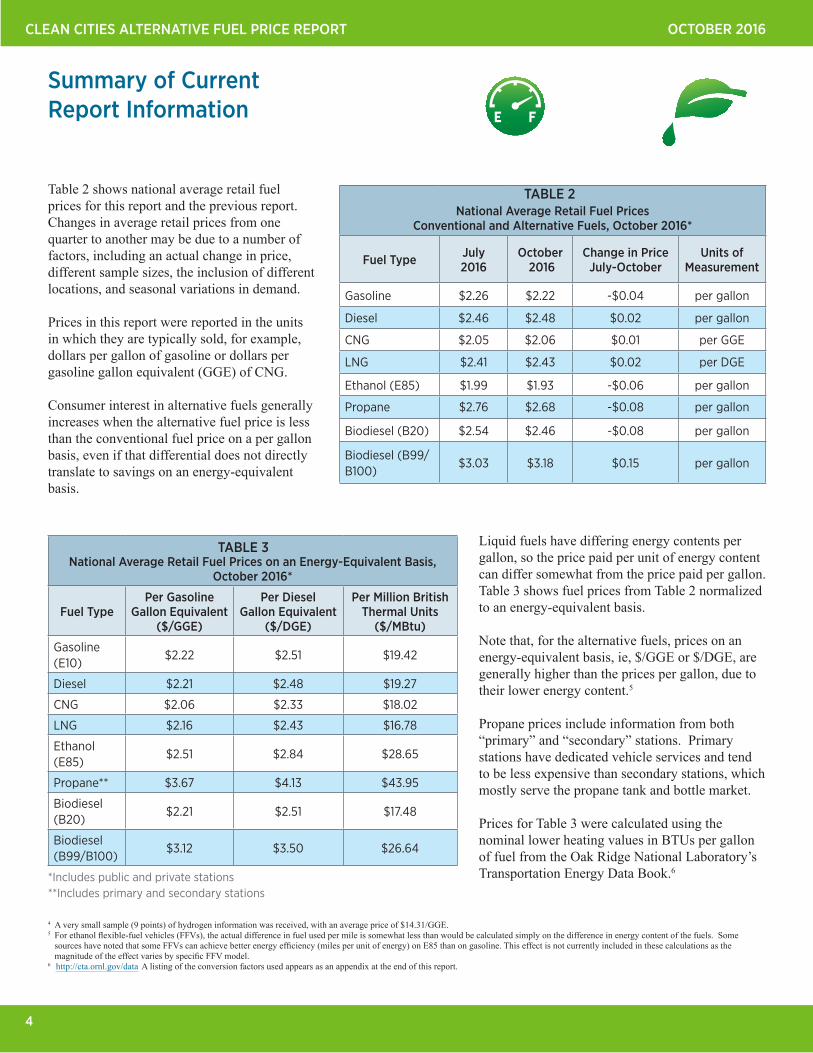
Summary of Current Report Information
National Average Retail Fuel Prices Conventional and Alternative Fuels, October 2016*
Fuel Type July2016
October 2016
Change in PriceJuly-October
Units of Measurement
Gasoline $2.26 $2.22 -$0.04 per gallon
Diesel $2.46 $2.48 $0.02 per gallon
CNG $2.05 $2.06 $0.01 per GGE
LNG $2.41 $2.43 $0.02 per DGE
Ethanol (E85) $1.99 $1.93 -$0.06 per gallon
Propane $2.76 $2.68 -$0.08 per gallon
Biodiesel (B20) $2.54 $2.46 -$0.08 per gallon
Biodiesel (B99/B100)
$3.03 $3.18 $0.15 per gallon
TABLE 2
Liquid fuels have differing energy contents per gallon, so the price paid per unit of energy content can differ somewhat from the price paid per gallon. Table 3 shows fuel prices from Table 2 normalized to an energy-equivalent basis.
Note that, for the alternative fuels, prices on an energy-equivalent basis, ie, $/GGE or $/DGE, are generally higher than the prices per gallon, due to their lower energy content.5
Propane prices include information from both “primary” and “secondary” stations. Primary stations have dedicated vehicle services and tend to be less expensive than secondary stations, which mostly serve the propane tank and bottle market.
Prices for Table 3 were calculated using the nominal lower heating values in BTUs per gallon of fuel from the Oak Ridge National Laboratory’s Transportation Energy Data Book.6
National Average Retail Fuel Prices on an Energy-Equivalent Basis,October 2016*
Fuel TypePer Gasoline
Gallon Equivalent ($/GGE)
Per Diesel Gallon Equivalent
($/DGE)
Per Million British Thermal Units
($/MBtu)
Gasoline (E10)
$2.22 $2.51 $19.42
Diesel $2.21 $2.48 $19.27
CNG $2.06 $2.33 $18.02
LNG $2.16 $2.43 $16.78
Ethanol (E85)
$2.51 $2.84 $28.65
Propane** $3.67 $4.13 $43.95
Biodiesel (B20)
$2.21 $2.51 $17.48
Biodiesel (B99/B100)
$3.12 $3.50 $26.64
Table 2 shows national average retail fuel prices for this report and the previous report. Changes in average retail prices from one quarter to another may be due to a number of factors, including an actual change in price, different sample sizes, the inclusion of different locations, and seasonal variations in demand.
Prices in this report were reported in the units in which they are typically sold, for example, dollars per gallon of gasoline or dollars per gasoline gallon equivalent (GGE) of CNG.
Consumer interest in alternative fuels generally increases when the alternative fuel price is less than the conventional fuel price on a per gallon basis, even if that differential does not directly translate to savings on an energy-equivalent basis.
TABLE 3
4 A very small sample (9 points) of hydrogen information was received, with an average price of $14.31/GGE. 5 For ethanol flexible-fuel vehicles (FFVs), the actual difference in fuel used per mile is somewhat less than would be calculated simply on the difference in energy content of the fuels. Some sources have noted that some FFVs can achieve better energy efficiency (miles per unit of energy) on E85 than on gasoline. This effect is not currently included in these calculations as the magnitude of the effect varies by specific FFV model.6 http://cta.ornl.gov/data A listing of the conversion factors used appears as an appendix at the end of this report.
*Includes public and private stations**Includes primary and secondary stations
5
CLEAN CITIES ALTERNATIVE FUEL PRICE REPORT OCTOBER 2016
Gasoline and Diesel Prices: Clean Cities and EIA Data
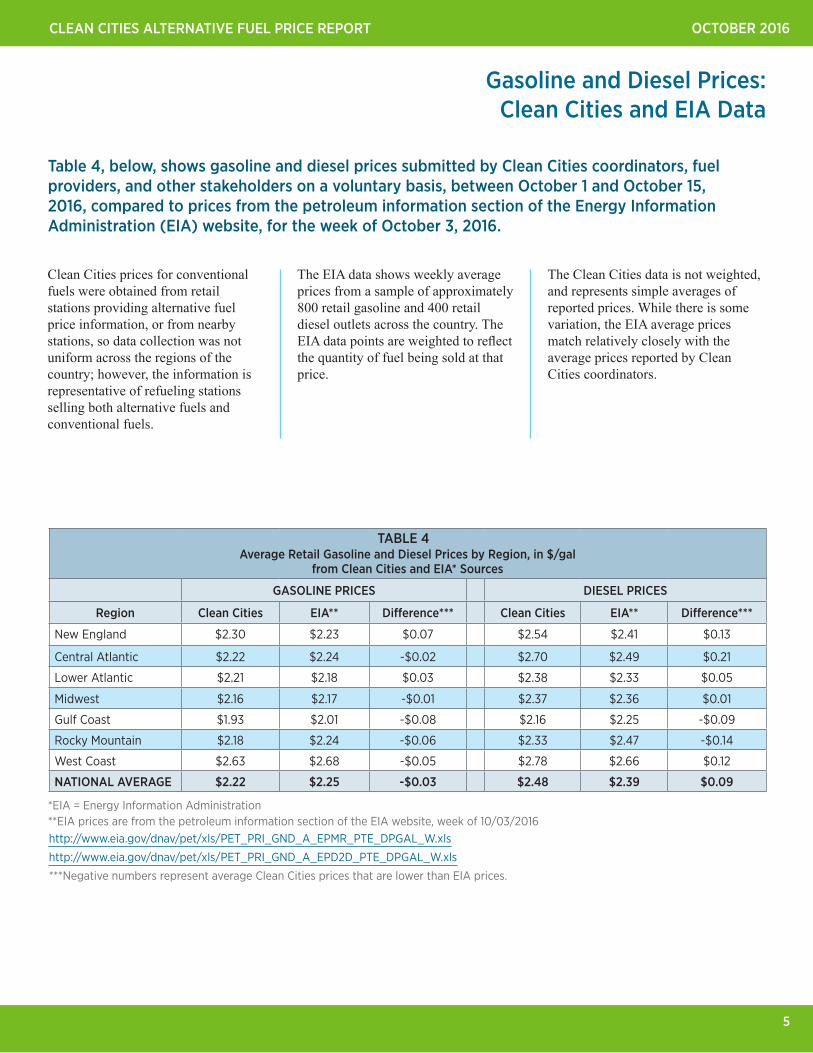
Table 4, below, shows gasoline and diesel prices submitted by Clean Cities coordinators, fuel providers, and other stakeholders on a voluntary basis, between October 1 and October 15, 2016, compared to prices from the petroleum information section of the Energy Information Administration (EIA) website, for the week of October 3, 2016.
Clean Cities prices for conventional fuels were obtained from retail stations providing alternative fuel price information, or from nearby stations, so data collection was not uniform across the regions of the country; however, the information is representative of refueling stations selling both alternative fuels and conventional fuels.
Average Retail Gasoline and Diesel Prices by Region, in $/gal from Clean Cities and EIA* Sources
GASOLINE PRICES DIESEL PRICES
Region Clean Cities EIA** Difference*** Clean Cities EIA** Difference***
New England $2.30 $2.23 $0.07 $2.54 $2.41 $0.13
Central Atlantic $2.22 $2.24 -$0.02 $2.70 $2.49 $0.21
Lower Atlantic $2.21 $2.18 $0.03 $2.38 $2.33 $0.05
Midwest $2.16 $2.17 -$0.01 $2.37 $2.36 $0.01
Gulf Coast $1.93 $2.01 -$0.08 $2.16 $2.25 -$0.09
Rocky Mountain $2.18 $2.24 -$0.06 $2.33 $2.47 -$0.14
West Coast $2.63 $2.68 -$0.05 $2.78 $2.66 $0.12
NATIONAL AVERAGE $2.22 $2.25 -$0.03 $2.48 $2.39 $0.09
*EIA = Energy Information Administration**EIA prices are from the petroleum information section of the EIA website, week of 10/03/2016
TABLE 4
The EIA data shows weekly average prices from a sample of approximately 800 retail gasoline and 400 retail diesel outlets across the country. The EIA data points are weighted to reflect the quantity of fuel being sold at that price.
The Clean Cities data is not weighted, and represents simple averages of reported prices. While there is some variation, the EIA average prices match relatively closely with the average prices reported by Clean Cities coordinators.
http://www.eia.gov/dnav/pet/xls/PET_PRI_GND_A_EPMR_PTE_DPGAL_W.xls
http://www.eia.gov/dnav/pet/xls/PET_PRI_GND_A_EPD2D_PTE_DPGAL_W.xls
***Negative numbers represent average Clean Cities prices that are lower than EIA prices.
CLEAN CITIES ALTERNATIVE FUEL PRICE REPORT OCTOBER 2016
6
Compressed Natural Gas (Relative to Gasoline)
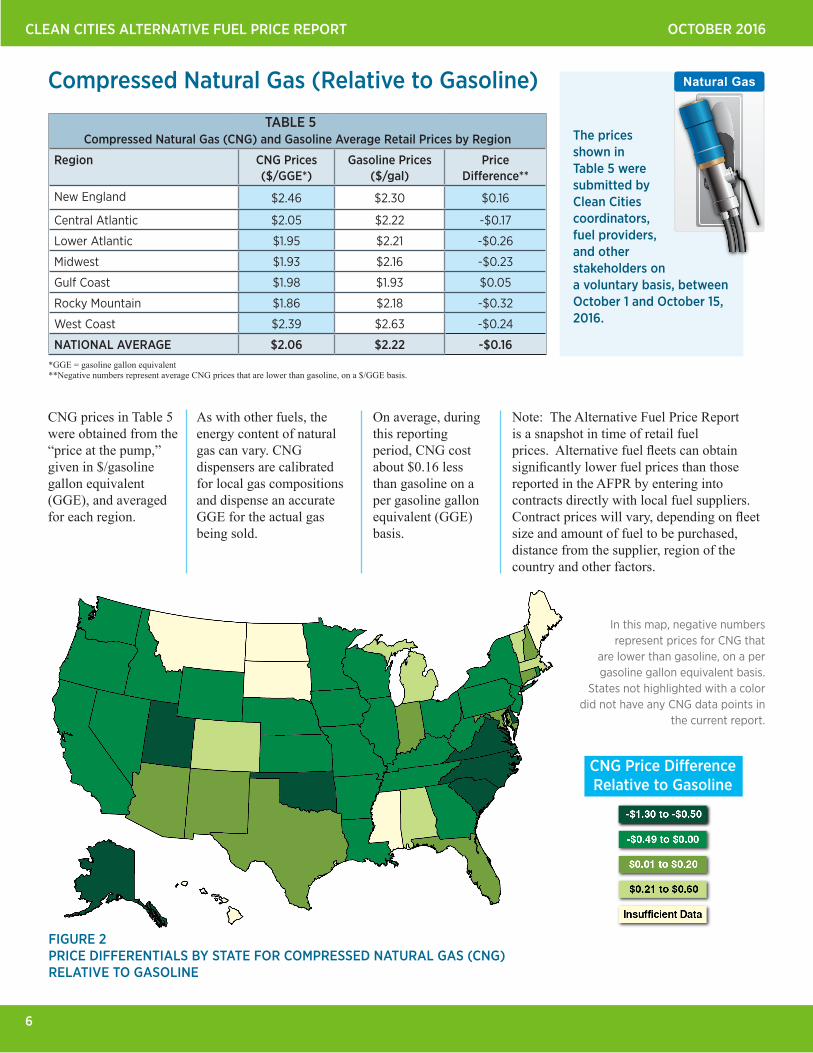
CNG prices in Table 5 were obtained from the “price at the pump,” given in $/gasoline gallon equivalent (GGE), and averaged for each region.
As with other fuels, the energy content of natural gas can vary. CNG dispensers are calibrated for local gas compositions and dispense an accurate GGE for the actual gas being sold.
Compressed Natural Gas (CNG) and Gasoline Average Retail Prices by Region
Region CNG Prices($/GGE*)
Gasoline Prices($/gal)
PriceDifference**
New England $2.46 $2.30 $0.16
Central Atlantic $2.05 $2.22 -$0.17
Lower Atlantic $1.95 $2.21 -$0.26
Midwest $1.93 $2.16 -$0.23
Gulf Coast $1.98 $1.93 $0.05
Rocky Mountain $1.86 $2.18 -$0.32
West Coast $2.39 $2.63 -$0.24
NATIONAL AVERAGE $2.06 $2.22 -$0.16
The prices shown in Table 5 were submitted by Clean Cities coordinators, fuel providers, and other stakeholders on a voluntary basis, between October 1 and October 15, 2016.
On average, during this reporting period, CNG cost about $0.16 less than gasoline on a per gasoline gallon equivalent (GGE) basis.
In this map, negative numbers represent prices for CNG that
are lower than gasoline, on a per gasoline gallon equivalent basis.
States not highlighted with a color did not have any CNG data points in
the current report.
FIGURE 2 PRICE DIFFERENTIALS BY STATE FOR COMPRESSED NATURAL GAS (CNG) RELATIVE TO GASOLINE
CNG Price DifferenceRelative to Gasoline
TABLE 5
Note: The Alternative Fuel Price Report is a snapshot in time of retail fuel prices. Alternative fuel fleets can obtain significantly lower fuel prices than those reported in the AFPR by entering into contracts directly with local fuel suppliers. Contract prices will vary, depending on fleet size and amount of fuel to be purchased, distance from the supplier, region of the country and other factors.
*GGE = gasoline gallon equivalent**Negative numbers represent average CNG prices that are lower than gasoline, on a $/GGE basis.
7
CLEAN CITIES ALTERNATIVE FUEL PRICE REPORT OCTOBER 2016
2010 2012 20142009 2011 20162013 20152008J O A J O J A J O J A J O J A J O J A J O J A J O J JA J JO AJ O
Pric
e pe
r gas
olin
e ga
llon
equi
vale
nt (
$/G
GE)
$1.75
$2.00
$2.25
$2.50
$2.75
$3.00
$3.25
$3.50
$3.75
$4.00
$4.25
$4.50
$4.75
$5.00
$1.25
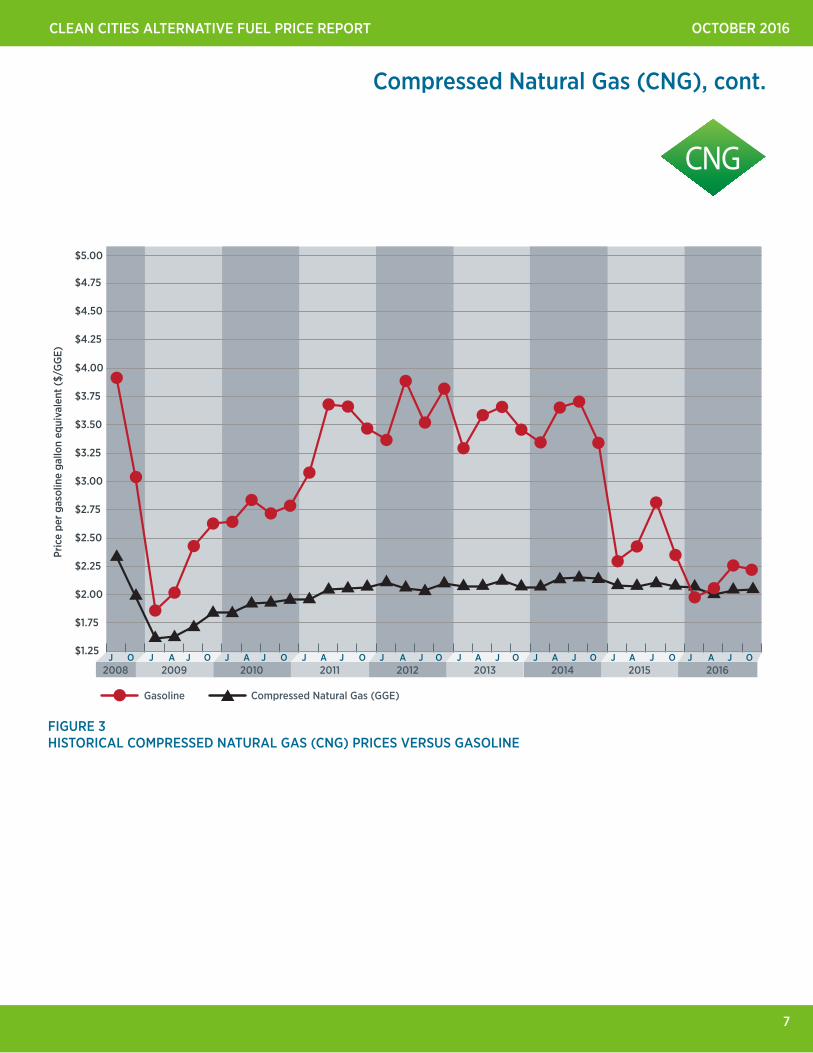
Compressed Natural Gas (GGE)Gasoline
Compressed Natural Gas (CNG), cont.
FIGURE 3 HISTORICAL COMPRESSED NATURAL GAS (CNG) PRICES VERSUS GASOLINE
CNG
CLEAN CITIES ALTERNATIVE FUEL PRICE REPORT OCTOBER 2016
8
Compressed Natural Gas (Relative to Diesel)
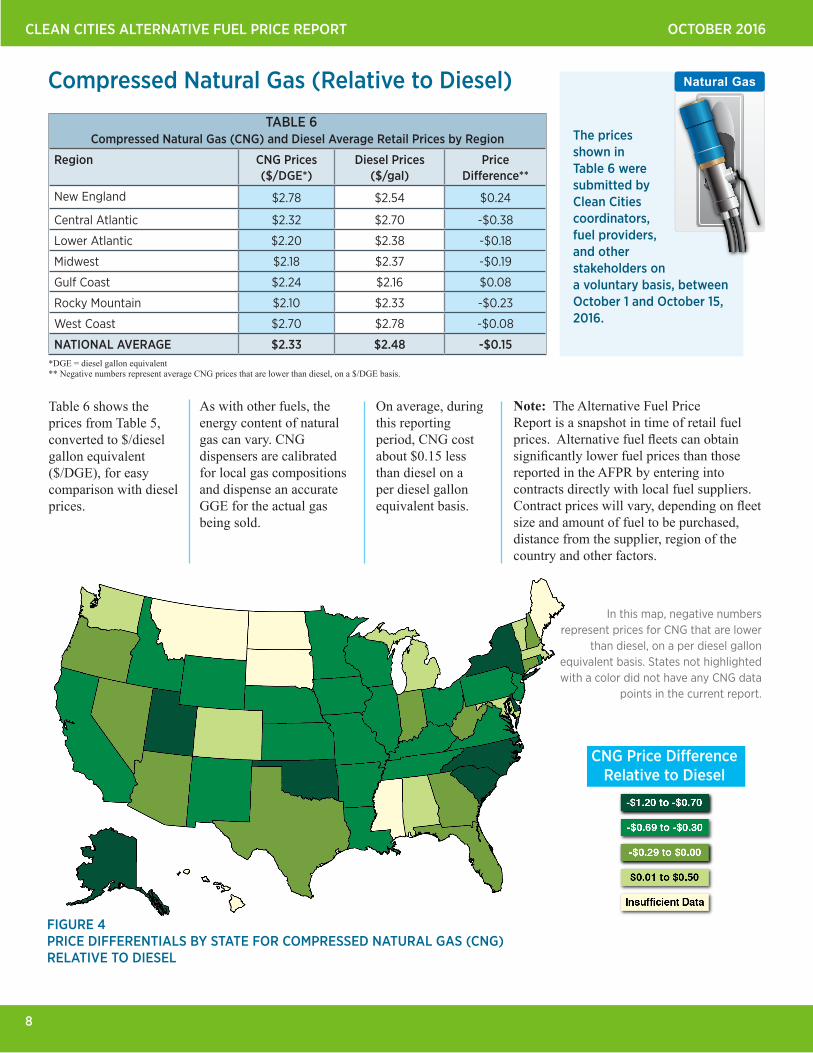
Table 6 shows the prices from Table 5, converted to $/diesel gallon equivalent ($/DGE), for easy comparison with diesel prices.
As with other fuels, the energy content of natural gas can vary. CNG dispensers are calibrated for local gas compositions and dispense an accurate GGE for the actual gas being sold.
Compressed Natural Gas (CNG) and Diesel Average Retail Prices by Region
Region CNG Prices($/DGE*)
Diesel Prices($/gal)
PriceDifference**
New England $2.78 $2.54 $0.24
Central Atlantic $2.32 $2.70 -$0.38
Lower Atlantic $2.20 $2.38 -$0.18
Midwest $2.18 $2.37 -$0.19
Gulf Coast $2.24 $2.16 $0.08
Rocky Mountain $2.10 $2.33 -$0.23
West Coast $2.70 $2.78 -$0.08
NATIONAL AVERAGE $2.33 $2.48 -$0.15
The prices shown in Table 6 were submitted by Clean Cities coordinators, fuel providers, and other stakeholders on a voluntary basis, between October 1 and October 15, 2016.
On average, during this reporting period, CNG cost about $0.15 less than diesel on a per diesel gallon equivalent basis.
In this map, negative numbers represent prices for CNG that are lower
than diesel, on a per diesel gallon equivalent basis. States not highlighted with a color did not have any CNG data
points in the current report.
FIGURE 4 PRICE DIFFERENTIALS BY STATE FOR COMPRESSED NATURAL GAS (CNG) RELATIVE TO DIESEL
CNG Price DifferenceRelative to Diesel
TABLE 6
Note: The Alternative Fuel Price Report is a snapshot in time of retail fuel prices. Alternative fuel fleets can obtain significantly lower fuel prices than those reported in the AFPR by entering into contracts directly with local fuel suppliers. Contract prices will vary, depending on fleet size and amount of fuel to be purchased, distance from the supplier, region of the country and other factors.
*DGE = diesel gallon equivalent** Negative numbers represent average CNG prices that are lower than diesel, on a $/DGE basis.

9
CLEAN CITIES ALTERNATIVE FUEL PRICE REPORT OCTOBER 2016
2010 2012 20142009 2011 20162013 20152008J O A J O J A J O J A J O J A J O J A J O J A J O J JA J JO AJ O
Pric
e pe
r die
sel g
allo
n eq
uiva
lent
($/
DG
E)
$1.75
$2.00
$2.25
$2.50
$2.75
$3.00
$3.25
$3.50
$3.75
$4.00
$4.25
$4.50
$4.75
$5.00
$1.25
Compressed Natural Gas (DGE)Diesel
Compressed Natural Gas (CNG), cont.
FIGURE 5 HISTORICAL COMPRESSED NATURAL GAS (CNG) PRICES VERSUS DIESEL
CNG
CLEAN CITIES ALTERNATIVE FUEL PRICE REPORT OCTOBER 2016
10
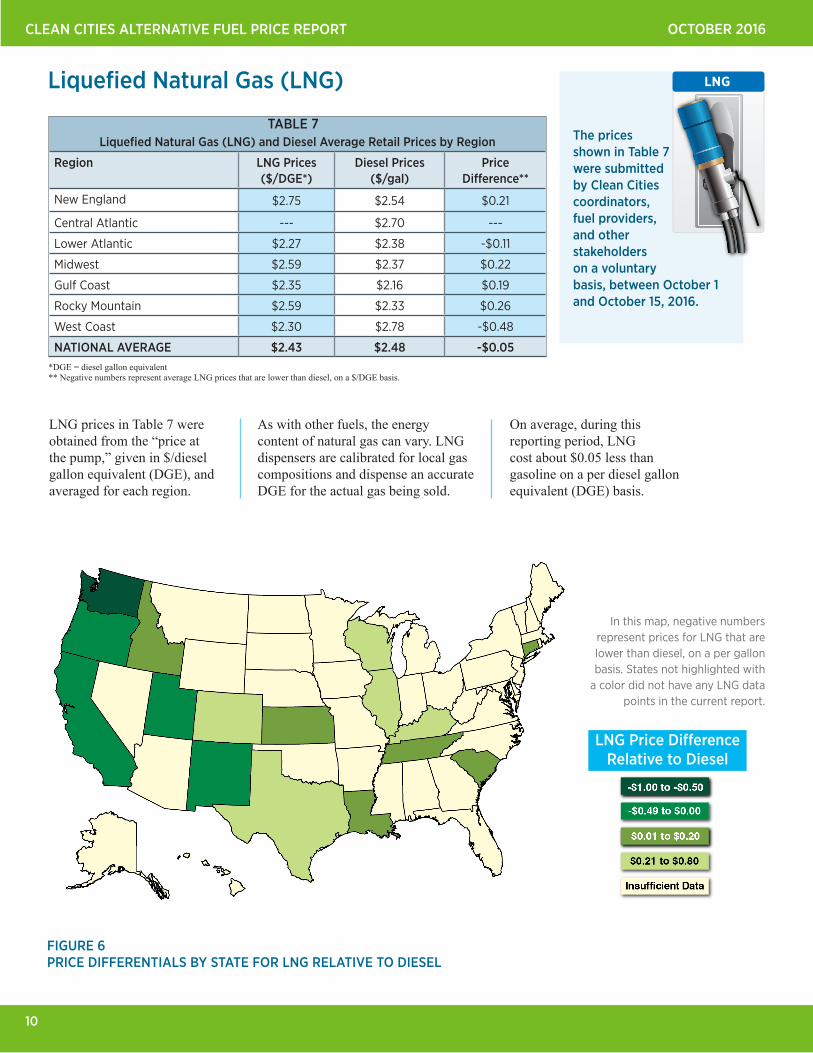
Liquefied Natural Gas (LNG)
Liquefied Natural Gas (LNG) and Diesel Average Retail Prices by Region
Region LNG Prices($/DGE*)
Diesel Prices($/gal)
PriceDifference**
New England $2.75 $2.54 $0.21
Central Atlantic --- $2.70 ---
Lower Atlantic $2.27 $2.38 -$0.11
Midwest $2.59 $2.37 $0.22
Gulf Coast $2.35 $2.16 $0.19
Rocky Mountain $2.59 $2.33 $0.26
West Coast $2.30 $2.78 -$0.48
NATIONAL AVERAGE $2.43 $2.48 -$0.05
The prices shown in Table 7 were submitted by Clean Cities coordinators, fuel providers, and other stakeholders on a voluntary basis, between October 1 and October 15, 2016.
In this map, negative numbers represent prices for LNG that are lower than diesel, on a per gallon basis. States not highlighted with
a color did not have any LNG data points in the current report.
FIGURE 6 PRICE DIFFERENTIALS BY STATE FOR LNG RELATIVE TO DIESEL
LNG Price DifferenceRelative to Diesel
TABLE 7
*DGE = diesel gallon equivalent** Negative numbers represent average LNG prices that are lower than diesel, on a $/DGE basis.
LNG prices in Table 7 were obtained from the “price at the pump,” given in $/diesel gallon equivalent (DGE), and averaged for each region.
As with other fuels, the energy content of natural gas can vary. LNG dispensers are calibrated for local gas compositions and dispense an accurate DGE for the actual gas being sold.
On average, during this reporting period, LNG cost about $0.05 less than gasoline on a per diesel gallon equivalent (DGE) basis.
11
CLEAN CITIES ALTERNATIVE FUEL PRICE REPORT OCTOBER 2016
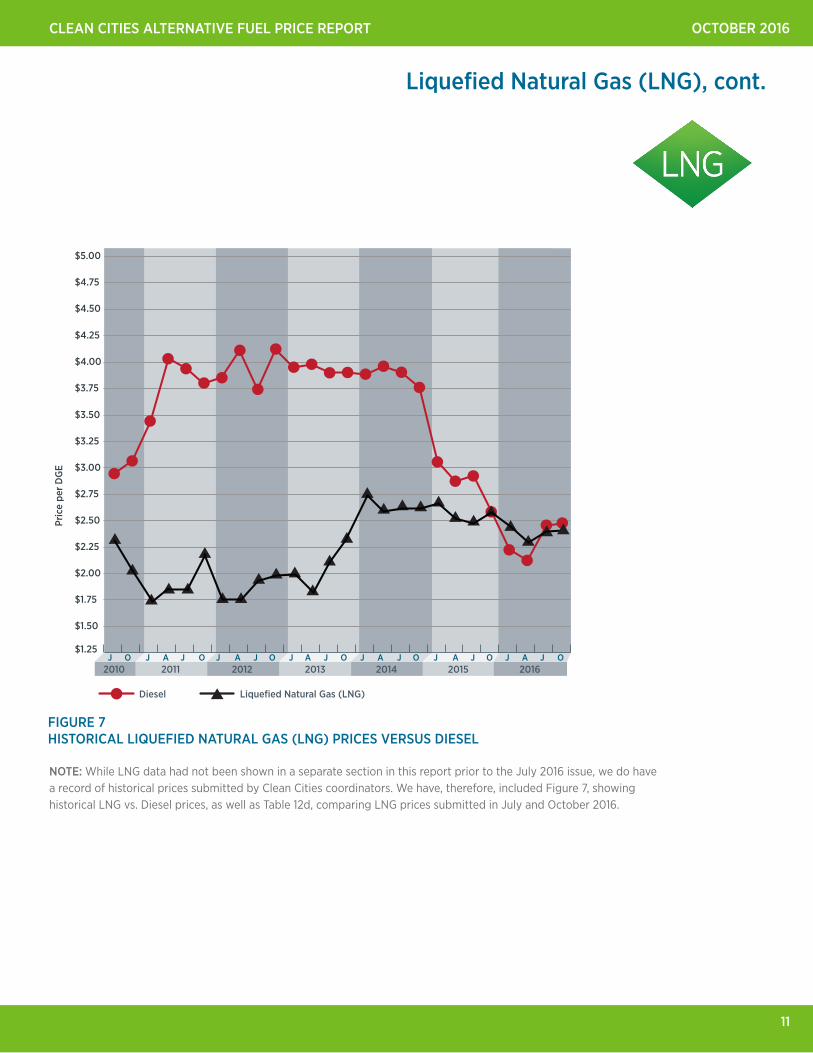
Liquefied Natural Gas (LNG), cont.
FIGURE 7 HISTORICAL LIQUEFIED NATURAL GAS (LNG) PRICES VERSUS DIESEL
NOTE: While LNG data had not been shown in a separate section in this report prior to the July 2016 issue, we do have a record of historical prices submitted by Clean Cities coordinators. We have, therefore, included Figure 7, showing historical LNG vs. Diesel prices, as well as Table 12d, comparing LNG prices submitted in July and October 2016.
2010 2012 20142011 20162013 2015J O J A J O J A J O J A J O J A J O J JA J JO A O
Liquefied Natural Gas (LNG)Diesel
Pric
e pe
r DG
E
$1.25
$1.50
$1.75
$2.00
$2.25
$2.50
$2.75
$3.00
$3.25
$3.50
$3.75
$4.00
$4.25
$4.50
$4.75
$5.00
CLEAN CITIES ALTERNATIVE FUEL PRICE REPORT OCTOBER 2016
12
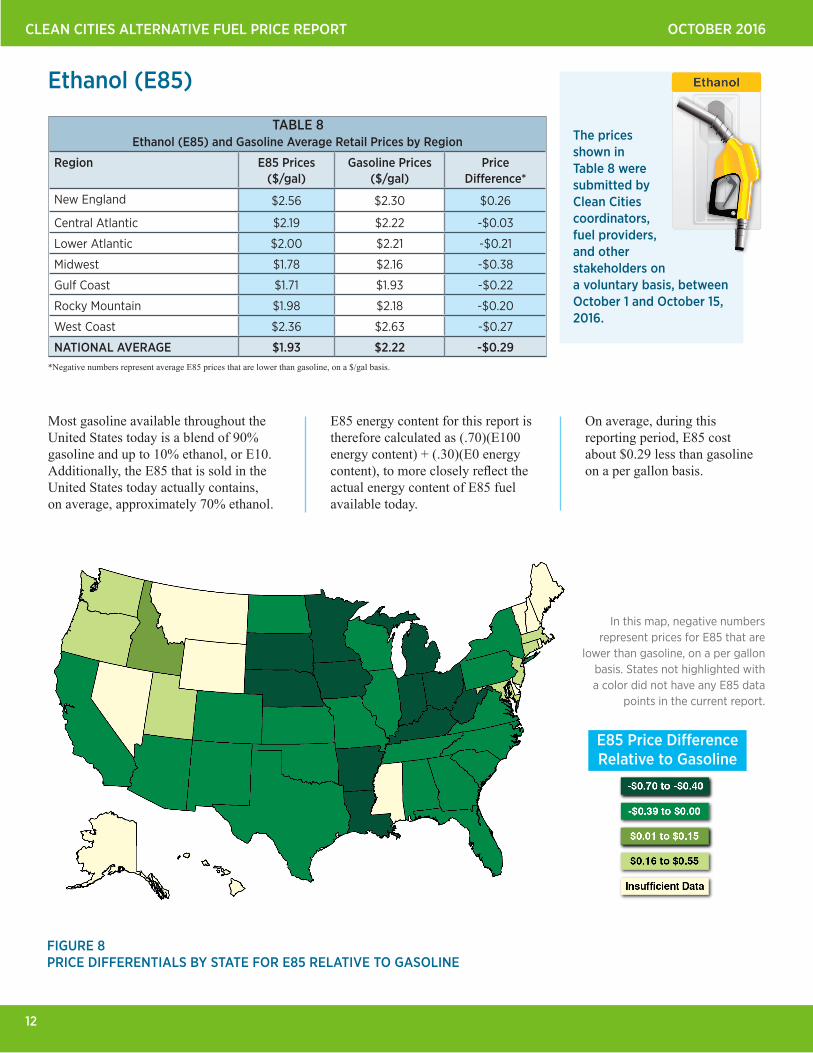
Ethanol (E85)
Most gasoline available throughout the United States today is a blend of 90% gasoline and up to 10% ethanol, or E10. Additionally, the E85 that is sold in the United States today actually contains, on average, approximately 70% ethanol.
E85 energy content for this report is therefore calculated as (.70)(E100 energy content) + (.30)(E0 energy content), to more closely reflect the actual energy content of E85 fuel available today.
Ethanol (E85) and Gasoline Average Retail Prices by Region
Region E85 Prices($/gal)
Gasoline Prices($/gal)
PriceDifference*
New England $2.56 $2.30 $0.26
Central Atlantic $2.19 $2.22 -$0.03
Lower Atlantic $2.00 $2.21 -$0.21
Midwest $1.78 $2.16 -$0.38
Gulf Coast $1.71 $1.93 -$0.22
Rocky Mountain $1.98 $2.18 -$0.20
West Coast $2.36 $2.63 -$0.27
NATIONAL AVERAGE $1.93 $2.22 -$0.29
The prices shown in Table 8 were submitted by Clean Cities coordinators, fuel providers, and other stakeholders on a voluntary basis, between October 1 and October 15, 2016.
On average, during this reporting period, E85 cost about $0.29 less than gasoline on a per gallon basis.
In this map, negative numbers represent prices for E85 that are
lower than gasoline, on a per gallon basis. States not highlighted with a color did not have any E85 data
points in the current report.
FIGURE 8 PRICE DIFFERENTIALS BY STATE FOR E85 RELATIVE TO GASOLINE
E85 Price DifferenceRelative to Gasoline
TABLE 8
*Negative numbers represent average E85 prices that are lower than gasoline, on a $/gal basis.
13
CLEAN CITIES ALTERNATIVE FUEL PRICE REPORT OCTOBER 2016
2010 2012 20142009 2011 20162013 20152008J O A J O J A J O J A J O J A J O J A J O J A J O J JA J JO AJ O
Pric
e pe
r gal
lon
$1.75
$2.00
$2.25
$2.50
$2.75
$3.00
$3.25
$3.50
$3.75
$4.00
$4.25
$4.50
$4.75
$5.00
$1.25
EthanolGasoline
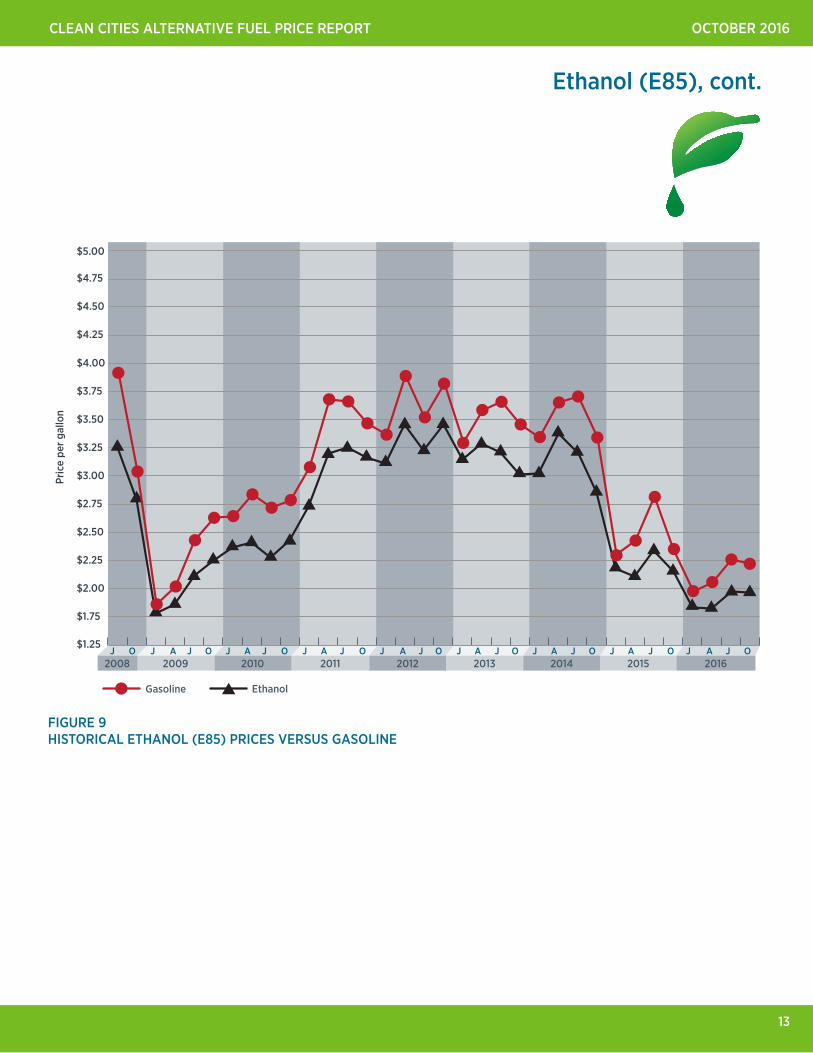
Ethanol (E85), cont.
FIGURE 9 HISTORICAL ETHANOL (E85) PRICES VERSUS GASOLINE
CLEAN CITIES ALTERNATIVE FUEL PRICE REPORT OCTOBER 2016
14
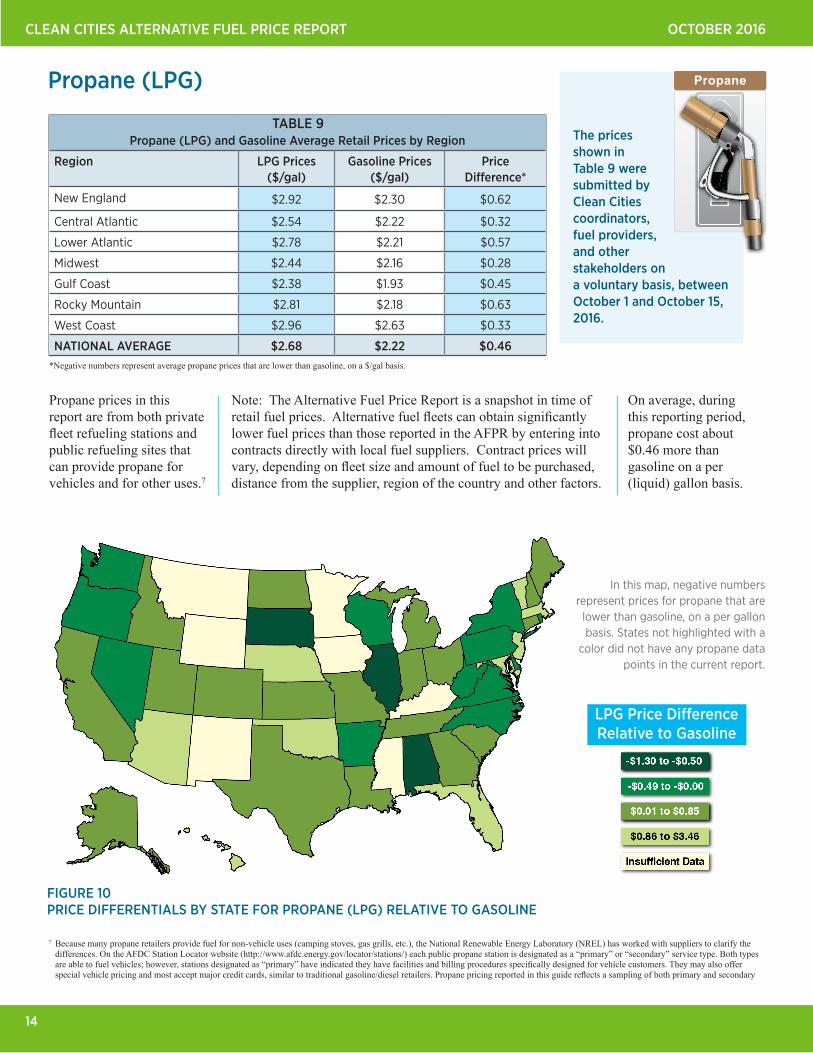
Propane (LPG)
Propane prices in this report are from both private fleet refueling stations and public refueling sites that can provide propane for vehicles and for other uses.7
Note: The Alternative Fuel Price Report is a snapshot in time of retail fuel prices. Alternative fuel fleets can obtain significantly lower fuel prices than those reported in the AFPR by entering into contracts directly with local fuel suppliers. Contract prices will vary, depending on fleet size and amount of fuel to be purchased, distance from the supplier, region of the country and other factors.
Propane (LPG) and Gasoline Average Retail Prices by Region
Region LPG Prices($/gal)
Gasoline Prices($/gal)
PriceDifference*
New England $2.92 $2.30 $0.62
Central Atlantic $2.54 $2.22 $0.32
Lower Atlantic $2.78 $2.21 $0.57
Midwest $2.44 $2.16 $0.28
Gulf Coast $2.38 $1.93 $0.45
Rocky Mountain $2.81 $2.18 $0.63
West Coast $2.96 $2.63 $0.33
NATIONAL AVERAGE $2.68 $2.22 $0.46
The prices shown in Table 9 were submitted by Clean Cities coordinators, fuel providers, and other stakeholders on a voluntary basis, between October 1 and October 15, 2016.
On average, during this reporting period, propane cost about $0.46 more than gasoline on a per (liquid) gallon basis.
7 Because many propane retailers provide fuel for non-vehicle uses (camping stoves, gas grills, etc.), the National Renewable Energy Laboratory (NREL) has worked with suppliers to clarify the differences. On the AFDC Station Locator website (http://www.afdc.energy.gov/locator/stations/) each public propane station is designated as a “primary” or “secondary” service type. Both types are able to fuel vehicles; however, stations designated as “primary” have indicated they have facilities and billing procedures specifically designed for vehicle customers. They may also offer special vehicle pricing and most accept major credit cards, similar to traditional gasoline/diesel retailers. Propane pricing reported in this guide reflects a sampling of both primary and secondary
In this map, negative numbers represent prices for propane that are
lower than gasoline, on a per gallon basis. States not highlighted with a
color did not have any propane data points in the current report.
FIGURE 10 PRICE DIFFERENTIALS BY STATE FOR PROPANE (LPG) RELATIVE TO GASOLINE
LPG Price DifferenceRelative to Gasoline
TABLE 9
*Negative numbers represent average propane prices that are lower than gasoline, on a $/gal basis.
15
CLEAN CITIES ALTERNATIVE FUEL PRICE REPORT OCTOBER 2016
2010 2012 20142009 2011 20162013 20152008J O A J O J A J O J A J O J A J O J A J O J A J O J JA J JO AJ O
Pric
e pe
r gal
lon
$1.75
$2.00
$2.25
$2.50
$2.75
$3.00
$3.25
$3.50
$3.75
$4.00
$4.25
$4.50
$4.75
$5.00
$1.25
PropaneGasoline
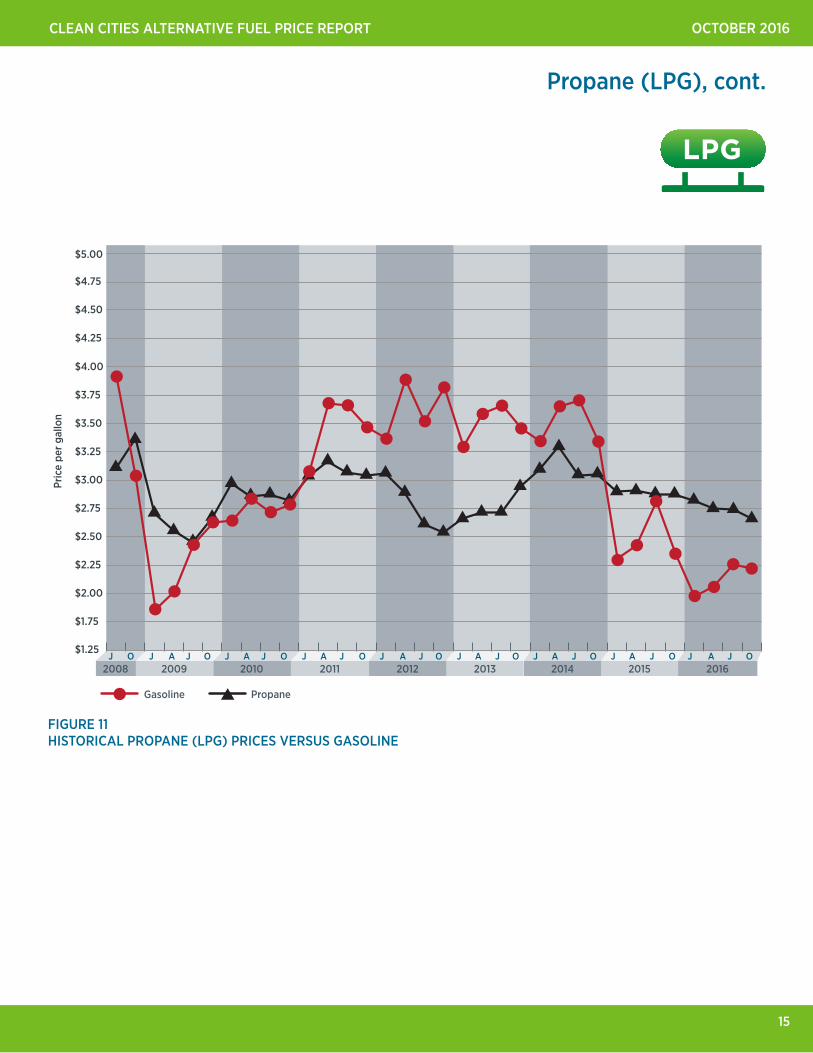
Propane (LPG), cont.
FIGURE 11 HISTORICAL PROPANE (LPG) PRICES VERSUS GASOLINE
LPG

CLEAN CITIES ALTERNATIVE FUEL PRICE REPORT OCTOBER 2016
16
Biodiesel Blends: B20
B20 is a blend of 20% biodiesel and 80% conventional diesel. B20 contains only about 2% less energy (BTUs) per volume than 100% diesel. The appendix at the end of this report provides conversion factors for calculating B20 prices on a GGE and DGE basis.
Biodiesel (B20) and Diesel Average Retail Prices by Region
Region B20 Prices($/gal)
Diesel Prices($/gal)
PriceDifference*
New England $2.68 $2.54 $0.14
Central Atlantic $2.55 $2.70 -$0.15
Lower Atlantic $2.20 $2.38 -$0.18
Midwest $2.29 $2.37 -$0.08
Gulf Coast $2.36 $2.16 $0.20
Rocky Mountain $2.31 $2.33 -$0.02
West Coast $2.64 $2.78 -$0.14
NATIONAL AVERAGE $2.46 $2.48 -$0.02
The prices shown in Table 10 were submitted by Clean Cities coordinators, fuel providers, and other stakeholders on a voluntary basis, between October 1 and October 15, 2016.
On a national average basis, during this reporting period, B20 cost about $0.02 less than diesel on a per gallon basis.
In this map, negative numbers represent prices for B20 that are lower than diesel, on a per gallon basis. States not highlighted with
a color did not have any B20 data points in the current report.
FIGURE 12 PRICE DIFFERENTIALS BY STATE FOR B20 RELATIVE TO DIESEL
B20 Price DifferenceRelative to Diesel
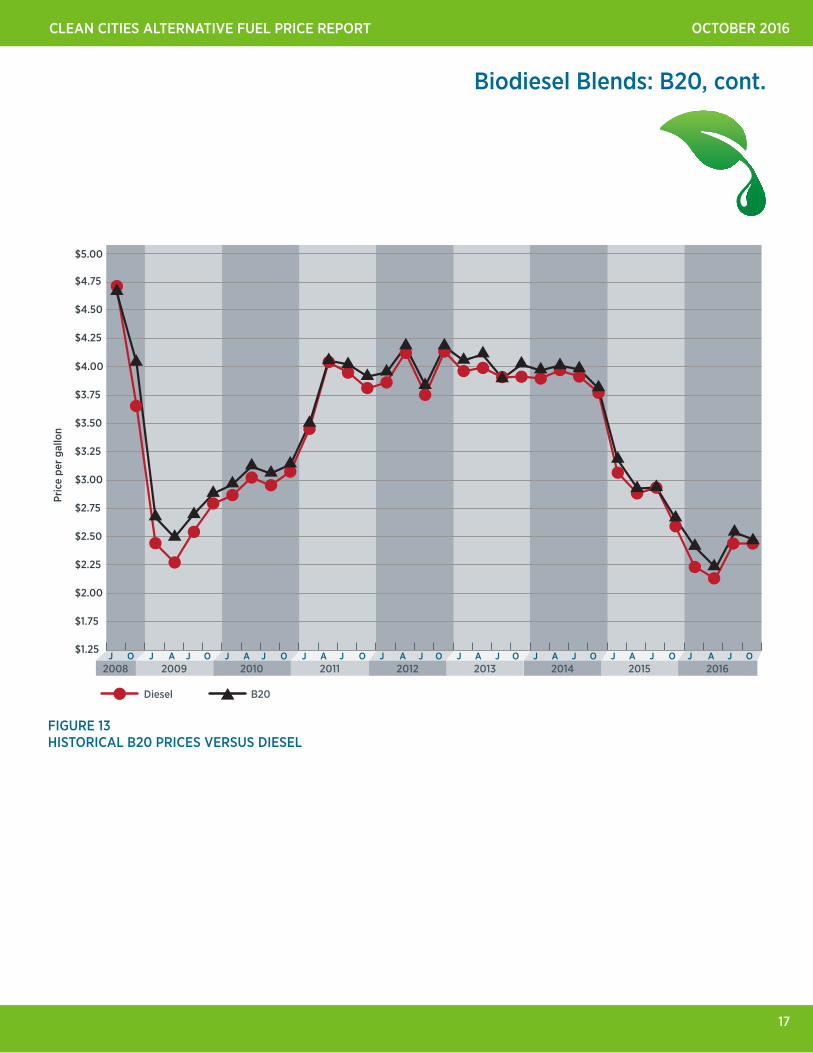
Note that B20 prices, in many regions, track closely with diesel prices.
*Negative numbers represent average B20 prices that are lower than diesel, on a $/gal basis.
TABLE 10
17
CLEAN CITIES ALTERNATIVE FUEL PRICE REPORT OCTOBER 2016
2010 2012 20142009 2011 20162013 20152008J O A J O J A J O J A J O J A J O J A J O J A J O J JA J JO AJ O
Pric
e pe
r gal
lon
$1.75
$2.00
$2.25
$2.50
$2.75
$3.00
$3.25
$3.50
$3.75
$4.00
$4.25
$4.50
$4.75
$5.00
$1.25
B20Diesel
Biodiesel Blends: B20, cont.
FIGURE 13 HISTORICAL B20 PRICES VERSUS DIESEL
CLEAN CITIES ALTERNATIVE FUEL PRICE REPORT OCTOBER 2016
18
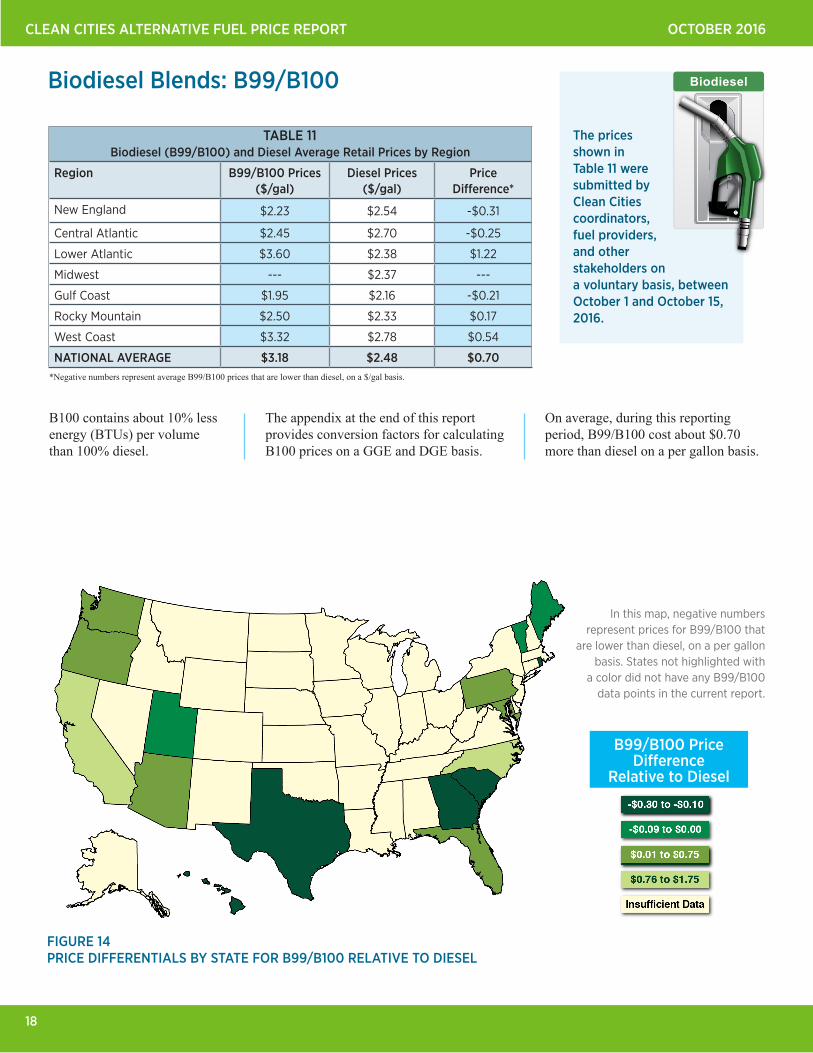
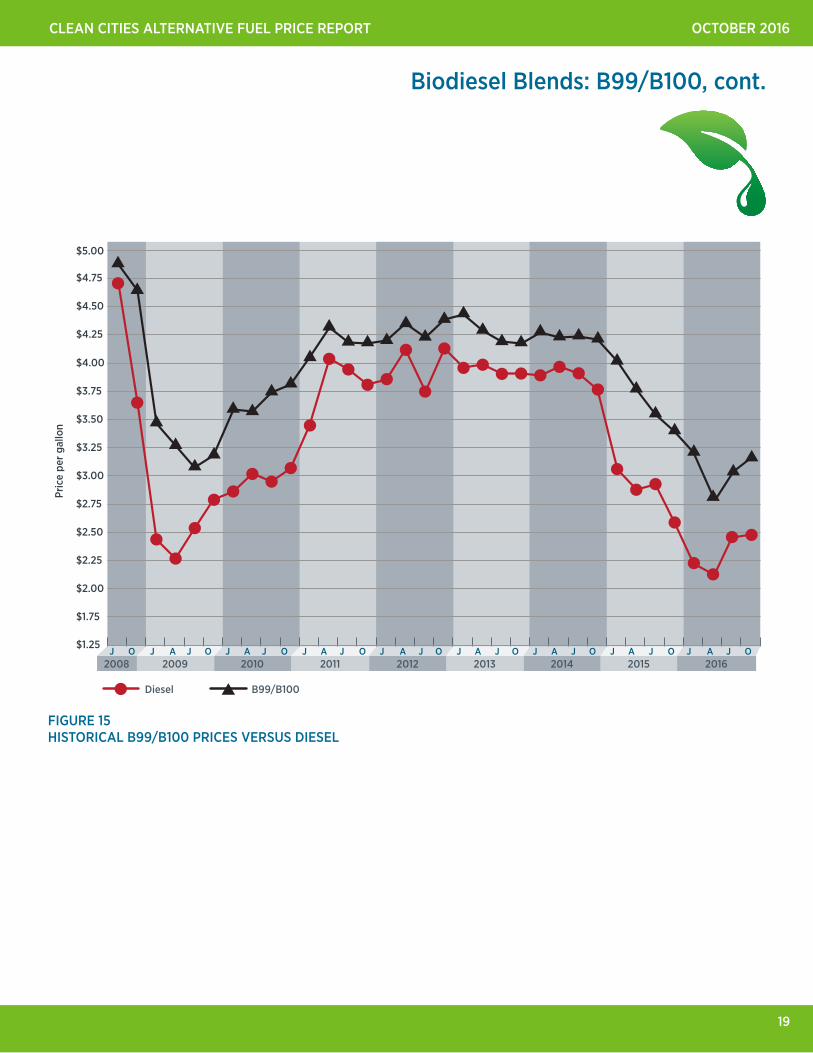
Biodiesel Blends: B99/B100
B100 contains about 10% less energy (BTUs) per volume than 100% diesel.
The appendix at the end of this report provides conversion factors for calculating B100 prices on a GGE and DGE basis.
Biodiesel (B99/B100) and Diesel Average Retail Prices by Region
Region B99/B100 Prices($/gal)
Diesel Prices($/gal)
PriceDifference*
New England $2.23 $2.54 -$0.31
Central Atlantic $2.45 $2.70 -$0.25
Lower Atlantic $3.60 $2.38 $1.22
Midwest --- $2.37 ---
Gulf Coast $1.95 $2.16 -$0.21
Rocky Mountain $2.50 $2.33 $0.17
West Coast $3.32 $2.78 $0.54
NATIONAL AVERAGE $3.18 $2.48 $0.70
The prices shown in Table 11 were submitted by Clean Cities coordinators, fuel providers, and other stakeholders on a voluntary basis, between October 1 and October 15, 2016.
On average, during this reporting period, B99/B100 cost about $0.70 more than diesel on a per gallon basis.
In this map, negative numbers represent prices for B99/B100 that
are lower than diesel, on a per gallon basis. States not highlighted with
a color did not have any B99/B100 data points in the current report.
FIGURE 14 PRICE DIFFERENTIALS BY STATE FOR B99/B100 RELATIVE TO DIESEL
B99/B100 Price Difference
Relative to Diesel
*Negative numbers represent average B99/B100 prices that are lower than diesel, on a $/gal basis.
TABLE 11
19
CLEAN CITIES ALTERNATIVE FUEL PRICE REPORT OCTOBER 2016
2010 2012 20142009 2011 20162013 20152008J O A J O J A J O J A J O J A J O J A J O J A J O J JA J JO AJ O
Pric
e pe
r gal
lon
$1.75
$2.00
$2.25
$2.50
$2.75
$3.00
$3.25
$3.50
$3.75
$4.00
$4.25
$4.50
$4.75
$5.00
$1.25
B99/B100Diesel
Biodiesel Blends: B99/B100, cont.
FIGURE 15 HISTORICAL B99/B100 PRICES VERSUS DIESEL
CLEAN CITIES ALTERNATIVE FUEL PRICE REPORT OCTOBER 2016
20
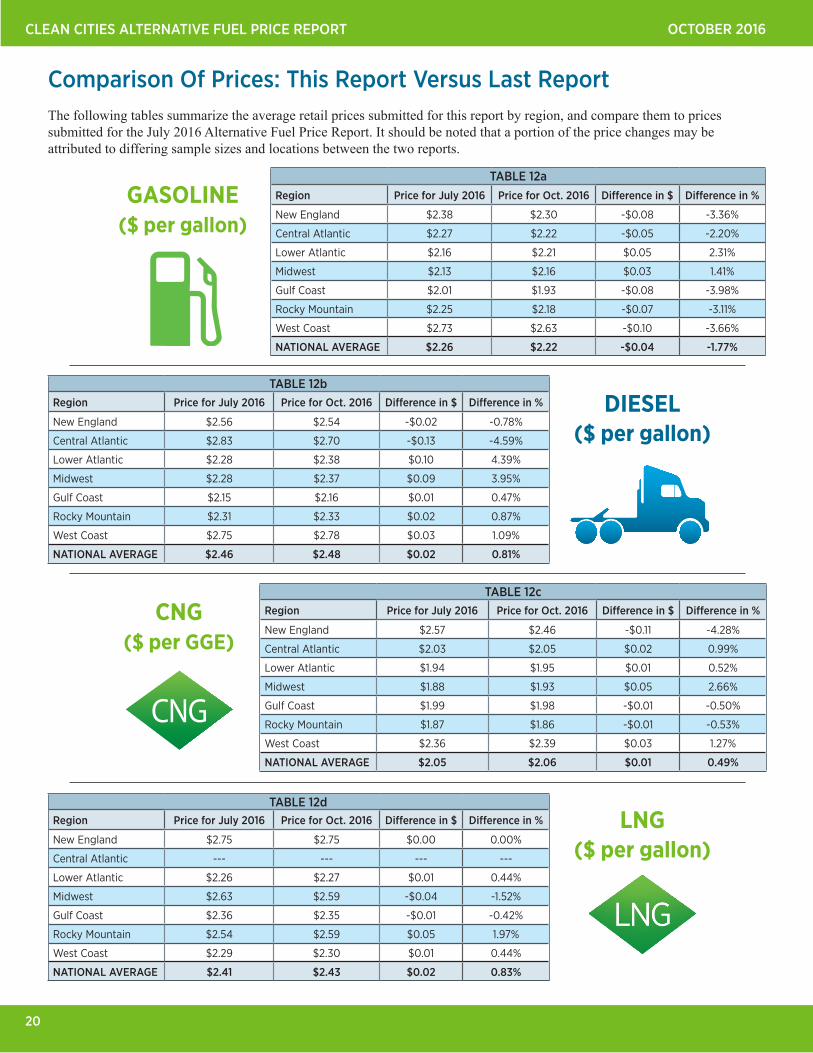
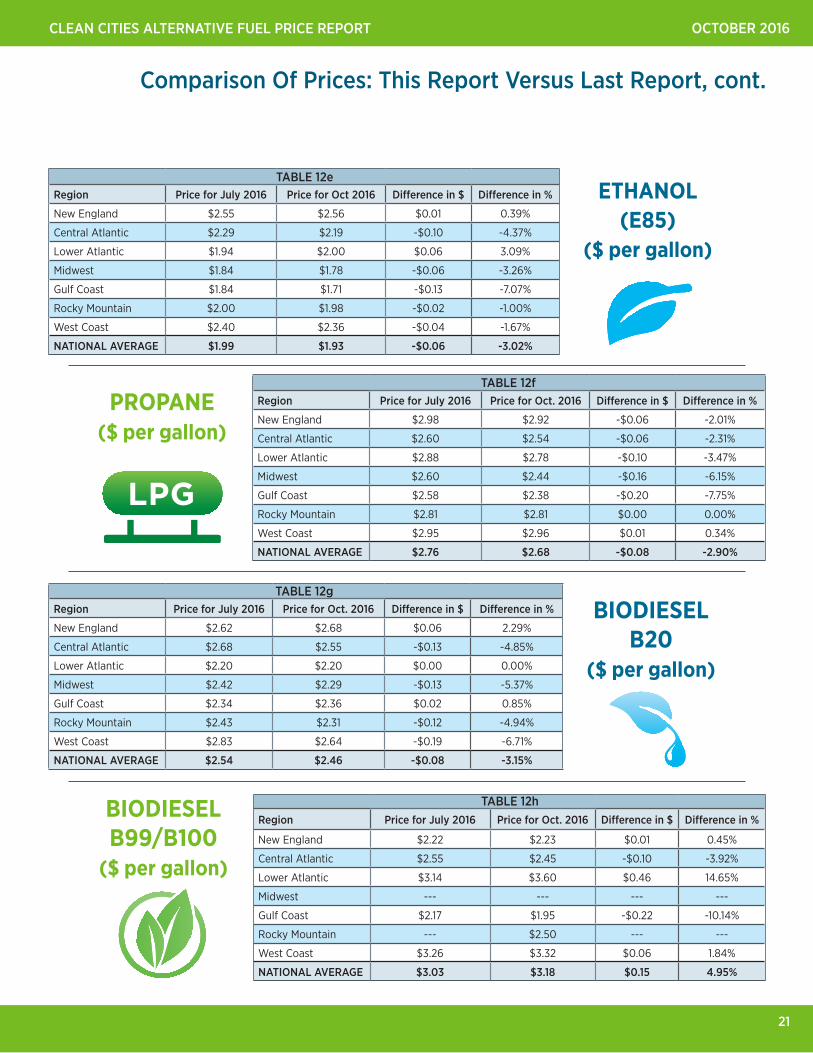
Comparison Of Prices: This Report Versus Last ReportThe following tables summarize the average retail prices submitted for this report by region, and compare them to prices submitted for the July 2016 Alternative Fuel Price Report. It should be noted that a portion of the price changes may be attributed to differing sample sizes and locations between the two reports.
GASOLINE ($ per gallon)
Region Price for July 2016 Price for Oct. 2016 Difference in $ Difference in %
New England $2.38 $2.30 -$0.08 -3.36%
Central Atlantic $2.27 $2.22 -$0.05 -2.20%
Lower Atlantic $2.16 $2.21 $0.05 2.31%
Midwest $2.13 $2.16 $0.03 1.41%
Gulf Coast $2.01 $1.93 -$0.08 -3.98%
Rocky Mountain $2.25 $2.18 -$0.07 -3.11%
West Coast $2.73 $2.63 -$0.10 -3.66%
NATIONAL AVERAGE $2.26 $2.22 -$0.04 -1.77%
Region Price for July 2016 Price for Oct. 2016 Difference in $ Difference in %
New England $2.56 $2.54 -$0.02 -0.78%
Central Atlantic $2.83 $2.70 -$0.13 -4.59%
Lower Atlantic $2.28 $2.38 $0.10 4.39%
Midwest $2.28 $2.37 $0.09 3.95%
Gulf Coast $2.15 $2.16 $0.01 0.47%
Rocky Mountain $2.31 $2.33 $0.02 0.87%
West Coast $2.75 $2.78 $0.03 1.09%
NATIONAL AVERAGE $2.46 $2.48 $0.02 0.81%
DIESEL ($ per gallon)
CNG ($ per GGE)
Region Price for July 2016 Price for Oct. 2016 Difference in $ Difference in %
New England $2.57 $2.46 -$0.11 -4.28%
Central Atlantic $2.03 $2.05 $0.02 0.99%
Lower Atlantic $1.94 $1.95 $0.01 0.52%
Midwest $1.88 $1.93 $0.05 2.66%
Gulf Coast $1.99 $1.98 -$0.01 -0.50%
Rocky Mountain $1.87 $1.86 -$0.01 -0.53%
West Coast $2.36 $2.39 $0.03 1.27%
NATIONAL AVERAGE $2.05 $2.06 $0.01 0.49%
CNG
TABLE 12a
TABLE 12b
TABLE 12c
Region Price for July 2016 Price for Oct. 2016 Difference in $ Difference in %
New England $2.75 $2.75 $0.00 0.00%
Central Atlantic --- --- --- ---
Lower Atlantic $2.26 $2.27 $0.01 0.44%
Midwest $2.63 $2.59 -$0.04 -1.52%
Gulf Coast $2.36 $2.35 -$0.01 -0.42%
Rocky Mountain $2.54 $2.59 $0.05 1.97%
West Coast $2.29 $2.30 $0.01 0.44%
NATIONAL AVERAGE $2.41 $2.43 $0.02 0.83%
LNG ($ per gallon)
TABLE 12d
21
CLEAN CITIES ALTERNATIVE FUEL PRICE REPORT OCTOBER 2016
Comparison Of Prices: This Report Versus Last Report, cont.
Region Price for July 2016 Price for Oct 2016 Difference in $ Difference in %
New England $2.55 $2.56 $0.01 0.39%
Central Atlantic $2.29 $2.19 -$0.10 -4.37%
Lower Atlantic $1.94 $2.00 $0.06 3.09%
Midwest $1.84 $1.78 -$0.06 -3.26%
Gulf Coast $1.84 $1.71 -$0.13 -7.07%
Rocky Mountain $2.00 $1.98 -$0.02 -1.00%
West Coast $2.40 $2.36 -$0.04 -1.67%
NATIONAL AVERAGE $1.99 $1.93 -$0.06 -3.02%
Region Price for July 2016 Price for Oct. 2016 Difference in $ Difference in %
New England $2.98 $2.92 -$0.06 -2.01%
Central Atlantic $2.60 $2.54 -$0.06 -2.31%
Lower Atlantic $2.88 $2.78 -$0.10 -3.47%
Midwest $2.60 $2.44 -$0.16 -6.15%
Gulf Coast $2.58 $2.38 -$0.20 -7.75%
Rocky Mountain $2.81 $2.81 $0.00 0.00%
West Coast $2.95 $2.96 $0.01 0.34%
NATIONAL AVERAGE $2.76 $2.68 -$0.08 -2.90%
Region Price for July 2016 Price for Oct. 2016 Difference in $ Difference in %
New England $2.62 $2.68 $0.06 2.29%
Central Atlantic $2.68 $2.55 -$0.13 -4.85%
Lower Atlantic $2.20 $2.20 $0.00 0.00%
Midwest $2.42 $2.29 -$0.13 -5.37%
Gulf Coast $2.34 $2.36 $0.02 0.85%
Rocky Mountain $2.43 $2.31 -$0.12 -4.94%
West Coast $2.83 $2.64 -$0.19 -6.71%
NATIONAL AVERAGE $2.54 $2.46 -$0.08 -3.15%
Region Price for July 2016 Price for Oct. 2016 Difference in $ Difference in %
New England $2.22 $2.23 $0.01 0.45%
Central Atlantic $2.55 $2.45 -$0.10 -3.92%
Lower Atlantic $3.14 $3.60 $0.46 14.65%
Midwest --- --- --- ---
Gulf Coast $2.17 $1.95 -$0.22 -10.14%
Rocky Mountain --- $2.50 --- ---
West Coast $3.26 $3.32 $0.06 1.84%
NATIONAL AVERAGE $3.03 $3.18 $0.15 4.95%
ETHANOL (E85)
($ per gallon)
PROPANE ($ per gallon)
BIODIESELB20
($ per gallon)
LPG
BIODIESELB99/B100
($ per gallon)
TABLE 12e
TABLE 12f
TABLE 12g
TABLE 12h
CLEAN CITIES ALTERNATIVE FUEL PRICE REPORT OCTOBER 2016
22
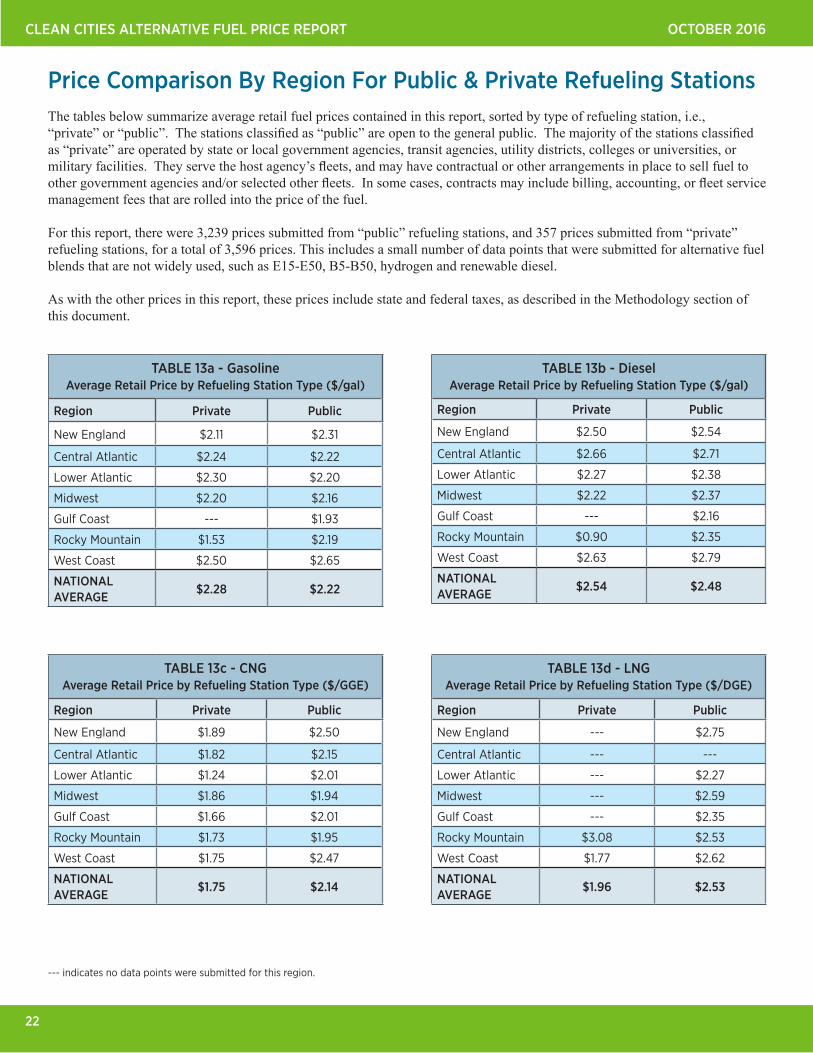
Price Comparison By Region For Public & Private Refueling StationsThe tables below summarize average retail fuel prices contained in this report, sorted by type of refueling station, i.e., “private” or “public”. The stations classified as “public” are open to the general public. The majority of the stations classified as “private” are operated by state or local government agencies, transit agencies, utility districts, colleges or universities, or military facilities. They serve the host agency’s fleets, and may have contractual or other arrangements in place to sell fuel to other government agencies and/or selected other fleets. In some cases, contracts may include billing, accounting, or fleet service management fees that are rolled into the price of the fuel.
For this report, there were 3,239 prices submitted from “public” refueling stations, and 357 prices submitted from “private” refueling stations, for a total of 3,596 prices. This includes a small number of data points that were submitted for alternative fuel blends that are not widely used, such as E15-E50, B5-B50, hydrogen and renewable diesel.
As with the other prices in this report, these prices include state and federal taxes, as described in the Methodology section of this document.
Region Private Public
New England $2.11 $2.31
Central Atlantic $2.24 $2.22
Lower Atlantic $2.30 $2.20
Midwest $2.20 $2.16
Gulf Coast --- $1.93
Rocky Mountain $1.53 $2.19
West Coast $2.50 $2.65
NATIONAL AVERAGE
$2.28 $2.22
Region Private Public
New England $1.89 $2.50
Central Atlantic $1.82 $2.15
Lower Atlantic $1.24 $2.01
Midwest $1.86 $1.94
Gulf Coast $1.66 $2.01
Rocky Mountain $1.73 $1.95
West Coast $1.75 $2.47
NATIONAL AVERAGE
$1.75 $2.14
Region Private Public
New England $2.50 $2.54
Central Atlantic $2.66 $2.71
Lower Atlantic $2.27 $2.38
Midwest $2.22 $2.37
Gulf Coast --- $2.16
Rocky Mountain $0.90 $2.35
West Coast $2.63 $2.79
NATIONAL AVERAGE
$2.54 $2.48
Region Private Public
New England --- $2.75
Central Atlantic --- ---
Lower Atlantic --- $2.27
Midwest --- $2.59
Gulf Coast --- $2.35
Rocky Mountain $3.08 $2.53
West Coast $1.77 $2.62
NATIONAL AVERAGE
$1.96 $2.53
TABLE 13a - GasolineAverage Retail Price by Refueling Station Type ($/gal)
TABLE 13b - DieselAverage Retail Price by Refueling Station Type ($/gal)
TABLE 13c - CNGAverage Retail Price by Refueling Station Type ($/GGE)
TABLE 13d - LNGAverage Retail Price by Refueling Station Type ($/DGE)
--- indicates no data points were submitted for this region.

23
CLEAN CITIES ALTERNATIVE FUEL PRICE REPORT OCTOBER 2016
Region Private Public
New England $1.96 $3.00
Central Atlantic $1.38 $2.86
Lower Atlantic $2.38 $2.79
Midwest $1.89 $2.48
Gulf Coast $1.32 $2.45
Rocky Mountain $1.75 $2.84
West Coast $3.46 $2.92
NATIONAL AVERAGE
$2.06 $2.73
Region Private Public
New England $2.63 $2.69
Central Atlantic $2.57 $2.51
Lower Atlantic $1.87 $2.32
Midwest $2.18 $2.31
Gulf Coast $1.81 $2.41
Rocky Mountain $1.67 $2.40
West Coast $2.50 $2.65
NATIONAL AVERAGE
$2.41 $2.48
Comparison Of Prices By Region For Public & Private Refueling Stations cont.
Region Private Public
New England --- $2.23
Central Atlantic --- $2.45
Lower Atlantic $4.69 $2.94
Midwest --- ---
Gulf Coast --- $1.95
Rocky Mountain --- $2.50
West Coast $3.61 $3.29
NATIONAL AVERAGE
$4.42 $2.93
TABLE 13f - PropaneAverage Retail Price by Refueling Station Type ($/gal)
TABLE 13g - B20Average Retail Price by Refueling Station Type ($/gal)
TABLE 13h - B99/B100Average Retail Price by Refueling Station Type ($/gal)
--- indicates no data points were submitted for this region.
Region Private Public
New England --- $2.56
Central Atlantic $2.29 $2.18
Lower Atlantic $2.19 $1.99
Midwest $2.20 $1.75
Gulf Coast $1.84 $1.71
Rocky Mountain $0.81 $2.00
West Coast $2.47 $2.36
NATIONAL AVERAGE
$2.19 $1.92
TABLE 13e - E85Average Retail Price by Refueling Station Type ($/gal)
CLEAN CITIES ALTERNATIVE FUEL PRICE REPORT OCTOBER 2016
24
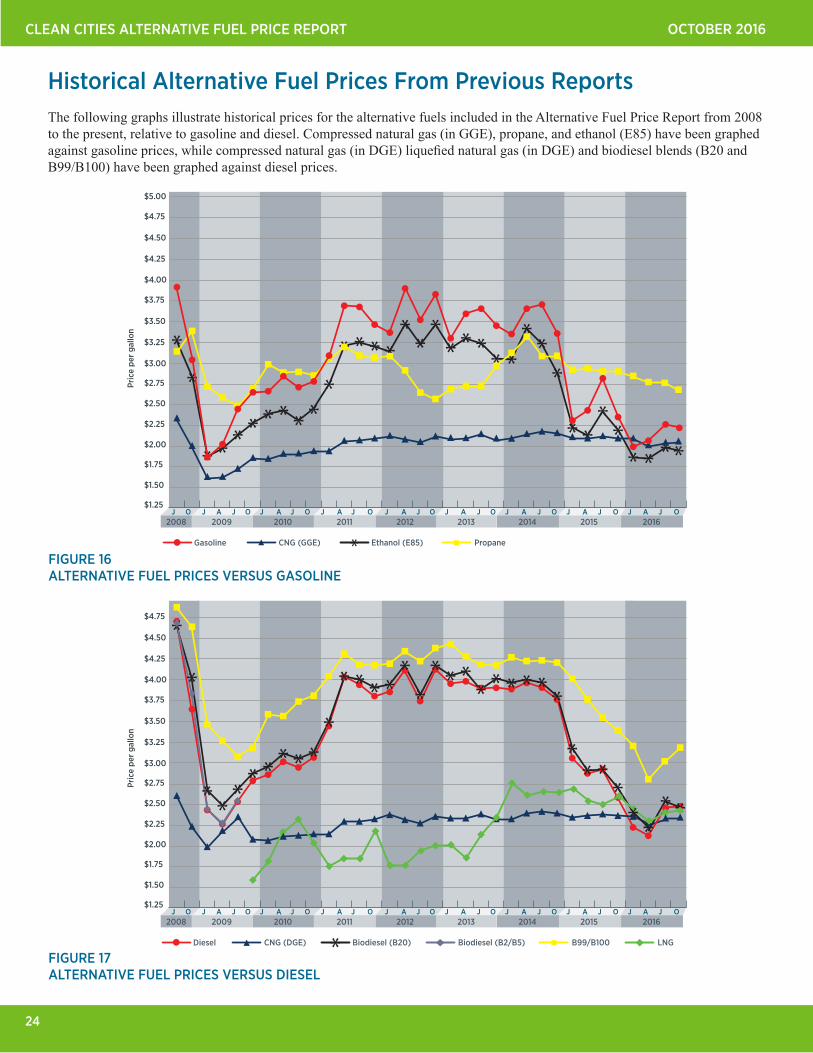
Historical Alternative Fuel Prices From Previous ReportsThe following graphs illustrate historical prices for the alternative fuels included in the Alternative Fuel Price Report from 2008 to the present, relative to gasoline and diesel. Compressed natural gas (in GGE), propane, and ethanol (E85) have been graphed against gasoline prices, while compressed natural gas (in DGE) liquefied natural gas (in DGE) and biodiesel blends (B20 and B99/B100) have been graphed against diesel prices.
2010 2012 20142009 2011 20162013 20152008J A J O J AO J O J A J O J A J O J A J O J A J O J JA J JO AJ O
Pric
e pe
r gal
lon
$1.75
$2.00
$2.25
$2.50
$2.75
$3.00
$3.25
$3.50
$3.75
$4.00
$4.25
$4.50
$4.75
$5.00
$1.50
CNG (GGE)Gasoline Ethanol (E85) Propane
$1.25
2010 2012 20142009 2011 20162013 20152008J A J O J AO J O J A J O J A J O J A J O J A J O J JA J JO AJ O
Pric
e pe
r gal
lon
$1.75
$2.00
$2.25
$2.50
$2.75
$3.00
$3.25
$3.50
$3.75
$4.00
$4.25
$4.50
$4.75
$5.00
$1.50
$1.25
CNG (DGE)Diesel Biodiesel (B20) Biodiesel (B2/B5) B99/B100 LNG
FIGURE 16 ALTERNATIVE FUEL PRICES VERSUS GASOLINE
FIGURE 17 ALTERNATIVE FUEL PRICES VERSUS DIESEL
25
CLEAN CITIES ALTERNATIVE FUEL PRICE REPORT OCTOBER 2016
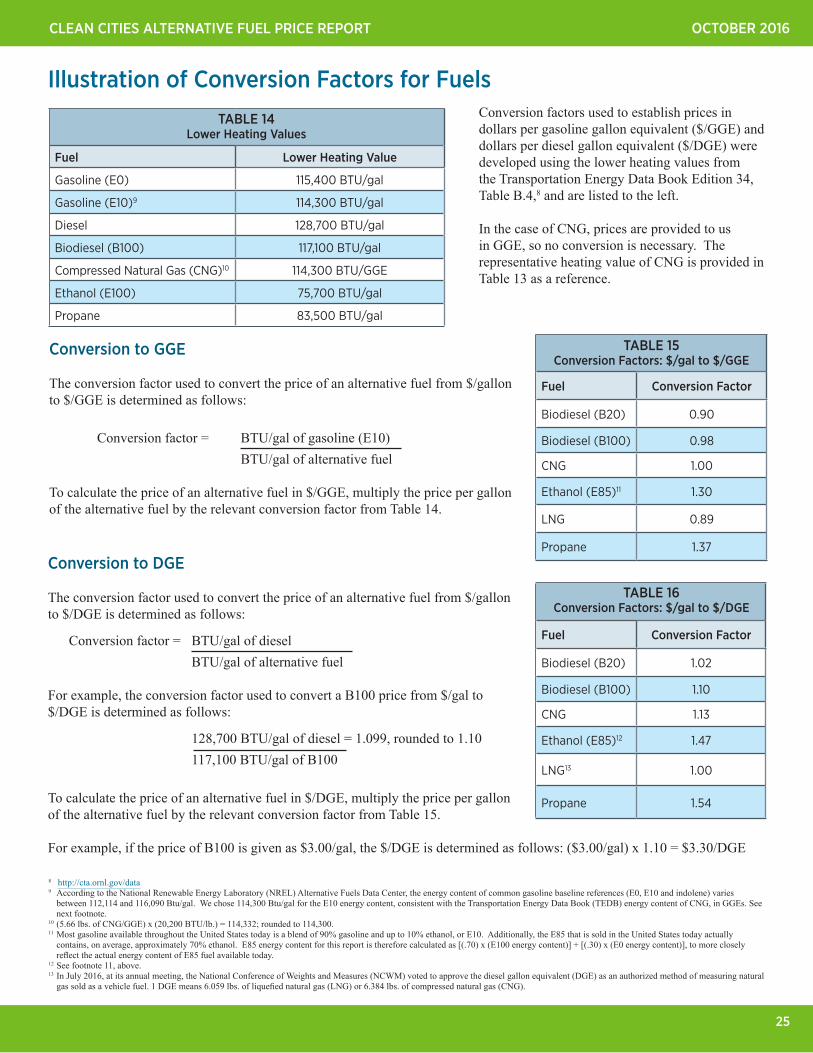
Illustration of Conversion Factors for Fuels
8 http://cta.ornl.gov/data9 According to the National Renewable Energy Laboratory (NREL) Alternative Fuels Data Center, the energy content of common gasoline baseline references (E0, E10 and indolene) varies between 112,114 and 116,090 Btu/gal. We chose 114,300 Btu/gal for the E10 energy content, consistent with the Transportation Energy Data Book (TEDB) energy content of CNG, in GGEs. See next footnote.10 (5.66 lbs. of CNG/GGE) x (20,200 BTU/lb.) = 114,332; rounded to 114,300.11 Most gasoline available throughout the United States today is a blend of 90% gasoline and up to 10% ethanol, or E10. Additionally, the E85 that is sold in the United States today actually contains, on average, approximately 70% ethanol. E85 energy content for this report is therefore calculated as [(.70) x (E100 energy content)] + [(.30) x (E0 energy content)], to more closely reflect the actual energy content of E85 fuel available today.12 See footnote 11, above.13 In July 2016, at its annual meeting, the National Conference of Weights and Measures (NCWM) voted to approve the diesel gallon equivalent (DGE) as an authorized method of measuring natural gas sold as a vehicle fuel. 1 DGE means 6.059 lbs. of liquefied natural gas (LNG) or 6.384 lbs. of compressed natural gas (CNG).
Fuel Lower Heating Value
Gasoline (E0) 115,400 BTU/gal
Gasoline (E10)9 114,300 BTU/gal
Diesel 128,700 BTU/gal
Biodiesel (B100) 117,100 BTU/gal
Compressed Natural Gas (CNG)10 114,300 BTU/GGE
Ethanol (E100) 75,700 BTU/gal
Propane 83,500 BTU/gal
TABLE 14 Lower Heating Values
Conversion to GGE
The conversion factor used to convert the price of an alternative fuel from $/gallon to $/GGE is determined as follows:
Conversion factor = BTU/gal of gasoline (E10) BTU/gal of alternative fuel
To calculate the price of an alternative fuel in $/GGE, multiply the price per gallon of the alternative fuel by the relevant conversion factor from Table 14.
Fuel Conversion Factor
Biodiesel (B20) 0.90
Biodiesel (B100) 0.98
CNG 1.00
Ethanol (E85)11 1.30
LNG 0.89
Propane 1.37
TABLE 15 Conversion Factors: $/gal to $/GGE
Fuel Conversion Factor
Biodiesel (B20) 1.02
Biodiesel (B100) 1.10
CNG 1.13
Ethanol (E85)12 1.47
LNG13 1.00
Propane 1.54
TABLE 16 Conversion Factors: $/gal to $/DGE
Conversion factors used to establish prices in dollars per gasoline gallon equivalent ($/GGE) and dollars per diesel gallon equivalent ($/DGE) were developed using the lower heating values from the Transportation Energy Data Book Edition 34, Table B.4,8 and are listed to the left.
In the case of CNG, prices are provided to us in GGE, so no conversion is necessary. The representative heating value of CNG is provided in Table 13 as a reference.
Conversion to DGE
The conversion factor used to convert the price of an alternative fuel from $/gallon to $/DGE is determined as follows:
Conversion factor = BTU/gal of diesel BTU/gal of alternative fuel
For example, the conversion factor used to convert a B100 price from $/gal to $/DGE is determined as follows:
128,700 BTU/gal of diesel = 1.099, rounded to 1.10 117,100 BTU/gal of B100
To calculate the price of an alternative fuel in $/DGE, multiply the price per gallon of the alternative fuel by the relevant conversion factor from Table 15.
For example, if the price of B100 is given as $3.00/gal, the $/DGE is determined as follows: ($3.00/gal) x 1.10 = $3.30/DGE
CLEAN CITIES ALTERNATIVE FUEL PRICE REPORT OCTOBER 2016
26
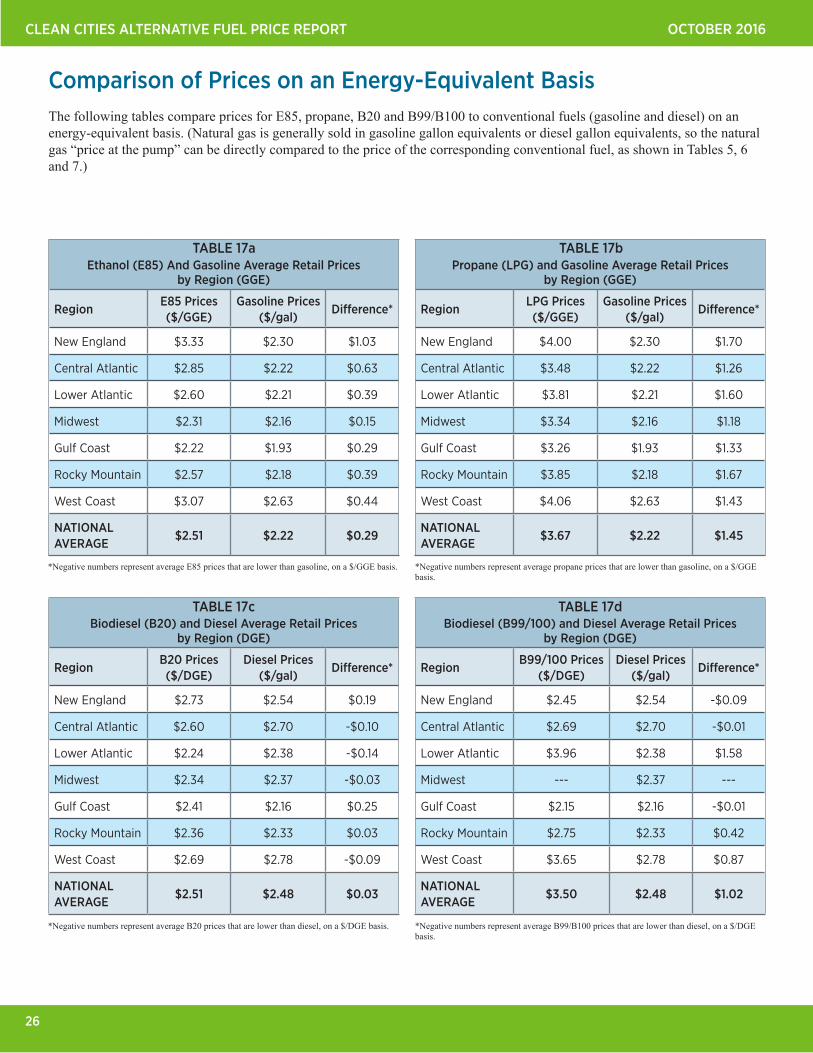
Biodiesel (B99/100) and Diesel Average Retail Prices by Region (DGE)
RegionB99/100 Prices
($/DGE)Diesel Prices
($/gal)Difference*
New England $2.45 $2.54 -$0.09
Central Atlantic $2.69 $2.70 -$0.01
Lower Atlantic $3.96 $2.38 $1.58
Midwest --- $2.37 ---
Gulf Coast $2.15 $2.16 -$0.01
Rocky Mountain $2.75 $2.33 $0.42
West Coast $3.65 $2.78 $0.87
NATIONAL AVERAGE
$3.50 $2.48 $1.02
Biodiesel (B20) and Diesel Average Retail Prices by Region (DGE)
RegionB20 Prices ($/DGE)
Diesel Prices ($/gal)
Difference*
New England $2.73 $2.54 $0.19
Central Atlantic $2.60 $2.70 -$0.10
Lower Atlantic $2.24 $2.38 -$0.14
Midwest $2.34 $2.37 -$0.03
Gulf Coast $2.41 $2.16 $0.25
Rocky Mountain $2.36 $2.33 $0.03
West Coast $2.69 $2.78 -$0.09
NATIONAL AVERAGE
$2.51 $2.48 $0.03
Propane (LPG) and Gasoline Average Retail Prices by Region (GGE)
RegionLPG Prices ($/GGE)
Gasoline Prices ($/gal)
Difference*
New England $4.00 $2.30 $1.70
Central Atlantic $3.48 $2.22 $1.26
Lower Atlantic $3.81 $2.21 $1.60
Midwest $3.34 $2.16 $1.18
Gulf Coast $3.26 $1.93 $1.33
Rocky Mountain $3.85 $2.18 $1.67
West Coast $4.06 $2.63 $1.43
NATIONAL AVERAGE
$3.67 $2.22 $1.45
Ethanol (E85) And Gasoline Average Retail Prices by Region (GGE)
RegionE85 Prices ($/GGE)
Gasoline Prices ($/gal)
Difference*
New England $3.33 $2.30 $1.03
Central Atlantic $2.85 $2.22 $0.63
Lower Atlantic $2.60 $2.21 $0.39
Midwest $2.31 $2.16 $0.15
Gulf Coast $2.22 $1.93 $0.29
Rocky Mountain $2.57 $2.18 $0.39
West Coast $3.07 $2.63 $0.44
NATIONAL AVERAGE
$2.51 $2.22 $0.29
TABLE 17a TABLE 17b
TABLE 17c TABLE 17d
Comparison of Prices on an Energy-Equivalent BasisThe following tables compare prices for E85, propane, B20 and B99/B100 to conventional fuels (gasoline and diesel) on an energy-equivalent basis. (Natural gas is generally sold in gasoline gallon equivalents or diesel gallon equivalents, so the natural gas “price at the pump” can be directly compared to the price of the corresponding conventional fuel, as shown in Tables 5, 6 and 7.)
*Negative numbers represent average E85 prices that are lower than gasoline, on a $/GGE basis. *Negative numbers represent average propane prices that are lower than gasoline, on a $/GGE basis.
*Negative numbers represent average B20 prices that are lower than diesel, on a $/DGE basis. *Negative numbers represent average B99/B100 prices that are lower than diesel, on a $/DGE basis.
27
CLEAN CITIES ALTERNATIVE FUEL PRICE REPORT OCTOBER 2016
AcknowledgementsThe authors would like to acknowledge all of the contributors from the Clean Cities community who have provided prices for this report; we sincerely appreciate your continued dedication to the success of this report. The authors would also like to acknowledge the continued support of DOE for developing this report.
Would You Like To Participate?If you would like to provide prices for alternative fuels in your region and be part of the data collection effort for this report, or if you have any questions, please contact:
U.S. DOE, Clean CitiesEE-3V1000 Independence Avenue, SWWashington, D.C. 20585Phone: (202) [email protected]
DISCLAIMERThis document highlights work sponsored by agencies of the U.S. Government. Neither the U.S. Government nor any agency thereof, nor any of their employees, makes any warranty, express or implied, or assumes any legal liability or responsibility for the accuracy, completeness, or usefulness of any information, apparatus, product, or process disclosed, or represents that its use would not infringe privately owned rights. Reference herein to any specific commercial product, process, or ser-vice by trade name, trademark, manufacturer, or otherwise does not necessarily constitute or imply its endorsement, recommendation, or favoring by the U.S. Govern-ment or any agency thereof. The views and opinions of authors expressed herein do not necessarily state or reflect those of the U.S. Government or any agency thereof.
For more information on this and other Clean Cities publications, visit www.cleancities.energy.gov or contact the Clean Cities Technical Response Service at 800-254-6735.
Related Documents