Clay linked Gels Mechanical Enhancement of Hydrogels by Incorporation of Clay Minerals Dissertation zur Erlangung des akademischen Grades Doktor der Naturwissenschaften – Dr. rer. nat. an der Fakultät für Biologie, Chemie und Geowissenschaften der Universität Bayreuth vorgelegt von Manuela Stirner aus Passau Bayreuth, 2014

Welcome message from author
This document is posted to help you gain knowledge. Please leave a comment to let me know what you think about it! Share it to your friends and learn new things together.
Transcript
Clay linked Gels
Mechanical Enhancement of Hydrogels by
Incorporation of Clay Minerals
Dissertation
zur Erlangung des akademischen Grades
Doktor der Naturwissenschaften – Dr. rer. nat.
an der Fakultät für Biologie, Chemie und Geowissenschaften
der Universität Bayreuth
vorgelegt von
Manuela Stirner
aus Passau
Bayreuth, 2014

Die vorliegende Arbeit wurde n der Zeit von Oktober 2009 bis August 2013 in Bayreuth
am Lehrstuhl für Anorganische Chemie I unter Betreuung von Herrn Professor Dr. Josef
Breu angefertigt.
Vollständiger Abdruck der von der Fakultät für Biologie, Chemie und
Geowissenschaften der Universität Bayreuth genehmigten Dissertation zur Erlangung des
akademischen Grades eines Doktors der Naturwissenschaften (Dr. rer. nat.).
Dissertation eingereicht am: 01.04.2014
Zulassung durch die Promotionskommission: 30.04.2014
Wissenschaftliches Kolloquium: 01.07.2014
Amtierender Dekan: Prof. Dr. Rhett Kempe
Prüfungsausschuss:
Prof. Dr. Josef Breu (Erstgutachter)
Prof. Dr. Axel Müller (Zweitgutachter)
Prof. Dr. Jürgen Senker (Vorsitz)
Prof. Dr. Matthias Karg


“An investment in knowledge pays the best interest.”
Benjamin Franklin
To my parents Christine and Franz

Summary
Superabsorbent polymers are found in numerous industrial applications due to their
outstanding swelling ability for water. Besides swelling capacity, the performance of
absorbent gel materials (AGM) is critically determined by the gel strength in the swollen
state. If the gel strength of the hydrogel is low, it is easily deformable, which allows the
occurrence of gel blocking. Gel blocking hampers homogeneous swelling of the AGM
and limits the effective total capacity. The primarily swollen particles gain volume upon
swelling and built up a sealing layer that avoids wetting of the lower AGM layers. For
application of AGM in hygiene products it is therefore highly desirable to minimize gel
blocking while not sacrificing any swelling capacity. In order to strengthen AGM
particles, either the gel strength of the bulk polymer may be improved or the surface of
AGM particles may be stiffened by additional crosslinking, which results in core – shell
particles.
This work explores the incorporation of stiff inorganic fillers - clay minerals - into the
AGM matrix in order to improve the gel strength of bulk AGM or Young’s -modulus of
surface shells of AGM particles. Enhancement of the gel strength and Young’s -modulus
is thus achieved by designing AGM composites. The high ionic strength in combination
with low pH of the partially neutralized acrylic acid mixtures used to polymerize AGM
represents the major obstacle on the way to such AGM composites. Clays tend to
agglomerate in such environments and resulting agglomerates might even weaken the
gels. In order to exploit the full potential of clay minerals as fillers in AGM matrices it is
essential to first disperse the clay platelets homogeneously in the suspension of the
partially neutralized monomers.
We were able to obtain stable suspensions of clay minerals by modifying them with a
commercial cationic dentrimer, ODD. ODD carries an ethylene glycol brush on a poly
(ethylene imine) core and is electrostatically bound to the clay surface by intrinsic
protonation. A successful dispersion of modified clays allowed to explore the influence of
critical parameters like the aspect ratio of the clay platelets on the mechanical
performance of the AGM composites by comparing synthetic lithium hectorite (aspect
ratio 10000) and montmorillonite PGV® (aspect ratio 30).
While the hydrogels could be reinforced by incorporating the different fillers, the tradeoff
between swelling capacity and gel strength of the AGM in fully swollen state could be
improved only with montmorillonite PGV®, however not with lithium hectorite.
Interestingly, for the high aspect ratio lithium hectorite a crossing of the trade off curve
could be observed with better performance of the AGM at low swelling (< 5.5 g/g),
whereas the PGV® AGM composites showed superior properties at any swelling degree
compared to the reference.
With the core – shell approach high swelling capacity and high gel strength are spatially
separated. While the core of the particle provides the high swelling ability, the shell will
grant pressure resistance of shape reducing gel blocking. To optimize this concept,
mechanical strengthening of the shell has to be achieved while preserving maximum
flexibility expressed by a high stress at break beyond certain threshold values for strain
(> 400 %) and Young’s -modulus (> 100 kPa). Moreover, core and shell have to be kept
chemically compatible. We considered commercial bulk AGM for the core, while the
shell should be built up by an AGM composite material incorporating different clay
minerals as filler. The type of clay, the filler content, the amount of organic crosslinker,
the acrylic acid content, and the degree of neutralization were varied to optimize the
mechanical properties of the composite shells. For the large aspect ratio lithium hectorite
both strain at break and Young’s -modulus were found to be below the threshold values.
For composites of modified montmorillonite PGV®, however, a significant improvement
in performance of the shells could be achieved. For the best composite shells 800 % strain
at break in combination with 600 kPa stress at break and a Young’s -modulus of 140 kPA
were observed.
Zusammenfassung
Superabsorbierende Polymere finden auf Grund ihrer herausragenden Quellfähigkeit in
zahlreichen industriellen Produkten Anwendung. Neben der Quellfähigkeit ist die
Effizienz absorbierender Gel – Materialien (AGM) entscheidend von der Stärke des Gels
im vollständig gequollenen Zustand abhängig. Ist die Gelstärke gering, ist das Hydrogel
leicht verformbar, was das Auftreten von „gel blocking“ ermöglicht. Gel blocking
verhindert ein homogenes Quellen des AGM und beschränkt dessen effektive maximale
Kapazität. Die zuerst gequollenen Partikel gewinnen während des Quellens an Volumen
und bilden eine versiegelnde Schicht aus, welche das Durchnässen der unteren AGM
Schichten verhindert. Für die Anwendung von AGM in Hygieneartikeln ist es deshalb
höchst erstrebenswert den gel blocking Effekt zu minimieren ohne dabei an
Quellkapazität einzubüßen. Um AGM zu verstärken kann entweder die Stärke des bulk
Polymers verbessert werden oder die Oberfläche der AGM Partikel durch zusätzliche
Quervernetzung versteift werden woraus Kern – Schale Partikel resultieren.
Diese Arbeit erforscht die Einlagerung steifer anorganischer Füllstoffe – Schichtsilicate –
in die AGM Matrix, um die Gelstärke bulk AGM oder den Youngschen -Modul von
oberflächlichen Schalen von AGM Partikeln zu verbessern. Eine Erhöhung der Gelstärke
und des Youngschen -Moduls wird also durch das Design von AGM Kompositen
erreicht. Die hohe Ionenstärke in Kombination mit dem niedrigen pH Wert der teil-
neutralisierten Acrylsäuremischungen, welche zur Polymerisation von AGM verwendet
werden, stellen das größte Hindernis auf dem Weg zu solchen AGM Kompositen dar.
Schichtsilicate tendieren unter derartigen Umständen dazu, zu agglomerieren und
resultierende Agglomerate könnten das Gel sogar schwächen. Um das volle Potential von
Schichtsilicaten als Füllstoff in AGM Matrizen ausnutzen zu können, ist es essenziell die
Schichtsilicat Plättchen zunächst homogen in der Suspension von teil-neutralisierten
Monomeren zu dispergieren.
Wir waren in der Lage stabile Suspensionen von Schichtsilicaten zu erhalten, indem diese
mit einem kommerziellen kationischen Dentrimer, ODD, modifiziert wurden. ODD weist
eine Ethylenglykol Bürste gebunden an einen Polyethylenimin – Kern auf und wird
elektrostatisch an die Schichtsilicat Oberfläche durch intrinsische Protonierung gebunden.
Das erfolgreiche Dispergieren der modifizierten Schichtsilicate ermöglichte eine

Untersuchung des Einflusses von kritischen Parametern wie des Aspektverhältnisses auf
das mechanische Verhalten der AGM Komposite, wobei der synthetische Lithium
Hectorit (Aspektverhältnis 10000) mit Montmorillonite PGV® (Aspektverhältnis 30)
verglichen wurde.
Während die Hydrogele durch die Einlagerung der verschiedenen Füllstoffe verstärkt
werden konnten, konnte der Tradeoff aus Quellkapazität und Gelstärke des AGM im
vollständig gequollenen Zustand nur mit Montmorillonit PGV® verbessert werden,
jedoch nicht mit Lithium Hectorit . Interessanterweise wurde für den Lithium Hectorit mit
hohem Aspektverhältnis ein Überkreuzen der Tradeoff Kurve beobachtet, wobei nur bei
einem geringem Quellgrad (< 5.5 g/g) des AGM eine Verbesserung erreicht wurde.
Dahingegen zeigte das PGV® AGM Komposit bei jedem Quellgrad bessere
Eigenschaften im Vergleich zur Referenz.
Durch den Kern – Schale Ansatz werden hohe Quellkapazität und hohe Gelstärke
räumlich voneinander getrennt. Während der Kern des Partikels die hohe Quellkapazität
bereitstellt, garantiert die Schale mechanische Stärke welche das gel blocking reduziert.
Um dieses Konzept zu optimieren muss eine mechanische Verstärkung der Schale
erreicht werden, wobei eine maximale Flexibilität erhalten bleiben soll, was durch eine
hohe Reißspannung oberhalb bestimmter Grenzwerte für Dehnung (> 400%) und
Youngscher -Modul (> 100 kPa) wiedergegeben wird. Außerdem müssen Kern und
Schale chemisch kompatibel sein. Wir haben kommerzielles bulk AGM für den Kern in
Betracht gezogen, während die Schale aus einem AGM Komposit, welches verschiedene
Schichtsilicate als Füllstoff enthielt, aufgebaut werden sollte. Die Art des Schichtsilicats,
der Schichtsilicat Gehalt, die Menge an organischem Quervernetzer, der Acrylsäuregehalt
und der Neutralisationsgrad wurden variiert um die mechanischen Eigenschaften der
Komposit Schalen zu optimieren. Für Lithium Hectorite mit hohem Aspektverhältnis
lagen sowohl die Reißdehnung als auch der Youngsche-Modul unter den Grenzwerten.
Für Komposite des modifizierten Montmorillonite PGV® jedoch konnte eine signifikante
Verbesserung des Verhaltens der Schale erreicht werden. Für die besten Komposit
Schalen wurden 800 % Reißdehnung in Kombination mit 600 kPa Reißspannung und
einem Youngschen -Modul von 140 kPa beobachtet.
Contents
1 Introduction .......................................................................................... 1
1.1 Hydrogels ................................................................................................................ 1
1.2 Hydrogel nanocomposites ...................................................................................... 3
1.3 Superabsorbent polymers (SAP) .......................................................................... 3
1.4 Challenges concerning the synthesis of clay nanocomposites of AGM ........... 15
2 Objective .............................................................................................. 19
2.1 Dispersion of clay minerals in the polymerization mixture ............................. 20
2.2 Mechanical enhancement of bulk AGM ............................................................ 20
2.3 Core – Shell concept: Enhancement of stress at break and strain at break ... 21
3 Materials and methods ....................................................................... 22
3.1 Synthesis of AGM and AGM composites in the glass reactor ......................... 22
1.1.1 Definition ............................................................................................................... 1
1.1.2 Commercial applications of hydrogels .................................................................. 2
1.3.1 Defining the performance of AGM ....................................................................... 4
1.3.2 Enhancing the performance of AGM – Optimizing gel strength without
sacrificing swelling capacity .................................................................................. 8
1.4.1 Structure of clay minerals .................................................................................... 15
1.4.2 House of cards agglomeration due to acidic polymerization medium ................ 16
1.4.3 Acid activation of clays ....................................................................................... 17
1.4.4 Lamellar agglomeration due to high ionic strength ............................................. 17

3.2 Estimation of the point of zero net proton charge of clay minerals ................ 27
3.3 Investigation of the sedimentation stability of clay suspensions ...................... 32
3.4 Judging the gel strength of hydrogels: VRLH measurement .......................... 37
3.5 Stress – Strain measurement ............................................................................... 40
3.6 Lithium hectorite .................................................................................................. 45
3.7 Montmorillonite PGV® ....................................................................................... 46
4 Results and Discussion ...................................................................... 51
4.1 Dispersion of clay minerals in the polymerization mixture ............................. 51
3.1.1 Synthesis of AGM ............................................................................................... 22
3.1.2 Synthesis of AGM composites ............................................................................ 23
3.1.3 Geometry of the glass reactor .............................................................................. 25
3.2.1 Problem statement ............................................................................................... 27
3.2.2 Streaming potential titration ................................................................................ 31
3.3.1 Preparation of the samples ................................................................................... 32
3.3.2 Fast qualitative screening of sedimentation stability via visual testing ............... 33
3.3.3 Quantitative study of sedimentation stability via LUMiFuge® measurements .. 35
3.4.1 Sample preparation – Swelling of the AGM hydrogels ....................................... 38
3.4.2 Method validation ................................................................................................ 39
3.5.1 Preparation of the samples ................................................................................... 41
3.5.2 Method development ........................................................................................... 42
3.7.1 Montmorillonite PGV® – Characteristics of the raw material ............................ 46
3.7.2 Purification of montmorillonite PGV® ............................................................... 47
3.7.3 Montmorillonite PGV® – Characteristics of the purified material ..................... 49
4.1.1 Modification of the clay edge – Prevention of house of cards structure ............. 51
4.1.2 Modification of basal planes – Prevention of lamellar agglomeration ................ 59

4.2 Enhancement of the gel strength of bulk AGM ................................................ 74
4.3 Core – shell concept: Enhancement of stress at break and strain at break ... 95
5 Conclusion and Perspective ............................................................. 114
6 Reference list ..................................................................................... 119
7 Acknowledgements ........................................................................... 125
4.2.1 Analysis of the mechanical properties of fully swollen hydrogels ...................... 75
4.2.2 Analysis of the mechanical properties of partially swollen hydrogels ................ 81
4.2.3 Discussion of possible failure mechanisms of the AGM – composite system .... 84
4.2.4 Covalent linking of the modifier to AGM polymer ............................................. 88
4.2.5 Summary of attempts to enhance the gel strength of bulk AGM ........................ 93
4.3.1 Stepwise optimization of the synthesis parameters for the shell ......................... 99
4.3.2 Fine-tuning of the shell hydrogel ....................................................................... 109
List of abbreviations:
AA Acrylic acid
AGM Absorbent gel material
AllylODD Modifier ODD functionalized with Allyl glycidyl ether
DN Degree of neutralization
EDTA Ethylene diamine tetra acetate
KPS Potassium persulfate
LiHec Nanocomposite containing lithium hectorite
MBAA Methylene bis acrylamide
PDADMAC Poly diallyldimethylammoniumchloride
PGV Nanocomposite containing montmorillonite PGV®
PXRD Powder X-ray diffraction
PZC Point of zero charge
PZNPC Point of zero net proton charge
PZSE Point of zero salt effect
Ref Reference sample
rpm Revolutions per minute
SAP Super absorbent polymer
TEMED Tetra methyl ethylene diamine
VLRH Very low rubber hardness
1 Introduction
1
1 Introduction
1.1 Hydrogels
1.1.1 Definition
Hydrogels are hydrophilic polymer networks. The crosslinked polymer chains are natural
or synthetic polymers, which, due to their hydrophilic nature, swell in water without
dissolving. Upon swelling, the polymer network maintains its three-dimensional structure
and retains a significant fraction of water within its structure. For superabsorbent
materials, the absorption of water can reach more than thousand times of the dry
material’s weight.
Hydrogels may be classified regarding the type of hydrophilic group which is responsible
for the swelling behavior. Consequently hydrogels can be divided into five groups:
Non-ionic
Cationic
Anionic
Amphoteric (anionic and cationic monomers)
Zwitterionic (monomers have both anionic and cationic groups)
The swelling behavior of absorbent materials is judged regarding swelling in water and in
saline or other salt solutions. Non-ionic polymers do not show any difference in their
swelling behavior in water or salt solutions. The driving force for swelling in this case is
dipolar interactions. In all other cases, where the polymer carries ionic subunits, swelling
is driven by osmotic pressure. Amphoteric and zwitterionic hydrogels exhibit a higher
absorption for salt solutions than for pure water. Additional water is included into the gel
structure by hydration of the free counterions which are associated to the charged
polymer. The free counterions also induce ionic repulsion. Consequently anionic and
cationic hydrogels swell more in pure water, whereas in salt solutions the polymer chains
are partially collapsed. Out of these five different groups of hydrogels only non-ionic and

1 Introduction
2
anionic polymers are used in commercial applications due to monomer availability and
more important due to their performance.[1]
1.1.2 Commercial applications of hydrogels
Hydrogels attract commercial attention in several fields of applications. Many
applications for hydrogels can be found in the area of biomedicine as they can be
polymerized under mild conditions, for example via photopolymerization, and as they are
biodegradable. Furthermore, hydrogels are sensitive towards external stimuli and show
response to their environment. The response mechanism is based on the chemical
structure of the polymer. In biomedical applications, the response to pH, temperature, and
ionic composition are of most importance.[2]
The stimuli-responsive changes in the
structural network of the hydrogels make them suitable as drug-delivery systems.[3-5]
Furthermore, the mechanical properties of hydrogels, in particular the elastic modulus and
the deformability, can be tailored to address the specific field of utilization. Gong et al.
synthesized very strong hydrogels with double network structures in order to serve as
articular cartilage.[6]
Additional to the physical properties, also mass transport properties
and biological interaction requirements are to be considered if hydrogels are chosen to
provide a scaffold as space filling material or in tissue engineering, like bone tissue
engineering or muscle growth.[7-9]
Besides biomedical applications, environmentally
responsive hydrogels are used as pumps and valves, for example in microfluidic channels
which can be regulated by swelling and deswelling of pH responsive hydrogels.[10]
The
response to external stimuli can furthermore be utilized to construct sensors, for instance
pH or ionic strength sensors or chemical sensors.[11,12]
Hydrogels are also used for metal
particle preparation and in miniature biofuel cells.[13,14]
In addition to the mentioned more academic examples, large quantities of hydrogels also
find use in applications where the stimuli-response plays a minor role. In agriculture and
in hygiene products such as disposable diapers the high water or saline absorption and the
ability of retaining the liquid are the features that attract attention to (superabsorbent)
hydrogels. In agriculture hydrogels are used for water storage to slow down wilting of
plants and for controlled release of fertilizer or pesticides.[15]

1 Introduction
3
1.2 Hydrogel nanocomposites
In the last decades, nanocomposites of polymers have gained more and more importance
also in industrial applications. By incorporating inorganic materials into polymer
matrices, the polymer’s chemical properties are retained to a good deal while at the same
time remarkable improvements in physical properties can be obtained. Consequently,
nanocomposites of hydrogels have also been explored and numerous applications are
reported in several fields of applications, conserving the hydrogels’ outstanding stimuli
responsive behavior and combining it with additional features. As mentioned above, the
use of hydrogels is widespread in biomedicine. Electro-sensitive hydrogels used for drug
delivery show material fatigue after several on- off switching cycles. The fatigue problem
can be overcome by incorporating clay nanoparticles into the hydrogel.[16]
Besides for
drugs, hydrogels can also serve as scaffold for metal particles. For instance, silver
nanoparticles, which display antimicrobial activity and show poor binding characteristics
with surfaces, can be embedded in hydrogel networks. The resulting nanocomposite
opens new doors towards antibacterial applications.[17]
Silica containing nanocomposite
hydrogels are used as intra-ocular lenses.[18]
Hydrogel nanocomposites also occur in
several health care products, such as wound dressings. In this case clay minerals are used
in order to strengthen the hydrogel and make it more elastic.[19]
Another example for
metal containing hydrogel nanocomposites can be found in microfluidic valves. Particles
with distinct and strong optical absorption profiles, e.g. gold particles, are entrapped in
the hydrogel and allow external control of swelling behavior and hence valve operation
with light of specific wavelength as stimulus.[20]
Further fields of applications of
nanocomposite hydrogels are dye adsorption and catalysis.[21,22]
1.3 Superabsorbent polymers (SAP)
A superabsorbent polymer per definition is a hydrogel that in dry state is able to take up
10 times or more of a fluid as compared to its own weight. While taking up the liquid and
increasing its volume the hydrogel retains its original form. Due to their excellent
swelling ability SAP are applied in agriculture and horticulture and in healthcare products
like disposable diapers and napkins.[1,23]
1 Introduction
4
SAP can be distinguished between natural SAP and synthetic SAP. Natural SAP can be
based on polysaccharides like chitin, cellulose, starch and natural gums. These
polysaccharides can be transformed into SAP either by graft copolymerization with
suitable vinyl monomers in the presence of a crosslinker or by direct crosslinking.
Furthermore, there are poly (amino acid) based natural SAP. These SAP contain
polypeptides as main part of their structure which are obtained from soybeans or fish.[24]
Examples for synthetic SAP are poly (acryl amide), poly (ethylene oxide), poly (acrylo
nitrile), or poly (2-hydroxyethyl methacrylate). The most established synthetic SAP are
poly acrylates, especially poly (acrylic acid). Poly (acrylic acid) hydrogels can reach a
maximum swelling of more than 99 wt% water.[25]
In industrial environment SAP are
often referred to as absorbent gel material (AGM). This synonym is used in the remaining
part of this thesis.
1.3.1 Defining the performance of AGM
As pointed out above, AGM are of importance in industrial applications due to their
excellent swelling properties. To be more precise, the performance of AGM encompasses
three aspects to be considered:
Swelling capacity
Absorption rate
Gel bed permeability and gel strength of the swollen gel
In other words, AGM have to be able to take up high amounts of liquids in a reasonable
timeframe and retain this liquid without being easily deformed. Low deformability and
hence high gel strength of the swollen AGM is necessary to preserve high gel bed
permeability.
In an ideal hydrogel, the crosslinking points would be homogenously distributed and the
gel strength of the gel would increase with the number of crosslinking points. Given
constant osmotic pressure, the maximum capacity would be determined by fully stretched
chains between the crosslinking points and would linearly decrease with the number of
crosslinking points. To optimize capacity, soft gels would be the choice.
In health care products and in agricultural applications, the gel strength should, however,
be high enough to avoid major deformation or even mashing of the hydrogel.[26]
In order
1 Introduction
5
to exploit the full capacity of the AGM, high gel bed permeability is desirable and the so
called “gel blocking” has to be avoided. Therefore, a minimum pressure resistance of
shape represented by the gel strength is required.
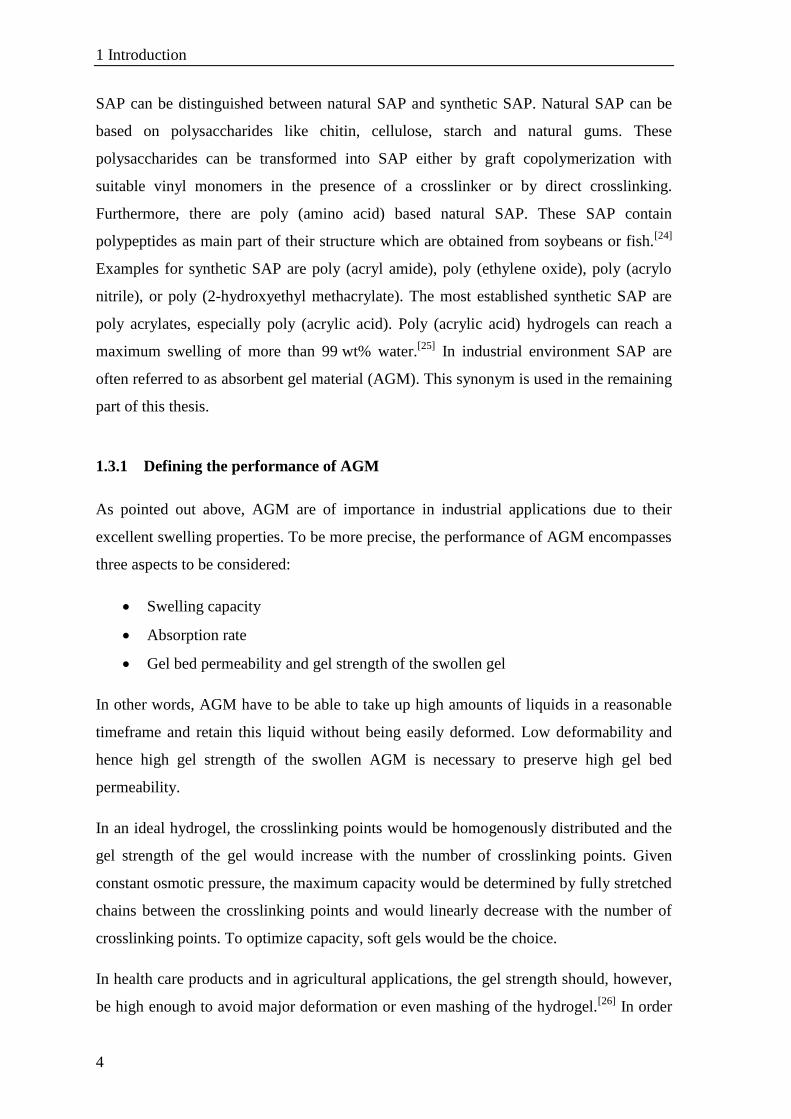
Fig. 1. Schematic description of the gel blocking process
When the liquid reaches the AGM grains, the dry particles start to swell. Upon swelling,
the AGM particles grow in size. Gel bed permeability depends on the pores and
interconnecting channels in between the swollen AGM particles, which means on the
gel’s wet porosity.[27]
The softer the swollen material, the more easily the gaps and
channels in between the swollen grains (wet porosity) will be closed if pressure is
applied, e.g. by a baby’s weight. A dense swollen AGM layer is built up (i.e. wet porosity
drops drastically) and blocks further influx of more liquid (Fig. 1, right). The adjacent
layers of dry AGM cannot be reached by the liquid directly anymore, but can only be
swollen via transfer of the liquid from swollen particle to dry particle. Swelling of the
lower layers of AGM then is a diffusion controlled process. A gradient of highly swollen
particles, which form the sealing layer, to barely or even non-swollen particles in the
lower layers is developed. This gradient persists if the liquid supply is stopped before the
fully swollen state for all AGM particles is reached.[28]
In health care products gel blocking is thus highly undesired. High efficiency of the AGM
grains is only achieved if the extraordinary swelling capacity of all AGM grains present
can be fully exploited. Therefore, the incoming liquid needs to reach all dry particles
without hindrance in order to achieve complete uptake of the liquid in the fastest way.
Fast liquid uptake is only possible if all AGM particles can be reached by the liquid
quickly and diffusion controlled swelling can be avoided.
Consequently, for the performance of specific AGM not only the swelling capacity but
also the gel strength is essential. Crosslinking levels must be chosen that show a reduced
capacity in order to provide a threshold gel strength (Fig. 2).
1 Introduction
6
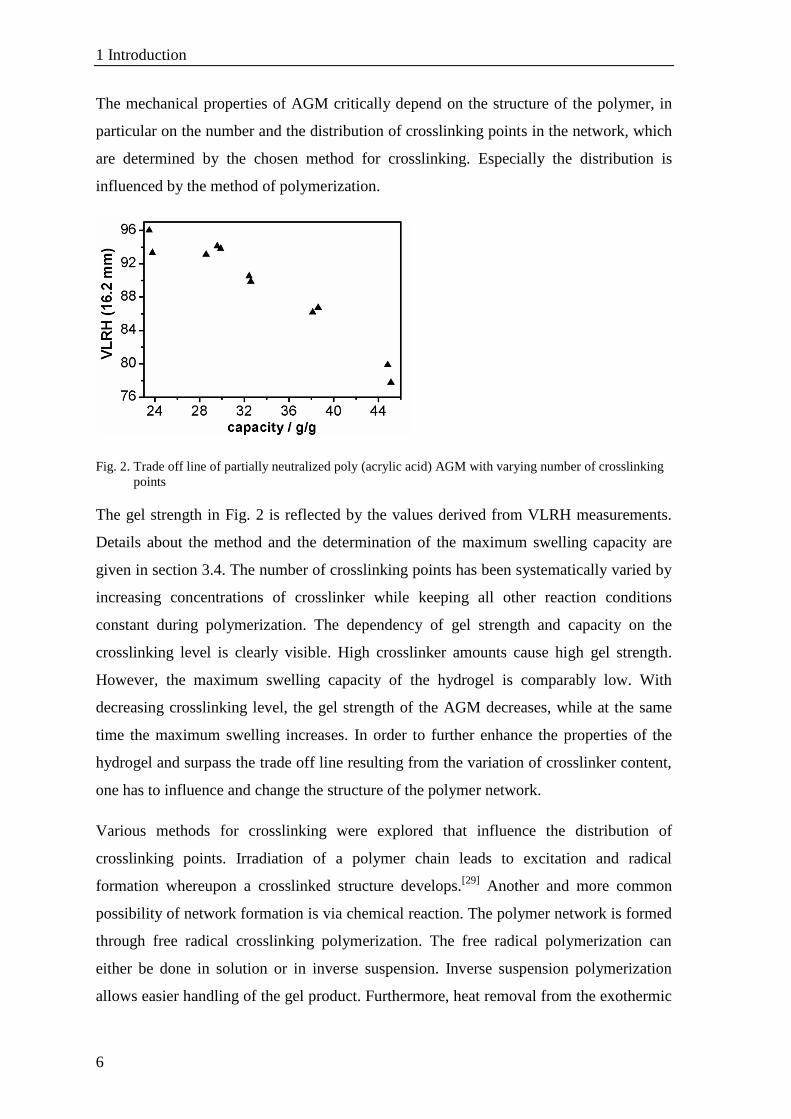
The mechanical properties of AGM critically depend on the structure of the polymer, in
particular on the number and the distribution of crosslinking points in the network, which
are determined by the chosen method for crosslinking. Especially the distribution is
influenced by the method of polymerization.
Fig. 2. Trade off line of partially neutralized poly (acrylic acid) AGM with varying number of crosslinking
points
The gel strength in Fig. 2 is reflected by the values derived from VLRH measurements.
Details about the method and the determination of the maximum swelling capacity are
given in section 3.4. The number of crosslinking points has been systematically varied by
increasing concentrations of crosslinker while keeping all other reaction conditions
constant during polymerization. The dependency of gel strength and capacity on the
crosslinking level is clearly visible. High crosslinker amounts cause high gel strength.
However, the maximum swelling capacity of the hydrogel is comparably low. With
decreasing crosslinking level, the gel strength of the AGM decreases, while at the same
time the maximum swelling increases. In order to further enhance the properties of the
hydrogel and surpass the trade off line resulting from the variation of crosslinker content,
one has to influence and change the structure of the polymer network.
Various methods for crosslinking were explored that influence the distribution of
crosslinking points. Irradiation of a polymer chain leads to excitation and radical
formation whereupon a crosslinked structure develops.[29]
Another and more common
possibility of network formation is via chemical reaction. The polymer network is formed
through free radical crosslinking polymerization. The free radical polymerization can
either be done in solution or in inverse suspension. Inverse suspension polymerization
allows easier handling of the gel product. Furthermore, heat removal from the exothermic

1 Introduction
7
polymerization process is more efficient and the particle size of the product is easier
definable and more homogeneous compared to solution polymerization. Drawbacks
however are the higher complexity of the process and the additional ingredients which
need to be recycled.
Free radical crosslinking polymerization offers several options to tune the final polymer
structure and consequently the polymers properties. Important polymerization variables
are: [30]
Monomer type and concentration
Crosslinker type and concentration
Initiator type and concentration
Polymerization temperature
Specific solvent
Chen and Zhao give an overview how the above mentioned polymerization conditions
influence the structure of the polymer and hence the polymer´s properties for the example
of a poly acrylate superabsorbent and its water absorbency.[31]
Increasing the monomer
concentration results in an increase of the kinetic chain length and an increase of the
crosslinking efficiency. A denser polymer network is obtained, which is less swellable
and the water absorbency decreases. A reduction of the water absorbency is also obtained
with increasing crosslinker concentration. An increase of the initiator concentration
causes an increase of the water absorbency. The network gets less homogenous and
contains more chain ends, which have higher swelling ratios. This effect also appears if
the polymerization temperature is increased. Increasing the reaction temperature
decreases the half life time of the initiator. The number of free radicals per time is
increased and hence the consequence is comparable to an increase of the initiator amount.
Free radical crosslinking polymerizations lead to inhomogeneous gel structures. This is
due to the fact that the crosslinker exhibits at least two functional groups and hence the
reactivity of the crosslinker is higher than the one of the monomers. As a consequence,
the crosslinker molecules are incorporated into the growing polymer chains more rapidly
than the monomer molecules so that the final network exhibits a crosslinking density
distribution with higher crosslinked regions formed in early stages of the polymerization
and less crosslinked regions formed in later stages of the polymerization.[32]
At the

1 Introduction
8
beginning of the polymerization, when conversion rates are low, a considerable part of
the crosslinker has already reacted at both double bonds. Furthermore, a strong tendency
towards cyclization relative to intermolecular crosslinking is found at early stages of the
polymerization. As at the beginning of the polymerization only few polymer chains are
found in the monomer mixture, the probability of a free radical at the end of one growing
chain to meet a double bond of another chain and hence intermolecular crosslinking is
low.[33]
The gel strength however is a bulk value averaged over the total gel volume. The gel
includes areas of high crosslinking resulting in high gel strength and low swelling
capacity and areas of low crosslinking resulting in low gel strength and high swelling
capacity. In volumes with low crosslinking density the gel strength is still below what is
needed to minimize gel blocking. Moreover, the heterogeneities in crosslinking density
hamper the effective swelling capacity. Consequently, the experimentally measured trade
off line (Fig. 2) between capacity and gel strength is below what could be expected for an
ideal homogenous network. Factors influencing the quality of a polymer network are
discussed in the next section.
1.3.2 Enhancing the performance of AGM – Optimizing gel strength without
sacrificing swelling capacity
In order to enhance the performance of AGM, higher gel strength needs to be achieved
without reducing the maximum swelling capacity. The objective of this thesis was to
achieve this goal for an AGM based on poly (acrylic acid) by applying platy clay fillers.
The fillers are envisaged to improve the performance of hydrogels by several
mechanisms:
Homogenization of the polymer network
Incorporation of stiff, reinforcing fillers
Attachment of a composite shell with high mechanical strength
1.3.2.1 Homogenization of the polymer network
As mentioned, optimum swelling ability and gel strength are found in an ideal network
where all crosslinking points are uniformly distributed and no irregularities occur. The
1 Introduction
9
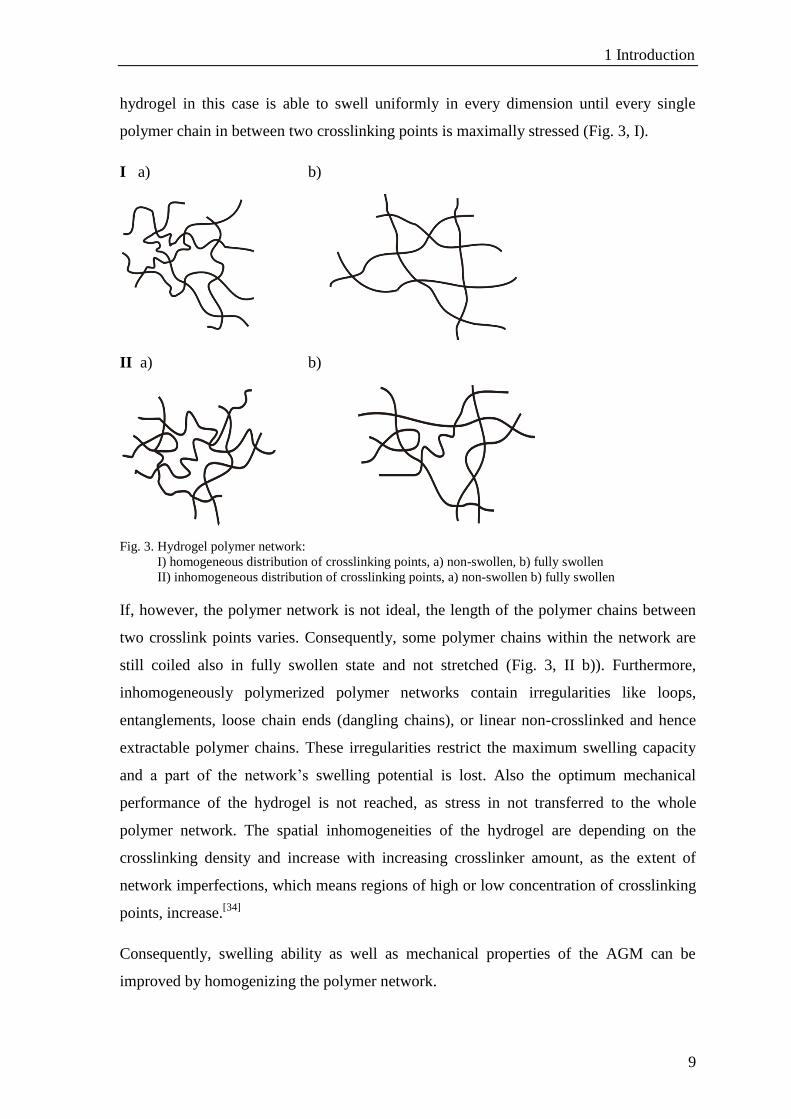
hydrogel in this case is able to swell uniformly in every dimension until every single
polymer chain in between two crosslinking points is maximally stressed (Fig. 3, I).
I a) b)
II a) b)
Fig. 3. Hydrogel polymer network:
I) homogeneous distribution of crosslinking points, a) non-swollen, b) fully swollen
II) inhomogeneous distribution of crosslinking points, a) non-swollen b) fully swollen
If, however, the polymer network is not ideal, the length of the polymer chains between
two crosslink points varies. Consequently, some polymer chains within the network are
still coiled also in fully swollen state and not stretched (Fig. 3, II b)). Furthermore,
inhomogeneously polymerized polymer networks contain irregularities like loops,
entanglements, loose chain ends (dangling chains), or linear non-crosslinked and hence
extractable polymer chains. These irregularities restrict the maximum swelling capacity
and a part of the network’s swelling potential is lost. Also the optimum mechanical
performance of the hydrogel is not reached, as stress in not transferred to the whole
polymer network. The spatial inhomogeneities of the hydrogel are depending on the
crosslinking density and increase with increasing crosslinker amount, as the extent of
network imperfections, which means regions of high or low concentration of crosslinking
points, increase.[34]
Consequently, swelling ability as well as mechanical properties of the AGM can be
improved by homogenizing the polymer network.
1 Introduction
10
Haraguchi et al. prepared AGM composites consisting of poly (N-isopropyl acrylamide)
and Laponite® XLG. They observed a stabilizing effect of the N-isopropyl acrylamide
monomer on a Laponite® dispersion and conclude that the monomers surround the clay
platelets.[35,36]
Furthermore, they show that initiation of the polymerization occurs only at
the clay surface and all resulting polymer chains are attached to clay surfaces by ionic or
polar interactions. The clay platelet thus acts as multifunctional crosslinking agent with a
much smaller number of crosslinking points than comparable AGM with the same
quantity of an organic crosslinker. Moreover, these crosslinking points are
homogeneously distributed with only few structural inhomogeneities. The chain length in
between the crosslinking points is equal throughout the AGM composite and large in
comparison to organically crosslinked gels, which leads to higher deformability of the
sample.[35,37]
1.3.2.2 Reinforcement by stiff fillers with high aspect ratio
The incorporation of filler material into AGM was studied intensively in the past years.
Fillers of different geometries, like spherical nanoparticles, fibers or platelets were
integrated into divers AGM systems in order to strengthen the material or improve the
liquid uptake. As an example for spherical nanoparticles incorporated into AGM, metal
nanoparticles or zeolithes can be mentioned.[38,39]
Imogolite fibers were used by
Shikinaka et al. to enhance the properties of their poly (acyl amide) AGM.[40]
Among the
platelet shaped fillers used for the enhancement of AGM qualities, clay minerals of
different kinds are widely spread. Natural AGM as well as synthetic AGM were used for
the synthesis of nanocomposites including clay minerals like mica, kaolin, attapulgite,
and montmorillonite.[41-45]
However, the studies on the mentioned AGM composites
incorporating clay minerals mainly focused on swelling capacity. The quality of the
dispersion of the clay minerals used as fillers was not further investigated and discussed.
The quality of the dispersion of the clay mineral and a homogenous distribution is a key
factor on the way to improving AGM’s swelling properties and gel strength. Therefore,
enhancement of both swelling capacity and gel strength can be expected when addressing
the optimization of the clay dispersion in the polymer matrix.
The focus of this work was set on clay minerals as filler material, as they feature high
moduli and much higher aspect ratios as compared to fibers or spherical particles.[46]
1 Introduction
11
Reinforcement of a rubbery matrix by incorporation of fillers was already described in
1944 by Smallwood.[47]
Smallwood characterizes the implementation of a rigid spherical
particle into a rubbery matrix. The composites exhibit complete adhesion between filler
and matrix. The volume loading of the filler is low and spherical particles are completely
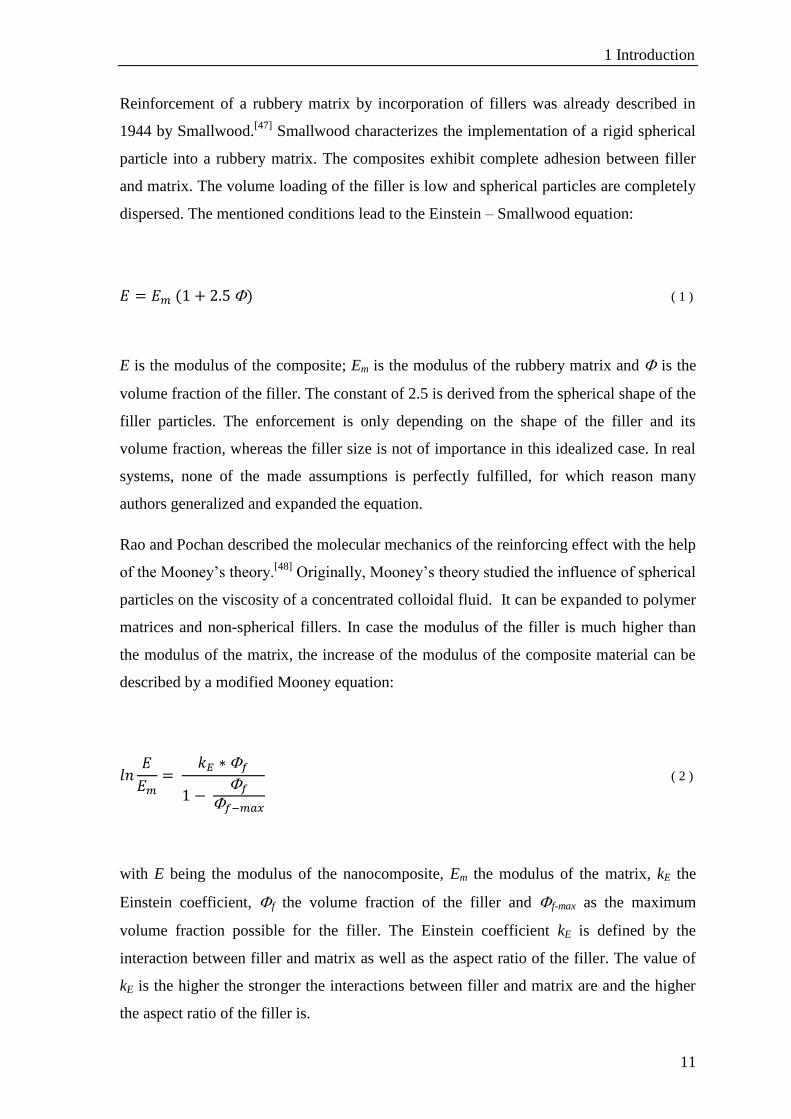
dispersed. The mentioned conditions lead to the Einstein – Smallwood equation:
( 1 )
E is the modulus of the composite; Em is the modulus of the rubbery matrix and is the
volume fraction of the filler. The constant of 2.5 is derived from the spherical shape of the
filler particles. The enforcement is only depending on the shape of the filler and its
volume fraction, whereas the filler size is not of importance in this idealized case. In real
systems, none of the made assumptions is perfectly fulfilled, for which reason many
authors generalized and expanded the equation.
Rao and Pochan described the molecular mechanics of the reinforcing effect with the help
of the Mooney’s theory.[48]
Originally, Mooney’s theory studied the influence of spherical
particles on the viscosity of a concentrated colloidal fluid. It can be expanded to polymer
matrices and non-spherical fillers. In case the modulus of the filler is much higher than
the modulus of the matrix, the increase of the modulus of the composite material can be
described by a modified Mooney equation:
( 2 )
with E being the modulus of the nanocomposite, Em the modulus of the matrix, kE the
Einstein coefficient, f the volume fraction of the filler and f-max as the maximum
volume fraction possible for the filler. The Einstein coefficient kE is defined by the
interaction between filler and matrix as well as the aspect ratio of the filler. The value of
kE is the higher the stronger the interactions between filler and matrix are and the higher
the aspect ratio of the filler is.

1 Introduction
12
Another theory concerning the enhancing effect of filler materials on the mechanical
properties of a polymer was developed by Halpin and Tsai.[49]
The theory is based on
early works by Hill and Hermans.[50,51]
Hill assumed a composite cylinder model in which
an embedded phase consists of cylindrical fibers which are continuous and perfectly
aligned. Hermans generalizes the model and considers a single fiber which is surrounded
by a cylinder of pure matrix. This cylinder is embedded in an infinite body that exhibits
the properties of the composite. Halpin and Tsai reduced the findings of Hermans to a
simpler analytical form and extended it to a variety of reinforcement geometries,
including also discontinuous filler reinforcement. The resulting Halpin-Tsai equations
enable the calculation of the effect of volume fraction of the filler, the relative moduli of
the components, and the geometry of the filler on the modulus of the composite.
A general form of the Halpin-Tsai equation is expressed as follows:
( 3 )
where
( 4 )
P represents one of the three different composite moduli, which are plain strain bulk
modulus, transverse shear modulus and longitudinal shear modulus, Pm is the
corresponding matrix modulus and Pf the corresponding fiber modulus. is the volume
fraction of the fiber and ζ is a measure for the reinforcement geometry, which depends on
loading conditions.
As described above, incorporation of clay minerals can be used to enhance mechanical
properties of polymers, such as tensile properties or impact resistance and ductility. Also
several other properties of polymers are affected by the incorporation of clay minerals. To
be mentioned are thermal properties and fire retardancy, electrical and electrochemical
properties, and gas – and water – permeation. Furthermore, polymer crystallization and

1 Introduction
13
degradation can be influenced.[52]
Like stated before, the focus in this work is the
mechanical enhancement of AGM by incorporation of clay minerals.
1.3.2.3 Attachment of a shell
Alternatively to improving the gel strength of bulk AGM, gel blocking can be minimized
by attaching a stiff, permeable shell to a softer particle core. Attaching a shell around the
AGM particle would lead to an enhancement of the pressure resistance of shape of the
particle. The swelling capacity would be barely influenced as the shell amounts only a
small part of the total volume of the particle. The strong elastic shell surrounding the soft
core with high capacity forces the particle shape to a sphere upon swelling. Thereby, wet
porosity and hence gel bed permeability will be improved compared to AGM without
surface treatment. Ideally, the shell should resist the tension created upon swelling and
not crack. In practice, cracking of the shell might occur due to its non-uniform thickness.
However, this cracking should be limited and open the complete swelling capacity to
incoming saline without allowing the soft core to escape. The core – shell approach
requires a shell material expandable far beyond the reversible part of the stress-strain
curve. It is the stress and strain at break, hence the point when the shell starts breaking,
which determines performance improvement. Precisely, a threshold value of 400 % of
strain at break has to be overcome in combination with a high Young’s -modulus and
hence high stress at break. The threshold is determined by the requirement of sufficient
swelling capacity of the core and high gel bed permeability. In case the shell is very
strong at low strain at break, the tension created upon swelling of the core will not extend
it sufficiently. Consequently, the swelling capacity will be intrinsically limited by the
small volume of the swollen particle. In case the shell is soft and breaks below 300 –
400 % of strain, the AGM particle will be easily deformable and gel bed permeability will
decrease tremendously.
A method already applied commercially is surface crosslinking. In this process,
multifunctional compounds which are capable of reacting with active groups (e.g.
carboxyl groups) of the AGM are deposited for example by spraying on the dry AGM
grains. Heat treatment initiates the crosslinking process.[53]
The technique of surface
crosslinking was applied in literature for both pure AGM as well as for AGM
composites.[53-55]
1 Introduction
14
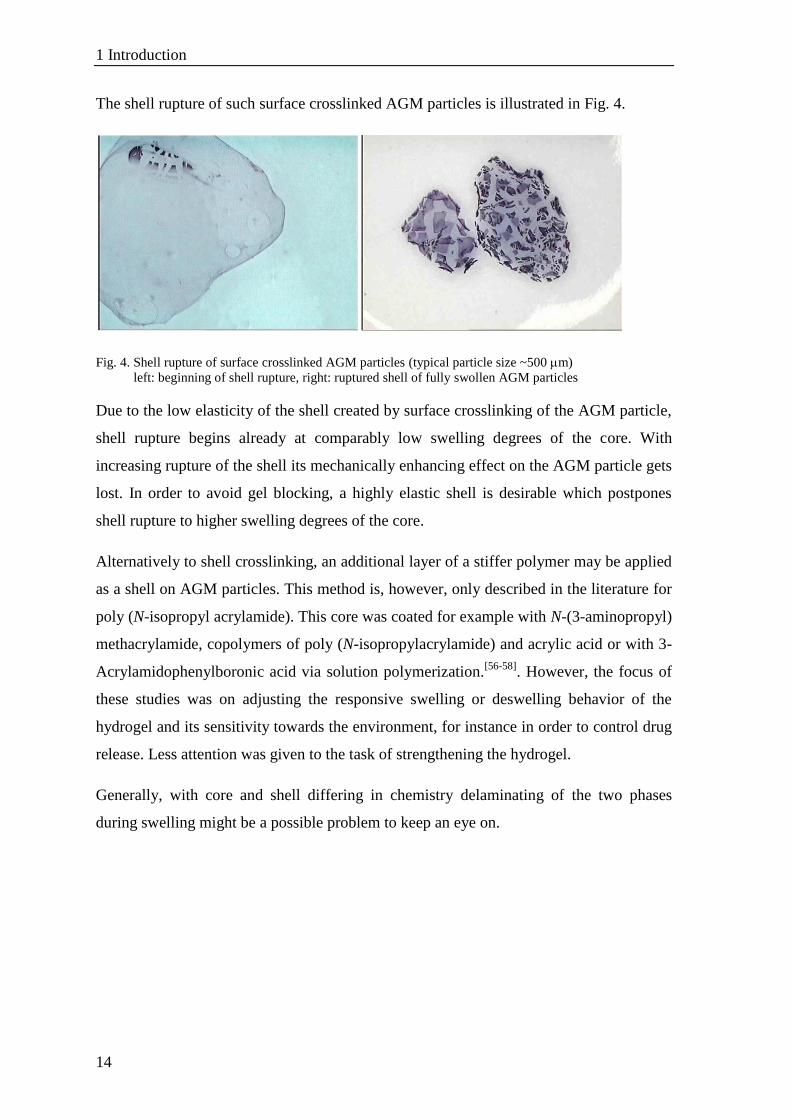
The shell rupture of such surface crosslinked AGM particles is illustrated in Fig. 4.
Fig. 4. Shell rupture of surface crosslinked AGM particles (typical particle size ~500 m)
left: beginning of shell rupture, right: ruptured shell of fully swollen AGM particles
Due to the low elasticity of the shell created by surface crosslinking of the AGM particle,
shell rupture begins already at comparably low swelling degrees of the core. With
increasing rupture of the shell its mechanically enhancing effect on the AGM particle gets
lost. In order to avoid gel blocking, a highly elastic shell is desirable which postpones
shell rupture to higher swelling degrees of the core.
Alternatively to shell crosslinking, an additional layer of a stiffer polymer may be applied
as a shell on AGM particles. This method is, however, only described in the literature for
poly (N-isopropyl acrylamide). This core was coated for example with N-(3-aminopropyl)
methacrylamide, copolymers of poly (N-isopropylacrylamide) and acrylic acid or with 3-
Acrylamidophenylboronic acid via solution polymerization.[56-58]
. However, the focus of
these studies was on adjusting the responsive swelling or deswelling behavior of the
hydrogel and its sensitivity towards the environment, for instance in order to control drug
release. Less attention was given to the task of strengthening the hydrogel.
Generally, with core and shell differing in chemistry delaminating of the two phases
during swelling might be a possible problem to keep an eye on.
1 Introduction
15
1.4 Challenges concerning the synthesis of clay nanocomposites
of AGM
Aiming to incorporate clay minerals in AGM, several aspects have to be considered. As
mentioned above, the AGM investigated in this work was based on poly (acrylic acid).
The polymer was either synthesized as crosslinked poly (acrylic acid) or pre-neutralized
to 75 mol% with NaOH. Hence, the monomer mixture exhibits an acidic pH in both cases
and high ionic strength, especially in the DN 75 case.
Clays tend to agglomerate in such environments. Resulting agglomerates might even
weaken the gels as they exhibit lower aspect ratios than single clay platelets and hence
less reinforcement can be achieved. In order to exploit the full potential of clay minerals
as fillers in AGM matrices it is essential to first disperse the clay platelets homogeneously
in the suspension of the monomers.[59-61]
1.4.1 Structure of clay minerals
Due to the particular structural features of clay minerals, it is extremely difficult under the
given conditions of low pH < 7 and high ionic strength to obtain a homogeneous
suspension of clay minerals which is at least stable on the time scale of processing and
polymerization.
Clay minerals are composed of tetrahedral and octahedral sheets. The tetrahedral sheet is
built up by silicon cations which are tetrahedrally coordinated by oxygen. Each SiO4
tetrahedron shares three of its corner oxygen atoms with adjacent tetrahedra, forming a
two-dimensional network which in ideal case exhibits a hexagonal structure. The forth
oxygen atom is part of the contiguous octahedral layer consisting of cations octahedrally
coordinated by oxygen. The octahedra, which are connected via edges, are completed by
hydroxyl groups situated above the center of the hexagonal gaps presented by the
tetrahedral layer. The clay mineral is called dioctahedral if two thirds of the centers of all
octahedra of the octahedral layer are occupied. In case all centers of the octahedra are
occupied, the clay mineral is called trioctahedral. Furthermore, clay minerals can be
distinguished between 1:1 clay minerals which are built up of one tetrahedral and one
octahedral sheet and 2:1 clay minerals consisting of two tetrahedral sheets and one
octahedral sheet.[62]
The clay minerals utilized in this work are 2:1 clays.
1 Introduction
16
2:1 Clay minerals show bi-functional character. The basal plane of these clay minerals
exhibits a permanent negative charge due to isomorphic substitution of cations within the
octahedral and/or tetrahedral layers by cations with lower valence.[63]
Contrary to the
permanent nature of the charge of the basal plane, the charge of the clay edge is
depending on the pH of the suspension medium. The edges of clay minerals possess
hydroxyl groups. The acidity of these hydroxyl groups is depending on the type of cations
within the tetrahedral and octahedral sheet. In general, the edge charge is positive in
acidic suspension media and negative in basic suspension media.
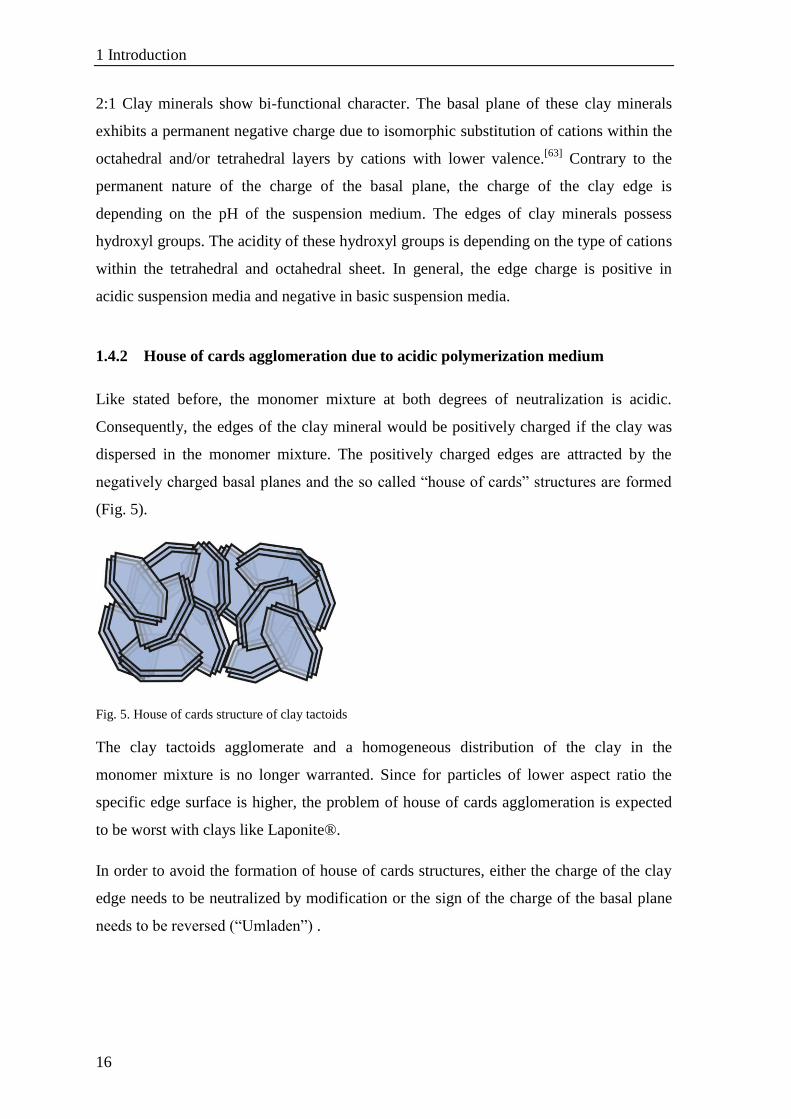
1.4.2 House of cards agglomeration due to acidic polymerization medium
Like stated before, the monomer mixture at both degrees of neutralization is acidic.
Consequently, the edges of the clay mineral would be positively charged if the clay was
dispersed in the monomer mixture. The positively charged edges are attracted by the
negatively charged basal planes and the so called “house of cards” structures are formed
(Fig. 5).
Fig. 5. House of cards structure of clay tactoids
The clay tactoids agglomerate and a homogeneous distribution of the clay in the
monomer mixture is no longer warranted. Since for particles of lower aspect ratio the
specific edge surface is higher, the problem of house of cards agglomeration is expected
to be worst with clays like Laponite®.
In order to avoid the formation of house of cards structures, either the charge of the clay
edge needs to be neutralized by modification or the sign of the charge of the basal plane
needs to be reversed (“Umladen”) .
1 Introduction
17
1.4.3 Acid activation of clays
If clays are kept at pH values below the point of zero charge, the edges not only start
carrying a positive charge, the clay also acts as solid buffer system. Consequently, the
octahedral layers start to dissolve as soluble complexes in the suspension medium. This
process is well known as acid activation used to produce bleaching earths with high
surface area. The degree of dissolution is highly dependent on the basic nature of the
octahedral cations, the temperature and the reaction time. Furthermore, clay particles with
small diameters offer more exposed specific edge surface and therefore react more
quickly. Laponite® consists of small particles (< 20 nm) and contains basic octahedral
cations (Li, Mg) and will therefore be most quickly dissolved. Contrary to this,
montmorillonite PGV® carries rather acidic Fe and Al cations and comes in larger
particles and will be dissolved comparatively slow.
For this reason we did not attempt to produce any Laponite® based AGM composites but
rather concentrated efforts on montmorillonite PGV® and synthetic lithium hectorite
showing particle diameters of > 10 µm.
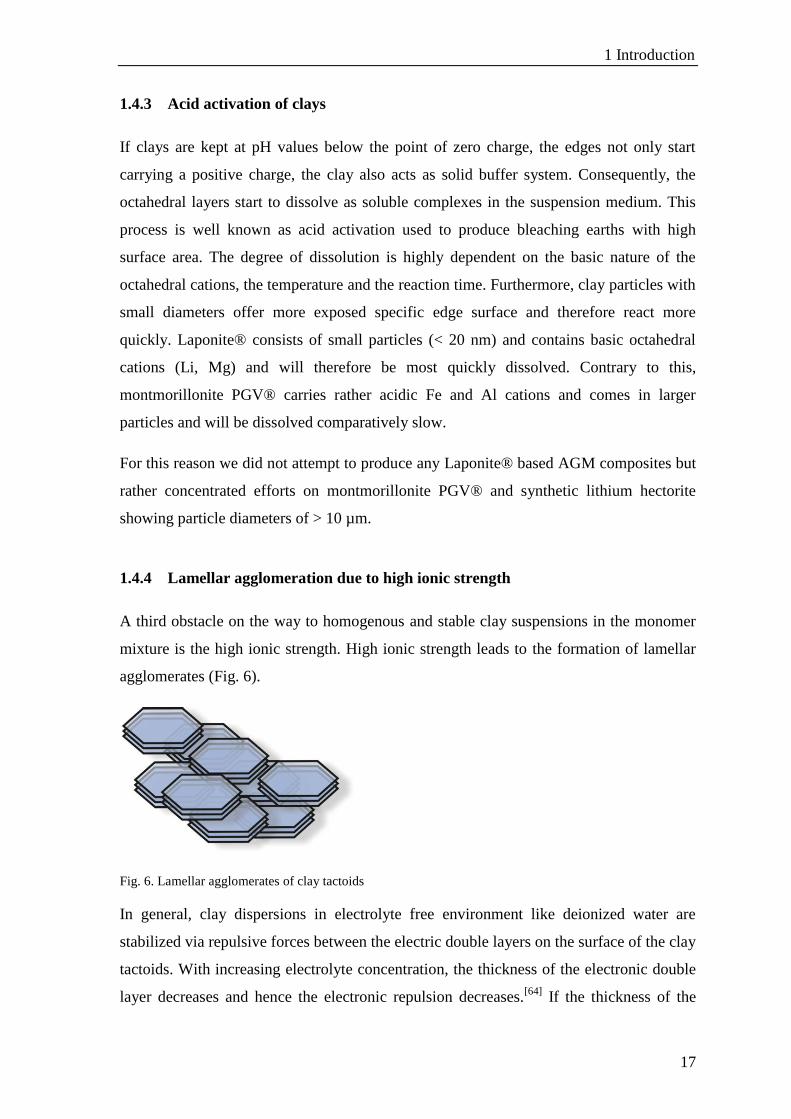
1.4.4 Lamellar agglomeration due to high ionic strength
A third obstacle on the way to homogenous and stable clay suspensions in the monomer
mixture is the high ionic strength. High ionic strength leads to the formation of lamellar
agglomerates (Fig. 6).
Fig. 6. Lamellar agglomerates of clay tactoids
In general, clay dispersions in electrolyte free environment like deionized water are
stabilized via repulsive forces between the electric double layers on the surface of the clay
tactoids. With increasing electrolyte concentration, the thickness of the electronic double
layer decreases and hence the electronic repulsion decreases.[64]
If the thickness of the

1 Introduction
18
electronic double layer falls below a certain limit, the attractive van der Waals forces
between the clay tactoids dominate the repulsive force and the clay tactoids coagulate and
trigger formation of lamellar agglomerates. The tendency toward the formation of
lamellar agglomerates increases with increasing diameter of the clay mineral since the
absolute area of parallel overlap and hence the absolute attractive force between parallel
platelets increases with diameter.
The formation of lamellar agglomerates can be avoided by adding steric stabilization of
the clay tactoids with the help of suitable modifiers.
2 Objective
19
2 Objective
The objective of this work is improving the performance of AGM for their application in
hygiene products. The most important features of AGM in these applications are high
maximum swelling capacity and pressure resistance of shape, represented by the gel
strength. The material does not only have to absorb large amounts of liquids, it also needs
to retain its shape in order to prevent gel blocking, which would restrict the liquid uptake
dramatically.
As pointed out, in commercial AGM maximum swelling capacity and gel strength are
manipulated by changing the portion of organic crosslinker in the polymerization process.
The higher the amount of crosslinker, the lower is the maximum swelling capacity, and
the higher is the gel strength. Most frequently, commercial products are crosslinked with
amounts between 0.1 and 0.5 mol% in respect to the monomer. However, the crosslinking
points in AGM networks that contain organic crosslinkers and which are polymerized via
free radical crosslinking polymerization are inhomogeneously distributed, as previously
discussed in section 1.3.1.
The AGM investigated in this work consisted of poly (acrylic acid), which was either
applied in non-neutralized condition or neutralized to 75 % with sodium hydroxide.
Consequently, the pH of the monomer mixture in any case was acidic. The amount of
acrylic acid in the polymerization mixture was 15 wt% of the total mass or higher. This
means, the monomer mixture possessed a high ionic strength.
We attempted to strengthen the AGM without restricting its extraordinary swelling ability
by two approaches. First, clay minerals were incorporated into the bulk polymer network.
By this mean, a homogeneous distribution of crosslinking points should be provided and
the gel strength of the material should be enhanced. In a second approach, clay-linked gel
formulas were envisaged to serve as shell elastomers in a core-shell context. Taking
commercial AGM as core, the composition of the shell had to be optimized to maximize
the mechanical strength, in particular Young’s -modulus and strain at break. Two
different clay minerals with different aspect ratios were chosen for these investigations.
2 Objective
20
Before any AGM composite materials could be fabricated, first and foremost the difficult
task of producing stable and homogenous suspensions in the hostile polymerization
environment needed to be tackled.
2.1 Dispersion of clay minerals in the polymerization mixture
The conditions of the polymerization mixture prohibit the formation of stable clay particle
suspensions and may lead to house of card and lamellar agglomeration. House of card
agglomeration is caused by the different charge of clay edge and basal plane and hence
the pH dependent charge of the clay edge plays a decisive role. Consequently, the pH
dependency of the edge charge was investigated and a method to estimate the point of
zero charge of the clay edge via streaming potential titration was developed. As the edge
amounts only a small percentage of the total clay surface, it was addressed first for charge
neutralization or charge reversion in order to avoid house of cards agglomeration as the
amount of added modifier will be kept at low contents. Elimination of the positive edge
charge was approached by charge neutralization via fluorination and charge reversion via
phosphorylation. Lamellar agglomeration can be suppressed by electrostatic binding of
sterically demanding modifiers to the negatively charged basal plane of the clay platelet.
The charge of the basal plane is neutralized and thus house of card formation is avoided at
once. A suitable modifier for the basal plane had to be identified and subsequently the
minimum amount had to be quantified in order to stabilize the clay mineral suspensions
while keeping non-absorbent content minimal.
2.2 Mechanical enhancement of bulk AGM
After succeeding in homogeneously and stably suspending the clay minerals in the
monomer mixture the suspensions were polymerized and samples containing various
types and amounts of clay minerals were prepared. As a comparison, reference samples
without filler and varying amounts of organic crosslinker were prepared. Initially, all
samples were investigated at fully swollen state and the swelling capacity in saline was
calculated. In order to evaluate the gel strength of the AGM, the VLRH method was
established and validated as an alternative to the more time-consuming rheological
measurements of G-modulus. In order to identify possible dilution effects which might
2 Objective
21
occur with increasing swelling degree of the hydrogels the synthesized AGM samples
were also investigated at intermediate swelling degrees.
2.3 Core – Shell concept: Enhancement of stress at break and
strain at break
For the composition of the shell in a core – shell particle a clay mineral composite based
on commercial AGM was chosen. In order to optimize strain at break and Young’s -
modulus in the above described way, the content of acrylic acid, organic crosslinker and
clay mineral as well as the type of clay mineral and the degree of neutralization were
varied and in each case compared to a reference sample without filler. The tensile
properties of each sample were examined via stress – strain measurements. Therefore, the
procedure of the measurement had to be optimized and adjusted to the features of the soft
hydrogels. The exact position of the clamps during the measurements had to be
considered to eliminate under- or overestimation of the results. Furthermore, slippage of
the sample had to be avoided without damaging the sample prior to the measurement.
3 Materials and methods
22
3 Materials and methods
3.1 Synthesis of AGM and AGM composites in the glass reactor
3.1.1 Synthesis of AGM
AGM is a copolymer from acrylic acid and sodium acrylate, crosslinked with an organic
crosslinker. The ratio between acrylic acid and sodium acrylate is variable, as it is
determined by the amount of sodium hydroxide added to the polymerization mixture to
partially neutralize the acrylic acid. Consequently, for AGM any composition from a pure
acrylic acid polymer to pure sodium acrylate polymer is possible. In this work, AGM
polymers of acrylic acid and of acrylic acid neutralized to 75 % with sodium hydroxide
were prepared.
For the synthesis of AGM the following educts were used:
Acrylic acid
Sodium hydroxide
Methylene bis acrylamide (MBAA) as crosslinker
Potassium persulfate (KPS) as initiator
Tetra methyl ethylene diamine (TEMED) as catalyst
Deionized water
The required amounts of educts for the synthesis of AGM used in this work were
calculated according to following conditions:
Table 1. Calculation of the required amounts of educts for the synthesis of AGM
Reference: Chosen values:
Acrylic acid wt% referred to batch size 15 – 25 wt%
Sodium hydroxide
mol% referred to acrylic acid
0 or 75 mol%
MBAA 0.3 – 1.3 mol%
KPS 0.1 mol%
TEMED 0.05 mol%
3 Materials and methods
23
The synthesis procedure consisted of the following steps, which had to be executed in the
listed order. During all steps the polymerization mixture was stirred. The synthesis was
accomplished via a subsequent step of initiation as soon as the reaction mixture appeared
visually homogeneous.
The crosslinker MBAA was dissolved in acrylic acid.
The mixture was diluted with deionized water; about 10 ml of the deionized water
was put aside
The mixture was cooled with an ice bath
The sodium hydroxide solution was added dropwise to the acrylic acid mixture
Initiator and catalyst were dissolved in the remaining 10 ml of deionized water
and added to the mixture
The monomer mixture was injected via a syringe into the reactor (described further in
section 3.1.3) which was then purged with argon through the needle for approximately
five minutes. The glass reactor containing the polymerization mixture was then placed in
an ultrasonic bath for three minutes before it was kept in an oven at 60 °C over night to
complete polymerization.
3.1.2 Synthesis of AGM composites
AGM composites in general incorporate inorganic fillers in the acrylic acid – sodium
acrylate copolymer, either additionally to or instead of an organic crosslinker. In this
work, clay minerals were chosen as inorganic filler. AGM composites including either the
natural montmorillonite PGV® or the synthetic lithium hectorite were prepared. The clay
mineral was incorporated into the polymer matrix additionally to an organic crosslinker.
For the synthesis of AGM composites the following educts were used:
Clay mineral
Modifier
Acrylid acid
Sodium hydroxide
MBAA as crosslinker
KPS as initiator

3 Materials and methods
24
TEMED as catalyst
Deionized water
The calculation of the required amounts of educts for the synthesis of AGM composites
containing clay minerals was done according to the following conditions:
Table 2. Calculation of the required amounts of educts for the synthesis of AGM composites
Reference: Chosen values:
Clay wt% of solids 0 – 10 wt%
Modifier wt% referred to clay content 0 – 45 wt%
Acrylic acid wt% referred to batch size 15 – 25 wt%
Sodium hydroxide
mol% referred to acrylic acid
0 or 75 mol%
MBAA 0.3 – 1.0 mol%
KPS 0.1 mol%
TEMED 0.05 mol%
For AGM composites, the order of the steps during synthesis had to be adjusted. Again it
was of vital importance to stick accurately to the listed sequence in order to avoid
agglomeration of clay platelets. The mixture was stirred during all steps of the synthesis.
The synthesis was pursued with subsequent steps initiated as soon as the reaction mixture
appeared visually homogeneous.
The clay suspension was presented in a suitable vessel
If possible the suspension was diluted with deionized water; about 10 ml of the
deionized water was put aside
The modifier was added to the clay suspension
The crosslinker MBAA was dissolved in acrylic acid in a separate vessel
The acrylic acid – MBAA mixture was added to the modified clay suspension
The polymerization mixture was cooled with an ice bath
The sodium hydroxide solution was added dropwise to the polymerization mixture
Initiator and catalyst were dissolved in the remaining 10 ml of deionized water
and added to the mixture

3 Materials and methods
25
The monomer mixture was injected via a syringe into the reactor which was then purged
with argon through the needle for approximately five minutes. Afterwards, the glass
reactor containing the polymerization mixture was placed in an ultrasonic bath for three
minutes before it was kept in an oven at 60 °C over night to complete polymerization.
3.1.3 Geometry of the glass reactor
For the analysis of the hydrogel samples via VLRH, rheometry, and stress – strain
measurements, a plane surface of the sample was needed and the hydrogel samples had to
have a certain thickness. Therefore, an appropriate disk geometry was chosen for the
polymerization chamber. The most suitable material for the chamber was supposed to be
glass. During the initiation of the polymerization oxygen was released by the initiator. It
is important, that the generated gas bubbles are not trapped in the polymer gel to achieve
a homogeneous sample for the subsequent measurements. The adhesion of oxygen on
glass is low, so that the oxygen bubbles should not stick to the glass surface but easily
detach.
The design of the glass chamber was developed by Procter & Gamble (Fig. 7).
Fig. 7. Geometry of the glass reaction chamber used for the polymerization of hydrogel disks
3 Materials and methods
26
The reactor consists of two Plexiglas® base plates, two glass plates, a rubber ring with a
diameter of 20 cm, four spacers, four cylinder head screws and four wing nuts.
Furthermore, two hollow needles were required.
The glass reactor had to be mounted according to the following procedure: One of the
Plexiglas® base planes was equipped with the four cylindrical head screws. A glass plate
was cleaned carefully with deionized water and acetone and was positioned on the
Plexiglas® base plane. The rubber ring was put on the glass plate. In between the rubber
ring and the glass plate the two needles were positioned. The second glass plate was put
on the rubber ring after cleaning. The spacers were put over the screws to guarantee a
specific distance between the two glass plates. Finally the second Plexiglas® plate was
placed on top of the glass plate and the whole construction was fixed with the wing nuts.
The dimensions of the spacers were chosen in a way that tightening of the screws lead to
a slight squeezing of the rubber ring. In this way the whole reactor was sealed.
The thickness of the polymerized hydrogel disks is depending on the thickness of the
rubber ring and the dimension of the spacer. In this work, two different thicknesses of the
hydrogel disks were required for the analysis of the specific AGM composites.
Hydrogel disks with a thickness of 3.6 mm were used for samples analyzed via VLRH
and via rheometry done by Procter & Gamble. To achieve a thickness of 3.6 mm for the
as synthesized gel, the spacer had to have a thickness of 15.7 mm and the rubber ring had
to have a diameter of 4 mm.
For the stress – strain measurements thinner hydrogel samples were required. The as-
synthesized hydrogel disks had to have a thickness of 1.6 mm. Therefore, the spacers
were chosen with a dimension of 13.7 mm and the diameter of the rubber ring was 2 mm.
For the synthesis of thick gel disks the size of the batch was 120 g, whereas for the
synthesis of the thin gel disks the batch size was 70 g.

3 Materials and methods
27
3.2 Estimation of the point of zero net proton charge of clay
minerals
3.2.1 Problem statement
In order to gain full access to the benefitting contribution of the clay as filler in AGM a
homogeneous distribution of the clay within the polymer matrix is mandatory.[59,60]
Agglomeration of the clay platelets within the polymer matrix has to be avoided during
the mixing of all educts as well as during the polymerization.
In order to prevent agglomeration of clay platelets within the polymer the chemistry of
both basal planes and edges of the clay have to be considered. Many efforts have been
made investigating and modifying the clay’s basal planes.[65-67]
The charge of the basal
plane is permanently negative and results from isomorphic substitution of cations within
the octahedral and/or tetrahedral sheets by cations with lower valence.[63]
By electrostatic
binding of suitable cationic modifiers to the basal plane the surface tension of the clay
particle can be adjusted to the polarity of the polymer matrix. The influence of the edges
on the agglomeration behavior of the clay has attracted less attention. The clay edge
exhibits hydroxyl groups and its charge therefore is depending on the pH of the dispersion
medium. In general, it is negative at high pH and positive at low pH. The exact charge of
the clay edge is depending on the type of cations within the tetrahedral and octahedral
sheets, more precisely on the mineral acid groups at the clay edge. Common tetrahedral
and octahedral cations are Al3+
, Si4+
, Fe3+
, Fe2+
, Mg2+
and Li+.[68]
As a first
approximation, the point of zero charge (PZC) of the oxides may be considered. Whereas
for alumina the PZC is well documented at a pH of approximately 9, the values for silica
are rather scattered. However the reported PZC values are always found at a pH lower
than 3. Iron oxides generally show a PZC around pH 8 – 8.5. The PZC of magnesia is
listed at about pH 12.[69]
For lithium oxide no PZC value is reported because of rapid
hydrolysis in water. In order to estimate the charge of the whole clay edge one would
have to average the PZC of the oxides of the constituting structural cations of octahedral
and tetrahedral sheets (Table 3).
3 Materials and methods
28
Table 3. PZC of oxides of elements constituting typical clay minerals
Material PZC
Al2O3 ~ 9
SiO2 < 3
Fe2O3 ~ 8.5
Fe3O4 ~ 8
MgO ~ 12
Especially if in-situ polymerizations comparable to those introduced by Haraguchi and
Takehisa are carried out in aqueous media the pH of the reaction mixture has to be
considered.[35]
If the solutions of monomers show a pH below the PZC of the clay edge
the then positively charged edge will be attracted to the negatively charged basal plane
and so called house of cards structures are formed, which means the clay particles
agglomerate.[70]
While comparison with PZC values of oxides already suggests that edge surfaces of
hectorites will change sign and become positively charged at higher pH values as
compared to montmorillonite, exact values for the clay edge under consideration were
needed. In literature several approaches to determine the acidity of the clay edge
theoretically by modeling are reported.[71,72]
Especially for natural bentonite type of clays
various attempts have been made to determine the acidity of the clay edge experimentally
via potentiometric titration.[73-75]
The results of these studies were picked up and several
groups tried to determine the Ka value of the clay edges by fitting the experimental
potentiometric titration data.[76-79]
Due to different experimental setups and the presence
of many fitting parameters, such as charge density on edge and basal surface, surface
potential, edge surface area etc., these studies resulted in a variety of different models and
therefore result in ambiguous and unclear interpretations. Bourg et al. gives an overview
of various models used to describe montmorillonite edge surface chemistry and the results
for the acidity of the surface groups of montmorillonite consequently are extremely
variable.[80]
Kaufhold et al. approached the pKa of the clay edge by recalculating the
titration data into proton affinity distributions.[81]
An effect all these studies have in
common is the dependency of the resulting point of zero edge charge on the electrolyte
background. This means a point of zero salt effect (PZSE) does not exist. As the PZC is

3 Materials and methods
29
defined as the common intersection point between PZSE and the point of zero net proton
charge (PZNPC), its determination is not possible for 2:1 clays. Instead, the PZNPC,
which is the intersection point between the raw titration curve for the blank and the
suspension, is used to evaluate the acidity of clay edges.[73,82]
A shift of the acid-base
titration curve to lower pH values with increasing ionic strength occurs for all type of
clays used by the different workgroups. This shift can be attributed to the effect of a
“spillover” of the electrostatic potential from the basal plane onto the edge surface. This
spillover is mentioned by Bourg et al. as a further reason for the diversity of models
trying to describe the acidity of clay edges.[80]
The spillover was described first in 1985
by Secor and Radke and later picked up by Chang and Sposito and is observed at low
concentration of electrolytes and in case the thickness of the electric double layer of the
basal plane is larger than the thickness of the lamella.[83,84]
Confirmation for the spillover
effect was later found in experimental data and is revealed by a shift of the acid-base
titration curve of montmorillonites to lower pH values with increasing electrolyte
concentration as mentioned above.[74,80,84,85]
Wanting to determine the point of zero charge of clay edges experimentally, another
severe challenge emerges. Looking at the morphology of a clay platelet, it is clear that the
edge charge accounts only for a minor part of the total charge of the clay. The relative
quantity of the edge charge compared to the overall clay charge is depending on the
actual particle diameter. Typical clay diameters stretch from about 10 nm for synthetic
Laponite® clays over 300 nm for natural montmorillonites up to 10 m for synthetic
hectorites. In Fig. 8, the number of Si – atoms residing at the clay edge are referred to the
total number of Si – atoms within a clay platelet in dependency of the particle diameter.
3 Materials and methods
30
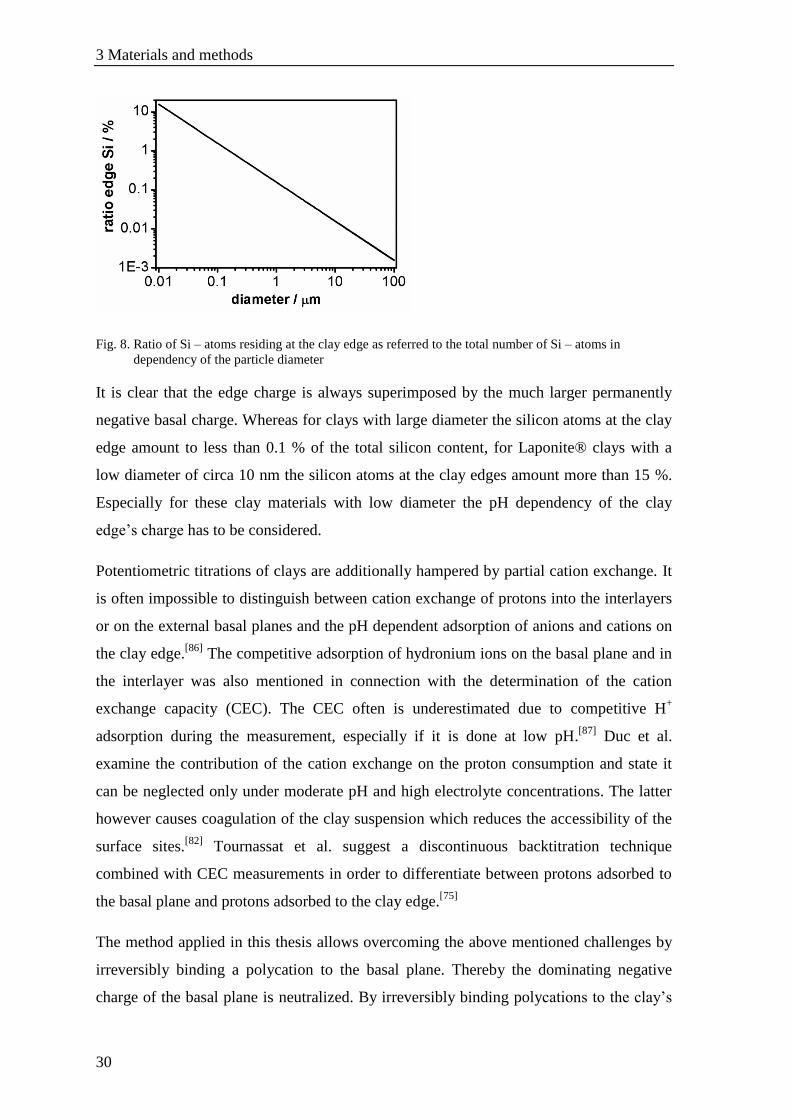
Fig. 8. Ratio of Si – atoms residing at the clay edge as referred to the total number of Si – atoms in
dependency of the particle diameter
It is clear that the edge charge is always superimposed by the much larger permanently
negative basal charge. Whereas for clays with large diameter the silicon atoms at the clay
edge amount to less than 0.1 % of the total silicon content, for Laponite® clays with a
low diameter of circa 10 nm the silicon atoms at the clay edges amount more than 15 %.
Especially for these clay materials with low diameter the pH dependency of the clay
edge’s charge has to be considered.
Potentiometric titrations of clays are additionally hampered by partial cation exchange. It
is often impossible to distinguish between cation exchange of protons into the interlayers
or on the external basal planes and the pH dependent adsorption of anions and cations on
the clay edge.[86]
The competitive adsorption of hydronium ions on the basal plane and in
the interlayer was also mentioned in connection with the determination of the cation
exchange capacity (CEC). The CEC often is underestimated due to competitive H+
adsorption during the measurement, especially if it is done at low pH.[87]
Duc et al.
examine the contribution of the cation exchange on the proton consumption and state it
can be neglected only under moderate pH and high electrolyte concentrations. The latter
however causes coagulation of the clay suspension which reduces the accessibility of the
surface sites.[82]
Tournassat et al. suggest a discontinuous backtitration technique
combined with CEC measurements in order to differentiate between protons adsorbed to
the basal plane and protons adsorbed to the clay edge.[75]
The method applied in this thesis allows overcoming the above mentioned challenges by
irreversibly binding a polycation to the basal plane. Thereby the dominating negative
charge of the basal plane is neutralized. By irreversibly binding polycations to the clay’s

3 Materials and methods
31
basal plane its electrostatic potential and a possible spillover effect are eliminated and
hence the detection of the edge charge is possible independently of any electrolyte effect.
At the same time cation exchange at the basal plane is avoided as the polycations show
much higher affinity to the basal plane than protons. Delhorme et al. theoretically
investigated the titratable charge of clay minerals using a Monte Carlo method.[76]
They
demonstrate that the PZC of clay edges is independent of the electrolyte concentration in
case the clay exhibits no structural basal charge or in case the structural basal charge is
neutralized by counterions. Pecini and Avena picked up this idea and neutralized the
charge of their montmorillonite samples prior to the determination of the isoelecric point
of the edge surface by using electrophoretic mobility measurements.[88]
3.2.2 Streaming potential titration
Streaming potential measurement allows examining the charge of solid particles even if
they are not stable towards sedimentation and therefore it is perfectly suitable to
investigate clay suspensions. Streaming potential titrations were executed on a
Stabisizer®, a charge titration system of the company Particlemetrix.
The investigated suspension is filled in a cylindrical Teflon chamber with an oscillating
Teflon piston. Both chamber and piston carry only very little charge. A fraction of the
particles contained in the suspension is immobilized at the surface of the chamber’s wall.
The oscillation of the piston causes a flow of the liquid within the gap between chamber
and piston, which results in mechanical sheering of the particles’ diffuse double layer. An
alternating voltage, the streaming potential, is detectable. Depending on the
characteristics of the particle suspension diverse pistons with different notches are
available influencing the degree of sheering. For the investigations described in this work
the piston with notches of 200 m was chosen.
During the first step the clay suspension is titrated with a solution of cations. Suitable
cations are e.g. alkyl ammonium cations, mono- or multivalent complex-cations or
polymeric polycations. In this work, the polycation Poly (diallyl dimethyl ammonium
chloride) (PDADMAC) was chosen. The particular cations electro-statically bind to the
negative basal planes of the clay and neutralize the basal charge. By neutralization of the
basal charge the direct detection of the edge charge becomes possible. During the second
step, the pH titration, the PZNPC of the clay edge is revealed.

3 Materials and methods
32
Determination of the PZNPC via streaming potential titration was carried out with
montmorillonite PGV® and Laponite® RD suspensions. Therefore, 10 ml of a 0.1 wt%
suspension of montmorillonite PGV® in deionized water were titrated with a 0.001N
solution of PDADMAC. Subsequently, pH titration was carried out with 0.01M
hydrochloric acid. Investigations on Laponite® RD were executed with a 1 wt%
suspension of the clay mineral in deionized water. 10 ml of the Laponite® RD suspension
were titrated with 0.01 N PDADMAC for neutralization of the negative charge of the
basal plane. Following pH titrations were carried out with 0.01M hydrochloric acid.
3.3 Investigation of the sedimentation stability of clay suspensions
Due to the characteristics of the polymerization mixture, clay suspensions were not stable
without the addition of a stabilizing agent. The formed agglomerates either settle or float.
In order to investigate the stabilizing effect of an added modifier on the suspensions of
the clay minerals, different approaches have been applied. First of all, a fast and easy
method for screening a huge amount of samples was required to identify suitable
stabilizing agents qualitatively. In the next step, the identified modifiers were further
investigated to confirm the findings of the qualitative screening and finally a quantitative
analysis was done.
3.3.1 Preparation of the samples
The sedimentation stability of clay suspensions were tested under polymerization
conditions in acrylic acid/acrylate. To prevent polymerization during the analysis,
however, neither crosslinker nor initiator and catalyst were added. The educts had to be
added in the order described in the following. After the addition of each reactant the vial
was shaken manually to guarantee thorough mixing. The next ingredient was added as
soon as the reaction mixture appeared visually homogeneous.
The clay suspension was presented in a vial
If possible the suspension was diluted with deionized water
The modifier was added to the clay suspension
The acrylic acid was added to the modified clay suspension
The polymerization mixture was cooled with an ice bath
3 Materials and methods
33
The sodium hydroxide solution was added slowly to the polymerization mixture
The remaining volume of deioinzed water was added
Analysis of the suspension of clay minerals in the polymerization mixture had to be
carried out directly after the sample preparation. The polymerization mixture had a final
pH of about 5. The acidic pH causes degradation of clay minerals, known as acid
activation. Additionally, other aging effects of the polymerization mixture were possible,
like beginning polymerization of monomers. Consequently, the composition of the
sample changes with time not allowing comparison of samples.
3.3.2 Fast qualitative screening of sedimentation stability via visual testing
Visual sedimentation tests are the easiest method to get a qualitative impression of the
stability of dispersion with little effort. Especially if a huge amount of samples has to be
screened visual sedimentation test can be very useful. In this work, visual investigations
were used to monitor both edge and basal modifications.
Visual examination – edge modification
For the modification of the clay edge, either sodium fluoride or sodium pyrophosphate
decahydrate were applied. The number of hydroxyl groups at the clay edge and thus the
amount of modification reagent required was estimated by considering the density of the
clay material of 2.5 g/cm3, the Si – Si distance (0.303 nm) and the diameter of a single
clay platelet. Furthermore, a hexagonal shape of the clay platelets was assumed.
The concentration of the clay mineral in the investigated monomer mixtures was 5 wt%
of solids, which equals to 2.66 wt% of the total mass. A content of acrylic acid of 20 wt%
of the total mass was chosen and it was neutralized with sodium hydroxide to 75 %.
The proportion of edge surface and hence the number of exchangeable hydroxyl groups
of the different types of clays applied vary significantly due to the very pronounced
difference in lateral extension. Efficiency of edge modification was tested on
montmorillonite PGV® suspensions. For montmorillonite PGV® a typical side length of
150 nm was assumed in the calculation. Consequently, a necessary amount of modifier of
about 0.16 mmol was assumed.
3 Materials and methods
34
Visual investigation of the edge modified clay suspensions suggested a significant
reduction of agglomeration with increasing amounts of edge modifiers. Agglomerates
were no longer visible only for the samples treated with large amounts of modifiers
(17 mg/g and 178 mg/g of sodium fluoride and sodium pyrophosphate decahydrate,
respectively).
To corroborate and verify the subjective visual impressions, the montmorillonite PGV®
suspensions were additionally checked for house of card agglomerates by determining the
particle size distributions applying static light scattering. Note that the investigated
montmorillonite PGV® clay platelets have a medium diameter of about 260 nm.
Therefore, this clay is well suited for particle size measurements via static light scattering
with the device LA-950 of the company Retsch.
Visual examination – basal plane modification
27 different modifiers for the basal plane were initially screened regarding their
stabilizing effect on the suspension of clay minerals in the AGM polymerization mixture.
The clay mineral montmorillonite PGV® was used for the sedimentation tests after
modification of the basal plane. Visual testing of the sedimentation stability is not
applicable for lithium hectorite due to its large particle size. However the basic
mechanism of stabilizing the clay suspension is the same for both clays as it is achieved
through electrostatical binding of polycations to the negatively charged basal plane of
comparable layer charge. The results regarding the suitability of a modifier should
therefore be transferable from montmorillonite PGV® to lithium hectorite.
Sedimentation tests were carried out in 40 ml snap cap vials. The chosen concentration of
montmorillonite PGV® was 1 wt% of solids. The amount of modifier was varied from 0
to 100 wt% referred to clay weight. An acrylic acid content of 20 wt% referred to the total
mass of the sample was chosen and neutralized to 75 % with sodium hydroxide. After
preparation, the samples were left to sediment over night. The next day, the samples were
investigated visually to judge the sedimentation stability in a qualitative way and pictures
were taken.
Visual evaluation of the sedimentation stability is of course highly subjective and only
qualitative picture is obtained that moreover relates to a long period of time as compared
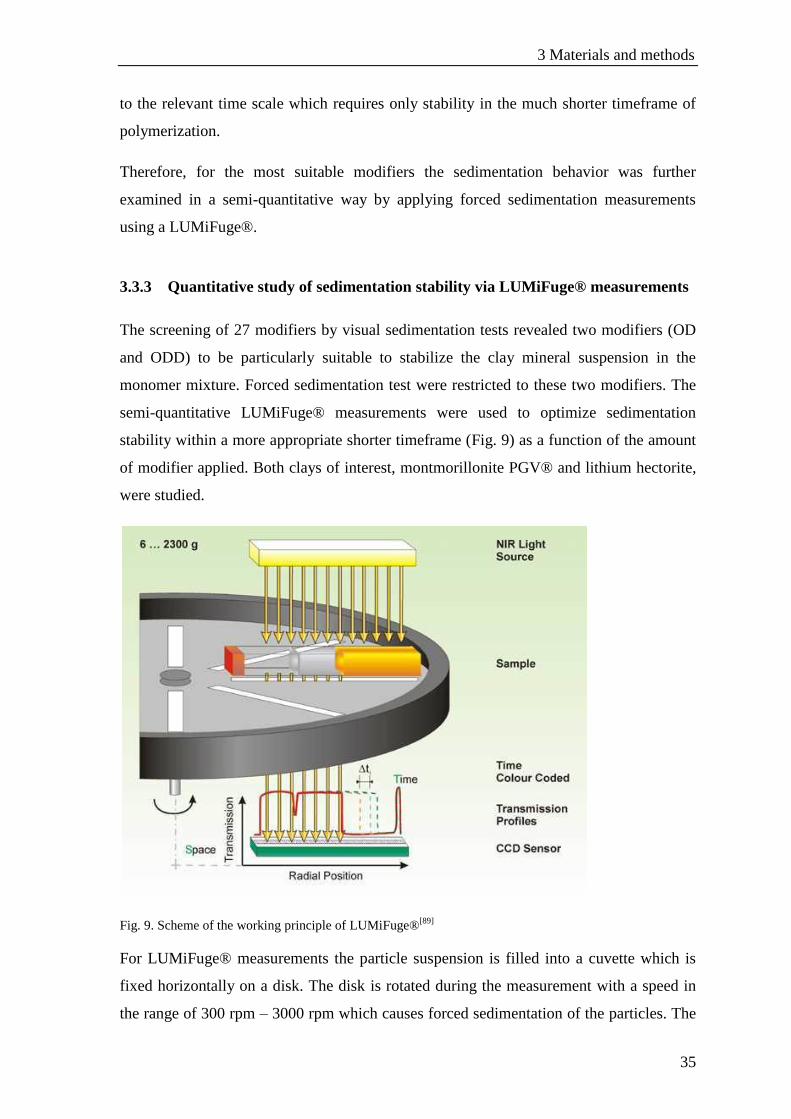
3 Materials and methods
35
to the relevant time scale which requires only stability in the much shorter timeframe of
polymerization.
Therefore, for the most suitable modifiers the sedimentation behavior was further
examined in a semi-quantitative way by applying forced sedimentation measurements
using a LUMiFuge®.
3.3.3 Quantitative study of sedimentation stability via LUMiFuge® measurements
The screening of 27 modifiers by visual sedimentation tests revealed two modifiers (OD
and ODD) to be particularly suitable to stabilize the clay mineral suspension in the
monomer mixture. Forced sedimentation test were restricted to these two modifiers. The
semi-quantitative LUMiFuge® measurements were used to optimize sedimentation
stability within a more appropriate shorter timeframe (Fig. 9) as a function of the amount
of modifier applied. Both clays of interest, montmorillonite PGV® and lithium hectorite,
were studied.
Fig. 9. Scheme of the working principle of LUMiFuge®[89]
For LUMiFuge® measurements the particle suspension is filled into a cuvette which is
fixed horizontally on a disk. The disk is rotated during the measurement with a speed in
the range of 300 rpm – 3000 rpm which causes forced sedimentation of the particles. The
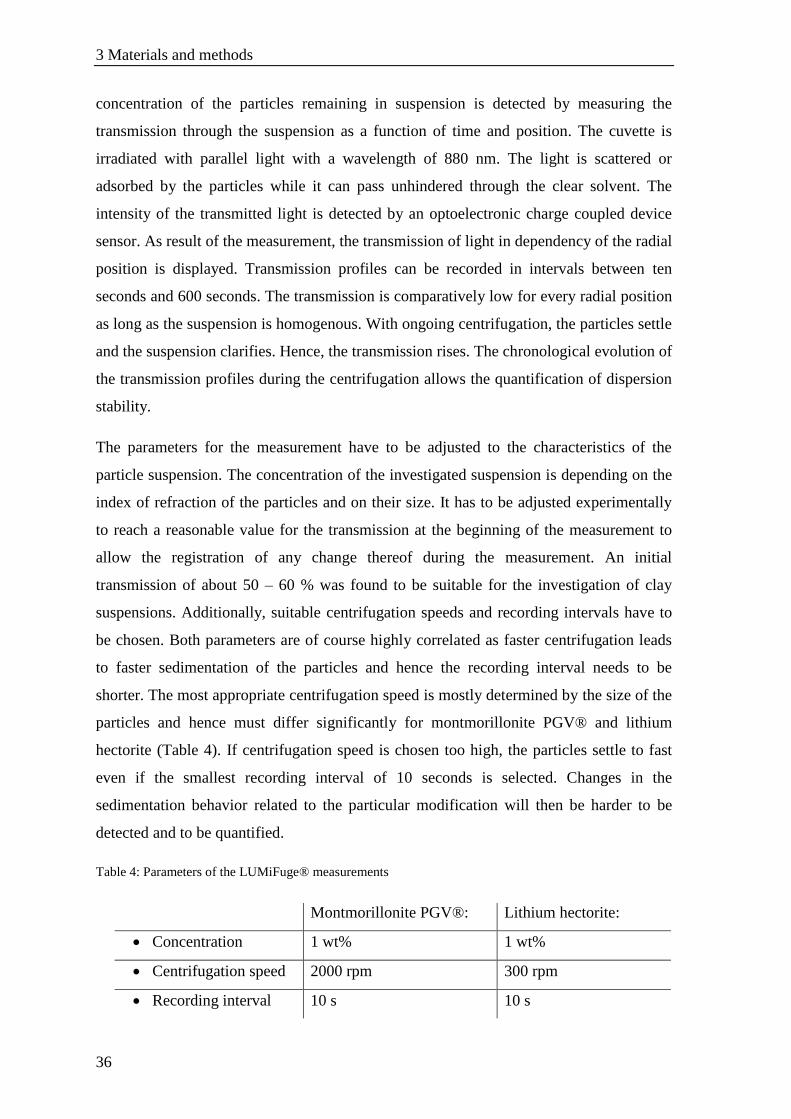
3 Materials and methods
36
concentration of the particles remaining in suspension is detected by measuring the
transmission through the suspension as a function of time and position. The cuvette is
irradiated with parallel light with a wavelength of 880 nm. The light is scattered or
adsorbed by the particles while it can pass unhindered through the clear solvent. The
intensity of the transmitted light is detected by an optoelectronic charge coupled device
sensor. As result of the measurement, the transmission of light in dependency of the radial
position is displayed. Transmission profiles can be recorded in intervals between ten
seconds and 600 seconds. The transmission is comparatively low for every radial position
as long as the suspension is homogenous. With ongoing centrifugation, the particles settle
and the suspension clarifies. Hence, the transmission rises. The chronological evolution of
the transmission profiles during the centrifugation allows the quantification of dispersion
stability.
The parameters for the measurement have to be adjusted to the characteristics of the
particle suspension. The concentration of the investigated suspension is depending on the
index of refraction of the particles and on their size. It has to be adjusted experimentally
to reach a reasonable value for the transmission at the beginning of the measurement to
allow the registration of any change thereof during the measurement. An initial
transmission of about 50 – 60 % was found to be suitable for the investigation of clay
suspensions. Additionally, suitable centrifugation speeds and recording intervals have to
be chosen. Both parameters are of course highly correlated as faster centrifugation leads
to faster sedimentation of the particles and hence the recording interval needs to be
shorter. The most appropriate centrifugation speed is mostly determined by the size of the
particles and hence must differ significantly for montmorillonite PGV® and lithium
hectorite (Table 4). If centrifugation speed is chosen too high, the particles settle to fast
even if the smallest recording interval of 10 seconds is selected. Changes in the
sedimentation behavior related to the particular modification will then be harder to be
detected and to be quantified.
Table 4: Parameters of the LUMiFuge® measurements
Montmorillonite PGV®: Lithium hectorite:
Concentration 1 wt% 1 wt%
Centrifugation speed 2000 rpm 300 rpm
Recording interval 10 s 10 s

3 Materials and methods
37
The clay suspensions were filled into disposable poly carbonate cuvettes with an optical
path length of 2 mm. The duration of the LUMiFuge® measurement was 25 minutes.
3.4 Judging the gel strength of hydrogels: VRLH measurement
One of the major goals of this work was mechanical enhancement of the hydrogel without
suffering a loss of swelling capacity. For an efficient approach to this topic a fast an easy
method for evaluating the gel strength of the hydrogel was essential. In general, the
mechanical strength of AGM is determined by measuring the storage modulus G’.
However, the whole procedure of sample preparation and the execution of the rheometry
measurement itself requires several weeks of work. For this reason, the measurement of
“very low rubber hardness” (VLRH) was chosen for screening purposes. Testing of the
mechanical strength via the VLRH method reduced the time for a measurement to few
minutes per sample and hence the duration of the measurement procedure is determined
by the duration of the sample preparation. Furthermore, the method is easy to handle.
VLRH measurement is a method introduced by the company Bareiss and is certified
according DIN ISO 27588. The setup for this method includes the VLRH measuring
device which is used in combination with the digi test II testing device (Fig. 10).[90]
Fig. 10. left: digi test II testing device and control unit;
right: VLRH measurement device with exchangeable indenter
The hardness of a sample is determined by measuring the indentation depth (m) of an
indenter into the test specimen with an applied force of 100 mN. Different shapes and
3 Materials and methods
38
sizes of indenters are available. The indenter can be exchanged easily and adapted to the
conditions of the sample. The resulting VRLH value is found in the range between 0 and
100 and is generated through the following equation:
VLRH = 100 – 0.1 * D ( 5 )
where D stands for the depth of indentation in m.
For the investigation of AGM and AGM composites synthesized in this work, two
different indenters were chosen. Both were round plates, one with a diameter of 16.2 mm
and the other one with a diameter of 10 mm.
3.4.1 Sample preparation – Swelling of the AGM hydrogels
VLRH measurements were used to quickly characterize the mechanical properties of
AGM and AGM composites. The hydrogels were synthesized as described in section 3.1.
For VLRH measurements, gel disks with a thickness of 3.6 mm were required. AGM and
AGM composites were examined in both fully swollen and in partially swollen state. For
this purpose, the as-synthesized gel disks were cut into quadratic pieces of 2.5 cm * 2.5
cm size.
These samples were swollen individually in saline with a salinity of 0.9 wt% and a
conductivity of 16.05 mS/cm ± 0.20.
The sample preparation for fully swollen and partially swollen state differed from one
another.
Fully swollen AGM hydrogels
The samples were put into a closed container and covered completely with the saline. The
AGM hydrogels were left to swell completely to equilibrium. To ensure equilibration, the
samples were allowed to equilibrate for at least 10 days at ambient temperature. During
this period, the closed container was swung several times to avoid sticking of the
hydrogel sample to the walls of the container which might lead to non-uniform swelling.
During the swelling process, the hydrogel increased dramatically in size. Therefore, the
amount of saline in the vessel was controlled in order to ensure that the sample was fully
covered at any time.

3 Materials and methods
39
Partially swollen AGM hydrogels
The exact degree of swelling of the as-synthesized samples was not known precisely. In
order to be able to adjust a defined swelling degree, the hydrogel pieces first had to be
dried completely and then swollen to the desired degree. For a complete dehydration the
gel pieces were dried in an oven at 60 °C for three days. The weight before and after
drying was measured and the solid content was calculated for at least three different gel
pieces of one sample. When the relative deviation of the solid content of the individual
samples was less than 1.5 % the samples were considered as dry. The dry gel pieces were
weighed and put into zip-lock bags. A specific amount of saline was added to achieve the
desired degree of swelling, given in gram saline per gram solid AGM. In this work,
swelling degrees of 3 g/g, 6 g/g and 12 g/g were chosen and three samples of each
swelling degree were prepared. The dry gel pieces were arranged lying flat on a plain
surface in the zip lock bags in order to allow homogeneous swelling. Furthermore, long
equilibration times (> 10 days) were chosen to ensure equilibration and thus uniform
swelling. During this period the position of the gel piece in the saline was regularly
controlled. To minimize alterations of the degree of swelling by evaporation of water,
handling times were kept as short as possible. The gel pieces were removed from the zip
lock bag, weighed to determine the exact swelling degree, and VLRH was immediately
measured.
3.4.2 Method validation
In order to ensure that the VLRH method is reproducible independently of the location
and the person executing it, a method validation was done by measuring the same fully
swollen hydrogels at Procter & Gamble and Bayreuth. Data analysis by Procter &
Gamble revealed the following trends:
The variability of VLRH values was higher for soft hydrogel samples, meaning at
low VLRH values.
Nevertheless, for low VLRH values the sensitivity of the method was higher,
meaning that the difference between samples was more pronounced as compared
to values measured for stiffer samples.
It is advantageous to use a smaller indenter for stiffer samples.
In order to reduce errors at least six measurements should be done per sample.

3 Materials and methods
40
The data gained with VLRH measurement correlated well to the storage modulus
G’.
The sample preparation was found to be crucial. In particular, friction caused by
lubrication with saline remaining at the surface was detrimental and had to be
strictly avoided.
Summarizing, VLRH measurement is a suitable method to estimate the mechanical
strength of hydrogel samples. The indenter with a diameter of 16.2 mm is restricted to
samples that deliver a VLRH value smaller then 85. For samples of higher stiffness, it is
recommended to exchange the indenter for another one with smaller diameter, which
leads to higher sensitivity for stiffer samples. The VLRH data showed a good correlation
to storage moduli G’ determined for identical samples by rheometry which is most
frequently used to judge the mechanical strength of hydrogels.
3.5 Stress – Strain measurement
The diameter of the sample is the most crucial parameter for the evaluation of the stress –
strain data. Therefore, a dog bone shaped knife, conform to DIN 53504 S3a, was used to
cut the hydrogels (Fig. 11).
Fig. 11. Diameters of dog bone shaped sample, cut with knife conform to DIN 53504 S3a
The decisive diameters of the dog bone shaped sample are width and length of the thin
zone and the thickness of the sample. The width and the length of the thin zone are
determined by the choice of the cutting knife. For the chosen knife (DIN 53504 S3a), the
width was 4 mm and the length is 16 mm. The thickness of the sample was depending on
the composition and swelling degree of each sample, which are in turn determined by
sample preparation. The thickness varied slightly for each hydrogel prepared and had to
be measured individually for each sample prior to the stress – strain measurement for
accurate determination of cross-section area and tensile modulus.

3 Materials and methods
41
Stress – strain measurements were carried out with a universal tester, model 5565
(Instron). The universal tester was equipped with a 10 N load cell. The stress – strain
measurements were carried out with a velocity of 100 mm per minute of straining. The
pressure of the hydraulic clamps was chosen between 0.5 and 1 bar.
Tensile testing via stress – strain measurements allows the determination of Young’s -
modulus, tensile stress and tensile strain of a material up to failure. Characteristic points
of a typical stress – strain curve are tensile stress at break and tensile strain at break. The
Young’s -modulus quantifies the stiffness of a material undergoing tension (or
compression). The Young’s -modulus can be calculated by dividing tensile stress by
tensile strain in the linear elastic region of the stress – strain curve at low elongation.
Note, that ASTM standards use the terms “tensile elongation” and “tensile strength”
while ISO standards use the terms “tensile strain” and “tensile stress” for identical
parameters. In this work, the ISO terminology is used.
3.5.1 Preparation of the samples
All samples investigated via stress – strain measurements were intermediately swollen
samples with a known swelling degree. Consequently, the preparation of the samples was
comparable to the preparation of intermediately swollen samples for VLRH
measurements. The hydrogels were synthesized as described in section 3.1. For stress –
strain measurements, the thinner gel disks with a thickness of 1.6 mm were required.
The gel disks were cut in 6 cm * 6 cm big pieces. As stated before, the exact swelling
degree of the as-synthesized samples was not known. Therefore, identical and
homogeneous swelling degrees for all samples that allow comparison of the data could
only be assured by drying and controlled rehydration as described in the VLRH section.
For stress – strain measurements, swelling degrees of 3 g/g and 6 g/g were chosen.
During the swelling period the position of the gel piece in the saline was regularly
controlled. To minimize dehydration effects, again handling times were kept as short as
possible. The average handling time for one sample including several measurements was
about 20 minutes.

3 Materials and methods
42
3.5.2 Method development
As the investigated hydrogel is highly elastomeric and rather soft, clamping of the
samples was not trivial. First of all, the hydraulic pressure of the clamps fixing the sample
had to be individually adjusted to each sample according to its softness. On one hand,
clamping has to be tight enough to avoid sample slippage. On the other hand, too severe
squeezing baring the risk of damaging the clamped ends of the dog bone prior to the
measurement had to be avoided. Furthermore, the sharp edges of the clamps tended to cut
into the sample inducing fracture at the rim. Any failure outside the thin zone gives
erroneous values as it underestimates stress and strain at break. Therefore, special
attention was paid to sample preparation and the following modifications were made to
the standard procedure.
3.5.2.1 Positioning of the dog bone sample
Ideally, for the evaluation of the data only the elongation of the thin zone of the dog bone
should be considered. Therefore, it is important to pay attention to the exact position of
the clamp. The thin zones concentrate most of the stress due to their minimal cross-
section area compared to the cross-section at the broader ends. The ideal place for the
clamp is in the area where the width of the dog bone is just starting to narrow down
towards the thin zone. Hydrogel samples are, however, flexible and slippery and therefore
hard to position. As a consequence, there was always some variation in the clamping
position. Variability in the clamp position introduces error in the overall stress dissipated
by the sample and for precise measurements of elastic properties it is advisory to keep
track of clamp position by means of sample marking and calculating a corrected
elongation from the measured value. The typical clamping of the sample at the beginning
of the measurement is shown in Fig. 12 on the left. When applying stress in addition to a0
also b0 zones are stretched. At any given stress, however, the broader regions of b0 do not
stretch as much as the thin zone a0. Consequently, the maximum strain measured would
be underestimated. Therefore, the measured strain for each sample had to be corrected.
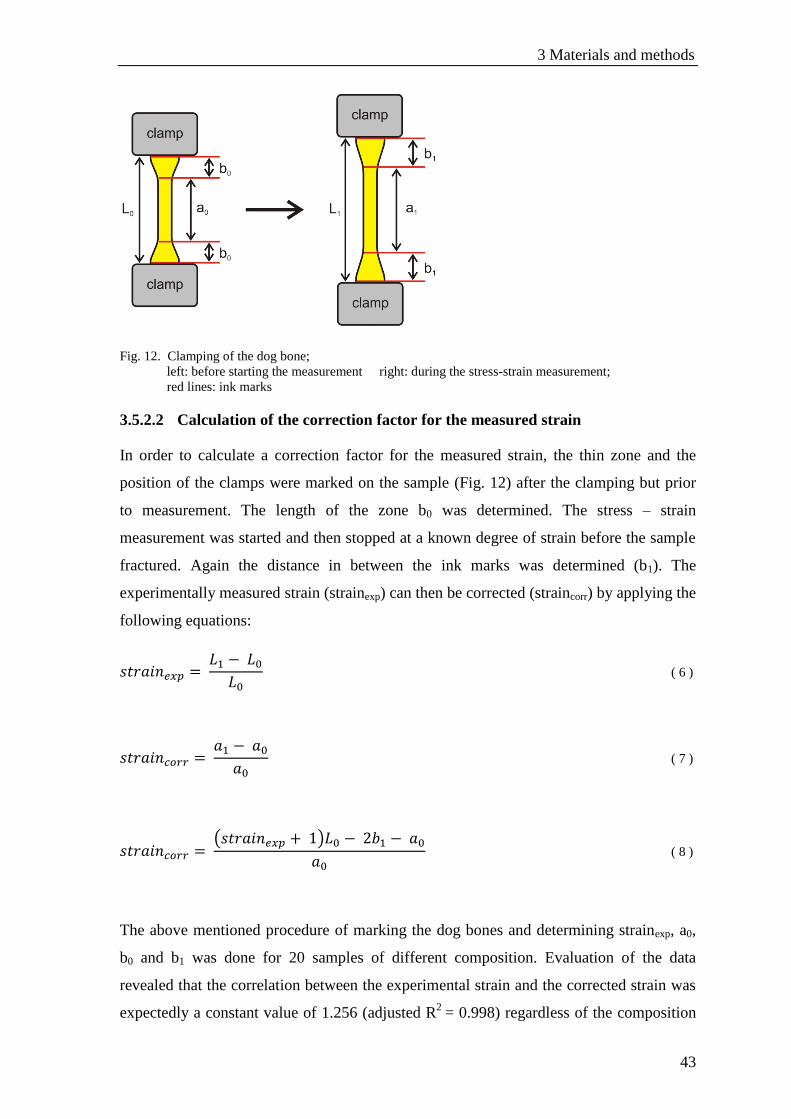
3 Materials and methods
43
Fig. 12. Clamping of the dog bone;
left: before starting the measurement right: during the stress-strain measurement;
red lines: ink marks
3.5.2.2 Calculation of the correction factor for the measured strain
In order to calculate a correction factor for the measured strain, the thin zone and the
position of the clamps were marked on the sample (Fig. 12) after the clamping but prior
to measurement. The length of the zone b0 was determined. The stress – strain
measurement was started and then stopped at a known degree of strain before the sample
fractured. Again the distance in between the ink marks was determined (b1). The
experimentally measured strain (strainexp) can then be corrected (straincorr) by applying the
following equations:
( 6 )
( 7 )
( 8 )
The above mentioned procedure of marking the dog bones and determining strainexp, a0,
b0 and b1 was done for 20 samples of different composition. Evaluation of the data
revealed that the correlation between the experimental strain and the corrected strain was
expectedly a constant value of 1.256 (adjusted R2
= 0.998) regardless of the composition

3 Materials and methods
44
of the hydrogel, the type and amount of filler, and the degree of swelling (Fig. 13). The
constant represents the bias that emerges from the dog bone geometry.
Fig. 13. Linear correlation of experimental strain and corrected strain
Consequently, a much simpler empirical correction ( 9 ) was applied to correct the
experimental strain for all remaining samples:
( 9 )
3.5.2.3 Taping of the dog bone sample to avoid slippage and damaging
The hydrogel samples were fixed between the clamps with a hydraulic system. The
pressure applied had to be adjusted manually to the individual softness and brittleness of
the samples, as these parameters are determined by the composition and the swelling
degree of the AGM. It was noticed that, at a pressure sufficient to avoid slippage of the
samples, the hard edges of the clamps frequently damaged the AGM dog bone, especially
for the samples with higher swelling degree or higher crosslinking level. Protecting the
hydrogel sample with a tape in the clamping area turned out to be an easy and reliable
solution to the problem. The tape of choice was “Tesa® Gewebeband”.

3 Materials and methods
45
Fig. 14. Mounting of the tape to the hydrogel dog bone
The tape was mounted at the broad area of the dog bone from both sides, as shown in Fig.
14. Taping of the hydrogel samples made them less sensitive to the normal pressure
applied by the clamping and made it easier to adjust the pressure in order to avoid
slippage of the sample. Moreover, the dog bone was less prone to damage by the rims of
the clamps.
3.6 Lithium hectorite
Lithium hectorite with a nominal layer charge of - 0.8 was synthesized according to a
melt synthesis method developed by Kalo et al. in our laboratory.[91]
The synthesis
consists of three steps: 1. Synthesis of a glass precursor with the composition Li2O-2SiO2
2. Synthesis of MgO-SiO2 as sources for MgO and SiO2 3. Combination of glass
precursor Li2O-2SiO2 and the MgO-SiO2 mixtures with MgF2. The nominal composition
of the lithium hectorite was Li0.8[Mg2.2Li0.8][Si4]O10F2.
According to Kalo et al. the synthesized lithium hectorite showed the following
characteristics:
Powder X-ray diffraction (PXRD) traces were dominated by the hectorite peaks, while
only traces of crystalline impurities could be detected.
Colorometric determination of the cation exchange capacity by [Co(en)3]3+ [92]
gave a
value of 130 meq / 100 g. This was significantly lower than expected considering the
nominal formula, which suggested that some amorphous impurities were present.
3 Materials and methods
46
As judged by a well defined hydration behavior, the material exhibited a uniform intra-
crystalline reactivity corroborating a homogeneous charge density. In deionized water the
sample showed osmotic swelling eventually leading to a complete delamination as
confirmed by AFM images.
As synthesized lithium hectorite was purified and delaminated by suspending it in
deionized water followed by dialyses until the conductivity of the surrounding water
decreased to a value less than 50 S and its pH stayed at a constant value ( 8).
Subsequently to dialysis, the lithium hectorite suspension was concentrated to about
4.5 wt% by evaporating water. The concentrated lithium hectorite suspension was then
milled in a stirred media mill in order to sheer remaining stacks and complete
delamination.[93]
For milling zirconium oxide particles coated with yttrium oxide with a
size if 0.6 – 0.8 mm were used. The chamber of the mill was filled with the beads to 80 %
of its volume. The pump speed was 100 rpm and the agitator speed was kept at 1000 rpm.
Only one cycle of milling was applied. The particle size of the lithium hectorite was
finally determined by focused beam reflectance measurement. The average particle size
of lithium hectorite used for hydrogel composites was determined to be 14 m. Assuming
complete delamination, the average aspect ratio consequently was found to be more than
10000.
As described in section 3.2, the PZNPC of lithium hectorite with Mg and Li in the
octahedral sheet is expected to be slightly above pH = 7.
3.7 Montmorillonite PGV®
3.7.1 Montmorillonite PGV® – Characteristics of the raw material
Montmorillonite PGV® was provided by Nanocor and is described as high purity
aluminosilicate. As it is a natural product only a generic formula is given:
M+
y(Al2-y Mgy)(Si4)O10(OH)2 * nH2O. It is pointed out, that due to variations in the
degree of isomorphous substitution of cations the layer charge of the material is
inhomogeneous and consequently the exact formula varies. Despite variations in the
composition, Nanocor attributes the natural clay material high phase purity of more than
3 Materials and methods
47
98% montmorillonite. The aspect ratio of the montmorillonite PGV® is stated to be 150 –
200. The cation exchange capacity of the material is given at 145 meq / 100 g ± 10 %.
3.7.2 Purification of montmorillonite PGV®
Montmorillonite PGV is a natural material and thus contains different types and amounts
of impurities. Nanocor applies different physical purification steps but accessory minerals
tightly intergrown with the clay platelets can only be removed by a selective chemical
dissolution. Since such impurities may influence the polymerization process, they were
removed. In particular, quenching of initiated radicals by amorphous iron oxyhydroxides
binders could influence the polymerization. Furthermore, these impurities can act like a
“glue” and hamper disaggregation of clay platelets. The purification process for clay
minerals implies several selective dissolution steps,[94]
which are described in the
following section.
3.7.2.1 Decomposition of Carbonates
During the first purification step carbonates are decomposed by adjusting the pH of the
clay suspension to a slightly acidic level. Furthermore, released cations, like calcium,
were removed from equilibrium by ethylene diamine tetra acetate (EDTA).
Montmorillonite PGV® powder was suspended in deionized water ( 5 wt%) and stirred
until no clumps are left and a visually homogeneous suspension was obtained. Na4EDTA
was added in portions to a final concentration of 0.1 M. The clay suspension was then
stirred at about 55 °C for two hours. In order to remove the metal complexes formed and
excessive EDTA salt the suspension was dialyzed against deionized water. Progress of
the dialysis was controlled by measuring the conductivity of the deionized water. The
dialysis was ended when the conductivity decreased to a value less than 50 µS.
The stability of EDTA complexes increases with pH. For complete removal of
magnesium carbonate a higher pH of around 8 is recommended. Therefore, in the next
step fresh Na4EDTA (0.1 M) was added and the pH was adjusted to 8. The clay
dispersion was stirred at about 55 °C for two hours. The dispersion was again dialysed
against deionized water in order to remove the EDTA complex and excessive EDTA salt.
Progress of the dialysis was controlled by measuring the conductivity of the deionized
water. The dialysis was ended when the conductivity decreased to a value less than 50 S.
3 Materials and methods
48
3.7.2.2 Dissolution of iron oxyhydroxides
Amorphous iron oxyhydroxide can be selectively removed by the dithionite/citrate/
bicarbonate method, suggested by Mehra and Jackson.[94]
Fe(III) is reduced to Fe(II) by
sodium dithionite which increases the solubility of iron. Moreover, citrate can form a
stable and water soluble complex with Fe(II). Sodium carbonate serves as buffer to
provide a pH of approximately 7.3 in order to prevent disproportionation of the dithionite.
Some structural iron of montmorillonite is also reduced in this process but is quickly re-
oxidized without any precautions.[95]
Sodium citrate was added to the PGV® suspension (0.3 M in citrate). The suspension was
buffered with 5 ml 1M sodium bicarbonate per 40 ml 0.3 M citrate solution. The
suspension was heated to 80 °C. 1 g sodium dithionite per g clay was added and the
suspension was stirred at 80 °C for one hour. The color of the suspended clay changed
from beige to green. After cooling the suspension to room temperature, just enough
sodium chloride was added to provoke flocculation of the clay. This allows centrifugation
of the clay. Proper sedimentation of the clay particles during the centrifugation is crucial
to not lose a fraction of small particles. Therefore centrifugation was carried out at 3700
rpm for ten minutes with the device Multifuge 1L of the company Heraeus. The clay
dispersion was washed once via centrifugation to remove most part of the unreacted
dithionate as it can damage the dialysis tube. After centrifugation the dispersion was
dialysed in deionized water in order to remove the citrate complex and excessive citrate
and dithionite. Progress of the dialysis was controlled by measuring the conductivity of
the deionized water. The dialysis was ended when the conductivity decreased to a value
less than 50 S.
3.7.2.3 Oxidation of organic compounds
During the final purification step, organic compounds like humic substances are removed
from the dispersion by oxidation.
The PGV® suspension was purged with ozone produced by an ozonizer during three
days.
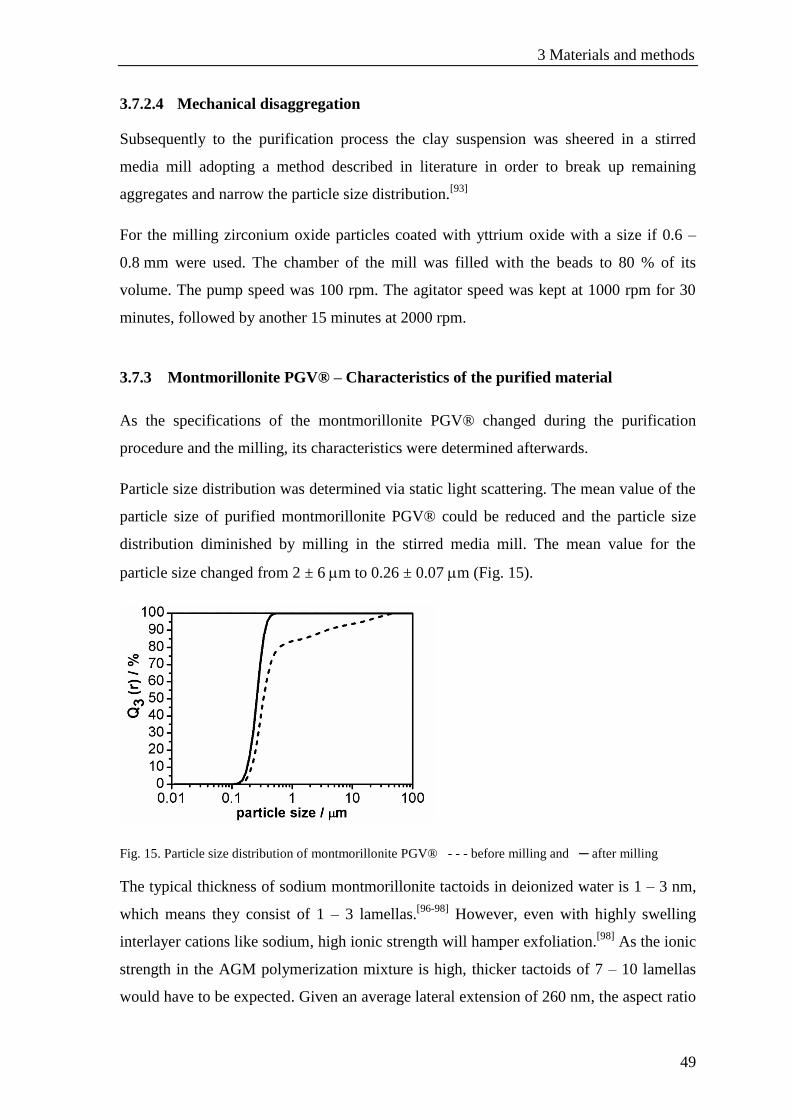
3 Materials and methods
49
3.7.2.4 Mechanical disaggregation
Subsequently to the purification process the clay suspension was sheered in a stirred
media mill adopting a method described in literature in order to break up remaining
aggregates and narrow the particle size distribution.[93]
For the milling zirconium oxide particles coated with yttrium oxide with a size if 0.6 –
0.8 mm were used. The chamber of the mill was filled with the beads to 80 % of its
volume. The pump speed was 100 rpm. The agitator speed was kept at 1000 rpm for 30
minutes, followed by another 15 minutes at 2000 rpm.
3.7.3 Montmorillonite PGV® – Characteristics of the purified material
As the specifications of the montmorillonite PGV® changed during the purification
procedure and the milling, its characteristics were determined afterwards.
Particle size distribution was determined via static light scattering. The mean value of the
particle size of purified montmorillonite PGV® could be reduced and the particle size
distribution diminished by milling in the stirred media mill. The mean value for the
particle size changed from 2 ± 6 m to 0.26 ± 0.07 m (Fig. 15).
Fig. 15. Particle size distribution of montmorillonite PGV® - - - before milling and ─ after milling
The typical thickness of sodium montmorillonite tactoids in deionized water is 1 – 3 nm,
which means they consist of 1 – 3 lamellas.[96-98]
However, even with highly swelling
interlayer cations like sodium, high ionic strength will hamper exfoliation.[98]
As the ionic
strength in the AGM polymerization mixture is high, thicker tactoids of 7 – 10 lamellas
would have to be expected. Given an average lateral extension of 260 nm, the aspect ratio
3 Materials and methods
50
for montmorillonite suspended in the polymerization mixture was assumed to be in the
range 25 – 35.
Cation exchange capacity (CEC) was analyzed applying both the copper complex method
described by Ammann et al.[92]
and the barium chloride method (DIN ISO 11260). Both
methods delivered almost identical results. The cation exchange capacity of purified
montmorillonite PGV® determined by the copper complex method was 123 meq / 100 g.
The method according to DIN ISO 11260 delivered a CEC of 122 meq / 100g.
Furthermore, the PZNPC of the clay edge was estimated with the method described in
section 3.2.
4 Results and Discussion
51
4 Results and Discussion
4.1 Dispersion of clay minerals in the polymerization mixture
AGM is a polymer based on acrylic acid with a degree of neutralization (DN) that can be
chosen from pure acid to fully neutralized. Consequently, any composition from pure
poly (acrylic acid) to pure poly acrylate is possible. Most frequently for applications in
hygiene products a DN of 75 % is chosen. Neutralization of the acrylic acid is
accomplished by the addition of sodium hydroxide. For the synthesis of AGM the content
of acrylic acid in the polymerization mixture has to be at least 15 wt%. Furthermore, the
polymerization mixture contains organic crosslinker, initiator and catalyst. For AGM
composites, inorganic fillers and necessary modifiers are additionally added.
In this work, AGM with degrees of neutralization for the acrylic acid of 0 % and 75 %
were investigated. Consequently, the pH of the monomer mixture was acidic. The content
of acrylic acid in the polymerization mixture was chosen between 15 wt% and 25 wt%.
The pH of the monomer mixture was determined with colorimetric pH test paper. The
non-neutralized monomer mixture showed a pH of about 2. If the acrylic acid was
neutralized to 75 %, the pH of the monomer mixture was found to be pH 5.
The scope of this work was to incorporate different clay minerals into the AGM polymer
and synthesize a new type of AGM composite. As stated in the introductory section, the
incorporation of clay minerals into the described AGM was not straight forward due to
immanent surface properties of clay minerals. House of cards agglomeration is expected
to be provoked due to the acidic dispersion medium. Furthermore, the high ionic strength
of the monomer mixture could cause lamellar agglomeration.
4.1.1 Modification of the clay edge – Prevention of house of cards structure
Lithium hectorite has an aspect ratio higher than 10000. Consequently, the clay edge
amounts to only a small percentage of the whole clay surface, namely 0.1 %. Therefore, a
Laponite® clay was chosen to model for lithium hectorite to determine the PZC of the
edges. Like the lithium hectorite, Laponite® clays are also synthetic clays. The
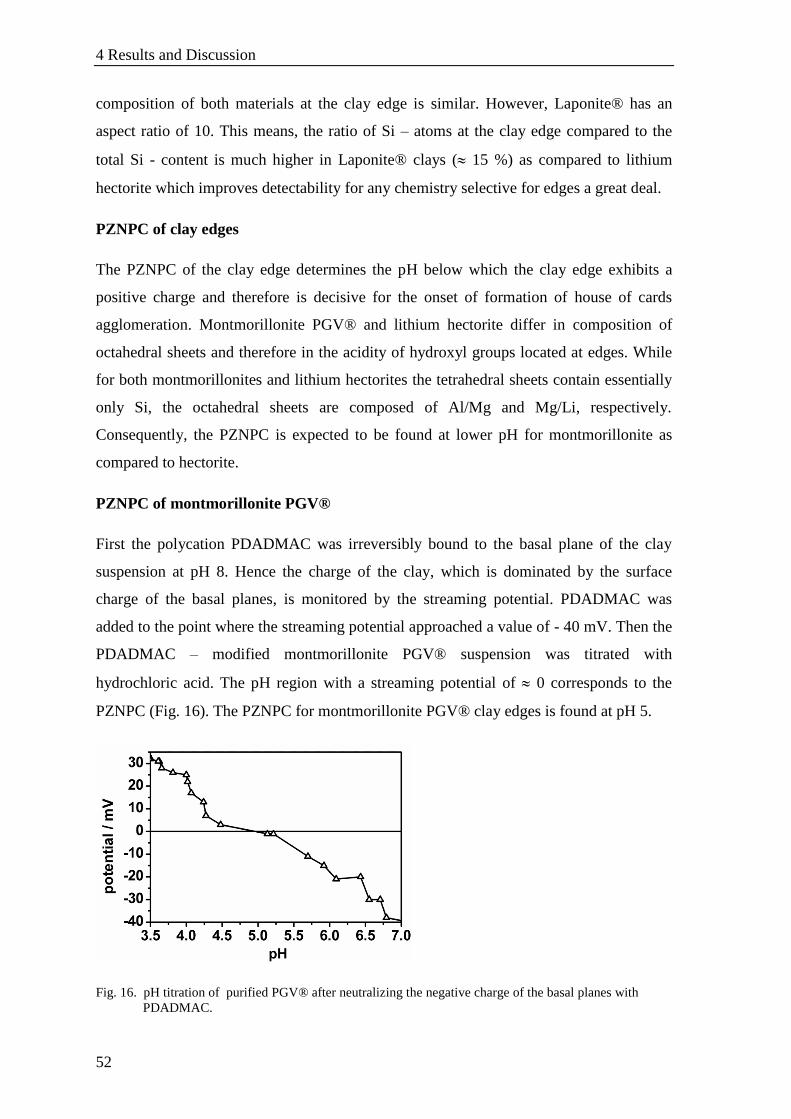
4 Results and Discussion
52
composition of both materials at the clay edge is similar. However, Laponite® has an
aspect ratio of 10. This means, the ratio of Si – atoms at the clay edge compared to the
total Si - content is much higher in Laponite® clays ( 15 %) as compared to lithium
hectorite which improves detectability for any chemistry selective for edges a great deal.
PZNPC of clay edges
The PZNPC of the clay edge determines the pH below which the clay edge exhibits a
positive charge and therefore is decisive for the onset of formation of house of cards
agglomeration. Montmorillonite PGV® and lithium hectorite differ in composition of
octahedral sheets and therefore in the acidity of hydroxyl groups located at edges. While
for both montmorillonites and lithium hectorites the tetrahedral sheets contain essentially
only Si, the octahedral sheets are composed of Al/Mg and Mg/Li, respectively.
Consequently, the PZNPC is expected to be found at lower pH for montmorillonite as
compared to hectorite.
PZNPC of montmorillonite PGV®
First the polycation PDADMAC was irreversibly bound to the basal plane of the clay
suspension at pH 8. Hence the charge of the clay, which is dominated by the surface
charge of the basal planes, is monitored by the streaming potential. PDADMAC was
added to the point where the streaming potential approached a value of - 40 mV. Then the
PDADMAC – modified montmorillonite PGV® suspension was titrated with
hydrochloric acid. The pH region with a streaming potential of 0 corresponds to the
PZNPC (Fig. 16). The PZNPC for montmorillonite PGV® clay edges is found at pH 5.
Fig. 16. pH titration of purified PGV® after neutralizing the negative charge of the basal planes with
PDADMAC.
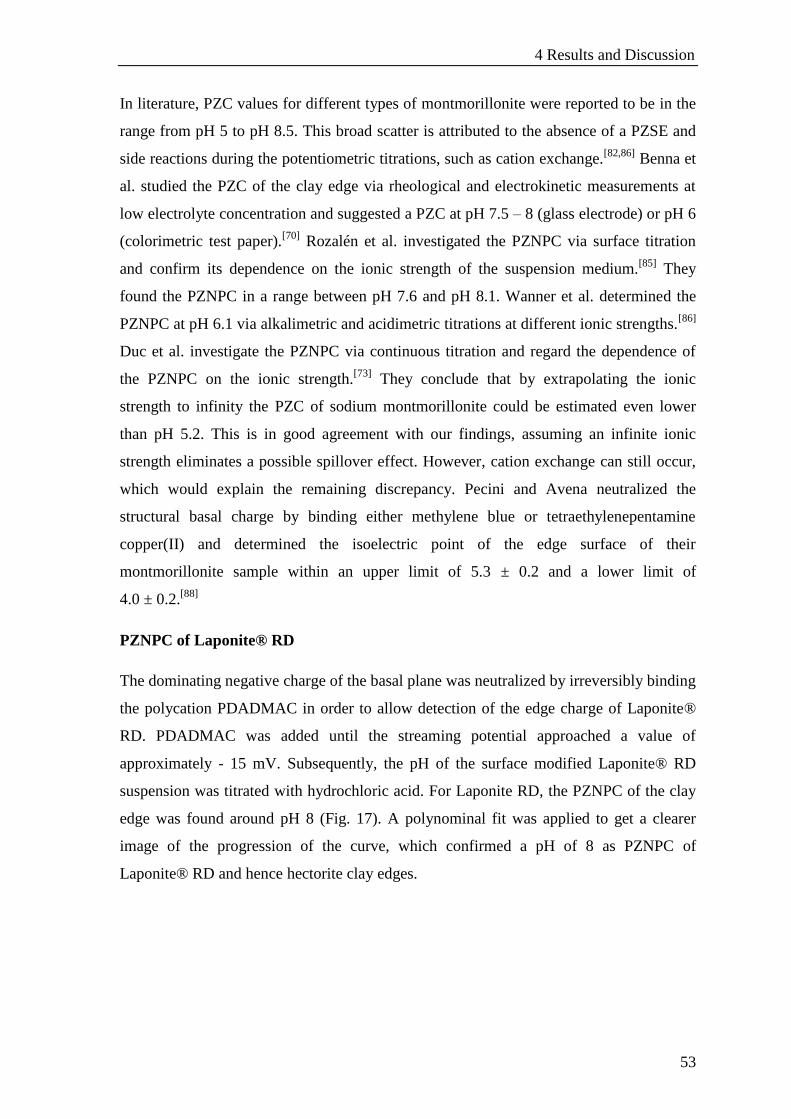
4 Results and Discussion
53
In literature, PZC values for different types of montmorillonite were reported to be in the
range from pH 5 to pH 8.5. This broad scatter is attributed to the absence of a PZSE and
side reactions during the potentiometric titrations, such as cation exchange.[82,86]
Benna et
al. studied the PZC of the clay edge via rheological and electrokinetic measurements at
low electrolyte concentration and suggested a PZC at pH 7.5 – 8 (glass electrode) or pH 6
(colorimetric test paper).[70]
Rozalén et al. investigated the PZNPC via surface titration
and confirm its dependence on the ionic strength of the suspension medium.[85]
They
found the PZNPC in a range between pH 7.6 and pH 8.1. Wanner et al. determined the
PZNPC at pH 6.1 via alkalimetric and acidimetric titrations at different ionic strengths.[86]
Duc et al. investigate the PZNPC via continuous titration and regard the dependence of
the PZNPC on the ionic strength.[73]
They conclude that by extrapolating the ionic
strength to infinity the PZC of sodium montmorillonite could be estimated even lower
than pH 5.2. This is in good agreement with our findings, assuming an infinite ionic
strength eliminates a possible spillover effect. However, cation exchange can still occur,
which would explain the remaining discrepancy. Pecini and Avena neutralized the
structural basal charge by binding either methylene blue or tetraethylenepentamine
copper(II) and determined the isoelectric point of the edge surface of their
montmorillonite sample within an upper limit of 5.3 ± 0.2 and a lower limit of
4.0 ± 0.2.[88]
PZNPC of Laponite® RD
The dominating negative charge of the basal plane was neutralized by irreversibly binding
the polycation PDADMAC in order to allow detection of the edge charge of Laponite®
RD. PDADMAC was added until the streaming potential approached a value of
approximately - 15 mV. Subsequently, the pH of the surface modified Laponite® RD
suspension was titrated with hydrochloric acid. For Laponite RD, the PZNPC of the clay
edge was found around pH 8 (Fig. 17). A polynominal fit was applied to get a clearer
image of the progression of the curve, which confirmed a pH of 8 as PZNPC of
Laponite® RD and hence hectorite clay edges.
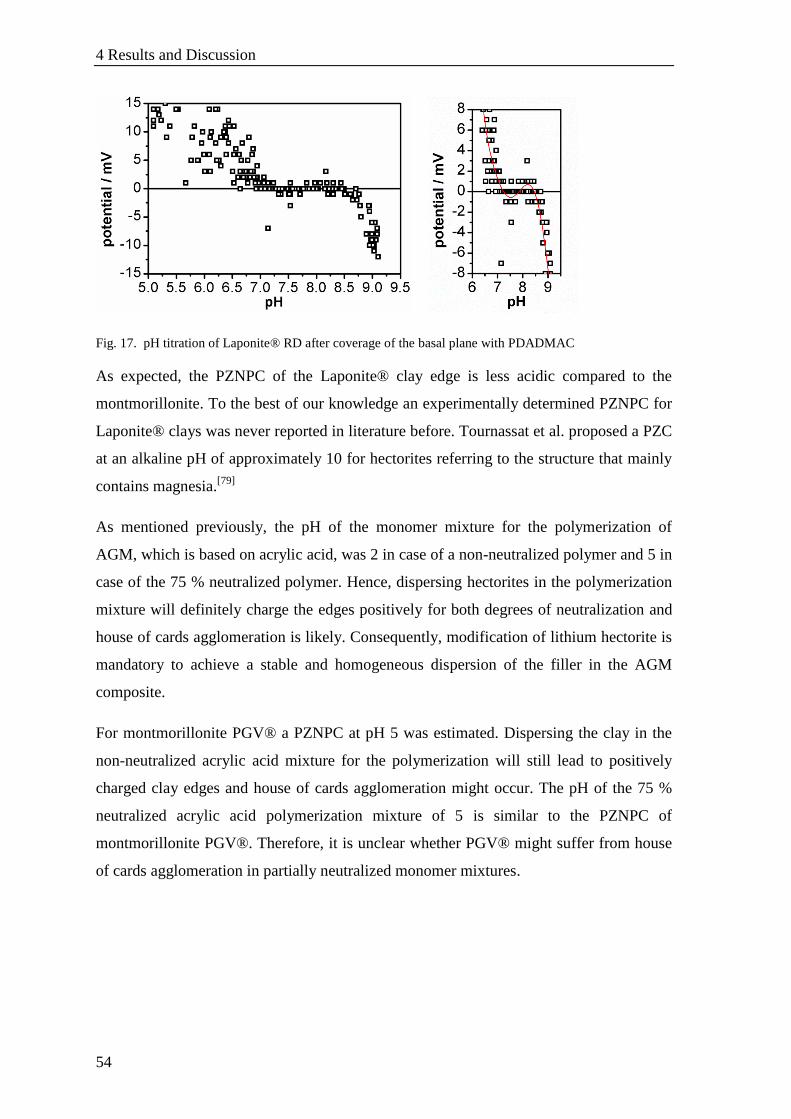
4 Results and Discussion
54
Fig. 17. pH titration of Laponite® RD after coverage of the basal plane with PDADMAC
As expected, the PZNPC of the Laponite® clay edge is less acidic compared to the
montmorillonite. To the best of our knowledge an experimentally determined PZNPC for
Laponite® clays was never reported in literature before. Tournassat et al. proposed a PZC
at an alkaline pH of approximately 10 for hectorites referring to the structure that mainly
contains magnesia.[79]
As mentioned previously, the pH of the monomer mixture for the polymerization of
AGM, which is based on acrylic acid, was 2 in case of a non-neutralized polymer and 5 in
case of the 75 % neutralized polymer. Hence, dispersing hectorites in the polymerization
mixture will definitely charge the edges positively for both degrees of neutralization and
house of cards agglomeration is likely. Consequently, modification of lithium hectorite is
mandatory to achieve a stable and homogeneous dispersion of the filler in the AGM
composite.
For montmorillonite PGV® a PZNPC at pH 5 was estimated. Dispersing the clay in the
non-neutralized acrylic acid mixture for the polymerization will still lead to positively
charged clay edges and house of cards agglomeration might occur. The pH of the 75 %
neutralized acrylic acid polymerization mixture of 5 is similar to the PZNPC of
montmorillonite PGV®. Therefore, it is unclear whether PGV® might suffer from house
of cards agglomeration in partially neutralized monomer mixtures.
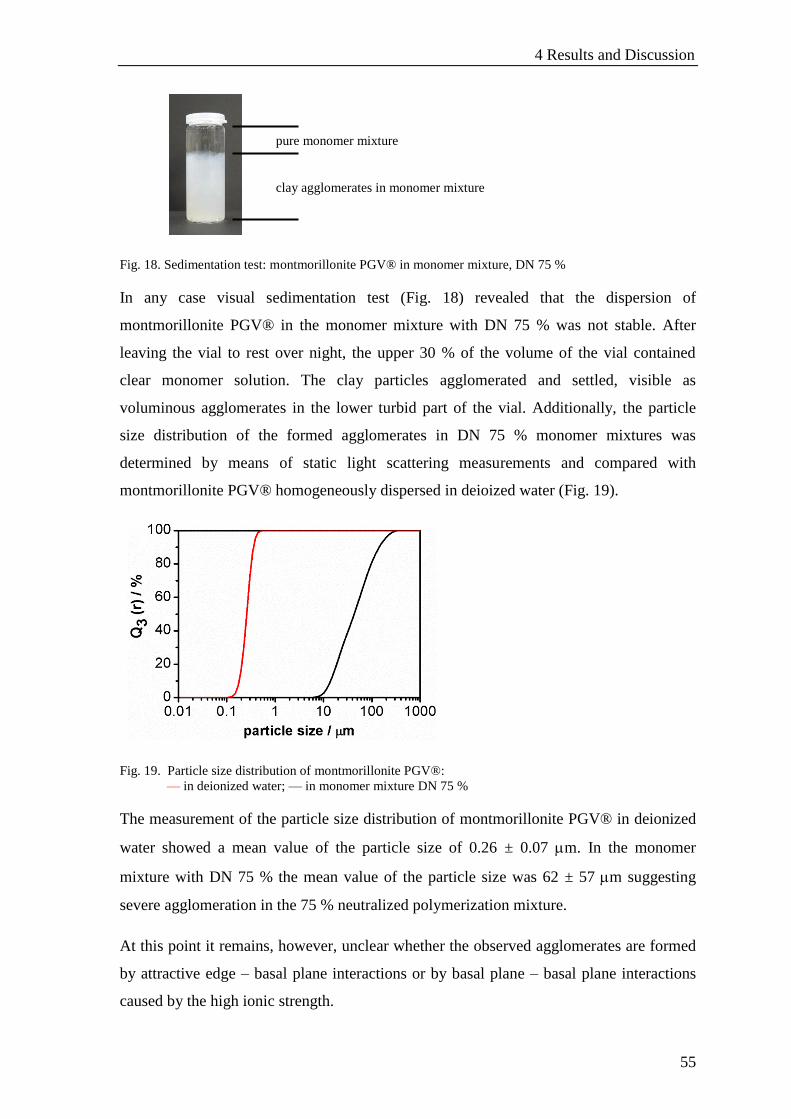
4 Results and Discussion
55
Fig. 18. Sedimentation test: montmorillonite PGV® in monomer mixture, DN 75 %
In any case visual sedimentation test (Fig. 18) revealed that the dispersion of
montmorillonite PGV® in the monomer mixture with DN 75 % was not stable. After
leaving the vial to rest over night, the upper 30 % of the volume of the vial contained
clear monomer solution. The clay particles agglomerated and settled, visible as
voluminous agglomerates in the lower turbid part of the vial. Additionally, the particle
size distribution of the formed agglomerates in DN 75 % monomer mixtures was
determined by means of static light scattering measurements and compared with
montmorillonite PGV® homogeneously dispersed in deioized water (Fig. 19).
Fig. 19. Particle size distribution of montmorillonite PGV®:
— in deionized water; — in monomer mixture DN 75 %
The measurement of the particle size distribution of montmorillonite PGV® in deionized
water showed a mean value of the particle size of 0.26 ± 0.07 m. In the monomer
mixture with DN 75 % the mean value of the particle size was 62 ± 57 m suggesting
severe agglomeration in the 75 % neutralized polymerization mixture.
At this point it remains, however, unclear whether the observed agglomerates are formed
by attractive edge – basal plane interactions or by basal plane – basal plane interactions
caused by the high ionic strength.
pure monomer mixture
clay agglomerates in monomer mixture

4 Results and Discussion
56
4.1.1.1 Modification of clay edges
Two different approaches were pursued to achieve a modification of clay edges that
would remove the pH-dependency of the edge charge:
Conversion of Si – OH groups to Si – F groups by ion exchange via fluorination
Charge reversion by strongly binding multivalent anions to octahedral cations via
phosphorylation
As described in some detail in section 3.3.2, the number of hydroxyl groups at the clay
edge was estimated assuming a density of the clay material of 2.5 g/cm3, a Si – Si
distance of 0.303 nm, a hexagonal shape of clay platelet, and a typical size which differs
for the two types of clays applied.
Fluorination of the clay minerals was carried out with sodium fluoride. The
phosphorylation was done with sodium pyrophosphate. The efficiency of these two edge
modifiers to prevent or reduce agglomeration in a polymerization environment was
mainly judged by particles size distributions as measured by static light scattering.
Montmorillonite PGV® is particularly well suited to monitor any agglomeration since its
primary particles (tactoids) are in the range of 260 nm which can safely be spotted in
static light scattering and this size of primarily particles is well separated from much
larger aggregates or agglomerates. Laponite® diameters are way too small to be detected
with static light scattering and hectorite is so large that its primary particles might fall
within the range of aggregates or agglomerates.
Edge modification of montmorillonite PGV®
The number of hydroxyl groups at the edges of montmorillonite PGV® was estimated to
be 0.16 mmol assuming a typical side length of 150 nm for the hexagonal platelets.
Fluorination of montmorillonite PGV®
Fluorination of the clay edge converts the Si – OH groups into Si – F groups and
consequently the clay edge will no longer vary with pH. To evaluate the efficiency of
edge fluorination on the agglomeration behavior of montmorillonite PGV® in the
monomer mixture with DN 75 %, the amounts of sodium fluoride applied was varied
systematically and the stability of the following suspensions were compared:
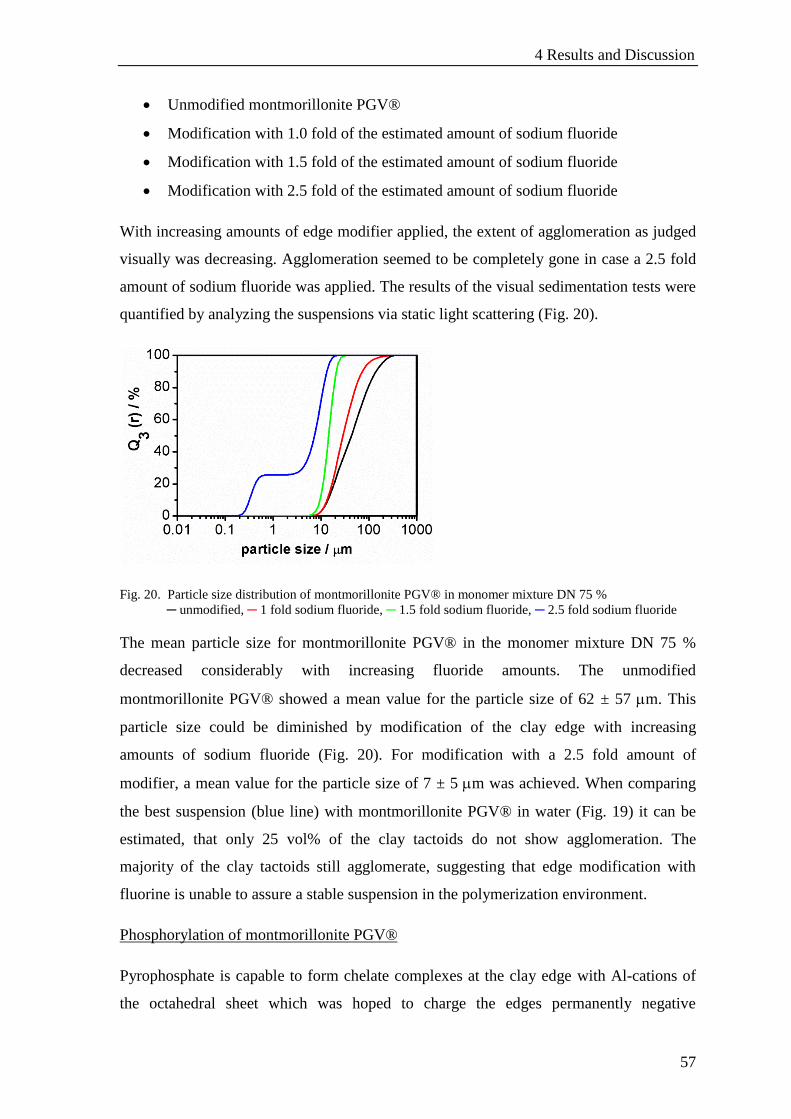
4 Results and Discussion
57
Unmodified montmorillonite PGV®
Modification with 1.0 fold of the estimated amount of sodium fluoride
Modification with 1.5 fold of the estimated amount of sodium fluoride
Modification with 2.5 fold of the estimated amount of sodium fluoride
With increasing amounts of edge modifier applied, the extent of agglomeration as judged
visually was decreasing. Agglomeration seemed to be completely gone in case a 2.5 fold
amount of sodium fluoride was applied. The results of the visual sedimentation tests were
quantified by analyzing the suspensions via static light scattering (Fig. 20).
Fig. 20. Particle size distribution of montmorillonite PGV® in monomer mixture DN 75 %
─ unmodified, ─ 1 fold sodium fluoride, ─ 1.5 fold sodium fluoride, ─ 2.5 fold sodium fluoride
The mean particle size for montmorillonite PGV® in the monomer mixture DN 75 %
decreased considerably with increasing fluoride amounts. The unmodified
montmorillonite PGV® showed a mean value for the particle size of 62 ± 57 m. This
particle size could be diminished by modification of the clay edge with increasing
amounts of sodium fluoride (Fig. 20). For modification with a 2.5 fold amount of
modifier, a mean value for the particle size of 7 ± 5 m was achieved. When comparing
the best suspension (blue line) with montmorillonite PGV® in water (Fig. 19) it can be
estimated, that only 25 vol% of the clay tactoids do not show agglomeration. The
majority of the clay tactoids still agglomerate, suggesting that edge modification with
fluorine is unable to assure a stable suspension in the polymerization environment.
Phosphorylation of montmorillonite PGV®
Pyrophosphate is capable to form chelate complexes at the clay edge with Al-cations of
the octahedral sheet which was hoped to charge the edges permanently negative
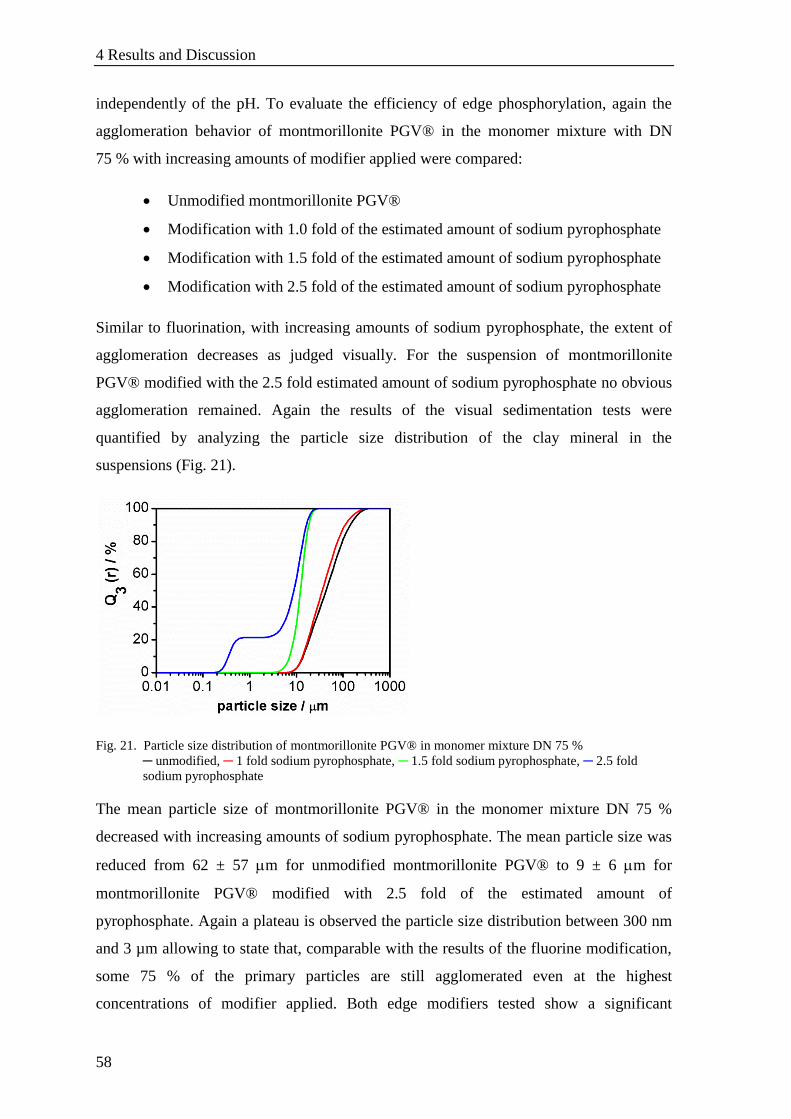
4 Results and Discussion
58
independently of the pH. To evaluate the efficiency of edge phosphorylation, again the
agglomeration behavior of montmorillonite PGV® in the monomer mixture with DN
75 % with increasing amounts of modifier applied were compared:
Unmodified montmorillonite PGV®
Modification with 1.0 fold of the estimated amount of sodium pyrophosphate
Modification with 1.5 fold of the estimated amount of sodium pyrophosphate
Modification with 2.5 fold of the estimated amount of sodium pyrophosphate
Similar to fluorination, with increasing amounts of sodium pyrophosphate, the extent of
agglomeration decreases as judged visually. For the suspension of montmorillonite
PGV® modified with the 2.5 fold estimated amount of sodium pyrophosphate no obvious
agglomeration remained. Again the results of the visual sedimentation tests were
quantified by analyzing the particle size distribution of the clay mineral in the
suspensions (Fig. 21).
Fig. 21. Particle size distribution of montmorillonite PGV® in monomer mixture DN 75 %
─ unmodified, ─ 1 fold sodium pyrophosphate, ─ 1.5 fold sodium pyrophosphate, ─ 2.5 fold
sodium pyrophosphate
The mean particle size of montmorillonite PGV® in the monomer mixture DN 75 %
decreased with increasing amounts of sodium pyrophosphate. The mean particle size was
reduced from 62 ± 57 m for unmodified montmorillonite PGV® to 9 ± 6 m for
montmorillonite PGV® modified with 2.5 fold of the estimated amount of
pyrophosphate. Again a plateau is observed the particle size distribution between 300 nm
and 3 µm allowing to state that, comparable with the results of the fluorine modification,
some 75 % of the primary particles are still agglomerated even at the highest
concentrations of modifier applied. Both edge modifiers tested show a significant
4 Results and Discussion
59
reduction in agglomeration tendency. However, they both fail to assure a well dispersed
and stable suspension in the rather harsh polymerization environment of AGM.
Summarizing, one can say, that edge modification of the clay clearly helped to reduce the
extent of agglomeration of clay particles in the acidic monomer mixture. However,
flocculation could not be completely avoided. Consequently, edge modification alone is
not sufficient to establish a homogeneous distribution of clay minerals in AGM.
Therefore, next the possibility of basal plane modification was probed in order to reduce
band-like agglomerate structures fostered by the high ionic strength.
4.1.2 Modification of basal planes – Prevention of lamellar agglomeration
As explained in the introduction, high ionic strength of the suspension medium reduces
the electrostatic repulsion between the permanently negatively charged basal planes and
therefore leads to lamellar agglomeration of clay platelets. The effect will be even more
severe in solvents of lower dielectric constant, e.g. monomer mixtures. Consequently, the
basal planes of the clay mineral had to be modified to achieve an (elctro-)steric
stabilization in the polymerization environment. As the basal planes of clay minerals are
permanently negatively charged, they can easily be modified by electrostatic binding of
polycations. Possible charge reversion of the basal plane additionally helps avoiding the
formation of house of cards structures at low pH values where the edges are also
positively charged.
4.1.2.1 Identification of suitable basal modifiers
27 different modifiers of various composition and molecular weight were screened by
visual sedimentation tests (Table 5).
Table 5. Modifiers screened by visual sedimentation tests; charge at pH 5
Cationic
OD poly (ethylene imine), ethoxylated (1 unit)
ODD poly (ethylene imine), ethoxylated (chain length: 20 units)
POD poly (ethylene imine), ethoxylated (chain length: 10 units)
and propoxylated (chain length: 7 units)
HOD poly (ethylene imine), ethoxylated (chain length: 24 units)
and propoxylated (chain length: 16 units)
PAM poly (acrylamide)
4 Results and Discussion
60
PB hexamethylene diamine, ethoxylated (chain length: 24
units), quaternized with methyl chloride
Sokalan HP56K poly (vinylpyrrolidone – co – vinylimidazol)
Dimethyl aminoethyl methacrylate (monomer)
Tris(hydroxymethyl) amino methane
Poly (ethylene imine), 80% ethoxylated (Sigma Aldrich)
PAMAM dendrimer
Anionic
Sokalan CP 5 poly (maleic acid – co – acrylic acid)
Sokalan CP 10S modified poly (acrylic acid)
Carboxymethylcellulose
Non-ionic RV grafted poly (ethyleneglycol)
Sokalan HP 53 poly (vinylpyrrolidone)
Zwitterionic ZPB zwitterionic poly amine
Various
confidential
material of P&G
RD#164877; RD#169525; RD#169527; RD#170766;
RD#170768; RD#171741; RD#171744; RD#173387;
RD#173490; RD#1694276
Suspensions of montmorillonite PGV® in the monomer mixture with DN 75 % were
prepared with varying amounts of each tested modifier. Due to the large particle sizes of
lithium hectorite, suspensions tend to sediment in any medium. The tests were therefore
restricted to montmorillonite PGV® and it is assumed that the results can be transferred
to lithium hectorite.
After sedimentation over night, all samples were investigated visually to judge the
sedimentation stability qualitatively and pictures were taken (Fig. 22). Note that
voluminous flocculation was easily detectable by eye. However, on the pictures
flocculation is harder to identify and might be mistaken for stable dispersion.
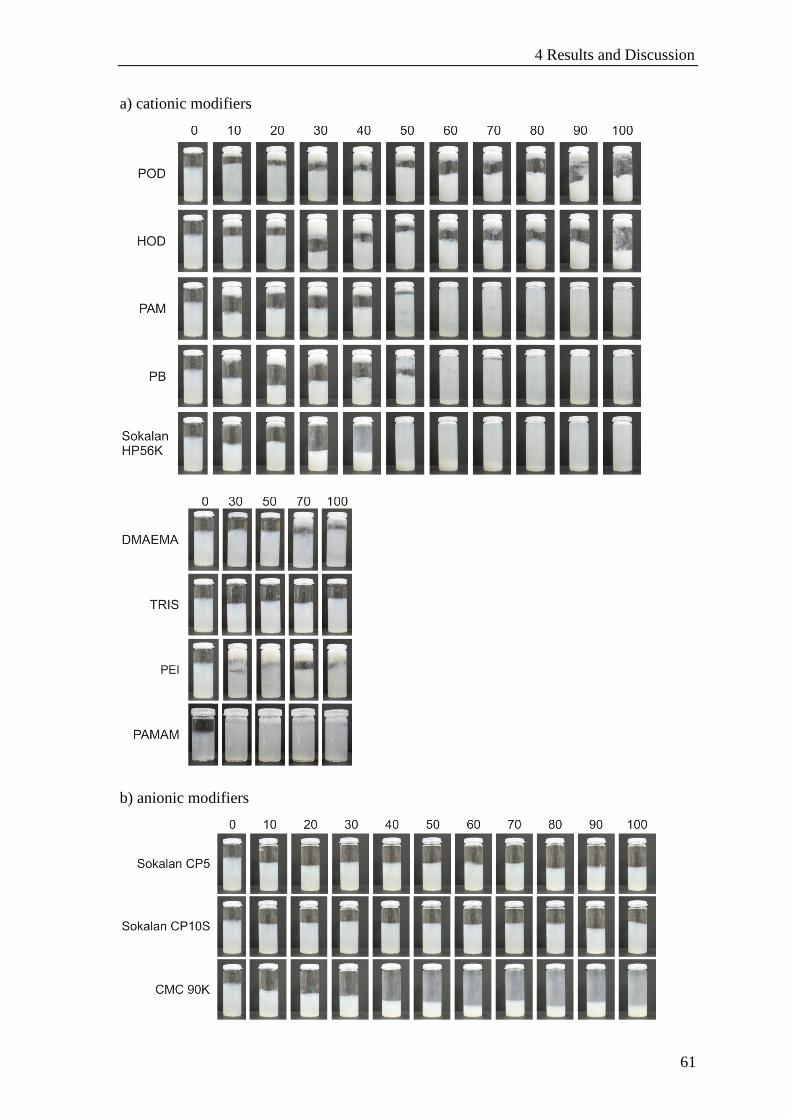
4 Results and Discussion
61
a) cationic modifiers
b) anionic modifiers
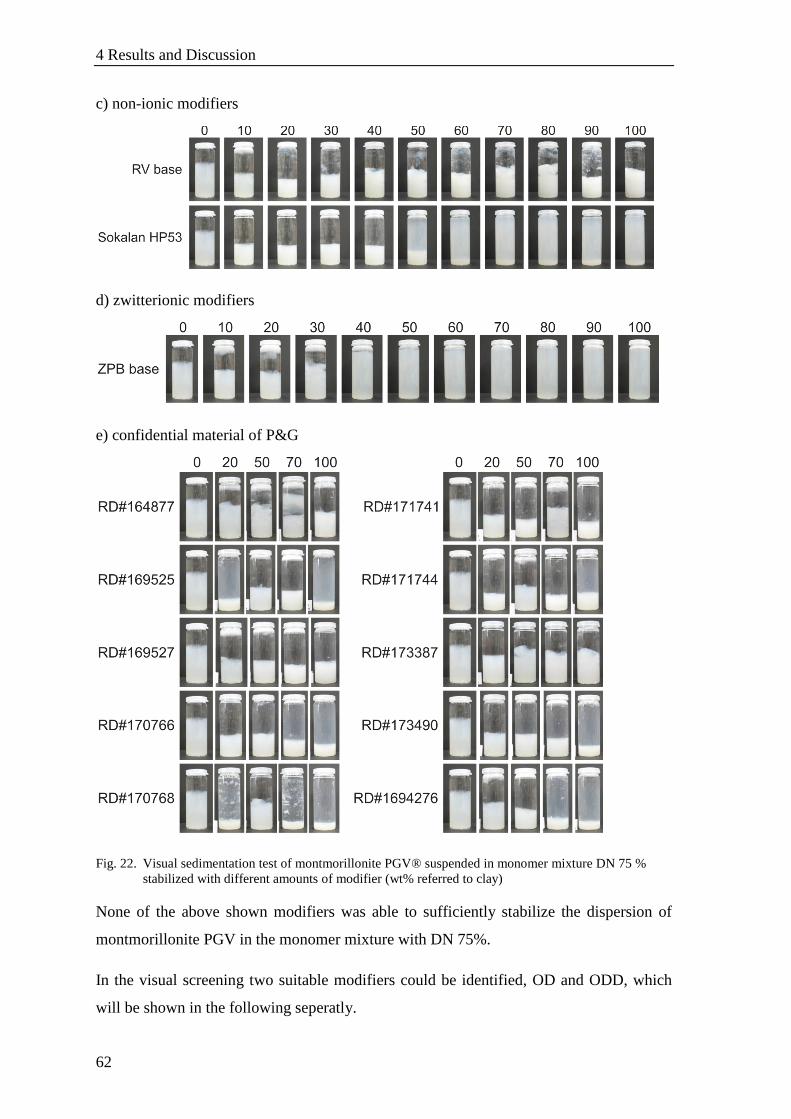
4 Results and Discussion
62
c) non-ionic modifiers
d) zwitterionic modifiers
e) confidential material of P&G
Fig. 22. Visual sedimentation test of montmorillonite PGV® suspended in monomer mixture DN 75 %
stabilized with different amounts of modifier (wt% referred to clay)
None of the above shown modifiers was able to sufficiently stabilize the dispersion of
montmorillonite PGV in the monomer mixture with DN 75%.
In the visual screening two suitable modifiers could be identified, OD and ODD, which
will be shown in the following seperatly.
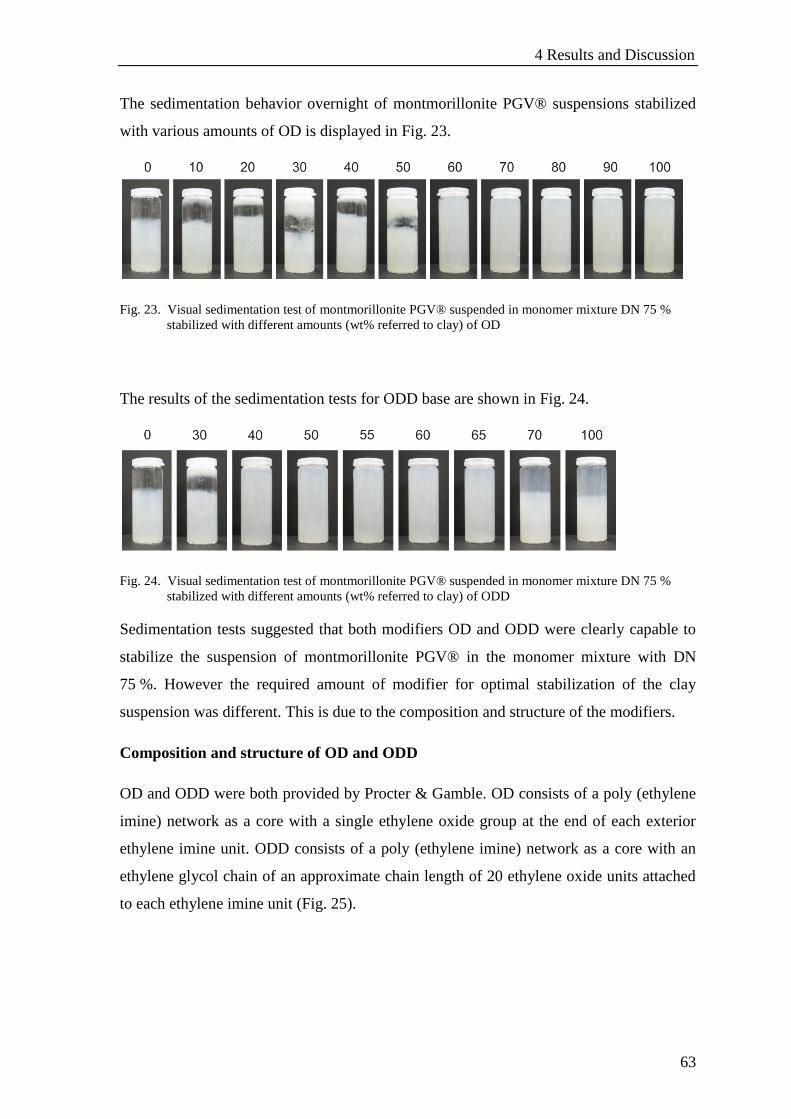
4 Results and Discussion
63
The sedimentation behavior overnight of montmorillonite PGV® suspensions stabilized
with various amounts of OD is displayed in Fig. 23.
Fig. 23. Visual sedimentation test of montmorillonite PGV® suspended in monomer mixture DN 75 %
stabilized with different amounts (wt% referred to clay) of OD
The results of the sedimentation tests for ODD base are shown in Fig. 24.
Fig. 24. Visual sedimentation test of montmorillonite PGV® suspended in monomer mixture DN 75 %
stabilized with different amounts (wt% referred to clay) of ODD
Sedimentation tests suggested that both modifiers OD and ODD were clearly capable to
stabilize the suspension of montmorillonite PGV® in the monomer mixture with DN
75 %. However the required amount of modifier for optimal stabilization of the clay
suspension was different. This is due to the composition and structure of the modifiers.
Composition and structure of OD and ODD
OD and ODD were both provided by Procter & Gamble. OD consists of a poly (ethylene
imine) network as a core with a single ethylene oxide group at the end of each exterior
ethylene imine unit. ODD consists of a poly (ethylene imine) network as a core with an
ethylene glycol chain of an approximate chain length of 20 ethylene oxide units attached
to each ethylene imine unit (Fig. 25).
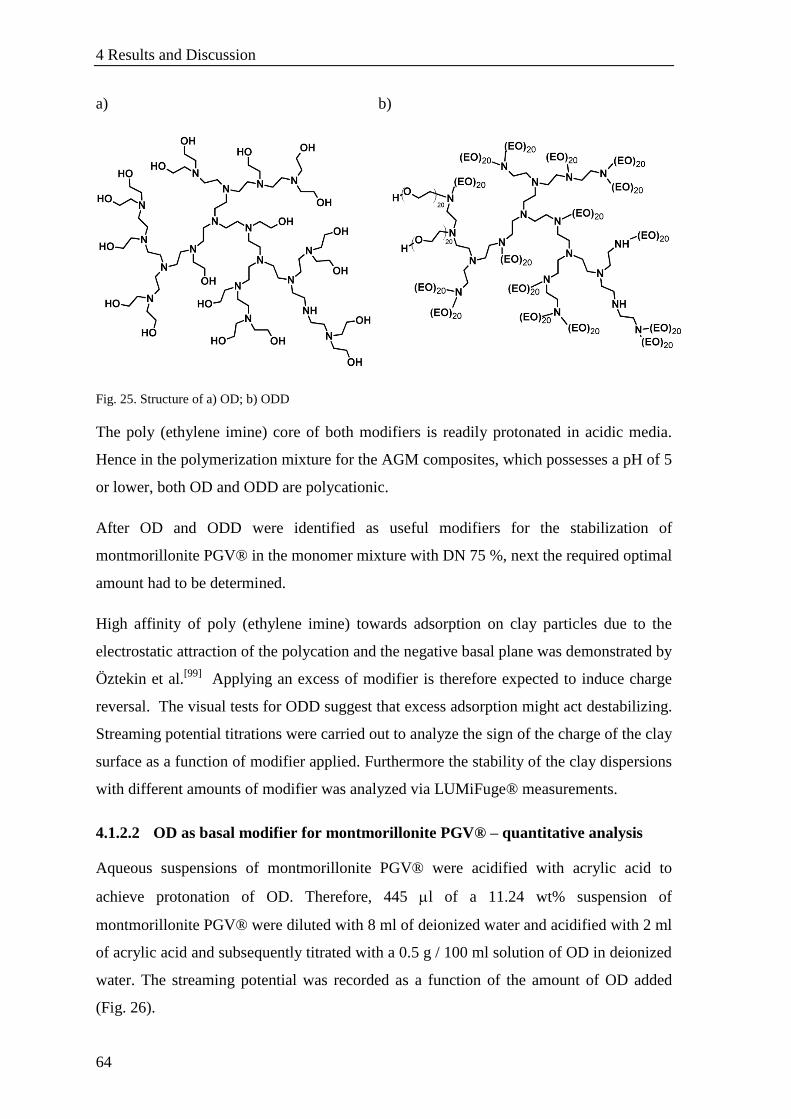
4 Results and Discussion
64
a) b)
Fig. 25. Structure of a) OD; b) ODD
The poly (ethylene imine) core of both modifiers is readily protonated in acidic media.
Hence in the polymerization mixture for the AGM composites, which possesses a pH of 5
or lower, both OD and ODD are polycationic.
After OD and ODD were identified as useful modifiers for the stabilization of
montmorillonite PGV® in the monomer mixture with DN 75 %, next the required optimal
amount had to be determined.
High affinity of poly (ethylene imine) towards adsorption on clay particles due to the
electrostatic attraction of the polycation and the negative basal plane was demonstrated by
Öztekin et al.[99]
Applying an excess of modifier is therefore expected to induce charge
reversal. The visual tests for ODD suggest that excess adsorption might act destabilizing.
Streaming potential titrations were carried out to analyze the sign of the charge of the clay
surface as a function of modifier applied. Furthermore the stability of the clay dispersions
with different amounts of modifier was analyzed via LUMiFuge® measurements.
4.1.2.2 OD as basal modifier for montmorillonite PGV® – quantitative analysis
Aqueous suspensions of montmorillonite PGV® were acidified with acrylic acid to
achieve protonation of OD. Therefore, 445 l of a 11.24 wt% suspension of
montmorillonite PGV® were diluted with 8 ml of deionized water and acidified with 2 ml
of acrylic acid and subsequently titrated with a 0.5 g / 100 ml solution of OD in deionized
water. The streaming potential was recorded as a function of the amount of OD added
(Fig. 26).
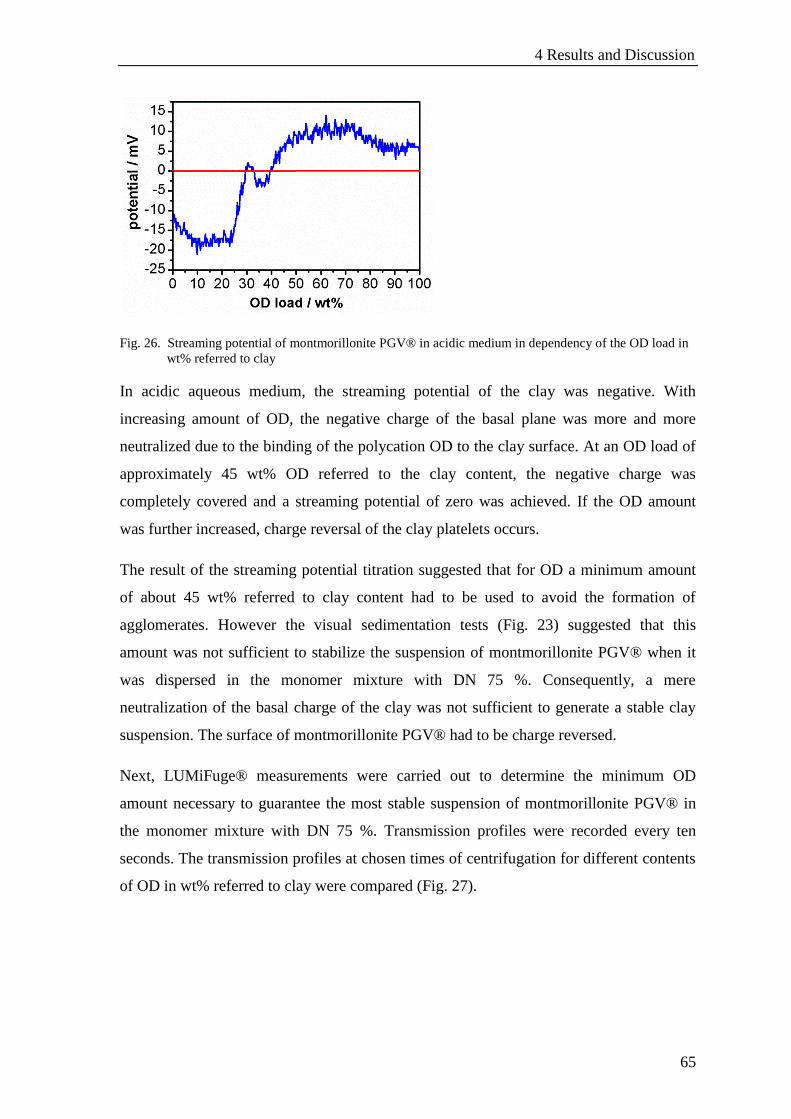
4 Results and Discussion
65
Fig. 26. Streaming potential of montmorillonite PGV® in acidic medium in dependency of the OD load in
wt% referred to clay
In acidic aqueous medium, the streaming potential of the clay was negative. With
increasing amount of OD, the negative charge of the basal plane was more and more
neutralized due to the binding of the polycation OD to the clay surface. At an OD load of
approximately 45 wt% OD referred to the clay content, the negative charge was
completely covered and a streaming potential of zero was achieved. If the OD amount
was further increased, charge reversal of the clay platelets occurs.
The result of the streaming potential titration suggested that for OD a minimum amount
of about 45 wt% referred to clay content had to be used to avoid the formation of
agglomerates. However the visual sedimentation tests (Fig. 23) suggested that this
amount was not sufficient to stabilize the suspension of montmorillonite PGV® when it
was dispersed in the monomer mixture with DN 75 %. Consequently, a mere
neutralization of the basal charge of the clay was not sufficient to generate a stable clay
suspension. The surface of montmorillonite PGV® had to be charge reversed.
Next, LUMiFuge® measurements were carried out to determine the minimum OD
amount necessary to guarantee the most stable suspension of montmorillonite PGV® in
the monomer mixture with DN 75 %. Transmission profiles were recorded every ten
seconds. The transmission profiles at chosen times of centrifugation for different contents
of OD in wt% referred to clay were compared (Fig. 27).

4 Results and Discussion
66
a) b)
c) d)
Fig. 27. LUMiFuge® measurements of montmorillonite PGV® suspended in monomer mixture DN 75 %,
recorded after: ─ 10 s, ─ 1 min, ─ 5 min, ─ 10 min, ─ 20 min
a) without modifier; b) with 72 wt% OD; c) with 75 wt% OD; d) with 77 wt% OD
Unmodified montmorillonite PGV® (Fig. 27 a)) was still homogeneously dispersed after
ten seconds of centrifugation in the LUMiFuge®. After a minute the clay already started
settling. With ongoing centrifugation the sedimentation process quickly proceeded.
Significantly different results are obtained when OD is added to the clay suspension. The
optimum amount of OD was, however, found at much higher concentrations as needed
for charge neutrality. With 72 wt% of OD (Fig. 27 b)) sedimentation is clearly slowed
down as compared to the unmodified sample but pronounced sedimentation still sets in
after 10 min. With 75 wt% (Fig. 27 c)) of OD an optimal sedimentation stability is
reached than could not be improved further with 77 wt% OD (Fig. 27 d)).
In summary, OD was found suitable to stabilize the dispersion of montmorillonite PGV®
in monomer mixture with DN 75 %. The optimum amount of OD was 75 wt% referred to
clay, which was already roughly indicated by the visual sedimentation tests. A
modification of montmorillonite PGV® with 75 wt% of OD has already been shown by
streaming potential experiments (Fig. 26) to cause charge reversal of the clay platelet. A
mere charge neutralization of the negative basal charge was not sufficient to stabilize the
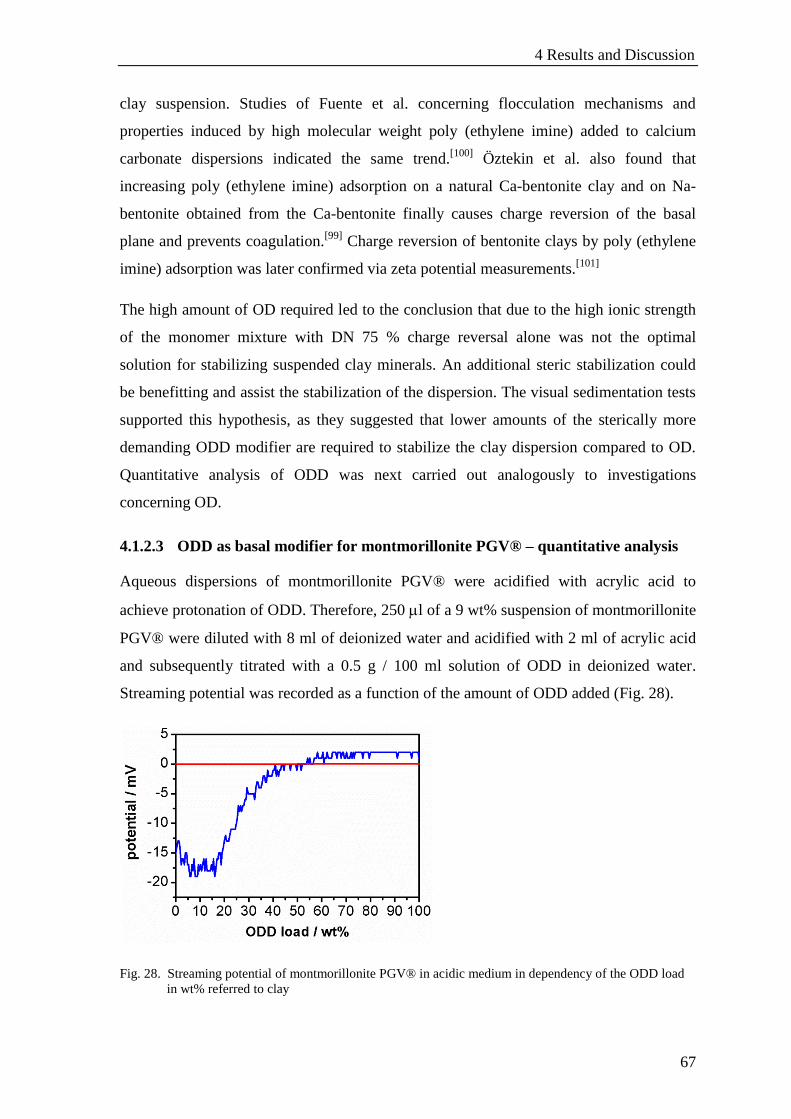
4 Results and Discussion
67
clay suspension. Studies of Fuente et al. concerning flocculation mechanisms and
properties induced by high molecular weight poly (ethylene imine) added to calcium
carbonate dispersions indicated the same trend.[100]
Öztekin et al. also found that
increasing poly (ethylene imine) adsorption on a natural Ca-bentonite clay and on Na-
bentonite obtained from the Ca-bentonite finally causes charge reversion of the basal
plane and prevents coagulation.[99]
Charge reversion of bentonite clays by poly (ethylene
imine) adsorption was later confirmed via zeta potential measurements.[101]
The high amount of OD required led to the conclusion that due to the high ionic strength
of the monomer mixture with DN 75 % charge reversal alone was not the optimal
solution for stabilizing suspended clay minerals. An additional steric stabilization could
be benefitting and assist the stabilization of the dispersion. The visual sedimentation tests
supported this hypothesis, as they suggested that lower amounts of the sterically more
demanding ODD modifier are required to stabilize the clay dispersion compared to OD.
Quantitative analysis of ODD was next carried out analogously to investigations
concerning OD.
4.1.2.3 ODD as basal modifier for montmorillonite PGV® – quantitative analysis
Aqueous dispersions of montmorillonite PGV® were acidified with acrylic acid to
achieve protonation of ODD. Therefore, 250 l of a 9 wt% suspension of montmorillonite
PGV® were diluted with 8 ml of deionized water and acidified with 2 ml of acrylic acid
and subsequently titrated with a 0.5 g / 100 ml solution of ODD in deionized water.
Streaming potential was recorded as a function of the amount of ODD added (Fig. 28).
Fig. 28. Streaming potential of montmorillonite PGV® in acidic medium in dependency of the ODD load
in wt% referred to clay
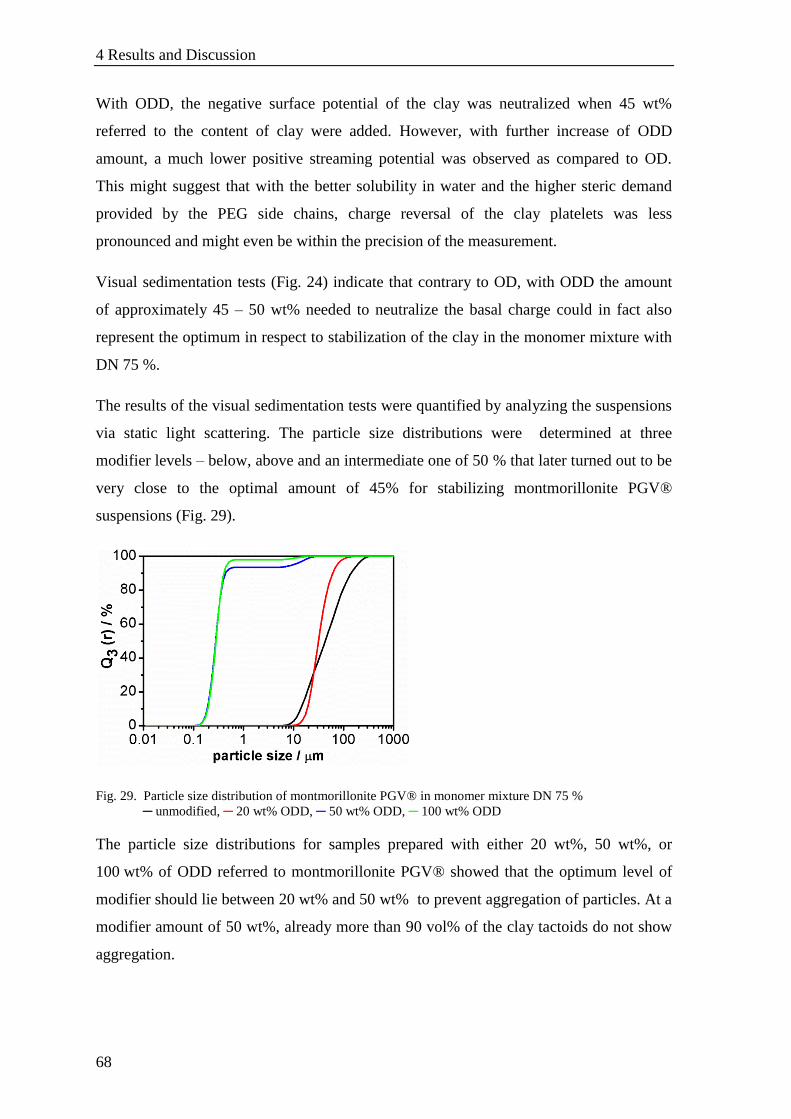
4 Results and Discussion
68
With ODD, the negative surface potential of the clay was neutralized when 45 wt%
referred to the content of clay were added. However, with further increase of ODD
amount, a much lower positive streaming potential was observed as compared to OD.
This might suggest that with the better solubility in water and the higher steric demand
provided by the PEG side chains, charge reversal of the clay platelets was less
pronounced and might even be within the precision of the measurement.
Visual sedimentation tests (Fig. 24) indicate that contrary to OD, with ODD the amount
of approximately 45 – 50 wt% needed to neutralize the basal charge could in fact also
represent the optimum in respect to stabilization of the clay in the monomer mixture with
DN 75 %.
The results of the visual sedimentation tests were quantified by analyzing the suspensions
via static light scattering. The particle size distributions were determined at three
modifier levels – below, above and an intermediate one of 50 % that later turned out to be
very close to the optimal amount of 45% for stabilizing montmorillonite PGV®
suspensions (Fig. 29).
Fig. 29. Particle size distribution of montmorillonite PGV® in monomer mixture DN 75 %
─ unmodified, ─ 20 wt% ODD, ─ 50 wt% ODD, ─ 100 wt% ODD
The particle size distributions for samples prepared with either 20 wt%, 50 wt%, or
100 wt% of ODD referred to montmorillonite PGV® showed that the optimum level of
modifier should lie between 20 wt% and 50 wt% to prevent aggregation of particles. At a
modifier amount of 50 wt%, already more than 90 vol% of the clay tactoids do not show
aggregation.

4 Results and Discussion
69
Quantitative analysis and precise determination of the optimum amount of ODD required
for stabilizing montmorillonite PGV® in the monomer mixture with DN 75 % was
carried out via LUMiFuge® measurements. Suspensions with different amounts of ODD
modifier were prepared and investigated. Transmission profiles of the different samples
were recorded every ten seconds. Transmission profiles at chosen times of centrifugation
were compared (Fig. 30).
a) b)
c) d)
Fig. 30. LUMiFuge® measurements of montmorillonite PGV® suspended in monomer mixture DN 75 %,
recorded after: ─ 10 s, ─ 1 min, ─ 5 min, ─ 10 min, ─ 20 min
a) without modifier; b) with 42 wt% ODD; c) with 45 wt% ODD; d) with 47 wt% ODD
The transmission profiles for unmodified montmorillonite PGV® were already discussed
but are repeated in Fig. 30 a) to make comparison easier. With ODD lower amounts were
needed to approach the optimum stabilization. For 42 wt% ODD referred to clay (Fig. 30
b)) the suspension was already stable during centrifugation for five minutes. Stable
dispersions over the whole period of centrifugation were achieved with an ODD amount
of 45 wt% or more (Fig. 30 c), d)). The montmorillonite PGV® suspension only slightly
clarified during the centrifugation, but sedimentation of particles as it was seen for
samples with lower amounts of ODD was not detected.
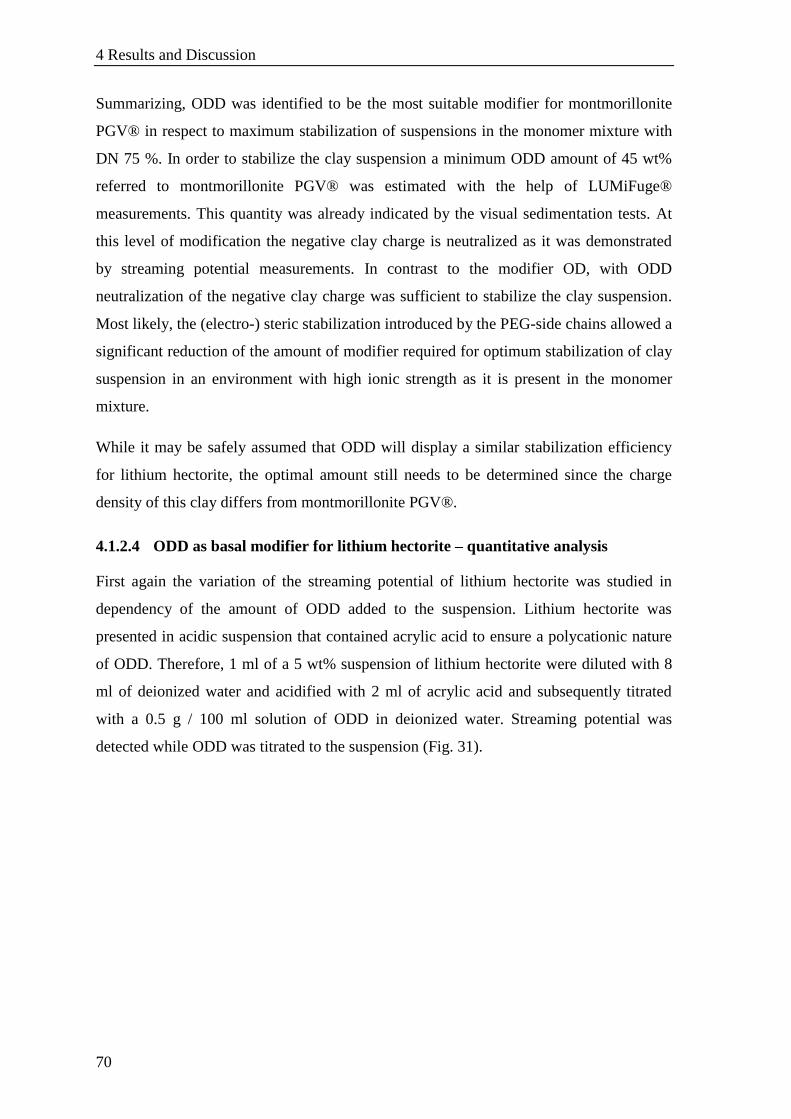
4 Results and Discussion
70
Summarizing, ODD was identified to be the most suitable modifier for montmorillonite
PGV® in respect to maximum stabilization of suspensions in the monomer mixture with
DN 75 %. In order to stabilize the clay suspension a minimum ODD amount of 45 wt%
referred to montmorillonite PGV® was estimated with the help of LUMiFuge®
measurements. This quantity was already indicated by the visual sedimentation tests. At
this level of modification the negative clay charge is neutralized as it was demonstrated
by streaming potential measurements. In contrast to the modifier OD, with ODD
neutralization of the negative clay charge was sufficient to stabilize the clay suspension.
Most likely, the (electro-) steric stabilization introduced by the PEG-side chains allowed a
significant reduction of the amount of modifier required for optimum stabilization of clay
suspension in an environment with high ionic strength as it is present in the monomer
mixture.
While it may be safely assumed that ODD will display a similar stabilization efficiency
for lithium hectorite, the optimal amount still needs to be determined since the charge
density of this clay differs from montmorillonite PGV®.
4.1.2.4 ODD as basal modifier for lithium hectorite – quantitative analysis
First again the variation of the streaming potential of lithium hectorite was studied in
dependency of the amount of ODD added to the suspension. Lithium hectorite was
presented in acidic suspension that contained acrylic acid to ensure a polycationic nature
of ODD. Therefore, 1 ml of a 5 wt% suspension of lithium hectorite were diluted with 8
ml of deionized water and acidified with 2 ml of acrylic acid and subsequently titrated
with a 0.5 g / 100 ml solution of ODD in deionized water. Streaming potential was
detected while ODD was titrated to the suspension (Fig. 31).
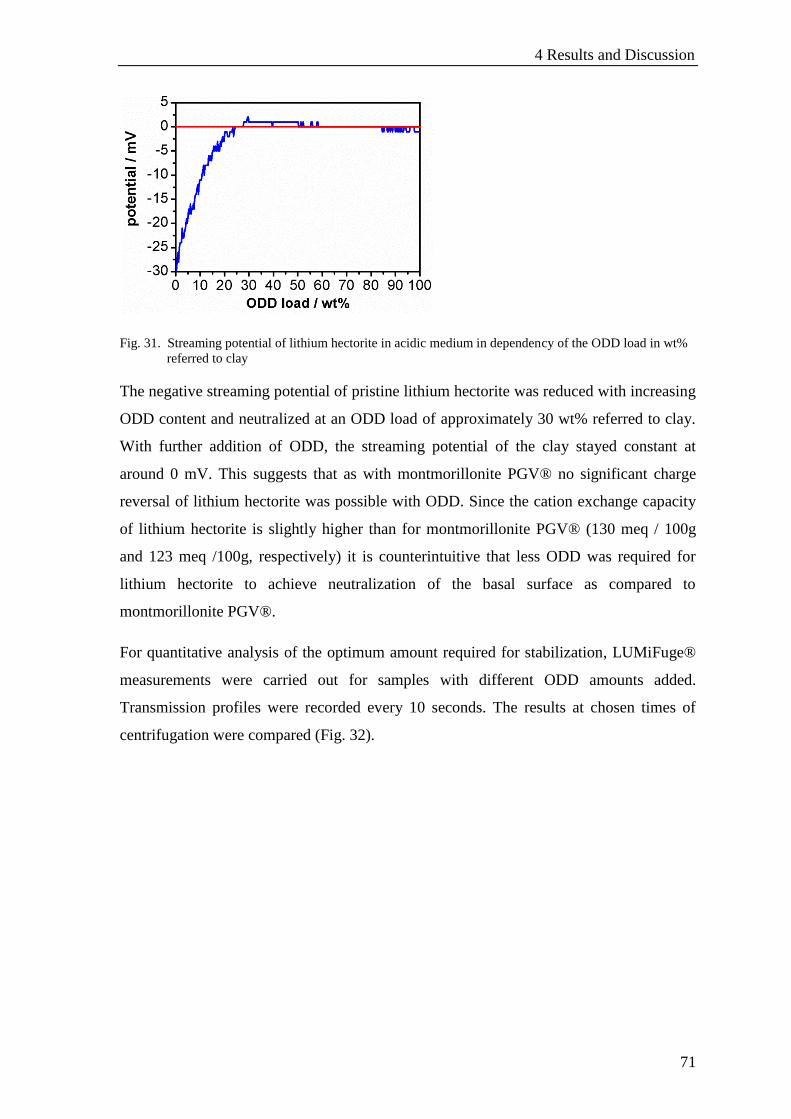
4 Results and Discussion
71
Fig. 31. Streaming potential of lithium hectorite in acidic medium in dependency of the ODD load in wt%
referred to clay
The negative streaming potential of pristine lithium hectorite was reduced with increasing
ODD content and neutralized at an ODD load of approximately 30 wt% referred to clay.
With further addition of ODD, the streaming potential of the clay stayed constant at
around 0 mV. This suggests that as with montmorillonite PGV® no significant charge
reversal of lithium hectorite was possible with ODD. Since the cation exchange capacity
of lithium hectorite is slightly higher than for montmorillonite PGV® (130 meq / 100g
and 123 meq /100g, respectively) it is counterintuitive that less ODD was required for
lithium hectorite to achieve neutralization of the basal surface as compared to
montmorillonite PGV®.
For quantitative analysis of the optimum amount required for stabilization, LUMiFuge®
measurements were carried out for samples with different ODD amounts added.
Transmission profiles were recorded every 10 seconds. The results at chosen times of
centrifugation were compared (Fig. 32).
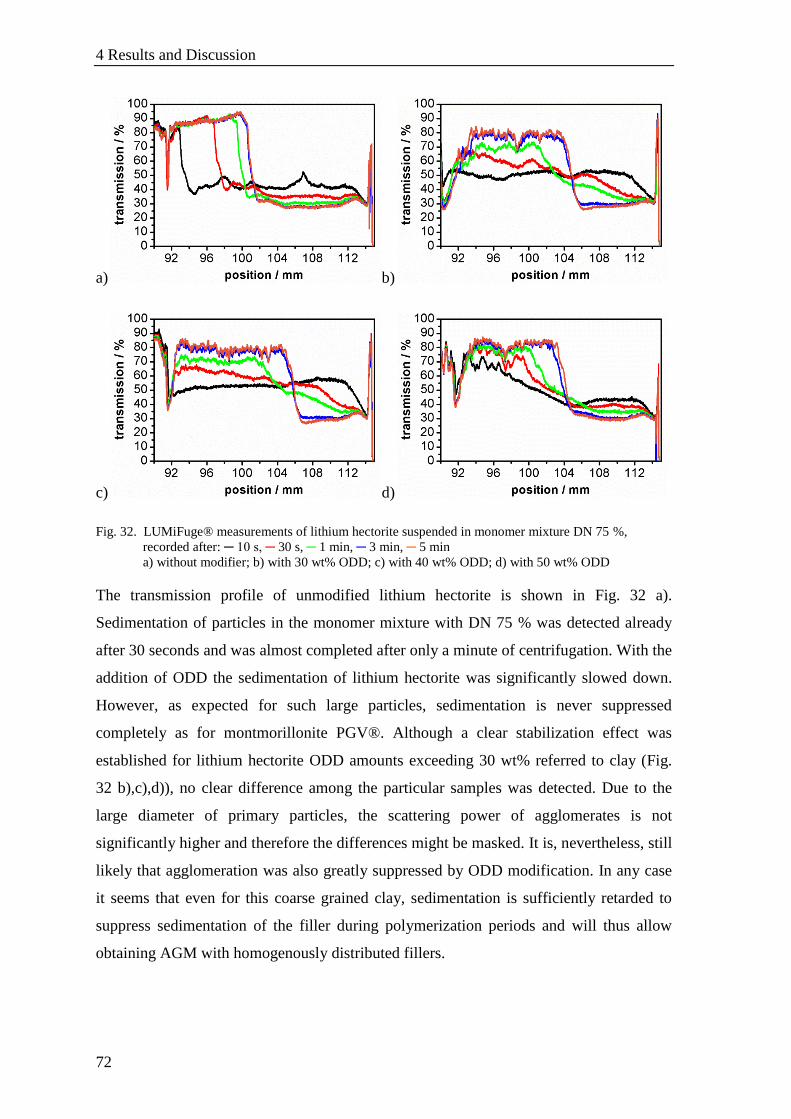
4 Results and Discussion
72
a) b)
c) d)
Fig. 32. LUMiFuge® measurements of lithium hectorite suspended in monomer mixture DN 75 %,
recorded after: ─ 10 s, ─ 30 s, ─ 1 min, ─ 3 min, ─ 5 min
a) without modifier; b) with 30 wt% ODD; c) with 40 wt% ODD; d) with 50 wt% ODD
The transmission profile of unmodified lithium hectorite is shown in Fig. 32 a).
Sedimentation of particles in the monomer mixture with DN 75 % was detected already
after 30 seconds and was almost completed after only a minute of centrifugation. With the
addition of ODD the sedimentation of lithium hectorite was significantly slowed down.
However, as expected for such large particles, sedimentation is never suppressed
completely as for montmorillonite PGV®. Although a clear stabilization effect was
established for lithium hectorite ODD amounts exceeding 30 wt% referred to clay (Fig.
32 b),c),d)), no clear difference among the particular samples was detected. Due to the
large diameter of primary particles, the scattering power of agglomerates is not
significantly higher and therefore the differences might be masked. It is, nevertheless, still
likely that agglomeration was also greatly suppressed by ODD modification. In any case
it seems that even for this coarse grained clay, sedimentation is sufficiently retarded to
suppress sedimentation of the filler during polymerization periods and will thus allow
obtaining AGM with homogenously distributed fillers.
4 Results and Discussion
73
Since anyhow no differences were noted, the amount of ODD applied to modify lithium
hectorite was chosen to be at the same level of 45 wt% as proven optimal for
montmorillonite PGV®. This way, samples with identical compositions but different
clay mineral could be directly compared and the mere effect of higher or lower aspect
ratios could be studied.
In conclusion, for both clays, montmorillonite PGV® and lithium hectorite, modification
of the clay was essential to provide stable dispersions in the monomer mixture. For both
clays edge modification showed a positive effect on the agglomeration behavior.
However, agglomeration could not be completely avoided. Due to the high ionic strength
of the monomer mixture, lamellar agglomeration of the clay particles occurred. Hence a
suitable modifier for basal modification was identified and the minimum necessary
amount for stabilization of the clay minerals in the monomer mixture was determined.
The sterically demanding modifier ODD delivered stable and homogeneous dispersions
of the clay minerals at a level of 45 wt% referred to clay content. Since sufficient
stabilization could be obtained solely with basal modification, we abstained from
additional edge modification to minimize addition of non-absorbing / capacity-hampering
mass to the gel formulations.

4 Results and Discussion
74
4.2 Enhancement of the gel strength of bulk AGM
Incorporation clay minerals as filler into the bulk AGM should cause enhancement of the
gel strength of AGM in two ways:
(1) Homogenization of the distribution of crosslinking points
(2) Enhancement of Young’s -modulus by incorporation of filler materials
Homogeneous distribution of crosslinking points
As already stated in the introduction, a key factor for designing an AGM with high
swelling capacity and high gel strength is crosslinking. One aspect thereof is the
crosslinking density. Higher crosslinking density leads to less swelling capacity and
higher gel strength. The crosslinking density is easily adjustable by the varying the
amount of added crosslinker to the polymerization mixture. A second and trickier aspect
is the homogeneity of crosslinking. Maximum swelling capacity and gel strength would
be found in an ideal polymer network. No irregularities like loops, loose chain ends, or
entanglements would occur in this network and the crosslinking points are uniformly
distributed. Consequently, the AGM will swell equally in every dimension until each
single polymer chain between crosslinking points is equally stressed and fully extended.
For AGM composites with clay minerals as filler, crosslinking density is regulated by the
content of organic crosslinker and the clay mineral. In order to provide a uniform
crosslinking, the clay mineral has to be homogeneously distributed in the AGM
composite polymer. Dispersion of the clay mineral and maximization of the
sedimentation stability was extensively discussed in section 4.1.
Enhancement of Young’s -modulus by incorporation of filler materials
Enhancement of the Young’s -modulus of polymers by incorporation of filler materials of
different kinds and shape, e.g. like spheres, fibers, hollow fibers or platelets is reported
numerous times in literature for diverse polymer matrices, from elastic hydrogels to bulk
metallic glass materials with high toughness. Theories have been developed to predict
potential reinforcing effects of filler materials, e.g. the Halpin-Tsai equations. The
Halpin-Tsai equations enable calculating the reinforcement that might be realized as a
function of the volume fraction of the filler, the relative Young’s -moduli of the
components, and the geometry of the filler. The latter is a crucial parameter and hence the
4 Results and Discussion
75
aspect ratio of the filler is the most important property of the filler.[49]
As mentioned
before, lithium hectorite or Montmorillonite PGV® differ most significantly in respect to
their aspect ratio and therefore comparison of the two types of fillers will allow judging
the importance of filler reinforcement on AGM performance.
After establishing basal surface modifications that yield stable and homogeneous
suspensions of the clay minerals in AGM polymerization mixtures, AGM composites
were synthesized containing lithium hectorite or montmorillonite PGV®. Additionally,
reference samples without filler were prepared for comparison. By variation of the
crosslinker content of the reference samples a tradeoff line was established. The effect of
incorporation of clay minerals on swelling capacity and gel strength of AGM hydrogels
was then investigated and evaluated in respect to the tradeoff given by the reference
samples.
4.2.1 Analysis of the mechanical properties of fully swollen hydrogels
The quality of AGM is defined by its swelling ability and the corresponding gel strength
at capacity or as a function of intermediate saline load. Both variables are inversely
related, as gels with higher swelling degree are softer and hence their gel strength is low.
Calculation of the maximum swelling capacity
The maximum swelling capacity is defined as the amount of saline (0.9 wt%) in gram that
can be absorbed per gram of dry AGM. The maximum capacity was calculated with
following formula:
( 10 )
( 11 )
A piece of the as-synthesized gel was weighed to get mas prep. The same gel piece then was
swollen to equilibrium as described in section 3.4.1 and weighed again to get mswollen. σ is
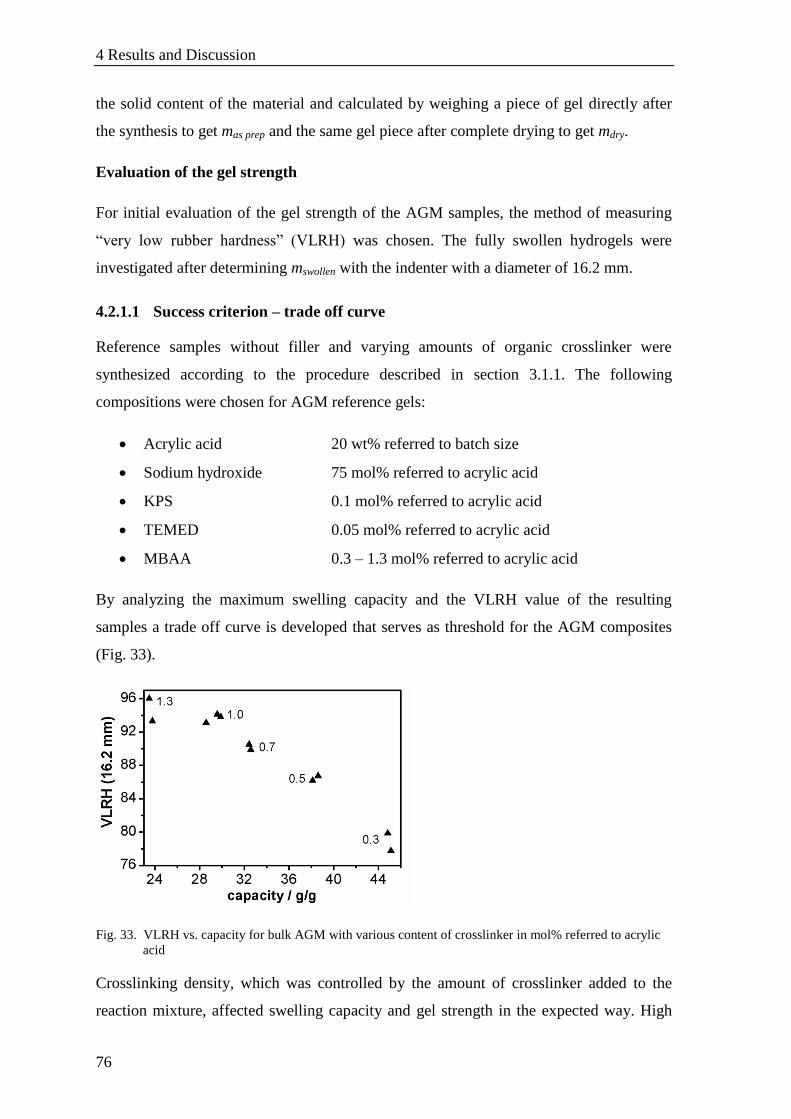
4 Results and Discussion
76
the solid content of the material and calculated by weighing a piece of gel directly after
the synthesis to get mas prep and the same gel piece after complete drying to get mdry.
Evaluation of the gel strength
For initial evaluation of the gel strength of the AGM samples, the method of measuring
“very low rubber hardness” (VLRH) was chosen. The fully swollen hydrogels were
investigated after determining mswollen with the indenter with a diameter of 16.2 mm.
4.2.1.1 Success criterion – trade off curve
Reference samples without filler and varying amounts of organic crosslinker were
synthesized according to the procedure described in section 3.1.1. The following
compositions were chosen for AGM reference gels:
Acrylic acid 20 wt% referred to batch size
Sodium hydroxide 75 mol% referred to acrylic acid
KPS 0.1 mol% referred to acrylic acid
TEMED 0.05 mol% referred to acrylic acid
MBAA 0.3 – 1.3 mol% referred to acrylic acid
By analyzing the maximum swelling capacity and the VLRH value of the resulting
samples a trade off curve is developed that serves as threshold for the AGM composites
(Fig. 33).
Fig. 33. VLRH vs. capacity for bulk AGM with various content of crosslinker in mol% referred to acrylic
acid
Crosslinking density, which was controlled by the amount of crosslinker added to the
reaction mixture, affected swelling capacity and gel strength in the expected way. High
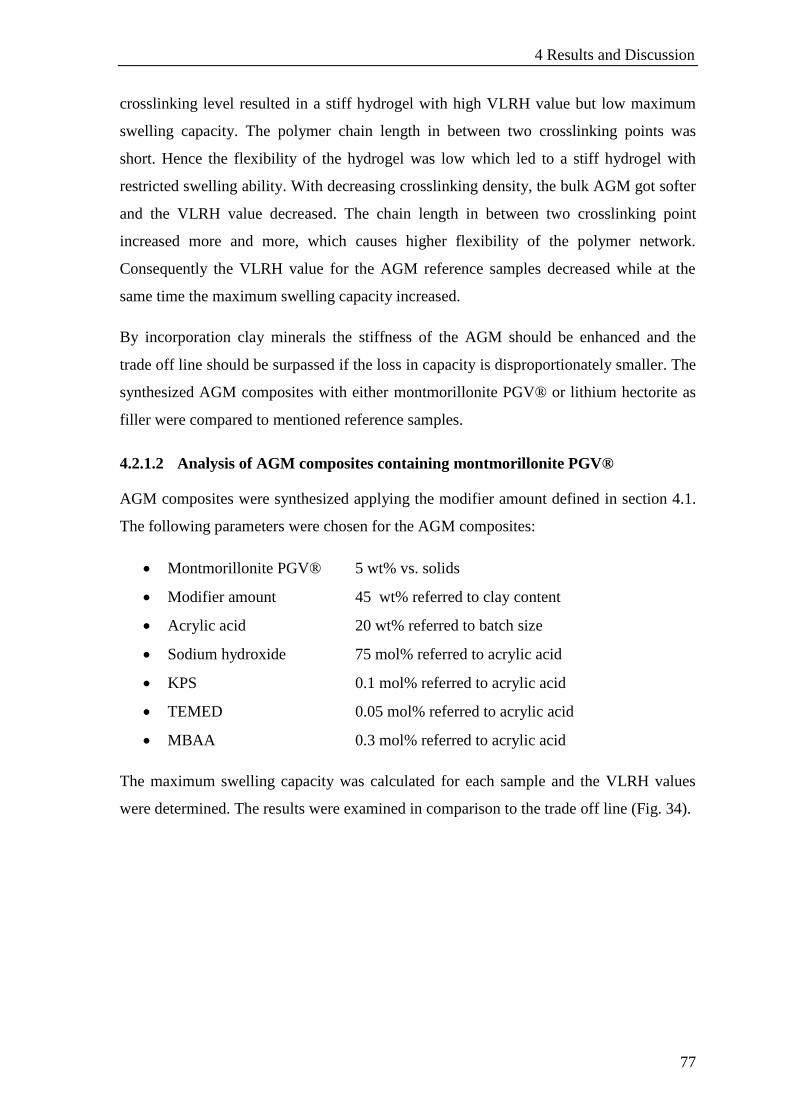
4 Results and Discussion
77
crosslinking level resulted in a stiff hydrogel with high VLRH value but low maximum
swelling capacity. The polymer chain length in between two crosslinking points was
short. Hence the flexibility of the hydrogel was low which led to a stiff hydrogel with
restricted swelling ability. With decreasing crosslinking density, the bulk AGM got softer
and the VLRH value decreased. The chain length in between two crosslinking point
increased more and more, which causes higher flexibility of the polymer network.
Consequently the VLRH value for the AGM reference samples decreased while at the
same time the maximum swelling capacity increased.
By incorporation clay minerals the stiffness of the AGM should be enhanced and the
trade off line should be surpassed if the loss in capacity is disproportionately smaller. The
synthesized AGM composites with either montmorillonite PGV® or lithium hectorite as
filler were compared to mentioned reference samples.
4.2.1.2 Analysis of AGM composites containing montmorillonite PGV®
AGM composites were synthesized applying the modifier amount defined in section 4.1.
The following parameters were chosen for the AGM composites:
Montmorillonite PGV® 5 wt% vs. solids
Modifier amount 45 wt% referred to clay content
Acrylic acid 20 wt% referred to batch size
Sodium hydroxide 75 mol% referred to acrylic acid
KPS 0.1 mol% referred to acrylic acid
TEMED 0.05 mol% referred to acrylic acid
MBAA 0.3 mol% referred to acrylic acid
The maximum swelling capacity was calculated for each sample and the VLRH values
were determined. The results were examined in comparison to the trade off line (Fig. 34).
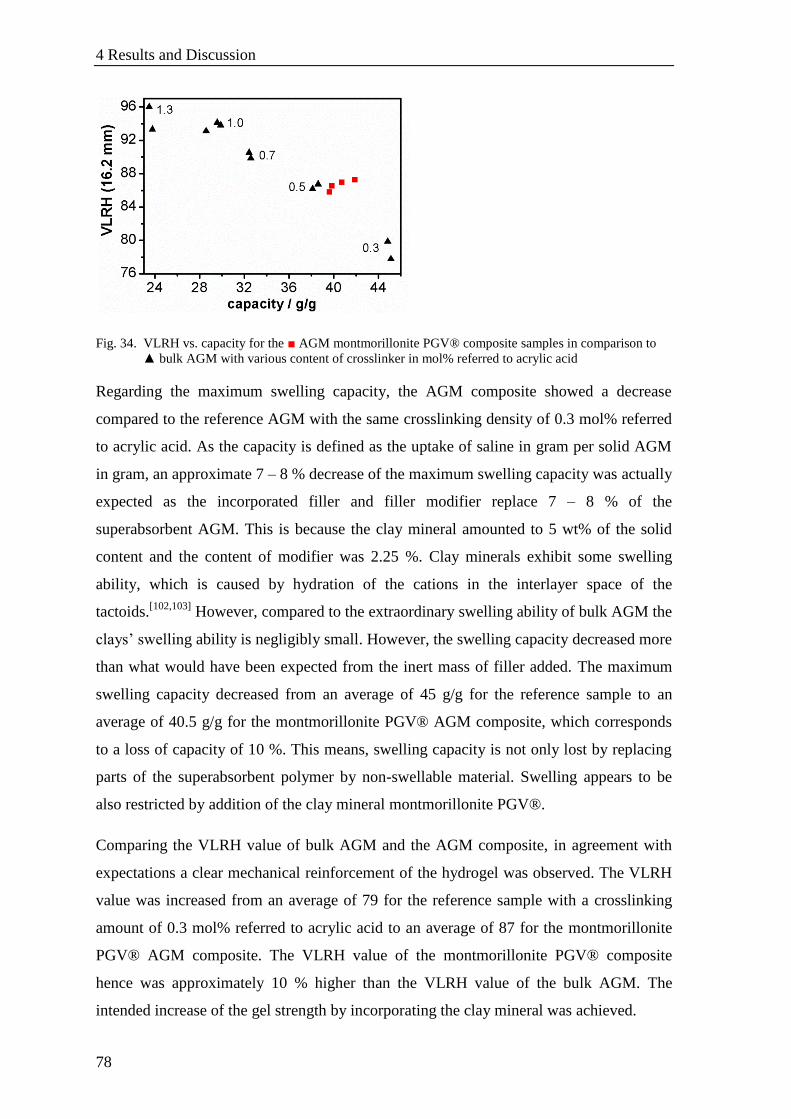
4 Results and Discussion
78
Fig. 34. VLRH vs. capacity for the ■ AGM montmorillonite PGV® composite samples in comparison to
▲ bulk AGM with various content of crosslinker in mol% referred to acrylic acid
Regarding the maximum swelling capacity, the AGM composite showed a decrease
compared to the reference AGM with the same crosslinking density of 0.3 mol% referred
to acrylic acid. As the capacity is defined as the uptake of saline in gram per solid AGM
in gram, an approximate 7 – 8 % decrease of the maximum swelling capacity was actually
expected as the incorporated filler and filler modifier replace 7 – 8 % of the
superabsorbent AGM. This is because the clay mineral amounted to 5 wt% of the solid
content and the content of modifier was 2.25 %. Clay minerals exhibit some swelling
ability, which is caused by hydration of the cations in the interlayer space of the
tactoids.[102,103]
However, compared to the extraordinary swelling ability of bulk AGM the
clays’ swelling ability is negligibly small. However, the swelling capacity decreased more
than what would have been expected from the inert mass of filler added. The maximum
swelling capacity decreased from an average of 45 g/g for the reference sample to an
average of 40.5 g/g for the montmorillonite PGV® AGM composite, which corresponds
to a loss of capacity of 10 %. This means, swelling capacity is not only lost by replacing
parts of the superabsorbent polymer by non-swellable material. Swelling appears to be
also restricted by addition of the clay mineral montmorillonite PGV®.
Comparing the VLRH value of bulk AGM and the AGM composite, in agreement with
expectations a clear mechanical reinforcement of the hydrogel was observed. The VLRH
value was increased from an average of 79 for the reference sample with a crosslinking
amount of 0.3 mol% referred to acrylic acid to an average of 87 for the montmorillonite
PGV® AGM composite. The VLRH value of the montmorillonite PGV® composite
hence was approximately 10 % higher than the VLRH value of the bulk AGM. The
intended increase of the gel strength by incorporating the clay mineral was achieved.
4 Results and Discussion
79
Regarding the trade off curve which is defined by the data of the reference samples, an
improvement of the material’s mechanical properties could be detected. Compared to the
reference at equal VLRH value corresponding to a crosslink amount of 0.5 mol%, an
enhancement of the maximum swelling capacity from 38.4 g/g to 40 - 42 g/g is achieved,
which is an improvement of about 5 – 10 %. This means, the loss of maximum swelling
capacity of the nanocomposite was compensated by a disproportionate increase of the gel
strength.
4.2.1.3 Analysis of AGM composites containing lithium hectorite
AGM composites incorporating lithium hectorite were synthesized with the modifier
amount defined before. The following parameters for the AGM composite were chosen:
Lithium hectorite 5 wt% vs. solids
Modifier amount 45 wt% referred to clay content
Acrylic acid 20 wt% referred to batch size
Sodium hydroxide 75 mol% referred to acrylic acid
KPS 0.1 mol% referred to acrylic acid
TEMED 0.05 mol% referred to acrylic acid
MBAA 0.3 mol% referred to acrylic acid
The maximum swelling capacity was calculated for each sample and the VLRH values
were determined. The results were examined in comparison to the trade off line (Fig. 35).
Fig. 35. VLRH vs. capacity for the ● AGM lithium hectorite composite samples in comparison to ▲ bulk
AGM with various content of crosslinker in mol% referred to acrylic acid

4 Results and Discussion
80
The AGM lithium hectorite nanocomposite also showed lower swelling ability than the
corresponding AGM with the crosslinking level of 0.3 mol%. The swelling ability was
reduced from an average of 45 g/g for the reference sample to 39.7 g/g for the lithium
hectorite AGM composite, which was a loss of swelling capacity of 12 %. Analogous to
the montmorillonite PGV® composite, part of the swelling ability was lost due to the
replacement of highly swellable AGM by clay mineral and modifier. Furthermore,
beyond this dilution effect an additional swelling restriction was observed by
incorporation of lithium hectorite. Lithium hectorite restricted the maximum swelling
capacity even more than montmorillonite PGV® which might be ascribed to the higher
aspect ratio.
The VLRH value of the lithium hectorite AGM nanocomposite was found at an average
of 82. Hence again an enhancement of the gel strength was observed when comparing the
lithium hectorite AGM composite with the reference sample of the same crosslinking
density which exhibited a VLRH of 79. However the increase in VLRH amounted to less
than 5 %. Contrary to expectations based on Halpin-Tsai equations, the mechanical
reinforcement achieved by incorporating lithium hectorite was lower than for
incorporating montmorillonite PGV® into the AGM polymer.
The capacity and VLRH properties of the lithium hectorite AGM composite are found
below the trade off curve determined by the reference samples.
AGM composites made with both types of clay showed a reduction of the maximum
swelling capacity. Swelling capacity is not only lost by replacing part of the
superabsorbent polymer by less-swellable material. Swelling is restricted beyond this
dilution effect by addition of clay minerals and this is more pronounced for higher aspect
ratio fillers. Regarding the montmorillonite PGV® AGM composite, this loss in the
maximum swelling capacity was compensated by an increase in the gel strength of the
hydrogel. By combining both effects it was possible to beat the trade off curve. While the
lithium hectorite AGM composite also showed some mechanical reinforcement as
compared to the sample with the same amount of organic crosslinker, surprisingly the
gain in gel strength was, despite the much larger aspect ratio, less pronounced for the
lithium hectorite AGM composite as for the montmorillonite PGV® AGM composite.
Consequently, in combination of gel strengthening and swelling reduction, the lithium
hectorite AGM composite even ended up below the trade off curve.
4 Results and Discussion
81
4.2.2 Analysis of the mechanical properties of partially swollen hydrogels
AGM are hardly ever really swollen to full capacity when applied in hygiene products. It
is therefore necessary to check whether the trend that was established for the mechanical
reinforcement of fully swollen hydrogels would also be confirmed for the intermediate
swollen state. It was decided to explore the capacity – gel strength tradeoff behavior of
the samples at equal intermediate swelling degrees. Consequently, both AGM composites
with either montmorillonite PGV® or lithium hectorite as filler were swollen to different
degrees of swelling (x-load) and compared to the corresponding reference sample.
Calculation of the swelling capacity
Swelling of the samples with intermediate x-load was carried out as described in section
3.4.1. After equilibration for 10 – 14 days in the zip lock bags at room temperature the
swollen samples were weighed and the exact degree of swelling was calculated.
Evaluation of the gel strength
The VLRH method could also be applied for judging the gel strength of the AGM
samples with intermediate swelling state. The method validation executed in cooperation
with Procter & Gamble showed, that the measurements done with the indenter with a
diameter of 16.2 mm were restricted to samples that delivered a VLRH value smaller then
85. For samples of higher stiffness the use of an indenter with a smaller diameter was
recommended to achieve higher sensitivity in this measurement range. For samples with
low x-load, high VLRH values were expected. Therefore, the indenter of the VLRH
device was exchanged and an indenter with a diameter of 10 mm was used for the
analysis of intermediate swollen samples. Additionally to the intermediate swollen
samples also the fully swollen hydrogel was measured with the smaller indenter.
4.2.2.1 Analysis of AGM composites containing montmorillonite PGV®
Analysis of AGM composites at intermediate swelling state was carried out with
montmorillonite PGV® AGM composites of identical composition as the samples studied
in fully swollen state. The composition of the montmorillonite PGV® AGM composite is
described in section 4.2.1.2.

4 Results and Discussion
82
The VLRH values for the different x-loads of montmorillonite PGV® AGM composite
were compared to the corresponding reference AGM with a crosslinking amount of
0.3 mol% referred to acrylic acid (Fig. 36).
Fig. 36. VLRH vs. x-load for the ■ montmorillonite PGV® AGM composite in comparison to ▲ bulk
AGM with the same crosslinking content
As the smaller indenter (10.0 mm) is more sensitive, the differences in the gel strength of
the AGM composite and the reference sample appear more pronounced. For instance, the
VLRH value of the montmorillonite PGV® AGM composite at fully swollen state was
20 % higher than the VLRH value of the reference sample as compared to 10 % found
with the larger indenter.
The sample with an x-load of approximately 2.5 g/g exhibited no significant difference in
the VLRH value. All montmorillonite PGV® nanocomposites at higher x-load were,
however, found above the corresponding non-filled AGM. With increasing saline uptake,
the reinforcing effect of the montmorillonite PGV® became increasingly obvious. Apart
from the higher accuracy of the VLRH method values between 90 and 60, this is in line
with expectations from Halpin-Tsai equations. With increasing swelling the gel becomes
softer and the correspondingly increasing ratio of the moduli of filler and matrix predicts
increasingly better relative reinforcements.
4.2.2.2 Analysis of AGM composites containing lithium hectorite
Analysis of AGM composites at intermediate swelling state was carried out with lithium
hectorite AGM composites of identical composition as the samples studied in fully
swollen state. The sample composition is described in section 4.2.1.3.
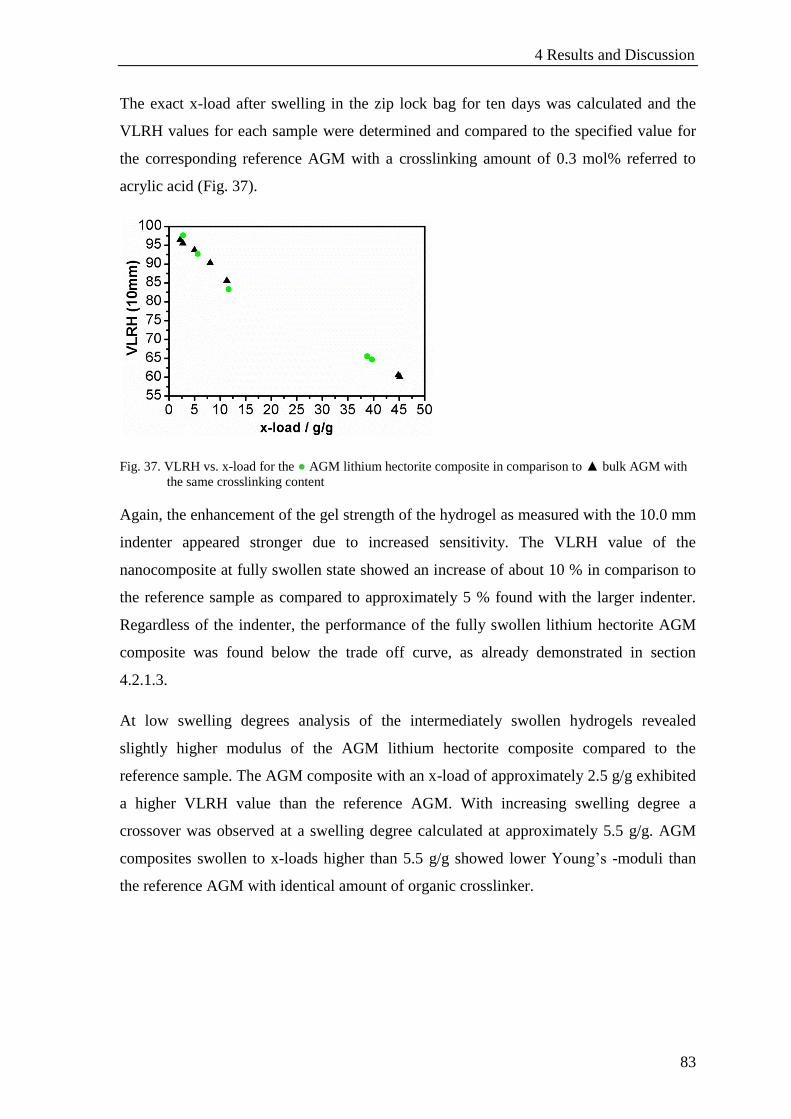
4 Results and Discussion
83
The exact x-load after swelling in the zip lock bag for ten days was calculated and the
VLRH values for each sample were determined and compared to the specified value for
the corresponding reference AGM with a crosslinking amount of 0.3 mol% referred to
acrylic acid (Fig. 37).
Fig. 37. VLRH vs. x-load for the ● AGM lithium hectorite composite in comparison to ▲ bulk AGM with
the same crosslinking content
Again, the enhancement of the gel strength of the hydrogel as measured with the 10.0 mm
indenter appeared stronger due to increased sensitivity. The VLRH value of the
nanocomposite at fully swollen state showed an increase of about 10 % in comparison to
the reference sample as compared to approximately 5 % found with the larger indenter.
Regardless of the indenter, the performance of the fully swollen lithium hectorite AGM
composite was found below the trade off curve, as already demonstrated in section
4.2.1.3.
At low swelling degrees analysis of the intermediately swollen hydrogels revealed
slightly higher modulus of the AGM lithium hectorite composite compared to the
reference sample. The AGM composite with an x-load of approximately 2.5 g/g exhibited
a higher VLRH value than the reference AGM. With increasing swelling degree a
crossover was observed at a swelling degree calculated at approximately 5.5 g/g. AGM
composites swollen to x-loads higher than 5.5 g/g showed lower Young’s -moduli than
the reference AGM with identical amount of organic crosslinker.

4 Results and Discussion
84
4.2.3 Discussion of possible failure mechanisms of the AGM – composite system
Contrary to montmorillonite PGV®, at higher swelling degrees lithium hectorite filled
AGM underperforms the trade off curve. This deviation from expectations for the larger
aspect ratio lithium hectorite suggests that the stress transfer from the matrix to the
nanofiller might be failing at some point. It is known, that incompatible fillers decrease
the Young’s -modulus and gel strength of nanocomposites compared to the unfilled
reference. Since the quality of compatibilization is the same for both clays and does
change in the same way with swelling, it is still a riddle why stress transfer works better
with montmorillonite PGV®. The two materials differ in respect to three parameters: 1.
While both materials show in plane moduli > 150 GPa [104]
, lithium hectorite is more
sensitive to the acidic environment and might be weakened by acid activation. 2. The
lateral extension of lithium hectorite is an order of magnitude higher than for
montmorillonite PGV®. Consequently, only lithium hectorite might be large enough to
negatively influence the crosslinking network during polymerization. 3. Since the weight
content of the filler was kept at comparable values, for montmorillonite PGV® the
number of independent particles is several orders of magnitude higher than for lithium
hectorite. This in turn will influence the stress developed at a single filler platelet during
the swelling process. During the swelling process, the volume of the hydrogel samples
increased by ~ 1.5 orders of magnitude. In case a cavity is included in the hydrogel, it
would increase its size proportionally together with the hydrogel matrix upon swelling to
satisfy geometrical requirements for uniform swelling (Fig. 38 a)).
a)
b)
Fig. 38. Swelling of hydrogels a) including an air bubble; b) including a filler

4 Results and Discussion
85
If a hard and indeformable filler particle is included into the hydrogel, expansion upon
swelling causes stress at the interface of polymer matrix and filler (Fig. 38 b)). The stress
induced during swelling can cause failure of the composite material. Several mechanisms
of failure are possible and are discussed in more detail as follows.
In respect to the location of failure, three different types of failure may be identified:
Failure of the filler
Failure of the matrix
Failure of the interface due to insufficient stress transfer
Failure of the filler
A first potential location for failure of the AGM composite is the filler itself. In case of
the clay minerals, either breakage or (partial) dissolution of the clay platelets may occur.
Due to the comparatively high strength of the clay tactoids, breakage of the tactoids
appeared very unlikely as the implemented forces during the swelling process and the
VLRH measurement were too small to cause rupture of the clay tactoids.
Clay minerals are sensitive towards acidic and basic media and dissolve if the
environment gets too harsh.[105-108]
The progress of the dissolution is depending on the pH
of the suspension medium and the composition of the particular clay. Hectorites show a
much higher PZC and therefore are considerably more sensitive to acid attack compared
to montmorillonite. At a pH = 5 of the polymerization mixture, slightly elevated
temperature and typical synthesis and polymerization times of 45 min., dissolution of the
lithium hectorite may not be negligible anymore while montmorillonite PGV® is
expected to be much more robust. It is, however, very unlikely even for lithium hectorite
that the strength of the clay platelet would be so much deteriorated that the clay platelet
would rupture.
The mechanical strength of agglomerates would, however, be much lower as compared to
clay platelets themselves. Agglomerates formed by insufficient stabilization by the
chosen surface modifier would serve as possible points of failure. Due to the largely
differing sizes of lithium hectorite and montmorillonite PGV®, it was difficult to judge
whether the same degree of stability towards agglomeration could be achieved for both
fillers since force sedimentation tests applied to judge agglomeration stability are always
4 Results and Discussion
86
overlapped by sedimentation stability which is of course largely dependent on the size of
the clay platelets. Not surprisingly, montmorillonite PGV® with a diameter of 260 nm
showed much higher stability towards sedimentation in the monomer mixture with DN
75% compared to the lithium hectorite with a diameter of 12 m when both clays were
modified with the same stabilizing agent ODD. This fact was also reflected by the
conditions chosen for the LUMiFuge® measurements. While for the lithium hectorite the
slowest speed of centrifugation of 300 rpm was selected, montmorillonite PGV® required
a speed of 2000 rpm in order to observe sedimentation in a decent period of time. Even
for short periods of centrifugation the sedimentation stability of the modified lithium
hectorite appeared inferior as apparent from the transmission profiles.
Failure of the matrix
A second potential location for failure of the AGM composite system is the matrix: the
polymer network. Failure of the polymer network means cleavage of C – C bonds of the
polymer. As discussed in some detail in the introduction, the gel strength of the polymer
network is mostly determined by the distribution of the crosslinking points. The very
large lithium hectorite platelets might indeed suppress crosslinking over large areas
excluded by the clay, resulting in a less homogenous crosslinking network and locally
reduced gel strength. At the same time the capacity of the AGM would be reduced in the
volumes with increased crosslinking density. The detrimental effect would not show up at
low degrees of swelling as long as no chains are fully stretched. While this reasoning
would be capable to explain both the differences with the two clays and the crossing of
the trade off curve with lithium hectorite it is difficult if not impossible to be verified
experimentally.
Failure of the interface due to insufficient stress transfer
Finally, failure at the interface of filler and matrix can occur in different ways:
Failure of the modifier itself
Failure at the interface of modifier and filler
Failure at the interface of modifier and polymer network
Since the total stress generated by swelling can always be dissipated more efficiently by a
much higher number of particles due to the larger specific interface area for AGM
4 Results and Discussion
87
composites of montmorillonite PGV® as compared to lithium hectorite while the type
and strength of interaction at the various potential failures is comparable, the latter
material will always be affected more severely.
Failure of the modifier itself
Failure of the modifier is comparable with the failure of the polymer network. The
strength of chemical bonds in the modifier is comparable with the ones in the matrix and
therefore chances of failure are comparable to pristine AGM. Insufficient chemical
stability of the modifier can also be ruled out as failure mechanism as all types of bonds
found within the modifier are stable in the polymerization environment.
Failure at the interface of modifier and filler
The probability of failure at this interface is depending on the interaction of the modifier
to the filler. The modifier ODD interacts with the clay minerals via electrostatic
interactions. The adsorption of ions on charged surfaces is a reversible process.
Competing interactions in this context would have been cation exchange of the ODD
against cations present in the monomer mixture, sodium and protons, which both are
monovalent. At the pH of the monomer mixture with DN 75 %, the modifier was
polycationic. Hence the interacting forces of the ODD with the negatively charged basal
plane of the clay were much stronger than the interactions of sodium or protons with the
clay surface. Partial exchange for sodium or proton and partial “debonding” of ODD is
therefore very unlikely. Failure at this interface appears rather unlikely. Moreover, the
charge densities of montmorillonite PGV® and lithium hectorite are too similar to explain
the different behavior of composites of these two fillers.
Failure at the interface of modifier and polymer network
The most likely location for failure is the interface of the modifier with the polymer
network. This interface lacks covalent bonding and relies on van der Waals and hydrogen
bonding to transfer stress. In case of the modifier ODD and the poly (acrylate co acrylic
acid) polymer, the dominant interaction is hydrogen bonding between the hydroxyl
groups of the ODD and the acrylate groups of the polymer. The interaction across this
interface nevertheless is the weakest of all possible failure planes discussed, possibly with
the exception of agglomerate disruption.
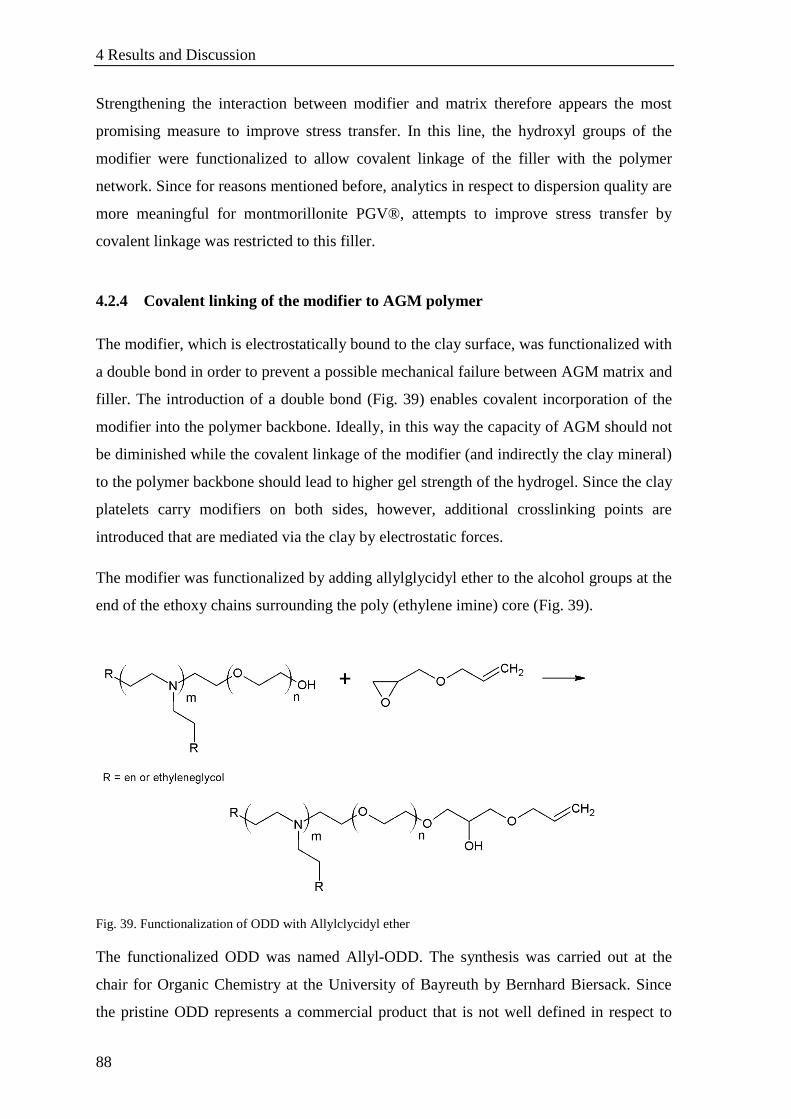
4 Results and Discussion
88
Strengthening the interaction between modifier and matrix therefore appears the most
promising measure to improve stress transfer. In this line, the hydroxyl groups of the
modifier were functionalized to allow covalent linkage of the filler with the polymer
network. Since for reasons mentioned before, analytics in respect to dispersion quality are
more meaningful for montmorillonite PGV®, attempts to improve stress transfer by
covalent linkage was restricted to this filler.
4.2.4 Covalent linking of the modifier to AGM polymer
The modifier, which is electrostatically bound to the clay surface, was functionalized with
a double bond in order to prevent a possible mechanical failure between AGM matrix and
filler. The introduction of a double bond (Fig. 39) enables covalent incorporation of the
modifier into the polymer backbone. Ideally, in this way the capacity of AGM should not
be diminished while the covalent linkage of the modifier (and indirectly the clay mineral)
to the polymer backbone should lead to higher gel strength of the hydrogel. Since the clay
platelets carry modifiers on both sides, however, additional crosslinking points are
introduced that are mediated via the clay by electrostatic forces.
The modifier was functionalized by adding allylglycidyl ether to the alcohol groups at the
end of the ethoxy chains surrounding the poly (ethylene imine) core (Fig. 39).
Fig. 39. Functionalization of ODD with Allylclycidyl ether
The functionalized ODD was named Allyl-ODD. The synthesis was carried out at the
chair for Organic Chemistry at the University of Bayreuth by Bernhard Biersack. Since
the pristine ODD represents a commercial product that is not well defined in respect to
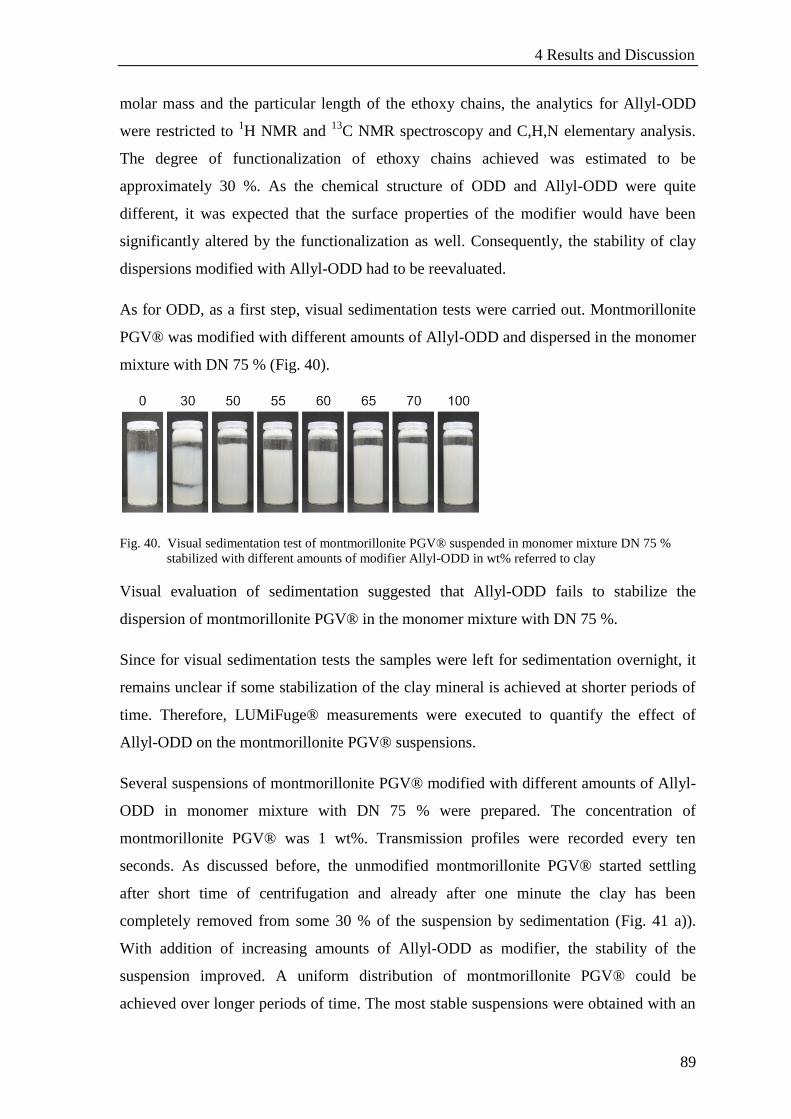
4 Results and Discussion
89
molar mass and the particular length of the ethoxy chains, the analytics for Allyl-ODD
were restricted to 1H NMR and
13C NMR spectroscopy and C,H,N elementary analysis.
The degree of functionalization of ethoxy chains achieved was estimated to be
approximately 30 %. As the chemical structure of ODD and Allyl-ODD were quite
different, it was expected that the surface properties of the modifier would have been
significantly altered by the functionalization as well. Consequently, the stability of clay
dispersions modified with Allyl-ODD had to be reevaluated.
As for ODD, as a first step, visual sedimentation tests were carried out. Montmorillonite
PGV® was modified with different amounts of Allyl-ODD and dispersed in the monomer
mixture with DN 75 % (Fig. 40).
Fig. 40. Visual sedimentation test of montmorillonite PGV® suspended in monomer mixture DN 75 %
stabilized with different amounts of modifier Allyl-ODD in wt% referred to clay
Visual evaluation of sedimentation suggested that Allyl-ODD fails to stabilize the
dispersion of montmorillonite PGV® in the monomer mixture with DN 75 %.
Since for visual sedimentation tests the samples were left for sedimentation overnight, it
remains unclear if some stabilization of the clay mineral is achieved at shorter periods of
time. Therefore, LUMiFuge® measurements were executed to quantify the effect of
Allyl-ODD on the montmorillonite PGV® suspensions.
Several suspensions of montmorillonite PGV® modified with different amounts of Allyl-
ODD in monomer mixture with DN 75 % were prepared. The concentration of
montmorillonite PGV® was 1 wt%. Transmission profiles were recorded every ten
seconds. As discussed before, the unmodified montmorillonite PGV® started settling
after short time of centrifugation and already after one minute the clay has been
completely removed from some 30 % of the suspension by sedimentation (Fig. 41 a)).
With addition of increasing amounts of Allyl-ODD as modifier, the stability of the
suspension improved. A uniform distribution of montmorillonite PGV® could be
achieved over longer periods of time. The most stable suspensions were obtained with an
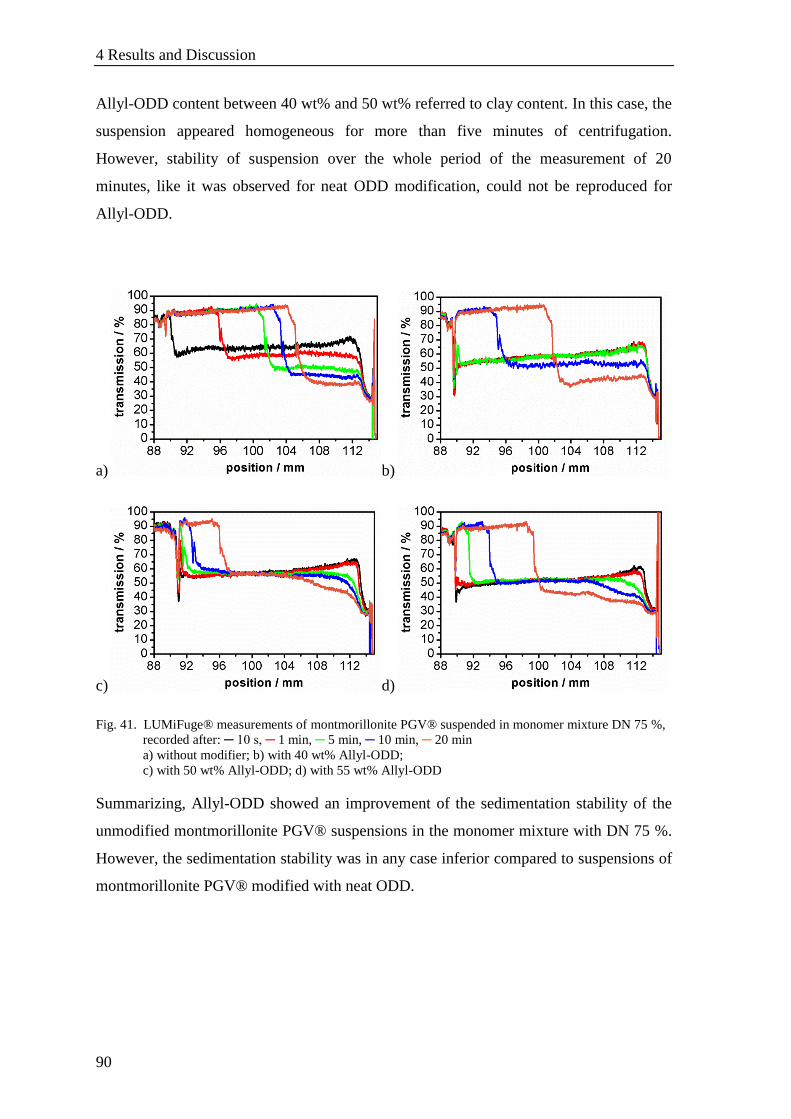
4 Results and Discussion
90
Allyl-ODD content between 40 wt% and 50 wt% referred to clay content. In this case, the
suspension appeared homogeneous for more than five minutes of centrifugation.
However, stability of suspension over the whole period of the measurement of 20
minutes, like it was observed for neat ODD modification, could not be reproduced for
Allyl-ODD.
a) b)
c) d)
Fig. 41. LUMiFuge® measurements of montmorillonite PGV® suspended in monomer mixture DN 75 %,
recorded after: ─ 10 s, ─ 1 min, ─ 5 min, ─ 10 min, ─ 20 min
a) without modifier; b) with 40 wt% Allyl-ODD;
c) with 50 wt% Allyl-ODD; d) with 55 wt% Allyl-ODD
Summarizing, Allyl-ODD showed an improvement of the sedimentation stability of the
unmodified montmorillonite PGV® suspensions in the monomer mixture with DN 75 %.
However, the sedimentation stability was in any case inferior compared to suspensions of
montmorillonite PGV® modified with neat ODD.
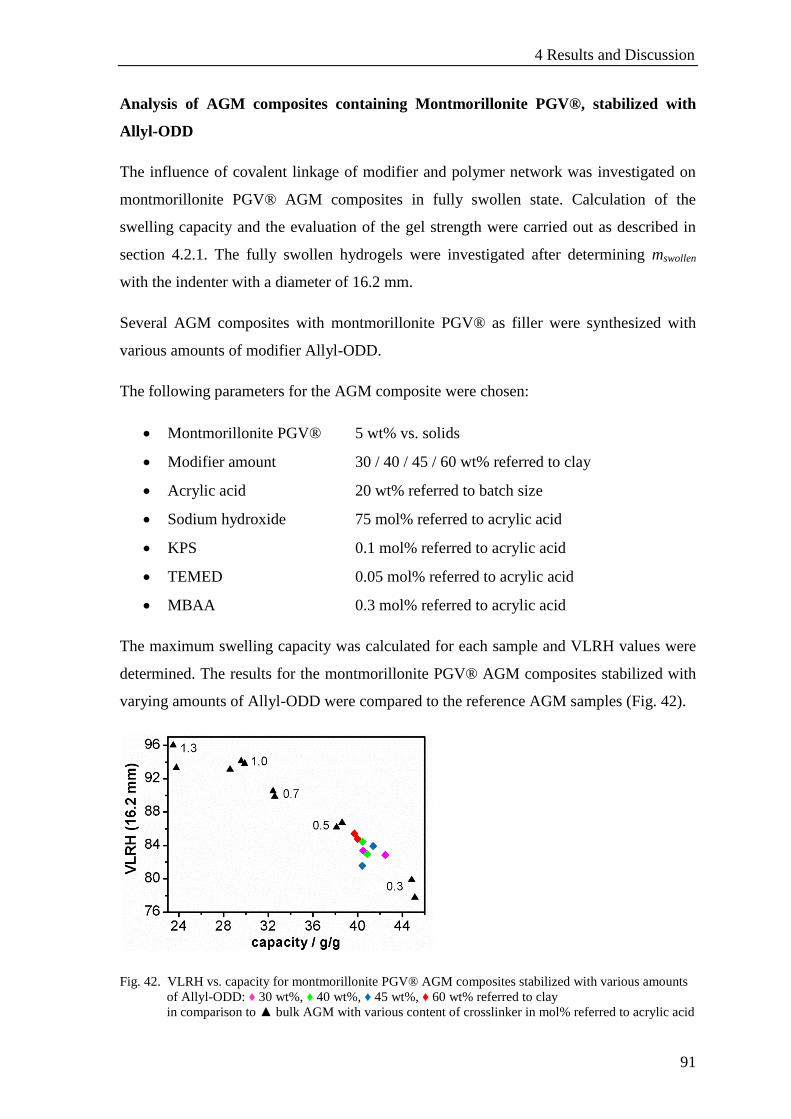
4 Results and Discussion
91
Analysis of AGM composites containing Montmorillonite PGV®, stabilized with
Allyl-ODD
The influence of covalent linkage of modifier and polymer network was investigated on
montmorillonite PGV® AGM composites in fully swollen state. Calculation of the
swelling capacity and the evaluation of the gel strength were carried out as described in
section 4.2.1. The fully swollen hydrogels were investigated after determining mswollen
with the indenter with a diameter of 16.2 mm.
Several AGM composites with montmorillonite PGV® as filler were synthesized with
various amounts of modifier Allyl-ODD.
The following parameters for the AGM composite were chosen:
Montmorillonite PGV® 5 wt% vs. solids
Modifier amount 30 / 40 / 45 / 60 wt% referred to clay
Acrylic acid 20 wt% referred to batch size
Sodium hydroxide 75 mol% referred to acrylic acid
KPS 0.1 mol% referred to acrylic acid
TEMED 0.05 mol% referred to acrylic acid
MBAA 0.3 mol% referred to acrylic acid
The maximum swelling capacity was calculated for each sample and VLRH values were
determined. The results for the montmorillonite PGV® AGM composites stabilized with
varying amounts of Allyl-ODD were compared to the reference AGM samples (Fig. 42).
Fig. 42. VLRH vs. capacity for montmorillonite PGV® AGM composites stabilized with various amounts
of Allyl-ODD: ♦ 30 wt%, ♦ 40 wt%, ♦ 45 wt%, ♦ 60 wt% referred to clay
in comparison to ▲ bulk AGM with various content of crosslinker in mol% referred to acrylic acid
4 Results and Discussion
92
The maximum swelling capacity of the montmorillonite PGV® AGM composites
decreased with increasing amounts of modifier Allyl-ODD added. This trend was
expected, as the modifier does not contribute to the swelling capacity. With increasing
modifier content, the non-swellable mass per gram solid increases. The maximum
swelling capacity decreased from an average of 45 g/g for the reference sample with the
identical crosslinking amount of 0.3 mol% to an average of 40.9 g/g for the AGM
composite with a modifier amount of 45 wt% referred to clay. This is comparable to the
result found for non-functionalized ODD, which was 40.5 g/g for the montmorillonite
PGV® AGM composite.
The VLRH values increased with increasing amounts of Allyl-ODD added for
modification. This means, the addition of Allyl-ODD to the hydrogel causes stiffening of
the sample. However the increase of the VLRH value was less for all Allyl-ODD
stabilized samples as compared to corresponding AGM composites stabilized with non-
functionalized ODD. This can be attributed to the lower stability of the clay suspension
indicating some agglomeration.
In respect to the combination of maximum swelling capacity and gel strength, it was
striking that within experimental error, all AGM composites were found on the trade off
curve. With increasing Allyl-ODD amount, the data points shifted along the trade off
curve from the values found for the reference sample with the organic crosslinker amount
of 0.3 mol% towards the values of the reference sample with the organic crosslinker
amount of 0.5 mol%. This suggests that indeed covalent linking to the modifier is
equivalent to increasing the amount of organic crosslinker. This implies that the targeted
transgression of the trade off curve could not be achieved by the application of Allyl-
ODD.
In order to confirm this hypothesis several AGM composites with a fixed amount of
Allyl- ODD but a varying amounts of organic crosslinker were prepared.
The following parameters for the AGM composite were chosen:
Montmorillonite PGV® 5 wt% vs. solids
Modifier amount 45 wt% referred to clay
Acrylic acid 20 wt% referred to batch size
Sodium hydroxide 75 mol% referred to acrylic acid
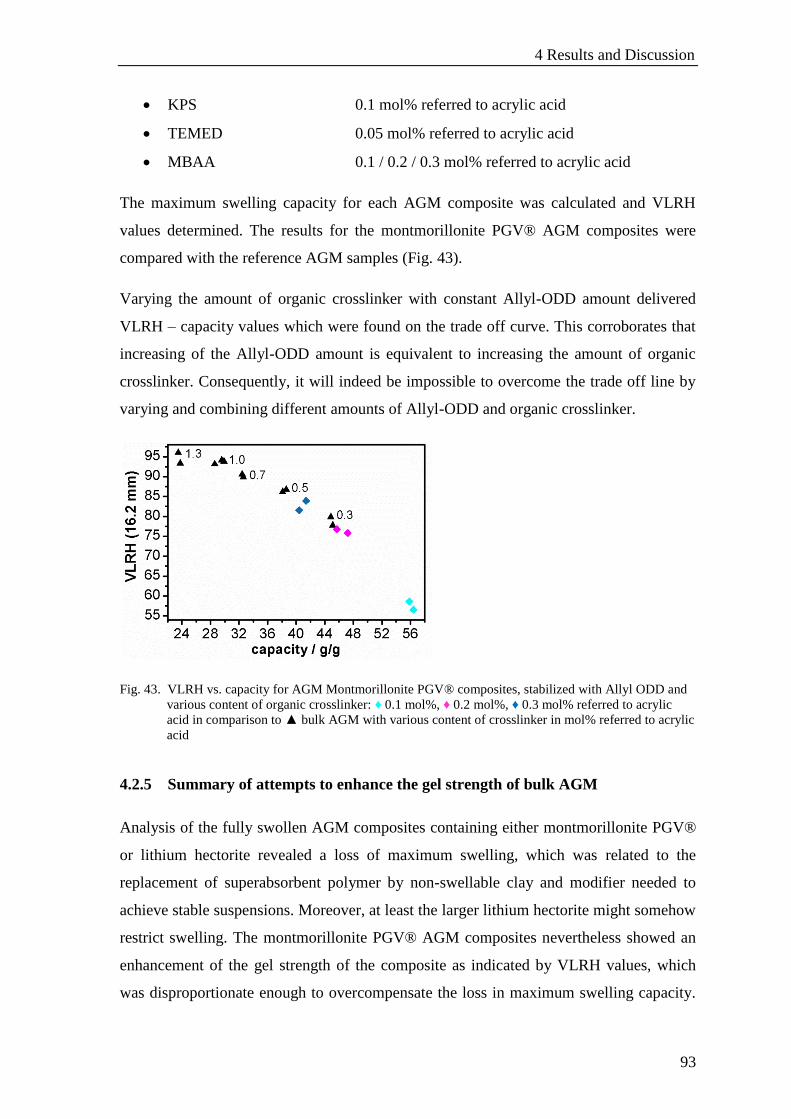
4 Results and Discussion
93
KPS 0.1 mol% referred to acrylic acid
TEMED 0.05 mol% referred to acrylic acid
MBAA 0.1 / 0.2 / 0.3 mol% referred to acrylic acid
The maximum swelling capacity for each AGM composite was calculated and VLRH
values determined. The results for the montmorillonite PGV® AGM composites were
compared with the reference AGM samples (Fig. 43).
Varying the amount of organic crosslinker with constant Allyl-ODD amount delivered
VLRH – capacity values which were found on the trade off curve. This corroborates that
increasing of the Allyl-ODD amount is equivalent to increasing the amount of organic
crosslinker. Consequently, it will indeed be impossible to overcome the trade off line by
varying and combining different amounts of Allyl-ODD and organic crosslinker.
Fig. 43. VLRH vs. capacity for AGM Montmorillonite PGV® composites, stabilized with Allyl ODD and
various content of organic crosslinker: ♦ 0.1 mol%, ♦ 0.2 mol%, ♦ 0.3 mol% referred to acrylic
acid in comparison to ▲ bulk AGM with various content of crosslinker in mol% referred to acrylic
acid
4.2.5 Summary of attempts to enhance the gel strength of bulk AGM
Analysis of the fully swollen AGM composites containing either montmorillonite PGV®
or lithium hectorite revealed a loss of maximum swelling, which was related to the
replacement of superabsorbent polymer by non-swellable clay and modifier needed to
achieve stable suspensions. Moreover, at least the larger lithium hectorite might somehow
restrict swelling. The montmorillonite PGV® AGM composites nevertheless showed an
enhancement of the gel strength of the composite as indicated by VLRH values, which
was disproportionate enough to overcompensate the loss in maximum swelling capacity.

4 Results and Discussion
94
Therefore, the montmorillonite PGV® AGM composites were found above the trade off
curve defined by clay-free reference samples with various amounts of organic crosslinker.
For lithium hectorite, the enhancement of the gel strength found for AGM composites,
however, was too low to compensate the loss of swelling capacity and consequently
lithium hectorite AGM composites were found below the trade off curve.
At intermediate swelling montmorillonite PGV® AGM composites were found above the
trade off curve over the whole range of swelling degrees. For lithium hectorite AGM
composites, however, a crossover was found and this composite outperformed the un-
filled AGM only up to swelling degrees of 5.5 g/g. It is unclear whether this may be
attributed to changes in the crosslinking network expected for this clay or to higher stress
developed at a single clay platelet.
Concerning possible failure mechanisms responsible for the disappointing enhancement
of bulk AGM’s gel strength achieved by reinforcement with clay minerals the following
conclusions were made:
Failure of the filler material was judged as improbable, as the forces arising during the
swelling process were not high enough to break clay platelets with in plane moduli
>150 GPa. At the given pH and duration of synthesis of AGM composites dissolution of
clay minerals may be regarded irrelevant. The larger lithium hectorites might hamper
formation of a homogeneous crosslinking network and this way introduce defects, restrict
swelling or foster failure of the matrix at higher degrees of swelling. Experimental
validation of this hypothesis would be, however, very difficult. Most probable failure of
the composite likely occurs at the interface between modifier and polymer network,
where stress is insufficiently transferred by rather weak hydrogen bonds. In line with this,
the problem is more pronounced for the much larger lithium hectorite, where at the same
weight content of filler much fewer platelets are incorporated at which the same total
stress has to be dissipated.
When attempting to eliminate this failure mode by covalently linking the modifier and the
polymer network the gel strength decreased. Apparently for this setup, the covalently
linked filler acts simply like an additional crosslinking and hence the trade off curve
could not be surpassed.

4 Results and Discussion
95
The best result for enhancing the bulk AGM’s properties was accomplished by
incorporating montmorillonite PGV® into the polymer network. The filler was stabilized
in the monomer suspension applying the modifier ODD in amounts of 45 wt% referred to
the content of the clay mineral. The achieved improvement was 5 – 10 % capacity at
same gel stiffness measured as VLRH.
4.3 Core – shell concept: Enhancement of stress at break and
strain at break
The optimum superabsorbent material for application in hygiene products exhibits high
maximum swelling ability combined with high pressure resistance of shape in order to
avoid gel blocking. Chapter 4.2 presented an approach to optimize these parameters for
the bulk AGM by incorporation of clay minerals as fillers into the polymer network.
Another approach to improve the interplay of the maximum swelling capacity and the
pressure resistance of shape of the material is presented by the core – shell concept. The
main advantage of the core – shell concept is that the requirements of high swelling
ability and high gel strength do not have to be fulfilled by one single material at the same
time. Instead, the requirements are spatially separated to core and shell: While the core
should provide a high swelling capacity, the shell should provide the mechanical stability
required to reduce gel blocking.
Requirements on the core
The core material is optimized to provide high swelling capacity. The mechanical
stability is of minor importance as long as a minimum stability is provided that allows
handling the core polymer before the shell is attached, e.g. via spray coating. For the core,
bulk non-surface treated AGM can be selected, as the chemistry of this hydrogel and its
handling is well-known.
Requirements on the shell
The shell ideally must provide the required mechanical strength of the AGM particle to
avoid breakage and deformation upon swelling under pressure. During the swelling
process, the AGM in the core of the structure increases its volume by ~ 1.5 orders of

4 Results and Discussion
96
magnitude. Consequently, the shell has to be highly expandable and at the same time
resistant to the stress developed during its extension. The minimum elongation to break is
needed at 300 – 400 % in order to secure sufficient capacity of the swollen particle and
not break upon swelling. Own swelling capacity is not required for the shell, but certainly
a benefit as it would offset potential capacity loss. The shell furthermore has to be
chemically compatible with the core and permeable to water.
These requirements on the shell were addressed by using bulk AGM as matrix that was
reinforced with clay minerals as fillers. Since the chemistry of core and shell materials is
the same, compatibility was obviously ensured. The clay mineral should accomplish
enhancement of Young’s -modulus, strain at break, and maximum stress that is applicable
before the polymer ruptures.
Enhancement of the strain at break:
Incorporation of clay minerals into the elastomeric AGM polymer and other hydrogels
increases its strain at break.[109]
The cause for the increase of strain at break by
incorporation of clay minerals into a polymer matrix is widely discussed in literature.
Several authors compare hydrogels “crosslinked” by clay minerals with hydrogels
crosslinked by an organic crosslinker. Laponite® clay was used as filler in these
nanocomposites and the clay was claimed to operate as inorganic crosslinker for the
polymer network although no specific bonding of the clay to the matrix was realized as it
was described in section 4.2.4. Nevertheless, the authors claimed that the Laponite® clay
platelets were tied to each other by polymer chains, which means that the polymer
provides bridging between clay platelets. It should be stressed that in all these
nanocomposites, the chemical interaction between matrix and Laponite® could only be
based on hydrogen bonding. Since Laponite® platelets have, however, a very small
diameter (< 20 nm), the platelets, additionally might be “entangled” by polymer chains.
The “intercrosslinking” distance between the clay platelets is much longer than the
intercrosslinking distance in organically crosslinked polymer networks. Consequently, the
length of the polymer chains in between two crosslinking points was claimed to be higher
in the Laponite® crosslinked polymer. In other words, the effective network chain density
is lower in the inorganically crosslinked polymer. Hence strain at break of the Laponite®
hydrogel nanocomposite is higher than strain at break of hydrogels crosslinked with an
organic crosslinker.[110-113]
Upon swelling, the clay platelets align in respect to the force
4 Results and Discussion
97
applied. Interestingly, for low and high (> 10 mol%) clay contents the clay platelets were
found to align differently: perpendicular[110,111]
and parallel to the stretch direction,[110]
respectively.
Less research was done on systems combining organic crosslinking with inorganic
crosslinking by clay minerals. Haraguchi and Song combined MBAA and a Laponite®
clay as crosslinker in a poly (N-isopropyl acrylamide) network. They describe the
formation of microstructures with a high chemical crosslinking density near the periphery
of the clay particles and a low chemical crosslinking density in the polymer network far
from the clay. Haraguchi and Song consequently attribute the high strain at break of their
composites with low degrees of organic crosslinking in both tensile and compression
measurements to diluted chemical crosslinking between polymer chains, as the organic
crosslinker segregates into areas close to the clay.[114]
The structure of the hydrogel nanocomposite discussed in this work differs from the
systems discussed in literature. Both clay mineral and organic crosslinker were combined.
However, both clay minerals applied here had much larger diameters. Moreover, for the
AGM matrix they had to be stabilized in the monomer mixture by means of a modifier
adding to the total volume of the filler platelets. “Entanglement” of these fillers by
polymer chains therefore seems very unlikely. Hence, the matrix will only interact by
hydrogen bonding to the modifier on the basal surface of the clay platelets.
Only little information was published dealing with fracture toughness, crack formation
and propagation in hydrogels. Lin et al. reported, that incorporation of silica into poly
(dimethyl acylamide) slows down crack velocity.[115]
A similar effect can also be
supposed for clay minerals incorporated into hydrogels. Furthermore extrinsic toughening
by crack bridging like it was described for bulk metallic glass materials is possible [116]
,
provided that the filler dimension is larger than the crack opening displacement.
Recently[93]
, a number of toughening mechanisms including crack deflection, crack
debonding and platelets pull-out were described for such high aspect ratio nanoplatelets in
PMMA matrix.
Enhancement of tensile stress at break
Incorporation of clay minerals into hydrogels of different kinds enhances the materials’
Young’s -modulus and tensile stress at break.[109,110,113,114,117]
Okay and Oppermann

4 Results and Discussion
98
observed an increase of the Young’s -moduli for their poly (acryl amide) gels containing
Laponite®. Their rheological investigations further revealed large energy dissipation in
clay containing gels. They ascribe it to a dynamic adsorption-desorption equilibrium
between the polymer chains and the clay mineral or alternatively to a friction of the clay –
polymer interface resulting from sliding of the adsorbed chains along the clay surface.[118]
Abdurrahmanoglu et al. picked up the idea that these rearrangements are a reason for the
excellent mechanical performance of Laponite® composite gels. They studied the elastic
properties of Laponite® composites based on poly acrylamide, poly (N,N-
dimethylacylamide) and poly (N-isopropylacrylamide) and observe a dependency of the
higher Young’s -moduli of the Laponite® composites on the strength of attractive
interactions between polymer and clay.[119]
Incorporation of clay minerals into soft
polymers furthermore causes strain hardening. Strain hardening means, the material is
strengthened when it is expanded. Hence, the more the material is expanded, the higher
the force needed to expand it further. Wang et al. observed strain hardening for a poly (N-
isopropyl acrylamide) – Laponite® nanocomposite. This strain hardening effect was
enhanced with increasing Laponite® content in the nanocomposite gel. Wang et al.
attribute the strain hardening effect to the orientation of the Laponite® platelets which is
induced upon stretching, as described above.[120]
This effect should support the form
stability of the AGM particles during the swelling process and consequently gel blocking
should be avoided.
Earlier investigations at Procter & Gamble on core – shell particles identified several key
attributes of the shell. As mentioned earlier, the strain at break of the shell has to be
higher than 300 – 400 % of elongation to secure sufficient final capacity. Other
requirements depend on the diameters of core and shell. The lower the Young’s -modulus
of the shell, the higher its thickness has to be. As the intention is to keep the diameter of
the shell low, high Young’s -modulus for the shell and high average elastic modulus
(secant modulus) in the 0 – 400 % strain region are desirable, which due to strain
hardening also implies a high stress at break of the material. As an example, earlier
investigations at Procter & Gamble revealed that for AGM particles with a size of 500 µm
the Young’s -modulus of the shell needs to be higher than 100 kPa in order to make a
shell thickness of less than 20 µm sufficient to produce core - shell materials with
superior tradeoff vs. reference.
4 Results and Discussion
99
4.3.1 Stepwise optimization of the synthesis parameters for the shell
Since, as already mentioned, the swelling capacity is of minor importance for the shell,
the composition of the shell AGM nanocomposite may be varied in several ways in order
to optimize elongation and stress at break. For example, the clay content could be raised
to high levels, which restricts the swelling abilities of the hydrogel, however according to
literature extraordinary mechanical properties can be expected.[110,112,114,117,121]
The synthesized AGM composites consisted of following educts:
Clay mineral
Modifier ODD
Acrylic acid
Sodium hydroxide
KPS
TEMED
MBAA
While keeping the composition of the nanocomposite materials simple by fixing the
amounts of initiator KPS (0.1 mol% referred to acrylic acid), catalyst TEMED
(0.05 mol% referred to acrylic acid), and modifier ODD (45 wt% referred to the content
of clay), elongation and stress at break were sought to be optimized by systematically
varying the following parameters:
Type of clay mineral
Acrylic acid content
Sodium hydroxide content – degree of neutralization
Amount of organic crosslinker
Clay mineral content
For each AGM composite, a reference sample with identical composition, however
without clay and modifier, was synthesized. Like for enforcement of bulk AGM,
montmorillonite PGV® and lithium hectorite were applied for shell AGM
nanocomposites to probe the effect of the different aspect ratio of the filler.

4 Results and Discussion
100
All samples were investigated at two different degrees of swelling. X-loads of 3g/g and
6 g/g were chosen. These intermediate swollen samples were prepared like described in
section 3.5.1.
All prepared samples were characterized with stress – strain measurements and the
derived Young’s -modulus, stress at break, and strain at break were compared.
4.3.1.1 Influence of the amount of organic crosslinker
The influence of the amount of organic crosslinker was studied by preparing identical
samples with three different crosslinking amounts. The chosen amounts were 0.3 mol%,
0.7 mol% and 1.0 mol% of organic crosslinker MBAA in reference to the amount of
acrylic acid.
In this series of hydrogels the amount of acrylic acid was fixed at 25 wt% referred to the
mass of the polymerization mixture. The degree of neutralization was 75 mol% referred
to acrylic acid. The content of the clay mineral was 5 wt% referred to the content of
solids.
The amount of organic crosslinker was indicated by labeling the samples with “0.3”,
“0.7” or “1.0” in respect of the corresponding crosslinker content. Furthermore, reference
samples were denoted with “Ref”, the lithium hectorite composite with “LiHec”, and the
montmorillonite PGV® composite with “PGV”. As an example, the “PGV 0.3”
represented the composite with montmorillonite PGV® as filler and the crosslinker
amount of 0.3 mol% referred to acrylic acid.
At a swelling degree of 3 g/g, a clear enhancement of Young’s -modulus, stress at break
and strain at break was only observed for the samples with low crosslinking content of
0.3 mol% (Table 6). At a crosslinking level of 0.7 mol% no significant effects on
Young’s -modulus and stress at break were observed for the two types of clay minerals
while the strain at break was improved with both fillers. At a crosslinking level of
1.0 mol% measurement of the reference sample was not possible as the sample was too
brittle. However, measurements at this high crosslinking content were possible for both
composite materials indicating improved hydrogel properties by incorporating clay
minerals although reference values are lacking.

4 Results and Discussion
101
Table 6. Young’s -modulus, stress at break and strain at break for hydrogels with varying crosslinker
amount at a swelling degree of 3 g/g
Young’s -modulus / kPa Stress at break / kPa Strain at break
Ref 0.3 32 ± 2 57 ± 7 3.1 ± 0.6
Ref 0.7 84 ± 2 62 ± 11 1.3 ± 0.3
Ref 1.0 - - -
LiHec 0.3 41 ± 8 149 ± 41 8 ± 1
LiHec 0.7 82 ± 17 56 ± 7 2.1 ± 0.3
LiHec 1.0 88 ± 12 48 ± 2 1.2 ± 0.1
PGV 0.3 52 ± 1 137 ± 16 5.2 ± 0.7
PGV 0.7 83 ± 4 92 ± 15 2.1 ± 0.2
PGV 1.0 141 ± 12 157 ± 46 2.2 ± 0.6
As expected, the Young’s -modulus was increasing with increasing crosslinking content
within each type of hydrogel. For the stress at break no clear trend could be observed. For
the LiHec series stress at break continuously decreased with increasing crosslinker
content while for the PGV series the maximum was observed at 1.0 mol%. The strain at
break was found to decrease dramatically with increasing amount of crosslinker for all
three series of hydrogels. Consequently, at low swelling degree a small amount of organic
crosslinker seems most advantageous.
At a higher swelling degree of 6 g/g the trends observed for the less swollen hydrogels
were mostly confirmed (Table 7). Enhancement of Young’s -modulus, stress at break and
strain at break was again found for the samples with 0.3 mol% of organic crosslinker. At
a crosslinking level of 0.7 mol% converse effects on the Young’s -modulus were
observed for the two types of clay minerals while stress and strain at break were
improved with both fillers. The favorable influence of incorporating clay minerals into
the hydrogel with a crosslinker content of 1.0 mol% was again evident as the reference
sample was too fragile to be measured while the composite materials were stable enough.
However the exact amplification could not be evaluated.
Aside the expected increase of Young’s -modulus with increasing crosslinking level, at
the x-load of 6 g/g a decrease of stress at break with increasing organic crosslinker
amount was observed for the lithium hectorite composites. Furthermore, a decrease of
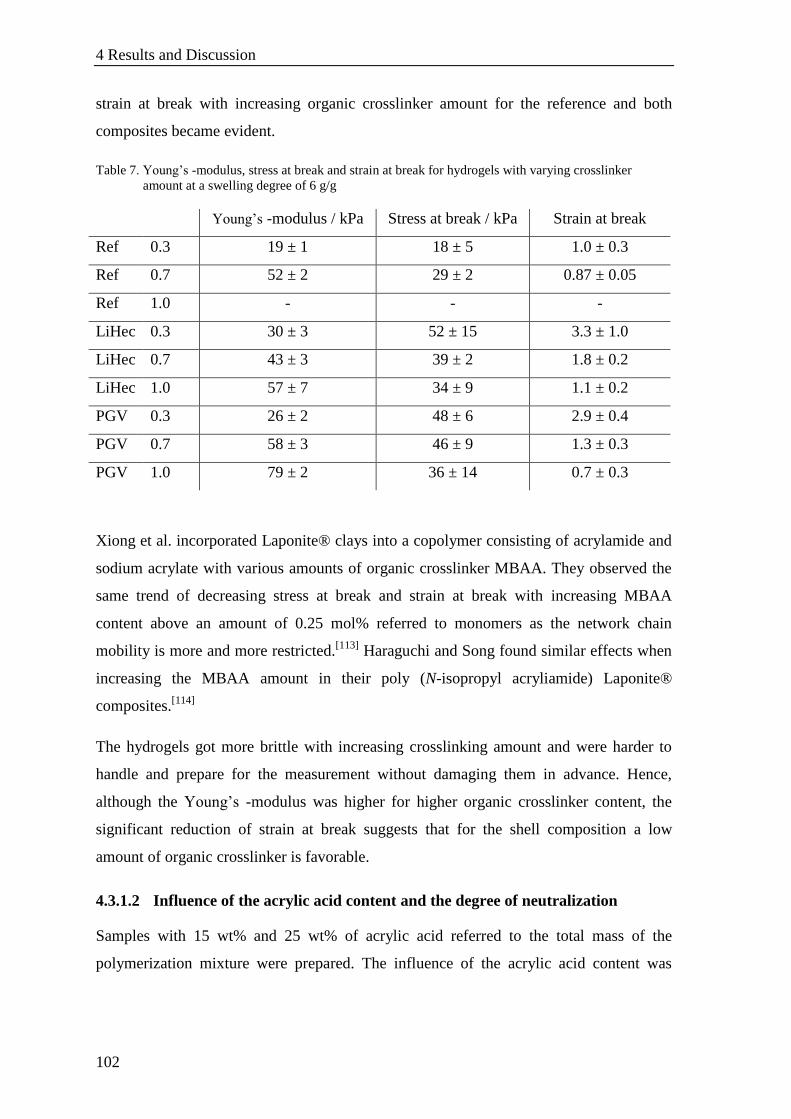
4 Results and Discussion
102
strain at break with increasing organic crosslinker amount for the reference and both
composites became evident.
Table 7. Young’s -modulus, stress at break and strain at break for hydrogels with varying crosslinker
amount at a swelling degree of 6 g/g
Young’s -modulus / kPa Stress at break / kPa Strain at break
Ref 0.3 19 ± 1 18 ± 5 1.0 ± 0.3
Ref 0.7 52 ± 2 29 ± 2 0.87 ± 0.05
Ref 1.0 - - -
LiHec 0.3 30 ± 3 52 ± 15 3.3 ± 1.0
LiHec 0.7 43 ± 3 39 ± 2 1.8 ± 0.2
LiHec 1.0 57 ± 7 34 ± 9 1.1 ± 0.2
PGV 0.3 26 ± 2 48 ± 6 2.9 ± 0.4
PGV 0.7 58 ± 3 46 ± 9 1.3 ± 0.3
PGV 1.0 79 ± 2 36 ± 14 0.7 ± 0.3
Xiong et al. incorporated Laponite® clays into a copolymer consisting of acrylamide and
sodium acrylate with various amounts of organic crosslinker MBAA. They observed the
same trend of decreasing stress at break and strain at break with increasing MBAA
content above an amount of 0.25 mol% referred to monomers as the network chain
mobility is more and more restricted.[113]
Haraguchi and Song found similar effects when
increasing the MBAA amount in their poly (N-isopropyl acryliamide) Laponite®
composites.[114]
The hydrogels got more brittle with increasing crosslinking amount and were harder to
handle and prepare for the measurement without damaging them in advance. Hence,
although the Young’s -modulus was higher for higher organic crosslinker content, the
significant reduction of strain at break suggests that for the shell composition a low
amount of organic crosslinker is favorable.
4.3.1.2 Influence of the acrylic acid content and the degree of neutralization
Samples with 15 wt% and 25 wt% of acrylic acid referred to the total mass of the
polymerization mixture were prepared. The influence of the acrylic acid content was

4 Results and Discussion
103
investigated for both non-neutralized polymer and the 75 mol% neutralized polymer in
order to check for possible cooperative effects.
The amount of organic crosslinker was chosen with 0.3 mol% referred to acrylic acid.
The content of the clay mineral was 5 wt% referred to the content of solids.
Samples were labeled with respect to the investigated variable. Here, samples were
marked with AA n, where n was the amount of acrylic acid in wt% referred to the amount
of monomer mixture. Furthermore, the degree of neutralization was denoted by DN m.
“Ref” was used for the reference, “LiHec” for the lithium hectorite composite and “PGV”
for the montmorillonite PGV® composite. For example, “LiHec AA15 DN 75” would be
the AGM composite with lithium hectorite as filler and 15 wt% of acrylic acid with 75 %
neutralization.
At a swelling degree of 3 g/g, all clay containing samples of the non-neutralized polymer
exhibited higher Young’s -modulus, stress at break and strain at break (Table 8) as
compared to reference samples. Increasing the acrylic acid content resulted in higher
Young’s -moduli for the reference samples and both nanocomposite and in case of the
reference samples also in higher stress at break. No significant change of strain at break
was found for the reference samples with increasing acrylic acid content. Both AGM
composites, however, become less elastic with higher acrylic acid amount. Consequently
a clear decision whether high or low acrylic acid content should be favored could not be
drawn at this point.
Table 8. Young’s -modulus, stress at break and strain at break for non-neutralized hydrogels with varying
acrylic acid content at a swelling degree of 3 g/g
Young’s -
modulus / kPa Stress at break / kPa Strain at break
Ref AA 15 DN 0 29 ± 1 39 ± 5 2.4 ± 0.6
Ref AA 25 DN 0 48 ± 4 86 ± 19 3.6 ± 1.0
LiHec AA 15 DN 0 38 ± 1 176 ± 10 9.6 ± 0.8
LiHec AA 25 DN 0 59 ± 2 186 ± 2 6.2 ± 0.1
PGV AA 15 DN 0 45 ± 5 140 ± 15 7.3 ± 0.7
PGV AA 25 DN 0 67 ± 6 179 ± 33 4.6 ± 0.8
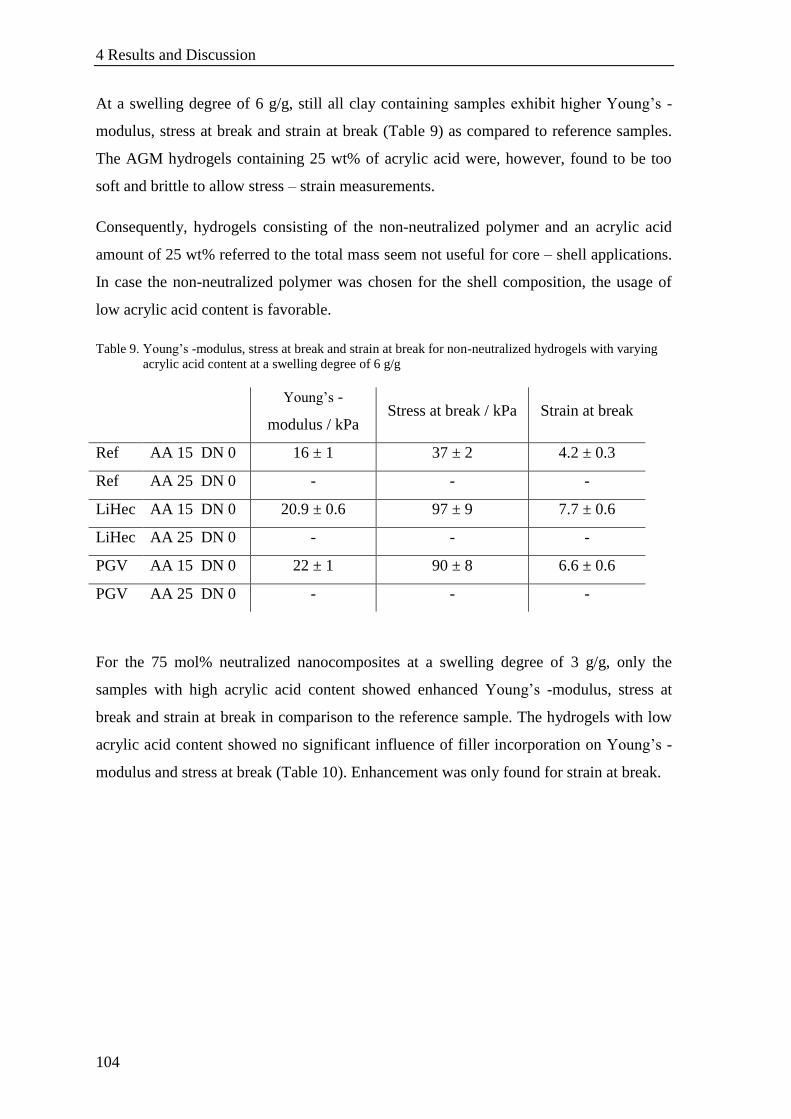
4 Results and Discussion
104
At a swelling degree of 6 g/g, still all clay containing samples exhibit higher Young’s -
modulus, stress at break and strain at break (Table 9) as compared to reference samples.
The AGM hydrogels containing 25 wt% of acrylic acid were, however, found to be too
soft and brittle to allow stress – strain measurements.
Consequently, hydrogels consisting of the non-neutralized polymer and an acrylic acid
amount of 25 wt% referred to the total mass seem not useful for core – shell applications.
In case the non-neutralized polymer was chosen for the shell composition, the usage of
low acrylic acid content is favorable.
Table 9. Young’s -modulus, stress at break and strain at break for non-neutralized hydrogels with varying
acrylic acid content at a swelling degree of 6 g/g
Young’s -
modulus / kPa Stress at break / kPa Strain at break
Ref AA 15 DN 0 16 ± 1 37 ± 2 4.2 ± 0.3
Ref AA 25 DN 0 - - -
LiHec AA 15 DN 0 20.9 ± 0.6 97 ± 9 7.7 ± 0.6
LiHec AA 25 DN 0 - - -
PGV AA 15 DN 0 22 ± 1 90 ± 8 6.6 ± 0.6
PGV AA 25 DN 0 - - -
For the 75 mol% neutralized nanocomposites at a swelling degree of 3 g/g, only the
samples with high acrylic acid content showed enhanced Young’s -modulus, stress at
break and strain at break in comparison to the reference sample. The hydrogels with low
acrylic acid content showed no significant influence of filler incorporation on Young’s -
modulus and stress at break (Table 10). Enhancement was only found for strain at break.

4 Results and Discussion
105
Table 10. Young’s -modulus, stress at break and strain at break for 75 mol% neutralized hydrogels with
varying acrylic acid content at a swelling degree of 3 g/g
Young’s -
modulus / kPa Stress at break / kPa Strain at break
Ref AA 15 DN 75 16 ± 1 73 ± 7 8.0 ± 0.4
Ref AA 25 DN 75 32 ± 2 57 ± 7 3.1 ± 0.6
LiHec AA 15 DN 75 15 ± 1 89 ± 13 13 ± 2
LiHec AA 25 DN 75 41 ± 8 149 ± 41 8 ± 1
PGV AA 15 DN 75 13.3 ± 0.4 69 ± 16 8.7 ± 0.9
PGV AA 25 DN 75 52 ± 1 137 ± 16 5.2 ± 0.7
Comparing samples with either low or high acrylic acid content, again an increase of
Young’s -modulus increasing acrylic acid content was observed. For both AGM
composites, additionally an increase of stress at break was found. However, the elasticity
was dramatically decreased with higher acrylic acid content for both nanocomposites and
the reference samples. This result suggested a preference for low acrylic acid contents.
Again, Young’s -modulus, stress at break and strain at break were also investigated at a
higher degree of swelling, which was 6 g/g (Table 11).
Table 11. Young’s -modulus, stress at break and strain at break for 75 mol% neutralized hydrogels with
varying acrylic acid content at a swelling degree of 6 g/g
Young’s -
modulus / kPa Stress at break / kPa Strain at break
Ref AA 15 DN 75 9 ± 1 27 ± 5 4.7 ± 0.5
Ref AA 25 DN 75 19 ± 1 18 ± 5 1.3 ± 0.3
LiHec AA 15 DN 75 (nd) (nd) (nd)
LiHec AA 25 DN 75 30 ± 3 52 ± 15 3.3 ± 1.0
PGV AA 15 DN 75 8.24 ± 0.02 74 ± 8 9.6 ± 0.3
PGV AA 25 DN 75 26 ± 2 48 ± 6 2.9 ± 0.4
Results for higher swollen hydrogel samples resembled those observed at low swelling
degree. The nanocomposite samples with low acrylic acid content revealed a slight, non-
significant reduction of the Young’s -modulus as compared to the reference while stress

4 Results and Discussion
106
and strain at break were enhanced. For the nanocomposites with high acrylic acid content
enhancement of all three properties, namely Young’s -modulus, stress and strain at break,
was observed. With increasing acrylic acid amount, an increase of the Young’s -modulus
was observed. For both stress and strain at break a decrease was detected with raising
acrylic acid content. This tendency matched the findings for non-neutralized polymers
that at higher swelling degrees the samples with higher acrylic acid content were more
brittle and ruptured more easily. Especially the stress at break was negatively affected.
While at a swelling degree of 3 g/g still an enhancement of the stress at break was found
comparing the low acrylic acid content with the high acrylic acid content, at 6 g/g the
hydrogels with more acrylic acid exhibited lower stress at break. Hence, low acrylic acid
content was recommended when using the 75 mol% neutralized polymer for the shell
chemistry.
Low acrylic acid content turned out to be favorable independently of the degree of
neutralization of the polymer. Comparing the samples with low acrylic acid content, a
neutralization of the polymer to 75 % resulted in a decrease of both Young’s -modulus
and stress at break while the strain at break was slightly increased.
In summary, the results suggest that the usage of low acrylic acid content in combination
with a degree of neutralization of zero should be best for the composition of the shell.
4.3.1.3 Variation of filler content
Finally the amount of clay mineral added to the composites was varied and the materials
were characterized by stress – strain measurements. For the investigations, 2.5 wt%,
5 wt%, 7.5 wt% and 10 wt% of clay mineral referred to the solid were chosen.
In this series of hydrogels the amount of acrylic acid was fixed at 15 wt% referred to the
total mass. The acrylic acid was not neutralized. Although it was shown in section 4.3.1.1
that a high content of organic crosslinker is counterproductive when aiming for a high
strain at break, an amount of organic crosslinker of 1 wt% was chosen. It was expected
that by increasing the amount of filler the detrimental effect of the higher crosslinking
level could be compensated. Labeling of the samples was done similar than above. The
amount of each clay mineral was indicated by stating “2.5”, “5”, “7.5” or “10” for the
corresponding amount of clay mineral. As an example, “LiHec 5” represents the lithium
hectorite composite with 5 wt% clay mineral referred to the content of solids.
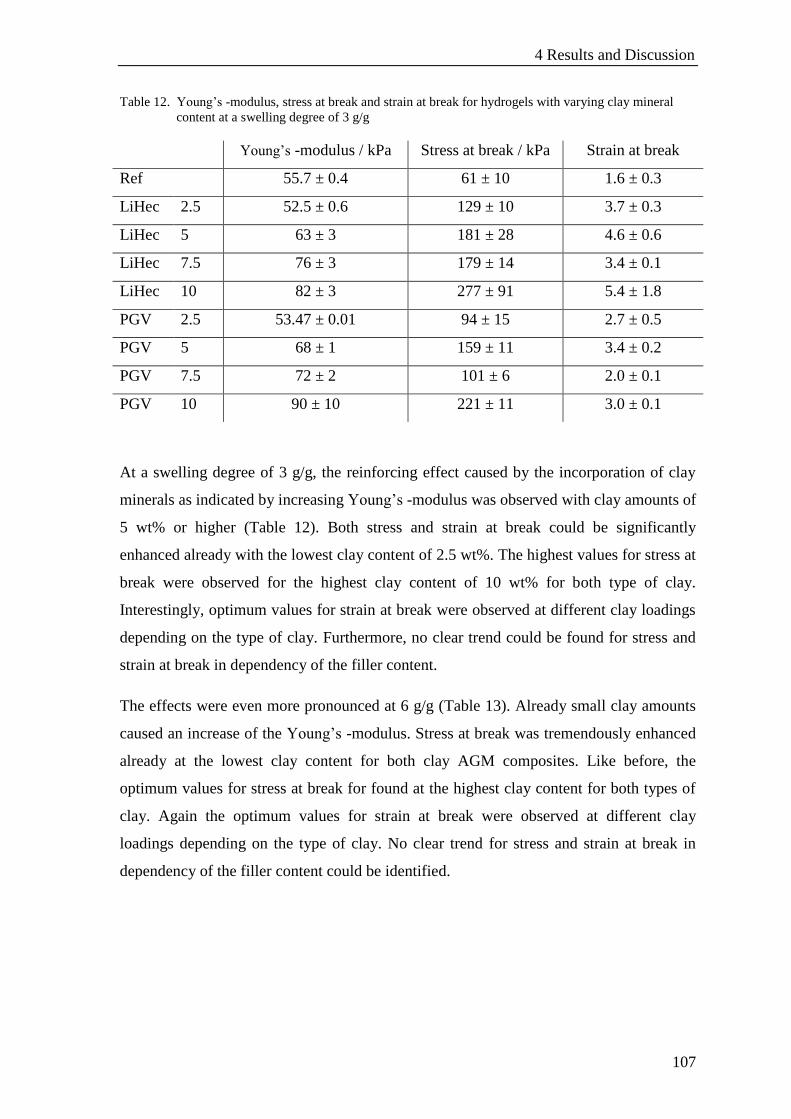
4 Results and Discussion
107
Table 12. Young’s -modulus, stress at break and strain at break for hydrogels with varying clay mineral
content at a swelling degree of 3 g/g
Young’s -modulus / kPa Stress at break / kPa Strain at break
Ref 55.7 ± 0.4 61 ± 10 1.6 ± 0.3
LiHec 2.5 52.5 ± 0.6 129 ± 10 3.7 ± 0.3
LiHec 5 63 ± 3 181 ± 28 4.6 ± 0.6
LiHec 7.5 76 ± 3 179 ± 14 3.4 ± 0.1
LiHec 10 82 ± 3 277 ± 91 5.4 ± 1.8
PGV 2.5 53.47 ± 0.01 94 ± 15 2.7 ± 0.5
PGV 5 68 ± 1 159 ± 11 3.4 ± 0.2
PGV 7.5 72 ± 2 101 ± 6 2.0 ± 0.1
PGV 10 90 ± 10 221 ± 11 3.0 ± 0.1
At a swelling degree of 3 g/g, the reinforcing effect caused by the incorporation of clay
minerals as indicated by increasing Young’s -modulus was observed with clay amounts of
5 wt% or higher (Table 12). Both stress and strain at break could be significantly
enhanced already with the lowest clay content of 2.5 wt%. The highest values for stress at
break were observed for the highest clay content of 10 wt% for both type of clay.
Interestingly, optimum values for strain at break were observed at different clay loadings
depending on the type of clay. Furthermore, no clear trend could be found for stress and
strain at break in dependency of the filler content.
The effects were even more pronounced at 6 g/g (Table 13). Already small clay amounts
caused an increase of the Young’s -modulus. Stress at break was tremendously enhanced
already at the lowest clay content for both clay AGM composites. Like before, the
optimum values for stress at break for found at the highest clay content for both types of
clay. Again the optimum values for strain at break were observed at different clay
loadings depending on the type of clay. No clear trend for stress and strain at break in
dependency of the filler content could be identified.

4 Results and Discussion
108
Table 13. Young’s -modulus, stress at break and strain at break for hydrogels with varying clay mineral
content at a swelling degree of 6 g/g
Young’s -modulus / kPa Stress at break / kPa Strain at break
Ref 35 ± 1 37 ± 12 1.5 ± 0.6
LiHec 2.5 40 ± 3 109 ± 6 4.1 ± 0.3
LiHec 5 46. ± 3 109 ± 9 3.6 ± 0.1
LiHec 7.5 51 ± 2 92 ± 5 2.6 ± 0.1
LiHec 10 67 ± 3 133 ± 3 3.31 ± 0.01
PGV 2.5 46 ± 1 99 ± 23 3.1 ± 0.7
PGV 5 55 ± 1 138 ± 18 3.4 ± 0.3
PGV 7.5 63 ± 2 92 ± 41 1.9 ± 0.8
PGV 10 70 ± 1 226 ± 40 4.2 ± 0.6
Liu et al. incorporated Laponite® clays in poly (N-isopropyl acrylamide) gels and found
an increase of Young’s -modulus and tensile stress at break with increasing filler
content.[117]
Haraguchi et al. and Haraguchi and Li presented comparable results for their
Laponite® containing poly (N-isopropyl acryliamide) hydrogels in respect of Young’s -
modulus and stress at break. At the same time strain at break was reduced with increasing
clay content.[110,121]
Xiong et al. observed that tensile stress at break of their poly
(acrylamide) – Laponite® nanocomposites increases dramatically with increasing
Laponite® concentration.[112]
Haraguchi and Song confirmed the enhancing effect of clay
incorporation on the Young’s -modulus of the poly (N-isopropyl acrylamide) hydrogel
and observed increasing values for increasing clay content. They furthermore showed that
the reinforcement always occurs independently of the amount of additionally added
organic crosslinker, however the extent of reinforcement decreases with increasing
crosslink content.[114]
Wang et al. confirmed the findings of Haraguchi et al. for
Laponite® incorporated poly (N-isopropyl acrylamide) hydrogels. They also found an
increase of tensile stress at break and a decrease of strain at break with increasing
Laponite® content and ascribe the effect to the increase of crosslinking density.
Furthermore, Wang et al. demonstrated the occurrence of strain hardening which
increases with increasing amount of clay mineral in their nanocomposite.[120]
Also for
gelatin – montmorillonite nanocomposites a dependency of the enforcement on the

4 Results and Discussion
109
content of clay was demonstrated. Both tensile stress at break and Young’s -modulus
were found to increase with increasing clay content.[122]
The results presented in literature would suggest that despite some fluctuations seen in the
presented results Young’s -modulus and stress at break would improve while the strain
steadily decreases with increasing clay content. Comparing the two types of clay the
overall performance of montmorillonite PGV® was found superior to lithium hectorite
regarding the composite gels with high clay content.
As stated earlier, the relevant thresholds are 400 % of strain and an Young’s -modulus of
> 100 kPa. At the higher investigated swelling level of 6g/g the threshold value for strain
was met by PGV 10 despite the high amount of organic crosslinker. Possibly the clay
content could even by increased beyond that level. Unfortunately, the loss of strain at
break caused by the high amount of organic crosslinker could not be fully compensated
by the increasing filler amounts. Consequently, the amount of organic crosslinker in the
shell composition should be kept low while the clay content has to be chosen at high
levels.
4.3.2 Fine-tuning of the shell hydrogel
Systematic variation of the different parameters expected to influence the mechanical
properties defining the performance of the shell material (Young’s -modulus, stress at
break and strain at break) suggested the following optimal composition:
Acrylic acid: 15 wt% referred to total mass
Degree of neutralization: 0 %
Amount of organic crosslinker: low, ≤ 0.3 mol% referred to acrylic acid
Clay content: high, ≥ 10 wt% referred to solid content
Clay type (aspect ratio): montmorillonite PGV®
For two parameters the optima were observed at extreme values. In a final attempt to
locate the best settings for high performance shell materials the variation range for these
two parameters was further extended.

4 Results and Discussion
110
The amount of acrylic acid was fixed to 15 wt% referred to the total mass of the sample
and the acrylic acid was not neutralized. The amount of organic crosslinker was further
reduced to 0.2 wt% referred to acrylic acid while the clay content was maximized. Any
drying of the clay minerals will unequivocally induce irreversible aggregation. The clay
minerals therefore have to be handled continuously in suspension. The maximum clay
mineral content that could be achieved in the nanocomposites was hence limited by the
maximum solid content of the clay suspension in water added to the polymerization
mixture. This in turn was mostly determined by the maximum viscosity of this suspension
which could still be handled and which increased with increasing clay content until it
finally got a paste-like texture. For lithium hectorite, this point was reached at a
concentration of 5 wt% of clay mineral in water. Hence, the maximum concentration of
clay mineral that could be chosen for the polymerization mixture was 20 wt% referred to
the total solid content.
A reference sample and the composite hydrogels of the two types of clay minerals were
prepared with above mentioned compositions. The samples were attempted to be swollen
to the swelling degree of 6 g/g to investigate the performance of the shell. However, after
equilibration for 10 days it was noticed that the AGM composite hydrogels were
incapable to take up the saline completely. Thus the maximum swelling capacities of the
investigated composite hydrogels were apparently below 6 g/g. Therefore the real
maximum swelling degree was determined for each sample by drying pieces of the fully
swollen samples. The following maximum swelling capacities were found:
Reference: 7.3 g/g
Lithium hectorite composite: 3.4 g/g
Montmorillonite PGV® composite: 5.6 g/g
The reference hydrogel was mechanically characterized at 6 g/g, while the composite
hydrogels were investigated at their maximum swelling degrees.
Unfortunately the reference sample turned out to be mechanically too unstable and sticky
to be handled and allow measurement in the stress-strain device due to its low cross-
linking level. The bare fact that both composite materials could be handled already
indicates that the hydrogels were significantly reinforced by incorporation of clay
minerals and that Young’s -modulus, stress at break and strain at break could be
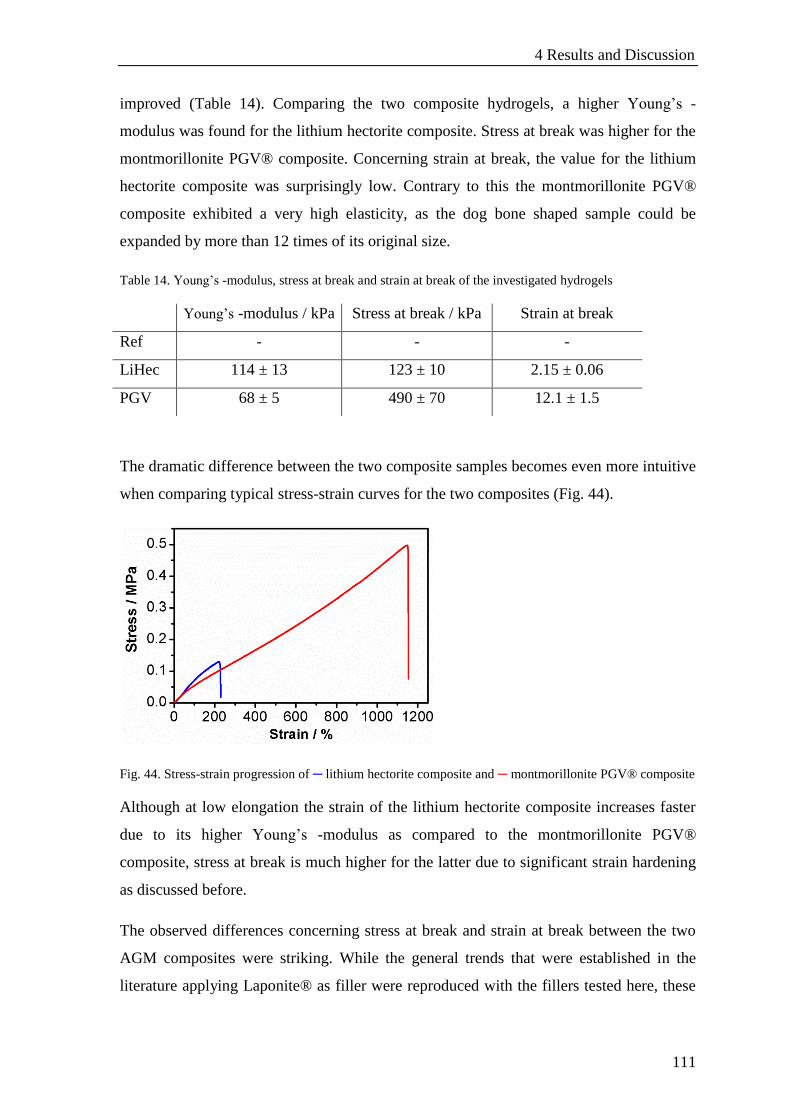
4 Results and Discussion
111
improved (Table 14). Comparing the two composite hydrogels, a higher Young’s -
modulus was found for the lithium hectorite composite. Stress at break was higher for the
montmorillonite PGV® composite. Concerning strain at break, the value for the lithium
hectorite composite was surprisingly low. Contrary to this the montmorillonite PGV®
composite exhibited a very high elasticity, as the dog bone shaped sample could be
expanded by more than 12 times of its original size.
Table 14. Young’s -modulus, stress at break and strain at break of the investigated hydrogels
Young’s -modulus / kPa Stress at break / kPa Strain at break
Ref - - -
LiHec 114 ± 13 123 ± 10 2.15 ± 0.06
PGV 68 ± 5 490 ± 70 12.1 ± 1.5
The dramatic difference between the two composite samples becomes even more intuitive
when comparing typical stress-strain curves for the two composites (Fig. 44).
Fig. 44. Stress-strain progression of ─ lithium hectorite composite and ─ montmorillonite PGV® composite
Although at low elongation the strain of the lithium hectorite composite increases faster
due to its higher Young’s -modulus as compared to the montmorillonite PGV®
composite, stress at break is much higher for the latter due to significant strain hardening
as discussed before.
The observed differences concerning stress at break and strain at break between the two
AGM composites were striking. While the general trends that were established in the
literature applying Laponite® as filler were reproduced with the fillers tested here, these

4 Results and Discussion
112
results additionally suggest a very strong dependency on the dimensions and/or the aspect
ratio of the filler which is more pronounced for clays with higher lateral dimension.
As discussed earlier (4.2.5) with the larger aspect ratio of the lithium hectorite two
potential disadvantages are connected that might explain the different performances:
1. The larger lithium hectorites might hamper formation of a homogeneous crosslinking
network and this way foster failure of the matrix in more brittle areas of higher cross-
linking density. 2. For the much larger lithium hectorite at the same weight content of
filler much fewer platelets are incorporated at which the same total stress has to be
dissipated and where therefore failure might occur more easily.
Contrary to the lithium hectorite composites, for the montmorillonite PGV® composite
the required threshold for the shell composition in respect of strain at break (> 400%) was
surpassed by a factor of 3. The requirements (> 100 kPa) in respect of Young’s -modulus
(68.2 kPa) were however not met yet. Young’s -modulus can, however, be easily
increased in two ways which are either increasing the amount of organic crosslinker or
increasing the amount of acrylic acid in the polymerization mixture. Both means will of
course decrease the materials strain at break for which the benchmark was surpassed by
far.
Since the impact of high crosslinker content on the strain at break was found to be more
severe than the reduction induced by increasing the content of acrylic acid, the latter
parameter was chosen to be increased to improve the Young’s -modulus. An AGM
composite was synthesized with the following parameters:
Acrylic acid: 25 wt% referred to total mass
Degree of neutralization: 0 %
Amount of organic crosslinker: 0.2 mol% referred to acrylic acid
Clay content: 18 wt% referred to solid content
Reference sample and montmorillonite PGV® AGM composite were left to swell to a x-
load of 6 g/g for 10 days. Since as expected the swelling capacity of the composite
material was insufficient to completely adsorb this amount of saline, the realized capacity
was determined:
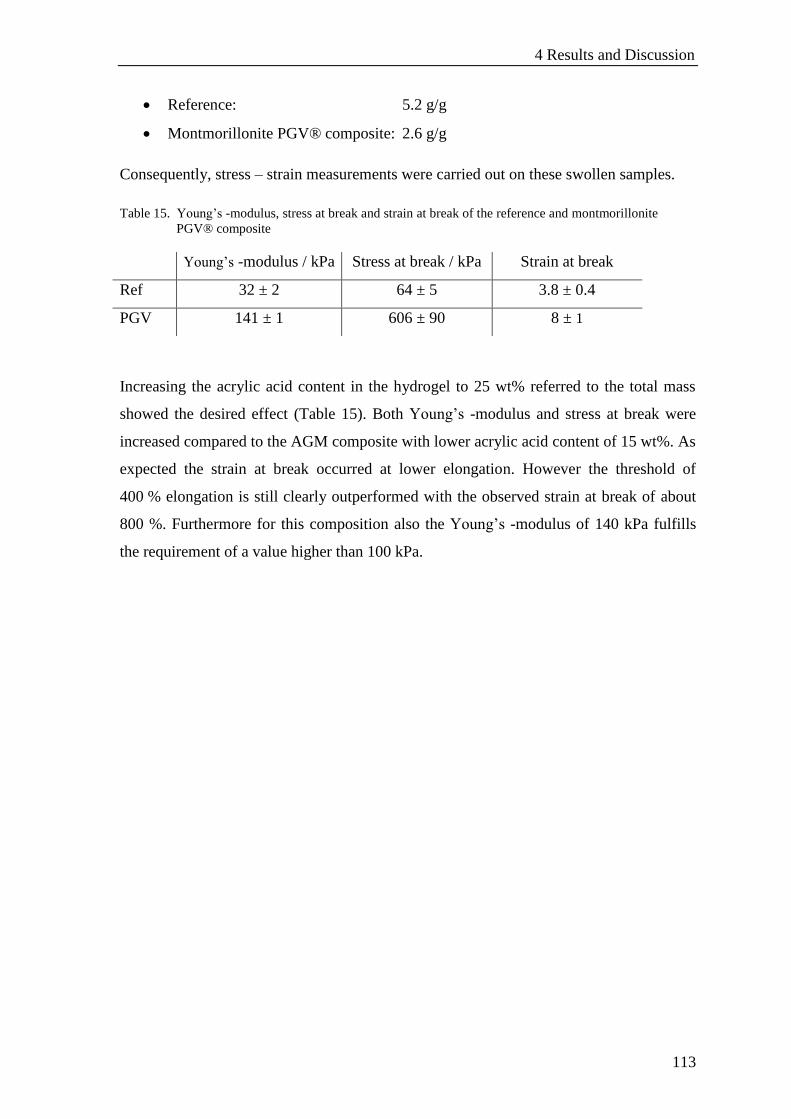
4 Results and Discussion
113
Reference: 5.2 g/g
Montmorillonite PGV® composite: 2.6 g/g
Consequently, stress – strain measurements were carried out on these swollen samples.
Table 15. Young’s -modulus, stress at break and strain at break of the reference and montmorillonite
PGV® composite
Young’s -modulus / kPa Stress at break / kPa Strain at break
Ref 32 ± 2 64 ± 5 3.8 ± 0.4
PGV 141 ± 1 606 ± 90 8 ± 1
Increasing the acrylic acid content in the hydrogel to 25 wt% referred to the total mass
showed the desired effect (Table 15). Both Young’s -modulus and stress at break were
increased compared to the AGM composite with lower acrylic acid content of 15 wt%. As
expected the strain at break occurred at lower elongation. However the threshold of
400 % elongation is still clearly outperformed with the observed strain at break of about
800 %. Furthermore for this composition also the Young’s -modulus of 140 kPa fulfills
the requirement of a value higher than 100 kPa.
5 Conclusion and Perspective
114
5 Conclusion and Perspective
Superabsorbent polymers are known for their excellent swelling behavior. AGM can
absorb more than 20 times amount of liquids referred to the dry weight. Upon swelling,
polymer grains are desired to retain their shape. However, highly swollen AGM often
exhibit low Young’s -moduli and are easily deformable when exposed to pressure. The
deformability upon load causes gel blocking. For usage in agricultural or hygiene
products gel blocking dramatically restricts the overall performance of the AGM. This
work focuses on AGM based on acrylic acid for the application in hygiene products.
Consequently high pressure resistance of shape is desired in order to avoid gel blocking,
while at the same time the maximum swelling capacity of the AGM particle should be
sustained. The decisive features of AGM, which are swelling capacity and pressure
resistance of shape represented by the gel strength, result from the structure of the
polymer network, more precisely from crosslinking density and distribution of
crosslinking points. The most common polymerization route for the synthesis of AGM,
which was also applied in this work, is free radical crosslinking polymerization. Free
radical crosslinking polymerization always causes heterogeneities in the polymer network
like for example loose ends or loops, which reduces both swelling capacity and gel
strength compared to samples with ideal network structure. Studies introduced by
Haraguchi et al. claim that implementing inorganic fillers, specifically clay minerals, will
improve the homogeneity of the polymer network and consequently performance of the
hydrogels.[35,37]
This approach was picked up and transferred to AGM chemistry with all
corresponding development needed. Additional advantage was taken of the reinforcing
effect induced by incorporation of stiff and anisometric clay platelets into the polymer.
Two different clay minerals with different aspect ratios were chosen, namely
montmorillonite PGV® with an aspect ratio of approximately 30 and lithium hectorite
with an aspect ratio higher than 1000. By incorporating both types of clay minerals
homogeneously into the AGM polymer it was possible to compare the effect of the
different aspect ratios.
Incorporating clay minerals into the given AGM based on acrylic acid was by far not
trivial as the polymerization mixture exhibits acidic pH and high ionic strength. Under
these given conditions clay minerals agglomerate due to their structural features and
surface chemistry. The basal planes of clay minerals are negatively charged, whereas the

5 Conclusion and Perspective
115
pH-dependent charge of the edges is positive at the pH of 5 defined by the polymerization
mixture. This causes the formation of house of cards structures by attraction of positive
edge and negative basal plane. House of cards formation can be avoided either by charge
neutralization of the clay edge or charge inversion of either the edge charge or the basal
charge. High ionic strength of the suspension medium causes lamellar agglomeration of
the clay minerals. It can be prevented by electrosterical stabilization by modification of
the negatively charged basal plane with sterically demanding polycations.
Initially, modification of the clay edges was attempted as the utilized amount of modifier
in this case could be kept small and its influence on the AGM properties minimal. Before
modifying the clay edges, their acidity was investigated. Therefore, first the charge of the
basal plane was covered by binding a polycation to avoid spillover effects of the
electrostatic potential of the basal plane to the clay edge as well as cation exchange
reactions that would adulterate the result. Then the PZNPC of the clay mineral was
determined by pH titrations. The PZNPC of montmorillonite PGV® was found at pH 5.
The PZNPC of Laponite® used as a model for lithium hectorite was found at pH 7.9.
Charge neutralization was attempted by anion exchange of hydroxyl by fluorine and
charge reversion of the clay edge was attempted by complexation of poly anionic
pyrophosphate to octahedral cations located at the clay edge. While the degree of
agglomeration of montmorillonite PGV® in polymerization mixtures could be reduced by
edge modification, analysis of the particle size distributions via static light scattering
revealed remaining agglomerates in both fluorinated and phosphorylated clay
suspensions.
The remaining agglomeration in the clay suspension after edge modification was
attributed to the formation of lamellar agglomerates caused by the high ionic strength of
the dispersion medium and was tackled by modification of the basal plane of the clay
minerals. Two modifiers were identified that are capable to establish visually stable clay
suspensions. The modifiers, OD and ODD, both exhibit a poly (ethylene imine) core
which is protonized at pH = 5. For ODD, poly ethylene oxide chains are attached to the
core. The quality of the stabilizing effect on clay mineral suspensions was quantified
applying force sedimentation which allowed optimizing the amount of modifier needed.
Force sedimentation also revealed that the additional sterical stabilization provided by
ODD is beneficial for the suspension stability. The necessary amount of ODD to stabilize
5 Conclusion and Perspective
116
the suspension of montmorillonite PGV® was determined at 45 wt% referred to clay. The
same modifier level was subsequently applied for lithium hectorite stabilization in
polymerization mixtures.
After establishing homogeneous suspensions of clay minerals bulk AGM composites
were synthesized and compared with unfilled reference materials of the same composition
in respect to their swelling capacity and gel strength as judged by VLRH measurements.
By incorporation of surface-modified clay minerals it was attempted to cross the trade off
line defined by the reference samples.
For both montmorillonite PGV® and lithium hectorite nanocomposites, a loss of the
maximum swelling capacity was detected. Reasons for the reduction of the swelling
capacity are the replacement of AGM by non-swelling inorganic filler plus modifier and
possible restrictions of swelling induced by the clay mineral. Both types of
nanocomposites showed an increase of the gel strength. For the montmorillonite PGV®
nanocomposites, the increase of gel strength was sufficient to produce values for
maximum swelling capacity and VLRH above the trade off line. The trade off line was,
however, not crossed by the lithium hectorite composites.
Montmorillonite PGV® composite outperformed the unfilled reference material with
identical amount of organic crosslinker at the full range of intermediate swelling degrees.
For the lithium hectorite, a crossover the line defined by the reference samples was
observed. At low swelling the nanocomposites of lithium hectorite as well as
montmorillonite PGV® composites were slightly better as compared to the reference
sample. At higher swelling and even more, as discussed in the previous paragraph, in the
fully swollen state the lithium hectorites composites underperformed. With the larger
aspect ratio of the lithium hectorite two potential disadvantages are connected that might
explain the inferior performance: 1. The larger lithium hectorites might hamper formation
of a homogeneous crosslinking network and this way foster failure of the matrix in more
brittle areas of higher cross-linking density. 2. For the much larger lithium hectorite at the
same weight content of filler much fewer platelets are incorporated at which the same
total stress has to be dissipated and where therefore failure might occur more easily.
Among the possible failure mechanisms failure at the interface of modifier and polymer
matrix was regarded the most probable. Therefore, the modifier was functionalized with a
reactive double bond which could be incorporated into the polymer network during
5 Conclusion and Perspective
117
polymerization. Covalently linking the modifier and thus the filler to the AGM was
comparable to increasing organic crosslinking and the resulting composites were found
on the trade off line.
In conclusion, even if montmorillonite PGV® composite improvements seem within
~ 10 % vs. reference, it is worthwhile to elucidate the effect on gel blocking in more
detail and in particle AGM context.
Next the reinforcement of clay fillers on the performance of a potential shell in core –
shell particles was studied. In this core – shell approach, the two competing functions of
high maximum swelling capacity and high pressure resistance of shape were spatially
separated. The core of the structure should provide high swelling ability, while the shell
should grant high mechanical strength. As the main function of the core was delivering
high swelling ability, the commercial bulk non surface crosslinked AGM would be
chosen as core material. Previous studies examining other shell materials suggested that
the Young’s -modulus should be > 100 kPa to make a thin shell appropriate, while a
minimum strain at break of 300 - 400 % elongation was required to break reference
capacity/gel bed permeability tradeoff. With AGM composite materials applied as shells,
compatibility of core and shell would be granted. As swelling ability would not be of big
importance for the shell, the degree of neutralization of the polymer was irrelevant and
was included in the systematic variation of polymerization parameters. Acrylic acid
content, degree of neutralization, amount of organic crosslinker, clay content and type of
clay were varied and the mechanical properties as characterized by stress-strain
measurements were compared with unfilled reference materials. Low acrylic acid content,
a degree of neutralization of zero, low content of organic crosslinker and high clay
content were found to be favorable. As to the type of clay montmorillonite PGV® was
superior over lithium hectorite.
As reported in literature with increasing clay content Young’s -moduli and stress at break
were found to increase while the composites become increasingly brittle and suffer a loss
of strain at break. This latter effect is also strongly dependent on the aspect ratio and
therefore for similar reasons as for bulk AGM performance, lithium hectorite composites
failed to meet the above mentioned threshold criteria. In contrast, the best AGM
montmorillonite PGV® composite outperformed the set thresholds and reached values of
800 % of elongation for the strain at break, a stress at break of 600 kPa and an Young’s -
5 Conclusion and Perspective
118
modulus of 140 kPa. The strain value leaves sufficient space to be rebalanced further to
achieve even higher tensile modulus.
Next the performance of these core-shell particles with composite shells has to be studied
in respect to its efficiency to prevent gel blocking. Appropriate processing has to be
established that allows attachment of a composite shell to the AGM core, for example via
spray coating. A parameter that needs to be intensively monitored in this context is the
thickness of the shell and its influence on the performance of the core – shell particle. Gel
blocking in dependence of the thickness of the shell should be analyzed.
While the larger aspect ratio of lithium hectorite as expected lead to the most pronounced
improvements in the Young’s -moduli, the overall performance of this type of clay was
inferior both when applied as filler in bulk AGM and shell. Apparently for the overall
performance in this particular polymer matrix, the number of particles per gram of filler
and the possibly detrimental influence of the huge platelets on the homogeneity of the
organic crosslinking points are more important factors. In this light, Laponite® modified
with ODD should be reinvestigated.

6 Reference list
119
6 Reference list
[1.] J. R. Gross, in Studies in Polymer Science: Absorbent Polymer Technology (Ed.:
Lisa Brannon-Peppas and Ronald S.Harland), Elsevier, 1990, 3-22
[2.] N. A. Peppas, J. Z. Hilt, A. Khademhosseini, R. Langer, Adv. Mater. 2006, 18,
1345-1360.
[3.] B. Jeong, Y. H. Bae, D. S. Lee, S. W. Kim, Nature 1997, 388, 860-862.
[4.] P. Gupta, K. Vermani, S. Garg, Drug Discovery Today 2002, 7, 569-579.
[5.] N. A. Peppas, P. Bures, W. Leobandung, H. Ichikawa, European Journal of
Pharmaceutics and Biopharmaceutics 2000, 50, 27-46.
[6.] J. P. Gong, Y. Katsuyama, T. Kurokawa, Y. Osada, Adv. Mater. 2003, 15, 1155-
1158.
[7.] J. L. Drury, D. J. Mooney, Biomaterials 2003, 24, 4337-4351.
[8.] B. K. Mann, A. S. Gobin, A. T. Tsai, R. H. Schmedlen, J. L. West, Biomaterials
2001, 22, 3045-3051.
[9.] K. T. Nguyen, J. L. West, Biomaterials 2002, 23, 4307-4314.
[10.] D. J. Beebe, J. S. Moore, J. M. Bauer, Q. Yu, R. H. Liu, C. Devadoss, B. H. Jo,
Nature 2000, 404, 588-590.
[11.] J. H. Holtz, S. A. Asher, Nature 1997, 389, 829-832.
[12.] K. Lee, S. A. Asher, J. Am. Chem. Soc. 2000, 122, 9534-9537.
[13.] A. Heller, Phys. Chem. Chem. Phys. 2004, 6, 209-216.
[14.] N. Sahiner, Colloid Polym Sci 2006, 285, 283-292.
[15.] M. Liu, R. Liang, F. Zhan, Z. Liu, A. Niu, Polym. Int. 2007, 56, 729-737.
[16.] K. H. Liu, T. Y. Liu, S. Y. Chen, D. M. Liu, Acta Biomaterialia 2008, 4, 1038-
1045.
[17.] P. S. K. Murthy, Y. Murali Mohan, K. Varaprasad, B. Sreedhar, K. Mohana
Raju, J. Colloid Interface Sci. 2008, 318, 217-224.
[18.] N. Ravi, H. A. Aliyar, P. D. Hamilton, Macromol. Symp. 2005, 227, 191-202.
[19.] M. Kokabi, M. Sirousazar, Z. M. Hassan, European Polymer Journal 2007, 43,
773-781.
6 Reference list
120
[20.] S. R. Sershen, G. A. Mensing, M. Ng, N. J. Halas, D. J. Beebe, J. L. West, Adv.
Mater. 2005, 17, 1366-1368.
[21.] P. Li, Siddaramaiah, N. H. Kim, S. B. Heo, J. H. Lee, Composites Part B:
Engineering 2008, 39, 756-763.
[22.] N. Sahiner, S. Butun, O. Ozay, B. Dibek, J. Colloid Interface Sci. 2012, 373,
122-128.
[23.] C. Mo, Z. Shu-quan, L. Hua-Min, H. Zhan-bin, L. Shu-qin, J. Appl. Polym. Sci.
2006, 102, 5137-5143.
[24.] M. J. Zohuriaan-Mehr, K. Kabiri, Iranian Polymer Journal 2008, 17, 451-477.
[25.] A. B. Kinney, A. B. Scranton, in Superabsorbent Polymers, American Chemical
Society, 1994, 2-26
[26.] K. Kabiri, H. Omidian, M. J. Zohuriaan-Mehr, S. Doroudiani, Polym Compos
2011, 32, 277-289.
[27.] F. L. Buchholz, J. Appl. Polym. Sci. 2006, 102, 4075-4084.
[28.] H. Wack, M. Ulbricht, Ind. Eng. Chem. Res. 2006, 46, 359-364.
[29.] L. Brannon-Peppas, in Studies in Polymer Science: Absorbent Polymer
Technology (Ed.: Lisa Brannon-Peppas and Ronald S.Harland), Elsevier, 1990,
45-66
[30.] F. L. Buchholz, in Studies in Polymer Science: Absorbent Polymer Technology
(Ed.: Lisa Brannon-Peppas and Ronald S.Harland), Elsevier, 1990, 23-44
[31.] J. Chen, Y. Zhao, J. Appl. Polym. Sci. 2000, 75, 808-814.
[32.] O. Okay, Progress in Polymer Science 2000, 25, 711-779.
[33.] K. Dušek, Angew. Makromol. Chem. 1996, 240, 1-15.
[34.] O. Okay, in Hydrogel Sensors and Actuators (Eds.: G. Gerlach, K. F. Arndt),
Springer Berlin Heidelberg, 2010, 1-14
[35.] K. Haraguchi, T. Takehisa, Adv. Mater. 2002, 14, 1120-1124.
[36.] M. Shibayama, J. Suda, T. Karino, S. Okabe, T. Takehisa, K. Haraguchi,
Macromolecules 2004, 37, 9606-9612.
[37.] K. Haraguchi, H. J. Li, K. Matsuda, T. Takehisa, E. Elliott, Macromolecules
2005, 38, 3482-3490.
[38.] M. Zendehdel, A. Barati, H. Alikhani, Polym. Bull. 2011, 67, 343-360.
[39.] W. F. Lee, Y. C. Huang, J. Appl. Polym. Sci. 2007, 106, 1992-1999.

6 Reference list
121
[40.] K. Shikinaka, Y. Koizumi, Y. Osada, K. Shigehara, Polym. Adv. Technol. 2011,
22, 1212-1215.
[41.] K. Kabiri, M. J. Zohuriaan-Mehr, Macromol. Mater. Eng. 2004, 289, 653-661.
[42.] W. F. Lee, L. G. Yang, J. Appl. Polym. Sci. 2004, 92, 3422-3429.
[43.] W. F. Lee, Y. C. Chen, European Polymer Journal 2005, 41, 1605-1612.
[44.] J. M. Lin, J. H. Wu, Z. F. Yang, M. L. Pu, Macromolecular Rapid
Communications 2001, 22, 422-424.
[45.] W. Wang, Y. Zheng, A. Wang, Polym. Adv. Technol. 2008, 19, 1852-1859.
[46.] T. D. Fornes, D. R. Paul, Polymer 2003, 44, 4993-5013.
[47.] H. M. Smallwood, J. Appl. Phys. 1944, 15, 758-766.
[48.] Rao, J. M. Pochan, Macromolecules 2006, 40, 290-296.
[49.] J. C. Halpin, J. L. Kardos, Polymer Engineering and Science 1976, 16, 344-352.
[50.] R. Hill, Journal of the Mechanics and Physics of Solids 1964, 12, 199-212.
[51.] J. J. Hermans, Koninklijke Nederlandse Akademie Van Weteschappen-
Proceedings Series B-Physical Sciences 1967, 70, 1-9.
[52.] E. Ruiz-Hitzky, A. Van Meerbeek, in Developments in Clay Science: Handbook
of Clay Science (Eds.: F. Bergaya, B. K. B. Theng, G. Lagaly), Elsevier, 2006,
583-621
[53.] K. Kabiri, M. J. Zohuriaan-Mehr, Polym. Adv. Technol. 2003, 14, 438-444.
[54.] S. Jockusch, N. J. Turro, Y. Mitsukami, M. Matsumoto, T. Iwamura, T. Lindner,
A. Flohr, G. di Massimo, J. Appl. Polym. Sci. 2009, 111, 2163-2170.
[55.] S. Ma, M. Liu, Z. Chen, J. Appl. Polym. Sci. 2004, 93, 2532-2541.
[56.] W. H. Blackburn, L. A. Lyon, Colloid Polym Sci 2008, 286, 563-569.
[57.] C. D. Jones, L. A. Lyon, Macromolecules 2000, 33, 8301-8306.
[58.] V. Lapeyre, C. Ancla, B. Catargi, V. Ravaine, J. Colloid Interface Sci. 2008,
327, 316-323.
[59.] J. W. Gilman, Appl. Clay Sci. 1999, 15, 31-49.
[60.] Y. Yang, Z. K. Zhu, J. Yin, X. Y. Wang, Z. E. Qi, Polymer 1999, 40, 4407-
4414.
[61.] W. J. Boo, L. Sun, J. Liu, E. Moghbelli, A. Clearfield, H. J. Sue, H. Pham, N.
Verghese, J. Polym. Sci. B Polym. Phys. 2007, 45, 1459-1469.

6 Reference list
122
[62.] F. Bergaya, B. K. G. Theng, G. Lagaly, Handbook of Clay Science, 2006.
[63.] H. v. Olphen, An Introduction to Clay Colloid Chemistry, second edition ed.
John Wiley & Sons, 1977.
[64.] M. Onikata, M. Kondo, N. Hayashi, S. Yamanaka, Clays Clay Miner. 1999, 47,
672-677.
[65.] W. Loyens, P. Jannasch, F. H. J. Maurer, Polymer 2005, 46, 915-928.
[66.] Y. Xi, R. L. Frost, H. He, J. Colloid Interface Sci. 2007, 305, 150-158.
[67.] E. Manias, A. Touny, L. Wu, K. Strawhecker, B. Lu, T. C. Chung, Chem.
Mater. 2001, 13, 3516-3523.
[68.] M. F. Brigatti, E. Galan, B. K. G. Theng, in Developments in Clay Science:
Handbook of Clay Science (Eds.: F. Bergaya, B. K. G. Theng, G. Lagaly),
Elsevier, 2006, 19-86
[69.] M. Kosmulski, J. Colloid Interface Sci. 2004, 275, 214-224.
[70.] M. Benna, N. Kbir-Ariguib, A. Magnin, F. Bergaya, J. Colloid Interface Sci.
1999, 218, 442-455.
[71.] M. Delhorme, B. Jonsson, C. Labbez, Soft Matter 2012, 8, 9691-9704.
[72.] S. Tazi, B. Rotenberg, M. Salanne, M. Sprik, M. Sulpizi, Geochim. Cosmochim.
Acta 2012, 94, 1-11.
[73.] M. Duc, F. Gaboriaud, F. Thomas, J. Colloid Interface Sci. 2005, 289, 148-156.
[74.] E. Tombácz, M. Szekeres, Appl. Clay Sci. 2004, 27, 75-94.
[75.] C. Tournassat, J. M. Greneche, D. Tisserand, L. Charlet, J. Colloid Interface Sci.
2004, 273, 224-233.
[76.] M. Delhorme, C. Labbez, C. Caillet, F. Thomas, Langmuir 2010, 26, 9240-
9249.
[77.] A. M. L. Kraepiel, K. Keller, F. M. M. Morel, Environmental Science &
Technology 1998, 32, 2829-2838.
[78.] E. Tertre, S. Castet, G. Berger, M. Loubet, E. Giffaut, Geochim. Cosmochim.
Acta 2006, 70, 4579-4599.
[79.] C. Tournassat, E. Ferrage, C. Poinsignon, L. Charlet, J. Colloid Interface Sci.
2004, 273, 234-246.
[80.] I. C. Bourg, G. Sposito, A. C. M. Bourg, J. Colloid Interface Sci. 2007, 312,
297-310.
[81.] S. Kaufhold, H. Stanjek, D. P. Ner, R. Dohrmann, Clay Miner. 2011, 46, 583-
592.

6 Reference list
123
[82.] M. Duc, F. Gaboriaud, F. Thomas, J. Colloid Interface Sci. 2005, 289, 139-147.
[83.] R. B. Secor, C. J. Radke, J. Colloid Interface Sci. 1985, 103, 237-244.
[84.] F. R. C. Chang, G. Sposito, J. Colloid Interface Sci. 1996, 178, 555-564.
[85.] M. Rozalén, P. V. Brady, F. J. Huertas, J. Colloid Interface Sci. 2009, 333, 474-
484.
[86.] H. Wanner, Y. Albinsson, O. Karnland, E. Wieland, P. Wersin, L. Charlet,
Radiochim. Acta 1994, 66-7, 157-162.
[87.] G. E. Christidis, Appl. Clay Sci. 2008, 42, 1-7.
[88.] E. M. Pecini, M. J. Avena, Langmuir 2013, 29, 14926-14934.
[89.] www.lum-gmbh.com, 29-8-2013.
[90.] www.bareiss.de, 29-8-2013.
[91.] H. Kalo, M. W. Möller, D. A. Kunz, J. Breu, Nanoscale 2012, 4, 5633-5639.
[92.] L. Ammann, F. Bergaya, G. Lagaly, Clay Miner. 2005, 40, 441-453.
[93.] M. Ziadeh, B. Chwalka, H. Kalo, M. R. Schütz, J. Breu, Clay Miner. 2012, 47,
341-353.
[94.] O. P. Mehra, M. L. Jackson, Clays Clay Miner. 1958, 317-327.
[95.] J. Breu, K. J. Range, E. E. Kohler, U. Wagner, Appl. Clay Sci. 1993, 8, 313-320.
[96.] M. Segad, B. Jönsson, B. Cabane, J. Phys. Chem. C 2012, 116, 25425-25433.
[97.] M. Segad, S. Hanski, U. Olsson, J. Ruokolainen, T. Åkesson, B. Jönsson, J.
Phys. Chem. C 2012, 116, 7596-7601.
[98.] C. Tournassat, M. Bizi, G. Braibant, C. Crouzet, J. Colloid Interface Sci. 2011,
364, 443-454.
[99.] N. Öztekin, A. Alemdar, N. Güngör, F. B. Erim, Materials Letters 2002, 55, 73-
76.
[100.] E. Fuente, A. Blanco, C. Negro, M. A. Pelach, P. Mutje, J. Tijero, Ind. Eng.
Chem. Res. 2005, 44, 5616-5621.
[101.] A. Alemdar, N. Öztekin, N. Güngör, Ö. I. Ece, F. B. Erim, Colloids and
Surfaces A: Physicochemical and Engineering Aspects 2005, 252, 95-98.
[102.] G. Sposito, N. T. Skipper, R. Sutton, S. H. Park, A. K. Soper, J. A. Greathouse,
Proceedings Of The National Academy Of Sciences Of The United States Of
America 1999, 96, 3358-3364.
[103.] H. Kalo, W. Milius, J. Breu, Rsc Advances 2012, 2, 8452-8459.

6 Reference list
124
[104.] D. A. Kunz, J. Erath, D. Kluge, H. Thurn, B. Putz, A. Fery, J. Breu, ACS Appl.
Mater. Interfaces 2013, 5, 5851-5855.
[105.] E. A. C. Follett, W. J. McHardy, B. D. Mitchell, B. F. L. Smith, Clay Miner.
1965, 6, 23-34.
[106.] H. Hayashi, M. Yamada, Clays Clay Miner. 1990, 38, 308-314.
[107.] P. Komadel, J. Madejová, in Developments in Clay Science: Handbook of Clay
Science (Eds.: F. Bergaya, B. K. G. Theng, G. Lagaly), Elsevier, 2006, 263-287
[108.] W. H. Huang, W. D. Keller, Amer. Mineral. 1971, 56, 1082-&.
[109.] C. J. Wu, A. K. Gaharwar, B. K. Chan, G. Schmidt, Macromolecules 2011, 44,
8215-8224.
[110.] K. Haraguchi, H. J. Li, Macromolecules 2006, 39, 1898-1905.
[111.] M. Shibayama, T. Karino, S. Miyazaki, S. Okabe, T. Takehisa, K. Haraguchi,
Macromolecules 2005, 38, 10772-10781.
[112.] L. Xiong, X. Hu, X. Liu, Z. Tong, Polymer 2008, 49, 5064-5071.
[113.] L. Xiong, M. Zhu, X. Hu, X. Liu, Z. Tong, Macromolecules 2009, 42, 3811-
3817.
[114.] K. Haraguchi, L. Song, Macromolecules 2007, 40, 5526-5536.
[115.] W. C. Lin, W. Fan, A. Marcellan, D. Hourdet, C. Creton, Macromolecules 2010,
43, 2554-2563.
[116.] R. O. Ritchie, Nat Mater 2011, 10, 817-822.
[117.] Y. Liu, M. Zhu, X. Liu, W. Zhang, B. Sun, Y. Chen, H. J. Adler, Polymer 2006,
47, 1-5.
[118.] O. Okay, W. Oppermann, Macromolecules 2007, 40, 3378-3387.
[119.] S. Abdurrahmanoglu, V. Can, O. Okay, J. Appl. Polym. Sci. 2008, 109, 3714-
3724.
[120.] T. Wang, D. Liu, C. Lian, S. Zheng, X. Liu, Z. Tong, Soft Matter 2012, 8, 774-
783.
[121.] K. Haraguchi, T. Takehisa, S. Fan, Macromolecules 2002, 35, 10162-10171.
[122.] J. P. Zheng, P. Li, Y. L. Ma, K. D. Yao, J. Appl. Polym. Sci. 2002, 86, 1189-
1194.
7 Acknowledgements
125
7 Acknowledgements
I would like to thank Prof. Dr. Josef Breu for giving me the opportunity to accomplish my
PhD thesis at his chair, for his guidance and advice during my work on a highly
interesting subject and for the great change work on a project in cooperation with an
industry partner.
I also would like to thank Dr. Mattias Schmidt, Dr. Peter Dziezok and Dr. Arsen
Simonyan from Procter & Gamble for the pleasant, constructive collaboration and the
inspiring and motivating discussions.
Furthermore, I want to express my gratitude to Wolfgang Milius, Bernd Putz, Beate
Bojer, Sonja Lutschinger, Dieter Will, and Lena Geiling. Thank you for your help with
every day lab problems, for the scientific advice and the provided support in the
laboratory. Great thanks also to Petra Seidler and Iris Raithel for their assistance with
bureaucratic paperwork of any kind.
Thanks to my students Sabrina Eller, Christina Wagner, Daniel Forberg, Andreas Schedl,
Raphael Kunz and Laura Schwinger for assisting me with the lab work and bringing some
diversion to the daily routine.
Special thanks go to my colleagues who accompanied during my work:
Thanks guys of the “rotes Labor”: Michael Möller, Bettina Chwalka, Thomas
Lunkenbein, Evgeny Tsurko, Carina Bojer, Patrick Feicht, Mazen Ziadeh and Martin
Schieder. Thank you for the fun we had together in the lab, for the numerous times you
made me laugh and for all the interesting discussions and your advice.
I also would like to thank Markus Herling and Wolfgang Milius for not only supporting
me during the working day but also for the running sessions we spent together many
evenings. Thank you, Thomas Martin, for helping with and solving my computer
problems. Bashar Diar Bakerly, thank you for always being ready to help and for all the
scientific and non-scientific conversations we shared during our “15 minutes of break in
the sun”.
7 Acknowledgements
126
Great thanks also to the rest of the group: Daniel Kunz, Jasmin Schmid, Josef Hausner,
Matthias Stöter, Hussein Kalo, Andreas Edenharter, Christian Butterhof and Sebastian
Koch for always having an open ear and helping hand and for the enjoyable atmosphere.
I also would like to thank everybody else who crossed my way and supported me in some
way or another:
Thanks to our barbeque masters Paul Niemietz, Marko Schmidt and Dominik Greim for
taking care of sufficient beer, meat, and - most important - coffee supply. Thank you
Theresa Winkler, for pushing me on early working days and for all the nice conversations
we had while doing our rounds in the “Hofgarten”.
Furthermore I would like to thank my friends and housemates from Jean-Paul Str.
Sebastian, Niklas, Anne and Andi, thank you for the cooking events, the barbecues, the
lazy relaxing moments enjoying the sun in our garden, the parties and all fun we had
together.
Thank you, Sven Kochmann, for our daily “conversations”, the countless you tube videos
that made me laugh, and for your endless creativity when it came to motivate me to finish
my work.
I especially would like to thank you, Ricard, for motivating me, for your patience and
your continuous support. Thank you for always finding the right words to cheer me up in
hard times and for always being there for me.
Finally, I would like to sincerely thank my family for their love and support. Your help
and advice made it possible for me to grow the person I am right now and reach this
important step in my life.
Thanks also to Procter & Gamble for financial support.


(Eidesstattliche) Versicherungen und Erklärungen
(§ 5 Nr. 4 PromO)
Hiermit erkläre ich, dass keine Tatsachen vorliegen, die mich nach den gesetzlichen
Bestimmungen über die Führung akademischer Grade zur Führung eines Doktorgrades
unwürdig erscheinen lassen.
(§ 8 S. 2 Nr. 5 PromO)
Hiermit erkläre ich mich damit einverstanden, dass die elektronische Fassung meiner
Dissertation unter Wahrung meiner Urheberrechte und des Datenschutzes einer
gesonderten Überprüfung hinsichtlich der eigenständigen Anfertigung der Dissertation
unterzogen werden kann.
(§ 8 S. 2 Nr. 7 PromO)
Hiermit erkläre ich eidesstattlich, dass ich die Dissertation selbständig verfasst und keine
anderen als die von mir angegebenen Quellen und Hilfsmittel benutzt habe.
Ich habe die Dissertation nicht bereits zur Erlangung eines akademischen Grades
anderweitig eingereicht und habe auch nicht bereits diese oder eine gleichartige
Doktorprüfung endgültig nicht bestanden.
(§ 8 S. 2 Nr. 9 PromO)
Hiermit erkläre ich, dass ich keine Hilfe von gewerblichen Promotionsberatern bzw. -
vermittlern in Anspruch genommen habe und auch künftig nicht nehmen werde.
……………………………………………………………………………………….
Ort, Datum, Unterschrift
Related Documents