Strathprints Institutional Repository Sentenac, P. and Zielinski, M. (2009) Clay fine fissuring monitoring using miniature geo-electrical resistivity arrays. Environmental Earth Sciences, 59 (1). pp. 205-214. ISSN 1866-6280 Strathprints is designed to allow users to access the research output of the University of Strathclyde. Copyright c and Moral Rights for the papers on this site are retained by the individual authors and/or other copyright owners. You may not engage in further distribution of the material for any profitmaking activities or any commercial gain. You may freely distribute both the url (http:// strathprints.strath.ac.uk/) and the content of this paper for research or study, educational, or not-for-profit purposes without prior permission or charge. Any correspondence concerning this service should be sent to Strathprints administrator: mailto:[email protected] http://strathprints.strath.ac.uk/

Welcome message from author
This document is posted to help you gain knowledge. Please leave a comment to let me know what you think about it! Share it to your friends and learn new things together.
Transcript

Strathprints Institutional Repository
Sentenac, P. and Zielinski, M. (2009) Clay fine fissuring monitoring using miniature geo-electricalresistivity arrays. Environmental Earth Sciences, 59 (1). pp. 205-214. ISSN 1866-6280
Strathprints is designed to allow users to access the research output of the University of Strathclyde.Copyright c© and Moral Rights for the papers on this site are retained by the individual authorsand/or other copyright owners. You may not engage in further distribution of the material for anyprofitmaking activities or any commercial gain. You may freely distribute both the url (http://strathprints.strath.ac.uk/) and the content of this paper for research or study, educational, ornot-for-profit purposes without prior permission or charge.
Any correspondence concerning this service should be sent to Strathprints administrator:mailto:[email protected]
http://strathprints.strath.ac.uk/

Sentenac, P. and Zielinski, M. (2009) Clay fine fissuring monitoring using miniature geo-electrical resistivity arrays. Environmental Earth Sciences, 59 (1). pp. 205-214. ISSN 1866-6280 http://strathprints.strath.ac.uk/13524/ This is an author produced version of a paper published in Environmental Earth Sciences, 59 (1). pp. 205-214. ISSN 1866-6280. This version has been peer-reviewed but does not include the final publisher proof corrections, published layout or pagination. Strathprints is designed to allow users to access the research output of the University of Strathclyde. Copyright © and Moral Rights for the papers on this site are retained by the individual authors and/or other copyright owners. You may not engage in further distribution of the material for any profitmaking activities or any commercial gain. You may freely distribute both the url (http://strathprints.strath.ac.uk) and the content of this paper for research or study, educational, or not-for-profit purposes without prior permission or charge. You may freely distribute the url (http://strathprints.strath.ac.uk) of the Strathprints website. Any correspondence concerning this service should be sent to The Strathprints Administrator: [email protected]

Clay fine fissuring monitoring using miniature geo-electricalresistivity arrays
Abstract This article describes a miniaturised electrical
imaging (resistivity tomography) technique to map the
cracking pattern of a clay model. The clay used was taken
from a scaled flood embankment built to study the fine
fissuring due to desiccation and breaching process in
flooding conditions. The potential of using a miniature
array of electrodes to follow the evolution of the vertical
cracks and number them during the drying process was
explored. The imaging technique generated two-dimen-
sional contoured plots of the resistivity distribution within
the model before and at different stages of the desiccation
process. The change in resistivity associated with the
widening of the cracks were monitored as a function of
time. Experiments were also carried out using a selected
conductive gel to slow down the transport process into the
cracks to improve the scanning capabilities of the equip-
ment. The main vertical clay fissuring network was
obtained after inversion of the experimental resistivity
measurements and validated by direct observations.
Keywords Resistivity � Clay cracking � Desiccation �Embankments
Introduction
Long term deterioration is recognised to be an important
factor affecting the integrity and reliability of flood
embankments. Changes in material properties due to des-
iccation or softening of clays as well as changes in the
structural form of embankments caused by erosion and/or
burrowing can affect the full structure. The process of
desiccation fissuring is known to contribute to embankment
failure during overflow conditions that can lead to exces-
sive ingress of water into the crest and on the outward slope
ending into breaching and slope failure. However, very
little information is known about the rate of desiccation and
the cracking network within newly constructed flood
embankments. Likewise no robust methods have been
developed to monitor the presence of fissures except than
excavating trial pits for inspection.
The fine fissuring of clay fill was first recognised as a
major cause of flood embankment failure in the UK fol-
lowing the devastating North Sea floods of 1953. Cooling
and Marsland (1954) carried out extensive field studies of
the areas affecting by flooding in Essex and Kent and
concluded that embankment failure was a result of one or a
combination of the following causes: (1) erosion of the
outward face by wave action, (2) erosion of the inward face
due to overflow, (3) slipping of the inward face caused by
seepage through the embankment, (4) build up water
pressures in underlying permeable strata resulting in uplift.
Alternations in weather patterns due to climate change
(i.e. increased rates of evaporation due to drier summers
coupled with increase in heavy rainfall and extreme flood
events) have induced a greater likelihood of long term
desiccation of flood embankments with the possibility of
more frequent extreme flood events like in 2003. Marsland
(1968) carried on the study in investigating the fissuring of
clay in flood embankments.
Therefore, the aim of the present study was to investi-
gate the evolution of the desiccation process using a
miniature geo-electrical method in order to map the

vertical fissuring network and number the cracks in the clay
used to build a scaled embankment in the hydraulic labo-
ratory of the Civil Engineering Department. Further
experiments will be carried out on the field to explore
cracks on real embankments.
Clay soils tend to crack when they dry. However, the
precise mechanism of cracking in not perfectly understood.
Factors that influence cracking are known qualitatively, but
it is not clear how to predict the depth of cracking and the
spacing of cracks. Konrad and Ayad (1997) proposed an
idealized framework for the analysis of cohesive soils
undergoing desiccation. This has led to a simplified model
referred to as CRACK, which enables the prediction of the
average spacing between primary cracks for a homoge-
neous soil deposit subjected to a given surface evaporation
flux. Konrad and Ayad (1997) presented the results of a
field desiccation experiment in a top soil, a weathered
crust, and an intact clay deposit at the experimental site of
Saint-Alban, Quebec, Canada. The excavation in the intact
clay was instrumented to monitor the evolution of different
parameters such as suction, moisture content, settlement,
temperature, and relative humidity with time while the
evolution of surface cracking was recorded using photo-
graphs. Desiccation of the intact Saint-Alban clay under
restrained conditions, at an average evaporation rate of
0.018 cm/h and an initial gravimetric water content of
103% (kg/kg), produced visible primary cracks after 17 h
with an average spacing of 20–24 cm. The average size of
the major polygonal blocks ranged between 20 and 24 cm.
After 27 h of evaporation, the average opening between
cracks was about 1.5 mm, and after 68 h it was 4 mm,
indicating an ongoing volume shrinkage.
The results from Rayhani et al. (2007) showed that the
dimension of cracks increased with increasing plasticity
index and clay content and so, the initial hydraulic con-
ductivity increased with increasing plasticity index and
cycles of drying and wetting.
Nahlawi and Kodikara (2006) carried out some experi-
ments on the induced cracking tests on thin layers of clay
soils using humidity and temperature controlled chamber
for observation, crack initiation and evolution and for
moisture content measurement during desiccation. The
lengths of the moulds were considerably larger than their
widths so that parallel cracking were generated in thin
layers.
Lecocq and Vandewalle (2003) used a simple one-
dimensional experiment to investigate the dynamical
aspects of crack opening that occurs in clay exposed to
shrinkage induced by desiccation. The opening rate of
cracks was a varying (diminishing) function of time. They
observed a strong influence between the rate of apparition
of a new crack and existing cracks. As soon as the second
crack appears, the opening rate of the first crack falls by
half. The mechanism of clay cracking has been well doc-
umented by other authors (Towner et al. 1987; Moore
1984; Chertkov and Ravina 1998; Augier et al. 2002) but
the identification of the subsurface cracking network is still
under-estimated especially for embankments.
Geophysical methods based on miniature resistivity
arrays could be the solution as they have proved to be
reliable to monitor contaminant transport in soils scaled
models in centrifuge experiments (Depountis et al. 1999).
This technique is non-invasive and hence is reducing
considerably the disturbance of the soil, improving the
accuracy of the measurements.
For the assessment of embankments this technique could
be very useful for long term monitoring of clay sealings
which are not accessible.
Although the technique presented here may not have the
accuracy of a local sampling strategy and laboratory test-
ing, subsurface tomography is valuable for interpretation in
heterogeneous soils.
The subsurface soil properties are determined by mea-
suring the distribution of resistivity. The basis of the
technique is to pass a direct current through the soil
between a pair of electrodes. This process is observed by
monitoring the distortion of the equipotentials (assuming
the soil to be a homogeneous half-space) using another pair
of potential electrodes located at the ground surface (Bar-
ker 1997). This provides a simple, repeatable technique
that can be applied where any contrast in electrical con-
ductivity exists in space (or time). Lataste et al. (2003) used
the resistivity technique with a device made of four elec-
trodes spaced out 5 or 10 cm, arranged in a square to study
the cracks on a damage concrete slab. He used a numerical
modelling approach rather than an inversion model show-
ing a qualitative similar disturbance of apparent resistivity
right to cracks, for depth or opening variations. On a wider
scope at geology level, Nguyen et al. (2005) proposed a
methodology to locate automatically limits or boundaries
between synthetic faults and layer boundaries in two
dimension electrical tomography using a crest line
extraction process in gradient images. He found that the
method showed poor results when vertical gradients are
greater than horizontal ones but otherwise should be sys-
tematically used to improve tomography interpretation.
In most of the geo-electrical surveys the resistivity
technique usually involves a computer controlled multi-
electrode arrays to give a tomography contour model of the
subsurface in two and three dimension (Griffiths and Bar-
ker 1993). One of the first team to use miniature resistivity
imaging to detect cracks of cm size was Samouelian et al.
(2003). They used porous special electrodes filled with
CuSO4 similar to the one currently used for self potential
measurements to improve the electrical contact in creating
a wet contact with the surrounding dried soil. They created

artificially a crack of 2 mm width with a saw at varying
depths (1, 2, 3, and 4 cm deep) in order to obtain four
cracking stages. The highest interpreted electrical resis-
tivity was detected in the top 1.5-cm depth of their soil
sample, whereas the crack developed down to 4 cm. The
electrical images obtained from these electrodes enabled
the detection of structures at the millimeter scale. More
recently Tabbagh et al. (2007) developed a new inversion
model for assessing and simulating the electrical response
and the main physical parameters of cracks in soils. Their
model allowed a faster inversion of the experimental
results. Rather than recreating artificially cracks and
improve the inversion model, the present research has
focused on the natural apparition of cracks and their direct
detection using resistivity arrays and then using viscous
tracers.
Experimental procedure
Material
Most of UK flood embankments are constructed as
homogenous and impermeable bodies. The type of material
used for the construction varies with the location and
especially with the geological deposit available close to the
planned construction site. In UK clay is mainly used as the
fundamental fill, and plays a major role in the embank-
ments design.
The soil chosen for this experiment is called Boulder
Clay, and has been used to construct a flood embankment
in the village of Galston, on the south-west from Glasgow,
UK, as flood prevention.
According to the British Standards, a series of tests have
been carried out to investigate the used clay properties,
like: Attenberg Limits, Standard Proctor Method and linear
shrinkage.
The maximum dry density for Galston clay has been
found as 1.95 Mg/m3 at an optimum moisture content of
12%. Particle dry density was found as 2.58 Mg/m3. Liquid
and plastic limit for tested clay, were found as 35.7 and
16.4% with the Plasticity Index to be 36.2%. Linear
shrinkage was defined from the average of 9 samples, to be
10.13%.
The undrained shear strength has been found to be
70 kPa, and soil was classified as firm clay, according to
the British Standards 8004:1986.
Experimental set up
One hundred and ninety kilograms of clay was oven dried
to remove all the moisture and sieved using 20 mm mesh
sieves. The sample was mixed with water to obtain 15% of
soil moisture content. Then it was left for 24 h for a curing
period. The chosen value of moisture content was within
the range of moisture for 95% of maximum dry density,
and was close to the natural moisture content measured in
the field.
After the soil preparation, a 2.5 kg compaction load was
applied to several layers 5 cm deep, over the 1.5 m length,
0.25 m wide and 0.4 m high Perspex tank, secured by 3
steel clamps. The transparency of the Perspex tank allowed
checking the uniformity of the clay compaction.
Miniature resistivity array
To identify the soil layers location already known, a min-
iature resistivity array was adapted to be used with the
ARES earth meter equipment purchased from the company
Gf instruments. Forty eight non-corrosive 1.5 mm diameter
and 6 cm long electrodes (see Fig. 1) were wired up and
connected with the automatic resistivity system using
double 24 ways connectors.
The electrodes were pushed 3 cm into the compacted
clay keeping a 3 cm spacing between them. To initiate and
perform the desiccation and drying process a 1.2 kW infra-
red heater was placed 0.9 m above the clay surface, as
shown in Fig. 2.
The measurements selected option was a two-dimen-
sional multi-electrodes resistivity profile. A Wenner-
Schlumberger array profiling method as shown in Fig. 3,
was chosen in this study because it is the most sensitive
configuration to vertical resistivity changes (horizontal
structures) in the soil strata and the groundwater table, and
it is also more sensitive than other arrays to the horizontal
resistivity changes (vertical structures). Furthermore, the
extensive horizontal coverage and greater number of data
points than other arrays justified its choice.
In the case presented here, only the first four levels and
168 plotting points were chosen for data analysis in relation
to the measurements taken outside the physical boundaries
Fig. 1 Non-corosive electrodes mounted in block terminals

(depth) of the flume model, which were identified as high
resistivity measurements due to the plastic interferences at
the bottom of the Perspex tank.
An experiment was carried out with the flume tank only
filled with water with a measured conductivity of 63.2 ls/m
to investigate the geometry of outer boundaries and elec-
trodes. Figure 4 shows the geo-electrical profile obtained. It
can clearly be seen the resistivity artifact due to the bottom
Perspex tank boundaries in deep purple and the water in
deep blue.
The experiments were carried out for 12 days. Every
morning the infra-red heater was switched on and left for
6 h to initiate and perform desiccation cracking. During
this drying stage the variations in soil temperature were
recorded every hour. Then the geo-electrical scan was
carried out, and the equipment was switched off overnight.
The initial temperature of the soil in the morning was
recorded at 20 cm depth every day before starting a new
drying stage. Each last measurement was taken after drying
has been finished (see Fig. 5).
Fig. 2 Experimental setup with infra-red heater and electrodes
installed
Fig. 3 Four levels array of
plotting points chosen for data
analysis
Fig. 4 Water and tank boundaries resistivity profile, baseline
0 20 40 60 80 100 120 140 160 180 200 220 240 260 280
Elapsed time [h]
10
15
20
25
30
35
40
Tem
pera
ture
[οC
]
Temperature variations
Fig. 5 Temperature variations for 12 days drying process

Results and discussion
Figure 6 shows the schematic description presented by
Konrad and Ayad (1997) of the mechanisms leading to
vertical cracks below shear plane and formation of pro-
tuberance. Within each polygon, vertical crack surfaces
are initiated at a spacing of about one-third of the
polygon width. Finally, continued evaporation and vol-
ume change leads to the formation of the observed
protuberance in each polygon. The crack depth in the
soil below the horizontal shear plane is thus reflected by
the size of the protuberance and ranges between 4 and
6 cm.
As it was mentioned before, the Wenner-Schlumberger
method was used to measure the resistivity changes in the
soil during the desiccation process.
The experiments were carried out in the same spirit as
during a field survey on a real embankment as it is the final
goal. The numbering and detection of vertical crack was
the main target taking into account the limitation of the
scanning method which was the electrodes geometry as the
spacing kept between them was the same as the contact
depth into the soil.
The first scan was taken after the clay compaction and
before drying in order to confirm that the model was
homogenous and was compacted to the expected state. The
baseline map presented in Fig. 7, shows that the compac-
tion was fully achieved and the measured resistivity was in
the range of 20–30 ohm m. This can be seen as a deep-blue
color, which is the resistivity contour obtained after
inversion of the experimental measurements.Fig. 6 Suggested mechanisms in play during the desiccation of the
intact Saint-Alban clay (Konrad and Ayad 1997)
Fig. 7 Inverted resistivity baseline map using Res2DINV taken before drying process and after 4 h of heating

A visual observation of the clay surface after the first 4 h
is shown in Fig. 7. The temperature was increased from
15.0 up to 37.0�C. The heat generated from the infra-red
lamp, generated a temperature of 35.3�C above the model,
similar to a very hot summer day.
The resistivity measurements were taken every morning,
before the IR heater was switched on and every afternoon
after the drying was finished. Due to the small changes in
readings caused by evaporation process only morning’s
measurements were analyzed.
Figures 8 and 9 show how the resistivity changed with
time and with cracks formation.
It can be clearly seen on the resistivity profile presented
on Figs. 8 and 9 that several vertical openings occurred and
Fig. 8 Comparison between two measurements taken after 20 and 27 h of drying
Fig. 9 Comparison between two measurements taken after 43 and 50 h of drying
became wider with time (vertical purple channels) corre-
sponding visually to the same vertical cracks location on
the laboratory clay sample.
However, it can be explained that during the fast heating
process, the decrease in soil resistivity may be due to two
phenomenon. The first can be described as micro swelling
of the clay and closing up of the cracks caused by evapo-
rating water represented by the disappearance of the light
green vertical afternoon contours shown in Fig. 9. The
second phenomenon could be due to the moisture content
redistribution in the model due to evaporation and the
water rising to the surface from deeper regions. A post
mortem excavation of the model, and measurements of the
moisture content at different depths, have shown a good
agreement with the second assumption. The moisture
content in the sample was between 8 and 9% below 5 cm
depth and decreased sharply in the top 5 cm where the
cracks developed. (Fig. 10)
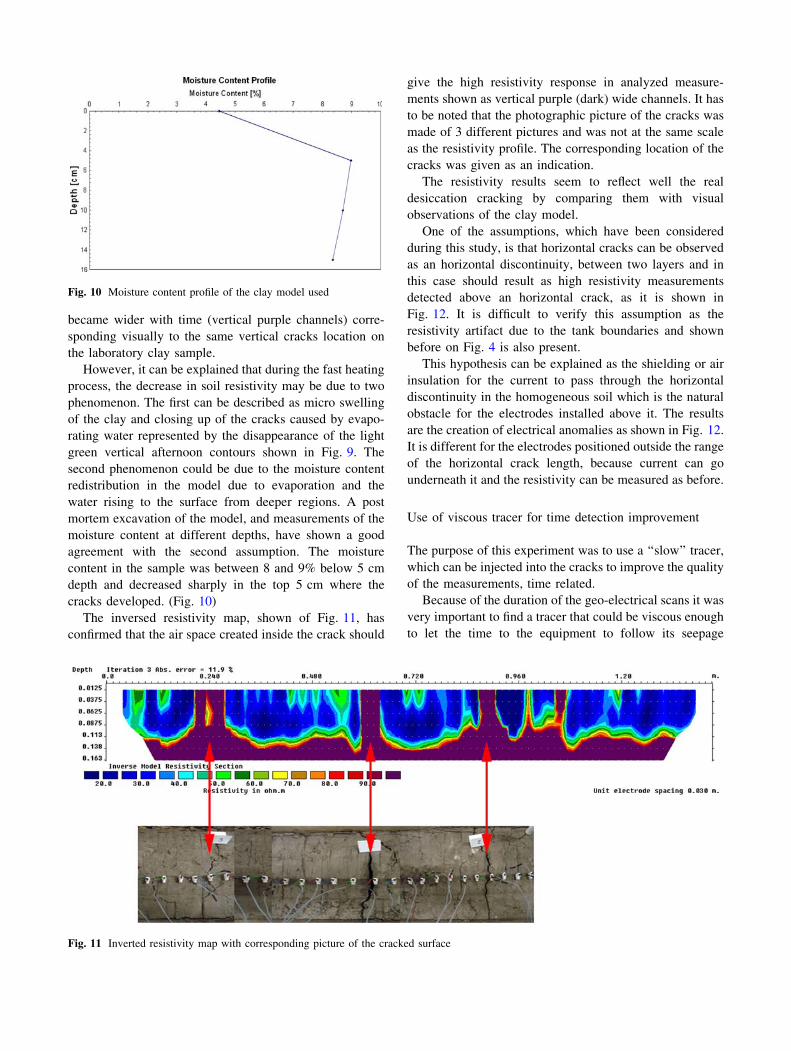
The inversed resistivity map, shown of Fig. 11, has
confirmed that the air space created inside the crack should
give the high resistivity response in analyzed measure-
ments shown as vertical purple (dark) wide channels. It has
to be noted that the photographic picture of the cracks was
made of 3 different pictures and was not at the same scale
as the resistivity profile. The corresponding location of the
cracks was given as an indication.
The resistivity results seem to reflect well the real
desiccation cracking by comparing them with visual
observations of the clay model.
One of the assumptions, which have been considered
during this study, is that horizontal cracks can be observed
as an horizontal discontinuity, between two layers and in
this case should result as high resistivity measurements
detected above an horizontal crack, as it is shown in
Fig. 12. It is difficult to verify this assumption as the
resistivity artifact due to the tank boundaries and shown
before on Fig. 4 is also present.
This hypothesis can be explained as the shielding or air
insulation for the current to pass through the horizontal
discontinuity in the homogeneous soil which is the natural
obstacle for the electrodes installed above it. The results
are the creation of electrical anomalies as shown in Fig. 12.
It is different for the electrodes positioned outside the range
of the horizontal crack length, because current can go
underneath it and the resistivity can be measured as before.
Use of viscous tracer for time detection improvement
The purpose of this experiment was to use a ‘‘slow’’ tracer,
which can be injected into the cracks to improve the quality
of the measurements, time related.
Because of the duration of the geo-electrical scans it was
very important to find a tracer that could be viscous enough
to let the time to the equipment to follow its seepage
Fig. 10 Moisture content profile of the clay model used
Fig. 11 Inverted resistivity map with corresponding picture of the cracked surface

though the cracks. Another requirement for the tracer was
to be able to penetrate the cracks remaining on the walls
without any absorption by clay, which could significantly
change the measurements.
It was decided to use the gelatinous substance, chiefly
used as a solid substrate to contain culture medium for
microbiological work. This substance called Plate Agar at a
concentration of 8 g/l, was first dissolved in hot water and
than 1% of NaCl was added to rise its electrical conduc-
tivity from 0.02 to 18.6 mS/m.
Hence Agar mixed with 1% of NaCl was selected
because the viscosity can be adjusted during the mixing. As
Agar settles down at 46�C and then becomes a jelly sub-
stance too viscous to spread efficiently into the cracks it
was very important to inject it into the crack in a state
where it will flow freely, just after preparation.
This tracer was injected in a chosen crack in the
experimental model (see Fig. 13).
The conductivity of the gel used was also measured
before injection, to check the difference between higher
resistive locations such as air pockets and cracks filled with
the conductive substances.
As shown in Fig. 14, the scan taken after injection
revealed the biggest changes in resistivity. The significant
changes in the contour, from dark purple to deep blue as
indicated by the circle on Fig. 14, showed that resistivity of
the soil has dramatically decreased, and that the injected
substance has mostly penetrated all surrounding area. It can
be also seen that, in the place where horizontal crack was
formed, the deep purple color started changing to a red line
boundary indicated by arrows on Fig. 14, which could
mean that air void was also filled with injected gel.
Conclusions
This experimental study has shown that a miniature geo-
electrical method using resistivity arrays can be used as
non-invasive method for the detection of desiccation cracks.
Fig. 12 Proposed interpretation
for horizontal crack detection.
Example of two points on
picture (a) corresponding to the
measurements shown in the
cross section (b) and inverted to
the resistivity contour model (c)
Fig. 13 Crack 3 where the Agar gel was injected alongside other
cracks

All the major vertical cracks, which have been visually
observed at the surface of the clay model, have been
recorded by the resistivity equipment and displayed using
the two-dimensional contour model software Res2Dinv.
Despite the limitations of the method explained before, the
vertical cracking network detected by the miniature resis-
tivity arrays has been identified and validated by visual
observations and post mortem examinations.
Assumptions were made about the detection of hori-
zontal cracks that could be hampered by the insulating
property of air related to crack continuity. The Agar gel
results confirmed the boundaries of the cracks obtained
from the previous results and delimited further the
selected horizontal crack where the gel was injected. It is
also very important to remember that electrical resistivity
images are the outcome of data processing (i.e. they are
based on apparent resistivity values) and for this reason
they must not be interpreted as a direct representation of
the field situation, but rather as a guide for qualitative
estimation of the electrical resistivity distribution in the
soil model. The limitation of the method was the geom-
etry of the electrodes and boundary effects that will be
necessary to investigate further to fully map the structure
of the cracks also along the horizontal pattern in the
future experiments on the scaled embankment built in our
laboratory.
Acknowledgments Authors would acknowledge Francis McGillian,
Antonio Montiaro, Ron Baron and Matthew Russell for their technical
work and advice given to carry out this study.
References
Augier F et al (2002) On the risk of cracking in clay drying. Chem
Eng J 86(1–2):133–138
Barker RD (1997) Electrical imaging and its application in engineer-
ing applications. Mod Phys Eng Geol 12:37–43
Chertkov VY, Ravina I (1998) Modelling the crack network of
swelling clay soils. Soil Sci Soc Am J 62:1162–1171
Cooling LF, Marsland A (1954) Soil mechanics studies in the sea
defense banks of Essex and Kent. In: Proceedings of the ICE
conference on the north sea floods of 31 January/1 February 1953
Depountis N, Harris C, Davies MCR (1999) The application of
miniaturised electrical imaging in scaled centrifuge modelling of
pollution plume migration. In: Proceedings of 2nd BGS inter-
national geoenvironmental engineering conference, London,
pp 214–221
Griffiths DH, Barker RD (1993) Two-dimensional resitivity imaging
and modelling in areas of complex geology. J Appl Geophys
29:211–226
Konrad JM, Ayad R (1997) Desiccation of a sensitive clay: field
experimental observations. Can Geotech J 34:929–942
Lataste JF, Sirieix C, Breysse D, Frappa M (2003) Electrical
resistivity measurement applied to cracking assessment on
reinforced concrete structures in civil engineering. NDT & E
Int 36(6):383–394
Lecocq N, Vandewalle N (2003) Dynamics of crack opening in a one-
dimensional desiccation experiment. Phys A 321(3):431–441
Marsland A (1968) The Shrinkage and fissuring of clay in flood
banks. Building research establishment, internal report No. 39/68
Moore PJ, Hor AYT (1984) Cracking behaviour of compacted clay.
In: Proceedings of 4th Australia–New Zealand conference on
geomechanics, Perth(2), pp 569–573
Nahlawi H, Kodikara J (2006) Laboratory experiments on desiccation
cracking of thin soil layers. Geotech Geol Eng 24(6):1641–1664
Nguyen F et al (2005) Image processing of 2D resistivity data for
imaging faults. J Appl Geophys 57(4):260–277
Fig. 14 Inverted resistivity scans for plate agar mixed with 1% of NaCl: a before injection, b after injection

Rayhani MH, Yanful EK, Fakher A (2007) Desiccation-induced
cracking and its effect on the hydraulic conductivity of clayey
soils from Iran. Can Geotech J 44(3):276–283
Samouelian A et al (2003) Electrical resistivity imaging for detecting
soil cracking at the centimetric scale. Soil Sci Soc Am J
67(5):1319–1326
Tabbagh J, Samouelian A, Cousin I (2007) Numerical modelling of
direct current electrical resistivity for the characterisation of
cracks in soils. J Appl Geophys 62(4):313–323
Towner GD et al (1987) The mechanics of cracking of drying clay.
J Agri Eng Res 36(2):115–124
Related Documents