Sensors 2017, 17, 272; doi:10.3390/s17020272 www.mdpi.com/journal/sensors Article Classification of Multiple Chinese Liquors by Means of a QCM-based E-Nose and MDS-SVM Classifier Qiang Li, Yu Gu * and Jing Jia School of Automation and Electrical Engineering, University of Science and Technology Beijing, Beijing 100083, China; [email protected] (Q.L.); [email protected] (J.J.) * Correspondence: [email protected]; Tel.: +86-10-8237-7825 Academic Editor: Ki-Hyun Kim Received: 8 November 2016; Accepted: 25 January 2017; Published: 30 January 2017 Abstract: Chinese liquors are internationally well-known fermentative alcoholic beverages. They have unique flavors attributable to the use of various bacteria and fungi, raw materials, and production processes. Developing a novel, rapid, and reliable method to identify multiple Chinese liquors is of positive significance. This paper presents a pattern recognition system for classifying ten brands of Chinese liquors based on multidimensional scaling (MDS) and support vector machine (SVM) algorithms in a quartz crystal microbalance (QCM)-based electronic nose (e-nose) we designed. We evaluated the comprehensive performance of the MDS-SVM classifier that predicted all ten brands of Chinese liquors individually. The prediction accuracy (98.3%) showed superior performance of the MDS-SVM classifier over the back-propagation artificial neural network (BP-ANN) classifier (93.3%) and moving average-linear discriminant analysis (MA-LDA) classifier (87.6%). The MDS-SVM classifier has reasonable reliability, good fitting and prediction (generalization) performance in classification of the Chinese liquors. Taking both application of the e-nose and validation of the MDS-SVM classifier into account, we have thus created a useful method for the classification of multiple Chinese liquors. Keywords: Chinese liquor classification; Multidimensional scaling (MDS); Support Vector Machine (SVM); QCM-based e-nose 1. Introduction Chinese liquor is one of the oldest distillates in the world, dating back thousands of years [1]. Some four million kiloliters of Chinese liquor are consumed annually, worth 500 billion Chinese Yuan (equivalent to US$80 billion) [2]. As famous drinks, Chinese liquors are usually fermented from grains for several months or years. The fresh fermented liquors are then distilled and aged for a long time to enhance the bouquet. The different brewing processes (fermentation, distillation, and aging) lead to the formation of a diverse set of components in Chinese liquor products, e.g., over 1600 compounds for Xifeng liquor, over 1800 compounds for Moutai liquor, and over 1900 compounds for Fen liquor. Chinese liquors from different plants have unique flavors attributable to the use of various bacteria and fungi, raw materials, and production processes [3]. Therefore, different brands of Chinese liquors display remarkable differences in flavor. The flavors of Chinese liquors are traditionally classified into five groups: namely strong-flavor, mixed-flavor, fen-flavor, moutai-flavor, and special-flavor. In particular, strong-flavor and mixed-flavor are the most common. Chinese liquors labelled with false information not only harm the interests of consumers, but also damage producers’ interests [4]. The traditional and most commonly used method for the classification of Chinese liquors is by professional sommeliers, but accuracy and objectivity cannot always be ensured because sommeliers’ judgement can affected by their health condition, emotions,

Welcome message from author
This document is posted to help you gain knowledge. Please leave a comment to let me know what you think about it! Share it to your friends and learn new things together.
Transcript
Sensors 2017, 17, 272; doi:10.3390/s17020272 www.mdpi.com/journal/sensors
Article
Classification of Multiple Chinese Liquors by Means of a QCM-based E-Nose and MDS-SVM Classifier
Qiang Li, Yu Gu * and Jing Jia
School of Automation and Electrical Engineering, University of Science and Technology Beijing,
Beijing 100083, China; [email protected] (Q.L.); [email protected] (J.J.)
* Correspondence: [email protected]; Tel.: +86-10-8237-7825
Academic Editor: Ki-Hyun Kim
Received: 8 November 2016; Accepted: 25 January 2017; Published: 30 January 2017
Abstract: Chinese liquors are internationally well-known fermentative alcoholic beverages. They
have unique flavors attributable to the use of various bacteria and fungi, raw materials, and
production processes. Developing a novel, rapid, and reliable method to identify multiple Chinese
liquors is of positive significance. This paper presents a pattern recognition system for classifying
ten brands of Chinese liquors based on multidimensional scaling (MDS) and support vector
machine (SVM) algorithms in a quartz crystal microbalance (QCM)-based electronic nose (e-nose)
we designed. We evaluated the comprehensive performance of the MDS-SVM classifier that
predicted all ten brands of Chinese liquors individually. The prediction accuracy (98.3%) showed
superior performance of the MDS-SVM classifier over the back-propagation artificial neural
network (BP-ANN) classifier (93.3%) and moving average-linear discriminant analysis (MA-LDA)
classifier (87.6%). The MDS-SVM classifier has reasonable reliability, good fitting and prediction
(generalization) performance in classification of the Chinese liquors. Taking both application of the
e-nose and validation of the MDS-SVM classifier into account, we have thus created a useful method
for the classification of multiple Chinese liquors.
Keywords: Chinese liquor classification; Multidimensional scaling (MDS); Support Vector Machine
(SVM); QCM-based e-nose
1. Introduction
Chinese liquor is one of the oldest distillates in the world, dating back thousands of years [1].
Some four million kiloliters of Chinese liquor are consumed annually, worth 500 billion Chinese Yuan
(equivalent to US$80 billion) [2]. As famous drinks, Chinese liquors are usually fermented from
grains for several months or years. The fresh fermented liquors are then distilled and aged for a long
time to enhance the bouquet. The different brewing processes (fermentation, distillation, and aging)
lead to the formation of a diverse set of components in Chinese liquor products, e.g., over
1600 compounds for Xifeng liquor, over 1800 compounds for Moutai liquor, and over
1900 compounds for Fen liquor. Chinese liquors from different plants have unique flavors
attributable to the use of various bacteria and fungi, raw materials, and production processes [3].
Therefore, different brands of Chinese liquors display remarkable differences in flavor. The flavors
of Chinese liquors are traditionally classified into five groups: namely strong-flavor, mixed-flavor,
fen-flavor, moutai-flavor, and special-flavor. In particular, strong-flavor and mixed-flavor are the
most common.
Chinese liquors labelled with false information not only harm the interests of consumers, but
also damage producers’ interests [4]. The traditional and most commonly used method for the
classification of Chinese liquors is by professional sommeliers, but accuracy and objectivity cannot
always be ensured because sommeliers’ judgement can affected by their health condition, emotions,
Sensors 2017, 17, 272 2 of 15
and the environment. Other methods for the analysis and classification of Chinese liquors are
chemistry-based methods such as gas chromatography, mass spectrometry, and gas
chromatography-mass spectrometry [5–8]. These methods are highly reliable because they use a
complete component-by-component approach. However, their shortcomings include high cost, being
time-consuming, and low capability for in situ and online measurements [9]. Overall, developinga
novel, rapid and reliable method to identify multiple Chinese liquors is of positive significance.
A quartz crystal microbalance (QCM)-based electronic nose (e-nose) has been successfully
utilized to detect characteristics of Chinese liquors by imitating the human senses using sensor arrays
and a pattern recognition system [10]. The use of an excellent pattern recognition algorithm in the
pattern recognition system is a key component for improving the performance of QCM-based
e-noses. Shaffer et al. [11] summarized six qualities of the ideal pattern recognition algorithm for an
e-nose: it should have high accuracy, low memory requirements, and be fast, simple to train, robust
to outliers, and produce a measure of uncertainty.
Unfortunately, until now, no pattern recognition algorithm is able to fully meet all of these
requirements. In an attempt to determine the optimal classifier, several researchers have performed
studies comparing pattern recognition algorithms as well as specific applications. Peng et al. [12]
presented discriminant models of Chinese Tongshan kaoliang liquor using principal component
analysis (PCA) and discriminant factor analysis (DFA), and realized a correct prediction classification
rate of 93%.
Our group has reported the design and application of a novel and simple QCM-based
e-nose [13,14] for quickly and easily summarizing Chinese liquor characteristics. We identified three
types of Chinese liquors on the basis of the Moving AverageLinear Discriminant Analysis (MA-LDA)
algorithm, which had a prediction accuracy of 98%, and five types of Chinese liquors by means of the
Principle Components AnalysisBack Propagation Neutral Network (PCA-BPNN) algorithm, which
had a prediction accuracy of 93.3%. Additionally, Zhang et al. [15] used PCA incorporated with
discriminant analysis (PCA-DA), a back propagation artificial neural network (BP-ANN), and
learning vector quantization (LVQ) for the recognition of five Chinese liquors; the recognition
accuracies of PCA-DA, BP-ANN, and LVQ were 76.8, 71.4, and 89.3%, respectively. Jing et al. [9]
studied the classification of seven Chinese liquors by using BP-ANN, LDA, and a multi-linear
classifier; the classification rates were 97.22, 98.75, and 100%, respectively. Lastly, Ema et al. [16]
presented an odor-sensing system to identify eleven brands of liquors using six QCM resonators with
different coating materials and neural network pattern recognition. However, the prediction accuracy
of this system was only 88%.
In this paper, we present the used in a QCM-based e-nose we have designed of an algorithm
based on Multidimensional Scaling (MDS) and Support Vector Machine (SVM). Performance was
assessed through classifying ten brands of Chinese liquor samples.
2. Experiments and Methods
2.1. Chinese Liquor Samples
A total of ten experimental samples, corresponding to ten Chinese liquor brands, were obtained
from the China National Research Institute of Food & Fermentation Industries (Beijing, China). The
samples differed in main raw materials, fermentation starter, fermentation duration, aging duration,
flavor type and geographic origin. All samples were produced in 2011, and had equivalent proofs.
The Chinese liquors included in the study are listed in Table 1 (all data is from the database of China
Alcoholic Drinks Association).
Sensors 2017, 17, 272 3 of 15
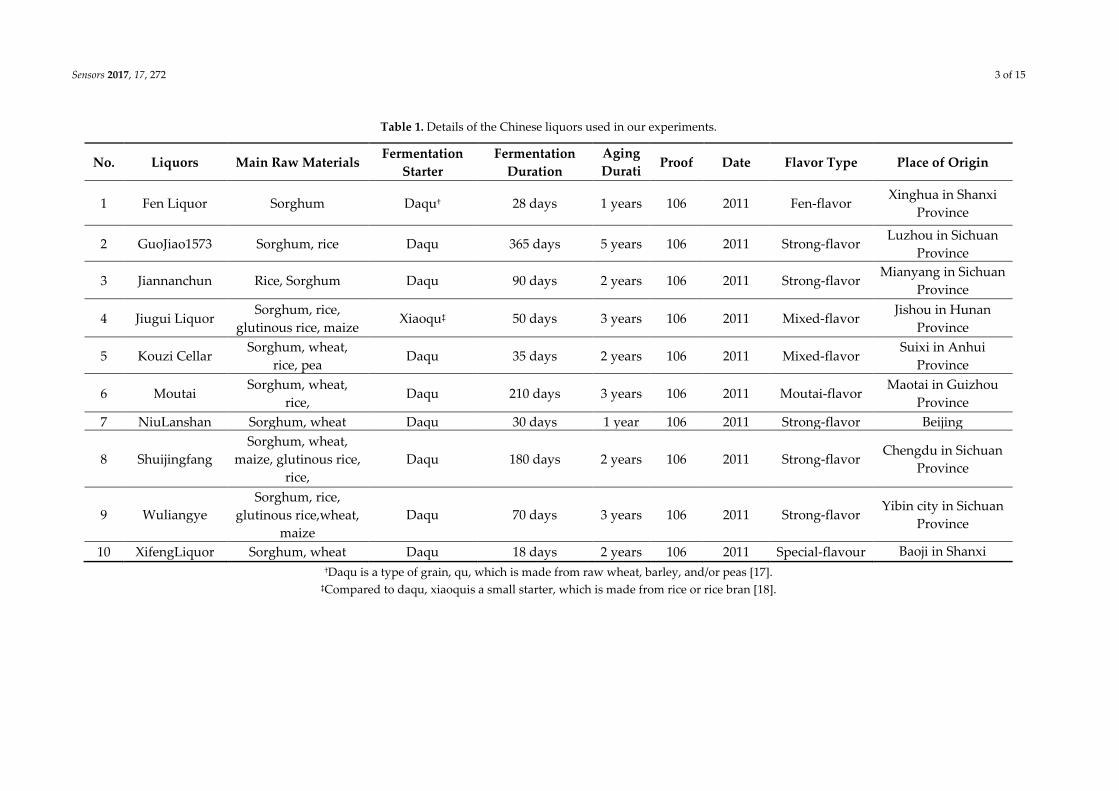
Table 1. Details of the Chinese liquors used in our experiments.
No. Liquors Main Raw Materials Fermentation
Starter
Fermentation
Duration
Aging
Durati
on
Proof Date Flavor Type Place of Origin
1 Fen Liquor Sorghum Daqu† 28 days 1 years 106 2011 Fen-flavor Xinghua in Shanxi
Province
2 GuoJiao1573 Sorghum, rice Daqu 365 days 5 years 106 2011 Strong-flavor Luzhou in Sichuan
Province
3 Jiannanchun Rice, Sorghum Daqu 90 days 2 years 106 2011 Strong-flavor Mianyang in Sichuan
Province
4 Jiugui Liquor Sorghum, rice,
glutinous rice, maize Xiaoqu‡ 50 days 3 years 106 2011 Mixed-flavor
Jishou in Hunan
Province
5 Kouzi Cellar Sorghum, wheat,
rice, pea Daqu 35 days 2 years 106 2011 Mixed-flavor
Suixi in Anhui
Province
6 Moutai Sorghum, wheat,
rice, Daqu 210 days 3 years 106 2011 Moutai-flavor
Maotai in Guizhou
Province
7 NiuLanshan Sorghum, wheat Daqu 30 days 1 year 106 2011 Strong-flavor Beijing
8 Shuijingfang
Sorghum, wheat,
maize, glutinous rice,
rice,
Daqu 180 days 2 years 106 2011 Strong-flavor Chengdu in Sichuan
Province
9 Wuliangye
Sorghum, rice,
glutinous rice,wheat,
maize
Daqu 70 days 3 years 106 2011 Strong-flavor Yibin city in Sichuan
Province
10 XifengLiquor Sorghum, wheat Daqu 18 days 2 years 106 2011 Special-flavour Baoji in Shanxi
Province †Daqu is a type of grain, qu, which is made from raw wheat, barley, and/or peas [17]. ‡Compared to daqu, xiaoquis a small starter, which is made from rice or rice bran [18].

Sensors 2017, 17, 272 4 of 15
2.2. QCM-Based Sensor
Figure 1a shows an individual QCM-based sensor; Figure 1b,c presents its structure, which had
thin coatings symmetrically adhered on both sides of an AT-cut quartz piezoelectric crystal plate
resonator; Figure 1d shows the diameter of the sensor. The diameter of the sensor was d = 8 mm and
its thickness was = 0.17 mm.
(a) (b)
(c) (d)
Figure 1. (a) Photo of the sensor; (b) structure chart of the sensor; (c) schematic diagram of the sensor;
(d) diameter drawing of the sensor.
The AT-cut quartz piezoelectric crystal plateresonator is an electromechanical converter that can
present resonant frequency signals based on the QCM principle [19], as illustrated by
Equation (1):
mA
ff
2
02 (1)
where, f0 is the resonant frequency (Hz), f is the frequency change (Hz), m is the mass change(g),
A is the piezoelectrically active crystal area (cm2), q is the density of quartz (q = 2.643 g/cm3), and μq
is the shear modulus of quartz for AT-cut crystalquartz (μq = 2.947 1011 gcm−1s−2).
The thin coatings were analyte-sensitive with adsorption-desorption properties. QCMs measure
the mass per unit area by measuring the change in resonator frequency of the sensor, which is
disturbed by the addition or removal of mass deposited at the sensor surface. Sensor properties
(selectivity, sensitivity, regenerability, cumulability) can be adjusted within wide limits by an
appropriate choice of thin coating.
The thin coatings were prepared by electron beam vapor dispersion (EBVD) equipment [20], as
shown in Figure 2a. The EBVD equipment contained an electron beam deposition system in the
vacuum chamber, a control system, and a real-time monitoring system of the thin coating’s thickness
(Figure 2b).
Sensors 2017, 17, 272 5 of 15
(a) (b)
Figure 2. (a) Photo of the EBVD equipment; (b) schematic representation of the EBVD technology:
(i) electron beam deposition system in vacuum chamber; (ii) control system; (iii) coating thickness
control system.
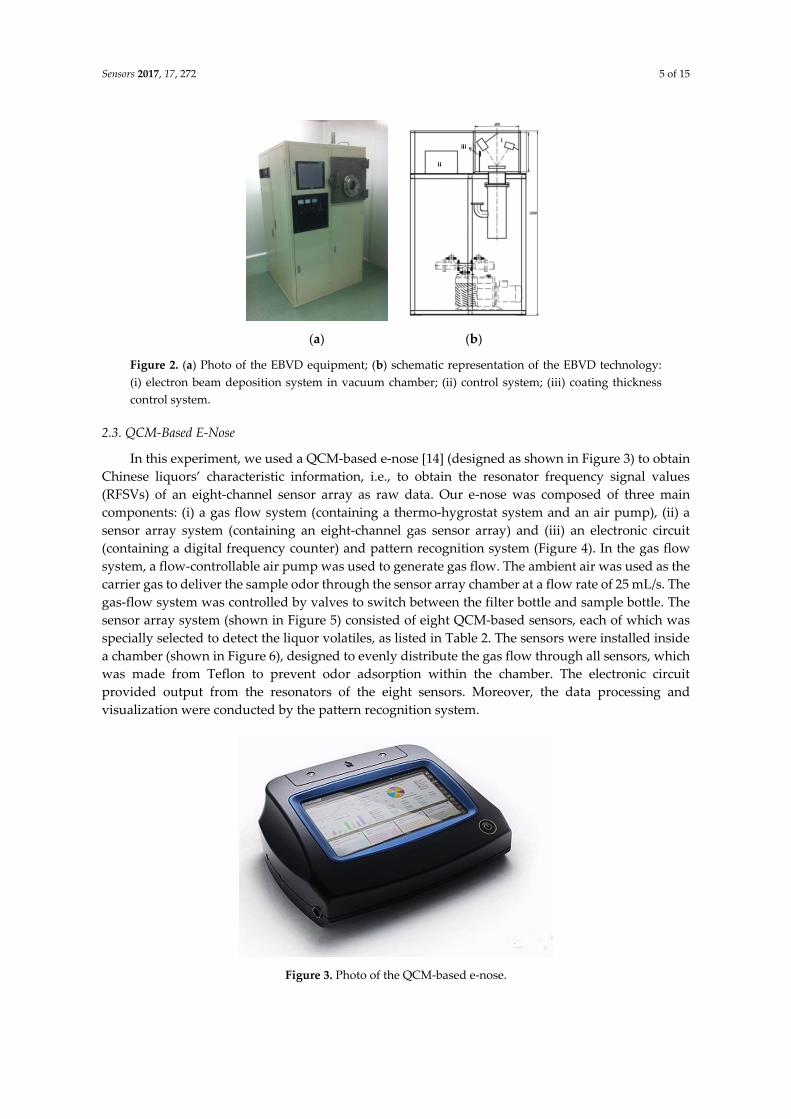
2.3. QCM-Based E-Nose
In this experiment, we used a QCM-based e-nose [14] (designed as shown in Figure 3) to obtain
Chinese liquors’ characteristic information, i.e., to obtain the resonator frequency signal values
(RFSVs) of an eight-channel sensor array as raw data. Our e-nose was composed of three main
components: (i) a gas flow system (containing a thermo-hygrostat system and an air pump), (ii) a
sensor array system (containing an eight-channel gas sensor array) and (iii) an electronic circuit
(containing a digital frequency counter) and pattern recognition system (Figure 4). In the gas flow
system, a flow-controllable air pump was used to generate gas flow. The ambient air was used as the
carrier gas to deliver the sample odor through the sensor array chamber at a flow rate of 25 mL/s. The
gas-flow system was controlled by valves to switch between the filter bottle and sample bottle. The
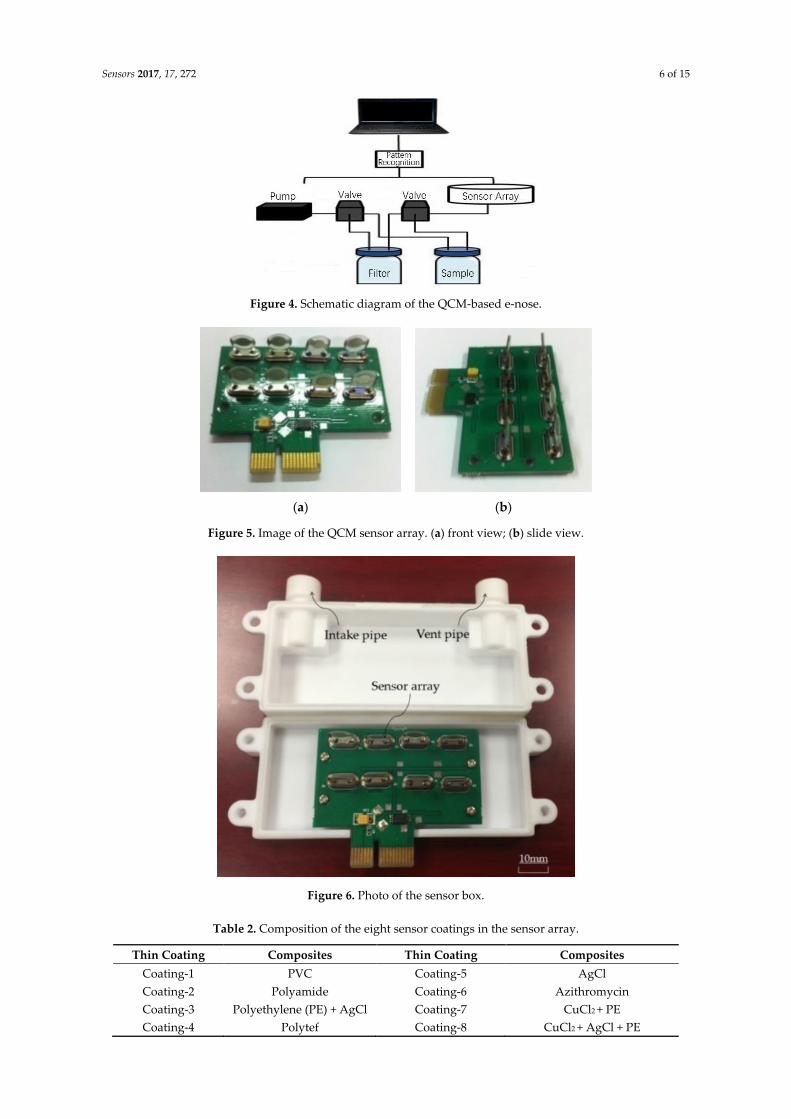
sensor array system (shown in Figure 5) consisted of eight QCM-based sensors, each of which was
specially selected to detect the liquor volatiles, as listed in Table 2. The sensors were installed inside
a chamber (shown in Figure 6), designed to evenly distribute the gas flow through all sensors, which
was made from Teflon to prevent odor adsorption within the chamber. The electronic circuit
provided output from the resonators of the eight sensors. Moreover, the data processing and
visualization were conducted by the pattern recognition system.
Figure 3. Photo of the QCM-based e-nose.
Sensors 2017, 17, 272 6 of 15
Figure 4. Schematic diagram of the QCM-based e-nose.
(a) (b)
Figure 5. Image of the QCM sensor array. (a) front view; (b) slide view.
Figure 6. Photo of the sensor box.
Table 2. Composition of the eight sensor coatings in the sensor array.
Thin Coating Composites Thin Coating Composites
Coating-1 PVC Coating-5 AgCl
Coating-2 Polyamide Coating-6 Azithromycin
Coating-3 Polyethylene (PE) + AgCl Coating-7 CuCl2 + PE
Coating-4 Polytef Coating-8 CuCl2 + AgCl + PE
Sensors 2017, 17, 272 7 of 15
2.4. Characteristic Information Acquisition by the QCM-Based E-Nose
We used ten brands of Chinese liquors (shown in Table 1) as samples in our experiments. The
experiments were conducted in a clean room at a controlled temperature of 25 C. Taking the Fen
liquor (number 1 in Table 1) as an example, we firstly injected 15 mL of the Fen liquor sample into a
head space bottle (volume 25 mL). Then, the e-nose was utilized for acquiring characteristic
information (resonant frequency signal values) of the Fen liquor sample. The RFSVs of the sensor
array were output 100 times per minute and saved. Experiments lasted for two minutes for each
sample. The same process was used for the other nine liquor samples.
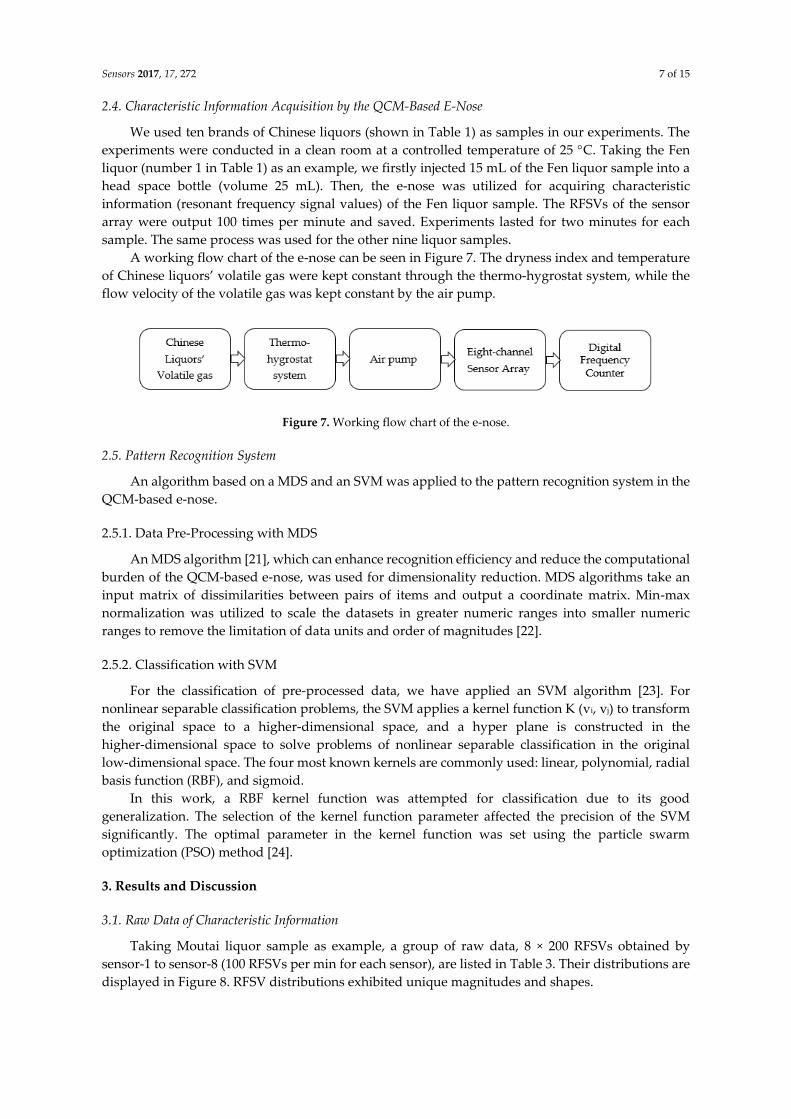
A working flow chart of the e-nose can be seen in Figure 7. The dryness index and temperature
of Chinese liquors’ volatile gas were kept constant through the thermo-hygrostat system, while the
flow velocity of the volatile gas was kept constant by the air pump.
Figure 7. Working flow chart of the e-nose.
2.5. Pattern Recognition System
An algorithm based on a MDS and an SVM was applied to the pattern recognition system in the
QCM-based e-nose.
2.5.1. Data Pre-Processing with MDS
An MDS algorithm [21], which can enhance recognition efficiency and reduce the computational
burden of the QCM-based e-nose, was used for dimensionality reduction. MDS algorithms take an
input matrix of dissimilarities between pairs of items and output a coordinate matrix. Min-max
normalization was utilized to scale the datasets in greater numeric ranges into smaller numeric
ranges to remove the limitation of data units and order of magnitudes [22].
2.5.2. Classification with SVM
For the classification of pre-processed data, we have applied an SVM algorithm [23]. For
nonlinear separable classification problems, the SVM applies a kernel function K (vi, vj) to transform
the original space to a higher-dimensional space, and a hyper plane is constructed in the
higher-dimensional space to solve problems of nonlinear separable classification in the original
low-dimensional space. The four most known kernels are commonly used: linear, polynomial, radial
basis function (RBF), and sigmoid.
In this work, a RBF kernel function was attempted for classification due to its good
generalization. The selection of the kernel function parameter affected the precision of the SVM
significantly. The optimal parameter in the kernel function was set using the particle swarm
optimization (PSO) method [24].
3. Results and Discussion
3.1. Raw Data of Characteristic Information
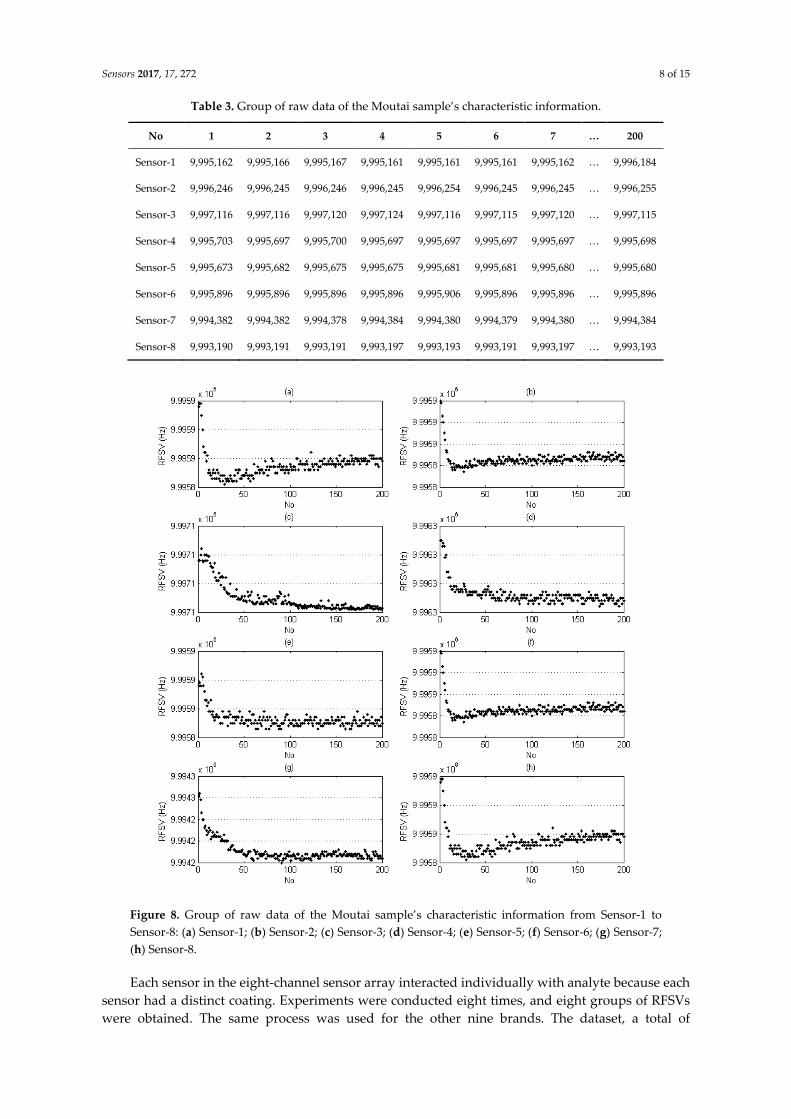
Taking Moutai liquor sample as example, a group of raw data, 8 × 200 RFSVs obtained by
sensor-1 to sensor-8 (100 RFSVs per min for each sensor), are listed in Table 3. Their distributions are
displayed in Figure 8. RFSV distributions exhibited unique magnitudes and shapes.
Sensors 2017, 17, 272 8 of 15
Table 3. Group of raw data of the Moutai sample’s characteristic information.
No 1 2 3 4 5 6 7 … 200
Sensor-1 9,995,162 9,995,166 9,995,167 9,995,161 9,995,161 9,995,161 9,995,162 … 9,996,184
Sensor-2 9,996,246 9,996,245 9,996,246 9,996,245 9,996,254 9,996,245 9,996,245 … 9,996,255
Sensor-3 9,997,116 9,997,116 9,997,120 9,997,124 9,997,116 9,997,115 9,997,120 … 9,997,115
Sensor-4 9,995,703 9,995,697 9,995,700 9,995,697 9,995,697 9,995,697 9,995,697 … 9,995,698
Sensor-5 9,995,673 9,995,682 9,995,675 9,995,675 9,995,681 9,995,681 9,995,680 … 9,995,680
Sensor-6 9,995,896 9,995,896 9,995,896 9,995,896 9,995,906 9,995,896 9,995,896 … 9,995,896
Sensor-7 9,994,382 9,994,382 9,994,378 9,994,384 9,994,380 9,994,379 9,994,380 … 9,994,384
Sensor-8 9,993,190 9,993,191 9,993,191 9,993,197 9,993,193 9,993,191 9,993,197 … 9,993,193
Figure 8. Group of raw data of the Moutai sample’s characteristic information from Sensor-1 to
Sensor-8: (a) Sensor-1; (b) Sensor-2; (c) Sensor-3; (d) Sensor-4; (e) Sensor-5; (f) Sensor-6; (g) Sensor-7;
(h) Sensor-8.
Each sensor in the eight-channel sensor array interacted individually with analyte because each
sensor had a distinct coating. Experiments were conducted eight times, and eight groups of RFSVs
were obtained. The same process was used for the other nine brands. The dataset, a total of
Sensors 2017, 17, 272 9 of 15
8 × 10 groups of raw data, was utilized to establish the pattern recognition system in the QCM-based
e-nose for classifying the ten brands of Chinese liquors.
3.2. Liquor Classification
3.2.1. Data Pre-Processing Results with MDS
Each group of raw data, 8 × 200 RFSVs, was constructed into an original sample matrix in
order by:
Soriginal = {S1,2,3,......,i}, (10)
where, the i-th matrix Si is shown Equation (11):
Si=
200,82,81,8
200,22,21,2
200,12,11,1
iii
iii
iii
fff
fff
fff
,
(11)
where, Niii 80,1 , and fim,n represents the n-th RFSV acquired by the sensor m. For each
matrix Si, MDS algorithm was used to extract a characteristic value from 200 RFSVs in each row for
dimension reduction. Thus we obtained the characteristic value matrix Ni for each Si:
8
2
1
i
i
i
i
c
c
c
N
, (12)
where, cij (j = 1,...,8) represents the characteristic value of sensor j. Then a new sample matrix Snew,
8 × 80, was obtained as Equation (13):
80321 ,...,,, NNNNSnew (13)
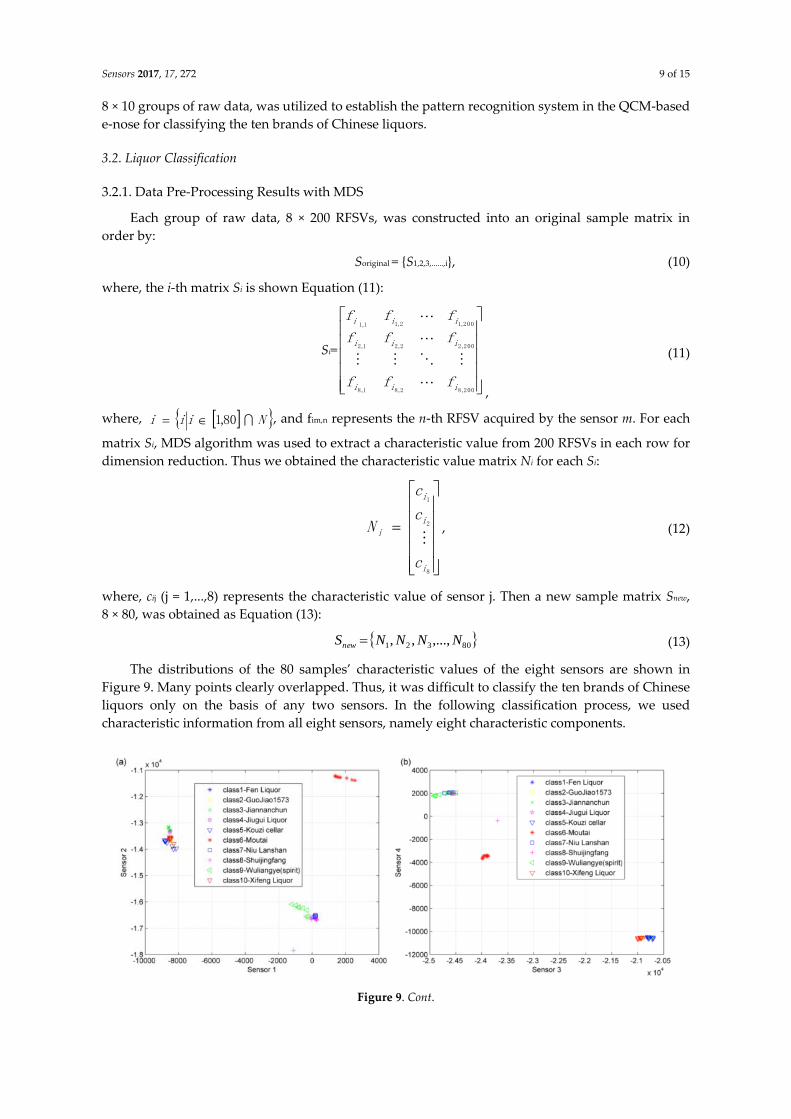
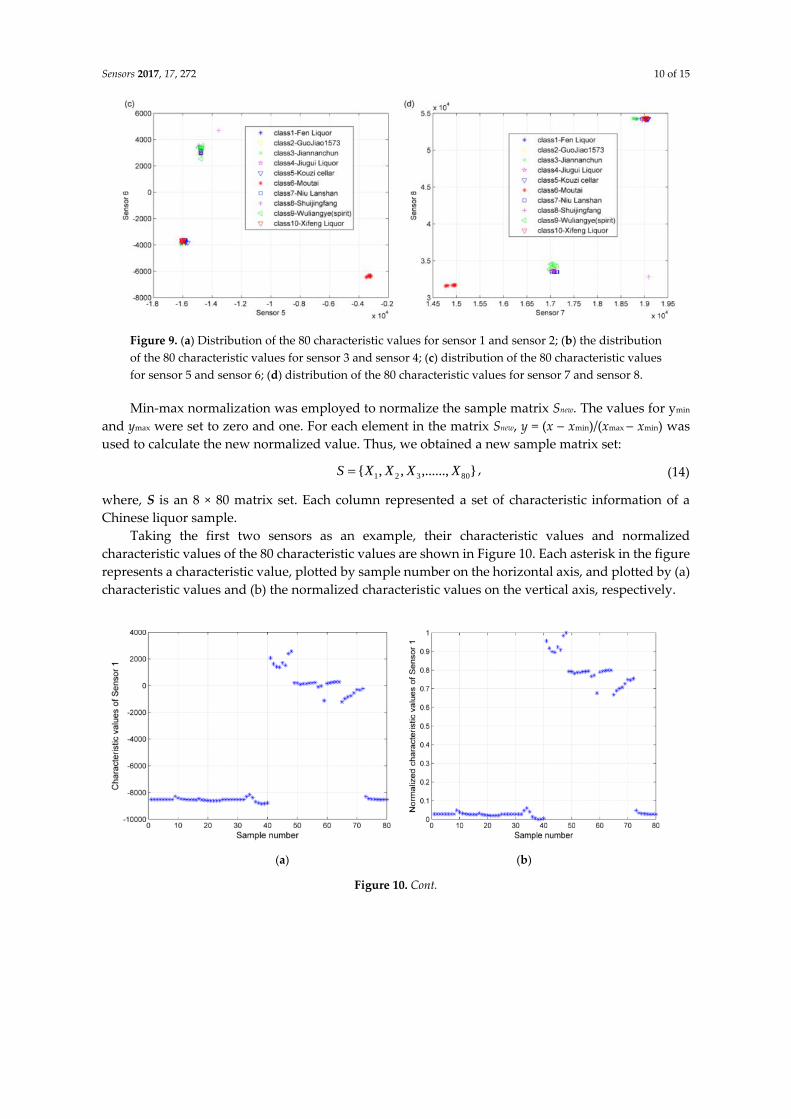
The distributions of the 80 samples’ characteristic values of the eight sensors are shown in
Figure 9. Many points clearly overlapped. Thus, it was difficult to classify the ten brands of Chinese
liquors only on the basis of any two sensors. In the following classification process, we used
characteristic information from all eight sensors, namely eight characteristic components.
Figure 9. Cont.
Sensors 2017, 17, 272 10 of 15
Figure 9. (a) Distribution of the 80 characteristic values for sensor 1 and sensor 2; (b) the distribution
of the 80 characteristic values for sensor 3 and sensor 4; (c) distribution of the 80 characteristic values
for sensor 5 and sensor 6; (d) distribution of the 80 characteristic values for sensor 7 and sensor 8.
Min-max normalization was employed to normalize the sample matrix Snew. The values for ymin
and ymax were set to zero and one. For each element in the matrix Snew, y = (x xmin)/(xmax xmin) was
used to calculate the new normalized value. Thus, we obtained a new sample matrix set:
},......,,,{ 80321 XXXXS , (14)
where, S is an 8 × 80 matrix set. Each column represented a set of characteristic information of a
Chinese liquor sample.
Taking the first two sensors as an example, their characteristic values and normalized
characteristic values of the 80 characteristic values are shown in Figure 10. Each asterisk in the figure
represents a characteristic value, plotted by sample number on the horizontal axis, and plotted by (a)
characteristic values and (b) the normalized characteristic values on the vertical axis, respectively.
(a) (b)
Figure 10. Cont.
Sensors 2017, 17, 272 11 of 15
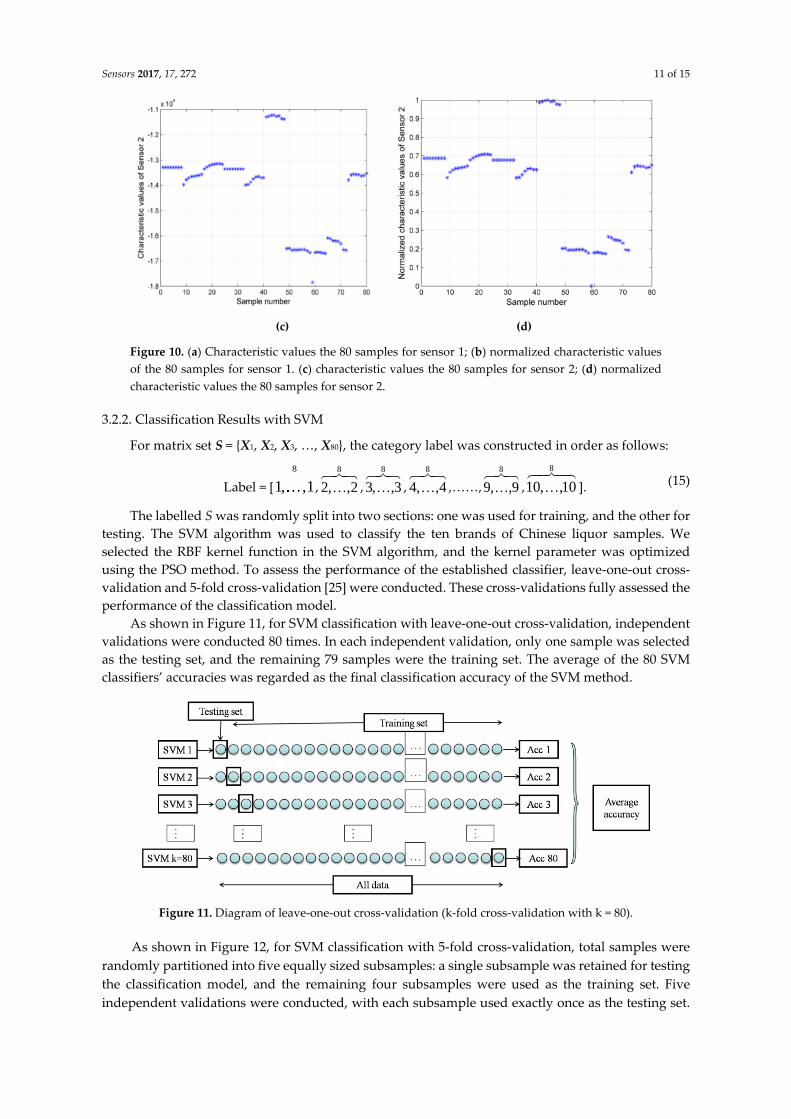
(c) (d)
Figure 10. (a) Characteristic values the 80 samples for sensor 1; (b) normalized characteristic values
of the 80 samples for sensor 1. (c) characteristic values the 80 samples for sensor 2; (d) normalized
characteristic values the 80 samples for sensor 2.
3.2.2. Classification Results with SVM
For matrix set S = {X1, X2, X3, …, X80}, the category label was constructed in order as follows:
Label = [
8
1, ,1,
8
2,,2 ,
8
3,,3 ,
8
4,,4 ,……,
8
9,,9 ,
8
10,,10 ]. (15)
The labelled S was randomly split into two sections: one was used for training, and the other for
testing. The SVM algorithm was used to classify the ten brands of Chinese liquor samples. We
selected the RBF kernel function in the SVM algorithm, and the kernel parameter was optimized
using the PSO method. To assess the performance of the established classifier, leave-one-out cross-
validation and 5-fold cross-validation [25] were conducted. These cross-validations fully assessed the
performance of the classification model.
As shown in Figure 11, for SVM classification with leave-one-out cross-validation, independent
validations were conducted 80 times. In each independent validation, only one sample was selected
as the testing set, and the remaining 79 samples were the training set. The average of the 80 SVM
classifiers’ accuracies was regarded as the final classification accuracy of the SVM method.
Figure 11. Diagram of leave-one-out cross-validation (k-fold cross-validation with k = 80).
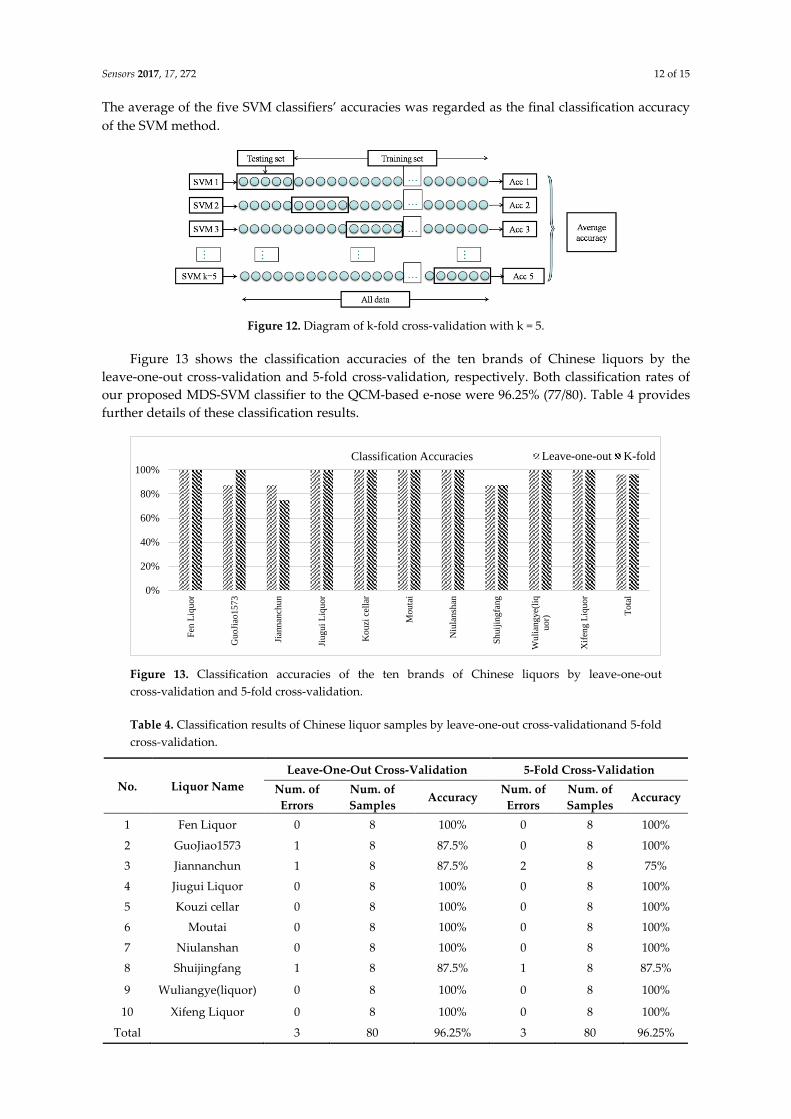
As shown in Figure 12, for SVM classification with 5-fold cross-validation, total samples were
randomly partitioned into five equally sized subsamples: a single subsample was retained for testing
the classification model, and the remaining four subsamples were used as the training set. Five
independent validations were conducted, with each subsample used exactly once as the testing set.
Sensors 2017, 17, 272 12 of 15
The average of the five SVM classifiers’ accuracies was regarded as the final classification accuracy
of the SVM method.
Figure 12. Diagram of k-fold cross-validation with k = 5.
Figure 13 shows the classification accuracies of the ten brands of Chinese liquors by the
leave-one-out cross-validation and 5-fold cross-validation, respectively. Both classification rates of
our proposed MDS-SVM classifier to the QCM-based e-nose were 96.25% (77/80). Table 4 provides
further details of these classification results.
Figure 13. Classification accuracies of the ten brands of Chinese liquors by leave-one-out
cross-validation and 5-fold cross-validation.
Table 4. Classification results of Chinese liquor samples by leave-one-out cross-validationand 5-fold
cross-validation.
No. Liquor Name
Leave-One-Out Cross-Validation 5-Fold Cross-Validation
Num. of
Errors
Num. of
Samples Accuracy
Num. of
Errors
Num. of
Samples Accuracy
1 Fen Liquor 0 8 100% 0 8 100%
2 GuoJiao1573 1 8 87.5% 0 8 100%
3 Jiannanchun 1 8 87.5% 2 8 75%
4 Jiugui Liquor 0 8 100% 0 8 100%
5 Kouzi cellar 0 8 100% 0 8 100%
6 Moutai 0 8 100% 0 8 100%
7 Niulanshan 0 8 100% 0 8 100%
8 Shuijingfang 1 8 87.5% 1 8 87.5%
9 Wuliangye(liquor) 0 8 100% 0 8 100%
10 Xifeng Liquor 0 8 100% 0 8 100%
Total 3 80 96.25% 3 80 96.25%
0%
20%
40%
60%
80%
100%
Fen
Liq
uor
Gu
oJi
ao15
73
Jian
nan
chu
n
Jiug
ui
Liq
uor
Ko
uzi
cel
lar
Mouta
i
Niu
lan
shan
Shu
ijin
gfa
ng
Wuli
ang
ye(
liq
uo
r)
Xif
eng L
iquo
r
To
tal
Classification Accuracies Leave-one-out K-fold
Sensors 2017, 17, 272 13 of 15
3.3. Test Experiments
We evaluated the comprehensive performance of the MDS-SVM classifier that predicted all ten
brands of Chinese liquors individually. The ten brands of Chinese liquors used as samples in our
experiments, whose details are listed in Table 1, were purchased from the China National Research
Institute of Food & Fermentation Industries.
The experiments were conducted in a clean room at a controlled temperature of 25 C. Taking
the Fen liquor as an example, we firstly injected 15 mL of the Fen liquor sample into ahead space
bottle (volume 25 mL). Then, the e-nose was utilized for acquiring the RFSVs of the Fen liquor sample.
Same as Section 2.4—remove one The RFSVs were processed by the proposed MDS-SVM classifier.
We repeated the experiment with the same brand of Chinese liquor sample 30 times. The same
processes were conducted for the other nine brands of Chinese liquor samples.
Table 5 presents the overall accuracy for each brand of the Chinese liquors. In predicting all ten
samples, the highest performing predictions are obtained for the Fen Liquor, Jiugui Liquor, Kouzi,
Moutai, Niulanshan, Wuliangye and Xifeng Liquor, with overall accuracies of 100%, while, the
prediction accuracies of the MDS-SVM classifier on classification of GuoJiao1573, Jiannanchun and
Shuijingfang are 93.4, 93.4 and 96.7%, respectively. The average predicted accuracy for all ten brands
is 98.3%. The experiments indicate that the MDS-SVM classifier has reasonable reliability, good fitting
and prediction (generalization) performance in the classification of the Chinese liquors.
Table 5. Classification results of the Chinese liquor samples by means of the e-nose and the
MDS-SVM classifier.
Actual Brand
(Liquor Name)
Mispredicted Brand
(Liquor Name) Num. of Errors Num. of Samples Accuracy
Fen Liquor - 0 30 100%
GuoJiao1573 Shuijingfang 2 30 93.4%
Jiannanchun Shuijingfang / GuoJiao1573 1/1 30 93.4%
Jiugui Liquor - 0 30 100%
Kouzi cellar - 0 30 100%
Moutai - 0 30 100%
Niulanshan - 0 30 100%
Shuijingfang Jiannanchun 1 30 96.7%
Wuliangye - 0 30 100%
Xifeng Liquor - 0 30 100%
Total 5 300 98.3%
3.4. Comparison of Classification Ability
Table 6 shows the classification ability of the MDS-SVM method we proposed in terms of
classification accuracy over Principle Components AnalysisBack Propagation neutral network
(PCA-BPNN) and Moving AverageLinear Discriminant Analysis (MA-LDA). We found that the
classification accuracy of the proposed classifier was greater than that of PCA-BPNN by 5%, and
greater than that of LDA by 10.7%.
Table 6. Comparison of Classification Ability.
Method Classification Accuracy
MDS-SVM 98.3%
PCA-BPNN 93.3%
MA-LDA 87.6%
Sensors 2017, 17, 272 14 of 15
4. Conclusions
This paper presented a pattern recognition system for classifying ten brands of Chinese liquors
based on MDS and SVM algorithms in the QCM-based e-nose we designed. We evaluated the
comprehensive performance of the MDS-SVM classifier for predicting all ten brands of Chinese
liquors individually. The prediction accuracy of the MDS-SVM classifier is superior to that of both
the LDA and BP-ANN classifiers. Numerical experiment results of the classification of the ten brands
of Chinese liquors showed that our recognition system is a viable solution for liquor classification
problems. The proposed approach based on MDS and SVM applications has the following properties:
Good accuracy at the reasonably small size of samples,
Low calibration cost,
Objective analysis and comprehensive assessment of Chinese liquors,
Good adaptability and prediction (generalization) performance on general working conditions.
Conclusively, our proposed system may find practical application in Chinese liquors quality
control and flavor assessment.
Acknowledgements: The work is supported by the National Natural Science Foundation of China (Grant No.:
61672094).
Author Contributions: All authors contributed extensively to the study presented in this manuscript. Yu Gu
contributed significantly to the conception of the study. Yu Gu and Qiang Li designed the software and analyzed
the measurements. Qiang Li supervised the work and contributed with valuable discussions and scientific
advice. Jing Jia carried out the experiments and acquired the data. All authors contributed in writing this
manuscript.
Conflicts of Interest: The authors declare no conflict of interest.
References
1. Wu, J.; Xu, Y. Comparison of pyrazine compounds in seven Chinese liquors using headspace solid-phase
micro-extraction and GC-nitrogen phosphourus detection. Food Sci. Biotechnol. 2013, 22, 1–6.
2. Fan, W.; Qian, M.C. Characterization of aroma compounds of Chinese “Wuliangye” and “Jiannanchun”
liquors by aroma extract dilution analysis. J. Agric. Food. Chem. 2016, 54, 2695–704.
3. Yao, F.; Yi, B.; Shen, C.; Xu, Ping. Chemical analysis of the Chinese liquor Luzhoulaojiao by comprehensive
two-dimensional gas chromatography/time-of-flight mass spectrometry. Sci. Rep. 2015, 5, 9553.
4. Zheng, X.; Han B. Baijiu, Chinese liquor: History, classification and manufacture. J Ethn Foods. 2016, 3,
19–25.
5. Zhou, W.; Zhou, X.; Zhao, G.; Liu, H.; Gao, L.; Chen, L.; Tang, Y. Quality fingerprint expert discriminating
system of Chinese famous white liquor. Chinese J. Anal. Chem. 2004, 32, 735–740.
6. Wu; T. X.; Zheng, Y.; Tang, Q. L. Study on gas chromatography fingerprint map of maotai-flavor liquor.
Chinese Liquor Making Sci. Tech. 2008, 10, 30–36.
7. Huang, Y.; Lu, J.; Li, A.; Lv, C.; Wang, L.; Huang, G. Analysis of flavoring substances in Gujing Gongjiu
Liquor by GC/MS. Chinese Liquor Making Sci. Tech. 2004, 7, 91–94.
8. Qin, H.; Huo, D.; Zhang, L.; Yang, L.; Zhang, S.; Yang, M.; Shen, C.; Hou, C. Colorimetric artificial nose for
identification of Chinese liquor with different geographic origins. Food. Res. Int. 2012, 45, 45–51.
9. Jing, Y.; Meng, Q.; Qi P.; Zeng, M.; Li, W.; Ma, S. Electronic nose with a new feature reduction method and
a multi-linear classifier for Chinese liquor classification. Rev. Sci. Instrum. 2014, 85, 055004.
10. Albert, K.J.; Lewis, N.S.; Schauer, C.L.; Sotzing, G.A.; Stitzel, S.E.; Vaid, T.P.; Walt, D.R. Cross-reactive
chemical sensor arrays. Chem. Rev. 2000, 100, 2595–2626.
11. Shaffer, R.E.; Rose-Pehrsson, S.L.; Mcgill, R.A. A comparison study of chemical sensor array pattern
recognition algorithms. Anal. Chim. Acta. 1999, 384, 305–317.
12. Peng, Q.; Tian, R.; Chen, F.; Li, B.; Gao, H. Discrimination of producing area of Chinese Tongshan kaoliang
spirit using electronic nose sensing characteristics combined with the chemometrics methods. Food Chem.
2015, 178, 301–305.
13. Gu, Y.; Li, Q. Application of the new pattern recognition system in the new e-nose to detecting Chinese
spirits. Chin. Phys. B 2014, 39, 330–334.
Sensors 2017, 17, 272 15 of 15
14. Zeng, H., Li, Q.; Gu, Y. New pattern recognition system in the e-nose for Chinese spirit identification. Chin.
Phys. B 2016, 2, 168–173.
15. Zhang, Q.; Xie, C.; Zhang, S.; Wang, A.; Zhu, B.; Wang, L.; Yang, Z. Identification and pattern recognition
analysis of Chinese liquors by doped nano ZnO gas sensor array. Sens. Actuators B Chem. 2005, 110,
370–376.
16. Ema, K.; Yokoyama, Y.; Nakamoto, T.; Moriizumi, T. Odour-sensing system using a quartz-resonator
sensor array and neural-network pattern recognition. Sens. Actuators B Chem. 1989, 18, 291–296.
17. Zheng, X.W.; Tabrizi, M.R.; Nout, M.J.R.; Han, B.Z. Daqu—A Traditional Chinese Liquor Fermentation
Starter. J. Inst. Brew. 2011, 117, 82–90.
18. Shen, Y. F. Xiaoqu liquord a wonderful flow in Chinese traditional baijiu production techniques. Liquor
Making. 2001, 28, 19–22. (In Chinese)
19. Sauerbrey, G. Verwendung von Schwing quarzen zur Wagungdunner Schichten und zur Mikrowagung.
Z. Phys. A: Hadrons Nucl. 1995, 155, 206–222.
20. Gu, Y.; Li, Q. Preparation and characterization of PTFE coating of new polymer quartz piezoelectric crystal
sensor for testing Chinese spirits. Chine. Phys. B 2015, 24, 544–547.
21. Herve, A. Metric Multidimensional Scaling (MDS): Analyzing Distance Matrices. Encyclopedia Meas Stat.
Sage. 2007, doi: 10.1007/s10489–016–0839–2.
22. Jain, Y.K.;Bhandare, S. K. Min max normalization based data perturbation method for privacy protection.
Int. J. Comput Commun. Technol. 2011. 2, 45–50.
23. Pardo, M.; Sberveglieri G. Classification of electronic nose data with support vector machines.
Sens. Actuators B. Chem. 2005, 107, 730–737.
24. Eberhart, R.; Kennedy, J. A new optimizer using particle swarm theory. In Proceedings of the Sixth
International Symposium on Micro Machine and Human Science, Nagoya, Japan, 4–6 October 1995
25. Rodriguez-Lujan, I.; Fonollosa, J.; Vergara, A.; Homer, M.; Huerta, R. On the calibration of sensor arrays
for pattern recognition using the minimal number of experiments. Chemom. Intell. Lab. Syst. 2013, 130,
123–134.
© 2017 by the authors; licensee MDPI, Basel, Switzerland. This article is an open access
article distributed under the terms and conditions of the Creative Commons Attribution
(CC-BY) license (http://creativecommons.org/licenses/by/4.0/).
Related Documents