Classification of Genes and Putative Biomarker Identification Using Distribution Metrics on Expression Profiles Hung-Chung Huang, Daniel Jupiter, Vincent VanBuren* Department of Systems Biology and Translational Medicine, Texas A&M Health Science Center College of Medicine, Temple, Texas, United States of America Abstract Background: Identification of genes with switch-like properties will facilitate discovery of regulatory mechanisms that underlie these properties, and will provide knowledge for the appropriate application of Boolean networks in gene regulatory models. As switch-like behavior is likely associated with tissue-specific expression, these gene products are expected to be plausible candidates as tissue-specific biomarkers. Methodology/Principal Findings: In a systematic classification of genes and search for biomarkers, gene expression profiles (GEPs) of more than 16,000 genes from 2,145 mouse array samples were analyzed. Four distribution metrics (mean, standard deviation, kurtosis and skewness) were used to classify GEPs into four categories: predominantly-off, predominantly-on, graded (rheostatic), and switch-like genes. The arrays under study were also grouped and examined by tissue type. For example, arrays were categorized as ‘brain group’ and ‘non-brain group’; the Kolmogorov-Smirnov distance and Pearson correlation coefficient were then used to compare GEPs between brain and non-brain for each gene. We were thus able to identify tissue-specific biomarker candidate genes. Conclusions/Significance: The methodology employed here may be used to facilitate disease-specific biomarker discovery. Citation: Huang H-C, Jupiter D, VanBuren V (2010) Classification of Genes and Putative Biomarker Identification Using Distribution Metrics on Expression Profiles. PLoS ONE 5(2): e9056. doi:10.1371/journal.pone.0009056 Editor: Timothy Ravasi, University of California San Diego, United States of America Received September 22, 2009; Accepted January 11, 2010; Published February 4, 2010 Copyright: ß 2010 Huang et al. This is an open-access article distributed under the terms of the Creative Commons Attribution License, which permits unrestricted use, distribution, and reproduction in any medium, provided the original author and source are credited. Funding: This work was supported by start-up funds to VV from the Department of Systems Biology and Translational Medicine and the Dean of the Texas A&M Health Science Center College of Medicine. Identification of candidate biomarkers for heart (supplied in Table S3) was supported by AHA SDG 0630263N (PI: VV). The funders had no role in study design, data collection and analysis, decision to publish, or preparation of the manuscript. Competing Interests: The authors have declared that no competing interests exist. * E-mail: [email protected] Introduction It is becoming increasingly clear that the bistability (or, more generally, multistability) phenomenon found in switch-like genes is an important recurring theme in development and cell signaling [1]. Numerous synthetic gene circuits have been created in the past decade, including bistable switches, oscillators, and logic gates [2]. Bistability may be of particular relevance to biological systems that transition between discrete states (e.g., embryo maturation via positive feedback loop), that generate oscillatory responses (e.g., mitosis via negative feedback loop), or that remember transitory stimuli (e.g., cell differentiation via hysteresis) [1,3–5]. Thus, it is crucial to be able to identify switch-like genes and other categories of gene expression to assist in the construction of gene regulatory networks. Additionally, distinguishing between genes with on- or off- transcriptional states and genes with rheostatic expression offers an important contribution to computational modeling efforts, including the appropriate application of Boolean network theory for gene regulatory network simulation [6–9]. Expression profiles of more than 16,000 genes from 2,145 mouse microarray experiments were analyzed. We define the gene expression profile (GEP) of a gene as the distribution of the log 2 values of normalized signal intensity across the set of studied arrays. According to visual inspection of the GEP histograms, we proposed that there were four major classes of gene expression profiles. These classes are predominantly off, predominantly on, graded (rheostatic), or multistable (the largest portion of which are bistable) switch-like gene expression profiles (Figure 1). In an effort to automatically assign genes to these four classes, genes were clustered according to four metrics describing the distribution characteristics of expression profiles over the large heterogeneous collection of microarray experiments described above. This work provides a foundation for the systematic classification of gene expression profiles via mining the vast resource of publicly available microarray data. Although blood serum tests are one of the least invasive diagnostic procedures, tissue biopsy tests are commonly seen in the medical diagnosis field. Some biopsies, however, have been replaced by less invasive procedures, e.g., primary care physicians frequently perform lumbar puncture, as cerebrospinal fluid (CSF) combined with blood analyses are invaluable diagnosis windows to the diseases in the central nervous system (CNS) [10–13]. It has also been suggested that PCR of CSF samples should be able to replace brain biopsies for some infection tests [14]. Other examples of the analysis of biomarkers in bodily fluids include prenatal genetic tests via amniocentesis that extracts amniotic fluid PLoS ONE | www.plosone.org 1 February 2010 | Volume 5 | Issue 2 | e9056

Welcome message from author
This document is posted to help you gain knowledge. Please leave a comment to let me know what you think about it! Share it to your friends and learn new things together.
Transcript
Classification of Genes and Putative BiomarkerIdentification Using Distribution Metrics on ExpressionProfilesHung-Chung Huang, Daniel Jupiter, Vincent VanBuren*
Department of Systems Biology and Translational Medicine, Texas A&M Health Science Center College of Medicine, Temple, Texas, United States of America
Abstract
Background: Identification of genes with switch-like properties will facilitate discovery of regulatory mechanisms thatunderlie these properties, and will provide knowledge for the appropriate application of Boolean networks in generegulatory models. As switch-like behavior is likely associated with tissue-specific expression, these gene products areexpected to be plausible candidates as tissue-specific biomarkers.
Methodology/Principal Findings: In a systematic classification of genes and search for biomarkers, gene expression profiles(GEPs) of more than 16,000 genes from 2,145 mouse array samples were analyzed. Four distribution metrics (mean, standarddeviation, kurtosis and skewness) were used to classify GEPs into four categories: predominantly-off, predominantly-on,graded (rheostatic), and switch-like genes. The arrays under study were also grouped and examined by tissue type. Forexample, arrays were categorized as ‘brain group’ and ‘non-brain group’; the Kolmogorov-Smirnov distance and Pearsoncorrelation coefficient were then used to compare GEPs between brain and non-brain for each gene. We were thus able toidentify tissue-specific biomarker candidate genes.
Conclusions/Significance: The methodology employed here may be used to facilitate disease-specific biomarker discovery.
Citation: Huang H-C, Jupiter D, VanBuren V (2010) Classification of Genes and Putative Biomarker Identification Using Distribution Metrics on ExpressionProfiles. PLoS ONE 5(2): e9056. doi:10.1371/journal.pone.0009056
Editor: Timothy Ravasi, University of California San Diego, United States of America
Received September 22, 2009; Accepted January 11, 2010; Published February 4, 2010
Copyright: � 2010 Huang et al. This is an open-access article distributed under the terms of the Creative Commons Attribution License, which permitsunrestricted use, distribution, and reproduction in any medium, provided the original author and source are credited.
Funding: This work was supported by start-up funds to VV from the Department of Systems Biology and Translational Medicine and the Dean of the Texas A&MHealth Science Center College of Medicine. Identification of candidate biomarkers for heart (supplied in Table S3) was supported by AHA SDG 0630263N (PI: VV).The funders had no role in study design, data collection and analysis, decision to publish, or preparation of the manuscript.
Competing Interests: The authors have declared that no competing interests exist.
* E-mail: [email protected]
Introduction
It is becoming increasingly clear that the bistability (or, more
generally, multistability) phenomenon found in switch-like genes is
an important recurring theme in development and cell signaling
[1]. Numerous synthetic gene circuits have been created in the
past decade, including bistable switches, oscillators, and logic gates
[2]. Bistability may be of particular relevance to biological systems
that transition between discrete states (e.g., embryo maturation via
positive feedback loop), that generate oscillatory responses (e.g.,
mitosis via negative feedback loop), or that remember transitory
stimuli (e.g., cell differentiation via hysteresis) [1,3–5]. Thus, it is
crucial to be able to identify switch-like genes and other categories
of gene expression to assist in the construction of gene regulatory
networks. Additionally, distinguishing between genes with on- or
off- transcriptional states and genes with rheostatic expression
offers an important contribution to computational modeling
efforts, including the appropriate application of Boolean network
theory for gene regulatory network simulation [6–9].
Expression profiles of more than 16,000 genes from 2,145
mouse microarray experiments were analyzed. We define the gene
expression profile (GEP) of a gene as the distribution of the log2 values
of normalized signal intensity across the set of studied arrays.
According to visual inspection of the GEP histograms, we
proposed that there were four major classes of gene expression
profiles. These classes are predominantly off, predominantly on, graded
(rheostatic), or multistable (the largest portion of which are bistable)
switch-like gene expression profiles (Figure 1). In an effort to
automatically assign genes to these four classes, genes were
clustered according to four metrics describing the distribution
characteristics of expression profiles over the large heterogeneous
collection of microarray experiments described above. This work
provides a foundation for the systematic classification of gene
expression profiles via mining the vast resource of publicly
available microarray data.
Although blood serum tests are one of the least invasive
diagnostic procedures, tissue biopsy tests are commonly seen in the
medical diagnosis field. Some biopsies, however, have been
replaced by less invasive procedures, e.g., primary care physicians
frequently perform lumbar puncture, as cerebrospinal fluid (CSF)
combined with blood analyses are invaluable diagnosis windows to
the diseases in the central nervous system (CNS) [10–13]. It has
also been suggested that PCR of CSF samples should be able to
replace brain biopsies for some infection tests [14]. Other
examples of the analysis of biomarkers in bodily fluids include
prenatal genetic tests via amniocentesis that extracts amniotic fluid
PLoS ONE | www.plosone.org 1 February 2010 | Volume 5 | Issue 2 | e9056

from around the fetus (as an indirect test of fetus tissue) [15,16],
and liver function tests via blood sample, which test for the
presence of liver enzymes, e.g., ALT(GPT), AST(GOT), ALP,
GGT, and LDH [17,18]. Thus, serum biomarkers for disease
states have become increasingly important to the diagnosis and
treatment of disease [19–23].
In addition to the classification of gene expression profiles, this
report identifies a list of tissue-specific biomarker candidate genes.
These candidates are expected to be useful for directly assaying the
tissue of interest for transcript or expressed protein abundance.
Additionally, this list provides a narrowed field of candidates of
gene products or metabolites that may be measurable in patient’s
blood serum for diagnosis and prognosis purposes. To identify
candidate biomarkers, we leveraged our studies of gene expression
profiles to find genes with differential behavior between, e.g., brain
and non-brain tissue samples. By identifying genes that are
specifically expressed in brain, a preliminary list of candidate
biomarkers for neurological disorders can be generated. We
further analyzed this list to look for known biomarkers as a means
of validating our approach, and performed literature reviews to
identify promising candidates with potential for secretion into the
blood and passage though the blood-brain barrier.
Figure 1. Frequency histogram plot for the expression intensity profile of genes in four categories. (a) predominantly-off, (b)predominantly-on, (c) graded (rheostatic), and (d) multistable (switch-like). The Y-axis is in log scale.doi:10.1371/journal.pone.0009056.g001
Biomarker Discovery
PLoS ONE | www.plosone.org 2 February 2010 | Volume 5 | Issue 2 | e9056
Methods
Data PreprocessingA dataset that was compiled from publicly available data and
used in a previous study (by Jupiter and VanBuren) [24] of more
than 16,000 genes represented on 2,145 mouse array experiments
conducted on Affymetrix GeneChipH mouse genome 430 2.0
arrays was analyzed in this work to study gene expression profiles.
Briefly, raw microarray data was collected from NCBI’s Gene
Expression Omnibus (GEO) [25,26], and features on the array
were mapped to NCBI Entrez Gene IDs using Version 9 of the
mapping provided by Dai et al. [27], yielding 16,297 gene probe
sets and 64 Affymetrix control gene probe sets. The arrays were
normalized using the justRMALite package [28] in BioConductor
[29], which performs quantile normalization, positive match only
adjustment, and Tukey median polish. A complete listing of the
GSE data series on the Affymetrix platform used (GEO accession
GPL1261) in the present study is given in Table S1.
Metrics Used to Evaluate the GEP: Mean, SD, Kurtosis, andSkewness
Kurtosis as used here is defined as m4/s4 - 3, where m4 is the
fourth moment about the mean and s is the standard deviation.
Subtracting 3 gives the so-called ‘‘excess kurtosis’’, which sets the
kurtosis of a Normal distribution equal to zero. Kurtosis is a
measure of the ‘‘peakedness’’ of a distribution (e.g., ‘‘gene
expression intensity’’), relative to a Normal distribution. A
distribution with a tall peak has high kurtosis value. Skewness is
a measure of the asymmetry of a distribution. A left-skewed
distribution has a long left tail, and negative skewness (e. g., the
GEP profile for the predominantly-on gene, Figure 1b). A right-
skewed distribution has a long right tail, and positive skewness (e.
g., the GEP profile for the predominantly-off gene, Figure 1a).
As kurtosis and skewness effectively describe the shape of
distributions, they are good parameter choices for clustering
distributions into profiles according to shape properties. Kurtosis
and skewness of a GEP are expected to be useful metrics for the
classification of predominantly-on and predominantly-off genes,
given the high peaks and high skewness of these proposed classes of
genes. Those metrics, however, do not give a good description the
central position of the distribution along the x axis, nor do they
fully describe the spread of the data. The standard deviations (s.d.)
of the expression intensities for switch-like genes (e.g., those with a
distinct bi-modal distribution) and rheostatic genes (e.g., those with
a mono-modal and relatively unskewed distribution) will differ
even though the means may be similar. Hence, s.d. is a good
metric to separate rheostatic from switch-like genes. Mean
expression intensity is also expected to facilitate grouping genes
into one of three groups: predominantly-off, rheostatic & switch-like, and
predominantly-on, based on their mean intensities at low, middle, and
high ranges respectively. Therefore, these four metrics (mean, s.d.,
kurtosis, and skewness) describing GEPs were used as the metrics
and parameters to cluster all the genes in the studied mouse arrays.
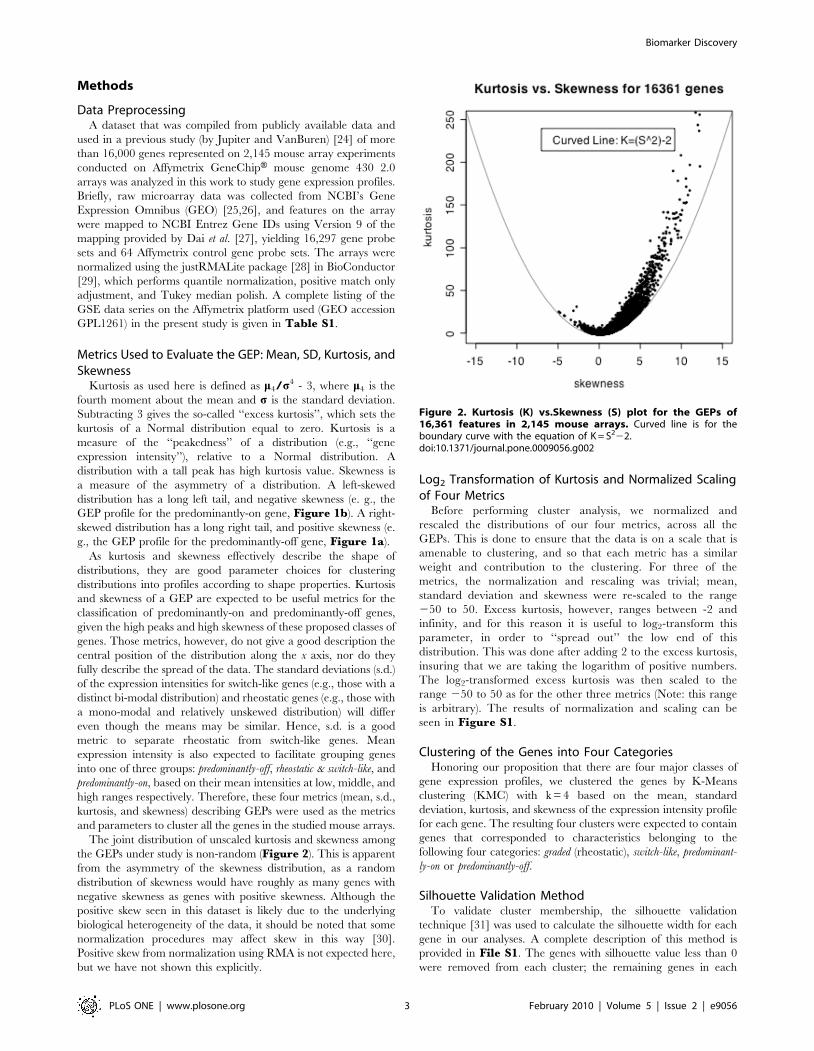
The joint distribution of unscaled kurtosis and skewness among
the GEPs under study is non-random (Figure 2). This is apparent
from the asymmetry of the skewness distribution, as a random
distribution of skewness would have roughly as many genes with
negative skewness as genes with positive skewness. Although the
positive skew seen in this dataset is likely due to the underlying
biological heterogeneity of the data, it should be noted that some
normalization procedures may affect skew in this way [30].
Positive skew from normalization using RMA is not expected here,
but we have not shown this explicitly.
Log2 Transformation of Kurtosis and Normalized Scalingof Four Metrics
Before performing cluster analysis, we normalized and
rescaled the distributions of our four metrics, across all the
GEPs. This is done to ensure that the data is on a scale that is
amenable to clustering, and so that each metric has a similar
weight and contribution to the clustering. For three of the
metrics, the normalization and rescaling was trivial; mean,
standard deviation and skewness were re-scaled to the range
250 to 50. Excess kurtosis, however, ranges between -2 and
infinity, and for this reason it is useful to log2-transform this
parameter, in order to ‘‘spread out’’ the low end of this
distribution. This was done after adding 2 to the excess kurtosis,
insuring that we are taking the logarithm of positive numbers.
The log2-transformed excess kurtosis was then scaled to the
range 250 to 50 as for the other three metrics (Note: this range
is arbitrary). The results of normalization and scaling can be
seen in Figure S1.
Clustering of the Genes into Four CategoriesHonoring our proposition that there are four major classes of
gene expression profiles, we clustered the genes by K-Means
clustering (KMC) with k = 4 based on the mean, standard
deviation, kurtosis, and skewness of the expression intensity profile
for each gene. The resulting four clusters were expected to contain
genes that corresponded to characteristics belonging to the
following four categories: graded (rheostatic), switch-like, predominant-
ly-on or predominantly-off.
Silhouette Validation MethodTo validate cluster membership, the silhouette validation
technique [31] was used to calculate the silhouette width for each
gene in our analyses. A complete description of this method is
provided in File S1. The genes with silhouette value less than 0
were removed from each cluster; the remaining genes in each
Figure 2. Kurtosis (K) vs.Skewness (S) plot for the GEPs of16,361 features in 2,145 mouse arrays. Curved line is for theboundary curve with the equation of K = S222.doi:10.1371/journal.pone.0009056.g002
Biomarker Discovery
PLoS ONE | www.plosone.org 3 February 2010 | Volume 5 | Issue 2 | e9056
cluster were then designated to belong to one of the four categories
as described above.
Gene Function Enrichment AnalysisEach class of genes defined by our final clustering was further
analyzed using the WebGestalt Gene Set Analysis ToolKit [32].
This allowed us to identify KEGG pathways and Gene Ontology
(GO) terms that are enriched within each class of genes.
Tissue-specific Studies and Biomarker IdentificationThe arrays used in this study assay a heterogeneous selection of
tissues and biological states. This heterogeneity may confound
results. For example, a switch-like gene may be predominantly-on
in some tissues, and predominantly-off in some other tissues; another
switch-like gene may have both high and low expression states in
some tissues, while it has exclusively high or low expression states
in other tissues. Additionally, predominantly-on or predominantly-off
genes are likely to be interesting with respect to the exceptional
cases in specific tissues (i.e. the cases where predominantly-on genes
are ‘off’, and the cases where predominantly-off genes are ‘on’). With
these ideas in mind, we further examined GEPs after grouping the
arrays by the tissue type of the hybridized sample. In addition,
strong candidates for tissue-specific biomarker genes are expected
to have distinctive GEP in the tissue of interest when compared to
the GEP derived from other tissues.
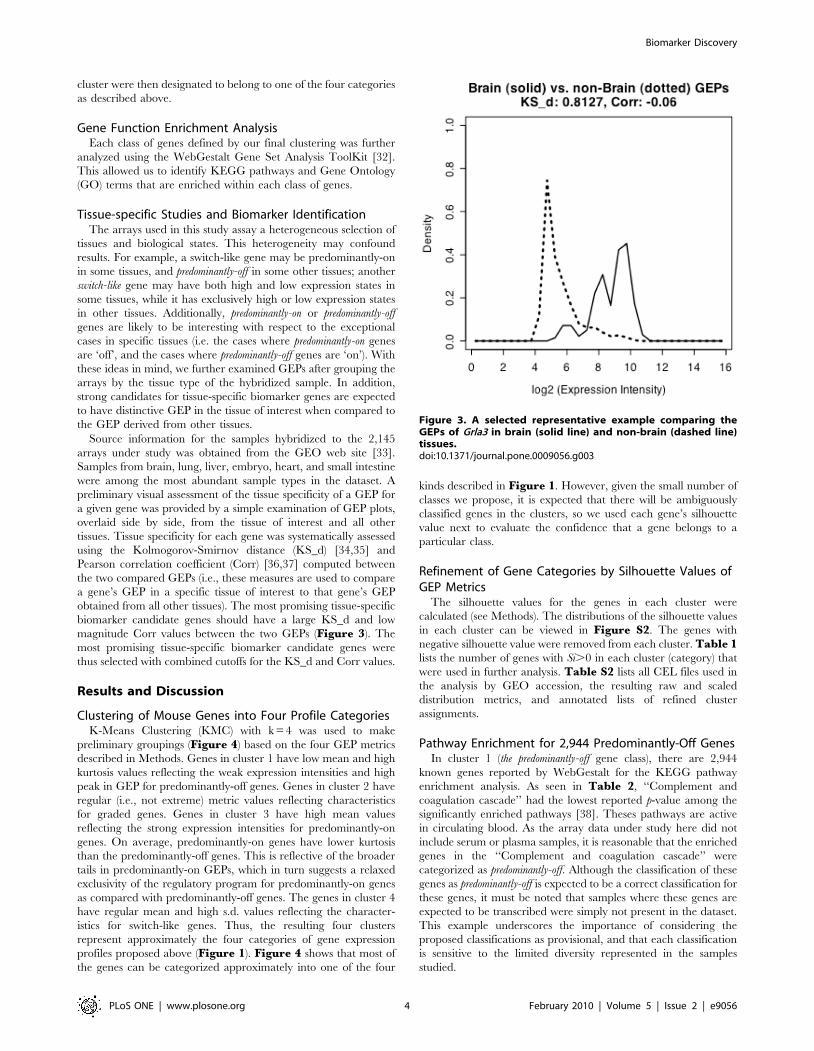
Source information for the samples hybridized to the 2,145
arrays under study was obtained from the GEO web site [33].
Samples from brain, lung, liver, embryo, heart, and small intestine
were among the most abundant sample types in the dataset. A
preliminary visual assessment of the tissue specificity of a GEP for
a given gene was provided by a simple examination of GEP plots,
overlaid side by side, from the tissue of interest and all other
tissues. Tissue specificity for each gene was systematically assessed
using the Kolmogorov-Smirnov distance (KS_d) [34,35] and
Pearson correlation coefficient (Corr) [36,37] computed between
the two compared GEPs (i.e., these measures are used to compare
a gene’s GEP in a specific tissue of interest to that gene’s GEP
obtained from all other tissues). The most promising tissue-specific
biomarker candidate genes should have a large KS_d and low
magnitude Corr values between the two GEPs (Figure 3). The
most promising tissue-specific biomarker candidate genes were
thus selected with combined cutoffs for the KS_d and Corr values.
Results and Discussion
Clustering of Mouse Genes into Four Profile CategoriesK-Means Clustering (KMC) with k = 4 was used to make
preliminary groupings (Figure 4) based on the four GEP metrics
described in Methods. Genes in cluster 1 have low mean and high
kurtosis values reflecting the weak expression intensities and high
peak in GEP for predominantly-off genes. Genes in cluster 2 have
regular (i.e., not extreme) metric values reflecting characteristics
for graded genes. Genes in cluster 3 have high mean values
reflecting the strong expression intensities for predominantly-on
genes. On average, predominantly-on genes have lower kurtosis
than the predominantly-off genes. This is reflective of the broader
tails in predominantly-on GEPs, which in turn suggests a relaxed
exclusivity of the regulatory program for predominantly-on genes
as compared with predominantly-off genes. The genes in cluster 4
have regular mean and high s.d. values reflecting the character-
istics for switch-like genes. Thus, the resulting four clusters
represent approximately the four categories of gene expression
profiles proposed above (Figure 1). Figure 4 shows that most of
the genes can be categorized approximately into one of the four
kinds described in Figure 1. However, given the small number of
classes we propose, it is expected that there will be ambiguously
classified genes in the clusters, so we used each gene’s silhouette
value next to evaluate the confidence that a gene belongs to a
particular class.
Refinement of Gene Categories by Silhouette Values ofGEP Metrics
The silhouette values for the genes in each cluster were
calculated (see Methods). The distributions of the silhouette values
in each cluster can be viewed in Figure S2. The genes with
negative silhouette value were removed from each cluster. Table 1lists the number of genes with Si.0 in each cluster (category) that
were used in further analysis. Table S2 lists all CEL files used in
the analysis by GEO accession, the resulting raw and scaled
distribution metrics, and annotated lists of refined cluster
assignments.
Pathway Enrichment for 2,944 Predominantly-Off GenesIn cluster 1 (the predominantly-off gene class), there are 2,944
known genes reported by WebGestalt for the KEGG pathway
enrichment analysis. As seen in Table 2, ‘‘Complement and
coagulation cascade’’ had the lowest reported p-value among the
significantly enriched pathways [38]. Theses pathways are active
in circulating blood. As the array data under study here did not
include serum or plasma samples, it is reasonable that the enriched
genes in the ‘‘Complement and coagulation cascade’’ were
categorized as predominantly-off. Although the classification of these
genes as predominantly-off is expected to be a correct classification for
these genes, it must be noted that samples where these genes are
expected to be transcribed were simply not present in the dataset.
This example underscores the importance of considering the
proposed classifications as provisional, and that each classification
is sensitive to the limited diversity represented in the samples
studied.
Figure 3. A selected representative example comparing theGEPs of Grla3 in brain (solid line) and non-brain (dashed line)tissues.doi:10.1371/journal.pone.0009056.g003
Biomarker Discovery
PLoS ONE | www.plosone.org 4 February 2010 | Volume 5 | Issue 2 | e9056

The enriched ‘‘Linoleic acid metabolism’’ and ‘‘Arachidonic
acid metabolism’’ pathways are involved in hormone protein
biosynthesis and inflammatory processes [39–43]. Linoleic acid is
an essential fatty acid which must be supplied in food. One of the
products in ‘‘Linoleic acid metabolism’’ is arachidonic acid which
is a precursor in the production of eicosanoids like Prostaglandins
and Leukotrienes (in ‘‘Arachidonic acid metabolism’’) [44–47].
Arachidonic acid is esterified into the phospholipid fats in the cell
membrane. In response to many inflammatory stimuli, phospho-
lipase is generated and cleaves this fat, releasing arachidonic acid
as a free fatty acid to be further modified to form eicosanoids.
Eicosanoids like Prostaglandins and Leukotrienes are potent
mediators of inflammation. Prostaglandins are produced by most
soft tissues. Therefore, ‘‘Linoleic acid and Arachidonic acid
metabolisms’’ should not be confined to a limited number of
tissues. Classification of these genes as predominantly-off thus implies
that some genes for these pathways are expected be in the off state
under normal conditions. For example, as seen in our result
(Figure S3, ‘‘Linoleic acid metabolism’’), the cleavage of Lecithin
(i.e., phosphatidylcholine) in the cell membrane by phosphalipase
A2 (EC: 3.1.1.4) [48] to release linoleic acid (Linoleate) is expected
to be blocked most of the time as the gene (PLA2g1b) encoding a
subunit for phosphalipase A2 is predominantly-off in our result. If the
gene for this phospholipase was not transcriptionally off most of
the time, the gene product (phosphalipase A2) would be expected
to promote decomposition of the cell membranes in multiple soft
tissues, which under normal conditions would have a deleterious
effect on cellular health.
Pathway Enrichment for 5,478 Graded GenesIn cluster 2, the graded (rheostatic) gene class, 5,478 known
genes were reported by WebGestalt for KEGG pathway
enrichment analysis. There were only four significantly enriched
KEGG pathways from this set of genes as shown in Table 3.
Genes for the ‘‘Neuroactive ligand-receptor interaction’’ pathway
group were enriched with the lowest p-value for this class of genes.
This is notable, as the predominantly-off gene class was also enriched
for this collection of pathways, as seen in previous section. Some
genes (68 genes; Table 2) in the ‘‘Neuroactive ligand-receptor
interaction’’ collection of pathways are thus regulated to be in
predominantly-off state while a larger number of genes (125 genes;
Table 3) in this pathway group are controlled in a more graded
manner. In our results, most of the significantly enriched and
graded genes for ‘‘Neuroactive ligand-receptor interaction’’
encode for the miscellaneous receptor proteins located on the
membrane, which belong to the transmembrane G-protein
coupled receptors (GPCRs) superfamily. GPCRs are known to
allow a graded signal response to fluctuating extracellular stimuli
[49]. This points to a relationship between the graded
transcriptional activity (encoding for the above-mentioned
GPCRs) and the graded signal response (for those neuroactive
ligand-receptor interactions).
Axon guidance (second pathway in Table 3) is a neural
development process by which neurons send out axons to reach
the correct targets [50]. Growing axons have a highly motile
growing tip (growth cone) sniffing out the extracellular signals
(guidance cues) for which way to grow. These signals can attract or
repel axons. In our results, the enriched graded genes in the ‘‘Axon
guidance’’ pathway have been found to include genes encoding for
the following three important classes of axon guidance molecules
and their receptors.
1) Neutrins and the receptors, DCC and UNC5 [51,52]:
Neutrins are secreted molecules that can attract or repel
axons.
Figure 4. GEP metrics for each gene clustered into one of four clusters. Gene categories: (a) predominantly-off, (b) graded, (c)predominantly-on, and (d) switch-like genes.doi:10.1371/journal.pone.0009056.g004
Table 1. The number of genes in each cluster (category).
Cluster 1 Cluster 2 Cluster 3 Cluster 4
Initial 3129 5497 5043 2692
Si .0 2951 5484 5008 2388
Known Genes* 2944 5478 5004 2387
*Numbers of ‘‘Known Genes’’ that were reported by the WebGestalt gene setanalysis toolkit.
doi:10.1371/journal.pone.0009056.t001
Biomarker Discovery
PLoS ONE | www.plosone.org 5 February 2010 | Volume 5 | Issue 2 | e9056

2) Ephrins and the Eph receptors (Ephs) [53,54]: Ephrins are
cell surface molecules that activate Eph receptors on the
surface of other cells with an attractive or repulsive
interaction.
3) Semaphorins and the Plexin receptors [55]: Semaphorins are
primarily axonal repellents.
The gene for another axon guidance molecule, Slit [56], was
also found to be graded-like in our results, although the genes for its
receptors (Robo class receptors) were not. As our results show that
most of the components between the axon guidance molecules and
their receptors are encoded by graded genes, we can infer a graded
response for axon growth via the axon guidance pathway. Such a
graded response does exist and it is best understood by the
interaction of Ephrin ligands and their receptors (Ephs) which can
be described by a topographic mapping model with gradients for
guidance in a field of neurons such as the retina [57,58]. In this
model, a gradient of Eph receptor was expressed in retina with the
anterior cells expressing very low levels and the posterior cells
expressing the highest levels of the receptor. Likewise, in the optic
tectum (i.e., the target of the retinal cells) of the brain, Ephrin
ligands are organized in a similar gradient: high posterior to low
anterior. In this manner, axons from different areas of retina can
appropriately project to specific areas in the tectum in brain. This
is a major feature of nervous system organization, particular in
sensory systems.
The ‘‘Hedgehog signaling pathway’’ (third pathway in Table 3)
provides cells with developmental programming via differential
concentrations of the hedgehog signaling proteins – the Hedgehog
homologues (HH) [59–61]. Sonic hedgehog homolog (SHH) is the
best studied one of three proteins in the mammalian hedgehog
family; the other two being desert hedgehog (DHH) and Indian
hedgehog (IHH). SHH plays a key role in regulating vertebrate
organogenesis and remains important in the adult by controlling
cell division of adult stem cells and has been implicated in
development of some cancers [62–66]. SHH is also a prominent
example of a morphogen molecule that diffuses to form a
concentration gradient and has different effects on the cells of
the developing embryo in a concentration-dependent manner. In
our results, most of the genes for ‘‘Hedgehog signaling pathway’’
are graded genes including the ones encoding for SHH and IHH
homologues, and the transmembrane protein called Patched
(PTCH) [67] which is the target for HH to bind on the cell surface.
The pathway for ‘‘Taste transduction’’ (fourth pathway in
Table 3; Figure S4) shows a typical example that the sensory
stimuli from the environment impinge on receptors, which
respond by producing receptor potentials, and in turn lead to
the generation of action potentials which carry information
substantial distances to the brain [68–72]. In a taste bud, the
taste is thus converted into an electrical signal sent to the brain. A
receptor potential is often produced by sensory transduction with a
depolarizing event resulting from inward current flow. Like the
photo perception in the visual pathway [73], the ion-dependent
release of neurotransmitter is graded with respect to the
presynaptic membrane potential (i.e., receptor potential). A
receptor potential is a form of graded potential [73–76]. This is
Table 2. Significantly enriched KEGG pathways for predominantly-off genes (p, = 0.01).
KEGG pathway O: Genes observed 1E: Genes expected 2R: Ratio of enrichment 3p-Values, = 0.01
Complement and coagulation cascade 28 10.85 2.58 3.48e-7
Arachidonic acid metabolism 25 11.39 2.19 4.74e-5
Metabolism of xenobiotics by cyrochrome P450 21 9.04 2.32 7.10e-5
Linoleic acid metabolism 17 6.87 2.47 1.35e-4
Neuroactive ligand-receptor interaction 68 44.67 1.52 1.49e-4
C21-Steroid hormone metabolism 7 1.81 3.87 4.51e-4
Maturity onset diabetes of the young 12 4.52 2.65 5.98e-4
Cell communication 30 17.00 1.76 8.34e-4
Cytokine-cytokine receptor interaction 55 36.71 1.50 9.20e-4
Stilbene, Coumarine and lignin biosynthesis 5 1.09 4.61 9.84e-4
1The 3rd column gives the expected number of genes in a given KEGG pathway (This is equal to the total number of genes in the selected set multiplied by the totalnumber of genes in the reference set that belong to the KEGG pathway divided by the total number of genes in the reference set).
2The 4th column is the ratio of enrichment for the KEGG pathway (R = O/E).3In the 5th column, P is the p-value given by the Hypergeometric test.doi:10.1371/journal.pone.0009056.t002
Table 3. The only four significantly enriched KEGG pathways for graded genes (p, = 0.01).
KEGG pathway O: Genes observed 1E: Genes expected 2R: Ratio of enrichment 3p-Values, = 0.01
Neuroactive ligand-receptor interaction 125 83.12 1.50 2.35e-8
Axon guidance 58 39.37 1.47 2.59e-4
Hedgehog signaling pathway 28 17.16 1.63 1.43e-3
Taste transduction 17 9.42 1.80 3.01e-3
Column legend is the same as in Table 2.doi:10.1371/journal.pone.0009056.t003
Biomarker Discovery
PLoS ONE | www.plosone.org 6 February 2010 | Volume 5 | Issue 2 | e9056
reflected in our results, where genes encoding most of the ion
channels and taste receptors on the membrane of taste receptor
cells were found to be graded (Figure S4).
We found the common factor in these four enriched pathways
described above is a graded signal response of ligand-receptor
interaction in a gradient environment. These genes are regulated
to control graded gene expression for ligands or receptors related
to the graded response of the cell to environmental signals or
stimuli.
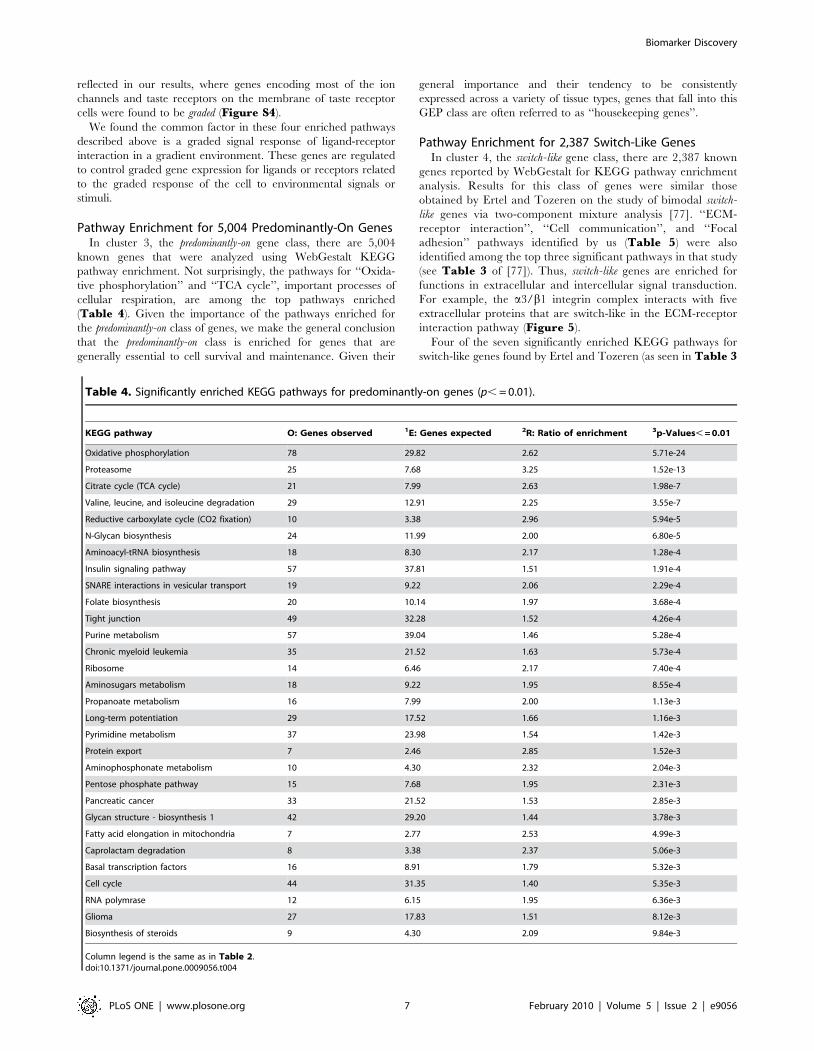
Pathway Enrichment for 5,004 Predominantly-On GenesIn cluster 3, the predominantly-on gene class, there are 5,004
known genes that were analyzed using WebGestalt KEGG
pathway enrichment. Not surprisingly, the pathways for ‘‘Oxida-
tive phosphorylation’’ and ‘‘TCA cycle’’, important processes of
cellular respiration, are among the top pathways enriched
(Table 4). Given the importance of the pathways enriched for
the predominantly-on class of genes, we make the general conclusion
that the predominantly-on class is enriched for genes that are
generally essential to cell survival and maintenance. Given their
general importance and their tendency to be consistently
expressed across a variety of tissue types, genes that fall into this
GEP class are often referred to as ‘‘housekeeping genes’’.
Pathway Enrichment for 2,387 Switch-Like GenesIn cluster 4, the switch-like gene class, there are 2,387 known
genes reported by WebGestalt for KEGG pathway enrichment
analysis. Results for this class of genes were similar those
obtained by Ertel and Tozeren on the study of bimodal switch-
like genes via two-component mixture analysis [77]. ‘‘ECM-
receptor interaction’’, ‘‘Cell communication’’, and ‘‘Focal
adhesion’’ pathways identified by us (Table 5) were also
identified among the top three significant pathways in that study
(see Table 3 of [77]). Thus, switch-like genes are enriched for
functions in extracellular and intercellular signal transduction.
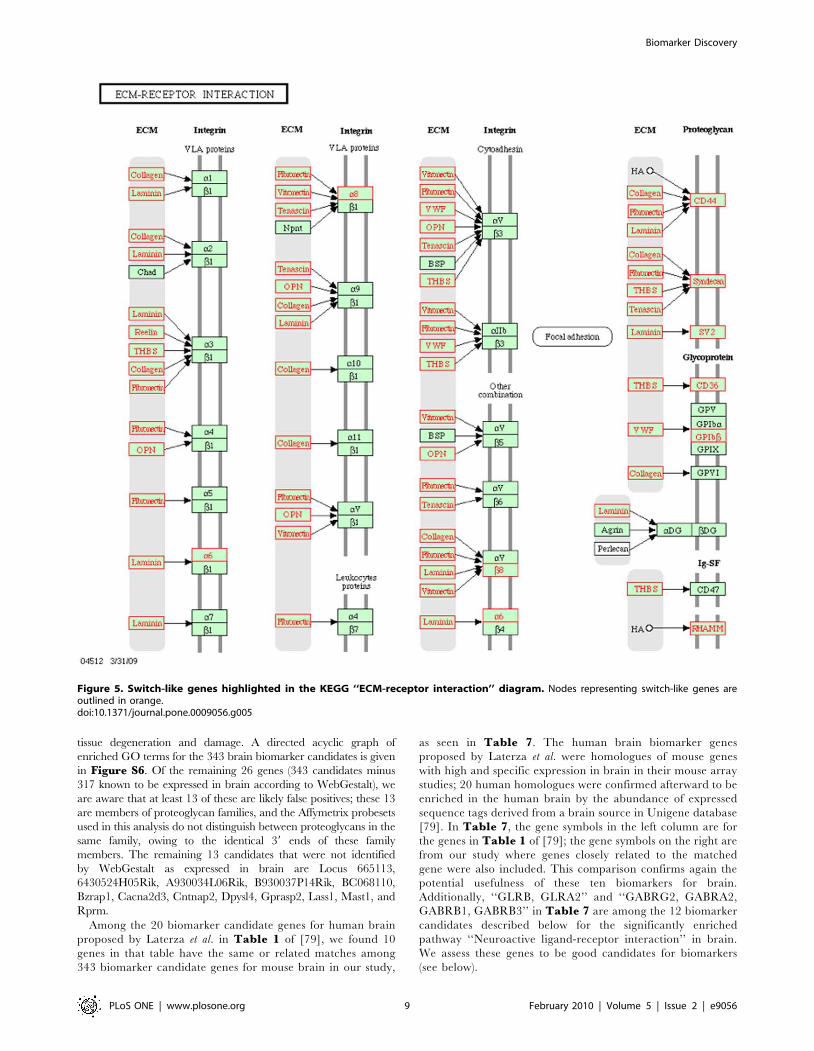
For example, the a3/b1 integrin complex interacts with five
extracellular proteins that are switch-like in the ECM-receptor
interaction pathway (Figure 5).
Four of the seven significantly enriched KEGG pathways for
switch-like genes found by Ertel and Tozeren (as seen in Table 3
Table 4. Significantly enriched KEGG pathways for predominantly-on genes (p, = 0.01).
KEGG pathway O: Genes observed 1E: Genes expected 2R: Ratio of enrichment 3p-Values, = 0.01
Oxidative phosphorylation 78 29.82 2.62 5.71e-24
Proteasome 25 7.68 3.25 1.52e-13
Citrate cycle (TCA cycle) 21 7.99 2.63 1.98e-7
Valine, leucine, and isoleucine degradation 29 12.91 2.25 3.55e-7
Reductive carboxylate cycle (CO2 fixation) 10 3.38 2.96 5.94e-5
N-Glycan biosynthesis 24 11.99 2.00 6.80e-5
Aminoacyl-tRNA biosynthesis 18 8.30 2.17 1.28e-4
Insulin signaling pathway 57 37.81 1.51 1.91e-4
SNARE interactions in vesicular transport 19 9.22 2.06 2.29e-4
Folate biosynthesis 20 10.14 1.97 3.68e-4
Tight junction 49 32.28 1.52 4.26e-4
Purine metabolism 57 39.04 1.46 5.28e-4
Chronic myeloid leukemia 35 21.52 1.63 5.73e-4
Ribosome 14 6.46 2.17 7.40e-4
Aminosugars metabolism 18 9.22 1.95 8.55e-4
Propanoate metabolism 16 7.99 2.00 1.13e-3
Long-term potentiation 29 17.52 1.66 1.16e-3
Pyrimidine metabolism 37 23.98 1.54 1.42e-3
Protein export 7 2.46 2.85 1.52e-3
Aminophosphonate metabolism 10 4.30 2.32 2.04e-3
Pentose phosphate pathway 15 7.68 1.95 2.31e-3
Pancreatic cancer 33 21.52 1.53 2.85e-3
Glycan structure - biosynthesis 1 42 29.20 1.44 3.78e-3
Fatty acid elongation in mitochondria 7 2.77 2.53 4.99e-3
Caprolactam degradation 8 3.38 2.37 5.06e-3
Basal transcription factors 16 8.91 1.79 5.32e-3
Cell cycle 44 31.35 1.40 5.35e-3
RNA polymrase 12 6.15 1.95 6.36e-3
Glioma 27 17.83 1.51 8.12e-3
Biosynthesis of steroids 9 4.30 2.09 9.84e-3
Column legend is the same as in Table 2.doi:10.1371/journal.pone.0009056.t004
Biomarker Discovery
PLoS ONE | www.plosone.org 7 February 2010 | Volume 5 | Issue 2 | e9056
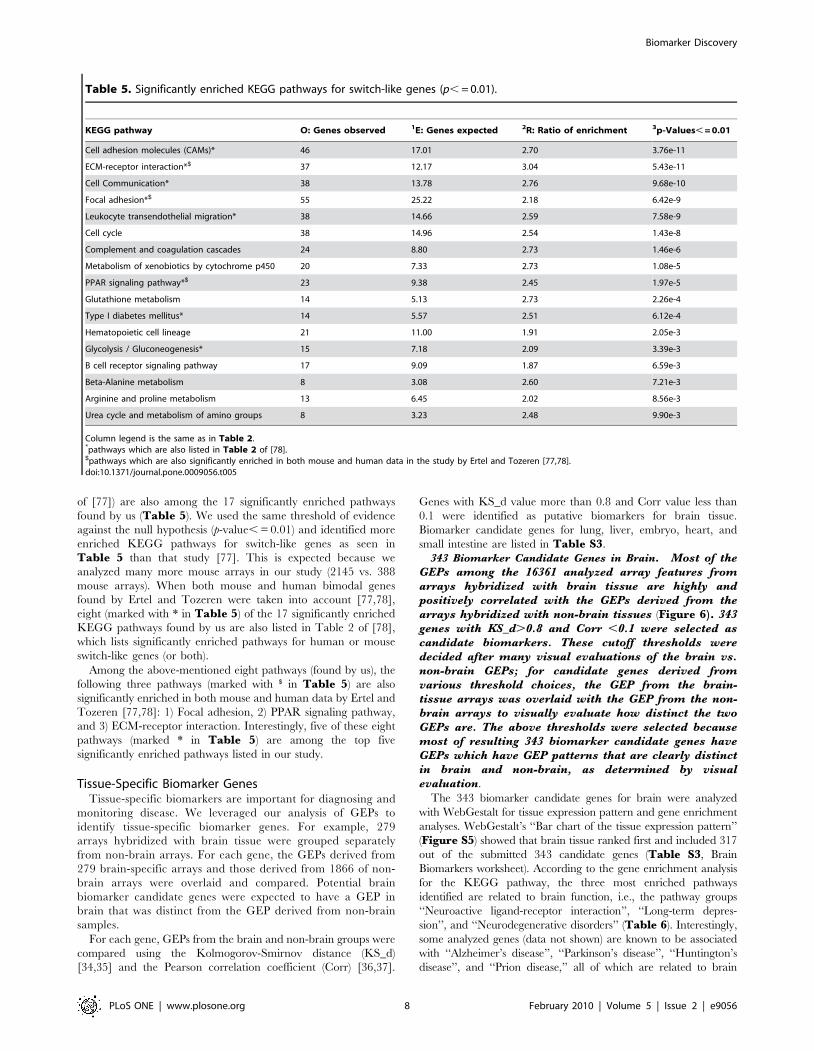
of [77]) are also among the 17 significantly enriched pathways
found by us (Table 5). We used the same threshold of evidence
against the null hypothesis (p-value, = 0.01) and identified more
enriched KEGG pathways for switch-like genes as seen in
Table 5 than that study [77]. This is expected because we
analyzed many more mouse arrays in our study (2145 vs. 388
mouse arrays). When both mouse and human bimodal genes
found by Ertel and Tozeren were taken into account [77,78],
eight (marked with * in Table 5) of the 17 significantly enriched
KEGG pathways found by us are also listed in Table 2 of [78],
which lists significantly enriched pathways for human or mouse
switch-like genes (or both).
Among the above-mentioned eight pathways (found by us), the
following three pathways (marked with $ in Table 5) are also
significantly enriched in both mouse and human data by Ertel and
Tozeren [77,78]: 1) Focal adhesion, 2) PPAR signaling pathway,
and 3) ECM-receptor interaction. Interestingly, five of these eight
pathways (marked * in Table 5) are among the top five
significantly enriched pathways listed in our study.
Tissue-Specific Biomarker GenesTissue-specific biomarkers are important for diagnosing and
monitoring disease. We leveraged our analysis of GEPs to
identify tissue-specific biomarker genes. For example, 279
arrays hybridized with brain tissue were grouped separately
from non-brain arrays. For each gene, the GEPs derived from
279 brain-specific arrays and those derived from 1866 of non-
brain arrays were overlaid and compared. Potential brain
biomarker candidate genes were expected to have a GEP in
brain that was distinct from the GEP derived from non-brain
samples.
For each gene, GEPs from the brain and non-brain groups were
compared using the Kolmogorov-Smirnov distance (KS_d)
[34,35] and the Pearson correlation coefficient (Corr) [36,37].
Genes with KS_d value more than 0.8 and Corr value less than
0.1 were identified as putative biomarkers for brain tissue.
Biomarker candidate genes for lung, liver, embryo, heart, and
small intestine are listed in Table S3.
343 Biomarker Candidate Genes in Brain. Most of theGEPs among the 16361 analyzed array features fromarrays hybridized with brain tissue are highly andpositively correlated with the GEPs derived from thearrays hybridized with non-brain tissues (Figure 6). 343genes with KS_d.0.8 and Corr ,0.1 were selected ascandidate biomarkers. These cutoff thresholds weredecided after many visual evaluations of the brain vs.non-brain GEPs; for candidate genes derived fromvarious threshold choices, the GEP from the brain-tissue arrays was overlaid with the GEP from the non-brain arrays to visually evaluate how distinct the twoGEPs are. The above thresholds were selected becausemost of resulting 343 biomarker candidate genes haveGEPs which have GEP patterns that are clearly distinctin brain and non-brain, as determined by visualevaluation.
The 343 biomarker candidate genes for brain were analyzed
with WebGestalt for tissue expression pattern and gene enrichment
analyses. WebGestalt’s ‘‘Bar chart of the tissue expression pattern’’
(Figure S5) showed that brain tissue ranked first and included 317
out of the submitted 343 candidate genes (Table S3, Brain
Biomarkers worksheet). According to the gene enrichment analysis
for the KEGG pathway, the three most enriched pathways
identified are related to brain function, i.e., the pathway groups
‘‘Neuroactive ligand-receptor interaction’’, ‘‘Long-term depres-
sion’’, and ‘‘Neurodegenerative disorders’’ (Table 6). Interestingly,
some analyzed genes (data not shown) are known to be associated
with ‘‘Alzheimer’s disease’’, ‘‘Parkinson’s disease’’, ‘‘Huntington’s
disease’’, and ‘‘Prion disease,’’ all of which are related to brain
Table 5. Significantly enriched KEGG pathways for switch-like genes (p, = 0.01).
KEGG pathway O: Genes observed 1E: Genes expected 2R: Ratio of enrichment 3p-Values, = 0.01
Cell adhesion molecules (CAMs)* 46 17.01 2.70 3.76e-11
ECM-receptor interaction*$ 37 12.17 3.04 5.43e-11
Cell Communication* 38 13.78 2.76 9.68e-10
Focal adhesion*$ 55 25.22 2.18 6.42e-9
Leukocyte transendothelial migration* 38 14.66 2.59 7.58e-9
Cell cycle 38 14.96 2.54 1.43e-8
Complement and coagulation cascades 24 8.80 2.73 1.46e-6
Metabolism of xenobiotics by cytochrome p450 20 7.33 2.73 1.08e-5
PPAR signaling pathway*$ 23 9.38 2.45 1.97e-5
Glutathione metabolism 14 5.13 2.73 2.26e-4
Type I diabetes mellitus* 14 5.57 2.51 6.12e-4
Hematopoietic cell lineage 21 11.00 1.91 2.05e-3
Glycolysis / Gluconeogenesis* 15 7.18 2.09 3.39e-3
B cell receptor signaling pathway 17 9.09 1.87 6.59e-3
Beta-Alanine metabolism 8 3.08 2.60 7.21e-3
Arginine and proline metabolism 13 6.45 2.02 8.56e-3
Urea cycle and metabolism of amino groups 8 3.23 2.48 9.90e-3
Column legend is the same as in Table 2.*pathways which are also listed in Table 2 of [78].$pathways which are also significantly enriched in both mouse and human data in the study by Ertel and Tozeren [77,78].doi:10.1371/journal.pone.0009056.t005
Biomarker Discovery
PLoS ONE | www.plosone.org 8 February 2010 | Volume 5 | Issue 2 | e9056
tissue degeneration and damage. A directed acyclic graph of
enriched GO terms for the 343 brain biomarker candidates is given
in Figure S6. Of the remaining 26 genes (343 candidates minus
317 known to be expressed in brain according to WebGestalt), we
are aware that at least 13 of these are likely false positives; these 13
are members of proteoglycan families, and the Affymetrix probesets
used in this analysis do not distinguish between proteoglycans in the
same family, owing to the identical 39 ends of these family
members. The remaining 13 candidates that were not identified
by WebGestalt as expressed in brain are Locus 665113,
6430524H05Rik, A930034L06Rik, B930037P14Rik, BC068110,
Bzrap1, Cacna2d3, Cntnap2, Dpysl4, Gprasp2, Lass1, Mast1, and
Rprm.
Among the 20 biomarker candidate genes for human brain
proposed by Laterza et al. in Table 1 of [79], we found 10
genes in that table have the same or related matches among
343 biomarker candidate genes for mouse brain in our study,
as seen in Table 7. The human brain biomarker genes
proposed by Laterza et al. were homologues of mouse genes
with high and specific expression in brain in their mouse array
studies; 20 human homologues were confirmed afterward to be
enriched in the human brain by the abundance of expressed
sequence tags derived from a brain source in Unigene database
[79]. In Table 7, the gene symbols in the left column are for
the genes in Table 1 of [79]; the gene symbols on the right are
from our study where genes closely related to the matched
gene were also included. This comparison confirms again the
potential usefulness of these ten biomarkers for brain.
Additionally, ‘‘GLRB, GLRA2’’ and ‘‘GABRG2, GABRA2,
GABRB1, GABRB3’’ in Table 7 are among the 12 biomarker
candidates described below for the significantly enriched
pathway ‘‘Neuroactive ligand-receptor interaction’’ in brain.
We assess these genes to be good candidates for biomarkers
(see below).
Figure 5. Switch-like genes highlighted in the KEGG ‘‘ECM-receptor interaction’’ diagram. Nodes representing switch-like genes areoutlined in orange.doi:10.1371/journal.pone.0009056.g005
Biomarker Discovery
PLoS ONE | www.plosone.org 9 February 2010 | Volume 5 | Issue 2 | e9056

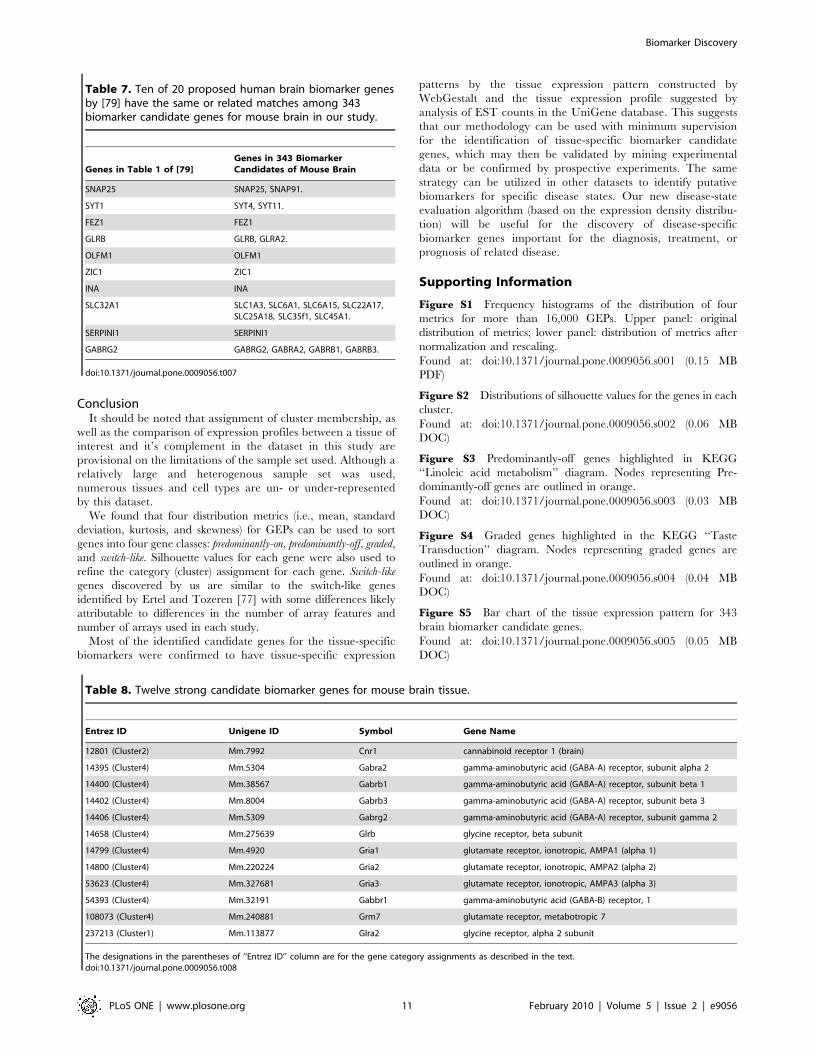
12 Selected Brain Biomarker Candidate Genes in anEnriched KEGG Pathway
Of the the 343 candidate genes, 330 of them (343 minus 13
likely false positives) have potential as good biomarkers for brain.
Here, we narrow our attention to the significantly enriched
pathway group ‘‘Neuroactive ligand-receptor interaction,’’ which
has the largest number of brain-specific genes (12 genes) among
the enriched pathways (Table 8).
Most of the genes on the list in Table 8 are switch-like genes
belonging to cluster 4 (C4) as described previously. The GEPs of
these 12 genes for brain-specific and non-brain tissues were
overlaid in Figure 7. Most of these genes have weak expression
intensity (around 2̂5 = 32) in non-brain tissues; also, most of the
GEPs between brain-specific and non-brain tissues are different
and clearly separated (i.e., switch-like) except the genes Cnr1,
Gabra2, and Glra2 (Figure 7).
The gene expression heat maps for these 12 genes in the tissues
of liver, lung, heart and brain were displayed in Figure 8.
Figures 7 and 8 show that the third to eleventh genes have very
distinct expression profiles in brain as compared with other tissues.
These genes thus have stronger potential to be good biomarkers
for brain tissue.
There are three types of potentially good biomarkers
identified here: the subunit genes for gamma-aminobutyric acid
receptor (GABAAR and GABABR), glycine receptor (GLR), and
glutamate receptor. Subunit genes for both GABAA and GABAB
receptors were identified in Table 8. GABAA receptor is an
ionotropic receptor and ligand-gated ion channel [80,81].
GABAB receptor is a metabotropic transmembrane receptor
[82,83]. Both receptors interact with gamma-aminobutyric acid
(GABA), which is the chief inhibitory neurotransmitter in the
mammalian central nervous system. Glycine receptor is the
receptor for the amino acid neurotransmitter glycine; it is one of
the most widely distributed inhibitory receptors in the central
nervous system [84,85]. Glutamate receptors bind glutamate,
the most prominent neurotransmitter in the body, and are
transmembrane receptors located on the membranes of neurons
[86,87]. Therefore, these three kinds of receptors have
specialized functions in the central nervous system and the
subunit genes for them can indeed be good biomarkers in the
brain tissue. Subunit genes for GABAAR and GLR were also
proposed by Laterza et al. (Table 1 of [79]) as human brain
biomarker genes. Although these biomarker gene products are
the subunit proteins for assembly of the above-mentioned
receptors, which are mostly transmembrane complexes, the
subunit proteins of these receptor complexes can egress out of
the brain to the peripheral blood when they are highly expressed
in brain in a disease or cancer state. This is due to their size with
a predicted protein sequence chain of Mr ,70,000. The Mr
70,000 cutoff was selected because plasma albumin is known to
enter the brain when blood-brain barrier was damaged after
brain injury, suggesting this cutoff value for the egress of
proteins out of the brain [79].
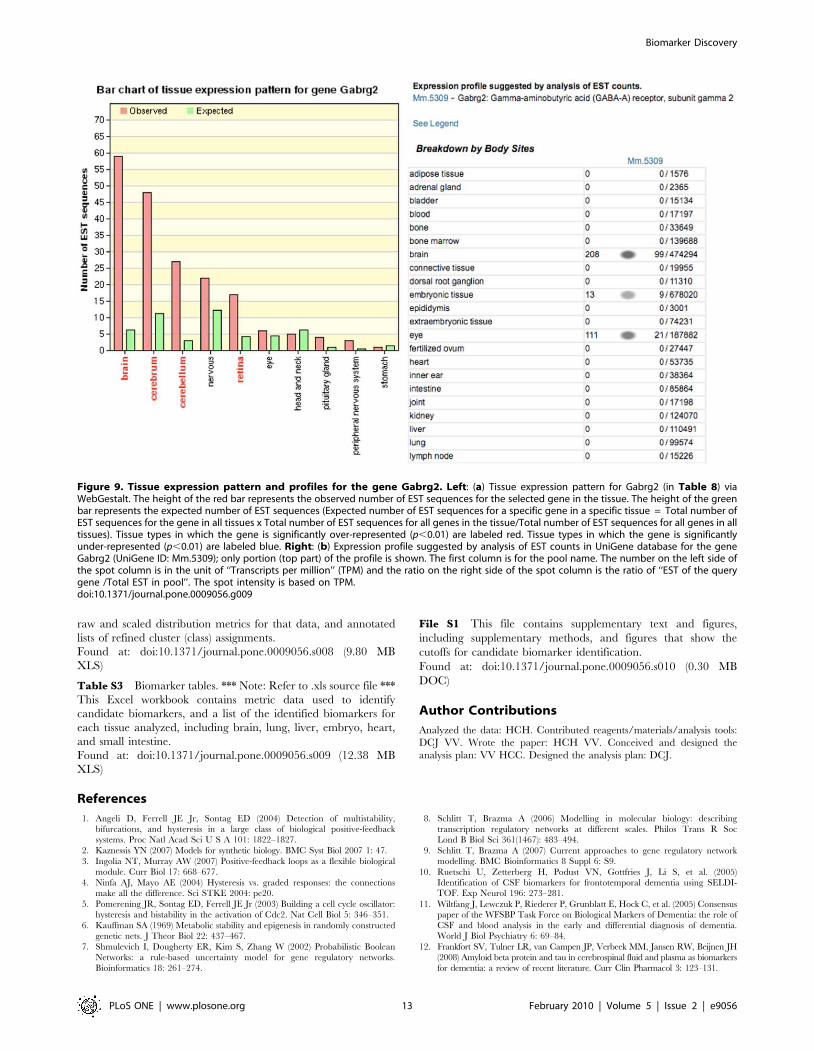
Another way to confirm the above 12 candidate genes as
good biomarkers for brain tissue is to query the UniGene
database on the tissue expression pattern of these genes based
on the counts of Expressed Sequence Tags (ESTs) that have
been sequenced to date. We examined Gabrg2 as an example.
This gene is confirmed to be highly expressed in brain as
shown in the tissue expression pattern created by WebGestalt
with EST counts (Figure 9a) and the tissue expression levels
seen with UniGene’s EST ProfileViewer (Figure 9b). In the
same way, most of the 12 genes in Table 8 were confirmed to
be highly expressed in brain, with the genes Gabra2, Gabrb1,
Gabrg2, Gria1, Gria2, and Glra2 also highly expressed in
spinal cord. The two exceptions in the EST profiles are Glrb
(highly expressed in adrenal gland) and Gria3 (highly
expressed in oviduct). In summary, 317 of the 343 candidate
genes described above were found to be highly expressed in
brain or nervous system by WebGestalt (Figure S5). This
suggests that our methodology can be effectively used to
automatically detect biomarker candidate genes among
different tissues.
Figure 6. KS__d vs. Corr values for all GEPs. The horizontal linerepresents the cutoff KS_d.0.8; the vertical line represents the cutoffCorr ,0.1. Potential biomarkers are in the box at upper left. Similarfigures for lung, liver, embryo, heart, and small intestine are in File S1.doi:10.1371/journal.pone.0009056.g006
Table 6. Three significantly enriched (p,0.05) KEGG pathways among 343 biomarker candidate genes for mouse brain.
KEGG pathway Number of Genes Entrez Gene IDs Enrichment*
Long-term depression 7 14681 14687 14799 14800 269643 53623 72930 O = 7;E = 1.496;R = 4.6791;P = 7.26e-4
Neuroactive ligand-receptorinteraction
12 108073 12801 14395 14400 1440214406 14658 14799 14800 237213 53623 54393
O = 12;E = 5.2043;R = 2.3058;P = 6.30e-3
Neurodegenerative Disorders 3 11803 17762 22223 O = 3;E = 0.6532;R = 4.5928;P = 2.70e-2
*Abbreviations used in the ‘‘Enrichment’’ column: O: observed, E: expected, R: enrichment ratio, and P: hypergeometric p-value for enrichment.doi:10.1371/journal.pone.0009056.t006
Biomarker Discovery
PLoS ONE | www.plosone.org 10 February 2010 | Volume 5 | Issue 2 | e9056
ConclusionIt should be noted that assignment of cluster membership, as
well as the comparison of expression profiles between a tissue of
interest and it’s complement in the dataset in this study are
provisional on the limitations of the sample set used. Although a
relatively large and heterogenous sample set was used,
numerous tissues and cell types are un- or under-represented
by this dataset.
We found that four distribution metrics (i.e., mean, standard
deviation, kurtosis, and skewness) for GEPs can be used to sort
genes into four gene classes: predominantly-on, predominantly-off, graded,
and switch-like. Silhouette values for each gene were also used to
refine the category (cluster) assignment for each gene. Switch-like
genes discovered by us are similar to the switch-like genes
identified by Ertel and Tozeren [77] with some differences likely
attributable to differences in the number of array features and
number of arrays used in each study.
Most of the identified candidate genes for the tissue-specific
biomarkers were confirmed to have tissue-specific expression
patterns by the tissue expression pattern constructed by
WebGestalt and the tissue expression profile suggested by
analysis of EST counts in the UniGene database. This suggests
that our methodology can be used with minimum supervision
for the identification of tissue-specific biomarker candidate
genes, which may then be validated by mining experimental
data or be confirmed by prospective experiments. The same
strategy can be utilized in other datasets to identify putative
biomarkers for specific disease states. Our new disease-state
evaluation algorithm (based on the expression density distribu-
tion) will be useful for the discovery of disease-specific
biomarker genes important for the diagnosis, treatment, or
prognosis of related disease.
Supporting Information
Figure S1 Frequency histograms of the distribution of four
metrics for more than 16,000 GEPs. Upper panel: original
distribution of metrics; lower panel: distribution of metrics after
normalization and rescaling.
Found at: doi:10.1371/journal.pone.0009056.s001 (0.15 MB
PDF)
Figure S2 Distributions of silhouette values for the genes in each
cluster.
Found at: doi:10.1371/journal.pone.0009056.s002 (0.06 MB
DOC)
Figure S3 Predominantly-off genes highlighted in KEGG
‘‘Linoleic acid metabolism’’ diagram. Nodes representing Pre-
dominantly-off genes are outlined in orange.
Found at: doi:10.1371/journal.pone.0009056.s003 (0.03 MB
DOC)
Figure S4 Graded genes highlighted in the KEGG ‘‘Taste
Transduction’’ diagram. Nodes representing graded genes are
outlined in orange.
Found at: doi:10.1371/journal.pone.0009056.s004 (0.04 MB
DOC)
Figure S5 Bar chart of the tissue expression pattern for 343
brain biomarker candidate genes.
Found at: doi:10.1371/journal.pone.0009056.s005 (0.05 MB
DOC)
Table 7. Ten of 20 proposed human brain biomarker genesby [79] have the same or related matches among 343biomarker candidate genes for mouse brain in our study.
Genes in Table 1 of [79]Genes in 343 BiomarkerCandidates of Mouse Brain
SNAP25 SNAP25, SNAP91.
SYT1 SYT4, SYT11.
FEZ1 FEZ1
GLRB GLRB, GLRA2.
OLFM1 OLFM1
ZIC1 ZIC1
INA INA
SLC32A1 SLC1A3, SLC6A1, SLC6A15, SLC22A17,SLC25A18, SLC35f1, SLC45A1.
SERPINI1 SERPINI1
GABRG2 GABRG2, GABRA2, GABRB1, GABRB3.
doi:10.1371/journal.pone.0009056.t007
Table 8. Twelve strong candidate biomarker genes for mouse brain tissue.
Entrez ID Unigene ID Symbol Gene Name
12801 (Cluster2) Mm.7992 Cnr1 cannabinoid receptor 1 (brain)
14395 (Cluster4) Mm.5304 Gabra2 gamma-aminobutyric acid (GABA-A) receptor, subunit alpha 2
14400 (Cluster4) Mm.38567 Gabrb1 gamma-aminobutyric acid (GABA-A) receptor, subunit beta 1
14402 (Cluster4) Mm.8004 Gabrb3 gamma-aminobutyric acid (GABA-A) receptor, subunit beta 3
14406 (Cluster4) Mm.5309 Gabrg2 gamma-aminobutyric acid (GABA-A) receptor, subunit gamma 2
14658 (Cluster4) Mm.275639 Glrb glycine receptor, beta subunit
14799 (Cluster4) Mm.4920 Gria1 glutamate receptor, ionotropic, AMPA1 (alpha 1)
14800 (Cluster4) Mm.220224 Gria2 glutamate receptor, ionotropic, AMPA2 (alpha 2)
53623 (Cluster4) Mm.327681 Gria3 glutamate receptor, ionotropic, AMPA3 (alpha 3)
54393 (Cluster4) Mm.32191 Gabbr1 gamma-aminobutyric acid (GABA-B) receptor, 1
108073 (Cluster4) Mm.240881 Grm7 glutamate receptor, metabotropic 7
237213 (Cluster1) Mm.113877 Glra2 glycine receptor, alpha 2 subunit
The designations in the parentheses of ‘‘Entrez ID’’ column are for the gene category assignments as described in the text.doi:10.1371/journal.pone.0009056.t008
Biomarker Discovery
PLoS ONE | www.plosone.org 11 February 2010 | Volume 5 | Issue 2 | e9056
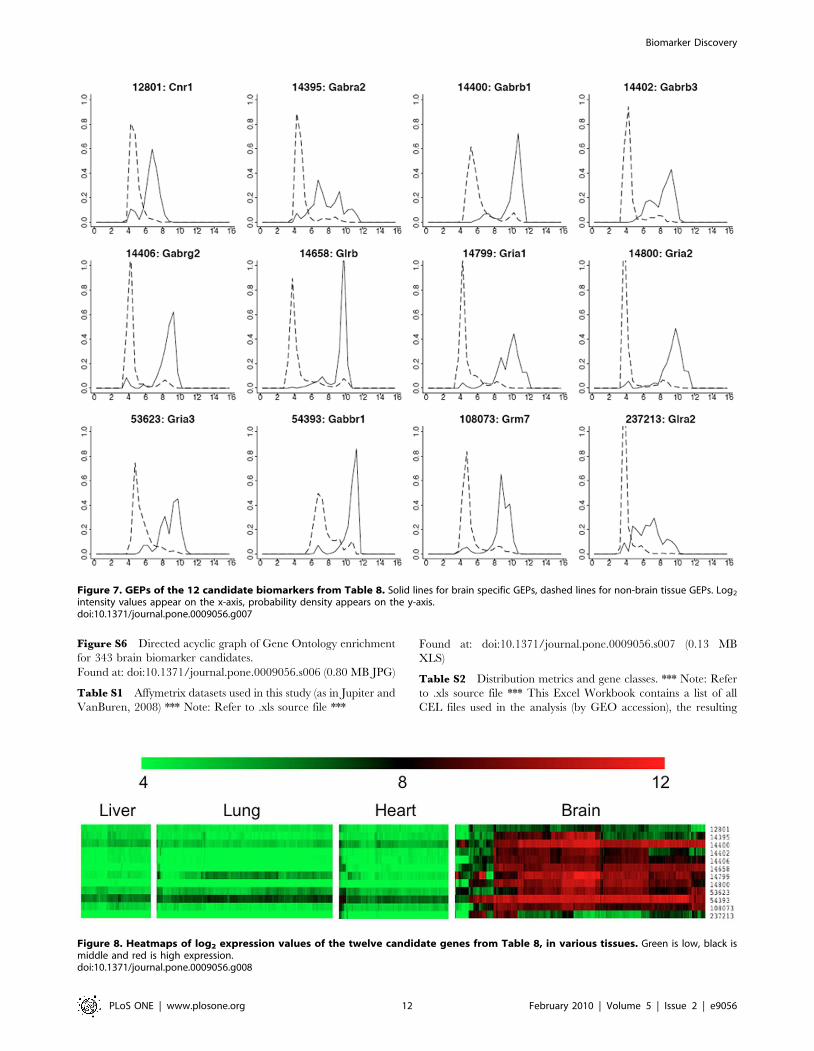
Figure S6 Directed acyclic graph of Gene Ontology enrichment
for 343 brain biomarker candidates.
Found at: doi:10.1371/journal.pone.0009056.s006 (0.80 MB JPG)
Table S1 Affymetrix datasets used in this study (as in Jupiter and
VanBuren, 2008) *** Note: Refer to .xls source file ***
Found at: doi:10.1371/journal.pone.0009056.s007 (0.13 MB
XLS)
Table S2 Distribution metrics and gene classes. *** Note: Refer
to .xls source file *** This Excel Workbook contains a list of all
CEL files used in the analysis (by GEO accession), the resulting
Figure 7. GEPs of the 12 candidate biomarkers from Table 8. Solid lines for brain specific GEPs, dashed lines for non-brain tissue GEPs. Log2
intensity values appear on the x-axis, probability density appears on the y-axis.doi:10.1371/journal.pone.0009056.g007
Figure 8. Heatmaps of log2 expression values of the twelve candidate genes from Table 8, in various tissues. Green is low, black ismiddle and red is high expression.doi:10.1371/journal.pone.0009056.g008
Biomarker Discovery
PLoS ONE | www.plosone.org 12 February 2010 | Volume 5 | Issue 2 | e9056
raw and scaled distribution metrics for that data, and annotated
lists of refined cluster (class) assignments.
Found at: doi:10.1371/journal.pone.0009056.s008 (9.80 MB
XLS)
Table S3 Biomarker tables. *** Note: Refer to .xls source file ***
This Excel workbook contains metric data used to identify
candidate biomarkers, and a list of the identified biomarkers for
each tissue analyzed, including brain, lung, liver, embryo, heart,
and small intestine.
Found at: doi:10.1371/journal.pone.0009056.s009 (12.38 MB
XLS)
File S1 This file contains supplementary text and figures,
including supplementary methods, and figures that show the
cutoffs for candidate biomarker identification.
Found at: doi:10.1371/journal.pone.0009056.s010 (0.30 MB
DOC)
Author Contributions
Analyzed the data: HCH. Contributed reagents/materials/analysis tools:
DCJ VV. Wrote the paper: HCH VV. Conceived and designed the
analysis plan: VV HCC. Designed the analysis plan: DCJ.
References
1. Angeli D, Ferrell JE Jr, Sontag ED (2004) Detection of multistability,bifurcations, and hysteresis in a large class of biological positive-feedback
systems. Proc Natl Acad Sci U S A 101: 1822–1827.
2. Kaznessis YN (2007) Models for synthetic biology. BMC Syst Biol 2007 1: 47.
3. Ingolia NT, Murray AW (2007) Positive-feedback loops as a flexible biological
module. Curr Biol 17: 668–677.
4. Ninfa AJ, Mayo AE (2004) Hysteresis vs. graded responses: the connectionsmake all the difference. Sci STKE 2004: pe20.
5. Pomerening JR, Sontag ED, Ferrell JE Jr (2003) Building a cell cycle oscillator:
hysteresis and bistability in the activation of Cdc2. Nat Cell Biol 5: 346–351.
6. Kauffman SA (1969) Metabolic stability and epigenesis in randomly constructedgenetic nets. J Theor Biol 22: 437–467.
7. Shmulevich I, Dougherty ER, Kim S, Zhang W (2002) Probabilistic Boolean
Networks: a rule-based uncertainty model for gene regulatory networks.
Bioinformatics 18: 261–274.
8. Schlitt T, Brazma A (2006) Modelling in molecular biology: describing
transcription regulatory networks at different scales. Philos Trans R Soc
Lond B Biol Sci 361(1467): 483–494.
9. Schlitt T, Brazma A (2007) Current approaches to gene regulatory networkmodelling. BMC Bioinformatics 8 Suppl 6: S9.
10. Ruetschi U, Zetterberg H, Podust VN, Gottfries J, Li S, et al. (2005)
Identification of CSF biomarkers for frontotemporal dementia using SELDI-TOF. Exp Neurol 196: 273–281.
11. Wiltfang J, Lewczuk P, Riederer P, Grunblatt E, Hock C, et al. (2005) Consensuspaper of the WFSBP Task Force on Biological Markers of Dementia: the role of
CSF and blood analysis in the early and differential diagnosis of dementia.World J Biol Psychiatry 6: 69–84.
12. Frankfort SV, Tulner LR, van Campen JP, Verbeek MM, Jansen RW, Beijnen JH
(2008) Amyloid beta protein and tau in cerebrospinal fluid and plasma as biomarkers
for dementia: a review of recent literature. Curr Clin Pharmacol 3: 123–131.
Figure 9. Tissue expression pattern and profiles for the gene Gabrg2. Left: (a) Tissue expression pattern for Gabrg2 (in Table 8) viaWebGestalt. The height of the red bar represents the observed number of EST sequences for the selected gene in the tissue. The height of the greenbar represents the expected number of EST sequences (Expected number of EST sequences for a specific gene in a specific tissue = Total number ofEST sequences for the gene in all tissues x Total number of EST sequences for all genes in the tissue/Total number of EST sequences for all genes in alltissues). Tissue types in which the gene is significantly over-represented (p,0.01) are labeled red. Tissue types in which the gene is significantlyunder-represented (p,0.01) are labeled blue. Right: (b) Expression profile suggested by analysis of EST counts in UniGene database for the geneGabrg2 (UniGene ID: Mm.5309); only portion (top part) of the profile is shown. The first column is for the pool name. The number on the left side ofthe spot column is in the unit of ‘‘Transcripts per million’’ (TPM) and the ratio on the right side of the spot column is the ratio of ‘‘EST of the querygene /Total EST in pool’’. The spot intensity is based on TPM.doi:10.1371/journal.pone.0009056.g009
Biomarker Discovery
PLoS ONE | www.plosone.org 13 February 2010 | Volume 5 | Issue 2 | e9056
13. Lewczuk P, Wiltfang J (2008) Neurochemical dementia diagnostics: State of theart and research perspectives. Proteomics 8: 1292–1301.
14. Davies NW, Brown LJ, Gonde J, Irish D, Robinson RO, et al. (2005) Factors
influencing PCR detection of viruses in cerebrospinal fluid of patients withsuspected CNS infections. J Neurol Neurosurg Psychiatry 76: 82–87.
15. Choolani M, Narasimhan K, Kolla V, Hahn S (2009) Proteomic technologies forprenatal diagnostics: advances and challenges ahead. Expert Rev Proteomics 6:
87–101.
16. Van den Veyver IB, Patel A, Shaw CA, Pursley AN, Kang SH, et al. (2009)
Clinical use of array comparative genomic hybridization (aCGH) for prenatal
diagnosis in 300 cases. Prenat Diagn 29: 29–39.
17. Jamjute P, Ahmad A, Ghosh T, Banfield P (2009) Liver function test and
pregnancy. J Matern Fetal Neonatal Med 22: 274–283.
18. Lo R, Rye K, Austin A, Freeman J (2009) Screening for liver disease - are LFTs
old hat? Curr Med Chem 16: 1442–1450.
19. Chen L, Fatima S, Peng J, Leng X (2009) SELDI protein chip technology for thedetection of serum biomarkers for liver disease. Protein Pept Lett 16: 467–472.
20. Lennon S, Barton C, Banken L, Gianni L, Marty M, Baselga J, Leyland-Jones B(2009) Utility of serum HER2 extracellular domain assessment in clinical
decision making: pooled analysis of four trials of trastuzumab in metastatic breast
cancer. J Clin Oncol 27: 1685–1693.
21. Kotake S, Nanke Y, Yago T, Yamanaka H (2009) [Serum markers of synovitis
and bone metabolism in rheumatoid arthritis]. Clin Calcium 19: 362–371.
22. Creaney J, Robinson BW (2009) Serum and pleural fluid biomarkers for
mesothelioma. Curr Opin Pulm Med 15: 366–370.
23. Graeber MB (2009) Biomarkers for Parkinson’s disease. Exp Neurol 216:249–253.
24. Jupiter DC, VanBuren V (2008) A visual data mining tool that facilitatesreconstruction of transcription regulatory networks. PLoS ONE 3: e1717.
25. Edgar R, Domrachev M, Lash AE (2002) Gene Expression Omnibus: NCBI
gene expression and hybridization array data repository. Nucleic Acids Res 30:207–210.
26. Barrett T, Troup DB, Wilhite SE, Ledoux P, Rudnev D, et al. (2007) NCBIGEO: mining tens of millions of expression profiles–database and tools update.
Nucleic Acids Res 35: D760–765.
27. Dai M, Wang P, Boyd AD, Kostov G, Athey B, et al. (2005) Evolving gene/transcript definitions significantly alter the interpretation of GeneChip data.
Nucleic Acids Res 33: e175.
28. Irizarry RA, Hobbs B, Collin F, Beazer-Barclay YD, Antonellis KJ, et al. (2003)
Exploration, normalization, and summaries of high density oligonucleotide arrayprobe level data. Biostatistics 4: 249–264.
29. Gentleman R, Carey V, Huber W, Irizarry RA, Dudoit S (2005) Bioinformatics
and computational biology solutions using R and Bioconductor. New York:Springer.
30. Giles PJ, Kipling D (2003) Normality of oligonucleotide microarray data andimplications for parametric statistical analyses. Bioinformatics 19: 2254–2262.
31. Rousseeuw PJ (1987) Silhouettes: a Graphical Aid to the Interpretation and
Validation of Cluster Analysis. Computational and Applied Mathematics 20:53–65.
32. Zhang B, Kirov S, Snoddy J (2005) WebGestalt: an integrated system forexploring gene sets in various biological contexts. Nucleic Acids Res 33:
W741–748.
33. Barrett T, Troup DB, Wilhite SE, Ledoux P, Rudnev D, et al. (2009) NCBIGEO: archive for high-throughput functional genomic data. Nucleic Acids Res
37: D885–890.
34. Chakravarti IM, Laha RG, Roy J (1967) Handbook of Methods of Applied
Statistics, vol. I. New York: John Wiley and Sons 160.
35. Stephens MA (1974) EDF Statistics for Goodness of Fit and Some Comparisons.Journal of the American Statistical Association 69: 730–737.
36. Cohen J, Cohen P, West SG, Aiken LS (2002) Applied multiple regression/correlation analysis for the behavioral sciences. Hillsdale, NJ: Lawrence Erlbaum
Associates 736.
37. Rodgers JL, Nicewander WA (1988) Thirteen ways to look at the correlationcoefficient. The American Statistician 42: 59–66.
38. Amara U, Rittirsch D, Flierl M, Bruckner U, Klos A, et al. (2008) Interactionbetween the coagulation and complement system. Adv Exp Med Biol 632:
71–79.
39. Das UN (2006) Essential Fatty acids - a review. Curr Pharm Biotechnol 7:
467–482.
40. Das UN (2006) Essential fatty acids: biochemistry, physiology and pathology.Biotechnol J 1: 420–439.
41. Calder PC (2006) Polyunsaturated fatty acids and inflammation. ProstaglandinsLeukot Essent Fatty Acids 75: 197–202.
42. El-Badry AM, Graf R, Clavien PA (2007) Omega 3 - Omega 6: What is right for
the liver? J Hepatol 47: 718–725.
43. Cunnane SC, Anderson MJ (1997) Pure linoleate deficiency in the rat: influence
on growth, accumulation of n-6 polyunsaturates, and [1-14C]linoleate oxidation.J Lipid Res 38: 805–812.
44. Massoumi R, Sjolander A (2007) The role of leukotriene receptor signaling in
inflammation and cancer. ScientificWorldJournal 7: 1413–1421.
45. Khanapure SP, Garvey DS, Janero DR, Letts LG (2007) Eicosanoids in
inflammation: biosynthesis, pharmacology, and therapeutic frontiers. Curr TopMed Chem 7: 311–340.
46. Boyce JA (2008) Eicosanoids in asthma, allergic inflammation, and host defense.
Curr Mol Med 8: 335–349.
47. Phillis JW, Horrocks LA, Farooqui AA (2006) Cyclooxygenases, lipoxygenases,and epoxygenases in CNS: their role and involvement in neurological disorders.
Brain Res Rev 52: 201–243.
48. Reid RC (2005) Inhibitors of secretory phospholipase A2 group IIA. Curr MedChem 12: 3011–3026.
49. Ma B, Nussinov R (2009) Amplification of signaling via cellular allosteric relay
and protein disorder. Proc Natl Acad Sci U S A 106: 6887–6888.
50. Dickson BJ (2002) Molecular mechanisms of axon guidance. Science 298:1959–1964.
51. Killeen MT, Sybingco SS (2008) Netrin, Slit and Wnt receptors allow axons to
choose the axis of migration. Dev Biol 323: 143–151.
52. Bernet A, Fitamant J (2008) Netrin-1 and its receptors in tumour growth
promotion. Expert Opin Ther Targets 12: 995–1007.
53. Lai KO, Ip NY (2009) Synapse development and plasticity: roles of ephrin/Ephreceptor signaling. Curr Opin Neurobiol 19: 275–283.
54. Klein R (2009) Bidirectional modulation of synaptic functions by Eph/ephrin
signaling. Nat Neurosci 12: 15–20.
55. Negishi M, Oinuma I, Katoh H (2005) Plexins: axon guidance and signaltransduction. Cell Mol Life Sci 62: 1363–1371.
56. Brose K, Tessier-Lavigne M (2000) Slit proteins: key regulators of axon
guidance, axonal branching, and cell migration. Curr Opin Neurobiol 10:95–102.
57. Mann F, Harris WA, Holt CE (2004) New views on retinal axon development: a
navigation guide. Int J Dev Biol 48: 957–964.
58. McLaughlin T, O’Leary DD (2005) Molecular gradients and development ofretinotopic maps. Annu Rev Neurosci 28: 327–355.
59. Scales SJ, de Sauvage FJ (2009) Mechanisms of Hedgehog pathway activation in
cancer and implications for therapy. Trends Pharmacol Sci 30: 303–312.
60. Jenkins D (2009) Hedgehog signalling: emerging evidence for non-canonical
pathways. Cell Signal 21: 1023–1034.
61. Simpson F, Kerr MC, Wicking C (2009) Trafficking, development andhedgehog. Mech Dev 126: 279–288.
62. Sheng T, Li C, Zhang X, Chi S, He N, et al. (2004) Activation of the hedgehog
pathway in advanced prostate cancer. Mol Cancer 3: 29.
63. Pasca di Magliano M, Sekine S, Ermilov A, Ferris J, Dlugosz AA, Hebrok M(2006) Hedgehog/Ras interactions regulate early stages of pancreatic cancer.
Genes Dev 20: 3161–3173.
64. Yang SH, Andl T, Grachtchouk V, Wang A, Liu J, et al. (2008) Pathologicalresponses to oncogenic Hedgehog signaling in skin are dependent on canonical
Wnt/Œ#-catenin signaling. Nat Genet 40: 1130–1135.
65. Barginear MF, Leung M, Budman DR (2009) The hedgehog pathway as atherapeutic target for treatment of breast cancer. Breast Cancer Res Treat 116:
239–246.
66. Medina V, Calvo MB, Diaz-Prado S, Espada J (2009) Hedgehog signalling as atarget in cancer stem cells. Clin Transl Oncol 11: 199–207.
67. Bosanac I, Maun HR, Scales SJ, Wen X, Lingel A, et al. (2009) The structure of
SHH in complex with HHIP reveals a recognition role for the Shh pseudo activesite in signaling. Nat Struct Mol Biol 16: 691–697.
68. Akabas MH (1990) Mechanisms of chemosensory transduction in taste cells. Int
Rev Neurobiol 32: 241–279.
69. Meyers B, Brewer MS (2008) Sweet taste in man: a review. J Food Sci 73:R81–90.
70. Yasuo T, Kusuhara Y, Yasumatsu K, Ninomiya Y (2008) Multiple receptor
systems for glutamate detection in the taste organ. Biol Pharm Bull 31:1833–1837.
71. Sugita M (2006) Taste perception and coding in the periphery. Cell Mol Life Sci
63: 2000–2015.
72. DeSimone JA, Ye Q, Heck GL (1993) Ion pathways in the taste bud and their
significance for transduction. Ciba Found Symp. pp 179–218-229; discussion
229-234.
73. Heidelberger R (2007) Mechanisms of tonic, graded release: lessons from the
vertebrate photoreceptor. J Physiol 585: 663–667.
74. Bourque CW, Ciura S, Trudel E, Stachniak TJ, Sharif-Naeini R (2007)Neurophysiological characterization of mammalian osmosensitive neurones. Exp
Physiol 92: 499–505.
75. Singer JH (2007) Multivesicular release and saturation of glutamatergicsignalling at retinal ribbon synapses. J Physiol 580: 23–29.
76. Biscoe TJ, Duchen MR (1990) Cellular basis of transduction in carotid
chemoreceptors. Am J Physiol 258: L271–278.
77. Ertel A, Tozeren A (2008) Switch-like genes populate cell communicationpathways and are enriched for extracellular proteins. BMC Genomics 9: 3.
78. Ertel A, Tozeren A (2008) Human and mouse switch-like genes share common
transcriptional regulatory mechanisms for bimodality. BMC Genomics 9: 628.
79. Laterza OF, Modur VR, Crimmins DL, Olander JV, Landt Y, et al. (2006)
Identification of novel brain biomarkers. Clin Chem 52: 1713–1721.
80. Veleiro AS, Burton G (2009) Structure-activity relationships of neuroactive
steroids acting on the GABAA receptor. Curr Med Chem 16: 455–472.
81. Mody I (2008) Extrasynaptic GABAA receptors in the crosshairs of hormones
and ethanol. Neurochem Int 52: 60–64.
82. Huang ZJ (2006) GABAB receptor isoforms caught in action at the scene.Neuron 50: 521–524.
Biomarker Discovery
PLoS ONE | www.plosone.org 14 February 2010 | Volume 5 | Issue 2 | e9056

83. Bettler B, Tiao JY (2006) Molecular diversity, trafficking and subcellular
localization of GABAB receptors. Pharmacol Ther 110: 533–543.84. Rajendra S, Lynch JW, Schofield PR (1997) The glycine receptor. Pharmacol
Ther 73: 121–146.
85. Lynch JW (2004) Molecular structure and function of the glycine receptorchloride channel. Physiol Rev 84: 1051–1095.
86. Palmada M, Centelles JJ (1998) Excitatory amino acid neurotransmission.
Pathways for metabolism, storage and reuptake of glutamate in brain. FrontBiosci 3: d701–718.
87. Tang FR, Bradford HF, Ling EA (2009) Metabotropic glutamate receptors in
the control of neuronal activity and as targets for development of anti-epileptogenic drugs. Curr Med Chem 16: 2189–2204.
Biomarker Discovery
PLoS ONE | www.plosone.org 15 February 2010 | Volume 5 | Issue 2 | e9056
Related Documents