RESEARCH ARTICLE Classification of early and late stage liver hepatocellular carcinoma patients from their genomics and epigenomics profiles Harpreet Kaur 1 , Sherry Bhalla 2,3 , Gajendra P. S. Raghava ID 2 * 1 Bioinformatics Centre, CSIR-Institute of Microbial Technology, Chandigarh, India, 2 Department of Computational Biology, Indraprastha Institute of Information Technology, New Delhi, India, 3 Centre for Systems Biology and Bioinformatics, Panjab University, Chandigarh, India * [email protected] Abstract Background Liver Hepatocellular Carcinoma (LIHC) is one of the major cancers worldwide, responsible for millions of premature deaths every year. Prediction of clinical staging is vital to implement optimal therapeutic strategy and prognostic prediction in cancer patients. However, to date, no method has been developed for predicting the stage of LIHC from the genomic profile of samples. Methods The Cancer Genome Atlas (TCGA) dataset of 173 early stage (stage-I), 177 late stage (stage-II, Stage-III and stage-IV) and 50 adjacent normal tissue samples for 60,483 RNA transcripts and 485,577 methylation CpG sites, was extensively analyzed to identify the key transcriptomic expression and methylation-based features using different feature selection techniques. Further, different classification models were developed based on selected key features to categorize different classes of samples implementing different machine learning algorithms. Results In the current study, in silico models have been developed for classifying LIHC patients in the early vs. late stage and cancerous vs. normal samples using RNA expression and DNA methylation data. TCGA datasets were extensively analyzed to identify differentially expressed RNA transcripts and methylated CpG sites that can discriminate early vs. late stages and cancer vs. normal samples of LIHC with high precision. Naive Bayes model developed using 51 features that combine 21 CpG methylation sites and 30 RNA transcripts achieved maximum MCC (Matthew’s correlation coefficient) 0.58 with an accuracy of 78.87% on the validation dataset in discrimination of early and late stage. Additionally, the prediction models developed based on 5 RNA transcripts and 5 CpG sites classify LIHC and normal samples with an accuracy of 96–98% and AUC (Area Under the Receiver Operating PLOS ONE | https://doi.org/10.1371/journal.pone.0221476 September 6, 2019 1 / 27 a1111111111 a1111111111 a1111111111 a1111111111 a1111111111 OPEN ACCESS Citation: Kaur H, Bhalla S, Raghava GPS (2019) Classification of early and late stage liver hepatocellular carcinoma patients from their genomics and epigenomics profiles. PLoS ONE 14 (9): e0221476. https://doi.org/10.1371/journal. pone.0221476 Editor: Ernest K. Amankwah, Johns Hopkins University School of Medicine, UNITED STATES Received: April 1, 2019 Accepted: August 7, 2019 Published: September 6, 2019 Copyright: © 2019 Kaur et al. This is an open access article distributed under the terms of the Creative Commons Attribution License, which permits unrestricted use, distribution, and reproduction in any medium, provided the original author and source are credited. Data Availability Statement: We have used the Expression data of RNA-seq and Methylation-seq for TCGA-LIHC from the public repository GDC data portal which is accessible at the following URL: https://portal.gdc.cancer.gov/projects/TCGA- LIHC. Further, pre-processed and normalised datasets used in our study for different types of analysis are also available at our website with following URL: https://webs.iiitd.edu.in/raghava/ cancerlsp/down.php.

Welcome message from author
This document is posted to help you gain knowledge. Please leave a comment to let me know what you think about it! Share it to your friends and learn new things together.
Transcript
RESEARCH ARTICLE
Classification of early and late stage liver
hepatocellular carcinoma patients from their
genomics and epigenomics profiles
Harpreet Kaur1, Sherry Bhalla2,3, Gajendra P. S. RaghavaID2*
1 Bioinformatics Centre, CSIR-Institute of Microbial Technology, Chandigarh, India, 2 Department of
Computational Biology, Indraprastha Institute of Information Technology, New Delhi, India, 3 Centre for
Systems Biology and Bioinformatics, Panjab University, Chandigarh, India
Abstract
Background
Liver Hepatocellular Carcinoma (LIHC) is one of the major cancers worldwide, responsible
for millions of premature deaths every year. Prediction of clinical staging is vital to implement
optimal therapeutic strategy and prognostic prediction in cancer patients. However, to date,
no method has been developed for predicting the stage of LIHC from the genomic profile of
samples.
Methods
The Cancer Genome Atlas (TCGA) dataset of 173 early stage (stage-I), 177 late stage
(stage-II, Stage-III and stage-IV) and 50 adjacent normal tissue samples for 60,483 RNA
transcripts and 485,577 methylation CpG sites, was extensively analyzed to identify the key
transcriptomic expression and methylation-based features using different feature selection
techniques. Further, different classification models were developed based on selected key
features to categorize different classes of samples implementing different machine learning
algorithms.
Results
In the current study, in silico models have been developed for classifying LIHC patients
in the early vs. late stage and cancerous vs. normal samples using RNA expression and
DNA methylation data. TCGA datasets were extensively analyzed to identify differentially
expressed RNA transcripts and methylated CpG sites that can discriminate early vs. late
stages and cancer vs. normal samples of LIHC with high precision. Naive Bayes model
developed using 51 features that combine 21 CpG methylation sites and 30 RNA transcripts
achieved maximum MCC (Matthew’s correlation coefficient) 0.58 with an accuracy of
78.87% on the validation dataset in discrimination of early and late stage. Additionally, the
prediction models developed based on 5 RNA transcripts and 5 CpG sites classify LIHC and
normal samples with an accuracy of 96–98% and AUC (Area Under the Receiver Operating
PLOS ONE | https://doi.org/10.1371/journal.pone.0221476 September 6, 2019 1 / 27
a1111111111
a1111111111
a1111111111
a1111111111
a1111111111
OPEN ACCESS
Citation: Kaur H, Bhalla S, Raghava GPS (2019)
Classification of early and late stage liver
hepatocellular carcinoma patients from their
genomics and epigenomics profiles. PLoS ONE 14
(9): e0221476. https://doi.org/10.1371/journal.
pone.0221476
Editor: Ernest K. Amankwah, Johns Hopkins
University School of Medicine, UNITED STATES
Received: April 1, 2019
Accepted: August 7, 2019
Published: September 6, 2019
Copyright: © 2019 Kaur et al. This is an open
access article distributed under the terms of the
Creative Commons Attribution License, which
permits unrestricted use, distribution, and
reproduction in any medium, provided the original
author and source are credited.
Data Availability Statement: We have used the
Expression data of RNA-seq and Methylation-seq
for TCGA-LIHC from the public repository GDC
data portal which is accessible at the following
URL: https://portal.gdc.cancer.gov/projects/TCGA-
LIHC. Further, pre-processed and normalised
datasets used in our study for different types of
analysis are also available at our website with
following URL: https://webs.iiitd.edu.in/raghava/
cancerlsp/down.php.
Characteristic curve) 0.99. Besides, multiclass models also developed for classifying sam-
ples in the normal, early and late stage of cancer and achieved an accuracy of 76.54% and
AUC of 0.86.
Conclusion
Our study reveals stage prediction of LIHC samples with high accuracy based on the geno-
mics and epigenomics profiling is a challenging task in comparison to the classification of
cancerous and normal samples. Comprehensive analysis, differentially expressed RNA
transcripts, methylated CpG sites in LIHC samples and prediction models are available from
CancerLSP (http://webs.iiitd.edu.in/raghava/cancerlsp/).
Introduction
Liver Hepatocellular Carcinoma (LIHC) or Hepatocellular Carcinoma (HCC) is the fifth most
common cancer and considered as the second major cause of cancer-related mortality with
nearly 7,88,000 deaths occurring worldwide in the year 2015 [1]. Further in the United States,
there is an estimation of approximately 31,780 deaths and 42,030 new cases in 2018. It is nearly
two times more frequent in males than in females. Moreover, a higher number of LIHC cases
is reported in Africa and Asia than in Europe [2]. These observations indicate that many fac-
tors like viral hepatitis infection (hepatitis B or C) or cirrhosis, smoking, alcohol and lifestyle,
etc. contribute the pathogenesis of LIHC [3]. Despite improved screening and discoveries,
LIHC exhibits rapid clinical course with elevated mortality rate. Patients with LIHC are usually
identified at advanced stages due to the lack of pathognomonic symptoms, which consequently
limits the potential treatment options and leads to early death [4]. Furthermore, there is a high
recurrence rate of 70%, even after curative resection treatment [5]. Therefore, the absolute
cure of this disease is quite challenging, indicating an urgent need for the identification of sen-
sitive diagnostic and prognostic markers for LIHC [6,7].
Traditionally in most of the developing countries, alpha-fetoprotein (AFP) is extensively
employed as LIHC biomarker. Its level becomes detectable in patients once a tumor is in an
advanced stage [8,9]. Besides, AFP-L3, a glycoform of AFP (AFP reacts with Lens culinaris
agglutinin) has also been employed as LIHC biomarker due to its higher sensitivity and speci-
ficity than alone AFP. The lack of reliability, insufficient sensitivity and specificity are the
major limitations associated with these markers [10]. Des-gamma-carboxyprothrombin
(DCP) is another vital biomarker. Its levels have shown to be upregulated in advanced stages
[11–13].
In recent times, next-generation sequencing technology and bioinformatics analysis emer-
gence have facilitated the identification of tumor diagnostic and prognostic biomarkers candi-
dates of LIHC [14]. Anomalous expression of cancer-associated genes is one of the main
causes of tumorigenesis and plays a vital role in hepatocarcinogenesis [15]. Evidently, various
reports have shown the elevated expression of USP22, CBX6, NRAGE, ACTL6, and CHMP4Bgenes correlate with larger tumor size, advanced tumor stages, poor prognosis and short sur-
vival time of patients in LIHC [16–20]. Moreover, the downregulation of BTG1, FOXF2, and
CYP3A5 genes, have been observed to link with poorly differentiated and aggressive tumors,
shorter disease survival rates and shorter recurrence times in LIHC [21–23]. Beside this,
recently, long non-coding RNAs have also been found to be aberrantly expressed and impli-
cated in LIHC pathogenesis. For instance, ZEB1- AS1 and ANRIL get upregulated in higher
Classification of early and late stage liver hepatocellular carcinoma
PLOS ONE | https://doi.org/10.1371/journal.pone.0221476 September 6, 2019 2 / 27
Funding: All authors acknowledge funding
agencies J. C. Bose National Fellowship (DST-
Department of Science & Technology, Ministry of
Science and Technology, India). HK and SB are
thankful to CSIR (Council of Scientific and
Industrial Research, India) and ICMR (Indian
Council Of Medical Research, India) for providing
Senior Research fellowships respectively.
Competing interests: The authors declare no
competing financial and non-financial interests.
Abbreviations: AUC, Area under Receiver
Operating Characteristics; CI, Confidence Interval;
FDR, False Discovery Rate; J48, decision tree
(J48); MCC, Matthews correlation coefficient;
SMO, Sequential minimal optimization.
histological grade and stage in LIHC [24–28]. Hence, the potential reversibility of epigenetic
abnormalities and restoration of the expression of tumor suppressor genes or other genes by
specific inhibitors offer a rational therapeutic approach for LIHC. Although in recent past,
numerous tumor drivers for LIHC identified like TERT, CTNNB1, etc.; however, most of
them have not been translated into efficient modalities [29].
In addition, various studies have shown that the alterations in epigenetics and miRNA
pattern lead to progression from precancerous lesions to LIHC [30,31]. The epigenetic modifi-
cations including DNA hypermethylation or hypomethylation, dysregulation of histone modi-
fication patterns, chromatin remodelling etc. are associated with LIHC [32]. The promoter
hypermethylation leads to inactivation of various tumor suppressor genes such as SOCS1,
hMLH1, GSTP1,MGMT, CDH1, and TIMP3, etc. [33].
Detection of cancer at an early stage is vital to reduce the mortality rate by providing appro-
priate treatment based on the cancer stage. In previous studies, researchers focused mainly on
the identification of differentially expressed RNA transcripts or genes in cancerous vs. normal
or cancer vs. other liver disease conditions to elucidate marker for LIHC [34–40]. To the best
of our knowledge, no method has been developed for predicting the stage of LIHC from the
genomic profile of samples. In this study, a systematic attempt has been made to a develop
model for discriminating early and late stage of LIHC samples. First, we identified CpG sites
that are differentially methylated in the early vs. late stage of LIHC and cancerous vs. normal.
Second, we identified aberrantly expressed RNA transcripts that can differentiate early stage
from the late stage of LIHC and cancerous from non-tumorous samples of LIHC. Ultimately,
models were developed based on different machine learning techniques for predicting the
stage of LIHC samples using the above derived genomic and epigenomic features. Using
diverse feature spaces, we were able to establish models discriminating early and late stage of
LIHC cancer. In addition, we tried to develop models to distinguish normal and LIHC tissue
samples. Our models successfully predict LIHC samples with high accuracy. It indicates that
it is easy to predict LIHC samples, but it is challenging to classify them in early and late stage.
We also attempted to develop multiclass prediction models to categorize samples in three clas-
ses: i) normal or control samples, ii) LIHC early stage and iii) LIHC late stage tissue samples.
Methods
Data description
Main dataset of early & late stage samples. We extracted the expression and methylation
profiles of Liver Hepatocellular Carcinoma (LIHC) samples from GDC Data Portal (https://
portal.gdc.cancer.gov/). In addition, manifest, metadata, clinical data, biospecimen files were
downloaded to extract clinical information using Biospecimen Core Resource (BCR) IDs of
patients. Finally, we obtained 173 stage-I, 87 stage-II, 85 stage-III and 5 stage- IV stage sam-
ples. Clinical characteristics of these patients displayed in Figure A in S2 File. As the number
of stage-IV samples in the dataset is small, we have considered stage-II, stage-III and stage-IV
samples as late stage samples, while stage-I samples as early stage samples as stage I samples
are of localized cancer which shows no sign of metastasis. We also downloaded the methyla-
tion profiles acquired using the Illumina Human- Methylation450K DNA Analysis BeadChip
assay, based on genotyping of bisulfite-converted genomic DNA at individual CpG-sites. This
data provided Beta values, a quantitative measure of DNA methylation [41]. Besides, for each
subject, RNA expression in terms of FPKM values for 60,483 RNA transcripts was reported. In
this study, we have used FPKM values of RNA transcripts as quantification values.
Pre-processing of data. Methylation Data. There are a total of 485,577 Methylation CpG
sites (Probe IDs associated with CpG sites) for each tissue sample. The methylation score for
Classification of early and late stage liver hepatocellular carcinoma
PLOS ONE | https://doi.org/10.1371/journal.pone.0221476 September 6, 2019 3 / 27
every CpG site was defined in terms of beta value. Approximately 23–25% CpG sites excluded
from the study for which beta value is missing among any of samples using an in-house bash
script. Hence CpG sites number reduced to 374,292 for staging analysis and 369,221 for Can-
cer v/s Normal analysis.
Normalization of RNA Expression. The expression values of RNA transcripts from the
GDC portal were obtained in terms of FPKM (fragments per kilobase of transcript per million
mapped reads). There is a wide range of variation in FPKM values, thus we transformed values
using log2 after addition of 1.0 as a constant number to each of FPKM value. Further, features
with low variance were removed and data was z-score normalized using the caret package in R
[42]. The following equations were used for computing the transformation and normalization:
x ¼ Log2ðFPKM þ 1Þ ð1Þ
Z score ¼x � msd
ð2Þ
Where Z_score is the normalized score, x is the log-transformed expression, μ is the mean of
expression and sd is the standard deviation of expression. The validation data was Z score nor-
malized using the mean and variance of the training data.
As methylation beta values vary between 0 to 1; thus, normalization is not performed on
methylation data. Further to build a hybrid model based on methylation of CpG sites and
RNA expression of transcripts, we have transformed FPKM value to 0 to 1 using the Min-Max
normalization method of caret package in R [42].
Identification of differentially methylated CpG sites and expressed RNA
transcripts
To identify differentially CpG methylated sites; first, we computed the mean methylation score
for each CpG site in early and late stage samples. Secondly, we calculated whether the differ-
ence in the mean of methylation score in early and late stage samples was statistically signifi-
cant or not using the t-test. Here, the Welch t-test or Yuen-Welch test was implemented using
in-house R and bash scripts. In literature, Welch’s t-test considered robust for skewed distribu-
tions and large sample sizes [43,44]. Similarly, differentially expressed RNA transcripts in early
and late stage samples from a total of 60,483 RNA transcripts were identified.
Feature selection techniques
One of the challenges in developing a prediction model is to identify essential features from
the large dimension of features. In this study, we used a number of techniques for feature selec-
tion. First, we used Area under Receiver operating characteristic (AUC) based feature selection
technique in which we developed single feature-based models for discriminating early and late
stage samples. The single feature-based models (threshold based models) were developed as
wherein the features with a score above than a threshold are assigned to the early stage if it is
found to be upregulated in the early stage [45]. We compute the performance of each model
based on a given feature and identify features having the highest performance in term of AUC.
Second, we perform feature selection using two different algorithms like attribute evaluator
named, ‘SymmetricalUncertAttributeSetEval’ with search method of ‘FCBFSearch’ of WEKA
software package and sklearn.feature_selection F-ANOVA method from Scikit package. The
FCBF (Fast Correlation-Based Feature) algorithm employed correlation to identify relevant
features in high-dimensional datasets in small feature space [46].
Classification of early and late stage liver hepatocellular carcinoma
PLOS ONE | https://doi.org/10.1371/journal.pone.0221476 September 6, 2019 4 / 27
Implementation of machine learning techniques
Primarily, we have developed the Support Vector Machine (SVM) based prediction models
using the package SVMlight [47] and WEKA [46]. In the present study, the RBF (radial basis
function) kernel was employed to optimize various parameters to get the best performance on
the training dataset. Furthermore, some of the commonly used classifiers were employed for
developing the prediction models. These classifiers include Random forests, SMO, Naïve
Bayes, and J48 were implemented exploiting WEKA software.
Performance evaluation of models
In this study, we used both cross-validation and independent validation technique to evaluate
the performance of models. As our dataset contains a reasonable number of samples i.e. a total
of 350 (for stage analysis) and 425 (for cancer v/s normal analysis); therefore, it is crucial to
develop and train the model with the appropriate number of samples to avoid parameter esti-
mation variance. In the past, various studies employed the 80:20 ratio for the partitioning of a
dataset into training and validation dataset [48–52]. Hence, we applied this standard protocol
and divided our dataset into two datasets in the ratio of 80:20; where 80% data is used for train-
ing called training dataset and the remaining 20% data is used for validation called validation
dataset or independent dataset. The training dataset used for building and evaluating our
models using 10-fold cross-validation technique, where nine folds are used for training and
remaining one fold for testing and process is repeated ten times so that each fold is used once
for testing. The performance of models on the testing dataset is called internal validation. In
internal validation, we optimize parameters to achieve the best performance on the test dataset.
Though models are trained and tested on separate sets still over optimization of models cannot
be ruled out. To avoid over optimization, we evaluate the performance of our final model from
internal validation (10-fold cross-validation) on an independent dataset which is not used for
training or testing our final model.
To measure the performance of models, we used standard parameters, commonly used to
measure the performance of classification models. Both threshold-dependent and threshold-
independent parameters were employed to measure performance. In the case of threshold-
dependent parameters, we computed sensitivity, specificity, accuracy and Matthew’s correla-
tion coefficient (MCC) using the following equations.
Sensitivity Sensð Þ ¼TP
TP þ FN� 100 ð3Þ
Specificty Specð Þ ¼TN
TN þ FP� 100 ð4Þ
Accuracy Accð Þ ¼TP þ TN
TPþ FPþ TN þ FN� 100 ð5Þ
MCC ¼ðTP�TNÞ � ðFP�FNÞ
ffiffiffiffiffiffiffiffiffiffiffiffiffiffiffiffiffiffiffiffiffiðTPþ FPÞ
pðTP þ FNÞðTN þ FPÞðTN þ FNÞ
ð6Þ
Where, FP, FN, TP, and TN are false positive, false negative true positive and true negative
predictions, respectively.
While, for threshold-independent measures, we used standard parameter Area Under
the Receiver Operating Characteristic curve (AUROC) or commonly known as Area Under
(AUC) or Receiver Operating Characteristic curve (ROC). The AUC curve is generated by
Classification of early and late stage liver hepatocellular carcinoma
PLOS ONE | https://doi.org/10.1371/journal.pone.0221476 September 6, 2019 5 / 27
plotting sensitivity or true positive rate against the false positive rate (1-specificity) at various
thresholds. Finally, the area under the ROC curve calculated to compute a single parameter
called AUC. AUC with CI (Confidence Interval) computed using the pROC package in R [53].
Functional annotation or enrichment analysis of genes
In order to discern the biological relevance of the signature genes or the genes associated with
signature CpG sites, enrichment analysis performed using Enrichr [54]. Enrichr applies Fisher
exact test to identify enrichment score. It also provides Z-score which is derived by applying
correction on a Fisher Exact test.
Results
Models for classification of early stage and late stage of LIHC samples
Our primary objective is to identify potential markers, i.e. CpG sites and RNA transcripts that
can classify early stage and late stage tissue samples. Subsequently, in-silico predictive models
were developed based on these signature markers using various machine learning algorithms.
Potential markers and prediction models based on them are explained in the following sec-
tions. The overall workflow represented in Fig 1.
Single feature-based stage classification model using CpG sites. Here, we used a single
feature-based classification technique to classify early and late stage samples. In this study, we
first identified 447 CpG sites (from 3,74,292 sites) that are significantly differentially methyl-
ated in an early and late stage of the sample using t-test (FDR (False Discovery Rate)< 0.05).
These differentially methylated sites are further segregated in two classes; i) 199 hypermethy-
lated CpG sites (high level of methylation in early stage) and ii) 248 hypomethylated CpG site
(low-level methylation in early stage). Subsequently, each differentially methylated CpG sites is
used to develop a simple threshold-based model for classifying early and late stage samples. In
the threshold-based model, a sample is categorized in the early stage if the methylation level
of CpG site (in case site is hypermethylated) is higher than a threshold value otherwise in late
stage. In these models, the threshold is varied incrementally from minimum to maximum
beta-value. In the final step, that threshold is selected which leads to maximum AUC between
early and late samples. Subsequently, all the 447 CpG sites are ranked according to AUC to
assess the ability of a CpG site to categorize early and late stage tissue samples (Table A in S1
File). As shown in Table A in S1 File, there are 170 differentially methylated CpG sites (named
as LS-CPG-AUC) that can differentiate two types of samples with high precision (AUC� 0.6).
LS-CPG-AUC includes 105 hypermethylated and 65 hypomethylated CpG sites. Hypermethy-
lated CpG sites in the early stage such as cg20457523, cg18563987, cg18578954 can distinguish
early and late stage samples with AUC 0.66, 0.65 and 0.65 at threshold 0.83, 0.70 and 0.44
respectively; while the hypomethylated sites in the early stage include cg16876964 and
cg00590251 have AUC 0.64 and 0.63 at thresholds 0.90 and 0.75. Methylation pattern of the
top 20 CpG from 447 CpG sites and their chromosome location and associated genes are rep-
resented in Figure B in S2 File.
LS-CPG-AUC signature is significantly enriched (adjusted p-value<0.05) in various
immune system associated pathways and cancer-associated cell signaling pathways present in
BioCarta. For instance, 4 out of 55 genes of T Cell Receptor Signaling Pathway and 5 out of 33
genes of Integrin Signaling Pathway_Homosapiens, are enriched in LS-CPG-AUC. Further-
more, ITGB1, SHC1, and PTK2 are associated with PTEN dependent cell cycle arrest and apo-
ptosis, VEGF, Hypoxia, and Angiogenesis Pathway. This signature is also enriched in actin
filament binding (GO:0051015).
Classification of early and late stage liver hepatocellular carcinoma
PLOS ONE | https://doi.org/10.1371/journal.pone.0221476 September 6, 2019 6 / 27
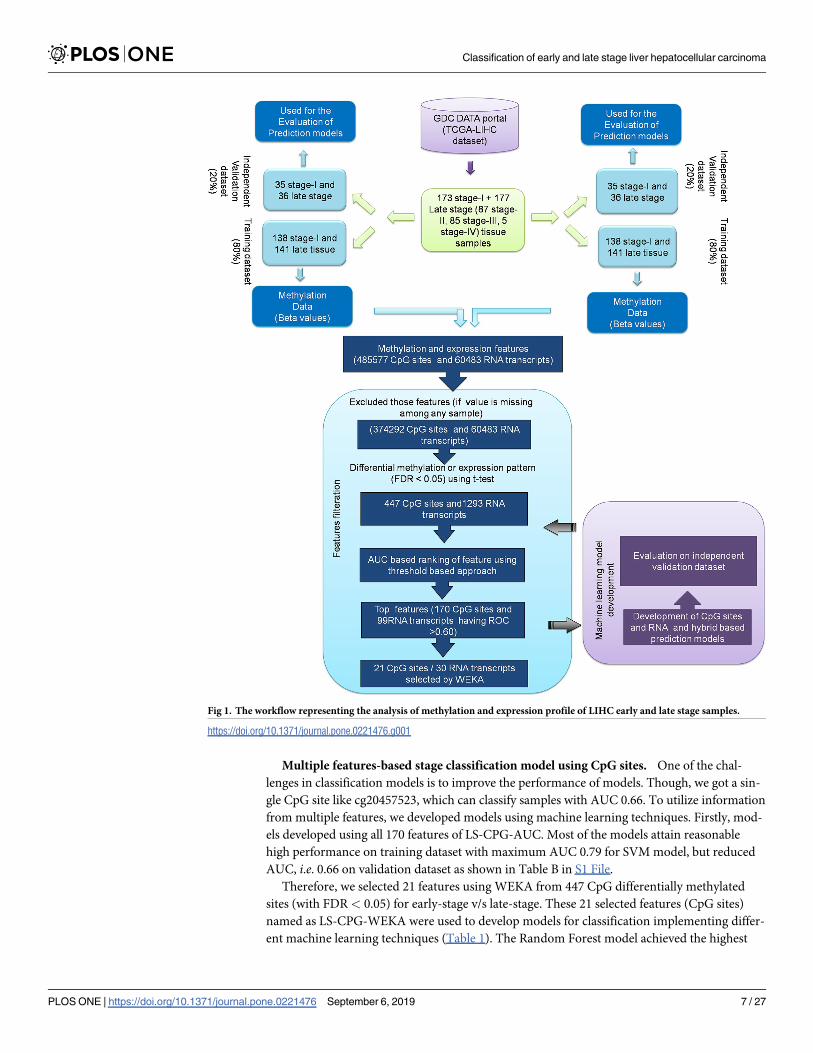
Multiple features-based stage classification model using CpG sites. One of the chal-
lenges in classification models is to improve the performance of models. Though, we got a sin-
gle CpG site like cg20457523, which can classify samples with AUC 0.66. To utilize information
from multiple features, we developed models using machine learning techniques. Firstly, mod-
els developed using all 170 features of LS-CPG-AUC. Most of the models attain reasonable
high performance on training dataset with maximum AUC 0.79 for SVM model, but reduced
AUC, i.e. 0.66 on validation dataset as shown in Table B in S1 File.
Therefore, we selected 21 features using WEKA from 447 CpG differentially methylated
sites (with FDR< 0.05) for early-stage v/s late-stage. These 21 selected features (CpG sites)
named as LS-CPG-WEKA were used to develop models for classification implementing differ-
ent machine learning techniques (Table 1). The Random Forest model achieved the highest
Fig 1. The workflow representing the analysis of methylation and expression profile of LIHC early and late stage samples.
https://doi.org/10.1371/journal.pone.0221476.g001
Classification of early and late stage liver hepatocellular carcinoma
PLOS ONE | https://doi.org/10.1371/journal.pone.0221476 September 6, 2019 7 / 27
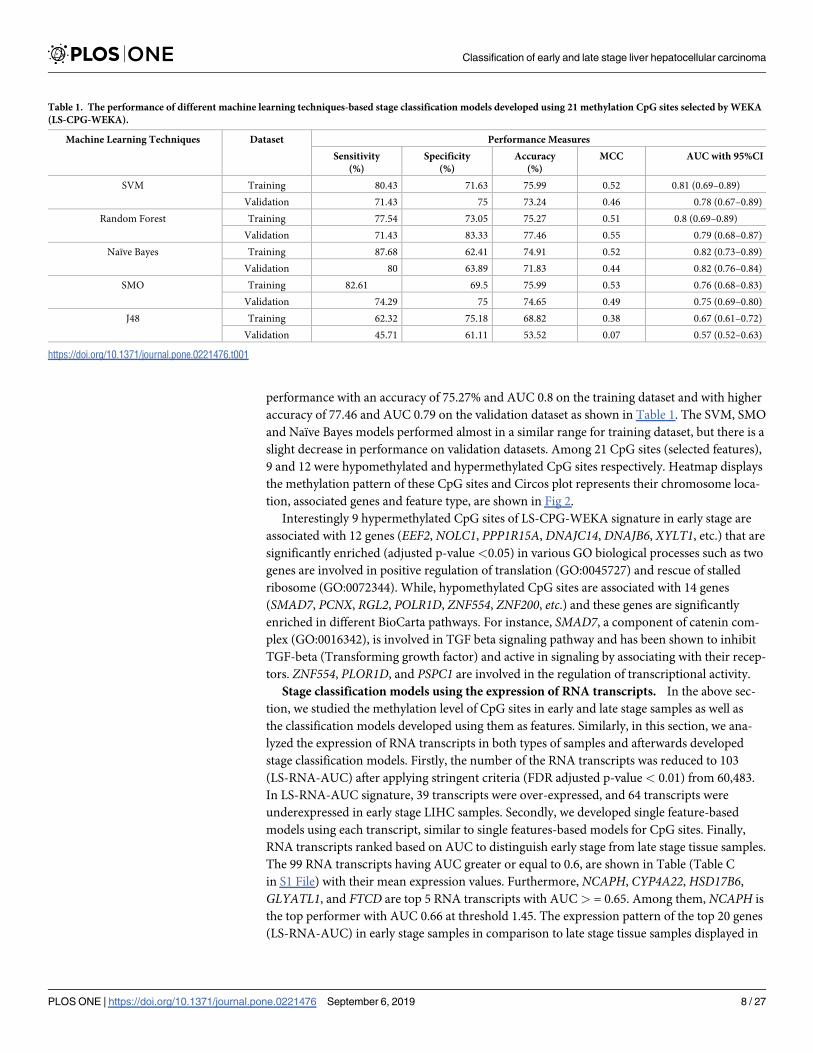
performance with an accuracy of 75.27% and AUC 0.8 on the training dataset and with higher
accuracy of 77.46 and AUC 0.79 on the validation dataset as shown in Table 1. The SVM, SMO
and Naïve Bayes models performed almost in a similar range for training dataset, but there is a
slight decrease in performance on validation datasets. Among 21 CpG sites (selected features),
9 and 12 were hypomethylated and hypermethylated CpG sites respectively. Heatmap displays
the methylation pattern of these CpG sites and Circos plot represents their chromosome loca-
tion, associated genes and feature type, are shown in Fig 2.
Interestingly 9 hypermethylated CpG sites of LS-CPG-WEKA signature in early stage are
associated with 12 genes (EEF2, NOLC1, PPP1R15A, DNAJC14, DNAJB6, XYLT1, etc.) that are
significantly enriched (adjusted p-value <0.05) in various GO biological processes such as two
genes are involved in positive regulation of translation (GO:0045727) and rescue of stalled
ribosome (GO:0072344). While, hypomethylated CpG sites are associated with 14 genes
(SMAD7, PCNX, RGL2, POLR1D, ZNF554, ZNF200, etc.) and these genes are significantly
enriched in different BioCarta pathways. For instance, SMAD7, a component of catenin com-
plex (GO:0016342), is involved in TGF beta signaling pathway and has been shown to inhibit
TGF-beta (Transforming growth factor) and active in signaling by associating with their recep-
tors. ZNF554, PLOR1D, and PSPC1 are involved in the regulation of transcriptional activity.
Stage classification models using the expression of RNA transcripts. In the above sec-
tion, we studied the methylation level of CpG sites in early and late stage samples as well as
the classification models developed using them as features. Similarly, in this section, we ana-
lyzed the expression of RNA transcripts in both types of samples and afterwards developed
stage classification models. Firstly, the number of the RNA transcripts was reduced to 103
(LS-RNA-AUC) after applying stringent criteria (FDR adjusted p-value < 0.01) from 60,483.
In LS-RNA-AUC signature, 39 transcripts were over-expressed, and 64 transcripts were
underexpressed in early stage LIHC samples. Secondly, we developed single feature-based
models using each transcript, similar to single features-based models for CpG sites. Finally,
RNA transcripts ranked based on AUC to distinguish early stage from late stage tissue samples.
The 99 RNA transcripts having AUC greater or equal to 0.6, are shown in Table (Table C
in S1 File) with their mean expression values. Furthermore, NCAPH, CYP4A22,HSD17B6,
GLYATL1, and FTCD are top 5 RNA transcripts with AUC > = 0.65. Among them, NCAPH is
the top performer with AUC 0.66 at threshold 1.45. The expression pattern of the top 20 genes
(LS-RNA-AUC) in early stage samples in comparison to late stage tissue samples displayed in
Table 1. The performance of different machine learning techniques-based stage classification models developed using 21 methylation CpG sites selected by WEKA
(LS-CPG-WEKA).
Machine Learning Techniques Dataset Performance Measures
Sensitivity
(%)
Specificity
(%)
Accuracy
(%)
MCC AUC with 95%CI
SVM Training 80.43 71.63 75.99 0.52 0.81 (0.69–0.89)
Validation 71.43 75 73.24 0.46 0.78 (0.67–0.89)
Random Forest Training 77.54 73.05 75.27 0.51 0.8 (0.69–0.89)
Validation 71.43 83.33 77.46 0.55 0.79 (0.68–0.87)
Naïve Bayes Training 87.68 62.41 74.91 0.52 0.82 (0.73–0.89)
Validation 80 63.89 71.83 0.44 0.82 (0.76–0.84)
SMO Training 82.61 69.5 75.99 0.53 0.76 (0.68–0.83)
Validation 74.29 75 74.65 0.49 0.75 (0.69–0.80)
J48 Training 62.32 75.18 68.82 0.38 0.67 (0.61–0.72)
Validation 45.71 61.11 53.52 0.07 0.57 (0.52–0.63)
https://doi.org/10.1371/journal.pone.0221476.t001
Classification of early and late stage liver hepatocellular carcinoma
PLOS ONE | https://doi.org/10.1371/journal.pone.0221476 September 6, 2019 8 / 27
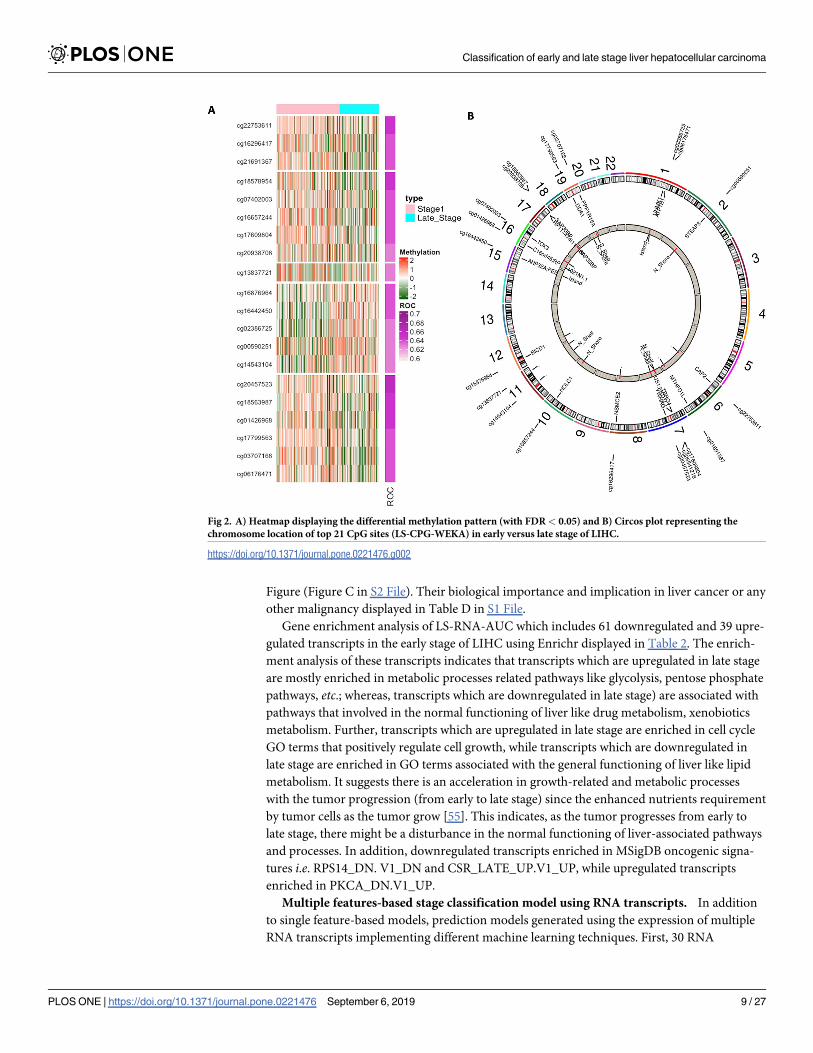
Figure (Figure C in S2 File). Their biological importance and implication in liver cancer or any
other malignancy displayed in Table D in S1 File.
Gene enrichment analysis of LS-RNA-AUC which includes 61 downregulated and 39 upre-
gulated transcripts in the early stage of LIHC using Enrichr displayed in Table 2. The enrich-
ment analysis of these transcripts indicates that transcripts which are upregulated in late stage
are mostly enriched in metabolic processes related pathways like glycolysis, pentose phosphate
pathways, etc.; whereas, transcripts which are downregulated in late stage) are associated with
pathways that involved in the normal functioning of liver like drug metabolism, xenobiotics
metabolism. Further, transcripts which are upregulated in late stage are enriched in cell cycle
GO terms that positively regulate cell growth, while transcripts which are downregulated in
late stage are enriched in GO terms associated with the general functioning of liver like lipid
metabolism. It suggests there is an acceleration in growth-related and metabolic processes
with the tumor progression (from early to late stage) since the enhanced nutrients requirement
by tumor cells as the tumor grow [55]. This indicates, as the tumor progresses from early to
late stage, there might be a disturbance in the normal functioning of liver-associated pathways
and processes. In addition, downregulated transcripts enriched in MSigDB oncogenic signa-
tures i.e. RPS14_DN. V1_DN and CSR_LATE_UP.V1_UP, while upregulated transcripts
enriched in PKCA_DN.V1_UP.
Multiple features-based stage classification model using RNA transcripts. In addition
to single feature-based models, prediction models generated using the expression of multiple
RNA transcripts implementing different machine learning techniques. First, 30 RNA
Fig 2. A) Heatmap displaying the differential methylation pattern (with FDR< 0.05) and B) Circos plot representing the
chromosome location of top 21 CpG sites (LS-CPG-WEKA) in early versus late stage of LIHC.
https://doi.org/10.1371/journal.pone.0221476.g002
Classification of early and late stage liver hepatocellular carcinoma
PLOS ONE | https://doi.org/10.1371/journal.pone.0221476 September 6, 2019 9 / 27
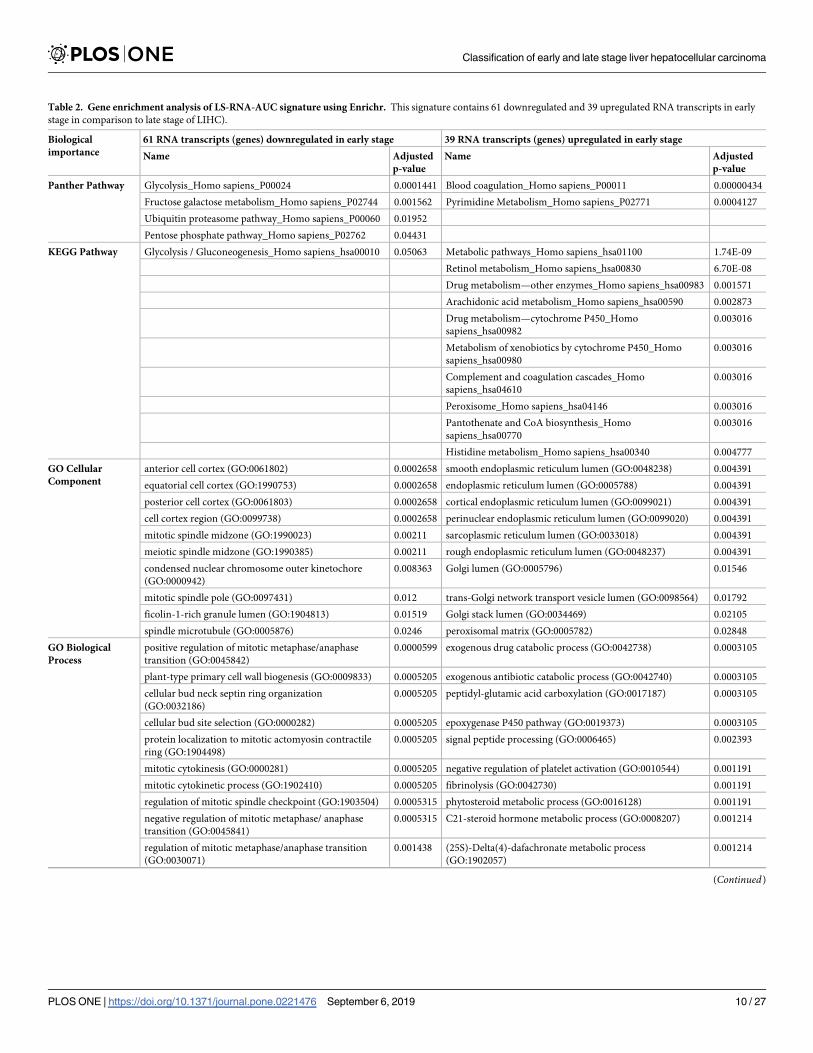
Table 2. Gene enrichment analysis of LS-RNA-AUC signature using Enrichr. This signature contains 61 downregulated and 39 upregulated RNA transcripts in early
stage in comparison to late stage of LIHC).
Biological
importance
61 RNA transcripts (genes) downregulated in early stage 39 RNA transcripts (genes) upregulated in early stage
Name Adjusted
p-value
Name Adjusted
p-value
Panther Pathway Glycolysis_Homo sapiens_P00024 0.0001441 Blood coagulation_Homo sapiens_P00011 0.00000434
Fructose galactose metabolism_Homo sapiens_P02744 0.001562 Pyrimidine Metabolism_Homo sapiens_P02771 0.0004127
Ubiquitin proteasome pathway_Homo sapiens_P00060 0.01952
Pentose phosphate pathway_Homo sapiens_P02762 0.04431
KEGG Pathway Glycolysis / Gluconeogenesis_Homo sapiens_hsa00010 0.05063 Metabolic pathways_Homo sapiens_hsa01100 1.74E-09
Retinol metabolism_Homo sapiens_hsa00830 6.70E-08
Drug metabolism—other enzymes_Homo sapiens_hsa00983 0.001571
Arachidonic acid metabolism_Homo sapiens_hsa00590 0.002873
Drug metabolism—cytochrome P450_Homo
sapiens_hsa00982
0.003016
Metabolism of xenobiotics by cytochrome P450_Homo
sapiens_hsa00980
0.003016
Complement and coagulation cascades_Homo
sapiens_hsa04610
0.003016
Peroxisome_Homo sapiens_hsa04146 0.003016
Pantothenate and CoA biosynthesis_Homo
sapiens_hsa00770
0.003016
Histidine metabolism_Homo sapiens_hsa00340 0.004777
GO Cellular
Component
anterior cell cortex (GO:0061802) 0.0002658 smooth endoplasmic reticulum lumen (GO:0048238) 0.004391
equatorial cell cortex (GO:1990753) 0.0002658 endoplasmic reticulum lumen (GO:0005788) 0.004391
posterior cell cortex (GO:0061803) 0.0002658 cortical endoplasmic reticulum lumen (GO:0099021) 0.004391
cell cortex region (GO:0099738) 0.0002658 perinuclear endoplasmic reticulum lumen (GO:0099020) 0.004391
mitotic spindle midzone (GO:1990023) 0.00211 sarcoplasmic reticulum lumen (GO:0033018) 0.004391
meiotic spindle midzone (GO:1990385) 0.00211 rough endoplasmic reticulum lumen (GO:0048237) 0.004391
condensed nuclear chromosome outer kinetochore
(GO:0000942)
0.008363 Golgi lumen (GO:0005796) 0.01546
mitotic spindle pole (GO:0097431) 0.012 trans-Golgi network transport vesicle lumen (GO:0098564) 0.01792
ficolin-1-rich granule lumen (GO:1904813) 0.01519 Golgi stack lumen (GO:0034469) 0.02105
spindle microtubule (GO:0005876) 0.0246 peroxisomal matrix (GO:0005782) 0.02848
GO Biological
Process
positive regulation of mitotic metaphase/anaphase
transition (GO:0045842)
0.0000599 exogenous drug catabolic process (GO:0042738) 0.0003105
plant-type primary cell wall biogenesis (GO:0009833) 0.0005205 exogenous antibiotic catabolic process (GO:0042740) 0.0003105
cellular bud neck septin ring organization
(GO:0032186)
0.0005205 peptidyl-glutamic acid carboxylation (GO:0017187) 0.0003105
cellular bud site selection (GO:0000282) 0.0005205 epoxygenase P450 pathway (GO:0019373) 0.0003105
protein localization to mitotic actomyosin contractile
ring (GO:1904498)
0.0005205 signal peptide processing (GO:0006465) 0.002393
mitotic cytokinesis (GO:0000281) 0.0005205 negative regulation of platelet activation (GO:0010544) 0.001191
mitotic cytokinetic process (GO:1902410) 0.0005205 fibrinolysis (GO:0042730) 0.001191
regulation of mitotic spindle checkpoint (GO:1903504) 0.0005315 phytosteroid metabolic process (GO:0016128) 0.001191
negative regulation of mitotic metaphase/ anaphase
transition (GO:0045841)
0.0005315 C21-steroid hormone metabolic process (GO:0008207) 0.001214
regulation of mitotic metaphase/anaphase transition
(GO:0030071)
0.001438 (25S)-Delta(4)-dafachronate metabolic process
(GO:1902057)
0.001214
(Continued)
Classification of early and late stage liver hepatocellular carcinoma
PLOS ONE | https://doi.org/10.1371/journal.pone.0221476 September 6, 2019 10 / 27
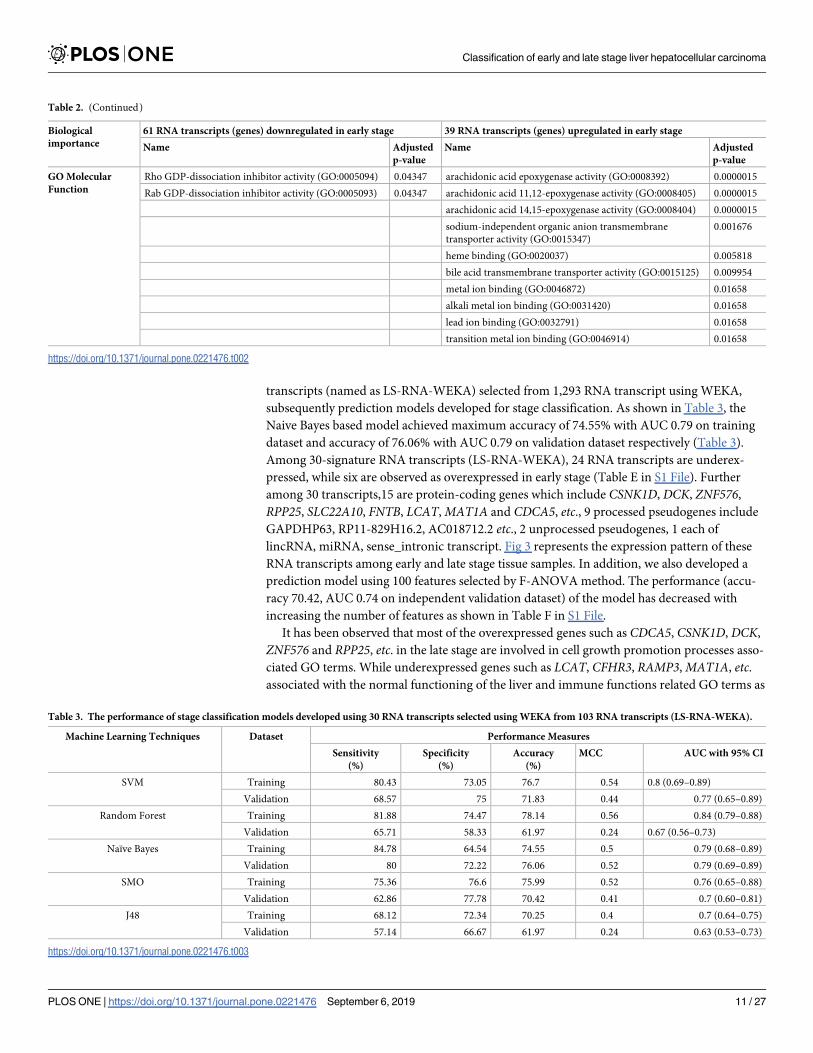
transcripts (named as LS-RNA-WEKA) selected from 1,293 RNA transcript using WEKA,
subsequently prediction models developed for stage classification. As shown in Table 3, the
Naive Bayes based model achieved maximum accuracy of 74.55% with AUC 0.79 on training
dataset and accuracy of 76.06% with AUC 0.79 on validation dataset respectively (Table 3).
Among 30-signature RNA transcripts (LS-RNA-WEKA), 24 RNA transcripts are underex-
pressed, while six are observed as overexpressed in early stage (Table E in S1 File). Further
among 30 transcripts,15 are protein-coding genes which include CSNK1D, DCK, ZNF576,
RPP25, SLC22A10, FNTB, LCAT,MAT1A and CDCA5, etc., 9 processed pseudogenes include
GAPDHP63, RP11-829H16.2, AC018712.2 etc., 2 unprocessed pseudogenes, 1 each of
lincRNA, miRNA, sense_intronic transcript. Fig 3 represents the expression pattern of these
RNA transcripts among early and late stage tissue samples. In addition, we also developed a
prediction model using 100 features selected by F-ANOVA method. The performance (accu-
racy 70.42, AUC 0.74 on independent validation dataset) of the model has decreased with
increasing the number of features as shown in Table F in S1 File.
It has been observed that most of the overexpressed genes such as CDCA5, CSNK1D, DCK,
ZNF576 and RPP25, etc. in the late stage are involved in cell growth promotion processes asso-
ciated GO terms. While underexpressed genes such as LCAT, CFHR3, RAMP3,MAT1A, etc.associated with the normal functioning of the liver and immune functions related GO terms as
Table 2. (Continued)
Biological
importance
61 RNA transcripts (genes) downregulated in early stage 39 RNA transcripts (genes) upregulated in early stage
Name Adjusted
p-value
Name Adjusted
p-value
GO Molecular
Function
Rho GDP-dissociation inhibitor activity (GO:0005094) 0.04347 arachidonic acid epoxygenase activity (GO:0008392) 0.0000015
Rab GDP-dissociation inhibitor activity (GO:0005093) 0.04347 arachidonic acid 11,12-epoxygenase activity (GO:0008405) 0.0000015
arachidonic acid 14,15-epoxygenase activity (GO:0008404) 0.0000015
sodium-independent organic anion transmembrane
transporter activity (GO:0015347)
0.001676
heme binding (GO:0020037) 0.005818
bile acid transmembrane transporter activity (GO:0015125) 0.009954
metal ion binding (GO:0046872) 0.01658
alkali metal ion binding (GO:0031420) 0.01658
lead ion binding (GO:0032791) 0.01658
transition metal ion binding (GO:0046914) 0.01658
https://doi.org/10.1371/journal.pone.0221476.t002
Table 3. The performance of stage classification models developed using 30 RNA transcripts selected using WEKA from 103 RNA transcripts (LS-RNA-WEKA).
Machine Learning Techniques Dataset Performance Measures
Sensitivity
(%)
Specificity
(%)
Accuracy
(%)
MCC AUC with 95% CI
SVM Training 80.43 73.05 76.7 0.54 0.8 (0.69–0.89)
Validation 68.57 75 71.83 0.44 0.77 (0.65–0.89)
Random Forest Training 81.88 74.47 78.14 0.56 0.84 (0.79–0.88)
Validation 65.71 58.33 61.97 0.24 0.67 (0.56–0.73)
Naïve Bayes Training 84.78 64.54 74.55 0.5 0.79 (0.68–0.89)
Validation 80 72.22 76.06 0.52 0.79 (0.69–0.89)
SMO Training 75.36 76.6 75.99 0.52 0.76 (0.65–0.88)
Validation 62.86 77.78 70.42 0.41 0.7 (0.60–0.81)
J48 Training 68.12 72.34 70.25 0.4 0.7 (0.64–0.75)
Validation 57.14 66.67 61.97 0.24 0.63 (0.53–0.73)
https://doi.org/10.1371/journal.pone.0221476.t003
Classification of early and late stage liver hepatocellular carcinoma
PLOS ONE | https://doi.org/10.1371/journal.pone.0221476 September 6, 2019 11 / 27
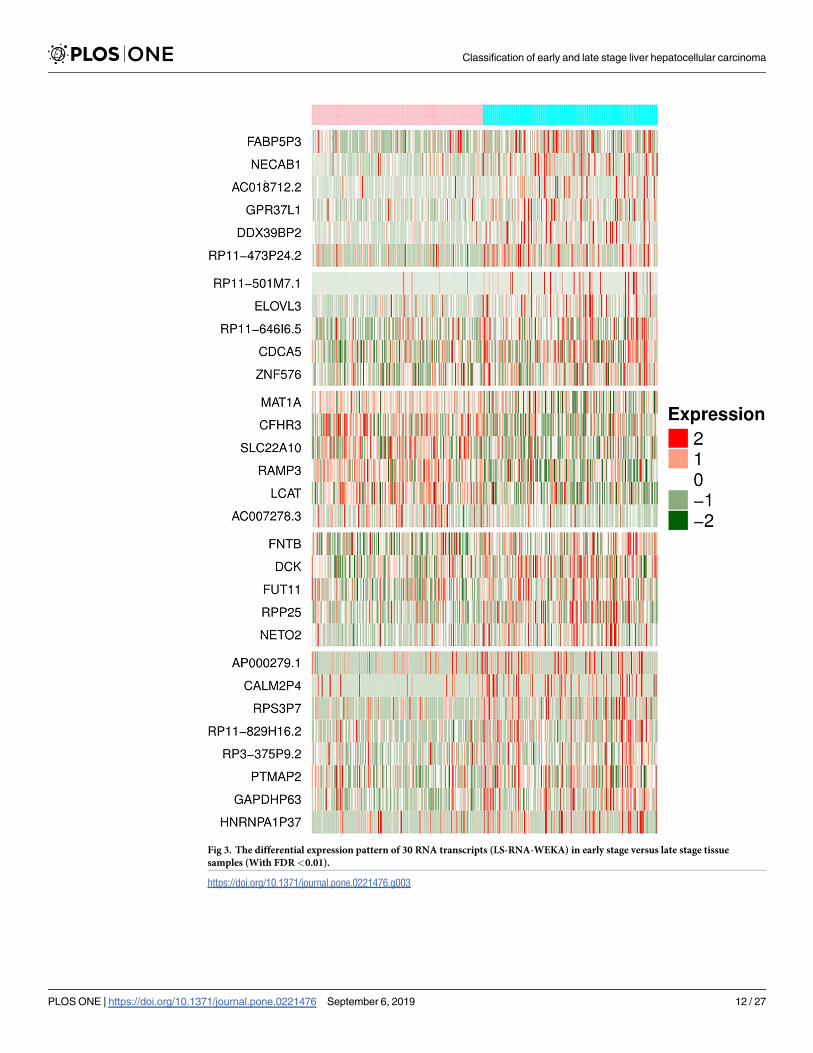
Fig 3. The differential expression pattern of 30 RNA transcripts (LS-RNA-WEKA) in early stage versus late stage tissue
samples (With FDR<0.01).
https://doi.org/10.1371/journal.pone.0221476.g003
Classification of early and late stage liver hepatocellular carcinoma
PLOS ONE | https://doi.org/10.1371/journal.pone.0221476 September 6, 2019 12 / 27
shown in Table D in S1 File. It also represents their implication previously in the liver cancer
or any other malignancies Table D in S1 File.
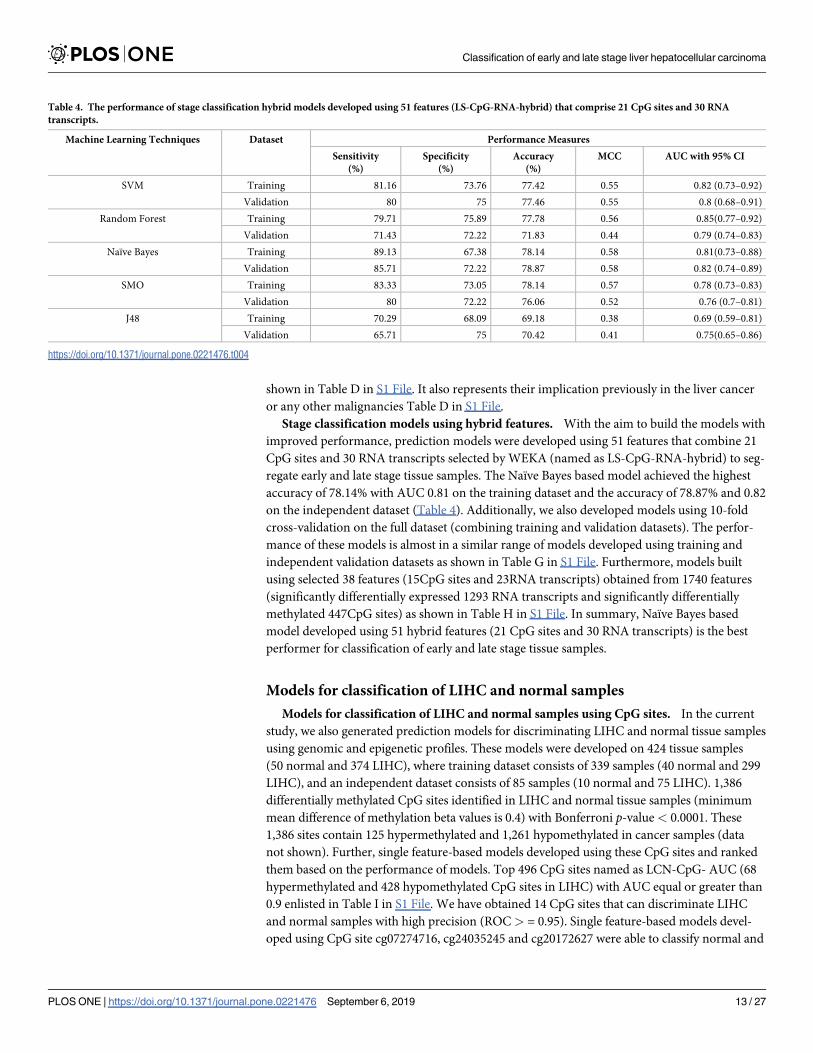
Stage classification models using hybrid features. With the aim to build the models with
improved performance, prediction models were developed using 51 features that combine 21
CpG sites and 30 RNA transcripts selected by WEKA (named as LS-CpG-RNA-hybrid) to seg-
regate early and late stage tissue samples. The Naïve Bayes based model achieved the highest
accuracy of 78.14% with AUC 0.81 on the training dataset and the accuracy of 78.87% and 0.82
on the independent dataset (Table 4). Additionally, we also developed models using 10-fold
cross-validation on the full dataset (combining training and validation datasets). The perfor-
mance of these models is almost in a similar range of models developed using training and
independent validation datasets as shown in Table G in S1 File. Furthermore, models built
using selected 38 features (15CpG sites and 23RNA transcripts) obtained from 1740 features
(significantly differentially expressed 1293 RNA transcripts and significantly differentially
methylated 447CpG sites) as shown in Table H in S1 File. In summary, Naïve Bayes based
model developed using 51 hybrid features (21 CpG sites and 30 RNA transcripts) is the best
performer for classification of early and late stage tissue samples.
Models for classification of LIHC and normal samples
Models for classification of LIHC and normal samples using CpG sites. In the current
study, we also generated prediction models for discriminating LIHC and normal tissue samples
using genomic and epigenetic profiles. These models were developed on 424 tissue samples
(50 normal and 374 LIHC), where training dataset consists of 339 samples (40 normal and 299
LIHC), and an independent dataset consists of 85 samples (10 normal and 75 LIHC). 1,386
differentially methylated CpG sites identified in LIHC and normal tissue samples (minimum
mean difference of methylation beta values is 0.4) with Bonferroni p-value< 0.0001. These
1,386 sites contain 125 hypermethylated and 1,261 hypomethylated in cancer samples (data
not shown). Further, single feature-based models developed using these CpG sites and ranked
them based on the performance of models. Top 496 CpG sites named as LCN-CpG- AUC (68
hypermethylated and 428 hypomethylated CpG sites in LIHC) with AUC equal or greater than
0.9 enlisted in Table I in S1 File. We have obtained 14 CpG sites that can discriminate LIHC
and normal samples with high precision (ROC> = 0.95). Single feature-based models devel-
oped using CpG site cg07274716, cg24035245 and cg20172627 were able to classify normal and
Table 4. The performance of stage classification hybrid models developed using 51 features (LS-CpG-RNA-hybrid) that comprise 21 CpG sites and 30 RNA
transcripts.
Machine Learning Techniques Dataset Performance Measures
Sensitivity
(%)
Specificity
(%)
Accuracy
(%)
MCC AUC with 95% CI
SVM Training 81.16 73.76 77.42 0.55 0.82 (0.73–0.92)
Validation 80 75 77.46 0.55 0.8 (0.68–0.91)
Random Forest Training 79.71 75.89 77.78 0.56 0.85(0.77–0.92)
Validation 71.43 72.22 71.83 0.44 0.79 (0.74–0.83)
Naïve Bayes Training 89.13 67.38 78.14 0.58 0.81(0.73–0.88)
Validation 85.71 72.22 78.87 0.58 0.82 (0.74–0.89)
SMO Training 83.33 73.05 78.14 0.57 0.78 (0.73–0.83)
Validation 80 72.22 76.06 0.52 0.76 (0.7–0.81)
J48 Training 70.29 68.09 69.18 0.38 0.69 (0.59–0.81)
Validation 65.71 75 70.42 0.41 0.75(0.65–0.86)
https://doi.org/10.1371/journal.pone.0221476.t004
Classification of early and late stage liver hepatocellular carcinoma
PLOS ONE | https://doi.org/10.1371/journal.pone.0221476 September 6, 2019 13 / 27
LIHC tissue with AUC 0.97, 0.96 and 0.95 at threshold 0.35, 0.44, 0.32 and 0.12 respectively.
The methylation pattern of the top 10 CpG sites is depicted by Heatmap (Figure D in S2 File)
and chromosome locations and associated genes of the CpG sites represented in Circos plot
(Figure E in S2 File).
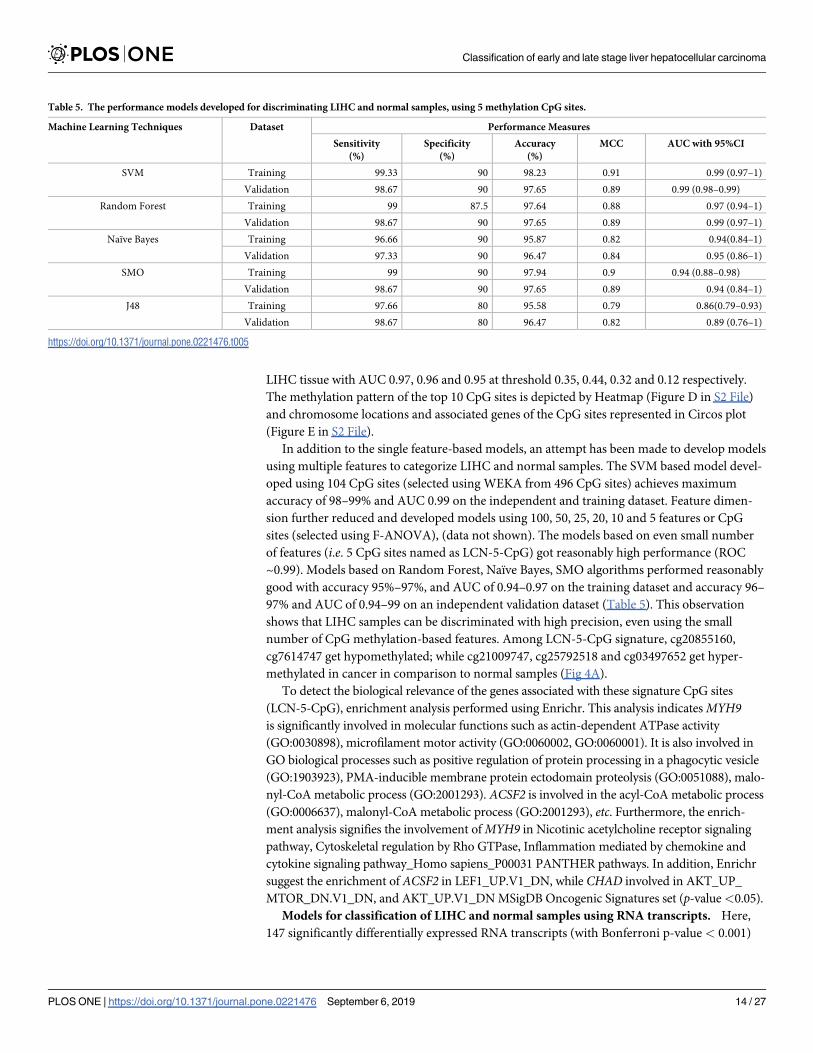
In addition to the single feature-based models, an attempt has been made to develop models
using multiple features to categorize LIHC and normal samples. The SVM based model devel-
oped using 104 CpG sites (selected using WEKA from 496 CpG sites) achieves maximum
accuracy of 98–99% and AUC 0.99 on the independent and training dataset. Feature dimen-
sion further reduced and developed models using 100, 50, 25, 20, 10 and 5 features or CpG
sites (selected using F-ANOVA), (data not shown). The models based on even small number
of features (i.e. 5 CpG sites named as LCN-5-CpG) got reasonably high performance (ROC
~0.99). Models based on Random Forest, Naïve Bayes, SMO algorithms performed reasonably
good with accuracy 95%–97%, and AUC of 0.94–0.97 on the training dataset and accuracy 96–
97% and AUC of 0.94–99 on an independent validation dataset (Table 5). This observation
shows that LIHC samples can be discriminated with high precision, even using the small
number of CpG methylation-based features. Among LCN-5-CpG signature, cg20855160,
cg7614747 get hypomethylated; while cg21009747, cg25792518 and cg03497652 get hyper-
methylated in cancer in comparison to normal samples (Fig 4A).
To detect the biological relevance of the genes associated with these signature CpG sites
(LCN-5-CpG), enrichment analysis performed using Enrichr. This analysis indicatesMYH9is significantly involved in molecular functions such as actin-dependent ATPase activity
(GO:0030898), microfilament motor activity (GO:0060002, GO:0060001). It is also involved in
GO biological processes such as positive regulation of protein processing in a phagocytic vesicle
(GO:1903923), PMA-inducible membrane protein ectodomain proteolysis (GO:0051088), malo-
nyl-CoA metabolic process (GO:2001293). ACSF2 is involved in the acyl-CoA metabolic process
(GO:0006637), malonyl-CoA metabolic process (GO:2001293), etc. Furthermore, the enrich-
ment analysis signifies the involvement ofMYH9 in Nicotinic acetylcholine receptor signaling
pathway, Cytoskeletal regulation by Rho GTPase, Inflammation mediated by chemokine and
cytokine signaling pathway_Homo sapiens_P00031 PANTHER pathways. In addition, Enrichr
suggest the enrichment of ACSF2 in LEF1_UP.V1_DN, while CHAD involved in AKT_UP_
MTOR_DN.V1_DN, and AKT_UP.V1_DN MSigDB Oncogenic Signatures set (p-value<0.05).
Models for classification of LIHC and normal samples using RNA transcripts. Here,
147 significantly differentially expressed RNA transcripts (with Bonferroni p-value < 0.001)
Table 5. The performance models developed for discriminating LIHC and normal samples, using 5 methylation CpG sites.
Machine Learning Techniques Dataset Performance Measures
Sensitivity
(%)
Specificity
(%)
Accuracy
(%)
MCC AUC with 95%CI
SVM Training 99.33 90 98.23 0.91 0.99 (0.97–1)
Validation 98.67 90 97.65 0.89 0.99 (0.98–0.99)
Random Forest Training 99 87.5 97.64 0.88 0.97 (0.94–1)
Validation 98.67 90 97.65 0.89 0.99 (0.97–1)
Naïve Bayes Training 96.66 90 95.87 0.82 0.94(0.84–1)
Validation 97.33 90 96.47 0.84 0.95 (0.86–1)
SMO Training 99 90 97.94 0.9 0.94 (0.88–0.98)
Validation 98.67 90 97.65 0.89 0.94 (0.84–1)
J48 Training 97.66 80 95.58 0.79 0.86(0.79–0.93)
Validation 98.67 80 96.47 0.82 0.89 (0.76–1)
https://doi.org/10.1371/journal.pone.0221476.t005
Classification of early and late stage liver hepatocellular carcinoma
PLOS ONE | https://doi.org/10.1371/journal.pone.0221476 September 6, 2019 14 / 27
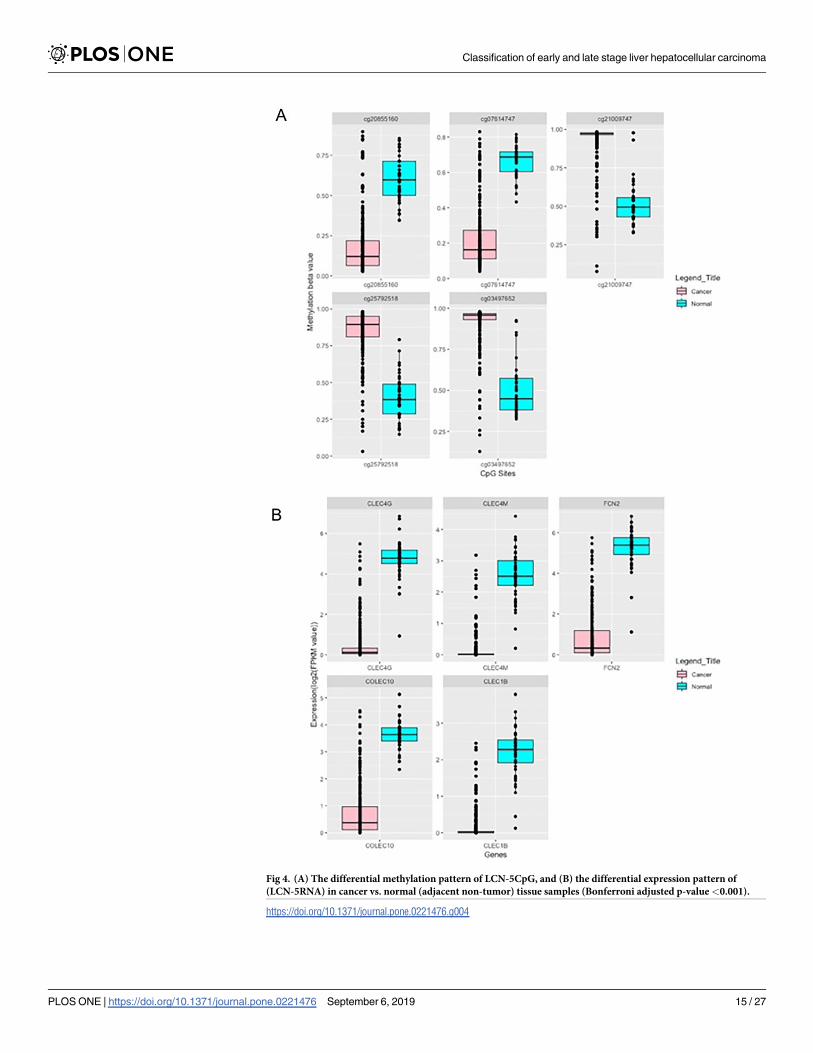
Fig 4. (A) The differential methylation pattern of LCN-5CpG, and (B) the differential expression pattern of
(LCN-5RNA) in cancer vs. normal (adjacent non-tumor) tissue samples (Bonferroni adjusted p-value<0.001).
https://doi.org/10.1371/journal.pone.0221476.g004
Classification of early and late stage liver hepatocellular carcinoma
PLOS ONE | https://doi.org/10.1371/journal.pone.0221476 September 6, 2019 15 / 27
identified in LIHC and normal samples (Table J in S1 File). The performance of models devel-
oped using top 53 RNA transcripts (ROC equal or greater than 0.9) is shown in Table K in S1
File. Among 53 transcripts, 50 are protein coding, one each of Linc-RNA, snoRNA and pro-
cessed transcripts. Further, among them, 18 and 35 observed to be overexpressed and underex-
pressed respectively in LIHC in comparison to normal tissue samples. Moreover, CLEC4G,
CLEC4M, FCN2, COLEC10, CLEC1B, and PLVAP can classify LIHC and normal tissue sam-
ples with AUC> = 0.96. CLEC4G which is an underexpressed gene in cancer is the chief per-
former with AUC ~0.99 at threshold 2.9; whereas PLVAP is overexpressed gene in cancer
samples, it can distinguish samples with AUC 0.97 at threshold 3.8. Expression pattern of top
10 RNA transcripts is displayed in the heatmap (Figure D in S2 File).
Gene enrichment analysis of LCN-RNA-AUC is represented in Figure F (Figure F in S2
File). The functional enrichment of these genes suggested their involvement in various growth
progression processes. As these genes upregulated in LIHC; this might lay insight toward their
contribution in the diseased state. Table L-A in S1 File representing the biological importance
of these signatures and their previous implication in liver cancer or any other malignancies.
Moreover, they are also enriched in various MSigDB oncogenic signatures (Table L-B in S1
File). Besides, all the identified CpG sites signatures (both for stage classification and cancer
v/s normal classification) that are implicated in liver cancer and other cancers are shown in
Table M in S1 File.
Further, we proceed to develop models based on multiple RNA transcripts/features selected
by different techniques, i.e. WEKA and F-ANOVA method. In this, an effort has been made
to build a prediction model using 35 WEKA selected features (from 147 RNA transcripts) to
differentiate liver cancer samples from the normal samples. The SVM based model attains
maximum accuracy nearly 99% with AUC 0.99 on both training and independent validation
dataset respectively (result not shown). To develop the prediction model based on least num-
ber of genes/features, that can categorize samples with reasonably good accuracy; we firstly
selected 25, 20, 15, 10 and 5 feature sets (results not shown) using F-ANOVA method. After-
wards, prediction models developed on the training dataset and independent validation
dataset. The model’s performance on the independent validation dataset is similar to the per-
formance obtained using CpG sites. Interestingly models based on this feature set almost per-
formed comparably to that of model based on 35 features selected by WEKA. 5-RNA feature
set (LCN-5-RNA) based SVM prediction model categorize samples with accuracy 98.53 and
AUC 0.97 of training dataset and with accuracy 97.65 and AUC 0.93 of the independent vali-
dation dataset. Additionally, models based on the Random forest, SMO, Naïve Bayes, and J48
algorithms also performed almost equal to that of SVM, as indicated in Table 6. The LCN-
5-RNA signature includes CLEC4G, CLEC4M, FCN2, CLEC1B and COLEC10 get downregu-
lated in cancer vs. normal samples, as shown in Fig 4(B).
Enrichment analysis of LCN-5-RNA using Enrichr implies the involvement of CLEC4M in
Phagosome KEGG pathways and GDF2 in the TGF-beta signaling pathway_Homo sapiens_
P00052 (p-value <0.05). CLEC4M involved in receptor-mediated virion attachment to host
cell (GO:0046813), evasion or tolerance of host defences by the virus (GO:0019049) etc. This
analysis also denotes their enrichment in various MSigDB Oncogenic Signatures sets such as
KRAS, p53, PTEN, mTOR and SNF5 [KRAS.AMP.LUNG_UP.V1_UP, P53_DN.V2_DN, and
PTEN_DN.V1_UP], etc. (p-value<0.05).
Multi-class classification
With an intent to ascertain the features that can segregate normal, early and late stage tissue
samples, we have independently selected 33 CpG sites (multiclass-CpG) and 5 RNA transcripts
Classification of early and late stage liver hepatocellular carcinoma
PLOS ONE | https://doi.org/10.1371/journal.pone.0221476 September 6, 2019 16 / 27
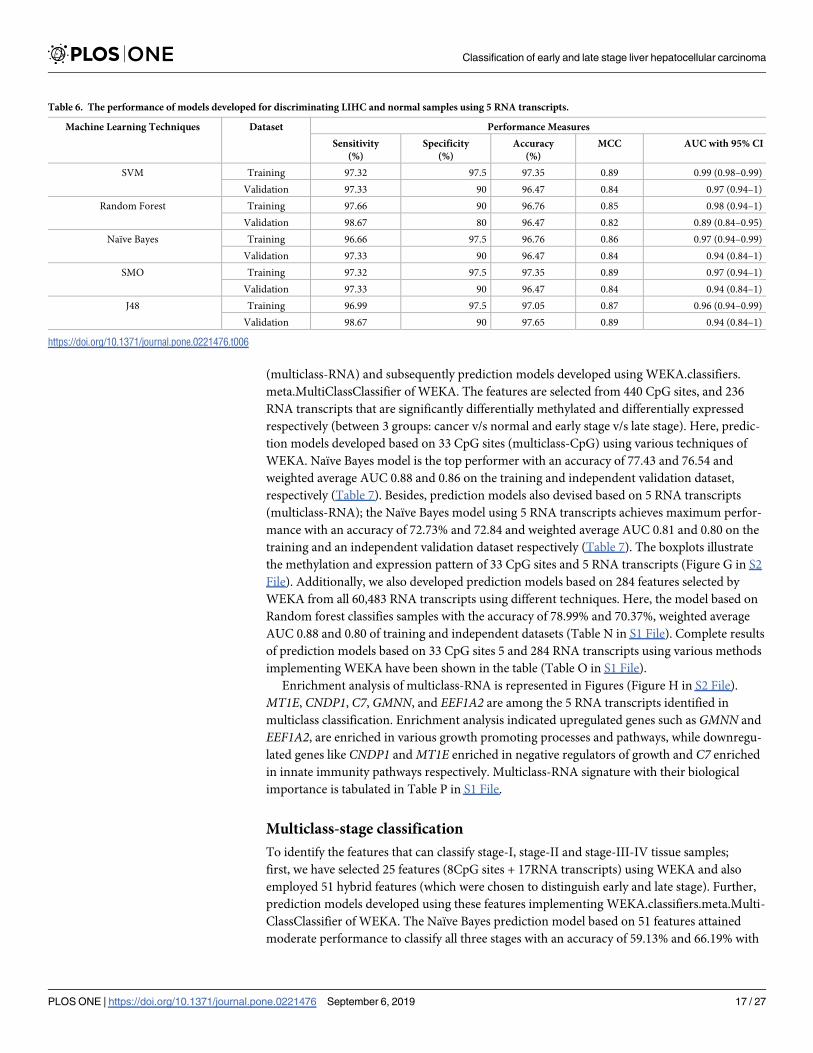
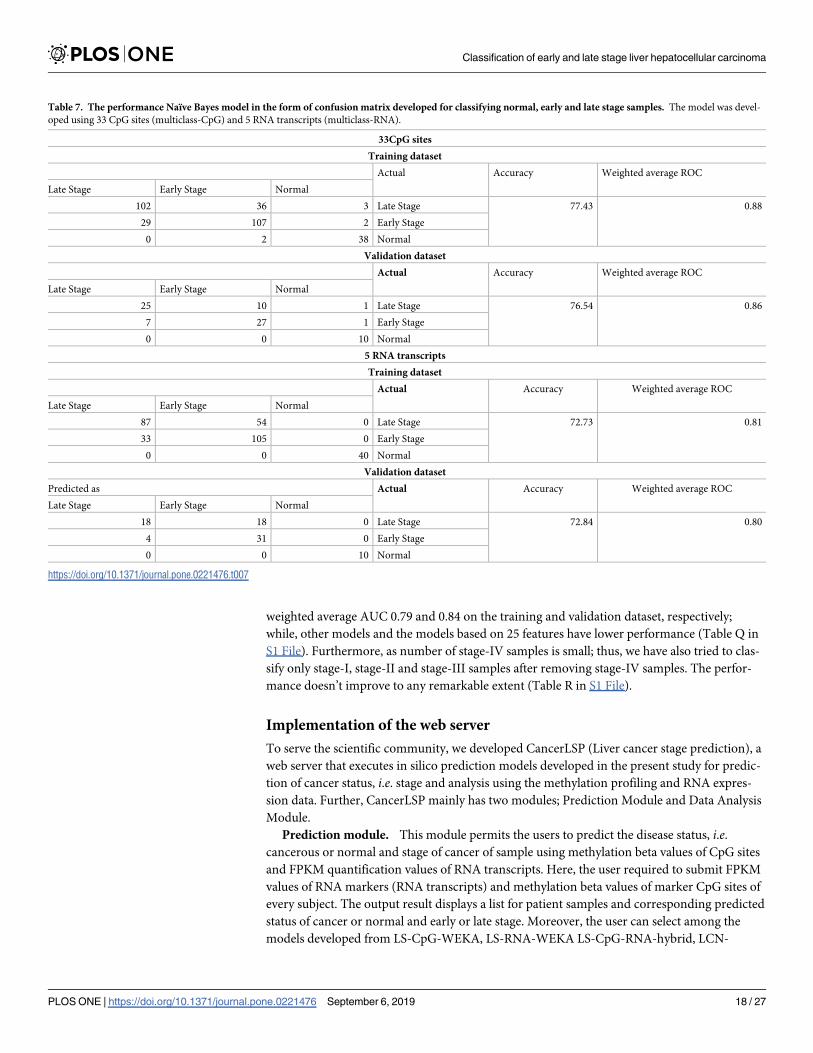
(multiclass-RNA) and subsequently prediction models developed using WEKA.classifiers.
meta.MultiClassClassifier of WEKA. The features are selected from 440 CpG sites, and 236
RNA transcripts that are significantly differentially methylated and differentially expressed
respectively (between 3 groups: cancer v/s normal and early stage v/s late stage). Here, predic-
tion models developed based on 33 CpG sites (multiclass-CpG) using various techniques of
WEKA. Naïve Bayes model is the top performer with an accuracy of 77.43 and 76.54 and
weighted average AUC 0.88 and 0.86 on the training and independent validation dataset,
respectively (Table 7). Besides, prediction models also devised based on 5 RNA transcripts
(multiclass-RNA); the Naïve Bayes model using 5 RNA transcripts achieves maximum perfor-
mance with an accuracy of 72.73% and 72.84 and weighted average AUC 0.81 and 0.80 on the
training and an independent validation dataset respectively (Table 7). The boxplots illustrate
the methylation and expression pattern of 33 CpG sites and 5 RNA transcripts (Figure G in S2
File). Additionally, we also developed prediction models based on 284 features selected by
WEKA from all 60,483 RNA transcripts using different techniques. Here, the model based on
Random forest classifies samples with the accuracy of 78.99% and 70.37%, weighted average
AUC 0.88 and 0.80 of training and independent datasets (Table N in S1 File). Complete results
of prediction models based on 33 CpG sites 5 and 284 RNA transcripts using various methods
implementing WEKA have been shown in the table (Table O in S1 File).
Enrichment analysis of multiclass-RNA is represented in Figures (Figure H in S2 File).
MT1E, CNDP1, C7, GMNN, and EEF1A2 are among the 5 RNA transcripts identified in
multiclass classification. Enrichment analysis indicated upregulated genes such as GMNN and
EEF1A2, are enriched in various growth promoting processes and pathways, while downregu-
lated genes like CNDP1 andMT1E enriched in negative regulators of growth and C7 enriched
in innate immunity pathways respectively. Multiclass-RNA signature with their biological
importance is tabulated in Table P in S1 File.
Multiclass-stage classification
To identify the features that can classify stage-I, stage-II and stage-III-IV tissue samples;
first, we have selected 25 features (8CpG sites + 17RNA transcripts) using WEKA and also
employed 51 hybrid features (which were chosen to distinguish early and late stage). Further,
prediction models developed using these features implementing WEKA.classifiers.meta.Multi-
ClassClassifier of WEKA. The Naïve Bayes prediction model based on 51 features attained
moderate performance to classify all three stages with an accuracy of 59.13% and 66.19% with
Table 6. The performance of models developed for discriminating LIHC and normal samples using 5 RNA transcripts.
Machine Learning Techniques Dataset Performance Measures
Sensitivity
(%)
Specificity
(%)
Accuracy
(%)
MCC AUC with 95% CI
SVM Training 97.32 97.5 97.35 0.89 0.99 (0.98–0.99)
Validation 97.33 90 96.47 0.84 0.97 (0.94–1)
Random Forest Training 97.66 90 96.76 0.85 0.98 (0.94–1)
Validation 98.67 80 96.47 0.82 0.89 (0.84–0.95)
Naïve Bayes Training 96.66 97.5 96.76 0.86 0.97 (0.94–0.99)
Validation 97.33 90 96.47 0.84 0.94 (0.84–1)
SMO Training 97.32 97.5 97.35 0.89 0.97 (0.94–1)
Validation 97.33 90 96.47 0.84 0.94 (0.84–1)
J48 Training 96.99 97.5 97.05 0.87 0.96 (0.94–0.99)
Validation 98.67 90 97.65 0.89 0.94 (0.84–1)
https://doi.org/10.1371/journal.pone.0221476.t006
Classification of early and late stage liver hepatocellular carcinoma
PLOS ONE | https://doi.org/10.1371/journal.pone.0221476 September 6, 2019 17 / 27
weighted average AUC 0.79 and 0.84 on the training and validation dataset, respectively;
while, other models and the models based on 25 features have lower performance (Table Q in
S1 File). Furthermore, as number of stage-IV samples is small; thus, we have also tried to clas-
sify only stage-I, stage-II and stage-III samples after removing stage-IV samples. The perfor-
mance doesn’t improve to any remarkable extent (Table R in S1 File).
Implementation of the web server
To serve the scientific community, we developed CancerLSP (Liver cancer stage prediction), a
web server that executes in silico prediction models developed in the present study for predic-
tion of cancer status, i.e. stage and analysis using the methylation profiling and RNA expres-
sion data. Further, CancerLSP mainly has two modules; Prediction Module and Data Analysis
Module.
Prediction module. This module permits the users to predict the disease status, i.e.cancerous or normal and stage of cancer of sample using methylation beta values of CpG sites
and FPKM quantification values of RNA transcripts. Here, the user required to submit FPKM
values of RNA markers (RNA transcripts) and methylation beta values of marker CpG sites of
every subject. The output result displays a list for patient samples and corresponding predicted
status of cancer or normal and early or late stage. Moreover, the user can select among the
models developed from LS-CpG-WEKA, LS-RNA-WEKA LS-CpG-RNA-hybrid, LCN-
Table 7. The performance Naïve Bayes model in the form of confusion matrix developed for classifying normal, early and late stage samples. The model was devel-
oped using 33 CpG sites (multiclass-CpG) and 5 RNA transcripts (multiclass-RNA).
33CpG sites
Training dataset
Actual Accuracy Weighted average ROC
Late Stage Early Stage Normal
102 36 3 Late Stage 77.43 0.88
29 107 2 Early Stage
0 2 38 Normal
Validation dataset
Actual Accuracy Weighted average ROC
Late Stage Early Stage Normal
25 10 1 Late Stage 76.54 0.86
7 27 1 Early Stage
0 0 10 Normal
5 RNA transcripts
Training dataset
Actual Accuracy Weighted average ROC
Late Stage Early Stage Normal
87 54 0 Late Stage 72.73 0.81
33 105 0 Early Stage
0 0 40 Normal
Validation dataset
Predicted as Actual Accuracy Weighted average ROC
Late Stage Early Stage Normal
18 18 0 Late Stage 72.84 0.80
4 31 0 Early Stage
0 0 10 Normal
https://doi.org/10.1371/journal.pone.0221476.t007
Classification of early and late stage liver hepatocellular carcinoma
PLOS ONE | https://doi.org/10.1371/journal.pone.0221476 September 6, 2019 18 / 27
5-CpG, LCN-5-RNA, multiclass-RNA, and multiclass-RNA which have been identified as
putative markers sets for stage progression of LIHC.
Data Analysis Module. This module is beneficial in assessing the role of each RNA tran-
script and CpG site to distinguish early stage from the late stage. In addition, it provides a p-
value for every feature that indicates whether there is a significant difference in the methyla-
tion pattern of CpG site or RNA expression in early and late stage. Furthermore, it also pro-
vides threshold-based ROC of each feature along with mean methylation of CpG site and
mean expression of that RNA transcript in the early and late stage of LIHC. This web server is
available from URL (http://webs.iiitd.edu.in/raghava/cancerlsp/) for the scientific community.
Discussion
LIHC has become a major threat worldwide owing to its high morbidity and mortality rate.
Furthermore, the appropriate treatment options are affected not only by the degree of liver
dysfunction but also by tumor stage [56]. Therefore, accurate stage classification and predic-
tion of disease at an early stage are crucial for patient management. Hence, the primary goal
of the present study is to identify the genomic and epigenomic features that distinguish the
early stage from the late stage of LIHC using TCGA cohort. To decipher the contribution of a
single feature (CpG site or gene) in the prediction of the early stage, we ranked differentially
methylated CpG sites and differentially expressed transcripts based on the AUC using a simple
threshold-based classification method.
Two highest scoring hypomethylated CpG sites in early stage i.e. cg07132710 and
cg11232136 (LS-CPG-AUC signatures) are associated with GATA2 and ZNF566 genes
respectively. While, four hypermethylated CpG sites in early stage (cg18578954, cg07402003
cg16657244, cg06176471) are associated with TRIM27, TOX3, NOLC1, and ATP1B1. In the lit-
erature, it has been shown that these genes are epigenetically regulated and associated with
cancer progression in different malignancies [57–63].
On ranking the gene expression of all the transcripts, we found NCAPH, CYP4A,
GLYATL1,HILPDA, CANT1, SLC2A2, ALDOA, CNFN, A1BG, CYP2B6,HN1, and ITIH1were among top-ranking genes based on AUC. Previously, different reports uncover their
involvement in a variety of malignancies [64–71]. Evidently, recent studies have revealed the
association ofHN1 and SLC2A2 with the survival of LIHC patients and ITIH1 with the pro-
gression of LIHC [72–74]. Aberrant expression of ALDOA, EFNA3, and FTCD was also
observed in LIHC [75–78].
As cancer is a complex disease for which a single feature is not enough to define its progres-
sion. Therefore, we used state of the art machine learning techniques to elucidate key features
associated with LIHC stage and further improve the performance of the models. We found 21
CpG (LS-CPG-WEKA) methylation sites that achieved the AUC of 0.78 on validation data
to discriminate early stage from the late stage. Among LS-CPG-WEKA signature CpG sites
such as cg16657244, cg11232136, cg11023721, and cg27111890 are associated with NOLC1,
ZNF566, SMAD7 and UBASH3A respectively. Previously the aberrant methylation pattern of
these genes has been observed in different types of cancers [62].
We also report 30 RNA transcripts (LS-RNA-WEKA) that achieved the AUC of 0.77 on
the validation dataset. Among the 15 protein-coding transcripts in LS-RNA-WEKA signature,
DCK, CDCA5, RPP25, FUT11, NECAB1, FNTB, ZNF576, NETO2, and ELOVL3 are observed
as upregulated genes in late stage and are involved in cell division processes, transcriptional
regulation, while the genes downregulated in late stage such asMAT1A, LCAT, CFHR3 are
involved in normal functioning of liver including lipid and lipoprotein metabolism [79] (S6
Table). Previously, different studies have shown the role ofMAT1A in LIHC [80–82]. Two of
Classification of early and late stage liver hepatocellular carcinoma
PLOS ONE | https://doi.org/10.1371/journal.pone.0221476 September 6, 2019 19 / 27
the genes (CDCA5 and RAMP3) in this biomarker panel have already been identified as prog-
nostic markers in LIHC in the literature [83,84]. In the recent past, the role of pseudogenes
has been revealed in the pathogenesis of cancer including LIHC [85–88]. LS-RNA-WEKA also
contains 12 pseudogenes (9 processed, two unprocessed and one transcribed processed pseu-
dogenes) including RP3-375P9.2, GAPDHP63, PTMAP2, RPS3P7, FABP5P3, HNRNPA1P37,
AC018712.2 etc. They are observed as significantly upregulated in the late stage of LIHC sam-
ples in our study.
Models based on 21 methylation CpG sites and 30 RNA transcripts achieved reasonable
performance independently for classifying early and late stage tissue samples. On combining
these features or markers, hybrid prediction models developed based on 51 features can clas-
sify samples of independent validation dataset with higher performance with an accuracy of
nearly 78% and AUC 0.82.
In addition to stage classification, we have also elucidated vital features that are differen-
tially expressed in LIHC as compared to normal samples. Using a simple threshold-based
approach, we have identified the top 10 CpG sites and top 10 RNA transcripts that discrimi-
nate cancer samples from adjacent normal with AUC greater than 0.9. CLEC4G and CpG
site cg07274716 (associated with PITX1) distinguish cancer samples from normal with AUC
0.98 and 0.97 respectively. Earlier studies have shown the association of downregulation of
CLEC4G expression with the progression of LIHC [89,90]. Our study corroborates this signa-
ture marker in LIHC and further extends the importance of this gene as a diagnostic marker.
Also, one of CpG sites cg06353345 that can distinguish cancer normal samples with AUC 0.96
was also earlier observed hypomethylated in LIHC [91]. Previous reports indicate that the
hypermethylation of the PITX1 correlated with the tumor progression HNSCC [92] and ESCC
[93]. Similarly, the present study reveals the association hypermethylation of PITX1 with the
progression of LIHC.
Additionally, prediction models developed using multiple features filtered by different
techniques to distinguish cancer from control samples. Interestingly, our study has shown
that the model based on 5 features i.e. 5 RNA transcripts (CLEC4G, CLEC4M, FCN2, CLEC1B
and COLEC10), or 5 CpG sites (cg20855160, cg7614747, cg21009747, cg25792518 and
cg03497652) performed quite similar to that of models based on much large dimension of fea-
tures as indicated by the performance to discriminate cancer and normal samples with 96.47%
accuracy and AUC 0.97 on the independent validation dataset. Interestingly in the current
study, we observed that LCAT gene could classify cancer and normal samples with AUC 0.92,
is also identified as one of the important markers (LS-RNA-WEKA) to distinguish early stage
samples from the late stage. Thus, our report suggests the role of LCAT as an important signa-
ture marker in the progression of LIHC. Previously its association was observed with the poor
survival of LIHC patients [94].
Our next aim was to enhance our model for the stage classification, so we included the nor-
mal samples along with early and late stage samples to develop multiclass prediction models
that can separate normal, early stage and late stage tissue samples. The advantage of this
model as compared to the binary model is that it also captures the gene expression differences
between adjacent normal and early stage samples. Based on the 5 RNA transcripts include
MT1E, CNDP1, C7, GMNN, and EEF1A2, we achieved an accuracy of 72.84% with weighted
AUC of 0.81. Further using 33 CpG sites (cg13093389, cg05488681, cg01426968, cg00590251,
cg14106046, cg08081390, cg06958636, cg18110553, cg17329745, cg22816909, cg07906520,
cg23931819 etc) accuracy of 77.54% and weighted AUC 0.86 is obtained. Their enrichment
analysis shows that upregulated genes are enriched in various growth enhancing processes and
pathways such as positives regulation of different kinase signaling, GTPase; while downregu-
lated genes are enriched in negative regulators of growth processes and innate immunity
Classification of early and late stage liver hepatocellular carcinoma
PLOS ONE | https://doi.org/10.1371/journal.pone.0221476 September 6, 2019 20 / 27
pathways. This might lay insight towards their involvement in the progression of the cancerous
condition.
Conclusion
In summary, we have achieved only reasonable performance (AUC 0.82) using the hybrid
model based on 51 potential markers (include 21 CpG sites and 30 RNA transcripts) to classify
early stage from the late stage via our systematic analysis of methylation and gene expression
profiles of LIHC tissue despite implementing different approaches. In addition, 5 RNA and 5
CpG sites based prediction models distinguish cancer vs. normal samples with quite high pre-
cision. Furthermore, multiclass prediction models based on 5 RNA transcripts and 33 CpG
sites attained reasonable performance in categorizing normal, early and late stage samples.
Our findings suggest that the stage classification is a quite challenging task in comparison to
cancer vs. normal samples classification from their expression and methylation profiling.
Moreover, LIHC is a complex disease with various pathological bases; thus, our results raise
the hypothesis that the exploration of these potential biomarker combinations might offer
more accurate and precise diagnosis LIHC at the early stage.
Potential implications
We anticipate this study would be beneficial to recognize these new important epigenetic and
genomic-based candidate markers for early diagnosis of liver cancer. Their potential as a prog-
nostic marker of LIHC can be further investigated by clinicians and researchers involved in
the respective research area. We have integrated all our models based on these potential mark-
ers in the form of web server named CancerLSP for the use of scientific community working
in the respective research area.
Limitation of the study
In the current study, we have identified potential biomarkers based on genomic and epigenetic
profiles to differentiate the early and late of HCC with reasonable performance. One of the
limitations associated with these biomarkers is that they are derived from the tissue samples;
which required invasive approaches for their isolation. But, one can employ a similar strategy
if sufficient data is available for blood, serum, urine, cell-free DNA etc. to develop non-invasive
biomarkers. Furthermore, our study mainly based on TCGA high throughput datasets for
both internal and independent validation. These potential biomarkers further need to be vali-
dated on other external datasets derived from various other studies to elucidate their clinical
utility.
Supporting information
S1 File. Supplementary Tables.
(DOC)
S2 File. Supplementary Figures.
(DOCX)
Acknowledgments
The authors acknowledge funding agencies J. C. Bose National Fellowship (DST). HK and SB
are thankful to CSIR and ICMR for providing fellowships.
Classification of early and late stage liver hepatocellular carcinoma
PLOS ONE | https://doi.org/10.1371/journal.pone.0221476 September 6, 2019 21 / 27
Author Contributions
Conceptualization: Harpreet Kaur, Gajendra P. S. Raghava.
Data curation: Harpreet Kaur.
Formal analysis: Harpreet Kaur, Sherry Bhalla, Gajendra P. S. Raghava.
Funding acquisition: Gajendra P. S. Raghava.
Investigation: Gajendra P. S. Raghava.
Methodology: Harpreet Kaur, Sherry Bhalla.
Project administration: Gajendra P. S. Raghava.
Resources: Gajendra P. S. Raghava.
Supervision: Gajendra P. S. Raghava.
Validation: Harpreet Kaur, Sherry Bhalla.
Visualization: Harpreet Kaur, Gajendra P. S. Raghava.
Writing – original draft: Harpreet Kaur, Sherry Bhalla.
Writing – review & editing: Harpreet Kaur, Sherry Bhalla, Gajendra P. S. Raghava.
References1. Bray F, Ferlay J, Soerjomataram I, Siegel RL, Torre LA, Jemal A. Global cancer statistics 2018: GLO-
BOCAN estimates of incidence and mortality worldwide for 36 cancers in 185 countries. CA Cancer J
Clin. American Cancer Society; 2018; 68: 394–424. https://doi.org/10.3322/caac.21492 PMID:
30207593
2. Siegel RL, Miller KD, Jemal A. Cancer statistics, 2019. CA Cancer J Clin. 2019; 69: 7–34. https://doi.
org/10.3322/caac.21551 PMID: 30620402
3. Herceg Z, Paliwal A. Epigenetic mechanisms in hepatocellular carcinoma: how environmental factors
influence the epigenome. Mutat Res. 2011; 727: 55–61. https://doi.org/10.1016/j.mrrev.2011.04.001
PMID: 21514401
4. El-Serag HB. Epidemiology of Viral Hepatitis and Hepatocellular Carcinoma. Gastroenterology. 2012;
142: 1264–1273.e1. https://doi.org/10.1053/j.gastro.2011.12.061 PMID: 22537432
5. Poon D, Anderson BO, Chen L-T, Tanaka K, Lau WY, Van Cutsem E, et al. Management of hepatocel-
lular carcinoma in Asia: consensus statement from the Asian Oncology Summit 2009. Lancet Oncol.
2009; 10: 1111–1118. https://doi.org/10.1016/S1470-2045(09)70241-4 PMID: 19880065
6. Kimhofer T, Fye H, Taylor-Robinson S, Thursz M, Holmes E. Proteomic and metabonomic biomarkers
for hepatocellular carcinoma: a comprehensive review. Br J Cancer. 2015; 112: 1141–1156. https://doi.
org/10.1038/bjc.2015.38 PMID: 25826224
7. Sukowati CH. Significance of hepatitis virus infection in the oncogenic initiation of hepatocellular carci-
noma. World J Gastroenterol. 2016; 22: 1497. https://doi.org/10.3748/wjg.v22.i4.1497 PMID: 26819517
8. [DETECTION OF EMBRYO-SPECIFIC ALPHA-GLOBULIN IN THE BLOOD SERUM OF A PATIENT
WITH PRIMARY LIVER CANCER].—PubMed—NCBI [Internet]. [cited 1 Apr 2019]. https://www.ncbi.
nlm.nih.gov/pubmed/?term=%5BDetection+of+Embryo-Specific+Alpha-Globulin+in+the+Blood
+Serum+of+a+Patient+with+Primary+Liver+Cancer
9. Debruyne EN, Delanghe JR. Diagnosing and monitoring hepatocellular carcinoma with alpha-fetopro-
tein: new aspects and applications. Clin Chim Acta. 2008; 395: 19–26. https://doi.org/10.1016/j.cca.
2008.05.010 PMID: 18538135
10. Bruix J, Sherman M, American Association for the Study of Liver Diseases. Management of hepatocel-
lular carcinoma: An update. Hepatology. 2011; 53: 1020–1022. https://doi.org/10.1002/hep.24199
PMID: 21374666
11. Li D, Satomura S. Biomarkers for Hepatocellular Carcinoma (HCC): An Update. Adv Exp Med Biol.
2015; 867: 179–93. https://doi.org/10.1007/978-94-017-7215-0_12 PMID: 26530367
12. Lou J, Zhang L, Lv S, Zhang C, Jiang S. Biomarkers for Hepatocellular Carcinoma. Biomark Cancer.
2017; 9: 1–9. https://doi.org/10.1177/1179299X16684640 PMID: 28469485
Classification of early and late stage liver hepatocellular carcinoma
PLOS ONE | https://doi.org/10.1371/journal.pone.0221476 September 6, 2019 22 / 27
13. Huang J, Zeng Y. Current clinical uses of the biomarkers for hepatocellular carcinoma. Drug Discov
Ther. 2014; 8: 98–9. http://www.ncbi.nlm.nih.gov/pubmed/24815586 PMID: 24815586
14. Li L, Lei Q, Zhang S, Kong L, Qin B. Screening and identification of key biomarkers in hepatocellular car-
cinoma: Evidence from bioinformatic analysis. Oncol Rep. 2017; 38: 2607–2618. https://doi.org/10.
3892/or.2017.5946 PMID: 28901457
15. Umeda S, Kanda M, Kodera Y. Emerging evidence of molecular biomarkers in hepatocellular carci-
noma. Histol Histopathol. 2018; 33: 343–355. https://doi.org/10.14670/HH-11-936 PMID: 28959824
16. Hu B, Jiang D, Chen Y, Wei L, Zhang S, Zhao F, et al. High CHMP4B expression is associated with
accelerated cell proliferation and resistance to doxorubicin in hepatocellular carcinoma. Tumor Biol.
2015; 36: 2569–2581. https://doi.org/10.1007/s13277-014-2873-1 PMID: 25874485
17. Tang B, Tang F, Li B, Yuan S, Xu Q, Tomlinson S, et al. High USP22 expression indicates poor progno-
sis in hepatocellular carcinoma. Oncotarget. 2015; 6: 12654–67. https://doi.org/10.18632/oncotarget.
3705 PMID: 25909224
18. Xiao S, Chang R-M, Yang M-Y, Lei X, Liu X, Gao W-B, et al. Actin-like 6A predicts poor prognosis of
hepatocellular carcinoma and promotes metastasis and epithelial-mesenchymal transition. Hepatology.
2016; 63: 1256–71. https://doi.org/10.1002/hep.28417 PMID: 26698646
19. SHIMIZU D, KANDA M, SUGIMOTO H, SUEOKA S, TAKAMI H, EZAKA K, et al. NRAGE promotes the
malignant phenotype of hepatocellular carcinoma. Oncol Lett. 2016; 11: 1847–1854. https://doi.org/10.
3892/ol.2016.4120 PMID: 26998088
20. Zheng H, Jiang W-H, Tian T, Tan H-S, Chen Y, Qiao G-L, et al. CBX6 overexpression contributes to
tumor progression and is predictive of a poor prognosis in hepatocellular carcinoma. Oncotarget. 2017;
8: 18872–18884. https://doi.org/10.18632/oncotarget.14770 PMID: 28122351
21. Kanda M, Sugimoto H, Nomoto S, Oya H, Hibino S, Shimizu D, et al. B-cell translocation gene 1 serves
as a novel prognostic indicator of hepatocellular carcinoma. Int J Oncol. 2015; 46: 641–8. https://doi.
org/10.3892/ijo.2014.2762 PMID: 25405901
22. Jiang F, Chen L, Yang Y-C, Wang X-M, Wang R-Y, Li L, et al. CYP3A5 Functions as a Tumor Suppres-
sor in Hepatocellular Carcinoma by Regulating mTORC2/Akt Signaling. Cancer Res. 2015; 75: 1470–
81. https://doi.org/10.1158/0008-5472.CAN-14-1589 PMID: 25649767
23. Shi Z, Liu J, Yu X, Huang J, Shen S, Zhang Y, et al. Loss of FOXF2 Expression Predicts Poor Prognosis
in Hepatocellular Carcinoma Patients. Ann Surg Oncol. 2016; 23: 211–7. https://doi.org/10.1245/
s10434-015-4515-2 PMID: 25824262
24. Hua L, Wang C-Y, Yao K-H, Chen J-T, Zhang J-J, Ma W-L. High expression of long non-coding RNA
ANRIL is associated with poor prognosis in hepatocellular carcinoma. Int J Clin Exp Pathol. 2015; 8:
3076–82. http://www.ncbi.nlm.nih.gov/pubmed/26045820 PMID: 26045820
25. Li T, Xie J, Shen C, Cheng D, Shi Y, Wu Z, et al. Upregulation of long noncoding RNA ZEB1-AS1 pro-
motes tumor metastasis and predicts poor prognosis in hepatocellular carcinoma. Oncogene. 2016; 35:
1575–1584. https://doi.org/10.1038/onc.2015.223 PMID: 26073087
26. Fang T-T, Sun X-J, Chen J, Zhao Y, Sun R-X, Ren N, et al. Long non-coding RNAs are differentially
expressed in hepatocellular carcinoma cell lines with differing metastatic potential. Asian Pac J Cancer
Prev. 2014; 15: 10513–24. http://www.ncbi.nlm.nih.gov/pubmed/25556502 https://doi.org/10.7314/
apjcp.2014.15.23.10513
27. Niu Z-S, Niu X-J, Wang W-H. Long non-coding RNAs in hepatocellular carcinoma: Potential roles and
clinical implications. World J Gastroenterol. 2017; 23: 5860. https://doi.org/10.3748/wjg.v23.i32.5860
PMID: 28932078
28. Mehra M, Chauhan R. Long Noncoding RNAs as a Key Player in Hepatocellular Carcinoma.
Biomark Cancer. 2017; 9: 1179299X1773730. https://doi.org/10.1177/1179299X17737301 PMID:
29147078
29. Pezzuto F, Izzo F, Buonaguro L, Annunziata C, Tatangelo F, Botti G, et al. Tumor specific mutations in
TERT promoter and CTNNB1 gene in hepatitis B and hepatitis C related hepatocellular carcinoma.
Oncotarget. 2016; 7: 54253–54262. https://doi.org/10.18632/oncotarget.9801 PMID: 27276713
30. Saito Y, Hibino S, Saito H. Alterations of epigenetics and microRNA in hepatocellular carcinoma. Hepa-
tol Res. 2014; 44: 31–42. https://doi.org/10.1111/hepr.12147 PMID: 23617364
31. Niu Z-S, Niu X-J, Wang W-H. Genetic alterations in hepatocellular carcinoma: An update. World J Gas-
troenterol. 2016; 22: 9069–9095. https://doi.org/10.3748/wjg.v22.i41.9069 PMID: 27895396
32. Zhang Y. Detection of Epigenetic Aberrations in the Development of Hepatocellular Carcinoma. Meth-
ods in molecular biology ( Clifton, NJ). 2015. pp. 709–731. https://doi.org/10.1007/978-1-4939-1804-1_
37 PMID: 25421688
33. Esteller M, Corn PG, Baylin SB, Herman JG. A gene hypermethylation profile of human cancer. Cancer
Res. 2001; 61: 3225–9. http://www.ncbi.nlm.nih.gov/pubmed/11309270 PMID: 11309270
Classification of early and late stage liver hepatocellular carcinoma
PLOS ONE | https://doi.org/10.1371/journal.pone.0221476 September 6, 2019 23 / 27
34. Bai WX, Gao J, Qian C, Zhang XQ. [A bioinformatics analysis of differentially expressed genes associ-
ated with liver cancer]. Zhonghua Gan Zang Bing Za Zhi. 2017; 25: 435–439. https://doi.org/10.3760/
cma.j.issn.1007-3418.2017.06.009 PMID: 28763861
35. Falcon T, Freitas M, Mello AC, Coutinho L, Alvares-da-Silva MR, Matte U. Analysis of the Cancer
Genome Atlas Data Reveals Novel Putative ncRNAs Targets in Hepatocellular Carcinoma. Biomed
Res Int. Hindawi; 2018; 2018: 1–9. https://doi.org/10.1155/2018/2864120 PMID: 30046591
36. Kim JW, Wang XW. Gene expression profiling of preneoplastic liver disease and liver cancer: a new era
for improved early detection and treatment of these deadly diseases? Carcinogenesis. Narnia; 2003;
24: 363–369. https://doi.org/10.1093/carcin/24.3.363 PMID: 12663493
37. Chen J, Qian Z, Li F, Li J, Lu Y. Integrative Analysis of Microarray Data to Reveal Regulation Patterns in
the Pathogenesis of Hepatocellular Carcinoma. Gut Liver. 2017; 11: 112–120. https://doi.org/10.5009/
gnl16063 PMID: 27458175
38. Chen J, Qian Z, Li F, Li J, Lu Y. Integrative Analysis of Microarray Data to Reveal Regulation Patterns in
the Pathogenesis of Hepatocellular Carcinoma. Gut Liver. 2017; 11: 112–120. https://doi.org/10.5009/
gnl16063 PMID: 27458175
39. Marshall A, Lukk M, Kutter C, Davies S, Alexander G, Odom DT. Global Gene Expression Profiling
Reveals SPINK1 as a Potential Hepatocellular Carcinoma Marker. Syn W-K, editor. PLoS One.
Public Library of Science; 2013; 8: e59459. https://doi.org/10.1371/journal.pone.0059459 PMID:
23527199
40. Marshall A. P41 Liver disease-specific gene expression profile in hepatocellular carcinoma. Gut. BMJ
Publishing Group; 2011; 60: A19–A20. https://doi.org/10.1136/gutjnl-2011-300857a.41
41. Bibikova M, Barnes B, Tsan C, Ho V, Klotzle B, Le JM, et al. High density DNA methylation array with
single CpG site resolution. Genomics. 2011; 98: 288–295. https://doi.org/10.1016/j.ygeno.2011.07.007
PMID: 21839163
42. Caret Package—A Complete Guide to Build Machine Learning in R [Internet]. [cited 2 Jul 2019]. https://
www.machinelearningplus.com/machine-learning/caret-package/
43. Fagerland MW, Sandvik L. Performance of five two-sample location tests for skewed distributions with
unequal variances. Contemp Clin Trials. 2009; 30: 490–6. https://doi.org/10.1016/j.cct.2009.06.007
PMID: 19577012
44. Fagerland MW. t-tests, non-parametric tests, and large studies—a paradox of statistical practice? BMC
Med Res Methodol. 2012; 12: 78. https://doi.org/10.1186/1471-2288-12-78 PMID: 22697476
45. Bhalla S, Chaudhary K, Kumar R, Sehgal M, Kaur H, Sharma S, et al. Gene expression-based biomark-
ers for discriminating early and late stage of clear cell renal cancer. Sci Rep. 2017; 7: 44997. https://doi.
org/10.1038/srep44997 PMID: 28349958
46. Frank E, Hall M, Trigg L, Holmes G, Witten IH. Data mining in bioinformatics using Weka. Bioinformat-
ics. 2004; 20: 2479–81. https://doi.org/10.1093/bioinformatics/bth261 PMID: 15073010
47. Joachims T, Thorsten. Learning to classify text using support vector machines [Internet]. Kluwer Aca-
demic Publishers; 2002. https://dl.acm.org/citation.cfm?id=572351
48. Qureshi A, Thakur N, Kumar M. VIRsiRNApred: a web server for predicting inhibition efficacy of siRNAs
targeting human viruses. J Transl Med. 2013; 11: 305. https://doi.org/10.1186/1479-5876-11-305
PMID: 24330765
49. Jagga Z, Gupta D. Classification models for clear cell renal carcinoma stage progression, based on
tumor RNAseq expression trained supervised machine learning algorithms. BMC Proc. 2014; 8: S2.
https://doi.org/10.1186/1753-6561-8-S6-S2 PMID: 25374611
50. Bhalla S, Chaudhary K, Kumar R, Sehgal M, Kaur H, Sharma S, et al. Gene expression-based biomark-
ers for discriminating early and late stage of clear cell renal cancer. Sci Rep. 2017; 7: 44997. https://doi.
org/10.1038/srep44997 PMID: 28349958
51. Nagpal G, Chaudhary K, Agrawal P, Raghava GPS. Computer-aided prediction of antigen presenting
cell modulators for designing peptide-based vaccine adjuvants. J Transl Med. BioMed Central; 2018;
16: 181. https://doi.org/10.1186/s12967-018-1560-1 PMID: 29970096
52. Agrawal P, Bhalla S, Chaudhary K, Kumar R, Sharma M, Raghava GPS. In Silico Approach for Predic-
tion of Antifungal Peptides. Front Microbiol. 2018; 9: 323. https://doi.org/10.3389/fmicb.2018.00323
PMID: 29535692
53. Robin X, Turck N, Hainard A, Tiberti N, Lisacek F, Sanchez J-C, et al. pROC: an open-source package
for R and S+ to analyze and compare ROC curves. BMC Bioinformatics. 2011; 12: 77. https://doi.org/
10.1186/1471-2105-12-77 PMID: 21414208
54. Kuleshov M V, Jones MR, Rouillard AD, Fernandez NF, Duan Q, Wang Z, et al. Enrichr: a comprehen-
sive gene set enrichment analysis web server 2016 update. Nucleic Acids Res. 2016; 44: W90–7.
https://doi.org/10.1093/nar/gkw377 PMID: 27141961
Classification of early and late stage liver hepatocellular carcinoma
PLOS ONE | https://doi.org/10.1371/journal.pone.0221476 September 6, 2019 24 / 27
55. DeBerardinis RJ, Sayed N, Ditsworth D, Thompson CB. Brick by brick: metabolism and tumor cell
growth. Curr Opin Genet Dev. 2008; 18: 54–61. https://doi.org/10.1016/j.gde.2008.02.003 PMID:
18387799
56. EASL–EORTC Clinical Practice Guidelines: Management of hepatocellular carcinoma. J Hepatol.
2012; 56: 908–943. https://doi.org/10.1016/j.jhep.2011.12.001 PMID: 22424438
57. Weber M, Davies JJ, Wittig D, Oakeley EJ, Haase M, Lam WL, et al. Chromosome-wide and promoter-
specific analyses identify sites of differential DNA methylation in normal and transformed human cells.
Nat Genet. 2005; 37: 853–62. https://doi.org/10.1038/ng1598 PMID: 16007088
58. Kandimalla R, van Tilborg AAG, Kompier LC, Stumpel DJPM, Stam RW, Bangma CH, et al. Genome-
wide analysis of CpG island methylation in bladder cancer identified TBX2, TBX3, GATA2, and ZIC4 as
pTa-specific prognostic markers. Eur Urol. 2012; 61: 1245–56. https://doi.org/10.1016/j.eururo.2012.
01.011 PMID: 22284968
59. Heyn H, Carmona FJ, Gomez A, Ferreira HJ, Bell JT, Sayols S, et al. DNA methylation profiling in breast
cancer discordant identical twins identifies DOK7 as novel epigenetic biomarker. Carcinogenesis. 2013;
34: 102–8. https://doi.org/10.1093/carcin/bgs321 PMID: 23054610
60. DUAN X, ZHANG J, LIU S, ZHANG M, WANG Q, CHENG J. Methylation of nucleolar and coiled-body
phosphoprotein 1 is associated with the mechanism of tumorigenesis in hepatocellular carcinoma.
Oncol Rep. 2013; 30: 2220–2228. https://doi.org/10.3892/or.2013.2676 PMID: 23970161
61. Selvakumar P, Owens TA, David JM, Petrelli NJ, Christensen BC, Lakshmikuttyamma A, et al. Epige-
netic silencing of Na,K-ATPase β 1 subunit gene ATP1B1 by methylation in clear cell renal cell carci-
noma. Epigenetics. Taylor & Francis; 2014; 9: 579–86. https://doi.org/10.4161/epi.27795 PMID:
24452105
62. Tessema M, Yingling CM, Snider AM, Do K, Juri DE, Picchi MA, et al. GATA2 is epigenetically
repressed in human and mouse lung tumors and is not requisite for survival of KRAS mutant lung can-
cer. J Thorac Oncol. 2014; 9: 784–93. https://doi.org/10.1097/JTO.0000000000000165 PMID:
24807155
63. Han Y-J, Zhang J, Zheng Y, Huo D, Olopade OI. Genetic and Epigenetic Regulation of TOX3 Expres-
sion in Breast Cancer. Suzuki H, editor. PLoS One. 2016; 11: e0165559. https://doi.org/10.1371/
journal.pone.0165559 PMID: 27806084
64. Chen Q, Watson JT, Marengo SR, Decker KS, Coleman I, Nelson PS, et al. Gene expression in the
LNCaP human prostate cancer progression model: progression associated expression in vitro corre-
sponds to expression changes associated with prostate cancer progression in vivo. Cancer Lett. 2006;
244: 274–88. https://doi.org/10.1016/j.canlet.2005.12.027 PMID: 16500022
65. Gerhardt J, Steinbrech C, Buchi O, Behnke S, Bohnert A, Fritzsche F, et al. The androgen-regulated
Calcium-Activated Nucleotidase 1 (CANT1) is commonly overexpressed in prostate cancer and is
tumor-biologically relevant in vitro. Am J Pathol. 2011; 178: 1847–60. https://doi.org/10.1016/j.ajpath.
2010.12.046 PMID: 21435463
66. Canales NAG, Marina VM, Castro JS, Jimenez AA, Mendoza-Hernandez G, McCARRON EL, et al.
A1BG and C3 are overexpressed in patients with cervical intraepithelial neoplasia III. Oncol Lett. 2014;
8: 939–947. https://doi.org/10.3892/ol.2014.2195 PMID: 25009667
67. Royse KE, Zhi D, Conner MG, Clodfelder-Miller B, Srinivasasainagendra V, Vaughan LK, et al. Differen-
tial Gene Expression Landscape of Co-Existing Cervical Pre-Cancer Lesions Using RNA-seq. Front
Oncol. 2014; 4: 339. https://doi.org/10.3389/fonc.2014.00339 PMID: 25505737
68. Kawai K, Uemura M, Munakata K, Takahashi H, Haraguchi N, Nishimura J, et al. Fructose-bispho-
sphate aldolase A is a key regulator of hypoxic adaptation in colorectal cancer cells and involved in
treatment resistance and poor prognosis. Int J Oncol. 2017; 50: 525–534. https://doi.org/10.3892/ijo.
2016.3814 PMID: 28000858
69. Zhang F, Lin J-D, Zuo X-Y, Zhuang Y-X, Hong C-Q, Zhang G-J, et al. Elevated transcriptional levels of
aldolase A (ALDOA) associates with cell cycle-related genes in patients with NSCLC and several solid
tumors. BioData Min. 2017; 10: 6. https://doi.org/10.1186/s13040-016-0122-4 PMID: 28191039
70. Yin L, Jiang L-P, Shen Q-S, Xiong Q-X, Zhuo X, Zhang L-L, et al. NCAPH plays important roles in
human colon cancer. Cell Death Dis. 2017; 8: e2680. https://doi.org/10.1038/cddis.2017.88 PMID:
28300828
71. Chen XW, Yu TJ, Zhang J, Li Y, Chen HL, Yang GF, et al. CYP4A in tumor-associated macrophages
promotes pre-metastatic niche formation and metastasis. Oncogene. 2017; 36: 5045–5057. https://doi.
org/10.1038/onc.2017.118 PMID: 28481877
72. Hamm A, Veeck J, Bektas N, Wild PJ, Hartmann A, Heindrichs U, et al. Frequent expression loss of
Inter-alpha-trypsin inhibitor heavy chain (ITIH) genes in multiple human solid tumors: a systematic
expression analysis. BMC Cancer. 2008; 8: 25. https://doi.org/10.1186/1471-2407-8-25 PMID:
18226209
Classification of early and late stage liver hepatocellular carcinoma
PLOS ONE | https://doi.org/10.1371/journal.pone.0221476 September 6, 2019 25 / 27
73. Nault J, De Reyniès A, Villanueva A, Calderaro J, Rebouissou S, Couchy G, et al. A Hepatocellular Car-
cinoma 5-Gene Score Associated With Survival of Patients After Liver Resection. Gastroenterology.
2013; 145: 176–187. https://doi.org/10.1053/j.gastro.2013.03.051 PMID: 23567350
74. Kim YH, Jeong DC, Pak K, Han M-E, Kim J-Y, Liangwen L, et al. SLC2A2 (GLUT2) as a novel prognos-
tic factor for hepatocellular carcinoma. Oncotarget. 2017; 8: 68381–68392. https://doi.org/10.18632/
oncotarget.20266 PMID: 28978124
75. Seimiya M, Tomonaga T, Matsushita K, Sunaga M, Oh-Ishi M, Kodera Y, et al. Identification of novel
immunohistochemical tumor markers for primary hepatocellular carcinoma; clathrin heavy chain and
formiminotransferase cyclodeaminase. Hepatology. 2008; 48: 519–30. https://doi.org/10.1002/hep.
22364 PMID: 18571811
76. Hamaguchi T, Iizuka N, Tsunedomi R, Hamamoto Y, Miyamoto T, Iida M, et al. Glycolysis module acti-
vated by hypoxia-inducible factor 1alpha is related to the aggressive phenotype of hepatocellular carci-
noma. Int J Oncol. 2008; 33: 725–31. http://www.ncbi.nlm.nih.gov/pubmed/18813785 PMID: 18813785
77. Gomez-Maldonado L, Tiana M, Roche O, Prado-Cabrero A, Jensen L, Fernandez-Barral A, et al.
EFNA3 long noncoding RNAs induced by hypoxia promote metastatic dissemination. Oncogene. 2015;
34: 2609–20. https://doi.org/10.1038/onc.2014.200 PMID: 25023702
78. Chaudhary K, Poirion OB, Lu L, Garmire LX. Deep Learning-Based Multi-Omics Integration Robustly
Predicts Survival in Liver Cancer. Clin Cancer Res. 2018; 24: 1248–1259. https://doi.org/10.1158/1078-
0432.CCR-17-0853 PMID: 28982688
79. Szklarczyk D, Franceschini A, Wyder S, Forslund K, Heller D, Huerta-Cepas J, et al. STRING v10: pro-
tein-protein interaction networks, integrated over the tree of life. Nucleic Acids Res. 2015; 43: D447–52.
https://doi.org/10.1093/nar/gku1003 PMID: 25352553
80. Lu SC, Mato JM. Role of methionine adenosyltransferase and S-adenosylmethionine in alcohol-associ-
ated liver cancer. Alcohol. 2005; 35: 227–34. https://doi.org/10.1016/j.alcohol.2005.03.011 PMID:
16054984
81. Lu SC, Mato JM. S -adenosylmethionine in Liver Health, Injury, and Cancer. Physiol Rev. 2012; 92:
1515–1542. https://doi.org/10.1152/physrev.00047.2011 PMID: 23073625
82. Ramani K, Lu SC. Methionine adenosyltransferases in liver health and diseases. Liver Res. 2017; 1:
103–111. https://doi.org/10.1016/j.livres.2017.07.002 PMID: 29170720
83. Shen Z, Yu X, Zheng Y, Lai X, Li J, Hong Y, et al. CDCA5 regulates proliferation in hepatocellular carci-
noma and has potential as a negative prognostic marker. Onco Targets Ther. 2018; 11: 891–901.
https://doi.org/10.2147/OTT.S154754 PMID: 29503564
84. Fang A, Zhou S, Su X, Liu C, Chen X, Wan Y, et al. RAMP3 is a prognostic indicator of liver cancer and
might reduce the adverse effect of TP53 mutation on survival. Future Oncol. 2018; 14: 2615–2625.
https://doi.org/10.2217/fon-2018-0296 PMID: 29882679
85. Kong Y, Zhang L, Huang Y, He T, Zhang L, Zhao X, et al. Pseudogene PDIA3P1 promotes cell prolifera-
tion, migration and invasion, and suppresses apoptosis in hepatocellular carcinoma by regulating the
p53 pathway. Cancer Lett. 2017; 407: 76–83. https://doi.org/10.1016/j.canlet.2017.07.031 PMID:
28823960
86. Cooke SL, Shlien A, Marshall J, Pipinikas CP, Martincorena I, Tubio JMC, et al. Processed pseudo-
genes acquired somatically during cancer development. Nat Commun. 2014; 5: 3644. https://doi.org/
10.1038/ncomms4644 PMID: 24714652
87. Xiao-Jie L, Ai-Mei G, Li-Juan J, Jiang X. Pseudogene in cancer: real functions and promising signature.
J Med Genet. 2015; 52: 17–24. https://doi.org/10.1136/jmedgenet-2014-102785 PMID: 25391452
88. Shi X, Nie F, Wang Z, Sun M. Pseudogene-expressed RNAs: a new frontier in cancers. Tumour Biol.
2016; 37: 1471–8. https://doi.org/10.1007/s13277-015-4482-z PMID: 26662308
89. Hodo Y, Hashimoto S, Honda M, Yamashita T, Suzuki Y, Sugano S, et al. Comprehensive gene expres-
sion analysis of 50-end of mRNA identified novel intronic transcripts associated with hepatocellular carci-
noma. Genomics. 2010; 95: 217–223. https://doi.org/10.1016/j.ygeno.2010.01.004 PMID: 20096344
90. Chen J, Qian Z, Li F, Li J, Lu Y. Integrative Analysis of Microarray Data to Reveal Regulation Patterns in
the Pathogenesis of Hepatocellular Carcinoma. Gut Liver. 2017; 11: 112–120. https://doi.org/10.5009/
gnl16063 PMID: 27458175
91. Shen J, Wang S, Zhang Y-J, Kappil M, Wu H-C, Kibriya MG, et al. Genome-wide DNA methylation pro-
files in hepatocellular carcinoma. Hepatology. 2012; 55: 1799–1808. https://doi.org/10.1002/hep.25569
PMID: 22234943
92. Sailer V, Charpentier A, Dietrich J, Vogt TJ, Franzen A, Bootz F, et al. Intragenic DNA methylation of
PITX1 and the adjacent long non-coding RNA C5orf66-AS1 are prognostic biomarkers in patients with
head and neck squamous cell carcinomas. Langevin SM, editor. PLoS One. 2018; 13: e0192742.
https://doi.org/10.1371/journal.pone.0192742 PMID: 29425237
Classification of early and late stage liver hepatocellular carcinoma
PLOS ONE | https://doi.org/10.1371/journal.pone.0221476 September 6, 2019 26 / 27
93. Otsubo T, Yamada K, Hagiwara T, Oshima K, Iida K, Nishikata K, et al. DNA hypermethyation and
silencing of PITX1 correlated with advanced stage and poor postoperative prognosis of esophageal
squamous cell carcinoma. Oncotarget. 2017; 8: 84434–84448. https://doi.org/10.18632/oncotarget.
21375 PMID: 29137437
94. Yin F, Shu L, Liu X, Li T, Peng T, Nan Y, et al. Microarray-based identification of genes associated with
cancer progression and prognosis in hepatocellular carcinoma. J Exp Clin Cancer Res. 2016; 35: 127.
https://doi.org/10.1186/s13046-016-0403-2 PMID: 27567667
Classification of early and late stage liver hepatocellular carcinoma
PLOS ONE | https://doi.org/10.1371/journal.pone.0221476 September 6, 2019 27 / 27
Related Documents


![Transcriptional expressions of Chromobox 1/2/3/6/8 as ... · Liver Fold Change P value t-test Ref CBX1 Hepatocellular Carcinoma 2.688 4.33E-80 23.586 Roessler Liver 2[25] Hepatocellular](https://static.cupdf.com/doc/110x72/60623c7767ea2b0b6d294b7f/transcriptional-expressions-of-chromobox-12368-as-liver-fold-change-p-value.jpg)