1 2002-1 Classification of Births by Birth Weight and Gestational Age: An Application of Multivariate Mixture Models Timothy B. Gage University at Albany-SUNY and Southwest Foundation for Biomedical Research Draft July 2002 DRAFT COPY B NOT FOR CITATION OR QUOTATION WITHOUT THE AUTHORS= PERMISSION *Support for this research was provided by grants to the Center for Social and Demographic Analysis from NICHD (P30 HD32041) and NSF (SBR-9512290). Opinions, findings, and conclusions expressed here are those of the author and do not necessarily reflect the views of the funding agencies. Address all correspondence to Timothy B. Gage, Department of Anthropology, Arts & Sciences Building, Room 237, University at Albany, Albany, NY 12222. Office: 518-442- 4704 Fax: 518-442-5710

Welcome message from author
This document is posted to help you gain knowledge. Please leave a comment to let me know what you think about it! Share it to your friends and learn new things together.
Transcript
1
2002-1
Classification of Births by Birth Weight and Gestational Age: An Application
of Multivariate Mixture Models
Timothy B. Gage
University at Albany-SUNY
and
Southwest Foundation for Biomedical Research
Draft
July 2002
DRAFT COPY BB NOT FOR CITATION OR QUOTATION WITHOUT THE AUTHORS ==
PERMISSION
*Support for this research was provided by grants to the Center for Social and Demographic Analysis from NICHD (P30 HD32041) and NSF (SBR-9512290). Opinions, findings, and conclusions expressed here are those of the author and do not necessarily reflect the views of the funding agencies. Address all correspondence to Timothy B. Gage, Department of Anthropology, Arts & Sciences Building, Room 237, University at Albany, Albany, NY 12222. Office: 518-442-4704 Fax: 518-442-5710
2
Abstract
Multivariate Gaussian mixture models with covariates are used to study
the birth weight by gestational age distribution of several ethnically diverse
populations. The results suggest that birth cohorts are heterogeneous and
composed of at least two sub-populations. One sub-population accounting for
the majority of births has a higher mean birth weight and gestational age but
small variance. The other sub-population has a lower mean birth weight and
gestational but very large variances. As a result of the large variances this sub-
population accounts for most premature, intrauterine growth retarded, and,
post-term infants, i.e. all of the births traditionally considered to be
compromised. The model also suggests that a number of compromised births
occur within the normal birth weight and gestational age range. These births
have been largely overlooked in the birth outcomes literature because of the
difficulties of distinguishing them from normal births. An analysis of the effects
of maternal age (>19 years) indicate that birth weight increases and gestational
age declines with maternal age among normal births. The effects on
compromised births varies among ethnic groups. These models provide a
statistical method for detailed study of the birth weight by gestational age
distribution that is not possible with conventional methods.
3
Introduction
The proximate determinants model of infant mortality assumes that a
variety of exogenous determinants (such as socioeconomic level, maternal age,
parity etc) potentially influence mortality directly, as well as, indirectly through
intervening biological variables called proximate determinants(1). The most
important proximate determinants are considered to be birth weight and/or
gestational age. The extremes of birth weight and gestational age are
consistently associated with increased risk of infant morbidity and mortality(2-
7). Early studies focused on births weighting < 2500 grams, i.e. low birth weight
(LBW), as an indicator of elevated risk at both individual and population levels.
However, similar results have been reported for short gestational age, i.e.,
gestational lengths < 38 weeks (premature). Clearly birth weight is related to
gestational age, nevertheless, empirical research has shown that the combination
of both variables provides additional information. Mortality patterns differ
among infants that are LBW and premature, LBW and mature (intrauterine
growth retarded, IUGR) and normal birth weight and premature (2, 3, 8-12).
Infants may also be classified on the basis of weight at birth for gestational age.
This is more accurate then purely dichotomous classifications such as LBW,
premature or IUGR, because it uses continuous measures of birth weight and
gestational age. Nevertheless, the final result is generally dichotomized for
further analysis. Small for gestational age (SGA) is typically defined as the 10th
percentile of weight for gestational age, standardized on the data itself or on
some published standard (7, 11, 13).
While the proximate determinants model is generally used to
conceptualize infant mortality, the currently available statistical methodologies,
cannot fully operationalize this model. First, these methods can not account for
both the direct and indirect effects of exogenous variables. For example,
4
including a proximate determinant in a logistic regression often masks the
indirect effects on mortality of the exogenous variables that operate partially or
completely through a proximate determinant. Second, standard logistic
regression assumes that the birth cohort is homogeneous. Birth weight and
gestational age distributions are generally Gaussian i.e., normally distributed,
but with heavy upper and particularly lower tails. The heavy tails have
traditionally been cited as evidence that birth cohorts are heterogeneous,
possibly composed of several different sub-populations (2, 14-18). Third,
information is lost when continuous proximate determinants such as birth
weight or gestational age are dicotomized to facilitate analysis. And finally, it is
not clear that the cut points used to dicotomize birth weight and gestational age
are equivalent across diverse populations. Is the definition of LBW equally
applicable to European and African American births given that there are
significant differences in the mean birth weight of these two populations?
The research presented here is a step toward developing statistical
methods that better operationalize the proximate determinants model. Our
approach uses multivariate Gaussian mixture models to describe the birth
weight by gestational age distribution, and control for heterogeneity in the birth
cohort. Covariates can be introduced into the mixture model to account for the
effects of exogenous determinants on birth weight and gestational age. Finally,
each component of the mixture can be combined with a logistic regression model
to fully operationalize the proximate determinants model. This paper presents
the multivariate Gaussian mixture model with covariates and describes the birth
weight by gestational age distribution and the effects of maternal age on this
distribution. The specific aims are a) to apply the multivariate Gaussian mixture
model to eight populations differing by sex and ethnicity, b) to evaluate the
utility of this model for identifying compromised births compared to univariate
5
mixture models, and the traditional classification systems, and c) to estimate the
effects of maternal age on the birth weight by gestational age distribution in four
of the eight populations.
Methods
The probability density function of a two component multivariate
Gaussian mixture can be expressed as:
f (x) = 1
ρ ( 12 π Σp 1/ 2 )exp(−.5(x − up)Σ −1(x − up )) +
(1 − 1ρ )( 1
2 π Σ s1/ 2 )exp( −.5(x − us )Σ −1(x − us)) 1.
where 1/ρ is the mixing proportion (the proportion of the birth cohort in the
component labeled p, up and us are vectors of means for the primary (p) and
secondary (s) components of the mixture, Σp and Σs are variance-covariance
matrices for the primary and secondary components of the mixture, and x is the
data matrix of birth weight and gestational age. The covariance of gestational
age and birth weight accounts for the theoretical association between birth
weight and gestational age, while the variances of birth weight and gestational
age represent the variation in one independent of the other. In the results below
the covariances are presented as correlations, since these are more directly
interpretable.
Covariates on the birth weight and gestational age distribution can be
easily introduced by redefining the parameters of the mixture model as a
function of the covariates. For example, the mean of birth weight and/or
gestational age of the primary component might be defined as a linear function
of the covariate y, e.g. up =ap+bpy where ap and bp are vectors of coefficients for
birth weight and gestational age on the primary component. In the illustrative

6
analysis of maternal age presented below, age effects are examined for all four
means and for the mixing proportion.
Fitting is carried out using standard maximum likelihood methods, that
is, by minimizing the sum across the observed data of the negative log of the
probability density function (equation 1). The “ms” function of the Splus
statistical library (a quasi-Newton method) is employed here. Identical results
(without covaiates) can be obtained using the EM algorithm as implemented in
EMMIX (19).
The parsimonious mixture model is identified using standard hierarchical
procedures. Model 6 is the full model (equation 1). The nested models
examined are: Model 5; covariance term of the primary component is 0.0; Model
4; covariance term of the secondary component is 0.0; Model 3; covariance in
both the primary and secondary components are 0.0; Model 2; variance-
covariance matrix is equivalent in the primary and secondary components, and
Model 1; a single component (homogeneous) multivariate Gaussian model. In
general, comparisons of nested models are conducted using the standard
likelihood ratio criterion. However, comparisons of the number of components
in a mixture (models 6 with model 1) occur on a boundary and hence the
asymptotic properties of maximum likelihood do not apply and the standard
likelihood ratio criterion can not be assumed to be Chi-square (19). In this case a
bootstrap estimation of the “p” value (19, 20), is employed. This method uses
simulated data (of the same size as the original data set) based on the 1
component fit to the original data and then fits 1 and 2 component mixture
models to the simulated data. One hundred repetitions of this process provide a
direct estimate of the probability density function of the likelihood ratio criterion
under the null hypothesis of a 1 component mixture. The significance of
maternal age as a covariate is also investigated using hierarchical methods. In

7
this case the most general model consists of Model 6 above with simple linear
models of maternal age replacing the mixing proportion and all four means. The
significance of a maternal age effect on each parameter is tested by comparing
the likelihood of the general model with a series of simpler models in which one
of the five coefficients on maternal age is set to 0.0.
Standard errors of the parameter estimates are estimated using bootstrap
methods. One hundred data sets (the same size as the original data set) are
generated by sampling with replacement from the original data set and then
fitted to the parsimonious model. The standard errors of the estimate are
computed as the standard deviation of the 100 estimates for each parameter.
The utility of the multivariate mixture model is contrasted to those of the
univariate birth weight and gestational age models based on their ability to
classify individuals into the components of the model. This is inversely related
to the degree of overlap between the probability density functions of the mixture
components. To estimate the degree of overlap, a cohort of 100,000 births was
simulated using the parsimonious fitted model. The result is a data set for
which birth weight, gestational age and component membership are known.
These data are then classified into the most likely components based only on
birth weight, and/or gestational age using the parsimonious fitted model. A
simple cross-tabulation of the known component membership versus predicted
component membership provides estimates of the proportion of observations
correctly and incorrectly classified. It should be noted that this procedure, like
standard linear discriminate functions, slightly overestimates the proportion of
correctly classified cases since the parameters used to generate the data and to
classify the data are identical. Nevertheless, it provides a useful relative
comparison of the classification efficiency of the multivariate with the two
univariate mixture models.
8
The data consists of all singleton live births in New York State in 1988 by
sex and ethnic group. The ethnic categories included are Asian, European
Hispanic, African, and European (non-Hispanic) Americans. All births to inter
ethnic unions, and with missing data are excluded. Birth weight is in grams.
Gestational age is in weeks (reported to the nearest day). Maternal age is
reported in years and the effects are examined on the African and European
American populations. Maternal ages less then 20 years have been excluded
from the analysis, since teenage child bearing is likely to introduce non-
linearities in the age effects. Sample statistics are presented in Table 1.
Table 1 about here
Results
The hierarchical analyses support the full two component multivariate
mixture model over simpler nested models (Table 2). The estimated parameters
of the parsimonious models for each sex and ethnic group are presented in Table
3. The primary component accounts for 82 to 89% of the birth cohort. The mean
birth weight and gestational age are higher in the primary component (3232 to
3568 grams for birth weight and 39.59 to 40.10 weeks for gestational age)
compared to the secondary component (2647 to 3139 grams for birth weight and
35.84 to 39.05 weeks for gestational age). The standard deviations in birth
weight and gestational age, on the other hand, are lower for the primary
component (368.1 to 467.6 grams for birth weight and 1.38 to 1.82 weeks for
gestational age) compared to the secondary component (774.9 to 990.5 grams for
birth weight and 4.01 to 5.56 weeks for gestational age). A graphical
representation of this distribution is presented in Figures 1 and 2. In general, the
primary component predominates in the region of the plot defined as “normal”
using the traditional classifications. Due to the large standard deviations the
9
secondary component predominates at the lowest and highest birth weights and
gestational ages, where LBW, premature, IUGR, and SGA births occur.
However, the secondary component also accounts for some births within the
normal range of birth weight and gestational age.
Table 2 about here
Table 3 about here
Figures 1 and 2 about here
Rejection of nested models with covariances set to 0.0 (Table 3) indicate
that birth weight is correlated with gestational age, i.e. that there is a joint effect.
This is not surprising. However, further analyses suggest that the correlation
between birth weight and gestational age is stronger in the secondary
component (r=0.37 to 0.51) compared to the primary component (r=0.24 to 0.33)
(Table 3). These comparisons are statistically different in all populations except
Asian Americans (the smallest sample). In general, the correlation also appears
to be slightly stronger for males than females, although the sex differences have
not been statistically examined.
The classification efficiency of the multivariate mixture model is slightly
higher then the univariate gestational age model, and considerably higher then
the univariate birth weight model. Members of the primary component are
classified into the primary component more than 98% of the time in all models
and all populations examined. Thus about 98% of primary births occur within
the heavy circle in Figures 1 and 2 while only about 2% of primary births fall
outside of this circle. On the other hand, the efficiency of classifying individuals
in the secondary component is considerably more variable (Table 4). The
properly classified secondary births fall outside the heavy circle in Figures 1 and
2, the miss-classified secondary births all fall within the heavy circle. In general,
mixture models based on birth weight and gestational age correctly classify 43 to
10
62% of the secondary component, while mixture models based on gestational
age correctly classify 34 to 54% of secondary births, and models based on birth
weight correctly classify only 24 to 38% of secondary births.
Table 4 about here
Hierarchical analyses of maternal age indicates significant linear effects on
all five parameters for European Americans but significant effects on only the
primary component means for African Americans (results for male births for
women of maternal ages 20 and 40 are presented in Table 5). As maternal age
increases the primary component mean birth weight increases while the mean
gestational age declines. The coefficients are remarkably similar in both ethnic
groups (4.06 versus 5.70 gms. and –0.0225 versus –0.0186 weeks per year of
maternal age for European and African American males respectively). The effect
of maternal age on the secondary component of the birth cohort, however, differs
between the racial groups. Among African Americans, the means of the
secondary component do not change with age, while among European American
males, the mean of both birth weight and gestational age decline at rates of –13.2
gms and –0.0824 weeks per year of maternal age. On the other hand, the
proportion of births in the secondary component remains constant with respect
to maternal age among African Americans, and declines substantially among
European Americans. Thus among European Americans, births in the secondary
component decline with maternal age, except in the very lower left triangle of
the LBW-premature quadrangle (Figures 1 and 2), while among African
Americans births in this component remain constant with maternal age.
Table 5 about here
Discussion
There are potential limitations with all of the classification systems that
use gestational age. Gestational age is defined as the time from last menses to
11
birth where last menses is reported retrospectively by the mother. As a result of
inaccuracies in reporting last menses, both long and short gestational ages are
thought to be biased (21). In any event, gestational age incorporates
considerable estimation error, particularly compared to measures like birth
weight. Further, because it is reported retrospectively, gestational age is
missing more frequently than birth weight (Table 1). It is unclear what kind of
bias eliminating births with missing gestational ages introduces. On the other
hand, the utility of models that incorporate both birth weight and gestational age
are clearly established in the literature (8, 9, 11, 13), and are confirmed by the
multivariate mixture analyses presented above. There is a joint effect,
represented in our analysis by the co-variance terms, nevertheless considerable
variation in birth weight and gestational age remains after the joint effects are
removed. Thus, models that include both birth weight and gestational age are
better predictors of component membership than either component alone.
Additional research is needed to identify and evaluate the biases that might
result from excluding births with missing gestational ages. Nevertheless, there
are compelling reasons for including gestational age.
Empirically the mixture model results suggest that birth weight by
gestational age distributions is a contaminated Gaussian. The primary
component accounts for the majority of births and has higher mean birth weights
and gestational ages and relatively small variances and covariances. The
“contaminating” component, the secondary component, has lower means, but
very large variances and covariances. Due to the large variances, the secondary
component accounts for the majority of the births at low and high values of both
birth weight and gestational age. The secondary component also accounts for a
number of births, although not the majority, in the “normal” birth weight and
gestational age ranges. These results are similar to the univariate estimates (15,

12
17, 18). Thus all the extremes of this distribution appear to have heavy tails. In
addition the “normal” range is contaminated as well.
The analysis of the effects of maternal age on the birth weight gestational
age distribution indicates the utility of this approach with respect to identifying
covariates that effect the shape of this distribution. Conventional methods show
that birth weight increases and that mean gestational age decreases with
increasing maternal age (excluding births to teen age mothers). Although in
African Americans, it is sometimes reported that birth weight declines with
maternal age, i.e. Gernonimus’s “weathering“ hypothesis (22). The analysis
presented above, however, provides a more detailed empirical description of
the changes in the shape of the birth weight by gestational age distribution with
maternal age. The primary component’s mean birth weight increases and mean
gestational age decreases at similar rates, in both European and African
American populations. On the other hand, the proportion of the birth cohort in
the primary component increases in European Americans from about 80% at age
20 to about 93% at age 40, but remains constant in African Americans at about
80%. The secondary “contaminating” component mean birth weights and
gestational ages decline in European Americans but remain constant in African
Americans. Basically, the “heavy” tails of the birth weight by gestation age
distribution decline with maternal age in European Americans (except for births
in the extreme lower left corner of the distribution (LBW and premature), which
increase. However, the heavy tails remain constant in African Americans.
One interpretation of these results is that the primary component
represents a “normal” fetal growth sub-population that responds similarly to
maternal age in both racial groups. This accounts for the general trends, an
increase in birth weight and a decline in gestational age with maternal age (and
indirectly parity). The secondary “contaminating” component, on the other
13
hand, may represent a sub-population “compromised” in some way during fetal
development. The primary difference between the races is that the frequency of
the compromised sub-population declines with maternal age in European
Americans but not in African Americans. Thus these results do not support the
weathering hypothesis per se, which suggests that African American birth
outcomes worsen with maternal age. Rather they suggest that there is a sub-
population of African Americans who do not benefit from the improvements in
birth outcomes (decline in the overall size of the compromised sub-population)
that occur with maternal age in European Americans. These interpretations,
however, go beyond the empirical application of mixture modeling to describe
birth weight by gestational age distributions and assume that the components
reflect heterogeneous sub-populations in the birth cohort.
What evidence exists that the secondary component represents a
compromised sub-population in the birth cohort? First, the secondary
component accounts for all of the traditional classifications of compromised
births (Figures 1 and 2). The primary component is largely confined to births
with birth weights greater than 2500 grams and gestational ages longer than 37
weeks. The secondary component, on the other hand, accounts for premature,
LBW, IUGR, post-term, and macrosomic births. All of these characteristics are
associated with compromised fetal development and increased infant mortality
(8, 9, 11, 13).
If the secondary component does represent a “compromised” sub-
population, however, it suggest that more than 40% of these births occur within
the normal birth weight and gestational age ranges. In fact the secondary mean
of birth weight and gestational age always occurs within the area where births in
the primary component predominate. This characteristic of the model is likely
to be controversial. Umbach and Wilcox (16) have argued that the
14
epidemiological “concept” of birth weight distributions consists of a
predominant Gaussian distribution that is uncontaminated in the normal range,
but contaminated in the upper and lower tails. The theoretical strength of this
argument, however, tends to break down in the multivariate case, i.e. to have an
uncomtaminated multivariate Gaussian in the normal range one must assume
that it is surrounded by contaminating distributions, at least four (LBW, high
birth weight, premature, and post-term) and perhaps more. Further the
empirical work (15, 17) including Umbach and Wilcox’s (16), suggests that the
predominant Gaussian distribution is contaminated throughout its range.
Finally, there is every reason to assume that compromised births can occur
within the normal birth weight and gestational age ranges. Clinicians have
argued that some births have the genetic potential to be very large and despite
fetal asphyxia and wasting may not fall below the birth weight and gestational
age norms. Since these infants do not meet the traditional criterion for
compromised births, for example IUGR or SGA, they are not generally
recognized and as a result have not been carefully evaluated (13). The mixture
model approach not only provides evidence for the existence of these
compromised births, it also provides a basis for statistically characterizing these
previously under-recognized compromised births (15).
Second, known complications of pregnancy can account for characteristics
of the secondary component relative to the primary component. In general most
disturbances in fetal development can be expected to lower the fetal growth rate
and/or precipitate premature delivery and hence, mean birth weight and
gestational age should be lower in the compromised sub-population.
Conditions associated with these births include, congenital anomalies,
congenital infections (notably rubella, cytomegalovirus and Toxoplasma), fetal
and maternal nutritional status, hypertensive cardiovascular disease, toxemia,

15
small placenta, low socio-economic level, smoking and maternal alcohol
consumption. In general these conditions are thought to disrupt fetal growth
rates (11, 13). On the other hand, maternal diabetes, Beckwith syndrome, and Rh
isoimmunization are associated with very large infants, presumably due to
accelerated growth. Finally, post-mature infants, particularly those of relatively
low birth weight, display increased rates of congenital anomalies (11). The
combination of factors could account for the lower means but larger variances of
the secondary “contaminating” distribution compared to the primary
distribution.
Third, the relatively weaker correlation between birth weight and
gestational age in the primary component, compared to the secondary
component is consistent with “normal” births. Assuming that there is some
individual variation in fetal growth rates among normal births, and that a normal
birth occurs when the fetus is optimally developed, then a low correlation
between birth weight and gestational age might be expected. On the other hand,
if a birth is compromised during fetal development low birth weights are
expected if the disturbance results in an early delivery, while higher birth
weights are expected if gestation is prolonged as a response to the disturbance.
Thus the higher correlation between birth weight and gestational age in the
secondary component is consistent with the idea that this component consists of
a diverse set of births disturbed in some way during fetal development.
Finally, there is a close association between the size of the secondary
component and the level of infant mortality. The only exception appears to be
Asian American females (Tables 1 and 3), although this could be due to the
relatively small size of the Asian population. Thus there is a good deal of
circumstantial evidence that the two components of the mixture model may

16
reflect the presence of heterogeneous sub-populations within the birth cohort.
Further research is necessary to formally substantiate this hypothesis.
A significant advantage of the mixture modeling approach, compared to
traditional methods of classifying births, LBW, SGA etc. is that the mixture
models do not impose arbitrary standards on the data. Methods that depend
upon particular cut points such as LBW, IUGR, and premature raise the issue as
to whether these values are identical across populations (23). Should low birth
weight be defined as >2500 grams for both sexes or both European and African
Americans? These populations all have consistently different mean birth
weights. Perhaps the definition of low birth weight should differ among
populations (23). SGA suffers from similar problems in identifying and
justifying an appropriate standard of normal fetal growth and cut off level (e.g.
the tenth percentile), for identifying infants at risk (13). Mixture models, on the
other hand, use the distribution of the population itself to empirically determine
the size, location and spread of the secondary component. This by itself is an
advantage. However, if the mixture model does in fact identify heterogeneous
sub-populations then it measures directly what crude dichotomous concepts
such as LBW, premature, IUGR and SGA attempt to measure.
Conclusions
Overall, these considerations suggest that the secondary component of a
two component multivariate Gaussian mixture model is likely to be a better
definition of compromised births, and the population at risk of increased infant
morbidity and mortality then traditional classification systems. The method can
be extended to include the effects of exogenous covariates on the birth weight
and gestational age distribution. These covariates represent indirect effects on
morbidity and mortality that operate through their effects on the birth weight
and gestational age distribution. The task that remains is the development of

17
statistics that combine multivariate Gaussian mixture models with logistic
regression models so that mortality rates (or the strength of associations with
complications of pregnancy) can be estimated and studied for each sub-
population. Exogenous covariates introduced in the logistic regression models
represent direct effects of these covariates. Such models could fully
operationalize the proximate determinants model of infant mortality.
18
References 1. Eberstein, I. W. (1989) Sociological Forum 4, 409-422.
2. Karn, M. N. & Penrose, L. S. (1951) Ann. Eugen 16, 147-160.
3. Hoffman, H. J., Lundin, J. F. E., Bakketeig, L. S. & Harley, E. E. (1977) in
Epidemiology of Prematurity, eds. Reed, D. M. & Stanley, F. J. (Urban &
Schwarzenberg, Baltimore), pp. 297-333.
4. Medicine, I. o. (1985) Preventing Low Birthweight (National Academy Press,
Washington).
5. Sappenfield, W. M., Buehler, J. W., Binkin, N. J., Hogue, C. J. R., Strauss, L.
T. & Smith, J. C. (1987) Public Health Reports 102, 182-192.
6. Eberstein, I. W. (1989) Sociological Forum 4, 409-422.
7. Kline, J., Stein, Z. & Susser, M. (1989) Conception to Birth: Epidemiology of
Prenatal Development (Oxford University Press, New York).
8. Battaglia, F. C. & Lubchenco, L. O. (1967) Journal of Pediatrics 71, 159-163.
9. Lubchenco, L. O., Searls, D. T. & Brazie, J. V. (1972) Journal of Pediatrics 81,
814-822.
10. Susser, M., Marolla, F. M. & Fleiss, J. (1972) Am. Journal of Epidemiology 96,
197-204.
11. Lubchenco, L. O. & Koops, B. L. (1987) in Neonatology, ed. Avery, G. B. (J.
P. Lippincott Co., Philadelphia), pp. 235-257.
12. Wilcox, A. J. & Skjoerven, R. (1992) American Journal of Public Health 82, 378-
382.
13. Cassady, G. & Strange, M. (1987) in Neonatology, ed. Avery, G. B. (J. B.
Lippincott, Co., Philadelphia), pp. 299-331.
14. Brimblecombe, F. S. W., Ashford, J. R. & Fryer, J. G. (1968) Br. J. Prev Soc
Med 22, 27-35.

19
15. Fryer, J. G., Hunt, R. G. & Simons, A. M. (1984) in Prevention of Perinatal
Mortality and Morbidity, ed. Falkner, F. (Karger, Basel), Vol. Vol. 3, pp. 9-30.
16. Umbach, D. M. & Wilcox, A. J. (1996) Statistics in Medicine 15, 1333-1348.
17. Gage, T. B. & Therriault, G. (1998) Human Biology 70, 517-534.
18. Gage, T. B. (2000) American Journal of Human Biology 12, 181-191.
19. McLachlan, G. J. & Peel, D. (2000) Finite Mixture Models (Wiley, New York).
20. McLachlan, G. J. (1987) Appl. Statist. 36, 318-324.
21. Kramer, M. S., McLean, F. H., Boyd, M. E. & Usher, R. H. (1988) Journal of
the American Medical Association 260, 3306-3308. 22. Geronimus, A. T., (1996) Soc. Sci. Med. 42, 589-597
23. Rooth, G. (1980) The Lancet 22, 639-641.
20
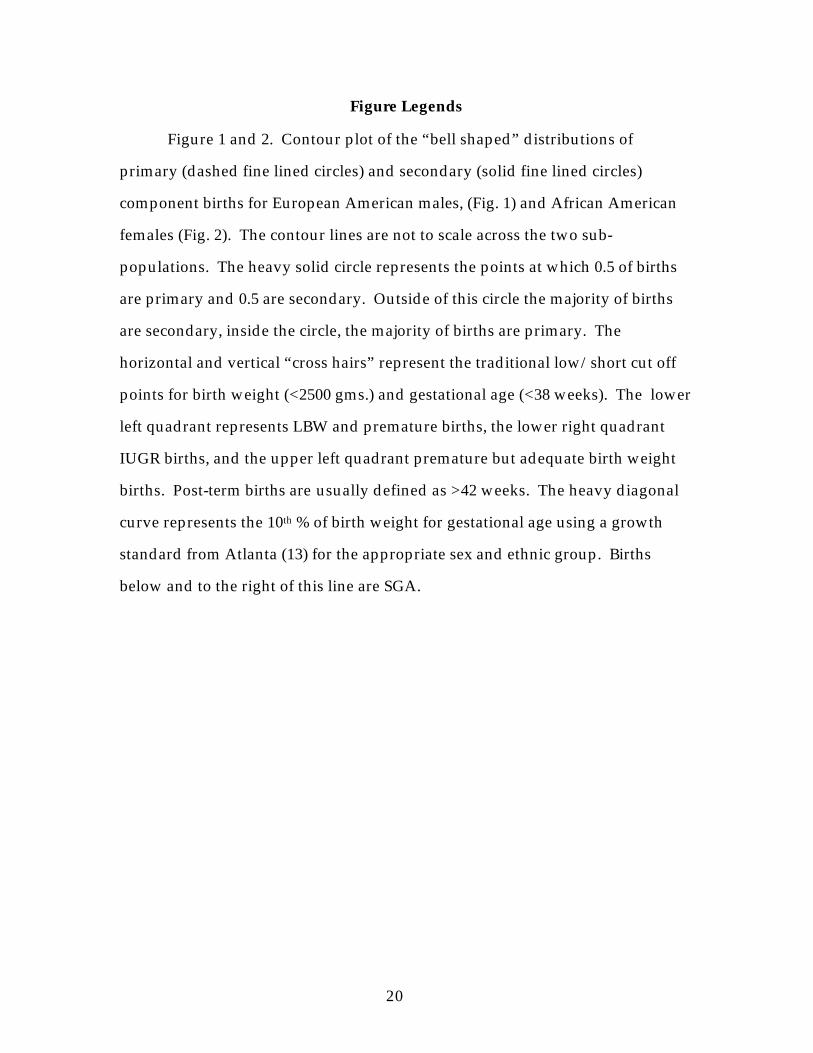
Figure Legends
Figure 1 and 2. Contour plot of the “bell shaped” distributions of
primary (dashed fine lined circles) and secondary (solid fine lined circles)
component births for European American males, (Fig. 1) and African American
females (Fig. 2). The contour lines are not to scale across the two sub-
populations. The heavy solid circle represents the points at which 0.5 of births
are primary and 0.5 are secondary. Outside of this circle the majority of births
are secondary, inside the circle, the majority of births are primary. The
horizontal and vertical “cross hairs” represent the traditional low/short cut off
points for birth weight (<2500 gms.) and gestational age (<38 weeks). The lower
left quadrant represents LBW and premature births, the lower right quadrant
IUGR births, and the upper left quadrant premature but adequate birth weight
births. Post-term births are usually defined as >42 weeks. The heavy diagonal
curve represents the 10th % of birth weight for gestational age using a growth
standard from Atlanta (13) for the appropriate sex and ethnic group. Births
below and to the right of this line are SGA.

21
Related Documents