GIS in Water Resources – Class Project Report Brackish Water Recharge Potential in Texas by David Nguyen Instructed by Dr. David R. Maidment and Dr. David G. Tarboton December 6, 2018 1. Introduction Brackish water is defined as groundwater with salinity levels higher than fresh water, but lower than salt water. Brackish groundwater originates from a mixture of fresh and sea water or rainfall that seeps into the ground where minerals within the subsurface react with water, thus increasing Total Dissolved Solids (TDS). The moderately salinity of brackish water makes it a prime resource to apply desalination, especially now that membrane technology has improved enough to become economically viable with water costs ranging from $1.50/Kgal to $2.75/Kgal (LBG-Guyton Associates, 2003. Texas entities have recently taken an interest in brackish water, with the Texas Water Development Board having already identified brackish groundwater production zones in a few aquifers in 2016 and the state having already legislatively mandated identification in the rest of the aquifers by 2022. Austin has also acknowledged brackish water desalination as an option in the near future since the Water Forward program has suggested using desalination in the next water treatment as part of the 100 year water plan. An estimated 880 trillion gallons of brackish water exists underneath the surface of Texas, However, it is important to note that reverse osmosis in desalination involves flushing a waste stream of brine, effectively flushing a large portion of water away. The increased interest is a direct result of the increasing Texas population and depleting fresh water supplies. Groundwater in general has already been a major challenge for the state of Texas to manage and regulate as a “mysterious and occult” natural resource. It is difficult to understand what truly occurs beneath the surface, but using information from multiple sources can provide a prediction of how groundwater can be sustained for human consumption. Brackish groundwater in particular is a new regulatory challenge as interest grows, and must be mapped and characterized to help future decision regarding this potential water supply for human consumption and minimal environmental impact. For instance, determining water rights for water below a property is difficult due to The lack of direct measurements to characterize groundwater raises the importance to define the resource as extensively as possible. In this project, I collect and create maps with datasets describing different variables for groundwater recharge potential such as slope, land cover, lithology, drainage density, and precipitation. Each variable is weighted based on relative importance and summed to obtain a value describing recharge potential in Texas areas known to have wells of brackish water. With this information, evaluation of groundwater potential for every city in Texas becomes possible. 2. Methods To produce project deliverables, ArcGis Pro, Microsoft Excel, and Python are used for their data processing, calculation, analysis, and visualization applications. A detailed walkthrough of project procedures is described in the following subsections and depicted in Figure 1 below.

Welcome message from author
This document is posted to help you gain knowledge. Please leave a comment to let me know what you think about it! Share it to your friends and learn new things together.
Transcript

GIS in Water Resources – Class Project Report
Brackish Water Recharge Potential in Texas by
David Nguyen
Instructed by Dr. David R. Maidment and Dr. David G. Tarboton
December 6, 2018
1. Introduction
Brackish water is defined as groundwater with salinity levels higher than fresh water, but lower
than salt water. Brackish groundwater originates from a mixture of fresh and sea water or rainfall that
seeps into the ground where minerals within the subsurface react with water, thus increasing Total
Dissolved Solids (TDS). The moderately salinity of brackish water makes it a prime resource to apply
desalination, especially now that membrane technology has improved enough to become economically
viable with water costs ranging from $1.50/Kgal to $2.75/Kgal (LBG-Guyton Associates, 2003.
Texas entities have recently taken an interest in brackish water, with the Texas Water
Development Board having already identified brackish groundwater production zones in a few aquifers in
2016 and the state having already legislatively mandated identification in the rest of the aquifers by 2022.
Austin has also acknowledged brackish water desalination as an option in the near future since the Water
Forward program has suggested using desalination in the next water treatment as part of the 100 year
water plan. An estimated 880 trillion gallons of brackish water exists underneath the surface of Texas,
However, it is important to note that reverse osmosis in desalination involves flushing a waste stream of
brine, effectively flushing a large portion of water away. The increased interest is a direct result of the
increasing Texas population and depleting fresh water supplies.
Groundwater in general has already been a major challenge for the state of Texas to manage and
regulate as a “mysterious and occult” natural resource. It is difficult to understand what truly occurs
beneath the surface, but using information from multiple sources can provide a prediction of how
groundwater can be sustained for human consumption. Brackish groundwater in particular is a new
regulatory challenge as interest grows, and must be mapped and characterized to help future decision
regarding this potential water supply for human consumption and minimal environmental impact. For
instance, determining water rights for water below a property is difficult due to The lack of direct
measurements to characterize groundwater raises the importance to define the resource as extensively as
possible. In this project, I collect and create maps with datasets describing different variables for
groundwater recharge potential such as slope, land cover, lithology, drainage density, and precipitation.
Each variable is weighted based on relative importance and summed to obtain a value describing recharge
potential in Texas areas known to have wells of brackish water. With this information, evaluation of
groundwater potential for every city in Texas becomes possible.
2. Methods
To produce project deliverables, ArcGis Pro, Microsoft Excel, and Python are used for their data
processing, calculation, analysis, and visualization applications. A detailed walkthrough of project
procedures is described in the following subsections and depicted in Figure 1 below.

Figure 1. Project Procedure for Objective 1
Brackish Area
Shapefile
● Select by
Attribute for
moderate
saline levels ● Export ● Aggregate
Points ● Smooth
● Line
Density
● Intersect
● Rasterize
● Extract by Mask
● Slope
● Fill
● Flow Direction (D8)
● Flow Accumulation
● Raster Calculator
(“Flow
Accumulation”>5000)
● Raster to Polyline
● Intersect (LINE)
with Watershed
shapefile from TWDB
● Spatial Join (SUM
shape_length)
● Calculate Field for
drainage density
● Python Code to
Project Rasters to
Albers Conical Equal
Area ● Mosaic Raster
● Extract by Mask
● Intersect
● Rasterize
● Raster Calculator with Python Coding Block
Weighted
Precipitation
Raster
Weighted
Lithology Raster Weighted Land
Cover Raster
Weighted Slope
Raster Weighted
Drainage Density
Raster
● Raster Calculator to Sum All Rasters
Brackish Groundwater
Recharge Potential
Raster

Figure 2. Project Procedure for Objective 2
The study region is the entire state of Texas, but the target area can be narrowed by selecting
wells containing moderately saline water between 1000 and 10,000 mg/L of total dissolved solids (TDS).
The defined brackish groundwater area of Texas if depicted in Figure 3. The map bears close similarities
to the brackish water area defined by TWDB, except for the area along the Gulf Coast. It is assumed that
this is an error in the map produced here since the Gulf Coast Aquifer is supposed to be the largest
groundwater sink in Texas. This makes sense since seawater contact is another means by which brackish
groundwater is produced. Perhaps the upper part was excluded due to high salinity.
Figure 3. Brackish Water Coverage in Texas
● Export to Excel with “|”
as delimiter
● Export to ArcGIS Pro
● XY Table to Point
●Create Thiessen Polygon
● Summarize Raster Within ● Raster to Polygon
Brackish Groundwater
Recharge Potential
Raster
Shapefile with Polygons and
Average Recharge Potential for
Each City
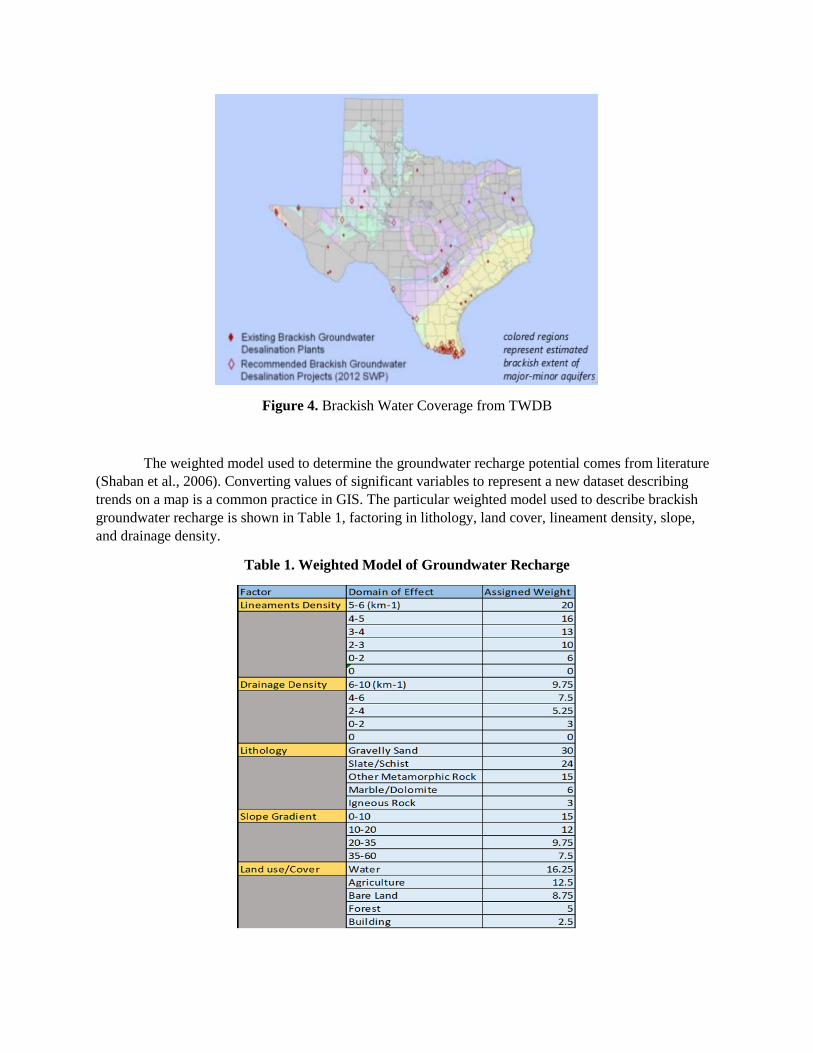
Figure 4. Brackish Water Coverage from TWDB
The weighted model used to determine the groundwater recharge potential comes from literature
(Shaban et al., 2006). Converting values of significant variables to represent a new dataset describing
trends on a map is a common practice in GIS. The particular weighted model used to describe brackish
groundwater recharge is shown in Table 1, factoring in lithology, land cover, lineament density, slope,
and drainage density.
Table 1. Weighted Model of Groundwater Recharge

Lithology plays a role in the percolation of water as different rock formations with varying
porosities can influence how water travels in the subsurface. Although there are investigations that
consider lithology negligible by referring to lineament and drainage density as functions of primary and
secondary porosity, including the data provides greater certainty. From Table 1, it is clear that the impact
of lithology on groundwater recharge potential increases with porous and permeable media, such as
gravel, but decreases with smooth and cohesive rocks such as igneous rock. As show in Figure 1 the
lithology shapefile was retrieved from the Geologic Atlas of Texas (GAT) by the Texas Natural
Resources Information System as a joint project with USGS Texas Water Science Center. Figure 3
presents the raw geology dataset and the resulting assigned weight of geology towards recharge potential.
Figure 3. Geology in Groundwater Recharge
Land cover data gives an impression of the soil deposits, residential area distribution, water
demand, and vegetation in an area and how these factors affect the ability for water to enter the
subsurface. All these factors impact the evapotranspiration, runoff, and surface permeability. For
instance, Table 1 suggests developed areas greatly reduce groundwater recharge potential; likely because
infrastructure is designed to drain water into city water systems rather than lost to the subsurface. On the
other end of the spectrum, areas with water greatly increase recharge potential due to the large availability
of water that can permeate the surface. The land cover raster was obtained from the National Land Cover
Database (NLCD) that was obtained from the United States Geologic Survey (USGS).

Lineaments are linear geologic formations and are commonly faults where water can easily pass
into, thus supplementing groundwater recharge. However, some cases can slow the flow of groundwater.
Overall, the model used in this project suggests that faults create a net increase in the ability for water to
enter the ground. The lineaments were taken from the Geologic Atlas of Texas. In addition to lineament
density and recharge potential weight, Figure 5 includes the lines of the original lineament polylines.
Figure 5. Lineaments in Groundwater Recharge
Slope mainly impacts recharge as steep terrain results in less time for water to permeate the
surface. Table 1 shows how greater slopes result means lower recharge potential. The slope was
calculated with the Slope geoprocessing tool with the National Elevation Dataset from USGS as the input.

Figure 6. Slope in Groundwater Recharge
According to Table 1, the weighted recharge potential is directly proportional to drainage density.
This correlation results from an increase in the amount of rivers, similar to bodies of water increase
potential from land cover. Furthermore, a larger drainage density means less distance is required for
rainfall to travel to a stream, meaning less time spent as runoff just as lower slope resulted in less time as
runoff. Additionally, drainage density can indicate how prone to flooding an area is and floods can pick
up clay sediment, thus increasing permeability. Like slope, drainage density calculation started with the
Digital Elevation Model (DEM) for Texas, which then fed into the flow direction and flow accumulation
geoprocessing tools to yield delineation of flow streams. The polylines were then broken at the
boundaries of all watersheds and the length of polylines within were divided by the respective watershed
area.
Figure 7. Drainage Density in Groundwater Recharge
3. Results
Once all the recharge potentials from each contributing factor are rasterized and mapped, the total
groundwater recharge potential can be calculated from the model equation (Yeh et al., 2009):
𝑃𝑟 = 𝐿𝐷𝑤 + 𝐷𝐷𝑤 + 𝐿𝐺𝑤 + 𝑆𝐺𝑤 + 𝐿𝐶𝑤
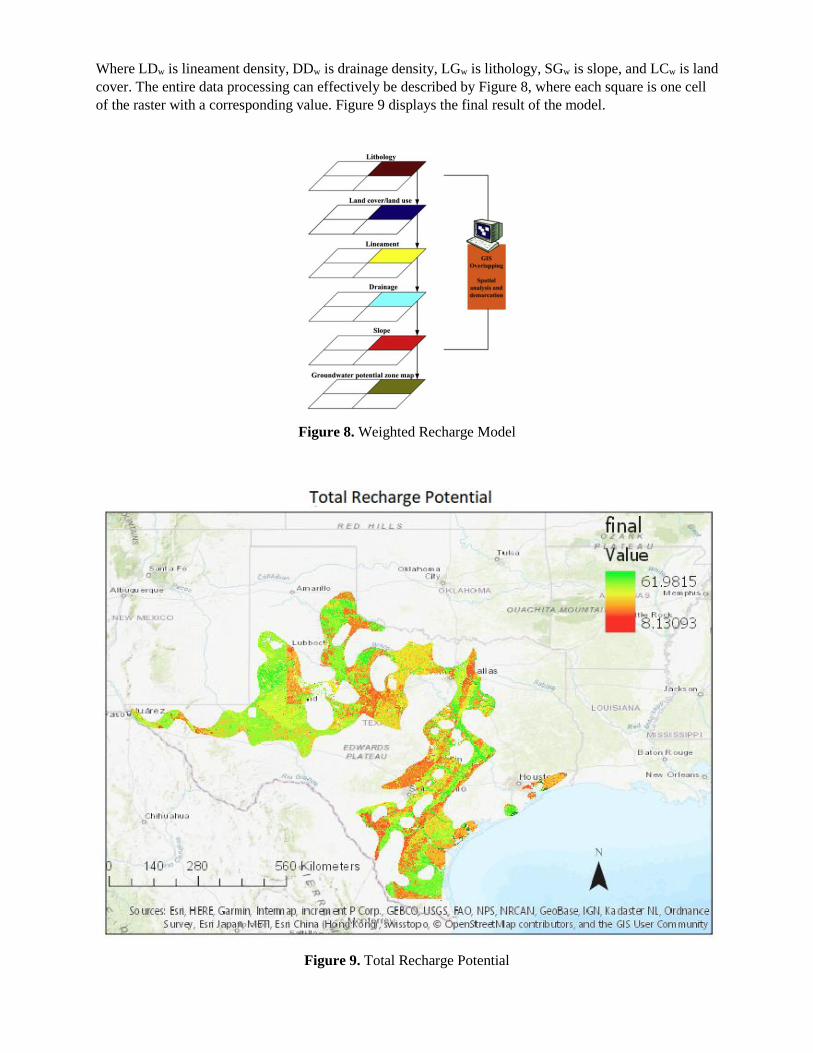
Where LDw is lineament density, DDw is drainage density, LGw is lithology, SGw is slope, and LCw is land
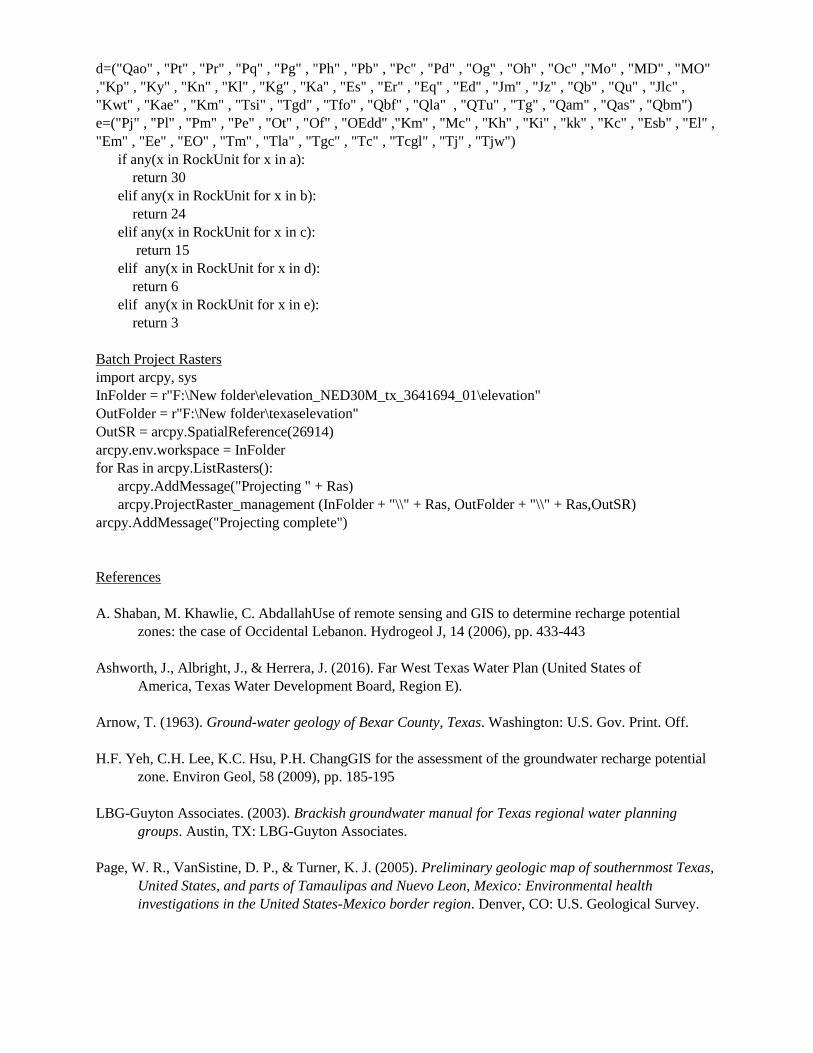
cover. The entire data processing can effectively be described by Figure 8, where each square is one cell
of the raster with a corresponding value. Figure 9 displays the final result of the model.
Figure 8. Weighted Recharge Model
Figure 9. Total Recharge Potential

Based on the map, West appears to have the greatest potential for groundwater recharge, which is
good since that area struggle with water issues. However, this raises the question of why precipitation was
not included in the literature model since rainfall is generally where groundwater originates. Another
interesting point was the low recharge potential around the San Antonio area, which relies heavily on
groundwater and even utilizes desalination. However, further research revealed that recharge in the area is
primarily from groundwater underflow from the west (Arnow, 1963). The biggest contributors that
differentiated between high and low potential areas were land cover and lithology, whereas slope
contributed to the final potential value but did not vary greatly across the state except for small areas.
lineaments and drainage density appeared to minimal impact on final values, despite having the same
magnitude as densities calculated in past exercises. Although lineament density only contributed up to 1.3
units of recharge potential, I believe it influenced the value of lithology, as the Trans-Pecos Texas area
has high permeability earth overlain the lineaments.
After converting city coordinate data from a text file into Excel and again into ArcGIS Pro, the
points were used to create Thiessen polygons. The groundwater potential can then be averaged within
each polygon to describe the extent a city could use brackish groundwater as a water supply. Figure 10
displays the Thiessen polygons overlaid across Texas and Figure 11 displays the polygon representing
Austin. The bar chart shown in Figure 12 displays the groundwater potential for a select few cities that
may have the water demand to tap into this resource. This secondary objective of determining recharge
potential needs refinement as the project was done with the Texas raster as the top priority. Mainly, the
areas need to be defined in a broader way, instead of having Round Rock and Austin as two separate
water users. Initially, the plan was to find GIS data for water municipalities or some other representation
to define a metropolitan area. However, the cities were the easiest since a text file with coordinate data
was available and would supply enough cities to create Thiessen polygons of reasonable sizes.
Figure 10. Groundwater Recharge Potential for Individual Cities

Figure 11. Thiessen Polygon for Austin
Figure 12. Groundwater Potential in Select Texas Cities
0
5
10
15
20
25
30
35
40
45
50
Austin Dallas El Paso San Marcos Houston Arlington Lubbock
Gro
un
dw
ater
Rec
har
ge P
ote
nti
al
City
Groundwater Potential

4. Conclusions
As said before, groundwater alone has proven a difficult resource to manage and regulate, so it is
difficult to draw conclusions about how to move forward with the massive resource that is brackish
groundwater. However, it is clear that the resource is there when needed. Austin has a moderately high
recharge potential so the next brackish water desalination plant that Austin Water plans to construct
should be a good buffer to the water supply. El Paso will also have the opportunity to access brackish
water as it has a relatively high recharge potential and may need to rely on it heavily in an area that is arid
and has a competing water user across the border.
With regards to the primary objective of building the brackish groundwater recharge potential
raster, future work will involve considering more variables that may also impact recharge such as
precipitation or soil. For the secondary objective, refinement of the Thiessen polygons for Texas cities
will be necessary, either by finding another data set to apply the recharge raster or potentially by merging
and averaging city polygons of interest, like Austin, with adjacent polygons to be more representative of
the coverage that Austin Water utility provides.
Appendix A. Code
Land Cover Reclassify
Lithology Reclassify
def ReClass(!RockUnit!):
a=("Qq" , "Qd" , "Qap" , "QT" , "Pvc" , "Pw" , "Kl" , "Kw" , "Ks" , "Kf" , "Ey" , "Ej" , "Ttr" , "Tscg" ,
"Tcg" , "F S" , "Qal" , "Qtf" , "Qbi" , "Qsd" , "Qds" , "Qs" , "Qt" , "Qcg" , "Qli"
b=("Qu" , "T-qu" , "Qw" , "Qo" , "Ql" , "Qh" , "Qf" , "Qg" , "Qc" , "Ke" , "Eb" , "Ec" , "Tsc" , "Tl" , "Tli"
, "Qcd" , "Qeo")
c=("Qaf" , "Py" , "Ps" , "Pn" , "Po" , "Pp" , "PA" , "Pa" , "Mf" , "Mg" , "Kt" , "Ko" , "Kd" ,"Kb" , "IP" ,
"Ew" , "Ek" , "EPA" , "Eh" , "Ei" , "Ty" , "Td" , "Tgd" , "Tmz" , "Tcv" , "Ql" , "Qa" , "Tfo")
d=("Qao" , "Pt" , "Pr" , "Pq" , "Pg" , "Ph" , "Pb" , "Pc" , "Pd" , "Og" , "Oh" , "Oc" ,"Mo" , "MD" , "MO"
,"Kp" , "Ky" , "Kn" , "Kl" , "Kg" , "Ka" , "Es" , "Er" , "Eq" , "Ed" , "Jm" , "Jz" , "Qb" , "Qu" , "Jlc" ,
"Kwt" , "Kae" , "Km" , "Tsi" , "Tgd" , "Tfo" , "Qbf" , "Qla" , "QTu" , "Tg" , "Qam" , "Qas" , "Qbm")
e=("Pj" , "Pl" , "Pm" , "Pe" , "Ot" , "Of" , "OEdd" ,"Km" , "Mc" , "Kh" , "Ki" , "kk" , "Kc" , "Esb" , "El" ,
"Em" , "Ee" , "EO" , "Tm" , "Tla" , "Tgc" , "Tc" , "Tcgl" , "Tj" , "Tjw")
if any(x in RockUnit for x in a):
return 30
elif any(x in RockUnit for x in b):
return 24
elif any(x in RockUnit for x in c):
return 15
elif any(x in RockUnit for x in d):
return 6
elif any(x in RockUnit for x in e):
return 3
Batch Project Rasters
import arcpy, sys
InFolder = r"F:\New folder\elevation_NED30M_tx_3641694_01\elevation"
OutFolder = r"F:\New folder\texaselevation"
OutSR = arcpy.SpatialReference(26914)
arcpy.env.workspace = InFolder
for Ras in arcpy.ListRasters():
arcpy.AddMessage("Projecting " + Ras)
arcpy.ProjectRaster_management (InFolder + "\\" + Ras, OutFolder + "\\" + Ras,OutSR)
arcpy.AddMessage("Projecting complete")
References
A. Shaban, M. Khawlie, C. AbdallahUse of remote sensing and GIS to determine recharge potential
zones: the case of Occidental Lebanon. Hydrogeol J, 14 (2006), pp. 433-443
Ashworth, J., Albright, J., & Herrera, J. (2016). Far West Texas Water Plan (United States of
America, Texas Water Development Board, Region E).
Arnow, T. (1963). Ground-water geology of Bexar County, Texas. Washington: U.S. Gov. Print. Off.
H.F. Yeh, C.H. Lee, K.C. Hsu, P.H. ChangGIS for the assessment of the groundwater recharge potential
zone. Environ Geol, 58 (2009), pp. 185-195
LBG-Guyton Associates. (2003). Brackish groundwater manual for Texas regional water planning
groups. Austin, TX: LBG-Guyton Associates.
Page, W. R., VanSistine, D. P., & Turner, K. J. (2005). Preliminary geologic map of southernmost Texas,
United States, and parts of Tamaulipas and Nuevo Leon, Mexico: Environmental health
investigations in the United States-Mexico border region. Denver, CO: U.S. Geological Survey.
Related Documents