CLASS PROFILE YEAR 11 CLASS PROFILE IN CONSIDERATION TO THE YEAR 9 NAPLAN RESULTS FROM 2014

Welcome message from author
This document is posted to help you gain knowledge. Please leave a comment to let me know what you think about it! Share it to your friends and learn new things together.
Transcript

CLASS PROFILEYEAR 11 CLASS PROFILE IN CONSIDERATION TO THE YEAR 9
NAPLAN RESULTS FROM 2014

CLASS PROFILE
• For the ease of management and resources, the NAPLAN 2014 results were used in consideration to the year 9 results.
• These results give an indication of the students profiles found within the 2011 Year 11 students.
(NAPLAN, 2014)

STUDENT SUMMARY
• Our classroom is of a standard Year 11 cohort that includes 15 boys and 11 girls.
• 2 student (one girl and one boy) are of the advanced ability to self-manage their learning and ICT applications and as seen in recent NAPLAN results are consisted above average in their abilities in literacy and numeracy.
• Of the remaining 14 boys, 3 were found to be below average in literacy and 2 was found to be below average in numeracy as well. These three students will required additional modelling and scaffolding to achieve the learning outcomes.
• All Students are considered to be of average ability or above in their ICT skills and have been confident and competent users of a variety of only line school approved ICT programs.
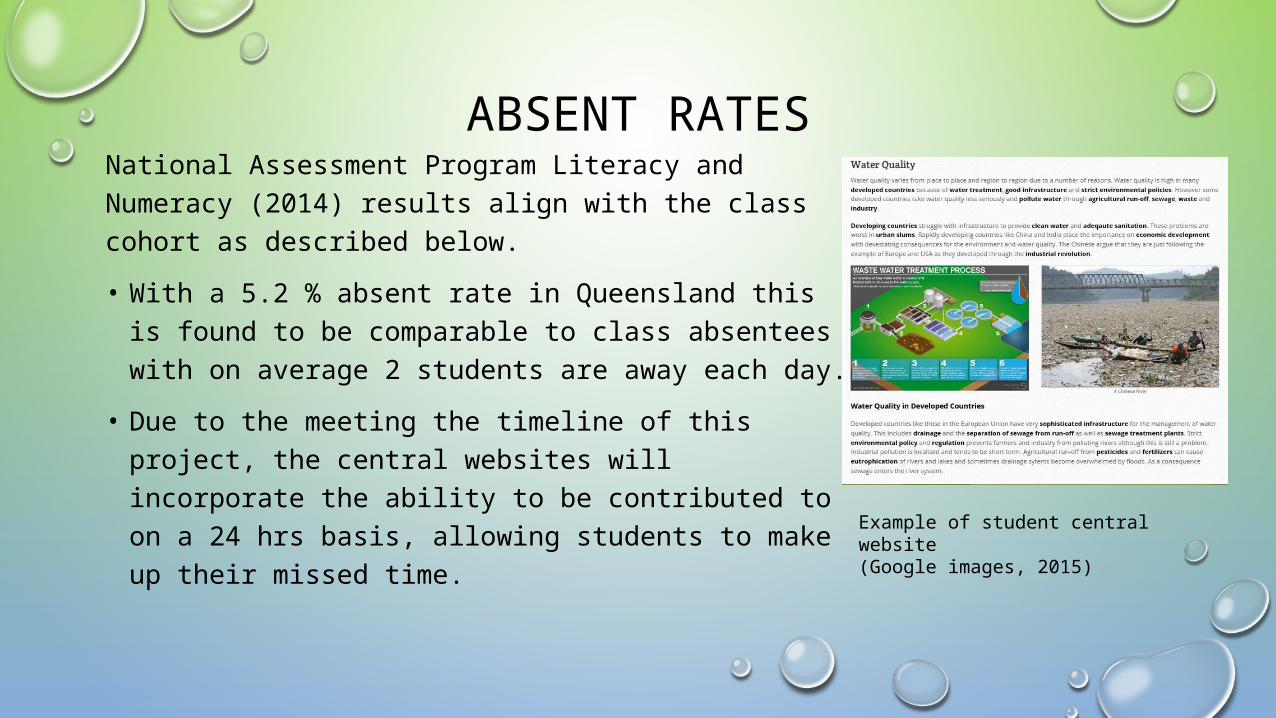
ABSENT RATESNational Assessment Program Literacy and Numeracy (2014) results align with the class cohort as described below.
• With a 5.2 % absent rate in Queensland this is found to be comparable to class absentees with on average 2 students are away each day.
• Due to the meeting the timeline of this project, the central websites will incorporate the ability to be contributed to on a 24 hrs basis, allowing students to make up their missed time.
Example of student central website (Google images, 2015)

ABSENT RATES CONT..
• All contributions will be monitored by the teacher at all times and will have to meet the behavioural standards outlined by safely, legally and ethical guidelines.
• All resources contributed in class by the teacher to guide the students, will be posted online and readily available to be used to review or catch up on missed lessons.
Bundaberg Council website (2015)

READING AND SPELLING• Within the NAPLAN results for reading and spelling, 1.7 % of
students are below the national minimum standards and 7% achieving at the national minimum standards. Thus 9% of students achieve the minimum national standards or below.
• This is slightly higher in this class cohort, with 11 % of the class reading and spelling below national standards. It should be noted that one student has English as their second language and one student is of aboriginal and Torres strait.
• These result correlate with regional results and as parts of the catchment of this particular school has a high proportion of low socio economic background.
(Google Images, 2015)

PERSUASIVE WRITING
• As noted in the 2014 NAPLAN results, regional Queensland had over 18 % of students constructing persuasive writing below the national minimum standard.
• These results has been noted in this particular class and scaffolding and additional guidance will be used to help the students develop their persuasive writing skills within this project.
• Additional resources and guidance may be needed for the students who also struggle with reading and spelling.

PERSUASIVE WRITING AND PROJECT CONSIDERATIONS
• In consideration to Persuasive writing results, the learning objectives of this project include the option of using other multimedia programs to develop their final report.
• Although there will be a minimum of one written piece of work that will be evidence of their learning and developing skilling in persuasive writing.
Persuasive Writing
Below National AverageAt national minimum standardAbove national minumum standardAbsent

NUMERACY
• With the numeracy results of the 2014 NAPLAN Queensland showed to have 4 % of students below the minimum standard in numeracy skills and nearly 18 % meeting the minimum national standards as defined by NAPLAN.
• These results also show a solid spread of above average students and these results correlate strongly with the profiling on this class. This is again consistent with the class profiling.
• It was found the class has closers to 7% of students below average, this again is consisted with results shown for the regional centres in Queensland.

CURRICULUM STANDARDS
• As seen within the Curriculum science Yr. 10 - Science Achievement Standard, by the end of Year 10 students have a strong understanding of environmental influences and impacts on society.
• Students have the ability to plan and understand how to develop questions and hypotheses and independently design and improve appropriate methods of investigation, including field work and laboratory experimentation.
Case Studies sourced from BCCA (2015)

CURRICULUM STANDARDS• To achieve curriculum strands for Year 11;
• When analysing data, selecting evidence and developing and justifying conclusions, they will identify alternative explanations for findings and explain any sources of uncertainty.
• Students will evaluate the validity and reliability of claims made in secondary sources with reference to currently held scientific views, the quality of the methodology and the evidence cited.
• They will construct evidence-based arguments and select appropriate representations and text types to communicate science ideas for specific purposes.
• They will explain how they have considered reliability, safety, fairness and ethical actions in their methods and identify where digital technologies can be used to enhance the quality of data.

CLASS PROFILECLASS GROUPS NAPLAN RESULTS GROUP SUMMARY
• The first group [1] of three male students consists of the ‘academically at risk’ students. These students require management strategies to bring them back to task, and to repeatedly give them the specific step-by-step instructions to undertake the work.

CLASS PROFILECLASS GROUPS NAPLAN RESULTS
GROUP SUMMARY
• The second group [2] of nine students consists of 5 female and 6 male students. These students are of mixed academic ability who can achieve medium outcomes.

CLASS PROFILE
CLASS GROUPS NAPLAN RESULTSGROUP SUMMARY
• The third group [3] consist of higher ability students. This group of ten students consists of five female and five male students. These students assimilate the material quickly, but need the time allowed to complete the learning objectives

CLASS PROFILECLASS GROUPS NAPLAN RESULTS
GROUP SUMMARY• The fourth group [4] consist of higher
ability students. This group of two students consists of one female and one male students. These students assimilate the material quickly, they need to be managed carefully to keep them occupied and interested.

REFERENCE LIST
Bundaberg Regional council (2015) retrieved from http://www.bundaberg.qld.gov.au/
Burnett Catchment Care Association (2015) BCCA Website. Retrieved from http://betterburnett.com/
National Assessment Program Literacy and Numeracy (2014) Achievement in Reading, Persuasive Writing, Language Conventions and Numeracy. National Report for 2014
http://www.nap.edu.au/results-and-reports/national-reports.html
Related Documents


![Yale College Class of 2022 First-Year Class Profile 1,5781].pdf · Yale College Class of 2022 First-Year Class Profile 1,578 Enrolled first-years 35,308 First-year applicants (Single-Choice](https://static.cupdf.com/doc/110x72/601d7f89d7b3b56024730ebd/yale-college-class-of-2022-first-year-class-profile-1578-1pdf-yale-college.jpg)