Clarendon County State of the Workforce Report Bruce Mills, Research Analyst Santee-Lynches Regional COG Clarendon Co. Development Board Jan. 24, 2013

Clarendon County State of the Workforce Report Bruce Mills, Research Analyst Santee-Lynches Regional COG Clarendon Co. Development Board Jan. 24, 2013.
Dec 26, 2015
Welcome message from author
This document is posted to help you gain knowledge. Please leave a comment to let me know what you think about it! Share it to your friends and learn new things together.
Transcript
Clarendon County State of the Workforce Report
Bruce Mills, Research Analyst
Santee-Lynches Regional COG
Clarendon Co. Development Board
Jan. 24, 2013
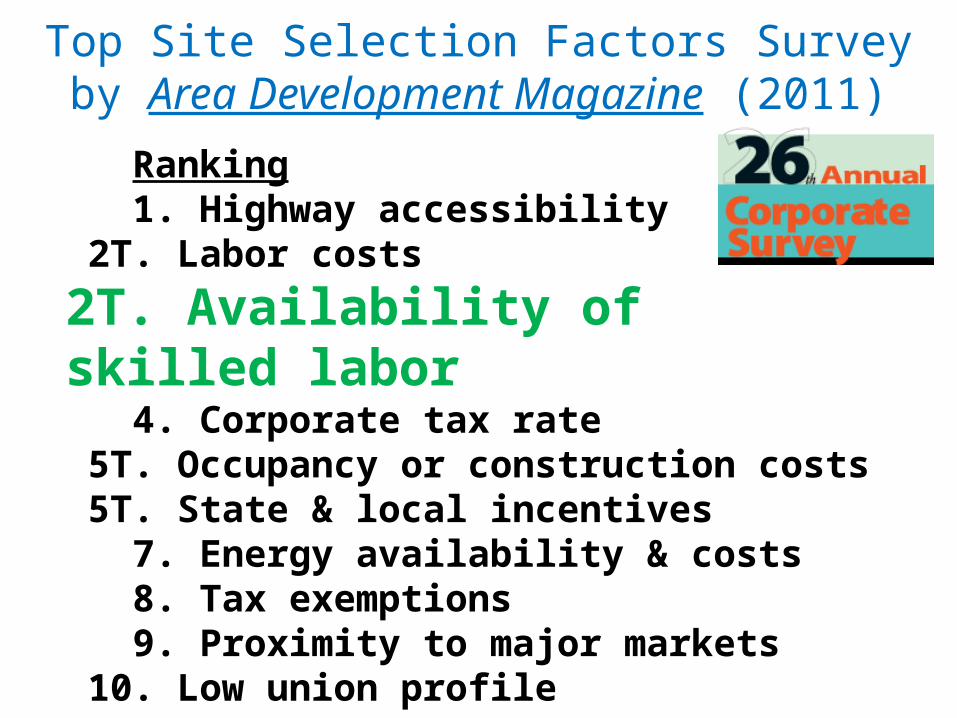
Top Site Selection Factors Surveyby Area Development Magazine (2011)
Ranking 1. Highway accessibility 2T. Labor costs
2T. Availability of skilled labor 4. Corporate tax rate 5T. Occupancy or construction costs 5T. State & local incentives 7. Energy availability & costs 8. Tax exemptions 9. Proximity to major markets 10. Low union profile

• Strong academic skills– Math and Math Reasoning– Science– Literacy – Writing, Reading, Public Speaking
• Practical and social skills– Teamwork– Critical thinking / problem solving– Communication– Work ethic– Time management
• Tech-savvy
RESULT = Creative and innovative workforce– Capacity to a) make improvements on the product and service line
and b) conduct out-of-the-box breakthrough thinking if started fresh with the product or service. An entrepreneurial environment to meet customers’ needs in a unique and new way even if it means building whole new competencies.
Skill sets for now and into the future
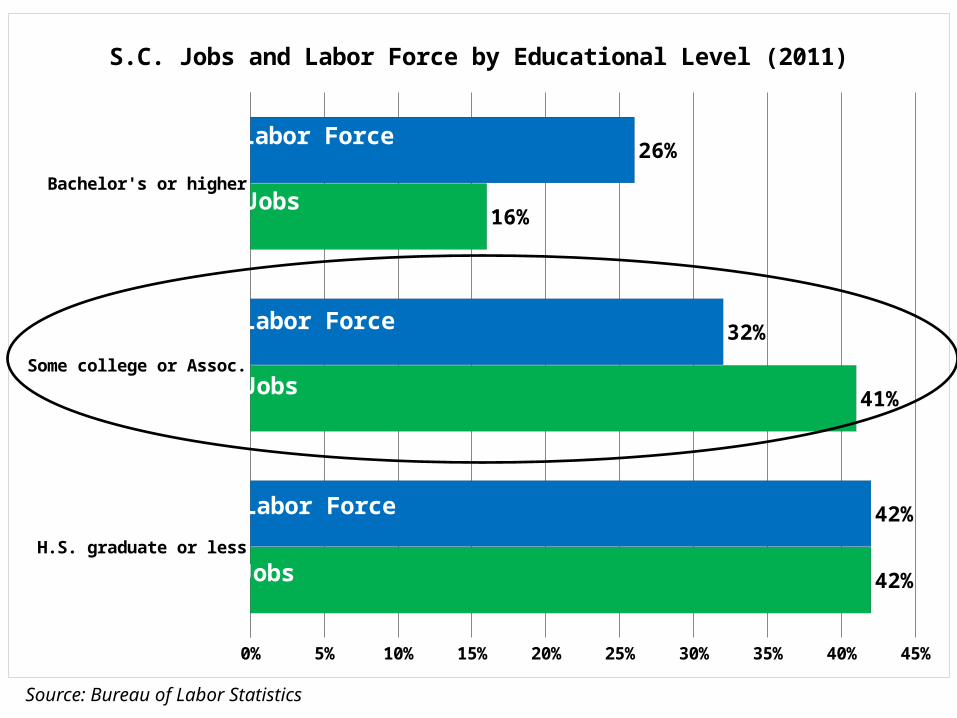
Source: Bureau of Labor Statistics
Jobs
Jobs
Labor Force
Labor Force
Labor Force
H.S. graduate or less
Some college or Assoc.
Bachelor's or higher
0% 5% 10% 15% 20% 25% 30% 35% 40% 45%
42%
41%
16%
42%
32%
26%
S.C. Jobs and Labor Force by Educational Level (2011)
Jobs
Jobs
Jobs
Labor Force
Labor Force
Labor Force
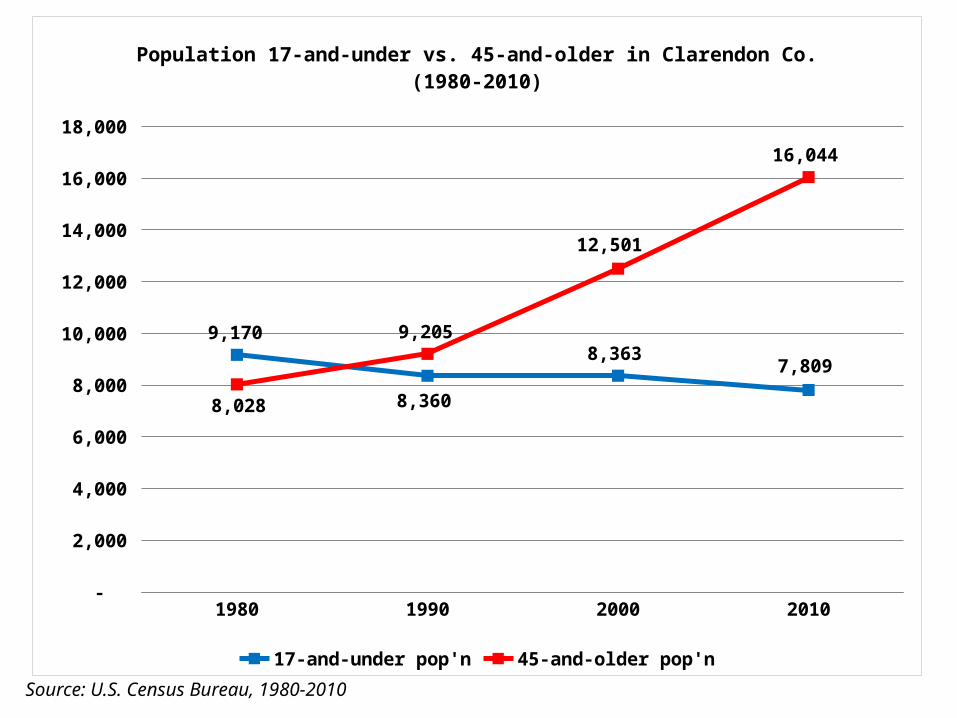
1980 1990 2000 2010 -
2,000
4,000
6,000
8,000
10,000
12,000
14,000
16,000
18,000
9,170
8,360
8,363 7,809
8,028
9,205
12,501
16,044
Population 17-and-under vs. 45-and-older in Clarendon Co. (1980-2010)
17-and-under pop'n 45-and-older pop'n
Source: U.S. Census Bureau, 1980-2010
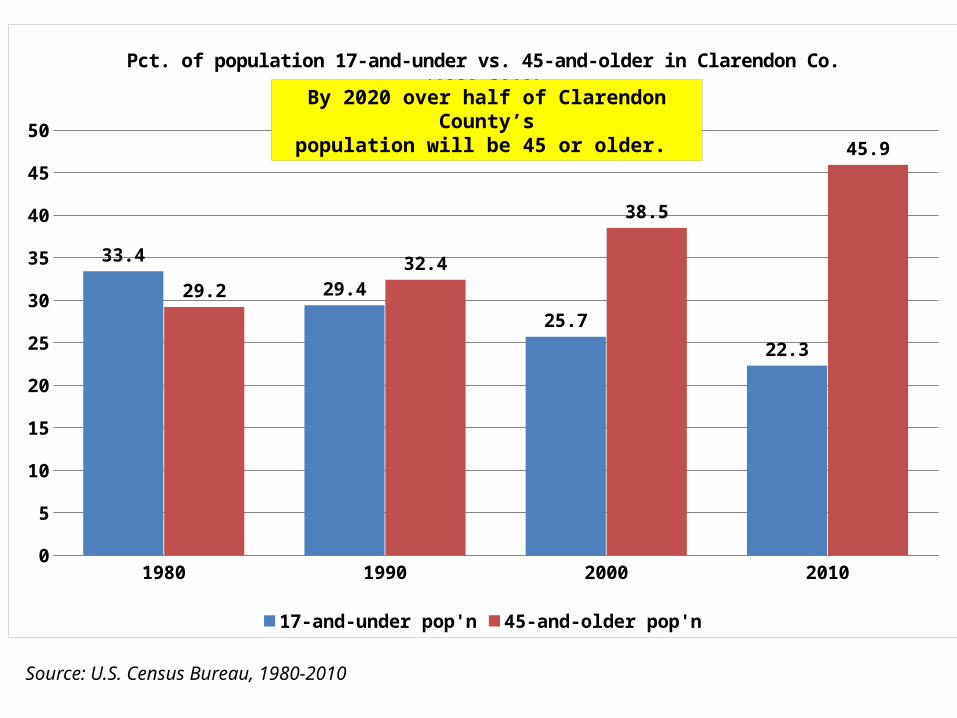
1980 1990 2000 20100
5
10
15
20
25
30
35
40
45
50
33.4
29.4
25.7
22.3
29.2
32.4
38.5
45.9
Pct. of population 17-and-under vs. 45-and-older in Clarendon Co. (1980-2010)
17-and-under pop'n 45-and-older pop'n
Source: U.S. Census Bureau, 1980-2010
By 2020 over half of Clarendon County’spopulation will be 45 or older.
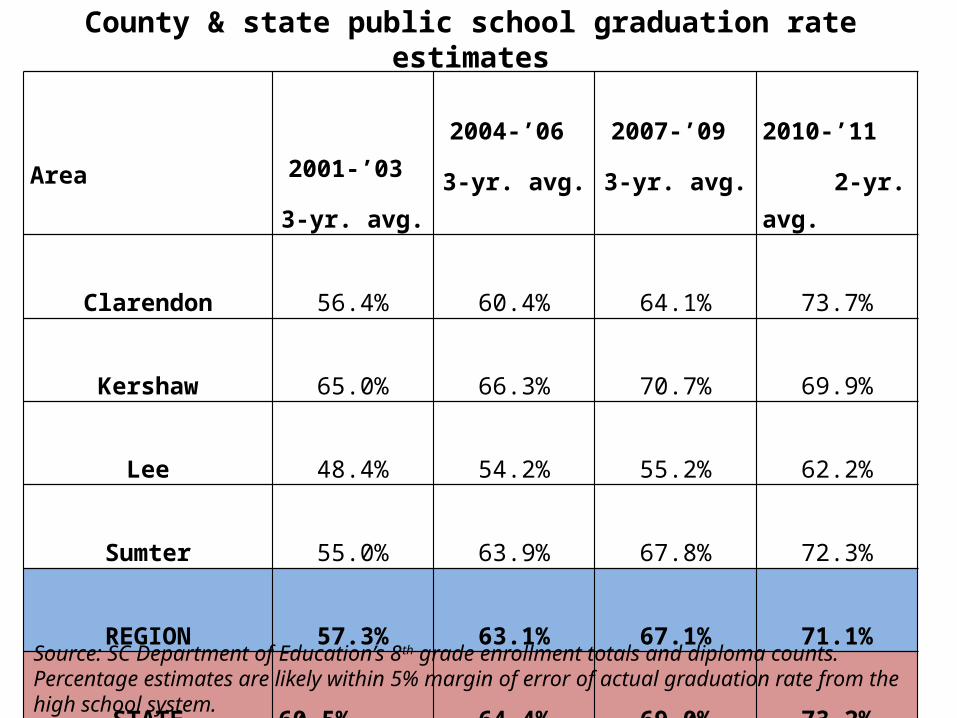
Area2001-’03
3-yr. avg.
2004-’06
3-yr. avg.
2007-’09
3-yr. avg.
2010-’11
2-yr. avg.
Clarendon 56.4% 60.4% 64.1% 73.7%
Kershaw 65.0% 66.3% 70.7% 69.9%
Lee 48.4% 54.2% 55.2% 62.2%
Sumter 55.0% 63.9% 67.8% 72.3%
REGION 57.3% 63.1% 67.1% 71.1%
STATE 60.5% 64.4% 69.0% 73.2%
County & state public school graduation rate estimates
Source: SC Department of Education’s 8th grade enrollment totals and diploma counts.Percentage estimates are likely within 5% margin of error of actual graduation rate from the high school system.
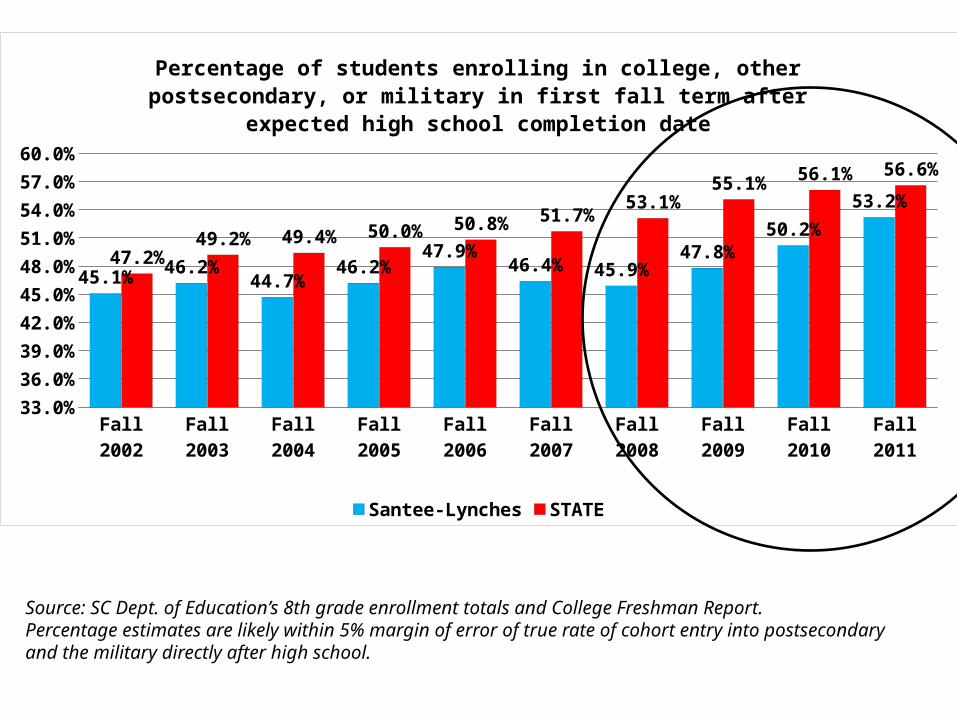
Source: SC Dept. of Education’s 8th grade enrollment totals and College Freshman Report.Percentage estimates are likely within 5% margin of error of true rate of cohort entry into postsecondary and the military directly after high school.
Fall 2002
Fall 2003
Fall 2004
Fall 2005
Fall 2006
Fall 2007
Fall 2008
Fall 2009
Fall 2010
Fall 2011
33.0%
36.0%
39.0%
42.0%
45.0%
48.0%
51.0%
54.0%
57.0%
60.0%
45.1%46.2%
44.7%46.2%
47.9%46.4% 45.9%
47.8%
50.2%
53.2%
47.2%49.2% 49.4% 50.0% 50.8% 51.7%
53.1%55.1%
56.1% 56.6%
Percentage of students enrolling in college, other postsecondary, or mili-tary in first fall term after expected high school completion date
Santee-Lynches STATE

* Represents combined Sumter 2 and Sumter 17 scoresSource: SC Dept. of Education, PASS 2010-’12
STATE REGION Clarendon 3
Sumter * Kershaw Clarendon 2
Clarendon 1
Lee25.0
35.0
45.0
55.0
65.0
75.0
85.0
77.673.8
81.7
75.777.9
68.7 69.3
46.8
69.265.4
71.2
64.3
73.7
62.258.2
35.6
Three-year averages of students reading on grade level
5th graders 6th - 8th graders
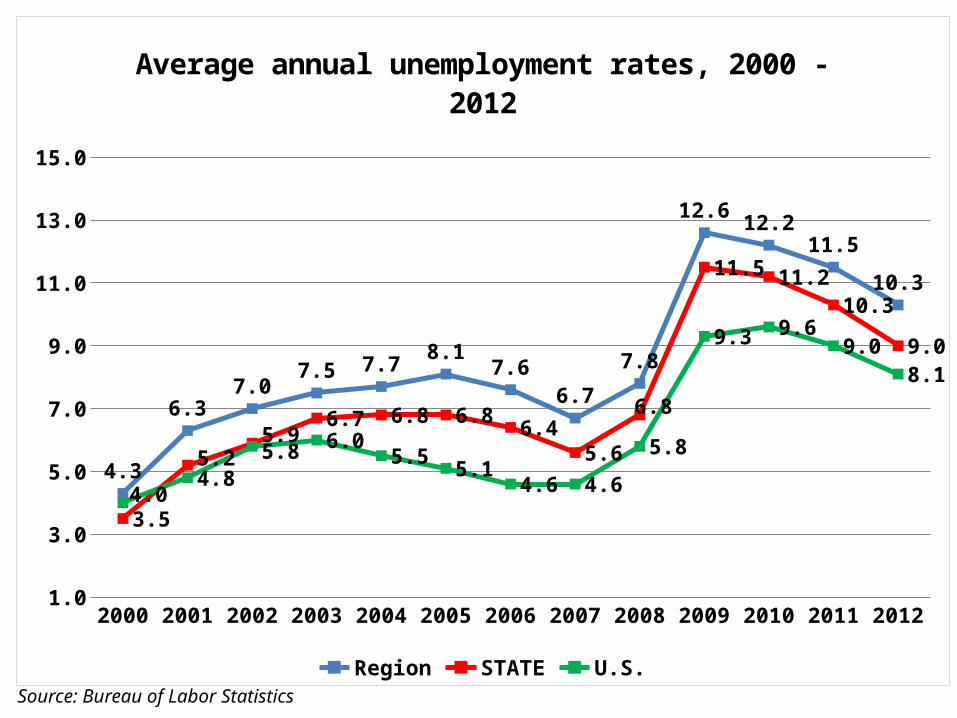
2000 2001 2002 2003 2004 2005 2006 2007 2008 2009 2010 2011 20121.0
3.0
5.0
7.0
9.0
11.0
13.0
15.0
4.3
6.37.0
7.5 7.78.1
7.6
6.7
7.8
12.612.2
11.5
10.3
3.5
5.25.9
6.7 6.8 6.86.4
5.6
6.8
11.5 11.2
10.3
9.0
4.04.8
5.8 6.05.5
5.14.6 4.6
5.8
9.3 9.69.0
8.1
Average annual unemployment rates, 2000 - 2012
Region STATE U.S.Source: Bureau of Labor Statistics

Source: Bureau of Labor Statistics’ August 2011 U6 Unemployment Rates for adults 25-and-older. U6 Rate measures the total unemployed, plus those employed part-time involuntarily, plus discouraged workers who have at least temporarily given up searching for work. Thus, U6 rates describe the real number of people in the U.S. who are feeling the effects of unemployment. U6 national rates applied to Santee-Lynches Region by COG calculation.

Average student age for Fall 2012: 27.7 years old Source: S.C. Commission on Higher Education Statistical Abstract
Fall 2000
Fall 2001
Fall 2002
Fall 2003
Fall 2004
Fall 2005
Fall 2006
Fall 2007
Fall 2008
Fall 2009
Fall 2010
Fall 2011
Fall 2012
-
500
1,000
1,500
2,000
2,500
3,000
3,500
4,000
4,500
5,000
2,546
2,962
3,265 3,191 3,259 3,244
2,931
3,283 3,206
4,137 4,382
4,522 4,577
528 486 543 525 643 721 744 745
Central Carolina Technical College enrollment
Credit student enrollment 18 and 19-year-old enrollment
16.5%
16.3% 16.6% 16.5% 16.4%15.5% 16.5% 16.3%
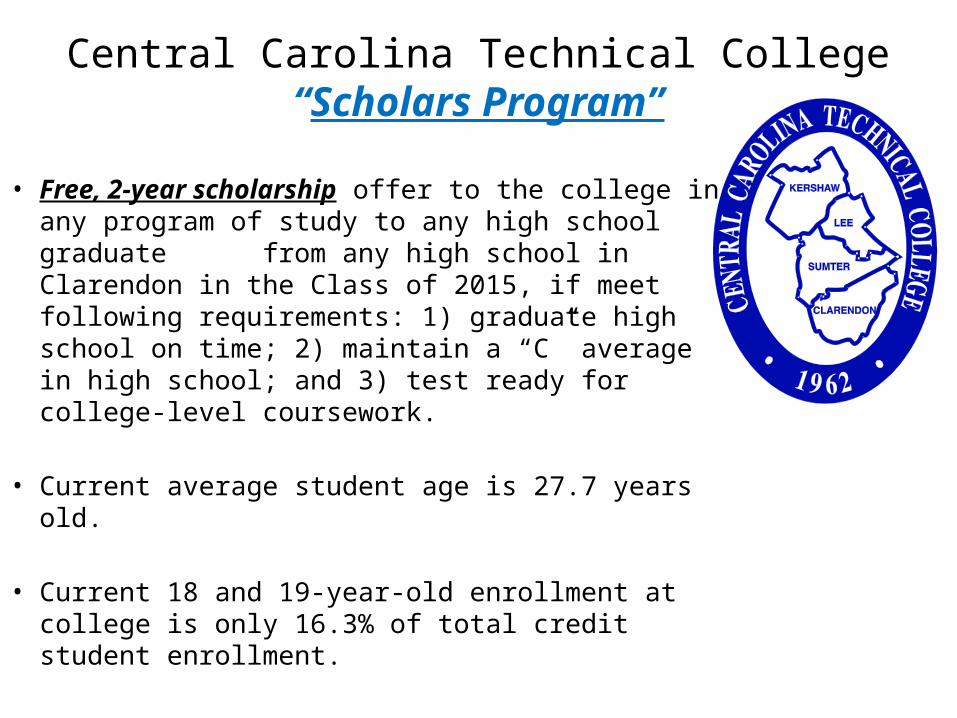
Central Carolina Technical College“Scholars Program”
• Free, 2-year scholarship offer to the college in any program of study to any high school graduate from any high school in Clarendon in the Class of 2015, if meet following requirements: 1) graduate high school on time; 2) maintain a “C” average in high school; and 3) test ready for college-level coursework.
• Current average student age is 27.7 years old.
• Current 18 and 19-year-old enrollment at college is only 16.3% of total credit student enrollment.

2-year field of study Occupation Starting pay
• Nursing Registered Nurse $50,000
• Computer Technology Programmer/Technician $40,000
• Mechatronics Maintenance Technician $40,000
• Welding Welder $40,000-$50,000
• Engineering Graphics Eng. Graphics Technician $36,000
• Machine Tool Machine Tool/CNC Operator $30,000-$36,000
• Automotive Technology Automotive Technician $30,000
• HVAC/R Technology HVAC Service Technician $30,000
• Criminal Justice Police Officer $25,000
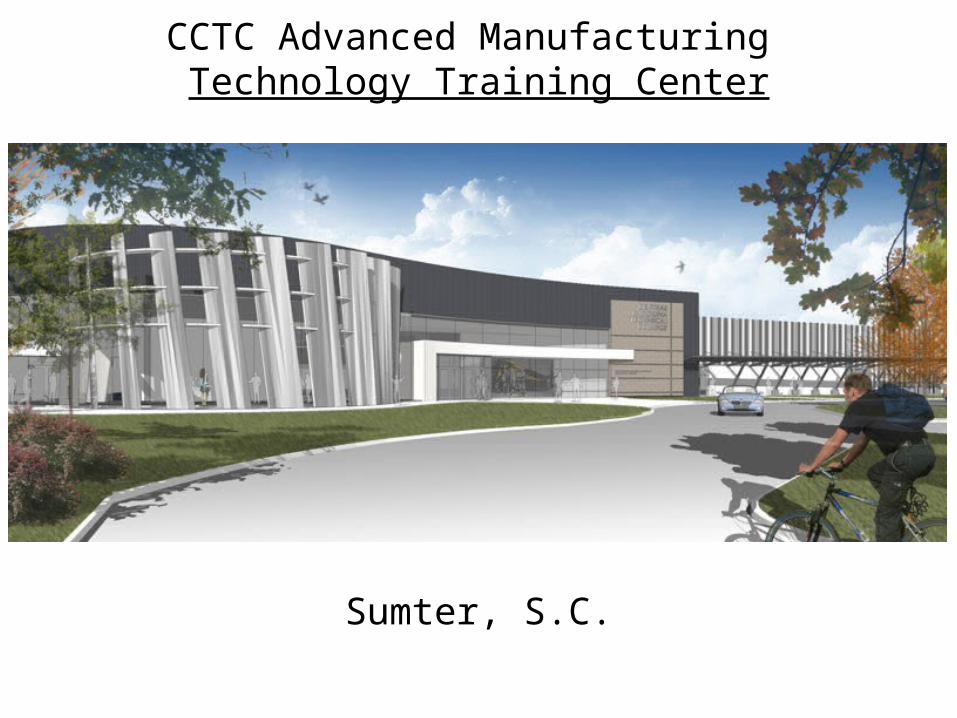
CCTC Advanced Manufacturing Technology Training Center
Sumter, S.C.

Powerpoint from tonight is available for download from our Web site:
www.santeelynchescog.org
in the “News You Can Use” section on the Front Page of site.
Related Documents