Welcome message from author
This document is posted to help you gain knowledge. Please leave a comment to let me know what you think about it! Share it to your friends and learn new things together.
Transcript
Community Health Assessment RWJ Barnabas Health: Clara Maass Medical Center Page i
ACKNOWLEDGEMENTS The following partners led the Clara Maass Medical Center (CMMC) Community Health Assessment: CLARA MAASS MEDICAL CENTER EXECUTIVES AND SENIOR TEAM
• Mary Ellen Clyne, Ph.D. President and Chief Executive Officer • Jeffrey Holt – Chief Operating Officer • Frank Mazzarella, MD – Chief Medical Officer • Teresa DiElmo – Chief Nursing Officer • Naveen Ballem, MD – Chief Clinical Effectiveness Officer • Yasmir Bisal – Senior Financial Officer • Al Torres – Vice President, Human Resources • Celeste Oranchak –Vice President, Foundation
CLARA MAASS MEDICAL CENTER OVERSIGHT COMMITTEE
• Mary Ellen Clyne, Ph.D., President and CEO, Clara Maass Medical Center • Buddy Evans, President and CEO, YMCA of Montclair • Deborah Day, Manager, United Way Caregivers Coalition in Montclair • Noreen Haveron, Executive Director/President at Job Haines Home • Joan Reeves, MSW, LSW, Social Case Work Supervisor, Health and Human Services Division of
Senior Services, City of East Orange • Margaret Brodowski, RN, Director of Nursing, Department of Health & Human Services
Montclair • Pastor Ivan Sciberras, St. Peter’s Church, Belleville • Ezequiel Garcia, NJ Sharing Network Trustee and Volunteer • Katie York PhD, MBA, Director of Senior Services/Lifelong Montclair Department of Health &
Human Services Township of Montclair • Cheryl Young, Volunteer and Community Representative • Jacqueline Pagano, Director of Marketing, Above the Rest Home Care of NJ, LLC • Ruth Lambo, Community Health Outreach Coordinator, CMMC • Tamara Cunningham, VP, System Development Planning, RWJBH
RWJ BARNABAS HEALTH COMMUNITY HEALTH NEEDS ASSESSMENT STEERING COMMITTEE The RWJ Barnabas Health CHNA Steering Committee oversees the 2018-2019 CNA process to update Hospitals CNAs and create new Implementation/Community Health Improvement Plans. The key tasks of the Steering Committee include:
• Oversight and guidance of CHNA implementation plan development • Review facility implementation/health improvement plans and results • Review of suggested priorities for facility implementation planning • Share strategies and best practices
Community Health Assessment RWJ Barnabas Health: Clara Maass Medical Center Page ii
Members of the RWJ Barnabas Health CHNA Steering Committee include:
• Jen Velez, Executive Vice President, Community and Behavioral Health, Committee Chair • Michellene Davis, Executive Vice President, Corporate Affairs • Bryan Soltes, System Vice President, Network Development, Oncology Services • Connie Greene, Behavioral Health/Preventive Care • Joseph Jaeger, DrPH, Chief Academic Officer • Barbara Mintz, Senior Vice President, Health and Wellness • Jessica Israel, M.D., Corporate Chair, Geriatrics • Michael Knecht, Corporate Vice President, Strategic Messaging and Marketing • Ernani Sadural, M.D., Director of Global Health for Barnabas Health • Richard Henwood, Vice President, Finance • Tamara Cunningham, Vice President, System Development/Planning • Hospital Representatives:
o Céu Cirne Neves, Vice President, Physician and Support Services, Saint Barnabas Medical Center (Designee: Margie Heller, Vice President, Community Health & Global Strategic Partnerships, Saint Barnabas Medical Center)
o Darrell K. Terry, Sr., MHA, MPH, FACHE, President and CEO, Newark Beth Israel Medical Center (Designee: Kim Cook, Director, Community Relations & Volunteer Services)
o Frank Mazzarella, M.D., Chief Medical Officer, Clara Maass Medical Center (Designee: Fran Monteleone, Director, Physician Relations and Community Outreach)
o Judy Colorado, Chief Nursing Officer and Vice President of Patient Care Services, Monmouth Medical Center Southern Campus (Designee: Jean McKinney, Community Education Department)
o Anna Burian, Vice President of Ambulatory Care Services, Monmouth Medical Center (Designee: Jean McKinney, Community Education Department)
o Teri Kubiel, DNP, Vice President, Patient Experience and Community Affairs o Shari Beirne, Director of Marketing and Patient Satisfaction, Barnabas Health Behavioral
Health Center o Serena Collado, Director, Community Health, Robert Wood Johnson University Hospital
Somerset o Mariam Merced, Director, Community Health Promotions, Robert Wood Johnson
University Hospital New Brunswick o Donna Mancuso, Manager, Public & Community Affairs, Robert Wood Johnson University
Hospital Rahway o Ruth Bash, Vice President & Chief Culture Officer, Children’s Specialized Hospital o Irene Borgen, Vice President, Quality and Standards, Jersey City Medical Center o Diane Grillo, Vice President, Health Promotion, Robert Wood Johnson University Hospital
Hamilton (Designee: Lauren Stabinsky, Director Community & Corporate Health, Robert Wood Johnson University Hospital Hamilton)
Community Health Assessment RWJ Barnabas Health: Clara Maass Medical Center Page iii
CLARA MAASS MEDICAL CENTER STEERING COMMITTEE CONSULTANT ADVISORS Steering Committee Technical Advisors:
• Withum, Smith & Brown (Scott Mariani) • New Solutions Inc. (Nancy Erickson1) • Bruno & Ridgway, Inc. (Joseph Ridgway)
Questions regarding the Community Needs Assessments should be directed to RWJ Barnabas Health System Development & Planning at [email protected].
1 The CHA’s development consultants, New Solutions, Inc., have planned and conducted numerous community needs assessments and implementation plans with multiple organizations including individual hospitals, health systems, other health care and community organizations such as consortia comprised of a wide range of participant organizations. The NSI team, of which two are Ph.D. prepared, includes: planning consultants, market researchers, epidemiologists, computer programmers and data analysts. NSI has extensive regional and local community knowledge of health issues, community services and provider resources for the community reviewed by this assessment. This expertise, as well as the methodological and technical skills of the entire staff, was brought to bear in conducting this Community Health Needs Assessment.
Community Health Assessment RWJ Barnabas Health: Clara Maass Medical Center Page iv
TABLE OF CONTENTS
Executive Summary ....................................................................................................................... ES-1 1. Introduction .................................................................................................................................. 1 2. Methodology/Service Area ............................................................................................................ 3
A. Methodology ............................................................................................................................. 3 B. Service Area ............................................................................................................................... 6
3. Community Health Needs Survey ................................................................................................... 7
A. Survey Respondents’ Profile...................................................................................................... 7 B. Health-Related Concerns of Area Residents ........................................................................... 10 C. Barriers to Accessing Health Care Services ............................................................................. 16 D. Community Strengths/Opportunities...................................................................................... 22 E. Personal Health Habits and Practices ...................................................................................... 28 F. Incidence of Screening Tests and Conditions Diagnosed ........................................................ 34 G. Additional Data ........................................................................................................................ 47
4. Essex County/Service Area Health Profile ..................................................................................... 51
A. Essex County Overview ........................................................................................................... 51 B. CMMC Service Area Overview ................................................................................................. 52 C. Social Determinants of Health................................................................................................. 53 D. Health Factors ......................................................................................................................... 96 E. Health Outcomes ................................................................................................................... 143
5. Assets and Gaps Analysis ........................................................................................................... 194
A. Health Disparities .................................................................................................................. 194 B. Health Factors ....................................................................................................................... 195 C. Health Outcomes ................................................................................................................... 198
Appendix ....................................................................................................................................... 201
A. CMMC CHNA Implementation Plan Results................................................................................. 202 B. Secondary Data Sources .............................................................................................................. 218 C. Cancer Incidence and Mortality Rate Report by Cancer Site: Essex County 2010-2017 ............. 220 D. Resource Inventory ...................................................................................................................... 242 E. Discharges and Population 18-64 for Ambulatory Care Sensitive Conditions ............................. 259
ES-1 Community Health Needs Assessment RWJ Barnabas Health: Clara Maass Medical Center
EXECUTIVE SUMMARY
Background CMMC Service Area
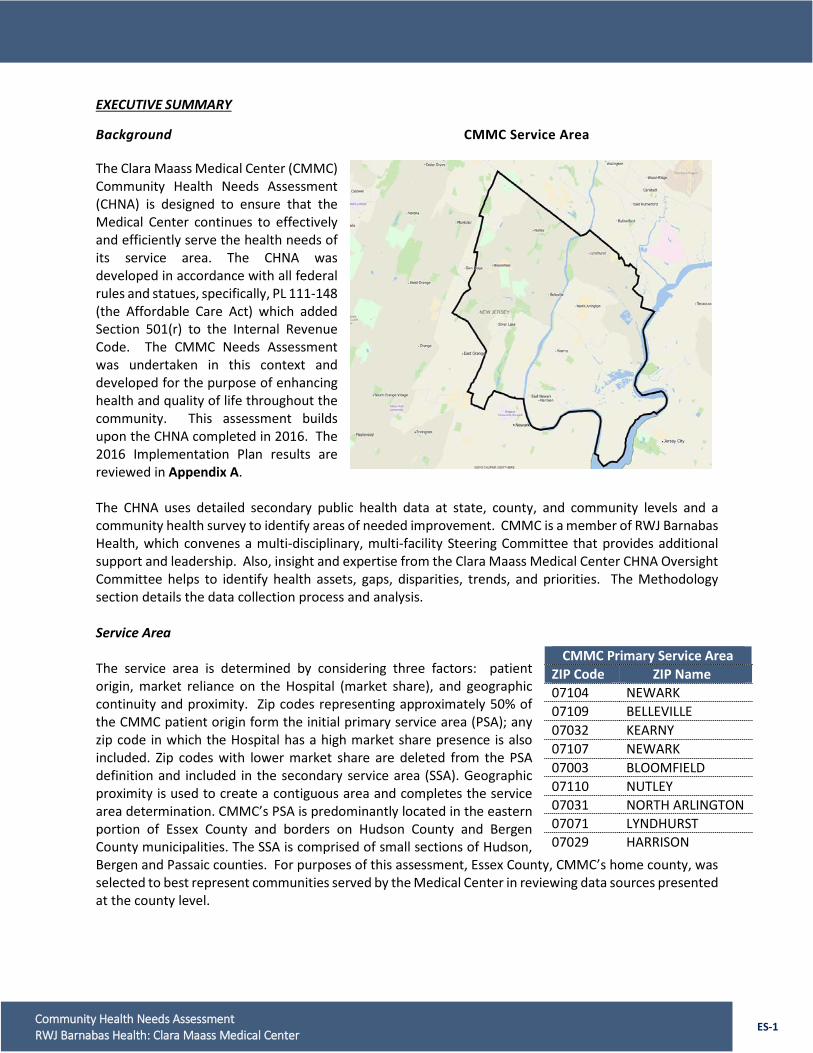
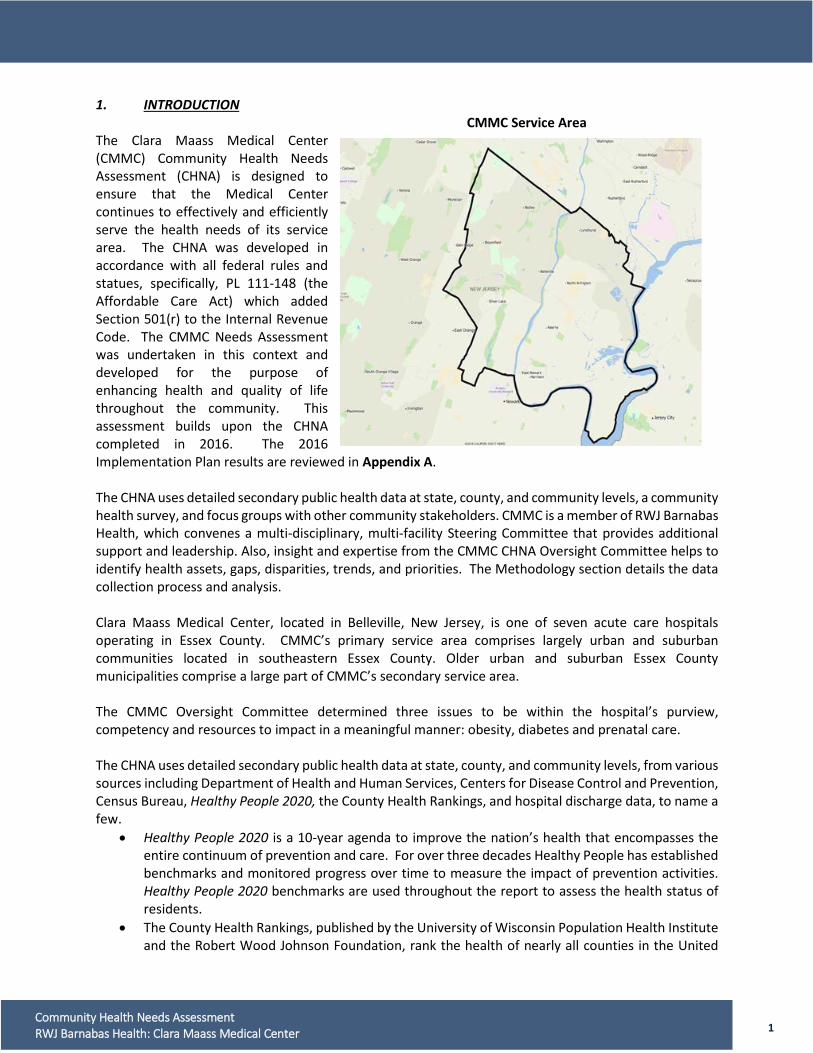
The Clara Maass Medical Center (CMMC) Community Health Needs Assessment (CHNA) is designed to ensure that the Medical Center continues to effectively and efficiently serve the health needs of its service area. The CHNA was developed in accordance with all federal rules and statues, specifically, PL 111-148 (the Affordable Care Act) which added Section 501(r) to the Internal Revenue Code. The CMMC Needs Assessment was undertaken in this context and developed for the purpose of enhancing health and quality of life throughout the community. This assessment builds upon the CHNA completed in 2016. The 2016 Implementation Plan results are reviewed in Appendix A. The CHNA uses detailed secondary public health data at state, county, and community levels and a community health survey to identify areas of needed improvement. CMMC is a member of RWJ Barnabas Health, which convenes a multi-disciplinary, multi-facility Steering Committee that provides additional support and leadership. Also, insight and expertise from the Clara Maass Medical Center CHNA Oversight Committee helps to identify health assets, gaps, disparities, trends, and priorities. The Methodology section details the data collection process and analysis. Service Area The service area is determined by considering three factors: patient origin, market reliance on the Hospital (market share), and geographic continuity and proximity. Zip codes representing approximately 50% of the CMMC patient origin form the initial primary service area (PSA); any zip code in which the Hospital has a high market share presence is also included. Zip codes with lower market share are deleted from the PSA definition and included in the secondary service area (SSA). Geographic proximity is used to create a contiguous area and completes the service area determination. CMMC’s PSA is predominantly located in the eastern portion of Essex County and borders on Hudson County and Bergen County municipalities. The SSA is comprised of small sections of Hudson, Bergen and Passaic counties. For purposes of this assessment, Essex County, CMMC’s home county, was selected to best represent communities served by the Medical Center in reviewing data sources presented at the county level.
CMMC Primary Service Area ZIP Code ZIP Name 07104 NEWARK 07109 BELLEVILLE 07032 KEARNY 07107 NEWARK 07003 BLOOMFIELD 07110 NUTLEY 07031 NORTH ARLINGTON 07071 LYNDHURST 07029 HARRISON
ES-2 Community Health Needs Assessment RWJ Barnabas Health: Clara Maass Medical Center
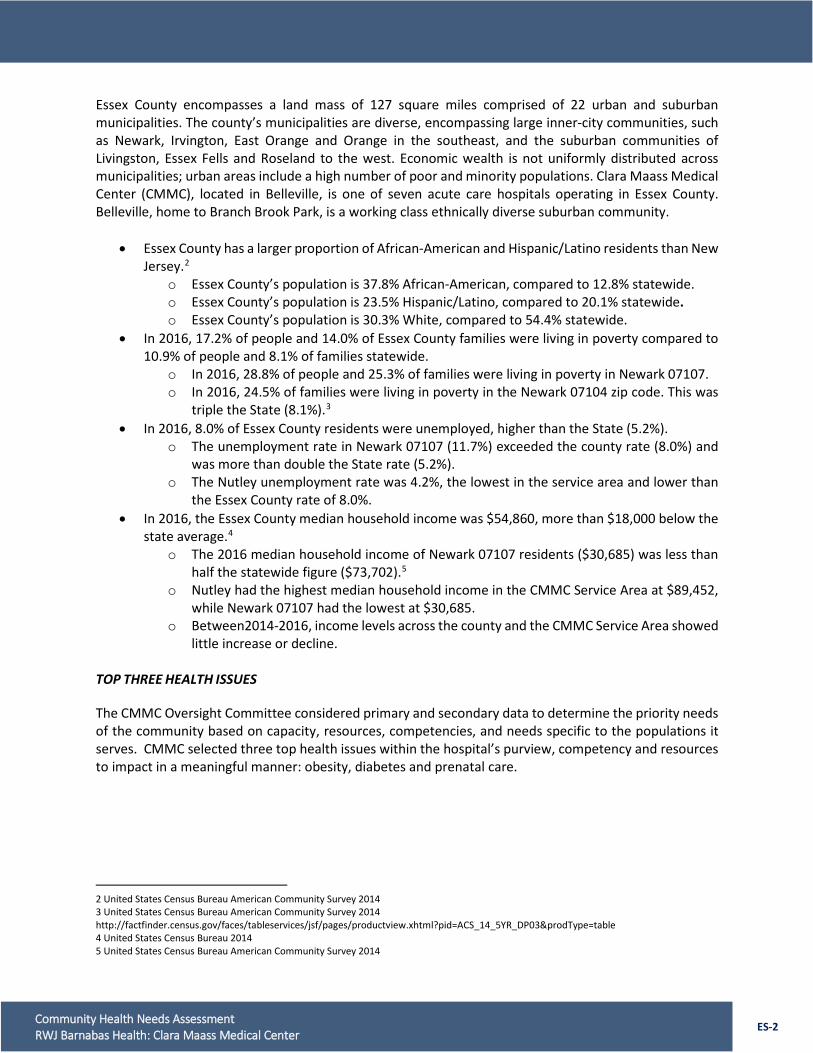
Essex County encompasses a land mass of 127 square miles comprised of 22 urban and suburban municipalities. The county’s municipalities are diverse, encompassing large inner-city communities, such as Newark, Irvington, East Orange and Orange in the southeast, and the suburban communities of Livingston, Essex Fells and Roseland to the west. Economic wealth is not uniformly distributed across municipalities; urban areas include a high number of poor and minority populations. Clara Maass Medical Center (CMMC), located in Belleville, is one of seven acute care hospitals operating in Essex County. Belleville, home to Branch Brook Park, is a working class ethnically diverse suburban community.
• Essex County has a larger proportion of African-American and Hispanic/Latino residents than New Jersey.2
o Essex County’s population is 37.8% African-American, compared to 12.8% statewide. o Essex County’s population is 23.5% Hispanic/Latino, compared to 20.1% statewide. o Essex County’s population is 30.3% White, compared to 54.4% statewide.
• In 2016, 17.2% of people and 14.0% of Essex County families were living in poverty compared to 10.9% of people and 8.1% of families statewide.
o In 2016, 28.8% of people and 25.3% of families were living in poverty in Newark 07107. o In 2016, 24.5% of families were living in poverty in the Newark 07104 zip code. This was
triple the State (8.1%).3 • In 2016, 8.0% of Essex County residents were unemployed, higher than the State (5.2%).
o The unemployment rate in Newark 07107 (11.7%) exceeded the county rate (8.0%) and was more than double the State rate (5.2%).
o The Nutley unemployment rate was 4.2%, the lowest in the service area and lower than the Essex County rate of 8.0%.
• In 2016, the Essex County median household income was $54,860, more than $18,000 below the state average.4
o The 2016 median household income of Newark 07107 residents ($30,685) was less than half the statewide figure ($73,702).5
o Nutley had the highest median household income in the CMMC Service Area at $89,452, while Newark 07107 had the lowest at $30,685.
o Between2014-2016, income levels across the county and the CMMC Service Area showed little increase or decline.
TOP THREE HEALTH ISSUES
The CMMC Oversight Committee considered primary and secondary data to determine the priority needs of the community based on capacity, resources, competencies, and needs specific to the populations it serves. CMMC selected three top health issues within the hospital’s purview, competency and resources to impact in a meaningful manner: obesity, diabetes and prenatal care.
2 United States Census Bureau American Community Survey 2014 3 United States Census Bureau American Community Survey 2014 http://factfinder.census.gov/faces/tableservices/jsf/pages/productview.xhtml?pid=ACS_14_5YR_DP03&prodType=table 4 United States Census Bureau 2014 5 United States Census Bureau American Community Survey 2014
ES-3 Community Health Needs Assessment RWJ Barnabas Health: Clara Maass Medical Center
1. Obesity Obesity and overweight are abnormal or excessive fat accumulation that presents a health risk. A crude population measure of obesity is the body mass index (BMI), a person’s weight (in kilograms) divided by the square of his or her height (in meters). A person with a BMI of 30 or more is considered obese; a person with a BMI equal to or more than 25 is overweight. Once considered a problem only in high income countries, overweight and obesity are now increasing in low and middle-income countries, particularly in urban settings. Being overweight or obese can have a serious impact on health. Overweight and obesity are risk factors for a number of chronic diseases, including: cardiovascular disease (mainly heart disease and stroke), type 2 diabetes, musculoskeletal disorders like osteoarthritis, and some cancers (endometrial, breast and colon). These conditions cause premature death and disability. Onset of increased risk begins when someone is only slightly overweight, and the risk increases as weight rises. Many conditions cause long-term consequences for individuals and families. In addition, the costs of care are high. Prevention and wellness programs are necessary to address the insidious effects of excess weight. Genetics affect the amount of body fat stored, where fat is distributed, and how efficiently the body converts food into energy. Family eating and physical activity habits play a role in the development of obesity. Prolonged inactivity results in calorie imbalance, the intake of calories is higher than the burning of calories. Often, inactivity is a result of other medical problems like arthritis or injuries. An unhealthy diet, high in calories and lacking in fruits and vegetables, is a significant contributor to weight gain. Research has linked social and economic factors to obesity. Socioeconomic factors include not having safe areas to exercise, cultural traditions of eating unhealthy and obese family members. Obesity can occur at any age, even among young children. Hormonal changes and physical inactivity in older individuals also increase risk. The amount of body muscle decreases with age, leading to a decrease in metabolism. Quitting smoking is also associated with weight gain, sometimes resulting in obesity. Structured smoking cessation programs can help mitigate the effects of weight gain associated with quitting. Not getting enough sleep or conversely getting too much sleep can cause changes in the hormones that increase appetite and contribute to weight gain.
• In 2015, Essex County residents ranked 7.5 out of 10 on an index of factors that contribute to access to healthy foods, lower than statewide (9.2).
• In 2016, 32.6% of Essex County adults reported no physical exercise within the past month, higher than New Jersey (29.8%) and CHR national benchmark.6
• The 2016 Essex County age-adjusted mortality rate due to diabetes (26.3/100,000) was higher than the statewide rate (17.6/100,000).7
• The percent of Essex County residents with a body mass index >-30 trended upward from 24.8% in 2011 to 26.8% in 2016.
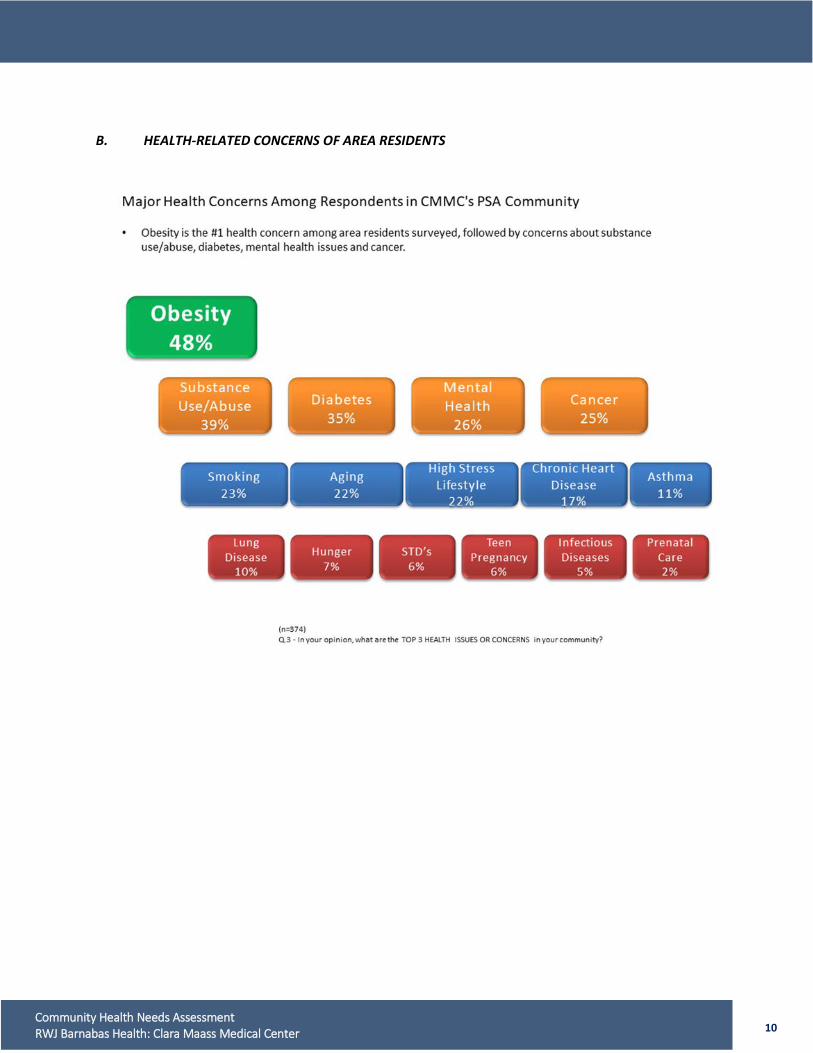
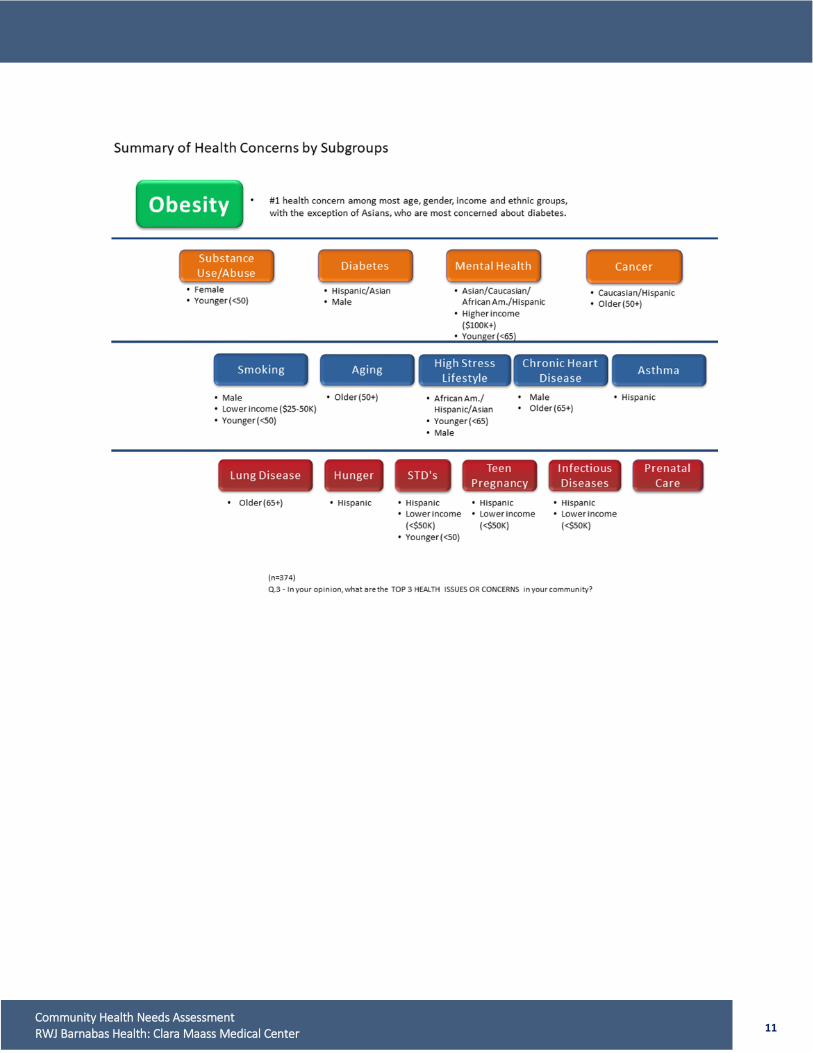
• Obesity was the top health concern mentioned by primary respondents in the CMMC service area.
6 Behavioral Risk Factor Surveillance System 2012 7 New Jersey Death Certificate Database, Office of Vital Statistics and Registry, New Jersey Department of Health; Population Estimates: New Jersey Department of Labor and Workforce Development, State Data Center
ES-4 Community Health Needs Assessment RWJ Barnabas Health: Clara Maass Medical Center
CMMC provides a bariatric clinic to address the needs of the Medicaid population by providing surgical options for weight loss. The Medical Center also provides ongoing educational programming and support group programs to patients undergoing bariatric surgery and supports community programming on topics like healthy shopping and meal preparation.
2. Diabetes Diabetes is a disease in which blood glucose levels are too high due to abnormal levels of the hormone insulin. In type 1 diabetes, the body is not able to make insulin. In type 2 diabetes, the more common type, the body does not make or use insulin well. Without enough insulin, glucose stays in your blood. Over time, too much glucose in the blood can cause serious problems, damaging the eyes, kidneys, and nerves. Diabetes can also cause heart disease, stroke and even the need to remove a limb. Pregnant women can get gestational diabetes. The American Diabetes Association estimates the total cost of diagnosed diabetes rose to $245 billion in 2012, from $174 billion in 2007. Prediabetes is a precursor to diabetes in which blood sugar is higher than normal, but not high enough to be diabetes. Having prediabetes puts an individual at a higher risk of Type 2 diabetes. Obesity is a major risk factor for Type 2 Diabetes. This form of diabetes, once believed to affect only adults, is now being diagnosed in children. Between 1980 and 2000, obesity rates doubled among children and adults and tripled among adolescents.8 Overweight children with diabetes are at risk for serious complications including kidney disease, blindness, and amputations. Other risk factors related to obesity include unhealthy diet, physical inactivity, and high blood pressure. While many diabetes risk factors are modifiable, other factors including a family history, increasing age, and ethnicity are uncontrollable.
• Diabetes is the fifth leading cause of death in Essex County. • When comparing diabetes age-adjusted mortality by race and ethnicity in Essex County, Blacks
had the highest age-adjusted mortality rate for diabetes (36.7/100,000). • The age-adjusted mortality rate for diabetes among Essex County Blacks increased from
35.5/100,000 in 2014 and to 36.7/100,000 in 2016, higher than statewide at 32.1/100,000. • In 2016, 13.1% of Essex County residents reported diabetes higher than the statewide rate 9.2%
and all comparison counties. • Diabetes is the third most common inpatient Ambulatory Care Sensitive Condition in Essex
County.9 The diabetes self-management education program works collaboratively with departments at Clara Maass Medical Center to provide a full continuum of care for those who have been diagnosed with diabetes. The program is for adults and is facilitated by certified diabetes educators, nurses and nutritionists, and includes 1:1 counseling available both during the day and in the evening. Topics covered include an overview of diabetes and how it affects your body: carbohydrate counting and dosing insulin; monitoring blood sugar levels; treatment options; meal planning, healthy cooking and eating, portion control and dining out; smart shopping and how to read food labels; regular physical activity; preventing complications; healthy coping; and weight management.
8 www.cdc.gov/pdf/facts_about_obesity_in_the_united_states.pdf 9 Health Care Decision Analyst Internal Data 2014
ES-5 Community Health Needs Assessment RWJ Barnabas Health: Clara Maass Medical Center
3. Prenatal Care
Getting early and regular prenatal care improves the chances of a healthy pregnancy. This type of care can begin prior to pregnancy with a preconception care visit to a health provider. A preconception care visit can identify the steps a woman can take before pregnancy to promote a healthy birth. These steps include:
• Increasing their daily intake of folic acid. • Marking sure immunizations are up to date. • Controlling diabetes or other medical conditions. • Avoid smoking, alcohol and using illicit drugs. • Attain a healthy weight. • Learn about family health history and that of their partner. • Seek help for anxiety, depression or other mental health issues.
Prenatal Care visits should begin by the 12th week of pregnancy. These visits will usually include a physical exam, weight checks, and urine tests. Blood tests, imaging rests such as ultra-sound exams will also occur at different stages of the pregnancy.
Regular prenatal care can help reduce the risk of pregnancy complications. Following a safe diet, getting regular exercise and avoiding exposure to lead and radiation, can help reduce the risk for problems during pregnancy and promote fetal health and development. Controlling existing medical conditions such as high blood pressure and diabetes is important o prevent serious complications. Tobacco and alcohol use have been shown to increase the risk of sudden infant death syndrome. Alcohol use increases the risk for alcohol spectrum disorders which can cause a variety of problems. In addition, taking 400mg of folic acid reduces the risk of neural tube defects by 70%. Women should also not take certain medications or herbal supplements which may be harmful to the fetus.
• Only 63.5% of Essex County women entered prenatal care in the first trimester compared to 72.1% in New Jersey.
• The percent of Essex County women enrolled in 1st trimester prenatal care declined from 81% in 2010, to 63.5% in 2016.
• The percent of women without prenatal care ranged from a low of 1.9% in 2013, to a high of 3.3% in 2016.
• The 2016 Essex County rates for no prenatal care (3.3%) places it in the worst performing quantile. Clara Maass Medical Center offers an obstetrics clinic to provide 24-hour access to care for pregnant women and their families, including prenatal, intraportal and postpartum care. In addition, the Medical Center offers classes in preparing for childbirth, breastfeeding, infant care classes, and weekend childbirth services to pregnant women and their families.
1 Community Health Needs Assessment RWJ Barnabas Health: Clara Maass Medical Center
1. INTRODUCTION CMMC Service Area The Clara Maass Medical Center (CMMC) Community Health Needs Assessment (CHNA) is designed to ensure that the Medical Center continues to effectively and efficiently serve the health needs of its service area. The CHNA was developed in accordance with all federal rules and statues, specifically, PL 111-148 (the Affordable Care Act) which added Section 501(r) to the Internal Revenue Code. The CMMC Needs Assessment was undertaken in this context and developed for the purpose of enhancing health and quality of life throughout the community. This assessment builds upon the CHNA completed in 2016. The 2016 Implementation Plan results are reviewed in Appendix A. The CHNA uses detailed secondary public health data at state, county, and community levels, a community health survey, and focus groups with other community stakeholders. CMMC is a member of RWJ Barnabas Health, which convenes a multi-disciplinary, multi-facility Steering Committee that provides additional support and leadership. Also, insight and expertise from the CMMC CHNA Oversight Committee helps to identify health assets, gaps, disparities, trends, and priorities. The Methodology section details the data collection process and analysis. Clara Maass Medical Center, located in Belleville, New Jersey, is one of seven acute care hospitals operating in Essex County. CMMC’s primary service area comprises largely urban and suburban communities located in southeastern Essex County. Older urban and suburban Essex County municipalities comprise a large part of CMMC’s secondary service area. The CMMC Oversight Committee determined three issues to be within the hospital’s purview, competency and resources to impact in a meaningful manner: obesity, diabetes and prenatal care. The CHNA uses detailed secondary public health data at state, county, and community levels, from various sources including Department of Health and Human Services, Centers for Disease Control and Prevention, Census Bureau, Healthy People 2020, the County Health Rankings, and hospital discharge data, to name a few.
• Healthy People 2020 is a 10-year agenda to improve the nation’s health that encompasses the entire continuum of prevention and care. For over three decades Healthy People has established benchmarks and monitored progress over time to measure the impact of prevention activities. Healthy People 2020 benchmarks are used throughout the report to assess the health status of residents.
• The County Health Rankings, published by the University of Wisconsin Population Health Institute and the Robert Wood Johnson Foundation, rank the health of nearly all counties in the United
2 Community Health Needs Assessment RWJ Barnabas Health: Clara Maass Medical Center
States. The rankings look at a variety of measures that affect health such as high school graduation rates, air pollution levels, income, rates of obesity and smoking, etc. These rankings are also used throughout the report to measure the overall health of Essex County residents. County rates are also compared to statewide rates.
The CMMC needs assessment was developed for the purpose of enhancing the health and quality of life throughout the community. To this end, both internal and external data were used to understand recent health indicators and opportunities to provide a positive impact on health and wellness. Other significant needs determined by this CHNA include:
• Geriatric Care • Access to Care (Cost of Care, Insurance) • Language • Substance Abuse • Heart Disease • Transportation • Mental Health • Cancer
3 Community Health Needs Assessment RWJ Barnabas Health: Clara Maass Medical Center
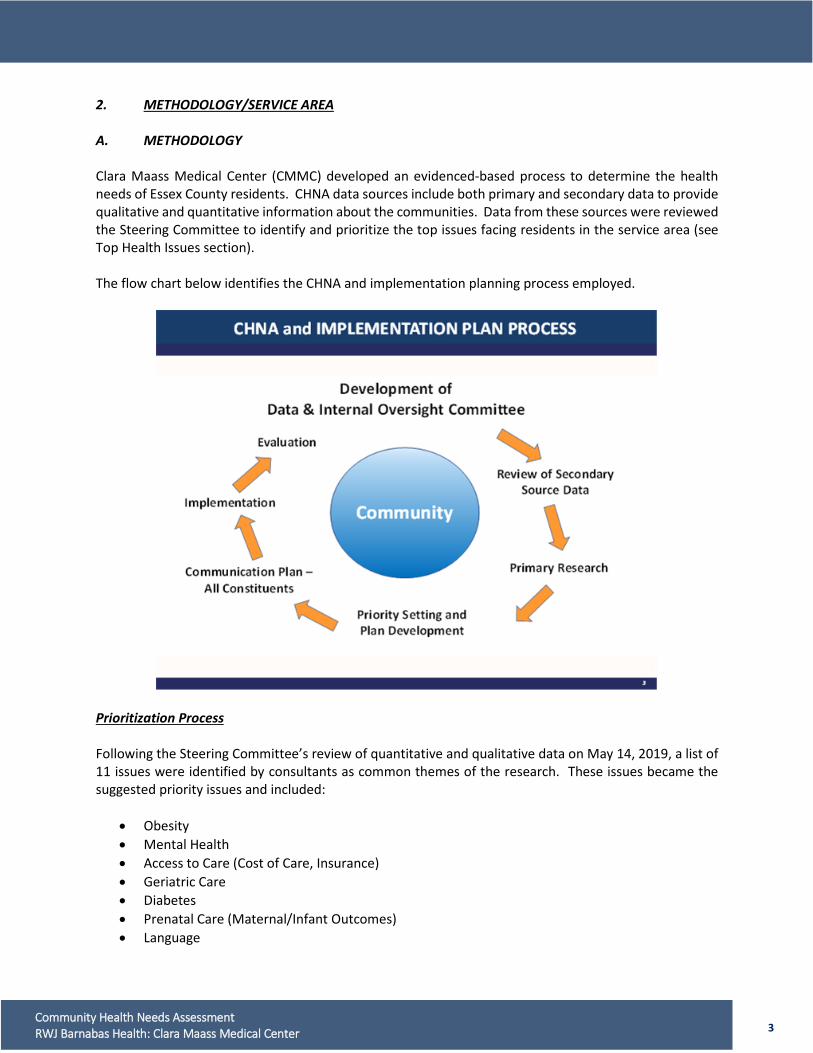
2. METHODOLOGY/SERVICE AREA A. METHODOLOGY Clara Maass Medical Center (CMMC) developed an evidenced-based process to determine the health needs of Essex County residents. CHNA data sources include both primary and secondary data to provide qualitative and quantitative information about the communities. Data from these sources were reviewed the Steering Committee to identify and prioritize the top issues facing residents in the service area (see Top Health Issues section). The flow chart below identifies the CHNA and implementation planning process employed.
Prioritization Process Following the Steering Committee’s review of quantitative and qualitative data on May 14, 2019, a list of 11 issues were identified by consultants as common themes of the research. These issues became the suggested priority issues and included:
• Obesity • Mental Health • Access to Care (Cost of Care, Insurance) • Geriatric Care • Diabetes • Prenatal Care (Maternal/Infant Outcomes) • Language

4 Community Health Needs Assessment RWJ Barnabas Health: Clara Maass Medical Center
• Substance Abuse • Heart Disease • Transportation • Cancer
A ballot was developed, and a survey sent to the oversight membership asking them to rank each issue based on the following criteria.
• Number of people impacted • Risk of mortality and morbidity associated with the problem • Impact of the problem on vulnerable populations • Meaningful progress can be made within a three-year timeframe • Community’s capability and competency to impact
A tally of the ballots cast resulted in the selection of the following three issues:
• Obesity • Diabetes • Prenatal Care
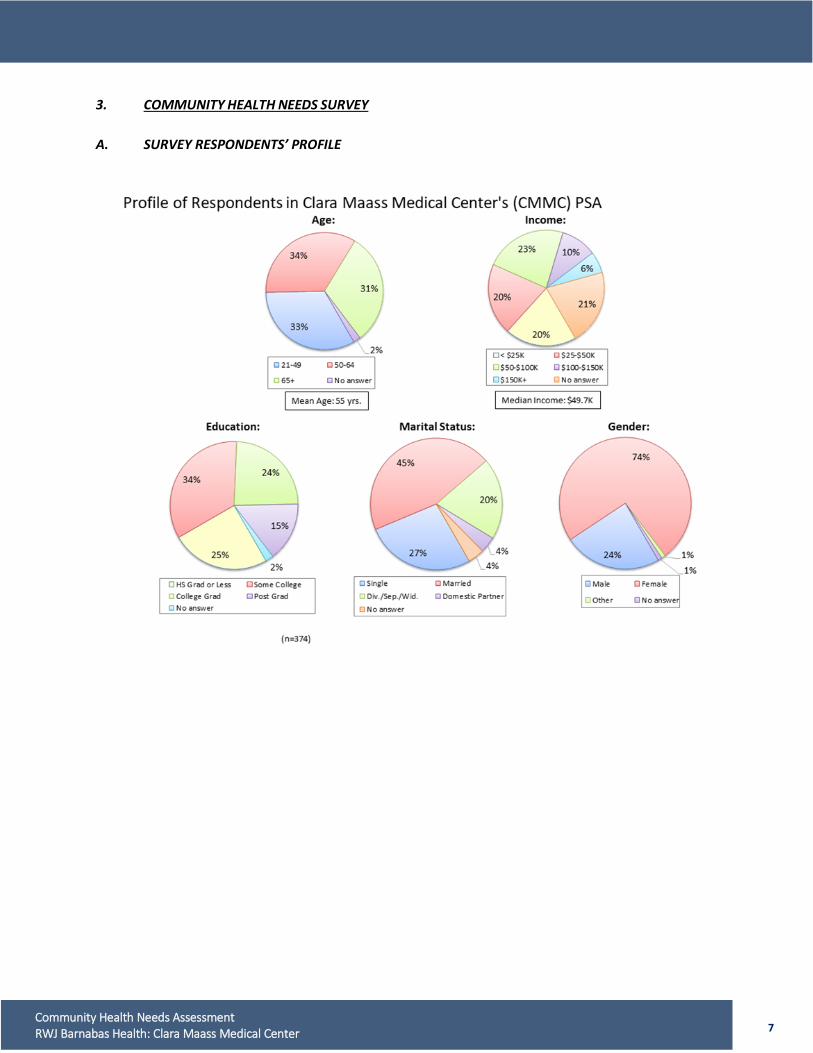
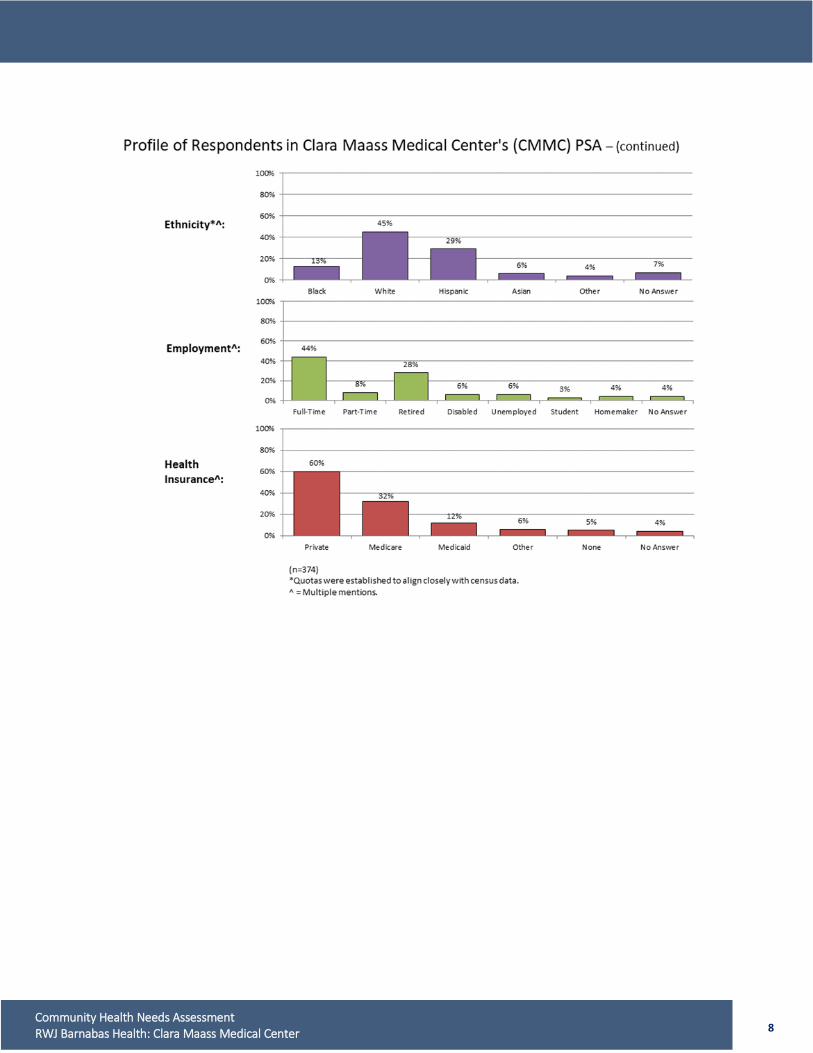
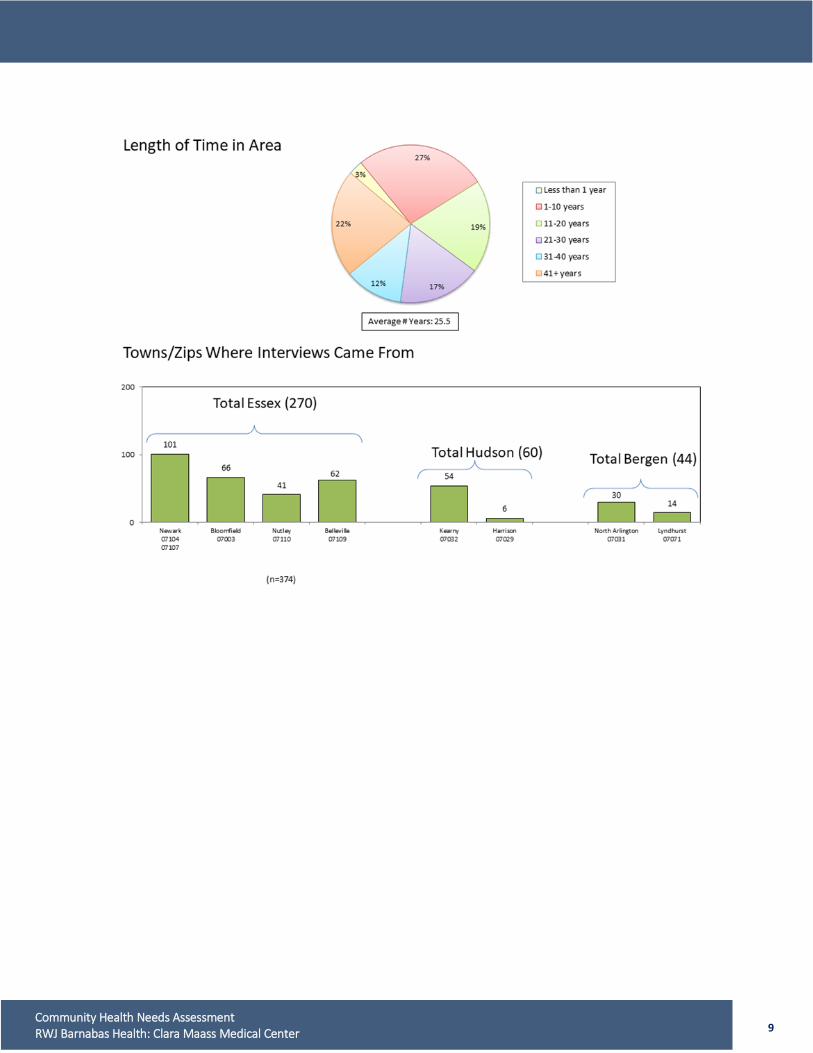
Primary Data Sources Community Health Needs Surveys In order to obtain a service area-specific analysis for the CMMC service area, on-line survey Interviews were conducted among 374 residents of the Hospital’s PSA. Interviews were conducted online and by telephone. A link to the online survey was displayed on hospital web pages and social media sites. Additionally, postcards were handed out at area businesses and libraries, directing residents to the online survey link. A telephone augment was conducted to capture additional interviews in specific areas and among specific ethnic groups. For the telephone portion, a representative sample of households was generated from a database of residential telephone numbers. Bruno and Ridgway Research Associates, Inc. administered the on-line and telephone surveys from June 1, 2018 – September 27, 2018. Survey results are incorporated into this CHNA. (See Section 3) Secondary Data Sources Over 100 secondary data sources are compiled in this CHNA, presenting data by indicator by county and state. Sources include The United States Census Bureau, Centers for Disease Control and Prevention (CDC), New Jersey Department of Health (NJDOH), and Behavioral Risk Factor Surveillance System (BRFSS). See Appendix B for a detailed list of sources. Appendix C contains a detailed report of cancer incidence and mortality by cancer site for Essex County for the years 2010-2017. In addition, hospital tumor registry data is utilized to understand stage of cancer at time of diagnosis.
5 Community Health Needs Assessment RWJ Barnabas Health: Clara Maass Medical Center
Health Profile Section 5 provides a comprehensive presentation of health outcomes as well as the social determinants of health and other health factors that contribute to the health and well-being of Essex County residents. Color Indicator Tables Throughout the Health Profile Section of this CHNA, the color indicator tables compare county level data to Healthy People 2020 targets, County Health Rankings benchmarks, and New Jersey State data. Data by race/ethnicity are compared to data for all races in the county, unless otherwise indicated. Essex County was the midpoint value compared to a range 20% higher than the value for New Jersey, Healthy People 2020, or County Health Rankings Benchmarks, or 20% lower than the value for New Jersey, Healthy People 2020, or County Health Rankings Benchmarks. If the county value was within the range 20% lower or 20% higher than the comparison indicator, or considered within reasonable range, the indicator will be yellow. The table will be red if the Essex County value is more than 20% worse or lower than the indicator value. If the Essex County value is 20% better or higher than the indicator value, the table will be green. Comparative counties are also presented providing additional context for select health indicators. Assets and Gaps Section 6, Assets and Gaps, summarizes the preceding components of the CHNA. Assets highlight county information indicating improvement over time, in comparison to other counties and the State, or in comparison to other races or genders. Gaps focus on disparities in Essex County or the CMMC Service Area that have a negative trend, in comparison to other counties in the State or to other races or genders. Resource Inventory A service area-specific resource inventory is included as Appendix D, which details health and social service resources available to residents in Essex County. Providers’ names, addresses, and phone numbers and type of services provided are contained in the inventory.
6 Community Health Needs Assessment RWJ Barnabas Health: Clara Maass Medical Center
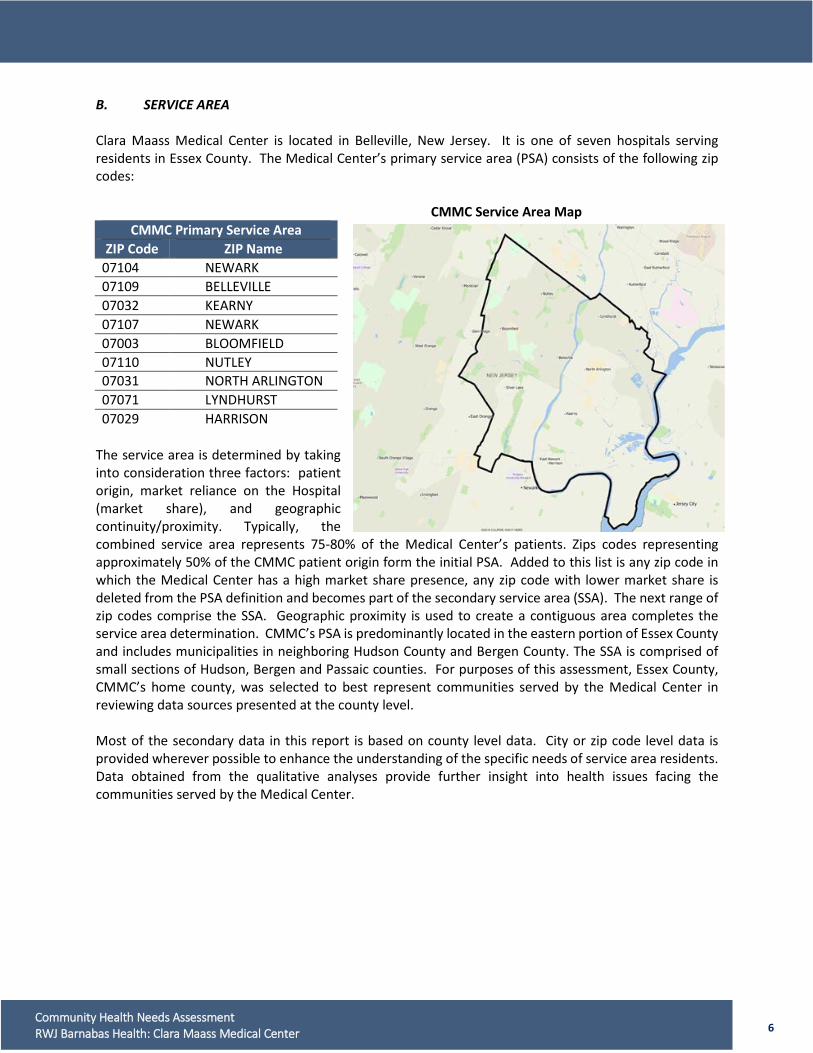
B. SERVICE AREA Clara Maass Medical Center is located in Belleville, New Jersey. It is one of seven hospitals serving residents in Essex County. The Medical Center’s primary service area (PSA) consists of the following zip codes: CMMC Service Area Map
CMMC Primary Service Area ZIP Code ZIP Name
07104 NEWARK 07109 BELLEVILLE 07032 KEARNY 07107 NEWARK 07003 BLOOMFIELD 07110 NUTLEY 07031 NORTH ARLINGTON 07071 LYNDHURST 07029 HARRISON
The service area is determined by taking into consideration three factors: patient origin, market reliance on the Hospital (market share), and geographic continuity/proximity. Typically, the combined service area represents 75-80% of the Medical Center’s patients. Zips codes representing approximately 50% of the CMMC patient origin form the initial PSA. Added to this list is any zip code in which the Medical Center has a high market share presence, any zip code with lower market share is deleted from the PSA definition and becomes part of the secondary service area (SSA). The next range of zip codes comprise the SSA. Geographic proximity is used to create a contiguous area completes the service area determination. CMMC’s PSA is predominantly located in the eastern portion of Essex County and includes municipalities in neighboring Hudson County and Bergen County. The SSA is comprised of small sections of Hudson, Bergen and Passaic counties. For purposes of this assessment, Essex County, CMMC’s home county, was selected to best represent communities served by the Medical Center in reviewing data sources presented at the county level. Most of the secondary data in this report is based on county level data. City or zip code level data is provided wherever possible to enhance the understanding of the specific needs of service area residents. Data obtained from the qualitative analyses provide further insight into health issues facing the communities served by the Medical Center.
7 Community Health Needs Assessment RWJ Barnabas Health: Clara Maass Medical Center
3. COMMUNITY HEALTH NEEDS SURVEY A. SURVEY RESPONDENTS’ PROFILE
8 Community Health Needs Assessment RWJ Barnabas Health: Clara Maass Medical Center
9 Community Health Needs Assessment RWJ Barnabas Health: Clara Maass Medical Center
10 Community Health Needs Assessment RWJ Barnabas Health: Clara Maass Medical Center
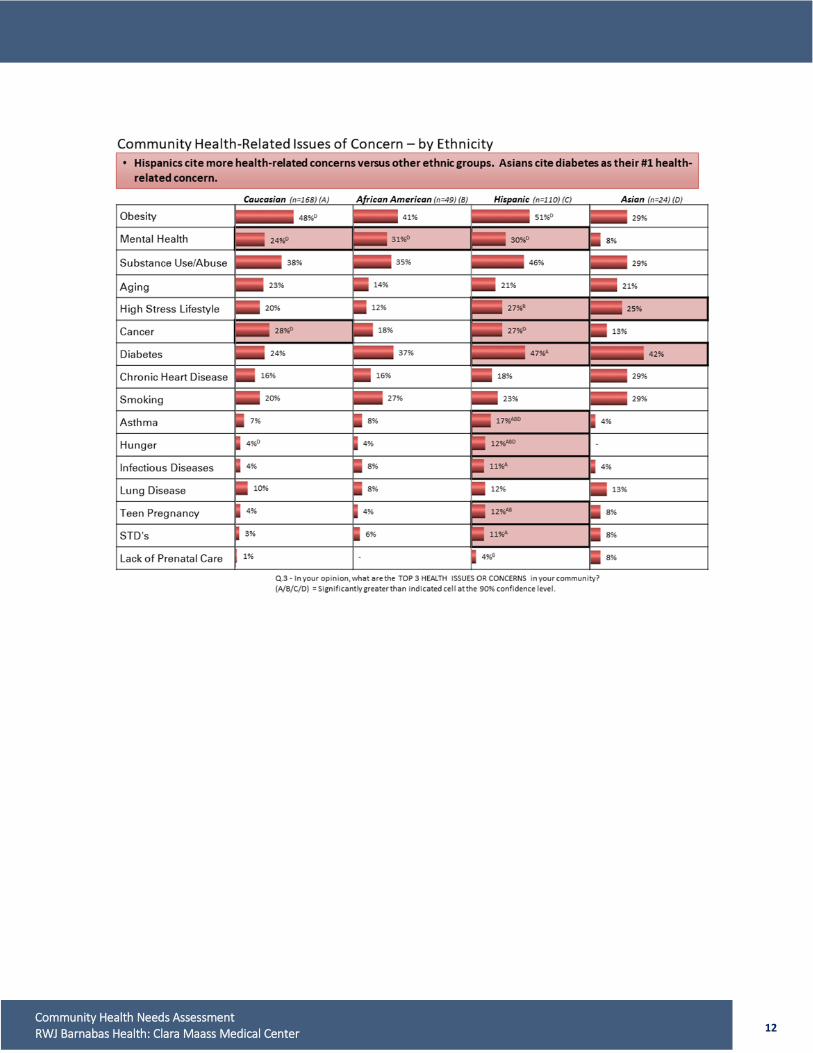
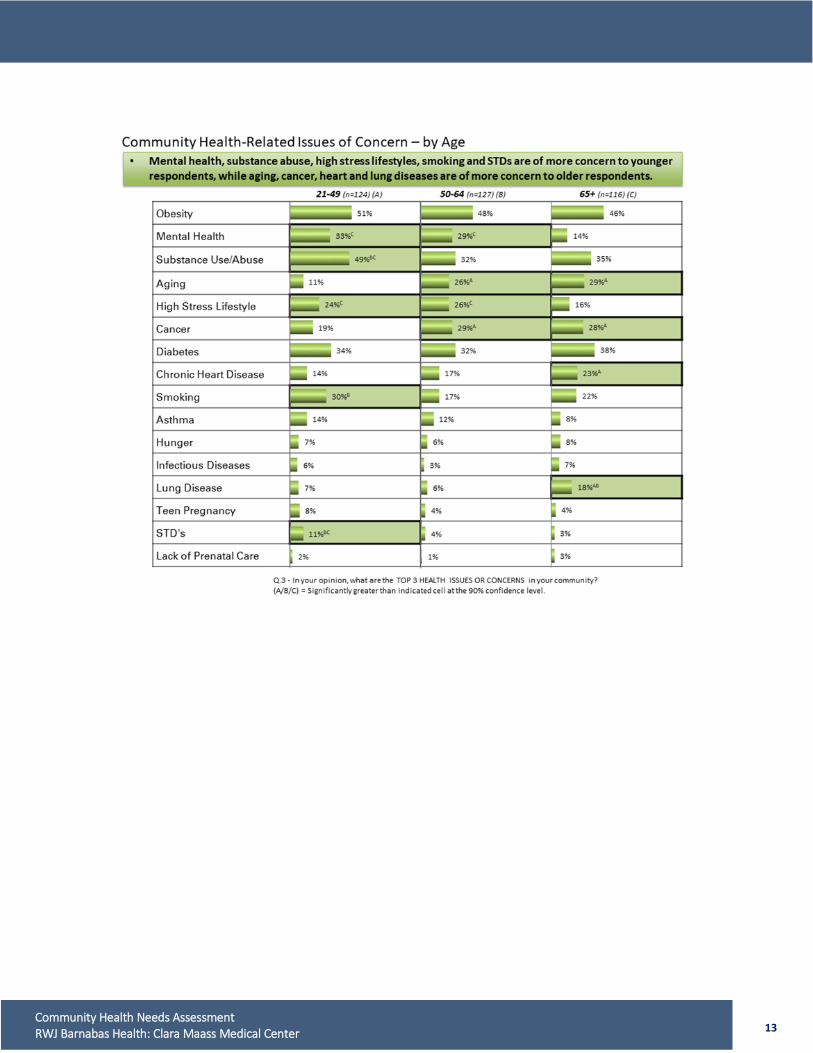
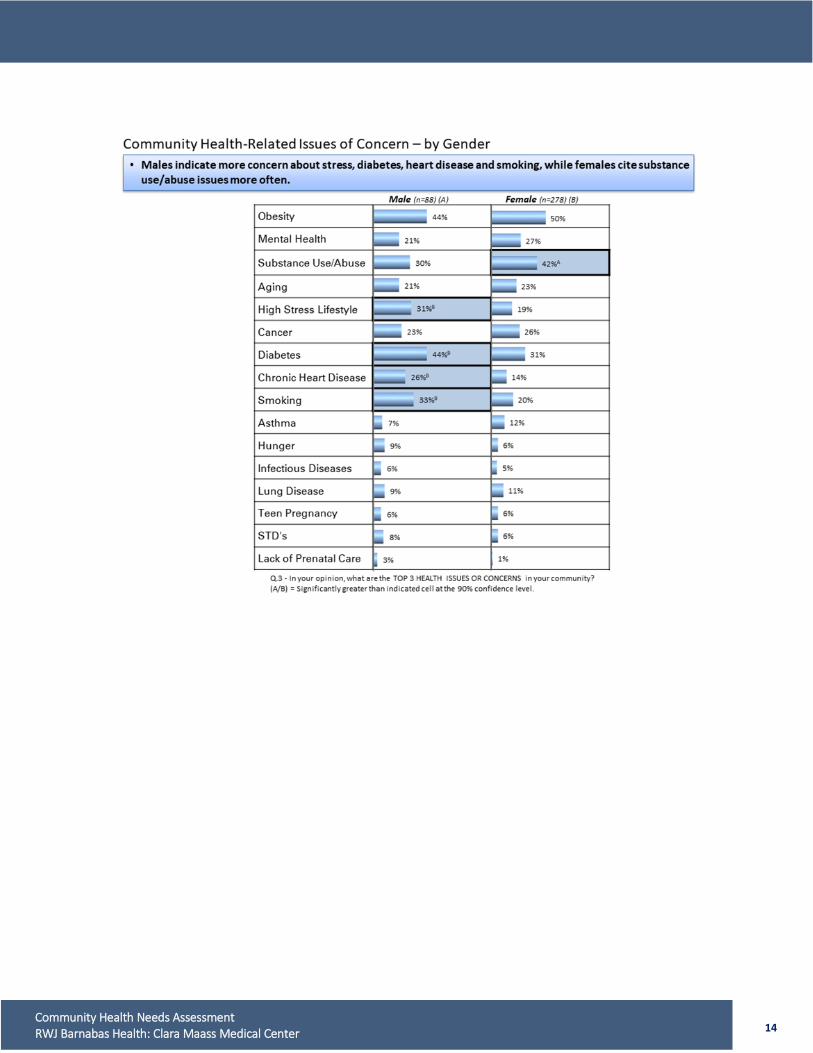
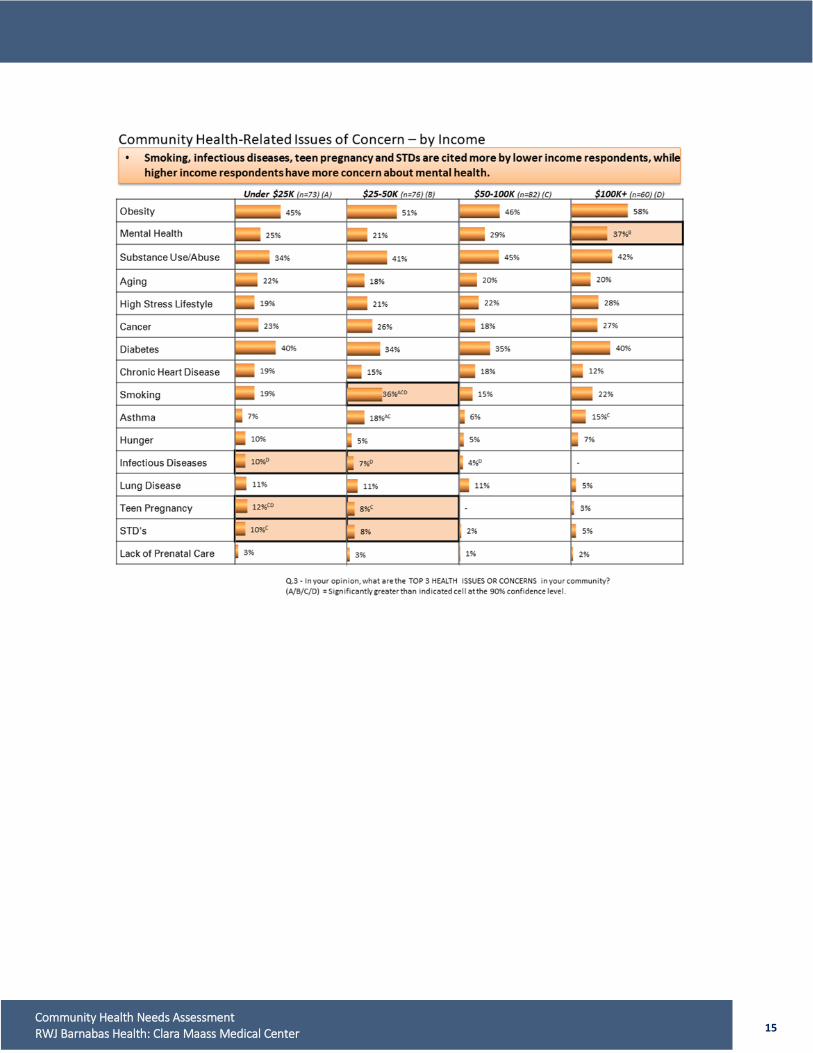
B. HEALTH-RELATED CONCERNS OF AREA RESIDENTS
11 Community Health Needs Assessment RWJ Barnabas Health: Clara Maass Medical Center
12 Community Health Needs Assessment RWJ Barnabas Health: Clara Maass Medical Center
13 Community Health Needs Assessment RWJ Barnabas Health: Clara Maass Medical Center
14 Community Health Needs Assessment RWJ Barnabas Health: Clara Maass Medical Center
15 Community Health Needs Assessment RWJ Barnabas Health: Clara Maass Medical Center
16 Community Health Needs Assessment RWJ Barnabas Health: Clara Maass Medical Center
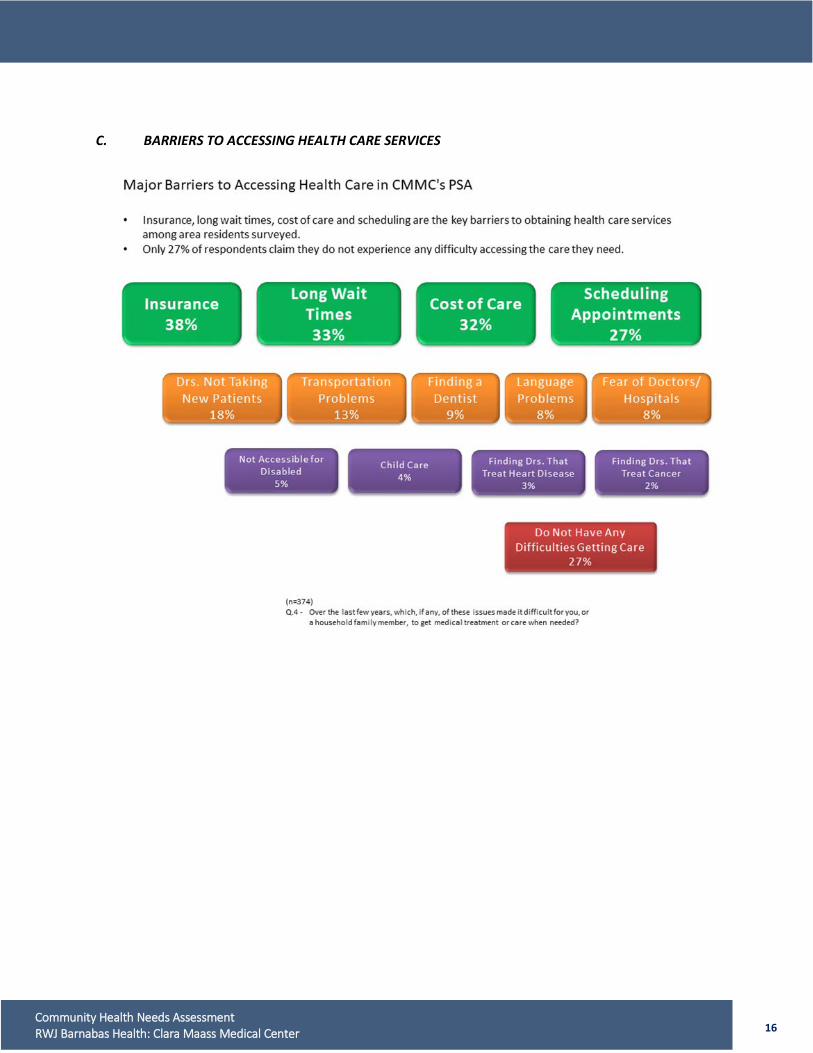
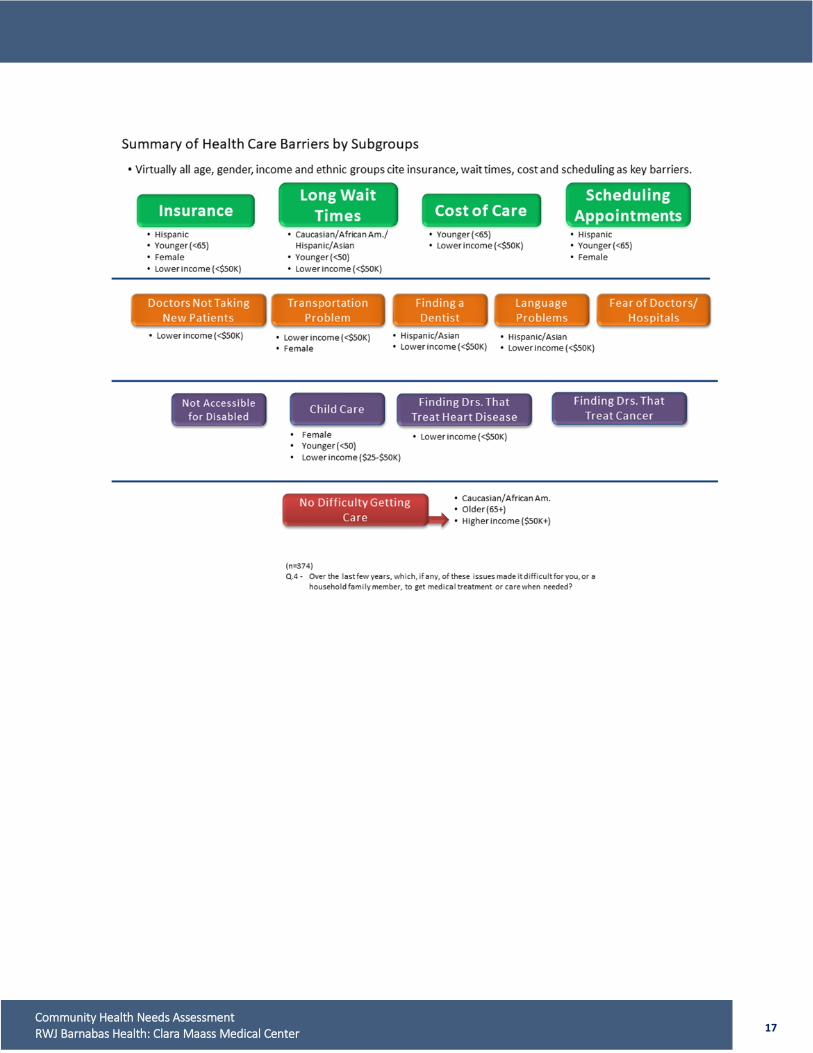
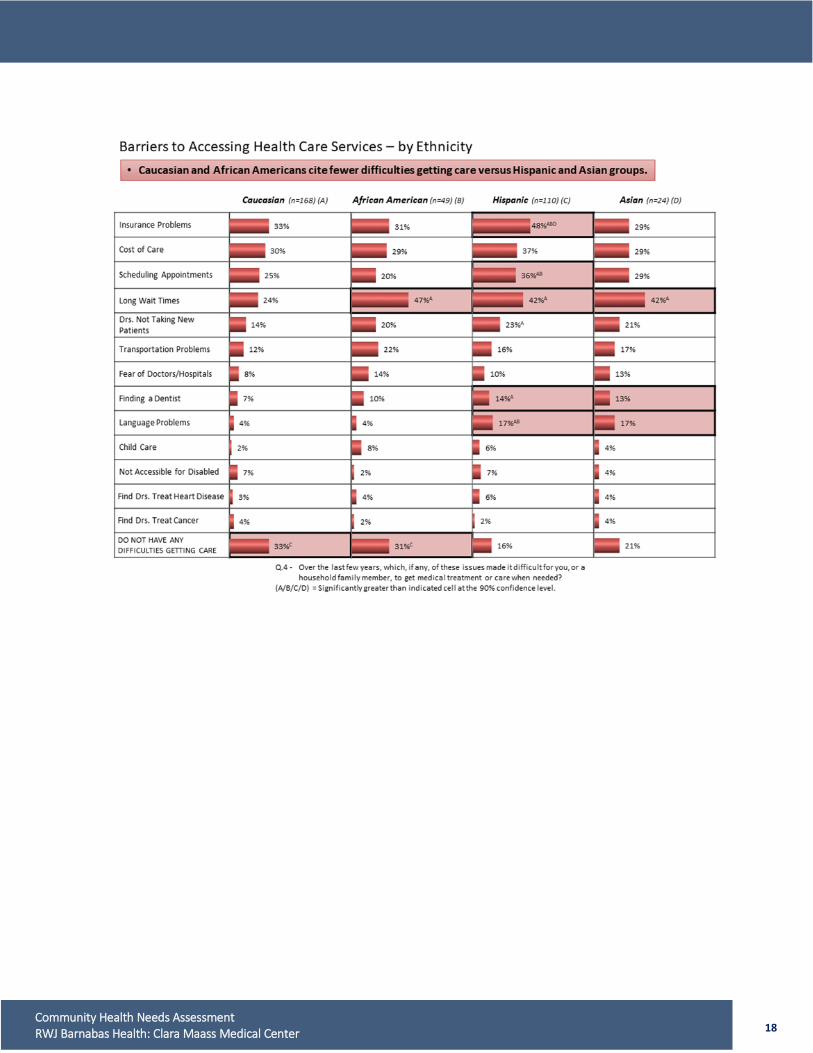
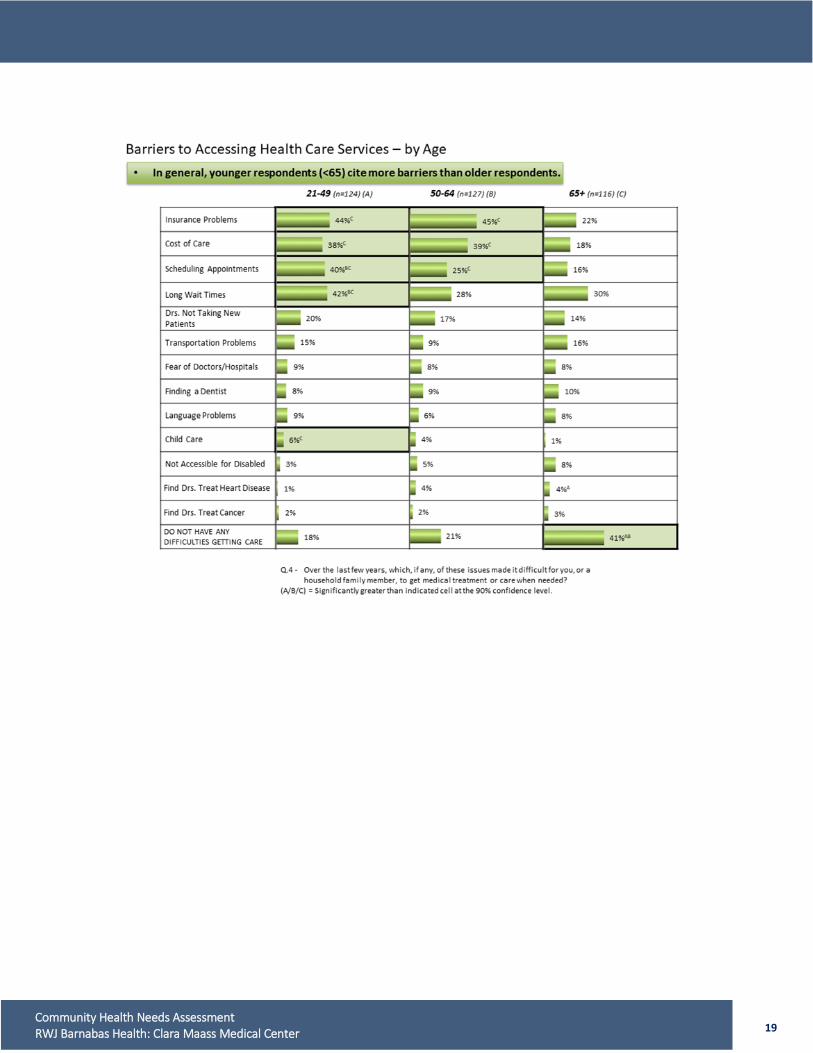
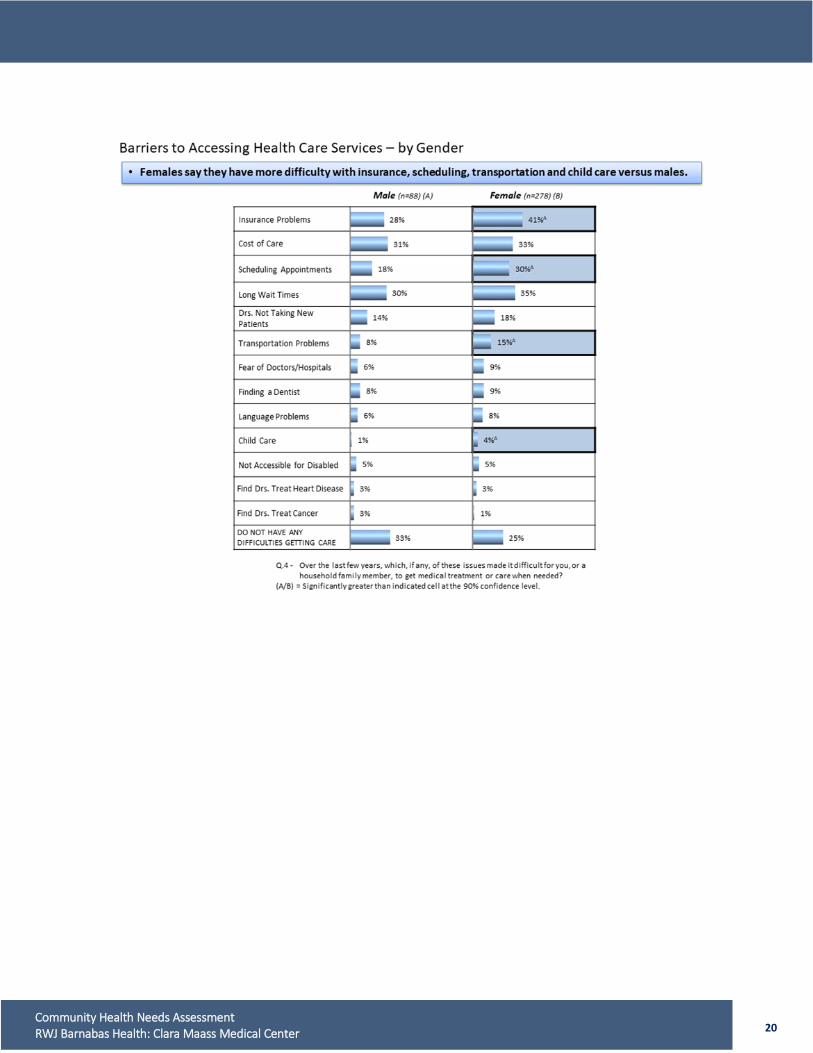
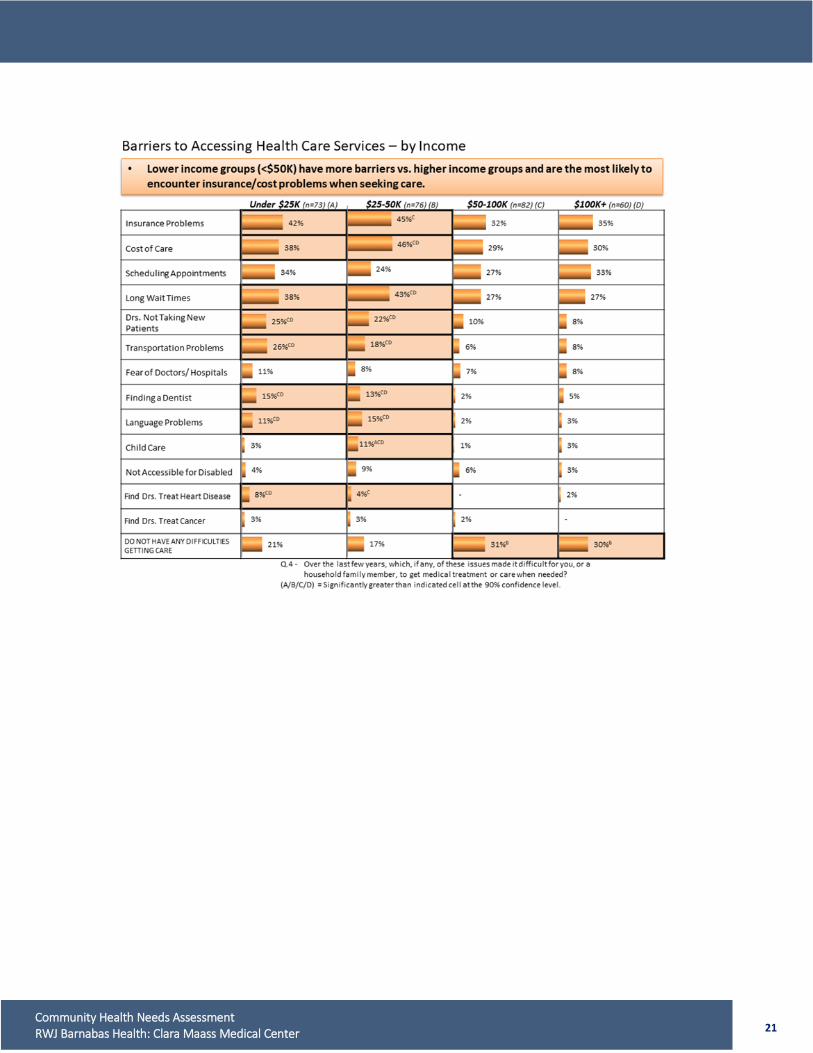
C. BARRIERS TO ACCESSING HEALTH CARE SERVICES
17 Community Health Needs Assessment RWJ Barnabas Health: Clara Maass Medical Center
18 Community Health Needs Assessment RWJ Barnabas Health: Clara Maass Medical Center
19 Community Health Needs Assessment RWJ Barnabas Health: Clara Maass Medical Center
20 Community Health Needs Assessment RWJ Barnabas Health: Clara Maass Medical Center
21 Community Health Needs Assessment RWJ Barnabas Health: Clara Maass Medical Center
22 Community Health Needs Assessment RWJ Barnabas Health: Clara Maass Medical Center
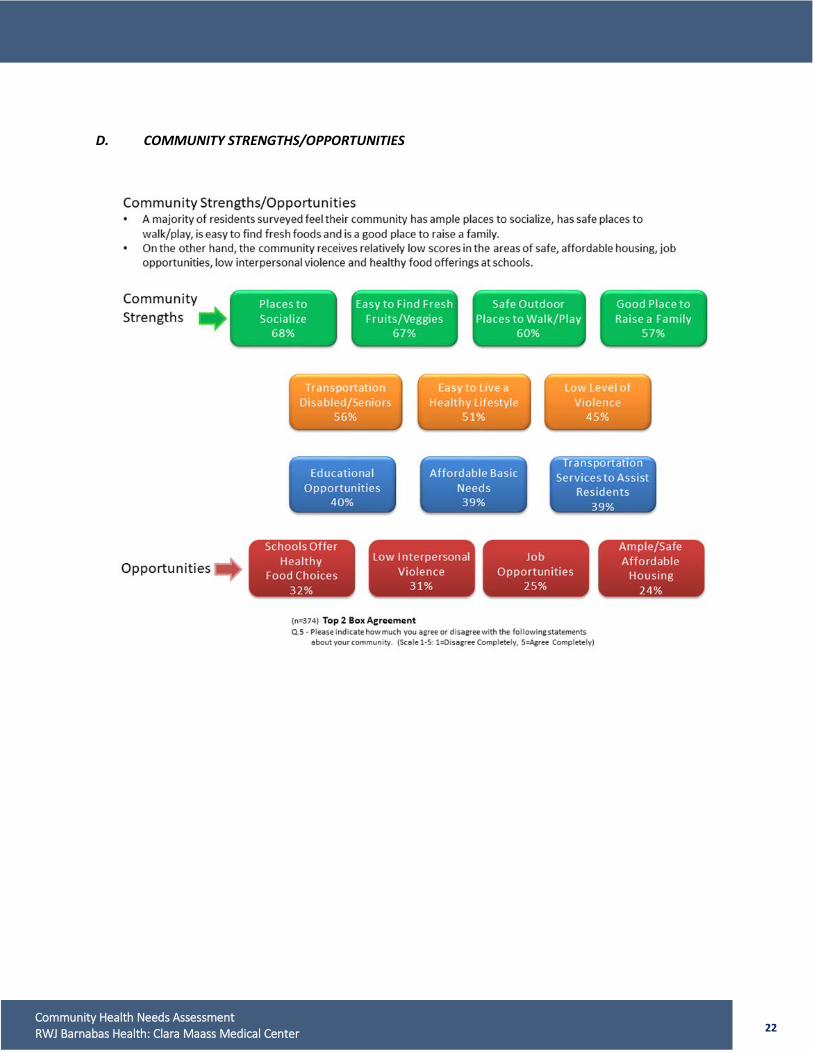
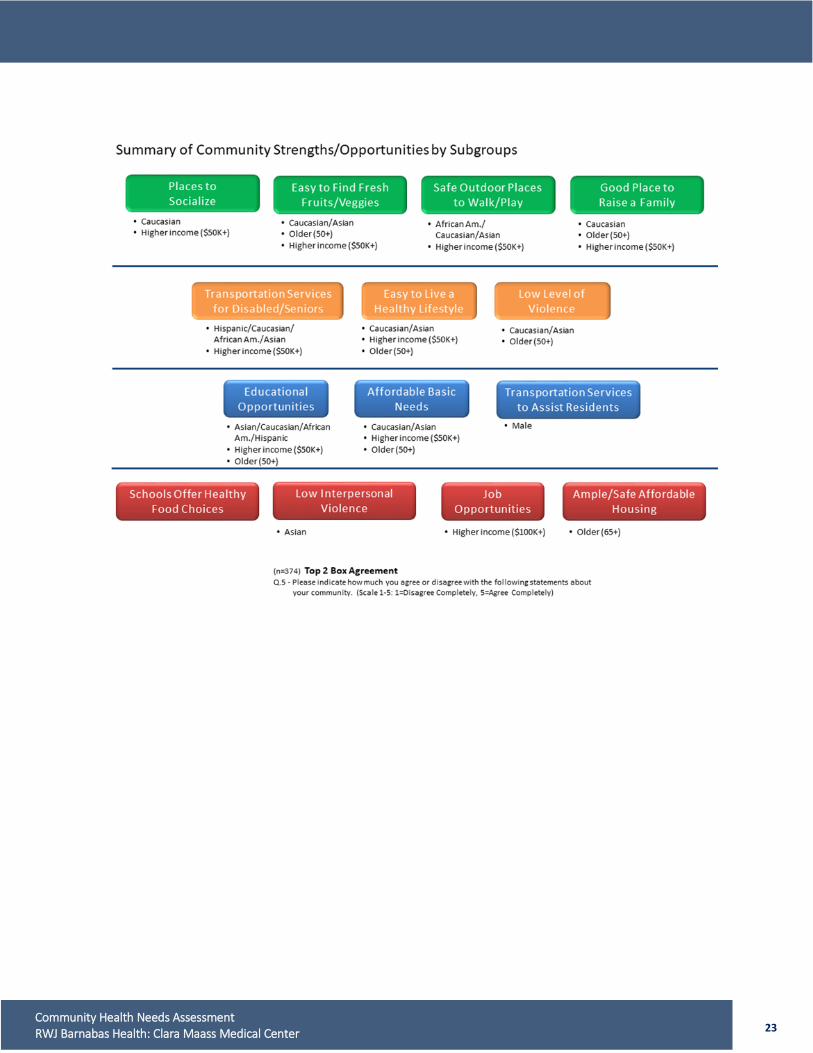
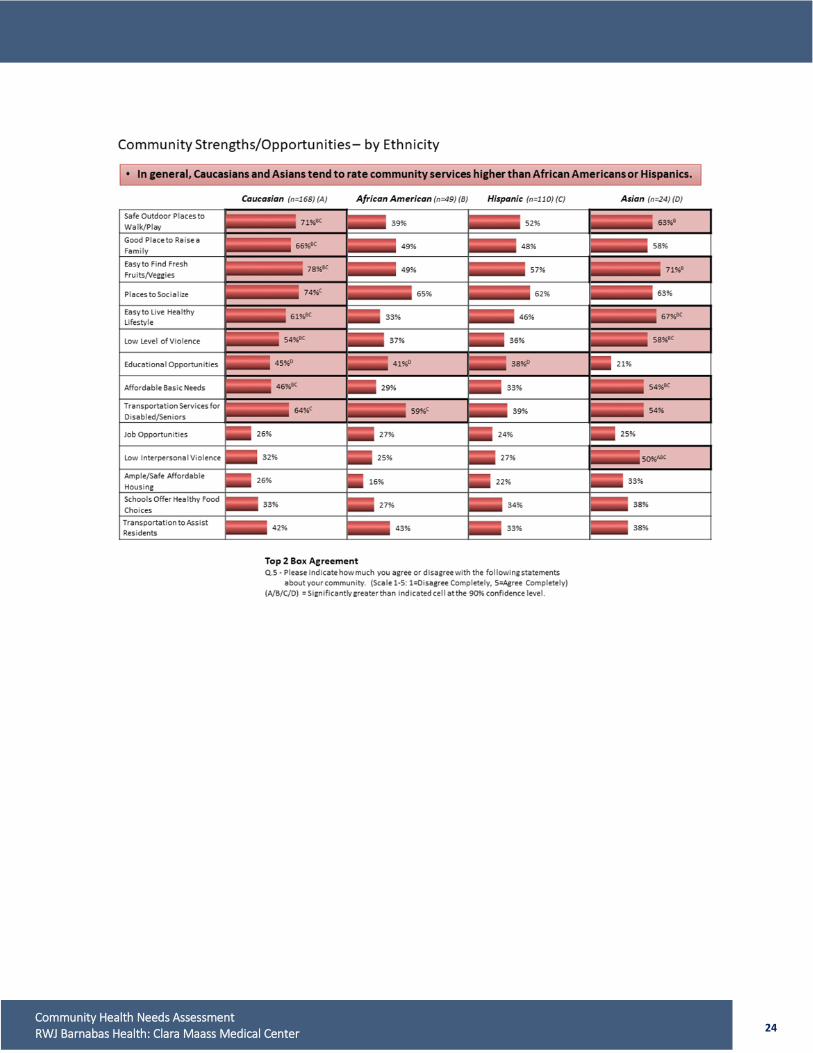
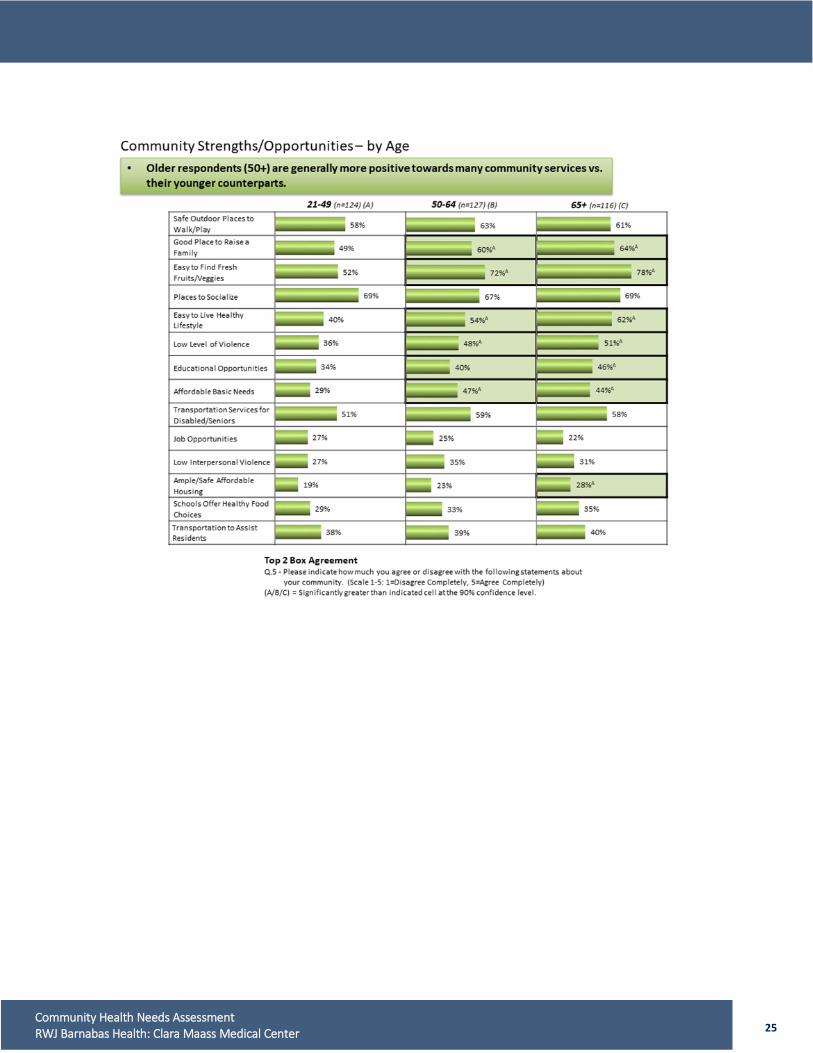
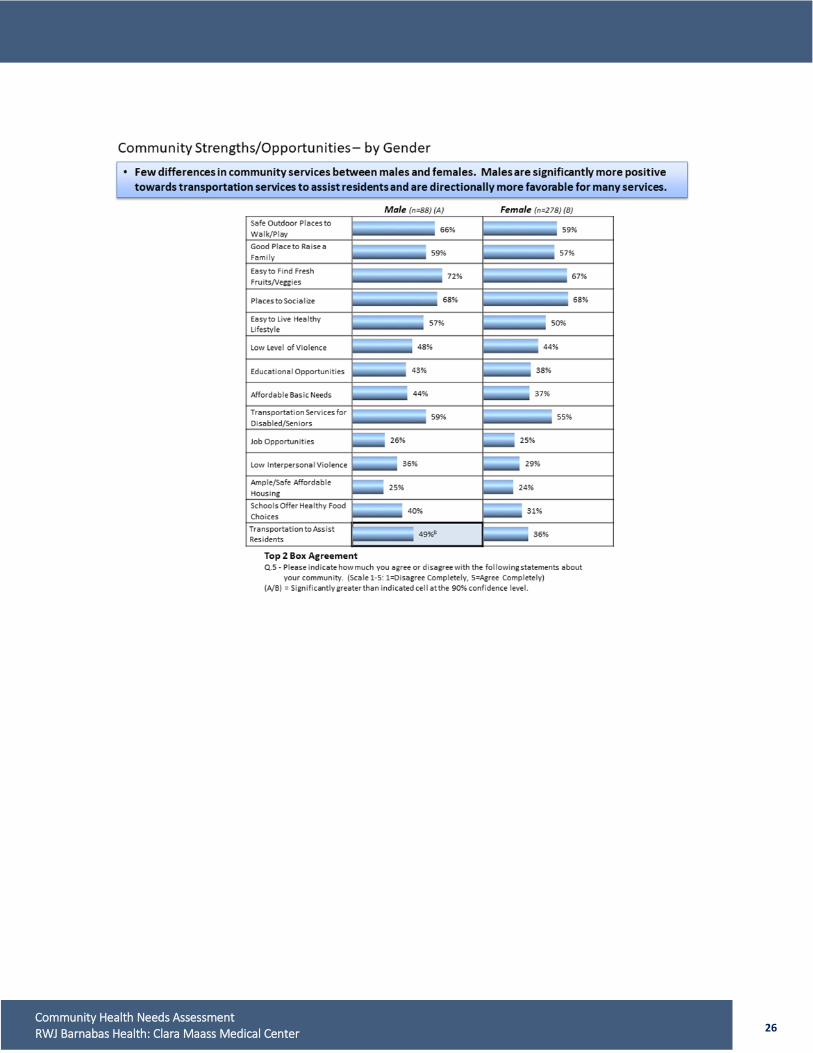
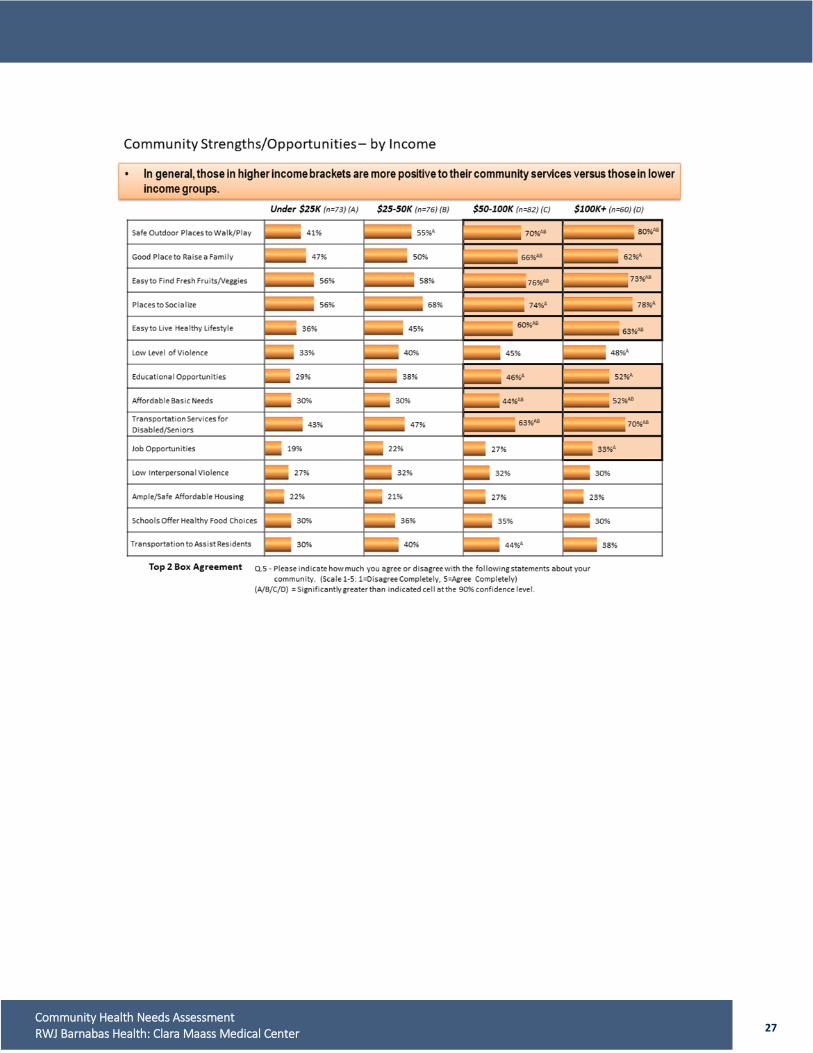
D. COMMUNITY STRENGTHS/OPPORTUNITIES
23 Community Health Needs Assessment RWJ Barnabas Health: Clara Maass Medical Center
24 Community Health Needs Assessment RWJ Barnabas Health: Clara Maass Medical Center
25 Community Health Needs Assessment RWJ Barnabas Health: Clara Maass Medical Center
26 Community Health Needs Assessment RWJ Barnabas Health: Clara Maass Medical Center
27 Community Health Needs Assessment RWJ Barnabas Health: Clara Maass Medical Center
28 Community Health Needs Assessment RWJ Barnabas Health: Clara Maass Medical Center
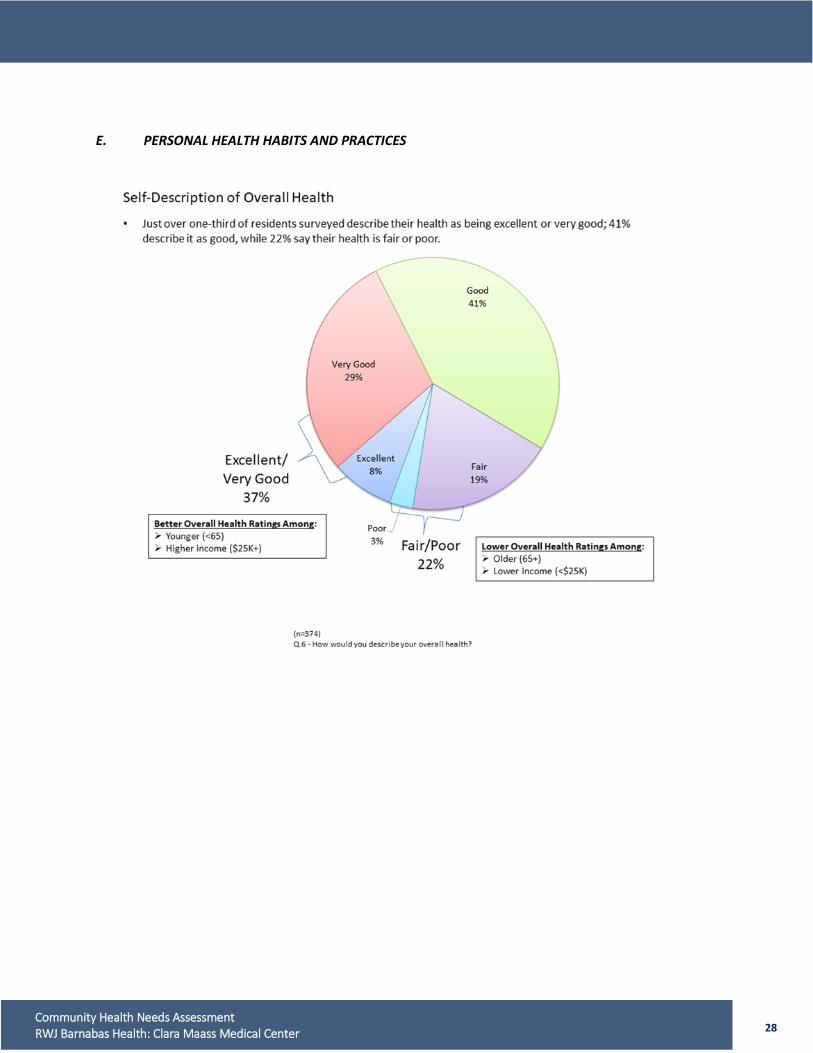
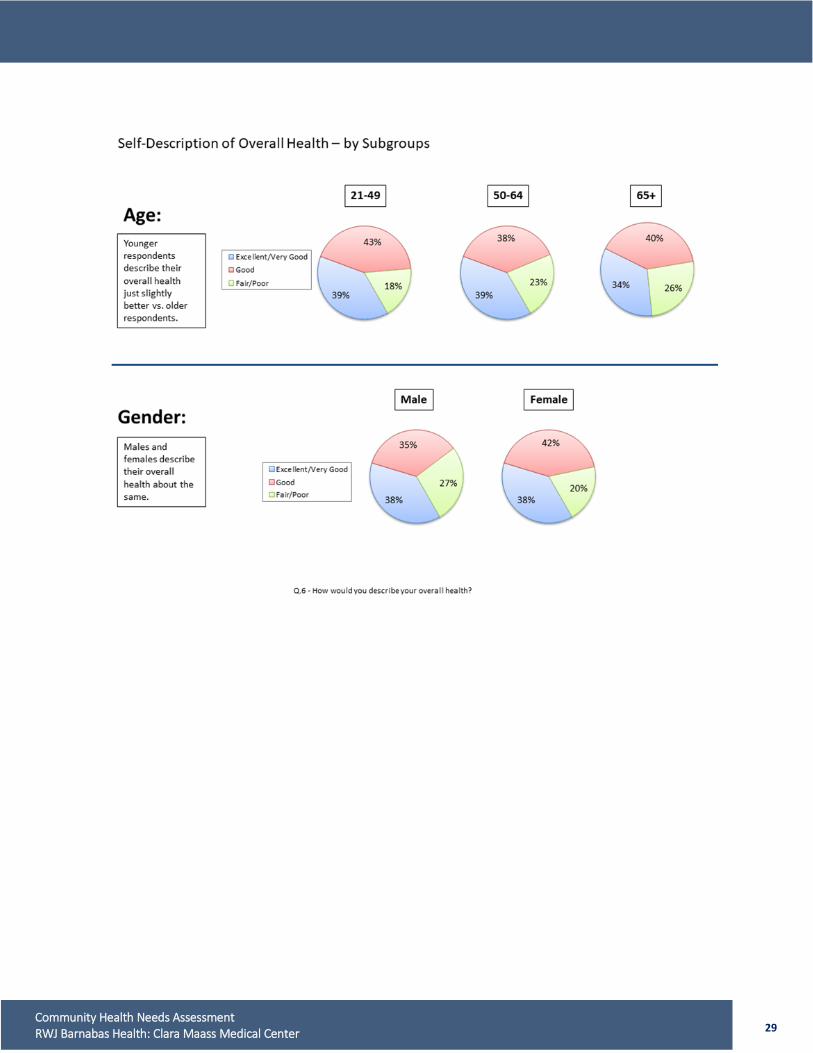
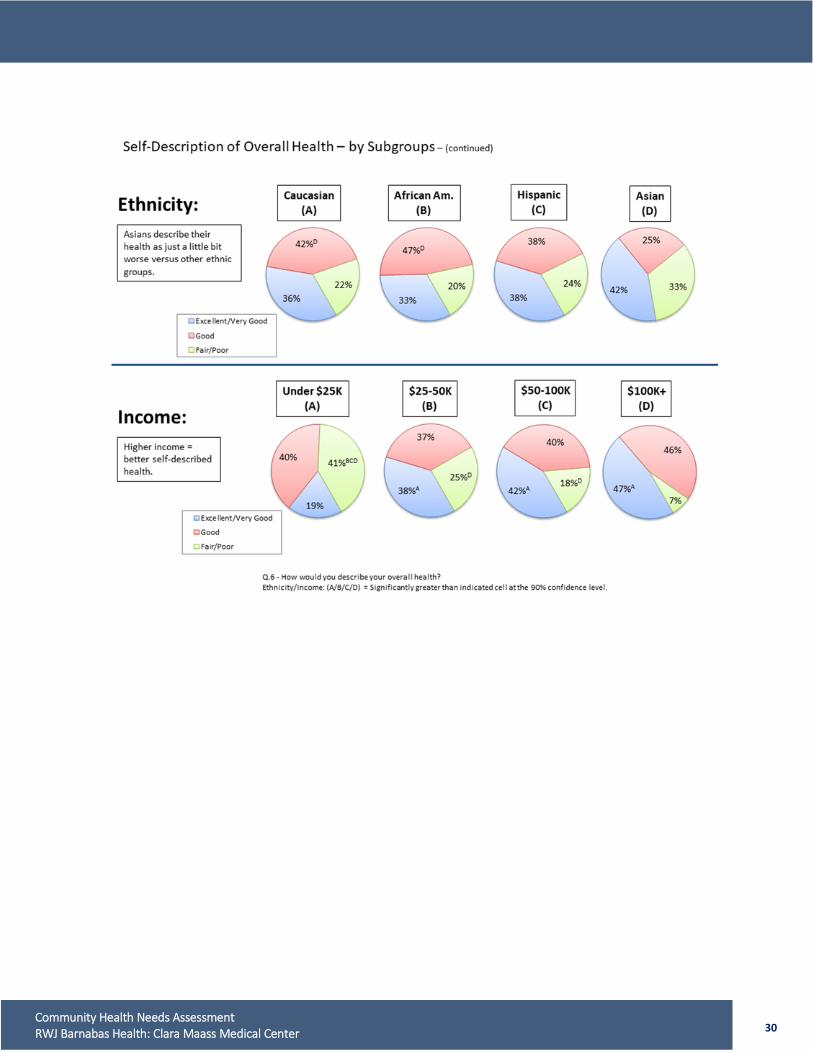
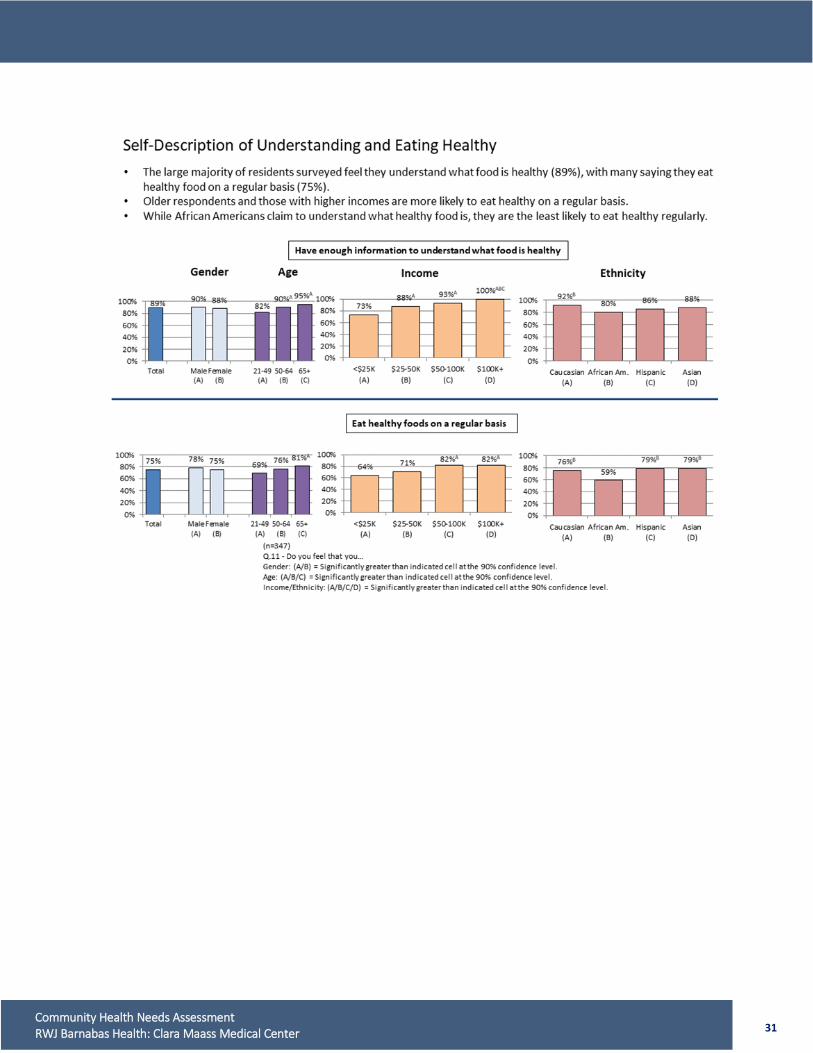
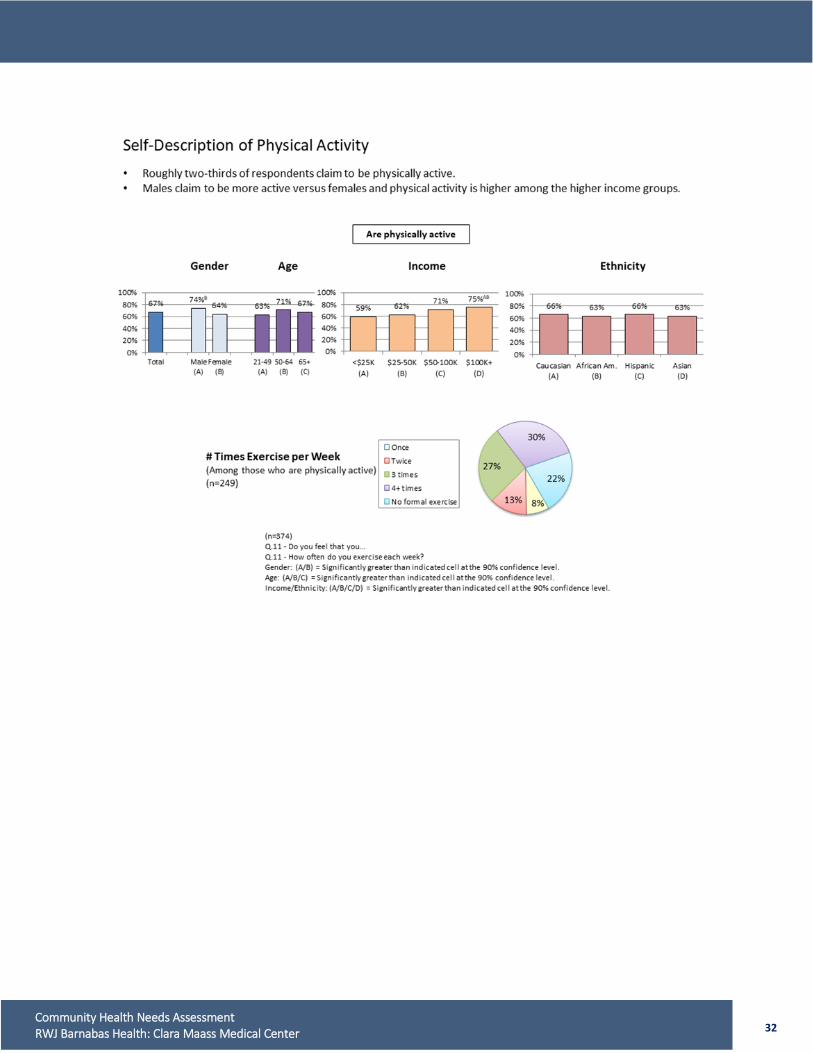
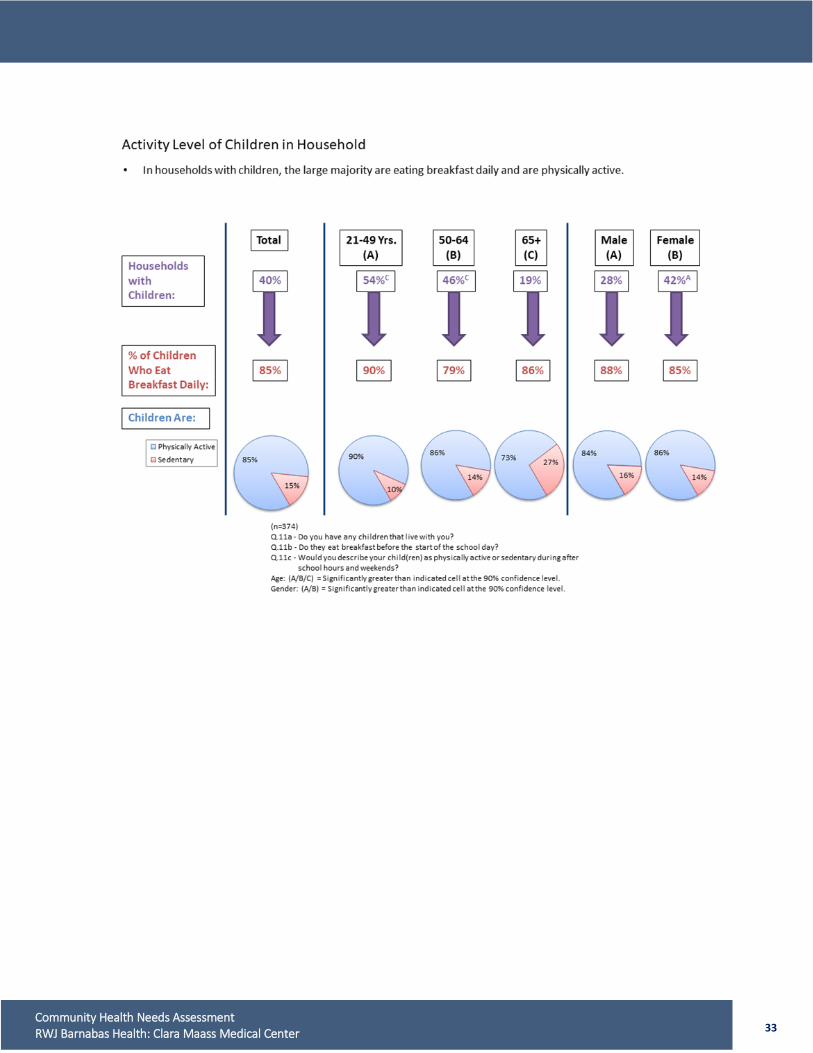
E. PERSONAL HEALTH HABITS AND PRACTICES
29 Community Health Needs Assessment RWJ Barnabas Health: Clara Maass Medical Center
30 Community Health Needs Assessment RWJ Barnabas Health: Clara Maass Medical Center
31 Community Health Needs Assessment RWJ Barnabas Health: Clara Maass Medical Center
32 Community Health Needs Assessment RWJ Barnabas Health: Clara Maass Medical Center
33 Community Health Needs Assessment RWJ Barnabas Health: Clara Maass Medical Center
34 Community Health Needs Assessment RWJ Barnabas Health: Clara Maass Medical Center
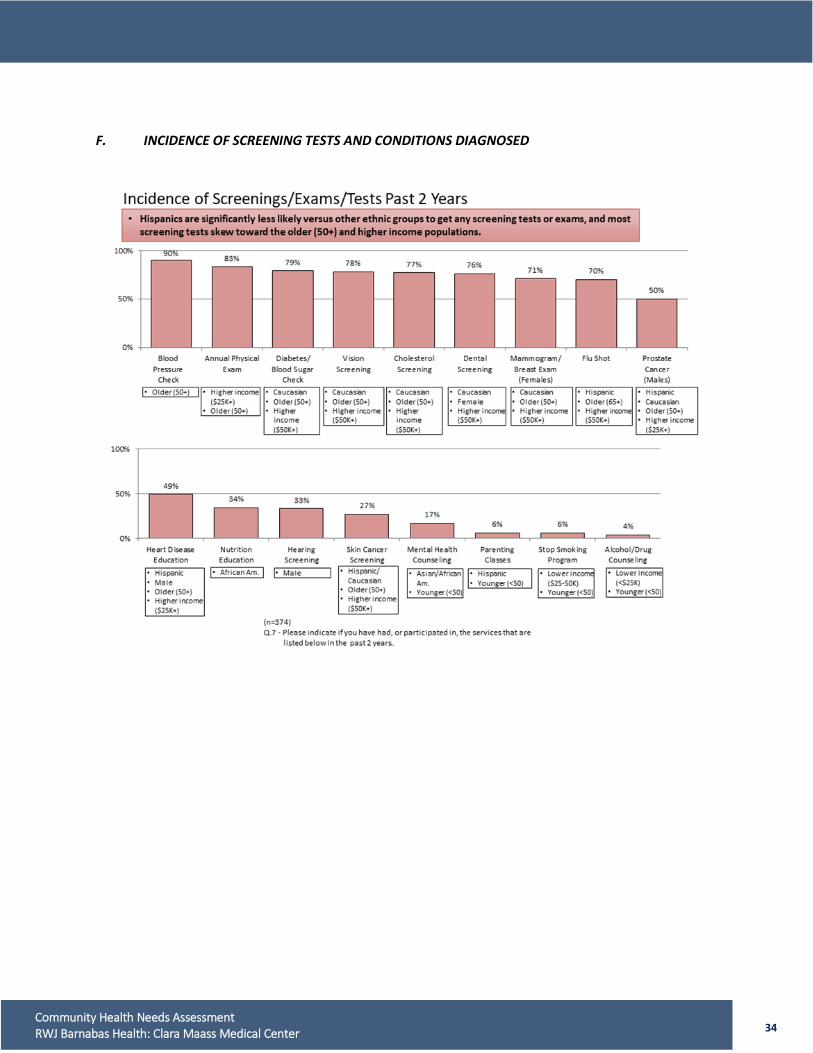
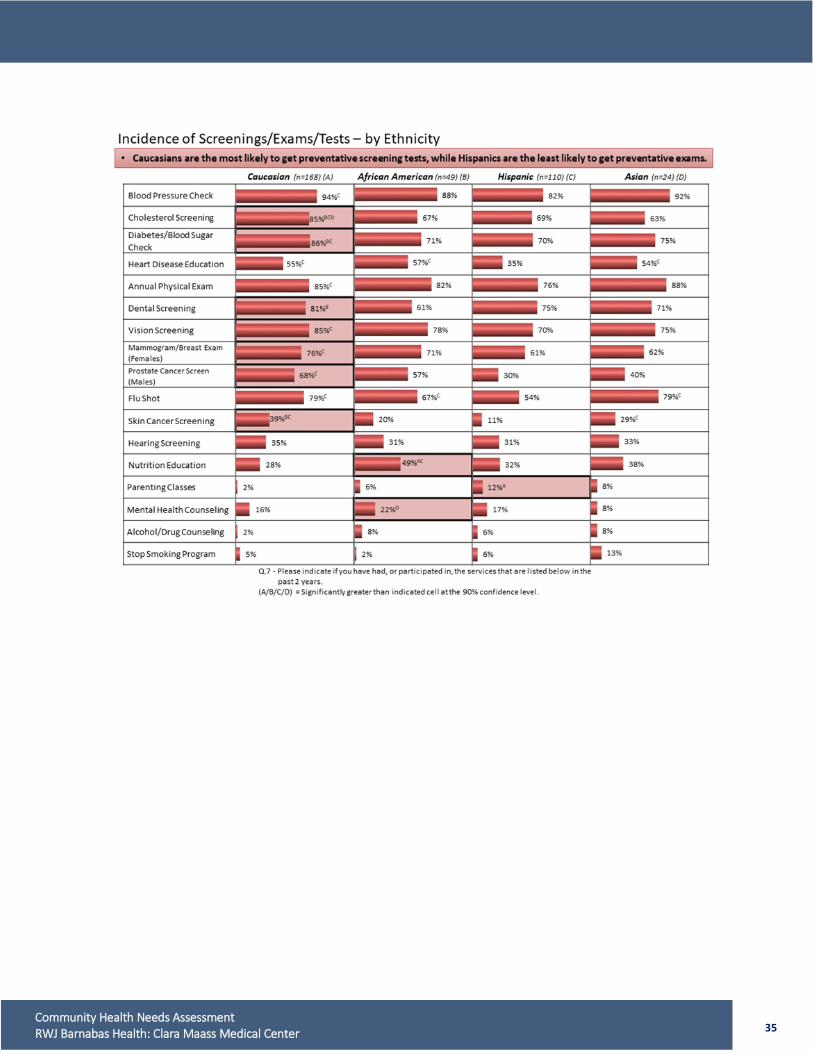
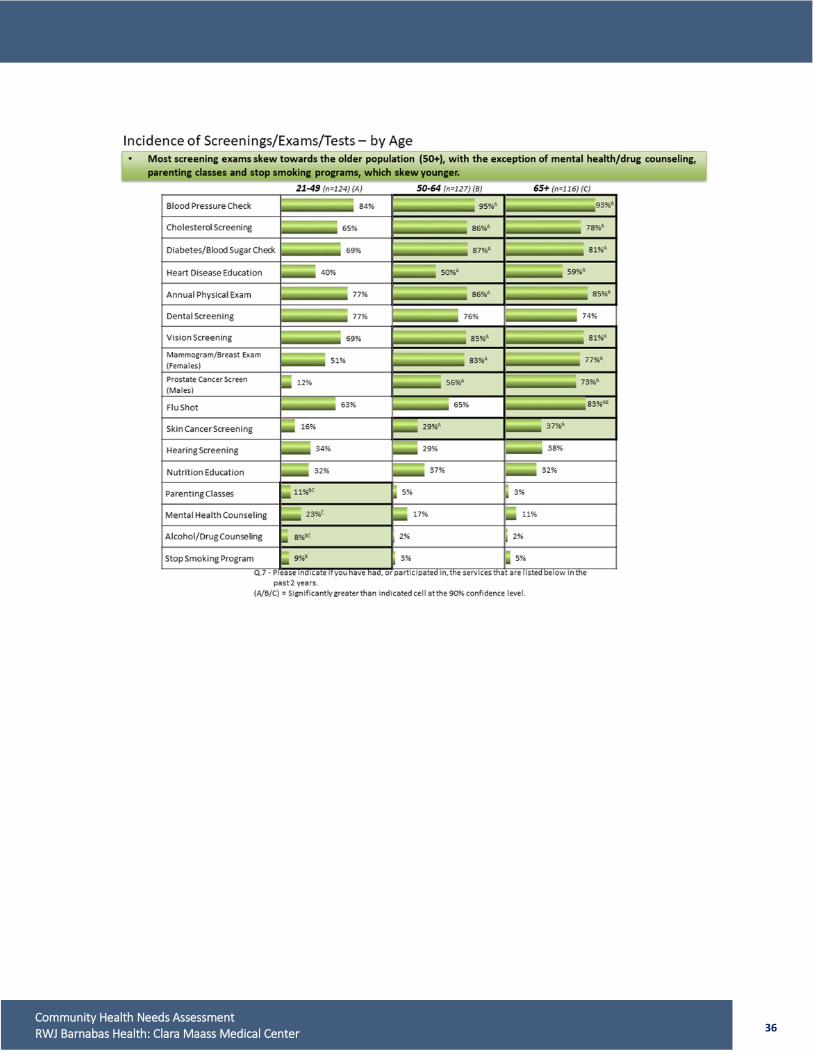
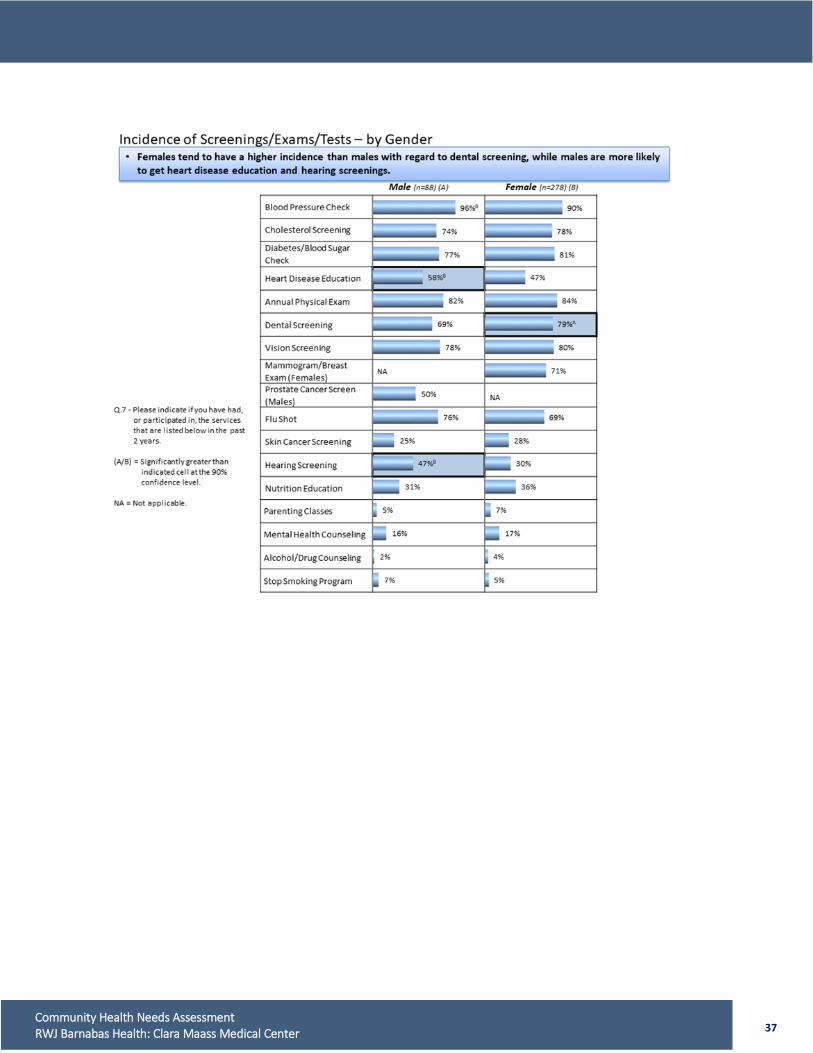
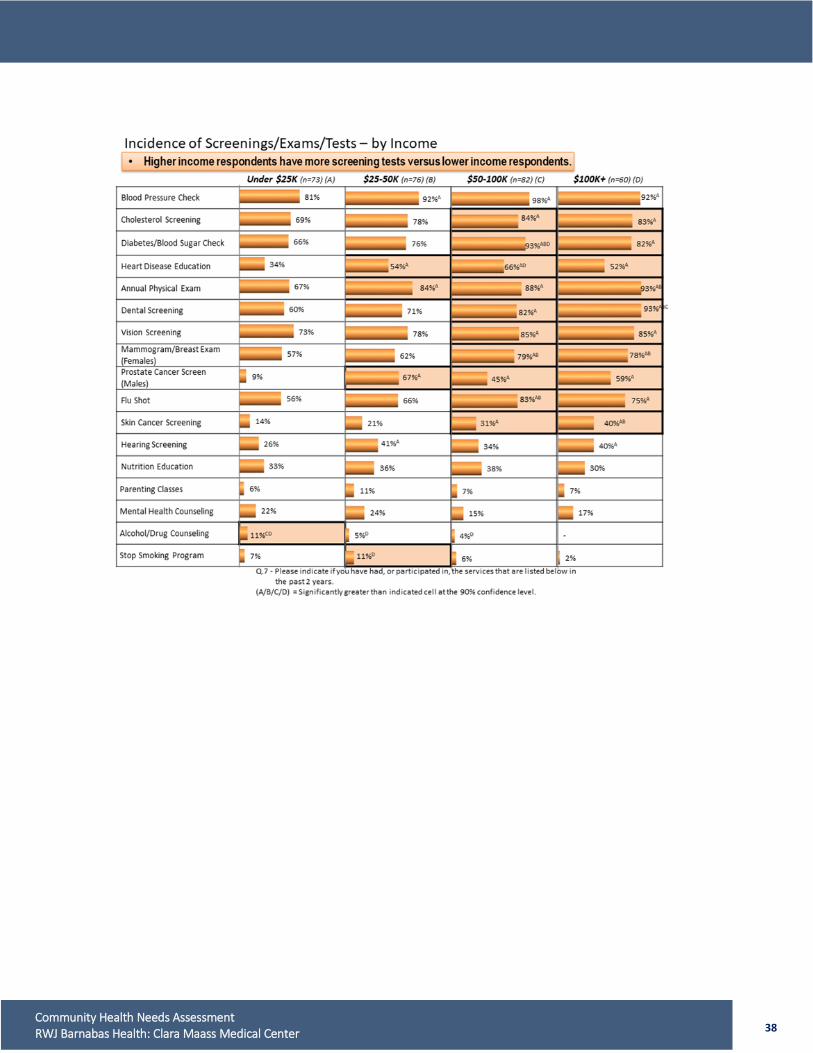
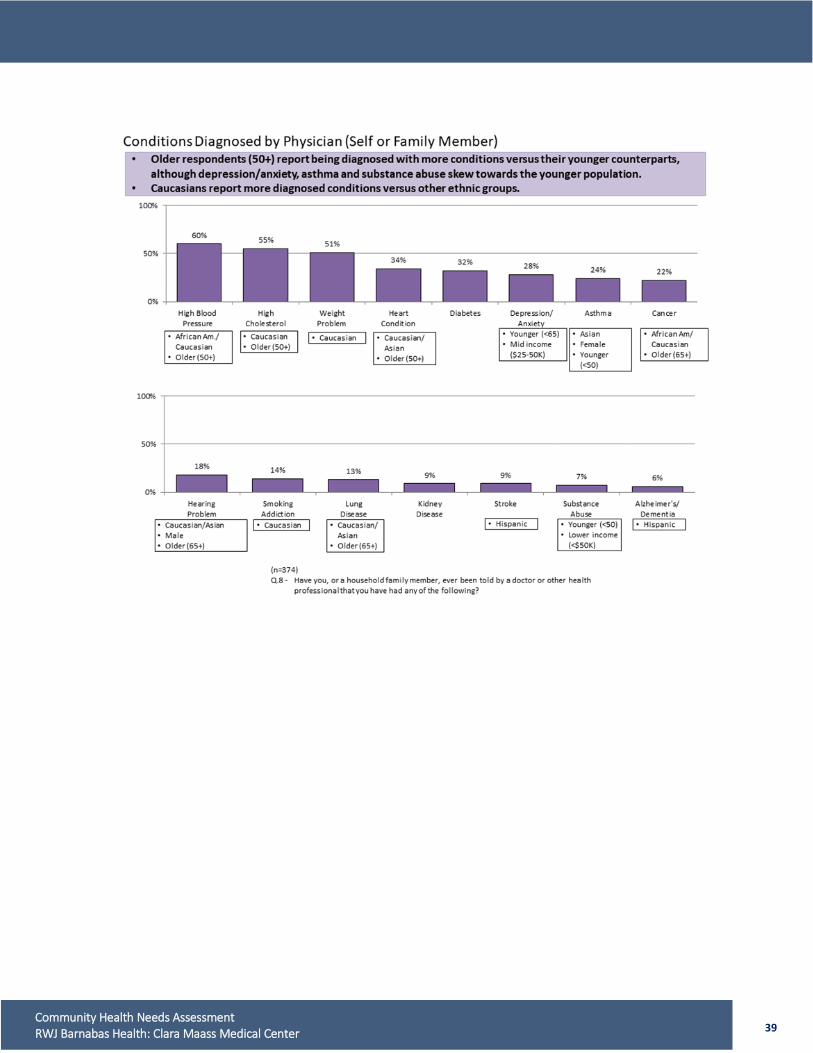
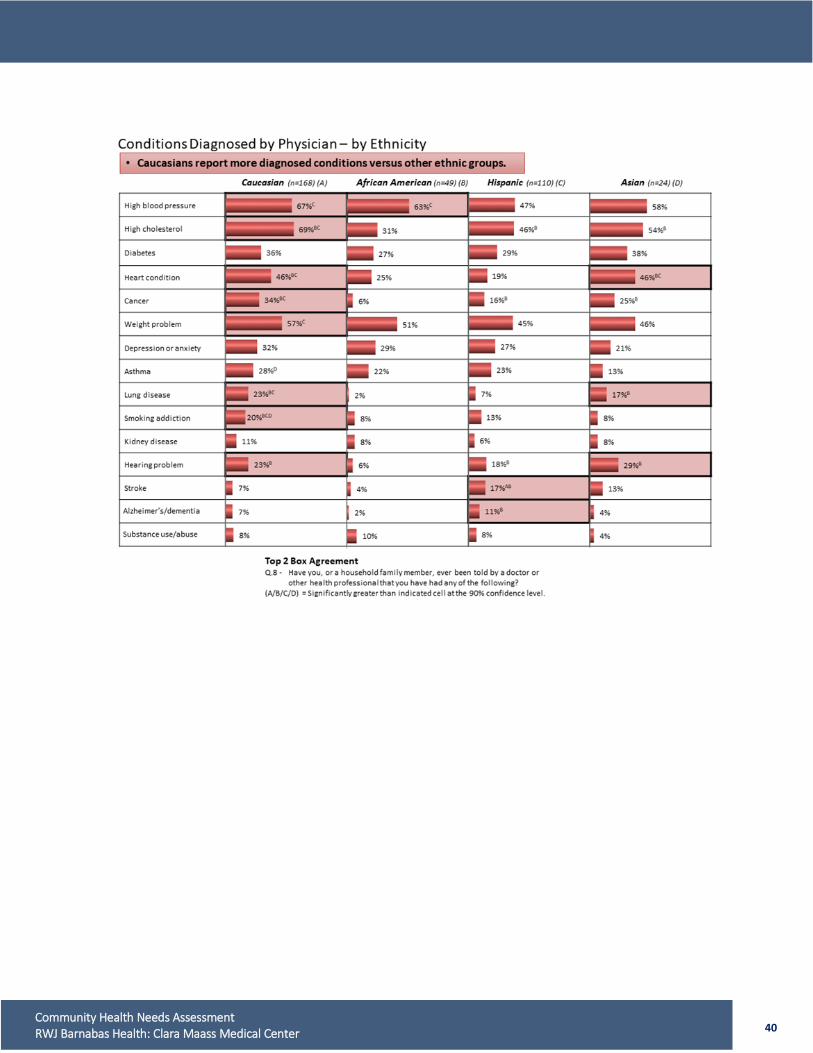
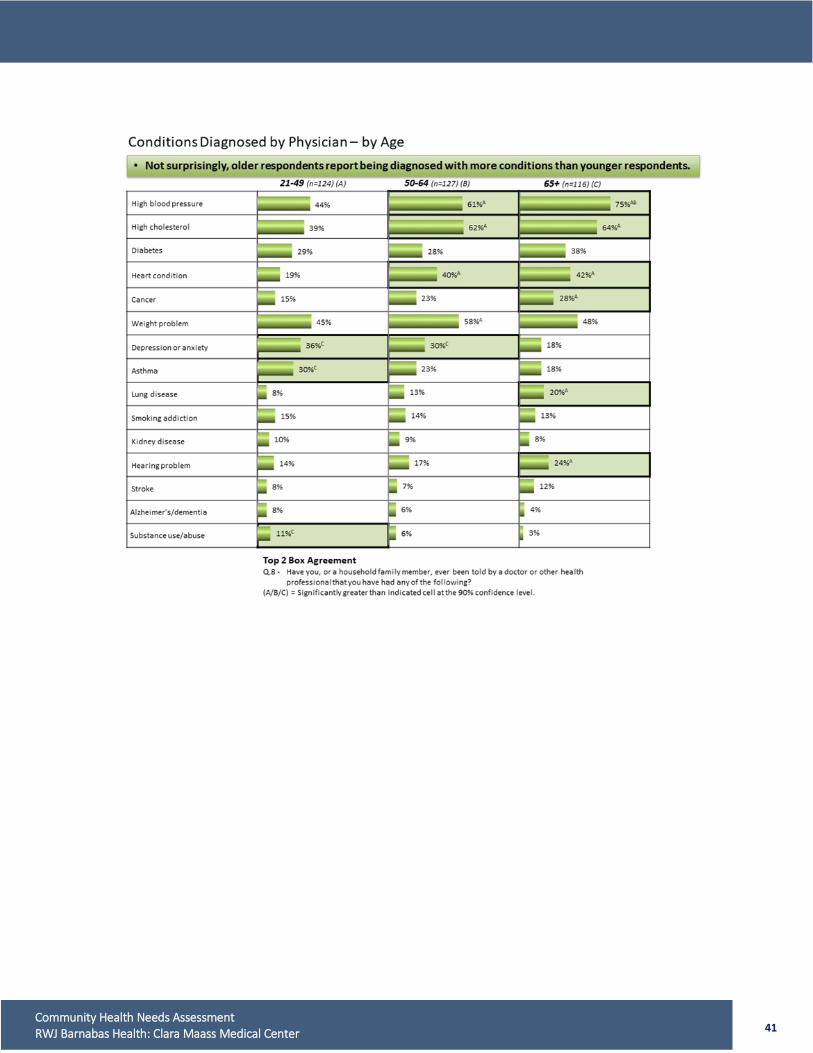
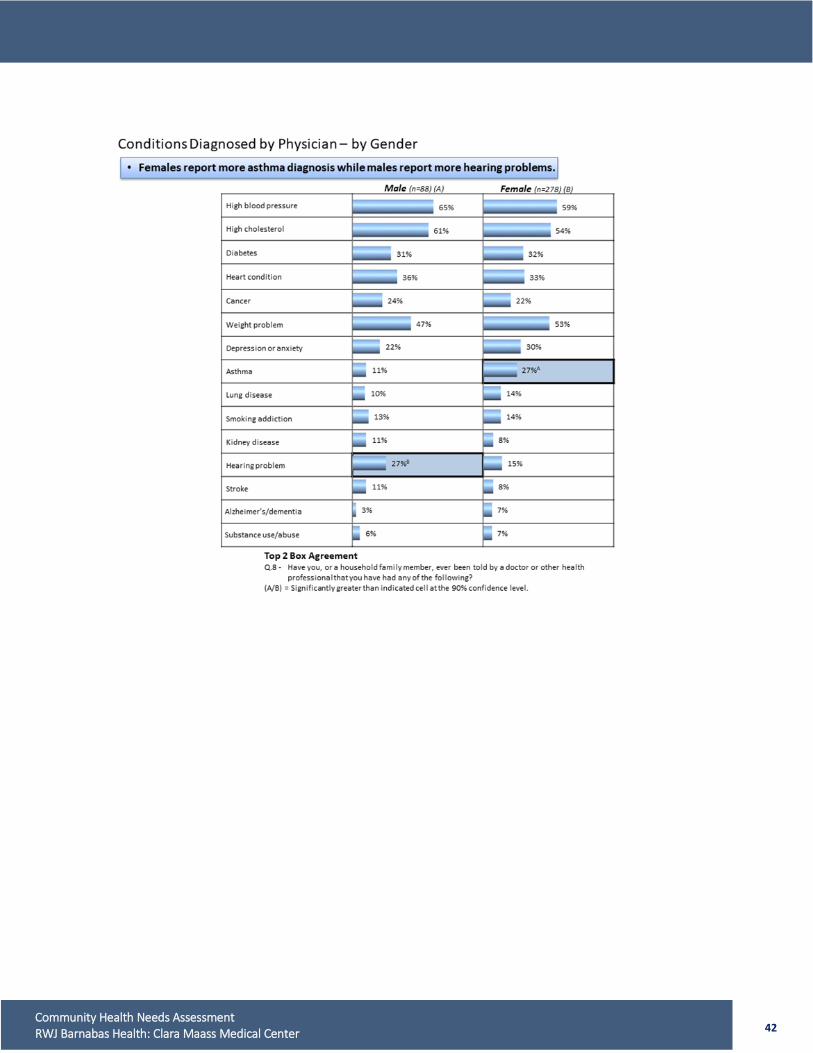
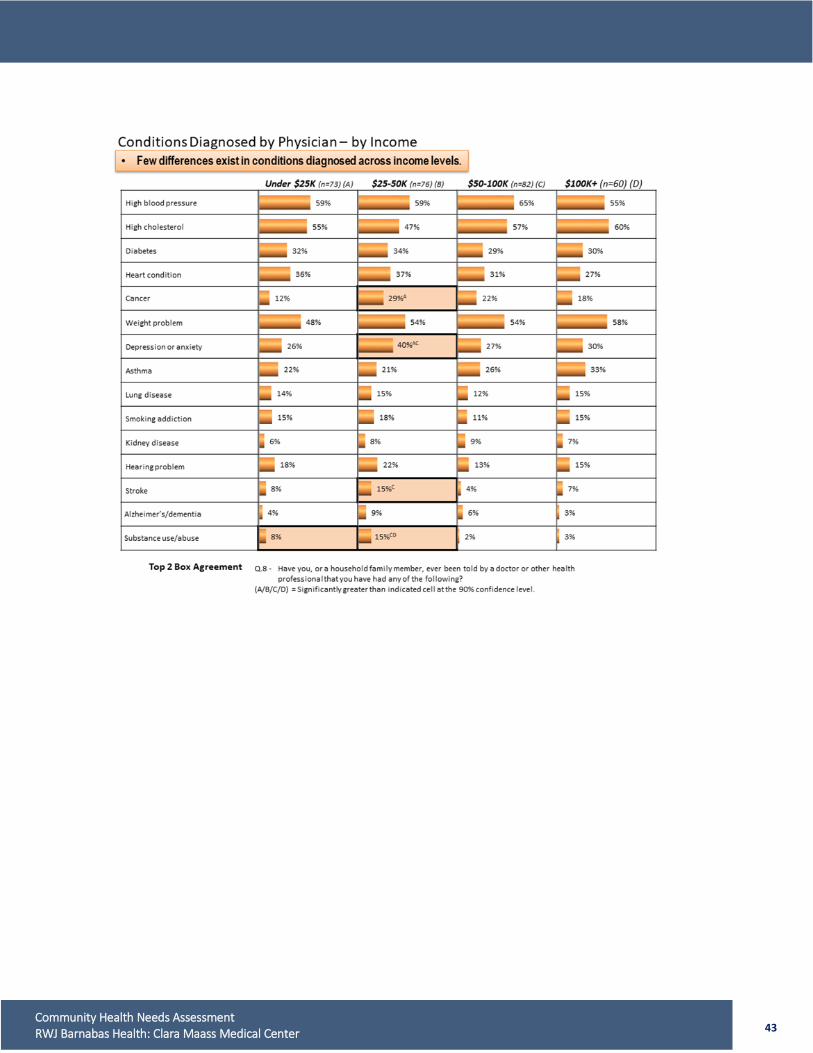
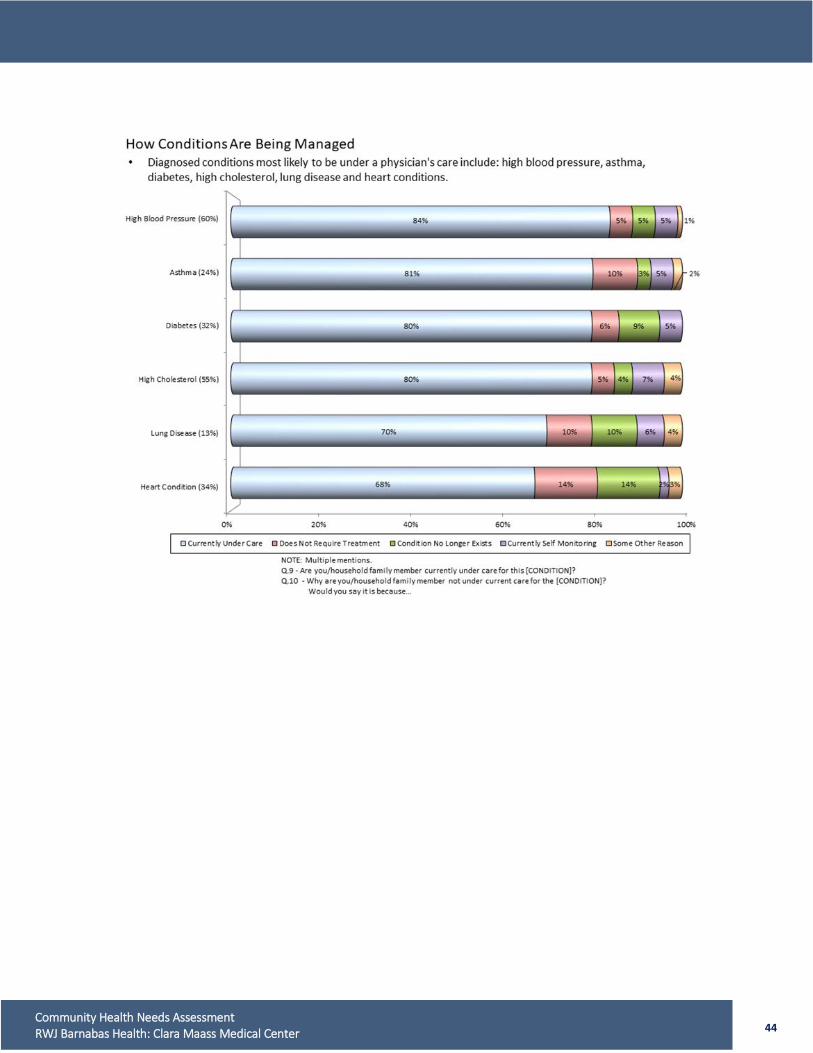
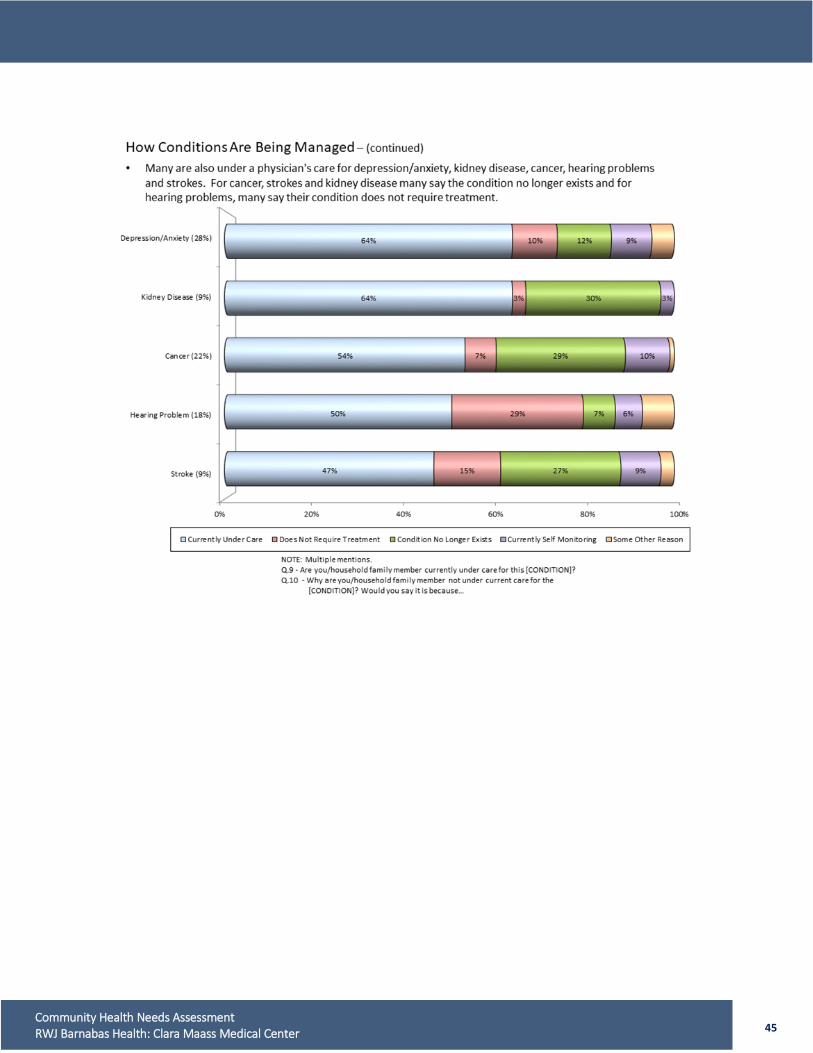
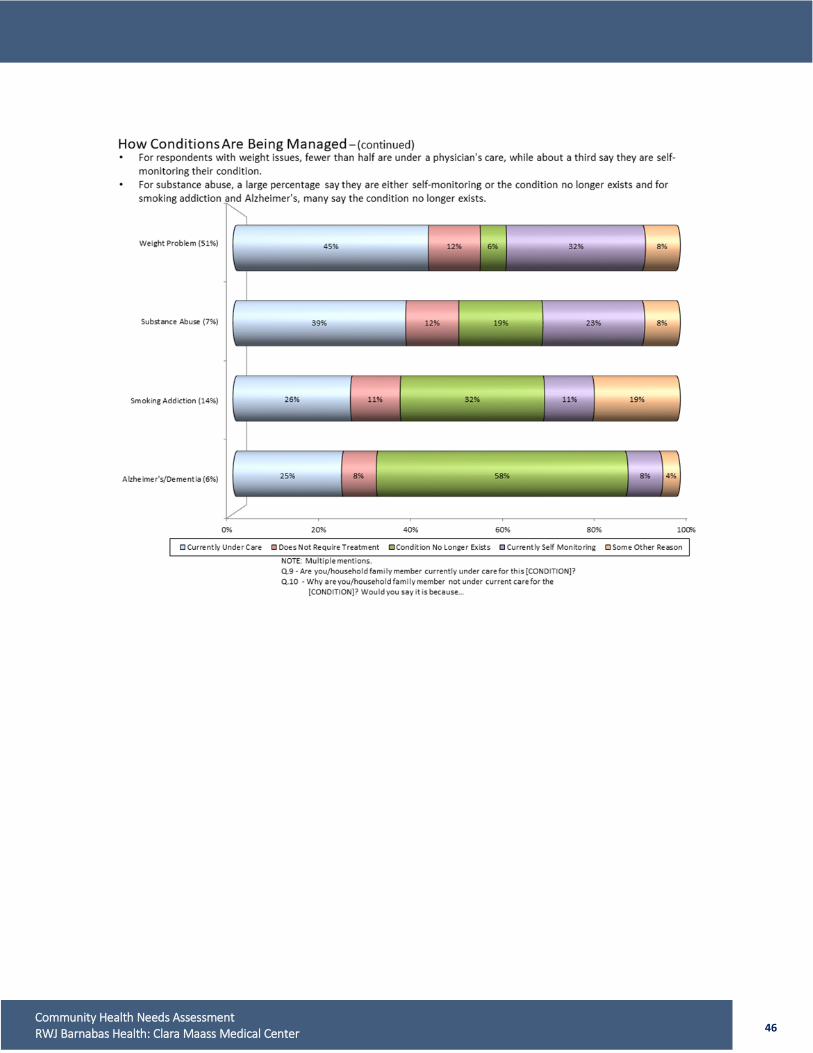
F. INCIDENCE OF SCREENING TESTS AND CONDITIONS DIAGNOSED
35 Community Health Needs Assessment RWJ Barnabas Health: Clara Maass Medical Center
36 Community Health Needs Assessment RWJ Barnabas Health: Clara Maass Medical Center
37 Community Health Needs Assessment RWJ Barnabas Health: Clara Maass Medical Center
38 Community Health Needs Assessment RWJ Barnabas Health: Clara Maass Medical Center
39 Community Health Needs Assessment RWJ Barnabas Health: Clara Maass Medical Center
40 Community Health Needs Assessment RWJ Barnabas Health: Clara Maass Medical Center
41 Community Health Needs Assessment RWJ Barnabas Health: Clara Maass Medical Center
42 Community Health Needs Assessment RWJ Barnabas Health: Clara Maass Medical Center
43 Community Health Needs Assessment RWJ Barnabas Health: Clara Maass Medical Center
44 Community Health Needs Assessment RWJ Barnabas Health: Clara Maass Medical Center
45 Community Health Needs Assessment RWJ Barnabas Health: Clara Maass Medical Center
46 Community Health Needs Assessment RWJ Barnabas Health: Clara Maass Medical Center
47 Community Health Needs Assessment RWJ Barnabas Health: Clara Maass Medical Center
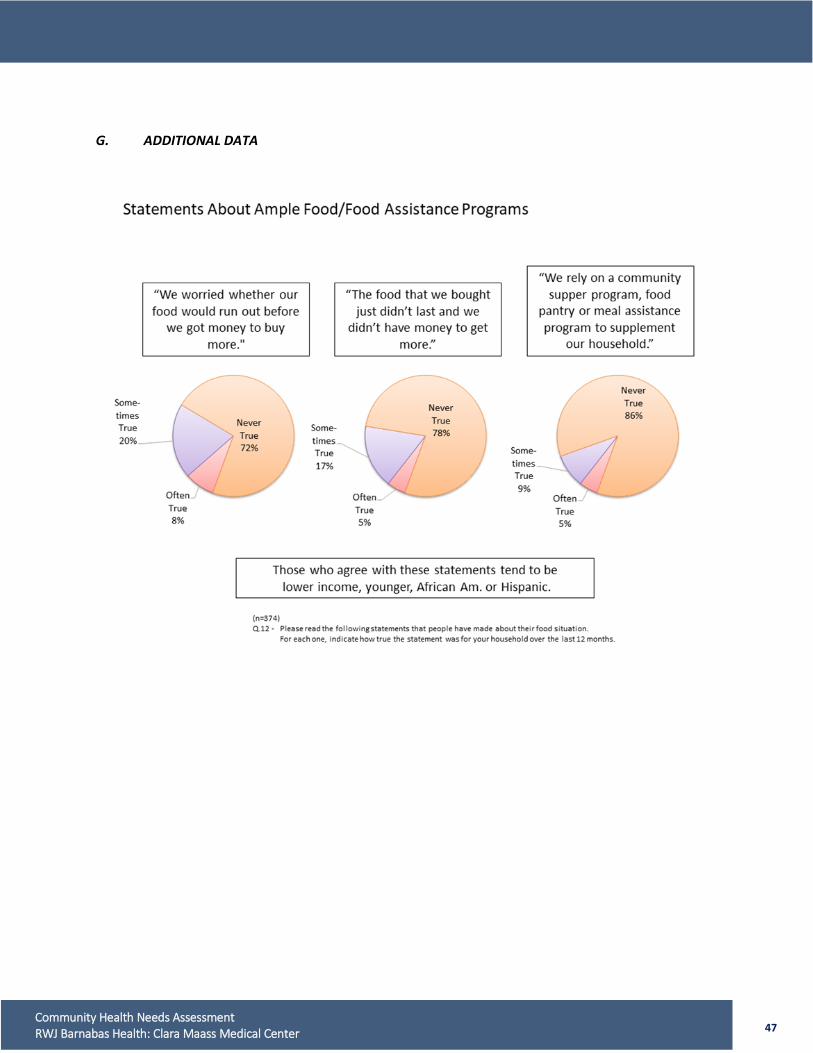
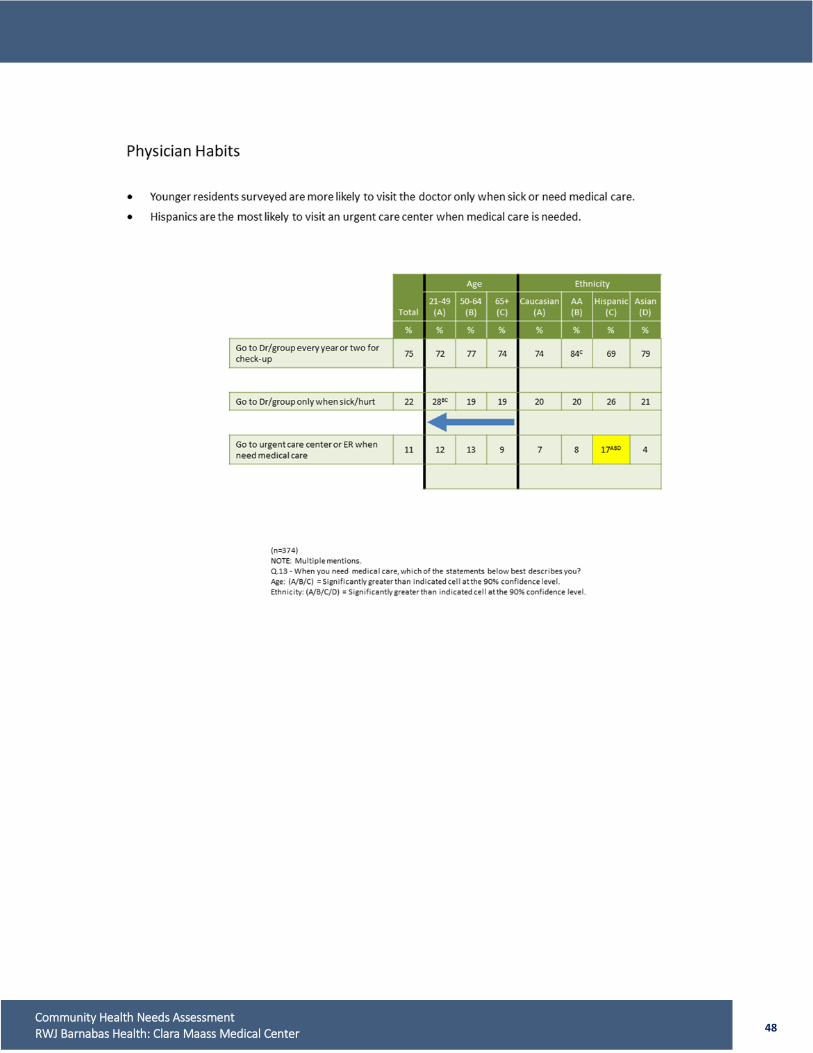
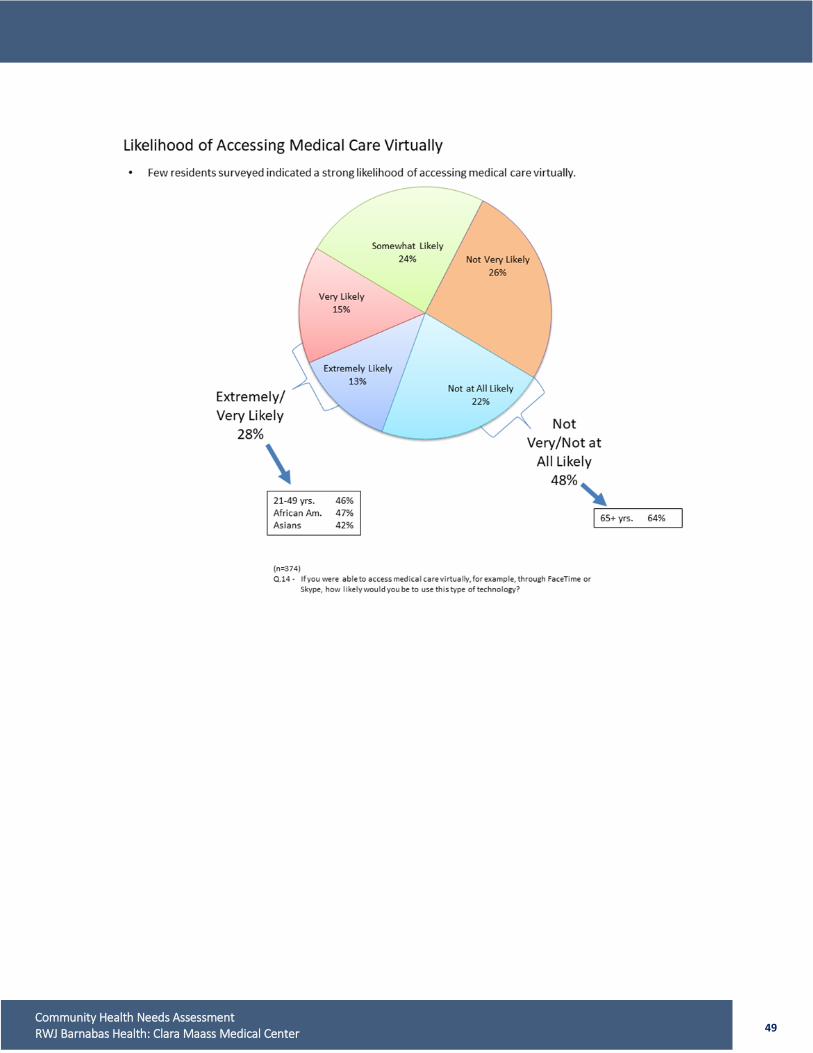
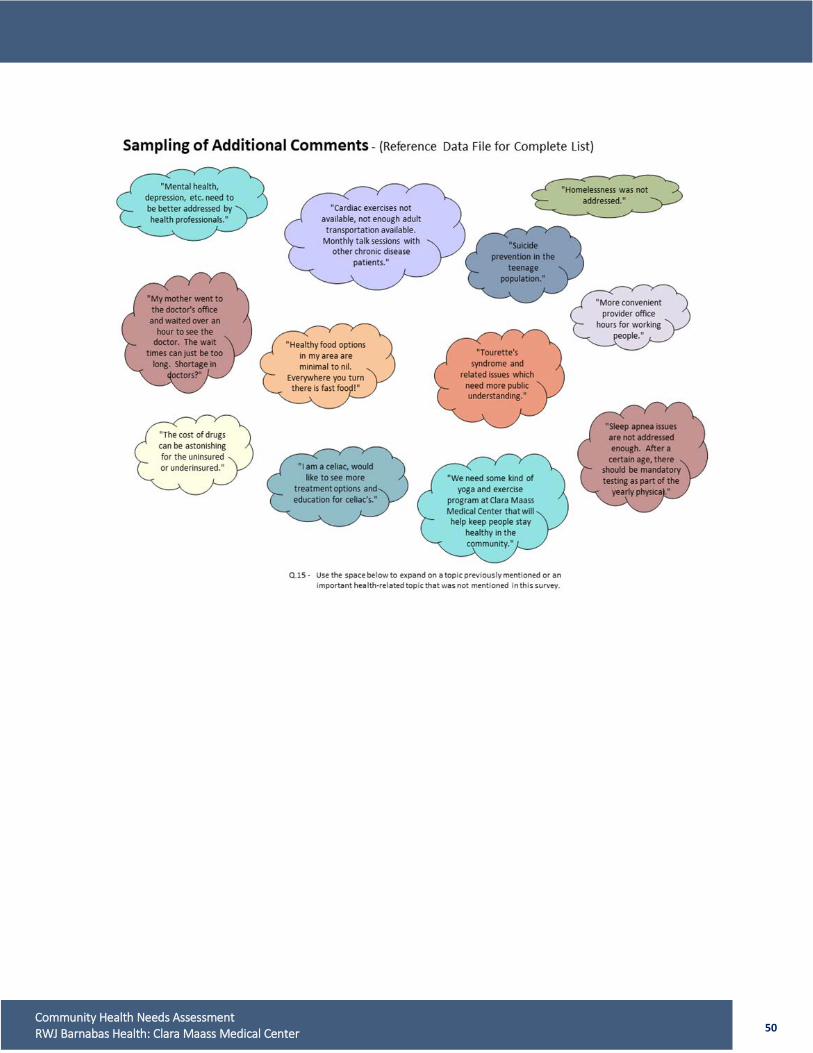
G. ADDITIONAL DATA
48 Community Health Needs Assessment RWJ Barnabas Health: Clara Maass Medical Center
49 Community Health Needs Assessment RWJ Barnabas Health: Clara Maass Medical Center
50 Community Health Needs Assessment RWJ Barnabas Health: Clara Maass Medical Center
51 Community Health Needs Assessment RWJ Barnabas Health: Clara Maass Medical Center
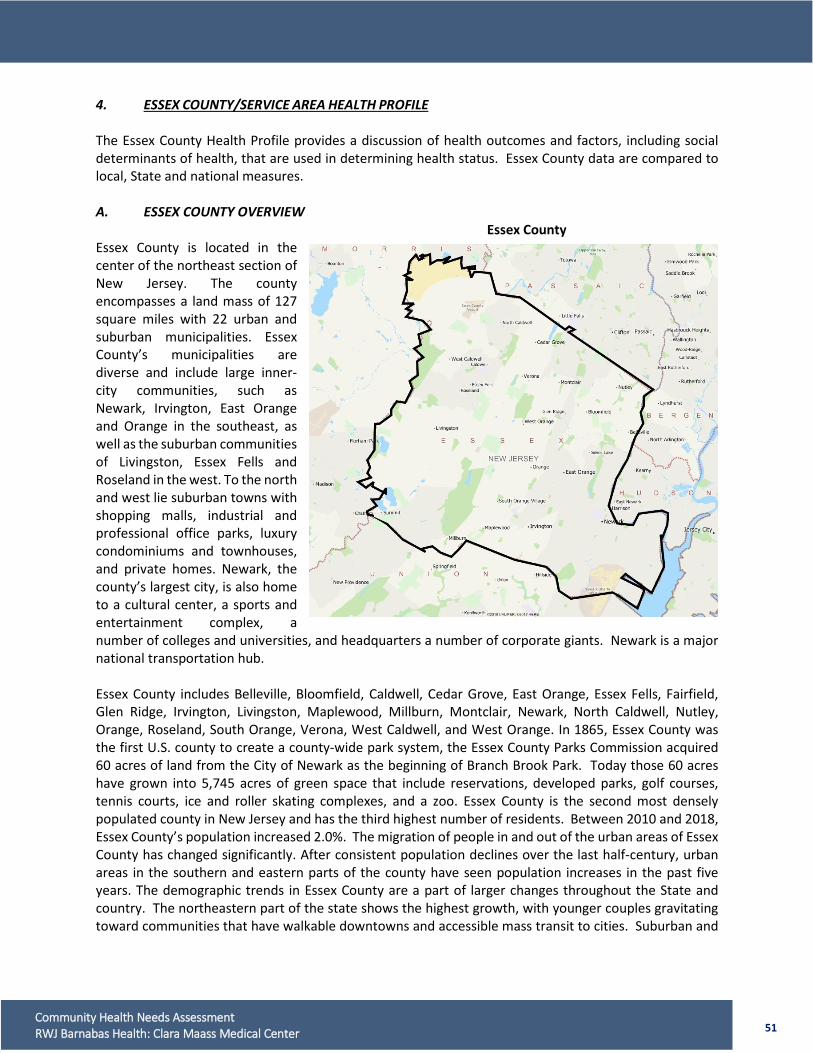
4. ESSEX COUNTY/SERVICE AREA HEALTH PROFILE The Essex County Health Profile provides a discussion of health outcomes and factors, including social determinants of health, that are used in determining health status. Essex County data are compared to local, State and national measures. A. ESSEX COUNTY OVERVIEW Essex County Essex County is located in the center of the northeast section of New Jersey. The county encompasses a land mass of 127 square miles with 22 urban and suburban municipalities. Essex County’s municipalities are diverse and include large inner-city communities, such as Newark, Irvington, East Orange and Orange in the southeast, as well as the suburban communities of Livingston, Essex Fells and Roseland in the west. To the north and west lie suburban towns with shopping malls, industrial and professional office parks, luxury condominiums and townhouses, and private homes. Newark, the county’s largest city, is also home to a cultural center, a sports and entertainment complex, a number of colleges and universities, and headquarters a number of corporate giants. Newark is a major national transportation hub. Essex County includes Belleville, Bloomfield, Caldwell, Cedar Grove, East Orange, Essex Fells, Fairfield, Glen Ridge, Irvington, Livingston, Maplewood, Millburn, Montclair, Newark, North Caldwell, Nutley, Orange, Roseland, South Orange, Verona, West Caldwell, and West Orange. In 1865, Essex County was the first U.S. county to create a county-wide park system, the Essex County Parks Commission acquired 60 acres of land from the City of Newark as the beginning of Branch Brook Park. Today those 60 acres have grown into 5,745 acres of green space that include reservations, developed parks, golf courses, tennis courts, ice and roller skating complexes, and a zoo. Essex County is the second most densely populated county in New Jersey and has the third highest number of residents. Between 2010 and 2018, Essex County’s population increased 2.0%. The migration of people in and out of the urban areas of Essex County has changed significantly. After consistent population declines over the last half-century, urban areas in the southern and eastern parts of the county have seen population increases in the past five years. The demographic trends in Essex County are a part of larger changes throughout the State and country. The northeastern part of the state shows the highest growth, with younger couples gravitating toward communities that have walkable downtowns and accessible mass transit to cities. Suburban and

52 Community Health Needs Assessment RWJ Barnabas Health: Clara Maass Medical Center
rural parts of the state to the west and south are losing residents as they retire and leave the state in search of lower taxes and living costs. B. CMMC SERVICE AREA Between 2010 and 2018, the population of the CMMC Service Area grew (3.2%) faster than Essex County (1.5%) and New Jersey (1.3%). Between 2018-2023, the Service Area is projected to grow nearly 2% (1.9%).
Population Change in CMMC Service Area 2018-2023
* Source: Claritas Population Estimates 2018, 2023
53 Community Health Needs Assessment RWJ Barnabas Health: Clara Maass Medical Center
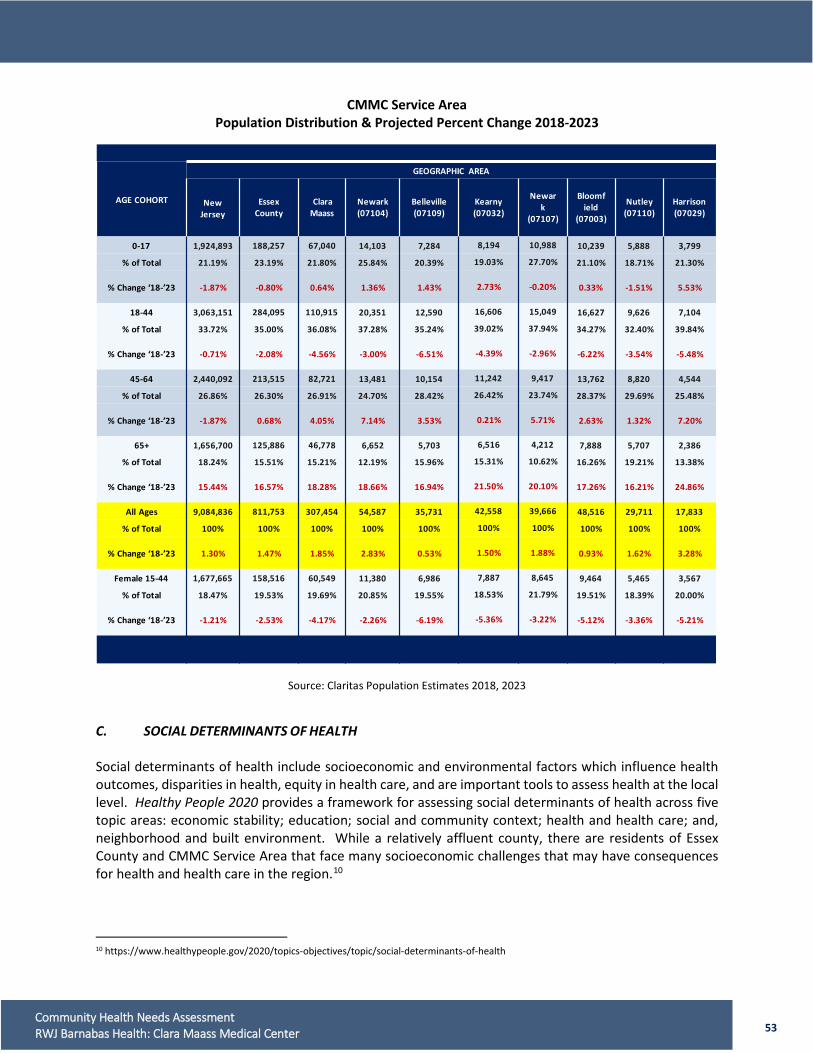
CMMC Service Area Population Distribution & Projected Percent Change 2018-2023
Source: Claritas Population Estimates 2018, 2023 C. SOCIAL DETERMINANTS OF HEALTH Social determinants of health include socioeconomic and environmental factors which influence health outcomes, disparities in health, equity in health care, and are important tools to assess health at the local level. Healthy People 2020 provides a framework for assessing social determinants of health across five topic areas: economic stability; education; social and community context; health and health care; and, neighborhood and built environment. While a relatively affluent county, there are residents of Essex County and CMMC Service Area that face many socioeconomic challenges that may have consequences for health and health care in the region.10
10 https://www.healthypeople.gov/2020/topics-objectives/topic/social-determinants-of-health
AGE COHORT
GEOGRAPHIC AREA
New Jersey
EssexCounty
Clara Maass
Newark(07104)
Belleville(07109)
Kearny(07032)
Newark
(07107)
Bloomfield
(07003)
Nutley(07110)
Harrison(07029)
0-17 1,924,893 188,257 67,040 14,103 7,284 8,194 10,988 10,239 5,888 3,799
% of Total 21.19% 23.19% 21.80% 25.84% 20.39% 19.03% 27.70% 21.10% 18.71% 21.30%
% Change ‘18-’23 -1.87% -0.80% 0.64% 1.36% 1.43% 2.73% -0.20% 0.33% -1.51% 5.53%
18-44 3,063,151 284,095 110,915 20,351 12,590 16,606 15,049 16,627 9,626 7,104
% of Total 33.72% 35.00% 36.08% 37.28% 35.24% 39.02% 37.94% 34.27% 32.40% 39.84%
% Change ‘18-’23 -0.71% -2.08% -4.56% -3.00% -6.51% -4.39% -2.96% -6.22% -3.54% -5.48%
45-64 2,440,092 213,515 82,721 13,481 10,154 11,242 9,417 13,762 8,820 4,544
% of Total 26.86% 26.30% 26.91% 24.70% 28.42% 26.42% 23.74% 28.37% 29.69% 25.48%
% Change ‘18-’23 -1.87% 0.68% 4.05% 7.14% 3.53% 0.21% 5.71% 2.63% 1.32% 7.20%
65+ 1,656,700 125,886 46,778 6,652 5,703 6,516 4,212 7,888 5,707 2,386
% of Total 18.24% 15.51% 15.21% 12.19% 15.96% 15.31% 10.62% 16.26% 19.21% 13.38%
% Change ‘18-’23 15.44% 16.57% 18.28% 18.66% 16.94% 21.50% 20.10% 17.26% 16.21% 24.86%
All Ages 9,084,836 811,753 307,454 54,587 35,731 42,558 39,666 48,516 29,711 17,833
% of Total 100% 100% 100% 100% 100% 100% 100% 100% 100% 100%
% Change ‘18-’23 1.30% 1.47% 1.85% 2.83% 0.53% 1.50% 1.88% 0.93% 1.62% 3.28%
Female 15-44 1,677,665 158,516 60,549 11,380 6,986 7,887 8,645 9,464 5,465 3,567
% of Total 18.47% 19.53% 19.69% 20.85% 19.55% 18.53% 21.79% 19.51% 18.39% 20.00%
% Change ‘18-’23 -1.21% -2.53% -4.17% -2.26% -6.19% -5.36% -3.22% -5.12% -3.36% -5.21%
54 Community Health Needs Assessment RWJ Barnabas Health: Clara Maass Medical Center
1. Socioeconomic Status Socioeconomic status is the aggregate of several social, economic, and demographic measures. In this analysis, these measures include household Income and poverty, unemployment, education, ethnic and racial makeup, age, and Divinity Health’s Health Need Index by service area. According to Healthy People 2020, socioeconomic factors contribute to disparities in disease incidence and mortality among racial, ethnic and underserved groups. Studies indicate that income and socioeconomic status (SES) is a better predictor of the likelihood of an individual’s or group’s access to education, health insurance, and safe and healthy living and working conditions than race or ethnicity. SES also impacts the prevalence of behavioral risk factors (tobacco smoking, physical inactivity, obesity, excessive alcohol use) and rates of preventive screenings (lower SES, fewer screenings). Income, Poverty, and Unemployment Income influences the way people invest in their health and provides options for healthy lifestyle choices. In low income circumstances, preventive care expenses are more often neglected in favor of immediate living expenses. The longer people live in poverty, the more abject their income disadvantage and the more likely they are to suffer from a range of health problems. Circumstances that lead to poverty also may lead to social exclusion, discrimination, racism, stigmatization, and unemployment. Thus, the following measures of income and poverty may be evidence of these problems. Unemployment puts health at risk, starting when people first feel their jobs are threatened, before they become unemployed. Job insecurity increases mental health issues, particularly anxiety and depression. Populations with higher unemployment rates have collective increased risk of premature death. Those who are unemployed face greater challenges to health and well-being, including lost income and health insurance. Unemployed individuals are 54% more likely to be in poor or fair health as compared to employed individuals. According to CHR, racial and ethnic minorities and those with less education, often already at-risk for poor health outcomes, are most likely to be unemployed. Labor statistics indicate unemployment rates peaked at the height of the recession in 2010 and began to show some improvement beginning in 2014. Most areas of the State have shown continued improvement. Essex County Although Essex County has affluent areas, pockets of poverty in Newark, East Orange and Irvington exist.
• In 2016, the median household income in Essex County was $54,860, more than $18,000 below the State median of $73,702
• In 2016, Essex County had a higher percentage of people living below the federal poverty level than statewide, 17.2% and 10.9% respectively. 11
• Between 2014 and 2016, unemployment throughout New Jersey declined. In 2016, the Essex County unemployment rate was 8.0%, a decrease of 1.1% from 2014, but higher than the New Jersey unemployment rate of 5.2%.12
11 Ibid. 12 United States Bureau of Labor Statistics Newark, NJ-PA, Division Economic Summary 2016 http://www.bls.gov/regions/new-york-new-jersey/summary/blssummary_newark_div.pdf
55 Community Health Needs Assessment RWJ Barnabas Health: Clara Maass Medical Center
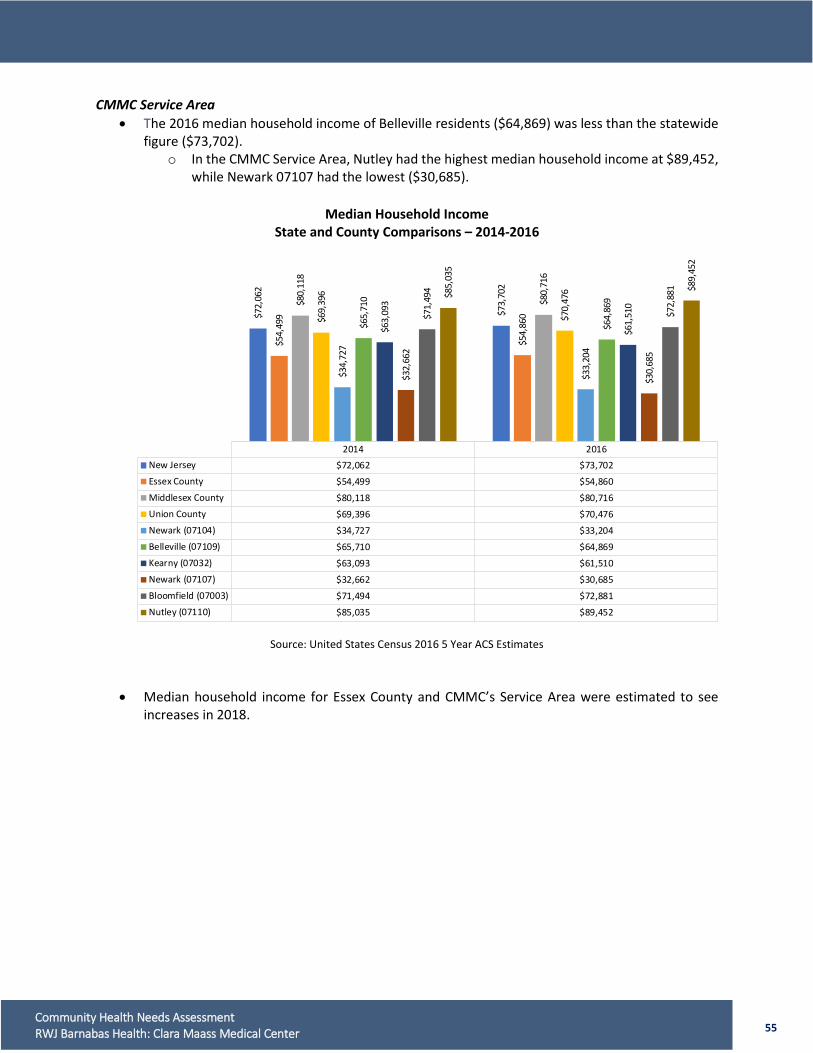
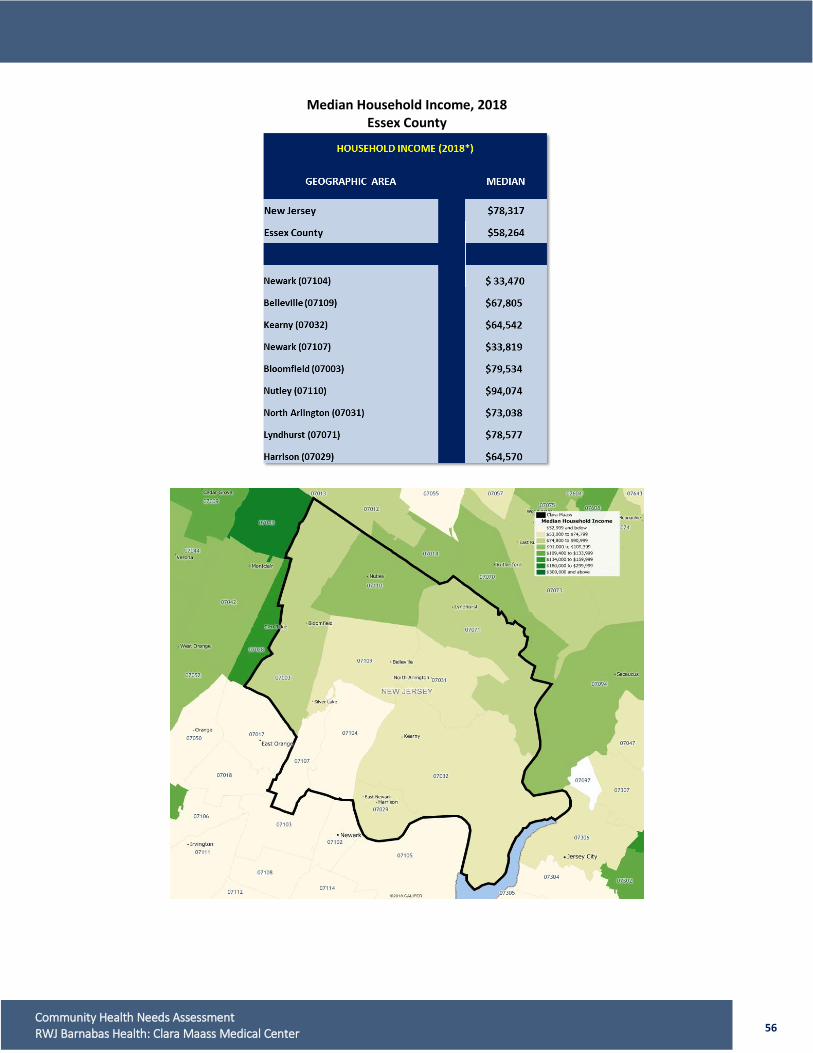
CMMC Service Area • The 2016 median household income of Belleville residents ($64,869) was less than the statewide
figure ($73,702). o In the CMMC Service Area, Nutley had the highest median household income at $89,452,
while Newark 07107 had the lowest ($30,685).
Median Household Income State and County Comparisons – 2014-2016
Source: United States Census 2016 5 Year ACS Estimates
• Median household income for Essex County and CMMC’s Service Area were estimated to see increases in 2018.
2014 2016New Jersey $72,062 $73,702Essex County $54,499 $54,860Middlesex County $80,118 $80,716Union County $69,396 $70,476Newark (07104) $34,727 $33,204Belleville (07109) $65,710 $64,869Kearny (07032) $63,093 $61,510Newark (07107) $32,662 $30,685Bloomfield (07003) $71,494 $72,881Nutley (07110) $85,035 $89,452
$72,
062
$73,
702
$54,
499
$54,
860
$80,
118
$80,
716
$69,
396
$70,
476
$34,
727
$33,
204
$65,
710
$64,
869
$63,
093
$61,
510
$32,
662
$30,
685
$71,
494
$72,
881
$85,
035
$89,
452
56 Community Health Needs Assessment RWJ Barnabas Health: Clara Maass Medical Center
Median Household Income, 2018 Essex County
57 Community Health Needs Assessment RWJ Barnabas Health: Clara Maass Medical Center
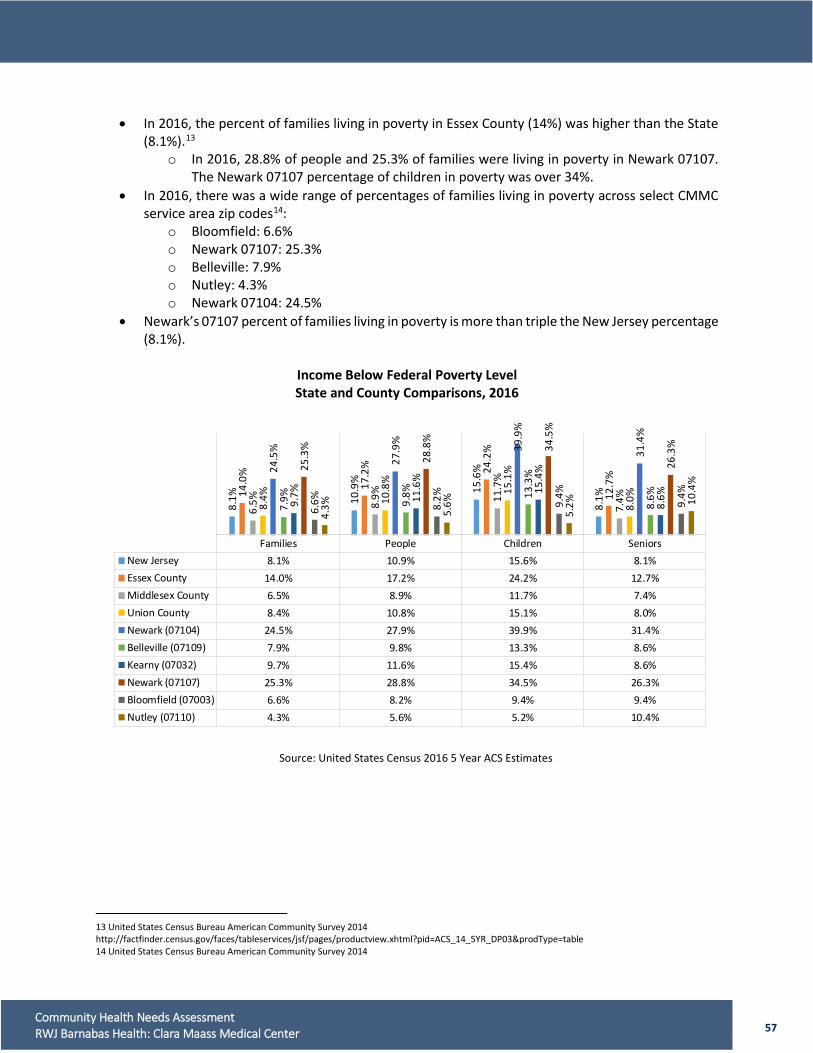
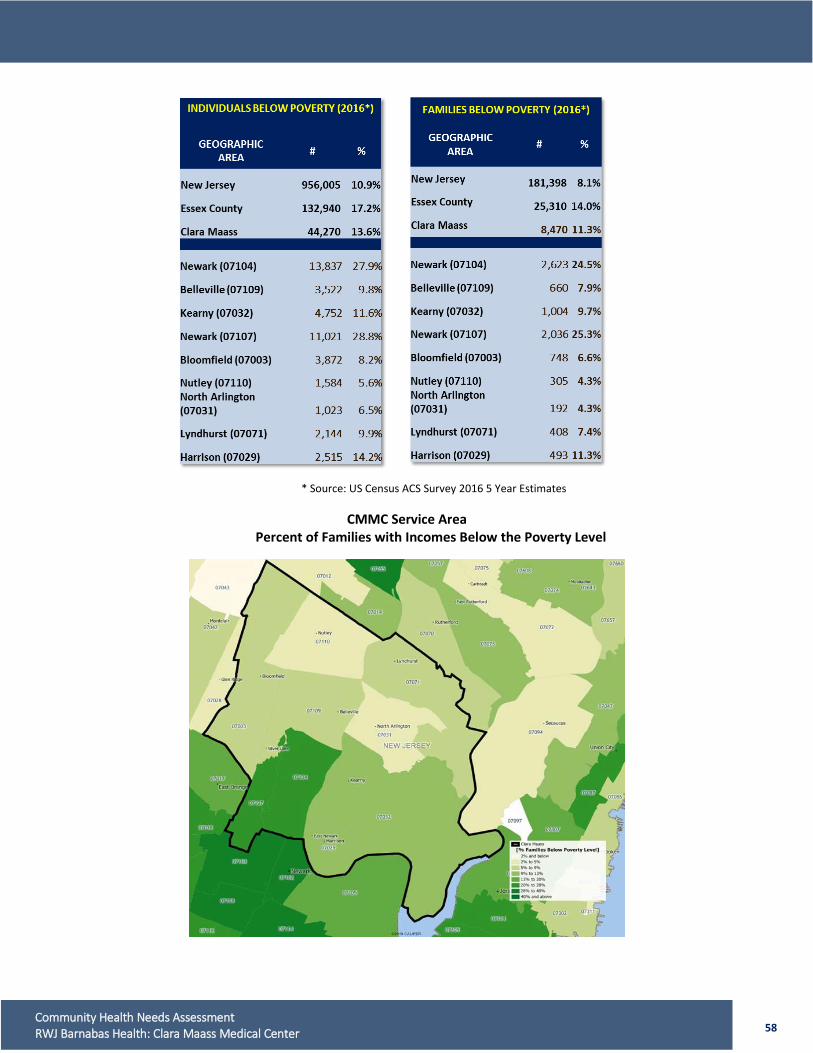
• In 2016, the percent of families living in poverty in Essex County (14%) was higher than the State
(8.1%).13 o In 2016, 28.8% of people and 25.3% of families were living in poverty in Newark 07107.
The Newark 07107 percentage of children in poverty was over 34%. • In 2016, there was a wide range of percentages of families living in poverty across select CMMC
service area zip codes14: o Bloomfield: 6.6% o Newark 07107: 25.3% o Belleville: 7.9% o Nutley: 4.3% o Newark 07104: 24.5%
• Newark’s 07107 percent of families living in poverty is more than triple the New Jersey percentage (8.1%).
Income Below Federal Poverty Level State and County Comparisons, 2016
Source: United States Census 2016 5 Year ACS Estimates
13 United States Census Bureau American Community Survey 2014 http://factfinder.census.gov/faces/tableservices/jsf/pages/productview.xhtml?pid=ACS_14_5YR_DP03&prodType=table 14 United States Census Bureau American Community Survey 2014
Families People Children SeniorsNew Jersey 8.1% 10.9% 15.6% 8.1%Essex County 14.0% 17.2% 24.2% 12.7%Middlesex County 6.5% 8.9% 11.7% 7.4%Union County 8.4% 10.8% 15.1% 8.0%Newark (07104) 24.5% 27.9% 39.9% 31.4%Belleville (07109) 7.9% 9.8% 13.3% 8.6%Kearny (07032) 9.7% 11.6% 15.4% 8.6%Newark (07107) 25.3% 28.8% 34.5% 26.3%Bloomfield (07003) 6.6% 8.2% 9.4% 9.4%Nutley (07110) 4.3% 5.6% 5.2% 10.4%
8.1% 10
.9%
15.6
%
8.1%14
.0%
17.2
% 24.2
%
12.7
%
6.5% 8.
9% 11.7
%
7.4%8.4% 10
.8%
15.1
%
8.0%
24.5
%
27.9
% 39.9
%
31.4
%
7.9% 9.8% 13
.3%
8.6%9.7% 11
.6%
15.4
%
8.6%
25.3
%
28.8
%
34.5
%
26.3
%
6.6% 8.2% 9.4%
9.4%
4.3% 5.6%
5.2% 10
.4%
58 Community Health Needs Assessment RWJ Barnabas Health: Clara Maass Medical Center
* Source: US Census ACS Survey 2016 5 Year Estimates
CMMC Service Area Percent of Families with Incomes Below the Poverty Level
59 Community Health Needs Assessment RWJ Barnabas Health: Clara Maass Medical Center
Unemployment
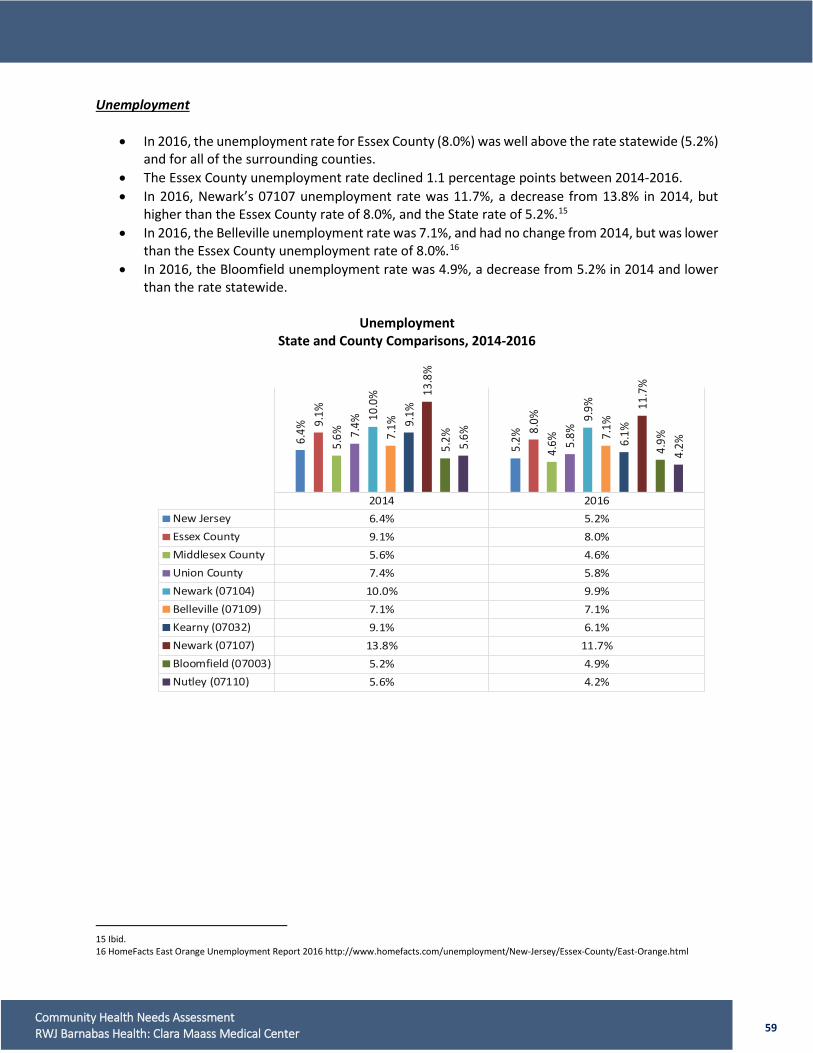
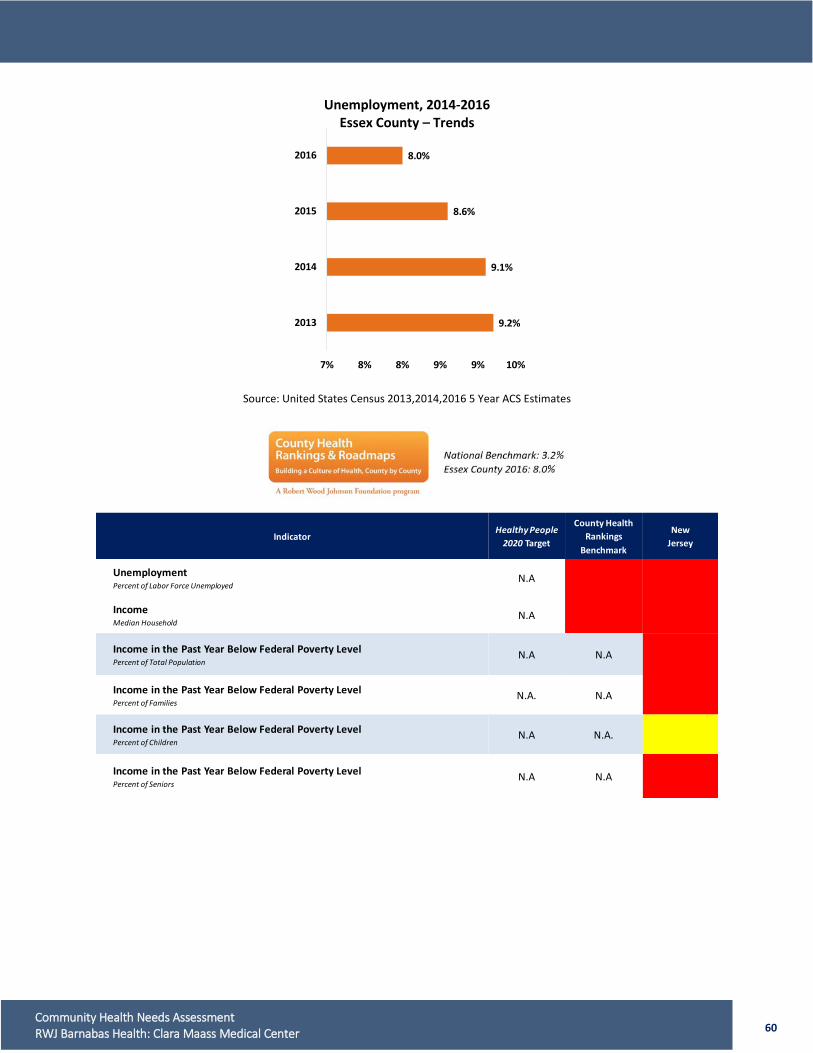
• In 2016, the unemployment rate for Essex County (8.0%) was well above the rate statewide (5.2%) and for all of the surrounding counties.
• The Essex County unemployment rate declined 1.1 percentage points between 2014-2016. • In 2016, Newark’s 07107 unemployment rate was 11.7%, a decrease from 13.8% in 2014, but
higher than the Essex County rate of 8.0%, and the State rate of 5.2%.15 • In 2016, the Belleville unemployment rate was 7.1%, and had no change from 2014, but was lower
than the Essex County unemployment rate of 8.0%.16 • In 2016, the Bloomfield unemployment rate was 4.9%, a decrease from 5.2% in 2014 and lower
than the rate statewide.
Unemployment State and County Comparisons, 2014-2016
15 Ibid. 16 HomeFacts East Orange Unemployment Report 2016 http://www.homefacts.com/unemployment/New-Jersey/Essex-County/East-Orange.html
2014 2016New Jersey 6.4% 5.2%Essex County 9.1% 8.0%Middlesex County 5.6% 4.6%Union County 7.4% 5.8%Newark (07104) 10.0% 9.9%Belleville (07109) 7.1% 7.1%Kearny (07032) 9.1% 6.1%Newark (07107) 13.8% 11.7%Bloomfield (07003) 5.2% 4.9%Nutley (07110) 5.6% 4.2%
6.4%
5.2%
9.1%
8.0%
5.6%
4.6%
7.4%
5.8%
10.0
%
9.9%
7.1%
7.1%9.
1%
6.1%
13.8
%
11.7
%
5.2%
4.9%5.6%
4.2%
60 Community Health Needs Assessment RWJ Barnabas Health: Clara Maass Medical Center
Unemployment, 2014-2016 Essex County – Trends
Source: United States Census 2013,2014,2016 5 Year ACS Estimates
IndicatorHealthy People
2020 Target
County Health Rankings
Benchmark
NewJersey
UnemploymentPercent of Labor Force Unemployed
N.A
IncomeMedian Household
N.A
Income in the Past Year Below Federal Poverty LevelPercent of Total Population
N.A N.A
Income in the Past Year Below Federal Poverty LevelPercent of Families
N.A. N.A
Income in the Past Year Below Federal Poverty LevelPercent of Children
N.A N.A.
Income in the Past Year Below Federal Poverty LevelPercent of Seniors
N.A N.A
9.2%
9.1%
8.6%
8.0%
7% 8% 8% 9% 9% 10%
2013
2014
2015
2016
61 Community Health Needs Assessment RWJ Barnabas Health: Clara Maass Medical Center
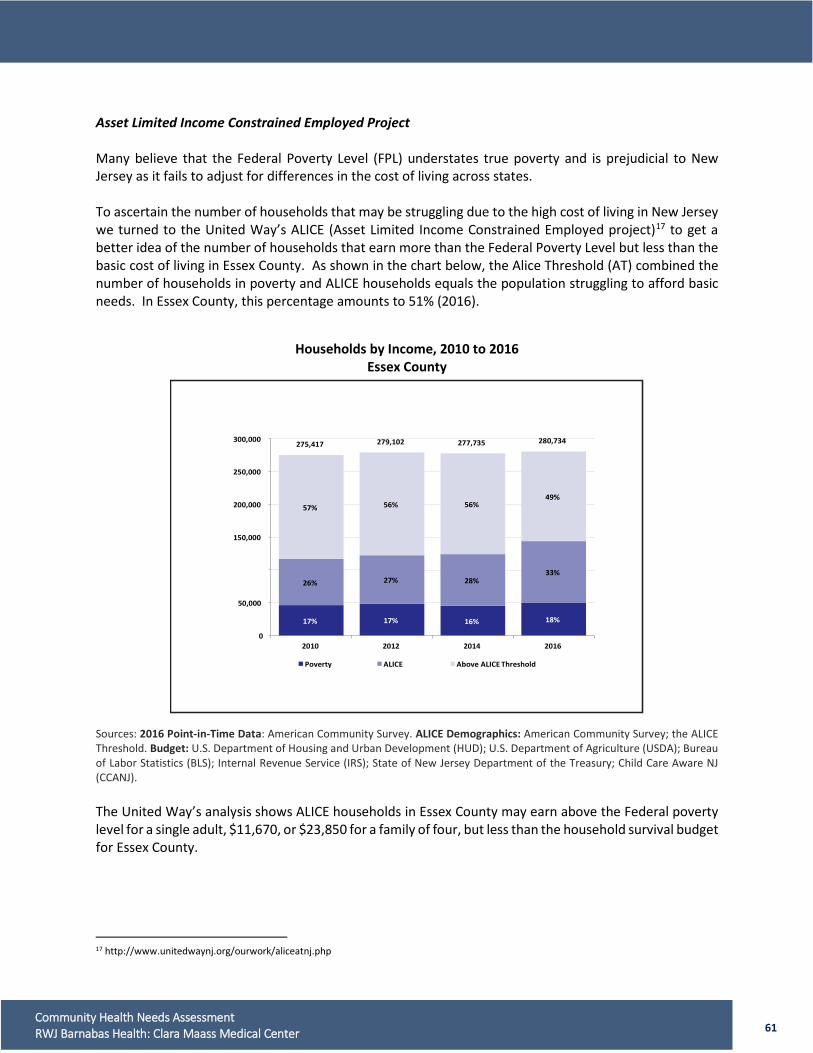
Asset Limited Income Constrained Employed Project Many believe that the Federal Poverty Level (FPL) understates true poverty and is prejudicial to New Jersey as it fails to adjust for differences in the cost of living across states. To ascertain the number of households that may be struggling due to the high cost of living in New Jersey we turned to the United Way’s ALICE (Asset Limited Income Constrained Employed project)17 to get a better idea of the number of households that earn more than the Federal Poverty Level but less than the basic cost of living in Essex County. As shown in the chart below, the Alice Threshold (AT) combined the number of households in poverty and ALICE households equals the population struggling to afford basic needs. In Essex County, this percentage amounts to 51% (2016).
Households by Income, 2010 to 2016 Essex County
Sources: 2016 Point-in-Time Data: American Community Survey. ALICE Demographics: American Community Survey; the ALICE Threshold. Budget: U.S. Department of Housing and Urban Development (HUD); U.S. Department of Agriculture (USDA); Bureau of Labor Statistics (BLS); Internal Revenue Service (IRS); State of New Jersey Department of the Treasury; Child Care Aware NJ (CCANJ). The United Way’s analysis shows ALICE households in Essex County may earn above the Federal poverty level for a single adult, $11,670, or $23,850 for a family of four, but less than the household survival budget for Essex County.
17 http://www.unitedwaynj.org/ourwork/aliceatnj.php
Poverty ALICE Above ALICE Threshold
2016 2014 2012 2010 0
18% 16% 17% 17%
50,000
28% 27% 26% 33%
150,000
56% 56% 57% 200,000 49%
250,000
280,734 277,735 279,102 275,417 300,000
62 Community Health Needs Assessment RWJ Barnabas Health: Clara Maass Medical Center
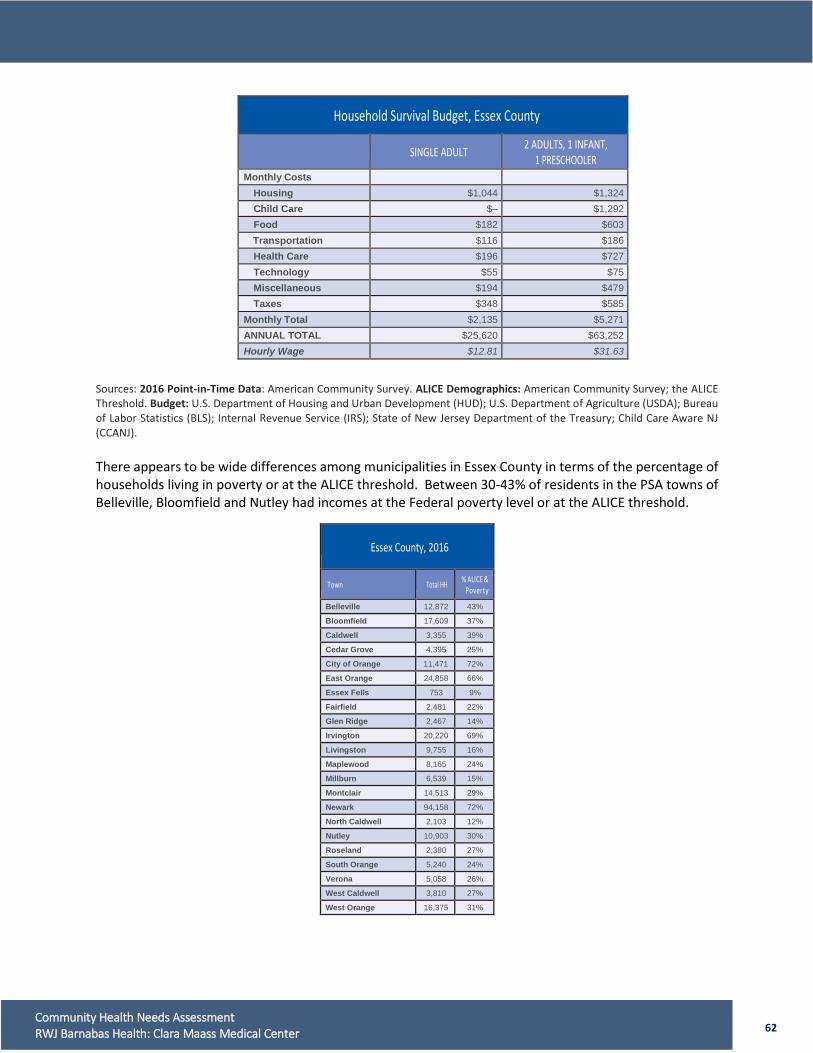
Sources: 2016 Point-in-Time Data: American Community Survey. ALICE Demographics: American Community Survey; the ALICE Threshold. Budget: U.S. Department of Housing and Urban Development (HUD); U.S. Department of Agriculture (USDA); Bureau of Labor Statistics (BLS); Internal Revenue Service (IRS); State of New Jersey Department of the Treasury; Child Care Aware NJ (CCANJ). There appears to be wide differences among municipalities in Essex County in terms of the percentage of households living in poverty or at the ALICE threshold. Between 30-43% of residents in the PSA towns of Belleville, Bloomfield and Nutley had incomes at the Federal poverty level or at the ALICE threshold.
Household Survival Budget, Essex County
SINGLE ADULT 2 ADULTS, 1 INFANT, 1 PRESCHOOLER
Monthly Costs
Housing $1,044 $1,324 Child Care $– $1,292 Food $182 $603 Transportation $116 $186 Health Care $196 $727 Technology $55 $75 Miscellaneous $194 $479 Taxes $348 $585
Monthly Total $2,135 $5,271 ANNUAL TOTAL $25,620 $63,252 Hourly Wage $12.81 $31.63
Essex County, 2016
Town Total HH % ALICE & Poverty
Belleville 12,872 43%
Bloomfield 17,609 37%
Caldwell 3,355 39%
Cedar Grove 4,395 25%
City of Orange 11,471 72%
East Orange 24,858 66%
Essex Fells 753 9%
Fairfield 2,481 22%
Glen Ridge 2,467 14%
Irvington 20,220 69%
Livingston 9,755 16%
Maplewood 8,165 24%
Millburn 6,539 15%
Montclair 14,513 29%
Newark 94,158 72%
North Caldwell 2,103 12%
Nutley 10,903 30%
Roseland 2,380 27%
South Orange 5,240 24%
Verona 5,058 26%
West Caldwell 3,810 27%
West Orange 16,375 31%
63 Community Health Needs Assessment RWJ Barnabas Health: Clara Maass Medical Center
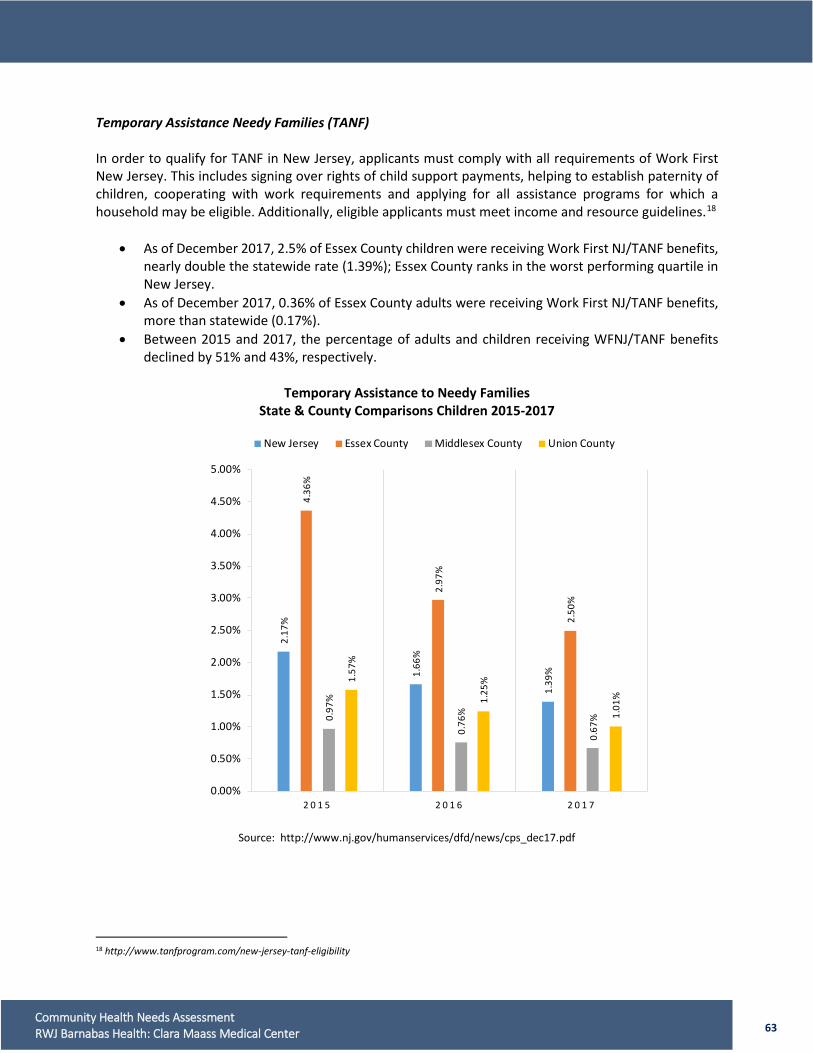
Temporary Assistance Needy Families (TANF) In order to qualify for TANF in New Jersey, applicants must comply with all requirements of Work First New Jersey. This includes signing over rights of child support payments, helping to establish paternity of children, cooperating with work requirements and applying for all assistance programs for which a household may be eligible. Additionally, eligible applicants must meet income and resource guidelines.18
• As of December 2017, 2.5% of Essex County children were receiving Work First NJ/TANF benefits, nearly double the statewide rate (1.39%); Essex County ranks in the worst performing quartile in New Jersey.
• As of December 2017, 0.36% of Essex County adults were receiving Work First NJ/TANF benefits, more than statewide (0.17%).
• Between 2015 and 2017, the percentage of adults and children receiving WFNJ/TANF benefits declined by 51% and 43%, respectively.
Temporary Assistance to Needy Families
State & County Comparisons Children 2015-2017
Source: http://www.nj.gov/humanservices/dfd/news/cps_dec17.pdf
18 http://www.tanfprogram.com/new-jersey-tanf-eligibility
2.17
%
1.66
%
1.39
%
4.36
%
2.97
%
2.50
%
0.97
%
0.76
%
0.67
%
1.57
%
1.25
%
1.01
%
0.00%
0.50%
1.00%
1.50%
2.00%
2.50%
3.00%
3.50%
4.00%
4.50%
5.00%
2 0 1 5 2 0 1 6 2 0 1 7
New Jersey Essex County Middlesex County Union County
64 Community Health Needs Assessment RWJ Barnabas Health: Clara Maass Medical Center
Temporary Assistance to Needy Families
State & County Comparisons Adults 2015-2017
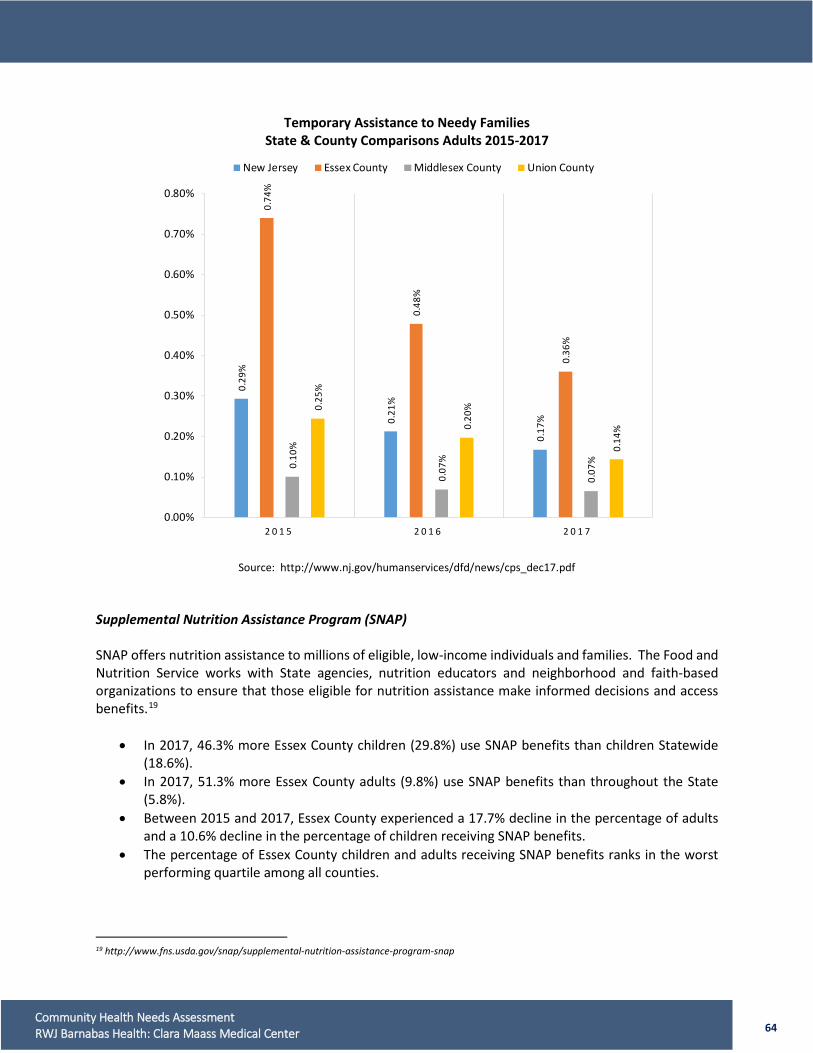
Source: http://www.nj.gov/humanservices/dfd/news/cps_dec17.pdf Supplemental Nutrition Assistance Program (SNAP) SNAP offers nutrition assistance to millions of eligible, low-income individuals and families. The Food and Nutrition Service works with State agencies, nutrition educators and neighborhood and faith-based organizations to ensure that those eligible for nutrition assistance make informed decisions and access benefits.19
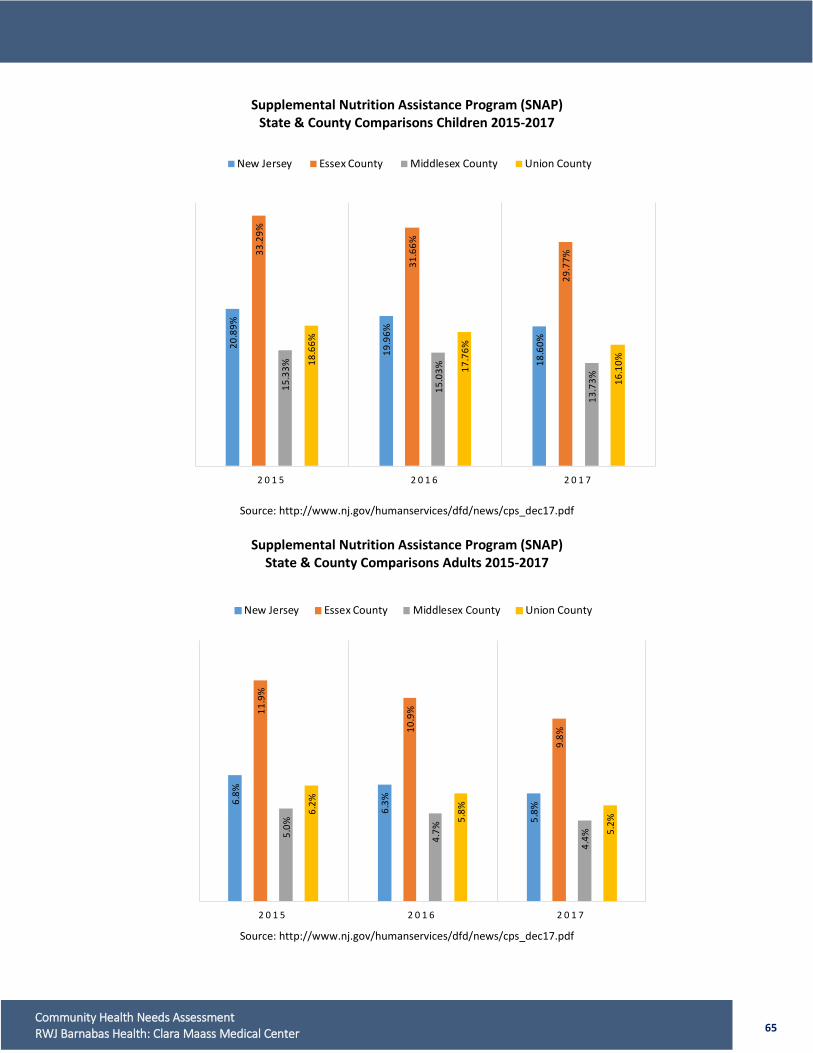
• In 2017, 46.3% more Essex County children (29.8%) use SNAP benefits than children Statewide (18.6%).
• In 2017, 51.3% more Essex County adults (9.8%) use SNAP benefits than throughout the State (5.8%).
• Between 2015 and 2017, Essex County experienced a 17.7% decline in the percentage of adults and a 10.6% decline in the percentage of children receiving SNAP benefits.
• The percentage of Essex County children and adults receiving SNAP benefits ranks in the worst performing quartile among all counties.
19 http://www.fns.usda.gov/snap/supplemental-nutrition-assistance-program-snap
0.29
%
0.21
%
0.17
%
0.74
%
0.48
%
0.36
%
0.10
%
0.07
%
0.07
%
0.25
%
0.20
%
0.14
%
0.00%
0.10%
0.20%
0.30%
0.40%
0.50%
0.60%
0.70%
0.80%
2 0 1 5 2 0 1 6 2 0 1 7
New Jersey Essex County Middlesex County Union County
65 Community Health Needs Assessment RWJ Barnabas Health: Clara Maass Medical Center
6.8%
6.3%
5.8%
11.9
%
10.9
%
9.8%
5.0%
4.7%
4.4%
6.2%
5.8%
5.2%
2 0 1 5 2 0 1 6 2 0 1 7
New Jersey Essex County Middlesex County Union County
20.8
9%
19.9
6%
18.6
0%
33.2
9%
31.6
6%
29.7
7%
15.3
3%
15.0
3%
13.7
3%
18.6
6%
17.7
6%
16.1
0%
2 0 1 5 2 0 1 6 2 0 1 7
New Jersey Essex County Middlesex County Union County
Supplemental Nutrition Assistance Program (SNAP) State & County Comparisons Children 2015-2017
Source: http://www.nj.gov/humanservices/dfd/news/cps_dec17.pdf
Supplemental Nutrition Assistance Program (SNAP)
State & County Comparisons Adults 2015-2017
Source: http://www.nj.gov/humanservices/dfd/news/cps_dec17.pdf
66 Community Health Needs Assessment RWJ Barnabas Health: Clara Maass Medical Center
31%
37%
38%
47%
54%
54%
26%
35%
33%
40%
47%
47%
2 0 1 2 - 2 0 1 3 2 0 1 4 - 2 0 1 5 2 0 1 5 - 2 0 1 6
New Jersey Essex County Middlesex County Union County
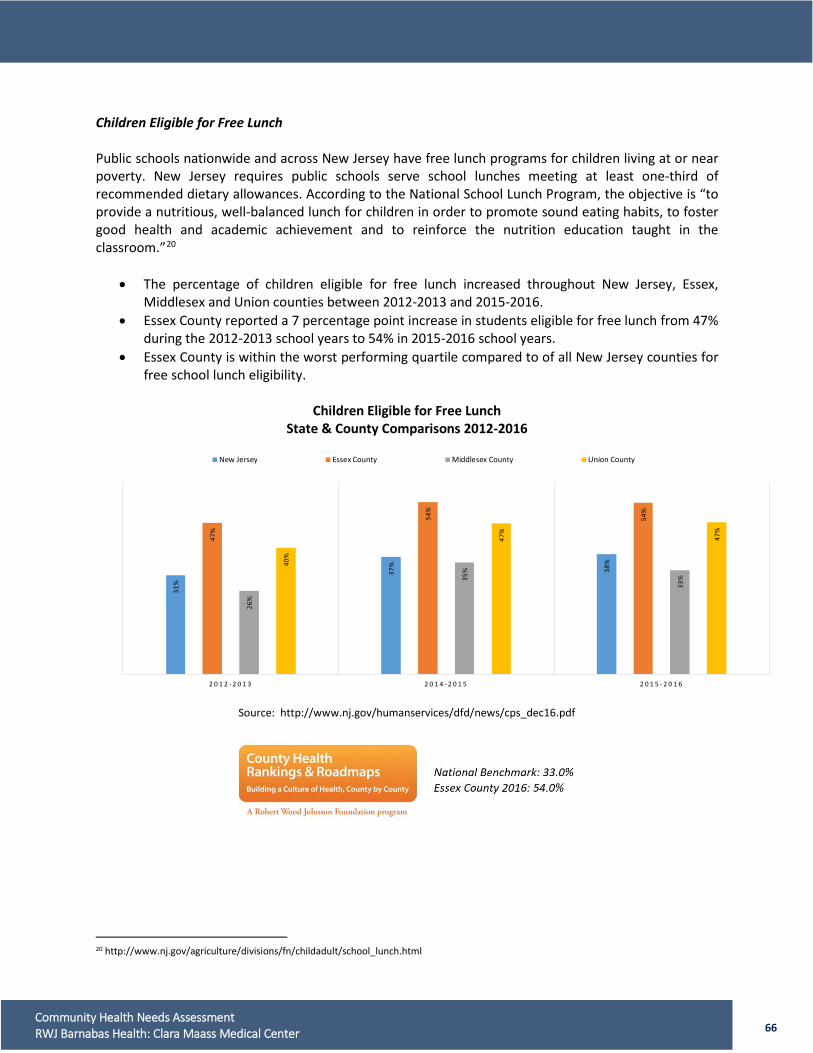
Children Eligible for Free Lunch Public schools nationwide and across New Jersey have free lunch programs for children living at or near poverty. New Jersey requires public schools serve school lunches meeting at least one-third of recommended dietary allowances. According to the National School Lunch Program, the objective is “to provide a nutritious, well-balanced lunch for children in order to promote sound eating habits, to foster good health and academic achievement and to reinforce the nutrition education taught in the classroom.”20
• The percentage of children eligible for free lunch increased throughout New Jersey, Essex, Middlesex and Union counties between 2012-2013 and 2015-2016.
• Essex County reported a 7 percentage point increase in students eligible for free lunch from 47% during the 2012-2013 school years to 54% in 2015-2016 school years.
• Essex County is within the worst performing quartile compared to of all New Jersey counties for free school lunch eligibility.
Children Eligible for Free Lunch
State & County Comparisons 2012-2016
Source: http://www.nj.gov/humanservices/dfd/news/cps_dec16.pdf
20 http://www.nj.gov/agriculture/divisions/fn/childadult/school_lunch.html
67 Community Health Needs Assessment RWJ Barnabas Health: Clara Maass Medical Center
Indicator Healthy People 2020 Target
County Health Rankings
Benchmark
New Jersey
WFNJ/TANF (Supplemental Nutritional Assistance Program) Percent of Population N.A. N.A.
WFNJ/TANF-Children Percent of Children N.A. N.A.
SNAP (Supplemental Nutrition Assistance Program) Percent of Population Receiving SNAP N.A. N.A.
SNAP-Children Percent of Children Receiving SNAP N.A. N.A.
Children Eligible for Free Lunch N.A.
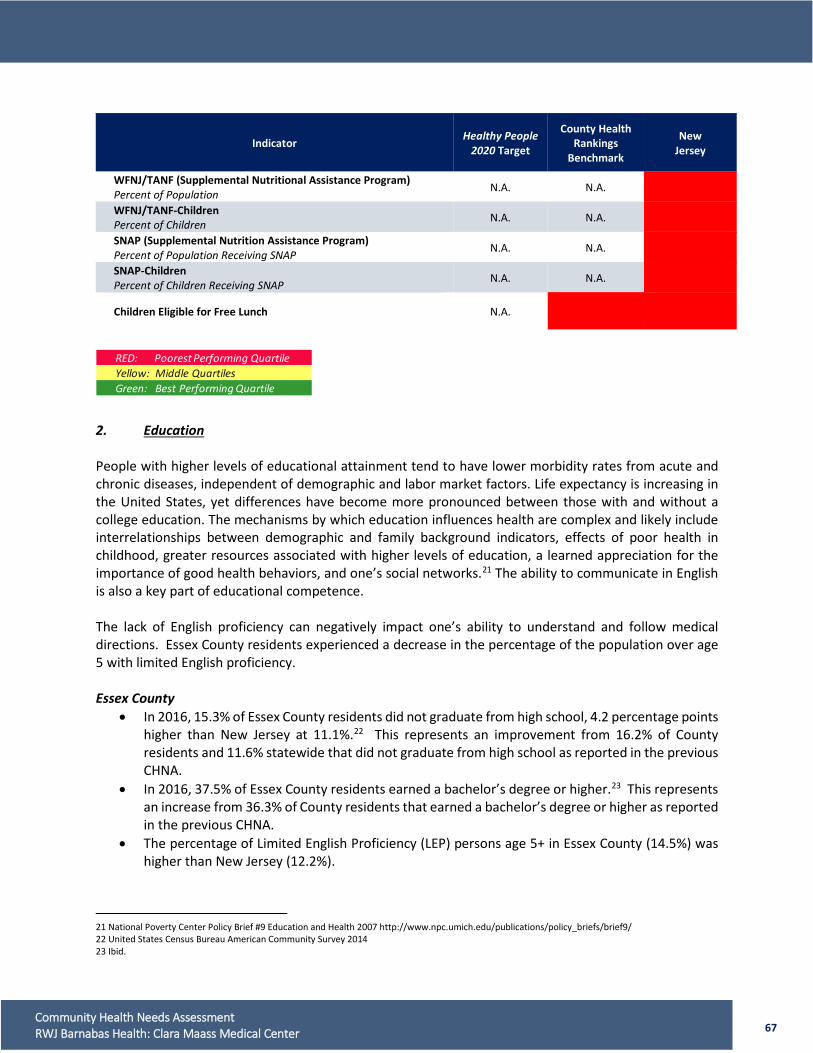
2. Education People with higher levels of educational attainment tend to have lower morbidity rates from acute and chronic diseases, independent of demographic and labor market factors. Life expectancy is increasing in the United States, yet differences have become more pronounced between those with and without a college education. The mechanisms by which education influences health are complex and likely include interrelationships between demographic and family background indicators, effects of poor health in childhood, greater resources associated with higher levels of education, a learned appreciation for the importance of good health behaviors, and one’s social networks.21 The ability to communicate in English is also a key part of educational competence. The lack of English proficiency can negatively impact one’s ability to understand and follow medical directions. Essex County residents experienced a decrease in the percentage of the population over age 5 with limited English proficiency. Essex County
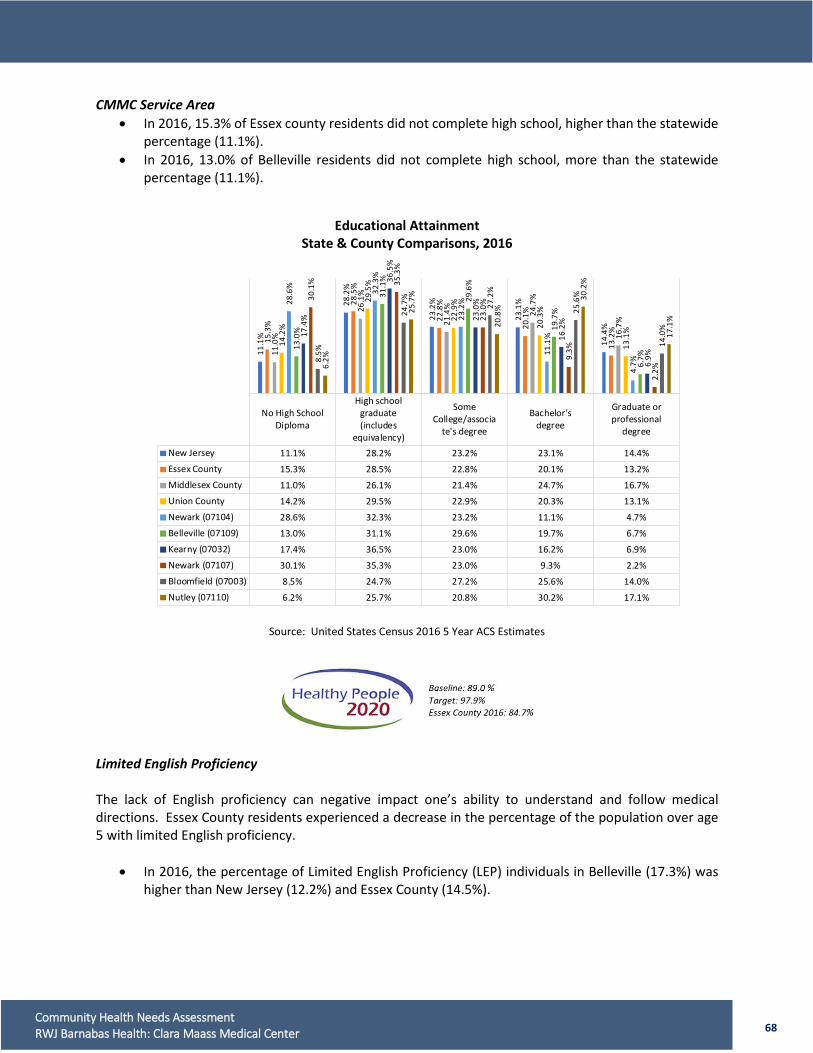
• In 2016, 15.3% of Essex County residents did not graduate from high school, 4.2 percentage points higher than New Jersey at 11.1%.22 This represents an improvement from 16.2% of County residents and 11.6% statewide that did not graduate from high school as reported in the previous CHNA.
• In 2016, 37.5% of Essex County residents earned a bachelor’s degree or higher.23 This represents an increase from 36.3% of County residents that earned a bachelor’s degree or higher as reported in the previous CHNA.
• The percentage of Limited English Proficiency (LEP) persons age 5+ in Essex County (14.5%) was higher than New Jersey (12.2%).
21 National Poverty Center Policy Brief #9 Education and Health 2007 http://www.npc.umich.edu/publications/policy_briefs/brief9/ 22 United States Census Bureau American Community Survey 2014 23 Ibid.
RED: Poorest Performing QuartileYellow: Middle QuartilesGreen: Best Performing Quartile
68 Community Health Needs Assessment RWJ Barnabas Health: Clara Maass Medical Center
CMMC Service Area • In 2016, 15.3% of Essex county residents did not complete high school, higher than the statewide
percentage (11.1%). • In 2016, 13.0% of Belleville residents did not complete high school, more than the statewide
percentage (11.1%).
Educational Attainment State & County Comparisons, 2016
Source: United States Census 2016 5 Year ACS Estimates
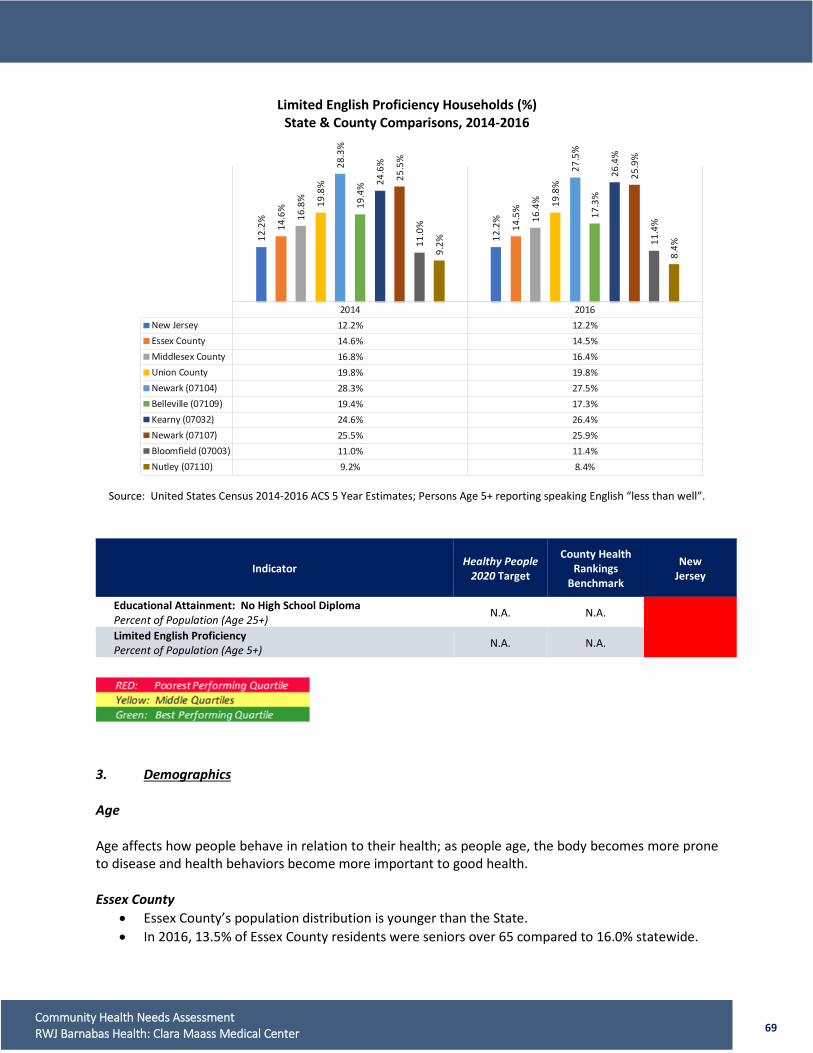
Limited English Proficiency The lack of English proficiency can negative impact one’s ability to understand and follow medical directions. Essex County residents experienced a decrease in the percentage of the population over age 5 with limited English proficiency.
• In 2016, the percentage of Limited English Proficiency (LEP) individuals in Belleville (17.3%) was higher than New Jersey (12.2%) and Essex County (14.5%).
No High SchoolDiploma
High schoolgraduate(includes
equivalency)
SomeCollege/associa
te's degree
Bachelor'sdegree
Graduate orprofessional
degree
New Jersey 11.1% 28.2% 23.2% 23.1% 14.4%Essex County 15.3% 28.5% 22.8% 20.1% 13.2%Middlesex County 11.0% 26.1% 21.4% 24.7% 16.7%Union County 14.2% 29.5% 22.9% 20.3% 13.1%Newark (07104) 28.6% 32.3% 23.2% 11.1% 4.7%Belleville (07109) 13.0% 31.1% 29.6% 19.7% 6.7%Kearny (07032) 17.4% 36.5% 23.0% 16.2% 6.9%Newark (07107) 30.1% 35.3% 23.0% 9.3% 2.2%Bloomfield (07003) 8.5% 24.7% 27.2% 25.6% 14.0%Nutley (07110) 6.2% 25.7% 20.8% 30.2% 17.1%
11.1
%
28.2
%
23.2
%
23.1
%
14.4
%
15.3
%
28.5
%
22.8
%
20.1
%
13.2
%
11.0
%
26.1
%
21.4
%
24.7
%
16.7
%
14.2
%
29.5
%
22.9
%
20.3
%
13.1
%
28.6
% 32.3
%
23.2
%
11.1
%
4.7%
13.0
%
31.1
%
29.6
%
19.7
%
6.7%
17.4
%
36.5
%
23.0
%
16.2
%
6.9%
30.1
% 35.3
%
23.0
%
9.3%
2.2%
8.5%
24.7
%
27.2
%
25.6
%
14.0
%
6.2%
25.7
%
20.8
%
30.2
%
17.1
%
69 Community Health Needs Assessment RWJ Barnabas Health: Clara Maass Medical Center
Limited English Proficiency Households (%) State & County Comparisons, 2014-2016
Source: United States Census 2014-2016 ACS 5 Year Estimates; Persons Age 5+ reporting speaking English “less than well”.
Indicator Healthy People 2020 Target
County Health Rankings
Benchmark
New Jersey
Educational Attainment: No High School Diploma Percent of Population (Age 25+) N.A. N.A.
Limited English Proficiency Percent of Population (Age 5+) N.A. N.A.
3. Demographics Age Age affects how people behave in relation to their health; as people age, the body becomes more prone to disease and health behaviors become more important to good health. Essex County
• Essex County’s population distribution is younger than the State. • In 2016, 13.5% of Essex County residents were seniors over 65 compared to 16.0% statewide.
2014 2016New Jersey 12.2% 12.2%Essex County 14.6% 14.5%Middlesex County 16.8% 16.4%Union County 19.8% 19.8%Newark (07104) 28.3% 27.5%Belleville (07109) 19.4% 17.3%Kearny (07032) 24.6% 26.4%Newark (07107) 25.5% 25.9%Bloomfield (07003) 11.0% 11.4%Nutley (07110) 9.2% 8.4%
12.2
%
12.2
%
14.6
%
14.5
%
16.8
%
16.4
%19.8
%
19.8
%
28.3
%
27.5
%
19.4
%
17.3
%
24.6
%
26.4
%
25.5
%
25.9
%
11.0
%
11.4
%
9.2%
8.4%
70 Community Health Needs Assessment RWJ Barnabas Health: Clara Maass Medical Center
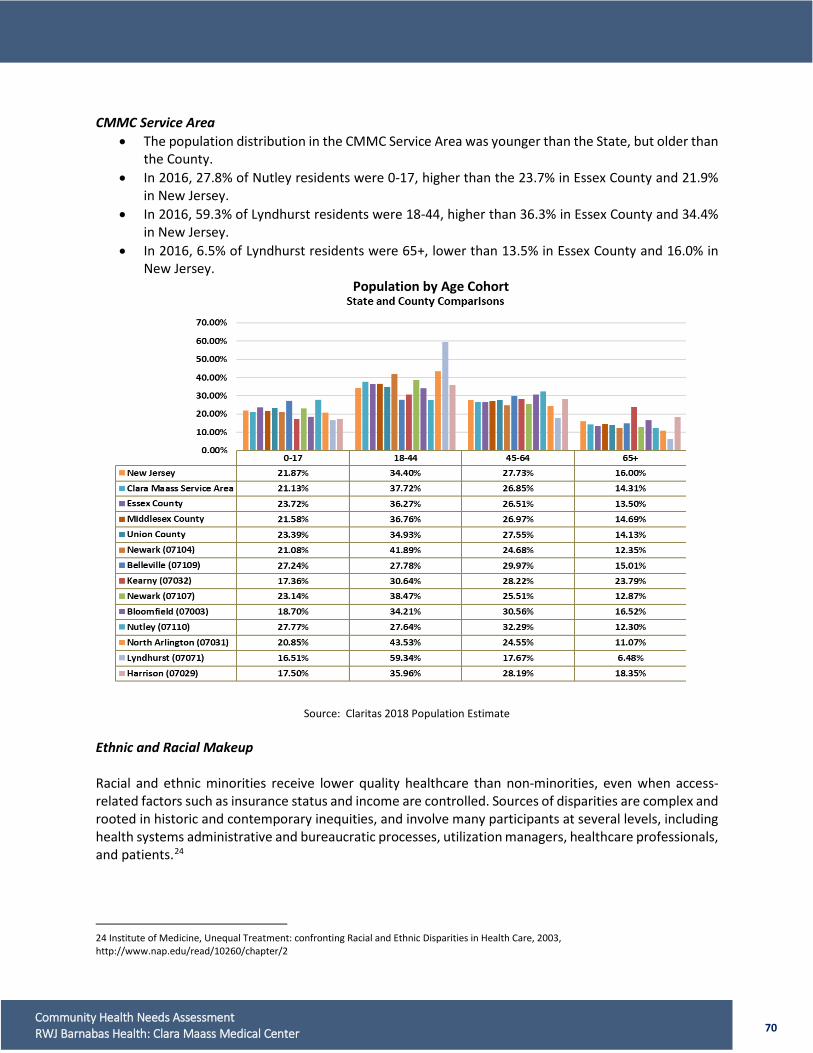
CMMC Service Area
• The population distribution in the CMMC Service Area was younger than the State, but older than the County.
• In 2016, 27.8% of Nutley residents were 0-17, higher than the 23.7% in Essex County and 21.9% in New Jersey.
• In 2016, 59.3% of Lyndhurst residents were 18-44, higher than 36.3% in Essex County and 34.4% in New Jersey.
• In 2016, 6.5% of Lyndhurst residents were 65+, lower than 13.5% in Essex County and 16.0% in New Jersey.
Population by Age Cohort
Source: Claritas 2018 Population Estimate Ethnic and Racial Makeup Racial and ethnic minorities receive lower quality healthcare than non-minorities, even when access-related factors such as insurance status and income are controlled. Sources of disparities are complex and rooted in historic and contemporary inequities, and involve many participants at several levels, including health systems administrative and bureaucratic processes, utilization managers, healthcare professionals, and patients.24
24 Institute of Medicine, Unequal Treatment: confronting Racial and Ethnic Disparities in Health Care, 2003, http://www.nap.edu/read/10260/chapter/2
71 Community Health Needs Assessment RWJ Barnabas Health: Clara Maass Medical Center
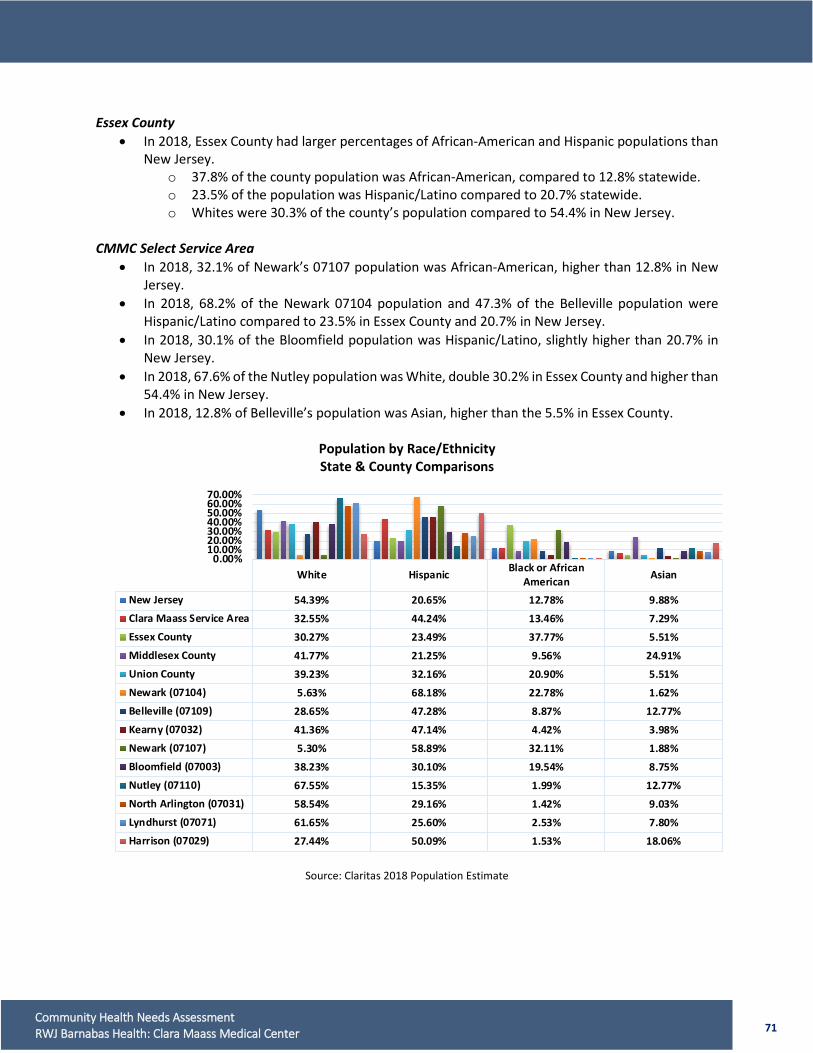
Essex County
• In 2018, Essex County had larger percentages of African-American and Hispanic populations than New Jersey.
o 37.8% of the county population was African-American, compared to 12.8% statewide. o 23.5% of the population was Hispanic/Latino compared to 20.7% statewide. o Whites were 30.3% of the county’s population compared to 54.4% in New Jersey.
CMMC Select Service Area
• In 2018, 32.1% of Newark’s 07107 population was African-American, higher than 12.8% in New Jersey.
• In 2018, 68.2% of the Newark 07104 population and 47.3% of the Belleville population were Hispanic/Latino compared to 23.5% in Essex County and 20.7% in New Jersey.
• In 2018, 30.1% of the Bloomfield population was Hispanic/Latino, slightly higher than 20.7% in New Jersey.
• In 2018, 67.6% of the Nutley population was White, double 30.2% in Essex County and higher than 54.4% in New Jersey.
• In 2018, 12.8% of Belleville’s population was Asian, higher than the 5.5% in Essex County.
Population by Race/Ethnicity State & County Comparisons
Source: Claritas 2018 Population Estimate
White Hispanic Black or AfricanAmerican Asian
New Jersey 54.39% 20.65% 12.78% 9.88%Clara Maass Service Area 32.55% 44.24% 13.46% 7.29%Essex County 30.27% 23.49% 37.77% 5.51%Middlesex County 41.77% 21.25% 9.56% 24.91%Union County 39.23% 32.16% 20.90% 5.51%Newark (07104) 5.63% 68.18% 22.78% 1.62%Belleville (07109) 28.65% 47.28% 8.87% 12.77%Kearny (07032) 41.36% 47.14% 4.42% 3.98%Newark (07107) 5.30% 58.89% 32.11% 1.88%Bloomfield (07003) 38.23% 30.10% 19.54% 8.75%Nutley (07110) 67.55% 15.35% 1.99% 12.77%North Arlington (07031) 58.54% 29.16% 1.42% 9.03%Lyndhurst (07071) 61.65% 25.60% 2.53% 7.80%Harrison (07029) 27.44% 50.09% 1.53% 18.06%
0.00%10.00%20.00%30.00%40.00%50.00%60.00%70.00%
72 Community Health Needs Assessment RWJ Barnabas Health: Clara Maass Medical Center
Population by Race/Ethnicity
Essex County – Trend
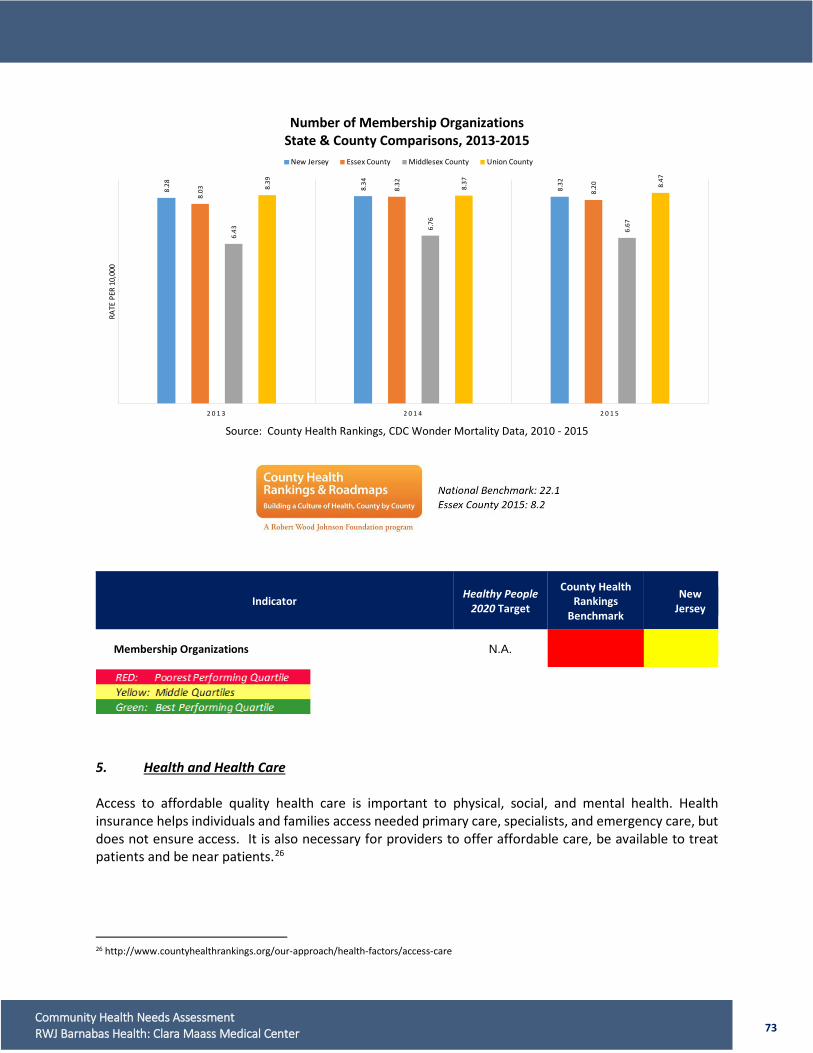
Source: Claritas 2018 Population Estimate 4. Social and Community Context Social Associations Social isolation can negatively impact health outcomes. Having a strong social network is associated with healthy lifestyle choices, positive health status, and reduced morbidity and mortality. Participation in community organizations can enhance social trust and a sense of belonging.25 Social associations include structured membership organizations such as civic organizations, bowling centers, golf clubs, fitness centers, sports organizations, religious organizations, political organizations, business and professional associations.
• Between 2013 and 2015, Essex County had slightly lower membership association rates than New Jersey and Union County, but higher than the Middlesex County rate.
• The membership association rate for Essex County falls within the worst performing quartile compared to all 21 counties statewide.
25 http://www.countyhealthrankings.org/app/new-jersey/2015/measure/factors/140/description
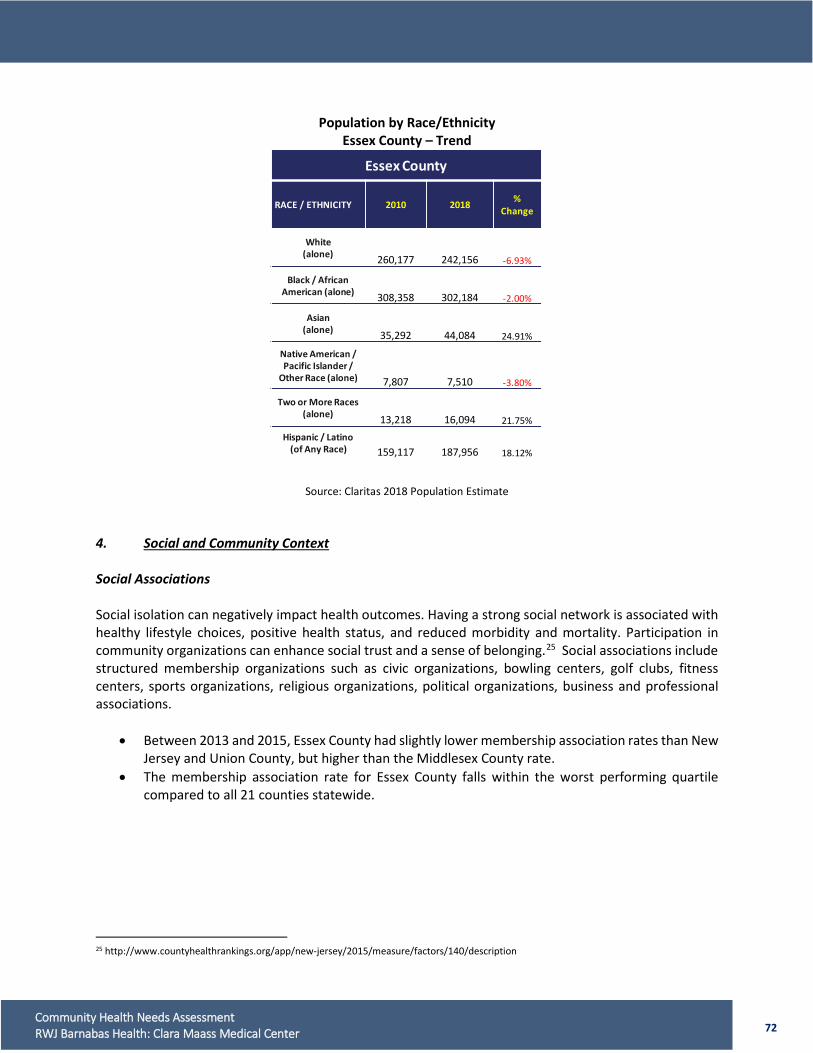
Essex County
RACE / ETHNICITY 2010 2018 % Change
White (alone) 260,177 242,156 -6.93%
Black / African American (alone) 308,358 302,184 -2.00%
Asian (alone) 35,292 44,084 24.91%
Native American / Pacific Islander /
Other Race (alone) 7,807 7,510 -3.80%
Two or More Races (alone) 13,218 16,094 21.75%
Hispanic / Latino(of Any Race) 159,117 187,956 18.12%
73 Community Health Needs Assessment RWJ Barnabas Health: Clara Maass Medical Center
Number of Membership Organizations
State & County Comparisons, 2013-2015
Source: County Health Rankings, CDC Wonder Mortality Data, 2010 - 2015
5. Health and Health Care Access to affordable quality health care is important to physical, social, and mental health. Health insurance helps individuals and families access needed primary care, specialists, and emergency care, but does not ensure access. It is also necessary for providers to offer affordable care, be available to treat patients and be near patients.26
26 http://www.countyhealthrankings.org/our-approach/health-factors/access-care
8.28 8.34
8.32
8.03 8.
32
8.20
6.43 6.
76
6.67
8.39
8.37 8.47
2 0 1 3 2 0 1 4 2 0 1 5
RATE
PER
10,
000
New Jersey Essex County Middlesex County Union County
Indicator Healthy People 2020 Target
County Health Rankings
Benchmark
New Jersey
Membership Organizations N.A.
74 Community Health Needs Assessment RWJ Barnabas Health: Clara Maass Medical Center
Health Insurance The expansion of Medicaid coverage and the Affordable Care Act’s (ACA) coverage provisions, which began taking effect in 2010, helped decrease the nation's uninsured rate by 7.2 percentage points, from 16 percent in 2016. That translates into 20.4 million fewer people who lacked health insurance in 2016 compared to 2010. The uninsured rate is estimated to have increased to 15.5% in the first quarter of 2018, meaning another 4 million lost coverage since 2016 due to changes in health policy and insurance offerings. The uninsured are less likely to have primary care providers than the insured; they also receive less preventive care, dental care, chronic disease management, and behavioral health counseling. Those without insurance are often diagnosed at later, less treatable disease stages than those with insurance and, overall, have worse health outcomes, lower quality of life, and higher mortality rates. Neighborhoods with low health insurance rates often have fewer providers, hospital beds and emergency resources than areas with higher rates. Even the insured have more difficulty getting care in these areas. Cost can be a barrier to care even for those who have insurance. Lack of insurance creates barriers to timely access to care for patients and financial burdens to the providers who care for them.
• Since 2013, the non-elderly population without health insurance in Essex County has trended downward, decreasing from 18.5% in 2013 to 13.6% in 2015.
• From 2013 through 2015, Essex County had consistently higher rates of non-elderly population without health insurance than statewide.
• In 2015, Essex County (13.6%) was higher than the ambitious Healthy People 2020 target of no person without health coverage. Essex County also had a higher percentage of individuals without insurance than the CHR Benchmark.
Non-elderly Population Without Health Insurance
State & County Comparisons 2013-2015
Source: Healthy People 2020 - CDC Behavioral Risk Factor Surveillance System County Health Rankings - US Census Bureau's Small Area Health Insurance Estimates (SAHIE)
Access to Care
15.0
%
12.6
%
10.0
%
18.5
%
16.5
%
13.6
%
14.4
%
11.9
%
9.7%
18.5
%
15.5
%
13.0
%
2 0 1 3 2 0 1 4 2 0 1 5
New Jersey Essex County Middlesex County Union County
Baseline: 10.0% Target: 0.0% Essex County 2015: 13.6%
National Benchmark: 6.0% Essex County 2015: 13.6%
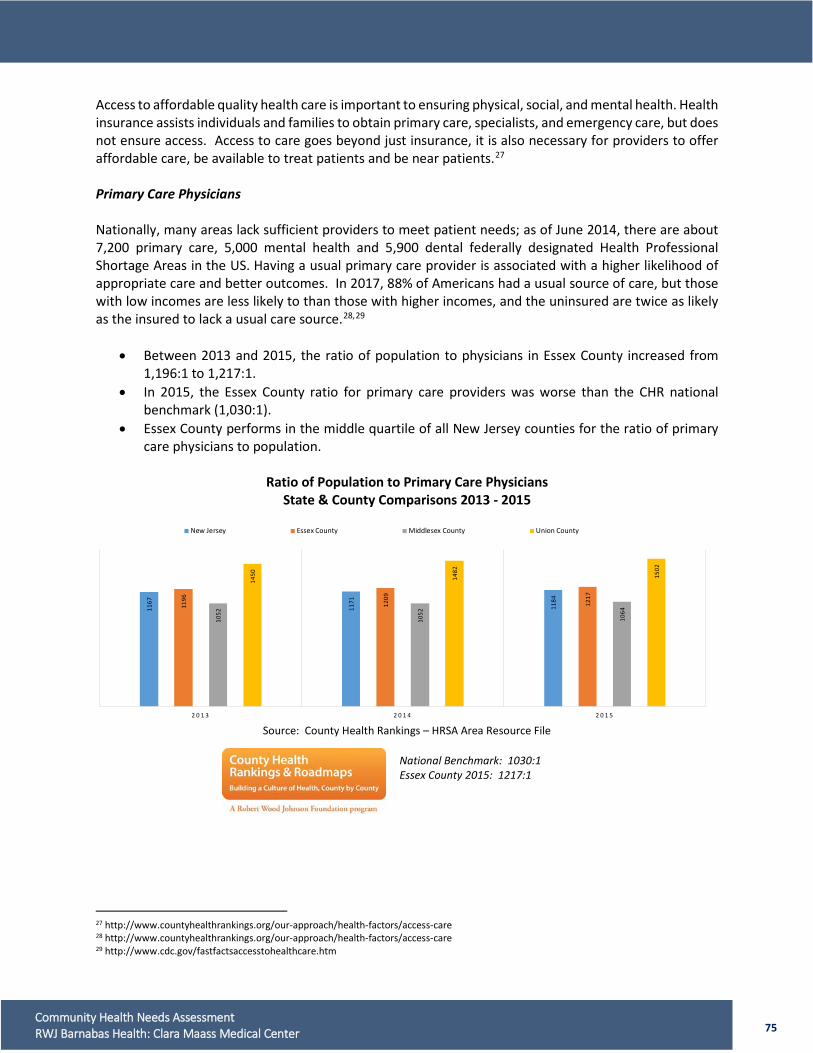
75 Community Health Needs Assessment RWJ Barnabas Health: Clara Maass Medical Center
1167
1171
1184
1196
1209
1217
1052
1052
1064
1450 14
82
1502
2 0 1 3 2 0 1 4 2 0 1 5
New Jersey Essex County Middlesex County Union County
Access to affordable quality health care is important to ensuring physical, social, and mental health. Health insurance assists individuals and families to obtain primary care, specialists, and emergency care, but does not ensure access. Access to care goes beyond just insurance, it is also necessary for providers to offer affordable care, be available to treat patients and be near patients.27 Primary Care Physicians Nationally, many areas lack sufficient providers to meet patient needs; as of June 2014, there are about 7,200 primary care, 5,000 mental health and 5,900 dental federally designated Health Professional Shortage Areas in the US. Having a usual primary care provider is associated with a higher likelihood of appropriate care and better outcomes. In 2017, 88% of Americans had a usual source of care, but those with low incomes are less likely to than those with higher incomes, and the uninsured are twice as likely as the insured to lack a usual care source.28,29
• Between 2013 and 2015, the ratio of population to physicians in Essex County increased from 1,196:1 to 1,217:1.
• In 2015, the Essex County ratio for primary care providers was worse than the CHR national benchmark (1,030:1).
• Essex County performs in the middle quartile of all New Jersey counties for the ratio of primary care physicians to population.
Ratio of Population to Primary Care Physicians
State & County Comparisons 2013 - 2015
Source: County Health Rankings – HRSA Area Resource File
27 http://www.countyhealthrankings.org/our-approach/health-factors/access-care 28 http://www.countyhealthrankings.org/our-approach/health-factors/access-care 29 http://www.cdc.gov/fastfactsaccesstohealthcare.htm
National Benchmark: 1030:1 Essex County 2015: 1217:1
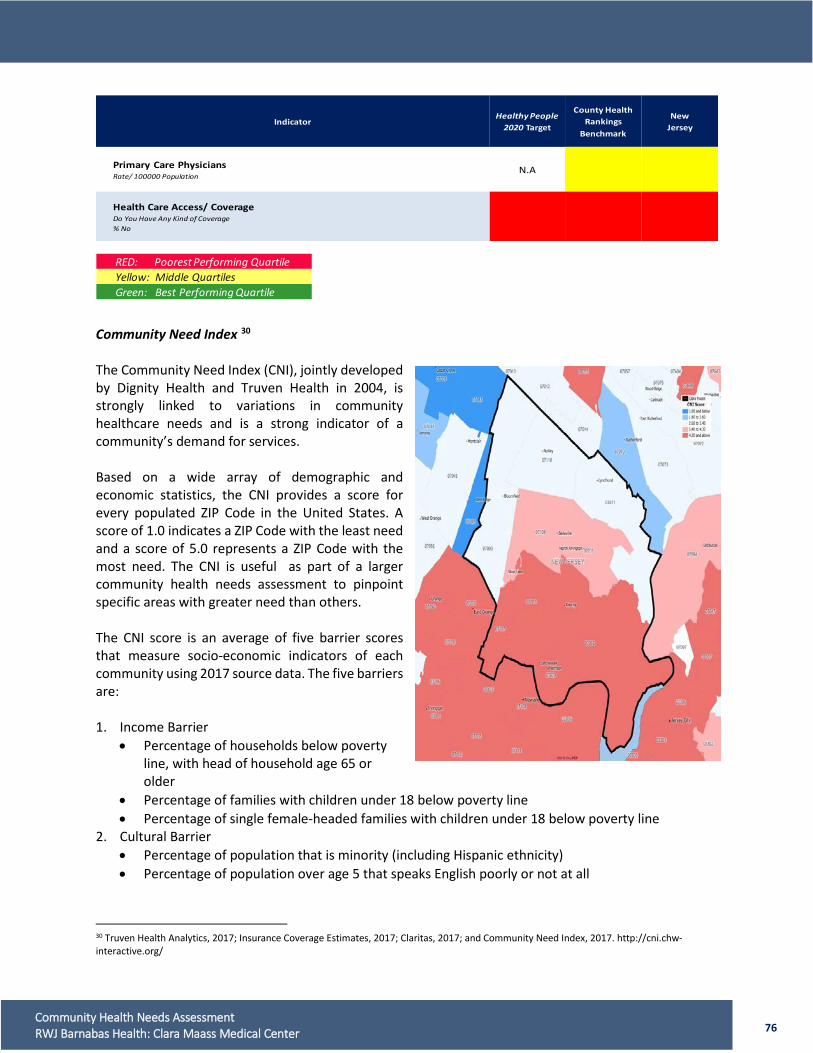
76 Community Health Needs Assessment RWJ Barnabas Health: Clara Maass Medical Center
Community Need Index 30 The Community Need Index (CNI), jointly developed by Dignity Health and Truven Health in 2004, is strongly linked to variations in community healthcare needs and is a strong indicator of a community’s demand for services. Based on a wide array of demographic and economic statistics, the CNI provides a score for every populated ZIP Code in the United States. A score of 1.0 indicates a ZIP Code with the least need and a score of 5.0 represents a ZIP Code with the most need. The CNI is useful as part of a larger community health needs assessment to pinpoint specific areas with greater need than others. The CNI score is an average of five barrier scores that measure socio-economic indicators of each community using 2017 source data. The five barriers are: 1. Income Barrier
• Percentage of households below poverty line, with head of household age 65 or older
• Percentage of families with children under 18 below poverty line • Percentage of single female-headed families with children under 18 below poverty line
2. Cultural Barrier • Percentage of population that is minority (including Hispanic ethnicity) • Percentage of population over age 5 that speaks English poorly or not at all
30 Truven Health Analytics, 2017; Insurance Coverage Estimates, 2017; Claritas, 2017; and Community Need Index, 2017. http://cni.chw-interactive.org/
IndicatorHealthy People
2020 Target
County Health Rankings
Benchmark
NewJersey
Primary Care PhysiciansRate/ 100000 Population
N.A
Health Care Access/ CoverageDo You Have Any Kind of Coverage% No
RED: Poorest Performing QuartileYellow: Middle QuartilesGreen: Best Performing Quartile
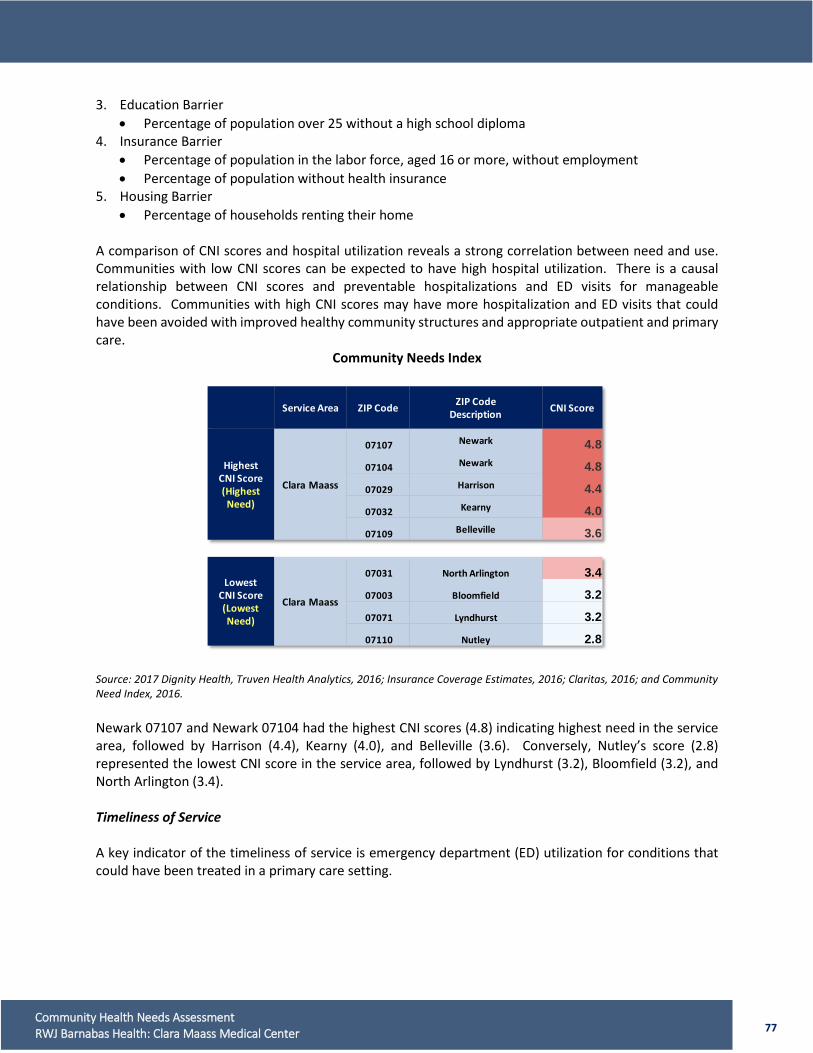
77 Community Health Needs Assessment RWJ Barnabas Health: Clara Maass Medical Center
3. Education Barrier • Percentage of population over 25 without a high school diploma
4. Insurance Barrier • Percentage of population in the labor force, aged 16 or more, without employment • Percentage of population without health insurance
5. Housing Barrier • Percentage of households renting their home
A comparison of CNI scores and hospital utilization reveals a strong correlation between need and use. Communities with low CNI scores can be expected to have high hospital utilization. There is a causal relationship between CNI scores and preventable hospitalizations and ED visits for manageable conditions. Communities with high CNI scores may have more hospitalization and ED visits that could have been avoided with improved healthy community structures and appropriate outpatient and primary care.
Community Needs Index
Source: 2017 Dignity Health, Truven Health Analytics, 2016; Insurance Coverage Estimates, 2016; Claritas, 2016; and Community Need Index, 2016. Newark 07107 and Newark 07104 had the highest CNI scores (4.8) indicating highest need in the service area, followed by Harrison (4.4), Kearny (4.0), and Belleville (3.6). Conversely, Nutley’s score (2.8) represented the lowest CNI score in the service area, followed by Lyndhurst (3.2), Bloomfield (3.2), and North Arlington (3.4). Timeliness of Service A key indicator of the timeliness of service is emergency department (ED) utilization for conditions that could have been treated in a primary care setting.
Service Area ZIP Code ZIP Code Description CNI Score
HighestCNI Score(Highest Need)
Clara Maass
07107 Newark 4.8
07104 Newark 4.8
07029 Harrison 4.4
07032 Kearny 4.0
07109 Belleville 3.6
LowestCNI Score(Lowest Need)
Clara Maass
07031 North Arlington 3.4
07003 Bloomfield 3.2
07071 Lyndhurst 3.2
07110 Nutley 2.8
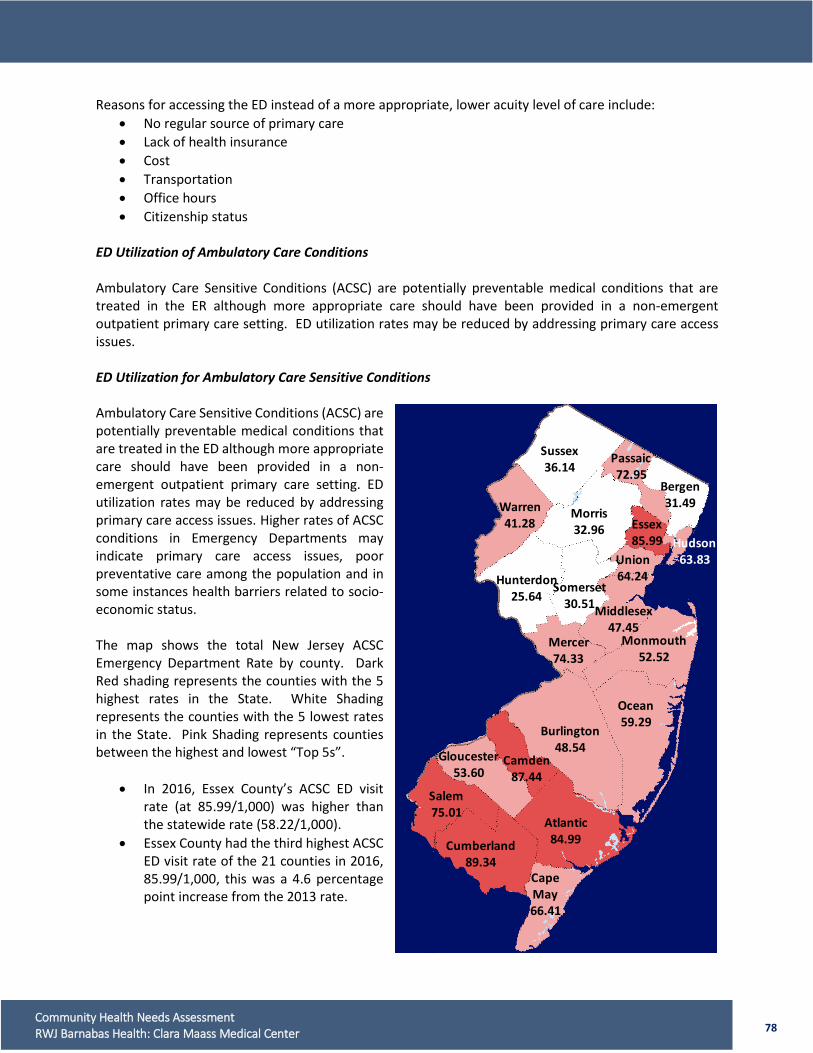
78 Community Health Needs Assessment RWJ Barnabas Health: Clara Maass Medical Center
Reasons for accessing the ED instead of a more appropriate, lower acuity level of care include: • No regular source of primary care • Lack of health insurance • Cost • Transportation • Office hours • Citizenship status
ED Utilization of Ambulatory Care Conditions Ambulatory Care Sensitive Conditions (ACSC) are potentially preventable medical conditions that are treated in the ER although more appropriate care should have been provided in a non-emergent outpatient primary care setting. ED utilization rates may be reduced by addressing primary care access issues. ED Utilization for Ambulatory Care Sensitive Conditions Ambulatory Care Sensitive Conditions (ACSC) are potentially preventable medical conditions that are treated in the ED although more appropriate care should have been provided in a non-emergent outpatient primary care setting. ED utilization rates may be reduced by addressing primary care access issues. Higher rates of ACSC conditions in Emergency Departments may indicate primary care access issues, poor preventative care among the population and in some instances health barriers related to socio-economic status. The map shows the total New Jersey ACSC Emergency Department Rate by county. Dark Red shading represents the counties with the 5 highest rates in the State. White Shading represents the counties with the 5 lowest rates in the State. Pink Shading represents counties between the highest and lowest “Top 5s”.
• In 2016, Essex County’s ACSC ED visit rate (at 85.99/1,000) was higher than the statewide rate (58.22/1,000).
• Essex County had the third highest ACSC ED visit rate of the 21 counties in 2016, 85.99/1,000, this was a 4.6 percentage point increase from the 2013 rate.
Camden87.44
Gloucester53.60
Salem75.01
Cumberland89.34
CapeMay66.41
Atlantic84.99
Burlington48.54
Ocean59.29
Monmouth52.52
Middlesex47.45
Mercer74.33
Hunterdon25.64
Somerset30.51
Union64.24
Warren41.28
Sussex36.14
Morris32.96
Passaic72.95
Bergen31.49
Hudson63.83
Essex85.99
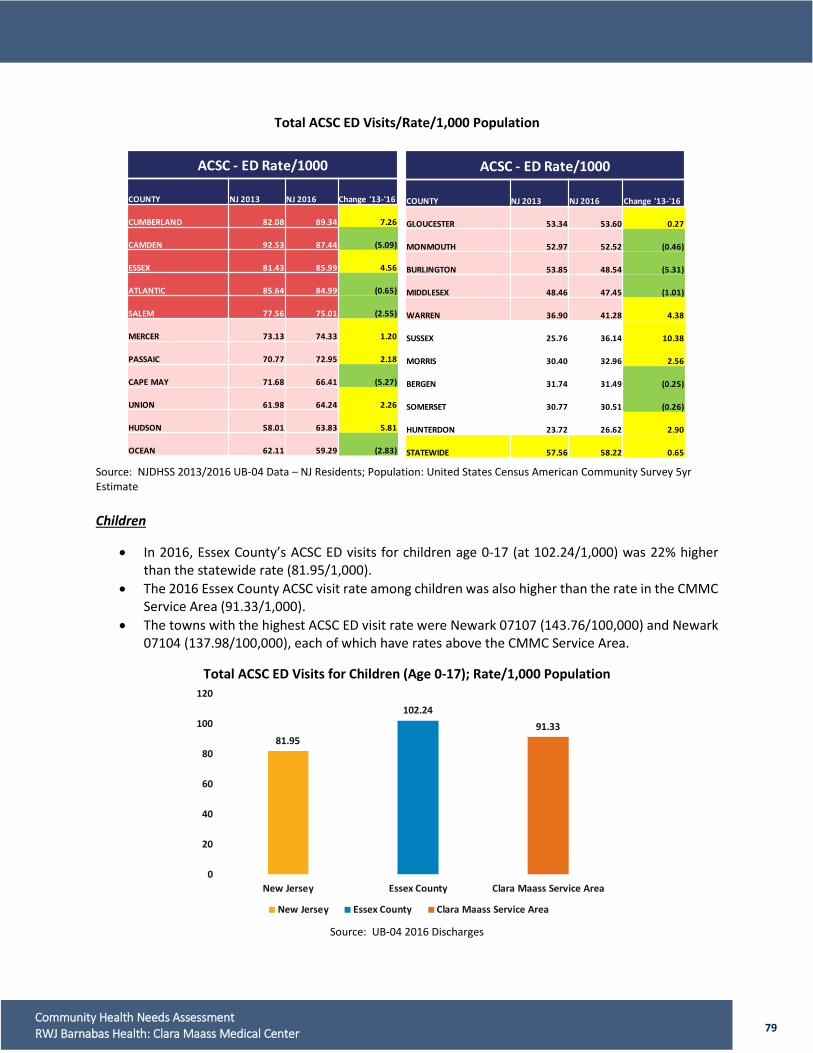
79 Community Health Needs Assessment RWJ Barnabas Health: Clara Maass Medical Center
Total ACSC ED Visits/Rate/1,000 Population
Source: NJDHSS 2013/2016 UB-04 Data – NJ Residents; Population: United States Census American Community Survey 5yr Estimate Children
• In 2016, Essex County’s ACSC ED visits for children age 0-17 (at 102.24/1,000) was 22% higher than the statewide rate (81.95/1,000).
• The 2016 Essex County ACSC visit rate among children was also higher than the rate in the CMMC Service Area (91.33/1,000).
• The towns with the highest ACSC ED visit rate were Newark 07107 (143.76/100,000) and Newark 07104 (137.98/100,000), each of which have rates above the CMMC Service Area.
Total ACSC ED Visits for Children (Age 0-17); Rate/1,000 Population
Source: UB-04 2016 Discharges
ACSC - ED Rate/1000
COUNTY NJ 2013 NJ 2016 Change '13-'16
CUMBERLAND 82.08 89.34 7.26
CAMDEN 92.53 87.44 (5.09)
ESSEX 81.43 85.99 4.56
ATLANTIC 85.64 84.99 (0.65)
SALEM 77.56 75.01 (2.55)
MERCER 73.13 74.33 1.20
PASSAIC 70.77 72.95 2.18
CAPE MAY 71.68 66.41 (5.27)
UNION 61.98 64.24 2.26
HUDSON 58.01 63.83 5.81
OCEAN 62.11 59.29 (2.83)
ACSC - ED Rate/1000
COUNTY NJ 2013 NJ 2016 Change '13-'16
GLOUCESTER 53.34 53.60 0.27
MONMOUTH 52.97 52.52 (0.46)
BURLINGTON 53.85 48.54 (5.31)
MIDDLESEX 48.46 47.45 (1.01)
WARREN 36.90 41.28 4.38
SUSSEX 25.76 36.14 10.38
MORRIS 30.40 32.96 2.56
BERGEN 31.74 31.49 (0.25)
SOMERSET 30.77 30.51 (0.26)
HUNTERDON 23.72 26.62 2.90
STATEWIDE 57.56 58.22 0.65
81.95
102.2491.33
0
20
40
60
80
100
120
New Jersey Essex County Clara Maass Service Area
New Jersey Essex County Clara Maass Service Area
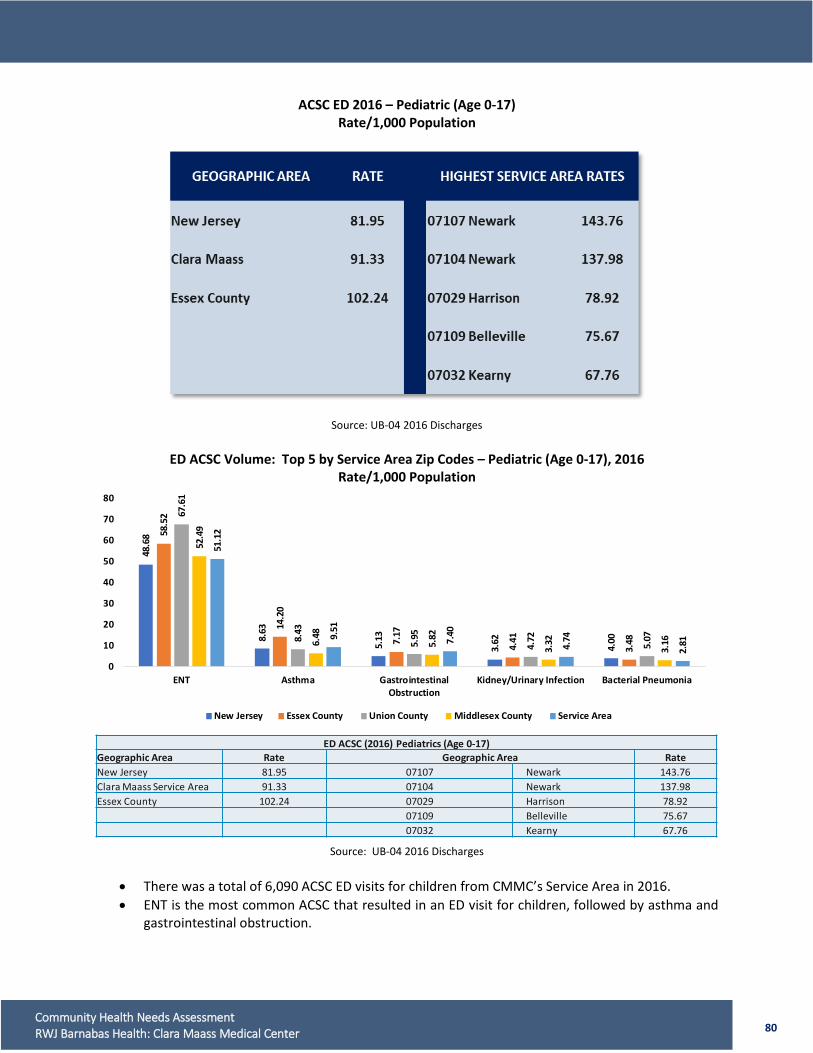
80 Community Health Needs Assessment RWJ Barnabas Health: Clara Maass Medical Center
ACSC ED 2016 – Pediatric (Age 0-17) Rate/1,000 Population
Source: UB-04 2016 Discharges
ED ACSC Volume: Top 5 by Service Area Zip Codes – Pediatric (Age 0-17), 2016 Rate/1,000 Population
Source: UB-04 2016 Discharges
• There was a total of 6,090 ACSC ED visits for children from CMMC’s Service Area in 2016. • ENT is the most common ACSC that resulted in an ED visit for children, followed by asthma and
gastrointestinal obstruction.
48.6
8
8.63
5.13
3.62
4.00
58.5
2
14.2
0
7.17
4.41
3.48
67.6
1
8.43
5.95
4.72
5.07
52.4
9
6.48
5.82
3.32
3.16
51.1
2
9.51
7.40
4.74
2.81
0
10
20
30
40
50
60
70
80
ENT Asthma GastrointestinalObstruction
Kidney/Urinary Infection Bacterial Pneumonia
New Jersey Essex County Union County Middlesex County Service Area
ED ACSC (2016) Pediatrics (Age 0-17)Geographic Area Rate Geographic Area RateNew Jersey 81.95 07107 Newark 143.76Clara Maass Service Area 91.33 07104 Newark 137.98Essex County 102.24 07029 Harrison 78.92
07109 Belleville 75.6707032 Kearny 67.76
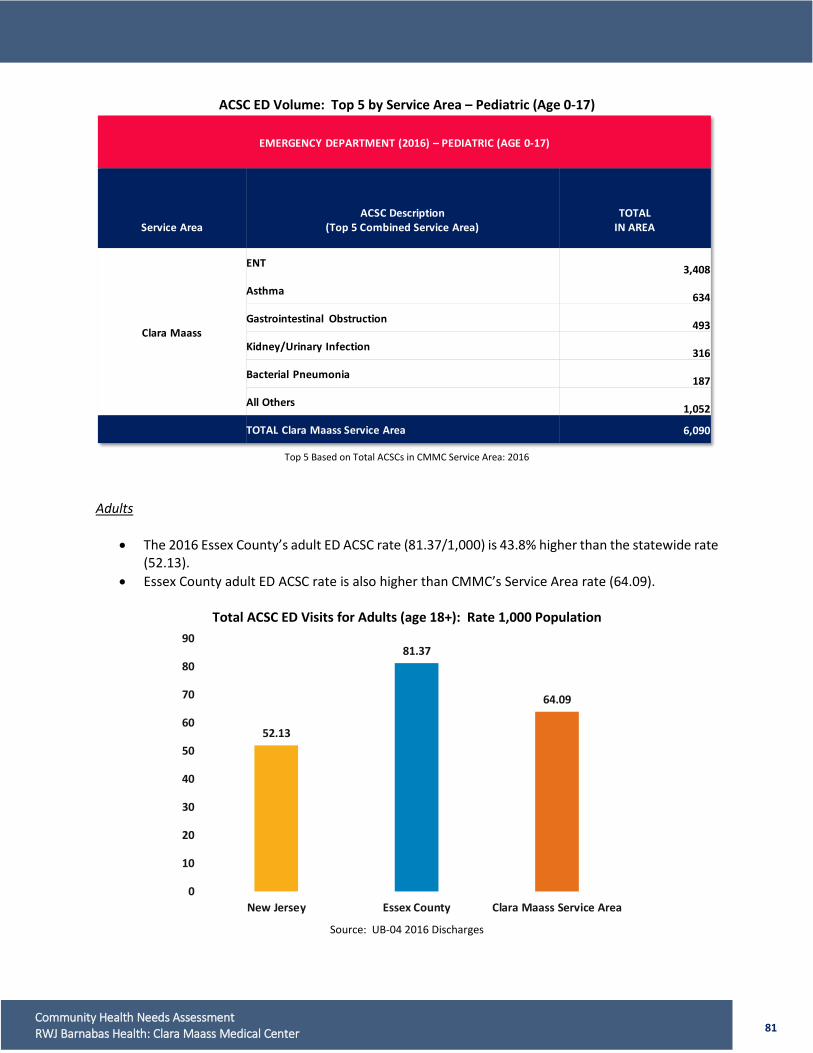
81 Community Health Needs Assessment RWJ Barnabas Health: Clara Maass Medical Center
ACSC ED Volume: Top 5 by Service Area – Pediatric (Age 0-17)
Top 5 Based on Total ACSCs in CMMC Service Area: 2016
Adults
• The 2016 Essex County’s adult ED ACSC rate (81.37/1,000) is 43.8% higher than the statewide rate (52.13).
• Essex County adult ED ACSC rate is also higher than CMMC’s Service Area rate (64.09).
Total ACSC ED Visits for Adults (age 18+): Rate 1,000 Population
Source: UB-04 2016 Discharges
EMERGENCY DEPARTMENT (2016) – PEDIATRIC (AGE 0-17)
Service AreaACSC Description
(Top 5 Combined Service Area)TOTAL
IN AREA
Clara Maass
ENT 3,408
Asthma 634
Gastrointestinal Obstruction 493
Kidney/Urinary Infection 316
Bacterial Pneumonia 187
All Others 1,052
TOTAL Clara Maass Service Area 6,090
52.13
81.37
64.09
0
10
20
30
40
50
60
70
80
90
New Jersey Essex County Clara Maass Service Area
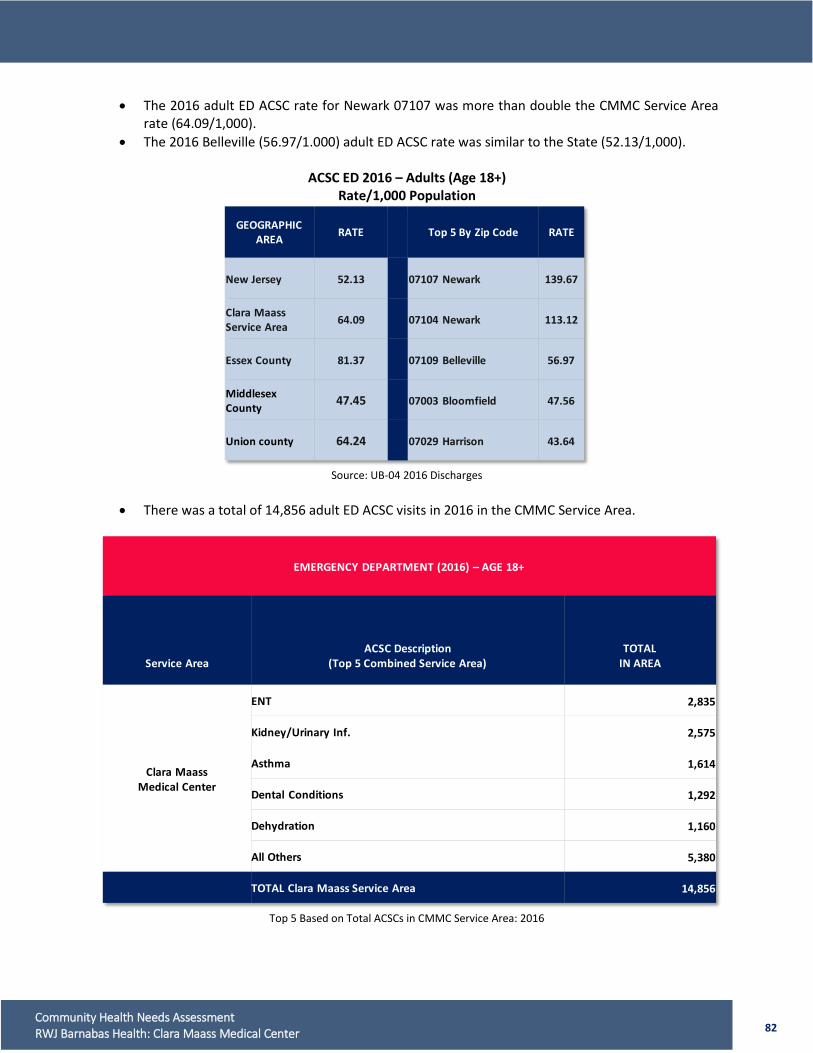
82 Community Health Needs Assessment RWJ Barnabas Health: Clara Maass Medical Center
• The 2016 adult ED ACSC rate for Newark 07107 was more than double the CMMC Service Area rate (64.09/1,000).
• The 2016 Belleville (56.97/1.000) adult ED ACSC rate was similar to the State (52.13/1,000).
ACSC ED 2016 – Adults (Age 18+) Rate/1,000 Population
Source: UB-04 2016 Discharges
• There was a total of 14,856 adult ED ACSC visits in 2016 in the CMMC Service Area.
Top 5 Based on Total ACSCs in CMMC Service Area: 2016
GEOGRAPHICAREA RATE Top 5 By Zip Code RATE
New Jersey 52.13 07107 Newark 139.67
Clara MaassService Area 64.09 07104 Newark 113.12
Essex County 81.37 07109 Belleville 56.97
Middlesex County 47.45 07003 Bloomfield 47.56
Union county 64.24 07029 Harrison 43.64
EMERGENCY DEPARTMENT (2016) – AGE 18+
Service AreaACSC Description
(Top 5 Combined Service Area)TOTAL
IN AREA
Clara MaassMedical Center
ENT 2,835
Kidney/Urinary Inf. 2,575
Asthma 1,614
Dental Conditions 1,292
Dehydration 1,160
All Others 5,380
TOTAL Clara Maass Service Area 14,856
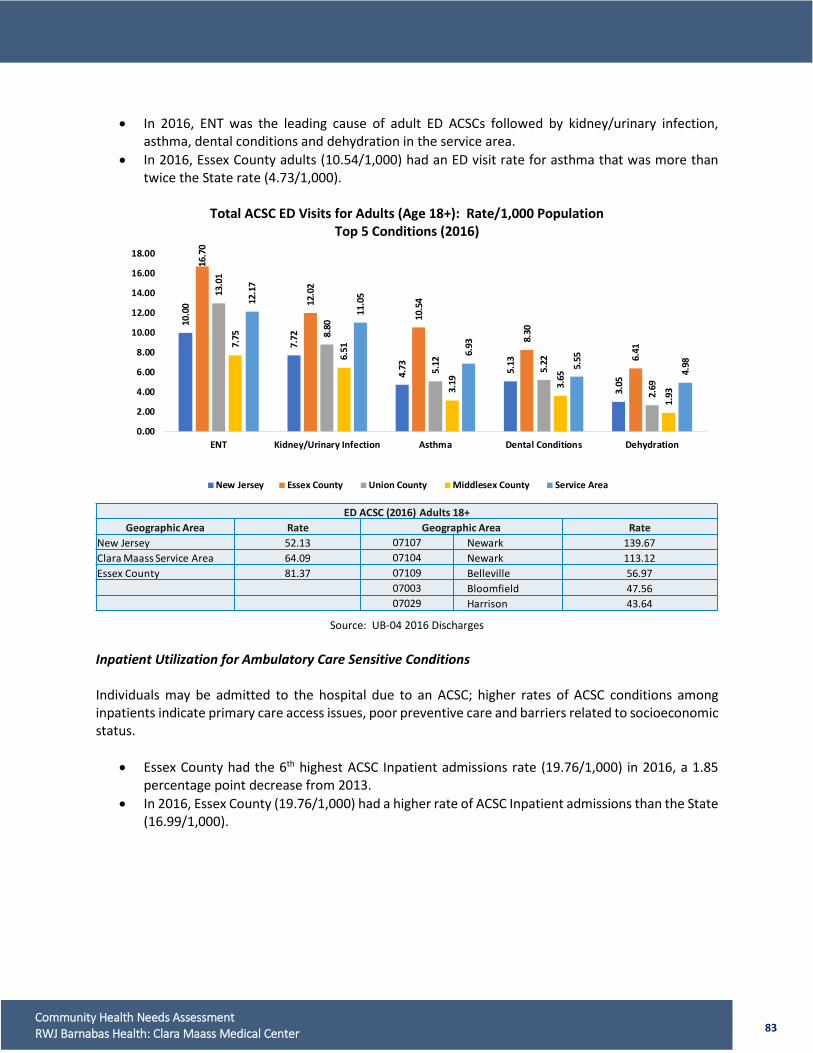
83 Community Health Needs Assessment RWJ Barnabas Health: Clara Maass Medical Center
• In 2016, ENT was the leading cause of adult ED ACSCs followed by kidney/urinary infection,
asthma, dental conditions and dehydration in the service area. • In 2016, Essex County adults (10.54/1,000) had an ED visit rate for asthma that was more than
twice the State rate (4.73/1,000).
Total ACSC ED Visits for Adults (Age 18+): Rate/1,000 Population Top 5 Conditions (2016)
Source: UB-04 2016 Discharges
Inpatient Utilization for Ambulatory Care Sensitive Conditions Individuals may be admitted to the hospital due to an ACSC; higher rates of ACSC conditions among inpatients indicate primary care access issues, poor preventive care and barriers related to socioeconomic status.
• Essex County had the 6th highest ACSC Inpatient admissions rate (19.76/1,000) in 2016, a 1.85 percentage point decrease from 2013.
• In 2016, Essex County (19.76/1,000) had a higher rate of ACSC Inpatient admissions than the State (16.99/1,000).
10.0
0
7.72
4.73 5.13
3.05
16.7
0
12.0
2
10.5
4
8.30
6.41
13.0
1
8.80
5.12
5.22
2.69
7.75
6.51
3.19 3.65
1.93
12.1
7
11.0
5
6.93
5.55
4.98
0.00
2.00
4.00
6.00
8.00
10.00
12.00
14.00
16.00
18.00
ENT Kidney/Urinary Infection Asthma Dental Conditions Dehydration
New Jersey Essex County Union County Middlesex County Service Area
ED ACSC (2016) Adults 18+Geographic Area Rate Geographic Area Rate
New Jersey 52.13 07107 Newark 139.67Clara Maass Service Area 64.09 07104 Newark 113.12Essex County 81.37 07109 Belleville 56.97
07003 Bloomfield 47.5607029 Harrison 43.64
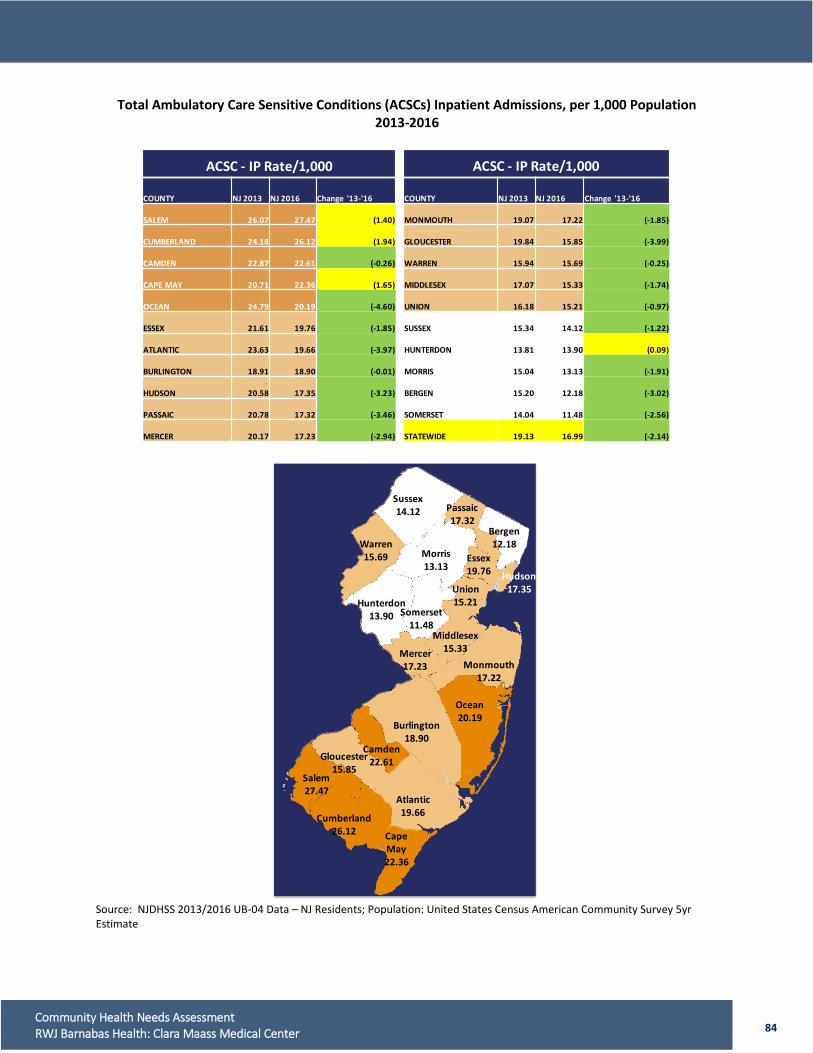
84 Community Health Needs Assessment RWJ Barnabas Health: Clara Maass Medical Center
Total Ambulatory Care Sensitive Conditions (ACSCs) Inpatient Admissions, per 1,000 Population 2013-2016
Source: NJDHSS 2013/2016 UB-04 Data – NJ Residents; Population: United States Census American Community Survey 5yr Estimate
ACSC - IP Rate/1,000
COUNTY NJ 2013 NJ 2016 Change '13-'16
MONMOUTH 19.07 17.22 (-1.85)
GLOUCESTER 19.84 15.85 (-3.99)
WARREN 15.94 15.69 (-0.25)
MIDDLESEX 17.07 15.33 (-1.74)
UNION 16.18 15.21 (-0.97)
SUSSEX 15.34 14.12 (-1.22)
HUNTERDON 13.81 13.90 (0.09)
MORRIS 15.04 13.13 (-1.91)
BERGEN 15.20 12.18 (-3.02)
SOMERSET 14.04 11.48 (-2.56)
STATEWIDE 19.13 16.99 (-2.14)
ACSC - IP Rate/1,000
COUNTY NJ 2013 NJ 2016 Change '13-'16
SALEM 26.07 27.47 (1.40)
CUMBERLAND 24.18 26.12 (1.94)
CAMDEN 22.87 22.61 (-0.26)
CAPE MAY 20.71 22.36 (1.65)
OCEAN 24.79 20.19 (-4.60)
ESSEX 21.61 19.76 (-1.85)
ATLANTIC 23.63 19.66 (-3.97)
BURLINGTON 18.91 18.90 (-0.01)
HUDSON 20.58 17.35 (-3.23)
PASSAIC 20.78 17.32 (-3.46)
MERCER 20.17 17.23 (-2.94)
Camden22.61Gloucester
15.85Salem27.47
Cumberland26.12 Cape
May22.36
Atlantic19.66
Burlington18.90
Ocean20.19
Monmouth17.22
Middlesex15.33Mercer
17.23
Hunterdon13.90 Somerset
11.48
Union15.21
Warren15.69
Sussex14.12
Morris13.13
Passaic17.32
Bergen12.18
Hudson17.35
Essex19.76
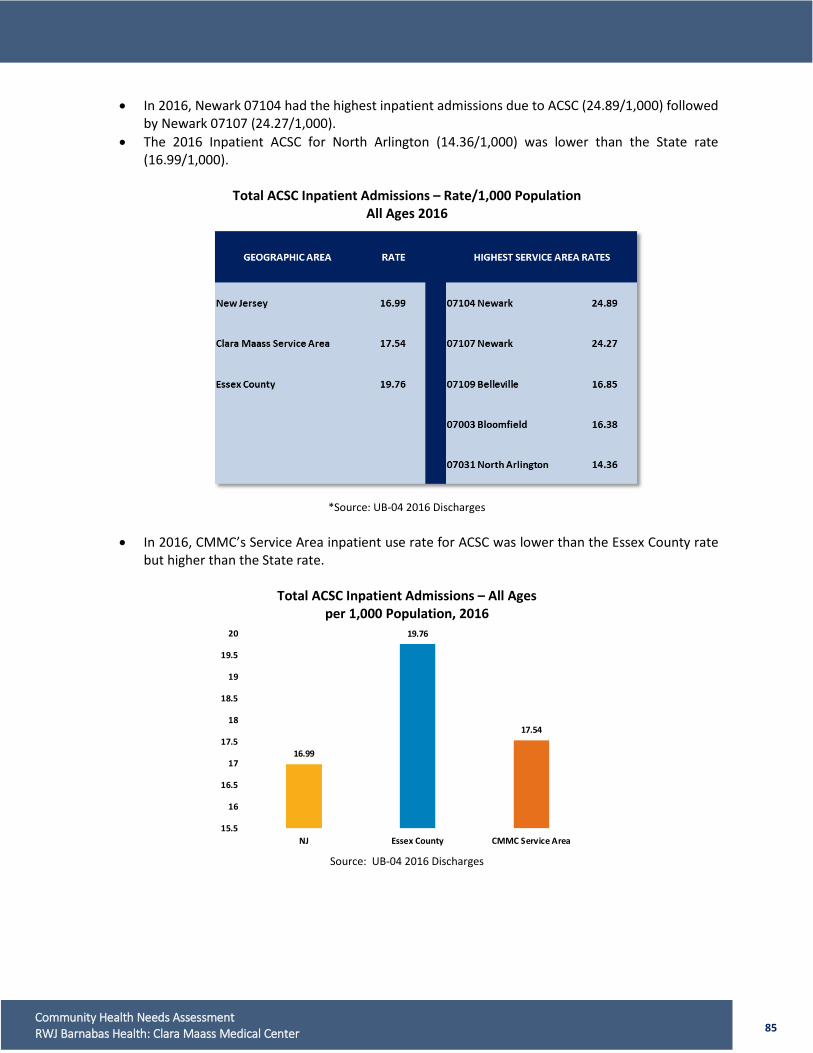
85 Community Health Needs Assessment RWJ Barnabas Health: Clara Maass Medical Center
• In 2016, Newark 07104 had the highest inpatient admissions due to ACSC (24.89/1,000) followed by Newark 07107 (24.27/1,000).
• The 2016 Inpatient ACSC for North Arlington (14.36/1,000) was lower than the State rate (16.99/1,000).
Total ACSC Inpatient Admissions – Rate/1,000 Population
All Ages 2016
*Source: UB-04 2016 Discharges
• In 2016, CMMC’s Service Area inpatient use rate for ACSC was lower than the Essex County rate but higher than the State rate.
Total ACSC Inpatient Admissions – All Ages
per 1,000 Population, 2016
Source: UB-04 2016 Discharges
16.99
19.76
17.54
15.5
16
16.5
17
17.5
18
18.5
19
19.5
20
NJ Essex County CMMC Service Area
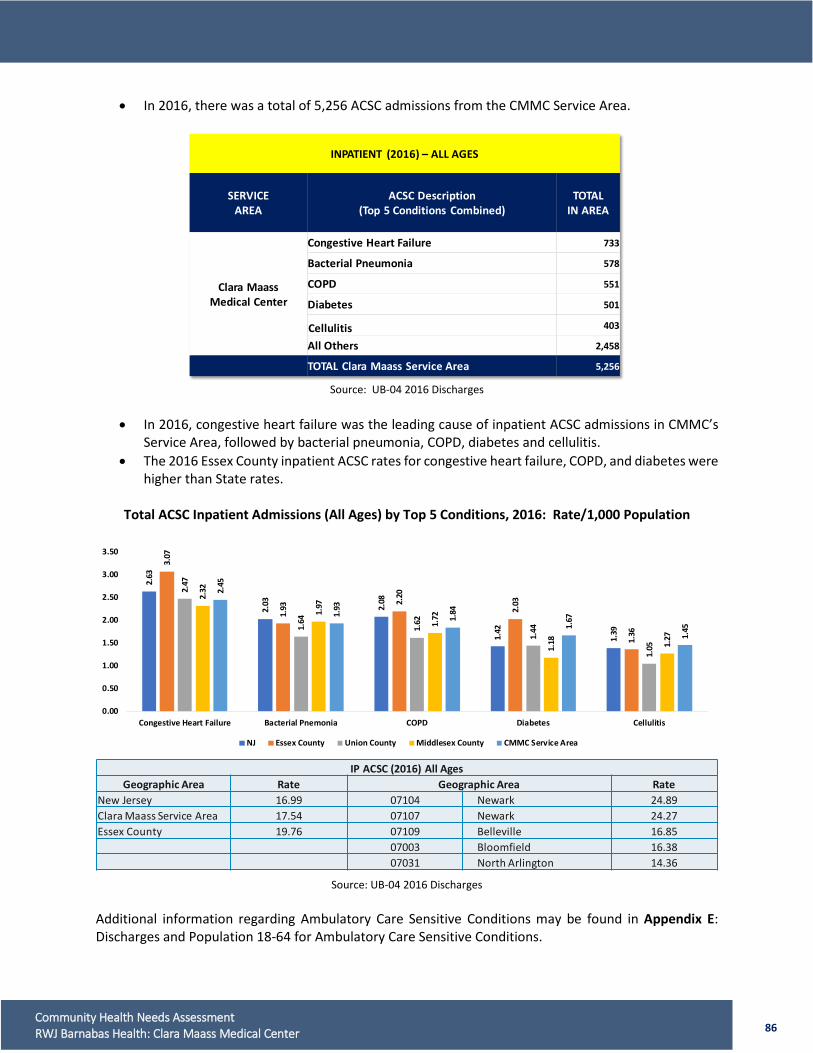
86 Community Health Needs Assessment RWJ Barnabas Health: Clara Maass Medical Center
• In 2016, there was a total of 5,256 ACSC admissions from the CMMC Service Area.
Source: UB-04 2016 Discharges
• In 2016, congestive heart failure was the leading cause of inpatient ACSC admissions in CMMC’s
Service Area, followed by bacterial pneumonia, COPD, diabetes and cellulitis. • The 2016 Essex County inpatient ACSC rates for congestive heart failure, COPD, and diabetes were
higher than State rates.
Total ACSC Inpatient Admissions (All Ages) by Top 5 Conditions, 2016: Rate/1,000 Population
Source: UB-04 2016 Discharges
Additional information regarding Ambulatory Care Sensitive Conditions may be found in Appendix E: Discharges and Population 18-64 for Ambulatory Care Sensitive Conditions.
INPATIENT (2016) – ALL AGES
SERVICEAREA
ACSC Description(Top 5 Conditions Combined)
TOTALIN AREA
Clara MaassMedical Center
Congestive Heart Failure 733
Bacterial Pneumonia 578
COPD 551
Diabetes 501
Cellulitis 403
All Others 2,458
TOTAL Clara Maass Service Area 5,256
2.63
2.03 2.08
1.42
1.39
3.07
1.93 2.
20
2.03
1.36
2.47
1.64
1.62
1.44
1.05
2.32
1.97
1.72
1.18 1.27
2.45
1.93
1.84
1.67
1.45
0.00
0.50
1.00
1.50
2.00
2.50
3.00
3.50
Congestive Heart Failure Bacterial Pnemonia COPD Diabetes Cellulitis
NJ Essex County Union County Middlesex County CMMC Service Area
IP ACSC (2016) All AgesGeographic Area Rate Geographic Area Rate
New Jersey 16.99 07104 Newark 24.89Clara Maass Service Area 17.54 07107 Newark 24.27Essex County 19.76 07109 Belleville 16.85
07003 Bloomfield 16.3807031 North Arlington 14.36
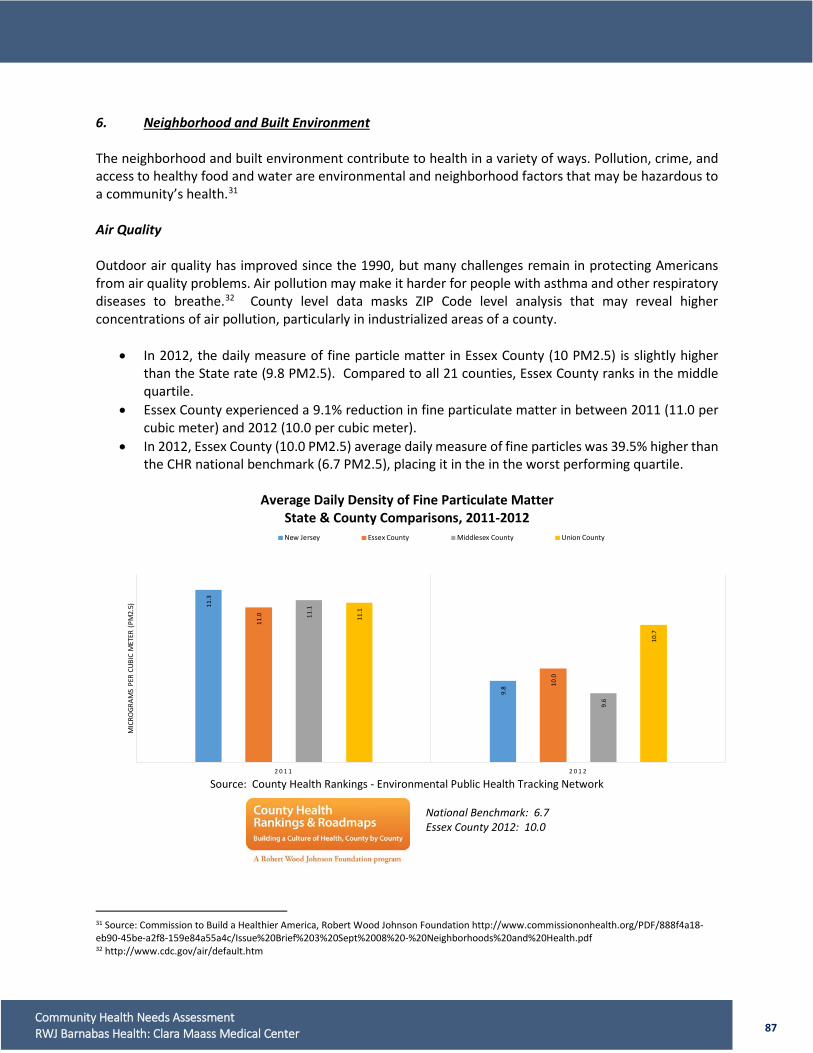
87 Community Health Needs Assessment RWJ Barnabas Health: Clara Maass Medical Center
6. Neighborhood and Built Environment The neighborhood and built environment contribute to health in a variety of ways. Pollution, crime, and access to healthy food and water are environmental and neighborhood factors that may be hazardous to a community’s health.31 Air Quality Outdoor air quality has improved since the 1990, but many challenges remain in protecting Americans from air quality problems. Air pollution may make it harder for people with asthma and other respiratory diseases to breathe.32 County level data masks ZIP Code level analysis that may reveal higher concentrations of air pollution, particularly in industrialized areas of a county.
• In 2012, the daily measure of fine particle matter in Essex County (10 PM2.5) is slightly higher than the State rate (9.8 PM2.5). Compared to all 21 counties, Essex County ranks in the middle quartile.
• Essex County experienced a 9.1% reduction in fine particulate matter in between 2011 (11.0 per cubic meter) and 2012 (10.0 per cubic meter).
• In 2012, Essex County (10.0 PM2.5) average daily measure of fine particles was 39.5% higher than the CHR national benchmark (6.7 PM2.5), placing it in the in the worst performing quartile.
Average Daily Density of Fine Particulate Matter
State & County Comparisons, 2011-2012
Source: County Health Rankings - Environmental Public Health Tracking Network
31 Source: Commission to Build a Healthier America, Robert Wood Johnson Foundation http://www.commissiononhealth.org/PDF/888f4a18-eb90-45be-a2f8-159e84a55a4c/Issue%20Brief%203%20Sept%2008%20-%20Neighborhoods%20and%20Health.pdf 32 http://www.cdc.gov/air/default.htm
National Benchmark: 6.7 Essex County 2012: 10.0
11.3
9.8
11.0
10.0
11.1
9.6
11.1
10.7
2 0 1 1 2 0 1 2
MIC
ROGR
AMS
PER
CUBI
C M
ETER
(PM
2.5)
New Jersey Essex County Middlesex County Union County
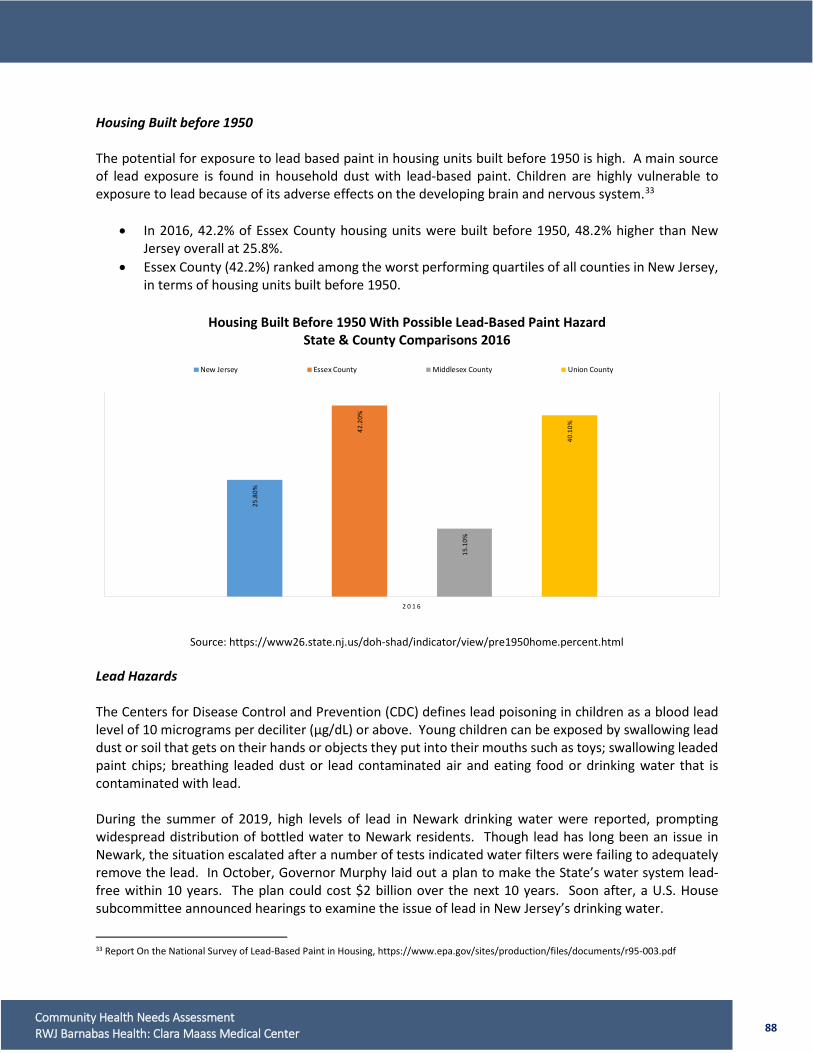
88 Community Health Needs Assessment RWJ Barnabas Health: Clara Maass Medical Center
25.8
0%
42.2
0%
15.1
0%
40.1
0%
2 0 1 6
New Jersey Essex County Middlesex County Union County
Housing Built before 1950 The potential for exposure to lead based paint in housing units built before 1950 is high. A main source of lead exposure is found in household dust with lead-based paint. Children are highly vulnerable to exposure to lead because of its adverse effects on the developing brain and nervous system.33
• In 2016, 42.2% of Essex County housing units were built before 1950, 48.2% higher than New Jersey overall at 25.8%.
• Essex County (42.2%) ranked among the worst performing quartiles of all counties in New Jersey, in terms of housing units built before 1950.
Housing Built Before 1950 With Possible Lead-Based Paint Hazard
State & County Comparisons 2016
Source: https://www26.state.nj.us/doh-shad/indicator/view/pre1950home.percent.html Lead Hazards The Centers for Disease Control and Prevention (CDC) defines lead poisoning in children as a blood lead level of 10 micrograms per deciliter (µg/dL) or above. Young children can be exposed by swallowing lead dust or soil that gets on their hands or objects they put into their mouths such as toys; swallowing leaded paint chips; breathing leaded dust or lead contaminated air and eating food or drinking water that is contaminated with lead. During the summer of 2019, high levels of lead in Newark drinking water were reported, prompting widespread distribution of bottled water to Newark residents. Though lead has long been an issue in Newark, the situation escalated after a number of tests indicated water filters were failing to adequately remove the lead. In October, Governor Murphy laid out a plan to make the State’s water system lead-free within 10 years. The plan could cost $2 billion over the next 10 years. Soon after, a U.S. House subcommittee announced hearings to examine the issue of lead in New Jersey’s drinking water.
33 Report On the National Survey of Lead-Based Paint in Housing, https://www.epa.gov/sites/production/files/documents/r95-003.pdf
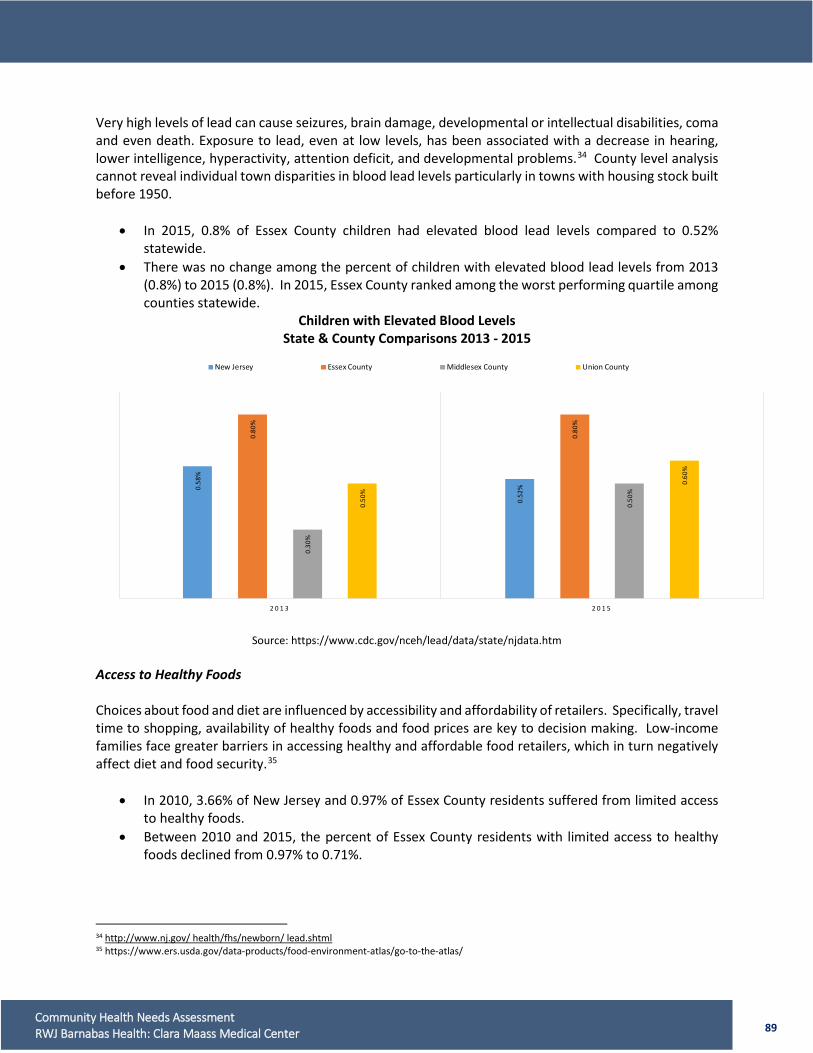
89 Community Health Needs Assessment RWJ Barnabas Health: Clara Maass Medical Center
0.58
%
0.52
%
0.80
%
0.80
%
0.30
%
0.50
%
0.50
%
0.60
%
2 0 1 3 2 0 1 5
New Jersey Essex County Middlesex County Union County
Very high levels of lead can cause seizures, brain damage, developmental or intellectual disabilities, coma and even death. Exposure to lead, even at low levels, has been associated with a decrease in hearing, lower intelligence, hyperactivity, attention deficit, and developmental problems.34 County level analysis cannot reveal individual town disparities in blood lead levels particularly in towns with housing stock built before 1950.
• In 2015, 0.8% of Essex County children had elevated blood lead levels compared to 0.52% statewide.
• There was no change among the percent of children with elevated blood lead levels from 2013 (0.8%) to 2015 (0.8%). In 2015, Essex County ranked among the worst performing quartile among counties statewide.
Children with Elevated Blood Levels State & County Comparisons 2013 - 2015
Source: https://www.cdc.gov/nceh/lead/data/state/njdata.htm Access to Healthy Foods Choices about food and diet are influenced by accessibility and affordability of retailers. Specifically, travel time to shopping, availability of healthy foods and food prices are key to decision making. Low-income families face greater barriers in accessing healthy and affordable food retailers, which in turn negatively affect diet and food security.35
• In 2010, 3.66% of New Jersey and 0.97% of Essex County residents suffered from limited access to healthy foods.
• Between 2010 and 2015, the percent of Essex County residents with limited access to healthy foods declined from 0.97% to 0.71%.
34 http://www.nj.gov/ health/fhs/newborn/ lead.shtml 35 https://www.ers.usda.gov/data-products/food-environment-atlas/go-to-the-atlas/
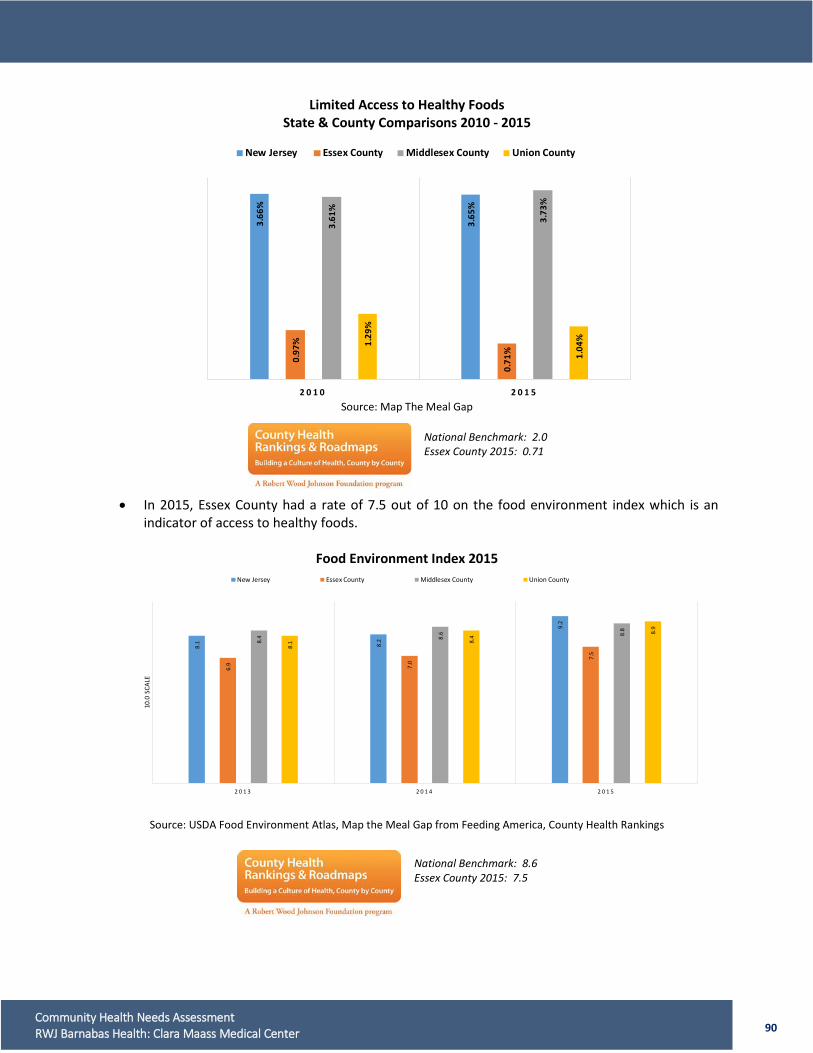
90 Community Health Needs Assessment RWJ Barnabas Health: Clara Maass Medical Center
8.1 8.2
9.2
6.9 7.0
7.5
8.4 8.
6 8.8
8.1 8.
4
8.9
2 0 1 3 2 0 1 4 2 0 1 5
10.0
SCA
LE
New Jersey Essex County Middlesex County Union County
Limited Access to Healthy Foods State & County Comparisons 2010 - 2015
Source: Map The Meal Gap
• In 2015, Essex County had a rate of 7.5 out of 10 on the food environment index which is an indicator of access to healthy foods.
Food Environment Index 2015
Source: USDA Food Environment Atlas, Map the Meal Gap from Feeding America, County Health Rankings
3.66
%
3.65
%
0.97
%
0.71
%
3.61
%
3.73
%
1.29
%
1.04
%
2 0 1 0 2 0 1 5
New Jersey Essex County Middlesex County Union County
National Benchmark: 2.0 Essex County 2015: 0.71
National Benchmark: 8.6 Essex County 2015: 7.5
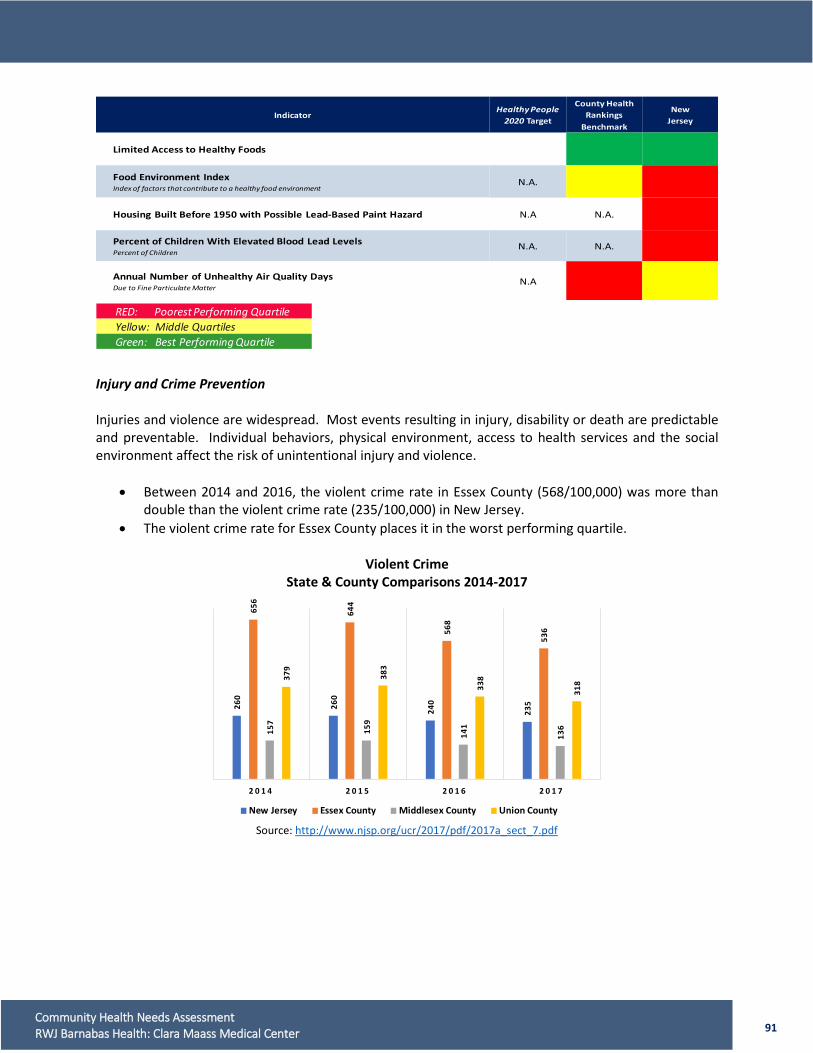
91 Community Health Needs Assessment RWJ Barnabas Health: Clara Maass Medical Center
Injury and Crime Prevention Injuries and violence are widespread. Most events resulting in injury, disability or death are predictable and preventable. Individual behaviors, physical environment, access to health services and the social environment affect the risk of unintentional injury and violence.
• Between 2014 and 2016, the violent crime rate in Essex County (568/100,000) was more than double than the violent crime rate (235/100,000) in New Jersey.
• The violent crime rate for Essex County places it in the worst performing quartile.
Violent Crime State & County Comparisons 2014-2017
Source: http://www.njsp.org/ucr/2017/pdf/2017a_sect_7.pdf
IndicatorHealthy People
2020 Target
County Health Rankings
Benchmark
NewJersey
Limited Access to Healthy Foods
Food Environment IndexIndex of factors that contribute to a healthy food environment
N.A.
Housing Built Before 1950 with Possible Lead-Based Paint Hazard N.A N.A.
Percent of Children With Elevated Blood Lead LevelsPercent of Children
N.A. N.A.
Annual Number of Unhealthy Air Quality DaysDue to Fine Particulate Matter
N.A
RED: Poorest Performing QuartileYellow: Middle QuartilesGreen: Best Performing Quartile
260
260
240
235
656
644
568
536
157
159
141
136
379
383
338
318
2 0 1 4 2 0 1 5 2 0 1 6 2 0 1 7
New Jersey Essex County Middlesex County Union County

92 Community Health Needs Assessment RWJ Barnabas Health: Clara Maass Medical Center
Violent Crime 2014-2017 Essex County – Trends
Burglaries
• Essex County (328.0/100,000) had 16.7% more burglaries than New Jersey (277.5/100,000) in 2016.
• The Essex County burglary rate decreased 34.6% from 501.7/100,000 in 2014 to 328.0/100,000 in 2016.
• Essex County’s burglary rate ranks in the worst performing quartile of New Jersey counties.
Burglary Rate State & County Comparisons, 2014-2016
Source: http://www.njsp.org/ucr/2015/pdf/2016a_sect_7.pdf
352.
0
308.
2
277.
5
501.
7
406.
5
328.
0
306.
7
254.
2
207.
3
357.
9
298.
4
297.
5
2 0 1 4 2 0 1 5 2 0 1 6
RATE
PER
100
,000
New Jersey Essex County Middlesex County Union County
656
644
568
536
0 100 200 300 400 500 600 700
2014
2015
2016
2017
National Benchmark: 62 Essex County 2016: 536

93 Community Health Needs Assessment RWJ Barnabas Health: Clara Maass Medical Center
Domestic Violence Arrests Domestic violence can negatively impact a victim’s health beyond the domestic violence incident. Victims of domestic violence exhibit physical and emotional problems including, but not limited to, chronic pain, depression, anxiety, eating disorders, and post-traumatic stress disorder.36
• Statewide domestic violence arrest rates have remained fairly constant. • In 2016, the Essex County domestic violence arrest rates were higher than the State and all
comparison counties. • Between 2014 and 2016, the rate of domestic violence arrests in Essex County increased 15.9%. • Essex County is within the middle quartile compared to all New Jersey counties for arrests due to
domestic violence.
Domestic Violence Arrests: Rate per 1,000 State & County Comparisons 2014 - 2016
Source: County Health Rankings - The Uniform Crime Reporting (UCR) Program
36 http://www.stopvaw.org/health_effects_of_domestic_violence
2.17
2.15 2.172.
26 2.33
2.62
1.73 1.
80
1.60
1.88
1.75
2.53
2 0 1 4 2 0 1 5 2 0 1 6
New Jersey Essex County Middlesex County Union County
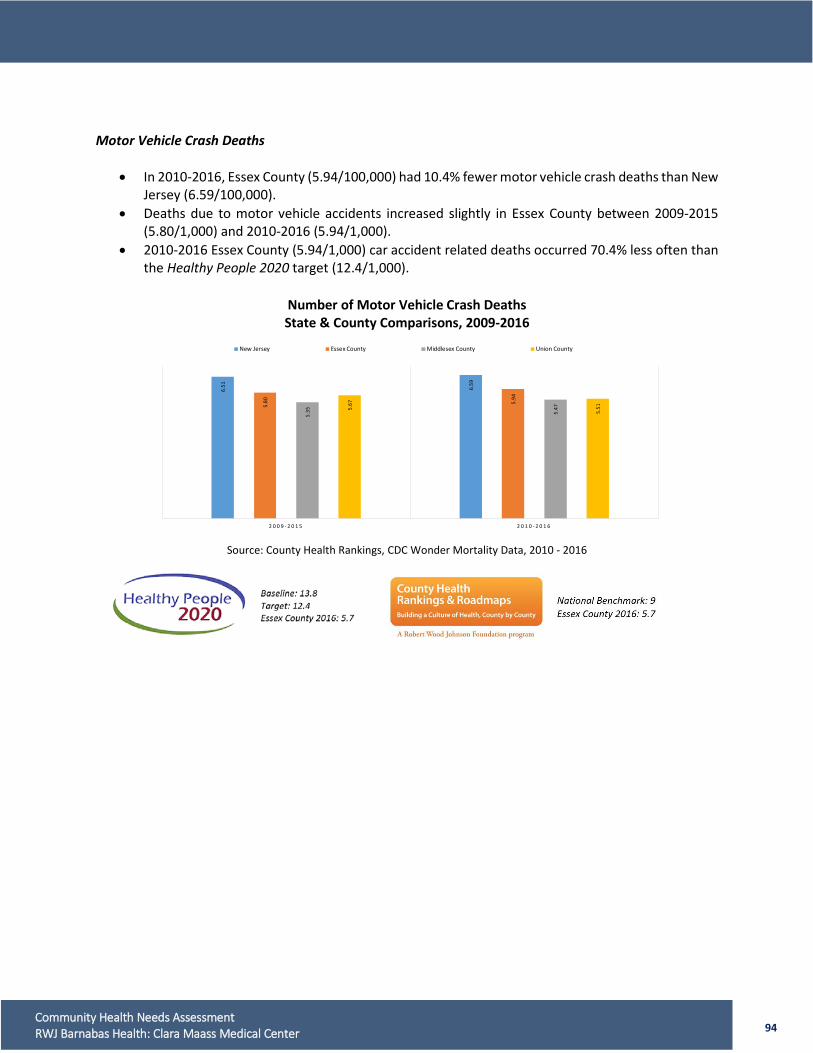
94 Community Health Needs Assessment RWJ Barnabas Health: Clara Maass Medical Center
6.51 6.59
5.80 5.
94
5.35 5.
475.67
5.51
2 0 0 9 - 2 0 1 5 2 0 1 0 - 2 0 1 6
New Jersey Essex County Middlesex County Union County
Motor Vehicle Crash Deaths
• In 2010-2016, Essex County (5.94/100,000) had 10.4% fewer motor vehicle crash deaths than New Jersey (6.59/100,000).
• Deaths due to motor vehicle accidents increased slightly in Essex County between 2009-2015 (5.80/1,000) and 2010-2016 (5.94/1,000).
• 2010-2016 Essex County (5.94/1,000) car accident related deaths occurred 70.4% less often than the Healthy People 2020 target (12.4/1,000).
Number of Motor Vehicle Crash Deaths State & County Comparisons, 2009-2016
Source: County Health Rankings, CDC Wonder Mortality Data, 2010 - 2016
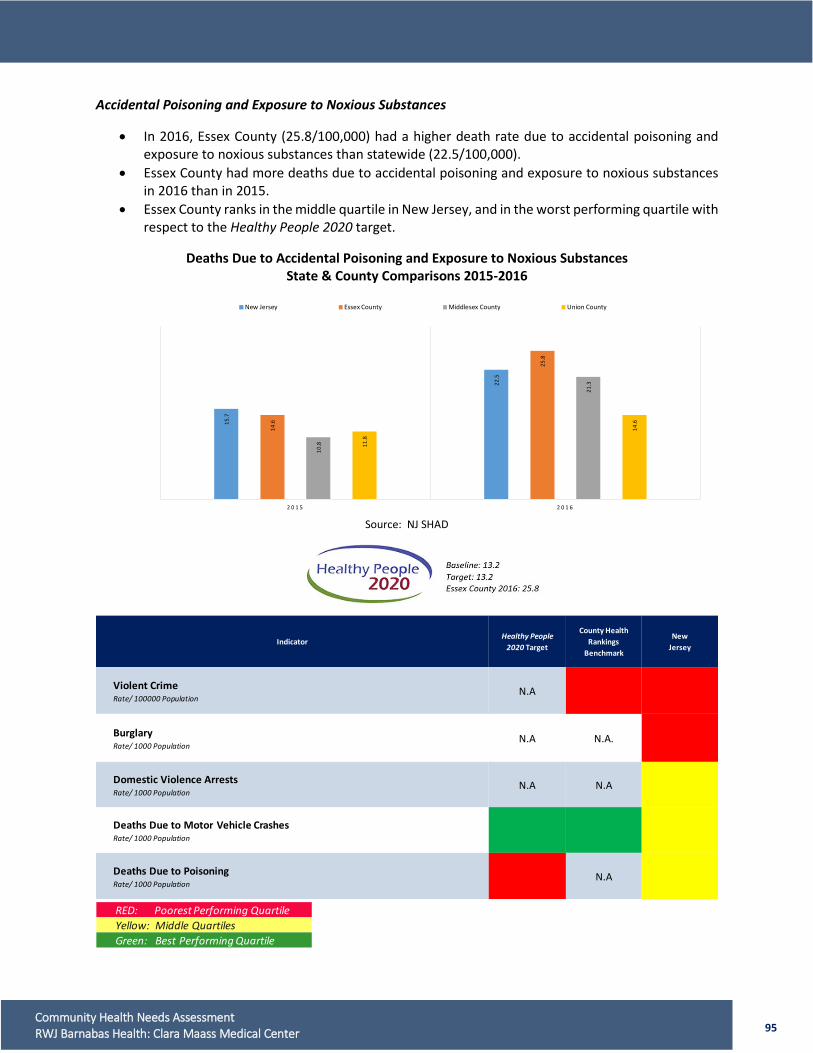
95 Community Health Needs Assessment RWJ Barnabas Health: Clara Maass Medical Center
15.7
22.5
14.6
25.8
10.8
21.3
11.8
14.6
2 0 1 5 2 0 1 6
New Jersey Essex County Middlesex County Union County
Accidental Poisoning and Exposure to Noxious Substances
• In 2016, Essex County (25.8/100,000) had a higher death rate due to accidental poisoning and exposure to noxious substances than statewide (22.5/100,000).
• Essex County had more deaths due to accidental poisoning and exposure to noxious substances in 2016 than in 2015.
• Essex County ranks in the middle quartile in New Jersey, and in the worst performing quartile with respect to the Healthy People 2020 target.
Deaths Due to Accidental Poisoning and Exposure to Noxious Substances State & County Comparisons 2015-2016
Source: NJ SHAD
IndicatorHealthy People
2020 Target
County Health Rankings
Benchmark
NewJersey
Violent Crime Rate/ 100000 Population
N.A
BurglaryRate/ 1000 Population
N.A N.A.
Domestic Violence ArrestsRate/ 1000 Population
N.A N.A
Deaths Due to Motor Vehicle CrashesRate/ 1000 Population
Deaths Due to PoisoningRate/ 1000 Population
N.A
RED: Poorest Performing QuartileYellow: Middle QuartilesGreen: Best Performing Quartile
96 Community Health Needs Assessment RWJ Barnabas Health: Clara Maass Medical Center
D. HEALTH FACTORS Health factors represent the influences that impact one’s health. These include demographic, social, environmental, economic, and individual behaviors as well as clinical care and access to services. Social determinants are described in Section B preceding Health Factors. 1. Clinical Care Measures Inpatient and ED Utilization Factors impacting hospital utilization may include policy change, advances in technology, practice patterns and demographics. Many federal and state health care payment reforms, including the Affordable Care Act (ACA), were designed to improve care transitions, coordination of care, enhance ambulatory care and improve access to primary care. The anticipatory result would include improved coordinated care and declines in inpatient and ED utilization. Inpatient
• Essex County’s 2016 inpatient utilization rate (163.15/1,000) was slightly higher than the State (160.22/1,000).
• CMMC’s Service Area inpatient rate (163.28/1,000) was nearly the same as the Essex County rate, and slightly higher than the State rate.
• Newark 07107 had the highest inpatient use rate in the CMMC Service Area (197.11/1,000).
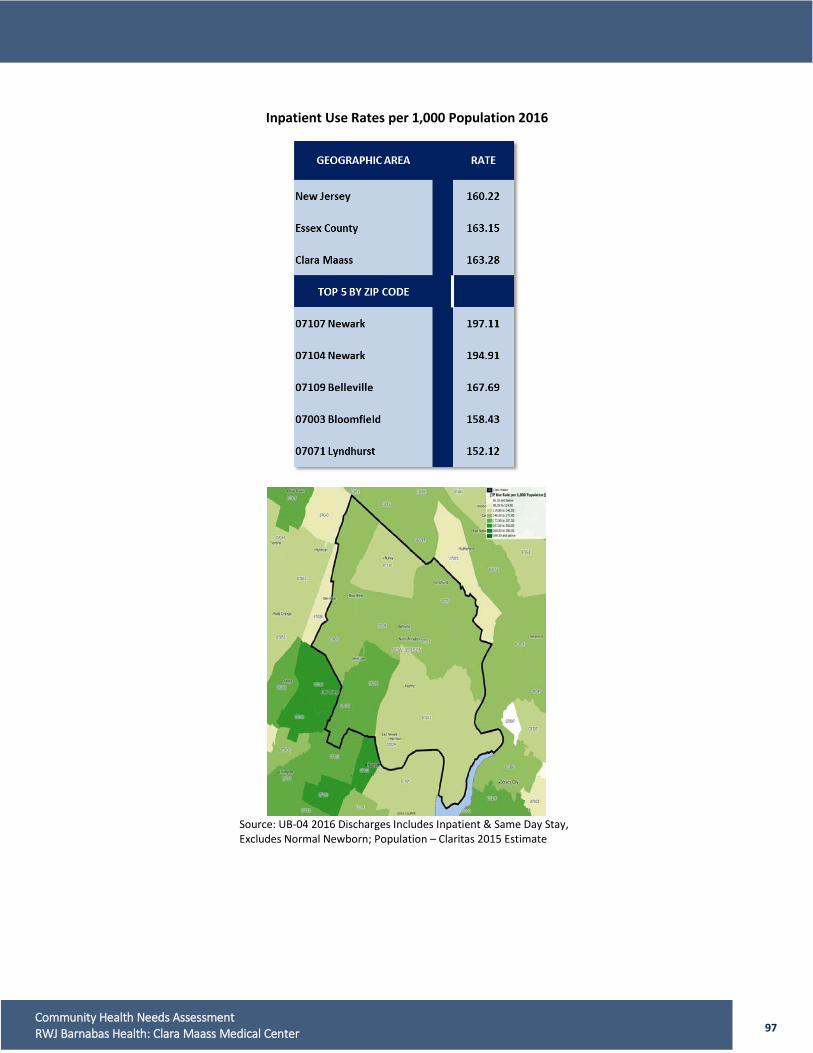
97 Community Health Needs Assessment RWJ Barnabas Health: Clara Maass Medical Center
Inpatient Use Rates per 1,000 Population 2016
Source: UB-04 2016 Discharges Includes Inpatient & Same Day Stay, Excludes Normal Newborn; Population – Claritas 2015 Estimate
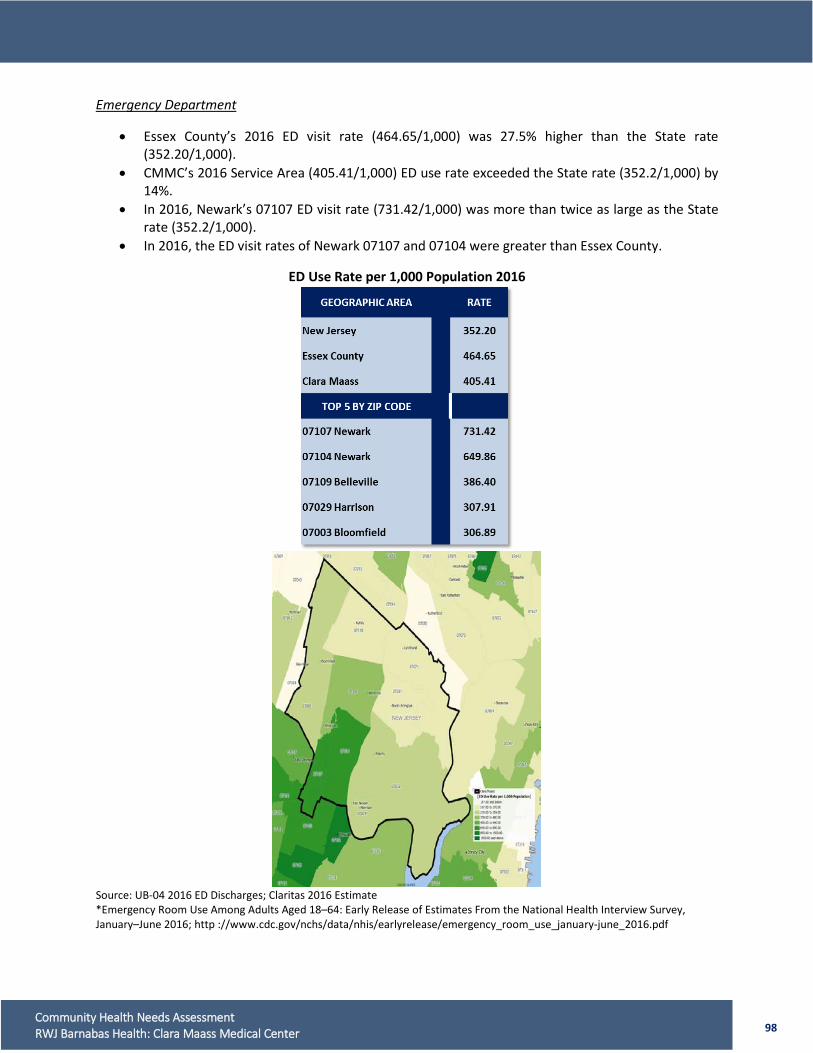
98 Community Health Needs Assessment RWJ Barnabas Health: Clara Maass Medical Center
Emergency Department
• Essex County’s 2016 ED visit rate (464.65/1,000) was 27.5% higher than the State rate (352.20/1,000).
• CMMC’s 2016 Service Area (405.41/1,000) ED use rate exceeded the State rate (352.2/1,000) by 14%.
• In 2016, Newark’s 07107 ED visit rate (731.42/1,000) was more than twice as large as the State rate (352.2/1,000).
• In 2016, the ED visit rates of Newark 07107 and 07104 were greater than Essex County.
ED Use Rate per 1,000 Population 2016
Source: UB-04 2016 ED Discharges; Claritas 2016 Estimate *Emergency Room Use Among Adults Aged 18–64: Early Release of Estimates From the National Health Interview Survey, January–June 2016; http ://www.cdc.gov/nchs/data/nhis/earlyrelease/emergency_room_use_january-june_2016.pdf
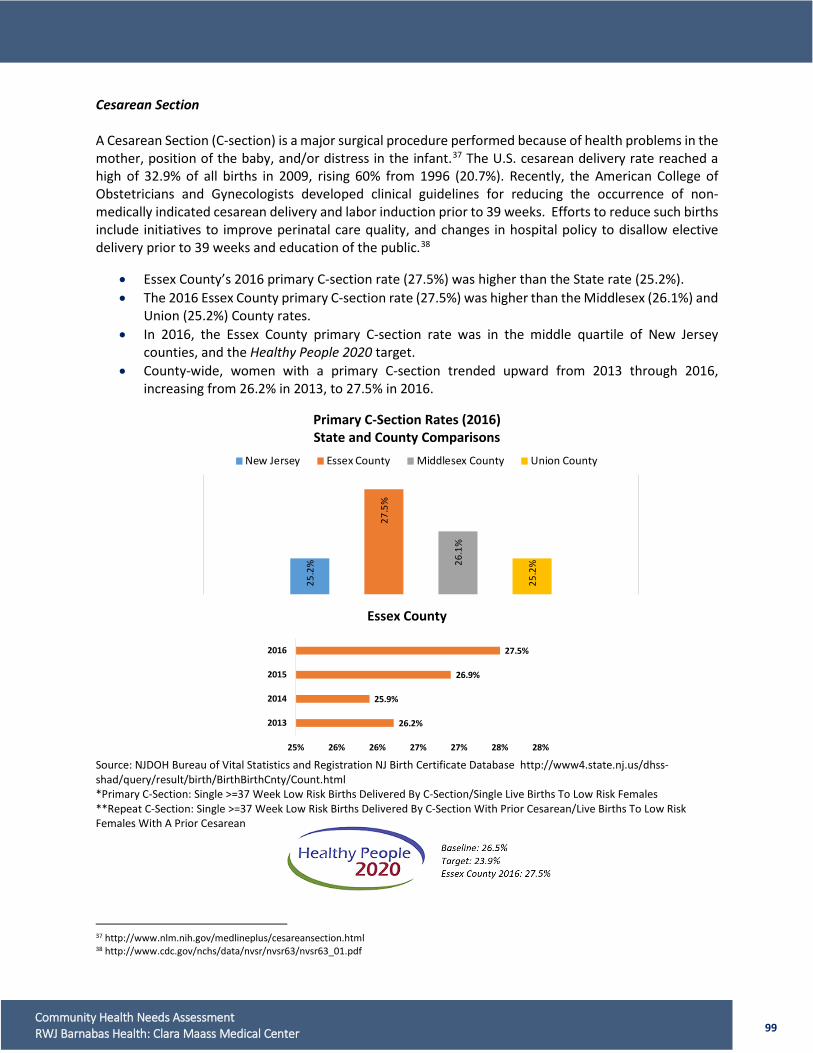
99 Community Health Needs Assessment RWJ Barnabas Health: Clara Maass Medical Center
25.2
%
27.5
%
26.1
%
25.2
%
New Jersey Essex County Middlesex County Union County
Cesarean Section A Cesarean Section (C-section) is a major surgical procedure performed because of health problems in the mother, position of the baby, and/or distress in the infant.37 The U.S. cesarean delivery rate reached a high of 32.9% of all births in 2009, rising 60% from 1996 (20.7%). Recently, the American College of Obstetricians and Gynecologists developed clinical guidelines for reducing the occurrence of non-medically indicated cesarean delivery and labor induction prior to 39 weeks. Efforts to reduce such births include initiatives to improve perinatal care quality, and changes in hospital policy to disallow elective delivery prior to 39 weeks and education of the public.38
• Essex County’s 2016 primary C-section rate (27.5%) was higher than the State rate (25.2%). • The 2016 Essex County primary C-section rate (27.5%) was higher than the Middlesex (26.1%) and
Union (25.2%) County rates. • In 2016, the Essex County primary C-section rate was in the middle quartile of New Jersey
counties, and the Healthy People 2020 target. • County-wide, women with a primary C-section trended upward from 2013 through 2016,
increasing from 26.2% in 2013, to 27.5% in 2016.
Primary C-Section Rates (2016) State and County Comparisons
Essex County
Source: NJDOH Bureau of Vital Statistics and Registration NJ Birth Certificate Database http://www4.state.nj.us/dhss-shad/query/result/birth/BirthBirthCnty/Count.html *Primary C-Section: Single >=37 Week Low Risk Births Delivered By C-Section/Single Live Births To Low Risk Females **Repeat C-Section: Single >=37 Week Low Risk Births Delivered By C-Section With Prior Cesarean/Live Births To Low Risk Females With A Prior Cesarean
37 http://www.nlm.nih.gov/medlineplus/cesareansection.html 38 http://www.cdc.gov/nchs/data/nvsr/nvsr63/nvsr63_01.pdf
26.2%
25.9%
26.9%
27.5%
25% 26% 26% 27% 27% 28% 28%
2013
2014
2015
2016
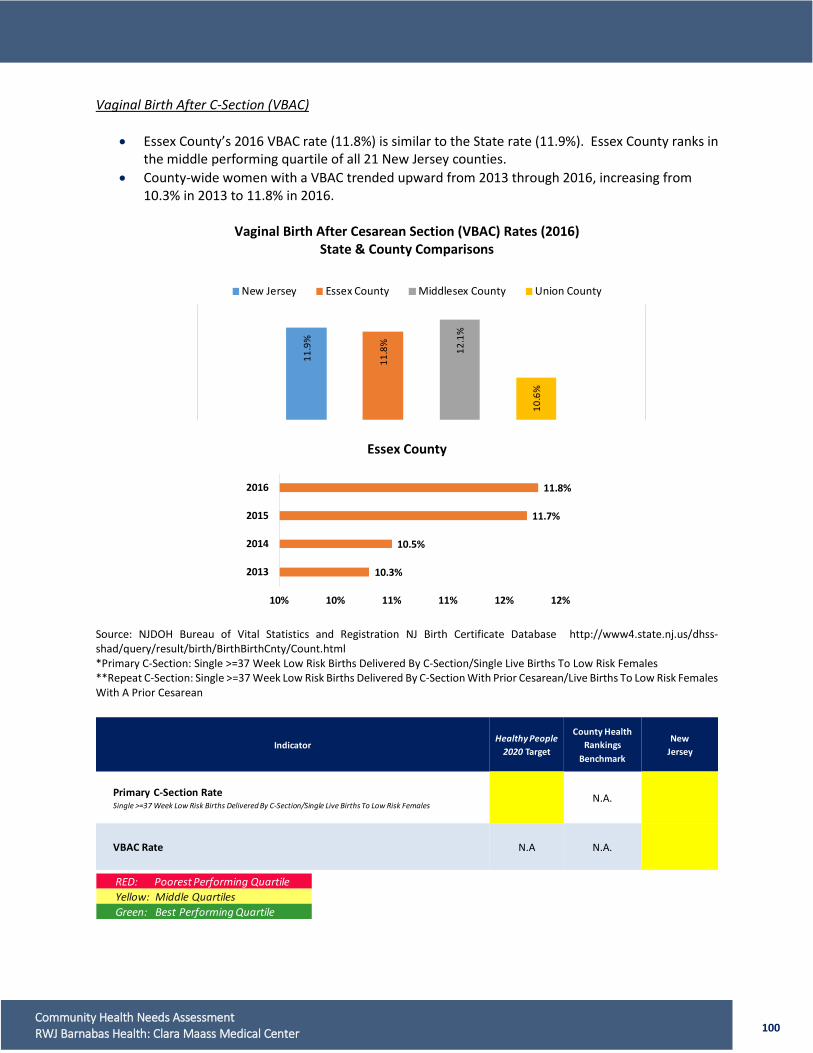
100 Community Health Needs Assessment RWJ Barnabas Health: Clara Maass Medical Center
Vaginal Birth After C-Section (VBAC)
• Essex County’s 2016 VBAC rate (11.8%) is similar to the State rate (11.9%). Essex County ranks in the middle performing quartile of all 21 New Jersey counties.
• County-wide women with a VBAC trended upward from 2013 through 2016, increasing from 10.3% in 2013 to 11.8% in 2016.
Vaginal Birth After Cesarean Section (VBAC) Rates (2016)
State & County Comparisons
Essex County
Source: NJDOH Bureau of Vital Statistics and Registration NJ Birth Certificate Database http://www4.state.nj.us/dhss-shad/query/result/birth/BirthBirthCnty/Count.html *Primary C-Section: Single >=37 Week Low Risk Births Delivered By C-Section/Single Live Births To Low Risk Females **Repeat C-Section: Single >=37 Week Low Risk Births Delivered By C-Section With Prior Cesarean/Live Births To Low Risk Females With A Prior Cesarean
11.9
%
11.8
%
12.1
%
10.6
%
New Jersey Essex County Middlesex County Union County
10.3%
10.5%
11.7%
11.8%
10% 10% 11% 11% 12% 12%
2013
2014
2015
2016
IndicatorHealthy People
2020 Target
County Health Rankings
Benchmark
NewJersey
Primary C-Section RateSingle >=37 Week Low Risk Births Delivered By C-Section/Single Live Births To Low Risk Females
N.A.
VBAC Rate N.A N.A.
RED: Poorest Performing QuartileYellow: Middle QuartilesGreen: Best Performing Quartile

101 Community Health Needs Assessment RWJ Barnabas Health: Clara Maass Medical Center
2. Health Behaviors Maternal / Fetal Health Prenatal Care The medical care a woman receives during pregnancy monitors her health and the developing fetus. Low-risk pregnancies should visit a prenatal provider every four or six weeks through 28 weeks, then every two or three weeks from weeks 28-36, and finally every week in the ninth month until delivery. A high-risk pregnancy requires additional visits.39 Pregnant women who do not receive adequate prenatal care risk undetected complications and an increased possibility of adverse outcomes. Early and regular prenatal care is a strategy to improve health outcomes for mothers and infants. Two significant benefits are improved birth weight and decreased preterm delivery. Infants born to mothers who receive no prenatal care have an infant mortality rate five times higher than mothers who receive appropriate prenatal care in the first trimester of pregnancy. Enrollment in care during the first trimester of pregnancy reflects timely initiation of prenatal care.40
• In 2016, only 63.5% of Essex County women entered prenatal care in the first trimester compared
to 72.1% in New Jersey. As compared to other New Jersey counties, Essex County ranks in the lowest quartile.
• The percent of Essex County women enrolled in first trimester prenatal care declined from 81% in 2010 to 63.5% in 2016.
39 http://www.plannedparenthood.org/health-info/pregnancy/prenatal-care 40 http://www.hrsa.gov/quality/toolbox/measures/prenatalfirsttrimester/index.html
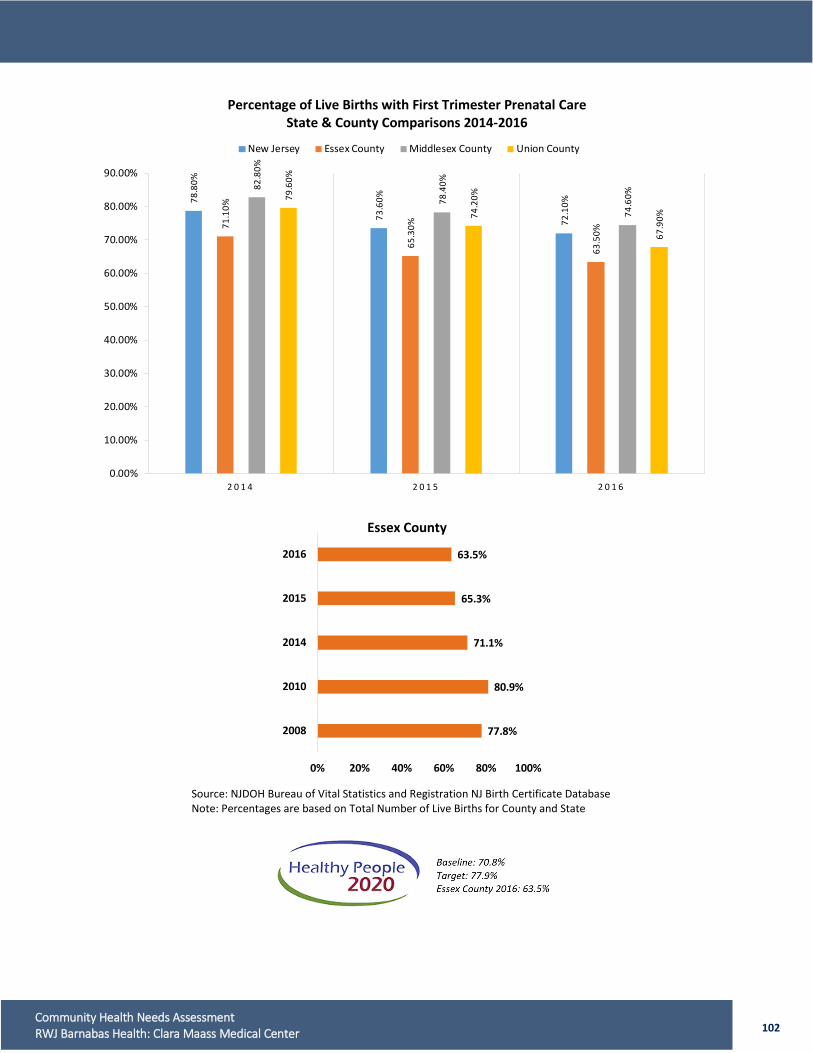
102 Community Health Needs Assessment RWJ Barnabas Health: Clara Maass Medical Center
Percentage of Live Births with First Trimester Prenatal Care State & County Comparisons 2014-2016
Essex County
Source: NJDOH Bureau of Vital Statistics and Registration NJ Birth Certificate Database Note: Percentages are based on Total Number of Live Births for County and State
78.8
0%
73.6
0%
72.1
0%
71.1
0%
65.3
0%
63.5
0%
82.8
0%
78.4
0%
74.6
0%79.6
0%
74.2
0%
67.9
0%
0.00%
10.00%
20.00%
30.00%
40.00%
50.00%
60.00%
70.00%
80.00%
90.00%
2 0 1 4 2 0 1 5 2 0 1 6
New Jersey Essex County Middlesex County Union County
77.8%
80.9%
71.1%
65.3%
63.5%
0% 20% 40% 60% 80% 100%
2008
2010
2014
2015
2016
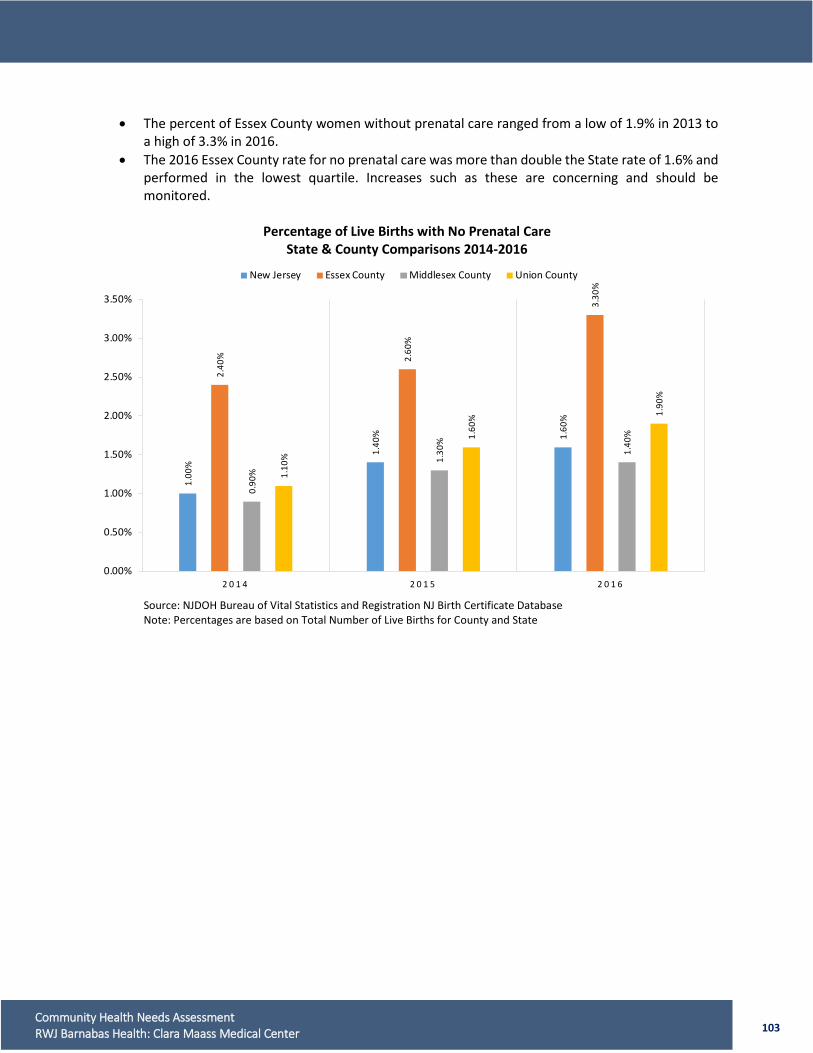
103 Community Health Needs Assessment RWJ Barnabas Health: Clara Maass Medical Center
• The percent of Essex County women without prenatal care ranged from a low of 1.9% in 2013 to
a high of 3.3% in 2016. • The 2016 Essex County rate for no prenatal care was more than double the State rate of 1.6% and
performed in the lowest quartile. Increases such as these are concerning and should be monitored.
Percentage of Live Births with No Prenatal Care
State & County Comparisons 2014-2016
Source: NJDOH Bureau of Vital Statistics and Registration NJ Birth Certificate Database Note: Percentages are based on Total Number of Live Births for County and State
1.00
%
1.40
% 1.60
%
2.40
% 2.60
%
3.30
%
0.90
%
1.30
%
1.40
%
1.10
%
1.60
% 1.90
%
0.00%
0.50%
1.00%
1.50%
2.00%
2.50%
3.00%
3.50%
2 0 1 4 2 0 1 5 2 0 1 6
New Jersey Essex County Middlesex County Union County

104 Community Health Needs Assessment RWJ Barnabas Health: Clara Maass Medical Center
Percentage of Live Births with No Prenatal Care, 2014-2016
Essex County – Trend
Source: NJDOH Bureau of Vital Statistics and Registration NJ Birth Certificate Database Note: Percentages are based on Total Number of Live Births for County and State
High Risk Sexual Behaviors Teen Pregnancy In 2016, there were 20.3 births/1,000 American adolescent females aged 15-19 years; approximately 209,809 babies were born to teens, with nearly eighty-nine percent of these births occurring outside of marriage. The national teen birth rate has trended downward over the past 20 years. In 1991, the U.S. teen birth rate was 61.8 births/1,000 adolescent females. However, the U.S. teen birth rate remains higher than that of many other developed countries, including Canada and the United Kingdom.41 Pregnant teens are less likely than older women to receive recommended prenatal care and are more likely to have pre-term or low birth weight babies. Teen mothers are often at increased risk for STIs and repeat
41 http://www.hhs.gov/ash/oah/adolescent-health-topics/reproductive-health/teen-pregnancy/trends.html
IndicatorHealthy People
2020 Target
County Health Rankings
Benchmark
NewJersey
First Trimester Prenatal CarePercentage of Live Births
N.A.
No Prenatal CarePercentage of Live Births
N.A N.A.
RED: Poorest Performing QuartileYellow: Middle QuartilesGreen: Best Performing Quartile
2.6%
2.6%
2.8%
2.0%
2.4%
2.3%
1.9%
2.4%
2.6%
3.3%
0% 1% 2% 3% 4%
2007
2008
2009
2010
2011
2012
2013
2014
2015
2016
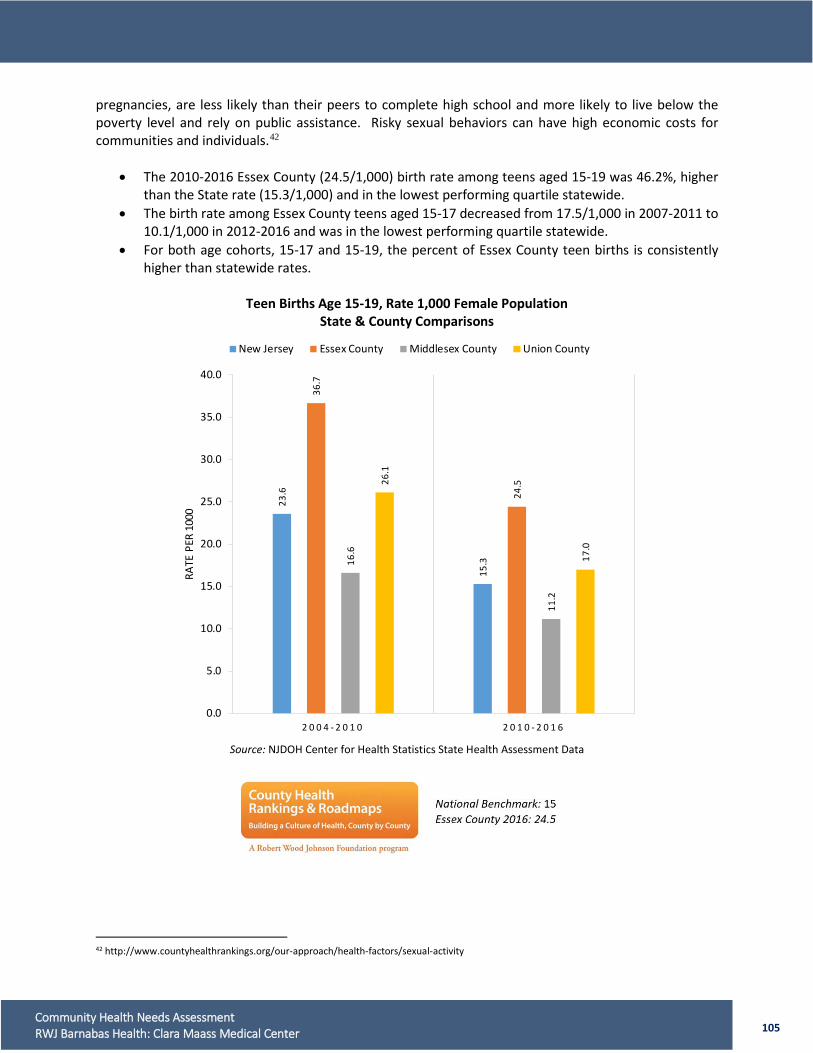
105 Community Health Needs Assessment RWJ Barnabas Health: Clara Maass Medical Center
pregnancies, are less likely than their peers to complete high school and more likely to live below the poverty level and rely on public assistance. Risky sexual behaviors can have high economic costs for communities and individuals.42
• The 2010-2016 Essex County (24.5/1,000) birth rate among teens aged 15-19 was 46.2%, higher than the State rate (15.3/1,000) and in the lowest performing quartile statewide.
• The birth rate among Essex County teens aged 15-17 decreased from 17.5/1,000 in 2007-2011 to 10.1/1,000 in 2012-2016 and was in the lowest performing quartile statewide.
• For both age cohorts, 15-17 and 15-19, the percent of Essex County teen births is consistently higher than statewide rates.
Teen Births Age 15-19, Rate 1,000 Female Population
State & County Comparisons
Source: NJDOH Center for Health Statistics State Health Assessment Data
42 http://www.countyhealthrankings.org/our-approach/health-factors/sexual-activity
23.6
15.3
36.7
24.5
16.6
11.2
26.1
17.0
0.0
5.0
10.0
15.0
20.0
25.0
30.0
35.0
40.0
2 0 0 4 - 2 0 1 0 2 0 1 0 - 2 0 1 6
RATE
PER
100
0
New Jersey Essex County Middlesex County Union County
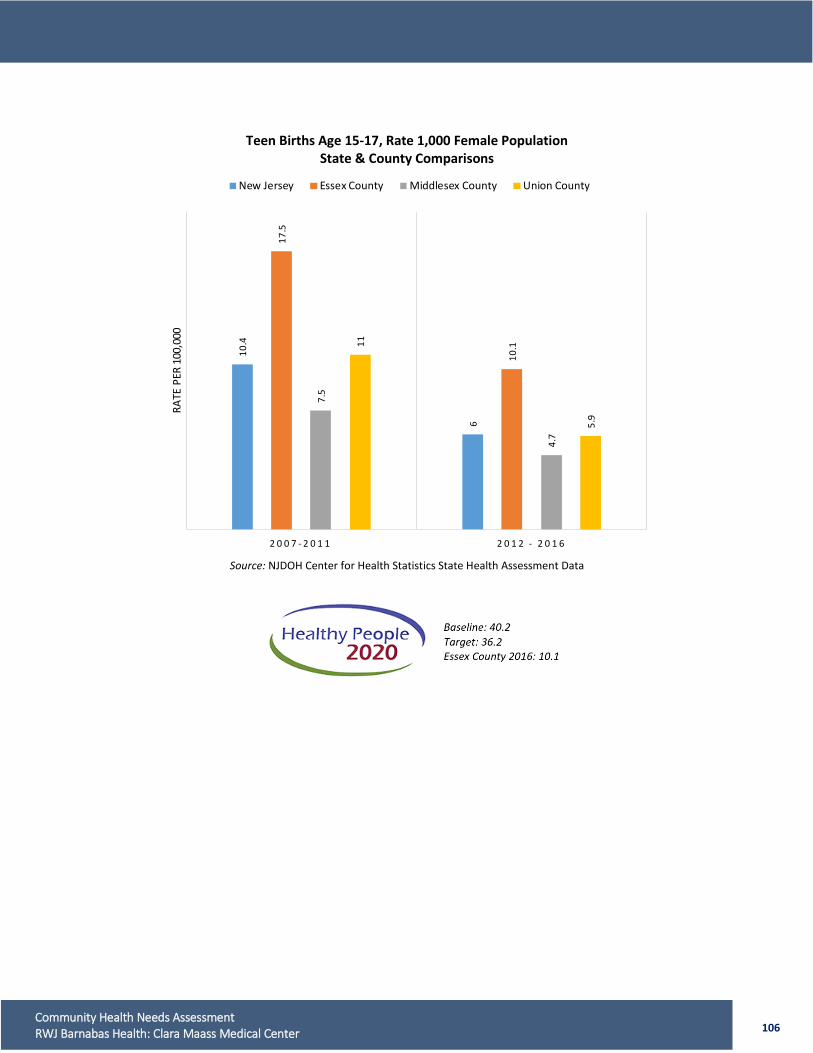
106 Community Health Needs Assessment RWJ Barnabas Health: Clara Maass Medical Center
Teen Births Age 15-17, Rate 1,000 Female Population State & County Comparisons
Source: NJDOH Center for Health Statistics State Health Assessment Data
10.4
6
17.5
10.1
7.5
4.7
11
5.9
2 0 0 7 - 2 0 1 1 2 0 1 2 - 2 0 1 6
RATE
PER
100
,000
New Jersey Essex County Middlesex County Union County

107 Community Health Needs Assessment RWJ Barnabas Health: Clara Maass Medical Center
In a 2016 CDC Teen Pregnancy Statistics data brief, State Disparities in Teenage Birth Rates in the United States, based upon 2014 data, New Jersey is one of 10 states with the lowest teen birth rates (<20/1,000) compared to National figures (41.5/1,000). However, the New Jersey rate shows tremendous variability when examined by town.
• The Newark 07107 2016 birth rate to teens aged 15-19 (50.94/1,000) was nearly 5 times the New Jersey rate (11.6/1,000).
Teen Birth Rates 2016 – Deliveries Among 15-19 Year Old
*Source: UB-04 2016 Discharges – All Deliveries to Mothers Age 15-19; Claritas Population Estimate ** NCHS Data Brief http://www.cdc.gov/nchs/data/databriefs/db46.pdf
Teen Births by Mother’s Race/Ethnicity (Age 15-17)
• The 2012-2016 Essex County teen birth rate for Blacks and Hispanics was the highest relative to New Jersey and the comparison counties.
• The rate among Essex County teens, 15-17, was highest among Hispanics (17.4/1,000).
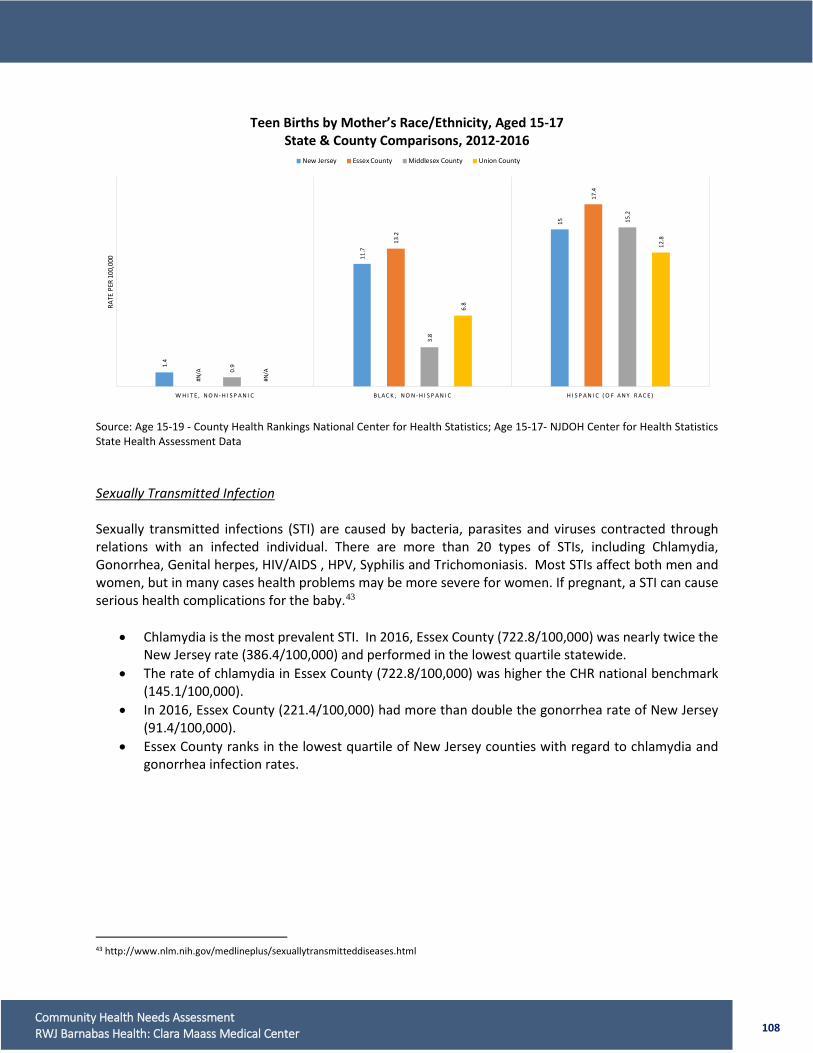
108 Community Health Needs Assessment RWJ Barnabas Health: Clara Maass Medical Center
Teen Births by Mother’s Race/Ethnicity, Aged 15-17
State & County Comparisons, 2012-2016
Source: Age 15-19 - County Health Rankings National Center for Health Statistics; Age 15-17- NJDOH Center for Health Statistics State Health Assessment Data Sexually Transmitted Infection Sexually transmitted infections (STI) are caused by bacteria, parasites and viruses contracted through relations with an infected individual. There are more than 20 types of STIs, including Chlamydia, Gonorrhea, Genital herpes, HIV/AIDS , HPV, Syphilis and Trichomoniasis. Most STIs affect both men and women, but in many cases health problems may be more severe for women. If pregnant, a STI can cause serious health complications for the baby.43
• Chlamydia is the most prevalent STI. In 2016, Essex County (722.8/100,000) was nearly twice the New Jersey rate (386.4/100,000) and performed in the lowest quartile statewide.
• The rate of chlamydia in Essex County (722.8/100,000) was higher the CHR national benchmark (145.1/100,000).
• In 2016, Essex County (221.4/100,000) had more than double the gonorrhea rate of New Jersey (91.4/100,000).
• Essex County ranks in the lowest quartile of New Jersey counties with regard to chlamydia and gonorrhea infection rates.
43 http://www.nlm.nih.gov/medlineplus/sexuallytransmitteddiseases.html
1.4
11.7
15
#N/A
13.2
17.4
0.9
3.8
15.2
#N/A
6.8
12.8
W H I T E , N O N - H I S P A N I C B L A C K , N O N - H I S P A N I C H I S P A N I C ( O F A N Y R A C E )
RATE
PER
100
,000
New Jersey Essex County Middlesex County Union County
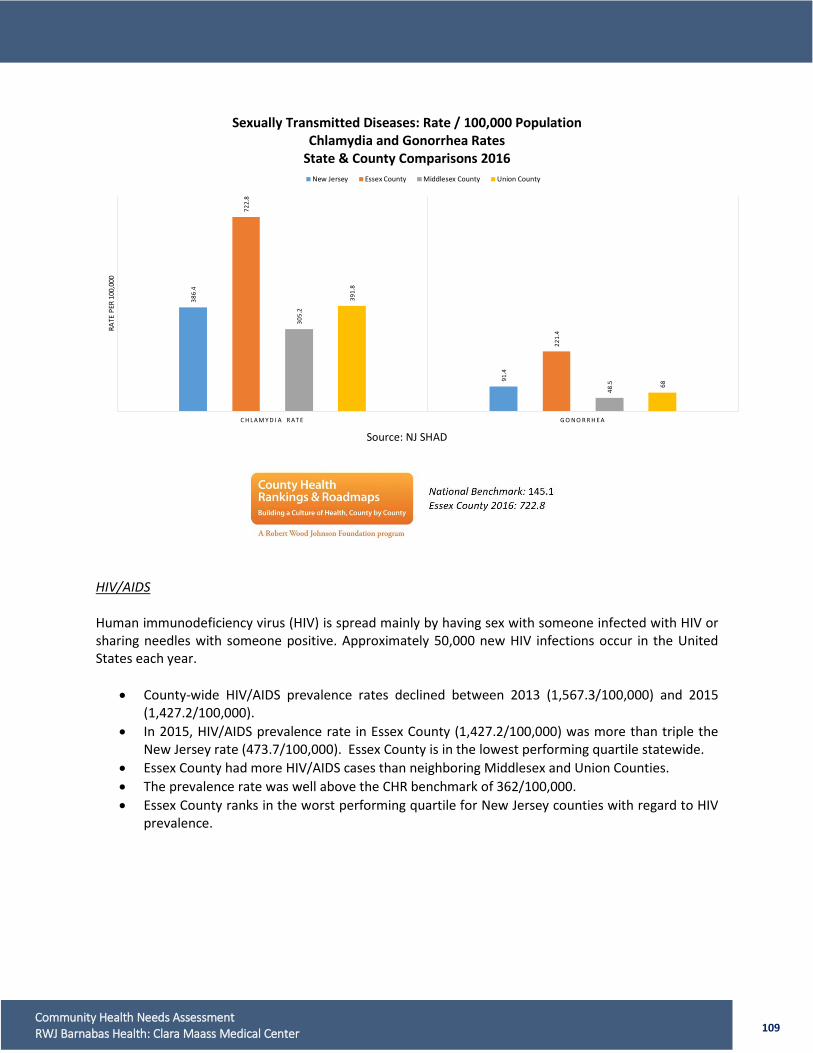
109 Community Health Needs Assessment RWJ Barnabas Health: Clara Maass Medical Center
Sexually Transmitted Diseases: Rate / 100,000 Population
Chlamydia and Gonorrhea Rates State & County Comparisons 2016
Source: NJ SHAD
HIV/AIDS Human immunodeficiency virus (HIV) is spread mainly by having sex with someone infected with HIV or sharing needles with someone positive. Approximately 50,000 new HIV infections occur in the United States each year.
• County-wide HIV/AIDS prevalence rates declined between 2013 (1,567.3/100,000) and 2015 (1,427.2/100,000).
• In 2015, HIV/AIDS prevalence rate in Essex County (1,427.2/100,000) was more than triple the New Jersey rate (473.7/100,000). Essex County is in the lowest performing quartile statewide.
• Essex County had more HIV/AIDS cases than neighboring Middlesex and Union Counties. • The prevalence rate was well above the CHR benchmark of 362/100,000. • Essex County ranks in the worst performing quartile for New Jersey counties with regard to HIV
prevalence.
386.
4
91.4
722.
8
221.
4
305.
2
48.5
391.
8
68
C H L A M Y D I A R A T E G O N O R R H E A
RATE
PER
100
,000
New Jersey Essex County Middlesex County Union County
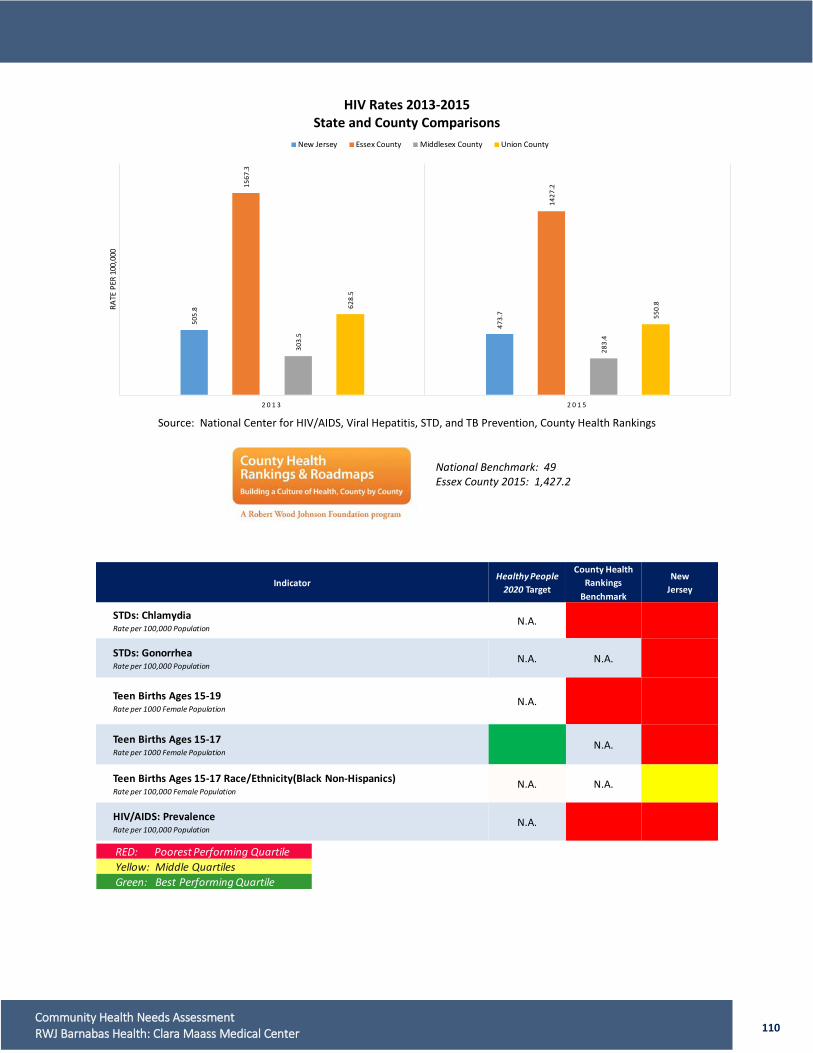
110 Community Health Needs Assessment RWJ Barnabas Health: Clara Maass Medical Center
HIV Rates 2013-2015 State and County Comparisons
Source: National Center for HIV/AIDS, Viral Hepatitis, STD, and TB Prevention, County Health Rankings
505.
8
473.
7
1567
.3
1427
.2
303.
5
283.
4
628.
5
550.
8
2 0 1 3 2 0 1 5
RATE
PER
100
,000
New Jersey Essex County Middlesex County Union County
National Benchmark: 49 Essex County 2015: 1,427.2
IndicatorHealthy People
2020 Target
County Health Rankings
Benchmark
NewJersey
STDs: Chlamydia Rate per 100,000 Population
N.A.
STDs: Gonorrhea Rate per 100,000 Population
N.A. N.A.
Teen Births Ages 15-19Rate per 1000 Female Population
N.A.
Teen Births Ages 15-17Rate per 1000 Female Population
N.A.
Teen Births Ages 15-17 Race/Ethnicity(Black Non-Hispanics)Rate per 100,000 Female Population
N.A. N.A.
HIV/AIDS: PrevalenceRate per 100,000 Population
N.A.
RED: Poorest Performing QuartileYellow: Middle QuartilesGreen: Best Performing Quartile
111 Community Health Needs Assessment RWJ Barnabas Health: Clara Maass Medical Center
Individual Behavior A CDC report indicates that people can live longer if they practice one or more healthy lifestyle behaviors including: eating a healthy diet, not smoking, regular exercise and limiting alcohol consumption. People who engage in all of these behaviors are 66 percent less likely to die early from cancer, 65 percent less likely to die early from cardiovascular disease and 57 percent less likely to die early from other causes compared to those who do not engage in any of these behaviors.44 Tobacco Use Tobacco use is the leading cause of preventable death in the United States. Smoking leads to disease and disability, and harms nearly every organ in the body, and causes cancer, heart disease, stroke, diabetes, and lung diseases such as emphysema, bronchitis, and chronic airway obstruction. Exposure to secondhand smoke can lead to lung cancer and heart disease. Each year, smoking kills approximately 480,000 Americans, including 41,000 from secondhand smoke. On average, smokers die 10 years earlier than nonsmokers. About 15% of U.S. adults smoke. Each day, nearly 3,200 youth smoke their first cigarette, and 2,100 people transition from occasional to daily smokers. Smokeless tobacco also leads to various cancers, gum and teeth problems, and nicotine addiction. Almost 6% of young adults use smokeless tobacco and half of new users are younger than 18.45, 46
• Between 2012 and 2016, smoking rates have fluctuated in Essex County with an overall decrease of 1.9 percentage points.
• In 2016, there were 3.5% more smokers in Essex County (14.5%) than New Jersey (14.0%). Essex County had more adult smokers than neighboring Middlesex (12.5%) and Union (13.0%) Counties. Essex County performs in the middle quartile statewide.
• In 2016, Essex County was also in the middle performing County Health Rankings benchmark and the Healthy People 2020 target.
44 http://www.cdc.gov/features/livelonger/ 45 http://www.countyhealthrankings.org/our-approach/health-factors/tobacco-use 46 http://www.cdc.gov/tobacco/data_statistics/fact_sheets/index.htm
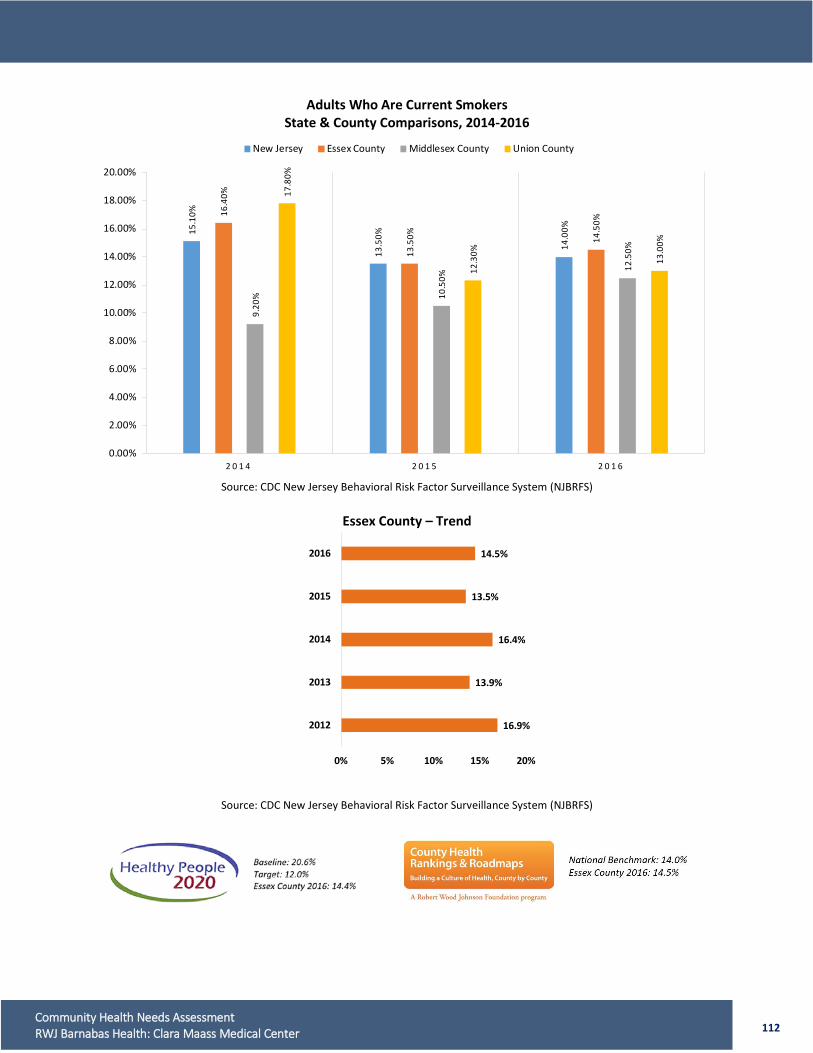
112 Community Health Needs Assessment RWJ Barnabas Health: Clara Maass Medical Center
Adults Who Are Current Smokers State & County Comparisons, 2014-2016
Source: CDC New Jersey Behavioral Risk Factor Surveillance System (NJBRFS)
Essex County – Trend
Source: CDC New Jersey Behavioral Risk Factor Surveillance System (NJBRFS)
15.1
0%
13.5
0%
14.0
0%
16.4
0%
13.5
0% 14.5
0%
9.20
% 10.5
0%
12.5
0%
17.8
0%
12.3
0%
13.0
0%
0.00%
2.00%
4.00%
6.00%
8.00%
10.00%
12.00%
14.00%
16.00%
18.00%
20.00%
2 0 1 4 2 0 1 5 2 0 1 6
New Jersey Essex County Middlesex County Union County
16.9%
13.9%
16.4%
13.5%
14.5%
0% 5% 10% 15% 20%
2012
2013
2014
2015
2016
113 Community Health Needs Assessment RWJ Barnabas Health: Clara Maass Medical Center
Alcohol Use Although moderate alcohol use is associated with reduced risk of heart disease and diabetes, excessive consumption is the third leading cause of preventable death nationally. Excessive consumption considers both the amount and the frequency of drinking. Short-term, excessive drinking is linked to alcohol poisoning, intimate partner violence, risky sexual behaviors, failure to fulfill responsibilities and motor vehicle crashes. Over time, excessive alcohol consumption is a risk factor for hypertension, acute myocardial infarction, fetal alcohol syndrome, liver disease and certain cancers.47
• Binge drinkers, those men that consume more than 5 drinks and women that consume more than 4 drinks in one occasion, increased from 13.9% in 2014, to 15.4% in 2016.
• In 2016, 15.4% of Essex County residents were binge drinkers compared to 16% statewide. Essex County had fewer binge drinkers than surrounding Middlesex County, but slightly more than Union County.
• Statewide, Essex County performs in the middle quartile.
47 http://www.countyhealthrankings.org/our-approach/health-factors/alcohol-drug-use
IndicatorHealthy People
2020 Target
County Health Rankings
Benchmark
NewJersey
Tobacco UseAdults Who Are Current Smokers
RED: Poorest Performing QuartileYellow: Middle QuartilesGreen: Best Performing Quartile
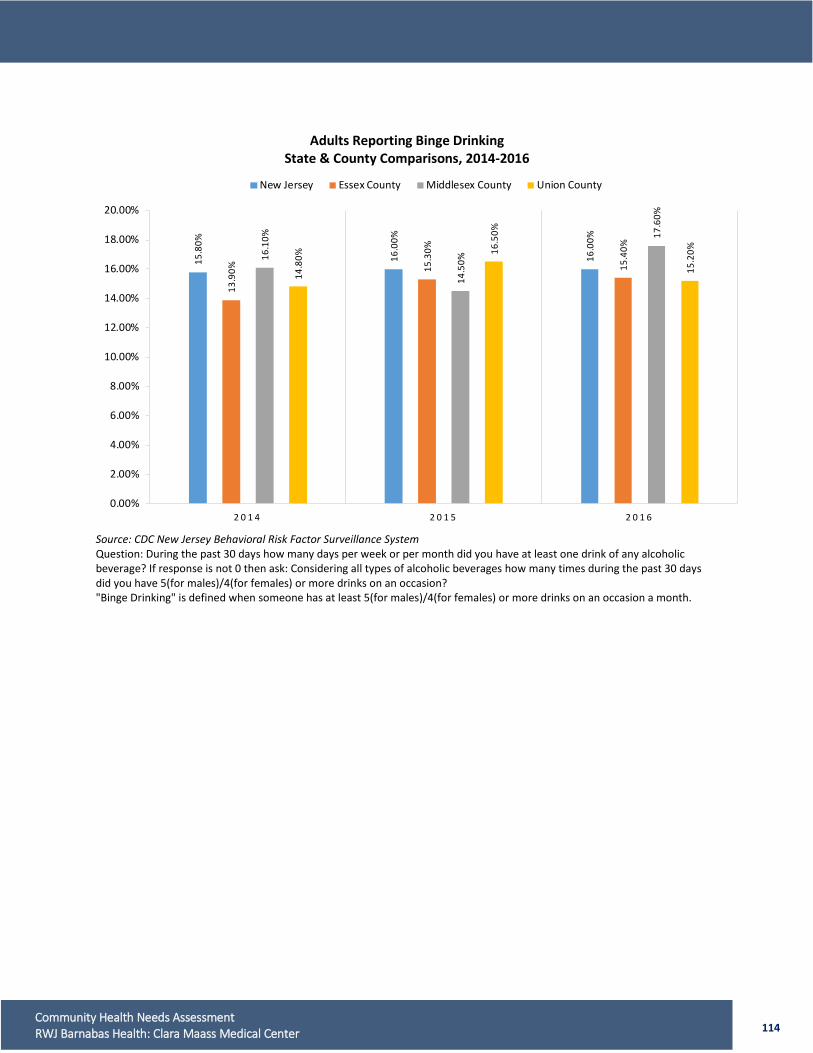
114 Community Health Needs Assessment RWJ Barnabas Health: Clara Maass Medical Center
Adults Reporting Binge Drinking State & County Comparisons, 2014-2016
Source: CDC New Jersey Behavioral Risk Factor Surveillance System Question: During the past 30 days how many days per week or per month did you have at least one drink of any alcoholic beverage? If response is not 0 then ask: Considering all types of alcoholic beverages how many times during the past 30 days did you have 5(for males)/4(for females) or more drinks on an occasion? "Binge Drinking" is defined when someone has at least 5(for males)/4(for females) or more drinks on an occasion a month.
15.8
0%
16.0
0%
16.0
0%
13.9
0% 15.3
0%
15.4
0%
16.1
0%
14.5
0%
17.6
0%
14.8
0% 16.5
0%
15.2
0%
0.00%
2.00%
4.00%
6.00%
8.00%
10.00%
12.00%
14.00%
16.00%
18.00%
20.00%
2 0 1 4 2 0 1 5 2 0 1 6
New Jersey Essex County Middlesex County Union County
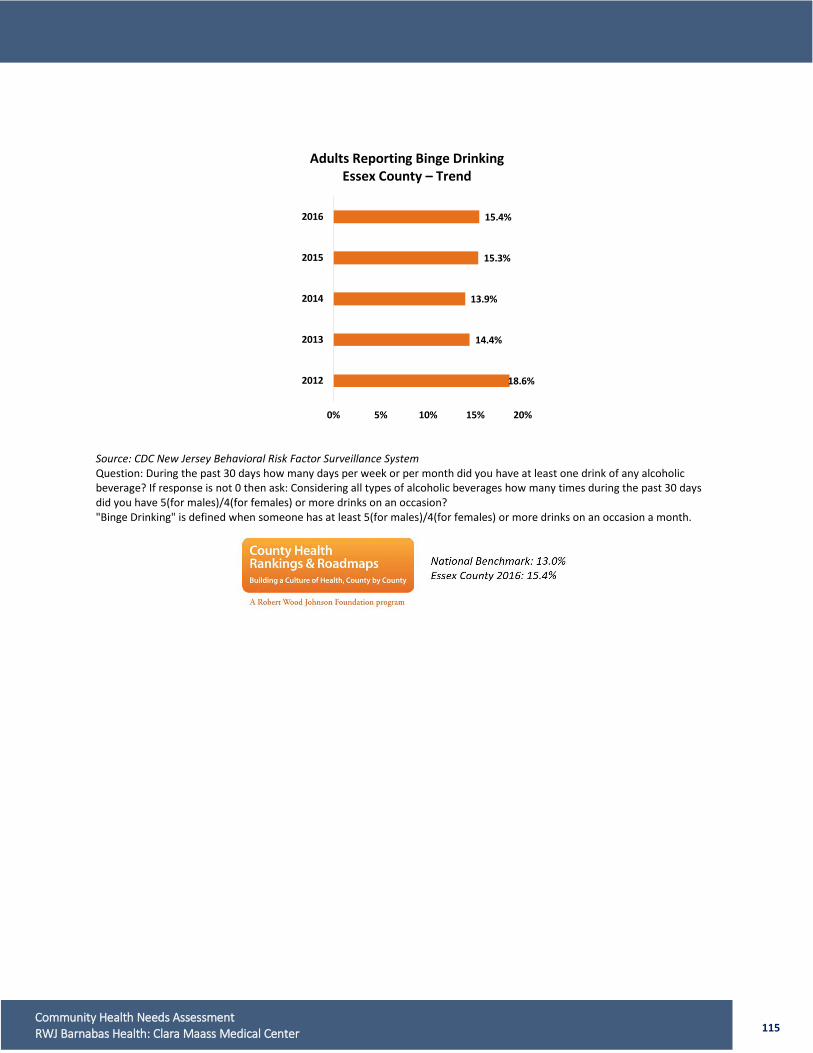
115 Community Health Needs Assessment RWJ Barnabas Health: Clara Maass Medical Center
Adults Reporting Binge Drinking Essex County – Trend
Source: CDC New Jersey Behavioral Risk Factor Surveillance System Question: During the past 30 days how many days per week or per month did you have at least one drink of any alcoholic beverage? If response is not 0 then ask: Considering all types of alcoholic beverages how many times during the past 30 days did you have 5(for males)/4(for females) or more drinks on an occasion? "Binge Drinking" is defined when someone has at least 5(for males)/4(for females) or more drinks on an occasion a month.
18.6%
14.4%
13.9%
15.3%
15.4%
0% 5% 10% 15% 20%
2012
2013
2014
2015
2016

116 Community Health Needs Assessment RWJ Barnabas Health: Clara Maass Medical Center
Heavy drinking is defined when someone has at least 60 drinks a month (for males) and 30 (for females).
• County-wide, residents who were heavy drinkers increased from 4.5% in 2012 to 6.2% in 2016. • In 2016, Essex County had the highest percent of residents reporting heavy drinking, relative to
the State and the surrounding counties. • Essex County ranked in the lowest quartile among the 21 counties in New Jersey.
Adults Reporting Heavy Drinking
State & County Comparisons, 2014-2016
Essex County
Source: CDC New Jersey Behavioral Risk Factor Surveillance System Question: During the past 30 days how many days per week or per month did you have at least one drink of any alcoholic beverage? If response is not 0 then ask: Considering all types of alcoholic beverages how many drinks have you had during the past 30 days? “Heavy Drinking" is defined when someone has at least 60(for males)/30(for females) or more drinks a month.
4.80
%
4.80
%
4.40
%
3.20
%
4.20
%
6.20
%
3.60
%
3.10
%
3.00
%
5.50
%
3.70
%
5.40
%
0.00%
1.00%
2.00%
3.00%
4.00%
5.00%
6.00%
7.00%
2 0 1 4 2 0 1 5 2 0 1 6
New Jersey Essex County Middlesex County Union County
4.5%
4.7%
3.2%
4.2%
6.2%
0% 2% 4% 6% 8%
2012
2013
2014
2015
2016
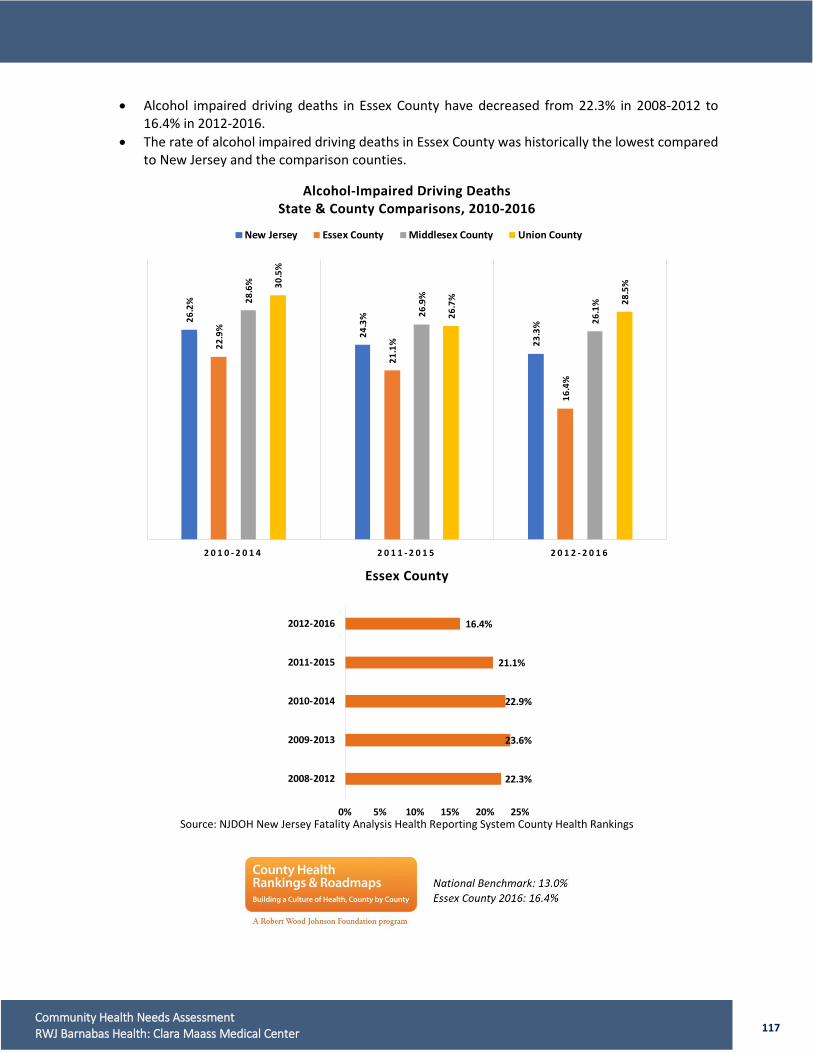
117 Community Health Needs Assessment RWJ Barnabas Health: Clara Maass Medical Center
• Alcohol impaired driving deaths in Essex County have decreased from 22.3% in 2008-2012 to 16.4% in 2012-2016.
• The rate of alcohol impaired driving deaths in Essex County was historically the lowest compared to New Jersey and the comparison counties.
Alcohol-Impaired Driving Deaths State & County Comparisons, 2010-2016
Essex County
Source: NJDOH New Jersey Fatality Analysis Health Reporting System County Health Rankings
26.2
%
24.3
%
23.3
%
22.9
%
21.1
%
16.4
%
28.6
%
26.9
%
26.1
%
30.5
%
26.7
% 28.5
%
2 0 1 0 - 2 0 1 4 2 0 1 1 - 2 0 1 5 2 0 1 2 - 2 0 1 6
New Jersey Essex County Middlesex County Union County
22.3%
23.6%
22.9%
21.1%
16.4%
0% 5% 10% 15% 20% 25%
2008-2012
2009-2013
2010-2014
2011-2015
2012-2016
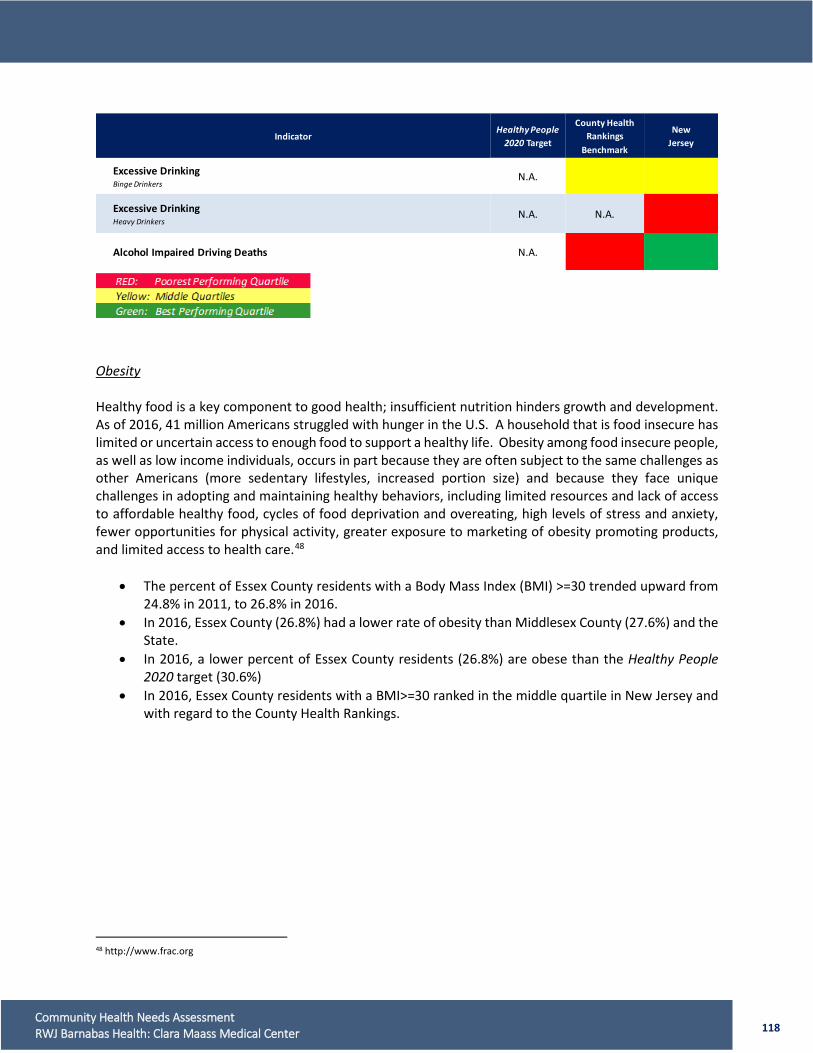
118 Community Health Needs Assessment RWJ Barnabas Health: Clara Maass Medical Center
Obesity Healthy food is a key component to good health; insufficient nutrition hinders growth and development. As of 2016, 41 million Americans struggled with hunger in the U.S. A household that is food insecure has limited or uncertain access to enough food to support a healthy life. Obesity among food insecure people, as well as low income individuals, occurs in part because they are often subject to the same challenges as other Americans (more sedentary lifestyles, increased portion size) and because they face unique challenges in adopting and maintaining healthy behaviors, including limited resources and lack of access to affordable healthy food, cycles of food deprivation and overeating, high levels of stress and anxiety, fewer opportunities for physical activity, greater exposure to marketing of obesity promoting products, and limited access to health care.48
• The percent of Essex County residents with a Body Mass Index (BMI) >=30 trended upward from 24.8% in 2011, to 26.8% in 2016.
• In 2016, Essex County (26.8%) had a lower rate of obesity than Middlesex County (27.6%) and the State.
• In 2016, a lower percent of Essex County residents (26.8%) are obese than the Healthy People 2020 target (30.6%)
• In 2016, Essex County residents with a BMI>=30 ranked in the middle quartile in New Jersey and with regard to the County Health Rankings.
48 http://www.frac.org
IndicatorHealthy People
2020 Target
County Health Rankings
Benchmark
NewJersey
Excessive DrinkingBinge Drinkers
N.A.
Excessive DrinkingHeavy Drinkers
N.A. N.A.
Alcohol Impaired Driving Deaths N.A.

119 Community Health Needs Assessment RWJ Barnabas Health: Clara Maass Medical Center
Reported BMI>=30 State & County Comparisons, 2012-2016
Essex County
Source: CDC Behavioral Risk Factor Surveillance System
24.6
0% 26.9
0%
27.3
0%29.5
0% 31.5
0%
26.8
0%
23.6
0% 26.2
0%
27.6
0%
23.3
0% 25.5
0%
25.6
0%
0.00%
5.00%
10.00%
15.00%
20.00%
25.00%
30.00%
35.00%
2 0 1 2 2 0 1 4 2 0 1 6
New Jersey Essex County Middlesex County Union County
24.8%
29.5%
27.8%
31.5%
28.1%
26.8%
0% 10% 20% 30% 40%
2011
2012
2013
2014
2015
2016
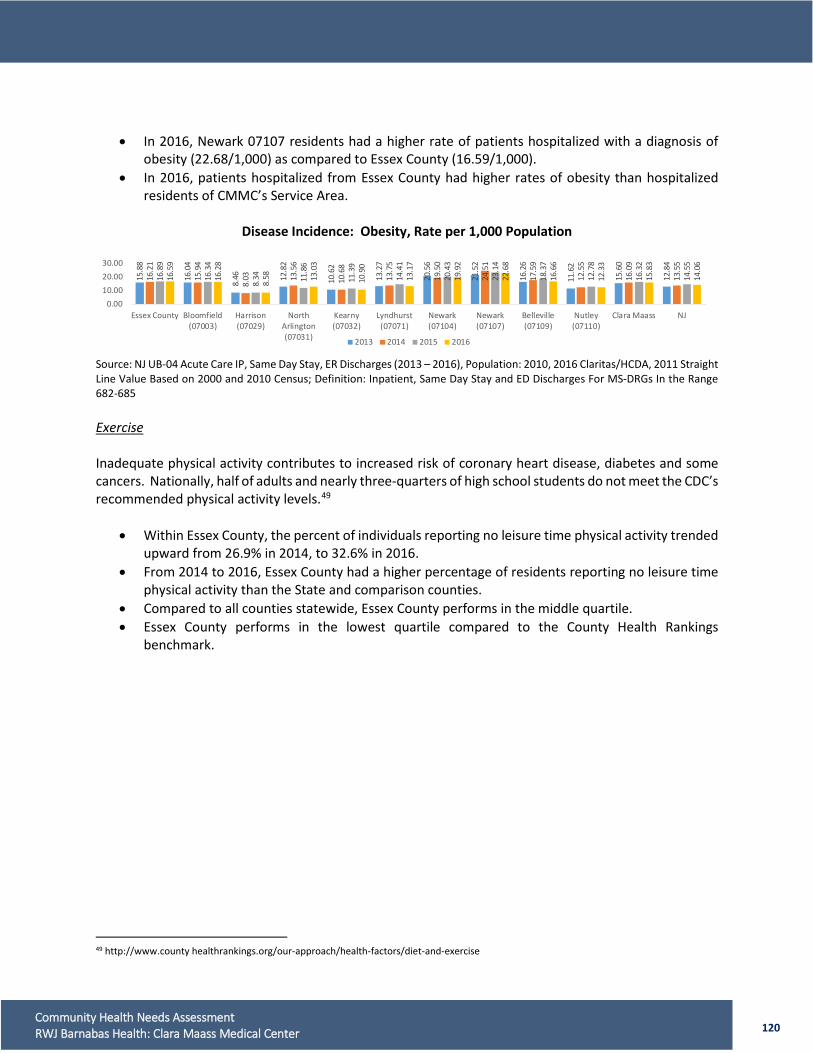
120 Community Health Needs Assessment RWJ Barnabas Health: Clara Maass Medical Center
• In 2016, Newark 07107 residents had a higher rate of patients hospitalized with a diagnosis of obesity (22.68/1,000) as compared to Essex County (16.59/1,000).
• In 2016, patients hospitalized from Essex County had higher rates of obesity than hospitalized residents of CMMC’s Service Area.
Disease Incidence: Obesity, Rate per 1,000 Population
Source: NJ UB-04 Acute Care IP, Same Day Stay, ER Discharges (2013 – 2016), Population: 2010, 2016 Claritas/HCDA, 2011 Straight Line Value Based on 2000 and 2010 Census; Definition: Inpatient, Same Day Stay and ED Discharges For MS-DRGs In the Range 682-685 Exercise Inadequate physical activity contributes to increased risk of coronary heart disease, diabetes and some cancers. Nationally, half of adults and nearly three-quarters of high school students do not meet the CDC’s recommended physical activity levels.49
• Within Essex County, the percent of individuals reporting no leisure time physical activity trended upward from 26.9% in 2014, to 32.6% in 2016.
• From 2014 to 2016, Essex County had a higher percentage of residents reporting no leisure time physical activity than the State and comparison counties.
• Compared to all counties statewide, Essex County performs in the middle quartile. • Essex County performs in the lowest quartile compared to the County Health Rankings
benchmark.
49 http://www.county healthrankings.org/our-approach/health-factors/diet-and-exercise
15.8
8
16.0
4
8.46 12
.82
10.6
2
13.2
7
20.5
6
21.5
2
16.2
6
11.6
2
15.6
0
12.8
4
16.2
1
15.9
4
8.03 13
.56
10.6
8
13.7
5
19.5
0
24.5
1
17.5
9
12.5
5
16.0
9
13.5
5
16.8
9
16.3
4
8.34 11
.86
11.3
9
14.4
1
20.4
3
23.1
4
18.3
7
12.7
8
16.3
2
14.5
5
16.5
9
16.2
8
8.58 13
.03
10.9
0
13.1
7
19.9
2
22.6
8
16.6
6
12.3
3
15.8
3
14.0
6
0.0010.0020.0030.00
Essex County Bloomfield(07003)
Harrison(07029)
NorthArlington(07031)
Kearny(07032)
Lyndhurst(07071)
Newark(07104)
Newark(07107)
Belleville(07109)
Nutley(07110)
Clara Maass NJ
2013 2014 2015 2016
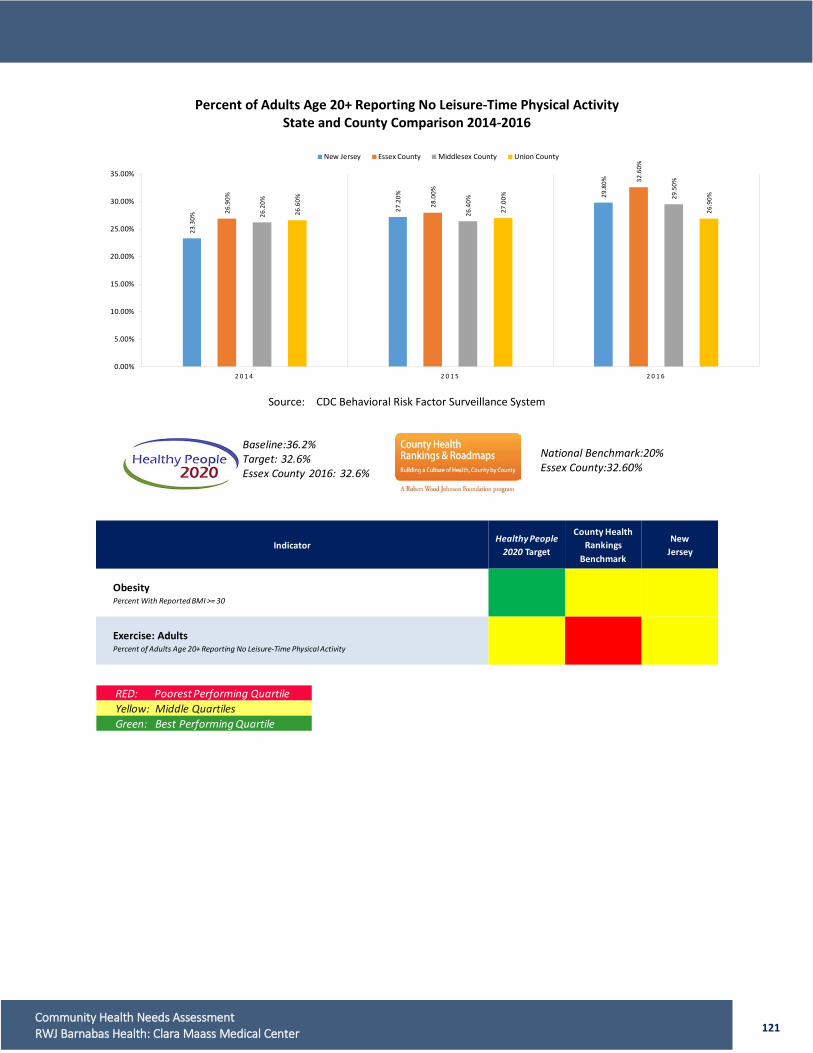
121 Community Health Needs Assessment RWJ Barnabas Health: Clara Maass Medical Center
Percent of Adults Age 20+ Reporting No Leisure-Time Physical Activity State and County Comparison 2014-2016
Source: CDC Behavioral Risk Factor Surveillance System
IndicatorHealthy People
2020 Target
County Health Rankings
Benchmark
NewJersey
ObesityPercent With Reported BMI >= 30
Exercise: AdultsPercent of Adults Age 20+ Reporting No Leisure-Time Physical Activity
RED: Poorest Performing QuartileYellow: Middle QuartilesGreen: Best Performing Quartile
23.3
0%
27.2
0% 29.8
0%
26.9
0%
28.0
0%
32.6
0%
26.2
0%
26.4
0% 29.5
0%
26.6
0%
27.0
0%
26.9
0%
0.00%
5.00%
10.00%
15.00%
20.00%
25.00%
30.00%
35.00%
2 0 1 4 2 0 1 5 2 0 1 6
New Jersey Essex County Middlesex County Union County
Baseline:36.2%Target: 32.6%Essex County 2016: 32.6%
National Benchmark:20% Essex County:32.60%
122 Community Health Needs Assessment RWJ Barnabas Health: Clara Maass Medical Center
Health Screenings Screening tests can detect disease and conditions in early stages, when they may be easier to treat. Cancer Screening Breast Cancer (mammography) According to the American Cancer Association, women ages 40 to 44 should have the choice to start annual breast cancer screening with mammograms (x-rays of the breast) if they wish to do so. Women age 45 to 54 should get mammograms every year. Women 55 and older should switch to mammograms every 2 years, or can continue yearly screening. Screening should continue as long as a woman is in good health and is expected to live 10 more years or longer. Women should also know how their breasts normally look and feel and report any breast changes to a health care provider right away. Some women – because of their family history, a genetic tendency, or certain other factors – should be screened with MRIs along with mammograms. The number of women who fall into this category is very small.
• In 2016, 82.7% of Essex County women over age 40 had a mammography within the past two
years, up 31 percentage points since 2012. Compared to all counties statewide, Essex County performs in the top quartile.
• In 2016, Essex County performed in the top quartile in terms of the County Health Ranking benchmark and Healthy People 2020 target.
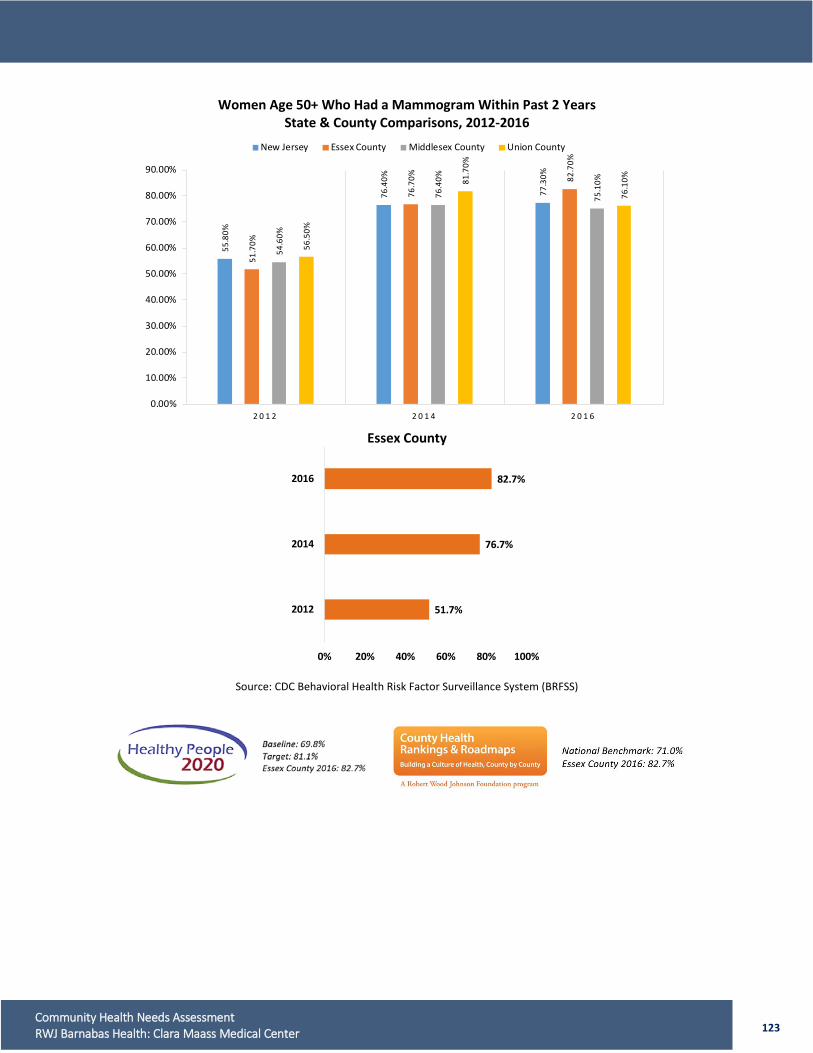
123 Community Health Needs Assessment RWJ Barnabas Health: Clara Maass Medical Center
Women Age 50+ Who Had a Mammogram Within Past 2 Years State & County Comparisons, 2012-2016
Essex County
Source: CDC Behavioral Health Risk Factor Surveillance System (BRFSS)
55.8
0%
76.4
0%
77.3
0%
51.7
0%
76.7
0% 82.7
0%
54.6
0%
76.4
0%
75.1
0%
56.5
0%
81.7
0%
76.1
0%
0.00%
10.00%
20.00%
30.00%
40.00%
50.00%
60.00%
70.00%
80.00%
90.00%
2 0 1 2 2 0 1 4 2 0 1 6
New Jersey Essex County Middlesex County Union County
51.7%
76.7%
82.7%
0% 20% 40% 60% 80% 100%
2012
2014
2016
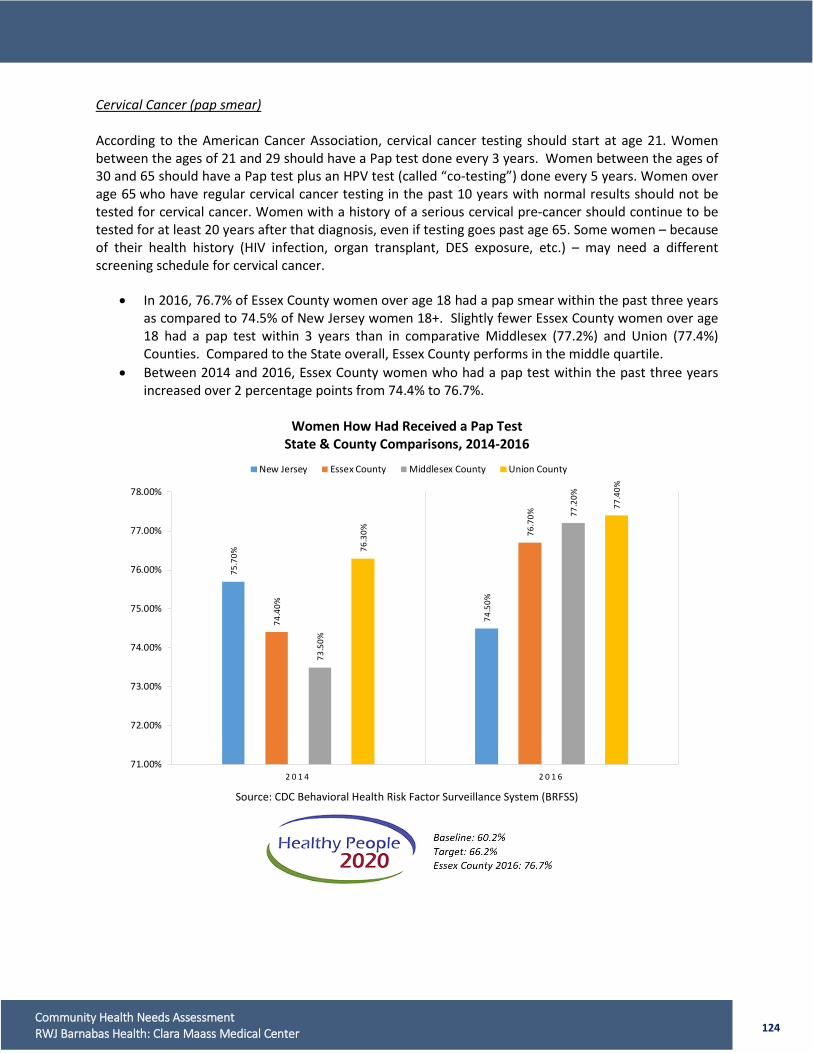
124 Community Health Needs Assessment RWJ Barnabas Health: Clara Maass Medical Center
Cervical Cancer (pap smear) According to the American Cancer Association, cervical cancer testing should start at age 21. Women between the ages of 21 and 29 should have a Pap test done every 3 years. Women between the ages of 30 and 65 should have a Pap test plus an HPV test (called “co-testing”) done every 5 years. Women over age 65 who have regular cervical cancer testing in the past 10 years with normal results should not be tested for cervical cancer. Women with a history of a serious cervical pre-cancer should continue to be tested for at least 20 years after that diagnosis, even if testing goes past age 65. Some women – because of their health history (HIV infection, organ transplant, DES exposure, etc.) – may need a different screening schedule for cervical cancer.
• In 2016, 76.7% of Essex County women over age 18 had a pap smear within the past three years as compared to 74.5% of New Jersey women 18+. Slightly fewer Essex County women over age 18 had a pap test within 3 years than in comparative Middlesex (77.2%) and Union (77.4%) Counties. Compared to the State overall, Essex County performs in the middle quartile.
• Between 2014 and 2016, Essex County women who had a pap test within the past three years increased over 2 percentage points from 74.4% to 76.7%.
Women How Had Received a Pap Test
State & County Comparisons, 2014-2016
Source: CDC Behavioral Health Risk Factor Surveillance System (BRFSS)
75.7
0%
74.5
0%
74.4
0%
76.7
0%
73.5
0%
77.2
0%
76.3
0%
77.4
0%
71.00%
72.00%
73.00%
74.00%
75.00%
76.00%
77.00%
78.00%
2 0 1 4 2 0 1 6
New Jersey Essex County Middlesex County Union County
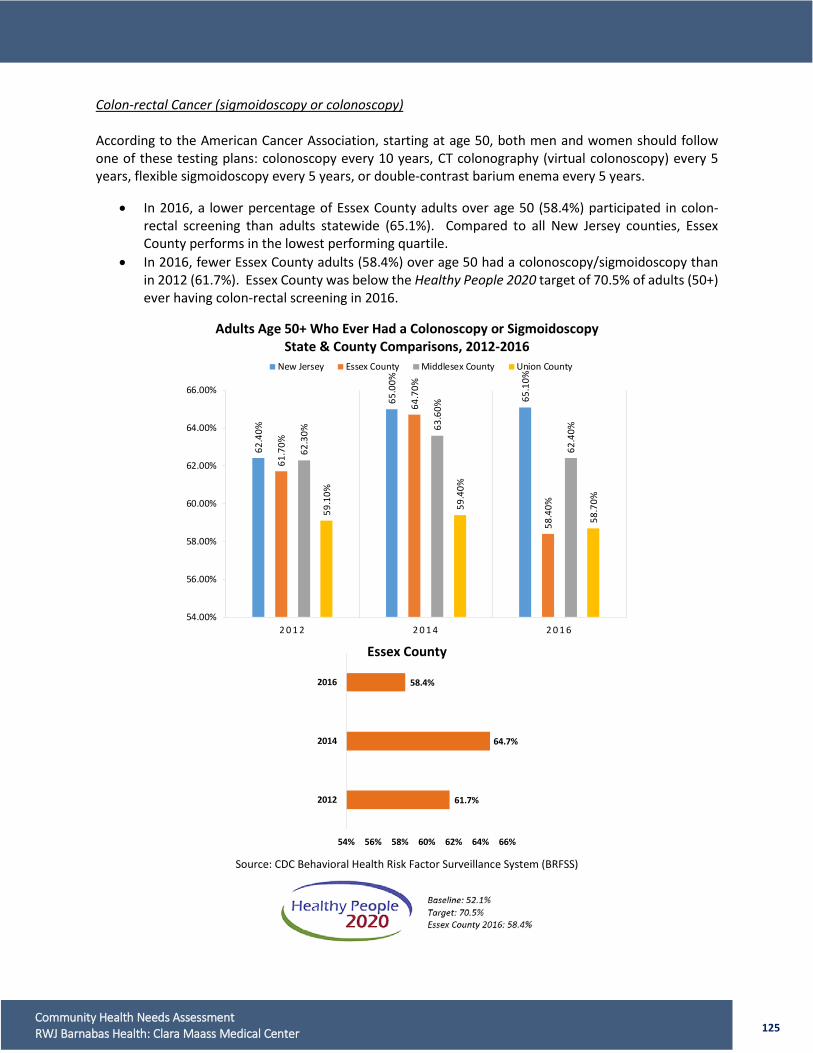
125 Community Health Needs Assessment RWJ Barnabas Health: Clara Maass Medical Center
Colon-rectal Cancer (sigmoidoscopy or colonoscopy) According to the American Cancer Association, starting at age 50, both men and women should follow one of these testing plans: colonoscopy every 10 years, CT colonography (virtual colonoscopy) every 5 years, flexible sigmoidoscopy every 5 years, or double-contrast barium enema every 5 years.
• In 2016, a lower percentage of Essex County adults over age 50 (58.4%) participated in colon-rectal screening than adults statewide (65.1%). Compared to all New Jersey counties, Essex County performs in the lowest performing quartile.
• In 2016, fewer Essex County adults (58.4%) over age 50 had a colonoscopy/sigmoidoscopy than in 2012 (61.7%). Essex County was below the Healthy People 2020 target of 70.5% of adults (50+) ever having colon-rectal screening in 2016.
Adults Age 50+ Who Ever Had a Colonoscopy or Sigmoidoscopy
State & County Comparisons, 2012-2016
Essex County
Source: CDC Behavioral Health Risk Factor Surveillance System (BRFSS)
62.4
0%
65.0
0%
65.1
0%
61.7
0%
64.7
0%
58.4
0%
62.3
0% 63.6
0%
62.4
0%
59.1
0%
59.4
0%
58.7
0%
54.00%
56.00%
58.00%
60.00%
62.00%
64.00%
66.00%
2 0 1 2 2 0 1 4 2 0 1 6
New Jersey Essex County Middlesex County Union County
61.7%
64.7%
58.4%
54% 56% 58% 60% 62% 64% 66%
2012
2014
2016
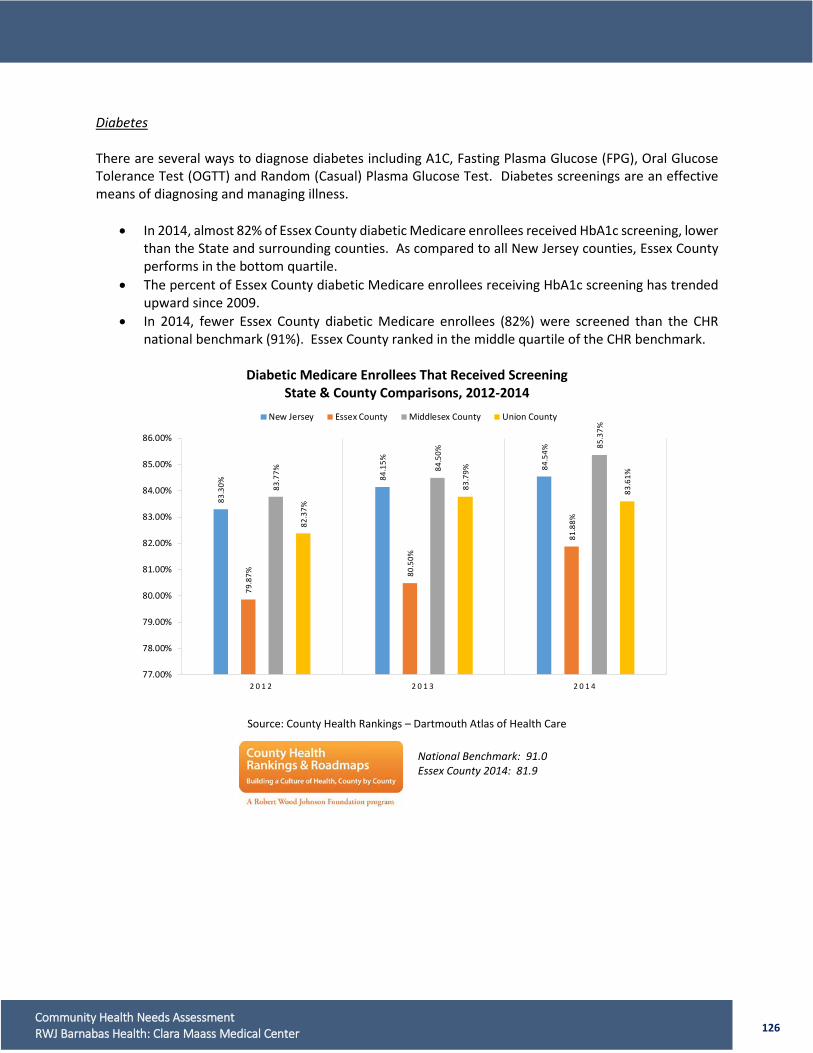
126 Community Health Needs Assessment RWJ Barnabas Health: Clara Maass Medical Center
Diabetes There are several ways to diagnose diabetes including A1C, Fasting Plasma Glucose (FPG), Oral Glucose Tolerance Test (OGTT) and Random (Casual) Plasma Glucose Test. Diabetes screenings are an effective means of diagnosing and managing illness.
• In 2014, almost 82% of Essex County diabetic Medicare enrollees received HbA1c screening, lower than the State and surrounding counties. As compared to all New Jersey counties, Essex County performs in the bottom quartile.
• The percent of Essex County diabetic Medicare enrollees receiving HbA1c screening has trended upward since 2009.
• In 2014, fewer Essex County diabetic Medicare enrollees (82%) were screened than the CHR national benchmark (91%). Essex County ranked in the middle quartile of the CHR benchmark.
Diabetic Medicare Enrollees That Received Screening
State & County Comparisons, 2012-2014
Source: County Health Rankings – Dartmouth Atlas of Health Care
83.3
0%
84.1
5%
84.5
4%
79.8
7% 80.5
0%
81.8
8%
83.7
7% 84.5
0%
85.3
7%
82.3
7%
83.7
9%
83.6
1%
77.00%
78.00%
79.00%
80.00%
81.00%
82.00%
83.00%
84.00%
85.00%
86.00%
2 0 1 2 2 0 1 3 2 0 1 4
New Jersey Essex County Middlesex County Union County
National Benchmark: 91.0 Essex County 2014: 81.9
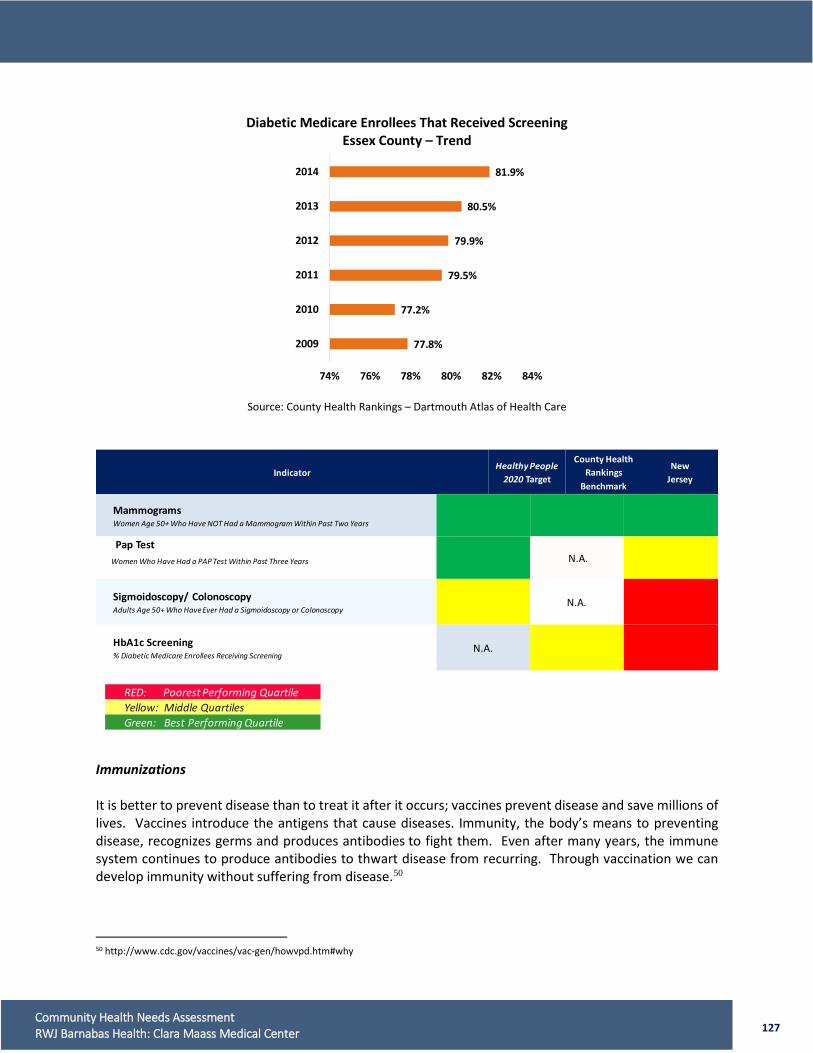
127 Community Health Needs Assessment RWJ Barnabas Health: Clara Maass Medical Center
Diabetic Medicare Enrollees That Received Screening
Essex County – Trend
Source: County Health Rankings – Dartmouth Atlas of Health Care
Immunizations It is better to prevent disease than to treat it after it occurs; vaccines prevent disease and save millions of lives. Vaccines introduce the antigens that cause diseases. Immunity, the body’s means to preventing disease, recognizes germs and produces antibodies to fight them. Even after many years, the immune system continues to produce antibodies to thwart disease from recurring. Through vaccination we can develop immunity without suffering from disease.50
50 http://www.cdc.gov/vaccines/vac-gen/howvpd.htm#why
IndicatorHealthy People
2020 Target
County Health Rankings
Benchmark
NewJersey
MammogramsWomen Age 50+ Who Have NOT Had a Mammogram Within Past Two Years
Pap TestWomen Who Have Had a PAP Test Within Past Three Years N.A.
Sigmoidoscopy/ ColonoscopyAdults Age 50+ Who Have Ever Had a Sigmoidoscopy or Colonoscopy
N.A.
HbA1c Screening% Diabetic Medicare Enrollees Receiving Screening
N.A.
77.8%
77.2%
79.5%
79.9%
80.5%
81.9%
74% 76% 78% 80% 82% 84%
2009
2010
2011
2012
2013
2014
RED: Poorest Performing QuartileYellow: Middle QuartilesGreen: Best Performing Quartile
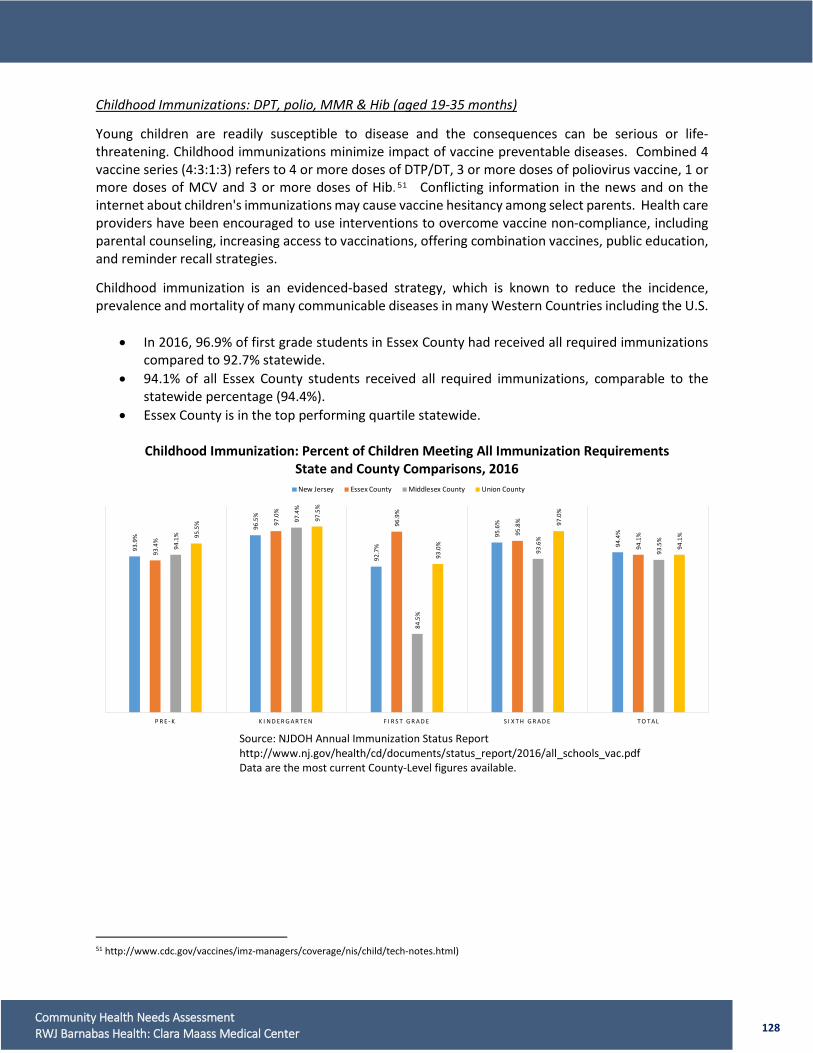
128 Community Health Needs Assessment RWJ Barnabas Health: Clara Maass Medical Center
Childhood Immunizations: DPT, polio, MMR & Hib (aged 19-35 months)
Young children are readily susceptible to disease and the consequences can be serious or life-threatening. Childhood immunizations minimize impact of vaccine preventable diseases. Combined 4 vaccine series (4:3:1:3) refers to 4 or more doses of DTP/DT, 3 or more doses of poliovirus vaccine, 1 or more doses of MCV and 3 or more doses of Hib.51 Conflicting information in the news and on the internet about children's immunizations may cause vaccine hesitancy among select parents. Health care providers have been encouraged to use interventions to overcome vaccine non-compliance, including parental counseling, increasing access to vaccinations, offering combination vaccines, public education, and reminder recall strategies.
Childhood immunization is an evidenced-based strategy, which is known to reduce the incidence, prevalence and mortality of many communicable diseases in many Western Countries including the U.S.
• In 2016, 96.9% of first grade students in Essex County had received all required immunizations compared to 92.7% statewide.
• 94.1% of all Essex County students received all required immunizations, comparable to the statewide percentage (94.4%).
• Essex County is in the top performing quartile statewide.
Childhood Immunization: Percent of Children Meeting All Immunization Requirements State and County Comparisons, 2016
Source: NJDOH Annual Immunization Status Report http://www.nj.gov/health/cd/documents/status_report/2016/all_schools_vac.pdf Data are the most current County-Level figures available.
51 http://www.cdc.gov/vaccines/imz-managers/coverage/nis/child/tech-notes.html)
93.9
%
96.5
%
92.7
%
95.6
%
94.4
%
93.4
%
97.0
%
96.9
%
95.8
%
94.1
%
94.1
%
97.4
%
84.5
%
93.6
%
93.5
%95.5
% 97.5
%
93.0
%
97.0
%
94.1
%
P R E - K K I N D E R G A R T E N F I R S T G R A D E S I X T H G R A D E T O T A L
New Jersey Essex County Middlesex County Union County
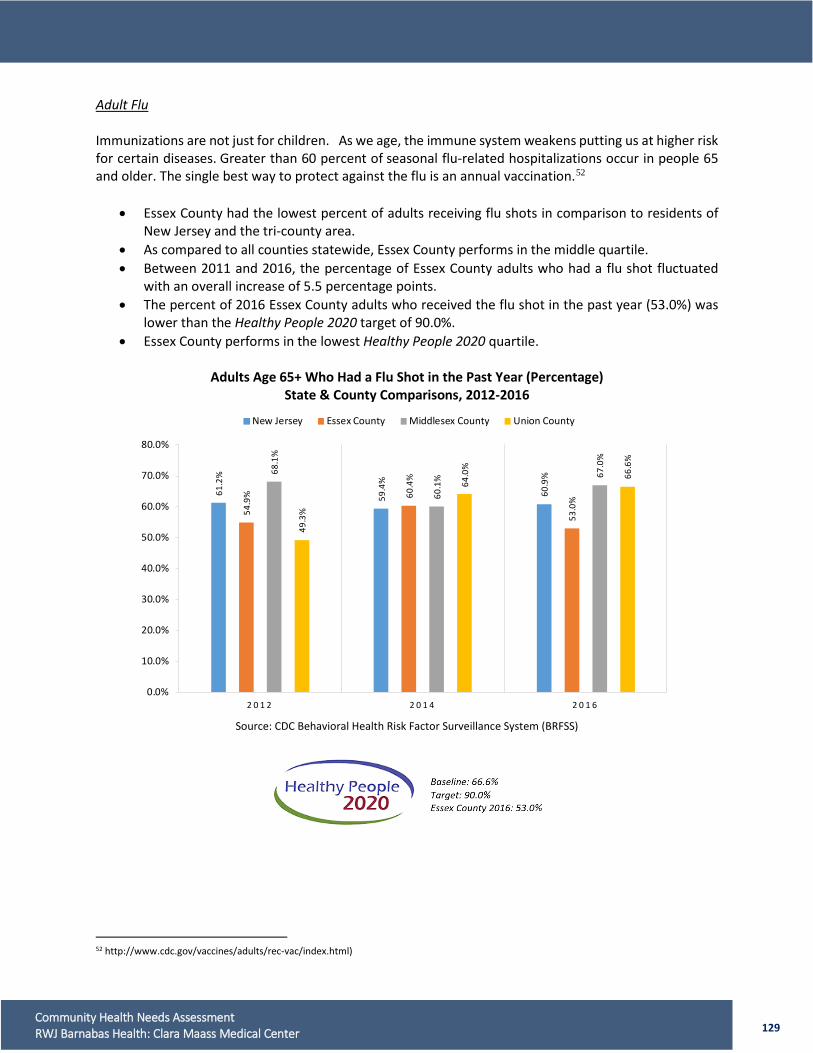
129 Community Health Needs Assessment RWJ Barnabas Health: Clara Maass Medical Center
Adult Flu Immunizations are not just for children. As we age, the immune system weakens putting us at higher risk for certain diseases. Greater than 60 percent of seasonal flu-related hospitalizations occur in people 65 and older. The single best way to protect against the flu is an annual vaccination.52
• Essex County had the lowest percent of adults receiving flu shots in comparison to residents of New Jersey and the tri-county area.
• As compared to all counties statewide, Essex County performs in the middle quartile. • Between 2011 and 2016, the percentage of Essex County adults who had a flu shot fluctuated
with an overall increase of 5.5 percentage points. • The percent of 2016 Essex County adults who received the flu shot in the past year (53.0%) was
lower than the Healthy People 2020 target of 90.0%. • Essex County performs in the lowest Healthy People 2020 quartile.
Adults Age 65+ Who Had a Flu Shot in the Past Year (Percentage)
State & County Comparisons, 2012-2016
Source: CDC Behavioral Health Risk Factor Surveillance System (BRFSS)
52 http://www.cdc.gov/vaccines/adults/rec-vac/index.html)
61.2
%
59.4
%
60.9
%
54.9
% 60.4
%
53.0
%
68.1
%
60.1
% 67.0
%
49.3
%
64.0
%
66.6
%
0.0%
10.0%
20.0%
30.0%
40.0%
50.0%
60.0%
70.0%
80.0%
2 0 1 2 2 0 1 4 2 0 1 6
New Jersey Essex County Middlesex County Union County
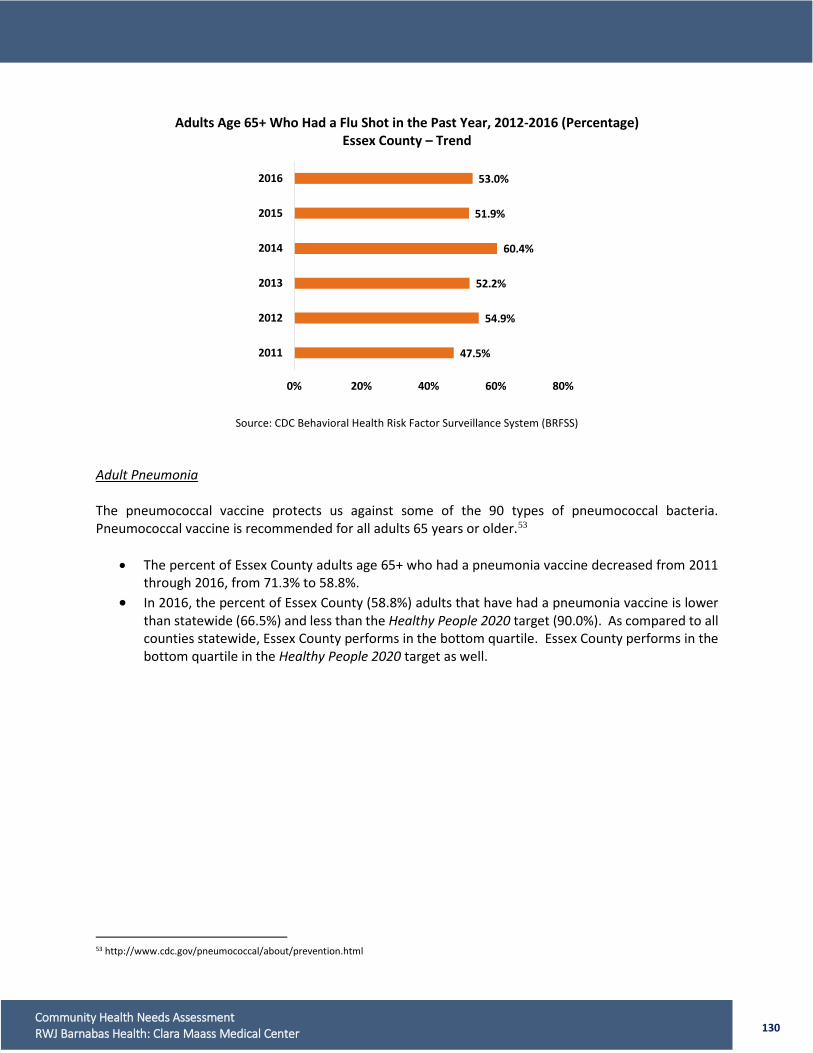
130 Community Health Needs Assessment RWJ Barnabas Health: Clara Maass Medical Center
Adults Age 65+ Who Had a Flu Shot in the Past Year, 2012-2016 (Percentage)
Essex County – Trend
Source: CDC Behavioral Health Risk Factor Surveillance System (BRFSS) Adult Pneumonia The pneumococcal vaccine protects us against some of the 90 types of pneumococcal bacteria. Pneumococcal vaccine is recommended for all adults 65 years or older.53
• The percent of Essex County adults age 65+ who had a pneumonia vaccine decreased from 2011 through 2016, from 71.3% to 58.8%.
• In 2016, the percent of Essex County (58.8%) adults that have had a pneumonia vaccine is lower than statewide (66.5%) and less than the Healthy People 2020 target (90.0%). As compared to all counties statewide, Essex County performs in the bottom quartile. Essex County performs in the bottom quartile in the Healthy People 2020 target as well.
53 http://www.cdc.gov/pneumococcal/about/prevention.html
47.5%
54.9%
52.2%
60.4%
51.9%
53.0%
0% 20% 40% 60% 80%
2011
2012
2013
2014
2015
2016
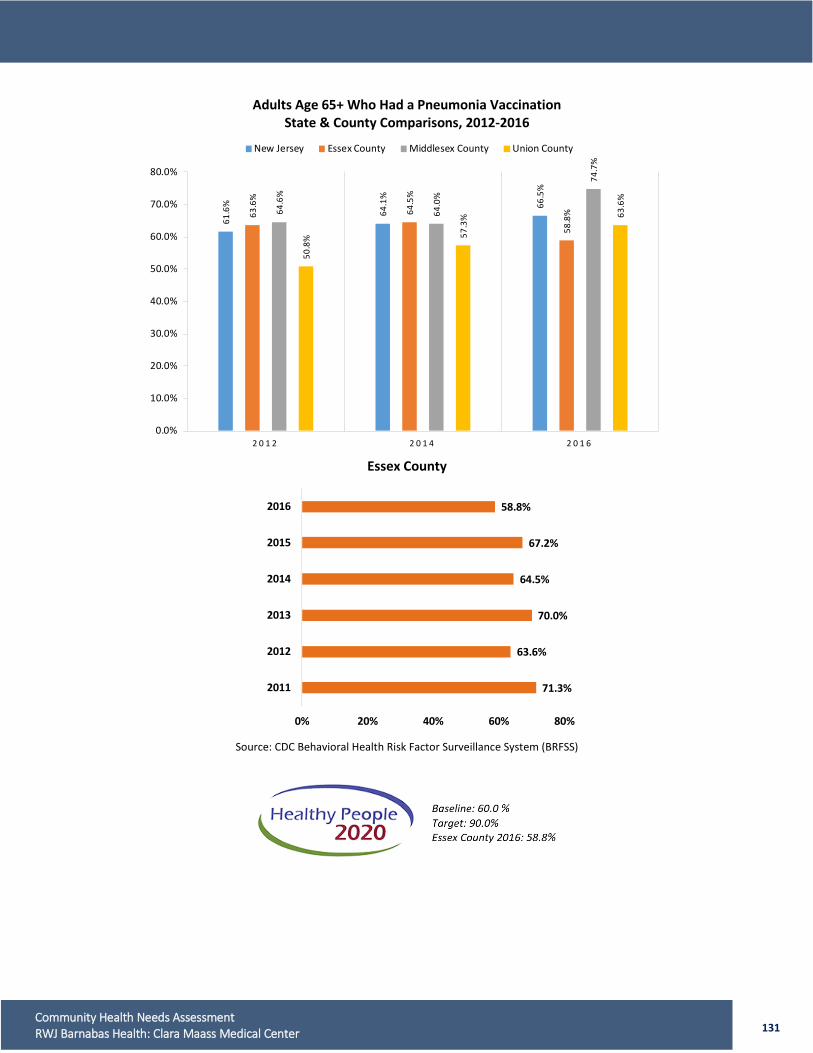
131 Community Health Needs Assessment RWJ Barnabas Health: Clara Maass Medical Center
Adults Age 65+ Who Had a Pneumonia Vaccination State & County Comparisons, 2012-2016
Essex County
Source: CDC Behavioral Health Risk Factor Surveillance System (BRFSS)
61.6
%
64.1
%
66.5
%
63.6
%
64.5
%
58.8
%64.6
%
64.0
%
74.7
%
50.8
% 57.3
% 63.6
%
0.0%
10.0%
20.0%
30.0%
40.0%
50.0%
60.0%
70.0%
80.0%
2 0 1 2 2 0 1 4 2 0 1 6
New Jersey Essex County Middlesex County Union County
71.3%
63.6%
70.0%
64.5%
67.2%
58.8%
0% 20% 40% 60% 80%
2011
2012
2013
2014
2015
2016

132 Community Health Needs Assessment RWJ Barnabas Health: Clara Maass Medical Center
• In 2016, Newark 07107 residents who used a hospital service had the highest rate of pneumonia (7.34/1,000) and Nutley at 3.34/1,000 was the lowest as compared to all geographies.
Acute Care IP, Same Day and ED Discharges; Rate / 1,000 Population: Pneumonia
Source: NJ UB-04 Acute Care IP, Same Day Stay, ER Discharges (2013 – 2016), Population: 2010, 2016 Claritas/HCDA, 2011 Straight Line Value Based on 2000 and 2010 Census Definition: Inpatient, Same Day Stay and ED Discharges – For MS-DRGs 177, 178, 179, 193, 194, 195
4. Behavioral Health Utilization Mental Health
• In 2016, Essex County (7.21/1,000) had the highest rate of residents with an inpatient hospitalization for a mental health condition across all age cohorts, as compared to the State and comparison counties.
• Within Essex County, by age cohort in 2016, adults 18-64 (9.30/1,000) had the highest rate of mental/behavioral health inpatient hospital admissions compared to older adults 65+ (4.63/1,000) and children (3.13/1,000).
• Essex County had slightly fewer patient hospitalizations for mental/behavioral health conditions in 2016 (7.21/1,000) than in 2012 (7.48/1,000).
4.84
3.90
3.06 3.79
3.86
2.69
6.25
5.05
4.99
3.16 4.
37 5.41
4.22
3.90
2.56 3.
70
3.52
2.90 4.
83
4.95
4.20
3.28 3.96 4.
97
4.44
4.02
3.69
3.49
3.17
2.96 5.
12
4.72
4.19
2.81 3.
97 5.075.60
3.66
3.48 4.28
3.72 3.95 6.
72
7.34
5.04
3.34 4.
86 5.84
0.00
5.00
10.00
Essex County Bloomfield(07003)
Harrison(07029)
NorthArlington(07031)
Kearny(07032)
Lyndhurst(07071)
Newark(07104)
Newark(07107)
Belleville(07109)
Nutley(07110)
Clara Maass NJ
2013 2014 2015 2016
IndicatorHealthy People
2020 Target
County Health Rankings
Benchmark
NewJersey
Flu ShotAdults Age 65+ Who Have NOT Had a Flu Shot in the Past Year %No
N.A
Pneumonia VaccinationAdults Age 65+ Who Have NOT Ever Had a Pneumonia Vaccination%Never
N.A.
Children Meeting All Immunization Requirements N.A. N.A.
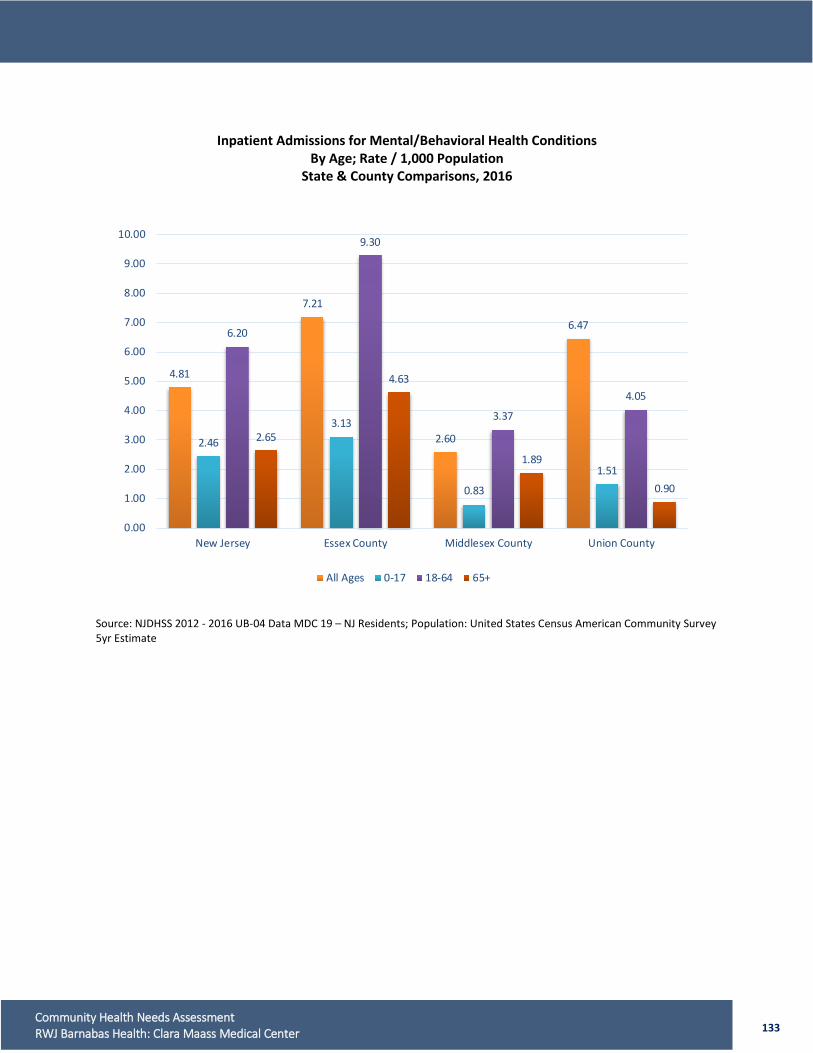
133 Community Health Needs Assessment RWJ Barnabas Health: Clara Maass Medical Center
Inpatient Admissions for Mental/Behavioral Health Conditions By Age; Rate / 1,000 Population
State & County Comparisons, 2016
Source: NJDHSS 2012 - 2016 UB-04 Data MDC 19 – NJ Residents; Population: United States Census American Community Survey 5yr Estimate
4.81
7.21
2.60
6.47
2.46
3.13
0.83
1.51
6.20
9.30
3.37
4.05
2.65
4.63
1.89
0.90
0.00
1.00
2.00
3.00
4.00
5.00
6.00
7.00
8.00
9.00
10.00
New Jersey Essex County Middlesex County Union County
All Ages 0-17 18-64 65+
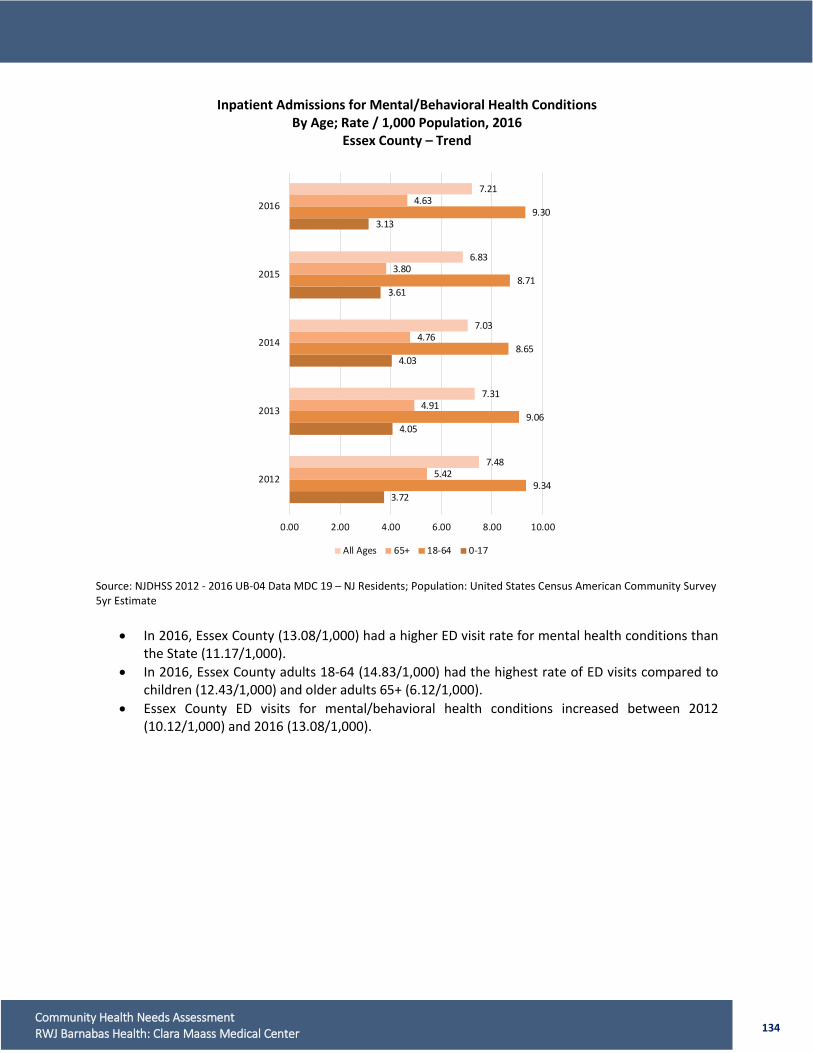
134 Community Health Needs Assessment RWJ Barnabas Health: Clara Maass Medical Center
Inpatient Admissions for Mental/Behavioral Health Conditions By Age; Rate / 1,000 Population, 2016
Essex County – Trend
Source: NJDHSS 2012 - 2016 UB-04 Data MDC 19 – NJ Residents; Population: United States Census American Community Survey 5yr Estimate
• In 2016, Essex County (13.08/1,000) had a higher ED visit rate for mental health conditions than the State (11.17/1,000).
• In 2016, Essex County adults 18-64 (14.83/1,000) had the highest rate of ED visits compared to children (12.43/1,000) and older adults 65+ (6.12/1,000).
• Essex County ED visits for mental/behavioral health conditions increased between 2012 (10.12/1,000) and 2016 (13.08/1,000).
3.72
4.05
4.03
3.61
3.13
9.34
9.06
8.65
8.71
9.30
5.42
4.91
4.76
3.80
4.63
7.48
7.31
7.03
6.83
7.21
0.00 2.00 4.00 6.00 8.00 10.00
2012
2013
2014
2015
2016
All Ages 65+ 18-64 0-17
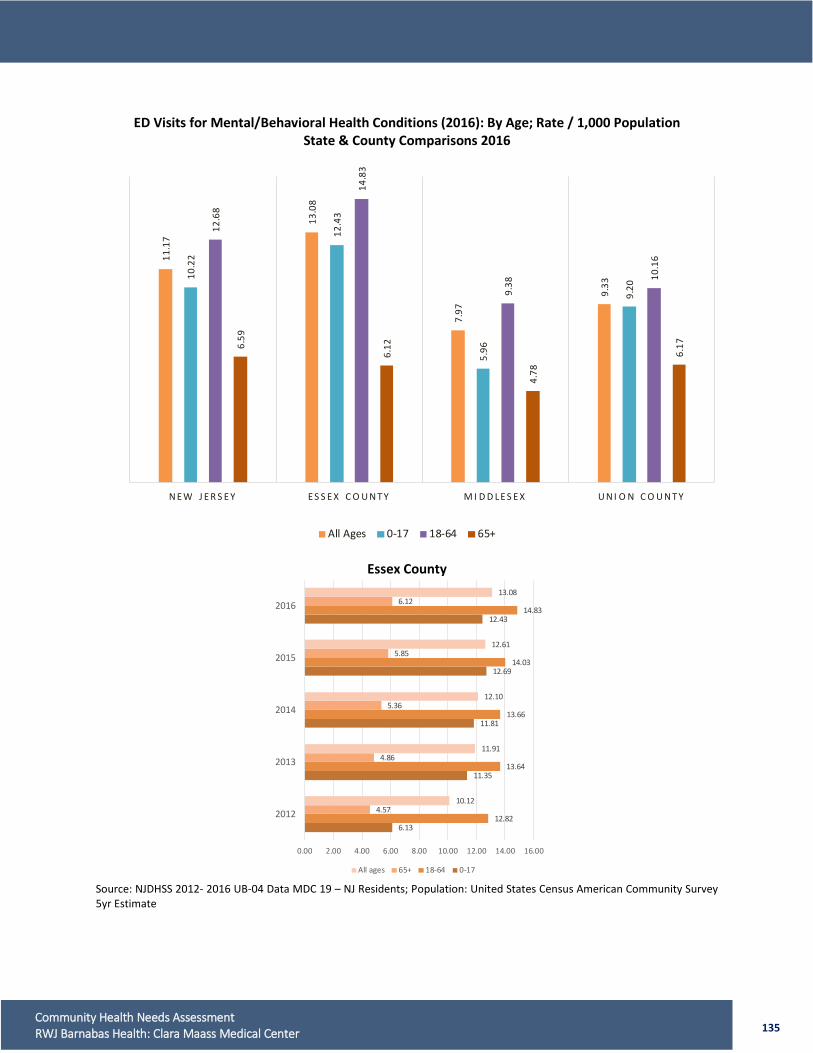
135 Community Health Needs Assessment RWJ Barnabas Health: Clara Maass Medical Center
ED Visits for Mental/Behavioral Health Conditions (2016): By Age; Rate / 1,000 Population
State & County Comparisons 2016
Essex County Source: NJDHSS 2012- 2016 UB-04 Data MDC 19 – NJ Residents; Population: United States Census American Community Survey 5yr Estimate
11.1
7
13.0
8
7.97
9.33
10.2
2
12.4
3
5.96
9.20
12.6
8
14.8
3
9.38
10.1
6
6.59
6.12
4.78
6.17
N E W J E R S E Y E S S E X C O U N T Y M I D D L E S E X U N I O N C O U N T Y
All Ages 0-17 18-64 65+
6.13
11.35
11.81
12.69
12.43
12.82
13.64
13.66
14.03
14.83
4.57
4.86
5.36
5.85
6.12
10.12
11.91
12.10
12.61
13.08
0.00 2.00 4.00 6.00 8.00 10.00 12.00 14.00 16.00
2012
2013
2014
2015
2016
All ages 65+ 18-64 0-17
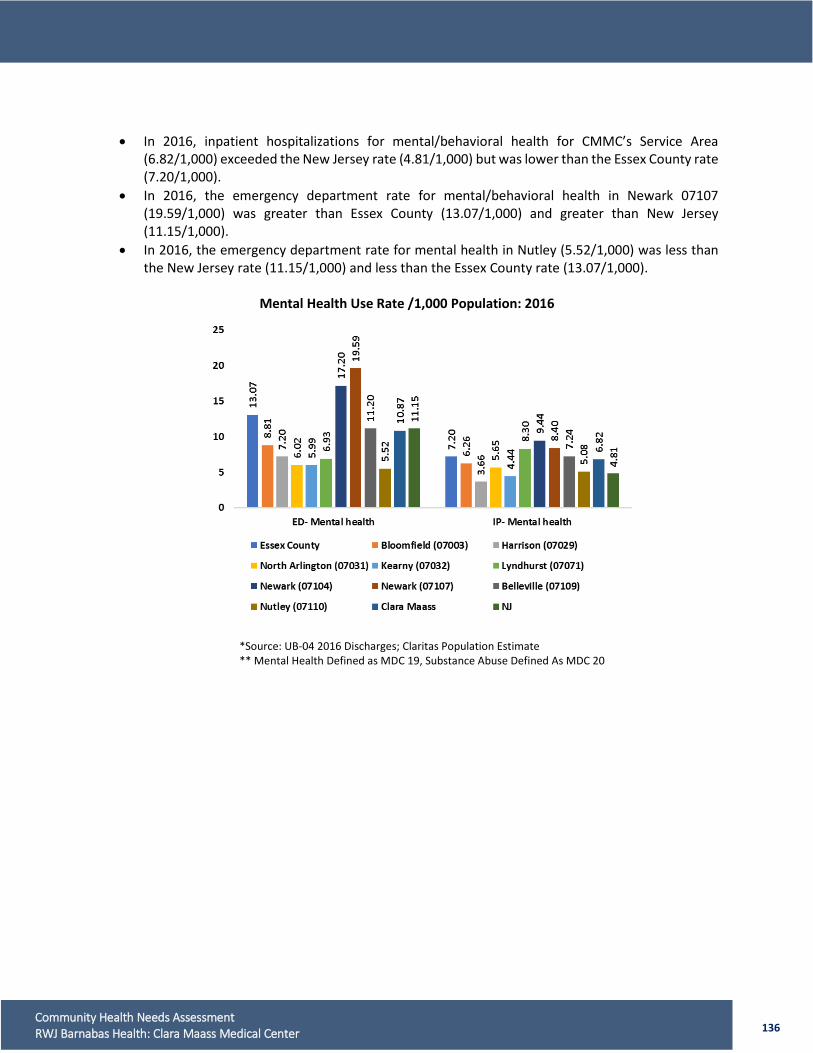
136 Community Health Needs Assessment RWJ Barnabas Health: Clara Maass Medical Center
• In 2016, inpatient hospitalizations for mental/behavioral health for CMMC’s Service Area (6.82/1,000) exceeded the New Jersey rate (4.81/1,000) but was lower than the Essex County rate (7.20/1,000).
• In 2016, the emergency department rate for mental/behavioral health in Newark 07107 (19.59/1,000) was greater than Essex County (13.07/1,000) and greater than New Jersey (11.15/1,000).
• In 2016, the emergency department rate for mental health in Nutley (5.52/1,000) was less than the New Jersey rate (11.15/1,000) and less than the Essex County rate (13.07/1,000).
Mental Health Use Rate /1,000 Population: 2016
*Source: UB-04 2016 Discharges; Claritas Population Estimate ** Mental Health Defined as MDC 19, Substance Abuse Defined As MDC 20
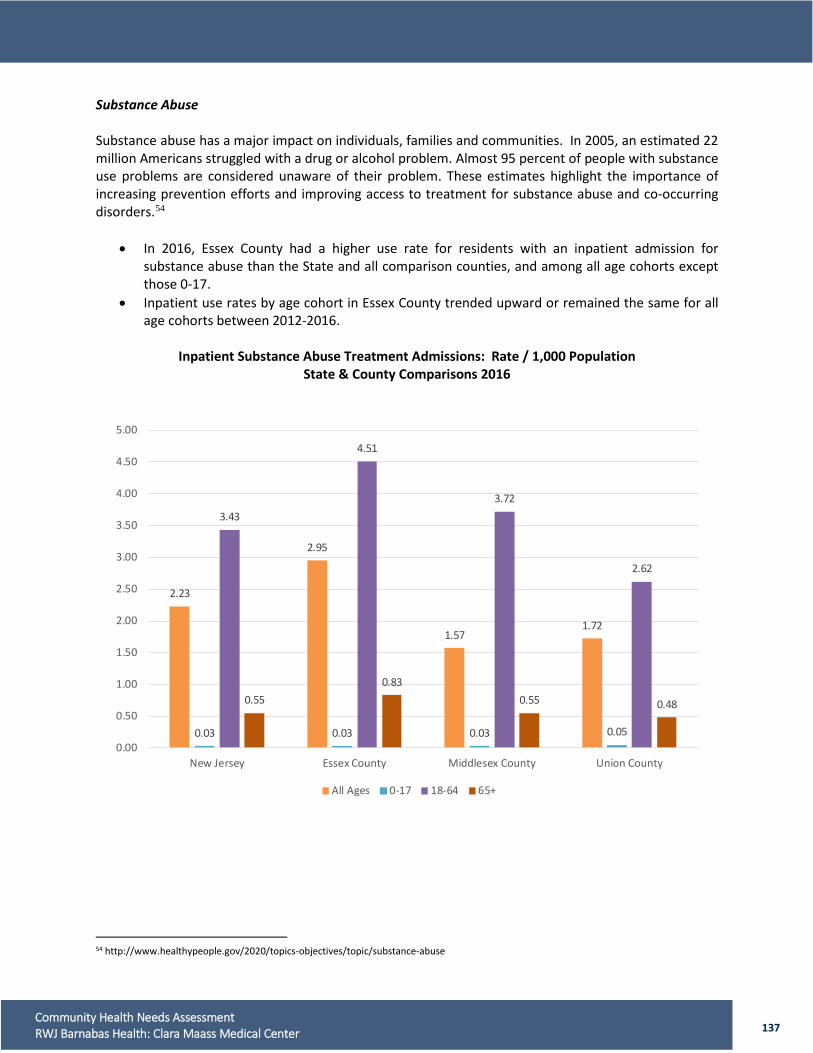
137 Community Health Needs Assessment RWJ Barnabas Health: Clara Maass Medical Center
Substance Abuse Substance abuse has a major impact on individuals, families and communities. In 2005, an estimated 22 million Americans struggled with a drug or alcohol problem. Almost 95 percent of people with substance use problems are considered unaware of their problem. These estimates highlight the importance of increasing prevention efforts and improving access to treatment for substance abuse and co-occurring disorders.54
• In 2016, Essex County had a higher use rate for residents with an inpatient admission for substance abuse than the State and all comparison counties, and among all age cohorts except those 0-17.
• Inpatient use rates by age cohort in Essex County trended upward or remained the same for all age cohorts between 2012-2016.
Inpatient Substance Abuse Treatment Admissions: Rate / 1,000 Population
State & County Comparisons 2016
54 http://www.healthypeople.gov/2020/topics-objectives/topic/substance-abuse
2.23
2.95
1.571.72
0.03 0.03 0.03 0.05
3.43
4.51
3.72
2.62
0.550.83
0.55 0.48
0.00
0.50
1.00
1.50
2.00
2.50
3.00
3.50
4.00
4.50
5.00
New Jersey Essex County Middlesex County Union County
All Ages 0-17 18-64 65+
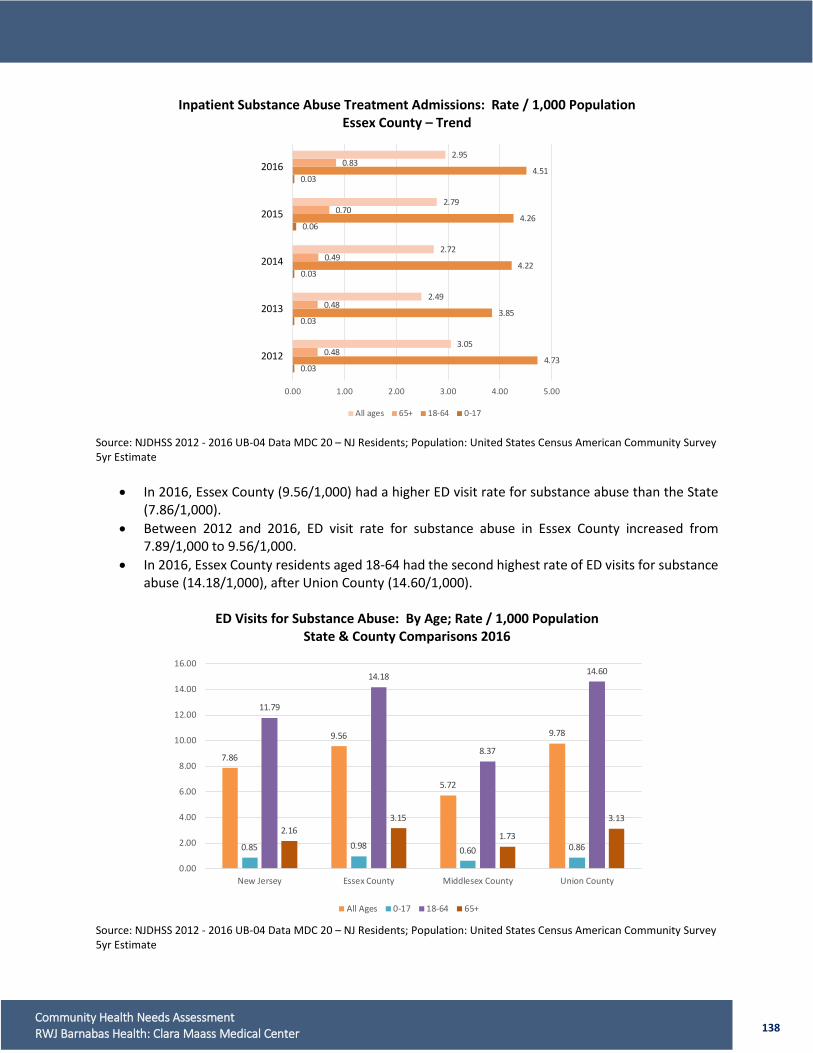
138 Community Health Needs Assessment RWJ Barnabas Health: Clara Maass Medical Center
Inpatient Substance Abuse Treatment Admissions: Rate / 1,000 Population Essex County – Trend
Source: NJDHSS 2012 - 2016 UB-04 Data MDC 20 – NJ Residents; Population: United States Census American Community Survey 5yr Estimate
• In 2016, Essex County (9.56/1,000) had a higher ED visit rate for substance abuse than the State (7.86/1,000).
• Between 2012 and 2016, ED visit rate for substance abuse in Essex County increased from 7.89/1,000 to 9.56/1,000.
• In 2016, Essex County residents aged 18-64 had the second highest rate of ED visits for substance abuse (14.18/1,000), after Union County (14.60/1,000).
ED Visits for Substance Abuse: By Age; Rate / 1,000 Population
State & County Comparisons 2016
Source: NJDHSS 2012 - 2016 UB-04 Data MDC 20 – NJ Residents; Population: United States Census American Community Survey 5yr Estimate
0.03
0.03
0.03
0.06
0.03
4.73
3.85
4.22
4.26
4.51
0.48
0.48
0.49
0.70
0.83
3.05
2.49
2.72
2.79
2.95
0.00 1.00 2.00 3.00 4.00 5.00
2012
2013
2014
2015
2016
All ages 65+ 18-64 0-17
7.86
9.56
5.72
9.78
0.85 0.98 0.60 0.86
11.79
14.18
8.37
14.60
2.163.15
1.73
3.13
0.00
2.00
4.00
6.00
8.00
10.00
12.00
14.00
16.00
New Jersey Essex County Middlesex County Union County
All Ages 0-17 18-64 65+
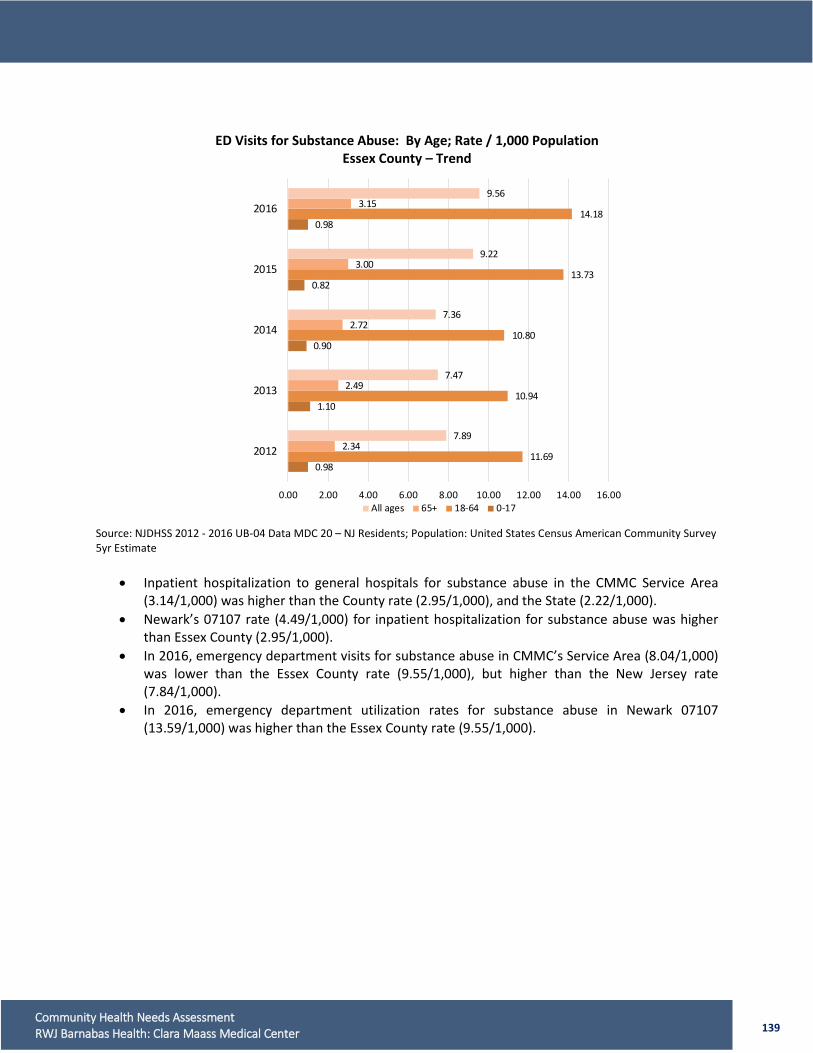
139 Community Health Needs Assessment RWJ Barnabas Health: Clara Maass Medical Center
ED Visits for Substance Abuse: By Age; Rate / 1,000 Population Essex County – Trend
Source: NJDHSS 2012 - 2016 UB-04 Data MDC 20 – NJ Residents; Population: United States Census American Community Survey 5yr Estimate
• Inpatient hospitalization to general hospitals for substance abuse in the CMMC Service Area (3.14/1,000) was higher than the County rate (2.95/1,000), and the State (2.22/1,000).
• Newark’s 07107 rate (4.49/1,000) for inpatient hospitalization for substance abuse was higher than Essex County (2.95/1,000).
• In 2016, emergency department visits for substance abuse in CMMC’s Service Area (8.04/1,000) was lower than the Essex County rate (9.55/1,000), but higher than the New Jersey rate (7.84/1,000).
• In 2016, emergency department utilization rates for substance abuse in Newark 07107 (13.59/1,000) was higher than the Essex County rate (9.55/1,000).
0.98
1.10
0.90
0.82
0.98
11.69
10.94
10.80
13.73
14.18
2.34
2.49
2.72
3.00
3.15
7.89
7.47
7.36
9.22
9.56
0.00 2.00 4.00 6.00 8.00 10.00 12.00 14.00 16.00
2012
2013
2014
2015
2016
All ages 65+ 18-64 0-17
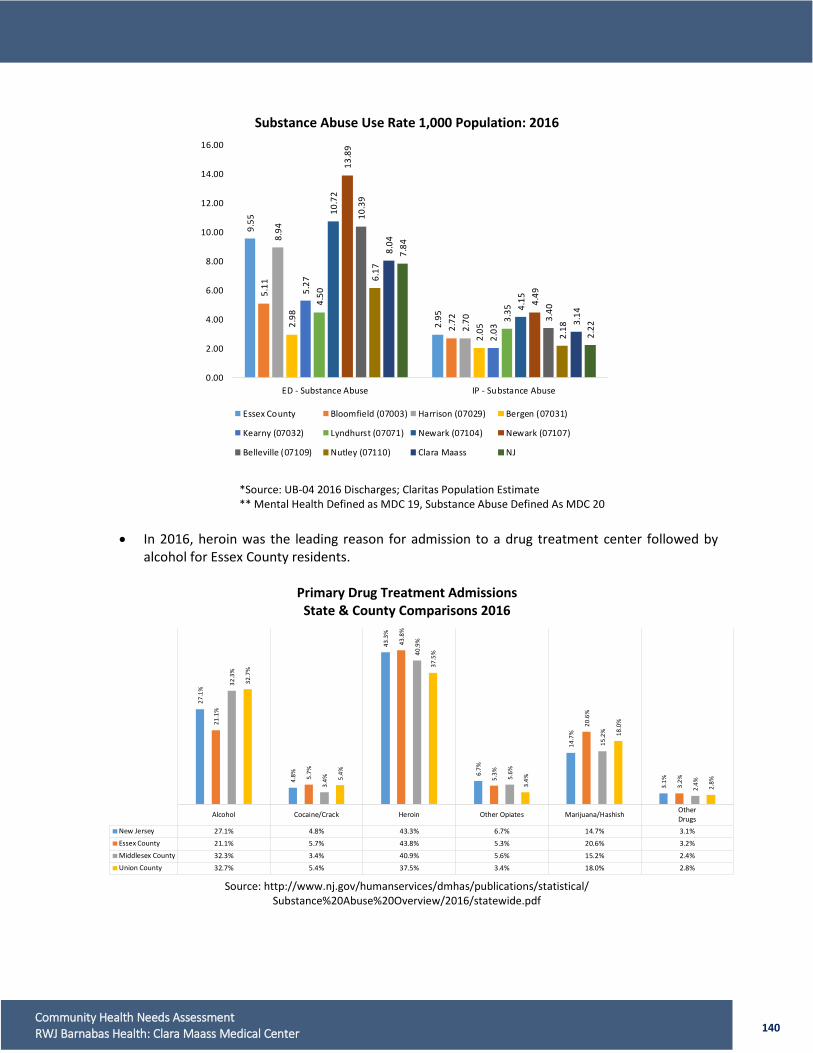
140 Community Health Needs Assessment RWJ Barnabas Health: Clara Maass Medical Center
Substance Abuse Use Rate 1,000 Population: 2016
*Source: UB-04 2016 Discharges; Claritas Population Estimate ** Mental Health Defined as MDC 19, Substance Abuse Defined As MDC 20
• In 2016, heroin was the leading reason for admission to a drug treatment center followed by
alcohol for Essex County residents.
Primary Drug Treatment Admissions State & County Comparisons 2016
Source: http://www.nj.gov/humanservices/dmhas/publications/statistical/
Substance%20Abuse%20Overview/2016/statewide.pdf
9.55
2.95
5.11
2.72
8.94
2.702.98
2.05
5.27
2.03
4.50
3.35
10.7
2
4.15
13.8
9
4.49
10.3
9
3.40
6.17
2.18
8.04
3.14
7.84
2.22
0.00
2.00
4.00
6.00
8.00
10.00
12.00
14.00
16.00
ED - Substance Abuse IP - Substance Abuse
Essex County Bloomfield (07003) Harrison (07029) Bergen (07031)
Kearny (07032) Lyndhurst (07071) Newark (07104) Newark (07107)
Belleville (07109) Nutley (07110) Clara Maass NJ
Alcohol Cocaine/Crack Heroin Other Opiates Marijuana/Hashish OtherDrugs
New Jersey 27.1% 4.8% 43.3% 6.7% 14.7% 3.1%Essex County 21.1% 5.7% 43.8% 5.3% 20.6% 3.2%Middlesex County 32.3% 3.4% 40.9% 5.6% 15.2% 2.4%Union County 32.7% 5.4% 37.5% 3.4% 18.0% 2.8%
27.1
%
4.8%
43.3
%
6.7%
14.7
%
3.1%
21.1
%
5.7%
43.8
%
5.3%
20.6
%
3.2%
32.3
%
3.4%
40.9
%
5.6%
15.2
%
2.4%
32.7
%
5.4%
37.5
%
3.4%
18.0
%
2.8%
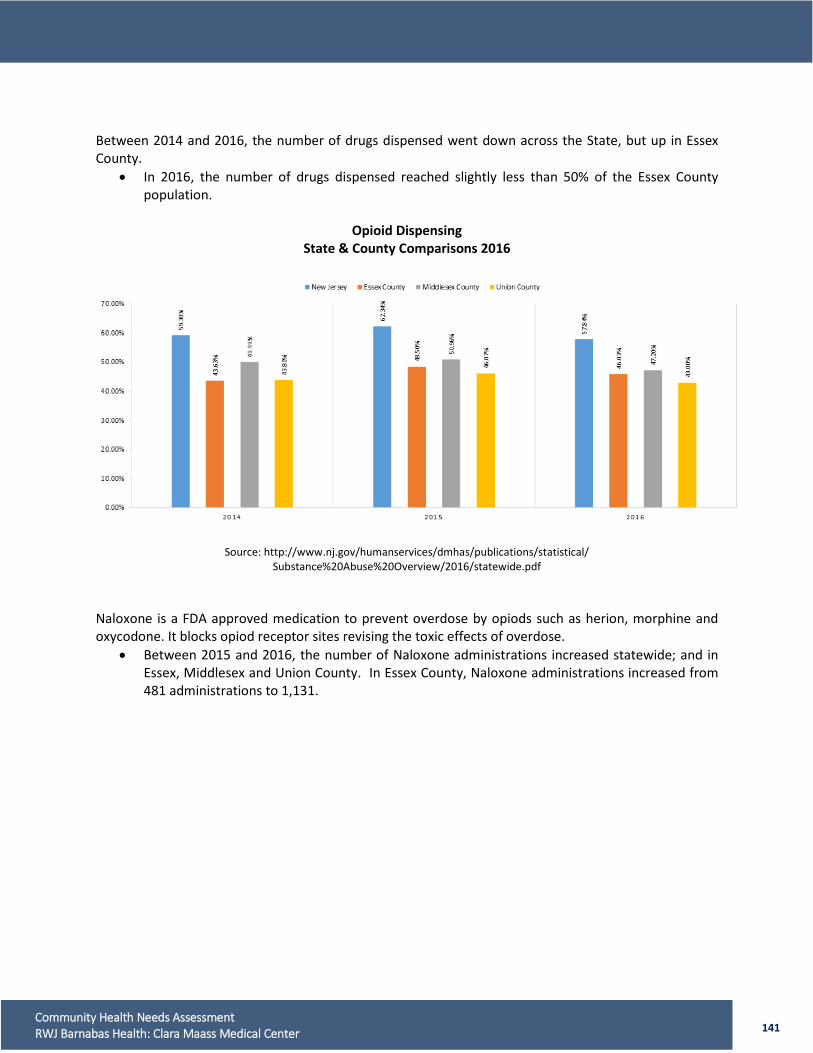
141 Community Health Needs Assessment RWJ Barnabas Health: Clara Maass Medical Center
Between 2014 and 2016, the number of drugs dispensed went down across the State, but up in Essex County.
• In 2016, the number of drugs dispensed reached slightly less than 50% of the Essex County population.
Opioid Dispensing
State & County Comparisons 2016
Source: http://www.nj.gov/humanservices/dmhas/publications/statistical/ Substance%20Abuse%20Overview/2016/statewide.pdf
Naloxone is a FDA approved medication to prevent overdose by opiods such as herion, morphine and oxycodone. It blocks opiod receptor sites revising the toxic effects of overdose.
• Between 2015 and 2016, the number of Naloxone administrations increased statewide; and in Essex, Middlesex and Union County. In Essex County, Naloxone administrations increased from 481 administrations to 1,131.
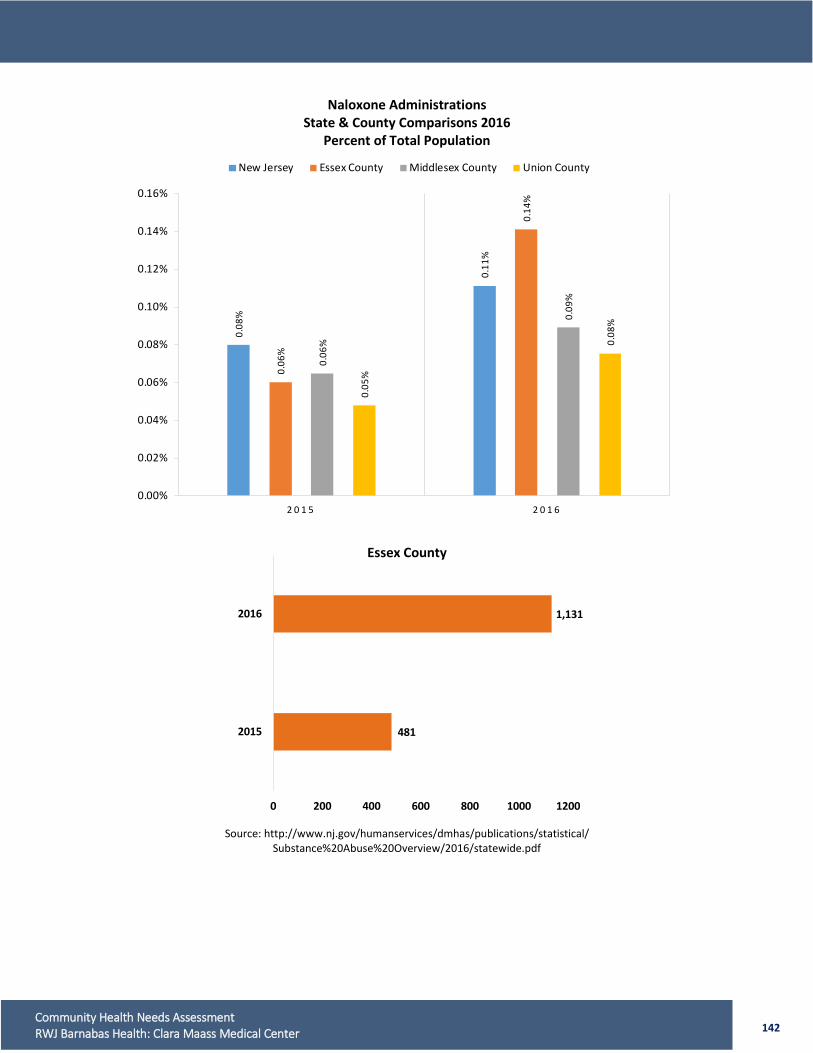
142 Community Health Needs Assessment RWJ Barnabas Health: Clara Maass Medical Center
Naloxone Administrations State & County Comparisons 2016
Percent of Total Population
Essex County
Source: http://www.nj.gov/humanservices/dmhas/publications/statistical/
Substance%20Abuse%20Overview/2016/statewide.pdf
0.08
%
0.11
%
0.06
%
0.14
%
0.06
%
0.09
%
0.05
%
0.08
%
0.00%
0.02%
0.04%
0.06%
0.08%
0.10%
0.12%
0.14%
0.16%
2 0 1 5 2 0 1 6
New Jersey Essex County Middlesex County Union County
481
1,131
0 200 400 600 800 1000 1200
2015
2016
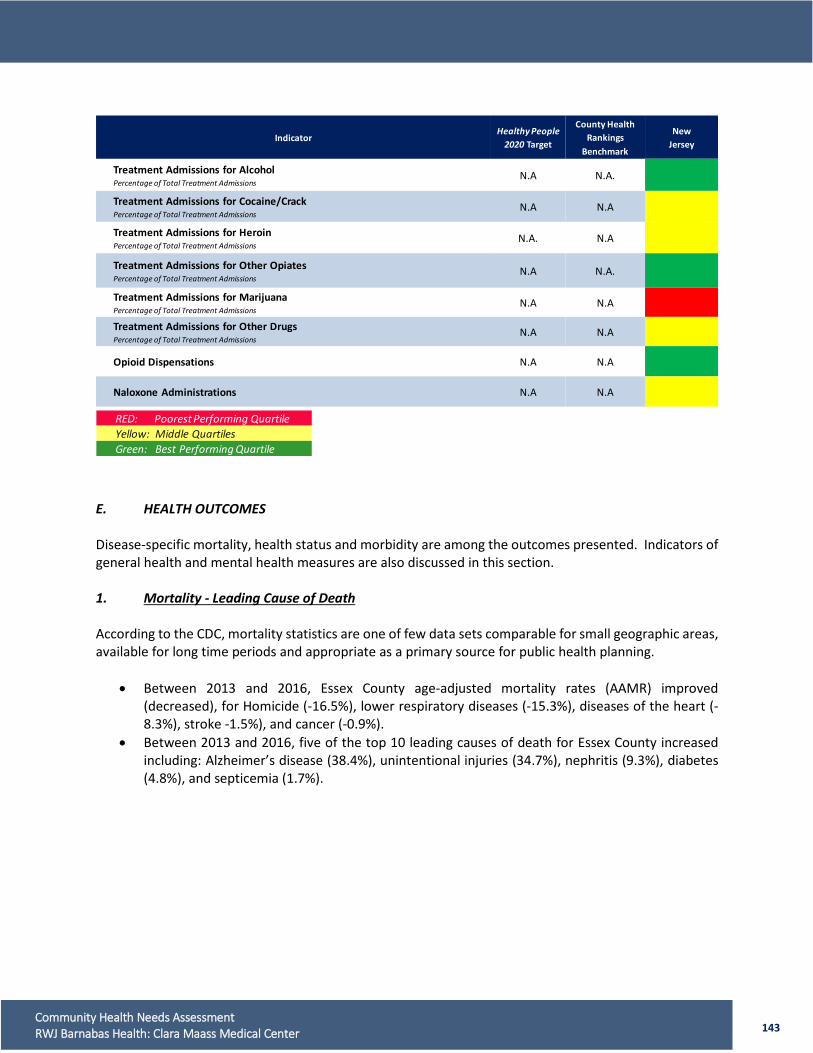
143 Community Health Needs Assessment RWJ Barnabas Health: Clara Maass Medical Center
E. HEALTH OUTCOMES Disease-specific mortality, health status and morbidity are among the outcomes presented. Indicators of general health and mental health measures are also discussed in this section. 1. Mortality - Leading Cause of Death According to the CDC, mortality statistics are one of few data sets comparable for small geographic areas, available for long time periods and appropriate as a primary source for public health planning.
• Between 2013 and 2016, Essex County age-adjusted mortality rates (AAMR) improved (decreased), for Homicide (-16.5%), lower respiratory diseases (-15.3%), diseases of the heart (-8.3%), stroke -1.5%), and cancer (-0.9%).
• Between 2013 and 2016, five of the top 10 leading causes of death for Essex County increased including: Alzheimer’s disease (38.4%), unintentional injuries (34.7%), nephritis (9.3%), diabetes (4.8%), and septicemia (1.7%).
IndicatorHealthy People
2020 Target
County Health Rankings
Benchmark
NewJersey
Treatment Admissions for AlcoholPercentage of Total Treatment Admissions
N.A N.A.
Treatment Admissions for Cocaine/CrackPercentage of Total Treatment Admissions
N.A N.A
Treatment Admissions for HeroinPercentage of Total Treatment Admissions
N.A. N.A
Treatment Admissions for Other OpiatesPercentage of Total Treatment Admissions
N.A N.A.
Treatment Admissions for MarijuanaPercentage of Total Treatment Admissions
N.A N.A
Treatment Admissions for Other DrugsPercentage of Total Treatment Admissions
N.A N.A
Opioid Dispensations N.A N.A
Naloxone Administrations N.A N.A
RED: Poorest Performing QuartileYellow: Middle QuartilesGreen: Best Performing Quartile
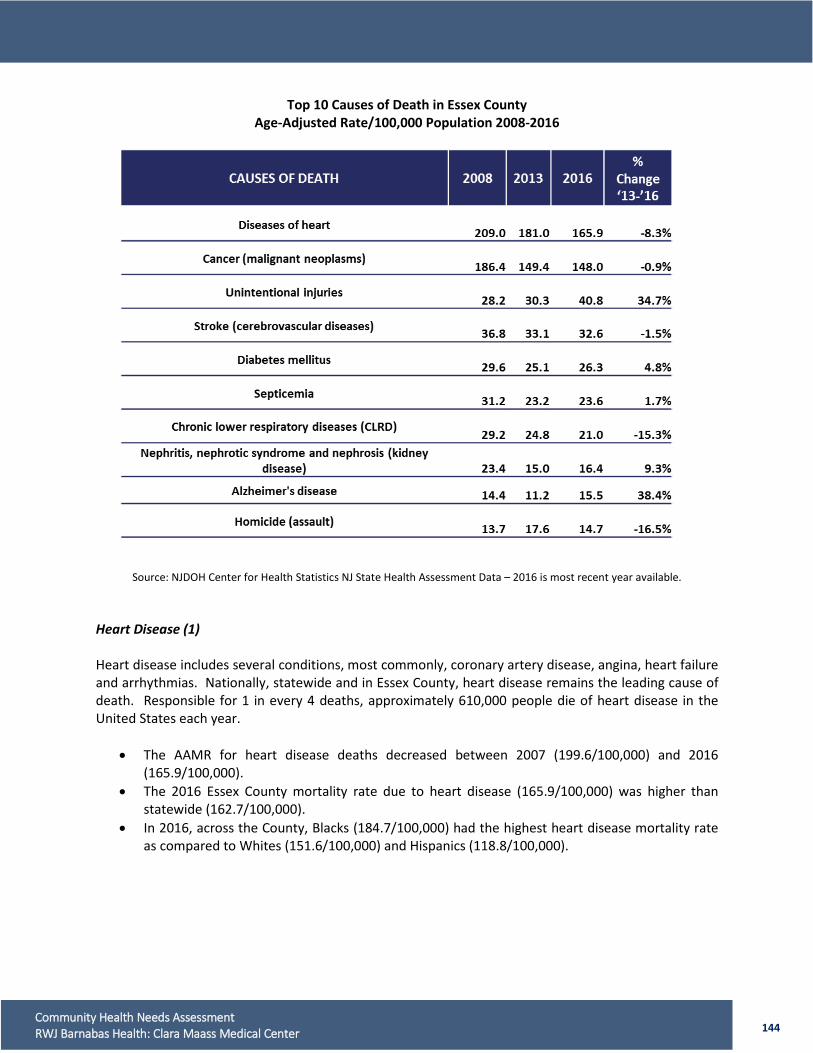
144 Community Health Needs Assessment RWJ Barnabas Health: Clara Maass Medical Center
Top 10 Causes of Death in Essex County Age-Adjusted Rate/100,000 Population 2008-2016
Source: NJDOH Center for Health Statistics NJ State Health Assessment Data – 2016 is most recent year available. Heart Disease (1) Heart disease includes several conditions, most commonly, coronary artery disease, angina, heart failure and arrhythmias. Nationally, statewide and in Essex County, heart disease remains the leading cause of death. Responsible for 1 in every 4 deaths, approximately 610,000 people die of heart disease in the United States each year.
• The AAMR for heart disease deaths decreased between 2007 (199.6/100,000) and 2016 (165.9/100,000).
• The 2016 Essex County mortality rate due to heart disease (165.9/100,000) was higher than statewide (162.7/100,000).
• In 2016, across the County, Blacks (184.7/100,000) had the highest heart disease mortality rate as compared to Whites (151.6/100,000) and Hispanics (118.8/100,000).
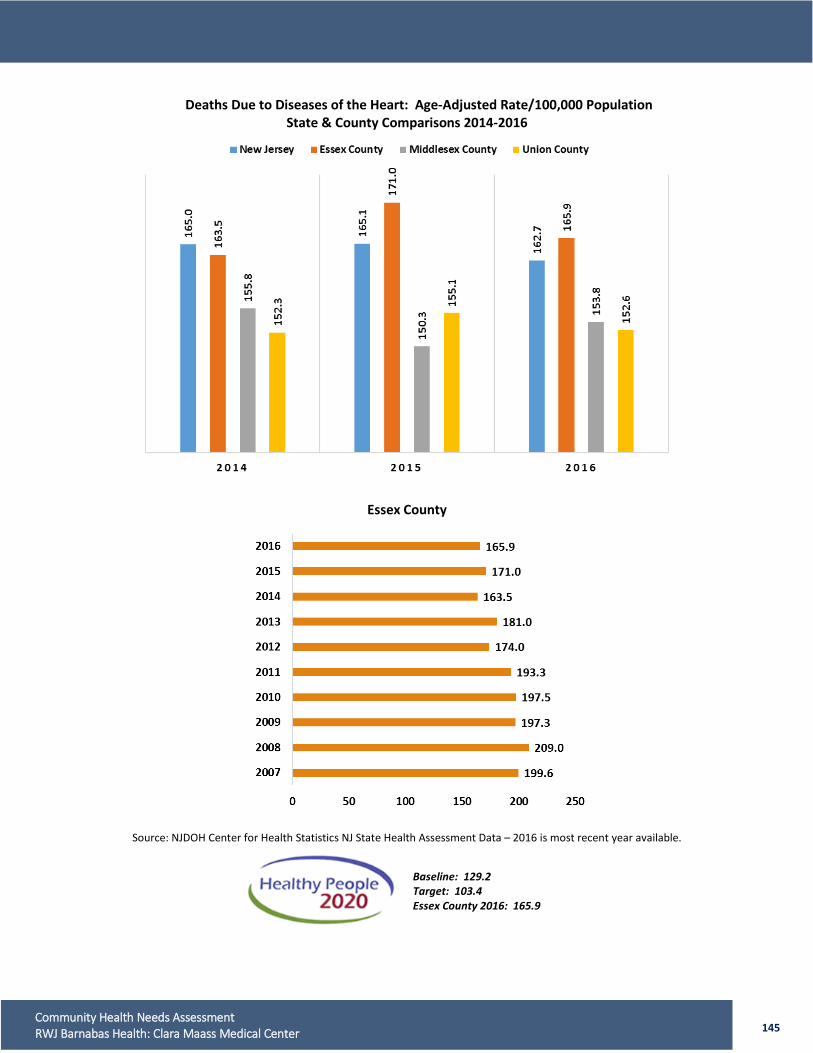
145 Community Health Needs Assessment RWJ Barnabas Health: Clara Maass Medical Center
Deaths Due to Diseases of the Heart: Age-Adjusted Rate/100,000 Population State & County Comparisons 2014-2016
Essex County
Source: NJDOH Center for Health Statistics NJ State Health Assessment Data – 2016 is most recent year available.
Baseline: 129.2
Target: 103.4 Essex County 2016: 165.9
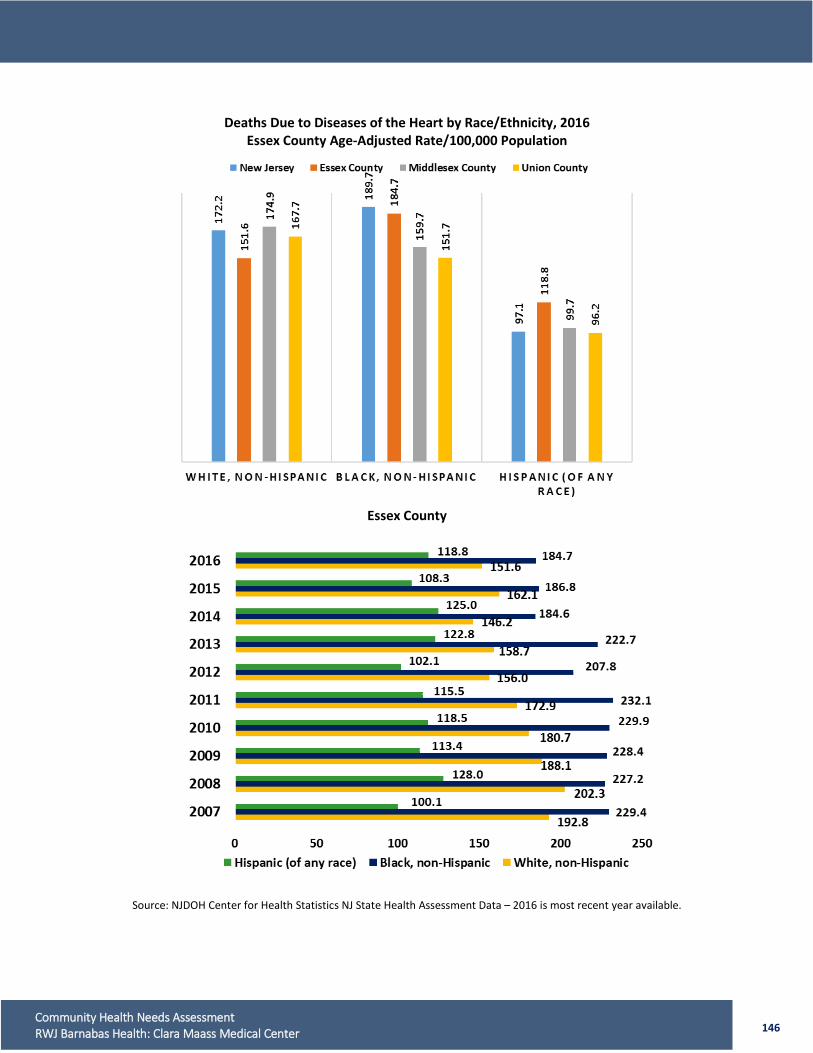
146 Community Health Needs Assessment RWJ Barnabas Health: Clara Maass Medical Center
Deaths Due to Diseases of the Heart by Race/Ethnicity, 2016
Essex County Age-Adjusted Rate/100,000 Population
Essex County
Source: NJDOH Center for Health Statistics NJ State Health Assessment Data – 2016 is most recent year available.
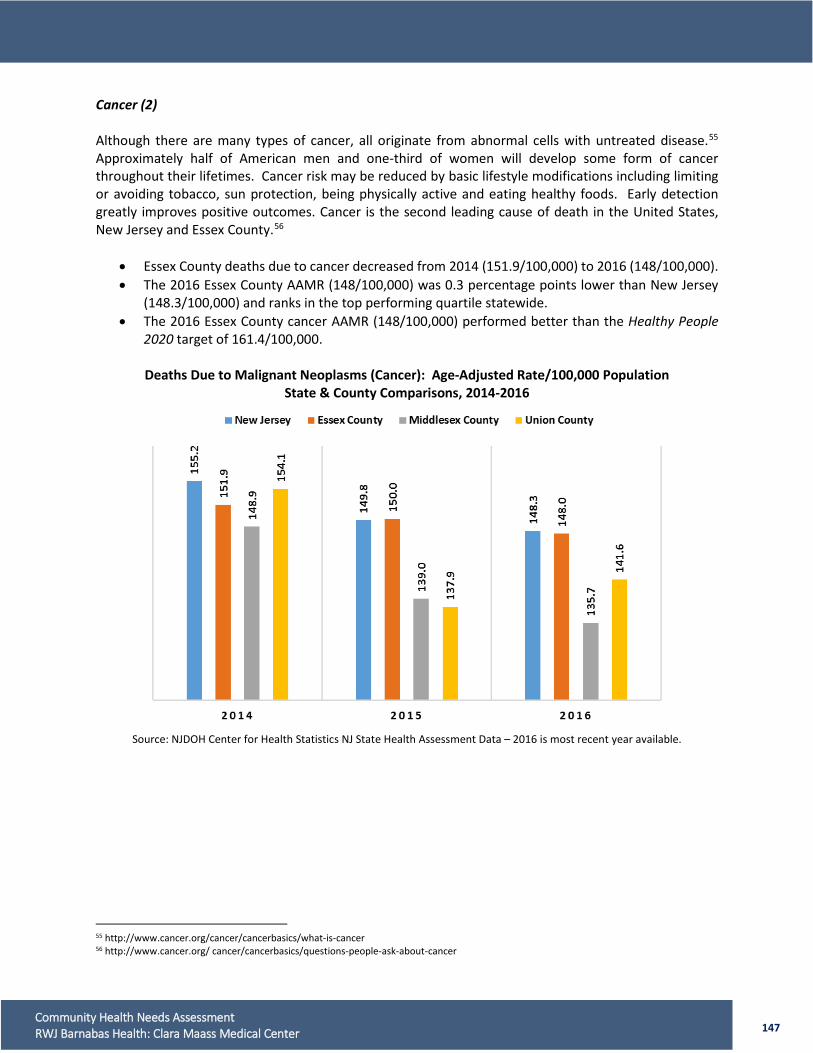
147 Community Health Needs Assessment RWJ Barnabas Health: Clara Maass Medical Center
Cancer (2) Although there are many types of cancer, all originate from abnormal cells with untreated disease.55 Approximately half of American men and one-third of women will develop some form of cancer throughout their lifetimes. Cancer risk may be reduced by basic lifestyle modifications including limiting or avoiding tobacco, sun protection, being physically active and eating healthy foods. Early detection greatly improves positive outcomes. Cancer is the second leading cause of death in the United States, New Jersey and Essex County.56
• Essex County deaths due to cancer decreased from 2014 (151.9/100,000) to 2016 (148/100,000). • The 2016 Essex County AAMR (148/100,000) was 0.3 percentage points lower than New Jersey
(148.3/100,000) and ranks in the top performing quartile statewide. • The 2016 Essex County cancer AAMR (148/100,000) performed better than the Healthy People
2020 target of 161.4/100,000.
Deaths Due to Malignant Neoplasms (Cancer): Age-Adjusted Rate/100,000 Population State & County Comparisons, 2014-2016
Source: NJDOH Center for Health Statistics NJ State Health Assessment Data – 2016 is most recent year available.
55 http://www.cancer.org/cancer/cancerbasics/what-is-cancer 56 http://www.cancer.org/ cancer/cancerbasics/questions-people-ask-about-cancer
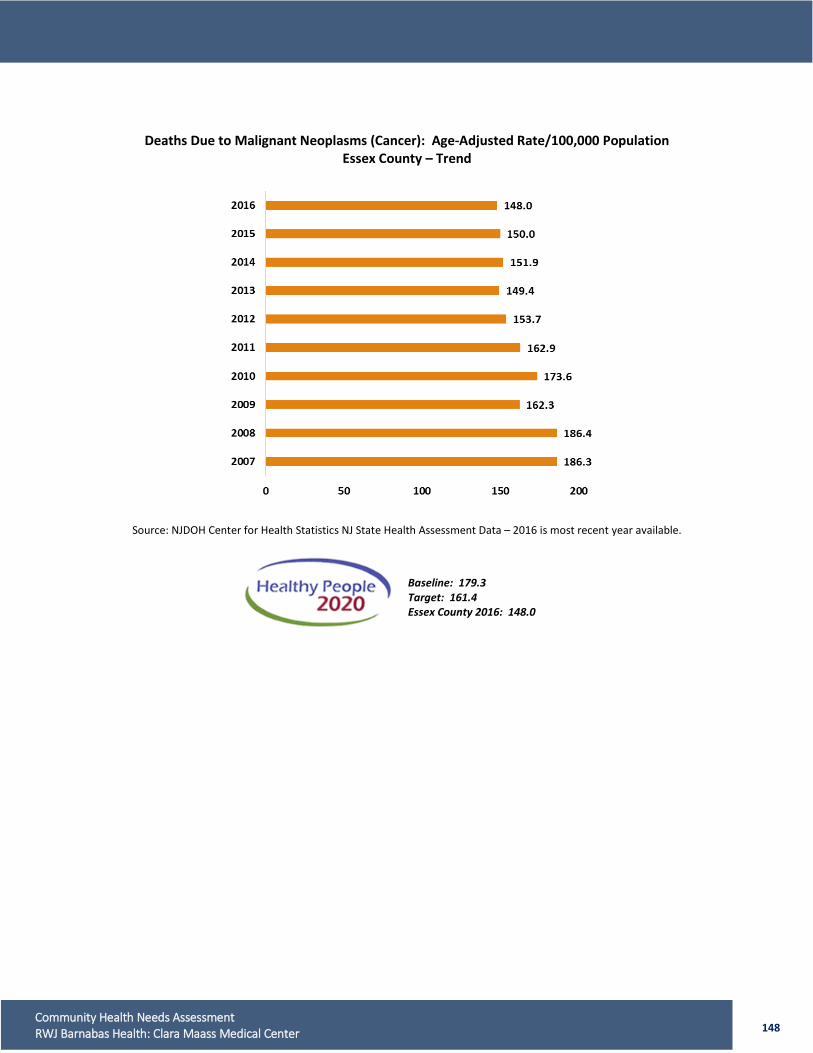
148 Community Health Needs Assessment RWJ Barnabas Health: Clara Maass Medical Center
Deaths Due to Malignant Neoplasms (Cancer): Age-Adjusted Rate/100,000 Population Essex County – Trend
Source: NJDOH Center for Health Statistics NJ State Health Assessment Data – 2016 is most recent year available.
Baseline: 179.3
Target: 161.4 Essex County 2016: 148.0
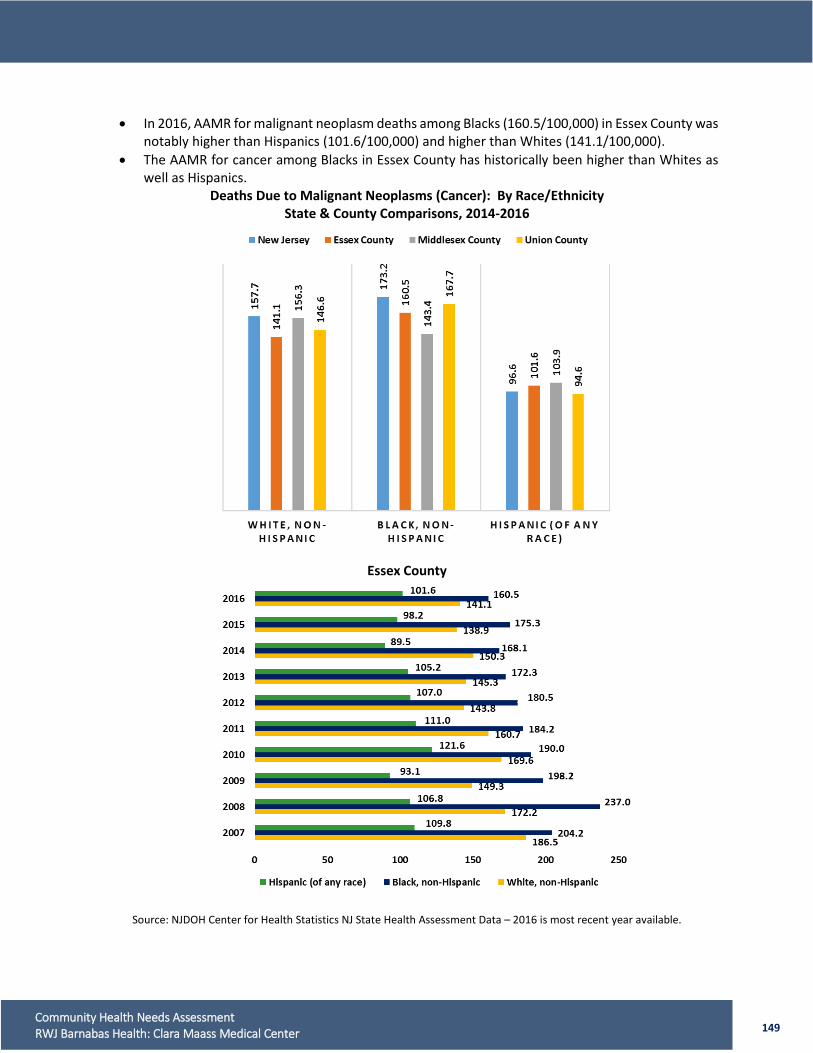
149 Community Health Needs Assessment RWJ Barnabas Health: Clara Maass Medical Center
• In 2016, AAMR for malignant neoplasm deaths among Blacks (160.5/100,000) in Essex County was
notably higher than Hispanics (101.6/100,000) and higher than Whites (141.1/100,000). • The AAMR for cancer among Blacks in Essex County has historically been higher than Whites as
well as Hispanics. Deaths Due to Malignant Neoplasms (Cancer): By Race/Ethnicity
State & County Comparisons, 2014-2016
Essex County
Source: NJDOH Center for Health Statistics NJ State Health Assessment Data – 2016 is most recent year available.
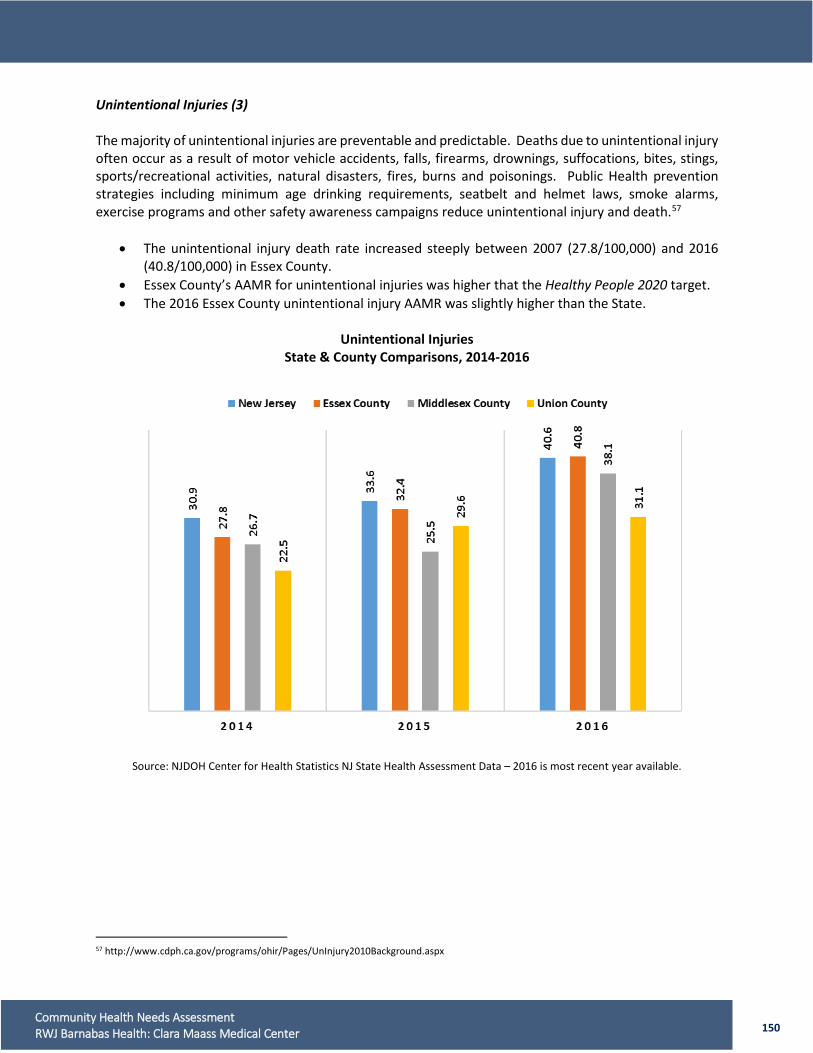
150 Community Health Needs Assessment RWJ Barnabas Health: Clara Maass Medical Center
Unintentional Injuries (3) The majority of unintentional injuries are preventable and predictable. Deaths due to unintentional injury often occur as a result of motor vehicle accidents, falls, firearms, drownings, suffocations, bites, stings, sports/recreational activities, natural disasters, fires, burns and poisonings. Public Health prevention strategies including minimum age drinking requirements, seatbelt and helmet laws, smoke alarms, exercise programs and other safety awareness campaigns reduce unintentional injury and death.57
• The unintentional injury death rate increased steeply between 2007 (27.8/100,000) and 2016 (40.8/100,000) in Essex County.
• Essex County’s AAMR for unintentional injuries was higher that the Healthy People 2020 target. • The 2016 Essex County unintentional injury AAMR was slightly higher than the State.
Unintentional Injuries
State & County Comparisons, 2014-2016
Source: NJDOH Center for Health Statistics NJ State Health Assessment Data – 2016 is most recent year available.
57 http://www.cdph.ca.gov/programs/ohir/Pages/UnInjury2010Background.aspx
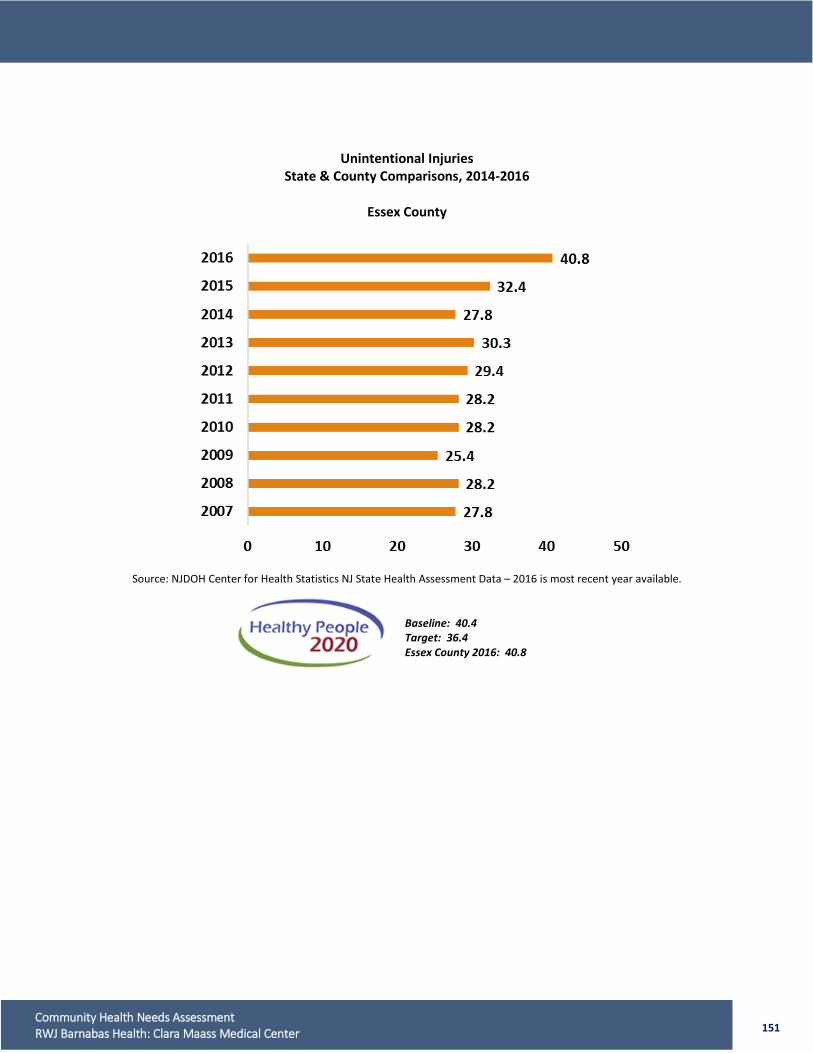
151 Community Health Needs Assessment RWJ Barnabas Health: Clara Maass Medical Center
Unintentional Injuries State & County Comparisons, 2014-2016
Essex County
Source: NJDOH Center for Health Statistics NJ State Health Assessment Data – 2016 is most recent year available.
Baseline: 40.4
Target: 36.4 Essex County 2016: 40.8
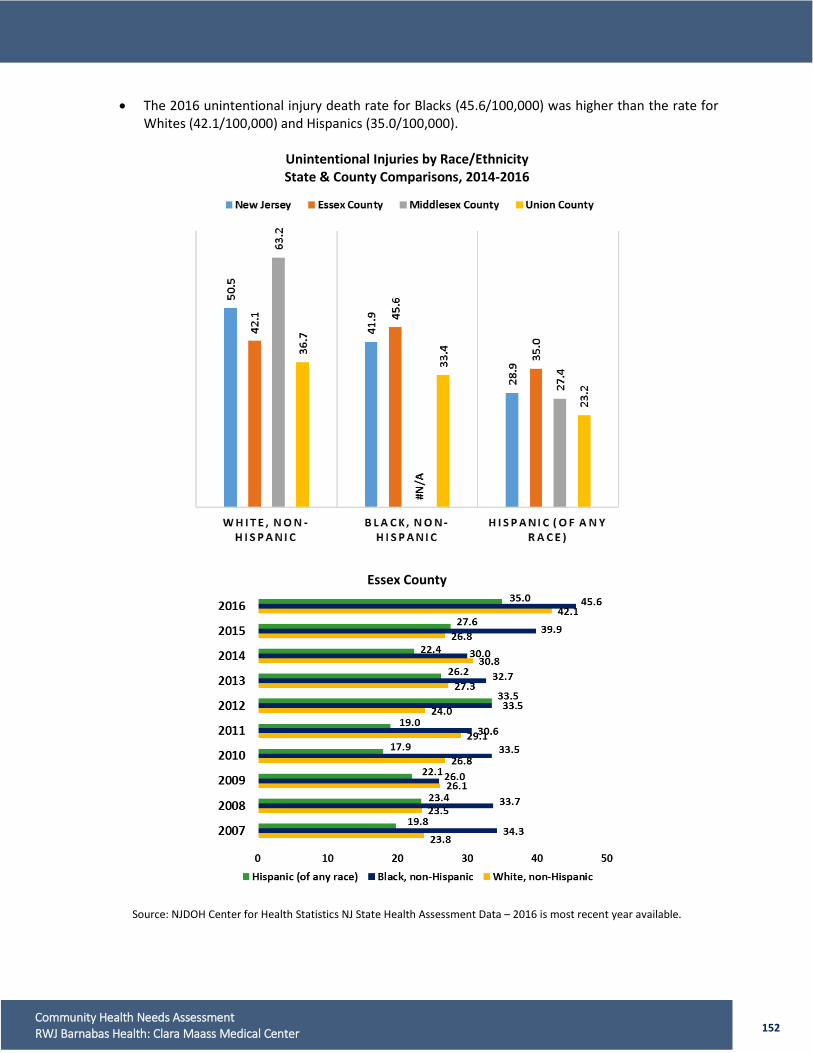
152 Community Health Needs Assessment RWJ Barnabas Health: Clara Maass Medical Center
• The 2016 unintentional injury death rate for Blacks (45.6/100,000) was higher than the rate for Whites (42.1/100,000) and Hispanics (35.0/100,000).
Unintentional Injuries by Race/Ethnicity State & County Comparisons, 2014-2016
Essex County
Source: NJDOH Center for Health Statistics NJ State Health Assessment Data – 2016 is most recent year available.

153 Community Health Needs Assessment RWJ Barnabas Health: Clara Maass Medical Center
Stroke (Cerebrovascular Diseases) (4) A stroke occurs when a clot blocks blood supply to the brain or if a blood vessel within the brain bursts.
• The Essex County stroke AAMR decreased from 2014 (34.9/100,000) to 2016 (32.6/100,000). In 2016, the County AAMR was lower than the Healthy People 2020 target (34.8/100,000).
• The 2016 Essex County stroke AAMR (32.6/100,000) was higher than the State (30.0/100,000) and ranks in the middle quartile statewide.
Deaths Due to Stroke: Age-Adjusted Rate/100,000 Population
State & County Comparisons, 2014-2016
Source: NJDOH Center for Health Statistics NJ State Health Assessment Data – 2016 is most recent year available.
Baseline: 43.5 Target: 34.8 Essex County 2016: 32.6

154 Community Health Needs Assessment RWJ Barnabas Health: Clara Maass Medical Center
Deaths Due to Stroke: Age-Adjusted Rate/100,000 Population Essex County – Trend
Source: NJDOH Center for Health Statistics NJ State Health Assessment Data – 2016 is most recent year available.
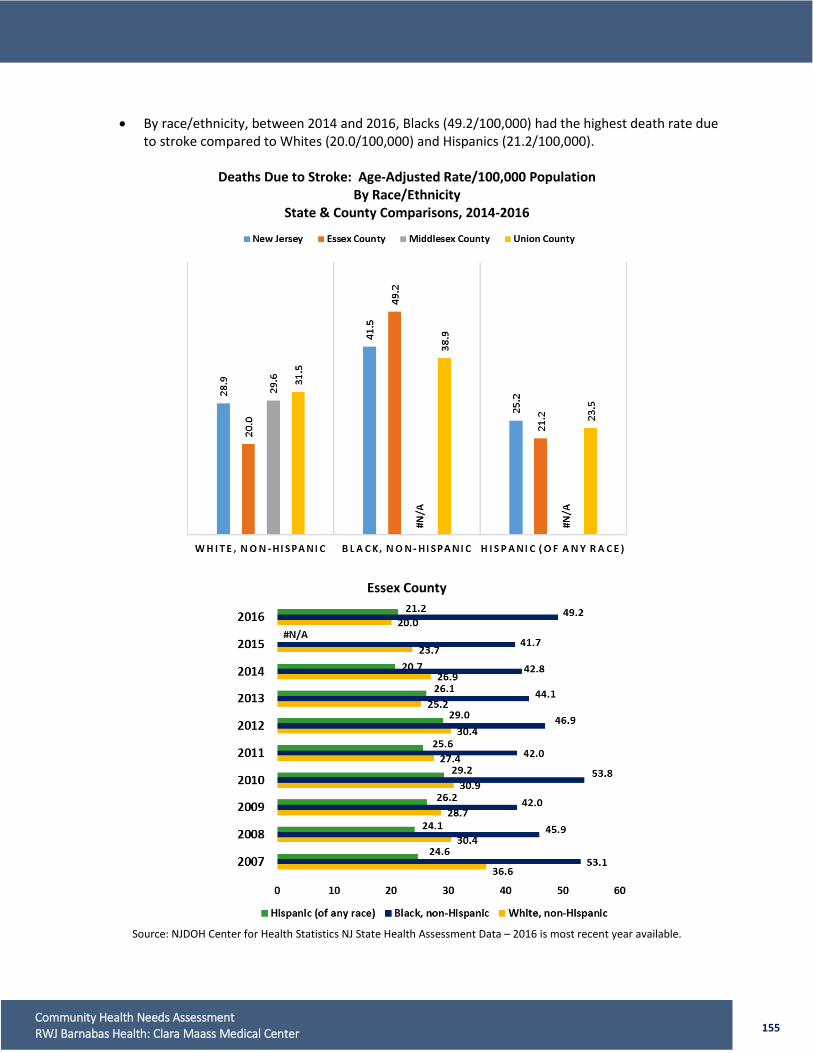
155 Community Health Needs Assessment RWJ Barnabas Health: Clara Maass Medical Center
• By race/ethnicity, between 2014 and 2016, Blacks (49.2/100,000) had the highest death rate due
to stroke compared to Whites (20.0/100,000) and Hispanics (21.2/100,000).
Deaths Due to Stroke: Age-Adjusted Rate/100,000 Population By Race/Ethnicity
State & County Comparisons, 2014-2016
Essex County
Source: NJDOH Center for Health Statistics NJ State Health Assessment Data – 2016 is most recent year available.
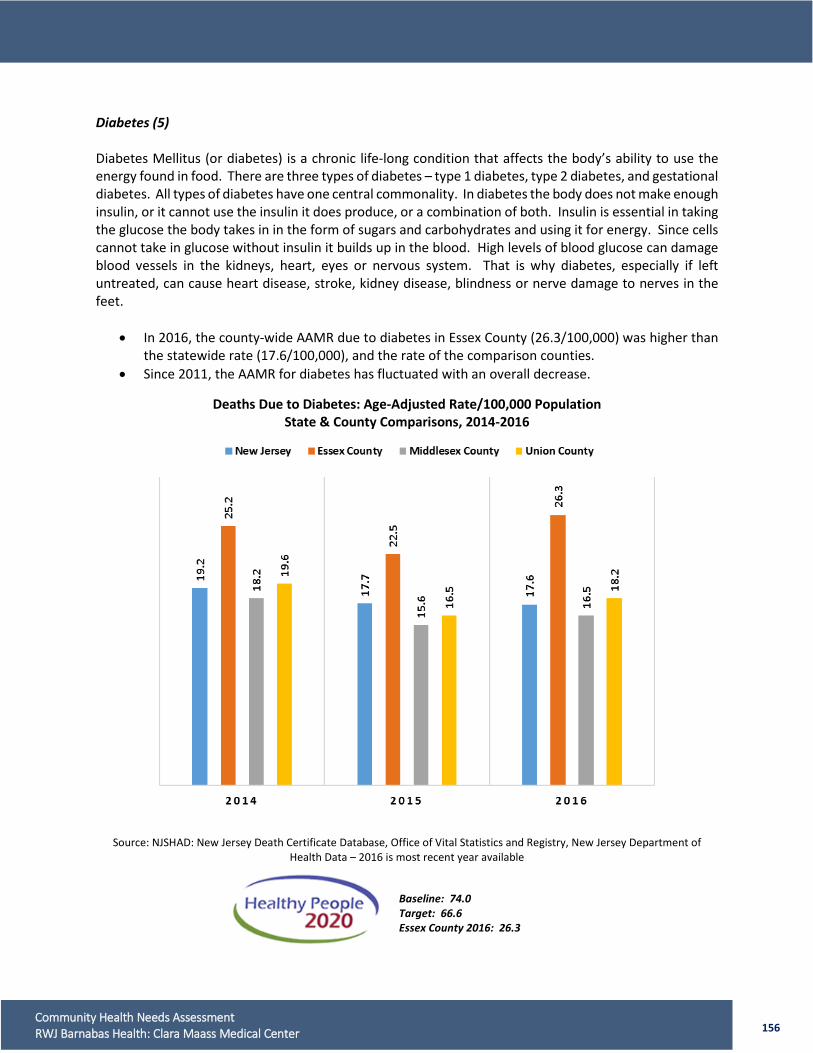
156 Community Health Needs Assessment RWJ Barnabas Health: Clara Maass Medical Center
Diabetes (5) Diabetes Mellitus (or diabetes) is a chronic life-long condition that affects the body’s ability to use the energy found in food. There are three types of diabetes – type 1 diabetes, type 2 diabetes, and gestational diabetes. All types of diabetes have one central commonality. In diabetes the body does not make enough insulin, or it cannot use the insulin it does produce, or a combination of both. Insulin is essential in taking the glucose the body takes in in the form of sugars and carbohydrates and using it for energy. Since cells cannot take in glucose without insulin it builds up in the blood. High levels of blood glucose can damage blood vessels in the kidneys, heart, eyes or nervous system. That is why diabetes, especially if left untreated, can cause heart disease, stroke, kidney disease, blindness or nerve damage to nerves in the feet.
• In 2016, the county-wide AAMR due to diabetes in Essex County (26.3/100,000) was higher than the statewide rate (17.6/100,000), and the rate of the comparison counties.
• Since 2011, the AAMR for diabetes has fluctuated with an overall decrease.
Deaths Due to Diabetes: Age-Adjusted Rate/100,000 Population State & County Comparisons, 2014-2016
Source: NJSHAD: New Jersey Death Certificate Database, Office of Vital Statistics and Registry, New Jersey Department of Health Data – 2016 is most recent year available
Baseline: 74.0 Target: 66.6 Essex County 2016: 26.3

157 Community Health Needs Assessment RWJ Barnabas Health: Clara Maass Medical Center
Deaths Due to Diabetes: Age-Adjusted Rate/100,000 Population State & County Comparisons, 2014-2016
Essex County
Source: NJSHAD: New Jersey Death Certificate Database, Office of Vital Statistics and Registry, New Jersey Department of
Health Data – 2016 is most recent year available
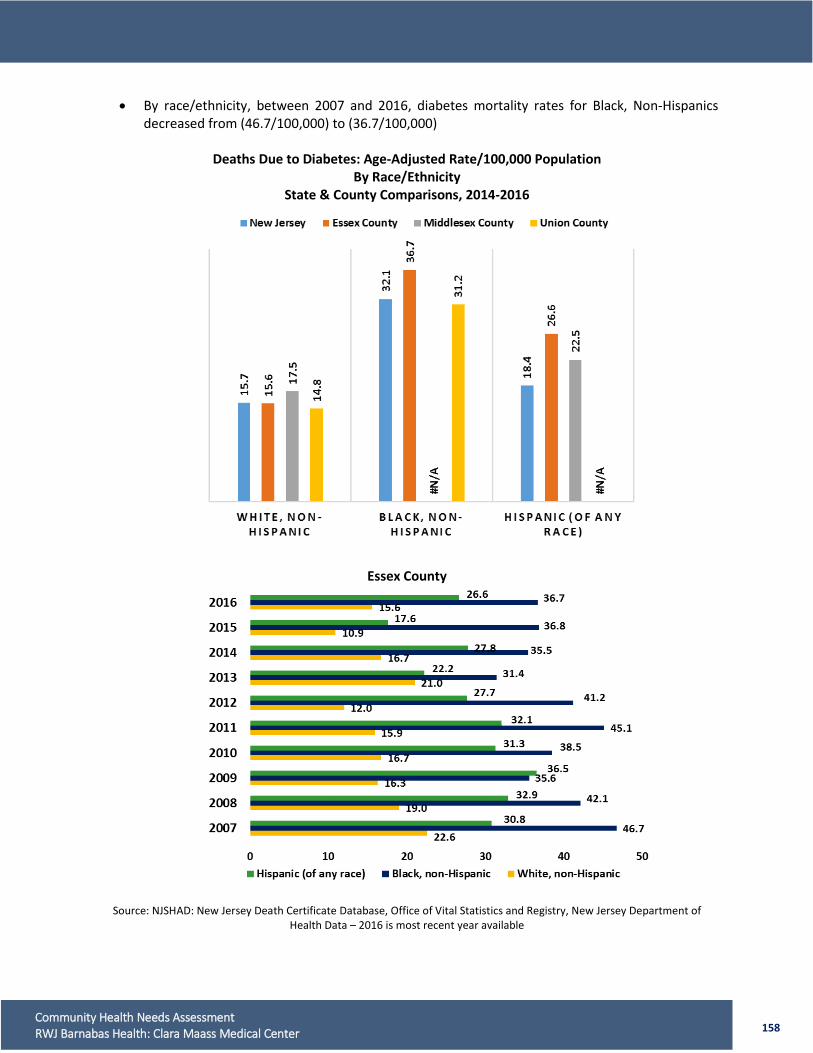
158 Community Health Needs Assessment RWJ Barnabas Health: Clara Maass Medical Center
• By race/ethnicity, between 2007 and 2016, diabetes mortality rates for Black, Non-Hispanics decreased from (46.7/100,000) to (36.7/100,000)
Deaths Due to Diabetes: Age-Adjusted Rate/100,000 Population
By Race/Ethnicity State & County Comparisons, 2014-2016
Essex County
Source: NJSHAD: New Jersey Death Certificate Database, Office of Vital Statistics and Registry, New Jersey Department of
Health Data – 2016 is most recent year available
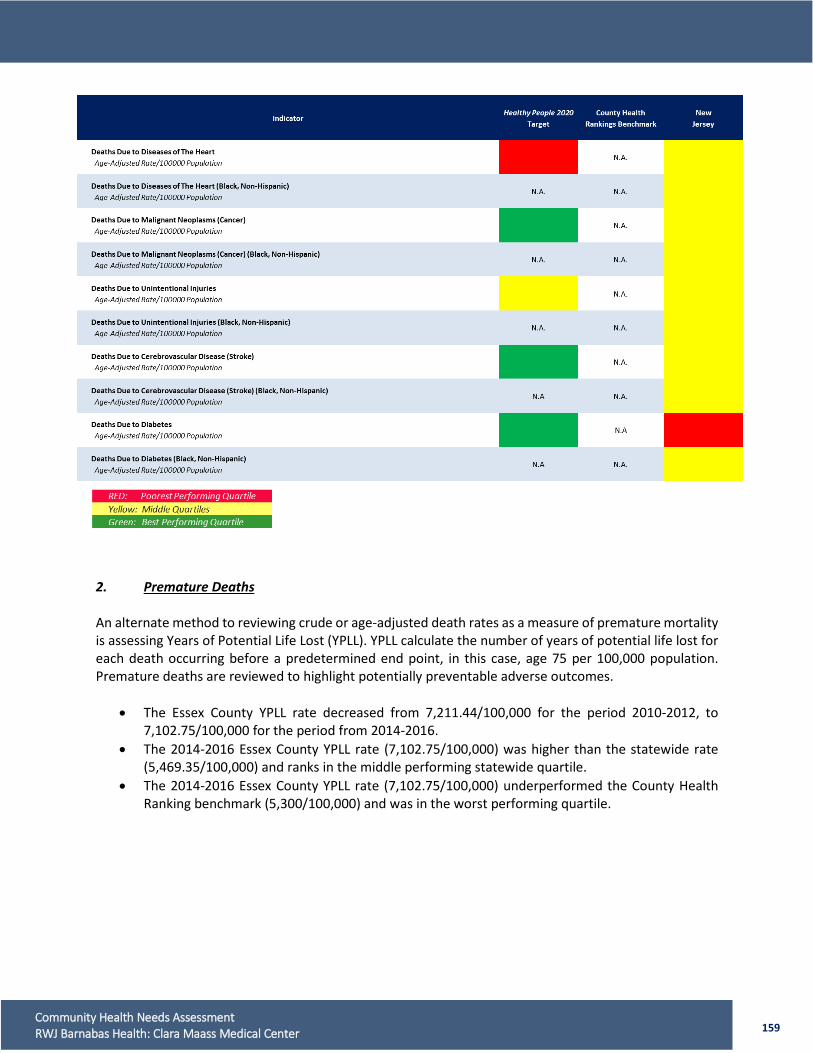
159 Community Health Needs Assessment RWJ Barnabas Health: Clara Maass Medical Center
2. Premature Deaths An alternate method to reviewing crude or age-adjusted death rates as a measure of premature mortality is assessing Years of Potential Life Lost (YPLL). YPLL calculate the number of years of potential life lost for each death occurring before a predetermined end point, in this case, age 75 per 100,000 population. Premature deaths are reviewed to highlight potentially preventable adverse outcomes.
• The Essex County YPLL rate decreased from 7,211.44/100,000 for the period 2010-2012, to 7,102.75/100,000 for the period from 2014-2016.
• The 2014-2016 Essex County YPLL rate (7,102.75/100,000) was higher than the statewide rate (5,469.35/100,000) and ranks in the middle performing statewide quartile.
• The 2014-2016 Essex County YPLL rate (7,102.75/100,000) underperformed the County Health Ranking benchmark (5,300/100,000) and was in the worst performing quartile.
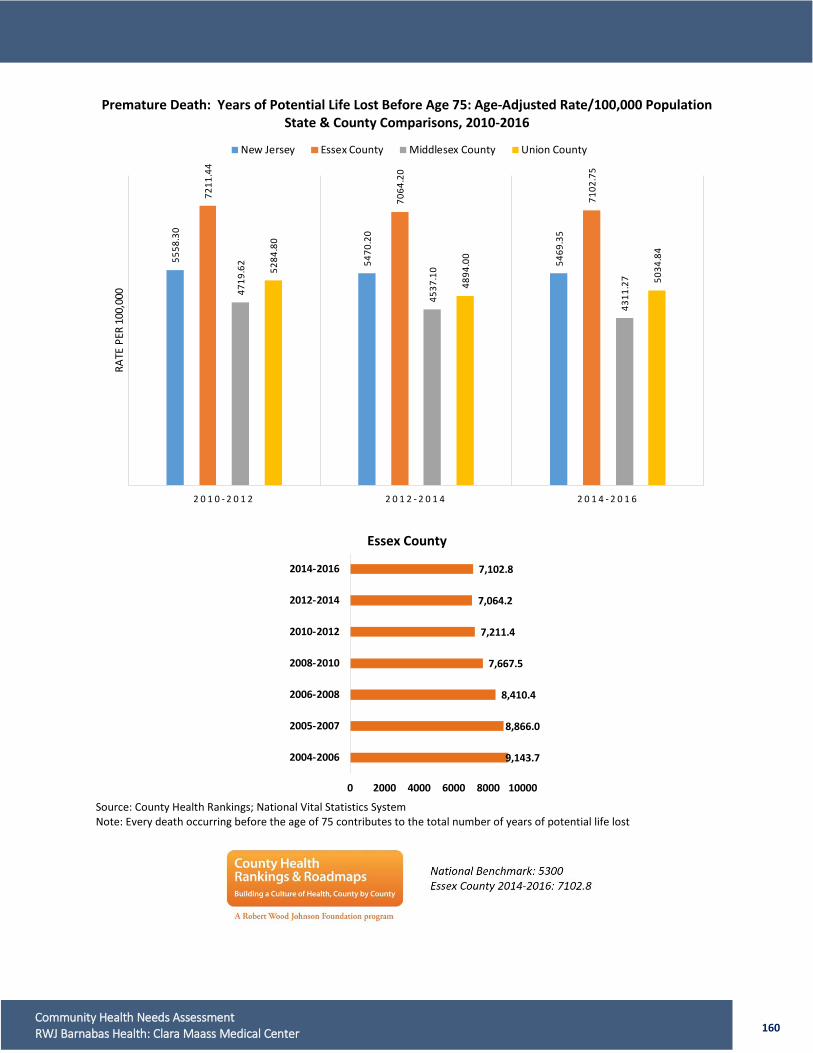
160 Community Health Needs Assessment RWJ Barnabas Health: Clara Maass Medical Center
Premature Death: Years of Potential Life Lost Before Age 75: Age-Adjusted Rate/100,000 Population State & County Comparisons, 2010-2016
Essex County Source: County Health Rankings; National Vital Statistics System Note: Every death occurring before the age of 75 contributes to the total number of years of potential life lost
5558
.30
5470
.20
5469
.35
7211
.44
7064
.20
7102
.75
4719
.62
4537
.10
4311
.27
5284
.80
4894
.00
5034
.84
2 0 1 0 - 2 0 1 2 2 0 1 2 - 2 0 1 4 2 0 1 4 - 2 0 1 6
RATE
PER
100
,000
New Jersey Essex County Middlesex County Union County
9,143.7
8,866.0
8,410.4
7,667.5
7,211.4
7,064.2
7,102.8
0 2000 4000 6000 8000 10000
2004-2006
2005-2007
2006-2008
2008-2010
2010-2012
2012-2014
2014-2016
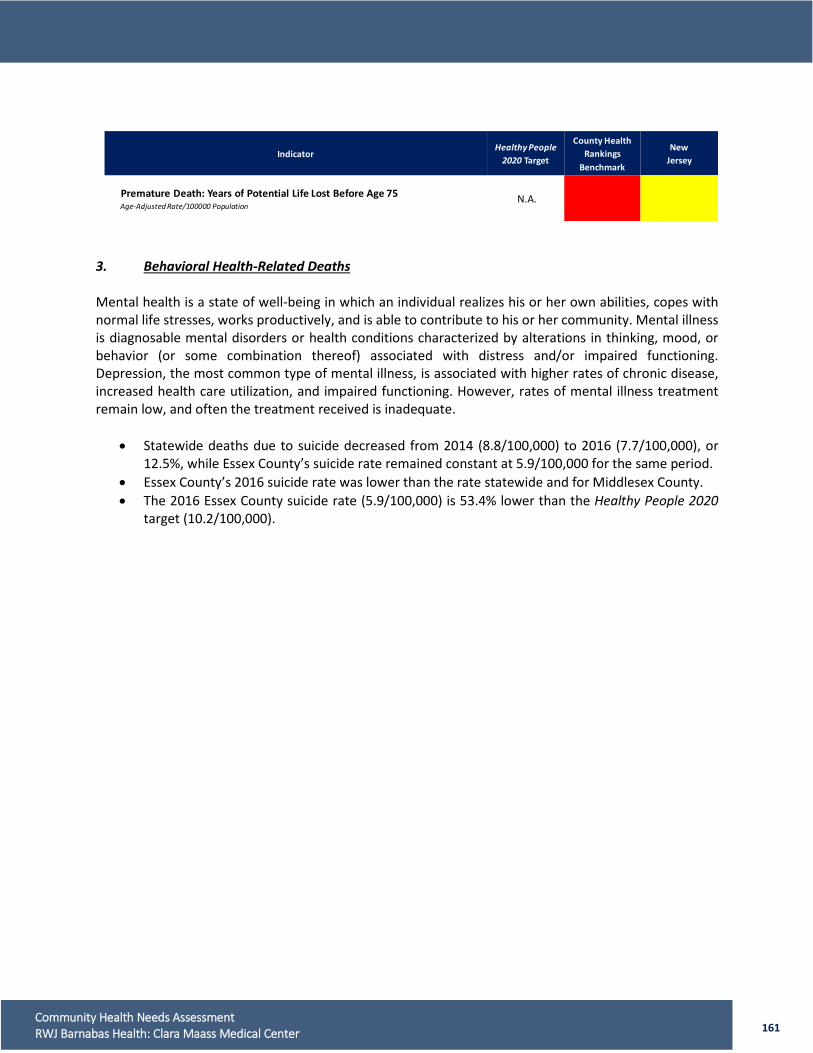
161 Community Health Needs Assessment RWJ Barnabas Health: Clara Maass Medical Center
3. Behavioral Health-Related Deaths Mental health is a state of well-being in which an individual realizes his or her own abilities, copes with normal life stresses, works productively, and is able to contribute to his or her community. Mental illness is diagnosable mental disorders or health conditions characterized by alterations in thinking, mood, or behavior (or some combination thereof) associated with distress and/or impaired functioning. Depression, the most common type of mental illness, is associated with higher rates of chronic disease, increased health care utilization, and impaired functioning. However, rates of mental illness treatment remain low, and often the treatment received is inadequate.
• Statewide deaths due to suicide decreased from 2014 (8.8/100,000) to 2016 (7.7/100,000), or 12.5%, while Essex County’s suicide rate remained constant at 5.9/100,000 for the same period.
• Essex County’s 2016 suicide rate was lower than the rate statewide and for Middlesex County. • The 2016 Essex County suicide rate (5.9/100,000) is 53.4% lower than the Healthy People 2020
target (10.2/100,000).
IndicatorHealthy People
2020 Target
County Health Rankings
Benchmark
NewJersey
Premature Death: Years of Potential Life Lost Before Age 75Age-Adjusted Rate/100000 Population
N.A.
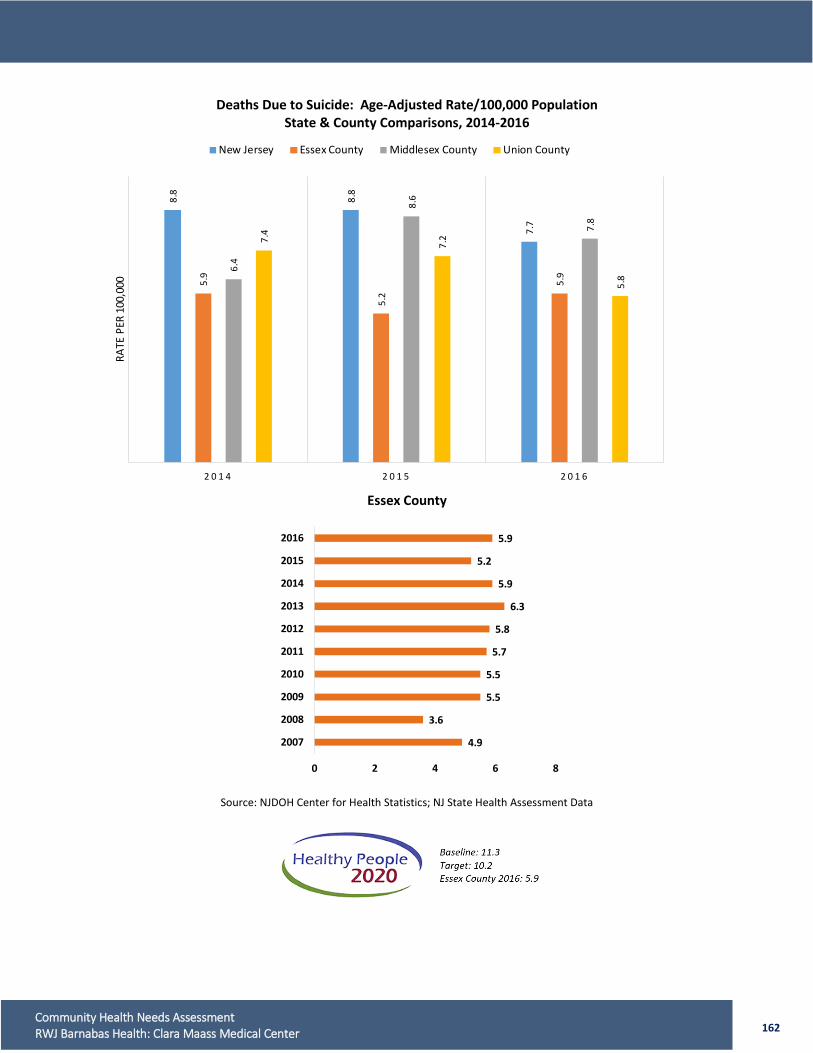
162 Community Health Needs Assessment RWJ Barnabas Health: Clara Maass Medical Center
Deaths Due to Suicide: Age-Adjusted Rate/100,000 Population State & County Comparisons, 2014-2016
Essex County
Source: NJDOH Center for Health Statistics; NJ State Health Assessment Data
8.8
8.8
7.7
5.9
5.2
5.96.
4
8.6
7.8
7.4
7.2
5.8
2 0 1 4 2 0 1 5 2 0 1 6
RATE
PER
100
,000
New Jersey Essex County Middlesex County Union County
4.9
3.6
5.5
5.5
5.7
5.8
6.3
5.9
5.2
5.9
0 2 4 6 8
2007
2008
2009
2010
2011
2012
2013
2014
2015
2016
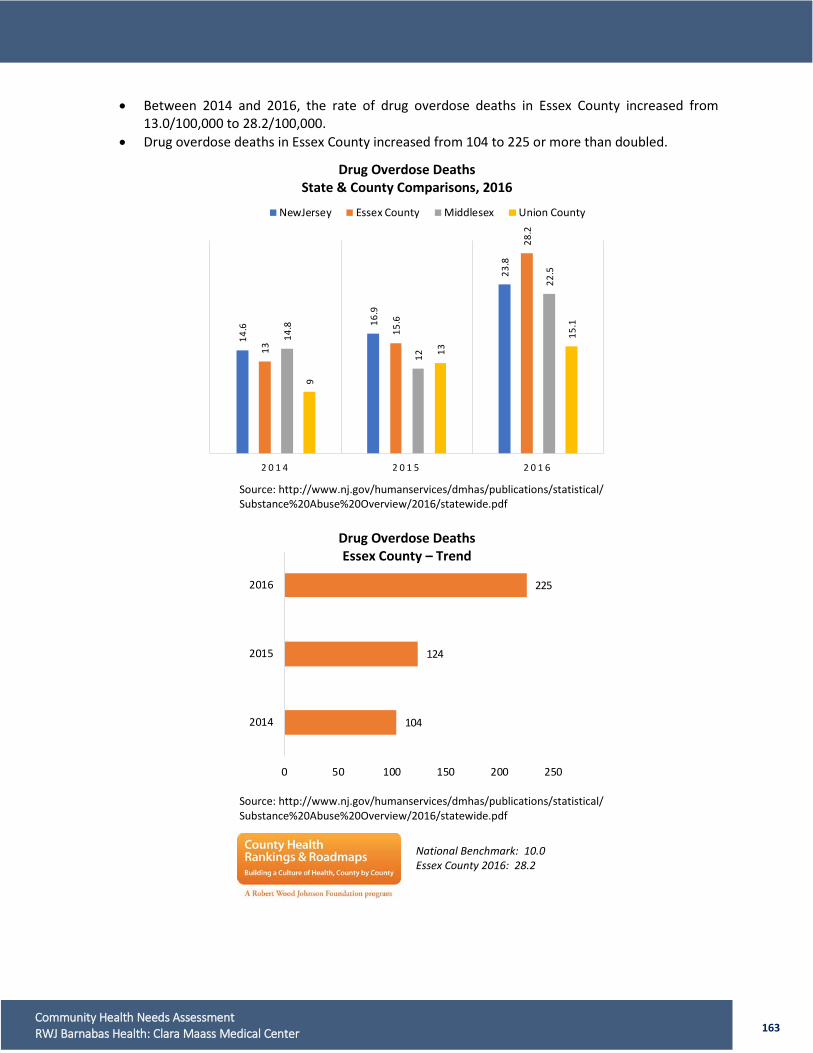
163 Community Health Needs Assessment RWJ Barnabas Health: Clara Maass Medical Center
• Between 2014 and 2016, the rate of drug overdose deaths in Essex County increased from 13.0/100,000 to 28.2/100,000.
• Drug overdose deaths in Essex County increased from 104 to 225 or more than doubled.
Drug Overdose Deaths State & County Comparisons, 2016
Source: http://www.nj.gov/humanservices/dmhas/publications/statistical/ Substance%20Abuse%20Overview/2016/statewide.pdf
Drug Overdose Deaths Essex County – Trend
Source: http://www.nj.gov/humanservices/dmhas/publications/statistical/ Substance%20Abuse%20Overview/2016/statewide.pdf
14.6 16
.9
23.8
13
15.6
28.2
14.8
12
22.5
9
13
15.1
2 0 1 4 2 0 1 5 2 0 1 6
NewJersey Essex County Middlesex Union County
104
124
225
0 50 100 150 200 250
2014
2015
2016
National Benchmark: 10.0 Essex County 2016: 28.2
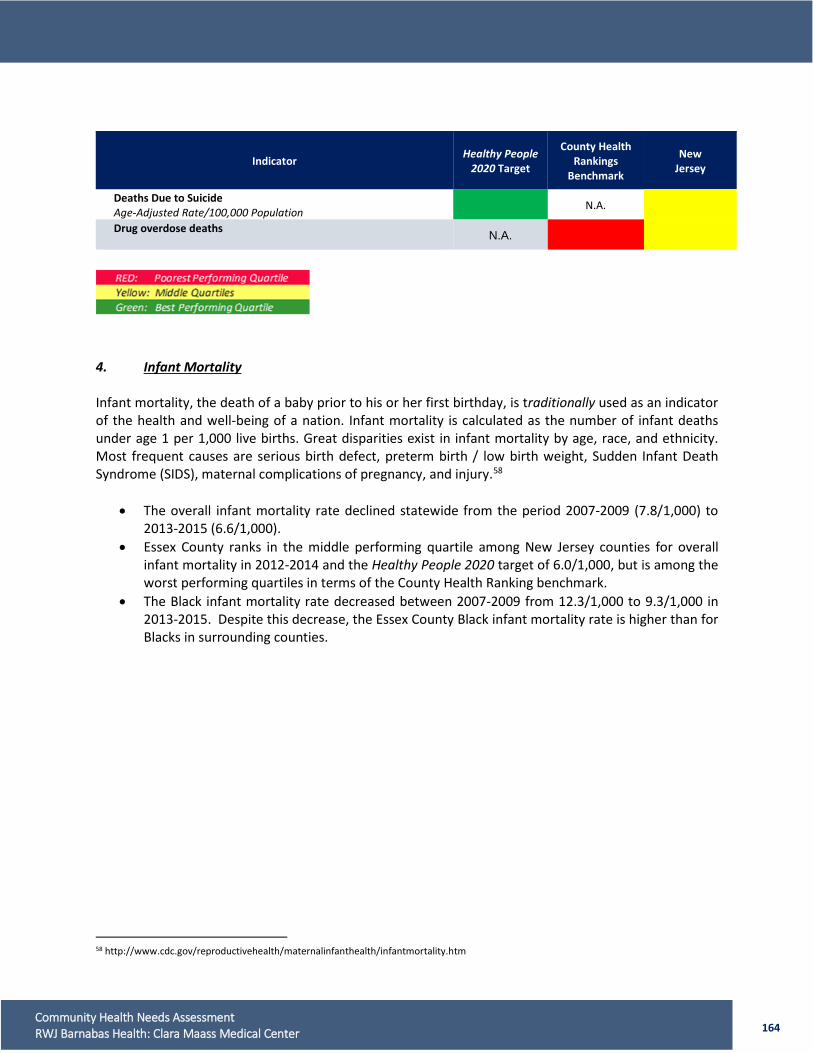
164 Community Health Needs Assessment RWJ Barnabas Health: Clara Maass Medical Center
Indicator Healthy People 2020 Target
County Health Rankings
Benchmark
New Jersey
Deaths Due to Suicide Age-Adjusted Rate/100,000 Population
N.A.
Drug overdose deaths N.A.
4. Infant Mortality Infant mortality, the death of a baby prior to his or her first birthday, is traditionally used as an indicator of the health and well-being of a nation. Infant mortality is calculated as the number of infant deaths under age 1 per 1,000 live births. Great disparities exist in infant mortality by age, race, and ethnicity. Most frequent causes are serious birth defect, preterm birth / low birth weight, Sudden Infant Death Syndrome (SIDS), maternal complications of pregnancy, and injury.58
• The overall infant mortality rate declined statewide from the period 2007-2009 (7.8/1,000) to
2013-2015 (6.6/1,000). • Essex County ranks in the middle performing quartile among New Jersey counties for overall
infant mortality in 2012-2014 and the Healthy People 2020 target of 6.0/1,000, but is among the worst performing quartiles in terms of the County Health Ranking benchmark.
• The Black infant mortality rate decreased between 2007-2009 from 12.3/1,000 to 9.3/1,000 in 2013-2015. Despite this decrease, the Essex County Black infant mortality rate is higher than for Blacks in surrounding counties.
58 http://www.cdc.gov/reproductivehealth/maternalinfanthealth/infantmortality.htm
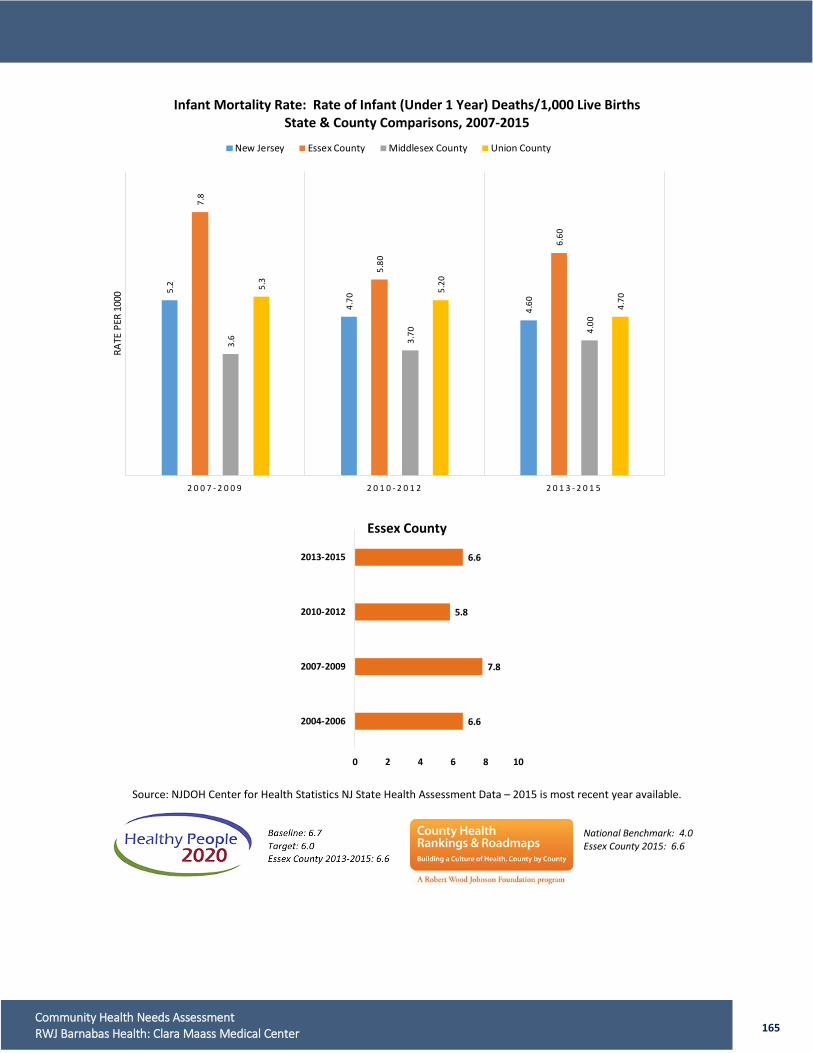
165 Community Health Needs Assessment RWJ Barnabas Health: Clara Maass Medical Center
Infant Mortality Rate: Rate of Infant (Under 1 Year) Deaths/1,000 Live Births State & County Comparisons, 2007-2015
Essex County
Source: NJDOH Center for Health Statistics NJ State Health Assessment Data – 2015 is most recent year available.
5.2
4.70
4.60
7.8
5.80
6.60
3.6 3.70 4.
00
5.3
5.20
4.70
2 0 0 7 - 2 0 0 9 2 0 1 0 - 2 0 1 2 2 0 1 3 - 2 0 1 5
RATE
PER
100
0
New Jersey Essex County Middlesex County Union County
6.6
7.8
5.8
6.6
0 2 4 6 8 10
2004-2006
2007-2009
2010-2012
2013-2015
National Benchmark: 4.0 Essex County 2015: 6.6
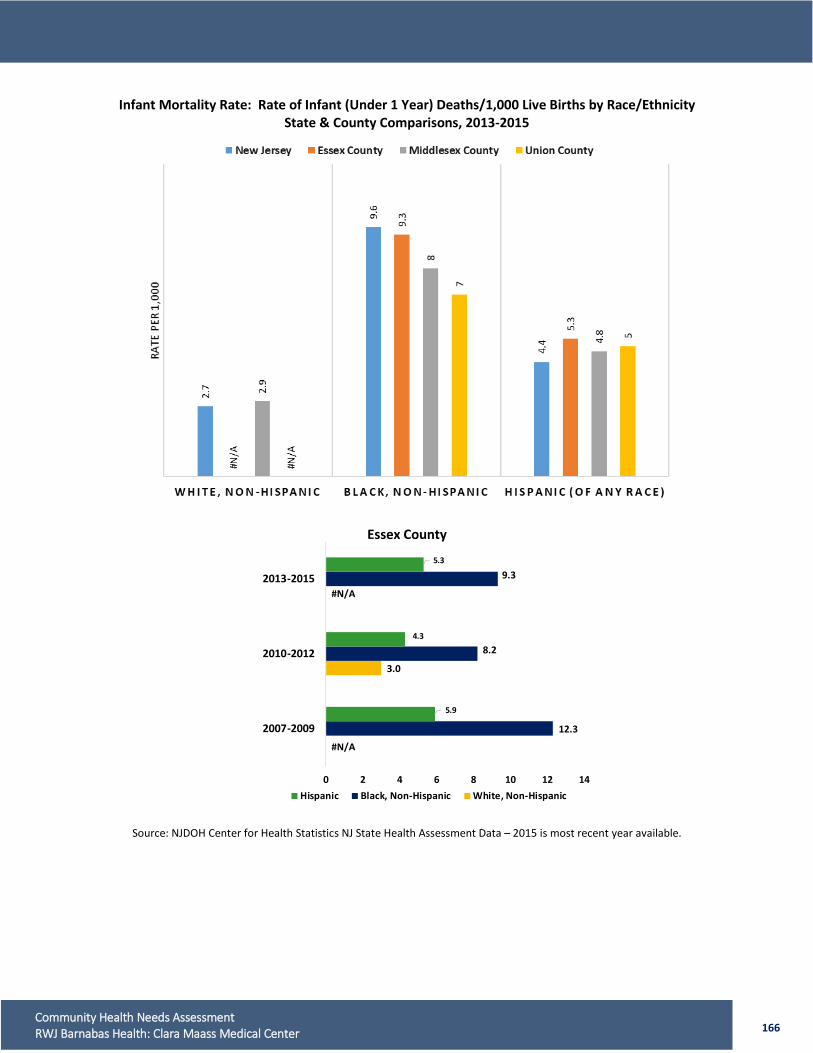
166 Community Health Needs Assessment RWJ Barnabas Health: Clara Maass Medical Center
Infant Mortality Rate: Rate of Infant (Under 1 Year) Deaths/1,000 Live Births by Race/Ethnicity State & County Comparisons, 2013-2015
Essex County
Source: NJDOH Center for Health Statistics NJ State Health Assessment Data – 2015 is most recent year available.
#N/A
3.0
#N/A
12.3
8.2
9.3
5.9
4.3
5.3
0 2 4 6 8 10 12 14
2007-2009
2010-2012
2013-2015
Hispanic Black, Non-Hispanic White, Non-Hispanic
167 Community Health Needs Assessment RWJ Barnabas Health: Clara Maass Medical Center
5. Low and Very Low Birth Weight Infants Birth weight is the most important factor affecting neonatal mortality and a significant determinant of post neonatal mortality. Low birth weight infants (less than 2,500 grams) are at an increased risk for health problems ranging from neurodevelopmental disabilities to respiratory disorders.59 Racial disparities in low birth weight babies persist; nationally, non-Hispanic Black infants continue to die at nearly twice the rate of non-Hispanic Whites. Low Birth Weight
• In 2016, Essex County had a higher percentage of low birth weight babies (9.7%) than Middlesex County (8.0%) Union County (7.6%), and the State (8.1%).
• The 2016 percent of Essex County low birth weight babies was more than the Healthy People 2020 target of 7.8%.
• The percentage of Essex County low birthweight babies was higher among Blacks (13.1%) than for Whites (6.4%) and Hispanics (7.8%) in 2016.
Very low birth weight babies (less than 1,500 grams) are at greater risk of adverse outcomes than low birth weight babies. Very Low Birth Weight
• In 2016, 2.0% of Essex County babies are very low birth weight as compared to 1.4% statewide. • The 2016, percent of very low birth weight babies in Essex County was higher than the rates in
Middlesex (1.3%) and Union (1.4%) Counties. • By race, between 2011 and 2016, the percentage of very low birthweight babies: decreased for
Whites from 1.1% to 0.5%; increased from 3.2% to 3.4% for Blacks; and increased from 1.1% to 1.4% for Hispanics.
59 http://www.cdc.gov/PEDNSS/how_to/interpret_data/case_studies/low_birthweight/what.htm
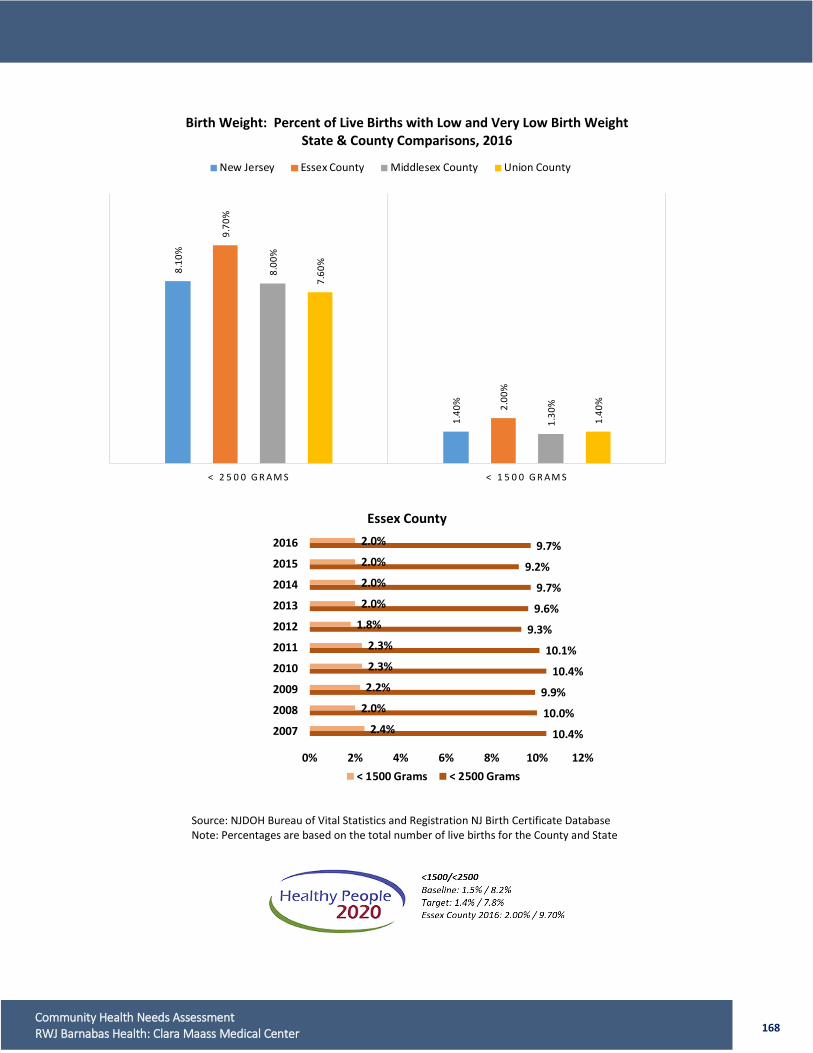
168 Community Health Needs Assessment RWJ Barnabas Health: Clara Maass Medical Center
Birth Weight: Percent of Live Births with Low and Very Low Birth Weight
State & County Comparisons, 2016
Essex County
Source: NJDOH Bureau of Vital Statistics and Registration NJ Birth Certificate Database Note: Percentages are based on the total number of live births for the County and State
8.10
%
1.40
%
9.70
%
2.00
%
8.00
%
1.30
%
7.60
%
1.40
%
< 2 5 0 0 G R A M S < 1 5 0 0 G R A M S
New Jersey Essex County Middlesex County Union County
10.4%
10.0%
9.9%
10.4%
10.1%
9.3%
9.6%
9.7%
9.2%
9.7%
2.4%
2.0%
2.2%
2.3%
2.3%
1.8%
2.0%
2.0%
2.0%
2.0%
0% 2% 4% 6% 8% 10% 12%
2007
2008
2009
2010
2011
2012
2013
2014
2015
2016
< 1500 Grams < 2500 Grams
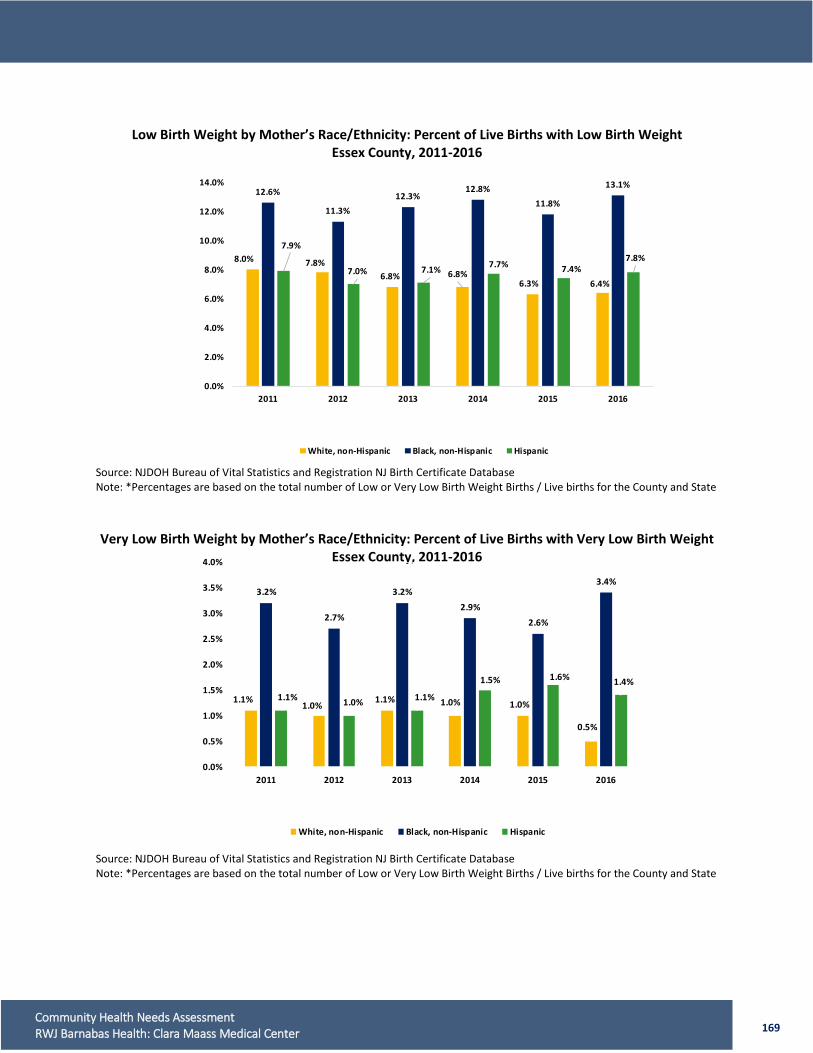
169 Community Health Needs Assessment RWJ Barnabas Health: Clara Maass Medical Center
Low Birth Weight by Mother’s Race/Ethnicity: Percent of Live Births with Low Birth Weight Essex County, 2011-2016
Source: NJDOH Bureau of Vital Statistics and Registration NJ Birth Certificate Database Note: *Percentages are based on the total number of Low or Very Low Birth Weight Births / Live births for the County and State Very Low Birth Weight by Mother’s Race/Ethnicity: Percent of Live Births with Very Low Birth Weight
Essex County, 2011-2016 Source: NJDOH Bureau of Vital Statistics and Registration NJ Birth Certificate Database Note: *Percentages are based on the total number of Low or Very Low Birth Weight Births / Live births for the County and State
8.0% 7.8%6.8% 6.8%
6.3% 6.4%
12.6%
11.3%12.3%
12.8%11.8%
13.1%
7.9%
7.0% 7.1% 7.7% 7.4%7.8%
0.0%
2.0%
4.0%
6.0%
8.0%
10.0%
12.0%
14.0%
2011 2012 2013 2014 2015 2016
White, non-Hispanic Black, non-Hispanic Hispanic
1.1%1.0%
1.1% 1.0% 1.0%
0.5%
3.2%
2.7%
3.2%2.9%
2.6%
3.4%
1.1% 1.0% 1.1%
1.5% 1.6% 1.4%
0.0%
0.5%
1.0%
1.5%
2.0%
2.5%
3.0%
3.5%
4.0%
2011 2012 2013 2014 2015 2016
White, non-Hispanic Black, non-Hispanic Hispanic
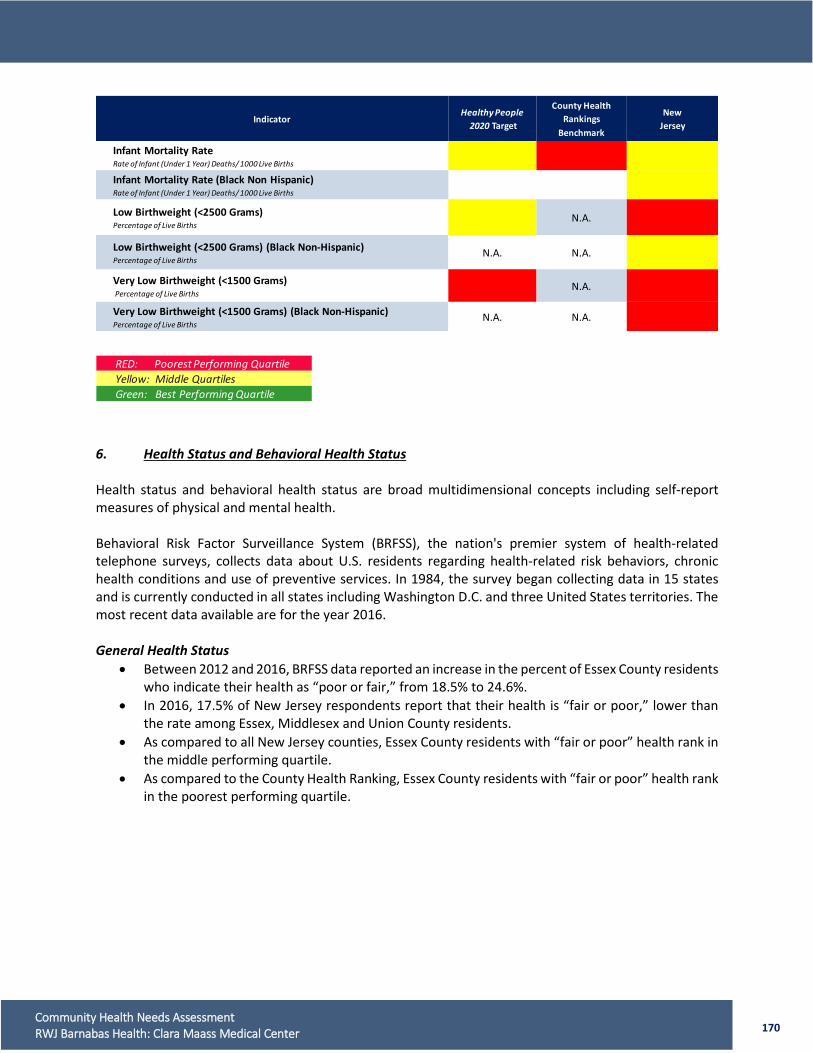
170 Community Health Needs Assessment RWJ Barnabas Health: Clara Maass Medical Center
6. Health Status and Behavioral Health Status Health status and behavioral health status are broad multidimensional concepts including self-report measures of physical and mental health. Behavioral Risk Factor Surveillance System (BRFSS), the nation's premier system of health-related telephone surveys, collects data about U.S. residents regarding health-related risk behaviors, chronic health conditions and use of preventive services. In 1984, the survey began collecting data in 15 states and is currently conducted in all states including Washington D.C. and three United States territories. The most recent data available are for the year 2016. General Health Status
• Between 2012 and 2016, BRFSS data reported an increase in the percent of Essex County residents who indicate their health as “poor or fair,” from 18.5% to 24.6%.
• In 2016, 17.5% of New Jersey respondents report that their health is “fair or poor,” lower than the rate among Essex, Middlesex and Union County residents.
• As compared to all New Jersey counties, Essex County residents with “fair or poor” health rank in the middle performing quartile.
• As compared to the County Health Ranking, Essex County residents with “fair or poor” health rank in the poorest performing quartile.
IndicatorHealthy People
2020 Target
County Health Rankings
Benchmark
NewJersey
Infant Mortality RateRate of Infant (Under 1 Year) Deaths/ 1000 Live Births
Infant Mortality Rate (Black Non Hispanic)Rate of Infant (Under 1 Year) Deaths/ 1000 Live Births
Low Birthweight (<2500 Grams)Percentage of Live Births
N.A.
Low Birthweight (<2500 Grams) (Black Non-Hispanic)Percentage of Live Births
N.A. N.A.
Very Low Birthweight (<1500 Grams)Percentage of Live Births
N.A.
Very Low Birthweight (<1500 Grams) (Black Non-Hispanic)Percentage of Live Births
N.A. N.A.
RED: Poorest Performing QuartileYellow: Middle QuartilesGreen: Best Performing Quartile
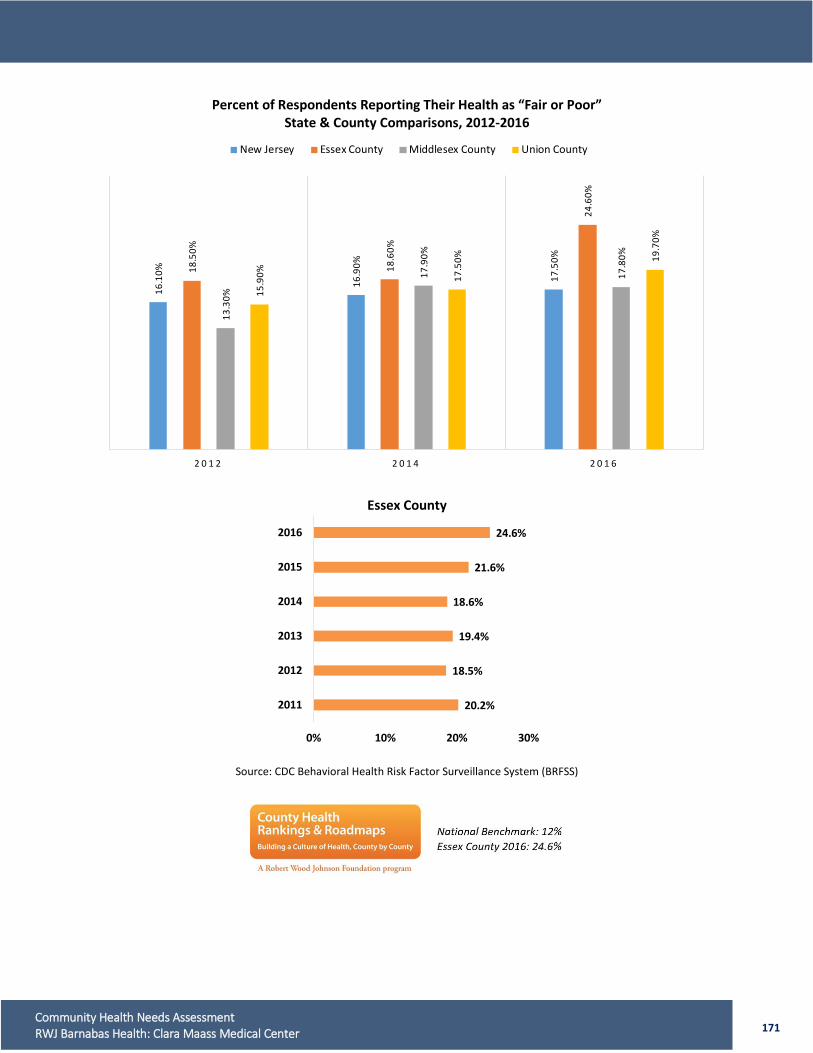
171 Community Health Needs Assessment RWJ Barnabas Health: Clara Maass Medical Center
Percent of Respondents Reporting Their Health as “Fair or Poor” State & County Comparisons, 2012-2016
Essex County
Source: CDC Behavioral Health Risk Factor Surveillance System (BRFSS)
16.1
0%
16.9
0%
17.5
0%
18.5
0%
18.6
0%
24.6
0%
13.3
0%
17.9
0%
17.8
0%
15.9
0% 17.5
0% 19.7
0%
2 0 1 2 2 0 1 4 2 0 1 6
New Jersey Essex County Middlesex County Union County
20.2%
18.5%
19.4%
18.6%
21.6%
24.6%
0% 10% 20% 30%
2011
2012
2013
2014
2015
2016
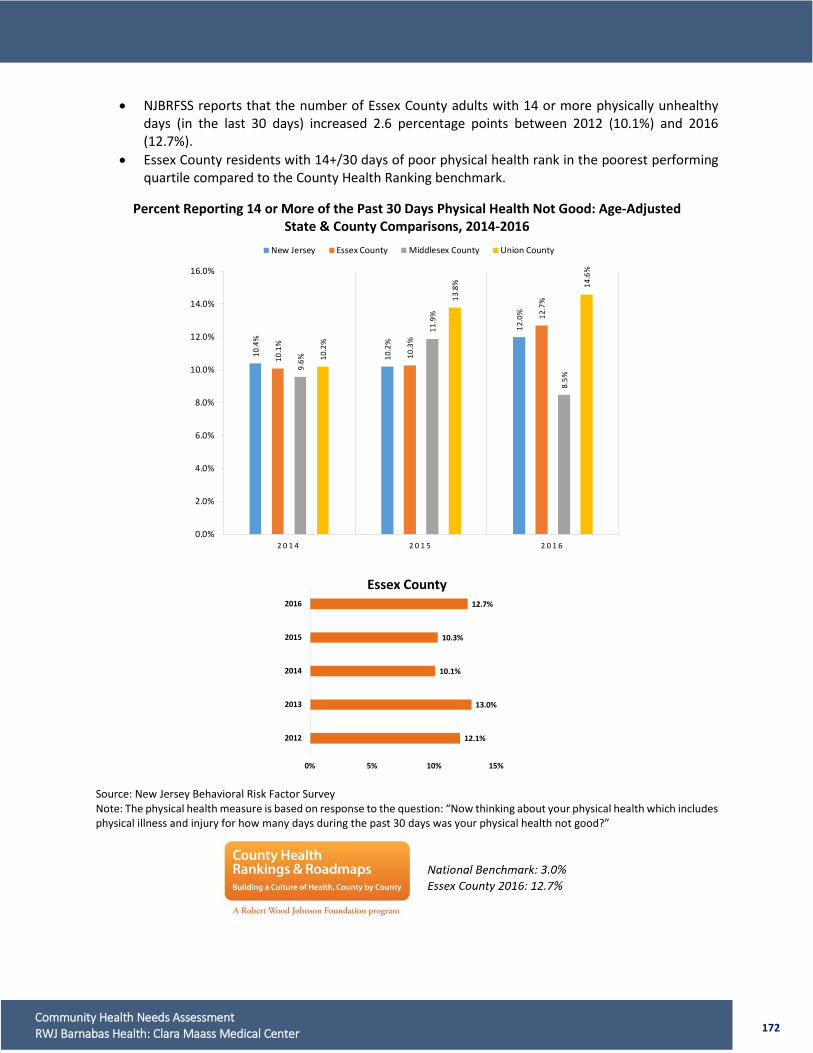
172 Community Health Needs Assessment RWJ Barnabas Health: Clara Maass Medical Center
• NJBRFSS reports that the number of Essex County adults with 14 or more physically unhealthy days (in the last 30 days) increased 2.6 percentage points between 2012 (10.1%) and 2016 (12.7%).
• Essex County residents with 14+/30 days of poor physical health rank in the poorest performing quartile compared to the County Health Ranking benchmark.
Percent Reporting 14 or More of the Past 30 Days Physical Health Not Good: Age-Adjusted State & County Comparisons, 2014-2016
Essex County Source: New Jersey Behavioral Risk Factor Survey Note: The physical health measure is based on response to the question: “Now thinking about your physical health which includes physical illness and injury for how many days during the past 30 days was your physical health not good?”
10.4
%
10.2
%
12.0
%
10.1
%
10.3
%
12.7
%
9.6%
11.9
%
8.5%
10.2
%
13.8
% 14.6
%
0.0%
2.0%
4.0%
6.0%
8.0%
10.0%
12.0%
14.0%
16.0%
2 0 1 4 2 0 1 5 2 0 1 6
New Jersey Essex County Middlesex County Union County
12.1%
13.0%
10.1%
10.3%
12.7%
0% 5% 10% 15%
2012
2013
2014
2015
2016

173 Community Health Needs Assessment RWJ Barnabas Health: Clara Maass Medical Center
Indicator Healthy People 2020 Target
County Health Rankings
Benchmark
New Jersey
Reported “Fair” or “Poor” Health Percentage of Respondents N.A.
Physically Unhealthy Days Reported in the Past 30 Days Average Age-Adjusted Number N.A.
Behavioral Health Status
• County-wide, adults who report 14 or more of the past 30 days with “not good” mental health status increased from 9.5% in 2014, to 11.6% in 2016. The 2016 Essex County report of 14+/30 days with “not good” mental health was slightly higher than New Jersey at 10.7%.
• As compared to all New Jersey counties, Essex County residents with 14+/30 days in poor physical health ranks in the middle quartile.
• As compared to County Health Ranking Essex County ranks in the bottom quartile.
Frequent Mental Distress Percent Reporting 14 or More of the Past 30 Days Mental Health Not Good
State & County Comparisons, 2014-2016
Source: New Jersey Behavioral Risk Factor Survey Note: The physical health measure is based on response to the question: “Now thinking about your physical health which includes physical illness and injury for how many days during the past 30 days was your physical health not good?”
10.5
%
10.7
%
10.7
%
9.5%
10.3
%
11.6
%
10.2
% 11.3
%
10.7
%
9.8%
11.0
%
9.1%
0.0%
2.0%
4.0%
6.0%
8.0%
10.0%
12.0%
14.0%
2 0 1 4 2 0 1 5 2 0 1 6
New Jersey Essex County Middlesex County Union County
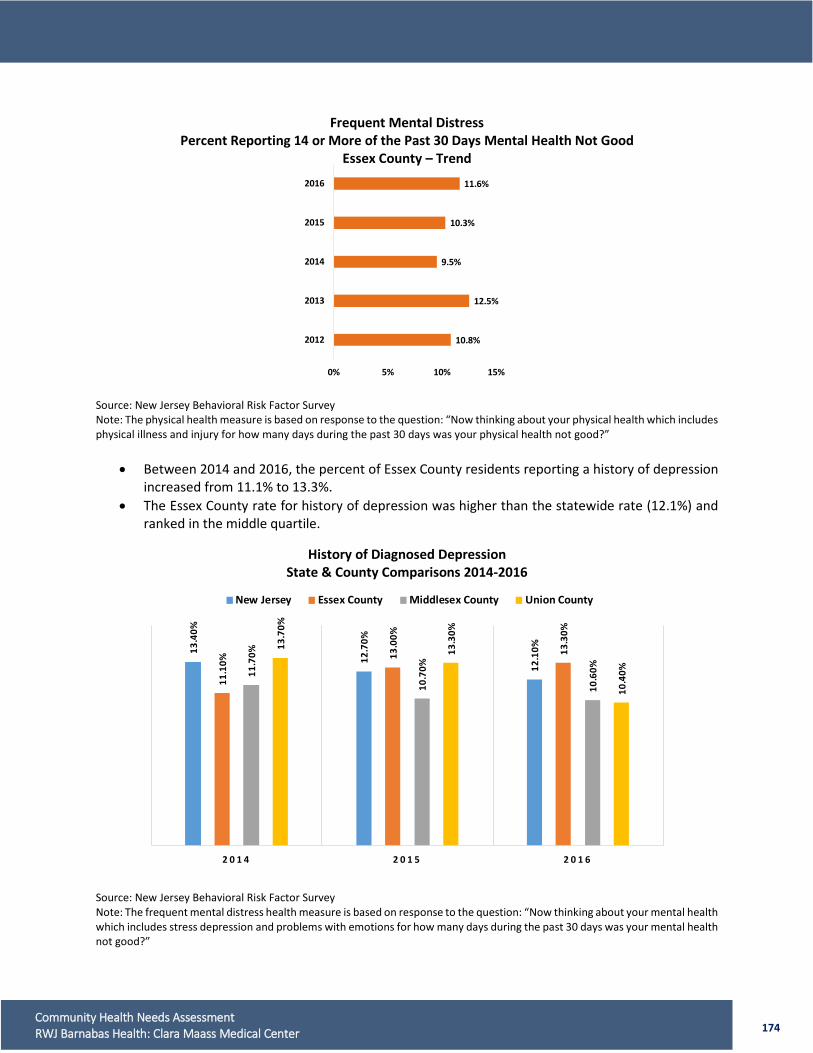
174 Community Health Needs Assessment RWJ Barnabas Health: Clara Maass Medical Center
Frequent Mental Distress
Percent Reporting 14 or More of the Past 30 Days Mental Health Not Good Essex County – Trend
Source: New Jersey Behavioral Risk Factor Survey Note: The physical health measure is based on response to the question: “Now thinking about your physical health which includes physical illness and injury for how many days during the past 30 days was your physical health not good?”
• Between 2014 and 2016, the percent of Essex County residents reporting a history of depression increased from 11.1% to 13.3%.
• The Essex County rate for history of depression was higher than the statewide rate (12.1%) and ranked in the middle quartile.
History of Diagnosed Depression
State & County Comparisons 2014-2016
Source: New Jersey Behavioral Risk Factor Survey Note: The frequent mental distress health measure is based on response to the question: “Now thinking about your mental health which includes stress depression and problems with emotions for how many days during the past 30 days was your mental health not good?”
13.4
0%
12.7
0%
12.1
0%
11.1
0%
13.0
0%
13.3
0%
11.7
0%
10.7
0%
10.6
0%
13.7
0%
13.3
0%
10.4
0%
2 0 1 4 2 0 1 5 2 0 1 6
New Jersey Essex County Middlesex County Union County
10.8%
12.5%
9.5%
10.3%
11.6%
0% 5% 10% 15%
2012
2013
2014
2015
2016

175 Community Health Needs Assessment RWJ Barnabas Health: Clara Maass Medical Center
History of Diagnosed Depression Essex County – Trend
Source: New Jersey Behavioral Risk Factor Survey Note: The frequent mental distress health measure is based on response to the question: “Now thinking about your mental health which includes stress depression and problems with emotions for how many days during the past 30 days was your mental health not good?”
Indicator Healthy People 2020 Target
County Health Rankings
Benchmark
New Jersey
Mentally Unhealthy Days Reported in the Past 30 Days Average Age-Adjusted Number N.A.
History of Diagnosed Depression N.A. N.A.
7. Morbidity Morbidity, the rate of disease incidence, is a measure of quality of life and how healthy a population is in terms of being disease free. Heart Disease
• According to BRFSS, the percent of Essex County residents told they have angina or coronary heart disease increased from 3.5% in 2014, to 4.5% in 2016. In 2016, BRFSS indicates 3.9% of New Jersey respondents have angina or coronary heart disease.
• As compared to New Jersey, Essex County residents reporting angina or coronary heart disease ranks in the middle performing quartile.
11.8%
11.6%
11.1%
13.0%
13.3%
10% 11% 12% 13% 14%
2012
2013
2014
2015
2016
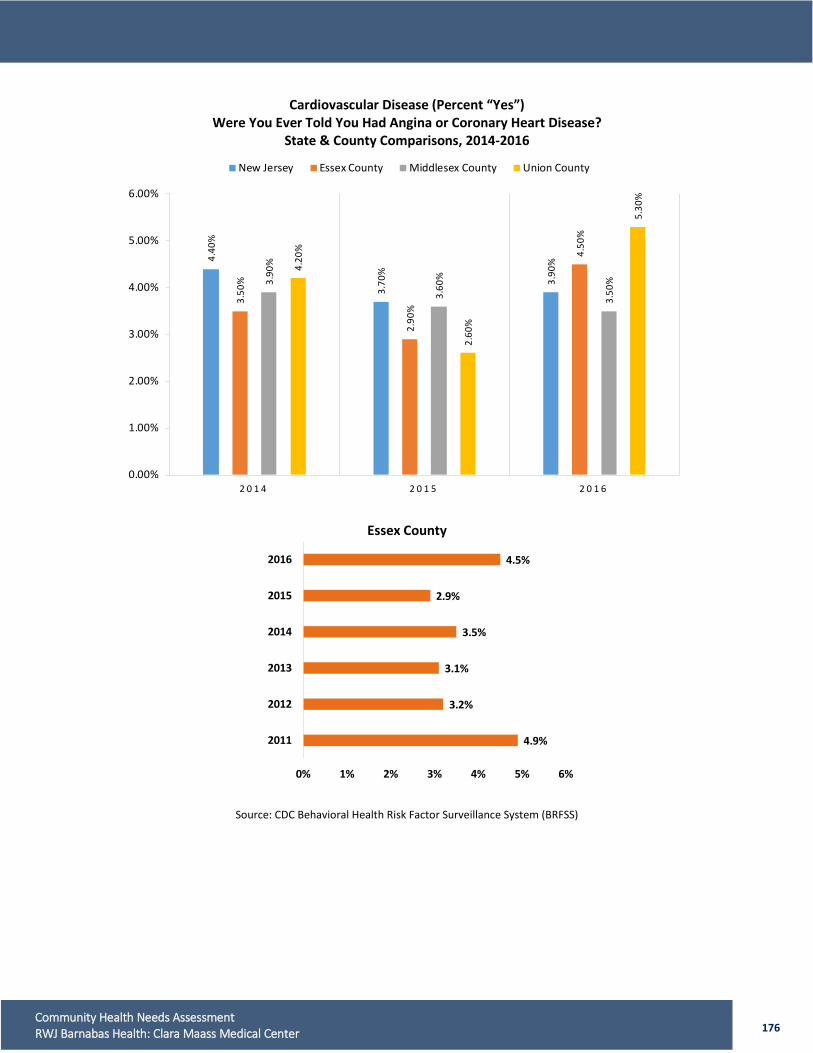
176 Community Health Needs Assessment RWJ Barnabas Health: Clara Maass Medical Center
Cardiovascular Disease (Percent “Yes”) Were You Ever Told You Had Angina or Coronary Heart Disease?
State & County Comparisons, 2014-2016
Essex County
Source: CDC Behavioral Health Risk Factor Surveillance System (BRFSS)
4.40
%
3.70
%
3.90
%
3.50
%
2.90
%
4.50
%
3.90
%
3.60
%
3.50
%
4.20
%
2.60
%
5.30
%
0.00%
1.00%
2.00%
3.00%
4.00%
5.00%
6.00%
2 0 1 4 2 0 1 5 2 0 1 6
New Jersey Essex County Middlesex County Union County
4.9%
3.2%
3.1%
3.5%
2.9%
4.5%
0% 1% 2% 3% 4% 5% 6%
2011
2012
2013
2014
2015
2016
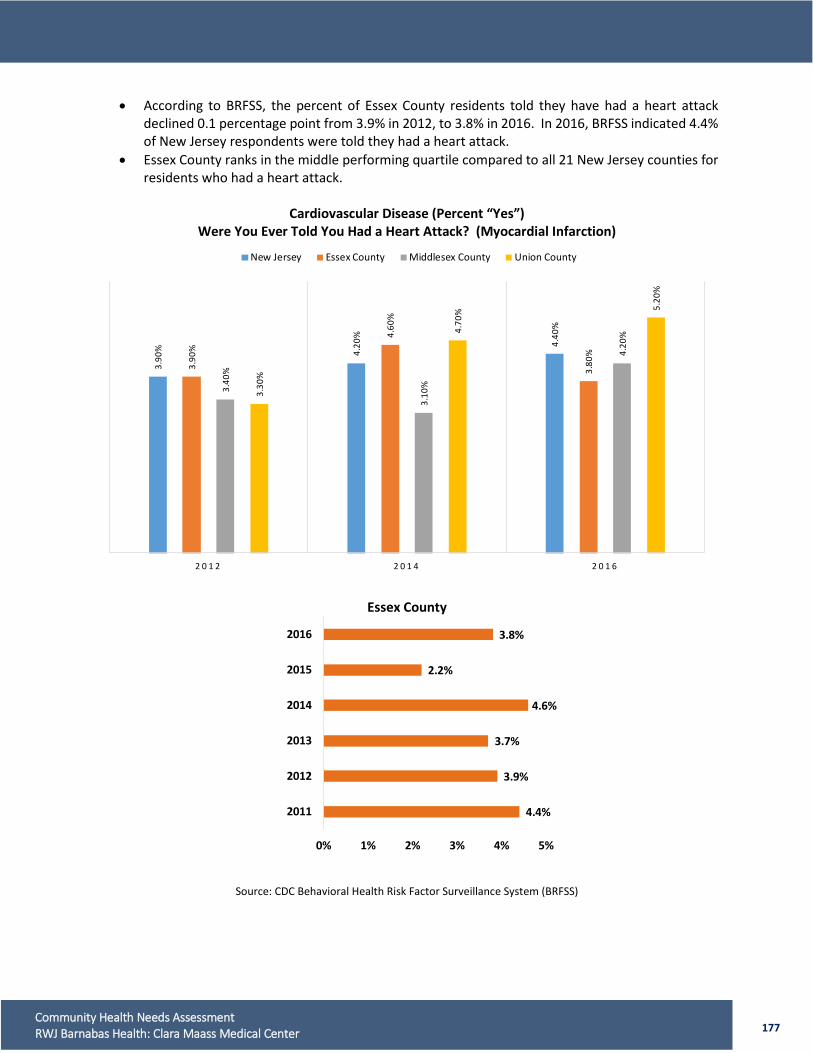
177 Community Health Needs Assessment RWJ Barnabas Health: Clara Maass Medical Center
• According to BRFSS, the percent of Essex County residents told they have had a heart attack declined 0.1 percentage point from 3.9% in 2012, to 3.8% in 2016. In 2016, BRFSS indicated 4.4% of New Jersey respondents were told they had a heart attack.
• Essex County ranks in the middle performing quartile compared to all 21 New Jersey counties for residents who had a heart attack.
Cardiovascular Disease (Percent “Yes”)
Were You Ever Told You Had a Heart Attack? (Myocardial Infarction)
Essex County
Source: CDC Behavioral Health Risk Factor Surveillance System (BRFSS)
3.90
% 4.20
%
4.40
%
3.90
%
4.60
%
3.80
%
3.40
%
3.10
%
4.20
%
3.30
%
4.70
% 5.20
%
2 0 1 2 2 0 1 4 2 0 1 6
New Jersey Essex County Middlesex County Union County
4.4%
3.9%
3.7%
4.6%
2.2%
3.8%
0% 1% 2% 3% 4% 5%
2011
2012
2013
2014
2015
2016
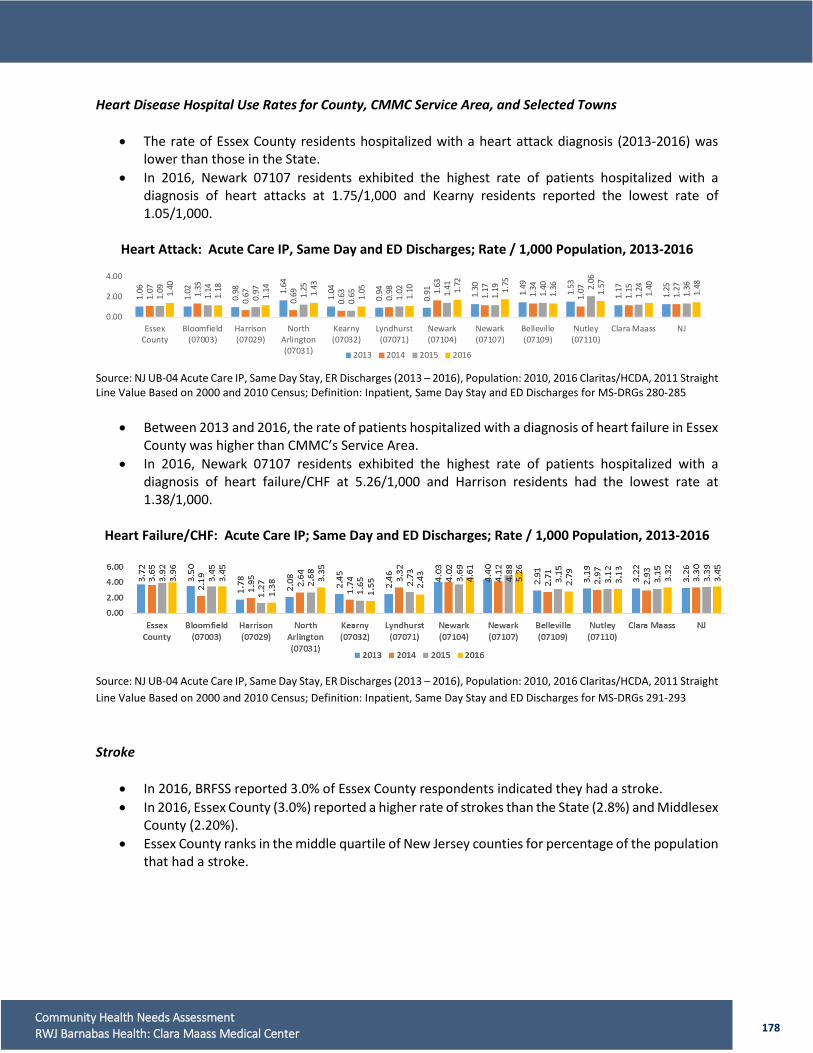
178 Community Health Needs Assessment RWJ Barnabas Health: Clara Maass Medical Center
Heart Disease Hospital Use Rates for County, CMMC Service Area, and Selected Towns
• The rate of Essex County residents hospitalized with a heart attack diagnosis (2013-2016) was lower than those in the State.
• In 2016, Newark 07107 residents exhibited the highest rate of patients hospitalized with a diagnosis of heart attacks at 1.75/1,000 and Kearny residents reported the lowest rate of 1.05/1,000.
Heart Attack: Acute Care IP, Same Day and ED Discharges; Rate / 1,000 Population, 2013-2016
Source: NJ UB-04 Acute Care IP, Same Day Stay, ER Discharges (2013 – 2016), Population: 2010, 2016 Claritas/HCDA, 2011 Straight Line Value Based on 2000 and 2010 Census; Definition: Inpatient, Same Day Stay and ED Discharges for MS-DRGs 280-285
• Between 2013 and 2016, the rate of patients hospitalized with a diagnosis of heart failure in Essex County was higher than CMMC’s Service Area.
• In 2016, Newark 07107 residents exhibited the highest rate of patients hospitalized with a diagnosis of heart failure/CHF at 5.26/1,000 and Harrison residents had the lowest rate at 1.38/1,000.
Heart Failure/CHF: Acute Care IP; Same Day and ED Discharges; Rate / 1,000 Population, 2013-2016
Source: NJ UB-04 Acute Care IP, Same Day Stay, ER Discharges (2013 – 2016), Population: 2010, 2016 Claritas/HCDA, 2011 Straight Line Value Based on 2000 and 2010 Census; Definition: Inpatient, Same Day Stay and ED Discharges for MS-DRGs 291-293
Stroke
• In 2016, BRFSS reported 3.0% of Essex County respondents indicated they had a stroke. • In 2016, Essex County (3.0%) reported a higher rate of strokes than the State (2.8%) and Middlesex
County (2.20%). • Essex County ranks in the middle quartile of New Jersey counties for percentage of the population
that had a stroke.
1.06
1.02
0.98 1.
64
1.04
0.94
0.91 1.30 1.49
1.53
1.17
1.25
1.07 1.35
0.67
0.69
0.63 0.98 1.
63
1.17 1.34
1.07
1.15 1.27
1.09
1.14
0.97 1.25
0.65 1.02 1.41
1.19 1.40 2.
06
1.24 1.36
1.40
1.18
1.14 1.43
1.05
1.10 1.
72
1.75
1.36 1.57
1.40 1.48
0.00
2.00
4.00
EssexCounty
Bloomfield(07003)
Harrison(07029)
NorthArlington(07031)
Kearny(07032)
Lyndhurst(07071)
Newark(07104)
Newark(07107)
Belleville(07109)
Nutley(07110)
Clara Maass NJ
2013 2014 2015 2016
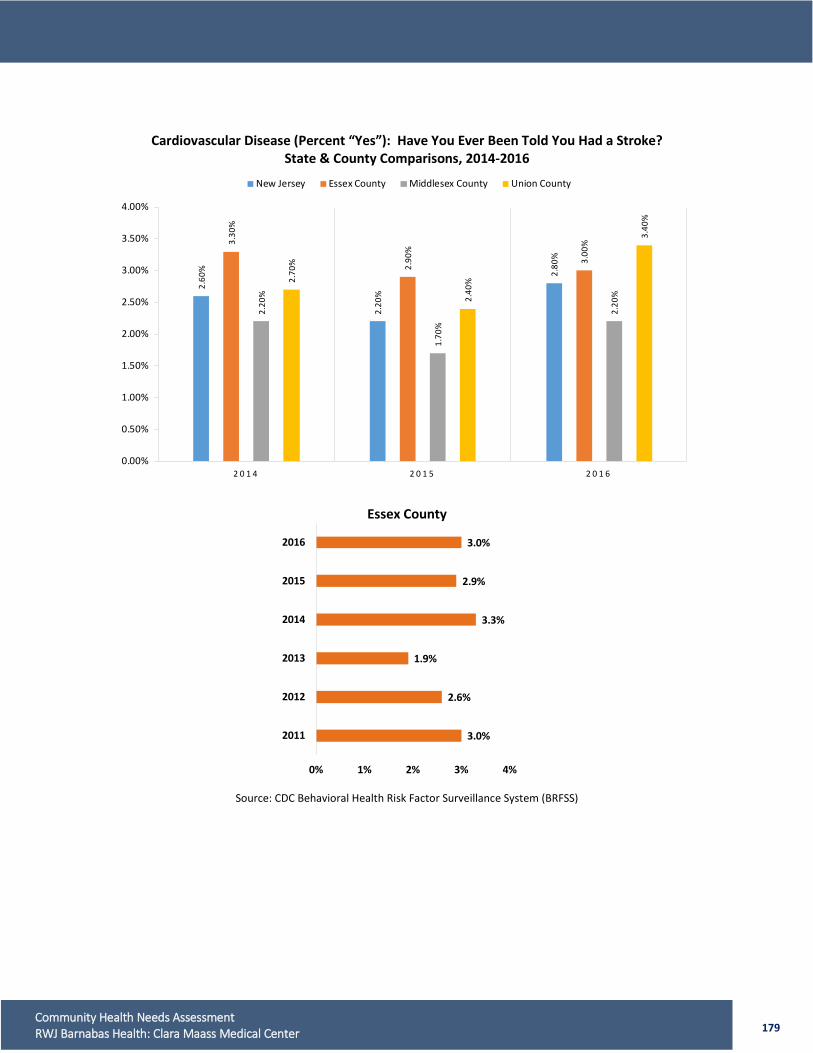
179 Community Health Needs Assessment RWJ Barnabas Health: Clara Maass Medical Center
Cardiovascular Disease (Percent “Yes”): Have You Ever Been Told You Had a Stroke? State & County Comparisons, 2014-2016
Essex County
Source: CDC Behavioral Health Risk Factor Surveillance System (BRFSS)
2.60
%
2.20
%
2.80
%
3.30
%
2.90
%
3.00
%
2.20
%
1.70
%
2.20
%
2.70
%
2.40
%
3.40
%
0.00%
0.50%
1.00%
1.50%
2.00%
2.50%
3.00%
3.50%
4.00%
2 0 1 4 2 0 1 5 2 0 1 6
New Jersey Essex County Middlesex County Union County
3.0%
2.6%
1.9%
3.3%
2.9%
3.0%
0% 1% 2% 3% 4%
2011
2012
2013
2014
2015
2016
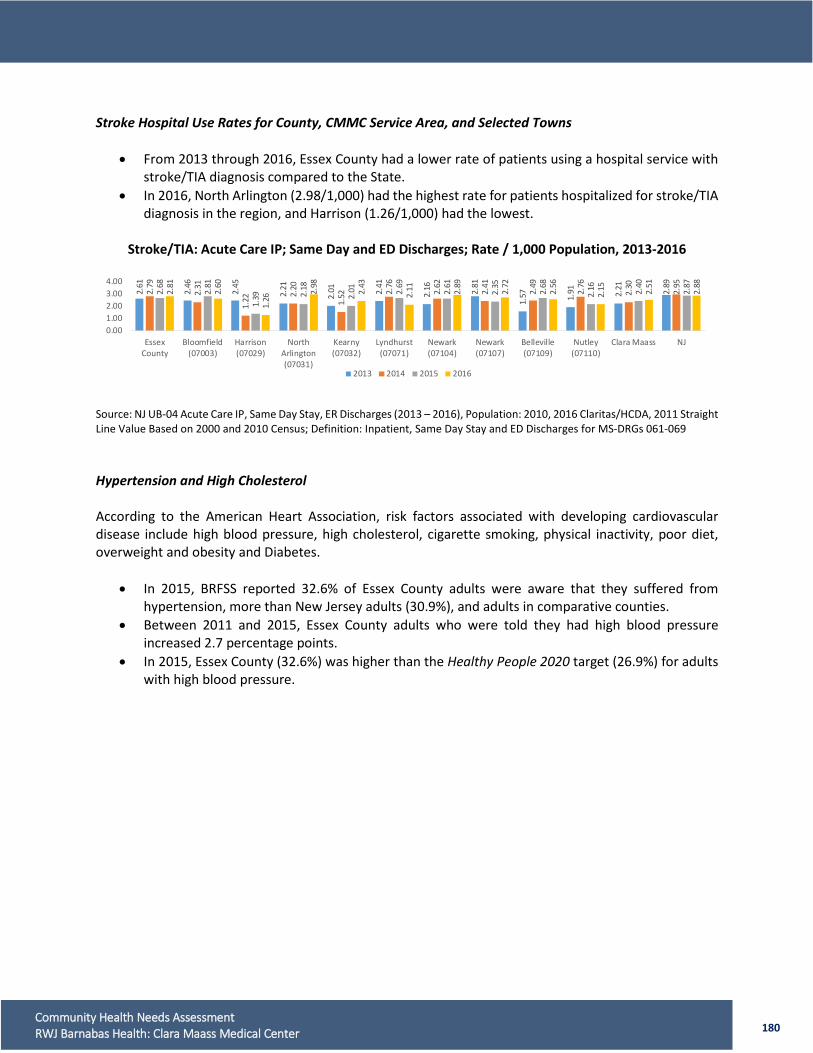
180 Community Health Needs Assessment RWJ Barnabas Health: Clara Maass Medical Center
Stroke Hospital Use Rates for County, CMMC Service Area, and Selected Towns
• From 2013 through 2016, Essex County had a lower rate of patients using a hospital service with stroke/TIA diagnosis compared to the State.
• In 2016, North Arlington (2.98/1,000) had the highest rate for patients hospitalized for stroke/TIA diagnosis in the region, and Harrison (1.26/1,000) had the lowest.
Stroke/TIA: Acute Care IP; Same Day and ED Discharges; Rate / 1,000 Population, 2013-2016
Source: NJ UB-04 Acute Care IP, Same Day Stay, ER Discharges (2013 – 2016), Population: 2010, 2016 Claritas/HCDA, 2011 Straight Line Value Based on 2000 and 2010 Census; Definition: Inpatient, Same Day Stay and ED Discharges for MS-DRGs 061-069 Hypertension and High Cholesterol According to the American Heart Association, risk factors associated with developing cardiovascular disease include high blood pressure, high cholesterol, cigarette smoking, physical inactivity, poor diet, overweight and obesity and Diabetes.
• In 2015, BRFSS reported 32.6% of Essex County adults were aware that they suffered from hypertension, more than New Jersey adults (30.9%), and adults in comparative counties.
• Between 2011 and 2015, Essex County adults who were told they had high blood pressure increased 2.7 percentage points.
• In 2015, Essex County (32.6%) was higher than the Healthy People 2020 target (26.9%) for adults with high blood pressure.
2.61
2.46
2.45
2.21
2.01 2.
41
2.16 2.81
1.57 1.
91 2.21 2.89
2.79
2.31
1.22 2.
20
1.52 2.
76
2.62
2.41
2.49
2.76
2.30 2.95
2.68
2.81
1.39 2.
18
2.01 2.
69
2.61
2.35
2.68
2.16 2.40
2.87
2.81
2.60
1.26
2.98
2.43
2.11 2.89
2.72
2.56
2.15 2.51
2.88
0.001.002.003.004.00
EssexCounty
Bloomfield(07003)
Harrison(07029)
NorthArlington(07031)
Kearny(07032)
Lyndhurst(07071)
Newark(07104)
Newark(07107)
Belleville(07109)
Nutley(07110)
Clara Maass NJ
2013 2014 2015 2016
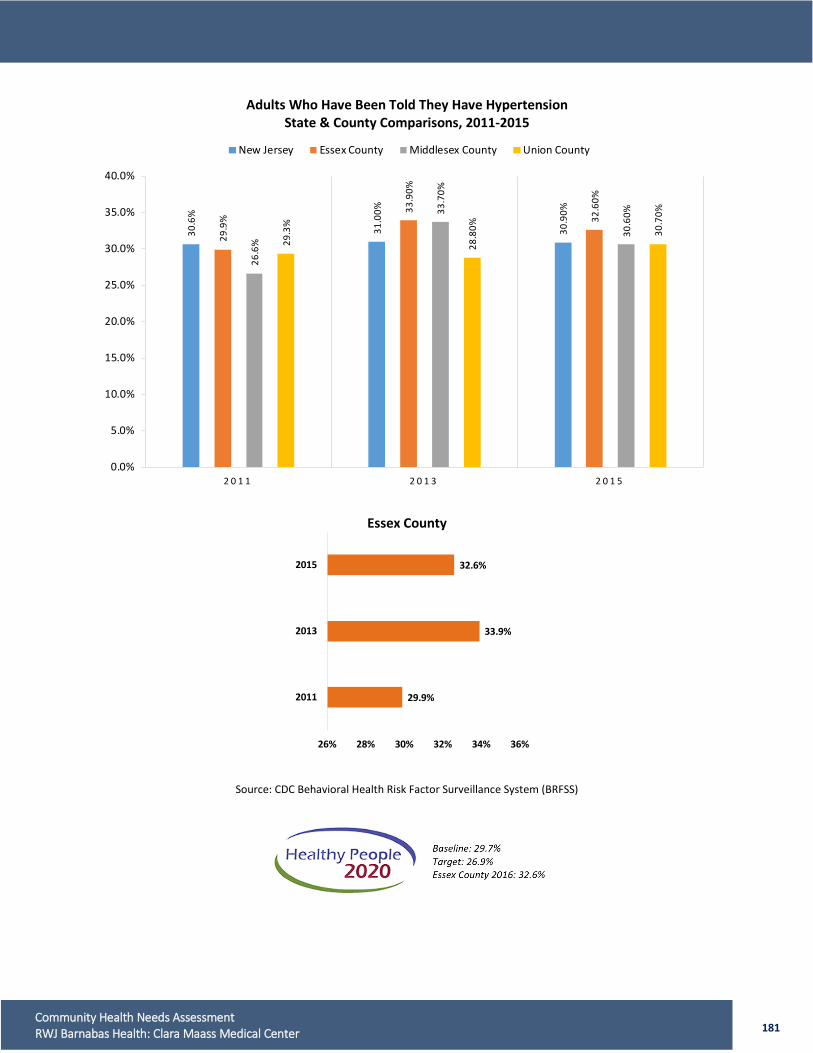
181 Community Health Needs Assessment RWJ Barnabas Health: Clara Maass Medical Center
Adults Who Have Been Told They Have Hypertension State & County Comparisons, 2011-2015
Essex County
Source: CDC Behavioral Health Risk Factor Surveillance System (BRFSS)
30.6
%
31.0
0%
30.9
0%
29.9
%
33.9
0%
32.6
0%
26.6
%
33.7
0%
30.6
0%
29.3
%
28.8
0% 30.7
0%
0.0%
5.0%
10.0%
15.0%
20.0%
25.0%
30.0%
35.0%
40.0%
2 0 1 1 2 0 1 3 2 0 1 5
New Jersey Essex County Middlesex County Union County
29.9%
33.9%
32.6%
26% 28% 30% 32% 34% 36%
2011
2013
2015
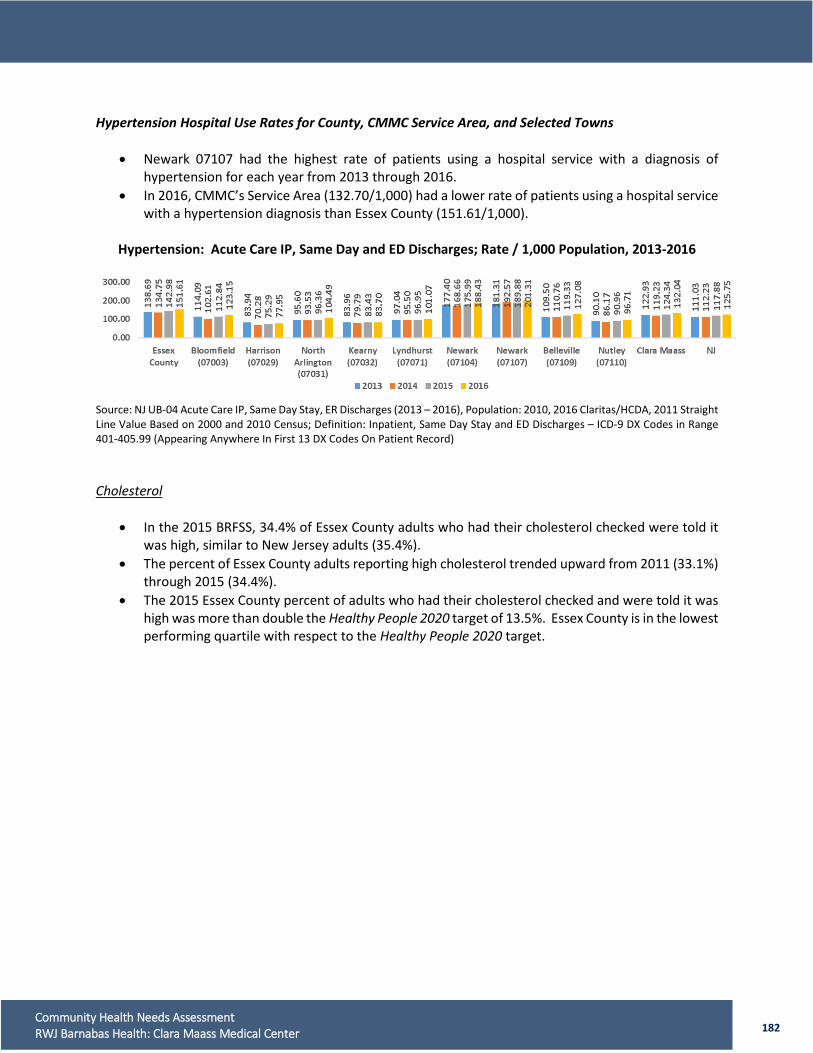
182 Community Health Needs Assessment RWJ Barnabas Health: Clara Maass Medical Center
Hypertension Hospital Use Rates for County, CMMC Service Area, and Selected Towns
• Newark 07107 had the highest rate of patients using a hospital service with a diagnosis of hypertension for each year from 2013 through 2016.
• In 2016, CMMC’s Service Area (132.70/1,000) had a lower rate of patients using a hospital service with a hypertension diagnosis than Essex County (151.61/1,000).
Hypertension: Acute Care IP, Same Day and ED Discharges; Rate / 1,000 Population, 2013-2016
Source: NJ UB-04 Acute Care IP, Same Day Stay, ER Discharges (2013 – 2016), Population: 2010, 2016 Claritas/HCDA, 2011 Straight Line Value Based on 2000 and 2010 Census; Definition: Inpatient, Same Day Stay and ED Discharges – ICD-9 DX Codes in Range 401-405.99 (Appearing Anywhere In First 13 DX Codes On Patient Record) Cholesterol
• In the 2015 BRFSS, 34.4% of Essex County adults who had their cholesterol checked were told it was high, similar to New Jersey adults (35.4%).
• The percent of Essex County adults reporting high cholesterol trended upward from 2011 (33.1%) through 2015 (34.4%).
• The 2015 Essex County percent of adults who had their cholesterol checked and were told it was high was more than double the Healthy People 2020 target of 13.5%. Essex County is in the lowest performing quartile with respect to the Healthy People 2020 target.
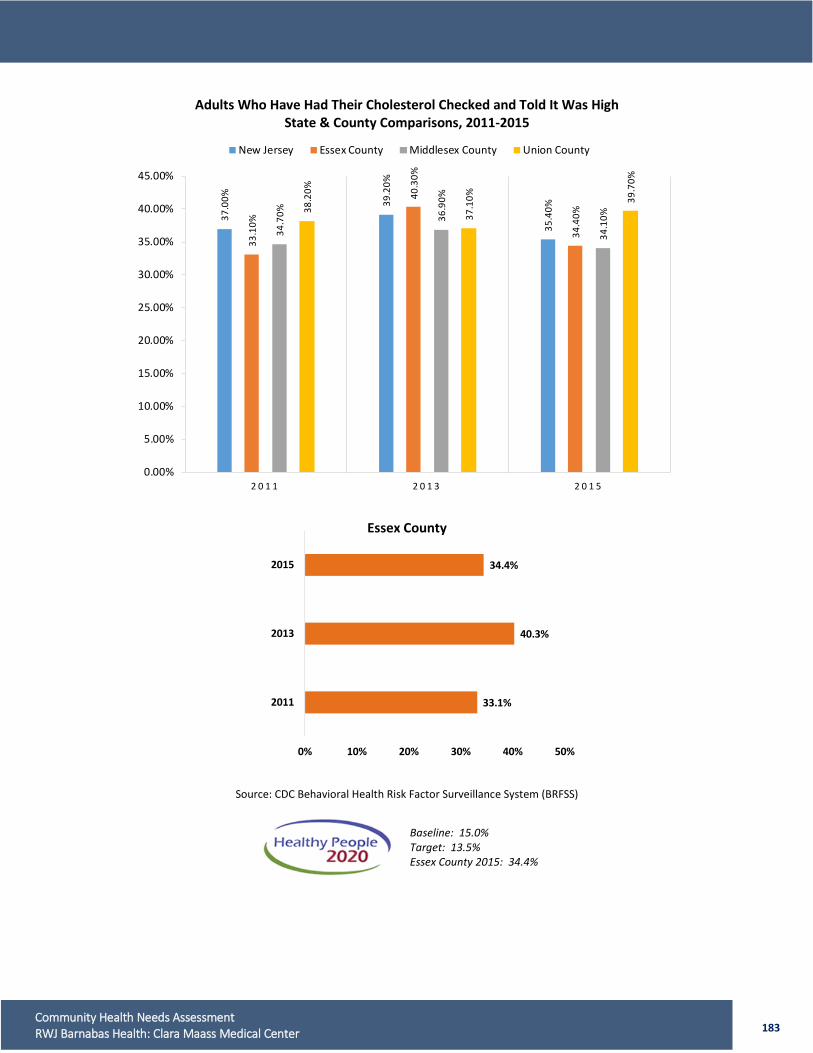
183 Community Health Needs Assessment RWJ Barnabas Health: Clara Maass Medical Center
Adults Who Have Had Their Cholesterol Checked and Told It Was High State & County Comparisons, 2011-2015
Essex County
Source: CDC Behavioral Health Risk Factor Surveillance System (BRFSS)
37.0
0% 39.2
0%
35.4
0%
33.1
0%
40.3
0%
34.4
0%
34.7
0% 36.9
0%
34.1
0%
38.2
0%
37.1
0% 39.7
0%
0.00%
5.00%
10.00%
15.00%
20.00%
25.00%
30.00%
35.00%
40.00%
45.00%
2 0 1 1 2 0 1 3 2 0 1 5
New Jersey Essex County Middlesex County Union County
33.1%
40.3%
34.4%
0% 10% 20% 30% 40% 50%
2011
2013
2015
Baseline: 15.0% Target: 13.5% Essex County 2015: 34.4%
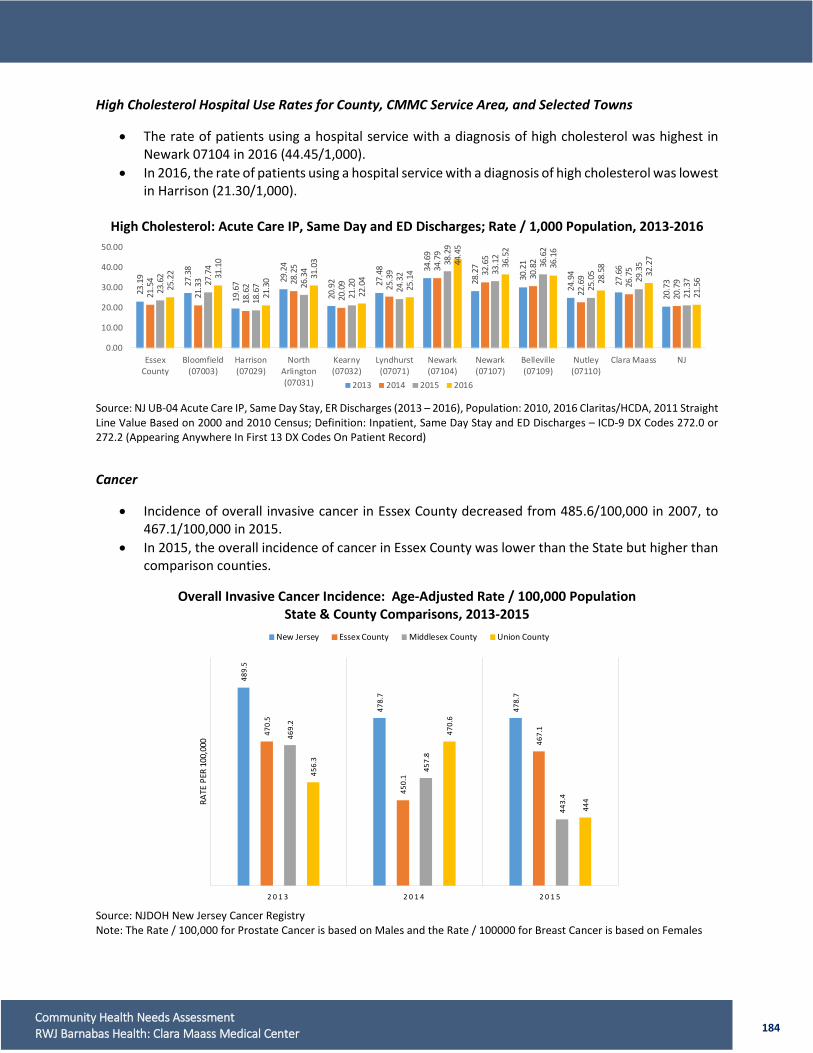
184 Community Health Needs Assessment RWJ Barnabas Health: Clara Maass Medical Center
High Cholesterol Hospital Use Rates for County, CMMC Service Area, and Selected Towns
• The rate of patients using a hospital service with a diagnosis of high cholesterol was highest in Newark 07104 in 2016 (44.45/1,000).
• In 2016, the rate of patients using a hospital service with a diagnosis of high cholesterol was lowest in Harrison (21.30/1,000).
High Cholesterol: Acute Care IP, Same Day and ED Discharges; Rate / 1,000 Population, 2013-2016
Source: NJ UB-04 Acute Care IP, Same Day Stay, ER Discharges (2013 – 2016), Population: 2010, 2016 Claritas/HCDA, 2011 Straight Line Value Based on 2000 and 2010 Census; Definition: Inpatient, Same Day Stay and ED Discharges – ICD-9 DX Codes 272.0 or 272.2 (Appearing Anywhere In First 13 DX Codes On Patient Record) Cancer
• Incidence of overall invasive cancer in Essex County decreased from 485.6/100,000 in 2007, to 467.1/100,000 in 2015.
• In 2015, the overall incidence of cancer in Essex County was lower than the State but higher than comparison counties.
Overall Invasive Cancer Incidence: Age-Adjusted Rate / 100,000 Population
State & County Comparisons, 2013-2015
Source: NJDOH New Jersey Cancer Registry Note: The Rate / 100,000 for Prostate Cancer is based on Males and the Rate / 100000 for Breast Cancer is based on Females
23.1
9
27.3
8
19.6
7 29.2
4
20.9
2 27.4
8 34.6
9
28.2
7
30.2
1
24.9
4
27.6
6
20.7
3
21.5
4
21.3
3
18.6
2 28.2
5
20.0
9 25.3
9 34.7
9
32.6
5
30.8
2
22.6
9
26.7
5
20.7
9
23.6
2
27.7
4
18.6
7 26.3
4
21.2
0
24.3
2
38.2
9
33.1
2
36.6
2
25.0
5
29.3
5
21.3
7
25.2
2 31.1
0
21.3
0 31.0
3
22.0
4
25.1
4
44.4
5
36.5
2
36.1
6
28.5
8
32.2
7
21.5
6
0.00
10.00
20.00
30.00
40.00
50.00
EssexCounty
Bloomfield(07003)
Harrison(07029)
NorthArlington(07031)
Kearny(07032)
Lyndhurst(07071)
Newark(07104)
Newark(07107)
Belleville(07109)
Nutley(07110)
Clara Maass NJ
2013 2014 2015 2016
489.
5
478.
7
478.
7
470.
5
450.
1
467.
1
469.
2
457.
8
443.
4
456.
3
470.
6
444
2 0 1 3 2 0 1 4 2 0 1 5
RATE
PER
100
,000
New Jersey Essex County Middlesex County Union County
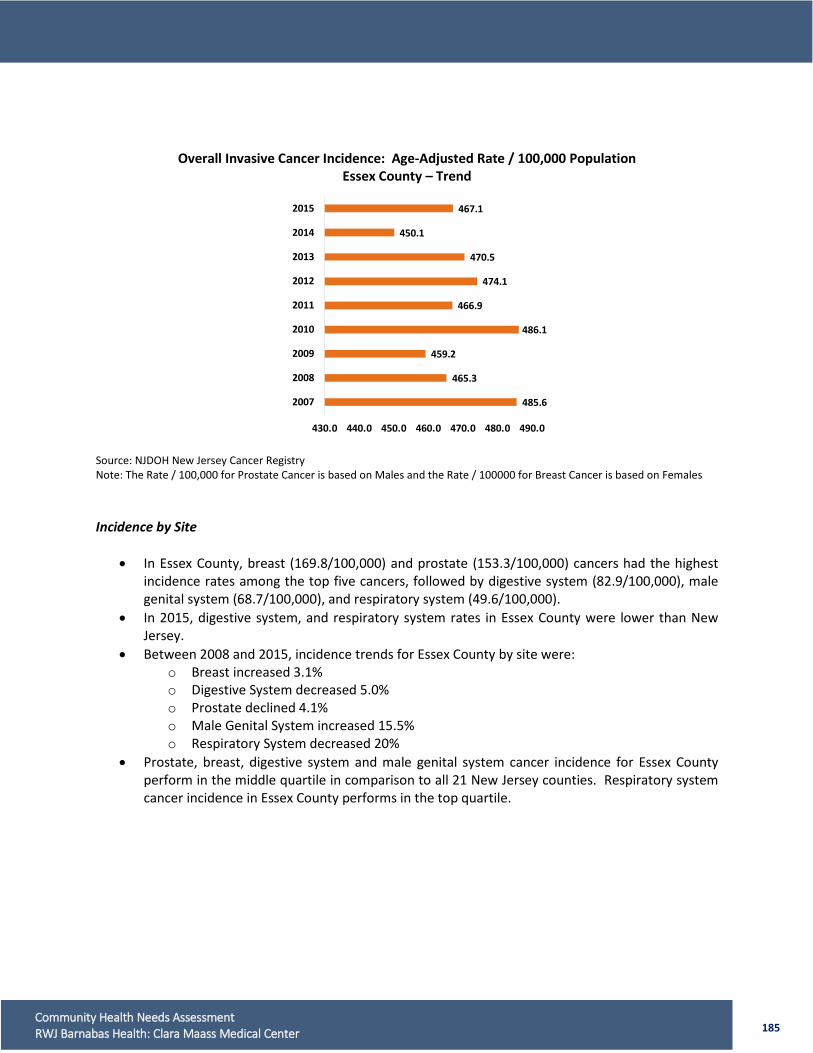
185 Community Health Needs Assessment RWJ Barnabas Health: Clara Maass Medical Center
Overall Invasive Cancer Incidence: Age-Adjusted Rate / 100,000 Population Essex County – Trend
Source: NJDOH New Jersey Cancer Registry Note: The Rate / 100,000 for Prostate Cancer is based on Males and the Rate / 100000 for Breast Cancer is based on Females Incidence by Site
• In Essex County, breast (169.8/100,000) and prostate (153.3/100,000) cancers had the highest incidence rates among the top five cancers, followed by digestive system (82.9/100,000), male genital system (68.7/100,000), and respiratory system (49.6/100,000).
• In 2015, digestive system, and respiratory system rates in Essex County were lower than New Jersey.
• Between 2008 and 2015, incidence trends for Essex County by site were: o Breast increased 3.1% o Digestive System decreased 5.0% o Prostate declined 4.1% o Male Genital System increased 15.5% o Respiratory System decreased 20%
• Prostate, breast, digestive system and male genital system cancer incidence for Essex County perform in the middle quartile in comparison to all 21 New Jersey counties. Respiratory system cancer incidence in Essex County performs in the top quartile.
485.6
465.3
459.2
486.1
466.9
474.1
470.5
450.1
467.1
430.0 440.0 450.0 460.0 470.0 480.0 490.0
2007
2008
2009
2010
2011
2012
2013
2014
2015
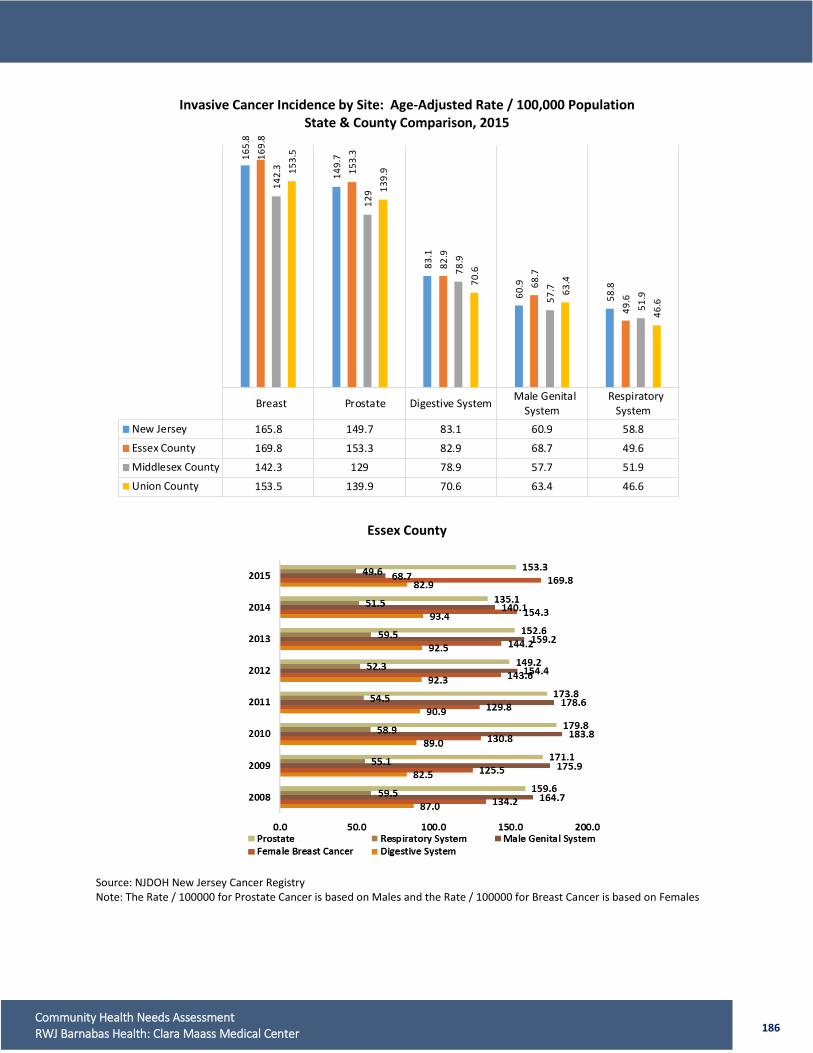
186 Community Health Needs Assessment RWJ Barnabas Health: Clara Maass Medical Center
Invasive Cancer Incidence by Site: Age-Adjusted Rate / 100,000 Population State & County Comparison, 2015
Essex County Source: NJDOH New Jersey Cancer Registry Note: The Rate / 100000 for Prostate Cancer is based on Males and the Rate / 100000 for Breast Cancer is based on Females
Breast Prostate Digestive System Male GenitalSystem
RespiratorySystem
New Jersey 165.8 149.7 83.1 60.9 58.8Essex County 169.8 153.3 82.9 68.7 49.6Middlesex County 142.3 129 78.9 57.7 51.9Union County 153.5 139.9 70.6 63.4 46.6
165.
8
149.
7
83.1
60.9
58.8
169.
8
153.
3
82.9
68.7
49.6
142.
3
129
78.9
57.7
51.9
153.
5
139.
9
70.6
63.4
46.6

187 Community Health Needs Assessment RWJ Barnabas Health: Clara Maass Medical Center
Cancer Hospital Use Rates for County, CMMC Service Area, and Selected Towns
• The 2016 rate of patients using a hospital service with a cancer diagnosis per 1,000 population was highest in Belleville (26.07/1,000).
• In 2016, the rate for patients discharged with a cancer diagnosis/1,000 population was slightly higher in the County (24.62/1,000) than in the CMMC Service Area (23.95/1,000).
Cancer: Acute Care IP, Same Day and ED Discharges; Rate / 1,000 Population, 2013-2016
Source: NJ UB-04 Acute Care IP, Same Day Stay, ER Discharges (2013 – 2016), Population: 2010, 2016 Claritas/HCDA, 2011 Straight Line Value Based on 2000 and 2010 Census Definition: Inpatient, Same Day Stay and ED Discharges – New Solution’s Inc. Oncology Product Line (includes History of Cancer)
• The 2016 rate of residents using a hospital service that had a history of cancer diagnosis was highest in Nutley (14.31/1,000).
• In 2016, the rate of patients hospitalized with a history of cancer diagnosis/1,000 population was lowest in Harrison (6.12/1,000).
History of Cancer: Acute Care Inpatient, Same Day and ED Discharges; Rate / 1,000 Population
Source: NJ UB-04 Acute Care IP, Same Day Stay, ER Discharges (2013 – 2016), Population: 2010, 2016 Claritas/HCDA, 2011 Straight Line Value Based on 2000 and 2010 Census Definition: Inpatient, Same Day Stay and ED Discharges – New Solution’s Inc. Oncology Product Line (History of Cancer Only) Asthma Asthma, a chronic lung disease often with childhood onset, inflames and narrows airways and causes recurring periods of wheezing, chest tightness, shortness of breath and coughing.60 The exact cause of asthma is unknown; however, researchers believe genetic and environmental factors are involved. Factors may include atopy, parents with asthma, certain respiratory infections during childhood and contact with some airborne allergens or exposure to some viral infections in infancy or in early childhood when the immune system is developing.61 60 http://www.nhlbi.nih.gov/health/health-topics/topics/asthma 61 ibid
24.7
8
25.2
8
18.5
7 24.1
4
21.2
4
25.1
8
27.9
8
24.8
6
23.9
8
25.0
3
24.4
0
23.6
4
25.4
4
24.0
2
18.0
1 25.4
9
21.2
2
22.3
5
25.6
0
27.7
0
25.1
7
28.3
8
24.5
7
24.5
0
26.1
6
26.2
8
17.6
4 25.0
3
21.3
0
23.8
1
26.9
5
29.5
9
26.7
7
25.3
3
25.3
8
25.1
9
24.6
2
25.1
5
17.9
4 24.2
0
20.8
0
22.2
1
24.8
9
25.6
5
26.0
7
24.4
6
23.9
5
25.0
3
0.00
10.00
20.00
30.00
40.00
Essex County Bloomfield(07003)
Harrison(07029)
NorthArlington(07031)
Kearny(07032)
Lyndhurst(07071)
Newark(07104)
Newark(07107)
Belleville(07109)
Nutley(07110)
Clara Maass NJ
2013 2014 2015 2016
11.3
6
12.7
6
7.17
14.9
6
9.82
12.9
4
10.4
2
10.0
5
10.2
6
11.7
6
11.0
2 13.6
8
11.3
8
10.9
0
7.12
11.9
3
8.85
12.5
8
10.4
8
9.82 10
.52 13
.65
10.5
9 13.7
7
11.4
9
10.9
3
7.25
11.9
2
8.68
12.9
7
10.6
7
9.39 11
.28
11.9
6
10.5
1 13.6
0
12.1
3
12.0
8
6.12
12.6
0
9.73 11
.47
10.9
1
10.7
6
12.4
2
14.3
1
11.2
9 13.9
0
0.00
5.00
10.00
15.00
20.00
Essex County Bloomfield(07003)
Harrison(07029)
NorthArlington(07031)
Kearny(07032)
Lyndhurst(07071)
Newark(07104)
Newark(07107)
Belleville(07109)
Nutley(07110)
Clara Maass NJ2013 2014 2015 2016
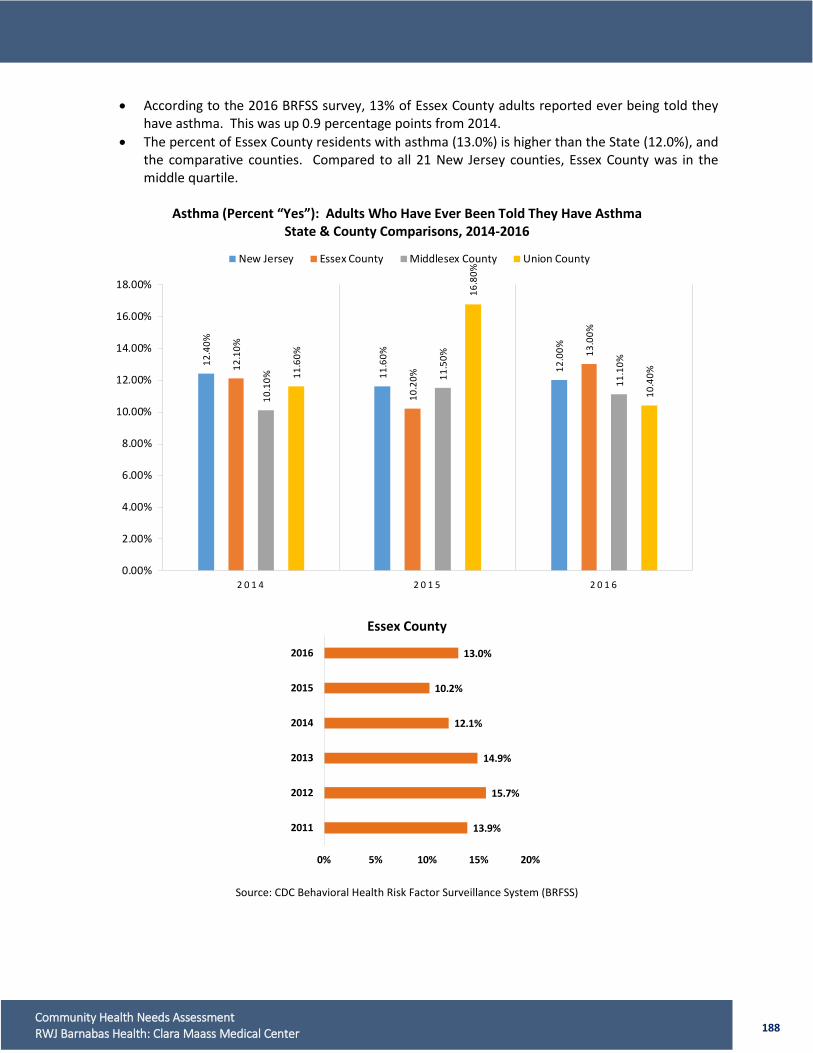
188 Community Health Needs Assessment RWJ Barnabas Health: Clara Maass Medical Center
• According to the 2016 BRFSS survey, 13% of Essex County adults reported ever being told they have asthma. This was up 0.9 percentage points from 2014.
• The percent of Essex County residents with asthma (13.0%) is higher than the State (12.0%), and the comparative counties. Compared to all 21 New Jersey counties, Essex County was in the middle quartile.
Asthma (Percent “Yes”): Adults Who Have Ever Been Told They Have Asthma
State & County Comparisons, 2014-2016
Essex County
Source: CDC Behavioral Health Risk Factor Surveillance System (BRFSS)
12.4
0%
11.6
0%
12.0
0%
12.1
0%
10.2
0%
13.0
0%
10.1
0% 11.5
0%
11.1
0%
11.6
0%
16.8
0%
10.4
0%
0.00%
2.00%
4.00%
6.00%
8.00%
10.00%
12.00%
14.00%
16.00%
18.00%
2 0 1 4 2 0 1 5 2 0 1 6
New Jersey Essex County Middlesex County Union County
13.9%
15.7%
14.9%
12.1%
10.2%
13.0%
0% 5% 10% 15% 20%
2011
2012
2013
2014
2015
2016
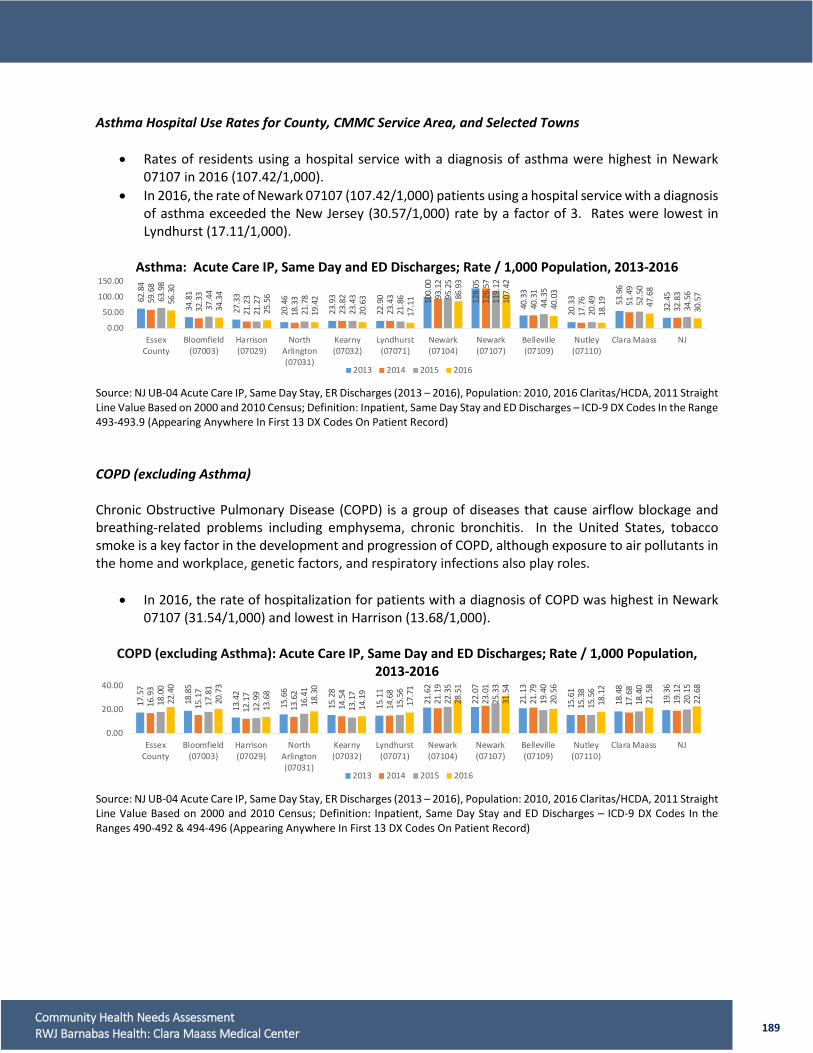
189 Community Health Needs Assessment RWJ Barnabas Health: Clara Maass Medical Center
Asthma Hospital Use Rates for County, CMMC Service Area, and Selected Towns
• Rates of residents using a hospital service with a diagnosis of asthma were highest in Newark 07107 in 2016 (107.42/1,000).
• In 2016, the rate of Newark 07107 (107.42/1,000) patients using a hospital service with a diagnosis of asthma exceeded the New Jersey (30.57/1,000) rate by a factor of 3. Rates were lowest in Lyndhurst (17.11/1,000).
Asthma: Acute Care IP, Same Day and ED Discharges; Rate / 1,000 Population, 2013-2016
Source: NJ UB-04 Acute Care IP, Same Day Stay, ER Discharges (2013 – 2016), Population: 2010, 2016 Claritas/HCDA, 2011 Straight Line Value Based on 2000 and 2010 Census; Definition: Inpatient, Same Day Stay and ED Discharges – ICD-9 DX Codes In the Range 493-493.9 (Appearing Anywhere In First 13 DX Codes On Patient Record) COPD (excluding Asthma) Chronic Obstructive Pulmonary Disease (COPD) is a group of diseases that cause airflow blockage and breathing-related problems including emphysema, chronic bronchitis. In the United States, tobacco smoke is a key factor in the development and progression of COPD, although exposure to air pollutants in the home and workplace, genetic factors, and respiratory infections also play roles.
• In 2016, the rate of hospitalization for patients with a diagnosis of COPD was highest in Newark 07107 (31.54/1,000) and lowest in Harrison (13.68/1,000).
COPD (excluding Asthma): Acute Care IP, Same Day and ED Discharges; Rate / 1,000 Population,
2013-2016
Source: NJ UB-04 Acute Care IP, Same Day Stay, ER Discharges (2013 – 2016), Population: 2010, 2016 Claritas/HCDA, 2011 Straight Line Value Based on 2000 and 2010 Census; Definition: Inpatient, Same Day Stay and ED Discharges – ICD-9 DX Codes In the Ranges 490-492 & 494-496 (Appearing Anywhere In First 13 DX Codes On Patient Record)
62.8
4
34.8
1
27.3
3
20.4
6
23.9
3
22.9
0 100.
00
128.
05
40.3
3
20.3
3 53.9
6
32.4
5
59.6
8
32.3
3
21.2
3
18.3
3
23.8
2
23.4
3 93.1
2
126.
57
40.3
1
17.7
6 51.4
9
32.8
363.9
8
37.4
4
21.2
7
21.7
8
23.4
3
21.8
6 95.2
5
119.
12
44.3
5
20.4
9 52.5
0
34.5
6
56.3
0
34.3
4
25.5
6
19.4
2
20.6
3
17.1
1 86.9
3
107.
42
40.0
3
18.1
9
47.6
8
30.5
7
0.00
50.00
100.00
150.00
EssexCounty
Bloomfield(07003)
Harrison(07029)
NorthArlington(07031)
Kearny(07032)
Lyndhurst(07071)
Newark(07104)
Newark(07107)
Belleville(07109)
Nutley(07110)
Clara Maass NJ
2013 2014 2015 2016
17.5
7
18.8
5
13.4
2
15.6
6
15.2
8
15.1
1
21.6
2
22.0
7
21.1
3
15.6
1
18.4
8
19.3
6
16.9
3
15.1
7
12.1
7
13.6
2
14.5
4
14.6
8
21.1
9
23.0
1
21.7
9
15.3
8
17.6
8
19.1
2
18.0
0
17.8
1
12.9
9
16.4
1
13.1
7
15.5
6
22.3
5
25.3
3
19.4
0
15.5
6
18.4
0
20.1
5
22.4
0
20.7
3
13.6
8
18.3
0
14.1
9
17.7
1
28.5
1
31.5
4
20.5
6
18.1
2
21.5
8
22.6
8
0.00
20.00
40.00
EssexCounty
Bloomfield(07003)
Harrison(07029)
NorthArlington(07031)
Kearny(07032)
Lyndhurst(07071)
Newark(07104)
Newark(07107)
Belleville(07109)
Nutley(07110)
Clara Maass NJ
2013 2014 2015 2016
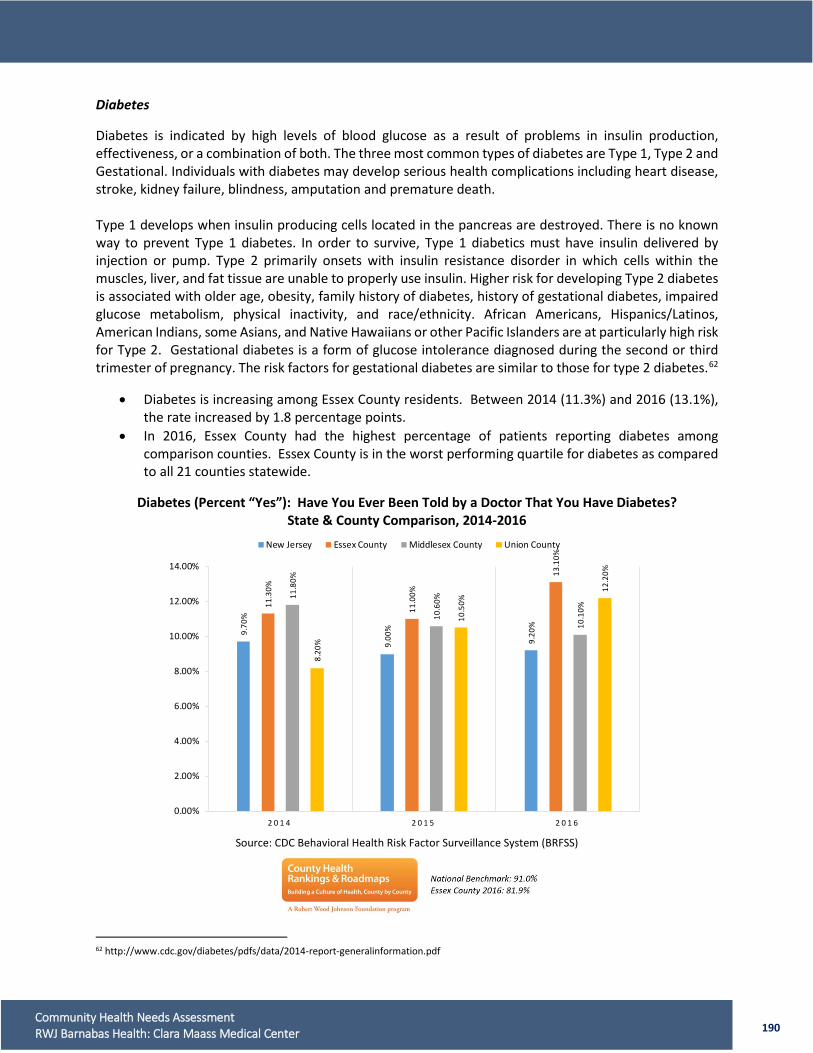
190 Community Health Needs Assessment RWJ Barnabas Health: Clara Maass Medical Center
Diabetes Diabetes is indicated by high levels of blood glucose as a result of problems in insulin production, effectiveness, or a combination of both. The three most common types of diabetes are Type 1, Type 2 and Gestational. Individuals with diabetes may develop serious health complications including heart disease, stroke, kidney failure, blindness, amputation and premature death. Type 1 develops when insulin producing cells located in the pancreas are destroyed. There is no known way to prevent Type 1 diabetes. In order to survive, Type 1 diabetics must have insulin delivered by injection or pump. Type 2 primarily onsets with insulin resistance disorder in which cells within the muscles, liver, and fat tissue are unable to properly use insulin. Higher risk for developing Type 2 diabetes is associated with older age, obesity, family history of diabetes, history of gestational diabetes, impaired glucose metabolism, physical inactivity, and race/ethnicity. African Americans, Hispanics/Latinos, American Indians, some Asians, and Native Hawaiians or other Pacific Islanders are at particularly high risk for Type 2. Gestational diabetes is a form of glucose intolerance diagnosed during the second or third trimester of pregnancy. The risk factors for gestational diabetes are similar to those for type 2 diabetes.62
• Diabetes is increasing among Essex County residents. Between 2014 (11.3%) and 2016 (13.1%), the rate increased by 1.8 percentage points.
• In 2016, Essex County had the highest percentage of patients reporting diabetes among comparison counties. Essex County is in the worst performing quartile for diabetes as compared to all 21 counties statewide.
Diabetes (Percent “Yes”): Have You Ever Been Told by a Doctor That You Have Diabetes? State & County Comparison, 2014-2016
Source: CDC Behavioral Health Risk Factor Surveillance System (BRFSS)
62 http://www.cdc.gov/diabetes/pdfs/data/2014-report-generalinformation.pdf
9.70
%
9.00
%
9.20
%
11.3
0%
11.0
0%
13.1
0%
11.8
0%
10.6
0%
10.1
0%
8.20
%
10.5
0%
12.2
0%
0.00%
2.00%
4.00%
6.00%
8.00%
10.00%
12.00%
14.00%
2 0 1 4 2 0 1 5 2 0 1 6
New Jersey Essex County Middlesex County Union County
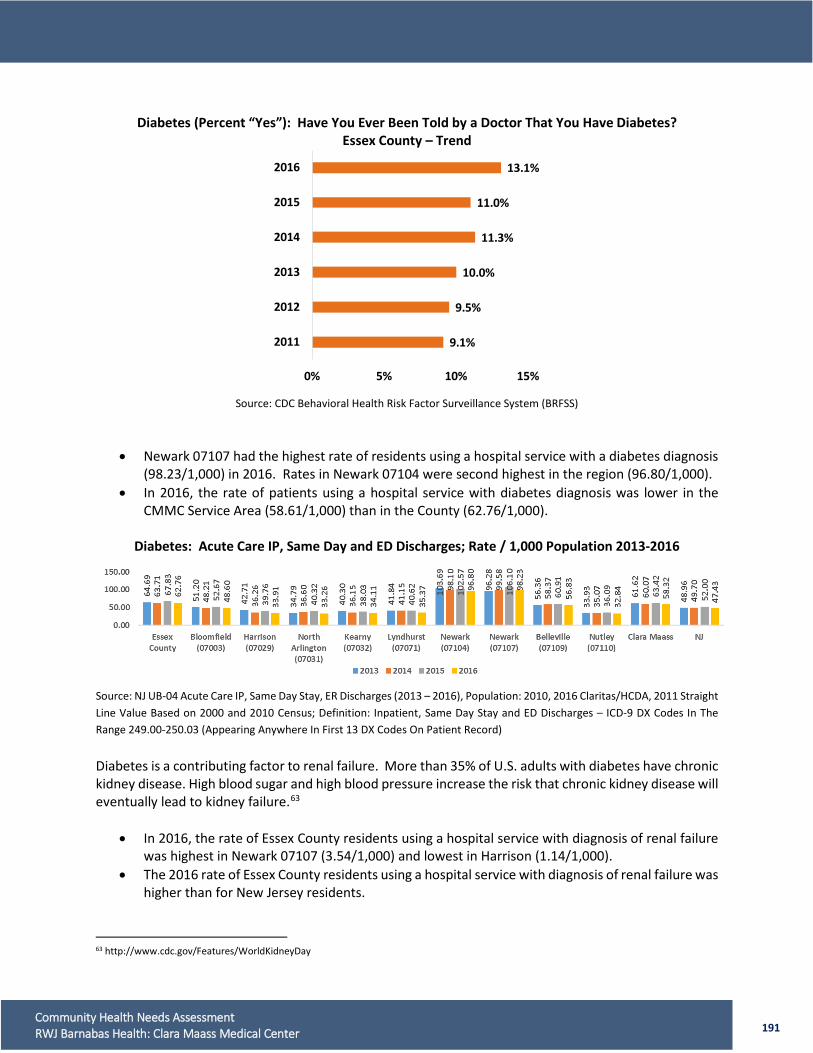
191 Community Health Needs Assessment RWJ Barnabas Health: Clara Maass Medical Center
Diabetes (Percent “Yes”): Have You Ever Been Told by a Doctor That You Have Diabetes?
Essex County – Trend
Source: CDC Behavioral Health Risk Factor Surveillance System (BRFSS)
• Newark 07107 had the highest rate of residents using a hospital service with a diabetes diagnosis (98.23/1,000) in 2016. Rates in Newark 07104 were second highest in the region (96.80/1,000).
• In 2016, the rate of patients using a hospital service with diabetes diagnosis was lower in the CMMC Service Area (58.61/1,000) than in the County (62.76/1,000).
Diabetes: Acute Care IP, Same Day and ED Discharges; Rate / 1,000 Population 2013-2016
Source: NJ UB-04 Acute Care IP, Same Day Stay, ER Discharges (2013 – 2016), Population: 2010, 2016 Claritas/HCDA, 2011 Straight Line Value Based on 2000 and 2010 Census; Definition: Inpatient, Same Day Stay and ED Discharges – ICD-9 DX Codes In The Range 249.00-250.03 (Appearing Anywhere In First 13 DX Codes On Patient Record)
Diabetes is a contributing factor to renal failure. More than 35% of U.S. adults with diabetes have chronic kidney disease. High blood sugar and high blood pressure increase the risk that chronic kidney disease will eventually lead to kidney failure.63
• In 2016, the rate of Essex County residents using a hospital service with diagnosis of renal failure was highest in Newark 07107 (3.54/1,000) and lowest in Harrison (1.14/1,000).
• The 2016 rate of Essex County residents using a hospital service with diagnosis of renal failure was higher than for New Jersey residents.
63 http://www.cdc.gov/Features/WorldKidneyDay
9.1%
9.5%
10.0%
11.3%
11.0%
13.1%
0% 5% 10% 15%
2011
2012
2013
2014
2015
2016
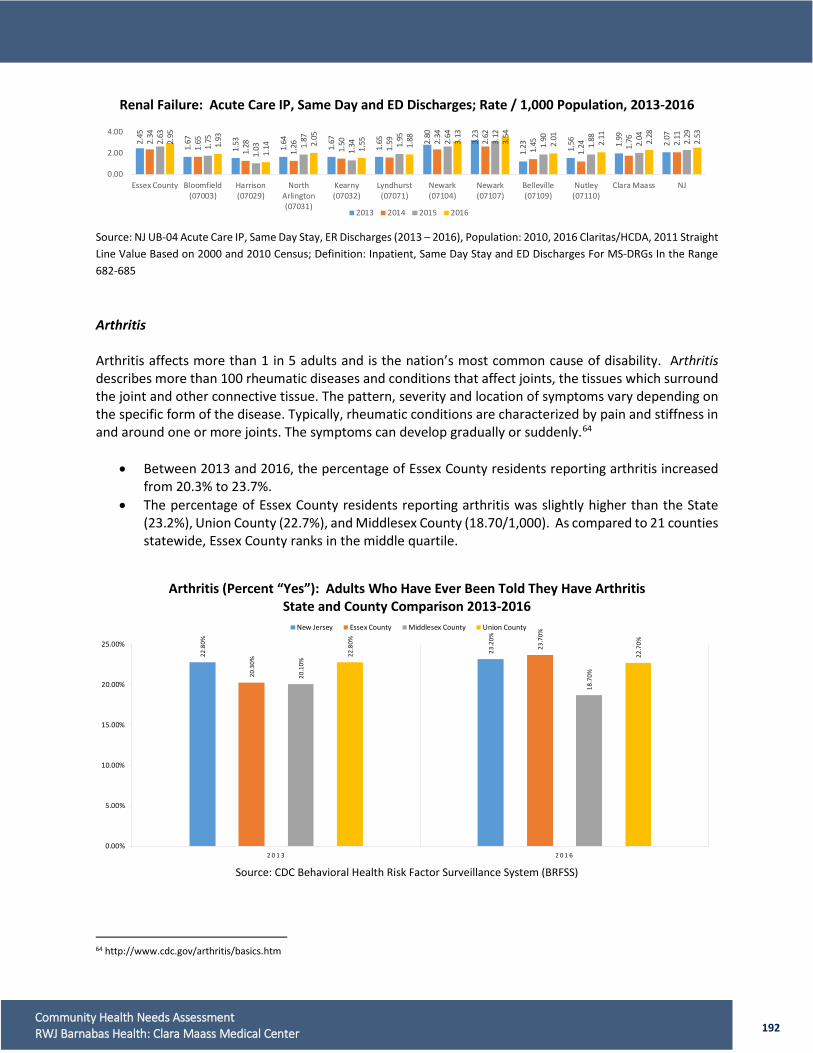
192 Community Health Needs Assessment RWJ Barnabas Health: Clara Maass Medical Center
Renal Failure: Acute Care IP, Same Day and ED Discharges; Rate / 1,000 Population, 2013-2016
Source: NJ UB-04 Acute Care IP, Same Day Stay, ER Discharges (2013 – 2016), Population: 2010, 2016 Claritas/HCDA, 2011 Straight Line Value Based on 2000 and 2010 Census; Definition: Inpatient, Same Day Stay and ED Discharges For MS-DRGs In the Range 682-685
Arthritis Arthritis affects more than 1 in 5 adults and is the nation’s most common cause of disability. Arthritis describes more than 100 rheumatic diseases and conditions that affect joints, the tissues which surround the joint and other connective tissue. The pattern, severity and location of symptoms vary depending on the specific form of the disease. Typically, rheumatic conditions are characterized by pain and stiffness in and around one or more joints. The symptoms can develop gradually or suddenly.64
• Between 2013 and 2016, the percentage of Essex County residents reporting arthritis increased from 20.3% to 23.7%.
• The percentage of Essex County residents reporting arthritis was slightly higher than the State (23.2%), Union County (22.7%), and Middlesex County (18.70/1,000). As compared to 21 counties statewide, Essex County ranks in the middle quartile.
Arthritis (Percent “Yes”): Adults Who Have Ever Been Told They Have Arthritis State and County Comparison 2013-2016
Source: CDC Behavioral Health Risk Factor Surveillance System (BRFSS)
64 http://www.cdc.gov/arthritis/basics.htm
2.45
1.67
1.53 1.64
1.67
1.65 2.
80
3.23
1.23 1.56 1.
99
2.072.34
1.65
1.28
1.26 1.50 1.59 2.
34
2.62
1.45
1.24 1.
76 2.112.63
1.75
1.03 1.
87
1.34 1.
95 2.64
3.12
1.90
1.88 2.04 2.29
2.95
1.93
1.14 2.
05
1.55 1.88 3.13
3.54
2.01 2.11 2.28
2.53
0.00
2.00
4.00
Essex County Bloomfield(07003)
Harrison(07029)
NorthArlington(07031)
Kearny(07032)
Lyndhurst(07071)
Newark(07104)
Newark(07107)
Belleville(07109)
Nutley(07110)
Clara Maass NJ
2013 2014 2015 201622
.80%
23.2
0%
20.3
0%
23.7
0%
20.1
0%
18.7
0%
22.8
0%
22.7
0%
0.00%
5.00%
10.00%
15.00%
20.00%
25.00%
2 0 1 3 2 0 1 6
New Jersey Essex County Middlesex County Union County
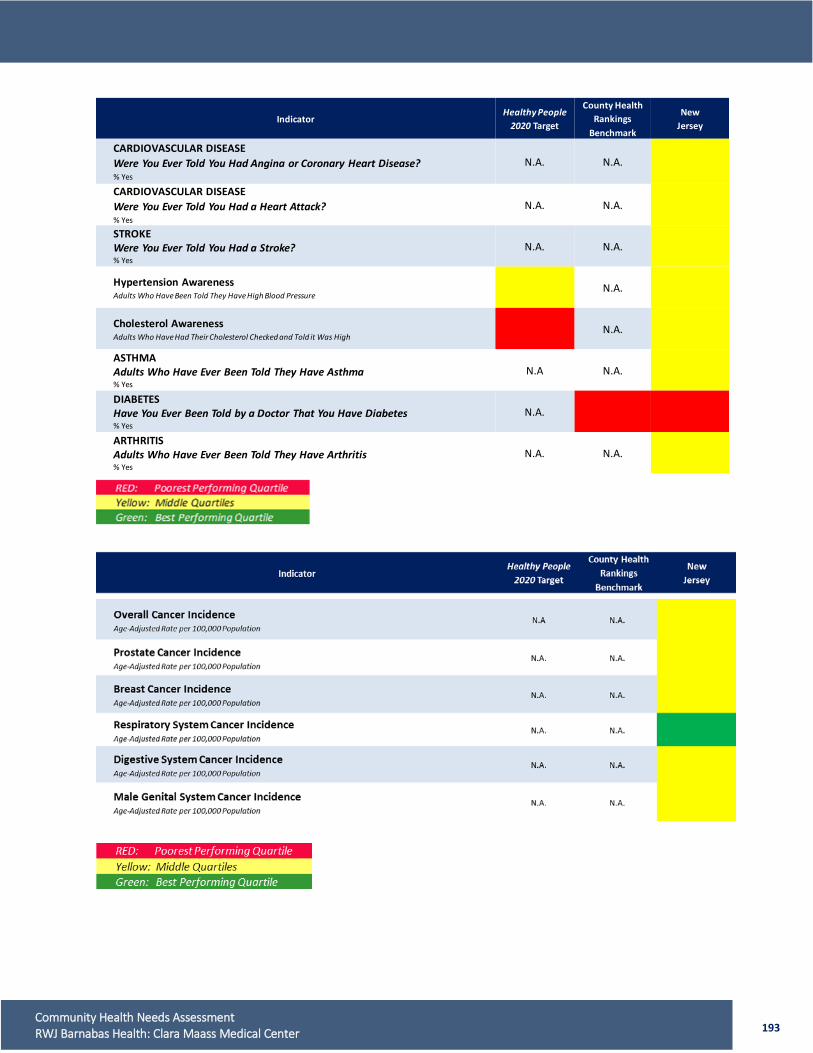
193 Community Health Needs Assessment RWJ Barnabas Health: Clara Maass Medical Center
IndicatorHealthy People
2020 Target
County Health Rankings
Benchmark
NewJersey
CARDIOVASCULAR DISEASEWere You Ever Told You Had Angina or Coronary Heart Disease?% Yes
N.A. N.A.
CARDIOVASCULAR DISEASEWere You Ever Told You Had a Heart Attack?% Yes
N.A. N.A.
STROKEWere You Ever Told You Had a Stroke?% Yes
N.A. N.A.
Hypertension AwarenessAdults Who Have Been Told They Have High Blood Pressure
N.A.
Cholesterol AwarenessAdults Who Have Had Their Cholesterol Checked and Told it Was High
N.A.
ASTHMAAdults Who Have Ever Been Told They Have Asthma% Yes
N.A N.A.
DIABETESHave You Ever Been Told by a Doctor That You Have Diabetes% Yes
N.A.
ARTHRITISAdults Who Have Ever Been Told They Have Arthritis% Yes
N.A. N.A.
194 Community Health Needs Assessment RWJ Barnabas Health: Clara Maass Medical Center
6. ASSETS AND GAPS ANALYSIS The Assets and Gaps Analysis summarizes and highlights each component of the CHNA. Assets highlight Essex County or CMMC’s Service Area information indicating improvement over time in comparison to other counties and the State or in comparison to other races and genders. Gaps focus on disparities in Essex County or in the CMMC Service Area that have a negative trend, in comparison to other counties and the State or in comparison to other races or genders. A. HEALTH DISPARITIES Economic Status ASSETS
• The median household income of Nutley residents was $89,452, notably higher than the County rate.
• The percent of people living in poverty in Bloomfield was 8.2% in 2016, lower than the State and County.
• In 2016, the percent of unemployment in Nutley (4.2%) was lower than the County and State. • Between 2015 and 2017, the percent of adults and children receiving TANF/WFNJ benefits
declined by 51% and 43%, respectively. • Over 17% of Nutley residents earned a graduate or professional degree, higher than the State,
County, and the CMMC Service Area. GAPS
• In 2016, the median household income in Essex County was $54,860, more than $18,000 below the State.
• In 2016, Essex County had a higher percentage of people living below the poverty level than statewide, 17.2% and 10.9%, respectively.
• Between 2014 and 2016, unemployment declined to 8% in Essex County, but remained higher than New Jersey, 5.2%.
• The percent of children living in poverty in Newark (07104) and Newark (07107) are notably higher than the New Jersey percentage.
• Essex County reported a 7 percentage point increase in the number of students eligible for free lunch between 2012-2013 and 2015-2016.
• In 2016, 15.3% of Essex County residents did not complete high school, 4.2 percentage points higher than New Jersey.
• In 2016, 30.1% of Newark (07107) residents did not complete high school, much higher than the State (11.1%) and County (15.3%).
195 Community Health Needs Assessment RWJ Barnabas Health: Clara Maass Medical Center
Health and Health Care ASSETS
• Since 2013, the non-elderly population without health insurance in Essex County decreased from 18.5% to 13.6%.
• The adult ED ACSC rate for the CMMC Service Area was lower than the County rate. • The 2016 inpatient ACSC for the CMMC Service Area was lower than the County rate.
GAPS
• From 2013 to 2015, Essex County had a higher percentage of non-elderly population without health insurance than statewide.
• Between 2013 and 2016, the population to physician ratio was higher in Essex County than the CHR benchmark.
• Essex County had the third highest ACSC ED visit rate of the 21 counties in the State. • Towns with the highest ED visit rate for children were Newark (07107) and Newark (07104).
Neighborhood and Built Environment ASSETS
• Essex County experienced a 9.1% reduction in fine particulate matter between 2011 and 2012. • Between 2010 and 2015, the percent of Essex County residents with limited access to healthy
foods declined. • Between 2010 and 2016, Essex County’s motor vehicle crash deaths were 10.4% lower than New
Jersey. GAPS
• In 2016, 42.2% of Essex County housing units were built before 1952, higher than New Jersey overall at 25.8%.
• In 2015, Essex County ranked in the lowest performing quartile in terms of children with elevated blood lead levels.
• Between 2014 and 2017, the violent crime rate in Essex County was more than double the crime rate in New Jersey.
• In 2016, Essex County (25.8/100,000) had a higher death rate due to accidental poisoning and exposure to noxious substances than statewide (22.5/100,000).
B. HEALTH FACTORS Clinical Care Measures ASSETS
• The county-wide percentage of VBACs trended upward from 2013 to 2016, increasing from 10.3% to 11.8% in 2016.
196 Community Health Needs Assessment RWJ Barnabas Health: Clara Maass Medical Center
GAPS
• In 2016, CMMC’s Service Area inpatient use rate (163.28/1,000) was slightly higher than the Essex County rate (163.15) and the State rate (160.22).
• CMMC’s Service Area ED visit rate (405.41/1,000) was higher than the State rate (352.2/1,000). • In 2016, the ED visit rates in Newark (07107) and Newark (07104) were notably higher than the
CMMC Service area, State, and County rates. • Essex County’s c-section rate (27.5%) was higher than the State rate (25.2%).
Health Behaviors ASSETS
• The teen birth rate among CMMC Service Area residents (18.01/1,000) was lower than the Essex County rate (20.39/1,000).
GAPS
• In 2016, only 63.5% of Essex County women entered prenatal care in the first trimester. • The 2010-2016 Essex County teen birth rate (15-19) was 46.2% higher than the State rate. • In 2016, the teen birth rate (15-19) for Newark (07107) was nearly 5 times higher than the State
rate. • In 2016, the County’s chlamydia and gonorrhea rates were nearly twice the respective rates in
New Jersey. • In 2015, the HIV prevalence rate in Essex County was more than triple the rate in New Jersey.
Individual Behaviors ASSETS
• Between 2014 and 2016, smoking rates fluctuated in Essex County with an overall decrease of 1.9 percentage points.
• Alcohol impaired driving deaths in the County decreased from 22.3% in 2008-2012 to 16.4% in 2012-2016.
• In 2016, a lower percentage of Essex County residents were obese (26.8%) than the Healthy People 2020 target (30.5%).
GAPS
• Adults reporting binge drinking in Essex County increased from 13.9% in 2014 to 15.4% in 2016. • Essex County had the highest percent of residents reporting heavy drinking relative to the State
and surrounding counties. • From 2014 to 2016, Essex County had a higher percentage of residents reporting no physical
activity than residents of the State and comparison counties.
197 Community Health Needs Assessment RWJ Barnabas Health: Clara Maass Medical Center
Health Screenings and Immunizations ASSETS
• In 2016, 82.7% of Essex County women over age 40 had a mammogram in the last two years, up 31 percentage points from 2012.
• In 2016, 76.7% of Essex County women over 18 had a pap smear within the past three years compared to the Healthy People 2020 target of 66.2%.
• In 2016, 96.9% of first grade students in Essex County received all required immunizations compared to 92.7% statewide.
GAPS
• In 2016, a lower percentage of Essex County adults over 50 (58.4%) participated in colon-rectal screenings than residents statewide (62.4%).
• In 2014, almost 82% of Essex County diabetic Medicare enrollees received HbA1c screening, lower than the State and surrounding counties.
• Essex County had the lowest percent of adults receiving flu shots compared to residents of New Jersey and surrounding counties.
• The percent of Essex County adults 65+ who had a pneumonia vaccine decreased from 2011-2016, from 71.3% to 58.8%.
Behavioral Health Utilization ASSETS
• Inpatient hospitalizations for mental health conditions were lower than the County rate. • In 2016, ED visit rates for substance use in the CMMC Service Area was lower than the State rate.
GAPS
• In 2016, Newark 07104 (9.44/1,000) had the highest rate of residents with an inpatient hospitalization for a mental health condition, compared to all comparative figures.
• In 2016, Newark 07107 (19.59/1,000) had a higher ED visit rate for mental health conditions than the CMMC service area, State, and County.
• In 2016, Newark (07107) had a higher use rate for residents with an inpatient admission for substance abuse than the State and other comparison figures.
• In 2016, Essex County (9.55/1,000) had a higher ED visit rate for substance abuse than the State (7.84/1,000).
• Between 2015 and 2016, Naloxone administrations in Essex County increased from 481 to 1,131.

198 Community Health Needs Assessment RWJ Barnabas Health: Clara Maass Medical Center
C. HEALTH OUTCOMES Mortality ASSETS
• Between 2013 and 2016, Essex County’s age-adjusted mortality rates improved (decreased) for diseases of the heart (-8.3%), cancer (-.9%), stroke (-1.5%), chronic lower respiratory diseases (-15.3%), and homicide (-16.5%).
• Essex County’s cancer AAMR decreased from 151.9/100,000 in 2014 to 148/100,000 in 2016. • The 2016 suicide mortality rate in Essex County (5.9/100,000) was lower than the State
(7.7/100,000). • The infant mortality rate in Essex County decreased from 7.8/1,000 from 2007-2009, to 6.6/1,000
from 2013-2016. GAPS
• Between 2013 and 2016, Essex County’s age adjusted mortality rates increased for unintentional injuries (34.7%), diabetes (4.8%), septicemia (1.7%), nephritis, nephrotic syndrome and nephrosis (9.3%), and Alzheimer’s Disease (38.4%).
• Blacks (184.7/100,000) had the highest heart disease AAMR for Essex County in 2016 compared to Whites (151.6/100,000) and Hispanics (118.8/100,000).
• The AMMR for cancer deaths among Whites and Blacks in Essex County was notably higher than for Hispanics in 2016.
• The 2016 unintentional injury death rate among Blacks (45.6/100,000) was highest compared to Whites (42.1/100,000) and Hispanics (35.0/100,000).
• The 2016 stroke AAMR for Essex County (32.6/100,000) was higher than the State rate (30.0/100,000).
• Blacks (49.2/100,000) had a higher death rate due to stroke than Whites (20.0/100,000) and Hispanics (21.2/100,000).
• The years of potential life lost in Essex County from 2014-2016 (7,102.75/100,000) was higher than the rate statewide (5,469.35/100,000).
• The rate of drug overdose deaths in Essex County more than doubled between 2014 and 2016. Maternal and Child Health GAPS
• In 2016, Essex County had higher rates of low birth weight and very low birth weight babies than the State.
• The percentage of low birth weight babies were higher among Black (13.1%) than for Whites (6.4%) or Hispanics (7.8%).
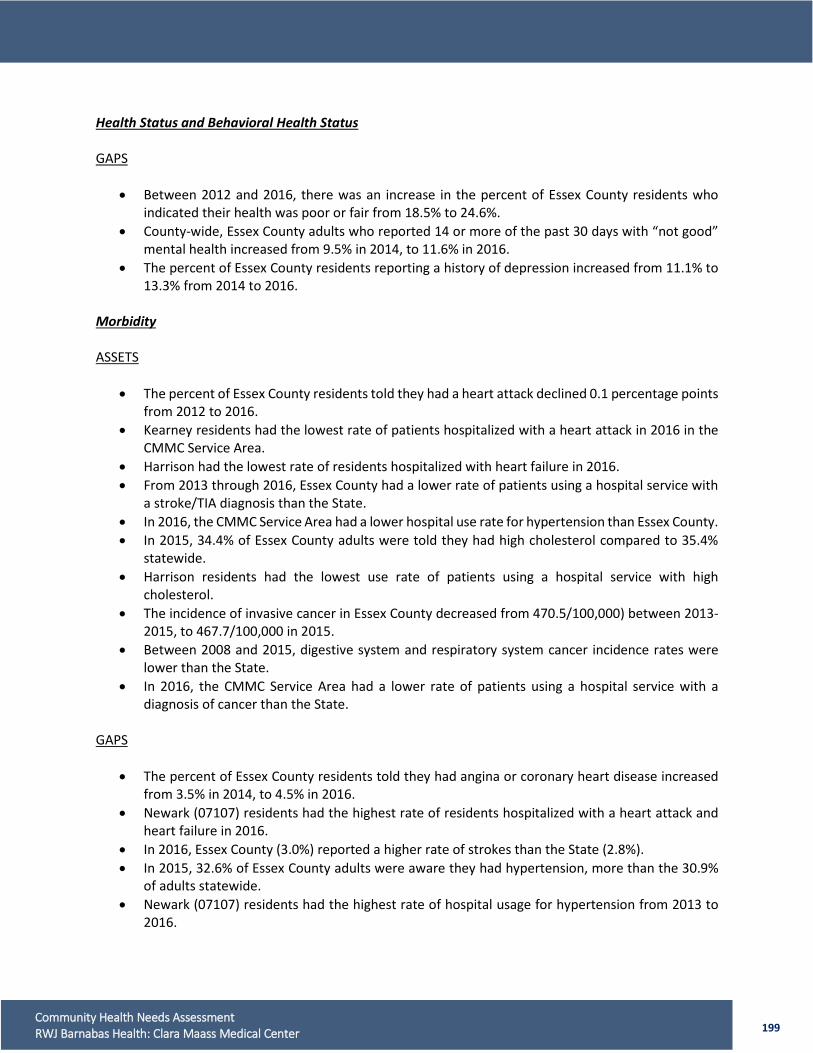
199 Community Health Needs Assessment RWJ Barnabas Health: Clara Maass Medical Center
Health Status and Behavioral Health Status GAPS
• Between 2012 and 2016, there was an increase in the percent of Essex County residents who indicated their health was poor or fair from 18.5% to 24.6%.
• County-wide, Essex County adults who reported 14 or more of the past 30 days with “not good” mental health increased from 9.5% in 2014, to 11.6% in 2016.
• The percent of Essex County residents reporting a history of depression increased from 11.1% to 13.3% from 2014 to 2016.
Morbidity ASSETS
• The percent of Essex County residents told they had a heart attack declined 0.1 percentage points from 2012 to 2016.
• Kearney residents had the lowest rate of patients hospitalized with a heart attack in 2016 in the CMMC Service Area.
• Harrison had the lowest rate of residents hospitalized with heart failure in 2016. • From 2013 through 2016, Essex County had a lower rate of patients using a hospital service with
a stroke/TIA diagnosis than the State. • In 2016, the CMMC Service Area had a lower hospital use rate for hypertension than Essex County. • In 2015, 34.4% of Essex County adults were told they had high cholesterol compared to 35.4%
statewide. • Harrison residents had the lowest use rate of patients using a hospital service with high
cholesterol. • The incidence of invasive cancer in Essex County decreased from 470.5/100,000) between 2013-
2015, to 467.7/100,000 in 2015. • Between 2008 and 2015, digestive system and respiratory system cancer incidence rates were
lower than the State. • In 2016, the CMMC Service Area had a lower rate of patients using a hospital service with a
diagnosis of cancer than the State. GAPS
• The percent of Essex County residents told they had angina or coronary heart disease increased from 3.5% in 2014, to 4.5% in 2016.
• Newark (07107) residents had the highest rate of residents hospitalized with a heart attack and heart failure in 2016.
• In 2016, Essex County (3.0%) reported a higher rate of strokes than the State (2.8%). • In 2015, 32.6% of Essex County adults were aware they had hypertension, more than the 30.9%
of adults statewide. • Newark (07107) residents had the highest rate of hospital usage for hypertension from 2013 to
2016.
200 Community Health Needs Assessment RWJ Barnabas Health: Clara Maass Medical Center
• In 2016, Newark (07104) residents with high cholesterol had the highest hospital use rate in the Service Area.
• Between 2008 and 2015, breast cancer (3.1%) and male genital cancer (15.5%) increased. • In 2016, the rate of patients using a hospital with a cancer diagnosis was highest in Belleville. • The percent of Essex County residents reporting diabetes was higher than the State and all
comparison counties from 2014 to 2016. • Between 2013 and 2016, the percentage of Essex County residents reporting arthritis increased
from 20.3% to 23.7%.

201 Community Health Needs Assessment RWJ Barnabas Health: Clara Maass Medical Center
APPENDICES
202 Community Health Needs Assessment RWJ Barnabas Health: Clara Maass Medical Center
APPENDIX A: CMMC CHNA IMPLEMENTATION PLAN RESULTS

203 Community Health Needs Assessment RWJ Barnabas Health: Clara Maass Medical Center

204 Community Health Needs Assessment RWJ Barnabas Health: Clara Maass Medical Center
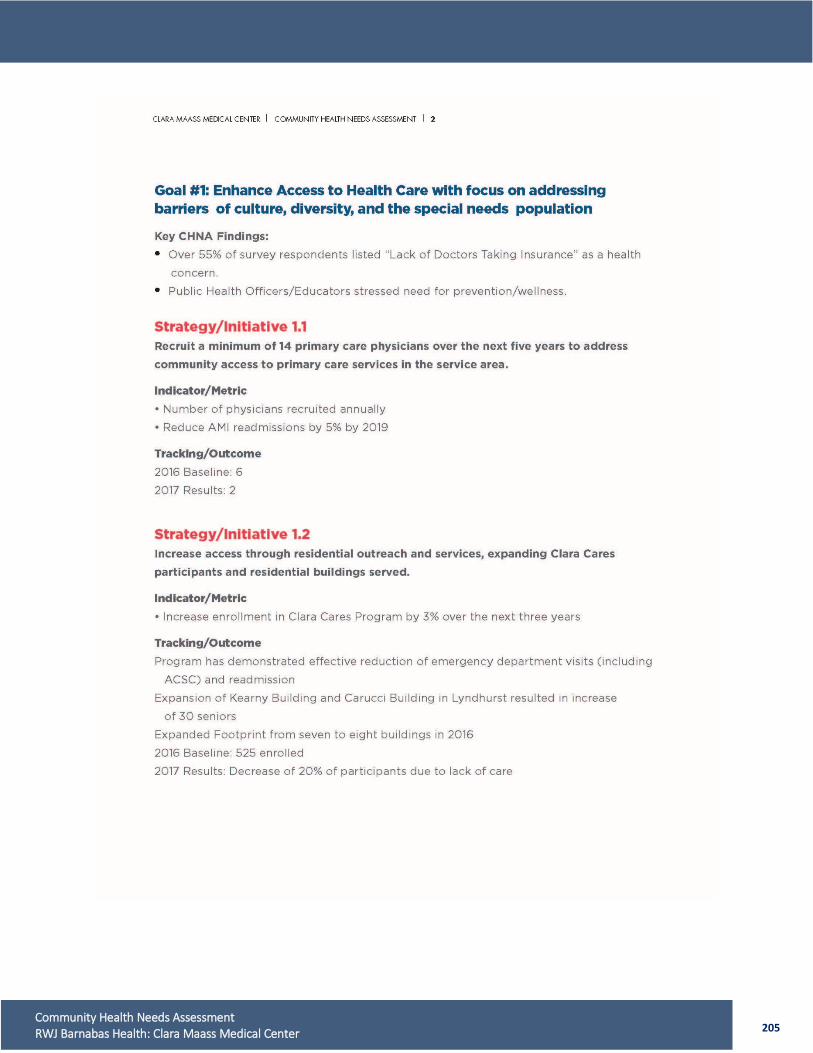
205 Community Health Needs Assessment RWJ Barnabas Health: Clara Maass Medical Center
206 Community Health Needs Assessment RWJ Barnabas Health: Clara Maass Medical Center
207 Community Health Needs Assessment RWJ Barnabas Health: Clara Maass Medical Center
208 Community Health Needs Assessment RWJ Barnabas Health: Clara Maass Medical Center

209 Community Health Needs Assessment RWJ Barnabas Health: Clara Maass Medical Center
210 Community Health Needs Assessment RWJ Barnabas Health: Clara Maass Medical Center

211 Community Health Needs Assessment RWJ Barnabas Health: Clara Maass Medical Center

212 Community Health Needs Assessment RWJ Barnabas Health: Clara Maass Medical Center
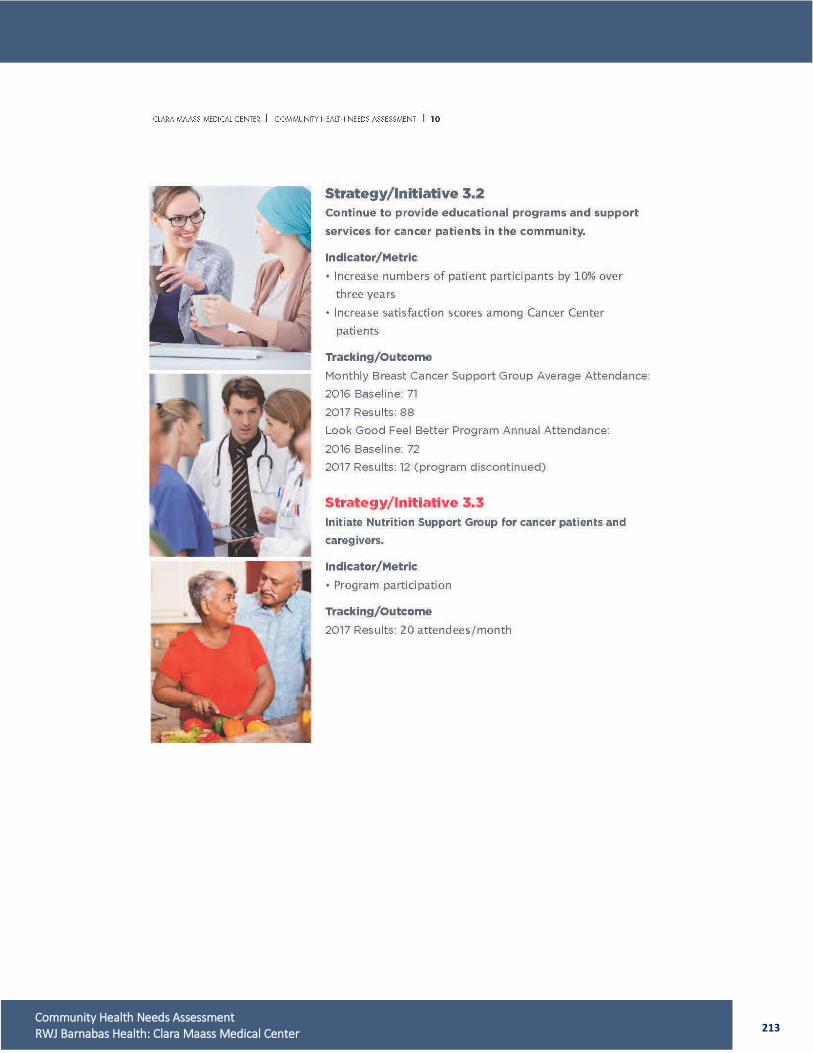
213 Community Health Needs Assessment RWJ Barnabas Health: Clara Maass Medical Center
214 Community Health Needs Assessment RWJ Barnabas Health: Clara Maass Medical Center
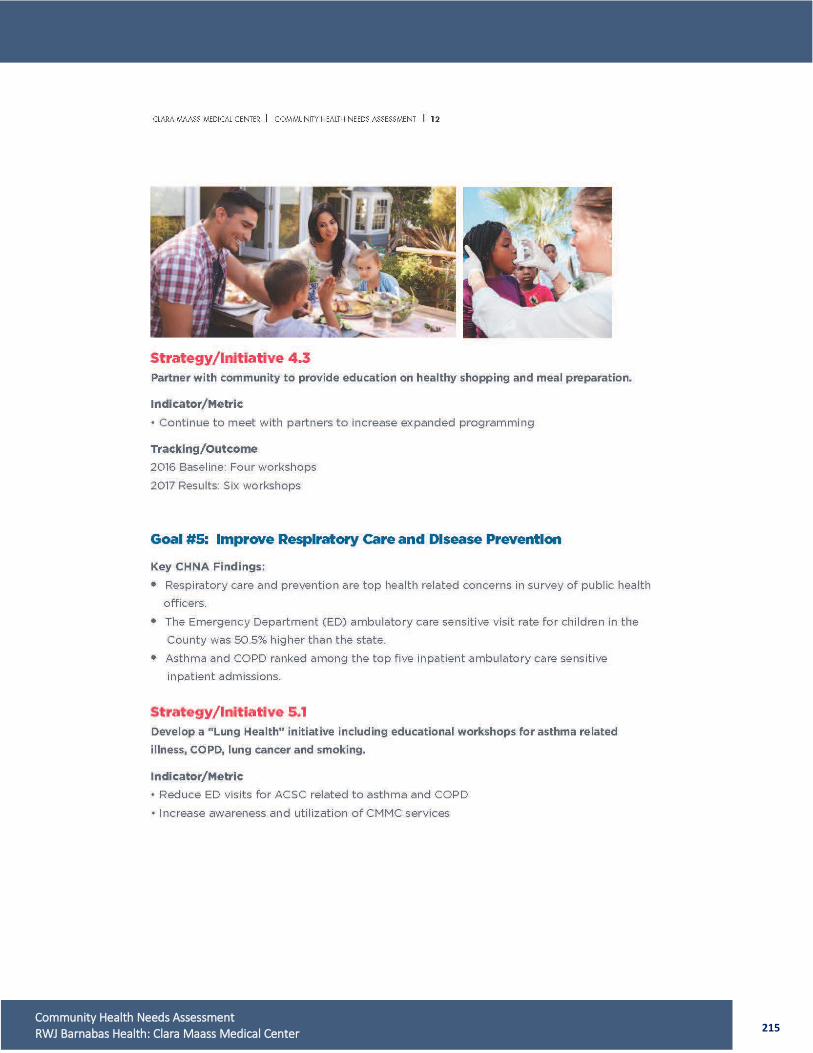
215 Community Health Needs Assessment RWJ Barnabas Health: Clara Maass Medical Center
216 Community Health Needs Assessment RWJ Barnabas Health: Clara Maass Medical Center
217 Community Health Needs Assessment RWJ Barnabas Health: Clara Maass Medical Center
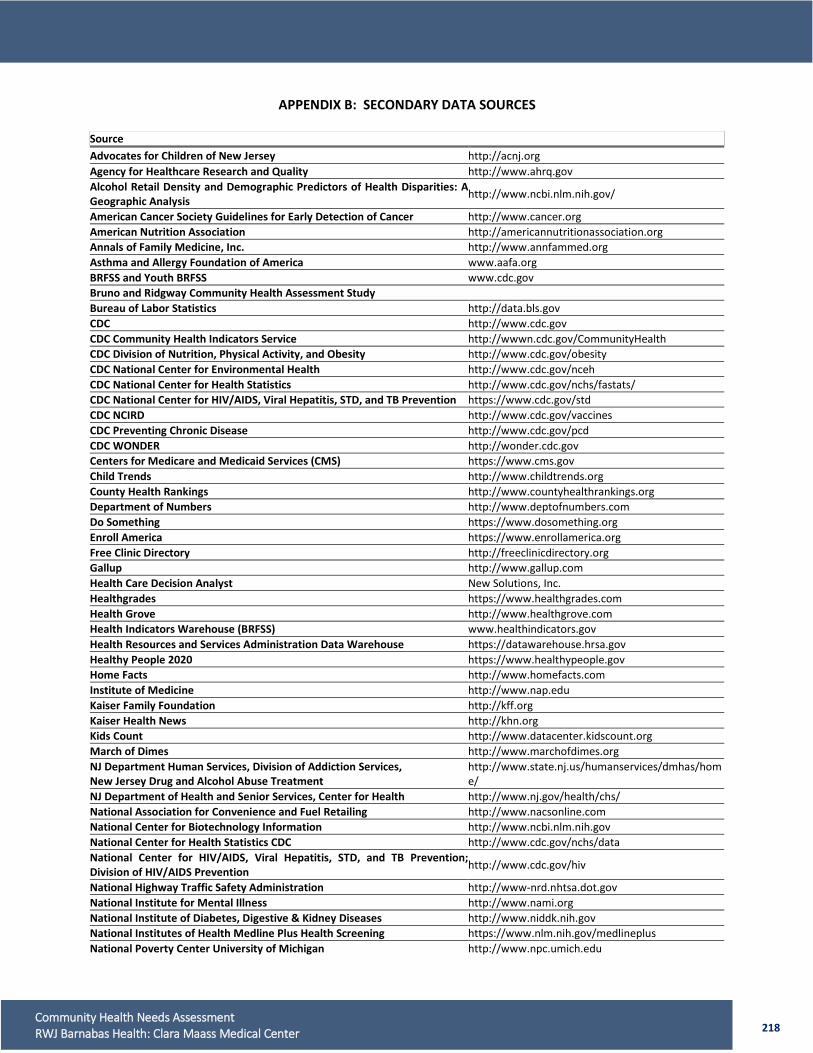
218 Community Health Needs Assessment RWJ Barnabas Health: Clara Maass Medical Center
APPENDIX B: SECONDARY DATA SOURCES
Source Advocates for Children of New Jersey http://acnj.org Agency for Healthcare Research and Quality http://www.ahrq.gov Alcohol Retail Density and Demographic Predictors of Health Disparities: A Geographic Analysis http://www.ncbi.nlm.nih.gov/
American Cancer Society Guidelines for Early Detection of Cancer http://www.cancer.org American Nutrition Association http://americannutritionassociation.org Annals of Family Medicine, Inc. http://www.annfammed.org Asthma and Allergy Foundation of America www.aafa.org BRFSS and Youth BRFSS www.cdc.gov Bruno and Ridgway Community Health Assessment Study Bureau of Labor Statistics http://data.bls.gov CDC http://www.cdc.gov CDC Community Health Indicators Service http://wwwn.cdc.gov/CommunityHealth CDC Division of Nutrition, Physical Activity, and Obesity http://www.cdc.gov/obesity CDC National Center for Environmental Health http://www.cdc.gov/nceh CDC National Center for Health Statistics http://www.cdc.gov/nchs/fastats/ CDC National Center for HIV/AIDS, Viral Hepatitis, STD, and TB Prevention https://www.cdc.gov/std CDC NCIRD http://www.cdc.gov/vaccines CDC Preventing Chronic Disease http://www.cdc.gov/pcd CDC WONDER http://wonder.cdc.gov Centers for Medicare and Medicaid Services (CMS) https://www.cms.gov Child Trends http://www.childtrends.org County Health Rankings http://www.countyhealthrankings.org Department of Numbers http://www.deptofnumbers.com Do Something https://www.dosomething.org Enroll America https://www.enrollamerica.org Free Clinic Directory http://freeclinicdirectory.org Gallup http://www.gallup.com Health Care Decision Analyst New Solutions, Inc. Healthgrades https://www.healthgrades.com Health Grove http://www.healthgrove.com Health Indicators Warehouse (BRFSS) www.healthindicators.gov Health Resources and Services Administration Data Warehouse https://datawarehouse.hrsa.gov Healthy People 2020 https://www.healthypeople.gov Home Facts http://www.homefacts.com Institute of Medicine http://www.nap.edu Kaiser Family Foundation http://kff.org Kaiser Health News http://khn.org Kids Count http://www.datacenter.kidscount.org March of Dimes http://www.marchofdimes.org NJ Department Human Services, Division of Addiction Services, New Jersey Drug and Alcohol Abuse Treatment
http://www.state.nj.us/humanservices/dmhas/home/
NJ Department of Health and Senior Services, Center for Health http://www.nj.gov/health/chs/ National Association for Convenience and Fuel Retailing http://www.nacsonline.com National Center for Biotechnology Information http://www.ncbi.nlm.nih.gov National Center for Health Statistics CDC http://www.cdc.gov/nchs/data National Center for HIV/AIDS, Viral Hepatitis, STD, and TB Prevention; Division of HIV/AIDS Prevention http://www.cdc.gov/hiv
National Highway Traffic Safety Administration http://www-nrd.nhtsa.dot.gov National Institute for Mental Illness http://www.nami.org National Institute of Diabetes, Digestive & Kidney Diseases http://www.niddk.nih.gov National Institutes of Health Medline Plus Health Screening https://www.nlm.nih.gov/medlineplus National Poverty Center University of Michigan http://www.npc.umich.edu
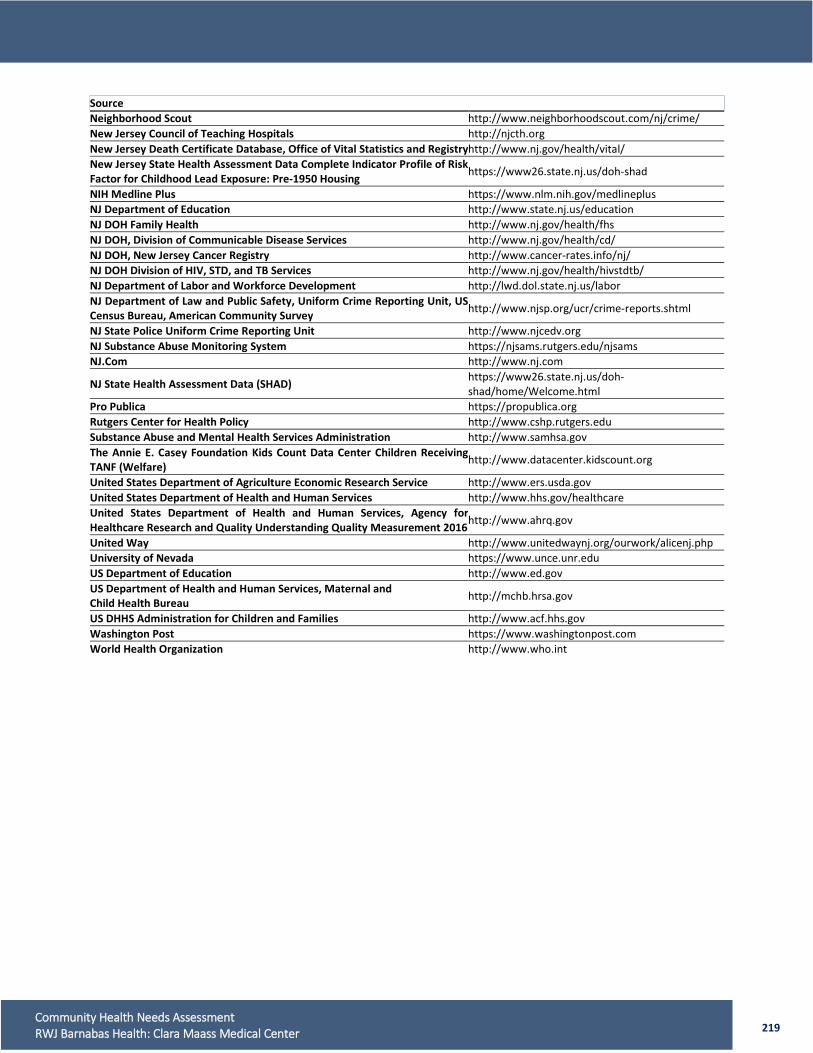
219 Community Health Needs Assessment RWJ Barnabas Health: Clara Maass Medical Center
Source Neighborhood Scout http://www.neighborhoodscout.com/nj/crime/ New Jersey Council of Teaching Hospitals http://njcth.org New Jersey Death Certificate Database, Office of Vital Statistics and Registry http://www.nj.gov/health/vital/ New Jersey State Health Assessment Data Complete Indicator Profile of Risk Factor for Childhood Lead Exposure: Pre-1950 Housing https://www26.state.nj.us/doh-shad
NIH Medline Plus https://www.nlm.nih.gov/medlineplus NJ Department of Education http://www.state.nj.us/education NJ DOH Family Health http://www.nj.gov/health/fhs NJ DOH, Division of Communicable Disease Services http://www.nj.gov/health/cd/ NJ DOH, New Jersey Cancer Registry http://www.cancer-rates.info/nj/ NJ DOH Division of HIV, STD, and TB Services http://www.nj.gov/health/hivstdtb/ NJ Department of Labor and Workforce Development http://lwd.dol.state.nj.us/labor NJ Department of Law and Public Safety, Uniform Crime Reporting Unit, US Census Bureau, American Community Survey http://www.njsp.org/ucr/crime-reports.shtml
NJ State Police Uniform Crime Reporting Unit http://www.njcedv.org NJ Substance Abuse Monitoring System https://njsams.rutgers.edu/njsams NJ.Com http://www.nj.com
NJ State Health Assessment Data (SHAD) https://www26.state.nj.us/doh-shad/home/Welcome.html
Pro Publica https://propublica.org Rutgers Center for Health Policy http://www.cshp.rutgers.edu Substance Abuse and Mental Health Services Administration http://www.samhsa.gov The Annie E. Casey Foundation Kids Count Data Center Children Receiving TANF (Welfare) http://www.datacenter.kidscount.org
United States Department of Agriculture Economic Research Service http://www.ers.usda.gov United States Department of Health and Human Services http://www.hhs.gov/healthcare United States Department of Health and Human Services, Agency for Healthcare Research and Quality Understanding Quality Measurement 2016 http://www.ahrq.gov
United Way http://www.unitedwaynj.org/ourwork/alicenj.php University of Nevada https://www.unce.unr.edu US Department of Education http://www.ed.gov US Department of Health and Human Services, Maternal and Child Health Bureau http://mchb.hrsa.gov
US DHHS Administration for Children and Families http://www.acf.hhs.gov Washington Post https://www.washingtonpost.com World Health Organization http://www.who.int
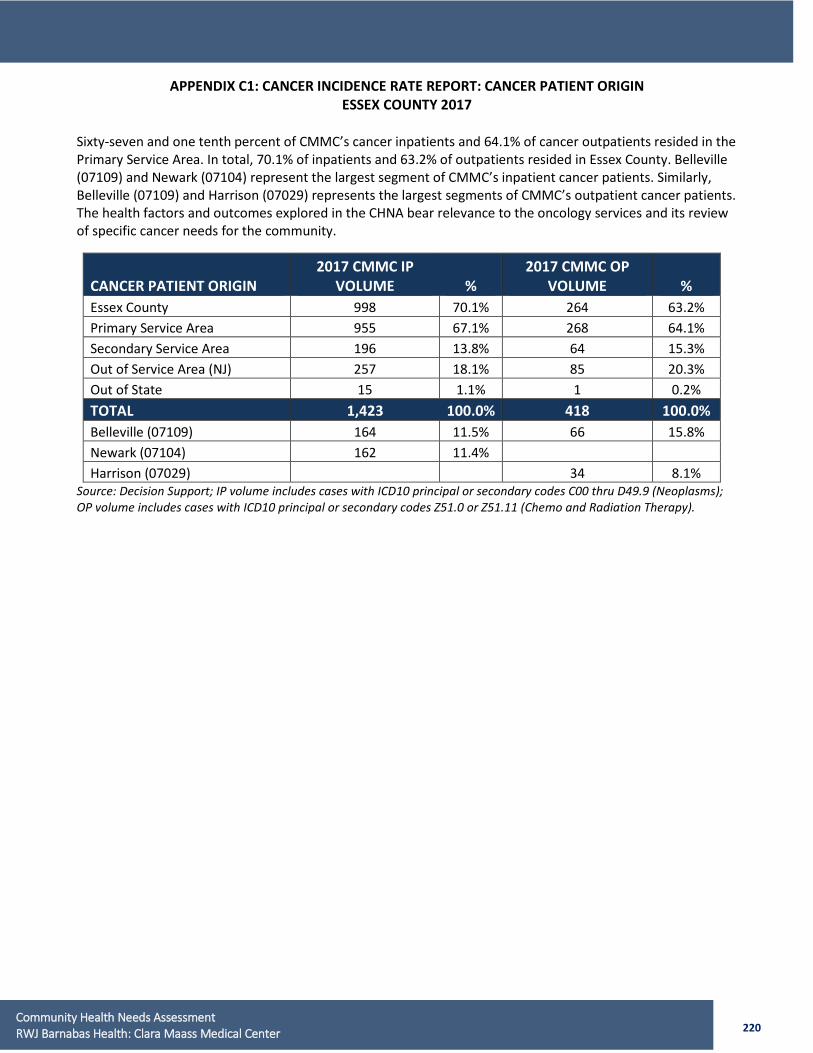
220 Community Health Needs Assessment RWJ Barnabas Health: Clara Maass Medical Center
APPENDIX C1: CANCER INCIDENCE RATE REPORT: CANCER PATIENT ORIGIN ESSEX COUNTY 2017
Sixty-seven and one tenth percent of CMMC’s cancer inpatients and 64.1% of cancer outpatients resided in the Primary Service Area. In total, 70.1% of inpatients and 63.2% of outpatients resided in Essex County. Belleville (07109) and Newark (07104) represent the largest segment of CMMC’s inpatient cancer patients. Similarly, Belleville (07109) and Harrison (07029) represents the largest segments of CMMC’s outpatient cancer patients. The health factors and outcomes explored in the CHNA bear relevance to the oncology services and its review of specific cancer needs for the community.
CANCER PATIENT ORIGIN 2017 CMMC IP
VOLUME % 2017 CMMC OP
VOLUME % Essex County 998 70.1% 264 63.2% Primary Service Area 955 67.1% 268 64.1% Secondary Service Area 196 13.8% 64 15.3% Out of Service Area (NJ) 257 18.1% 85 20.3% Out of State 15 1.1% 1 0.2% TOTAL 1,423 100.0% 418 100.0% Belleville (07109) 164 11.5% 66 15.8% Newark (07104) 162 11.4% Harrison (07029) 34 8.1%
Source: Decision Support; IP volume includes cases with ICD10 principal or secondary codes C00 thru D49.9 (Neoplasms); OP volume includes cases with ICD10 principal or secondary codes Z51.0 or Z51.11 (Chemo and Radiation Therapy).
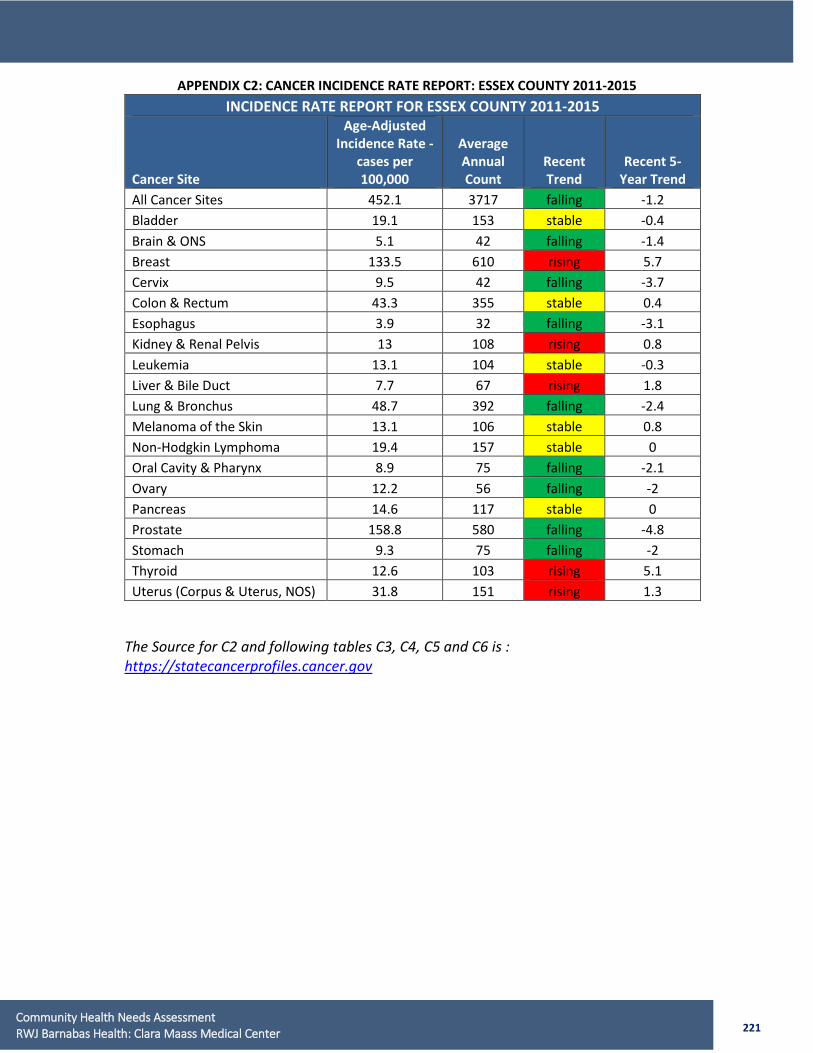
221 Community Health Needs Assessment RWJ Barnabas Health: Clara Maass Medical Center
APPENDIX C2: CANCER INCIDENCE RATE REPORT: ESSEX COUNTY 2011-2015 INCIDENCE RATE REPORT FOR ESSEX COUNTY 2011-2015
Cancer Site
Age-Adjusted Incidence Rate -
cases per 100,000
Average Annual Count
Recent Trend
Recent 5-Year Trend
All Cancer Sites 452.1 3717 falling -1.2 Bladder 19.1 153 stable -0.4 Brain & ONS 5.1 42 falling -1.4 Breast 133.5 610 rising 5.7 Cervix 9.5 42 falling -3.7 Colon & Rectum 43.3 355 stable 0.4 Esophagus 3.9 32 falling -3.1 Kidney & Renal Pelvis 13 108 rising 0.8 Leukemia 13.1 104 stable -0.3 Liver & Bile Duct 7.7 67 rising 1.8 Lung & Bronchus 48.7 392 falling -2.4 Melanoma of the Skin 13.1 106 stable 0.8 Non-Hodgkin Lymphoma 19.4 157 stable 0 Oral Cavity & Pharynx 8.9 75 falling -2.1 Ovary 12.2 56 falling -2 Pancreas 14.6 117 stable 0 Prostate 158.8 580 falling -4.8 Stomach 9.3 75 falling -2 Thyroid 12.6 103 rising 5.1 Uterus (Corpus & Uterus, NOS) 31.8 151 rising 1.3
The Source for C2 and following tables C3, C4, C5 and C6 is : https://statecancerprofiles.cancer.gov
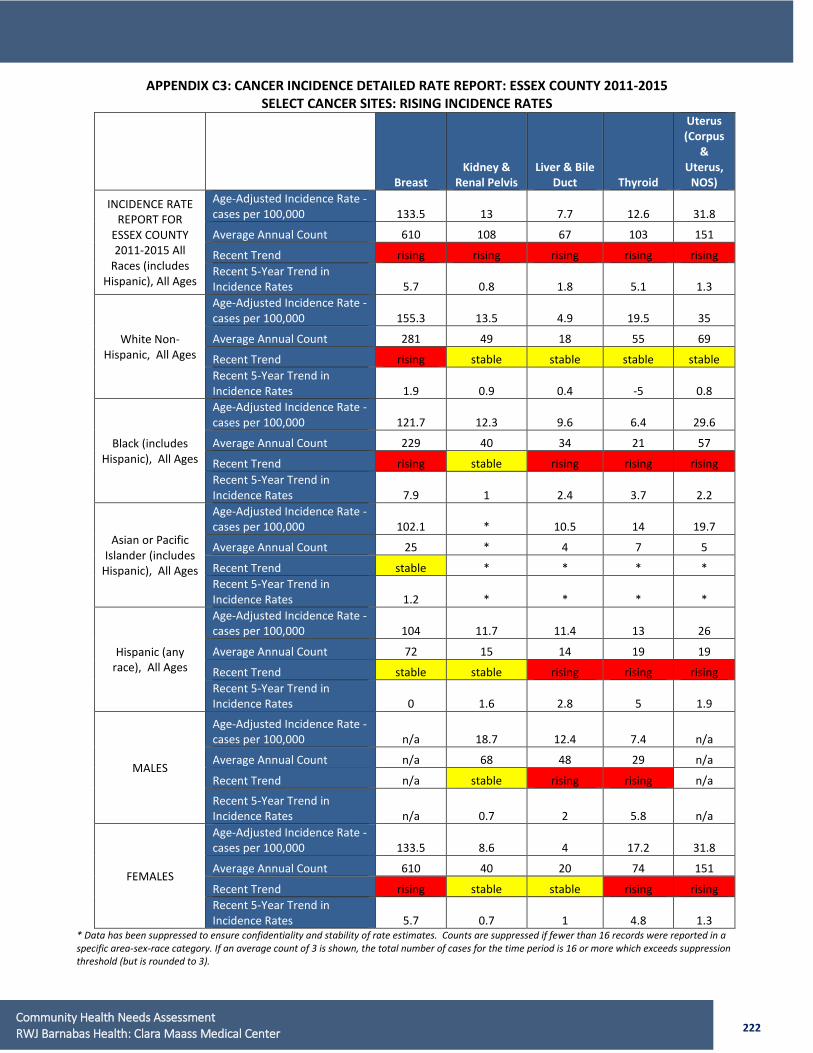
222 Community Health Needs Assessment RWJ Barnabas Health: Clara Maass Medical Center
APPENDIX C3: CANCER INCIDENCE DETAILED RATE REPORT: ESSEX COUNTY 2011-2015 SELECT CANCER SITES: RISING INCIDENCE RATES
Breast Kidney &
Renal Pelvis Liver & Bile
Duct Thyroid
Uterus (Corpus
& Uterus,
NOS)
INCIDENCE RATE REPORT FOR
ESSEX COUNTY 2011-2015 All
Races (includes Hispanic), All Ages
Age-Adjusted Incidence Rate - cases per 100,000 133.5 13 7.7 12.6 31.8
Average Annual Count 610 108 67 103 151
Recent Trend rising rising rising rising rising Recent 5-Year Trend in Incidence Rates 5.7 0.8 1.8 5.1 1.3
White Non-Hispanic, All Ages
Age-Adjusted Incidence Rate - cases per 100,000 155.3 13.5 4.9 19.5 35
Average Annual Count 281 49 18 55 69
Recent Trend rising stable stable stable stable Recent 5-Year Trend in Incidence Rates 1.9 0.9 0.4 -5 0.8
Black (includes Hispanic), All Ages
Age-Adjusted Incidence Rate - cases per 100,000 121.7 12.3 9.6 6.4 29.6
Average Annual Count 229 40 34 21 57
Recent Trend rising stable rising rising rising Recent 5-Year Trend in Incidence Rates 7.9 1 2.4 3.7 2.2
Asian or Pacific Islander (includes
Hispanic), All Ages
Age-Adjusted Incidence Rate - cases per 100,000 102.1 * 10.5 14 19.7
Average Annual Count 25 * 4 7 5
Recent Trend stable * * * * Recent 5-Year Trend in Incidence Rates 1.2 * * * *
Hispanic (any race), All Ages
Age-Adjusted Incidence Rate - cases per 100,000 104 11.7 11.4 13 26
Average Annual Count 72 15 14 19 19
Recent Trend stable stable rising rising rising Recent 5-Year Trend in Incidence Rates 0 1.6 2.8 5 1.9
MALES
Age-Adjusted Incidence Rate - cases per 100,000 n/a 18.7 12.4 7.4 n/a
Average Annual Count n/a 68 48 29 n/a
Recent Trend n/a stable rising rising n/a
Recent 5-Year Trend in Incidence Rates n/a 0.7 2 5.8 n/a
FEMALES
Age-Adjusted Incidence Rate - cases per 100,000 133.5 8.6 4 17.2 31.8
Average Annual Count 610 40 20 74 151
Recent Trend rising stable stable rising rising Recent 5-Year Trend in Incidence Rates 5.7 0.7 1 4.8 1.3
* Data has been suppressed to ensure confidentiality and stability of rate estimates. Counts are suppressed if fewer than 16 records were reported in a specific area-sex-race category. If an average count of 3 is shown, the total number of cases for the time period is 16 or more which exceeds suppression threshold (but is rounded to 3).
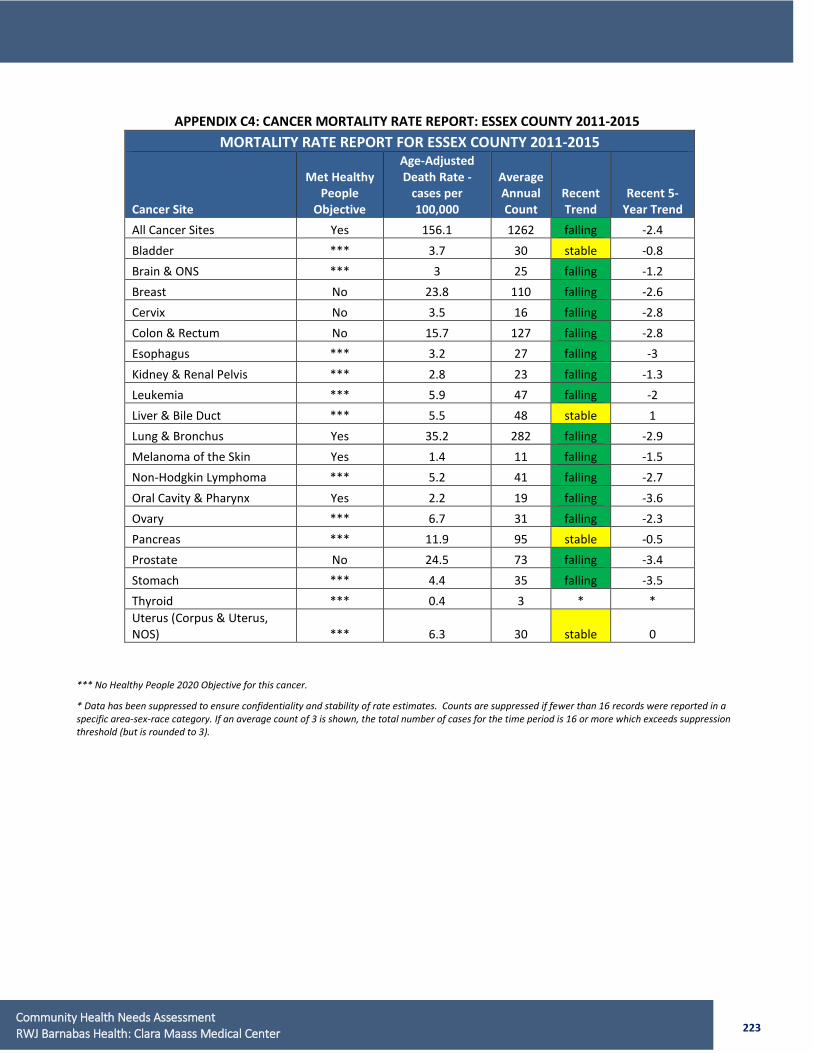
223 Community Health Needs Assessment RWJ Barnabas Health: Clara Maass Medical Center
APPENDIX C4: CANCER MORTALITY RATE REPORT: ESSEX COUNTY 2011-2015 MORTALITY RATE REPORT FOR ESSEX COUNTY 2011-2015
Cancer Site
Met Healthy People
Objective
Age-Adjusted Death Rate -
cases per 100,000
Average Annual Count
Recent Trend
Recent 5-Year Trend
All Cancer Sites Yes 156.1 1262 falling -2.4 Bladder *** 3.7 30 stable -0.8 Brain & ONS *** 3 25 falling -1.2 Breast No 23.8 110 falling -2.6 Cervix No 3.5 16 falling -2.8 Colon & Rectum No 15.7 127 falling -2.8 Esophagus *** 3.2 27 falling -3 Kidney & Renal Pelvis *** 2.8 23 falling -1.3 Leukemia *** 5.9 47 falling -2 Liver & Bile Duct *** 5.5 48 stable 1 Lung & Bronchus Yes 35.2 282 falling -2.9 Melanoma of the Skin Yes 1.4 11 falling -1.5 Non-Hodgkin Lymphoma *** 5.2 41 falling -2.7 Oral Cavity & Pharynx Yes 2.2 19 falling -3.6 Ovary *** 6.7 31 falling -2.3 Pancreas *** 11.9 95 stable -0.5 Prostate No 24.5 73 falling -3.4 Stomach *** 4.4 35 falling -3.5 Thyroid *** 0.4 3 * * Uterus (Corpus & Uterus, NOS) *** 6.3 30 stable 0
*** No Healthy People 2020 Objective for this cancer.
* Data has been suppressed to ensure confidentiality and stability of rate estimates. Counts are suppressed if fewer than 16 records were reported in a specific area-sex-race category. If an average count of 3 is shown, the total number of cases for the time period is 16 or more which exceeds suppression threshold (but is rounded to 3).

224 Community Health Needs Assessment RWJ Barnabas Health: Clara Maass Medical Center
APPENDIX C5: CANCER MORTALITY DETAILED RATE REPORT (Highest Volume): ESSEX COUNTY 2011-2015
Breast Colon & Rectum
Lung & Bronchus
MORTALITY RATE REPORT FOR ESSEX COUNTY 2011-2015 All Races (includes
Hispanic), All Ages
Met Healthy People Objective No No Yes Age-Adjusted Death Rate - cases per 100,000 23.8 15.7 35.2 Average Annual Count 110 127 282 Recent Trend falling falling falling Recent 5-Year Trend in Death Rates -2.6 -2.8 -2.9
White Non-Hispanic, All Ages
Met Healthy People Objective No Yes Yes Age-Adjusted Death Rate - cases per 100,000 20.8 14.3 37 Average Annual Count 44 57 142 Recent Trend falling falling falling Recent 5-Year Trend in Death Rates -3.2 -3.2 -1.6
Black (includes Hispanic), All Ages
Met Healthy People Objective No No Yes Age-Adjusted Death Rate - cases per 100,000 28.6 18.7 38.7 Average Annual Count 54 56 117 Recent Trend falling falling falling Recent 5-Year Trend in Death Rates -1.7 -2.4 -2.9
Asian or Pacific Islander (includes Hispanic), All
Ages
Met Healthy People Objective * * Yes Age-Adjusted Death Rate - cases per 100,000 * * 16.1 Average Annual Count 3 or fewer 3 or fewer 5 Recent Trend * * falling Recent 5-Year Trend in Death Rates * * -4.1
Hispanic (any race), All Ages
Met Healthy People Objective Yes Yes Yes Age-Adjusted Death Rate - cases per 100,000 17.1 11.6 17.4 Average Annual Count 11 12 18 Recent Trend * stable falling Recent 5-Year Trend in Death Rates * -0.1 -2.9
MALES
Met Healthy People Objective n/a No Yes Age-Adjusted Death Rate - cases per 100,000 n/a 18.3 44.9 Average Annual Count n/a 61 145 Recent Trend n/a falling falling Recent 5-Year Trend in Death Rates n/a -3 -3.2
FEMALES
Met Healthy People Objective No Yes Yes Age-Adjusted Death Rate - cases per 100,000 23.8 13.8 28.9 Average Annual Count 110 66 136 Recent Trend falling falling falling Recent 5-Year Trend in Death Rates -2.6 -2.6 -1.9
*** No Healthy People 2020 Objective for this cancer. * Data has been suppressed to ensure confidentiality and stability of rate estimates. Counts are suppressed if fewer than 16 records were reported in a specific area-sex-race category. If an average count of 3 is shown, the total number of cases for the time period is 16 or more which exceeds suppression threshold (but is rounded to 3).
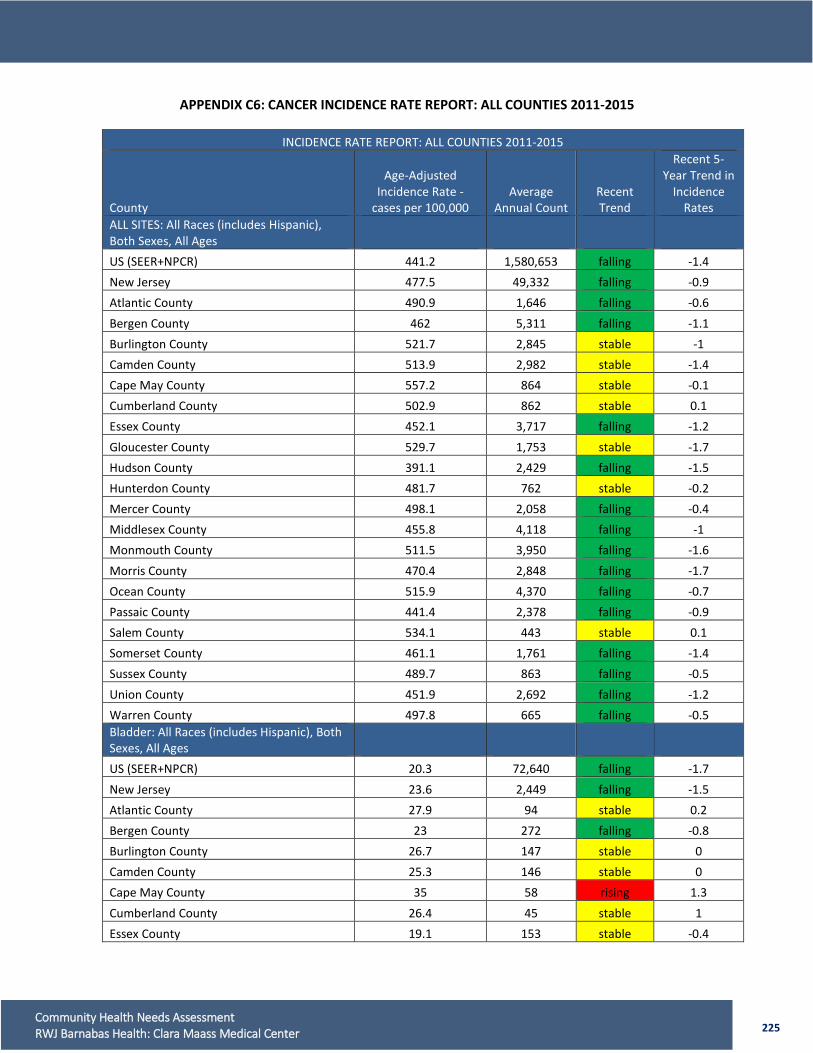
225 Community Health Needs Assessment RWJ Barnabas Health: Clara Maass Medical Center
APPENDIX C6: CANCER INCIDENCE RATE REPORT: ALL COUNTIES 2011-2015
INCIDENCE RATE REPORT: ALL COUNTIES 2011-2015
County
Age-Adjusted Incidence Rate -
cases per 100,000 Average
Annual Count Recent Trend
Recent 5-Year Trend in
Incidence Rates
ALL SITES: All Races (includes Hispanic), Both Sexes, All Ages US (SEER+NPCR) 441.2 1,580,653 falling -1.4 New Jersey 477.5 49,332 falling -0.9 Atlantic County 490.9 1,646 falling -0.6 Bergen County 462 5,311 falling -1.1 Burlington County 521.7 2,845 stable -1 Camden County 513.9 2,982 stable -1.4 Cape May County 557.2 864 stable -0.1 Cumberland County 502.9 862 stable 0.1 Essex County 452.1 3,717 falling -1.2 Gloucester County 529.7 1,753 stable -1.7 Hudson County 391.1 2,429 falling -1.5 Hunterdon County 481.7 762 stable -0.2 Mercer County 498.1 2,058 falling -0.4 Middlesex County 455.8 4,118 falling -1 Monmouth County 511.5 3,950 falling -1.6 Morris County 470.4 2,848 falling -1.7 Ocean County 515.9 4,370 falling -0.7 Passaic County 441.4 2,378 falling -0.9 Salem County 534.1 443 stable 0.1 Somerset County 461.1 1,761 falling -1.4 Sussex County 489.7 863 falling -0.5 Union County 451.9 2,692 falling -1.2 Warren County 497.8 665 falling -0.5 Bladder: All Races (includes Hispanic), Both Sexes, All Ages US (SEER+NPCR) 20.3 72,640 falling -1.7 New Jersey 23.6 2,449 falling -1.5 Atlantic County 27.9 94 stable 0.2 Bergen County 23 272 falling -0.8 Burlington County 26.7 147 stable 0 Camden County 25.3 146 stable 0 Cape May County 35 58 rising 1.3 Cumberland County 26.4 45 stable 1 Essex County 19.1 153 stable -0.4
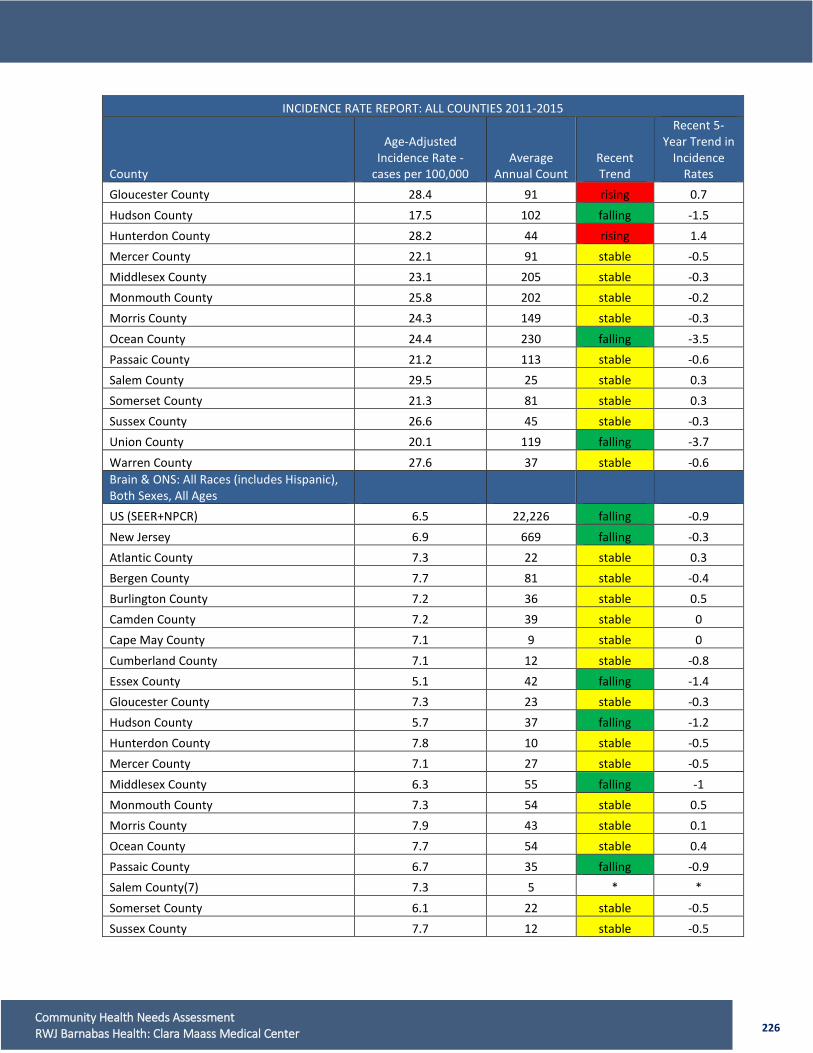
226 Community Health Needs Assessment RWJ Barnabas Health: Clara Maass Medical Center
INCIDENCE RATE REPORT: ALL COUNTIES 2011-2015
County
Age-Adjusted Incidence Rate -
cases per 100,000 Average
Annual Count Recent Trend
Recent 5-Year Trend in
Incidence Rates
Gloucester County 28.4 91 rising 0.7 Hudson County 17.5 102 falling -1.5 Hunterdon County 28.2 44 rising 1.4 Mercer County 22.1 91 stable -0.5 Middlesex County 23.1 205 stable -0.3 Monmouth County 25.8 202 stable -0.2 Morris County 24.3 149 stable -0.3 Ocean County 24.4 230 falling -3.5 Passaic County 21.2 113 stable -0.6 Salem County 29.5 25 stable 0.3 Somerset County 21.3 81 stable 0.3 Sussex County 26.6 45 stable -0.3 Union County 20.1 119 falling -3.7 Warren County 27.6 37 stable -0.6 Brain & ONS: All Races (includes Hispanic), Both Sexes, All Ages US (SEER+NPCR) 6.5 22,226 falling -0.9 New Jersey 6.9 669 falling -0.3 Atlantic County 7.3 22 stable 0.3 Bergen County 7.7 81 stable -0.4 Burlington County 7.2 36 stable 0.5 Camden County 7.2 39 stable 0 Cape May County 7.1 9 stable 0 Cumberland County 7.1 12 stable -0.8 Essex County 5.1 42 falling -1.4 Gloucester County 7.3 23 stable -0.3 Hudson County 5.7 37 falling -1.2 Hunterdon County 7.8 10 stable -0.5 Mercer County 7.1 27 stable -0.5 Middlesex County 6.3 55 falling -1 Monmouth County 7.3 54 stable 0.5 Morris County 7.9 43 stable 0.1 Ocean County 7.7 54 stable 0.4 Passaic County 6.7 35 falling -0.9 Salem County(7) 7.3 5 * * Somerset County 6.1 22 stable -0.5 Sussex County 7.7 12 stable -0.5
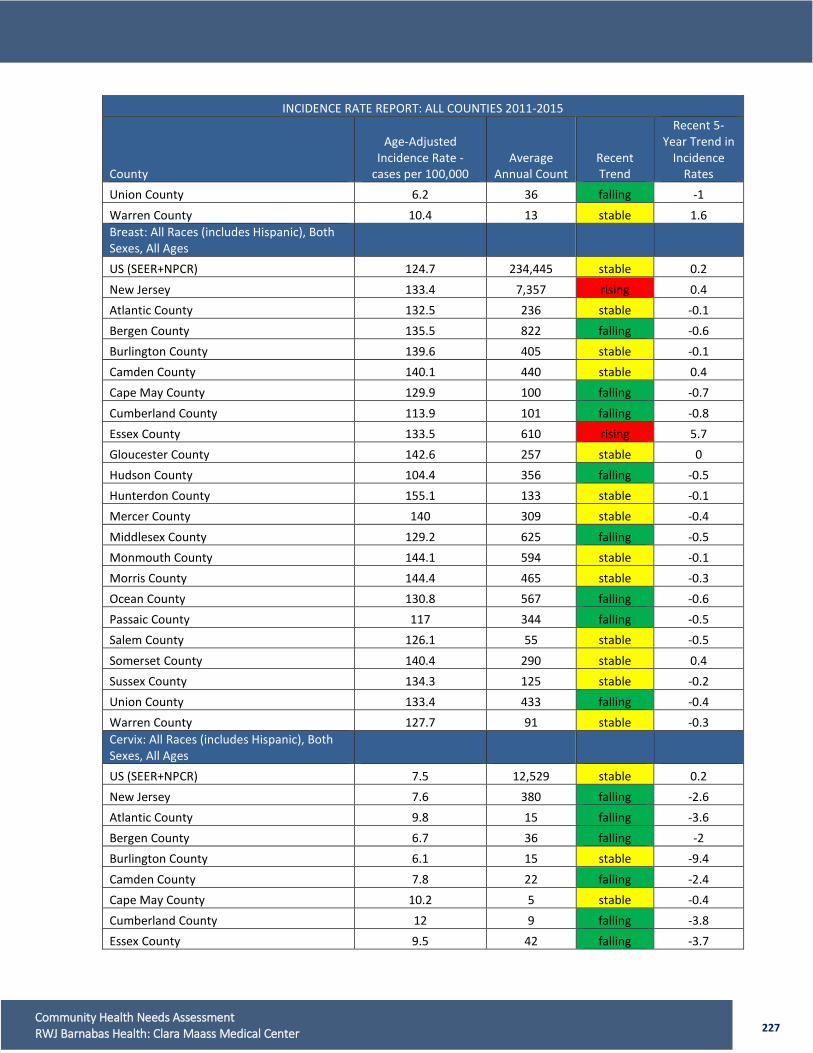
227 Community Health Needs Assessment RWJ Barnabas Health: Clara Maass Medical Center
INCIDENCE RATE REPORT: ALL COUNTIES 2011-2015
County
Age-Adjusted Incidence Rate -
cases per 100,000 Average
Annual Count Recent Trend
Recent 5-Year Trend in
Incidence Rates
Union County 6.2 36 falling -1 Warren County 10.4 13 stable 1.6 Breast: All Races (includes Hispanic), Both Sexes, All Ages US (SEER+NPCR) 124.7 234,445 stable 0.2 New Jersey 133.4 7,357 rising 0.4 Atlantic County 132.5 236 stable -0.1 Bergen County 135.5 822 falling -0.6 Burlington County 139.6 405 stable -0.1 Camden County 140.1 440 stable 0.4 Cape May County 129.9 100 falling -0.7 Cumberland County 113.9 101 falling -0.8 Essex County 133.5 610 rising 5.7 Gloucester County 142.6 257 stable 0 Hudson County 104.4 356 falling -0.5 Hunterdon County 155.1 133 stable -0.1 Mercer County 140 309 stable -0.4 Middlesex County 129.2 625 falling -0.5 Monmouth County 144.1 594 stable -0.1 Morris County 144.4 465 stable -0.3 Ocean County 130.8 567 falling -0.6 Passaic County 117 344 falling -0.5 Salem County 126.1 55 stable -0.5 Somerset County 140.4 290 stable 0.4 Sussex County 134.3 125 stable -0.2 Union County 133.4 433 falling -0.4 Warren County 127.7 91 stable -0.3 Cervix: All Races (includes Hispanic), Both Sexes, All Ages US (SEER+NPCR) 7.5 12,529 stable 0.2 New Jersey 7.6 380 falling -2.6 Atlantic County 9.8 15 falling -3.6 Bergen County 6.7 36 falling -2 Burlington County 6.1 15 stable -9.4 Camden County 7.8 22 falling -2.4 Cape May County 10.2 5 stable -0.4 Cumberland County 12 9 falling -3.8 Essex County 9.5 42 falling -3.7
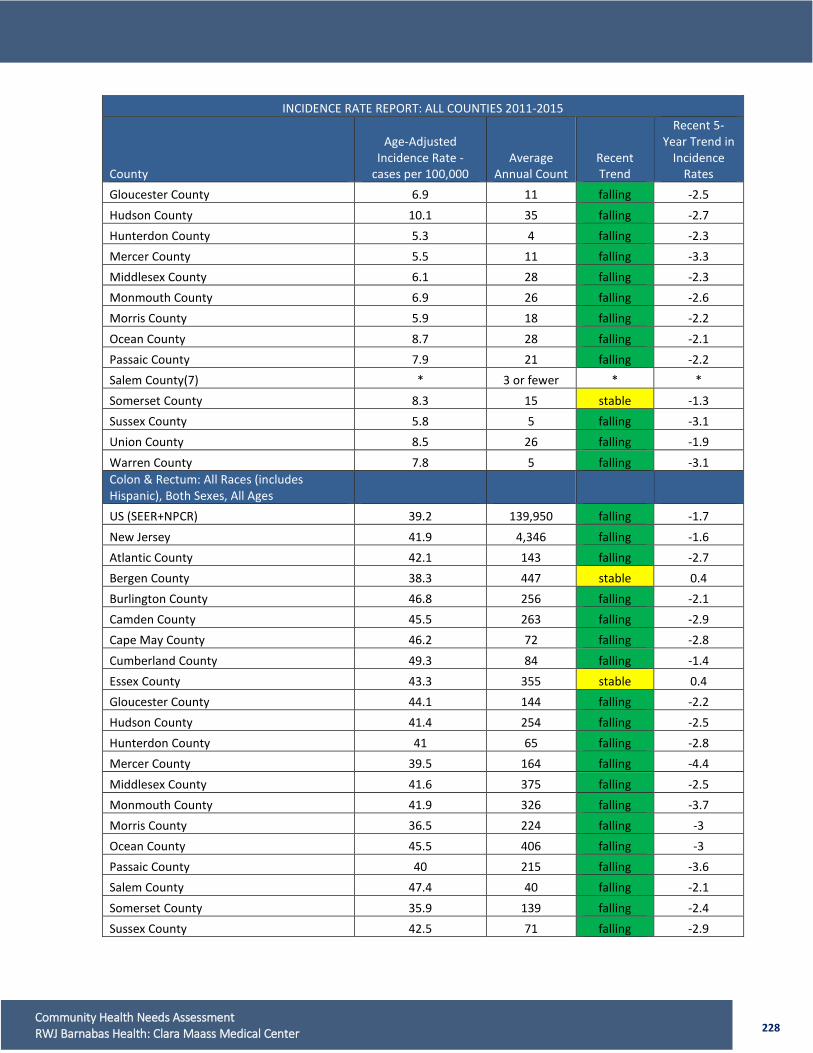
228 Community Health Needs Assessment RWJ Barnabas Health: Clara Maass Medical Center
INCIDENCE RATE REPORT: ALL COUNTIES 2011-2015
County
Age-Adjusted Incidence Rate -
cases per 100,000 Average
Annual Count Recent Trend
Recent 5-Year Trend in
Incidence Rates
Gloucester County 6.9 11 falling -2.5 Hudson County 10.1 35 falling -2.7 Hunterdon County 5.3 4 falling -2.3 Mercer County 5.5 11 falling -3.3 Middlesex County 6.1 28 falling -2.3 Monmouth County 6.9 26 falling -2.6 Morris County 5.9 18 falling -2.2 Ocean County 8.7 28 falling -2.1 Passaic County 7.9 21 falling -2.2 Salem County(7) * 3 or fewer * * Somerset County 8.3 15 stable -1.3 Sussex County 5.8 5 falling -3.1 Union County 8.5 26 falling -1.9 Warren County 7.8 5 falling -3.1 Colon & Rectum: All Races (includes Hispanic), Both Sexes, All Ages US (SEER+NPCR) 39.2 139,950 falling -1.7 New Jersey 41.9 4,346 falling -1.6 Atlantic County 42.1 143 falling -2.7 Bergen County 38.3 447 stable 0.4 Burlington County 46.8 256 falling -2.1 Camden County 45.5 263 falling -2.9 Cape May County 46.2 72 falling -2.8 Cumberland County 49.3 84 falling -1.4 Essex County 43.3 355 stable 0.4 Gloucester County 44.1 144 falling -2.2 Hudson County 41.4 254 falling -2.5 Hunterdon County 41 65 falling -2.8 Mercer County 39.5 164 falling -4.4 Middlesex County 41.6 375 falling -2.5 Monmouth County 41.9 326 falling -3.7 Morris County 36.5 224 falling -3 Ocean County 45.5 406 falling -3 Passaic County 40 215 falling -3.6 Salem County 47.4 40 falling -2.1 Somerset County 35.9 139 falling -2.4 Sussex County 42.5 71 falling -2.9
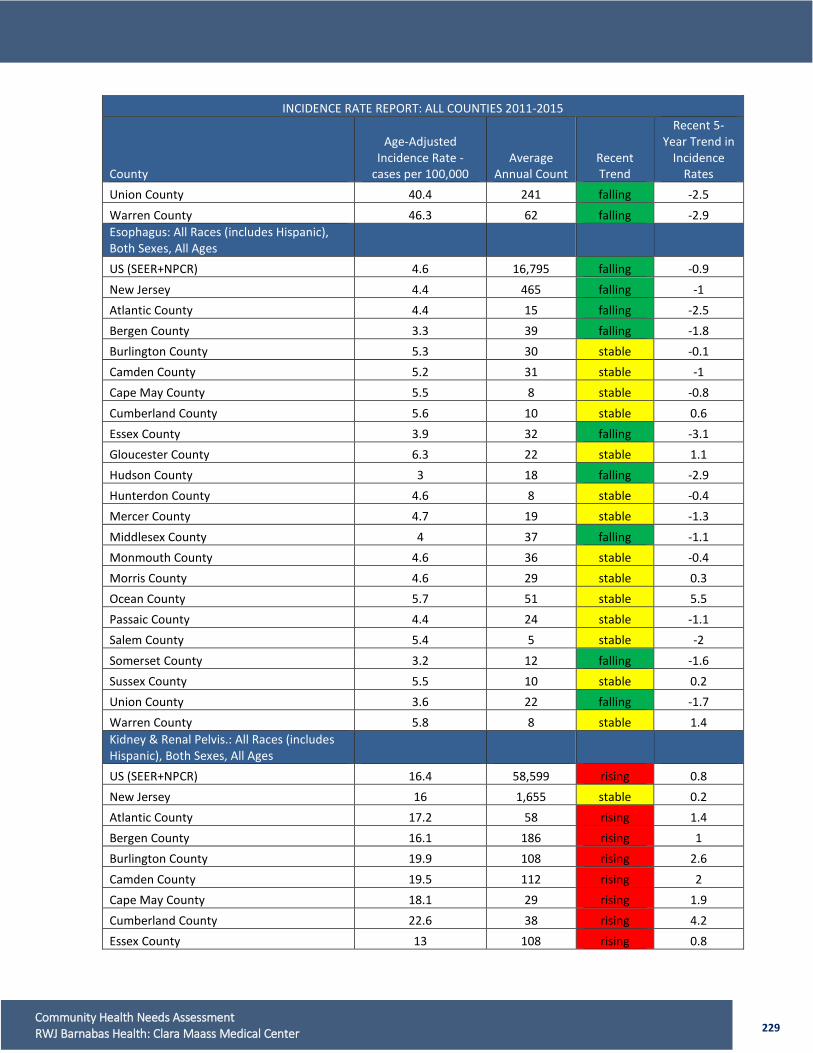
229 Community Health Needs Assessment RWJ Barnabas Health: Clara Maass Medical Center
INCIDENCE RATE REPORT: ALL COUNTIES 2011-2015
County
Age-Adjusted Incidence Rate -
cases per 100,000 Average
Annual Count Recent Trend
Recent 5-Year Trend in
Incidence Rates
Union County 40.4 241 falling -2.5 Warren County 46.3 62 falling -2.9 Esophagus: All Races (includes Hispanic), Both Sexes, All Ages US (SEER+NPCR) 4.6 16,795 falling -0.9 New Jersey 4.4 465 falling -1 Atlantic County 4.4 15 falling -2.5 Bergen County 3.3 39 falling -1.8 Burlington County 5.3 30 stable -0.1 Camden County 5.2 31 stable -1 Cape May County 5.5 8 stable -0.8 Cumberland County 5.6 10 stable 0.6 Essex County 3.9 32 falling -3.1 Gloucester County 6.3 22 stable 1.1 Hudson County 3 18 falling -2.9 Hunterdon County 4.6 8 stable -0.4 Mercer County 4.7 19 stable -1.3 Middlesex County 4 37 falling -1.1 Monmouth County 4.6 36 stable -0.4 Morris County 4.6 29 stable 0.3 Ocean County 5.7 51 stable 5.5 Passaic County 4.4 24 stable -1.1 Salem County 5.4 5 stable -2 Somerset County 3.2 12 falling -1.6 Sussex County 5.5 10 stable 0.2 Union County 3.6 22 falling -1.7 Warren County 5.8 8 stable 1.4 Kidney & Renal Pelvis.: All Races (includes Hispanic), Both Sexes, All Ages US (SEER+NPCR) 16.4 58,599 rising 0.8 New Jersey 16 1,655 stable 0.2 Atlantic County 17.2 58 rising 1.4 Bergen County 16.1 186 rising 1 Burlington County 19.9 108 rising 2.6 Camden County 19.5 112 rising 2 Cape May County 18.1 29 rising 1.9 Cumberland County 22.6 38 rising 4.2 Essex County 13 108 rising 0.8
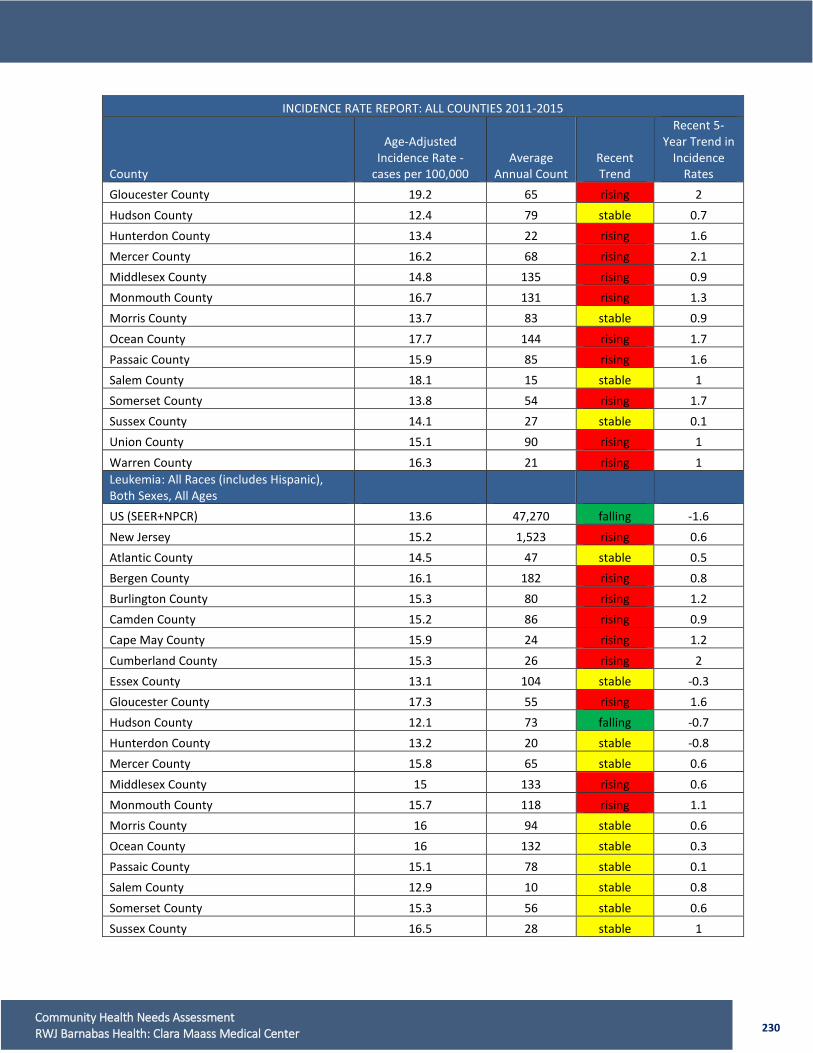
230 Community Health Needs Assessment RWJ Barnabas Health: Clara Maass Medical Center
INCIDENCE RATE REPORT: ALL COUNTIES 2011-2015
County
Age-Adjusted Incidence Rate -
cases per 100,000 Average
Annual Count Recent Trend
Recent 5-Year Trend in
Incidence Rates
Gloucester County 19.2 65 rising 2 Hudson County 12.4 79 stable 0.7 Hunterdon County 13.4 22 rising 1.6 Mercer County 16.2 68 rising 2.1 Middlesex County 14.8 135 rising 0.9 Monmouth County 16.7 131 rising 1.3 Morris County 13.7 83 stable 0.9 Ocean County 17.7 144 rising 1.7 Passaic County 15.9 85 rising 1.6 Salem County 18.1 15 stable 1 Somerset County 13.8 54 rising 1.7 Sussex County 14.1 27 stable 0.1 Union County 15.1 90 rising 1 Warren County 16.3 21 rising 1 Leukemia: All Races (includes Hispanic), Both Sexes, All Ages US (SEER+NPCR) 13.6 47,270 falling -1.6 New Jersey 15.2 1,523 rising 0.6 Atlantic County 14.5 47 stable 0.5 Bergen County 16.1 182 rising 0.8 Burlington County 15.3 80 rising 1.2 Camden County 15.2 86 rising 0.9 Cape May County 15.9 24 rising 1.2 Cumberland County 15.3 26 rising 2 Essex County 13.1 104 stable -0.3 Gloucester County 17.3 55 rising 1.6 Hudson County 12.1 73 falling -0.7 Hunterdon County 13.2 20 stable -0.8 Mercer County 15.8 65 stable 0.6 Middlesex County 15 133 rising 0.6 Monmouth County 15.7 118 rising 1.1 Morris County 16 94 stable 0.6 Ocean County 16 132 stable 0.3 Passaic County 15.1 78 stable 0.1 Salem County 12.9 10 stable 0.8 Somerset County 15.3 56 stable 0.6 Sussex County 16.5 28 stable 1
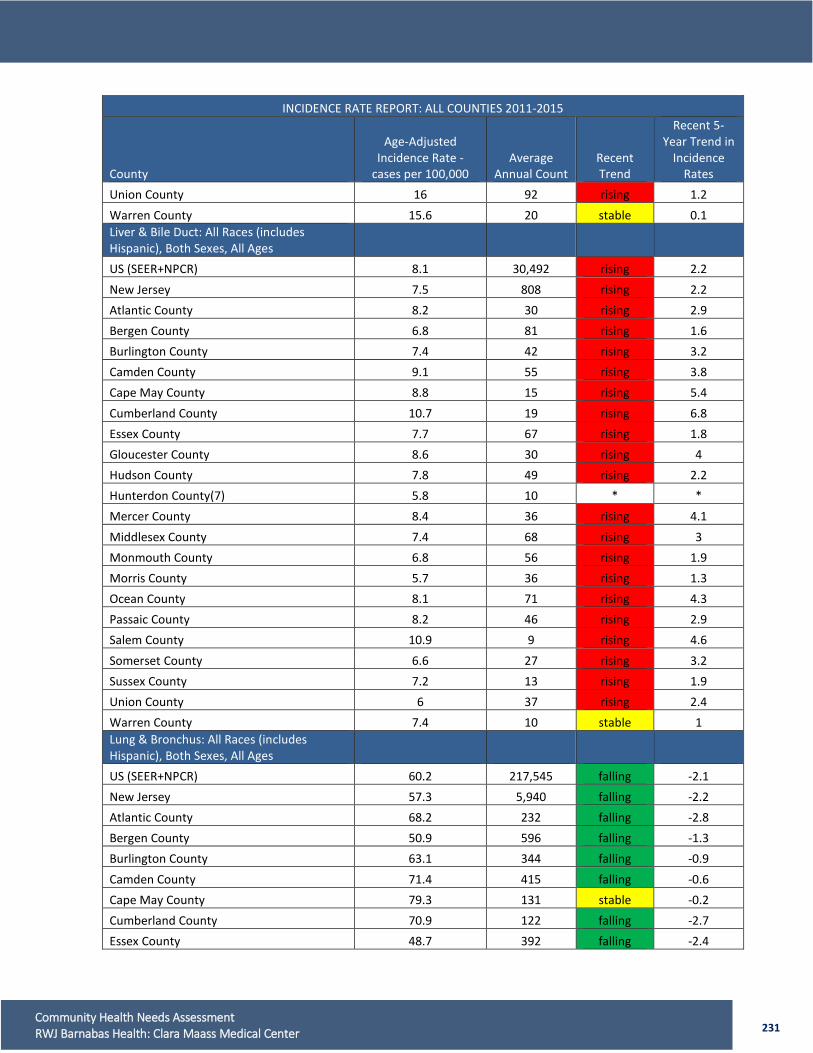
231 Community Health Needs Assessment RWJ Barnabas Health: Clara Maass Medical Center
INCIDENCE RATE REPORT: ALL COUNTIES 2011-2015
County
Age-Adjusted Incidence Rate -
cases per 100,000 Average
Annual Count Recent Trend
Recent 5-Year Trend in
Incidence Rates
Union County 16 92 rising 1.2 Warren County 15.6 20 stable 0.1 Liver & Bile Duct: All Races (includes Hispanic), Both Sexes, All Ages US (SEER+NPCR) 8.1 30,492 rising 2.2 New Jersey 7.5 808 rising 2.2 Atlantic County 8.2 30 rising 2.9 Bergen County 6.8 81 rising 1.6 Burlington County 7.4 42 rising 3.2 Camden County 9.1 55 rising 3.8 Cape May County 8.8 15 rising 5.4 Cumberland County 10.7 19 rising 6.8 Essex County 7.7 67 rising 1.8 Gloucester County 8.6 30 rising 4 Hudson County 7.8 49 rising 2.2 Hunterdon County(7) 5.8 10 * * Mercer County 8.4 36 rising 4.1 Middlesex County 7.4 68 rising 3 Monmouth County 6.8 56 rising 1.9 Morris County 5.7 36 rising 1.3 Ocean County 8.1 71 rising 4.3 Passaic County 8.2 46 rising 2.9 Salem County 10.9 9 rising 4.6 Somerset County 6.6 27 rising 3.2 Sussex County 7.2 13 rising 1.9 Union County 6 37 rising 2.4 Warren County 7.4 10 stable 1 Lung & Bronchus: All Races (includes Hispanic), Both Sexes, All Ages US (SEER+NPCR) 60.2 217,545 falling -2.1 New Jersey 57.3 5,940 falling -2.2 Atlantic County 68.2 232 falling -2.8 Bergen County 50.9 596 falling -1.3 Burlington County 63.1 344 falling -0.9 Camden County 71.4 415 falling -0.6 Cape May County 79.3 131 stable -0.2 Cumberland County 70.9 122 falling -2.7 Essex County 48.7 392 falling -2.4
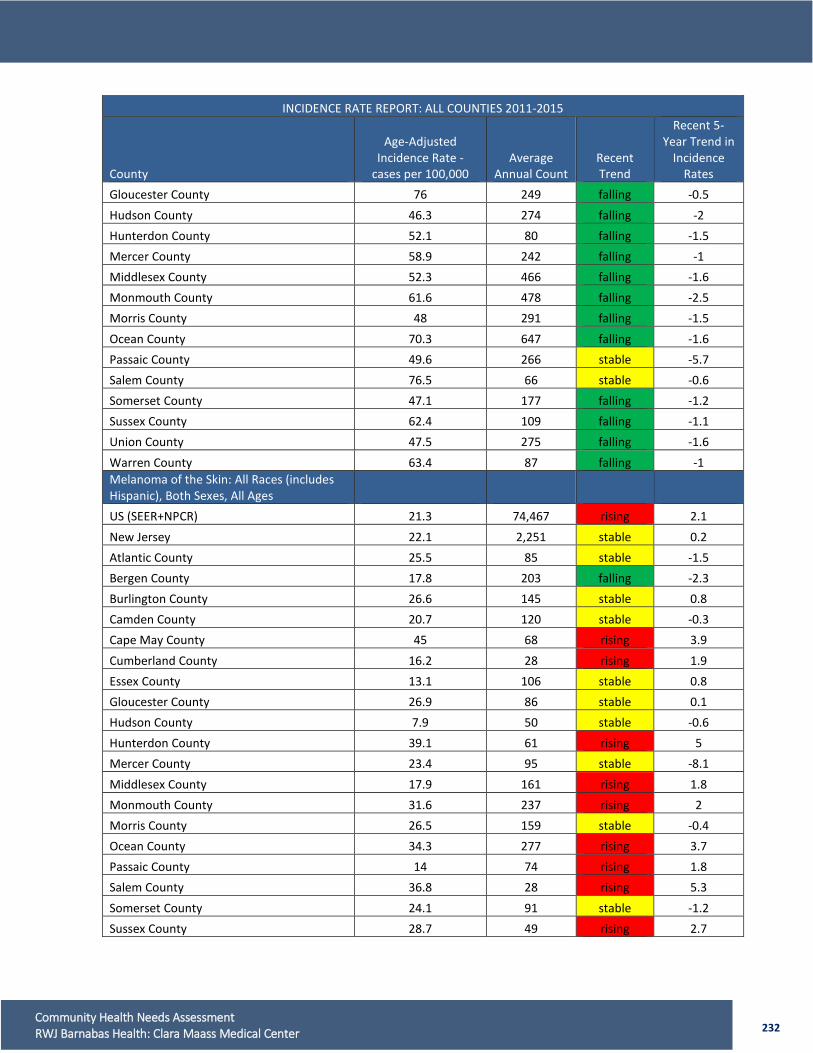
232 Community Health Needs Assessment RWJ Barnabas Health: Clara Maass Medical Center
INCIDENCE RATE REPORT: ALL COUNTIES 2011-2015
County
Age-Adjusted Incidence Rate -
cases per 100,000 Average
Annual Count Recent Trend
Recent 5-Year Trend in
Incidence Rates
Gloucester County 76 249 falling -0.5 Hudson County 46.3 274 falling -2 Hunterdon County 52.1 80 falling -1.5 Mercer County 58.9 242 falling -1 Middlesex County 52.3 466 falling -1.6 Monmouth County 61.6 478 falling -2.5 Morris County 48 291 falling -1.5 Ocean County 70.3 647 falling -1.6 Passaic County 49.6 266 stable -5.7 Salem County 76.5 66 stable -0.6 Somerset County 47.1 177 falling -1.2 Sussex County 62.4 109 falling -1.1 Union County 47.5 275 falling -1.6 Warren County 63.4 87 falling -1 Melanoma of the Skin: All Races (includes Hispanic), Both Sexes, All Ages US (SEER+NPCR) 21.3 74,467 rising 2.1 New Jersey 22.1 2,251 stable 0.2 Atlantic County 25.5 85 stable -1.5 Bergen County 17.8 203 falling -2.3 Burlington County 26.6 145 stable 0.8 Camden County 20.7 120 stable -0.3 Cape May County 45 68 rising 3.9 Cumberland County 16.2 28 rising 1.9 Essex County 13.1 106 stable 0.8 Gloucester County 26.9 86 stable 0.1 Hudson County 7.9 50 stable -0.6 Hunterdon County 39.1 61 rising 5 Mercer County 23.4 95 stable -8.1 Middlesex County 17.9 161 rising 1.8 Monmouth County 31.6 237 rising 2 Morris County 26.5 159 stable -0.4 Ocean County 34.3 277 rising 3.7 Passaic County 14 74 rising 1.8 Salem County 36.8 28 rising 5.3 Somerset County 24.1 91 stable -1.2 Sussex County 28.7 49 rising 2.7
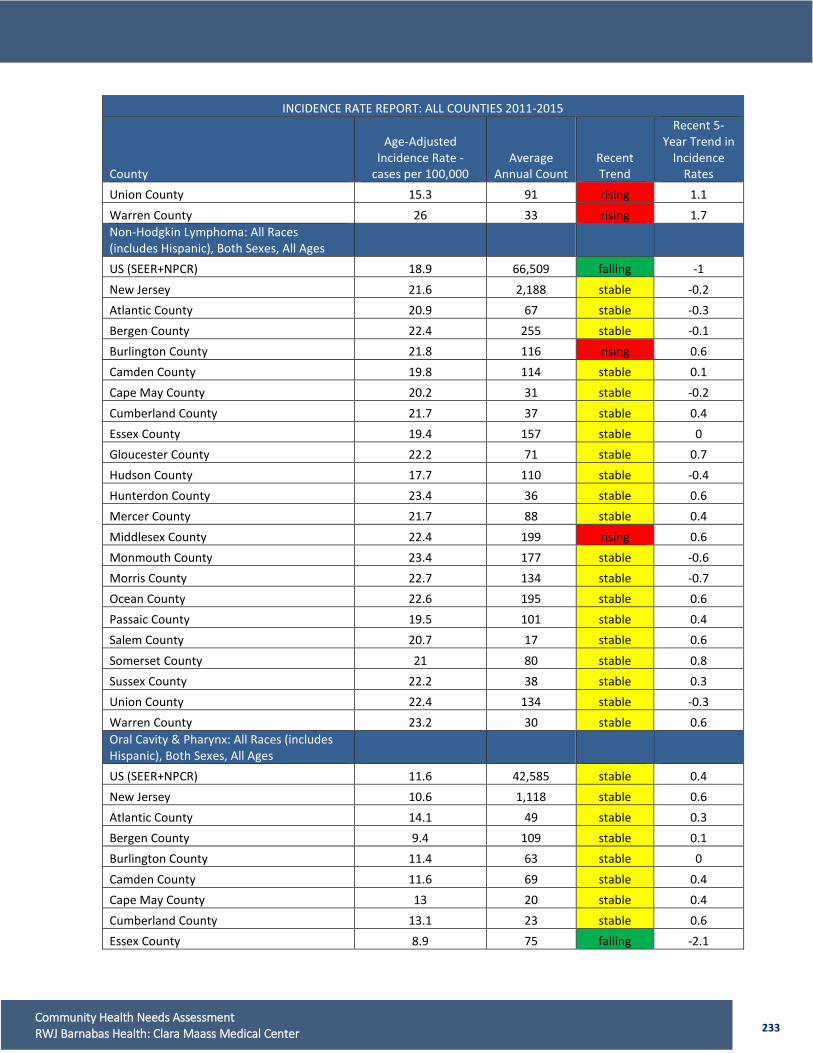
233 Community Health Needs Assessment RWJ Barnabas Health: Clara Maass Medical Center
INCIDENCE RATE REPORT: ALL COUNTIES 2011-2015
County
Age-Adjusted Incidence Rate -
cases per 100,000 Average
Annual Count Recent Trend
Recent 5-Year Trend in
Incidence Rates
Union County 15.3 91 rising 1.1 Warren County 26 33 rising 1.7 Non-Hodgkin Lymphoma: All Races (includes Hispanic), Both Sexes, All Ages US (SEER+NPCR) 18.9 66,509 falling -1 New Jersey 21.6 2,188 stable -0.2 Atlantic County 20.9 67 stable -0.3 Bergen County 22.4 255 stable -0.1 Burlington County 21.8 116 rising 0.6 Camden County 19.8 114 stable 0.1 Cape May County 20.2 31 stable -0.2 Cumberland County 21.7 37 stable 0.4 Essex County 19.4 157 stable 0 Gloucester County 22.2 71 stable 0.7 Hudson County 17.7 110 stable -0.4 Hunterdon County 23.4 36 stable 0.6 Mercer County 21.7 88 stable 0.4 Middlesex County 22.4 199 rising 0.6 Monmouth County 23.4 177 stable -0.6 Morris County 22.7 134 stable -0.7 Ocean County 22.6 195 stable 0.6 Passaic County 19.5 101 stable 0.4 Salem County 20.7 17 stable 0.6 Somerset County 21 80 stable 0.8 Sussex County 22.2 38 stable 0.3 Union County 22.4 134 stable -0.3 Warren County 23.2 30 stable 0.6 Oral Cavity & Pharynx: All Races (includes Hispanic), Both Sexes, All Ages US (SEER+NPCR) 11.6 42,585 stable 0.4 New Jersey 10.6 1,118 stable 0.6 Atlantic County 14.1 49 stable 0.3 Bergen County 9.4 109 stable 0.1 Burlington County 11.4 63 stable 0 Camden County 11.6 69 stable 0.4 Cape May County 13 20 stable 0.4 Cumberland County 13.1 23 stable 0.6 Essex County 8.9 75 falling -2.1
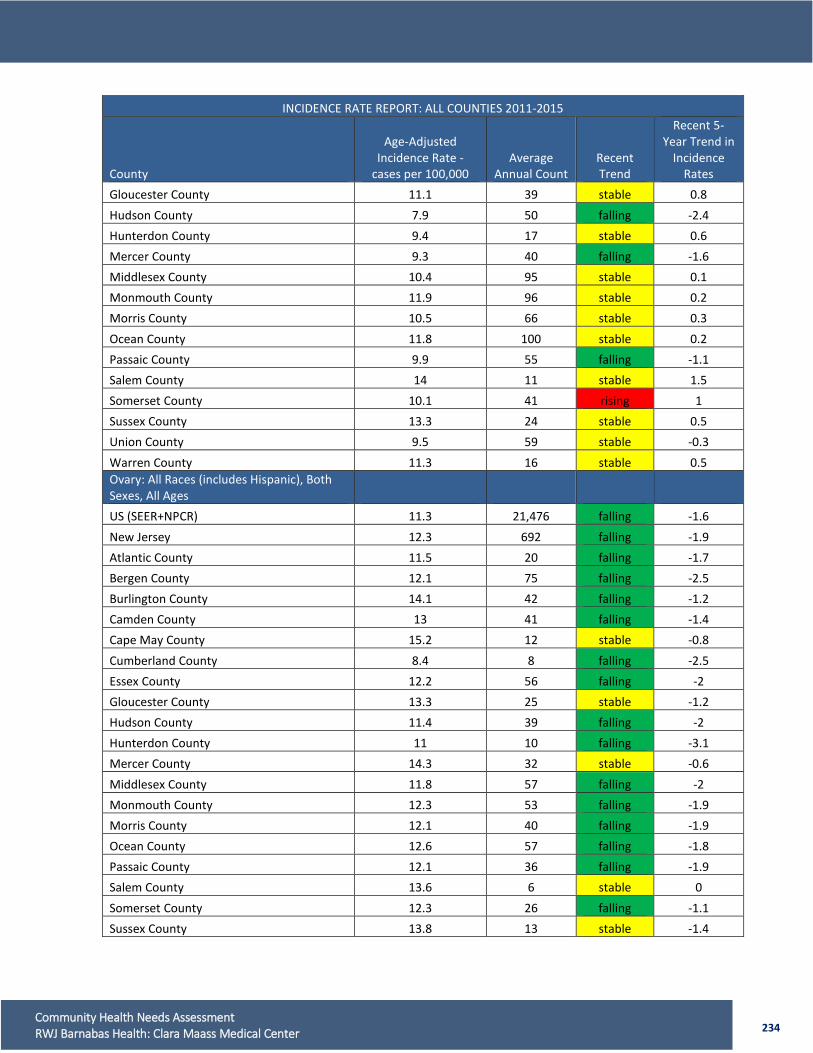
234 Community Health Needs Assessment RWJ Barnabas Health: Clara Maass Medical Center
INCIDENCE RATE REPORT: ALL COUNTIES 2011-2015
County
Age-Adjusted Incidence Rate -
cases per 100,000 Average
Annual Count Recent Trend
Recent 5-Year Trend in
Incidence Rates
Gloucester County 11.1 39 stable 0.8 Hudson County 7.9 50 falling -2.4 Hunterdon County 9.4 17 stable 0.6 Mercer County 9.3 40 falling -1.6 Middlesex County 10.4 95 stable 0.1 Monmouth County 11.9 96 stable 0.2 Morris County 10.5 66 stable 0.3 Ocean County 11.8 100 stable 0.2 Passaic County 9.9 55 falling -1.1 Salem County 14 11 stable 1.5 Somerset County 10.1 41 rising 1 Sussex County 13.3 24 stable 0.5 Union County 9.5 59 stable -0.3 Warren County 11.3 16 stable 0.5 Ovary: All Races (includes Hispanic), Both Sexes, All Ages US (SEER+NPCR) 11.3 21,476 falling -1.6 New Jersey 12.3 692 falling -1.9 Atlantic County 11.5 20 falling -1.7 Bergen County 12.1 75 falling -2.5 Burlington County 14.1 42 falling -1.2 Camden County 13 41 falling -1.4 Cape May County 15.2 12 stable -0.8 Cumberland County 8.4 8 falling -2.5 Essex County 12.2 56 falling -2 Gloucester County 13.3 25 stable -1.2 Hudson County 11.4 39 falling -2 Hunterdon County 11 10 falling -3.1 Mercer County 14.3 32 stable -0.6 Middlesex County 11.8 57 falling -2 Monmouth County 12.3 53 falling -1.9 Morris County 12.1 40 falling -1.9 Ocean County 12.6 57 falling -1.8 Passaic County 12.1 36 falling -1.9 Salem County 13.6 6 stable 0 Somerset County 12.3 26 falling -1.1 Sussex County 13.8 13 stable -1.4
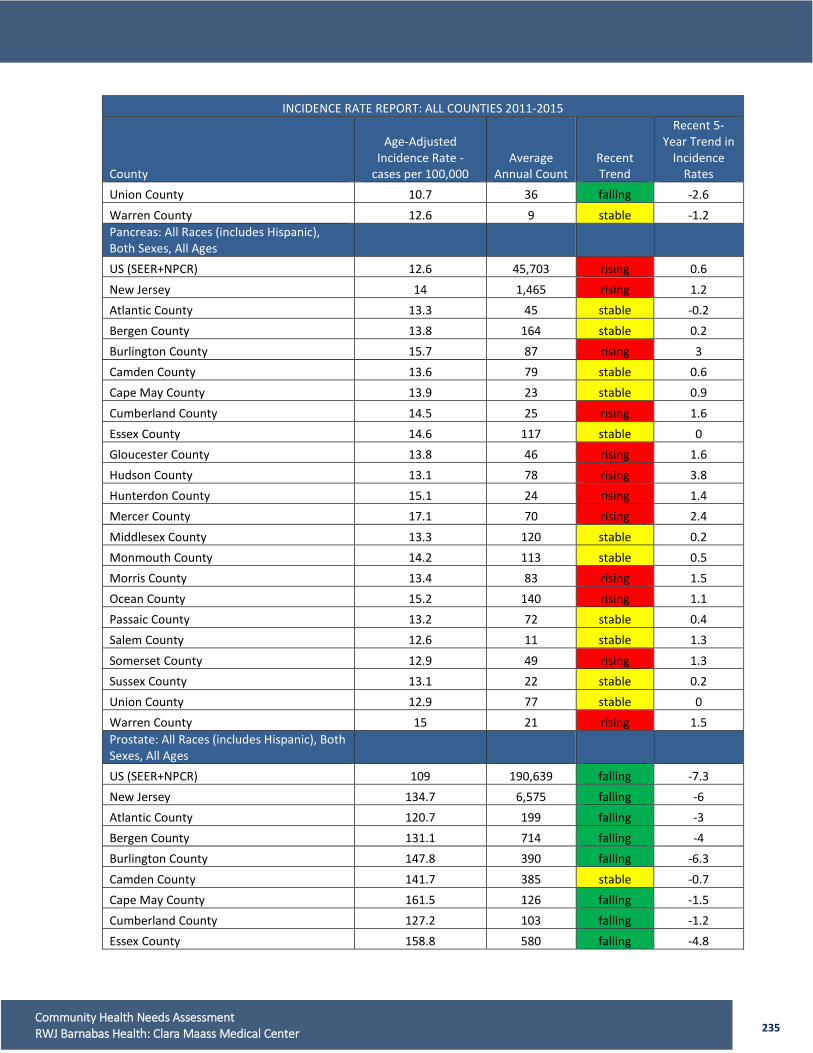
235 Community Health Needs Assessment RWJ Barnabas Health: Clara Maass Medical Center
INCIDENCE RATE REPORT: ALL COUNTIES 2011-2015
County
Age-Adjusted Incidence Rate -
cases per 100,000 Average
Annual Count Recent Trend
Recent 5-Year Trend in
Incidence Rates
Union County 10.7 36 falling -2.6 Warren County 12.6 9 stable -1.2 Pancreas: All Races (includes Hispanic), Both Sexes, All Ages US (SEER+NPCR) 12.6 45,703 rising 0.6 New Jersey 14 1,465 rising 1.2 Atlantic County 13.3 45 stable -0.2 Bergen County 13.8 164 stable 0.2 Burlington County 15.7 87 rising 3 Camden County 13.6 79 stable 0.6 Cape May County 13.9 23 stable 0.9 Cumberland County 14.5 25 rising 1.6 Essex County 14.6 117 stable 0 Gloucester County 13.8 46 rising 1.6 Hudson County 13.1 78 rising 3.8 Hunterdon County 15.1 24 rising 1.4 Mercer County 17.1 70 rising 2.4 Middlesex County 13.3 120 stable 0.2 Monmouth County 14.2 113 stable 0.5 Morris County 13.4 83 rising 1.5 Ocean County 15.2 140 rising 1.1 Passaic County 13.2 72 stable 0.4 Salem County 12.6 11 stable 1.3 Somerset County 12.9 49 rising 1.3 Sussex County 13.1 22 stable 0.2 Union County 12.9 77 stable 0 Warren County 15 21 rising 1.5 Prostate: All Races (includes Hispanic), Both Sexes, All Ages US (SEER+NPCR) 109 190,639 falling -7.3 New Jersey 134.7 6,575 falling -6 Atlantic County 120.7 199 falling -3 Bergen County 131.1 714 falling -4 Burlington County 147.8 390 falling -6.3 Camden County 141.7 385 stable -0.7 Cape May County 161.5 126 falling -1.5 Cumberland County 127.2 103 falling -1.2 Essex County 158.8 580 falling -4.8

236 Community Health Needs Assessment RWJ Barnabas Health: Clara Maass Medical Center
INCIDENCE RATE REPORT: ALL COUNTIES 2011-2015
County
Age-Adjusted Incidence Rate -
cases per 100,000 Average
Annual Count Recent Trend
Recent 5-Year Trend in
Incidence Rates
Gloucester County 136.8 219 falling -7.5 Hudson County 111.8 297 falling -4.4 Hunterdon County 103 83 falling -2.1 Mercer County 147 285 falling -1.7 Middlesex County 127.3 542 falling -3.4 Monmouth County 144.9 544 falling -1.8 Morris County 135.5 397 falling -7.8 Ocean County 125.8 506 falling -2.9 Passaic County 137.1 342 falling -1.4 Salem County 138.9 57 stable -1 Somerset County 125.2 228 falling -2.3 Sussex County 122.5 115 falling -6.8 Union County 138.4 378 falling -6 Warren County 125.2 84 falling -8.3 Stomach: All Races (includes Hispanic), Both Sexes, All Ages US (SEER+NPCR) 6.6 23,501 falling -1.2 New Jersey 8 827 falling -1.6 Atlantic County 7.5 25 falling -1.5 Bergen County 9.1 107 falling -1.1 Burlington County 6.4 36 falling -1.6 Camden County 8.9 51 stable -0.5 Cape May County 5.8 9 stable -0.4
Cumberland County 7.4 12 falling -1.7 Essex County 9.3 75 falling -2 Gloucester County 6.7 22 falling -1.5 Hudson County 10 61 falling -0.9 Hunterdon County 5 8 falling -3.4 Mercer County 8.2 33 falling -2.2 Middlesex County 7.4 67 falling -1.8 Monmouth County 6.1 49 falling -2.3 Morris County 7.1 43 falling -1.2 Ocean County 7.6 68 falling -1.6 Passaic County 9.8 53 stable -0.8 Salem County 6.6 5 stable -1.3 Somerset County 6.9 26 falling -1.7 Sussex County 6.8 11 falling -2.5
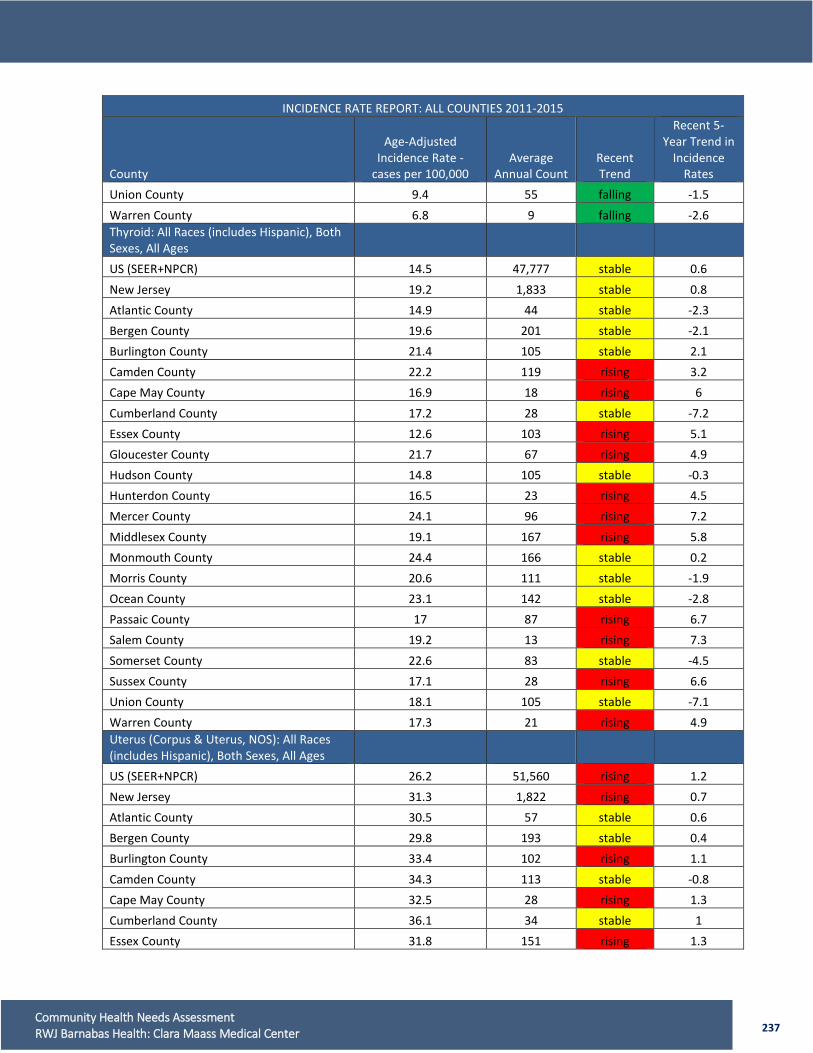
237 Community Health Needs Assessment RWJ Barnabas Health: Clara Maass Medical Center
INCIDENCE RATE REPORT: ALL COUNTIES 2011-2015
County
Age-Adjusted Incidence Rate -
cases per 100,000 Average
Annual Count Recent Trend
Recent 5-Year Trend in
Incidence Rates
Union County 9.4 55 falling -1.5 Warren County 6.8 9 falling -2.6 Thyroid: All Races (includes Hispanic), Both Sexes, All Ages US (SEER+NPCR) 14.5 47,777 stable 0.6 New Jersey 19.2 1,833 stable 0.8 Atlantic County 14.9 44 stable -2.3 Bergen County 19.6 201 stable -2.1 Burlington County 21.4 105 stable 2.1 Camden County 22.2 119 rising 3.2 Cape May County 16.9 18 rising 6 Cumberland County 17.2 28 stable -7.2 Essex County 12.6 103 rising 5.1 Gloucester County 21.7 67 rising 4.9 Hudson County 14.8 105 stable -0.3 Hunterdon County 16.5 23 rising 4.5 Mercer County 24.1 96 rising 7.2 Middlesex County 19.1 167 rising 5.8 Monmouth County 24.4 166 stable 0.2 Morris County 20.6 111 stable -1.9 Ocean County 23.1 142 stable -2.8 Passaic County 17 87 rising 6.7 Salem County 19.2 13 rising 7.3 Somerset County 22.6 83 stable -4.5 Sussex County 17.1 28 rising 6.6 Union County 18.1 105 stable -7.1 Warren County 17.3 21 rising 4.9 Uterus (Corpus & Uterus, NOS): All Races (includes Hispanic), Both Sexes, All Ages US (SEER+NPCR) 26.2 51,560 rising 1.2 New Jersey 31.3 1,822 rising 0.7 Atlantic County 30.5 57 stable 0.6 Bergen County 29.8 193 stable 0.4 Burlington County 33.4 102 rising 1.1 Camden County 34.3 113 stable -0.8 Cape May County 32.5 28 rising 1.3 Cumberland County 36.1 34 stable 1 Essex County 31.8 151 rising 1.3
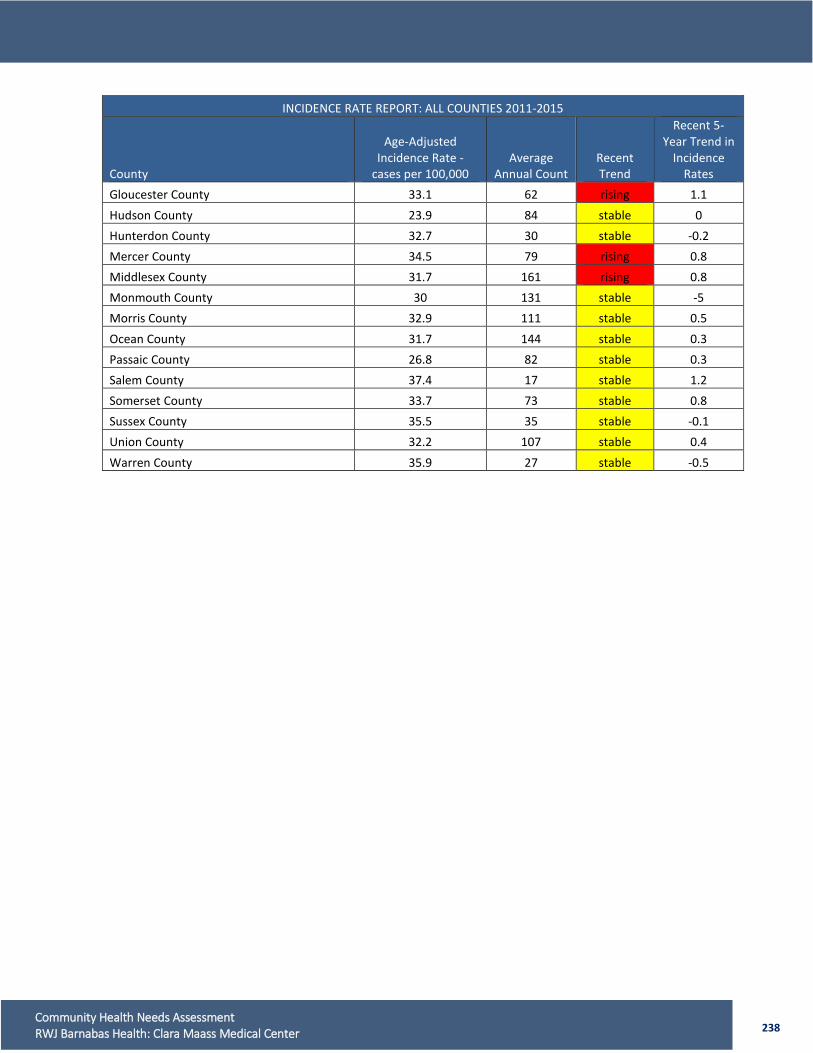
238 Community Health Needs Assessment RWJ Barnabas Health: Clara Maass Medical Center
INCIDENCE RATE REPORT: ALL COUNTIES 2011-2015
County
Age-Adjusted Incidence Rate -
cases per 100,000 Average
Annual Count Recent Trend
Recent 5-Year Trend in
Incidence Rates
Gloucester County 33.1 62 rising 1.1 Hudson County 23.9 84 stable 0 Hunterdon County 32.7 30 stable -0.2 Mercer County 34.5 79 rising 0.8 Middlesex County 31.7 161 rising 0.8 Monmouth County 30 131 stable -5 Morris County 32.9 111 stable 0.5 Ocean County 31.7 144 stable 0.3 Passaic County 26.8 82 stable 0.3 Salem County 37.4 17 stable 1.2 Somerset County 33.7 73 stable 0.8 Sussex County 35.5 35 stable -0.1 Union County 32.2 107 stable 0.4 Warren County 35.9 27 stable -0.5
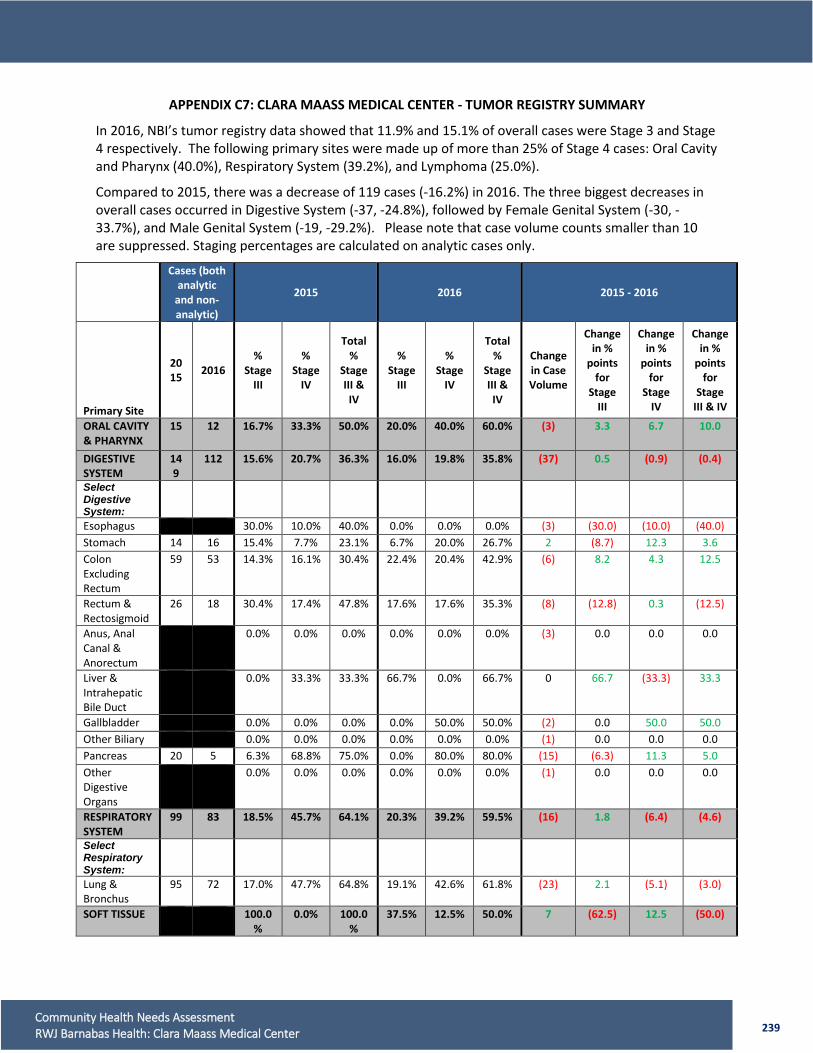
239 Community Health Needs Assessment RWJ Barnabas Health: Clara Maass Medical Center
APPENDIX C7: CLARA MAASS MEDICAL CENTER - TUMOR REGISTRY SUMMARY
In 2016, NBI’s tumor registry data showed that 11.9% and 15.1% of overall cases were Stage 3 and Stage 4 respectively. The following primary sites were made up of more than 25% of Stage 4 cases: Oral Cavity and Pharynx (40.0%), Respiratory System (39.2%), and Lymphoma (25.0%).
Compared to 2015, there was a decrease of 119 cases (-16.2%) in 2016. The three biggest decreases in overall cases occurred in Digestive System (-37, -24.8%), followed by Female Genital System (-30, -33.7%), and Male Genital System (-19, -29.2%). Please note that case volume counts smaller than 10 are suppressed. Staging percentages are calculated on analytic cases only.
Cases (both analytic
and non-analytic)
2015 2016 2015 - 2016
Primary Site
2015 2016
% Stage
III
% Stage
IV
Total %
Stage III & IV
% Stage
III
% Stage
IV
Total %
Stage III & IV
Change in Case Volume
Change in %
points for
Stage III
Change in %
points for
Stage IV
Change in %
points for
Stage III & IV
ORAL CAVITY & PHARYNX
15 12 16.7% 33.3% 50.0% 20.0% 40.0% 60.0% (3) 3.3 6.7 10.0
DIGESTIVE SYSTEM
149
112 15.6% 20.7% 36.3% 16.0% 19.8% 35.8% (37) 0.5 (0.9) (0.4)
Select Digestive System:
Esophagus 11 8 30.0% 10.0% 40.0% 0.0% 0.0% 0.0% (3) (30.0) (10.0) (40.0) Stomach 14 16 15.4% 7.7% 23.1% 6.7% 20.0% 26.7% 2 (8.7) 12.3 3.6 Colon Excluding Rectum
59 53 14.3% 16.1% 30.4% 22.4% 20.4% 42.9% (6) 8.2 4.3 12.5
Rectum & Rectosigmoid
26 18 30.4% 17.4% 47.8% 17.6% 17.6% 35.3% (8) (12.8) 0.3 (12.5)
Anus, Anal Canal & Anorectum
4 1 0.0% 0.0% 0.0% 0.0% 0.0% 0.0% (3) 0.0 0.0 0.0
Liver & Intrahepatic Bile Duct
3 3 0.0% 33.3% 33.3% 66.7% 0.0% 66.7% 0 66.7 (33.3) 33.3
Gallbladder 4 2 0.0% 0.0% 0.0% 0.0% 50.0% 50.0% (2) 0.0 50.0 50.0 Other Biliary 2 1 0.0% 0.0% 0.0% 0.0% 0.0% 0.0% (1) 0.0 0.0 0.0 Pancreas 20 5 6.3% 68.8% 75.0% 0.0% 80.0% 80.0% (15) (6.3) 11.3 5.0 Other Digestive Organs
2 1 0.0% 0.0% 0.0% 0.0% 0.0% 0.0% (1) 0.0 0.0 0.0
RESPIRATORY SYSTEM
99 83 18.5% 45.7% 64.1% 20.3% 39.2% 59.5% (16) 1.8 (6.4) (4.6)
Select Respiratory System:
Lung & Bronchus
95 72 17.0% 47.7% 64.8% 19.1% 42.6% 61.8% (23) 2.1 (5.1) (3.0)
SOFT TISSUE 2 9 100.0%
0.0% 100.0%
37.5% 12.5% 50.0% 7 (62.5) 12.5 (50.0)
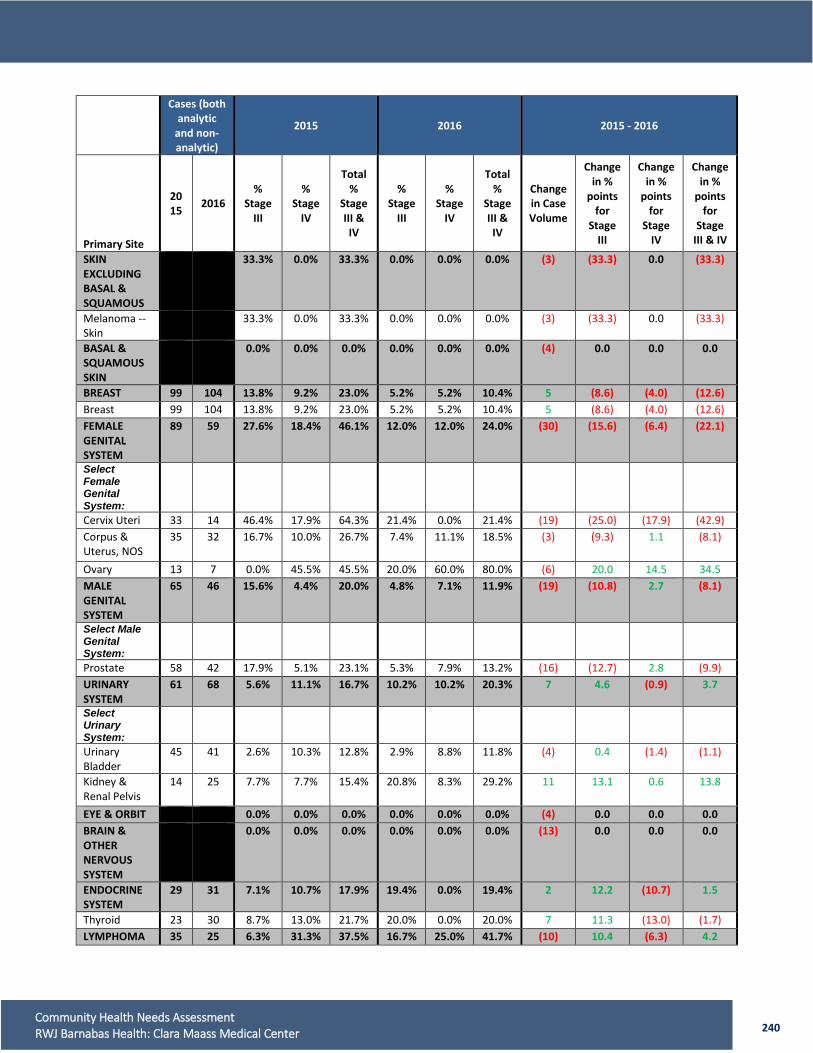
240 Community Health Needs Assessment RWJ Barnabas Health: Clara Maass Medical Center
Cases (both analytic
and non-analytic)
2015 2016 2015 - 2016
Primary Site
2015 2016
% Stage
III
% Stage
IV
Total %
Stage III & IV
% Stage
III
% Stage
IV
Total %
Stage III & IV
Change in Case Volume
Change in %
points for
Stage III
Change in %
points for
Stage IV
Change in %
points for
Stage III & IV
SKIN EXCLUDING BASAL & SQUAMOUS
5 2 33.3% 0.0% 33.3% 0.0% 0.0% 0.0% (3) (33.3) 0.0 (33.3)
Melanoma -- Skin
5 2 33.3% 0.0% 33.3% 0.0% 0.0% 0.0% (3) (33.3) 0.0 (33.3)
BASAL & SQUAMOUS SKIN
4 0 0.0% 0.0% 0.0% 0.0% 0.0% 0.0% (4) 0.0 0.0 0.0
BREAST 99 104 13.8% 9.2% 23.0% 5.2% 5.2% 10.4% 5 (8.6) (4.0) (12.6) Breast 99 104 13.8% 9.2% 23.0% 5.2% 5.2% 10.4% 5 (8.6) (4.0) (12.6) FEMALE GENITAL SYSTEM
89 59 27.6% 18.4% 46.1% 12.0% 12.0% 24.0% (30) (15.6) (6.4) (22.1)
Select Female Genital System:
Cervix Uteri 33 14 46.4% 17.9% 64.3% 21.4% 0.0% 21.4% (19) (25.0) (17.9) (42.9) Corpus & Uterus, NOS
35 32 16.7% 10.0% 26.7% 7.4% 11.1% 18.5% (3) (9.3) 1.1 (8.1)
Ovary 13 7 0.0% 45.5% 45.5% 20.0% 60.0% 80.0% (6) 20.0 14.5 34.5 MALE GENITAL SYSTEM
65 46 15.6% 4.4% 20.0% 4.8% 7.1% 11.9% (19) (10.8) 2.7 (8.1)
Select Male Genital System:
Prostate 58 42 17.9% 5.1% 23.1% 5.3% 7.9% 13.2% (16) (12.7) 2.8 (9.9) URINARY SYSTEM
61 68 5.6% 11.1% 16.7% 10.2% 10.2% 20.3% 7 4.6 (0.9) 3.7
Select Urinary System:
Urinary Bladder
45 41 2.6% 10.3% 12.8% 2.9% 8.8% 11.8% (4) 0.4 (1.4) (1.1)
Kidney & Renal Pelvis
14 25 7.7% 7.7% 15.4% 20.8% 8.3% 29.2% 11 13.1 0.6 13.8
EYE & ORBIT 10 6 0.0% 0.0% 0.0% 0.0% 0.0% 0.0% (4) 0.0 0.0 0.0 BRAIN & OTHER NERVOUS SYSTEM
22 9 0.0% 0.0% 0.0% 0.0% 0.0% 0.0% (13) 0.0 0.0 0.0
ENDOCRINE SYSTEM
29 31 7.1% 10.7% 17.9% 19.4% 0.0% 19.4% 2 12.2 (10.7) 1.5
Thyroid 23 30 8.7% 13.0% 21.7% 20.0% 0.0% 20.0% 7 11.3 (13.0) (1.7) LYMPHOMA 35 25 6.3% 31.3% 37.5% 16.7% 25.0% 41.7% (10) 10.4 (6.3) 4.2

241 Community Health Needs Assessment RWJ Barnabas Health: Clara Maass Medical Center
Cases (both analytic
and non-analytic)
2015 2016 2015 - 2016
Primary Site
2015 2016
% Stage
III
% Stage
IV
Total %
Stage III & IV
% Stage
III
% Stage
IV
Total %
Stage III & IV
Change in Case Volume
Change in %
points for
Stage III
Change in %
points for
Stage IV
Change in %
points for
Stage III & IV
Select Lymphoma:
Hodgkin Lymphoma
7 4 14.3% 14.3% 28.6% 0.0% 0.0% 0.0% (3) (14.3) (14.3) (28.6)
Non-Hodgkin Lymphoma
28 21 4.0% 36.0% 40.0% 20.0% 30.0% 50.0% (7) 16.0 (6.0) 10.0
MYELOMA 9 5 0.0% 0.0% 0.0% 0.0% 0.0% 0.0% (4) 0.0 0.0 0.0 LEUKEMIA 14 21 0.0% 0.0% 0.0% 0.0% 0.0% 0.0% 7 0.0 0.0 0.0 MESOTHELIOMA
0 3 0.0% 0.0% 0.0% 0.0% 66.7% 66.7% 3 0.0 66.7 66.7
KAPOSI SARCOMA
0 1 0.0% 0.0% 0.0% 0.0% 0.0% 0.0% 1 0.0 0.0 0.0
MISCELLANEOUS
26 18 0.0% 0.0% 0.0% 0.0% 0.0% 0.0% (8) 0.0 0.0 0.0
Total 73
3 614 14.1% 18.6% 32.8% 11.9% 15.1% 27.0% (119) (2.2) (3.5) (5.8)
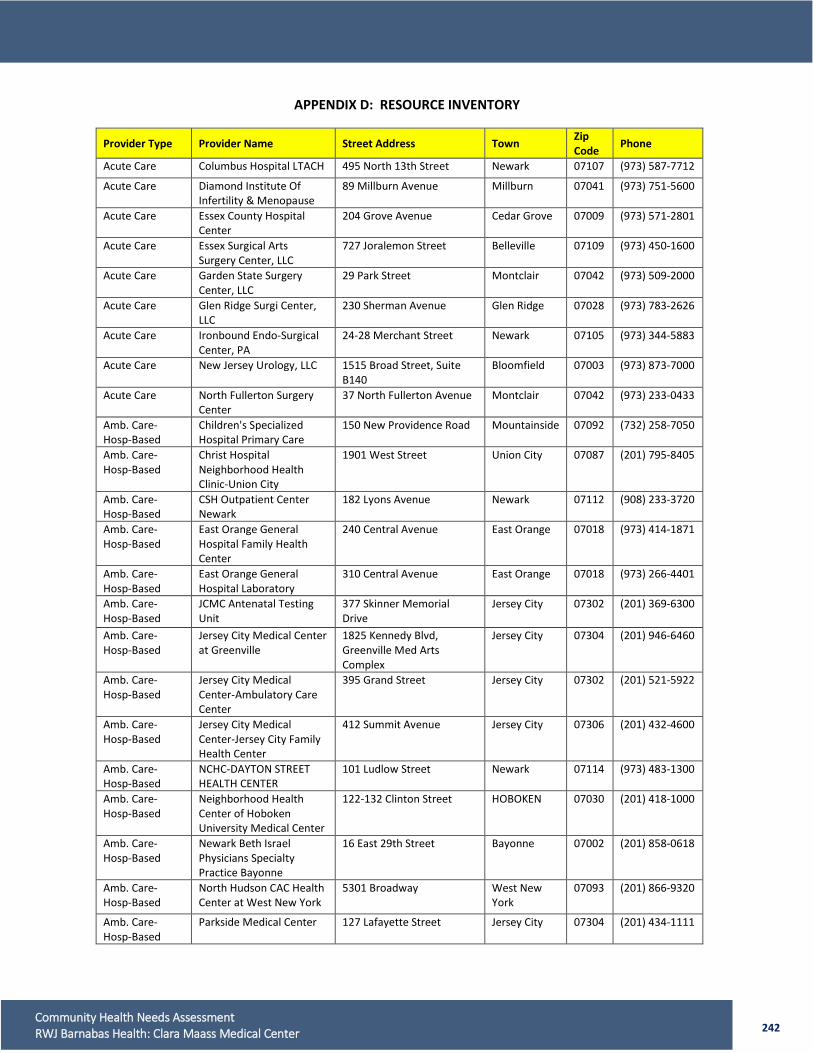
242 Community Health Needs Assessment RWJ Barnabas Health: Clara Maass Medical Center
APPENDIX D: RESOURCE INVENTORY
Provider Type Provider Name Street Address Town Zip Code Phone
Acute Care Columbus Hospital LTACH 495 North 13th Street Newark 07107 (973) 587-7712
Acute Care Diamond Institute Of Infertility & Menopause
89 Millburn Avenue Millburn 07041 (973) 751-5600
Acute Care Essex County Hospital Center
204 Grove Avenue Cedar Grove 07009 (973) 571-2801
Acute Care Essex Surgical Arts Surgery Center, LLC
727 Joralemon Street Belleville 07109 (973) 450-1600
Acute Care Garden State Surgery Center, LLC
29 Park Street Montclair 07042 (973) 509-2000
Acute Care Glen Ridge Surgi Center, LLC
230 Sherman Avenue Glen Ridge 07028 (973) 783-2626
Acute Care Ironbound Endo-Surgical Center, PA
24-28 Merchant Street Newark 07105 (973) 344-5883
Acute Care New Jersey Urology, LLC 1515 Broad Street, Suite B140
Bloomfield 07003 (973) 873-7000
Acute Care North Fullerton Surgery Center
37 North Fullerton Avenue Montclair 07042 (973) 233-0433
Amb. Care-Hosp-Based
Children's Specialized Hospital Primary Care
150 New Providence Road Mountainside 07092 (732) 258-7050
Amb. Care-Hosp-Based
Christ Hospital Neighborhood Health Clinic-Union City
1901 West Street Union City 07087 (201) 795-8405
Amb. Care-Hosp-Based
CSH Outpatient Center Newark
182 Lyons Avenue Newark 07112 (908) 233-3720
Amb. Care-Hosp-Based
East Orange General Hospital Family Health Center
240 Central Avenue East Orange 07018 (973) 414-1871
Amb. Care-Hosp-Based
East Orange General Hospital Laboratory
310 Central Avenue East Orange 07018 (973) 266-4401
Amb. Care-Hosp-Based
JCMC Antenatal Testing Unit
377 Skinner Memorial Drive
Jersey City 07302 (201) 369-6300
Amb. Care-Hosp-Based
Jersey City Medical Center at Greenville
1825 Kennedy Blvd, Greenville Med Arts Complex
Jersey City 07304 (201) 946-6460
Amb. Care-Hosp-Based
Jersey City Medical Center-Ambulatory Care Center
395 Grand Street Jersey City 07302 (201) 521-5922
Amb. Care-Hosp-Based
Jersey City Medical Center-Jersey City Family Health Center
412 Summit Avenue Jersey City 07306 (201) 432-4600
Amb. Care-Hosp-Based
NCHC-DAYTON STREET HEALTH CENTER
101 Ludlow Street Newark 07114 (973) 483-1300
Amb. Care-Hosp-Based
Neighborhood Health Center of Hoboken University Medical Center
122-132 Clinton Street HOBOKEN 07030 (201) 418-1000
Amb. Care-Hosp-Based
Newark Beth Israel Physicians Specialty Practice Bayonne
16 East 29th Street Bayonne 07002 (201) 858-0618
Amb. Care-Hosp-Based
North Hudson CAC Health Center at West New York
5301 Broadway West New York
07093 (201) 866-9320
Amb. Care-Hosp-Based
Parkside Medical Center 127 Lafayette Street Jersey City 07304 (201) 434-1111
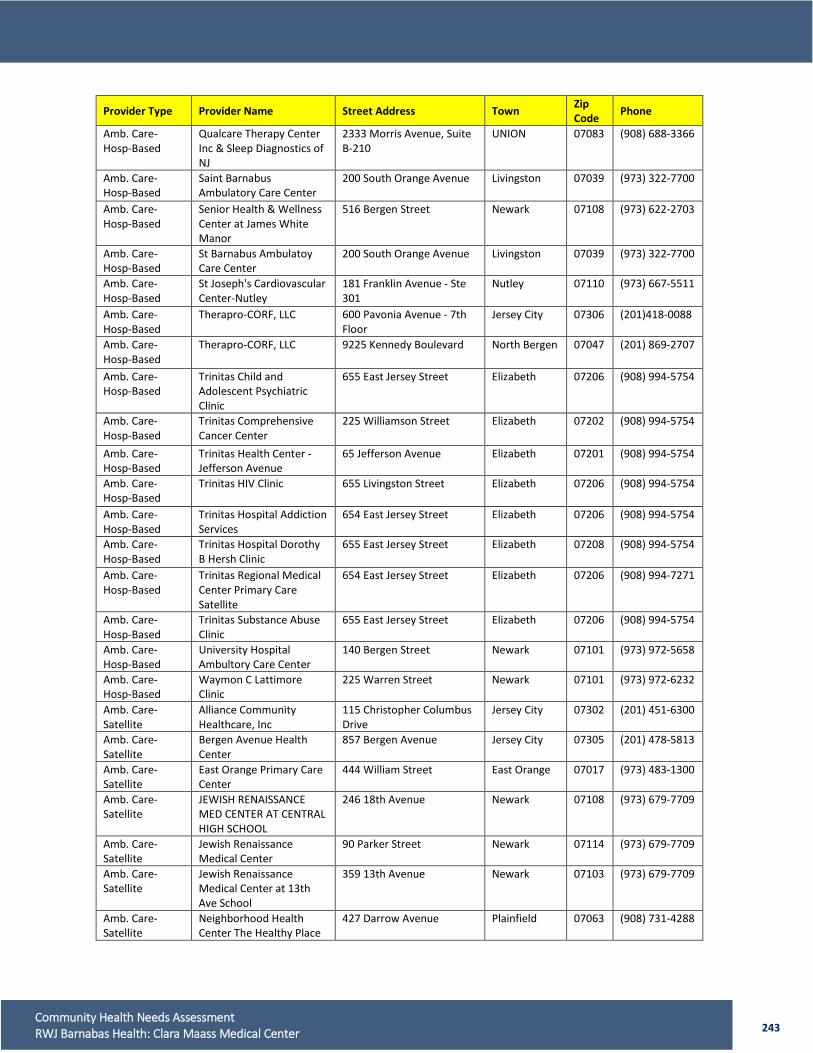
243 Community Health Needs Assessment RWJ Barnabas Health: Clara Maass Medical Center
Provider Type Provider Name Street Address Town Zip Code Phone
Amb. Care-Hosp-Based
Qualcare Therapy Center Inc & Sleep Diagnostics of NJ
2333 Morris Avenue, Suite B-210
UNION 07083 (908) 688-3366
Amb. Care-Hosp-Based
Saint Barnabus Ambulatory Care Center
200 South Orange Avenue Livingston 07039 (973) 322-7700
Amb. Care-Hosp-Based
Senior Health & Wellness Center at James White Manor
516 Bergen Street Newark 07108 (973) 622-2703
Amb. Care-Hosp-Based
St Barnabus Ambulatoy Care Center
200 South Orange Avenue Livingston 07039 (973) 322-7700
Amb. Care-Hosp-Based
St Joseph's Cardiovascular Center-Nutley
181 Franklin Avenue - Ste 301
Nutley 07110 (973) 667-5511
Amb. Care-Hosp-Based
Therapro-CORF, LLC 600 Pavonia Avenue - 7th Floor
Jersey City 07306 (201)418-0088
Amb. Care-Hosp-Based
Therapro-CORF, LLC 9225 Kennedy Boulevard North Bergen 07047 (201) 869-2707
Amb. Care-Hosp-Based
Trinitas Child and Adolescent Psychiatric Clinic
655 East Jersey Street Elizabeth 07206 (908) 994-5754
Amb. Care-Hosp-Based
Trinitas Comprehensive Cancer Center
225 Williamson Street Elizabeth 07202 (908) 994-5754
Amb. Care-Hosp-Based
Trinitas Health Center - Jefferson Avenue
65 Jefferson Avenue Elizabeth 07201 (908) 994-5754
Amb. Care-Hosp-Based
Trinitas HIV Clinic 655 Livingston Street Elizabeth 07206 (908) 994-5754
Amb. Care-Hosp-Based
Trinitas Hospital Addiction Services
654 East Jersey Street Elizabeth 07206 (908) 994-5754
Amb. Care-Hosp-Based
Trinitas Hospital Dorothy B Hersh Clinic
655 East Jersey Street Elizabeth 07208 (908) 994-5754
Amb. Care-Hosp-Based
Trinitas Regional Medical Center Primary Care Satellite
654 East Jersey Street Elizabeth 07206 (908) 994-7271
Amb. Care-Hosp-Based
Trinitas Substance Abuse Clinic
655 East Jersey Street Elizabeth 07206 (908) 994-5754
Amb. Care-Hosp-Based
University Hospital Ambultory Care Center
140 Bergen Street Newark 07101 (973) 972-5658
Amb. Care-Hosp-Based
Waymon C Lattimore Clinic
225 Warren Street Newark 07101 (973) 972-6232
Amb. Care-Satellite
Alliance Community Healthcare, Inc
115 Christopher Columbus Drive
Jersey City 07302 (201) 451-6300
Amb. Care-Satellite
Bergen Avenue Health Center
857 Bergen Avenue Jersey City 07305 (201) 478-5813
Amb. Care-Satellite
East Orange Primary Care Center
444 William Street East Orange 07017 (973) 483-1300
Amb. Care-Satellite
JEWISH RENAISSANCE MED CENTER AT CENTRAL HIGH SCHOOL
246 18th Avenue Newark 07108 (973) 679-7709
Amb. Care-Satellite
Jewish Renaissance Medical Center
90 Parker Street Newark 07114 (973) 679-7709
Amb. Care-Satellite
Jewish Renaissance Medical Center at 13th Ave School
359 13th Avenue Newark 07103 (973) 679-7709
Amb. Care-Satellite
Neighborhood Health Center The Healthy Place
427 Darrow Avenue Plainfield 07063 (908) 731-4288
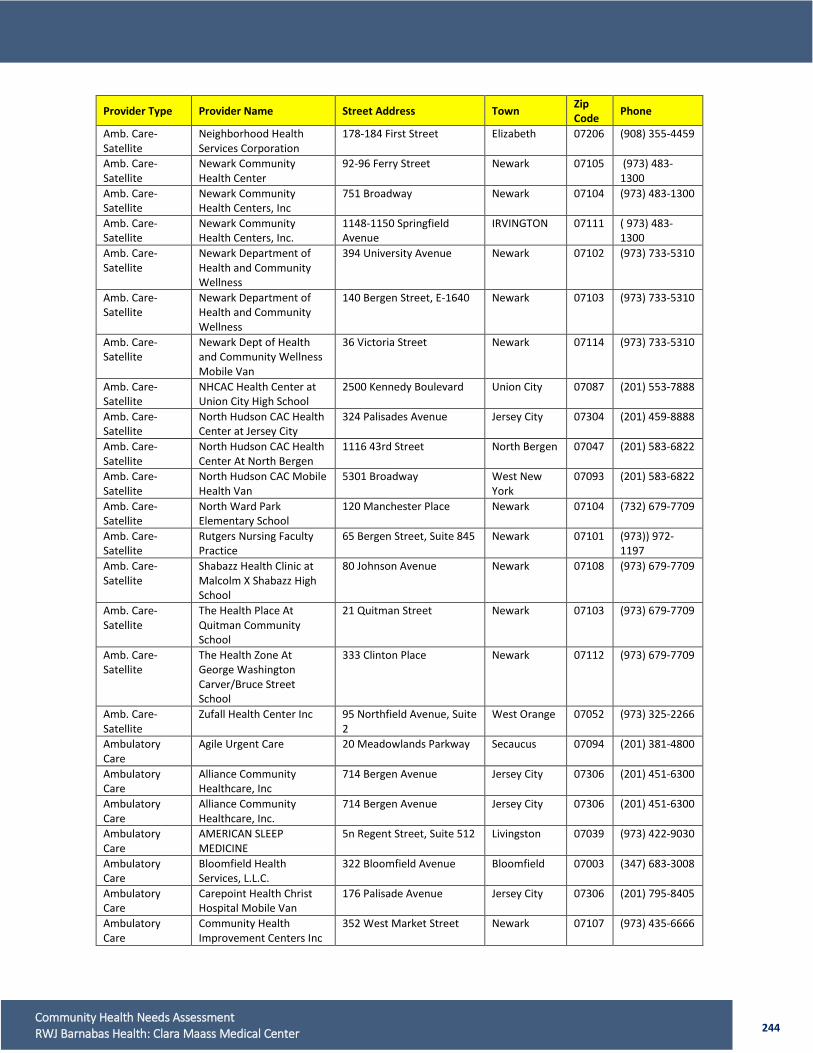
244 Community Health Needs Assessment RWJ Barnabas Health: Clara Maass Medical Center
Provider Type Provider Name Street Address Town Zip Code Phone
Amb. Care-Satellite
Neighborhood Health Services Corporation
178-184 First Street Elizabeth 07206 (908) 355-4459
Amb. Care-Satellite
Newark Community Health Center
92-96 Ferry Street Newark 07105 (973) 483-1300
Amb. Care-Satellite
Newark Community Health Centers, Inc
751 Broadway Newark 07104 (973) 483-1300
Amb. Care-Satellite
Newark Community Health Centers, Inc.
1148-1150 Springfield Avenue
IRVINGTON 07111 ( 973) 483-1300
Amb. Care-Satellite
Newark Department of Health and Community Wellness
394 University Avenue Newark 07102 (973) 733-5310
Amb. Care-Satellite
Newark Department of Health and Community Wellness
140 Bergen Street, E-1640 Newark 07103 (973) 733-5310
Amb. Care-Satellite
Newark Dept of Health and Community Wellness Mobile Van
36 Victoria Street Newark 07114 (973) 733-5310
Amb. Care-Satellite
NHCAC Health Center at Union City High School
2500 Kennedy Boulevard Union City 07087 (201) 553-7888
Amb. Care-Satellite
North Hudson CAC Health Center at Jersey City
324 Palisades Avenue Jersey City 07304 (201) 459-8888
Amb. Care-Satellite
North Hudson CAC Health Center At North Bergen
1116 43rd Street North Bergen 07047 (201) 583-6822
Amb. Care-Satellite
North Hudson CAC Mobile Health Van
5301 Broadway West New York
07093 (201) 583-6822
Amb. Care-Satellite
North Ward Park Elementary School
120 Manchester Place Newark 07104 (732) 679-7709
Amb. Care-Satellite
Rutgers Nursing Faculty Practice
65 Bergen Street, Suite 845 Newark 07101 (973)) 972-1197
Amb. Care-Satellite
Shabazz Health Clinic at Malcolm X Shabazz High School
80 Johnson Avenue Newark 07108 (973) 679-7709
Amb. Care-Satellite
The Health Place At Quitman Community School
21 Quitman Street Newark 07103 (973) 679-7709
Amb. Care-Satellite
The Health Zone At George Washington Carver/Bruce Street School
333 Clinton Place Newark 07112 (973) 679-7709
Amb. Care-Satellite
Zufall Health Center Inc 95 Northfield Avenue, Suite 2
West Orange 07052 (973) 325-2266
Ambulatory Care
Agile Urgent Care 20 Meadowlands Parkway Secaucus 07094 (201) 381-4800
Ambulatory Care
Alliance Community Healthcare, Inc
714 Bergen Avenue Jersey City 07306 (201) 451-6300
Ambulatory Care
Alliance Community Healthcare, Inc.
714 Bergen Avenue Jersey City 07306 (201) 451-6300
Ambulatory Care
AMERICAN SLEEP MEDICINE
5n Regent Street, Suite 512 Livingston 07039 (973) 422-9030
Ambulatory Care
Bloomfield Health Services, L.L.C.
322 Bloomfield Avenue Bloomfield 07003 (347) 683-3008
Ambulatory Care
Carepoint Health Christ Hospital Mobile Van
176 Palisade Avenue Jersey City 07306 (201) 795-8405
Ambulatory Care
Community Health Improvement Centers Inc
352 West Market Street Newark 07107 (973) 435-6666
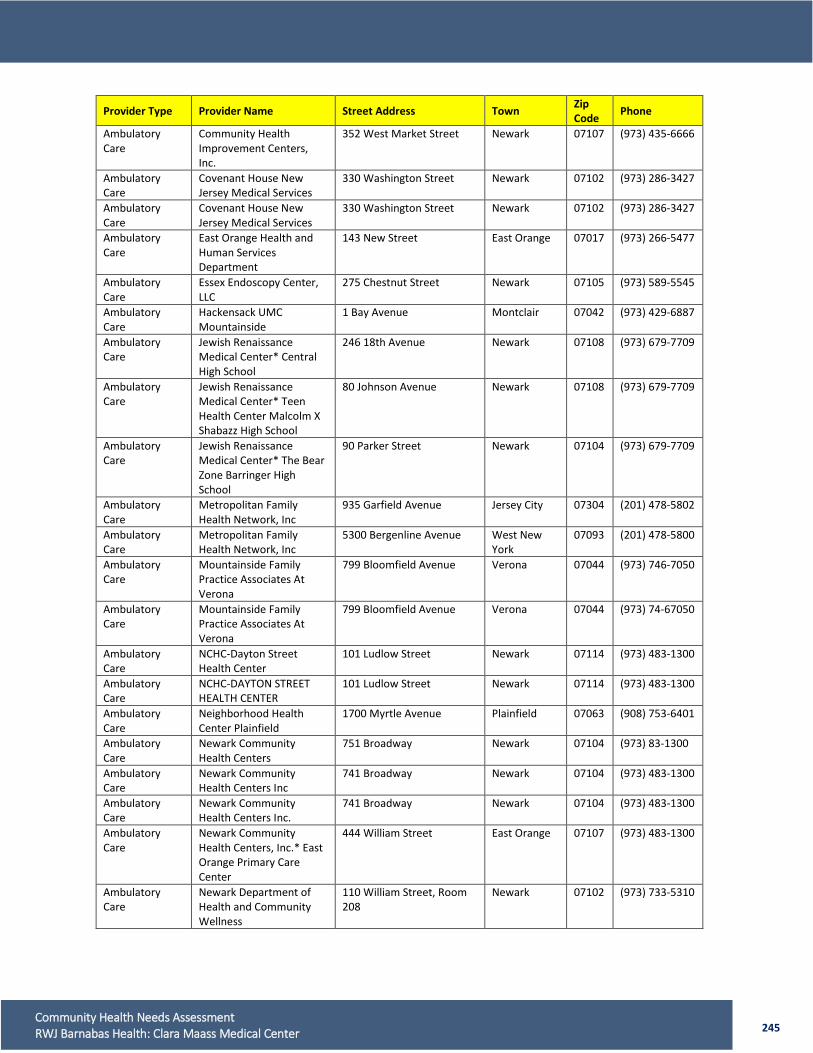
245 Community Health Needs Assessment RWJ Barnabas Health: Clara Maass Medical Center
Provider Type Provider Name Street Address Town Zip Code Phone
Ambulatory Care
Community Health Improvement Centers, Inc.
352 West Market Street Newark 07107 (973) 435-6666
Ambulatory Care
Covenant House New Jersey Medical Services
330 Washington Street Newark 07102 (973) 286-3427
Ambulatory Care
Covenant House New Jersey Medical Services
330 Washington Street Newark 07102 (973) 286-3427
Ambulatory Care
East Orange Health and Human Services Department
143 New Street East Orange 07017 (973) 266-5477
Ambulatory Care
Essex Endoscopy Center, LLC
275 Chestnut Street Newark 07105 (973) 589-5545
Ambulatory Care
Hackensack UMC Mountainside
1 Bay Avenue Montclair 07042 (973) 429-6887
Ambulatory Care
Jewish Renaissance Medical Center* Central High School
246 18th Avenue Newark 07108 (973) 679-7709
Ambulatory Care
Jewish Renaissance Medical Center* Teen Health Center Malcolm X Shabazz High School
80 Johnson Avenue Newark 07108 (973) 679-7709
Ambulatory Care
Jewish Renaissance Medical Center* The Bear Zone Barringer High School
90 Parker Street Newark 07104 (973) 679-7709
Ambulatory Care
Metropolitan Family Health Network, Inc
935 Garfield Avenue Jersey City 07304 (201) 478-5802
Ambulatory Care
Metropolitan Family Health Network, Inc
5300 Bergenline Avenue West New York
07093 (201) 478-5800
Ambulatory Care
Mountainside Family Practice Associates At Verona
799 Bloomfield Avenue Verona 07044 (973) 746-7050
Ambulatory Care
Mountainside Family Practice Associates At Verona
799 Bloomfield Avenue Verona 07044 (973) 74-67050
Ambulatory Care
NCHC-Dayton Street Health Center
101 Ludlow Street Newark 07114 (973) 483-1300
Ambulatory Care
NCHC-DAYTON STREET HEALTH CENTER
101 Ludlow Street Newark 07114 (973) 483-1300
Ambulatory Care
Neighborhood Health Center Plainfield
1700 Myrtle Avenue Plainfield 07063 (908) 753-6401
Ambulatory Care
Newark Community Health Centers
751 Broadway Newark 07104 (973) 83-1300
Ambulatory Care
Newark Community Health Centers Inc
741 Broadway Newark 07104 (973) 483-1300
Ambulatory Care
Newark Community Health Centers Inc.
741 Broadway Newark 07104 (973) 483-1300
Ambulatory Care
Newark Community Health Centers, Inc.* East Orange Primary Care Center
444 William Street East Orange 07107 (973) 483-1300
Ambulatory Care
Newark Department of Health and Community Wellness
110 William Street, Room 208
Newark 07102 (973) 733-5310
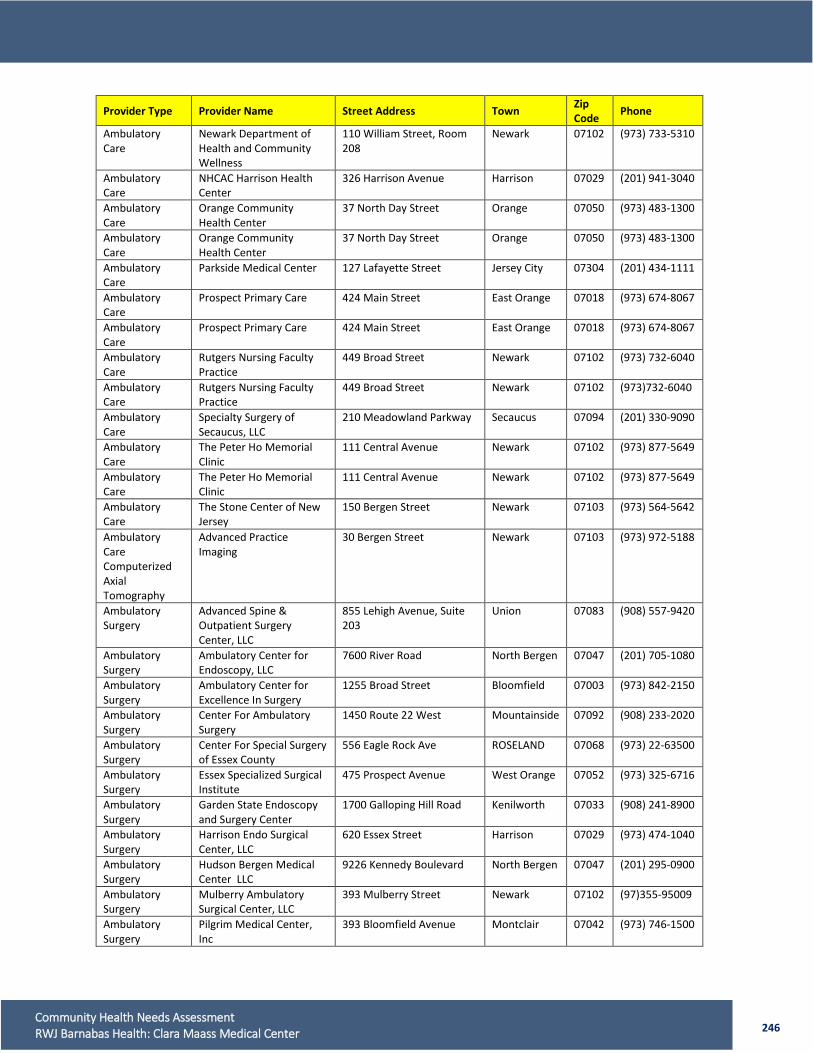
246 Community Health Needs Assessment RWJ Barnabas Health: Clara Maass Medical Center
Provider Type Provider Name Street Address Town Zip Code Phone
Ambulatory Care
Newark Department of Health and Community Wellness
110 William Street, Room 208
Newark 07102 (973) 733-5310
Ambulatory Care
NHCAC Harrison Health Center
326 Harrison Avenue Harrison 07029 (201) 941-3040
Ambulatory Care
Orange Community Health Center
37 North Day Street Orange 07050 (973) 483-1300
Ambulatory Care
Orange Community Health Center
37 North Day Street Orange 07050 (973) 483-1300
Ambulatory Care
Parkside Medical Center 127 Lafayette Street Jersey City 07304 (201) 434-1111
Ambulatory Care
Prospect Primary Care 424 Main Street East Orange 07018 (973) 674-8067
Ambulatory Care
Prospect Primary Care 424 Main Street East Orange 07018 (973) 674-8067
Ambulatory Care
Rutgers Nursing Faculty Practice
449 Broad Street Newark 07102 (973) 732-6040
Ambulatory Care
Rutgers Nursing Faculty Practice
449 Broad Street Newark 07102 (973)732-6040
Ambulatory Care
Specialty Surgery of Secaucus, LLC
210 Meadowland Parkway Secaucus 07094 (201) 330-9090
Ambulatory Care
The Peter Ho Memorial Clinic
111 Central Avenue Newark 07102 (973) 877-5649
Ambulatory Care
The Peter Ho Memorial Clinic
111 Central Avenue Newark 07102 (973) 877-5649
Ambulatory Care
The Stone Center of New Jersey
150 Bergen Street Newark 07103 (973) 564-5642
Ambulatory Care Computerized Axial Tomography
Advanced Practice Imaging
30 Bergen Street Newark 07103 (973) 972-5188
Ambulatory Surgery
Advanced Spine & Outpatient Surgery Center, LLC
855 Lehigh Avenue, Suite 203
Union 07083 (908) 557-9420
Ambulatory Surgery
Ambulatory Center for Endoscopy, LLC
7600 River Road North Bergen 07047 (201) 705-1080
Ambulatory Surgery
Ambulatory Center for Excellence In Surgery
1255 Broad Street Bloomfield 07003 (973) 842-2150
Ambulatory Surgery
Center For Ambulatory Surgery
1450 Route 22 West Mountainside 07092 (908) 233-2020
Ambulatory Surgery
Center For Special Surgery of Essex County
556 Eagle Rock Ave ROSELAND 07068 (973) 22-63500
Ambulatory Surgery
Essex Specialized Surgical Institute
475 Prospect Avenue West Orange 07052 (973) 325-6716
Ambulatory Surgery
Garden State Endoscopy and Surgery Center
1700 Galloping Hill Road Kenilworth 07033 (908) 241-8900
Ambulatory Surgery
Harrison Endo Surgical Center, LLC
620 Essex Street Harrison 07029 (973) 474-1040
Ambulatory Surgery
Hudson Bergen Medical Center LLC
9226 Kennedy Boulevard North Bergen 07047 (201) 295-0900
Ambulatory Surgery
Mulberry Ambulatory Surgical Center, LLC
393 Mulberry Street Newark 07102 (97)355-95009
Ambulatory Surgery
Pilgrim Medical Center, Inc
393 Bloomfield Avenue Montclair 07042 (973) 746-1500
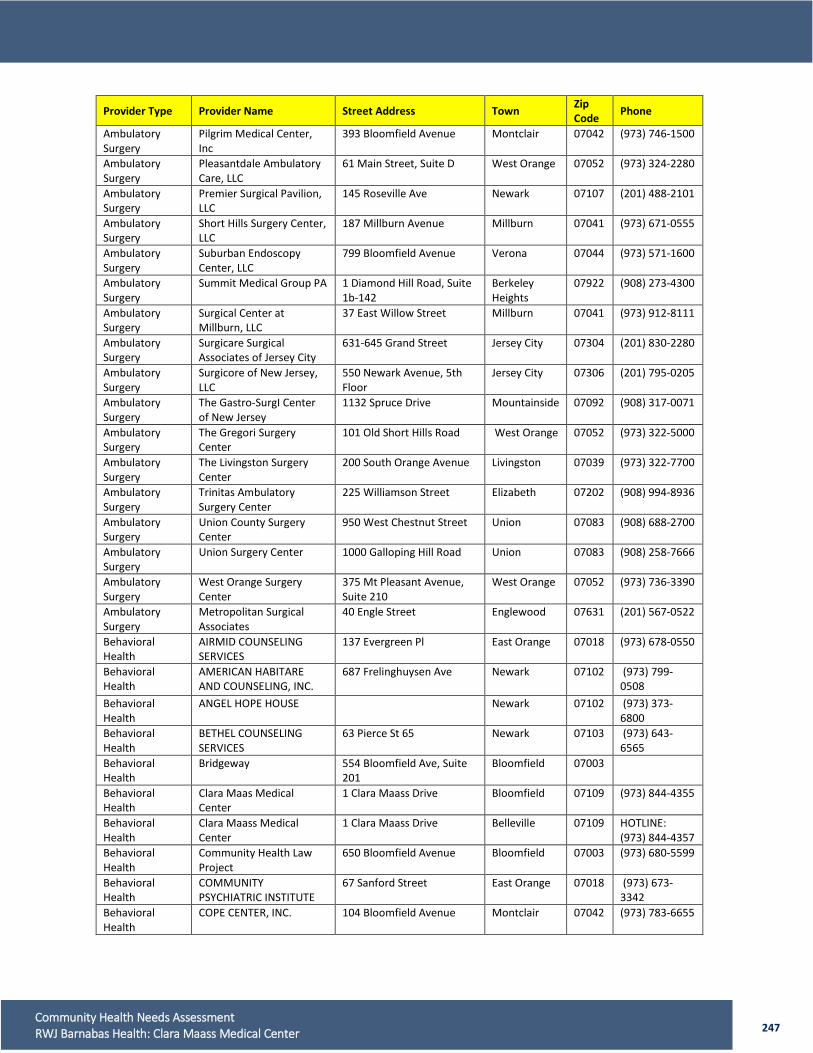
247 Community Health Needs Assessment RWJ Barnabas Health: Clara Maass Medical Center
Provider Type Provider Name Street Address Town Zip Code Phone
Ambulatory Surgery
Pilgrim Medical Center, Inc
393 Bloomfield Avenue Montclair 07042 (973) 746-1500
Ambulatory Surgery
Pleasantdale Ambulatory Care, LLC
61 Main Street, Suite D West Orange 07052 (973) 324-2280
Ambulatory Surgery
Premier Surgical Pavilion, LLC
145 Roseville Ave Newark 07107 (201) 488-2101
Ambulatory Surgery
Short Hills Surgery Center, LLC
187 Millburn Avenue Millburn 07041 (973) 671-0555
Ambulatory Surgery
Suburban Endoscopy Center, LLC
799 Bloomfield Avenue Verona 07044 (973) 571-1600
Ambulatory Surgery
Summit Medical Group PA 1 Diamond Hill Road, Suite 1b-142
Berkeley Heights
07922 (908) 273-4300
Ambulatory Surgery
Surgical Center at Millburn, LLC
37 East Willow Street Millburn 07041 (973) 912-8111
Ambulatory Surgery
Surgicare Surgical Associates of Jersey City
631-645 Grand Street Jersey City 07304 (201) 830-2280
Ambulatory Surgery
Surgicore of New Jersey, LLC
550 Newark Avenue, 5th Floor
Jersey City 07306 (201) 795-0205
Ambulatory Surgery
The Gastro-SurgI Center of New Jersey
1132 Spruce Drive Mountainside 07092 (908) 317-0071
Ambulatory Surgery
The Gregori Surgery Center
101 Old Short Hills Road West Orange 07052 (973) 322-5000
Ambulatory Surgery
The Livingston Surgery Center
200 South Orange Avenue Livingston 07039 (973) 322-7700
Ambulatory Surgery
Trinitas Ambulatory Surgery Center
225 Williamson Street Elizabeth 07202 (908) 994-8936
Ambulatory Surgery
Union County Surgery Center
950 West Chestnut Street Union 07083 (908) 688-2700
Ambulatory Surgery
Union Surgery Center 1000 Galloping Hill Road Union 07083 (908) 258-7666
Ambulatory Surgery
West Orange Surgery Center
375 Mt Pleasant Avenue, Suite 210
West Orange 07052 (973) 736-3390
Ambulatory Surgery
Metropolitan Surgical Associates
40 Engle Street Englewood 07631 (201) 567-0522
Behavioral Health
AIRMID COUNSELING SERVICES
137 Evergreen Pl East Orange 07018 (973) 678-0550
Behavioral Health
AMERICAN HABITARE AND COUNSELING, INC.
687 Frelinghuysen Ave Newark 07102 (973) 799-0508
Behavioral Health
ANGEL HOPE HOUSE
Newark 07102 (973) 373-6800
Behavioral Health
BETHEL COUNSELING SERVICES
63 Pierce St 65 Newark 07103 (973) 643-6565
Behavioral Health
Bridgeway 554 Bloomfield Ave, Suite 201
Bloomfield 07003
Behavioral Health
Clara Maas Medical Center
1 Clara Maass Drive Bloomfield 07109 (973) 844-4355
Behavioral Health
Clara Maass Medical Center
1 Clara Maass Drive Belleville 07109 HOTLINE: (973) 844-4357
Behavioral Health
Community Health Law Project
650 Bloomfield Avenue Bloomfield 07003 (973) 680-5599
Behavioral Health
COMMUNITY PSYCHIATRIC INSTITUTE
67 Sanford Street East Orange 07018 (973) 673-3342
Behavioral Health
COPE CENTER, INC. 104 Bloomfield Avenue Montclair 07042 (973) 783-6655
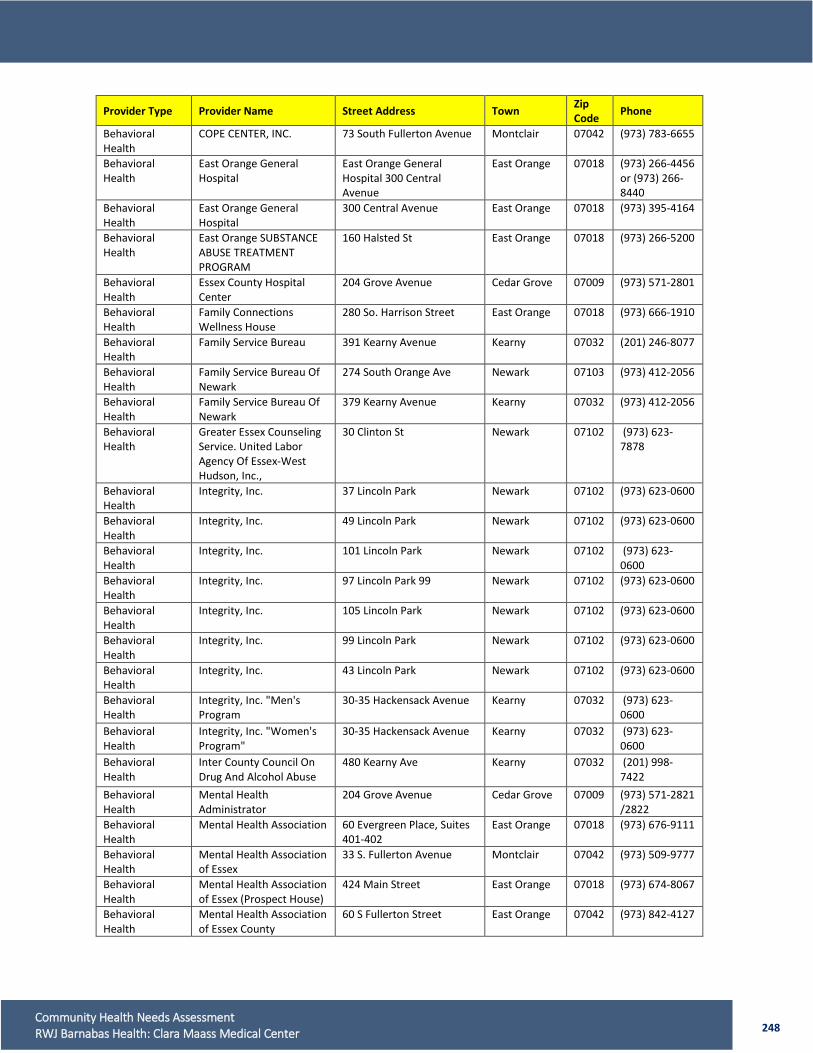
248 Community Health Needs Assessment RWJ Barnabas Health: Clara Maass Medical Center
Provider Type Provider Name Street Address Town Zip Code Phone
Behavioral Health
COPE CENTER, INC. 73 South Fullerton Avenue Montclair 07042 (973) 783-6655
Behavioral Health
East Orange General Hospital
East Orange General Hospital 300 Central Avenue
East Orange 07018 (973) 266-4456 or (973) 266-8440
Behavioral Health
East Orange General Hospital
300 Central Avenue East Orange 07018 (973) 395-4164
Behavioral Health
East Orange SUBSTANCE ABUSE TREATMENT PROGRAM
160 Halsted St East Orange 07018 (973) 266-5200
Behavioral Health
Essex County Hospital Center
204 Grove Avenue Cedar Grove 07009 (973) 571-2801
Behavioral Health
Family Connections Wellness House
280 So. Harrison Street East Orange 07018 (973) 666-1910
Behavioral Health
Family Service Bureau 391 Kearny Avenue Kearny 07032 (201) 246-8077
Behavioral Health
Family Service Bureau Of Newark
274 South Orange Ave Newark 07103 (973) 412-2056
Behavioral Health
Family Service Bureau Of Newark
379 Kearny Avenue Kearny 07032 (973) 412-2056
Behavioral Health
Greater Essex Counseling Service. United Labor Agency Of Essex-West Hudson, Inc.,
30 Clinton St Newark 07102 (973) 623-7878
Behavioral Health
Integrity, Inc. 37 Lincoln Park Newark 07102 (973) 623-0600
Behavioral Health
Integrity, Inc. 49 Lincoln Park Newark 07102 (973) 623-0600
Behavioral Health
Integrity, Inc. 101 Lincoln Park Newark 07102 (973) 623-0600
Behavioral Health
Integrity, Inc. 97 Lincoln Park 99 Newark 07102 (973) 623-0600
Behavioral Health
Integrity, Inc. 105 Lincoln Park Newark 07102 (973) 623-0600
Behavioral Health
Integrity, Inc. 99 Lincoln Park Newark 07102 (973) 623-0600
Behavioral Health
Integrity, Inc. 43 Lincoln Park Newark 07102 (973) 623-0600
Behavioral Health
Integrity, Inc. "Men's Program
30-35 Hackensack Avenue Kearny 07032 (973) 623-0600
Behavioral Health
Integrity, Inc. "Women's Program"
30-35 Hackensack Avenue Kearny 07032 (973) 623-0600
Behavioral Health
Inter County Council On Drug And Alcohol Abuse
480 Kearny Ave Kearny 07032 (201) 998-7422
Behavioral Health
Mental Health Administrator
204 Grove Avenue Cedar Grove 07009 (973) 571-2821 /2822
Behavioral Health
Mental Health Association 60 Evergreen Place, Suites 401-402
East Orange 07018 (973) 676-9111
Behavioral Health
Mental Health Association of Essex
33 S. Fullerton Avenue Montclair 07042 (973) 509-9777
Behavioral Health
Mental Health Association of Essex (Prospect House)
424 Main Street East Orange 07018 (973) 674-8067
Behavioral Health
Mental Health Association of Essex County
60 S Fullerton Street East Orange 07042 (973) 842-4127
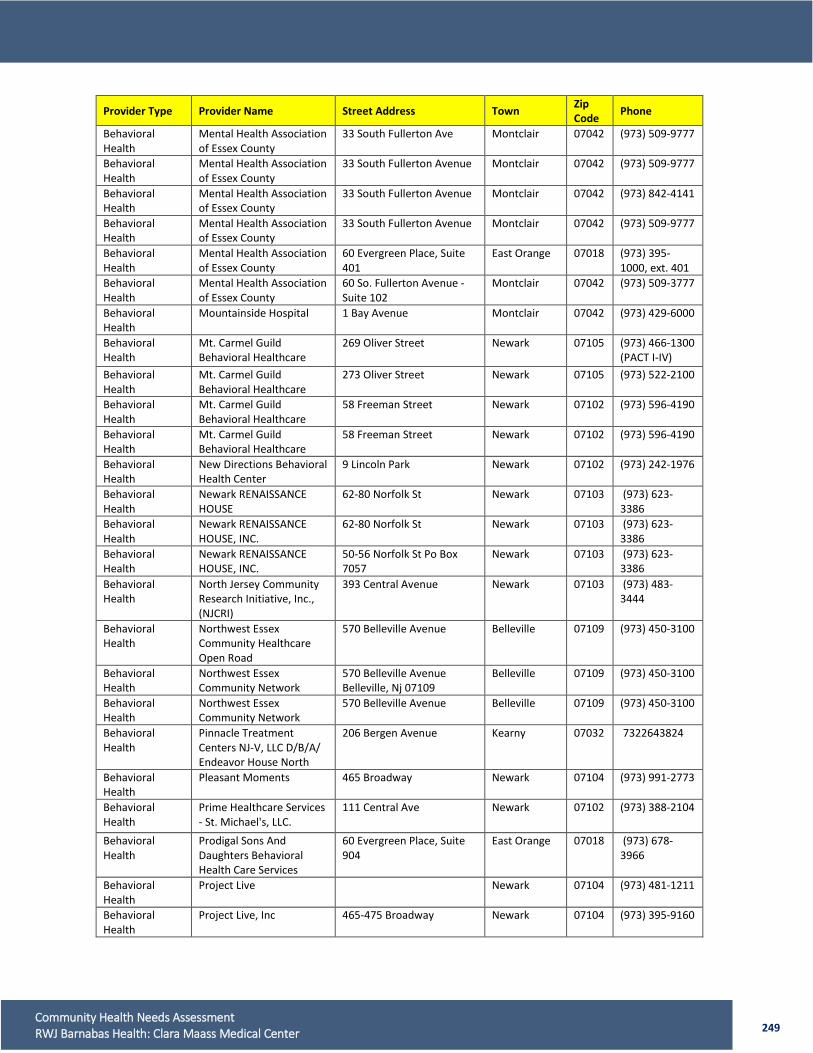
249 Community Health Needs Assessment RWJ Barnabas Health: Clara Maass Medical Center
Provider Type Provider Name Street Address Town Zip Code Phone
Behavioral Health
Mental Health Association of Essex County
33 South Fullerton Ave Montclair 07042 (973) 509-9777
Behavioral Health
Mental Health Association of Essex County
33 South Fullerton Avenue Montclair 07042 (973) 509-9777
Behavioral Health
Mental Health Association of Essex County
33 South Fullerton Avenue Montclair 07042 (973) 842-4141
Behavioral Health
Mental Health Association of Essex County
33 South Fullerton Avenue Montclair 07042 (973) 509-9777
Behavioral Health
Mental Health Association of Essex County
60 Evergreen Place, Suite 401
East Orange 07018 (973) 395-1000, ext. 401
Behavioral Health
Mental Health Association of Essex County
60 So. Fullerton Avenue - Suite 102
Montclair 07042 (973) 509-3777
Behavioral Health
Mountainside Hospital 1 Bay Avenue Montclair 07042 (973) 429-6000
Behavioral Health
Mt. Carmel Guild Behavioral Healthcare
269 Oliver Street Newark 07105 (973) 466-1300 (PACT I-IV)
Behavioral Health
Mt. Carmel Guild Behavioral Healthcare
273 Oliver Street Newark 07105 (973) 522-2100
Behavioral Health
Mt. Carmel Guild Behavioral Healthcare
58 Freeman Street Newark 07102 (973) 596-4190
Behavioral Health
Mt. Carmel Guild Behavioral Healthcare
58 Freeman Street Newark 07102 (973) 596-4190
Behavioral Health
New Directions Behavioral Health Center
9 Lincoln Park Newark 07102 (973) 242-1976
Behavioral Health
Newark RENAISSANCE HOUSE
62-80 Norfolk St Newark 07103 (973) 623-3386
Behavioral Health
Newark RENAISSANCE HOUSE, INC.
62-80 Norfolk St Newark 07103 (973) 623-3386
Behavioral Health
Newark RENAISSANCE HOUSE, INC.
50-56 Norfolk St Po Box 7057
Newark 07103 (973) 623-3386
Behavioral Health
North Jersey Community Research Initiative, Inc., (NJCRI)
393 Central Avenue Newark 07103 (973) 483-3444
Behavioral Health
Northwest Essex Community Healthcare Open Road
570 Belleville Avenue Belleville 07109 (973) 450-3100
Behavioral Health
Northwest Essex Community Network
570 Belleville Avenue Belleville, Nj 07109
Belleville 07109 (973) 450-3100
Behavioral Health
Northwest Essex Community Network
570 Belleville Avenue Belleville 07109 (973) 450-3100
Behavioral Health
Pinnacle Treatment Centers NJ-V, LLC D/B/A/ Endeavor House North
206 Bergen Avenue Kearny 07032 7322643824
Behavioral Health
Pleasant Moments 465 Broadway Newark 07104 (973) 991-2773
Behavioral Health
Prime Healthcare Services - St. Michael's, LLC.
111 Central Ave Newark 07102 (973) 388-2104
Behavioral Health
Prodigal Sons And Daughters Behavioral Health Care Services
60 Evergreen Place, Suite 904
East Orange 07018 (973) 678-3966
Behavioral Health
Project Live
Newark 07104 (973) 481-1211
Behavioral Health
Project Live, Inc 465-475 Broadway Newark 07104 (973) 395-9160
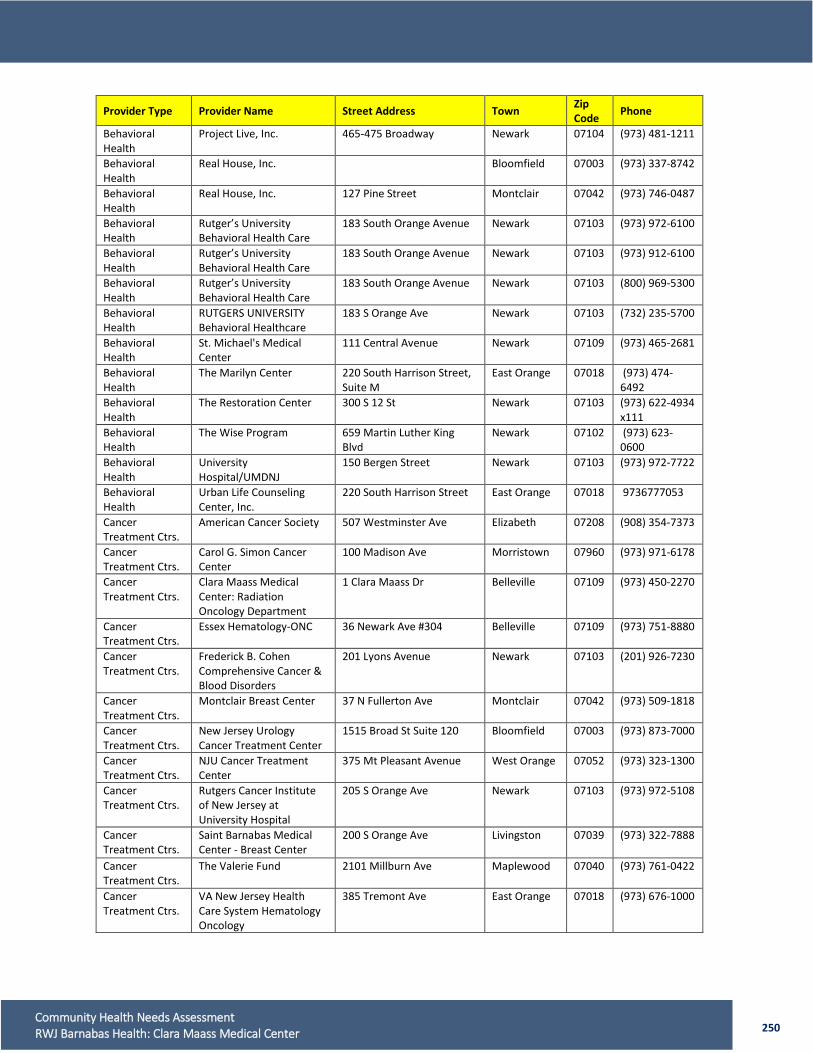
250 Community Health Needs Assessment RWJ Barnabas Health: Clara Maass Medical Center
Provider Type Provider Name Street Address Town Zip Code Phone
Behavioral Health
Project Live, Inc. 465-475 Broadway Newark 07104 (973) 481-1211
Behavioral Health
Real House, Inc.
Bloomfield 07003 (973) 337-8742
Behavioral Health
Real House, Inc. 127 Pine Street Montclair 07042 (973) 746-0487
Behavioral Health
Rutger’s University Behavioral Health Care
183 South Orange Avenue Newark 07103 (973) 972-6100
Behavioral Health
Rutger’s University Behavioral Health Care
183 South Orange Avenue Newark 07103 (973) 912-6100
Behavioral Health
Rutger’s University Behavioral Health Care
183 South Orange Avenue Newark 07103 (800) 969-5300
Behavioral Health
RUTGERS UNIVERSITY Behavioral Healthcare
183 S Orange Ave Newark 07103 (732) 235-5700
Behavioral Health
St. Michael's Medical Center
111 Central Avenue Newark 07109 (973) 465-2681
Behavioral Health
The Marilyn Center 220 South Harrison Street, Suite M
East Orange 07018 (973) 474-6492
Behavioral Health
The Restoration Center 300 S 12 St Newark 07103 (973) 622-4934 x111
Behavioral Health
The Wise Program 659 Martin Luther King Blvd
Newark 07102 (973) 623-0600
Behavioral Health
University Hospital/UMDNJ
150 Bergen Street Newark 07103 (973) 972-7722
Behavioral Health
Urban Life Counseling Center, Inc.
220 South Harrison Street East Orange 07018 9736777053
Cancer Treatment Ctrs.
American Cancer Society 507 Westminster Ave Elizabeth 07208 (908) 354-7373
Cancer Treatment Ctrs.
Carol G. Simon Cancer Center
100 Madison Ave Morristown 07960 (973) 971-6178
Cancer Treatment Ctrs.
Clara Maass Medical Center: Radiation Oncology Department
1 Clara Maass Dr Belleville 07109 (973) 450-2270
Cancer Treatment Ctrs.
Essex Hematology-ONC 36 Newark Ave #304 Belleville 07109 (973) 751-8880
Cancer Treatment Ctrs.
Frederick B. Cohen Comprehensive Cancer & Blood Disorders
201 Lyons Avenue Newark 07103 (201) 926-7230
Cancer Treatment Ctrs.
Montclair Breast Center 37 N Fullerton Ave Montclair 07042 (973) 509-1818
Cancer Treatment Ctrs.
New Jersey Urology Cancer Treatment Center
1515 Broad St Suite 120 Bloomfield 07003 (973) 873-7000
Cancer Treatment Ctrs.
NJU Cancer Treatment Center
375 Mt Pleasant Avenue West Orange 07052 (973) 323-1300
Cancer Treatment Ctrs.
Rutgers Cancer Institute of New Jersey at University Hospital
205 S Orange Ave Newark 07103 (973) 972-5108
Cancer Treatment Ctrs.
Saint Barnabas Medical Center - Breast Center
200 S Orange Ave Livingston 07039 (973) 322-7888
Cancer Treatment Ctrs.
The Valerie Fund 2101 Millburn Ave Maplewood 07040 (973) 761-0422
Cancer Treatment Ctrs.
VA New Jersey Health Care System Hematology Oncology
385 Tremont Ave East Orange 07018 (973) 676-1000
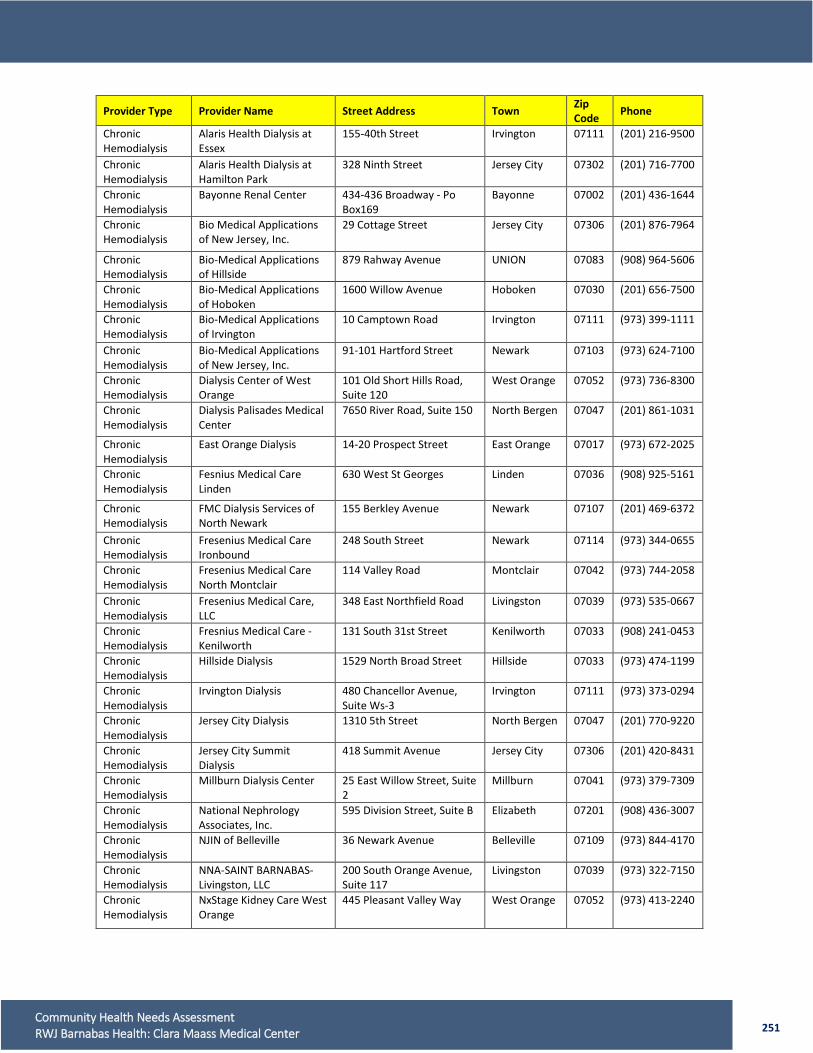
251 Community Health Needs Assessment RWJ Barnabas Health: Clara Maass Medical Center
Provider Type Provider Name Street Address Town Zip Code Phone
Chronic Hemodialysis
Alaris Health Dialysis at Essex
155-40th Street Irvington 07111 (201) 216-9500
Chronic Hemodialysis
Alaris Health Dialysis at Hamilton Park
328 Ninth Street Jersey City 07302 (201) 716-7700
Chronic Hemodialysis
Bayonne Renal Center 434-436 Broadway - Po Box169
Bayonne 07002 (201) 436-1644
Chronic Hemodialysis
Bio Medical Applications of New Jersey, Inc.
29 Cottage Street Jersey City 07306 (201) 876-7964
Chronic Hemodialysis
Bio-Medical Applications of Hillside
879 Rahway Avenue UNION 07083 (908) 964-5606
Chronic Hemodialysis
Bio-Medical Applications of Hoboken
1600 Willow Avenue Hoboken 07030 (201) 656-7500
Chronic Hemodialysis
Bio-Medical Applications of Irvington
10 Camptown Road Irvington 07111 (973) 399-1111
Chronic Hemodialysis
Bio-Medical Applications of New Jersey, Inc.
91-101 Hartford Street Newark 07103 (973) 624-7100
Chronic Hemodialysis
Dialysis Center of West Orange
101 Old Short Hills Road, Suite 120
West Orange 07052 (973) 736-8300
Chronic Hemodialysis
Dialysis Palisades Medical Center
7650 River Road, Suite 150 North Bergen 07047 (201) 861-1031
Chronic Hemodialysis
East Orange Dialysis 14-20 Prospect Street East Orange 07017 (973) 672-2025
Chronic Hemodialysis
Fesnius Medical Care Linden
630 West St Georges Linden 07036 (908) 925-5161
Chronic Hemodialysis
FMC Dialysis Services of North Newark
155 Berkley Avenue Newark 07107 (201) 469-6372
Chronic Hemodialysis
Fresenius Medical Care Ironbound
248 South Street Newark 07114 (973) 344-0655
Chronic Hemodialysis
Fresenius Medical Care North Montclair
114 Valley Road Montclair 07042 (973) 744-2058
Chronic Hemodialysis
Fresenius Medical Care, LLC
348 East Northfield Road Livingston 07039 (973) 535-0667
Chronic Hemodialysis
Fresnius Medical Care - Kenilworth
131 South 31st Street Kenilworth 07033 (908) 241-0453
Chronic Hemodialysis
Hillside Dialysis 1529 North Broad Street Hillside 07033 (973) 474-1199
Chronic Hemodialysis
Irvington Dialysis 480 Chancellor Avenue, Suite Ws-3
Irvington 07111 (973) 373-0294
Chronic Hemodialysis
Jersey City Dialysis 1310 5th Street North Bergen 07047 (201) 770-9220
Chronic Hemodialysis
Jersey City Summit Dialysis
418 Summit Avenue Jersey City 07306 (201) 420-8431
Chronic Hemodialysis
Millburn Dialysis Center 25 East Willow Street, Suite 2
Millburn 07041 (973) 379-7309
Chronic Hemodialysis
National Nephrology Associates, Inc.
595 Division Street, Suite B Elizabeth 07201 (908) 436-3007
Chronic Hemodialysis
NJIN of Belleville 36 Newark Avenue Belleville 07109 (973) 844-4170
Chronic Hemodialysis
NNA-SAINT BARNABAS-Livingston, LLC
200 South Orange Avenue, Suite 117
Livingston 07039 (973) 322-7150
Chronic Hemodialysis
NxStage Kidney Care West Orange
445 Pleasant Valley Way West Orange 07052 (973) 413-2240
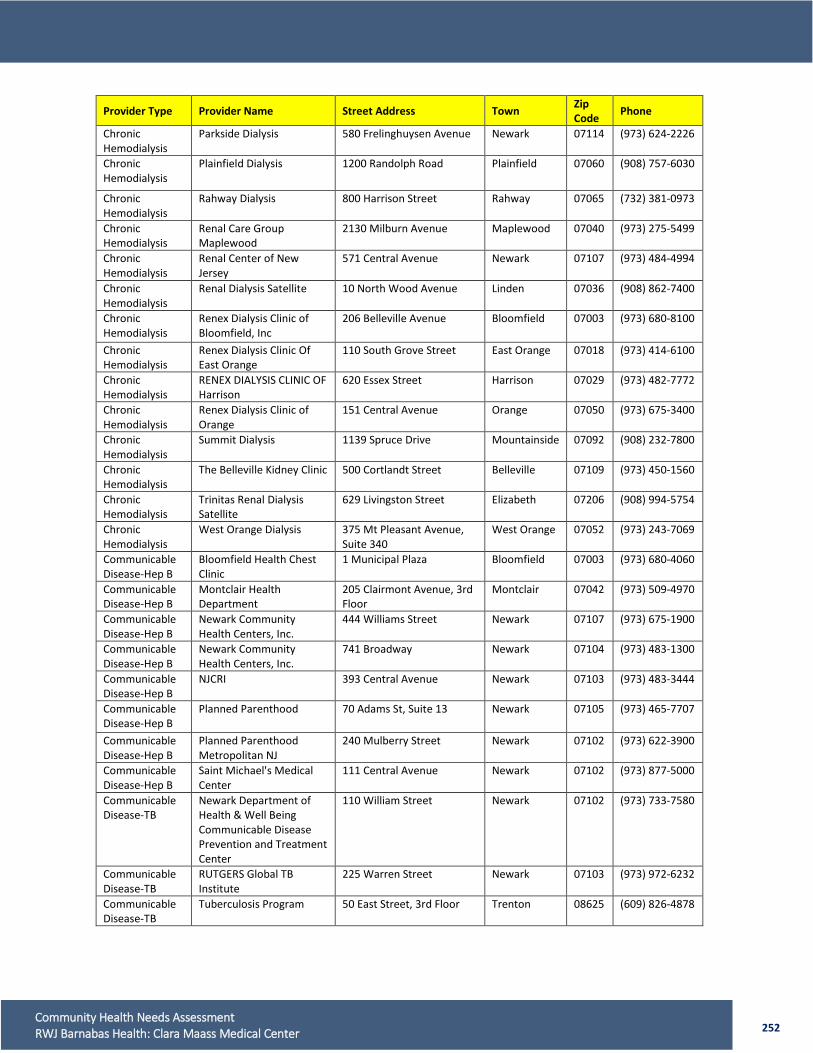
252 Community Health Needs Assessment RWJ Barnabas Health: Clara Maass Medical Center
Provider Type Provider Name Street Address Town Zip Code Phone
Chronic Hemodialysis
Parkside Dialysis 580 Frelinghuysen Avenue Newark 07114 (973) 624-2226
Chronic Hemodialysis
Plainfield Dialysis 1200 Randolph Road Plainfield 07060 (908) 757-6030
Chronic Hemodialysis
Rahway Dialysis 800 Harrison Street Rahway 07065 (732) 381-0973
Chronic Hemodialysis
Renal Care Group Maplewood
2130 Milburn Avenue Maplewood 07040 (973) 275-5499
Chronic Hemodialysis
Renal Center of New Jersey
571 Central Avenue Newark 07107 (973) 484-4994
Chronic Hemodialysis
Renal Dialysis Satellite 10 North Wood Avenue Linden 07036 (908) 862-7400
Chronic Hemodialysis
Renex Dialysis Clinic of Bloomfield, Inc
206 Belleville Avenue Bloomfield 07003 (973) 680-8100
Chronic Hemodialysis
Renex Dialysis Clinic Of East Orange
110 South Grove Street East Orange 07018 (973) 414-6100
Chronic Hemodialysis
RENEX DIALYSIS CLINIC OF Harrison
620 Essex Street Harrison 07029 (973) 482-7772
Chronic Hemodialysis
Renex Dialysis Clinic of Orange
151 Central Avenue Orange 07050 (973) 675-3400
Chronic Hemodialysis
Summit Dialysis 1139 Spruce Drive Mountainside 07092 (908) 232-7800
Chronic Hemodialysis
The Belleville Kidney Clinic 500 Cortlandt Street Belleville 07109 (973) 450-1560
Chronic Hemodialysis
Trinitas Renal Dialysis Satellite
629 Livingston Street Elizabeth 07206 (908) 994-5754
Chronic Hemodialysis
West Orange Dialysis 375 Mt Pleasant Avenue, Suite 340
West Orange 07052 (973) 243-7069
Communicable Disease-Hep B
Bloomfield Health Chest Clinic
1 Municipal Plaza Bloomfield 07003 (973) 680-4060
Communicable Disease-Hep B
Montclair Health Department
205 Clairmont Avenue, 3rd Floor
Montclair 07042 (973) 509-4970
Communicable Disease-Hep B
Newark Community Health Centers, Inc.
444 Williams Street Newark 07107 (973) 675-1900
Communicable Disease-Hep B
Newark Community Health Centers, Inc.
741 Broadway Newark 07104 (973) 483-1300
Communicable Disease-Hep B
NJCRI 393 Central Avenue Newark 07103 (973) 483-3444
Communicable Disease-Hep B
Planned Parenthood 70 Adams St, Suite 13 Newark 07105 (973) 465-7707
Communicable Disease-Hep B
Planned Parenthood Metropolitan NJ
240 Mulberry Street Newark 07102 (973) 622-3900
Communicable Disease-Hep B
Saint Michael's Medical Center
111 Central Avenue Newark 07102 (973) 877-5000
Communicable Disease-TB
Newark Department of Health & Well Being Communicable Disease Prevention and Treatment Center
110 William Street Newark 07102 (973) 733-7580
Communicable Disease-TB
RUTGERS Global TB Institute
225 Warren Street Newark 07103 (973) 972-6232
Communicable Disease-TB
Tuberculosis Program 50 East Street, 3rd Floor Trenton 08625 (609) 826-4878

253 Community Health Needs Assessment RWJ Barnabas Health: Clara Maass Medical Center
Provider Type Provider Name Street Address Town Zip Code Phone
Computerized Axial Tomography
A P Diagnostic Imaging 2 Ferry Street Newark 07105 (973) 589-0373
Computerized Axial Tomography
Advanced Imaging Center, LLC
400 Delancey Street, Suite 108
Newark 07105 (973) 589-7777
Computerized Axial Tomography
Barnabas Health Ambulatory Care Center
200 South Orange Avenue, Suite 215
Livingston 07039 (973) 322-7700
Computerized Axial Tomography
Central Imaging Associates
514 Joyce Street Orange 07050 (973) 294-9507
Computerized Axial Tomography
Columbus Imaging Center, LLC
481 North 13th Street Newark 07107 (973) 481-7770
Computerized Axial Tomography
Hudson Radiology Center of NJ
657 Broadway Bayonne 07002 (201) 437-3007
Computerized Axial Tomography
Ironbound Open MRI 119-137 Clifford Street Newark 07102 (973) 508-1400
Computerized Axial Tomography
Irvington Medical Imaging Center
277-285 Coit Street Irvington 07111 (973) 351-1277
Computerized Axial Tomography
Magnetic Resonance of N.J.
410 Center Street Nutley 07110 (973) 661-2000
Computerized Axial Tomography
Millburn Medical Imaging, P.A.
2130 Millburn Avenue Maplewood 07040 (973) 912-0404
Computerized Axial Tomography
Montclair Breast Center 37 North Fullerton Avenue Montclair 07042 (973) 509-1818
Computerized Axial Tomography
Montclair Radiology 116 Park Street Montclair 07042 (973) 746-2525
Computerized Axial Tomography
Montclair Radiology 20 High Street Nutley 07110 (973) 284-1881
Computerized Axial Tomography
Montclair Radiology 1140 Bloomfield Avenue West Caldwell
07006 (973) 439-9729
Computerized Axial Tomography
MRNJ Newark 9-25 Alling Street Newark 07102 (973) 242-5600
Computerized Axial Tomography
NJIN West Orange 772 Northfield Avenue West Orange 07052 (973) 325-0002
Computerized Axial Tomography
NJU Cancer Treatment Centers
1515 Broad Street, Suite B120
Bloomfield 07003 (973) 873-7000
Computerized Axial Tomography
ODI Diagnostic Imaging of New Jersey, LLC
243 Chestnut Street Newark 07105 (973) 521-5685
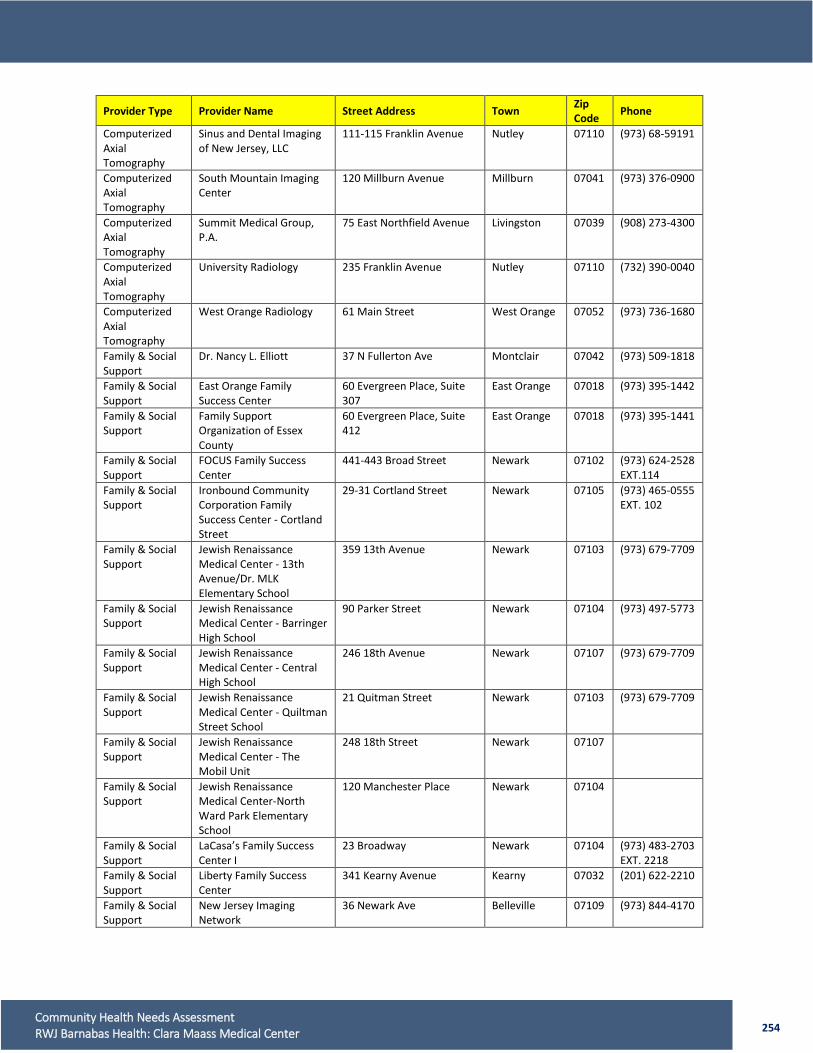
254 Community Health Needs Assessment RWJ Barnabas Health: Clara Maass Medical Center
Provider Type Provider Name Street Address Town Zip Code Phone
Computerized Axial Tomography
Sinus and Dental Imaging of New Jersey, LLC
111-115 Franklin Avenue Nutley 07110 (973) 68-59191
Computerized Axial Tomography
South Mountain Imaging Center
120 Millburn Avenue Millburn 07041 (973) 376-0900
Computerized Axial Tomography
Summit Medical Group, P.A.
75 East Northfield Avenue Livingston 07039 (908) 273-4300
Computerized Axial Tomography
University Radiology 235 Franklin Avenue Nutley 07110 (732) 390-0040
Computerized Axial Tomography
West Orange Radiology 61 Main Street West Orange 07052 (973) 736-1680
Family & Social Support
Dr. Nancy L. Elliott 37 N Fullerton Ave Montclair 07042 (973) 509-1818
Family & Social Support
East Orange Family Success Center
60 Evergreen Place, Suite 307
East Orange 07018 (973) 395-1442
Family & Social Support
Family Support Organization of Essex County
60 Evergreen Place, Suite 412
East Orange 07018 (973) 395-1441
Family & Social Support
FOCUS Family Success Center
441-443 Broad Street Newark 07102 (973) 624-2528 EXT.114
Family & Social Support
Ironbound Community Corporation Family Success Center - Cortland Street
29-31 Cortland Street Newark 07105 (973) 465-0555 EXT. 102
Family & Social Support
Jewish Renaissance Medical Center - 13th Avenue/Dr. MLK Elementary School
359 13th Avenue Newark 07103 (973) 679-7709
Family & Social Support
Jewish Renaissance Medical Center - Barringer High School
90 Parker Street Newark 07104 (973) 497-5773
Family & Social Support
Jewish Renaissance Medical Center - Central High School
246 18th Avenue Newark 07107 (973) 679-7709
Family & Social Support
Jewish Renaissance Medical Center - Quiltman Street School
21 Quitman Street Newark 07103 (973) 679-7709
Family & Social Support
Jewish Renaissance Medical Center - The Mobil Unit
248 18th Street Newark 07107
Family & Social Support
Jewish Renaissance Medical Center-North Ward Park Elementary School
120 Manchester Place Newark 07104
Family & Social Support
LaCasa’s Family Success Center I
23 Broadway Newark 07104 (973) 483-2703 EXT. 2218
Family & Social Support
Liberty Family Success Center
341 Kearny Avenue Kearny 07032 (201) 622-2210
Family & Social Support
New Jersey Imaging Network
36 Newark Ave Belleville 07109 (973) 844-4170
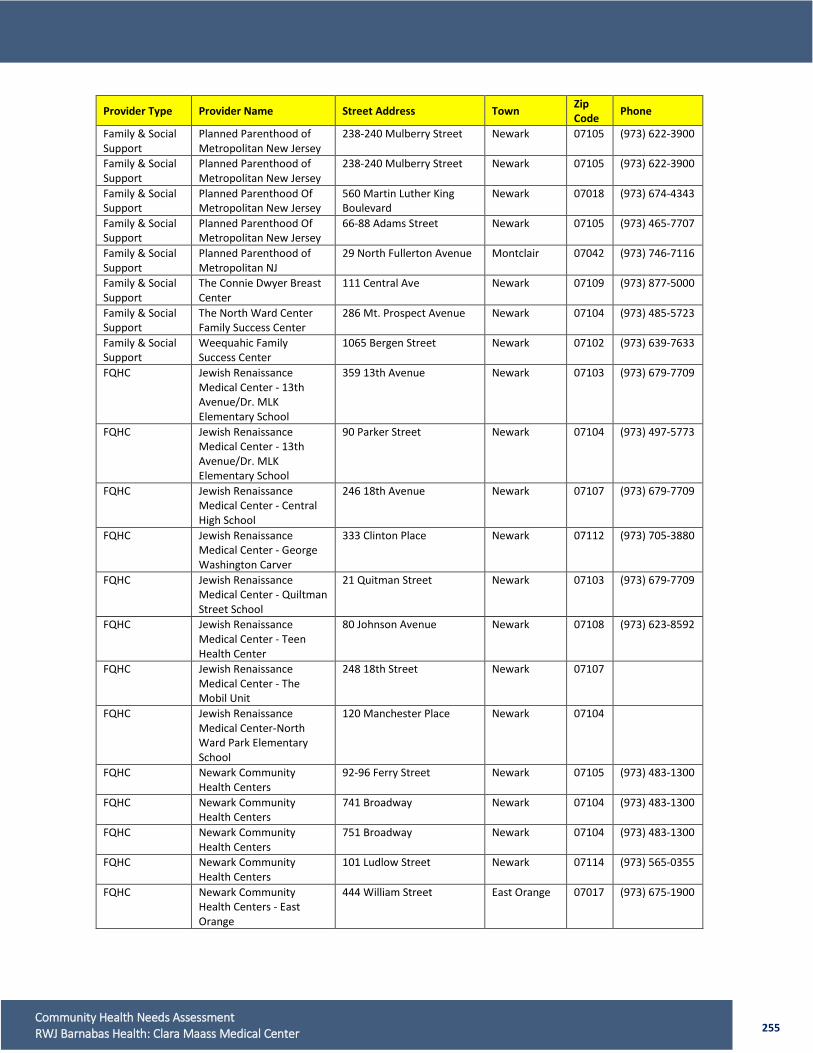
255 Community Health Needs Assessment RWJ Barnabas Health: Clara Maass Medical Center
Provider Type Provider Name Street Address Town Zip Code Phone
Family & Social Support
Planned Parenthood of Metropolitan New Jersey
238-240 Mulberry Street Newark 07105 (973) 622-3900
Family & Social Support
Planned Parenthood of Metropolitan New Jersey
238-240 Mulberry Street Newark 07105 (973) 622-3900
Family & Social Support
Planned Parenthood Of Metropolitan New Jersey
560 Martin Luther King Boulevard
Newark 07018 (973) 674-4343
Family & Social Support
Planned Parenthood Of Metropolitan New Jersey
66-88 Adams Street Newark 07105 (973) 465-7707
Family & Social Support
Planned Parenthood of Metropolitan NJ
29 North Fullerton Avenue Montclair 07042 (973) 746-7116
Family & Social Support
The Connie Dwyer Breast Center
111 Central Ave Newark 07109 (973) 877-5000
Family & Social Support
The North Ward Center Family Success Center
286 Mt. Prospect Avenue Newark 07104 (973) 485-5723
Family & Social Support
Weequahic Family Success Center
1065 Bergen Street Newark 07102 (973) 639-7633
FQHC Jewish Renaissance Medical Center - 13th Avenue/Dr. MLK Elementary School
359 13th Avenue Newark 07103 (973) 679-7709
FQHC Jewish Renaissance Medical Center - 13th Avenue/Dr. MLK Elementary School
90 Parker Street Newark 07104 (973) 497-5773
FQHC Jewish Renaissance Medical Center - Central High School
246 18th Avenue Newark 07107 (973) 679-7709
FQHC Jewish Renaissance Medical Center - George Washington Carver
333 Clinton Place Newark 07112 (973) 705-3880
FQHC Jewish Renaissance Medical Center - Quiltman Street School
21 Quitman Street Newark 07103 (973) 679-7709
FQHC Jewish Renaissance Medical Center - Teen Health Center
80 Johnson Avenue Newark 07108 (973) 623-8592
FQHC Jewish Renaissance Medical Center - The Mobil Unit
248 18th Street Newark 07107
FQHC Jewish Renaissance Medical Center-North Ward Park Elementary School
120 Manchester Place Newark 07104
FQHC Newark Community Health Centers
92-96 Ferry Street Newark 07105 (973) 483-1300
FQHC Newark Community Health Centers
741 Broadway Newark 07104 (973) 483-1300
FQHC Newark Community Health Centers
751 Broadway Newark 07104 (973) 483-1300
FQHC Newark Community Health Centers
101 Ludlow Street Newark 07114 (973) 565-0355
FQHC Newark Community Health Centers - East Orange
444 William Street East Orange 07017 (973) 675-1900
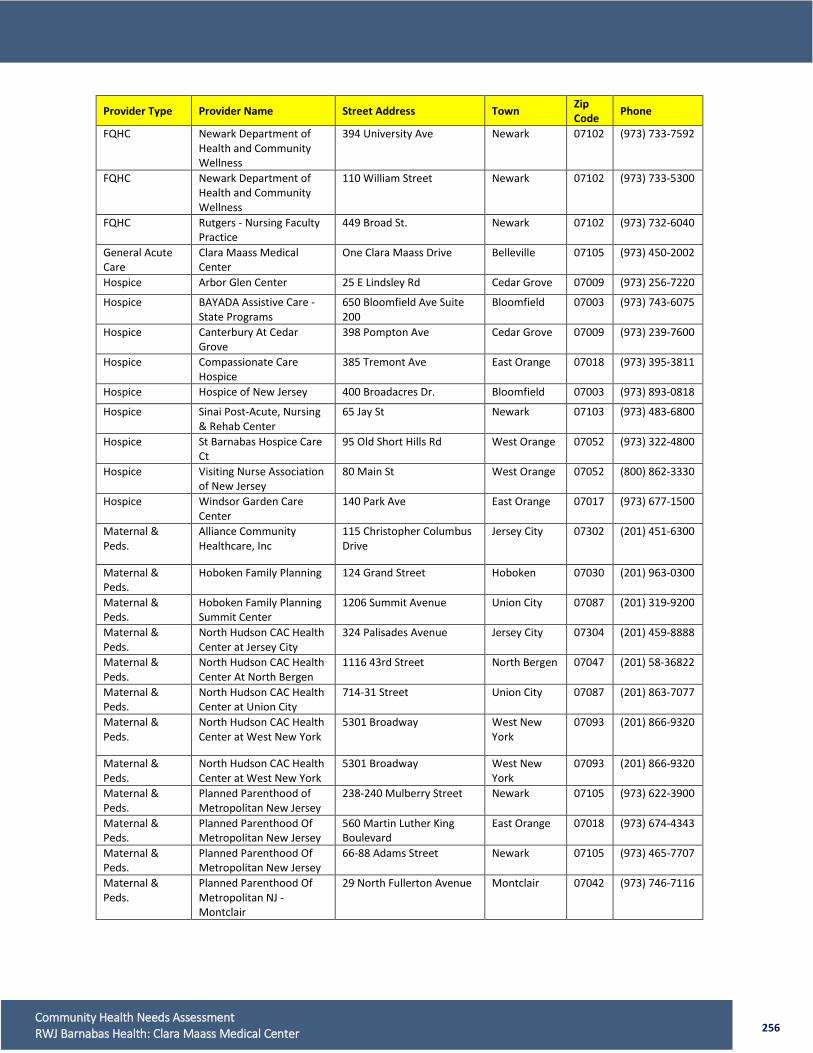
256 Community Health Needs Assessment RWJ Barnabas Health: Clara Maass Medical Center
Provider Type Provider Name Street Address Town Zip Code Phone
FQHC Newark Department of Health and Community Wellness
394 University Ave Newark 07102 (973) 733-7592
FQHC Newark Department of Health and Community Wellness
110 William Street Newark 07102 (973) 733-5300
FQHC Rutgers - Nursing Faculty Practice
449 Broad St. Newark 07102 (973) 732-6040
General Acute Care
Clara Maass Medical Center
One Clara Maass Drive Belleville 07105 (973) 450-2002
Hospice Arbor Glen Center 25 E Lindsley Rd Cedar Grove 07009 (973) 256-7220
Hospice BAYADA Assistive Care - State Programs
650 Bloomfield Ave Suite 200
Bloomfield 07003 (973) 743-6075
Hospice Canterbury At Cedar Grove
398 Pompton Ave Cedar Grove 07009 (973) 239-7600
Hospice Compassionate Care Hospice
385 Tremont Ave East Orange 07018 (973) 395-3811
Hospice Hospice of New Jersey 400 Broadacres Dr. Bloomfield 07003 (973) 893-0818
Hospice Sinai Post-Acute, Nursing & Rehab Center
65 Jay St Newark 07103 (973) 483-6800
Hospice St Barnabas Hospice Care Ct
95 Old Short Hills Rd West Orange 07052 (973) 322-4800
Hospice Visiting Nurse Association of New Jersey
80 Main St West Orange 07052 (800) 862-3330
Hospice Windsor Garden Care Center
140 Park Ave East Orange 07017 (973) 677-1500
Maternal & Peds.
Alliance Community Healthcare, Inc
115 Christopher Columbus Drive
Jersey City 07302 (201) 451-6300
Maternal & Peds.
Hoboken Family Planning 124 Grand Street Hoboken 07030 (201) 963-0300
Maternal & Peds.
Hoboken Family Planning Summit Center
1206 Summit Avenue Union City 07087 (201) 319-9200
Maternal & Peds.
North Hudson CAC Health Center at Jersey City
324 Palisades Avenue Jersey City 07304 (201) 459-8888
Maternal & Peds.
North Hudson CAC Health Center At North Bergen
1116 43rd Street North Bergen 07047 (201) 58-36822
Maternal & Peds.
North Hudson CAC Health Center at Union City
714-31 Street Union City 07087 (201) 863-7077
Maternal & Peds.
North Hudson CAC Health Center at West New York
5301 Broadway West New York
07093 (201) 866-9320
Maternal & Peds.
North Hudson CAC Health Center at West New York
5301 Broadway West New York
07093 (201) 866-9320
Maternal & Peds.
Planned Parenthood of Metropolitan New Jersey
238-240 Mulberry Street Newark 07105 (973) 622-3900
Maternal & Peds.
Planned Parenthood Of Metropolitan New Jersey
560 Martin Luther King Boulevard
East Orange 07018 (973) 674-4343
Maternal & Peds.
Planned Parenthood Of Metropolitan New Jersey
66-88 Adams Street Newark 07105 (973) 465-7707
Maternal & Peds.
Planned Parenthood Of Metropolitan NJ - Montclair
29 North Fullerton Avenue Montclair 07042 (973) 746-7116
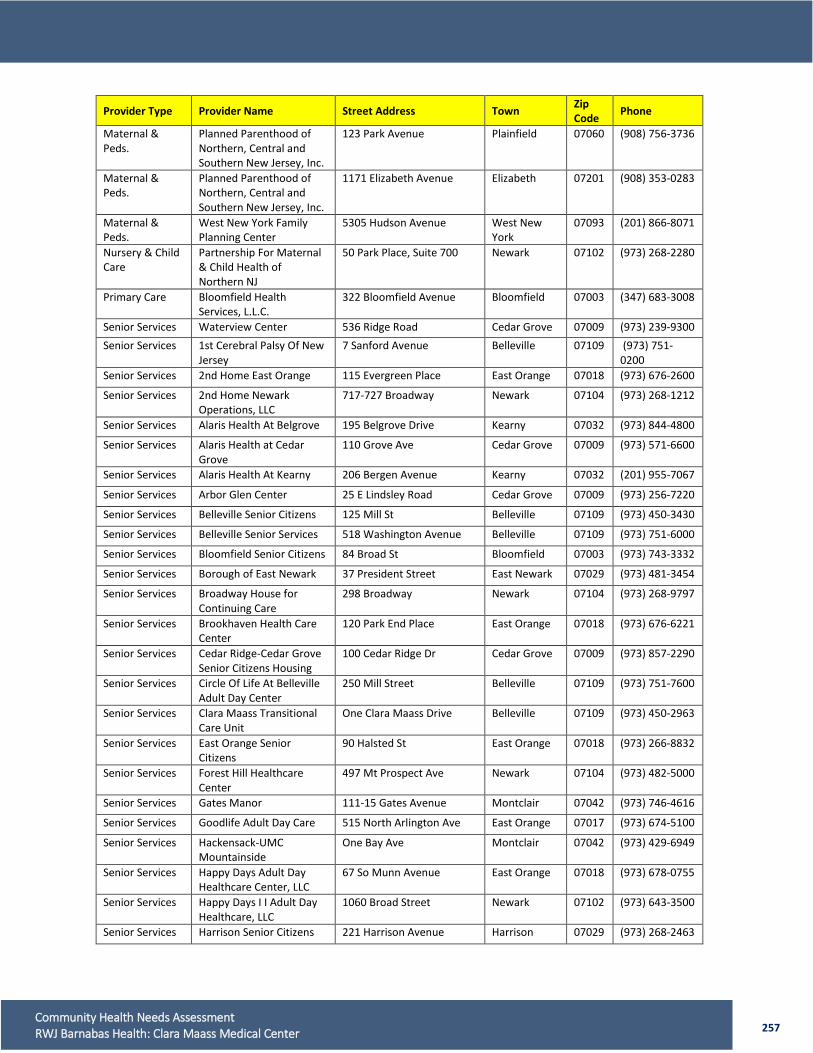
257 Community Health Needs Assessment RWJ Barnabas Health: Clara Maass Medical Center
Provider Type Provider Name Street Address Town Zip Code Phone
Maternal & Peds.
Planned Parenthood of Northern, Central and Southern New Jersey, Inc.
123 Park Avenue Plainfield 07060 (908) 756-3736
Maternal & Peds.
Planned Parenthood of Northern, Central and Southern New Jersey, Inc.
1171 Elizabeth Avenue Elizabeth 07201 (908) 353-0283
Maternal & Peds.
West New York Family Planning Center
5305 Hudson Avenue West New York
07093 (201) 866-8071
Nursery & Child Care
Partnership For Maternal & Child Health of Northern NJ
50 Park Place, Suite 700 Newark 07102 (973) 268-2280
Primary Care Bloomfield Health Services, L.L.C.
322 Bloomfield Avenue Bloomfield 07003 (347) 683-3008
Senior Services Waterview Center 536 Ridge Road Cedar Grove 07009 (973) 239-9300 Senior Services 1st Cerebral Palsy Of New
Jersey 7 Sanford Avenue Belleville 07109 (973) 751-
0200 Senior Services 2nd Home East Orange 115 Evergreen Place East Orange 07018 (973) 676-2600
Senior Services 2nd Home Newark Operations, LLC
717-727 Broadway Newark 07104 (973) 268-1212
Senior Services Alaris Health At Belgrove 195 Belgrove Drive Kearny 07032 (973) 844-4800
Senior Services Alaris Health at Cedar Grove
110 Grove Ave Cedar Grove 07009 (973) 571-6600
Senior Services Alaris Health At Kearny 206 Bergen Avenue Kearny 07032 (201) 955-7067
Senior Services Arbor Glen Center 25 E Lindsley Road Cedar Grove 07009 (973) 256-7220
Senior Services Belleville Senior Citizens 125 Mill St Belleville 07109 (973) 450-3430
Senior Services Belleville Senior Services 518 Washington Avenue Belleville 07109 (973) 751-6000
Senior Services Bloomfield Senior Citizens 84 Broad St Bloomfield 07003 (973) 743-3332
Senior Services Borough of East Newark 37 President Street East Newark 07029 (973) 481-3454
Senior Services Broadway House for Continuing Care
298 Broadway Newark 07104 (973) 268-9797
Senior Services Brookhaven Health Care Center
120 Park End Place East Orange 07018 (973) 676-6221
Senior Services Cedar Ridge-Cedar Grove Senior Citizens Housing
100 Cedar Ridge Dr Cedar Grove 07009 (973) 857-2290
Senior Services Circle Of Life At Belleville Adult Day Center
250 Mill Street Belleville 07109 (973) 751-7600
Senior Services Clara Maass Transitional Care Unit
One Clara Maass Drive Belleville 07109 (973) 450-2963
Senior Services East Orange Senior Citizens
90 Halsted St East Orange 07018 (973) 266-8832
Senior Services Forest Hill Healthcare Center
497 Mt Prospect Ave Newark 07104 (973) 482-5000
Senior Services Gates Manor 111-15 Gates Avenue Montclair 07042 (973) 746-4616
Senior Services Goodlife Adult Day Care 515 North Arlington Ave East Orange 07017 (973) 674-5100
Senior Services Hackensack-UMC Mountainside
One Bay Ave Montclair 07042 (973) 429-6949
Senior Services Happy Days Adult Day Healthcare Center, LLC
67 So Munn Avenue East Orange 07018 (973) 678-0755
Senior Services Happy Days I I Adult Day Healthcare, LLC
1060 Broad Street Newark 07102 (973) 643-3500
Senior Services Harrison Senior Citizens 221 Harrison Avenue Harrison 07029 (973) 268-2463
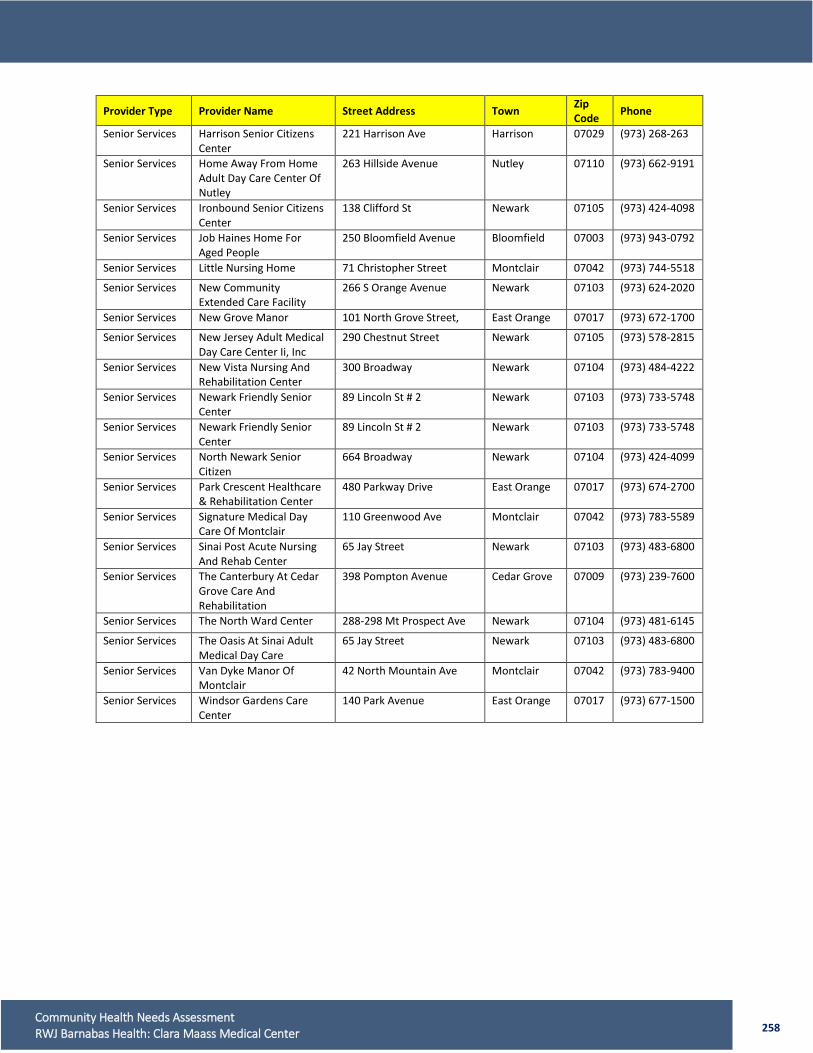
258 Community Health Needs Assessment RWJ Barnabas Health: Clara Maass Medical Center
Provider Type Provider Name Street Address Town Zip Code Phone
Senior Services Harrison Senior Citizens Center
221 Harrison Ave Harrison 07029 (973) 268-263
Senior Services Home Away From Home Adult Day Care Center Of Nutley
263 Hillside Avenue Nutley 07110 (973) 662-9191
Senior Services Ironbound Senior Citizens Center
138 Clifford St Newark 07105 (973) 424-4098
Senior Services Job Haines Home For Aged People
250 Bloomfield Avenue Bloomfield 07003 (973) 943-0792
Senior Services Little Nursing Home 71 Christopher Street Montclair 07042 (973) 744-5518
Senior Services New Community Extended Care Facility
266 S Orange Avenue Newark 07103 (973) 624-2020
Senior Services New Grove Manor 101 North Grove Street, East Orange 07017 (973) 672-1700
Senior Services New Jersey Adult Medical Day Care Center Ii, Inc
290 Chestnut Street Newark 07105 (973) 578-2815
Senior Services New Vista Nursing And Rehabilitation Center
300 Broadway Newark 07104 (973) 484-4222
Senior Services Newark Friendly Senior Center
89 Lincoln St # 2 Newark 07103 (973) 733-5748
Senior Services Newark Friendly Senior Center
89 Lincoln St # 2 Newark 07103 (973) 733-5748
Senior Services North Newark Senior Citizen
664 Broadway Newark 07104 (973) 424-4099
Senior Services Park Crescent Healthcare & Rehabilitation Center
480 Parkway Drive East Orange 07017 (973) 674-2700
Senior Services Signature Medical Day Care Of Montclair
110 Greenwood Ave Montclair 07042 (973) 783-5589
Senior Services Sinai Post Acute Nursing And Rehab Center
65 Jay Street Newark 07103 (973) 483-6800
Senior Services The Canterbury At Cedar Grove Care And Rehabilitation
398 Pompton Avenue Cedar Grove 07009 (973) 239-7600
Senior Services The North Ward Center 288-298 Mt Prospect Ave Newark 07104 (973) 481-6145
Senior Services The Oasis At Sinai Adult Medical Day Care
65 Jay Street Newark 07103 (973) 483-6800
Senior Services Van Dyke Manor Of Montclair
42 North Mountain Ave Montclair 07042 (973) 783-9400
Senior Services Windsor Gardens Care Center
140 Park Avenue East Orange 07017 (973) 677-1500
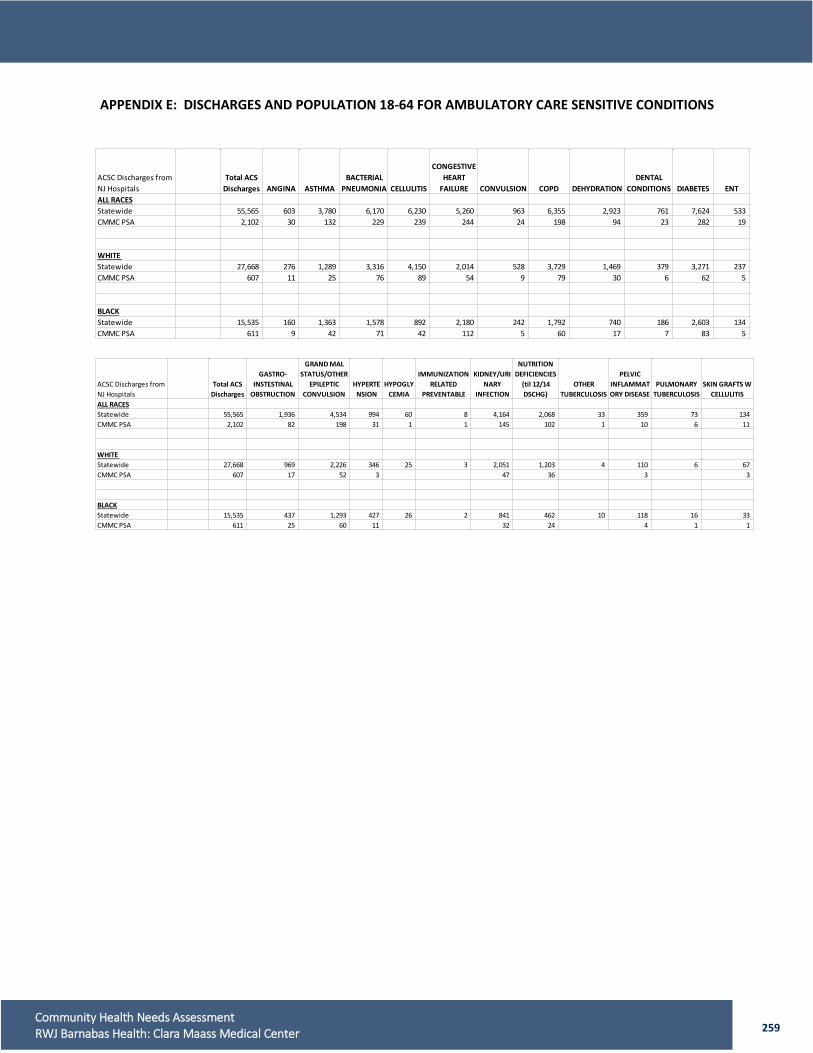
259 Community Health Needs Assessment RWJ Barnabas Health: Clara Maass Medical Center
APPENDIX E: DISCHARGES AND POPULATION 18-64 FOR AMBULATORY CARE SENSITIVE CONDITIONS
ACSC Discharges from NJ Hospitals
Total ACS Discharges ANGINA ASTHMA
BACTERIAL PNEUMONIA CELLULITIS
CONGESTIVE HEART
FAILURE CONVULSION COPD DEHYDRATIONDENTAL
CONDITIONS DIABETES ENTALL RACESStatewide 55,565 603 3,780 6,170 6,230 5,260 963 6,355 2,923 761 7,624 533 CMMC PSA 2,102 30 132 229 239 244 24 198 94 23 282 19
WHITE Statewide 27,668 276 1,289 3,316 4,150 2,014 528 3,729 1,469 379 3,271 237 CMMC PSA 607 11 25 76 89 54 9 79 30 6 62 5
BLACKStatewide 15,535 160 1,363 1,578 892 2,180 242 1,792 740 186 2,603 134 CMMC PSA 611 9 42 71 42 112 5 60 17 7 83 5
ACSC Discharges from NJ Hospitals
Total ACS Discharges
GASTRO-INSTESTINAL
OBSTRUCTION
GRAND MAL STATUS/OTHER
EPILEPTIC CONVULSION
HYPERTENSION
HYPOGLYCEMIA
IMMUNIZATION RELATED
PREVENTABLE
KIDNEY/URINARY
INFECTION
NUTRITION DEFICIENCIES
(til 12/14 DSCHG)
OTHER TUBERCULOSIS
PELVIC INFLAMMATORY DISEASE
PULMONARY TUBERCULOSIS
SKIN GRAFTS W CELLULITIS
ALL RACESStatewide 55,565 1,936 4,534 994 60 8 4,164 2,068 33 359 73 134 CMMC PSA 2,102 82 198 31 1 1 145 102 1 10 6 11
WHITE Statewide 27,668 969 2,226 346 25 3 2,051 1,203 4 110 6 67 CMMC PSA 607 17 52 3 47 36 3 3
BLACKStatewide 15,535 437 1,293 427 26 2 841 462 10 118 16 33 CMMC PSA 611 25 60 11 32 24 4 1 1
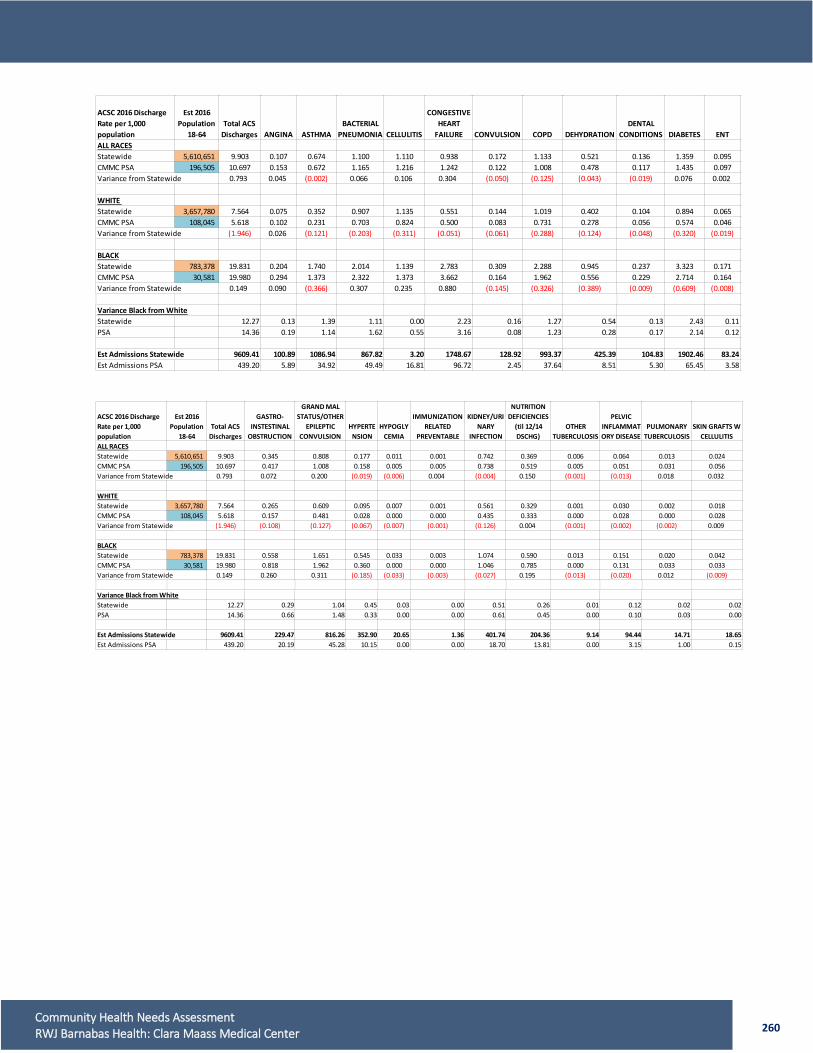
260 Community Health Needs Assessment RWJ Barnabas Health: Clara Maass Medical Center
ACSC 2016 Discharge Rate per 1,000 population
Est 2016 Population
18-64Total ACS
Discharges ANGINA ASTHMABACTERIAL
PNEUMONIA CELLULITIS
CONGESTIVE HEART
FAILURE CONVULSION COPD DEHYDRATIONDENTAL
CONDITIONS DIABETES ENTALL RACESStatewide 5,610,651 9.903 0.107 0.674 1.100 1.110 0.938 0.172 1.133 0.521 0.136 1.359 0.095CMMC PSA 196,505 10.697 0.153 0.672 1.165 1.216 1.242 0.122 1.008 0.478 0.117 1.435 0.097Variance from Statewide 0.793 0.045 (0.002) 0.066 0.106 0.304 (0.050) (0.125) (0.043) (0.019) 0.076 0.002
WHITE Statewide 3,657,780 7.564 0.075 0.352 0.907 1.135 0.551 0.144 1.019 0.402 0.104 0.894 0.065CMMC PSA 108,045 5.618 0.102 0.231 0.703 0.824 0.500 0.083 0.731 0.278 0.056 0.574 0.046Variance from Statewide (1.946) 0.026 (0.121) (0.203) (0.311) (0.051) (0.061) (0.288) (0.124) (0.048) (0.320) (0.019)
BLACKStatewide 783,378 19.831 0.204 1.740 2.014 1.139 2.783 0.309 2.288 0.945 0.237 3.323 0.171CMMC PSA 30,581 19.980 0.294 1.373 2.322 1.373 3.662 0.164 1.962 0.556 0.229 2.714 0.164Variance from Statewide 0.149 0.090 (0.366) 0.307 0.235 0.880 (0.145) (0.326) (0.389) (0.009) (0.609) (0.008)
Variance Black from WhiteStatewide 12.27 0.13 1.39 1.11 0.00 2.23 0.16 1.27 0.54 0.13 2.43 0.11PSA 14.36 0.19 1.14 1.62 0.55 3.16 0.08 1.23 0.28 0.17 2.14 0.12
Est Admissions Statewide 9609.41 100.89 1086.94 867.82 3.20 1748.67 128.92 993.37 425.39 104.83 1902.46 83.24Est Admissions PSA 439.20 5.89 34.92 49.49 16.81 96.72 2.45 37.64 8.51 5.30 65.45 3.58
ACSC 2016 Discharge Rate per 1,000 population
Est 2016 Population
18-64Total ACS
Discharges
GASTRO-INSTESTINAL
OBSTRUCTION
GRAND MAL STATUS/OTHER
EPILEPTIC CONVULSION
HYPERTENSION
HYPOGLYCEMIA
IMMUNIZATION RELATED
PREVENTABLE
KIDNEY/URINARY
INFECTION
NUTRITION DEFICIENCIES
(til 12/14 DSCHG)
OTHER TUBERCULOSIS
PELVIC INFLAMMATORY DISEASE
PULMONARY TUBERCULOSIS
SKIN GRAFTS W CELLULITIS
ALL RACESStatewide 5,610,651 9.903 0.345 0.808 0.177 0.011 0.001 0.742 0.369 0.006 0.064 0.013 0.024CMMC PSA 196,505 10.697 0.417 1.008 0.158 0.005 0.005 0.738 0.519 0.005 0.051 0.031 0.056Variance from Statewide 0.793 0.072 0.200 (0.019) (0.006) 0.004 (0.004) 0.150 (0.001) (0.013) 0.018 0.032
WHITE Statewide 3,657,780 7.564 0.265 0.609 0.095 0.007 0.001 0.561 0.329 0.001 0.030 0.002 0.018CMMC PSA 108,045 5.618 0.157 0.481 0.028 0.000 0.000 0.435 0.333 0.000 0.028 0.000 0.028Variance from Statewide (1.946) (0.108) (0.127) (0.067) (0.007) (0.001) (0.126) 0.004 (0.001) (0.002) (0.002) 0.009
BLACKStatewide 783,378 19.831 0.558 1.651 0.545 0.033 0.003 1.074 0.590 0.013 0.151 0.020 0.042CMMC PSA 30,581 19.980 0.818 1.962 0.360 0.000 0.000 1.046 0.785 0.000 0.131 0.033 0.033Variance from Statewide 0.149 0.260 0.311 (0.185) (0.033) (0.003) (0.027) 0.195 (0.013) (0.020) 0.012 (0.009)
Variance Black from WhiteStatewide 12.27 0.29 1.04 0.45 0.03 0.00 0.51 0.26 0.01 0.12 0.02 0.02PSA 14.36 0.66 1.48 0.33 0.00 0.00 0.61 0.45 0.00 0.10 0.03 0.00
Est Admissions Statewide 9609.41 229.47 816.26 352.90 20.65 1.36 401.74 204.36 9.14 94.44 14.71 18.65Est Admissions PSA 439.20 20.19 45.28 10.15 0.00 0.00 18.70 13.81 0.00 3.15 1.00 0.15
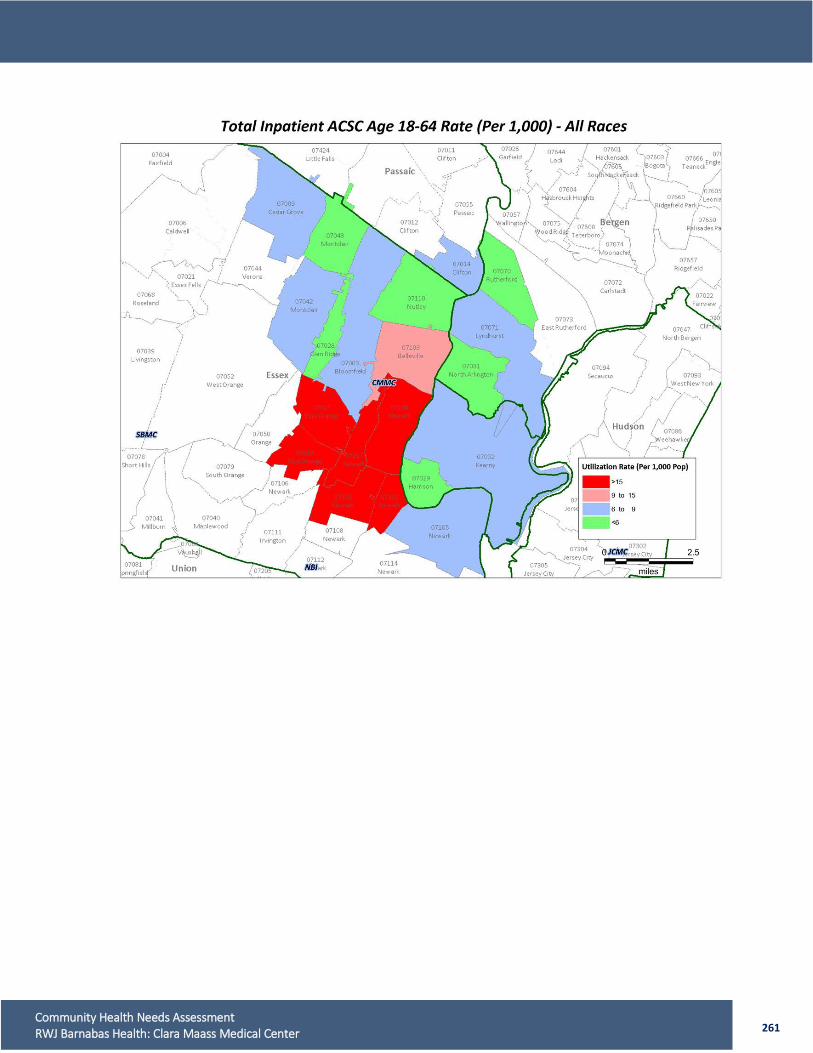
261 Community Health Needs Assessment RWJ Barnabas Health: Clara Maass Medical Center
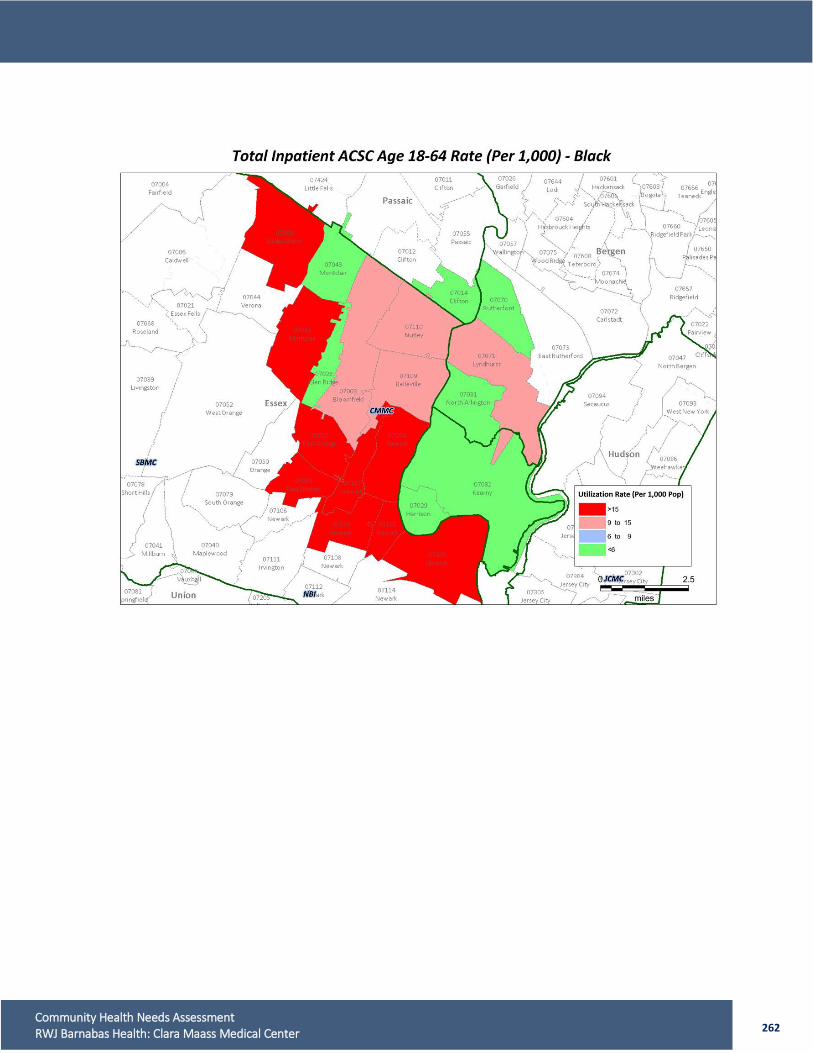
262 Community Health Needs Assessment RWJ Barnabas Health: Clara Maass Medical Center
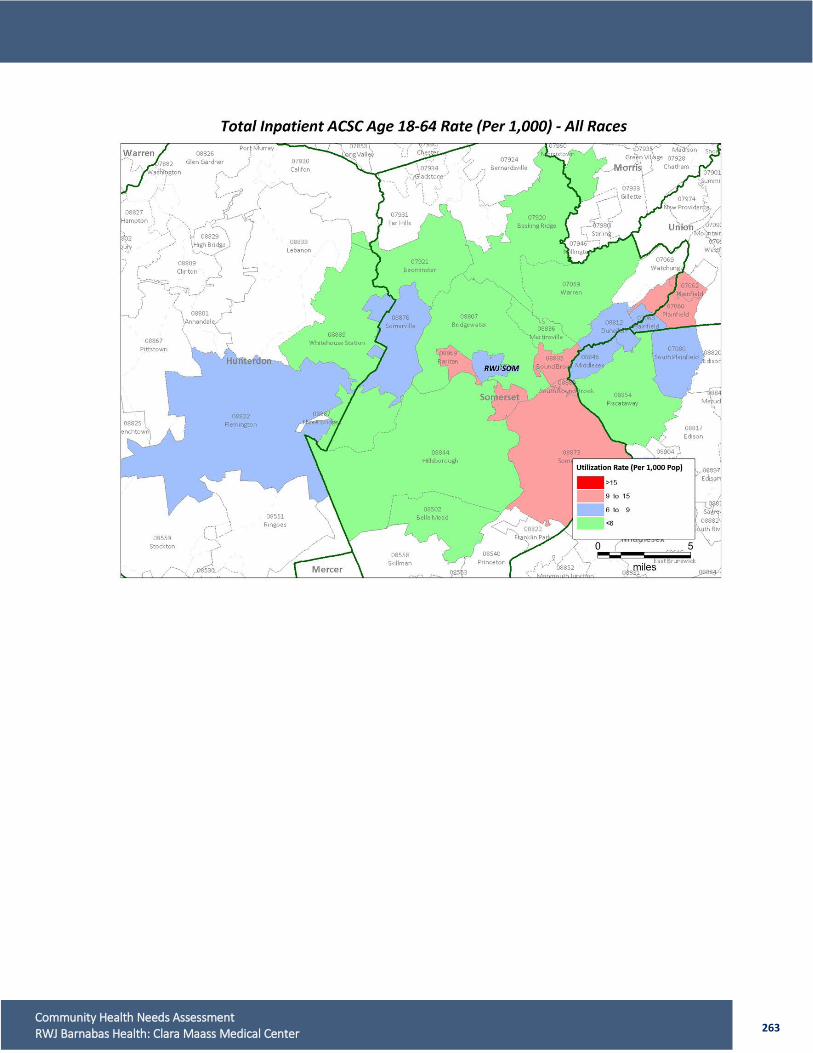
263 Community Health Needs Assessment RWJ Barnabas Health: Clara Maass Medical Center
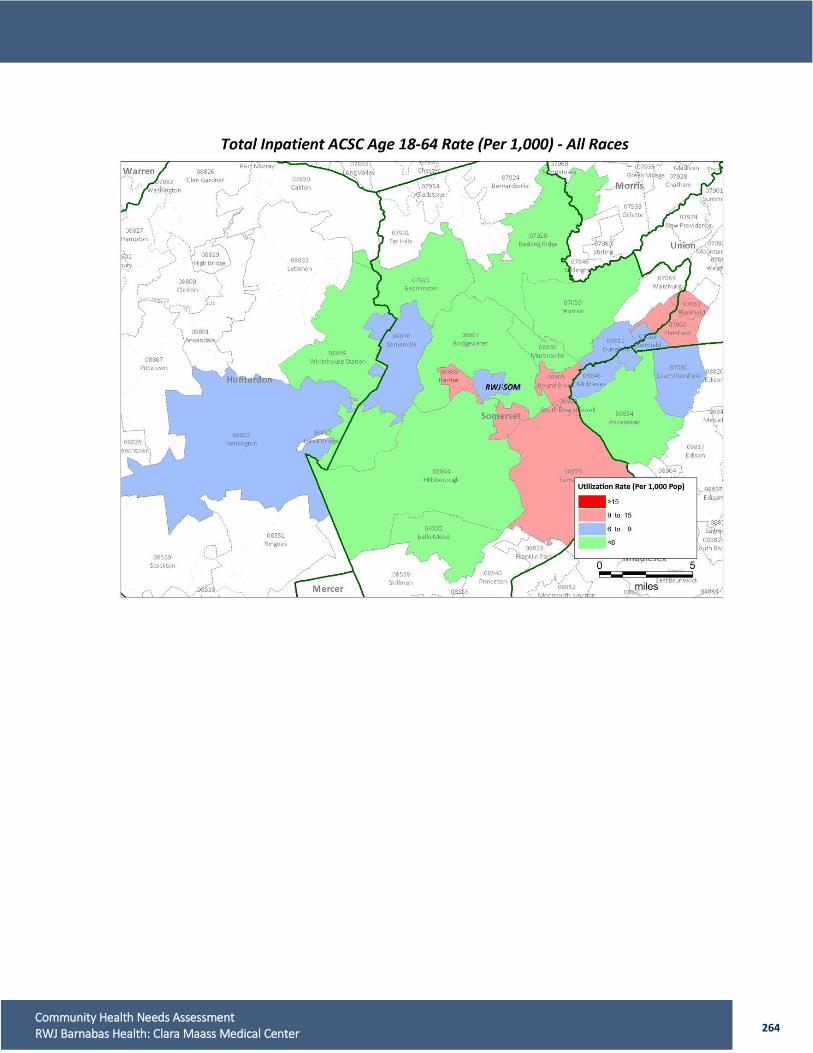
264 Community Health Needs Assessment RWJ Barnabas Health: Clara Maass Medical Center
Related Documents