CJ Corporation and Subsidiaries Consolidated Financial Statements December 31, 2018 and 2017

Welcome message from author
This document is posted to help you gain knowledge. Please leave a comment to let me know what you think about it! Share it to your friends and learn new things together.
Transcript
CJ Corporation and Subsidiaries
Consolidated Financial Statements
December 31, 2018 and 2017
CJ Corporation and Subsidiaries Index
December 31, 2018 and 2017
Page(s)
Independent Auditor’s Report ..................................................................................................... 1 – 6
Consolidated Financial Statements
Consolidated Statements of Financial Position…. ...................................................................... 7 - 8
Consolidated Statements of Profit or Loss ...................................................................................... 9
Consolidated Statements of Comprehensive Income.................................................................... 10
Consolidated Statements of Changes in Equity ..................................................................... 11 - 12
Consolidated Statements of Cash Flows ................................................................................ 13 - 14
Notes to the Consolidated Financial Statements ................................................................. 15 – 144
Independent Auditor’s Report
(English Translation of a Report Originally Issued in Korean)
To the Board of Directors and Shareholders of
CJ Corporation
Opinion
We have audited the accompanying consolidated financial statements of CJ Corporation
and its subsidiaries (collectively referred to as the "Group"), which comprise the consolidated
statements of financial position as at December 31, 2018 and 2017, and the consolidated statements
of profit or loss, consolidated statements of comprehensive income, consolidated statements of
changes in equity and consolidated statements of cash flows for the years then ended, and notes to
the consolidated financial statements, including a summary of significant accounting policies.
In our opinion, the accompanying consolidated financial statements present fairly, in all material
respects, the consolidated financial position of the Group as at December 31, 2018 and 2017, and its
consolidated financial performance and its consolidated cash flows for the years then ended in
accordance with International Financial Reporting Standards as adopted by the Republic of Korea
(Korean IFRS).
Basis for Opinion
We conducted our audits in accordance with Korean Standards on Auditing. Our responsibilities
under those standards are further described in the Auditor’s Responsibilities for the Audit of the
Consolidated Financial Statements section of our report. We are independent of the Group in
accordance with the ethical requirements of the Republic of Korea that are relevant to our audit of the
consolidated financial statements and we have fulfilled our other ethical responsibilities in accordance
with the ethical requirements. We believe that the audit evidence we have obtained is sufficient and
appropriate to provide a basis for our audit opinion.
Key Audit Matters
Key audit matters are those matters that, in our professional judgment, were of most significance in
our audit of the consolidated financial statements of the current period. These matters were
addressed in the context of our audit of the consolidated financial statements as a whole, and in
forming our opinion thereon, and we do not provide a separate opinion on these matters.
3
(1) Goodwill impairment assessment
Why it is determined to be a Key Audit Matter
As explained in Note 17 to the consolidated financial statements, the Group’s goodwill as at
December 31, 2018, amounts to \ 3,511,814 million. And, goodwill amounting to \ 2,676,177 million
is related to CJ Logistics Corporation, CJ CheilJedang Corporation and CJ Hello Co., Ltd. (collectively
referred to as ‘Cash Generating Unit (CGU) subject to valuation’), and accounts for 8.4% and 76.2%
of the Group’s total assets and goodwill, respectively.
The Group engaged independent external specialists for impairment assessment of CGU subject to
valuation. Based on historical performance and estimations for the future periods, the Group believes
there is significant headroom between the value in use of the CGUs and their carrying value.
We focused on this area due to the significance of size of goodwill balance and because the
assessment of the ‘value in use’ of the Group’s CGU involves management's judgements about the
future results of the business and the discount rates applied to future cash flow forecast.
How our audit addressed the Key Audit Matter
We have performed the following audit procedures to address the Key Audit Matter:
- Evaluating the qualification and independence of external specialists engaged.
- Evaluating the appropriateness of valuation model used in estimating the value-in-use.
- Evaluating the reasonableness of the key assumptions used in estimating the value-in-use.
- Verifying the consistency of the estimates of sales growth rate, operating margin ratio and
investment activities of the Group in comparison to the historical performance and market
conditions.
- Comparing the long-term growth rates with the economic and industry estimates
- Comparing the discount rates calculated independently using the observable information
with the discount rates applied by the Group’s management.
- Evaluating the sensitivity analysis result with respect to the discount rates and permanent
growth rates applied by the management, in order to assess the impacts of changes in key
assumptions to impairment assessment.
4
Other Matter
Auditing standards and their application in practice vary among countries. The procedures and
practices used in the Republic of Korea to audit such consolidated financial statements may differ
from those generally accepted and applied in other countries.
Responsibilities of Management and Those Charged with Governance for the Consolidated
Financial Statements
Management is responsible for the preparation and fair presentation of the consolidated financial
statements in accordance with Korean IFRS, and for such internal control as management determines
is necessary to enable the preparation of consolidated financial statements that are free from material
misstatement, whether due to fraud or error.
In preparing the consolidated financial statements, management is responsible for assessing the
Group’s ability to continue as a going concern, disclosing, as applicable, matters related to going
concern and using the going concern basis of accounting unless management either intends to
liquidate the Group or to cease operations.
Those charged with governance are responsible for overseeing the Group’s financial reporting
process.
Auditor’s Responsibilities for the Audit of the Consolidated Financial Statements
Our objectives are to obtain reasonable assurance about whether the consolidated financial
statements as a whole are free from material misstatement, whether due to fraud or error, and to
issue an auditor’s report that includes our opinion. Reasonable assurance is a high level of assurance,
but is not a guarantee that an audit conducted in accordance with Korean Standards on Auditing will
always detect a material misstatement when it exists. Misstatements can arise from fraud or error and
are considered material if, individually or in the aggregate, they could reasonably be expected to
influence the economic decisions of users taken on the basis of these consolidated financial
statements.
As part of an audit in accordance with Korean Standards on Auditing, we exercise professional
judgment and maintain professional skepticism throughout the audit. We also:
· Identify and assess the risks of material misstatement of the consolidated financial statements,
whether due to fraud or error, design and perform audit procedures responsive to those risks, and
obtain audit evidence that is sufficient and appropriate to provide a basis for our opinion. The risk
of not detecting a material misstatement resulting from fraud is higher than for one resulting from
error, as fraud may involve collusion, forgery, intentional omissions, misrepresentations, or the
override of internal control.
· Obtain an understanding of internal control relevant to the audit in order to design audit
procedures that are appropriate in the circumstances, but not for the purpose of expressing an
opinion on the effectiveness of the entity's internal control.
5
· Evaluate the appropriateness of accounting policies used and the reasonableness of accounting
estimates and related disclosures made by management.
· Conclude on the appropriateness of management’s use of the going concern basis of accounting
and, based on the audit evidence obtained, whether a material uncertainty exists related to events
or conditions that may cast significant doubt on the Group’s ability to continue as a going concern.
If we conclude that a material uncertainty exists, we are required to draw attention in our auditor’s
report to the related disclosures in the consolidated financial statements or, if such disclosures
are inadequate, to modify our opinion. Our conclusions are based on the audit evidence obtained
up to the date of our auditor’s report. However, future events or conditions may cause the Group
to cease to continue as a going concern.
· Evaluate the overall presentation, structure and content of the consolidated financial statements,
including the disclosures, and whether the consolidated financial statements represent the
underlying transactions and events in a manner that achieves fair presentation.
· Obtain sufficient appropriate audit evidence regarding the financial information of the entities or
business activities within the Group to express an opinion on the consolidated financial
statements. We are responsible for the direction, supervision and performance of the Group audit.
We remain solely responsible for our audit opinion.
We communicate with those charged with governance regarding, among other matters, the planned
scope and timing of the audit and significant audit findings, including any significant deficiencies in
internal control that we identify during our audit.
We also provide those charged with governance with a statement that we have complied with relevant
ethical requirements regarding independence, and to communicate with them all relationships and
other matters that may reasonably be thought to bear on our independence, and where applicable,
related safeguards.
From the matters communicated with those charged with governance, we determine those matters
that were of most significance in the audit of the consolidated financial statements of the current
period and are therefore the key audit matters. We describe these matters in our auditor’s report
unless law or regulation precludes public disclosure about the matter or when, in extremely rare
circumstances, we determine that a matter should not be communicated in our report because the
adverse consequences of doing so would reasonably be expected to outweigh the public interest
benefits of such communication.
The engagement partner on the audit resulting in this independent auditor’s report is Byoung-Muk
Kim, Certified Public Accountant.
6
Seoul, Korea
March 19, 2019
This report is effective as of March 19, 2019, the audit report date. Certain subsequent events or
circumstances, which may occur between the audit report date and the time of reading this report,
could have a material impact on the accompanying consolidated financial statements and notes
thereto. Accordingly, the readers of the audit report should understand that there is a possibility that
the above audit report may have to be revised to reflect the impact of such subsequent events or
circumstances, if any.
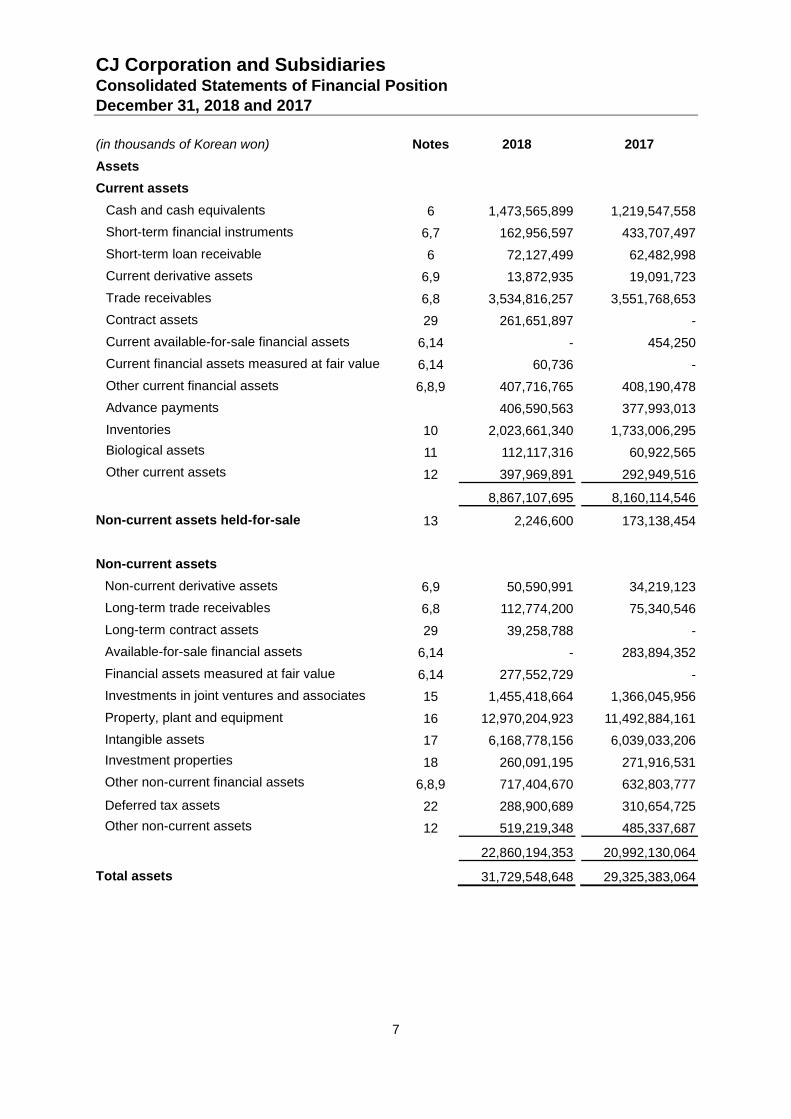
CJ Corporation and Subsidiaries Consolidated Statements of Financial Position December 31, 2018 and 2017
7
(in thousands of Korean won) Notes 2018
2017
Assets
Current assets
Cash and cash equivalents 6 1,473,565,899 1,219,547,558
Short-term financial instruments 6,7 162,956,597 433,707,497
Short-term loan receivable 6 72,127,499 62,482,998
Current derivative assets 6,9 13,872,935 19,091,723
Trade receivables 6,8 3,534,816,257 3,551,768,653
Contract assets 29 261,651,897 -
Current available-for-sale financial assets 6,14 - 454,250
Current financial assets measured at fair value 6,14 60,736 -
Other current financial assets 6,8,9 407,716,765 408,190,478
Advance payments 406,590,563 377,993,013
Inventories 10 2,023,661,340 1,733,006,295
Biological assets 11 112,117,316 60,922,565
Other current assets 12 397,969,891 292,949,516
8,867,107,695 8,160,114,546
Non-current assets held-for-sale 13 2,246,600 173,138,454
Non-current assets
Non-current derivative assets 6,9 50,590,991 34,219,123
Long-term trade receivables 6,8 112,774,200 75,340,546
Long-term contract assets 29 39,258,788 -
Available-for-sale financial assets 6,14 - 283,894,352
Financial assets measured at fair value 6,14 277,552,729 -
Investments in joint ventures and associates 15 1,455,418,664 1,366,045,956
Property, plant and equipment 16 12,970,204,923 11,492,884,161
Intangible assets 17 6,168,778,156 6,039,033,206
Investment properties 18 260,091,195 271,916,531
Other non-current financial assets 6,8,9 717,404,670 632,803,777
Deferred tax assets 22 288,900,689 310,654,725
Other non-current assets 12 519,219,348 485,337,687
22,860,194,353 20,992,130,064
Total assets 31,729,548,648 29,325,383,064
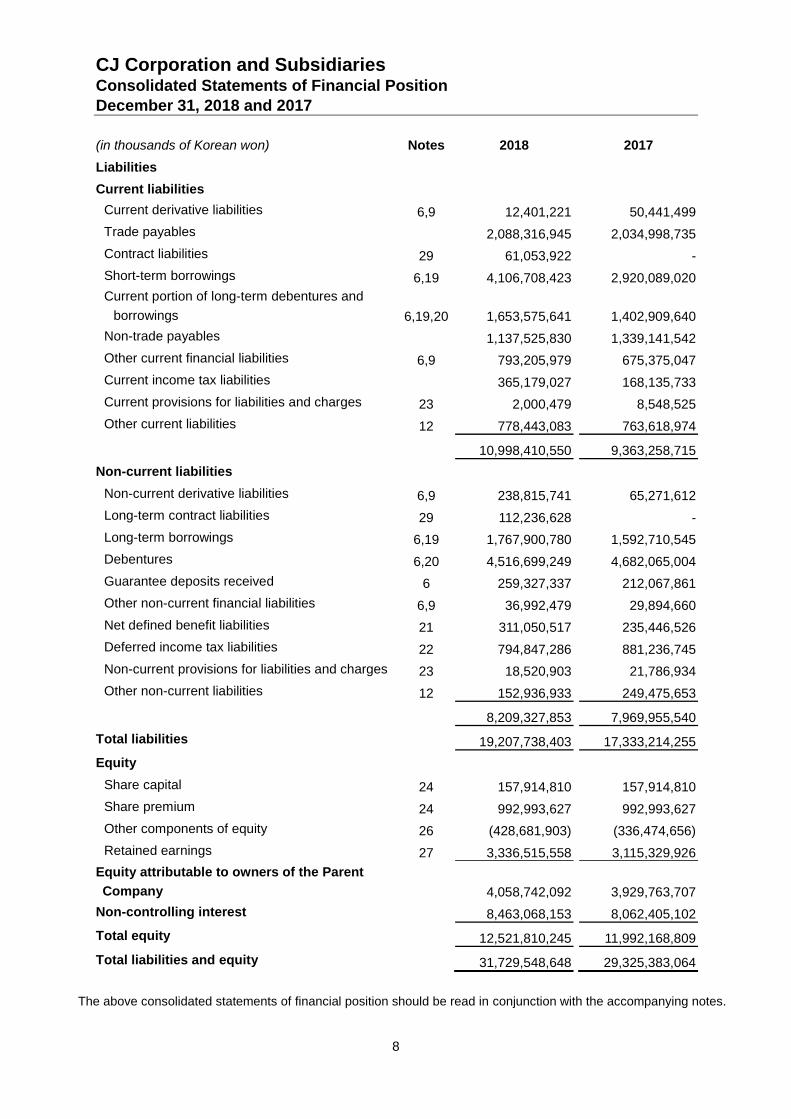
CJ Corporation and Subsidiaries Consolidated Statements of Financial Position December 31, 2018 and 2017
8
(in thousands of Korean won) Notes 2018
2017
Liabilities
Current liabilities
Current derivative liabilities 6,9 12,401,221 50,441,499
Trade payables 2,088,316,945 2,034,998,735
Contract liabilities 29 61,053,922 -
Short-term borrowings 6,19 4,106,708,423 2,920,089,020
Current portion of long-term debentures and
borrowings 6,19,20 1,653,575,641 1,402,909,640
Non-trade payables 1,137,525,830 1,339,141,542
Other current financial liabilities 6,9 793,205,979 675,375,047
Current income tax liabilities 365,179,027 168,135,733
Current provisions for liabilities and charges 23 2,000,479 8,548,525
Other current liabilities 12 778,443,083 763,618,974
10,998,410,550 9,363,258,715
Non-current liabilities
Non-current derivative liabilities 6,9 238,815,741 65,271,612
Long-term contract liabilities 29 112,236,628 -
Long-term borrowings 6,19 1,767,900,780 1,592,710,545
Debentures 6,20 4,516,699,249 4,682,065,004
Guarantee deposits received 6 259,327,337 212,067,861
Other non-current financial liabilities 6,9 36,992,479 29,894,660
Net defined benefit liabilities 21 311,050,517 235,446,526
Deferred income tax liabilities 22 794,847,286 881,236,745
Non-current provisions for liabilities and charges 23 18,520,903 21,786,934
Other non-current liabilities 12 152,936,933 249,475,653
8,209,327,853 7,969,955,540
Total liabilities 19,207,738,403 17,333,214,255
Equity
Share capital 24 157,914,810 157,914,810
Share premium 24 992,993,627 992,993,627
Other components of equity 26 (428,681,903) (336,474,656)
Retained earnings 27 3,336,515,558 3,115,329,926
Equity attributable to owners of the Parent
Company
4,058,742,092 3,929,763,707
Non-controlling interest 8,463,068,153 8,062,405,102
Total equity 12,521,810,245 11,992,168,809
Total liabilities and equity 31,729,548,648 29,325,383,064
The above consolidated statements of financial position should be read in conjunction with the accompanying notes.
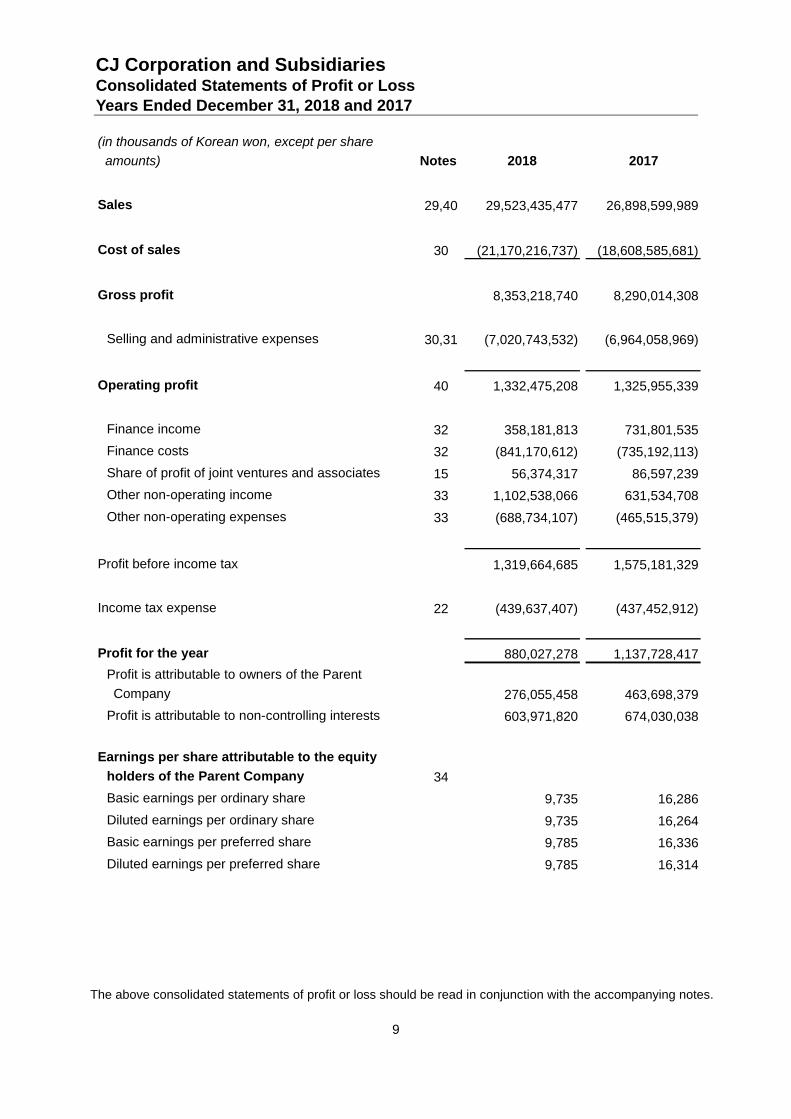
CJ Corporation and Subsidiaries Consolidated Statements of Profit or Loss Years Ended December 31, 2018 and 2017
9
(in thousands of Korean won, except per share
amounts) Notes 2018
2017
Sales 29,40 29,523,435,477 26,898,599,989
Cost of sales 30 (21,170,216,737) (18,608,585,681)
Gross profit 8,353,218,740 8,290,014,308
Selling and administrative expenses 30,31 (7,020,743,532) (6,964,058,969)
Operating profit 40 1,332,475,208 1,325,955,339
Finance income 32 358,181,813 731,801,535
Finance costs 32 (841,170,612) (735,192,113)
Share of profit of joint ventures and associates 15 56,374,317 86,597,239
Other non-operating income 33 1,102,538,066 631,534,708
Other non-operating expenses 33 (688,734,107) (465,515,379)
Profit before income tax 1,319,664,685 1,575,181,329
Income tax expense 22 (439,637,407) (437,452,912)
Profit for the year 880,027,278 1,137,728,417
Profit is attributable to owners of the Parent
Company 276,055,458 463,698,379
Profit is attributable to non-controlling interests
603,971,820
674,030,038
Earnings per share attributable to the equity
holders of the Parent Company 34
Basic earnings per ordinary share
9,735
16,286
Diluted earnings per ordinary share 9,735 16,264
Basic earnings per preferred share
9,785 16,336
Diluted earnings per preferred share
9,785 16,314
The above consolidated statements of profit or loss should be read in conjunction with the accompanying notes.
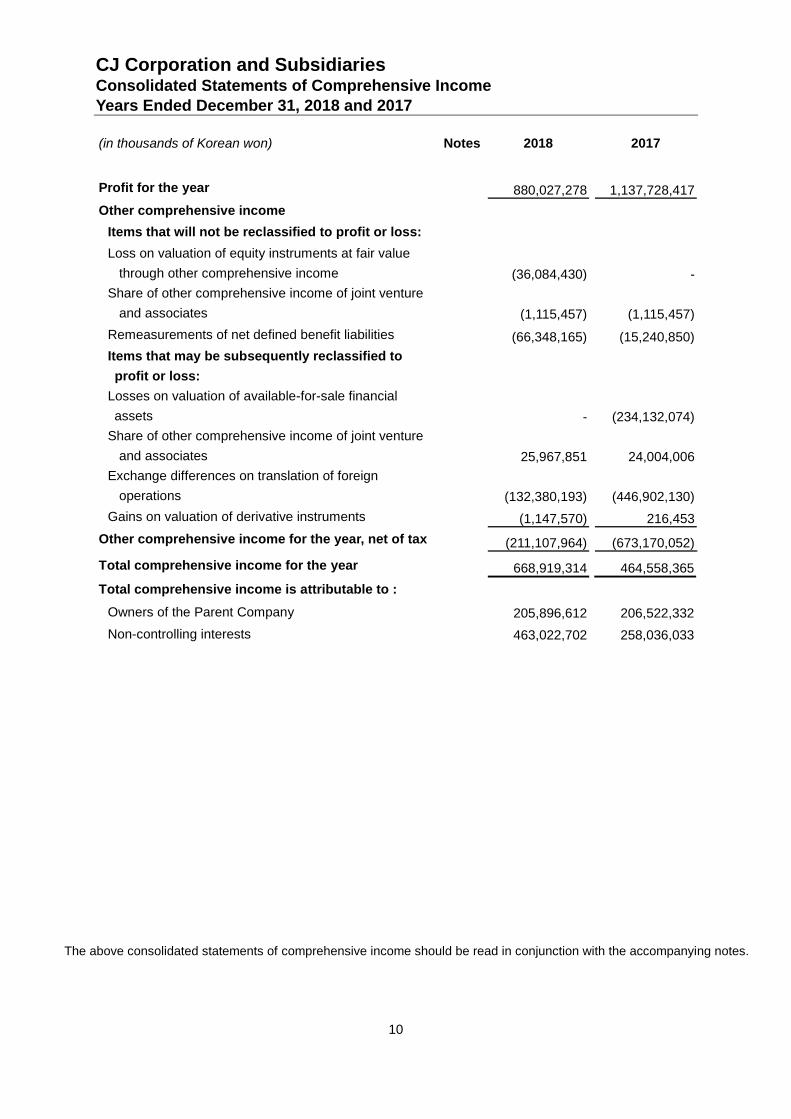
CJ Corporation and Subsidiaries Consolidated Statements of Comprehensive Income Years Ended December 31, 2018 and 2017
10
(in thousands of Korean won) Notes 2018
2017
Profit for the year
880,027,278 1,137,728,417
Other comprehensive income
Items that will not be reclassified to profit or loss:
Loss on valuation of equity instruments at fair value
through other comprehensive income
(36,084,430) -
Share of other comprehensive income of joint venture
and associates
(1,115,457) (1,115,457)
Remeasurements of net defined benefit liabilities (66,348,165) (15,240,850)
Items that may be subsequently reclassified to
profit or loss:
Losses on valuation of available-for-sale financial
assets
- (234,132,074)
Share of other comprehensive income of joint venture
and associates
25,967,851 24,004,006
Exchange differences on translation of foreign
operations
(132,380,193) (446,902,130)
Gains on valuation of derivative instruments (1,147,570) 216,453
Other comprehensive income for the year, net of tax (211,107,964) (673,170,052)
Total comprehensive income for the year 668,919,314 464,558,365
Total comprehensive income is attributable to :
Owners of the Parent Company 205,896,612 206,522,332
Non-controlling interests 463,022,702 258,036,033
The above consolidated statements of comprehensive income should be read in conjunction with the accompanying notes.
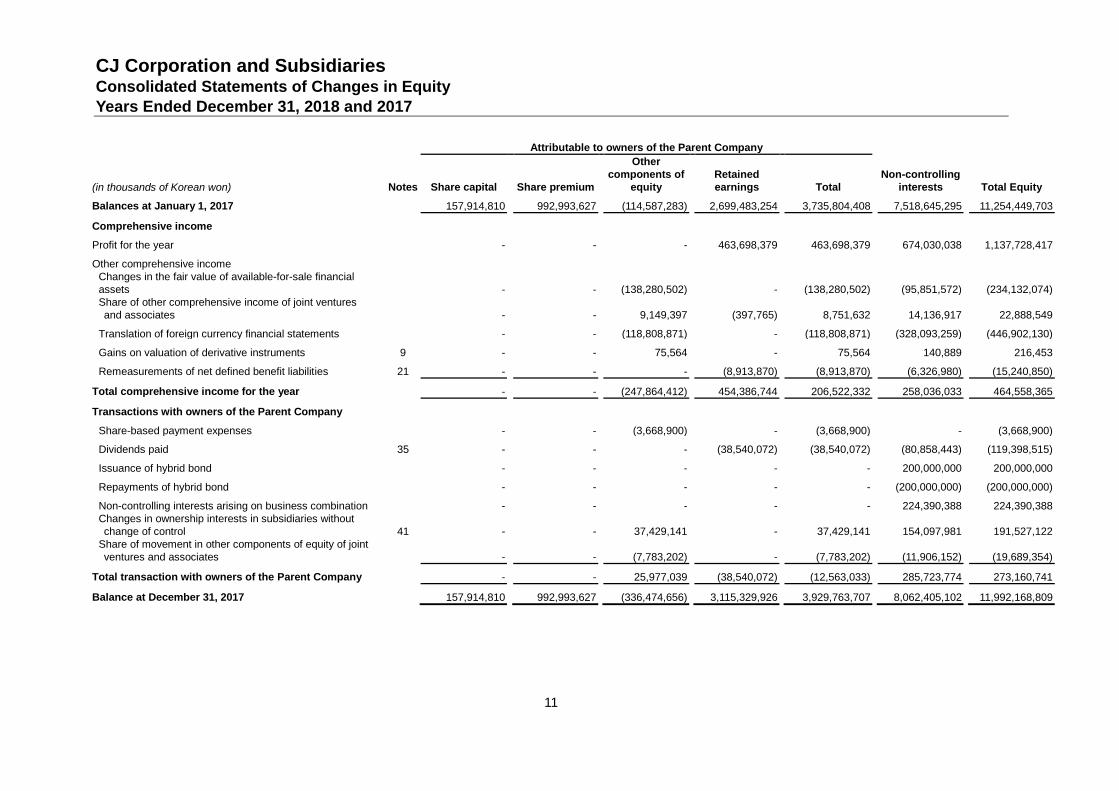
CJ Corporation and Subsidiaries Consolidated Statements of Changes in Equity Years Ended December 31, 2018 and 2017
11
Attributable to owners of the Parent Company
Non-controlling
interests
Total Equity (in thousands of Korean won) Notes Share capital
Share premium
Other
components of
equity
Retained
earnings
Total
Balances at January 1, 2017
157,914,810 992,993,627 (114,587,283) 2,699,483,254 3,735,804,408 7,518,645,295 11,254,449,703
Comprehensive income
Profit for the year - - - 463,698,379 463,698,379 674,030,038 1,137,728,417
Other comprehensive income
Changes in the fair value of available-for-sale financial
assets - - (138,280,502) - (138,280,502) (95,851,572) (234,132,074)
Share of other comprehensive income of joint ventures
and associates
- - 9,149,397 (397,765) 8,751,632 14,136,917 22,888,549
Translation of foreign currency financial statements - - (118,808,871) - (118,808,871) (328,093,259) (446,902,130)
Gains on valuation of derivative instruments 9 -
- 75,564 - 75,564 140,889 216,453
Remeasurements of net defined benefit liabilities 21 - - - (8,913,870) (8,913,870) (6,326,980) (15,240,850)
Total comprehensive income for the year - - (247,864,412) 454,386,744 206,522,332 258,036,033 464,558,365
Transactions with owners of the Parent Company
Share-based payment expenses - - (3,668,900) - (3,668,900) - (3,668,900)
Dividends paid 35 - - - (38,540,072) (38,540,072) (80,858,443) (119,398,515)
Issuance of hybrid bond - - - - - 200,000,000 200,000,000
Repayments of hybrid bond - - - - - (200,000,000) (200,000,000)
Non-controlling interests arising on business combination - - - - - 224,390,388 224,390,388
Changes in ownership interests in subsidiaries without
change of control 41 - - 37,429,141 - 37,429,141 154,097,981 191,527,122
Share of movement in other components of equity of joint
ventures and associates - - (7,783,202) - (7,783,202) (11,906,152) (19,689,354)
Total transaction with owners of the Parent Company - - 25,977,039 (38,540,072) (12,563,033) 285,723,774 273,160,741
Balance at December 31, 2017
157,914,810 992,993,627 (336,474,656) 3,115,329,926 3,929,763,707 8,062,405,102 11,992,168,809
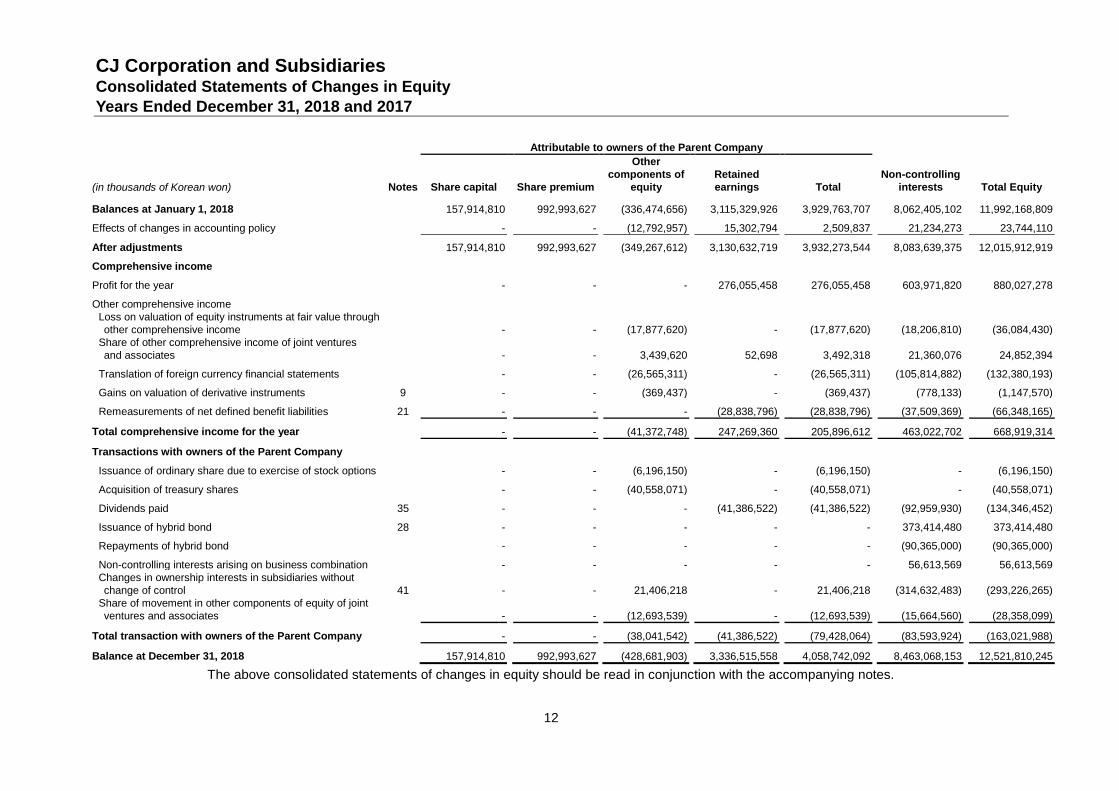
CJ Corporation and Subsidiaries Consolidated Statements of Changes in Equity Years Ended December 31, 2018 and 2017
12
Attributable to owners of the Parent Company
Non-controlling
interests
Total Equity (in thousands of Korean won) Notes Share capital
Share premium
Other
components of
equity
Retained
earnings
Total
Balances at January 1, 2018
157,914,810 992,993,627 (336,474,656) 3,115,329,926 3,929,763,707 8,062,405,102 11,992,168,809
Effects of changes in accounting policy - - (12,792,957) 15,302,794 2,509,837 21,234,273 23,744,110
After adjustments 157,914,810 992,993,627 (349,267,612) 3,130,632,719 3,932,273,544 8,083,639,375 12,015,912,919
Comprehensive income
Profit for the year - - - 276,055,458 276,055,458 603,971,820 880,027,278
Other comprehensive income
Loss on valuation of equity instruments at fair value through
other comprehensive income - - (17,877,620) - (17,877,620) (18,206,810) (36,084,430)
Share of other comprehensive income of joint ventures
and associates
- - 3,439,620 52,698 3,492,318 21,360,076 24,852,394
Translation of foreign currency financial statements - - (26,565,311) - (26,565,311) (105,814,882) (132,380,193)
Gains on valuation of derivative instruments 9 -
- (369,437) - (369,437) (778,133) (1,147,570)
Remeasurements of net defined benefit liabilities 21 - - - (28,838,796) (28,838,796) (37,509,369) (66,348,165)
Total comprehensive income for the year - - (41,372,748) 247,269,360 205,896,612 463,022,702 668,919,314
Transactions with owners of the Parent Company
Issuance of ordinary share due to exercise of stock options - - (6,196,150) - (6,196,150) - (6,196,150)
Acquisition of treasury shares - - (40,558,071) - (40,558,071) - (40,558,071)
Dividends paid 35 - - - (41,386,522) (41,386,522) (92,959,930) (134,346,452)
Issuance of hybrid bond 28 - - - - - 373,414,480 373,414,480
Repayments of hybrid bond - - - - - (90,365,000) (90,365,000)
Non-controlling interests arising on business combination - - - - - 56,613,569 56,613,569
Changes in ownership interests in subsidiaries without
change of control 41 - - 21,406,218 - 21,406,218 (314,632,483) (293,226,265)
Share of movement in other components of equity of joint
ventures and associates - - (12,693,539) - (12,693,539) (15,664,560) (28,358,099)
Total transaction with owners of the Parent Company - - (38,041,542) (41,386,522) (79,428,064) (83,593,924) (163,021,988)
Balance at December 31, 2018
157,914,810 992,993,627 (428,681,903) 3,336,515,558 4,058,742,092 8,463,068,153 12,521,810,245
The above consolidated statements of changes in equity should be read in conjunction with the accompanying notes.
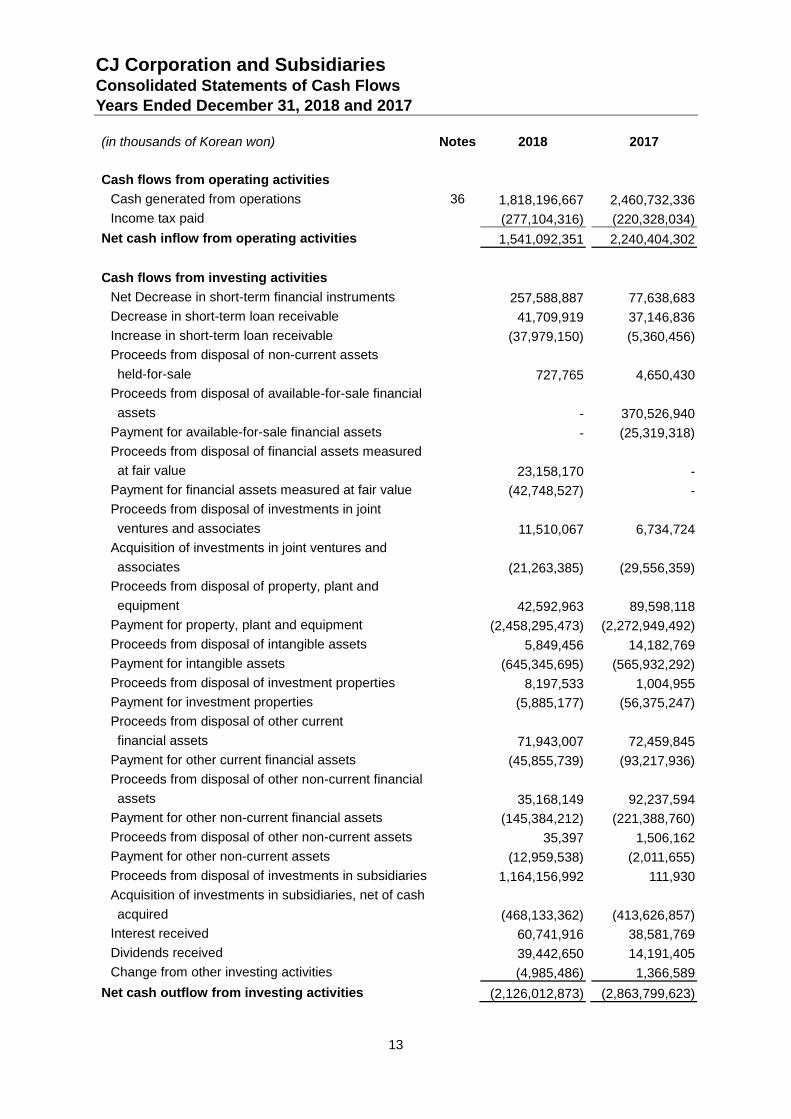
CJ Corporation and Subsidiaries Consolidated Statements of Cash Flows Years Ended December 31, 2018 and 2017
13
(in thousands of Korean won) Notes 2018
2017
Cash flows from operating activities
Cash generated from operations 36 1,818,196,667 2,460,732,336
Income tax paid (277,104,316) (220,328,034)
Net cash inflow from operating activities
1,541,092,351 2,240,404,302
Cash flows from investing activities
Net Decrease in short-term financial instruments
257,588,887 77,638,683
Decrease in short-term loan receivable
41,709,919 37,146,836
Increase in short-term loan receivable
(37,979,150) (5,360,456)
Proceeds from disposal of non-current assets
held-for-sale
727,765 4,650,430
Proceeds from disposal of available-for-sale financial
assets - 370,526,940
Payment for available-for-sale financial assets -
(25,319,318)
Proceeds from disposal of financial assets measured
at fair value 23,158,170 -
Payment for financial assets measured at fair value (42,748,527) -
Proceeds from disposal of investments in joint
ventures and associates 11,510,067 6,734,724
Acquisition of investments in joint ventures and
associates (21,263,385) (29,556,359)
Proceeds from disposal of property, plant and
equipment 42,592,963 89,598,118
Payment for property, plant and equipment
(2,458,295,473) (2,272,949,492)
Proceeds from disposal of intangible assets
5,849,456 14,182,769
Payment for intangible assets
(645,345,695) (565,932,292)
Proceeds from disposal of investment properties
8,197,533 1,004,955
Payment for investment properties
(5,885,177) (56,375,247)
Proceeds from disposal of other current
financial assets 71,943,007 72,459,845
Payment for other current financial assets
(45,855,739) (93,217,936)
Proceeds from disposal of other non-current financial
assets 35,168,149 92,237,594
Payment for other non-current financial assets (145,384,212) (221,388,760)
Proceeds from disposal of other non-current assets 35,397 1,506,162
Payment for other non-current assets (12,959,538) (2,011,655)
Proceeds from disposal of investments in subsidiaries 1,164,156,992 111,930
Acquisition of investments in subsidiaries, net of cash
acquired (468,133,362) (413,626,857)
Interest received 60,741,916 38,581,769
Dividends received 39,442,650 14,191,405
Change from other investing activities
(4,985,486) 1,366,589
Net cash outflow from investing activities (2,126,012,873) (2,863,799,623)
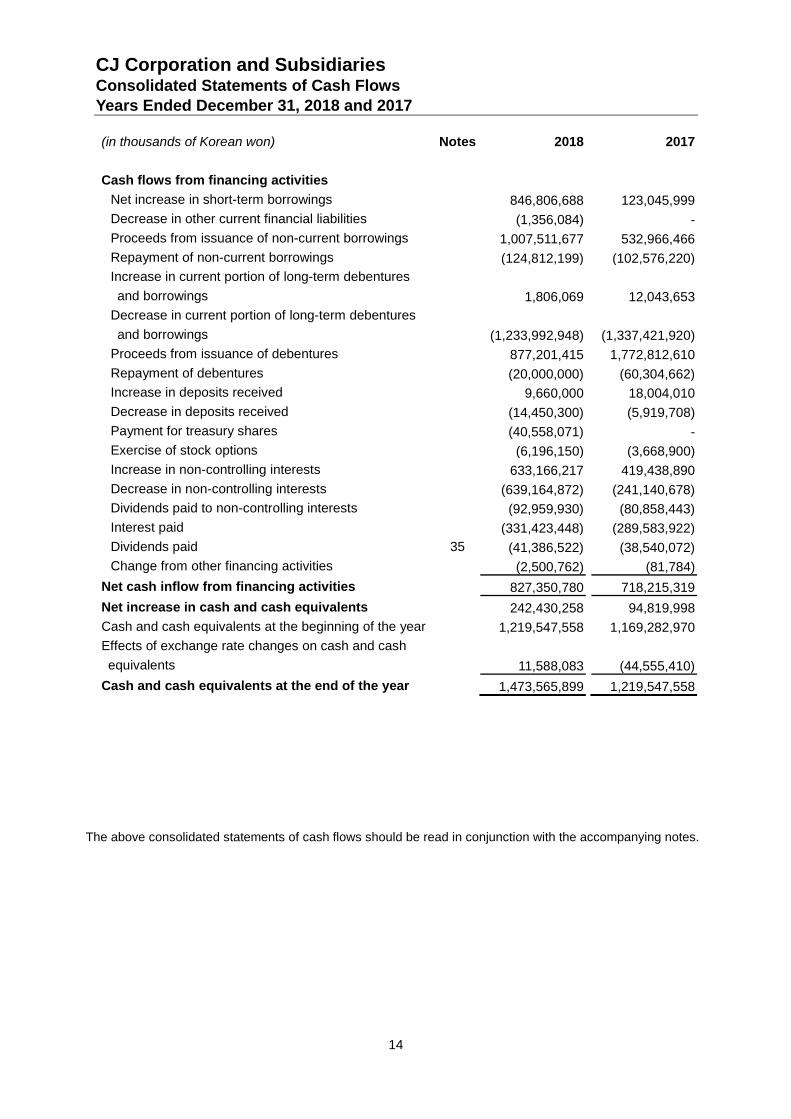
CJ Corporation and Subsidiaries Consolidated Statements of Cash Flows Years Ended December 31, 2018 and 2017
14
(in thousands of Korean won) Notes 2018 2017
Cash flows from financing activities
Net increase in short-term borrowings
846,806,688 123,045,999
Decrease in other current financial liabilities (1,356,084) -
Proceeds from issuance of non-current borrowings 1,007,511,677 532,966,466
Repayment of non-current borrowings (124,812,199) (102,576,220)
Increase in current portion of long-term debentures
and borrowings 1,806,069 12,043,653
Decrease in current portion of long-term debentures
and borrowings
(1,233,992,948) (1,337,421,920)
Proceeds from issuance of debentures
877,201,415 1,772,812,610
Repayment of debentures
(20,000,000) (60,304,662)
Increase in deposits received
9,660,000 18,004,010
Decrease in deposits received
(14,450,300) (5,919,708)
Payment for treasury shares (40,558,071) -
Exercise of stock options
(6,196,150) (3,668,900)
Increase in non-controlling interests
633,166,217 419,438,890
Decrease in non-controlling interests
(639,164,872) (241,140,678)
Dividends paid to non-controlling interests (92,959,930) (80,858,443)
Interest paid (331,423,448) (289,583,922)
Dividends paid 35 (41,386,522) (38,540,072)
Change from other financing activities
(2,500,762) (81,784)
Net cash inflow from financing activities
827,350,780 718,215,319
Net increase in cash and cash equivalents
242,430,258 94,819,998
Cash and cash equivalents at the beginning of the year
1,219,547,558 1,169,282,970
Effects of exchange rate changes on cash and cash
equivalents
11,588,083 (44,555,410)
Cash and cash equivalents at the end of the year
1,473,565,899 1,219,547,558
The above consolidated statements of cash flows should be read in conjunction with the accompanying notes.
CJ Corporation and Subsidiaries Notes to the Consolidated Financial Statements December 31, 2018 and 2017
15
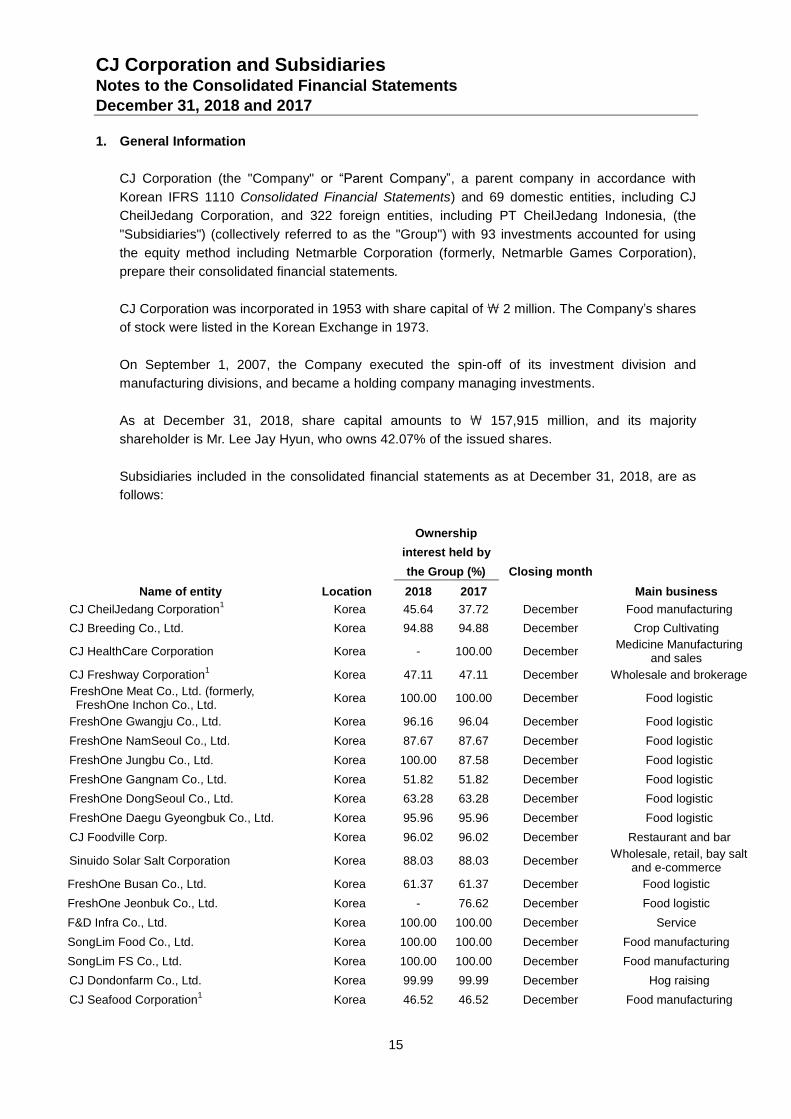
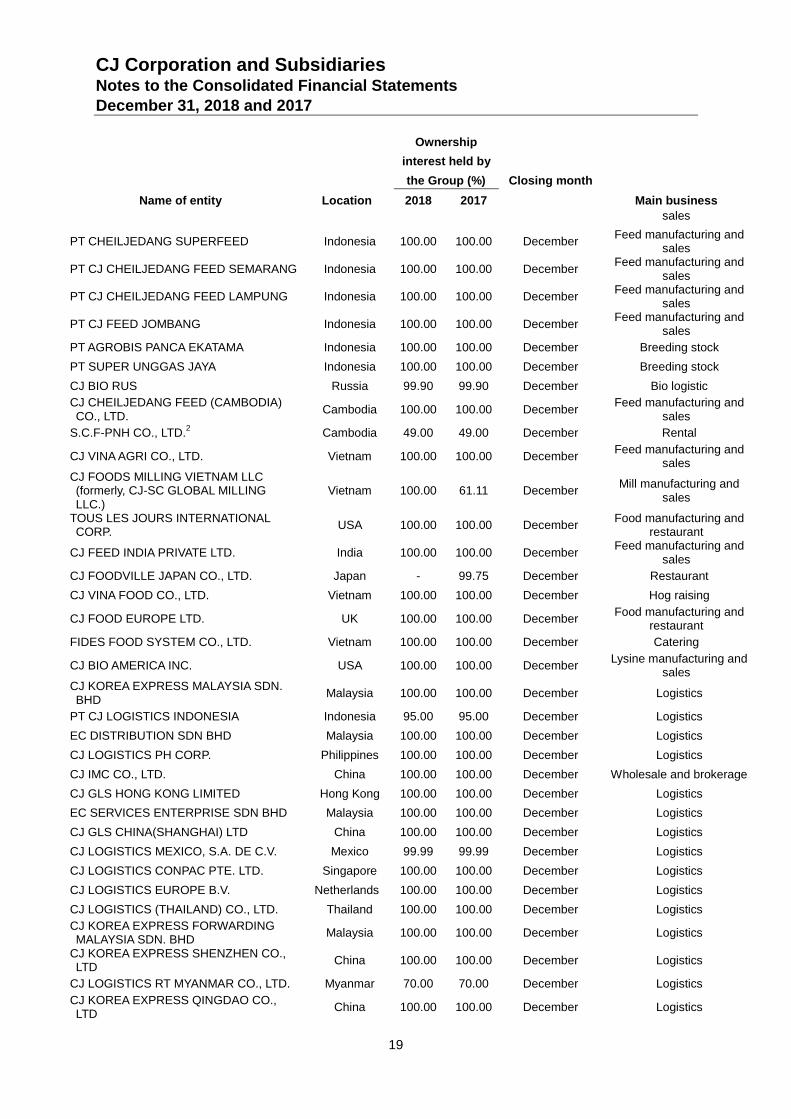
1. General Information
CJ Corporation (the "Company" or “Parent Company”, a parent company in accordance with
Korean IFRS 1110 Consolidated Financial Statements) and 69 domestic entities, including CJ
CheilJedang Corporation, and 322 foreign entities, including PT CheilJedang Indonesia, (the
"Subsidiaries") (collectively referred to as the "Group") with 93 investments accounted for using
the equity method including Netmarble Corporation (formerly, Netmarble Games Corporation),
prepare their consolidated financial statements.
CJ Corporation was incorporated in 1953 with share capital of \ 2 million. The Company’s shares
of stock were listed in the Korean Exchange in 1973.
On September 1, 2007, the Company executed the spin-off of its investment division and
manufacturing divisions, and became a holding company managing investments.
As at December 31, 2018, share capital amounts to \ 157,915 million, and its majority
shareholder is Mr. Lee Jay Hyun, who owns 42.07% of the issued shares.
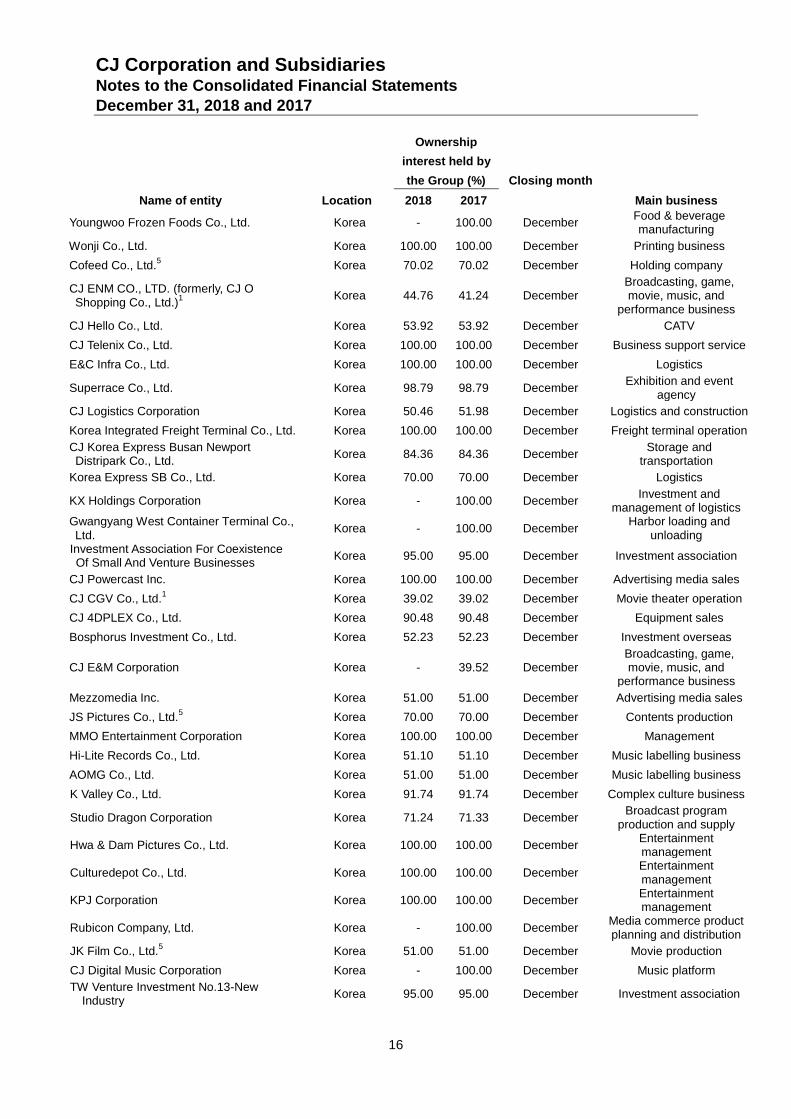
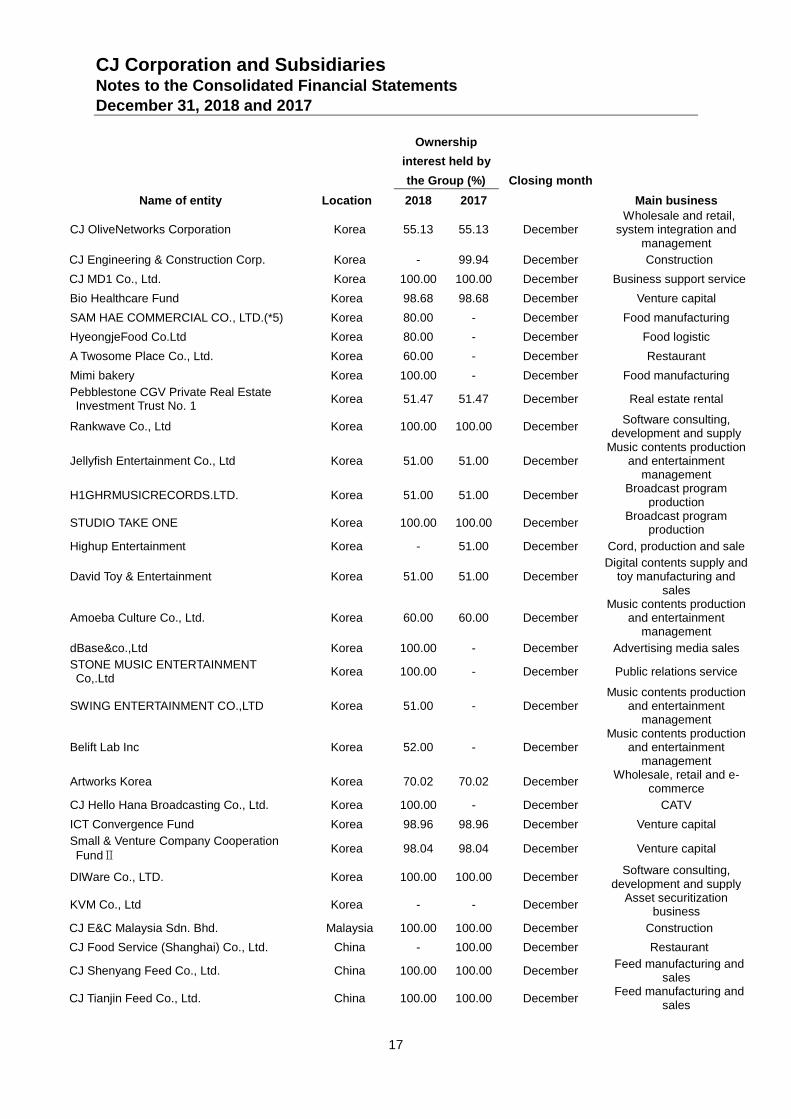
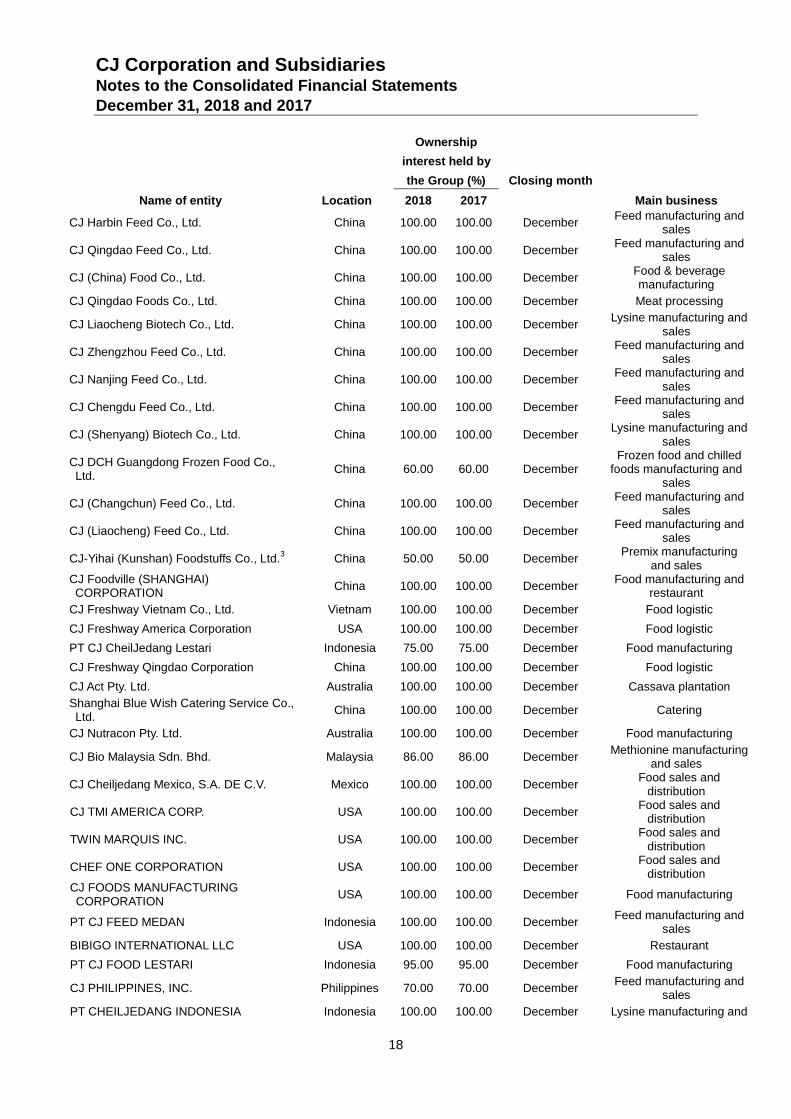
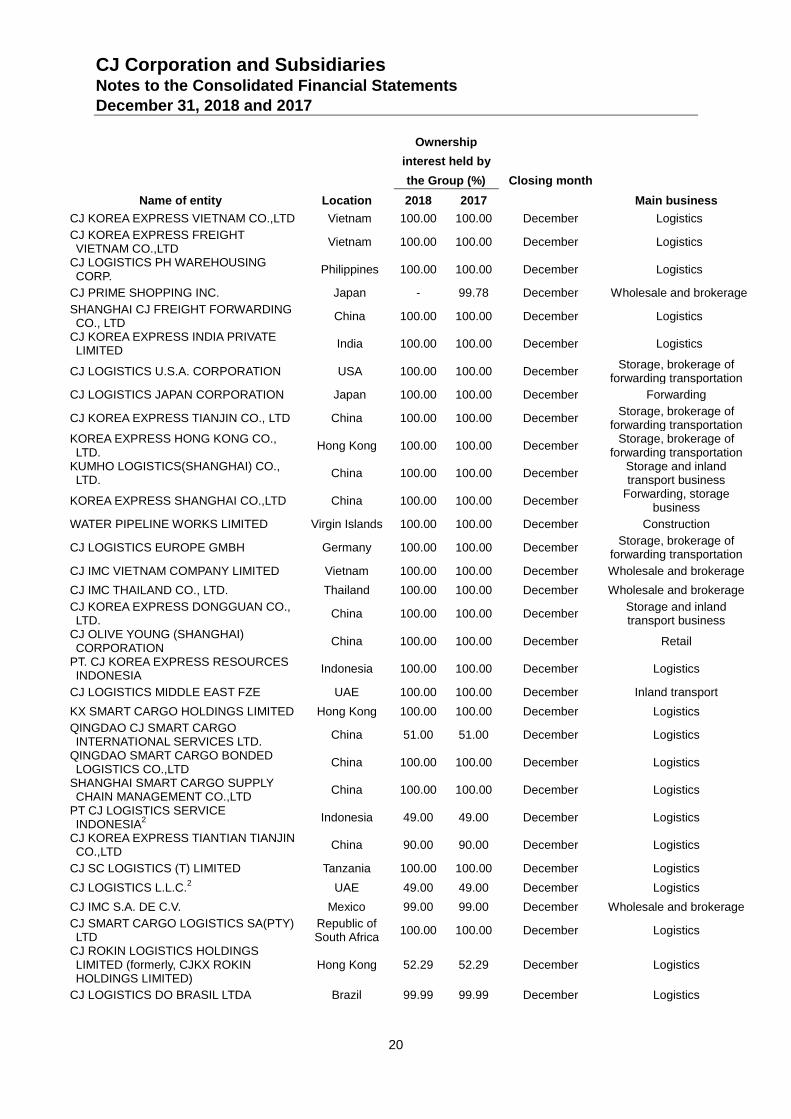
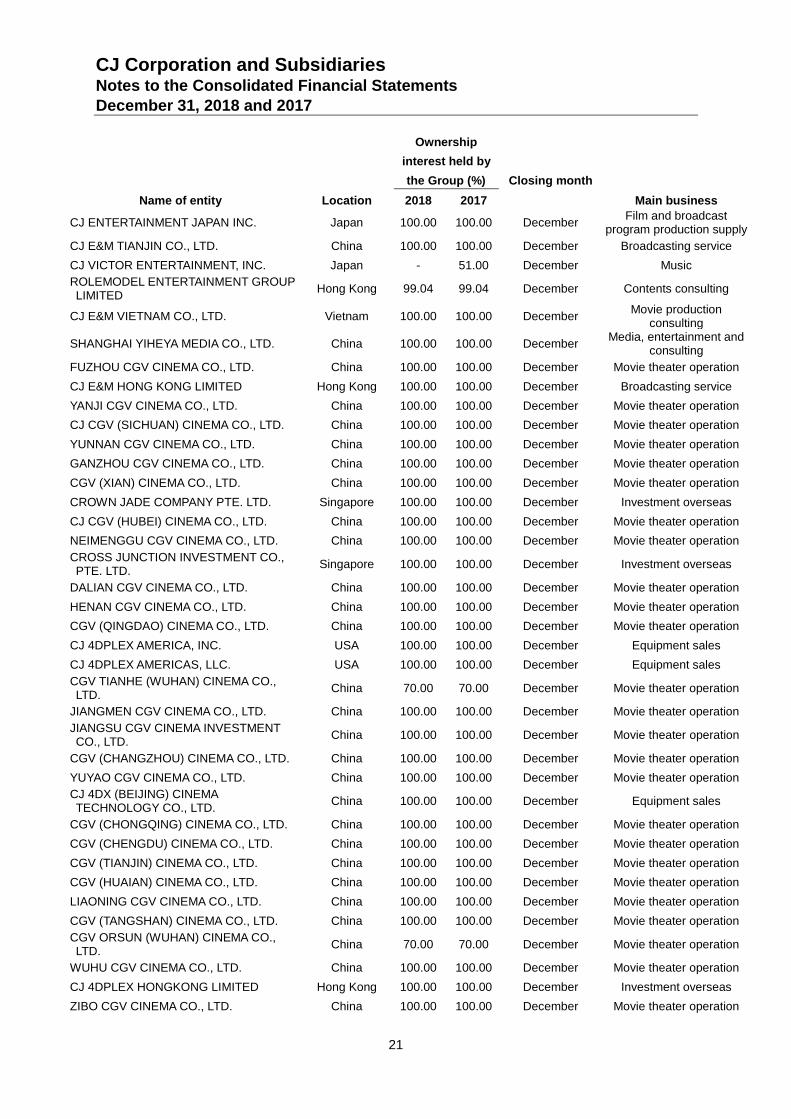
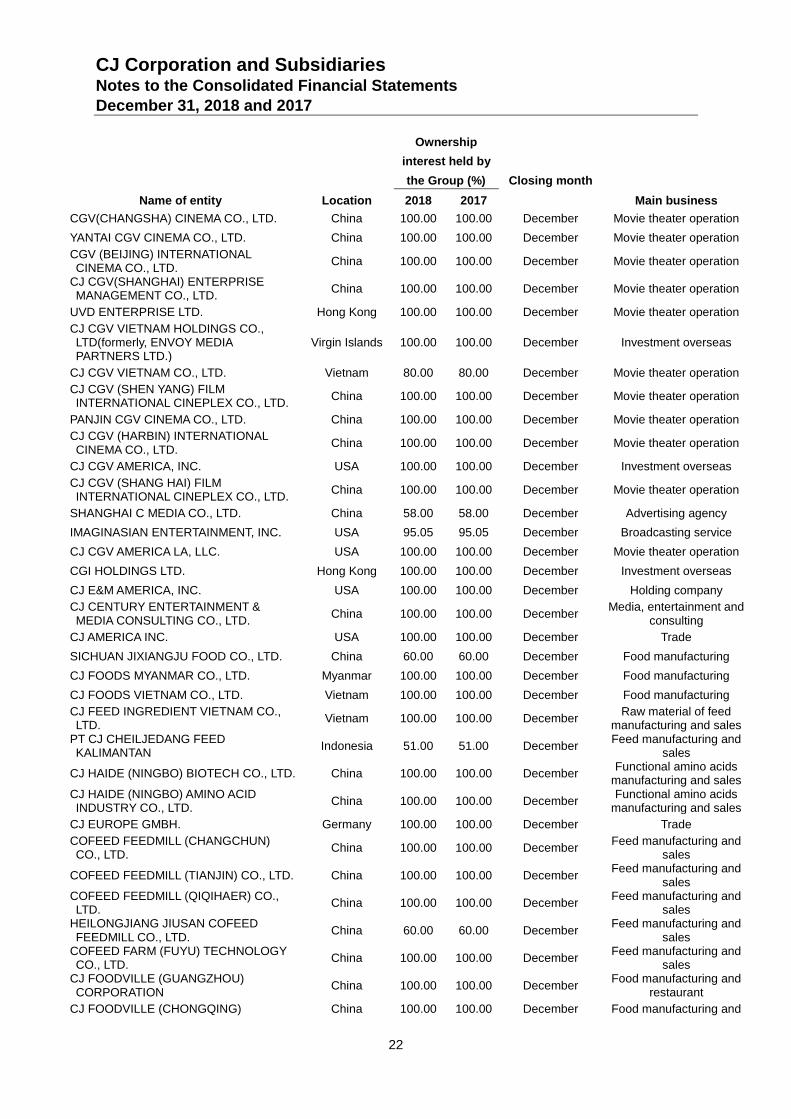
Subsidiaries included in the consolidated financial statements as at December 31, 2018, are as
follows:
Ownership
interest held by
the Group (%) Closing month
Name of entity Location 2018 2017 Main business
CJ CheilJedang Corporation1 Korea 45.64 37.72 December Food manufacturing
CJ Breeding Co., Ltd. Korea 94.88 94.88 December Crop Cultivating
CJ HealthCare Corporation Korea - 100.00 December Medicine Manufacturing
and sales
CJ Freshway Corporation1 Korea 47.11 47.11 December Wholesale and brokerage
FreshOne Meat Co., Ltd. (formerly, FreshOne Inchon Co., Ltd. Korea 100.00 100.00 December Food logistic
FreshOne Gwangju Co., Ltd. Korea 96.16 96.04 December Food logistic
FreshOne NamSeoul Co., Ltd. Korea 87.67 87.67 December Food logistic
FreshOne Jungbu Co., Ltd. Korea 100.00 87.58 December Food logistic
FreshOne Gangnam Co., Ltd. Korea 51.82 51.82 December Food logistic
FreshOne DongSeoul Co., Ltd. Korea 63.28 63.28 December Food logistic
FreshOne Daegu Gyeongbuk Co., Ltd. Korea 95.96 95.96 December Food logistic
CJ Foodville Corp. Korea 96.02 96.02 December Restaurant and bar
Sinuido Solar Salt Corporation Korea 88.03 88.03 December Wholesale, retail, bay salt
and e-commerce
FreshOne Busan Co., Ltd. Korea 61.37 61.37 December Food logistic
FreshOne Jeonbuk Co., Ltd. Korea - 76.62 December Food logistic
F&D Infra Co., Ltd. Korea 100.00 100.00 December Service
SongLim Food Co., Ltd. Korea 100.00 100.00 December Food manufacturing
SongLim FS Co., Ltd. Korea 100.00 100.00 December Food manufacturing
CJ Dondonfarm Co., Ltd. Korea 99.99 99.99 December Hog raising
CJ Seafood Corporation1 Korea 46.52 46.52 December Food manufacturing
CJ Corporation and Subsidiaries Notes to the Consolidated Financial Statements December 31, 2018 and 2017
16
Ownership
interest held by
the Group (%) Closing month
Name of entity Location 2018 2017 Main business
Youngwoo Frozen Foods Co., Ltd. Korea - 100.00 December Food & beverage
manufacturing
Wonji Co., Ltd. Korea 100.00 100.00 December Printing business
Cofeed Co., Ltd.5
Korea 70.02 70.02 December Holding company
CJ ENM CO., LTD. (formerly, CJ O Shopping Co., Ltd.)
1
Korea
44.76 41.24
December
Broadcasting, game, movie, music, and
performance business
CJ Hello Co., Ltd. Korea 53.92 53.92 December CATV
CJ Telenix Co., Ltd. Korea 100.00 100.00 December Business support service
E&C Infra Co., Ltd. Korea 100.00 100.00 December Logistics
Superrace Co., Ltd. Korea 98.79 98.79 December Exhibition and event
agency
CJ Logistics Corporation Korea 50.46 51.98 December Logistics and construction
Korea Integrated Freight Terminal Co., Ltd. Korea 100.00 100.00 December Freight terminal operation
CJ Korea Express Busan Newport Distripark Co., Ltd. Korea 84.36 84.36 December
Storage and transportation
Korea Express SB Co., Ltd. Korea 70.00 70.00 December Logistics
KX Holdings Corporation Korea - 100.00 December Investment and
management of logistics Gwangyang West Container Terminal Co.,
Ltd. Korea - 100.00 December Harbor loading and
unloading Investment Association For Coexistence Of Small And Venture Businesses Korea 95.00 95.00 December Investment association
CJ Powercast Inc. Korea 100.00 100.00 December Advertising media sales
CJ CGV Co., Ltd.1 Korea 39.02 39.02 December Movie theater operation
CJ 4DPLEX Co., Ltd. Korea 90.48 90.48 December Equipment sales
Bosphorus Investment Co., Ltd. Korea 52.23 52.23 December Investment overseas
CJ E&M Corporation
Korea
- 39.52
December
Broadcasting, game, movie, music, and
performance business
Mezzomedia Inc. Korea 51.00 51.00 December Advertising media sales
JS Pictures Co., Ltd.5 Korea 70.00 70.00 December Contents production
MMO Entertainment Corporation Korea 100.00 100.00 December Management
Hi-Lite Records Co., Ltd. Korea 51.10 51.10 December Music labelling business
AOMG Co., Ltd. Korea 51.00 51.00 December Music labelling business
K Valley Co., Ltd. Korea 91.74 91.74 December Complex culture business
Studio Dragon Corporation Korea 71.24 71.33 December Broadcast program
production and supply
Hwa & Dam Pictures Co., Ltd. Korea 100.00 100.00 December Entertainment management
Culturedepot Co., Ltd. Korea 100.00 100.00 December Entertainment management
KPJ Corporation Korea 100.00 100.00 December Entertainment management
Rubicon Company, Ltd. Korea - 100.00 December Media commerce product planning and distribution
JK Film Co., Ltd.5
Korea 51.00 51.00 December Movie production
CJ Digital Music Corporation Korea - 100.00 December Music platform
TW Venture Investment No.13-New Industry Korea 95.00 95.00 December Investment association
CJ Corporation and Subsidiaries Notes to the Consolidated Financial Statements December 31, 2018 and 2017
17
Ownership
interest held by
the Group (%) Closing month
Name of entity Location 2018 2017 Main business
CJ OliveNetworks Corporation
Korea
55.13 55.13
December
Wholesale and retail, system integration and
management
CJ Engineering & Construction Corp. Korea - 99.94 December Construction
CJ MD1 Co., Ltd. Korea 100.00 100.00 December Business support service
Bio Healthcare Fund Korea 98.68 98.68 December Venture capital
SAM HAE COMMERCIAL CO., LTD.(*5) Korea 80.00 - December Food manufacturing
HyeongjeFood Co.Ltd Korea 80.00 - December Food logistic
A Twosome Place Co., Ltd. Korea 60.00 - December Restaurant
Mimi bakery Korea 100.00 - December Food manufacturing
Pebblestone CGV Private Real Estate Investment Trust No. 1 Korea 51.47 51.47 December Real estate rental
Rankwave Co., Ltd Korea 100.00 100.00 December Software consulting,
development and supply
Jellyfish Entertainment Co., Ltd Korea 51.00 51.00 December
Music contents production and entertainment
management
H1GHRMUSICRECORDS.LTD. Korea 51.00 51.00 December Broadcast program
production
STUDIO TAKE ONE Korea 100.00 100.00 December Broadcast program
production
Highup Entertainment Korea - 51.00 December Cord, production and sale
David Toy & Entertainment Korea 51.00 51.00 December
Digital contents supply and toy manufacturing and
sales
Amoeba Culture Co., Ltd. Korea 60.00 60.00 December
Music contents production and entertainment
management
dBase&co.,Ltd Korea 100.00 - December Advertising media sales
STONE MUSIC ENTERTAINMENT Co,.Ltd Korea 100.00 - December Public relations service
SWING ENTERTAINMENT CO.,LTD Korea 51.00 - December
Music contents production and entertainment
management
Belift Lab Inc Korea 52.00 - December
Music contents production and entertainment
management
Artworks Korea Korea 70.02 70.02 December Wholesale, retail and e-
commerce
CJ Hello Hana Broadcasting Co., Ltd. Korea 100.00 - December CATV
ICT Convergence Fund Korea 98.96 98.96 December Venture capital
Small & Venture Company Cooperation
FundⅡ Korea 98.04 98.04 December Venture capital
DIWare Co., LTD. Korea 100.00 100.00 December Software consulting,
development and supply
KVM Co., Ltd Korea - - December Asset securitization
business
CJ E&C Malaysia Sdn. Bhd. Malaysia 100.00 100.00 December Construction
CJ Food Service (Shanghai) Co., Ltd. China - 100.00 December Restaurant
CJ Shenyang Feed Co., Ltd. China 100.00 100.00 December Feed manufacturing and
sales
CJ Tianjin Feed Co., Ltd. China 100.00 100.00 December Feed manufacturing and
sales
CJ Corporation and Subsidiaries Notes to the Consolidated Financial Statements December 31, 2018 and 2017
18
Ownership
interest held by
the Group (%) Closing month
Name of entity Location 2018 2017 Main business
CJ Harbin Feed Co., Ltd. China 100.00 100.00 December Feed manufacturing and
sales
CJ Qingdao Feed Co., Ltd. China 100.00 100.00 December Feed manufacturing and
sales
CJ (China) Food Co., Ltd. China 100.00 100.00 December Food & beverage
manufacturing
CJ Qingdao Foods Co., Ltd. China 100.00 100.00 December Meat processing
CJ Liaocheng Biotech Co., Ltd. China 100.00 100.00 December Lysine manufacturing and
sales
CJ Zhengzhou Feed Co., Ltd. China 100.00 100.00 December Feed manufacturing and
sales
CJ Nanjing Feed Co., Ltd. China 100.00 100.00 December Feed manufacturing and
sales
CJ Chengdu Feed Co., Ltd. China 100.00 100.00 December Feed manufacturing and
sales
CJ (Shenyang) Biotech Co., Ltd. China 100.00 100.00 December Lysine manufacturing and
sales
CJ DCH Guangdong Frozen Food Co., Ltd.
China
60.00 60.00
December
Frozen food and chilled foods manufacturing and
sales
CJ (Changchun) Feed Co., Ltd. China 100.00 100.00 December Feed manufacturing and
sales
CJ (Liaocheng) Feed Co., Ltd. China 100.00 100.00 December Feed manufacturing and
sales
CJ-Yihai (Kunshan) Foodstuffs Co., Ltd.3 China 50.00 50.00 December
Premix manufacturing and sales
CJ Foodville (SHANGHAI) CORPORATION China 100.00 100.00 December
Food manufacturing and restaurant
CJ Freshway Vietnam Co., Ltd. Vietnam 100.00 100.00 December Food logistic
CJ Freshway America Corporation USA 100.00 100.00 December Food logistic
PT CJ CheilJedang Lestari Indonesia 75.00 75.00 December Food manufacturing
CJ Freshway Qingdao Corporation China 100.00 100.00 December Food logistic
CJ Act Pty. Ltd. Australia 100.00 100.00 December Cassava plantation
Shanghai Blue Wish Catering Service Co., Ltd. China 100.00 100.00 December Catering
CJ Nutracon Pty. Ltd. Australia 100.00 100.00 December Food manufacturing
CJ Bio Malaysia Sdn. Bhd. Malaysia 86.00 86.00 December Methionine manufacturing
and sales
CJ Cheiljedang Mexico, S.A. DE C.V. Mexico 100.00 100.00 December Food sales and
distribution
CJ TMI AMERICA CORP. USA 100.00 100.00 December Food sales and
distribution
TWIN MARQUIS INC. USA 100.00 100.00 December Food sales and
distribution
CHEF ONE CORPORATION
USA
100.00 100.00
December
Food sales and distribution
CJ FOODS MANUFACTURING CORPORATION USA 100.00 100.00 December Food manufacturing
PT CJ FEED MEDAN Indonesia 100.00 100.00 December Feed manufacturing and
sales
BIBIGO INTERNATIONAL LLC USA 100.00 100.00 December Restaurant
PT CJ FOOD LESTARI Indonesia 95.00 95.00 December Food manufacturing
CJ PHILIPPINES, INC. Philippines 70.00 70.00 December Feed manufacturing and
sales
PT CHEILJEDANG INDONESIA Indonesia 100.00 100.00 December Lysine manufacturing and
CJ Corporation and Subsidiaries Notes to the Consolidated Financial Statements December 31, 2018 and 2017
19
Ownership
interest held by
the Group (%) Closing month
Name of entity Location 2018 2017 Main business
sales
PT CHEILJEDANG SUPERFEED Indonesia 100.00 100.00 December Feed manufacturing and
sales
PT CJ CHEILJEDANG FEED SEMARANG Indonesia 100.00 100.00 December Feed manufacturing and
sales
PT CJ CHEILJEDANG FEED LAMPUNG Indonesia 100.00 100.00 December Feed manufacturing and
sales
PT CJ FEED JOMBANG Indonesia 100.00 100.00 December Feed manufacturing and
sales
PT AGROBIS PANCA EKATAMA Indonesia 100.00 100.00 December Breeding stock
PT SUPER UNGGAS JAYA Indonesia 100.00 100.00 December Breeding stock
CJ BIO RUS Russia 99.90 99.90 December Bio logistic
CJ CHEILJEDANG FEED (CAMBODIA) CO., LTD. Cambodia 100.00 100.00 December
Feed manufacturing and sales
S.C.F-PNH CO., LTD.2 Cambodia 49.00 49.00 December Rental
CJ VINA AGRI CO., LTD. Vietnam 100.00 100.00 December Feed manufacturing and
sales CJ FOODS MILLING VIETNAM LLC (formerly, CJ-SC GLOBAL MILLING LLC.)
Vietnam
100.00 61.11
December
Mill manufacturing and sales
TOUS LES JOURS INTERNATIONAL CORP. USA 100.00 100.00 December
Food manufacturing and restaurant
CJ FEED INDIA PRIVATE LTD. India 100.00 100.00 December Feed manufacturing and
sales
CJ FOODVILLE JAPAN CO., LTD. Japan - 99.75 December Restaurant
CJ VINA FOOD CO., LTD. Vietnam 100.00 100.00 December Hog raising
CJ FOOD EUROPE LTD. UK 100.00 100.00 December Food manufacturing and
restaurant
FIDES FOOD SYSTEM CO., LTD. Vietnam 100.00 100.00 December Catering
CJ BIO AMERICA INC. USA 100.00 100.00 December Lysine manufacturing and
sales CJ KOREA EXPRESS MALAYSIA SDN. BHD Malaysia 100.00 100.00 December Logistics
PT CJ LOGISTICS INDONESIA Indonesia 95.00 95.00 December Logistics
EC DISTRIBUTION SDN BHD Malaysia 100.00 100.00 December Logistics
CJ LOGISTICS PH CORP. Philippines 100.00 100.00 December Logistics
CJ IMC CO., LTD. China 100.00 100.00 December Wholesale and brokerage
CJ GLS HONG KONG LIMITED Hong Kong 100.00 100.00 December Logistics
EC SERVICES ENTERPRISE SDN BHD Malaysia 100.00 100.00 December Logistics
CJ GLS CHINA(SHANGHAI) LTD China 100.00 100.00 December Logistics
CJ LOGISTICS MEXICO, S.A. DE C.V. Mexico 99.99 99.99 December Logistics
CJ LOGISTICS CONPAC PTE. LTD. Singapore 100.00 100.00 December Logistics
CJ LOGISTICS EUROPE B.V. Netherlands 100.00 100.00 December Logistics
CJ LOGISTICS (THAILAND) CO., LTD. Thailand 100.00 100.00 December Logistics
CJ KOREA EXPRESS FORWARDING MALAYSIA SDN. BHD Malaysia 100.00 100.00 December Logistics
CJ KOREA EXPRESS SHENZHEN CO., LTD China 100.00 100.00 December Logistics
CJ LOGISTICS RT MYANMAR CO., LTD. Myanmar 70.00 70.00 December Logistics
CJ KOREA EXPRESS QINGDAO CO., LTD China 100.00 100.00 December Logistics
CJ Corporation and Subsidiaries Notes to the Consolidated Financial Statements December 31, 2018 and 2017
20
Ownership
interest held by
the Group (%) Closing month
Name of entity Location 2018 2017 Main business
CJ KOREA EXPRESS VIETNAM CO.,LTD Vietnam 100.00 100.00 December Logistics
CJ KOREA EXPRESS FREIGHT VIETNAM CO.,LTD Vietnam 100.00 100.00 December Logistics
CJ LOGISTICS PH WAREHOUSING CORP. Philippines 100.00 100.00 December Logistics
CJ PRIME SHOPPING INC. Japan - 99.78 December Wholesale and brokerage
SHANGHAI CJ FREIGHT FORWARDING CO., LTD China 100.00 100.00 December Logistics
CJ KOREA EXPRESS INDIA PRIVATE LIMITED India 100.00 100.00 December Logistics
CJ LOGISTICS U.S.A. CORPORATION USA 100.00 100.00 December Storage, brokerage of
forwarding transportation
CJ LOGISTICS JAPAN CORPORATION Japan 100.00 100.00 December Forwarding
CJ KOREA EXPRESS TIANJIN CO., LTD China 100.00 100.00 December Storage, brokerage of
forwarding transportation KOREA EXPRESS HONG KONG CO., LTD. Hong Kong 100.00 100.00 December
Storage, brokerage of forwarding transportation
KUMHO LOGISTICS(SHANGHAI) CO., LTD. China 100.00 100.00 December
Storage and inland transport business
KOREA EXPRESS SHANGHAI CO.,LTD China 100.00 100.00 December Forwarding, storage
business
WATER PIPELINE WORKS LIMITED Virgin Islands 100.00 100.00 December Construction
CJ LOGISTICS EUROPE GMBH Germany 100.00 100.00 December Storage, brokerage of
forwarding transportation
CJ IMC VIETNAM COMPANY LIMITED Vietnam 100.00 100.00 December Wholesale and brokerage
CJ IMC THAILAND CO., LTD. Thailand 100.00 100.00 December Wholesale and brokerage
CJ KOREA EXPRESS DONGGUAN CO., LTD. China 100.00 100.00 December
Storage and inland transport business
CJ OLIVE YOUNG (SHANGHAI) CORPORATION China 100.00 100.00 December Retail
PT. CJ KOREA EXPRESS RESOURCES INDONESIA Indonesia 100.00 100.00 December Logistics
CJ LOGISTICS MIDDLE EAST FZE UAE 100.00 100.00 December Inland transport
KX SMART CARGO HOLDINGS LIMITED Hong Kong 100.00 100.00 December Logistics
QINGDAO CJ SMART CARGO INTERNATIONAL SERVICES LTD. China 51.00 51.00 December Logistics
QINGDAO SMART CARGO BONDED LOGISTICS CO.,LTD China 100.00 100.00 December Logistics
SHANGHAI SMART CARGO SUPPLY CHAIN MANAGEMENT CO.,LTD China 100.00 100.00 December Logistics
PT CJ LOGISTICS SERVICE INDONESIA
2 Indonesia 49.00 49.00 December Logistics
CJ KOREA EXPRESS TIANTIAN TIANJIN CO.,LTD China 90.00 90.00 December Logistics
CJ SC LOGISTICS (T) LIMITED Tanzania 100.00 100.00 December Logistics
CJ LOGISTICS L.L.C.2 UAE 49.00 49.00 December Logistics
CJ IMC S.A. DE C.V. Mexico 99.00 99.00 December Wholesale and brokerage
CJ SMART CARGO LOGISTICS SA(PTY) LTD
Republic of South Africa 100.00 100.00 December Logistics
CJ ROKIN LOGISTICS HOLDINGS LIMITED (formerly, CJKX ROKIN HOLDINGS LIMITED)
Hong Kong 52.29 52.29 December Logistics
CJ LOGISTICS DO BRASIL LTDA Brazil 99.99 99.99 December Logistics
CJ Corporation and Subsidiaries Notes to the Consolidated Financial Statements December 31, 2018 and 2017
21
Ownership
interest held by
the Group (%) Closing month
Name of entity Location 2018 2017 Main business
CJ ENTERTAINMENT JAPAN INC. Japan 100.00 100.00 December Film and broadcast
program production supply
CJ E&M TIANJIN CO., LTD. China 100.00 100.00 December Broadcasting service
CJ VICTOR ENTERTAINMENT, INC. Japan - 51.00 December Music
ROLEMODEL ENTERTAINMENT GROUP LIMITED Hong Kong 99.04 99.04 December Contents consulting
CJ E&M VIETNAM CO., LTD. Vietnam 100.00 100.00 December Movie production
consulting
SHANGHAI YIHEYA MEDIA CO., LTD. China 100.00 100.00 December Media, entertainment and
consulting
FUZHOU CGV CINEMA CO., LTD. China 100.00 100.00 December Movie theater operation
CJ E&M HONG KONG LIMITED Hong Kong 100.00 100.00 December Broadcasting service
YANJI CGV CINEMA CO., LTD. China 100.00 100.00 December Movie theater operation
CJ CGV (SICHUAN) CINEMA CO., LTD. China 100.00 100.00 December Movie theater operation
YUNNAN CGV CINEMA CO., LTD. China 100.00 100.00 December Movie theater operation
GANZHOU CGV CINEMA CO., LTD. China 100.00 100.00 December Movie theater operation
CGV (XIAN) CINEMA CO., LTD. China 100.00 100.00 December Movie theater operation
CROWN JADE COMPANY PTE. LTD. Singapore 100.00 100.00 December Investment overseas
CJ CGV (HUBEI) CINEMA CO., LTD. China 100.00 100.00 December Movie theater operation
NEIMENGGU CGV CINEMA CO., LTD. China 100.00 100.00 December Movie theater operation
CROSS JUNCTION INVESTMENT CO., PTE. LTD. Singapore 100.00 100.00 December Investment overseas
DALIAN CGV CINEMA CO., LTD. China 100.00 100.00 December Movie theater operation
HENAN CGV CINEMA CO., LTD. China 100.00 100.00 December Movie theater operation
CGV (QINGDAO) CINEMA CO., LTD. China 100.00 100.00 December Movie theater operation
CJ 4DPLEX AMERICA, INC. USA 100.00 100.00 December Equipment sales
CJ 4DPLEX AMERICAS, LLC. USA 100.00 100.00 December Equipment sales
CGV TIANHE (WUHAN) CINEMA CO., LTD. China 70.00 70.00 December Movie theater operation
JIANGMEN CGV CINEMA CO., LTD. China 100.00 100.00 December Movie theater operation
JIANGSU CGV CINEMA INVESTMENT CO., LTD. China 100.00 100.00 December Movie theater operation
CGV (CHANGZHOU) CINEMA CO., LTD. China 100.00 100.00 December Movie theater operation
YUYAO CGV CINEMA CO., LTD. China 100.00 100.00 December Movie theater operation
CJ 4DX (BEIJING) CINEMA TECHNOLOGY CO., LTD. China 100.00 100.00 December Equipment sales
CGV (CHONGQING) CINEMA CO., LTD. China 100.00 100.00 December Movie theater operation
CGV (CHENGDU) CINEMA CO., LTD. China 100.00 100.00 December Movie theater operation
CGV (TIANJIN) CINEMA CO., LTD. China 100.00 100.00 December Movie theater operation
CGV (HUAIAN) CINEMA CO., LTD. China 100.00 100.00 December Movie theater operation
LIAONING CGV CINEMA CO., LTD. China 100.00 100.00 December Movie theater operation
CGV (TANGSHAN) CINEMA CO., LTD. China 100.00 100.00 December Movie theater operation
CGV ORSUN (WUHAN) CINEMA CO., LTD. China 70.00 70.00 December Movie theater operation
WUHU CGV CINEMA CO., LTD. China 100.00 100.00 December Movie theater operation
CJ 4DPLEX HONGKONG LIMITED Hong Kong 100.00 100.00 December Investment overseas
ZIBO CGV CINEMA CO., LTD. China 100.00 100.00 December Movie theater operation
CJ Corporation and Subsidiaries Notes to the Consolidated Financial Statements December 31, 2018 and 2017
22
Ownership
interest held by
the Group (%) Closing month
Name of entity Location 2018 2017 Main business
CGV(CHANGSHA) CINEMA CO., LTD. China 100.00 100.00 December Movie theater operation
YANTAI CGV CINEMA CO., LTD. China 100.00 100.00 December Movie theater operation
CGV (BEIJING) INTERNATIONAL CINEMA CO., LTD. China 100.00 100.00 December Movie theater operation
CJ CGV(SHANGHAI) ENTERPRISE MANAGEMENT CO., LTD. China 100.00 100.00 December Movie theater operation
UVD ENTERPRISE LTD. Hong Kong 100.00 100.00 December Movie theater operation
CJ CGV VIETNAM HOLDINGS CO., LTD(formerly, ENVOY MEDIA PARTNERS LTD.)
Virgin Islands 100.00 100.00 December Investment overseas
CJ CGV VIETNAM CO., LTD. Vietnam 80.00 80.00 December Movie theater operation
CJ CGV (SHEN YANG) FILM INTERNATIONAL CINEPLEX CO., LTD. China 100.00 100.00 December Movie theater operation
PANJIN CGV CINEMA CO., LTD. China 100.00 100.00 December Movie theater operation
CJ CGV (HARBIN) INTERNATIONAL CINEMA CO., LTD. China 100.00 100.00 December Movie theater operation
CJ CGV AMERICA, INC. USA 100.00 100.00 December Investment overseas
CJ CGV (SHANG HAI) FILM INTERNATIONAL CINEPLEX CO., LTD. China 100.00 100.00 December Movie theater operation
SHANGHAI C MEDIA CO., LTD. China 58.00 58.00 December Advertising agency
IMAGINASIAN ENTERTAINMENT, INC. USA 95.05 95.05 December Broadcasting service
CJ CGV AMERICA LA, LLC. USA 100.00 100.00 December Movie theater operation
CGI HOLDINGS LTD. Hong Kong 100.00 100.00 December Investment overseas
CJ E&M AMERICA, INC. USA 100.00 100.00 December Holding company
CJ CENTURY ENTERTAINMENT & MEDIA CONSULTING CO., LTD. China 100.00 100.00 December
Media, entertainment and consulting
CJ AMERICA INC. USA 100.00 100.00 December Trade
SICHUAN JIXIANGJU FOOD CO., LTD. China 60.00 60.00 December Food manufacturing
CJ FOODS MYANMAR CO., LTD. Myanmar 100.00 100.00 December Food manufacturing
CJ FOODS VIETNAM CO., LTD. Vietnam 100.00 100.00 December Food manufacturing
CJ FEED INGREDIENT VIETNAM CO., LTD. Vietnam 100.00 100.00 December
Raw material of feed manufacturing and sales
PT CJ CHEILJEDANG FEED KALIMANTAN Indonesia 51.00 51.00 December
Feed manufacturing and sales
CJ HAIDE (NINGBO) BIOTECH CO., LTD. China 100.00 100.00 December Functional amino acids
manufacturing and sales CJ HAIDE (NINGBO) AMINO ACID INDUSTRY CO., LTD. China 100.00 100.00 December
Functional amino acids manufacturing and sales
CJ EUROPE GMBH. Germany 100.00 100.00 December Trade
COFEED FEEDMILL (CHANGCHUN) CO., LTD. China 100.00 100.00 December
Feed manufacturing and sales
COFEED FEEDMILL (TIANJIN) CO., LTD. China 100.00 100.00 December Feed manufacturing and
sales COFEED FEEDMILL (QIQIHAER) CO., LTD. China 100.00 100.00 December
Feed manufacturing and sales
HEILONGJIANG JIUSAN COFEED FEEDMILL CO., LTD. China 60.00 60.00 December
Feed manufacturing and sales
COFEED FARM (FUYU) TECHNOLOGY CO., LTD. China 100.00 100.00 December
Feed manufacturing and sales
CJ FOODVILLE (GUANGZHOU) CORPORATION China 100.00 100.00 December
Food manufacturing and restaurant
CJ FOODVILLE (CHONGQING) China 100.00 100.00 December Food manufacturing and
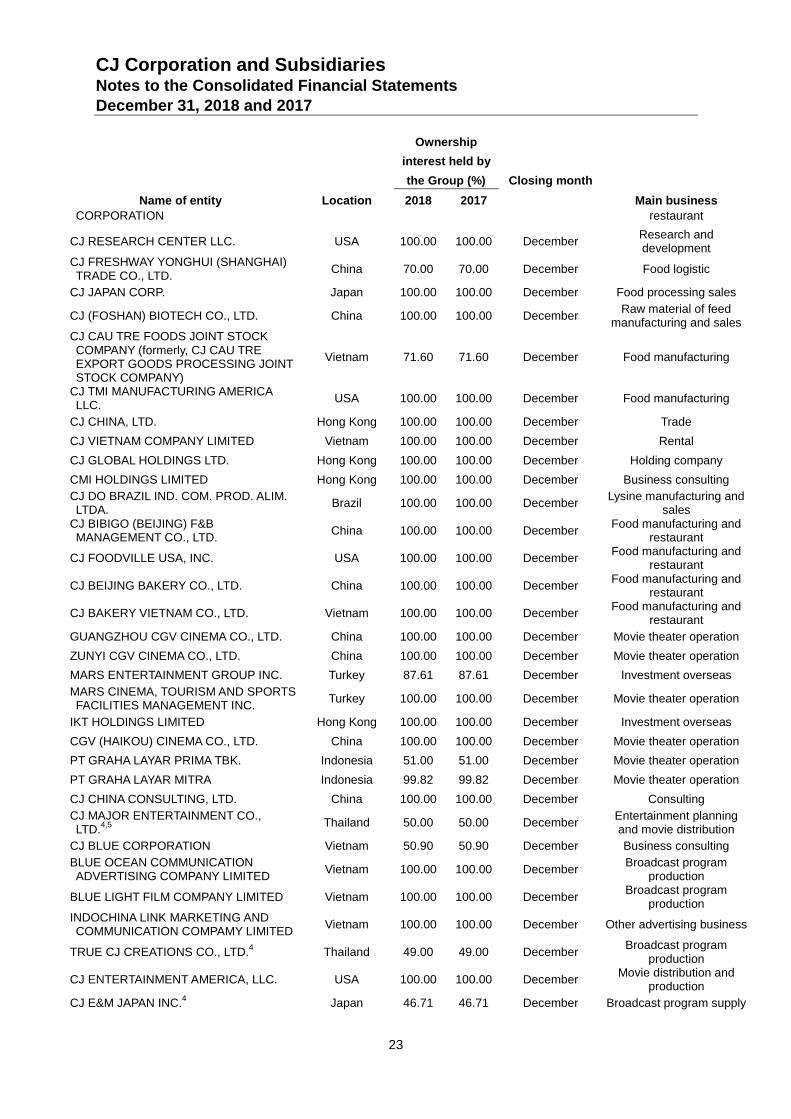
CJ Corporation and Subsidiaries Notes to the Consolidated Financial Statements December 31, 2018 and 2017
23
Ownership
interest held by
the Group (%) Closing month
Name of entity Location 2018 2017 Main business
CORPORATION restaurant
CJ RESEARCH CENTER LLC. USA 100.00 100.00 December Research and development
CJ FRESHWAY YONGHUI (SHANGHAI) TRADE CO., LTD. China 70.00 70.00 December Food logistic
CJ JAPAN CORP. Japan 100.00 100.00 December Food processing sales
CJ (FOSHAN) BIOTECH CO., LTD. China 100.00 100.00 December Raw material of feed
manufacturing and sales CJ CAU TRE FOODS JOINT STOCK COMPANY (formerly, CJ CAU TRE EXPORT GOODS PROCESSING JOINT STOCK COMPANY)
Vietnam 71.60 71.60 December Food manufacturing
CJ TMI MANUFACTURING AMERICA LLC. USA 100.00 100.00 December Food manufacturing
CJ CHINA, LTD. Hong Kong 100.00 100.00 December Trade
CJ VIETNAM COMPANY LIMITED Vietnam 100.00 100.00 December Rental
CJ GLOBAL HOLDINGS LTD. Hong Kong 100.00 100.00 December Holding company
CMI HOLDINGS LIMITED Hong Kong 100.00 100.00 December Business consulting
CJ DO BRAZIL IND. COM. PROD. ALIM. LTDA. Brazil 100.00 100.00 December
Lysine manufacturing and sales
CJ BIBIGO (BEIJING) F&B MANAGEMENT CO., LTD. China 100.00 100.00 December
Food manufacturing and restaurant
CJ FOODVILLE USA, INC. USA 100.00 100.00 December Food manufacturing and
restaurant
CJ BEIJING BAKERY CO., LTD. China 100.00 100.00 December Food manufacturing and
restaurant
CJ BAKERY VIETNAM CO., LTD. Vietnam 100.00 100.00 December Food manufacturing and
restaurant
GUANGZHOU CGV CINEMA CO., LTD. China 100.00 100.00 December Movie theater operation
ZUNYI CGV CINEMA CO., LTD. China 100.00 100.00 December Movie theater operation
MARS ENTERTAINMENT GROUP INC. Turkey 87.61 87.61 December Investment overseas
MARS CINEMA, TOURISM AND SPORTS FACILITIES MANAGEMENT INC. Turkey 100.00 100.00 December Movie theater operation
IKT HOLDINGS LIMITED Hong Kong 100.00 100.00 December Investment overseas
CGV (HAIKOU) CINEMA CO., LTD. China 100.00 100.00 December Movie theater operation
PT GRAHA LAYAR PRIMA TBK. Indonesia 51.00 51.00 December Movie theater operation
PT GRAHA LAYAR MITRA Indonesia 99.82 99.82 December Movie theater operation
CJ CHINA CONSULTING, LTD. China 100.00 100.00 December Consulting
CJ MAJOR ENTERTAINMENT CO., LTD.
4,5 Thailand 50.00 50.00 December
Entertainment planning and movie distribution
CJ BLUE CORPORATION Vietnam 50.90 50.90 December Business consulting
BLUE OCEAN COMMUNICATION ADVERTISING COMPANY LIMITED Vietnam 100.00 100.00 December
Broadcast program production
BLUE LIGHT FILM COMPANY LIMITED Vietnam 100.00 100.00 December Broadcast program
production INDOCHINA LINK MARKETING AND COMMUNICATION COMPAMY LIMITED Vietnam 100.00 100.00 December Other advertising business
TRUE CJ CREATIONS CO., LTD.4 Thailand 49.00 49.00 December
Broadcast program production
CJ ENTERTAINMENT AMERICA, LLC. USA 100.00 100.00 December Movie distribution and
production
CJ E&M JAPAN INC.4 Japan 46.71 46.71 December Broadcast program supply
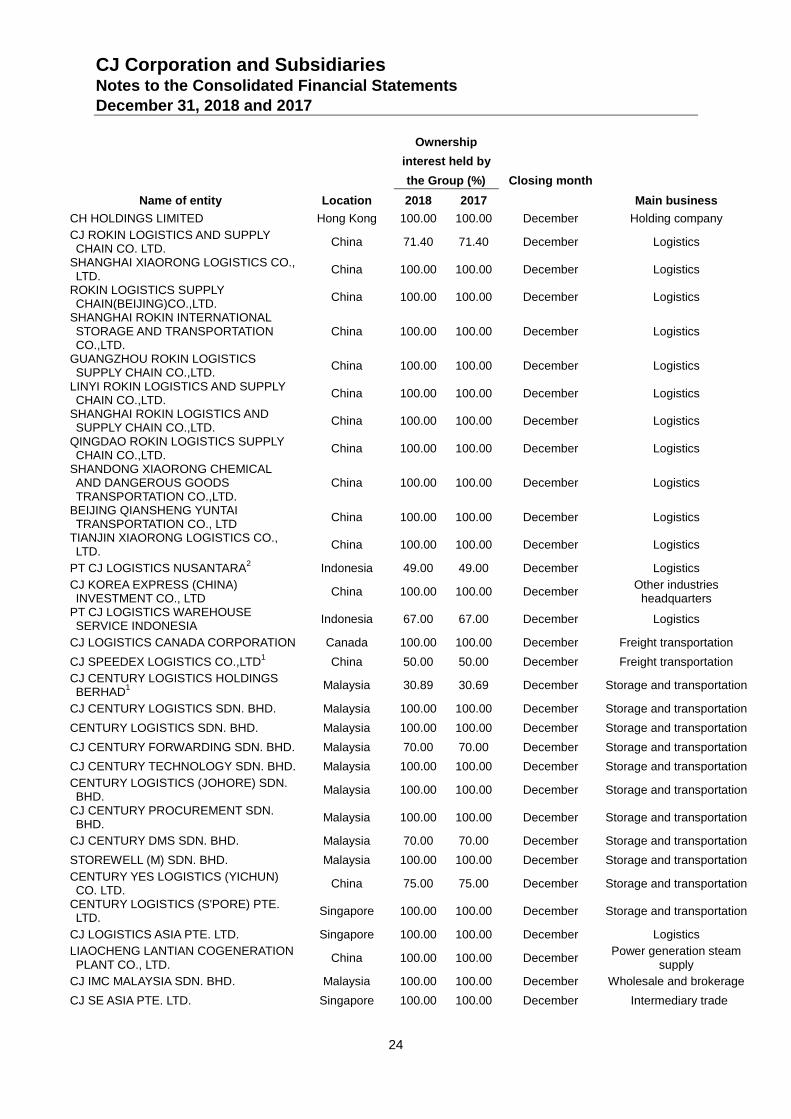
CJ Corporation and Subsidiaries Notes to the Consolidated Financial Statements December 31, 2018 and 2017
24
Ownership
interest held by
the Group (%) Closing month
Name of entity Location 2018 2017 Main business
CH HOLDINGS LIMITED Hong Kong 100.00 100.00 December Holding company
CJ ROKIN LOGISTICS AND SUPPLY CHAIN CO. LTD. China 71.40 71.40 December Logistics
SHANGHAI XIAORONG LOGISTICS CO., LTD. China 100.00 100.00 December Logistics
ROKIN LOGISTICS SUPPLY CHAIN(BEIJING)CO.,LTD. China 100.00 100.00 December Logistics
SHANGHAI ROKIN INTERNATIONAL STORAGE AND TRANSPORTATION CO.,LTD.
China 100.00 100.00 December Logistics
GUANGZHOU ROKIN LOGISTICS SUPPLY CHAIN CO.,LTD. China 100.00 100.00 December Logistics
LINYI ROKIN LOGISTICS AND SUPPLY CHAIN CO.,LTD. China 100.00 100.00 December Logistics
SHANGHAI ROKIN LOGISTICS AND SUPPLY CHAIN CO.,LTD. China 100.00 100.00 December Logistics
QINGDAO ROKIN LOGISTICS SUPPLY CHAIN CO.,LTD. China 100.00 100.00 December Logistics
SHANDONG XIAORONG CHEMICAL AND DANGEROUS GOODS TRANSPORTATION CO.,LTD.
China 100.00 100.00 December Logistics
BEIJING QIANSHENG YUNTAI TRANSPORTATION CO., LTD China 100.00 100.00 December Logistics
TIANJIN XIAORONG LOGISTICS CO., LTD. China 100.00 100.00 December Logistics
PT CJ LOGISTICS NUSANTARA2 Indonesia 49.00 49.00 December Logistics
CJ KOREA EXPRESS (CHINA) INVESTMENT CO., LTD China 100.00 100.00 December
Other industries headquarters
PT CJ LOGISTICS WAREHOUSE SERVICE INDONESIA Indonesia 67.00 67.00 December Logistics
CJ LOGISTICS CANADA CORPORATION Canada 100.00 100.00 December Freight transportation
CJ SPEEDEX LOGISTICS CO.,LTD1 China 50.00 50.00 December Freight transportation
CJ CENTURY LOGISTICS HOLDINGS BERHAD
1 Malaysia 30.89 30.69 December Storage and transportation
CJ CENTURY LOGISTICS SDN. BHD. Malaysia 100.00 100.00 December Storage and transportation
CENTURY LOGISTICS SDN. BHD. Malaysia 100.00 100.00 December Storage and transportation
CJ CENTURY FORWARDING SDN. BHD. Malaysia 70.00 70.00 December Storage and transportation
CJ CENTURY TECHNOLOGY SDN. BHD. Malaysia 100.00 100.00 December Storage and transportation
CENTURY LOGISTICS (JOHORE) SDN. BHD. Malaysia 100.00 100.00 December Storage and transportation
CJ CENTURY PROCUREMENT SDN. BHD. Malaysia 100.00 100.00 December Storage and transportation
CJ CENTURY DMS SDN. BHD. Malaysia 70.00 70.00 December Storage and transportation
STOREWELL (M) SDN. BHD. Malaysia 100.00 100.00 December Storage and transportation
CENTURY YES LOGISTICS (YICHUN) CO. LTD. China 75.00 75.00 December Storage and transportation
CENTURY LOGISTICS (S'PORE) PTE. LTD. Singapore 100.00 100.00 December Storage and transportation
CJ LOGISTICS ASIA PTE. LTD. Singapore 100.00 100.00 December Logistics
LIAOCHENG LANTIAN COGENERATION PLANT CO., LTD. China 100.00 100.00 December
Power generation steam supply
CJ IMC MALAYSIA SDN. BHD. Malaysia 100.00 100.00 December Wholesale and brokerage
CJ SE ASIA PTE. LTD. Singapore 100.00 100.00 December Intermediary trade
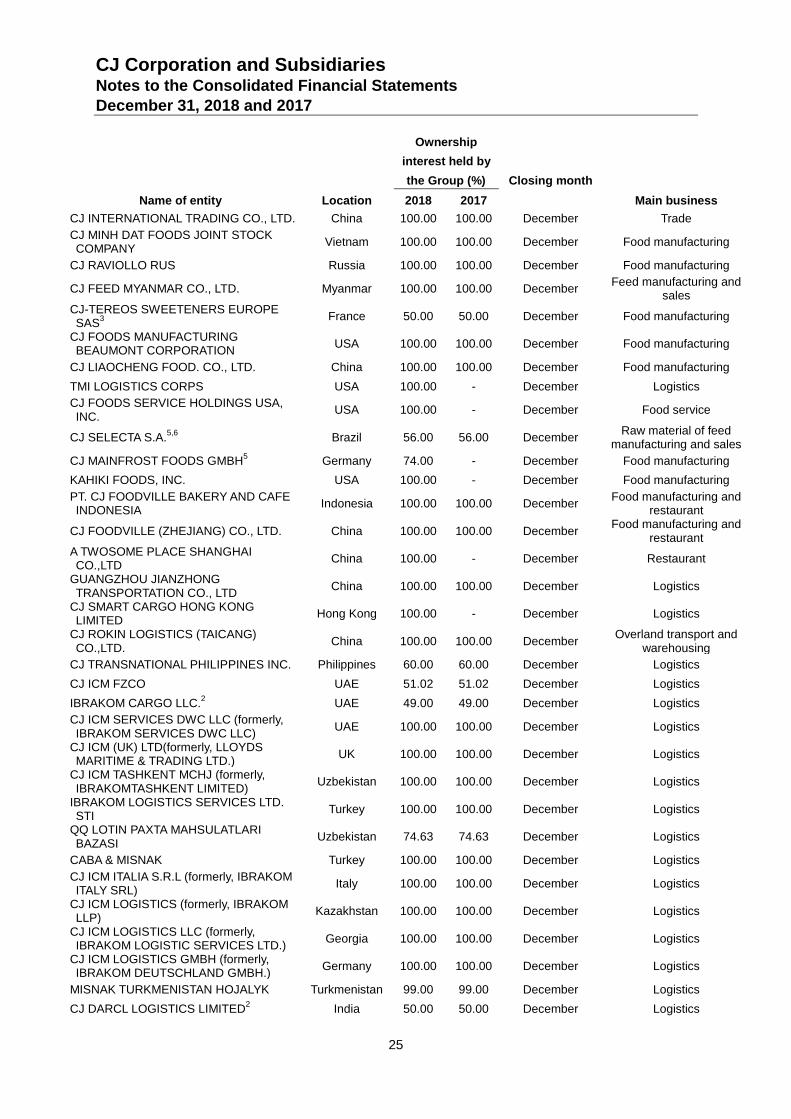
CJ Corporation and Subsidiaries Notes to the Consolidated Financial Statements December 31, 2018 and 2017
25
Ownership
interest held by
the Group (%) Closing month
Name of entity Location 2018 2017 Main business
CJ INTERNATIONAL TRADING CO., LTD. China 100.00 100.00 December Trade
CJ MINH DAT FOODS JOINT STOCK COMPANY Vietnam 100.00 100.00 December Food manufacturing
CJ RAVIOLLO RUS Russia 100.00 100.00 December Food manufacturing
CJ FEED MYANMAR CO., LTD. Myanmar 100.00 100.00 December Feed manufacturing and
sales CJ-TEREOS SWEETENERS EUROPE SAS
3 France 50.00 50.00 December Food manufacturing
CJ FOODS MANUFACTURING BEAUMONT CORPORATION USA 100.00 100.00 December Food manufacturing
CJ LIAOCHENG FOOD. CO., LTD. China 100.00 100.00 December Food manufacturing
TMI LOGISTICS CORPS USA 100.00 - December Logistics
CJ FOODS SERVICE HOLDINGS USA, INC. USA 100.00 - December Food service
CJ SELECTA S.A.5,6
Brazil 56.00 56.00 December Raw material of feed
manufacturing and sales
CJ MAINFROST FOODS GMBH5 Germany 74.00 - December Food manufacturing
KAHIKI FOODS, INC. USA 100.00 - December Food manufacturing
PT. CJ FOODVILLE BAKERY AND CAFE INDONESIA Indonesia 100.00 100.00 December
Food manufacturing and restaurant
CJ FOODVILLE (ZHEJIANG) CO., LTD. China 100.00 100.00 December Food manufacturing and
restaurant A TWOSOME PLACE SHANGHAI CO.,LTD China 100.00 - December Restaurant
GUANGZHOU JIANZHONG TRANSPORTATION CO., LTD China 100.00 100.00 December Logistics
CJ SMART CARGO HONG KONG LIMITED Hong Kong 100.00 - December Logistics
CJ ROKIN LOGISTICS (TAICANG) CO.,LTD. China 100.00 100.00 December
Overland transport and warehousing
CJ TRANSNATIONAL PHILIPPINES INC. Philippines 60.00 60.00 December Logistics
CJ ICM FZCO UAE 51.02 51.02 December Logistics
IBRAKOM CARGO LLC.2 UAE 49.00 49.00 December Logistics
CJ ICM SERVICES DWC LLC (formerly, IBRAKOM SERVICES DWC LLC) UAE 100.00 100.00 December Logistics
CJ ICM (UK) LTD(formerly, LLOYDS MARITIME & TRADING LTD.) UK 100.00 100.00 December Logistics
CJ ICM TASHKENT MCHJ (formerly, IBRAKOMTASHKENT LIMITED) Uzbekistan 100.00 100.00 December Logistics
IBRAKOM LOGISTICS SERVICES LTD. STI Turkey 100.00 100.00 December Logistics
QQ LOTIN PAXTA MAHSULATLARI BAZASI Uzbekistan 74.63 74.63 December Logistics
CABA & MISNAK Turkey 100.00 100.00 December Logistics
CJ ICM ITALIA S.R.L (formerly, IBRAKOM ITALY SRL) Italy 100.00 100.00 December Logistics
CJ ICM LOGISTICS (formerly, IBRAKOM LLP) Kazakhstan 100.00 100.00 December Logistics
CJ ICM LOGISTICS LLC (formerly, IBRAKOM LOGISTIC SERVICES LTD.) Georgia 100.00 100.00 December Logistics
CJ ICM LOGISTICS GMBH (formerly, IBRAKOM DEUTSCHLAND GMBH.) Germany 100.00 100.00 December Logistics
MISNAK TURKMENISTAN HOJALYK Turkmenistan 99.00 99.00 December Logistics
CJ DARCL LOGISTICS LIMITED2 India 50.00 50.00 December Logistics
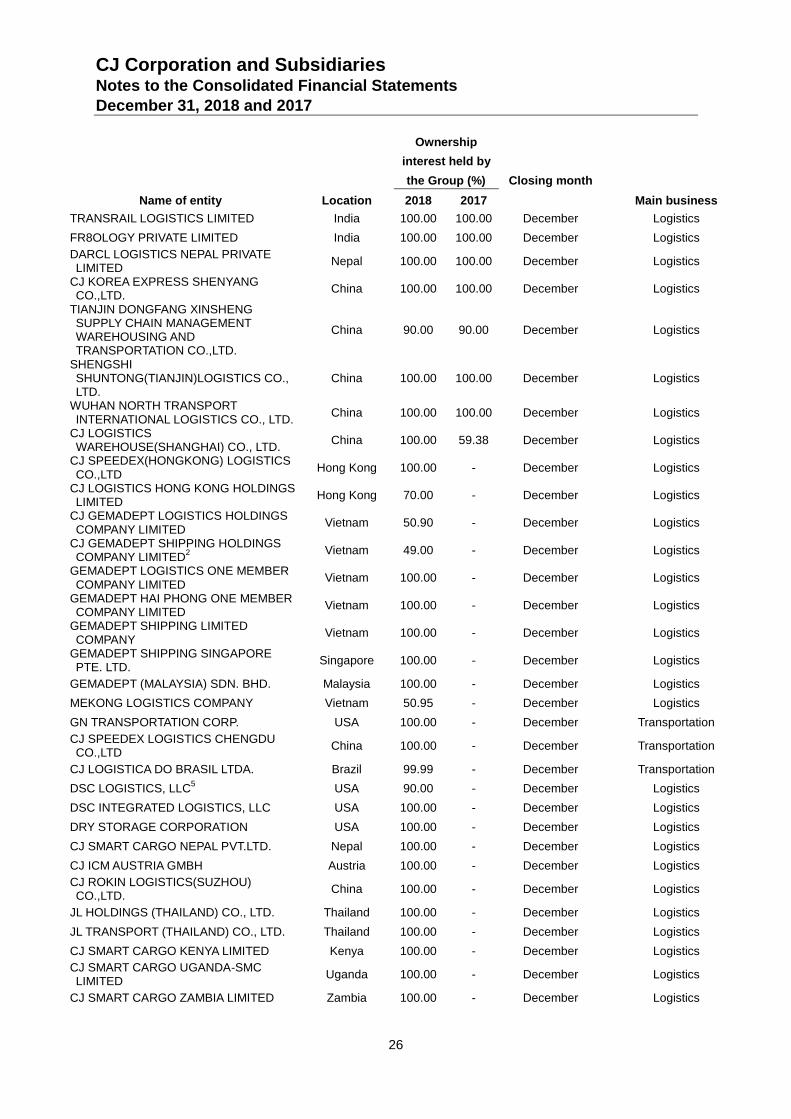
CJ Corporation and Subsidiaries Notes to the Consolidated Financial Statements December 31, 2018 and 2017
26
Ownership
interest held by
the Group (%) Closing month
Name of entity Location 2018 2017 Main business
TRANSRAIL LOGISTICS LIMITED India 100.00 100.00 December Logistics
FR8OLOGY PRIVATE LIMITED India 100.00 100.00 December Logistics
DARCL LOGISTICS NEPAL PRIVATE LIMITED Nepal 100.00 100.00 December Logistics
CJ KOREA EXPRESS SHENYANG CO.,LTD. China 100.00 100.00 December Logistics
TIANJIN DONGFANG XINSHENG SUPPLY CHAIN MANAGEMENT WAREHOUSING AND TRANSPORTATION CO.,LTD.
China 90.00 90.00 December Logistics
SHENGSHI SHUNTONG(TIANJIN)LOGISTICS CO., LTD.
China 100.00 100.00 December Logistics
WUHAN NORTH TRANSPORT INTERNATIONAL LOGISTICS CO., LTD. China 100.00 100.00 December Logistics
CJ LOGISTICS WAREHOUSE(SHANGHAI) CO., LTD. China 100.00 59.38 December Logistics
CJ SPEEDEX(HONGKONG) LOGISTICS CO.,LTD Hong Kong 100.00 - December Logistics
CJ LOGISTICS HONG KONG HOLDINGS LIMITED Hong Kong 70.00 - December Logistics
CJ GEMADEPT LOGISTICS HOLDINGS COMPANY LIMITED Vietnam 50.90 - December Logistics
CJ GEMADEPT SHIPPING HOLDINGS COMPANY LIMITED
2 Vietnam 49.00 - December Logistics
GEMADEPT LOGISTICS ONE MEMBER COMPANY LIMITED Vietnam 100.00 - December Logistics
GEMADEPT HAI PHONG ONE MEMBER COMPANY LIMITED Vietnam 100.00 - December Logistics
GEMADEPT SHIPPING LIMITED COMPANY Vietnam 100.00 - December Logistics
GEMADEPT SHIPPING SINGAPORE PTE. LTD. Singapore 100.00 - December Logistics
GEMADEPT (MALAYSIA) SDN. BHD. Malaysia 100.00 - December Logistics
MEKONG LOGISTICS COMPANY Vietnam 50.95 - December Logistics
GN TRANSPORTATION CORP. USA 100.00 - December Transportation
CJ SPEEDEX LOGISTICS CHENGDU CO.,LTD China 100.00 - December Transportation
CJ LOGISTICA DO BRASIL LTDA. Brazil 99.99 - December Transportation
DSC LOGISTICS, LLC5 USA 90.00 - December Logistics
DSC INTEGRATED LOGISTICS, LLC USA 100.00 - December Logistics
DRY STORAGE CORPORATION USA 100.00 - December Logistics
CJ SMART CARGO NEPAL PVT.LTD. Nepal 100.00 - December Logistics
CJ ICM AUSTRIA GMBH Austria 100.00 - December Logistics
CJ ROKIN LOGISTICS(SUZHOU) CO.,LTD. China 100.00 - December Logistics
JL HOLDINGS (THAILAND) CO., LTD. Thailand 100.00 - December Logistics
JL TRANSPORT (THAILAND) CO., LTD. Thailand 100.00 - December Logistics
CJ SMART CARGO KENYA LIMITED Kenya 100.00 - December Logistics
CJ SMART CARGO UGANDA-SMC LIMITED Uganda 100.00 - December Logistics
CJ SMART CARGO ZAMBIA LIMITED Zambia 100.00 - December Logistics
CJ Corporation and Subsidiaries Notes to the Consolidated Financial Statements December 31, 2018 and 2017
27
Ownership
interest held by
the Group (%) Closing month
Name of entity Location 2018 2017 Main business
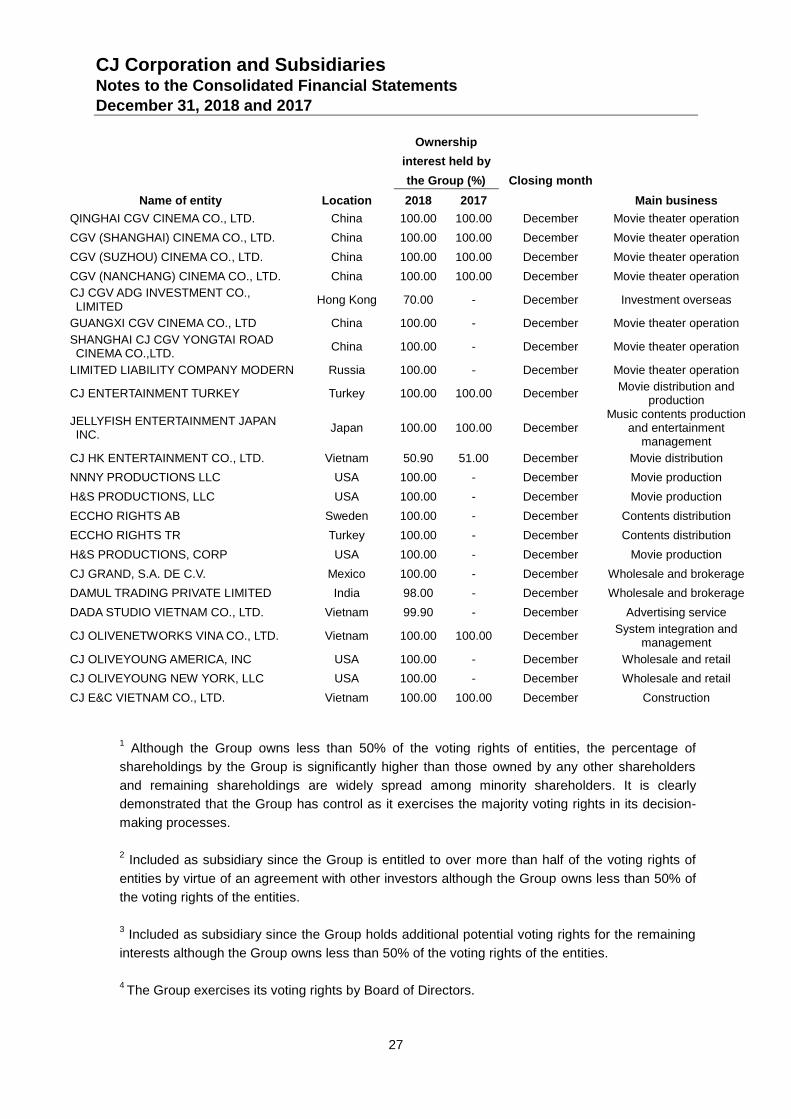
QINGHAI CGV CINEMA CO., LTD. China 100.00 100.00 December Movie theater operation
CGV (SHANGHAI) CINEMA CO., LTD. China 100.00 100.00 December Movie theater operation
CGV (SUZHOU) CINEMA CO., LTD. China 100.00 100.00 December Movie theater operation
CGV (NANCHANG) CINEMA CO., LTD. China 100.00 100.00 December Movie theater operation
CJ CGV ADG INVESTMENT CO., LIMITED Hong Kong 70.00 - December Investment overseas
GUANGXI CGV CINEMA CO., LTD China 100.00 - December Movie theater operation
SHANGHAI CJ CGV YONGTAI ROAD CINEMA CO.,LTD. China 100.00 - December Movie theater operation
LIMITED LIABILITY COMPANY MODERN Russia 100.00 - December Movie theater operation
CJ ENTERTAINMENT TURKEY Turkey 100.00 100.00 December Movie distribution and
production
JELLYFISH ENTERTAINMENT JAPAN INC. Japan 100.00 100.00 December
Music contents production and entertainment
management
CJ HK ENTERTAINMENT CO., LTD. Vietnam 50.90 51.00 December Movie distribution
NNNY PRODUCTIONS LLC USA 100.00 - December Movie production
H&S PRODUCTIONS, LLC USA 100.00 - December Movie production
ECCHO RIGHTS AB Sweden 100.00 - December Contents distribution
ECCHO RIGHTS TR Turkey 100.00 - December Contents distribution
H&S PRODUCTIONS, CORP USA 100.00 - December Movie production
CJ GRAND, S.A. DE C.V. Mexico 100.00 - December Wholesale and brokerage
DAMUL TRADING PRIVATE LIMITED India 98.00 - December Wholesale and brokerage
DADA STUDIO VIETNAM CO., LTD. Vietnam 99.90 - December Advertising service
CJ OLIVENETWORKS VINA CO., LTD. Vietnam 100.00 100.00 December System integration and
management
CJ OLIVEYOUNG AMERICA, INC USA 100.00 - December Wholesale and retail
CJ OLIVEYOUNG NEW YORK, LLC USA 100.00 - December Wholesale and retail
CJ E&C VIETNAM CO., LTD. Vietnam 100.00 100.00 December Construction
1 Although the Group owns less than 50% of the voting rights of entities, the percentage of
shareholdings by the Group is significantly higher than those owned by any other shareholders
and remaining shareholdings are widely spread among minority shareholders. It is clearly
demonstrated that the Group has control as it exercises the majority voting rights in its decision-
making processes.
2 Included as subsidiary since the Group is entitled to over more than half of the voting rights of
entities by virtue of an agreement with other investors although the Group owns less than 50% of
the voting rights of the entities.
3 Included as subsidiary since the Group holds additional potential voting rights for the remaining
interests although the Group owns less than 50% of the voting rights of the entities.
4 The Group exercises its voting rights by Board of Directors.
CJ Corporation and Subsidiaries Notes to the Consolidated Financial Statements December 31, 2018 and 2017
28
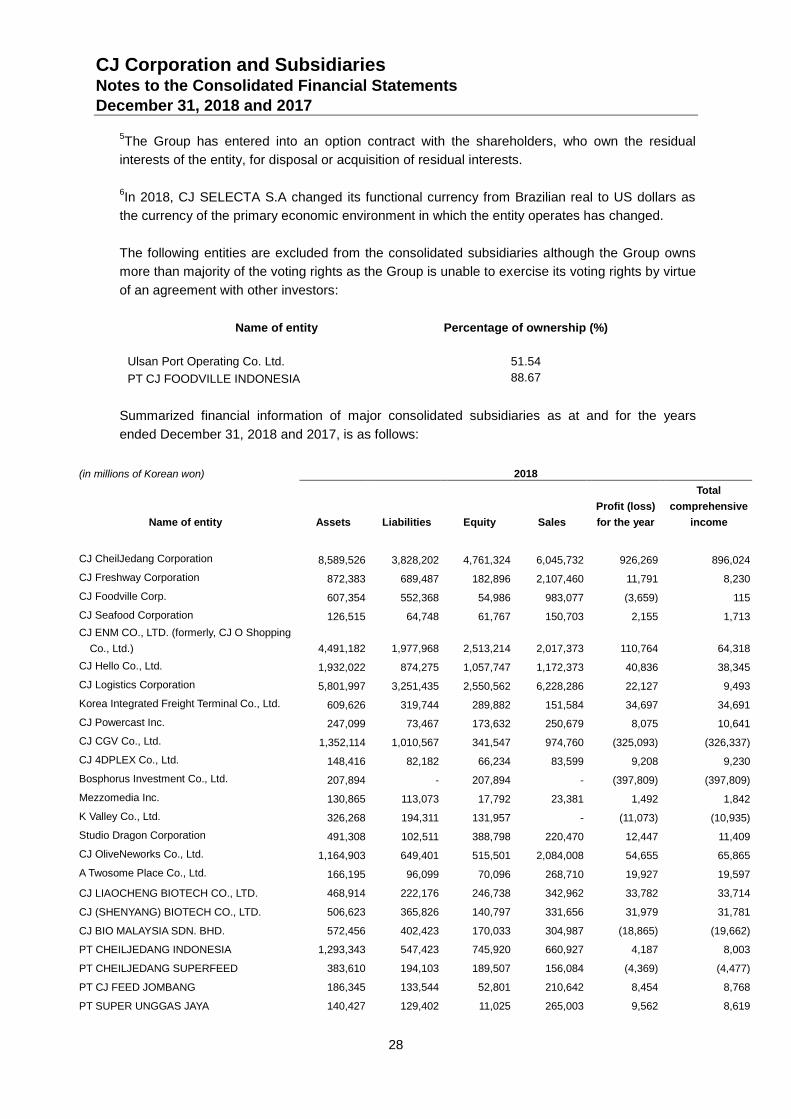
5The Group has entered into an option contract with the shareholders, who own the residual
interests of the entity, for disposal or acquisition of residual interests.
6In 2018, CJ SELECTA S.A changed its functional currency from Brazilian real to US dollars as
the currency of the primary economic environment in which the entity operates has changed.
The following entities are excluded from the consolidated subsidiaries although the Group owns
more than majority of the voting rights as the Group is unable to exercise its voting rights by virtue
of an agreement with other investors:
Name of entity Percentage of ownership (%)
Ulsan Port Operating Co. Ltd. 51.54
PT CJ FOODVILLE INDONESIA 88.67
Summarized financial information of major consolidated subsidiaries as at and for the years
ended December 31, 2018 and 2017, is as follows:
(in millions of Korean won) 2018
Name of entity Assets Liabilities Equity Sales
Profit (loss)
for the year
Total
comprehensive
income
CJ CheilJedang Corporation 8,589,526 3,828,202 4,761,324 6,045,732 926,269 896,024
CJ Freshway Corporation 872,383 689,487 182,896 2,107,460 11,791 8,230
CJ Foodville Corp. 607,354 552,368 54,986 983,077 (3,659) 115
CJ Seafood Corporation 126,515 64,748 61,767 150,703 2,155 1,713
CJ ENM CO., LTD. (formerly, CJ O Shopping
Co., Ltd.)
4,491,182 1,977,968 2,513,214 2,017,373 110,764 64,318
CJ Hello Co., Ltd. 1,932,022 874,275 1,057,747 1,172,373 40,836 38,345
CJ Logistics Corporation 5,801,997 3,251,435 2,550,562 6,228,286 22,127 9,493
Korea Integrated Freight Terminal Co., Ltd. 609,626 319,744 289,882 151,584 34,697 34,691
CJ Powercast Inc. 247,099 73,467 173,632 250,679 8,075 10,641
CJ CGV Co., Ltd. 1,352,114 1,010,567 341,547 974,760 (325,093) (326,337)
CJ 4DPLEX Co., Ltd. 148,416 82,182 66,234 83,599 9,208 9,230
Bosphorus Investment Co., Ltd. 207,894 - 207,894 - (397,809) (397,809)
Mezzomedia Inc. 130,865 113,073 17,792 23,381 1,492 1,842
K Valley Co., Ltd. 326,268 194,311 131,957 - (11,073) (10,935)
Studio Dragon Corporation 491,308 102,511 388,798 220,470 12,447 11,409
CJ OliveNeworks Co., Ltd. 1,164,903 649,401 515,501 2,084,008 54,655 65,865
A Twosome Place Co., Ltd. 166,195 96,099 70,096 268,710 19,927 19,597
CJ LIAOCHENG BIOTECH CO., LTD. 468,914 222,176 246,738 342,962 33,782 33,714
CJ (SHENYANG) BIOTECH CO., LTD. 506,623 365,826 140,797 331,656 31,979 31,781
CJ BIO MALAYSIA SDN. BHD. 572,456 402,423 170,033 304,987 (18,865) (19,662)
PT CHEILJEDANG INDONESIA 1,293,343 547,423 745,920 660,927 4,187 8,003
PT CHEILJEDANG SUPERFEED 383,610 194,103 189,507 156,084 (4,369) (4,477)
PT CJ FEED JOMBANG 186,345 133,544 52,801 210,642 8,454 8,768
PT SUPER UNGGAS JAYA 140,427 129,402 11,025 265,003 9,562 8,619
CJ Corporation and Subsidiaries Notes to the Consolidated Financial Statements December 31, 2018 and 2017
29
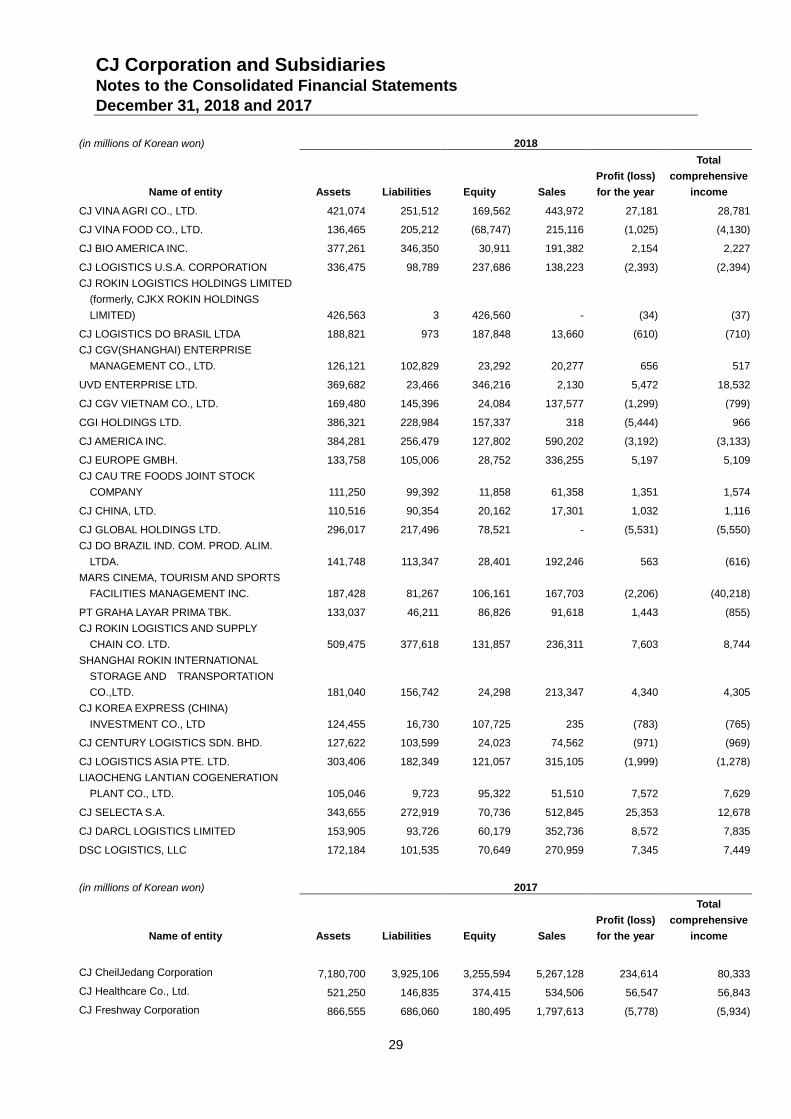
(in millions of Korean won) 2018
Name of entity Assets Liabilities Equity Sales
Profit (loss)
for the year
Total
comprehensive
income
CJ VINA AGRI CO., LTD. 421,074 251,512 169,562 443,972 27,181 28,781
CJ VINA FOOD CO., LTD. 136,465 205,212 (68,747) 215,116 (1,025) (4,130)
CJ BIO AMERICA INC. 377,261 346,350 30,911 191,382 2,154 2,227
CJ LOGISTICS U.S.A. CORPORATION 336,475 98,789 237,686 138,223 (2,393) (2,394)
CJ ROKIN LOGISTICS HOLDINGS LIMITED
(formerly, CJKX ROKIN HOLDINGS
LIMITED)
426,563 3 426,560 - (34) (37)
CJ LOGISTICS DO BRASIL LTDA 188,821 973 187,848 13,660 (610) (710)
CJ CGV(SHANGHAI) ENTERPRISE
MANAGEMENT CO., LTD.
126,121 102,829 23,292 20,277 656 517
UVD ENTERPRISE LTD. 369,682 23,466 346,216 2,130 5,472 18,532
CJ CGV VIETNAM CO., LTD. 169,480 145,396 24,084 137,577 (1,299) (799)
CGI HOLDINGS LTD. 386,321 228,984 157,337 318 (5,444) 966
CJ AMERICA INC. 384,281 256,479 127,802 590,202 (3,192) (3,133)
CJ EUROPE GMBH. 133,758 105,006 28,752 336,255 5,197 5,109
CJ CAU TRE FOODS JOINT STOCK
COMPANY
111,250 99,392 11,858 61,358 1,351 1,574
CJ CHINA, LTD. 110,516 90,354 20,162 17,301 1,032 1,116
CJ GLOBAL HOLDINGS LTD. 296,017 217,496 78,521 - (5,531) (5,550)
CJ DO BRAZIL IND. COM. PROD. ALIM.
LTDA.
141,748 113,347 28,401 192,246 563 (616)
MARS CINEMA, TOURISM AND SPORTS
FACILITIES MANAGEMENT INC.
187,428 81,267 106,161 167,703 (2,206) (40,218)
PT GRAHA LAYAR PRIMA TBK. 133,037 46,211 86,826 91,618 1,443 (855)
CJ ROKIN LOGISTICS AND SUPPLY
CHAIN CO. LTD.
509,475 377,618 131,857 236,311 7,603 8,744
SHANGHAI ROKIN INTERNATIONAL
STORAGE AND TRANSPORTATION
CO.,LTD.
181,040 156,742 24,298 213,347 4,340 4,305
CJ KOREA EXPRESS (CHINA)
INVESTMENT CO., LTD
124,455 16,730 107,725 235 (783) (765)
CJ CENTURY LOGISTICS SDN. BHD. 127,622 103,599 24,023 74,562 (971) (969)
CJ LOGISTICS ASIA PTE. LTD. 303,406 182,349 121,057 315,105 (1,999) (1,278)
LIAOCHENG LANTIAN COGENERATION
PLANT CO., LTD.
105,046 9,723 95,322 51,510 7,572 7,629
CJ SELECTA S.A. 343,655 272,919 70,736 512,845 25,353 12,678
CJ DARCL LOGISTICS LIMITED 153,905 93,726 60,179 352,736 8,572 7,835
DSC LOGISTICS, LLC 172,184 101,535 70,649 270,959 7,345 7,449
(in millions of Korean won) 2017
Name of entity Assets Liabilities Equity Sales
Profit (loss)
for the year
Total
comprehensive
income
CJ CheilJedang Corporation 7,180,700 3,925,106 3,255,594 5,267,128 234,614 80,333
CJ Healthcare Co., Ltd. 521,250 146,835 374,415 534,506 56,547 56,843
CJ Freshway Corporation 866,555 686,060 180,495 1,797,613 (5,778) (5,934)
CJ Corporation and Subsidiaries Notes to the Consolidated Financial Statements December 31, 2018 and 2017
30
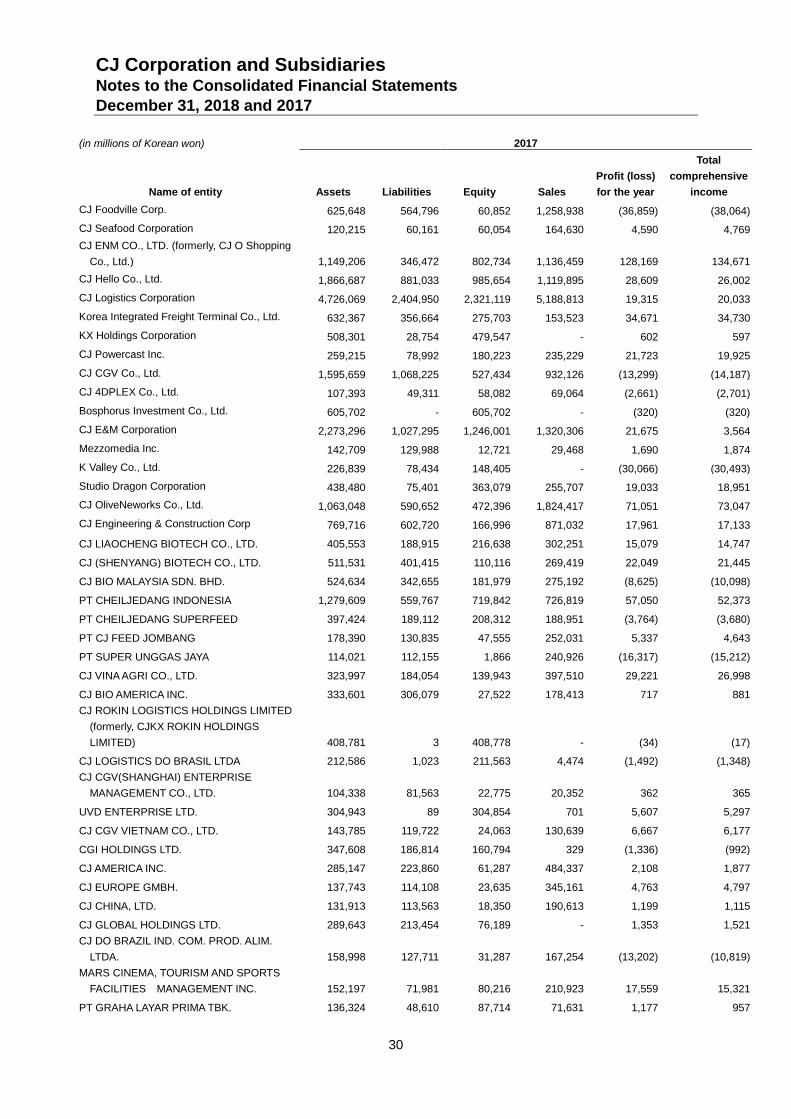
(in millions of Korean won) 2017
Name of entity Assets Liabilities Equity Sales
Profit (loss)
for the year
Total
comprehensive
income
CJ Foodville Corp. 625,648 564,796 60,852 1,258,938 (36,859) (38,064)
CJ Seafood Corporation 120,215 60,161 60,054 164,630 4,590 4,769
CJ ENM CO., LTD. (formerly, CJ O Shopping
Co., Ltd.)
1,149,206 346,472 802,734 1,136,459 128,169 134,671
CJ Hello Co., Ltd. 1,866,687 881,033 985,654 1,119,895 28,609 26,002
CJ Logistics Corporation 4,726,069 2,404,950 2,321,119 5,188,813 19,315 20,033
Korea Integrated Freight Terminal Co., Ltd. 632,367 356,664 275,703 153,523 34,671 34,730
KX Holdings Corporation 508,301 28,754 479,547 - 602 597
CJ Powercast Inc. 259,215 78,992 180,223 235,229 21,723 19,925
CJ CGV Co., Ltd. 1,595,659 1,068,225 527,434 932,126 (13,299) (14,187)
CJ 4DPLEX Co., Ltd. 107,393 49,311 58,082 69,064 (2,661) (2,701)
Bosphorus Investment Co., Ltd. 605,702 - 605,702 - (320) (320)
CJ E&M Corporation 2,273,296 1,027,295 1,246,001 1,320,306 21,675 3,564
Mezzomedia Inc. 142,709 129,988 12,721 29,468 1,690 1,874
K Valley Co., Ltd. 226,839 78,434 148,405 - (30,066) (30,493)
Studio Dragon Corporation 438,480 75,401 363,079 255,707 19,033 18,951
CJ OliveNeworks Co., Ltd. 1,063,048 590,652 472,396 1,824,417 71,051 73,047
CJ Engineering & Construction Corp 769,716 602,720 166,996 871,032 17,961 17,133
CJ LIAOCHENG BIOTECH CO., LTD. 405,553 188,915 216,638 302,251 15,079 14,747
CJ (SHENYANG) BIOTECH CO., LTD. 511,531 401,415 110,116 269,419 22,049 21,445
CJ BIO MALAYSIA SDN. BHD. 524,634 342,655 181,979 275,192 (8,625) (10,098)
PT CHEILJEDANG INDONESIA 1,279,609 559,767 719,842 726,819 57,050 52,373
PT CHEILJEDANG SUPERFEED 397,424 189,112 208,312 188,951 (3,764) (3,680)
PT CJ FEED JOMBANG 178,390 130,835 47,555 252,031 5,337 4,643
PT SUPER UNGGAS JAYA 114,021 112,155 1,866 240,926 (16,317) (15,212)
CJ VINA AGRI CO., LTD. 323,997 184,054 139,943 397,510 29,221 26,998
CJ BIO AMERICA INC. 333,601 306,079 27,522 178,413 717 881
CJ ROKIN LOGISTICS HOLDINGS LIMITED
(formerly, CJKX ROKIN HOLDINGS
LIMITED)
408,781 3 408,778 - (34) (17)
CJ LOGISTICS DO BRASIL LTDA 212,586 1,023 211,563 4,474 (1,492) (1,348)
CJ CGV(SHANGHAI) ENTERPRISE
MANAGEMENT CO., LTD.
104,338 81,563 22,775 20,352 362 365
UVD ENTERPRISE LTD. 304,943 89 304,854 701 5,607 5,297
CJ CGV VIETNAM CO., LTD. 143,785 119,722 24,063 130,639 6,667 6,177
CGI HOLDINGS LTD. 347,608 186,814 160,794 329 (1,336) (992)
CJ AMERICA INC. 285,147 223,860 61,287 484,337 2,108 1,877
CJ EUROPE GMBH. 137,743 114,108 23,635 345,161 4,763 4,797
CJ CHINA, LTD. 131,913 113,563 18,350 190,613 1,199 1,115
CJ GLOBAL HOLDINGS LTD. 289,643 213,454 76,189 - 1,353 1,521
CJ DO BRAZIL IND. COM. PROD. ALIM.
LTDA.
158,998 127,711 31,287 167,254 (13,202) (10,819)
MARS CINEMA, TOURISM AND SPORTS
FACILITIES MANAGEMENT INC.
152,197 71,981 80,216 210,923 17,559 15,321
PT GRAHA LAYAR PRIMA TBK. 136,324 48,610 87,714 71,631 1,177 957
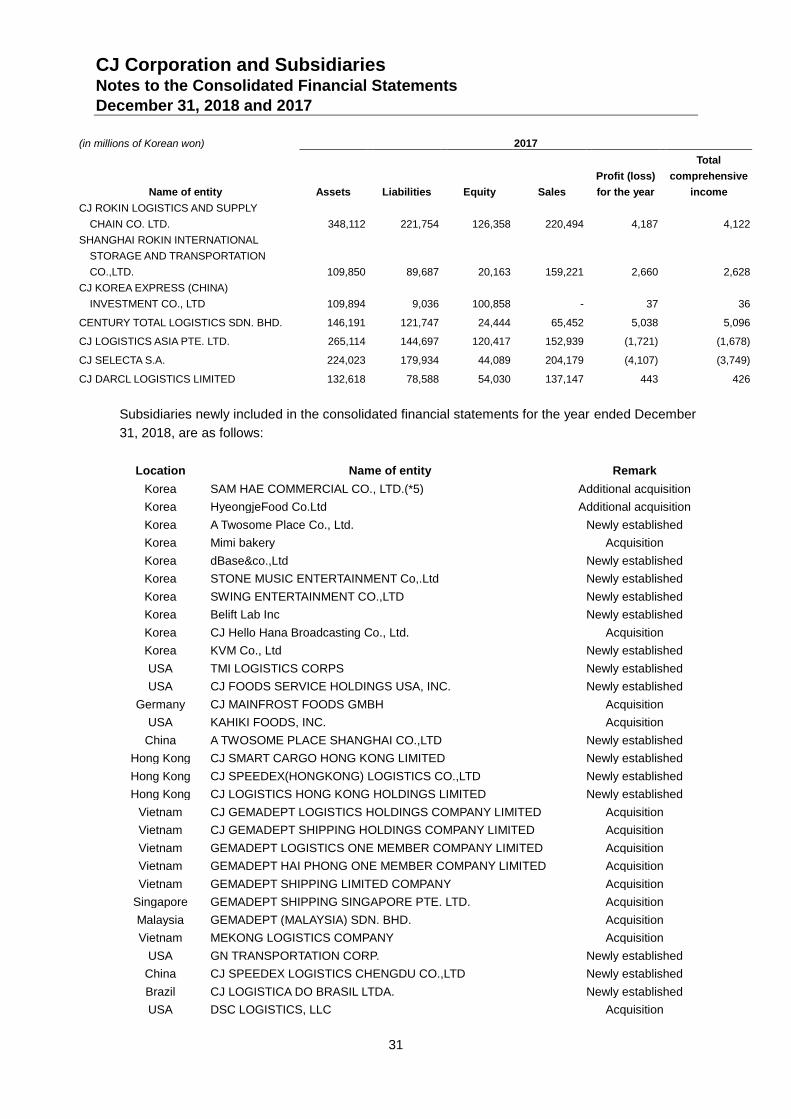
CJ Corporation and Subsidiaries Notes to the Consolidated Financial Statements December 31, 2018 and 2017
31
(in millions of Korean won) 2017
Name of entity Assets Liabilities Equity Sales
Profit (loss)
for the year
Total
comprehensive
income
CJ ROKIN LOGISTICS AND SUPPLY
CHAIN CO. LTD.
348,112 221,754 126,358 220,494 4,187 4,122
SHANGHAI ROKIN INTERNATIONAL
STORAGE AND TRANSPORTATION
CO.,LTD.
109,850 89,687 20,163 159,221 2,660 2,628
CJ KOREA EXPRESS (CHINA)
INVESTMENT CO., LTD
109,894 9,036 100,858 - 37 36
CENTURY TOTAL LOGISTICS SDN. BHD. 146,191 121,747 24,444 65,452 5,038 5,096
CJ LOGISTICS ASIA PTE. LTD. 265,114 144,697 120,417 152,939 (1,721) (1,678)
CJ SELECTA S.A. 224,023 179,934 44,089 204,179 (4,107) (3,749)
CJ DARCL LOGISTICS LIMITED 132,618 78,588 54,030 137,147 443 426
Subsidiaries newly included in the consolidated financial statements for the year ended December
31, 2018, are as follows:
Location Name of entity Remark
Korea SAM HAE COMMERCIAL CO., LTD.(*5) Additional acquisition
Korea HyeongjeFood Co.Ltd Additional acquisition
Korea A Twosome Place Co., Ltd. Newly established
Korea Mimi bakery Acquisition
Korea dBase&co.,Ltd Newly established
Korea STONE MUSIC ENTERTAINMENT Co,.Ltd Newly established
Korea SWING ENTERTAINMENT CO.,LTD Newly established
Korea Belift Lab Inc Newly established
Korea CJ Hello Hana Broadcasting Co., Ltd. Acquisition
Korea KVM Co., Ltd Newly established
USA TMI LOGISTICS CORPS Newly established
USA CJ FOODS SERVICE HOLDINGS USA, INC. Newly established
Germany CJ MAINFROST FOODS GMBH Acquisition
USA KAHIKI FOODS, INC. Acquisition
China A TWOSOME PLACE SHANGHAI CO.,LTD Newly established
Hong Kong CJ SMART CARGO HONG KONG LIMITED Newly established
Hong Kong CJ SPEEDEX(HONGKONG) LOGISTICS CO.,LTD Newly established
Hong Kong CJ LOGISTICS HONG KONG HOLDINGS LIMITED Newly established
Vietnam CJ GEMADEPT LOGISTICS HOLDINGS COMPANY LIMITED Acquisition
Vietnam CJ GEMADEPT SHIPPING HOLDINGS COMPANY LIMITED Acquisition
Vietnam GEMADEPT LOGISTICS ONE MEMBER COMPANY LIMITED Acquisition
Vietnam GEMADEPT HAI PHONG ONE MEMBER COMPANY LIMITED Acquisition
Vietnam GEMADEPT SHIPPING LIMITED COMPANY Acquisition
Singapore GEMADEPT SHIPPING SINGAPORE PTE. LTD. Acquisition
Malaysia GEMADEPT (MALAYSIA) SDN. BHD. Acquisition
Vietnam MEKONG LOGISTICS COMPANY Acquisition
USA GN TRANSPORTATION CORP. Newly established
China CJ SPEEDEX LOGISTICS CHENGDU CO.,LTD Newly established
Brazil CJ LOGISTICA DO BRASIL LTDA. Newly established
USA DSC LOGISTICS, LLC Acquisition
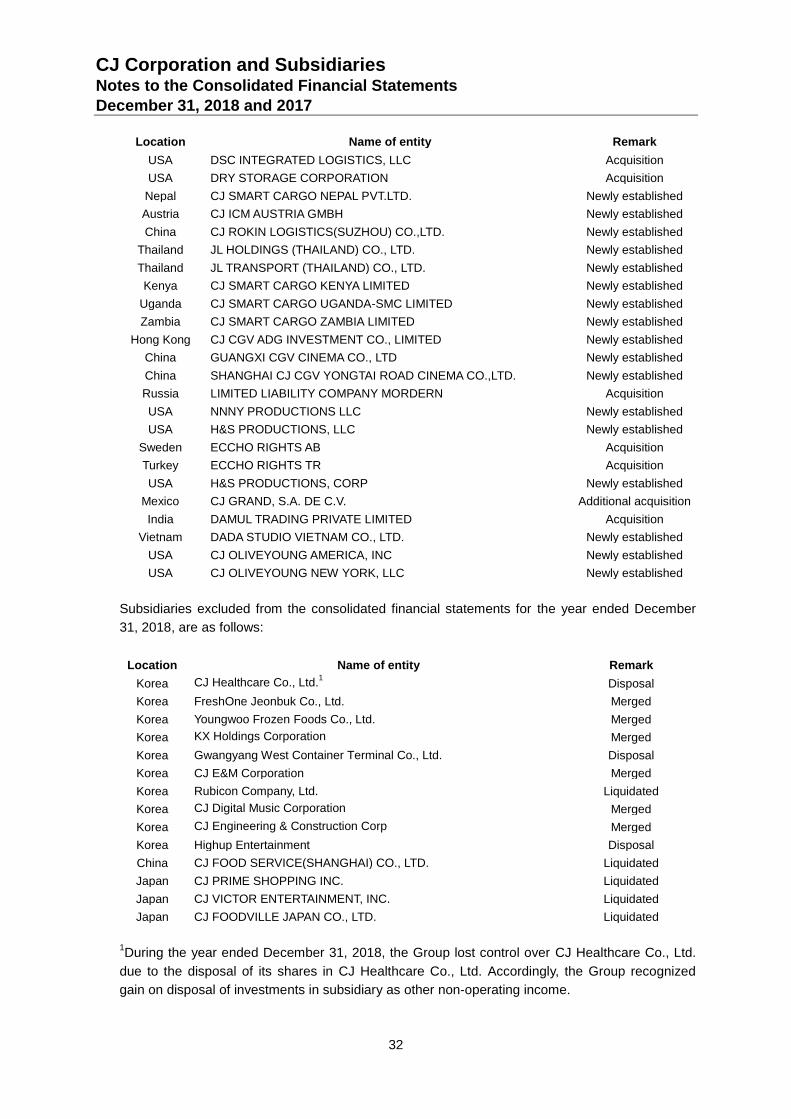
CJ Corporation and Subsidiaries Notes to the Consolidated Financial Statements December 31, 2018 and 2017
32
Location Name of entity Remark
USA DSC INTEGRATED LOGISTICS, LLC Acquisition
USA DRY STORAGE CORPORATION Acquisition
Nepal CJ SMART CARGO NEPAL PVT.LTD. Newly established
Austria CJ ICM AUSTRIA GMBH Newly established
China CJ ROKIN LOGISTICS(SUZHOU) CO.,LTD. Newly established
Thailand JL HOLDINGS (THAILAND) CO., LTD. Newly established
Thailand JL TRANSPORT (THAILAND) CO., LTD. Newly established
Kenya CJ SMART CARGO KENYA LIMITED Newly established
Uganda CJ SMART CARGO UGANDA-SMC LIMITED Newly established
Zambia CJ SMART CARGO ZAMBIA LIMITED Newly established
Hong Kong CJ CGV ADG INVESTMENT CO., LIMITED Newly established
China GUANGXI CGV CINEMA CO., LTD Newly established
China SHANGHAI CJ CGV YONGTAI ROAD CINEMA CO.,LTD. Newly established
Russia LIMITED LIABILITY COMPANY MORDERN Acquisition
USA NNNY PRODUCTIONS LLC Newly established
USA H&S PRODUCTIONS, LLC Newly established
Sweden ECCHO RIGHTS AB Acquisition
Turkey ECCHO RIGHTS TR Acquisition
USA H&S PRODUCTIONS, CORP Newly established
Mexico CJ GRAND, S.A. DE C.V. Additional acquisition
India DAMUL TRADING PRIVATE LIMITED Acquisition
Vietnam DADA STUDIO VIETNAM CO., LTD. Newly established
USA CJ OLIVEYOUNG AMERICA, INC Newly established
USA CJ OLIVEYOUNG NEW YORK, LLC Newly established
Subsidiaries excluded from the consolidated financial statements for the year ended December
31, 2018, are as follows:
Location Name of entity Remark
Korea CJ Healthcare Co., Ltd.1 Disposal
Korea FreshOne Jeonbuk Co., Ltd. Merged
Korea Youngwoo Frozen Foods Co., Ltd. Merged
Korea KX Holdings Corporation Merged
Korea Gwangyang West Container Terminal Co., Ltd. Disposal
Korea CJ E&M Corporation Merged
Korea Rubicon Company, Ltd. Liquidated
Korea CJ Digital Music Corporation Merged
Korea CJ Engineering & Construction Corp Merged
Korea Highup Entertainment Disposal
China CJ FOOD SERVICE(SHANGHAI) CO., LTD. Liquidated
Japan CJ PRIME SHOPPING INC. Liquidated
Japan CJ VICTOR ENTERTAINMENT, INC. Liquidated
Japan CJ FOODVILLE JAPAN CO., LTD. Liquidated
1During the year ended December 31, 2018, the Group lost control over CJ Healthcare Co., Ltd.
due to the disposal of its shares in CJ Healthcare Co., Ltd. Accordingly, the Group recognized
gain on disposal of investments in subsidiary as other non-operating income.
CJ Corporation and Subsidiaries Notes to the Consolidated Financial Statements December 31, 2018 and 2017
33
Dividends of CJ CheilJedang Corporation and PT CheilJedang Indonesia, PT CheilJedang
Superfeed will be restricted if PT CheilJedang Indonesia and PT CheilJedang Superfeed,
consolidated subsidiaries, postpone the payment of the principal and interests for its hybrid
securities.
2. Significant Accounting Policies
The principal accounting policies applied in the preparation of these consolidated financial
statements are set out below. These policies have been consistently applied to all the years
presented, unless otherwise stated.
2.1 Basis of Preparation
The Group maintains its accounting records in Korean won and prepares statutory financial
statements in the Korean language (Hangul) in accordance with International Financial Reporting
Standards as adopted by the Republic of Korea (Korean IFRS). The accompanying consolidated
financial statements have been condensed, restructured and translated into English from the
Korean language financial statements.
Certain information attached to the Korean language financial statements, but not required for a
fair presentation of the Group's financial position, financial performance or cash flows, is not
presented in the accompanying consolidated financial statements.
The consolidated financial statements of the Group have been prepared in accordance with
Korean IFRS. These are the standards, subsequent amendments and related interpretations
issued by the International Accounting Standards Board (IASB) that have been adopted by the
Republic of Korea.
The preparation of financial statements requires the use of critical accounting estimates.
Management also needs to exercise judgement in applying the Group’s accounting policies. The
areas involving a higher degree of judgment or complexity, or areas where assumptions and
estimates are significant to the consolidated financial statements are disclosed in Note 3.
2.2 Changes in Accounting Policy and Disclosures
(a) New and amended standards adopted by the Group
The Group has applied the following standards and amendments for the first time for their annual
reporting period commencing January 1, 2018.
- Amendment to Korean IFRS 1028 Investments in Associates and Joint Ventures
When an investment in an associate or a joint venture is held by, or is held indirectly through, an
entity that is a venture capital organization, or a mutual fund, unit trust and similar entities
including investment-linked insurance funds, the entity may elect to measure each investment
separately at fair value through profit or loss in accordance with Korean IFRS 1109. The
CJ Corporation and Subsidiaries Notes to the Consolidated Financial Statements December 31, 2018 and 2017
34
amendment does not have a significant impact on the financial statements because the Group is
not a venture capital organization.
- Amendment to Korean IFRS 1040 Transfers of Investment Property
The amendment to Korean IFRS 1040 clarifies that a transfer to, or from, investment property,
including property under construction, can only be made if there has been a change in use that is
supported by evidence, and the list of evidence for a change of use in the standard was re-
characterized as a non-exclusive list of example. The amendment does not have a significant
impact on the financial statements.
- Amendment to Korean IFRS 1102 Share-based Payment
Amendments to Korean IFRS 1102 clarify accounting for a modification to the terms and
conditions of a share-based payment that changes the classification of the transaction from cash-
settled to equity-settled. Amendments also clarify that the measurement approach should treat
the terms and conditions of a cash-settled award in the same way as for an equity-settled award.
The amendment does not have a significant impact on the financial statements.
- Enactment of Interpretation 2122 Foreign Currency Transaction and Advance Consideration
According to the enactment, the date of the transaction for the purpose of determining the
exchange rate to use on initial recognition of the related asset, expense or income (or part of it) is
the date on which an entity initially recognizes the non-monetary asset or non-monetary liability
arising from the payment or receipt of advance consideration. The enactment does not have a
significant impact on the financial statements.
- Korean IFRS 1109 Financial Instruments
The Group has applied Korean IFRS 1109 Financial Instruments on January 1, 2018, the date of
initial application. In accordance with the transitional provisions in Korean IFRS 1109,
comparative figures have not been restated, and the differences between previous book amounts
and book amounts at the date of initial application are recognized to retained earnings (or equity).
See Note 42 for further details on the impact of the application of the standard.
- Korean IFRS 1115 Revenue from Contracts with Customers
The Group has applied to apply Korean IFRS 1115 Revenue from Contracts with Customers. In
accordance with the transition provisions in Korean IFRS 1115, comparative figures have not
been restated. The Group elected the modified retrospective approach, and recognized the
cumulative impact of initially applying the revenue standard as an adjustment to retained earnings
as at January 1, 2018, the period of initial application. See Note 42 for further details on the
impact of the application of the standard.
CJ Corporation and Subsidiaries Notes to the Consolidated Financial Statements December 31, 2018 and 2017
35
(b) New standards and interpretations not yet adopted by the Group
Certain new accounting standards that have been published that are not mandatory for annual
reporting period commencing January 1, 2018 and have not been early adopted by the Group are
set out below.
- Korean IFRS 1116 Leases
Korean IFRS 1116 Leases issued on May 22, 2017 is effective for annual periods beginning on or
after January 1, 2019, with early adoption permitted. This standard will replace Korean IFRS 1017
Leases. The Group will apply the standards for annual periods beginning on or after January 1,
2019.
Under the new standard, with implementation of a single lease model, lessee is required to
recognize assets and liabilities for all lease which lease term is over 12 months and underlying
assets are not low value assets. A lessee is required to recognize a right-of-use asset and a lease
liability representing its obligation to make lease payments.
The Group performed an impact assessment to identify potential financial effects of applying
Korean IFRS 1116. The Group is analyzing the effects on the financial statements based on
available information as at December 31, 2018 to identify effects on 2018 financial statements;
however, it is difficult to provide reasonable estimates of financial effects until the analysis is
complete.
- Korean IFRS 1109 Financial Instruments
The narrow-scope amendments made to Korean IFRS 1109 Financial Instruments enable entities
to measure certain prepayable financial assets with negative compensation at amortized cost.
When a modification of a financial liability measured at amortized cost that does not result in the
derecognition, a modification gain or loss shall be recognized in profit or loss. These amendments
will be applied for annual periods beginning on or after January 1, 2019, with early adoption
permitted.
- Amendments to Korean IFRS 1019 Employee Benefits
The amendments require that an entity shall calculate current service cost and net interest for the
remainder of the reporting period after a plan amendment, curtailment or settlement based on
updated actuarial assumptions from the date of the change. The amendments also require that a
reduction in a surplus must be recognized in profit or loss even if that surplus was not previously
recognized because of the impact of the asset ceiling. The amendments are effective for plan
amendments, curtailments and settlements occurring in reporting periods that begin on or after 1
January 2019.
- Amendments to Korean IFRS 1028 Investments in Associates and Joint Ventures
The amendments clarify that an entity shall apply Korean IFRS 1109 to financial instruments in an
associate or joint venture to which the equity method is not applied. These include long-term
CJ Corporation and Subsidiaries Notes to the Consolidated Financial Statements December 31, 2018 and 2017
36
interests that, in substance, form part of the entity’s net investment in an associate or joint venture.
These amendments will be applied for annual periods beginning on or after January 1, 2019, with
early adoption permitted. In accordance with the transitional provisions in Korean IFRS 1109, the
restatement of the comparative information is not required and the cumulative effects of initially
applying the amendments retrospectively should be recognized in the beginning balance of
retained earnings (or other components of equity, as appropriate) at the date of initial application.
- Enactment to Interpretation of Korean IFRS 2123 Uncertainty over Income Tax Treatments
The Interpretation explains how to recognize and measure deferred and current income tax
assets and liabilities where there is uncertainty over a tax treatment, and includes guidance on
how to determine whether each uncertain tax treatment is considered separately or together. It
also presents examples of circumstances where a judgement or estimate is required to be
reassessed. This Interpretation will be applied for annual periods beginning on or after January 1,
2019, and an entity can either restate the comparative financial statements retrospectively or
recognize the cumulative effect of initially applying the Interpretation as an adjustment in the
beginning balance at the date of initial application.
- Annual Improvements to Korean IFRS 2015 – 2017 Cycle:
Korean IFRS 1103 Business Combination
The amendments clarify that when a party to a joint arrangement obtains control of a business
that is a joint operation, and had rights to the assets and obligations for the liabilities relating to
that joint operation immediately before the acquisition date, the transaction is a business
combination achieved in stages. In such cases, the acquirer shall remeasure its entire previously
held interest in the joint operation. These amendments will be applied to business combinations
for which the acquisition date is on or after the beginning of the first annual reporting period
beginning on or after 1 January 2019, with early adoption permitted.
Korean IFRS 1111 Joint Agreements
The amendments clarify that when a party that participates in, but does not have joint control of, a
joint operation might obtain joint control of the joint operation in which the activity of the join
operation constitutes a business. In such cases, previously held interests in the joint operation are
not remeasured. These amendments will be applied to transactions in which an entity obtains joint
control on or after the beginning of the first annual reporting period beginning on or after 1
January 2019, with early adoption permitted.
Paragraph 57A of Korean IFRS 1012 Income Tax
The amendment is applied to all the income tax consequences of dividends and requires an entity
to recognize the income tax consequences of dividends in profit or loss, other comprehensive
income or equity according to where the entity originally recognized those past transactions or
events. These amendments will be applied for annual reporting periods beginning on or after
January 1, 2019, with early adoption permitted.
CJ Corporation and Subsidiaries Notes to the Consolidated Financial Statements December 31, 2018 and 2017
37
Korean IFRS 1023 Borrowing Costs
The amendments clarify that if a specific borrowing remains outstanding after the related
qualifying asset is ready for its intended use (or sale), it becomes part of general borrowings.
These amendments will be applied to borrowing costs incurred on or after the beginning of the
first annual reporting period beginning on or after January 1, 2019, with early adoption permitted.
2.3 Consolidation
The Group has prepared the consolidated financial statements in accordance with Korean IFRS
1110 Consolidated Financial Statements.
(a) Subsidiaries
Subsidiaries are all entities over which the Group has control. The Group controls an entity when
the Group is exposed to, or has rights to, variable returns from its involvement with the entity and
has the ability to affect those returns through its power to direct the activities of the entity.
Subsidiaries are fully consolidated from the date on which control is transferred to the Group.
They are deconsolidated from the date that control ceases.
The acquisition method of accounting is used to account for business combinations by the Group.
The consideration transferred is measured at the fair values of the assets transferred, and
identifiable assets acquired and liabilities and contingent liabilities assumed in a business
combination are measured initially at their fair values at the acquisition date. The Group
recognizes any non-controlling interest in the acquired entity on an acquisition-by-acquisition
basis either at fair value or at the non-controlling interest’s proportionate share of the acquired
entity’s net identifiable assets. All other non-controlling interests are measured at fair values,
unless otherwise required by other standards. Acquisition-related costs are expensed as incurred.
The excess of consideration transferred, amount of any non-controlling interest in the acquired
entity and acquisition-date fair value of any previous equity interest in the acquired entity over the
fair value of the net identifiable assets acquired is recoded as goodwill. If those amounts are less
than the fair value of the net identifiable assets of the business acquired, the difference is
recognized directly in the profit or loss as a bargain purchase.
Intercompany transactions, balances and unrealized gains on transactions between group
companies are eliminated. Unrealized losses are also eliminated unless the transaction provides
evidence of an impairment of the transferred asset. Accounting policies of subsidiaries have been
changed where necessary to ensure consistency with the policies adopted by the Group.
The Group treats transactions with non-controlling interests that do not result in a loss of control
as transactions with equity owners of the Group. A changed in ownership interest results in an
adjustment between the carrying amounts of the controlling and non-controlling interest to reflect
their relative interest in the subsidiary. Any difference between the amount of the adjustment to
non-controlling interest and any consideration paid or received is recognized in a separate
reserve within equity attributable to owners of the Parent Company.
CJ Corporation and Subsidiaries Notes to the Consolidated Financial Statements December 31, 2018 and 2017
38
When the Group ceases to consolidate for a subsidiary because of a loss of control, any retained
interest in the subsidiary is remeasured to its fair value with the changed in carrying amount
recognized in profit or loss.
(b) Associates
Associates are entities over which the Group has significant influence but not control or joint
control. Investments in associates are accounted for using the equity method of accounting, after
initially being recognized at cost. Unrealized gains on transactions between the Group and its
associates are eliminated to the extent of the Group’s interest in the associates. If there is an
objective evidence of impairment for the investment in the associate, the Group recognizes the
difference between the recoverable amount of the associate and its book amount as impairment
loss.
(c) Joint Arrangements
A joint arrangement, wherein two or more parties have joint control, is classified as either a joint
operation or a joint venture. A joint operator recognizes its direct right to the assets, liabilities,
revenues and expenses of joint operations and its share of any jointly held or incurred assets,
liabilities, revenues and expenses. Interests in joint ventures are accounted for using the equity
method, after initially being recognized at cost in the consolidated statement of financial position.
2.4 Foreign Currency Translation
(a) Functional and presentation currency
Items included in the financial statements of each of the Group’s entities are measured using the
currency of the primary economic environment in which each entity operates (the “functional
currency”). The consolidated financial statements are presented in Korean won, which is the
Parent Company’s functional and presentation currency.
(b) Transactions and balances
Foreign currency transactions are translated into the functional currency using the exchange rates
at the dates of the transactions. Foreign exchange gains and losses resulting from the settlement
of such transactions and from the translation of monetary assets and liabilities denominated in
foreign currencies at year end exchange rates are generally recognized in profit or loss. They are
deferred in other comprehensive income if they relate to qualifying cash flow hedges and
qualifying effective portion of net investment hedges, or are attributable to monetary part of the
net investment in a foreign operation.
Foreign exchange gains and losses that relate to borrowings are presented in the statement of
profit or loss, within finance costs. All other foreign exchange gains and losses are presented in
the statement of profit or loss within ‘other income or other expenses’.
Non-monetary items that are measured at fair value in a foreign currency are translated using the
exchange rates at the date when the fair value was determined. Translation differences on assets
CJ Corporation and Subsidiaries Notes to the Consolidated Financial Statements December 31, 2018 and 2017
39
and liabilities carried at fair value are reported as part of the fair value gain or loss. For example,
translation differences on non-monetary assets and liabilities such as equities held at fair value
through profit or loss are recognized in profit or loss as part of the fair value gain or loss and
translation differences on non-monetary assets such as equities classified as available-for-sale
financial assets are recognized in other comprehensive income.
2.5 Financial Assets
(a) Classification
From January 1, 2018, the Group classifies its financial assets in the following measurement
categories:
those to be measured at fair value through profit or loss
those to be measured at fair value through other comprehensive income, and
those to be measured at amortized cost.
The classification depends on the Group’s business model for managing the financial assets and
the contractual terms of the cash flows.
For financial assets measured at fair value, gains and losses will either be recorded in profit or
loss or other comprehensive income. For investments in debt instruments, this will depend on the
business model in which the investment is held. The Group reclassifies debt investments when,
and only when its business model for managing those assets changes.
For investments in equity instruments that are not held for trading, this will depend on whether the
Group has made an irrevocable election at the time of initial recognition to account for the equity
investment at fair value through other comprehensive income. Changes in fair value of
investments in equity instruments for those the company did not make an irrevocable election, are
recognized in profit and loss.
(b) Measurement
At initial recognition, the Group measures a financial asset at its fair value plus, in the case of a
financial asset not at fair value through profit or loss, transaction costs that are directly attributable
to the acquisition of the financial asset. Transaction costs of financial assets carried at fair value
through profit or loss are expensed in profit or loss.
Financial assets with embedded derivatives are considered in their entirety when determining
whether their cash flows are solely payment of principal and interest.
A. Debt instruments
Subsequent measurement of debt instruments depends on the Group’s business model for
managing the asset and the cash flow characteristics of the asset. The Group classifies its debt
instruments into one of the following three measurement categories:
CJ Corporation and Subsidiaries Notes to the Consolidated Financial Statements December 31, 2018 and 2017
40
Amortized cost: Assets that are held for collection of contractual cash flows where those
cash flows represent solely payments of principal and interest are measured at amortized
cost. A gain or loss on a debt investment that is subsequently measured at amortized
cost and is not part of a hedging relationship is recognized in profit or loss when the asset
is derecognized or impaired. Interest income from these financial assets is included in
‘finance income’ using the effective interest rate method.
Fair value through other comprehensive income: Assets that are held for collection of
contractual cash flows and for selling the financial assets, where the assets’ cash flows
represent solely payments of principal and interest, are measured at fair value through
other comprehensive income. Movements in the carrying amount are taken through other
comprehensive income, except for the recognition of impairment loss (reversal of
impairment loss), interest income and foreign exchange gains and losses which are
recognized in profit or loss. When the financial asset is derecognized, the cumulative gain
or loss previously recognized in other comprehensive income is reclassified from equity
to profit or loss. Interest income from these financial assets is included in ‘finance income’
using the effective interest rate method. Foreign exchange gains and losses are
presented in ‘finance income or costs’ and impairment losses are presented in ‘finance
costs’.
Fair value through profit or loss: Assets that do not meet the criteria for amortized cost or
fair value through other comprehensive income are measured at fair value through profit
or loss. A gain or loss on a debt investment that is subsequently measured at fair value
through profit or loss and is not part of a hedging relationship is recognized in profit or
loss and presented net in the statement of profit or loss within ‘finance income or costs’ in
the year in which it arises.
B. Equity instruments
The Group subsequently measures all equity investments at fair value. Where the Group’s
management has elected to present fair value gains and losses on equity investments, which held
for long-term investment or strategic purpose, in other comprehensive income, there is no
subsequent reclassification of fair value gains and losses to profit or loss following the
derecognition of the investment. Dividend income from such investments continue to be
recognized in profit or loss as ‘finance income’ when the right to receive payments is established.
Changes in the fair value of financial assets at fair value through profit or loss are recognized in
‘finance income or costs’ in the statement of profit or loss as applicable. Impairment loss (reversal
of impairment loss) on equity investments measured at fair value through other comprehensive
income are not reported separately from other changes in fair value.
(c) Impairment
The Group assesses on a forward looking basis the expected credit losses associated with its
debt instruments carried at amortized cost and fair value through other comprehensive income.
The impairment methodology applied depends on whether there has been a significant increase
CJ Corporation and Subsidiaries Notes to the Consolidated Financial Statements December 31, 2018 and 2017
41
in credit risk. For trade receivables and lease receivables, the Group applies the simplified
approach, which requires expected lifetime credit losses to be recognized from initial recognition
of the receivables.
(d) Recognition and Derecognition
Regular way purchases and sales of financial assets are recognized or derecognized on trade-
date, the date on which the Group commits to purchase or sell the asset. Financial assets are
derecognized when the rights to receive cash flows from the financial assets have expired or have
been transferred and the Group has transferred substantially all the risks and rewards of
ownership.
(e) Offsetting of financial instruments
Financial assets and liabilities are offset and the net amount reported in the statements of
financial position where there is a legally enforceable right to offset the recognized amounts and
there is an intention to settle on a net basis or realize the assets and settle the liability
simultaneously. The legally enforceable right must not be contingent on future events and must
be enforceable in the normal course of business and in the event of default, insolvency or
bankruptcy of the Group or the counterparty.
2.6 Derivative Instruments
Derivatives are initially recognized at fair value on the date when a derivative contract is entered
into and are subsequently remeasured at their fair value at the end of each reporting period.
Changes in the fair value of any derivative instrument that does not qualify for hedge accounting
are recognized immediately in profit or loss within 'other non-operating income (expenses)' or
'finance income (costs)' based on the nature of transactions.
2.7 Trade Receivables
Trade receivables are recognized initially at fair value and subsequently measured at amortized
cost using the effective interest method, less loss allowance.
2.8 Inventories
Inventories are stated at the lower of cost and net realizable value. Cost is determined using the
first-in, first-out (FIFO) method, the weighted average cost method and the moving average cost
method, except for materials-in-transit which are stated at actual cost as determined using the
specific identification method.
CJ Logistics Corporation, a consolidated subsidiary, determines the acquisition cost of housing,
and building and site under construction using the specific identification method.
2.9 Biological Assets
Biological assets such as growing breed, broiler breed and others are measured at their fair value
CJ Corporation and Subsidiaries Notes to the Consolidated Financial Statements December 31, 2018 and 2017
42
less costs to sell. The fair value of biological assets are measured as market prices of growing
breed, broiler breed and others with similar age and breed less the costs to sell. Biological assets
for production, of which fair value cannot be reliably measured, are measured at their acquisition
costs less any accumulated depreciation and impairment losses.
2.10 Non-current Assets (or Disposal Group) Held for Sale
Non-current assets (or disposal group) are classified as held for sale when their carrying amount
will be recovered principally through a sale transaction rather than through continuing use and a
sale is considered highly probable. The assets are measured at the lower amount between their
carrying amount and the fair value less costs to sell.
2.11 Property, Plant and Equipment
Property, plant and equipment are stated at historical cost less accumulated depreciation and
accumulated impairment losses. Historical cost includes expenditure that is directly attributable to
the acquisition of the items.
Depreciation of all property, plant and equipment, except for land, course and art works, is
calculated using the straight-line method to allocate their cost or revalued amounts, net of their
residual values, over their estimated useful lives as follows:
Useful lives
Buildings 8 - 40 years
Structures 4 - 40 years
Machinery 4 - 10 years
Vehicles 4 - 5 years
Tools, equipment and supplies 3 - 10 years
Heavy equipment 5 - 15 years
Others 4 - 30 years
The assets’ depreciation method, residual values and useful lives are reviewed, and adjusted if
appropriate, at the end of each reporting period.
2.12 Borrowing Costs
General and specific borrowing costs that are directly attributable to the acquisition, construction
or production of a qualifying asset are capitalized during the period of time that is required to
complete and prepare the asset for its intended use or sale. Investment income earned on the
temporary investment of specific borrowings pending their expenditure on qualifying assets is
deducted from the borrowing costs eligible for capitalization. Other borrowing costs are expensed
in the period in which they are incurred.
2.13 Government Grants
Grants from the government are recognized at their fair value where there is a reasonable
assurance that the grant will be received and the Group will comply with all attached conditions.
CJ Corporation and Subsidiaries Notes to the Consolidated Financial Statements December 31, 2018 and 2017
43
Government grants related to assets are presented in the statement of financial position by
deducting the grant in arriving at the carrying amount of the asset, and government grants related
to income are deferred and later deducted from the related expense.
2.14 Intangible Assets
Goodwill is measured as described in Note 3.(1), and carried at cost less accumulated impairment
losses.
Intangible assets, except for goodwill, are initially recognized at its historical cost, and carried at
cost less accumulated amortization and accumulated impairment losses.
Development costs that are directly attributable to internally generated by the Group are
recognized when the criteria; such as, technically feasible, generate probable future economic
benefits and other, are met. Customer contracts acquired in a business combination are
recognized at fair value at the acquisition date. Membership rights, brand, and other intangible
assets (rights of using wharf, registration plate of transporters, trademarks, and others) that have
an indefinite useful life are not subject to amortization because there is no foreseeable limit to the
period over which the assets are expected to be utilized. The Group amortizes intangible assets
with a limited useful life using the straight-line method over the following periods:
Useful lives
Development costs 5 - 10 years
Publication rights and copyrights to music contents Contract terms or terms for realization
of revenue
Service concession arrangement 1
10 – 37 years
Other intangible assets 1 – 20 years
1 Service concession arrangement:
On the real estate owned by the Korea Rail Network Authority and the Ministry of Land, Transport
and Maritime Affairs, the Group built a cargo terminal with its own fund. The Group owns and
operates the cargo terminal for a certain period and then donates the terminal to the government.
The transfer period of ownership is under discussion with the Ministry of Land, Transport and
Maritime Affairs. Its estimated useful life will be determined after reaching an agreement on the
transfer period.
2.15 Investment Property
Investment property is property held to earn rentals or for capital appreciation or both. An
investment property is measured initially at its cost. An investment property is measured after
initial measurement at depreciated cost (less any accumulated impairment losses). After
recognition as an asset, investment property is carried at cost less accumulated depreciation and
impairment losses. The Group depreciates investment properties, except for land, using the
straight-line method over their useful lives.
Useful lives
Buildings 10 – 40 years
CJ Corporation and Subsidiaries Notes to the Consolidated Financial Statements December 31, 2018 and 2017
44
Structures 15 – 40 years
2.16 Impairment of Non-financial Assets
Goodwill and intangible assets that have an indefinite useful life are not subject to amortization
and are tested annually for impairment, or more frequently if events or changes in circumstances
indicate that they might be impaired. Other assets are tested for impairment whenever events or
changes in circumstances indicate that the carrying amount may not be recoverable. An
impairment loss is recognized for the amount by which the asset’s carrying amount exceeds its
recoverable amount. The recoverable amount is the higher of an asset’s fair value less costs of
disposal and value in use. Non-financial assets other than goodwill that suffered an impairment
are reviewed for possible reversal of the impairment at the end of each reporting period.
2.17 Trade and Other Payables
These amounts represent liabilities for goods and services provided to the Group prior to the end
of reporting period which are unpaid. The amounts are unsecured and are usually paid within 30
days of recognition. Trade and other payables are presented as current liabilities, unless payment
is not due within 12 months after the reporting period. They are recognized initially at their fair
value and subsequently measured at amortized cost using the effective interest method.
2.18 Financial Liabilities
(a) Classification and measurement
The Group’s financial liabilities at fair value through profit or loss are financial instruments held for
trading. A financial liability is held for trading if it is incurred principally for the purpose of
repurchasing in the near term. A derivative that is not a designated as hedging instruments and
an embedded derivative that is separated are also classified as held for trading.
The Group classifies non-derivative financial liabilities, except for financial liabilities at fair value
through profit or loss, financial guarantee contracts and financial liabilities that arise when a
transfer of financial assets does not qualify for derecognition, as financial liabilities carried at
amortized cost and present as ‘trade payables’, ‘short-term borrowings’, ‘current portion of long-
term debentures and borrowings’, ‘non-trade payables’, ‘other current financial liabilities’, ‘long-
term borrowings’, ‘debentures’, ‘deposits received’ and ‘other non-current financial liabilities’ in the
statement of financial position.
(a) Derecognition
Financial liabilities are removed from the statement of financial position when it is extinguished;
for example, when the obligation specified in the contract is discharged or cancelled or expired or
when the terms of an existing financial liability are substantially modified. The difference between
the carrying amount of a financial liability extinguished or transferred to another party and the
consideration paid (including any non-cash assets transferred or liabilities assumed) is recognized
in profit or loss.
CJ Corporation and Subsidiaries Notes to the Consolidated Financial Statements December 31, 2018 and 2017
45
2.19 Financial Guarantee Contract
Financial guarantee contracts are recognized as a financial liability at the time the guarantee is
issued. The liability is initially measured at fair value, subsequently at the higher of following and
recognized in the statement of financial position within ‘other financial liabilities’.
the amount determined in accordance with the expected credit loss model under Korean
IFRS 1109 Financial Instruments and
the amount initially recognized less, where appropriate, the cumulative amount of income
recognized in accordance with Korean IFRS 1115 Revenue from Contracts with
Customers
2.20 Compound Financial Instruments
Compound financial instruments are convertible notes and the convertible redeemable preferred
share that can be converted into equity instruments at the option of the holder. The liability
component of a compound financial instrument is recognized initially at the fair value of a similar
liability that does not have an equity conversion option. The equity component is recognized
initially on the difference between the fair value of the compound financial instrument as a whole
and the fair value of the liability component. Any directly attributable transaction costs are
allocated to the liability and equity components in proportion to their initial carrying amounts.
2.21 Provisions
Provisions for service warranties, make good obligation, and legal claims are recognized when
the Group has a present legal or constructive obligation as a result of past events, it is probable
that an outflow of resources will be required to settle the obligation and the amount can be reliably
estimated. Provisions are measured at the present value of management’s best estimate of the
expenditure required to settle the present obligation at the end of the reporting period, and the
increase in the provision due to the passage of time is recognized as interest expense.
2.22 Current and Deferred Tax
The tax expense for the period consists of current and deferred tax. Current and deferred tax is
recognized in profit or loss, except to the extent that it relates to items recognized in other
comprehensive income or directly in equity. In this case, the tax is also recognized in other
comprehensive income or directly in equity, respectively.
The tax expense is measured at the amount expected to be paid to the taxation authorities, using
the tax rates (and tax laws) that have been enacted or substantively enacted by the end of the
reporting period.
Management periodically evaluates positions taken in tax returns with respect to situations in
which applicable tax regulation is subject to interpretation. The Group recognizes current income
tax on the basis of amounts expected to be paid to the tax authorities.
CJ Corporation and Subsidiaries Notes to the Consolidated Financial Statements December 31, 2018 and 2017
46
Deferred income tax is provided in full, using the liability method, on temporary differences arising
between the tax bases of assets and liabilities and their carrying amounts in the consolidated
financial statements. However, deferred income tax is not accounted for if it arises from initial
recognition of an asset or liability in a transaction other than a business combination that at the
time of the transaction affects neither accounting nor taxable profit or loss.
Deferred tax assets are recognized only if it is probable that future taxable amounts will be
available to utilize those temporary differences and losses.
The Group recognizes a deferred tax liability all taxable temporary differences associated with
investments in subsidiaries, associates, and interests in joint arrangements, except to the extent
that the Group is able to control the timing of the reversal of the temporary difference and it is
probable that the temporary difference will not reverse in the foreseeable future. In addition, The
Group recognizes a deferred tax asset for all deductible temporary differences arising from such
investments to the extent that it is probable the temporary difference will reverse in the
foreseeable future and taxable profit will be available against which the temporary difference can
be utilized.
Deferred tax assets and liabilities are offset when there is a legally enforceable right to offset
current tax assets and liabilities and when the deferred tax balances relate to the same taxation
authority. Current tax assets and tax liabilities are offset where the entity has a legally enforceable
right to offset and intends either to settle on a net basis.
2.23 Employee Benefits
(a) Post-employment benefits
The Group operates both defined contribution and defined benefit pension plans.
For defined contribution plans, the Group pays contribution to publicly or privately administered
pension insurance plans on mandatory, contractual or voluntary basis. The Group has no further
payment obligation once the contribution have been paid. The contribution are recognized as
employee benefit expense when they are due.
A defined benefit plan is a pension plan that is not a defined contribution plan. Generally, post-
employment benefits are payable after the completion of employment, and the benefit amount
depended on the employee’s age, periods of service or salary levels. The liability recognized in
the statement of financial position in respect of defined benefit pension plans is the present value
of the defined benefit obligation at the end of the reporting period less the fair value of plan assets.
The defined benefit obligation is calculated annually by independent actuaries using the projected
unit credit method. The present value of the defined benefit obligation is determined by
discounting the estimated future cash outflows using interest rates of high-quality corporate bonds
that are denominated in the currency in which the benefits will be paid, and that have terms
approximating to the terms of the related obligation. Remeasurement gains and losses arising
from experience adjustments and changes in actuarial assumptions are recognized in the period
in which they occur, directly in other comprehensive income.
CJ Corporation and Subsidiaries Notes to the Consolidated Financial Statements December 31, 2018 and 2017
47
Changes in the present value of the defined benefit obligation resulting from plan amendments or
curtailments are recognized immediately in profit or loss as past service costs.
(b) Share-based payments
Equity-settled share-based payment is recognized at fair value of equity instruments granted, and
employee benefit expense is recognized over the vesting period. At the end of each period, the
Group revises its estimates of the number of options that are expected to vest based on the non-
market vesting and service conditions. It recognizes the impact of the revision to original
estimates, if any, in profit or loss, with a corresponding adjustment to equity.
When the options are exercised, the Group issues new shares. The proceeds received, net of any
directly attributable transaction costs, are recognized as share capital (nominal value) and share
premium.
However, in accordance with approval of the Board of Directors, the Group can distribute treasury
shares or make payment in share or cash for the valuation difference
(c) Long-term employee benefits
The Group has a long-term employee benefits to employees who stay with the Group for a certain
length of time. The expected costs of these benefits are accrued over the period of employment
using the same accounting methodology as used for defined benefit pension plans. The Group
recognizes service cost, net interest on long-term employee benefits and remeasurements as
profit or loss for the year. These liabilities are valued annually by an independent qualified actuary.
2.24 Revenue Recognition
From January 1, 2018, the Group has applied Korean IFRS 1115 Revenue from Contracts with
Customers.
(a) Identification of performance obligation
CJ OliveNetworks Co., Ltd., a consolidated subsidiary, engages in providing comprehensive total
IT service including consulting, system development, operation, maintenance, and managent
service to customers. The Group identifies performance obligations from comprehensive IT
contract with customers such as (a) sales of software, (b) installation, (c) software update and (d)
maintenance.
Since the Group is obliged to provide software update and maintenance services to customers
during the term of the contract, the Group recognizes the transaction price allocated to each
performance obligation as revenue over the service period.
CJ Hello Co., Ltd., a consolidated subsidiary, engages in providing broadcasting, internet and
internet phone service to customers. Under Korean IFRS 1115, the Group identifies performance
obligations from the combined service contract with customers such as (a) sales of handsets and
(b) telecommunication service.
CJ Corporation and Subsidiaries Notes to the Consolidated Financial Statements December 31, 2018 and 2017
48
The Group has not identified any significant performance obligations from contracts with
customers in relation to other divisions. The Group recognizes the transaction price allocated to
each performance obligation as revenue over the service period.
(b) Performance obligation satisfied over time
With respect to logistics related service and construction service, the Group measures the
percentage-of-completion for the satisfaction of performance obligation, and recognizes revenue
over the service period for each performance obligation that is satisfied over the period of beneifts
provided to customers. The Group measures the percentage-of-completion to represent the level
of performance while transferring control over promised goods or services (satisfying the
performance obligation) to customers. In addition, costs to fulfil a contract are expensed based on
the percentage-of-completion for the services.
(c) Variable consideration
The Group estimates an amount of variable consideration by using the method exepcted to better
predict the amount of consideration to which it will be entitled. The Group recognizes revenue by
including the transaction price some or all of an amount of variable consideration esimated only to
the extent that it is highly probable that a significant reversal in the amount of cumulative revenue
recognized will not occur when the refund period has lapsed. The contract liability is recognized
for an amount of consideration received for which the Group does not expect to be entitled.
(d) Allocation of transaction price
The transaction price in an arrangement must be allocated to each separate performance
obligation based on the relative stand-alone selling prices of the goods or services being provided
to customers. The Group determines the stand-alone selling price for each separate performance
obligation by using ‘adjust market assessment approach’. In limited circumstances, the Group
uses ‘expected cost plus a margin approach’ to estimate expected cost plus a reasonable margin.
(e) Incremental costs of obtaining a contract
The cable broadcasting division of the Group makes payments and recognizes them as costs that
an entity incurs to obtain a contract with a customer that it would not have incurred if the contract
had not been obtained. With implementation of Korean IFRS 1115, the Group recognizes the
incremental costs of obtaining a contract with a customer of the Group expects to recover as an
asset, and costs that are recognized as assets are amortized over the period of the related goods
or services transfer to the customer. However, the Group elected a practical expedient that
permits an entity to expense the costs to obtain a contract as incurred when the expected
amortization period is one year or less.
(f) Principal versus agent
The Group provides logistics services in accordance with the contracts with customers. The
Group recognizes the gross amount of revenue from the sale of goods and services whose
CJ Corporation and Subsidiaries Notes to the Consolidated Financial Statements December 31, 2018 and 2017
49
controls have not been transferred to customers as the Group is considered to be ‘Principal’.
(g) Return
The Group recognizes a refund liability for the expected portion of the consideration received from
a customer and adjusts salles accordingly. At the same time, the Group recognizes an asset of
the returned product as the Group has a right to recollect the product from the customer when the
customer exercises the right to return and adjusts cost of sales accordingly. The right to collect
the product is measured by carrying amount of the product less costs incurred in the course of
collecting the products.
2.25 Lease
A lease is an agreement, whereby the lessor conveys to the lessee, in return for a payment or
series of payments, the right to use an asset for an agreed period of time. Leases in which a
significant portion of the risks and rewards of ownership are not transferred to the Group are
classified as operating leases. Payments made under operating leases are charge to profit or loss
on a straight-line basis over the period of lease.
Leases where the Group, as a lessee, has substantially all the risks and rewards of ownership are
classified as finance leases. Finance leases are capitalized at the lease’s inception at the fair
value of the leased property or, if lower, the present value of the minimum lease payments. The
corresponding rental obligations, net of finance charges, are included in other short-term and
long-term payables. Each lease payment is allocated between the liability and finance cost.
If the Group is a lessor, a lease is classified as a finance lease if it transfers substantially all the
risks and rewards incidental to ownership at the inception of the lease. A lease other than a
finance lease is classified as an operating lease. Lease income from operating leases is
recognized in income on a straight-line basis over the lease term. Initial direct costs incurred by
the lessor in negotiating and arranging an operating lease is added to the carrying amount of the
leased asset and recognized as an expense over the lease term on the same basis as the lease
income.
A sale and leaseback transaction involves the sale of an asset and the leasing back of the same
asset. If a sale and leaseback transaction results in a finance lease, any excess of sales proceeds
over the carrying amount is not be immediately recognized as income by a seller-lessee (the
Group). Instead, it is deferred and amortized over the lease term. If a sale and leaseback
transaction results in an operating lease, and it is clear that the transaction is established at fair
value, any profit or loss is recognized immediately. Also, if the sale price is below fair value, any
profit or loss is recognized immediately, unless the loss is compensated for by future lease
payments at below market price, and it then is deferred and amortized in proportion to the lease
payments over the period for which the asset is expected to be used. If the sale price is above fair
value, the excess over fair value is deferred and amortized over the period for which the asset is
expected to be used.
2.26 Business Combination of Entities Under a Common Control
CJ Corporation and Subsidiaries Notes to the Consolidated Financial Statements December 31, 2018 and 2017
50
The company used book value method as the business consolidation under same controlling
company. Assets and liabilities transferred to a business consolidation are measured at the book
value method of the parent entity's consolidated financial statements. In the case that no
consolidated financial statements are prepared, assets and liabilities are measured at the book
value method of the acquiree’s financial statements. The difference of the book value of assets
and liabilities, the accumulated other comprehensive income and expenses with the amount of
consideration transferred is reflected in other adjustment to stockholder's equity.
2.27 Segment Reporting
Information of each operating segment is reported in a manner consistent with the business
segment reporting provided to the chief operating decision-maker who is the Chief Executive
Officer.
2.28 Approval of Issuance of the Financial Statements
The consolidated financial statements 2018 were approved for issue by the Board of Directors on
February 11, 2019 and are subject to change with the approval of shareholders at their Annual
General Meeting.
3. Critical Accounting Estimates and Assumptions
The preparation of financial statements requires the Group to make estimates and assumptions
concerning the future. Management also needs to exercise judgement in applying the Group’s
accounting policies. Estimates and assumptions are continually evaluated and are based on
historical experience and other factors, including expectations of future events that are believed to
be reasonable under the circumstances. As the resulting accounting estimates will, by definition,
seldom equal the related actual results, it can contain a significant risk of causing a material
adjustment.
The estimates and assumptions that have a significant risk of causing a material adjustment to
the carrying amounts of assets and liabilities within the next financial year are addressed below.
Additional information of significant estimates and judgements about certain items is included in
the separate notes.
(a) Estimated impairment of goodwill
The Group tests whether goodwill has suffered any impairment on an annual basis. The
recoverable amount of a cash generating unit (CGU) is determined based on value-in-use
calculations.
(b) Income taxes
The Group’s taxable income generated from these operations are subject to income taxes based
on tax laws and interpretations of tax authorities in numerous jurisdictions. There are many
transactions and calculations for which the ultimate tax determination is uncertain.
CJ Corporation and Subsidiaries Notes to the Consolidated Financial Statements December 31, 2018 and 2017
51
If certain portion of the taxable income is not used for investments or increase in wages in
accordance with the Tax System For Recirculation of Corporate Income, the Group is liable to pay
additional income tax calculated based on the tax laws. Accordingly, the measurement of current
and deferred income tax is affected by the tax effects from the new tax system. As the Group’s
income tax is dependent on the investments, and increase in wages, there is an uncertainty
measuring the final tax effects.
(c) Fair value of financial instruments
The fair value of financial instruments that are not traded in an active market is determined by
using valuation techniques. The Group uses its judgment to select a variety of methods and make
assumptions that are mainly based on market conditions existing at the end of each reporting
period.
(d) Impairment of financial assets
The provision for impairment for financial assets are based on assumptions about risk of default
and expected loss rates. The Group uses judgement in making these assumptions and selecting
the inputs to the impairment calculation based on the Group’s past history, existing market
conditions as well as forward looking estimates at the end of each reporting period.
(e) Net defined benefit liability
The present value of net defined benefit liability depends on a number of factors that are
determined on an actuarial basis using a number of assumptions including the discount rate.
(f) Revenue recognition
A refund liability and a right to the returned goods are recognized for the products expected to be
returned once they are sold. Accumulated experience is used to estimate such returns at the time
of sale at a portfolio level (expected value method), and the Group’s revenue is affected by
changes in expected return rate.
4. Financial Risk Management
4.1 Financial Risk Factors
The Group’s activities expose it to a variety of financial risks: market risk (including currency risk,
price risk and interest risk), credit risk and liquidity risk. In order to manage such risks, the Group
established financial risk management policies and programs which enable to closely monitor and
react to individual risk causes.
Certain subsidiaries invest on derivatives to hedge certain risk exposures. The Group documents
at the inception of the transaction the relationship between hedging instruments and hedged
items, as well as its risk management objectives and strategy for undertaking various hedging
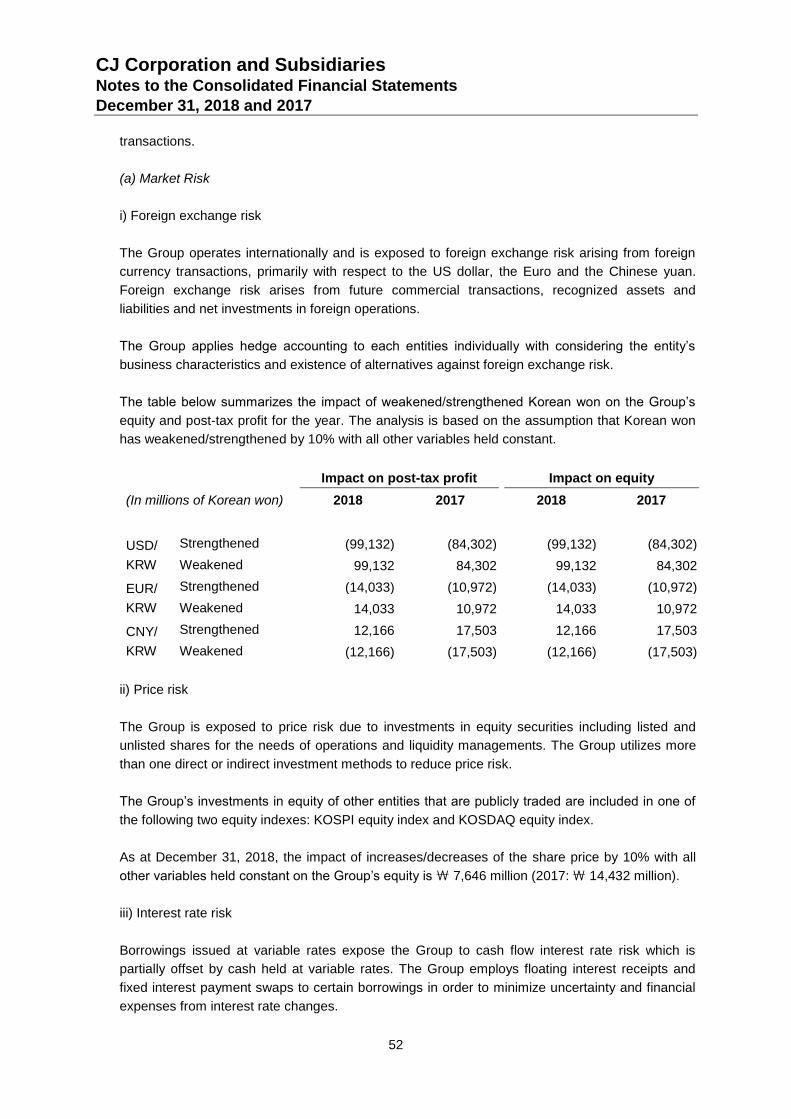
CJ Corporation and Subsidiaries Notes to the Consolidated Financial Statements December 31, 2018 and 2017
52
transactions.
(a) Market Risk
i) Foreign exchange risk
The Group operates internationally and is exposed to foreign exchange risk arising from foreign
currency transactions, primarily with respect to the US dollar, the Euro and the Chinese yuan.
Foreign exchange risk arises from future commercial transactions, recognized assets and
liabilities and net investments in foreign operations.
The Group applies hedge accounting to each entities individually with considering the entity’s
business characteristics and existence of alternatives against foreign exchange risk.
The table below summarizes the impact of weakened/strengthened Korean won on the Group’s
equity and post-tax profit for the year. The analysis is based on the assumption that Korean won
has weakened/strengthened by 10% with all other variables held constant.
Impact on post-tax profit Impact on equity
(In millions of Korean won) 2018 2017 2018 2017
USD/
KRW
Strengthened (99,132) (84,302) (99,132) (84,302)
Weakened 99,132 84,302 99,132 84,302
EUR/
KRW
Strengthened (14,033) (10,972) (14,033) (10,972)
Weakened 14,033 10,972 14,033 10,972
CNY/
KRW
Strengthened 12,166 17,503 12,166 17,503
Weakened (12,166) (17,503) (12,166) (17,503)
ii) Price risk
The Group is exposed to price risk due to investments in equity securities including listed and
unlisted shares for the needs of operations and liquidity managements. The Group utilizes more
than one direct or indirect investment methods to reduce price risk.
The Group’s investments in equity of other entities that are publicly traded are included in one of
the following two equity indexes: KOSPI equity index and KOSDAQ equity index.
As at December 31, 2018, the impact of increases/decreases of the share price by 10% with all
other variables held constant on the Group’s equity is \ 7,646 million (2017: \ 14,432 million).
iii) Interest rate risk
Borrowings issued at variable rates expose the Group to cash flow interest rate risk which is
partially offset by cash held at variable rates. The Group employs floating interest receipts and
fixed interest payment swaps to certain borrowings in order to minimize uncertainty and financial
expenses from interest rate changes.
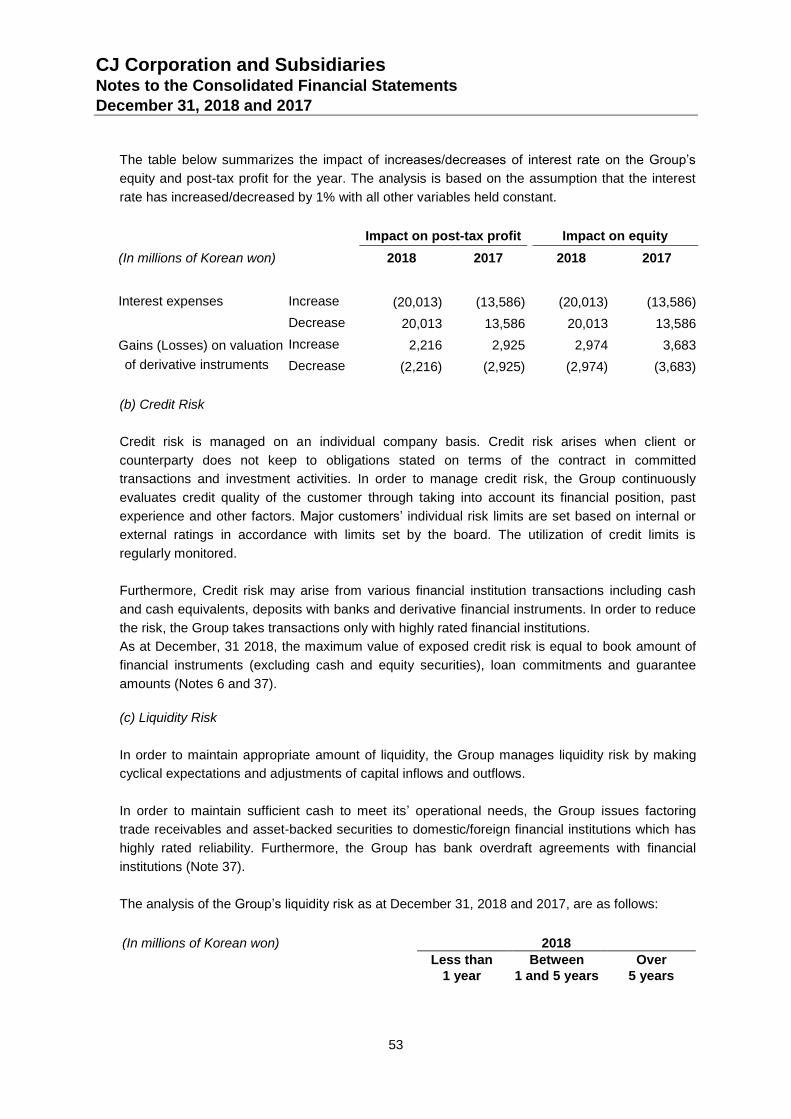
CJ Corporation and Subsidiaries Notes to the Consolidated Financial Statements December 31, 2018 and 2017
53
The table below summarizes the impact of increases/decreases of interest rate on the Group’s
equity and post-tax profit for the year. The analysis is based on the assumption that the interest
rate has increased/decreased by 1% with all other variables held constant.
Impact on post-tax profit Impact on equity
(In millions of Korean won) 2018 2017 2018 2017
Interest expenses Increase (20,013) (13,586) (20,013) (13,586)
Decrease 20,013 13,586 20,013 13,586
Gains (Losses) on valuation
of derivative instruments
Increase 2,216 2,925 2,974 3,683
Decrease (2,216) (2,925) (2,974) (3,683)
(b) Credit Risk
Credit risk is managed on an individual company basis. Credit risk arises when client or
counterparty does not keep to obligations stated on terms of the contract in committed
transactions and investment activities. In order to manage credit risk, the Group continuously
evaluates credit quality of the customer through taking into account its financial position, past
experience and other factors. Major customers’ individual risk limits are set based on internal or
external ratings in accordance with limits set by the board. The utilization of credit limits is
regularly monitored.
Furthermore, Credit risk may arise from various financial institution transactions including cash
and cash equivalents, deposits with banks and derivative financial instruments. In order to reduce
the risk, the Group takes transactions only with highly rated financial institutions.
As at December, 31 2018, the maximum value of exposed credit risk is equal to book amount of
financial instruments (excluding cash and equity securities), loan commitments and guarantee
amounts (Notes 6 and 37).
(c) Liquidity Risk
In order to maintain appropriate amount of liquidity, the Group manages liquidity risk by making
cyclical expectations and adjustments of capital inflows and outflows.
In order to maintain sufficient cash to meet its’ operational needs, the Group issues factoring
trade receivables and asset-backed securities to domestic/foreign financial institutions which has
highly rated reliability. Furthermore, the Group has bank overdraft agreements with financial
institutions (Note 37).
The analysis of the Group’s liquidity risk as at December 31, 2018 and 2017, are as follows:
(In millions of Korean won) 2018
Less than
1 year
Between
1 and 5 years
Over
5 years
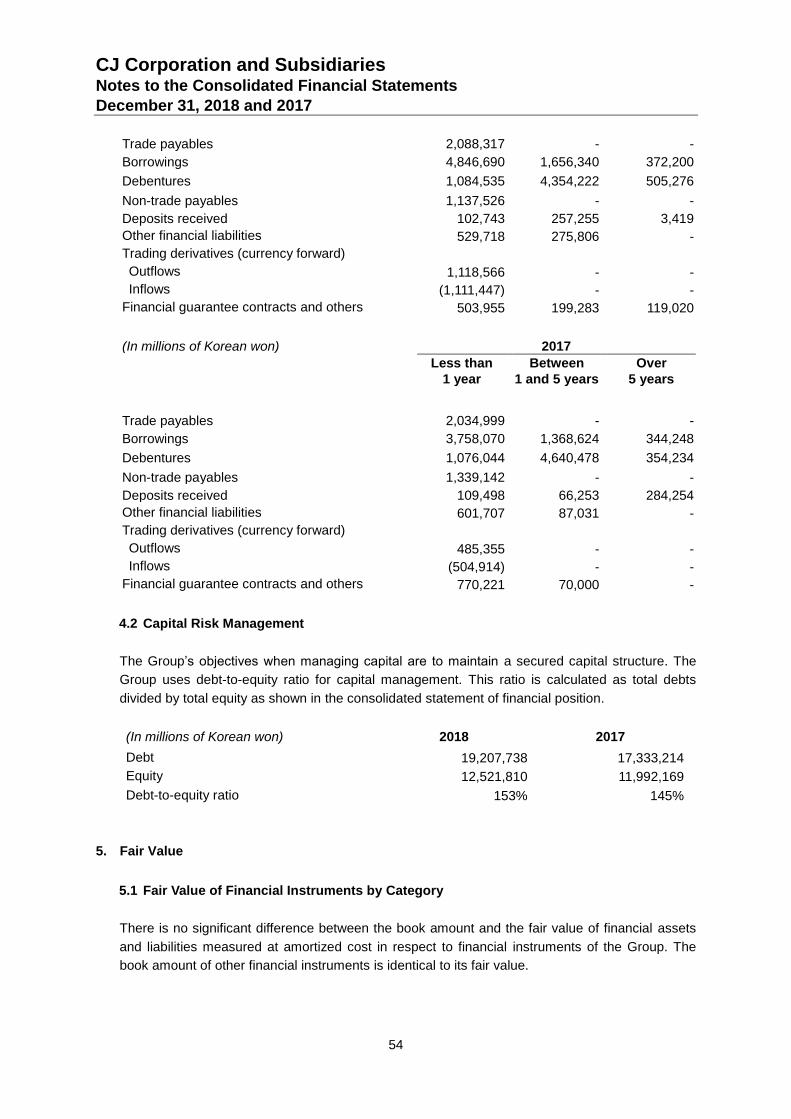
CJ Corporation and Subsidiaries Notes to the Consolidated Financial Statements December 31, 2018 and 2017
54
Trade payables 2,088,317 - -
Borrowings 4,846,690 1,656,340 372,200
Debentures 1,084,535 4,354,222 505,276
Non-trade payables 1,137,526 - -
Deposits received 102,743 257,255 3,419
Other financial liabilities 529,718 275,806 -
Trading derivatives (currency forward)
Outflows 1,118,566 - -
Inflows (1,111,447) - -
Financial guarantee contracts and others 503,955 199,283 119,020
(In millions of Korean won) 2017
Less than
1 year
Between
1 and 5 years
Over
5 years
Trade payables 2,034,999 - -
Borrowings 3,758,070 1,368,624 344,248
Debentures 1,076,044 4,640,478 354,234
Non-trade payables 1,339,142 - -
Deposits received 109,498 66,253 284,254
Other financial liabilities 601,707 87,031 -
Trading derivatives (currency forward)
Outflows 485,355 - -
Inflows (504,914) - -
Financial guarantee contracts and others 770,221 70,000 -
4.2 Capital Risk Management
The Group’s objectives when managing capital are to maintain a secured capital structure. The
Group uses debt-to-equity ratio for capital management. This ratio is calculated as total debts
divided by total equity as shown in the consolidated statement of financial position.
(In millions of Korean won) 2018 2017
Debt 19,207,738 17,333,214
Equity 12,521,810 11,992,169
Debt-to-equity ratio 153% 145%
5. Fair Value
5.1 Fair Value of Financial Instruments by Category
There is no significant difference between the book amount and the fair value of financial assets
and liabilities measured at amortized cost in respect to financial instruments of the Group. The
book amount of other financial instruments is identical to its fair value.
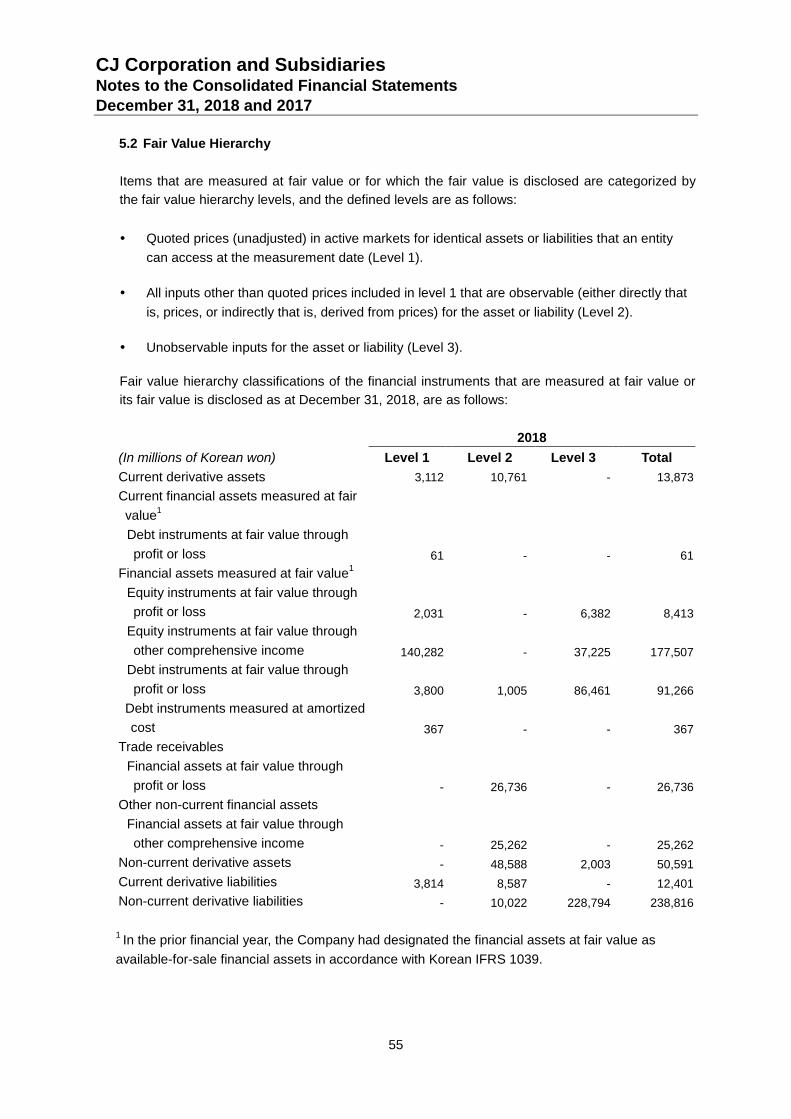
CJ Corporation and Subsidiaries Notes to the Consolidated Financial Statements December 31, 2018 and 2017
55
5.2 Fair Value Hierarchy
Items that are measured at fair value or for which the fair value is disclosed are categorized by
the fair value hierarchy levels, and the defined levels are as follows:
Quoted prices (unadjusted) in active markets for identical assets or liabilities that an entity
can access at the measurement date (Level 1).
All inputs other than quoted prices included in level 1 that are observable (either directly that
is, prices, or indirectly that is, derived from prices) for the asset or liability (Level 2).
Unobservable inputs for the asset or liability (Level 3).
Fair value hierarchy classifications of the financial instruments that are measured at fair value or
its fair value is disclosed as at December 31, 2018, are as follows:
2018
(In millions of Korean won) Level 1 Level 2 Level 3 Total
Current derivative assets 3,112 10,761 - 13,873
Current financial assets measured at fair
value1
Debt instruments at fair value through
profit or loss 61 - - 61
Financial assets measured at fair value1
Equity instruments at fair value through
profit or loss 2,031 - 6,382 8,413
Equity instruments at fair value through
other comprehensive income 140,282 - 37,225 177,507
Debt instruments at fair value through
profit or loss 3,800 1,005 86,461 91,266
Debt instruments measured at amortized
cost 367 - - 367
Trade receivables
Financial assets at fair value through
profit or loss - 26,736 - 26,736
Other non-current financial assets
Financial assets at fair value through
other comprehensive income - 25,262 - 25,262
Non-current derivative assets - 48,588 2,003 50,591
Current derivative liabilities 3,814 8,587 - 12,401
Non-current derivative liabilities - 10,022 228,794 238,816
1 In the prior financial year, the Company had designated the financial assets at fair value as
available-for-sale financial assets in accordance with Korean IFRS 1039.
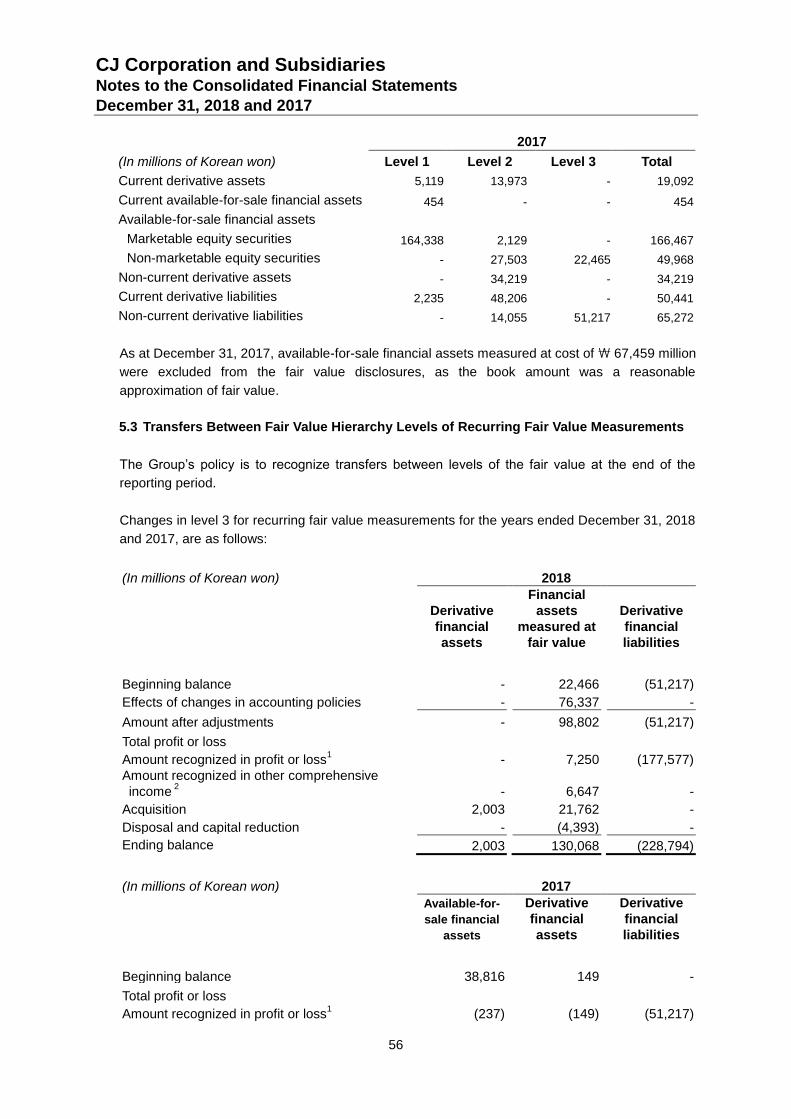
CJ Corporation and Subsidiaries Notes to the Consolidated Financial Statements December 31, 2018 and 2017
56
2017
(In millions of Korean won) Level 1 Level 2 Level 3 Total
Current derivative assets 5,119 13,973 - 19,092
Current available-for-sale financial assets 454 - - 454
Available-for-sale financial assets
Marketable equity securities 164,338 2,129 - 166,467
Non-marketable equity securities - 27,503 22,465 49,968
Non-current derivative assets - 34,219 - 34,219
Current derivative liabilities 2,235 48,206 - 50,441
Non-current derivative liabilities - 14,055 51,217 65,272
As at December 31, 2017, available-for-sale financial assets measured at cost of \ 67,459 million
were excluded from the fair value disclosures, as the book amount was a reasonable
approximation of fair value.
5.3 Transfers Between Fair Value Hierarchy Levels of Recurring Fair Value Measurements
The Group’s policy is to recognize transfers between levels of the fair value at the end of the
reporting period.
Changes in level 3 for recurring fair value measurements for the years ended December 31, 2018
and 2017, are as follows:
(In millions of Korean won) 2018
Derivative
financial
assets
Financial
assets
measured at
fair value
Derivative
financial
liabilities
Beginning balance - 22,466 (51,217)
Effects of changes in accounting policies - 76,337 -
Amount after adjustments - 98,802 (51,217)
Total profit or loss
Amount recognized in profit or loss1 - 7,250 (177,577)
Amount recognized in other comprehensive
income 2 - 6,647 -
Acquisition 2,003 21,762 -
Disposal and capital reduction - (4,393) -
Ending balance 2,003 130,068 (228,794)
(In millions of Korean won) 2017
Available-for-
sale financial
assets
Derivative
financial
assets
Derivative
financial
liabilities
Beginning balance 38,816 149 -
Total profit or loss
Amount recognized in profit or loss1 (237) (149) (51,217)
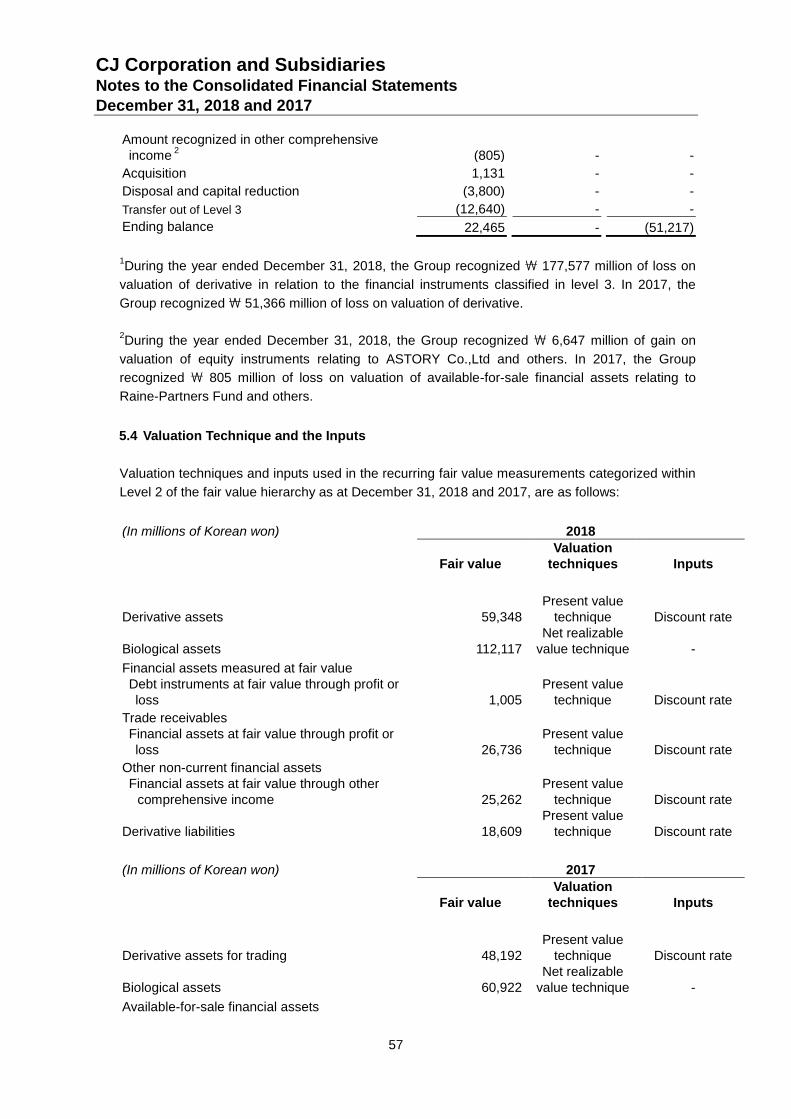
CJ Corporation and Subsidiaries Notes to the Consolidated Financial Statements December 31, 2018 and 2017
57
Amount recognized in other comprehensive
income 2 (805) - -
Acquisition 1,131 - -
Disposal and capital reduction (3,800) - -
Transfer out of Level 3 (12,640) - -
Ending balance 22,465 - (51,217)
1During the year ended December 31, 2018, the Group recognized \ 177,577 million of loss on
valuation of derivative in relation to the financial instruments classified in level 3. In 2017, the
Group recognized \ 51,366 million of loss on valuation of derivative.
2During the year ended December 31, 2018, the Group recognized \ 6,647 million of gain on
valuation of equity instruments relating to ASTORY Co.,Ltd and others. In 2017, the Group
recognized \ 805 million of loss on valuation of available-for-sale financial assets relating to
Raine-Partners Fund and others.
5.4 Valuation Technique and the Inputs
Valuation techniques and inputs used in the recurring fair value measurements categorized within
Level 2 of the fair value hierarchy as at December 31, 2018 and 2017, are as follows:
(In millions of Korean won) 2018
Fair value
Valuation
techniques Inputs
Derivative assets 59,348
Present value
technique Discount rate
Biological assets 112,117
Net realizable
value technique -
Financial assets measured at fair value
Debt instruments at fair value through profit or
loss 1,005
Present value
technique Discount rate
Trade receivables
Financial assets at fair value through profit or
loss 26,736
Present value
technique Discount rate
Other non-current financial assets
Financial assets at fair value through other
comprehensive income 25,262
Present value
technique Discount rate
Derivative liabilities 18,609
Present value
technique Discount rate
(In millions of Korean won) 2017
Fair value
Valuation
techniques Inputs
Derivative assets for trading 48,192
Present value
technique Discount rate
Biological assets 60,922
Net realizable
value technique -
Available-for-sale financial assets
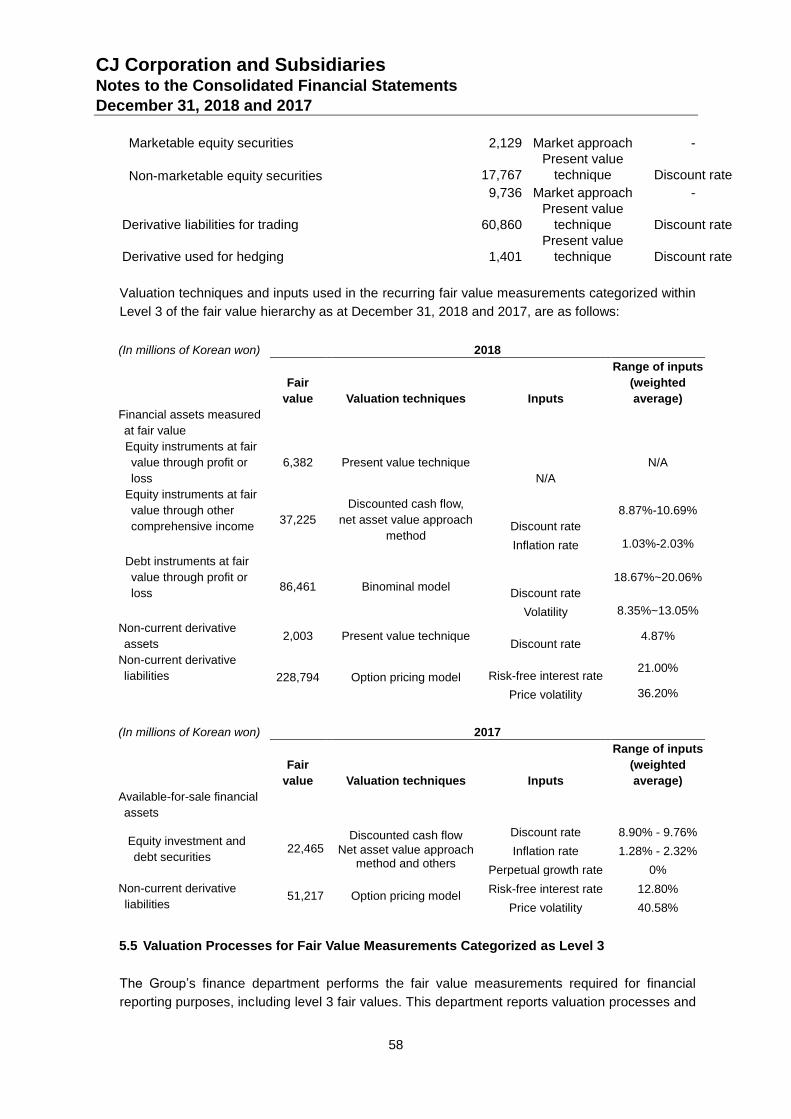
CJ Corporation and Subsidiaries Notes to the Consolidated Financial Statements December 31, 2018 and 2017
58
Marketable equity securities 2,129 Market approach -
Non-marketable equity securities 17,767
Present value
technique Discount rate
9,736 Market approach -
Derivative liabilities for trading 60,860
Present value
technique Discount rate
Derivative used for hedging 1,401
Present value
technique Discount rate
Valuation techniques and inputs used in the recurring fair value measurements categorized within
Level 3 of the fair value hierarchy as at December 31, 2018 and 2017, are as follows:
(In millions of Korean won) 2018
Fair
value Valuation techniques Inputs
Range of inputs
(weighted
average)
Financial assets measured
at fair value
Equity instruments at fair
value through profit or
loss
6,382
Present value technique
N/A
N/A
Equity instruments at fair
value through other
comprehensive income 37,225
Discounted cash flow,
net asset value approach
method Discount rate
8.87%-10.69%
Inflation rate 1.03%-2.03%
Debt instruments at fair
value through profit or
loss 86,461
Binominal model
Discount rate
18.67%~20.06%
Volatility 8.35%~13.05%
Non-current derivative
assets 2,003
Present value technique
Discount rate 4.87%
Non-current derivative
liabilities 228,794 Option pricing model Risk-free interest rate 21.00%
Price volatility 36.20%
(In millions of Korean won) 2017
Fair
value Valuation techniques Inputs
Range of inputs
(weighted
average)
Available-for-sale financial
assets
Equity investment and
debt securities
22,465
Discounted cash flow
Net asset value approach method and others
Discount rate 8.90% - 9.76%
Inflation rate 1.28% - 2.32%
Perpetual growth rate 0%
Non-current derivative
liabilities
51,217
Option pricing model
Risk-free interest rate 12.80%
Price volatility 40.58%
5.5 Valuation Processes for Fair Value Measurements Categorized as Level 3
The Group’s finance department performs the fair value measurements required for financial
reporting purposes, inc luding level 3 fair values. This department reports valuation processes and
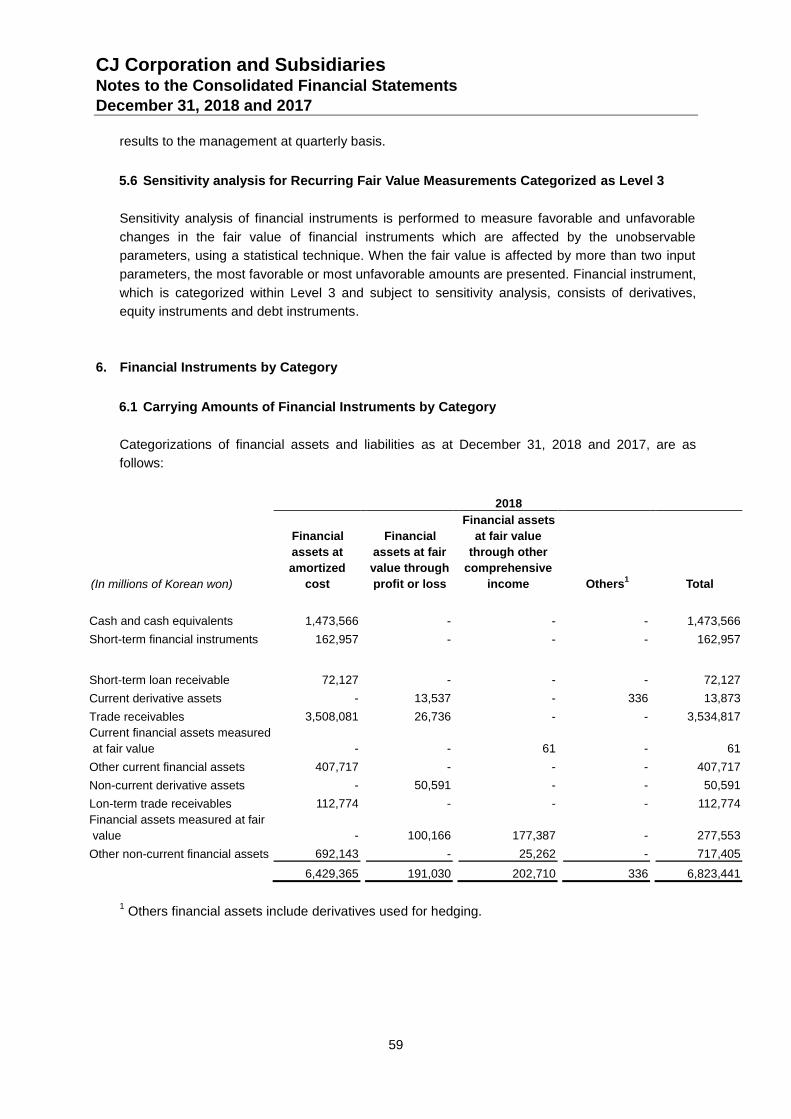
CJ Corporation and Subsidiaries Notes to the Consolidated Financial Statements December 31, 2018 and 2017
59
results to the management at quarterly basis.
5.6 Sensitivity analysis for Recurring Fair Value Measurements Categorized as Level 3
Sensitivity analysis of financial instruments is performed to measure favorable and unfavorable
changes in the fair value of financial instruments which are affected by the unobservable
parameters, using a statistical technique. When the fair value is affected by more than two input
parameters, the most favorable or most unfavorable amounts are presented. Financial instrument,
which is categorized within Level 3 and subject to sensitivity analysis, consists of derivatives,
equity instruments and debt instruments.
6. Financial Instruments by Category
6.1 Carrying Amounts of Financial Instruments by Category
Categorizations of financial assets and liabilities as at December 31, 2018 and 2017, are as
follows:
2018
(In millions of Korean won)
Financial
assets at
amortized
cost
Financial
assets at fair
value through
profit or loss
Financial assets
at fair value
through other
comprehensive
income
Others1 Total
Cash and cash equivalents 1,473,566 - - - 1,473,566
Short-term financial instruments 162,957 - - - 162,957
Short-term loan receivable 72,127 - - - 72,127
Current derivative assets - 13,537 - 336 13,873
Trade receivables 3,508,081 26,736 - - 3,534,817
Current financial assets measured
at fair value - - 61 - 61
Other current financial assets 407,717 - - - 407,717
Non-current derivative assets - 50,591 - - 50,591
Lon-term trade receivables 112,774 - - - 112,774
Financial assets measured at fair
value - 100,166 177,387 - 277,553
Other non-current financial assets 692,143 - 25,262 - 717,405
6,429,365 191,030 202,710 336 6,823,441
1 Others financial assets include derivatives used for hedging.
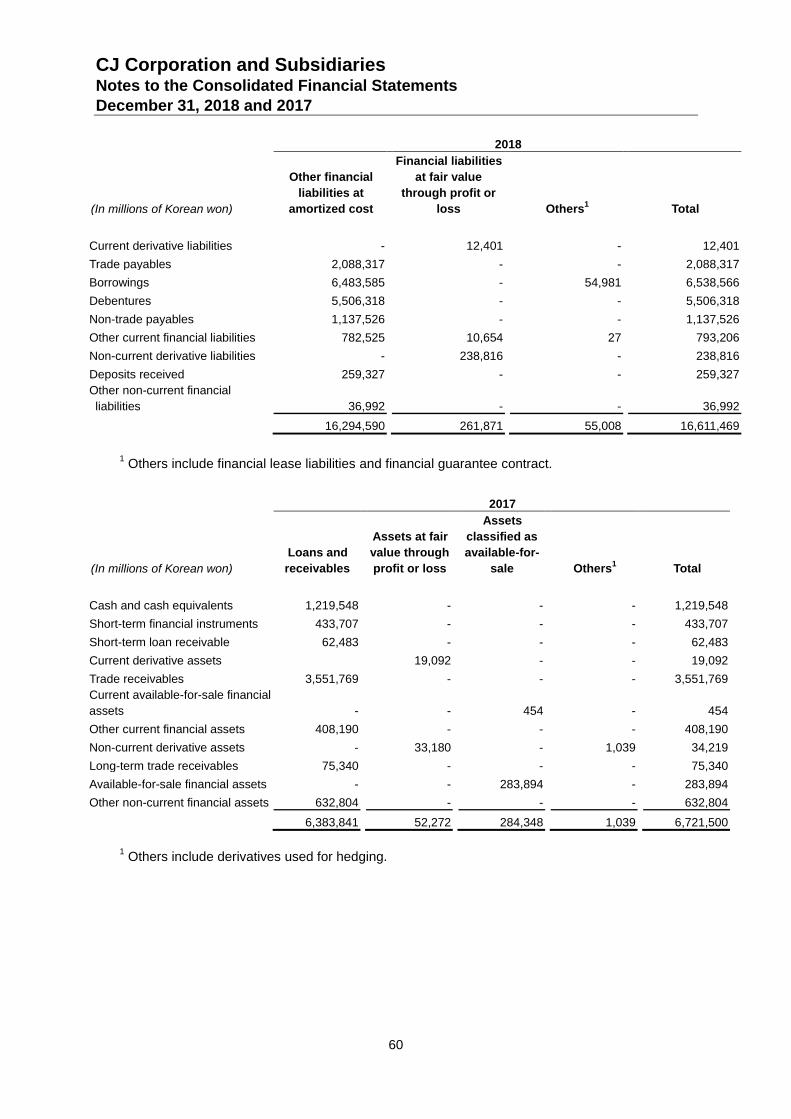
CJ Corporation and Subsidiaries Notes to the Consolidated Financial Statements December 31, 2018 and 2017
60
2018
(In millions of Korean won)
Other financial
liabilities at
amortized cost
Financial liabilities
at fair value
through profit or
loss
Others1 Total
Current derivative liabilities - 12,401 - 12,401
Trade payables 2,088,317 - - 2,088,317
Borrowings 6,483,585 - 54,981 6,538,566
Debentures 5,506,318 - - 5,506,318
Non-trade payables 1,137,526 - - 1,137,526
Other current financial liabilities 782,525 10,654 27 793,206
Non-current derivative liabilities - 238,816 - 238,816
Deposits received 259,327 - - 259,327
Other non-current financial
liabilities 36,992 - - 36,992
16,294,590 261,871 55,008 16,611,469
1 Others include financial lease liabilities and financial guarantee contract.
2017
(In millions of Korean won)
Loans and
receivables
Assets at fair
value through
profit or loss
Assets
classified as
available-for-
sale
Others1 Total
Cash and cash equivalents 1,219,548 - - - 1,219,548
Short-term financial instruments 433,707 - - - 433,707
Short-term loan receivable 62,483 - - - 62,483
Current derivative assets 19,092 - - 19,092
Trade receivables 3,551,769 - - - 3,551,769
Current available-for-sale financial
assets - - 454 - 454
Other current financial assets 408,190 - - - 408,190
Non-current derivative assets - 33,180 - 1,039 34,219
Long-term trade receivables 75,340 - - - 75,340
Available-for-sale financial assets - - 283,894 - 283,894
Other non-current financial assets 632,804 - - - 632,804
6,383,841 52,272 284,348 1,039 6,721,500
1 Others include derivatives used for hedging.
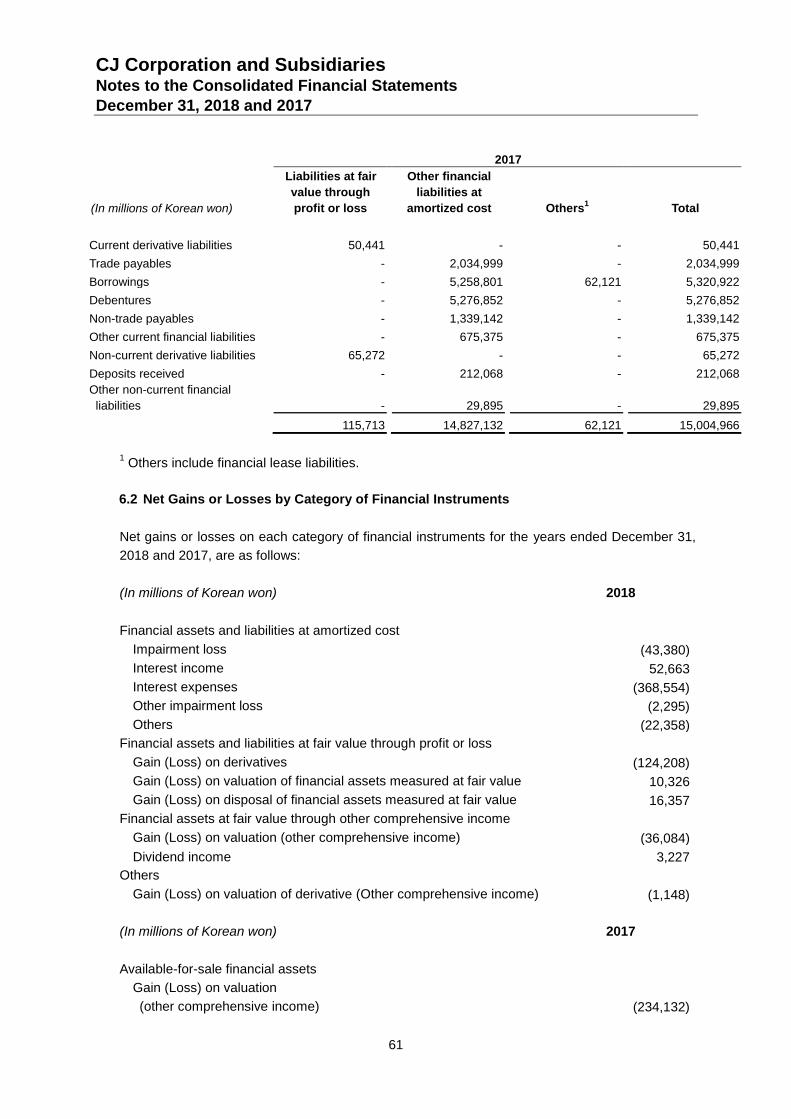
CJ Corporation and Subsidiaries Notes to the Consolidated Financial Statements December 31, 2018 and 2017
61
2017
(In millions of Korean won)
Liabilities at fair
value through
profit or loss
Other financial
liabilities at
amortized cost
Others1 Total
Current derivative liabilities 50,441 - - 50,441
Trade payables - 2,034,999 - 2,034,999
Borrowings - 5,258,801 62,121 5,320,922
Debentures - 5,276,852 - 5,276,852
Non-trade payables - 1,339,142 - 1,339,142
Other current financial liabilities - 675,375 - 675,375
Non-current derivative liabilities 65,272 - - 65,272
Deposits received - 212,068 - 212,068
Other non-current financial
liabilities - 29,895 - 29,895
115,713 14,827,132 62,121 15,004,966
1 Others include financial lease liabilities.
6.2 Net Gains or Losses by Category of Financial Instruments
Net gains or losses on each category of financial instruments for the years ended December 31,
2018 and 2017, are as follows:
(In millions of Korean won) 2018
Financial assets and liabilities at amortized cost
Impairment loss (43,380)
Interest income 52,663
Interest expenses (368,554)
Other impairment loss (2,295)
Others (22,358)
Financial assets and liabilities at fair value through profit or loss
Gain (Loss) on derivatives (124,208)
Gain (Loss) on valuation of financial assets measured at fair value 10,326
Gain (Loss) on disposal of financial assets measured at fair value 16,357
Financial assets at fair value through other comprehensive income
Gain (Loss) on valuation (other comprehensive income) (36,084)
Dividend income 3,227
Others
Gain (Loss) on valuation of derivative (Other comprehensive income)
(1,148)
(In millions of Korean won) 2017
Available-for-sale financial assets
Gain (Loss) on valuation
(other comprehensive income)
(234,132)
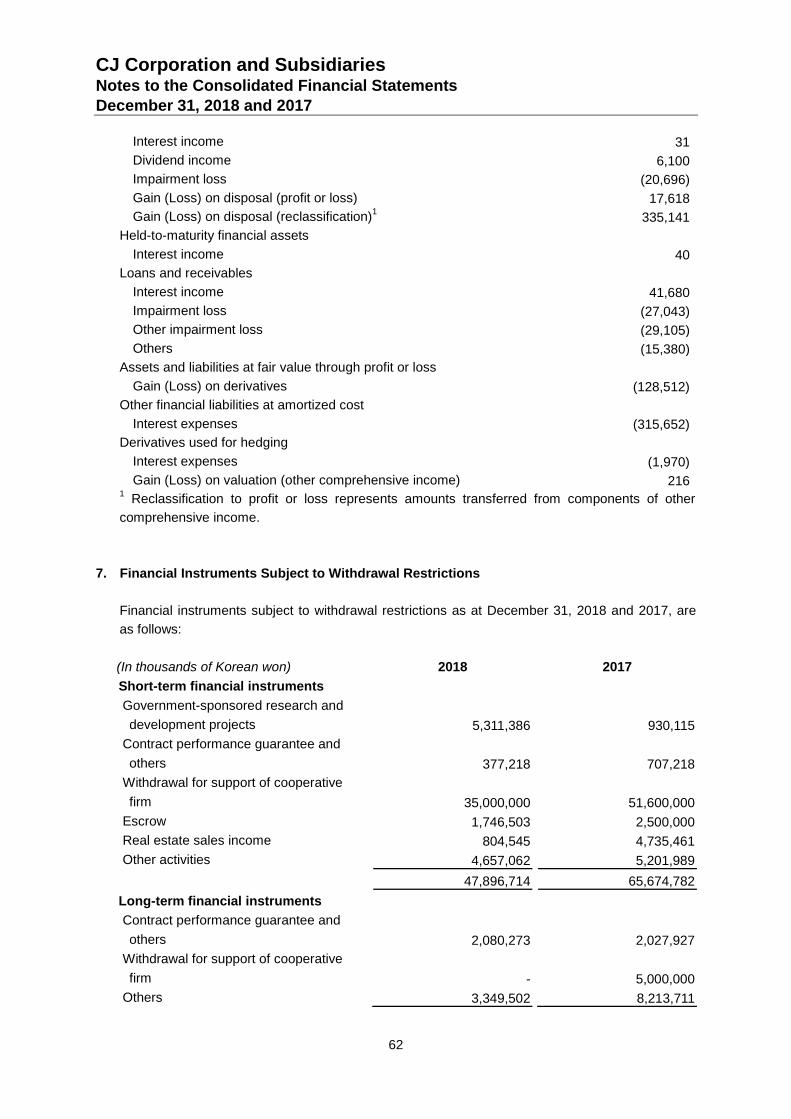
CJ Corporation and Subsidiaries Notes to the Consolidated Financial Statements December 31, 2018 and 2017
62
Interest income
31
Dividend income
6,100
Impairment loss
(20,696)
Gain (Loss) on disposal (profit or loss)
17,618
Gain (Loss) on disposal (reclassification)1 335,141
Held-to-maturity financial assets
Interest income
40
Loans and receivables
Interest income
41,680
Impairment loss
(27,043)
Other impairment loss
(29,105)
Others
(15,380)
Assets and liabilities at fair value through profit or loss
Gain (Loss) on derivatives
(128,512)
Other financial liabilities at amortized cost
Interest expenses
(315,652)
Derivatives used for hedging
Interest expenses
(1,970)
Gain (Loss) on valuation (other comprehensive income)
216 1 Reclassification to profit or loss represents amounts transferred from components of other
comprehensive income.
7. Financial Instruments Subject to Withdrawal Restrictions
Financial instruments subject to withdrawal restrictions as at December 31, 2018 and 2017, are
as follows:
(In thousands of Korean won) 2018 2017
Short-term financial instruments
Government-sponsored research and
development projects 5,311,386 930,115
Contract performance guarantee and
others 377,218 707,218
Withdrawal for support of cooperative
firm 35,000,000 51,600,000
Escrow 1,746,503 2,500,000
Real estate sales income 804,545 4,735,461
Other activities 4,657,062 5,201,989
47,896,714 65,674,782
Long-term financial instruments
Contract performance guarantee and
others 2,080,273 2,027,927
Withdrawal for support of cooperative
firm - 5,000,000
Others 3,349,502 8,213,711
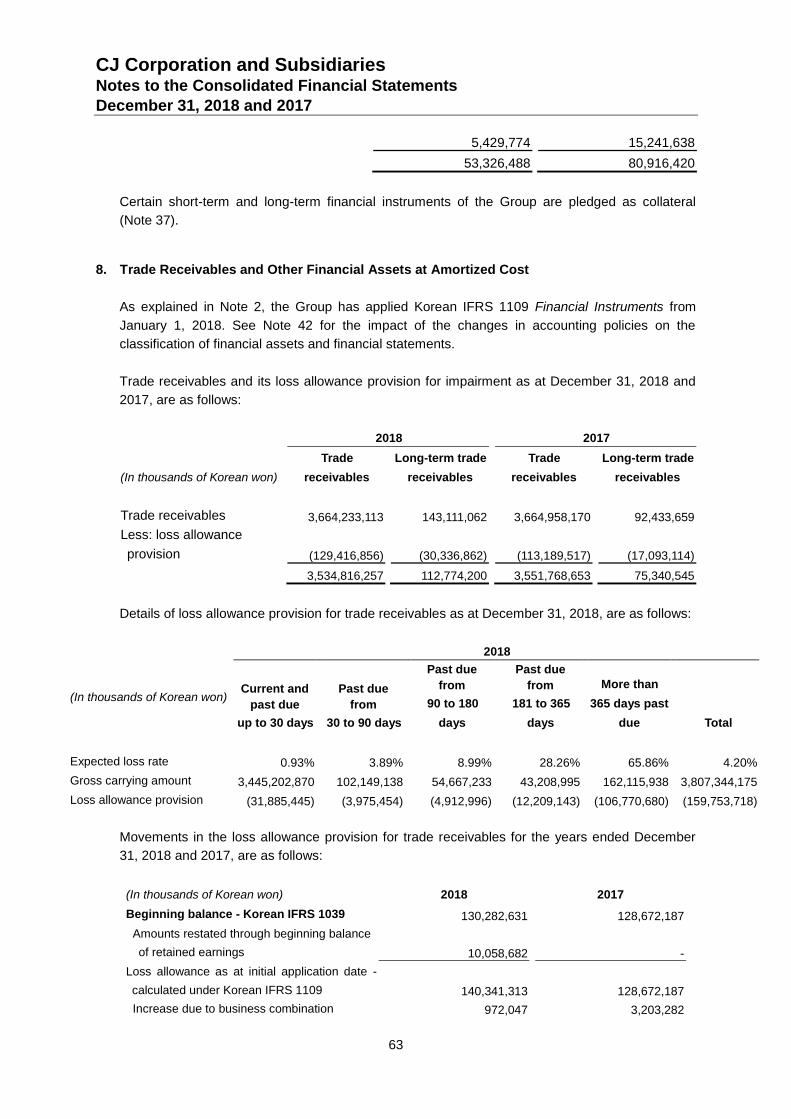
CJ Corporation and Subsidiaries Notes to the Consolidated Financial Statements December 31, 2018 and 2017
63
5,429,774 15,241,638
53,326,488 80,916,420
Certain short-term and long-term financial instruments of the Group are pledged as collateral
(Note 37).
8. Trade Receivables and Other Financial Assets at Amortized Cost
As explained in Note 2, the Group has applied Korean IFRS 1109 Financial Instruments from
January 1, 2018. See Note 42 for the impact of the changes in accounting policies on the
classification of financial assets and financial statements.
Trade receivables and its loss allowance provision for impairment as at December 31, 2018 and
2017, are as follows:
2018 2017
(In thousands of Korean won)
Trade
receivables
Long-term trade
receivables
Trade
receivables
Long-term trade
receivables
Trade receivables 3,664,233,113 143,111,062 3,664,958,170 92,433,659
Less: loss allowance
provision (129,416,856) (30,336,862) (113,189,517) (17,093,114)
3,534,816,257 112,774,200 3,551,768,653 75,340,545
Details of loss allowance provision for trade receivables as at December 31, 2018, are as follows:
2018
(In thousands of Korean won) Current and
past due
up to 30 days
Past due
from
30 to 90 days
Past due
from
90 to 180
days
Past due
from
181 to 365
days
More than
365 days past
due Total
Expected loss rate 0.93% 3.89% 8.99% 28.26% 65.86% 4.20%
Gross carrying amount 3,445,202,870 102,149,138 54,667,233 43,208,995 162,115,938 3,807,344,175
Loss allowance provision (31,885,445) (3,975,454) (4,912,996) (12,209,143) (106,770,680) (159,753,718)
Movements in the loss allowance provision for trade receivables for the years ended December
31, 2018 and 2017, are as follows:
(In thousands of Korean won) 2018 2017
Beginning balance - Korean IFRS 1039 130,282,631 128,672,187
Amounts restated through beginning balance
of retained earnings 10,058,682 -
Loss allowance as at initial application date -
calculated under Korean IFRS 1109 140,341,313 128,672,187
Increase due to business combination 972,047 3,203,282
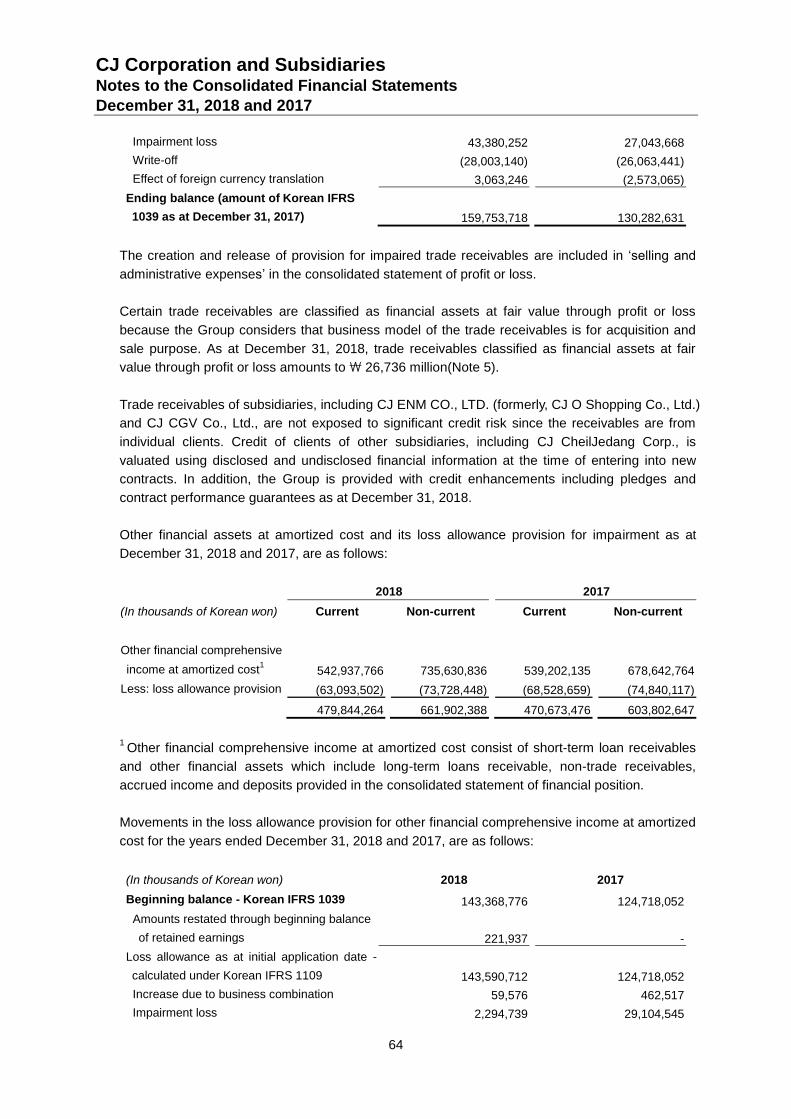
CJ Corporation and Subsidiaries Notes to the Consolidated Financial Statements December 31, 2018 and 2017
64
Impairment loss 43,380,252 27,043,668
Write-off (28,003,140) (26,063,441)
Effect of foreign currency translation 3,063,246 (2,573,065)
Ending balance (amount of Korean IFRS
1039 as at December 31, 2017) 159,753,718 130,282,631
The creation and release of provision for impaired trade receivables are included in ‘selling and
administrative expenses’ in the consolidated statement of profit or loss.
Certain trade receivables are classified as financial assets at fair value through profit or loss
because the Group considers that business model of the trade receivables is for acquisition and
sale purpose. As at December 31, 2018, trade receivables classified as financial assets at fair
value through profit or loss amounts to \ 26,736 million(Note 5).
Trade receivables of subsidiaries, including CJ ENM CO., LTD. (formerly, CJ O Shopping Co., Ltd.)
and CJ CGV Co., Ltd., are not exposed to significant credit risk since the receivables are from
individual clients. Credit of clients of other subsidiaries, including CJ CheilJedang Corp., is
valuated using disclosed and undisclosed financial information at the time of entering into new
contracts. In addition, the Group is provided with credit enhancements including pledges and
contract performance guarantees as at December 31, 2018.
Other financial assets at amortized cost and its loss allowance provision for impairment as at
December 31, 2018 and 2017, are as follows:
2018 2017
(In thousands of Korean won) Current Non-current Current Non-current
Other financial comprehensive
income at amortized cost1
542,937,766 735,630,836 539,202,135 678,642,764
Less: loss allowance provision (63,093,502) (73,728,448) (68,528,659) (74,840,117)
479,844,264 661,902,388 470,673,476 603,802,647
1 Other financial comprehensive income at amortized cost consist of short-term loan receivables
and other financial assets which include long-term loans receivable, non-trade receivables,
accrued income and deposits provided in the consolidated statement of financial position.
Movements in the loss allowance provision for other financial comprehensive income at amortized
cost for the years ended December 31, 2018 and 2017, are as follows:
(In thousands of Korean won) 2018 2017
Beginning balance - Korean IFRS 1039 143,368,776 124,718,052
Amounts restated through beginning balance
of retained earnings 221,937 -
Loss allowance as at initial application date -
calculated under Korean IFRS 1109 143,590,712 124,718,052
Increase due to business combination 59,576 462,517
Impairment loss 2,294,739 29,104,545
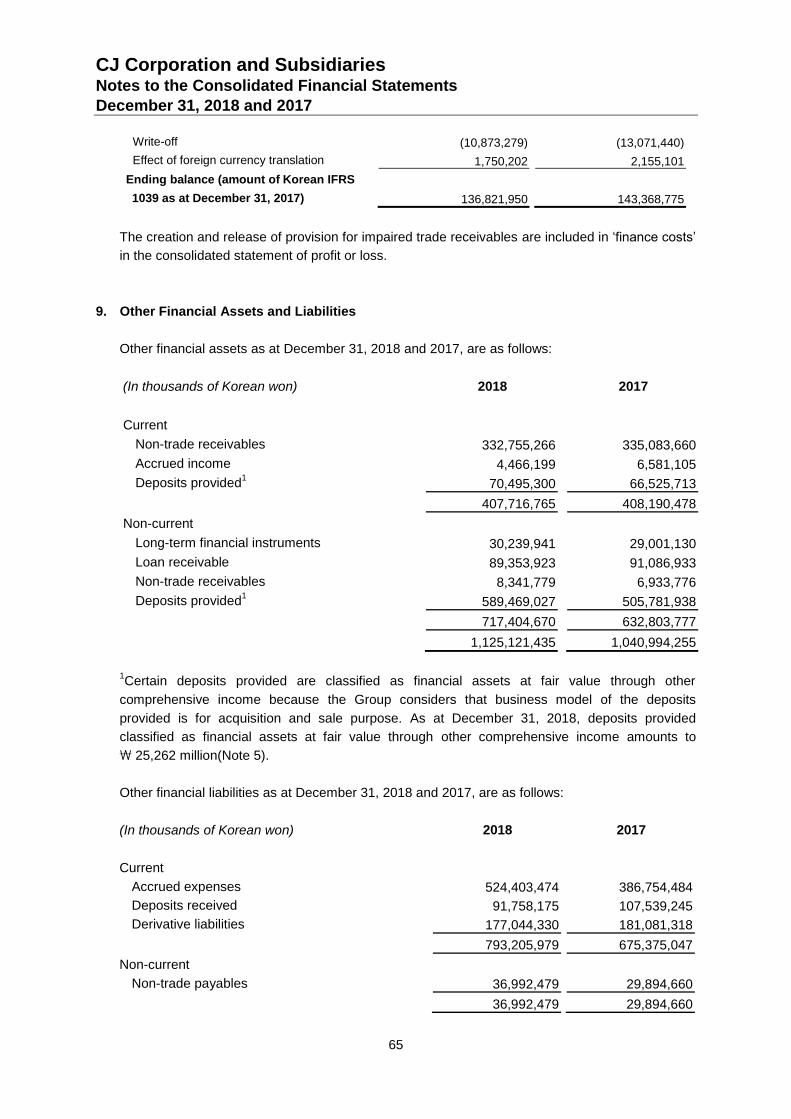
CJ Corporation and Subsidiaries Notes to the Consolidated Financial Statements December 31, 2018 and 2017
65
Write-off (10,873,279) (13,071,440)
Effect of foreign currency translation 1,750,202 2,155,101
Ending balance (amount of Korean IFRS
1039 as at December 31, 2017) 136,821,950 143,368,775
The creation and release of provision for impaired trade receivables are included in ‘finance costs’
in the consolidated statement of profit or loss.
9. Other Financial Assets and Liabilities
Other financial assets as at December 31, 2018 and 2017, are as follows:
(In thousands of Korean won) 2018
2017
Current
Non-trade receivables 332,755,266 335,083,660
Accrued income 4,466,199 6,581,105
Deposits provided1
70,495,300 66,525,713
407,716,765 408,190,478
Non-current
Long-term financial instruments 30,239,941 29,001,130
Loan receivable 89,353,923 91,086,933
Non-trade receivables 8,341,779 6,933,776
Deposits provided1
589,469,027 505,781,938
717,404,670 632,803,777
1,125,121,435 1,040,994,255
1Certain deposits provided are classified as financial assets at fair value through other
comprehensive income because the Group considers that business model of the deposits
provided is for acquisition and sale purpose. As at December 31, 2018, deposits provided
classified as financial assets at fair value through other comprehensive income amounts to
\ 25,262 million(Note 5).
Other financial liabilities as at December 31, 2018 and 2017, are as follows:
(In thousands of Korean won) 2018
2017
Current
Accrued expenses 524,403,474 386,754,484
Deposits received 91,758,175 107,539,245
Derivative liabilities 177,044,330 181,081,318
793,205,979 675,375,047
Non-current
Non-trade payables 36,992,479 29,894,660
36,992,479 29,894,660
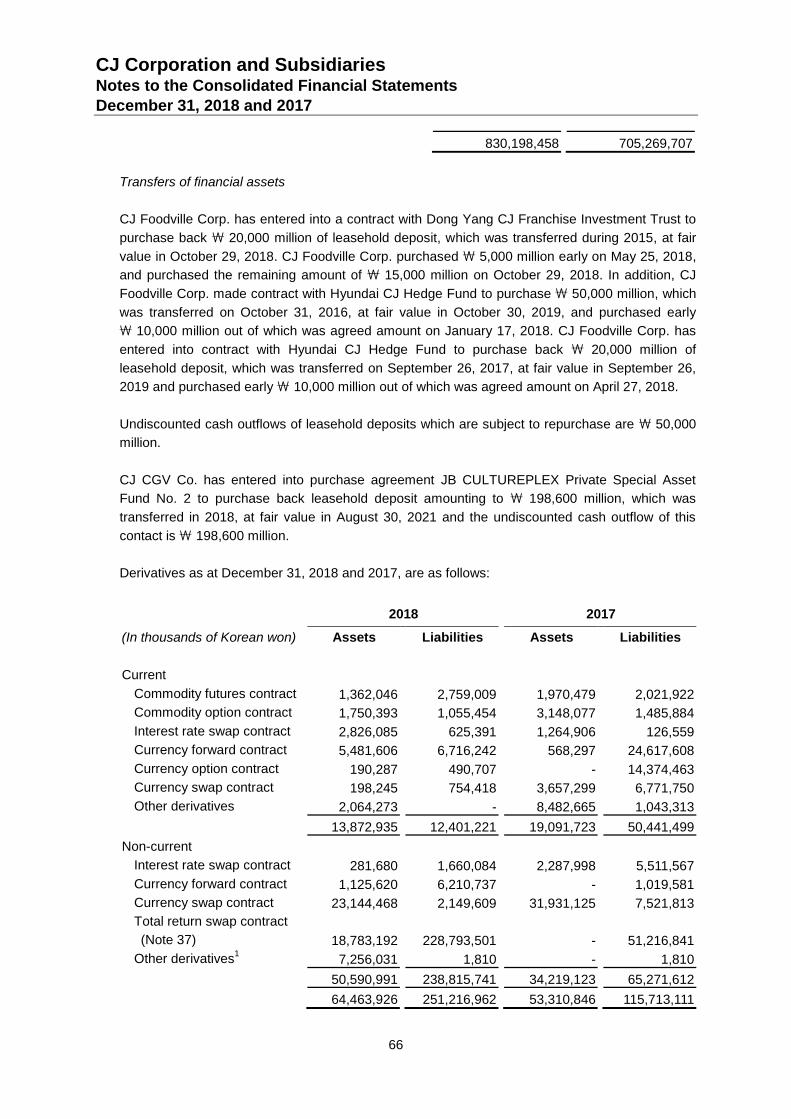
CJ Corporation and Subsidiaries Notes to the Consolidated Financial Statements December 31, 2018 and 2017
66
830,198,458 705,269,707
Transfers of financial assets
CJ Foodville Corp. has entered into a contract with Dong Yang CJ Franchise Investment Trust to
purchase back \ 20,000 million of leasehold deposit, which was transferred during 2015, at fair
value in October 29, 2018. CJ Foodville Corp. purchased \ 5,000 million early on May 25, 2018,
and purchased the remaining amount of \ 15,000 million on October 29, 2018. In addition, CJ
Foodville Corp. made contract with Hyundai CJ Hedge Fund to purchase \ 50,000 million, which
was transferred on October 31, 2016, at fair value in October 30, 2019, and purchased early
\ 10,000 million out of which was agreed amount on January 17, 2018. CJ Foodville Corp. has
entered into contract with Hyundai CJ Hedge Fund to purchase back \ 20,000 million of
leasehold deposit, which was transferred on September 26, 2017, at fair value in September 26,
2019 and purchased early \ 10,000 million out of which was agreed amount on April 27, 2018.
Undiscounted cash outflows of leasehold deposits which are subject to repurchase are \ 50,000
million.
CJ CGV Co. has entered into purchase agreement JB CULTUREPLEX Private Special Asset
Fund No. 2 to purchase back leasehold deposit amounting to \ 198,600 million, which was
transferred in 2018, at fair value in August 30, 2021 and the undiscounted cash outflow of this
contact is \ 198,600 million.
Derivatives as at December 31, 2018 and 2017, are as follows:
2018
2017
(In thousands of Korean won) Assets Liabilities
Assets Liabilities
Current
Commodity futures contract 1,362,046 2,759,009 1,970,479 2,021,922
Commodity option contract 1,750,393 1,055,454 3,148,077 1,485,884
Interest rate swap contract 2,826,085 625,391 1,264,906 126,559
Currency forward contract 5,481,606 6,716,242 568,297 24,617,608
Currency option contract 190,287 490,707 - 14,374,463
Currency swap contract 198,245 754,418 3,657,299 6,771,750
Other derivatives 2,064,273 - 8,482,665 1,043,313
13,872,935 12,401,221 19,091,723 50,441,499
Non-current
Interest rate swap contract 281,680 1,660,084 2,287,998 5,511,567
Currency forward contract 1,125,620 6,210,737 - 1,019,581
Currency swap contract 23,144,468 2,149,609 31,931,125 7,521,813
Total return swap contract
(Note 37) 18,783,192 228,793,501 - 51,216,841
Other derivatives1
7,256,031 1,810 - 1,810
50,590,991 238,815,741 34,219,123 65,271,612
64,463,926 251,216,962 53,310,846 115,713,111
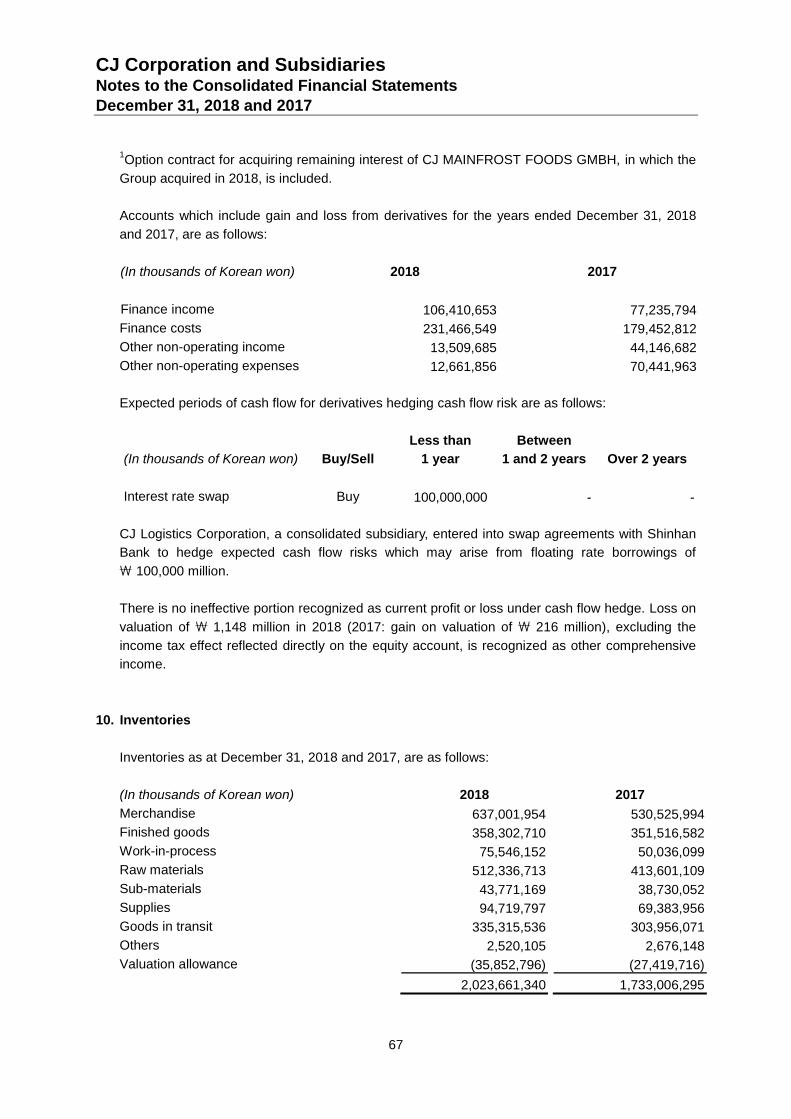
CJ Corporation and Subsidiaries Notes to the Consolidated Financial Statements December 31, 2018 and 2017
67
1Option contract for acquiring remaining interest of CJ MAINFROST FOODS GMBH, in which the
Group acquired in 2018, is included.
Accounts which include gain and loss from derivatives for the years ended December 31, 2018
and 2017, are as follows:
(In thousands of Korean won) 2018
2017
Finance income 106,410,653 77,235,794
Finance costs 231,466,549 179,452,812
Other non-operating income 13,509,685 44,146,682
Other non-operating expenses 12,661,856 70,441,963
Expected periods of cash flow for derivatives hedging cash flow risk are as follows:
(In thousands of Korean won) Buy/Sell
Less than
1 year
Between
1 and 2 years
Over 2 years
Interest rate swap Buy 100,000,000 - -
CJ Logistics Corporation, a consolidated subsidiary, entered into swap agreements with Shinhan
Bank to hedge expected cash flow risks which may arise from floating rate borrowings of
\ 100,000 million.
There is no ineffective portion recognized as current profit or loss under cash flow hedge. Loss on
valuation of \ 1,148 million in 2018 (2017: gain on valuation of \ 216 million), excluding the
income tax effect reflected directly on the equity account, is recognized as other comprehensive
income.
10. Inventories
Inventories as at December 31, 2018 and 2017, are as follows:
(In thousands of Korean won)
2018
2017
Merchandise
637,001,954 530,525,994
Finished goods
358,302,710 351,516,582
Work-in-process
75,546,152 50,036,099
Raw materials
512,336,713 413,601,109
Sub-materials
43,771,169 38,730,052
Supplies
94,719,797 69,383,956
Goods in transit
335,315,536 303,956,071
Others
2,520,105 2,676,148
Valuation allowance
(35,852,796) (27,419,716)
2,023,661,340 1,733,006,295
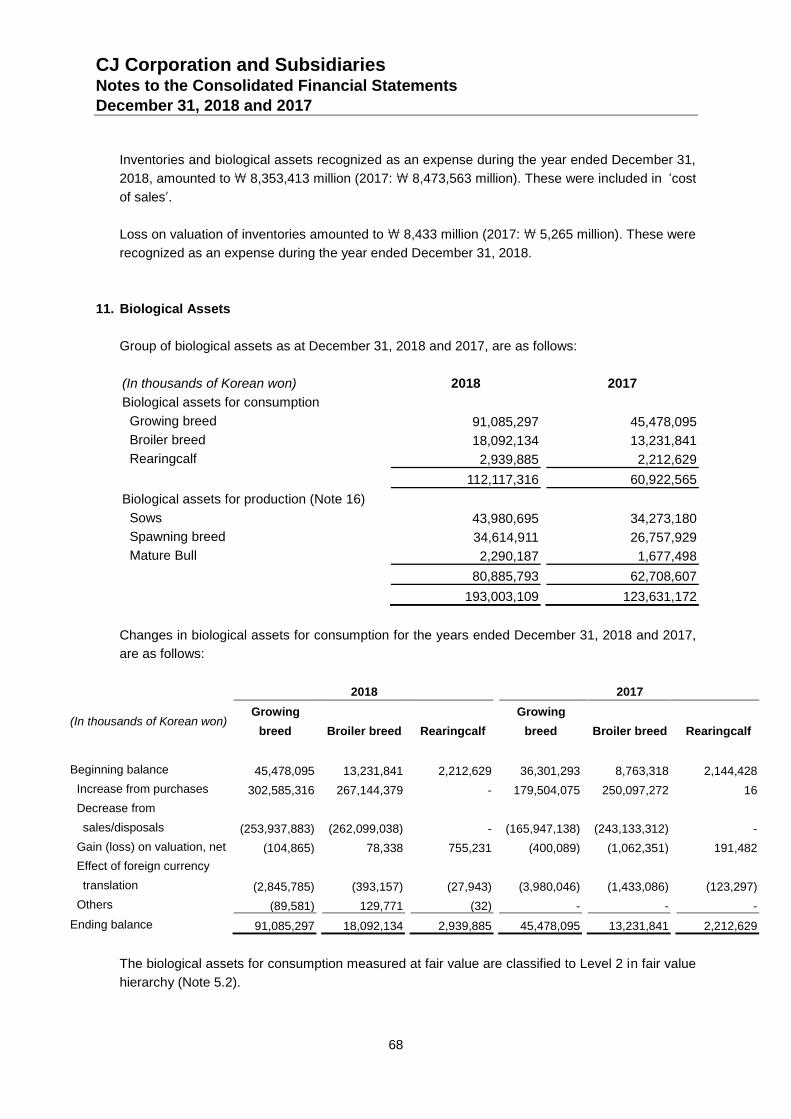
CJ Corporation and Subsidiaries Notes to the Consolidated Financial Statements December 31, 2018 and 2017
68
Inventories and biological assets recognized as an expense during the year ended December 31,
2018, amounted to \ 8,353,413 million (2017: \ 8,473,563 million). These were included in ‘cost
of sales’.
Loss on valuation of inventories amounted to \ 8,433 million (2017: \ 5,265 million). These were
recognized as an expense during the year ended December 31, 2018.
11. Biological Assets
Group of biological assets as at December 31, 2018 and 2017, are as follows:
(In thousands of Korean won) 2018
2017
Biological assets for consumption
Growing breed 91,085,297 45,478,095
Broiler breed 18,092,134 13,231,841
Rearingcalf 2,939,885 2,212,629
112,117,316 60,922,565
Biological assets for production (Note 16)
Sows 43,980,695 34,273,180
Spawning breed 34,614,911 26,757,929
Mature Bull 2,290,187 1,677,498
80,885,793 62,708,607
193,003,109 123,631,172
Changes in biological assets for consumption for the years ended December 31, 2018 and 2017,
are as follows:
2018 2017
(In thousands of Korean won) Growing
breed Broiler breed Rearingcalf
Growing
breed Broiler breed Rearingcalf
Beginning balance 45,478,095 13,231,841 2,212,629 36,301,293 8,763,318 2,144,428
Increase from purchases 302,585,316 267,144,379 - 179,504,075 250,097,272 16
Decrease from
sales/disposals (253,937,883) (262,099,038) - (165,947,138) (243,133,312) -
Gain (loss) on valuation, net (104,865) 78,338 755,231 (400,089) (1,062,351) 191,482
Effect of foreign currency
translation (2,845,785) (393,157) (27,943) (3,980,046) (1,433,086) (123,297)
Others (89,581) 129,771 (32) - - -
Ending balance 91,085,297 18,092,134 2,939,885 45,478,095 13,231,841 2,212,629
The biological assets for consumption measured at fair value are classified to Level 2 in fair value
hierarchy (Note 5.2).
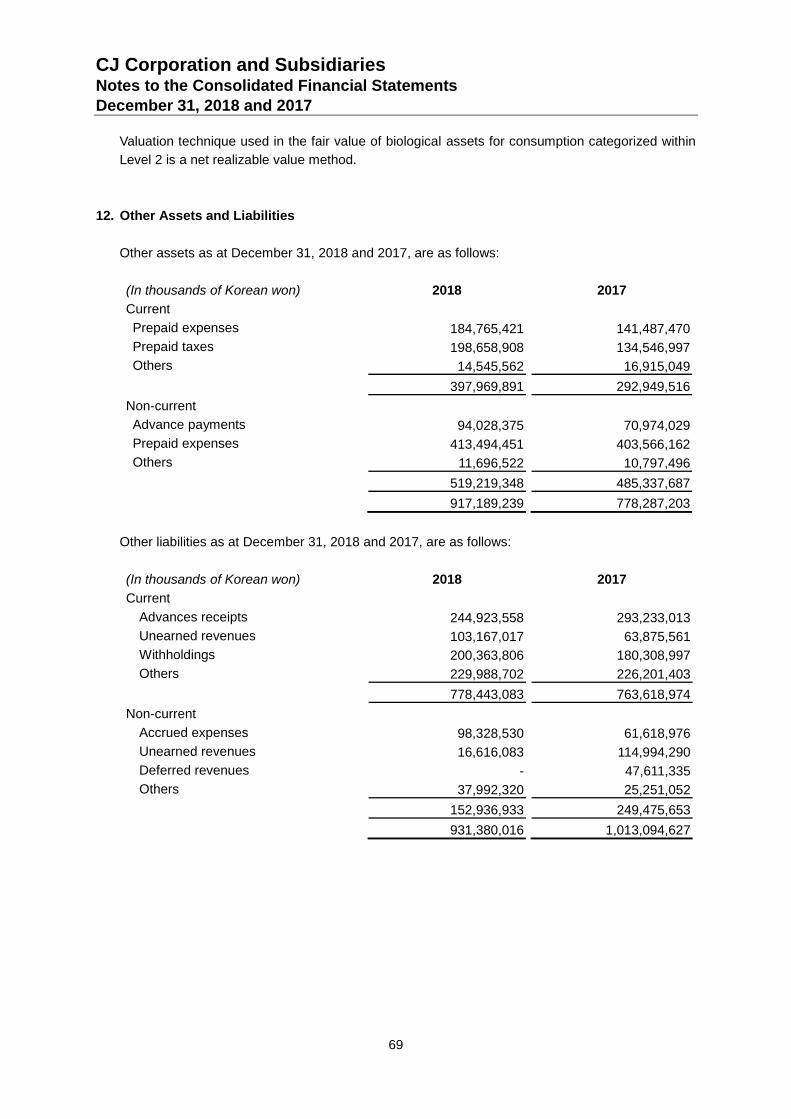
CJ Corporation and Subsidiaries Notes to the Consolidated Financial Statements December 31, 2018 and 2017
69
Valuation technique used in the fair value of biological assets for consumption categorized within
Level 2 is a net realizable value method.
12. Other Assets and Liabilities
Other assets as at December 31, 2018 and 2017, are as follows:
(In thousands of Korean won) 2018
2017
Current
Prepaid expenses 184,765,421 141,487,470
Prepaid taxes 198,658,908 134,546,997
Others 14,545,562 16,915,049
397,969,891 292,949,516
Non-current
Advance payments 94,028,375 70,974,029
Prepaid expenses 413,494,451 403,566,162
Others 11,696,522 10,797,496
519,219,348 485,337,687
917,189,239 778,287,203
Other liabilities as at December 31, 2018 and 2017, are as follows:
(In thousands of Korean won) 2018
2017
Current
Advances receipts 244,923,558 293,233,013
Unearned revenues 103,167,017 63,875,561
Withholdings 200,363,806 180,308,997
Others 229,988,702 226,201,403
778,443,083 763,618,974
Non-current
Accrued expenses 98,328,530 61,618,976
Unearned revenues 16,616,083 114,994,290
Deferred revenues - 47,611,335
Others 37,992,320 25,251,052
152,936,933 249,475,653
931,380,016 1,013,094,627
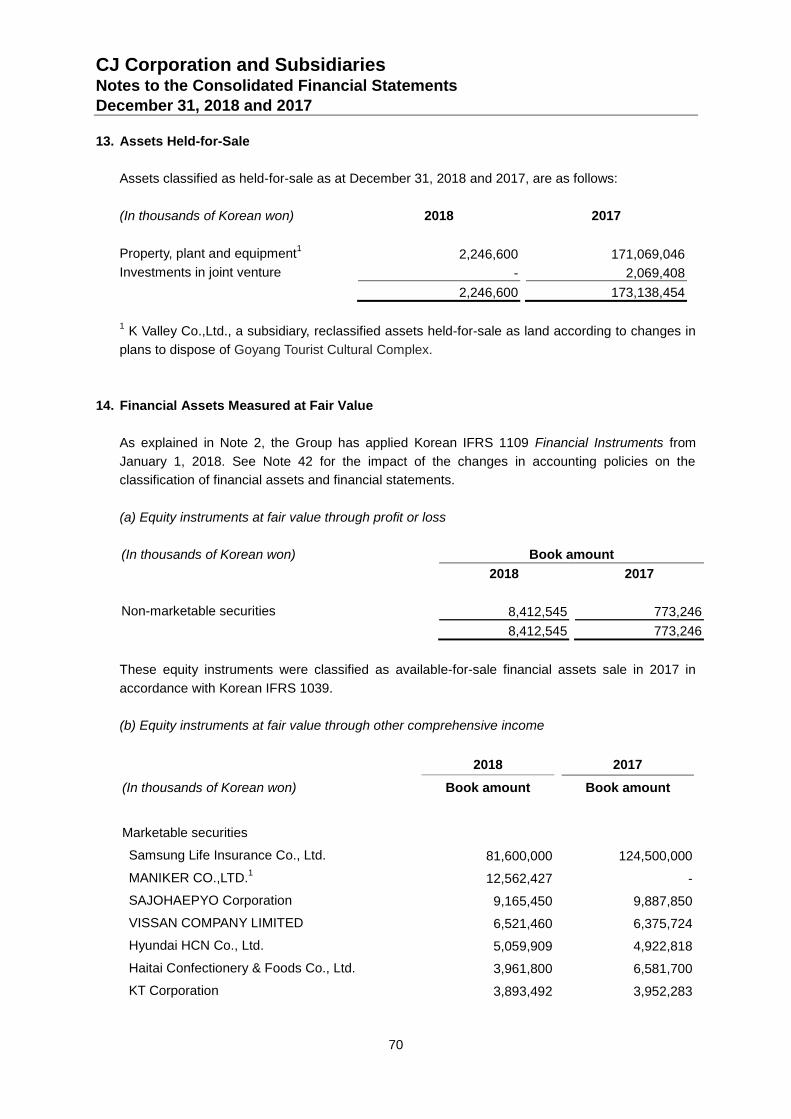
CJ Corporation and Subsidiaries Notes to the Consolidated Financial Statements December 31, 2018 and 2017
70
13. Assets Held-for-Sale
Assets classified as held-for-sale as at December 31, 2018 and 2017, are as follows:
(In thousands of Korean won)
2018
2017
Property, plant and equipment1 2,246,600 171,069,046
Investments in joint venture - 2,069,408
2,246,600 173,138,454
1 K Valley Co.,Ltd., a subsidiary, reclassified assets held-for-sale as land according to changes in
plans to dispose of Goyang Tourist Cultural Complex.
14. Financial Assets Measured at Fair Value
As explained in Note 2, the Group has applied Korean IFRS 1109 Financial Instruments from
January 1, 2018. See Note 42 for the impact of the changes in accounting policies on the
classification of financial assets and financial statements.
(a) Equity instruments at fair value through profit or loss
(In thousands of Korean won)
Book amount
2018 2017
Non-marketable securities
8,412,545 773,246
8,412,545 773,246
These equity instruments were classified as available-for-sale financial assets sale in 2017 in
accordance with Korean IFRS 1039.
(b) Equity instruments at fair value through other comprehensive income
2018
2017
(In thousands of Korean won)
Book amount
Book amount
Marketable securities
Samsung Life Insurance Co., Ltd.
81,600,000 124,500,000
MANIKER CO.,LTD.1
12,562,427 -
SAJOHAEPYO Corporation 9,165,450 9,887,850
VISSAN COMPANY LIMITED 6,521,460 6,375,724
Hyundai HCN Co., Ltd. 5,059,909 4,922,818
Haitai Confectionery & Foods Co., Ltd. 3,961,800 6,581,700
KT Corporation 3,893,492 3,952,283
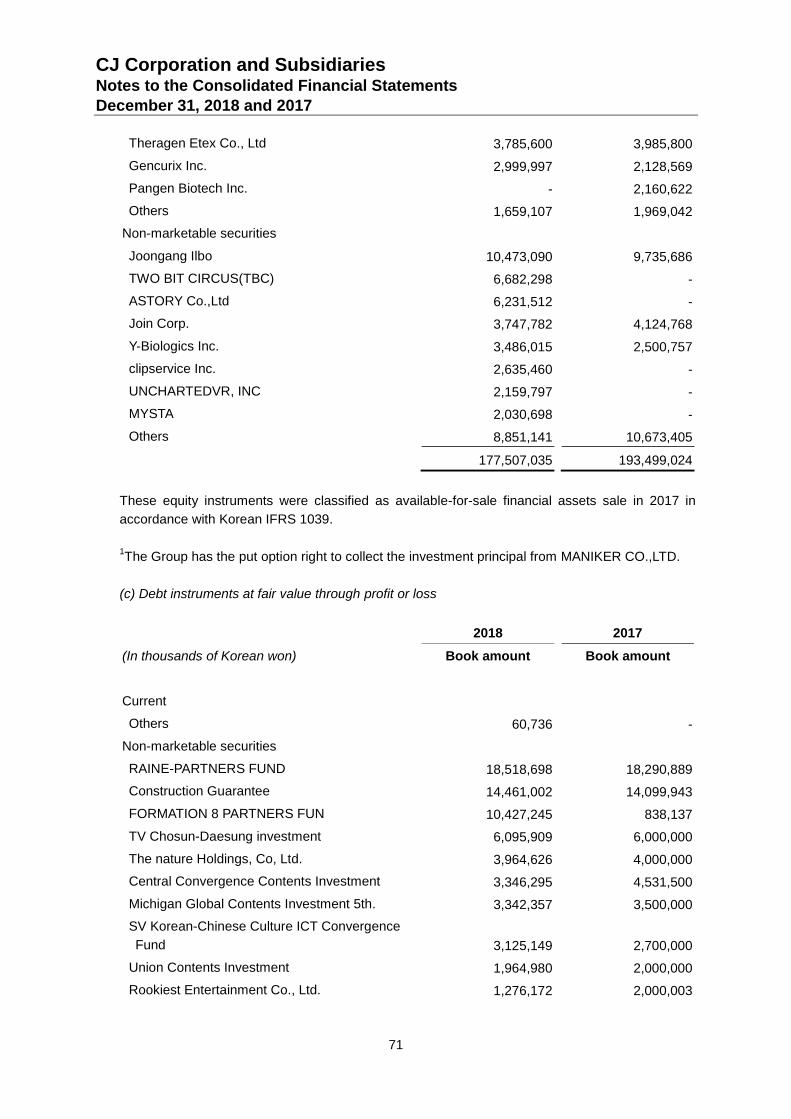
CJ Corporation and Subsidiaries Notes to the Consolidated Financial Statements December 31, 2018 and 2017
71
Theragen Etex Co., Ltd 3,785,600 3,985,800
Gencurix Inc. 2,999,997 2,128,569
Pangen Biotech Inc. - 2,160,622
Others 1,659,107 1,969,042
Non-marketable securities
Joongang Ilbo 10,473,090 9,735,686
TWO BIT CIRCUS(TBC) 6,682,298 -
ASTORY Co.,Ltd 6,231,512 -
Join Corp. 3,747,782 4,124,768
Y-Biologics Inc. 3,486,015 2,500,757
clipservice Inc. 2,635,460 -
UNCHARTEDVR, INC 2,159,797 -
MYSTA 2,030,698 -
Others 8,851,141 10,673,405
177,507,035 193,499,024
These equity instruments were classified as available-for-sale financial assets sale in 2017 in
accordance with Korean IFRS 1039.
1The Group has the put option right to collect the investment principal from MANIKER CO.,LTD.
(c) Debt instruments at fair value through profit or loss
2018
2017
(In thousands of Korean won)
Book amount
Book amount
Current
Others 60,736 -
Non-marketable securities
RAINE-PARTNERS FUND 18,518,698 18,290,889
Construction Guarantee 14,461,002 14,099,943
FORMATION 8 PARTNERS FUN 10,427,245 838,137
TV Chosun-Daesung investment 6,095,909 6,000,000
The nature Holdings, Co, Ltd. 3,964,626 4,000,000
Central Convergence Contents Investment 3,346,295 4,531,500
Michigan Global Contents Investment 5th. 3,342,357 3,500,000
SV Korean-Chinese Culture ICT Convergence
Fund
3,125,149 2,700,000
Union Contents Investment 1,964,980 2,000,000
Rookiest Entertainment Co., Ltd. 1,276,172 2,000,003
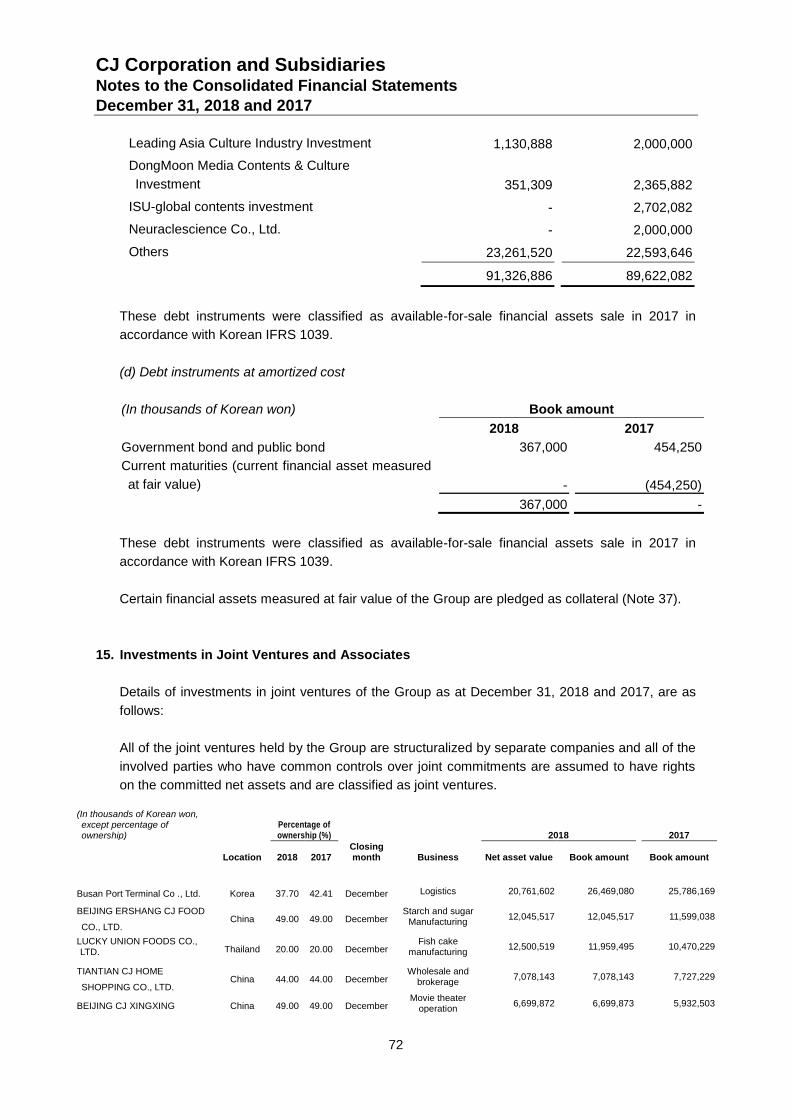
CJ Corporation and Subsidiaries Notes to the Consolidated Financial Statements December 31, 2018 and 2017
72
Leading Asia Culture Industry Investment 1,130,888 2,000,000
DongMoon Media Contents & Culture
Investment
351,309 2,365,882
ISU-global contents investment - 2,702,082
Neuraclescience Co., Ltd. - 2,000,000
Others 23,261,520 22,593,646
91,326,886 89,622,082
These debt instruments were classified as available-for-sale financial assets sale in 2017 in
accordance with Korean IFRS 1039.
(d) Debt instruments at amortized cost
(In thousands of Korean won)
Book amount
2018 2017
Government bond and public bond 367,000 454,250
Current maturities (current financial asset measured
at fair value) - (454,250)
367,000 -
These debt instruments were classified as available-for-sale financial assets sale in 2017 in
accordance with Korean IFRS 1039.
Certain financial assets measured at fair value of the Group are pledged as collateral (Note 37).
15. Investments in Joint Ventures and Associates
Details of investments in joint ventures of the Group as at December 31, 2018 and 2017, are as
follows:
All of the joint ventures held by the Group are structuralized by separate companies and all of the
involved parties who have common controls over joint commitments are assumed to have rights
on the committed net assets and are classified as joint ventures.
(In thousands of Korean won, except percentage of ownership)
Percentage of ownership (%) 2018 2017
Location 2018 2017 Closing month Business Net asset value Book amount Book amount
Busan Port Terminal Co ., Ltd. Korea 37.70 42.41 December Logistics 20,761,602 26,469,080 25,786,169
BEIJING ERSHANG CJ FOOD
CO., LTD. China 49.00 49.00 December
Starch and sugar Manufacturing
12,045,517 12,045,517 11,599,038
LUCKY UNION FOODS CO., LTD. Thailand 20.00 20.00 December
Fish cake manufacturing
12,500,519 11,959,495 10,470,229
TIANTIAN CJ HOME
SHOPPING CO., LTD. China 44.00 44.00 December
Wholesale and brokerage
7,078,143 7,078,143 7,727,229
BEIJING CJ XINGXING China 49.00 49.00 December Movie theater
operation 6,699,872 6,699,873 5,932,503
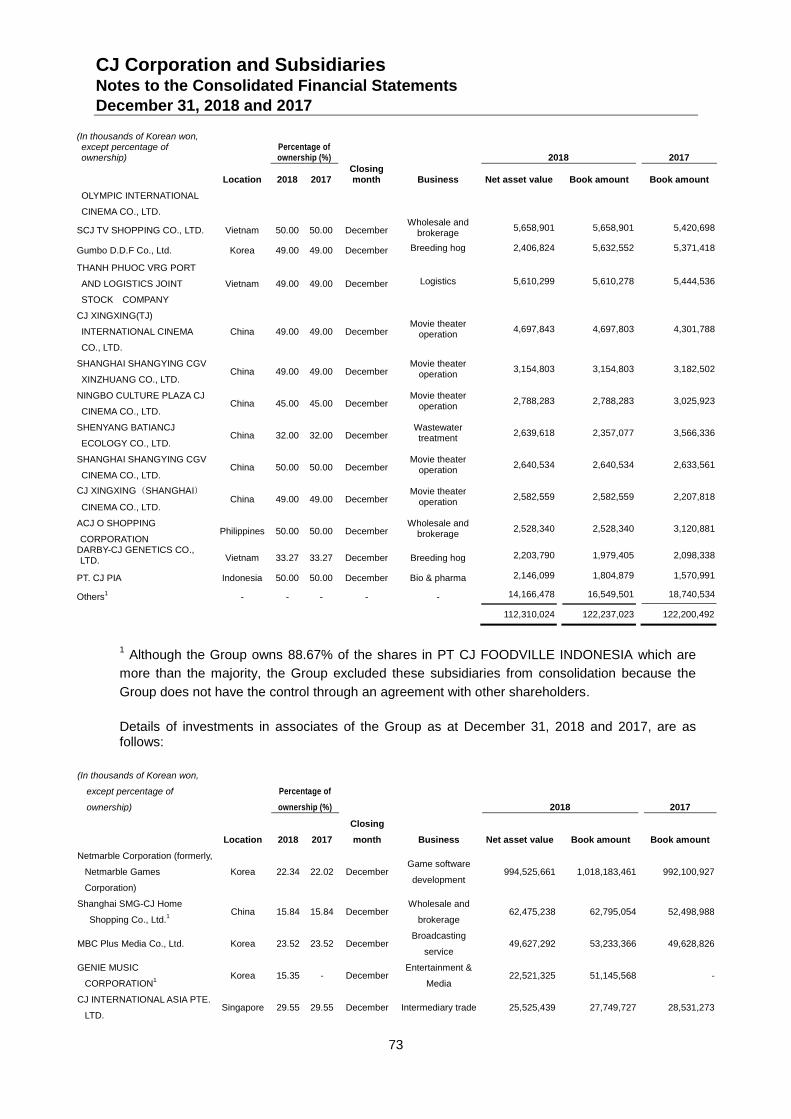
CJ Corporation and Subsidiaries Notes to the Consolidated Financial Statements December 31, 2018 and 2017
73
(In thousands of Korean won, except percentage of ownership)
Percentage of ownership (%) 2018 2017
Location 2018 2017 Closing month Business Net asset value Book amount Book amount
OLYMPIC INTERNATIONAL
CINEMA CO., LTD.
SCJ TV SHOPPING CO., LTD. Vietnam 50.00 50.00 December Wholesale and
brokerage 5,658,901 5,658,901 5,420,698
Gumbo D.D.F Co., Ltd. Korea 49.00 49.00 December Breeding hog 2,406,824 5,632,552 5,371,418
THANH PHUOC VRG PORT
AND LOGISTICS JOINT
STOCK COMPANY
Vietnam 49.00 49.00 December Logistics 5,610,299 5,610,278 5,444,536
CJ XINGXING(TJ)
INTERNATIONAL CINEMA
CO., LTD.
China 49.00 49.00 December Movie theater
operation 4,697,843 4,697,803 4,301,788
SHANGHAI SHANGYING CGV
XINZHUANG CO., LTD. China 49.00 49.00 December
Movie theater operation
3,154,803 3,154,803 3,182,502
NINGBO CULTURE PLAZA CJ
CINEMA CO., LTD. China 45.00 45.00 December
Movie theater operation
2,788,283 2,788,283 3,025,923
SHENYANG BATIANCJ
ECOLOGY CO., LTD. China 32.00 32.00 December
Wastewater treatment
2,639,618 2,357,077 3,566,336
SHANGHAI SHANGYING CGV
CINEMA CO., LTD. China 50.00 50.00 December
Movie theater operation
2,640,534 2,640,534 2,633,561
CJ XINGXING(SHANGHAI)
CINEMA CO., LTD. China 49.00 49.00 December
Movie theater operation
2,582,559 2,582,559 2,207,818
ACJ O SHOPPING
CORPORATION Philippines 50.00 50.00 December
Wholesale and brokerage
2,528,340 2,528,340 3,120,881
DARBY-CJ GENETICS CO., LTD. Vietnam 33.27 33.27 December Breeding hog 2,203,790 1,979,405 2,098,338
PT. CJ PIA Indonesia 50.00 50.00 December Bio & pharma 2,146,099 1,804,879 1,570,991
Others1 - - - - - 14,166,478 16,549,501 18,740,534
112,310,024 122,237,023 122,200,492
1 Although the Group owns 88.67% of the shares in PT CJ FOODVILLE INDONESIA which are
more than the majority, the Group excluded these subsidiaries from consolidation because the
Group does not have the control through an agreement with other shareholders.
Details of investments in associates of the Group as at December 31, 2018 and 2017, are as follows:
(In thousands of Korean won,
except percentage of
ownership)
Percentage of
ownership (%) 2018 2017
Location 2018 2017
Closing
month Business Net asset value Book amount Book amount
Netmarble Corporation (formerly,
Netmarble Games
Corporation)
Korea 22.34 22.02 December Game software
development 994,525,661 1,018,183,461 992,100,927
Shanghai SMG-CJ Home
Shopping Co., Ltd.1
China 15.84 15.84 December Wholesale and
brokerage 62,475,238 62,795,054 52,498,988
MBC Plus Media Co., Ltd. Korea 23.52 23.52 December Broadcasting
service 49,627,292 53,233,366 49,628,826
GENIE MUSIC
CORPORATION1
Korea 15.35 - December Entertainment &
Media 22,521,325 51,145,568 -
CJ INTERNATIONAL ASIA PTE.
LTD. Singapore 29.55 29.55 December Intermediary trade 25,525,439 27,749,727 28,531,273
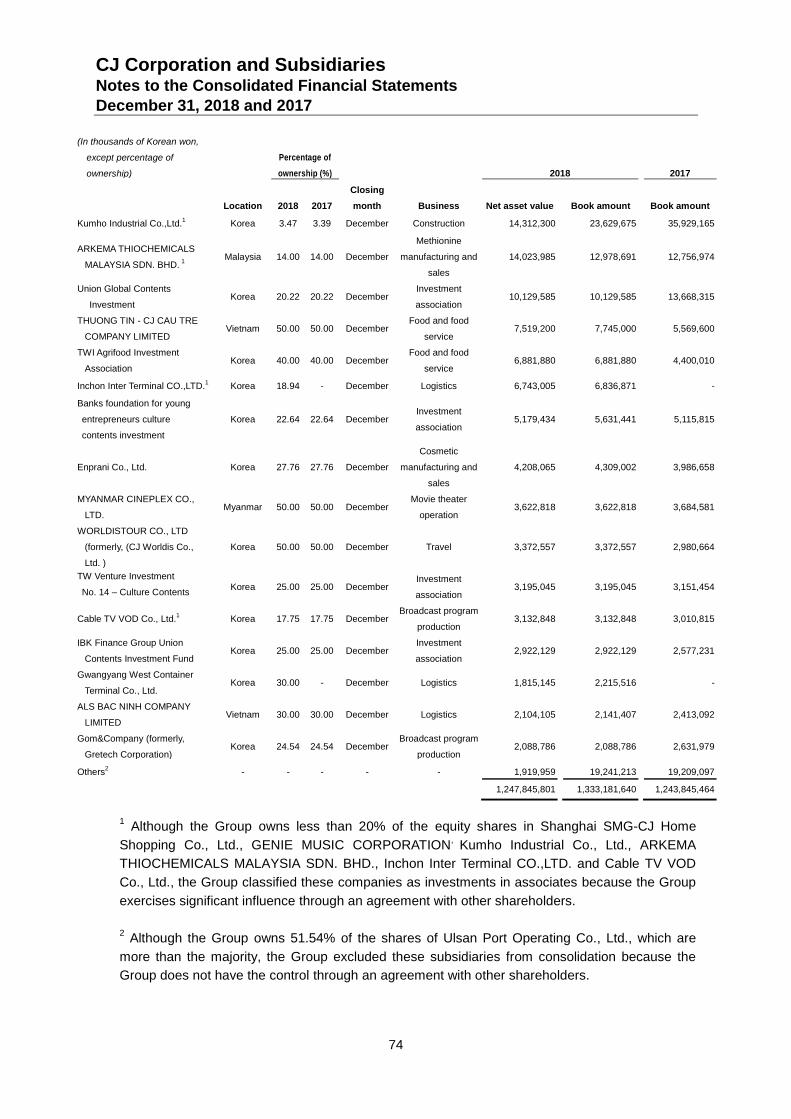
CJ Corporation and Subsidiaries Notes to the Consolidated Financial Statements December 31, 2018 and 2017
74
(In thousands of Korean won,
except percentage of
ownership)
Percentage of
ownership (%) 2018 2017
Location 2018 2017
Closing
month Business Net asset value Book amount Book amount
Kumho Industrial Co.,Ltd.1 Korea 3.47 3.39 December Construction 14,312,300 23,629,675 35,929,165
ARKEMA THIOCHEMICALS
MALAYSIA SDN. BHD. 1
Malaysia 14.00 14.00 December
Methionine
manufacturing and
sales
14,023,985 12,978,691 12,756,974
Union Global Contents
Investment Korea 20.22 20.22 December
Investment
association 10,129,585 10,129,585 13,668,315
THUONG TIN - CJ CAU TRE
COMPANY LIMITED Vietnam 50.00 50.00 December
Food and food
service 7,519,200 7,745,000 5,569,600
TWI Agrifood Investment
Association Korea 40.00 40.00 December
Food and food
service 6,881,880 6,881,880 4,400,010
Inchon Inter Terminal CO.,LTD.1 Korea 18.94 - December Logistics 6,743,005 6,836,871 -
Banks foundation for young
entrepreneurs culture
contents investment
Korea 22.64 22.64 December Investment
association 5,179,434 5,631,441 5,115,815
Enprani Co., Ltd. Korea 27.76 27.76 December
Cosmetic
manufacturing and
sales
4,208,065 4,309,002 3,986,658
MYANMAR CINEPLEX CO.,
LTD. Myanmar 50.00 50.00 December
Movie theater
operation 3,622,818 3,622,818 3,684,581
WORLDISTOUR CO., LTD
(formerly, (CJ Worldis Co.,
Ltd. )
Korea 50.00 50.00 December Travel 3,372,557 3,372,557 2,980,664
TW Venture Investment
No. 14 – Culture Contents Korea 25.00 25.00 December
Investment
association 3,195,045 3,195,045 3,151,454
Cable TV VOD Co., Ltd.1 Korea 17.75 17.75 December
Broadcast program
production 3,132,848 3,132,848 3,010,815
IBK Finance Group Union
Contents Investment Fund Korea 25.00 25.00 December
Investment
association 2,922,129 2,922,129 2,577,231
Gwangyang West Container
Terminal Co., Ltd. Korea 30.00 - December Logistics 1,815,145 2,215,516 -
ALS BAC NINH COMPANY
LIMITED Vietnam 30.00 30.00 December Logistics 2,104,105 2,141,407 2,413,092
Gom&Company (formerly,
Gretech Corporation) Korea 24.54 24.54 December
Broadcast program
production 2,088,786 2,088,786 2,631,979
Others2 - - - - - 1,919,959 19,241,213 19,209,097
1,247,845,801 1,333,181,640 1,243,845,464
1 Although the Group owns less than 20% of the equity shares in Shanghai SMG-CJ Home
Shopping Co., Ltd., GENIE MUSIC CORPORATION,
Kumho Industrial Co., Ltd., ARKEMA
THIOCHEMICALS MALAYSIA SDN. BHD., Inchon Inter Terminal CO.,LTD. and Cable TV VOD
Co., Ltd., the Group classified these companies as investments in associates because the Group
exercises significant influence through an agreement with other shareholders.
2 Although the Group owns 51.54% of the shares of Ulsan Port Operating Co., Ltd., which are
more than the majority, the Group excluded these subsidiaries from consolidation because the
Group does not have the control through an agreement with other shareholders.
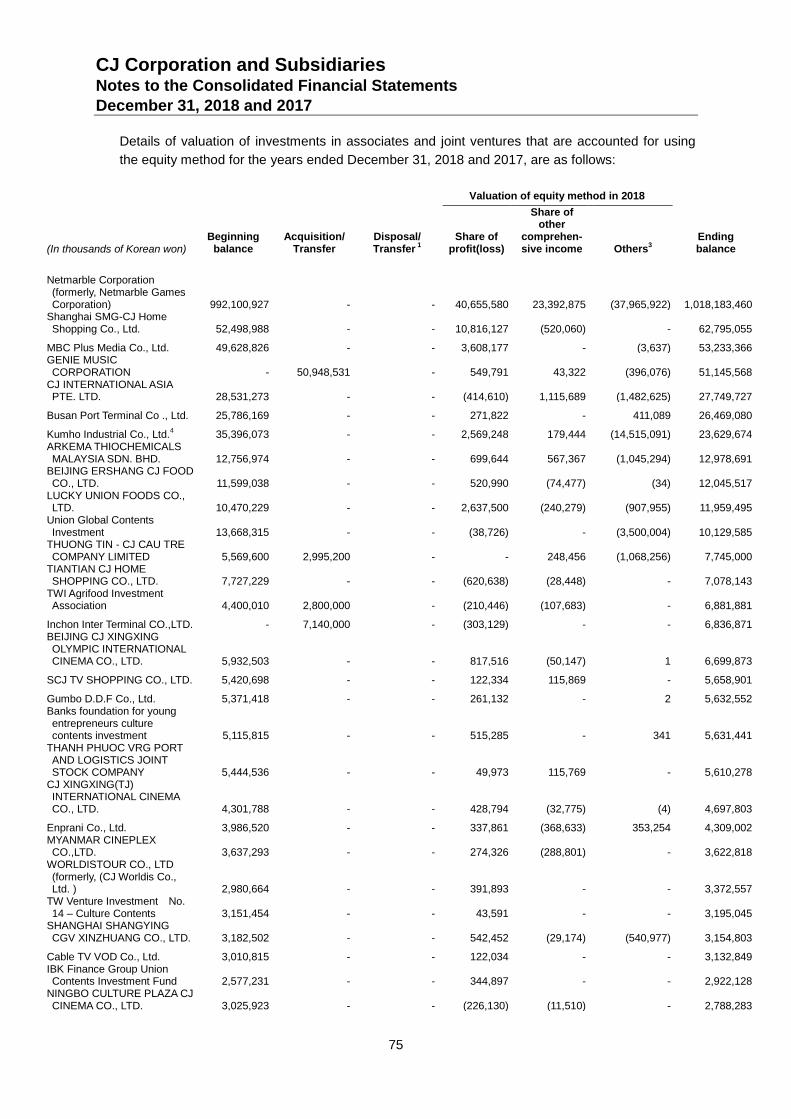
CJ Corporation and Subsidiaries Notes to the Consolidated Financial Statements December 31, 2018 and 2017
75
Details of valuation of investments in associates and joint ventures that are accounted for using
the equity method for the years ended December 31, 2018 and 2017, are as follows:
Valuation of equity method in 2018
(In thousands of Korean won) Beginning
balance
Acquisition/ Transfer
Disposal/ Transfer
1
Share of profit(loss)
Share of other
comprehen-sive income
Others
3
Ending balance
Netmarble Corporation (formerly, Netmarble Games Corporation) 992,100,927 - - 40,655,580 23,392,875 (37,965,922) 1,018,183,460
Shanghai SMG-CJ Home Shopping Co., Ltd. 52,498,988 - - 10,816,127 (520,060) - 62,795,055
MBC Plus Media Co., Ltd. 49,628,826 - - 3,608,177 - (3,637) 53,233,366 GENIE MUSIC CORPORATION - 50,948,531 - 549,791 43,322 (396,076) 51,145,568
CJ INTERNATIONAL ASIA PTE. LTD. 28,531,273 - - (414,610) 1,115,689 (1,482,625) 27,749,727
Busan Port Terminal Co ., Ltd. 25,786,169 - - 271,822 - 411,089 26,469,080
Kumho Industrial Co., Ltd.4 35,396,073 - - 2,569,248 179,444 (14,515,091) 23,629,674
ARKEMA THIOCHEMICALS MALAYSIA SDN. BHD. 12,756,974 - - 699,644 567,367 (1,045,294) 12,978,691
BEIJING ERSHANG CJ FOOD CO., LTD. 11,599,038 - - 520,990 (74,477) (34) 12,045,517
LUCKY UNION FOODS CO., LTD. 10,470,229 - - 2,637,500 (240,279) (907,955) 11,959,495
Union Global Contents Investment 13,668,315 - - (38,726) - (3,500,004) 10,129,585
THUONG TIN - CJ CAU TRE COMPANY LIMITED 5,569,600 2,995,200 - - 248,456 (1,068,256) 7,745,000
TIANTIAN CJ HOME SHOPPING CO., LTD. 7,727,229 - - (620,638) (28,448) - 7,078,143
TWI Agrifood Investment Association 4,400,010 2,800,000 - (210,446) (107,683) - 6,881,881
Inchon Inter Terminal CO.,LTD. - 7,140,000 - (303,129) - - 6,836,871 BEIJING CJ XINGXING OLYMPIC INTERNATIONAL CINEMA CO., LTD. 5,932,503 - - 817,516 (50,147) 1 6,699,873
SCJ TV SHOPPING CO., LTD. 5,420,698 - - 122,334 115,869 - 5,658,901
Gumbo D.D.F Co., Ltd. 5,371,418 - - 261,132 - 2 5,632,552 Banks foundation for young entrepreneurs culture contents investment 5,115,815 - - 515,285 - 341 5,631,441
THANH PHUOC VRG PORT AND LOGISTICS JOINT STOCK COMPANY 5,444,536 - - 49,973 115,769 - 5,610,278
CJ XINGXING(TJ) INTERNATIONAL CINEMA CO., LTD. 4,301,788 - - 428,794 (32,775) (4) 4,697,803
Enprani Co., Ltd. 3,986,520 - - 337,861 (368,633) 353,254 4,309,002 MYANMAR CINEPLEX CO.,LTD. 3,637,293 - - 274,326 (288,801) - 3,622,818
WORLDISTOUR CO., LTD (formerly, (CJ Worldis Co., Ltd. ) 2,980,664 - - 391,893 - - 3,372,557
TW Venture Investment No. 14 – Culture Contents 3,151,454 - - 43,591 - - 3,195,045
SHANGHAI SHANGYING CGV XINZHUANG CO., LTD. 3,182,502 - - 542,452 (29,174) (540,977) 3,154,803
Cable TV VOD Co., Ltd. 3,010,815 - - 122,034 - - 3,132,849 IBK Finance Group Union Contents Investment Fund 2,577,231 - - 344,897 - - 2,922,128
NINGBO CULTURE PLAZA CJ CINEMA CO., LTD. 3,025,923 - - (226,130) (11,510) - 2,788,283
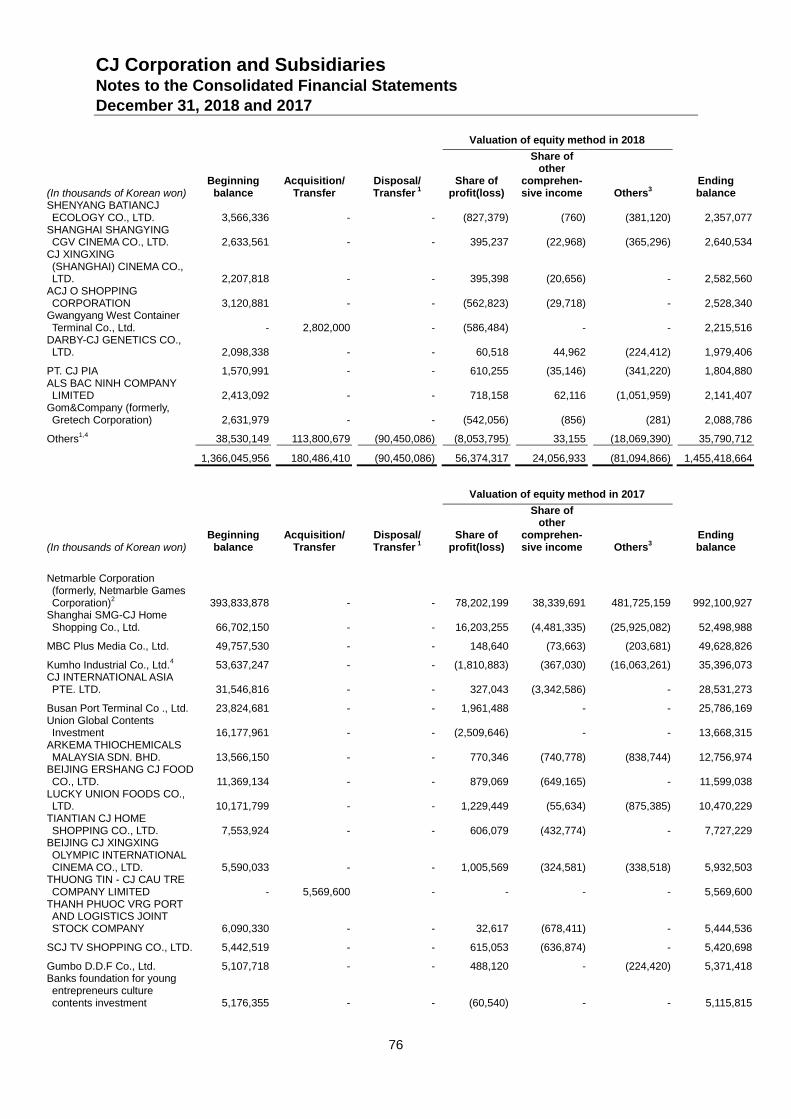
CJ Corporation and Subsidiaries Notes to the Consolidated Financial Statements December 31, 2018 and 2017
76
Valuation of equity method in 2018
(In thousands of Korean won) Beginning
balance
Acquisition/ Transfer
Disposal/ Transfer
1
Share of profit(loss)
Share of other
comprehen-sive income
Others
3
Ending balance
SHENYANG BATIANCJ ECOLOGY CO., LTD. 3,566,336 - - (827,379) (760) (381,120) 2,357,077
SHANGHAI SHANGYING CGV CINEMA CO., LTD. 2,633,561 - - 395,237 (22,968) (365,296) 2,640,534
CJ XINGXING (SHANGHAI) CINEMA CO., LTD. 2,207,818 - - 395,398 (20,656) - 2,582,560
ACJ O SHOPPING CORPORATION 3,120,881 - - (562,823) (29,718) - 2,528,340
Gwangyang West Container Terminal Co., Ltd. - 2,802,000 - (586,484) - - 2,215,516
DARBY-CJ GENETICS CO., LTD. 2,098,338 - - 60,518 44,962 (224,412) 1,979,406
PT. CJ PIA 1,570,991 - - 610,255 (35,146) (341,220) 1,804,880 ALS BAC NINH COMPANY LIMITED 2,413,092 - - 718,158 62,116 (1,051,959) 2,141,407
Gom&Company (formerly, Gretech Corporation) 2,631,979 - - (542,056) (856) (281) 2,088,786
Others1,4
38,530,149 113,800,679 (90,450,086) (8,053,795) 33,155 (18,069,390) 35,790,712
1,366,045,956 180,486,410 (90,450,086) 56,374,317 24,056,933 (81,094,866) 1,455,418,664
Valuation of equity method in 2017
(In thousands of Korean won) Beginning
balance
Acquisition/ Transfer
Disposal/ Transfer
1
Share of profit(loss)
Share of other
comprehen-sive income
Others
3
Ending balance
Netmarble Corporation (formerly, Netmarble Games Corporation)
2 393,833,878 - - 78,202,199 38,339,691 481,725,159 992,100,927
Shanghai SMG-CJ Home Shopping Co., Ltd. 66,702,150 - - 16,203,255 (4,481,335) (25,925,082) 52,498,988
MBC Plus Media Co., Ltd. 49,757,530 - - 148,640 (73,663) (203,681) 49,628,826
Kumho Industrial Co., Ltd.4 53,637,247 - - (1,810,883) (367,030) (16,063,261) 35,396,073
CJ INTERNATIONAL ASIA PTE. LTD. 31,546,816 - - 327,043 (3,342,586) - 28,531,273
Busan Port Terminal Co ., Ltd. 23,824,681 - - 1,961,488 - - 25,786,169 Union Global Contents Investment 16,177,961 - - (2,509,646) - - 13,668,315
ARKEMA THIOCHEMICALS MALAYSIA SDN. BHD. 13,566,150 - - 770,346 (740,778) (838,744) 12,756,974
BEIJING ERSHANG CJ FOOD CO., LTD. 11,369,134 - - 879,069 (649,165) - 11,599,038
LUCKY UNION FOODS CO., LTD. 10,171,799 - - 1,229,449 (55,634) (875,385) 10,470,229
TIANTIAN CJ HOME SHOPPING CO., LTD. 7,553,924 - - 606,079 (432,774) - 7,727,229
BEIJING CJ XINGXING OLYMPIC INTERNATIONAL CINEMA CO., LTD. 5,590,033 - - 1,005,569 (324,581) (338,518) 5,932,503
THUONG TIN - CJ CAU TRE COMPANY LIMITED - 5,569,600 - - - - 5,569,600
THANH PHUOC VRG PORT AND LOGISTICS JOINT STOCK COMPANY 6,090,330 - - 32,617 (678,411) - 5,444,536
SCJ TV SHOPPING CO., LTD. 5,442,519 - - 615,053 (636,874) - 5,420,698
Gumbo D.D.F Co., Ltd. 5,107,718 - - 488,120 - (224,420) 5,371,418 Banks foundation for young entrepreneurs culture contents investment 5,176,355 - - (60,540) - - 5,115,815
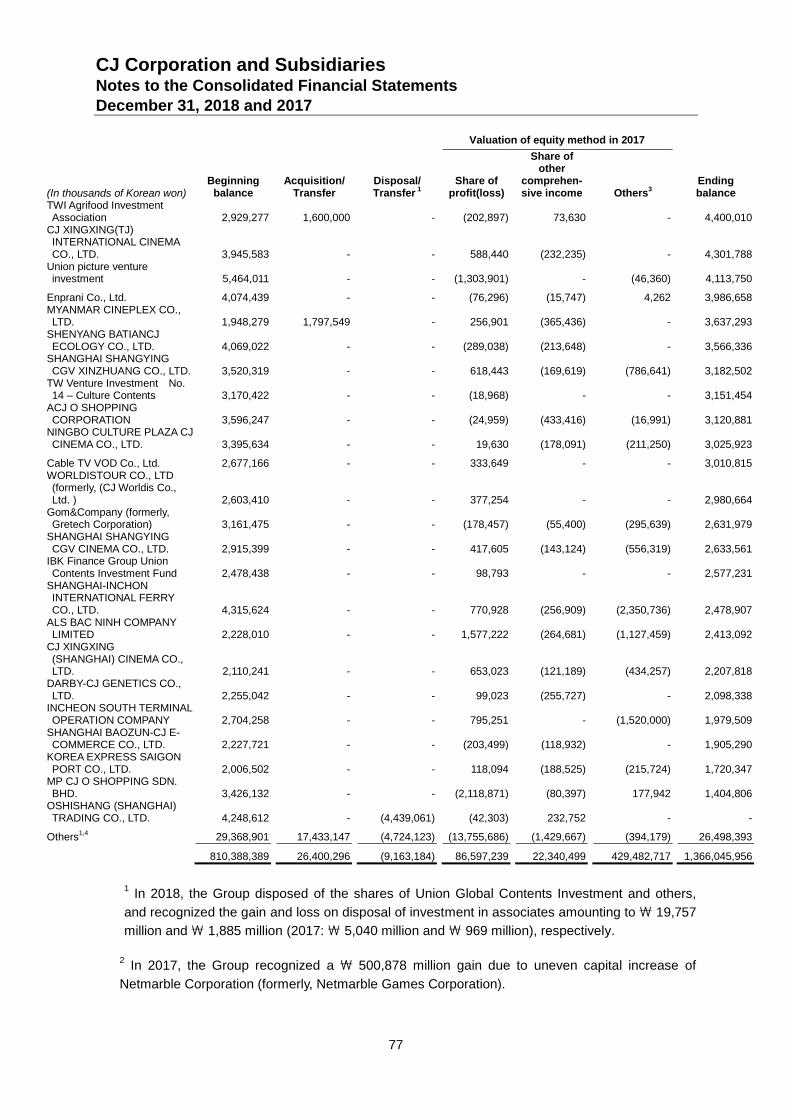
CJ Corporation and Subsidiaries Notes to the Consolidated Financial Statements December 31, 2018 and 2017
77
Valuation of equity method in 2017
(In thousands of Korean won) Beginning
balance
Acquisition/ Transfer
Disposal/ Transfer
1
Share of profit(loss)
Share of other
comprehen-sive income
Others
3
Ending balance
TWI Agrifood Investment Association 2,929,277 1,600,000 - (202,897) 73,630 - 4,400,010
CJ XINGXING(TJ) INTERNATIONAL CINEMA CO., LTD. 3,945,583 - - 588,440 (232,235) - 4,301,788
Union picture venture investment 5,464,011 - - (1,303,901) - (46,360) 4,113,750
Enprani Co., Ltd. 4,074,439 - - (76,296) (15,747) 4,262 3,986,658 MYANMAR CINEPLEX CO., LTD. 1,948,279 1,797,549 - 256,901 (365,436) - 3,637,293
SHENYANG BATIANCJ ECOLOGY CO., LTD. 4,069,022 - - (289,038) (213,648) - 3,566,336
SHANGHAI SHANGYING CGV XINZHUANG CO., LTD. 3,520,319 - - 618,443 (169,619) (786,641) 3,182,502
TW Venture Investment No. 14 – Culture Contents 3,170,422 - - (18,968) - - 3,151,454
ACJ O SHOPPING CORPORATION 3,596,247 - - (24,959) (433,416) (16,991) 3,120,881
NINGBO CULTURE PLAZA CJ CINEMA CO., LTD. 3,395,634 - - 19,630 (178,091) (211,250) 3,025,923
Cable TV VOD Co., Ltd. 2,677,166 - - 333,649 - - 3,010,815 WORLDISTOUR CO., LTD (formerly, (CJ Worldis Co., Ltd. ) 2,603,410 - - 377,254 - - 2,980,664
Gom&Company (formerly, Gretech Corporation) 3,161,475 - - (178,457) (55,400) (295,639) 2,631,979
SHANGHAI SHANGYING CGV CINEMA CO., LTD. 2,915,399 - - 417,605 (143,124) (556,319) 2,633,561
IBK Finance Group Union Contents Investment Fund 2,478,438 - - 98,793 - - 2,577,231
SHANGHAI-INCHON INTERNATIONAL FERRY CO., LTD. 4,315,624 - - 770,928 (256,909) (2,350,736) 2,478,907
ALS BAC NINH COMPANY LIMITED 2,228,010 - - 1,577,222 (264,681) (1,127,459) 2,413,092
CJ XINGXING (SHANGHAI) CINEMA CO., LTD. 2,110,241 - - 653,023 (121,189) (434,257) 2,207,818
DARBY-CJ GENETICS CO., LTD. 2,255,042 - - 99,023 (255,727) - 2,098,338
INCHEON SOUTH TERMINAL OPERATION COMPANY 2,704,258 - - 795,251 - (1,520,000) 1,979,509
SHANGHAI BAOZUN-CJ E-COMMERCE CO., LTD. 2,227,721 - - (203,499) (118,932) - 1,905,290
KOREA EXPRESS SAIGON PORT CO., LTD. 2,006,502 - - 118,094 (188,525) (215,724) 1,720,347
MP CJ O SHOPPING SDN. BHD. 3,426,132 - - (2,118,871) (80,397) 177,942 1,404,806
OSHISHANG (SHANGHAI) TRADING CO., LTD. 4,248,612 - (4,439,061) (42,303) 232,752 - -
Others1,4
29,368,901 17,433,147 (4,724,123) (13,755,686) (1,429,667) (394,179) 26,498,393
810,388,389 26,400,296 (9,163,184) 86,597,239 22,340,499 429,482,717 1,366,045,956
1 In 2018, the Group disposed of the shares of Union Global Contents Investment and others,
and recognized the gain and loss on disposal of investment in associates amounting to \ 19,757
million and \ 1,885 million (2017: \ 5,040 million and \ 969 million), respectively.
2 In 2017, the Group recognized a \ 500,878 million gain due to uneven capital increase of
Netmarble Corporation (formerly, Netmarble Games Corporation).
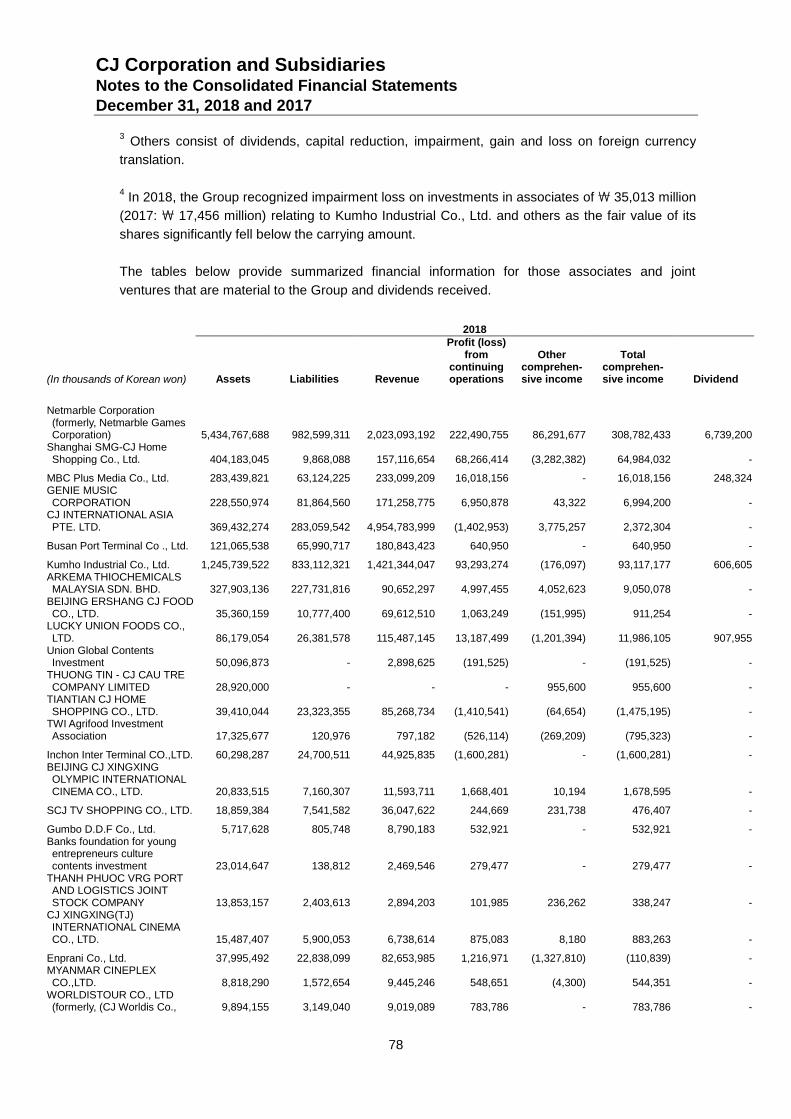
CJ Corporation and Subsidiaries Notes to the Consolidated Financial Statements December 31, 2018 and 2017
78
3 Others consist of dividends, capital reduction, impairment, gain and loss on foreign currency
translation.
4 In 2018, the Group recognized impairment loss on investments in associates of \ 35,013 million
(2017: \ 17,456 million) relating to Kumho Industrial Co., Ltd. and others as the fair value of its
shares significantly fell below the carrying amount.
The tables below provide summarized financial information for those associates and joint
ventures that are material to the Group and dividends received.
2018
(In thousands of Korean won) Assets
Liabilities
Revenue
Profit (loss) from
continuing operations
Other comprehen-sive income
Total comprehen-sive income
Dividend
Netmarble Corporation (formerly, Netmarble Games Corporation) 5,434,767,688 982,599,311 2,023,093,192 222,490,755 86,291,677 308,782,433 6,739,200
Shanghai SMG-CJ Home Shopping Co., Ltd. 404,183,045 9,868,088 157,116,654 68,266,414 (3,282,382) 64,984,032 -
MBC Plus Media Co., Ltd. 283,439,821 63,124,225 233,099,209 16,018,156 - 16,018,156 248,324 GENIE MUSIC CORPORATION 228,550,974 81,864,560 171,258,775 6,950,878 43,322 6,994,200 -
CJ INTERNATIONAL ASIA PTE. LTD. 369,432,274 283,059,542 4,954,783,999 (1,402,953) 3,775,257 2,372,304 -
Busan Port Terminal Co ., Ltd. 121,065,538 65,990,717 180,843,423 640,950 - 640,950 -
Kumho Industrial Co., Ltd. 1,245,739,522 833,112,321 1,421,344,047 93,293,274 (176,097) 93,117,177 606,605 ARKEMA THIOCHEMICALS MALAYSIA SDN. BHD. 327,903,136 227,731,816 90,652,297 4,997,455 4,052,623 9,050,078 -
BEIJING ERSHANG CJ FOOD CO., LTD. 35,360,159 10,777,400 69,612,510 1,063,249 (151,995) 911,254 -
LUCKY UNION FOODS CO., LTD. 86,179,054 26,381,578 115,487,145 13,187,499 (1,201,394) 11,986,105 907,955
Union Global Contents Investment 50,096,873 - 2,898,625 (191,525) - (191,525) -
THUONG TIN - CJ CAU TRE COMPANY LIMITED 28,920,000 - - - 955,600 955,600 -
TIANTIAN CJ HOME SHOPPING CO., LTD. 39,410,044 23,323,355 85,268,734 (1,410,541) (64,654) (1,475,195) -
TWI Agrifood Investment Association 17,325,677 120,976 797,182 (526,114) (269,209) (795,323) -
Inchon Inter Terminal CO.,LTD. 60,298,287 24,700,511 44,925,835 (1,600,281) - (1,600,281) - BEIJING CJ XINGXING OLYMPIC INTERNATIONAL CINEMA CO., LTD. 20,833,515 7,160,307 11,593,711 1,668,401 10,194 1,678,595 -
SCJ TV SHOPPING CO., LTD. 18,859,384 7,541,582 36,047,622 244,669 231,738 476,407 -
Gumbo D.D.F Co., Ltd. 5,717,628 805,748 8,790,183 532,921 - 532,921 - Banks foundation for young entrepreneurs culture contents investment 23,014,647 138,812 2,469,546 279,477 - 279,477 -
THANH PHUOC VRG PORT AND LOGISTICS JOINT STOCK COMPANY 13,853,157 2,403,613 2,894,203 101,985 236,262 338,247 -
CJ XINGXING(TJ) INTERNATIONAL CINEMA CO., LTD. 15,487,407 5,900,053 6,738,614 875,083 8,180 883,263 -
Enprani Co., Ltd. 37,995,492 22,838,099 82,653,985 1,216,971 (1,327,810) (110,839) - MYANMAR CINEPLEX CO.,LTD. 8,818,290 1,572,654 9,445,246 548,651 (4,300) 544,351 -
WORLDISTOUR CO., LTD (formerly, (CJ Worldis Co., 9,894,155 3,149,040 9,019,089 783,786 - 783,786 -
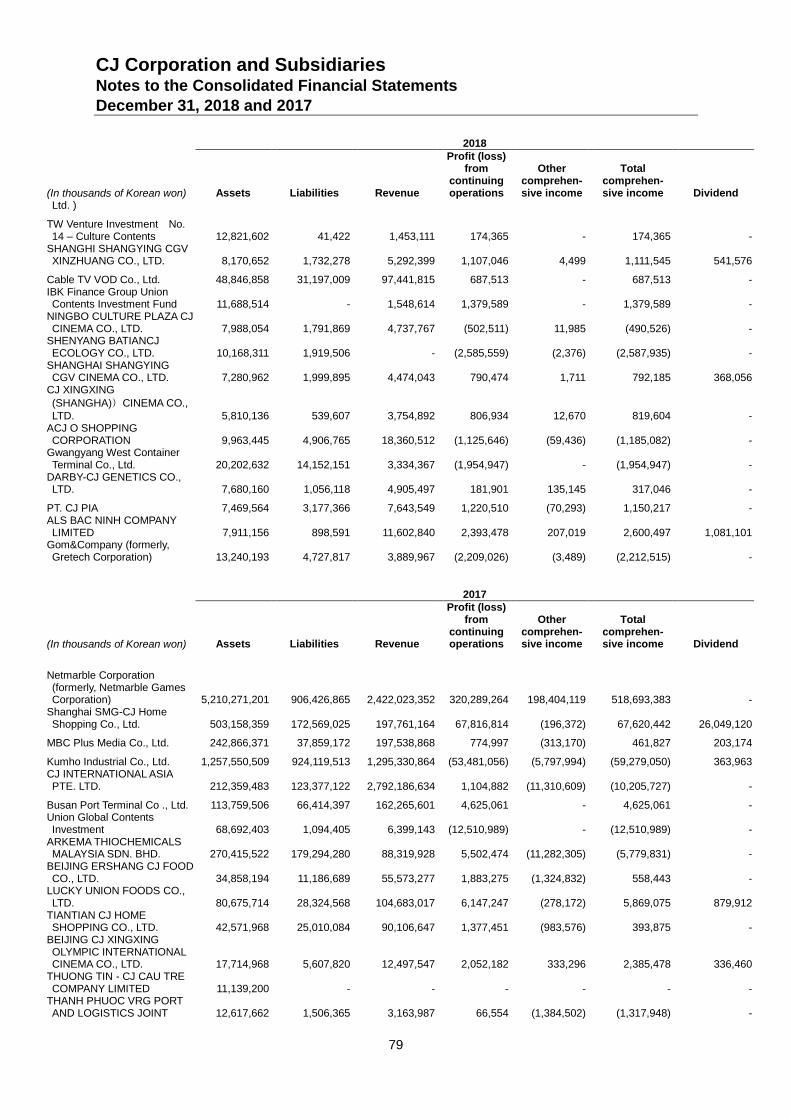
CJ Corporation and Subsidiaries Notes to the Consolidated Financial Statements December 31, 2018 and 2017
79
2018
(In thousands of Korean won) Assets
Liabilities
Revenue
Profit (loss) from
continuing operations
Other comprehen-sive income
Total comprehen-sive income
Dividend
Ltd. )
TW Venture Investment No. 14 – Culture Contents 12,821,602 41,422 1,453,111 174,365 - 174,365 -
SHANGHI SHANGYING CGV XINZHUANG CO., LTD. 8,170,652 1,732,278 5,292,399 1,107,046 4,499 1,111,545 541,576
Cable TV VOD Co., Ltd. 48,846,858 31,197,009 97,441,815 687,513 - 687,513 - IBK Finance Group Union Contents Investment Fund 11,688,514 - 1,548,614 1,379,589 - 1,379,589 -
NINGBO CULTURE PLAZA CJ CINEMA CO., LTD. 7,988,054 1,791,869 4,737,767 (502,511) 11,985 (490,526) -
SHENYANG BATIANCJ ECOLOGY CO., LTD. 10,168,311 1,919,506 - (2,585,559) (2,376) (2,587,935) -
SHANGHAI SHANGYING CGV CINEMA CO., LTD. 7,280,962 1,999,895 4,474,043 790,474 1,711 792,185 368,056
CJ XINGXING
(SHANGHA))CINEMA CO.,
LTD. 5,810,136 539,607 3,754,892 806,934 12,670 819,604 - ACJ O SHOPPING CORPORATION 9,963,445 4,906,765 18,360,512 (1,125,646) (59,436) (1,185,082) -
Gwangyang West Container Terminal Co., Ltd. 20,202,632 14,152,151 3,334,367 (1,954,947) - (1,954,947) -
DARBY-CJ GENETICS CO., LTD. 7,680,160 1,056,118 4,905,497 181,901 135,145 317,046 -
PT. CJ PIA 7,469,564 3,177,366 7,643,549 1,220,510 (70,293) 1,150,217 - ALS BAC NINH COMPANY LIMITED 7,911,156 898,591 11,602,840 2,393,478 207,019 2,600,497 1,081,101
Gom&Company (formerly, Gretech Corporation) 13,240,193 4,727,817 3,889,967 (2,209,026) (3,489) (2,212,515) -
2017
(In thousands of Korean won) Assets
Liabilities
Revenue
Profit (loss) from
continuing operations
Other comprehen-sive income
Total comprehen-sive income
Dividend
Netmarble Corporation (formerly, Netmarble Games Corporation) 5,210,271,201 906,426,865 2,422,023,352 320,289,264 198,404,119 518,693,383 -
Shanghai SMG-CJ Home Shopping Co., Ltd. 503,158,359 172,569,025 197,761,164 67,816,814 (196,372) 67,620,442 26,049,120
MBC Plus Media Co., Ltd. 242,866,371 37,859,172 197,538,868 774,997 (313,170) 461,827 203,174
Kumho Industrial Co., Ltd. 1,257,550,509 924,119,513 1,295,330,864 (53,481,056) (5,797,994) (59,279,050) 363,963 CJ INTERNATIONAL ASIA PTE. LTD. 212,359,483 123,377,122 2,792,186,634 1,104,882 (11,310,609) (10,205,727) -
Busan Port Terminal Co ., Ltd. 113,759,506 66,414,397 162,265,601 4,625,061 - 4,625,061 - Union Global Contents Investment 68,692,403 1,094,405 6,399,143 (12,510,989) - (12,510,989) -
ARKEMA THIOCHEMICALS MALAYSIA SDN. BHD. 270,415,522 179,294,280 88,319,928 5,502,474 (11,282,305) (5,779,831) -
BEIJING ERSHANG CJ FOOD CO., LTD. 34,858,194 11,186,689 55,573,277 1,883,275 (1,324,832) 558,443 -
LUCKY UNION FOODS CO., LTD. 80,675,714 28,324,568 104,683,017 6,147,247 (278,172) 5,869,075 879,912
TIANTIAN CJ HOME SHOPPING CO., LTD. 42,571,968 25,010,084 90,106,647 1,377,451 (983,576) 393,875 -
BEIJING CJ XINGXING OLYMPIC INTERNATIONAL CINEMA CO., LTD. 17,714,968 5,607,820 12,497,547 2,052,182 333,296 2,385,478 336,460
THUONG TIN - CJ CAU TRE COMPANY LIMITED 11,139,200 - - - - - -
THANH PHUOC VRG PORT AND LOGISTICS JOINT 12,617,662 1,506,365 3,163,987 66,554 (1,384,502) (1,317,948) -
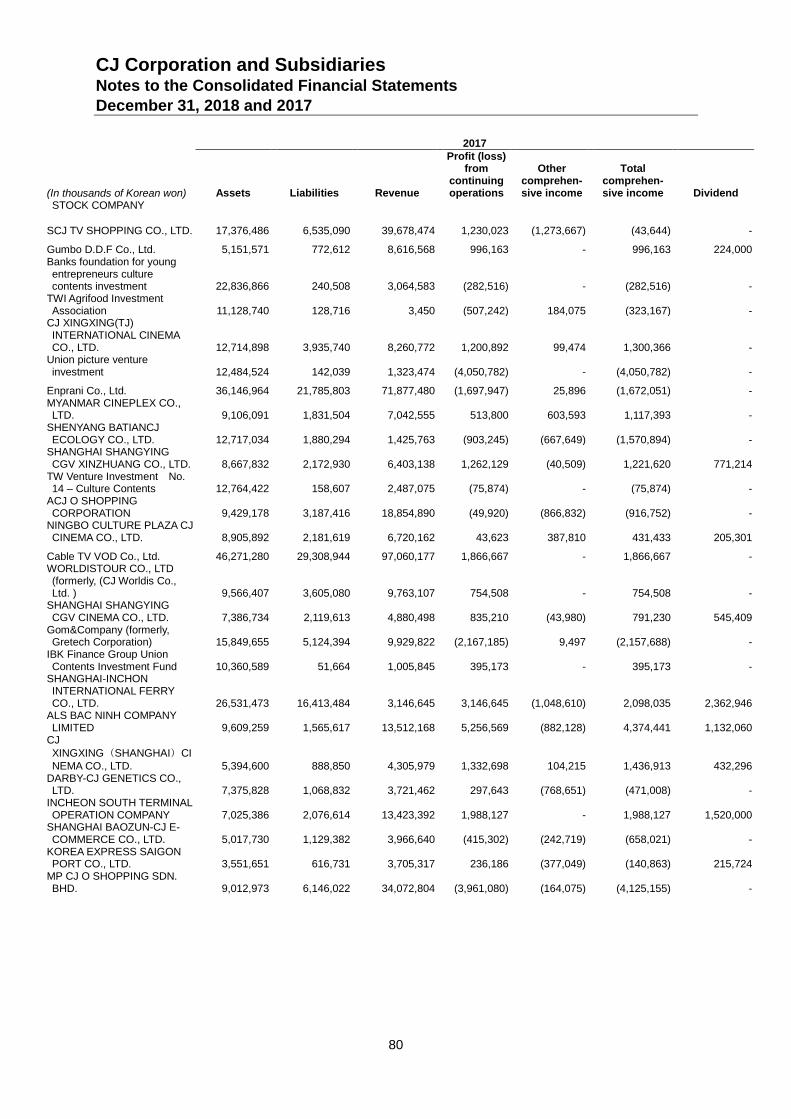
CJ Corporation and Subsidiaries Notes to the Consolidated Financial Statements December 31, 2018 and 2017
80
2017
(In thousands of Korean won) Assets
Liabilities
Revenue
Profit (loss) from
continuing operations
Other comprehen-sive income
Total comprehen-sive income
Dividend
STOCK COMPANY
SCJ TV SHOPPING CO., LTD. 17,376,486 6,535,090 39,678,474 1,230,023 (1,273,667) (43,644) -
Gumbo D.D.F Co., Ltd. 5,151,571 772,612 8,616,568 996,163 - 996,163 224,000 Banks foundation for young entrepreneurs culture contents investment 22,836,866 240,508 3,064,583 (282,516) - (282,516) -
TWI Agrifood Investment Association 11,128,740 128,716 3,450 (507,242) 184,075 (323,167) -
CJ XINGXING(TJ) INTERNATIONAL CINEMA CO., LTD. 12,714,898 3,935,740 8,260,772 1,200,892 99,474 1,300,366 -
Union picture venture investment 12,484,524 142,039 1,323,474 (4,050,782) - (4,050,782) -
Enprani Co., Ltd. 36,146,964 21,785,803 71,877,480 (1,697,947) 25,896 (1,672,051) - MYANMAR CINEPLEX CO., LTD. 9,106,091 1,831,504 7,042,555 513,800 603,593 1,117,393 -
SHENYANG BATIANCJ ECOLOGY CO., LTD. 12,717,034 1,880,294 1,425,763 (903,245) (667,649) (1,570,894) -
SHANGHAI SHANGYING CGV XINZHUANG CO., LTD. 8,667,832 2,172,930 6,403,138 1,262,129 (40,509) 1,221,620 771,214
TW Venture Investment No. 14 – Culture Contents 12,764,422 158,607 2,487,075 (75,874) - (75,874) -
ACJ O SHOPPING CORPORATION 9,429,178 3,187,416 18,854,890 (49,920) (866,832) (916,752) -
NINGBO CULTURE PLAZA CJ CINEMA CO., LTD. 8,905,892 2,181,619 6,720,162 43,623 387,810 431,433 205,301
Cable TV VOD Co., Ltd. 46,271,280 29,308,944 97,060,177 1,866,667 - 1,866,667 - WORLDISTOUR CO., LTD (formerly, (CJ Worldis Co., Ltd. ) 9,566,407 3,605,080 9,763,107 754,508 - 754,508 -
SHANGHAI SHANGYING CGV CINEMA CO., LTD. 7,386,734 2,119,613 4,880,498 835,210 (43,980) 791,230 545,409
Gom&Company (formerly, Gretech Corporation) 15,849,655 5,124,394 9,929,822 (2,167,185) 9,497 (2,157,688) -
IBK Finance Group Union Contents Investment Fund 10,360,589 51,664 1,005,845 395,173 - 395,173 -
SHANGHAI-INCHON INTERNATIONAL FERRY CO., LTD. 26,531,473 16,413,484 3,146,645 3,146,645 (1,048,610) 2,098,035 2,362,946
ALS BAC NINH COMPANY LIMITED 9,609,259 1,565,617 13,512,168 5,256,569 (882,128) 4,374,441 1,132,060
CJ
XINGXING(SHANGHAI)CI
NEMA CO., LTD. 5,394,600 888,850 4,305,979 1,332,698 104,215 1,436,913 432,296 DARBY-CJ GENETICS CO., LTD. 7,375,828 1,068,832 3,721,462 297,643 (768,651) (471,008) -
INCHEON SOUTH TERMINAL OPERATION COMPANY 7,025,386 2,076,614 13,423,392 1,988,127 - 1,988,127 1,520,000
SHANGHAI BAOZUN-CJ E-COMMERCE CO., LTD. 5,017,730 1,129,382 3,966,640 (415,302) (242,719) (658,021) -
KOREA EXPRESS SAIGON PORT CO., LTD. 3,551,651 616,731 3,705,317 236,186 (377,049) (140,863) 215,724
MP CJ O SHOPPING SDN. BHD. 9,012,973 6,146,022 34,072,804 (3,961,080) (164,075) (4,125,155) -
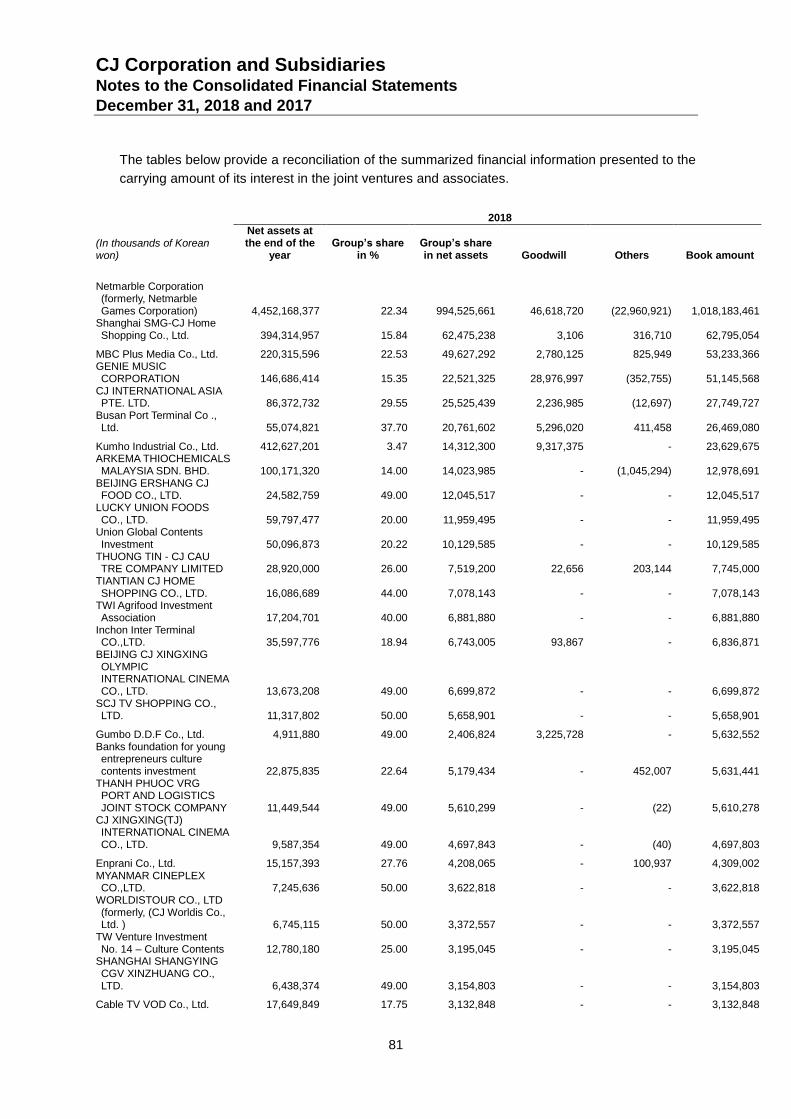
CJ Corporation and Subsidiaries Notes to the Consolidated Financial Statements December 31, 2018 and 2017
81
The tables below provide a reconciliation of the summarized financial information presented to the
carrying amount of its interest in the joint ventures and associates.
2018
(In thousands of Korean won)
Net assets at the end of the
year
Group’s share
in %
Group’s share in net assets
Goodwill
Others
Book amount
Netmarble Corporation (formerly, Netmarble Games Corporation)
4,452,168,377 22.34 994,525,661 46,618,720 (22,960,921) 1,018,183,461 Shanghai SMG-CJ Home Shopping Co., Ltd.
394,314,957 15.84 62,475,238 3,106 316,710 62,795,054
MBC Plus Media Co., Ltd.
220,315,596 22.53 49,627,292 2,780,125 825,949 53,233,366 GENIE MUSIC CORPORATION
146,686,414 15.35 22,521,325 28,976,997 (352,755) 51,145,568
CJ INTERNATIONAL ASIA PTE. LTD.
86,372,732 29.55 25,525,439 2,236,985 (12,697) 27,749,727
Busan Port Terminal Co ., Ltd.
55,074,821 37.70 20,761,602 5,296,020 411,458 26,469,080
Kumho Industrial Co., Ltd.
412,627,201 3.47 14,312,300 9,317,375 - 23,629,675 ARKEMA THIOCHEMICALS MALAYSIA SDN. BHD.
100,171,320 14.00 14,023,985 - (1,045,294) 12,978,691
BEIJING ERSHANG CJ FOOD CO., LTD.
24,582,759 49.00 12,045,517 - - 12,045,517
LUCKY UNION FOODS CO., LTD.
59,797,477 20.00 11,959,495 - - 11,959,495
Union Global Contents Investment
50,096,873 20.22 10,129,585 - - 10,129,585
THUONG TIN - CJ CAU TRE COMPANY LIMITED
28,920,000 26.00 7,519,200 22,656 203,144 7,745,000
TIANTIAN CJ HOME SHOPPING CO., LTD.
16,086,689 44.00 7,078,143 - - 7,078,143
TWI Agrifood Investment Association
17,204,701 40.00 6,881,880 - - 6,881,880
Inchon Inter Terminal CO.,LTD.
35,597,776 18.94 6,743,005 93,867 - 6,836,871
BEIJING CJ XINGXING OLYMPIC INTERNATIONAL CINEMA CO., LTD.
13,673,208 49.00 6,699,872 - - 6,699,872 SCJ TV SHOPPING CO., LTD.
11,317,802 50.00 5,658,901 - - 5,658,901
Gumbo D.D.F Co., Ltd.
4,911,880 49.00 2,406,824 3,225,728 - 5,632,552 Banks foundation for young entrepreneurs culture contents investment
22,875,835 22.64 5,179,434 - 452,007 5,631,441 THANH PHUOC VRG PORT AND LOGISTICS JOINT STOCK COMPANY
11,449,544 49.00 5,610,299 - (22) 5,610,278 CJ XINGXING(TJ) INTERNATIONAL CINEMA CO., LTD.
9,587,354 49.00 4,697,843 - (40) 4,697,803
Enprani Co., Ltd.
15,157,393 27.76 4,208,065 - 100,937 4,309,002 MYANMAR CINEPLEX CO.,LTD.
7,245,636 50.00 3,622,818 - - 3,622,818
WORLDISTOUR CO., LTD (formerly, (CJ Worldis Co., Ltd. )
6,745,115 50.00 3,372,557 - - 3,372,557 TW Venture Investment No. 14 – Culture Contents
12,780,180 25.00 3,195,045 - - 3,195,045
SHANGHAI SHANGYING CGV XINZHUANG CO., LTD.
6,438,374 49.00 3,154,803 - - 3,154,803
Cable TV VOD Co., Ltd.
17,649,849 17.75 3,132,848 - - 3,132,848
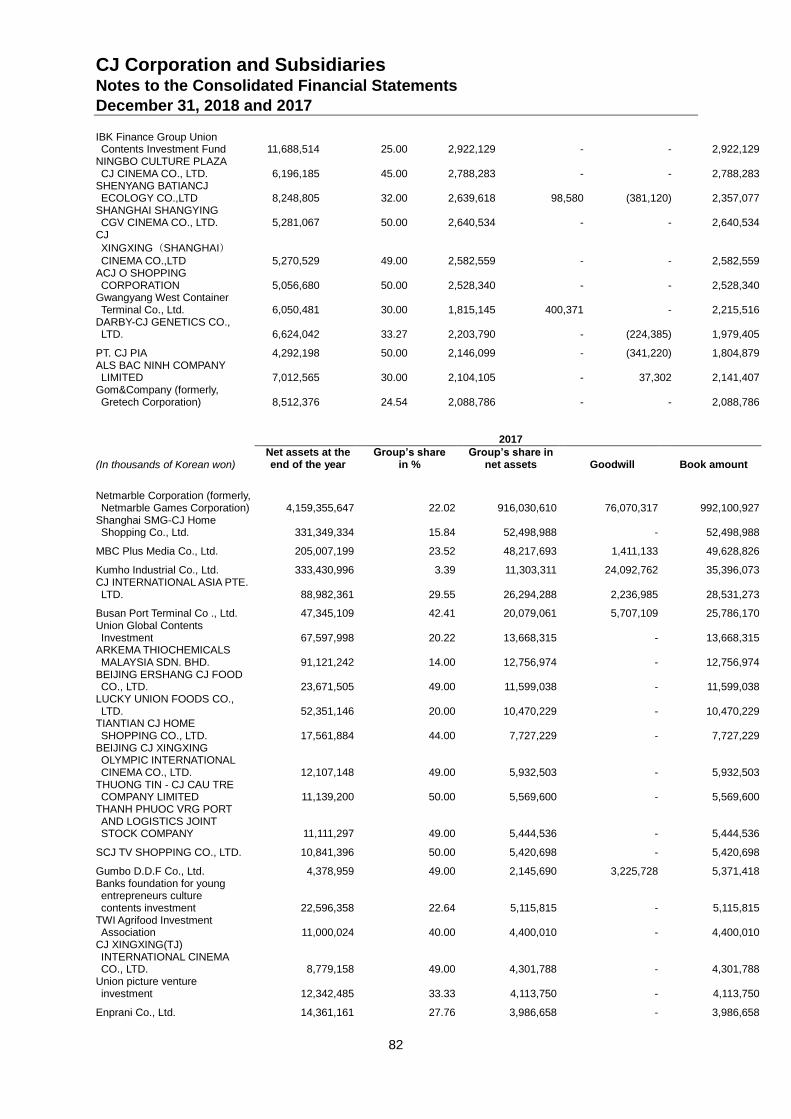
CJ Corporation and Subsidiaries Notes to the Consolidated Financial Statements December 31, 2018 and 2017
82
IBK Finance Group Union Contents Investment Fund
11,688,514 25.00 2,922,129 - - 2,922,129
NINGBO CULTURE PLAZA CJ CINEMA CO., LTD.
6,196,185 45.00 2,788,283 - - 2,788,283
SHENYANG BATIANCJ ECOLOGY CO.,LTD
8,248,805 32.00 2,639,618 98,580 (381,120) 2,357,077
SHANGHAI SHANGYING CGV CINEMA CO., LTD.
5,281,067 50.00 2,640,534 - - 2,640,534
CJ
XINGXING(SHANGHAI)CINEMA CO.,LTD
5,270,529 49.00 2,582,559 - - 2,582,559 ACJ O SHOPPING CORPORATION
5,056,680 50.00 2,528,340 - - 2,528,340
Gwangyang West Container Terminal Co., Ltd.
6,050,481 30.00 1,815,145 400,371 - 2,215,516
DARBY-CJ GENETICS CO., LTD.
6,624,042 33.27 2,203,790 - (224,385) 1,979,405
PT. CJ PIA
4,292,198 50.00 2,146,099 - (341,220) 1,804,879 ALS BAC NINH COMPANY LIMITED
7,012,565 30.00 2,104,105 - 37,302 2,141,407
Gom&Company (formerly, Gretech Corporation)
8,512,376 24.54 2,088,786 - - 2,088,786
2017
(In thousands of Korean won) Net assets at the
end of the year Group’s share
in % Group’s share in
net assets
Goodwill
Book amount
Netmarble Corporation (formerly, Netmarble Games Corporation)
4,159,355,647 22.02 916,030,610 76,070,317 992,100,927
Shanghai SMG-CJ Home Shopping Co., Ltd.
331,349,334 15.84 52,498,988 - 52,498,988
MBC Plus Media Co., Ltd.
205,007,199 23.52 48,217,693 1,411,133 49,628,826
Kumho Industrial Co., Ltd.
333,430,996 3.39 11,303,311 24,092,762 35,396,073 CJ INTERNATIONAL ASIA PTE. LTD.
88,982,361 29.55 26,294,288 2,236,985 28,531,273
Busan Port Terminal Co ., Ltd.
47,345,109 42.41 20,079,061 5,707,109 25,786,170 Union Global Contents Investment
67,597,998 20.22 13,668,315 - 13,668,315
ARKEMA THIOCHEMICALS MALAYSIA SDN. BHD.
91,121,242 14.00 12,756,974 - 12,756,974
BEIJING ERSHANG CJ FOOD CO., LTD.
23,671,505 49.00 11,599,038 - 11,599,038
LUCKY UNION FOODS CO., LTD.
52,351,146 20.00 10,470,229 - 10,470,229
TIANTIAN CJ HOME SHOPPING CO., LTD.
17,561,884 44.00 7,727,229 - 7,727,229
BEIJING CJ XINGXING OLYMPIC INTERNATIONAL CINEMA CO., LTD.
12,107,148 49.00 5,932,503 - 5,932,503 THUONG TIN - CJ CAU TRE COMPANY LIMITED
11,139,200 50.00 5,569,600 - 5,569,600
THANH PHUOC VRG PORT AND LOGISTICS JOINT STOCK COMPANY
11,111,297 49.00 5,444,536 - 5,444,536
SCJ TV SHOPPING CO., LTD.
10,841,396 50.00 5,420,698 - 5,420,698
Gumbo D.D.F Co., Ltd.
4,378,959 49.00 2,145,690 3,225,728 5,371,418 Banks foundation for young entrepreneurs culture contents investment
22,596,358 22.64 5,115,815 - 5,115,815 TWI Agrifood Investment Association
11,000,024 40.00 4,400,010 - 4,400,010
CJ XINGXING(TJ) INTERNATIONAL CINEMA CO., LTD.
8,779,158 49.00 4,301,788 - 4,301,788 Union picture venture investment
12,342,485 33.33 4,113,750 - 4,113,750
Enprani Co., Ltd.
14,361,161 27.76 3,986,658 - 3,986,658
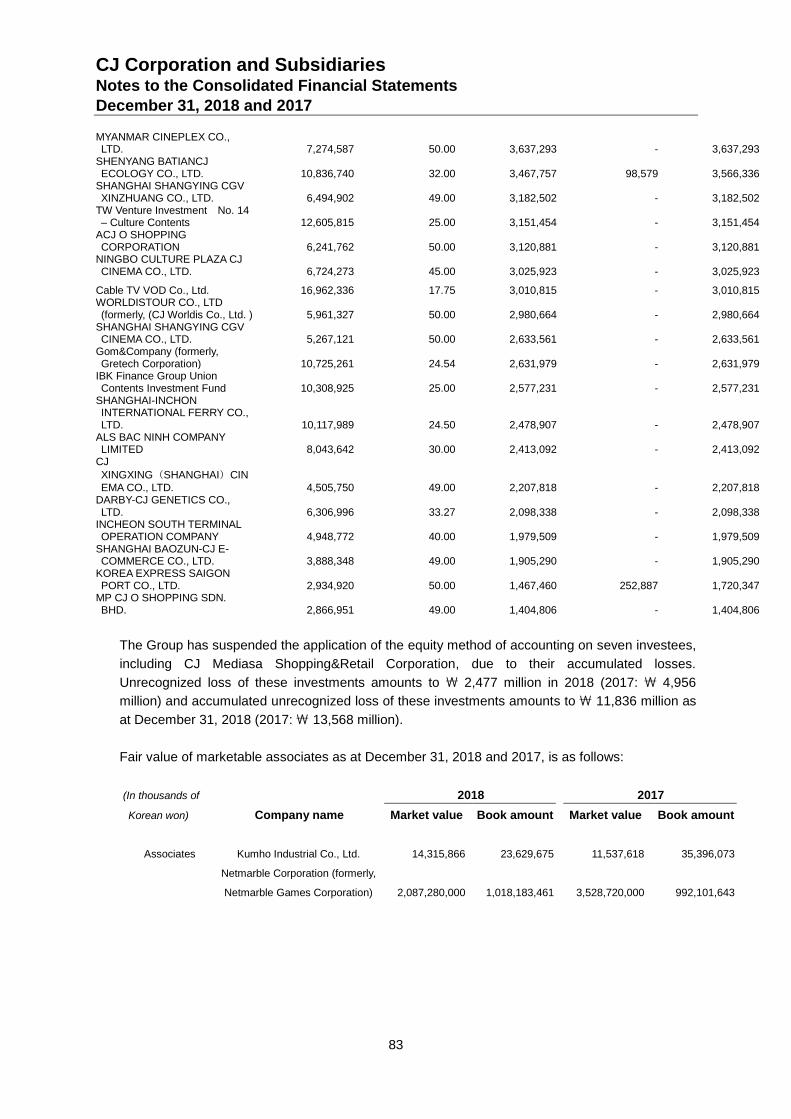
CJ Corporation and Subsidiaries Notes to the Consolidated Financial Statements December 31, 2018 and 2017
83
MYANMAR CINEPLEX CO., LTD.
7,274,587 50.00 3,637,293 - 3,637,293
SHENYANG BATIANCJ ECOLOGY CO., LTD.
10,836,740 32.00 3,467,757 98,579 3,566,336
SHANGHAI SHANGYING CGV XINZHUANG CO., LTD.
6,494,902 49.00 3,182,502 - 3,182,502
TW Venture Investment No. 14 – Culture Contents
12,605,815 25.00 3,151,454 - 3,151,454
ACJ O SHOPPING CORPORATION
6,241,762 50.00 3,120,881 - 3,120,881
NINGBO CULTURE PLAZA CJ CINEMA CO., LTD.
6,724,273 45.00 3,025,923 - 3,025,923
Cable TV VOD Co., Ltd.
16,962,336 17.75 3,010,815 - 3,010,815 WORLDISTOUR CO., LTD (formerly, (CJ Worldis Co., Ltd. )
5,961,327 50.00 2,980,664 - 2,980,664
SHANGHAI SHANGYING CGV CINEMA CO., LTD.
5,267,121 50.00 2,633,561 - 2,633,561
Gom&Company (formerly, Gretech Corporation)
10,725,261 24.54 2,631,979 - 2,631,979
IBK Finance Group Union Contents Investment Fund
10,308,925 25.00 2,577,231 - 2,577,231
SHANGHAI-INCHON INTERNATIONAL FERRY CO., LTD.
10,117,989 24.50 2,478,907 - 2,478,907 ALS BAC NINH COMPANY LIMITED
8,043,642 30.00 2,413,092 - 2,413,092
CJ
XINGXING(SHANGHAI)CIN
EMA CO., LTD.
4,505,750 49.00 2,207,818 - 2,207,818 DARBY-CJ GENETICS CO., LTD.
6,306,996 33.27 2,098,338 - 2,098,338
INCHEON SOUTH TERMINAL OPERATION COMPANY
4,948,772 40.00 1,979,509 - 1,979,509
SHANGHAI BAOZUN-CJ E-COMMERCE CO., LTD.
3,888,348 49.00 1,905,290 - 1,905,290
KOREA EXPRESS SAIGON PORT CO., LTD.
2,934,920 50.00 1,467,460 252,887 1,720,347
MP CJ O SHOPPING SDN. BHD.
2,866,951 49.00 1,404,806 - 1,404,806
The Group has suspended the application of the equity method of accounting on seven investees,
including CJ Mediasa Shopping&Retail Corporation, due to their accumulated losses.
Unrecognized loss of these investments amounts to \ 2,477 million in 2018 (2017: \ 4,956
million) and accumulated unrecognized loss of these investments amounts to \ 11,836 million as
at December 31, 2018 (2017: \ 13,568 million).
Fair value of marketable associates as at December 31, 2018 and 2017, is as follows:
(In thousands of 2018 2017
Korean won) Company name Market value Book amount Market value Book amount
Associates Kumho Industrial Co., Ltd. 14,315,866 23,629,675 11,537,618 35,396,073
Netmarble Corporation (formerly,
Netmarble Games Corporation)
2,087,280,000 1,018,183,461 3,528,720,000 992,101,643
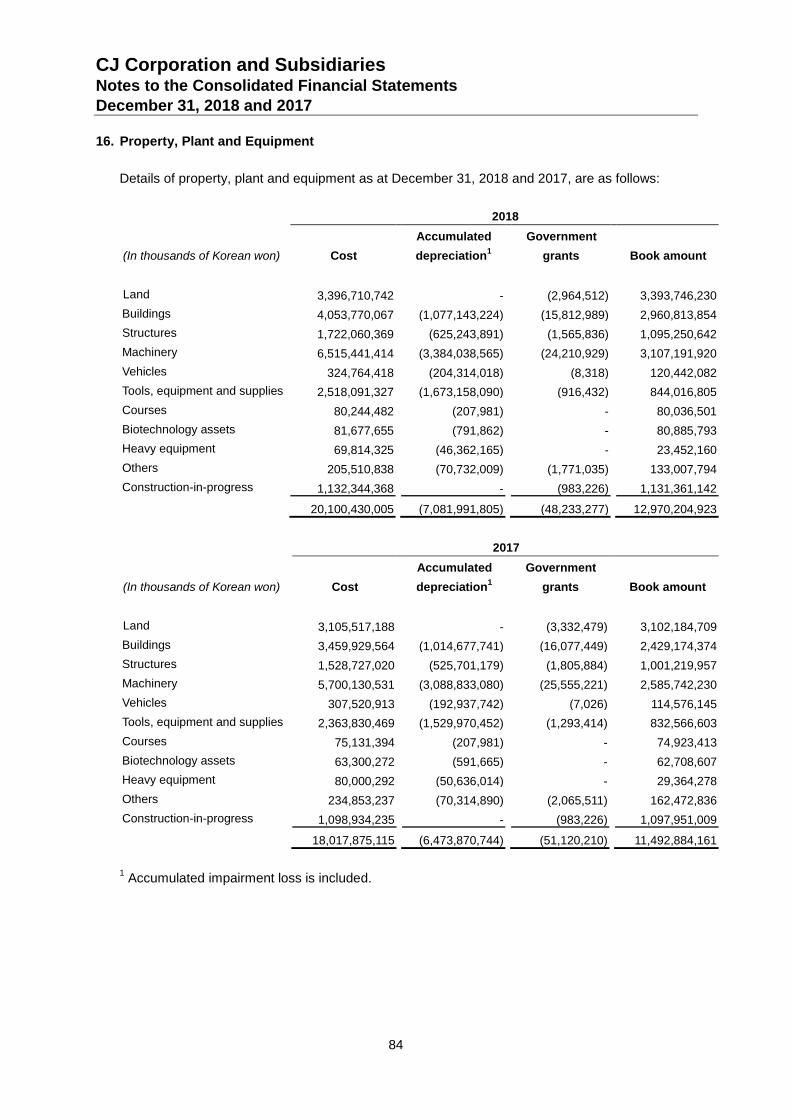
CJ Corporation and Subsidiaries Notes to the Consolidated Financial Statements December 31, 2018 and 2017
84
16. Property, Plant and Equipment
Details of property, plant and equipment as at December 31, 2018 and 2017, are as follows:
2018
(In thousands of Korean won) Cost
Accumulated
depreciation1
Government
grants Book amount
Land 3,396,710,742 - (2,964,512) 3,393,746,230
Buildings 4,053,770,067 (1,077,143,224) (15,812,989) 2,960,813,854
Structures 1,722,060,369 (625,243,891) (1,565,836) 1,095,250,642
Machinery 6,515,441,414 (3,384,038,565) (24,210,929) 3,107,191,920
Vehicles 324,764,418 (204,314,018) (8,318) 120,442,082
Tools, equipment and supplies 2,518,091,327 (1,673,158,090) (916,432) 844,016,805
Courses 80,244,482 (207,981) - 80,036,501
Biotechnology assets 81,677,655 (791,862) - 80,885,793
Heavy equipment 69,814,325 (46,362,165) - 23,452,160
Others 205,510,838 (70,732,009) (1,771,035) 133,007,794
Construction-in-progress 1,132,344,368 - (983,226) 1,131,361,142
20,100,430,005 (7,081,991,805) (48,233,277) 12,970,204,923
2017
(In thousands of Korean won) Cost
Accumulated
depreciation1
Government
grants Book amount
Land 3,105,517,188 - (3,332,479) 3,102,184,709
Buildings 3,459,929,564 (1,014,677,741) (16,077,449) 2,429,174,374
Structures 1,528,727,020 (525,701,179) (1,805,884) 1,001,219,957
Machinery 5,700,130,531 (3,088,833,080) (25,555,221) 2,585,742,230
Vehicles 307,520,913 (192,937,742) (7,026) 114,576,145
Tools, equipment and supplies 2,363,830,469 (1,529,970,452) (1,293,414) 832,566,603
Courses 75,131,394 (207,981) - 74,923,413
Biotechnology assets 63,300,272 (591,665) - 62,708,607
Heavy equipment 80,000,292 (50,636,014) - 29,364,278
Others 234,853,237 (70,314,890) (2,065,511) 162,472,836
Construction-in-progress 1,098,934,235 - (983,226) 1,097,951,009
18,017,875,115 (6,473,870,744) (51,120,210) 11,492,884,161
1 Accumulated impairment loss is included.
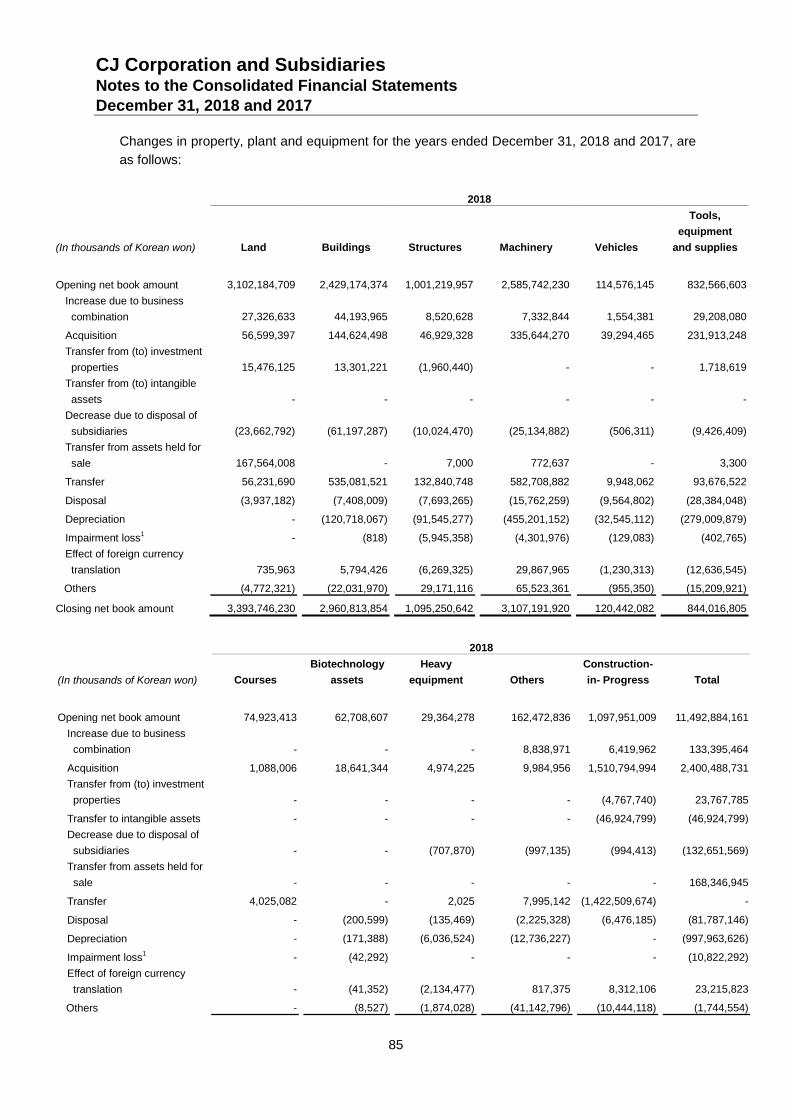
CJ Corporation and Subsidiaries Notes to the Consolidated Financial Statements December 31, 2018 and 2017
85
Changes in property, plant and equipment for the years ended December 31, 2018 and 2017, are
as follows:
2018
(In thousands of Korean won) Land Buildings Structures Machinery Vehicles
Tools,
equipment
and supplies
Opening net book amount 3,102,184,709 2,429,174,374 1,001,219,957 2,585,742,230 114,576,145 832,566,603
Increase due to business
combination 27,326,633 44,193,965 8,520,628 7,332,844 1,554,381 29,208,080
Acquisition 56,599,397 144,624,498 46,929,328 335,644,270 39,294,465 231,913,248
Transfer from (to) investment
properties 15,476,125 13,301,221 (1,960,440) - - 1,718,619
Transfer from (to) intangible
assets - - - - - -
Decrease due to disposal of
subsidiaries (23,662,792) (61,197,287) (10,024,470) (25,134,882) (506,311) (9,426,409)
Transfer from assets held for
sale 167,564,008 - 7,000 772,637 - 3,300
Transfer 56,231,690 535,081,521 132,840,748 582,708,882 9,948,062 93,676,522
Disposal (3,937,182) (7,408,009) (7,693,265) (15,762,259) (9,564,802) (28,384,048)
Depreciation - (120,718,067) (91,545,277) (455,201,152) (32,545,112) (279,009,879)
Impairment loss1
- (818) (5,945,358) (4,301,976) (129,083) (402,765)
Effect of foreign currency
translation 735,963 5,794,426 (6,269,325) 29,867,965 (1,230,313) (12,636,545)
Others (4,772,321) (22,031,970) 29,171,116 65,523,361 (955,350) (15,209,921)
Closing net book amount 3,393,746,230 2,960,813,854 1,095,250,642 3,107,191,920 120,442,082 844,016,805
2018
(In thousands of Korean won) Courses
Biotechnology
assets
Heavy
equipment Others
Construction-
in- Progress Total
Opening net book amount 74,923,413 62,708,607 29,364,278 162,472,836 1,097,951,009 11,492,884,161
Increase due to business
combination - - - 8,838,971 6,419,962 133,395,464
Acquisition 1,088,006 18,641,344 4,974,225 9,984,956 1,510,794,994 2,400,488,731
Transfer from (to) investment
properties - - - - (4,767,740) 23,767,785
Transfer to intangible assets - - - - (46,924,799) (46,924,799)
Decrease due to disposal of
subsidiaries - - (707,870) (997,135) (994,413) (132,651,569)
Transfer from assets held for
sale - - - - - 168,346,945
Transfer 4,025,082 - 2,025 7,995,142 (1,422,509,674) -
Disposal - (200,599) (135,469) (2,225,328) (6,476,185) (81,787,146)
Depreciation - (171,388) (6,036,524) (12,736,227) - (997,963,626)
Impairment loss1
- (42,292) - - - (10,822,292)
Effect of foreign currency
translation - (41,352) (2,134,477) 817,375 8,312,106 23,215,823
Others - (8,527) (1,874,028) (41,142,796) (10,444,118) (1,744,554)
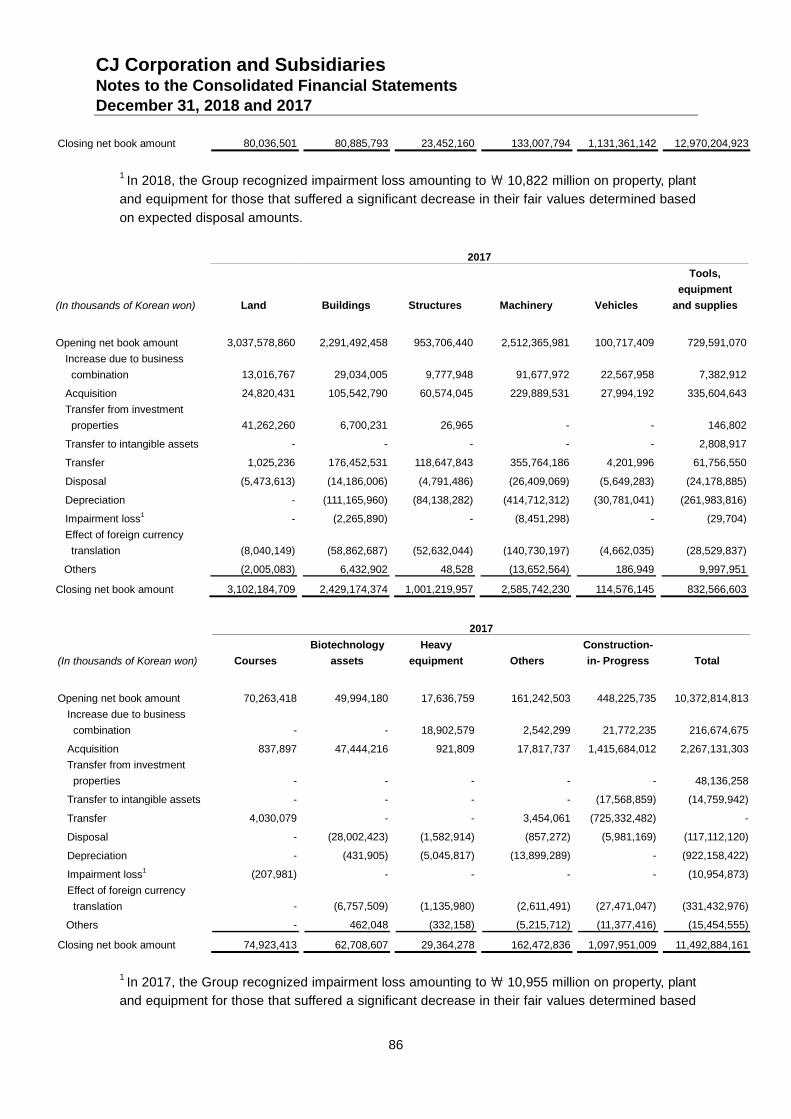
CJ Corporation and Subsidiaries Notes to the Consolidated Financial Statements December 31, 2018 and 2017
86
Closing net book amount 80,036,501 80,885,793 23,452,160 133,007,794 1,131,361,142 12,970,204,923
1 In 2018, the Group recognized impairment loss amounting to \ 10,822 million on property, plant
and equipment for those that suffered a significant decrease in their fair values determined based
on expected disposal amounts.
2017
(In thousands of Korean won) Land Buildings Structures Machinery Vehicles
Tools,
equipment
and supplies
Opening net book amount 3,037,578,860 2,291,492,458 953,706,440 2,512,365,981 100,717,409 729,591,070
Increase due to business
combination 13,016,767 29,034,005 9,777,948 91,677,972 22,567,958 7,382,912
Acquisition 24,820,431 105,542,790 60,574,045 229,889,531 27,994,192 335,604,643
Transfer from investment
properties 41,262,260 6,700,231 26,965 - - 146,802
Transfer to intangible assets - - - - - 2,808,917
Transfer 1,025,236 176,452,531 118,647,843 355,764,186 4,201,996 61,756,550
Disposal (5,473,613) (14,186,006) (4,791,486) (26,409,069) (5,649,283) (24,178,885)
Depreciation - (111,165,960) (84,138,282) (414,712,312) (30,781,041) (261,983,816)
Impairment loss1
- (2,265,890) - (8,451,298) - (29,704)
Effect of foreign currency
translation (8,040,149) (58,862,687) (52,632,044) (140,730,197) (4,662,035) (28,529,837)
Others (2,005,083) 6,432,902 48,528 (13,652,564) 186,949 9,997,951
Closing net book amount 3,102,184,709 2,429,174,374 1,001,219,957 2,585,742,230 114,576,145 832,566,603
2017
(In thousands of Korean won) Courses
Biotechnology
assets
Heavy
equipment Others
Construction-
in- Progress Total
Opening net book amount 70,263,418 49,994,180 17,636,759 161,242,503 448,225,735 10,372,814,813
Increase due to business
combination - - 18,902,579 2,542,299 21,772,235 216,674,675
Acquisition 837,897 47,444,216 921,809 17,817,737 1,415,684,012 2,267,131,303
Transfer from investment
properties - - - - - 48,136,258
Transfer to intangible assets - - - - (17,568,859) (14,759,942)
Transfer 4,030,079 - - 3,454,061 (725,332,482) -
Disposal - (28,002,423) (1,582,914) (857,272) (5,981,169) (117,112,120)
Depreciation - (431,905) (5,045,817) (13,899,289) - (922,158,422)
Impairment loss1
(207,981) - - - - (10,954,873)
Effect of foreign currency
translation - (6,757,509) (1,135,980) (2,611,491) (27,471,047) (331,432,976)
Others - 462,048 (332,158) (5,215,712) (11,377,416) (15,454,555)
Closing net book amount 74,923,413 62,708,607 29,364,278 162,472,836 1,097,951,009 11,492,884,161
1 In 2017, the Group recognized impairment loss amounting to \ 10,955 million on property, plant
and equipment for those that suffered a significant decrease in their fair values determined based
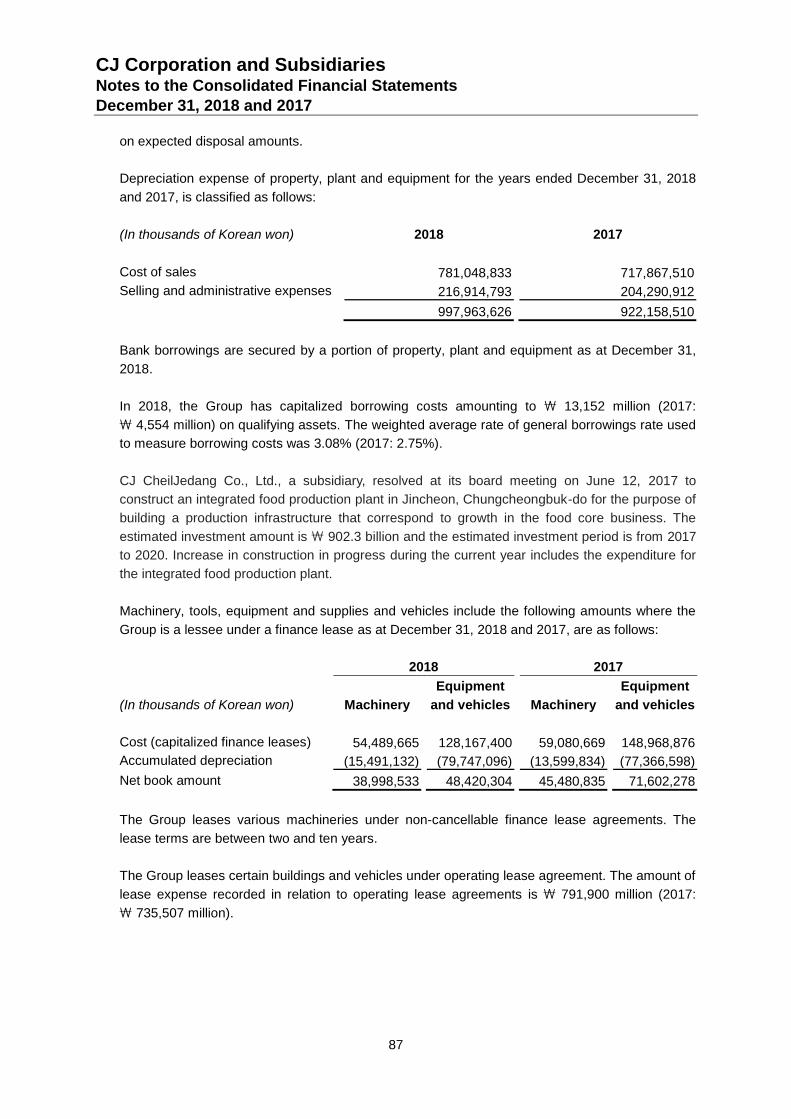
CJ Corporation and Subsidiaries Notes to the Consolidated Financial Statements December 31, 2018 and 2017
87
on expected disposal amounts.
Depreciation expense of property, plant and equipment for the years ended December 31, 2018
and 2017, is classified as follows:
(In thousands of Korean won) 2018
2017
Cost of sales 781,048,833 717,867,510
Selling and administrative expenses 216,914,793 204,290,912
997,963,626 922,158,510
Bank borrowings are secured by a portion of property, plant and equipment as at December 31,
2018.
In 2018, the Group has capitalized borrowing costs amounting to \ 13,152 million (2017:
\ 4,554 million) on qualifying assets. The weighted average rate of general borrowings rate used
to measure borrowing costs was 3.08% (2017: 2.75%).
CJ CheilJedang Co., Ltd., a subsidiary, resolved at its board meeting on June 12, 2017 to
construct an integrated food production plant in Jincheon, Chungcheongbuk-do for the purpose of
building a production infrastructure that correspond to growth in the food core business. The
estimated investment amount is ₩ 902.3 billion and the estimated investment period is from 2017
to 2020. Increase in construction in progress during the current year includes the expenditure for
the integrated food production plant.
Machinery, tools, equipment and supplies and vehicles include the following amounts where the
Group is a lessee under a finance lease as at December 31, 2018 and 2017, are as follows:
2018
2017
(In thousands of Korean won) Machinery
Equipment
and vehicles
Machinery
Equipment
and vehicles
Cost (capitalized finance leases) 54,489,665 128,167,400 59,080,669 148,968,876
Accumulated depreciation (15,491,132) (79,747,096) (13,599,834) (77,366,598)
Net book amount 38,998,533 48,420,304 45,480,835 71,602,278
The Group leases various machineries under non-cancellable finance lease agreements. The
lease terms are between two and ten years.
The Group leases certain buildings and vehicles under operating lease agreement. The amount of
lease expense recorded in relation to operating lease agreements is \ 791,900 million (2017:
\ 735,507 million).
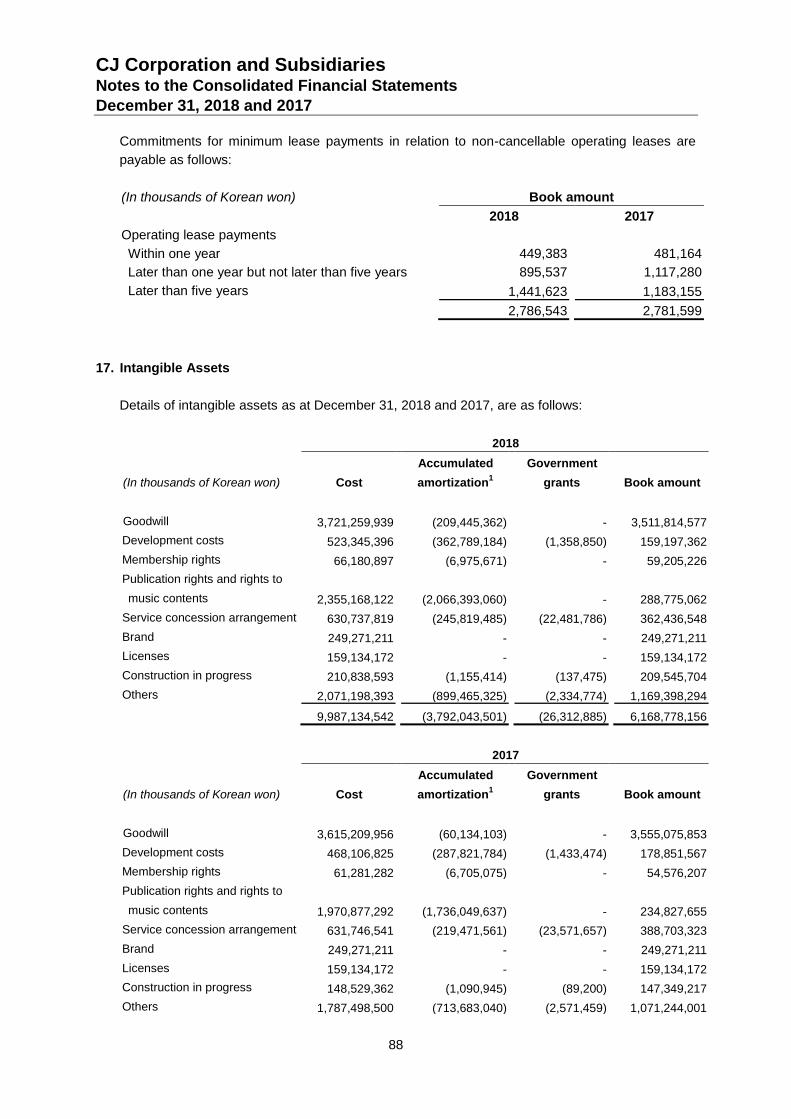
CJ Corporation and Subsidiaries Notes to the Consolidated Financial Statements December 31, 2018 and 2017
88
Commitments for minimum lease payments in relation to non-cancellable operating leases are
payable as follows:
(In thousands of Korean won)
Book amount
2018 2017
Operating lease payments
Within one year 449,383 481,164
Later than one year but not later than five years 895,537 1,117,280
Later than five years
1,441,623 1,183,155
2,786,543 2,781,599
17. Intangible Assets
Details of intangible assets as at December 31, 2018 and 2017, are as follows:
2018
(In thousands of Korean won) Cost
Accumulated
amortization1
Government
grants Book amount
Goodwill 3,721,259,939 (209,445,362) - 3,511,814,577
Development costs 523,345,396 (362,789,184) (1,358,850) 159,197,362
Membership rights 66,180,897 (6,975,671) - 59,205,226
Publication rights and rights to
music contents 2,355,168,122 (2,066,393,060) - 288,775,062
Service concession arrangement 630,737,819 (245,819,485) (22,481,786) 362,436,548
Brand 249,271,211 - - 249,271,211
Licenses 159,134,172 - - 159,134,172
Construction in progress 210,838,593 (1,155,414) (137,475) 209,545,704
Others 2,071,198,393 (899,465,325) (2,334,774) 1,169,398,294
9,987,134,542 (3,792,043,501) (26,312,885) 6,168,778,156
2017
(In thousands of Korean won) Cost
Accumulated
amortization1
Government
grants Book amount
Goodwill 3,615,209,956 (60,134,103) - 3,555,075,853
Development costs 468,106,825 (287,821,784) (1,433,474) 178,851,567
Membership rights 61,281,282 (6,705,075) - 54,576,207
Publication rights and rights to
music contents 1,970,877,292 (1,736,049,637) - 234,827,655
Service concession arrangement 631,746,541 (219,471,561) (23,571,657) 388,703,323
Brand 249,271,211 - - 249,271,211
Licenses 159,134,172 - - 159,134,172
Construction in progress 148,529,362 (1,090,945) (89,200) 147,349,217
Others 1,787,498,500 (713,683,040) (2,571,459) 1,071,244,001
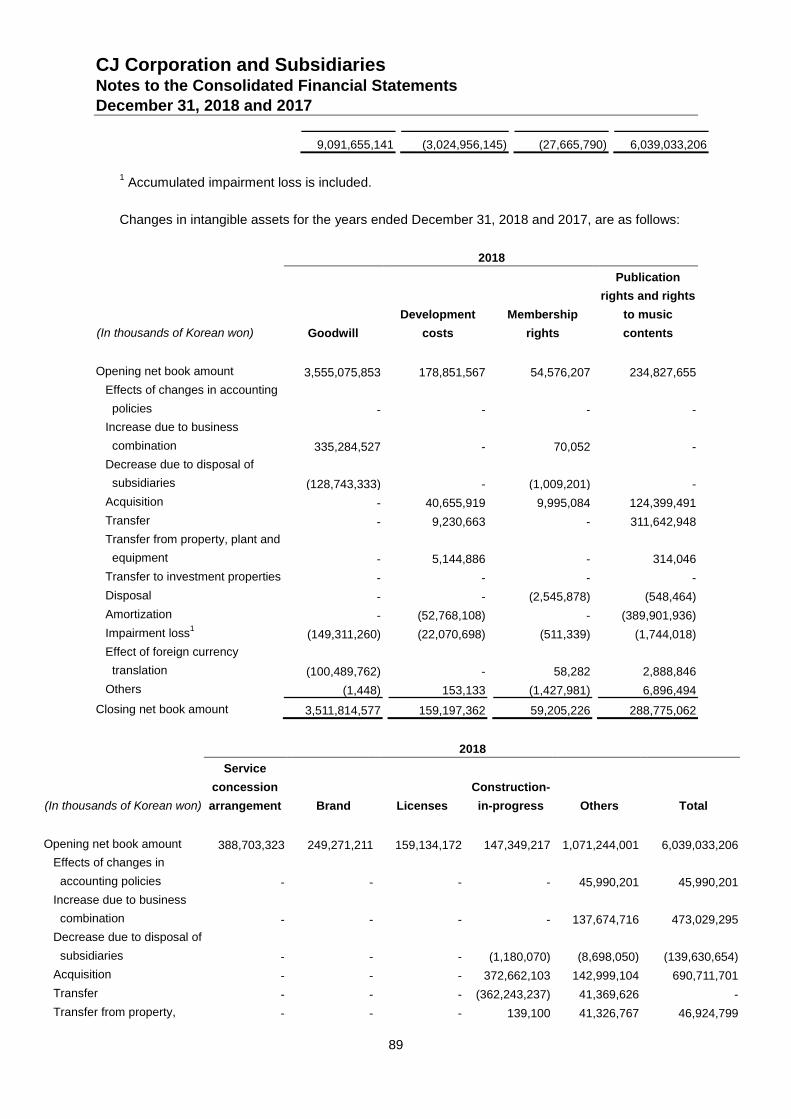
CJ Corporation and Subsidiaries Notes to the Consolidated Financial Statements December 31, 2018 and 2017
89
9,091,655,141 (3,024,956,145) (27,665,790) 6,039,033,206
1 Accumulated impairment loss is included.
Changes in intangible assets for the years ended December 31, 2018 and 2017, are as follows:
2018
(In thousands of Korean won) Goodwill
Development
costs
Membership
rights
Publication
rights and rights
to music
contents
Opening net book amount 3,555,075,853 178,851,567 54,576,207 234,827,655
Effects of changes in accounting
policies - - - -
Increase due to business
combination 335,284,527 - 70,052 -
Decrease due to disposal of
subsidiaries (128,743,333) - (1,009,201) -
Acquisition - 40,655,919 9,995,084 124,399,491
Transfer - 9,230,663 - 311,642,948
Transfer from property, plant and
equipment - 5,144,886 - 314,046
Transfer to investment properties - - - -
Disposal - - (2,545,878) (548,464)
Amortization - (52,768,108) - (389,901,936)
Impairment loss1
(149,311,260) (22,070,698) (511,339) (1,744,018)
Effect of foreign currency
translation (100,489,762) - 58,282 2,888,846
Others (1,448) 153,133 (1,427,981) 6,896,494
Closing net book amount 3,511,814,577 159,197,362 59,205,226 288,775,062
2018
(In thousands of Korean won)
Service
concession
arrangement Brand
Licenses
Construction-
in-progress Others Total
Opening net book amount 388,703,323 249,271,211 159,134,172 147,349,217 1,071,244,001 6,039,033,206
Effects of changes in
accounting policies - - - - 45,990,201 45,990,201
Increase due to business
combination - - - - 137,674,716 473,029,295
Decrease due to disposal of
subsidiaries - - - (1,180,070) (8,698,050) (139,630,654)
Acquisition - - - 372,662,103 142,999,104 690,711,701
Transfer - - - (362,243,237) 41,369,626 -
Transfer from property, - - - 139,100 41,326,767 46,924,799
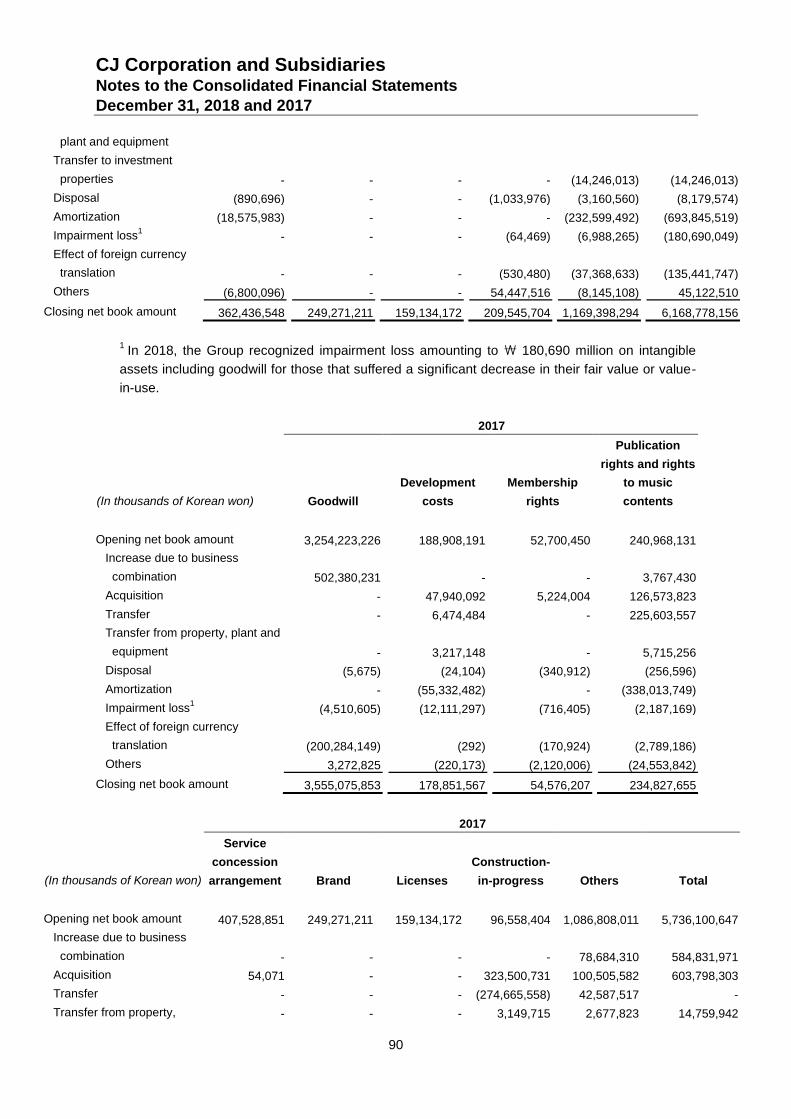
CJ Corporation and Subsidiaries Notes to the Consolidated Financial Statements December 31, 2018 and 2017
90
plant and equipment
Transfer to investment
properties - - - - (14,246,013) (14,246,013)
Disposal (890,696) - - (1,033,976) (3,160,560) (8,179,574)
Amortization (18,575,983) - - - (232,599,492) (693,845,519)
Impairment loss1
- - - (64,469) (6,988,265) (180,690,049)
Effect of foreign currency
translation - - - (530,480) (37,368,633) (135,441,747)
Others (6,800,096) - - 54,447,516 (8,145,108) 45,122,510
Closing net book amount 362,436,548 249,271,211 159,134,172 209,545,704 1,169,398,294 6,168,778,156
1
In 2018, the Group recognized impairment loss amounting to \ 180,690 million on intangible
assets including goodwill for those that suffered a significant decrease in their fair value or value-
in-use.
2017
(In thousands of Korean won) Goodwill
Development
costs
Membership
rights
Publication
rights and rights
to music
contents
Opening net book amount 3,254,223,226 188,908,191 52,700,450 240,968,131
Increase due to business
combination 502,380,231 - - 3,767,430
Acquisition - 47,940,092 5,224,004 126,573,823
Transfer - 6,474,484 - 225,603,557
Transfer from property, plant and
equipment - 3,217,148 - 5,715,256
Disposal (5,675) (24,104) (340,912) (256,596)
Amortization - (55,332,482) - (338,013,749)
Impairment loss1
(4,510,605) (12,111,297) (716,405) (2,187,169)
Effect of foreign currency
translation (200,284,149) (292) (170,924) (2,789,186)
Others 3,272,825 (220,173) (2,120,006) (24,553,842)
Closing net book amount 3,555,075,853 178,851,567 54,576,207 234,827,655
2017
(In thousands of Korean won)
Service
concession
arrangement Brand
Licenses
Construction-
in-progress Others Total
Opening net book amount 407,528,851 249,271,211 159,134,172 96,558,404 1,086,808,011 5,736,100,647
Increase due to business
combination - - - - 78,684,310 584,831,971
Acquisition 54,071 - - 323,500,731 100,505,582 603,798,303
Transfer - - - (274,665,558) 42,587,517 -
Transfer from property, - - - 3,149,715 2,677,823 14,759,942
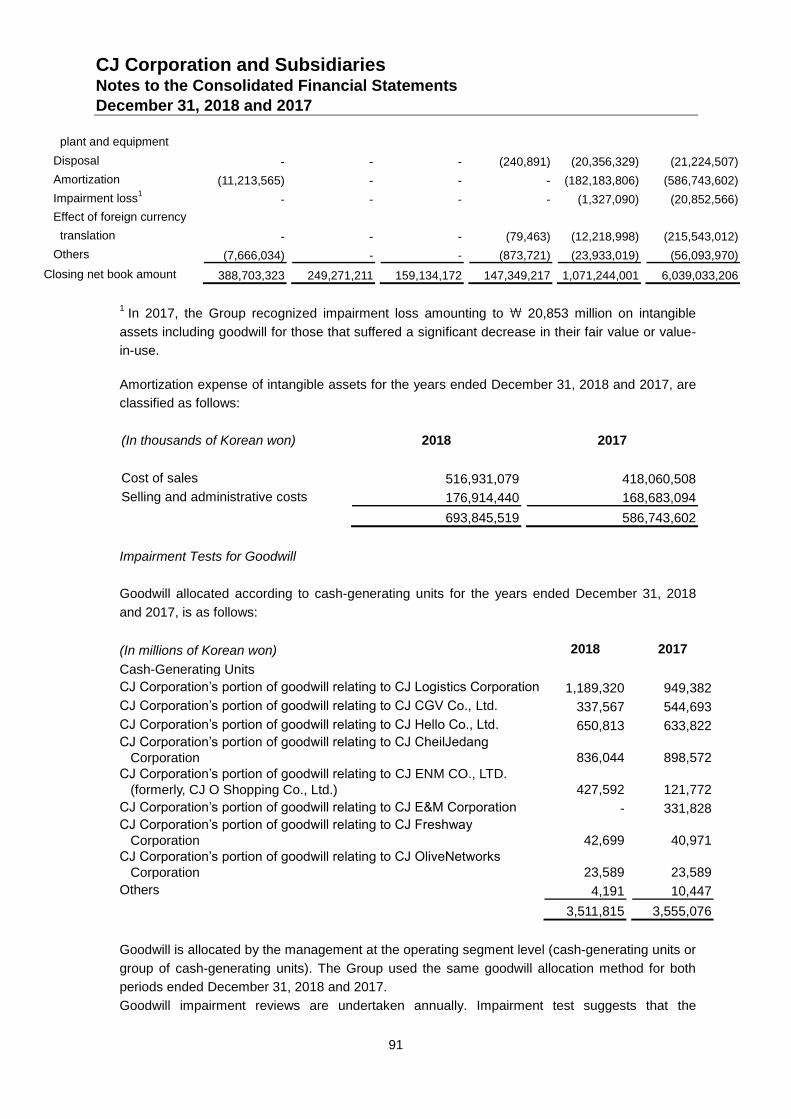
CJ Corporation and Subsidiaries Notes to the Consolidated Financial Statements December 31, 2018 and 2017
91
plant and equipment
Disposal - - - (240,891) (20,356,329) (21,224,507)
Amortization (11,213,565) - - - (182,183,806) (586,743,602)
Impairment loss1
- - - - (1,327,090) (20,852,566)
Effect of foreign currency
translation - - - (79,463) (12,218,998) (215,543,012)
Others (7,666,034) - - (873,721) (23,933,019) (56,093,970)
Closing net book amount 388,703,323 249,271,211 159,134,172 147,349,217 1,071,244,001 6,039,033,206
1
In 2017, the Group recognized impairment loss amounting to \ 20,853 million on intangible
assets including goodwill for those that suffered a significant decrease in their fair value or value-
in-use.
Amortization expense of intangible assets for the years ended December 31, 2018 and 2017, are
classified as follows:
(In thousands of Korean won)
2018
2017
Cost of sales
516,931,079 418,060,508
Selling and administrative costs
176,914,440 168,683,094
693,845,519 586,743,602
Impairment Tests for Goodwill
Goodwill allocated according to cash-generating units for the years ended December 31, 2018
and 2017, is as follows:
(In millions of Korean won) 2018 2017
Cash-Generating Units
CJ Corporation’s portion of goodwill relating to CJ Logistics Corporation 1,189,320 949,382
CJ Corporation’s portion of goodwill relating to CJ CGV Co., Ltd. 337,567 544,693
CJ Corporation’s portion of goodwill relating to CJ Hello Co., Ltd. 650,813 633,822
CJ Corporation’s portion of goodwill relating to CJ CheilJedang
Corporation 836,044 898,572
CJ Corporation’s portion of goodwill relating to CJ ENM CO., LTD.
(formerly, CJ O Shopping Co., Ltd.) 427,592 121,772
CJ Corporation’s portion of goodwill relating to CJ E&M Corporation - 331,828
CJ Corporation’s portion of goodwill relating to CJ Freshway
Corporation 42,699 40,971
CJ Corporation’s portion of goodwill relating to CJ OliveNetworks
Corporation 23,589 23,589
Others 4,191 10,447
3,511,815 3,555,076
Goodwill is allocated by the management at the operating segment level (cash-generating units or
group of cash-generating units). The Group used the same goodwill allocation method for both
periods ended December 31, 2018 and 2017.
Goodwill impairment reviews are undertaken annually. Impairment test suggests that the

CJ Corporation and Subsidiaries Notes to the Consolidated Financial Statements December 31, 2018 and 2017
92
recoverable amount of cash generating units does not exceed the book amount, and \ 149,311
million (2017: \ 4,511 million) are recognized as impairment loss on intangible assets. Some of
the recoverable amount of cash generation units used estimated cash flow amounts based on the
next five years of approved financial budget of the management and the cash flows beyond the
five-year period are extrapolated using the permanent growth rates. The key assumptions used
for value-in-use calculations in 2018 are as follows:
(In percentage, %) 2018
Average gross
margin rate Average sales
growth rate Discount rate
CJ Corporation’s portion of goodwill relating to CJ Logistics Corporation
3.46%~6.34% 4.08%~10.94% 7.16%
CJ Corporation’s portion of goodwill relating to CJ CGV Co., Ltd.
10.87%~11.21% 12.12%~19.28% 14.2%~16.10%
CJ Hello Co., Ltd. 10.76% 3.86% 7.50%
CJ Corporation’s portion of goodwill relating to CJ CheilJedang Corporation
0.20%~22.91% 0.22%~47.67% 5.81%~15.15%
CJ Corporation’s portion of goodwill relating to CJ ENM CO., LTD. (formerly, CJ O Shopping Co., Ltd.)
20.29%~34.31% 3.79%~19.38% 9.4%~12.8%
CJ Corporation’s portion of goodwill relating to CJ Freshway Corporation
8.23%~25.22% 2.83%~7.62% 8.3%~11%
CJ Corporation’s portion of goodwill relating to CJ OliveNetworks Corporation
5.73% 2.27% 10.50%
(In percentage, %) 2017
Average gross
margin rate Average sales
growth rate Discount rate
CJ Corporation’s portion of goodwill relating to CJ Logistics Corporation
1.63%~6.37% 3.71%~13.95% 6.80%
CJ Corporation’s portion of goodwill relating to CJ CGV Co., Ltd.
11.19% 22.15% 13.30%
CJ Hello Co., Ltd. 10.34% 2.94% 6.60%
CJ Corporation’s portion of goodwill relating to CJ CheilJedang Corporation
(0.47%)~25.07% (0.12%)~63.51% 4.91%~10.95%
CJ Corporation’s portion of goodwill relating to CJ E&M Corporation
5.54%~28.18% 10.64%~18.26% 5.4%~15.4%
CJ Corporation’s portion of goodwill relating to CJ ENM CO., LTD. (formerly, CJ O Shopping Co., Ltd.)
6.64%~6.69% 8.18%~13.43% 12.65%~14.41%
CJ Corporation’s portion of goodwill relating to CJ Freshway Corporation
7.08%~29.01% 2.64%~22.26% 9.06%~14%
CJ Corporation’s portion of goodwill relating to CJ OliveNetworks Corporation
8.30% 2.03% 10.30%
The Group determined budgeted gross margin growth rate based on past performance and its
expectations of market development. The discount rates used reflect specific risks relating to the
relevant operating segments.
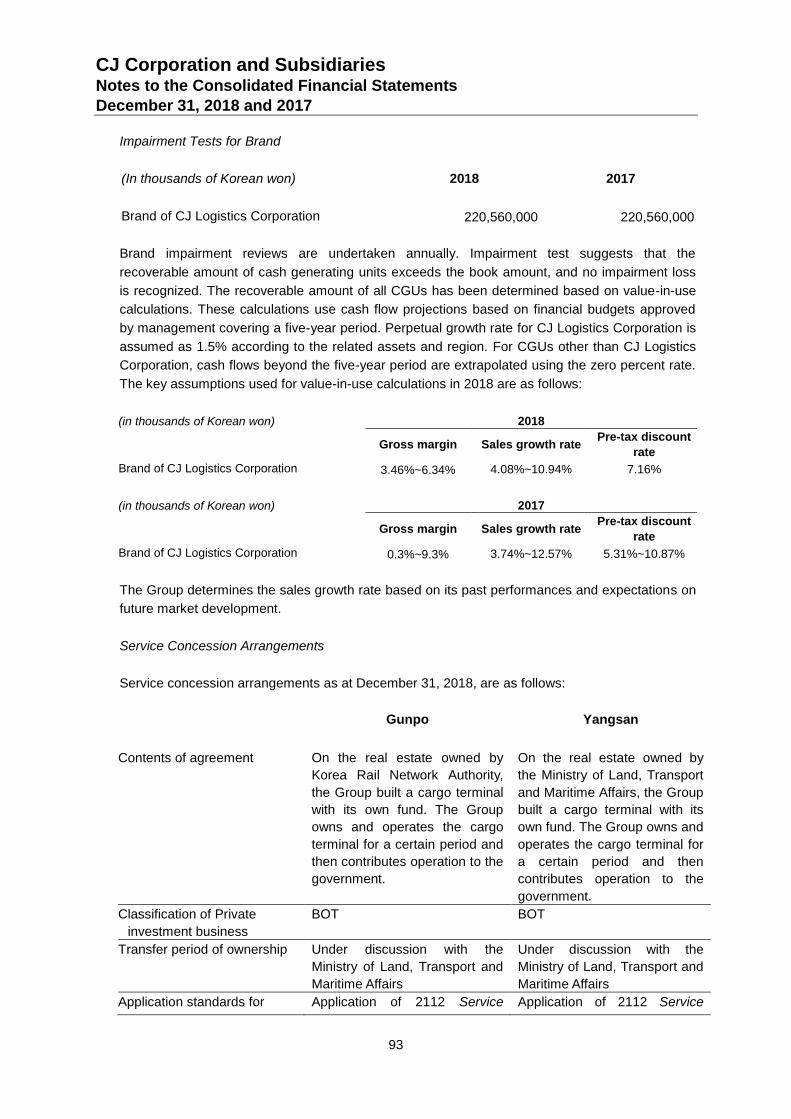
CJ Corporation and Subsidiaries Notes to the Consolidated Financial Statements December 31, 2018 and 2017
93
Impairment Tests for Brand
(In thousands of Korean won)
2018
2017
Brand of CJ Logistics Corporation
220,560,000 220,560,000
Brand impairment reviews are undertaken annually. Impairment test suggests that the
recoverable amount of cash generating units exceeds the book amount, and no impairment loss
is recognized. The recoverable amount of all CGUs has been determined based on value-in-use
calculations. These calculations use cash flow projections based on financial budgets approved
by management covering a five-year period. Perpetual growth rate for CJ Logistics Corporation is
assumed as 1.5% according to the related assets and region. For CGUs other than CJ Logistics
Corporation, cash flows beyond the five-year period are extrapolated using the zero percent rate.
The key assumptions used for value-in-use calculations in 2018 are as follows:
(in thousands of Korean won) 2018
Gross margin Sales growth rate
Pre-tax discount
rate
Brand of CJ Logistics Corporation 3.46%~6.34% 4.08%~10.94% 7.16%
(in thousands of Korean won) 2017
Gross margin Sales growth rate
Pre-tax discount
rate
Brand of CJ Logistics Corporation 0.3%~9.3% 3.74%~12.57% 5.31%~10.87%
The Group determines the sales growth rate based on its past performances and expectations on
future market development.
Service Concession Arrangements
Service concession arrangements as at December 31, 2018, are as follows:
Gunpo Yangsan
Contents of agreement On the real estate owned by
Korea Rail Network Authority,
the Group built a cargo terminal
with its own fund. The Group
owns and operates the cargo
terminal for a certain period and
then contributes operation to the
government.
On the real estate owned by
the Ministry of Land, Transport
and Maritime Affairs, the Group
built a cargo terminal with its
own fund. The Group owns and
operates the cargo terminal for
a certain period and then
contributes operation to the
government.
Classification of Private
investment business
BOT BOT
Transfer period of ownership Under discussion with the
Ministry of Land, Transport and
Maritime Affairs
Under discussion with the
Ministry of Land, Transport and
Maritime Affairs
Application standards for Application of 2112 Service Application of 2112 Service
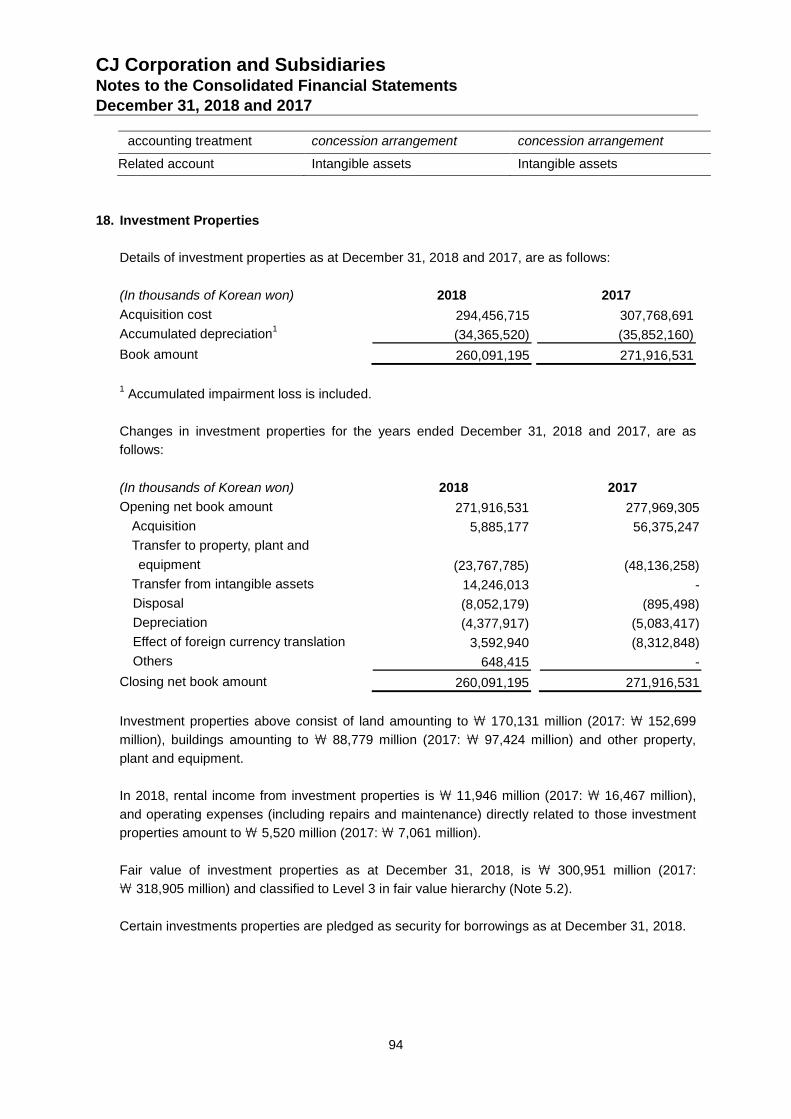
CJ Corporation and Subsidiaries Notes to the Consolidated Financial Statements December 31, 2018 and 2017
94
accounting treatment concession arrangement concession arrangement
Related account Intangible assets Intangible assets
18. Investment Properties
Details of investment properties as at December 31, 2018 and 2017, are as follows:
(In thousands of Korean won) 2018
2017
Acquisition cost 294,456,715 307,768,691
Accumulated depreciation1
(34,365,520) (35,852,160)
Book amount 260,091,195 271,916,531
1 Accumulated impairment loss is included.
Changes in investment properties for the years ended December 31, 2018 and 2017, are as
follows:
(In thousands of Korean won) 2018
2017
Opening net book amount 271,916,531 277,969,305
Acquisition 5,885,177 56,375,247
Transfer to property, plant and
equipment (23,767,785) (48,136,258)
Transfer from intangible assets 14,246,013 -
Disposal (8,052,179) (895,498)
Depreciation (4,377,917) (5,083,417)
Effect of foreign currency translation 3,592,940 (8,312,848)
Others 648,415 -
Closing net book amount 260,091,195 271,916,531
Investment properties above consist of land amounting to \ 170,131 million (2017: \ 152,699
million), buildings amounting to \ 88,779 million (2017: \ 97,424 million) and other property,
plant and equipment.
In 2018, rental income from investment properties is \ 11,946 million (2017: \ 16,467 million),
and operating expenses (including repairs and maintenance) directly related to those investment
properties amount to \ 5,520 million (2017: \ 7,061 million).
Fair value of investment properties as at December 31, 2018, is \ 300,951 million (2017:
\ 318,905 million) and classified to Level 3 in fair value hierarchy (Note 5.2).
Certain investments properties are pledged as security for borrowings as at December 31, 2018.
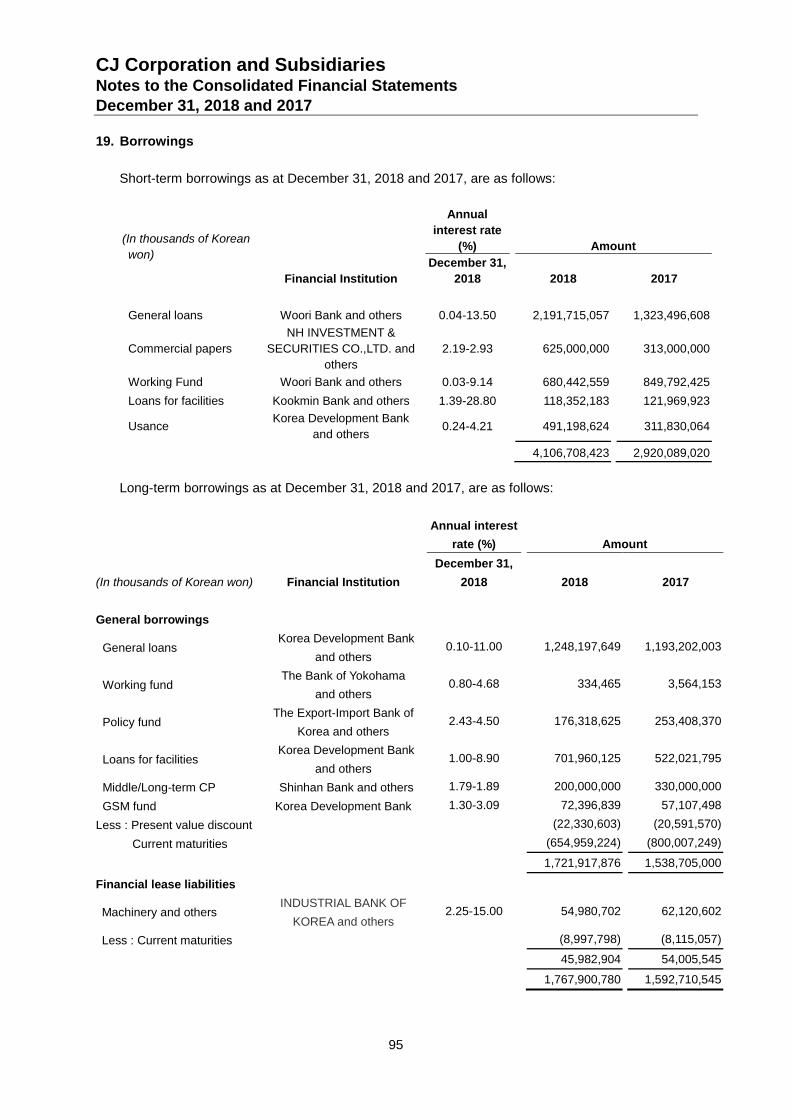
CJ Corporation and Subsidiaries Notes to the Consolidated Financial Statements December 31, 2018 and 2017
95
19. Borrowings
Short-term borrowings as at December 31, 2018 and 2017, are as follows:
(In thousands of Korean
won)
Financial Institution
Annual
interest rate
(%)
Amount
December 31,
2018
2018
2017
General loans
Woori Bank and others 0.04-13.50 2,191,715,057 1,323,496,608
Commercial papers
NH INVESTMENT &
SECURITIES CO.,LTD. and
others
2.19-2.93 625,000,000 313,000,000
Working Fund
Woori Bank and others 0.03-9.14 680,442,559 849,792,425
Loans for facilities
Kookmin Bank and others 1.39-28.80 118,352,183 121,969,923
Usance
Korea Development Bank
and others
0.24-4.21 491,198,624 311,830,064
4,106,708,423 2,920,089,020
Long-term borrowings as at December 31, 2018 and 2017, are as follows:
(In thousands of Korean won)
Financial Institution
Annual interest
rate (%)
Amount
December 31,
2018
2018
2017
General borrowings
General loans
Korea Development Bank
and others
0.10-11.00
1,248,197,649 1,193,202,003
Working fund
The Bank of Yokohama
and others 0.80-4.68
334,465 3,564,153
Policy fund
The Export-Import Bank of
Korea and others
2.43-4.50
176,318,625 253,408,370
Loans for facilities
Korea Development Bank
and others 1.00-8.90
701,960,125 522,021,795
Middle/Long-term CP Shinhan Bank and others 1.79-1.89 200,000,000 330,000,000
GSM fund Korea Development Bank 1.30-3.09 72,396,839 57,107,498
Less : Present value discount (22,330,603) (20,591,570)
Current maturities (654,959,224) (800,007,249)
1,721,917,876 1,538,705,000
Financial lease liabilities
Machinery and others
INDUSTRIAL BANK OF
KOREA and others 2.25-15.00
54,980,702 62,120,602
Less : Current maturities (8,997,798) (8,115,057)
45,982,904 54,005,545
1,767,900,780 1,592,710,545
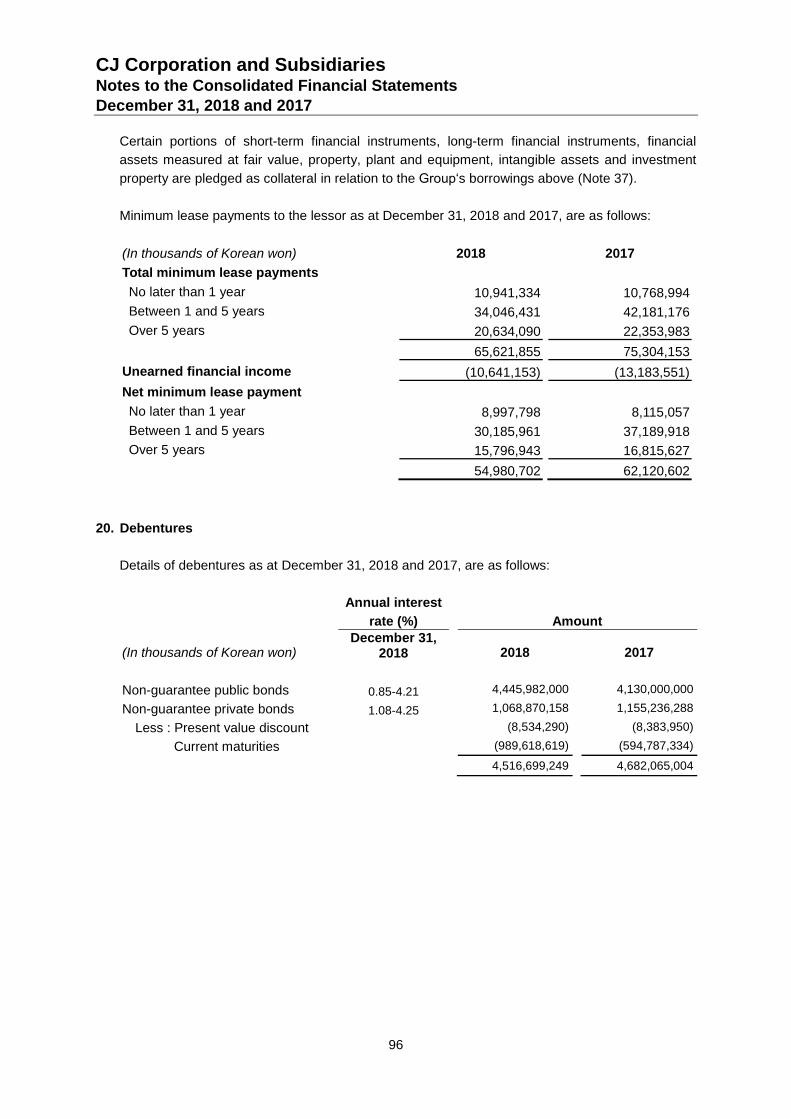
CJ Corporation and Subsidiaries Notes to the Consolidated Financial Statements December 31, 2018 and 2017
96
Certain portions of short-term financial instruments, long-term financial instruments, financial
assets measured at fair value, property, plant and equipment, intangible assets and investment
property are pledged as collateral in relation to the Group‘s borrowings above (Note 37).
Minimum lease payments to the lessor as at December 31, 2018 and 2017, are as follows:
(In thousands of Korean won) 2018
2017
Total minimum lease payments
No later than 1 year 10,941,334 10,768,994
Between 1 and 5 years 34,046,431 42,181,176
Over 5 years 20,634,090 22,353,983
65,621,855 75,304,153
Unearned financial income (10,641,153) (13,183,551)
Net minimum lease payment
No later than 1 year 8,997,798 8,115,057
Between 1 and 5 years 30,185,961 37,189,918
Over 5 years 15,796,943 16,815,627
54,980,702 62,120,602
20. Debentures
Details of debentures as at December 31, 2018 and 2017, are as follows:
Annual interest
rate (%) Amount
(In thousands of Korean won) December 31,
2018 2018 2017
Non-guarantee public bonds 0.85-4.21 4,445,982,000 4,130,000,000
Non-guarantee private bonds 1.08-4.25 1,068,870,158 1,155,236,288
Less : Present value discount (8,534,290) (8,383,950)
Current maturities (989,618,619) (594,787,334)
4,516,699,249 4,682,065,004
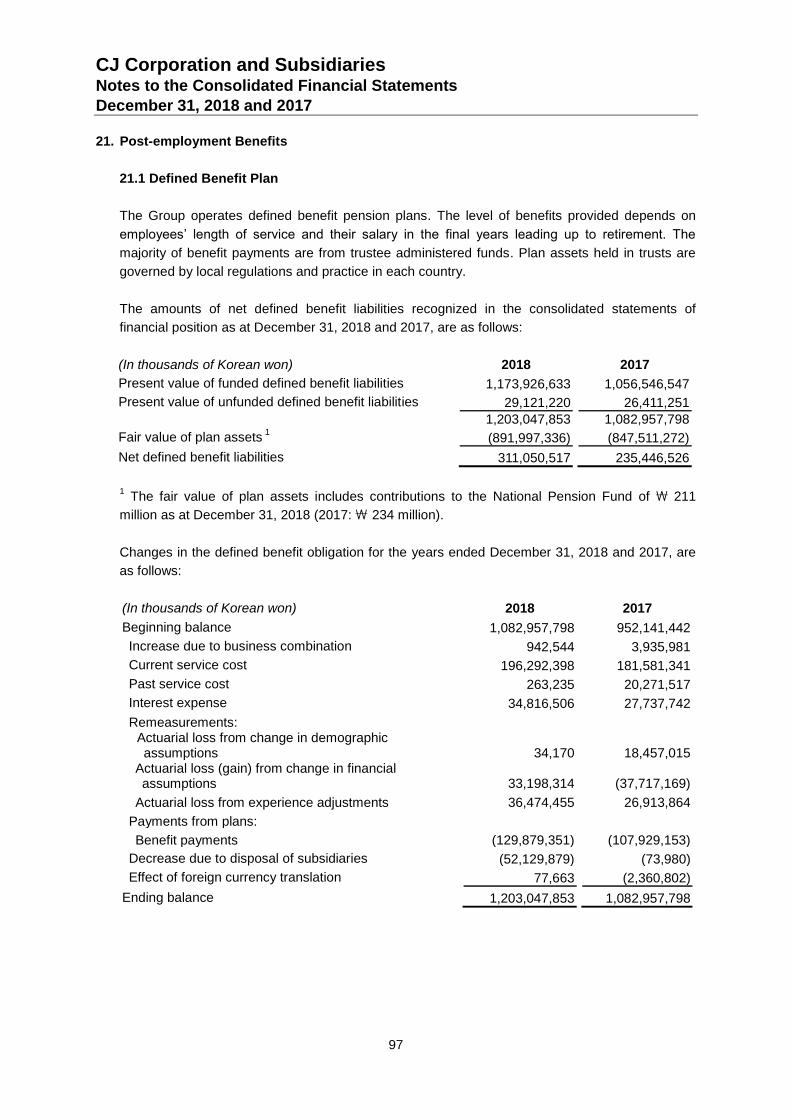
CJ Corporation and Subsidiaries Notes to the Consolidated Financial Statements December 31, 2018 and 2017
97
21. Post-employment Benefits
21.1 Defined Benefit Plan
The Group operates defined benefit pension plans. The level of benefits provided depends on
employees’ length of service and their salary in the final years leading up to retirement. The
majority of benefit payments are from trustee administered funds. Plan assets held in trusts are
governed by local regulations and practice in each country.
The amounts of net defined benefit liabilities recognized in the consolidated statements of
financial position as at December 31, 2018 and 2017, are as follows:
(In thousands of Korean won) 2018
2017
Present value of funded defined benefit liabilities 1,173,926,633 1,056,546,547
Present value of unfunded defined benefit liabilities 29,121,220 26,411,251
1,203,047,853 1,082,957,798
Fair value of plan assets 1
(891,997,336) (847,511,272)
Net defined benefit liabilities 311,050,517 235,446,526
1 The fair value of plan assets includes contributions to the National Pension Fund of \ 211
million as at December 31, 2018 (2017: \ 234 million).
Changes in the defined benefit obligation for the years ended December 31, 2018 and 2017, are
as follows:
(In thousands of Korean won) 2018
2017
Beginning balance 1,082,957,798 952,141,442
Increase due to business combination 942,544 3,935,981
Current service cost 196,292,398 181,581,341
Past service cost 263,235 20,271,517
Interest expense 34,816,506 27,737,742
Remeasurements: Actuarial loss from change in demographic assumptions 34,170 18,457,015
Actuarial loss (gain) from change in financial assumptions 33,198,314 (37,717,169)
Actuarial loss from experience adjustments 36,474,455 26,913,864
Payments from plans:
Benefit payments (129,879,351) (107,929,153)
Decrease due to disposal of subsidiaries (52,129,879) (73,980)
Effect of foreign currency translation 77,663 (2,360,802)
Ending balance 1,203,047,853 1,082,957,798
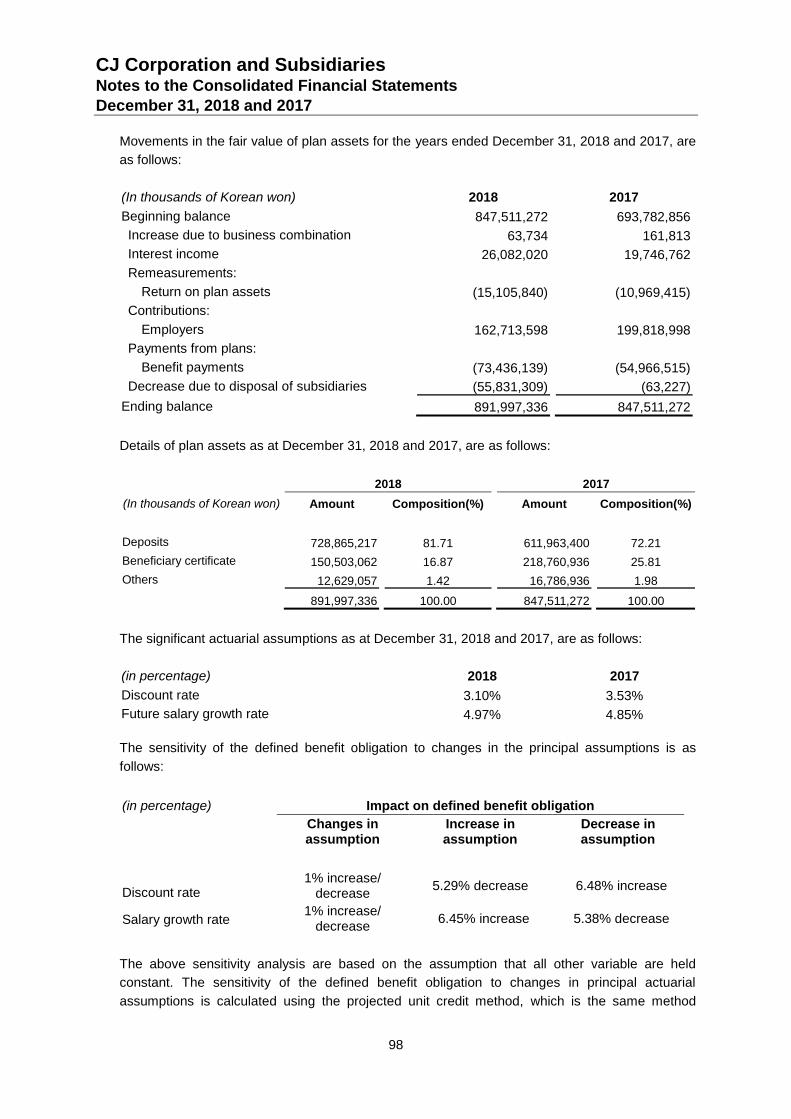
CJ Corporation and Subsidiaries Notes to the Consolidated Financial Statements December 31, 2018 and 2017
98
Movements in the fair value of plan assets for the years ended December 31, 2018 and 2017, are
as follows:
(In thousands of Korean won) 2018
2017
Beginning balance 847,511,272 693,782,856
Increase due to business combination 63,734 161,813
Interest income 26,082,020 19,746,762
Remeasurements:
Return on plan assets (15,105,840) (10,969,415)
Contributions:
Employers 162,713,598 199,818,998
Payments from plans:
Benefit payments (73,436,139) (54,966,515)
Decrease due to disposal of subsidiaries (55,831,309) (63,227)
Ending balance 891,997,336 847,511,272
Details of plan assets as at December 31, 2018 and 2017, are as follows:
2018 2017
(In thousands of Korean won) Amount Composition(%) Amount Composition(%)
Deposits 728,865,217 81.71 611,963,400 72.21
Beneficiary certificate 150,503,062 16.87 218,760,936 25.81
Others 12,629,057 1.42 16,786,936 1.98
891,997,336 100.00 847,511,272 100.00
The significant actuarial assumptions as at December 31, 2018 and 2017, are as follows:
(in percentage) 2018
2017
Discount rate 3.10% 3.53%
Future salary growth rate 4.97% 4.85%
The sensitivity of the defined benefit obligation to changes in the principal assumptions is as
follows:
(in percentage) Impact on defined benefit obligation
Changes in assumption
Increase in assumption
Decrease in assumption
Discount rate 1% increase/
decrease
5.29% decrease 6.48% increase
Salary growth rate
1% increase/ decrease
6.45% increase 5.38% decrease
The above sensitivity analysis are based on the assumption that all other variable are held
constant. The sensitivity of the defined benefit obligation to changes in principal actuarial
assumptions is calculated using the projected unit credit method, which is the same method
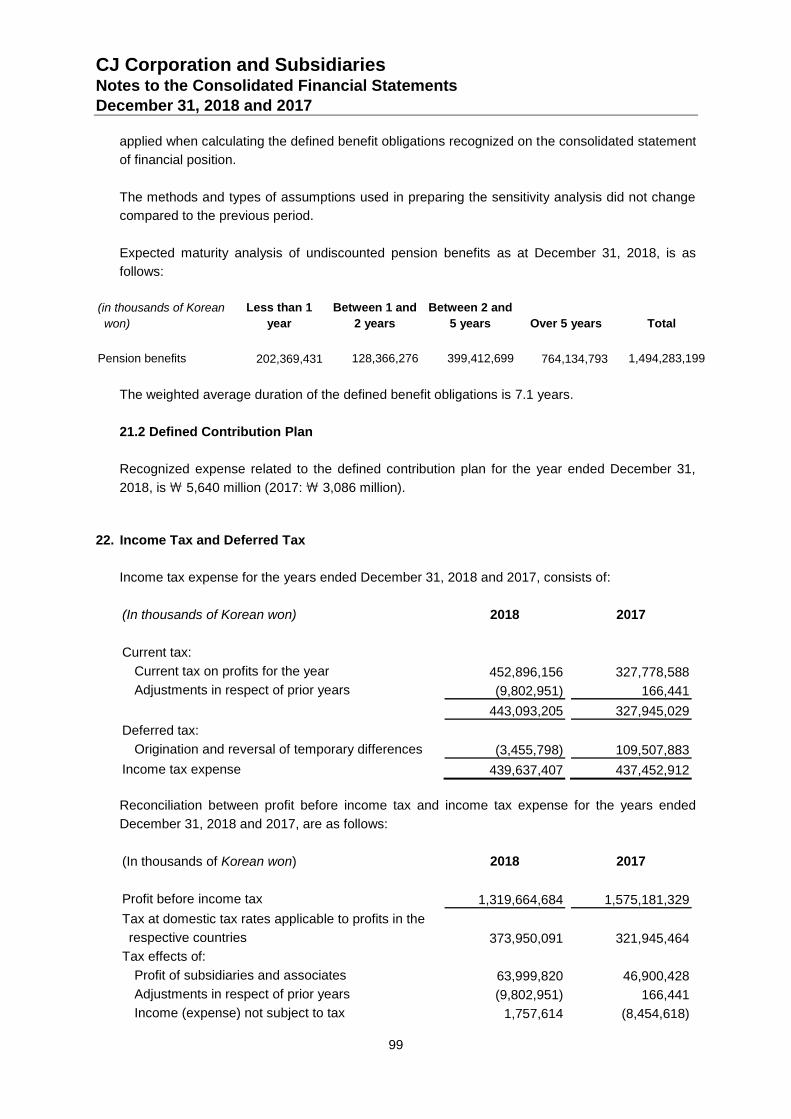
CJ Corporation and Subsidiaries Notes to the Consolidated Financial Statements December 31, 2018 and 2017
99
applied when calculating the defined benefit obligations recognized on the consolidated statement
of financial position.
The methods and types of assumptions used in preparing the sensitivity analysis did not change
compared to the previous period.
Expected maturity analysis of undiscounted pension benefits as at December 31, 2018, is as
follows:
(in thousands of Korean
won)
Less than 1
year
Between 1 and
2 years
Between 2 and
5 years Over 5 years Total
Pension benefits 202,369,431 128,366,276 399,412,699 764,134,793 1,494,283,199
The weighted average duration of the defined benefit obligations is 7.1 years.
21.2 Defined Contribution Plan
Recognized expense related to the defined contribution plan for the year ended December 31,
2018, is \ 5,640 million (2017: \ 3,086 million).
22. Income Tax and Deferred Tax
Income tax expense for the years ended December 31, 2018 and 2017, consists of:
(In thousands of Korean won) 2018
2017
Current tax:
Current tax on profits for the year 452,896,156 327,778,588
Adjustments in respect of prior years (9,802,951) 166,441
443,093,205 327,945,029
Deferred tax:
Origination and reversal of temporary differences (3,455,798) 109,507,883
Income tax expense 439,637,407 437,452,912
Reconciliation between profit before income tax and income tax expense for the years ended
December 31, 2018 and 2017, are as follows:
(In thousands of Korean won) 2018
2017
Profit before income tax 1,319,664,684 1,575,181,329
Tax at domestic tax rates applicable to profits in the
respective countries 373,950,091 321,945,464
Tax effects of:
Profit of subsidiaries and associates 63,999,820 46,900,428
Adjustments in respect of prior years (9,802,951) 166,441
Income (expense) not subject to tax 1,757,614 (8,454,618)
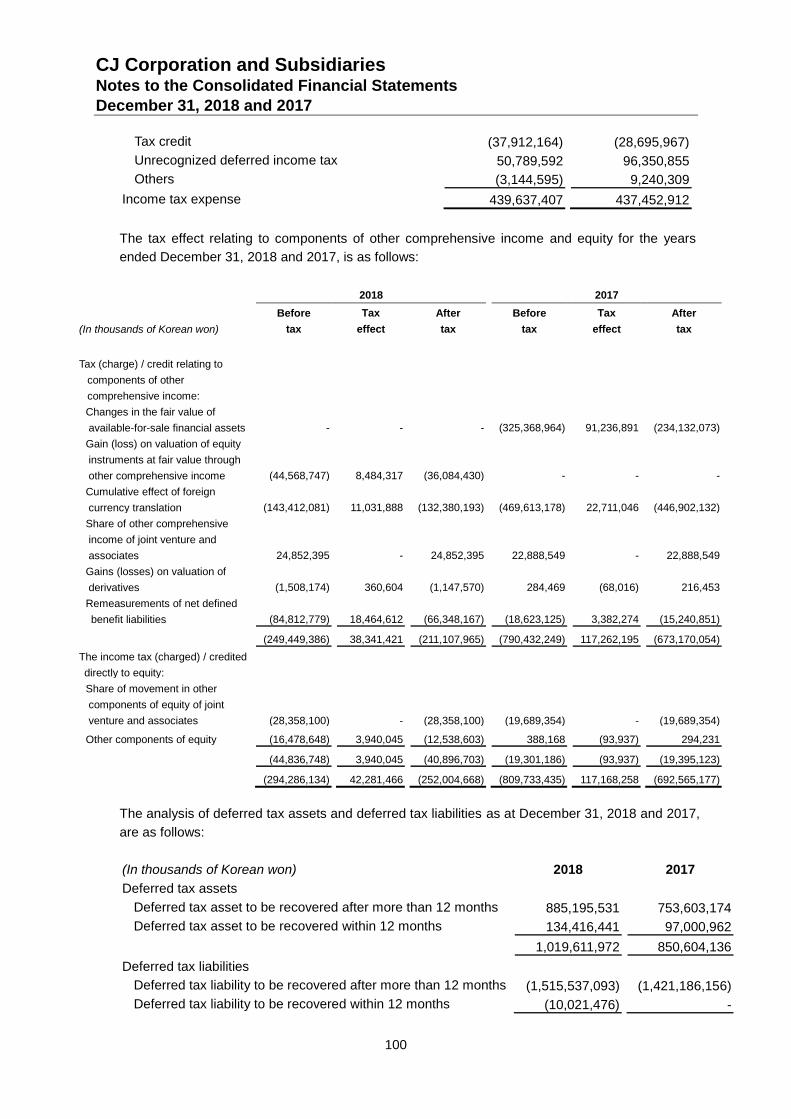
CJ Corporation and Subsidiaries Notes to the Consolidated Financial Statements December 31, 2018 and 2017
100
Tax credit (37,912,164) (28,695,967)
Unrecognized deferred income tax 50,789,592 96,350,855
Others (3,144,595) 9,240,309
Income tax expense 439,637,407 437,452,912
The tax effect relating to components of other comprehensive income and equity for the years
ended December 31, 2018 and 2017, is as follows:
2018 2017
(In thousands of Korean won)
Before
tax
Tax
effect
After
tax
Before
tax
Tax
effect
After
tax
Tax (charge) / credit relating to
components of other
comprehensive income:
Changes in the fair value of
available-for-sale financial assets
- - - (325,368,964) 91,236,891 (234,132,073)
Gain (loss) on valuation of equity
instruments at fair value through
other comprehensive income
(44,568,747) 8,484,317 (36,084,430) - - -
Cumulative effect of foreign
currency translation (143,412,081) 11,031,888 (132,380,193) (469,613,178) 22,711,046 (446,902,132)
Share of other comprehensive
income of joint venture and
associates
24,852,395 - 24,852,395 22,888,549 - 22,888,549
Gains (losses) on valuation of
derivatives (1,508,174) 360,604 (1,147,570) 284,469 (68,016) 216,453
Remeasurements of net defined
benefit liabilities (84,812,779) 18,464,612 (66,348,167) (18,623,125) 3,382,274 (15,240,851)
(249,449,386) 38,341,421 (211,107,965) (790,432,249) 117,262,195 (673,170,054)
The income tax (charged) / credited
directly to equity:
Share of movement in other
components of equity of joint
venture and associates
(28,358,100) - (28,358,100) (19,689,354) - (19,689,354)
Other components of equity
(16,478,648) 3,940,045 (12,538,603) 388,168 (93,937) 294,231
(44,836,748) 3,940,045 (40,896,703) (19,301,186) (93,937) (19,395,123)
(294,286,134) 42,281,466 (252,004,668) (809,733,435) 117,168,258 (692,565,177)
The analysis of deferred tax assets and deferred tax liabilities as at December 31, 2018 and 2017,
are as follows:
(In thousands of Korean won) 2018 2017
Deferred tax assets
Deferred tax asset to be recovered after more than 12 months 885,195,531 753,603,174
Deferred tax asset to be recovered within 12 months 134,416,441 97,000,962
1,019,611,972 850,604,136
Deferred tax liabilities
Deferred tax liability to be recovered after more than 12 months (1,515,537,093) (1,421,186,156)
Deferred tax liability to be recovered within 12 months (10,021,476) -
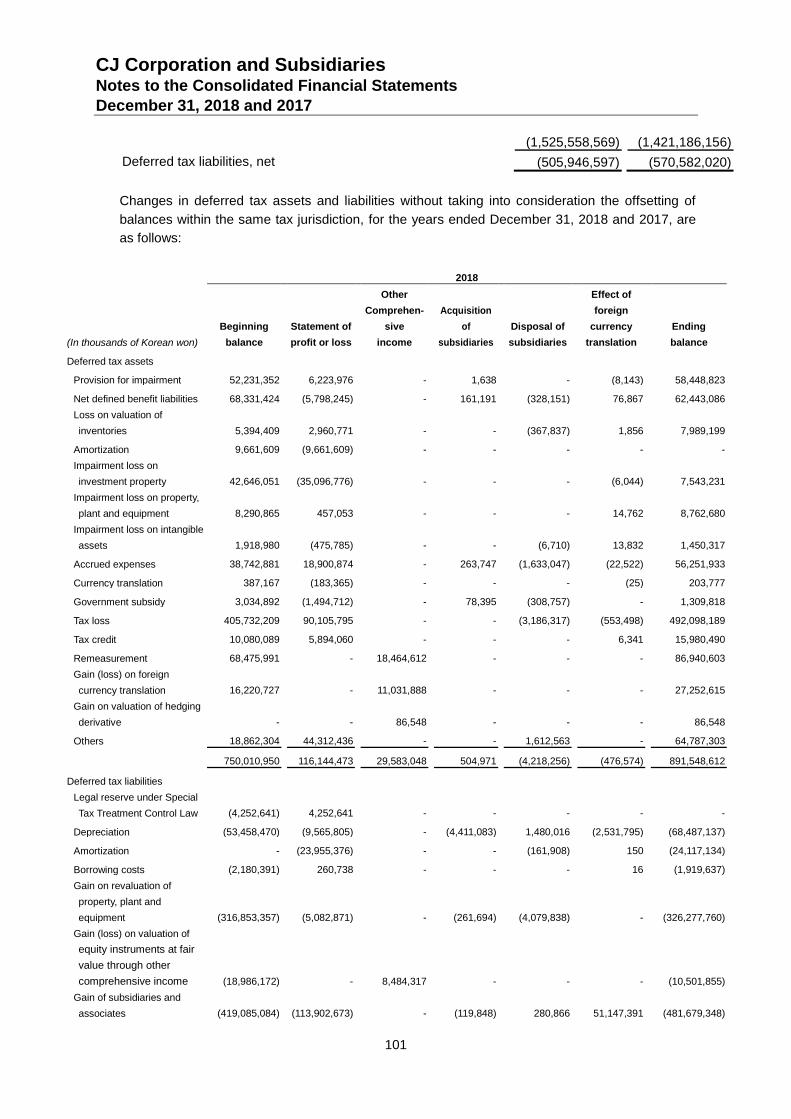
CJ Corporation and Subsidiaries Notes to the Consolidated Financial Statements December 31, 2018 and 2017
101
(1,525,558,569) (1,421,186,156)
Deferred tax liabilities, net (505,946,597) (570,582,020)
Changes in deferred tax assets and liabilities without taking into consideration the offsetting of
balances within the same tax jurisdiction, for the years ended December 31, 2018 and 2017, are
as follows:
2018
(In thousands of Korean won)
Beginning
balance
Statement of
profit or loss
Other
Comprehen-
sive
income
Acquisition
of
subsidiaries
Disposal of
subsidiaries
Effect of
foreign
currency
translation
Ending
balance
Deferred tax assets
Provision for impairment 52,231,352 6,223,976 - 1,638 - (8,143) 58,448,823
Net defined benefit liabilities 68,331,424 (5,798,245) - 161,191 (328,151) 76,867 62,443,086
Loss on valuation of
inventories 5,394,409 2,960,771 - - (367,837) 1,856 7,989,199
Amortization 9,661,609 (9,661,609) - - - - -
Impairment loss on
investment property 42,646,051 (35,096,776) - - - (6,044) 7,543,231
Impairment loss on property,
plant and equipment 8,290,865 457,053 - - - 14,762 8,762,680
Impairment loss on intangible
assets 1,918,980 (475,785) - - (6,710) 13,832 1,450,317
Accrued expenses 38,742,881 18,900,874 - 263,747 (1,633,047) (22,522) 56,251,933
Currency translation 387,167 (183,365) - - - (25) 203,777
Government subsidy 3,034,892 (1,494,712) - 78,395 (308,757) - 1,309,818
Tax loss 405,732,209 90,105,795 - - (3,186,317) (553,498) 492,098,189
Tax credit 10,080,089 5,894,060 - - - 6,341 15,980,490
Remeasurement 68,475,991 - 18,464,612 - - - 86,940,603
Gain (loss) on foreign
currency translation 16,220,727 - 11,031,888 - - - 27,252,615
Gain on valuation of hedging
derivative - - 86,548 - - - 86,548
Others 18,862,304 44,312,436 - - 1,612,563 - 64,787,303
750,010,950 116,144,473 29,583,048 504,971 (4,218,256) (476,574) 891,548,612
Deferred tax liabilities
Legal reserve under Special
Tax Treatment Control Law (4,252,641) 4,252,641 - - - - -
Depreciation (53,458,470) (9,565,805) - (4,411,083) 1,480,016 (2,531,795) (68,487,137)
Amortization - (23,955,376) - - (161,908) 150 (24,117,134)
Borrowing costs (2,180,391) 260,738 - - - 16 (1,919,637)
Gain on revaluation of
property, plant and
equipment (316,853,357) (5,082,871) - (261,694) (4,079,838) - (326,277,760)
Gain (loss) on valuation of
equity instruments at fair
value through other
comprehensive income (18,986,172) - 8,484,317 - - - (10,501,855)
Gain of subsidiaries and
associates (419,085,084) (113,902,673) - (119,848) 280,866 51,147,391 (481,679,348)
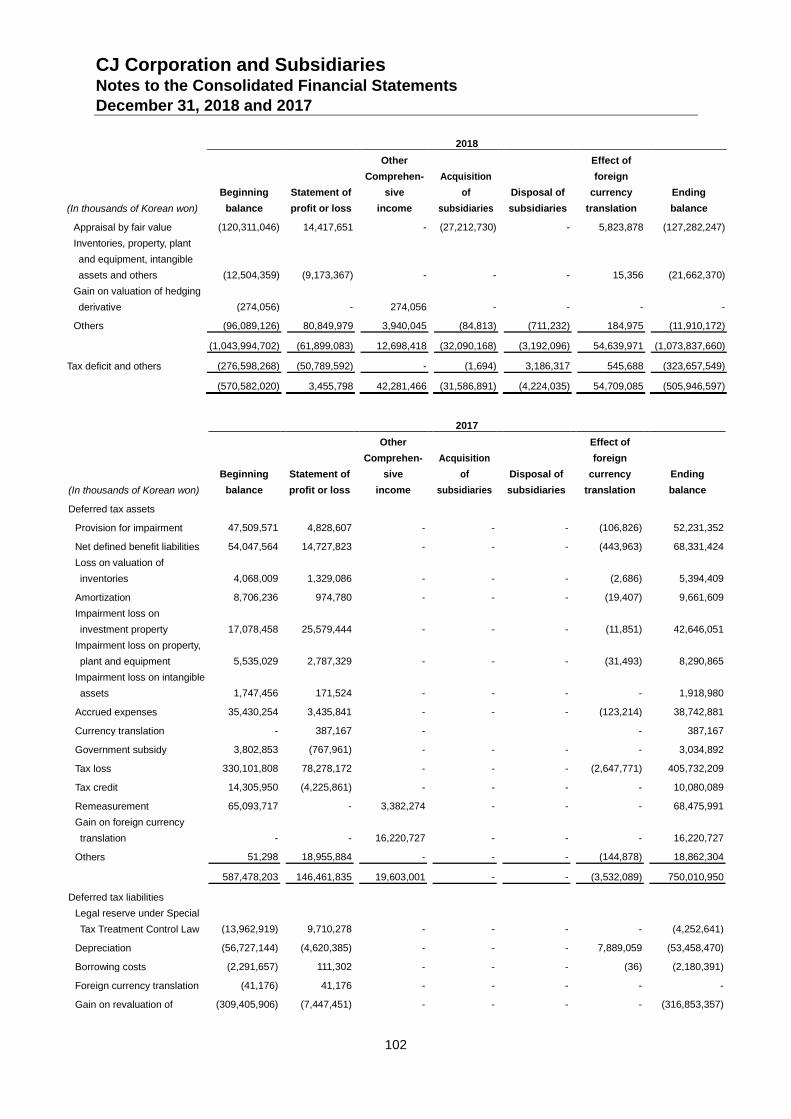
CJ Corporation and Subsidiaries Notes to the Consolidated Financial Statements December 31, 2018 and 2017
102
2018
(In thousands of Korean won)
Beginning
balance
Statement of
profit or loss
Other
Comprehen-
sive
income
Acquisition
of
subsidiaries
Disposal of
subsidiaries
Effect of
foreign
currency
translation
Ending
balance
Appraisal by fair value (120,311,046) 14,417,651 - (27,212,730) - 5,823,878 (127,282,247)
Inventories, property, plant
and equipment, intangible
assets and others (12,504,359) (9,173,367) - - - 15,356 (21,662,370)
Gain on valuation of hedging
derivative (274,056) - 274,056 - - - -
Others (96,089,126) 80,849,979 3,940,045 (84,813) (711,232) 184,975 (11,910,172)
(1,043,994,702) (61,899,083) 12,698,418 (32,090,168) (3,192,096) 54,639,971 (1,073,837,660)
Tax deficit and others (276,598,268) (50,789,592) - (1,694) 3,186,317 545,688 (323,657,549)
(570,582,020) 3,455,798 42,281,466 (31,586,891) (4,224,035) 54,709,085 (505,946,597)
2017
(In thousands of Korean won)
Beginning
balance
Statement of
profit or loss
Other
Comprehen-
sive
income
Acquisition
of
subsidiaries
Disposal of
subsidiaries
Effect of
foreign
currency
translation
Ending
balance
Deferred tax assets
Provision for impairment 47,509,571 4,828,607 - - - (106,826) 52,231,352
Net defined benefit liabilities 54,047,564 14,727,823 - - - (443,963) 68,331,424
Loss on valuation of
inventories 4,068,009 1,329,086 - - - (2,686) 5,394,409
Amortization 8,706,236 974,780 - - - (19,407) 9,661,609
Impairment loss on
investment property 17,078,458 25,579,444 - - - (11,851) 42,646,051
Impairment loss on property,
plant and equipment 5,535,029 2,787,329 - - - (31,493) 8,290,865
Impairment loss on intangible
assets 1,747,456 171,524 - - - - 1,918,980
Accrued expenses 35,430,254 3,435,841 - - - (123,214) 38,742,881
Currency translation - 387,167 - - 387,167
Government subsidy 3,802,853 (767,961) - - - - 3,034,892
Tax loss 330,101,808 78,278,172 - - - (2,647,771) 405,732,209
Tax credit 14,305,950 (4,225,861) - - - - 10,080,089
Remeasurement 65,093,717 - 3,382,274 - - - 68,475,991
Gain on foreign currency
translation - - 16,220,727 - - - 16,220,727
Others 51,298 18,955,884 - - - (144,878) 18,862,304
587,478,203 146,461,835 19,603,001 - - (3,532,089) 750,010,950
Deferred tax liabilities
Legal reserve under Special
Tax Treatment Control Law (13,962,919) 9,710,278 - - - - (4,252,641)
Depreciation (56,727,144) (4,620,385) - - - 7,889,059 (53,458,470)
Borrowing costs (2,291,657) 111,302 - - - (36) (2,180,391)
Foreign currency translation (41,176) 41,176 - - - - -
Gain on revaluation of (309,405,906) (7,447,451) - - - - (316,853,357)
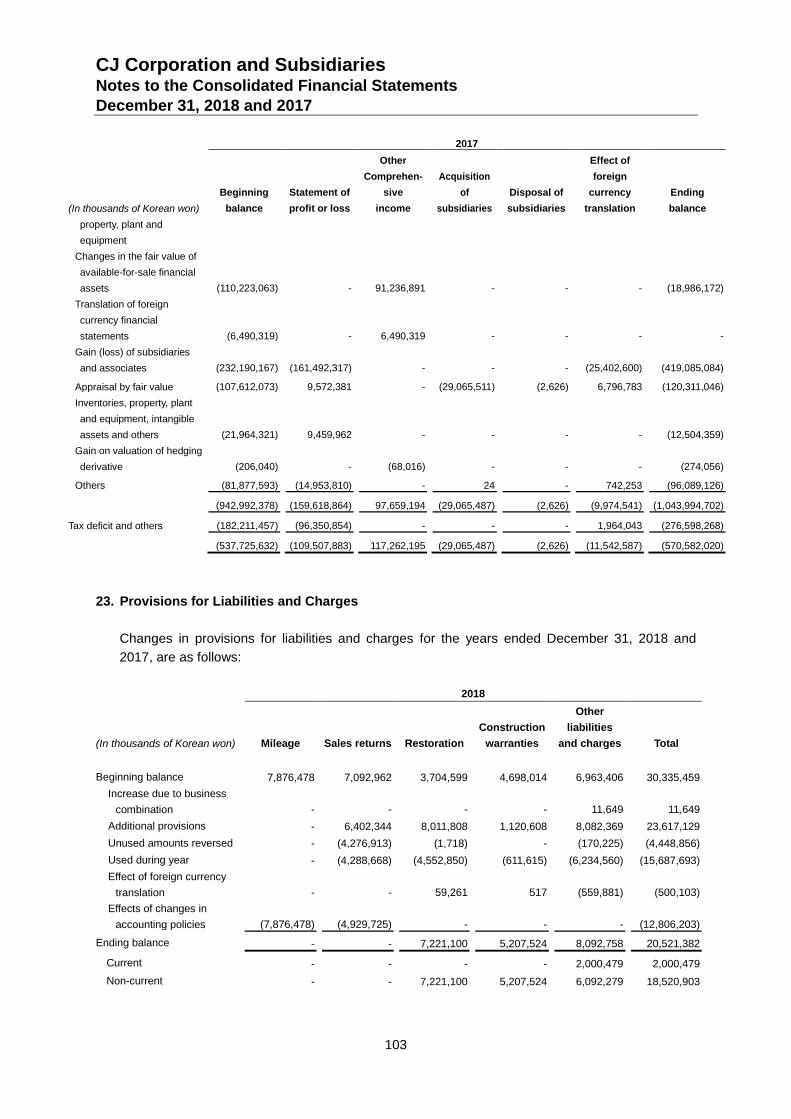
CJ Corporation and Subsidiaries Notes to the Consolidated Financial Statements December 31, 2018 and 2017
103
2017
(In thousands of Korean won)
Beginning
balance
Statement of
profit or loss
Other
Comprehen-
sive
income
Acquisition
of
subsidiaries
Disposal of
subsidiaries
Effect of
foreign
currency
translation
Ending
balance
property, plant and
equipment
Changes in the fair value of
available-for-sale financial
assets (110,223,063) - 91,236,891 - - - (18,986,172)
Translation of foreign
currency financial
statements (6,490,319) - 6,490,319 - - - -
Gain (loss) of subsidiaries
and associates (232,190,167) (161,492,317) - - - (25,402,600) (419,085,084)
Appraisal by fair value (107,612,073) 9,572,381 - (29,065,511) (2,626) 6,796,783 (120,311,046)
Inventories, property, plant
and equipment, intangible
assets and others (21,964,321) 9,459,962 - - - - (12,504,359)
Gain on valuation of hedging
derivative (206,040) - (68,016) - - - (274,056)
Others (81,877,593) (14,953,810) - 24 - 742,253 (96,089,126)
(942,992,378) (159,618,864) 97,659,194 (29,065,487) (2,626) (9,974,541) (1,043,994,702)
Tax deficit and others (182,211,457) (96,350,854) - - - 1,964,043 (276,598,268)
(537,725,632) (109,507,883) 117,262,195 (29,065,487) (2,626) (11,542,587) (570,582,020)
23. Provisions for Liabilities and Charges
Changes in provisions for liabilities and charges for the years ended December 31, 2018 and
2017, are as follows:
2018
(In thousands of Korean won) Mileage
Sales returns
Restoration
Construction
warranties
Other
liabilities
and charges
Total
Beginning balance 7,876,478 7,092,962 3,704,599 4,698,014 6,963,406 30,335,459
Increase due to business
combination - - - - 11,649 11,649
Additional provisions - 6,402,344 8,011,808 1,120,608 8,082,369 23,617,129
Unused amounts reversed - (4,276,913) (1,718) - (170,225) (4,448,856)
Used during year - (4,288,668) (4,552,850) (611,615) (6,234,560) (15,687,693)
Effect of foreign currency
translation - - 59,261 517 (559,881) (500,103)
Effects of changes in
accounting policies (7,876,478) (4,929,725) - - - (12,806,203)
Ending balance - - 7,221,100 5,207,524 8,092,758 20,521,382
Current - - - - 2,000,479 2,000,479
Non-current - - 7,221,100 5,207,524 6,092,279 18,520,903
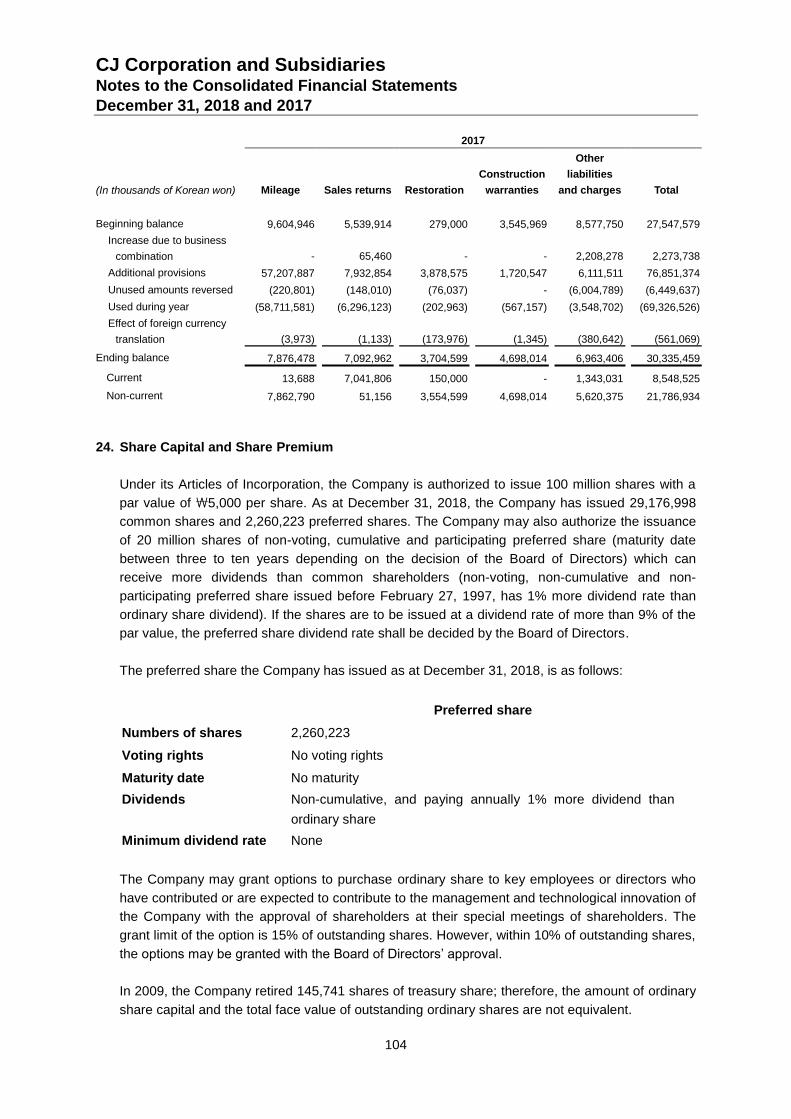
CJ Corporation and Subsidiaries Notes to the Consolidated Financial Statements December 31, 2018 and 2017
104
2017
(In thousands of Korean won) Mileage
Sales returns
Restoration
Construction
warranties
Other
liabilities
and charges
Total
Beginning balance 9,604,946 5,539,914 279,000 3,545,969 8,577,750 27,547,579
Increase due to business
combination - 65,460 - - 2,208,278 2,273,738
Additional provisions 57,207,887 7,932,854 3,878,575 1,720,547 6,111,511 76,851,374
Unused amounts reversed (220,801) (148,010) (76,037) - (6,004,789) (6,449,637)
Used during year (58,711,581) (6,296,123) (202,963) (567,157) (3,548,702) (69,326,526)
Effect of foreign currency
translation (3,973) (1,133) (173,976) (1,345) (380,642) (561,069)
Ending balance 7,876,478 7,092,962 3,704,599 4,698,014 6,963,406 30,335,459
Current 13,688 7,041,806 150,000 - 1,343,031 8,548,525
Non-current 7,862,790 51,156 3,554,599 4,698,014 5,620,375 21,786,934
24. Share Capital and Share Premium
Under its Articles of Incorporation, the Company is authorized to issue 100 million shares with a
par value of \5,000 per share. As at December 31, 2018, the Company has issued 29,176,998
common shares and 2,260,223 preferred shares. The Company may also authorize the issuance
of 20 million shares of non-voting, cumulative and participating preferred share (maturity date
between three to ten years depending on the decision of the Board of Directors) which can
receive more dividends than common shareholders (non-voting, non-cumulative and non-
participating preferred share issued before February 27, 1997, has 1% more dividend rate than
ordinary share dividend). If the shares are to be issued at a dividend rate of more than 9% of the
par value, the preferred share dividend rate shall be decided by the Board of Directors.
The preferred share the Company has issued as at December 31, 2018, is as follows:
Preferred share
Numbers of shares 2,260,223
Voting rights No voting rights
Maturity date No maturity
Dividends Non-cumulative, and paying annually 1% more dividend than
ordinary share
Minimum dividend rate None
The Company may grant options to purchase ordinary share to key employees or directors who
have contributed or are expected to contribute to the management and technological innovation of
the Company with the approval of shareholders at their special meetings of shareholders. The
grant limit of the option is 15% of outstanding shares. However, within 10% of outstanding shares,
the options may be granted with the Board of Directors’ approval.
In 2009, the Company retired 145,741 shares of treasury share; therefore, the amount of ordinary
share capital and the total face value of outstanding ordinary shares are not equivalent.
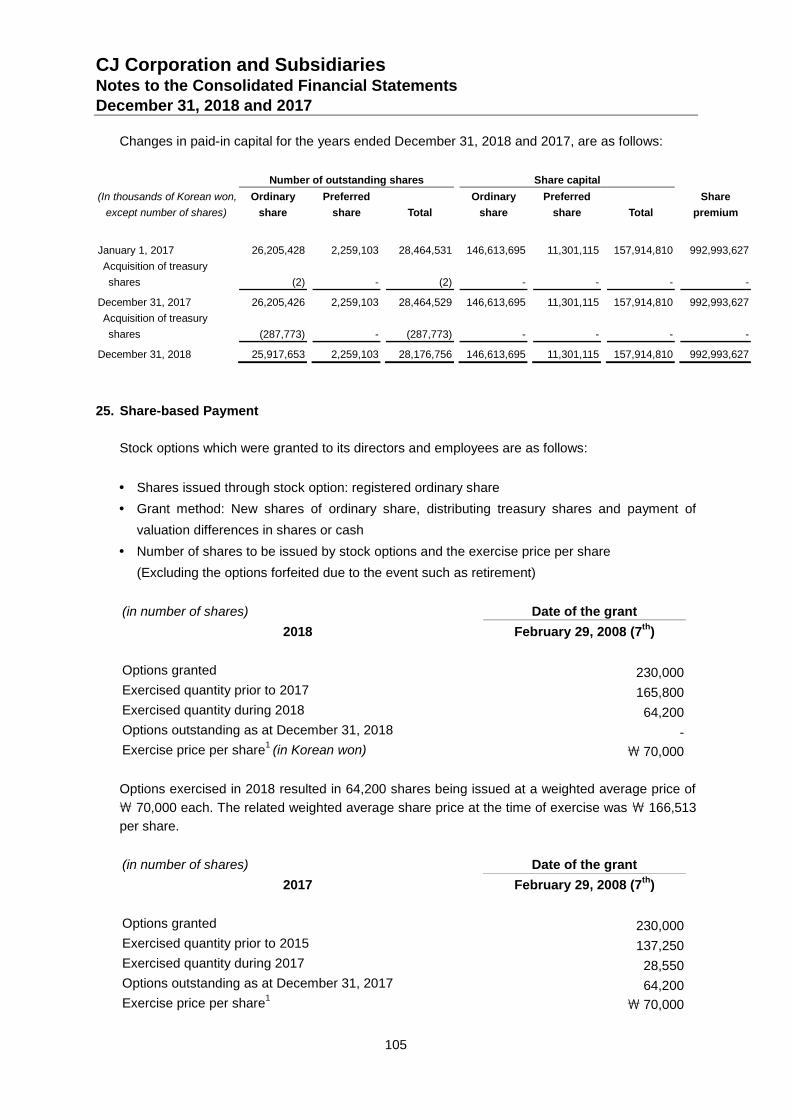
CJ Corporation and Subsidiaries Notes to the Consolidated Financial Statements December 31, 2018 and 2017
105
Changes in paid-in capital for the years ended December 31, 2018 and 2017, are as follows:
Number of outstanding shares Share capital
(In thousands of Korean won,
except number of shares)
Ordinary
share
Preferred
share Total
Ordinary
share
Preferred
share Total
Share
premium
January 1, 2017 26,205,428 2,259,103 28,464,531 146,613,695 11,301,115 157,914,810 992,993,627
Acquisition of treasury
shares (2) - (2) - - - -
December 31, 2017 26,205,426 2,259,103 28,464,529 146,613,695 11,301,115 157,914,810 992,993,627
Acquisition of treasury
shares (287,773) - (287,773) - - - -
December 31, 2018 25,917,653 2,259,103 28,176,756 146,613,695 11,301,115 157,914,810 992,993,627
25. Share-based Payment
Stock options which were granted to its directors and employees are as follows:
Shares issued through stock option: registered ordinary share
Grant method: New shares of ordinary share, distributing treasury shares and payment of
valuation differences in shares or cash
Number of shares to be issued by stock options and the exercise price per share
(Excluding the options forfeited due to the event such as retirement)
(in number of shares) Date of the grant
2018 February 29, 2008 (7th
)
Options granted 230,000
Exercised quantity prior to 2017 165,800
Exercised quantity during 2018 64,200
Options outstanding as at December 31, 2018 -
Exercise price per share1 (in Korean won) \ 70,000
Options exercised in 2018 resulted in 64,200 shares being issued at a weighted average price of
\ 70,000 each. The related weighted average share price at the time of exercise was \ 166,513
per share.
(in number of shares) Date of the grant
2017 February 29, 2008 (7th
)
Options granted 230,000
Exercised quantity prior to 2015 137,250
Exercised quantity during 2017 28,550
Options outstanding as at December 31, 2017 64,200
Exercise price per share1
\ 70,000
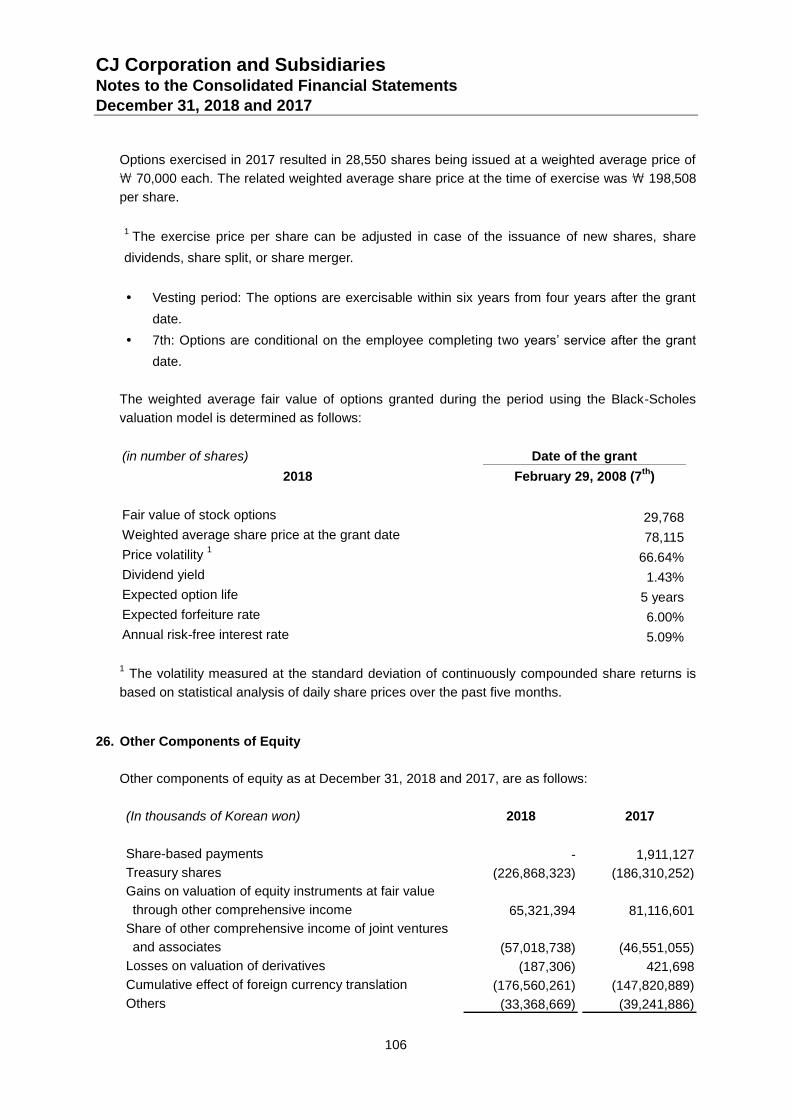
CJ Corporation and Subsidiaries Notes to the Consolidated Financial Statements December 31, 2018 and 2017
106
Options exercised in 2017 resulted in 28,550 shares being issued at a weighted average price of
\ 70,000 each. The related weighted average share price at the time of exercise was \ 198,508
per share.
1
The exercise price per share can be adjusted in case of the issuance of new shares, share
dividends, share split, or share merger.
Vesting period: The options are exercisable within six years from four years after the grant
date.
7th: Options are conditional on the employee completing two years’ service after the grant
date.
The weighted average fair value of options granted during the period using the Black-Scholes
valuation model is determined as follows:
(in number of shares) Date of the grant
2018 February 29, 2008 (7th
)
Fair value of stock options 29,768
Weighted average share price at the grant date 78,115
Price volatility 1 66.64%
Dividend yield 1.43%
Expected option life 5 years
Expected forfeiture rate 6.00%
Annual risk-free interest rate 5.09%
1 The volatility measured at the standard deviation of continuously compounded share returns is
based on statistical analysis of daily share prices over the past five months.
26. Other Components of Equity
Other components of equity as at December 31, 2018 and 2017, are as follows:
(In thousands of Korean won) 2018
2017
Share-based payments - 1,911,127
Treasury shares (226,868,323) (186,310,252)
Gains on valuation of equity instruments at fair value
through other comprehensive income 65,321,394 81,116,601
Share of other comprehensive income of joint ventures
and associates (57,018,738) (46,551,055)
Losses on valuation of derivatives (187,306) 421,698
Cumulative effect of foreign currency translation (176,560,261) (147,820,889)
Others (33,368,669) (39,241,886)
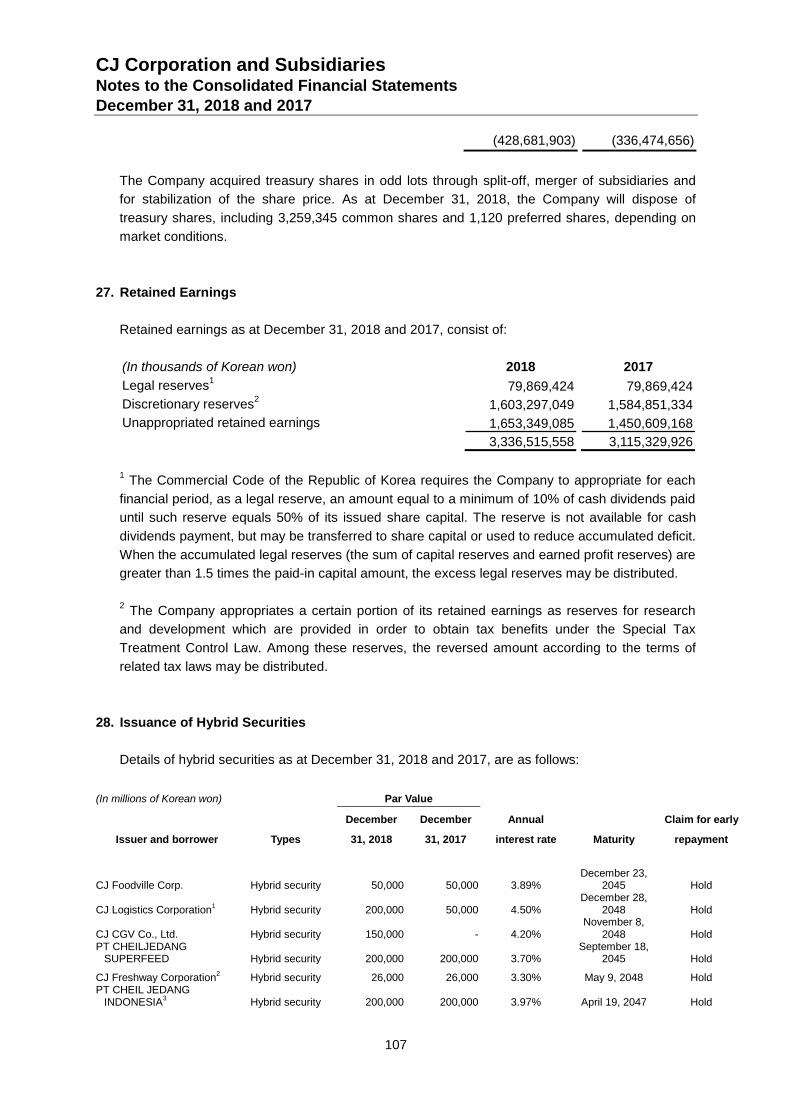
CJ Corporation and Subsidiaries Notes to the Consolidated Financial Statements December 31, 2018 and 2017
107
(428,681,903) (336,474,656)
The Company acquired treasury shares in odd lots through split-off, merger of subsidiaries and
for stabilization of the share price. As at December 31, 2018, the Company will dispose of
treasury shares, including 3,259,345 common shares and 1,120 preferred shares, depending on
market conditions.
27. Retained Earnings
Retained earnings as at December 31, 2018 and 2017, consist of:
(In thousands of Korean won) 2018
2017
Legal reserves1
79,869,424 79,869,424
Discretionary reserves2
1,603,297,049 1,584,851,334
Unappropriated retained earnings 1,653,349,085 1,450,609,168
3,336,515,558 3,115,329,926
1 The Commercial Code of the Republic of Korea requires the Company to appropriate for each
financial period, as a legal reserve, an amount equal to a minimum of 10% of cash dividends paid
until such reserve equals 50% of its issued share capital. The reserve is not available for cash
dividends payment, but may be transferred to share capital or used to reduce accumulated deficit.
When the accumulated legal reserves (the sum of capital reserves and earned profit reserves) are
greater than 1.5 times the paid-in capital amount, the excess legal reserves may be distributed.
2 The Company appropriates a certain portion of its retained earnings as reserves for research
and development which are provided in order to obtain tax benefits under the Special Tax
Treatment Control Law. Among these reserves, the reversed amount according to the terms of
related tax laws may be distributed.
28. Issuance of Hybrid Securities
Details of hybrid securities as at December 31, 2018 and 2017, are as follows:
(In millions of Korean won) Par Value
Issuer and borrower Types
December
31, 2018
December
31, 2017
Annual
interest rate Maturity
Claim for early
repayment
CJ Foodville Corp. Hybrid security
50,000 50,000 3.89% December 23,
2045 Hold
CJ Logistics Corporation1
Hybrid security
200,000 50,000 4.50% December 28,
2048 Hold
CJ CGV Co., Ltd. Hybrid security
150,000 - 4.20% November 8,
2048 Hold PT CHEILJEDANG
SUPERFEED Hybrid security
200,000 200,000 3.70% September 18,
2045 Hold
CJ Freshway Corporation2
Hybrid security 26,000 26,000 3.30% May 9, 2048 Hold PT CHEIL JEDANG
INDONESIA3
Hybrid security
200,000 200,000 3.97% April 19, 2047 Hold
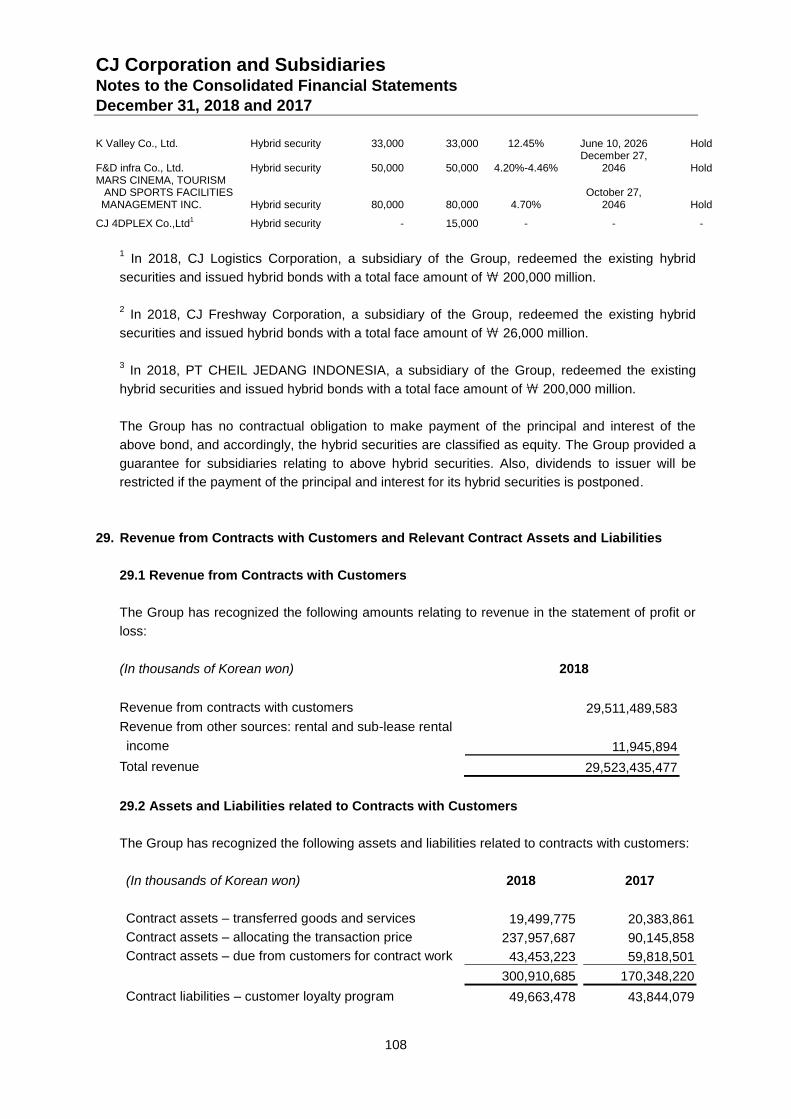
CJ Corporation and Subsidiaries Notes to the Consolidated Financial Statements December 31, 2018 and 2017
108
K Valley Co., Ltd. Hybrid security 33,000 33,000 12.45% June 10, 2026 Hold
F&D infra Co., Ltd. Hybrid security
50,000 50,000 4.20%-4.46% December 27,
2046 Hold MARS CINEMA, TOURISM
AND SPORTS FACILITIES MANAGEMENT INC. Hybrid security
80,000 80,000 4.70%
October 27, 2046 Hold
CJ 4DPLEX Co.,Ltd1 Hybrid security - 15,000 - - -
1 In 2018, CJ Logistics Corporation, a subsidiary of the Group, redeemed the existing hybrid
securities and issued hybrid bonds with a total face amount of \ 200,000 million.
2 In 2018, CJ Freshway Corporation, a subsidiary of the Group, redeemed the existing hybrid
securities and issued hybrid bonds with a total face amount of \ 26,000 million.
3 In 2018, PT CHEIL JEDANG INDONESIA, a subsidiary of the Group, redeemed the existing
hybrid securities and issued hybrid bonds with a total face amount of \ 200,000 million.
The Group has no contractual obligation to make payment of the principal and interest of the
above bond, and accordingly, the hybrid securities are classified as equity. The Group provided a
guarantee for subsidiaries relating to above hybrid securities. Also, dividends to issuer will be
restricted if the payment of the principal and interest for its hybrid securities is postponed.
29. Revenue from Contracts with Customers and Relevant Contract Assets and Liabilities
29.1 Revenue from Contracts with Customers
The Group has recognized the following amounts relating to revenue in the statement of profit or
loss:
(In thousands of Korean won) 2018
Revenue from contracts with customers 29,511,489,583
Revenue from other sources: rental and sub-lease rental
income 11,945,894
Total revenue 29,523,435,477
29.2 Assets and Liabilities related to Contracts with Customers
The Group has recognized the following assets and liabilities related to contracts with customers:
(In thousands of Korean won) 2018
2017
Contract assets – transferred goods and services 19,499,775 20,383,861
Contract assets – allocating the transaction price 237,957,687 90,145,858
Contract assets – due from customers for contract work 43,453,223 59,818,501
300,910,685 170,348,220
Contract liabilities – customer loyalty program 49,663,478 43,844,079
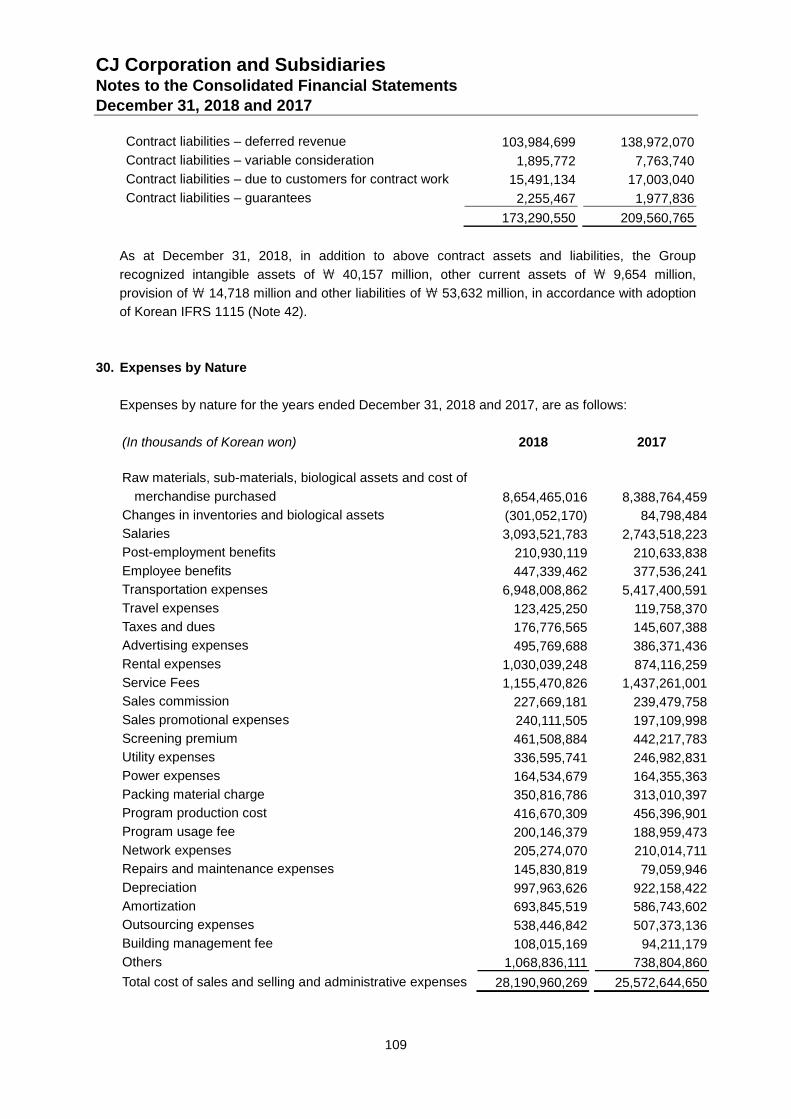
CJ Corporation and Subsidiaries Notes to the Consolidated Financial Statements December 31, 2018 and 2017
109
Contract liabilities – deferred revenue 103,984,699 138,972,070
Contract liabilities – variable consideration 1,895,772 7,763,740
Contract liabilities – due to customers for contract work 15,491,134 17,003,040
Contract liabilities – guarantees 2,255,467 1,977,836
173,290,550 209,560,765
As at December 31, 2018, in addition to above contract assets and liabilities, the Group
recognized intangible assets of \ 40,157 million, other current assets of \ 9,654 million,
provision of \ 14,718 million and other liabilities of \ 53,632 million, in accordance with adoption
of Korean IFRS 1115 (Note 42).
30. Expenses by Nature
Expenses by nature for the years ended December 31, 2018 and 2017, are as follows:
(In thousands of Korean won) 2018
2017
Raw materials, sub-materials, biological assets and cost of
merchandise purchased
8,654,465,016 8,388,764,459
Changes in inventories and biological assets (301,052,170) 84,798,484
Salaries 3,093,521,783 2,743,518,223
Post-employment benefits 210,930,119 210,633,838
Employee benefits 447,339,462 377,536,241
Transportation expenses 6,948,008,862 5,417,400,591
Travel expenses 123,425,250 119,758,370
Taxes and dues 176,776,565 145,607,388
Advertising expenses 495,769,688 386,371,436
Rental expenses 1,030,039,248 874,116,259
Service Fees 1,155,470,826 1,437,261,001
Sales commission 227,669,181 239,479,758
Sales promotional expenses 240,111,505 197,109,998
Screening premium 461,508,884 442,217,783
Utility expenses 336,595,741 246,982,831
Power expenses 164,534,679 164,355,363
Packing material charge 350,816,786 313,010,397
Program production cost 416,670,309 456,396,901
Program usage fee 200,146,379 188,959,473
Network expenses 205,274,070 210,014,711
Repairs and maintenance expenses 145,830,819 79,059,946
Depreciation 997,963,626 922,158,422
Amortization 693,845,519 586,743,602
Outsourcing expenses 538,446,842 507,373,136
Building management fee 108,015,169 94,211,179
Others 1,068,836,111 738,804,860
Total cost of sales and selling and administrative expenses
28,190,960,269 25,572,644,650
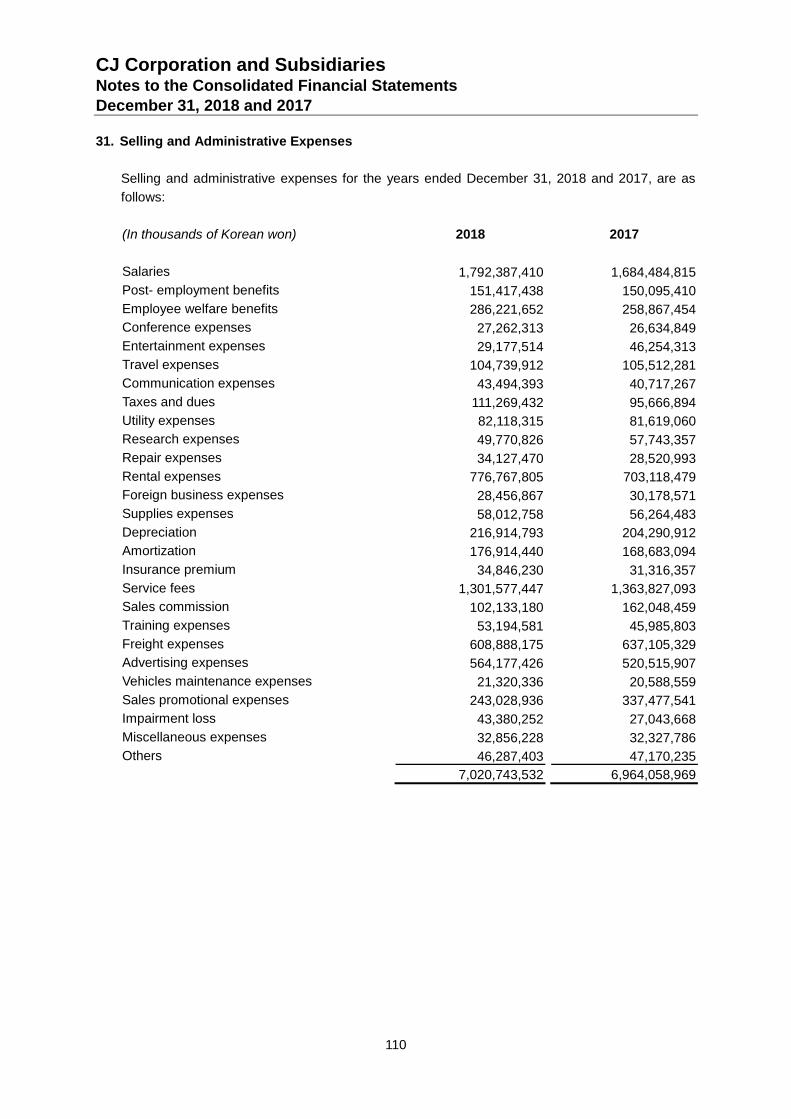
CJ Corporation and Subsidiaries Notes to the Consolidated Financial Statements December 31, 2018 and 2017
110
31. Selling and Administrative Expenses
Selling and administrative expenses for the years ended December 31, 2018 and 2017, are as
follows:
(In thousands of Korean won) 2018 2017
Salaries 1,792,387,410 1,684,484,815
Post- employment benefits 151,417,438 150,095,410
Employee welfare benefits 286,221,652 258,867,454
Conference expenses 27,262,313 26,634,849
Entertainment expenses 29,177,514 46,254,313
Travel expenses 104,739,912 105,512,281
Communication expenses 43,494,393 40,717,267
Taxes and dues 111,269,432 95,666,894
Utility expenses 82,118,315 81,619,060
Research expenses 49,770,826 57,743,357
Repair expenses 34,127,470 28,520,993
Rental expenses 776,767,805 703,118,479
Foreign business expenses 28,456,867 30,178,571
Supplies expenses 58,012,758 56,264,483
Depreciation 216,914,793 204,290,912
Amortization 176,914,440 168,683,094
Insurance premium 34,846,230 31,316,357
Service fees 1,301,577,447 1,363,827,093
Sales commission 102,133,180 162,048,459
Training expenses 53,194,581 45,985,803
Freight expenses 608,888,175 637,105,329
Advertising expenses 564,177,426 520,515,907
Vehicles maintenance expenses 21,320,336 20,588,559
Sales promotional expenses 243,028,936 337,477,541
Impairment loss 43,380,252 27,043,668
Miscellaneous expenses 32,856,228 32,327,786
Others 46,287,403 47,170,235
7,020,743,532 6,964,058,969
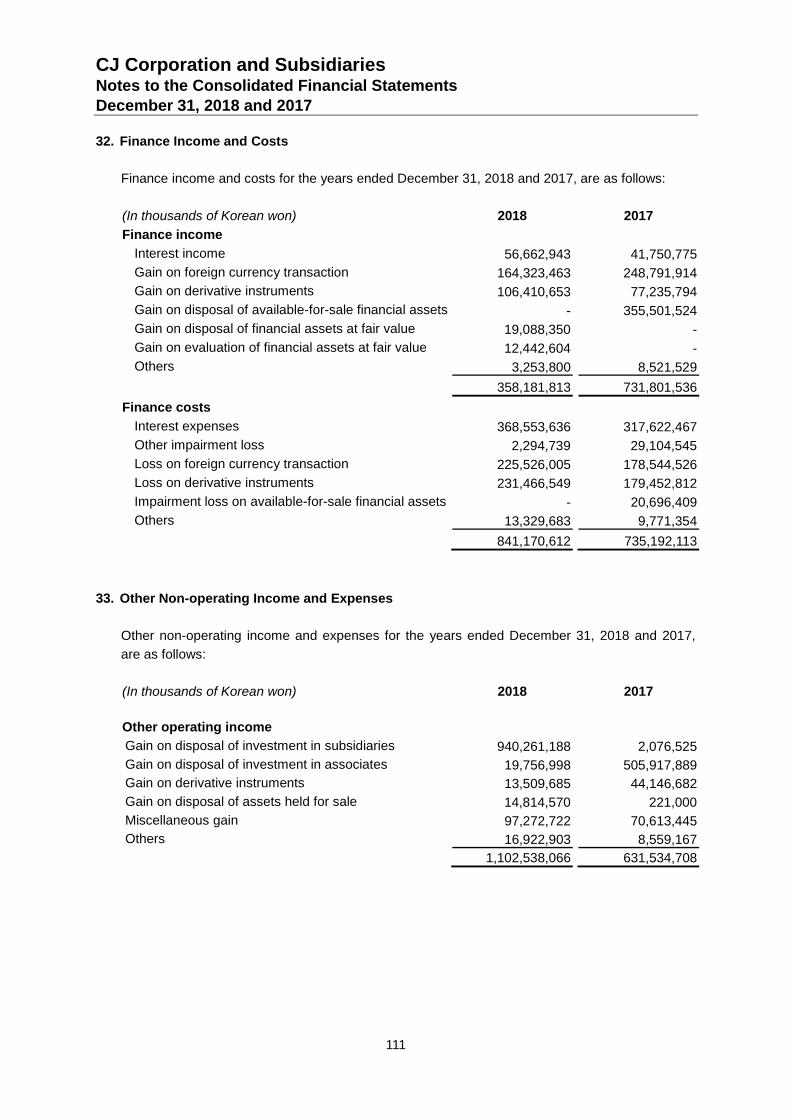
CJ Corporation and Subsidiaries Notes to the Consolidated Financial Statements December 31, 2018 and 2017
111
32. Finance Income and Costs
Finance income and costs for the years ended December 31, 2018 and 2017, are as follows:
(In thousands of Korean won) 2018
2017
Finance income
Interest income 56,662,943 41,750,775
Gain on foreign currency transaction 164,323,463 248,791,914
Gain on derivative instruments 106,410,653 77,235,794
Gain on disposal of available-for-sale financial assets - 355,501,524
Gain on disposal of financial assets at fair value 19,088,350 -
Gain on evaluation of financial assets at fair value 12,442,604 -
Others 3,253,800 8,521,529
358,181,813 731,801,536
Finance costs
Interest expenses 368,553,636 317,622,467
Other impairment loss 2,294,739 29,104,545
Loss on foreign currency transaction 225,526,005 178,544,526
Loss on derivative instruments 231,466,549 179,452,812
Impairment loss on available-for-sale financial assets - 20,696,409
Others 13,329,683 9,771,354
841,170,612 735,192,113
33. Other Non-operating Income and Expenses
Other non-operating income and expenses for the years ended December 31, 2018 and 2017,
are as follows:
(In thousands of Korean won) 2018 2017
Other operating income
Gain on disposal of investment in subsidiaries 940,261,188 2,076,525
Gain on disposal of investment in associates 19,756,998 505,917,889
Gain on derivative instruments 13,509,685 44,146,682
Gain on disposal of assets held for sale 14,814,570 221,000
Miscellaneous gain 97,272,722 70,613,445
Others 16,922,903 8,559,167
1,102,538,066 631,534,708
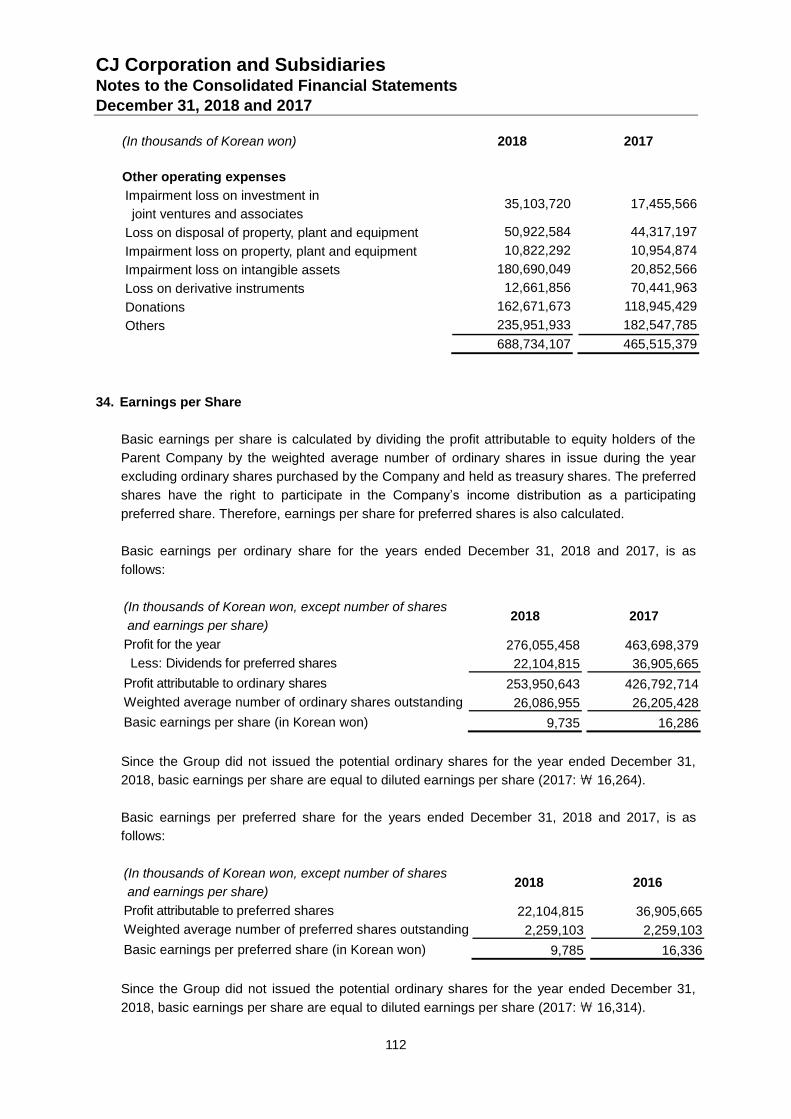
CJ Corporation and Subsidiaries Notes to the Consolidated Financial Statements December 31, 2018 and 2017
112
(In thousands of Korean won) 2018 2017
Other operating expenses
Impairment loss on investment in
joint ventures and associates 35,103,720 17,455,566
Loss on disposal of property, plant and equipment 50,922,584 44,317,197
Impairment loss on property, plant and equipment 10,822,292 10,954,874
Impairment loss on intangible assets 180,690,049 20,852,566
Loss on derivative instruments 12,661,856 70,441,963
Donations 162,671,673 118,945,429
Others 235,951,933 182,547,785
688,734,107 465,515,379
34. Earnings per Share
Basic earnings per share is calculated by dividing the profit attributable to equity holders of the
Parent Company by the weighted average number of ordinary shares in issue during the year
excluding ordinary shares purchased by the Company and held as treasury shares. The preferred
shares have the right to participate in the Company’s income distribution as a participating
preferred share. Therefore, earnings per share for preferred shares is also calculated.
Basic earnings per ordinary share for the years ended December 31, 2018 and 2017, is as
follows:
(In thousands of Korean won, except number of shares
and earnings per share) 2018
2017
Profit for the year 276,055,458 463,698,379
Less: Dividends for preferred shares 22,104,815 36,905,665
Profit attributable to ordinary shares 253,950,643 426,792,714
Weighted average number of ordinary shares outstanding 26,086,955 26,205,428
Basic earnings per share (in Korean won) 9,735 16,286
Since the Group did not issued the potential ordinary shares for the year ended December 31,
2018, basic earnings per share are equal to diluted earnings per share (2017: \ 16,264).
Basic earnings per preferred share for the years ended December 31, 2018 and 2017, is as
follows:
(In thousands of Korean won, except number of shares
and earnings per share) 2018
2016
Profit attributable to preferred shares 22,104,815 36,905,665
Weighted average number of preferred shares outstanding 2,259,103 2,259,103
Basic earnings per preferred share (in Korean won) 9,785 16,336
Since the Group did not issued the potential ordinary shares for the year ended December 31,
2018, basic earnings per share are equal to diluted earnings per share (2017: \ 16,314).
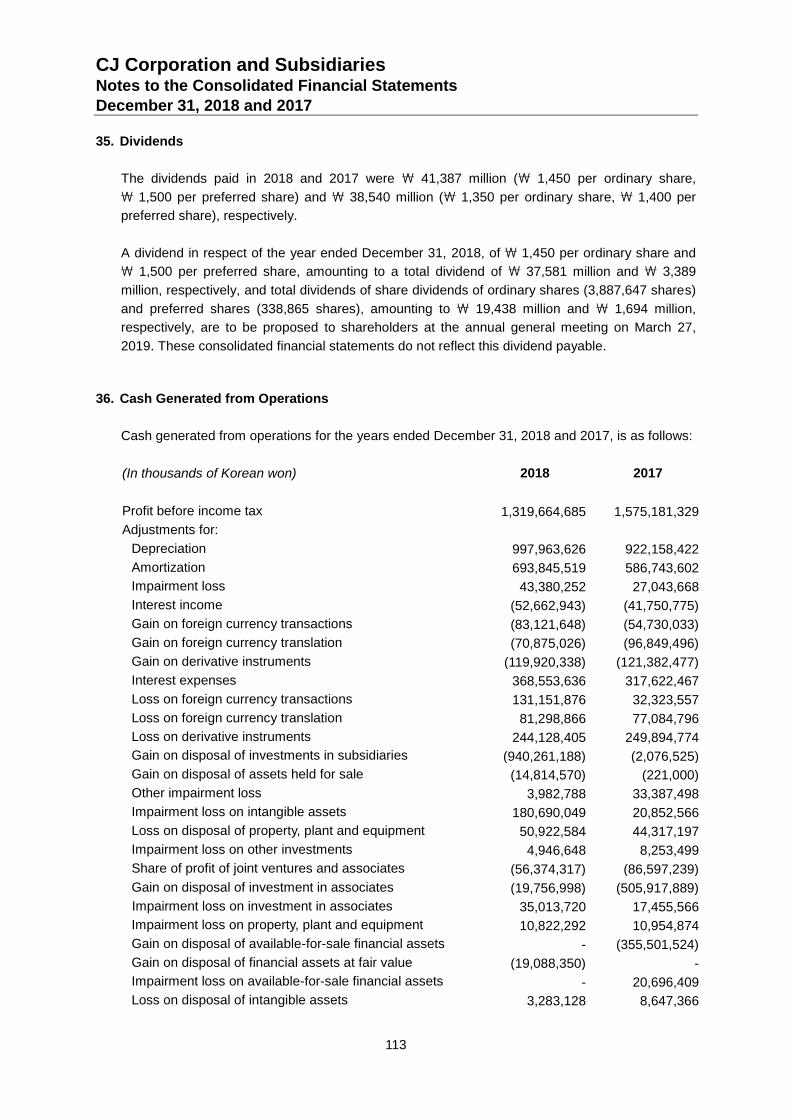
CJ Corporation and Subsidiaries Notes to the Consolidated Financial Statements December 31, 2018 and 2017
113
35. Dividends
The dividends paid in 2018 and 2017 were \ 41,387 million (\ 1,450 per ordinary share,
\ 1,500 per preferred share) and \ 38,540 million (\ 1,350 per ordinary share, \ 1,400 per
preferred share), respectively.
A dividend in respect of the year ended December 31, 2018, of \ 1,450 per ordinary share and
\ 1,500 per preferred share, amounting to a total dividend of \ 37,581 million and \ 3,389
million, respectively, and total dividends of share dividends of ordinary shares (3,887,647 shares)
and preferred shares (338,865 shares), amounting to \ 19,438 million and \ 1,694 million,
respectively, are to be proposed to shareholders at the annual general meeting on March 27,
2019. These consolidated financial statements do not reflect this dividend payable.
36. Cash Generated from Operations
Cash generated from operations for the years ended December 31, 2018 and 2017, is as follows:
(In thousands of Korean won)
2018
2017
Profit before income tax
1,319,664,685 1,575,181,329
Adjustments for:
Depreciation
997,963,626 922,158,422
Amortization
693,845,519 586,743,602
Impairment loss
43,380,252 27,043,668
Interest income
(52,662,943) (41,750,775)
Gain on foreign currency transactions (83,121,648) (54,730,033)
Gain on foreign currency translation (70,875,026) (96,849,496)
Gain on derivative instruments
(119,920,338) (121,382,477)
Interest expenses
368,553,636 317,622,467
Loss on foreign currency transactions 131,151,876 32,323,557
Loss on foreign currency translation 81,298,866 77,084,796
Loss on derivative instruments
244,128,405 249,894,774
Gain on disposal of investments in subsidiaries (940,261,188) (2,076,525)
Gain on disposal of assets held for sale (14,814,570) (221,000)
Other impairment loss 3,982,788 33,387,498
Impairment loss on intangible assets 180,690,049 20,852,566
Loss on disposal of property, plant and equipment 50,922,584 44,317,197
Impairment loss on other investments 4,946,648 8,253,499
Share of profit of joint ventures and associates (56,374,317) (86,597,239)
Gain on disposal of investment in associates (19,756,998) (505,917,889)
Impairment loss on investment in associates 35,013,720 17,455,566
Impairment loss on property, plant and equipment 10,822,292 10,954,874
Gain on disposal of available-for-sale financial assets - (355,501,524)
Gain on disposal of financial assets at fair value (19,088,350) -
Impairment loss on available-for-sale financial assets - 20,696,409
Loss on disposal of intangible assets 3,283,128 8,647,366
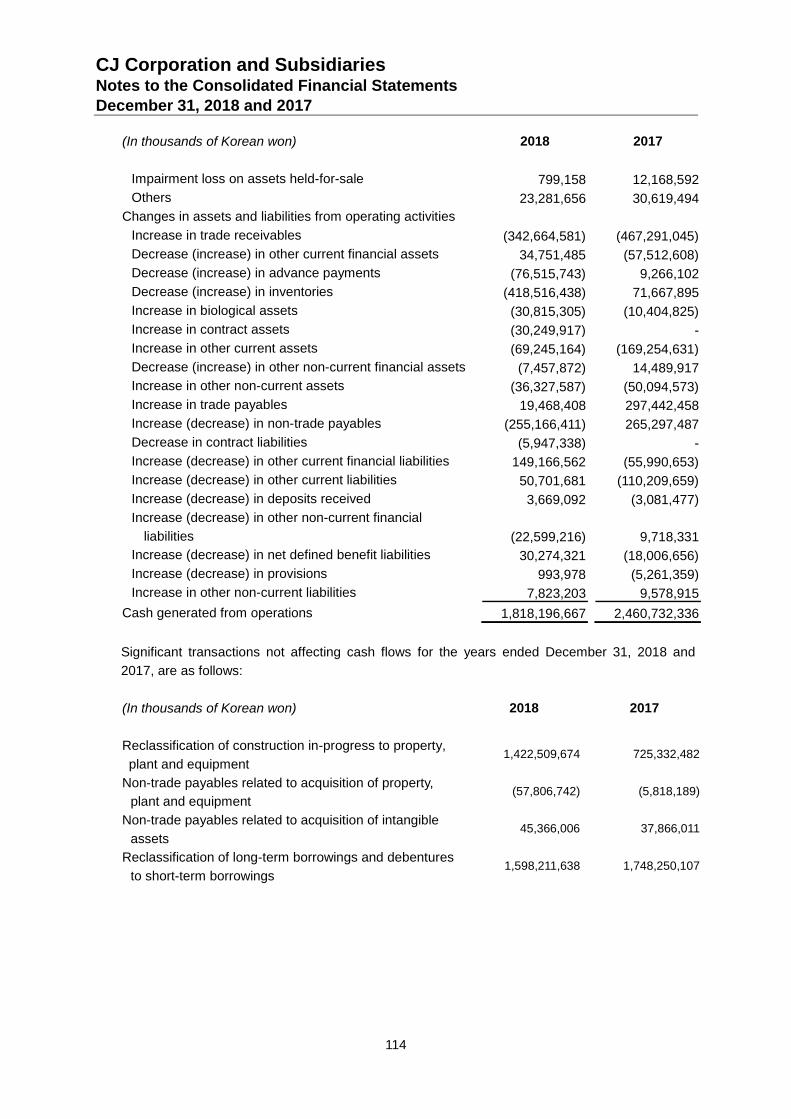
CJ Corporation and Subsidiaries Notes to the Consolidated Financial Statements December 31, 2018 and 2017
114
(In thousands of Korean won)
2018
2017
Impairment loss on assets held-for-sale 799,158 12,168,592
Others
23,281,656 30,619,494
Changes in assets and liabilities from operating activities
Increase in trade receivables
(342,664,581) (467,291,045)
Decrease (increase) in other current financial assets
34,751,485 (57,512,608)
Decrease (increase) in advance payments
(76,515,743) 9,266,102
Decrease (increase) in inventories
(418,516,438) 71,667,895
Increase in biological assets
(30,815,305) (10,404,825)
Increase in contract assets (30,249,917) -
Increase in other current assets
(69,245,164) (169,254,631)
Decrease (increase) in other non-current financial assets
(7,457,872) 14,489,917
Increase in other non-current assets (36,327,587) (50,094,573)
Increase in trade payables
19,468,408 297,442,458
Increase (decrease) in non-trade payables
(255,166,411) 265,297,487
Decrease in contract liabilities (5,947,338) -
Increase (decrease) in other current financial liabilities
149,166,562 (55,990,653)
Increase (decrease) in other current liabilities
50,701,681 (110,209,659)
Increase (decrease) in deposits received
3,669,092 (3,081,477)
Increase (decrease) in other non-current financial
liabilities
(22,599,216) 9,718,331
Increase (decrease) in net defined benefit liabilities 30,274,321 (18,006,656)
Increase (decrease) in provisions
993,978 (5,261,359)
Increase in other non-current liabilities
7,823,203 9,578,915
Cash generated from operations
1,818,196,667 2,460,732,336
Significant transactions not affecting cash flows for the years ended December 31, 2018 and
2017, are as follows:
(In thousands of Korean won)
2018
2017
Reclassification of construction in-progress to property,
plant and equipment 1,422,509,674 725,332,482
Non-trade payables related to acquisition of property,
plant and equipment (57,806,742) (5,818,189)
Non-trade payables related to acquisition of intangible
assets 45,366,006 37,866,011
Reclassification of long-term borrowings and debentures
to short-term borrowings 1,598,211,638 1,748,250,107
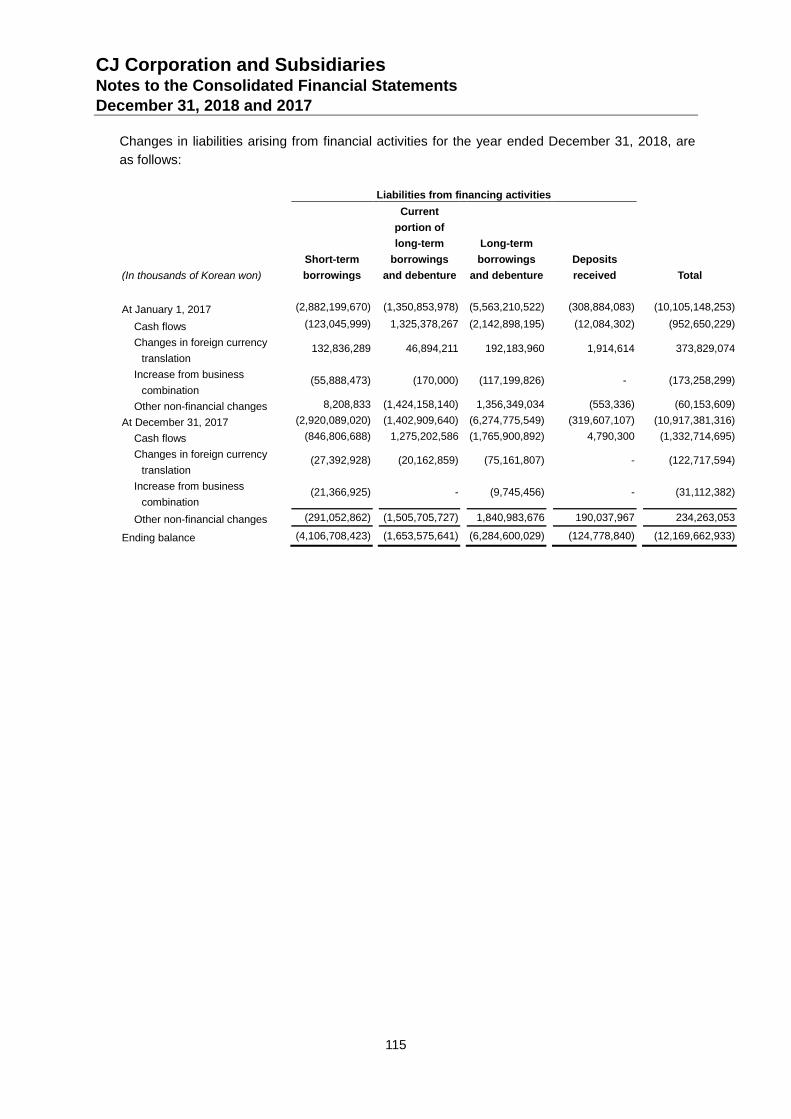
CJ Corporation and Subsidiaries Notes to the Consolidated Financial Statements December 31, 2018 and 2017
115
Changes in liabilities arising from financial activities for the year ended December 31, 2018, are
as follows:
Liabilities from financing activities
Total (In thousands of Korean won)
Short-term
borrowings
Current
portion of
long-term
borrowings
and debenture
Long-term
borrowings
and debenture
Deposits
received
At January 1, 2017 (2,882,199,670) (1,350,853,978) (5,563,210,522) (308,884,083) (10,105,148,253)
Cash flows (123,045,999) 1,325,378,267 (2,142,898,195) (12,084,302) (952,650,229)
Changes in foreign currency
translation 132,836,289 46,894,211 192,183,960 1,914,614 373,829,074
Increase from business
combination (55,888,473) (170,000) (117,199,826) - (173,258,299)
Other non-financial changes 8,208,833 (1,424,158,140) 1,356,349,034 (553,336) (60,153,609)
At December 31, 2017 (2,920,089,020) (1,402,909,640) (6,274,775,549) (319,607,107) (10,917,381,316)
Cash flows (846,806,688) 1,275,202,586 (1,765,900,892) 4,790,300 (1,332,714,695)
Changes in foreign currency
translation (27,392,928) (20,162,859) (75,161,807) - (122,717,594)
Increase from business
combination (21,366,925) - (9,745,456) - (31,112,382)
Other non-financial changes (291,052,862) (1,505,705,727) 1,840,983,676 190,037,967 234,263,053
Ending balance (4,106,708,423) (1,653,575,641) (6,284,600,029) (124,778,840) (12,169,662,933)
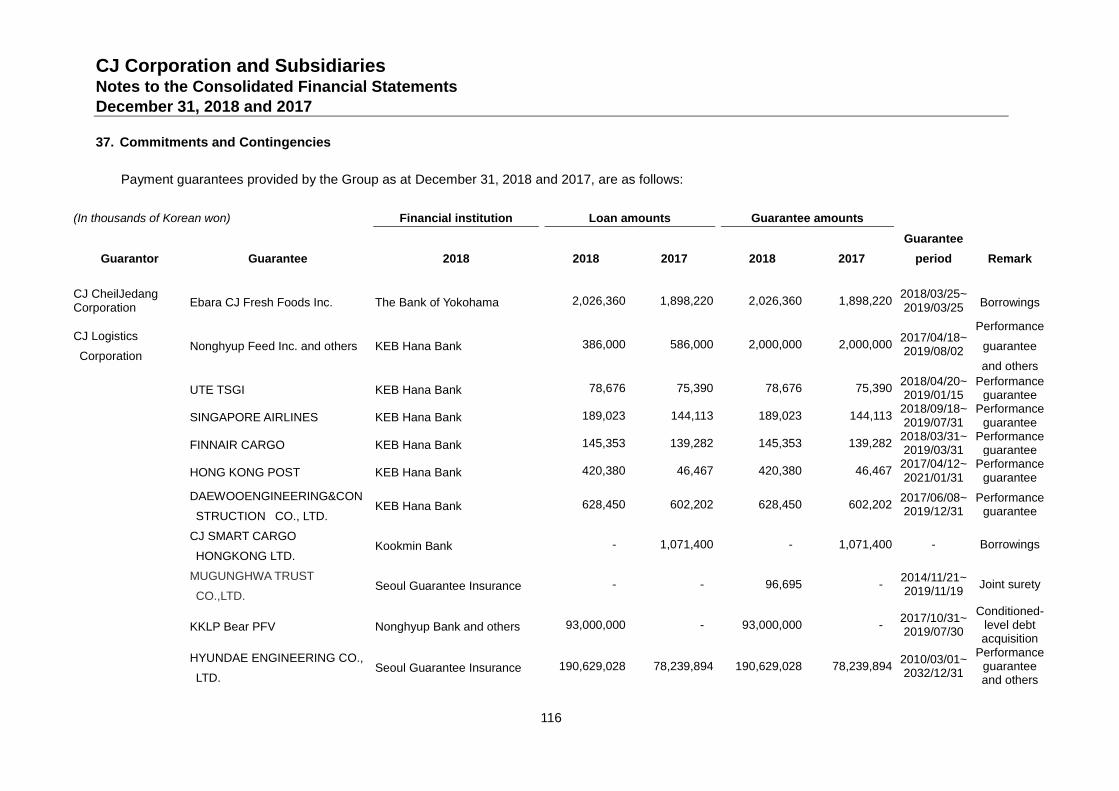
CJ Corporation and Subsidiaries Notes to the Consolidated Financial Statements December 31, 2018 and 2017
116
37. Commitments and Contingencies
Payment guarantees provided by the Group as at December 31, 2018 and 2017, are as follows:
(In thousands of Korean won) Financial institution Loan amounts Guarantee amounts
Guarantor Guarantee 2018 2018 2017 2018 2017
Guarantee
period Remark
CJ CheilJedang Corporation Ebara CJ Fresh Foods Inc. The Bank of Yokohama 2,026,360 1,898,220 2,026,360 1,898,220
2018/03/25~ 2019/03/25 Borrowings
CJ Logistics
Corporation Nonghyup Feed Inc. and others
KEB Hana Bank
386,000 586,000 2,000,000 2,000,000 2017/04/18~ 2019/08/02
Performance
guarantee
and others
UTE TSGI KEB Hana Bank 78,676 75,390 78,676 75,390 2018/04/20~ 2019/01/15
Performance guarantee
SINGAPORE AIRLINES KEB Hana Bank 189,023 144,113 189,023 144,113 2018/09/18~ 2019/07/31
Performance guarantee
FINNAIR CARGO KEB Hana Bank 145,353 139,282 145,353 139,282 2018/03/31~ 2019/03/31
Performance guarantee
HONG KONG POST KEB Hana Bank 420,380 46,467 420,380 46,467 2017/04/12~ 2021/01/31
Performance guarantee
DAEWOOENGINEERING&CON
STRUCTION CO., LTD.
KEB Hana Bank
628,450 602,202 628,450 602,202
2017/06/08~ 2019/12/31
Performance guarantee
CJ SMART CARGO
HONGKONG LTD.
Kookmin Bank
- 1,071,400 - 1,071,400 - Borrowings
MUGUNGHWA TRUST
CO.,LTD.
Seoul Guarantee Insurance
- - 96,695 -
2014/11/21~ 2019/11/19
Joint surety
KKLP Bear PFV Nonghyup Bank and others
93,000,000 - 93,000,000 -
2017/10/31~ 2019/07/30
Conditioned-level debt acquisition
HYUNDAE ENGINEERING CO.,
LTD.
Seoul Guarantee Insurance
190,629,028 78,239,894 190,629,028 78,239,894
2010/03/01~ 2032/12/31
Performance guarantee and others
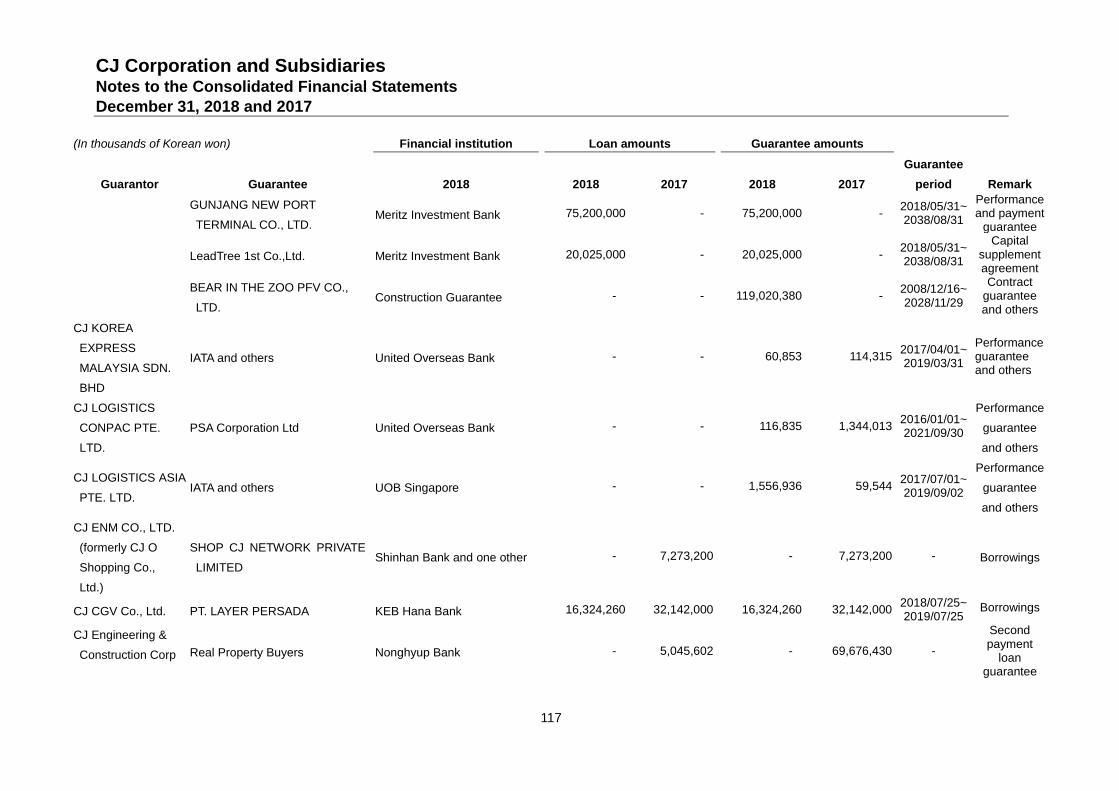
CJ Corporation and Subsidiaries Notes to the Consolidated Financial Statements December 31, 2018 and 2017
117
(In thousands of Korean won) Financial institution Loan amounts Guarantee amounts
Guarantor Guarantee 2018 2018 2017 2018 2017
Guarantee
period Remark
GUNJANG NEW PORT
TERMINAL CO., LTD.
Meritz Investment Bank
75,200,000 - 75,200,000 -
2018/05/31~ 2038/08/31
Performance and payment
guarantee
LeadTree 1st Co.,Ltd. Meritz Investment Bank
20,025,000 - 20,025,000 -
2018/05/31~ 2038/08/31
Capital supplement agreement
BEAR IN THE ZOO PFV CO.,
LTD.
Construction Guarantee
- - 119,020,380 -
2008/12/16~ 2028/11/29
Contract guarantee and others
CJ KOREA
EXPRESS
MALAYSIA SDN.
BHD
IATA and others
United Overseas Bank
- - 60,853 114,315 2017/04/01~ 2019/03/31
Performance guarantee and others
CJ LOGISTICS
CONPAC PTE.
LTD.
PSA Corporation Ltd
United Overseas Bank
- - 116,835 1,344,013 2016/01/01~ 2021/09/30
Performance
guarantee
and others
CJ LOGISTICS ASIA
PTE. LTD. IATA and others
UOB Singapore
- - 1,556,936 59,544 2017/07/01~ 2019/09/02
Performance
guarantee
and others
CJ ENM CO., LTD.
(formerly CJ O
Shopping Co.,
Ltd.)
SHOP CJ NETWORK PRIVATE
LIMITED
Shinhan Bank and one other
- 7,273,200 - 7,273,200 - Borrowings
CJ CGV Co., Ltd. PT. LAYER PERSADA KEB Hana Bank 16,324,260 32,142,000 16,324,260 32,142,000 2018/07/25~ 2019/07/25
Borrowings
CJ Engineering &
Construction Corp Real Property Buyers
Nonghyup Bank
- 5,045,602 - 69,676,430 -
Second payment
loan guarantee
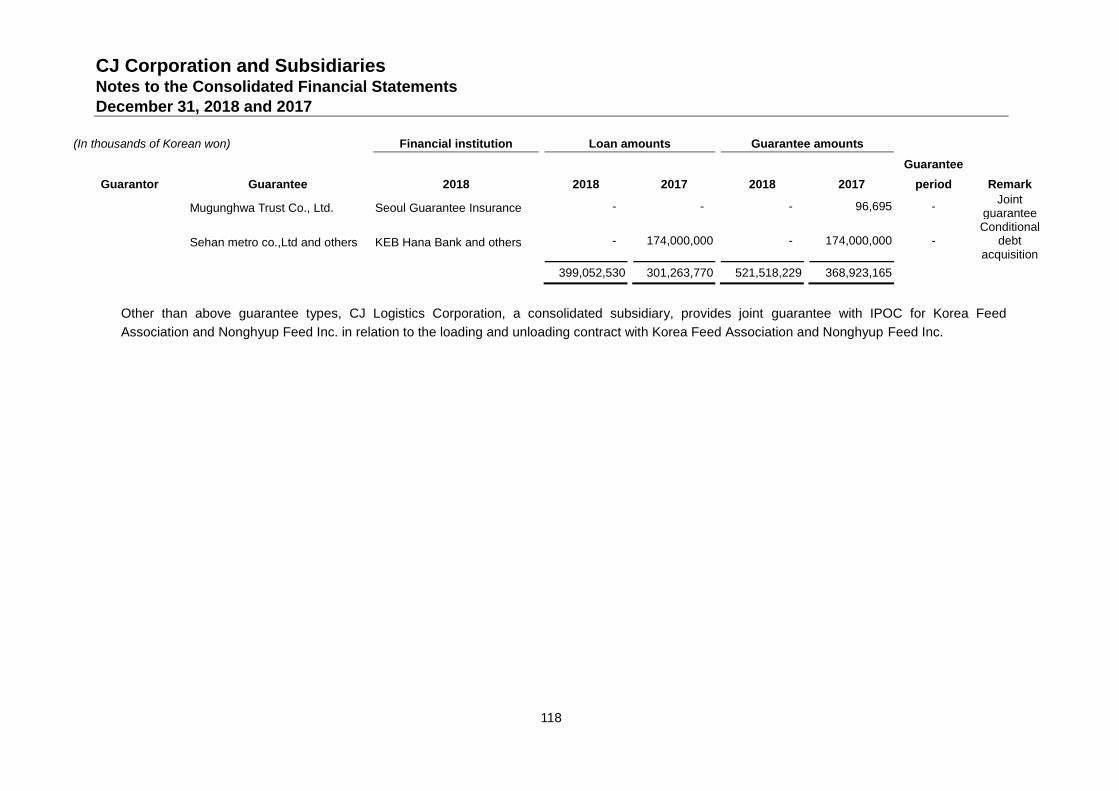
CJ Corporation and Subsidiaries Notes to the Consolidated Financial Statements December 31, 2018 and 2017
118
(In thousands of Korean won) Financial institution Loan amounts Guarantee amounts
Guarantor Guarantee 2018 2018 2017 2018 2017
Guarantee
period Remark
Mugunghwa Trust Co., Ltd. Seoul Guarantee Insurance - - - 96,695 - Joint
guarantee
Sehan metro co.,Ltd and others
KEB Hana Bank and others
- 174,000,000 - 174,000,000 -
Conditional debt
acquisition
399,052,530 301,263,770 521,518,229 368,923,165
Other than above guarantee types, CJ Logistics Corporation, a consolidated subsidiary, provides joint guarantee with IPOC for Korea Feed
Association and Nonghyup Feed Inc. in relation to the loading and unloading contract with Korea Feed Association and Nonghyup Feed Inc.
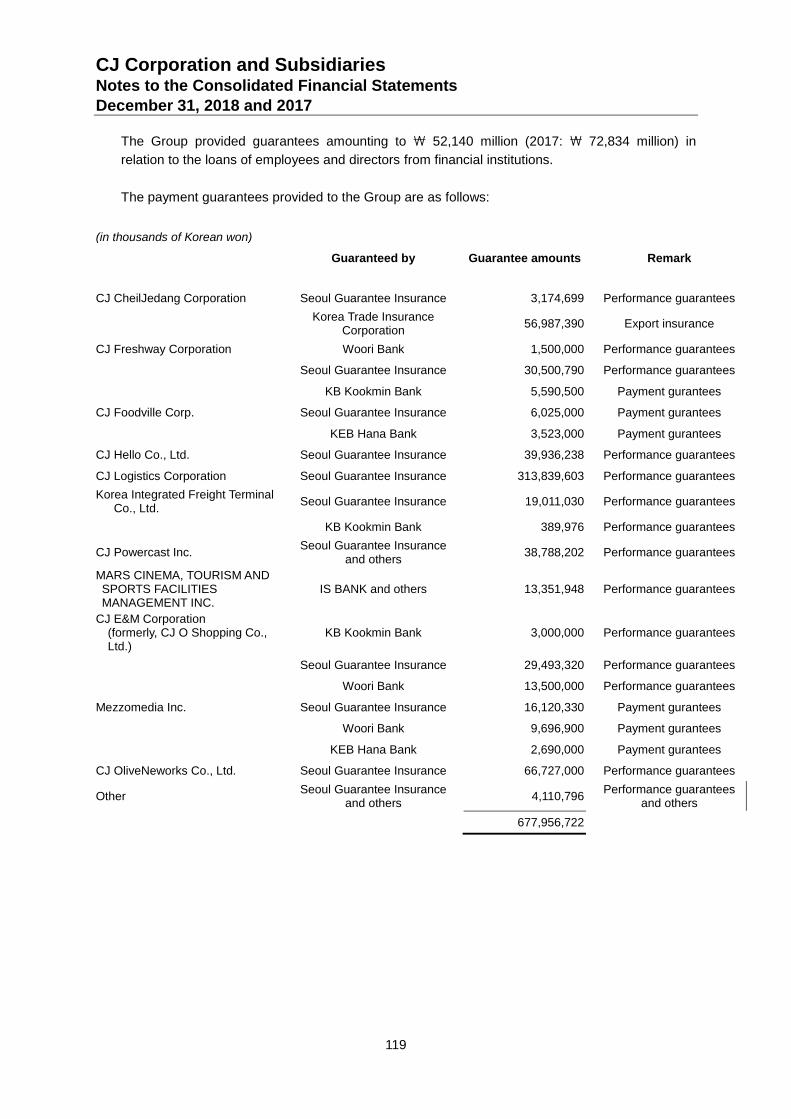
CJ Corporation and Subsidiaries Notes to the Consolidated Financial Statements December 31, 2018 and 2017
119
The Group provided guarantees amounting to \ 52,140 million (2017: \ 72,834 million) in
relation to the loans of employees and directors from financial institutions.
The payment guarantees provided to the Group are as follows:
(in thousands of Korean won)
Guaranteed by
Guarantee amounts Remark
CJ CheilJedang Corporation Seoul Guarantee Insurance
3,174,699 Performance guarantees
Korea Trade Insurance Corporation
56,987,390
Export insurance
CJ Freshway Corporation Woori Bank
1,500,000 Performance guarantees
Seoul Guarantee Insurance 30,500,790 Performance guarantees
KB Kookmin Bank 5,590,500 Payment gurantees
CJ Foodville Corp. Seoul Guarantee Insurance 6,025,000 Payment gurantees
KEB Hana Bank 3,523,000 Payment gurantees
CJ Hello Co., Ltd. Seoul Guarantee Insurance 39,936,238 Performance guarantees
CJ Logistics Corporation Seoul Guarantee Insurance 313,839,603 Performance guarantees
Korea Integrated Freight Terminal Co., Ltd.
Seoul Guarantee Insurance
19,011,030
Performance guarantees
KB Kookmin Bank 389,976 Performance guarantees
CJ Powercast Inc.
Seoul Guarantee Insurance and others
38,788,202
Performance guarantees
MARS CINEMA, TOURISM AND SPORTS FACILITIES MANAGEMENT INC.
IS BANK and others
13,351,948
Performance guarantees
CJ E&M Corporation (formerly, CJ O Shopping Co., Ltd.)
KB Kookmin Bank
3,000,000
Performance guarantees
Seoul Guarantee Insurance 29,493,320 Performance guarantees
Woori Bank 13,500,000 Performance guarantees
Mezzomedia Inc. Seoul Guarantee Insurance 16,120,330 Payment gurantees
Woori Bank 9,696,900 Payment gurantees
KEB Hana Bank 2,690,000 Payment gurantees
CJ OliveNeworks Co., Ltd. Seoul Guarantee Insurance 66,727,000 Performance guarantees
Other
Seoul Guarantee Insurance and others
4,110,796
Performance guarantees and others
677,956,722
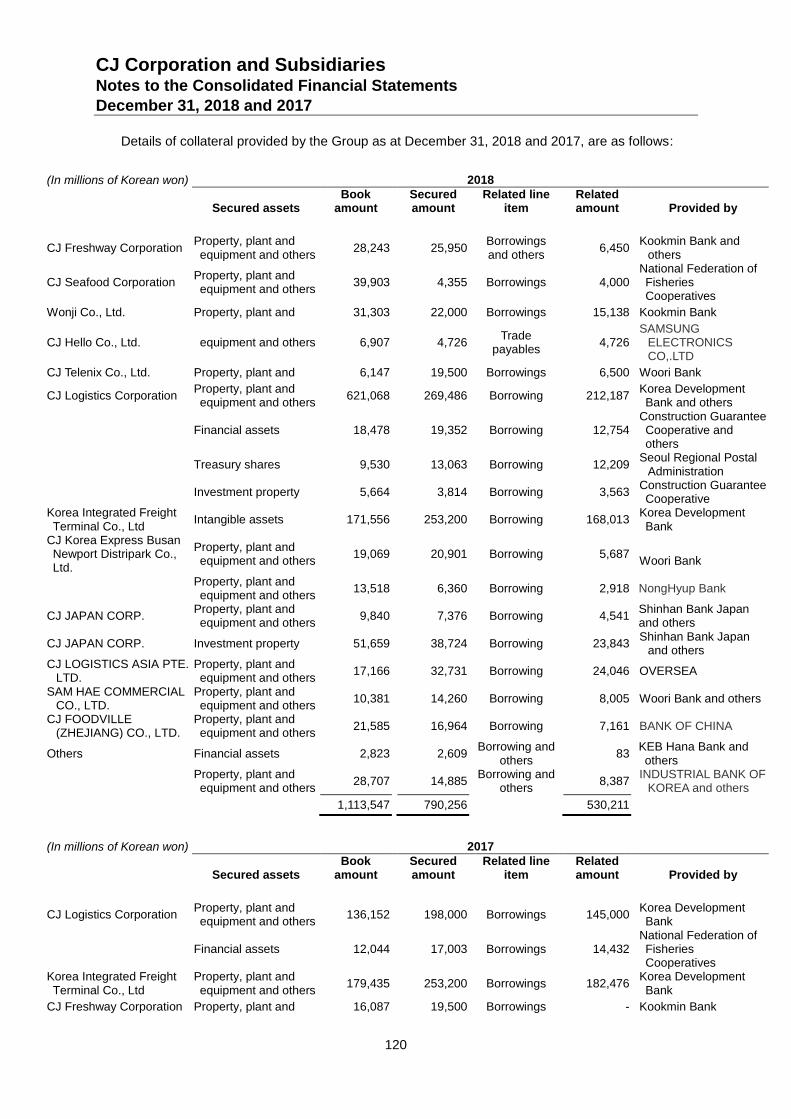
CJ Corporation and Subsidiaries Notes to the Consolidated Financial Statements December 31, 2018 and 2017
120
Details of collateral provided by the Group as at December 31, 2018 and 2017, are as follows:
(In millions of Korean won) 2018
Secured assets Book
amount Secured amount
Related line item
Related amount Provided by
CJ Freshway Corporation Property, plant and equipment and others
28,243 25,950 Borrowings and others
6,450
Kookmin Bank and
others
CJ Seafood Corporation Property, plant and equipment and others
39,903 4,355
Borrowings
4,000
National Federation of Fisheries Cooperatives
Wonji Co., Ltd. Property, plant and 31,303 22,000 Borrowings 15,138 Kookmin Bank
CJ Hello Co., Ltd. equipment and others 6,907 4,726
Trade payables
4,726
SAMSUNG ELECTRONICS CO,.LTD
CJ Telenix Co., Ltd. Property, plant and 6,147 19,500 Borrowings 6,500 Woori Bank
CJ Logistics Corporation Property, plant and equipment and others
621,068 269,486 Borrowing
212,187 Korea Development Bank and others
Financial assets 18,478 19,352
Borrowing
12,754
Construction Guarantee Cooperative and others
Treasury shares 9,530 13,063 Borrowing
12,209 Seoul Regional Postal
Administration
Investment property 5,664 3,814 Borrowing
3,563 Construction Guarantee Cooperative
Korea Integrated Freight Terminal Co., Ltd
Intangible assets 171,556 253,200 Borrowing
168,013 Korea Development Bank
CJ Korea Express Busan Newport Distripark Co., Ltd.
Property, plant and equipment and others
19,069 20,901
Borrowing
5,687
Woori Bank
Property, plant and equipment and others
13,518 6,360 Borrowing
2,918 NongHyup Bank
CJ JAPAN CORP. Property, plant and equipment and others
9,840 7,376 Borrowing
4,541 Shinhan Bank Japan and others
CJ JAPAN CORP. Investment property 51,659 38,724 Borrowing
23,843 Shinhan Bank Japan
and others CJ LOGISTICS ASIA PTE.
LTD. Property, plant and equipment and others
17,166 32,731 Borrowing
24,046 OVERSEA
SAM HAE COMMERCIAL CO., LTD.
Property, plant and equipment and others
10,381 14,260 Borrowing
8,005 Woori Bank and others
CJ FOODVILLE (ZHEJIANG) CO., LTD.
Property, plant and equipment and others
21,585 16,964 Borrowing
7,161 BANK OF CHINA
Others Financial assets 2,823 2,609 Borrowing and
others
83 KEB Hana Bank and others
Property, plant and equipment and others
28,707 14,885 Borrowing and
others
8,387 INDUSTRIAL BANK OF
KOREA and others
1,113,547 790,256 530,211
(In millions of Korean won) 2017
Secured assets Book
amount Secured amount
Related line item
Related amount Provided by
CJ Logistics Corporation Property, plant and equipment and others
136,152 198,000 Borrowings
145,000 Korea Development Bank
Financial assets 12,044 17,003
Borrowings
14,432
National Federation of Fisheries Cooperatives
Korea Integrated Freight Terminal Co., Ltd
Property, plant and equipment and others
179,435 253,200 Borrowings
182,476 Korea Development Bank
CJ Freshway Corporation Property, plant and 16,087 19,500 Borrowings - Kookmin Bank
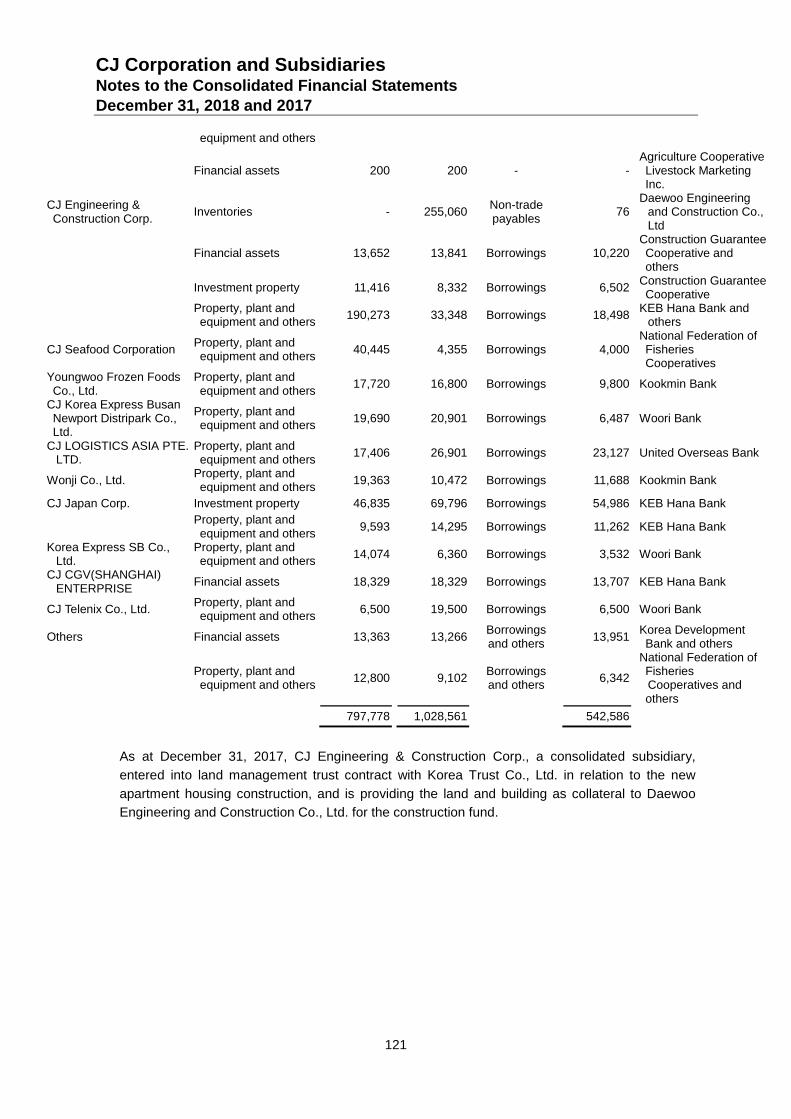
CJ Corporation and Subsidiaries Notes to the Consolidated Financial Statements December 31, 2018 and 2017
121
equipment and others
Financial assets 200 200
-
-
Agriculture Cooperative Livestock Marketing Inc.
CJ Engineering & Construction Corp.
Inventories - 255,060
Non-trade payables
76
Daewoo Engineering and Construction Co., Ltd
Financial assets 13,652 13,841
Borrowings
10,220
Construction Guarantee Cooperative and others
Investment property 11,416 8,332 Borrowings
6,502 Construction Guarantee Cooperative
Property, plant and equipment and others
190,273 33,348 Borrowings
18,498 KEB Hana Bank and
others
CJ Seafood Corporation Property, plant and equipment and others
40,445 4,355
Borrowings
4,000
National Federation of Fisheries Cooperatives
Youngwoo Frozen Foods Co., Ltd.
Property, plant and equipment and others
17,720 16,800 Borrowings
9,800 Kookmin Bank
CJ Korea Express Busan Newport Distripark Co., Ltd.
Property, plant and equipment and others
19,690 20,901
Borrowings
6,487 Woori Bank
CJ LOGISTICS ASIA PTE. LTD.
Property, plant and equipment and others
17,406 26,901 Borrowings
23,127 United Overseas Bank
Wonji Co., Ltd. Property, plant and equipment and others
19,363 10,472 Borrowings
11,688 Kookmin Bank
CJ Japan Corp. Investment property 46,835 69,796 Borrowings 54,986 KEB Hana Bank
Property, plant and equipment and others
9,593 14,295 Borrowings
11,262 KEB Hana Bank
Korea Express SB Co., Ltd.
Property, plant and equipment and others
14,074 6,360 Borrowings
3,532 Woori Bank
CJ CGV(SHANGHAI) ENTERPRISE
Financial assets 18,329 18,329 Borrowings
13,707 KEB Hana Bank
CJ Telenix Co., Ltd. Property, plant and equipment and others
6,500 19,500 Borrowings
6,500 Woori Bank
Others Financial assets 13,363 13,266 Borrowings and others
13,951
Korea Development Bank and others
Property, plant and equipment and others
12,800 9,102
Borrowings and others
6,342
National Federation of Fisheries
Cooperatives and others
797,778 1,028,561 542,586
As at December 31, 2017, CJ Engineering & Construction Corp., a consolidated subsidiary,
entered into land management trust contract with Korea Trust Co., Ltd. in relation to the new
apartment housing construction, and is providing the land and building as collateral to Daewoo
Engineering and Construction Co., Ltd. for the construction fund.
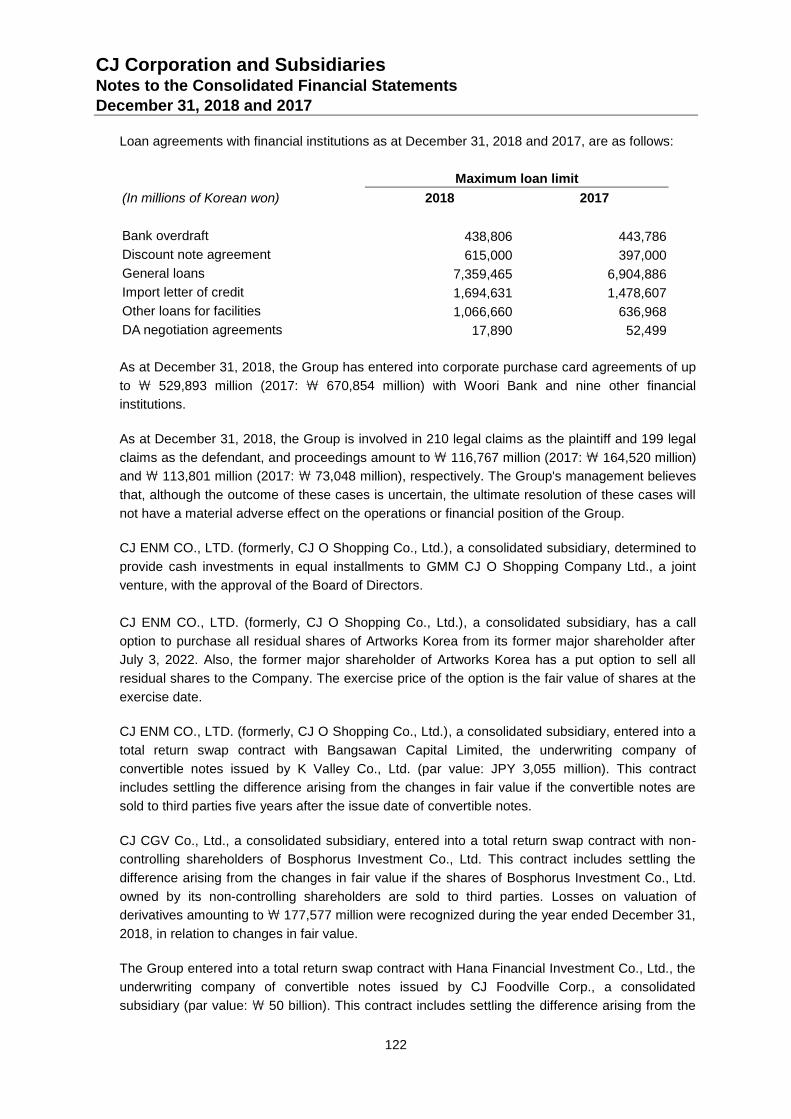
CJ Corporation and Subsidiaries Notes to the Consolidated Financial Statements December 31, 2018 and 2017
122
Loan agreements with financial institutions as at December 31, 2018 and 2017, are as follows:
Maximum loan limit
(In millions of Korean won) 2018 2017
Bank overdraft 438,806 443,786
Discount note agreement 615,000 397,000
General loans 7,359,465 6,904,886
Import letter of credit 1,694,631 1,478,607
Other loans for facilities 1,066,660 636,968
DA negotiation agreements 17,890 52,499
As at December 31, 2018, the Group has entered into corporate purchase card agreements of up
to \ 529,893 million (2017: \ 670,854 million) with Woori Bank and nine other financial
institutions.
As at December 31, 2018, the Group is involved in 210 legal claims as the plaintiff and 199 legal
claims as the defendant, and proceedings amount to \ 116,767 million (2017: \ 164,520 million)
and \ 113,801 million (2017: \ 73,048 million), respectively. The Group's management believes
that, although the outcome of these cases is uncertain, the ultimate resolution of these cases will
not have a material adverse effect on the operations or financial position of the Group.
CJ ENM CO., LTD. (formerly, CJ O Shopping Co., Ltd.), a consolidated subsidiary, determined to
provide cash investments in equal installments to GMM CJ O Shopping Company Ltd., a joint
venture, with the approval of the Board of Directors.
CJ ENM CO., LTD. (formerly, CJ O Shopping Co., Ltd.), a consolidated subsidiary, has a call
option to purchase all residual shares of Artworks Korea from its former major shareholder after
July 3, 2022. Also, the former major shareholder of Artworks Korea has a put option to sell all
residual shares to the Company. The exercise price of the option is the fair value of shares at the
exercise date.
CJ ENM CO., LTD. (formerly, CJ O Shopping Co., Ltd.), a consolidated subsidiary, entered into a
total return swap contract with Bangsawan Capital Limited, the underwriting company of
convertible notes issued by K Valley Co., Ltd. (par value: JPY 3,055 million). This contract
includes settling the difference arising from the changes in fair value if the convertible notes are
sold to third parties five years after the issue date of convertible notes.
CJ CGV Co., Ltd., a consolidated subsidiary, entered into a total return swap contract with non-
controlling shareholders of Bosphorus Investment Co., Ltd. This contract includes settling the
difference arising from the changes in fair value if the shares of Bosphorus Investment Co., Ltd.
owned by its non-controlling shareholders are sold to third parties. Losses on valuation of
derivatives amounting to \ 177,577 million were recognized during the year ended December 31,
2018, in relation to changes in fair value.
The Group entered into a total return swap contract with Hana Financial Investment Co., Ltd., the
underwriting company of convertible notes issued by CJ Foodville Corp., a consolidated
subsidiary (par value: \ 50 billion). This contract includes settling the difference arising from the
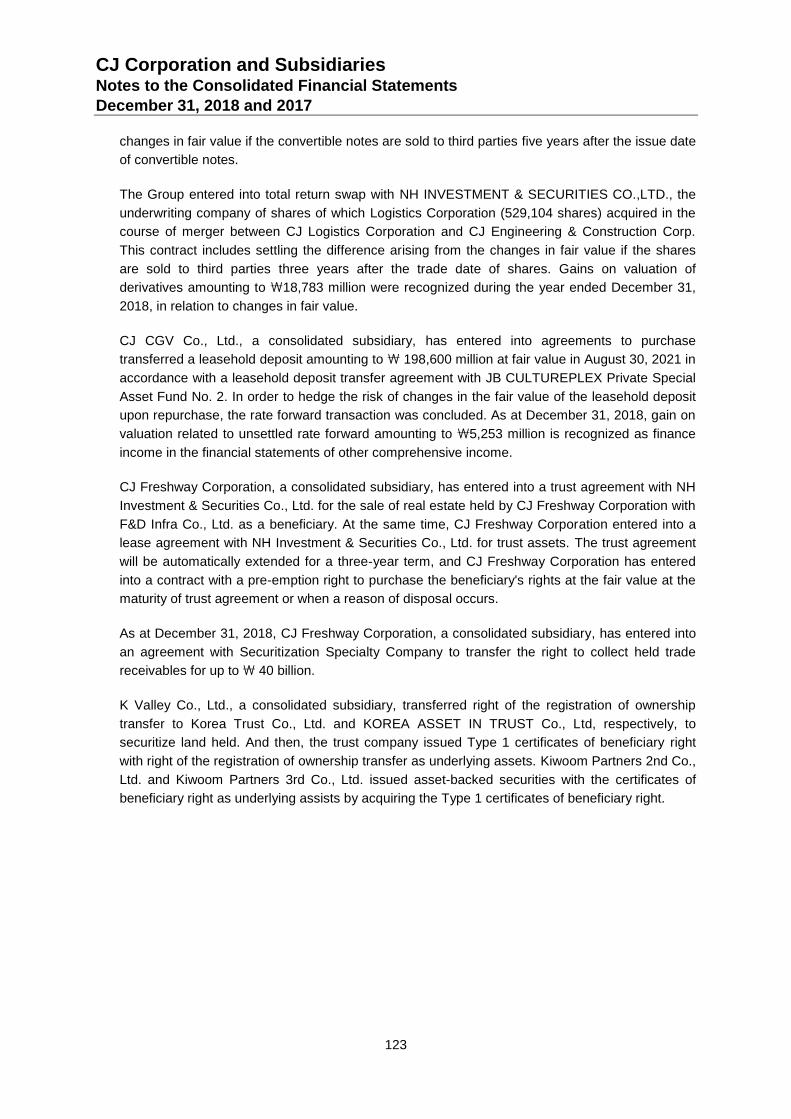
CJ Corporation and Subsidiaries Notes to the Consolidated Financial Statements December 31, 2018 and 2017
123
changes in fair value if the convertible notes are sold to third parties five years after the issue date
of convertible notes.
The Group entered into total return swap with NH INVESTMENT & SECURITIES CO.,LTD., the
underwriting company of shares of which Logistics Corporation (529,104 shares) acquired in the
course of merger between CJ Logistics Corporation and CJ Engineering & Construction Corp.
This contract includes settling the difference arising from the changes in fair value if the shares
are sold to third parties three years after the trade date of shares. Gains on valuation of
derivatives amounting to \18,783 million were recognized during the year ended December 31,
2018, in relation to changes in fair value.
CJ CGV Co., Ltd., a consolidated subsidiary, has entered into agreements to purchase
transferred a leasehold deposit amounting to \ 198,600 million at fair value in August 30, 2021 in
accordance with a leasehold deposit transfer agreement with JB CULTUREPLEX Private Special
Asset Fund No. 2. In order to hedge the risk of changes in the fair value of the leasehold deposit
upon repurchase, the rate forward transaction was concluded. As at December 31, 2018, gain on
valuation related to unsettled rate forward amounting to \5,253 million is recognized as finance
income in the financial statements of other comprehensive income.
CJ Freshway Corporation, a consolidated subsidiary, has entered into a trust agreement with NH
Investment & Securities Co., Ltd. for the sale of real estate held by CJ Freshway Corporation with
F&D Infra Co., Ltd. as a beneficiary. At the same time, CJ Freshway Corporation entered into a
lease agreement with NH Investment & Securities Co., Ltd. for trust assets. The trust agreement
will be automatically extended for a three-year term, and CJ Freshway Corporation has entered
into a contract with a pre-emption right to purchase the beneficiary's rights at the fair value at the
maturity of trust agreement or when a reason of disposal occurs.
As at December 31, 2018, CJ Freshway Corporation, a consolidated subsidiary, has entered into
an agreement with Securitization Specialty Company to transfer the right to collect held trade
receivables for up to \ 40 billion.
K Valley Co., Ltd., a consolidated subsidiary, transferred right of the registration of ownership
transfer to Korea Trust Co., Ltd. and KOREA ASSET IN TRUST Co., Ltd, respectively, to
securitize land held. And then, the trust company issued Type 1 certificates of beneficiary right
with right of the registration of ownership transfer as underlying assets. Kiwoom Partners 2nd Co.,
Ltd. and Kiwoom Partners 3rd Co., Ltd. issued asset-backed securities with the certificates of
beneficiary right as underlying assists by acquiring the Type 1 certificates of beneficiary right.
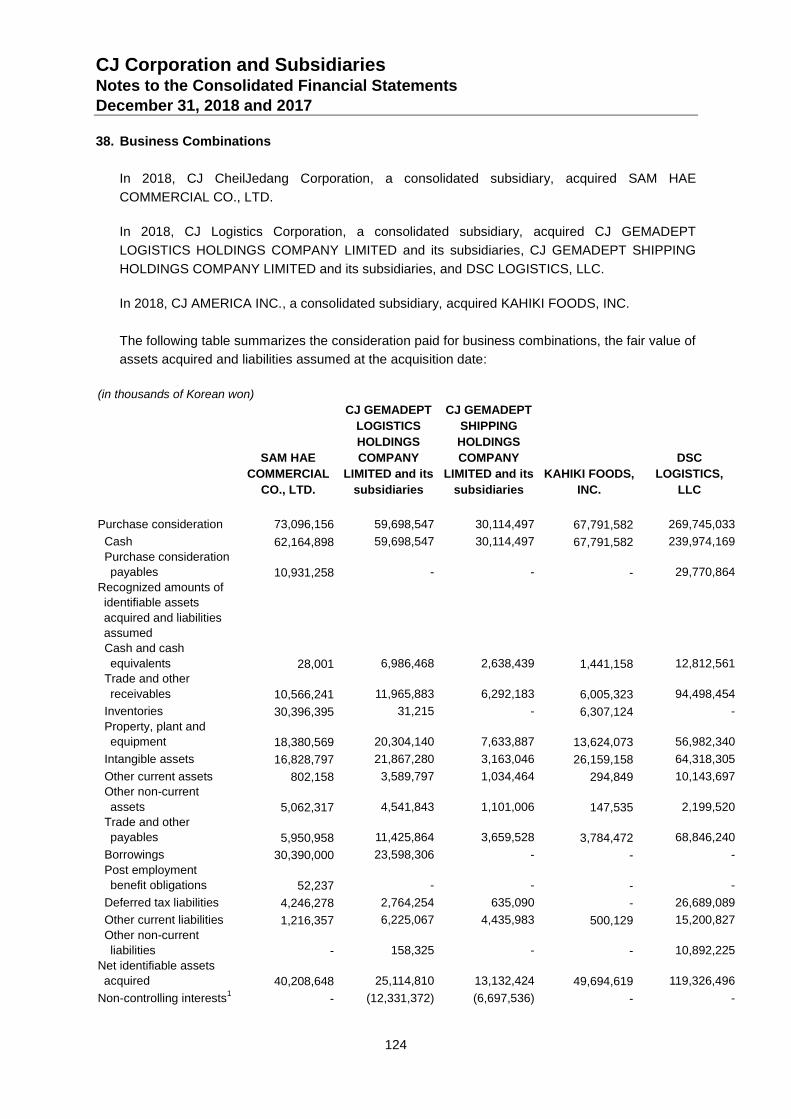
CJ Corporation and Subsidiaries Notes to the Consolidated Financial Statements December 31, 2018 and 2017
124
38. Business Combinations
In 2018, CJ CheilJedang Corporation, a consolidated subsidiary, acquired SAM HAE
COMMERCIAL CO., LTD.
In 2018, CJ Logistics Corporation, a consolidated subsidiary, acquired CJ GEMADEPT
LOGISTICS HOLDINGS COMPANY LIMITED and its subsidiaries, CJ GEMADEPT SHIPPING
HOLDINGS COMPANY LIMITED and its subsidiaries, and DSC LOGISTICS, LLC.
In 2018, CJ AMERICA INC., a consolidated subsidiary, acquired KAHIKI FOODS, INC.
The following table summarizes the consideration paid for business combinations, the fair value of
assets acquired and liabilities assumed at the acquisition date:
(in thousands of Korean won)
SAM HAE
COMMERCIAL
CO., LTD.
CJ GEMADEPT
LOGISTICS
HOLDINGS
COMPANY
LIMITED and its
subsidiaries
CJ GEMADEPT
SHIPPING
HOLDINGS
COMPANY
LIMITED and its
subsidiaries
KAHIKI FOODS,
INC.
DSC
LOGISTICS,
LLC
Purchase consideration 73,096,156 59,698,547 30,114,497 67,791,582 269,745,033
Cash 62,164,898 59,698,547 30,114,497 67,791,582 239,974,169
Purchase consideration
payables
10,931,258 - - - 29,770,864
Recognized amounts of
identifiable assets
acquired and liabilities
assumed
Cash and cash
equivalents
28,001 6,986,468 2,638,439 1,441,158 12,812,561
Trade and other
receivables
10,566,241 11,965,883 6,292,183 6,005,323 94,498,454
Inventories 30,396,395 31,215 - 6,307,124 -
Property, plant and
equipment
18,380,569 20,304,140 7,633,887 13,624,073 56,982,340
Intangible assets 16,828,797 21,867,280 3,163,046 26,159,158 64,318,305
Other current assets 802,158 3,589,797 1,034,464 294,849 10,143,697
Other non-current
assets
5,062,317 4,541,843 1,101,006 147,535 2,199,520
Trade and other
payables
5,950,958 11,425,864 3,659,528 3,784,472 68,846,240
Borrowings 30,390,000 23,598,306 - - -
Post employment
benefit obligations
52,237 - - - -
Deferred tax liabilities 4,246,278 2,764,254 635,090 - 26,689,089
Other current liabilities 1,216,357 6,225,067 4,435,983 500,129 15,200,827
Other non-current
liabilities
- 158,325 - - 10,892,225
Net identifiable assets
acquired
40,208,648 25,114,810 13,132,424 49,694,619 119,326,496
Non-controlling interests1 - (12,331,372) (6,697,536) - -
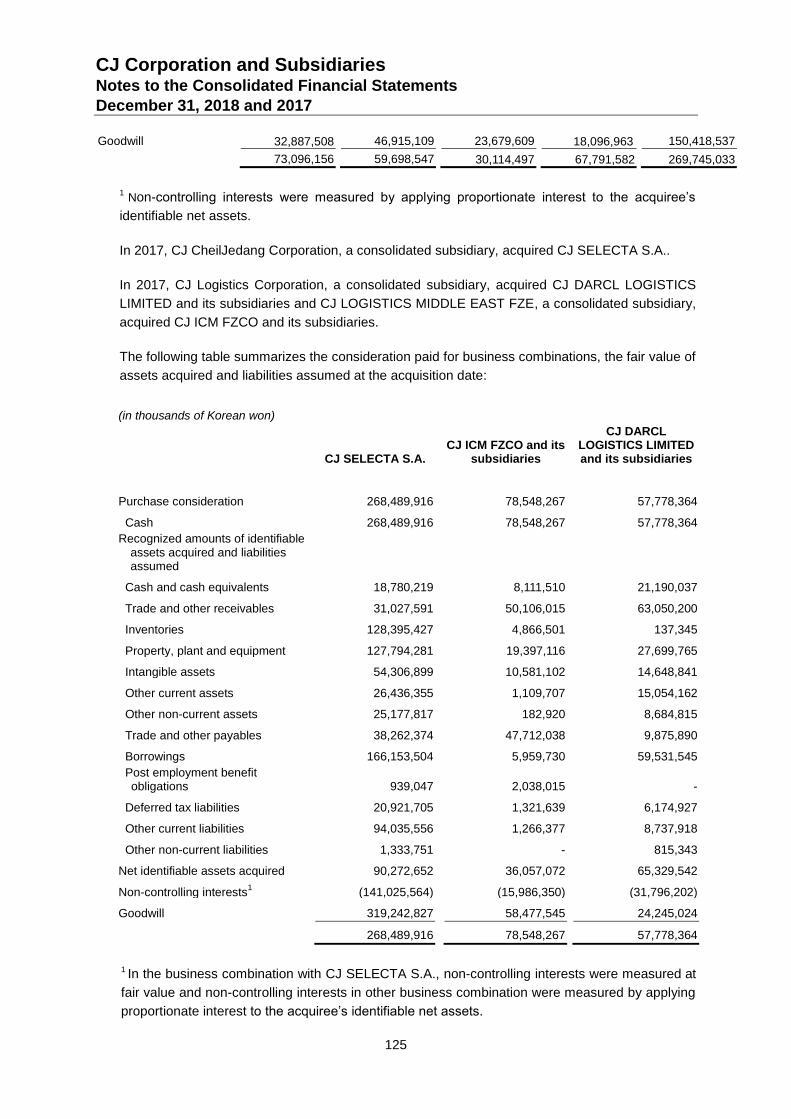
CJ Corporation and Subsidiaries Notes to the Consolidated Financial Statements December 31, 2018 and 2017
125
Goodwill 32,887,508 46,915,109 23,679,609 18,096,963 150,418,537
73,096,156 59,698,547 30,114,497 67,791,582 269,745,033
1
Non-controlling interests were measured by applying proportionate interest to the acquiree’s
identifiable net assets.
In 2017, CJ CheilJedang Corporation, a consolidated subsidiary, acquired CJ SELECTA S.A..
In 2017, CJ Logistics Corporation, a consolidated subsidiary, acquired CJ DARCL LOGISTICS
LIMITED and its subsidiaries and CJ LOGISTICS MIDDLE EAST FZE, a consolidated subsidiary,
acquired CJ ICM FZCO and its subsidiaries.
The following table summarizes the consideration paid for business combinations, the fair value of
assets acquired and liabilities assumed at the acquisition date:
(in thousands of Korean won)
CJ SELECTA S.A.
CJ ICM FZCO and its subsidiaries
CJ DARCL LOGISTICS LIMITED and its subsidiaries
Purchase consideration 268,489,916 78,548,267 57,778,364
Cash 268,489,916 78,548,267 57,778,364
Recognized amounts of identifiable assets acquired and liabilities assumed
Cash and cash equivalents 18,780,219 8,111,510 21,190,037
Trade and other receivables 31,027,591 50,106,015 63,050,200
Inventories 128,395,427 4,866,501 137,345
Property, plant and equipment 127,794,281 19,397,116 27,699,765
Intangible assets 54,306,899 10,581,102 14,648,841
Other current assets 26,436,355 1,109,707 15,054,162
Other non-current assets 25,177,817 182,920 8,684,815
Trade and other payables 38,262,374 47,712,038 9,875,890
Borrowings 166,153,504 5,959,730 59,531,545
Post employment benefit obligations 939,047 2,038,015 -
Deferred tax liabilities 20,921,705 1,321,639 6,174,927
Other current liabilities 94,035,556 1,266,377 8,737,918
Other non-current liabilities 1,333,751 - 815,343
Net identifiable assets acquired 90,272,652 36,057,072 65,329,542
Non-controlling interests1 (141,025,564) (15,986,350) (31,796,202)
Goodwill 319,242,827 58,477,545 24,245,024
268,489,916 78,548,267 57,778,364
1 In the business combination with CJ SELECTA S.A., non-controlling interests were measured at
fair value and non-controlling interests in other business combination were measured by applying
proportionate interest to the acquiree’s identifiable net assets.
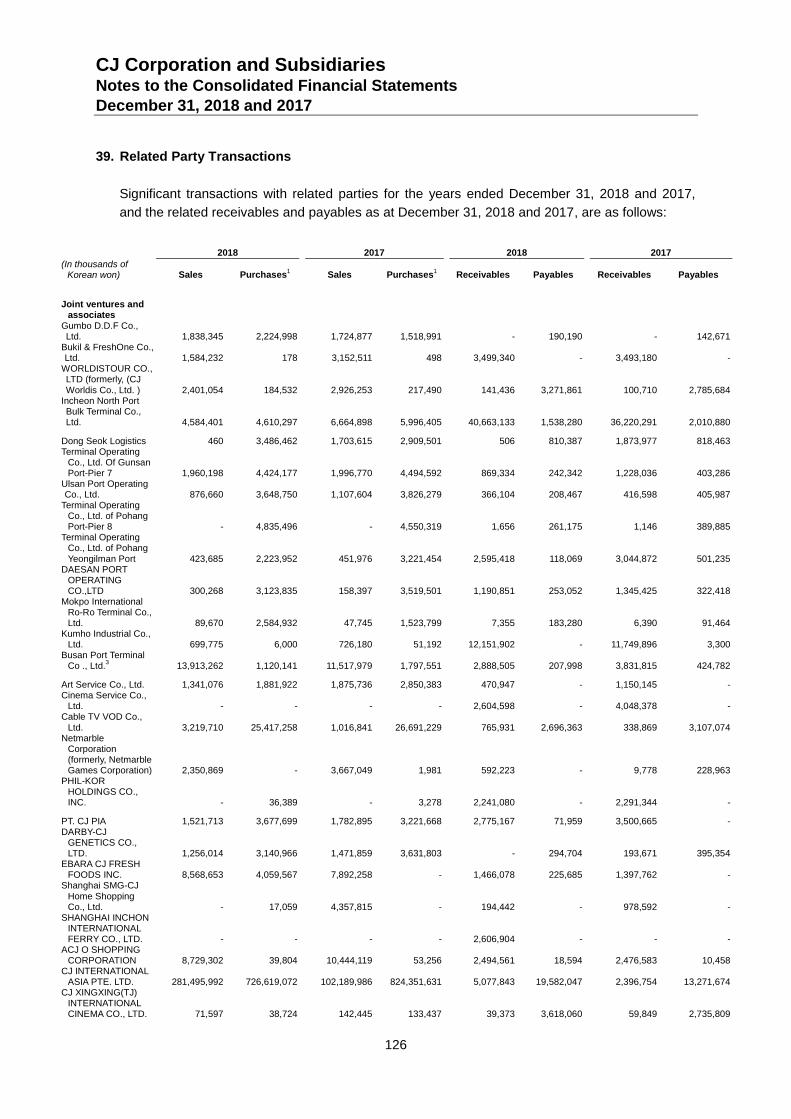
CJ Corporation and Subsidiaries Notes to the Consolidated Financial Statements December 31, 2018 and 2017
126
39. Related Party Transactions
Significant transactions with related parties for the years ended December 31, 2018 and 2017,
and the related receivables and payables as at December 31, 2018 and 2017, are as follows:
2018 2017 2018 2017
(In thousands of Korean won) Sales Purchases
1 Sales Purchases
1 Receivables Payables Receivables Payables
Joint ventures and associates
Gumbo D.D.F Co., Ltd. 1,838,345 2,224,998 1,724,877 1,518,991 - 190,190 - 142,671
Bukil & FreshOne Co., Ltd. 1,584,232 178 3,152,511 498 3,499,340 - 3,493,180 -
WORLDISTOUR CO., LTD (formerly, (CJ Worldis Co., Ltd. ) 2,401,054 184,532 2,926,253 217,490 141,436 3,271,861 100,710 2,785,684
Incheon North Port Bulk Terminal Co., Ltd. 4,584,401 4,610,297 6,664,898 5,996,405 40,663,133 1,538,280 36,220,291 2,010,880
Dong Seok Logistics 460 3,486,462 1,703,615 2,909,501 506 810,387 1,873,977 818,463 Terminal Operating
Co., Ltd. Of Gunsan Port-Pier 7 1,960,198 4,424,177 1,996,770 4,494,592 869,334 242,342 1,228,036 403,286
Ulsan Port Operating Co., Ltd. 876,660 3,648,750 1,107,604 3,826,279 366,104 208,467 416,598 405,987
Terminal Operating Co., Ltd. of Pohang Port-Pier 8 - 4,835,496 - 4,550,319 1,656 261,175 1,146 389,885
Terminal Operating Co., Ltd. of Pohang Yeongilman Port 423,685 2,223,952 451,976 3,221,454 2,595,418 118,069 3,044,872 501,235
DAESAN PORT OPERATING CO.,LTD 300,268 3,123,835 158,397 3,519,501 1,190,851 253,052 1,345,425 322,418
Mokpo International Ro-Ro Terminal Co., Ltd. 89,670 2,584,932 47,745 1,523,799 7,355 183,280 6,390 91,464
Kumho Industrial Co., Ltd. 699,775 6,000 726,180 51,192 12,151,902 - 11,749,896 3,300
Busan Port Terminal Co ., Ltd.
3 13,913,262 1,120,141 11,517,979 1,797,551 2,888,505 207,998 3,831,815 424,782
Art Service Co., Ltd. 1,341,076 1,881,922 1,875,736 2,850,383 470,947 - 1,150,145 - Cinema Service Co.,
Ltd. - - - - 2,604,598 - 4,048,378 - Cable TV VOD Co.,
Ltd. 3,219,710 25,417,258 1,016,841 26,691,229 765,931 2,696,363 338,869 3,107,074 Netmarble
Corporation (formerly, Netmarble Games Corporation) 2,350,869 - 3,667,049 1,981 592,223 - 9,778 228,963
PHIL-KOR HOLDINGS CO., INC. - 36,389 - 3,278 2,241,080 - 2,291,344 -
PT. CJ PIA 1,521,713 3,677,699 1,782,895 3,221,668 2,775,167 71,959 3,500,665 - DARBY-CJ
GENETICS CO., LTD. 1,256,014 3,140,966 1,471,859 3,631,803 - 294,704 193,671 395,354
EBARA CJ FRESH FOODS INC. 8,568,653 4,059,567 7,892,258 - 1,466,078 225,685 1,397,762 -
Shanghai SMG-CJ Home Shopping Co., Ltd. - 17,059 4,357,815 - 194,442 - 978,592 -
SHANGHAI INCHON INTERNATIONAL FERRY CO., LTD. - - - - 2,606,904 - - -
ACJ O SHOPPING CORPORATION 8,729,302 39,804 10,444,119 53,256 2,494,561 18,594 2,476,583 10,458
CJ INTERNATIONAL ASIA PTE. LTD. 281,495,992 726,619,072 102,189,986 824,351,631 5,077,843 19,582,047 2,396,754 13,271,674
CJ XINGXING(TJ) INTERNATIONAL CINEMA CO., LTD. 71,597 38,724 142,445 133,437 39,373 3,618,060 59,849 2,735,809
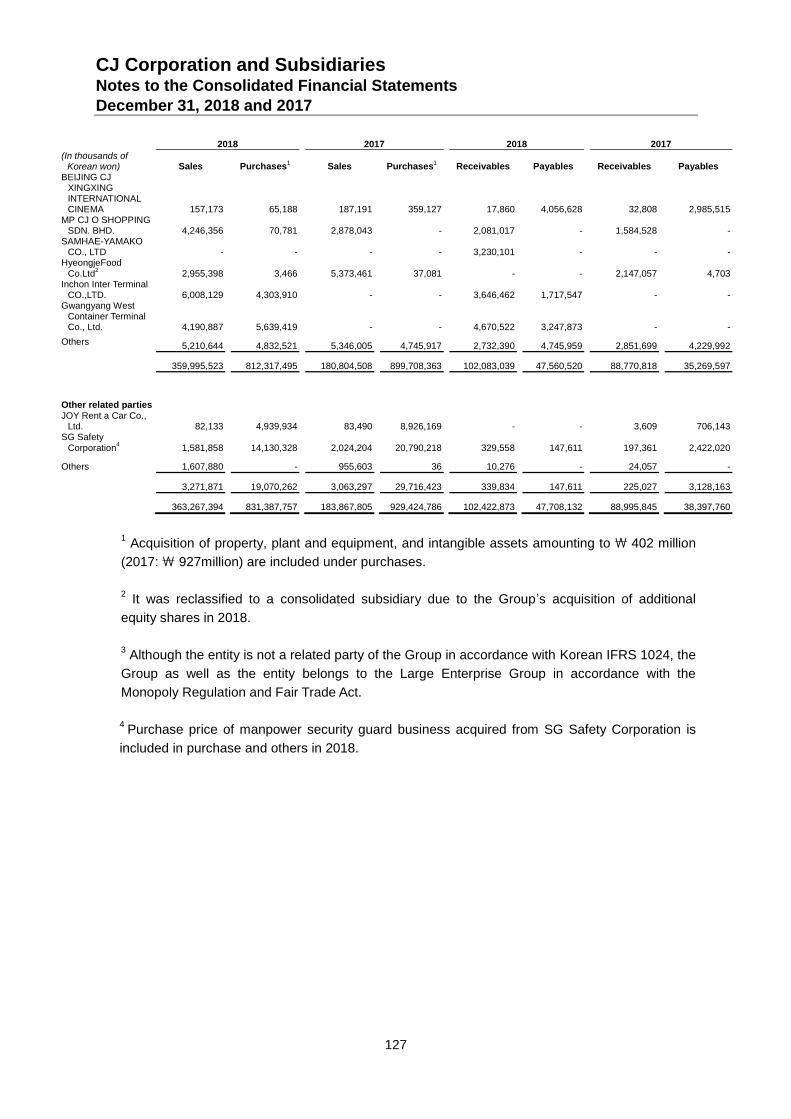
CJ Corporation and Subsidiaries Notes to the Consolidated Financial Statements December 31, 2018 and 2017
127
2018 2017 2018 2017
(In thousands of Korean won) Sales Purchases
1 Sales Purchases
1 Receivables Payables Receivables Payables
BEIJING CJ XINGXING INTERNATIONAL CINEMA 157,173 65,188 187,191 359,127 17,860 4,056,628 32,808 2,985,515
MP CJ O SHOPPING SDN. BHD. 4,246,356 70,781 2,878,043 - 2,081,017 - 1,584,528 -
SAMHAE-YAMAKO CO., LTD - - - - 3,230,101 - - -
HyeongjeFood Co.Ltd
2 2,955,398 3,466 5,373,461 37,081 - - 2,147,057 4,703
Inchon Inter Terminal CO.,LTD. 6,008,129 4,303,910 - - 3,646,462 1,717,547 - -
Gwangyang West Container Terminal Co., Ltd. 4,190,887 5,639,419 - - 4,670,522 3,247,873 - -
Others 5,210,644 4,832,521 5,346,005 4,745,917 2,732,390 4,745,959 2,851,699 4,229,992
359,995,523 812,317,495 180,804,508 899,708,363 102,083,039 47,560,520 88,770,818 35,269,597
Other related parties
JOY Rent a Car Co., Ltd. 82,133 4,939,934 83,490 8,926,169 - - 3,609 706,143
SG Safety Corporation
4 1,581,858 14,130,328 2,024,204 20,790,218 329,558 147,611 197,361 2,422,020
Others 1,607,880 - 955,603 36 10,276 - 24,057 -
3,271,871 19,070,262 3,063,297 29,716,423 339,834 147,611 225,027 3,128,163
363,267,394 831,387,757 183,867,805 929,424,786 102,422,873 47,708,132 88,995,845 38,397,760
1 Acquisition of property, plant and equipment, and intangible assets amounting to \ 402 million
(2017: \ 927million) are included under purchases.
2 It was reclassified to a consolidated subsidiary due to the Group’s acquisition of additional
equity shares in 2018.
3 Although the entity is not a related party of the Group in accordance with Korean IFRS 1024, the
Group as well as the entity belongs to the Large Enterprise Group in accordance with the
Monopoly Regulation and Fair Trade Act.
4
Purchase price of manpower security guard business acquired from SG Safety Corporation is
included in purchase and others in 2018.
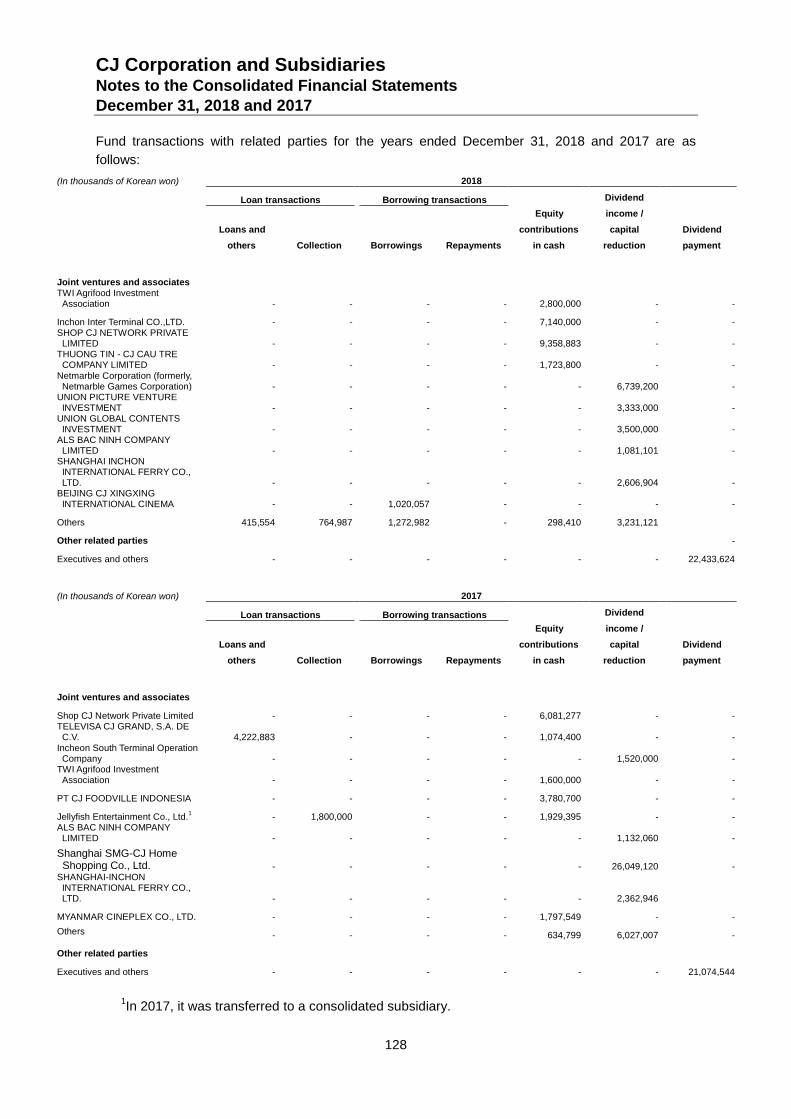
CJ Corporation and Subsidiaries Notes to the Consolidated Financial Statements December 31, 2018 and 2017
128
Fund transactions with related parties for the years ended December 31, 2018 and 2017 are as
follows:
(In thousands of Korean won) 2018
Loan transactions Borrowing transactions
Equity
contributions
in cash
Dividend
income /
capital
reduction
Dividend
payment
Loans and
others Collection Borrowings Repayments
Joint ventures and associates
TWI Agrifood Investment Association - - - - 2,800,000 - -
Inchon Inter Terminal CO.,LTD. - - - - 7,140,000 - - SHOP CJ NETWORK PRIVATE LIMITED - - - - 9,358,883 - -
THUONG TIN - CJ CAU TRE COMPANY LIMITED - - - - 1,723,800 - -
Netmarble Corporation (formerly, Netmarble Games Corporation) - - - - - 6,739,200 -
UNION PICTURE VENTURE INVESTMENT - - - - - 3,333,000 -
UNION GLOBAL CONTENTS INVESTMENT - - - - - 3,500,000 -
ALS BAC NINH COMPANY LIMITED - - - - - 1,081,101 -
SHANGHAI INCHON INTERNATIONAL FERRY CO., LTD. - - - - - 2,606,904 -
BEIJING CJ XINGXING INTERNATIONAL CINEMA - - 1,020,057 - - - -
Others 415,554 764,987 1,272,982 - 298,410 3,231,121
Other related parties -
Executives and others - - - - - - 22,433,624
(In thousands of Korean won) 2017
Loan transactions Borrowing transactions
Equity
contributions
in cash
Dividend
income /
capital
reduction
Dividend
payment
Loans and
others Collection Borrowings Repayments
Joint ventures and associates
Shop CJ Network Private Limited - - - - 6,081,277 - - TELEVISA CJ GRAND, S.A. DE C.V. 4,222,883 - - - 1,074,400 - -
Incheon South Terminal Operation Company - - - - - 1,520,000 -
TWI Agrifood Investment Association - - - - 1,600,000 - -
PT CJ FOODVILLE INDONESIA - - - - 3,780,700 - -
Jellyfish Entertainment Co., Ltd.1 - 1,800,000 - - 1,929,395 - -
ALS BAC NINH COMPANY LIMITED - - - - - 1,132,060 -
Shanghai SMG-CJ Home Shopping Co., Ltd. - - - - - 26,049,120 - SHANGHAI-INCHON INTERNATIONAL FERRY CO., LTD. - - - - - 2,362,946
MYANMAR CINEPLEX CO., LTD. - - - - 1,797,549 - -
Others - - - - 634,799 6,027,007 -
Other related parties
Executives and others - - - - - - 21,074,544
1In 2017, it was transferred to a consolidated subsidiary.
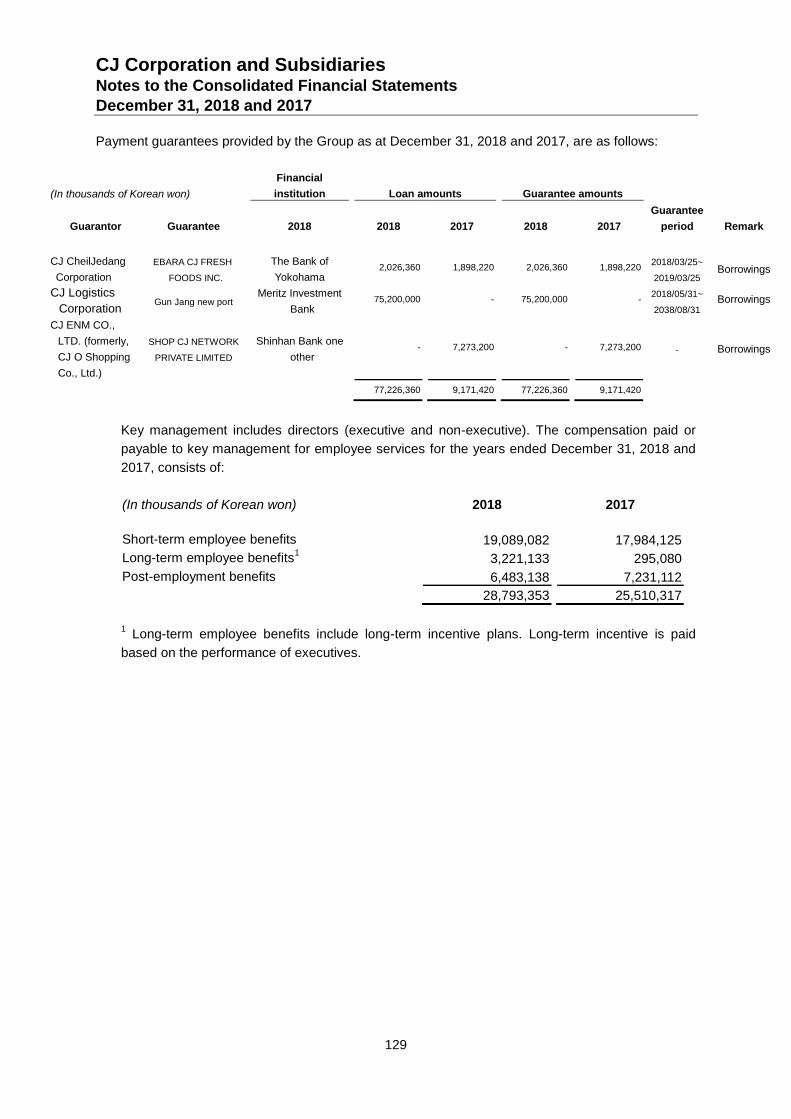
CJ Corporation and Subsidiaries Notes to the Consolidated Financial Statements December 31, 2018 and 2017
129
Payment guarantees provided by the Group as at December 31, 2018 and 2017, are as follows:
(In thousands of Korean won)
Financial
institution Loan amounts Guarantee amounts
Guarantor Guarantee 2018 2018 2017 2018 2017
Guarantee
period Remark
CJ CheilJedang
Corporation
EBARA CJ FRESH
FOODS INC.
The Bank of
Yokohama 2,026,360 1,898,220 2,026,360 1,898,220
2018/03/25~
2019/03/25 Borrowings
CJ Logistics
Corporation Gun Jang new port
Meritz Investment
Bank 75,200,000 - 75,200,000 -
2018/05/31~
2038/08/31 Borrowings
CJ ENM CO.,
LTD. (formerly,
CJ O Shopping
Co., Ltd.)
SHOP CJ NETWORK
PRIVATE LIMITED
Shinhan Bank one
other
- 7,273,200 - 7,273,200 - Borrowings
77,226,360 9,171,420 77,226,360 9,171,420
Key management includes directors (executive and non-executive). The compensation paid or
payable to key management for employee services for the years ended December 31, 2018 and
2017, consists of:
(In thousands of Korean won)
2018
2017
Short-term employee benefits
19,089,082 17,984,125
Long-term employee benefits1
3,221,133 295,080
Post-employment benefits
6,483,138 7,231,112
28,793,353 25,510,317
1 Long-term employee benefits include long-term incentive plans. Long-term incentive is paid
based on the performance of executives.
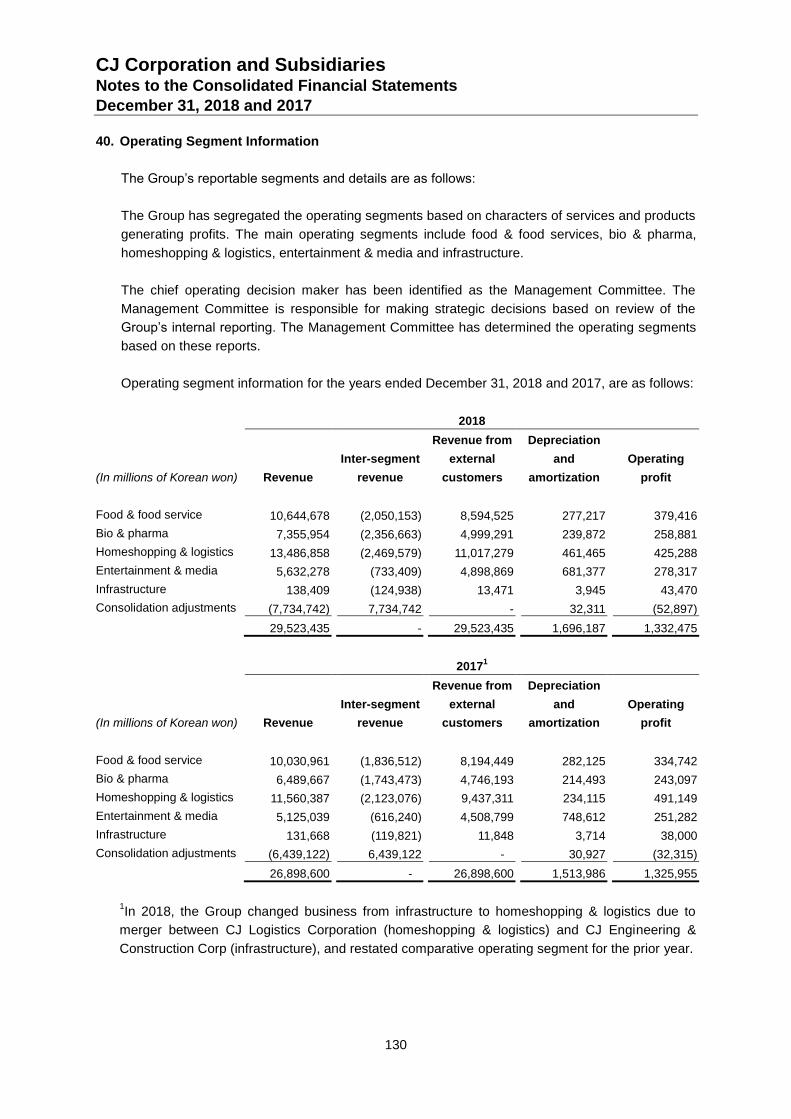
CJ Corporation and Subsidiaries Notes to the Consolidated Financial Statements December 31, 2018 and 2017
130
40. Operating Segment Information
The Group’s reportable segments and details are as follows:
The Group has segregated the operating segments based on characters of services and products
generating profits. The main operating segments include food & food services, bio & pharma,
homeshopping & logistics, entertainment & media and infrastructure.
The chief operating decision maker has been identified as the Management Committee. The
Management Committee is responsible for making strategic decisions based on review of the
Group’s internal reporting. The Management Committee has determined the operating segments
based on these reports.
Operating segment information for the years ended December 31, 2018 and 2017, are as follows:
2018
(In millions of Korean won) Revenue
Inter-segment
revenue
Revenue from
external
customers
Depreciation
and
amortization
Operating
profit
Food & food service 10,644,678 (2,050,153) 8,594,525 277,217 379,416
Bio & pharma 7,355,954 (2,356,663) 4,999,291 239,872 258,881
Homeshopping & logistics 13,486,858 (2,469,579) 11,017,279 461,465 425,288
Entertainment & media 5,632,278 (733,409) 4,898,869 681,377 278,317
Infrastructure 138,409 (124,938) 13,471 3,945 43,470
Consolidation adjustments (7,734,742) 7,734,742 - 32,311 (52,897)
29,523,435 - 29,523,435 1,696,187 1,332,475
20171
(In millions of Korean won) Revenue
Inter-segment
revenue
Revenue from
external
customers
Depreciation
and
amortization
Operating
profit
Food & food service 10,030,961 (1,836,512) 8,194,449 282,125 334,742
Bio & pharma 6,489,667 (1,743,473) 4,746,193 214,493 243,097
Homeshopping & logistics 11,560,387 (2,123,076) 9,437,311 234,115 491,149
Entertainment & media 5,125,039 (616,240) 4,508,799 748,612 251,282
Infrastructure 131,668 (119,821) 11,848 3,714 38,000
Consolidation adjustments (6,439,122) 6,439,122 - 30,927 (32,315)
26,898,600 - 26,898,600 1,513,986 1,325,955
1In 2018, the Group changed business from infrastructure to homeshopping & logistics due to
merger between CJ Logistics Corporation (homeshopping & logistics) and CJ Engineering &
Construction Corp (infrastructure), and restated comparative operating segment for the prior year.
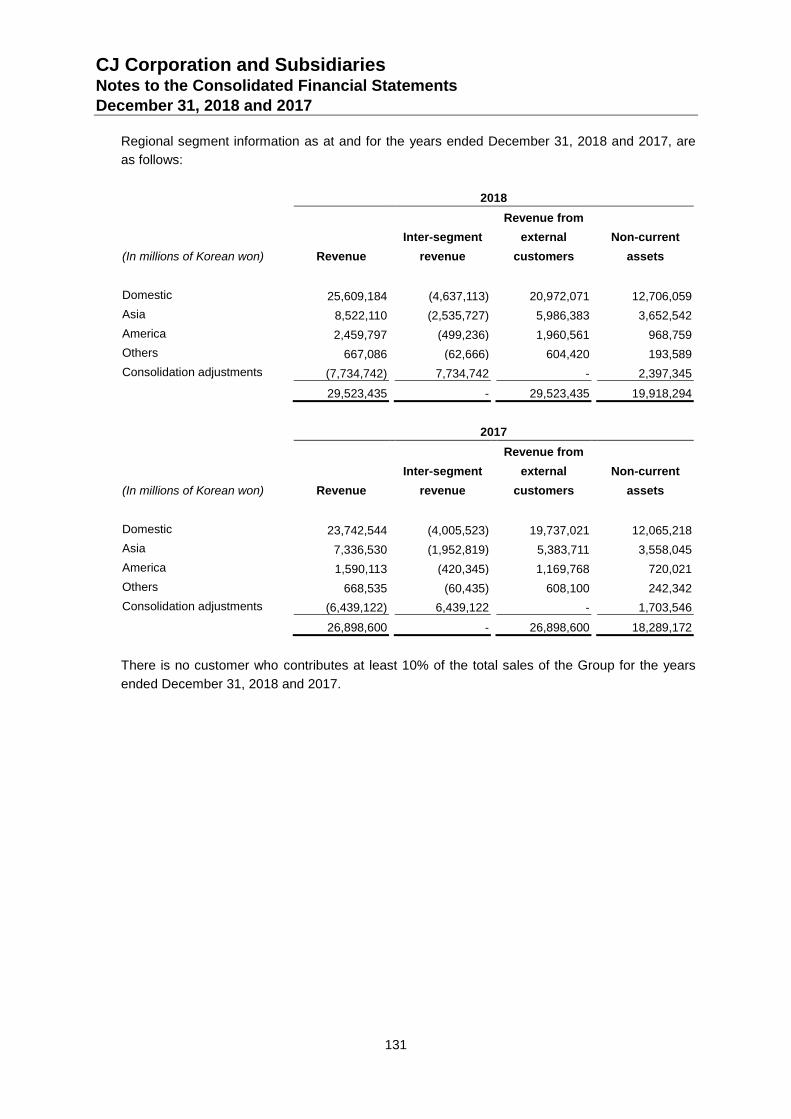
CJ Corporation and Subsidiaries Notes to the Consolidated Financial Statements December 31, 2018 and 2017
131
Regional segment information as at and for the years ended December 31, 2018 and 2017, are
as follows:
2018
(In millions of Korean won) Revenue
Inter-segment
revenue
Revenue from
external
customers
Non-current
assets
Domestic 25,609,184 (4,637,113) 20,972,071 12,706,059
Asia 8,522,110 (2,535,727) 5,986,383 3,652,542
America 2,459,797 (499,236) 1,960,561 968,759
Others 667,086 (62,666) 604,420 193,589
Consolidation adjustments (7,734,742) 7,734,742 - 2,397,345
29,523,435 - 29,523,435 19,918,294
2017
(In millions of Korean won) Revenue
Inter-segment
revenue
Revenue from
external
customers
Non-current
assets
Domestic 23,742,544 (4,005,523) 19,737,021 12,065,218
Asia 7,336,530 (1,952,819) 5,383,711 3,558,045
America 1,590,113 (420,345) 1,169,768 720,021
Others 668,535 (60,435) 608,100 242,342
Consolidation adjustments (6,439,122) 6,439,122 - 1,703,546
26,898,600 - 26,898,600 18,289,172
There is no customer who contributes at least 10% of the total sales of the Group for the years
ended December 31, 2018 and 2017.
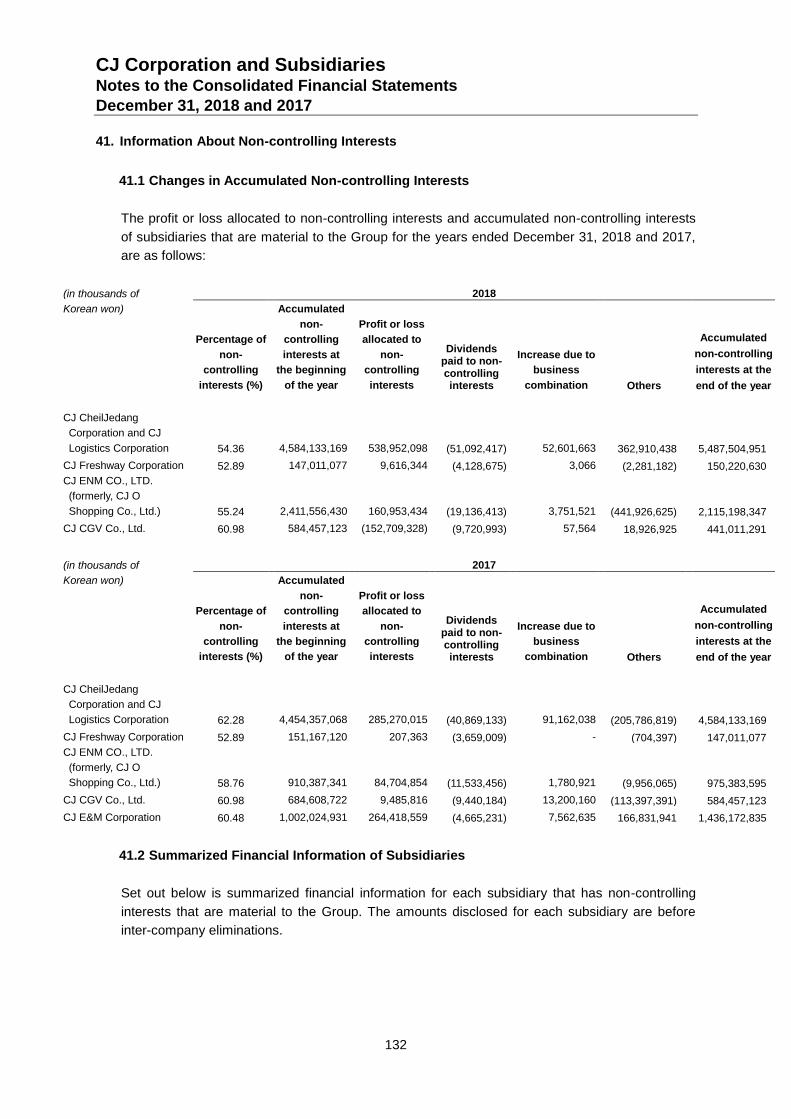
CJ Corporation and Subsidiaries Notes to the Consolidated Financial Statements December 31, 2018 and 2017
132
41. Information About Non-controlling Interests
41.1 Changes in Accumulated Non-controlling Interests
The profit or loss allocated to non-controlling interests and accumulated non-controlling interests
of subsidiaries that are material to the Group for the years ended December 31, 2018 and 2017,
are as follows:
(in thousands of 2018
Korean won)
Percentage of
non-
controlling
interests (%)
Accumulated
non-
controlling
interests at
the beginning
of the year
Profit or loss
allocated to
non-
controlling
interests
Dividends paid to non-controlling interests
Increase due to
business
combination
Others
Accumulated
non-controlling
interests at the
end of the year
CJ CheilJedang
Corporation and CJ
Logistics Corporation
54.36 4,584,133,169 538,952,098 (51,092,417) 52,601,663 362,910,438 5,487,504,951
CJ Freshway Corporation 52.89 147,011,077 9,616,344 (4,128,675) 3,066 (2,281,182) 150,220,630
CJ ENM CO., LTD.
(formerly, CJ O
Shopping Co., Ltd.)
55.24 2,411,556,430 160,953,434 (19,136,413) 3,751,521 (441,926,625) 2,115,198,347
CJ CGV Co., Ltd. 60.98 584,457,123 (152,709,328) (9,720,993) 57,564 18,926,925 441,011,291
(in thousands of 2017
Korean won)
Percentage of
non-
controlling
interests (%)
Accumulated
non-
controlling
interests at
the beginning
of the year
Profit or loss
allocated to
non-
controlling
interests
Dividends paid to non-controlling interests
Increase due to
business
combination
Others
Accumulated
non-controlling
interests at the
end of the year
CJ CheilJedang
Corporation and CJ
Logistics Corporation
62.28 4,454,357,068 285,270,015 (40,869,133) 91,162,038 (205,786,819) 4,584,133,169
CJ Freshway Corporation 52.89 151,167,120 207,363 (3,659,009) - (704,397) 147,011,077
CJ ENM CO., LTD.
(formerly, CJ O
Shopping Co., Ltd.)
58.76 910,387,341 84,704,854 (11,533,456) 1,780,921 (9,956,065) 975,383,595
CJ CGV Co., Ltd. 60.98 684,608,722 9,485,816 (9,440,184) 13,200,160 (113,397,391) 584,457,123
CJ E&M Corporation 60.48 1,002,024,931 264,418,559 (4,665,231) 7,562,635 166,831,941 1,436,172,835
41.2 Summarized Financial Information of Subsidiaries
Set out below is summarized financial information for each subsidiary that has non-controlling
interests that are material to the Group. The amounts disclosed for each subsidiary are before
inter-company eliminations.
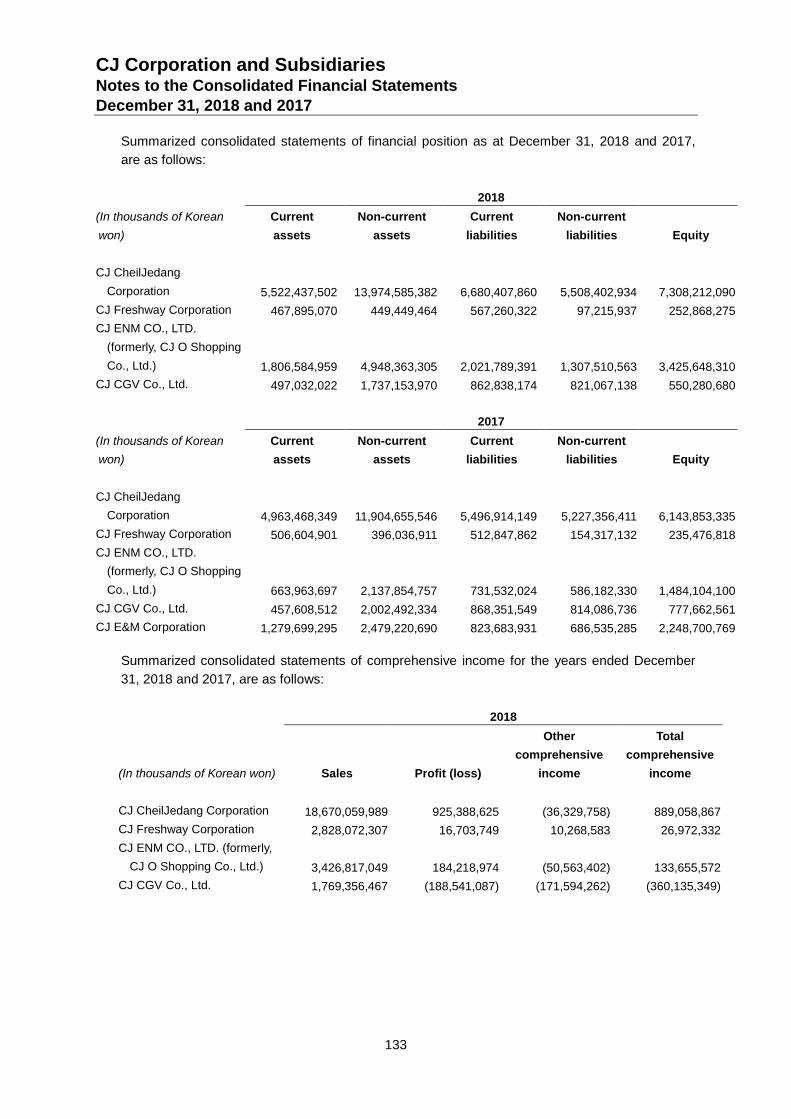
CJ Corporation and Subsidiaries Notes to the Consolidated Financial Statements December 31, 2018 and 2017
133
Summarized consolidated statements of financial position as at December 31, 2018 and 2017,
are as follows:
2018
(In thousands of Korean
won)
Current
assets
Non-current
assets
Current
liabilities
Non-current
liabilities Equity
CJ CheilJedang
Corporation 5,522,437,502 13,974,585,382 6,680,407,860 5,508,402,934 7,308,212,090
CJ Freshway Corporation 467,895,070 449,449,464 567,260,322 97,215,937 252,868,275
CJ ENM CO., LTD.
(formerly, CJ O Shopping
Co., Ltd.) 1,806,584,959 4,948,363,305 2,021,789,391 1,307,510,563 3,425,648,310
CJ CGV Co., Ltd. 497,032,022 1,737,153,970 862,838,174 821,067,138 550,280,680
2017
(In thousands of Korean
won)
Current
assets
Non-current
assets
Current
liabilities
Non-current
liabilities Equity
CJ CheilJedang
Corporation 4,963,468,349 11,904,655,546 5,496,914,149 5,227,356,411 6,143,853,335
CJ Freshway Corporation 506,604,901 396,036,911 512,847,862 154,317,132 235,476,818
CJ ENM CO., LTD.
(formerly, CJ O Shopping
Co., Ltd.) 663,963,697 2,137,854,757 731,532,024 586,182,330 1,484,104,100
CJ CGV Co., Ltd. 457,608,512 2,002,492,334 868,351,549 814,086,736 777,662,561
CJ E&M Corporation 1,279,699,295 2,479,220,690 823,683,931 686,535,285 2,248,700,769
Summarized consolidated statements of comprehensive income for the years ended December
31, 2018 and 2017, are as follows:
2018
(In thousands of Korean won) Sales
Profit (loss)
Other
comprehensive
income
Total
comprehensive
income
CJ CheilJedang Corporation 18,670,059,989 925,388,625 (36,329,758) 889,058,867
CJ Freshway Corporation 2,828,072,307 16,703,749 10,268,583 26,972,332
CJ ENM CO., LTD. (formerly,
CJ O Shopping Co., Ltd.) 3,426,817,049 184,218,974 (50,563,402) 133,655,572
CJ CGV Co., Ltd. 1,769,356,467 (188,541,087) (171,594,262) (360,135,349)
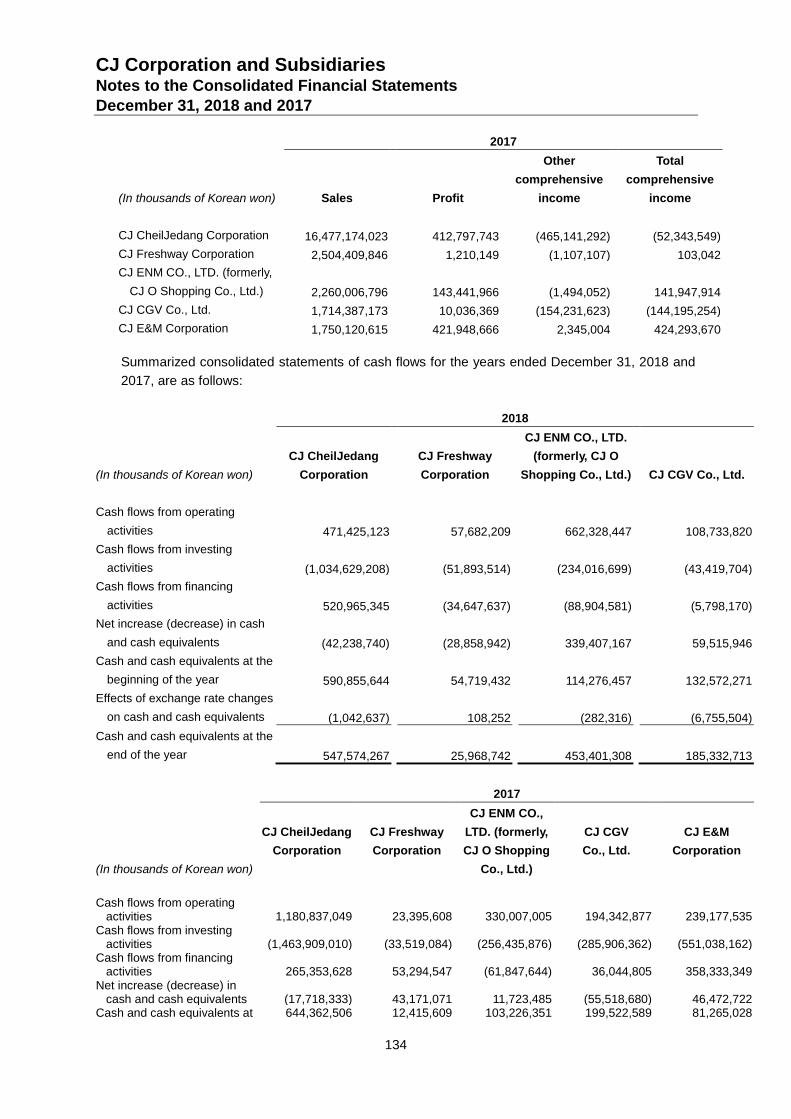
CJ Corporation and Subsidiaries Notes to the Consolidated Financial Statements December 31, 2018 and 2017
134
2017
(In thousands of Korean won) Sales
Profit
Other
comprehensive
income
Total
comprehensive
income
CJ CheilJedang Corporation 16,477,174,023 412,797,743 (465,141,292) (52,343,549)
CJ Freshway Corporation 2,504,409,846 1,210,149 (1,107,107) 103,042
CJ ENM CO., LTD. (formerly,
CJ O Shopping Co., Ltd.) 2,260,006,796 143,441,966 (1,494,052) 141,947,914
CJ CGV Co., Ltd. 1,714,387,173 10,036,369 (154,231,623) (144,195,254)
CJ E&M Corporation 1,750,120,615 421,948,666 2,345,004 424,293,670
Summarized consolidated statements of cash flows for the years ended December 31, 2018 and
2017, are as follows:
2018
(In thousands of Korean won)
CJ CheilJedang
Corporation
CJ Freshway
Corporation
CJ ENM CO., LTD.
(formerly, CJ O
Shopping Co., Ltd.)
CJ CGV Co., Ltd.
Cash flows from operating
activities 471,425,123 57,682,209 662,328,447 108,733,820
Cash flows from investing
activities (1,034,629,208) (51,893,514) (234,016,699) (43,419,704)
Cash flows from financing
activities 520,965,345 (34,647,637) (88,904,581) (5,798,170)
Net increase (decrease) in cash
and cash equivalents (42,238,740) (28,858,942) 339,407,167 59,515,946
Cash and cash equivalents at the
beginning of the year 590,855,644 54,719,432 114,276,457 132,572,271
Effects of exchange rate changes
on cash and cash equivalents (1,042,637) 108,252 (282,316) (6,755,504)
Cash and cash equivalents at the
end of the year 547,574,267 25,968,742 453,401,308 185,332,713
2017
(In thousands of Korean won)
CJ CheilJedang
Corporation
CJ Freshway
Corporation
CJ ENM CO.,
LTD. (formerly,
CJ O Shopping
Co., Ltd.)
CJ CGV
Co., Ltd.
CJ E&M
Corporation
Cash flows from operating activities 1,180,837,049 23,395,608 330,007,005 194,342,877 239,177,535
Cash flows from investing activities (1,463,909,010) (33,519,084) (256,435,876) (285,906,362) (551,038,162)
Cash flows from financing activities 265,353,628 53,294,547 (61,847,644) 36,044,805 358,333,349
Net increase (decrease) in cash and cash equivalents (17,718,333) 43,171,071 11,723,485 (55,518,680) 46,472,722
Cash and cash equivalents at 644,362,506 12,415,609 103,226,351 199,522,589 81,265,028
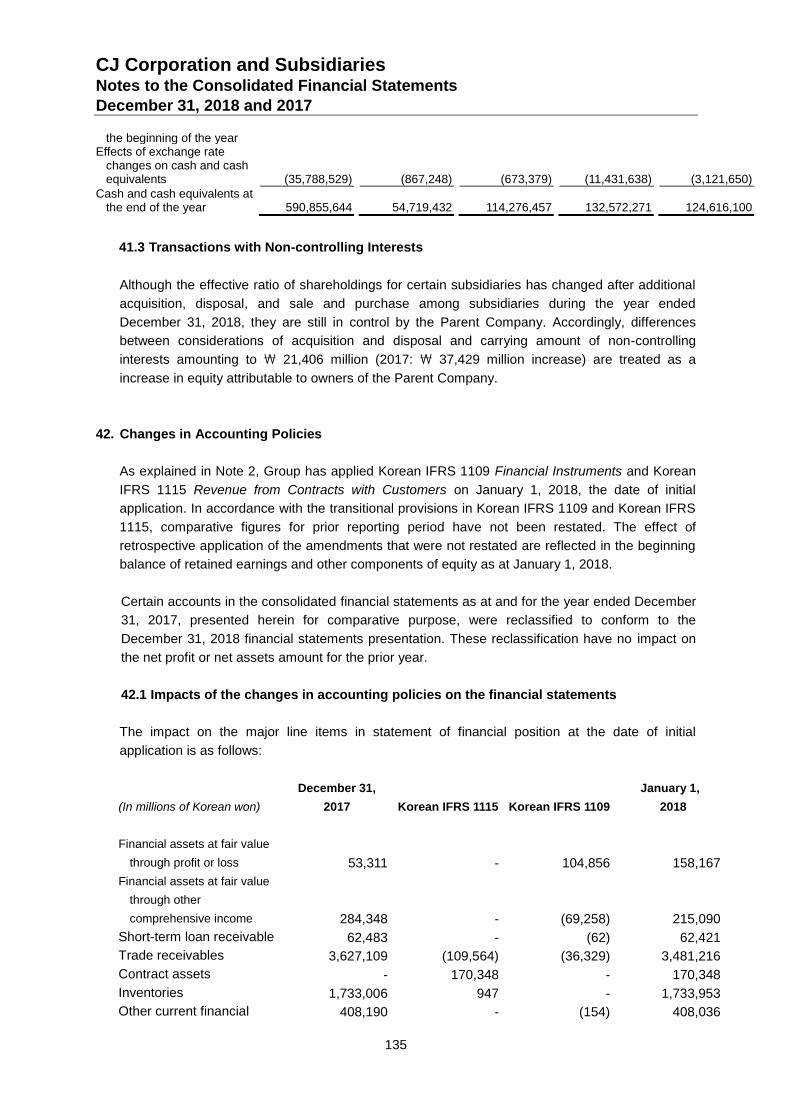
CJ Corporation and Subsidiaries Notes to the Consolidated Financial Statements December 31, 2018 and 2017
135
the beginning of the year Effects of exchange rate
changes on cash and cash equivalents (35,788,529) (867,248) (673,379) (11,431,638) (3,121,650)
Cash and cash equivalents at the end of the year 590,855,644 54,719,432 114,276,457 132,572,271 124,616,100
41.3 Transactions with Non-controlling Interests
Although the effective ratio of shareholdings for certain subsidiaries has changed after additional
acquisition, disposal, and sale and purchase among subsidiaries during the year ended
December 31, 2018, they are still in control by the Parent Company. Accordingly, differences
between considerations of acquisition and disposal and carrying amount of non-controlling
interests amounting to \ 21,406 million (2017: \ 37,429 million increase) are treated as a
increase in equity attributable to owners of the Parent Company.
42. Changes in Accounting Policies
As explained in Note 2, Group has applied Korean IFRS 1109 Financial Instruments and Korean
IFRS 1115 Revenue from Contracts with Customers on January 1, 2018, the date of initial
application. In accordance with the transitional provisions in Korean IFRS 1109 and Korean IFRS
1115, comparative figures for prior reporting period have not been restated. The effect of
retrospective application of the amendments that were not restated are reflected in the beginning
balance of retained earnings and other components of equity as at January 1, 2018.
Certain accounts in the consolidated financial statements as at and for the year ended December
31, 2017, presented herein for comparative purpose, were reclassified to conform to the
December 31, 2018 financial statements presentation. These reclassification have no impact on
the net profit or net assets amount for the prior year.
42.1 Impacts of the changes in accounting policies on the financial statements
The impact on the major line items in statement of financial position at the date of initial
application is as follows:
(In millions of Korean won)
December 31,
2017 Korean IFRS 1115
Korean IFRS 1109
January 1,
2018
Financial assets at fair value
through profit or loss 53,311 - 104,856 158,167
Financial assets at fair value
through other
comprehensive income 284,348 - (69,258) 215,090
Short-term loan receivable 62,483 - (62) 62,421
Trade receivables 3,627,109 (109,564) (36,329) 3,481,216
Contract assets - 170,348 - 170,348
Inventories 1,733,006 947 - 1,733,953
Other current financial 408,190 - (154) 408,036
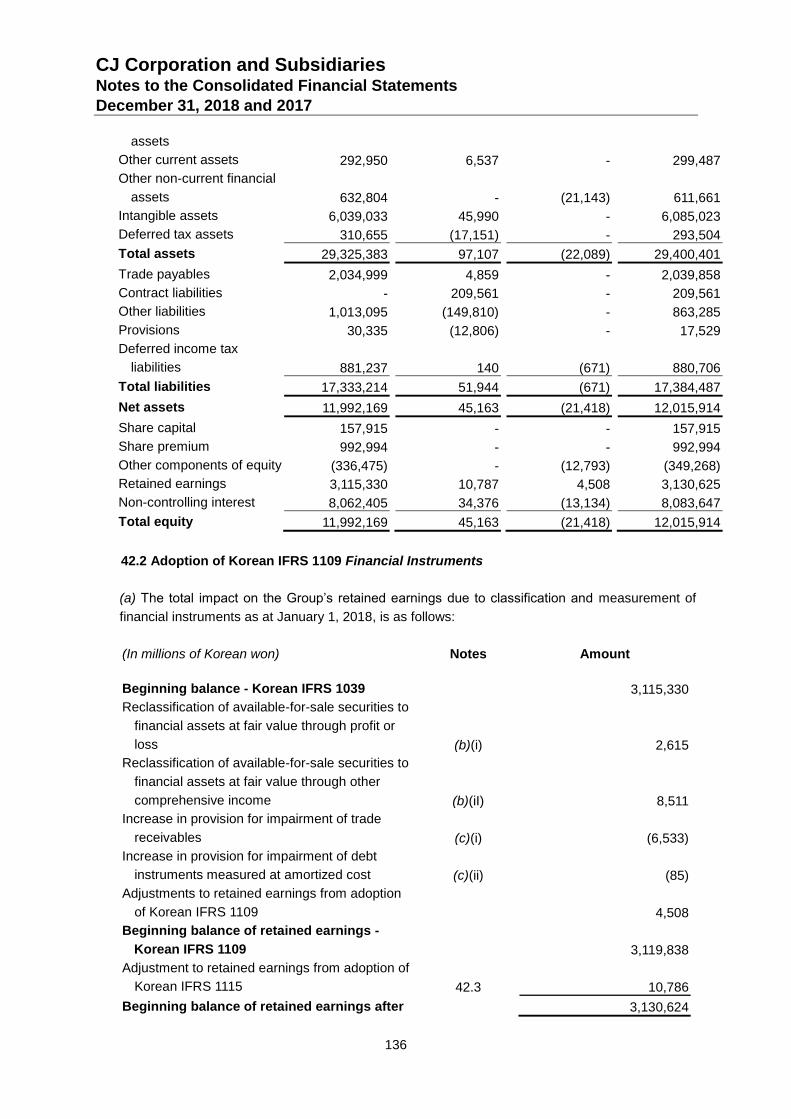
CJ Corporation and Subsidiaries Notes to the Consolidated Financial Statements December 31, 2018 and 2017
136
assets
Other current assets 292,950 6,537 - 299,487
Other non-current financial
assets 632,804 - (21,143) 611,661
Intangible assets 6,039,033 45,990 - 6,085,023
Deferred tax assets 310,655 (17,151) - 293,504
Total assets 29,325,383 97,107 (22,089) 29,400,401
Trade payables 2,034,999 4,859 - 2,039,858
Contract liabilities - 209,561 - 209,561
Other liabilities 1,013,095 (149,810) - 863,285
Provisions 30,335 (12,806) - 17,529
Deferred income tax
liabilities 881,237 140 (671) 880,706
Total liabilities 17,333,214 51,944 (671) 17,384,487
Net assets 11,992,169 45,163 (21,418) 12,015,914
Share capital 157,915 - - 157,915
Share premium 992,994 - - 992,994
Other components of equity (336,475) - (12,793) (349,268)
Retained earnings 3,115,330 10,787 4,508 3,130,625
Non-controlling interest 8,062,405 34,376 (13,134) 8,083,647
Total equity 11,992,169 45,163 (21,418) 12,015,914
42.2 Adoption of Korean IFRS 1109 Financial Instruments
(a) The total impact on the Group’s retained earnings due to classification and measurement of
financial instruments as at January 1, 2018, is as follows:
(In millions of Korean won)
Notes
Amount
Beginning balance - Korean IFRS 1039 3,115,330
Reclassification of available-for-sale securities to
financial assets at fair value through profit or
loss
(b)(i) 2,615
Reclassification of available-for-sale securities to
financial assets at fair value through other
comprehensive income
(b)(iI) 8,511
Increase in provision for impairment of trade
receivables
(c)(i) (6,533)
Increase in provision for impairment of debt
instruments measured at amortized cost
(c)(ii) (85)
Adjustments to retained earnings from adoption
of Korean IFRS 1109
4,508
Beginning balance of retained earnings -
Korean IFRS 1109
3,119,838
Adjustment to retained earnings from adoption of
Korean IFRS 1115
42.3 10,786
Beginning balance of retained earnings after 3,130,624
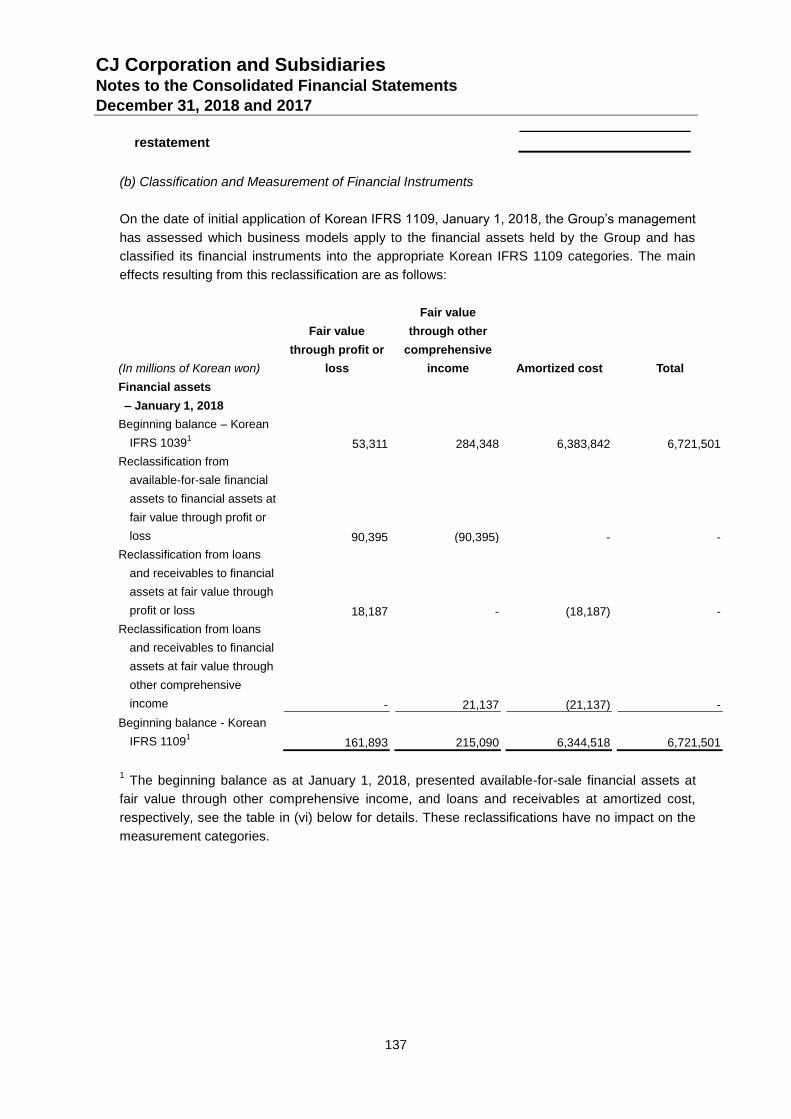
CJ Corporation and Subsidiaries Notes to the Consolidated Financial Statements December 31, 2018 and 2017
137
restatement
(b) Classification and Measurement of Financial Instruments
On the date of initial application of Korean IFRS 1109, January 1, 2018, the Group’s management
has assessed which business models apply to the financial assets held by the Group and has
classified its financial instruments into the appropriate Korean IFRS 1109 categories. The main
effects resulting from this reclassification are as follows:
(In millions of Korean won)
Fair value
through profit or
loss
Fair value
through other
comprehensive
income Amortized cost Total
Financial assets
– January 1, 2018
Beginning balance – Korean
IFRS 10391 53,311 284,348 6,383,842 6,721,501
Reclassification from
available-for-sale financial
assets to financial assets at
fair value through profit or
loss 90,395 (90,395) - -
Reclassification from loans
and receivables to financial
assets at fair value through
profit or loss 18,187 - (18,187) -
Reclassification from loans
and receivables to financial
assets at fair value through
other comprehensive
income - 21,137 (21,137) -
Beginning balance - Korean
IFRS 11091 161,893 215,090 6,344,518 6,721,501
1 The beginning balance as at January 1, 2018, presented available-for-sale financial assets at
fair value through other comprehensive income, and loans and receivables at amortized cost,
respectively, see the table in (vi) below for details. These reclassifications have no impact on the
measurement categories.
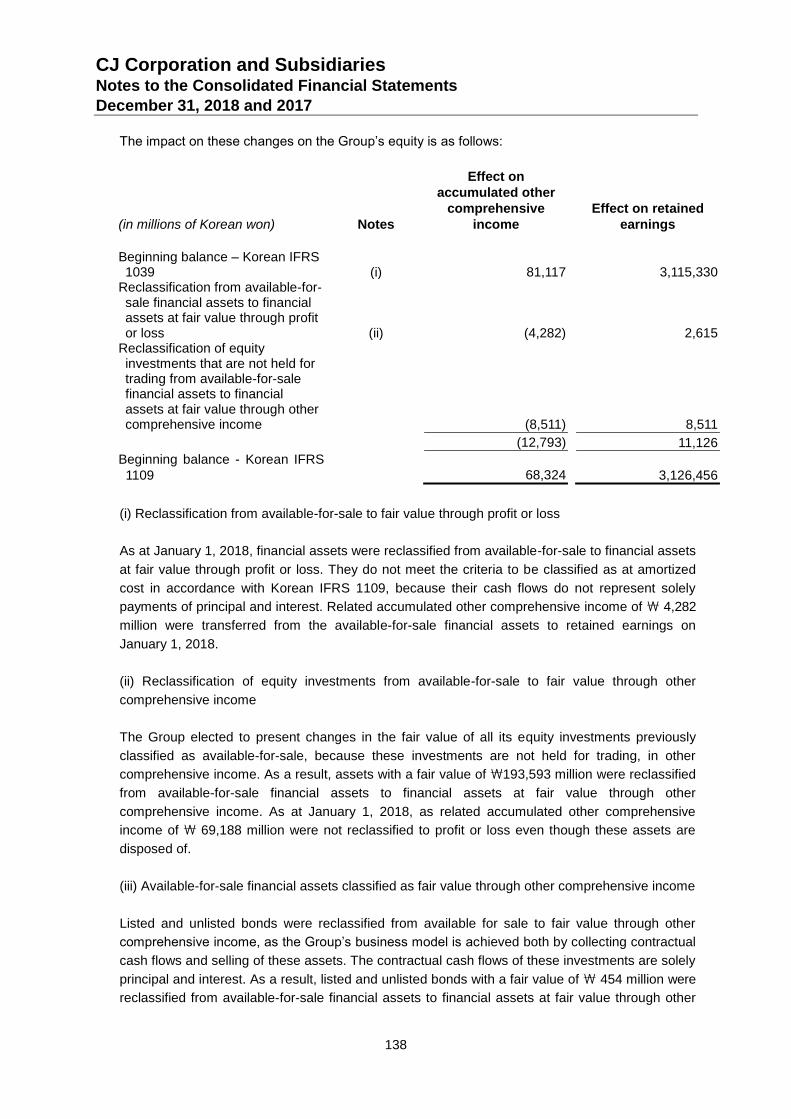
CJ Corporation and Subsidiaries Notes to the Consolidated Financial Statements December 31, 2018 and 2017
138
The impact on these changes on the Group’s equity is as follows:
(in millions of Korean won) Notes
Effect on
accumulated other
comprehensive
income
Effect on retained
earnings
Beginning balance – Korean IFRS 1039
(i) 81,117 3,115,330
Reclassification from available-for-sale financial assets to financial assets at fair value through profit or loss
(ii) (4,282) 2,615 Reclassification of equity investments that are not held for trading from available-for-sale financial assets to financial assets at fair value through other comprehensive income
(8,511) 8,511
(12,793) 11,126
Beginning balance - Korean IFRS
1109
68,324 3,126,456
(i) Reclassification from available-for-sale to fair value through profit or loss
As at January 1, 2018, financial assets were reclassified from available-for-sale to financial assets
at fair value through profit or loss. They do not meet the criteria to be classified as at amortized
cost in accordance with Korean IFRS 1109, because their cash flows do not represent solely
payments of principal and interest. Related accumulated other comprehensive income of \ 4,282
million were transferred from the available-for-sale financial assets to retained earnings on
January 1, 2018.
(ii) Reclassification of equity investments from available-for-sale to fair value through other
comprehensive income
The Group elected to present changes in the fair value of all its equity investments previously
classified as available-for-sale, because these investments are not held for trading, in other
comprehensive income. As a result, assets with a fair value of \193,593 million were reclassified
from available-for-sale financial assets to financial assets at fair value through other
comprehensive income. As at January 1, 2018, as related accumulated other comprehensive
income of \ 69,188 million were not reclassified to profit or loss even though these assets are
disposed of.
(iii) Available-for-sale financial assets classified as fair value through other comprehensive income
Listed and unlisted bonds were reclassified from available for sale to fair value through other
comprehensive income, as the Group’s business model is achieved both by collecting contractual
cash flows and selling of these assets. The contractual cash flows of these investments are solely
principal and interest. As a result, listed and unlisted bonds with a fair value of \ 454 million were
reclassified from available-for-sale financial assets to financial assets at fair value through other
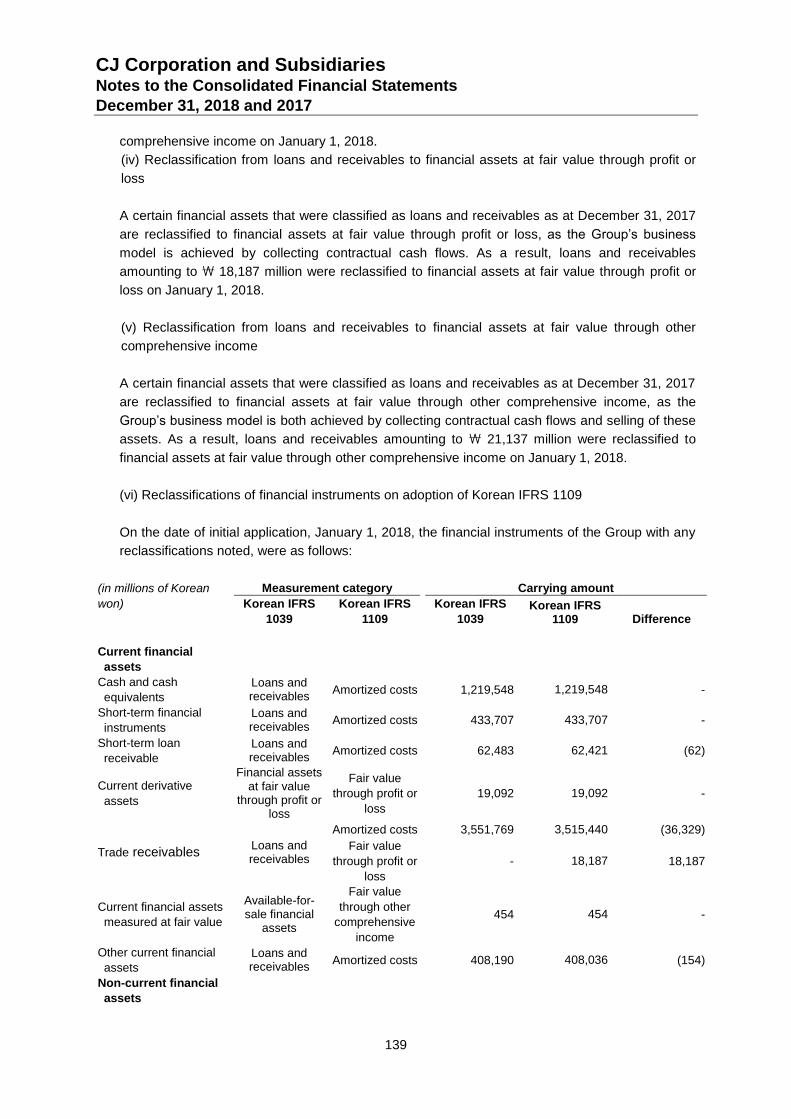
CJ Corporation and Subsidiaries Notes to the Consolidated Financial Statements December 31, 2018 and 2017
139
comprehensive income on January 1, 2018.
(iv) Reclassification from loans and receivables to financial assets at fair value through profit or
loss
A certain financial assets that were classified as loans and receivables as at December 31, 2017
are reclassified to financial assets at fair value through profit or loss, as the Group’s business
model is achieved by collecting contractual cash flows. As a result, loans and receivables
amounting to \ 18,187 million were reclassified to financial assets at fair value through profit or
loss on January 1, 2018.
(v) Reclassification from loans and receivables to financial assets at fair value through other
comprehensive income
A certain financial assets that were classified as loans and receivables as at December 31, 2017
are reclassified to financial assets at fair value through other comprehensive income, as the
Group’s business model is both achieved by collecting contractual cash flows and selling of these
assets. As a result, loans and receivables amounting to \ 21,137 million were reclassified to
financial assets at fair value through other comprehensive income on January 1, 2018.
(vi) Reclassifications of financial instruments on adoption of Korean IFRS 1109
On the date of initial application, January 1, 2018, the financial instruments of the Group with any
reclassifications noted, were as follows:
(in millions of Korean Measurement category Carrying amount
won)
Korean IFRS
1039
Korean IFRS
1109
Korean IFRS
1039 Korean IFRS
1109 Difference
Current financial
assets
Cash and cash
equivalents Loans and
receivables Amortized costs
1,219,548 1,219,548 -
Short-term financial
instruments Loans and
receivables Amortized costs
433,707 433,707 -
Short-term loan
receivable Loans and
receivables Amortized costs
62,483 62,421 (62)
Current derivative
assets
Financial assets at fair value
through profit or loss
Fair value
through profit or
loss
19,092 19,092 -
Trade receivables
Loans and receivables
Amortized costs 3,551,769 3,515,440 (36,329)
Fair value
through profit or
loss
- 18,187 18,187
Current financial assets
measured at fair value
Available-for-sale financial
assets
Fair value
through other
comprehensive
income
454 454 -
Other current financial
assets Loans and
receivables Amortized costs
408,190 408,036 (154)
Non-current financial
assets
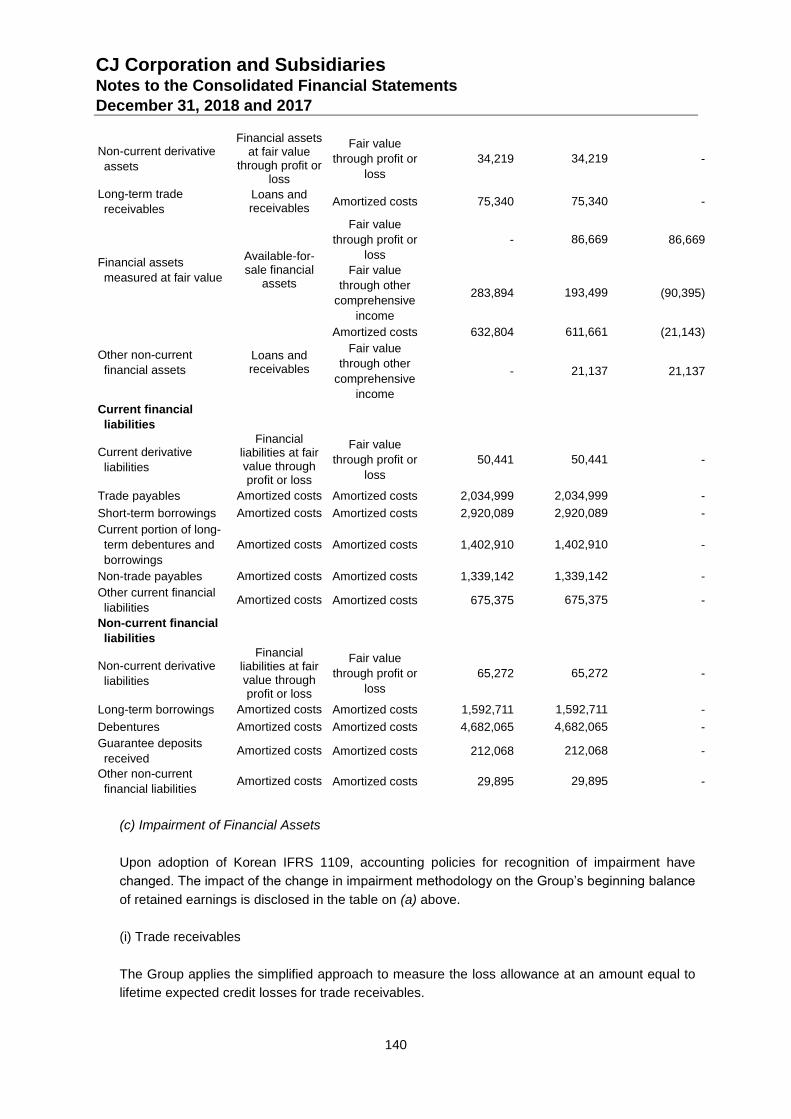
CJ Corporation and Subsidiaries Notes to the Consolidated Financial Statements December 31, 2018 and 2017
140
Non-current derivative
assets
Financial assets at fair value
through profit or loss
Fair value
through profit or
loss
34,219 34,219 -
Long-term trade
receivables Loans and
receivables Amortized costs
75,340 75,340 -
Financial assets
measured at fair value
Available-for-sale financial
assets
Fair value
through profit or
loss
- 86,669 86,669
Fair value
through other
comprehensive
income
283,894 193,499 (90,395)
Other non-current
financial assets
Loans and receivables
Amortized costs 632,804 611,661 (21,143)
Fair value
through other
comprehensive
income
- 21,137 21,137
Current financial
liabilities
Current derivative
liabilities
Financial liabilities at fair value through profit or loss
Fair value
through profit or
loss
50,441 50,441 -
Trade payables Amortized costs Amortized costs 2,034,999 2,034,999 -
Short-term borrowings Amortized costs Amortized costs 2,920,089 2,920,089 -
Current portion of long-
term debentures and
borrowings
Amortized costs Amortized costs
1,402,910 1,402,910 -
Non-trade payables Amortized costs Amortized costs 1,339,142 1,339,142 -
Other current financial
liabilities
Amortized costs Amortized costs
675,375 675,375 -
Non-current financial
liabilities
Non-current derivative
liabilities
Financial liabilities at fair value through profit or loss
Fair value
through profit or
loss
65,272 65,272 -
Long-term borrowings Amortized costs Amortized costs 1,592,711 1,592,711 -
Debentures Amortized costs Amortized costs 4,682,065 4,682,065 -
Guarantee deposits
received
Amortized costs Amortized costs
212,068 212,068 -
Other non-current
financial liabilities
Amortized costs Amortized costs
29,895 29,895 -
(c) Impairment of Financial Assets
Upon adoption of Korean IFRS 1109, accounting policies for recognition of impairment have
changed. The impact of the change in impairment methodology on the Group’s beginning balance
of retained earnings is disclosed in the table on (a) above.
(i) Trade receivables
The Group applies the simplified approach to measure the loss allowance at an amount equal to
lifetime expected credit losses for trade receivables.
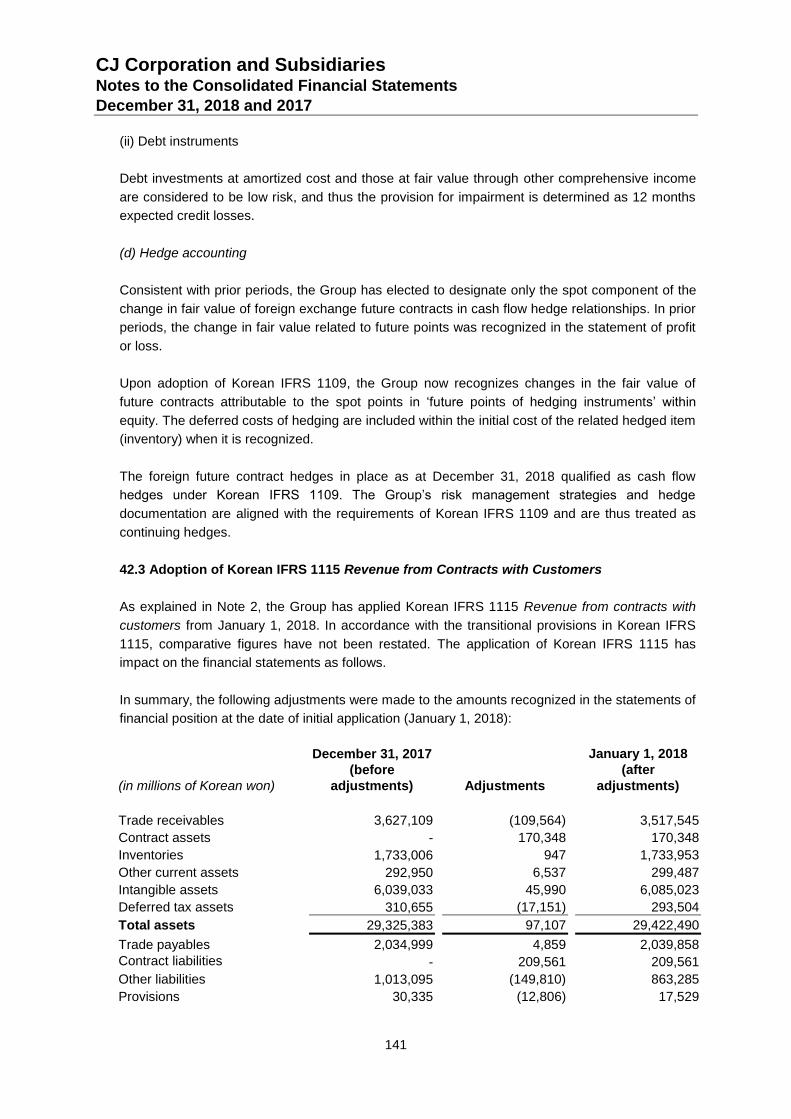
CJ Corporation and Subsidiaries Notes to the Consolidated Financial Statements December 31, 2018 and 2017
141
(ii) Debt instruments
Debt investments at amortized cost and those at fair value through other comprehensive income
are considered to be low risk, and thus the provision for impairment is determined as 12 months
expected credit losses.
(d) Hedge accounting
Consistent with prior periods, the Group has elected to designate only the spot component of the
change in fair value of foreign exchange future contracts in cash flow hedge relationships. In prior
periods, the change in fair value related to future points was recognized in the statement of profit
or loss.
Upon adoption of Korean IFRS 1109, the Group now recognizes changes in the fair value of
future contracts attributable to the spot points in ‘future points of hedging instruments’ within
equity. The deferred costs of hedging are included within the initial cost of the related hedged item
(inventory) when it is recognized.
The foreign future contract hedges in place as at December 31, 2018 qualified as cash flow
hedges under Korean IFRS 1109. The Group’s risk management strategies and hedge
documentation are aligned with the requirements of Korean IFRS 1109 and are thus treated as
continuing hedges.
42.3 Adoption of Korean IFRS 1115 Revenue from Contracts with Customers
As explained in Note 2, the Group has applied Korean IFRS 1115 Revenue from contracts with
customers from January 1, 2018. In accordance with the transitional provisions in Korean IFRS
1115, comparative figures have not been restated. The application of Korean IFRS 1115 has
impact on the financial statements as follows.
In summary, the following adjustments were made to the amounts recognized in the statements of
financial position at the date of initial application (January 1, 2018):
(in millions of Korean won)
December 31, 2017
(before
adjustments) Adjustments
January 1, 2018
(after
adjustments)
Trade receivables 3,627,109 (109,564) 3,517,545
Contract assets - 170,348 170,348
Inventories 1,733,006 947 1,733,953
Other current assets 292,950 6,537 299,487
Intangible assets 6,039,033 45,990 6,085,023
Deferred tax assets 310,655 (17,151) 293,504
Total assets 29,325,383 97,107 29,422,490
Trade payables 2,034,999 4,859 2,039,858
Contract liabilities - 209,561 209,561
Other liabilities 1,013,095 (149,810) 863,285
Provisions 30,335 (12,806) 17,529
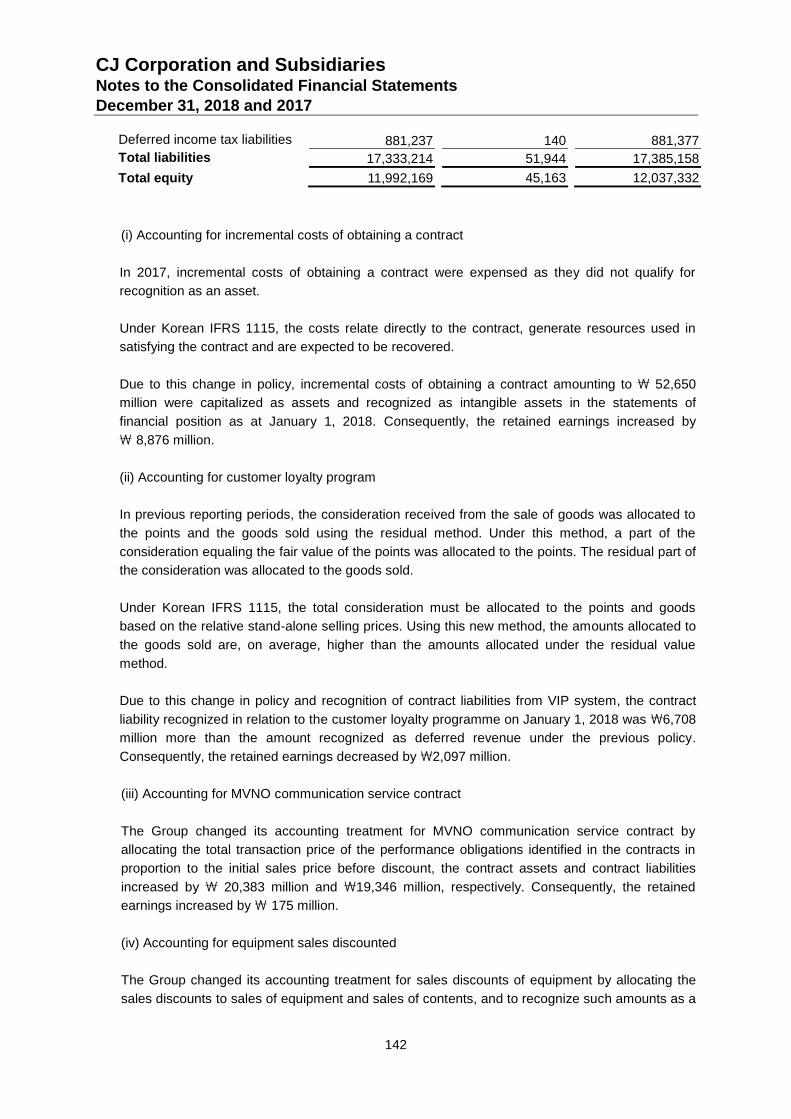
CJ Corporation and Subsidiaries Notes to the Consolidated Financial Statements December 31, 2018 and 2017
142
Deferred income tax liabilities 881,237 140 881,377
Total liabilities 17,333,214 51,944 17,385,158
Total equity 11,992,169 45,163 12,037,332
(i) Accounting for incremental costs of obtaining a contract
In 2017, incremental costs of obtaining a contract were expensed as they did not qualify for
recognition as an asset.
Under Korean IFRS 1115, the costs relate directly to the contract, generate resources used in
satisfying the contract and are expected to be recovered.
Due to this change in policy, incremental costs of obtaining a contract amounting to \ 52,650
million were capitalized as assets and recognized as intangible assets in the statements of
financial position as at January 1, 2018. Consequently, the retained earnings increased by
\ 8,876 million.
(ii) Accounting for customer loyalty program
In previous reporting periods, the consideration received from the sale of goods was allocated to
the points and the goods sold using the residual method. Under this method, a part of the
consideration equaling the fair value of the points was allocated to the points. The residual part of
the consideration was allocated to the goods sold.
Under Korean IFRS 1115, the total consideration must be allocated to the points and goods
based on the relative stand-alone selling prices. Using this new method, the amounts allocated to
the goods sold are, on average, higher than the amounts allocated under the residual value
method.
Due to this change in policy and recognition of contract liabilities from VIP system, the contract
liability recognized in relation to the customer loyalty programme on January 1, 2018 was \6,708
million more than the amount recognized as deferred revenue under the previous policy.
Consequently, the retained earnings decreased by \2,097 million.
(iii) Accounting for MVNO communication service contract
The Group changed its accounting treatment for MVNO communication service contract by
allocating the total transaction price of the performance obligations identified in the contracts in
proportion to the initial sales price before discount, the contract assets and contract liabilities
increased by \ 20,383 million and \19,346 million, respectively. Consequently, the retained
earnings increased by \ 175 million.
(iv) Accounting for equipment sales discounted
The Group changed its accounting treatment for sales discounts of equipment by allocating the
sales discounts to sales of equipment and sales of contents, and to recognize such amounts as a
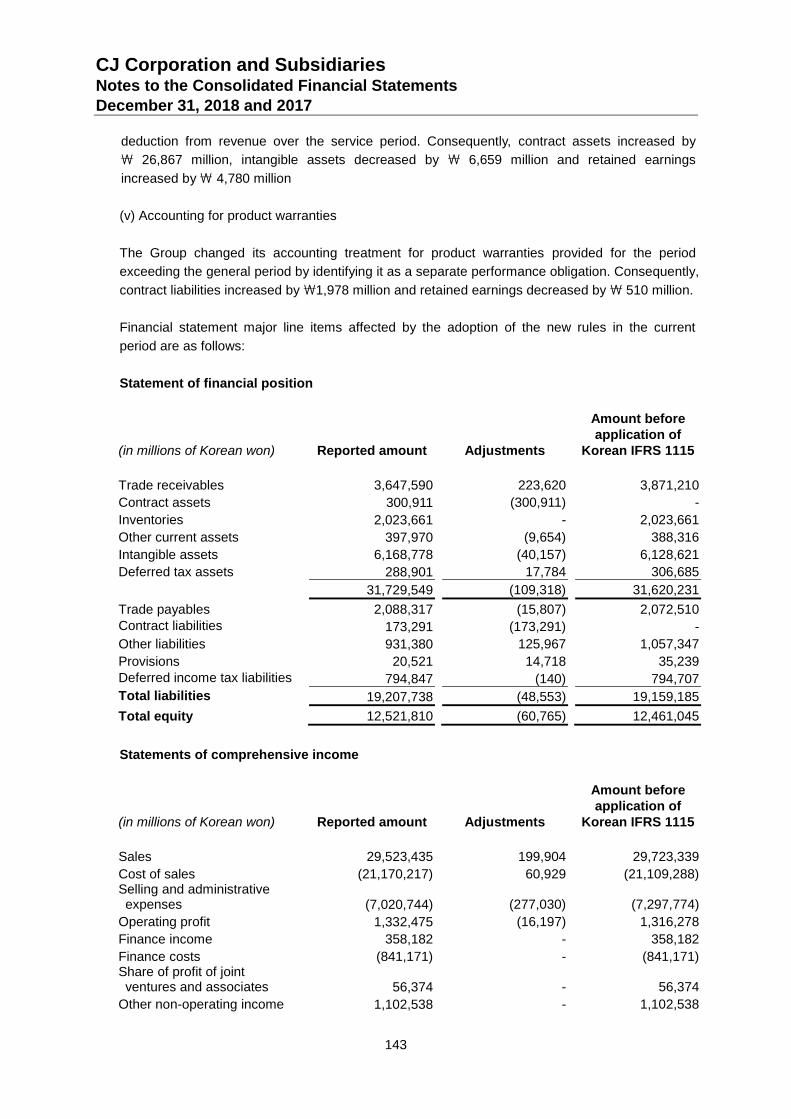
CJ Corporation and Subsidiaries Notes to the Consolidated Financial Statements December 31, 2018 and 2017
143
deduction from revenue over the service period. Consequently, contract assets increased by
\ 26,867 million, intangible assets decreased by \ 6,659 million and retained earnings
increased by \ 4,780 million
(v) Accounting for product warranties
The Group changed its accounting treatment for product warranties provided for the period
exceeding the general period by identifying it as a separate performance obligation. Consequently,
contract liabilities increased by \1,978 million and retained earnings decreased by \ 510 million.
Financial statement major line items affected by the adoption of the new rules in the current
period are as follows:
Statement of financial position
(in millions of Korean won) Reported amount Adjustments
Amount before
application of
Korean IFRS 1115
Trade receivables 3,647,590 223,620 3,871,210
Contract assets 300,911 (300,911) -
Inventories 2,023,661 - 2,023,661
Other current assets 397,970 (9,654) 388,316
Intangible assets 6,168,778 (40,157) 6,128,621
Deferred tax assets 288,901 17,784 306,685
31,729,549 (109,318) 31,620,231
Trade payables 2,088,317 (15,807) 2,072,510
Contract liabilities 173,291 (173,291) -
Other liabilities 931,380 125,967 1,057,347
Provisions 20,521 14,718 35,239
Deferred income tax liabilities 794,847 (140) 794,707
Total liabilities 19,207,738 (48,553) 19,159,185
Total equity 12,521,810 (60,765) 12,461,045
Statements of comprehensive income
(in millions of Korean won) Reported amount Adjustments
Amount before
application of
Korean IFRS 1115
Sales 29,523,435 199,904 29,723,339
Cost of sales (21,170,217) 60,929 (21,109,288) Selling and administrative expenses
(7,020,744) (277,030) (7,297,774)
Operating profit 1,332,475 (16,197) 1,316,278
Finance income 358,182 - 358,182
Finance costs (841,171) - (841,171) Share of profit of joint ventures and associates
56,374 - 56,374
Other non-operating income 1,102,538 - 1,102,538
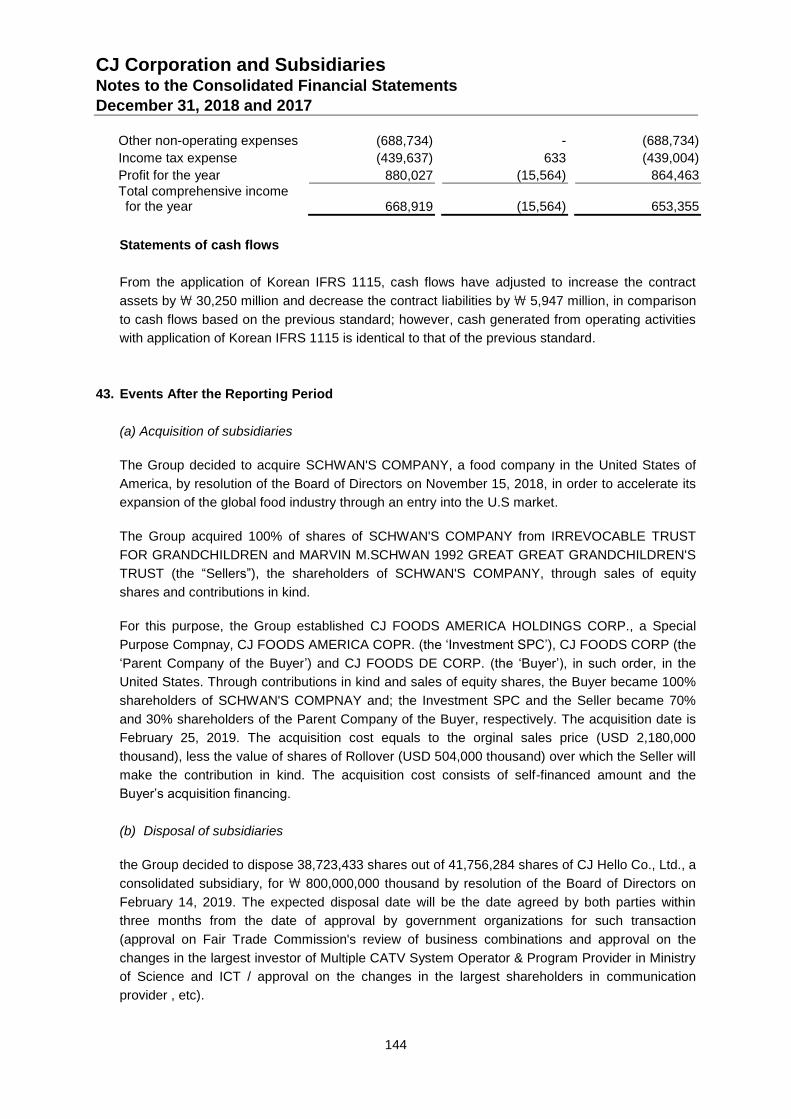
CJ Corporation and Subsidiaries Notes to the Consolidated Financial Statements December 31, 2018 and 2017
144
Other non-operating expenses (688,734) - (688,734)
Income tax expense (439,637) 633 (439,004)
Profit for the year 880,027 (15,564) 864,463
Total comprehensive income for the year
668,919 (15,564) 653,355
Statements of cash flows
From the application of Korean IFRS 1115, cash flows have adjusted to increase the contract
assets by \ 30,250 million and decrease the contract liabilities by \ 5,947 million, in comparison
to cash flows based on the previous standard; however, cash generated from operating activities
with application of Korean IFRS 1115 is identical to that of the previous standard.
43. Events After the Reporting Period
(a) Acquisition of subsidiaries
The Group decided to acquire SCHWAN'S COMPANY, a food company in the United States of
America, by resolution of the Board of Directors on November 15, 2018, in order to accelerate its
expansion of the global food industry through an entry into the U.S market.
The Group acquired 100% of shares of SCHWAN'S COMPANY from IRREVOCABLE TRUST
FOR GRANDCHILDREN and MARVIN M.SCHWAN 1992 GREAT GREAT GRANDCHILDREN'S
TRUST (the “Sellers”), the shareholders of SCHWAN'S COMPANY, through sales of equity
shares and contributions in kind.
For this purpose, the Group established CJ FOODS AMERICA HOLDINGS CORP., a Special
Purpose Compnay, CJ FOODS AMERICA COPR. (the ‘Investment SPC’), CJ FOODS CORP (the
‘Parent Company of the Buyer’) and CJ FOODS DE CORP. (the ‘Buyer’), in such order, in the
United States. Through contributions in kind and sales of equity shares, the Buyer became 100%
shareholders of SCHWAN'S COMPNAY and; the Investment SPC and the Seller became 70%
and 30% shareholders of the Parent Company of the Buyer, respectively. The acquisition date is
February 25, 2019. The acquisition cost equals to the orginal sales price (USD 2,180,000
thousand), less the value of shares of Rollover (USD 504,000 thousand) over which the Seller will
make the contribution in kind. The acquisition cost consists of self-financed amount and the
Buyer’s acquisition financing.
(b) Disposal of subsidiaries
the Group decided to dispose 38,723,433 shares out of 41,756,284 shares of CJ Hello Co., Ltd., a
consolidated subsidiary, for \ 800,000,000 thousand by resolution of the Board of Directors on
February 14, 2019. The expected disposal date will be the date agreed by both parties within
three months from the date of approval by government organizations for such transaction
(approval on Fair Trade Commission's review of business combinations and approval on the
changes in the largest investor of Multiple CATV System Operator & Program Provider in Ministry
of Science and ICT / approval on the changes in the largest shareholders in communication
provider , etc).
CJ Corporation and Subsidiaries Notes to the Consolidated Financial Statements December 31, 2018 and 2017
145
(c) The Group issued the 8th non-guaranteed debentures of \ 100,000 million for the purpose of
financing working capital and a repayment of public bonds that are expected to mature on
February 12, 2019, by resolution of the Board of Directors on December 18, 2018.
Related Documents