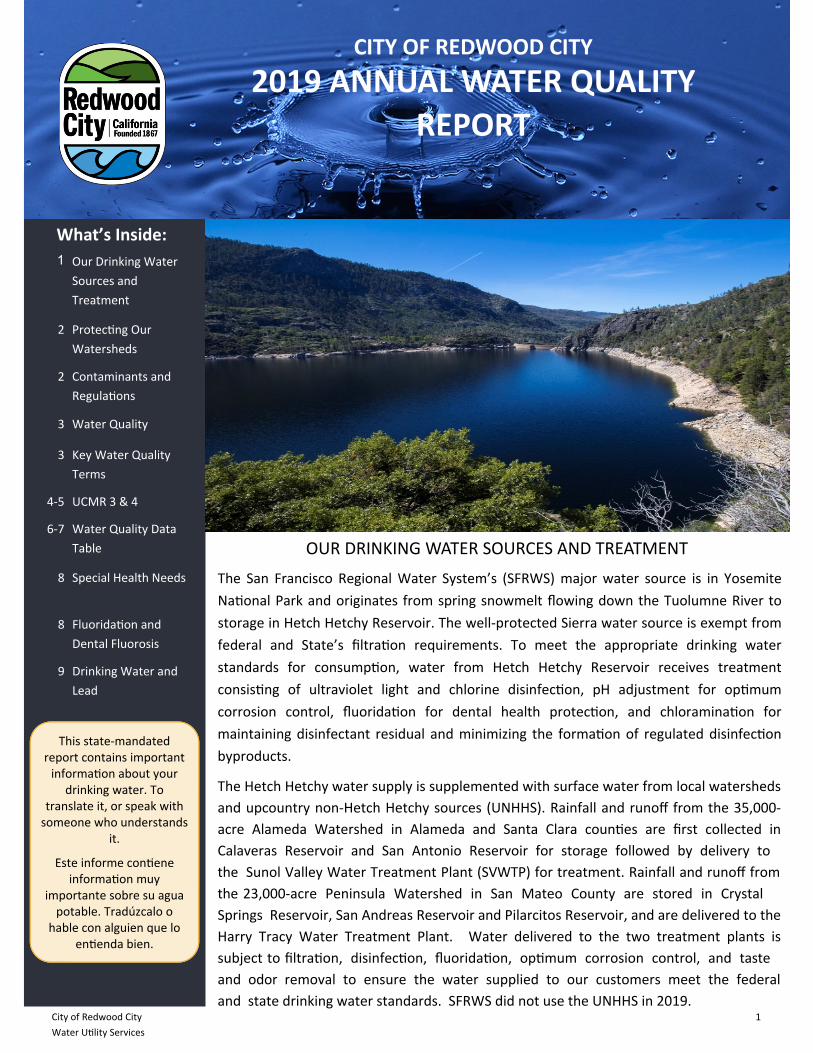
City of Redwood City 1 Water UƟlity Services OUR DRINKING WATER SOURCES AND TREATMENT The San Francisco Regional Water System’s (SFRWS) major water source is in Yosemite NaƟonal Park and originates from spring snowmelt flowing down the Tuolumne River to storage in Hetch Hetchy Reservoir. The well‐protected Sierra water source is exempt from federal and State’s filtraƟon requirements. To meet the appropriate drinking water standards for consumpƟon, water from Hetch Hetchy Reservoir receives treatment consisƟng of ultraviolet light and chlorine disinfecƟon, pH adjustment for opƟmum corrosion control, fluoridaƟon for dental health protecƟon, and chloraminaƟon for maintaining disinfectant residual and minimizing the formaƟon of regulated disinfecƟon byproducts. The Hetch Hetchy water supply is supplemented with surface water from local watersheds and upcountry non‐Hetch Hetchy sources (UNHHS). Rainfall and runoff from the 35,000‐ acre Alameda Watershed in Alameda and Santa Clara counƟes are first collected in Calaveras Reservoir and San Antonio Reservoir for storage followed by delivery to the Sunol Valley Water Treatment Plant (SVWTP) for treatment. Rainfall and runoff from the 23,000‐acre Peninsula Watershed in San Mateo County are stored in Crystal Springs Reservoir, San Andreas Reservoir and Pilarcitos Reservoir, and are delivered to the Harry Tracy Water Treatment Plant. Water delivered to the two treatment plants is subject to filtraƟon, disinfecƟon, fluoridaƟon, opƟmum corrosion control, and taste and odor removal to ensure the water supplied to our customers meet the federal and state drinking water standards. SFRWS did not use the UNHHS in 2019. This state‐mandated report contains important informaƟon about your drinking water. To translate it, or speak with someone who understands it. Este informe conƟene informaƟon muy importante sobre su agua potable. Tradúzcalo o hable con alguien que lo enƟenda bien. What’s Inside: 1 Our Drinking Water Sources and Treatment 2 ProtecƟng Our Watersheds 2 Contaminants and RegulaƟons 3 Water Quality 3 Key Water Quality Terms 4‐5 6‐7 UCMR 3 & 4 Water Quality Data Table 8 Special Health Needs 8 FluoridaƟon and Dental Fluorosis 9 Drinking Water and Lead CITY OF REDWOOD CITY 2019 ANNUAL WATER QUALITY REPORT

Welcome message from author
This document is posted to help you gain knowledge. Please leave a comment to let me know what you think about it! Share it to your friends and learn new things together.
Transcript
City of Redwood City 1
Water U lity Services
OUR DRINKING WATER SOURCES AND TREATMENT
The San Francisco Regional Water System’s (SFRWS) major water source is in Yosemite
Na onal Park and originates from spring snowmelt flowing down the Tuolumne River to
storage in Hetch Hetchy Reservoir. The well‐protected Sierra water source is exempt from
federal and State’s filtra on requirements. To meet the appropriate drinking water
standards for consump on, water from Hetch Hetchy Reservoir receives treatment
consis ng of ultraviolet light and chlorine disinfec on, pH adjustment for op mum
corrosion control, fluorida on for dental health protec on, and chloramina on for
maintaining disinfectant residual and minimizing the forma on of regulated disinfec on
byproducts.
The Hetch Hetchy water supply is supplemented with surface water from local watersheds
and upcountry non‐Hetch Hetchy sources (UNHHS). Rainfall and runoff from the 35,000‐
acre Alameda Watershed in Alameda and Santa Clara coun es are first collected in Calaveras Reservoir and San Antonio Reservoir for storage followed by delivery to the Sunol Valley Water Treatment Plant (SVWTP) for treatment. Rainfall and runoff from
the 23,000‐acre Peninsula Watershed in San Mateo County are stored in Crystal Springs Reservoir, San Andreas Reservoir and Pilarcitos Reservoir, and are delivered to the Harry Tracy Water Treatment Plant. Water delivered to the two treatment plants is
subject to filtra on, disinfec on, fluorida on, op mum corrosion control, and taste and odor removal to ensure the water supplied to our customers meet the federal and state drinking water standards. SFRWS did not use the UNHHS in 2019.
This state‐mandated report contains important informa on about your
drinking water. To translate it, or speak with someone who understands
it.
Este informe con ene informa on muy
importante sobre su agua potable. Tradúzcalo o
hable con alguien que lo en enda bien.
What’s Inside:
1 Our Drinking Water
Sources and
Treatment
2 Protec ng Our
Watersheds
2 Contaminants and
Regula ons
3 Water Quality
3 Key Water Quality
Terms
4‐5
6‐7
UCMR 3 & 4
Water Quality Data
Table
8 Special Health Needs
8 Fluorida on and
Dental Fluorosis
9 Drinking Water and
Lead
CITY OF REDWOOD CITY
2019 ANNUAL WATER QUALITY
REPORT

City of Redwood City 2
Water U lity Services
PROTECTING OUR WATERSHEDS
Watersheds Protec on
The San Francisco Public U li es Commission (SFPUC)
conducts watershed sanitary surveys for the Hetch Hetchy
source annually and for the local water sources and
UNHHS every five years. The latest local sanitary survey
was completed in 2016 for the period of 2011‐2015. The
last watershed sanitary survey for UNHHS was conducted
in 2015 as part of SFRWS’s drought response plan efforts.
All these surveys together with the stringent watershed
protec on management ac vi es were completed by the
SFPUC with support from partner agencies including
Na onal Park Service and US Forest Service. The
purposes of the surveys are to evaluate the sanitary
condi ons and water quality of the watersheds and to
review results of watershed management ac vi es
conducted in the preceding years. Wildlife, stock, and
human ac vi es are con nued to be the poten al
contamina on sources. You may contact the San
Francisco District office of the State Water Resources
Control Board’s Division of Drinking Water (SWRCB‐DDW)
at 510‐620‐3474 for the review of these reports.
CONTAMINANTS AND REGULATIONS
Generally, the sources of drinking water (both tap water and bo led water) include rivers, lakes, oceans, streams, ponds,
reservoirs, springs and wells. As water travels over the surface of the land or through the ground, it dissolves naturally occurring
minerals and, in some cases, radioac ve material, and can pick up substances resul ng from the presence of animals or from
human ac vity. Such substances are called contaminants, and may be present in source water as:
Microbial contaminants, such as viruses and bacteria that may come from sewage treatment plants, sep c systems, agricultural
livestock opera ons and wildlife,
Inorganic contaminants, such as salts and metals, that can be naturally occurring or result from urban stormwater runoff,
industrial or domes c wastewater discharges, oil and gas produc on, mining or farming,
Pes cides and herbicides that may come from a variety of sources such as agriculture, urban stormwater runoff and residen al
uses,
Organic chemical contaminants, including synthe c and vola le organic chemicals, which are by‐products of industrial processes
and petroleum produc on, and can also come from gas sta ons, urban stormwater runoff, agricultural applica on and sep c
systems,
Radioac ve contaminants, which can be naturally occurring or be the result of oil and gas produc on and mining ac vi es.
More informa on about contaminants and poten al health effects can be obtained by calling the USEPA's Safe Drinking Water
Hotline 800‐426‐4791, or at www.epa.gov/safewater.
LAWN BE GONE! REBATE

City of Redwood City 3
Water U lity Services
WATER QUALITY SFPUC regularly collects and tests water samples from reservoirs and
designated sampling points throughout the sources and the transmission
system to ensure the water delivered to you meets or exceeds federal
and State drinking water standards. In 2019, SFPUC conducted more than
53,650 drinking water tests in the sources and the transmission system.
This is in addi on to the extensive treatment process control monitoring
performed by SFPUC’s cer fied operators and online instruments.
The City of Redwood City also collects and tests water samples from the
City’s water system and storage reservoirs. Samples are collected weekly,
monthly, and quarterly depending on the type of analyses to be
performed. The City of Redwood City Water Division staff ensures water
delivered within the water system meets or exceeds federal and state
drinking water standards.
Drinking water, including bo led water, may reasonably be expected to
contain at least small amounts of some contaminants. The presence of
contaminants does not necessarily indicate that water poses a health
risk. In order to ensure that tap water is safe to drink, the United States
Environmental Protec on Agency (USEPA) and the California State Water
Resources Control Board ‐ Division of Drinking Water (SWRCB‐DDW)
prescribe regula ons that limit the amount of certain contaminants in
water provided by public water systems. The U.S. Food and Drug
Administra on regula ons and California law also establish limits for
contaminants in bo led water that provide the same protec on for
public health.
KEY
< / < = less than / less than or
equal to
NL = No fica on level
AL = Ac on Level NoP = Number of Coliform‐
Posi ve Sample
Max = Maximum NTU = Nephelometric Turbidity
Unit
Min = Minimum ORL = Other Regulatory level
N/A = Not Available ppb = part per billion
ND = Non‐Detect ppm = part per million
µS/cm = microSiemens/ cen meter
Key Water Quality Terms
The following are defini ons of key terms referring to standards and goals
of water quality noted on the data table.
Public Health Goal (PHG): The level of a contaminant in drinking water
below which there is no known or expected risk to health. PHGs are set by
the California Environmental Protec on Agency.
Maximum Contaminant Level Goal (MCLG): The level of a contaminant in
drinking water below which there is no known or expected risk to health.
MCLGs are set by the USEPA.
Maximum Contaminant Level (MCL): The highest level of a contaminant that is allowed in drinking water. Primary MCLs are set as close to the PHGs or MCLGs as is economically and technologically feasible. Secondary MCLs (SMCLs) are set to protect the odor, taste, and appearance of drinking water.
Maximum Residual Disinfectant Level (MRDL): The highest level of a disinfectant allowed in drinking water. There is convincing evidence that addi on of a disinfectant is necessary for control of microbial contaminants.
Maximum Residual Disinfectant Level Goal (MRDLG): The level of a drinking water disinfectant below which there is no known or expected risk to health. MRDLGs do not reflect the benefits of the use of disinfectants to control microbial contaminants.
Primary Drinking Water Standard (PDWS): MCLs and MRDLs for contaminants that affect health along with their monitoring and repor ng requirements, and water treatment requirements.
Regulatory Ac on Level: The concentra on of a contaminant which, if exceeded, triggers treatment or other requirements that a water system must follow.
Treatment Technique (TT): A required process intended to reduce the level of a contaminant in drinking water.
Turbidity: A water clarity indicator that measures cloudiness of the water, and is also used to indicate the effec veness of the filtra on system. High turbidity can hinder the effec veness of disinfectants.
Cryptosporidium is a parasi c microbe found in most surface water. The SFPUC regularly tests for this waterborne pathogen, and found it at very low levels in source water and treated water in 2019. However, current test methods approved by the USEPA do not dis nguish between dead organisms and those capable of causing disease. Inges on of Cryptosporidium may produce symptoms of nausea, abdominal cramps, diarrhea, and associated headaches. Cryptosporidium must be ingested to cause disease, and it may be spread through means other than drinking water.
TO LEARN MORE
Addi onal water quality data may be obtained by contac ng Jus n Chapel at Redwood City Public Works Services (650) 780‐7464.
Want to learn more about drinking water regula ons? Visit the SWRCB Division of Drinking Water at www.swrcb.ca.gov/drinkingwater or the U.S. Environmental Protec on Agency at www.epa.gov.
Water quality policies are decided at public hearings held at regularly scheduled City Council mee ngs. For more informa on visit www.redwoodcity.org.
Monitoring of Per‐ and Polyfluoroalkyl Substances (PFAS)
PFAS is a group of approximately 5,000 man‐made chemicals used in a
variety of industries and consumer products. These chemicals are very
persistent in the environment and human body. The SFPUC conducted a
special round of PFAS monitoring of its water sources and transmission
system in 2019. The monitoring effort was not under any federal or
State order/permit requirements; it was proac vely conducted on a
voluntary basis with the objec ve to iden fy if the SFRWS’s water sup‐
plies are impacted by PFAS. Using the State’s stringent sampling proce‐
dures and based on the currently approved/cer fied method of analysis
for 18 PFAS contaminants, SFPUC confirmed no PFAS was detected in its
water sources and transmission system. Considering USEPA’s recent
development of a newer method of analysis for addi onal PFAS contami‐
nants, SFPUC intends to conduct another round of monitoring when the
new analy cal method is available at its contract laboratory. For addi‐
onal informa on about PFAS, visit The SWRCB‐DDW website water-
boards.ca.gov/pfas and/or USEPA website epa.gov/pfas.

City of Redwood City 4
Water U lity Services
Unregulated Contaminant Monitoring Rule (UCMR) Background
The 1996 Amendments to the Safe Drinking Water Act required the U.S. EPA to establish criteria for a monitoring program for unregulated contaminants and to publish, once every 5 years, a list of no more than 30 contaminants to be monitored by public water systems.
Recent Sampling Event
The most recent sampling event was UCMR 4 which took place in March through December of 2018. This sampling event requires public water systems to monitor for 10 cyanotoxins and 20 addi onal chemical contaminants. The City of Redwood City performed 4 quarters of sampling for chemical contaminants. There were 6 chemicals detected at low levels that did not exceed any MCLs. UCMR 4 sampling is not yet complete and monitoring will resume in August of 2020 for cyanotoxins.
Prior to that event was UCMR 3 in which the City of Redwood City performed sampling for 28 poten al contaminants and two viruses from August 2014 through May 2015. Of the poten al contaminants, only 4 were detected at very low levels. During each event samples were taken from one of our SFPUC source water connec ons and from various sample points in the City’s distribu on system.
The results of the detected contaminants can be found in the table on the next page.
Repor ng
U.S. EPA does not provide guidance on the issue of repor ng federal UCMR contaminants beyond the previous calendar year’s detec ons, other than to say it is not required and that data older than 5 years need not be reported. As a result, the State Board recommends systems to report the data for 5 years.
For More Informa on
Unregulated contaminant monitoring helps the U.S. EPA and the State Water Resources Control Board to determine where certain contaminants occur and whether the contaminants need to be regulated. To view the results of sampling for the Unregulated Contaminant Monitoring Rule conducted by Redwood City please visit our website at www.redwoodcity.org/waterquality .
Visit Redwood City’s
Na ve plant demonstra on garden
The Redwood City Parks Department, and volunteers con‐verted this area from turf to a na ve garden. The volun‐teers a ended a workshop sponsored by Redwood City’s Water Conserva on Program "How to convert turf to a water efficient landscape", and the result of their work is a garden that's educa onal, supports wildlife, and uses a lot less water.
Loca on:
Redwood City Public Works

City of Redwood City 5
Water U lity Services
UCMR4 Detected Contaminants
Unit MCL PHG or (MCLG)
Range or Level Found
Average or [Max]
Major Sources in Drinking Water
Haloace c Acids
Bromochloroacetic Acid (BCAA)
ppb N/A N/A 0.374 - 0.977 0.642 Degradation of disinfectant
Dichloroacetic Acid (DCAA) ppb N/A N/A 12.8 - 32.6 19.8 Degradation of disinfectant
Monochloroacetic Acid (MCAA)
ppb N/A N/A 2.05 - 2.77 2.45 Degradation of disinfectant
Trichloroacetic Acid (TCAA) ppb N/A N/A 8.28 - 16.20 12.86 Degradation of disinfectant
HAA5 ppb 60
N/A 31.9 - 37.5 34.75 Degradation of disinfectant
Metals
Maganese ppb 2 N/A 1.33 - 1.99 1.75 Byproduct of drinking water disinfection
UCMR3 Detected Contaminants
Unit MCL PHG or (MCLG)
Range or Level Found
Average or [Max]
Major Sources in Drinking Water
Strontium ppb N/A N/A 15-47 28 Erosion of natural and pipe deposits
Vanadium ppb 50 (NL) N/A 0.2-0.3 0.25 Erosion of natural and pipe
Chromium-6 ppb 10 0.02 0.03-0.05 0.04 Erosion of natural deposits; industrial discharges
Chlorate ppb 800 (NL) N/A 94-180 131 Degradation of disinfectant
Unregulated Contaminant Monitoring Rule (UCMR) Results

City of Redwood City 6
Water U lity Services
City of Redwood City—Water Quality Data for Year 2019 (1)
Detected Contaminants Unit MCL PHG or (MCLG)
Range or Level Found
Average or [Max]
Major Sources in Drinking Water
Turbidity
Unfiltered Hetch Hetchy Water
NTU 5 N/A 0.3 - 0.7 (2) [2.1] Soil Runoff
Filtered Water from Sunol Valley Water Treatment Plant (SVWTP)
NTU
-
1(3) Min 95% of
samples
< 0.3 NTU(3)
N/A
N/A
-
99.89% - 100%
[1]
-
Soil Runoff
Soil Runoff
Filtered Water from Harry Tracy Water Treatment Plant (HTWTP) (13)
NTU
-
1(3) Min 95% of
samples
< 0.3 NTU(3)
N/A
N/A
-
100%
[0.1]
-
Soil Runoff
Soil Runoff
Disinfection Byproducts and Precursors
Total Trihalomethanes ppb 80 N/A 15.6 - 60.3 [43.6] (4) Byproduct of drinking water disinfection
Haloacetic Acids ppb 60 N/A 13.2 - 62.3 [35.5] (4) Byproduct of drinking water disinfection
Total Organic Carbon (5) ppm TT N/A 1.6 - 2.6 2.1 Various natural and man-made sources
Microbiological
Total Coliform - NoP <5.0% of monthly samples
(0) - [0.18%] Naturally present in the environment
Giardia lamblia Cyst/L TT (0) 0 - 0.09 0.02 Naturally present in the environment.
Inorganics
Fluoride (source water) (6) ppm 2.0 1 ND - 0.9 0.3(7) Erosion of natural deposits; water additive to promote strong teeth
Chloramine (as chlorine) ppm MRDL=4.0 MRDLG=4 0.04 - 3.24 [2.73] (8) Drinking water disinfectant added for treatment
Constituents with Secondary Standards
Unit SMCL PHG Range Average Major Sources of Contaminant
Chloride ppm 500 N/A <3 - 17 8.9 Runoff / leaching from natural deposits
Color unit 15 N/A <5 - 7 <5 Naturally-occurring organic materials
Specific Conductance µS/cm 1600 N/A 29 - 221 154 Substances that form ions when in water
Sulfate ppm 500 N/A 0.9 - 29 16 Runoff / leaching from natural deposits
Total Dissolved Solids ppm 1000 N/A <20 - 144 82 Runoff / leaching from natural deposits
Turbidity NTU 5 N/A ND - 0.3 0.1 Soil runoff
Lead and Copper Unit AL PHG Range 90th
Percentile Major Sources in Drinking Water
Copper ppb 1300 300 < 1 - 96 (9) 48.5 Internal corrosion of household water plumbing systems
Lead ppb 15 0.2 <1 - 9.8 (10) 2.8 Internal corrosion of household water plumbing systems
Aluminum ppb 200 600 ND - 68 ND Erosion of Natural Deposits/ Some Surface Water Treatment Residue

City of Redwood City 7
Water U lity Services
City of Redwood City—Water Quality Data for Year 2019
Other Water Quality
Parameters
Unit ORL Range Average
Alkalinity (as CaCO3)
ppm N/A 3.5 - 97 46
Boron ppb 1000 (NL) ND - 107 ND
Calcium (as Ca) ppm N/A 3.3 - 20 12
Chlorate (12) ppb 800 (NL) 40 - 220 84
Chromium (VI) (13) ppb NA 0.04 - 0.19 0.12
Hardness (as CaCO3)
ppm N/A 8.9 - 77 47
Magnesium ppm N/A 0.2 - 6.6 4.2
Potassium ppm N/A 0.3 - 1.2 0.8
Silica ppm N/A 4.9 - 8 6.1
pH - N/A 8.8 - 10.1 9.3
Sodium ppm N/A 2.8 - 21 14
Strontium ppb N/A 13 - 230 107
Footnotes:
(1) All results met State and Federal drinking water health standards.
(2) These are monthly average turbidity values measured every 4 hours
daily.
(3) There is no turbidity MCL for filtered water. The limits are based on
the TT requirements for filtra on systems.
(4) This is the highest loca onal running annual average value.
(5) Total organic carbon is a precursor for disinfec on byproduct
forma on. The TT requirement applies to the filtered water from
the SVWTP only.
(6) The natural fluoride levels in the upcountry sources were ND.
Elevated fluoride levels in the SVWTP and HTWTP raw water are
a ributed to the transfer of fluoridated Hetch Hetchy water into
the local reservoirs.
(7) In May 2015, the SWRCB recommended an op mal fluoride level of
0.7 ppm be maintained in the treated water. In 2019, the range and
average of the fluoride levels were 0.2 ppm ‐ 0.9 ppm and 0.7 ppm,
respec vely.
(8) This is the highest running annual average value.
(9) The most recent Lead and Copper Rule monitoring was in 2018. 0 of
31 site samples collected at consumer taps had copper
concentra ons above the AL.
(10) The most recent Lead and Copper Rule monitoring was in 2018. 0 of
31 site samples collected at consumer taps had lead concentra ons
above the AL.
(11) The detected chlorate in the treated water is a degrada on product
of sodium hypochlorite used by the SFPUC for water disinfec on.
(12) The detected chlorate in the treated water is a degrada on
product of sodium hypochlorite used by the SFRWS for water
disinfec on.
(13) Chromium (VI) has a PHG of 0.02 ppb but no MCL. The previous
MCL of 10 ppb was withdrawn by the SWRCB‐DDW on September
11, 2017. Currently, the SWRCB‐DDW regulates all chromium
through a MCL of 50 ppb for Total Chromium, which was not
detected in our water in 2019.
My Water, Redwood City’s customer water use portal and mobile app brings your water use, water outages and billing informa on to your finger‐
ps. Conserva on made easy! My Water’s core purpose is to empower customers through be er customer service so that we all may use water
more wisely, and in turn, save money and
help the environment.
My Water allows you to:
View hourly water use Sign up for no fica ons
Leak Alerts Outages
View your bill Compare use with others
To get started, visit www.mywater.redwoodcity.org and register using your account number.

City of Redwood City 8
Water U lity Services
SPECIAL HEALTH NEEDS FLUORIDATION AND
DENTAL FLUOROSIS
Some people may be more vulnerable to contaminants in
drinking water than the general popula on. Immuno‐
compromised persons, such as those with cancer undergoing
chemotherapy, persons who have undergone organ transplants,
people with HIV/AIDS or other immune system disorders, some
elderly people and infants, can be par cularly at risk from
infec ons.
These people should seek advice about drinking water from
their healthcare providers. USEPA/CDC guidelines on
appropriate means to lessen the risk of infec on by
Cryptosporidium and other microbial contaminants are available
from the USEPA's Safe Drinking Water Hotline 800‐426‐4791 or
at www.epa.gov/saf
Boron Detec on Above No fica on Level in Source Water
In 2019, boron was detected at a level of 1.49 ppm in the raw
water stored in Pond F3 East, one of SFRWS’s approved sources
in Alameda Watershed. A similar level was also detected in the
same pond in 2017. Although the detected value is above the
California No fica on Level of 1 ppm for source water, the
corresponding level in the treated water from the SVWTP was
only 0.1 ppm. Boron is an element in nature, and is typically
released into air and water when soils and rocks naturally
weather.
Mandated by State law, water fluorida on is a widely accepted
prac ce proven to be safe and effec ve for preven ng and
controlling tooth decay. The fluoride target level in the water is
0.7 milligram per liter (mg/L, or part per million, ppm),
consistent with the May 2015 State regulatory guidance on
op mal fluoride level. Infants fed formula mixed with water
containing fluoride at this level may s ll have a chance of
developing ny white lines or streaks in their teeth. These marks
are referred to as mild to very mild fluorosis, and are o en only
visible under a microscope. Even in cases where the marks are
visible, they do not pose any health risk. The Centers of Disease
Control (CDC) considers it safe to use op mally fluoridated water
for preparing infant formula. To lessen this chance of dental
fluorosis, you may choose to use low‐fluoride bo led water to
prepare infant formula. Nevertheless, children may s ll develop
dental fluorosis due to fluoride intake from other sources such
as food, toothpaste and dental products.
Contact your healthcare provider or SWRCB‐DDW if you have concerns about dental fluorosis. For addi onal informa on about fluorida on or oral health, visit the SWRCB‐DDW website www.waterboards.ca.gov/drinking_water/certlic/drinkingwater/Fluorida on.shtml, or the CDC website www.cdc.gov/fluorida on.

City of Redwood City 9
Water U lity Services
Exposure to lead, if present, can cause serious health effects in all age groups, especially for pregnant women and young children.
Infants and children who drink water containing lead could have decreases in IQ and a en on span and increases in learning and
behavior problems. Lead exposure among women who are pregnant increases prenatal risks. Lead exposure among women who
later become pregnant has similar risks if lead stored in the mother’s bones is released during pregnancy. Recent science suggests
that adults who drink water containing lead have increased risks of heart disease, high blood pressure, kidney or nervous system
problems.
Lead in drinking water is primarily from materials and components associated with service lines and home plumbing. There are no known lead service lines in our water distribu on system. We are responsible for providing high quality drinking water, but we cannot control the variety of materials used in plumbing components. You share the responsibility for protec ng yourself and your family from the lead in your home plumbing. You can take responsibility by iden fying and removing lead materials within your home plumbing and taking steps to reduce your family’s risk. Before drinking, flush your pipes for several minutes by running your tap, taking a shower, doing laundry or a load of dishes. You can also use a filter cer fied to remove lead from drinking water. If you are concerned about lead in your water you may wish to have your water tested, call your city phone (650) 780‐7462 for lead test. Informa on about lead in drinking water, tes ng methods, and steps you can take to minimize exposure is available at www.epa.gov/safewater/lead. As previously reported in 2018, the SFPUC completed an inventory of lead user service lines (LUSL) in our system and there are
known or no known pipelines and connectors between water mains and meters made of lead. The City of Redwood City is cur‐
rently conduc ng a service line inventory of all service lines in the water system to confirm pipe material. A plan for replacement
of pipe of unknown material and any known lead service lines must be submi ed to the State of California Division of Drinking Wa‐
ter by July 1, 2020. The City of Redwood City has currently has no known lead service lines.
DRINGKING WATER
AND LEAD

City of Redwood City 10
Water U lity Services
City of Redwood City Water Utility Services 1400 Broadway Redwood City, CA 94063-2505 Phone: 650-780-7464 www.redwoodcity.org
2019 ANNUAL WATER QUALITY REPORT
Related Documents