CITY OF PHILADELPHIA Philadelphia Airport System Municipal Securities Disclosure Annual Financial Information Fiscal Year Ended June 30, 2015

Welcome message from author
This document is posted to help you gain knowledge. Please leave a comment to let me know what you think about it! Share it to your friends and learn new things together.
Transcript
CITY OF PHILADELPHIA
Philadelphia Airport System
Municipal Securities Disclosure
Annual Financial Information
Fiscal Year Ended June 30, 2015
Intentionally Left Blank
i
Municipal Securities Disclosure Report
Annual Financial Report
For the Fiscal Year Ended June 30, 2015
TABLE OF CONTENTS
I. INTRODUCTORY SECTION
Disclosure Requirements 1 1
Table 1 Recent Trends in Enplaned Passengers – Fiscal Years 2013 – 2015 2 2
Table 2 Airline Market Shares of Enplaned Passengers – Fiscal Year 2015 3 3
Table 3 Airline Market Shared of Landed Weight – Fiscal Year 2015 4 4
Table 4 Summary of Historical Project Revenues and Expenses of
the Airport System – Fiscal Years 2011 – 2015 5 5
Table 5 History of Application to Use PFC Revenues 6 6
Table 6 Historical PFC Revenues 7 7
Table 7 Historical Enplaned Passengers 8 8
II. FINANCIAL SECTION
Financial Statements of the Division of Aviation 9
Management’s Discussion and Analysis 10-29 10-31
Basic Financial Statements
Statements of Net Position 30 32
Statements of Revenues, Expenses and Changes in Fund Net Position 31 33
Statements of Cash Flows 32 34
ii
Notes to Financial Statements 33-66 35-75
Required Supplementary Information
Reconciliation of Fund Balance (Legally Enacted Basis) to Net
Assets (GAAP Basis)
Budgetary Comparison Schedule
76
77
III. STATISTICAL SECTION
Exhibit S-1 Annual Revenues, Expenses and Changes in Fund Net Position 69 78
Exhibit S-2 Revenues by Source 70 79
Exhibit S-3 Scheduled Rates and Charges 71 80
Exhibit S-4 Ratios of Outstanding Debt 72 81
Exhibit S-5 Pledged Debt Service Coverage 73 82
Exhibit S-6 Airport Information 74 83
Exhibit S-7 Employment by Industry 75 84
Exhibit S-8 Population Trends 76 85
Exhibit S-9 City of Philadelphia Airport Employees 77 86
Exhibit S-10 Aircraft Operations by Airport 78 87
Exhibit S-11 Commercial Passenger Enplanements 78 88
Exhibit S-12 Commercial Enplanements 79 89
Exhibit S-13 Airline Market Share by Landed Weight 80 90-91
Exhibit S-14 Airline Market Share by Passenger Enplanements 81 92-93
Exhibit S-15 Passenger Facility Charges 82 94
Exhibit S-16 Current Top 30 Passenger Origin and Destination Markets 83 95
Exhibit S-17 Historical Top 10 Passenger Origin and Destination Markets 84 96
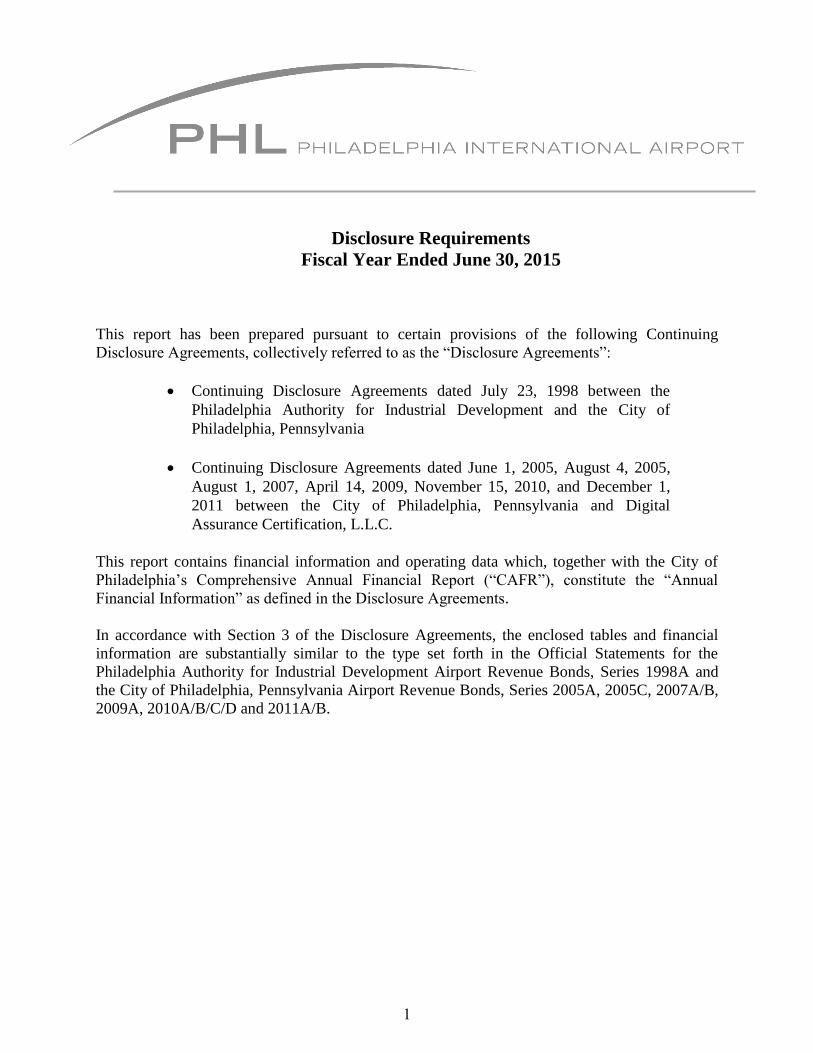
Disclosure Requirements
Fiscal Year Ended June 30, 2015
This report has been prepared pursuant to certain provisions of the following Continuing
Disclosure Agreements, collectively referred to as the “Disclosure Agreements”:
Continuing Disclosure Agreements dated July 23, 1998 between the
Philadelphia Authority for Industrial Development and the City of
Philadelphia, Pennsylvania
Continuing Disclosure Agreements dated June 1, 2005, August 4, 2005,
August 1, 2007, April 14, 2009, November 15, 2010, and December 1,
2011 between the City of Philadelphia, Pennsylvania and Digital
Assurance Certification, L.L.C.
This report contains financial information and operating data which, together with the City of
Philadelphia’s Comprehensive Annual Financial Report (“CAFR”), constitute the “Annual
Financial Information” as defined in the Disclosure Agreements.
In accordance with Section 3 of the Disclosure Agreements, the enclosed tables and financial
information are substantially similar to the type set forth in the Official Statements for the
Philadelphia Authority for Industrial Development Airport Revenue Bonds, Series 1998A and
the City of Philadelphia, Pennsylvania Airport Revenue Bonds, Series 2005A, 2005C, 2007A/B,
2009A, 2010A/B/C/D and 2011A/B.
1
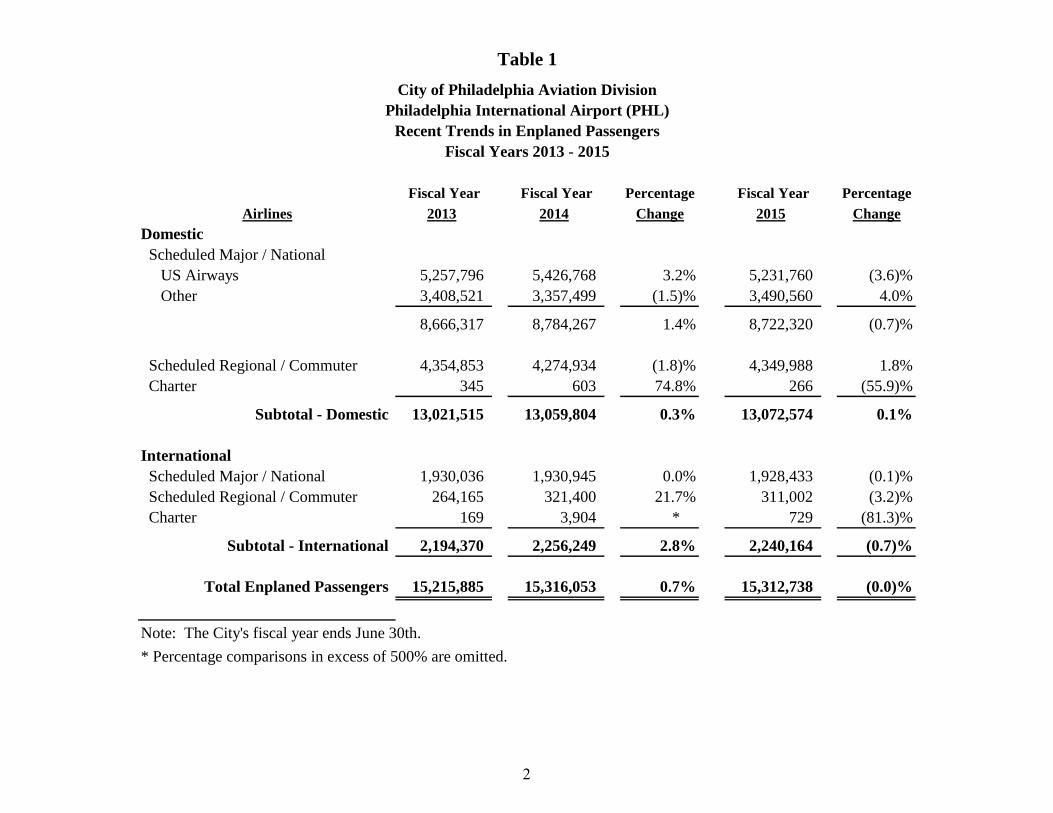
Fiscal Year Fiscal Year Percentage Fiscal Year Percentage
Airlines 2013 2014 Change 2015 Change
Domestic
Scheduled Major / National
US Airways 5,257,796 5,426,768 3.2% 5,231,760 (3.6)%
Other 3,408,521 3,357,499 (1.5)% 3,490,560 4.0%
8,666,317 8,784,267 1.4% 8,722,320 (0.7)%
Scheduled Regional / Commuter 4,354,853 4,274,934 (1.8)% 4,349,988 1.8%
Charter 345 603 74.8% 266 (55.9)%
Subtotal - Domestic 13,021,515 13,059,804 0.3% 13,072,574 0.1%
International
Scheduled Major / National 1,930,036 1,930,945 0.0% 1,928,433 (0.1)%
Scheduled Regional / Commuter 264,165 321,400 21.7% 311,002 (3.2)%
Charter 169 3,904 * 729 (81.3)%
Subtotal - International 2,194,370 2,256,249 2.8% 2,240,164 (0.7)%
Total Enplaned Passengers 15,215,885 15,316,053 0.7% 15,312,738 (0.0)%
Note: The City's fiscal year ends June 30th.
* Percentage comparisons in excess of 500% are omitted.
Table 1
City of Philadelphia Aviation Division
Recent Trends in Enplaned Passengers
Fiscal Years 2013 - 2015
Philadelphia International Airport (PHL)
2
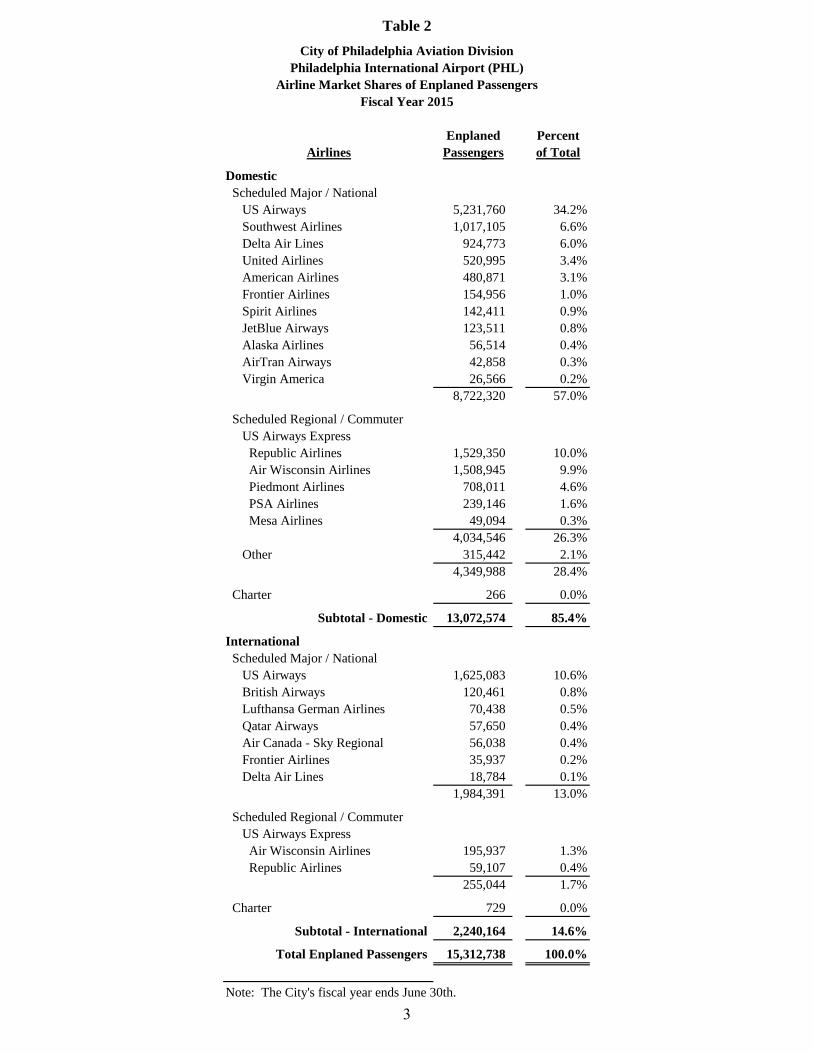
Enplaned Percent
Airlines Passengers of Total
Domestic
Scheduled Major / National
US Airways 5,231,760 34.2%
Southwest Airlines 1,017,105 6.6%
Delta Air Lines 924,773 6.0%
United Airlines 520,995 3.4%
American Airlines 480,871 3.1%
Frontier Airlines 154,956 1.0%
Spirit Airlines 142,411 0.9%
JetBlue Airways 123,511 0.8%
Alaska Airlines 56,514 0.4%
AirTran Airways 42,858 0.3%
Virgin America 26,566 0.2%
8,722,320 57.0%
Scheduled Regional / Commuter
US Airways Express
Republic Airlines 1,529,350 10.0%
Air Wisconsin Airlines 1,508,945 9.9%
Piedmont Airlines 708,011 4.6%
PSA Airlines 239,146 1.6%
Mesa Airlines 49,094 0.3%
4,034,546 26.3%
Other 315,442 2.1%
4,349,988 28.4%
Charter 266 0.0%
Subtotal - Domestic 13,072,574 85.4%
International
Scheduled Major / National
US Airways 1,625,083 10.6%
British Airways 120,461 0.8%
Lufthansa German Airlines 70,438 0.5%
Qatar Airways 57,650 0.4%
Air Canada - Sky Regional 56,038 0.4%
Frontier Airlines 35,937 0.2%
Delta Air Lines 18,784 0.1%
1,984,391 13.0%
Scheduled Regional / Commuter
US Airways Express
Air Wisconsin Airlines 195,937 1.3%
Republic Airlines 59,107 0.4%
255,044 1.7%
Charter 729 0.0%
Subtotal - International 2,240,164 14.6%
Total Enplaned Passengers 15,312,738 100.0%
Note: The City's fiscal year ends June 30th.
Table 2
City of Philadelphia Aviation Division
Airline Market Shares of Enplaned Passengers
Fiscal Year 2015
Philadelphia International Airport (PHL)
3
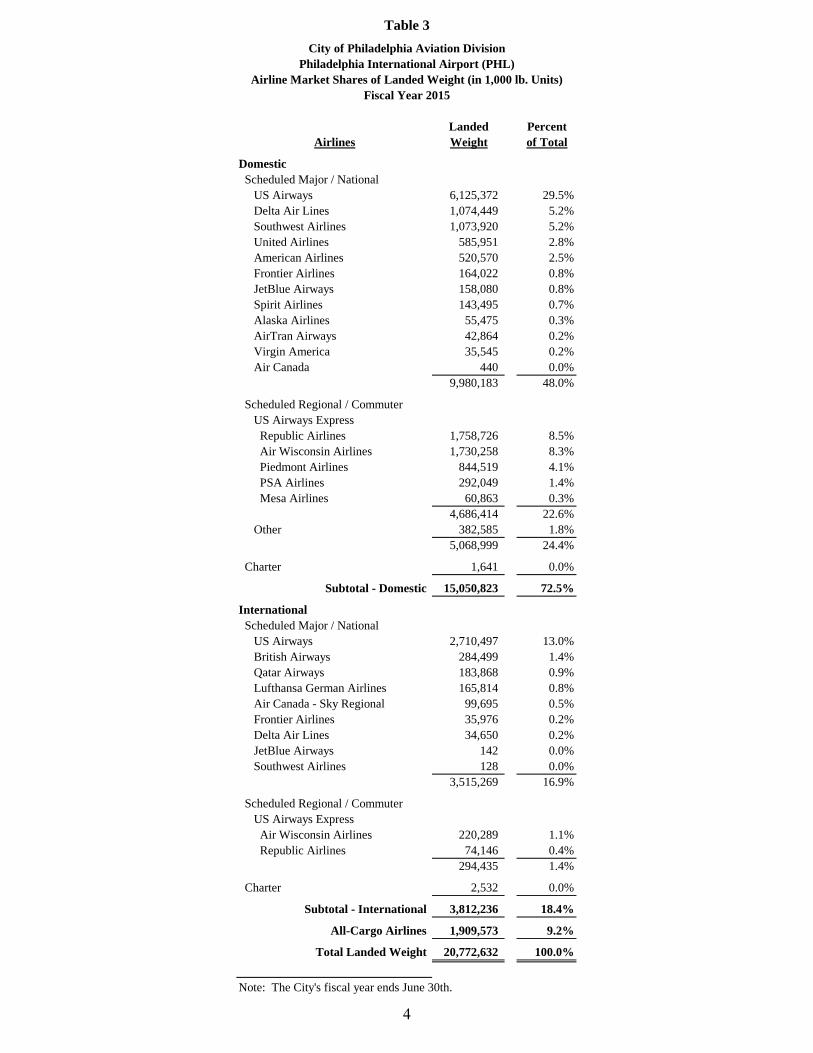
Landed Percent
Airlines Weight of Total
Domestic
Scheduled Major / National
US Airways 6,125,372 29.5%
Delta Air Lines 1,074,449 5.2%
Southwest Airlines 1,073,920 5.2%
United Airlines 585,951 2.8%
American Airlines 520,570 2.5%
Frontier Airlines 164,022 0.8%
JetBlue Airways 158,080 0.8%
Spirit Airlines 143,495 0.7%
Alaska Airlines 55,475 0.3%
AirTran Airways 42,864 0.2%
Virgin America 35,545 0.2%
Air Canada 440 0.0%
9,980,183 48.0%
Scheduled Regional / Commuter
US Airways Express
Republic Airlines 1,758,726 8.5%
Air Wisconsin Airlines 1,730,258 8.3%
Piedmont Airlines 844,519 4.1%
PSA Airlines 292,049 1.4%
Mesa Airlines 60,863 0.3%
4,686,414 22.6%
Other 382,585 1.8%
5,068,999 24.4%
Charter 1,641 0.0%
Subtotal - Domestic 15,050,823 72.5%
International
Scheduled Major / National
US Airways 2,710,497 13.0%
British Airways 284,499 1.4%
Qatar Airways 183,868 0.9%
Lufthansa German Airlines 165,814 0.8%
Air Canada - Sky Regional 99,695 0.5%
Frontier Airlines 35,976 0.2%
Delta Air Lines 34,650 0.2%
JetBlue Airways 142 0.0%
Southwest Airlines 128 0.0%
3,515,269 16.9%
Scheduled Regional / Commuter
US Airways Express
Air Wisconsin Airlines 220,289 1.1%
Republic Airlines 74,146 0.4%
294,435 1.4%
Charter 2,532 0.0%
Subtotal - International 3,812,236 18.4%
All-Cargo Airlines 1,909,573 9.2%
Total Landed Weight 20,772,632 100.0%
Note: The City's fiscal year ends June 30th.
Table 3
City of Philadelphia Aviation Division
Airline Market Shares of Landed Weight (in 1,000 lb. Units)
Fiscal Year 2015
Philadelphia International Airport (PHL)
4
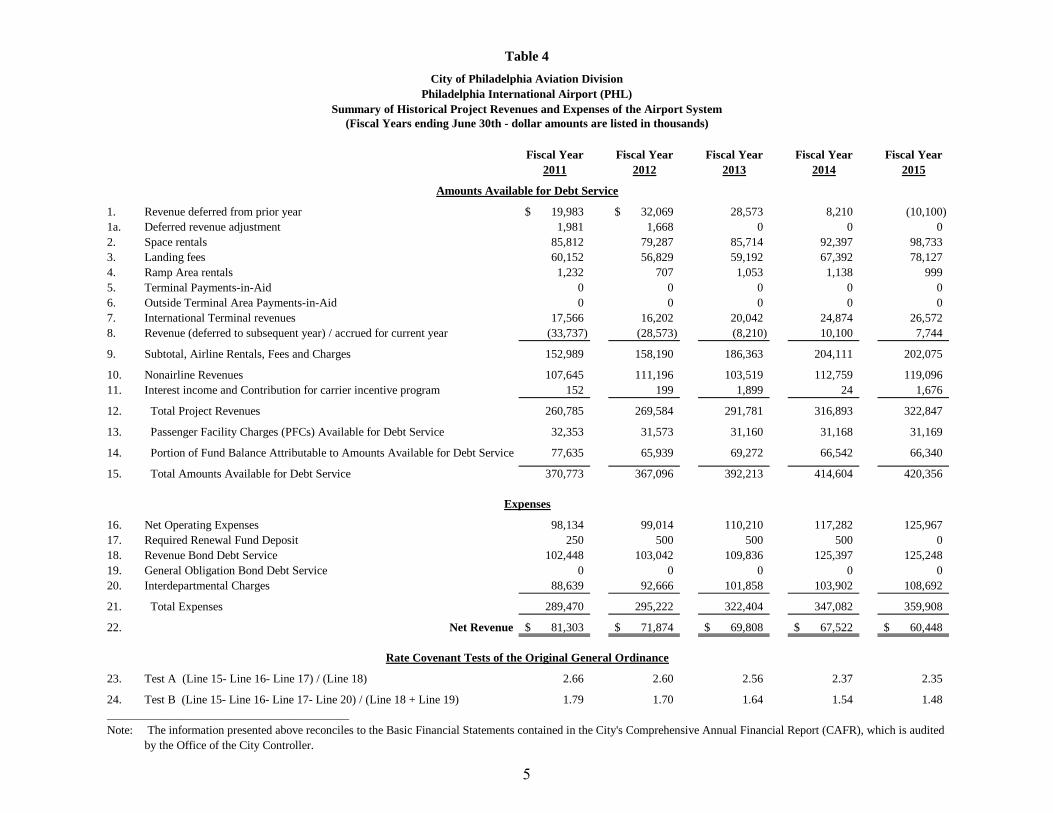
(Fiscal Years ending June 30th - dollar amounts are listed in thousands)
Fiscal Year Fiscal Year Fiscal Year Fiscal Year Fiscal Year
2011 2012 2013 2014 2015
1. Revenue deferred from prior year 19,983$ 32,069$ 28,573 8,210 (10,100)
1a. Deferred revenue adjustment 1,981 1,668 0 0 0
2. Space rentals 85,812 79,287 85,714 92,397 98,733
3. Landing fees 60,152 56,829 59,192 67,392 78,127
4. Ramp Area rentals 1,232 707 1,053 1,138 999
5. Terminal Payments-in-Aid 0 0 0 0 0
6. Outside Terminal Area Payments-in-Aid 0 0 0 0 0
7. International Terminal revenues 17,566 16,202 20,042 24,874 26,572
8. Revenue (deferred to subsequent year) / accrued for current year (33,737) (28,573) (8,210) 10,100 7,744
9. Subtotal, Airline Rentals, Fees and Charges 152,989 158,190 186,363 204,111 202,075
10. Nonairline Revenues 107,645 111,196 103,519 112,759 119,096
11. Interest income and Contribution for carrier incentive program 152 199 1,899 24 1,676
12. Total Project Revenues 260,785 269,584 291,781 316,893 322,847
13. Passenger Facility Charges (PFCs) Available for Debt Service 32,353 31,573 31,160 31,168 31,169
14. Portion of Fund Balance Attributable to Amounts Available for Debt Service 77,635 65,939 69,272 66,542 66,340
15. Total Amounts Available for Debt Service 370,773 367,096 392,213 414,604 420,356
16. Net Operating Expenses 98,134 99,014 110,210 117,282 125,967
17. Required Renewal Fund Deposit 250 500 500 500 0
18. Revenue Bond Debt Service 102,448 103,042 109,836 125,397 125,248
19. General Obligation Bond Debt Service 0 0 0 0 0
20. Interdepartmental Charges 88,639 92,666 101,858 103,902 108,692
21. Total Expenses 289,470 295,222 322,404 347,082 359,908
22. Net Revenue 81,303$ 71,874$ 69,808$ 67,522$ 60,448$
23. Test A (Line 15- Line 16- Line 17) / (Line 18) 2.66 2.60 2.56 2.37 2.35
24. Test B (Line 15- Line 16- Line 17- Line 20) / (Line 18 + Line 19) 1.79 1.70 1.64 1.54 1.48
_________________________________________
Note: The information presented above reconciles to the Basic Financial Statements contained in the City's Comprehensive Annual Financial Report (CAFR), which is audited
by the Office of the City Controller.
Rate Covenant Tests of the Original General Ordinance
Table 4
City of Philadelphia Aviation Division
Philadelphia International Airport (PHL)
Summary of Historical Project Revenues and Expenses of the Airport System
Expenses
Amounts Available for Debt Service
5
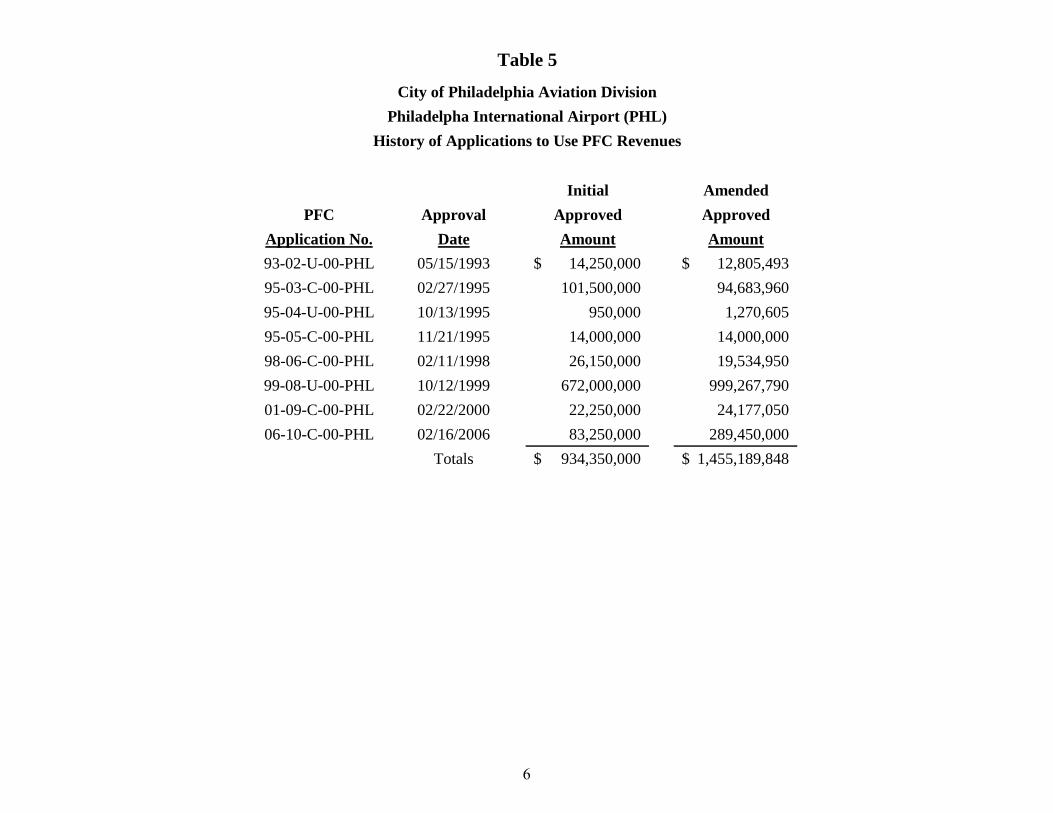
Initial Amended
PFC Approval Approved Approved
Application No. Date Amount Amount
93-02-U-00-PHL 05/15/1993 14,250,000$ 12,805,493$
95-03-C-00-PHL 02/27/1995 101,500,000 94,683,960
95-04-U-00-PHL 10/13/1995 950,000 1,270,605
95-05-C-00-PHL 11/21/1995 14,000,000 14,000,000
98-06-C-00-PHL 02/11/1998 26,150,000 19,534,950
99-08-U-00-PHL 10/12/1999 672,000,000 999,267,790
01-09-C-00-PHL 02/22/2000 22,250,000 24,177,050
06-10-C-00-PHL 02/16/2006 83,250,000 289,450,000
Totals 934,350,000$ 1,455,189,848$
City of Philadelphia Aviation Division
Philadelpha International Airport (PHL)
History of Applications to Use PFC Revenues
Table 5
6
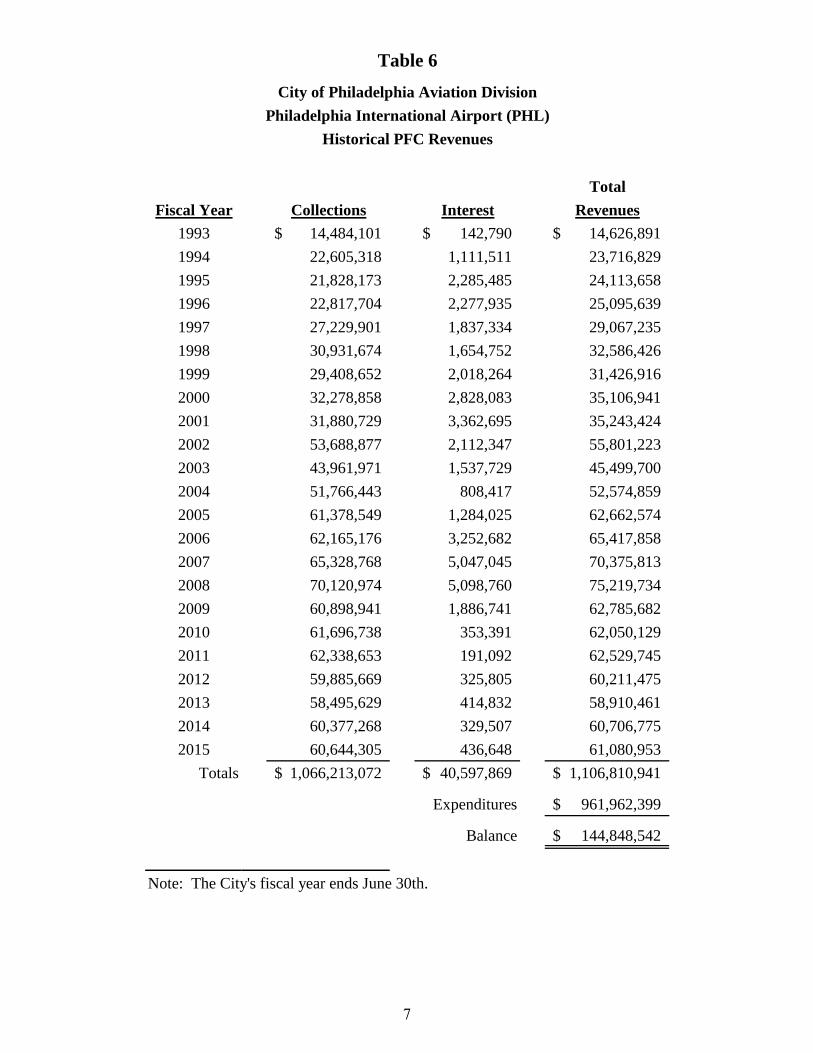
Total
Fiscal Year Collections Interest Revenues
1993 14,484,101$ 142,790$ 14,626,891$
1994 22,605,318 1,111,511 23,716,829
1995 21,828,173 2,285,485 24,113,658
1996 22,817,704 2,277,935 25,095,639
1997 27,229,901 1,837,334 29,067,235
1998 30,931,674 1,654,752 32,586,426
1999 29,408,652 2,018,264 31,426,916
2000 32,278,858 2,828,083 35,106,941
2001 31,880,729 3,362,695 35,243,424
2002 53,688,877 2,112,347 55,801,223
2003 43,961,971 1,537,729 45,499,700
2004 51,766,443 808,417 52,574,859
2005 61,378,549 1,284,025 62,662,574
2006 62,165,176 3,252,682 65,417,858
2007 65,328,768 5,047,045 70,375,813
2008 70,120,974 5,098,760 75,219,734
2009 60,898,941 1,886,741 62,785,682
2010 61,696,738 353,391 62,050,129
2011 62,338,653 191,092 62,529,745
2012 59,885,669 325,805 60,211,475
2013 58,495,629 414,832 58,910,461
2014 60,377,268 329,507 60,706,775
2015 60,644,305 436,648 61,080,953
Totals 1,066,213,072$ 40,597,869$ 1,106,810,941$
Expenditures 961,962,399$
Balance 144,848,542$
Note: The City's fiscal year ends June 30th.
Table 6
City of Philadelphia Aviation Division
Historical PFC Revenues
Philadelphia International Airport (PHL)
7
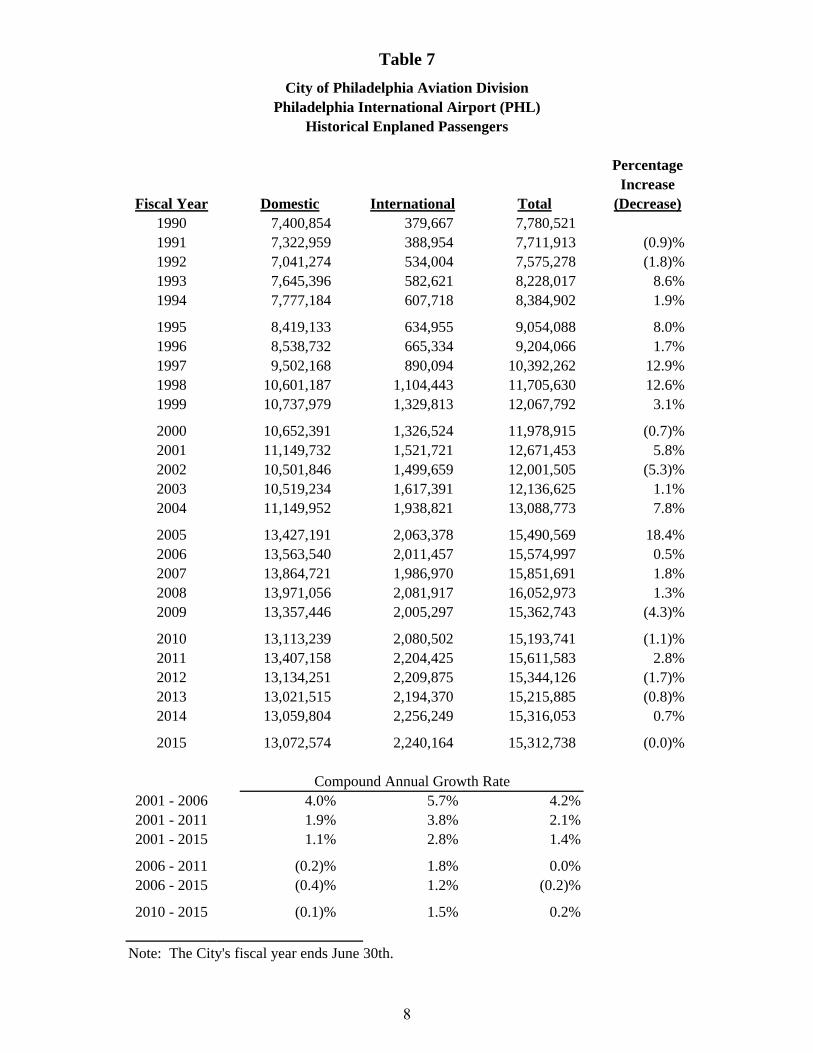
Percentage
Increase
Fiscal Year Domestic International Total (Decrease)
1990 7,400,854 379,667 7,780,521
1991 7,322,959 388,954 7,711,913 (0.9)%
1992 7,041,274 534,004 7,575,278 (1.8)%
1993 7,645,396 582,621 8,228,017 8.6%
1994 7,777,184 607,718 8,384,902 1.9%
1995 8,419,133 634,955 9,054,088 8.0%
1996 8,538,732 665,334 9,204,066 1.7%
1997 9,502,168 890,094 10,392,262 12.9%
1998 10,601,187 1,104,443 11,705,630 12.6%
1999 10,737,979 1,329,813 12,067,792 3.1%
2000 10,652,391 1,326,524 11,978,915 (0.7)%
2001 11,149,732 1,521,721 12,671,453 5.8%
2002 10,501,846 1,499,659 12,001,505 (5.3)%
2003 10,519,234 1,617,391 12,136,625 1.1%
2004 11,149,952 1,938,821 13,088,773 7.8%
2005 13,427,191 2,063,378 15,490,569 18.4%
2006 13,563,540 2,011,457 15,574,997 0.5%
2007 13,864,721 1,986,970 15,851,691 1.8%
2008 13,971,056 2,081,917 16,052,973 1.3%
2009 13,357,446 2,005,297 15,362,743 (4.3)%
2010 13,113,239 2,080,502 15,193,741 (1.1)%
2011 13,407,158 2,204,425 15,611,583 2.8%
2012 13,134,251 2,209,875 15,344,126 (1.7)%
2013 13,021,515 2,194,370 15,215,885 (0.8)%
2014 13,059,804 2,256,249 15,316,053 0.7%
2015 13,072,574 2,240,164 15,312,738 (0.0)%
2001 - 2006 4.0% 5.7% 4.2%
2001 - 2011 1.9% 3.8% 2.1%
2001 - 2015 1.1% 2.8% 1.4%
2006 - 2011 (0.2)% 1.8% 0.0%
2006 - 2015 (0.4)% 1.2% (0.2)%
2010 - 2015 (0.1)% 1.5% 0.2%
Note: The City's fiscal year ends June 30th.
Table 7
City of Philadelphia Aviation Division
Historical Enplaned Passengers
Compound Annual Growth Rate
Philadelphia International Airport (PHL)
8
FINANCIAL STATEMENTS
OF THE DIVISION OF AVIATION
For purposes of calculating Scheduled Airline rentals, fees and charges, and demonstrating
compliance with the Rate Covenant, Aviation Fund accounts are maintained on the accrual basis
of accounting adjusted to meet the particular requirements of the General Airport Revenue Bond
Ordinance of the City. Using this basis of accounting, revenues are recorded as they are earned,
and operating expenses are recorded as they are incurred. In addition, principal payments on debt
are recorded as an element of expense in lieu of depreciation, and equipment purchases and other
capital outlays funded from operations are charged to expense in the year of acquisition.
For purposes of budgeting, Aviation Fund accounts are maintained on the modified accrual basis
of accounting also referred to as the “legally enacted basis.” Under this basis, revenues are
recorded in the year received. Obligations are recognized and recorded as expenses at the time
they are paid or encumbered. A reserve is maintained for encumbrances at the close of the fiscal
year, intended to be sufficient to liquidate the estimated related obligations.
The accounting policies of the City of Philadelphia, as reflected in the accompanying Aviation
Fund financial statements, conform to accounting principles generally accepted in the United
States of America for local government units as prescribed by the Governmental Accounting
Standards Board. Accounting principles generally accepted in the United States of America for
proprietary funds, such as the Aviation Fund, require that both earnings and expenses be
recorded as they accrue, and that depreciation of fixed assets be recorded as an expense. The
financial statements for fiscal year 2015 are presented in accordance with accounting principles
generally accepted in the United States of America.
The financial statements contained in the Financial Section of this document are reconcilable
with the Basic Financial Statements contained in the City’s Comprehensive Annual Financial
Report for fiscal year 2015, which are audited by the Office of the Controller of the City of
Philadelphia.
9
CITY OF PHILADELPHIA
AVIATION FUND
Management’s Discussion and Analysis
INTRODUCTION
Philadelphia International Airport (PHL, or the Airport) and Northeast Philadelphia Airport (PNE)
are owned by the City of Philadelphia (the City) and operated by the Division of Aviation (the
Division). The following discussion and analysis of the financial performance and activity of the
Division is to provide an introduction and understanding of the basic financial statements of the
City’s Aviation Fund (Aviation Fund) for the fiscal year ended June 30, 2015 (FY 2015) with
selected comparative information for the fiscal year ended June 30, 2014 (FY 2014).
This discussion has been prepared by management and should be read in conjunction with the
financial statements and the notes thereto that follow this section. The financial statements
presented are for the Aviation Fund only, and are not intended to present fairly the financial
position of the City as a whole or the results of its operations and cash flows. The Comprehensive
Annual Financial Report of the City provides complete financial information as to the City and its
component units.
AIRPORT ACTIVITIES AND HIGHLIGHTS
Financial Position: In FY 2015, the City adopted Governmental Accounting Standards
Board (GASB) Statement No. 68, Accounting and Financial Reporting for Pensions, which
resulted in a $167.7 million prior period adjustment to the Airport’s FY 2014 total net position,
thereby recording PHL’s beginning net pension liability. The Airport’s proportionate share
is 3.55% of the City’s net pension liability of $5.5 billion at June 30, 2014. The net effect for
the Airport was a decrease in total net position to $727.3 million from $895.0 million for FY
2014. (See Note 1, Summary of Significant Accounting Policies, Recently Issued GASB
Statements for the effects of GASB 68 on the restatement of beginning net position.)
Notwithstanding the implementation of GASB 68, the Aviation Fund strengthened its
financial position with total revenues, including capital contributions, exceeding total
expenses by $77.0 million while assets and deferred outflows of resources exceeded liabilities
by $804.3 million.
Passenger Traffic: In FY 2015, enplaned passenger traffic was flat overall as a result of
reductions in the number of flights from PHL’s legacy carriers, as well as Southwest Airlines,
and the suspension of Virgin America’s service in October 2014. These reductions were offset
by increases in the number of flights from a combination of PHL’s low cost carriers and
international service providers. The Airport experienced a decline in aircraft operations while
also experiencing a slight increase in landed weight in FY 2015 due mainly to changes in
aircraft fleet mix instituted by PHL’s mainline carriers to enhance operational efficiencies.
10
CITY OF PHILADELPHIA
AVIATION FUND
Management’s Discussion and Analysis
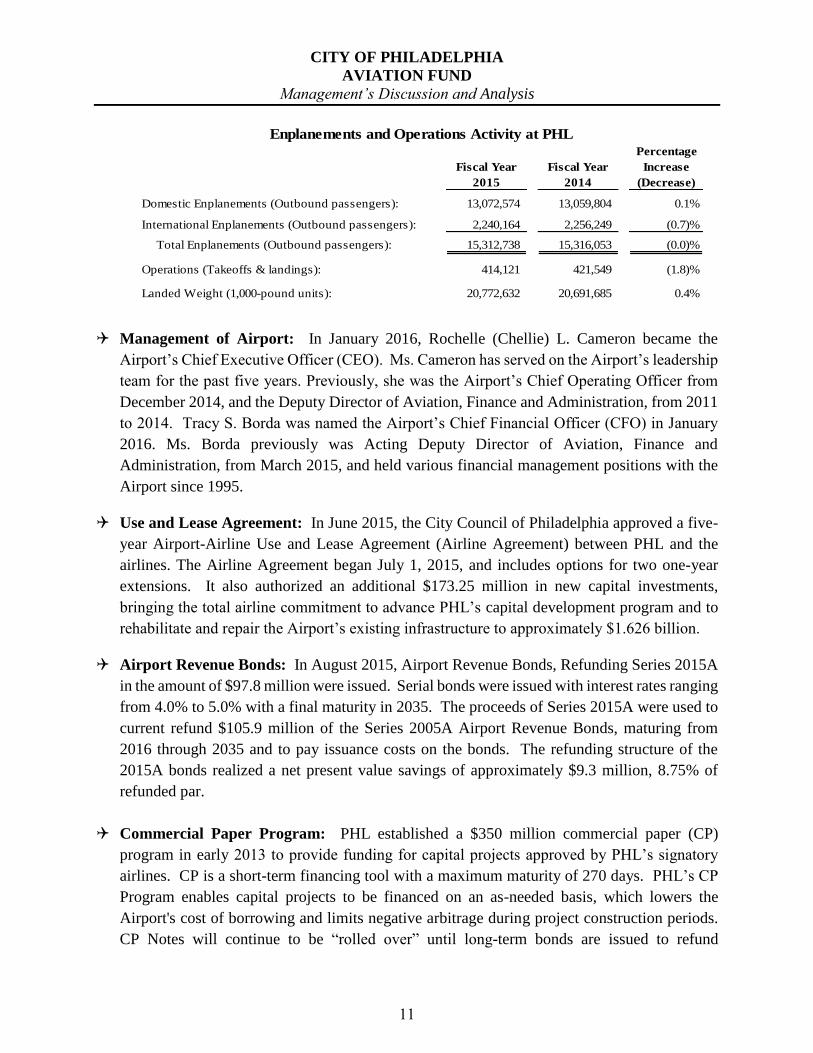
Management of Airport: In January 2016, Rochelle (Chellie) L. Cameron became the
Airport’s Chief Executive Officer (CEO). Ms. Cameron has served on the Airport’s leadership
team for the past five years. Previously, she was the Airport’s Chief Operating Officer from
December 2014, and the Deputy Director of Aviation, Finance and Administration, from 2011
to 2014. Tracy S. Borda was named the Airport’s Chief Financial Officer (CFO) in January
2016. Ms. Borda previously was Acting Deputy Director of Aviation, Finance and
Administration, from March 2015, and held various financial management positions with the
Airport since 1995.
Use and Lease Agreement: In June 2015, the City Council of Philadelphia approved a five-
year Airport-Airline Use and Lease Agreement (Airline Agreement) between PHL and the
airlines. The Airline Agreement began July 1, 2015, and includes options for two one-year
extensions. It also authorized an additional $173.25 million in new capital investments,
bringing the total airline commitment to advance PHL’s capital development program and to
rehabilitate and repair the Airport’s existing infrastructure to approximately $1.626 billion.
Airport Revenue Bonds: In August 2015, Airport Revenue Bonds, Refunding Series 2015A
in the amount of $97.8 million were issued. Serial bonds were issued with interest rates ranging
from 4.0% to 5.0% with a final maturity in 2035. The proceeds of Series 2015A were used to
current refund $105.9 million of the Series 2005A Airport Revenue Bonds, maturing from
2016 through 2035 and to pay issuance costs on the bonds. The refunding structure of the
2015A bonds realized a net present value savings of approximately $9.3 million, 8.75% of
refunded par.
Commercial Paper Program: PHL established a $350 million commercial paper (CP)
program in early 2013 to provide funding for capital projects approved by PHL’s signatory
airlines. CP is a short-term financing tool with a maximum maturity of 270 days. PHL’s CP
Program enables capital projects to be financed on an as-needed basis, which lowers the
Airport's cost of borrowing and limits negative arbitrage during project construction periods.
CP Notes will continue to be “rolled over” until long-term bonds are issued to refund
Percentage
Fiscal Year Fiscal Year Increase
2015 2014 (Decrease)
Domestic Enplanements (Outbound passengers): 13,072,574 13,059,804 0.1%
International Enplanements (Outbound passengers): 2,240,164 2,256,249 (0.7)%
Total Enplanements (Outbound passengers): 15,312,738 15,316,053 (0.0)%
Operations (Takeoffs & landings): 414,121 421,549 (1.8)%
Landed Weight (1,000-pound units): 20,772,632 20,691,685 0.4%
Enplanements and Operations Activity at PHL
11
CITY OF PHILADELPHIA
AVIATION FUND
Management’s Discussion and Analysis
outstanding CP. As of June 30, 2015, PHL had drawn $167.6 million of CP, which was used
to fund ongoing capital projects, program management efforts and the purchase of land parcels.
Customer Facility Charges: On November 25, 2013, the Governor of Pennsylvania signed
a comprehensive transportation bill into law which permitted PHL to establish and collect a
customer facility charge (CFC) of not more than $8 per rental day on customers renting motor
vehicles from Airport rental car operators. The proceeds of the CFC collections are to be used
solely for the planning, development, financing, construction and operation of a consolidated
rental car facility. Rental car operators began collecting CFCs in May 2014 from their
customers and remitting them to the Airport. As of June 30, 2015, CFC collections totaled
approximately $30.8 million.
Grant Funding: In FY 2015, PHL was awarded the following grants:
• $14.0 million, $3.8 million for design and $10.2 million for construction, from the FAA
for the Extension of Runway 9R-27L (Future Runway 9C-27C).
• $8.0 million from the FAA for land acquisition.
• $930 thousand from the FAA for the rehabilitation of the electrical vault at Northeast
Philadelphia Airport (PNE).
• $800 thousand from the Pennsylvania Department of Transportation’s (PennDOT’s)
Bureau of Aviation which matches the FAA’s grant for the Extension of Runway 9R-27L
(Future Runway 9C-27C).
• $16 thousand from the FAA for the design for Taxiway S rehabilitation, including signage
and lighting.
Capital Development
The Airport regularly renovates, improves and expands its facilities to improve passenger
experience and meet the demands of the aviation industry. Since 2000, the Airport has
constructed more than $1.5 billion of capital improvements, including new terminals,
expansion and renovation of existing terminals, and airfield improvement projects including a
runway extension.
The Airport’s capital projects are included in the long-range Capacity Enhancement Program
(CEP) and a near-term, on-going Capital Improvement Program (CIP). The CEP is a set of
projects being pursued to improve efficiency, modernize airport facilities and provide
additional capacity for future growth. The CEP will enable the Airport to enhance the Greater
Philadelphia region’s position by providing more efficient access and increased
competitiveness. It is a multi-year endeavor, with multiple phases and timing for each
development which will be closely coordinated with the airlines and other stakeholders in order
12
CITY OF PHILADELPHIA
AVIATION FUND
Management’s Discussion and Analysis
to maintain operational efficiency during construction. The major elements of the CEP include
expanding and reconfiguring the existing terminal complex; a new runway; two runway
extensions; taxiway improvements; relocating several on and off-airport facilities to facilitate
airfield improvements; a Ground Transportation Center, which includes a consolidated rental
car facility (CONRAC); cargo facility development; constructing an automated people mover
(APM); and parking expansion and roadway improvements. The Federal Aviation
Administration (FAA) issued a Letter of Intent to contribute $466.5 million toward the CEP
over the 12-15 year life of the program. In addition to federal funds, the CEP will be financed
by Airport Revenue Bonds and a variety of funding sources, such as user fees and additional
grants.
The CIP focuses on the near-term capital facility needs. CIP projects are developed to
complement the framework of the CEP and the Airport’s ultimate development. Major CIP
projects include an expansion of Terminal F; completion of Terminals D/E checked baggage
inspection system; and on-going rehabilitation and repair projects.
The following CEP and CIP projects with current airline or other funding approval are outlined
below. These projects are in various phases of planning, design, construction and completion.
Current Capital Projects Underway
Terminal F Expansion: This multi-phase project includes reconfiguring and adding
approximately 80,000 square feet to Terminal F. The expansion includes a new baggage claim
building on the arrivals roadway providing two claim devices; enlarged passenger holdrooms
and concession areas; enlarged club room; crew lounges; and other airline operations facilities
for American Airlines. The Airport completed Phase One of the Terminal F expansion project
in 2014 that included an enlarged “Central Hub” to accommodate additional concession space
and improve passenger flow. Phase Two of this project will provide additional capacity for
passenger and baggage processing for American’s affiliate airline operations. Phase Two of
this project is scheduled to be complete by spring of 2016. The approved project cost is $160.6
million.
Terminals D/E Expansion: Previously completed phases of this project consist of a new
210,000 square foot multi-level connector building between Terminals D and E; a 50,000
square foot addition to the Terminal E concourse that provided three additional passenger
gates; a 9,000 square foot connector building between baggage claim areas for Terminals D
and E; and various renovations to areas within the two terminals and the adjacent Thermal
Plant. The final phase of the project will be the activation of an in-line Explosive Detection
System (EDS) and the completion of the remaining Terminal E ticket counters and airline
ticket office items. This final phase is scheduled to be complete in the spring of 2017. The
approved project cost is $40.0 million.
13
CITY OF PHILADELPHIA
AVIATION FUND
Management’s Discussion and Analysis
Runway 9R-27L (future Runway 9C-27C) Extension and Associated Taxiways (EE and H):
This project will extend existing Runway 9R-27L to the east by approximately 1,500 feet to a
total length of 12,000 feet. In addition, this project includes the construction of Taxiways EE
and H in order to improve the flow and sequencing of aircraft to and from Terminals E and F
and reduce taxiway complexity. The final phase of this project includes relocation of fuel lines
and installation of a new localizer antenna array for Runway 9R-27L. All associated civil and
electrical infrastructure will also be performed at that time.This project is currently under
construction and scheduled for completion in 2018. The approved project cost is $193.1
million.
Consolidated Rental Car Facility (CONRAC): This project will replace the current rental car
facility surface lots with a new, multi-story consolidated rental car facility. This project is
currently in the planning phase. Customer Facility Charge (CFC) revenue is currently being
collected on rental transactions and will be the source of funding for the project. Funding for
this project is not subject to airline approval.
Terminal Modernization Program: This program is expected to increase the capacity of various
terminals and includes a redesigned and enhanced Terminal B/C ticketing area, which will
include a new automated baggage handling and screening system and a new, more spacious,
centralized passenger security checkpoint to provide for greater efficiency and enhanced
passenger flow. Funding for planning, design and initial construction of the Terminal
Modernization Program has been approved and work is in the initial planning stage. The
current approved project budget is $237.1 million for the first phase of work.
Roof and Air Handling Unit Replacement: This project includes the replacement of existing
roof and roof-top air handling units on Terminals B, C and D. This project is scheduled to be
completed in the summer of 2017.
Loading Bridge Replacement Program Phase 2: Phase 2 of the Passenger Loading Bridge
Replacement Program will replace the next 13 jet bridges in Terminals B, C, and D. This
project is scheduled to be complete in the fall of 2020.
Other Infrastructure Rehabilitation Projects: A myriad of other repair and rehabilitation
projects are in the planning and design phases, such as mechanical systems, roof repairs and
restroom upgrades.
Recently Completed Capital Projects
Taxiway K Extension: This project extended Taxiway K from Taxiway Y to Z, and to parallel
Taxiway J, thereby increasing the taxi flow between the terminal complex and runways in both
east and west flow operations. The project also provided dual queuing for the deicing facility
and serves as a perimeter route for Runway 9R-27L departures in order to avoid crossing
14
CITY OF PHILADELPHIA
AVIATION FUND
Management’s Discussion and Analysis
Runway 9L-27R during west flow operations. The project was substantially complete in
October 2014 at an approximate cost of $20 million.
Terminal Signage: The Terminal Way-finding Signage Upgrade project was initiated to
address customer concerns related to the connectivity, continuity, consistency and intuitiveness
of the signage within PHL. The signage upgrade consisted of a combination of new signage,
sign replacement, and retrofitting of existing signs to address these issues affecting airport
way-finding and the airport customer experience. The project was completed in March 2015
at a total approximate cost of $4.5 million.
Central Utilities Building: The terminal complex from Terminal A-East to Terminal D is
served by the boilers and chillers located in the CUB. Under this project, the boilers and
chillers were replaced, along with all related piping, by more modern and efficient equipment
which will result in lower energy costs. This project was completed in April 2015 at an
approximate cost of $8.2 million.
Closed-Circuit Television (CCTV): The purpose of this multi-phased project is to design,
install and operate a closed circuit system for shared use with TSA. The CCTV system
includes all surveillance hardware, cameras, storage equipment and associated electrical,
cabling and support facilities that monitor passenger and checked baggage screening areas at
PHL. The project was completed in June 2015 at a total approximate cost of $6.5 million.
Terminal A-East Improvements: This project consists of various improvements to the
Terminal A-East building and concourse to make them fully compatible with the adjacent
international Terminal A-West. The first phase of the work, which included conversion of
space formerly occupied by Federal Inspection Services (FIS) agencies, creation of a new
eight-lane security checkpoint, new ticket counters and an upgrade to the fire alarm and fire
protection systems, was completed in late-2007. The second phase of work, which included
improvements to the concourse and related spaces, was completed in mid-2011. The final
phase, which modified the outbound baggage handling system to provide a full in-line
Explosive Detection System for checked baggage, was substantially complete in July 2014.
Supplemental changes were added to the project scope including the addition of LED lighting.
The added work was completed in July 2015. The total aproximate cost of the Terminal A-
East project was $82 million.
Environmental Stewardship
• In calendar year (CY) 2014, PHL, US Airways (now American Airlines), and the
Airport’s concessionaire manager, MarketPlace Philadelphia Management
(MarketPlace), combined recycling efforts, resulting in a reduction of greenhouse gas
emissions by 8,200 metric tons CO2 equivalent (MTCO2E). PHL diverted approximately
18 percent of waste from landfills through the recycling program in the terminals,
15
CITY OF PHILADELPHIA
AVIATION FUND
Management’s Discussion and Analysis
warehouse, and office spaces. In addition to plastics, cardboard, metals, paper and glass,
the Airport recycles electronics, batteries, fluorescent lamps, and miscellaneous
construction and demolition materials collected. MarketPlace also recycles electronics,
mixed recyclables and metals. In CY 2014, over 20,000 gallons of fryer oil was recycled,
which resulted in the production of approximately 14,300 gallons of biodiesel.
• In FY 2015, PHL and airport concessionaires continued to install LED fixtures for
numerous applications, including over 550 fixtures within interior gates and airline areas
and the international arrivals hall. All directional signage lighting throughout the terminal
complex was also replaced. Exterior LED lighting applications include roadway, taxiway,
runway, and signage lighting on the airfield, as well as LED lighting in the rental car areas.
LED lighting is being installed whenever possible on a project by project basis. In addition
to lighting, PHL installed three new energy efficient boilers, a new chiller, new pumps and
associated piping in the Central Utility Building. Outdated HVAC equipment such as air
handling units are being upgraded with energy efficient units in the terminal mechanical
rooms.
• Ongoing restroom renovations are underway, that incorporate water and energy saving
features throughout the design, such as low flow toilets and urinals. Additionally, LED
lighting, new hand dryers, and new rooftop air handling units are being installed. The air
handling units incorporate energy recovery technology to capture energy from the
conditioned air that is being exhausted. In addition, water bottle filling stations are being
installed outside restroom areas for passengers to reduce waste by refilling and reusing
bottles.
• The Airport submitted an Environmental Assessment (EA) for the Fort Mifflin Sound
Insulation Project in CY 2014. The EA was approved by the FAA in February 2015 to
move forward with sound insulation work at the Fort Mifflin National Historic Landmark.
Once final design is completed, construction work will include door, window, and
mechanical and electrical treatment options for certain buildings to meet FAA noise level
reduction standards without compromising the historic fabric of the facility.
• In December 2015, seven electric vehicle (EV) charging stations were installed in the
parking facilities located at PHL. Each station can charge two vehicles at once, allowing
fourteen EVs to be charged at the Airport while parked. Two stations are located on level
one of parking garage C, two on level one of garage D and three near the exit tollbooths
in the economy parking lot. EV owners can charge their cars for free at PHL through April
1, 2016, however, normal parking rates for each parking facility will apply.
16
CITY OF PHILADELPHIA
AVIATION FUND
Management’s Discussion and Analysis
Awards and Recognition
Preparedness, Health and Safety Award: In September 2014, the American Red Cross (ARC)
presented its Preparedness, Health and Safety Award to PHL in recognition of the Airport’s
longstanding Partnership with the Southeastern Pennsylvania Chapter of the ARC in helping
to save lives through the deployment of Automated External Defibrillators thoughout the
terminal complex and providing life-saving training.
Outstanding Energy Performance Award: In February 2015, PHL was awarded the
Outstanding Energy Performance Award for achieving a reduction of 3,655 kW during the
summer of 2014, exceeding its committed 1,466 kW in the PJM Demand Response program.
PJM Interconnection is a regional transmission organization (RTO) that coordinates the
movement of wholesale electricity in all or parts of Delaware, Illinois, Indiana, Kentucky,
Maryland, Michigan, New Jersey, North Carolina, Ohio, Pennsylvania, Tennessee, Virginia,
West Virgina and the District of Columbia. Demand Response is a voluntary PJM program
that compensates end-use (retail) customers for reducing their electricity use (load), when
requested by PJM, during periods of high power prices or when the reliability of the grid is
threatened.
Way-Finding Recognition: PHL’s Way-Finding signage upgrade project was recognized in
the May/June 2015 Airport Improvement Magazine and in a September 2015 Airport
Cooperative Research Program (ACRP) Article. PHL initiated a major sign modernization
project based on the 3Cs (continuity, consistency, and connectivity) outlined in the ACRP
Report 52 guidance sponsored by the FAA. The Airport established new standards for signs
that featured increased lettering size, revised placement, and impoved lighting. Approximately
2,000 old signs were replaced and approximately 3,000 new signs were added. The project
was completed in March 2015.
Women Who Move the Nation Award: In observance of Women's History Month, the
Conference of Minority Transportation Officials (COMTO) presented PHL's Chellie Cameron,
Chief Executive Officer, with its 2015 "Women Who Move the Nation Award", in recognition
of her demonstrated leadership, commitment to diversity and inclusion, advancement of
minorities and women, and support of Historically Underutilized Businesses, in the aviation
sector. The award was announced at the organization's 4th Annual Awards Breakfast,
Celebrating Women Who Move the Nation, in March 2015 in Washington, DC.
Air Service Announcements
In January 2016, Frontier Airlines announced it will begin flying to Cleveland, OH,
Indianapolis, IN, Nashville, TN, New Orleans, LA, Raleigh-Durham, NC and St.
Augustine, FL in mid-April; Austin, TX and Cincinnati, OH in mid-May; and Columbus,
OH, San Antonio, TX, Kansas City, MO and Milwaukee, WI in early June. Since
January 2016, Frontier has launched service to twelve new markets from PHL. The new
17
CITY OF PHILADELPHIA
AVIATION FUND
Management’s Discussion and Analysis
service will bring the number of cities Frontier will serve from PHL to 24. Presently,
Frontier flies nonstop to ten cities from Philadelphia with year-round domestic service to
Fort Myers, Miami, Orlando and Tampa, FL, year-round international service to Cancun,
Mexico, Montego Bay, Jamaica (to be discontinued on April 12, 2016), and Punta Cana,
Dominican Republic as well as seasonal domestic service to Atlanta, GA, Charlotte, NC,
Chicago, IL (O’Hare), and Houston, TX. In March 2016, Frontier will also begin nonstop
flights between PHL and the airline’s home base in Denver, CO.
In December 2015, Spirit Airlines announced new daily nonstop service to Detroit, MI
and Fort Lauderdale, FL will begin in late April 2016. In November 2015, Spirit also
announced new daily nonstop service to Los Angeles, CA will begin in mid-April 2016.
In mid-April 2015, Spirit began daily nonstop service to Chicago, IL (O’Hare) and, in
June 2015, commenced new daily nonstop service to Atlanta, GA.
In November 2015, JetBlue Airways began twice daily nonstop service to Fort
Lauderdale, FL.
In November 2015, Air Canada announced twice daily nonstop service to Montreal,
Canada will commence in late May 2016.
In August 2015, Southwest Airlines commenced new daily nonstop service to Dallas
Love Field in Dallas, TX.
In April 2015, Delta Air Lines commenced new daily nonstop service to London,
England (Heathrow).
In September 2014, American Airlines (then US Airways) began twice daily flights to
Grand Rapids, MI; and in October 2014, began twice daily flights to Fort Wayne, IN.
(Each is now operated as American Eagle.) American Airlines began a second daily
nonstop flight to London, England (Heathrow) starting in late March 2015. On January
4, 2016, American Airlines discontinued its Tel Aviv, Israel route from PHL.
DESCRIPTION OF PHILADELPHIA AIRPORT SYSTEM
PHL is classified by the Federal Aviation Administration as a large air traffic hub (enplaning 1.0
percent or more of the total passengers enplaned in the U.S.). According to data reported by
Airports Council International – North America, PHL was ranked the nineteenth busiest airport in
the United States, serving 30.7 million passengers in calendar year 2014, and was ranked the twelth
busiest in the nation based on aircraft operations.
The Airport serves residents and visitors from a broad geographic area that includes eleven
counties within four states: Pennsylvania, New Jersey, Delaware and Maryland. The Airport
System consists of the following:
18
CITY OF PHILADELPHIA
AVIATION FUND
Management’s Discussion and Analysis
Philadelphia International Airport
Land. Approximately 2,410 acres located partly in the southwestern section of the City and
partly in the northeastern section of Delaware County, about 7.2 miles from center city
Philadelphia.
Runways. The Airport’s runway system consists of parallel Runways 9L-27R and 9R-27L,
crosswind Runway 17-35, commuter Runway 8-26, and interconnecting taxiways.
Terminal Buildings. Approximately 3.3 million square feet, consisting of seven terminal units
(A-West, A-East, B, C, D, E and F). Terminal facilities principally include: ticketing areas,
passenger holdrooms, baggage claim areas and approximately 185 food, retail and service
establishments.
Other Buildings and Areas. Consisting of six active cargo facilities, an Amerinan Airlines
aircraft maintenance hangar, a first class office complex, and a former United States Postal
Service building located at the western end of the Airport.
Outside Terminal Area. Consisting of a 14-story, 400-room hotel, seven rental car facilities, a
150-vehicle cell-phone lot and two employee parking lots with a total of 4,200 spaces. This
area also includes five parking garages and surface lots consisting of a total of 18,940 vehicle
spaces, operated by the Philadelphia Parking Authority.
Northeast Philadelphia Airport
PNE is located on approximately 1,126 acres situated within the City limits, ten miles northeast of
center city Philadelphia. PNE serves as a reliever airport for PHL and provides for general
aviation, air taxi, corporate, and occasional military use. The airport currently has no scheduled
commercial service. There are presently 85 T-hangars, nine corporate hangars and six open
hangars for general aviation activities. There are approximately 175 general aviation aircraft based
at PNE.
BACKGROUND INFORMATION ON THE AVIATION FUND
The Aviation Fund is an enterprise fund of the City. Enterprise funds are established by
governmental units to account for services that are provided to the general public based on user
charges, and they are operated in a manner similar to business-type activities. The Aviation Fund
was created and authorized as part of the FY 1974 Operating Budget Ordinance approved by City
Council on June 7, 1973 and made effective July 1, 1973.
The Aviation Fund is self-supporting, using aircraft landing fees, terminal building rentals,
concession revenue and other facility charges to fund annual expenses. The Airport’s capital
program is funded by airport revenue bonds issued by the City, commercial paper, federal and
state grants, Passenger Facility Charges (PFC), Customer Facility Charges (CFC), and operating
revenues.
19
CITY OF PHILADELPHIA
AVIATION FUND
Management’s Discussion and Analysis
FINANCIAL STATEMENTS OVERVIEW
The basic financial statements of the Aviation Fund are designed to provide the reader with a broad
overview of the organization’s finances, in a manner similar to the private sector. The financial
statements are prepared in accordance with generally accepted accounting principles (GAAP)
promulgated by the Governmental Accounting Standards Board (GASB).
The financial statements of the Aviation Fund are presented on an accrual basis, and accordingly,
income is recorded as earned and expenses as incurred. Operating revenues are comprised of
airline and non-airline revenues. Airline revenues are those paid by PHL’s agreement carriers and
include rents, landing fees, and per passenger fees. Non-airline revenues are all other operating
revenues that do not qualify as airline revenue. These consist of concession fees, other rents,
utilities and other operating revenue. Operating expenses include payroll and employee benefits;
the purchase of services, materials and supplies; and depreciation/amortization. Non-operating
revenue and expense items include interest income, interest expense, CFC and PFC revenues and
operating grants.
Aviation Fund financial activity is presented in three financial statements:
The Statement of Net Position presents information on all Aviation Fund assets, deferred
outflows of resources, liabilities, deferred inflows of resources as of the year-end, with the
difference between the amounts as net position, with assets and liabilities classified as
either current or non-current. The difference between (a) assets and deferred outflows of
resources and (b) liabilities and deferred inflows of resources is reported as net position.
Net position is segregated into four components: net investment in capital assets; restricted
for capital projects; restricted for debt service; and unrestricted net position.
The Statement of Revenues, Expenses and Changes in Fund Net Position presents revenue
and expense activity for the current year. The difference between revenue and expense
will either increase or decrease total net position. The ending balance of net position
resulting from this increase or decrease is reflected on the Statement of Net Position.
The Statement of Cash Flows presents the actual inflow and outflow of cash by category
during the year. The difference between the inflow and outflow of cash increases or
decreases the total cash balance. The resulting ending cash balance is reflected on the
Statement of Net Position.
The Aviation Fund financial statements can be found in Section II of this report. The Notes provide
additional information that is essential to a full understanding of the data provided in the Aviation
Fund financial statements. In addition to the basic financial statements and accompanying notes,
government accounting standards require presentation of required supplementary information
(RSI).
20
CITY OF PHILADELPHIA
AVIATION FUND
Management’s Discussion and Analysis
Please see the Comprehensive Annual Financial Report of the City of Philadelphia for complete
financial information for the City and its component units, which can be found at:
http://www.phila.gov/investor/CAFR.html.
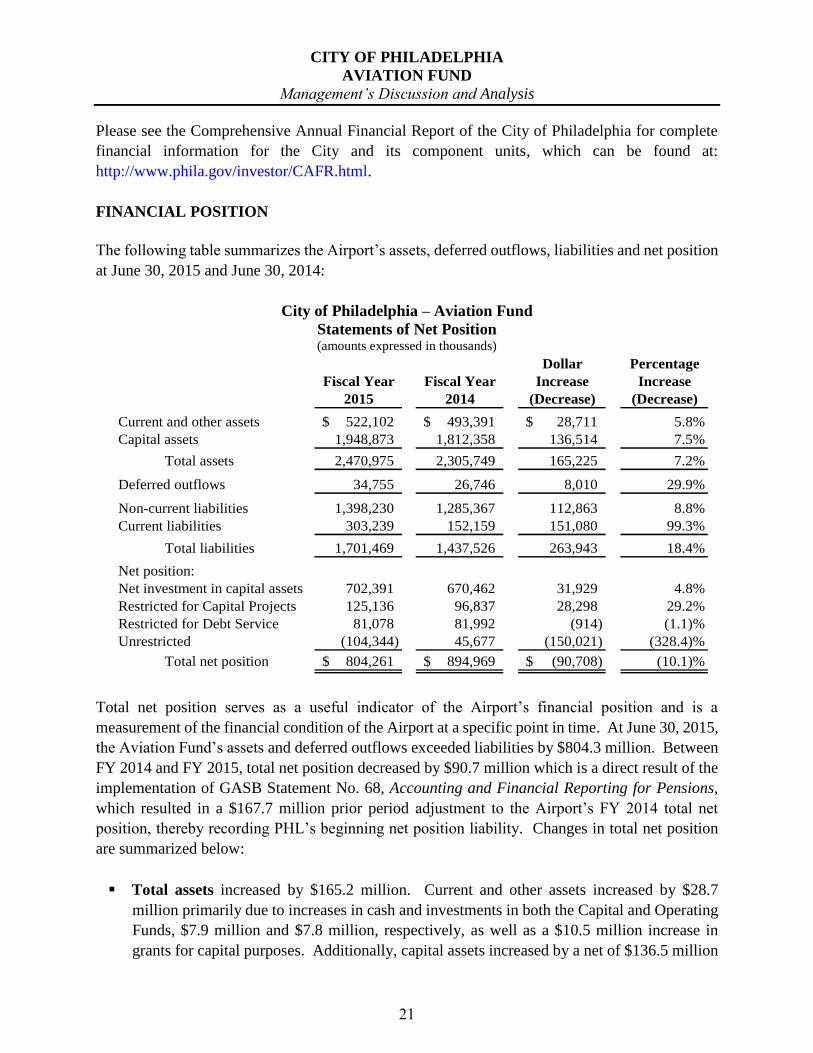
FINANCIAL POSITION
The following table summarizes the Airport’s assets, deferred outflows, liabilities and net position
at June 30, 2015 and June 30, 2014:
City of Philadelphia – Aviation Fund
Statements of Net Position (amounts expressed in thousands)
Dollar Percentage
Fiscal Year Fiscal Year Increase Increase
2015 2014 (Decrease) (Decrease)
Current and other assets 522,102$ 493,391$ 28,711$ 5.8%
Capital assets 1,948,873 1,812,358 136,514 7.5%
Total assets 2,470,975 2,305,749 165,225 7.2%
Deferred outflows 34,755 26,746 8,010 29.9%
Non-current liabilities 1,398,230 1,285,367 112,863 8.8%
Current liabilities 303,239 152,159 151,080 99.3%
Total liabilities 1,701,469 1,437,526 263,943 18.4%
Net position:
Net investment in capital assets 702,391 670,462 31,929 4.8%
Restricted for Capital Projects 125,136 96,837 28,298 29.2%
Restricted for Debt Service 81,078 81,992 (914) (1.1)%
Unrestricted (104,344) 45,677 (150,021) (328.4)%
Total net position 804,261$ 894,969$ (90,708)$ (10.1)%
Total net position serves as a useful indicator of the Airport’s financial position and is a
measurement of the financial condition of the Airport at a specific point in time. At June 30, 2015,
the Aviation Fund’s assets and deferred outflows exceeded liabilities by $804.3 million. Between
FY 2014 and FY 2015, total net position decreased by $90.7 million which is a direct result of the
implementation of GASB Statement No. 68, Accounting and Financial Reporting for Pensions,
which resulted in a $167.7 million prior period adjustment to the Airport’s FY 2014 total net
position, thereby recording PHL’s beginning net position liability. Changes in total net position
are summarized below:
Total assets increased by $165.2 million. Current and other assets increased by $28.7
million primarily due to increases in cash and investments in both the Capital and Operating
Funds, $7.9 million and $7.8 million, respectively, as well as a $10.5 million increase in
grants for capital purposes. Additionally, capital assets increased by a net of $136.5 million
21
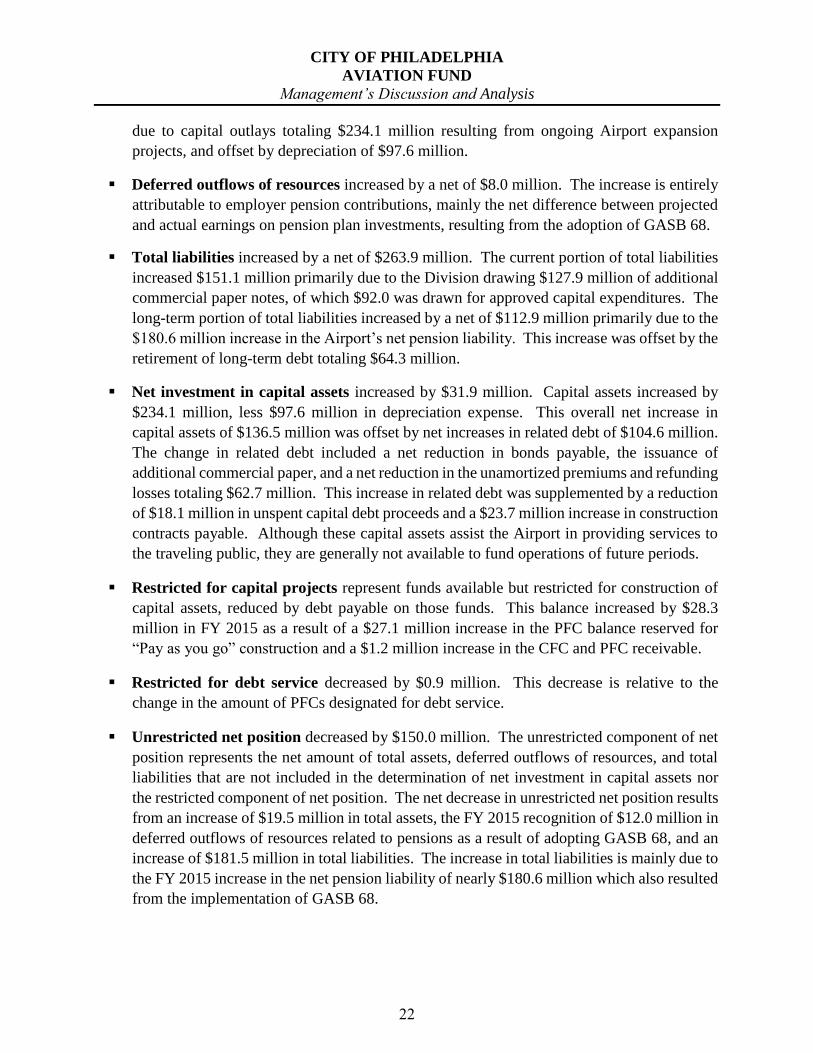
CITY OF PHILADELPHIA
AVIATION FUND
Management’s Discussion and Analysis
due to capital outlays totaling $234.1 million resulting from ongoing Airport expansion
projects, and offset by depreciation of $97.6 million.
Deferred outflows of resources increased by a net of $8.0 million. The increase is entirely
attributable to employer pension contributions, mainly the net difference between projected
and actual earnings on pension plan investments, resulting from the adoption of GASB 68.
Total liabilities increased by a net of $263.9 million. The current portion of total liabilities
increased $151.1 million primarily due to the Division drawing $127.9 million of additional
commercial paper notes, of which $92.0 was drawn for approved capital expenditures. The
long-term portion of total liabilities increased by a net of $112.9 million primarily due to the
$180.6 million increase in the Airport’s net pension liability. This increase was offset by the
retirement of long-term debt totaling $64.3 million.
Net investment in capital assets increased by $31.9 million. Capital assets increased by
$234.1 million, less $97.6 million in depreciation expense. This overall net increase in
capital assets of $136.5 million was offset by net increases in related debt of $104.6 million.
The change in related debt included a net reduction in bonds payable, the issuance of
additional commercial paper, and a net reduction in the unamortized premiums and refunding
losses totaling $62.7 million. This increase in related debt was supplemented by a reduction
of $18.1 million in unspent capital debt proceeds and a $23.7 million increase in construction
contracts payable. Although these capital assets assist the Airport in providing services to
the traveling public, they are generally not available to fund operations of future periods.
Restricted for capital projects represent funds available but restricted for construction of
capital assets, reduced by debt payable on those funds. This balance increased by $28.3
million in FY 2015 as a result of a $27.1 million increase in the PFC balance reserved for
“Pay as you go” construction and a $1.2 million increase in the CFC and PFC receivable.
Restricted for debt service decreased by $0.9 million. This decrease is relative to the
change in the amount of PFCs designated for debt service.
Unrestricted net position decreased by $150.0 million. The unrestricted component of net
position represents the net amount of total assets, deferred outflows of resources, and total
liabilities that are not included in the determination of net investment in capital assets nor
the restricted component of net position. The net decrease in unrestricted net position results
from an increase of $19.5 million in total assets, the FY 2015 recognition of $12.0 million in
deferred outflows of resources related to pensions as a result of adopting GASB 68, and an
increase of $181.5 million in total liabilities. The increase in total liabilities is mainly due to
the FY 2015 increase in the net pension liability of nearly $180.6 million which also resulted
from the implementation of GASB 68.
22
CITY OF PHILADELPHIA
AVIATION FUND
Management’s Discussion and Analysis
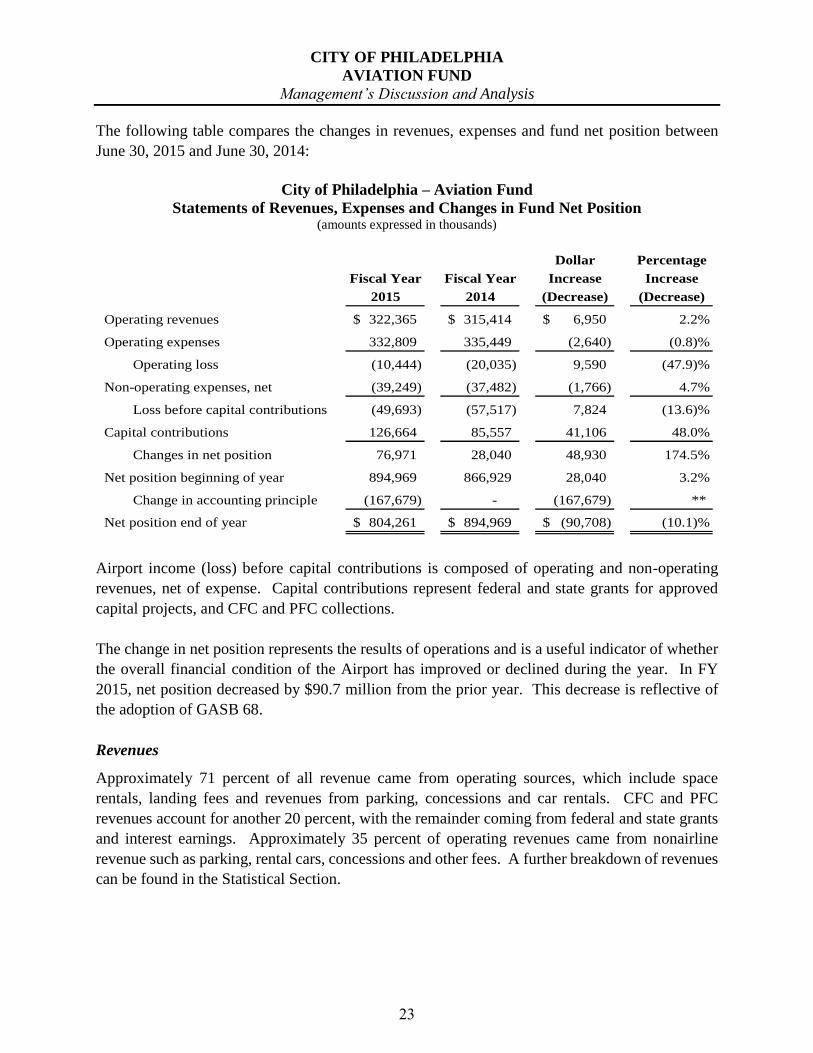
The following table compares the changes in revenues, expenses and fund net position between
June 30, 2015 and June 30, 2014:
City of Philadelphia – Aviation Fund
Statements of Revenues, Expenses and Changes in Fund Net Position (amounts expressed in thousands)
Dollar Percentage
Fiscal Year Fiscal Year Increase Increase
2015 2014 (Decrease) (Decrease)
Operating revenues 322,365$ 315,414$ 6,950$ 2.2%
Operating expenses 332,809 335,449 (2,640) (0.8)%
Operating loss (10,444) (20,035) 9,590 (47.9)%
Non-operating expenses, net (39,249) (37,482) (1,766) 4.7%
Loss before capital contributions (49,693) (57,517) 7,824 (13.6)%
Capital contributions 126,664 85,557 41,106 48.0%
Changes in net position 76,971 28,040 48,930 174.5%
Net position beginning of year 894,969 866,929 28,040 3.2%
Change in accounting principle (167,679) - (167,679) **
Net position end of year 804,261$ 894,969$ (90,708)$ (10.1)%
Airport income (loss) before capital contributions is composed of operating and non-operating
revenues, net of expense. Capital contributions represent federal and state grants for approved
capital projects, and CFC and PFC collections.
The change in net position represents the results of operations and is a useful indicator of whether
the overall financial condition of the Airport has improved or declined during the year. In FY
2015, net position decreased by $90.7 million from the prior year. This decrease is reflective of
the adoption of GASB 68.
Revenues
Approximately 71 percent of all revenue came from operating sources, which include space
rentals, landing fees and revenues from parking, concessions and car rentals. CFC and PFC
revenues account for another 20 percent, with the remainder coming from federal and state grants
and interest earnings. Approximately 35 percent of operating revenues came from nonairline
revenue such as parking, rental cars, concessions and other fees. A further breakdown of revenues
can be found in the Statistical Section.
23
CITY OF PHILADELPHIA
AVIATION FUND
Management’s Discussion and Analysis
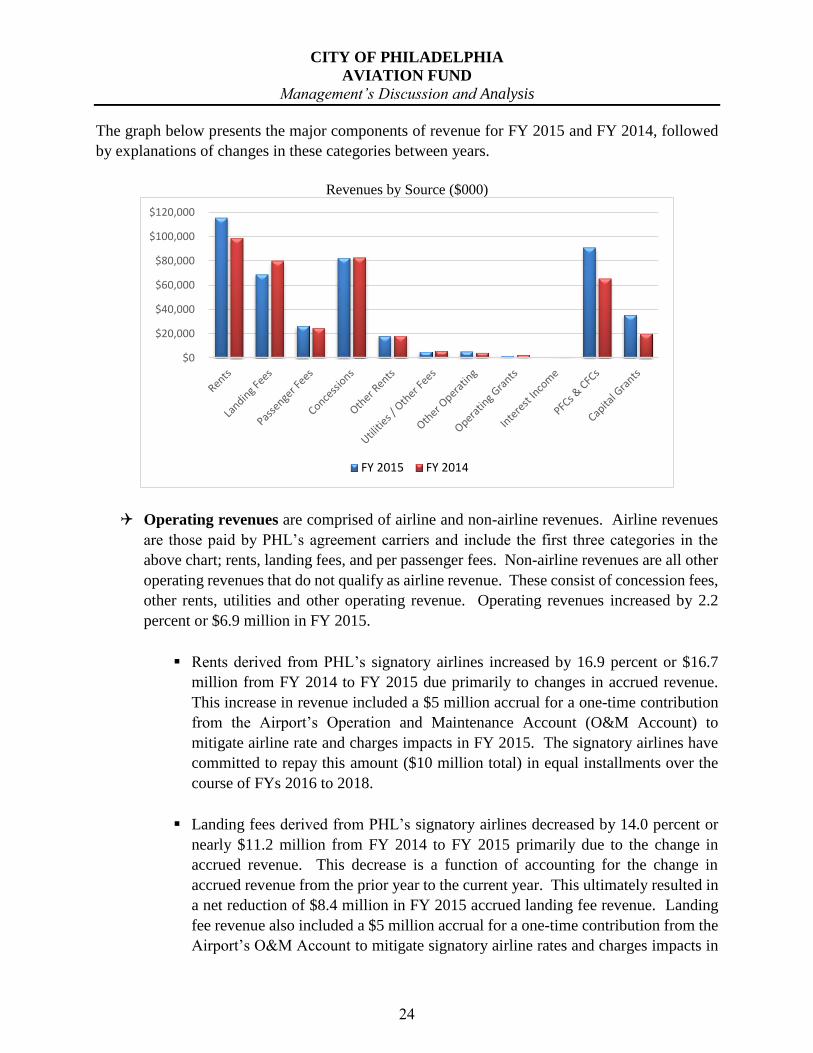
The graph below presents the major components of revenue for FY 2015 and FY 2014, followed
by explanations of changes in these categories between years.
Revenues by Source ($000)
Operating revenues are comprised of airline and non-airline revenues. Airline revenues
are those paid by PHL’s agreement carriers and include the first three categories in the
above chart; rents, landing fees, and per passenger fees. Non-airline revenues are all other
operating revenues that do not qualify as airline revenue. These consist of concession fees,
other rents, utilities and other operating revenue. Operating revenues increased by 2.2
percent or $6.9 million in FY 2015.
Rents derived from PHL’s signatory airlines increased by 16.9 percent or $16.7
million from FY 2014 to FY 2015 due primarily to changes in accrued revenue.
This increase in revenue included a $5 million accrual for a one-time contribution
from the Airport’s Operation and Maintenance Account (O&M Account) to
mitigate airline rate and charges impacts in FY 2015. The signatory airlines have
committed to repay this amount ($10 million total) in equal installments over the
course of FYs 2016 to 2018.
Landing fees derived from PHL’s signatory airlines decreased by 14.0 percent or
nearly $11.2 million from FY 2014 to FY 2015 primarily due to the change in
accrued revenue. This decrease is a function of accounting for the change in
accrued revenue from the prior year to the current year. This ultimately resulted in
a net reduction of $8.4 million in FY 2015 accrued landing fee revenue. Landing
fee revenue also included a $5 million accrual for a one-time contribution from the
Airport’s O&M Account to mitigate signatory airline rates and charges impacts in
$0
$20,000
$40,000
$60,000
$80,000
$100,000
$120,000
FY 2015 FY 2014
24
CITY OF PHILADELPHIA
AVIATION FUND
Management’s Discussion and Analysis
FY 2015. The signatory airlines have committed to repay this amount ($10 million
total as referenced above) in equal installments over the course of FYs 2016 to
2018.
Passenger fees derived from PHL’s signatory airlines increased by 6.8 percent or
$1.7 million in FY 2015 due primarily to an average increase of 6.6 percent in the
signatory passenger rates in FY 2015. Additionally, PHL experienced an increase
in domestic and international passenger traffic in the terminals (A-East and A-
West) that result in such revenue.
Concessions consist primarily of revenues derived from food and
beverage/retail/service establishments, on-Airport and off-Airport parking
operations, and rental car operations. Concessions decreased 0.6 percent or $0.5
million in FY 2015 mainly due to lost revenue derived from rental car operations
at PHL.
Non-operating revenues, which consist of federal, state and local grants for non-capital
purposes and interest income, decreased by 36.8 percent or $1.3 million in FY 2015.
Grants from other governments for non-capital purposes (operating grants)
decreased by 24.1 percent or $0.6 million in FY 2015. This decrease in revenue is
attributable to the decrease in the Transportation Security Administration’s (TSA)
federal grant reimbursement for PHL’s deployment of law enforcement officers.
Interest income decreased by 66.3 percent or $0.7 million in FY 2015 which is
reflective of the overall performance of the Airport’s investments across all funds.
Capital contributions, which consist of federal, state and local grants for capital purposes,
passenger facility charges, and customer facility charges, increased by 48.0 percent or
$41.1 million in FY 2015.
Grants from other governments for capital purposes (capital grants) increased by
77.3 percent or $15.5 million in FY 2015. Capital grant revenue in any given year
is dependent upon construction timelines for reimbursement of grant-eligible
Airport capital projects. The increase for FY 2015 is due mainly to three new PHL
capital grants relative to the construction of Taxiway EE and H, design of the
extension of runway 9R-27L, and land acquisition.
Passenger Facility Charges (PFCs) increased by 0.9 percent or $0.5 million in FY
2015 due primarily to an increase in outbound passenger traffic.
Customer Facility Charges (CFCs) increased 516.2 percent or $25.1 million in FY
2015, the first full year of revenue, after having imposed the CFC in May 2014.
25
CITY OF PHILADELPHIA
AVIATION FUND
Management’s Discussion and Analysis
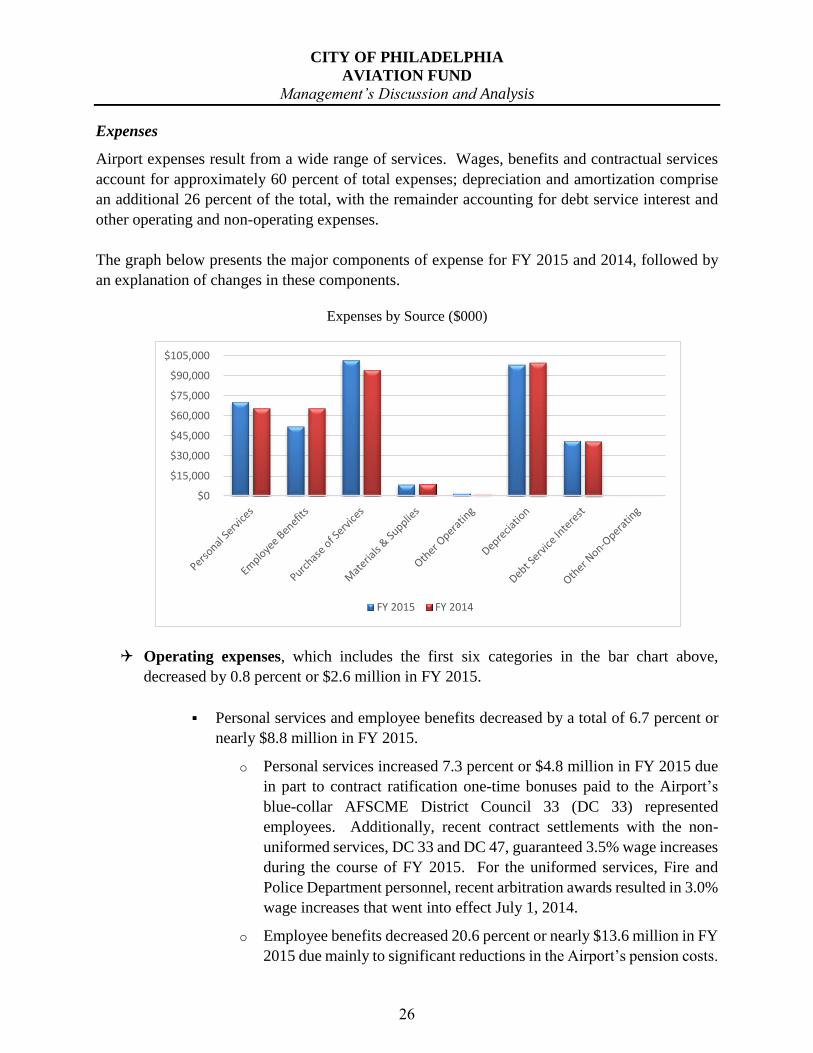
Expenses
Airport expenses result from a wide range of services. Wages, benefits and contractual services
account for approximately 60 percent of total expenses; depreciation and amortization comprise
an additional 26 percent of the total, with the remainder accounting for debt service interest and
other operating and non-operating expenses.
The graph below presents the major components of expense for FY 2015 and 2014, followed by
an explanation of changes in these components.
Expenses by Source ($000)
Operating expenses, which includes the first six categories in the bar chart above,
decreased by 0.8 percent or $2.6 million in FY 2015.
Personal services and employee benefits decreased by a total of 6.7 percent or
nearly $8.8 million in FY 2015.
o Personal services increased 7.3 percent or $4.8 million in FY 2015 due
in part to contract ratification one-time bonuses paid to the Airport’s
blue-collar AFSCME District Council 33 (DC 33) represented
employees. Additionally, recent contract settlements with the non-
uniformed services, DC 33 and DC 47, guaranteed 3.5% wage increases
during the course of FY 2015. For the uniformed services, Fire and
Police Department personnel, recent arbitration awards resulted in 3.0%
wage increases that went into effect July 1, 2014.
o Employee benefits decreased 20.6 percent or nearly $13.6 million in FY
2015 due mainly to significant reductions in the Airport’s pension costs.
$0
$15,000
$30,000
$45,000
$60,000
$75,000
$90,000
$105,000
FY 2015 FY 2014
26
CITY OF PHILADELPHIA
AVIATION FUND
Management’s Discussion and Analysis
Two factors contributed to the reduction this past year. First, the GASB
68 change in accounting for the net pension liability versus obligation
resulted in a savings of nearly $7.9 million in expense year-over-year.
Additionally, PHL benefited from a net reduction of $3.9 million in
pension obligation bond payments in FY 2015 after the City repaid the
partial deferral of fiscal years 2010 and 2011 pension payments in FY
2014. And finally, Aviation’s estimated outstanding workers’
compensation liability decreased by $2.1 million in FY 2015.
Purchase of services increased by 7.7 percent or $7.2 million in FY 2015 mainly
due to a $6.3 million net effect of expensing indirect costs from construction in
progress (CIP) and the capitalization of operating expenditures.
Materials and supplies and other operating expenses, including the purchase of
equipment, realized a modest decrease of nearly $0.3 million or 2.9 percent in
FY 2015.
Depreciation and amortization expense decreased 1.6 percent or $1.6 million in
FY 2015. The straight-line method is used to record depreciation starting in the
year following addition.
Non-operating expenses, which includes debt service interest and other non-operating
expenses, increased 1.1 percent or nearly $0.5 million in FY 2015. This increase is entirely
attributable to the marginal increase in FY 2015 debt service interest expense.
[INTENTIONALLY LEFT BLANK]
27
CITY OF PHILADELPHIA
AVIATION FUND
Management’s Discussion and Analysis
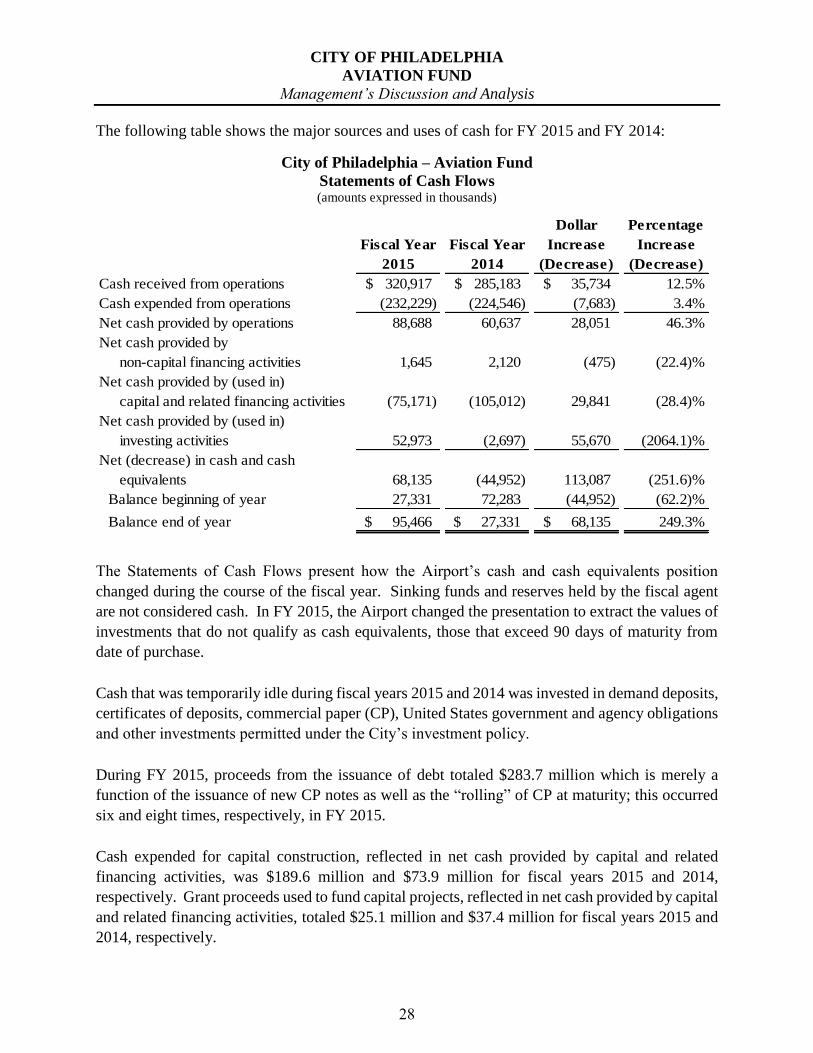
The following table shows the major sources and uses of cash for FY 2015 and FY 2014:
City of Philadelphia – Aviation Fund
Statements of Cash Flows (amounts expressed in thousands)
Dollar Percentage
Fiscal Year Fiscal Year Increase Increase
2015 2014 (Decrease) (Decrease)
Cash received from operations 320,917$ 285,183$ 35,734$ 12.5%
Cash expended from operations (232,229) (224,546) (7,683) 3.4%
Net cash provided by operations 88,688 60,637 28,051 46.3%
Net cash provided by
non-capital financing activities 1,645 2,120 (475) (22.4)%
Net cash provided by (used in)
capital and related financing activities (75,171) (105,012) 29,841 (28.4)%
Net cash provided by (used in)
investing activities 52,973 (2,697) 55,670 (2064.1)%
Net (decrease) in cash and cash
equivalents 68,135 (44,952) 113,087 (251.6)%
Balance beginning of year 27,331 72,283 (44,952) (62.2)%
Balance end of year 95,466$ 27,331$ 68,135$ 249.3%
The Statements of Cash Flows present how the Airport’s cash and cash equivalents position
changed during the course of the fiscal year. Sinking funds and reserves held by the fiscal agent
are not considered cash. In FY 2015, the Airport changed the presentation to extract the values of
investments that do not qualify as cash equivalents, those that exceed 90 days of maturity from
date of purchase.
Cash that was temporarily idle during fiscal years 2015 and 2014 was invested in demand deposits,
certificates of deposits, commercial paper (CP), United States government and agency obligations
and other investments permitted under the City’s investment policy.
During FY 2015, proceeds from the issuance of debt totaled $283.7 million which is merely a
function of the issuance of new CP notes as well as the “rolling” of CP at maturity; this occurred
six and eight times, respectively, in FY 2015.
Cash expended for capital construction, reflected in net cash provided by capital and related
financing activities, was $189.6 million and $73.9 million for fiscal years 2015 and 2014,
respectively. Grant proceeds used to fund capital projects, reflected in net cash provided by capital
and related financing activities, totaled $25.1 million and $37.4 million for fiscal years 2015 and
2014, respectively.
28
CITY OF PHILADELPHIA
AVIATION FUND
Management’s Discussion and Analysis
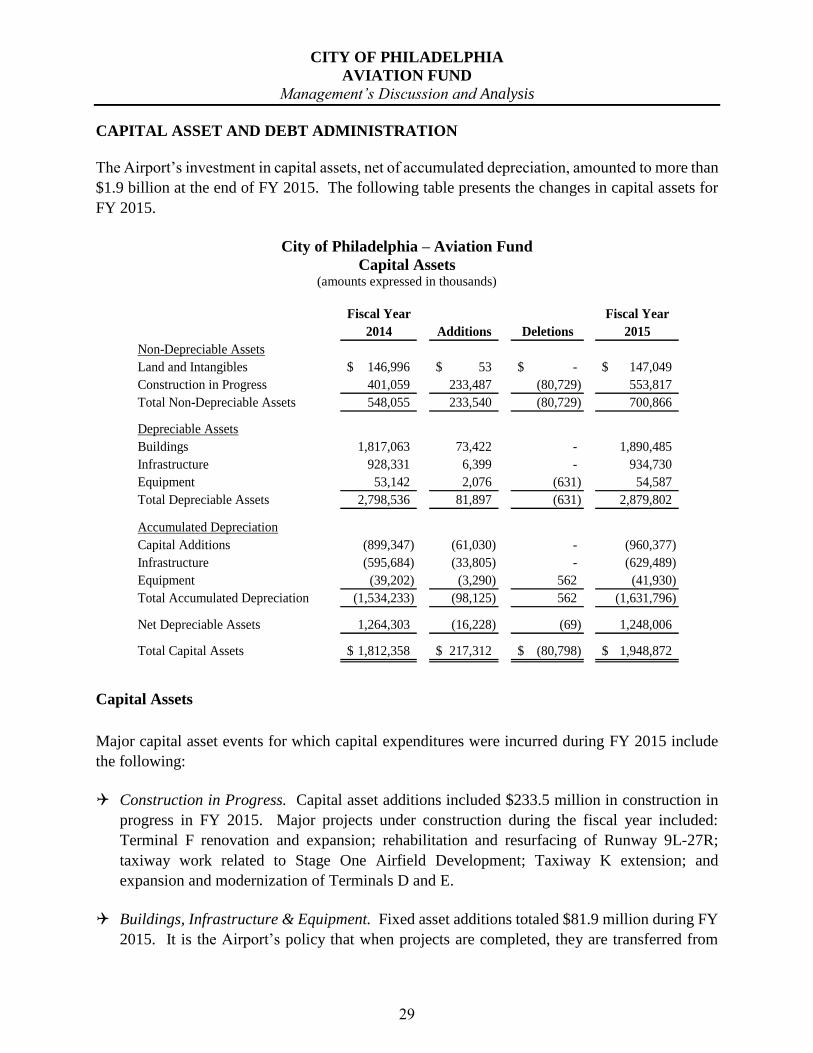
CAPITAL ASSET AND DEBT ADMINISTRATION
The Airport’s investment in capital assets, net of accumulated depreciation, amounted to more than
$1.9 billion at the end of FY 2015. The following table presents the changes in capital assets for
FY 2015.
City of Philadelphia – Aviation Fund
Capital Assets (amounts expressed in thousands)
Fiscal Year Fiscal Year
2014 Additions Deletions 2015
Non-Depreciable Assets
Land and Intangibles 146,996$ 53$ -$ 147,049$
Construction in Progress 401,059 233,487 (80,729) 553,817
Total Non-Depreciable Assets 548,055 233,540 (80,729) 700,866
Depreciable Assets
Buildings 1,817,063 73,422 - 1,890,485
Infrastructure 928,331 6,399 - 934,730
Equipment 53,142 2,076 (631) 54,587
Total Depreciable Assets 2,798,536 81,897 (631) 2,879,802
Accumulated Depreciation
Capital Additions (899,347) (61,030) - (960,377)
Infrastructure (595,684) (33,805) - (629,489)
Equipment (39,202) (3,290) 562 (41,930)
Total Accumulated Depreciation (1,534,233) (98,125) 562 (1,631,796)
Net Depreciable Assets 1,264,303 (16,228) (69) 1,248,006
Total Capital Assets 1,812,358$ 217,312$ (80,798)$ 1,948,872$
Capital Assets
Major capital asset events for which capital expenditures were incurred during FY 2015 include
the following:
Construction in Progress. Capital asset additions included $233.5 million in construction in
progress in FY 2015. Major projects under construction during the fiscal year included:
Terminal F renovation and expansion; rehabilitation and resurfacing of Runway 9L-27R;
taxiway work related to Stage One Airfield Development; Taxiway K extension; and
expansion and modernization of Terminals D and E.
Buildings, Infrastructure & Equipment. Fixed asset additions totaled $81.9 million during FY
2015. It is the Airport’s policy that when projects are completed, they are transferred from
29
CITY OF PHILADELPHIA
AVIATION FUND
Management’s Discussion and Analysis
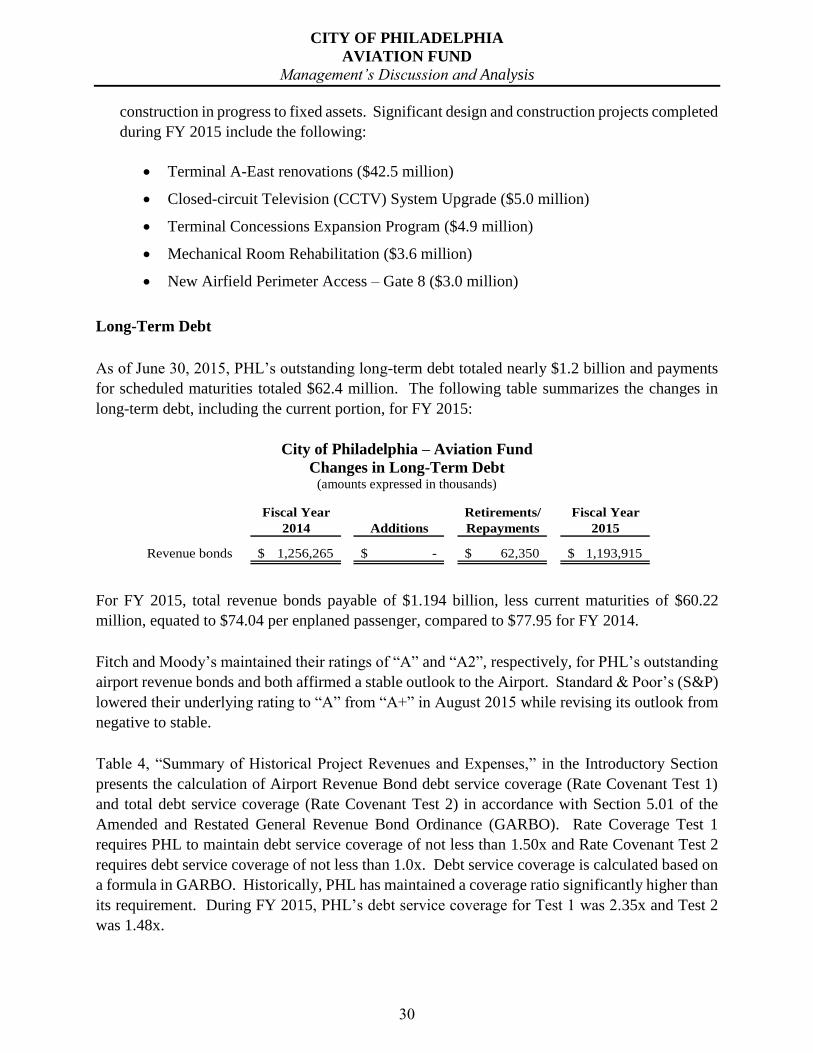
construction in progress to fixed assets. Significant design and construction projects completed
during FY 2015 include the following:
Terminal A-East renovations ($42.5 million)
Closed-circuit Television (CCTV) System Upgrade ($5.0 million)
Terminal Concessions Expansion Program ($4.9 million)
Mechanical Room Rehabilitation ($3.6 million)
New Airfield Perimeter Access – Gate 8 ($3.0 million)
Long-Term Debt
As of June 30, 2015, PHL’s outstanding long-term debt totaled nearly $1.2 billion and payments
for scheduled maturities totaled $62.4 million. The following table summarizes the changes in
long-term debt, including the current portion, for FY 2015:
City of Philadelphia – Aviation Fund
Changes in Long-Term Debt (amounts expressed in thousands)
Fiscal Year Retirements/ Fiscal Year
2014 Additions Repayments 2015
Revenue bonds 1,256,265$ -$ 62,350$ 1,193,915$
For FY 2015, total revenue bonds payable of $1.194 billion, less current maturities of $60.22
million, equated to $74.04 per enplaned passenger, compared to $77.95 for FY 2014.
Fitch and Moody’s maintained their ratings of “A” and “A2”, respectively, for PHL’s outstanding
airport revenue bonds and both affirmed a stable outlook to the Airport. Standard & Poor’s (S&P)
lowered their underlying rating to “A” from “A+” in August 2015 while revising its outlook from
negative to stable.
Table 4, “Summary of Historical Project Revenues and Expenses,” in the Introductory Section
presents the calculation of Airport Revenue Bond debt service coverage (Rate Covenant Test 1)
and total debt service coverage (Rate Covenant Test 2) in accordance with Section 5.01 of the
Amended and Restated General Revenue Bond Ordinance (GARBO). Rate Coverage Test 1
requires PHL to maintain debt service coverage of not less than 1.50x and Rate Covenant Test 2
requires debt service coverage of not less than 1.0x. Debt service coverage is calculated based on
a formula in GARBO. Historically, PHL has maintained a coverage ratio significantly higher than
its requirement. During FY 2015, PHL’s debt service coverage for Test 1 was 2.35x and Test 2
was 1.48x.
30
CITY OF PHILADELPHIA
AVIATION FUND
Management’s Discussion and Analysis
BUDGETARY HIGHLIGHTS FROM FISCAL YEAR 2015
Actual expenditures for FY 2015 were 2.6 percent higher than budgeted expenditures. The
following factors contributed to this difference:
Direct expenses were 9.3 percent, or $10.7 million, higher than budgeted in FY 2015. This
was mainly related to Aviation’s costs for payroll, contractual services, and materials &
supplies in FY 2015. As noted above, DC 33 and DC 47 contract terms and police & fire
arbitration awards dictated increases in wages. Additionally, expenses for professional
services were $8.0 million more than budgeted due to increased costs related to capital program
management, ground transportation management services, passenger information services,
security guard services, and the Airport’s shuttle bus operation.
Net interdepartmental charges were 1.7 percent, or $1.8 million, lower than projected in FY
2015. These results are a function of several expense categories. Specifically, an overall
increase of nearly $1.7 million in utility (electric, natural gas, telephones, and water, sewer &
stormwater) costs, above the forecasted amount, was absorbed by a $1.6 million savings when
comparing the actual expense to the amount budgeted for indemnities. Additional savings of
$1.5 million were realized from liability and property insurance coverage.
Net debt service was 0.7 percent, or $0.7 million, lower than budgeted in FY 2015. This was
due mainly to savings in anticipated interest expense on the CP Program. In addition, market
conditions remained favorable to PHL.
REQUESTS FOR INFORMATION
This financial report is designed to provide a general overview of Philadelphia International
Airport’s finances and to demonstrate the City’s accountability for the funds it receives and
disburses. For additional information concerning this report, please contact: Chief Financial
Officer, Philadelphia International Airport, Executive Offices, Terminal D, 3rd Floor, Philadelphia,
PA 19153.
31
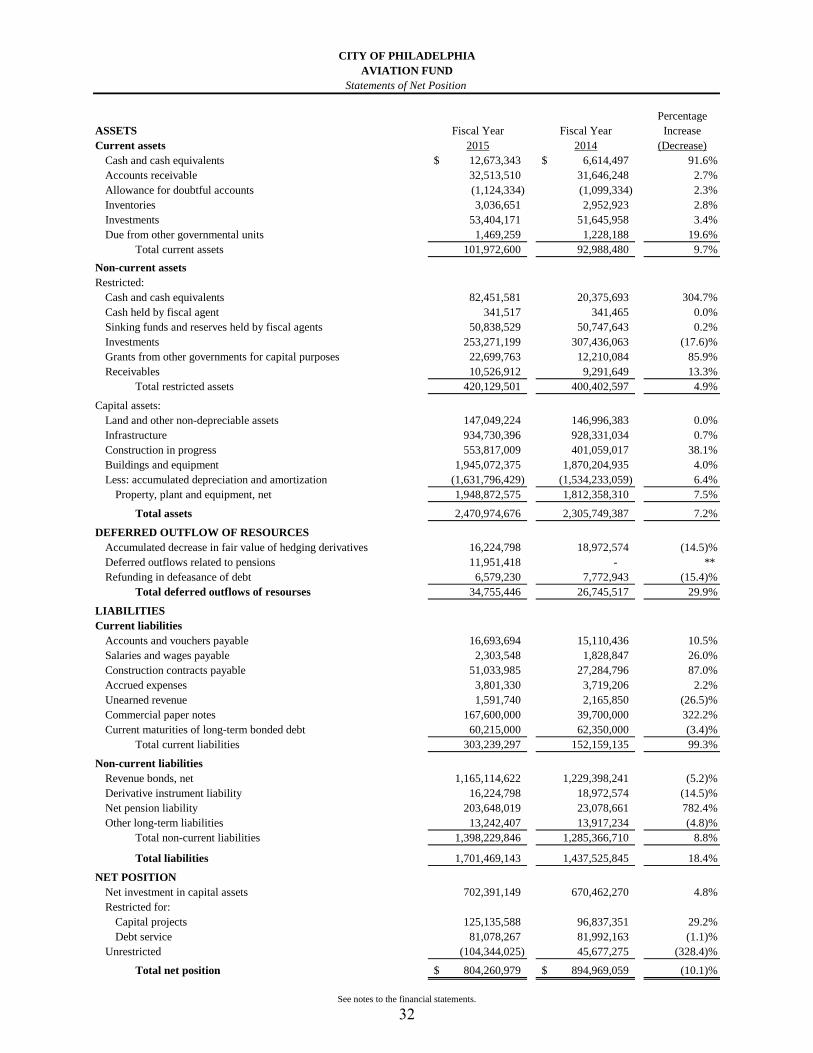
Percentage
ASSETS Fiscal Year Fiscal Year Increase
Current assets 2015 2014 (Decrease)
Cash and cash equivalents 12,673,343$ 6,614,497$ 91.6%
Accounts receivable 32,513,510 31,646,248 2.7%
Allowance for doubtful accounts (1,124,334) (1,099,334) 2.3%
Inventories 3,036,651 2,952,923 2.8%
Investments 53,404,171 51,645,958 3.4%
Due from other governmental units 1,469,259 1,228,188 19.6%
Total current assets 101,972,600 92,988,480 9.7%
Non-current assets
Restricted:
Cash and cash equivalents 82,451,581 20,375,693 304.7%
Cash held by fiscal agent 341,517 341,465 0.0%
Sinking funds and reserves held by fiscal agents 50,838,529 50,747,643 0.2%
Investments 253,271,199 307,436,063 (17.6)%
Grants from other governments for capital purposes 22,699,763 12,210,084 85.9%
Receivables 10,526,912 9,291,649 13.3%
Total restricted assets 420,129,501 400,402,597 4.9%
Capital assets:
Land and other non-depreciable assets 147,049,224 146,996,383 0.0%
Infrastructure 934,730,396 928,331,034 0.7%
Construction in progress 553,817,009 401,059,017 38.1%
Buildings and equipment 1,945,072,375 1,870,204,935 4.0%
Less: accumulated depreciation and amortization (1,631,796,429) (1,534,233,059) 6.4%
Property, plant and equipment, net 1,948,872,575 1,812,358,310 7.5%
Total assets 2,470,974,676 2,305,749,387 7.2%
DEFERRED OUTFLOW OF RESOURCES
Accumulated decrease in fair value of hedging derivatives 16,224,798 18,972,574 (14.5)%
Deferred outflows related to pensions 11,951,418 - **
Refunding in defeasance of debt 6,579,230 7,772,943 (15.4)%
Total deferred outflows of resourses 34,755,446 26,745,517 29.9%
LIABILITIES
Current liabilities
Accounts and vouchers payable 16,693,694 15,110,436 10.5%
Salaries and wages payable 2,303,548 1,828,847 26.0%
Construction contracts payable 51,033,985 27,284,796 87.0%
Accrued expenses 3,801,330 3,719,206 2.2%
Unearned revenue 1,591,740 2,165,850 (26.5)%
Commercial paper notes 167,600,000 39,700,000 322.2%
Current maturities of long-term bonded debt 60,215,000 62,350,000 (3.4)%
Total current liabilities 303,239,297 152,159,135 99.3%
Non-current liabilities
Revenue bonds, net 1,165,114,622 1,229,398,241 (5.2)%
Derivative instrument liability 16,224,798 18,972,574 (14.5)%
Net pension liability 203,648,019 23,078,661 782.4%
Other long-term liabilities 13,242,407 13,917,234 (4.8)%
Total non-current liabilities 1,398,229,846 1,285,366,710 8.8%
Total liabilities 1,701,469,143 1,437,525,845 18.4%
NET POSITION
Net investment in capital assets 702,391,149 670,462,270 4.8%
Restricted for:
Capital projects 125,135,588 96,837,351 29.2%
Debt service 81,078,267 81,992,163 (1.1)%
Unrestricted (104,344,025) 45,677,275 (328.4)%
Total net position 804,260,979$ 894,969,059$ (10.1)%
CITY OF PHILADELPHIA
AVIATION FUND
Statements of Net Position
See notes to the financial statements.
32
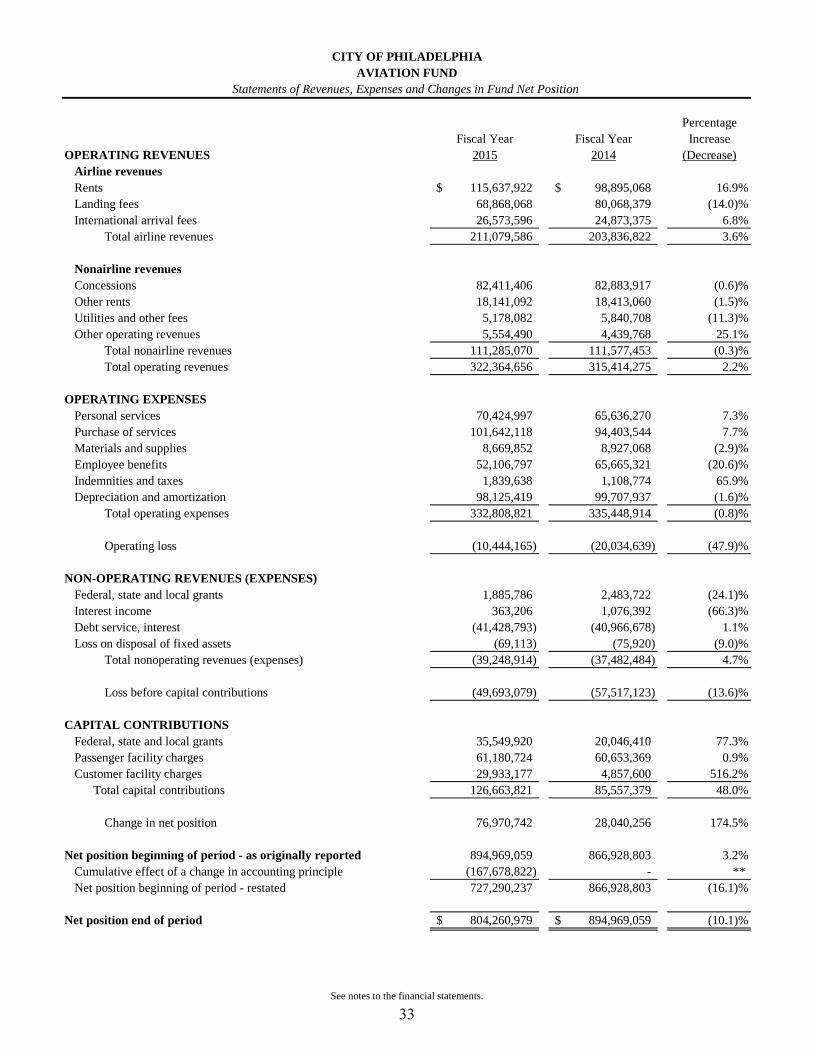
Percentage
Fiscal Year Fiscal Year Increase
OPERATING REVENUES 2015 2014 (Decrease)
Airline revenues
Rents 115,637,922$ 98,895,068$ 16.9%
Landing fees 68,868,068 80,068,379 (14.0)%
International arrival fees 26,573,596 24,873,375 6.8%
Total airline revenues 211,079,586 203,836,822 3.6%
Nonairline revenues
Concessions 82,411,406 82,883,917 (0.6)%
Other rents 18,141,092 18,413,060 (1.5)%
Utilities and other fees 5,178,082 5,840,708 (11.3)%
Other operating revenues 5,554,490 4,439,768 25.1%
Total nonairline revenues 111,285,070 111,577,453 (0.3)%
Total operating revenues 322,364,656 315,414,275 2.2%
OPERATING EXPENSES
Personal services 70,424,997 65,636,270 7.3%
Purchase of services 101,642,118 94,403,544 7.7%
Materials and supplies 8,669,852 8,927,068 (2.9)%
Employee benefits 52,106,797 65,665,321 (20.6)%
Indemnities and taxes 1,839,638 1,108,774 65.9%
Depreciation and amortization 98,125,419 99,707,937 (1.6)%
Total operating expenses 332,808,821 335,448,914 (0.8)%
Operating loss (10,444,165) (20,034,639) (47.9)%
NON-OPERATING REVENUES (EXPENSES)
Federal, state and local grants 1,885,786 2,483,722 (24.1)%
Interest income 363,206 1,076,392 (66.3)%
Debt service, interest (41,428,793) (40,966,678) 1.1%
Loss on disposal of fixed assets (69,113) (75,920) (9.0)%
Total nonoperating revenues (expenses) (39,248,914) (37,482,484) 4.7%
Loss before capital contributions (49,693,079) (57,517,123) (13.6)%
CAPITAL CONTRIBUTIONS
Federal, state and local grants 35,549,920 20,046,410 77.3%
Passenger facility charges 61,180,724 60,653,369 0.9%
Customer facility charges 29,933,177 4,857,600 516.2%
Total capital contributions 126,663,821 85,557,379 48.0%
Change in net position 76,970,742 28,040,256 174.5%
Net position beginning of period - as originally reported 894,969,059 866,928,803 3.2%
Cumulative effect of a change in accounting principle (167,678,822) - **
Net position beginning of period - restated 727,290,237 866,928,803 (16.1)%
Net position end of period 804,260,979$ 894,969,059$ (10.1)%
CITY OF PHILADELPHIA
AVIATION FUND
Statements of Revenues, Expenses and Changes in Fund Net Position
See notes to the financial statements.
33
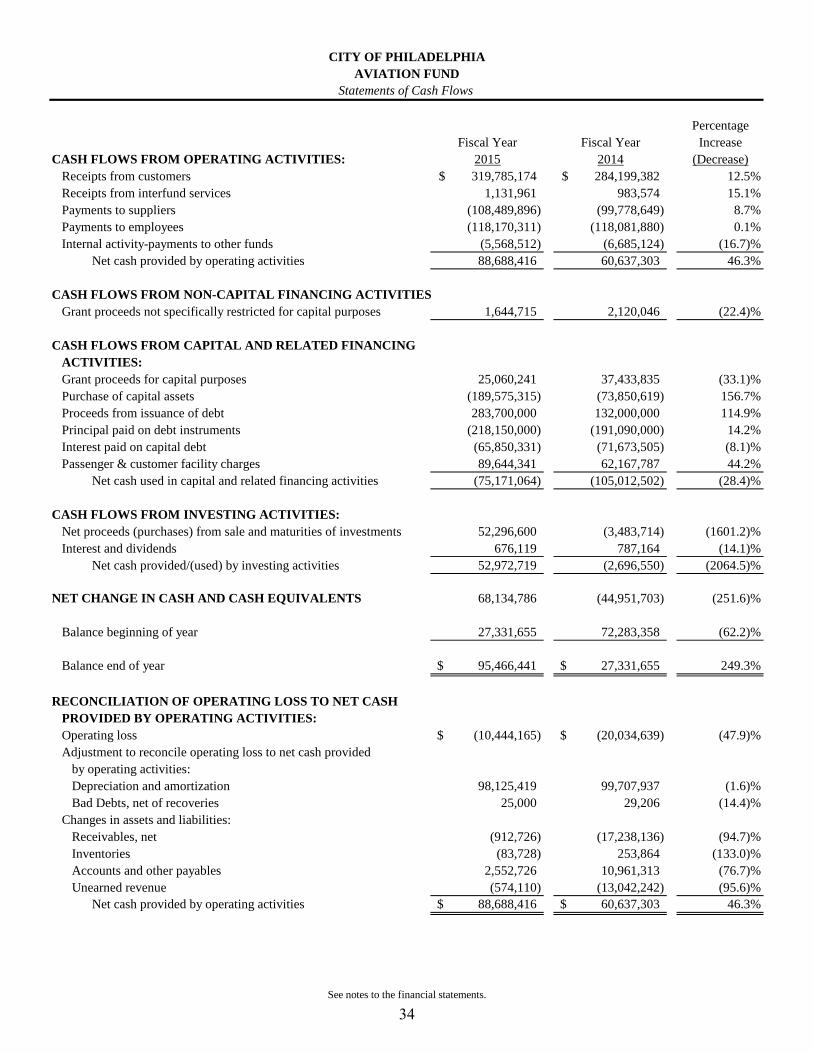
Percentage
Fiscal Year Fiscal Year Increase
CASH FLOWS FROM OPERATING ACTIVITIES: 2015 2014 (Decrease)
Receipts from customers 319,785,174$ 284,199,382$ 12.5%
Receipts from interfund services 1,131,961 983,574 15.1%
Payments to suppliers (108,489,896) (99,778,649) 8.7%
Payments to employees (118,170,311) (118,081,880) 0.1%
Internal activity-payments to other funds (5,568,512) (6,685,124) (16.7)%
Net cash provided by operating activities 88,688,416 60,637,303 46.3%
CASH FLOWS FROM NON-CAPITAL FINANCING ACTIVITIES
Grant proceeds not specifically restricted for capital purposes 1,644,715 2,120,046 (22.4)%
CASH FLOWS FROM CAPITAL AND RELATED FINANCING
ACTIVITIES:
Grant proceeds for capital purposes 25,060,241 37,433,835 (33.1)%
Purchase of capital assets (189,575,315) (73,850,619) 156.7%
Proceeds from issuance of debt 283,700,000 132,000,000 114.9%
Principal paid on debt instruments (218,150,000) (191,090,000) 14.2%
Interest paid on capital debt (65,850,331) (71,673,505) (8.1)%
Passenger & customer facility charges 89,644,341 62,167,787 44.2%
Net cash used in capital and related financing activities (75,171,064) (105,012,502) (28.4)%
CASH FLOWS FROM INVESTING ACTIVITIES:
Net proceeds (purchases) from sale and maturities of investments 52,296,600 (3,483,714) (1601.2)%
Interest and dividends 676,119 787,164 (14.1)%
Net cash provided/(used) by investing activities 52,972,719 (2,696,550) (2064.5)%
NET CHANGE IN CASH AND CASH EQUIVALENTS 68,134,786 (44,951,703) (251.6)%
Balance beginning of year 27,331,655 72,283,358 (62.2)%
Balance end of year 95,466,441$ 27,331,655$ 249.3%
RECONCILIATION OF OPERATING LOSS TO NET CASH
PROVIDED BY OPERATING ACTIVITIES:
Operating loss (10,444,165)$ (20,034,639)$ (47.9)%
Adjustment to reconcile operating loss to net cash provided
by operating activities:
Depreciation and amortization 98,125,419 99,707,937 (1.6)%
Bad Debts, net of recoveries 25,000 29,206 (14.4)%
Changes in assets and liabilities:
Receivables, net (912,726) (17,238,136) (94.7)%
Inventories (83,728) 253,864 (133.0)%
Accounts and other payables 2,552,726 10,961,313 (76.7)%
Unearned revenue (574,110) (13,042,242) (95.6)%
Net cash provided by operating activities 88,688,416$ 60,637,303$ 46.3%
CITY OF PHILADELPHIA
AVIATION FUND
Statements of Cash Flows
See notes to the financial statements.
34
CITY OF PHILADELPHIA
AVIATION FUND
Notes to Financial Statements
1. SUMMARY OF SIGNIFICANT ACCOUNTING POLICIES
Operations
The Aviation Fund is a proprietary fund of the City of Philadelphia (the City). It was
created and authorized as part of the Fiscal 1974 Operating Budget Ordinance approved
by City Council on June 7, 1973, with an effective date of July 1, 1973. This fund was
established to facilitate administrative and financial operations necessary to maintain,
improve, repair and operate Philadelphia International Airport (PHL, or the Airport) and
Northeast Philadelphia Airport (PNE). The financial statements presented are for the
Aviation Fund only, and are not intended to present fairly the financial position of the
City of Philadelphia as a whole or the results of its operations and cash flows. The
comprehensive annual financial report of the City of Philadelphia provides complete
financial information as to the City and its component units.
Basis of Accounting
The accompanying financial statements have been prepared on the accrual basis of
accounting. Under this method, revenues are recognized in the accounting period in
which they are earned and expenses are recognized at the time obligations are incurred.
Private sector standards of accounting and financial reporting issued prior to December 1,
1989, generally are followed in both the government wide and the proprietary fund
financial statements to the extent that they do not conflict or contradict guidance of the
Governmental Accounting Standards Board (GASB). Governments also have the option
of following subsequent private sector guidance for their business type activities and
enterprise funds. The City has elected not to follow subsequent private sector guidelines.
Proprietary funds distinguish operating revenues and expenses from non-operating items.
Operating revenues and expenses generally result from providing services and producing
and delivering goods in connection with a proprietary fund’s ongoing operations. The
principal operating revenue of the Aviation Fund is charges for the use of the airport.
Operating expenses for proprietary funds include the cost of sales and services,
administrative expenses, and depreciation on capital assets. All revenues and expenses
not meeting this definition are reported as non-operating revenues and expenses.
Recently Issued GASB Statements
In fiscal year 2015, the City implemented GASB Statement No. 68, Accounting and
Financial Reporting for Pensions – an amendment of GASB Statement No. 27, an
accounting pronouncement that revised existing standards for measuring and reporting
pension liabilities for pension plans. One of the objectives of this accounting standard is
to require governmental agencies to recognize the difference between its actuarial total
pension liability and pension plan’s fiduciary net position as the net pension liability on
35
CITY OF PHILADELPHIA
AVIATION FUND
Notes to Financial Statements
the Statement of Net Position. In addition to the benefits earned each year, the annual
pension expense will also include interest on the total pension liability and the impacts of
changes in benefit terms, projected investment earnings and other plan net position
changes. The adoption of this accounting standard had a material impact on recorded
pension liabilities compared to the application of prior standards. As a result of this
change in accounting principle, a net pension liability was established which required the
beginning net position as of July 1, 2014 to be adjusted to reflect the change.
Effective concurrently with GASB Statement No. 68, GASB Statement No. 71, Pension
Transition for Contributions made Subsequent to the Measurement Date – an amendment
of GASB Statement No. 68, clarified that, even if it is not practical to determine the
amount of all deferred outflows of resources and deferred inflows of resources related to
pensions at GASB 68 transition, a government should recognize a beginning deferred
outflow of resources for its pension contributions, if any, made subsequent to the
measurement date of the beginning net pension liability but before the start of the
government’s fiscal year. The City has determined that this standard has no impact on its
current year financial statements because the measurement date of the City’s beginning
net pension liability was June 30, 2014.
Cash and Investments
The Aviation Fund’s cash and investments are held in segregated operating and capital
accounts and by an outside fiscal agent. Sinking funds and reserves are maintained in
segregated investment accounts to comply with reserve and other requirements of the
bond covenants. No Aviation Fund accounts are commingled with other City funds.
Investments are recorded at fair value. Short-term investments are reported at cost,
which approximates fair value. Securities traded on national or international exchanges
are valued at the last reported sales price.
Statutes authorize the City to invest in obligations of the Treasury, agencies, and
instruments of the United States, repurchase agreements, collateralized certificates of
deposit, bank acceptance or mortgage obligations, certain corporate bonds, and money
market funds. Management is not aware of any violations of statutory authority or
contractual provisions for investments for the years ended June 30, 2015 and 2014.
36
CITY OF PHILADELPHIA
AVIATION FUND
Notes to Financial Statements
Accounts Receivable
Accounts receivable included in current assets consists of billed and unbilled rentals and
fees, which have been earned but not collected as of June 30, 2015 and 2014. Credit
balance receivables have been included in unearned revenue in the statement of net
position. The allowance for doubtful accounts is management’s estimate of the amount
of accounts receivable which will be deemed to be uncollectible and is based upon
specific identification. Unpaid accounts are referred to the City’s Law Department if
deemed uncollectible. Accounts are written off when recommended by the Law
Department.
In fiscal year 2015, the Division of Aviation and the Philadelphia Airport Affairs
Committee (PAAC) entered into an agreement that would reduce the fiscal year 2015
base rate to the airlines in exchange for a $10 million contribution from the Airport’s
Operation and Maintenance (O&M) reserve account that would be replenished by the
signatory airlines, through the rates and charges process, over a three-year period from
fiscal years 2016 to 2018. The Airport included this $10 million as part of the $32.5
million Accounts Receivable reported for the Aviation Fund in the FY 2015 Statement of
Net Position. However, since the agreement states that repayment of the contribution is
to take place over the next three years, $6.7 million of the $10 million receivable will not
be collected until fiscal years 2017 and 2018.
Inventories
Inventories consist of materials and supplies and are carried at amounts determined on a
moving-average cost basis.
Restricted Assets
Restricted assets represent amounts that have been legally restricted by contracts or
outside parties and are not available for payment of operating fund expenditures. The
following represent restricted assets of the Aviation Fund:
Funds available for construction, including grants due from other governments for
capital purposes.
Sinking funds and reserves reserved for debt service and construction, pursuant to
revenue bond indentures.
Passenger Facility Charges (PFCs) represent fees remitted by airlines based on
passenger ticket sales for flights boarding at Philadelphia International Airport. The
fees are reserved for funding certain Federal Aviation Administration (FAA)-
approved capital projects and debt service payments. Collection of PFCs began in the
37
CITY OF PHILADELPHIA
AVIATION FUND
Notes to Financial Statements
fall of 1992. All unexpended PFC funds, including accumulated interest, are
classified as restricted assets.
Customer Facility Charges (CFCs) represent fees collected by rental car operators
from customers renting motor vehicles at Philadelphia International Airport. CFCs
are not to exceed $8 per rental day. The proceeds are to be used for the planning,
development, financing, construction and operation of a consolidated rental car
facility. Collections of CFCs began in May 2014. All unexpended CFC funds,
including accumulated interest, are classified as restricted assets.
Capital Assets
Capital assets are defined by the GASB as including “land, improvements to land,
easements, buildings, building improvements, vehicles, machinery, equipment, works of
art and historical treasures, infrastructure, and all other tangible or intangible assets that
are used in operations that have initial useful lives extending beyond a single reporting
period.”
Land is always treated separately from any related capital asset associated with it
(i.e.: a building on the land, a runway on the land, etc.). The cost of the land includes
its acquisition price and the cost of preparing the land for its intended use. Included
in preparation costs are commissions, professional fees, permanent landscaping,
demolition of existing buildings, and other costs incurred in acquiring the land.
Intangible capital assets lack physical substance and can be expected in many cases to
provide benefit indefinitely. An example of an intangible capital asset is software
that was developed in-house.
Buildings and Building Improvements are permanent structures included in the
category of buildings. Building improvements increase the value of the building
and/or materially extends the useful life of the building. If the improvement does not
meet these conditions, those costs are expensed in the period incurred. Repairs and
maintenance are examples of items expensed because they help to retain value and do
not increase the value of the asset.
Costs to be included in the capitalized cost of buildings include purchase price,
expenses related to making the building ready for use, environmental compliance
costs, professional fees, taxes paid at the time of purchase, and other costs required to
place the asset into operation.
38
CITY OF PHILADELPHIA
AVIATION FUND
Notes to Financial Statements
Constructed buildings include, but are not limited to, project costs for interest accrued
during construction; cost of excavation, grading or filling; expenses incurred for the
plan preparation; specification; blueprints; permits and professional fees; and costs of
temporary buildings used during construction. Costs are expensed if a decision is
made to not proceed with the construction of a building.
Building improvements may include conversion of unused space into useable space,
original installation or upgrading of heating and cooling systems, wall or flooring
coverings, windows and doors, closets, restrooms, phone and closed circuit television
systems, security systems, wiring required for building equipment (that will remain in
the building), renovations of outside building surfaces (including roofs, installation or
replacement of plumbing and electrical wiring), permanently attached fixtures,
machinery, building additions, and costs associated with the above improvements.
Building repairs and maintenance that do not increase the value of the building or
extend its useful life are to be expensed. Examples of such costs may include
plumbing or electrical repairs, maintenance such as pest control and cleaning, interior
and exterior decorations, re-painting and repairing of interior and exterior portions of
buildings, and any other repairs and maintenance costs that do not increase the value
or extend its useful life of the asset.
Vehicles and equipment are defined as movable tangible assets used in operations. It
includes furniture and fixtures, vehicles, snow removal vehicles and equipment,
firefighting vehicles and equipment, computer equipment, and other moveable
equipment.
Infrastructure assets are long-lived capital assets that are normally stationary and can
be preserved for a significantly greater number of years than most capital assets.
Infrastructure includes, but is not limited to: runways, taxiways, aprons, ramps, roads,
sidewalks, signage, drainage systems, water and sewer systems, and lighting systems.
Construction in progress includes costs incurred to construct a capital asset before it
is substantially ready to be placed in service. At the time of being placed in service,
the asset will be reclassified into the appropriate asset category and be subject to
depreciation.
The following Depreciation Guidelines were implemented in the Aviation Fund’s FY
2015 financial statements.
The capital assets that are not depreciated because they have indefinite useful lives
are land, works of art, historical treasures, and intangibles.
39
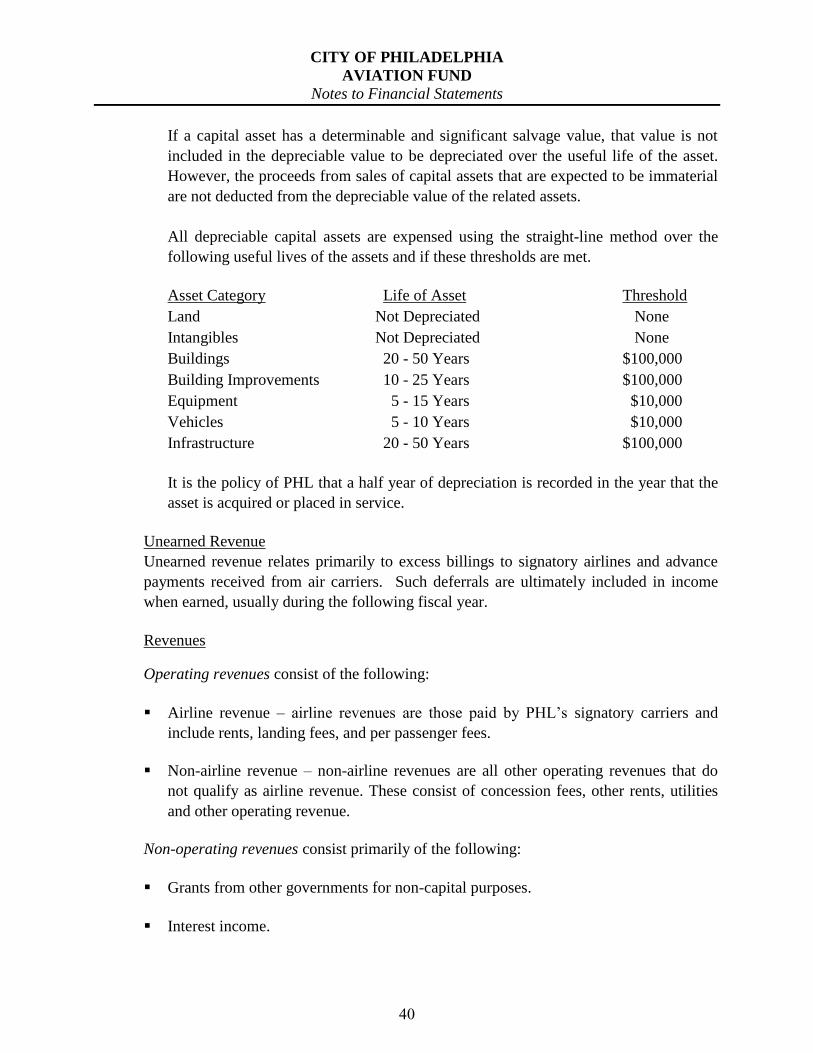
CITY OF PHILADELPHIA
AVIATION FUND
Notes to Financial Statements
If a capital asset has a determinable and significant salvage value, that value is not
included in the depreciable value to be depreciated over the useful life of the asset.
However, the proceeds from sales of capital assets that are expected to be immaterial
are not deducted from the depreciable value of the related assets.
All depreciable capital assets are expensed using the straight-line method over the
following useful lives of the assets and if these thresholds are met.
Asset Category Life of Asset Threshold
Land Not Depreciated None
Intangibles Not Depreciated None
Buildings 20 - 50 Years $100,000
Building Improvements 10 - 25 Years $100,000
Equipment 5 - 15 Years $10,000
Vehicles 5 - 10 Years $10,000
Infrastructure 20 - 50 Years $100,000
It is the policy of PHL that a half year of depreciation is recorded in the year that the
asset is acquired or placed in service.
Unearned Revenue
Unearned revenue relates primarily to excess billings to signatory airlines and advance
payments received from air carriers. Such deferrals are ultimately included in income
when earned, usually during the following fiscal year.
Revenues
Operating revenues consist of the following:
Airline revenue – airline revenues are those paid by PHL’s signatory carriers and
include rents, landing fees, and per passenger fees.
Non-airline revenue – non-airline revenues are all other operating revenues that do
not qualify as airline revenue. These consist of concession fees, other rents, utilities
and other operating revenue.
Non-operating revenues consist primarily of the following:
Grants from other governments for non-capital purposes.
Interest income.
40
CITY OF PHILADELPHIA
AVIATION FUND
Notes to Financial Statements
Capital contributions consist primarily of the following:
Grants from other governments for capital purposes.
PFCs – revenue from PFCs is reserved for the funding of certain capital expenditures
and debt service payments, as approved by the FAA.
CFCs – revenue from CFCs is reserved for the funding of certain capital expenditures
and will be used to plan, design, and construct a facility to be used by vehicle rental
companies on Airport property.
Operating Expenses
Operating expenses consist primarily of personnel and administrative services, purchase
of goods and services and depreciation and amortization expense.
Bonds and Related Premiums, Discounts, Issuance Costs and Loss on Refunding
Bond premiums and discounts are deferred and amortized on the straight-line method
over the life of the bonds using the effective interest method. Bonds payable are reported
net of applicable premium or discount. Bond issuance costs are expensed as incurred.
The loss on refunding of bonds is amortized on the straight-line method over the lesser of
the life of the old debt or the new debt issued.
Compensated Absences
It is the City’s policy to allow employees to accumulate earned but unused vacation
benefits. Vacation pay is accrued as earned. Sick leave balances are not accrued in the
financial statements because sick leave rights are non-vesting.
Claims and Judgments
Pending claims and judgments are recorded as expenses when the City Solicitor has
deemed that a probable loss to the City has occurred.
Management’s Use of Estimates
The preparation of financial statements in conformity with accounting principles
generally accepted in the United States of America requires management to make
estimates and assumptions that affect the reported amounts of assets and liabilities and
disclosure of contingent assets and liabilities at the date of the financial statements and
the reported amounts of revenues and expenses during the reporting period. Actual results
could differ from those estimates.
41
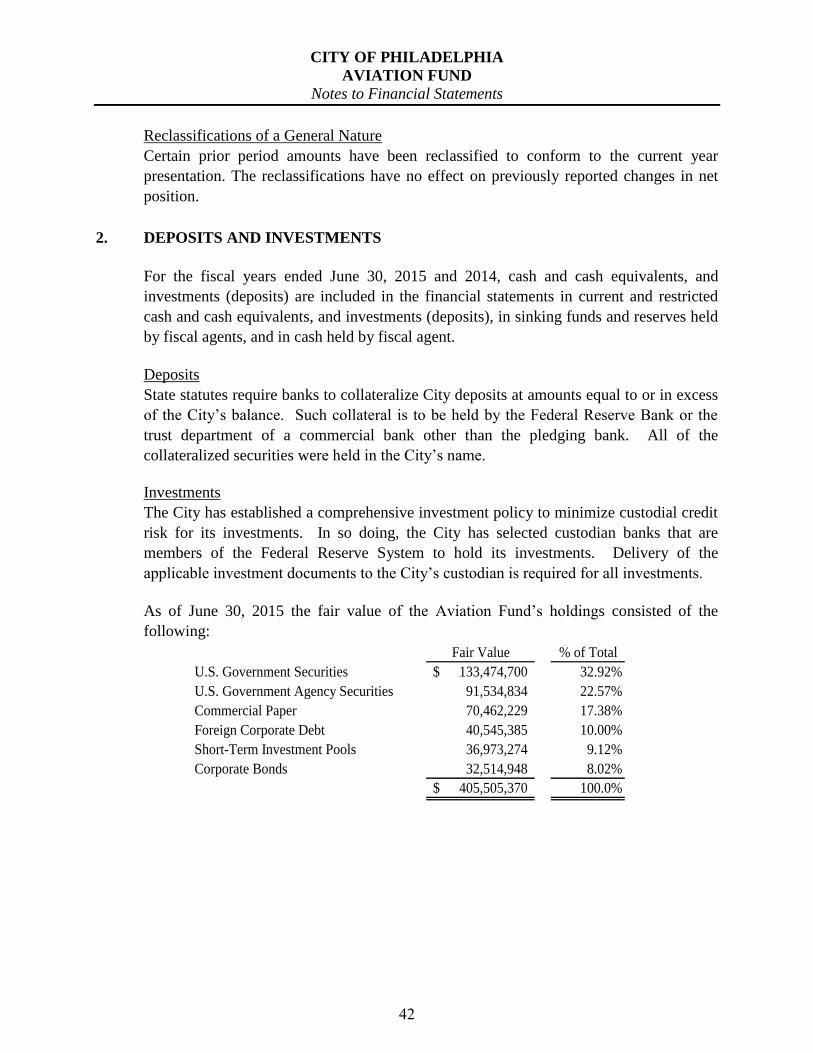
CITY OF PHILADELPHIA
AVIATION FUND
Notes to Financial Statements
Reclassifications of a General Nature
Certain prior period amounts have been reclassified to conform to the current year
presentation. The reclassifications have no effect on previously reported changes in net
position.
2. DEPOSITS AND INVESTMENTS
For the fiscal years ended June 30, 2015 and 2014, cash and cash equivalents, and
investments (deposits) are included in the financial statements in current and restricted
cash and cash equivalents, and investments (deposits), in sinking funds and reserves held
by fiscal agents, and in cash held by fiscal agent.
Deposits
State statutes require banks to collateralize City deposits at amounts equal to or in excess
of the City’s balance. Such collateral is to be held by the Federal Reserve Bank or the
trust department of a commercial bank other than the pledging bank. All of the
collateralized securities were held in the City’s name.
Investments
The City has established a comprehensive investment policy to minimize custodial credit
risk for its investments. In so doing, the City has selected custodian banks that are
members of the Federal Reserve System to hold its investments. Delivery of the
applicable investment documents to the City’s custodian is required for all investments.
As of June 30, 2015 the fair value of the Aviation Fund’s holdings consisted of the
following:
Fair Value % of Total
U.S. Government Securities 133,474,700$ 32.92%
U.S. Government Agency Securities 91,534,834 22.57%
Commercial Paper 70,462,229 17.38%
Foreign Corporate Debt 40,545,385 10.00%
Short-Term Investment Pools 36,973,274 9.12%
Corporate Bonds 32,514,948 8.02%
405,505,370$ 100.0%
42
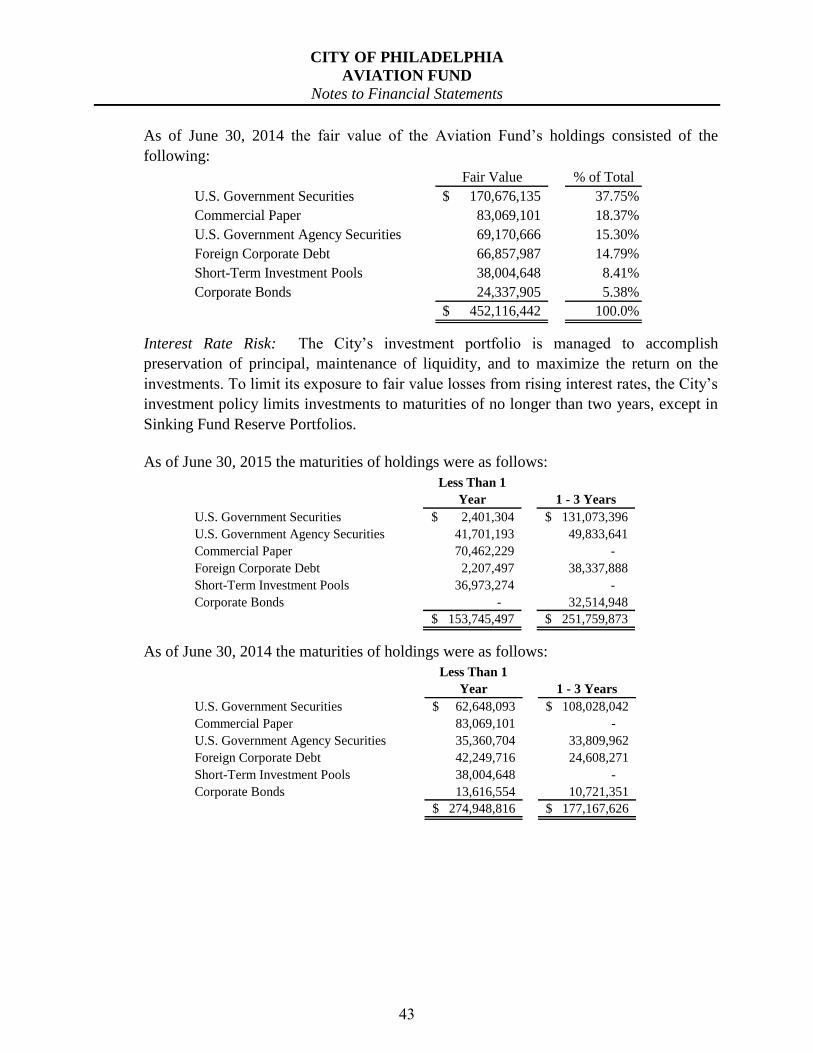
CITY OF PHILADELPHIA
AVIATION FUND
Notes to Financial Statements
As of June 30, 2014 the fair value of the Aviation Fund’s holdings consisted of the
following:
Fair Value % of Total
U.S. Government Securities 170,676,135$ 37.75%
Commercial Paper 83,069,101 18.37%
U.S. Government Agency Securities 69,170,666 15.30%
Foreign Corporate Debt 66,857,987 14.79%
Short-Term Investment Pools 38,004,648 8.41%
Corporate Bonds 24,337,905 5.38%
452,116,442$ 100.0%
Interest Rate Risk: The City’s investment portfolio is managed to accomplish
preservation of principal, maintenance of liquidity, and to maximize the return on the
investments. To limit its exposure to fair value losses from rising interest rates, the City’s
investment policy limits investments to maturities of no longer than two years, except in
Sinking Fund Reserve Portfolios.
As of June 30, 2015 the maturities of holdings were as follows:
Less Than 1
Year 1 - 3 Years
U.S. Government Securities 2,401,304$ 131,073,396$
U.S. Government Agency Securities 41,701,193 49,833,641
Commercial Paper 70,462,229 -
Foreign Corporate Debt 2,207,497 38,337,888
Short-Term Investment Pools 36,973,274 -
Corporate Bonds - 32,514,948
153,745,497$ 251,759,873$
As of June 30, 2014 the maturities of holdings were as follows:
Less Than 1
Year 1 - 3 Years
U.S. Government Securities 62,648,093$ 108,028,042$
Commercial Paper 83,069,101 -
U.S. Government Agency Securities 35,360,704 33,809,962
Foreign Corporate Debt 42,249,716 24,608,271
Short-Term Investment Pools 38,004,648 -
Corporate Bonds 13,616,554 10,721,351
274,948,816$ 177,167,626$
43
CITY OF PHILADELPHIA
AVIATION FUND
Notes to Financial Statements
Credit Risk: For the City as a whole, the policy to limit credit risk is to invest in US
Government securities (33.3%) or US Government Agency obligations (30.7%). The US
Government Agency obligations must be rated AAA by Standard & Poor’s Corp. (S&P)
or Aaa by Moody’s Investor Services (Moody’s). All US Government Securities meet
the criteria. The City’s investment in Commercial Paper (22.5%) must be rated A1 by
S&P and/or M1G1 by Moody’s and the senior long-term debt of the issuer must not be
rated lower than A by S&P and/or Moody’s. Commercial Paper is also limited to 25% of
the portfolio. All commercial paper investments meet the criteria. Of the corporate
bonds held by the City, 10.2% had an S&P rating of AAA to AA. Cash accounts are
swept nightly and idle cash invested in money market funds (short-term investment
pools). Short-term investment pools are rated AAA by S&P and Aaa by Moody’s. The
City limits its foreign currency risk by investing in certificates of deposit and bankers
acceptances issued or endorsed by non-domestic banks that are denominated in US
dollars providing that the banking institution has assets of not less than $100 million and
has a Thompson’s Bank Watch Service “Peer Group Rating” not lower than II. The
Aviation Fund currently has investments in Foreign Corporate Debt with Moody’s ratings
of A1 or better.
3. CASH HELD BY FISCAL AGENT
The amounts held by the fiscal agent consist of cash and investments related to the net
proceeds of Philadelphia Authority for Industrial Development’s (PAID) Airport
Revenue Bonds Series 1998A and 2001A. In accordance with GASB Interpretation #2,
these bonds are considered by PAID to be conduit debt. Therefore, no asset related to the
bond proceeds or liability related to the bonds is shown on PAID’s financial statements.
Instead, the proceeds are held by a fiscal agent and disbursed at the City’s direction to
pay for Airport related capital improvements. Both the assets and liabilities related to the
PAID bonds are included in the financial statements of the Aviation Fund.
44
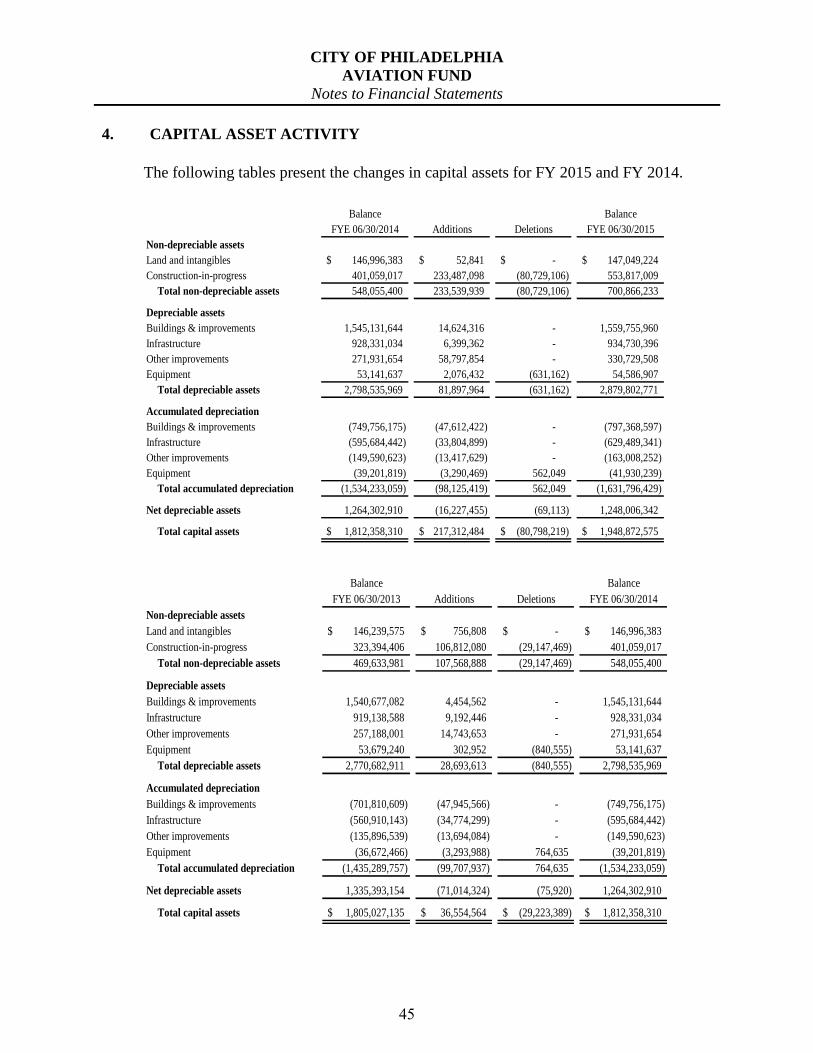
CITY OF PHILADELPHIA
AVIATION FUND
Notes to Financial Statements
4. CAPITAL ASSET ACTIVITY
The following tables present the changes in capital assets for FY 2015 and FY 2014.
Balance Balance
FYE 06/30/2014 Additions Deletions FYE 06/30/2015
Non-depreciable assets
Land and intangibles 146,996,383$ 52,841$ -$ 147,049,224$
Construction-in-progress 401,059,017 233,487,098 (80,729,106) 553,817,009
Total non-depreciable assets 548,055,400 233,539,939 (80,729,106) 700,866,233
Depreciable assets
Buildings & improvements 1,545,131,644 14,624,316 - 1,559,755,960
Infrastructure 928,331,034 6,399,362 - 934,730,396
Other improvements 271,931,654 58,797,854 - 330,729,508
Equipment 53,141,637 2,076,432 (631,162) 54,586,907
Total depreciable assets 2,798,535,969 81,897,964 (631,162) 2,879,802,771
Accumulated depreciation
Buildings & improvements (749,756,175) (47,612,422) - (797,368,597)
Infrastructure (595,684,442) (33,804,899) - (629,489,341)
Other improvements (149,590,623) (13,417,629) - (163,008,252)
Equipment (39,201,819) (3,290,469) 562,049 (41,930,239)
Total accumulated depreciation (1,534,233,059) (98,125,419) 562,049 (1,631,796,429)
Net depreciable assets 1,264,302,910 (16,227,455) (69,113) 1,248,006,342
Total capital assets 1,812,358,310$ 217,312,484$ (80,798,219)$ 1,948,872,575$
Balance Balance
FYE 06/30/2013 Additions Deletions FYE 06/30/2014
Non-depreciable assets
Land and intangibles 146,239,575$ 756,808$ -$ 146,996,383$
Construction-in-progress 323,394,406 106,812,080 (29,147,469) 401,059,017
Total non-depreciable assets 469,633,981 107,568,888 (29,147,469) 548,055,400
Depreciable assets
Buildings & improvements 1,540,677,082 4,454,562 - 1,545,131,644
Infrastructure 919,138,588 9,192,446 - 928,331,034
Other improvements 257,188,001 14,743,653 - 271,931,654
Equipment 53,679,240 302,952 (840,555) 53,141,637
Total depreciable assets 2,770,682,911 28,693,613 (840,555) 2,798,535,969
Accumulated depreciation
Buildings & improvements (701,810,609) (47,945,566) - (749,756,175)
Infrastructure (560,910,143) (34,774,299) - (595,684,442)
Other improvements (135,896,539) (13,694,084) - (149,590,623)
Equipment (36,672,466) (3,293,988) 764,635 (39,201,819)
Total accumulated depreciation (1,435,289,757) (99,707,937) 764,635 (1,534,233,059)
Net depreciable assets 1,335,393,154 (71,014,324) (75,920) 1,264,302,910
Total capital assets 1,805,027,135$ 36,554,564$ (29,223,389)$ 1,812,358,310$
45
CITY OF PHILADELPHIA
AVIATION FUND
Notes to Financial Statements
A portion of bond interest expense net of related interest income on unexpended funds is
capitalized during the construction phase of the projects funded by the bonds. Net
interest capitalized to construction in progress was $21,021,935 and $23,235,233 for the
fiscal years ending June 30, 2015 and 2014, respectively. For the fiscal year ending June
30, 2015, this represents $21,384,293 of interest expense net of $362,358 of interest
income. For the fiscal year ending June 30, 2014, this represents $23,824,149 of interest
expense net of $588,916 of related interest income.
Depreciation and amortization expense was $98,125,419 and $99,707,937 for the fiscal
years ending June 30, 2015 and 2014, respectively.
5. UNEARNED REVENUE
Unearned revenue was $1,591,740 and $2,165,850 for the fiscal years ending June 30,
2015 and 2014, respectively and includes revenues received in advance, excess billing to
the scheduled airlines, and credit balance receivables.
6. ARBITRAGE REBATE
The Aviation Fund has several series of revenue bonds subject to federal arbitrage
requirements. Federal tax legislation requires that the accumulated net excess of interest
income on the proceeds of these issues over interest expense paid on the bonds be paid to
the federal government at the end of a five-year period. The arbitrage rebate liability was
$312,932 and $298,945 as of June 30, 2015 and 2014, respectively, and is included in
other long-term liabilities.
In December 2015, the Airport remitted to the Internal Revenue Service 100% of the
liability resulting from the issuance of the Philadelphia Authority for Industrial
Development, Airport Revenue Bonds, Series 1998A Bonds. The liability totaled
$309,216.33 as of the installment computation date of October 31, 2015.
46
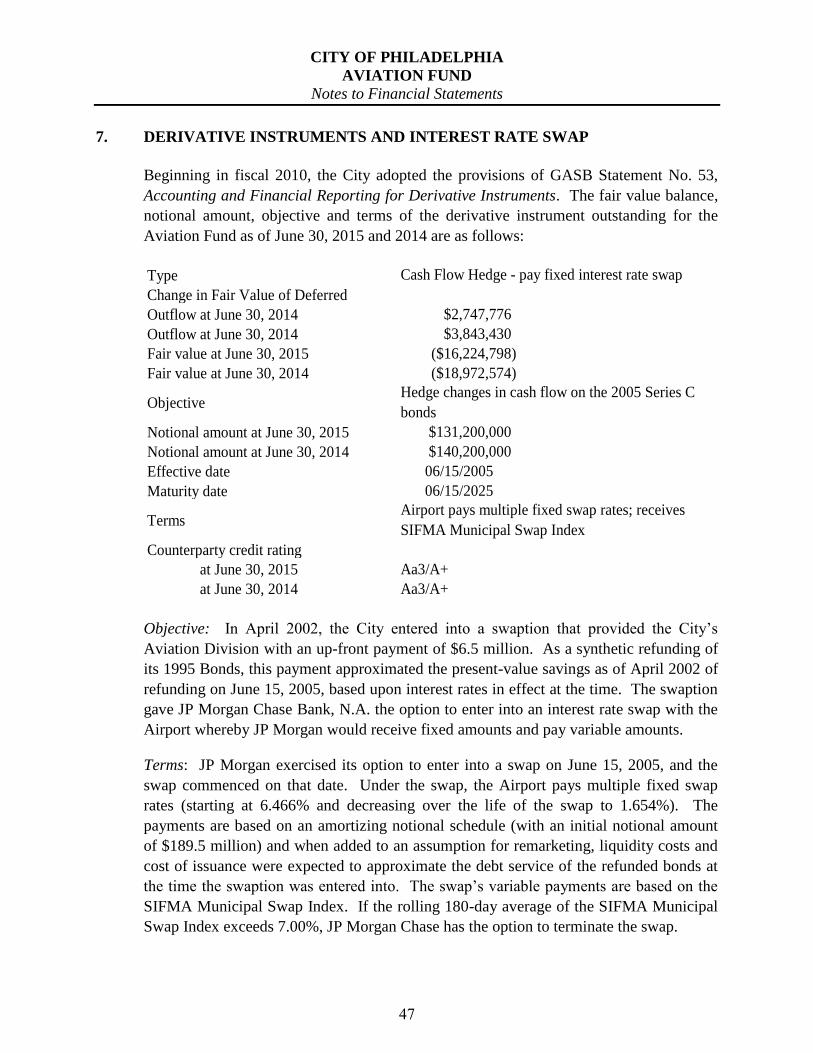
CITY OF PHILADELPHIA
AVIATION FUND
Notes to Financial Statements
7. DERIVATIVE INSTRUMENTS AND INTEREST RATE SWAP
Beginning in fiscal 2010, the City adopted the provisions of GASB Statement No. 53,
Accounting and Financial Reporting for Derivative Instruments. The fair value balance,
notional amount, objective and terms of the derivative instrument outstanding for the
Aviation Fund as of June 30, 2015 and 2014 are as follows:
Type
Change in Fair Value of Deferred
Outflow at June 30, 2014 $2,747,776
Outflow at June 30, 2014 $3,843,430
Fair value at June 30, 2015 ($16,224,798)
Fair value at June 30, 2014 ($18,972,574)
Objective
Notional amount at June 30, 2015 $131,200,000
Notional amount at June 30, 2014 $140,200,000
Effective date 06/15/2005
Maturity date 06/15/2025
Terms
Counterparty credit rating
at June 30, 2015 Aa3/A+
at June 30, 2014 Aa3/A+
Cash Flow Hedge - pay fixed interest rate swap
Airport pays multiple fixed swap rates; receives
SIFMA Municipal Swap Index
Hedge changes in cash flow on the 2005 Series C
bonds
Objective: In April 2002, the City entered into a swaption that provided the City’s
Aviation Division with an up-front payment of $6.5 million. As a synthetic refunding of
its 1995 Bonds, this payment approximated the present-value savings as of April 2002 of
refunding on June 15, 2005, based upon interest rates in effect at the time. The swaption
gave JP Morgan Chase Bank, N.A. the option to enter into an interest rate swap with the
Airport whereby JP Morgan would receive fixed amounts and pay variable amounts.
Terms: JP Morgan exercised its option to enter into a swap on June 15, 2005, and the
swap commenced on that date. Under the swap, the Airport pays multiple fixed swap
rates (starting at 6.466% and decreasing over the life of the swap to 1.654%). The
payments are based on an amortizing notional schedule (with an initial notional amount
of $189.5 million) and when added to an assumption for remarketing, liquidity costs and
cost of issuance were expected to approximate the debt service of the refunded bonds at
the time the swaption was entered into. The swap’s variable payments are based on the
SIFMA Municipal Swap Index. If the rolling 180-day average of the SIFMA Municipal
Swap Index exceeds 7.00%, JP Morgan Chase has the option to terminate the swap.
47
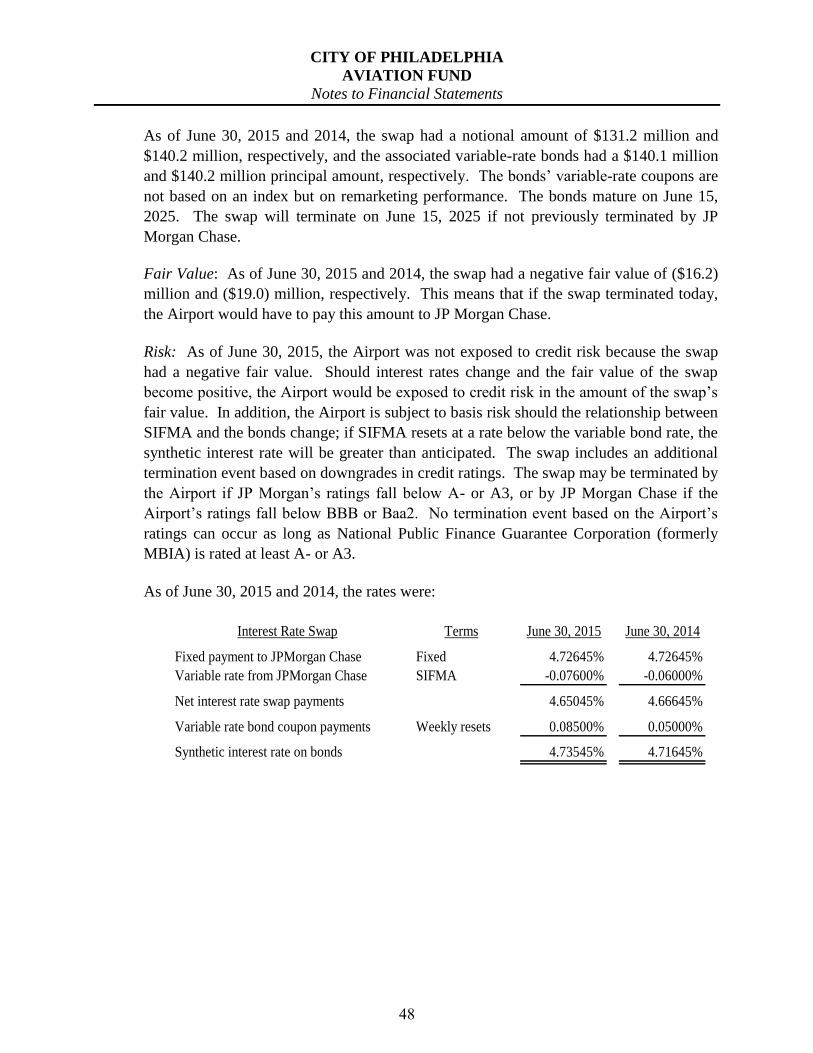
CITY OF PHILADELPHIA
AVIATION FUND
Notes to Financial Statements
As of June 30, 2015 and 2014, the swap had a notional amount of $131.2 million and
$140.2 million, respectively, and the associated variable-rate bonds had a $140.1 million
and $140.2 million principal amount, respectively. The bonds’ variable-rate coupons are
not based on an index but on remarketing performance. The bonds mature on June 15,
2025. The swap will terminate on June 15, 2025 if not previously terminated by JP
Morgan Chase.
Fair Value: As of June 30, 2015 and 2014, the swap had a negative fair value of ($16.2)
million and ($19.0) million, respectively. This means that if the swap terminated today,
the Airport would have to pay this amount to JP Morgan Chase.
Risk: As of June 30, 2015, the Airport was not exposed to credit risk because the swap
had a negative fair value. Should interest rates change and the fair value of the swap
become positive, the Airport would be exposed to credit risk in the amount of the swap’s
fair value. In addition, the Airport is subject to basis risk should the relationship between
SIFMA and the bonds change; if SIFMA resets at a rate below the variable bond rate, the
synthetic interest rate will be greater than anticipated. The swap includes an additional
termination event based on downgrades in credit ratings. The swap may be terminated by
the Airport if JP Morgan’s ratings fall below A- or A3, or by JP Morgan Chase if the
Airport’s ratings fall below BBB or Baa2. No termination event based on the Airport’s
ratings can occur as long as National Public Finance Guarantee Corporation (formerly
MBIA) is rated at least A- or A3.
As of June 30, 2015 and 2014, the rates were:
Interest Rate Swap Terms June 30, 2015 June 30, 2014
Fixed payment to JPMorgan Chase Fixed 4.72645% 4.72645%
Variable rate from JPMorgan Chase SIFMA -0.07600% -0.06000%
Net interest rate swap payments 4.65045% 4.66645%
Variable rate bond coupon payments Weekly resets 0.08500% 0.05000%
Synthetic interest rate on bonds 4.73545% 4.71645%
48
CITY OF PHILADELPHIA
AVIATION FUND
Notes to Financial Statements
Swap payments and associated debt: As of June 30, 2015, debt service requirements of
the variable-rate debt and net swap payments for their term, assuming current interest
rates remain the same, were as follows:
Fiscal Years Interest Rate Total
Ending June 30 Principal Interest Swaps Net Interest
2016 9,800,000 111,520 5,766,502 5,878,022
2017 10,700,000 103,190 5,335,773 5,438,963
2018 11,400,000 94,095 4,865,486 4,959,581
2019 12,200,000 84,405 4,364,433 4,448,838
2020 13,000,000 74,035 3,828,219 3,902,254
2021-2025 74,100,000 193,460 10,003,475 10,196,935
Totals 131,200,000$ 660,705$ 34,163,888$ 34,824,593$
Variable Rate Bonds
8. COMMERCIAL PAPER NOTES
The Aviation Fund established a $350 million commercial paper (CP) program in January
2013 to provide funding for capital projects approved by Philadelphia International
Airport’s signatory airlines. CP is a short-term financing tool with a maximum maturity
of 270 days. PHL’s CP Program enables capital projects to be financed on an as-needed
basis, which lowers the Airport's cost of borrowing and limits negative arbitrage during
project construction periods. CP Notes will continue to be “rolled over” until long-term
bonds are issued to refund the outstanding commercial paper. There was $167.6 million
of CP notes outstanding at June 30, 2015. CP interest expense charged to PHL’s
Statement of Revenues, Expenses, and Changes in Fund Net Position was $81,845 and
$79,478 for fiscal years ending June 30, 2015 and 2014, respectively.
As of June 30, 2015, the total outstanding balance of CP notes was $167,600,000.
Balance as of July 1, 2014 39,700,000$
Commercial Paper Notes Issued 283,700,000
Commercial Paper Notes Refunded (155,800,000)
Balance as of July 1, 2015 167,600,000$
49
CITY OF PHILADELPHIA
AVIATION FUND
Notes to Financial Statements
9. BONDS PAYABLE
General obligation (G.O.) bonds, payable out of Aviation Fund revenues, consist of
bonds declared by statute to be self-sustaining from airport revenues. There are no G.O.
bonds outstanding as of June 30, 2015.
In July 1998, Airport Revenue Bonds, Series 1998B in the amount of $443.7 million
were issued. The proceeds of Series 1998B were used to prepay the City’s fixed rental
obligation under a lease with PAID (“the PAID Lease”). Under this lease, the City
acquired a leasehold interest and will occupy, operate and manage certain new terminals
and related improvements (“the US Airways Project Facility”) constructed with funds
provided by the Series 1998A PAID Airport Revenue Bonds. In June 2008, the City
purchased a letter of credit from Wachovia Bank, N.A. to replace a surety policy
purchased from FGIC. When FGIC was downgraded below the ‘AA’ category the policy
no longer met the rating requirements of the Amended and Restated General Airport
Revenue Bond Ordinance (the Ordinance), approved June 16, 1995. The letter of credit
meets the Ordinance’s rating requirements. In FY 2011, the Series 1998B bonds were
partially refunded by the Airport Revenue Refunding Bonds Series 2010D, leaving a
balance of $69.5 million. In FY 2012, substantially all of the remaining 1998B bonds
were refunded, leaving a balance of $5,000.
In June 2005, Airport Revenue Refunding Bonds, Series 2005C in the amount of $189.5
million were issued. The proceeds of Series 2005C were used to refund $183.9 million
of the 1995A Series Airport Revenue Bonds, maturing from 2006 through 2025, and to
pay issuance and insurance costs on the bonds. The cash flow required by the new bonds
was the same as the cash flow required by the refunded bonds at the time of the sale.
JPMorgan entered into a swaption agreement with the Airport on the 1995A bonds in
2002, which agreement was exercised June 15, 2005. In December 2008, the outstanding
balance of $178.6 million of Airport Revenue Refunding Bonds, Series 2005C was
remarketed under an irrevocable direct pay letter of credit (“LOC”) from TD Bank (“the
Bank”). The LOC replaces a bond insurance policy from MBIA Insurance Corporation
and a liquidity facility for the 2005C bonds provided by JP Morgan Chase Bank, N.A.,
pursuant to a standby bond purchase agreement, issued simultaneously with the issuance
of the 2005C bonds in June 2005, and the surety policy for the sinking fund reserve
account for the 2005C bonds. The LOC constitutes both a credit facility and liquidity
facility under the Ordinance and the Variable Rate Securities Agreement, and the TD
Bank will be the credit provider and liquidity provider under the Ordinance and the
Variable Rate Securities Agreement for the 2005C bonds. The bonds will have a weekly
interest rate and maturity date in 2025.
50
CITY OF PHILADELPHIA
AVIATION FUND
Notes to Financial Statements
In August 2005, Airport Revenue Bonds, Series 2005A sub-series (1), (2) and (3) in the
amounts of $59.8 million, $22.6 million and $42.5 million, respectively, were issued.
The proceeds of Series 2005A were used to finance a portion of the cost of Airport
capital projects. Sub-series (1) are serial bonds and sub-series (2) and (3) are term bonds.
The Series 2005A bonds had MBIA Insurance Corporation surety policies for their
sinking fund reserve requirements. Because MBIA was downgraded below the ‘AA’
category, the surety policies no longer met the requirements of the Ordinance. During
FY 2009, the Aviation Fund replaced the surety policy by funding the sinking fund
reserve required under the Ordinance for the 2005A bonds.
In August 2007, Airport Revenue Bonds, Series 2007A, in the amount of $172.5 million
were issued. The proceeds from Series 2007A were used to finance a portion of the 2007
Project (infrastructure improvements and design of terminal building enhancements); to
finance capitalized interest during the construction period; and to pay the costs of issuing
and insuring the bonds with municipal bond insurance and a surety policy.
In August 2007, Airport Revenue Bonds, Refunding Series 2007B, in the amount of
$82.9 million were issued. The proceeds of Series 2007B were used to refund Revenue
Bonds, Series 1997B and the costs of issuing and insuring the bonds with municipal bond
insurance. The refunding structure of the 2007B bonds realized a net present value
savings of approximately $2.6 million or 3.22% of the principal amount of the refunded
bonds.
In April 2009, Airport Revenue Bonds, Refunding Series 2009A, sub series (1) through
(3) in the amount of $45.7 million were issued. Serial bonds were issued in the amount
of $25.7 million with interest rates ranging from 1.5% to 5.0% maturing in 2023. Term
bonds were issued in the amount of $3.9 million and $16.1 million with interest rates
ranging from 5.0% to 5.375% maturing in 2024 and 2029 respectively. The gain/loss on
the bonds cannot be calculated in the usual way because the refunded bonds (Series
2005B) were variable rate bonds that were subject to Alternative Minimum Tax (AMT).
However the 2009A bonds were issued on a fixed rate basis and are not subject to AMT.
The proceeds of Series 2009A along with other monies of the Aviation Fund were used to
currently refund Airport Revenue Bonds Series 2005B, fund a deposit to the parity
sinking fund reserve account in respect of the bonds, and pay the costs of issuance of the
bonds. The Series 2009A bonds were issued under a financial guaranty insurance policy
issued by Assured Guaranty Corp.
51
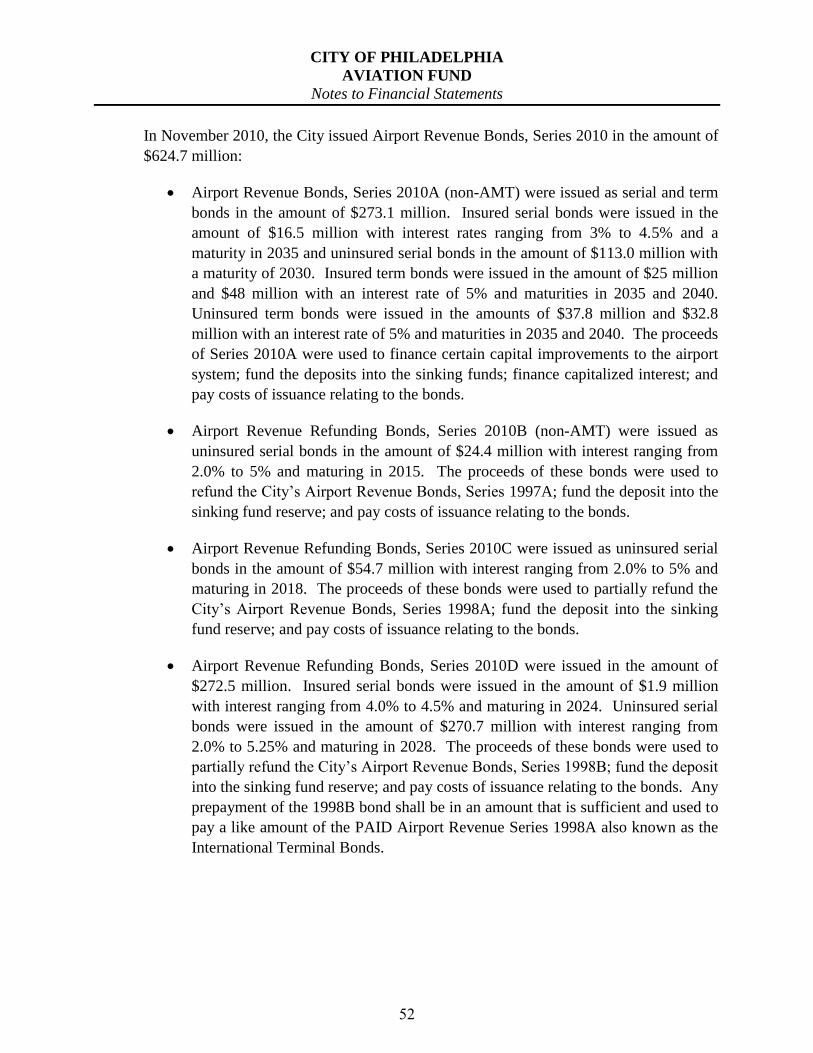
CITY OF PHILADELPHIA
AVIATION FUND
Notes to Financial Statements
In November 2010, the City issued Airport Revenue Bonds, Series 2010 in the amount of
$624.7 million:
Airport Revenue Bonds, Series 2010A (non-AMT) were issued as serial and term
bonds in the amount of $273.1 million. Insured serial bonds were issued in the
amount of $16.5 million with interest rates ranging from 3% to 4.5% and a
maturity in 2035 and uninsured serial bonds in the amount of $113.0 million with
a maturity of 2030. Insured term bonds were issued in the amount of $25 million
and $48 million with an interest rate of 5% and maturities in 2035 and 2040.
Uninsured term bonds were issued in the amounts of $37.8 million and $32.8
million with an interest rate of 5% and maturities in 2035 and 2040. The proceeds
of Series 2010A were used to finance certain capital improvements to the airport
system; fund the deposits into the sinking funds; finance capitalized interest; and
pay costs of issuance relating to the bonds.
Airport Revenue Refunding Bonds, Series 2010B (non-AMT) were issued as
uninsured serial bonds in the amount of $24.4 million with interest ranging from
2.0% to 5% and maturing in 2015. The proceeds of these bonds were used to
refund the City’s Airport Revenue Bonds, Series 1997A; fund the deposit into the
sinking fund reserve; and pay costs of issuance relating to the bonds.
Airport Revenue Refunding Bonds, Series 2010C were issued as uninsured serial
bonds in the amount of $54.7 million with interest ranging from 2.0% to 5% and
maturing in 2018. The proceeds of these bonds were used to partially refund the
City’s Airport Revenue Bonds, Series 1998A; fund the deposit into the sinking
fund reserve; and pay costs of issuance relating to the bonds.
Airport Revenue Refunding Bonds, Series 2010D were issued in the amount of
$272.5 million. Insured serial bonds were issued in the amount of $1.9 million
with interest ranging from 4.0% to 4.5% and maturing in 2024. Uninsured serial
bonds were issued in the amount of $270.7 million with interest ranging from
2.0% to 5.25% and maturing in 2028. The proceeds of these bonds were used to
partially refund the City’s Airport Revenue Bonds, Series 1998B; fund the deposit
into the sinking fund reserve; and pay costs of issuance relating to the bonds. Any
prepayment of the 1998B bond shall be in an amount that is sufficient and used to
pay a like amount of the PAID Airport Revenue Series 1998A also known as the
International Terminal Bonds.
52
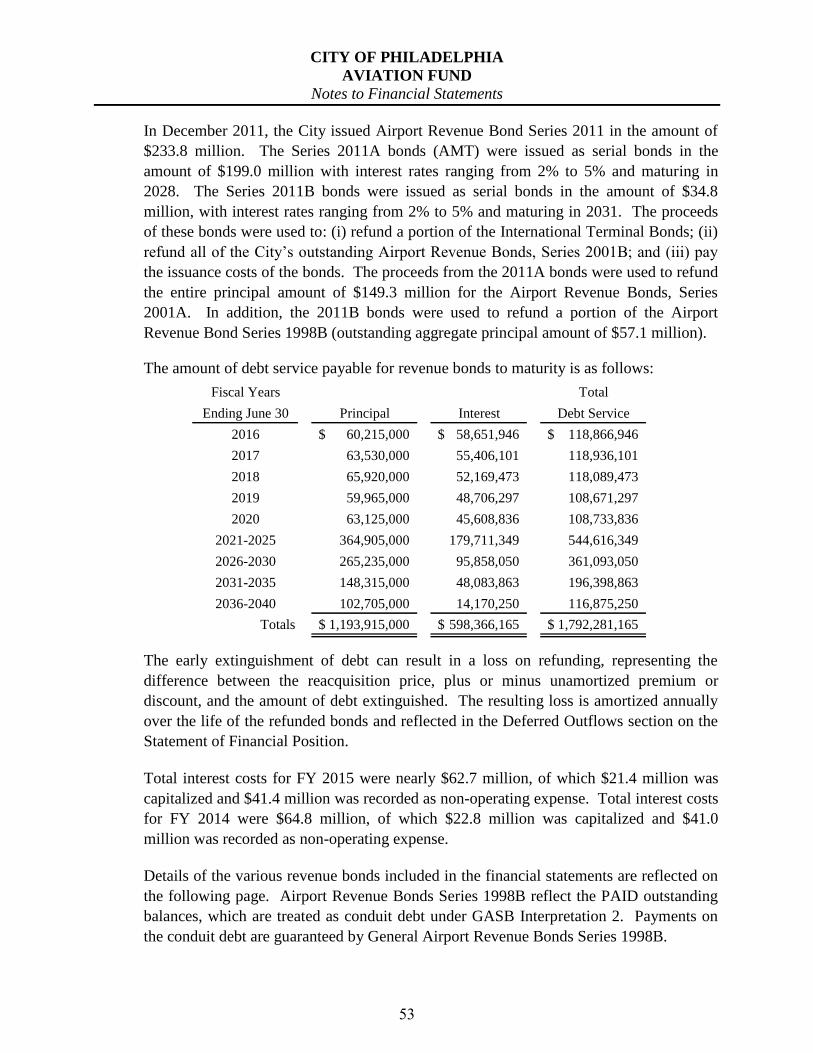
CITY OF PHILADELPHIA
AVIATION FUND
Notes to Financial Statements
In December 2011, the City issued Airport Revenue Bond Series 2011 in the amount of
$233.8 million. The Series 2011A bonds (AMT) were issued as serial bonds in the
amount of $199.0 million with interest rates ranging from 2% to 5% and maturing in
2028. The Series 2011B bonds were issued as serial bonds in the amount of $34.8
million, with interest rates ranging from 2% to 5% and maturing in 2031. The proceeds
of these bonds were used to: (i) refund a portion of the International Terminal Bonds; (ii)
refund all of the City’s outstanding Airport Revenue Bonds, Series 2001B; and (iii) pay
the issuance costs of the bonds. The proceeds from the 2011A bonds were used to refund
the entire principal amount of $149.3 million for the Airport Revenue Bonds, Series
2001A. In addition, the 2011B bonds were used to refund a portion of the Airport
Revenue Bond Series 1998B (outstanding aggregate principal amount of $57.1 million).
The amount of debt service payable for revenue bonds to maturity is as follows:
Fiscal Years Total
Ending June 30 Principal Interest Debt Service
2016 60,215,000$ 58,651,946$ 118,866,946$
2017 63,530,000 55,406,101 118,936,101
2018 65,920,000 52,169,473 118,089,473
2019 59,965,000 48,706,297 108,671,297
2020 63,125,000 45,608,836 108,733,836
2021-2025 364,905,000 179,711,349 544,616,349
2026-2030 265,235,000 95,858,050 361,093,050
2031-2035 148,315,000 48,083,863 196,398,863
2036-2040 102,705,000 14,170,250 116,875,250
Totals 1,193,915,000$ 598,366,165$ 1,792,281,165$
The early extinguishment of debt can result in a loss on refunding, representing the
difference between the reacquisition price, plus or minus unamortized premium or
discount, and the amount of debt extinguished. The resulting loss is amortized annually
over the life of the refunded bonds and reflected in the Deferred Outflows section on the
Statement of Financial Position.
Total interest costs for FY 2015 were nearly $62.7 million, of which $21.4 million was
capitalized and $41.4 million was recorded as non-operating expense. Total interest costs
for FY 2014 were $64.8 million, of which $22.8 million was capitalized and $41.0
million was recorded as non-operating expense.
Details of the various revenue bonds included in the financial statements are reflected on
the following page. Airport Revenue Bonds Series 1998B reflect the PAID outstanding
balances, which are treated as conduit debt under GASB Interpretation 2. Payments on
the conduit debt are guaranteed by General Airport Revenue Bonds Series 1998B.
53
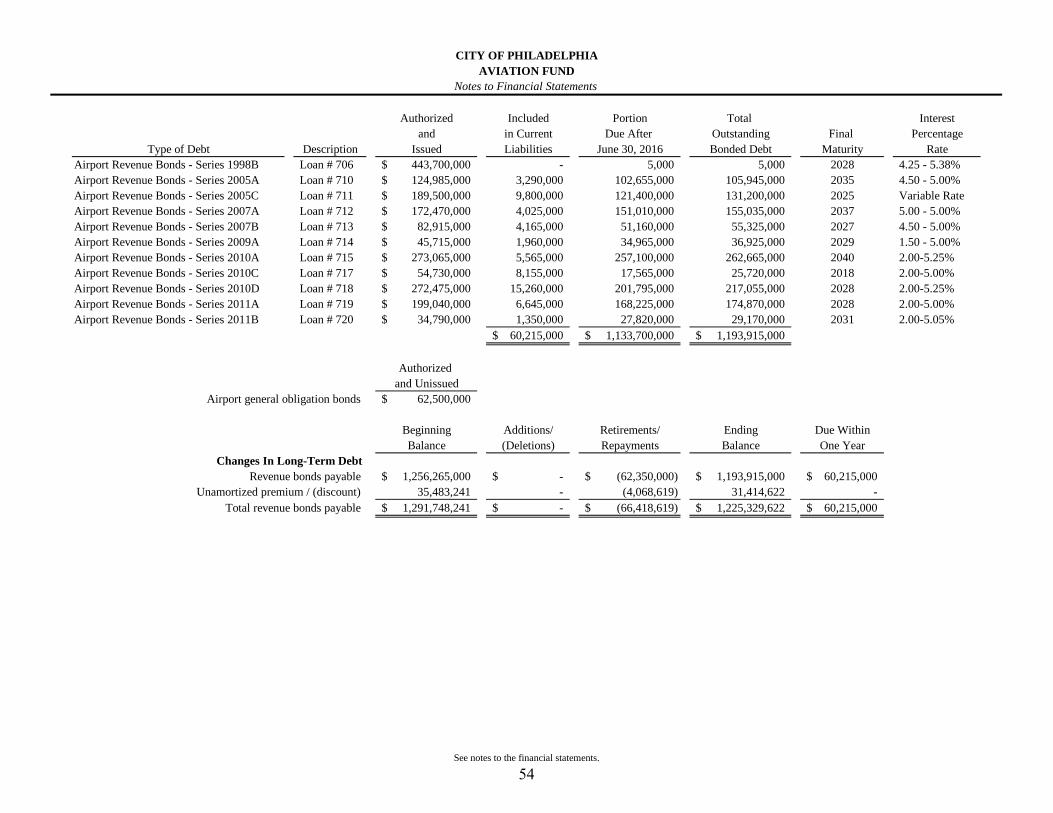
Authorized Included Portion Total Interest
and in Current Due After Outstanding Final Percentage
Type of Debt Description Issued Liabilities June 30, 2016 Bonded Debt Maturity Rate
Airport Revenue Bonds - Series 1998B Loan # 706 443,700,000$ - 5,000 5,000 2028 4.25 - 5.38%
Airport Revenue Bonds - Series 2005A Loan # 710 124,985,000$ 3,290,000 102,655,000 105,945,000 2035 4.50 - 5.00%
Airport Revenue Bonds - Series 2005C Loan # 711 189,500,000$ 9,800,000 121,400,000 131,200,000 2025 Variable Rate
Airport Revenue Bonds - Series 2007A Loan # 712 172,470,000$ 4,025,000 151,010,000 155,035,000 2037 5.00 - 5.00%
Airport Revenue Bonds - Series 2007B Loan # 713 82,915,000$ 4,165,000 51,160,000 55,325,000 2027 4.50 - 5.00%
Airport Revenue Bonds - Series 2009A Loan # 714 45,715,000$ 1,960,000 34,965,000 36,925,000 2029 1.50 - 5.00%
Airport Revenue Bonds - Series 2010A Loan # 715 273,065,000$ 5,565,000 257,100,000 262,665,000 2040 2.00-5.25%
Airport Revenue Bonds - Series 2010C Loan # 717 54,730,000$ 8,155,000 17,565,000 25,720,000 2018 2.00-5.00%
Airport Revenue Bonds - Series 2010D Loan # 718 272,475,000$ 15,260,000 201,795,000 217,055,000 2028 2.00-5.25%
Airport Revenue Bonds - Series 2011A Loan # 719 199,040,000$ 6,645,000 168,225,000 174,870,000 2028 2.00-5.00%
Airport Revenue Bonds - Series 2011B Loan # 720 34,790,000$ 1,350,000 27,820,000 29,170,000 2031 2.00-5.05%
60,215,000$ 1,133,700,000$ 1,193,915,000$
Authorized
and Unissued
Airport general obligation bonds 62,500,000$
Beginning Additions/ Retirements/ Ending Due Within
Balance (Deletions) Repayments Balance One Year
Changes In Long-Term Debt
1,256,265,000$ -$ (62,350,000)$ 1,193,915,000$ 60,215,000$
35,483,241 - (4,068,619) 31,414,622 -
1,291,748,241$ -$ (66,418,619)$ 1,225,329,622$ 60,215,000$
Unamortized premium / (discount)
Total revenue bonds payable
CITY OF PHILADELPHIA
AVIATION FUND
Notes to Financial Statements
Revenue bonds payable
See notes to the financial statements.
54
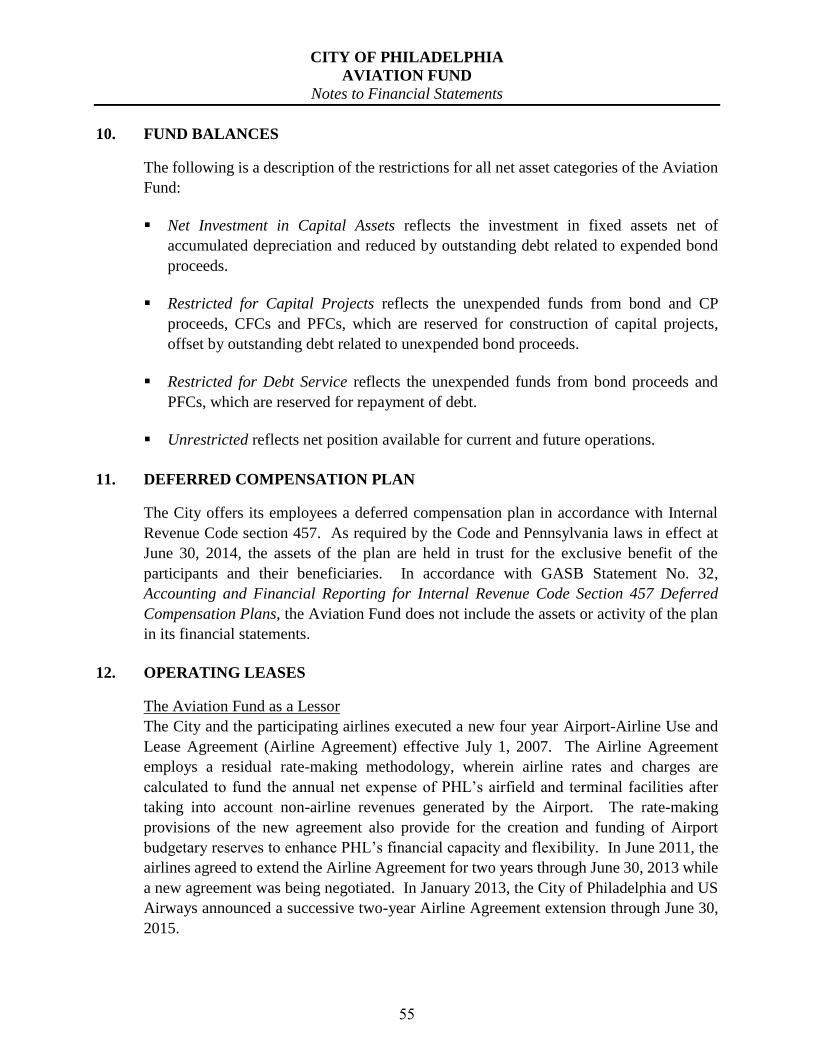
CITY OF PHILADELPHIA
AVIATION FUND
Notes to Financial Statements
10. FUND BALANCES
The following is a description of the restrictions for all net asset categories of the Aviation
Fund:
Net Investment in Capital Assets reflects the investment in fixed assets net of
accumulated depreciation and reduced by outstanding debt related to expended bond
proceeds.
Restricted for Capital Projects reflects the unexpended funds from bond and CP
proceeds, CFCs and PFCs, which are reserved for construction of capital projects,
offset by outstanding debt related to unexpended bond proceeds.
Restricted for Debt Service reflects the unexpended funds from bond proceeds and
PFCs, which are reserved for repayment of debt.
Unrestricted reflects net position available for current and future operations.
11. DEFERRED COMPENSATION PLAN
The City offers its employees a deferred compensation plan in accordance with Internal
Revenue Code section 457. As required by the Code and Pennsylvania laws in effect at
June 30, 2014, the assets of the plan are held in trust for the exclusive benefit of the
participants and their beneficiaries. In accordance with GASB Statement No. 32,
Accounting and Financial Reporting for Internal Revenue Code Section 457 Deferred
Compensation Plans, the Aviation Fund does not include the assets or activity of the plan
in its financial statements.
12. OPERATING LEASES
The Aviation Fund as a Lessor
The City and the participating airlines executed a new four year Airport-Airline Use and
Lease Agreement (Airline Agreement) effective July 1, 2007. The Airline Agreement
employs a residual rate-making methodology, wherein airline rates and charges are
calculated to fund the annual net expense of PHL’s airfield and terminal facilities after
taking into account non-airline revenues generated by the Airport. The rate-making
provisions of the new agreement also provide for the creation and funding of Airport
budgetary reserves to enhance PHL’s financial capacity and flexibility. In June 2011, the
airlines agreed to extend the Airline Agreement for two years through June 30, 2013 while
a new agreement was being negotiated. In January 2013, the City of Philadelphia and US
Airways announced a successive two-year Airline Agreement extension through June 30,
2015.
55
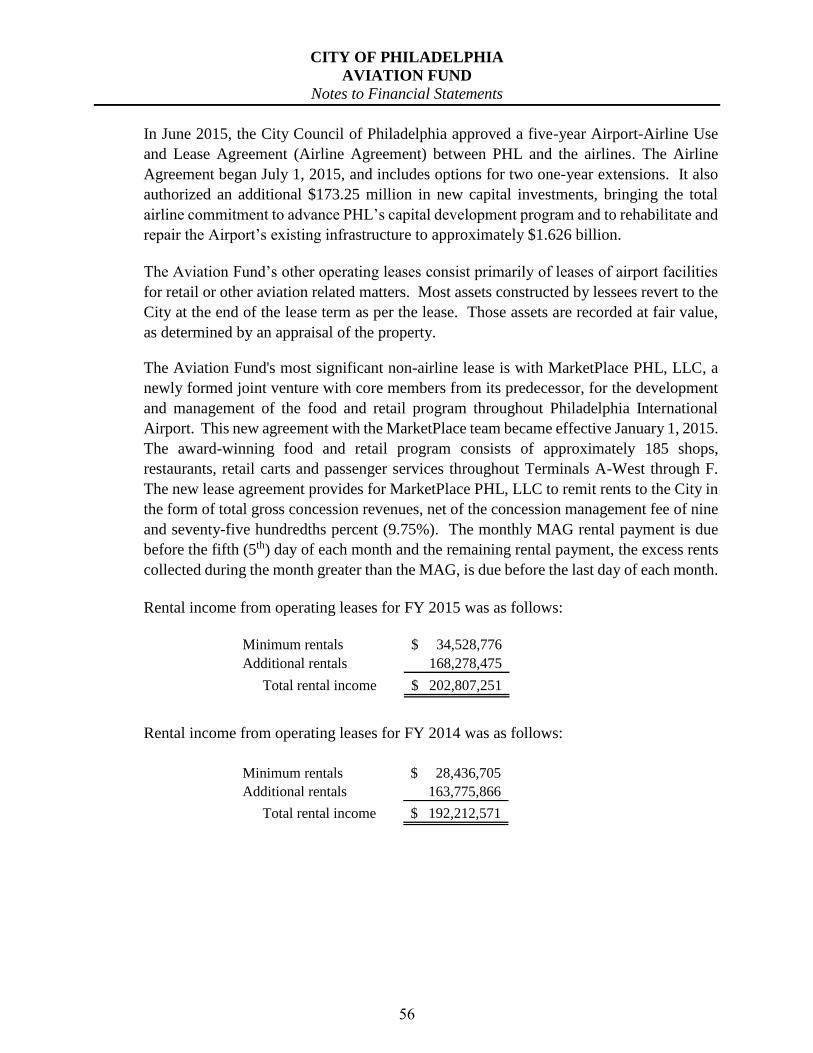
CITY OF PHILADELPHIA
AVIATION FUND
Notes to Financial Statements
In June 2015, the City Council of Philadelphia approved a five-year Airport-Airline Use
and Lease Agreement (Airline Agreement) between PHL and the airlines. The Airline
Agreement began July 1, 2015, and includes options for two one-year extensions. It also
authorized an additional $173.25 million in new capital investments, bringing the total
airline commitment to advance PHL’s capital development program and to rehabilitate and
repair the Airport’s existing infrastructure to approximately $1.626 billion.
The Aviation Fund’s other operating leases consist primarily of leases of airport facilities
for retail or other aviation related matters. Most assets constructed by lessees revert to the
City at the end of the lease term as per the lease. Those assets are recorded at fair value,
as determined by an appraisal of the property.
The Aviation Fund's most significant non-airline lease is with MarketPlace PHL, LLC, a
newly formed joint venture with core members from its predecessor, for the development
and management of the food and retail program throughout Philadelphia International
Airport. This new agreement with the MarketPlace team became effective January 1, 2015.
The award-winning food and retail program consists of approximately 185 shops,
restaurants, retail carts and passenger services throughout Terminals A-West through F.
The new lease agreement provides for MarketPlace PHL, LLC to remit rents to the City in
the form of total gross concession revenues, net of the concession management fee of nine
and seventy-five hundredths percent (9.75%). The monthly MAG rental payment is due
before the fifth (5th) day of each month and the remaining rental payment, the excess rents
collected during the month greater than the MAG, is due before the last day of each month.
Rental income from operating leases for FY 2015 was as follows:
Minimum rentals 34,528,776$
Additional rentals 168,278,475
Total rental income 202,807,251$
Rental income from operating leases for FY 2014 was as follows:
Minimum rentals 28,436,705$
Additional rentals 163,775,866
Total rental income 192,212,571$
56
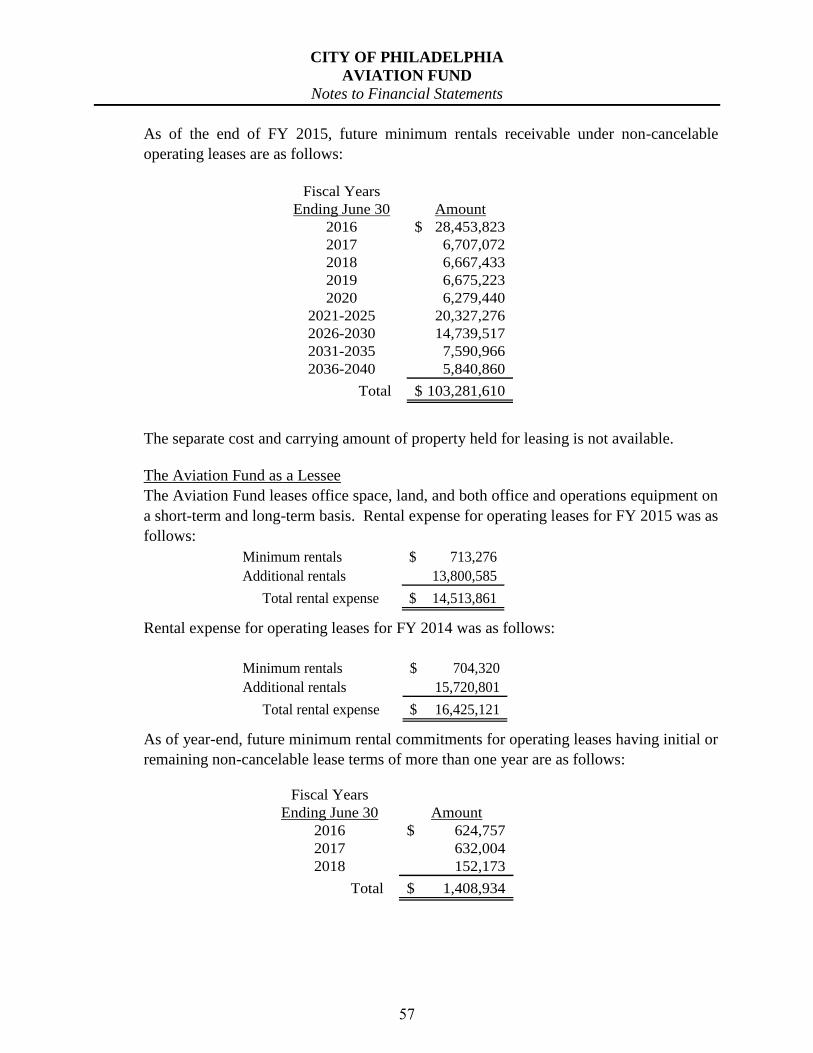
CITY OF PHILADELPHIA
AVIATION FUND
Notes to Financial Statements
As of the end of FY 2015, future minimum rentals receivable under non-cancelable
operating leases are as follows:
Fiscal Years
Ending June 30 Amount
2016 28,453,823$
2017 6,707,072
2018 6,667,433
2019 6,675,223
2020 6,279,440
2021-2025 20,327,276
2026-2030 14,739,517
2031-2035 7,590,966
2036-2040 5,840,860
Total 103,281,610$
The separate cost and carrying amount of property held for leasing is not available.
The Aviation Fund as a Lessee
The Aviation Fund leases office space, land, and both office and operations equipment on
a short-term and long-term basis. Rental expense for operating leases for FY 2015 was as
follows:
Minimum rentals 713,276$
Additional rentals 13,800,585
Total rental expense 14,513,861$
Rental expense for operating leases for FY 2014 was as follows:
Minimum rentals 704,320$
Additional rentals 15,720,801
Total rental expense 16,425,121$
As of year-end, future minimum rental commitments for operating leases having initial or
remaining non-cancelable lease terms of more than one year are as follows:
Fiscal Years
Ending June 30 Amount
2016 624,757$
2017 632,004
2018 152,173
Total 1,408,934$
57
CITY OF PHILADELPHIA
AVIATION FUND
Notes to Financial Statements
13. CONCENTRATION OF CREDIT RISK
The new American Airlines, resulting from the merger of American Airlines and US
Airways, is the principal airline serving Philadelphia International Airport. The airline,
together with its American Connection and US Airways Express affiliates accounted for
approximately 76.6% and 76.9% of passengers enplaned at the airport in fiscal years 2015
and 2014, respectively. Operating revenues from American Airlines and its affiliates
totaled approximately $164.2 million and $151.4 million in fiscal years 2015 and 2014,
respectively, which represented approximately 50.9% and 51.5% of total Aviation Fund
operating revenues in fiscal years 2015 and 2014, respectively.
14. PENSION PLAN
The Aviation Fund contributes to the Municipal Pension Plan (City Plan) of the City of
Philadelphia. The City maintains two single-employer defined benefit plans for its
employees and several of its component units. In addition to the City, the three other quasi-
governmental agencies that participate in the City Plan are the Philadelphia Parking
Authority (PPA), the Philadelphia Municipal Authority (PMA), and the Philadelphia
Housing Development Corporation (PHDC). Information for the City Plan as a whole is
available in the Comprehensive Annual Financial Report (CAFR) of the City of
Philadelphia for the year ended June 30, 2015.
Effective with fiscal year 2015, the City implemented GASB Statement No. 68,
Accounting and Financial Reporting for Pensions – an amendment of GASB Statement No.
27. This Statement revises existing standards for measuring and reporting pension
liabilities for pension plans. GASB Statement No. 68 defines a single employer as the
primary government and its component units. All three quasi-governmental agencies that
participate in the City Plan were determined to be component units of the City. Therefore,
the City Plan meets the definition of a single-employer plan.
The note disclosures and Required Supplementary Information calculated in accordance
with GASB Statement No. 67 are presented in audited financial statements of the
respective pension plans. Copies of these financial statements may be obtained by
contacting the Director of Finance of the City of Philadelphia.
58
CITY OF PHILADELPHIA
AVIATION FUND
Notes to Financial Statements
Plan Administration
The Philadelphia Board of Pensions and Retirement administers the City of Philadelphia
Public Employees Retirement System – a single-employer defined benefit pension plan
with a small but increasing defined contribution component, which provides pensions for
all officers and employees of the City, as well as those of three quasi-governmental
agencies (per applicable enabling legislation and contractual agreements). The Board was
established by section 2-308 of the 1952 Philadelphia Home Rule Charter. Its actions
in administering the Retirement System are governed by Title 22 of the Philadelphia Code.
Benefits
The Public Employees Retirement System (System) provides retirement, disability, and
death benefits according to the provisions of Title 22 of the Philadelphia Code. These
provisions prescribe retirement benefit calculations, vesting thresholds, and minimum
retirement ages, that vary based on bargaining unit, uniform/non-uniform status, and entry
date into the System.
Non-uniform employees may retire at either age 55 with up to 80% of average final
compensation (AFC) or may retire at either age 60 with up to 100% or 25% of AFC,
depending on entry date into the System. Uniform employees may retire at either age 45
with up to 100% of AFC or age 50 with up to either 100% or 35% of AFC, depending
on entry date into the System. Survivorship selections may result in an actuarial reduction
to the calculated benefit.
Members may qualify for service-connected disability benefits regardless of length of
service. Service-connected disability benefits are equal to 70% of a member’s final rate of
pay, and are payable immediately without an actuarial reduction. These applications require
approval by the Board.
Eligibility to apply for non-service-connected disability benefits varies by bargaining unit
and uniform/non-uniform status. Non-service-connected disability benefits are determined
in the same manner as retirement benefits, and are payable immediately.
Service-connected death benefits are payable to:
1) surviving spouse/life partner at 60% of final rate of pay plus up to 2 children
under age 18 at 10% each of final rate of pay (maximum payout: 80%);
2) if no surviving spouse/life partner, up to 3 children under age 18 at 25% each
of final rate of pay (maximum payout 75%); or
3) if no surviving spouse/life partner or children under age 18, up to 2 surviving
parents at 15% each of final rate of pay (maximum payout 30%).
Non-service-connected deaths are payable as a lump sum payment, unless the deceased
was either vested or had reached minimum retirement age for their plan, in which case
59
CITY OF PHILADELPHIA
AVIATION FUND
Notes to Financial Statements
the beneficiary(s) may instead select a lifetime monthly benefit, payable immediately with
an actuarial reduction.
A Pension Adjustment Fund (PAF) is funded with 50% of the excess earnings that are
between 1% and 6% above the actuarial assumed earnings rate. Each year within sixty
days of the end of the fiscal year, by majority vote of its members, the Board of
Directors of the Fund (the Board) shall consider whether sufficient funds have
accumulated in the PAF to support an enhanced benefit distribution (which may include,
but is not limited to, a lump sum bonus payment, monthly pension payment increases,
ad hoc cost-of-living adjustments, continuous cost-of-living adjustments, or some
other form of increase in benefits as determined by the Board) to retirees, their
beneficiaries, and their survivors. As of July 1, 2014, the date of the most recent actuarial
valuation, there was $62,439,228 in the PAF and the Board voted to make distributions of
$32,174,056 during the fiscal year ended June 30, 2015.
The Fund includes a Deferred Retirement Option Plan (DROP Plan). The DROP Plan
allows a participant to declare that they will retire within 4 years. During the 4-
year period, the City will make no further contributions for the participant. The
participant would continue to work and to receive their salary; however, any increases
would not be counted towards their pension benefit. During the 4-year period the
individual participates in the DROP Plan, their pension benefits will be paid into an
escrow account in the participant's name. After the 4-year period, the participant
would begin to receive their pension benefits and the amount that has been
accumulated in the escrow account in a lump sum payment. The balance in the DROP
Plan as of June 30, 2015 is $155.5 million.
60
CITY OF PHILADELPHIA
AVIATION FUND
Notes to Financial Statements
Plan Membership
At July 1, 2014, the date of the most recent actuarial valuation, pension plan membership
for the City as a whole was as follows:
Active Members 27,065
Retirees 21,768
Beneficiaries 8,547
Disabled 3,954
DROP Members 2,264
Terminated Vested 1,224
Total City Members 64,822
Annual Salaries
Average Salary per Active Member
Annual Retirement Allowances
Average Retirement Allowance
$1,495,421,387
$55,253
$686,601,608
$20,036
Contributions
Per Title 22 of the Philadelphia Code, members contribute to the System at various rates
based on bargaining unit, uniform status, and entry date into the System. As of July 1,
2014 uniform employees will be contributing either 5.00%, 5.50%, or 6.00% of
pensionable earnings; non-uniform employees will be contributing either 1.95%, 2.71%,
2.95%, 3.23%, 3.38%, 3.75%, or 6.00% of pensionable earnings; and elected employees
will be contributing either 8.33% or 9.94% of pensionable earnings.
Employer contributions are made by the City throughout each fiscal year (which ends June
30) and by three (3) quasi-governmental agencies on a quarterly basis. These
contributions, determined by an annual actuarial valuation report (AVR), when combined
with plan member contributions, are expected to finance the cost of benefits earned by
plan members during the year, with an additional amount to finance any unfunded accrued
liability. Within the AVR, two contribution amounts are determined based upon two
different sets of rules for determining the way the unfunded actuarial liability is funded.
The first method is defined in accordance with Act 205 and defines the Minimum
Municipal Obligation (MMO), which is the City’s minimum required contribution under
Pennsylvania state law.
The second method is in accordance with the City’s Funding Policy which predates the
Act 205 rules and calls for contributions that are greater than the MMO until the initial
unfunded liability determined in 1984 is fully funded.
61
CITY OF PHILADELPHIA
AVIATION FUND
Notes to Financial Statements
Under both funding methods there are two components: the normal cost and the amortized
unfunded actuarial liability. The actuarial unfunded liability is the amount of the unfunded
actuarial liability that is paid each year based upon the given or defined amortization
periods. The amortization periods are different under the MMO and City’s Funding Policy.
City’s Funding Policy
The initial July 1, 1985 unfunded actuarial liability (UAL) is amortized over 34
years ending June 30, 2019 with payments increasing at 3.3% per year, the
assumed payroll growth. Other charges in the actuarial liability are amortized in
level-dollar payments as follows:
* Actuarial gains and losses – 20 years beginning July 1, 2009. Prior gains
and losses were amortized over 15 years.
* Assumptions changes – 15 years beginning July 1, 2010. Prior changes were
amortized over 20 years.
* Plan changes for active members – 10 years.
* Plan changes for inactive members – 1 year.
* Plan changes mandated by the State – 20 years.
In fiscal year 2015, the City and other employers’ contributions of $577.2 million
was less than the actuarially determined employer contribution (ADEC) OF $798.0
million. In the event that the City contributes less than the funding policy, an
experience loss will be created that will be amortized in accordance with funding
policy over 20 years.
The Schedule of Employer Contributions (based on the City’s Funding Policy) is
included as Required Supplemental Information (in the City’s CAFR) and provides
a 10-year presentation of employer contributions.
MMO
For the purposes of the MMO under Act 205 reflecting the fresh start amortization
schedule, the July 1, 2009 UAL was “fresh started” to be amortized over 30 years
ending June 30, 2039. This is a level dollar amortization of the UAL. All future
amortization periods will follow the City’s Funding Policies as outlined above. In
fiscal year 2015, the City and other employers’ contributions of $577.2 million
exceeded the Minimum Municipal Obligation of $556.0 million.
62
CITY OF PHILADELPHIA
AVIATION FUND
Notes to Financial Statements
Investments
The Pension Board’s Investment Policy Statement provides, in part:
The overall investment objectives and goals should be achieved by use of a diversified
portfolio, with safety of principal a primary emphasis. The portfolio policy should employ
flexibility by prudent diversification into various asset classes based upon the relative
expected risk-reward relationship of the asset classes and the expected correlation of their
returns.
The Pension Fund seeks an annual total rate of return of not less than 7.80% over a full
market cycle. It is anticipated that this return standard should enable the Pension Fund to
meet its actuarially assumed earnings projection (currently 7.80%) over a market cycle.
The investment return assumption was reduced by the Pension Board from 7.85% to
7.80%. The Pension Fund’s investment program will pursue its stated total rate of return
by a combination of income and appreciation, relying upon neither exclusively in
evaluating a prospective investment for the Pension Fund.
All investments are made only upon recommendation of the Pension Fund’s Investment
Committee and approval by a majority of the Pension Board.
In order to document and communicate the objectives, restrictions, and guidelines for the
Pension Fund’s investment staff and investments, a continuously updated Investment
Policy Statement will be maintained. The Investment Policy Statement will be updated
(and reaffirmed) each year at the January Pension Board meeting.
63
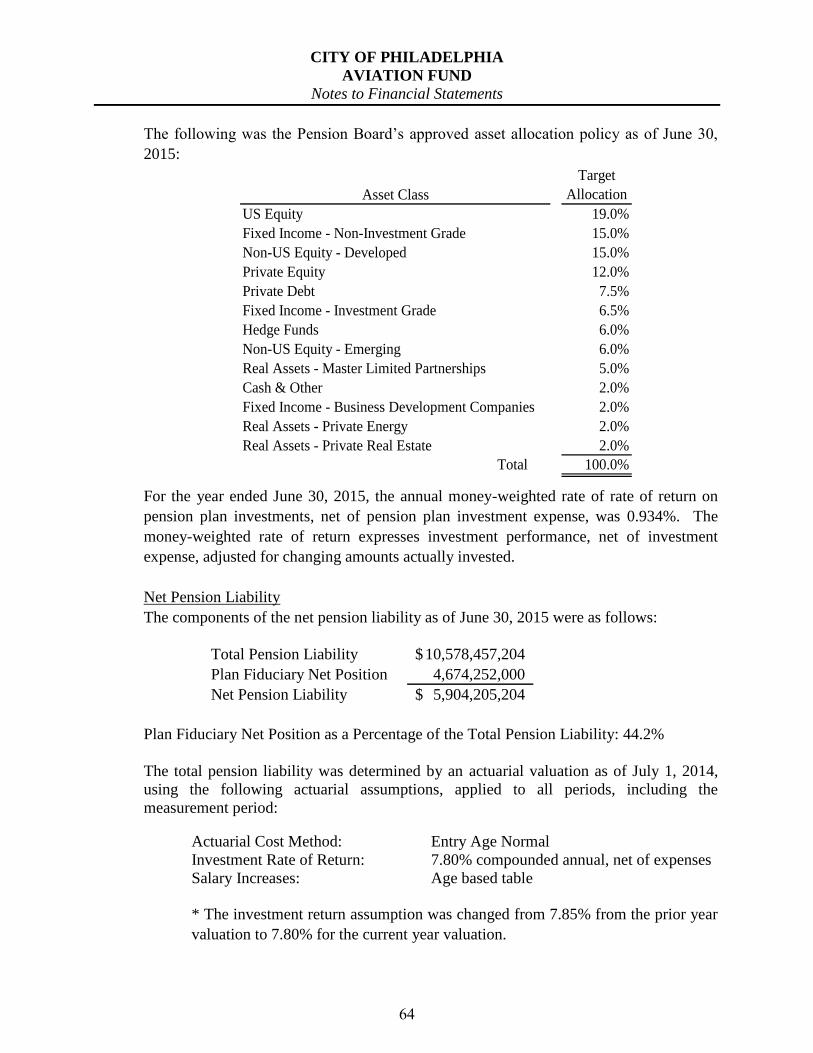
CITY OF PHILADELPHIA
AVIATION FUND
Notes to Financial Statements
The following was the Pension Board’s approved asset allocation policy as of June 30,
2015:
Asset Class
Target
Allocation
US Equity 19.0%
Fixed Income - Non-Investment Grade 15.0%
Non-US Equity - Developed 15.0%
Private Equity 12.0%
Private Debt 7.5%
Fixed Income - Investment Grade 6.5%
Hedge Funds 6.0%
Non-US Equity - Emerging 6.0%
Real Assets - Master Limited Partnerships 5.0%
Cash & Other 2.0%
Fixed Income - Business Development Companies 2.0%
Real Assets - Private Energy 2.0%
Real Assets - Private Real Estate 2.0%
Total 100.0%
For the year ended June 30, 2015, the annual money-weighted rate of rate of return on
pension plan investments, net of pension plan investment expense, was 0.934%. The
money-weighted rate of return expresses investment performance, net of investment
expense, adjusted for changing amounts actually invested.
Net Pension Liability
The components of the net pension liability as of June 30, 2015 were as follows:
Total Pension Liability 10,578,457,204$
Plan Fiduciary Net Position 4,674,252,000
Net Pension Liability 5,904,205,204$
Plan Fiduciary Net Position as a Percentage of the Total Pension Liability: 44.2%
The total pension liability was determined by an actuarial valuation as of July 1, 2014,
using the following actuarial assumptions, applied to all periods, including the
measurement period:
Actuarial Cost Method: Entry Age Normal
Investment Rate of Return: 7.80% compounded annual, net of expenses
Salary Increases: Age based table
* The investment return assumption was changed from 7.85% from the prior year
valuation to 7.80% for the current year valuation.
64
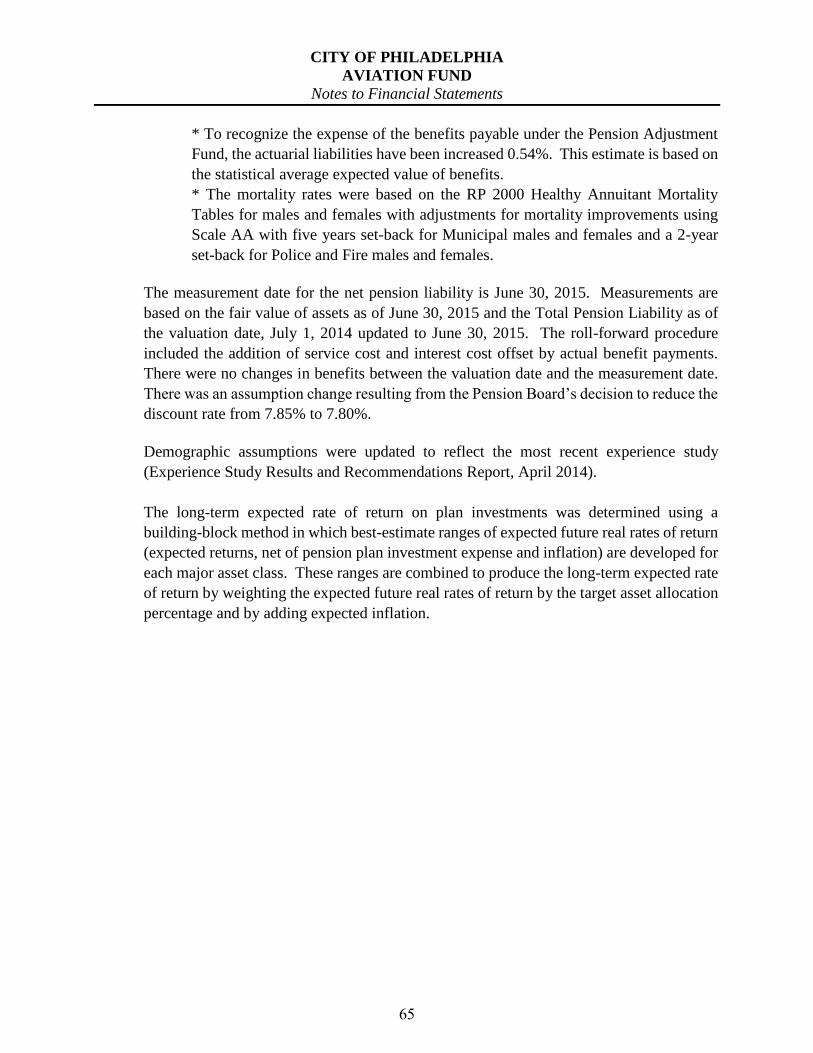
CITY OF PHILADELPHIA
AVIATION FUND
Notes to Financial Statements
* To recognize the expense of the benefits payable under the Pension Adjustment
Fund, the actuarial liabilities have been increased 0.54%. This estimate is based on
the statistical average expected value of benefits.
* The mortality rates were based on the RP 2000 Healthy Annuitant Mortality
Tables for males and females with adjustments for mortality improvements using
Scale AA with five years set-back for Municipal males and females and a 2-year
set-back for Police and Fire males and females.
The measurement date for the net pension liability is June 30, 2015. Measurements are
based on the fair value of assets as of June 30, 2015 and the Total Pension Liability as of
the valuation date, July 1, 2014 updated to June 30, 2015. The roll-forward procedure
included the addition of service cost and interest cost offset by actual benefit payments.
There were no changes in benefits between the valuation date and the measurement date.
There was an assumption change resulting from the Pension Board’s decision to reduce the
discount rate from 7.85% to 7.80%.
Demographic assumptions were updated to reflect the most recent experience study
(Experience Study Results and Recommendations Report, April 2014).
The long-term expected rate of return on plan investments was determined using a
building-block method in which best-estimate ranges of expected future real rates of return
(expected returns, net of pension plan investment expense and inflation) are developed for
each major asset class. These ranges are combined to produce the long-term expected rate
of return by weighting the expected future real rates of return by the target asset allocation
percentage and by adding expected inflation.
65
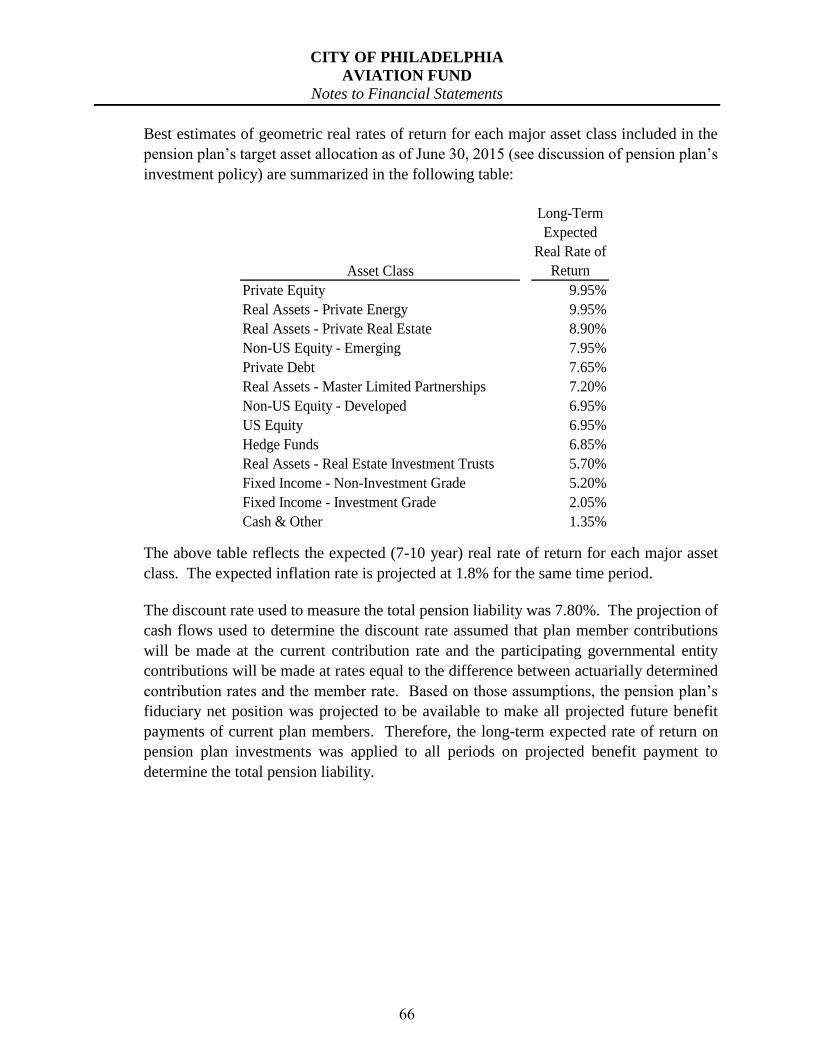
CITY OF PHILADELPHIA
AVIATION FUND
Notes to Financial Statements
Best estimates of geometric real rates of return for each major asset class included in the
pension plan’s target asset allocation as of June 30, 2015 (see discussion of pension plan’s
investment policy) are summarized in the following table:
Asset Class
Long-Term
Expected
Real Rate of
Return
Private Equity 9.95%
Real Assets - Private Energy 9.95%
Real Assets - Private Real Estate 8.90%
Non-US Equity - Emerging 7.95%
Private Debt 7.65%
Real Assets - Master Limited Partnerships 7.20%
Non-US Equity - Developed 6.95%
US Equity 6.95%
Hedge Funds 6.85%
Real Assets - Real Estate Investment Trusts 5.70%
Fixed Income - Non-Investment Grade 5.20%
Fixed Income - Investment Grade 2.05%
Cash & Other 1.35%
The above table reflects the expected (7-10 year) real rate of return for each major asset
class. The expected inflation rate is projected at 1.8% for the same time period.
The discount rate used to measure the total pension liability was 7.80%. The projection of
cash flows used to determine the discount rate assumed that plan member contributions
will be made at the current contribution rate and the participating governmental entity
contributions will be made at rates equal to the difference between actuarially determined
contribution rates and the member rate. Based on those assumptions, the pension plan’s
fiduciary net position was projected to be available to make all projected future benefit
payments of current plan members. Therefore, the long-term expected rate of return on
pension plan investments was applied to all periods on projected benefit payment to
determine the total pension liability.
66
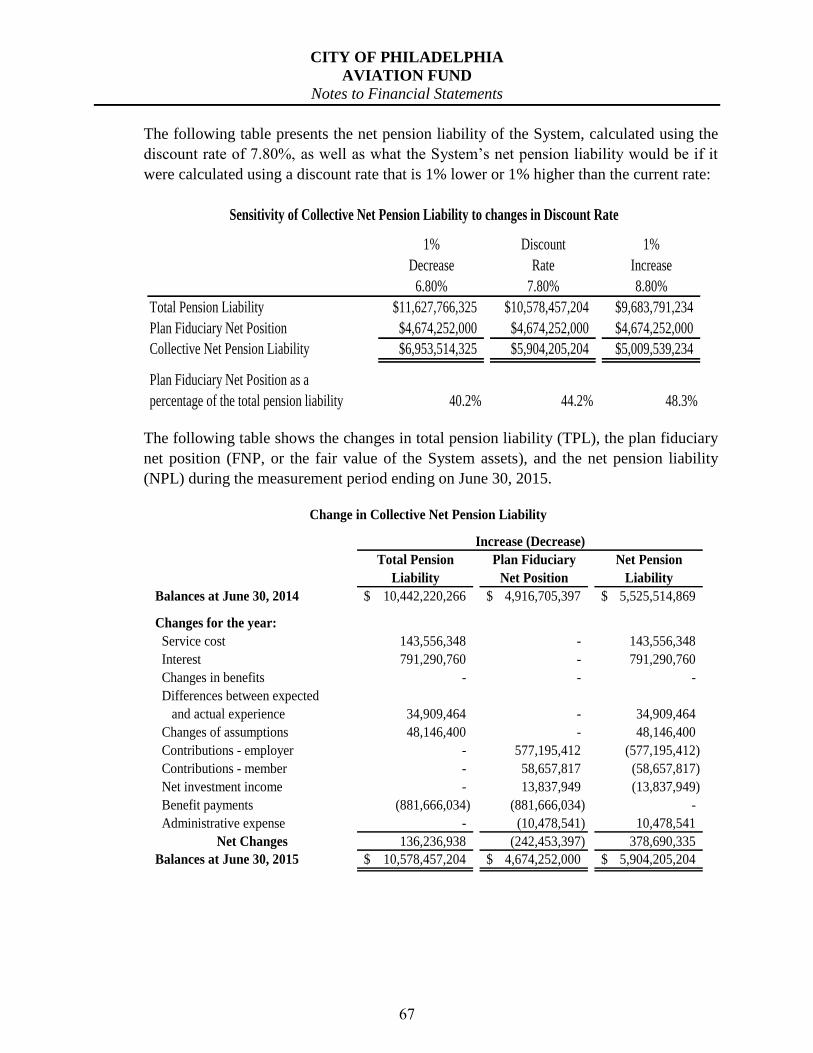
CITY OF PHILADELPHIA
AVIATION FUND
Notes to Financial Statements
The following table presents the net pension liability of the System, calculated using the
discount rate of 7.80%, as well as what the System’s net pension liability would be if it
were calculated using a discount rate that is 1% lower or 1% higher than the current rate:
1% Discount 1%
Decrease Rate Increase
6.80% 7.80% 8.80%
Total Pension Liability $11,627,766,325 $10,578,457,204 $9,683,791,234
Plan Fiduciary Net Position $4,674,252,000 $4,674,252,000 $4,674,252,000
Collective Net Pension Liability $6,953,514,325 $5,904,205,204 $5,009,539,234
Plan Fiduciary Net Position as a
percentage of the total pension liability 40.2% 44.2% 48.3%
Sensitivity of Collective Net Pension Liability to changes in Discount Rate
The following table shows the changes in total pension liability (TPL), the plan fiduciary
net position (FNP, or the fair value of the System assets), and the net pension liability
(NPL) during the measurement period ending on June 30, 2015.
Total Pension Plan Fiduciary Net Pension
Liability Net Position Liability
Balances at June 30, 2014 10,442,220,266$ 4,916,705,397$ 5,525,514,869$
Changes for the year:
Service cost 143,556,348 - 143,556,348
Interest 791,290,760 - 791,290,760
Changes in benefits - - -
Differences between expected
and actual experience 34,909,464 - 34,909,464
Changes of assumptions 48,146,400 - 48,146,400
Contributions - employer - 577,195,412 (577,195,412)
Contributions - member - 58,657,817 (58,657,817)
Net investment income - 13,837,949 (13,837,949)
Benefit payments (881,666,034) (881,666,034) -
Administrative expense - (10,478,541) 10,478,541
Net Changes 136,236,938 (242,453,397) 378,690,335
Balances at June 30, 2015 10,578,457,204$ 4,674,252,000$ 5,904,205,204$
Increase (Decrease)
Change in Collective Net Pension Liability
67
CITY OF PHILADELPHIA
AVIATION FUND
Notes to Financial Statements
GASB 68 requires that the proportionate share for each employer be determined based
upon the employer’s projected long-term contribution effort to the pension … as compared
to the total long-term contribution effort to all employees. In addition to the City, three
governmental agencies currently participate in the System, PHDC, PMA, and PPA. The
method of allocation is based on the ratio of quasi-agency contributions in proportion to
total contributions by plan.
Derivative Instruments
In 2010, the City of Philadelphia adopted GASB Statement No. 53 which addresses the
recognition, measurement, and disclosure of information regarding derivative instruments
entered into by state and local governments. Derivative instruments such as swaps,
options, futures and forwards are often complex financial arrangements used by
governments to manage specific risks or to make investments. By entering into these
arrangements, governments receive and make payments based on market prices without
actually entering into the related financial or commodity transactions. Derivative
instruments associated with changing financial and commodity prices result in changing
cash flows and fair values that can be used as effective risk management or investment
tools. Derivative instruments, however, also can expose governments to significant risks
and liabilities.
The City of Philadelphia Municipal Pension Fund (Pension Fund) enters into a variety of
financial contracts which include options, futures, forwards and swap agreements to gain
exposure to certain sectors of the equity and fixed income markets; collateralized mortgage
obligations (CMO’s); other forward contracts, and U.S. Treasury strips. The contracts are
used primarily to enhance performance and reduce volatility of the portfolio. The Pension
Fund is exposed to credit risk in the event of non-performance by counter-parties to
financial instruments. The Pension Fund generally enters into transactions only with high
quality institutions. Legal risk is mitigated through selection of executing brokers and
review of all documentation. The Pension Fund is exposed to market risk, the risk that
future changes in market conditions may make an instrument less valuable. Exposure to
market risk is managed in accordance with risk limits set by Board-approved guidelines,
through buying or selling instruments or entering into offsetting positions. The notional or
contractual amounts of derivatives indicate the extent of the Pension Fund’s involvement
in the various types and uses of derivative financial instruments and do not measure the
Pension Fund’s exposure to credit or market risks and do not necessarily represent amounts
exchanged by the parties. The amounts exchanged are determined by reference to the
notional amounts and the other terms of the derivatives.
68
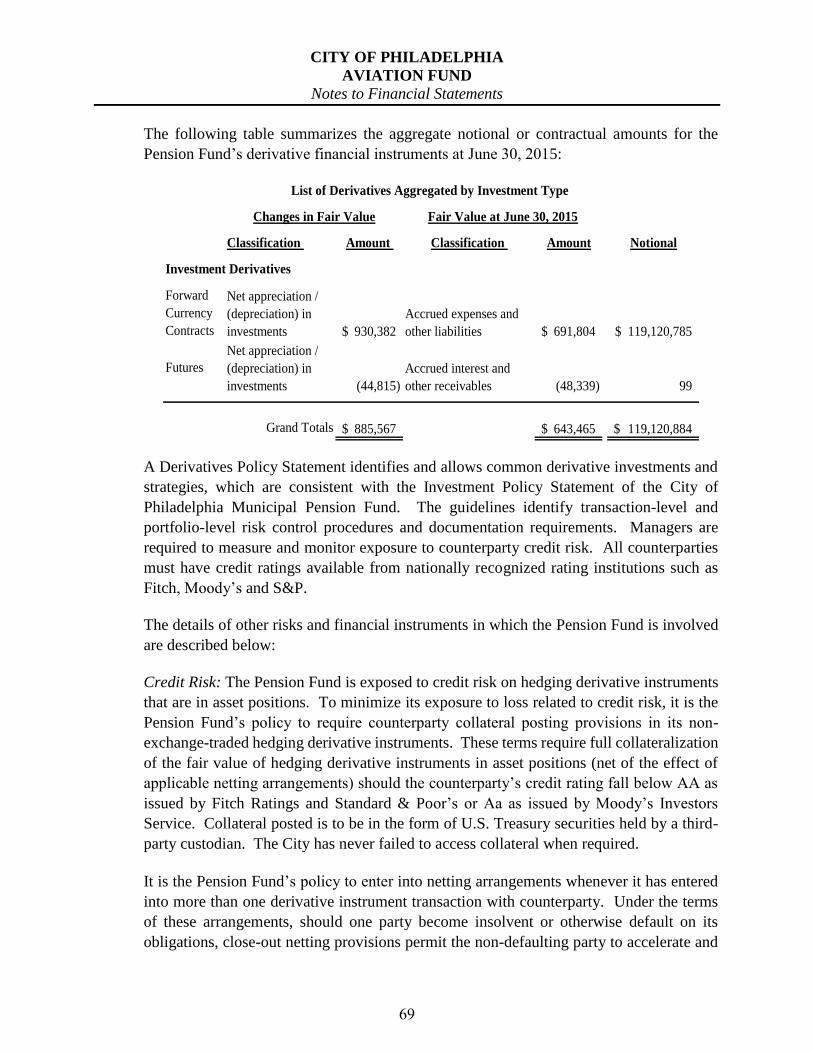
CITY OF PHILADELPHIA
AVIATION FUND
Notes to Financial Statements
The following table summarizes the aggregate notional or contractual amounts for the
Pension Fund’s derivative financial instruments at June 30, 2015:
Classification Amount Classification Amount Notional
Investment Derivatives
Forward
Currency
Contracts
Net appreciation /
(depreciation) in
investments 930,382$
Accrued expenses and
other liabilities 691,804$ 119,120,785$
Futures
Net appreciation /
(depreciation) in
investments (44,815)
Accrued interest and
other receivables (48,339) 99
Grand Totals 885,567$ 643,465$ 119,120,884$
Changes in Fair Value Fair Value at June 30, 2015
List of Derivatives Aggregated by Investment Type
A Derivatives Policy Statement identifies and allows common derivative investments and
strategies, which are consistent with the Investment Policy Statement of the City of
Philadelphia Municipal Pension Fund. The guidelines identify transaction-level and
portfolio-level risk control procedures and documentation requirements. Managers are
required to measure and monitor exposure to counterparty credit risk. All counterparties
must have credit ratings available from nationally recognized rating institutions such as
Fitch, Moody’s and S&P.
The details of other risks and financial instruments in which the Pension Fund is involved
are described below:
Credit Risk: The Pension Fund is exposed to credit risk on hedging derivative instruments
that are in asset positions. To minimize its exposure to loss related to credit risk, it is the
Pension Fund’s policy to require counterparty collateral posting provisions in its non-
exchange-traded hedging derivative instruments. These terms require full collateralization
of the fair value of hedging derivative instruments in asset positions (net of the effect of
applicable netting arrangements) should the counterparty’s credit rating fall below AA as
issued by Fitch Ratings and Standard & Poor’s or Aa as issued by Moody’s Investors
Service. Collateral posted is to be in the form of U.S. Treasury securities held by a third-
party custodian. The City has never failed to access collateral when required.
It is the Pension Fund’s policy to enter into netting arrangements whenever it has entered
into more than one derivative instrument transaction with counterparty. Under the terms
of these arrangements, should one party become insolvent or otherwise default on its
obligations, close-out netting provisions permit the non-defaulting party to accelerate and
69
CITY OF PHILADELPHIA
AVIATION FUND
Notes to Financial Statements
terminate all outstanding transactions and net the transactions’ fair values so that a single
sum will be owed by, or owed to, the non-defaulting party.
Swap Agreements provide for periodic payments at predetermined future dates between
parties based on the change in value of underlying securities, indexes or interest rates.
During the year ended June 30, 2012, the Pension Fund entered into interest rate swaps.
Under the receive-fixed interest rate type swap arrangements, the Pension Fund receives
the fixed interest rate on certain equity or debt securities or indexes in exchange for a fixed
charge. There were not any receive-fixed interest rate swaps received as of June 30, 2015.
On its pay-variable, received-fixed interest rate swap, as LIBOR increases, the Pension
Fund’s net payment on the swap increases. Alternatively, on its pay-fixed, receive-variable
interest rate swap, as LIBOR or the SIFMA swap index decreases, the Pension Fund’s net
payment on the swap increases.
Futures Contracts are types of contracts in which the buyer agrees to purchase and the seller
agrees to make delivery of a specific financial instrument at a predetermined date and price.
Gains and losses on futures contracts are settled daily based on a notional (underlying)
principal value and do not involve an actual transfer of the specific instrument. Futures
contracts are standardized and are traded on exchanges. The exchange assumes the risk
that counterparty will not pay and generally requires margin payments to minimize such
risk. In addition, the Pension Fund enters into short sales, sales of securities it does not
presently own, to neutralize the market risk of certain equity positions. Initial margin
requirements on futures contracts and collateral for short sales are provided by investment
securities pledged as collateral and by cash held by various brokers. Although the Pension
Fund has the right to access individual pledged securities, it must maintain the amount
pledged by substituting other securities for those accessed.
Forward Contracts: The Pension Fund is exposed to basis risk on its forward contracts
because the expected funds purchase being hedged will price based on a pricing point
different than the pricing point at which the forward contract is expected to settle.
Termination Risk: The Pension Fund or its counterparties may terminate a derivative
instrument if the other party fails to perform under the terms of the contract. In addition,
the Pension Fund is exposed to termination risk on its receive-fixed interest rate swap. The
Pension Fund is exposed to termination risk on its rate cap because the counterparty has
the option to terminate the contract if the SIFMA swap index exceeds 12%. If at the time
of termination, a hedging derivative instrument is in a liability position, the City would be
liable to the counterparty for a payment equal to the liability, subject to netting
arrangements.
70
CITY OF PHILADELPHIA
AVIATION FUND
Notes to Financial Statements
Rollover Risk: The Pension Fund is exposed to rollover risk on hedging derivative
instruments that are hedges of debt that mature or may be terminated prior to maturity of
the hedged debt. When these hedging derivative instruments terminate, or in the case of a
termination option, if the counterparty exercises its option, the Pension Fund will be re-
exposed to the risks being hedged by the hedging derivative instrument.
Summary of Significant Accounting Policies
Financial statements of the Pension Fund are prepared using the accrual basis of
accounting. Member contributions are recognized in the period in which the contributions
are due. Employer contributions are recognized when due and the employer has made a
formal commitment to provide the contributions. Benefits and refunds of contributions are
recognized when due and payable in accordance with the terms of the Pension Fund.
Investments are valued as described in Footnote 2.
15. ACCUMULATED UNPAID SICK LEAVE
The Aviation Fund follows City policies regarding the accumulation of sick leave. City
employees may accumulate unused sick leave to predetermined balances. Non-uniformed
employees (upon retirement only) and uniformed employees (upon retirement or in case of
death while on active duty) are paid varying amounts ranging from 25% to 50% of unused
sick time, not to exceed predetermined amounts. Employees who separate for any reason
other than indicated above forfeit their entire sick leave. The City budgets for and charges
the cost of sick leave as it is taken.
16. OTHER POST EMPLOYMENT BENEFITS (OPEB)
The following information is provided for the City as a whole because discrete information
is not available for the Aviation Fund. Please see the CAFR of the City of Philadelphia for
required supplemental information.
Plan Description: The City of Philadelphia self-administers a single-employer, defined
benefit plan and provides health care for five years subsequent to separation for eligible
retirees. Certain union represented employees may defer their coverage until a later date
but the amount that the City pays for their health care is limited to the amount that the City
would have paid at the date of their retirement. The City also provides lifetime insurance
coverage for all eligible retirees. Firefighters are entitled to $7,500 coverage and all other
employees receive $6,000 in coverage. The plan does not issue stand-alone financial
statements, and the accounting for the plan is reported within the financial statements of
the City of Philadelphia.
71
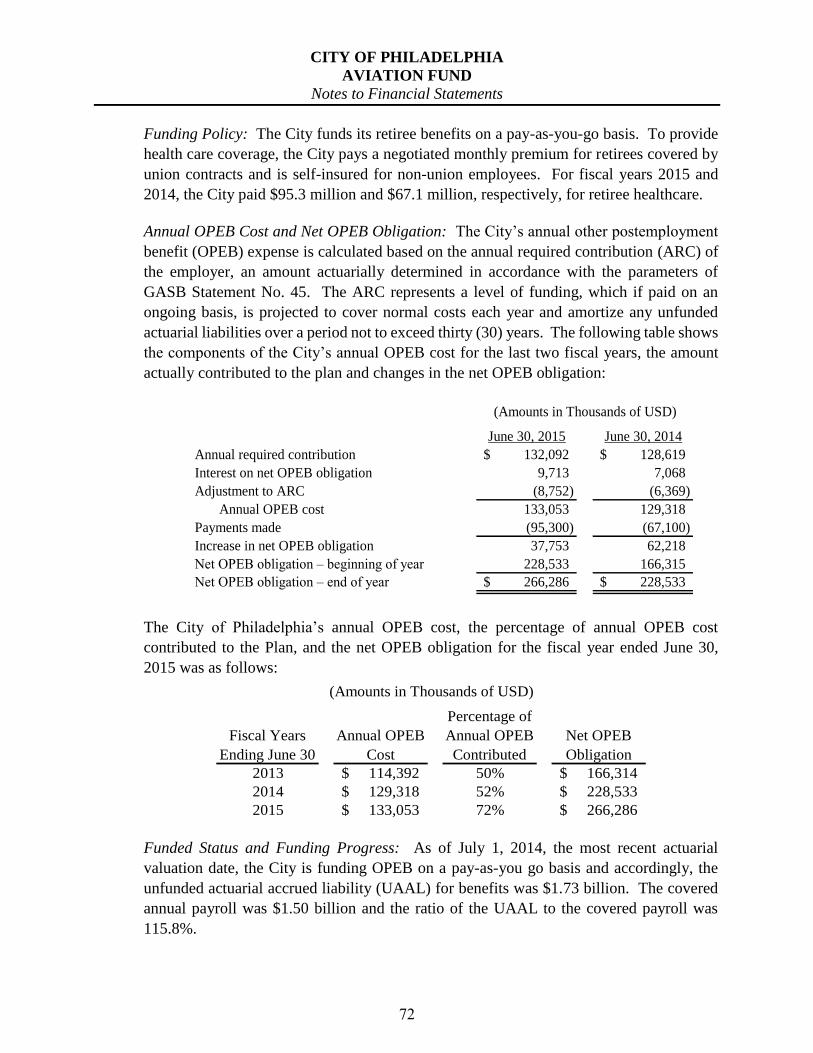
CITY OF PHILADELPHIA
AVIATION FUND
Notes to Financial Statements
Funding Policy: The City funds its retiree benefits on a pay-as-you-go basis. To provide
health care coverage, the City pays a negotiated monthly premium for retirees covered by
union contracts and is self-insured for non-union employees. For fiscal years 2015 and
2014, the City paid $95.3 million and $67.1 million, respectively, for retiree healthcare.
Annual OPEB Cost and Net OPEB Obligation: The City’s annual other postemployment
benefit (OPEB) expense is calculated based on the annual required contribution (ARC) of
the employer, an amount actuarially determined in accordance with the parameters of
GASB Statement No. 45. The ARC represents a level of funding, which if paid on an
ongoing basis, is projected to cover normal costs each year and amortize any unfunded
actuarial liabilities over a period not to exceed thirty (30) years. The following table shows
the components of the City’s annual OPEB cost for the last two fiscal years, the amount
actually contributed to the plan and changes in the net OPEB obligation:
(Amounts in Thousands of USD)
June 30, 2015 June 30, 2014
Annual required contribution 132,092$ 128,619$
Interest on net OPEB obligation 9,713 7,068
Adjustment to ARC (8,752) (6,369)
Annual OPEB cost 133,053 129,318
Payments made (95,300) (67,100)
Increase in net OPEB obligation 37,753 62,218
Net OPEB obligation – beginning of year 228,533 166,315
Net OPEB obligation – end of year 266,286$ 228,533$
The City of Philadelphia’s annual OPEB cost, the percentage of annual OPEB cost
contributed to the Plan, and the net OPEB obligation for the fiscal year ended June 30,
2015 was as follows:
Fiscal Years
Ending June 30
Annual OPEB
Cost
Percentage of
Annual OPEB
Contributed
Net OPEB
Obligation
2013 114,392$ 50% 166,314$
2014 129,318$ 52% 228,533$
2015 133,053$ 72% 266,286$
(Amounts in Thousands of USD)
Funded Status and Funding Progress: As of July 1, 2014, the most recent actuarial
valuation date, the City is funding OPEB on a pay-as-you go basis and accordingly, the
unfunded actuarial accrued liability (UAAL) for benefits was $1.73 billion. The covered
annual payroll was $1.50 billion and the ratio of the UAAL to the covered payroll was
115.8%.
72
CITY OF PHILADELPHIA
AVIATION FUND
Notes to Financial Statements
The required schedule of funding progress immediately following the City of Philadelphia
CAFR’s notes to the financial statements presents multi-year trend information about
whether the actuarial value of the plan assets is increasing or decreasing over time relative
to the actuarial accrued liability for benefits.
The projections of future benefit payments for an ongoing plan obligation involves
estimates of the value of reported amounts and assumptions about the probability of
occurrence of events far into the future. Amounts determined regarding the funded status
of the obligation and the contributions of the employer are subject to continual revision as
actual results are compared with past expectations and new estimates are made about the
future.
Actuarial Methods and Assumptions: Projections of costs for financial reporting purposes
are based on the types of benefits provided under the terms of the substantive plan at the
time of each valuation and on the pattern of sharing costs between the employer and the
plan members to that point.
Costs were determined according to the individual entry age actuarial cost method with the
attribution period ending at each decrement age. This is consistent with the cost method
used for the City of Philadelphia Municipal Retirement System. The City uses a level
percent open approach as its method of amortization. Unfunded liabilities are funded over
a 30-year period as a level percentage of payroll, which is assumed to increase at a
compound annual rate of 4.25% per year. The actuarial assumption included a 7.80%
compound annual interest rate on the City’s general investments. The current plan
incorporates the following assumptions: no post-retirement benefit increases since last
year; a 7.80% Investment Rate of Return; a 3.30% Rate of Salary Increases; and, a 4.00%
Ultimate Rate of Medical Inflation.
17. RISK MANAGEMENT
The Aviation Fund is exposed to various risks of loss related to torts; theft of, damage to,
and destruction of assets; errors and omissions; injuries to employees; and natural disasters.
The Aviation Fund is self-insured for Workers’ Compensation and Unemployment
Compensation and insured through insurance carriers for other coverage.
The City covers all claim settlements and judgments, except for those discussed above, out
of the resources of the fund associated with the claim. Claims expenditures and liabilities
are reported when it is probable that a loss has occurred and the amount of the loss can be
reasonably estimated. These losses include: an estimate of claims that have been incurred
but not reported; the effects of specific, incremental claims adjustment expenditures,
salvage and subrogation; and unallocated claims adjustment expenditures.
73
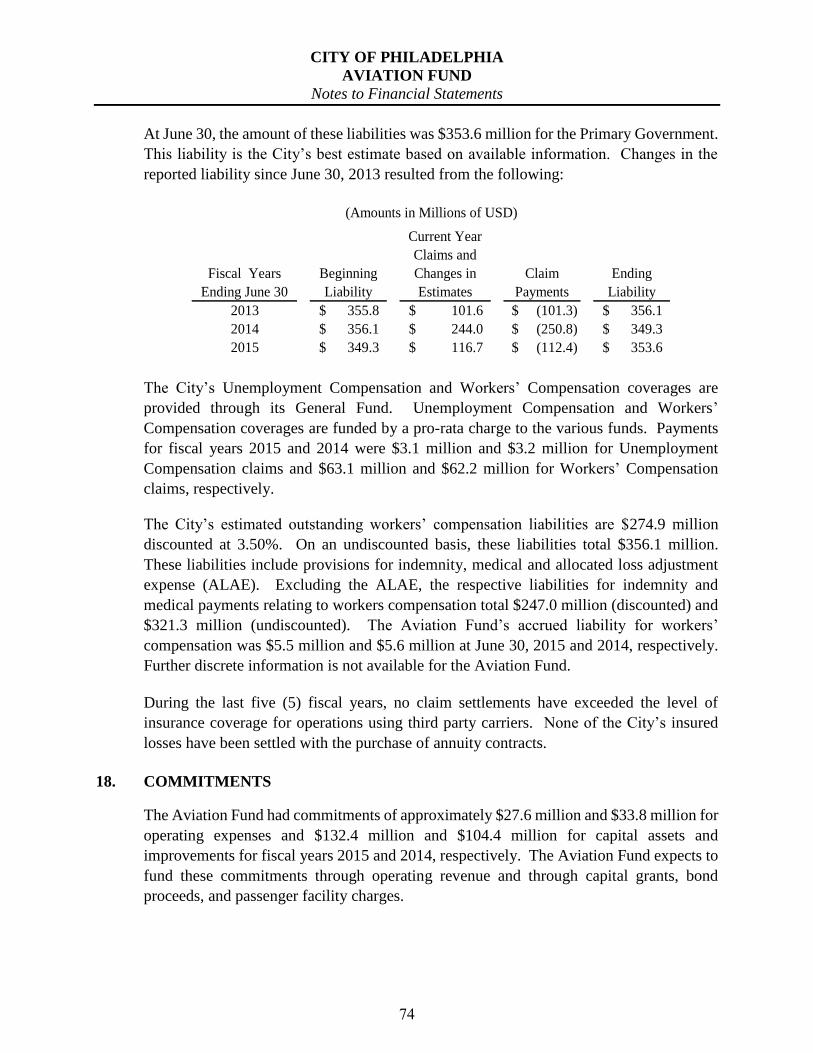
CITY OF PHILADELPHIA
AVIATION FUND
Notes to Financial Statements
At June 30, the amount of these liabilities was $353.6 million for the Primary Government.
This liability is the City’s best estimate based on available information. Changes in the
reported liability since June 30, 2013 resulted from the following:
Fiscal Years
Ending June 30
Beginning
Liability
Current Year
Claims and
Changes in
Estimates
Claim
Payments
Ending
Liability
2013 355.8$ 101.6$ (101.3)$ 356.1$
2014 356.1$ 244.0$ (250.8)$ 349.3$
2015 349.3$ 116.7$ (112.4)$ 353.6$
(Amounts in Millions of USD)
The City’s Unemployment Compensation and Workers’ Compensation coverages are
provided through its General Fund. Unemployment Compensation and Workers’
Compensation coverages are funded by a pro-rata charge to the various funds. Payments
for fiscal years 2015 and 2014 were $3.1 million and $3.2 million for Unemployment
Compensation claims and $63.1 million and $62.2 million for Workers’ Compensation
claims, respectively.
The City’s estimated outstanding workers’ compensation liabilities are $274.9 million
discounted at 3.50%. On an undiscounted basis, these liabilities total $356.1 million.
These liabilities include provisions for indemnity, medical and allocated loss adjustment
expense (ALAE). Excluding the ALAE, the respective liabilities for indemnity and
medical payments relating to workers compensation total $247.0 million (discounted) and
$321.3 million (undiscounted). The Aviation Fund’s accrued liability for workers’
compensation was $5.5 million and $5.6 million at June 30, 2015 and 2014, respectively.
Further discrete information is not available for the Aviation Fund.
During the last five (5) fiscal years, no claim settlements have exceeded the level of
insurance coverage for operations using third party carriers. None of the City’s insured
losses have been settled with the purchase of annuity contracts.
18. COMMITMENTS
The Aviation Fund had commitments of approximately $27.6 million and $33.8 million for
operating expenses and $132.4 million and $104.4 million for capital assets and
improvements for fiscal years 2015 and 2014, respectively. The Aviation Fund expects to
fund these commitments through operating revenue and through capital grants, bond
proceeds, and passenger facility charges.
74
CITY OF PHILADELPHIA
AVIATION FUND
Notes to Financial Statements
19. SUBSEQUENT EVENTS
In June 2015, the City Council of Philadelphia approved a five-year Airport-Airline Use
and Lease Agreement (Airline Agreement) between PHL and the airlines. The Airline
Agreement began July 1, 2015, and includes options for two one-year extensions. It
also authorized an additional $173.25 million in new capital investments, bringing the
total airline commitment to advance PHL’s capital development program and to
rehabilitate and repair the Airport’s existing infrastructure to approximately $1.626
billion.
In July 2015, the City of Philadelphia acquired a 27-acre parcel of property adjacent to
the Airport. The property consists of two 6-story office buildings, one of which has a
3-story annex, with the net floor area of the buildings totaling nearly five hundred
twenty-five thousand square feet, as well as entrance roads and setbacks, landscaping,
and surface parking lots. Commercial paper was used to fund the acquisition of the
property.
In August 2015, Airport Revenue Bonds, Refunding Series 2015A in the amount of
$97.8 million were issued. Serial bonds were issued with interest rates ranging from
4.00% to 5.00% with a final maturity in 2035. The proceeds of Series 2015A were used
to current refund $105.9 million of the Series 2005A Airport Revenue Bonds, maturing
from 2016 through 2035 and to pay issuance costs on the bonds. The refunding structure
of the 2015A bonds realized a net present value savings of approximately $9.3 million,
8.75% of refunded par. Fitch and Moody’s maintained their ratings of “A” and “A2”,
respectively, for PHL’s outstanding airport revenue bonds and both affirmed a stable
outlook to the Airport. Standard & Poor’s (S&P) lowered their underlying rating to “A”
from “A+” in August 2015 while revising its outlook from negative to stable.
75
REQUIRED SUPPLEMENTARY
INFORMATION
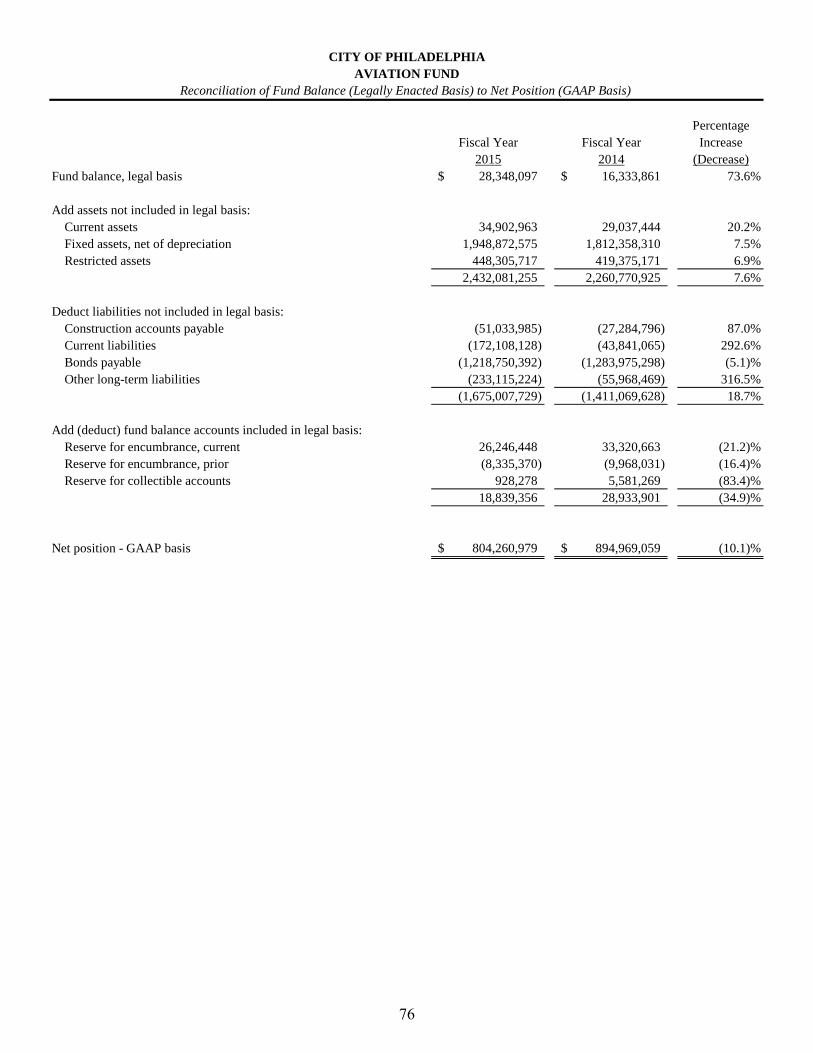
Percentage
Fiscal Year Fiscal Year Increase
2015 2014 (Decrease)
Fund balance, legal basis 28,348,097$ 16,333,861$ 73.6%
Add assets not included in legal basis:
Current assets 34,902,963 29,037,444 20.2%
Fixed assets, net of depreciation 1,948,872,575 1,812,358,310 7.5%
Restricted assets 448,305,717 419,375,171 6.9%
2,432,081,255 2,260,770,925 7.6%
Deduct liabilities not included in legal basis:
Construction accounts payable (51,033,985) (27,284,796) 87.0%
Current liabilities (172,108,128) (43,841,065) 292.6%
Bonds payable (1,218,750,392) (1,283,975,298) (5.1)%
Other long-term liabilities (233,115,224) (55,968,469) 316.5%
(1,675,007,729) (1,411,069,628) 18.7%
Add (deduct) fund balance accounts included in legal basis:
Reserve for encumbrance, current 26,246,448 33,320,663 (21.2)%
Reserve for encumbrance, prior (8,335,370) (9,968,031) (16.4)%
Reserve for collectible accounts 928,278 5,581,269 (83.4)%
18,839,356 28,933,901 (34.9)%
Net position - GAAP basis 804,260,979$ 894,969,059$ (10.1)%
Reconciliation of Fund Balance (Legally Enacted Basis) to Net Position (GAAP Basis)
CITY OF PHILADELPHIA
AVIATION FUND
76
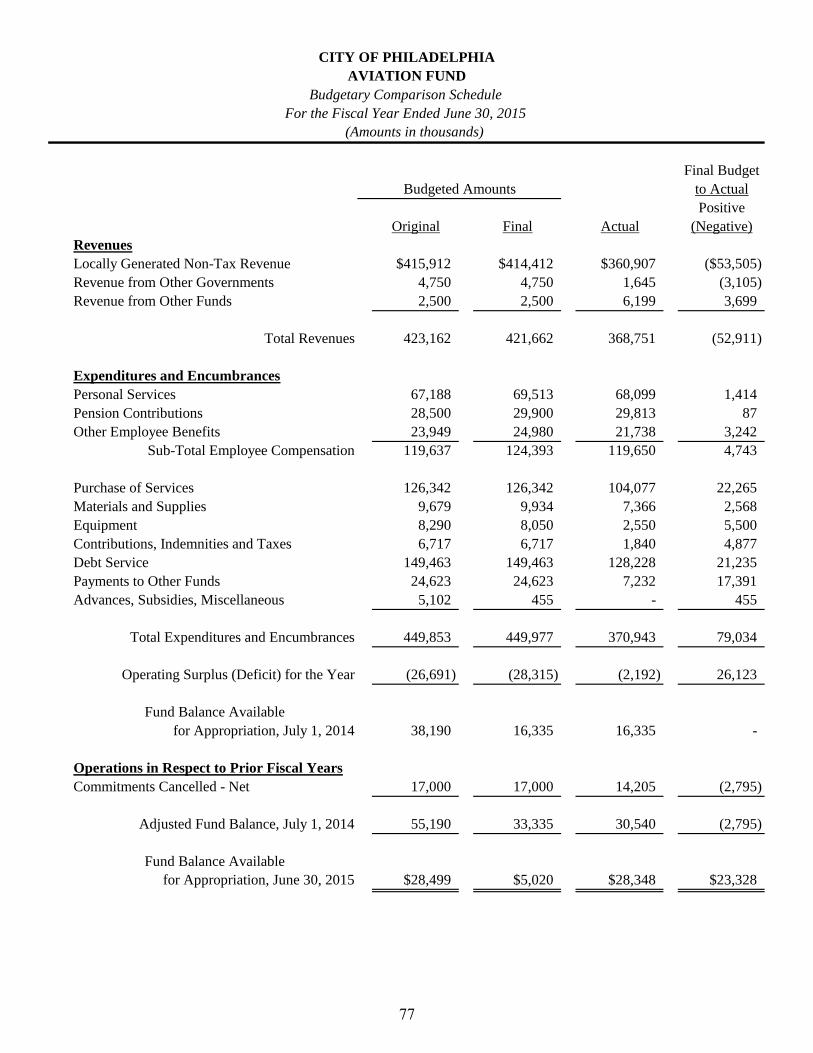
(Amounts in thousands)
Final Budget
Budgeted Amounts to Actual
Positive
Original Final Actual (Negative)
Revenues
Locally Generated Non-Tax Revenue $415,912 $414,412 $360,907 ($53,505)
Revenue from Other Governments 4,750 4,750 1,645 (3,105)
Revenue from Other Funds 2,500 2,500 6,199 3,699
Total Revenues 423,162 421,662 368,751 (52,911)
Expenditures and Encumbrances
Personal Services 67,188 69,513 68,099 1,414
Pension Contributions 28,500 29,900 29,813 87
Other Employee Benefits 23,949 24,980 21,738 3,242
Sub-Total Employee Compensation 119,637 124,393 119,650 4,743
Purchase of Services 126,342 126,342 104,077 22,265
Materials and Supplies 9,679 9,934 7,366 2,568
Equipment 8,290 8,050 2,550 5,500
Contributions, Indemnities and Taxes 6,717 6,717 1,840 4,877
Debt Service 149,463 149,463 128,228 21,235
Payments to Other Funds 24,623 24,623 7,232 17,391
Advances, Subsidies, Miscellaneous 5,102 455 - 455
Total Expenditures and Encumbrances 449,853 449,977 370,943 79,034
Operating Surplus (Deficit) for the Year (26,691) (28,315) (2,192) 26,123
Fund Balance Available
for Appropriation, July 1, 2014 38,190 16,335 16,335 -
Operations in Respect to Prior Fiscal Years
Commitments Cancelled - Net 17,000 17,000 14,205 (2,795)
Adjusted Fund Balance, July 1, 2014 55,190 33,335 30,540 (2,795)
Fund Balance Available
for Appropriation, June 30, 2015 $28,499 $5,020 $28,348 $23,328
For the Fiscal Year Ended June 30, 2015
CITY OF PHILADELPHIA
AVIATION FUND
Budgetary Comparison Schedule
77
STATISTICAL SECTION
Financial Trends and Revenue Capacity
These schedules show changes in Aviation's financial performance, major revenue
sources and rates and charges over the past ten years.
Exhibit S-1 Annual Revenues, Expenses and Changes in Fund Net Position
Exhibit S-2 Revenues by Source
Exhibit S-3 Scheduled Rates and Charges
Debt Capacity
These schedules show current levels of outstanding debt and how Aviaiton has fulfilled
debt obligations over the past ten years.
Exhibit S-4 Ratios of Outstanding Debt
Exhibit S-5 Pledged Debt Service Coverage
Demographic and Economic Information
These schedules show the airport service area environment over the past ten years.
Exhibit S-6 Airport Information
Exhibit S-7 Employment by Industry
Exhibit S-8 Population Trends
Operating Information
These schedules show airport performance over the past ten years.
Exhibit S-9 City of Philadelphia Airport Employees
Exhibit S-10 Aircraft Operations by Airport
Exhibit S-11 Commercial Passenger Enplanements
Exhibit S-12 Commercial Enplanements
Exhibit S-13 Airline Market Share by Landed Weight
Exhibit S-14 Airline Market Share by Passenger Enplanements
Exhibit S-15 Passenger Facility Charges
Exhibit S-16 Current Top 30 Passenger Origin and Destination Markets
Exhibit S-17 Historical Top 10 Passenger Origin and Destination Markets
III. Statistical Section
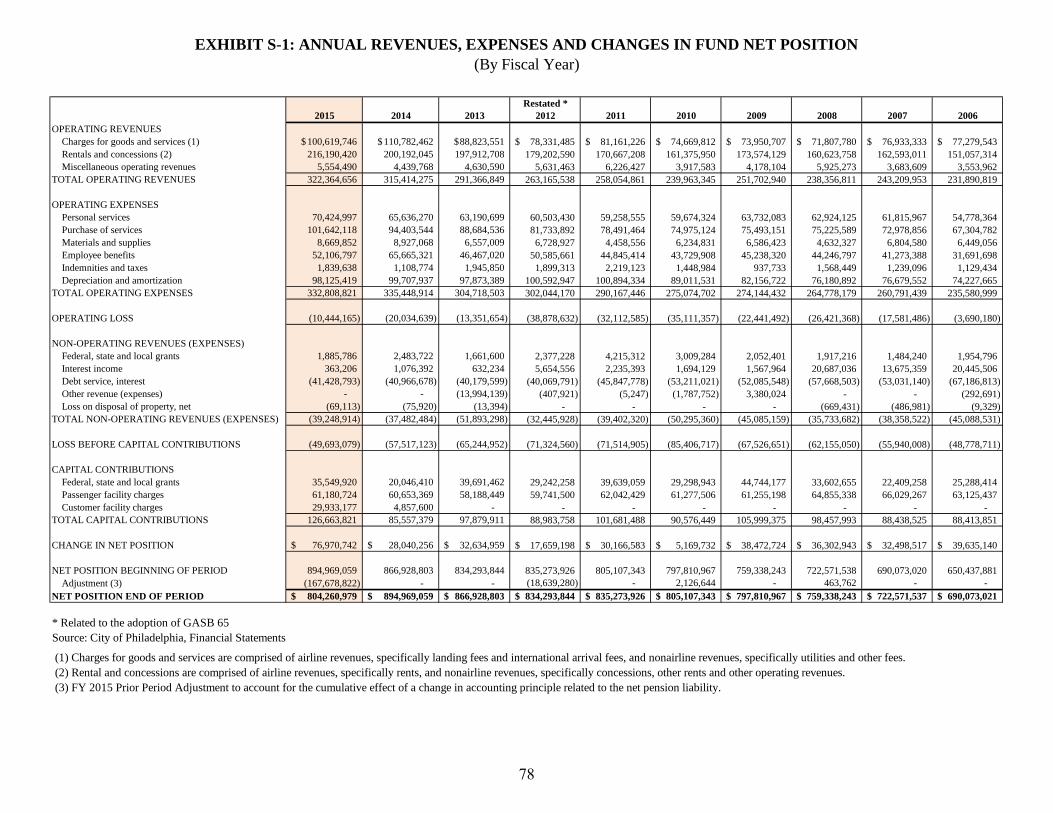
EXHIBIT S-1: ANNUAL REVENUES, EXPENSES AND CHANGES IN FUND NET POSITION
(By Fiscal Year)
Restated *
2015 2014 2013 2012 2011 2010 2009 2008 2007 2006
OPERATING REVENUES
Charges for goods and services (1) 100,619,746$ 110,782,462$ 88,823,551$ 78,331,485$ 81,161,226$ 74,669,812$ 73,950,707$ 71,807,780$ 76,933,333$ 77,279,543$
Rentals and concessions (2) 216,190,420 200,192,045 197,912,708 179,202,590 170,667,208 161,375,950 173,574,129 160,623,758 162,593,011 151,057,314
Miscellaneous operating revenues 5,554,490 4,439,768 4,630,590 5,631,463 6,226,427 3,917,583 4,178,104 5,925,273 3,683,609 3,553,962
TOTAL OPERATING REVENUES 322,364,656 315,414,275 291,366,849 263,165,538 258,054,861 239,963,345 251,702,940 238,356,811 243,209,953 231,890,819
OPERATING EXPENSES
Personal services 70,424,997 65,636,270 63,190,699 60,503,430 59,258,555 59,674,324 63,732,083 62,924,125 61,815,967 54,778,364
Purchase of services 101,642,118 94,403,544 88,684,536 81,733,892 78,491,464 74,975,124 75,493,151 75,225,589 72,978,856 67,304,782
Materials and supplies 8,669,852 8,927,068 6,557,009 6,728,927 4,458,556 6,234,831 6,586,423 4,632,327 6,804,580 6,449,056
Employee benefits 52,106,797 65,665,321 46,467,020 50,585,661 44,845,414 43,729,908 45,238,320 44,246,797 41,273,388 31,691,698
Indemnities and taxes 1,839,638 1,108,774 1,945,850 1,899,313 2,219,123 1,448,984 937,733 1,568,449 1,239,096 1,129,434
Depreciation and amortization 98,125,419 99,707,937 97,873,389 100,592,947 100,894,334 89,011,531 82,156,722 76,180,892 76,679,552 74,227,665
TOTAL OPERATING EXPENSES 332,808,821 335,448,914 304,718,503 302,044,170 290,167,446 275,074,702 274,144,432 264,778,179 260,791,439 235,580,999
OPERATING LOSS (10,444,165) (20,034,639) (13,351,654) (38,878,632) (32,112,585) (35,111,357) (22,441,492) (26,421,368) (17,581,486) (3,690,180)
NON-OPERATING REVENUES (EXPENSES)
Federal, state and local grants 1,885,786 2,483,722 1,661,600 2,377,228 4,215,312 3,009,284 2,052,401 1,917,216 1,484,240 1,954,796
Interest income 363,206 1,076,392 632,234 5,654,556 2,235,393 1,694,129 1,567,964 20,687,036 13,675,359 20,445,506
Debt service, interest (41,428,793) (40,966,678) (40,179,599) (40,069,791) (45,847,778) (53,211,021) (52,085,548) (57,668,503) (53,031,140) (67,186,813)
Other revenue (expenses) - - (13,994,139) (407,921) (5,247) (1,787,752) 3,380,024 - - (292,691)
Loss on disposal of property, net (69,113) (75,920) (13,394) - - - - (669,431) (486,981) (9,329)
TOTAL NON-OPERATING REVENUES (EXPENSES) (39,248,914) (37,482,484) (51,893,298) (32,445,928) (39,402,320) (50,295,360) (45,085,159) (35,733,682) (38,358,522) (45,088,531)
LOSS BEFORE CAPITAL CONTRIBUTIONS (49,693,079) (57,517,123) (65,244,952) (71,324,560) (71,514,905) (85,406,717) (67,526,651) (62,155,050) (55,940,008) (48,778,711)
CAPITAL CONTRIBUTIONS
Federal, state and local grants 35,549,920 20,046,410 39,691,462 29,242,258 39,639,059 29,298,943 44,744,177 33,602,655 22,409,258 25,288,414
Passenger facility charges 61,180,724 60,653,369 58,188,449 59,741,500 62,042,429 61,277,506 61,255,198 64,855,338 66,029,267 63,125,437
Customer facility charges 29,933,177 4,857,600 - - - - - - - -
TOTAL CAPITAL CONTRIBUTIONS 126,663,821 85,557,379 97,879,911 88,983,758 101,681,488 90,576,449 105,999,375 98,457,993 88,438,525 88,413,851
CHANGE IN NET POSITION 76,970,742$ 28,040,256$ 32,634,959$ 17,659,198$ 30,166,583$ 5,169,732$ 38,472,724$ 36,302,943$ 32,498,517$ 39,635,140$
NET POSITION BEGINNING OF PERIOD 894,969,059 866,928,803 834,293,844 835,273,926 805,107,343 797,810,967 759,338,243 722,571,538 690,073,020 650,437,881
Adjustment (3) (167,678,822) - - (18,639,280) - 2,126,644 - 463,762 - -
NET POSITION END OF PERIOD 804,260,979$ 894,969,059$ 866,928,803$ 834,293,844$ 835,273,926$ 805,107,343$ 797,810,967$ 759,338,243$ 722,571,537$ 690,073,021$
* Related to the adoption of GASB 65
Source: City of Philadelphia, Financial Statements
(1) Charges for goods and services are comprised of airline revenues, specifically landing fees and international arrival fees, and nonairline revenues, specifically utilities and other fees.
(2) Rental and concessions are comprised of airline revenues, specifically rents, and nonairline revenues, specifically concessions, other rents and other operating revenues.
(3) FY 2015 Prior Period Adjustment to account for the cumulative effect of a change in accounting principle related to the net pension liability.
78
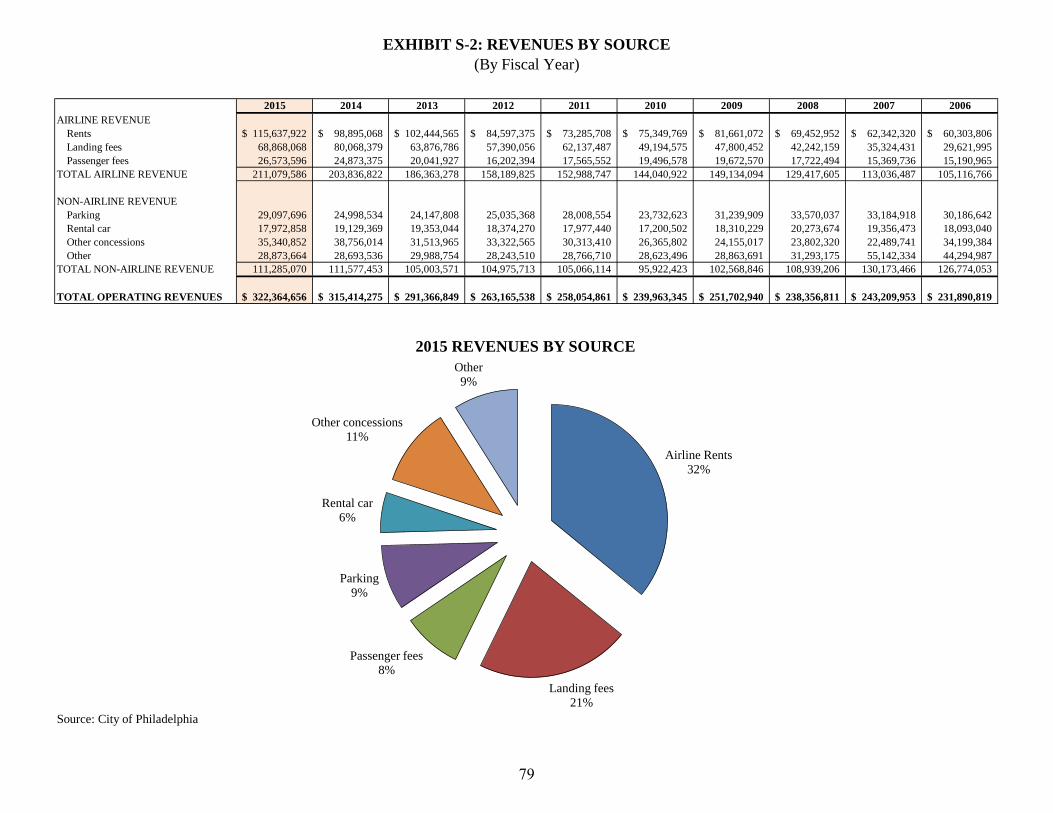
EXHIBIT S-2: REVENUES BY SOURCE
(By Fiscal Year)
2015 2014 2013 2012 2011 2010 2009 2008 2007 2006
AIRLINE REVENUE
Rents 115,637,922$ 98,895,068$ 102,444,565$ 84,597,375$ 73,285,708$ 75,349,769$ 81,661,072$ 69,452,952$ 62,342,320$ 60,303,806$
Landing fees 68,868,068 80,068,379 63,876,786 57,390,056 62,137,487 49,194,575 47,800,452 42,242,159 35,324,431 29,621,995
Passenger fees 26,573,596 24,873,375 20,041,927 16,202,394 17,565,552 19,496,578 19,672,570 17,722,494 15,369,736 15,190,965
TOTAL AIRLINE REVENUE 211,079,586 203,836,822 186,363,278 158,189,825 152,988,747 144,040,922 149,134,094 129,417,605 113,036,487 105,116,766
NON-AIRLINE REVENUE
Parking 29,097,696 24,998,534 24,147,808 25,035,368 28,008,554 23,732,623 31,239,909 33,570,037 33,184,918 30,186,642
Rental car 17,972,858 19,129,369 19,353,044 18,374,270 17,977,440 17,200,502 18,310,229 20,273,674 19,356,473 18,093,040
Other concessions 35,340,852 38,756,014 31,513,965 33,322,565 30,313,410 26,365,802 24,155,017 23,802,320 22,489,741 34,199,384
Other 28,873,664 28,693,536 29,988,754 28,243,510 28,766,710 28,623,496 28,863,691 31,293,175 55,142,334 44,294,987
TOTAL NON-AIRLINE REVENUE 111,285,070 111,577,453 105,003,571 104,975,713 105,066,114 95,922,423 102,568,846 108,939,206 130,173,466 126,774,053
TOTAL OPERATING REVENUES 322,364,656$ 315,414,275$ 291,366,849$ 263,165,538$ 258,054,861$ 239,963,345$ 251,702,940$ 238,356,811$ 243,209,953$ 231,890,819$
Source: City of Philadelphia
Airline Rents
32%
Landing fees
21%
Passenger fees
8%
Parking
9%
Rental car
6%
Other concessions
11%
Other
9%
2015 REVENUES BY SOURCE
79
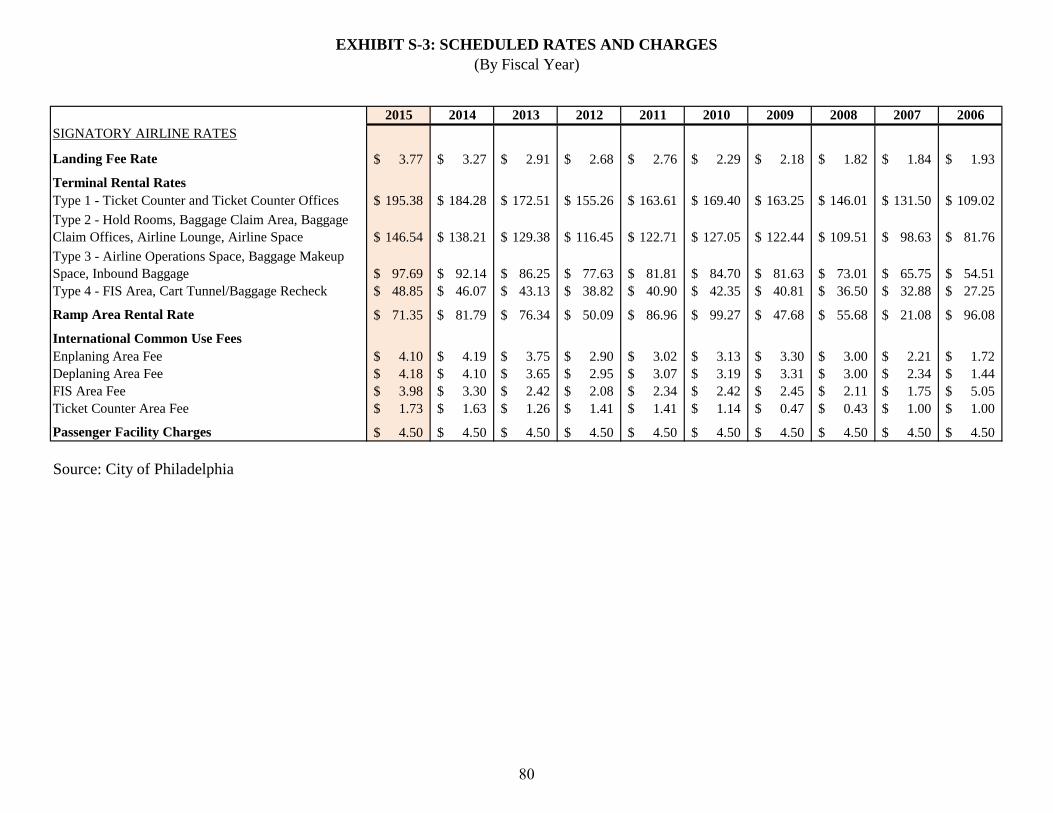
EXHIBIT S-3: SCHEDULED RATES AND CHARGES
(By Fiscal Year)
2015 2014 2013 2012 2011 2010 2009 2008 2007 2006
SIGNATORY AIRLINE RATES
Landing Fee Rate 3.77$ 3.27$ 2.91$ 2.68$ 2.76$ 2.29$ 2.18$ 1.82$ 1.84$ 1.93$
Terminal Rental Rates
Type 1 - Ticket Counter and Ticket Counter Offices 195.38$ 184.28$ 172.51$ 155.26$ 163.61$ 169.40$ 163.25$ 146.01$ 131.50$ 109.02$
Type 2 - Hold Rooms, Baggage Claim Area, Baggage
Claim Offices, Airline Lounge, Airline Space 146.54$ 138.21$ 129.38$ 116.45$ 122.71$ 127.05$ 122.44$ 109.51$ 98.63$ 81.76$
Type 3 - Airline Operations Space, Baggage Makeup
Space, Inbound Baggage 97.69$ 92.14$ 86.25$ 77.63$ 81.81$ 84.70$ 81.63$ 73.01$ 65.75$ 54.51$
Type 4 - FIS Area, Cart Tunnel/Baggage Recheck 48.85$ 46.07$ 43.13$ 38.82$ 40.90$ 42.35$ 40.81$ 36.50$ 32.88$ 27.25$
Ramp Area Rental Rate 71.35$ 81.79$ 76.34$ 50.09$ 86.96$ 99.27$ 47.68$ 55.68$ 21.08$ 96.08$
International Common Use Fees
Enplaning Area Fee 4.10$ 4.19$ 3.75$ 2.90$ 3.02$ 3.13$ 3.30$ 3.00$ 2.21$ 1.72$
Deplaning Area Fee 4.18$ 4.10$ 3.65$ 2.95$ 3.07$ 3.19$ 3.31$ 3.00$ 2.34$ 1.44$
FIS Area Fee 3.98$ 3.30$ 2.42$ 2.08$ 2.34$ 2.42$ 2.45$ 2.11$ 1.75$ 5.05$
Ticket Counter Area Fee 1.73$ 1.63$ 1.26$ 1.41$ 1.41$ 1.14$ 0.47$ 0.43$ 1.00$ 1.00$
Passenger Facility Charges 4.50$ 4.50$ 4.50$ 4.50$ 4.50$ 4.50$ 4.50$ 4.50$ 4.50$ 4.50$
Source: City of Philadelphia
80
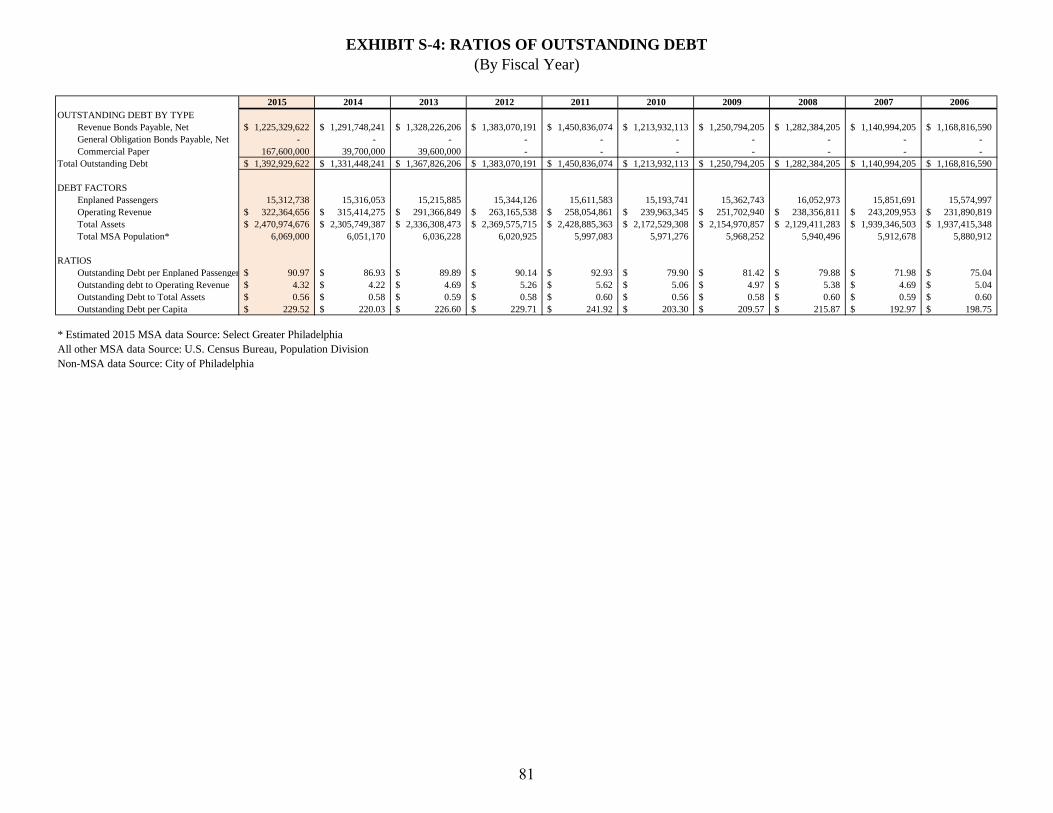
EXHIBIT S-4: RATIOS OF OUTSTANDING DEBT
(By Fiscal Year)
2015 2014 2013 2012 2011 2010 2009 2008 2007 2006
OUTSTANDING DEBT BY TYPE
Revenue Bonds Payable, Net 1,225,329,622$ 1,291,748,241$ 1,328,226,206$ 1,383,070,191$ 1,450,836,074$ 1,213,932,113$ 1,250,794,205$ 1,282,384,205$ 1,140,994,205$ 1,168,816,590$
General Obligation Bonds Payable, Net - - - - - - - - - -
Commercial Paper 167,600,000 39,700,000 39,600,000 - - - - - - -
Total Outstanding Debt 1,392,929,622$ 1,331,448,241$ 1,367,826,206$ 1,383,070,191$ 1,450,836,074$ 1,213,932,113$ 1,250,794,205$ 1,282,384,205$ 1,140,994,205$ 1,168,816,590$
DEBT FACTORS
Enplaned Passengers 15,312,738 15,316,053 15,215,885 15,344,126 15,611,583 15,193,741 15,362,743 16,052,973 15,851,691 15,574,997
Operating Revenue 322,364,656$ 315,414,275$ 291,366,849$ 263,165,538$ 258,054,861$ 239,963,345$ 251,702,940$ 238,356,811$ 243,209,953$ 231,890,819$
Total Assets 2,470,974,676$ 2,305,749,387$ 2,336,308,473$ 2,369,575,715$ 2,428,885,363$ 2,172,529,308$ 2,154,970,857$ 2,129,411,283$ 1,939,346,503$ 1,937,415,348$
Total MSA Population* 6,069,000 6,051,170 6,036,228 6,020,925 5,997,083 5,971,276 5,968,252 5,940,496 5,912,678 5,880,912
RATIOS
Outstanding Debt per Enplaned Passenger 90.97$ 86.93$ 89.89$ 90.14$ 92.93$ 79.90$ 81.42$ 79.88$ 71.98$ 75.04$
Outstanding debt to Operating Revenue 4.32$ 4.22$ 4.69$ 5.26$ 5.62$ 5.06$ 4.97$ 5.38$ 4.69$ 5.04$
Outstanding Debt to Total Assets 0.56$ 0.58$ 0.59$ 0.58$ 0.60$ 0.56$ 0.58$ 0.60$ 0.59$ 0.60$
Outstanding Debt per Capita 229.52$ 220.03$ 226.60$ 229.71$ 241.92$ 203.30$ 209.57$ 215.87$ 192.97$ 198.75$
Non-MSA data Source: City of Philadelphia
* Estimated 2015 MSA data Source: Select Greater Philadelphia
All other MSA data Source: U.S. Census Bureau, Population Division
81
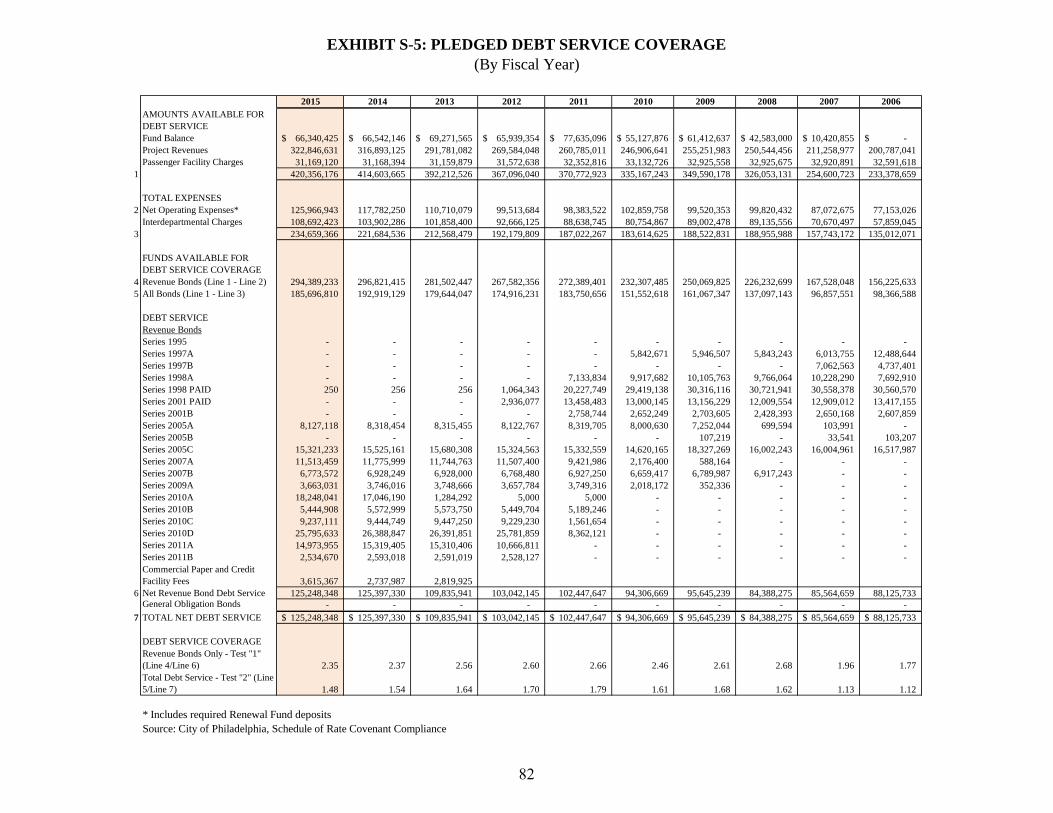
EXHIBIT S-5: PLEDGED DEBT SERVICE COVERAGE
(By Fiscal Year)
2015 2014 2013 2012 2011 2010 2009 2008 2007 2006
AMOUNTS AVAILABLE FOR
DEBT SERVICE
Fund Balance 66,340,425$ 66,542,146$ 69,271,565$ 65,939,354$ 77,635,096$ 55,127,876$ 61,412,637$ 42,583,000$ 10,420,855$ -$
Project Revenues 322,846,631 316,893,125 291,781,082 269,584,048 260,785,011 246,906,641 255,251,983 250,544,456 211,258,977 200,787,041
Passenger Facility Charges 31,169,120 31,168,394 31,159,879 31,572,638 32,352,816 33,132,726 32,925,558 32,925,675 32,920,891 32,591,618
1 420,356,176 414,603,665 392,212,526 367,096,040 370,772,923 335,167,243 349,590,178 326,053,131 254,600,723 233,378,659
TOTAL EXPENSES
2 Net Operating Expenses* 125,966,943 117,782,250 110,710,079 99,513,684 98,383,522 102,859,758 99,520,353 99,820,432 87,072,675 77,153,026
Interdepartmental Charges 108,692,423 103,902,286 101,858,400 92,666,125 88,638,745 80,754,867 89,002,478 89,135,556 70,670,497 57,859,045
3 234,659,366 221,684,536 212,568,479 192,179,809 187,022,267 183,614,625 188,522,831 188,955,988 157,743,172 135,012,071
FUNDS AVAILABLE FOR
DEBT SERVICE COVERAGE
4 Revenue Bonds (Line 1 - Line 2) 294,389,233 296,821,415 281,502,447 267,582,356 272,389,401 232,307,485 250,069,825 226,232,699 167,528,048 156,225,633
5 All Bonds (Line 1 - Line 3) 185,696,810 192,919,129 179,644,047 174,916,231 183,750,656 151,552,618 161,067,347 137,097,143 96,857,551 98,366,588
DEBT SERVICE
Revenue Bonds
Series 1995 - - - - - - - - - -
Series 1997A - - - - - 5,842,671 5,946,507 5,843,243 6,013,755 12,488,644
Series 1997B - - - - - - - - 7,062,563 4,737,401
Series 1998A - - - - 7,133,834 9,917,682 10,105,763 9,766,064 10,228,290 7,692,910
Series 1998 PAID 250 256 256 1,064,343 20,227,749 29,419,138 30,316,116 30,721,941 30,558,378 30,560,570
Series 2001 PAID - - - 2,936,077 13,458,483 13,000,145 13,156,229 12,009,554 12,909,012 13,417,155
Series 2001B - - - - 2,758,744 2,652,249 2,703,605 2,428,393 2,650,168 2,607,859
Series 2005A 8,127,118 8,318,454 8,315,455 8,122,767 8,319,705 8,000,630 7,252,044 699,594 103,991 -
Series 2005B - - - - - - 107,219 - 33,541 103,207
Series 2005C 15,321,233 15,525,161 15,680,308 15,324,563 15,332,559 14,620,165 18,327,269 16,002,243 16,004,961 16,517,987
Series 2007A 11,513,459 11,775,999 11,744,763 11,507,400 9,421,986 2,176,400 588,164 - - -
Series 2007B 6,773,572 6,928,249 6,928,000 6,768,480 6,927,250 6,659,417 6,789,987 6,917,243 - -
Series 2009A 3,663,031 3,746,016 3,748,666 3,657,784 3,749,316 2,018,172 352,336 - - -
Series 2010A 18,248,041 17,046,190 1,284,292 5,000 5,000 - - - - -
Series 2010B 5,444,908 5,572,999 5,573,750 5,449,704 5,189,246 - - - - -
Series 2010C 9,237,111 9,444,749 9,447,250 9,229,230 1,561,654 - - - - -
Series 2010D 25,795,633 26,388,847 26,391,851 25,781,859 8,362,121 - - - - -
Series 2011A 14,973,955 15,319,405 15,310,406 10,666,811 - - - - - -
Series 2011B 2,534,670 2,593,018 2,591,019 2,528,127 - - - - - -
Commercial Paper and Credit
Facility Fees 3,615,367 2,737,987 2,819,925
6 Net Revenue Bond Debt Service 125,248,348 125,397,330 109,835,941 103,042,145 102,447,647 94,306,669 95,645,239 84,388,275 85,564,659 88,125,733 General Obligation Bonds - - - - - - - - - -
7 TOTAL NET DEBT SERVICE 125,248,348$ 125,397,330$ 109,835,941$ 103,042,145$ 102,447,647$ 94,306,669$ 95,645,239$ 84,388,275$ 85,564,659$ 88,125,733$
DEBT SERVICE COVERAGE
Revenue Bonds Only - Test "1"
(Line 4/Line 6) 2.35 2.37 2.56 2.60 2.66 2.46 2.61 2.68 1.96 1.77
Total Debt Service - Test "2" (Line
5/Line 7) 1.48 1.54 1.64 1.70 1.79 1.61 1.68 1.62 1.13 1.12
* Includes required Renewal Fund deposits
Source: City of Philadelphia, Schedule of Rate Covenant Compliance
82
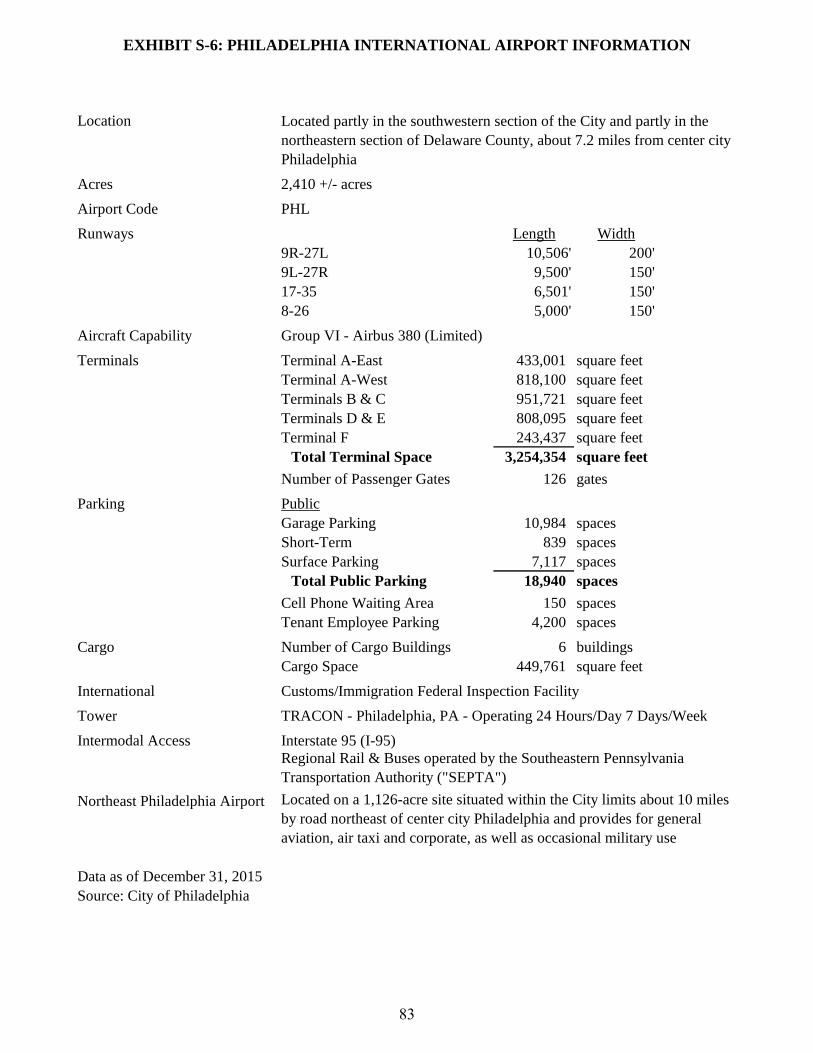
EXHIBIT S-6: PHILADELPHIA INTERNATIONAL AIRPORT INFORMATION
Location
Acres 2,410 +/- acres
Airport Code PHL
Runways Length Width
9R-27L 10,506' 200'
9L-27R 9,500' 150'
17-35 6,501' 150'
8-26 5,000' 150'
Aircraft Capability Group VI - Airbus 380 (Limited)
Terminals Terminal A-East 433,001 square feet
Terminal A-West 818,100 square feet
Terminals B & C 951,721 square feet
Terminals D & E 808,095 square feet
Terminal F 243,437 square feet
Total Terminal Space 3,254,354 square feet
Number of Passenger Gates 126 gates
Parking Public
Garage Parking 10,984 spaces
Short-Term 839 spaces
Surface Parking 7,117 spaces
Total Public Parking 18,940 spaces
Cell Phone Waiting Area 150 spaces
Tenant Employee Parking 4,200 spaces
Cargo Number of Cargo Buildings 6 buildings
Cargo Space 449,761 square feet
International Customs/Immigration Federal Inspection Facility
Tower TRACON - Philadelphia, PA - Operating 24 Hours/Day 7 Days/Week
Intermodal Access Interstate 95 (I-95)
Northeast Philadelphia Airport
Data as of December 31, 2015
Source: City of Philadelphia
Located partly in the southwestern section of the City and partly in the
northeastern section of Delaware County, about 7.2 miles from center city
Philadelphia
Regional Rail & Buses operated by the Southeastern Pennsylvania
Transportation Authority ("SEPTA")
Located on a 1,126-acre site situated within the City limits about 10 miles
by road northeast of center city Philadelphia and provides for general
aviation, air taxi and corporate, as well as occasional military use
83
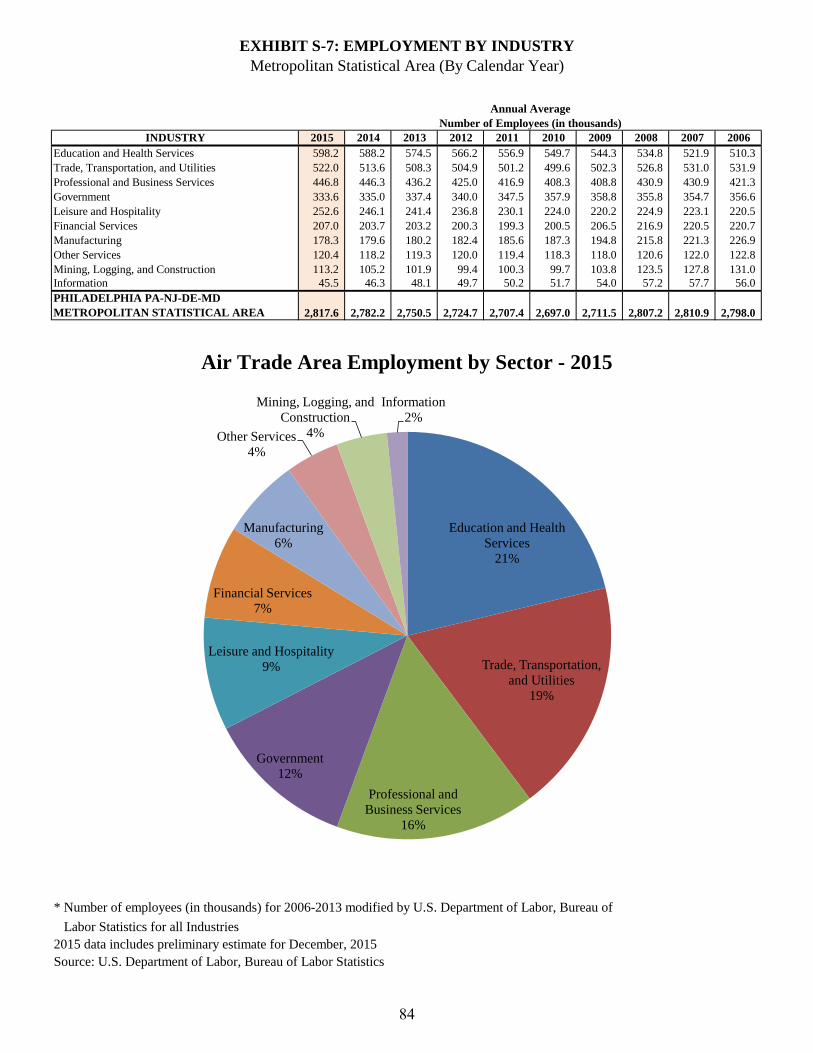
EXHIBIT S-7: EMPLOYMENT BY INDUSTRY
Metropolitan Statistical Area (By Calendar Year)
INDUSTRY 2015 2014 2013 2012 2011 2010 2009 2008 2007 2006
Education and Health Services 598.2 588.2 574.5 566.2 556.9 549.7 544.3 534.8 521.9 510.3
Trade, Transportation, and Utilities 522.0 513.6 508.3 504.9 501.2 499.6 502.3 526.8 531.0 531.9
Professional and Business Services 446.8 446.3 436.2 425.0 416.9 408.3 408.8 430.9 430.9 421.3
Government 333.6 335.0 337.4 340.0 347.5 357.9 358.8 355.8 354.7 356.6
Leisure and Hospitality 252.6 246.1 241.4 236.8 230.1 224.0 220.2 224.9 223.1 220.5
Financial Services 207.0 203.7 203.2 200.3 199.3 200.5 206.5 216.9 220.5 220.7
Manufacturing 178.3 179.6 180.2 182.4 185.6 187.3 194.8 215.8 221.3 226.9
Other Services 120.4 118.2 119.3 120.0 119.4 118.3 118.0 120.6 122.0 122.8
Mining, Logging, and Construction 113.2 105.2 101.9 99.4 100.3 99.7 103.8 123.5 127.8 131.0
Information 45.5 46.3 48.1 49.7 50.2 51.7 54.0 57.2 57.7 56.0
PHILADELPHIA PA-NJ-DE-MD
METROPOLITAN STATISTICAL AREA
Labor Statistics for all Industries
2015 data includes preliminary estimate for December, 2015
Source: U.S. Department of Labor, Bureau of Labor Statistics
* Number of employees (in thousands) for 2006-2013 modified by U.S. Department of Labor, Bureau of
Air Trade Area Employment by Sector - 2015
2,707.4 2,697.0 2,711.5 2,807.22,750.52,782.2 2,724.7 2,810.9 2,798.02,817.6
Annual Average
Number of Employees (in thousands)
Education and Health
Services
21%
Trade, Transportation,
and Utilities
19%
Professional and
Business Services
16%
Government
12%
Leisure and Hospitality
9%
Financial Services
7%
Manufacturing
6%
Other Services
4%
Mining, Logging, and
Construction
4%
Information
2%
84
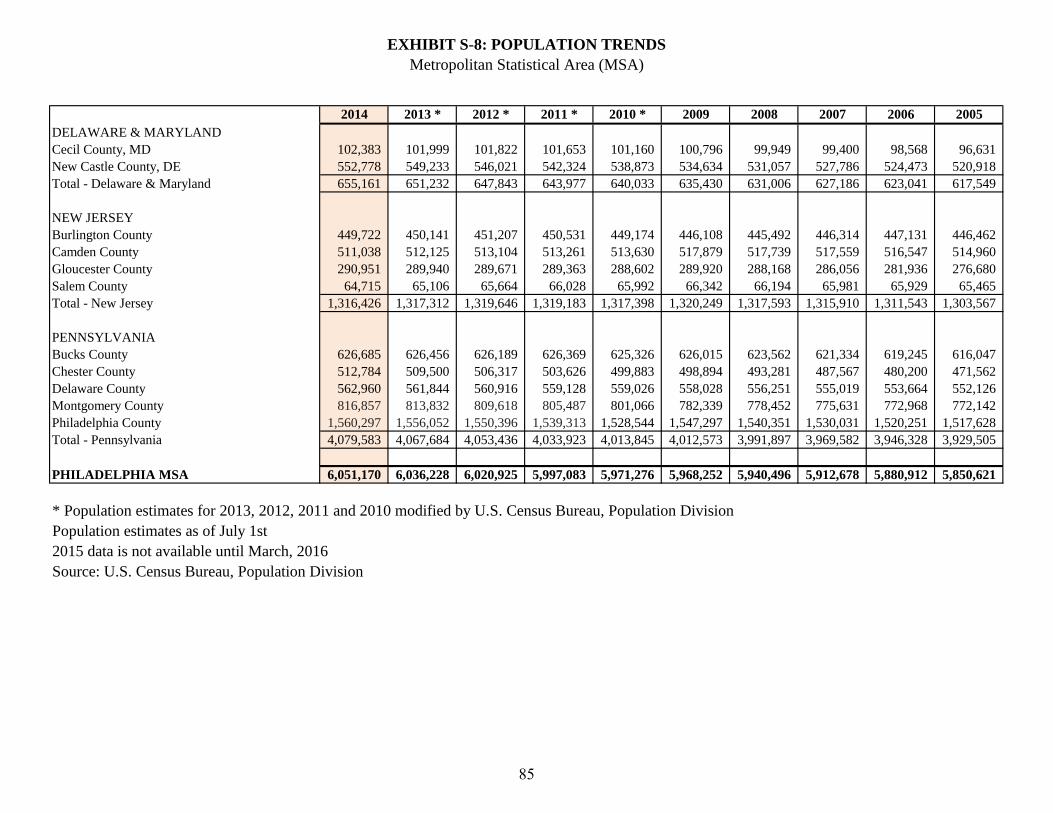
EXHIBIT S-8: POPULATION TRENDS
Metropolitan Statistical Area (MSA)
2014 2013 * 2012 * 2011 * 2010 * 2009 2008 2007 2006 2005
DELAWARE & MARYLAND
Cecil County, MD 102,383 101,999 101,822 101,653 101,160 100,796 99,949 99,400 98,568 96,631
New Castle County, DE 552,778 549,233 546,021 542,324 538,873 534,634 531,057 527,786 524,473 520,918
Total - Delaware & Maryland 655,161 651,232 647,843 643,977 640,033 635,430 631,006 627,186 623,041 617,549
NEW JERSEY
Burlington County 449,722 450,141 451,207 450,531 449,174 446,108 445,492 446,314 447,131 446,462
Camden County 511,038 512,125 513,104 513,261 513,630 517,879 517,739 517,559 516,547 514,960
Gloucester County 290,951 289,940 289,671 289,363 288,602 289,920 288,168 286,056 281,936 276,680
Salem County 64,715 65,106 65,664 66,028 65,992 66,342 66,194 65,981 65,929 65,465
Total - New Jersey 1,316,426 1,317,312 1,319,646 1,319,183 1,317,398 1,320,249 1,317,593 1,315,910 1,311,543 1,303,567
PENNSYLVANIA
Bucks County 626,685 626,456 626,189 626,369 625,326 626,015 623,562 621,334 619,245 616,047
Chester County 512,784 509,500 506,317 503,626 499,883 498,894 493,281 487,567 480,200 471,562
Delaware County 562,960 561,844 560,916 559,128 559,026 558,028 556,251 555,019 553,664 552,126
Montgomery County 816,857 813,832 809,618 805,487 801,066 782,339 778,452 775,631 772,968 772,142
Philadelphia County 1,560,297 1,556,052 1,550,396 1,539,313 1,528,544 1,547,297 1,540,351 1,530,031 1,520,251 1,517,628
Total - Pennsylvania 4,079,583 4,067,684 4,053,436 4,033,923 4,013,845 4,012,573 3,991,897 3,969,582 3,946,328 3,929,505
PHILADELPHIA MSA 6,051,170 6,036,228 6,020,925 5,997,083 5,971,276 5,968,252 5,940,496 5,912,678 5,880,912 5,850,621
* Population estimates for 2013, 2012, 2011 and 2010 modified by U.S. Census Bureau, Population Division
Population estimates as of July 1st
2015 data is not available until March, 2016
Source: U.S. Census Bureau, Population Division
85
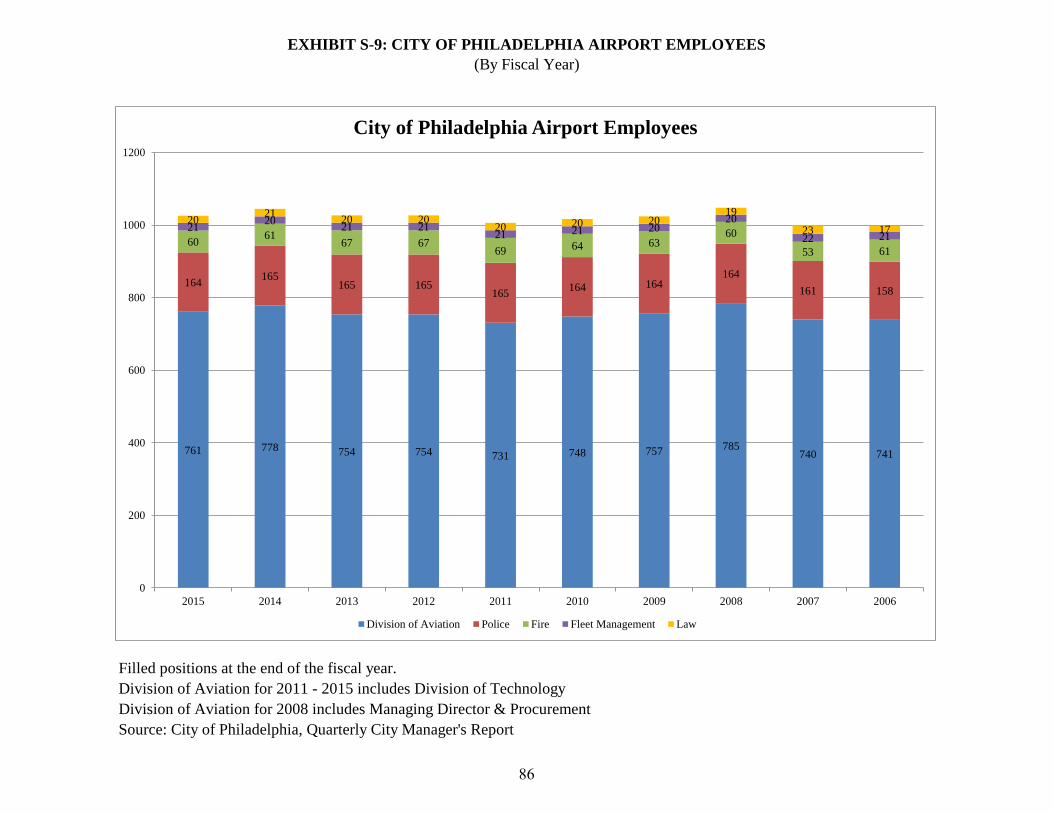
EXHIBIT S-9: CITY OF PHILADELPHIA AIRPORT EMPLOYEES
(By Fiscal Year)
Filled positions at the end of the fiscal year.
Division of Aviation for 2011 - 2015 includes Division of Technology
Division of Aviation for 2008 includes Managing Director & Procurement
Source: City of Philadelphia, Quarterly City Manager's Report
761 778 754 754 731 748 757 785 740 741
164165
165 165 165
164 164 164
161 158
6061
67 67 69 64 63
60
53 61
2120
21 21 21 21 20
20
22 21
2021
20 20 20 20 20
19
23 17
0
200
400
600
800
1000
1200
2015 2014 2013 2012 2011 2010 2009 2008 2007 2006
City of Philadelphia Airport Employees
Division of Aviation Police Fire Fleet Management Law
86
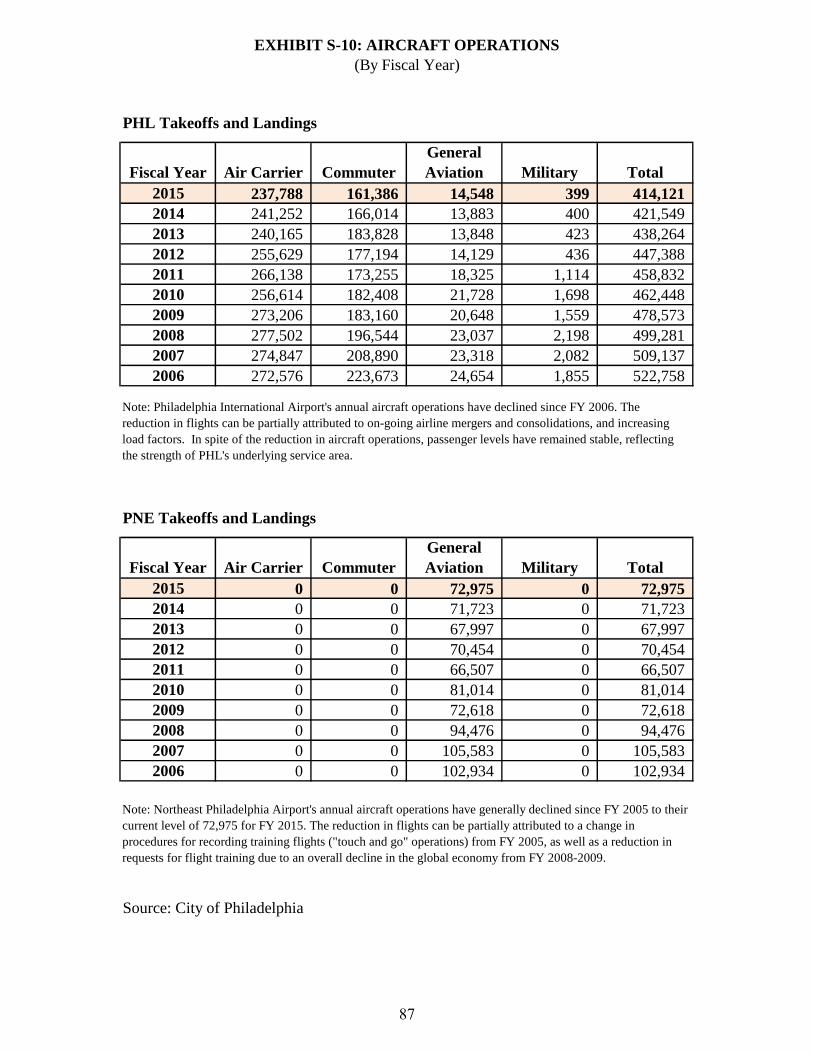
EXHIBIT S-10: AIRCRAFT OPERATIONS
(By Fiscal Year)
Fiscal Year Air Carrier Commuter
General
Aviation Military Total
2015 237,788 161,386 14,548 399 414,121
2014 241,252 166,014 13,883 400 421,549
2013 240,165 183,828 13,848 423 438,264
2012 255,629 177,194 14,129 436 447,388
2011 266,138 173,255 18,325 1,114 458,832
2010 256,614 182,408 21,728 1,698 462,448
2009 273,206 183,160 20,648 1,559 478,573
2008 277,502 196,544 23,037 2,198 499,281
2007 274,847 208,890 23,318 2,082 509,137
2006 272,576 223,673 24,654 1,855 522,758
Fiscal Year Air Carrier Commuter
General
Aviation Military Total
2015 0 0 72,975 0 72,975
2014 0 0 71,723 0 71,723
2013 0 0 67,997 0 67,997
2012 0 0 70,454 0 70,454
2011 0 0 66,507 0 66,507
2010 0 0 81,014 0 81,014
2009 0 0 72,618 0 72,618
2008 0 0 94,476 0 94,476
2007 0 0 105,583 0 105,583
2006 0 0 102,934 0 102,934
Source: City of Philadelphia
PHL Takeoffs and Landings
PNE Takeoffs and Landings
Note: Northeast Philadelphia Airport's annual aircraft operations have generally declined since FY 2005 to their
current level of 72,975 for FY 2015. The reduction in flights can be partially attributed to a change in
procedures for recording training flights ("touch and go" operations) from FY 2005, as well as a reduction in
requests for flight training due to an overall decline in the global economy from FY 2008-2009.
Note: Philadelphia International Airport's annual aircraft operations have declined since FY 2006. The
reduction in flights can be partially attributed to on-going airline mergers and consolidations, and increasing
load factors. In spite of the reduction in aircraft operations, passenger levels have remained stable, reflecting
the strength of PHL's underlying service area.
87
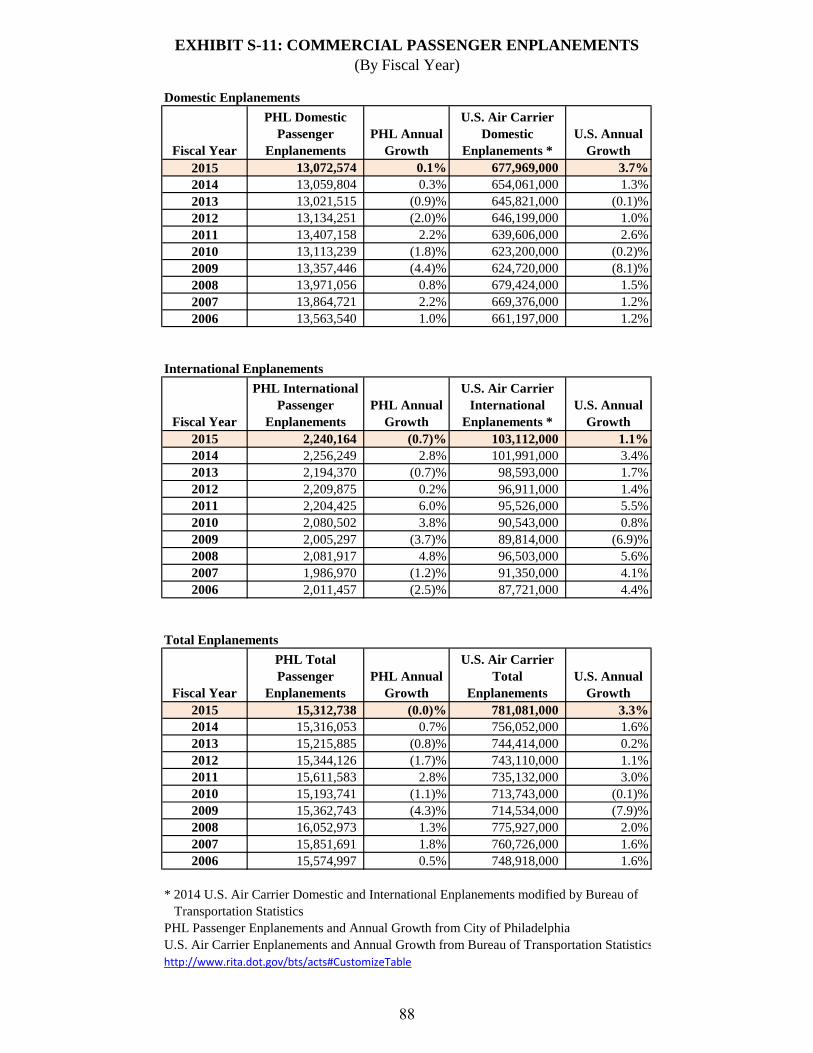
EXHIBIT S-11: COMMERCIAL PASSENGER ENPLANEMENTS
(By Fiscal Year)
Fiscal Year
PHL Domestic
Passenger
Enplanements
PHL Annual
Growth
U.S. Air Carrier
Domestic
Enplanements *
U.S. Annual
Growth
2015 13,072,574 0.1% 677,969,000 3.7%
2014 13,059,804 0.3% 654,061,000 1.3%
2013 13,021,515 (0.9)% 645,821,000 (0.1)%
2012 13,134,251 (2.0)% 646,199,000 1.0%
2011 13,407,158 2.2% 639,606,000 2.6%
2010 13,113,239 (1.8)% 623,200,000 (0.2)%
2009 13,357,446 (4.4)% 624,720,000 (8.1)%
2008 13,971,056 0.8% 679,424,000 1.5%
2007 13,864,721 2.2% 669,376,000 1.2%
2006 13,563,540 1.0% 661,197,000 1.2%
Fiscal Year
PHL International
Passenger
Enplanements
PHL Annual
Growth
U.S. Air Carrier
International
Enplanements *
U.S. Annual
Growth
2015 2,240,164 (0.7)% 103,112,000 1.1%
2014 2,256,249 2.8% 101,991,000 3.4%
2013 2,194,370 (0.7)% 98,593,000 1.7%
2012 2,209,875 0.2% 96,911,000 1.4%
2011 2,204,425 6.0% 95,526,000 5.5%
2010 2,080,502 3.8% 90,543,000 0.8%
2009 2,005,297 (3.7)% 89,814,000 (6.9)%
2008 2,081,917 4.8% 96,503,000 5.6%
2007 1,986,970 (1.2)% 91,350,000 4.1%
2006 2,011,457 (2.5)% 87,721,000 4.4%
Total Enplanements
Fiscal Year
PHL Total
Passenger
Enplanements
PHL Annual
Growth
U.S. Air Carrier
Total
Enplanements
U.S. Annual
Growth
2015 15,312,738 (0.0)% 781,081,000 3.3%
2014 15,316,053 0.7% 756,052,000 1.6%
2013 15,215,885 (0.8)% 744,414,000 0.2%
2012 15,344,126 (1.7)% 743,110,000 1.1%
2011 15,611,583 2.8% 735,132,000 3.0%
2010 15,193,741 (1.1)% 713,743,000 (0.1)%
2009 15,362,743 (4.3)% 714,534,000 (7.9)%
2008 16,052,973 1.3% 775,927,000 2.0%
2007 15,851,691 1.8% 760,726,000 1.6%
2006 15,574,997 0.5% 748,918,000 1.6%
* 2014 U.S. Air Carrier Domestic and International Enplanements modified by Bureau of
Transportation Statistics
PHL Passenger Enplanements and Annual Growth from City of Philadelphia
U.S. Air Carrier Enplanements and Annual Growth from Bureau of Transportation Statistics
http://www.rita.dot.gov/bts/acts#CustomizeTable
Domestic Enplanements
International Enplanements
88
EXHIBIT S-12: COMMERCIAL ENPLANEMENTS
(By Fiscal Year)
Source: City of Philadelphia
Source: Bureau of Transportation Statistics
-10.0%
-5.0%
0.0%
5.0%
10.0%
15.0%
20.0%
25.0%
0
1,500,000
3,000,000
4,500,000
6,000,000
7,500,000
9,000,000
10,500,000
12,000,000
13,500,000
15,000,000
2015 2014 2013 2012 2011 2010 2009 2008 2007 2006
An
nu
al G
row
th
Enp
lan
em
en
ts
Domestic Enplanements by Fiscal Year
Domestic Enplanements PHL Growth Industry Growth
-10.0%
-5.0%
0.0%
5.0%
10.0%
15.0%
20.0%
25.0%
0
500,000
1,000,000
1,500,000
2,000,000
2,500,000
2015 2014 2013 2012 2011 2010 2009 2008 2007 2006
An
nu
al G
row
th
Enp
lan
em
en
ts
International Enplanements by Fiscal Year
International Enplanements PHL Growth Industry Growth
-10.0%
-5.0%
0.0%
5.0%
10.0%
15.0%
20.0%
25.0%
0
1,500,000
3,000,000
4,500,000
6,000,000
7,500,000
9,000,000
10,500,000
12,000,000
13,500,000
15,000,000
16,500,000
2015 2014 2013 2012 2011 2010 2009 2008 2007 2006
An
nu
al G
row
th
Enp
lan
em
en
ts
Total Enplanements by Fiscal Year
Total Enplanements PHL Growth Industry Growth
89
EXHIBIT S-13: AIRLINE MARKET SHARE BY LANDED WEIGHT
(By Fiscal Year, Expressed in 1,000 lb. Units)
Landed
Weight
Market
Share
Landed
Weight
Market
Share
Landed
Weight
Market
Share
Landed
Weight
Market
Share
Landed
Weight
Market
Share
Domestic
Scheduled Major/National
US Airways 6,125,372 29.5% 6,264,113 30.3% 6,013,508 29.1% 6,027,737 28.2% 6,033,125 27.5%
Delta Air Lines 1,074,449 5.2% 1,024,831 5.0% 955,459 4.6% 972,645 4.6% 978,725 4.5%
Southwest Airlines 1,073,920 5.2% 1,010,276 4.9% 1,189,716 5.8% 1,883,282 8.8% 2,335,648 10.6%
United Airlines 585,951 2.8% 555,244 2.7% 661,536 3.2% 536,659 2.5% 518,260 2.4%
American Airlines 520,570 2.5% 465,219 2.2% 481,336 2.3% 491,389 2.3% 559,190 2.5%
Frontier Airlines 164,022 0.8% 4,693 0.0% 28,290 0.1% 79,842 0.4% 101,704 0.5%
JetBlue Airways 158,080 0.8% 158,398 0.8% 18,624 0.1% - - - -
Spirit Airlines 143,495 0.7% 132,519 0.6% 31,841 0.2% - - - -
Alaska Airlines 55,475 0.3% 55,410 0.3% 52,460 0.3% 2,880 0.0% - -
AirTran Airways 42,864 0.2% 204,488 1.0% 340,320 1.6% 301,816 1.4% 331,168 1.5%
Virgin America 35,545 0.2% 134,812 0.7% 213,741 1.0% 55,269 0.3% - -
Air Canada 440 0.0% 660 0.0% 1,100 0.0% 880 0.0% 1,173 0.0%
Continental Airlines - - - - - - 179,638 0.8% 242,627 1.1%
USA 3000 Airlines - - - - - - - - 23,036 0.1%
Midwest Airlines - - - - - - - - - -
Northwest Airlines - - - - - - - - - -
America West Airlines - - - - - - - - - -
Subtotal - Scheduled Major/National 9,980,183 48.0% 10,010,661 48.4% 9,987,931 48.4% 10,532,037 49.3% 11,124,656 50.7%
Scheduled Regional/Commuter
US Airways Express
Republic Airlines 1,758,726 8.5% 1,729,624 8.4% 1,575,475 7.6% 1,629,517 7.6% 1,732,415 7.9%
Air Wisconsin 1,730,258 8.3% 1,486,845 7.2% 1,559,460 7.6% 1,576,239 7.4% 1,573,231 7.2%
Piedmont Airlines 844,519 4.1% 984,862 4.8% 1,108,958 5.4% 1,035,539 4.8% 1,038,016 4.7%
PSA Airlines 292,049 1.4% 274,903 1.3% 321,950 1.6% 332,498 1.6% 243,104 1.1%
Mesa Airlines 60,863 0.3% 64,607 0.3% - - - - 74 0.0%
Chautauqua Airlines - - - - 86,587 0.4% 96,884 0.5% 70,759 0.3%
Trans States Airlines - - - - - - - - - -
Subtotal - US Airways Express 4,686,414 22.6% 4,540,840 21.9% 4,652,430 22.5% 4,670,677 21.9% 4,657,599 21.2%
Other 382,585 1.8% 501,896 2.4% 626,130 3.0% 620,913 2.9% 605,377 2.8%
Subtotal - Scheduled Regional/Commuter 5,068,999 24.4% 5,042,736 24.4% 5,278,560 25.6% 5,291,590 24.8% 5,262,976 24.0%
Charter 1,641 0.0% 4,257 0.0% 1,192 0.0% 9,055 0.0% 2,878 0.0%
Subtotal - Domestic 15,050,823 72.5% 15,057,655 72.8% 15,267,683 74.0% 15,832,682 74.1% 16,390,510 74.6%
International
Scheduled
US Airways 2,710,497 13.0% 2,809,292 13.6% 2,644,675 12.8% 2,634,850 12.3% 2,584,537 11.8%
British Airways 284,499 1.4% 275,550 1.3% 268,709 1.3% 277,447 1.3% 270,121 1.2%
Air Wisconsin 220,289 1.1% 255,351 1.2% 240,546 1.2% 228,326 1.1% 208,069 0.9%
Qatar Airways 183,868 0.9% 44,280 0.2% - - - - - -
Lufthansa German Airlines 165,814 0.8% 137,300 0.7% 112,147 0.5% 112,152 0.5% 135,775 0.6%
Air Canada / Sky Regional Airlines 99,695 0.5% 99,656 0.5% 99,814 0.5% 94,620 0.4% 95,210 0.4%
Republic Airlines 74,146 0.4% 58,631 0.3% 103,697 0.5% 158,701 0.7% 115,635 0.5%
Frontier Airlines 35,976 0.2% 25,738 0.1% 25,738 0.1% 18,770 0.1% - -
Delta Air Lines 34,650 0.2% 22,694 0.1% 24,104 0.1% 29,898 0.1% 62,752 0.3%
JetBlue Airways 142 0.0% - - - - - - - -
Southwest Airlines 128 0.0% - - - - - - - -
Air Jamaica / Caribbean Airlines - - - - - - 47,424 0.2% 50,394 0.2%
Continental Airlines - - - - - - 1,028 0.0% - -
USA 3000 Airlines - - - - - - - - 26,307 0.1%
American Airlines - - - - - - - - 188 0.0%
Air France - - - - - - - - - -
Chautauqua Airlines - - - - - - - - - -
PSA Airlines - - - - - - - - - -
Mesa Airlines - - - - - - - - - -
Piedmont Airlines - - - - - - - - - -
Subtotal - Scheduled 3,809,704 18.3% 3,728,492 18.0% 3,519,430 17.1% 3,603,216 16.9% 3,548,988 16.2%
Charter 2,532 0.0% 6,377 0.0% 1,483 0.0% 10,696 0.1% 9,394 0.0%
Subtotal - International 3,812,236 18.4% 3,734,869 18.1% 3,520,913 17.1% 3,613,912 16.9% 3,558,382 16.2%
All-Cargo Airlines 1,909,573 9.2% 1,899,162 9.2% 1,849,771 9.0% 1,911,577 9.0% 2,010,961 9.2%
Grand Totals 20,772,632 100.0% 20,691,686 100.0% 20,638,367 100.0% 21,358,171 100.0% 21,959,853 100.0%
Source: City of Philadelphia
Airlines
2013 2012 201120142015
90
EXHIBIT S-13: AIRLINE MARKET SHARE BY LANDED WEIGHT
(Continued, By Fiscal Year, Expressed in 1,000 lb. Units)
Landed
Weight
Market
Share
Landed
Weight
Market
Share
Landed
Weight
Market
Share
Landed
Weight
Market
Share
Landed
Weight
Market
Share
Domestic
Scheduled Major/National
US Airways 5,721,566 26.4% 5,522,430 24.3% 5,872,724 24.7% 6,994,525 28.4% 7,749,497 31.2%
Delta Air Lines 974,740 4.5% 662,037 2.9% 703,140 3.0% 675,917 2.7% 677,358 2.7%
Southwest Airlines 2,277,154 10.5% 2,825,044 12.4% 2,746,246 11.5% 2,789,734 11.3% 2,332,578 9.4%
United Airlines 606,595 2.8% 728,405 3.2% 790,431 3.3% 868,006 3.5% 888,874 3.6%
American Airlines 641,022 3.0% 696,871 3.1% 778,053 3.3% 849,936 3.4% 885,916 3.6%
Frontier Airlines 49,220 0.2% 57,622 0.3% 97,894 0.4% 97,417 0.4% 97,364 0.4%
JetBlue Airways - - - - - - - - - -
Spirit Airlines - - - - - - - - - -
Alaska Airlines - - - - - - - - - -
AirTran Airways 356,872 1.6% 420,984 1.9% 614,560 2.6% 724,080 2.9% 791,698 3.2%
Virgin America - - - - - - - - - -
Air Canada - - - - - - - - - -
Continental Airlines 239,403 1.1% 259,085 1.1% 284,767 1.2% 292,754 1.2% 299,590 1.2%
USA 3000 Airlines 28,866 0.1% 49,485 0.2% 81,622 0.3% 74,796 0.3% 93,566 0.4%
Midwest Airlines 57,713 0.3% 71,723 0.3% 106,316 0.4% 119,032 0.5% 105,086 0.4%
Northwest Airlines - - 421,248 1.9% 537,296 2.3% 570,382 2.3% 502,745 2.0%
America West Airlines - - - - - - - - 236,637 1.0%
Subtotal - Scheduled Major/National 10,953,151 50.6% 11,714,934 51.5% 12,613,049 52.9% 14,056,579 57.0% 14,660,909 59.0%
Scheduled Regional/Commuter
US Airways Express
Republic Airlines 1,715,114 7.9% 1,764,933 7.8% 1,540,131 6.5% 1,074,888 4.4% 288,091 1.2%
Air Wisconsin 1,750,797 8.1% 1,664,552 7.3% 1,828,253 7.7% 1,921,783 7.8% 1,462,358 5.9%
Piedmont Airlines 978,762 4.5% 998,160 4.4% 1,013,612 4.3% 986,413 4.0% 1,015,184 4.1%
PSA Airlines 217,536 1.0% 253,746 1.1% 224,519 0.9% 222,343 0.9% 443,069 1.8%
Mesa Airlines 147 0.0% - - 74 0.0% - - 363,541 1.5%
Chautauqua Airlines 61,781 0.3% 70,924 0.3% 79,352 0.3% 202,863 0.8% 299,893 1.2%
Trans States Airlines - - - - - - - - 1,659 0.0%
Subtotal - US Airways Express 4,724,137 21.8% 4,752,315 20.9% 4,685,941 19.7% 4,408,290 17.9% 3,873,795 15.6%
Other 538,679 2.5% 568,997 2.5% 471,357 2.0% 424,829 1.7% 421,096 1.7%
Subtotal - Scheduled Regional/Commuter 5,262,816 24.3% 5,321,312 23.4% 5,157,298 21.6% 4,833,119 19.6% 4,294,891 17.3%
Charter 3,543 0.0% 3,365 0.0% 4,554 0.0% 7,349 0.0% 5,602 0.0%
Subtotal - Domestic 16,219,510 74.9% 17,039,611 74.9% 17,774,901 74.6% 18,897,047 76.7% 18,961,402 76.4%
International
Scheduled
US Airways 2,574,713 11.9% 2,478,569 10.9% 2,424,939 10.2% 2,065,755 8.4% 2,057,456 8.3%
British Airways 254,332 1.2% 270,512 1.2% 279,575 1.2% 273,882 1.1% 312,392 1.3%
Air Wisconsin 177,801 0.8% 133,433 0.6% 183,676 0.8% 220,853 0.9% 163,325 0.7%
Qatar Airways - - - - - - - - - -
Lufthansa German Airlines 142,696 0.7% 136,488 0.6% 150,266 0.6% 148,931 0.6% 166,527 0.7%
Air Canada / Sky Regional Airlines 77,999 0.4% 86,187 0.4% 81,021 0.3% 73,714 0.3% 101,896 0.4%
Republic Airlines - - - - - - - - - -
Frontier Airlines - - - - - - - - - -
Delta Air Lines 38,052 - - - - - - - - -
JetBlue Airways - - - - - - - - - -
Southwest Airlines - - - - - - - - - -
Air Jamaica / Caribbean Airlines 44,165 0.2% 52,156 0.2% 53,416 0.2% 53,620 0.2% 52,378 0.2%
Continental Airlines - - - - - - - - - -
USA 3000 Airlines 28,440 0.1% 29,862 0.1% 39,247 0.2% 44,081 0.2% 60,576 0.2%
American Airlines - - - - - - - - - -
Air France 35,770 0.2% 114,804 0.5% 123,103 0.5% 126,976 0.5% 131,193 0.5%
Chautauqua Airlines - - - - - - - - 6,508 0.0%
PSA Airlines - - - - - - - - 40,420 0.2%
Mesa Airlines - - - - - - - - 24,948 0.1%
Piedmont Airlines - - - - 999 0.0% 136 0.0% - -
Subtotal - Scheduled 3,373,968 15.4% 3,302,011 14.5% 3,336,242 14.0% 3,007,948 12.2% 3,117,619 12.6%
Charter 1,685 0.0% 5,413 0.0% 7,272 0.0% 11,137 0.0% 6,771 0.0%
Subtotal - International 3,375,653 15.4% 3,307,424 14.5% 3,343,514 14.0% 3,019,085 12.3% 3,124,390 12.6%
All-Cargo Airlines 2,059,609 9.5% 2,387,809 10.5% 2,705,249 11.4% 2,728,332 11.1% 2,747,023 11.1%
Grand Totals 21,654,772 100.0% 22,734,844 100.0% 23,823,664 100.0% 24,644,464 100.0% 24,832,815 100.0%
Source: City of Philadelphia
Airlines
2007 2006200820092010
91
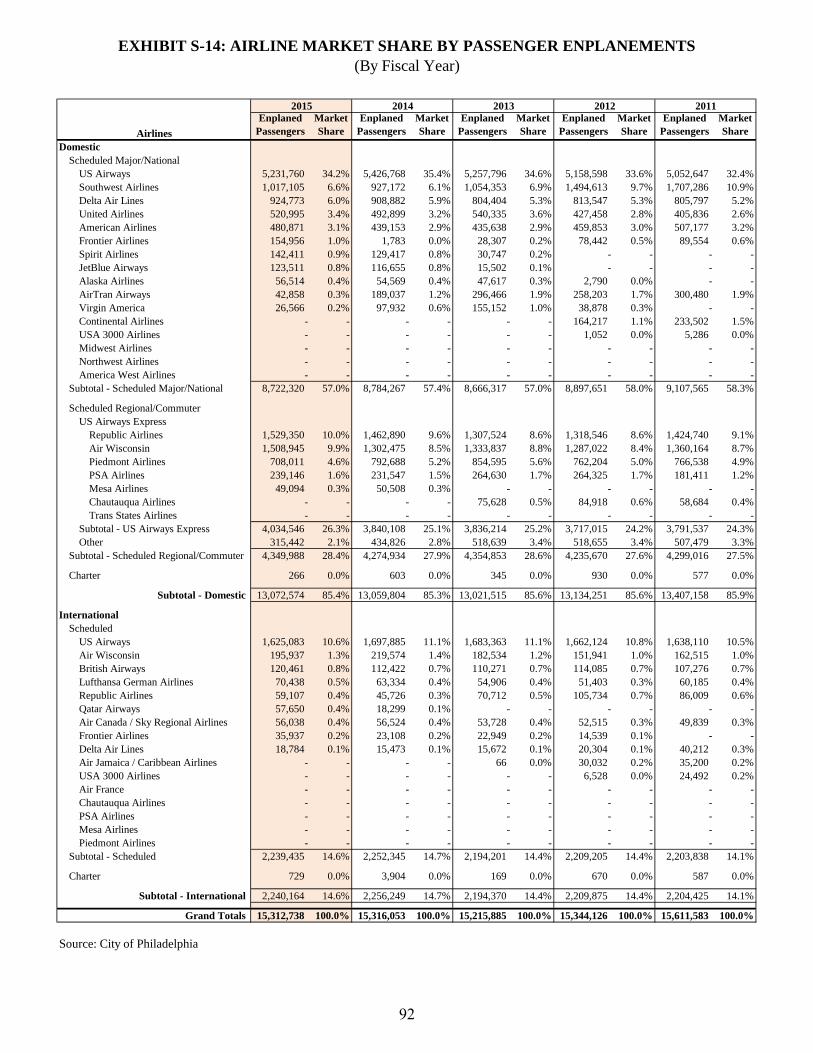
EXHIBIT S-14: AIRLINE MARKET SHARE BY PASSENGER ENPLANEMENTS
(By Fiscal Year)
Enplaned
Passengers
Market
Share
Enplaned
Passengers
Market
Share
Enplaned
Passengers
Market
Share
Enplaned
Passengers
Market
Share
Enplaned
Passengers
Market
Share
Domestic
Scheduled Major/National
US Airways 5,231,760 34.2% 5,426,768 35.4% 5,257,796 34.6% 5,158,598 33.6% 5,052,647 32.4%
Southwest Airlines 1,017,105 6.6% 927,172 6.1% 1,054,353 6.9% 1,494,613 9.7% 1,707,286 10.9%
Delta Air Lines 924,773 6.0% 908,882 5.9% 804,404 5.3% 813,547 5.3% 805,797 5.2%
United Airlines 520,995 3.4% 492,899 3.2% 540,335 3.6% 427,458 2.8% 405,836 2.6%
American Airlines 480,871 3.1% 439,153 2.9% 435,638 2.9% 459,853 3.0% 507,177 3.2%
Frontier Airlines 154,956 1.0% 1,783 0.0% 28,307 0.2% 78,442 0.5% 89,554 0.6%
Spirit Airlines 142,411 0.9% 129,417 0.8% 30,747 0.2% - - - -
JetBlue Airways 123,511 0.8% 116,655 0.8% 15,502 0.1% - - - -
Alaska Airlines 56,514 0.4% 54,569 0.4% 47,617 0.3% 2,790 0.0% - -
AirTran Airways 42,858 0.3% 189,037 1.2% 296,466 1.9% 258,203 1.7% 300,480 1.9%
Virgin America 26,566 0.2% 97,932 0.6% 155,152 1.0% 38,878 0.3% - -
Continental Airlines - - - - - - 164,217 1.1% 233,502 1.5%
USA 3000 Airlines - - - - - - 1,052 0.0% 5,286 0.0%
Midwest Airlines - - - - - - - - - -
Northwest Airlines - - - - - - - - - -
America West Airlines - - - - - - - - - -
Subtotal - Scheduled Major/National 8,722,320 57.0% 8,784,267 57.4% 8,666,317 57.0% 8,897,651 58.0% 9,107,565 58.3%
Scheduled Regional/Commuter
US Airways Express
Republic Airlines 1,529,350 10.0% 1,462,890 9.6% 1,307,524 8.6% 1,318,546 8.6% 1,424,740 9.1%
Air Wisconsin 1,508,945 9.9% 1,302,475 8.5% 1,333,837 8.8% 1,287,022 8.4% 1,360,164 8.7%
Piedmont Airlines 708,011 4.6% 792,688 5.2% 854,595 5.6% 762,204 5.0% 766,538 4.9%
PSA Airlines 239,146 1.6% 231,547 1.5% 264,630 1.7% 264,325 1.7% 181,411 1.2%
Mesa Airlines 49,094 0.3% 50,508 0.3% - - - - - -
Chautauqua Airlines - - - - 75,628 0.5% 84,918 0.6% 58,684 0.4%
Trans States Airlines - - - - - - - - - -
Subtotal - US Airways Express 4,034,546 26.3% 3,840,108 25.1% 3,836,214 25.2% 3,717,015 24.2% 3,791,537 24.3%
Other 315,442 2.1% 434,826 2.8% 518,639 3.4% 518,655 3.4% 507,479 3.3%
Subtotal - Scheduled Regional/Commuter 4,349,988 28.4% 4,274,934 27.9% 4,354,853 28.6% 4,235,670 27.6% 4,299,016 27.5%
Charter 266 0.0% 603 0.0% 345 0.0% 930 0.0% 577 0.0%
Subtotal - Domestic 13,072,574 85.4% 13,059,804 85.3% 13,021,515 85.6% 13,134,251 85.6% 13,407,158 85.9%
International
Scheduled
US Airways 1,625,083 10.6% 1,697,885 11.1% 1,683,363 11.1% 1,662,124 10.8% 1,638,110 10.5%
Air Wisconsin 195,937 1.3% 219,574 1.4% 182,534 1.2% 151,941 1.0% 162,515 1.0%
British Airways 120,461 0.8% 112,422 0.7% 110,271 0.7% 114,085 0.7% 107,276 0.7%
Lufthansa German Airlines 70,438 0.5% 63,334 0.4% 54,906 0.4% 51,403 0.3% 60,185 0.4%
Republic Airlines 59,107 0.4% 45,726 0.3% 70,712 0.5% 105,734 0.7% 86,009 0.6%
Qatar Airways 57,650 0.4% 18,299 0.1% - - - - - -
Air Canada / Sky Regional Airlines 56,038 0.4% 56,524 0.4% 53,728 0.4% 52,515 0.3% 49,839 0.3%
Frontier Airlines 35,937 0.2% 23,108 0.2% 22,949 0.2% 14,539 0.1% - -
Delta Air Lines 18,784 0.1% 15,473 0.1% 15,672 0.1% 20,304 0.1% 40,212 0.3%
Air Jamaica / Caribbean Airlines - - - - 66 0.0% 30,032 0.2% 35,200 0.2%
USA 3000 Airlines - - - - - - 6,528 0.0% 24,492 0.2%
Air France - - - - - - - - - -
Chautauqua Airlines - - - - - - - - - -
PSA Airlines - - - - - - - - - -
Mesa Airlines - - - - - - - - - -
Piedmont Airlines - - - - - - - - - -
Subtotal - Scheduled 2,239,435 14.6% 2,252,345 14.7% 2,194,201 14.4% 2,209,205 14.4% 2,203,838 14.1%
Charter 729 0.0% 3,904 0.0% 169 0.0% 670 0.0% 587 0.0%
Subtotal - International 2,240,164 14.6% 2,256,249 14.7% 2,194,370 14.4% 2,209,875 14.4% 2,204,425 14.1%
Grand Totals 15,312,738 100.0% 15,316,053 100.0% 15,215,885 100.0% 15,344,126 100.0% 15,611,583 100.0%
Source: City of Philadelphia
Airlines
2013 2012 201120142015
92
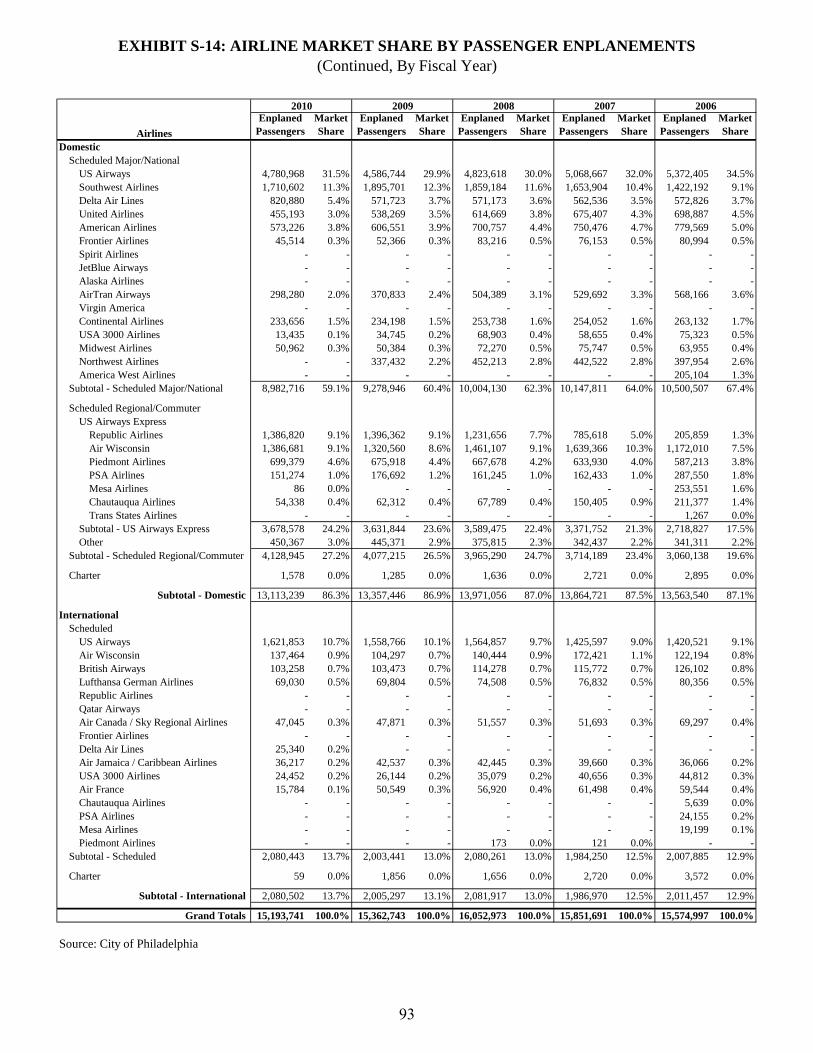
EXHIBIT S-14: AIRLINE MARKET SHARE BY PASSENGER ENPLANEMENTS
(Continued, By Fiscal Year)
Enplaned
Passengers
Market
Share
Enplaned
Passengers
Market
Share
Enplaned
Passengers
Market
Share
Enplaned
Passengers
Market
Share
Enplaned
Passengers
Market
Share
Domestic
Scheduled Major/National
US Airways 4,780,968 31.5% 4,586,744 29.9% 4,823,618 30.0% 5,068,667 32.0% 5,372,405 34.5%
Southwest Airlines 1,710,602 11.3% 1,895,701 12.3% 1,859,184 11.6% 1,653,904 10.4% 1,422,192 9.1%
Delta Air Lines 820,880 5.4% 571,723 3.7% 571,173 3.6% 562,536 3.5% 572,826 3.7%
United Airlines 455,193 3.0% 538,269 3.5% 614,669 3.8% 675,407 4.3% 698,887 4.5%
American Airlines 573,226 3.8% 606,551 3.9% 700,757 4.4% 750,476 4.7% 779,569 5.0%
Frontier Airlines 45,514 0.3% 52,366 0.3% 83,216 0.5% 76,153 0.5% 80,994 0.5%
Spirit Airlines - - - - - - - - - -
JetBlue Airways - - - - - - - - - -
Alaska Airlines - - - - - - - - - -
AirTran Airways 298,280 2.0% 370,833 2.4% 504,389 3.1% 529,692 3.3% 568,166 3.6%
Virgin America - - - - - - - - - -
Continental Airlines 233,656 1.5% 234,198 1.5% 253,738 1.6% 254,052 1.6% 263,132 1.7%
USA 3000 Airlines 13,435 0.1% 34,745 0.2% 68,903 0.4% 58,655 0.4% 75,323 0.5%
Midwest Airlines 50,962 0.3% 50,384 0.3% 72,270 0.5% 75,747 0.5% 63,955 0.4%
Northwest Airlines - - 337,432 2.2% 452,213 2.8% 442,522 2.8% 397,954 2.6%
America West Airlines - - - - - - - - 205,104 1.3%
Subtotal - Scheduled Major/National 8,982,716 59.1% 9,278,946 60.4% 10,004,130 62.3% 10,147,811 64.0% 10,500,507 67.4%
Scheduled Regional/Commuter
US Airways Express
Republic Airlines 1,386,820 9.1% 1,396,362 9.1% 1,231,656 7.7% 785,618 5.0% 205,859 1.3%
Air Wisconsin 1,386,681 9.1% 1,320,560 8.6% 1,461,107 9.1% 1,639,366 10.3% 1,172,010 7.5%
Piedmont Airlines 699,379 4.6% 675,918 4.4% 667,678 4.2% 633,930 4.0% 587,213 3.8%
PSA Airlines 151,274 1.0% 176,692 1.2% 161,245 1.0% 162,433 1.0% 287,550 1.8%
Mesa Airlines 86 0.0% - - - - - - 253,551 1.6%
Chautauqua Airlines 54,338 0.4% 62,312 0.4% 67,789 0.4% 150,405 0.9% 211,377 1.4%
Trans States Airlines - - - - - - - - 1,267 0.0%
Subtotal - US Airways Express 3,678,578 24.2% 3,631,844 23.6% 3,589,475 22.4% 3,371,752 21.3% 2,718,827 17.5%
Other 450,367 3.0% 445,371 2.9% 375,815 2.3% 342,437 2.2% 341,311 2.2%
Subtotal - Scheduled Regional/Commuter 4,128,945 27.2% 4,077,215 26.5% 3,965,290 24.7% 3,714,189 23.4% 3,060,138 19.6%
Charter 1,578 0.0% 1,285 0.0% 1,636 0.0% 2,721 0.0% 2,895 0.0%
Subtotal - Domestic 13,113,239 86.3% 13,357,446 86.9% 13,971,056 87.0% 13,864,721 87.5% 13,563,540 87.1%
International
Scheduled
US Airways 1,621,853 10.7% 1,558,766 10.1% 1,564,857 9.7% 1,425,597 9.0% 1,420,521 9.1%
Air Wisconsin 137,464 0.9% 104,297 0.7% 140,444 0.9% 172,421 1.1% 122,194 0.8%
British Airways 103,258 0.7% 103,473 0.7% 114,278 0.7% 115,772 0.7% 126,102 0.8%
Lufthansa German Airlines 69,030 0.5% 69,804 0.5% 74,508 0.5% 76,832 0.5% 80,356 0.5%
Republic Airlines - - - - - - - - - -
Qatar Airways - - - - - - - - - -
Air Canada / Sky Regional Airlines 47,045 0.3% 47,871 0.3% 51,557 0.3% 51,693 0.3% 69,297 0.4%
Frontier Airlines - - - - - - - - - -
Delta Air Lines 25,340 0.2% - - - - - - - -
Air Jamaica / Caribbean Airlines 36,217 0.2% 42,537 0.3% 42,445 0.3% 39,660 0.3% 36,066 0.2%
USA 3000 Airlines 24,452 0.2% 26,144 0.2% 35,079 0.2% 40,656 0.3% 44,812 0.3%
Air France 15,784 0.1% 50,549 0.3% 56,920 0.4% 61,498 0.4% 59,544 0.4%
Chautauqua Airlines - - - - - - - - 5,639 0.0%
PSA Airlines - - - - - - - - 24,155 0.2%
Mesa Airlines - - - - - - - - 19,199 0.1%
Piedmont Airlines - - - - 173 0.0% 121 0.0% - -
Subtotal - Scheduled 2,080,443 13.7% 2,003,441 13.0% 2,080,261 13.0% 1,984,250 12.5% 2,007,885 12.9%
Charter 59 0.0% 1,856 0.0% 1,656 0.0% 2,720 0.0% 3,572 0.0%
Subtotal - International 2,080,502 13.7% 2,005,297 13.1% 2,081,917 13.0% 1,986,970 12.5% 2,011,457 12.9%
Grand Totals 15,193,741 100.0% 15,362,743 100.0% 16,052,973 100.0% 15,851,691 100.0% 15,574,997 100.0%
Source: City of Philadelphia
Airlines
2008 2007 200620092010
93
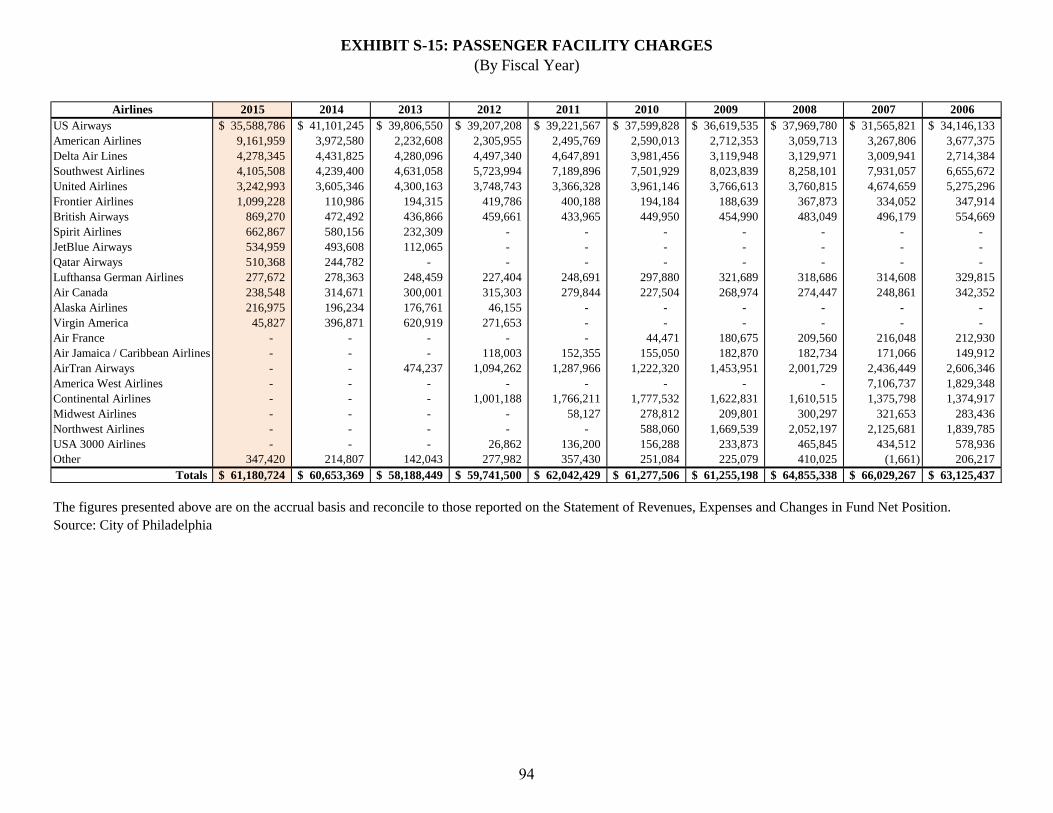
EXHIBIT S-15: PASSENGER FACILITY CHARGES
(By Fiscal Year)
Airlines 2015 2014 2013 2012 2011 2010 2009 2008 2007 2006
US Airways 35,588,786$ 41,101,245$ 39,806,550$ 39,207,208$ 39,221,567$ 37,599,828$ 36,619,535$ 37,969,780$ 31,565,821$ 34,146,133$
American Airlines 9,161,959 3,972,580 2,232,608 2,305,955 2,495,769 2,590,013 2,712,353 3,059,713 3,267,806 3,677,375
Delta Air Lines 4,278,345 4,431,825 4,280,096 4,497,340 4,647,891 3,981,456 3,119,948 3,129,971 3,009,941 2,714,384
Southwest Airlines 4,105,508 4,239,400 4,631,058 5,723,994 7,189,896 7,501,929 8,023,839 8,258,101 7,931,057 6,655,672
United Airlines 3,242,993 3,605,346 4,300,163 3,748,743 3,366,328 3,961,146 3,766,613 3,760,815 4,674,659 5,275,296
Frontier Airlines 1,099,228 110,986 194,315 419,786 400,188 194,184 188,639 367,873 334,052 347,914
British Airways 869,270 472,492 436,866 459,661 433,965 449,950 454,990 483,049 496,179 554,669
Spirit Airlines 662,867 580,156 232,309 - - - - - - -
JetBlue Airways 534,959 493,608 112,065 - - - - - - -
Qatar Airways 510,368 244,782 - - - - - - - -
Lufthansa German Airlines 277,672 278,363 248,459 227,404 248,691 297,880 321,689 318,686 314,608 329,815
Air Canada 238,548 314,671 300,001 315,303 279,844 227,504 268,974 274,447 248,861 342,352
Alaska Airlines 216,975 196,234 176,761 46,155 - - - - - -
Virgin America 45,827 396,871 620,919 271,653 - - - - - -
Air France - - - - - 44,471 180,675 209,560 216,048 212,930
Air Jamaica / Caribbean Airlines - - - 118,003 152,355 155,050 182,870 182,734 171,066 149,912
AirTran Airways - - 474,237 1,094,262 1,287,966 1,222,320 1,453,951 2,001,729 2,436,449 2,606,346
America West Airlines - - - - - - - - 7,106,737 1,829,348
Continental Airlines - - - 1,001,188 1,766,211 1,777,532 1,622,831 1,610,515 1,375,798 1,374,917
Midwest Airlines - - - - 58,127 278,812 209,801 300,297 321,653 283,436
Northwest Airlines - - - - - 588,060 1,669,539 2,052,197 2,125,681 1,839,785
USA 3000 Airlines - - - 26,862 136,200 156,288 233,873 465,845 434,512 578,936
Other 347,420 214,807 142,043 277,982 357,430 251,084 225,079 410,025 (1,661) 206,217
Totals 61,180,724$ 60,653,369$ 58,188,449$ 59,741,500$ 62,042,429$ 61,277,506$ 61,255,198$ 64,855,338$ 66,029,267$ 63,125,437$
The figures presented above are on the accrual basis and reconcile to those reported on the Statement of Revenues, Expenses and Changes in Fund Net Position.
Source: City of Philadelphia
94
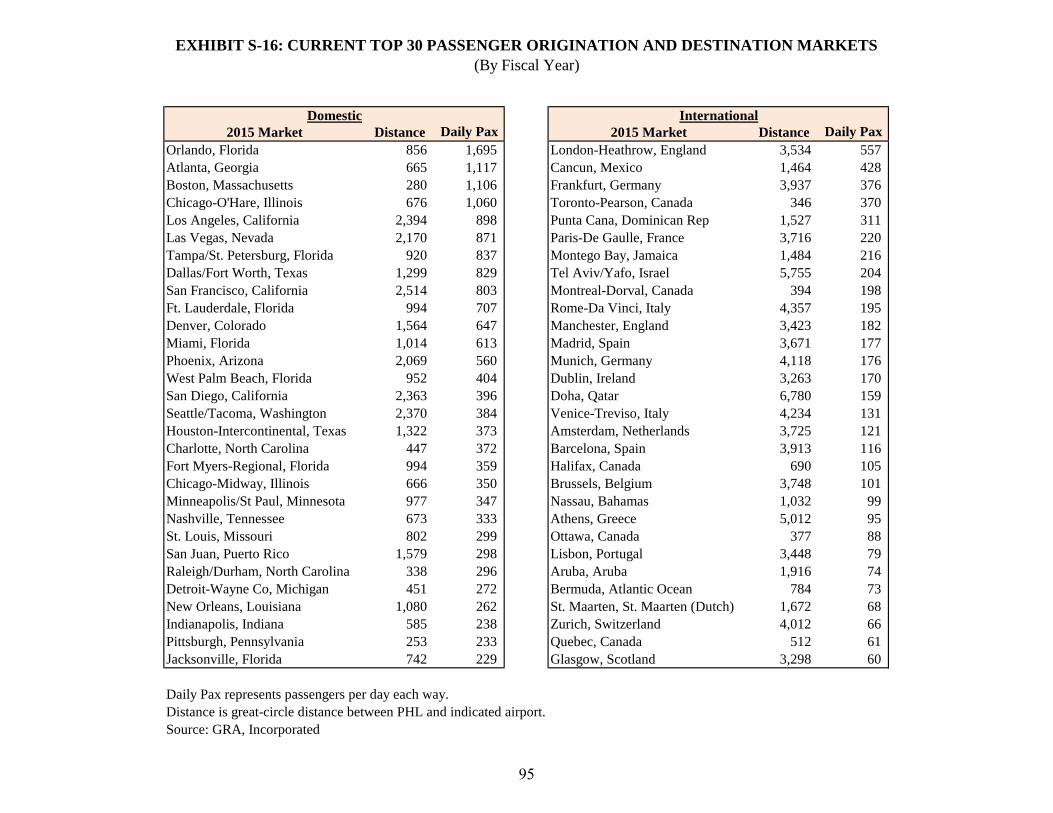
EXHIBIT S-16: CURRENT TOP 30 PASSENGER ORIGINATION AND DESTINATION MARKETS
(By Fiscal Year)
2015 Market Distance Daily Pax 2015 Market Distance Daily Pax
Orlando, Florida 856 1,695 London-Heathrow, England 3,534 557
Atlanta, Georgia 665 1,117 Cancun, Mexico 1,464 428
Boston, Massachusetts 280 1,106 Frankfurt, Germany 3,937 376
Chicago-O'Hare, Illinois 676 1,060 Toronto-Pearson, Canada 346 370
Los Angeles, California 2,394 898 Punta Cana, Dominican Rep 1,527 311
Las Vegas, Nevada 2,170 871 Paris-De Gaulle, France 3,716 220
Tampa/St. Petersburg, Florida 920 837 Montego Bay, Jamaica 1,484 216
Dallas/Fort Worth, Texas 1,299 829 Tel Aviv/Yafo, Israel 5,755 204
San Francisco, California 2,514 803 Montreal-Dorval, Canada 394 198
Ft. Lauderdale, Florida 994 707 Rome-Da Vinci, Italy 4,357 195
Denver, Colorado 1,564 647 Manchester, England 3,423 182
Miami, Florida 1,014 613 Madrid, Spain 3,671 177
Phoenix, Arizona 2,069 560 Munich, Germany 4,118 176
West Palm Beach, Florida 952 404 Dublin, Ireland 3,263 170
San Diego, California 2,363 396 Doha, Qatar 6,780 159
Seattle/Tacoma, Washington 2,370 384 Venice-Treviso, Italy 4,234 131
Houston-Intercontinental, Texas 1,322 373 Amsterdam, Netherlands 3,725 121
Charlotte, North Carolina 447 372 Barcelona, Spain 3,913 116
Fort Myers-Regional, Florida 994 359 Halifax, Canada 690 105
Chicago-Midway, Illinois 666 350 Brussels, Belgium 3,748 101
Minneapolis/St Paul, Minnesota 977 347 Nassau, Bahamas 1,032 99
Nashville, Tennessee 673 333 Athens, Greece 5,012 95
St. Louis, Missouri 802 299 Ottawa, Canada 377 88
San Juan, Puerto Rico 1,579 298 Lisbon, Portugal 3,448 79
Raleigh/Durham, North Carolina 338 296 Aruba, Aruba 1,916 74
Detroit-Wayne Co, Michigan 451 272 Bermuda, Atlantic Ocean 784 73
New Orleans, Louisiana 1,080 262 St. Maarten, St. Maarten (Dutch) 1,672 68
Indianapolis, Indiana 585 238 Zurich, Switzerland 4,012 66
Pittsburgh, Pennsylvania 253 233 Quebec, Canada 512 61
Jacksonville, Florida 742 229 Glasgow, Scotland 3,298 60
Daily Pax represents passengers per day each way.
Distance is great-circle distance between PHL and indicated airport.
Source: GRA, Incorporated
Domestic International
95
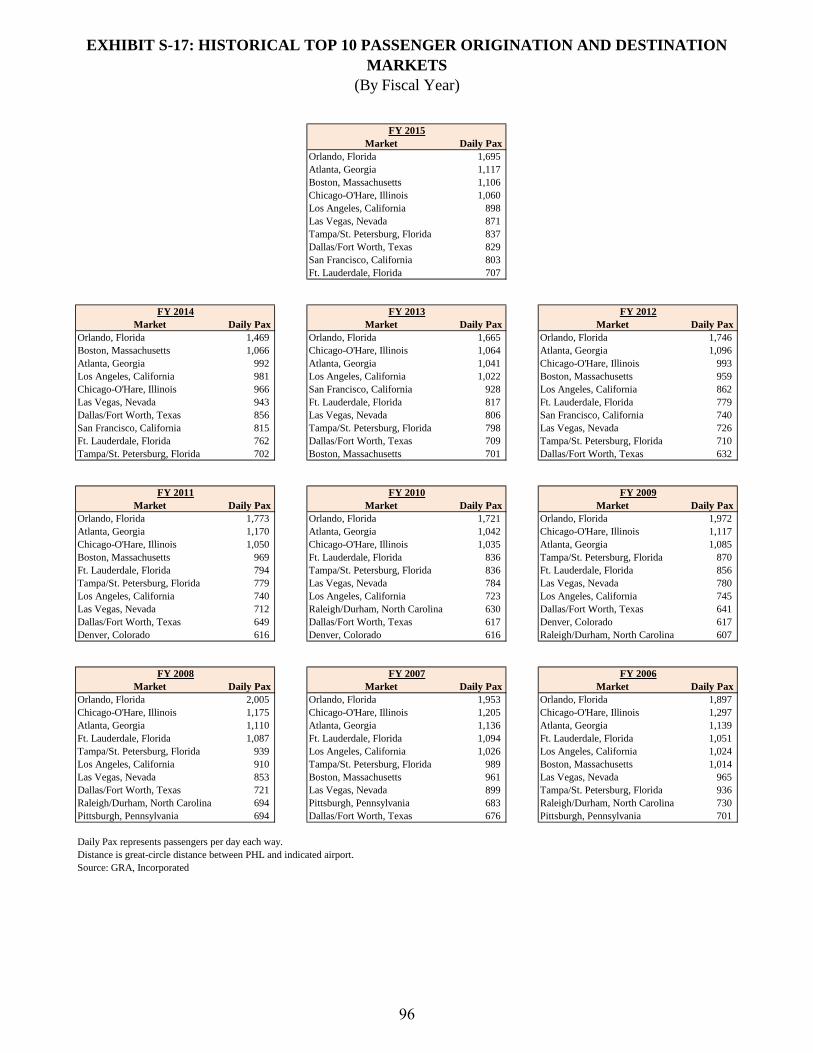
EXHIBIT S-17: HISTORICAL TOP 10 PASSENGER ORIGINATION AND DESTINATION
MARKETS
(By Fiscal Year)
Market Daily Pax
Orlando, Florida 1,695
Atlanta, Georgia 1,117
Boston, Massachusetts 1,106
Chicago-O'Hare, Illinois 1,060
Los Angeles, California 898
Las Vegas, Nevada 871
Tampa/St. Petersburg, Florida 837
Dallas/Fort Worth, Texas 829
San Francisco, California 803
Ft. Lauderdale, Florida 707
Market Daily Pax Market Daily Pax Market Daily Pax
Orlando, Florida 1,469 Orlando, Florida 1,665 Orlando, Florida 1,746
Boston, Massachusetts 1,066 Chicago-O'Hare, Illinois 1,064 Atlanta, Georgia 1,096
Atlanta, Georgia 992 Atlanta, Georgia 1,041 Chicago-O'Hare, Illinois 993
Los Angeles, California 981 Los Angeles, California 1,022 Boston, Massachusetts 959
Chicago-O'Hare, Illinois 966 San Francisco, California 928 Los Angeles, California 862
Las Vegas, Nevada 943 Ft. Lauderdale, Florida 817 Ft. Lauderdale, Florida 779
Dallas/Fort Worth, Texas 856 Las Vegas, Nevada 806 San Francisco, California 740
San Francisco, California 815 Tampa/St. Petersburg, Florida 798 Las Vegas, Nevada 726
Ft. Lauderdale, Florida 762 Dallas/Fort Worth, Texas 709 Tampa/St. Petersburg, Florida 710
Tampa/St. Petersburg, Florida 702 Boston, Massachusetts 701 Dallas/Fort Worth, Texas 632
Market Daily Pax Market Daily Pax Market Daily Pax
Orlando, Florida 1,773 Orlando, Florida 1,721 Orlando, Florida 1,972
Atlanta, Georgia 1,170 Atlanta, Georgia 1,042 Chicago-O'Hare, Illinois 1,117
Chicago-O'Hare, Illinois 1,050 Chicago-O'Hare, Illinois 1,035 Atlanta, Georgia 1,085
Boston, Massachusetts 969 Ft. Lauderdale, Florida 836 Tampa/St. Petersburg, Florida 870
Ft. Lauderdale, Florida 794 Tampa/St. Petersburg, Florida 836 Ft. Lauderdale, Florida 856
Tampa/St. Petersburg, Florida 779 Las Vegas, Nevada 784 Las Vegas, Nevada 780
Los Angeles, California 740 Los Angeles, California 723 Los Angeles, California 745
Las Vegas, Nevada 712 Raleigh/Durham, North Carolina 630 Dallas/Fort Worth, Texas 641
Dallas/Fort Worth, Texas 649 Dallas/Fort Worth, Texas 617 Denver, Colorado 617
Denver, Colorado 616 Denver, Colorado 616 Raleigh/Durham, North Carolina 607
Market Daily Pax Market Daily Pax Market Daily Pax
Orlando, Florida 2,005 Orlando, Florida 1,953 Orlando, Florida 1,897
Chicago-O'Hare, Illinois 1,175 Chicago-O'Hare, Illinois 1,205 Chicago-O'Hare, Illinois 1,297
Atlanta, Georgia 1,110 Atlanta, Georgia 1,136 Atlanta, Georgia 1,139
Ft. Lauderdale, Florida 1,087 Ft. Lauderdale, Florida 1,094 Ft. Lauderdale, Florida 1,051
Tampa/St. Petersburg, Florida 939 Los Angeles, California 1,026 Los Angeles, California 1,024
Los Angeles, California 910 Tampa/St. Petersburg, Florida 989 Boston, Massachusetts 1,014
Las Vegas, Nevada 853 Boston, Massachusetts 961 Las Vegas, Nevada 965
Dallas/Fort Worth, Texas 721 Las Vegas, Nevada 899 Tampa/St. Petersburg, Florida 936
Raleigh/Durham, North Carolina 694 Pittsburgh, Pennsylvania 683 Raleigh/Durham, North Carolina 730
Pittsburgh, Pennsylvania 694 Dallas/Fort Worth, Texas 676 Pittsburgh, Pennsylvania 701
Daily Pax represents passengers per day each way.
Distance is great-circle distance between PHL and indicated airport.
Source: GRA, Incorporated
FY 2008
FY 2015
FY 2014 FY 2013 FY 2012
FY 2007 FY 2006
FY 2011 FY 2010 FY 2009
96
Related Documents