City of Philadelphia Capital Program
May 17, 2015
City of Philadelphia Capital Program
Welcome message from author
This document is posted to help you gain knowledge. Please leave a comment to let me know what you think about it! Share it to your friends and learn new things together.
Transcript
P a g e | i

C I T Y O F P H I L A D E L P H I A : T H E F Y 2 0 1 0 - 2 0 1 5 C A P I T A L P R O G R A M
Special thanks to Richard Tustin, former Director of the City of Philadelphia’s Capital Program Office, who retired this year after more than 37 years of public service.
STRATEGIC PLANNING AND POLICY DIVISION Alan S. Urek, AICP, Director
Nicole L. Cross
John Haak, AICP
Octavia Hall
Jametta Johnson
Devorha Moultrie
Anthony M. Santaniello
Deborah Schaaf
CITY OF PHILADELPHIA Michael A. Nutter, Mayor
Andrew Altman, Deputy Mayor, Planning and
Economic Development
PHILADELPHIA CITY PLANNING COMMISSION Andrew Altman, Chairman
Camille Cates Barnett
Rob Dubow
Patrick J. Eiding
Bernard Lee, Esq.
Natalia Olson de Savyckyj, MCP
Joe Syrnick, Vice Chairman
Nilda Iris Ruiz, MBA
Nancy Rogo Trainer, AIA, AICP
Alan Greenberger, FAIA, Executive Director
Gary J. Jastrzab, Deputy Executive Director
One Parkway Building
1515 Arch Street, 13th Floor
Philadelphia, PA 19102
215.683.4615
www.philaplanning.org
C I T Y O F P H I L A D E L P H I A : T H E F Y 2 0 1 0 - 2 0 1 5 C A P I T A L P R O G R A M | i
Amendments to the FY2010-2015 Capital Program were signed into law on December 23, 2009, resulting in the addition of project funds and changes to funding sources. Together, the changes amount to an increase of $10.4 million to the FY2010-2015 Capital Program. All changes are to the FY2010 Budget year and for only the Departments of Public Property and Water, as follows:
Public Property
Added $8.4 million in new State funds for project 51 Communications Systems Improvements.
Water Department
Reassigned $42.764 million of Federal funds to City Self-sustaining New Loans for project 73 Improvements to Collector System.
Reassigned $37.0 million of Federal funds to City Self-sustaining New Loans for project 74 Storm Flood Relief/Combined Sewer Overflow.
Added $2.0 million in new State funds (PennWorks grant) and reassigned $47.964 million of Federal funds to City Self-sustaining New Loans for project 75 Improvements to Conveyance System.
Reassigned $42.887 million of Federal funds to City Self-sustaining New Loans for project 78 Improvements to Treatment Facilities.
Please see the Revised Table 1: Sources of Funds on reverse, indicating the changed amounts for the Budget year and six-year Program total.
CHANGES TO THE FY2010 – 2015 CAPITAL PROGRAM (DECEMBER 23, 2009)
i i | C I T Y O F P H I L A D E L P H I A : T H E F Y 2 0 1 0 - 2 0 1 5 C A P I T A L P R O G R A M
$x000 $x000 $x000 $x000
2010 - 2015 2015 2014 2013 2011
$x000
2010
$x000 $x000
2012
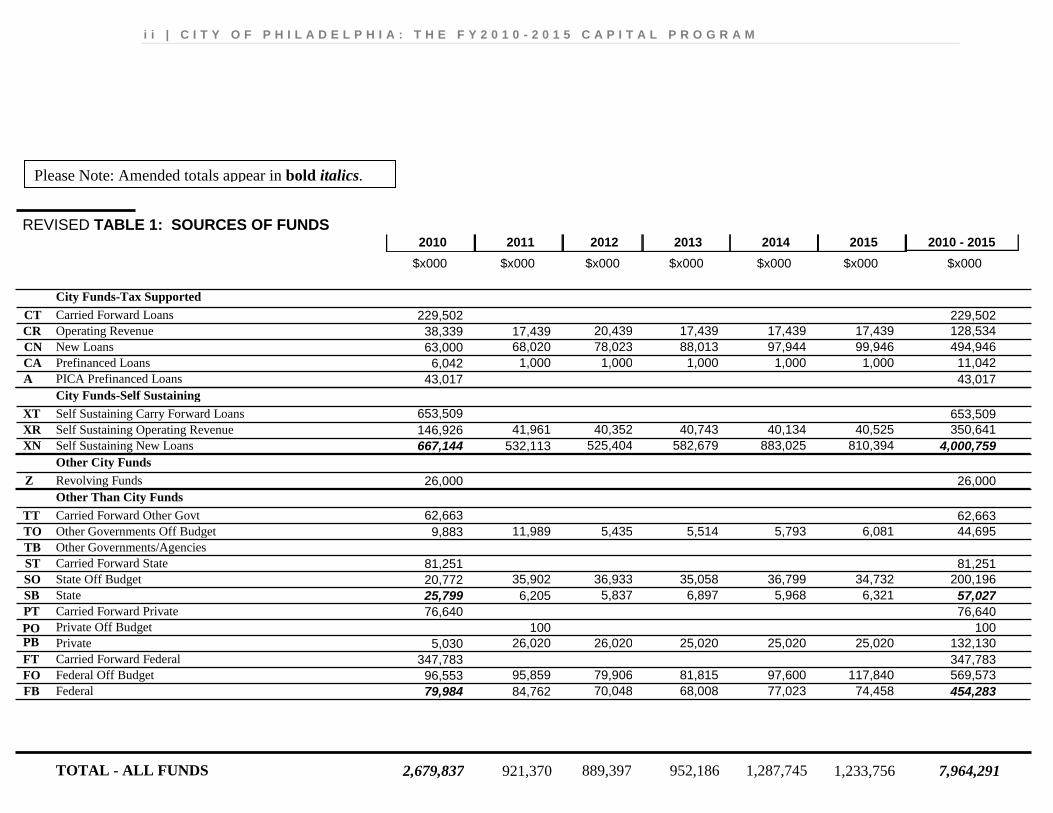
City Funds-Tax Supported Carried Forward Loans CT 229,502 229,502 Operating Revenue CR 38,339 17,439 20,439 17,439 17,439 17,439 128,534 New Loans CN 63,000 68,020 78,023 88,013 97,944 99,946 494,946 Prefinanced Loans CA 6,042 1,000 1,000 1,000 1,000 1,000 11,042 PICA Prefinanced Loans A 43,017 43,017 City Funds-Self Sustaining Self Sustaining Carry Forward Loans XT 653,509 653,509 Self Sustaining Operating Revenue XR 146,926 41,961 40,352 40,743 40,134 40,525 350,641 Self Sustaining New Loans XN 667,144 532,113 525,404 582,679 883,025 810,394 4,000,759 Other City Funds Revolving Funds 26,000 26,000 Other Than City Funds Carried Forward Other Govt TT 62,663 62,663 Other Governments Off Budget 9,883 11,989 5,435 5,514 5,793 6,081 44,695 Other Governments/Agencies TB Carried Forward State ST 81,251 81,251 State Off Budget 20,772 35,902 36,933 35,058 36,799 34,732 200,196 State 25,799 6,205 5,837 6,897 5,968 6,321 57,027 Carried Forward Private 76,640 76,640 Private Off Budget 100 100 Private 5,030 26,020 26,020 25,020 25,020 25,020 132,130 Carried Forward Federal FT 347,783 347,783 Federal Off Budget 96,553 95,859 79,906 81,815 97,600 117,840 569,573 Federal 79,984 84,762 70,048 68,008 77,023 74,458 454,283
TOTAL - ALL FUNDS 2,679,837 921,370 889,397 952,186 1,287,745 7,964,291 1,233,756
PO PB
SB
TO
Z
REVISED TABLE 1: SOURCES OF FUNDS
SO
PT
FO FB
Please Note: Amended totals appear in bold italics.
C I T Y O F P H I L A D E L P H I A : T H E F Y 2 0 1 0 - 2 0 1 5 C A P I T A L P R O G R A M | 1
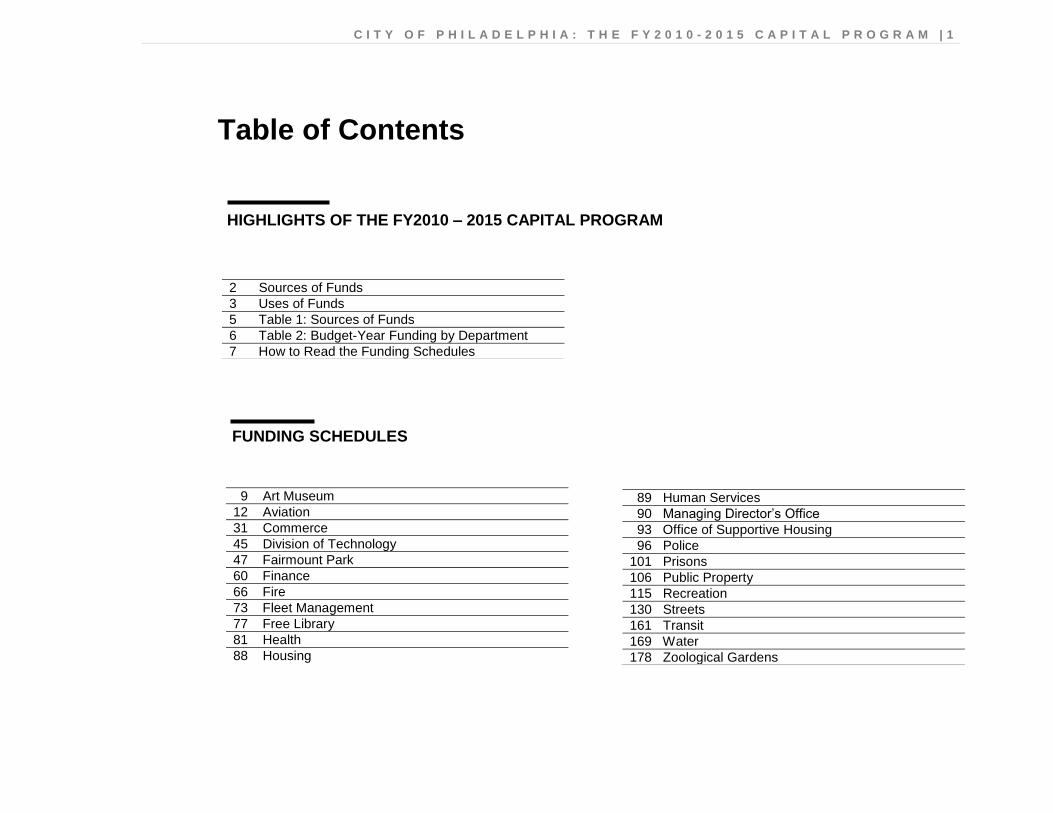
2 Sources of Funds
3 Uses of Funds
5 Table 1: Sources of Funds
6 Table 2: Budget-Year Funding by Department
7 How to Read the Funding Schedules
9 Art Museum
12 Aviation
31 Commerce
45 Division of Technology
47 Fairmount Park
60 Finance
66 Fire
73 Fleet Management
77 Free Library
81 Health
88 Housing
89 Human Services
90 Managing Director’s Office
93 Office of Supportive Housing
96 Police
101 Prisons
106 Public Property
115 Recreation
130 Streets
161 Transit
169 Water
178 Zoological Gardens
HIGHLIGHTS OF THE FY2010 – 2015 CAPITAL PROGRAM
FUNDING SCHEDULES
Table of Contents
2 | C I T Y O F P H I L A D E L P H I A : T H E F Y 2 0 1 0 - 2 0 1 5 C A P I T A L P R O G R A M
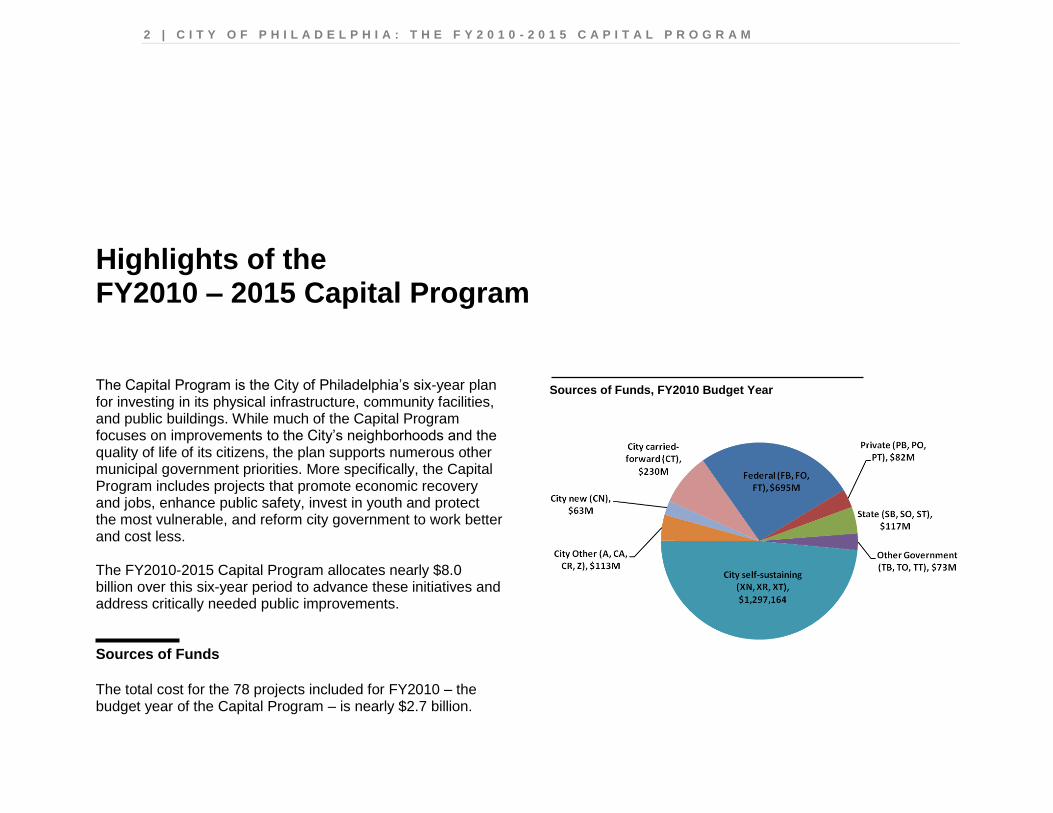
Highlights of the FY2010 – 2015 Capital Program The Capital Program is the City of Philadelphia’s six-year plan for investing in its physical infrastructure, community facilities, and public buildings. While much of the Capital Program focuses on improvements to the City’s neighborhoods and the quality of life of its citizens, the plan supports numerous other municipal government priorities. More specifically, the Capital Program includes projects that promote economic recovery and jobs, enhance public safety, invest in youth and protect the most vulnerable, and reform city government to work better and cost less. The FY2010-2015 Capital Program allocates nearly $8.0 billion over this six-year period to advance these initiatives and address critically needed public improvements. Sources of Funds
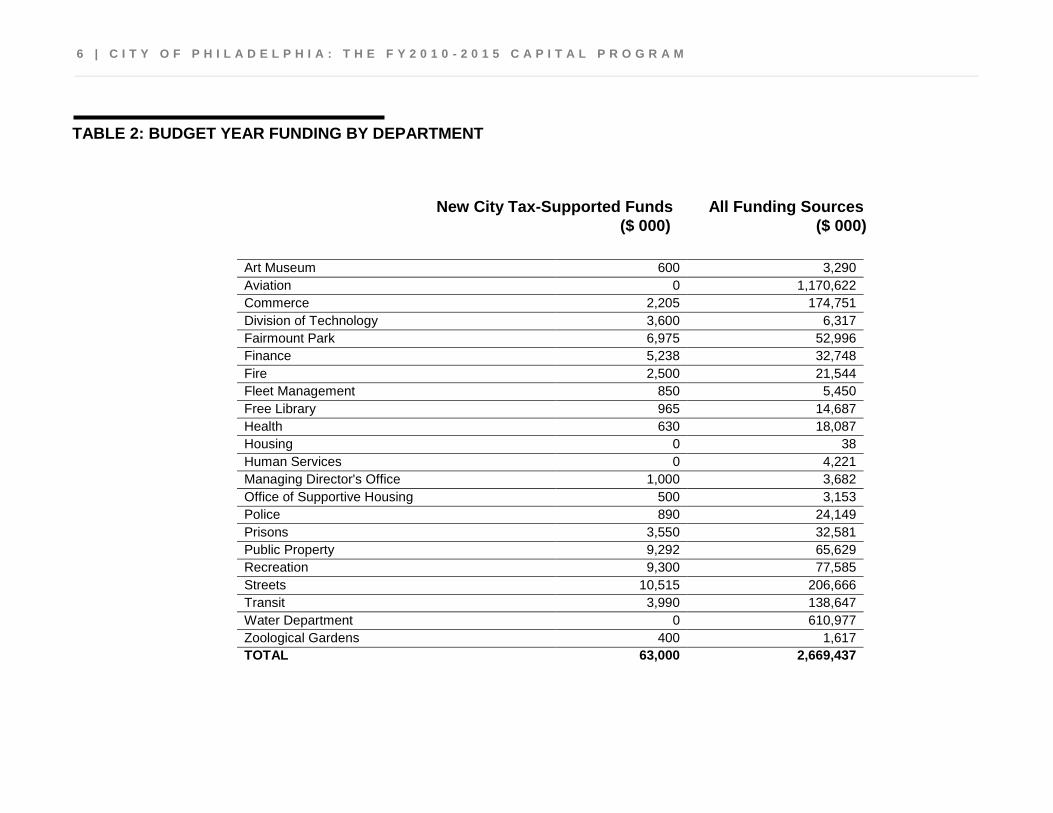
The total cost for the 78 projects included for FY2010 – the budget year of the Capital Program – is nearly $2.7 billion.
Sources of Funds, FY2010 Budget Year
C I T Y O F P H I L A D E L P H I A : T H E F Y 2 0 1 0 - 2 0 1 5 C A P I T A L P R O G R A M | 3
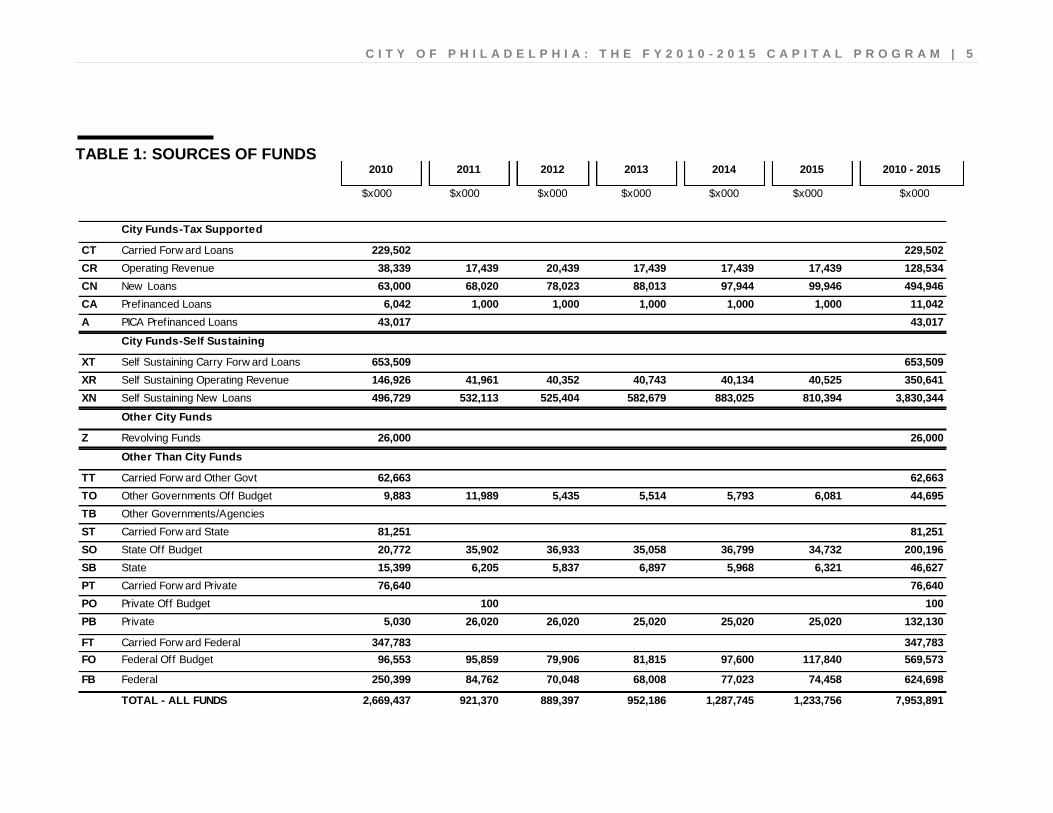
These 78 projects include several hundred ―subprojects‖ that are either new or ―carried forward‖ from previous years’ budgets. Of this total budget amount, $63.0 million is provided by new general-obligation bonds issued by the City of Philadelphia (see chart above and Table 1 on page 5). These bonds are tax-supported (i.e., repaid from the City’s general tax revenues). An additional $229.5 million will come from carried-forward City tax-supported loan funds. Other City sources total $113.4 million. City ―self-sustaining‖ loans account for nearly $1.3 billion of total budget-year funds. Funding from other levels of government, including Federal, Commonwealth of Pennsylvania, and regional sources, totals $695.0 million in the budget year. Finally, $81.7 million of FY2010 funding will be provided by private sources. As in years past, the availability of new, tax-supported general-obligation funding for capital projects is constrained in the FY2010-2015 Capital Program. This is due to the City’s debt limit established by the Pennsylvania Constitution, as well as by the City’s financial capacity. Nevertheless, the City administration is committed to investing in the City’s infrastructure to the greatest extent possible. Overall, the FY2010-2015 Capital Program proposes the most proactive and efficient spending plan possible by making the most effective use of available resources. The FY2010-2015 Capital Program continues our efforts to make Philadelphia a great place to live, work, learn, and play. Uses of Funds
In keeping with the City’s priorities, the FY2010-2015 Capital Program includes projects that promote the City’s goals for economic recovery and jobs, enhancing public safety, investing in youth and protecting the most vulnerable, and reforming government. A sampling of capital projects that support these goals is presented below. Projects that promote economic recovery and jobs strengthen fiscal integrity and stability now, and help to avoid unnecessary costs in the future: The Commerce Department will use $7.5 million in federal,
state and new City funds for Navy Yard infrastructure, in support of public and private development.
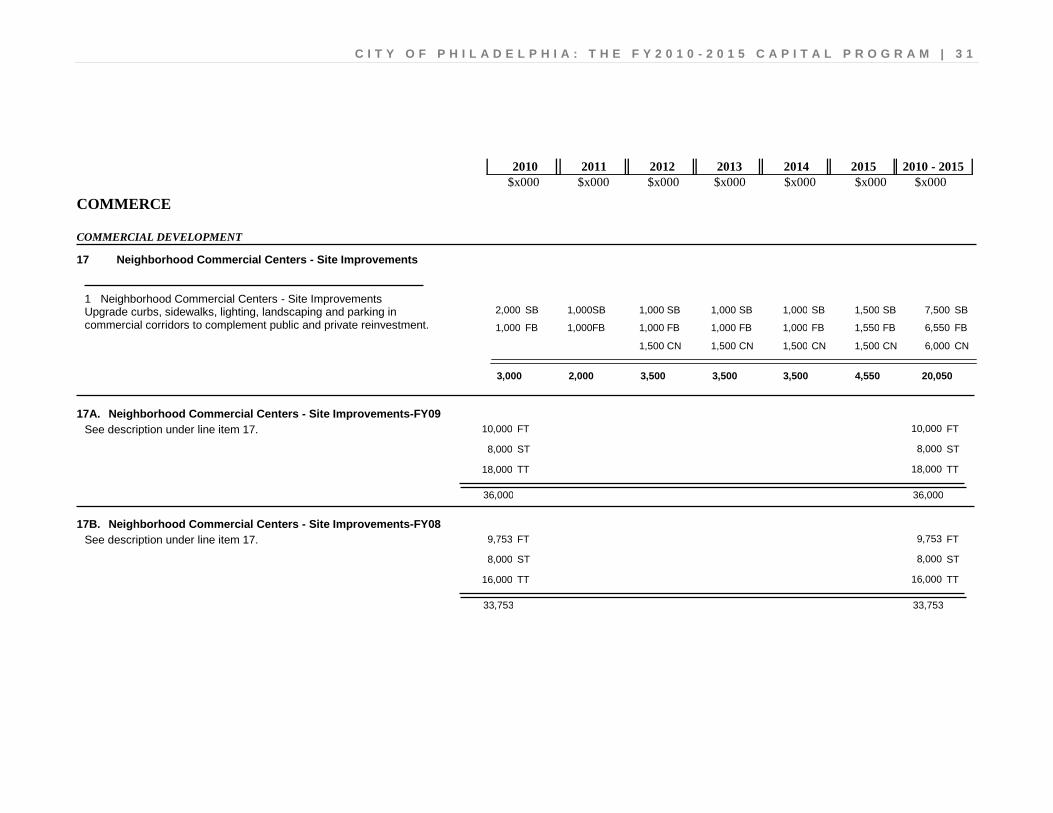
The Commerce Department’s commercial development projects total $3.0 million in FY2010 for upgrades to neighborhood commercial centers for curbs, sidewalks, lighting, landscaping and other complements to public and private reinvestment.
The capital budget includes $665,000 in new City funds for citywide environmental remediation through the Department of Public Property, including asbestos abatement and environmental consultant services regarding storage tank testing and replacements.
In FY2010, $505.3 million from federal, state, private and city self-sustaining funds will enable Philadelphia International Airport terminal expansion and modernization, airfield renovations and additions, and enhancements to baggage inspection to provide faster and better service for the growing demand of air traffic in and out of Philadelphia.
Projects that enhance public safety increase safety from crime, emergencies, and accidents at home, school, in the neighborhood, and at work and play: $890,000 in new City funds will be used for critical window
and door and roof replacements, mechanical, and electrical and plumbing renovations at 14 Police stations.
4 | C I T Y O F P H I L A D E L P H I A : T H E F Y 2 0 1 0 - 2 0 1 5 C A P I T A L P R O G R A M
Prisons will use $3.6 million in new City funds for much-needed prison facility renovations including ventilation and mold remediation at the Curran Fromhold detention facility; and an automatic lock security system, critical multi-phase mechanical, electrical and plumbing restoration, and fire alarm system at the House of Corrections.
A total of $8.9 million in new City funds will fund street reconstruction and resurfacing across the City’s neighborhoods through the Streets Department.
Projects that invest in youth & protect the most vulnerable assure that all children are ready to learn by the time of school entry, provide housing opportunities, ensure that life expectancy and the health and safety of children and adults are improved, and provide supportive services for all homeless: $630,000 of new City funds will fund health-facility
renovations at various health centers around the city to improve service, safety, and longevity of buildings.
Free Library improvements for FY2010 totaling $965,000 in new City funds will upgrade and enhance libraries serving the public across the City. Included are much-needed HVAC and boiler system replacements at several branches.
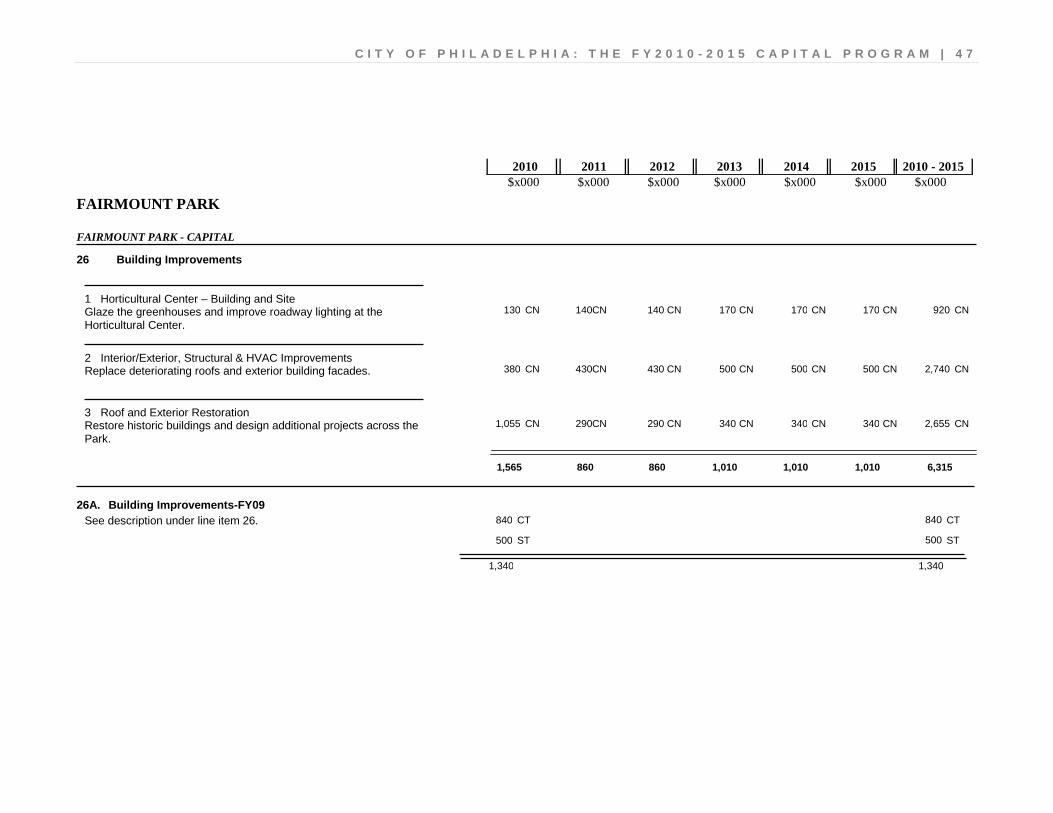
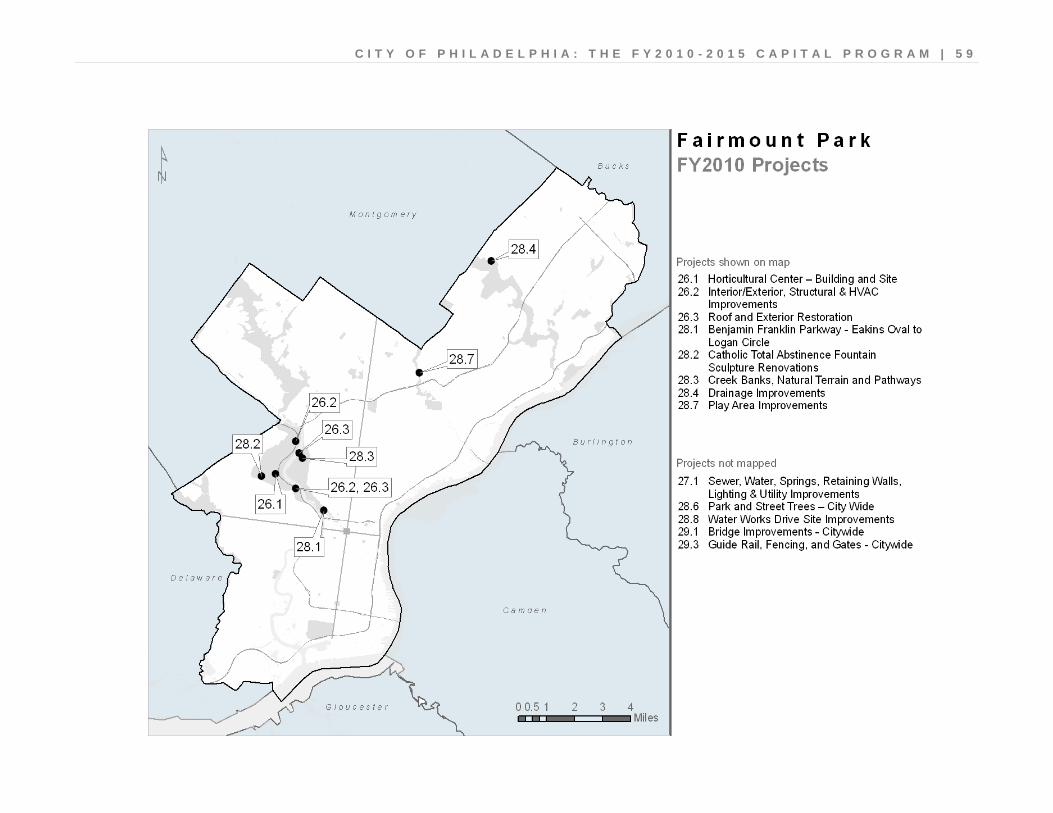
Fairmount Park site improvement projects total nearly $16.0 million from multiple sources in FY2010 for new amenities on the Parkway; drainage improvements on parkland to stabilize embankments, natural terrain and pathways; tree planting; and play-area improvements across the city.
SEPTA bridge, track, signal and infrastructure improvements secure access to work and other destinations for the region’s population, including the City of Philadelphia. In FY2010, over $3.0 million in new City funds and over $88.0 million in other monies will be used for the Market Elevated reconstruction.
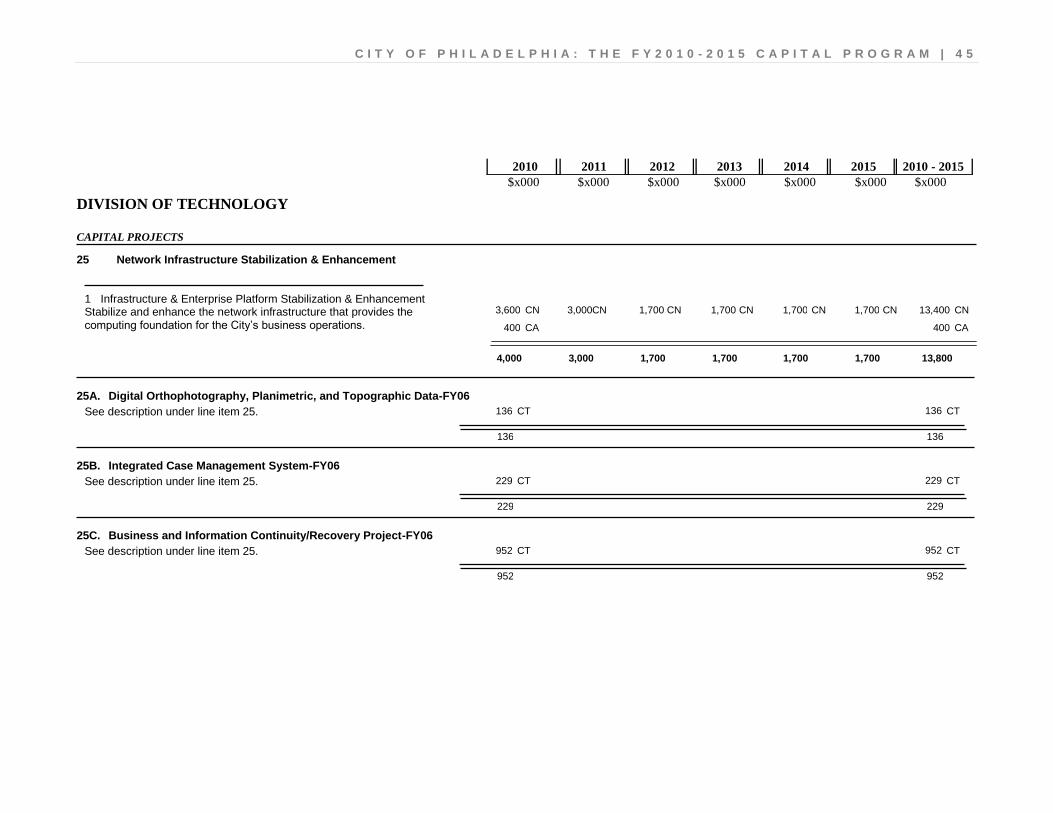
Projects that reform government create a high performing government that works better and costs less: A total of $4.0 million, including $3.6 million in new City
funds, and $400,000 in other prefinanced loans, will fund the Division of Technology’s network infrastructure stabilization and enhancements for the City’s computing foundation, improving business operations across agencies.
A total of $7.6 million in new City funds and PICA prefinanced funds enable Quadplex facilities improvements (City Hall, Municipal Services Building, One Parkway Building, and Criminal Justice Center) through the Department of Public Property, for improved business operations.
SEPTA New Payment Technologies will be funded with $23.7 million, including $566,000 in new City funds. This new fare system will replace the entire array of current collection equipment, providing better service to SEPTA’s riders throughout the region.
$500,000 of new City funding will enable energy efficiency improvements through the Office of Sustainability (funded by the Managing Director’s Office). This funding coupled with carried-forward loans from previous years, will enable energy efficiency improvements at locations across the City, Energy Star building upgrades, and Green Lights lighting upgrades.
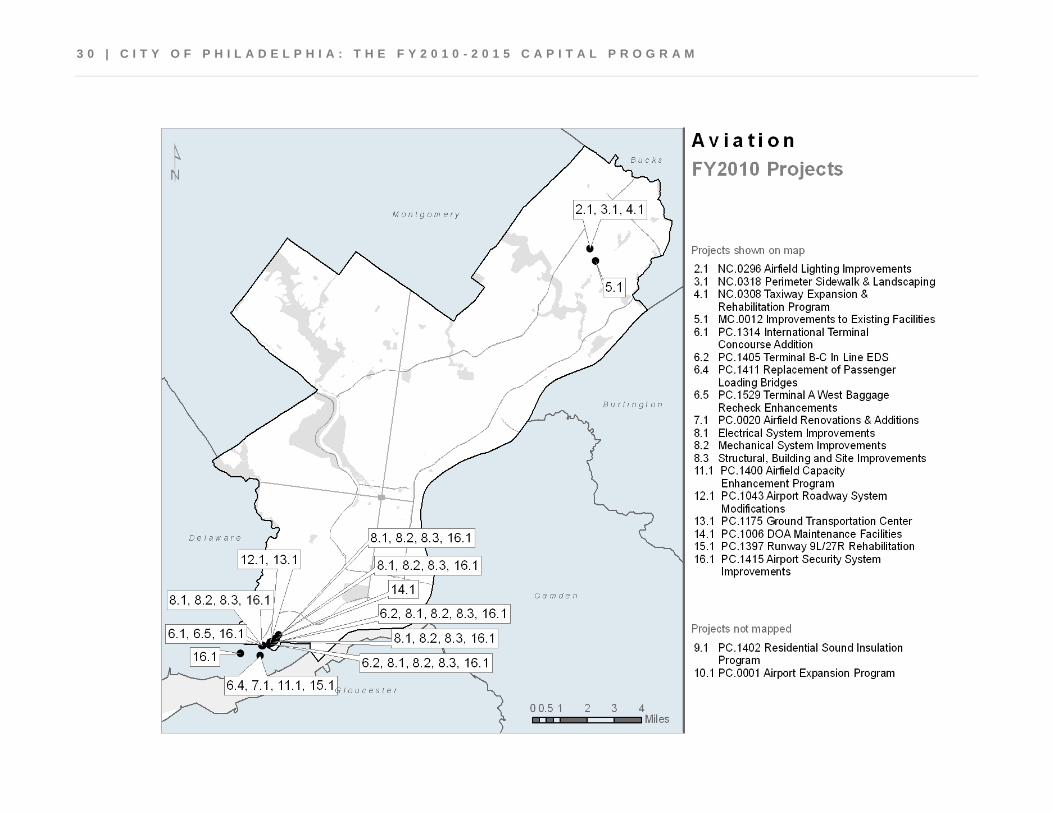
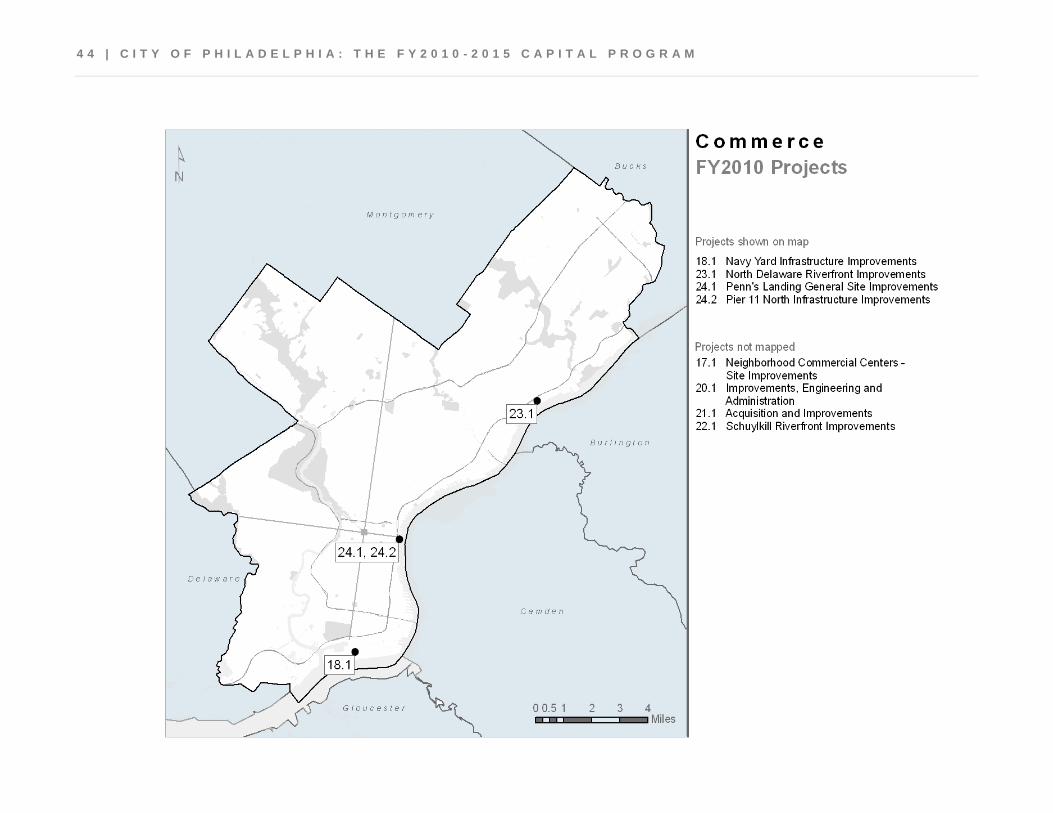
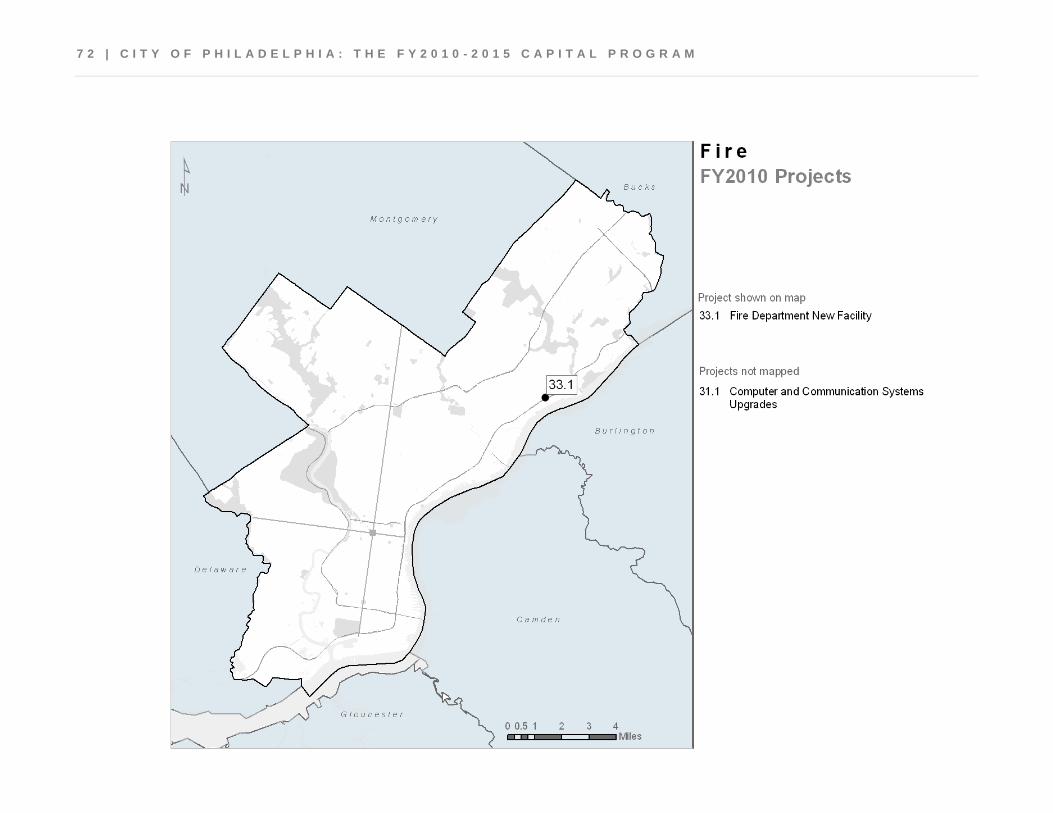
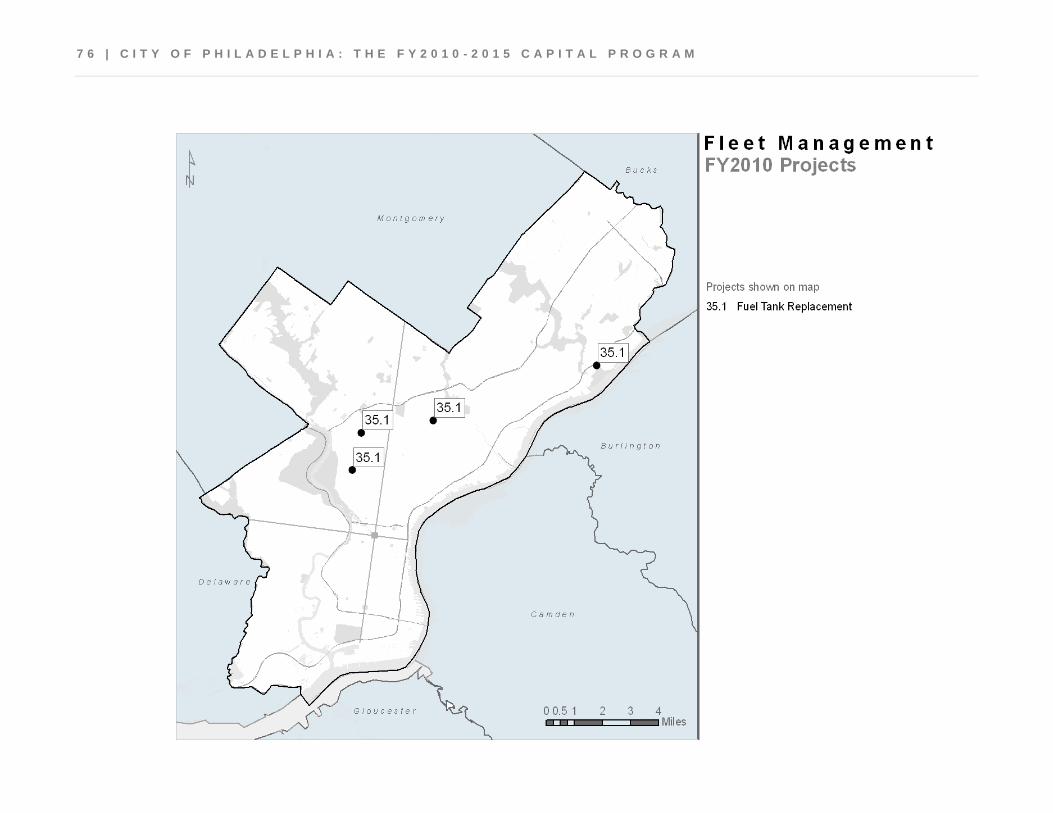
Maps
New for the FY2010-FY2015 Capital Program is a series of maps. Fiscal Year 2010 maps appear for each department following the department’s funding schedule. As indicated in the map legends, only projects with identified geographic locations are shown. Projects without an identified location are listed but not shown on the map.
C I T Y O F P H I L A D E L P H I A : T H E F Y 2 0 1 0 - 2 0 1 5 C A P I T A L P R O G R A M | 5
CT 229,502 229,502
CR 38,339 17,439 20,439 17,439 17,439 17,439 128,534
CN 63,000 68,020 78,023 88,013 97,944 99,946 494,946
CA 6,042 1,000 1,000 1,000 1,000 1,000 11,042
A 43,017 43,017
XT 653,509 653,509
XR 146,926 41,961 40,352 40,743 40,134 40,525 350,641
XN 496,729 532,113 525,404 582,679 883,025 810,394 3,830,344
Z 26,000 26,000
TT 62,663 62,663
TO 9,883 11,989 5,435 5,514 5,793 6,081 44,695
TB
ST 81,251 81,251
SO 20,772 35,902 36,933 35,058 36,799 34,732 200,196
SB 15,399 6,205 5,837 6,897 5,968 6,321 46,627
PT 76,640 76,640
PO 100 100
PB 5,030 26,020 26,020 25,020 25,020 25,020 132,130
FT 347,783 347,783
FO 96,553 95,859 79,906 81,815 97,600 117,840 569,573
FB 250,399 84,762 70,048 68,008 77,023 74,458 624,698
TOTAL - ALL FUNDS 889,397 952,186 1,287,745 1,233,756 7,953,891
Private
Carried Forw ard Federal
Federal Off Budget
Federal
2,669,437 921,370
State
Carried Forw ard Private
Private Off Budget
Other Than City Funds
Carried Forw ard Other Govt
Other Governments Off Budget
Other Governments/Agencies
Carried Forw ard State
State Off Budget
City Funds-Self Sustaining
Self Sustaining Carry Forw ard Loans
Self Sustaining Operating Revenue
Self Sustaining New Loans
Other City Funds
Revolving Funds
City Funds-Tax Supported
Carried Forw ard Loans
Operating Revenue
New Loans
Prefinanced Loans
PICA Prefinanced Loans
2015 2010 - 2015
$x000 $x000 $x000 $x000 $x000 $x000 $x000
2010 2011 2012 2013 2014
TABLE 1: SOURCES OF FUNDS
6 | C I T Y O F P H I L A D E L P H I A : T H E F Y 2 0 1 0 - 2 0 1 5 C A P I T A L P R O G R A M
Art Museum 600 3,290
Aviation 0 1,170,622
Commerce 2,205 174,751
Division of Technology 3,600 6,317
Fairmount Park 6,975 52,996
Finance 5,238 32,748
Fire 2,500 21,544
Fleet Management 850 5,450
Free Library 965 14,687
Health 630 18,087
Housing 0 38
Human Services 0 4,221
Managing Director's Office 1,000 3,682
Office of Supportive Housing 500 3,153
Police 890 24,149
Prisons 3,550 32,581
Public Property 9,292 65,629
Recreation 9,300 77,585
Streets 10,515 206,666
Transit 3,990 138,647
Water Department 0 610,977
Zoological Gardens 400 1,617
TOTAL 63,000 2,669,437
TABLE 2: BUDGET YEAR FUNDING BY DEPARTMENT
New City Tax-Supported Funds All Funding Sources
($ 000) ($ 000)
C I T Y O F P H I L A D E L P H I A : T H E F Y 2 0 1 0 - 2 0 1 5 C A P I T A L P R O G R A M | 7
HOW TO READ THE FUNDING SCHEDULES
Funding Source Codes – Non-City Sources
Funding Source Codes—City Sources
City sources identified with the prefix ―C‖ represent tax-supported funding. The prefix ―X‖ represents self-sustaining City amounts – projects that generate sufficient revenue from user charges to cover their debt service. CN, XN – New loans are financed either through tax-supported general obligation bonds (CN) or through revenue bonds (XN). CA, XA – Prefinanced Loans are funds for the same or equivalent project carried forward from FY 2009 to FY2010. CT, XT – Carried-Forward Loans are funds for the same or equivalent project carried forward from FY2009 to FY2010. CR, XR – Operating Revenue appropriated to the Capital Budget from the Operating Budget. A – Previously Authorized PICA Funds are provided through loans obtained on behalf of the City by the Pennsylvania Intergovernmental Cooperation Authority (PICA). Z – Revolving Funds are replenished through proceeds from the sale of property acquired in the past through the use of Capital funds.
For the non-City funding sources listed below, the suffix ―B‖—Budget—represents funds that are appropriated in the Capital Budget and for which the City will be responsible for accounting and spending. The suffix ―O‖— Off-Budget—is used for amounts that are not appropriated in the Capital Budget, but rather are the responsibility of other agencies, such as SEPTA, to budget and spend. These funds are shown in the Capital Program in order to provide complete information on the scope and cost of City-supported projects. The suffix ―T‖ represents funds for the same or equivalent project carried forward from FY2009 to FY2010. FB, FO, FT – Federal sources.
PB, PO, PT – Private sources. SB, SO, ST – State sources.
TB, TO, TT – Other Governments and Agencies include SEPTA, adjacent counties and townships, and proceeds from the bonds of quasi-public authorities

8 | C I T Y O F P H I L A D E L P H I A : T H E F Y 2 0 1 0 - 2 0 1 5 C A P I T A L P R O G R A M
C I T Y O F P H I L A D E L P H I A : T H E F Y 2 0 1 0 - 2 0 1 5 C A P I T A L P R O G R A M | 9
$x000 $x000 $x000 $x000 $x000 $x000 $x000 2010 2011 2012 2013 2014 2015 2010 - 2015
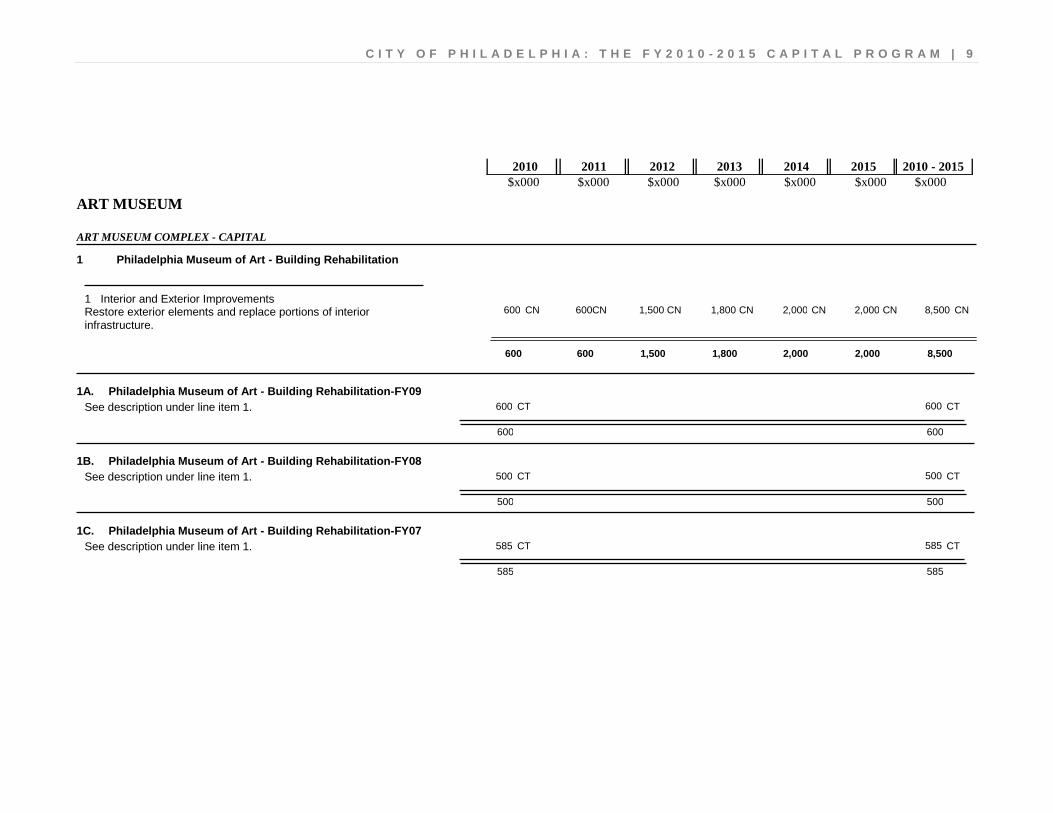
ART MUSEUM
ART MUSEUM COMPLEX - CAPITAL
Philadelphia Museum of Art - Building Rehabilitation 1
8,500 2,000 2,000 1,800 1,500 600 600 CN CN CN CN CN CN CN Restore exterior elements and replace portions of interior infrastructure.
Interior and Exterior Improvements 1
600 2,000 2,000 1,800 1,500 600 8,500
1A. Philadelphia Museum of Art - Building Rehabilitation-FY09 600 600 CT CT
600 600
See description under line item 1.
1B. Philadelphia Museum of Art - Building Rehabilitation-FY08 500 500 CT CT
500 500
See description under line item 1.
1C. Philadelphia Museum of Art - Building Rehabilitation-FY07 585 585 CT CT
585 585
See description under line item 1.
1 0 | C I T Y O F P H I L A D E L P H I A : T H E F Y 2 0 1 0 - 2 0 1 5 C A P I T A L P R O G R A M
$x000 $x000 $x000 $x000 $x000 $x000 $x000 2010 2011 2012 2013 2014 2015 2010 - 2015
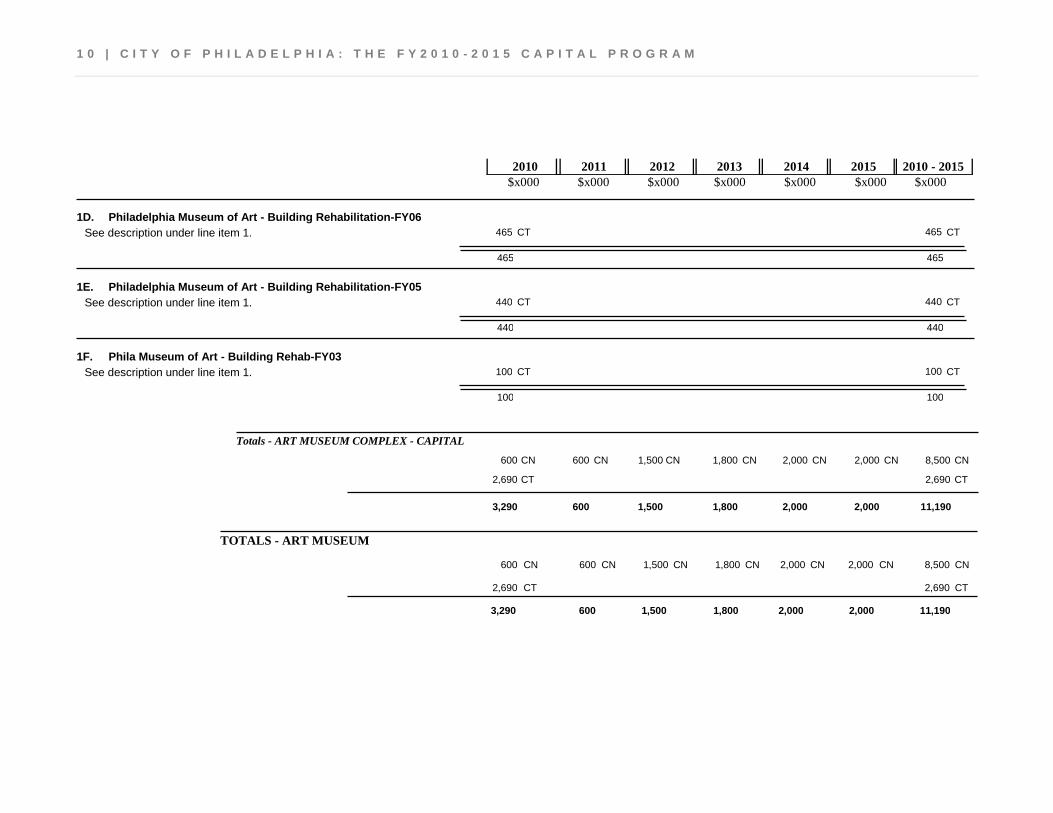
1D. Philadelphia Museum of Art - Building Rehabilitation-FY06 465 465 CT CT
465 465
See description under line item 1.
1E. Philadelphia Museum of Art - Building Rehabilitation-FY05 440 440 CT CT
440 440
See description under line item 1.
1F. Phila Museum of Art - Building Rehab-FY03 100 100 CT CT
100 100
See description under line item 1.
Totals - ART MUSEUM COMPLEX - CAPITAL
1,800 1,500 600 600 2,000 2,000 CN CN CN CN CN CN 8,500 CN
2,690 CT 2,690 CT
2,000 2,000 1,800 1,500 600 3,290 11,190
TOTALS - ART MUSEUM
1,800 1,500 600 600 2,000 2,000 CN CN CN CN CN CN 8,500 CN
2,690 CT 2,690 CT
2,000 2,000 1,800 1,500 600 3,290 11,190

C I T Y O F P H I L A D E L P H I A : T H E F Y 2 0 1 0 - 2 0 1 5 C A P I T A L P R O G R A M | 1 1
1 2 | C I T Y O F P H I L A D E L P H I A : T H E F Y 2 0 1 0 - 2 0 1 5 C A P I T A L P R O G R A M
$x000 $x000 $x000 $x000 $x000 $x000 $x000 2010 2011 2012 2013 2014 2015 2010 - 2015
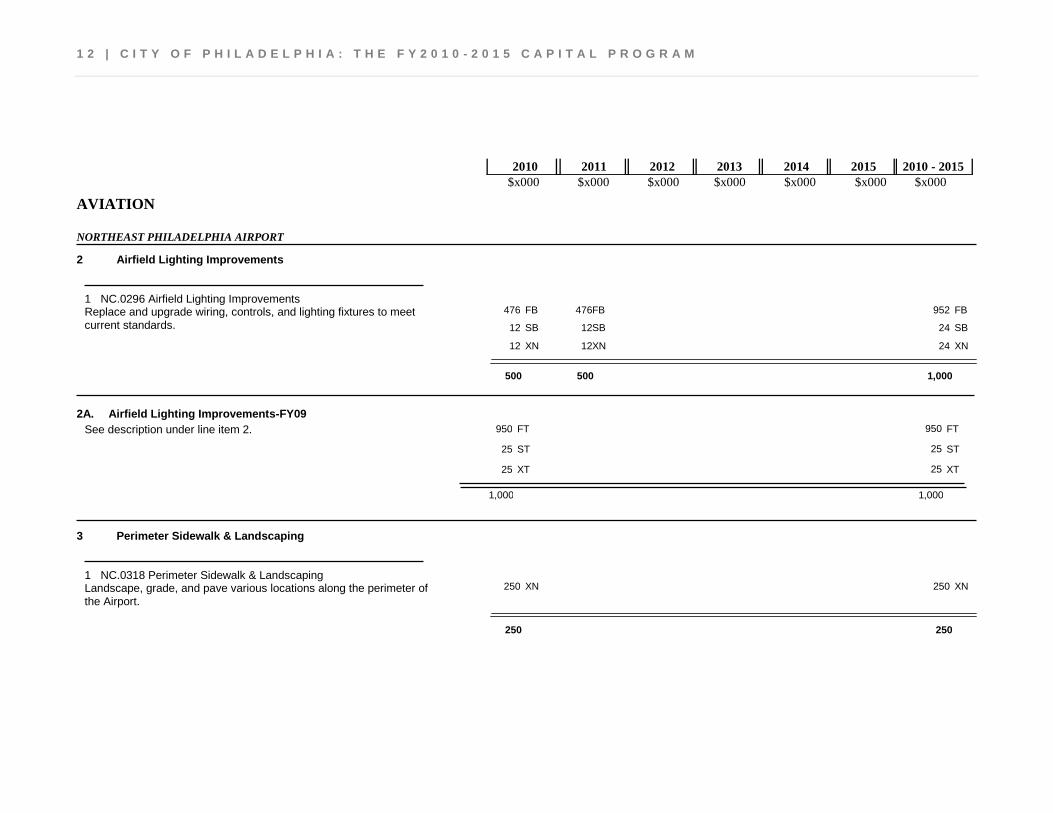
AVIATION
NORTHEAST PHILADELPHIA AIRPORT
Airfield Lighting Improvements 2
952 476 476 FB FB FB 24 12 12 SB SB SB
24 12 12 XN XN XN
Replace and upgrade wiring, controls, and lighting fixtures to meet current standards.
NC.0296 Airfield Lighting Improvements 1
500 500 1,000
2A. Airfield Lighting Improvements-FY09 950 950 FT FT
25 25 ST ST
25 25 XT XT
1,000 1,000
See description under line item 2.
Perimeter Sidewalk & Landscaping 3
250 250 XN XN Landscape, grade, and pave various locations along the perimeter of the Airport.
NC.0318 Perimeter Sidewalk & Landscaping 1
250 250

C I T Y O F P H I L A D E L P H I A : T H E F Y 2 0 1 0 - 2 0 1 5 C A P I T A L P R O G R A M | 1 3
$x000 $x000 $x000 $x000 $x000 $x000 $x000 2010 2011 2012 2013 2014 2015 2010 - 2015
3A. Perimeter Sidewalk & Landscaping-FY09 250 250 XT XT
250 250
See description under line item 3.
Taxiway Expansion & Rehabilitation Program 4
5,700 1,900 1,900 1,900 FB FB FB FB 150 50 50 50 SB SB SB SB 150 50 50 50 XN XN XN XN
Provide new and expanded taxiways at various locations on the airfield to optimize aircraft movement; repair existing taxiways as necessary.
NC.0308 Taxiway Expansion & Rehabilitation Program 1
2,000 2,000 2,000 6,000
4A. Taxiway Expansion Program-FY06 515 515 FT FT
100 100 ST ST
100 100 XT XT
715 715
See description under line item 4.
4B. Taxiway Expansion Program-FY05 900 900 FT FT
100 100 ST ST
100 100 XT XT
1,100 1,100
See description under line item 4.
1 4 | C I T Y O F P H I L A D E L P H I A : T H E F Y 2 0 1 0 - 2 0 1 5 C A P I T A L P R O G R A M
$x000 $x000 $x000 $x000 $x000 $x000 $x000 2010 2011 2012 2013 2014 2015 2010 - 2015
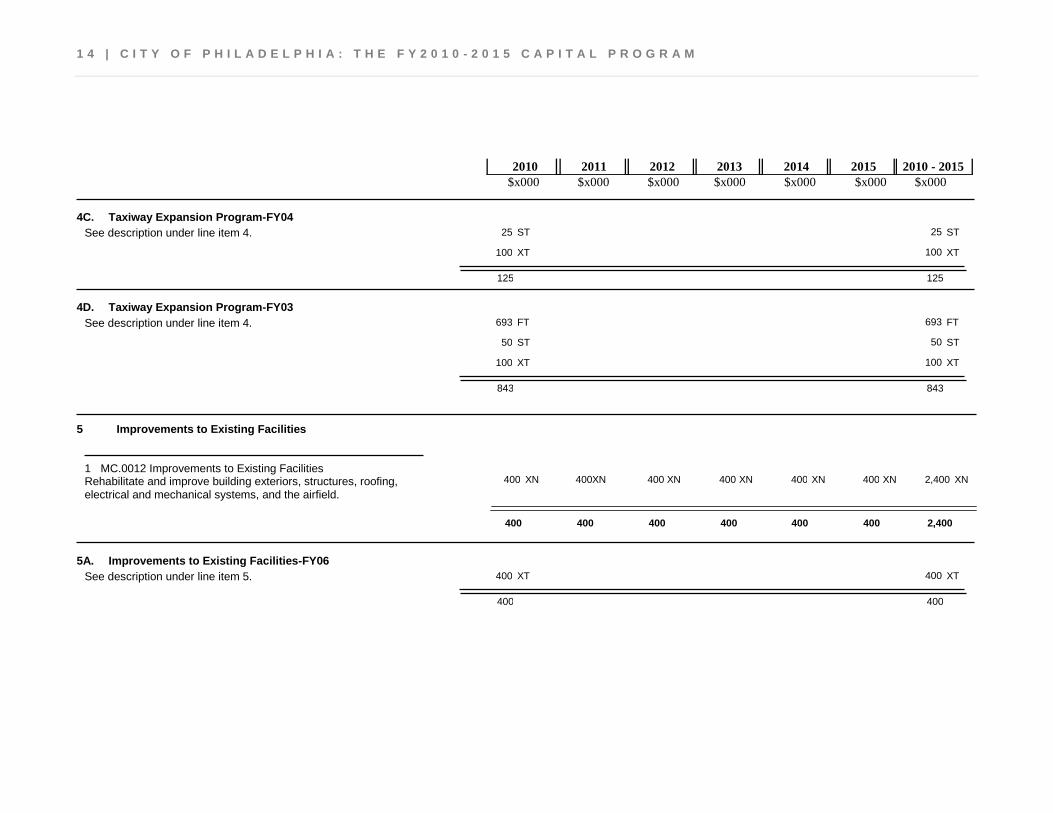
4C. Taxiway Expansion Program-FY04 25 25 ST ST
100 100 XT XT
125 125
See description under line item 4.
4D. Taxiway Expansion Program-FY03 693 693 FT FT
50 50 ST ST
100 100 XT XT
843 843
See description under line item 4.
Improvements to Existing Facilities 5
2,400 400 400 400 400 400 400 XN XN XN XN XN XN XN Rehabilitate and improve building exteriors, structures, roofing, electrical and mechanical systems, and the airfield.
MC.0012 Improvements to Existing Facilities 1
400 400 400 400 400 400 2,400
5A. Improvements to Existing Facilities-FY06 400 400 XT XT
400 400
See description under line item 5.
C I T Y O F P H I L A D E L P H I A : T H E F Y 2 0 1 0 - 2 0 1 5 C A P I T A L P R O G R A M | 1 5
$x000 $x000 $x000 $x000 $x000 $x000 $x000 2010 2011 2012 2013 2014 2015 2010 - 2015
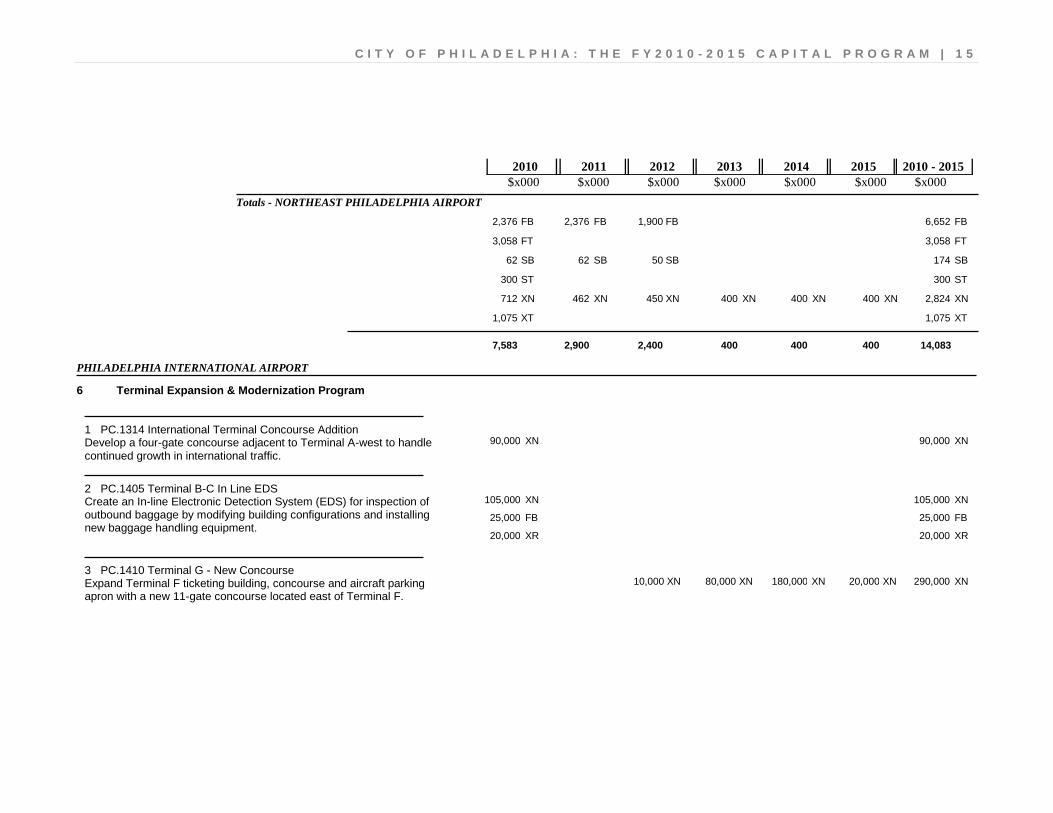
Totals - NORTHEAST PHILADELPHIA AIRPORT
1,900 2,376 2,376 FB FB FB 6,652 FB
3,058 FT 3,058 FT
50 62 62 SB SB SB 174 SB
300 ST 300 ST
400 450 462 712 400 400 XN XN XN XN XN XN 2,824 XN
1,075 XT 1,075 XT
400 400 400 2,400 2,900 7,583 14,083
PHILADELPHIA INTERNATIONAL AIRPORT
Terminal Expansion & Modernization Program 6
90,000 90,000 XN XN Develop a four-gate concourse adjacent to Terminal A-west to handle continued growth in international traffic.
PC.1314 International Terminal Concourse Addition 1
105,000 105,000 XN XN 25,000 25,000 FB FB 20,000 20,000 XR XR
Create an In-line Electronic Detection System (EDS) for inspection of outbound baggage by modifying building configurations and installing new baggage handling equipment.
PC.1405 Terminal B-C In Line EDS 2
290,000 20,000 180,000 80,000 10,000 XN XN XN XN XN Expand Terminal F ticketing building, concourse and aircraft parking apron with a new 11-gate concourse located east of Terminal F.
PC.1410 Terminal G - New Concourse 3
1 6 | C I T Y O F P H I L A D E L P H I A : T H E F Y 2 0 1 0 - 2 0 1 5 C A P I T A L P R O G R A M
$x000 $x000 $x000 $x000 $x000 $x000 $x000 2010 2011 2012 2013 2014 2015 2010 - 2015
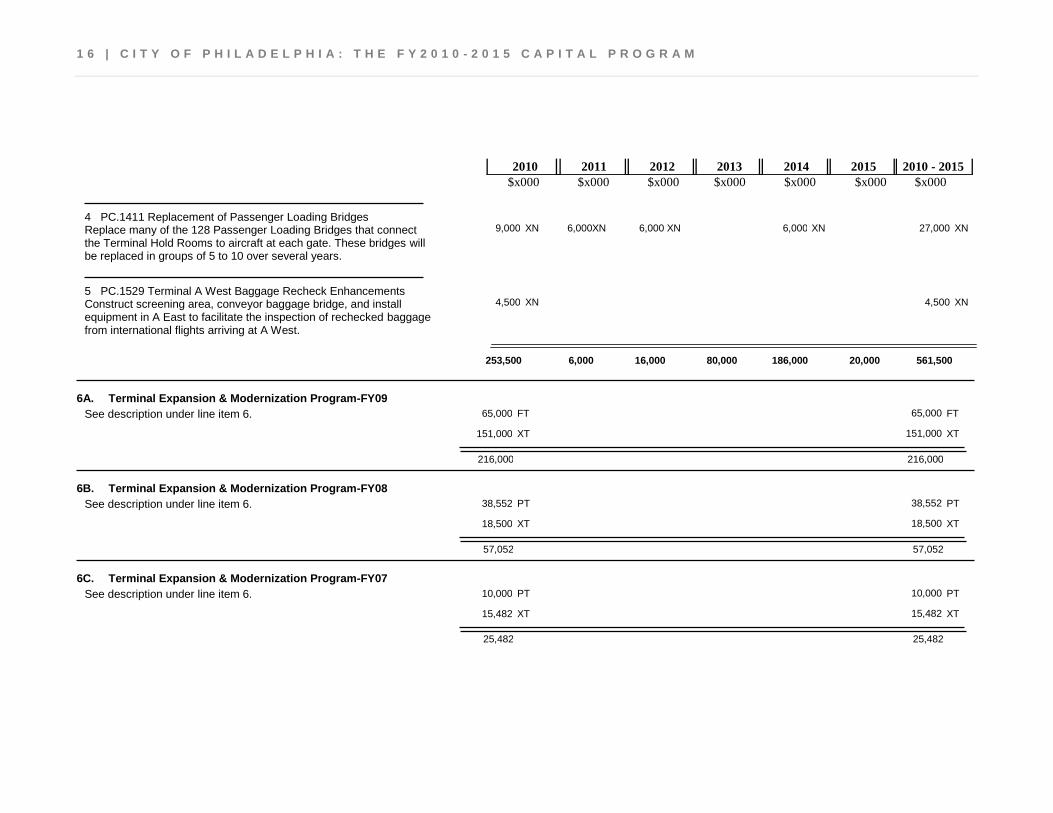
27,000 6,000 6,000 6,000 9,000 XN XN XN XN XN Replace many of the 128 Passenger Loading Bridges that connect the Terminal Hold Rooms to aircraft at each gate. These bridges will be replaced in groups of 5 to 10 over several years.
PC.1411 Replacement of Passenger Loading Bridges 4
4,500 4,500 XN XN Construct screening area, conveyor baggage bridge, and install equipment in A East to facilitate the inspection of rechecked baggage from international flights arriving at A West.
PC.1529 Terminal A West Baggage Recheck Enhancements 5
253,500 20,000 186,000 80,000 16,000 6,000 561,500
6A. Terminal Expansion & Modernization Program-FY09 65,000 65,000 FT FT
151,000 151,000 XT XT
216,000 216,000
See description under line item 6.
6B. Terminal Expansion & Modernization Program-FY08 38,552 38,552 PT PT
18,500 18,500 XT XT
57,052 57,052
See description under line item 6.
6C. Terminal Expansion & Modernization Program-FY07 10,000 10,000 PT PT
15,482 15,482 XT XT
25,482 25,482
See description under line item 6.
C I T Y O F P H I L A D E L P H I A : T H E F Y 2 0 1 0 - 2 0 1 5 C A P I T A L P R O G R A M | 1 7
$x000 $x000 $x000 $x000 $x000 $x000 $x000 2010 2011 2012 2013 2014 2015 2010 - 2015
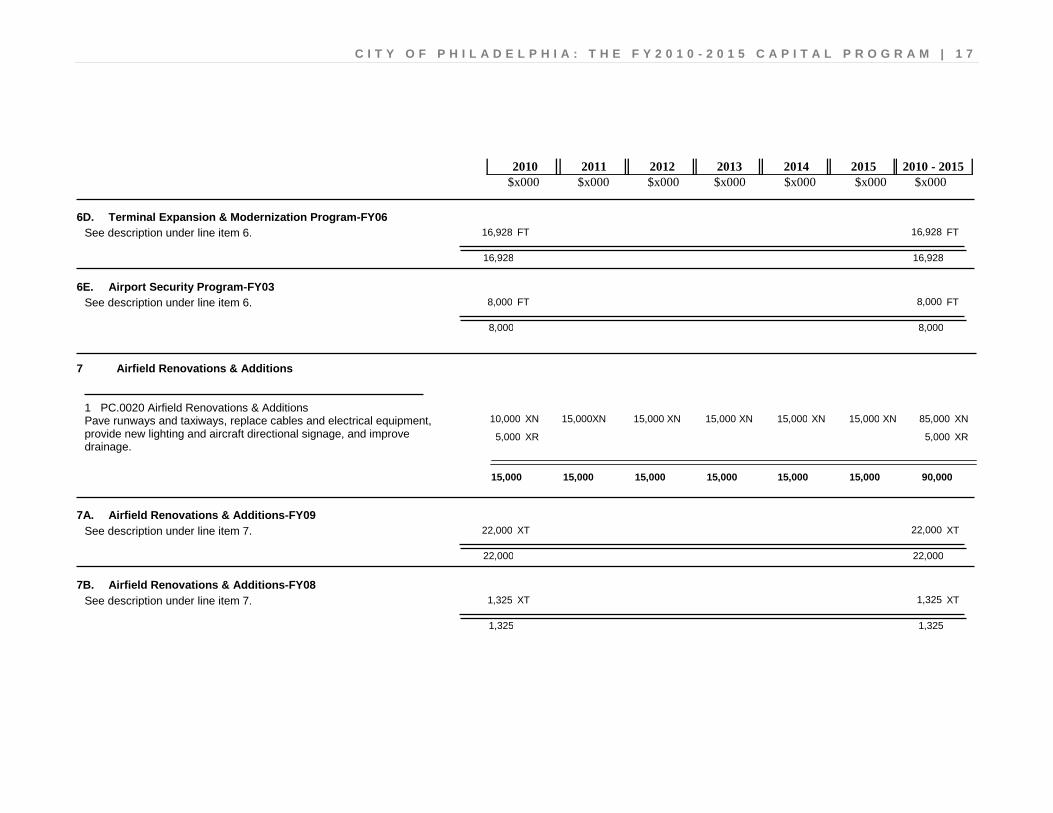
6D. Terminal Expansion & Modernization Program-FY06 16,928 16,928 FT FT
16,928 16,928
See description under line item 6.
6E. Airport Security Program-FY03 8,000 8,000 FT FT
8,000 8,000
See description under line item 6.
Airfield Renovations & Additions 7
85,000 15,000 15,000 15,000 15,000 15,000 10,000 XN XN XN XN XN XN XN 5,000 5,000 XR XR
Pave runways and taxiways, replace cables and electrical equipment, provide new lighting and aircraft directional signage, and improve drainage.
PC.0020 Airfield Renovations & Additions 1
15,000 15,000 15,000 15,000 15,000 15,000 90,000
7A. Airfield Renovations & Additions-FY09 22,000 22,000 XT XT
22,000 22,000
See description under line item 7.
7B. Airfield Renovations & Additions-FY08 1,325 1,325 XT XT
1,325 1,325
See description under line item 7.
1 8 | C I T Y O F P H I L A D E L P H I A : T H E F Y 2 0 1 0 - 2 0 1 5 C A P I T A L P R O G R A M
$x000 $x000 $x000 $x000 $x000 $x000 $x000 2010 2011 2012 2013 2014 2015 2010 - 2015
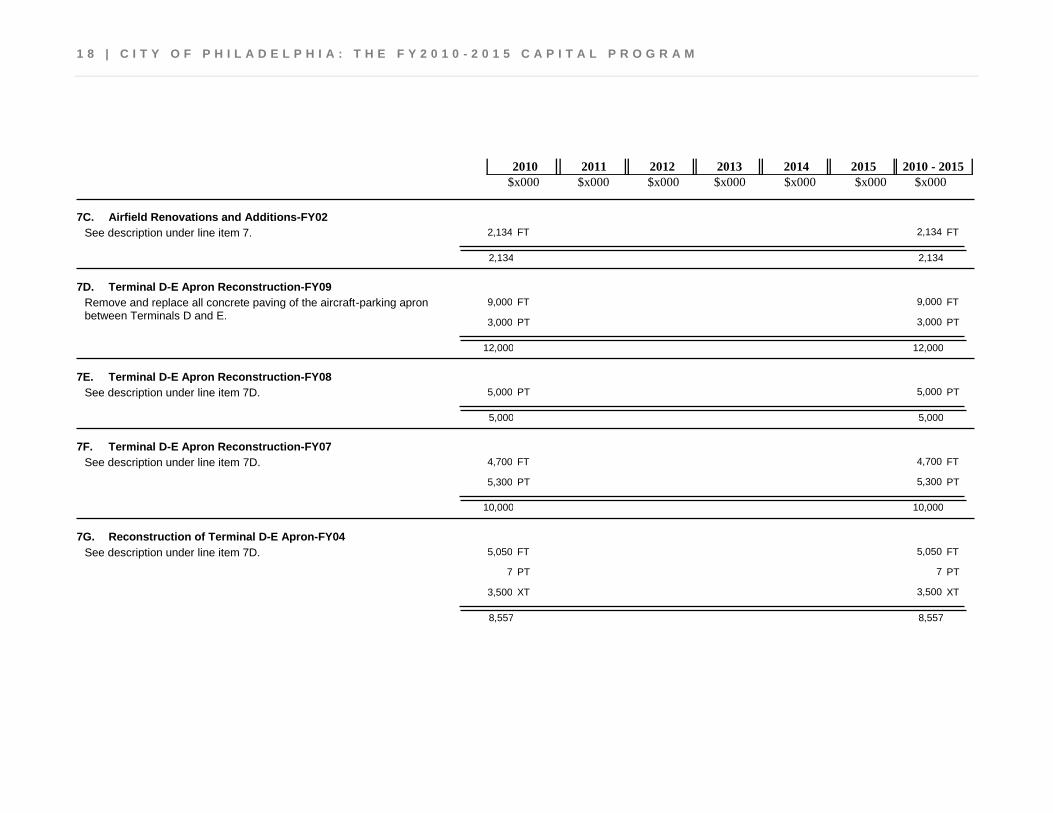
7C. Airfield Renovations and Additions-FY02 2,134 2,134 FT FT
2,134 2,134
See description under line item 7.
7D. Terminal D-E Apron Reconstruction-FY09 9,000 9,000 FT FT
3,000 3,000 PT PT
12,000 12,000
Remove and replace all concrete paving of the aircraft-parking apron between Terminals D and E.
7E. Terminal D-E Apron Reconstruction-FY08 5,000 5,000 PT PT
5,000 5,000
See description under line item 7D.
7F. Terminal D-E Apron Reconstruction-FY07 4,700 4,700 FT FT
5,300 5,300 PT PT
10,000 10,000
See description under line item 7D.
7G. Reconstruction of Terminal D-E Apron-FY04 5,050 5,050 FT FT
7 7 PT PT
3,500 3,500 XT XT
8,557 8,557
See description under line item 7D.
C I T Y O F P H I L A D E L P H I A : T H E F Y 2 0 1 0 - 2 0 1 5 C A P I T A L P R O G R A M | 1 9
$x000 $x000 $x000 $x000 $x000 $x000 $x000 2010 2011 2012 2013 2014 2015 2010 - 2015
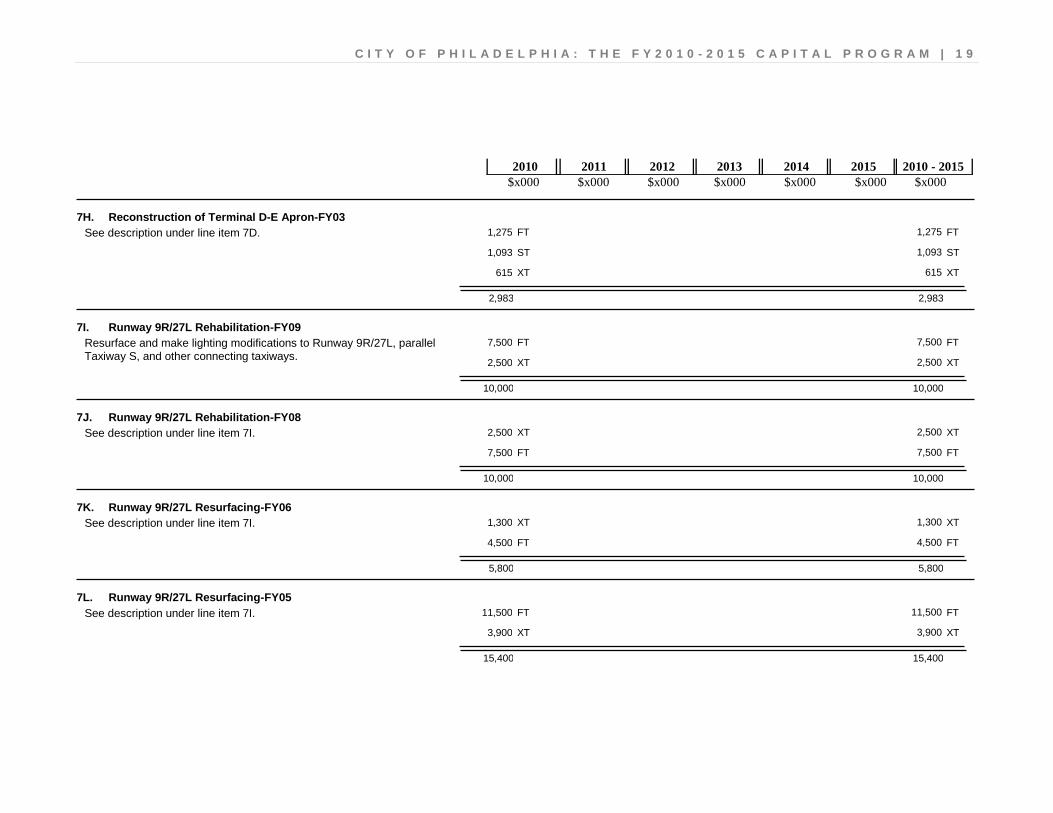
7H. Reconstruction of Terminal D-E Apron-FY03 1,275 1,275 FT FT
1,093 1,093 ST ST
615 615 XT XT
2,983 2,983
See description under line item 7D.
7I. Runway 9R/27L Rehabilitation-FY09 7,500 7,500 FT FT
2,500 2,500 XT XT
10,000 10,000
Resurface and make lighting modifications to Runway 9R/27L, parallel Taxiway S, and other connecting taxiways.
7J. Runway 9R/27L Rehabilitation-FY08 2,500 2,500 XT XT
7,500 7,500 FT FT
10,000 10,000
See description under line item 7I.
7K. Runway 9R/27L Resurfacing-FY06 1,300 1,300 XT XT
4,500 4,500 FT FT
5,800 5,800
See description under line item 7I.
7L. Runway 9R/27L Resurfacing-FY05 11,500 11,500 FT FT
3,900 3,900 XT XT
15,400 15,400
See description under line item 7I.
2 0 | C I T Y O F P H I L A D E L P H I A : T H E F Y 2 0 1 0 - 2 0 1 5 C A P I T A L P R O G R A M
$x000 $x000 $x000 $x000 $x000 $x000 $x000 2010 2011 2012 2013 2014 2015 2010 - 2015
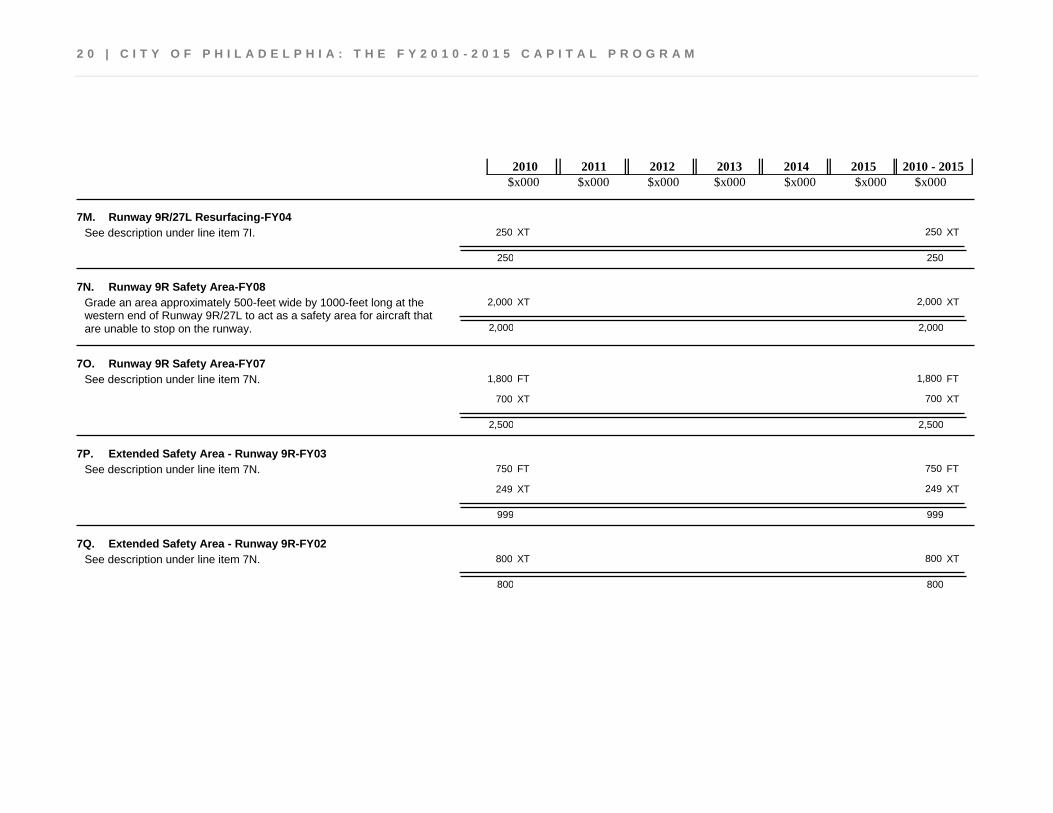
7M. Runway 9R/27L Resurfacing-FY04 250 250 XT XT
250 250
See description under line item 7I.
7N. Runway 9R Safety Area-FY08 2,000 2,000 XT XT
2,000 2,000
Grade an area approximately 500-feet wide by 1000-feet long at the western end of Runway 9R/27L to act as a safety area for aircraft that are unable to stop on the runway.
7O. Runway 9R Safety Area-FY07 1,800 1,800 FT FT
700 700 XT XT
2,500 2,500
See description under line item 7N.
7P. Extended Safety Area - Runway 9R-FY03 750 750 FT FT
249 249 XT XT
999 999
See description under line item 7N.
7Q. Extended Safety Area - Runway 9R-FY02 800 800 XT XT
800 800
See description under line item 7N.
C I T Y O F P H I L A D E L P H I A : T H E F Y 2 0 1 0 - 2 0 1 5 C A P I T A L P R O G R A M | 2 1
$x000 $x000 $x000 $x000 $x000 $x000 $x000 2010 2011 2012 2013 2014 2015 2010 - 2015
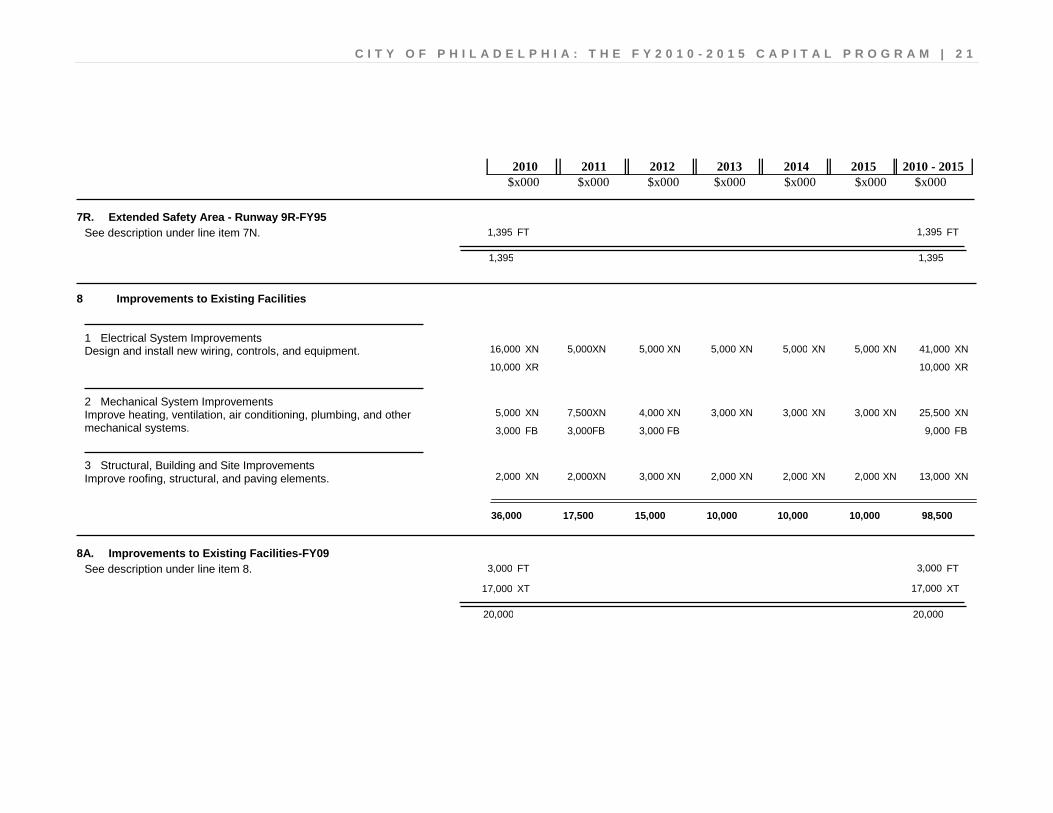
7R. Extended Safety Area - Runway 9R-FY95 1,395 1,395 FT FT
1,395 1,395
See description under line item 7N.
Improvements to Existing Facilities 8
41,000 5,000 5,000 5,000 5,000 5,000 16,000 XN XN XN XN XN XN XN 10,000 10,000 XR XR
Design and install new wiring, controls, and equipment. Electrical System Improvements 1
25,500 3,000 3,000 3,000 4,000 7,500 5,000 XN XN XN XN XN XN XN 9,000 3,000 3,000 3,000 FB FB FB FB
Improve heating, ventilation, air conditioning, plumbing, and other mechanical systems.
Mechanical System Improvements 2
13,000 2,000 2,000 2,000 3,000 2,000 2,000 XN XN XN XN XN XN XN Improve roofing, structural, and paving elements. Structural, Building and Site Improvements 3
36,000 10,000 10,000 10,000 15,000 17,500 98,500
8A. Improvements to Existing Facilities-FY09 3,000 3,000 FT FT
17,000 17,000 XT XT
20,000 20,000
See description under line item 8.
2 2 | C I T Y O F P H I L A D E L P H I A : T H E F Y 2 0 1 0 - 2 0 1 5 C A P I T A L P R O G R A M
$x000 $x000 $x000 $x000 $x000 $x000 $x000 2010 2011 2012 2013 2014 2015 2010 - 2015
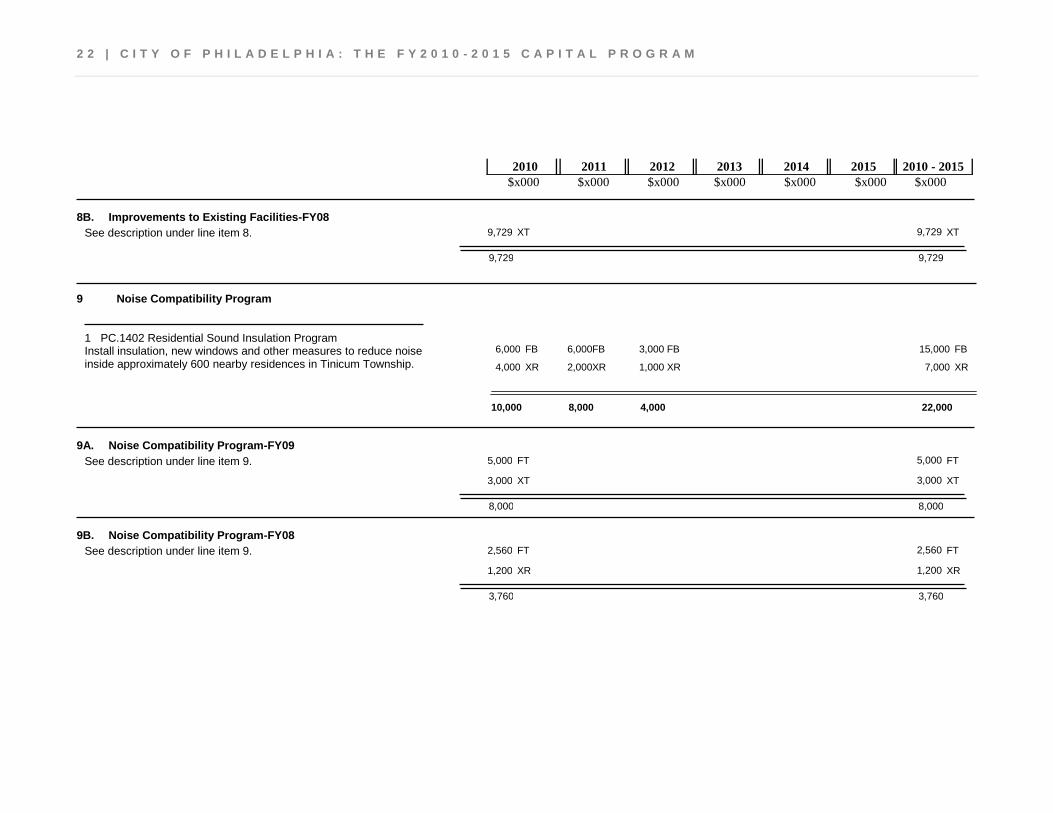
8B. Improvements to Existing Facilities-FY08 9,729 9,729 XT XT
9,729 9,729
See description under line item 8.
Noise Compatibility Program 9
15,000 3,000 6,000 6,000 FB FB FB FB 7,000 1,000 2,000 4,000 XR XR XR XR
Install insulation, new windows and other measures to reduce noise inside approximately 600 nearby residences in Tinicum Township.
PC.1402 Residential Sound Insulation Program 1
10,000 4,000 8,000 22,000
9A. Noise Compatibility Program-FY09 5,000 5,000 FT FT
3,000 3,000 XT XT
8,000 8,000
See description under line item 9.
9B. Noise Compatibility Program-FY08 2,560 2,560 FT FT
1,200 1,200 XR XR
3,760 3,760
See description under line item 9.
C I T Y O F P H I L A D E L P H I A : T H E F Y 2 0 1 0 - 2 0 1 5 C A P I T A L P R O G R A M | 2 3
$x000 $x000 $x000 $x000 $x000 $x000 $x000 2010 2011 2012 2013 2014 2015 2010 - 2015
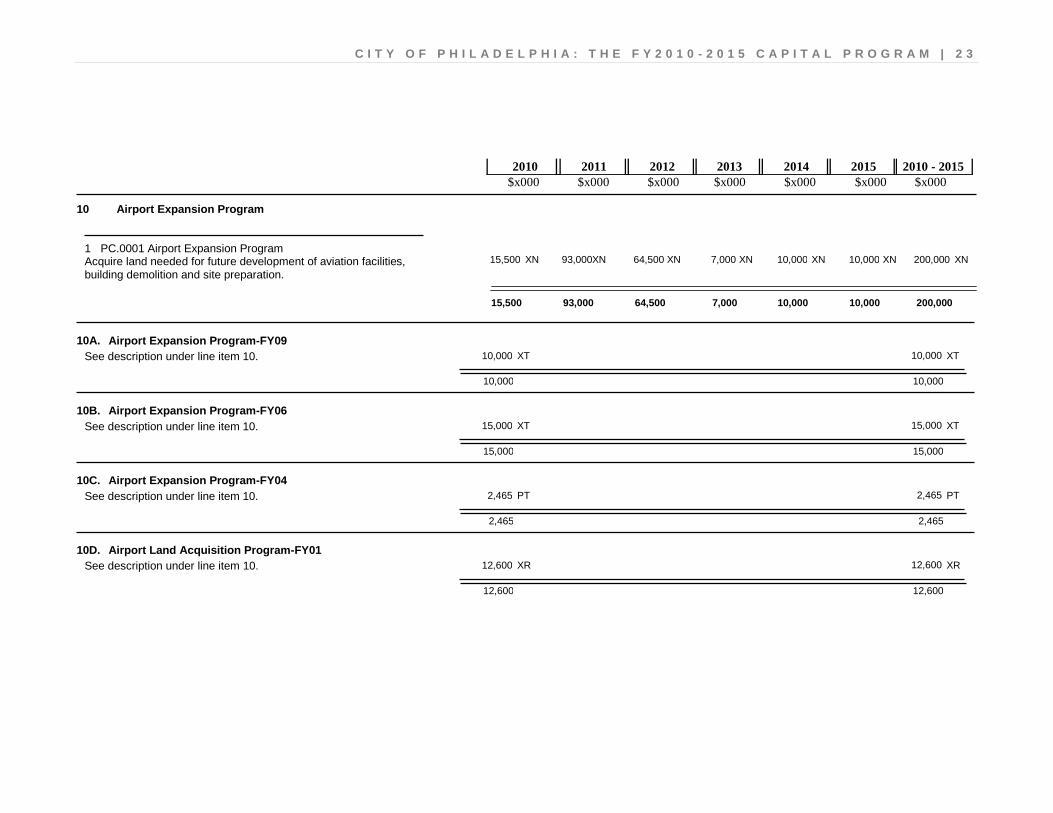
Airport Expansion Program 10
200,000 10,000 10,000 7,000 64,500 93,000 15,500 XN XN XN XN XN XN XN Acquire land needed for future development of aviation facilities, building demolition and site preparation.
PC.0001 Airport Expansion Program 1
15,500 10,000 10,000 7,000 64,500 93,000 200,000
10A. Airport Expansion Program-FY09 10,000 10,000 XT XT
10,000 10,000
See description under line item 10.
10B. Airport Expansion Program-FY06 15,000 15,000 XT XT
15,000 15,000
See description under line item 10.
10C. Airport Expansion Program-FY04 2,465 2,465 PT PT
2,465 2,465
See description under line item 10.
10D. Airport Land Acquisition Program-FY01 12,600 12,600 XR XR
12,600 12,600
See description under line item 10.
2 4 | C I T Y O F P H I L A D E L P H I A : T H E F Y 2 0 1 0 - 2 0 1 5 C A P I T A L P R O G R A M
$x000 $x000 $x000 $x000 $x000 $x000 $x000 2010 2011 2012 2013 2014 2015 2010 - 2015
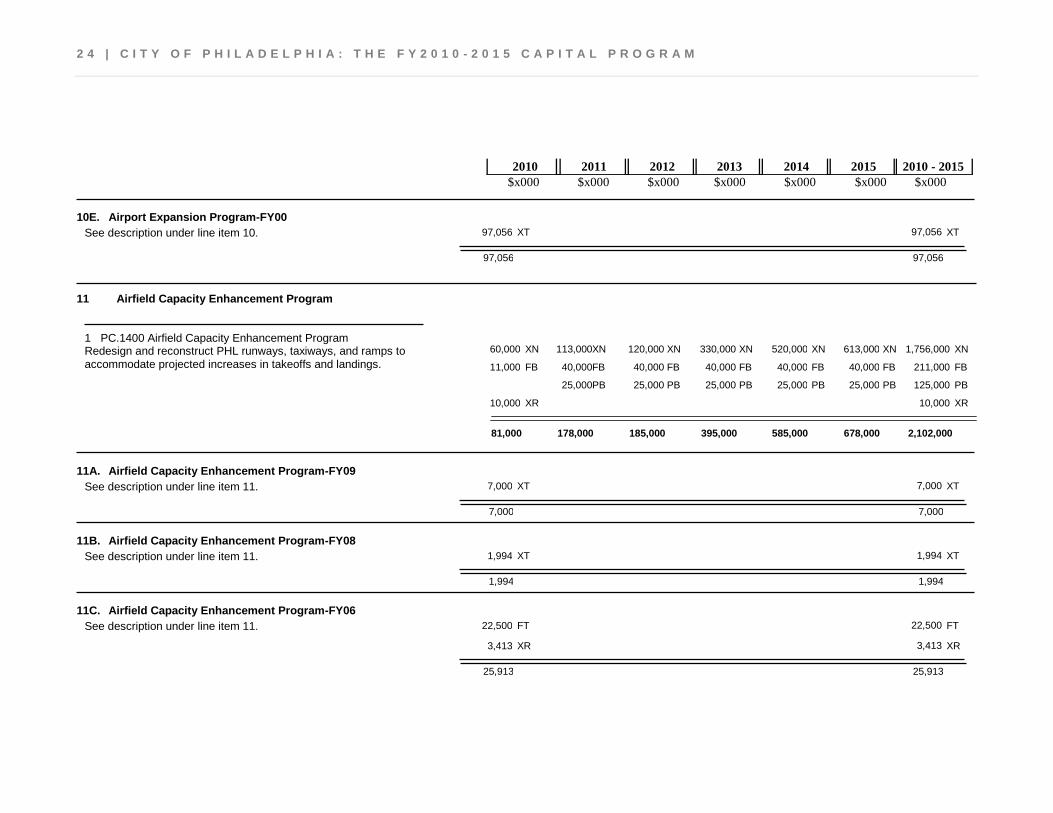
10E. Airport Expansion Program-FY00 97,056 97,056 XT XT
97,056 97,056
See description under line item 10.
Airfield Capacity Enhancement Program 11
1,756,000 613,000 520,000 330,000 120,000 113,000 60,000 XN XN XN XN XN XN XN 211,000 40,000 40,000 40,000 40,000 40,000 11,000 FB FB FB FB FB FB FB 125,000 25,000 25,000 25,000 25,000 25,000 PB PB PB PB PB PB 10,000 10,000 XR XR
Redesign and reconstruct PHL runways, taxiways, and ramps to accommodate projected increases in takeoffs and landings.
PC.1400 Airfield Capacity Enhancement Program 1
81,000 678,000 585,000 395,000 185,000 178,000 2,102,000
11A. Airfield Capacity Enhancement Program-FY09 7,000 7,000 XT XT
7,000 7,000
See description under line item 11.
11B. Airfield Capacity Enhancement Program-FY08 1,994 1,994 XT XT
1,994 1,994
See description under line item 11.
11C. Airfield Capacity Enhancement Program-FY06 22,500 22,500 FT FT
3,413 3,413 XR XR
25,913 25,913
See description under line item 11.
C I T Y O F P H I L A D E L P H I A : T H E F Y 2 0 1 0 - 2 0 1 5 C A P I T A L P R O G R A M | 2 5
$x000 $x000 $x000 $x000 $x000 $x000 $x000 2010 2011 2012 2013 2014 2015 2010 - 2015
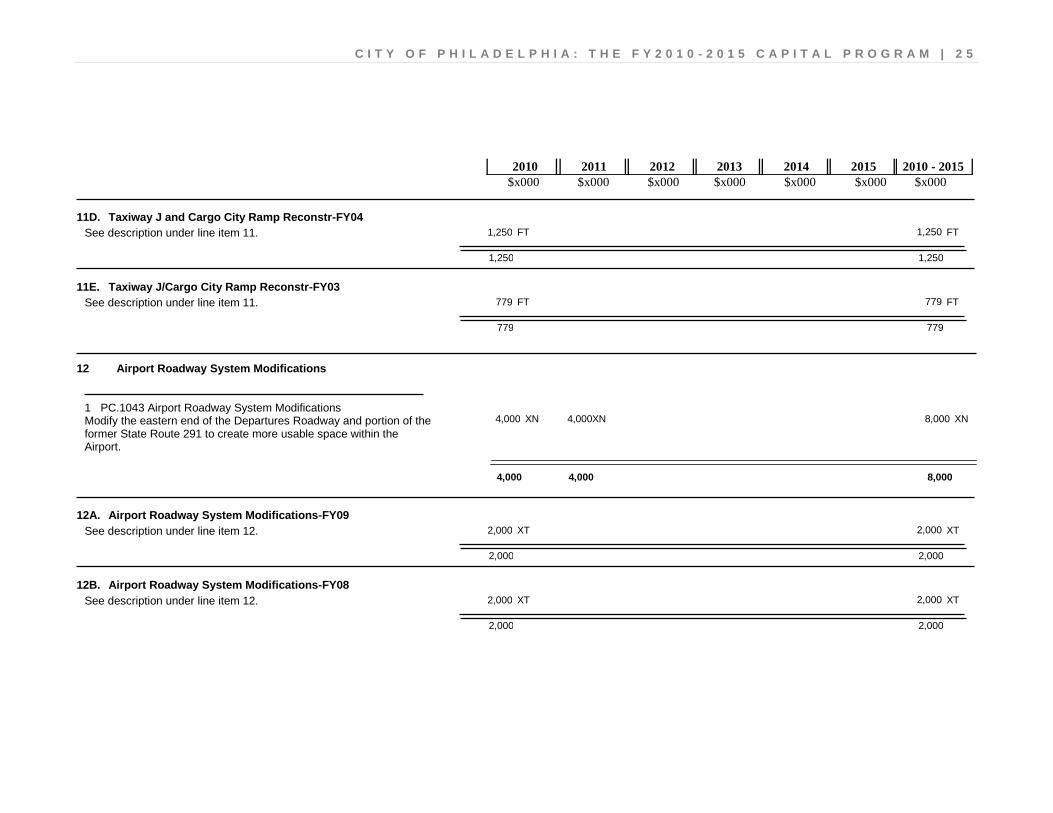
11D. Taxiway J and Cargo City Ramp Reconstr-FY04 1,250 1,250 FT FT
1,250 1,250
See description under line item 11.
11E. Taxiway J/Cargo City Ramp Reconstr-FY03 779 779 FT FT
779 779
See description under line item 11.
Airport Roadway System Modifications 12
8,000 4,000 4,000 XN XN XN Modify the eastern end of the Departures Roadway and portion of the former State Route 291 to create more usable space within the Airport.
PC.1043 Airport Roadway System Modifications 1
4,000 4,000 8,000
12A. Airport Roadway System Modifications-FY09 2,000 2,000 XT XT
2,000 2,000
See description under line item 12.
12B. Airport Roadway System Modifications-FY08 2,000 2,000 XT XT
2,000 2,000
See description under line item 12.
2 6 | C I T Y O F P H I L A D E L P H I A : T H E F Y 2 0 1 0 - 2 0 1 5 C A P I T A L P R O G R A M
$x000 $x000 $x000 $x000 $x000 $x000 $x000 2010 2011 2012 2013 2014 2015 2010 - 2015
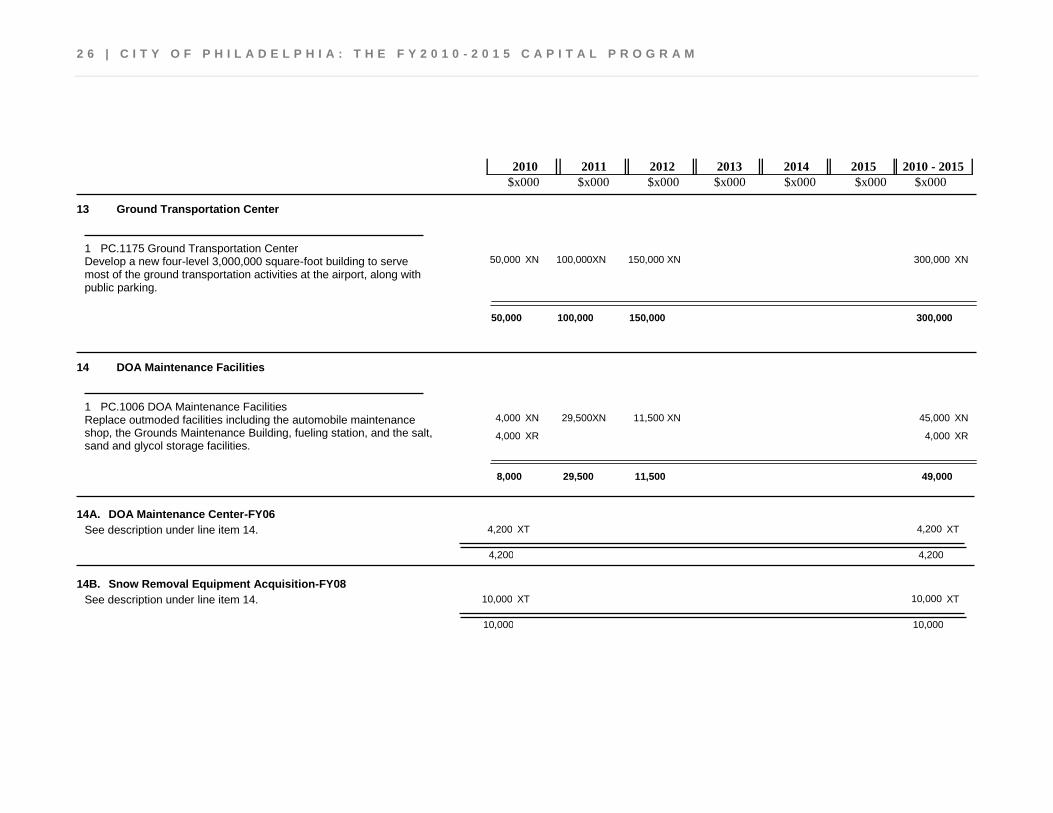
Ground Transportation Center 13
300,000 150,000 100,000 50,000 XN XN XN XN Develop a new four-level 3,000,000 square-foot building to serve most of the ground transportation activities at the airport, along with public parking.
PC.1175 Ground Transportation Center 1
50,000 150,000 100,000 300,000
DOA Maintenance Facilities 14
45,000 11,500 29,500 4,000 XN XN XN XN 4,000 4,000 XR XR
Replace outmoded facilities including the automobile maintenance shop, the Grounds Maintenance Building, fueling station, and the salt, sand and glycol storage facilities.
PC.1006 DOA Maintenance Facilities 1
8,000 11,500 29,500 49,000
14A. DOA Maintenance Center-FY06 4,200 4,200 XT XT
4,200 4,200
See description under line item 14.
14B. Snow Removal Equipment Acquisition-FY08 10,000 10,000 XT XT
10,000 10,000
See description under line item 14.
C I T Y O F P H I L A D E L P H I A : T H E F Y 2 0 1 0 - 2 0 1 5 C A P I T A L P R O G R A M | 2 7
$x000 $x000 $x000 $x000 $x000 $x000 $x000 2010 2011 2012 2013 2014 2015 2010 - 2015
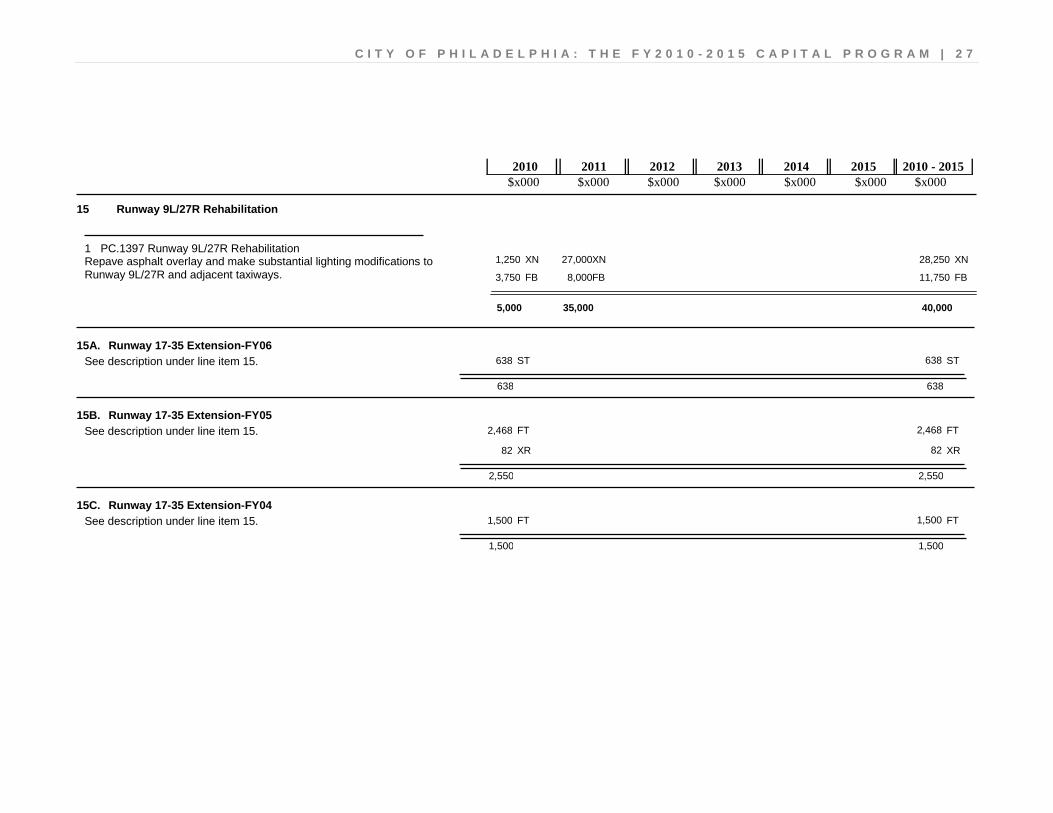
Runway 9L/27R Rehabilitation 15
28,250 27,000 1,250 XN XN XN 11,750 8,000 3,750 FB FB FB
Repave asphalt overlay and make substantial lighting modifications to Runway 9L/27R and adjacent taxiways.
PC.1397 Runway 9L/27R Rehabilitation 1
5,000 35,000 40,000
15A. Runway 17-35 Extension-FY06 638 638 ST ST
638 638
See description under line item 15.
15B. Runway 17-35 Extension-FY05 2,468 2,468 FT FT
82 82 XR XR
2,550 2,550
See description under line item 15.
15C. Runway 17-35 Extension-FY04 1,500 1,500 FT FT
1,500 1,500
See description under line item 15.
2 8 | C I T Y O F P H I L A D E L P H I A : T H E F Y 2 0 1 0 - 2 0 1 5 C A P I T A L P R O G R A M
$x000 $x000 $x000 $x000 $x000 $x000 $x000 2010 2011 2012 2013 2014 2015 2010 - 2015
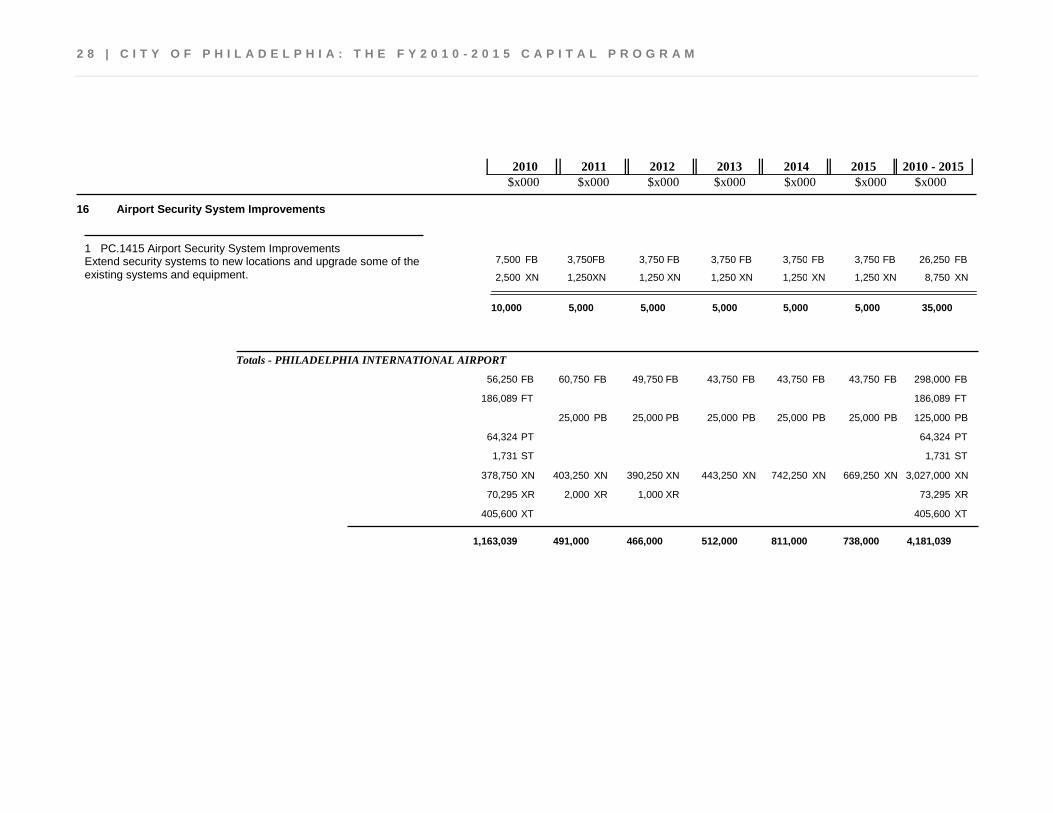
Airport Security System Improvements 16
26,250 3,750 3,750 3,750 3,750 3,750 7,500 FB FB FB FB FB FB FB 8,750 1,250 1,250 1,250 1,250 1,250 2,500 XN XN XN XN XN XN XN
Extend security systems to new locations and upgrade some of the existing systems and equipment.
PC.1415 Airport Security System Improvements 1
10,000 5,000 5,000 5,000 5,000 5,000 35,000
Totals - PHILADELPHIA INTERNATIONAL AIRPORT
43,750 49,750 60,750 56,250 43,750 43,750 FB FB FB FB FB FB 298,000 FB
186,089 FT 186,089 FT
25,000 25,000 25,000 25,000 25,000 PB PB PB PB PB 125,000 PB
64,324 PT 64,324 PT
1,731 ST 1,731 ST
443,250 390,250 403,250 378,750 742,250 669,250 XN XN XN XN XN XN 3,027,000 XN
1,000 2,000 70,295 XR XR XR 73,295 XR
405,600 XT 405,600 XT
738,000 811,000 512,000 466,000 491,000 1,163,039 4,181,039

C I T Y O F P H I L A D E L P H I A : T H E F Y 2 0 1 0 - 2 0 1 5 C A P I T A L P R O G R A M | 2 9
$x000 $x000 $x000 $x000 $x000 $x000 $x000 2010 2011 2012 2013 2014 2015 2010 - 2015
TOTALS - AVIATION
43,750 51,650 63,126 58,626 43,750 43,750 FB FB FB FB FB FB 304,652 FB
189,147 FT 189,147 FT
25,000 25,000 25,000 25,000 25,000 PB PB PB PB PB 125,000 PB
64,324 PT 64,324 PT
50 62 62 SB SB SB 174 SB
2,031 ST 2,031 ST
443,650 390,700 403,712 379,462 742,650 669,650 XN XN XN XN XN XN 3,029,824 XN
1,000 2,000 70,295 XR XR XR 73,295 XR
406,675 XT 406,675 XT
738,400 811,400 512,400 468,400 493,900 1,170,622 4,195,122
3 0 | C I T Y O F P H I L A D E L P H I A : T H E F Y 2 0 1 0 - 2 0 1 5 C A P I T A L P R O G R A M
C I T Y O F P H I L A D E L P H I A : T H E F Y 2 0 1 0 - 2 0 1 5 C A P I T A L P R O G R A M | 3 1
$x000 $x000 $x000 $x000 $x000 $x000 $x000 2010 2011 2012 2013 2014 2015 2010 - 2015
COMMERCE
COMMERCIAL DEVELOPMENT
Neighborhood Commercial Centers - Site Improvements 17
7,500 1,500 1,000 1,000 1,000 1,000 2,000 SB SB SB SB SB SB SB 6,550 1,550 1,000 1,000 1,000 1,000 1,000 FB FB FB FB FB FB FB
6,000 1,500 1,500 1,500 1,500 CN CN CN CN CN
Upgrade curbs, sidewalks, lighting, landscaping and parking in commercial corridors to complement public and private reinvestment.
Neighborhood Commercial Centers - Site Improvements 1
3,000 4,550 3,500 3,500 3,500 2,000 20,050
17A. Neighborhood Commercial Centers - Site Improvements-FY09 10,000 10,000 FT FT
8,000 8,000 ST ST
18,000 18,000 TT TT
36,000 36,000
See description under line item 17.
17B. Neighborhood Commercial Centers - Site Improvements-FY08 9,753 9,753 FT FT
8,000 8,000 ST ST
16,000 16,000 TT TT
33,753 33,753
See description under line item 17.
3 2 | C I T Y O F P H I L A D E L P H I A : T H E F Y 2 0 1 0 - 2 0 1 5 C A P I T A L P R O G R A M
$x000 $x000 $x000 $x000 $x000 $x000 $x000 2010 2011 2012 2013 2014 2015 2010 - 2015
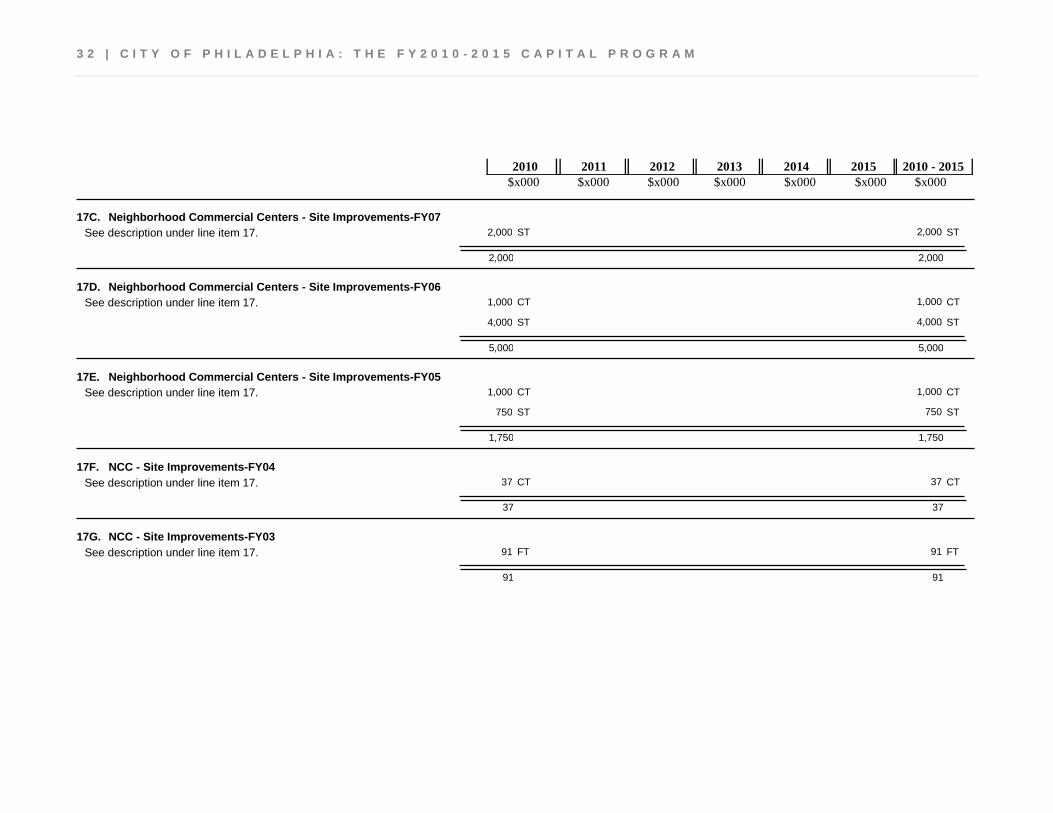
17C. Neighborhood Commercial Centers - Site Improvements-FY07 2,000 2,000 ST ST
2,000 2,000
See description under line item 17.
17D. Neighborhood Commercial Centers - Site Improvements-FY06 1,000 1,000 CT CT
4,000 4,000 ST ST
5,000 5,000
See description under line item 17.
17E. Neighborhood Commercial Centers - Site Improvements-FY05 1,000 1,000 CT CT
750 750 ST ST
1,750 1,750
See description under line item 17.
17F. NCC - Site Improvements-FY04 37 37 CT CT
37 37
See description under line item 17.
17G. NCC - Site Improvements-FY03 91 91 FT FT
91 91
See description under line item 17.
C I T Y O F P H I L A D E L P H I A : T H E F Y 2 0 1 0 - 2 0 1 5 C A P I T A L P R O G R A M | 3 3
$x000 $x000 $x000 $x000 $x000 $x000 $x000 2010 2011 2012 2013 2014 2015 2010 - 2015
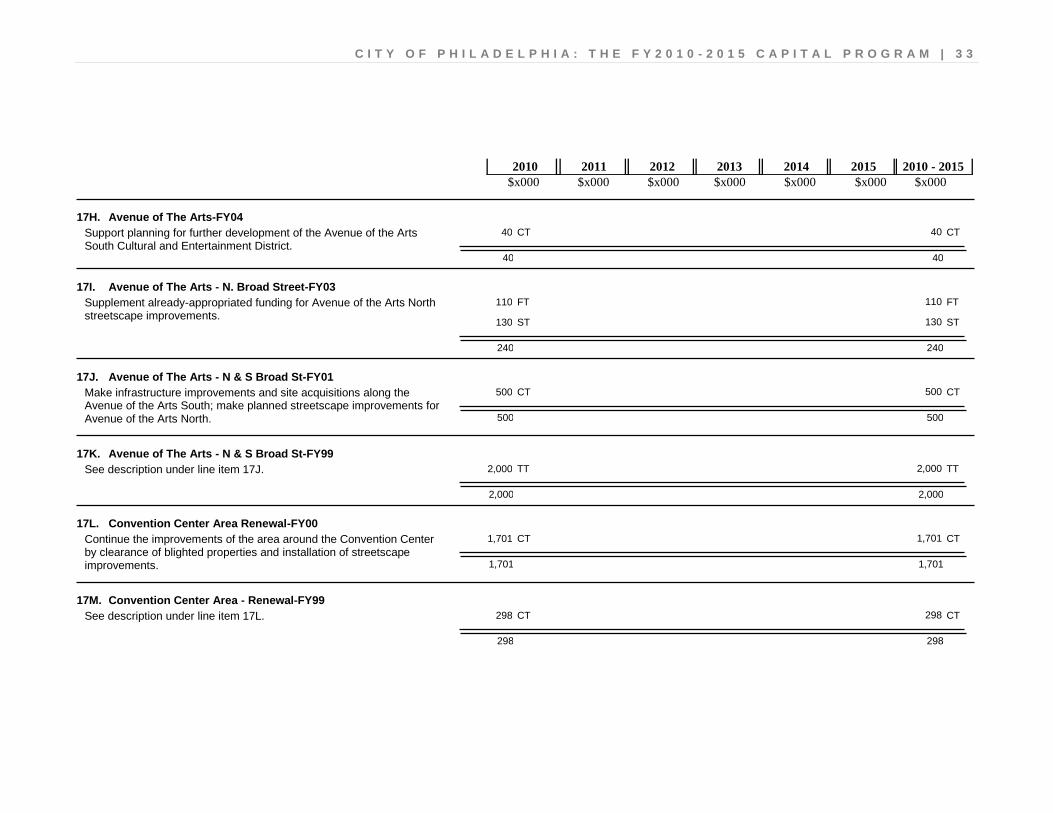
17H. Avenue of The Arts-FY04 40 40 CT CT
40 40
Support planning for further development of the Avenue of the Arts South Cultural and Entertainment District.
17I. Avenue of The Arts - N. Broad Street-FY03 110 110 FT FT
130 130 ST ST
240 240
Supplement already-appropriated funding for Avenue of the Arts North streetscape improvements.
17J. Avenue of The Arts - N & S Broad St-FY01 500 500 CT CT
500 500
Make infrastructure improvements and site acquisitions along the Avenue of the Arts South; make planned streetscape improvements for Avenue of the Arts North.
17K. Avenue of The Arts - N & S Broad St-FY99 2,000 2,000 TT TT
2,000 2,000
See description under line item 17J.
17L. Convention Center Area Renewal-FY00 1,701 1,701 CT CT
1,701 1,701
Continue the improvements of the area around the Convention Center by clearance of blighted properties and installation of streetscape improvements.
17M. Convention Center Area - Renewal-FY99 298 298 CT CT
298 298
See description under line item 17L.
3 4 | C I T Y O F P H I L A D E L P H I A : T H E F Y 2 0 1 0 - 2 0 1 5 C A P I T A L P R O G R A M
$x000 $x000 $x000 $x000 $x000 $x000 $x000 2010 2011 2012 2013 2014 2015 2010 - 2015
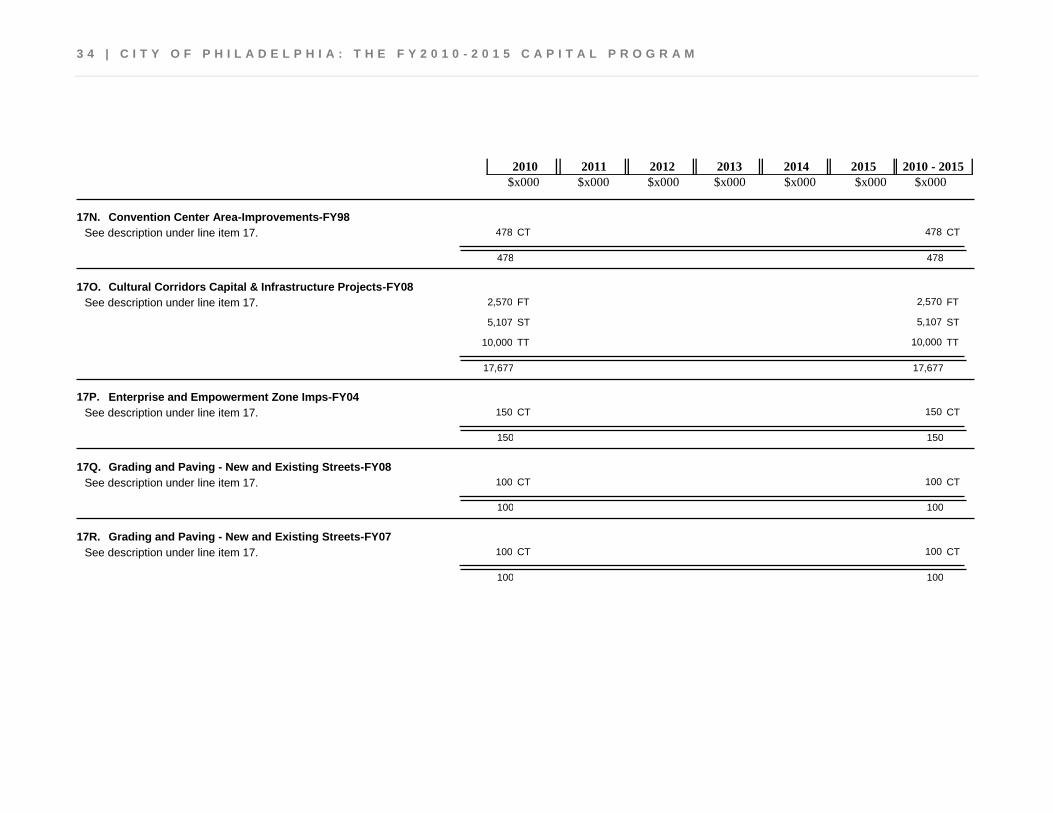
17N. Convention Center Area-Improvements-FY98 478 478 CT CT
478 478
See description under line item 17.
17O. Cultural Corridors Capital & Infrastructure Projects-FY08 2,570 2,570 FT FT
5,107 5,107 ST ST
10,000 10,000 TT TT
17,677 17,677
See description under line item 17.
17P. Enterprise and Empowerment Zone Imps-FY04 150 150 CT CT
150 150
See description under line item 17.
17Q. Grading and Paving - New and Existing Streets-FY08 100 100 CT CT
100 100
See description under line item 17.
17R. Grading and Paving - New and Existing Streets-FY07 100 100 CT CT
100 100
See description under line item 17.
C I T Y O F P H I L A D E L P H I A : T H E F Y 2 0 1 0 - 2 0 1 5 C A P I T A L P R O G R A M | 3 5
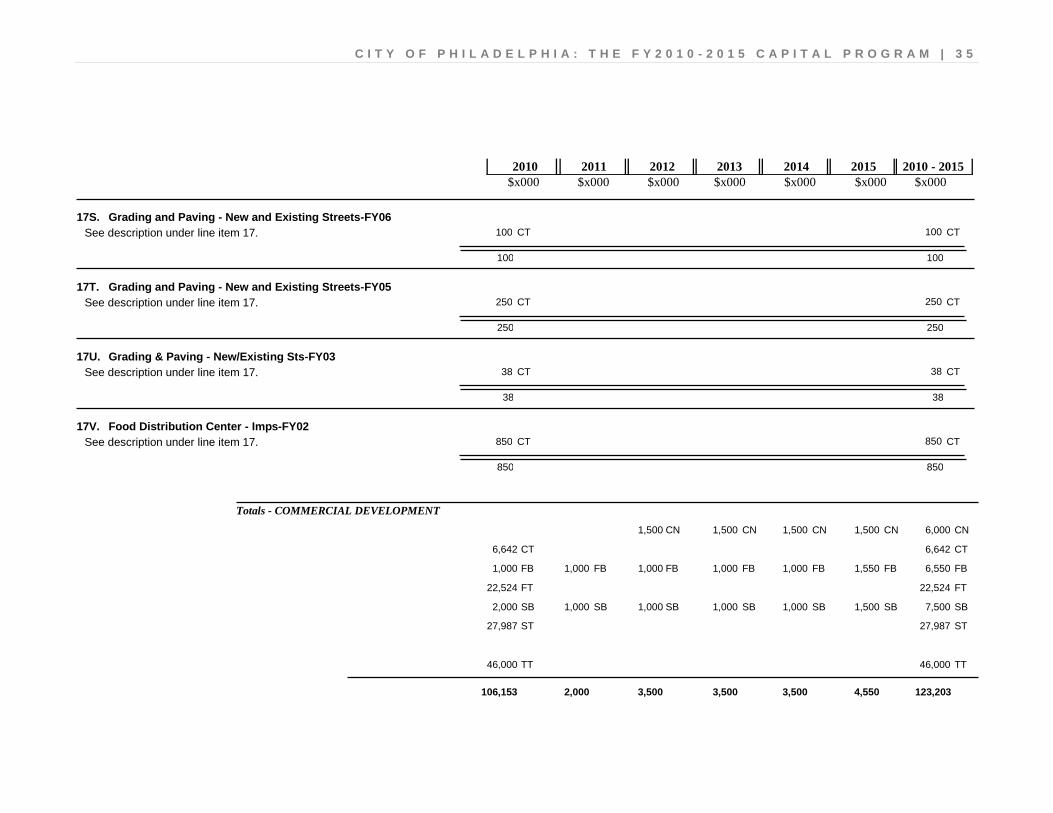
$x000 $x000 $x000 $x000 $x000 $x000 $x000 2010 2011 2012 2013 2014 2015 2010 - 2015
17S. Grading and Paving - New and Existing Streets-FY06 100 100 CT CT
100 100
See description under line item 17.
17T. Grading and Paving - New and Existing Streets-FY05 250 250 CT CT
250 250
See description under line item 17.
17U. Grading & Paving - New/Existing Sts-FY03 38 38 CT CT
38 38
See description under line item 17.
17V. Food Distribution Center - Imps-FY02 850 850 CT CT
850 850
See description under line item 17.
Totals - COMMERCIAL DEVELOPMENT
1,500 1,500 1,500 1,500 CN CN CN CN 6,000 CN
6,642 CT 6,642 CT
1,000 1,000 1,000 1,000 1,000 1,550 FB FB FB FB FB FB 6,550 FB
22,524 FT 22,524 FT
1,000 1,000 1,000 2,000 1,000 1,500 SB SB SB SB SB SB 7,500 SB
27,987 ST 27,987 ST
46,000 TT 46,000 TT
4,550 3,500 3,500 3,500 2,000 106,153 123,203
3 6 | C I T Y O F P H I L A D E L P H I A : T H E F Y 2 0 1 0 - 2 0 1 5 C A P I T A L P R O G R A M
$x000 $x000 $x000 $x000 $x000 $x000 $x000 2010 2011 2012 2013 2014 2015 2010 - 2015
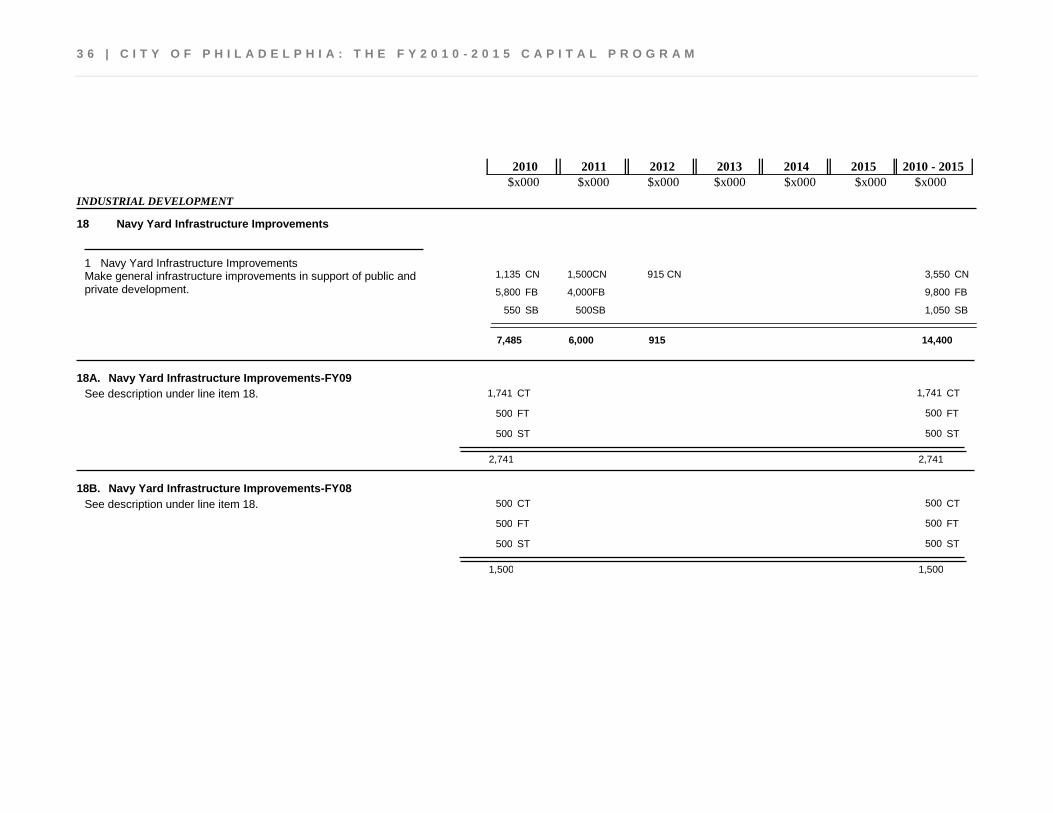
INDUSTRIAL DEVELOPMENT
Navy Yard Infrastructure Improvements 18
3,550 915 1,500 1,135 CN CN CN CN 9,800 4,000 5,800 FB FB FB 1,050 500 550 SB SB SB
Make general infrastructure improvements in support of public and private development.
Navy Yard Infrastructure Improvements 1
7,485 915 6,000 14,400
18A. Navy Yard Infrastructure Improvements-FY09 1,741 1,741 CT CT
500 500 FT FT
500 500 ST ST
2,741 2,741
See description under line item 18.
18B. Navy Yard Infrastructure Improvements-FY08 500 500 CT CT
500 500 FT FT
500 500 ST ST
1,500 1,500
See description under line item 18.
C I T Y O F P H I L A D E L P H I A : T H E F Y 2 0 1 0 - 2 0 1 5 C A P I T A L P R O G R A M | 3 7
$x000 $x000 $x000 $x000 $x000 $x000 $x000 2010 2011 2012 2013 2014 2015 2010 - 2015
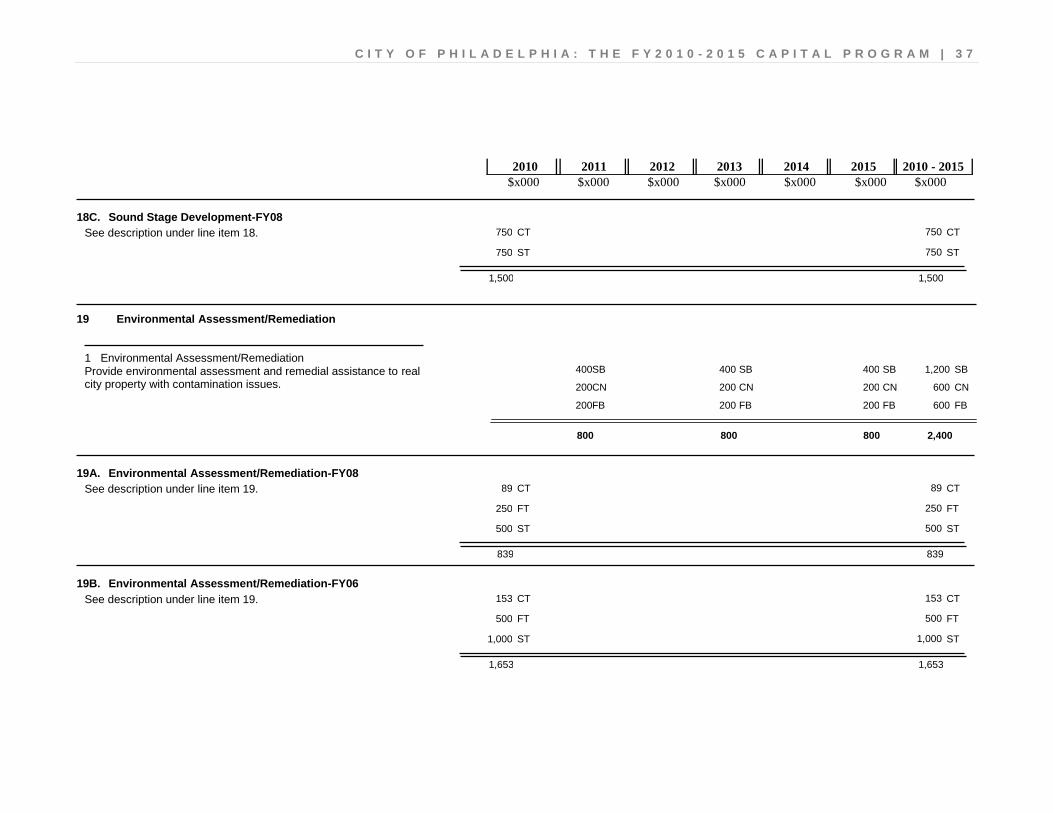
18C. Sound Stage Development-FY08 750 750 CT CT
750 750 ST ST
1,500 1,500
See description under line item 18.
Environmental Assessment/Remediation 19
1,200 400 400 400 SB SB SB SB 600 200 200 200 CN CN CN CN 600 200 200 200 FB FB FB FB
Provide environmental assessment and remedial assistance to real city property with contamination issues.
Environmental Assessment/Remediation 1
800 800 800 2,400
19A. Environmental Assessment/Remediation-FY08 89 89 CT CT
250 250 FT FT
500 500 ST ST
839 839
See description under line item 19.
19B. Environmental Assessment/Remediation-FY06 153 153 CT CT
500 500 FT FT
1,000 1,000 ST ST
1,653 1,653
See description under line item 19.
3 8 | C I T Y O F P H I L A D E L P H I A : T H E F Y 2 0 1 0 - 2 0 1 5 C A P I T A L P R O G R A M
$x000 $x000 $x000 $x000 $x000 $x000 $x000 2010 2011 2012 2013 2014 2015 2010 - 2015
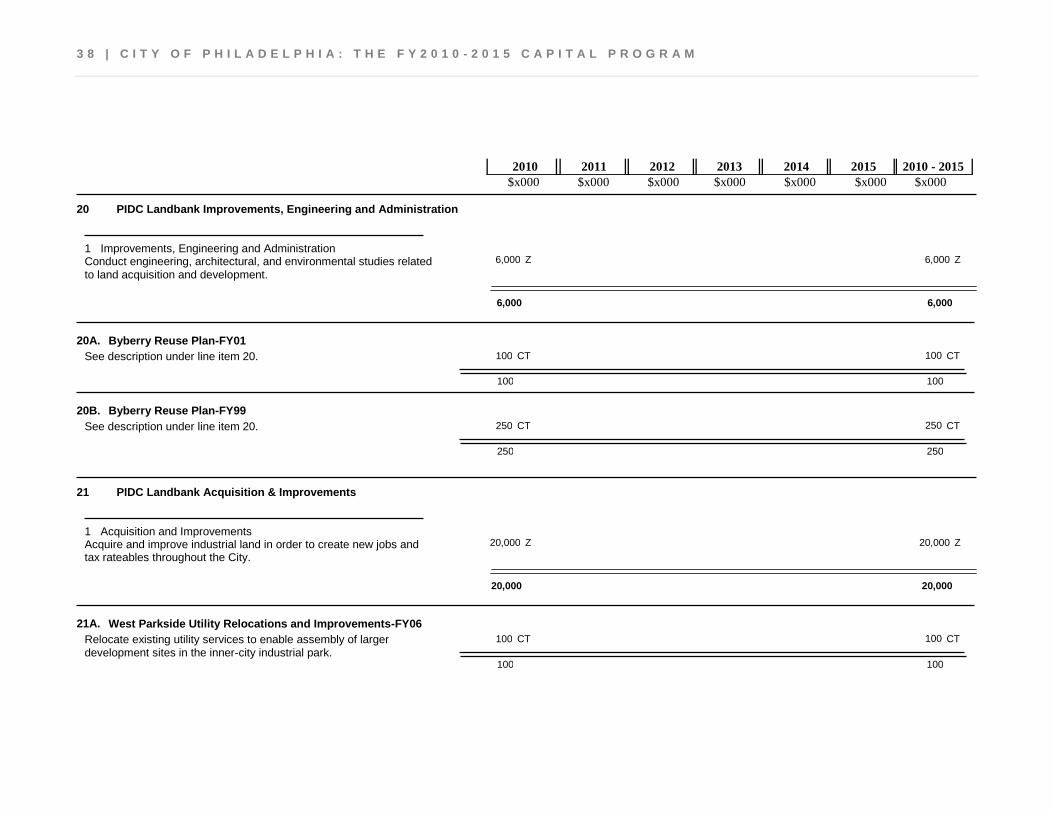
PIDC Landbank Improvements, Engineering and Administration 20
6,000 6,000 Z Z Conduct engineering, architectural, and environmental studies related to land acquisition and development.
Improvements, Engineering and Administration 1
6,000 6,000
20A. Byberry Reuse Plan-FY01 100 100 CT CT
100 100
See description under line item 20.
20B. Byberry Reuse Plan-FY99 250 250 CT CT
250 250
See description under line item 20.
PIDC Landbank Acquisition & Improvements 21
20,000 20,000 Z Z Acquire and improve industrial land in order to create new jobs and tax rateables throughout the City.
Acquisition and Improvements 1
20,000 20,000
21A. West Parkside Utility Relocations and Improvements-FY06 100 100 CT CT
100 100
Relocate existing utility services to enable assembly of larger development sites in the inner-city industrial park.

C I T Y O F P H I L A D E L P H I A : T H E F Y 2 0 1 0 - 2 0 1 5 C A P I T A L P R O G R A M | 3 9
$x000 $x000 $x000 $x000 $x000 $x000 $x000 2010 2011 2012 2013 2014 2015 2010 - 2015
21B. West Parkside Utility Relocations and Improvements-FY05 225 225 CT CT
225 225
See description under line item 21A.
Totals - INDUSTRIAL DEVELOPMENT
200 915 1,700 1,135 200 CN CN CN CN CN 4,150 CN
3,908 CT 3,908 CT
200 4,200 5,800 200 FB FB FB FB 10,400 FB
1,750 FT 1,750 FT
400 900 550 400 SB SB SB SB 2,250 SB
3,250 ST 3,250 ST
26,000 Z 26,000 Z
800 800 915 6,800 42,393 51,708
4 0 | C I T Y O F P H I L A D E L P H I A : T H E F Y 2 0 1 0 - 2 0 1 5 C A P I T A L P R O G R A M
$x000 $x000 $x000 $x000 $x000 $x000 $x000 2010 2011 2012 2013 2014 2015 2010 - 2015
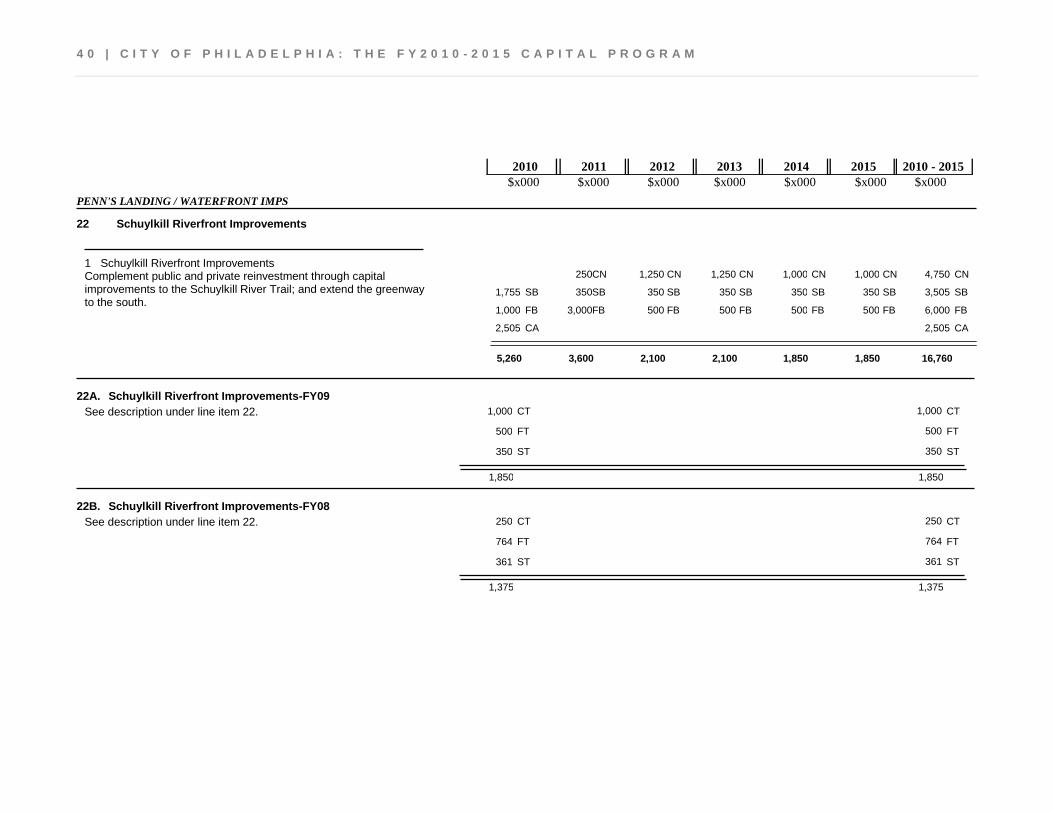
PENN'S LANDING / WATERFRONT IMPS
Schuylkill Riverfront Improvements 22
4,750 1,000 1,000 1,250 1,250 250 CN CN CN CN CN CN 3,505 350 350 350 350 350 1,755 SB SB SB SB SB SB SB 6,000 500 500 500 500 3,000 1,000 FB FB FB FB FB FB FB 2,505 2,505 CA CA
Complement public and private reinvestment through capital improvements to the Schuylkill River Trail; and extend the greenway to the south.
Schuylkill Riverfront Improvements 1
5,260 1,850 1,850 2,100 2,100 3,600 16,760
22A. Schuylkill Riverfront Improvements-FY09 1,000 1,000 CT CT
500 500 FT FT
350 350 ST ST
1,850 1,850
See description under line item 22.
22B. Schuylkill Riverfront Improvements-FY08 250 250 CT CT
764 764 FT FT
361 361 ST ST
1,375 1,375
See description under line item 22.
C I T Y O F P H I L A D E L P H I A : T H E F Y 2 0 1 0 - 2 0 1 5 C A P I T A L P R O G R A M | 4 1
$x000 $x000 $x000 $x000 $x000 $x000 $x000 2010 2011 2012 2013 2014 2015 2010 - 2015
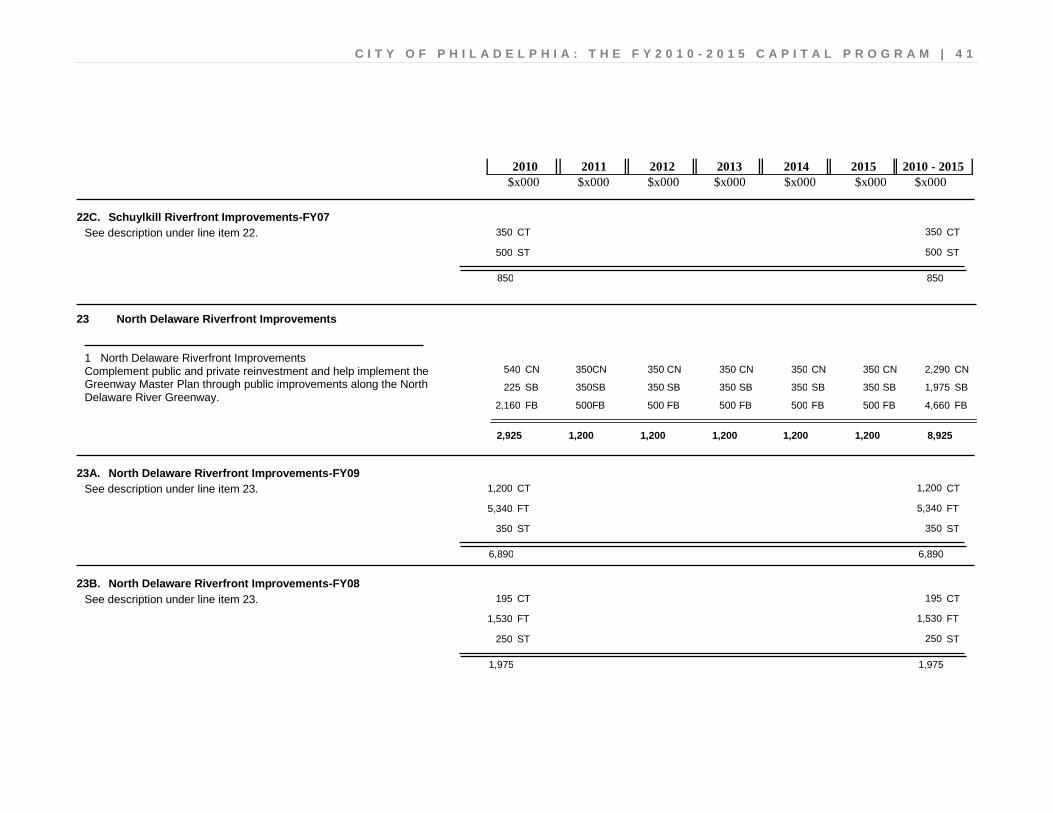
22C. Schuylkill Riverfront Improvements-FY07 350 350 CT CT
500 500 ST ST
850 850
See description under line item 22.
North Delaware Riverfront Improvements 23
2,290 350 350 350 350 350 540 CN CN CN CN CN CN CN 1,975 350 350 350 350 350 225 SB SB SB SB SB SB SB 4,660 500 500 500 500 500 2,160 FB FB FB FB FB FB FB
Complement public and private reinvestment and help implement the Greenway Master Plan through public improvements along the North Delaware River Greenway.
North Delaware Riverfront Improvements 1
2,925 1,200 1,200 1,200 1,200 1,200 8,925
23A. North Delaware Riverfront Improvements-FY09 1,200 1,200 CT CT
5,340 5,340 FT FT
350 350 ST ST
6,890 6,890
See description under line item 23.
23B. North Delaware Riverfront Improvements-FY08 195 195 CT CT
1,530 1,530 FT FT
250 250 ST ST
1,975 1,975
See description under line item 23.
4 2 | C I T Y O F P H I L A D E L P H I A : T H E F Y 2 0 1 0 - 2 0 1 5 C A P I T A L P R O G R A M
$x000 $x000 $x000 $x000 $x000 $x000 $x000 2010 2011 2012 2013 2014 2015 2010 - 2015
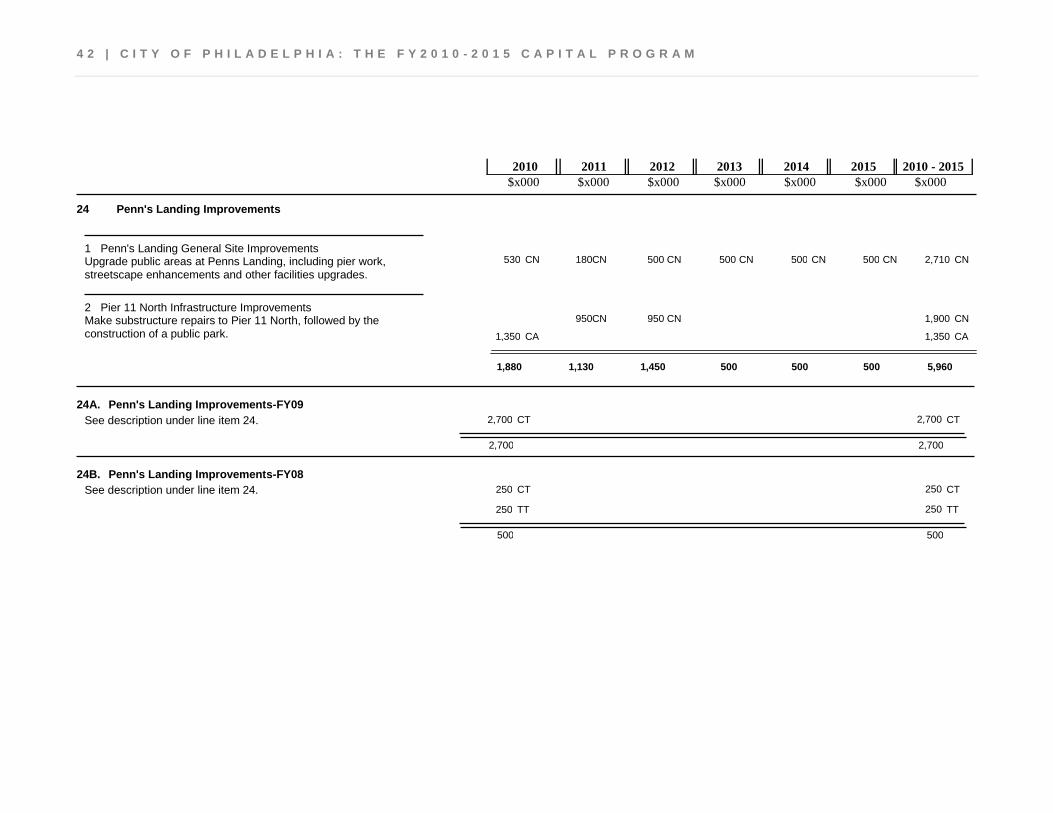
Penn's Landing Improvements 24
2,710 500 500 500 500 180 530 CN CN CN CN CN CN CN Upgrade public areas at Penns Landing, including pier work, streetscape enhancements and other facilities upgrades.
Penn's Landing General Site Improvements 1
1,900 950 950 CN CN CN 1,350 1,350 CA CA
Make substructure repairs to Pier 11 North, followed by the construction of a public park.
Pier 11 North Infrastructure Improvements 2
1,880 500 500 500 1,450 1,130 5,960
24A. Penn's Landing Improvements-FY09 2,700 2,700 CT CT
2,700 2,700
See description under line item 24.
24B. Penn's Landing Improvements-FY08 250 250 CT CT
250 250 TT TT
500 500
See description under line item 24.
C I T Y O F P H I L A D E L P H I A : T H E F Y 2 0 1 0 - 2 0 1 5 C A P I T A L P R O G R A M | 4 3
$x000 $x000 $x000 $x000 $x000 $x000 $x000 2010 2011 2012 2013 2014 2015 2010 - 2015
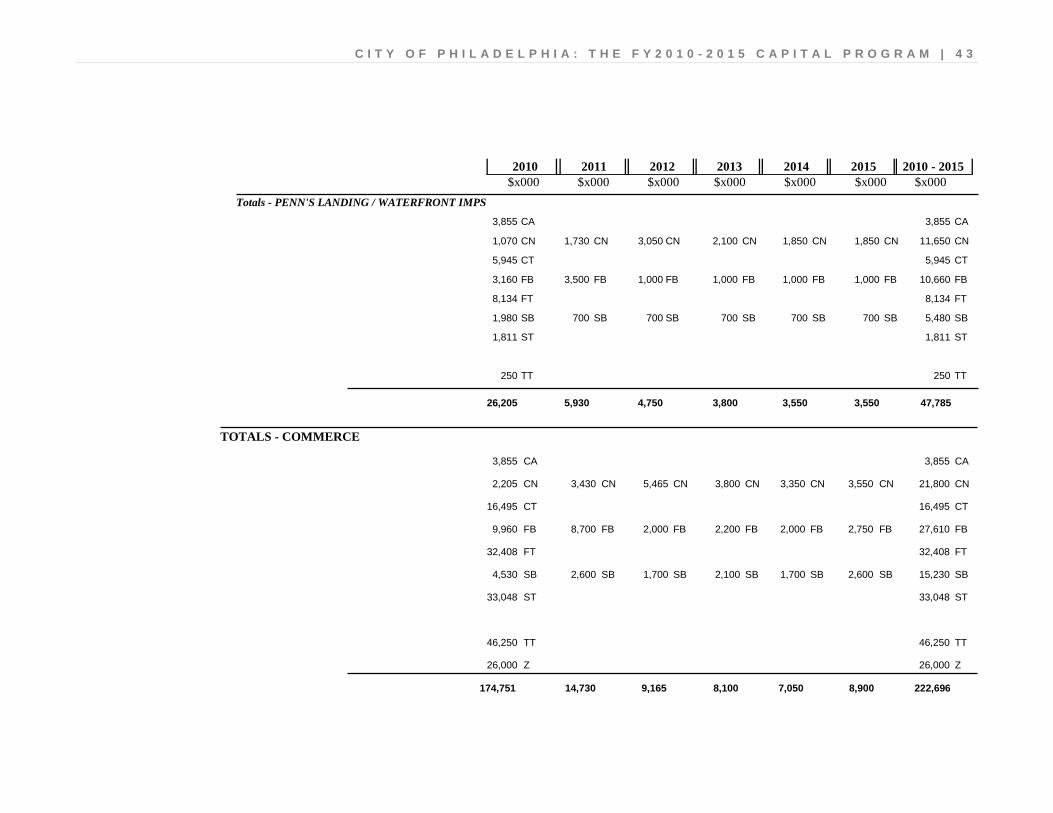
Totals - PENN'S LANDING / WATERFRONT IMPS
3,855 CA 3,855 CA
2,100 3,050 1,730 1,070 1,850 1,850 CN CN CN CN CN CN 11,650 CN
5,945 CT 5,945 CT
1,000 1,000 3,500 3,160 1,000 1,000 FB FB FB FB FB FB 10,660 FB
8,134 FT 8,134 FT
700 700 700 1,980 700 700 SB SB SB SB SB SB 5,480 SB
1,811 ST 1,811 ST
250 TT 250 TT
3,550 3,550 3,800 4,750 5,930 26,205 47,785
TOTALS - COMMERCE
3,855 CA 3,855 CA
3,800 5,465 3,430 2,205 3,350 3,550 CN CN CN CN CN CN 21,800 CN
16,495 CT 16,495 CT
2,200 2,000 8,700 9,960 2,000 2,750 FB FB FB FB FB FB 27,610 FB
32,408 FT 32,408 FT
2,100 1,700 2,600 4,530 1,700 2,600 SB SB SB SB SB SB 15,230 SB
33,048 ST 33,048 ST
46,250 TT 46,250 TT
26,000 Z 26,000 Z
8,900 7,050 8,100 9,165 14,730 174,751 222,696
4 4 | C I T Y O F P H I L A D E L P H I A : T H E F Y 2 0 1 0 - 2 0 1 5 C A P I T A L P R O G R A M
C I T Y O F P H I L A D E L P H I A : T H E F Y 2 0 1 0 - 2 0 1 5 C A P I T A L P R O G R A M | 4 5
$x000 $x000 $x000 $x000 $x000 $x000 $x000 2010 2011 2012 2013 2014 2015 2010 - 2015
DIVISION OF TECHNOLOGY
CAPITAL PROJECTS
Network Infrastructure Stabilization & Enhancement 25
13,400 1,700 1,700 1,700 1,700 3,000 3,600 CN CN CN CN CN CN CN 400 400 CA CA
Stabilize and enhance the network infrastructure that provides the computing foundation for the City’s business operations.
Infrastructure & Enterprise Platform Stabilization & Enhancement 1
4,000 1,700 1,700 1,700 1,700 3,000 13,800
25A. Digital Orthophotography, Planimetric, and Topographic Data-FY06 136 136 CT CT
136 136
See description under line item 25.
25B. Integrated Case Management System-FY06 229 229 CT CT
229 229
See description under line item 25.
25C. Business and Information Continuity/Recovery Project-FY06 952 952 CT CT
952 952
See description under line item 25.
4 6 | C I T Y O F P H I L A D E L P H I A : T H E F Y 2 0 1 0 - 2 0 1 5 C A P I T A L P R O G R A M
$x000 $x000 $x000 $x000 $x000 $x000 $x000 2010 2011 2012 2013 2014 2015 2010 - 2015
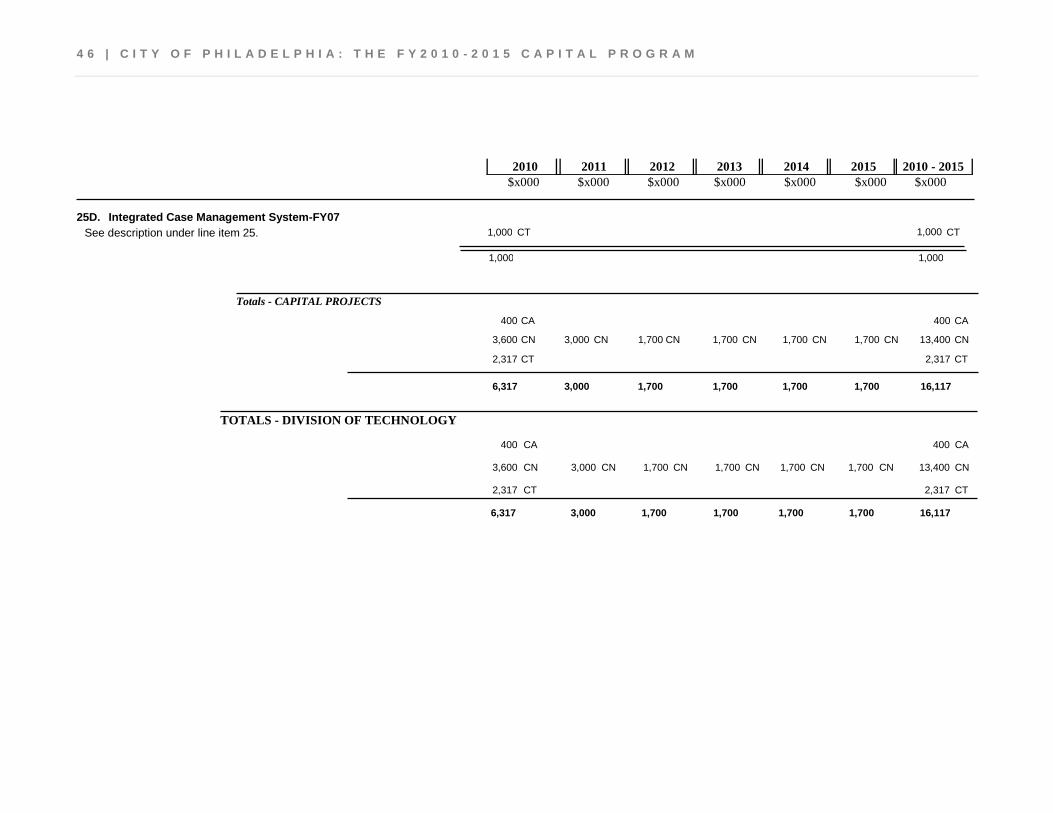
25D. Integrated Case Management System-FY07 1,000 1,000 CT CT
1,000 1,000
See description under line item 25.
Totals - CAPITAL PROJECTS
400 CA 400 CA
1,700 1,700 3,000 3,600 1,700 1,700 CN CN CN CN CN CN 13,400 CN
2,317 CT 2,317 CT
1,700 1,700 1,700 1,700 3,000 6,317 16,117
TOTALS - DIVISION OF TECHNOLOGY
400 CA 400 CA
1,700 1,700 3,000 3,600 1,700 1,700 CN CN CN CN CN CN 13,400 CN
2,317 CT 2,317 CT
1,700 1,700 1,700 1,700 3,000 6,317 16,117
C I T Y O F P H I L A D E L P H I A : T H E F Y 2 0 1 0 - 2 0 1 5 C A P I T A L P R O G R A M | 4 7
$x000 $x000 $x000 $x000 $x000 $x000 $x000 2010 2011 2012 2013 2014 2015 2010 - 2015
FAIRMOUNT PARK
FAIRMOUNT PARK - CAPITAL
Building Improvements 26
920 170 170 170 140 140 130 CN CN CN CN CN CN CN Glaze the greenhouses and improve roadway lighting at the Horticultural Center.
Horticultural Center – Building and Site 1
2,740 500 500 500 430 430 380 CN CN CN CN CN CN CN Replace deteriorating roofs and exterior building facades. Interior/Exterior, Structural & HVAC Improvements 2
2,655 340 340 340 290 290 1,055 CN CN CN CN CN CN CN Restore historic buildings and design additional projects across the Park.
Roof and Exterior Restoration 3
1,565 1,010 1,010 1,010 860 860 6,315
26A. Building Improvements-FY09 840 840 CT CT
500 500 ST ST
1,340 1,340
See description under line item 26.
4 8 | C I T Y O F P H I L A D E L P H I A : T H E F Y 2 0 1 0 - 2 0 1 5 C A P I T A L P R O G R A M
$x000 $x000 $x000 $x000 $x000 $x000 $x000 2010 2011 2012 2013 2014 2015 2010 - 2015
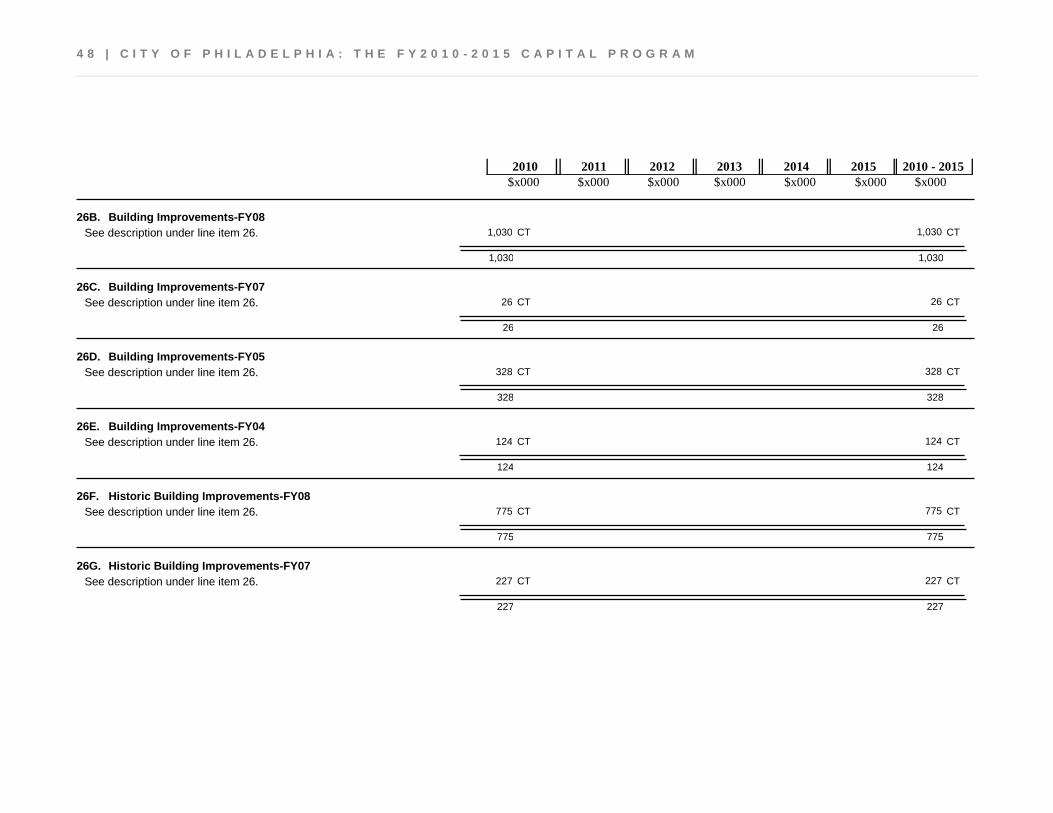
26B. Building Improvements-FY08 1,030 1,030 CT CT
1,030 1,030
See description under line item 26.
26C. Building Improvements-FY07 26 26 CT CT
26 26
See description under line item 26.
26D. Building Improvements-FY05 328 328 CT CT
328 328
See description under line item 26.
26E. Building Improvements-FY04 124 124 CT CT
124 124
See description under line item 26.
26F. Historic Building Improvements-FY08 775 775 CT CT
775 775
See description under line item 26.
26G. Historic Building Improvements-FY07 227 227 CT CT
227 227
See description under line item 26.
C I T Y O F P H I L A D E L P H I A : T H E F Y 2 0 1 0 - 2 0 1 5 C A P I T A L P R O G R A M | 4 9
$x000 $x000 $x000 $x000 $x000 $x000 $x000 2010 2011 2012 2013 2014 2015 2010 - 2015
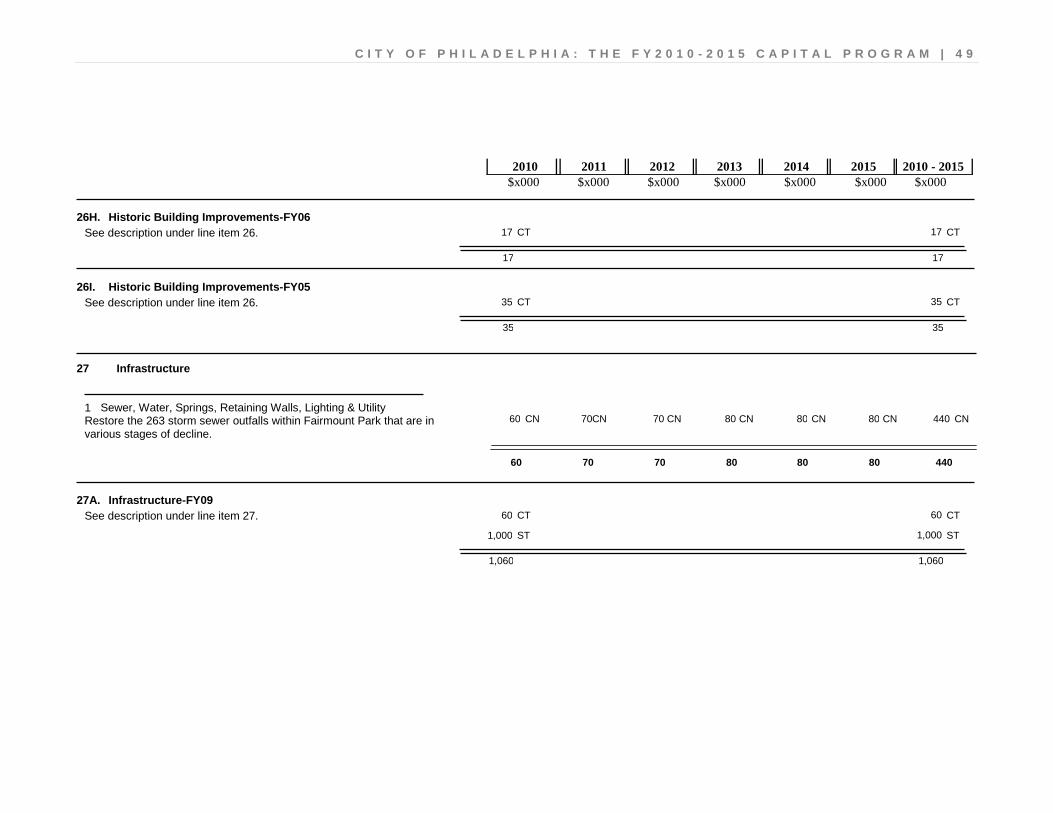
26H. Historic Building Improvements-FY06 17 17 CT CT
17 17
See description under line item 26.
26I. Historic Building Improvements-FY05 35 35 CT CT
35 35
See description under line item 26.
Infrastructure 27
440 80 80 80 70 70 60 CN CN CN CN CN CN CN Restore the 263 storm sewer outfalls within Fairmount Park that are in various stages of decline.
Sewer, Water, Springs, Retaining Walls, Lighting & Utility Improvements
1
60 80 80 80 70 70 440
27A. Infrastructure-FY09 60 60 CT CT
1,000 1,000 ST ST
1,060 1,060
See description under line item 27.
5 0 | C I T Y O F P H I L A D E L P H I A : T H E F Y 2 0 1 0 - 2 0 1 5 C A P I T A L P R O G R A M
$x000 $x000 $x000 $x000 $x000 $x000 $x000 2010 2011 2012 2013 2014 2015 2010 - 2015
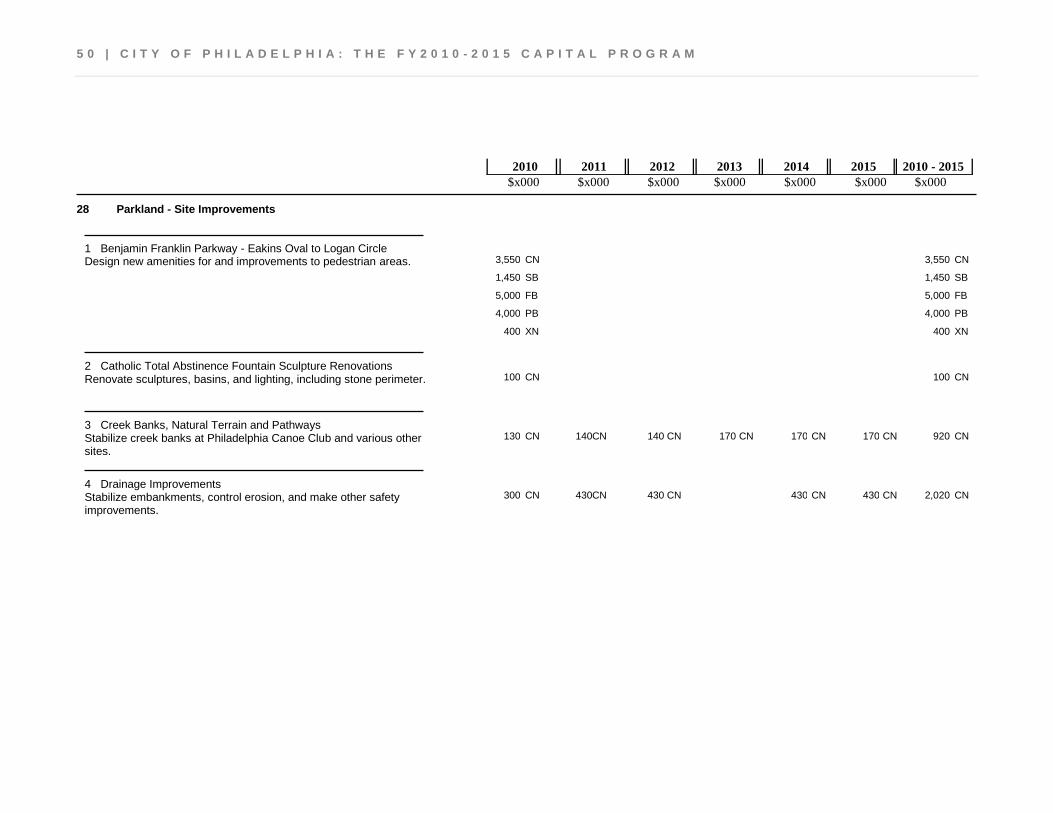
Parkland - Site Improvements 28
3,550 3,550 CN CN 1,450 1,450 SB SB 5,000 5,000 FB FB 4,000 4,000 PB PB
400 400 XN XN
Design new amenities for and improvements to pedestrian areas. Benjamin Franklin Parkway - Eakins Oval to Logan Circle 1
100 100 CN CN Renovate sculptures, basins, and lighting, including stone perimeter. Catholic Total Abstinence Fountain Sculpture Renovations 2
920 170 170 170 140 140 130 CN CN CN CN CN CN CN Stabilize creek banks at Philadelphia Canoe Club and various other sites.
Creek Banks, Natural Terrain and Pathways 3
2,020 430 430 430 430 300 CN CN CN CN CN CN Stabilize embankments, control erosion, and make other safety improvements.
Drainage Improvements 4

C I T Y O F P H I L A D E L P H I A : T H E F Y 2 0 1 0 - 2 0 1 5 C A P I T A L P R O G R A M | 5 1
$x000 $x000 $x000 $x000 $x000 $x000 $x000 2010 2011 2012 2013 2014 2015 2010 - 2015
440 80 80 80 70 130 CN CN CN CN CN CN Design and reconstruct the JFK, Ericsson, Rond Point & Phillips Fountains.
Fountain Rehabilitation 5
1,800 300 300 300 300 300 300 CN CN CN CN CN CN CN Plant 3,300 trees throughout the city. Park and Street Trees – City Wide 6
1,060 170 170 170 150 150 250 CN CN CN CN CN CN CN Rehabilitate various play areas across the city. Play Area Improvements 7
4,000 1,000 1,000 1,000 500 500 CN CN CN CN CN CN Improve lighting, parking, landscape, amenities, and other site features.
Water Works Drive Site Improvements 8
15,980 1,150 2,150 1,720 2,090 1,650 24,740
28A. Parkland - Site Improvements-FY09 3,127 3,127 CT CT
3,000 3,000 FT FT
3,000 3,000 PT PT
3,000 3,000 ST ST
2,000 2,000 TT TT
14,127 14,127
See description under line item 28.

5 2 | C I T Y O F P H I L A D E L P H I A : T H E F Y 2 0 1 0 - 2 0 1 5 C A P I T A L P R O G R A M
$x000 $x000 $x000 $x000 $x000 $x000 $x000 2010 2011 2012 2013 2014 2015 2010 - 2015
28B. Parkland - Site Improvements-FY08 300 300 CT CT
1,000 1,000 ST ST
1,300 1,300
See description under line item 28.
28C. Parkland - Site Improvements-FY07 102 102 CT CT
102 102
See description under line item 28.
28D. Parkland - Site Improvements-FY05 644 644 CT CT
1,280 1,280 FT FT
1,924 1,924
See description under line item 28.
28E. Parkland - Site Improvements-FY04 3 3 CT CT
3 3
See description under line item 28.
28F. Parkland - Site Improvements-FY02 49 49 CT CT
1,177 1,177 ST ST
1,226 1,226
See description under line item 28.
C I T Y O F P H I L A D E L P H I A : T H E F Y 2 0 1 0 - 2 0 1 5 C A P I T A L P R O G R A M | 5 3
$x000 $x000 $x000 $x000 $x000 $x000 $x000 2010 2011 2012 2013 2014 2015 2010 - 2015
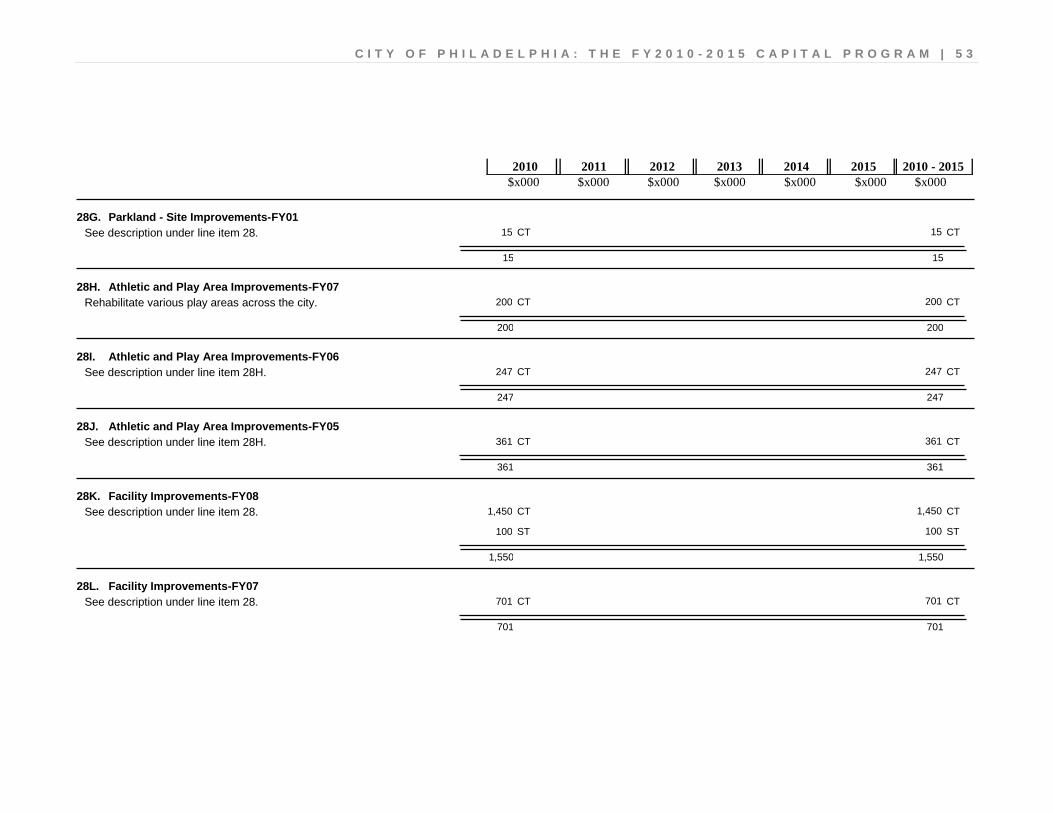
28G. Parkland - Site Improvements-FY01 15 15 CT CT
15 15
See description under line item 28.
28H. Athletic and Play Area Improvements-FY07 200 200 CT CT
200 200
Rehabilitate various play areas across the city.
28I. Athletic and Play Area Improvements-FY06 247 247 CT CT
247 247
See description under line item 28H.
28J. Athletic and Play Area Improvements-FY05 361 361 CT CT
361 361
See description under line item 28H.
28K. Facility Improvements-FY08 1,450 1,450 CT CT
100 100 ST ST
1,550 1,550
See description under line item 28.
28L. Facility Improvements-FY07 701 701 CT CT
701 701
See description under line item 28.

5 4 | C I T Y O F P H I L A D E L P H I A : T H E F Y 2 0 1 0 - 2 0 1 5 C A P I T A L P R O G R A M
$x000 $x000 $x000 $x000 $x000 $x000 $x000 2010 2011 2012 2013 2014 2015 2010 - 2015
28M. Facility Improvements-FY06 315 315 CT CT
315 315
See description under line item 28.
28N. Facility Improvements-FY05 400 400 ST ST
272 272 CT CT
672 672
See description under line item 28.
28O. Facility Improvements-FY04 501 501 CT CT
350 350 ST ST
851 851
See description under line item 28.
28P. Facility Improvements-FY03 400 400 ST ST
400 400
See description under line item 28.
28Q. Manayunk Canal Improvements-FY01 318 318 ST ST
318 318
Make site improvements on Lock Street to the end of Canal, including lights, fencing , drainage, landscaping and park facilities.
C I T Y O F P H I L A D E L P H I A : T H E F Y 2 0 1 0 - 2 0 1 5 C A P I T A L P R O G R A M | 5 5
$x000 $x000 $x000 $x000 $x000 $x000 $x000 2010 2011 2012 2013 2014 2015 2010 - 2015
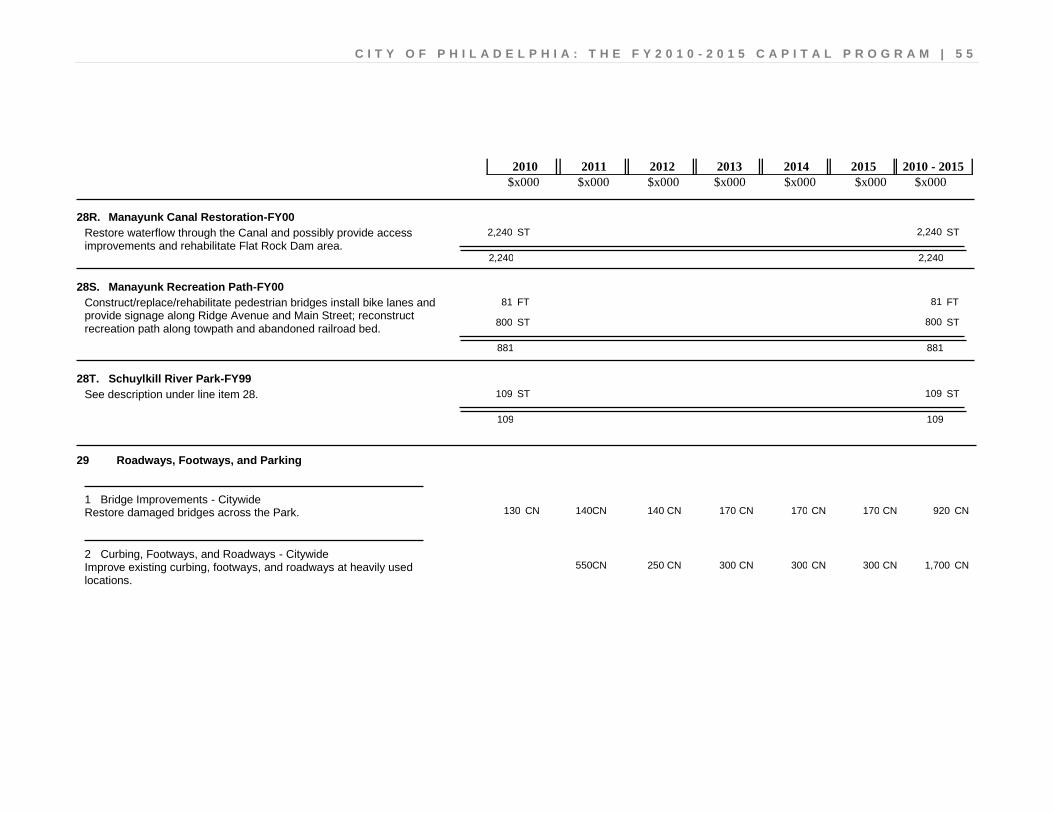
28R. Manayunk Canal Restoration-FY00 2,240 2,240 ST ST
2,240 2,240
Restore waterflow through the Canal and possibly provide access improvements and rehabilitate Flat Rock Dam area.
28S. Manayunk Recreation Path-FY00 81 81 FT FT
800 800 ST ST
881 881
Construct/replace/rehabilitate pedestrian bridges install bike lanes and provide signage along Ridge Avenue and Main Street; reconstruct recreation path along towpath and abandoned railroad bed.
28T. Schuylkill River Park-FY99 109 109 ST ST
109 109
See description under line item 28.
Roadways, Footways, and Parking 29
920 170 170 170 140 140 130 CN CN CN CN CN CN CN Restore damaged bridges across the Park. Bridge Improvements - Citywide 1
1,700 300 300 300 250 550 CN CN CN CN CN CN Improve existing curbing, footways, and roadways at heavily used locations.
Curbing, Footways, and Roadways - Citywide 2
5 6 | C I T Y O F P H I L A D E L P H I A : T H E F Y 2 0 1 0 - 2 0 1 5 C A P I T A L P R O G R A M
$x000 $x000 $x000 $x000 $x000 $x000 $x000 2010 2011 2012 2013 2014 2015 2010 - 2015
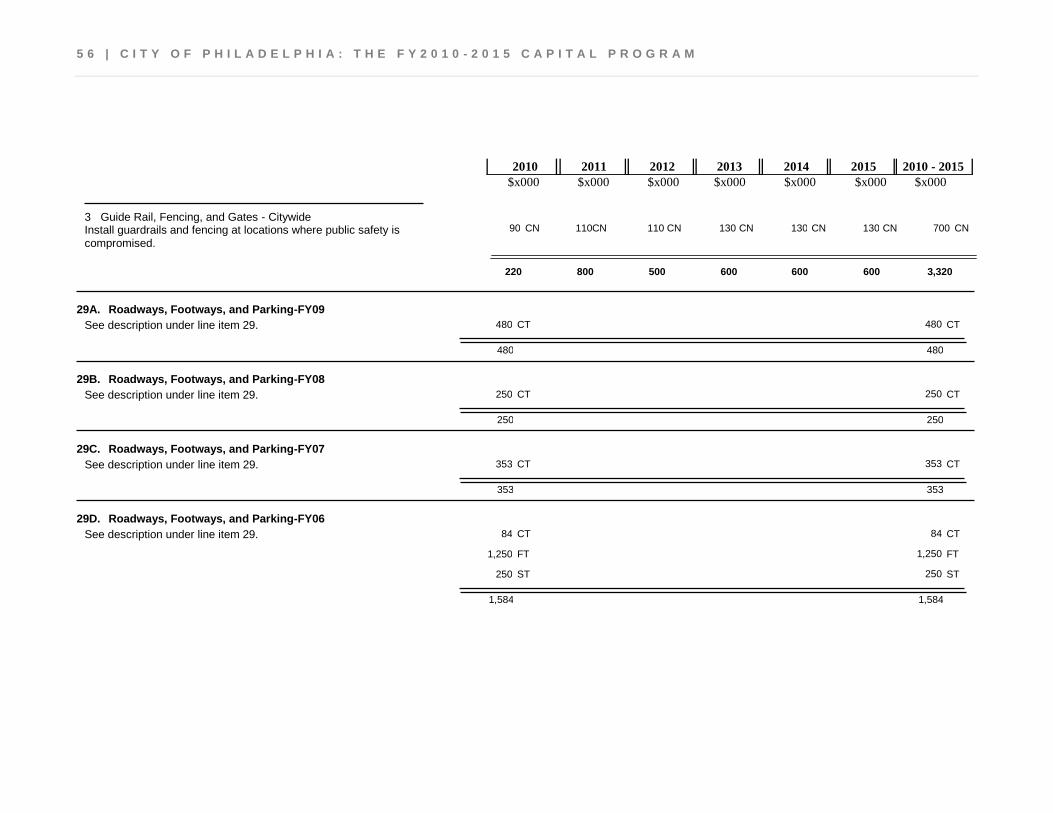
700 130 130 130 110 110 90 CN CN CN CN CN CN CN Install guardrails and fencing at locations where public safety is compromised.
Guide Rail, Fencing, and Gates - Citywide 3
220 600 600 600 500 800 3,320
29A. Roadways, Footways, and Parking-FY09 480 480 CT CT
480 480
See description under line item 29.
29B. Roadways, Footways, and Parking-FY08 250 250 CT CT
250 250
See description under line item 29.
29C. Roadways, Footways, and Parking-FY07 353 353 CT CT
353 353
See description under line item 29.
29D. Roadways, Footways, and Parking-FY06 84 84 CT CT
1,250 1,250 FT FT
250 250 ST ST
1,584 1,584
See description under line item 29.
C I T Y O F P H I L A D E L P H I A : T H E F Y 2 0 1 0 - 2 0 1 5 C A P I T A L P R O G R A M | 5 7
$x000 $x000 $x000 $x000 $x000 $x000 $x000 2010 2011 2012 2013 2014 2015 2010 - 2015
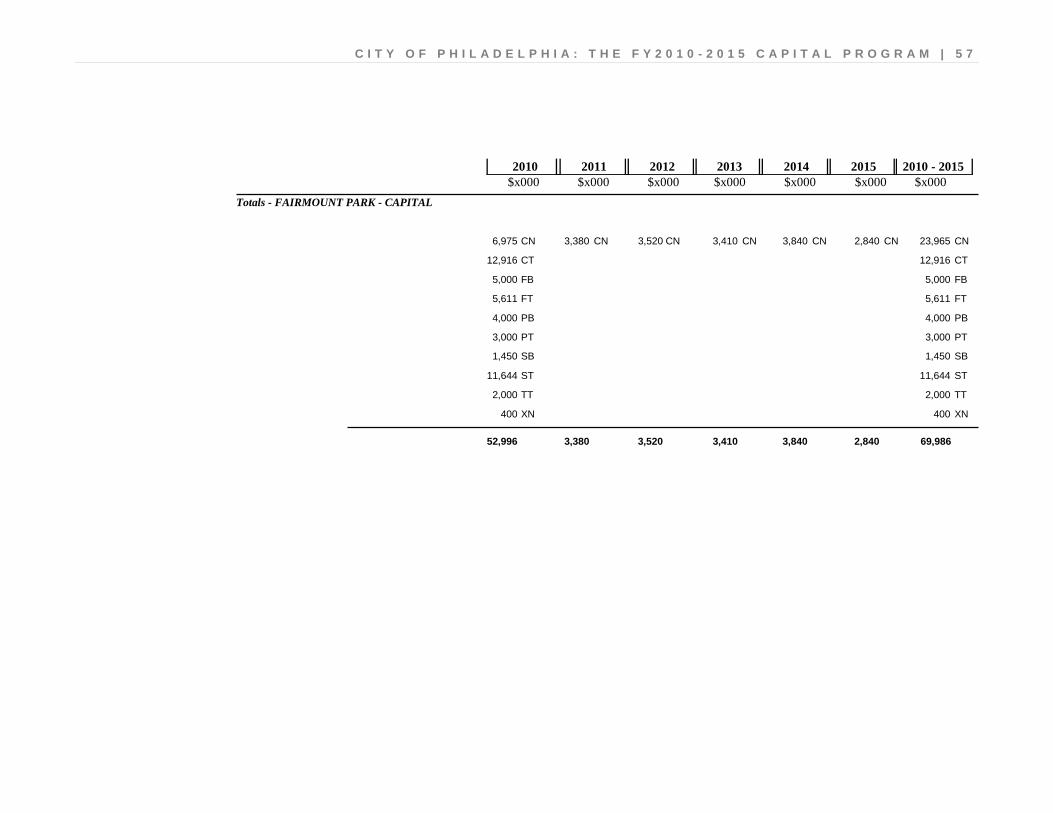
Totals - FAIRMOUNT PARK - CAPITAL
3,410 3,520 3,380 6,975 3,840 2,840 CN CN CN CN CN CN 23,965 CN
12,916 CT 12,916 CT
5,000 FB 5,000 FB
5,611 FT 5,611 FT
4,000 PB 4,000 PB
3,000 PT 3,000 PT
1,450 SB 1,450 SB
11,644 ST 11,644 ST
2,000 TT 2,000 TT
400 XN 400 XN
2,840 3,840 3,410 3,520 3,380 52,996 69,986
5 8 | C I T Y O F P H I L A D E L P H I A : T H E F Y 2 0 1 0 - 2 0 1 5 C A P I T A L P R O G R A M
$x000 $x000 $x000 $x000 $x000 $x000 $x000 2010 2011 2012 2013 2014 2015 2010 - 2015
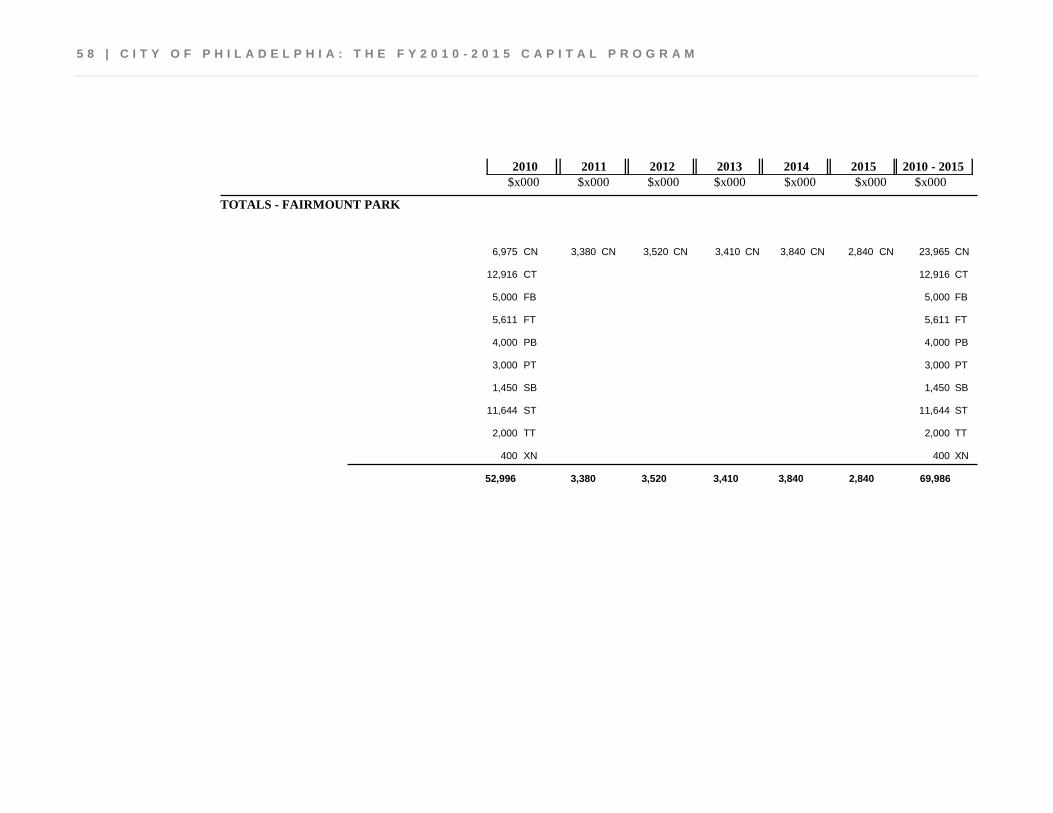
TOTALS - FAIRMOUNT PARK
3,410 3,520 3,380 6,975 3,840 2,840 CN CN CN CN CN CN 23,965 CN
12,916 CT 12,916 CT
5,000 FB 5,000 FB
5,611 FT 5,611 FT
4,000 PB 4,000 PB
3,000 PT 3,000 PT
1,450 SB 1,450 SB
11,644 ST 11,644 ST
2,000 TT 2,000 TT
400 XN 400 XN
2,840 3,840 3,410 3,520 3,380 52,996 69,986
C I T Y O F P H I L A D E L P H I A : T H E F Y 2 0 1 0 - 2 0 1 5 C A P I T A L P R O G R A M | 5 9
6 0 | C I T Y O F P H I L A D E L P H I A : T H E F Y 2 0 1 0 - 2 0 1 5 C A P I T A L P R O G R A M
$x000 $x000 $x000 $x000 $x000 $x000 $x000 2010 2011 2012 2013 2014 2015 2010 - 2015
FINANCE
CAPITAL PROJECTS
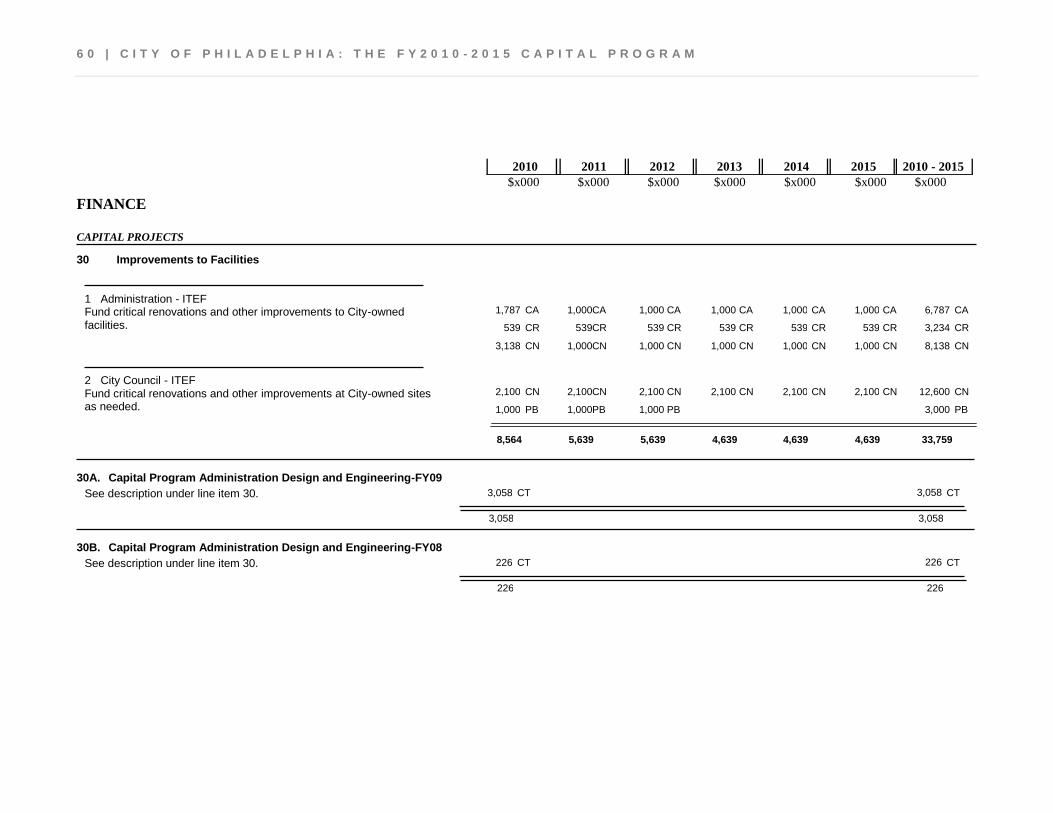
Improvements to Facilities 30
6,787 1,000 1,000 1,000 1,000 1,000 1,787 CA CA CA CA CA CA CA 3,234 539 539 539 539 539 539 CR CR CR CR CR CR CR
8,138 1,000 1,000 1,000 1,000 1,000 3,138 CN CN CN CN CN CN CN
Fund critical renovations and other improvements to City-owned facilities.
Administration - ITEF 1
12,600 2,100 2,100 2,100 2,100 2,100 2,100 CN CN CN CN CN CN CN 3,000 1,000 1,000 1,000 PB PB PB PB
Fund critical renovations and other improvements at City-owned sites as needed.
City Council - ITEF 2
8,564 4,639 4,639 4,639 5,639 5,639 33,759
30A. Capital Program Administration Design and Engineering-FY09 3,058 3,058 CT CT
3,058 3,058
See description under line item 30.
30B. Capital Program Administration Design and Engineering-FY08 226 226 CT CT
226 226
See description under line item 30.
C I T Y O F P H I L A D E L P H I A : T H E F Y 2 0 1 0 - 2 0 1 5 C A P I T A L P R O G R A M | 6 1
$x000 $x000 $x000 $x000 $x000 $x000 $x000 2010 2011 2012 2013 2014 2015 2010 - 2015
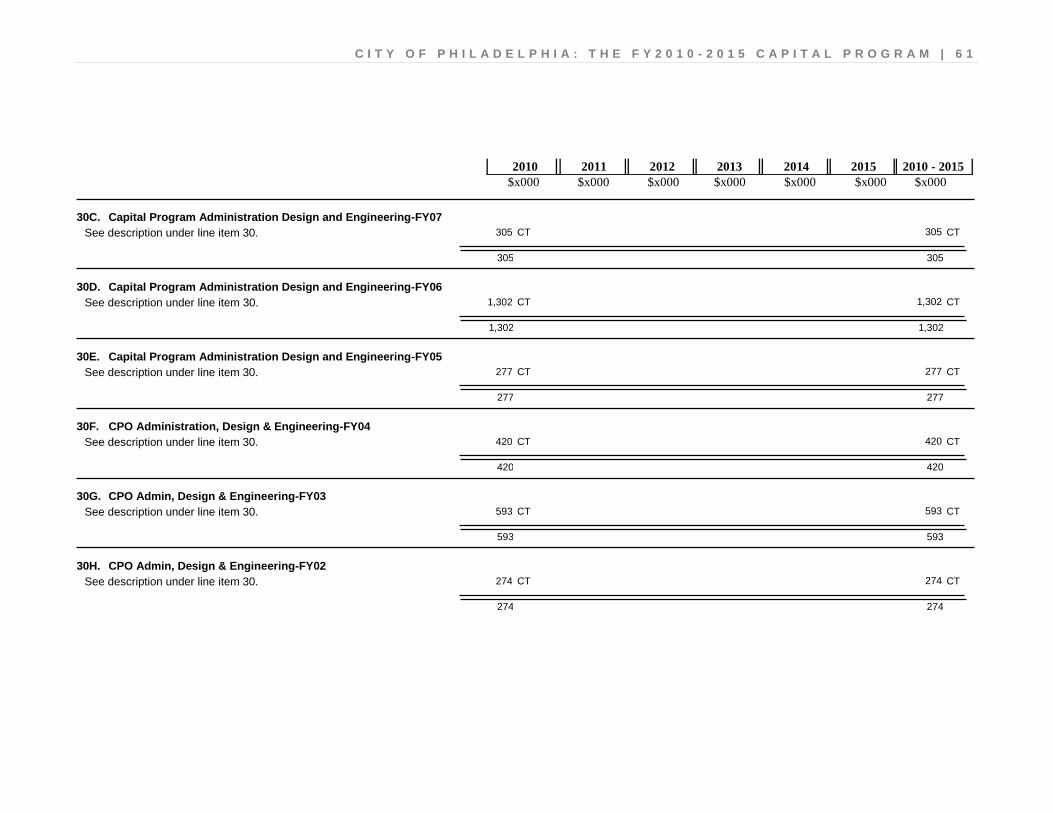
30C. Capital Program Administration Design and Engineering-FY07 305 305 CT CT
305 305
See description under line item 30.
30D. Capital Program Administration Design and Engineering-FY06 1,302 1,302 CT CT
1,302 1,302
See description under line item 30.
30E. Capital Program Administration Design and Engineering-FY05 277 277 CT CT
277 277
See description under line item 30.
30F. CPO Administration, Design & Engineering-FY04 420 420 CT CT
420 420
See description under line item 30.
30G. CPO Admin, Design & Engineering-FY03 593 593 CT CT
593 593
See description under line item 30.
30H. CPO Admin, Design & Engineering-FY02 274 274 CT CT
274 274
See description under line item 30.

6 2 | C I T Y O F P H I L A D E L P H I A : T H E F Y 2 0 1 0 - 2 0 1 5 C A P I T A L P R O G R A M
$x000 $x000 $x000 $x000 $x000 $x000 $x000 2010 2011 2012 2013 2014 2015 2010 - 2015
30I. CPO Admin, Design & Engineering-FY01 498 498 CT CT
498 498
See description under line item 30.
30J. CPO Admin, Design & Engineering-FY00 298 298 CT CT
298 298
See description under line item 30.
30K. Citywide Facilities-FY09 5,350 5,350 CT CT
1,000 1,000 PT PT
6,350 6,350
See description under line item 42.
30L. Citywide Facilities-FY08 1,750 1,750 CT CT
1,750 1,750
See description under line item 42.
30M. Citywide Facilities-FY07 1,868 1,868 CT CT
1,868 1,868
See description under line item 42.
30N. Citywide Facilities-FY06 2,720 2,720 CT CT
2,720 2,720
See description under line item 42.
C I T Y O F P H I L A D E L P H I A : T H E F Y 2 0 1 0 - 2 0 1 5 C A P I T A L P R O G R A M | 6 3
$x000 $x000 $x000 $x000 $x000 $x000 $x000 2010 2011 2012 2013 2014 2015 2010 - 2015
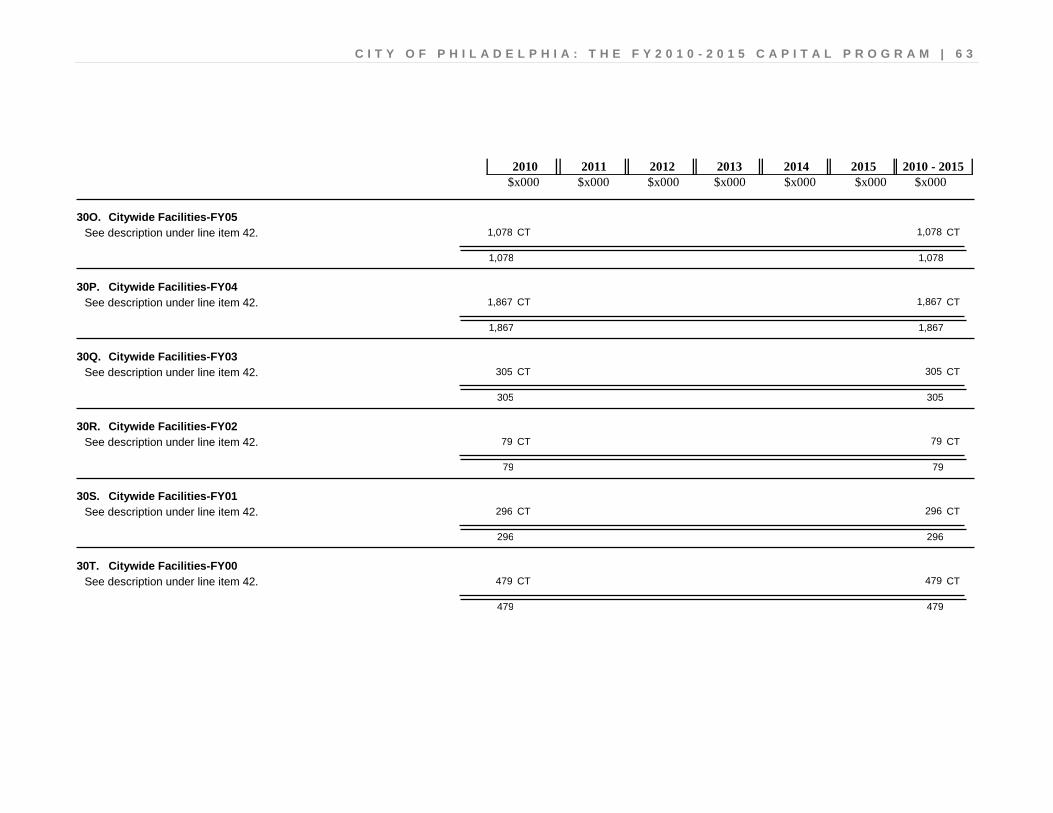
30O. Citywide Facilities-FY05 1,078 1,078 CT CT
1,078 1,078
See description under line item 42.
30P. Citywide Facilities-FY04 1,867 1,867 CT CT
1,867 1,867
See description under line item 42.
30Q. Citywide Facilities-FY03 305 305 CT CT
305 305
See description under line item 42.
30R. Citywide Facilities-FY02 79 79 CT CT
79 79
See description under line item 42.
30S. Citywide Facilities-FY01 296 296 CT CT
296 296
See description under line item 42.
30T. Citywide Facilities-FY00 479 479 CT CT
479 479
See description under line item 42.

6 4 | C I T Y O F P H I L A D E L P H I A : T H E F Y 2 0 1 0 - 2 0 1 5 C A P I T A L P R O G R A M
$x000 $x000 $x000 $x000 $x000 $x000 $x000 2010 2011 2012 2013 2014 2015 2010 - 2015
30U. Citywide Facilities-FY99 74 74 CT CT
74 74
See description under line item 42.
30V. Facilities Improvements-Citywide-FY98 9 9 CT CT
9 9
See description under line item 42.
30W. Facilities Improvements-Citywide-FY97 58 58 CT CT
58 58
See description under line item 42.
Totals - CAPITAL PROJECTS
1,000 1,000 1,000 1,787 1,000 1,000 CA CA CA CA CA CA 6,787 CA
3,100 3,100 3,100 5,238 3,100 3,100 CN CN CN CN CN CN 20,738 CN
539 539 539 539 539 539 CR CR CR CR CR CR 3,234 CR
23,184 CT 23,184 CT
1,000 1,000 1,000 PB PB PB 3,000 PB
1,000 PT 1,000 PT
4,639 4,639 4,639 5,639 5,639 32,748 57,943
C I T Y O F P H I L A D E L P H I A : T H E F Y 2 0 1 0 - 2 0 1 5 C A P I T A L P R O G R A M | 6 5
$x000 $x000 $x000 $x000 $x000 $x000 $x000 2010 2011 2012 2013 2014 2015 2010 - 2015
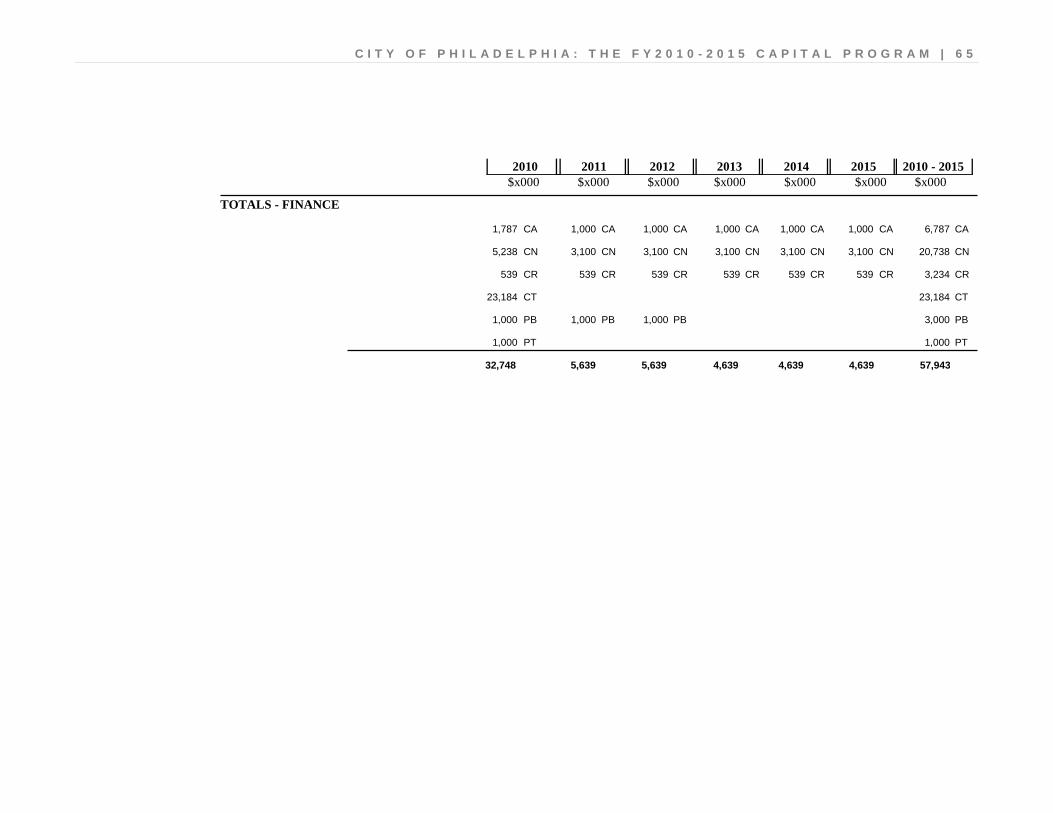
TOTALS - FINANCE
1,000 1,000 1,000 1,787 1,000 1,000 CA CA CA CA CA CA 6,787 CA
3,100 3,100 3,100 5,238 3,100 3,100 CN CN CN CN CN CN 20,738 CN
539 539 539 539 539 539 CR CR CR CR CR CR 3,234 CR
23,184 CT 23,184 CT
1,000 1,000 1,000 PB PB PB 3,000 PB
1,000 PT 1,000 PT
4,639 4,639 4,639 5,639 5,639 32,748 57,943
6 6 | C I T Y O F P H I L A D E L P H I A : T H E F Y 2 0 1 0 - 2 0 1 5 C A P I T A L P R O G R A M
$x000 $x000 $x000 $x000 $x000 $x000 $x000 2010 2011 2012 2013 2014 2015 2010 - 2015
FIRE
FIRE FACILITIES
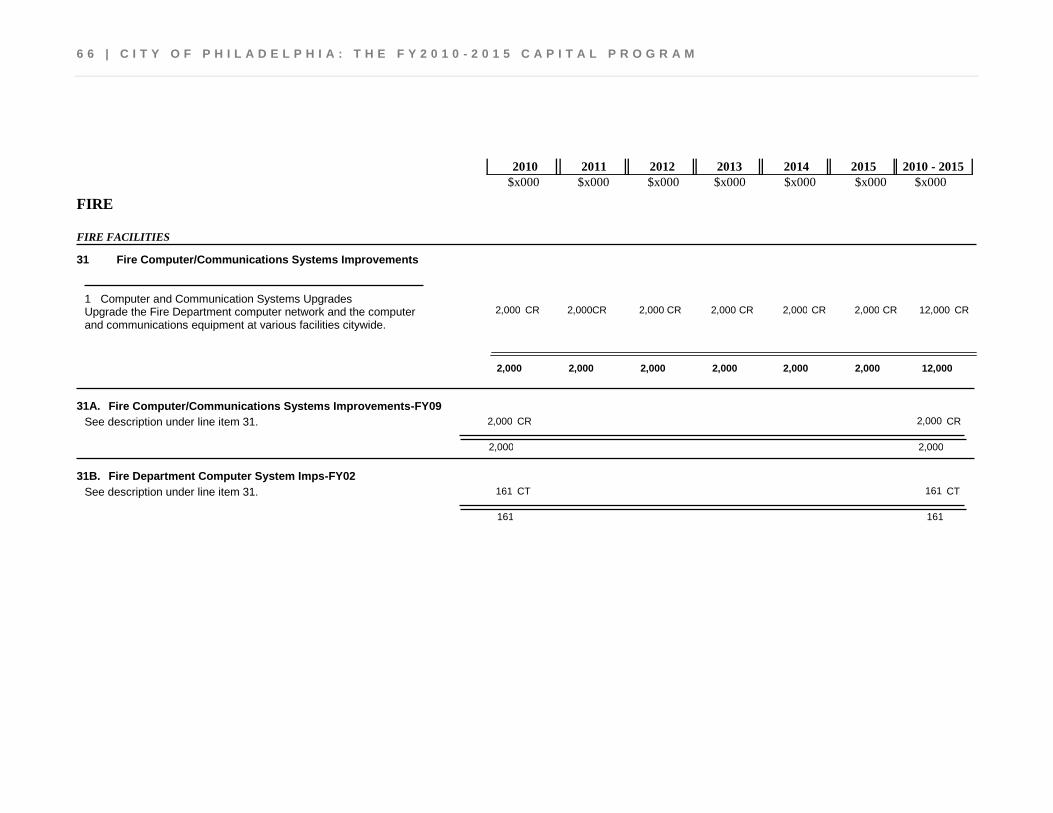
Fire Computer/Communications Systems Improvements 31
12,000 2,000 2,000 2,000 2,000 2,000 2,000 CR CR CR CR CR CR CR Upgrade the Fire Department computer network and the computer and communications equipment at various facilities citywide.
Computer and Communication Systems Upgrades 1
2,000 2,000 2,000 2,000 2,000 2,000 12,000
31A. Fire Computer/Communications Systems Improvements-FY09 2,000 2,000 CR CR
2,000 2,000
See description under line item 31.
31B. Fire Department Computer System Imps-FY02 161 161 CT CT
161 161
See description under line item 31.
C I T Y O F P H I L A D E L P H I A : T H E F Y 2 0 1 0 - 2 0 1 5 C A P I T A L P R O G R A M | 6 7
$x000 $x000 $x000 $x000 $x000 $x000 $x000 2010 2011 2012 2013 2014 2015 2010 - 2015
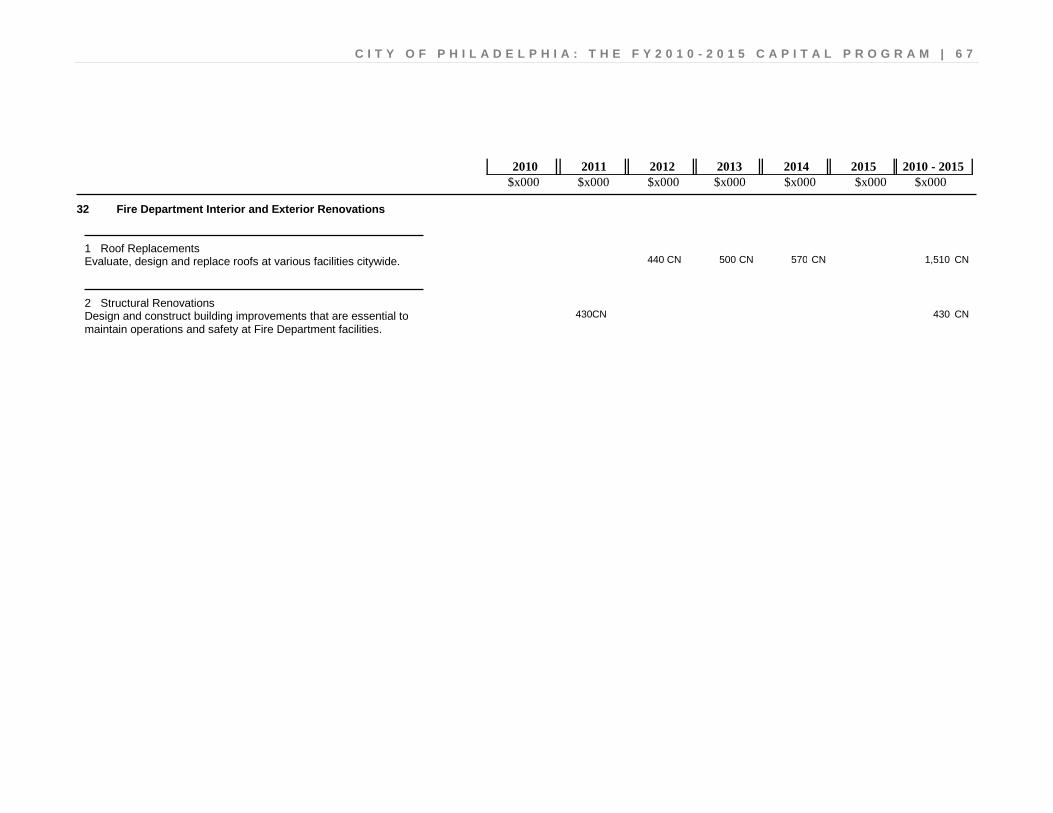
Fire Department Interior and Exterior Renovations 32
1,510 570 500 440 CN CN CN CN Evaluate, design and replace roofs at various facilities citywide. Roof Replacements 1
430 430 CN CN Design and construct building improvements that are essential to maintain operations and safety at Fire Department facilities.
Structural Renovations 2
6 8 | C I T Y O F P H I L A D E L P H I A : T H E F Y 2 0 1 0 - 2 0 1 5 C A P I T A L P R O G R A M
$x000 $x000 $x000 $x000 $x000 $x000 $x000 2010 2011 2012 2013 2014 2015 2010 - 2015
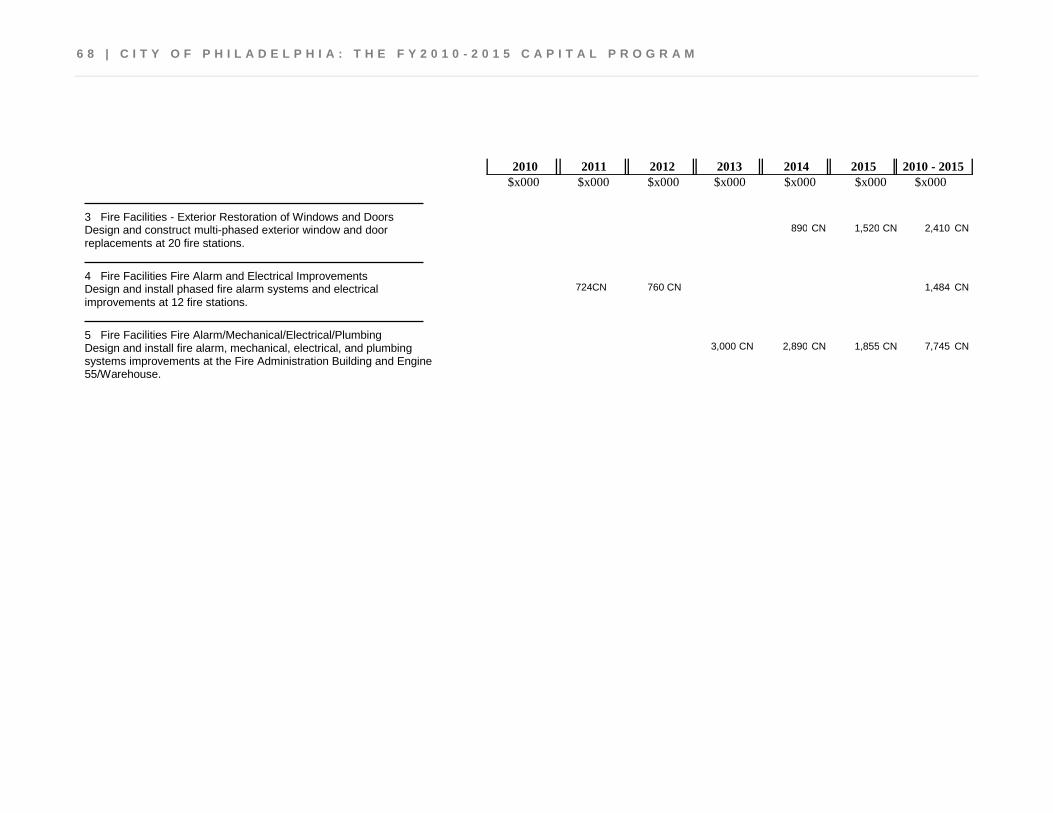
2,410 1,520 890 CN CN CN Design and construct multi-phased exterior window and door replacements at 20 fire stations.
Fire Facilities - Exterior Restoration of Windows and Doors 3
1,484 760 724 CN CN CN Design and install phased fire alarm systems and electrical improvements at 12 fire stations.
Fire Facilities Fire Alarm and Electrical Improvements 4
7,745 1,855 2,890 3,000 CN CN CN CN Design and install fire alarm, mechanical, electrical, and plumbing systems improvements at the Fire Administration Building and Engine 55/Warehouse.
Fire Facilities Fire Alarm/Mechanical/Electrical/Plumbing Improvements - FAB & Engine 55/Warehouse
5
C I T Y O F P H I L A D E L P H I A : T H E F Y 2 0 1 0 - 2 0 1 5 C A P I T A L P R O G R A M | 6 9
$x000 $x000 $x000 $x000 $x000 $x000 $x000 2010 2011 2012 2013 2014 2015 2010 - 2015
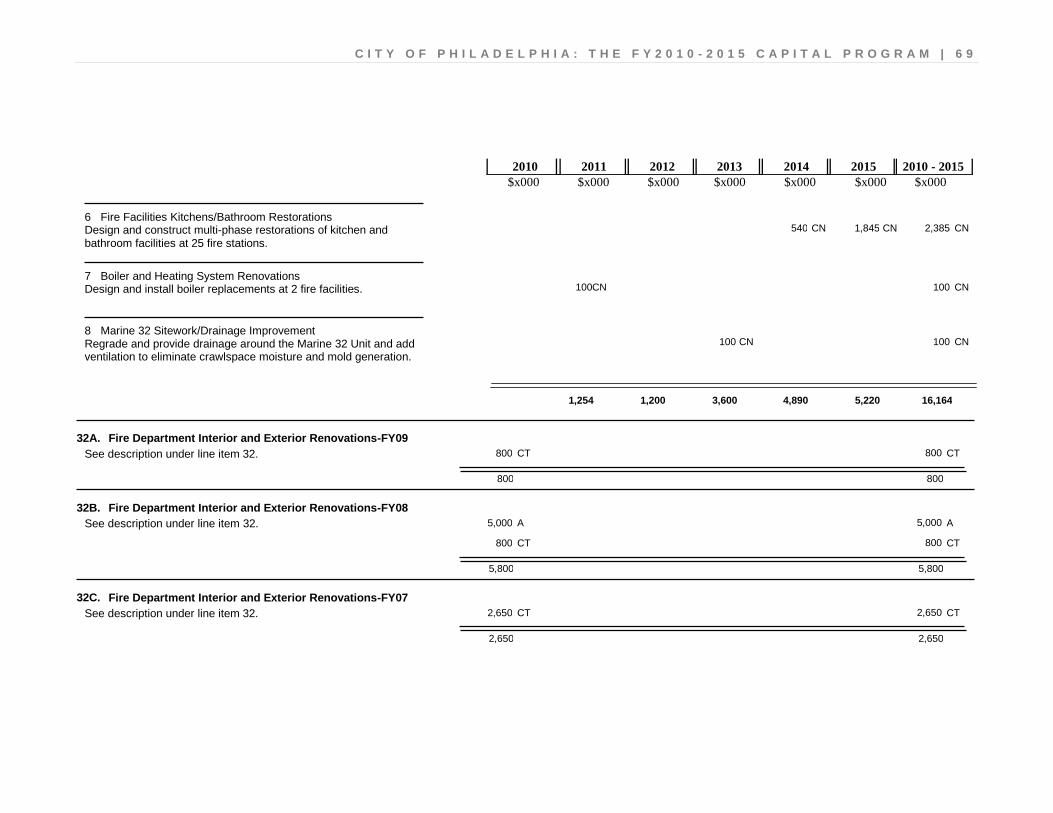
2,385 1,845 540 CN CN CN Design and construct multi-phase restorations of kitchen and bathroom facilities at 25 fire stations.
Fire Facilities Kitchens/Bathroom Restorations 6
100 100 CN CN Design and install boiler replacements at 2 fire facilities. Boiler and Heating System Renovations 7
100 100 CN CN Regrade and provide drainage around the Marine 32 Unit and add ventilation to eliminate crawlspace moisture and mold generation.
Marine 32 Sitework/Drainage Improvement 8
5,220 4,890 3,600 1,200 1,254 16,164
32A. Fire Department Interior and Exterior Renovations-FY09 800 800 CT CT
800 800
See description under line item 32.
32B. Fire Department Interior and Exterior Renovations-FY08 5,000 5,000 A A
800 800 CT CT
5,800 5,800
See description under line item 32.
32C. Fire Department Interior and Exterior Renovations-FY07 2,650 2,650 CT CT
2,650 2,650
See description under line item 32.
7 0 | C I T Y O F P H I L A D E L P H I A : T H E F Y 2 0 1 0 - 2 0 1 5 C A P I T A L P R O G R A M
$x000 $x000 $x000 $x000 $x000 $x000 $x000 2010 2011 2012 2013 2014 2015 2010 - 2015
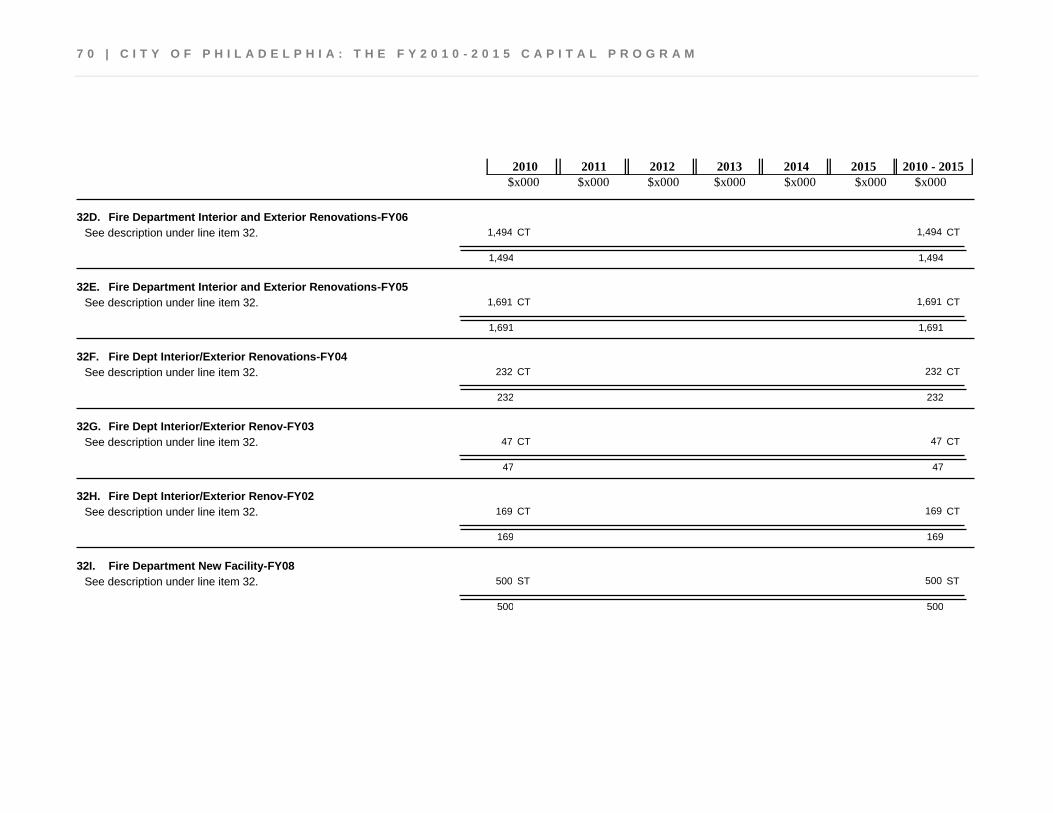
32D. Fire Department Interior and Exterior Renovations-FY06 1,494 1,494 CT CT
1,494 1,494
See description under line item 32.
32E. Fire Department Interior and Exterior Renovations-FY05 1,691 1,691 CT CT
1,691 1,691
See description under line item 32.
32F. Fire Dept Interior/Exterior Renovations-FY04 232 232 CT CT
232 232
See description under line item 32.
32G. Fire Dept Interior/Exterior Renov-FY03 47 47 CT CT
47 47
See description under line item 32.
32H. Fire Dept Interior/Exterior Renov-FY02 169 169 CT CT
169 169
See description under line item 32.
32I. Fire Department New Facility-FY08 500 500 ST ST
500 500
See description under line item 32.
C I T Y O F P H I L A D E L P H I A : T H E F Y 2 0 1 0 - 2 0 1 5 C A P I T A L P R O G R A M | 7 1
$x000 $x000 $x000 $x000 $x000 $x000 $x000 2010 2011 2012 2013 2014 2015 2010 - 2015
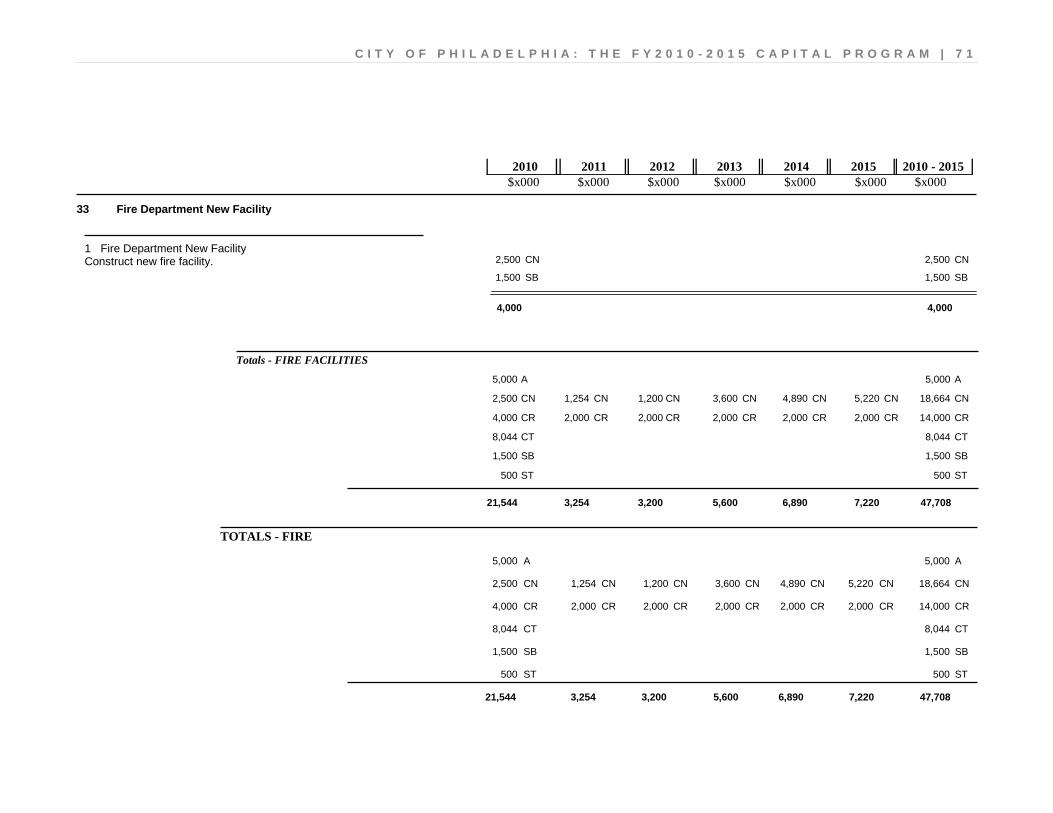
Fire Department New Facility 33
2,500 2,500 CN CN 1,500 1,500 SB SB
Construct new fire facility. Fire Department New Facility 1
4,000 4,000
Totals - FIRE FACILITIES
5,000 A 5,000 A
3,600 1,200 1,254 2,500 4,890 5,220 CN CN CN CN CN CN 18,664 CN
2,000 2,000 2,000 4,000 2,000 2,000 CR CR CR CR CR CR 14,000 CR
8,044 CT 8,044 CT
1,500 SB 1,500 SB
500 ST 500 ST
7,220 6,890 5,600 3,200 3,254 21,544 47,708
TOTALS - FIRE
5,000 A 5,000 A
3,600 1,200 1,254 2,500 4,890 5,220 CN CN CN CN CN CN 18,664 CN
2,000 2,000 2,000 4,000 2,000 2,000 CR CR CR CR CR CR 14,000 CR
8,044 CT 8,044 CT
1,500 SB 1,500 SB
500 ST 500 ST
7,220 6,890 5,600 3,200 3,254 21,544 47,708
7 2 | C I T Y O F P H I L A D E L P H I A : T H E F Y 2 0 1 0 - 2 0 1 5 C A P I T A L P R O G R A M

C I T Y O F P H I L A D E L P H I A : T H E F Y 2 0 1 0 - 2 0 1 5 C A P I T A L P R O G R A M | 7 3
$x000 $x000 $x000 $x000 $x000 $x000 $x000 2010 2011 2012 2013 2014 2015 2010 - 2015
FLEET MANAGEMENT
CAPITAL PROJECTS
Fleet Management Facilities 34
400 100 100 100 100 CN CN CN CN CN Make various interior and exterior improvements at Shops 423, 159, and 282.
Interior and exterior improvements 1
160 160 CN CN Design and construct new Tire Storage Shed at Shop 332. New Tire Storage Shed 2
100 100 CN CN Construct Steam Cleaning Pad at Shop 357 to resolve drainage problem.
Steam Cleaning Pad 3
100 100 100 100 260 660
34A. Fleet Management Facilities-FY09 1,300 1,300 CT CT
1,300 1,300
See description under line item 34.
34B. Fleet Management Facilities-FY08 881 881 CT CT
881 881
See description under line item 34.
7 4 | C I T Y O F P H I L A D E L P H I A : T H E F Y 2 0 1 0 - 2 0 1 5 C A P I T A L P R O G R A M
$x000 $x000 $x000 $x000 $x000 $x000 $x000 2010 2011 2012 2013 2014 2015 2010 - 2015
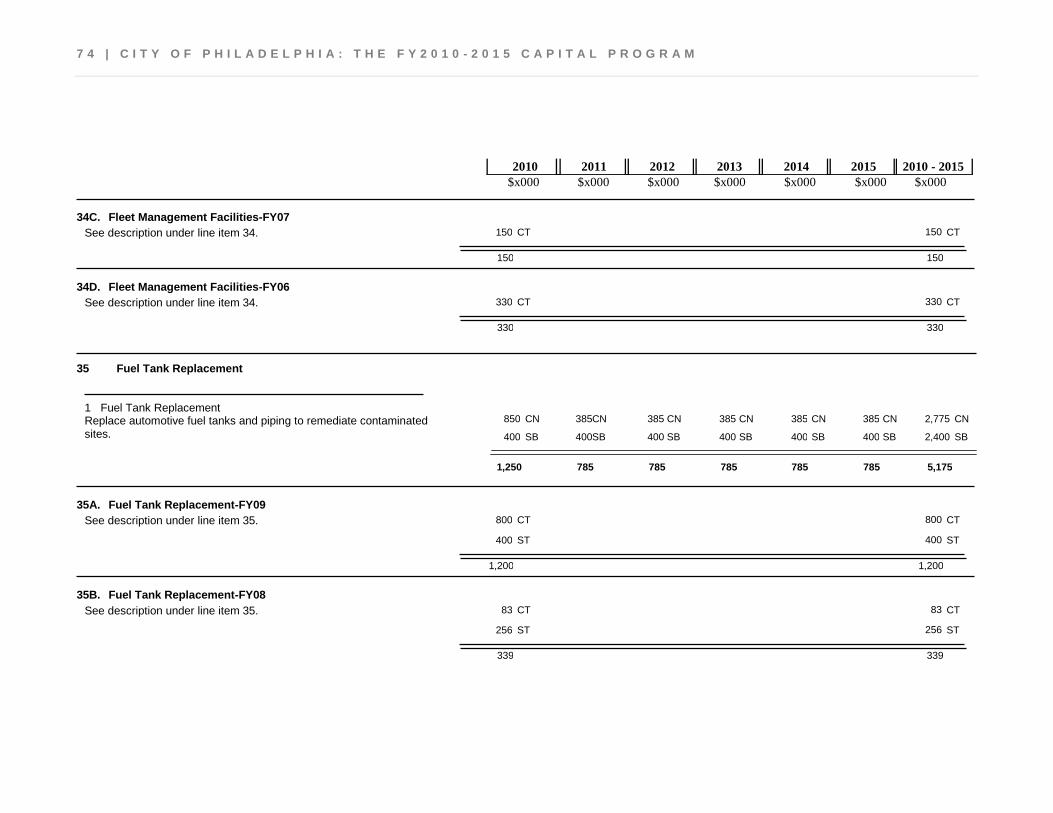
34C. Fleet Management Facilities-FY07 150 150 CT CT
150 150
See description under line item 34.
34D. Fleet Management Facilities-FY06 330 330 CT CT
330 330
See description under line item 34.
Fuel Tank Replacement 35
2,775 385 385 385 385 385 850 CN CN CN CN CN CN CN 2,400 400 400 400 400 400 400 SB SB SB SB SB SB SB
Replace automotive fuel tanks and piping to remediate contaminated sites.
Fuel Tank Replacement 1
1,250 785 785 785 785 785 5,175
35A. Fuel Tank Replacement-FY09 800 800 CT CT
400 400 ST ST
1,200 1,200
See description under line item 35.
35B. Fuel Tank Replacement-FY08 83 83 CT CT
256 256 ST ST
339 339
See description under line item 35.
C I T Y O F P H I L A D E L P H I A : T H E F Y 2 0 1 0 - 2 0 1 5 C A P I T A L P R O G R A M | 7 5
$x000 $x000 $x000 $x000 $x000 $x000 $x000 2010 2011 2012 2013 2014 2015 2010 - 2015
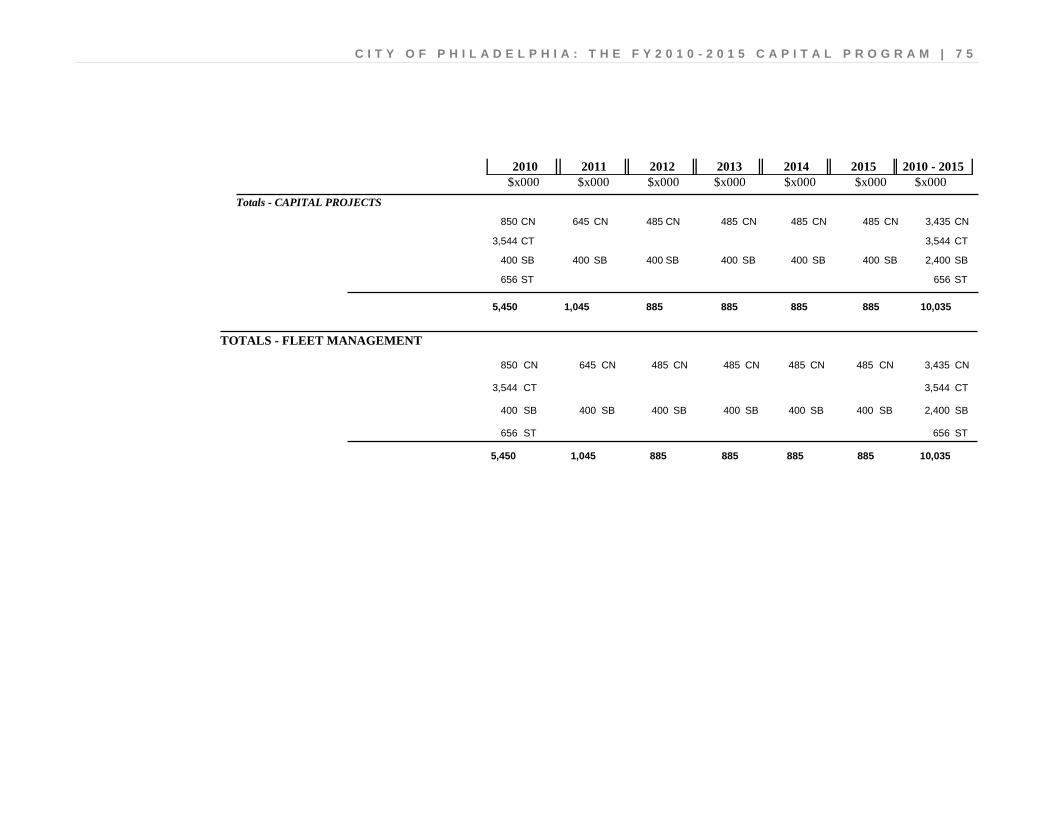
Totals - CAPITAL PROJECTS
485 485 645 850 485 485 CN CN CN CN CN CN 3,435 CN
3,544 CT 3,544 CT
400 400 400 400 400 400 SB SB SB SB SB SB 2,400 SB
656 ST 656 ST
885 885 885 885 1,045 5,450 10,035
TOTALS - FLEET MANAGEMENT
485 485 645 850 485 485 CN CN CN CN CN CN 3,435 CN
3,544 CT 3,544 CT
400 400 400 400 400 400 SB SB SB SB SB SB 2,400 SB
656 ST 656 ST
885 885 885 885 1,045 5,450 10,035
7 6 | C I T Y O F P H I L A D E L P H I A : T H E F Y 2 0 1 0 - 2 0 1 5 C A P I T A L P R O G R A M
C I T Y O F P H I L A D E L P H I A : T H E F Y 2 0 1 0 - 2 0 1 5 C A P I T A L P R O G R A M | 7 7
$x000 $x000 $x000 $x000 $x000 $x000 $x000 2010 2011 2012 2013 2014 2015 2010 - 2015
FREE LIBRARY
LIBRARY FACILITIES - CAPITAL
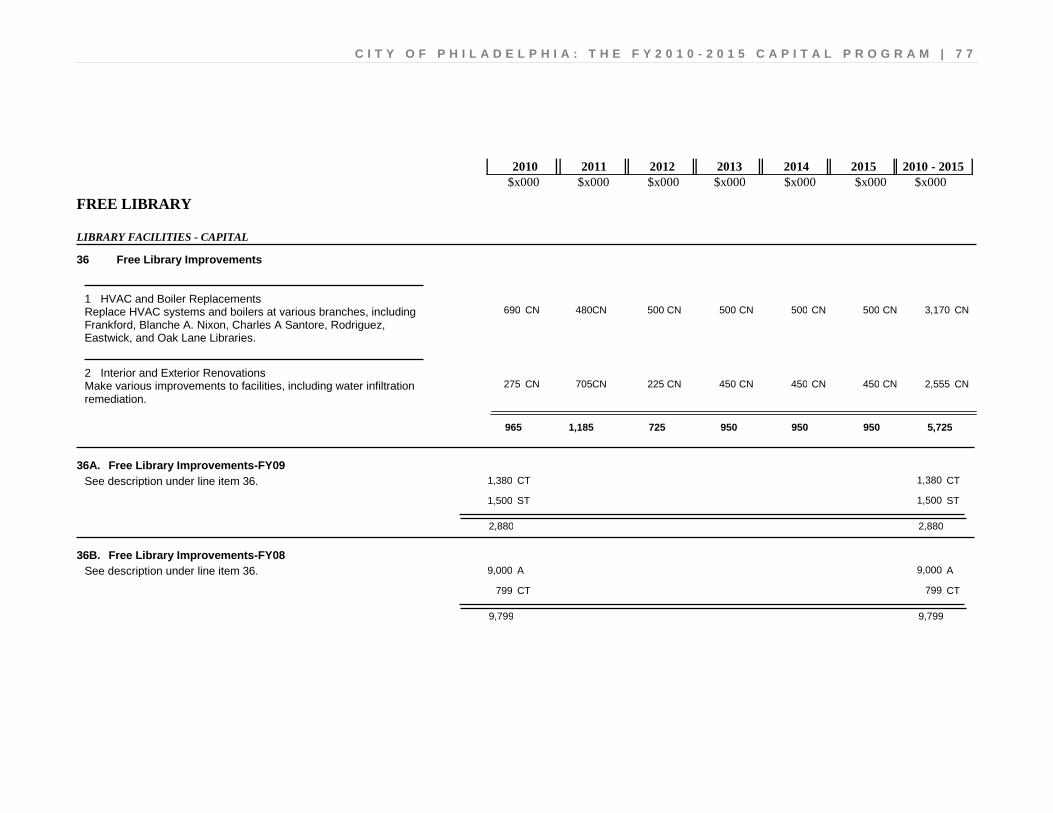
Free Library Improvements 36
3,170 500 500 500 500 480 690 CN CN CN CN CN CN CN Replace HVAC systems and boilers at various branches, including Frankford, Blanche A. Nixon, Charles A Santore, Rodriguez, Eastwick, and Oak Lane Libraries.
HVAC and Boiler Replacements 1
2,555 450 450 450 225 705 275 CN CN CN CN CN CN CN Make various improvements to facilities, including water infiltration remediation.
Interior and Exterior Renovations 2
965 950 950 950 725 1,185 5,725
36A. Free Library Improvements-FY09 1,380 1,380 CT CT
1,500 1,500 ST ST
2,880 2,880
See description under line item 36.
36B. Free Library Improvements-FY08 9,000 9,000 A A
799 799 CT CT
9,799 9,799
See description under line item 36.
7 8 | C I T Y O F P H I L A D E L P H I A : T H E F Y 2 0 1 0 - 2 0 1 5 C A P I T A L P R O G R A M
$x000 $x000 $x000 $x000 $x000 $x000 $x000 2010 2011 2012 2013 2014 2015 2010 - 2015
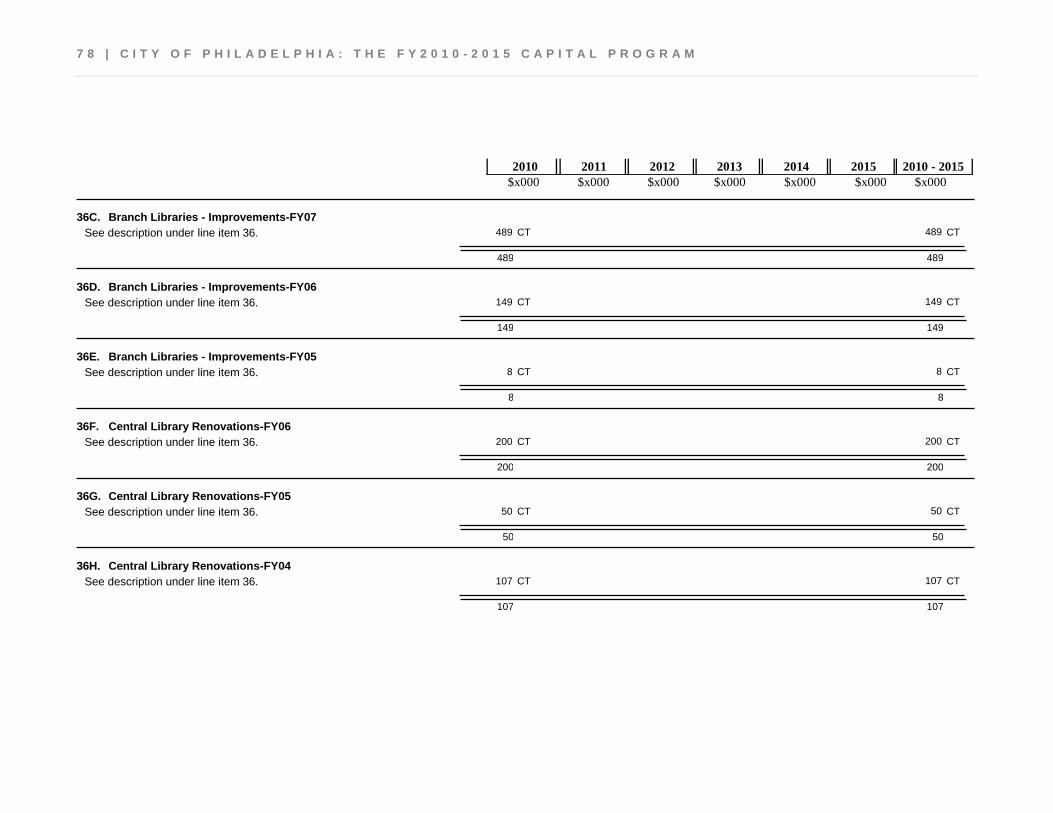
36C. Branch Libraries - Improvements-FY07 489 489 CT CT
489 489
See description under line item 36.
36D. Branch Libraries - Improvements-FY06 149 149 CT CT
149 149
See description under line item 36.
36E. Branch Libraries - Improvements-FY05 8 8 CT CT
8 8
See description under line item 36.
36F. Central Library Renovations-FY06 200 200 CT CT
200 200
See description under line item 36.
36G. Central Library Renovations-FY05 50 50 CT CT
50 50
See description under line item 36.
36H. Central Library Renovations-FY04 107 107 CT CT
107 107
See description under line item 36.
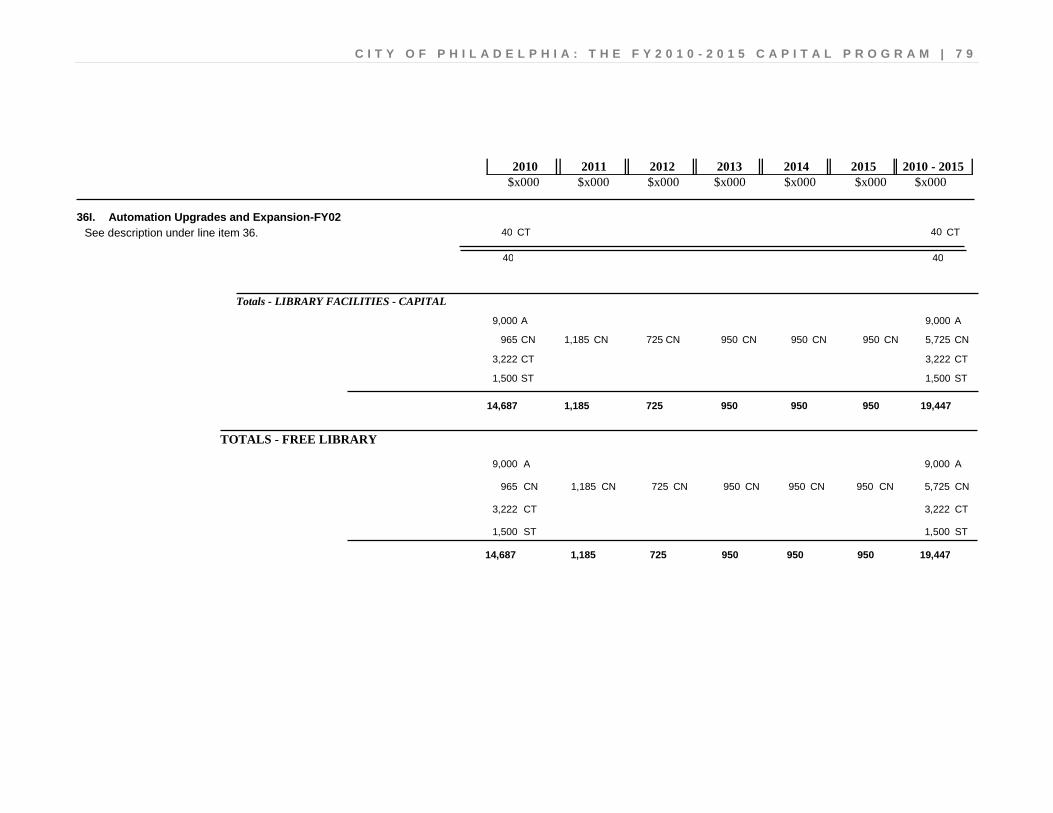
C I T Y O F P H I L A D E L P H I A : T H E F Y 2 0 1 0 - 2 0 1 5 C A P I T A L P R O G R A M | 7 9
$x000 $x000 $x000 $x000 $x000 $x000 $x000 2010 2011 2012 2013 2014 2015 2010 - 2015
36I. Automation Upgrades and Expansion-FY02 40 40 CT CT
40 40
See description under line item 36.
Totals - LIBRARY FACILITIES - CAPITAL
9,000 A 9,000 A
950 725 1,185 965 950 950 CN CN CN CN CN CN 5,725 CN
3,222 CT 3,222 CT
1,500 ST 1,500 ST
950 950 950 725 1,185 14,687 19,447
TOTALS - FREE LIBRARY
9,000 A 9,000 A
950 725 1,185 965 950 950 CN CN CN CN CN CN 5,725 CN
3,222 CT 3,222 CT
1,500 ST 1,500 ST
950 950 950 725 1,185 14,687 19,447

8 0 | C I T Y O F P H I L A D E L P H I A : T H E F Y 2 0 1 0 - 2 0 1 5 C A P I T A L P R O G R A M
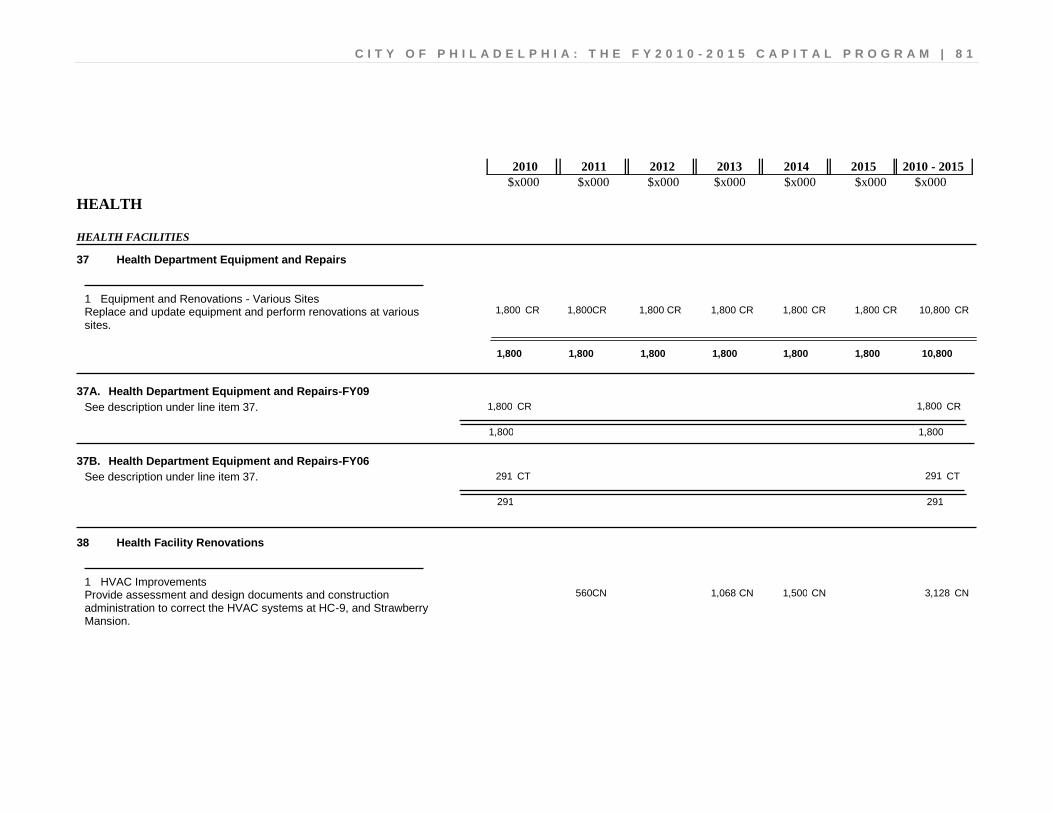
C I T Y O F P H I L A D E L P H I A : T H E F Y 2 0 1 0 - 2 0 1 5 C A P I T A L P R O G R A M | 8 1
$x000 $x000 $x000 $x000 $x000 $x000 $x000 2010 2011 2012 2013 2014 2015 2010 - 2015
HEALTH
HEALTH FACILITIES
Health Department Equipment and Repairs 37
10,800 1,800 1,800 1,800 1,800 1,800 1,800 CR CR CR CR CR CR CR Replace and update equipment and perform renovations at various sites.
Equipment and Renovations - Various Sites 1
1,800 1,800 1,800 1,800 1,800 1,800 10,800
37A. Health Department Equipment and Repairs-FY09 1,800 1,800 CR CR
1,800 1,800
See description under line item 37.
37B. Health Department Equipment and Repairs-FY06 291 291 CT CT
291 291
See description under line item 37.
Health Facility Renovations 38
3,128 1,500 1,068 560 CN CN CN CN Provide assessment and design documents and construction administration to correct the HVAC systems at HC-9, and Strawberry Mansion.
HVAC Improvements 1
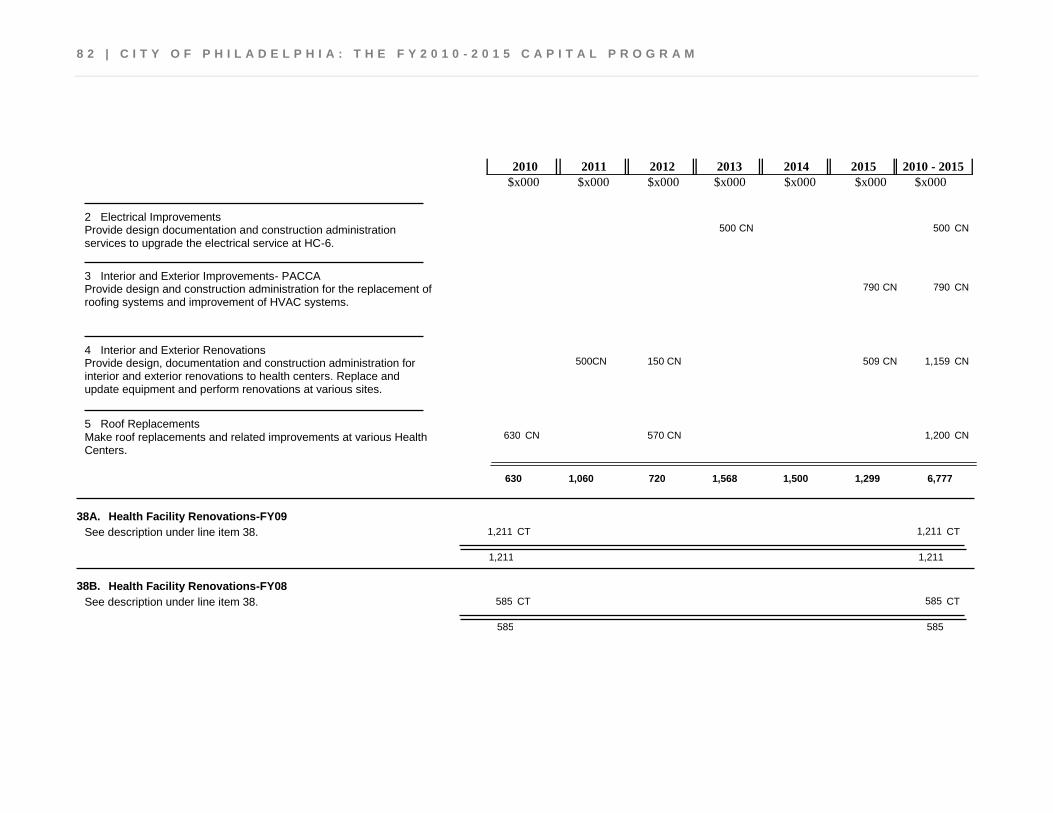
8 2 | C I T Y O F P H I L A D E L P H I A : T H E F Y 2 0 1 0 - 2 0 1 5 C A P I T A L P R O G R A M
$x000 $x000 $x000 $x000 $x000 $x000 $x000 2010 2011 2012 2013 2014 2015 2010 - 2015
500 500 CN CN Provide design documentation and construction administration services to upgrade the electrical service at HC-6.
Electrical Improvements 2
790 790 CN CN Provide design and construction administration for the replacement of roofing systems and improvement of HVAC systems.
Interior and Exterior Improvements- PACCA 3
1,159 509 150 500 CN CN CN CN Provide design, documentation and construction administration for interior and exterior renovations to health centers. Replace and update equipment and perform renovations at various sites.
Interior and Exterior Renovations 4
1,200 570 630 CN CN CN Make roof replacements and related improvements at various Health Centers.
Roof Replacements 5
630 1,299 1,500 1,568 720 1,060 6,777
38A. Health Facility Renovations-FY09 1,211 1,211 CT CT
1,211 1,211
See description under line item 38.
38B. Health Facility Renovations-FY08 585 585 CT CT
585 585
See description under line item 38.
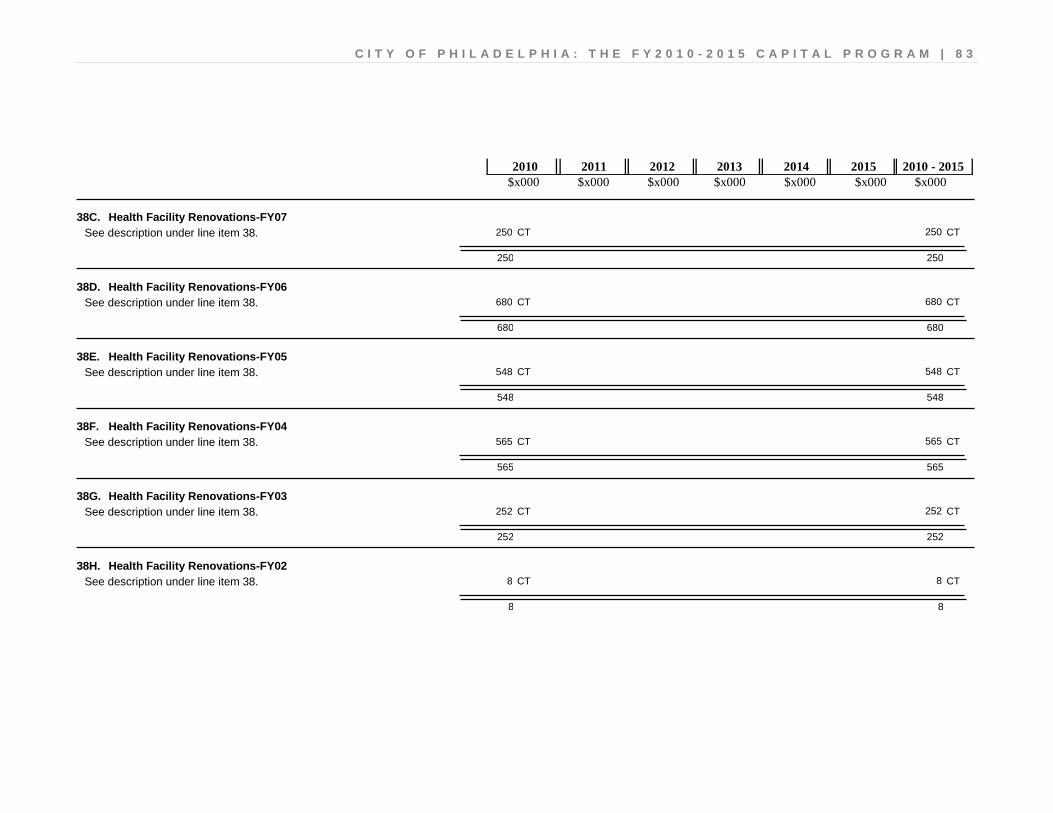
C I T Y O F P H I L A D E L P H I A : T H E F Y 2 0 1 0 - 2 0 1 5 C A P I T A L P R O G R A M | 8 3
$x000 $x000 $x000 $x000 $x000 $x000 $x000 2010 2011 2012 2013 2014 2015 2010 - 2015
38C. Health Facility Renovations-FY07 250 250 CT CT
250 250
See description under line item 38.
38D. Health Facility Renovations-FY06 680 680 CT CT
680 680
See description under line item 38.
38E. Health Facility Renovations-FY05 548 548 CT CT
548 548
See description under line item 38.
38F. Health Facility Renovations-FY04 565 565 CT CT
565 565
See description under line item 38.
38G. Health Facility Renovations-FY03 252 252 CT CT
252 252
See description under line item 38.
38H. Health Facility Renovations-FY02 8 8 CT CT
8 8
See description under line item 38.
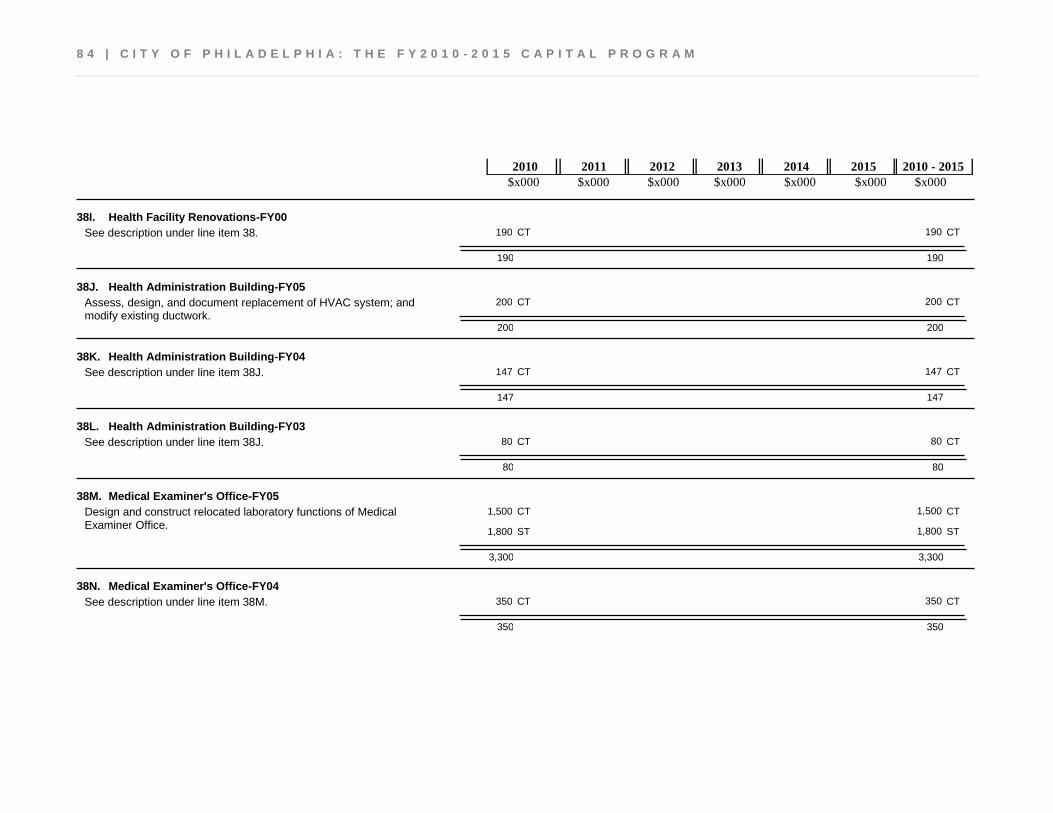
8 4 | C I T Y O F P H I L A D E L P H I A : T H E F Y 2 0 1 0 - 2 0 1 5 C A P I T A L P R O G R A M
$x000 $x000 $x000 $x000 $x000 $x000 $x000 2010 2011 2012 2013 2014 2015 2010 - 2015
38I. Health Facility Renovations-FY00 190 190 CT CT
190 190
See description under line item 38.
38J. Health Administration Building-FY05 200 200 CT CT
200 200
Assess, design, and document replacement of HVAC system; and modify existing ductwork.
38K. Health Administration Building-FY04 147 147 CT CT
147 147
See description under line item 38J.
38L. Health Administration Building-FY03 80 80 CT CT
80 80
See description under line item 38J.
38M. Medical Examiner's Office-FY05 1,500 1,500 CT CT
1,800 1,800 ST ST
3,300 3,300
Design and construct relocated laboratory functions of Medical Examiner Office.
38N. Medical Examiner's Office-FY04 350 350 CT CT
350 350
See description under line item 38M.
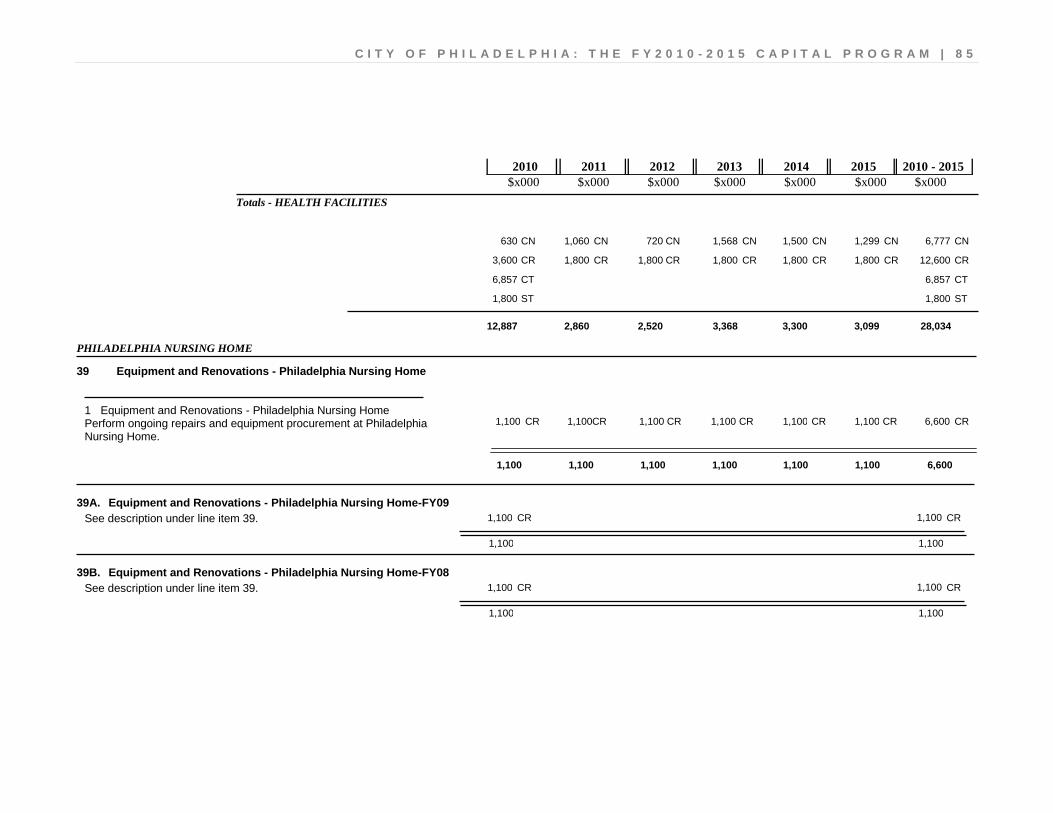
C I T Y O F P H I L A D E L P H I A : T H E F Y 2 0 1 0 - 2 0 1 5 C A P I T A L P R O G R A M | 8 5
$x000 $x000 $x000 $x000 $x000 $x000 $x000 2010 2011 2012 2013 2014 2015 2010 - 2015
Totals - HEALTH FACILITIES
1,568 720 1,060 630 1,500 1,299 CN CN CN CN CN CN 6,777 CN
1,800 1,800 1,800 3,600 1,800 1,800 CR CR CR CR CR CR 12,600 CR
6,857 CT 6,857 CT
1,800 ST 1,800 ST
3,099 3,300 3,368 2,520 2,860 12,887 28,034
PHILADELPHIA NURSING HOME
Equipment and Renovations - Philadelphia Nursing Home 39
6,600 1,100 1,100 1,100 1,100 1,100 1,100 CR CR CR CR CR CR CR Perform ongoing repairs and equipment procurement at Philadelphia Nursing Home.
Equipment and Renovations - Philadelphia Nursing Home 1
1,100 1,100 1,100 1,100 1,100 1,100 6,600
39A. Equipment and Renovations - Philadelphia Nursing Home-FY09 1,100 1,100 CR CR
1,100 1,100
See description under line item 39.
39B. Equipment and Renovations - Philadelphia Nursing Home-FY08 1,100 1,100 CR CR
1,100 1,100
See description under line item 39.
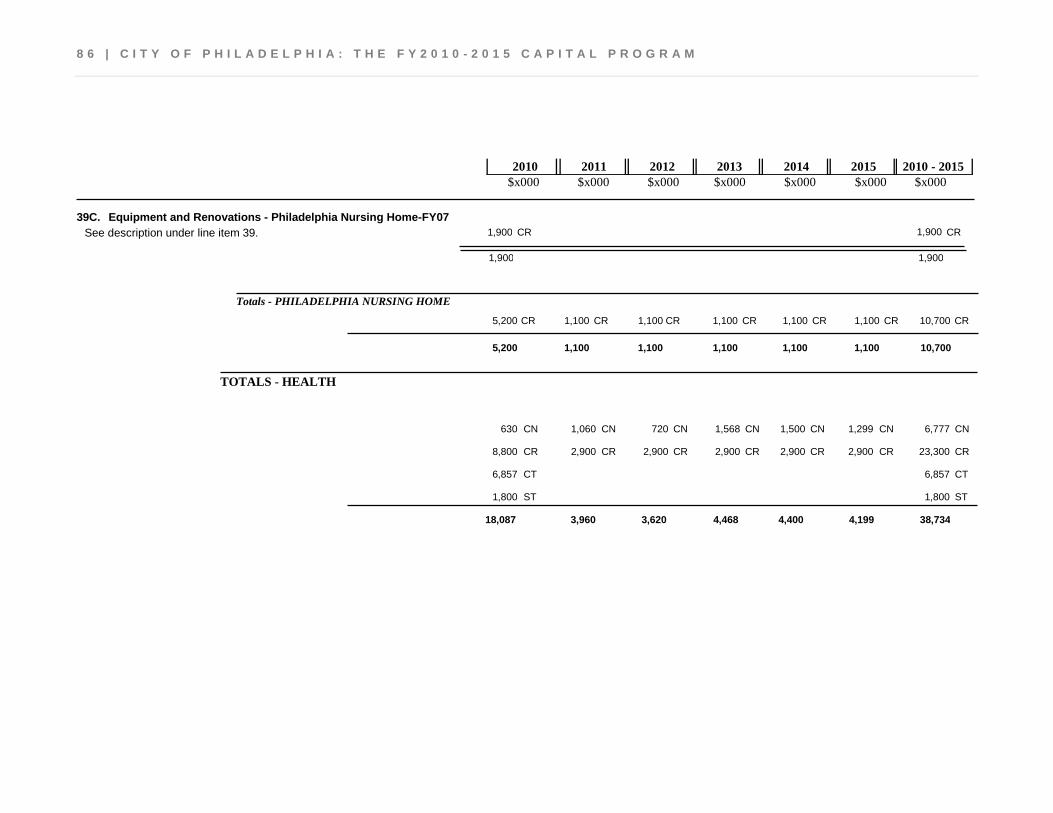
8 6 | C I T Y O F P H I L A D E L P H I A : T H E F Y 2 0 1 0 - 2 0 1 5 C A P I T A L P R O G R A M
$x000 $x000 $x000 $x000 $x000 $x000 $x000 2010 2011 2012 2013 2014 2015 2010 - 2015
39C. Equipment and Renovations - Philadelphia Nursing Home-FY07 1,900 1,900 CR CR
1,900 1,900
See description under line item 39.
Totals - PHILADELPHIA NURSING HOME
1,100 1,100 1,100 5,200 1,100 1,100 CR CR CR CR CR CR 10,700 CR
1,100 1,100 1,100 1,100 1,100 5,200 10,700
TOTALS - HEALTH
1,568 720 1,060 630 1,500 1,299 CN CN CN CN CN CN 6,777 CN
2,900 2,900 2,900 8,800 2,900 2,900 CR CR CR CR CR CR 23,300 CR
6,857 CT 6,857 CT
1,800 ST 1,800 ST
4,199 4,400 4,468 3,620 3,960 18,087 38,734
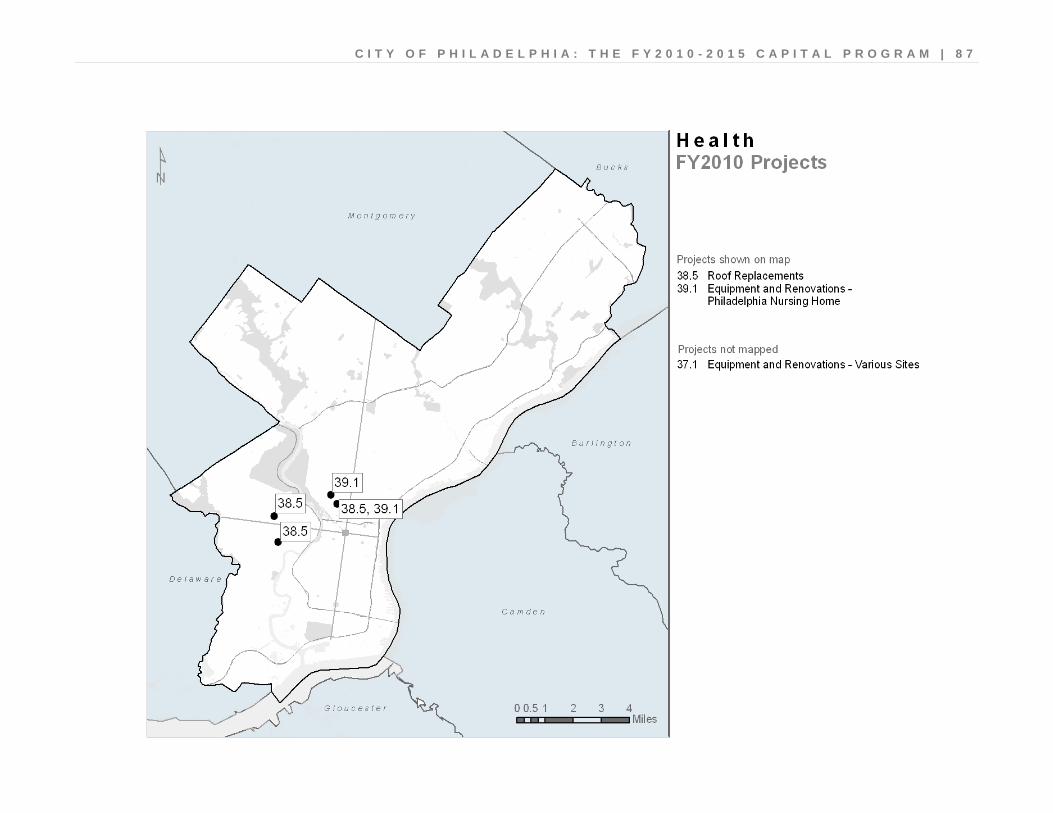
C I T Y O F P H I L A D E L P H I A : T H E F Y 2 0 1 0 - 2 0 1 5 C A P I T A L P R O G R A M | 8 7
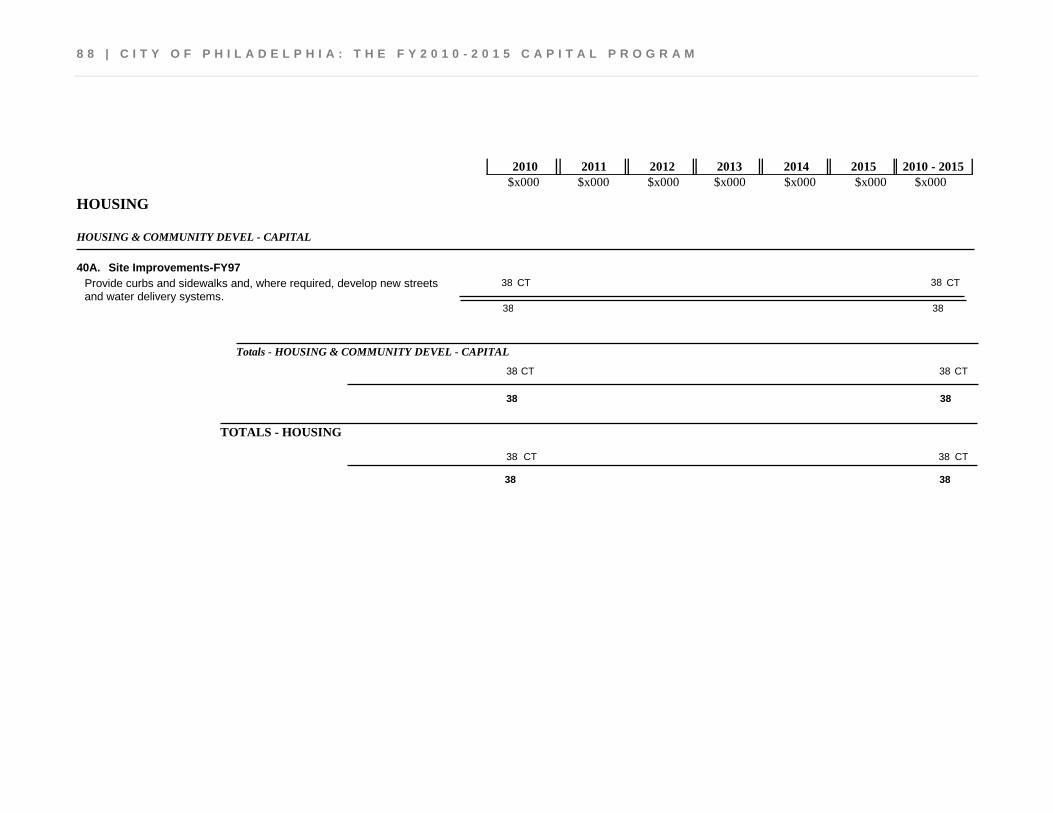
8 8 | C I T Y O F P H I L A D E L P H I A : T H E F Y 2 0 1 0 - 2 0 1 5 C A P I T A L P R O G R A M
$x000 $x000 $x000 $x000 $x000 $x000 $x000 2010 2011 2012 2013 2014 2015 2010 - 2015
HOUSING
HOUSING & COMMUNITY DEVEL - CAPITAL
40A. Site Improvements-FY97 38 38 CT CT
38 38
Provide curbs and sidewalks and, where required, develop new streets and water delivery systems.
Totals - HOUSING & COMMUNITY DEVEL - CAPITAL
38 CT 38 CT
38 38
TOTALS - HOUSING
38 CT 38 CT
38 38
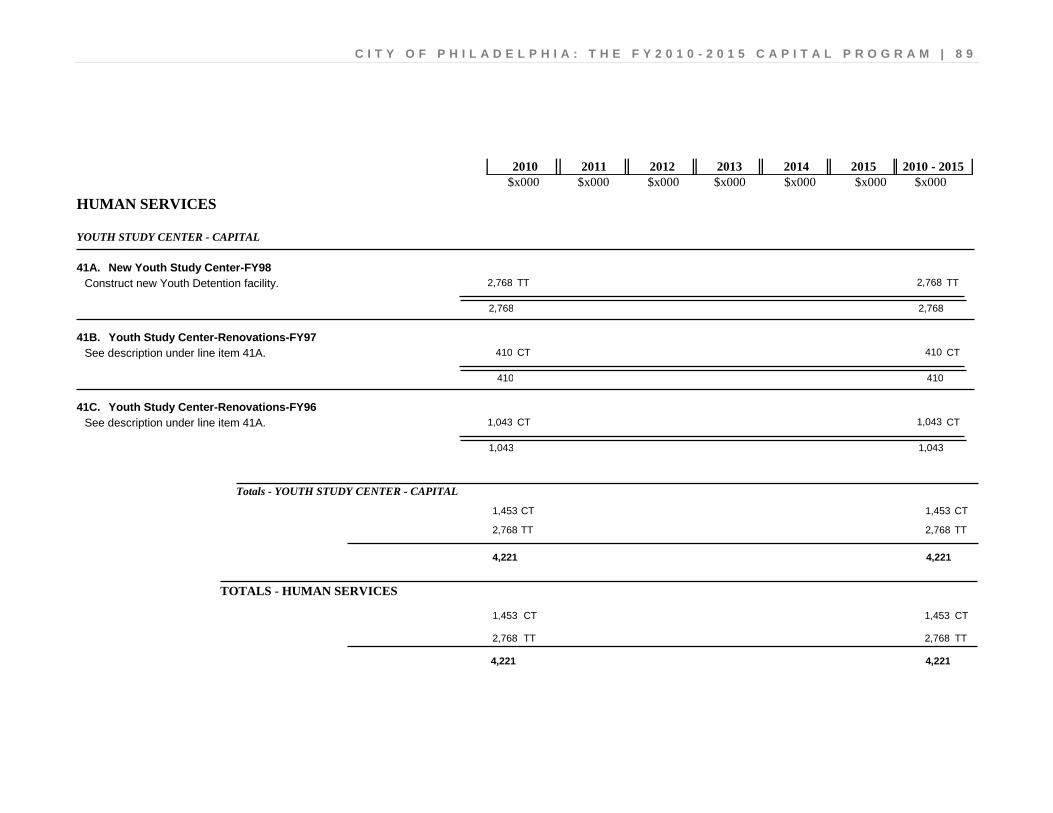
C I T Y O F P H I L A D E L P H I A : T H E F Y 2 0 1 0 - 2 0 1 5 C A P I T A L P R O G R A M | 8 9
$x000 $x000 $x000 $x000 $x000 $x000 $x000 2010 2011 2012 2013 2014 2015 2010 - 2015
HUMAN SERVICES
YOUTH STUDY CENTER - CAPITAL
41A. New Youth Study Center-FY98 2,768 2,768 TT TT
2,768 2,768
Construct new Youth Detention facility.
41B. Youth Study Center-Renovations-FY97 410 410 CT CT
410 410
See description under line item 41A.
41C. Youth Study Center-Renovations-FY96 1,043 1,043 CT CT
1,043 1,043
See description under line item 41A.
Totals - YOUTH STUDY CENTER - CAPITAL
1,453 CT 1,453 CT
2,768 TT 2,768 TT
4,221 4,221
TOTALS - HUMAN SERVICES
1,453 CT 1,453 CT
2,768 TT 2,768 TT
4,221 4,221
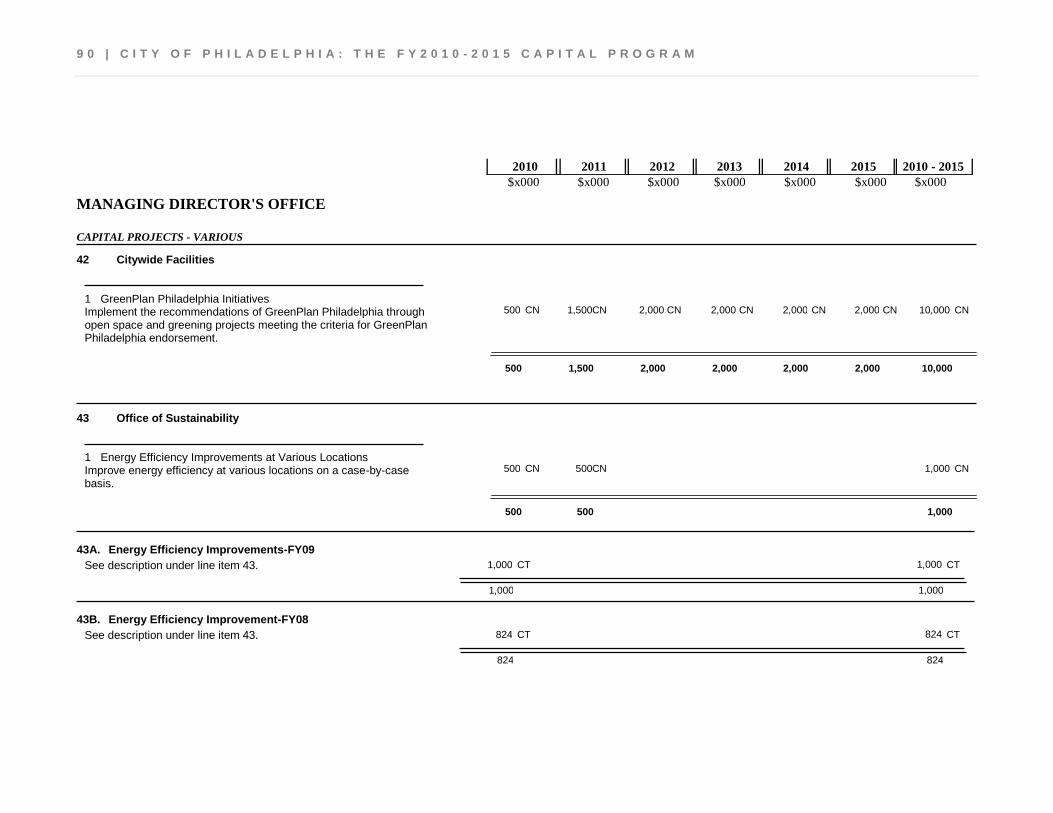
9 0 | C I T Y O F P H I L A D E L P H I A : T H E F Y 2 0 1 0 - 2 0 1 5 C A P I T A L P R O G R A M
$x000 $x000 $x000 $x000 $x000 $x000 $x000 2010 2011 2012 2013 2014 2015 2010 - 2015
MANAGING DIRECTOR'S OFFICE
CAPITAL PROJECTS - VARIOUS
Citywide Facilities 42
10,000 2,000 2,000 2,000 2,000 1,500 500 CN CN CN CN CN CN CN Implement the recommendations of GreenPlan Philadelphia through open space and greening projects meeting the criteria for GreenPlan Philadelphia endorsement.
GreenPlan Philadelphia Initiatives 1
500 2,000 2,000 2,000 2,000 1,500 10,000
Office of Sustainability 43
1,000 500 500 CN CN CN Improve energy efficiency at various locations on a case-by-case basis.
Energy Efficiency Improvements at Various Locations 1
500 500 1,000
43A. Energy Efficiency Improvements-FY09 1,000 1,000 CT CT
1,000 1,000
See description under line item 43.
43B. Energy Efficiency Improvement-FY08 824 824 CT CT
824 824
See description under line item 43.
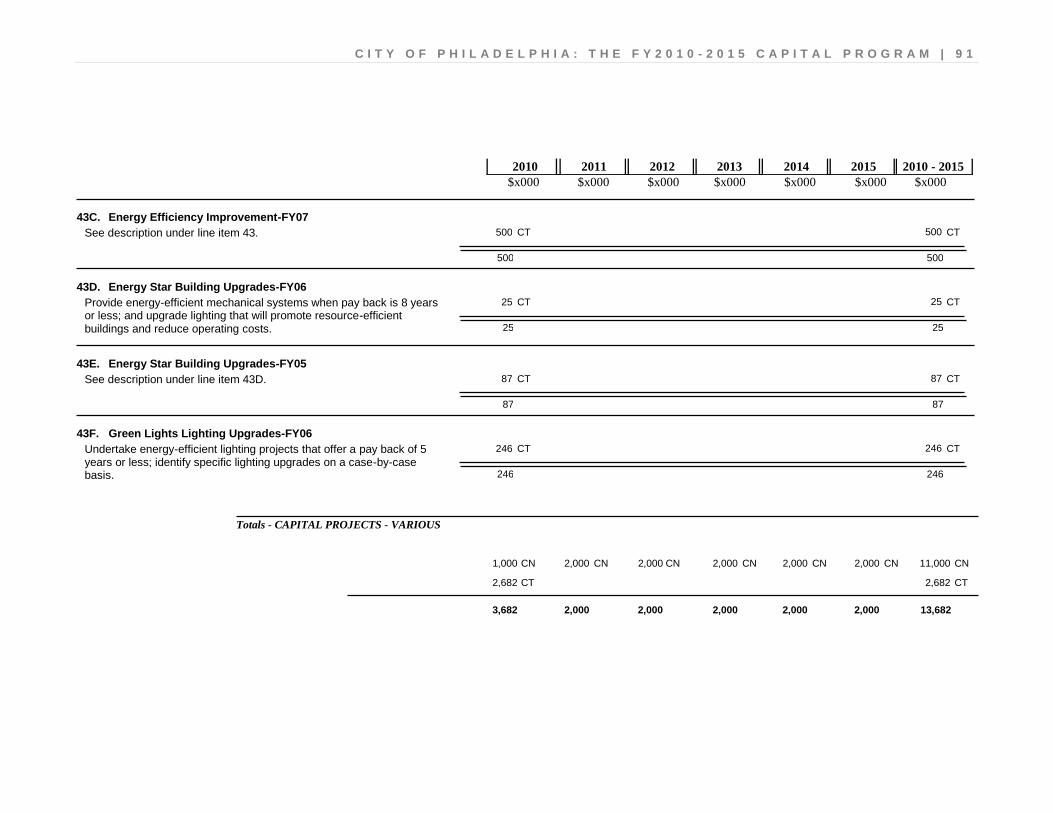
C I T Y O F P H I L A D E L P H I A : T H E F Y 2 0 1 0 - 2 0 1 5 C A P I T A L P R O G R A M | 9 1
$x000 $x000 $x000 $x000 $x000 $x000 $x000 2010 2011 2012 2013 2014 2015 2010 - 2015
43C. Energy Efficiency Improvement-FY07 500 500 CT CT
500 500
See description under line item 43.
43D. Energy Star Building Upgrades-FY06 25 25 CT CT
25 25
Provide energy-efficient mechanical systems when pay back is 8 years or less; and upgrade lighting that will promote resource-efficient buildings and reduce operating costs.
43E. Energy Star Building Upgrades-FY05 87 87 CT CT
87 87
See description under line item 43D.
43F. Green Lights Lighting Upgrades-FY06 246 246 CT CT
246 246
Undertake energy-efficient lighting projects that offer a pay back of 5 years or less; identify specific lighting upgrades on a case-by-case basis.
Totals - CAPITAL PROJECTS - VARIOUS
2,000 2,000 2,000 1,000 2,000 2,000 CN CN CN CN CN CN 11,000 CN
2,682 CT 2,682 CT
2,000 2,000 2,000 2,000 2,000 3,682 13,682
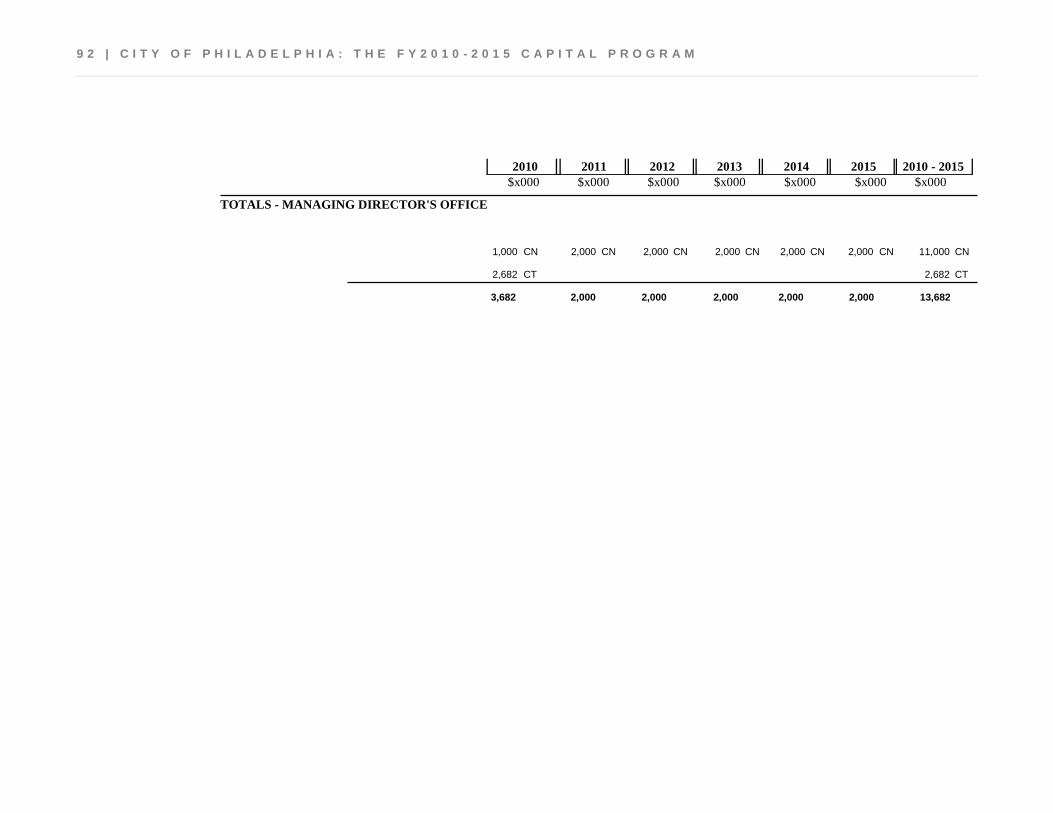
9 2 | C I T Y O F P H I L A D E L P H I A : T H E F Y 2 0 1 0 - 2 0 1 5 C A P I T A L P R O G R A M
$x000 $x000 $x000 $x000 $x000 $x000 $x000 2010 2011 2012 2013 2014 2015 2010 - 2015
TOTALS - MANAGING DIRECTOR'S OFFICE
2,000 2,000 2,000 1,000 2,000 2,000 CN CN CN CN CN CN 11,000 CN
2,682 CT 2,682 CT
2,000 2,000 2,000 2,000 2,000 3,682 13,682
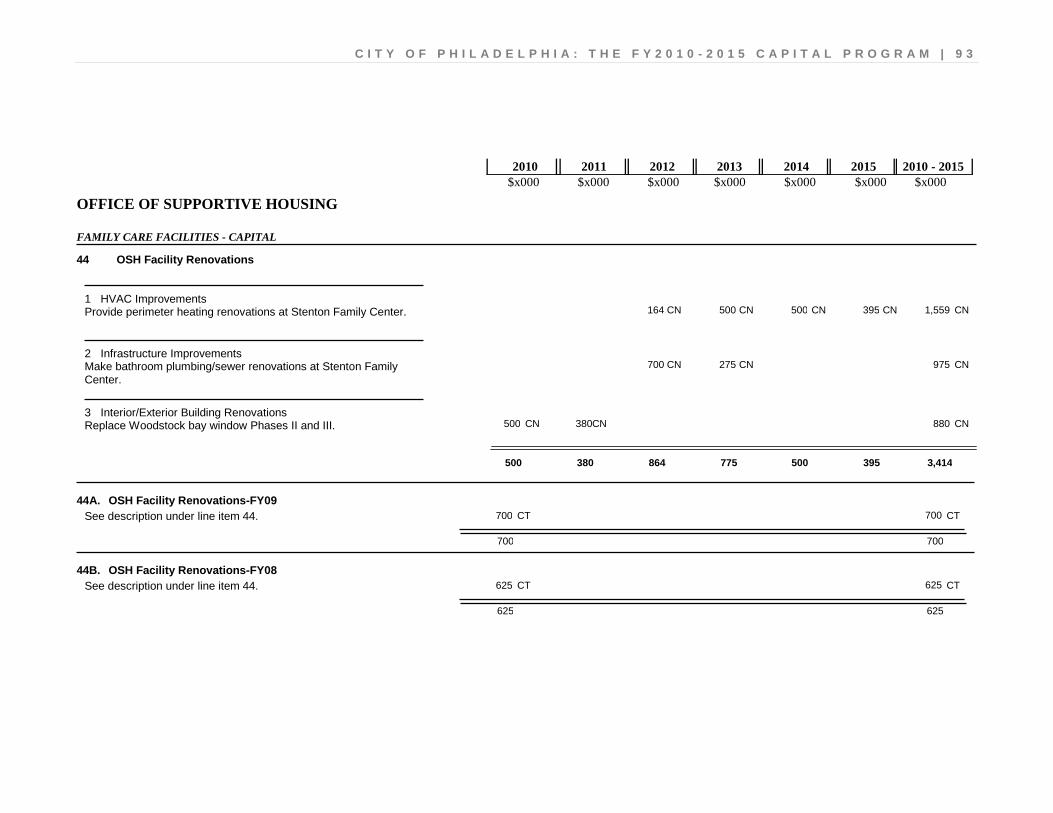
C I T Y O F P H I L A D E L P H I A : T H E F Y 2 0 1 0 - 2 0 1 5 C A P I T A L P R O G R A M | 9 3
$x000 $x000 $x000 $x000 $x000 $x000 $x000 2010 2011 2012 2013 2014 2015 2010 - 2015
OFFICE OF SUPPORTIVE HOUSING
FAMILY CARE FACILITIES - CAPITAL
OSH Facility Renovations 44
1,559 395 500 500 164 CN CN CN CN CN Provide perimeter heating renovations at Stenton Family Center. HVAC Improvements 1
975 275 700 CN CN CN Make bathroom plumbing/sewer renovations at Stenton Family Center.
Infrastructure Improvements 2
880 380 500 CN CN CN Replace Woodstock bay window Phases II and III. Interior/Exterior Building Renovations 3
500 395 500 775 864 380 3,414
44A. OSH Facility Renovations-FY09 700 700 CT CT
700 700
See description under line item 44.
44B. OSH Facility Renovations-FY08 625 625 CT CT
625 625
See description under line item 44.
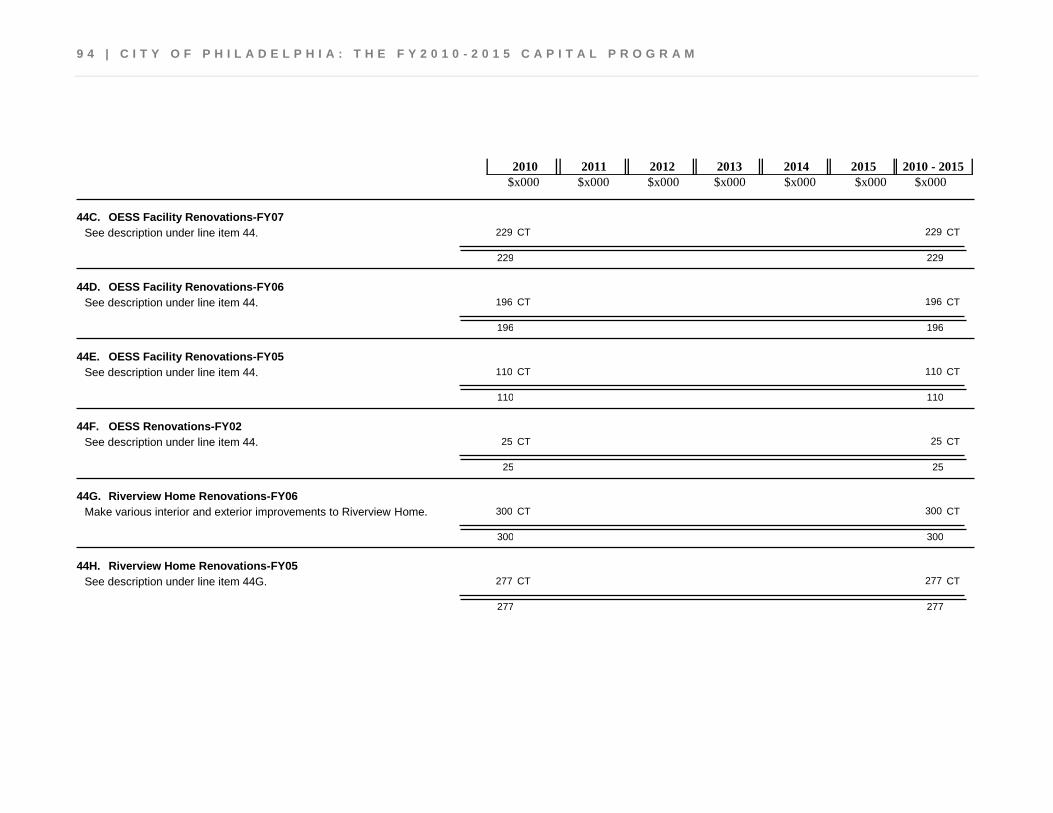
9 4 | C I T Y O F P H I L A D E L P H I A : T H E F Y 2 0 1 0 - 2 0 1 5 C A P I T A L P R O G R A M
$x000 $x000 $x000 $x000 $x000 $x000 $x000 2010 2011 2012 2013 2014 2015 2010 - 2015
44C. OESS Facility Renovations-FY07 229 229 CT CT
229 229
See description under line item 44.
44D. OESS Facility Renovations-FY06 196 196 CT CT
196 196
See description under line item 44.
44E. OESS Facility Renovations-FY05 110 110 CT CT
110 110
See description under line item 44.
44F. OESS Renovations-FY02 25 25 CT CT
25 25
See description under line item 44.
44G. Riverview Home Renovations-FY06 300 300 CT CT
300 300
Make various interior and exterior improvements to Riverview Home.
44H. Riverview Home Renovations-FY05 277 277 CT CT
277 277
See description under line item 44G.

C I T Y O F P H I L A D E L P H I A : T H E F Y 2 0 1 0 - 2 0 1 5 C A P I T A L P R O G R A M | 9 5
$x000 $x000 $x000 $x000 $x000 $x000 $x000 2010 2011 2012 2013 2014 2015 2010 - 2015
44I. Riverview Home Renovations-FY04 144 144 CT CT
144 144
See description under line item 44G.
44J. Riverview Home Renovations-FY01 47 47 CT CT
47 47
See description under line item 44G.
Totals - FAMILY CARE FACILITIES - CAPITAL
775 864 380 500 500 395 CN CN CN CN CN CN 3,414 CN
2,653 CT 2,653 CT
395 500 775 864 380 3,153 6,067
TOTALS - OFFICE OF SUPPORTIVE HOUSING
775 864 380 500 500 395 CN CN CN CN CN CN 3,414 CN
2,653 CT 2,653 CT
395 500 775 864 380 3,153 6,067

9 6 | C I T Y O F P H I L A D E L P H I A : T H E F Y 2 0 1 0 - 2 0 1 5 C A P I T A L P R O G R A M
$x000 $x000 $x000 $x000 $x000 $x000 $x000 2010 2011 2012 2013 2014 2015 2010 - 2015
POLICE
POLICE FACILITIES
Computer and Communication System Improvements 45
12,000 2,000 2,000 2,000 2,000 2,000 2,000 CR CR CR CR CR CR CR Upgrade and repair computer communications equipment and systems.
Computer and Communication Upgrades 1
2,000 2,000 2,000 2,000 2,000 2,000 12,000
45A. Computer and Communication System Improvements-FY09 2,000 2,000 CR CR
2,000 2,000
See description under line item 45.
45B. Computer/Communication Systems Imps-FY03 39 39 CT CT
39 39
See description under line item 45.
Police Facilities - Renovations 46
9,550 4,750 4,750 50 CN CN CN CN 3,000 3,000 CR CR
570 570 FB FB
Conduct facility assessment and develop space programming for the
Germantown and Woodhaven BRAC facilities.
BRAC Facilities - Design and Renovations 1
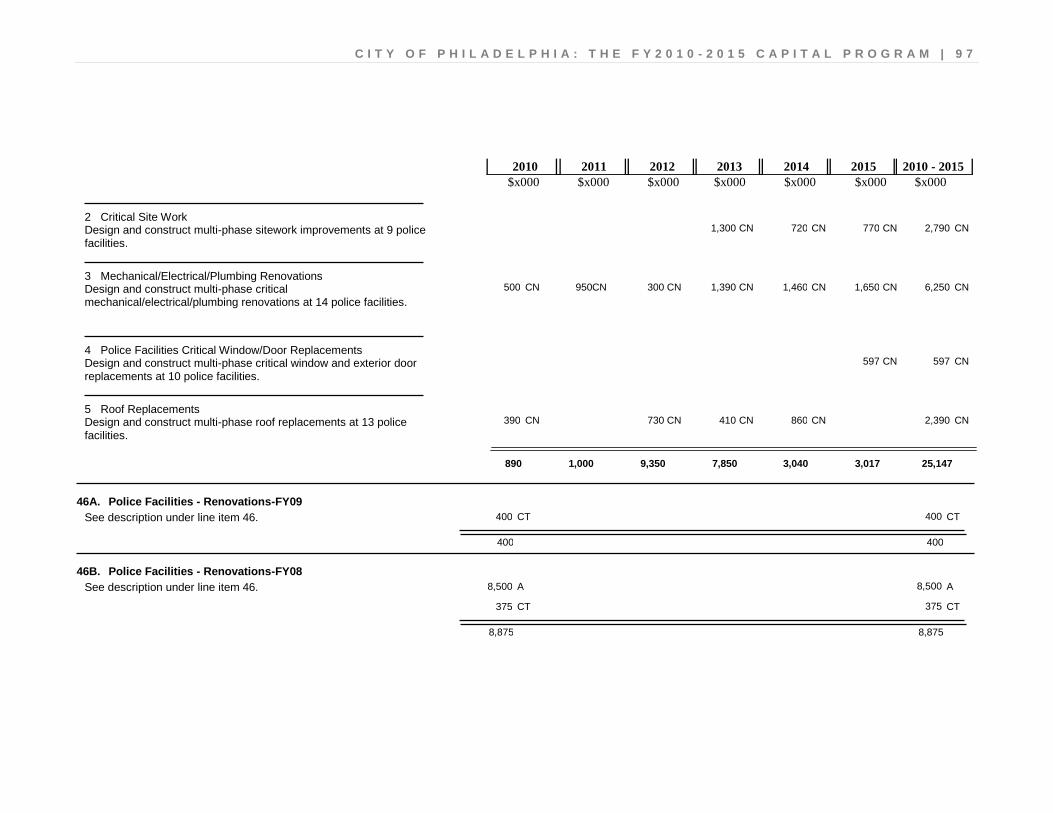
C I T Y O F P H I L A D E L P H I A : T H E F Y 2 0 1 0 - 2 0 1 5 C A P I T A L P R O G R A M | 9 7
$x000 $x000 $x000 $x000 $x000 $x000 $x000 2010 2011 2012 2013 2014 2015 2010 - 2015
2,790 770 720 1,300 CN CN CN CN Design and construct multi-phase sitework improvements at 9 police facilities.
Critical Site Work 2
6,250 1,650 1,460 1,390 300 950 500 CN CN CN CN CN CN CN Design and construct multi-phase critical mechanical/electrical/plumbing renovations at 14 police facilities.
Mechanical/Electrical/Plumbing Renovations 3
597 597 CN CN Design and construct multi-phase critical window and exterior door replacements at 10 police facilities.
Police Facilities Critical Window/Door Replacements 4
2,390 860 410 730 390 CN CN CN CN CN Design and construct multi-phase roof replacements at 13 police facilities.
Roof Replacements 5
890 3,017 3,040 7,850 9,350 1,000 25,147
46A. Police Facilities - Renovations-FY09 400 400 CT CT
400 400
See description under line item 46.
46B. Police Facilities - Renovations-FY08 8,500 8,500 A A
375 375 CT CT
8,875 8,875
See description under line item 46.
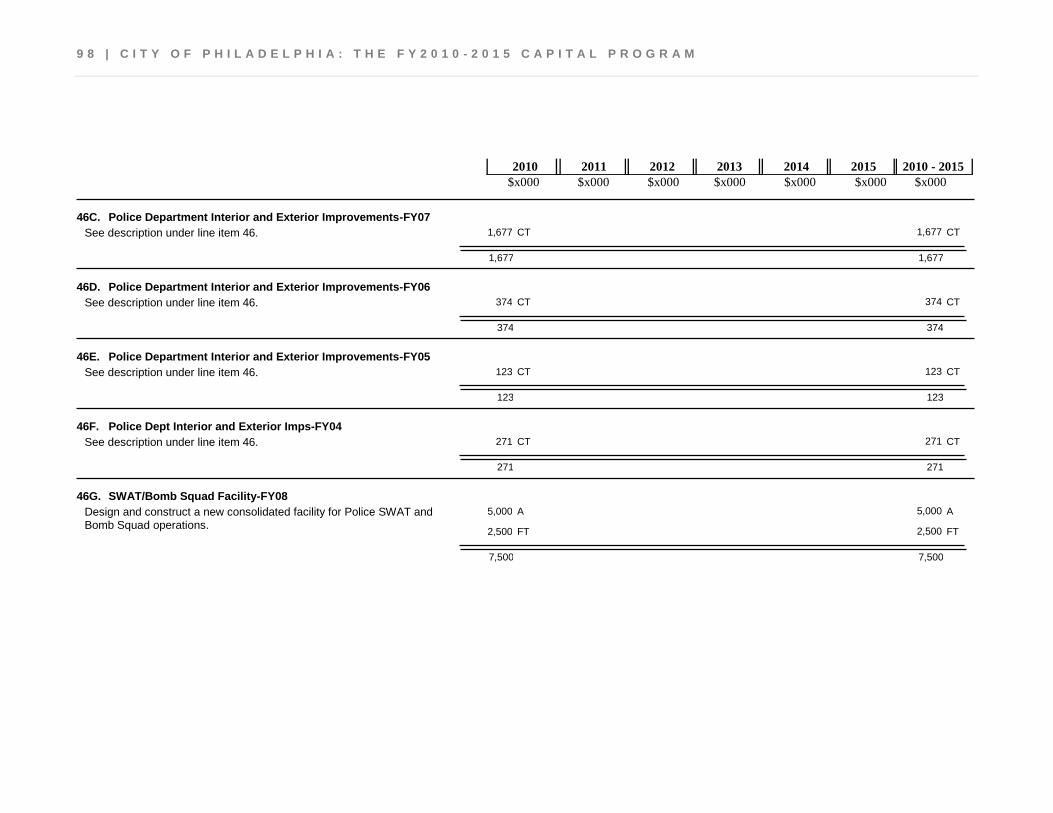
9 8 | C I T Y O F P H I L A D E L P H I A : T H E F Y 2 0 1 0 - 2 0 1 5 C A P I T A L P R O G R A M
$x000 $x000 $x000 $x000 $x000 $x000 $x000 2010 2011 2012 2013 2014 2015 2010 - 2015
46C. Police Department Interior and Exterior Improvements-FY07 1,677 1,677 CT CT
1,677 1,677
See description under line item 46.
46D. Police Department Interior and Exterior Improvements-FY06 374 374 CT CT
374 374
See description under line item 46.
46E. Police Department Interior and Exterior Improvements-FY05 123 123 CT CT
123 123
See description under line item 46.
46F. Police Dept Interior and Exterior Imps-FY04 271 271 CT CT
271 271
See description under line item 46.
46G. SWAT/Bomb Squad Facility-FY08 5,000 5,000 A A
2,500 2,500 FT FT
7,500 7,500
Design and construct a new consolidated facility for Police SWAT and Bomb Squad operations.
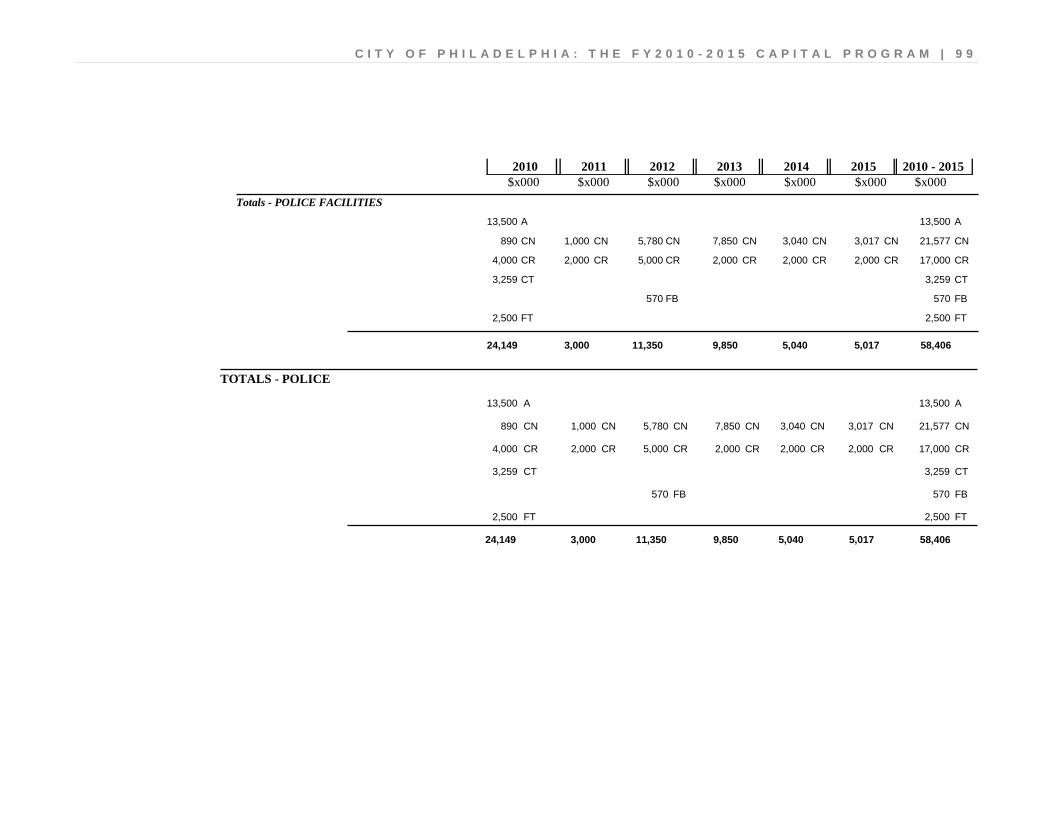
C I T Y O F P H I L A D E L P H I A : T H E F Y 2 0 1 0 - 2 0 1 5 C A P I T A L P R O G R A M | 9 9
$x000 $x000 $x000 $x000 $x000 $x000 $x000 2010 2011 2012 2013 2014 2015 2010 - 2015
Totals - POLICE FACILITIES
13,500 A 13,500 A
7,850 5,780 1,000 890 3,040 3,017 CN CN CN CN CN CN 21,577 CN
2,000 5,000 2,000 4,000 2,000 2,000 CR CR CR CR CR CR 17,000 CR
3,259 CT 3,259 CT
570 FB 570 FB
2,500 FT 2,500 FT
5,017 5,040 9,850 11,350 3,000 24,149 58,406
TOTALS - POLICE
13,500 A 13,500 A
7,850 5,780 1,000 890 3,040 3,017 CN CN CN CN CN CN 21,577 CN
2,000 5,000 2,000 4,000 2,000 2,000 CR CR CR CR CR CR 17,000 CR
3,259 CT 3,259 CT
570 FB 570 FB
2,500 FT 2,500 FT
5,017 5,040 9,850 11,350 3,000 24,149 58,406

1 0 0 | C I T Y O F P H I L A D E L P H I A : T H E F Y 2 0 1 0 - 2 0 1 5 C A P I T A L P R O G R A M
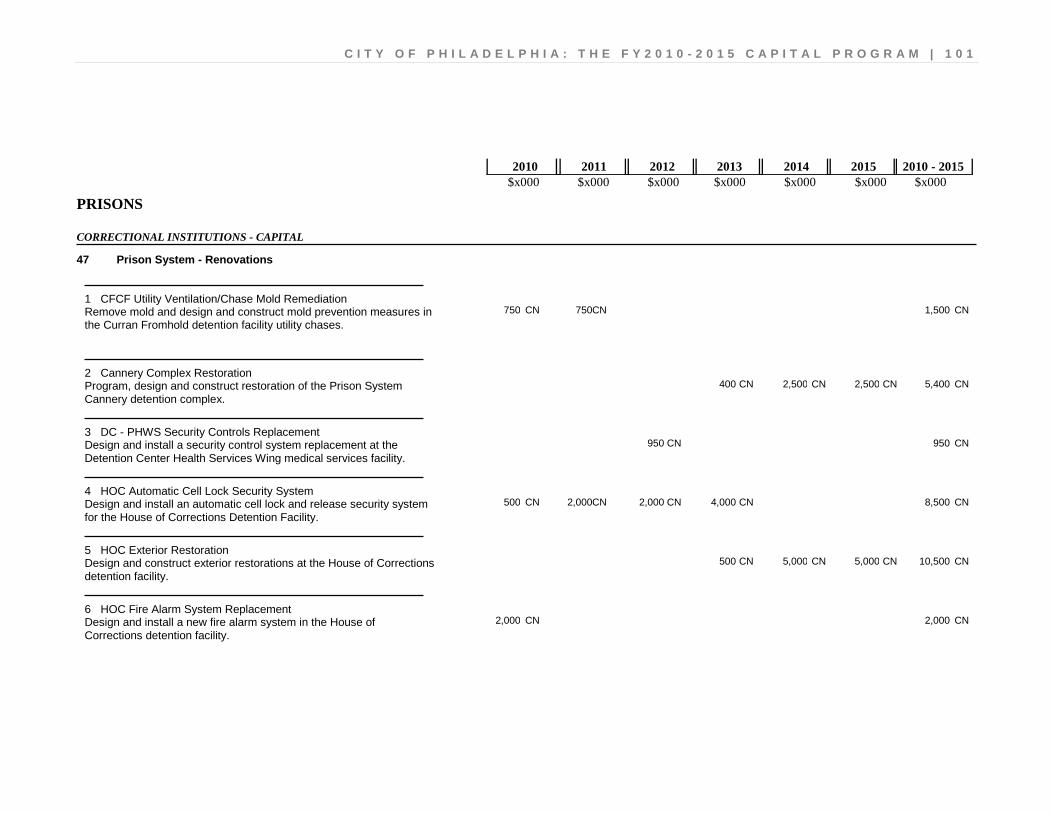
C I T Y O F P H I L A D E L P H I A : T H E F Y 2 0 1 0 - 2 0 1 5 C A P I T A L P R O G R A M | 1 0 1
$x000 $x000 $x000 $x000 $x000 $x000 $x000 2010 2011 2012 2013 2014 2015 2010 - 2015
PRISONS
CORRECTIONAL INSTITUTIONS - CAPITAL
Prison System - Renovations 47
1,500 750 750 CN CN CN Remove mold and design and construct mold prevention measures in the Curran Fromhold detention facility utility chases.
CFCF Utility Ventilation/Chase Mold Remediation 1
5,400 2,500 2,500 400 CN CN CN CN Program, design and construct restoration of the Prison System Cannery detention complex.
Cannery Complex Restoration 2
950 950 CN CN Design and install a security control system replacement at the Detention Center Health Services Wing medical services facility.
DC - PHWS Security Controls Replacement 3
8,500 4,000 2,000 2,000 500 CN CN CN CN CN Design and install an automatic cell lock and release security system for the House of Corrections Detention Facility.
HOC Automatic Cell Lock Security System 4
10,500 5,000 5,000 500 CN CN CN CN Design and construct exterior restorations at the House of Corrections detention facility.
HOC Exterior Restoration 5
2,000 2,000 CN CN Design and install a new fire alarm system in the House of Corrections detention facility.
HOC Fire Alarm System Replacement 6
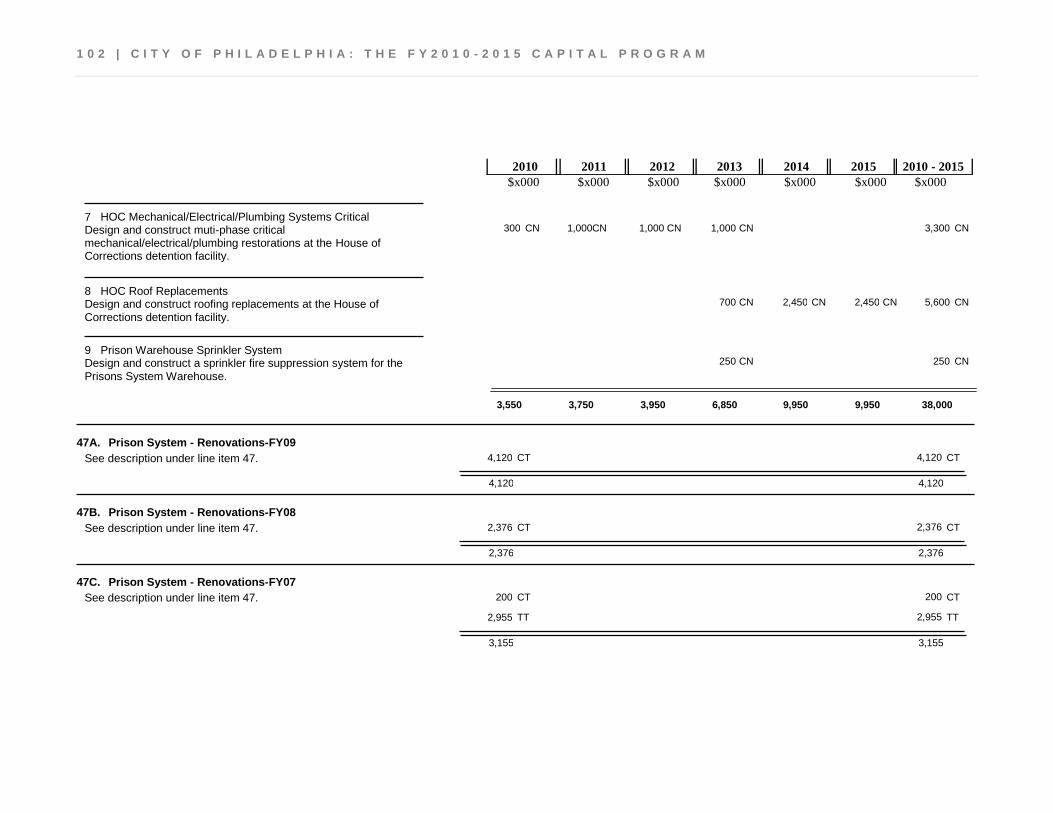
1 0 2 | C I T Y O F P H I L A D E L P H I A : T H E F Y 2 0 1 0 - 2 0 1 5 C A P I T A L P R O G R A M
$x000 $x000 $x000 $x000 $x000 $x000 $x000 2010 2011 2012 2013 2014 2015 2010 - 2015
3,300 1,000 1,000 1,000 300 CN CN CN CN CN Design and construct muti-phase critical mechanical/electrical/plumbing restorations at the House of Corrections detention facility.
HOC Mechanical/Electrical/Plumbing Systems Critical Restorations
7
5,600 2,450 2,450 700 CN CN CN CN Design and construct roofing replacements at the House of Corrections detention facility.
HOC Roof Replacements 8
250 250 CN CN Design and construct a sprinkler fire suppression system for the Prisons System Warehouse.
Prison Warehouse Sprinkler System 9
3,550 9,950 9,950 6,850 3,950 3,750 38,000
47A. Prison System - Renovations-FY09 4,120 4,120 CT CT
4,120 4,120
See description under line item 47.
47B. Prison System - Renovations-FY08 2,376 2,376 CT CT
2,376 2,376
See description under line item 47.
47C. Prison System - Renovations-FY07 200 200 CT CT
2,955 2,955 TT TT
3,155 3,155
See description under line item 47.
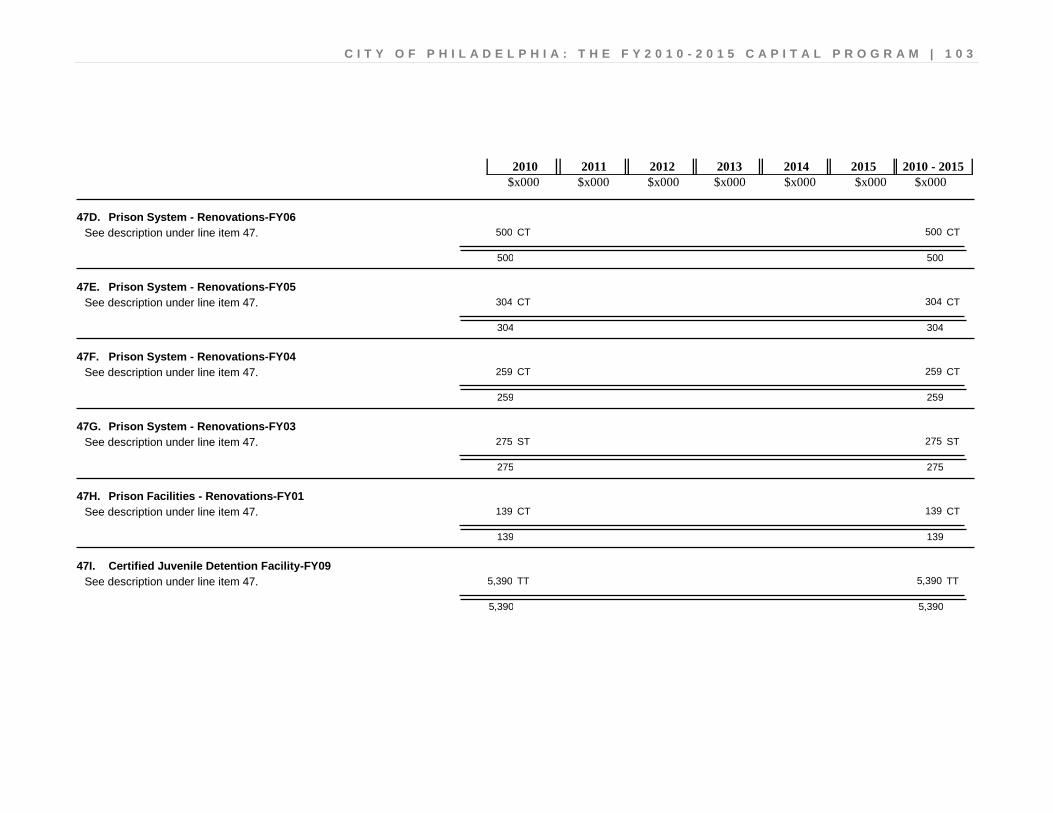
C I T Y O F P H I L A D E L P H I A : T H E F Y 2 0 1 0 - 2 0 1 5 C A P I T A L P R O G R A M | 1 0 3
$x000 $x000 $x000 $x000 $x000 $x000 $x000 2010 2011 2012 2013 2014 2015 2010 - 2015
47D. Prison System - Renovations-FY06 500 500 CT CT
500 500
See description under line item 47.
47E. Prison System - Renovations-FY05 304 304 CT CT
304 304
See description under line item 47.
47F. Prison System - Renovations-FY04 259 259 CT CT
259 259
See description under line item 47.
47G. Prison System - Renovations-FY03 275 275 ST ST
275 275
See description under line item 47.
47H. Prison Facilities - Renovations-FY01 139 139 CT CT
139 139
See description under line item 47.
47I. Certified Juvenile Detention Facility-FY09 5,390 5,390 TT TT
5,390 5,390
See description under line item 47.
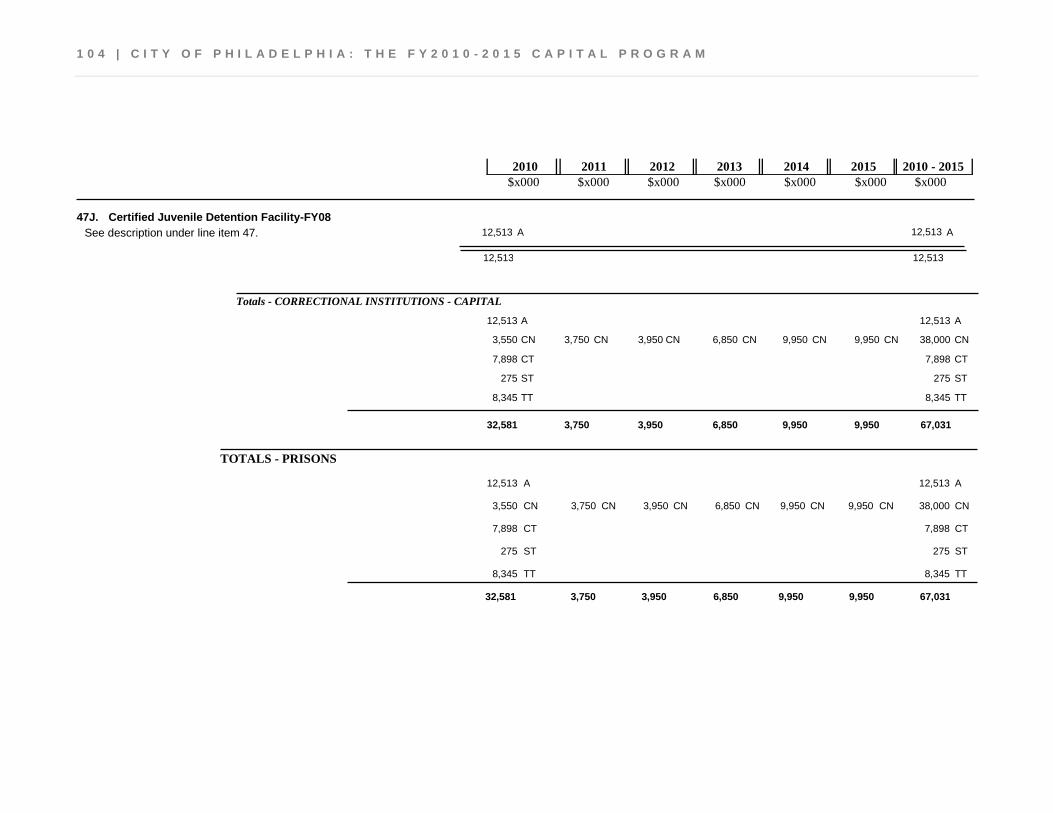
1 0 4 | C I T Y O F P H I L A D E L P H I A : T H E F Y 2 0 1 0 - 2 0 1 5 C A P I T A L P R O G R A M
$x000 $x000 $x000 $x000 $x000 $x000 $x000 2010 2011 2012 2013 2014 2015 2010 - 2015
47J. Certified Juvenile Detention Facility-FY08 12,513 12,513 A A
12,513 12,513
See description under line item 47.
Totals - CORRECTIONAL INSTITUTIONS - CAPITAL
12,513 A 12,513 A
6,850 3,950 3,750 3,550 9,950 9,950 CN CN CN CN CN CN 38,000 CN
7,898 CT 7,898 CT
275 ST 275 ST
8,345 TT 8,345 TT
9,950 9,950 6,850 3,950 3,750 32,581 67,031
TOTALS - PRISONS
12,513 A 12,513 A
6,850 3,950 3,750 3,550 9,950 9,950 CN CN CN CN CN CN 38,000 CN
7,898 CT 7,898 CT
275 ST 275 ST
8,345 TT 8,345 TT
9,950 9,950 6,850 3,950 3,750 32,581 67,031
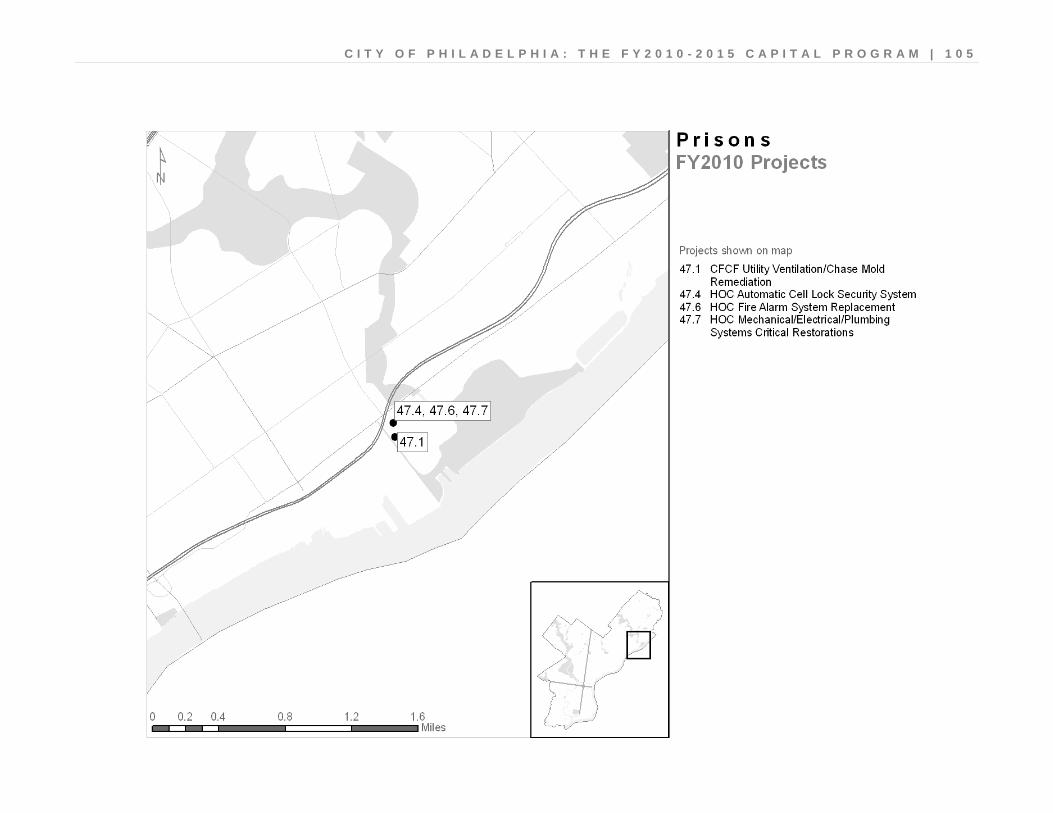
C I T Y O F P H I L A D E L P H I A : T H E F Y 2 0 1 0 - 2 0 1 5 C A P I T A L P R O G R A M | 1 0 5
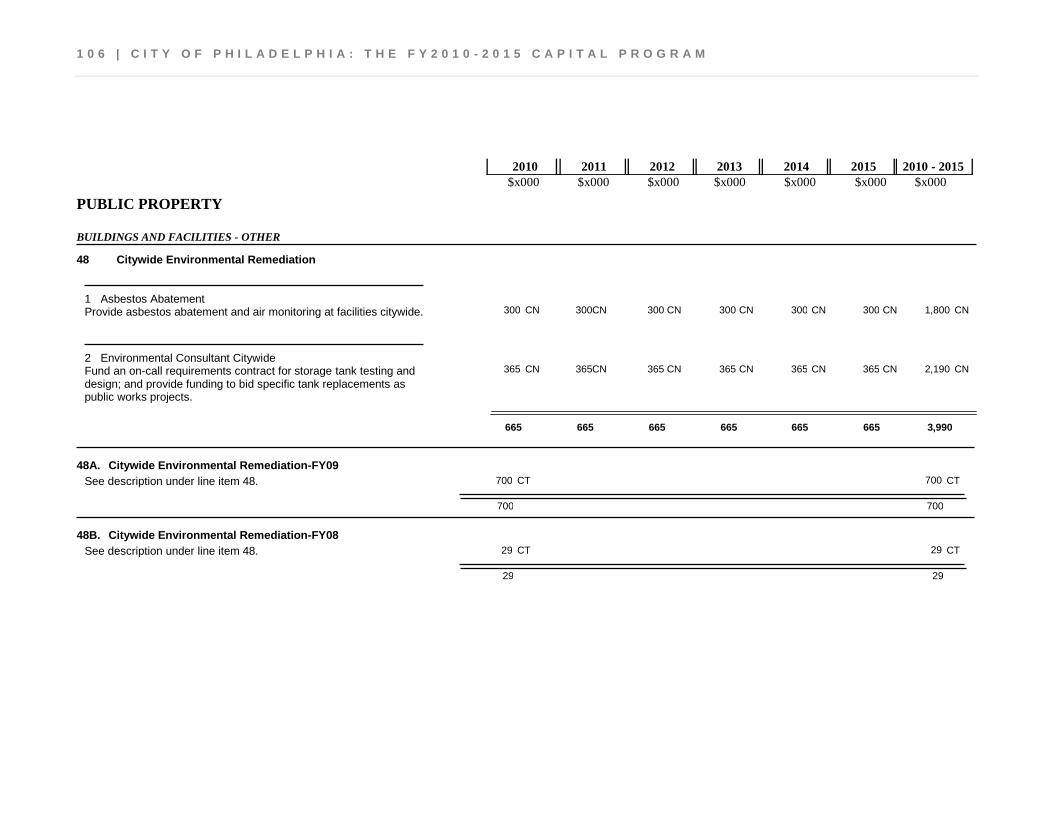
1 0 6 | C I T Y O F P H I L A D E L P H I A : T H E F Y 2 0 1 0 - 2 0 1 5 C A P I T A L P R O G R A M
$x000 $x000 $x000 $x000 $x000 $x000 $x000 2010 2011 2012 2013 2014 2015 2010 - 2015
PUBLIC PROPERTY
BUILDINGS AND FACILITIES - OTHER
Citywide Environmental Remediation 48
1,800 300 300 300 300 300 300 CN CN CN CN CN CN CN Provide asbestos abatement and air monitoring at facilities citywide. Asbestos Abatement 1
2,190 365 365 365 365 365 365 CN CN CN CN CN CN CN Fund an on-call requirements contract for storage tank testing and design; and provide funding to bid specific tank replacements as public works projects.
Environmental Consultant Citywide 2
665 665 665 665 665 665 3,990
48A. Citywide Environmental Remediation-FY09 700 700 CT CT
700 700
See description under line item 48.
48B. Citywide Environmental Remediation-FY08 29 29 CT CT
29 29
See description under line item 48.
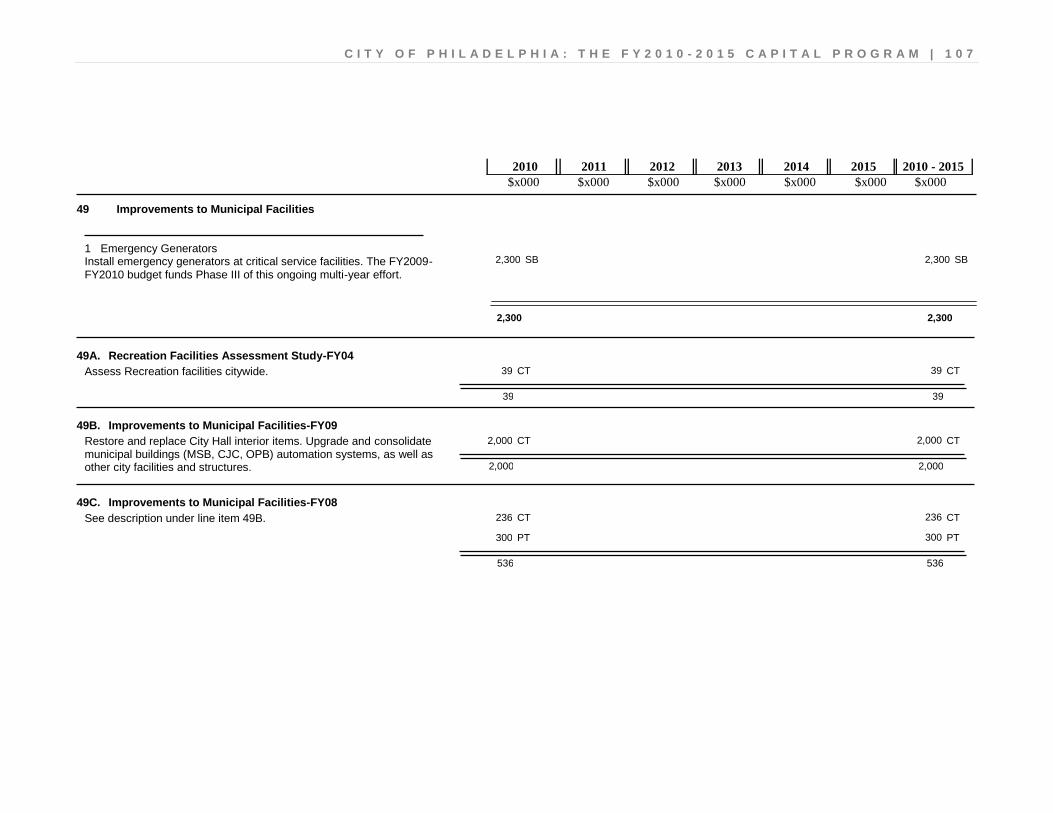
C I T Y O F P H I L A D E L P H I A : T H E F Y 2 0 1 0 - 2 0 1 5 C A P I T A L P R O G R A M | 1 0 7
$x000 $x000 $x000 $x000 $x000 $x000 $x000 2010 2011 2012 2013 2014 2015 2010 - 2015
Improvements to Municipal Facilities 49
2,300 2,300 SB SB Install emergency generators at critical service facilities. The FY2009-FY2010 budget funds Phase III of this ongoing multi-year effort.
Emergency Generators 1
2,300 2,300
49A. Recreation Facilities Assessment Study-FY04 39 39 CT CT
39 39
Assess Recreation facilities citywide.
49B. Improvements to Municipal Facilities-FY09 2,000 2,000 CT CT
2,000 2,000
Restore and replace City Hall interior items. Upgrade and consolidate municipal buildings (MSB, CJC, OPB) automation systems, as well as other city facilities and structures.
49C. Improvements to Municipal Facilities-FY08 236 236 CT CT
300 300 PT PT
536 536
See description under line item 49B.
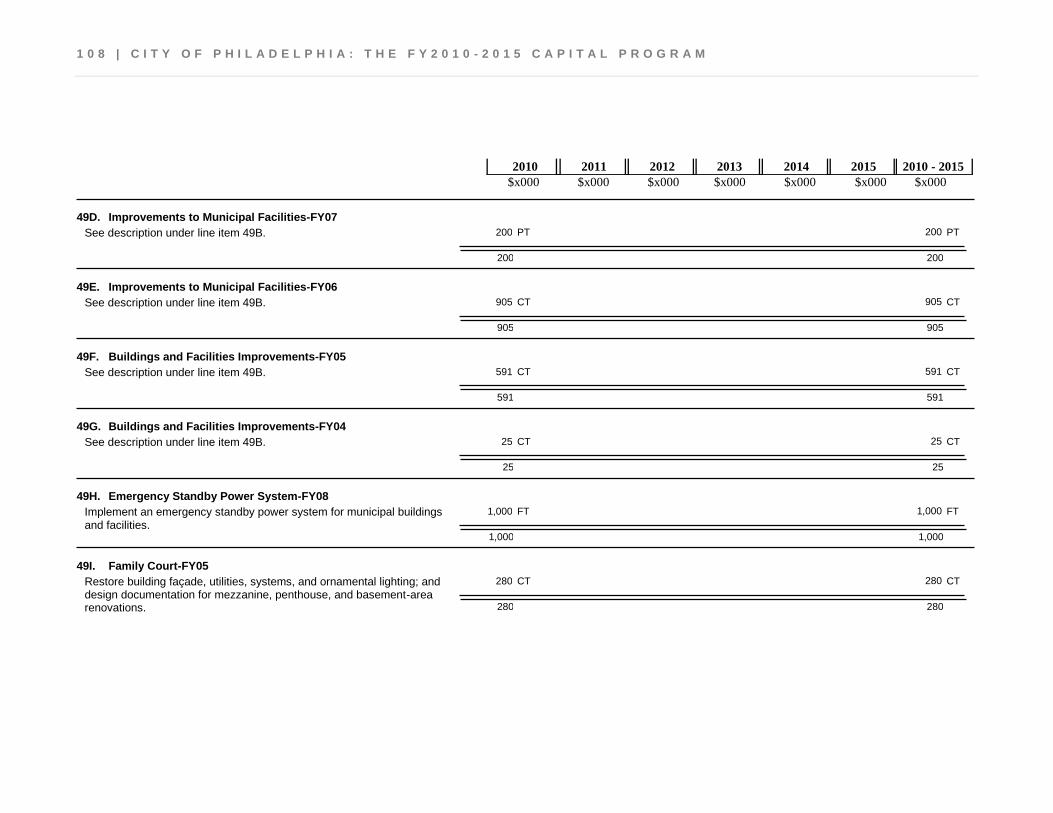
1 0 8 | C I T Y O F P H I L A D E L P H I A : T H E F Y 2 0 1 0 - 2 0 1 5 C A P I T A L P R O G R A M
$x000 $x000 $x000 $x000 $x000 $x000 $x000 2010 2011 2012 2013 2014 2015 2010 - 2015
49D. Improvements to Municipal Facilities-FY07 200 200 PT PT
200 200
See description under line item 49B.
49E. Improvements to Municipal Facilities-FY06 905 905 CT CT
905 905
See description under line item 49B.
49F. Buildings and Facilities Improvements-FY05 591 591 CT CT
591 591
See description under line item 49B.
49G. Buildings and Facilities Improvements-FY04 25 25 CT CT
25 25
See description under line item 49B.
49H. Emergency Standby Power System-FY08 1,000 1,000 FT FT
1,000 1,000
Implement an emergency standby power system for municipal buildings and facilities.
49I. Family Court-FY05 280 280 CT CT
280 280
Restore building façade, utilities, systems, and ornamental lighting; and design documentation for mezzanine, penthouse, and basement-area renovations.
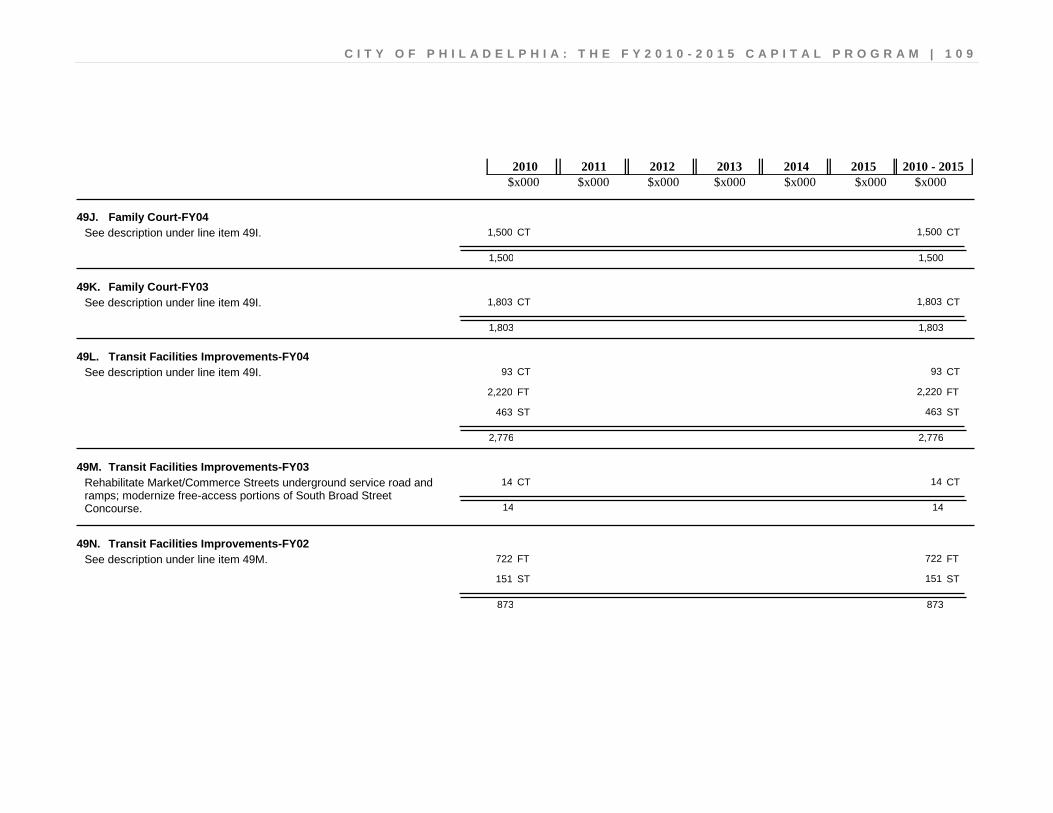
C I T Y O F P H I L A D E L P H I A : T H E F Y 2 0 1 0 - 2 0 1 5 C A P I T A L P R O G R A M | 1 0 9
$x000 $x000 $x000 $x000 $x000 $x000 $x000 2010 2011 2012 2013 2014 2015 2010 - 2015
49J. Family Court-FY04 1,500 1,500 CT CT
1,500 1,500
See description under line item 49I.
49K. Family Court-FY03 1,803 1,803 CT CT
1,803 1,803
See description under line item 49I.
49L. Transit Facilities Improvements-FY04 93 93 CT CT
2,220 2,220 FT FT
463 463 ST ST
2,776 2,776
See description under line item 49I.
49M. Transit Facilities Improvements-FY03 14 14 CT CT
14 14
Rehabilitate Market/Commerce Streets underground service road and ramps; modernize free-access portions of South Broad Street Concourse.
49N. Transit Facilities Improvements-FY02 722 722 FT FT
151 151 ST ST
873 873
See description under line item 49M.
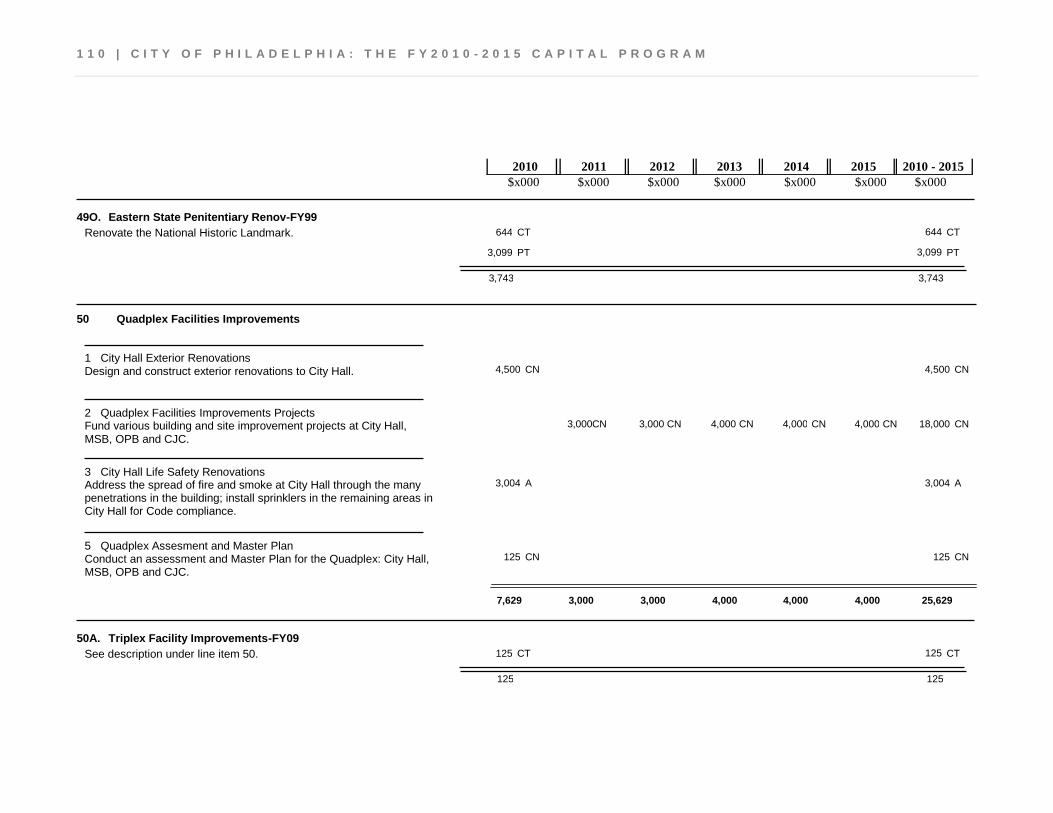
1 1 0 | C I T Y O F P H I L A D E L P H I A : T H E F Y 2 0 1 0 - 2 0 1 5 C A P I T A L P R O G R A M
$x000 $x000 $x000 $x000 $x000 $x000 $x000 2010 2011 2012 2013 2014 2015 2010 - 2015
49O. Eastern State Penitentiary Renov-FY99 644 644 CT CT
3,099 3,099 PT PT
3,743 3,743
Renovate the National Historic Landmark.
Quadplex Facilities Improvements 50
4,500 4,500 CN CN Design and construct exterior renovations to City Hall. City Hall Exterior Renovations 1
18,000 4,000 4,000 4,000 3,000 3,000 CN CN CN CN CN CN Fund various building and site improvement projects at City Hall, MSB, OPB and CJC.
Quadplex Facilities Improvements Projects 2
3,004 3,004 A A Address the spread of fire and smoke at City Hall through the many penetrations in the building; install sprinklers in the remaining areas in City Hall for Code compliance.
City Hall Life Safety Renovations 3
125 125 CN CN Conduct an assessment and Master Plan for the Quadplex: City Hall, MSB, OPB and CJC.
Quadplex Assesment and Master Plan 5
7,629 4,000 4,000 4,000 3,000 3,000 25,629
50A. Triplex Facility Improvements-FY09 125 125 CT CT
125 125
See description under line item 50.
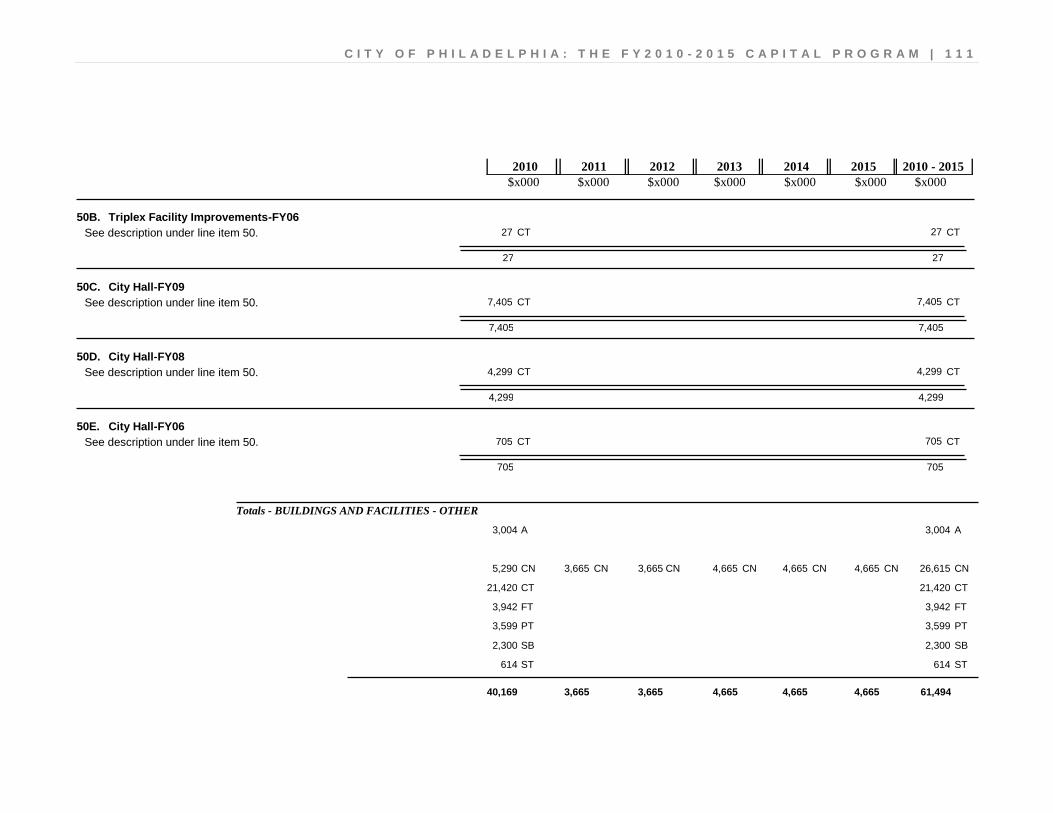
C I T Y O F P H I L A D E L P H I A : T H E F Y 2 0 1 0 - 2 0 1 5 C A P I T A L P R O G R A M | 1 1 1
$x000 $x000 $x000 $x000 $x000 $x000 $x000 2010 2011 2012 2013 2014 2015 2010 - 2015
50B. Triplex Facility Improvements-FY06 27 27 CT CT
27 27
See description under line item 50.
50C. City Hall-FY09 7,405 7,405 CT CT
7,405 7,405
See description under line item 50.
50D. City Hall-FY08 4,299 4,299 CT CT
4,299 4,299
See description under line item 50.
50E. City Hall-FY06 705 705 CT CT
705 705
See description under line item 50.
Totals - BUILDINGS AND FACILITIES - OTHER
3,004 A 3,004 A
4,665 3,665 3,665 5,290 4,665 4,665 CN CN CN CN CN CN 26,615 CN
21,420 CT 21,420 CT
3,942 FT 3,942 FT
3,599 PT 3,599 PT
2,300 SB 2,300 SB
614 ST 614 ST
4,665 4,665 4,665 3,665 3,665 40,169 61,494
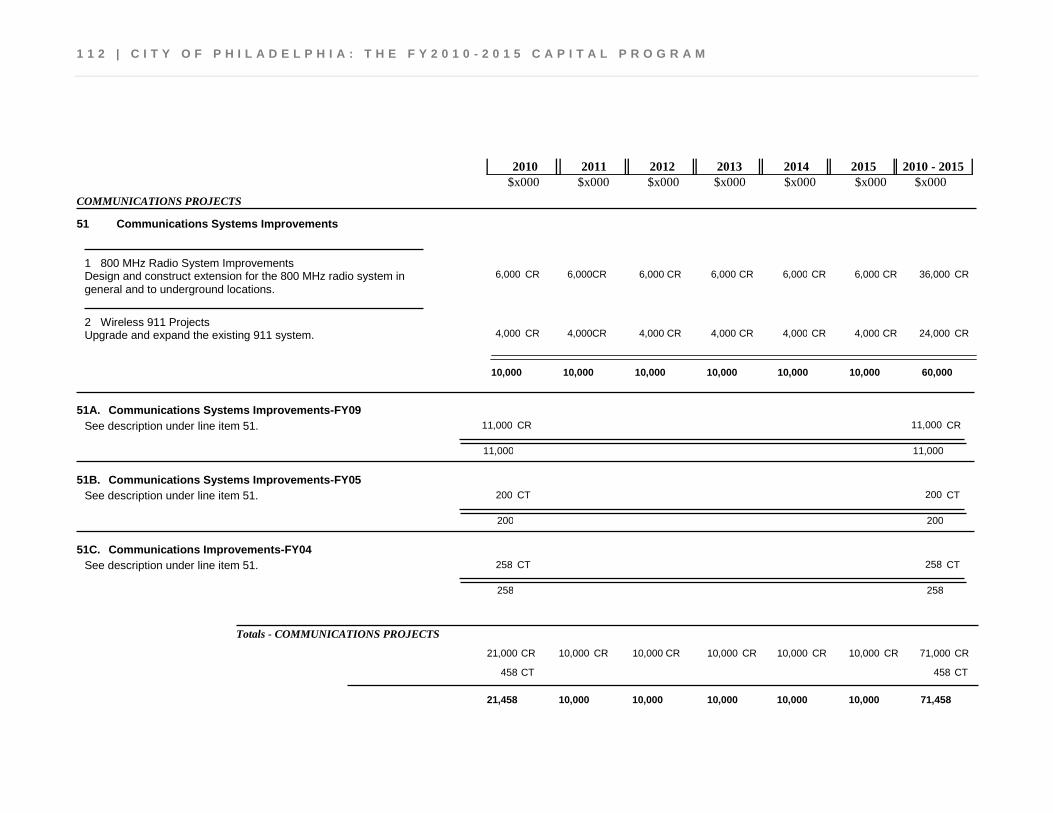
1 1 2 | C I T Y O F P H I L A D E L P H I A : T H E F Y 2 0 1 0 - 2 0 1 5 C A P I T A L P R O G R A M
$x000 $x000 $x000 $x000 $x000 $x000 $x000 2010 2011 2012 2013 2014 2015 2010 - 2015
COMMUNICATIONS PROJECTS
Communications Systems Improvements 51
36,000 6,000 6,000 6,000 6,000 6,000 6,000 CR CR CR CR CR CR CR Design and construct extension for the 800 MHz radio system in general and to underground locations.
800 MHz Radio System Improvements 1
24,000 4,000 4,000 4,000 4,000 4,000 4,000 CR CR CR CR CR CR CR Upgrade and expand the existing 911 system. Wireless 911 Projects 2
10,000 10,000 10,000 10,000 10,000 10,000 60,000
51A. Communications Systems Improvements-FY09 11,000 11,000 CR CR
11,000 11,000
See description under line item 51.
51B. Communications Systems Improvements-FY05 200 200 CT CT
200 200
See description under line item 51.
51C. Communications Improvements-FY04 258 258 CT CT
258 258
See description under line item 51.
Totals - COMMUNICATIONS PROJECTS
10,000 10,000 10,000 21,000 10,000 10,000 CR CR CR CR CR CR 71,000 CR
458 CT 458 CT
10,000 10,000 10,000 10,000 10,000 21,458 71,458
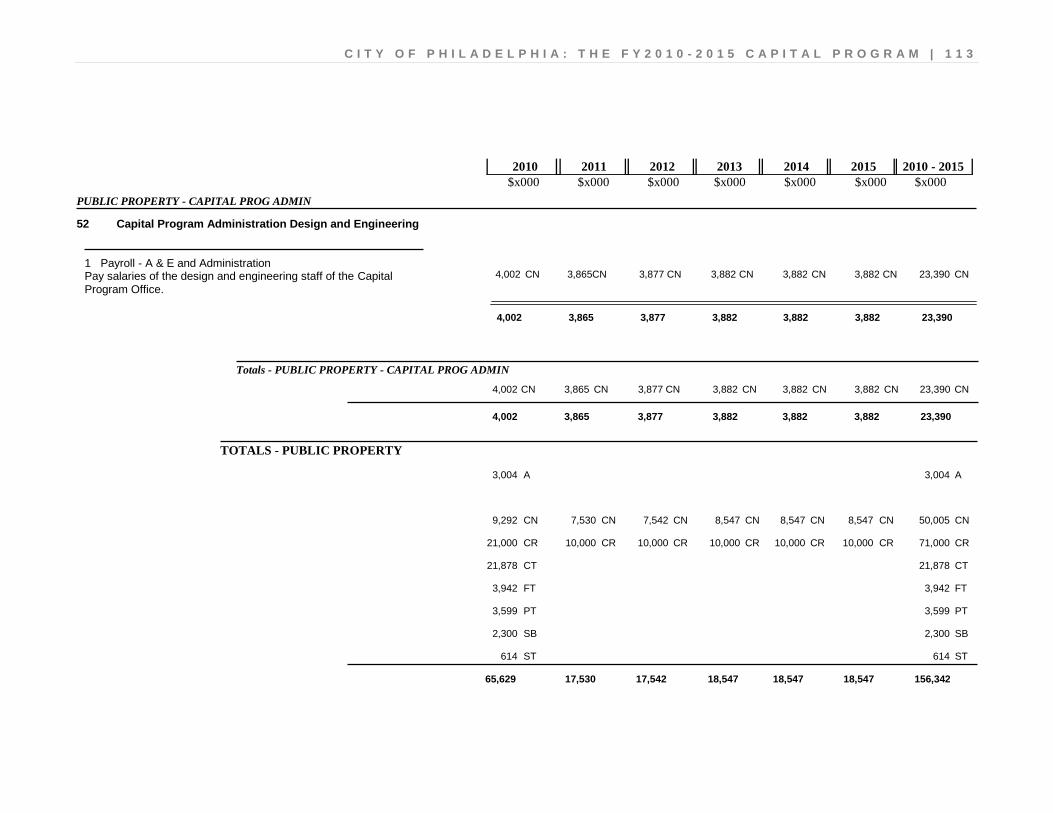
C I T Y O F P H I L A D E L P H I A : T H E F Y 2 0 1 0 - 2 0 1 5 C A P I T A L P R O G R A M | 1 1 3
$x000 $x000 $x000 $x000 $x000 $x000 $x000 2010 2011 2012 2013 2014 2015 2010 - 2015
PUBLIC PROPERTY - CAPITAL PROG ADMIN
Capital Program Administration Design and Engineering 52
23,390 3,882 3,882 3,882 3,877 3,865 4,002 CN CN CN CN CN CN CN Pay salaries of the design and engineering staff of the Capital Program Office.
Payroll - A & E and Administration 1
4,002 3,882 3,882 3,882 3,877 3,865 23,390
Totals - PUBLIC PROPERTY - CAPITAL PROG ADMIN
3,882 3,877 3,865 4,002 3,882 3,882 CN CN CN CN CN CN 23,390 CN
3,882 3,882 3,882 3,877 3,865 4,002 23,390
TOTALS - PUBLIC PROPERTY
3,004 A 3,004 A
8,547 7,542 7,530 9,292 8,547 8,547 CN CN CN CN CN CN 50,005 CN
10,000 10,000 10,000 21,000 10,000 10,000 CR CR CR CR CR CR 71,000 CR
21,878 CT 21,878 CT
3,942 FT 3,942 FT
3,599 PT 3,599 PT
2,300 SB 2,300 SB
614 ST 614 ST
18,547 18,547 18,547 17,542 17,530 65,629 156,342
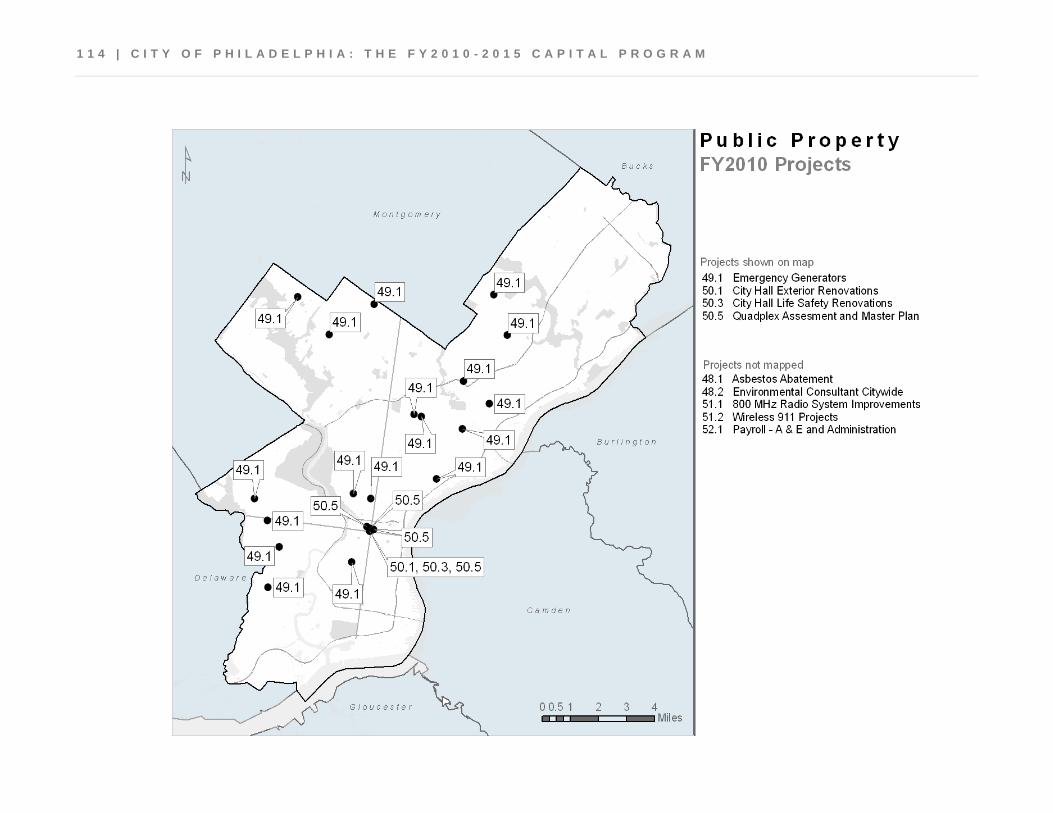
1 1 4 | C I T Y O F P H I L A D E L P H I A : T H E F Y 2 0 1 0 - 2 0 1 5 C A P I T A L P R O G R A M
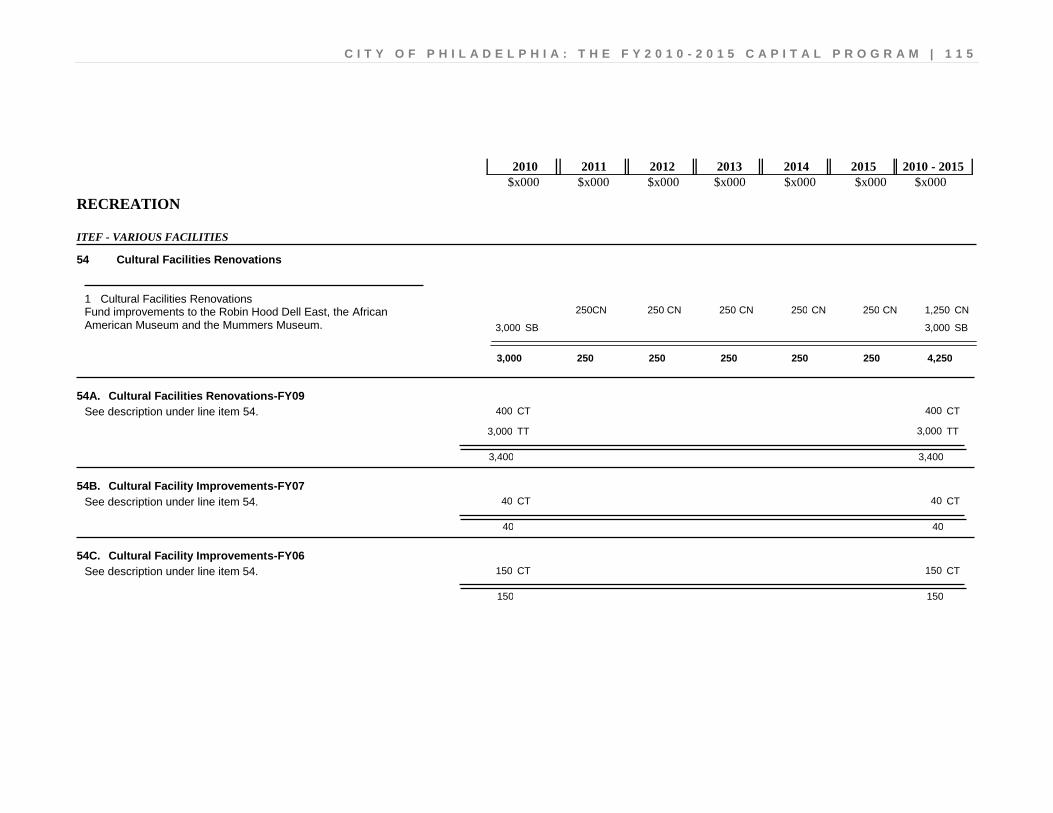
C I T Y O F P H I L A D E L P H I A : T H E F Y 2 0 1 0 - 2 0 1 5 C A P I T A L P R O G R A M | 1 1 5
$x000 $x000 $x000 $x000 $x000 $x000 $x000 2010 2011 2012 2013 2014 2015 2010 - 2015
RECREATION
ITEF - VARIOUS FACILITIES
Cultural Facilities Renovations 54
1,250 250 250 250 250 250 CN CN CN CN CN CN 3,000 3,000 SB SB
Fund improvements to the Robin Hood Dell East, the African American Museum and the Mummers Museum.
Cultural Facilities Renovations 1
3,000 250 250 250 250 250 4,250
54A. Cultural Facilities Renovations-FY09 400 400 CT CT
3,000 3,000 TT TT
3,400 3,400
See description under line item 54.
54B. Cultural Facility Improvements-FY07 40 40 CT CT
40 40
See description under line item 54.
54C. Cultural Facility Improvements-FY06 150 150 CT CT
150 150
See description under line item 54.

1 1 6 | C I T Y O F P H I L A D E L P H I A : T H E F Y 2 0 1 0 - 2 0 1 5 C A P I T A L P R O G R A M
$x000 $x000 $x000 $x000 $x000 $x000 $x000 2010 2011 2012 2013 2014 2015 2010 - 2015
54D. Cultural Facility Improvements-FY04 350 350 CT CT
1,000 1,000 PT PT
1,350 1,350
See description under line item 54.
54E. Cultural Facilities-FY03 221 221 CT CT
221 221
See description under line item 54.
54F. Cultural Facilities-FY01 13 13 CT CT
13 13
See description under line item 54.
54G. Cultural Facilities-FY00 100 100 CT CT
100 100
See description under line item 54.
54H. Cultural Facilities-FY99 68 68 CT CT
1,000 1,000 PT PT
1,068 1,068
See description under line item 54.
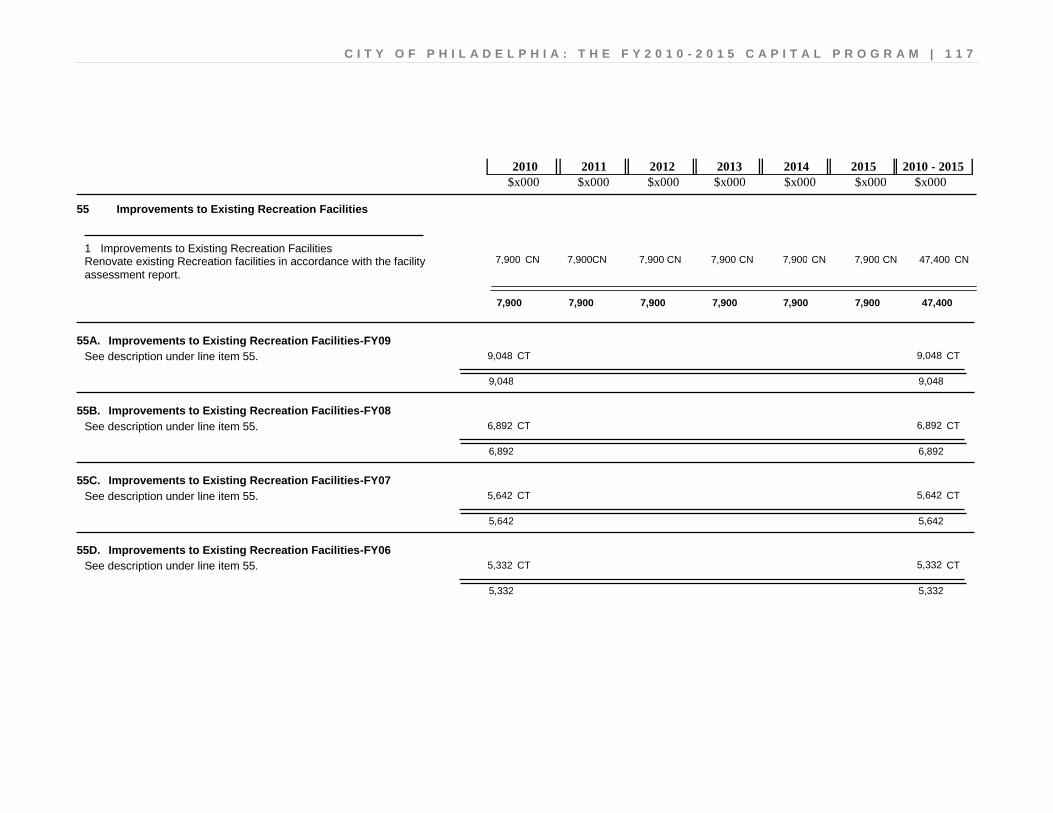
C I T Y O F P H I L A D E L P H I A : T H E F Y 2 0 1 0 - 2 0 1 5 C A P I T A L P R O G R A M | 1 1 7
$x000 $x000 $x000 $x000 $x000 $x000 $x000 2010 2011 2012 2013 2014 2015 2010 - 2015
Improvements to Existing Recreation Facilities 55
47,400 7,900 7,900 7,900 7,900 7,900 7,900 CN CN CN CN CN CN CN Renovate existing Recreation facilities in accordance with the facility assessment report.
Improvements to Existing Recreation Facilities 1
7,900 7,900 7,900 7,900 7,900 7,900 47,400
55A. Improvements to Existing Recreation Facilities-FY09 9,048 9,048 CT CT
9,048 9,048
See description under line item 55.
55B. Improvements to Existing Recreation Facilities-FY08 6,892 6,892 CT CT
6,892 6,892
See description under line item 55.
55C. Improvements to Existing Recreation Facilities-FY07 5,642 5,642 CT CT
5,642 5,642
See description under line item 55.
55D. Improvements to Existing Recreation Facilities-FY06 5,332 5,332 CT CT
5,332 5,332
See description under line item 55.
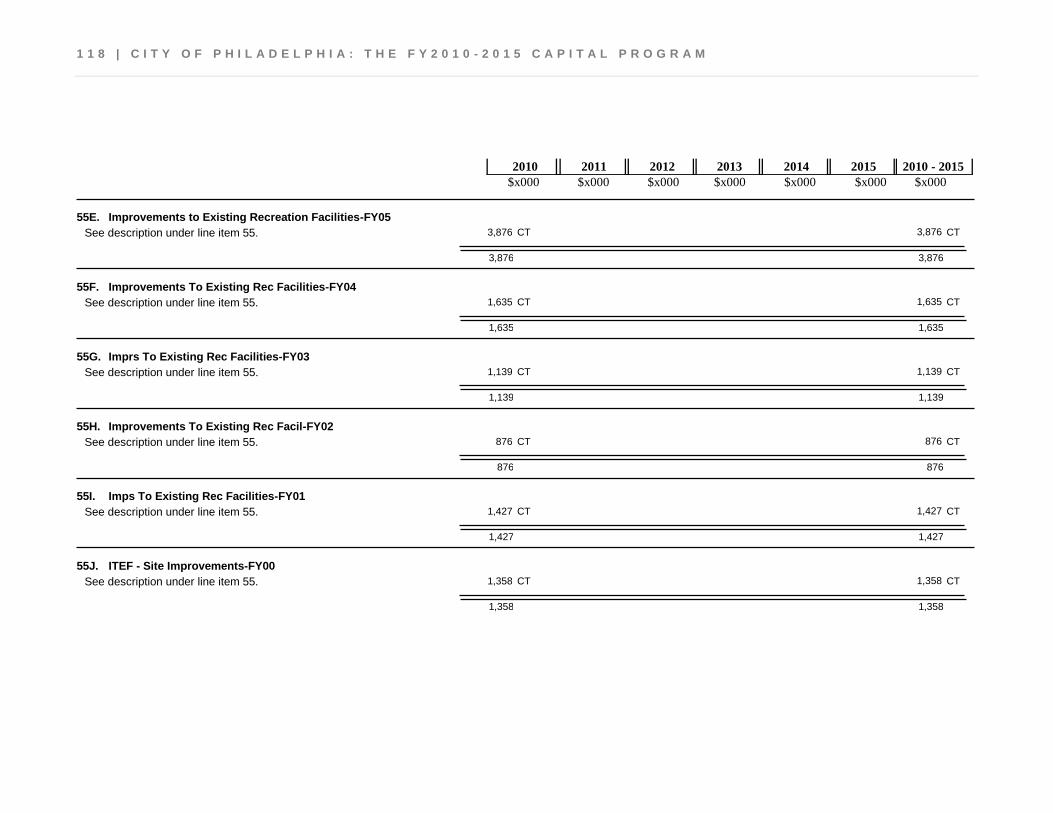
1 1 8 | C I T Y O F P H I L A D E L P H I A : T H E F Y 2 0 1 0 - 2 0 1 5 C A P I T A L P R O G R A M
$x000 $x000 $x000 $x000 $x000 $x000 $x000 2010 2011 2012 2013 2014 2015 2010 - 2015
55E. Improvements to Existing Recreation Facilities-FY05 3,876 3,876 CT CT
3,876 3,876
See description under line item 55.
55F. Improvements To Existing Rec Facilities-FY04 1,635 1,635 CT CT
1,635 1,635
See description under line item 55.
55G. Imprs To Existing Rec Facilities-FY03 1,139 1,139 CT CT
1,139 1,139
See description under line item 55.
55H. Improvements To Existing Rec Facil-FY02 876 876 CT CT
876 876
See description under line item 55.
55I. Imps To Existing Rec Facilities-FY01 1,427 1,427 CT CT
1,427 1,427
See description under line item 55.
55J. ITEF - Site Improvements-FY00 1,358 1,358 CT CT
1,358 1,358
See description under line item 55.

C I T Y O F P H I L A D E L P H I A : T H E F Y 2 0 1 0 - 2 0 1 5 C A P I T A L P R O G R A M | 1 1 9
$x000 $x000 $x000 $x000 $x000 $x000 $x000 2010 2011 2012 2013 2014 2015 2010 - 2015
55K. Improvements To Existing Facilities-FY99 585 585 CT CT
585 585
See description under line item 55.
55L. Improvements To Existing Facilities-FY98 12 12 CT CT
12 12
See description under line item 55.
55M. Improvements To Existing Facilities-FY96 10 10 CT CT
10 10
See description under line item 55.
55N. Improvements To Existing Facilities-FY95 15 15 CT CT
15 15
See description under line item 55.
55O. Lonnie Young Recreation Center-FY99 500 500 ST ST
500 500
See description under line item 55.
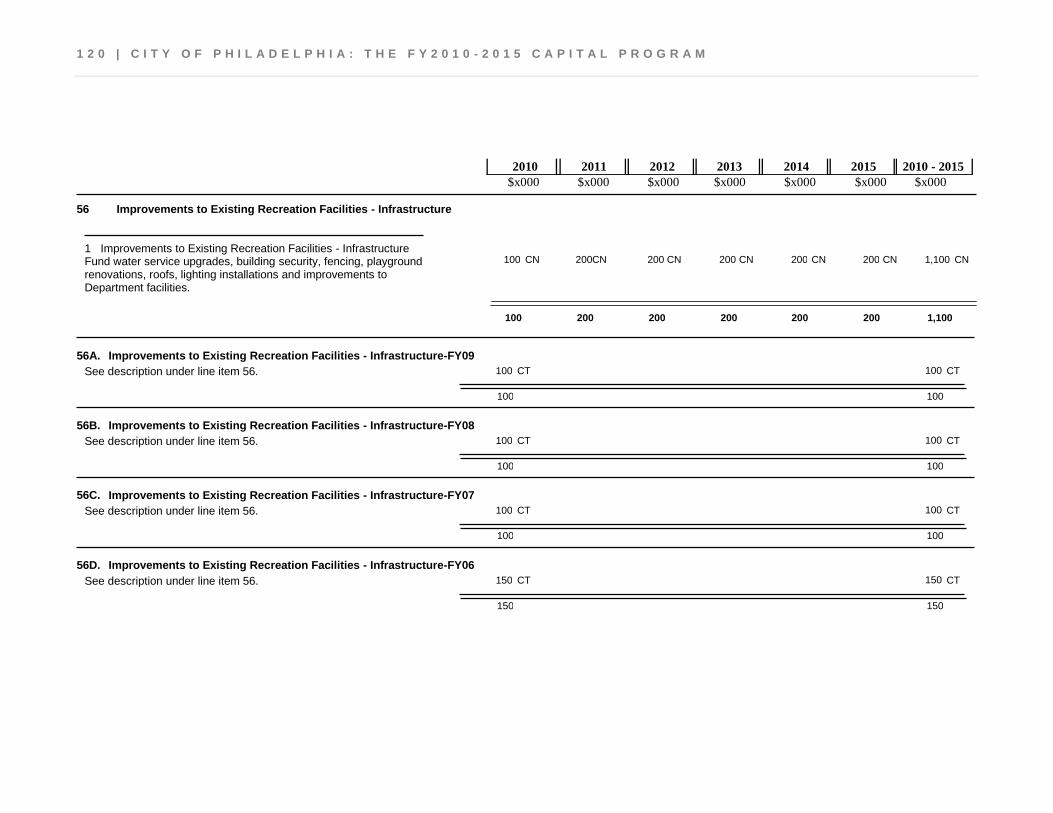
1 2 0 | C I T Y O F P H I L A D E L P H I A : T H E F Y 2 0 1 0 - 2 0 1 5 C A P I T A L P R O G R A M
$x000 $x000 $x000 $x000 $x000 $x000 $x000 2010 2011 2012 2013 2014 2015 2010 - 2015
Improvements to Existing Recreation Facilities - Infrastructure 56
1,100 200 200 200 200 200 100 CN CN CN CN CN CN CN Fund water service upgrades, building security, fencing, playground renovations, roofs, lighting installations and improvements to Department facilities.
Improvements to Existing Recreation Facilities - Infrastructure 1
100 200 200 200 200 200 1,100
56A. Improvements to Existing Recreation Facilities - Infrastructure-FY09 100 100 CT CT
100 100
See description under line item 56.
56B. Improvements to Existing Recreation Facilities - Infrastructure-FY08 100 100 CT CT
100 100
See description under line item 56.
56C. Improvements to Existing Recreation Facilities - Infrastructure-FY07 100 100 CT CT
100 100
See description under line item 56.
56D. Improvements to Existing Recreation Facilities - Infrastructure-FY06 150 150 CT CT
150 150
See description under line item 56.
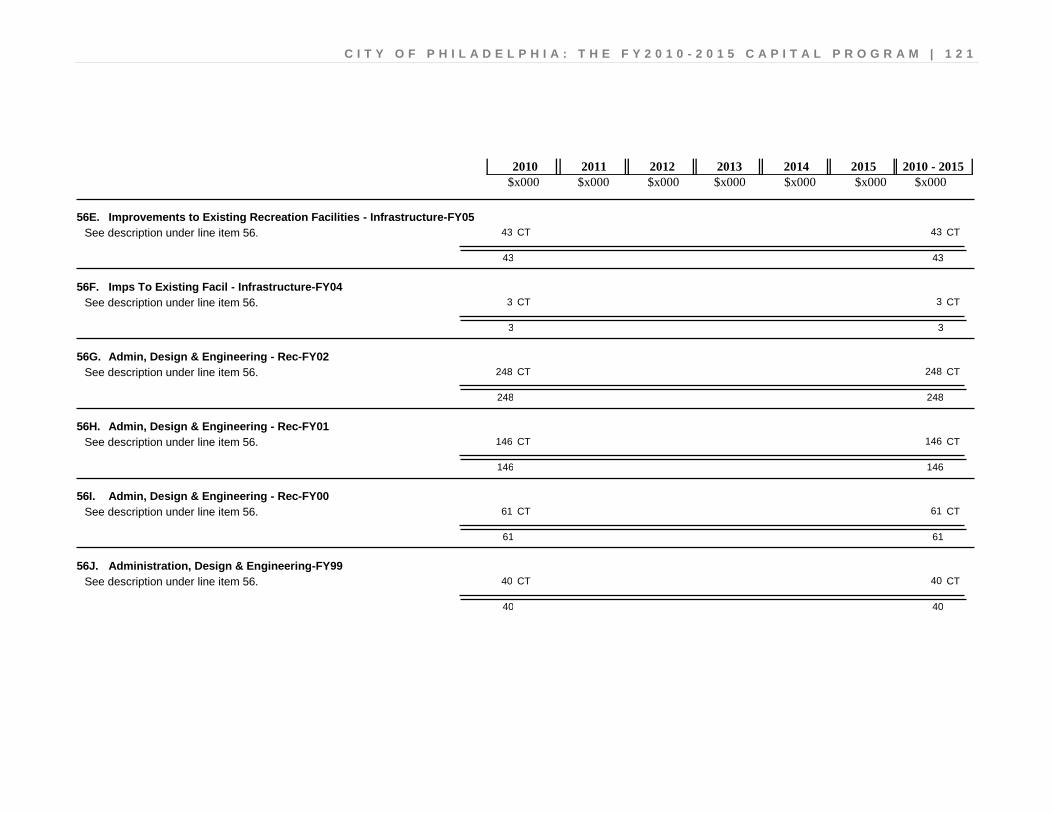
C I T Y O F P H I L A D E L P H I A : T H E F Y 2 0 1 0 - 2 0 1 5 C A P I T A L P R O G R A M | 1 2 1
$x000 $x000 $x000 $x000 $x000 $x000 $x000 2010 2011 2012 2013 2014 2015 2010 - 2015
56E. Improvements to Existing Recreation Facilities - Infrastructure-FY05 43 43 CT CT
43 43
See description under line item 56.
56F. Imps To Existing Facil - Infrastructure-FY04 3 3 CT CT
3 3
See description under line item 56.
56G. Admin, Design & Engineering - Rec-FY02 248 248 CT CT
248 248
See description under line item 56.
56H. Admin, Design & Engineering - Rec-FY01 146 146 CT CT
146 146
See description under line item 56.
56I. Admin, Design & Engineering - Rec-FY00 61 61 CT CT
61 61
See description under line item 56.
56J. Administration, Design & Engineering-FY99 40 40 CT CT
40 40
See description under line item 56.
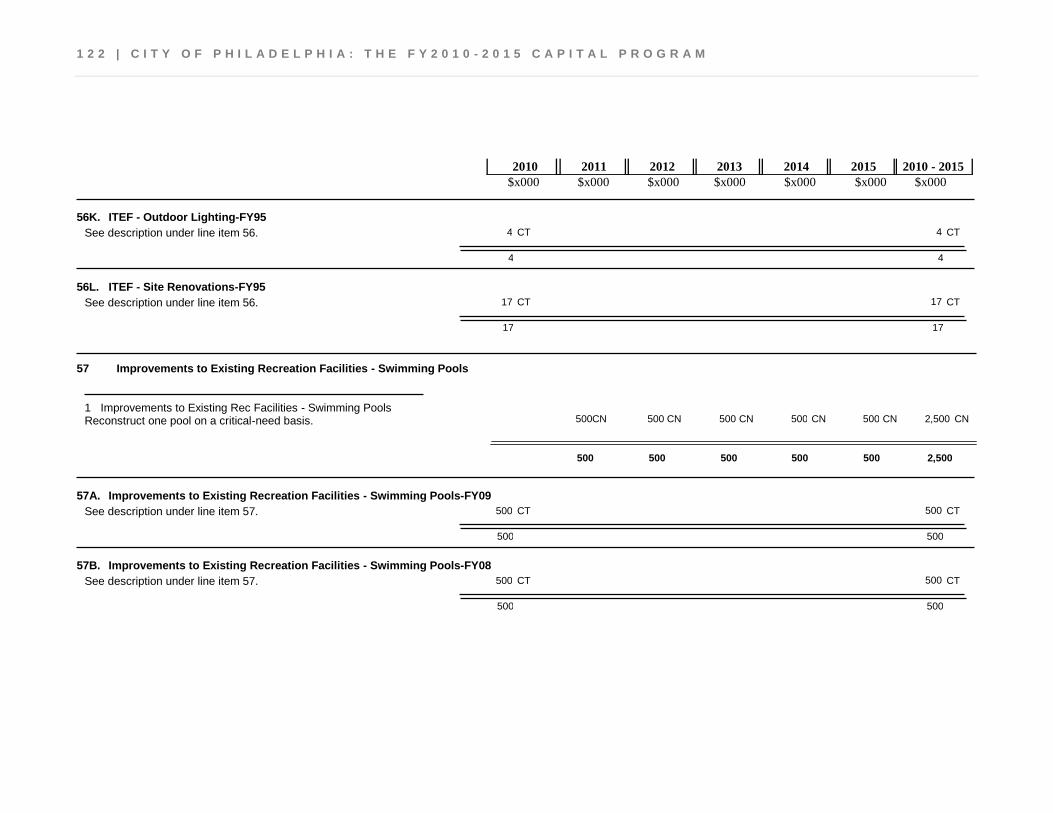
1 2 2 | C I T Y O F P H I L A D E L P H I A : T H E F Y 2 0 1 0 - 2 0 1 5 C A P I T A L P R O G R A M
$x000 $x000 $x000 $x000 $x000 $x000 $x000 2010 2011 2012 2013 2014 2015 2010 - 2015
56K. ITEF - Outdoor Lighting-FY95 4 4 CT CT
4 4
See description under line item 56.
56L. ITEF - Site Renovations-FY95 17 17 CT CT
17 17
See description under line item 56.
Improvements to Existing Recreation Facilities - Swimming Pools 57
2,500 500 500 500 500 500 CN CN CN CN CN CN Reconstruct one pool on a critical-need basis. Improvements to Existing Rec Facilities - Swimming Pools 1
500 500 500 500 500 2,500
57A. Improvements to Existing Recreation Facilities - Swimming Pools-FY09 500 500 CT CT
500 500
See description under line item 57.
57B. Improvements to Existing Recreation Facilities - Swimming Pools-FY08 500 500 CT CT
500 500
See description under line item 57.
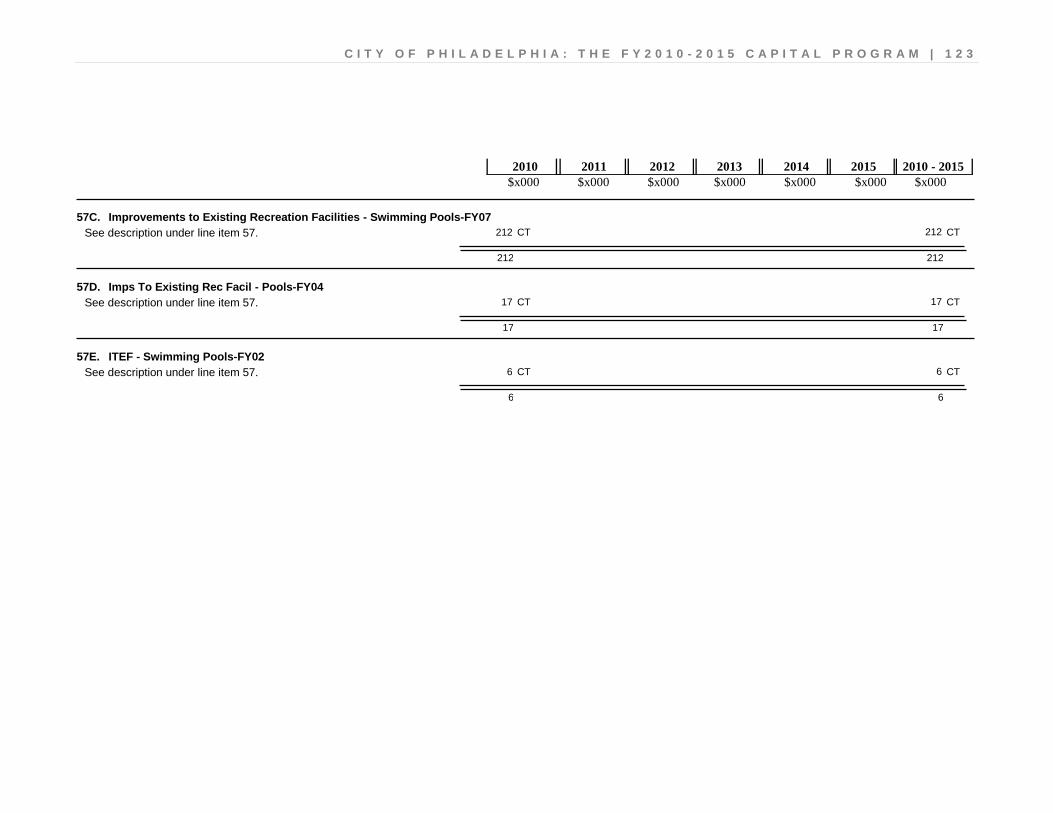
C I T Y O F P H I L A D E L P H I A : T H E F Y 2 0 1 0 - 2 0 1 5 C A P I T A L P R O G R A M | 1 2 3
$x000 $x000 $x000 $x000 $x000 $x000 $x000 2010 2011 2012 2013 2014 2015 2010 - 2015
57C. Improvements to Existing Recreation Facilities - Swimming Pools-FY07 212 212 CT CT
212 212
See description under line item 57.
57D. Imps To Existing Rec Facil - Pools-FY04 17 17 CT CT
17 17
See description under line item 57.
57E. ITEF - Swimming Pools-FY02 6 6 CT CT
6 6
See description under line item 57.
1 2 4 | C I T Y O F P H I L A D E L P H I A : T H E F Y 2 0 1 0 - 2 0 1 5 C A P I T A L P R O G R A M
$x000 $x000 $x000 $x000 $x000 $x000 $x000 2010 2011 2012 2013 2014 2015 2010 - 2015
Improvements to Existing Recreation Facilities - Life Safety Systems 58

C I T Y O F P H I L A D E L P H I A : T H E F Y 2 0 1 0 - 2 0 1 5 C A P I T A L P R O G R A M | 1 2 5
$x000 $x000 $x000 $x000 $x000 $x000 $x000 2010 2011 2012 2013 2014 2015 2010 - 2015
1,800 300 300 300 300 300 300 CN CN CN CN CN CN CN Replace alarm systems, modify egresses and other safety improvements at various Recreation Centers.
Improvements to Existing Recreation Life Safety Systems 1
300 300 300 300 300 300 1,800
58A. Improvements to Existing Recreation Facilities - Life Safety Systems-FY09 300 300 CT CT
300 300
See description under line item 58.
58B. Improvements to Existing Recreation Facilities - Life Safety Systems-FY08 300 300 CT CT
300 300
See description under line item 58.
58C. Improvements to Existing Recreation Facilities - Life Safety Systems-FY07 300 300 CT CT
300 300
See description under line item 58.
58D. Improvements to Existing Recreation Facilities - Life Safety Systems-FY06 300 300 CT CT
300 300
See description under line item 58.
58E. Improvements to Existing Recreation Facilities - Life Safety Systems-FY05 300 300 CT CT
300 300
See description under line item 58.
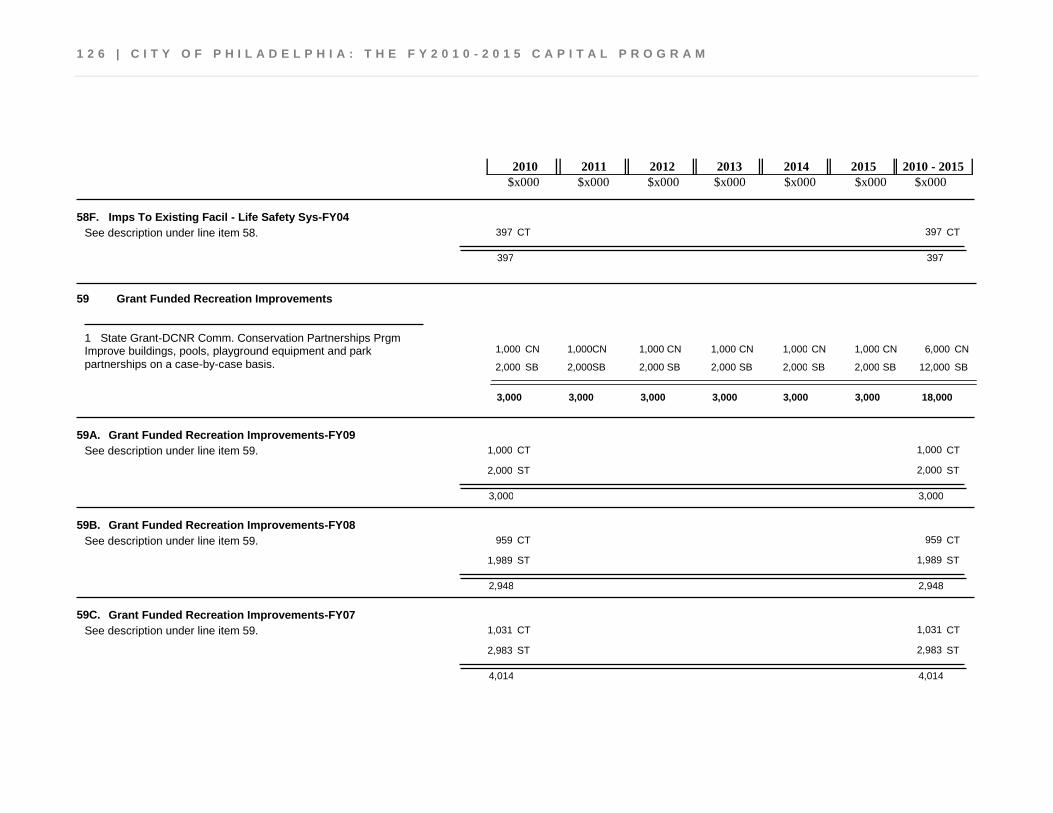
1 2 6 | C I T Y O F P H I L A D E L P H I A : T H E F Y 2 0 1 0 - 2 0 1 5 C A P I T A L P R O G R A M
$x000 $x000 $x000 $x000 $x000 $x000 $x000 2010 2011 2012 2013 2014 2015 2010 - 2015
58F. Imps To Existing Facil - Life Safety Sys-FY04 397 397 CT CT
397 397
See description under line item 58.
Grant Funded Recreation Improvements 59
6,000 1,000 1,000 1,000 1,000 1,000 1,000 CN CN CN CN CN CN CN 12,000 2,000 2,000 2,000 2,000 2,000 2,000 SB SB SB SB SB SB SB
Improve buildings, pools, playground equipment and park partnerships on a case-by-case basis.
State Grant-DCNR Comm. Conservation Partnerships Prgm 1
3,000 3,000 3,000 3,000 3,000 3,000 18,000
59A. Grant Funded Recreation Improvements-FY09 1,000 1,000 CT CT
2,000 2,000 ST ST
3,000 3,000
See description under line item 59.
59B. Grant Funded Recreation Improvements-FY08 959 959 CT CT
1,989 1,989 ST ST
2,948 2,948
See description under line item 59.
59C. Grant Funded Recreation Improvements-FY07 1,031 1,031 CT CT
2,983 2,983 ST ST
4,014 4,014
See description under line item 59.
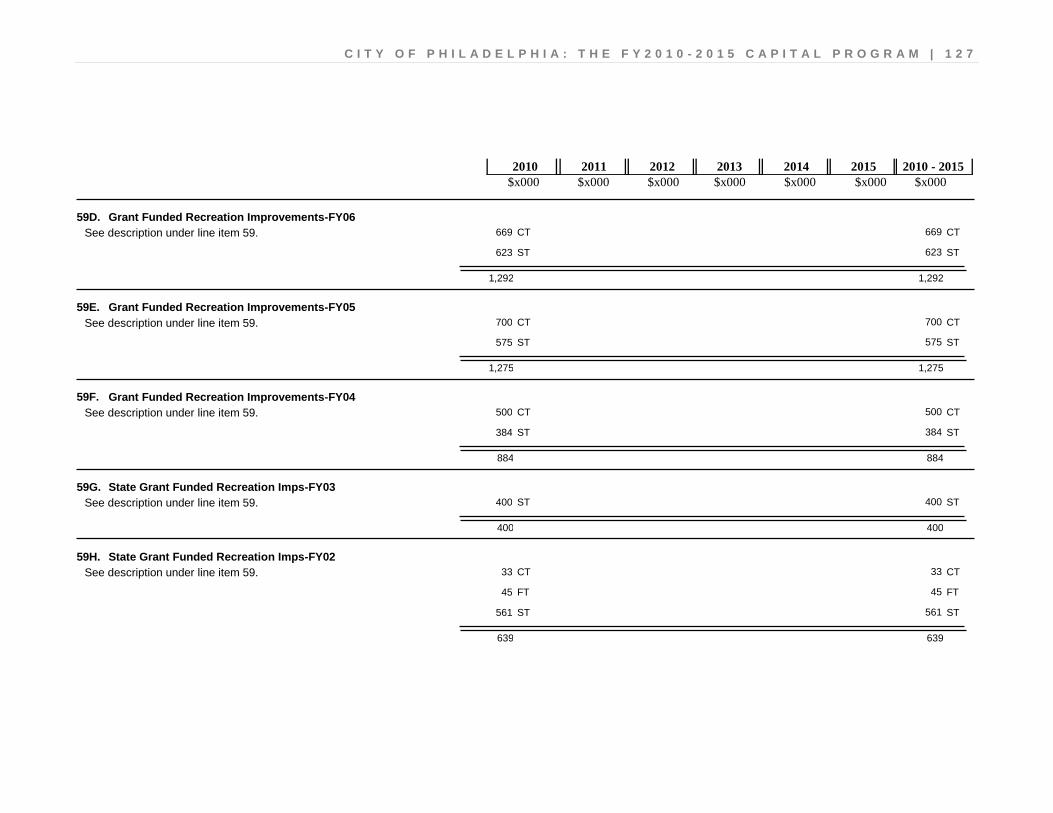
C I T Y O F P H I L A D E L P H I A : T H E F Y 2 0 1 0 - 2 0 1 5 C A P I T A L P R O G R A M | 1 2 7
$x000 $x000 $x000 $x000 $x000 $x000 $x000 2010 2011 2012 2013 2014 2015 2010 - 2015
59D. Grant Funded Recreation Improvements-FY06 669 669 CT CT
623 623 ST ST
1,292 1,292
See description under line item 59.
59E. Grant Funded Recreation Improvements-FY05 700 700 CT CT
575 575 ST ST
1,275 1,275
See description under line item 59.
59F. Grant Funded Recreation Improvements-FY04 500 500 CT CT
384 384 ST ST
884 884
See description under line item 59.
59G. State Grant Funded Recreation Imps-FY03 400 400 ST ST
400 400
See description under line item 59.
59H. State Grant Funded Recreation Imps-FY02 33 33 CT CT
45 45 FT FT
561 561 ST ST
639 639
See description under line item 59.
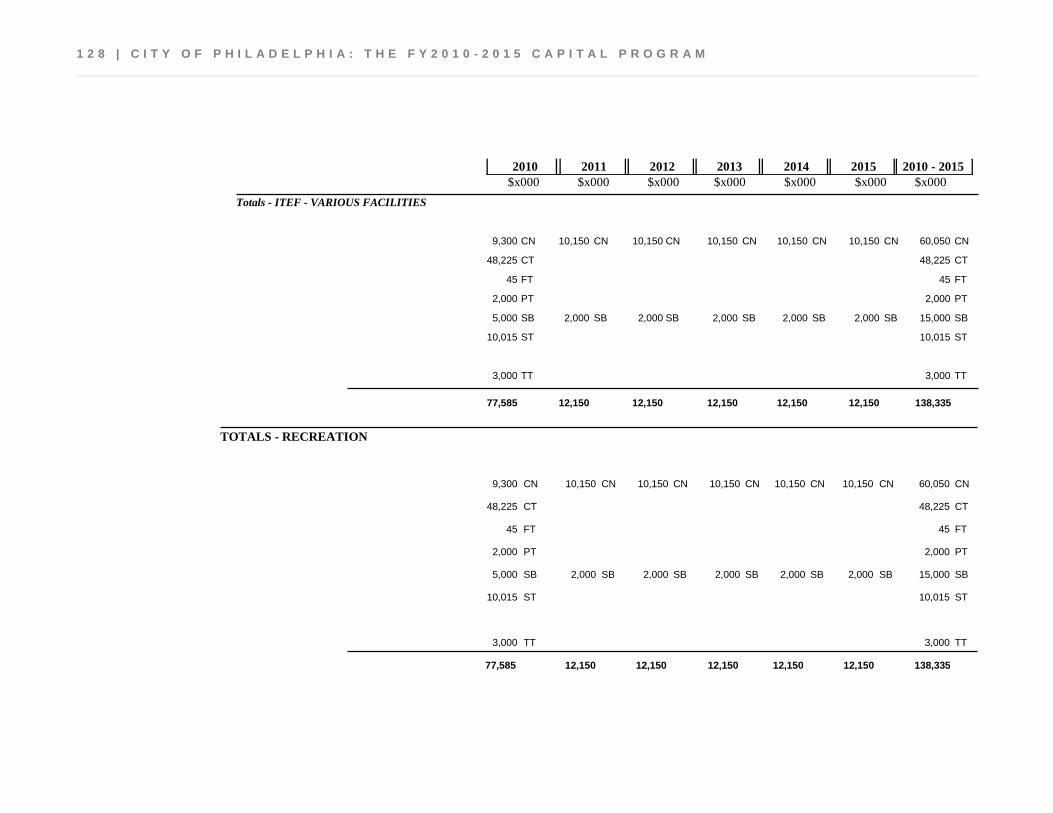
1 2 8 | C I T Y O F P H I L A D E L P H I A : T H E F Y 2 0 1 0 - 2 0 1 5 C A P I T A L P R O G R A M
$x000 $x000 $x000 $x000 $x000 $x000 $x000 2010 2011 2012 2013 2014 2015 2010 - 2015
Totals - ITEF - VARIOUS FACILITIES
10,150 10,150 10,150 9,300 10,150 10,150 CN CN CN CN CN CN 60,050 CN
48,225 CT 48,225 CT
45 FT 45 FT
2,000 PT 2,000 PT
2,000 2,000 2,000 5,000 2,000 2,000 SB SB SB SB SB SB 15,000 SB
10,015 ST 10,015 ST
3,000 TT 3,000 TT
12,150 12,150 12,150 12,150 12,150 77,585 138,335
TOTALS - RECREATION
10,150 10,150 10,150 9,300 10,150 10,150 CN CN CN CN CN CN 60,050 CN
48,225 CT 48,225 CT
45 FT 45 FT
2,000 PT 2,000 PT
2,000 2,000 2,000 5,000 2,000 2,000 SB SB SB SB SB SB 15,000 SB
10,015 ST 10,015 ST
3,000 TT 3,000 TT
12,150 12,150 12,150 12,150 12,150 77,585 138,335
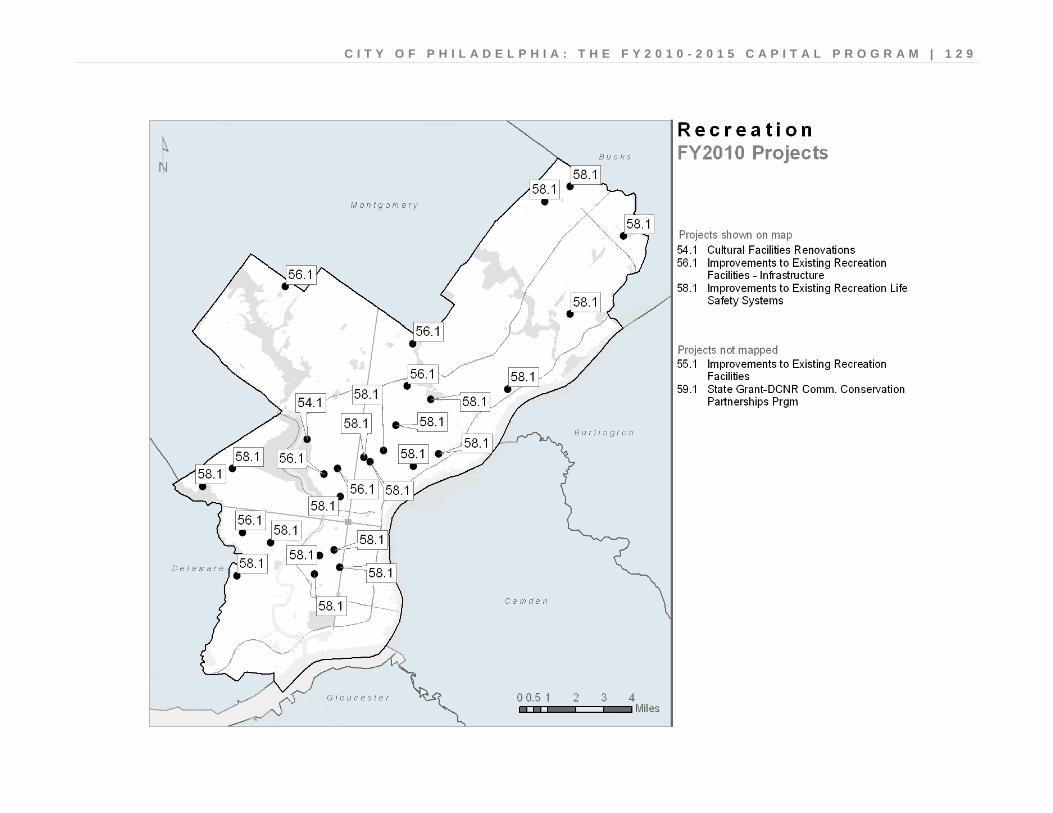
C I T Y O F P H I L A D E L P H I A : T H E F Y 2 0 1 0 - 2 0 1 5 C A P I T A L P R O G R A M | 1 2 9

1 3 0 | C I T Y O F P H I L A D E L P H I A : T H E F Y 2 0 1 0 - 2 0 1 5 C A P I T A L P R O G R A M
$x000 $x000 $x000 $x000 $x000 $x000 $x000 2010 2011 2012 2013 2014 2015 2010 - 2015
STREETS
BRIDGES
Bridge Reconstruction & Improvements 60
8 8 CN CN 120 120 FB FB
22 22 SB SB
Remove and reconstruct existing bridge over Amtrak, including modifications to the railroad catenary.
"G" Street over AMTRAK 1
240 240 CN CN 960 960 FB FB
Repair deck and bearings of existing bridge. 15th Street over Conrail 2
8 8 CN CN 120 120 FB FB 22 22 SB SB
Remove and reconstruct bridge over Amtrak, including modifications to the railroad catenary.
2nd Street over AMTRAK 3
640 640 CN CN 6,240 6,240 FB FB 1,120 1,120 SB SB
Remove and reconstruct existing bridge over Amtrak, including modifications to the railroad catenary.
41st Street over AMTRAK 4
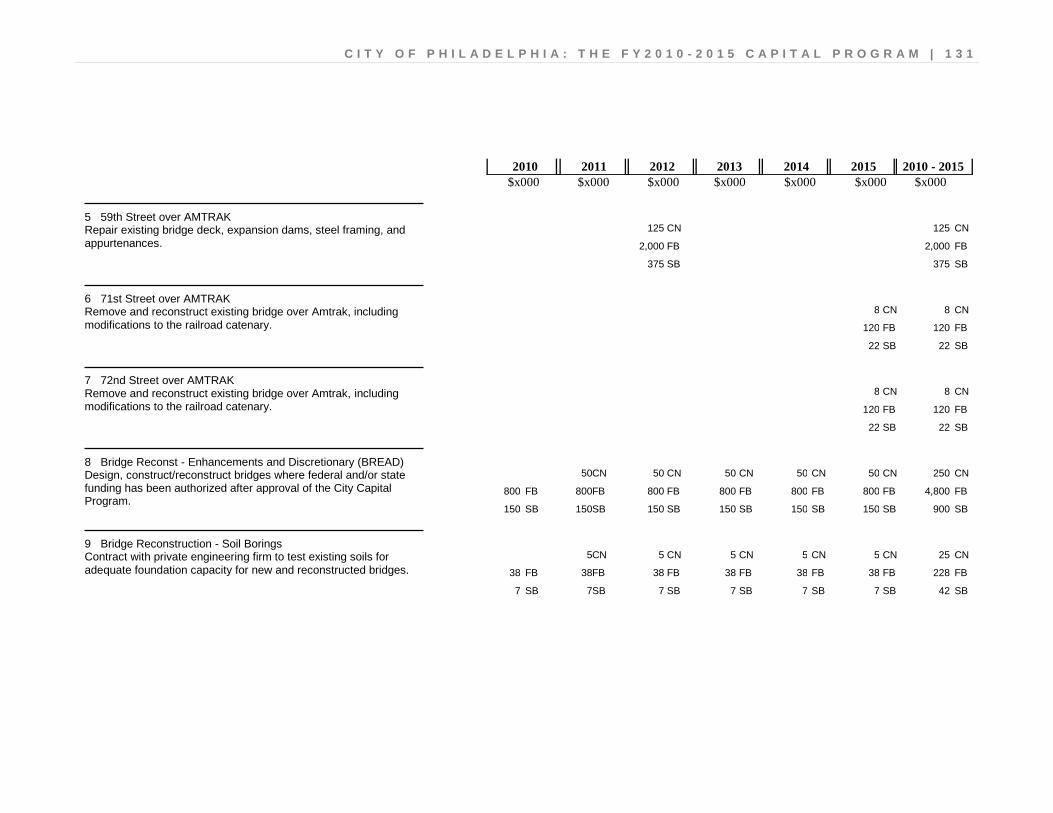
C I T Y O F P H I L A D E L P H I A : T H E F Y 2 0 1 0 - 2 0 1 5 C A P I T A L P R O G R A M | 1 3 1
$x000 $x000 $x000 $x000 $x000 $x000 $x000 2010 2011 2012 2013 2014 2015 2010 - 2015
125 125 CN CN 2,000 2,000 FB FB
375 375 SB SB
Repair existing bridge deck, expansion dams, steel framing, and appurtenances.
59th Street over AMTRAK 5
8 8 CN CN 120 120 FB FB 22 22 SB SB
Remove and reconstruct existing bridge over Amtrak, including modifications to the railroad catenary.
71st Street over AMTRAK 6
8 8 CN CN 120 120 FB FB 22 22 SB SB
Remove and reconstruct existing bridge over Amtrak, including modifications to the railroad catenary.
72nd Street over AMTRAK 7
250 50 50 50 50 50 CN CN CN CN CN CN 4,800 800 800 800 800 800 800 FB FB FB FB FB FB FB
900 150 150 150 150 150 150 SB SB SB SB SB SB SB
Design, construct/reconstruct bridges where federal and/or state funding has been authorized after approval of the City Capital Program.
Bridge Reconst - Enhancements and Discretionary (BREAD) 8
25 5 5 5 5 5 CN CN CN CN CN CN 228 38 38 38 38 38 38 FB FB FB FB FB FB FB 42 7 7 7 7 7 7 SB SB SB SB SB SB SB
Contract with private engineering firm to test existing soils for adequate foundation capacity for new and reconstructed bridges.
Bridge Reconstruction - Soil Borings 9
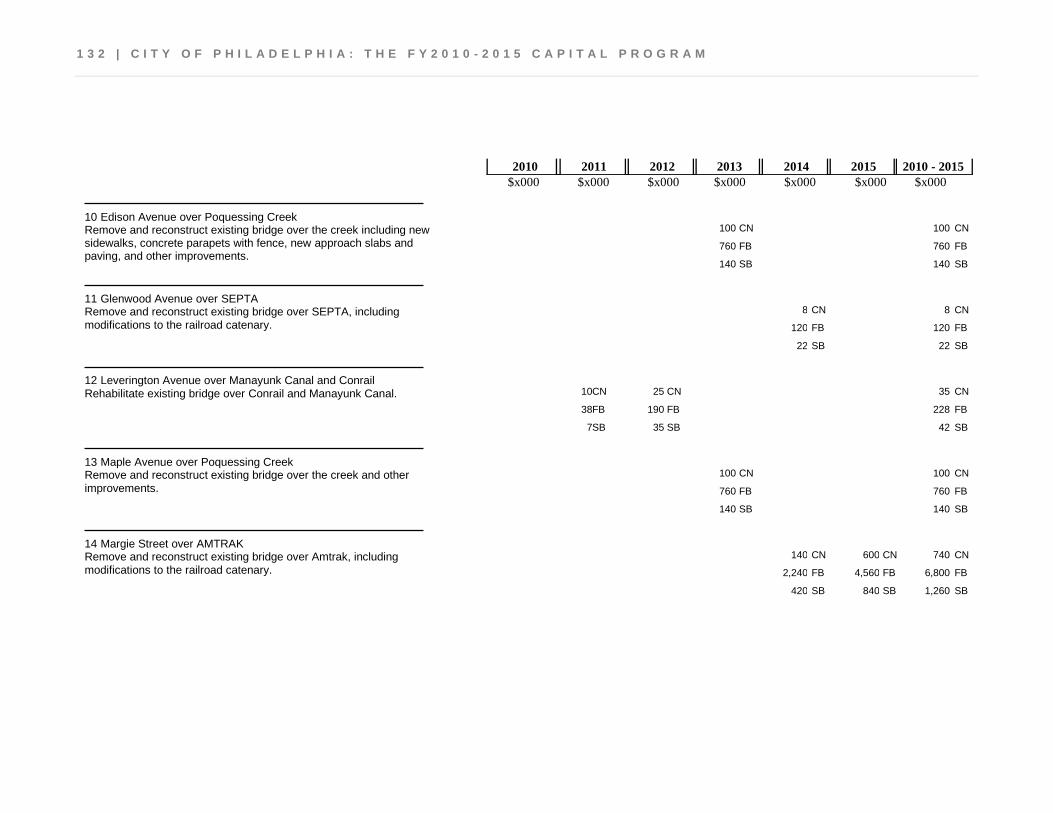
1 3 2 | C I T Y O F P H I L A D E L P H I A : T H E F Y 2 0 1 0 - 2 0 1 5 C A P I T A L P R O G R A M
$x000 $x000 $x000 $x000 $x000 $x000 $x000 2010 2011 2012 2013 2014 2015 2010 - 2015
100 100 CN CN 760 760 FB FB 140 140 SB SB
Remove and reconstruct existing bridge over the creek including new sidewalks, concrete parapets with fence, new approach slabs and paving, and other improvements.
Edison Avenue over Poquessing Creek 10
8 8 CN CN 120 120 FB FB 22 22 SB SB
Remove and reconstruct existing bridge over SEPTA, including modifications to the railroad catenary.
Glenwood Avenue over SEPTA 11
35 25 10 CN CN CN 228 190 38 FB FB FB 42 35 7 SB SB SB
Rehabilitate existing bridge over Conrail and Manayunk Canal. Leverington Avenue over Manayunk Canal and Conrail 12
100 100 CN CN 760 760 FB FB 140 140 SB SB
Remove and reconstruct existing bridge over the creek and other improvements.
Maple Avenue over Poquessing Creek 13
740 600 140 CN CN CN 6,800 4,560 2,240 FB FB FB 1,260 840 420 SB SB SB
Remove and reconstruct existing bridge over Amtrak, including modifications to the railroad catenary.
Margie Street over AMTRAK 14
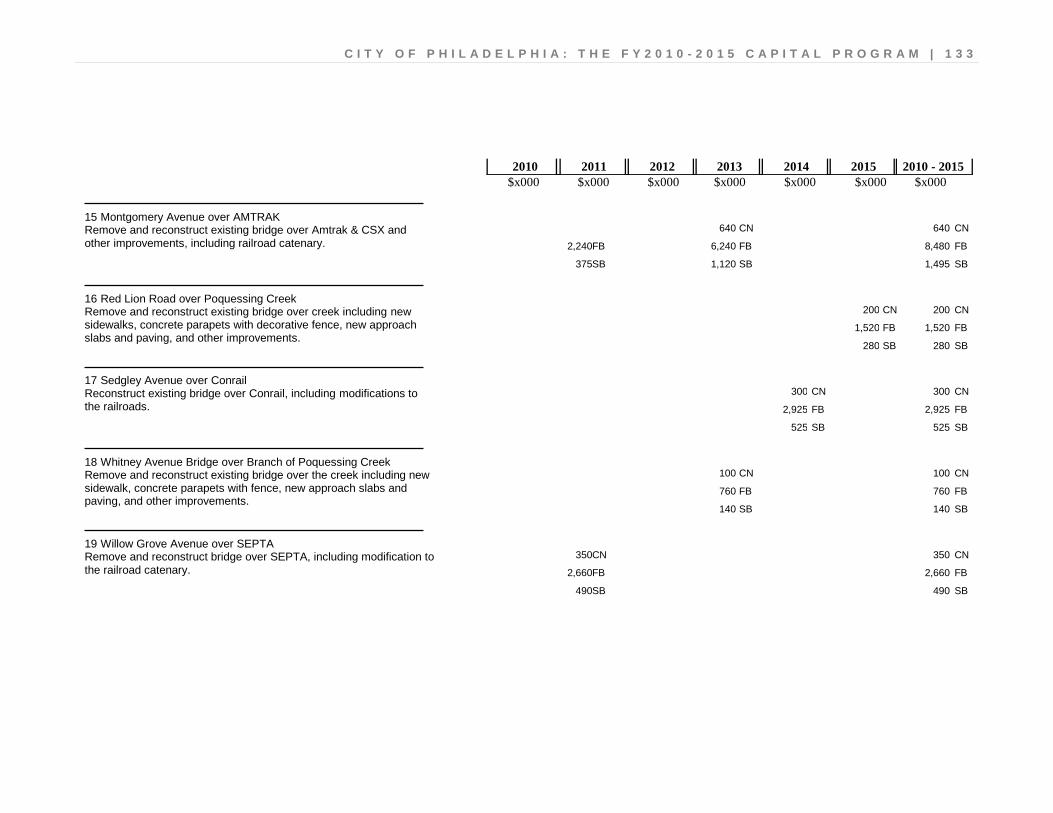
C I T Y O F P H I L A D E L P H I A : T H E F Y 2 0 1 0 - 2 0 1 5 C A P I T A L P R O G R A M | 1 3 3
$x000 $x000 $x000 $x000 $x000 $x000 $x000 2010 2011 2012 2013 2014 2015 2010 - 2015
640 640 CN CN 8,480 6,240 2,240 FB FB FB 1,495 1,120 375 SB SB SB
Remove and reconstruct existing bridge over Amtrak & CSX and other improvements, including railroad catenary.
Montgomery Avenue over AMTRAK 15
200 200 CN CN 1,520 1,520 FB FB
280 280 SB SB
Remove and reconstruct existing bridge over creek including new sidewalks, concrete parapets with decorative fence, new approach slabs and paving, and other improvements.
Red Lion Road over Poquessing Creek 16
300 300 CN CN 2,925 2,925 FB FB
525 525 SB SB
Reconstruct existing bridge over Conrail, including modifications to the railroads.
Sedgley Avenue over Conrail 17
100 100 CN CN 760 760 FB FB 140 140 SB SB
Remove and reconstruct existing bridge over the creek including new sidewalk, concrete parapets with fence, new approach slabs and paving, and other improvements.
Whitney Avenue Bridge over Branch of Poquessing Creek 18
350 350 CN CN 2,660 2,660 FB FB
490 490 SB SB
Remove and reconstruct bridge over SEPTA, including modification to the railroad catenary.
Willow Grove Avenue over SEPTA 19

1 3 4 | C I T Y O F P H I L A D E L P H I A : T H E F Y 2 0 1 0 - 2 0 1 5 C A P I T A L P R O G R A M
$x000 $x000 $x000 $x000 $x000 $x000 $x000 2010 2011 2012 2013 2014 2015 2010 - 2015
538 500 38 CN CN CN 4,400 3,800 600 FB FB FB
814 700 114 SB SB SB
Remove and reconstruct existing bridge over SEPTA and other improvements, including modifications to the railroad catenary.
Woodland Avenue over SEPTA 20
400 400 CN CN 1,600 1,600 FB FB
Repair, refurbish, and repaint existing viaduct including deck repairs and drainage improvements.
30th Street Viaduct from Market Street to Walnut Street 21
350 350 CN CN 3,950 3,950 FB FB
700 700 SB SB
Remove and reconstruct existing bridge over creek with appurtenant work.
Tabor Road over Tacony Creek 22
995 9,350 14,250 17,050 11,800 9,972 63,417
60A. Bridge Reconstruction & Improvements-FY09 4,431 4,431 CT CT
4,738 4,738 FT FT
682 682 ST ST
9,851 9,851
See description under line item 60.

C I T Y O F P H I L A D E L P H I A : T H E F Y 2 0 1 0 - 2 0 1 5 C A P I T A L P R O G R A M | 1 3 5
$x000 $x000 $x000 $x000 $x000 $x000 $x000 2010 2011 2012 2013 2014 2015 2010 - 2015
60B. Bridge Reconstruction & Improvements-FY08 400 400 CT CT
2,472 2,472 FT FT
458 458 ST ST
3,330 3,330
See description under line item 60.
60C. Bridge Reconstruction & Improvements-FY07 318 318 CT CT
5,000 5,000 FT FT
5,498 5,498 ST ST
10,816 10,816
See description under line item 60.
60D. Bridge Reconstruction & Improvements-FY06 2,063 2,063 CT CT
11,089 11,089 FT FT
1,636 1,636 ST ST
14,788 14,788
See description under line item 60.
60E. Bridge Reconstruction & Improvements-FY05 449 449 CT CT
4,629 4,629 FT FT
856 856 ST ST
5,934 5,934
See description under line item 60.
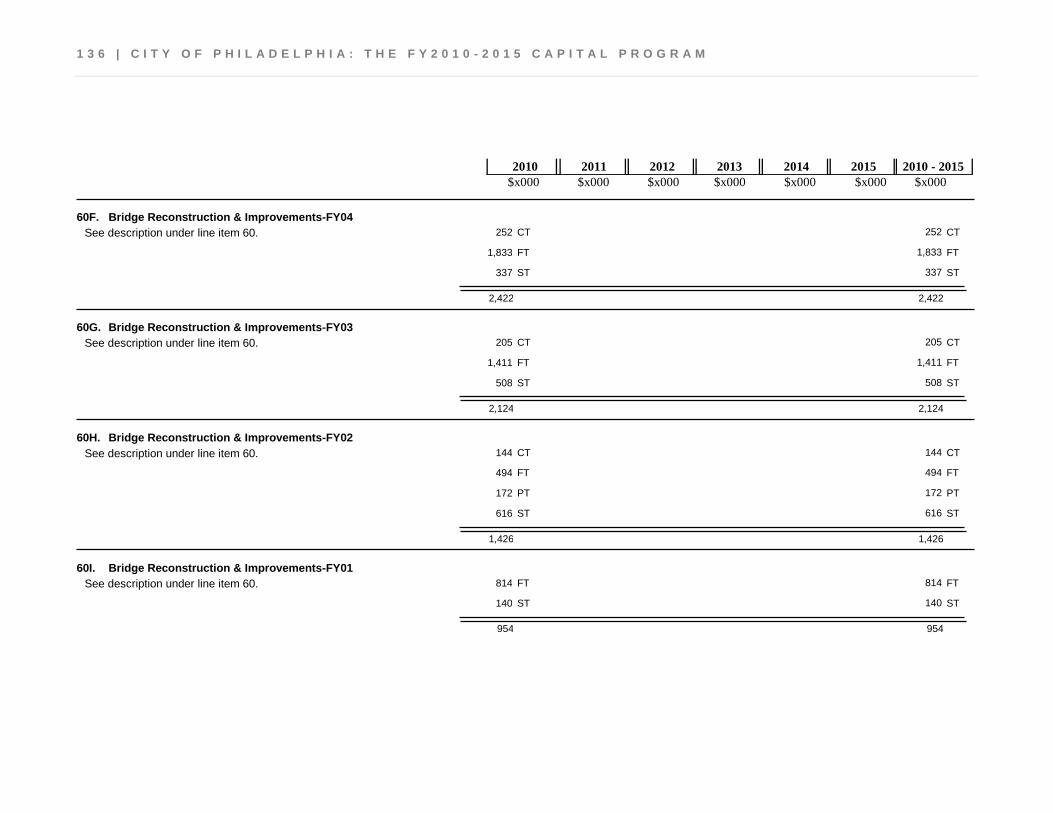
1 3 6 | C I T Y O F P H I L A D E L P H I A : T H E F Y 2 0 1 0 - 2 0 1 5 C A P I T A L P R O G R A M
$x000 $x000 $x000 $x000 $x000 $x000 $x000 2010 2011 2012 2013 2014 2015 2010 - 2015
60F. Bridge Reconstruction & Improvements-FY04 252 252 CT CT
1,833 1,833 FT FT
337 337 ST ST
2,422 2,422
See description under line item 60.
60G. Bridge Reconstruction & Improvements-FY03 205 205 CT CT
1,411 1,411 FT FT
508 508 ST ST
2,124 2,124
See description under line item 60.
60H. Bridge Reconstruction & Improvements-FY02 144 144 CT CT
494 494 FT FT
172 172 PT PT
616 616 ST ST
1,426 1,426
See description under line item 60.
60I. Bridge Reconstruction & Improvements-FY01 814 814 FT FT
140 140 ST ST
954 954
See description under line item 60.
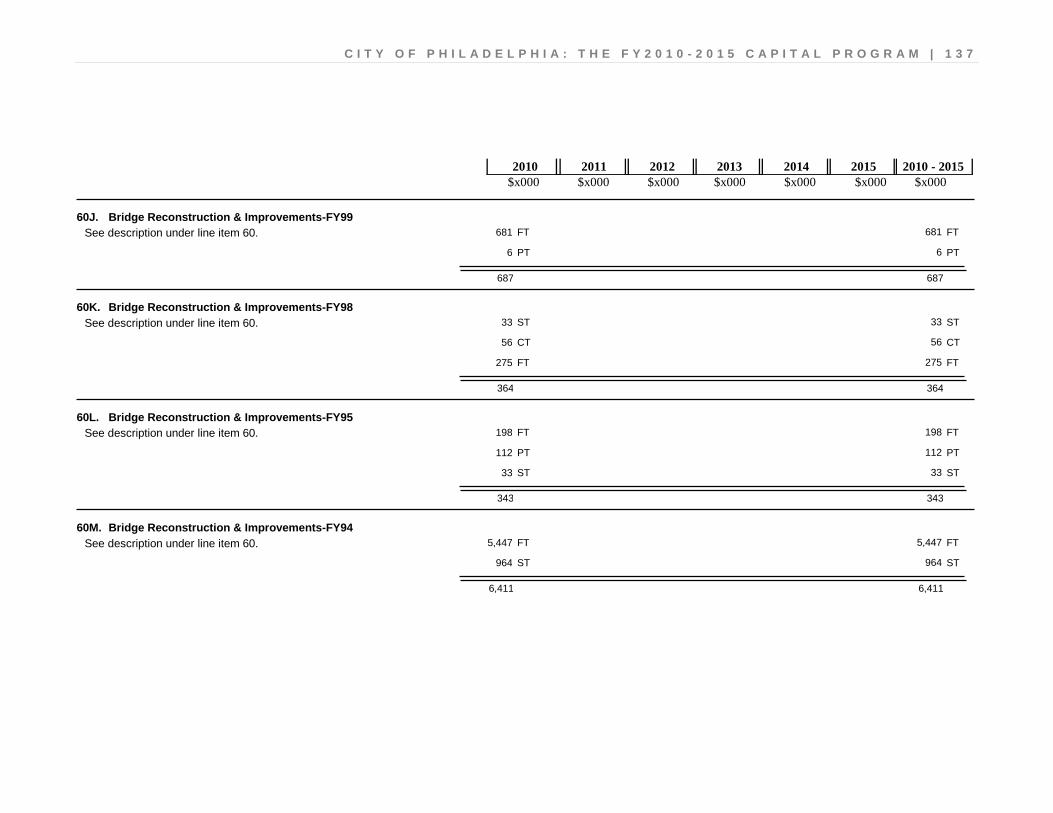
C I T Y O F P H I L A D E L P H I A : T H E F Y 2 0 1 0 - 2 0 1 5 C A P I T A L P R O G R A M | 1 3 7
$x000 $x000 $x000 $x000 $x000 $x000 $x000 2010 2011 2012 2013 2014 2015 2010 - 2015
60J. Bridge Reconstruction & Improvements-FY99 681 681 FT FT
6 6 PT PT
687 687
See description under line item 60.
60K. Bridge Reconstruction & Improvements-FY98 33 33 ST ST
56 56 CT CT
275 275 FT FT
364 364
See description under line item 60.
60L. Bridge Reconstruction & Improvements-FY95 198 198 FT FT
112 112 PT PT
33 33 ST ST
343 343
See description under line item 60.
60M. Bridge Reconstruction & Improvements-FY94 5,447 5,447 FT FT
964 964 ST ST
6,411 6,411
See description under line item 60.
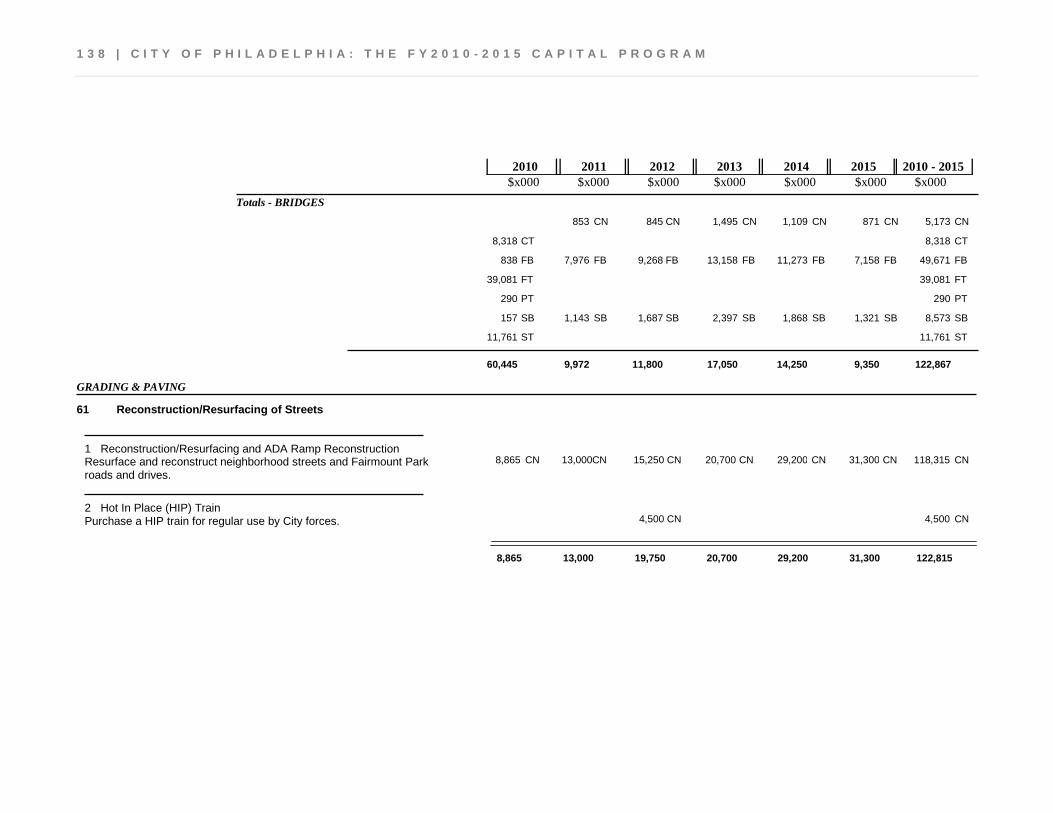
1 3 8 | C I T Y O F P H I L A D E L P H I A : T H E F Y 2 0 1 0 - 2 0 1 5 C A P I T A L P R O G R A M
$x000 $x000 $x000 $x000 $x000 $x000 $x000 2010 2011 2012 2013 2014 2015 2010 - 2015
Totals - BRIDGES
1,495 845 853 1,109 871 CN CN CN CN CN 5,173 CN
8,318 CT 8,318 CT
13,158 9,268 7,976 838 11,273 7,158 FB FB FB FB FB FB 49,671 FB
39,081 FT 39,081 FT
290 PT 290 PT
2,397 1,687 1,143 157 1,868 1,321 SB SB SB SB SB SB 8,573 SB
11,761 ST 11,761 ST
9,350 14,250 17,050 11,800 9,972 60,445 122,867
GRADING & PAVING
Reconstruction/Resurfacing of Streets 61
118,315 31,300 29,200 20,700 15,250 13,000 8,865 CN CN CN CN CN CN CN Resurface and reconstruct neighborhood streets and Fairmount Park roads and drives.
Reconstruction/Resurfacing and ADA Ramp Reconstruction 1
4,500 4,500 CN CN Purchase a HIP train for regular use by City forces. Hot In Place (HIP) Train 2
8,865 31,300 29,200 20,700 19,750 13,000 122,815
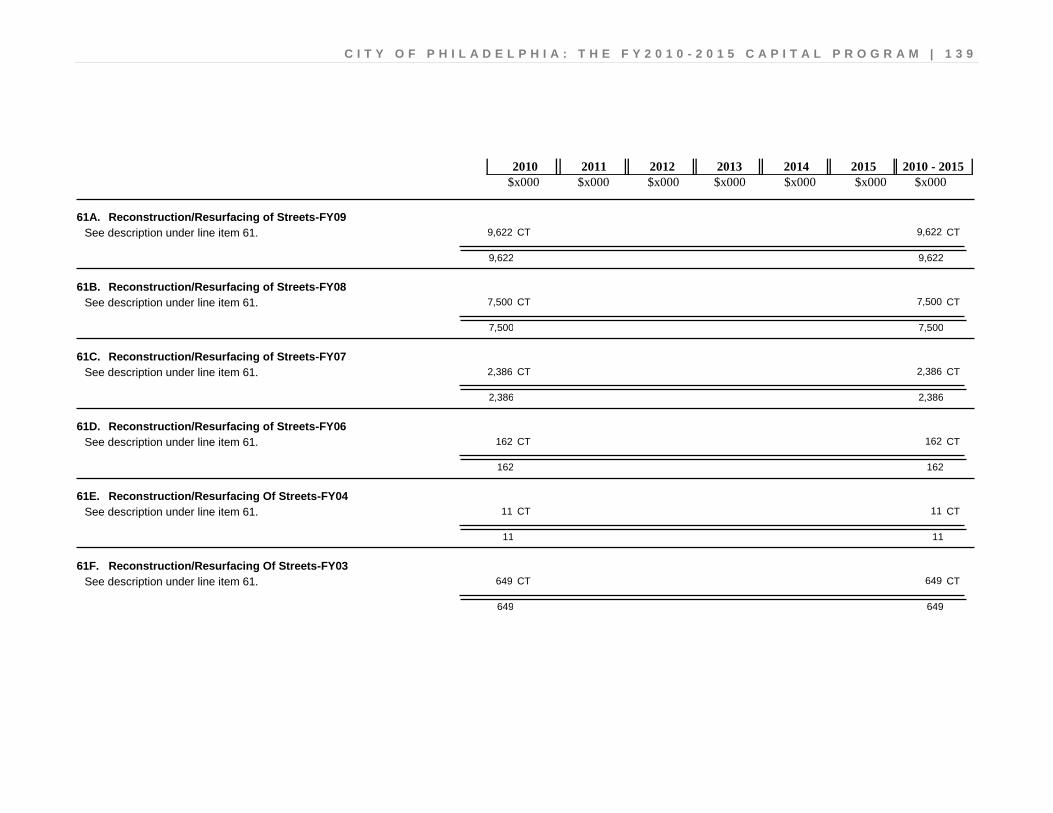
C I T Y O F P H I L A D E L P H I A : T H E F Y 2 0 1 0 - 2 0 1 5 C A P I T A L P R O G R A M | 1 3 9
$x000 $x000 $x000 $x000 $x000 $x000 $x000 2010 2011 2012 2013 2014 2015 2010 - 2015
61A. Reconstruction/Resurfacing of Streets-FY09 9,622 9,622 CT CT
9,622 9,622
See description under line item 61.
61B. Reconstruction/Resurfacing of Streets-FY08 7,500 7,500 CT CT
7,500 7,500
See description under line item 61.
61C. Reconstruction/Resurfacing of Streets-FY07 2,386 2,386 CT CT
2,386 2,386
See description under line item 61.
61D. Reconstruction/Resurfacing of Streets-FY06 162 162 CT CT
162 162
See description under line item 61.
61E. Reconstruction/Resurfacing Of Streets-FY04 11 11 CT CT
11 11
See description under line item 61.
61F. Reconstruction/Resurfacing Of Streets-FY03 649 649 CT CT
649 649
See description under line item 61.

1 4 0 | C I T Y O F P H I L A D E L P H I A : T H E F Y 2 0 1 0 - 2 0 1 5 C A P I T A L P R O G R A M
$x000 $x000 $x000 $x000 $x000 $x000 $x000 2010 2011 2012 2013 2014 2015 2010 - 2015
61G. Reconstruction/Resurfacing Of Streets-FY02 600 600 CT CT
600 600
See description under line item 61.
61H. Reconstruction/Resurfacing Of Streets-FY01 75 75 CT CT
75 75
See description under line item 61.
61I. Forever Green" Program-FY08" 40 40 CT CT
40 40
Support expansion of the Pennsylvania Horticultural Society program of street-tree planting and landscape management.
61J. Forever Green" Program-FY07" 40 40 CT CT
40 40
See description under line item 67I.
61K. Forever Green" Program-FY06" 40 40 CT CT
40 40
See description under line item 67I.
61L. Forever Green" Program-FY05" 40 40 CT CT
40 40
See description under line item 67I.

C I T Y O F P H I L A D E L P H I A : T H E F Y 2 0 1 0 - 2 0 1 5 C A P I T A L P R O G R A M | 1 4 1
$x000 $x000 $x000 $x000 $x000 $x000 $x000 2010 2011 2012 2013 2014 2015 2010 - 2015
61M. Schuylkill River Park-FY98 15 15 CT CT
15 15
Provide lighting and utility connections for park development.
Historic Streets 62
1,200 400 400 400 CN CN CN CN Resurface and reconstruct historic streets throughout the City. Historic Streets 1
400 400 400 1,200
62A. Historic Streets-FY09 200 200 CT CT
200 200
See description under line item 62.
62B. Historic Streets-FY08 200 200 CT CT
200 200
See description under line item 62.
62C. Historic Streets-FY07 200 200 CT CT
200 200
See description under line item 62.
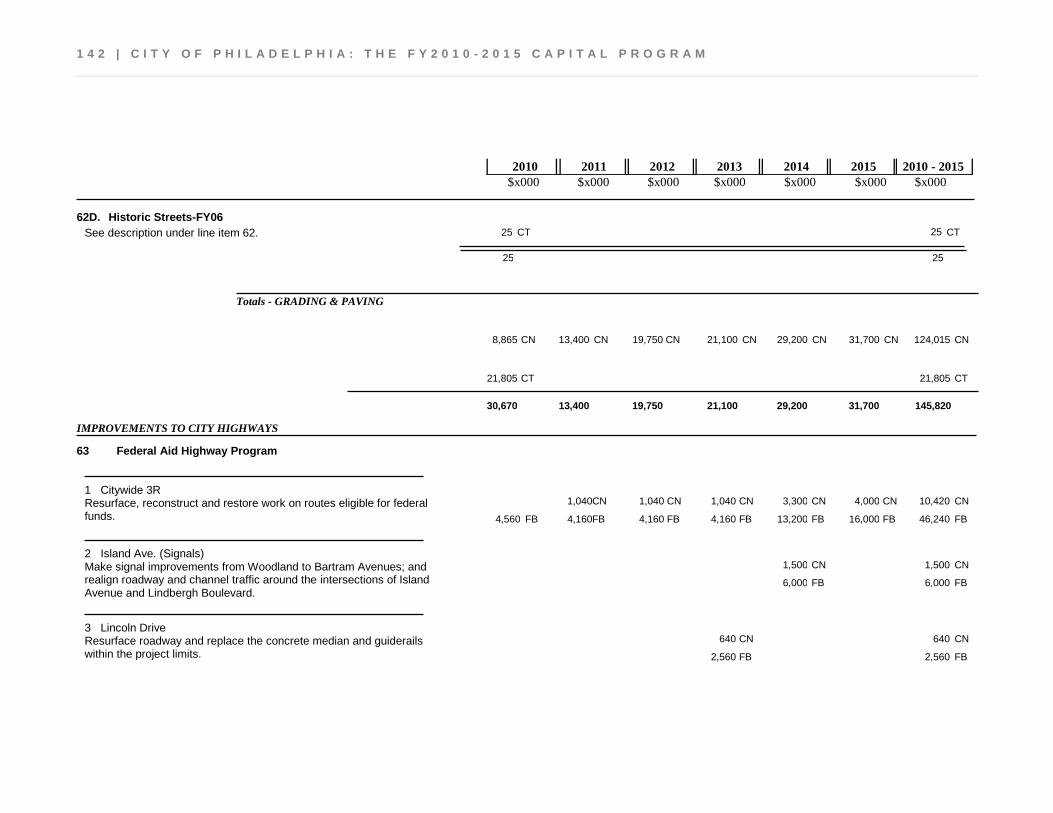
1 4 2 | C I T Y O F P H I L A D E L P H I A : T H E F Y 2 0 1 0 - 2 0 1 5 C A P I T A L P R O G R A M
$x000 $x000 $x000 $x000 $x000 $x000 $x000 2010 2011 2012 2013 2014 2015 2010 - 2015
62D. Historic Streets-FY06 25 25 CT CT
25 25
See description under line item 62.
Totals - GRADING & PAVING
21,100 19,750 13,400 8,865 29,200 31,700 CN CN CN CN CN CN 124,015 CN
21,805 CT 21,805 CT
31,700 29,200 21,100 19,750 13,400 30,670 145,820
IMPROVEMENTS TO CITY HIGHWAYS
Federal Aid Highway Program 63
10,420 4,000 3,300 1,040 1,040 1,040 CN CN CN CN CN CN 46,240 16,000 13,200 4,160 4,160 4,160 4,560 FB FB FB FB FB FB FB
Resurface, reconstruct and restore work on routes eligible for federal funds.
Citywide 3R 1
1,500 1,500 CN CN 6,000 6,000 FB FB
Make signal improvements from Woodland to Bartram Avenues; and realign roadway and channel traffic around the intersections of Island Avenue and Lindbergh Boulevard.
Island Ave. (Signals) 2
640 640 CN CN 2,560 2,560 FB FB
Resurface roadway and replace the concrete median and guiderails within the project limits.
Lincoln Drive 3
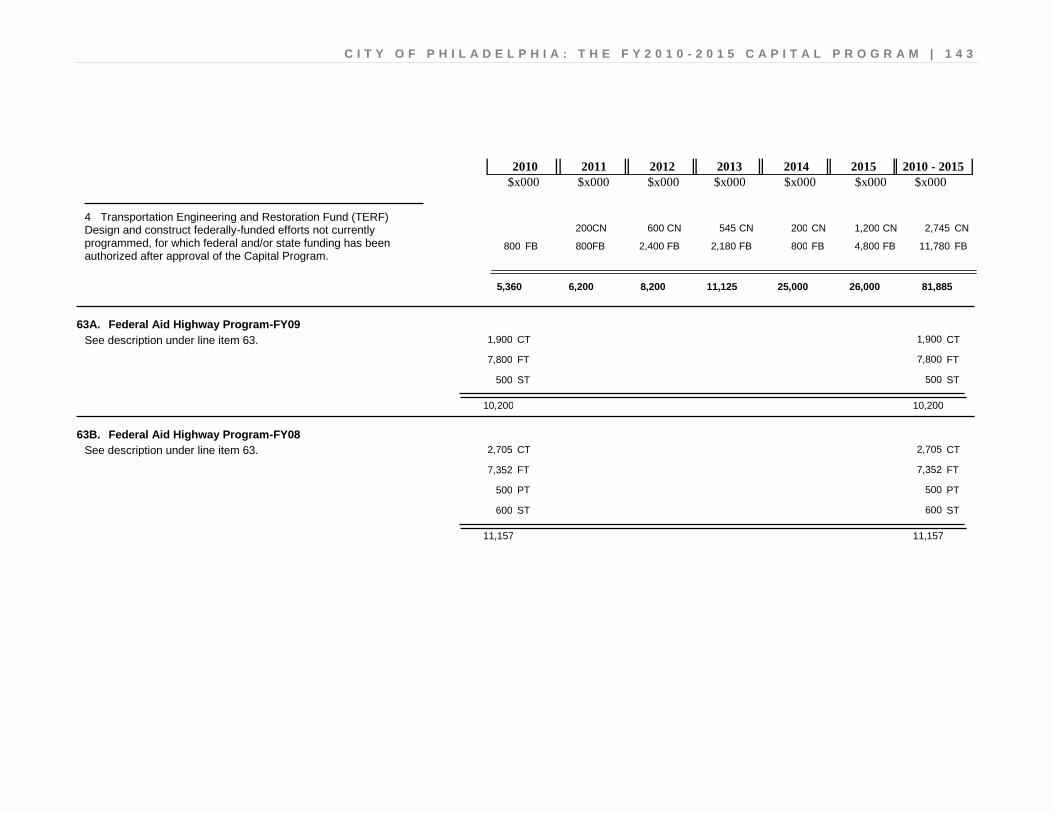
C I T Y O F P H I L A D E L P H I A : T H E F Y 2 0 1 0 - 2 0 1 5 C A P I T A L P R O G R A M | 1 4 3
$x000 $x000 $x000 $x000 $x000 $x000 $x000 2010 2011 2012 2013 2014 2015 2010 - 2015
2,745 1,200 200 545 600 200 CN CN CN CN CN CN 11,780 4,800 800 2,180 2,400 800 800 FB FB FB FB FB FB FB
Design and construct federally-funded efforts not currently programmed, for which federal and/or state funding has been authorized after approval of the Capital Program.
Transportation Engineering and Restoration Fund (TERF) 4
5,360 26,000 25,000 11,125 8,200 6,200 81,885
63A. Federal Aid Highway Program-FY09 1,900 1,900 CT CT
7,800 7,800 FT FT
500 500 ST ST
10,200 10,200
See description under line item 63.
63B. Federal Aid Highway Program-FY08 2,705 2,705 CT CT
7,352 7,352 FT FT
500 500 PT PT
600 600 ST ST
11,157 11,157
See description under line item 63.
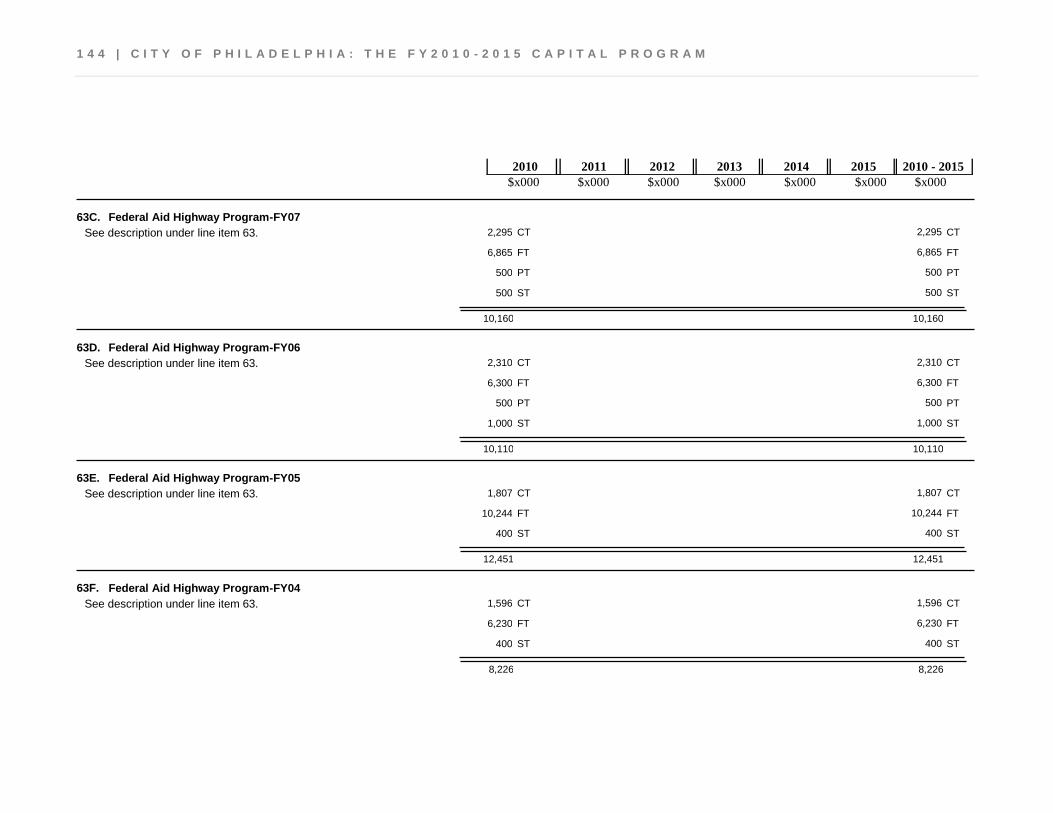
1 4 4 | C I T Y O F P H I L A D E L P H I A : T H E F Y 2 0 1 0 - 2 0 1 5 C A P I T A L P R O G R A M
$x000 $x000 $x000 $x000 $x000 $x000 $x000 2010 2011 2012 2013 2014 2015 2010 - 2015
63C. Federal Aid Highway Program-FY07 2,295 2,295 CT CT
6,865 6,865 FT FT
500 500 PT PT
500 500 ST ST
10,160 10,160
See description under line item 63.
63D. Federal Aid Highway Program-FY06 2,310 2,310 CT CT
6,300 6,300 FT FT
500 500 PT PT
1,000 1,000 ST ST
10,110 10,110
See description under line item 63.
63E. Federal Aid Highway Program-FY05 1,807 1,807 CT CT
10,244 10,244 FT FT
400 400 ST ST
12,451 12,451
See description under line item 63.
63F. Federal Aid Highway Program-FY04 1,596 1,596 CT CT
6,230 6,230 FT FT
400 400 ST ST
8,226 8,226
See description under line item 63.

C I T Y O F P H I L A D E L P H I A : T H E F Y 2 0 1 0 - 2 0 1 5 C A P I T A L P R O G R A M | 1 4 5
$x000 $x000 $x000 $x000 $x000 $x000 $x000 2010 2011 2012 2013 2014 2015 2010 - 2015
63G. Federal Aid Highway Program-FY03 89 89 CT CT
2,296 2,296 FT FT
250 250 ST ST
2,635 2,635
See description under line item 63.
63H. Federal Aid Highway Program-FY02 290 290 CT CT
2,520 2,520 FT FT
2,810 2,810
See description under line item 63.
63I. Federal Aid Highway Program-FY01 2,263 2,263 FT FT
2,263 2,263
See description under line item 63.
63J. Federal Aid Highway Program-FY99 53 53 CT CT
53 53
See description under line item 63.
63K. Federal Aid Highway Program-FY98 538 538 FT FT
538 538
See description under line item 63.
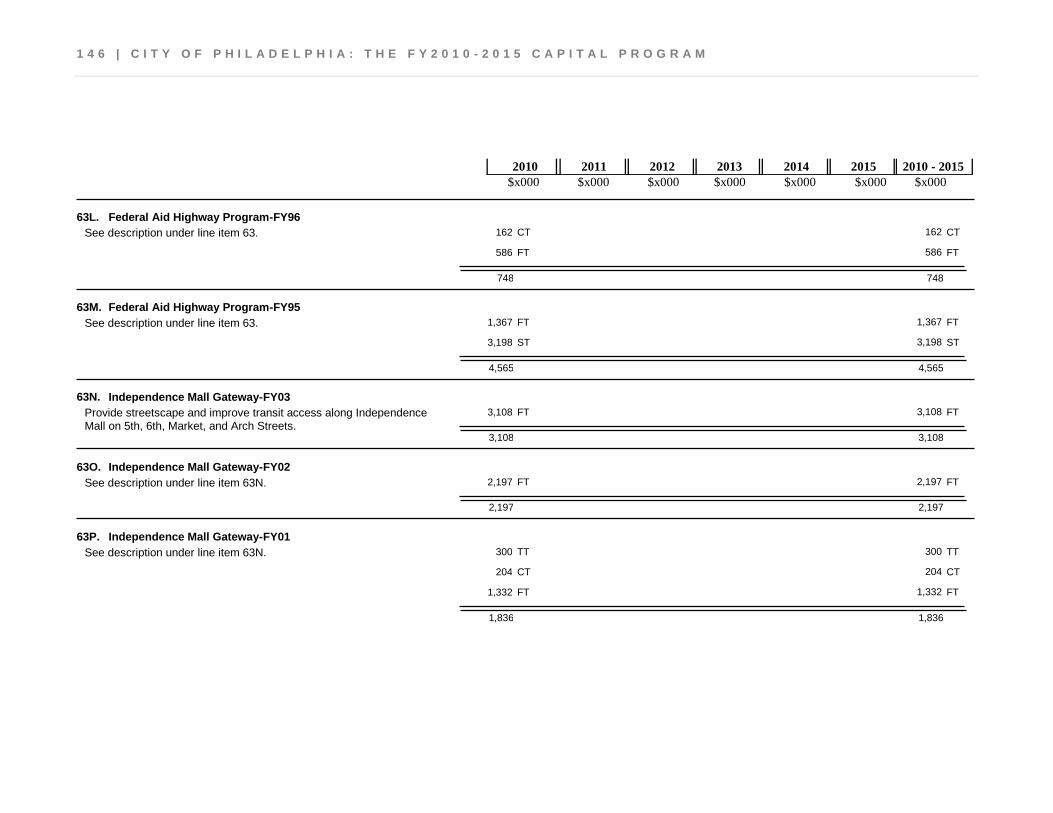
1 4 6 | C I T Y O F P H I L A D E L P H I A : T H E F Y 2 0 1 0 - 2 0 1 5 C A P I T A L P R O G R A M
$x000 $x000 $x000 $x000 $x000 $x000 $x000 2010 2011 2012 2013 2014 2015 2010 - 2015
63L. Federal Aid Highway Program-FY96 162 162 CT CT
586 586 FT FT
748 748
See description under line item 63.
63M. Federal Aid Highway Program-FY95 1,367 1,367 FT FT
3,198 3,198 ST ST
4,565 4,565
See description under line item 63.
63N. Independence Mall Gateway-FY03 3,108 3,108 FT FT
3,108 3,108
Provide streetscape and improve transit access along Independence Mall on 5th, 6th, Market, and Arch Streets.
63O. Independence Mall Gateway-FY02 2,197 2,197 FT FT
2,197 2,197
See description under line item 63N.
63P. Independence Mall Gateway-FY01 300 300 TT TT
204 204 CT CT
1,332 1,332 FT FT
1,836 1,836
See description under line item 63N.
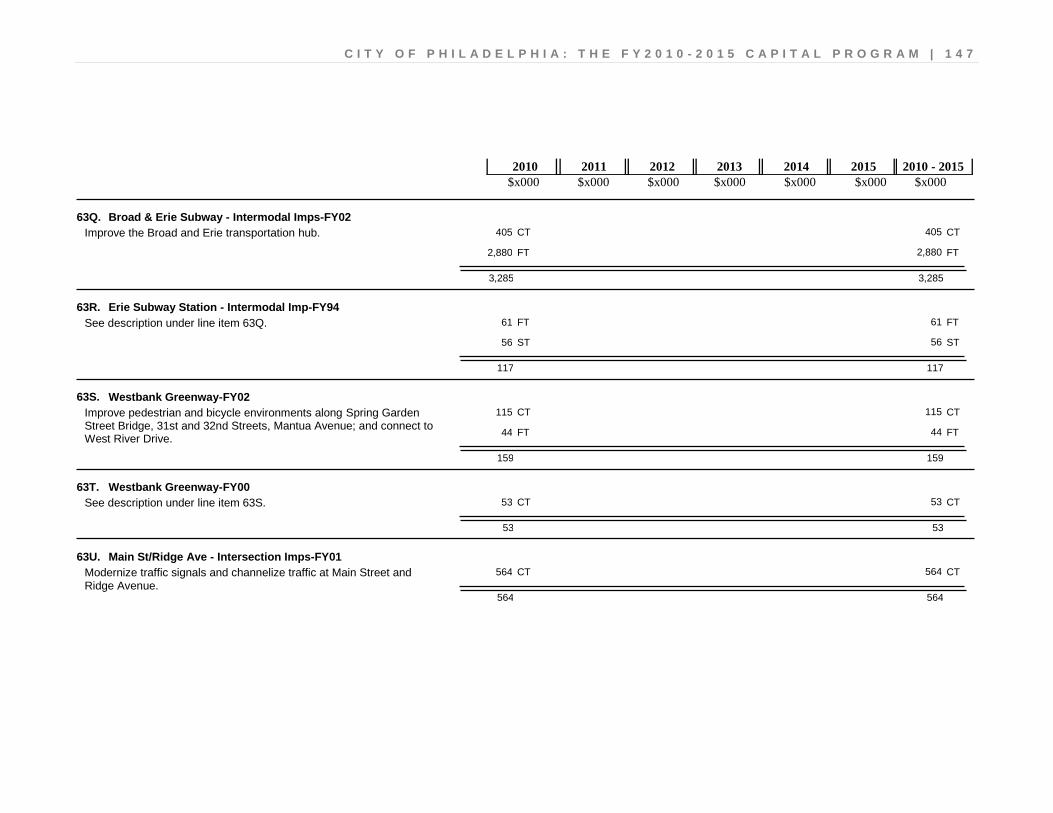
C I T Y O F P H I L A D E L P H I A : T H E F Y 2 0 1 0 - 2 0 1 5 C A P I T A L P R O G R A M | 1 4 7
$x000 $x000 $x000 $x000 $x000 $x000 $x000 2010 2011 2012 2013 2014 2015 2010 - 2015
63Q. Broad & Erie Subway - Intermodal Imps-FY02 405 405 CT CT
2,880 2,880 FT FT
3,285 3,285
Improve the Broad and Erie transportation hub.
63R. Erie Subway Station - Intermodal Imp-FY94 61 61 FT FT
56 56 ST ST
117 117
See description under line item 63Q.
63S. Westbank Greenway-FY02 115 115 CT CT
44 44 FT FT
159 159
Improve pedestrian and bicycle environments along Spring Garden Street Bridge, 31st and 32nd Streets, Mantua Avenue; and connect to West River Drive.
63T. Westbank Greenway-FY00 53 53 CT CT
53 53
See description under line item 63S.
63U. Main St/Ridge Ave - Intersection Imps-FY01 564 564 CT CT
564 564
Modernize traffic signals and channelize traffic at Main Street and Ridge Avenue.
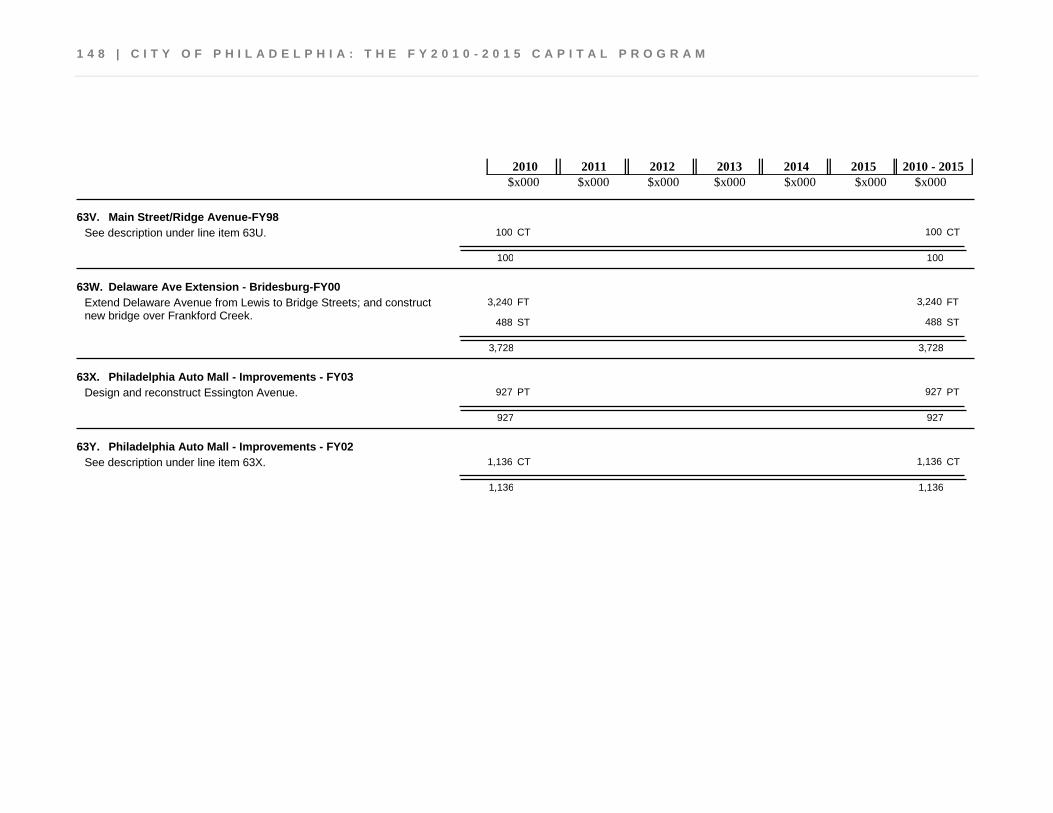
1 4 8 | C I T Y O F P H I L A D E L P H I A : T H E F Y 2 0 1 0 - 2 0 1 5 C A P I T A L P R O G R A M
$x000 $x000 $x000 $x000 $x000 $x000 $x000 2010 2011 2012 2013 2014 2015 2010 - 2015
63V. Main Street/Ridge Avenue-FY98 100 100 CT CT
100 100
See description under line item 63U.
63W. Delaware Ave Extension - Bridesburg-FY00 3,240 3,240 FT FT
488 488 ST ST
3,728 3,728
Extend Delaware Avenue from Lewis to Bridge Streets; and construct new bridge over Frankford Creek.
63X. Philadelphia Auto Mall - Improvements - FY03 927 927 PT PT
927 927
Design and reconstruct Essington Avenue.
63Y. Philadelphia Auto Mall - Improvements - FY02 1,136 1,136 CT CT
1,136 1,136
See description under line item 63X.
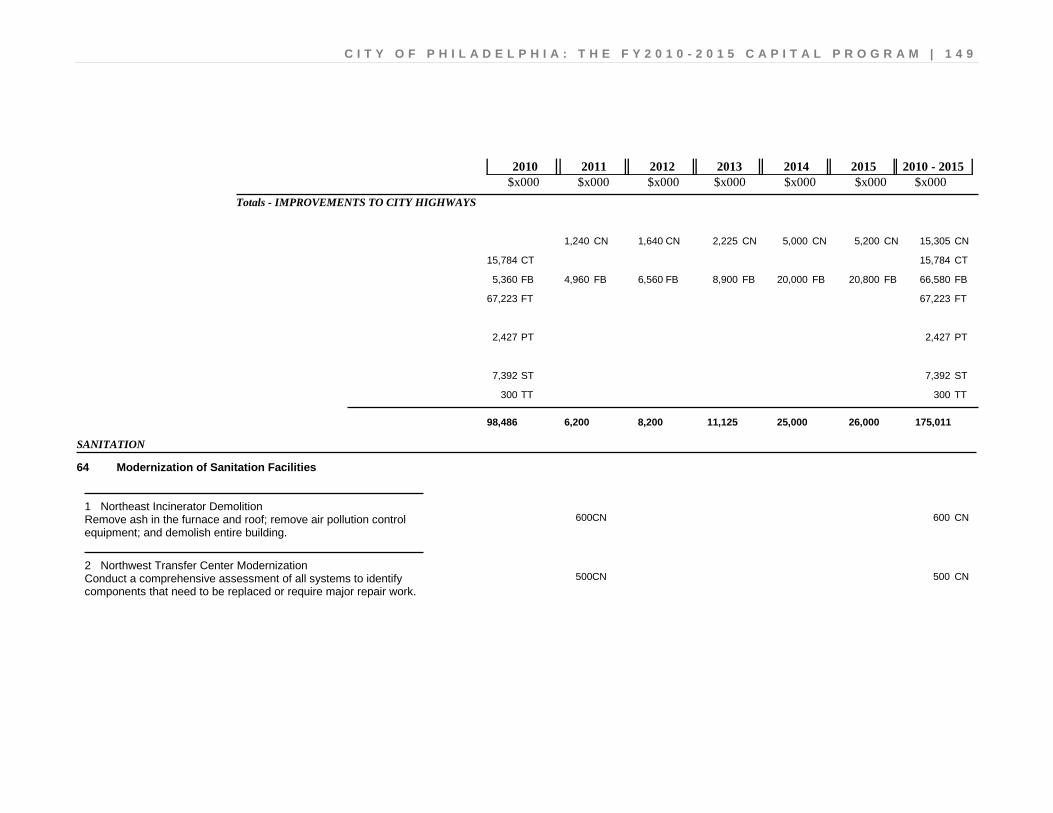
C I T Y O F P H I L A D E L P H I A : T H E F Y 2 0 1 0 - 2 0 1 5 C A P I T A L P R O G R A M | 1 4 9
$x000 $x000 $x000 $x000 $x000 $x000 $x000 2010 2011 2012 2013 2014 2015 2010 - 2015
Totals - IMPROVEMENTS TO CITY HIGHWAYS
2,225 1,640 1,240 5,000 5,200 CN CN CN CN CN 15,305 CN
15,784 CT 15,784 CT
8,900 6,560 4,960 5,360 20,000 20,800 FB FB FB FB FB FB 66,580 FB
67,223 FT 67,223 FT
2,427 PT 2,427 PT
7,392 ST 7,392 ST
300 TT 300 TT
26,000 25,000 11,125 8,200 6,200 98,486 175,011
SANITATION
Modernization of Sanitation Facilities 64
600 600 CN CN Remove ash in the furnace and roof; remove air pollution control equipment; and demolish entire building.
Northeast Incinerator Demolition 1
500 500 CN CN Conduct a comprehensive assessment of all systems to identify components that need to be replaced or require major repair work.
Northwest Transfer Center Modernization 2
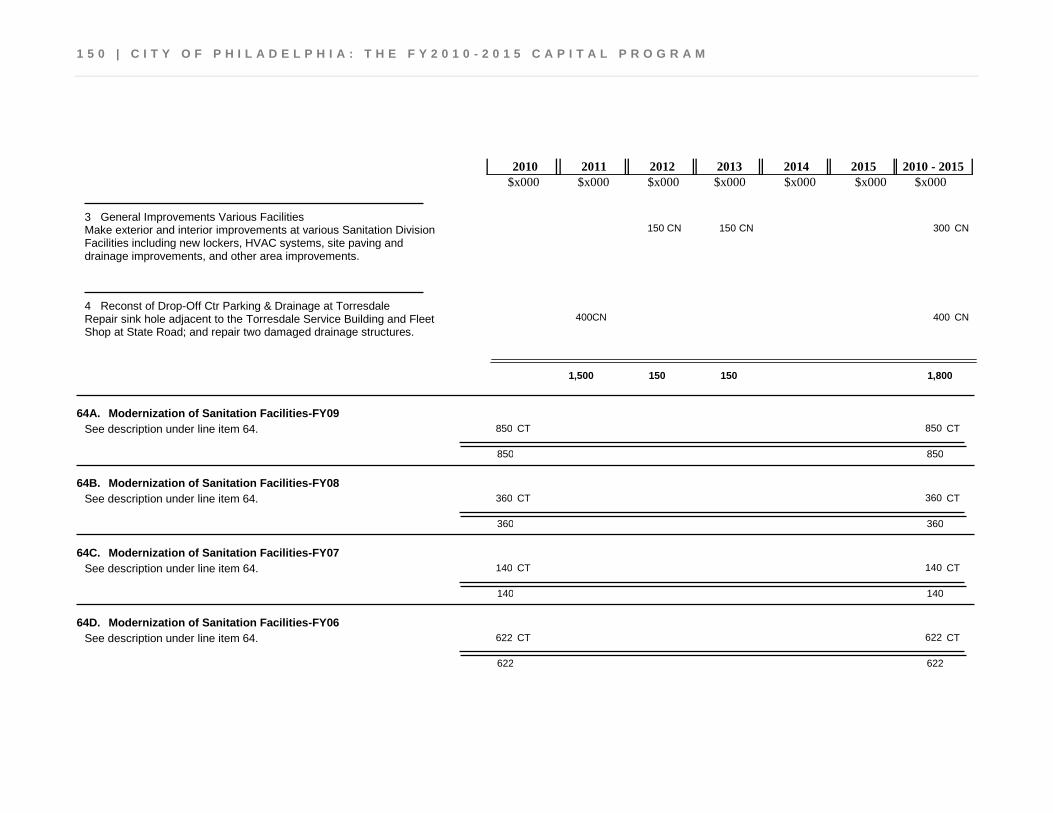
1 5 0 | C I T Y O F P H I L A D E L P H I A : T H E F Y 2 0 1 0 - 2 0 1 5 C A P I T A L P R O G R A M
$x000 $x000 $x000 $x000 $x000 $x000 $x000 2010 2011 2012 2013 2014 2015 2010 - 2015
300 150 150 CN CN CN Make exterior and interior improvements at various Sanitation Division Facilities including new lockers, HVAC systems, site paving and drainage improvements, and other area improvements.
General Improvements Various Facilities 3
400 400 CN CN Repair sink hole adjacent to the Torresdale Service Building and Fleet Shop at State Road; and repair two damaged drainage structures.
Reconst of Drop-Off Ctr Parking & Drainage at Torresdale 4
150 150 1,500 1,800
64A. Modernization of Sanitation Facilities-FY09 850 850 CT CT
850 850
See description under line item 64.
64B. Modernization of Sanitation Facilities-FY08 360 360 CT CT
360 360
See description under line item 64.
64C. Modernization of Sanitation Facilities-FY07 140 140 CT CT
140 140
See description under line item 64.
64D. Modernization of Sanitation Facilities-FY06 622 622 CT CT
622 622
See description under line item 64.
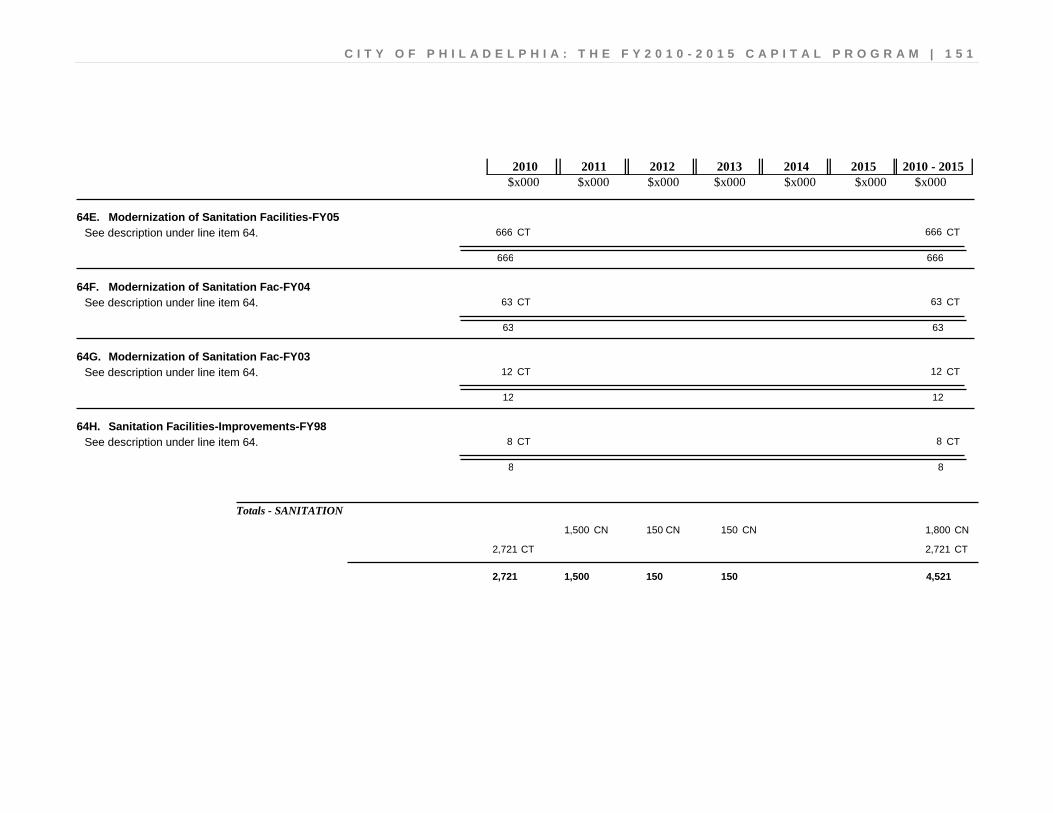
C I T Y O F P H I L A D E L P H I A : T H E F Y 2 0 1 0 - 2 0 1 5 C A P I T A L P R O G R A M | 1 5 1
$x000 $x000 $x000 $x000 $x000 $x000 $x000 2010 2011 2012 2013 2014 2015 2010 - 2015
64E. Modernization of Sanitation Facilities-FY05 666 666 CT CT
666 666
See description under line item 64.
64F. Modernization of Sanitation Fac-FY04 63 63 CT CT
63 63
See description under line item 64.
64G. Modernization of Sanitation Fac-FY03 12 12 CT CT
12 12
See description under line item 64.
64H. Sanitation Facilities-Improvements-FY98 8 8 CT CT
8 8
See description under line item 64.
Totals - SANITATION
150 150 1,500 CN CN CN 1,800 CN
2,721 CT 2,721 CT
150 150 1,500 2,721 4,521
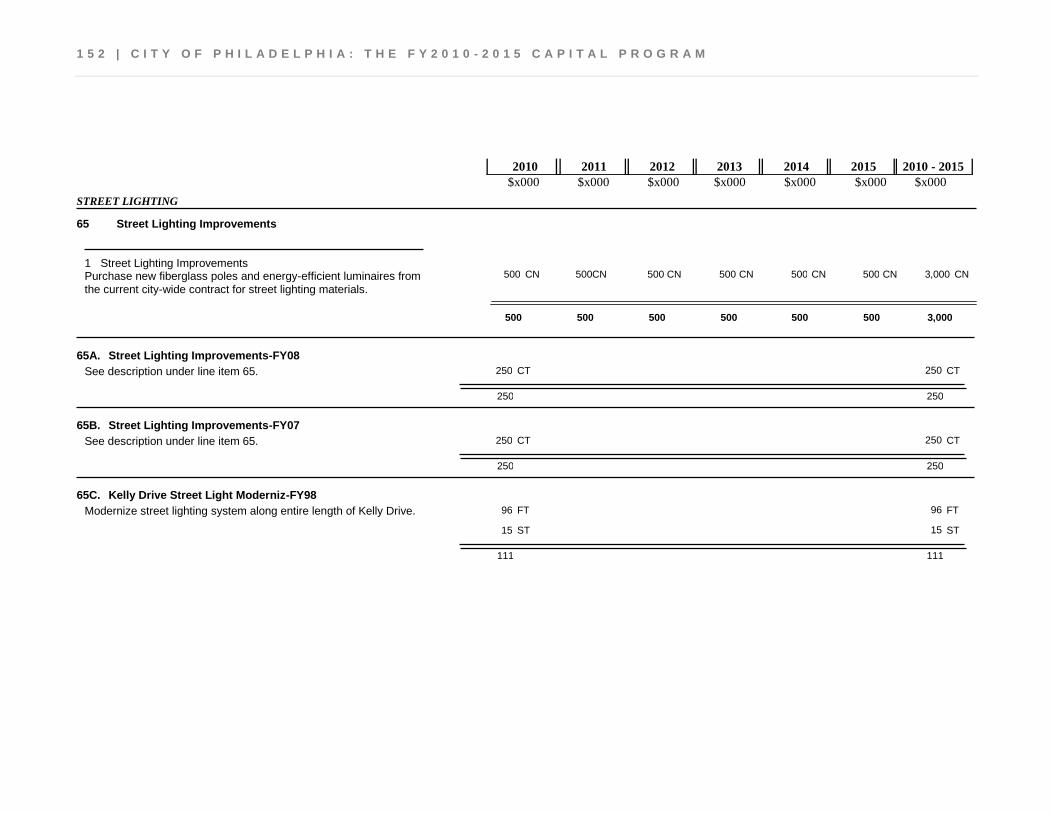
1 5 2 | C I T Y O F P H I L A D E L P H I A : T H E F Y 2 0 1 0 - 2 0 1 5 C A P I T A L P R O G R A M
$x000 $x000 $x000 $x000 $x000 $x000 $x000 2010 2011 2012 2013 2014 2015 2010 - 2015
STREET LIGHTING
Street Lighting Improvements 65
3,000 500 500 500 500 500 500 CN CN CN CN CN CN CN Purchase new fiberglass poles and energy-efficient luminaires from the current city-wide contract for street lighting materials.
Street Lighting Improvements 1
500 500 500 500 500 500 3,000
65A. Street Lighting Improvements-FY08 250 250 CT CT
250 250
See description under line item 65.
65B. Street Lighting Improvements-FY07 250 250 CT CT
250 250
See description under line item 65.
65C. Kelly Drive Street Light Moderniz-FY98 96 96 FT FT
15 15 ST ST
111 111
Modernize street lighting system along entire length of Kelly Drive.
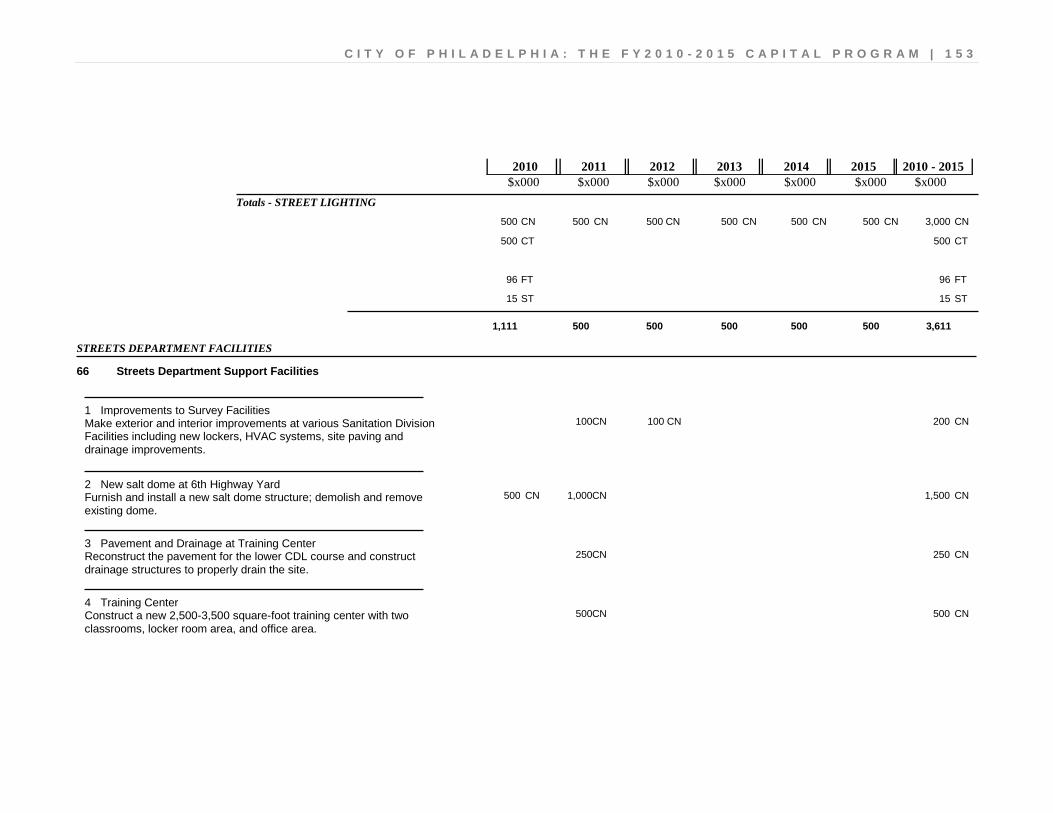
C I T Y O F P H I L A D E L P H I A : T H E F Y 2 0 1 0 - 2 0 1 5 C A P I T A L P R O G R A M | 1 5 3
$x000 $x000 $x000 $x000 $x000 $x000 $x000 2010 2011 2012 2013 2014 2015 2010 - 2015
Totals - STREET LIGHTING
500 500 500 500 500 500 CN CN CN CN CN CN 3,000 CN
500 CT 500 CT
96 FT 96 FT
15 ST 15 ST
500 500 500 500 500 1,111 3,611
STREETS DEPARTMENT FACILITIES
Streets Department Support Facilities 66
200 100 100 CN CN CN Make exterior and interior improvements at various Sanitation Division Facilities including new lockers, HVAC systems, site paving and drainage improvements.
Improvements to Survey Facilities 1
1,500 1,000 500 CN CN CN Furnish and install a new salt dome structure; demolish and remove existing dome.
New salt dome at 6th Highway Yard 2
250 250 CN CN Reconstruct the pavement for the lower CDL course and construct drainage structures to properly drain the site.
Pavement and Drainage at Training Center 3
500 500 CN CN Construct a new 2,500-3,500 square-foot training center with two classrooms, locker room area, and office area.
Training Center 4
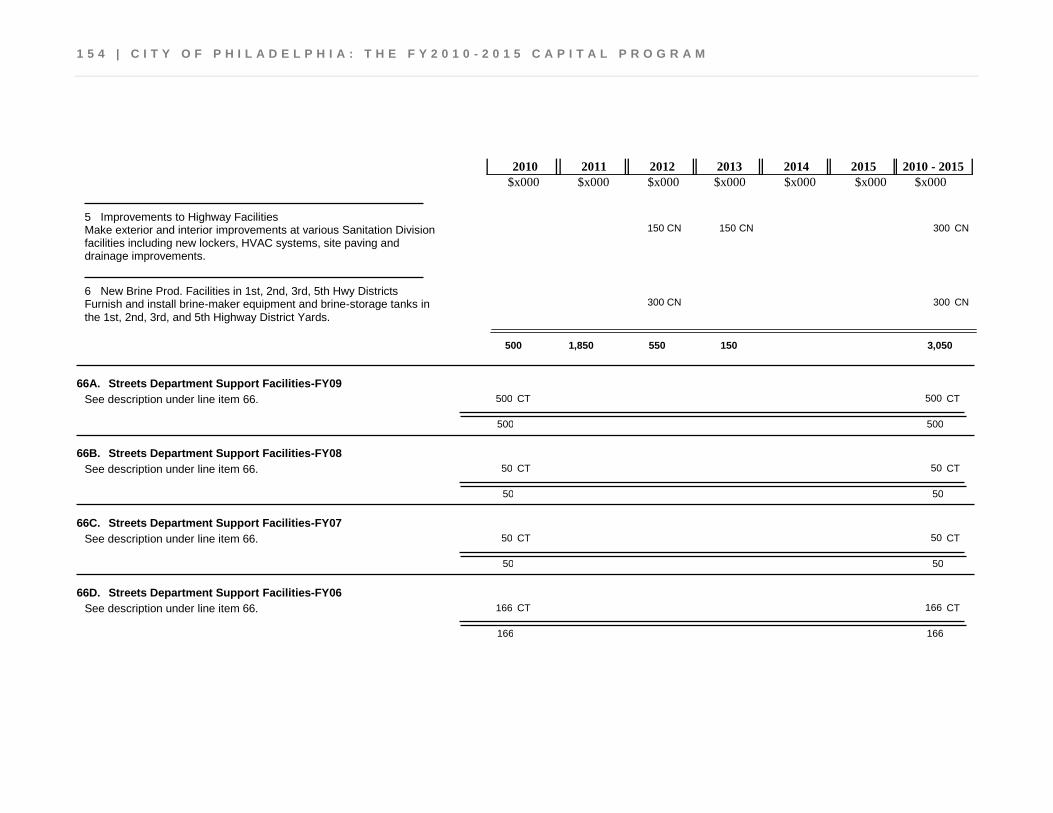
1 5 4 | C I T Y O F P H I L A D E L P H I A : T H E F Y 2 0 1 0 - 2 0 1 5 C A P I T A L P R O G R A M
$x000 $x000 $x000 $x000 $x000 $x000 $x000 2010 2011 2012 2013 2014 2015 2010 - 2015
300 150 150 CN CN CN Make exterior and interior improvements at various Sanitation Division facilities including new lockers, HVAC systems, site paving and drainage improvements.
Improvements to Highway Facilities 5
300 300 CN CN Furnish and install brine-maker equipment and brine-storage tanks in the 1st, 2nd, 3rd, and 5th Highway District Yards.
New Brine Prod. Facilities in 1st, 2nd, 3rd, 5th Hwy Districts 6
500 150 550 1,850 3,050
66A. Streets Department Support Facilities-FY09 500 500 CT CT
500 500
See description under line item 66.
66B. Streets Department Support Facilities-FY08 50 50 CT CT
50 50
See description under line item 66.
66C. Streets Department Support Facilities-FY07 50 50 CT CT
50 50
See description under line item 66.
66D. Streets Department Support Facilities-FY06 166 166 CT CT
166 166
See description under line item 66.
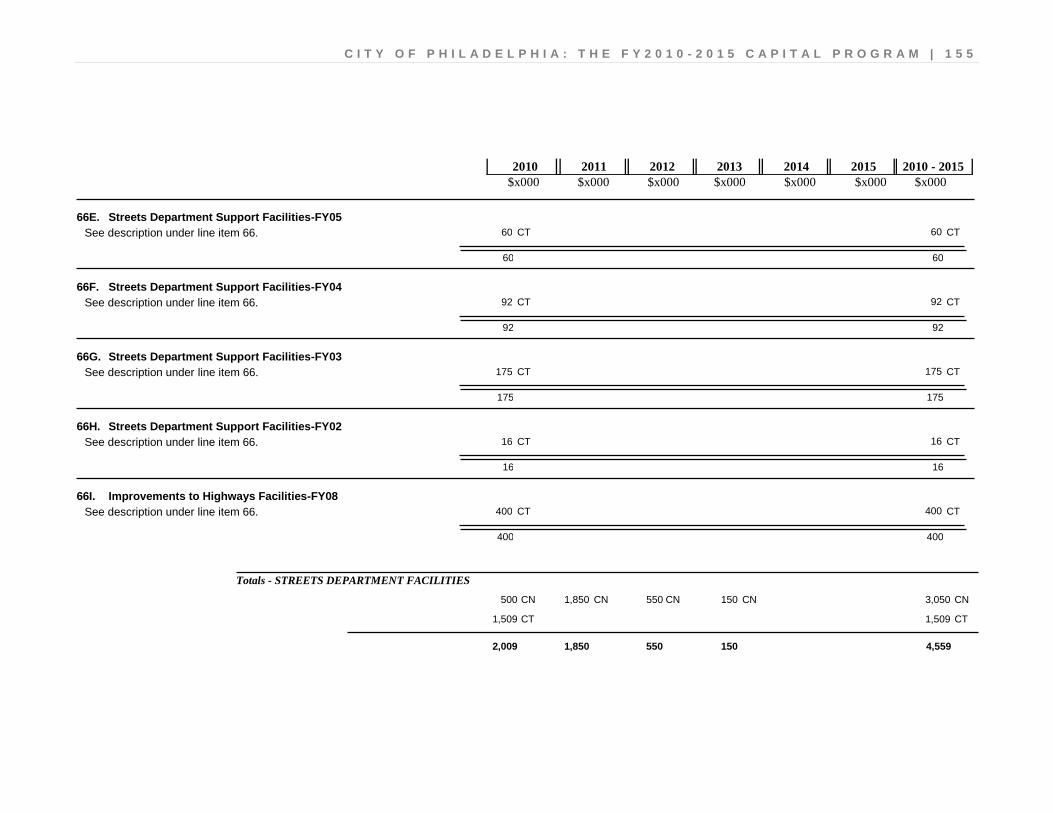
C I T Y O F P H I L A D E L P H I A : T H E F Y 2 0 1 0 - 2 0 1 5 C A P I T A L P R O G R A M | 1 5 5
$x000 $x000 $x000 $x000 $x000 $x000 $x000 2010 2011 2012 2013 2014 2015 2010 - 2015
66E. Streets Department Support Facilities-FY05 60 60 CT CT
60 60
See description under line item 66.
66F. Streets Department Support Facilities-FY04 92 92 CT CT
92 92
See description under line item 66.
66G. Streets Department Support Facilities-FY03 175 175 CT CT
175 175
See description under line item 66.
66H. Streets Department Support Facilities-FY02 16 16 CT CT
16 16
See description under line item 66.
66I. Improvements to Highways Facilities-FY08 400 400 CT CT
400 400
See description under line item 66.
Totals - STREETS DEPARTMENT FACILITIES
150 550 1,850 500 CN CN CN CN 3,050 CN
1,509 CT 1,509 CT
150 550 1,850 2,009 4,559
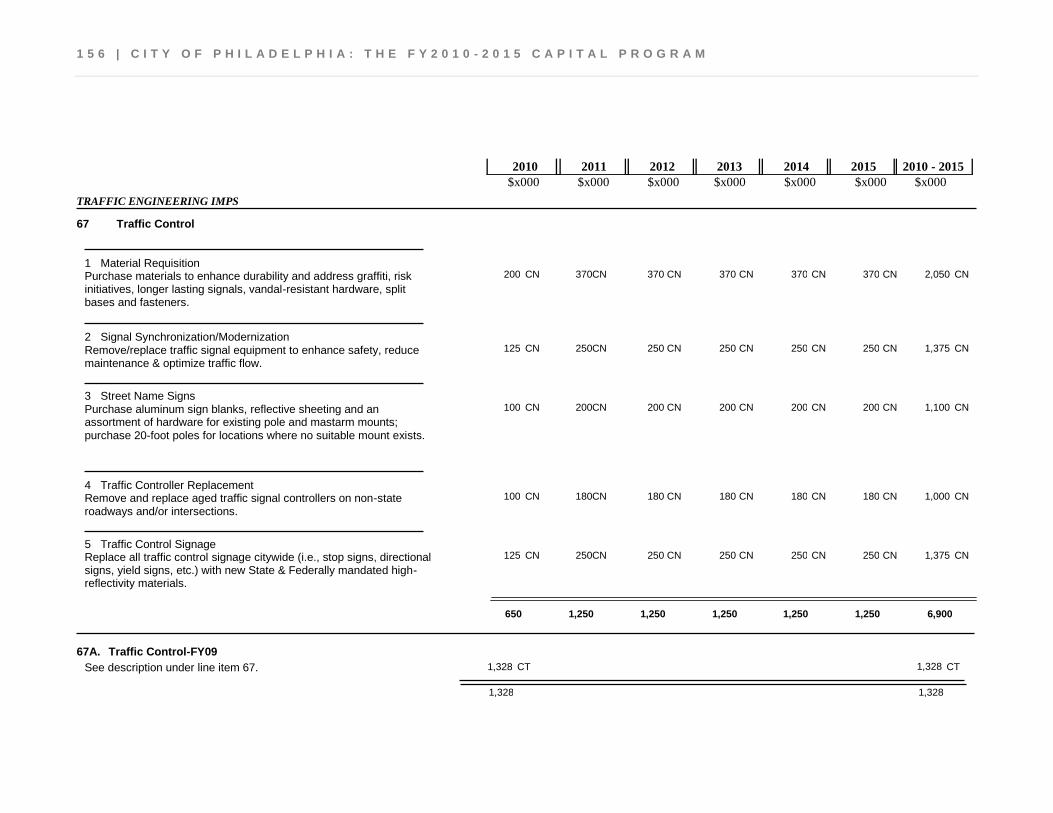
1 5 6 | C I T Y O F P H I L A D E L P H I A : T H E F Y 2 0 1 0 - 2 0 1 5 C A P I T A L P R O G R A M
$x000 $x000 $x000 $x000 $x000 $x000 $x000 2010 2011 2012 2013 2014 2015 2010 - 2015
TRAFFIC ENGINEERING IMPS
Traffic Control 67
2,050 370 370 370 370 370 200 CN CN CN CN CN CN CN Purchase materials to enhance durability and address graffiti, risk initiatives, longer lasting signals, vandal-resistant hardware, split bases and fasteners.
Material Requisition 1
1,375 250 250 250 250 250 125 CN CN CN CN CN CN CN Remove/replace traffic signal equipment to enhance safety, reduce maintenance & optimize traffic flow.
Signal Synchronization/Modernization 2
1,100 200 200 200 200 200 100 CN CN CN CN CN CN CN Purchase aluminum sign blanks, reflective sheeting and an assortment of hardware for existing pole and mastarm mounts; purchase 20-foot poles for locations where no suitable mount exists.
Street Name Signs 3
1,000 180 180 180 180 180 100 CN CN CN CN CN CN CN Remove and replace aged traffic signal controllers on non-state roadways and/or intersections.
Traffic Controller Replacement 4
1,375 250 250 250 250 250 125 CN CN CN CN CN CN CN Replace all traffic control signage citywide (i.e., stop signs, directional signs, yield signs, etc.) with new State & Federally mandated high-reflectivity materials.
Traffic Control Signage 5
650 1,250 1,250 1,250 1,250 1,250 6,900
67A. Traffic Control-FY09 1,328 1,328 CT CT
1,328 1,328
See description under line item 67.

C I T Y O F P H I L A D E L P H I A : T H E F Y 2 0 1 0 - 2 0 1 5 C A P I T A L P R O G R A M | 1 5 7
$x000 $x000 $x000 $x000 $x000 $x000 $x000 2010 2011 2012 2013 2014 2015 2010 - 2015
67B. Traffic Control-FY08 1,011 1,011 CT CT
1,011 1,011
See description under line item 67.
67C. Traffic Control-FY06 43 43 CT CT
43 43
See description under line item 67.
67D. Traffic Control-FY97 6 6 CT CT
463 463 FT FT
469 469
See description under line item 67.
67E. Center City Traffic Signals-FY08 4,000 4,000 FT FT
4,000 4,000
Replace traffic signals in Center City.
67F. Center City Traffic Signals-FY07 3,133 3,133 FT FT
3,133 3,133
See description under line item 67E.
67G. Center City Traffic Signals - Phase 2-FY02 134 134 FT FT
134 134
See description under line item 67E.
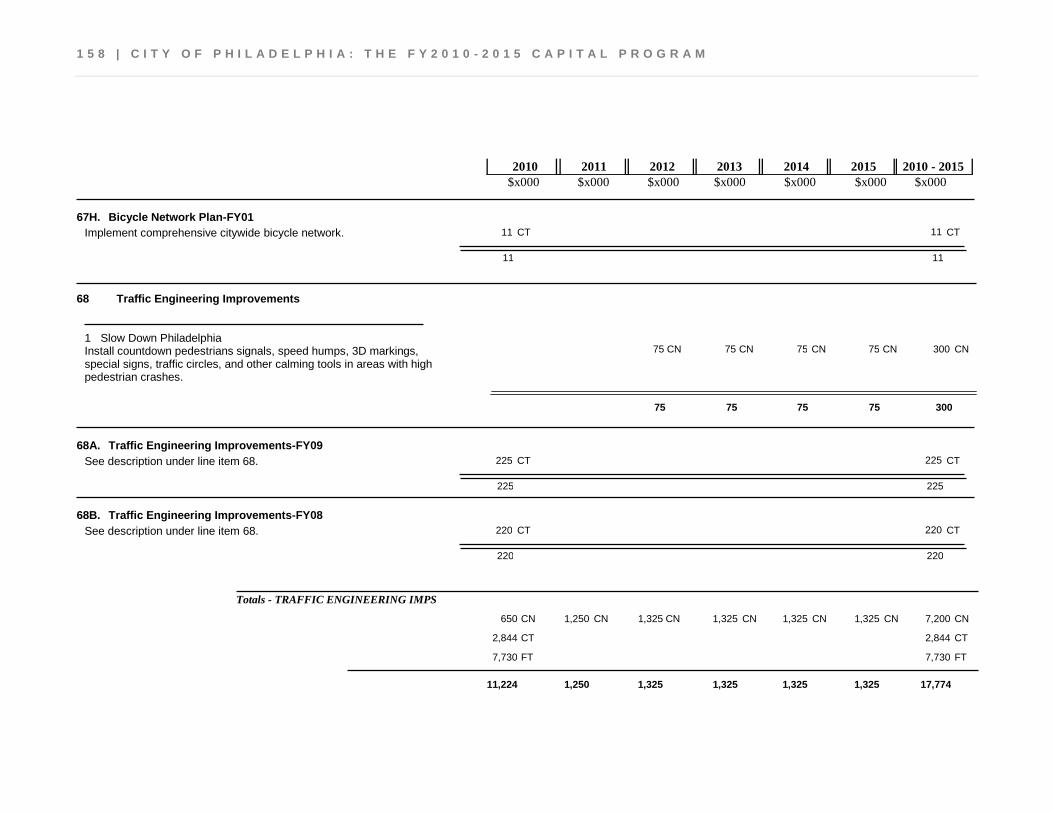
1 5 8 | C I T Y O F P H I L A D E L P H I A : T H E F Y 2 0 1 0 - 2 0 1 5 C A P I T A L P R O G R A M
$x000 $x000 $x000 $x000 $x000 $x000 $x000 2010 2011 2012 2013 2014 2015 2010 - 2015
67H. Bicycle Network Plan-FY01 11 11 CT CT
11 11
Implement comprehensive citywide bicycle network.
Traffic Engineering Improvements 68
300 75 75 75 75 CN CN CN CN CN Install countdown pedestrians signals, speed humps, 3D markings, special signs, traffic circles, and other calming tools in areas with high pedestrian crashes.
Slow Down Philadelphia 1
75 75 75 75 300
68A. Traffic Engineering Improvements-FY09 225 225 CT CT
225 225
See description under line item 68.
68B. Traffic Engineering Improvements-FY08 220 220 CT CT
220 220
See description under line item 68.
Totals - TRAFFIC ENGINEERING IMPS
1,325 1,325 1,250 650 1,325 1,325 CN CN CN CN CN CN 7,200 CN
2,844 CT 2,844 CT
7,730 FT 7,730 FT
1,325 1,325 1,325 1,325 1,250 11,224 17,774
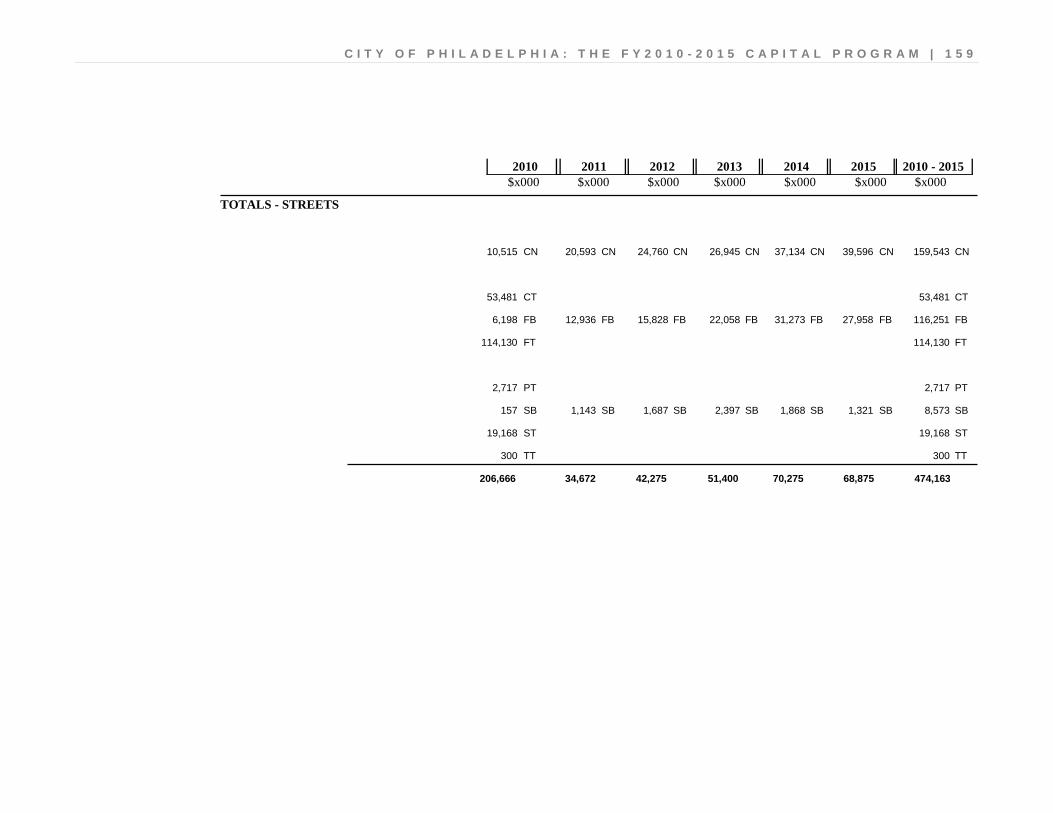
C I T Y O F P H I L A D E L P H I A : T H E F Y 2 0 1 0 - 2 0 1 5 C A P I T A L P R O G R A M | 1 5 9
$x000 $x000 $x000 $x000 $x000 $x000 $x000 2010 2011 2012 2013 2014 2015 2010 - 2015
TOTALS - STREETS
26,945 24,760 20,593 10,515 37,134 39,596 CN CN CN CN CN CN 159,543 CN
53,481 CT 53,481 CT
22,058 15,828 12,936 6,198 31,273 27,958 FB FB FB FB FB FB 116,251 FB
114,130 FT 114,130 FT
2,717 PT 2,717 PT
2,397 1,687 1,143 157 1,868 1,321 SB SB SB SB SB SB 8,573 SB
19,168 ST 19,168 ST
300 TT 300 TT
68,875 70,275 51,400 42,275 34,672 206,666 474,163
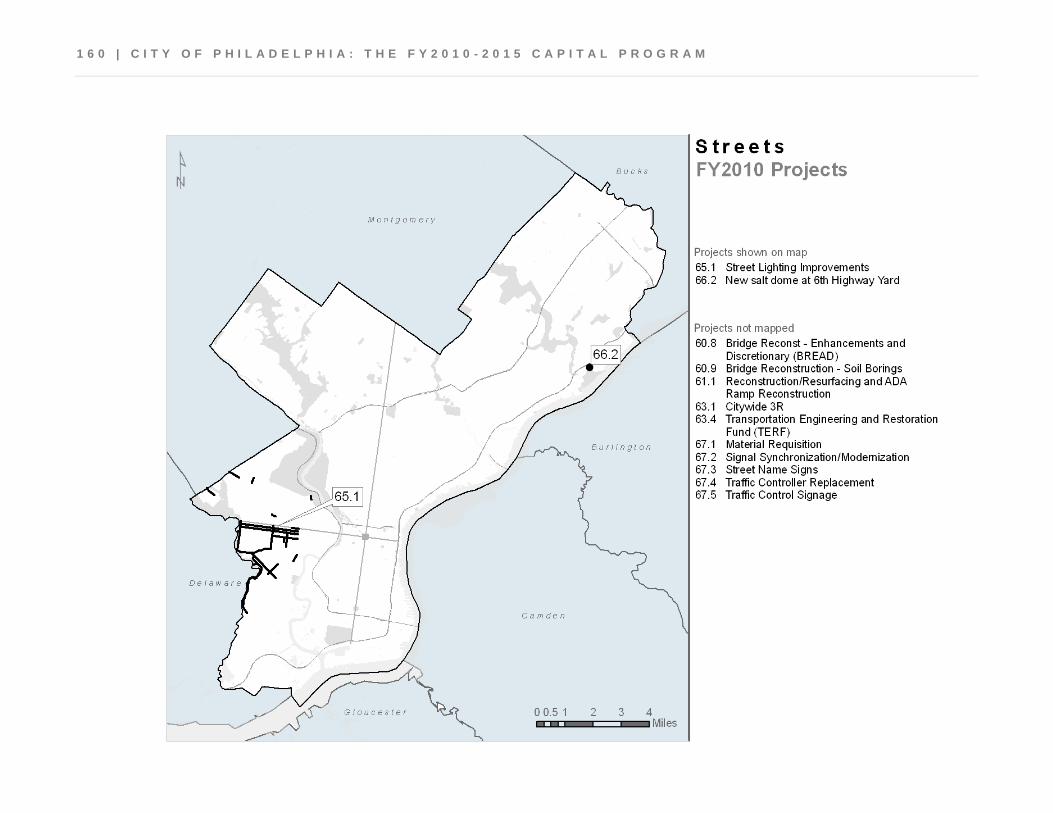
1 6 0 | C I T Y O F P H I L A D E L P H I A : T H E F Y 2 0 1 0 - 2 0 1 5 C A P I T A L P R O G R A M
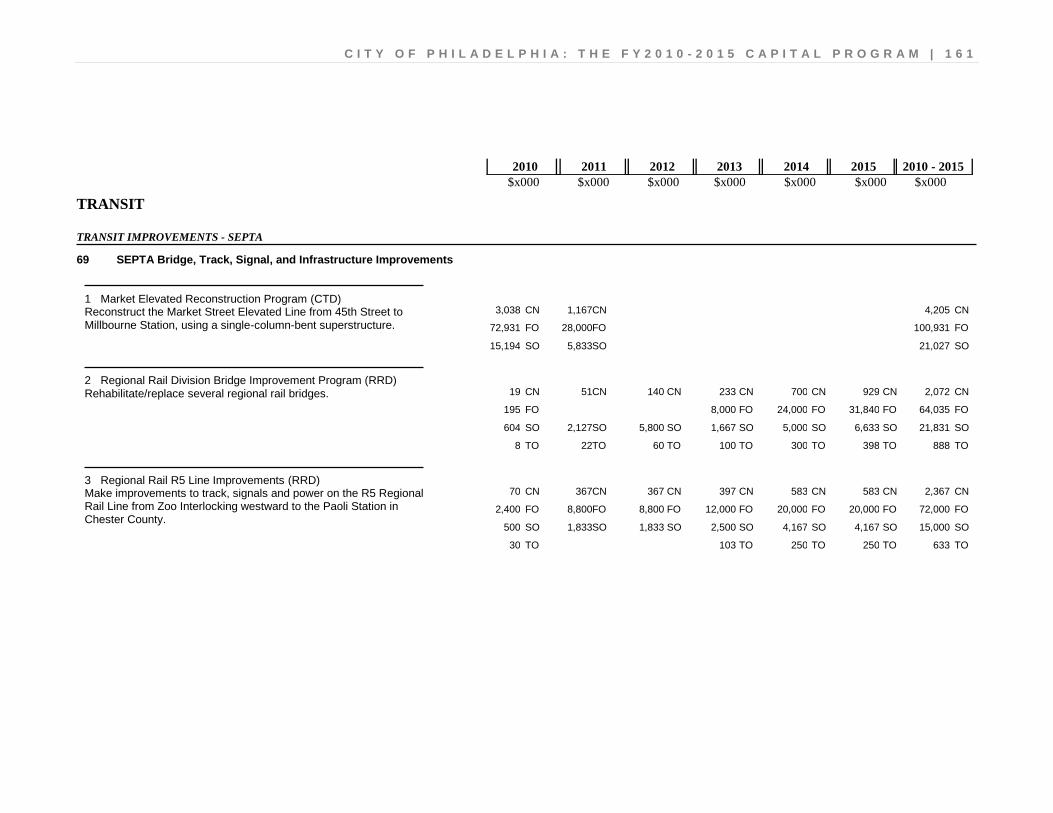
C I T Y O F P H I L A D E L P H I A : T H E F Y 2 0 1 0 - 2 0 1 5 C A P I T A L P R O G R A M | 1 6 1
$x000 $x000 $x000 $x000 $x000 $x000 $x000 2010 2011 2012 2013 2014 2015 2010 - 2015
TRANSIT
TRANSIT IMPROVEMENTS - SEPTA
SEPTA Bridge, Track, Signal, and Infrastructure Improvements 69
4,205 1,167 3,038 CN CN CN 100,931 28,000 72,931 FO FO FO
21,027 5,833 15,194 SO SO SO
Reconstruct the Market Street Elevated Line from 45th Street to Millbourne Station, using a single-column-bent superstructure.
Market Elevated Reconstruction Program (CTD) 1
2,072 929 700 233 140 51 19 CN CN CN CN CN CN CN 64,035 31,840 24,000 8,000 195 FO FO FO FO FO 21,831 6,633 5,000 1,667 5,800 2,127 604 SO SO SO SO SO SO SO
888 398 300 100 60 22 8 TO TO TO TO TO TO TO
Rehabilitate/replace several regional rail bridges. Regional Rail Division Bridge Improvement Program (RRD) 2
2,367 583 583 397 367 367 70 CN CN CN CN CN CN CN 72,000 20,000 20,000 12,000 8,800 8,800 2,400 FO FO FO FO FO FO FO 15,000 4,167 4,167 2,500 1,833 1,833 500 SO SO SO SO SO SO SO
633 250 250 103 30 TO TO TO TO TO
Make improvements to track, signals and power on the R5 Regional Rail Line from Zoo Interlocking westward to the Paoli Station in Chester County.
Regional Rail R5 Line Improvements (RRD) 3
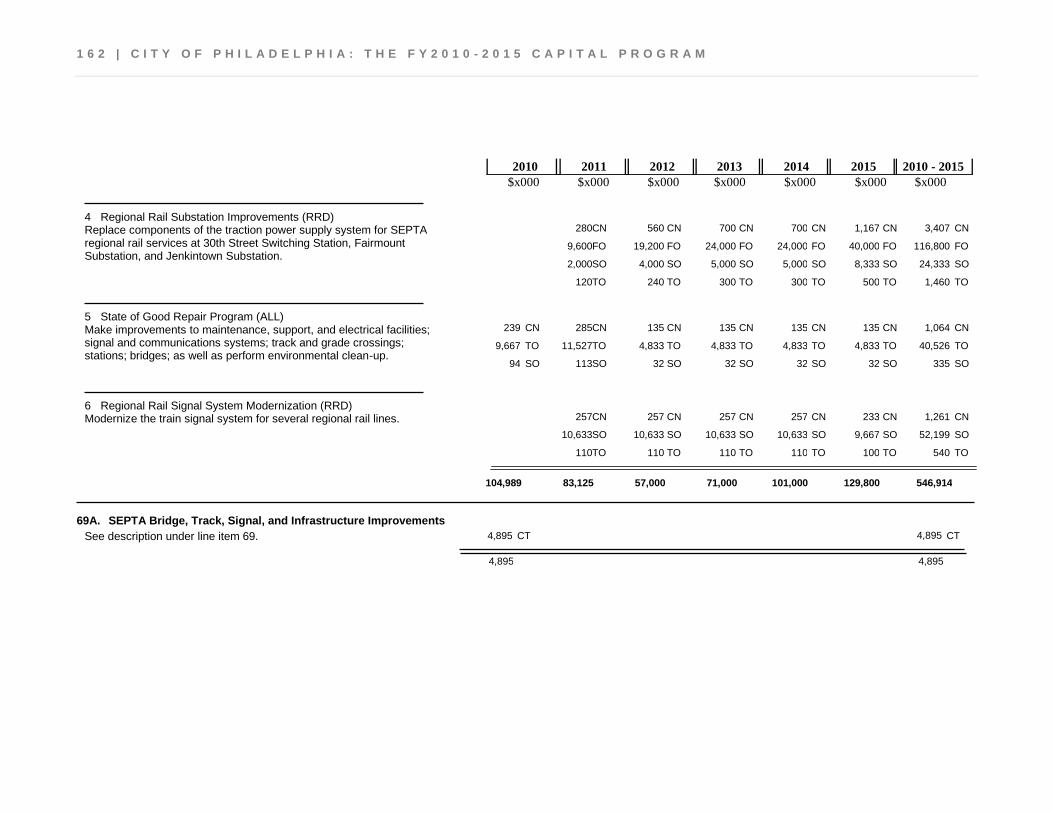
1 6 2 | C I T Y O F P H I L A D E L P H I A : T H E F Y 2 0 1 0 - 2 0 1 5 C A P I T A L P R O G R A M
$x000 $x000 $x000 $x000 $x000 $x000 $x000 2010 2011 2012 2013 2014 2015 2010 - 2015
3,407 1,167 700 700 560 280 CN CN CN CN CN CN 116,800 40,000 24,000 24,000 19,200 9,600 FO FO FO FO FO FO 24,333 8,333 5,000 5,000 4,000 2,000 SO SO SO SO SO SO 1,460 500 300 300 240 120 TO TO TO TO TO TO
Replace components of the traction power supply system for SEPTA regional rail services at 30th Street Switching Station, Fairmount Substation, and Jenkintown Substation.
Regional Rail Substation Improvements (RRD) 4
1,064 135 135 135 135 285 239 CN CN CN CN CN CN CN 40,526 4,833 4,833 4,833 4,833 11,527 9,667 TO TO TO TO TO TO TO
335 32 32 32 32 113 94 SO SO SO SO SO SO SO
Make improvements to maintenance, support, and electrical facilities; signal and communications systems; track and grade crossings; stations; bridges; as well as perform environmental clean-up.
State of Good Repair Program (ALL) 5
1,261 233 257 257 257 257 CN CN CN CN CN CN 52,199 9,667 10,633 10,633 10,633 10,633 SO SO SO SO SO SO
540 100 110 110 110 110 TO TO TO TO TO TO
Modernize the train signal system for several regional rail lines. Regional Rail Signal System Modernization (RRD) 6
104,989 129,800 101,000 71,000 57,000 83,125 546,914
69A. SEPTA Bridge, Track, Signal, and Infrastructure Improvements 4,895 4,895 CT CT
4,895 4,895
See description under line item 69.
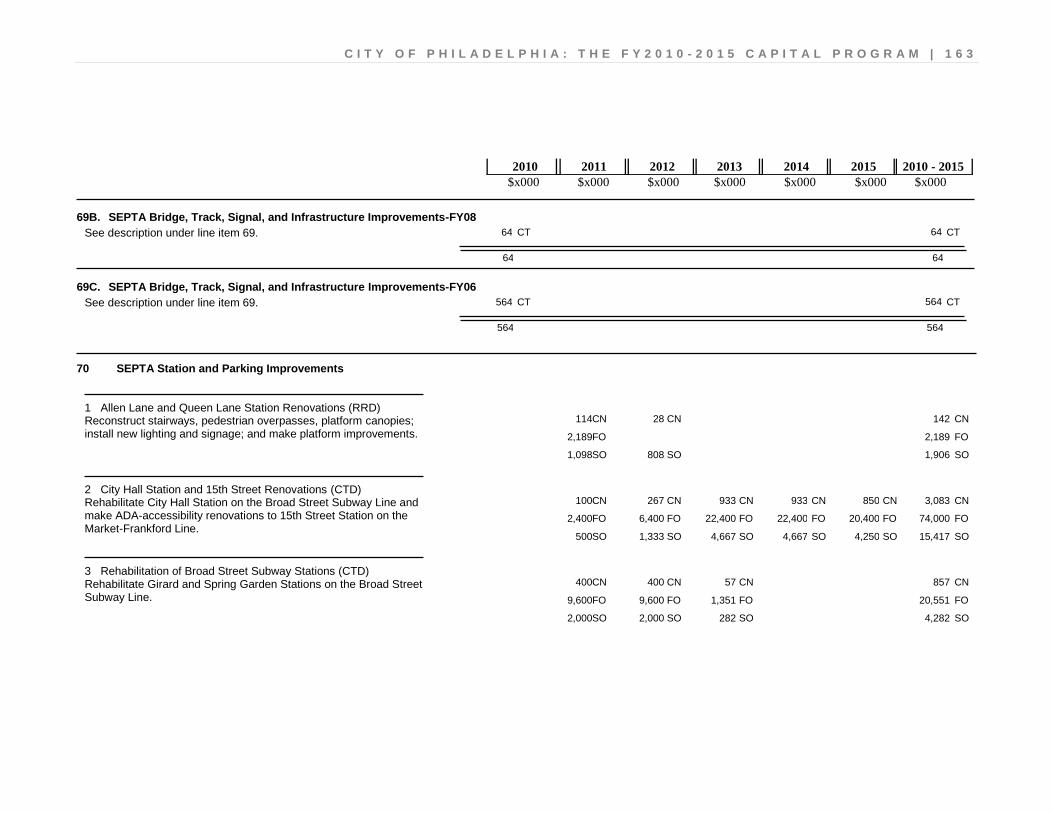
C I T Y O F P H I L A D E L P H I A : T H E F Y 2 0 1 0 - 2 0 1 5 C A P I T A L P R O G R A M | 1 6 3
$x000 $x000 $x000 $x000 $x000 $x000 $x000 2010 2011 2012 2013 2014 2015 2010 - 2015
69B. SEPTA Bridge, Track, Signal, and Infrastructure Improvements-FY08 64 64 CT CT
64 64
See description under line item 69.
69C. SEPTA Bridge, Track, Signal, and Infrastructure Improvements-FY06 564 564 CT CT
564 564
See description under line item 69.
SEPTA Station and Parking Improvements 70
142 28 114 CN CN CN 2,189 2,189 FO FO 1,906 808 1,098 SO SO SO
Reconstruct stairways, pedestrian overpasses, platform canopies; install new lighting and signage; and make platform improvements.
Allen Lane and Queen Lane Station Renovations (RRD) 1
3,083 850 933 933 267 100 CN CN CN CN CN CN 74,000 20,400 22,400 22,400 6,400 2,400 FO FO FO FO FO FO 15,417 4,250 4,667 4,667 1,333 500 SO SO SO SO SO SO
Rehabilitate City Hall Station on the Broad Street Subway Line and make ADA-accessibility renovations to 15th Street Station on the Market-Frankford Line.
City Hall Station and 15th Street Renovations (CTD) 2
857 57 400 400 CN CN CN CN 20,551 1,351 9,600 9,600 FO FO FO FO 4,282 282 2,000 2,000 SO SO SO SO
Rehabilitate Girard and Spring Garden Stations on the Broad Street Subway Line.
Rehabilitation of Broad Street Subway Stations (CTD) 3

1 6 4 | C I T Y O F P H I L A D E L P H I A : T H E F Y 2 0 1 0 - 2 0 1 5 C A P I T A L P R O G R A M
$x000 $x000 $x000 $x000 $x000 $x000 $x000 2010 2011 2012 2013 2014 2015 2010 - 2015
613 17 200 253 133 10 CN CN CN CN CN CN 946 706 240 FO FO FO
16,841 483 5,800 7,347 3,161 50 SO SO SO SO SO SO
Provide new canopies and windscreens; construct a high-level platform, install elevators or switchback ramps, tactile strips and an audio/visual public address system.
Wayne Junction Station Improvements (RRD) 4
83 83 CN CN 2,417 2,417 SO SO
Renew station facilities at Olney and Ryers on the R8 Fox Chase Regional Rail Line.
Olney and Ryers Station Reconstruction (RRD) 5
1,600 233 300 233 467 367 CN CN CN CN CN CN 38,400 5,600 7,200 5,600 11,200 8,800 FO FO FO FO FO FO 8,000 1,167 1,500 1,167 2,333 1,833 SO SO SO SO SO SO
Make ADA-accessibility improvements to Margaret-Orthodox, BSS Allegheny, BSS Erie, Snyder & 40th St. Stations.
Station Accessibility Program (CTD) 6
33,000 43,000 44,290 38,836 32,201 191,327
70A. SEPTA Station and Parking Improvements 214 214 CT CT
214 214
See description under line item 70.
70B. SEPTA Station and Parking Improvements-FY06 794 794 CT CT
794 794
See description under line item 70.

C I T Y O F P H I L A D E L P H I A : T H E F Y 2 0 1 0 - 2 0 1 5 C A P I T A L P R O G R A M | 1 6 5
$x000 $x000 $x000 $x000 $x000 $x000 $x000 2010 2011 2012 2013 2014 2015 2010 - 2015
SEPTA Vehicle/Equipment Acquisition and Improvement Program 71
58 58 CN CN 1,993 1,993 FO FO
415 415 SO SO 25 25 TO TO
Acquire 120 rail cars for SEPTA’s Regional Rail service, replacing vehicles that are currently 40 to 44 years old.
Regional Rail Car Acquisition (RRD) 1
2,491 2,491
71A. SEPTA Vehicle/Equipment Acquisition and Improvement Program 700 700 CT CT
700 700
See description under line item 71.
71B. SEPTA Vehicle/Equipment Acquisition and Improvement Program-FY06 47 47 CT CT
47 47
See description under line item 71.
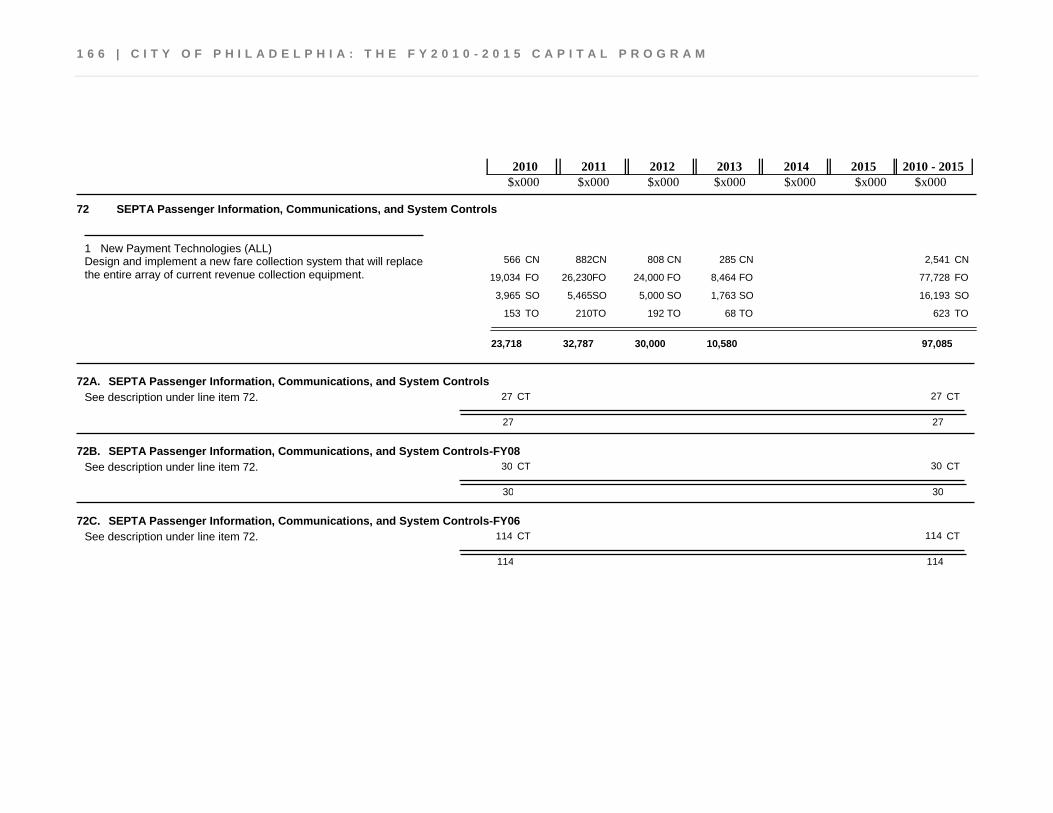
1 6 6 | C I T Y O F P H I L A D E L P H I A : T H E F Y 2 0 1 0 - 2 0 1 5 C A P I T A L P R O G R A M
$x000 $x000 $x000 $x000 $x000 $x000 $x000 2010 2011 2012 2013 2014 2015 2010 - 2015
SEPTA Passenger Information, Communications, and System Controls 72
2,541 285 808 882 566 CN CN CN CN CN 77,728 8,464 24,000 26,230 19,034 FO FO FO FO FO 16,193 1,763 5,000 5,465 3,965 SO SO SO SO SO
623 68 192 210 153 TO TO TO TO TO
Design and implement a new fare collection system that will replace the entire array of current revenue collection equipment.
New Payment Technologies (ALL) 1
23,718 10,580 30,000 32,787 97,085
72A. SEPTA Passenger Information, Communications, and System Controls 27 27 CT CT
27 27
See description under line item 72.
72B. SEPTA Passenger Information, Communications, and System Controls-FY08 30 30 CT CT
30 30
See description under line item 72.
72C. SEPTA Passenger Information, Communications, and System Controls-FY06 114 114 CT CT
114 114
See description under line item 72.
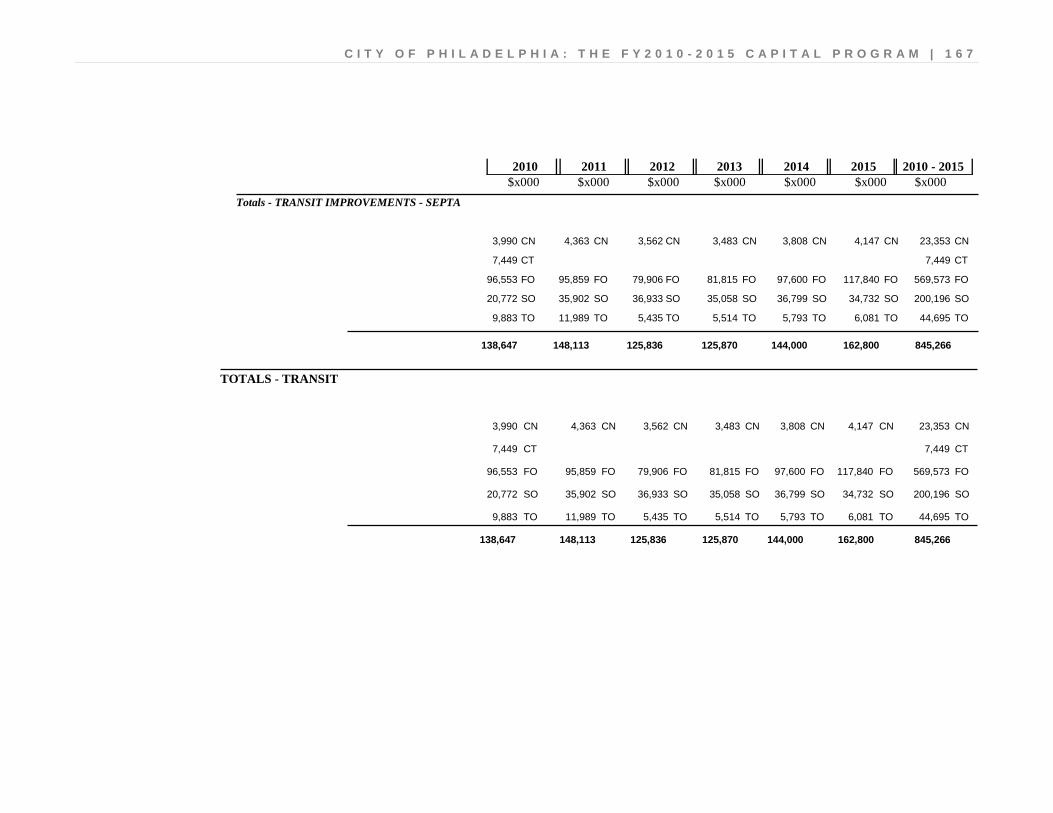
C I T Y O F P H I L A D E L P H I A : T H E F Y 2 0 1 0 - 2 0 1 5 C A P I T A L P R O G R A M | 1 6 7
$x000 $x000 $x000 $x000 $x000 $x000 $x000 2010 2011 2012 2013 2014 2015 2010 - 2015
Totals - TRANSIT IMPROVEMENTS - SEPTA
3,483 3,562 4,363 3,990 3,808 4,147 CN CN CN CN CN CN 23,353 CN
7,449 CT 7,449 CT
81,815 79,906 95,859 96,553 97,600 117,840 FO FO FO FO FO FO 569,573 FO
35,058 36,933 35,902 20,772 36,799 34,732 SO SO SO SO SO SO 200,196 SO
5,514 5,435 11,989 9,883 5,793 6,081 TO TO TO TO TO TO 44,695 TO
162,800 144,000 125,870 125,836 148,113 138,647 845,266
TOTALS - TRANSIT
3,483 3,562 4,363 3,990 3,808 4,147 CN CN CN CN CN CN 23,353 CN
7,449 CT 7,449 CT
81,815 79,906 95,859 96,553 97,600 117,840 FO FO FO FO FO FO 569,573 FO
35,058 36,933 35,902 20,772 36,799 34,732 SO SO SO SO SO SO 200,196 SO
5,514 5,435 11,989 9,883 5,793 6,081 TO TO TO TO TO TO 44,695 TO
162,800 144,000 125,870 125,836 148,113 138,647 845,266

1 6 8 | C I T Y O F P H I L A D E L P H I A : T H E F Y 2 0 1 0 - 2 0 1 5 C A P I T A L P R O G R A M
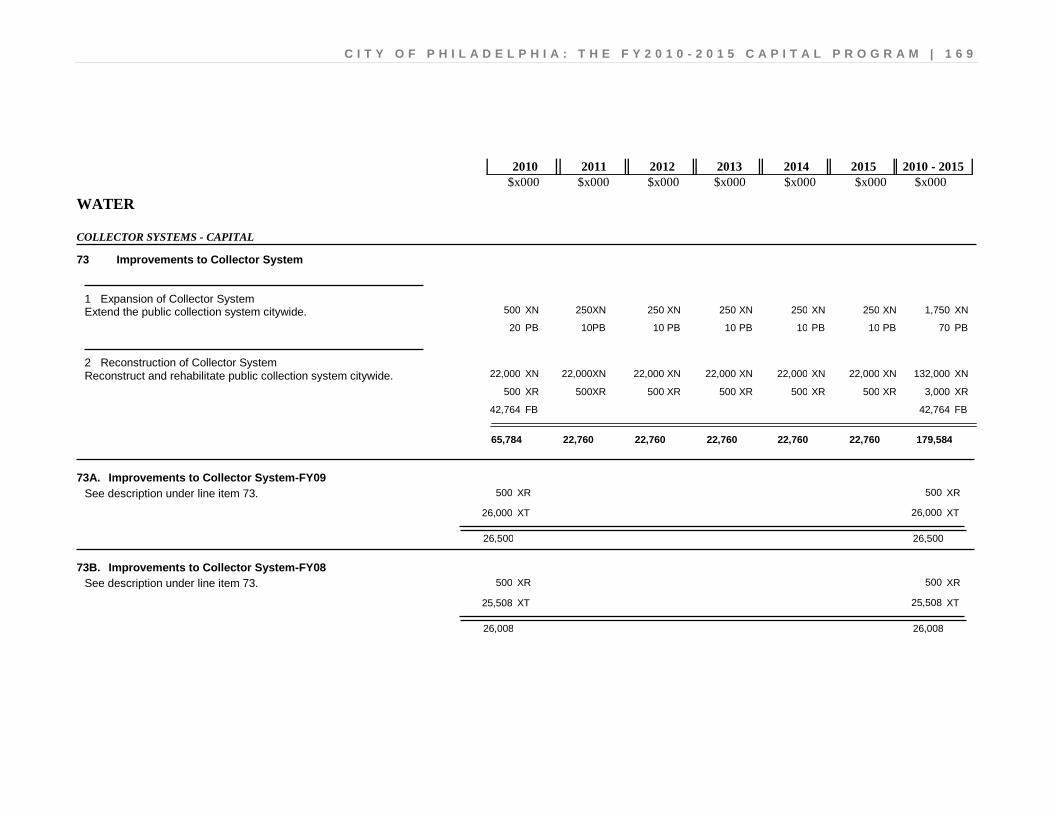
C I T Y O F P H I L A D E L P H I A : T H E F Y 2 0 1 0 - 2 0 1 5 C A P I T A L P R O G R A M | 1 6 9
$x000 $x000 $x000 $x000 $x000 $x000 $x000 2010 2011 2012 2013 2014 2015 2010 - 2015
WATER
COLLECTOR SYSTEMS - CAPITAL
Improvements to Collector System 73
1,750 250 250 250 250 250 500 XN XN XN XN XN XN XN 70 10 10 10 10 10 20 PB PB PB PB PB PB PB
Extend the public collection system citywide. Expansion of Collector System 1
132,000 22,000 22,000 22,000 22,000 22,000 22,000 XN XN XN XN XN XN XN 3,000 500 500 500 500 500 500 XR XR XR XR XR XR XR
42,764 42,764 FB FB
Reconstruct and rehabilitate public collection system citywide. Reconstruction of Collector System 2
65,784 22,760 22,760 22,760 22,760 22,760 179,584
73A. Improvements to Collector System-FY09 500 500 XR XR
26,000 26,000 XT XT
26,500 26,500
See description under line item 73.
73B. Improvements to Collector System-FY08 500 500 XR XR
25,508 25,508 XT XT
26,008 26,008
See description under line item 73.
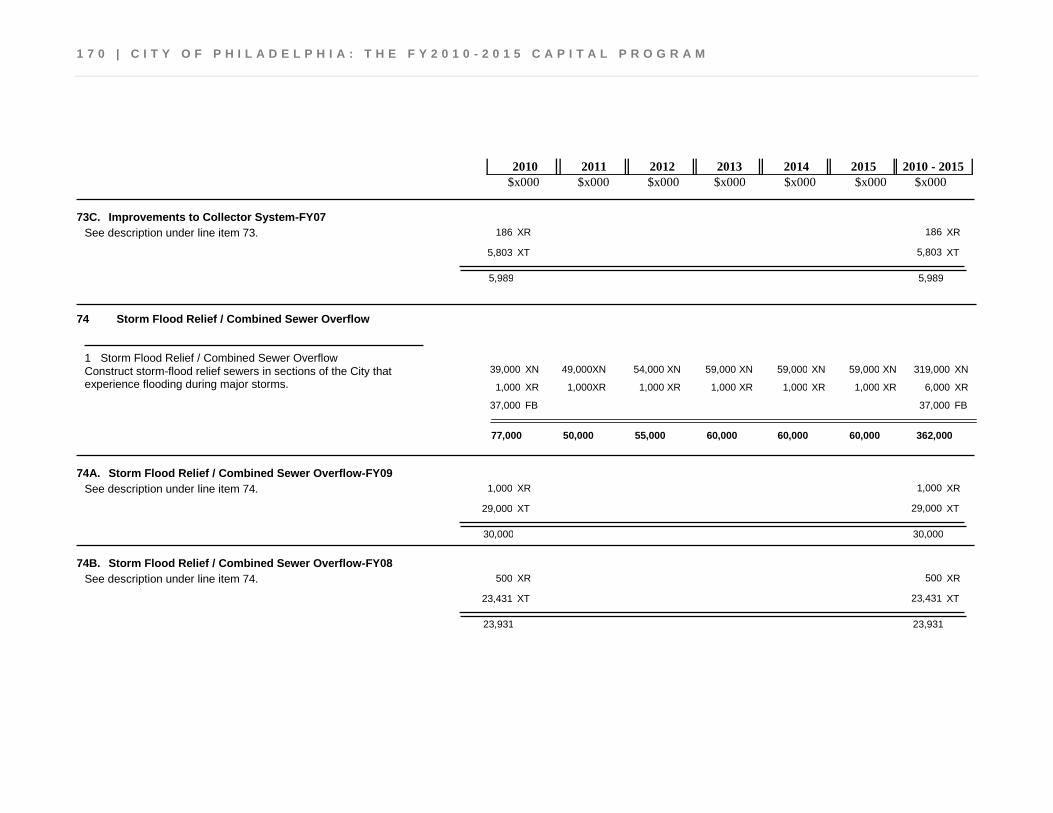
1 7 0 | C I T Y O F P H I L A D E L P H I A : T H E F Y 2 0 1 0 - 2 0 1 5 C A P I T A L P R O G R A M
$x000 $x000 $x000 $x000 $x000 $x000 $x000 2010 2011 2012 2013 2014 2015 2010 - 2015
73C. Improvements to Collector System-FY07 186 186 XR XR
5,803 5,803 XT XT
5,989 5,989
See description under line item 73.
Storm Flood Relief / Combined Sewer Overflow 74
319,000 59,000 59,000 59,000 54,000 49,000 39,000 XN XN XN XN XN XN XN 6,000 1,000 1,000 1,000 1,000 1,000 1,000 XR XR XR XR XR XR XR
37,000 37,000 FB FB
Construct storm-flood relief sewers in sections of the City that experience flooding during major storms.
Storm Flood Relief / Combined Sewer Overflow 1
77,000 60,000 60,000 60,000 55,000 50,000 362,000
74A. Storm Flood Relief / Combined Sewer Overflow-FY09 1,000 1,000 XR XR
29,000 29,000 XT XT
30,000 30,000
See description under line item 74.
74B. Storm Flood Relief / Combined Sewer Overflow-FY08 500 500 XR XR
23,431 23,431 XT XT
23,931 23,931
See description under line item 74.
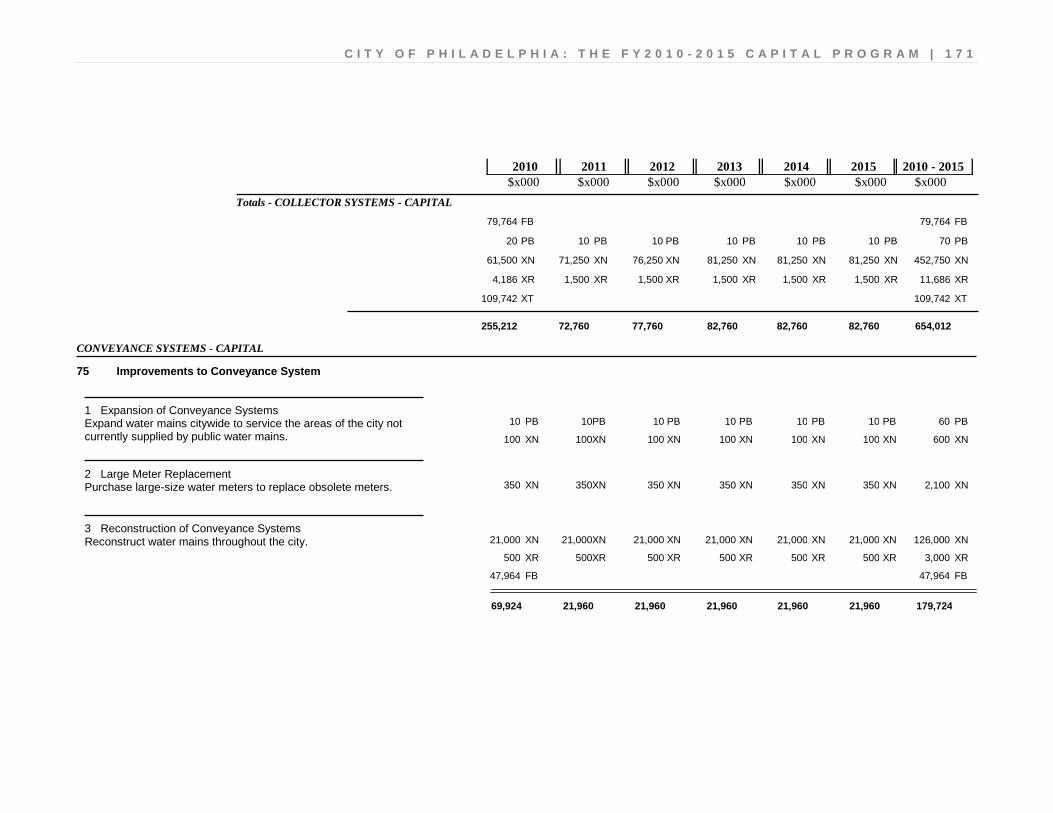
C I T Y O F P H I L A D E L P H I A : T H E F Y 2 0 1 0 - 2 0 1 5 C A P I T A L P R O G R A M | 1 7 1
$x000 $x000 $x000 $x000 $x000 $x000 $x000 2010 2011 2012 2013 2014 2015 2010 - 2015
Totals - COLLECTOR SYSTEMS - CAPITAL
79,764 FB 79,764 FB
10 10 10 20 10 10 PB PB PB PB PB PB 70 PB
81,250 76,250 71,250 61,500 81,250 81,250 XN XN XN XN XN XN 452,750 XN
1,500 1,500 1,500 4,186 1,500 1,500 XR XR XR XR XR XR 11,686 XR
109,742 XT 109,742 XT
82,760 82,760 82,760 77,760 72,760 255,212 654,012
CONVEYANCE SYSTEMS - CAPITAL
Improvements to Conveyance System 75
60 10 10 10 10 10 10 PB PB PB PB PB PB PB 600 100 100 100 100 100 100 XN XN XN XN XN XN XN
Expand water mains citywide to service the areas of the city not currently supplied by public water mains.
Expansion of Conveyance Systems 1
2,100 350 350 350 350 350 350 XN XN XN XN XN XN XN Purchase large-size water meters to replace obsolete meters. Large Meter Replacement 2
126,000 21,000 21,000 21,000 21,000 21,000 21,000 XN XN XN XN XN XN XN 3,000 500 500 500 500 500 500 XR XR XR XR XR XR XR
47,964 47,964 FB FB
Reconstruct water mains throughout the city. Reconstruction of Conveyance Systems 3
69,924 21,960 21,960 21,960 21,960 21,960 179,724
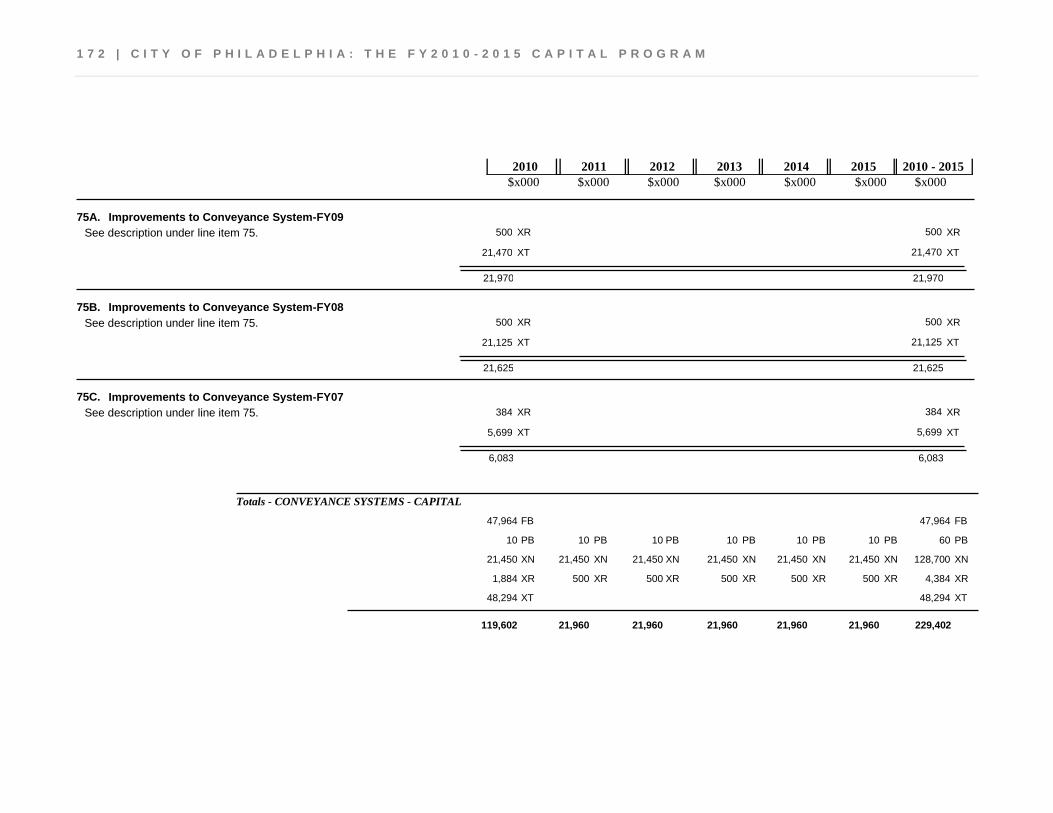
1 7 2 | C I T Y O F P H I L A D E L P H I A : T H E F Y 2 0 1 0 - 2 0 1 5 C A P I T A L P R O G R A M
$x000 $x000 $x000 $x000 $x000 $x000 $x000 2010 2011 2012 2013 2014 2015 2010 - 2015
75A. Improvements to Conveyance System-FY09 500 500 XR XR
21,470 21,470 XT XT
21,970 21,970
See description under line item 75.
75B. Improvements to Conveyance System-FY08 500 500 XR XR
21,125 21,125 XT XT
21,625 21,625
See description under line item 75.
75C. Improvements to Conveyance System-FY07 384 384 XR XR
5,699 5,699 XT XT
6,083 6,083
See description under line item 75.
Totals - CONVEYANCE SYSTEMS - CAPITAL
47,964 FB 47,964 FB
10 10 10 10 10 10 PB PB PB PB PB PB 60 PB
21,450 21,450 21,450 21,450 21,450 21,450 XN XN XN XN XN XN 128,700 XN
500 500 500 1,884 500 500 XR XR XR XR XR XR 4,384 XR
48,294 XT 48,294 XT
21,960 21,960 21,960 21,960 21,960 119,602 229,402
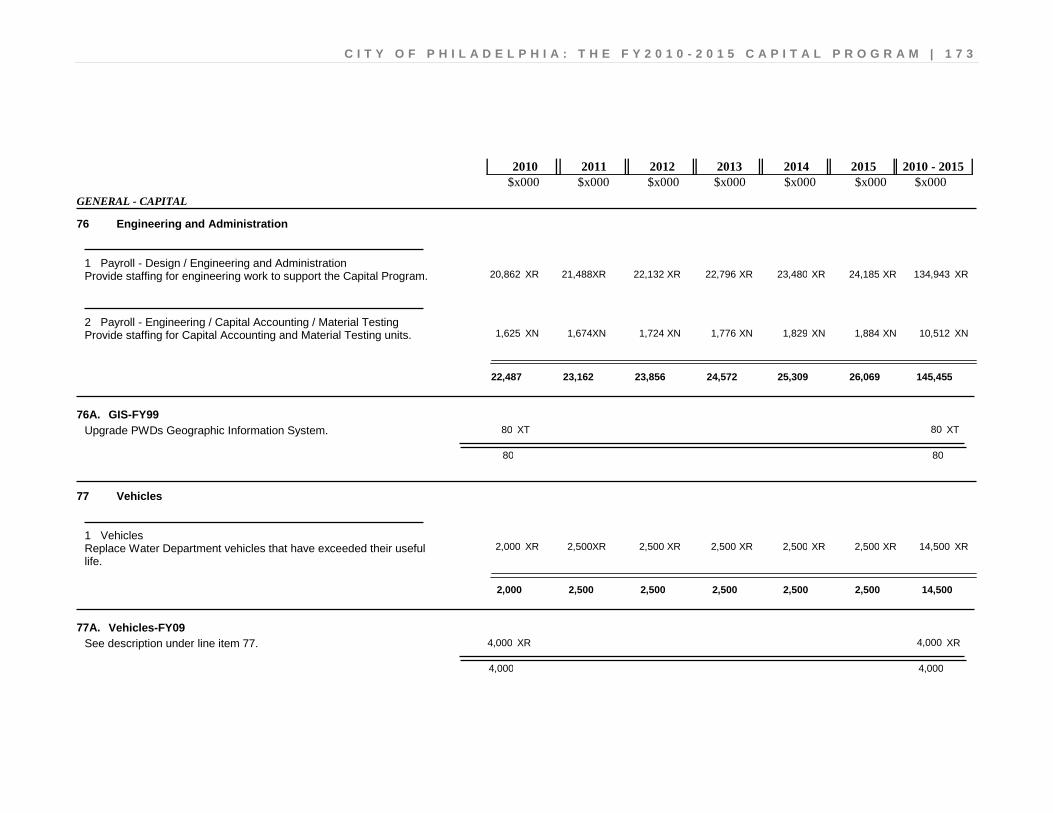
C I T Y O F P H I L A D E L P H I A : T H E F Y 2 0 1 0 - 2 0 1 5 C A P I T A L P R O G R A M | 1 7 3
$x000 $x000 $x000 $x000 $x000 $x000 $x000 2010 2011 2012 2013 2014 2015 2010 - 2015
GENERAL - CAPITAL
Engineering and Administration 76
134,943 24,185 23,480 22,796 22,132 21,488 20,862 XR XR XR XR XR XR XR Provide staffing for engineering work to support the Capital Program. Payroll - Design / Engineering and Administration 1
10,512 1,884 1,829 1,776 1,724 1,674 1,625 XN XN XN XN XN XN XN Provide staffing for Capital Accounting and Material Testing units. Payroll - Engineering / Capital Accounting / Material Testing 2
22,487 26,069 25,309 24,572 23,856 23,162 145,455
76A. GIS-FY99 80 80 XT XT
80 80
Upgrade PWDs Geographic Information System.
Vehicles 77
14,500 2,500 2,500 2,500 2,500 2,500 2,000 XR XR XR XR XR XR XR Replace Water Department vehicles that have exceeded their useful life.
Vehicles 1
2,000 2,500 2,500 2,500 2,500 2,500 14,500
77A. Vehicles-FY09 4,000 4,000 XR XR
4,000 4,000
See description under line item 77.
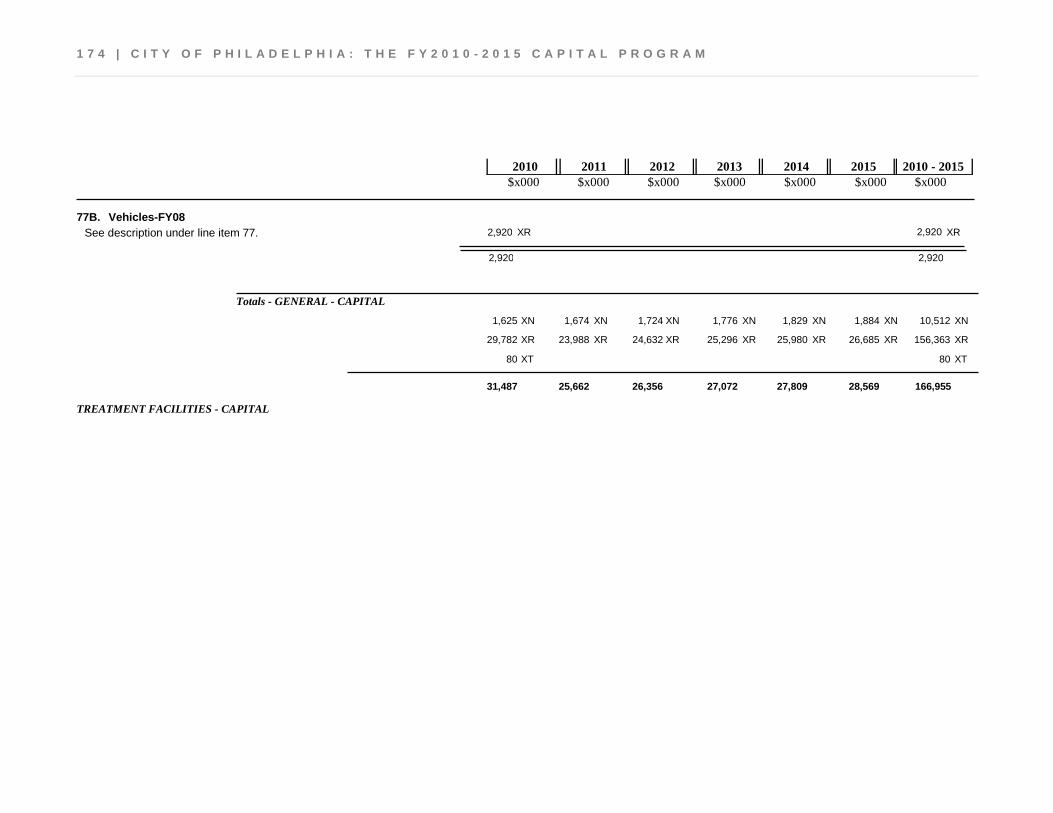
1 7 4 | C I T Y O F P H I L A D E L P H I A : T H E F Y 2 0 1 0 - 2 0 1 5 C A P I T A L P R O G R A M
$x000 $x000 $x000 $x000 $x000 $x000 $x000 2010 2011 2012 2013 2014 2015 2010 - 2015
77B. Vehicles-FY08 2,920 2,920 XR XR
2,920 2,920
See description under line item 77.
Totals - GENERAL - CAPITAL
1,776 1,724 1,674 1,625 1,829 1,884 XN XN XN XN XN XN 10,512 XN
25,296 24,632 23,988 29,782 25,980 26,685 XR XR XR XR XR XR 156,363 XR
80 XT 80 XT
28,569 27,809 27,072 26,356 25,662 31,487 166,955
TREATMENT FACILITIES - CAPITAL
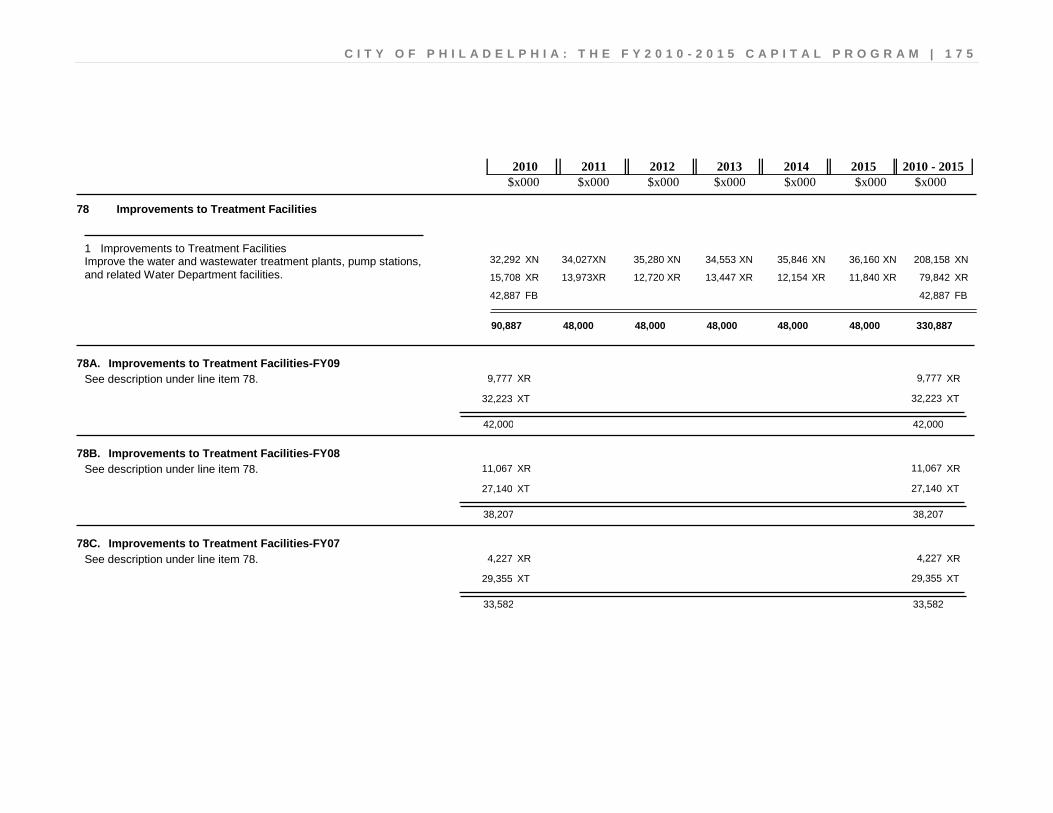
C I T Y O F P H I L A D E L P H I A : T H E F Y 2 0 1 0 - 2 0 1 5 C A P I T A L P R O G R A M | 1 7 5
$x000 $x000 $x000 $x000 $x000 $x000 $x000 2010 2011 2012 2013 2014 2015 2010 - 2015
Improvements to Treatment Facilities 78
208,158 36,160 35,846 34,553 35,280 34,027 32,292 XN XN XN XN XN XN XN 79,842 11,840 12,154 13,447 12,720 13,973 15,708 XR XR XR XR XR XR XR 42,887 42,887 FB FB
Improve the water and wastewater treatment plants, pump stations, and related Water Department facilities.
Improvements to Treatment Facilities 1
90,887 48,000 48,000 48,000 48,000 48,000 330,887
78A. Improvements to Treatment Facilities-FY09 9,777 9,777 XR XR
32,223 32,223 XT XT
42,000 42,000
See description under line item 78.
78B. Improvements to Treatment Facilities-FY08 11,067 11,067 XR XR
27,140 27,140 XT XT
38,207 38,207
See description under line item 78.
78C. Improvements to Treatment Facilities-FY07 4,227 4,227 XR XR
29,355 29,355 XT XT
33,582 33,582
See description under line item 78.
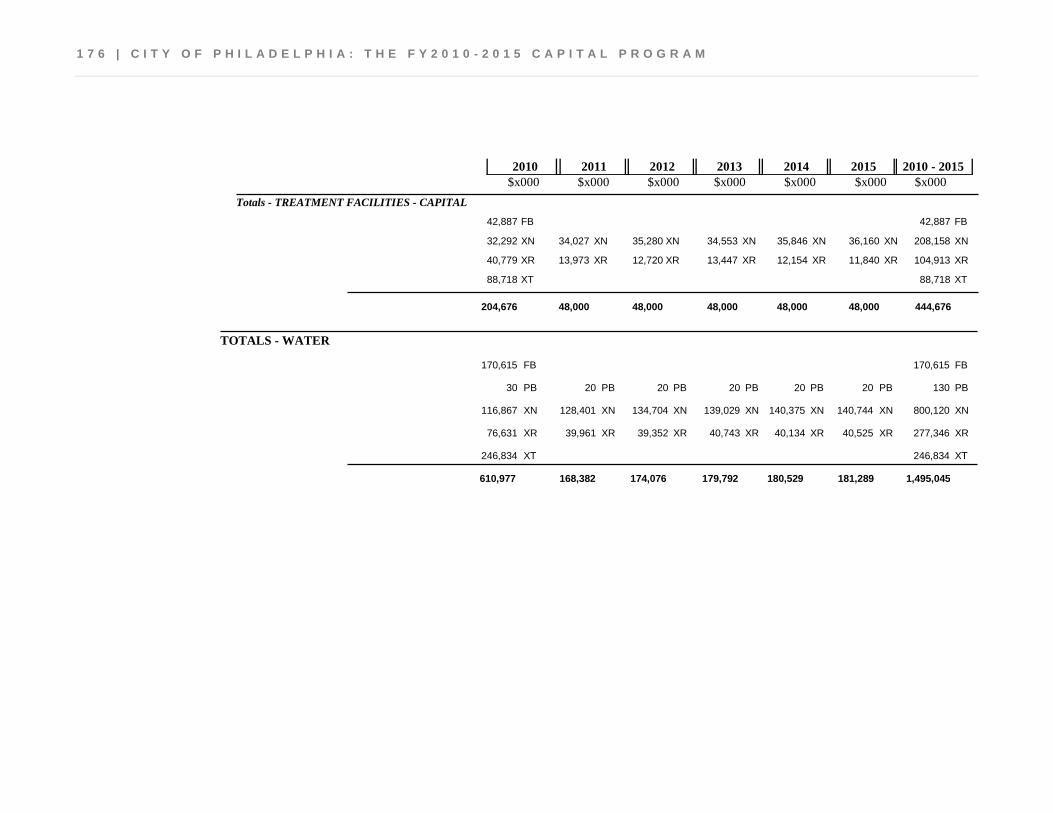
1 7 6 | C I T Y O F P H I L A D E L P H I A : T H E F Y 2 0 1 0 - 2 0 1 5 C A P I T A L P R O G R A M
$x000 $x000 $x000 $x000 $x000 $x000 $x000 2010 2011 2012 2013 2014 2015 2010 - 2015
Totals - TREATMENT FACILITIES - CAPITAL
42,887 FB 42,887 FB
34,553 35,280 34,027 32,292 35,846 36,160 XN XN XN XN XN XN 208,158 XN
13,447 12,720 13,973 40,779 12,154 11,840 XR XR XR XR XR XR 104,913 XR
88,718 XT 88,718 XT
48,000 48,000 48,000 48,000 48,000 204,676 444,676
TOTALS - WATER
170,615 FB 170,615 FB
20 20 20 30 20 20 PB PB PB PB PB PB 130 PB
139,029 134,704 128,401 116,867 140,375 140,744 XN XN XN XN XN XN 800,120 XN
40,743 39,352 39,961 76,631 40,134 40,525 XR XR XR XR XR XR 277,346 XR
246,834 XT 246,834 XT
181,289 180,529 179,792 174,076 168,382 610,977 1,495,045
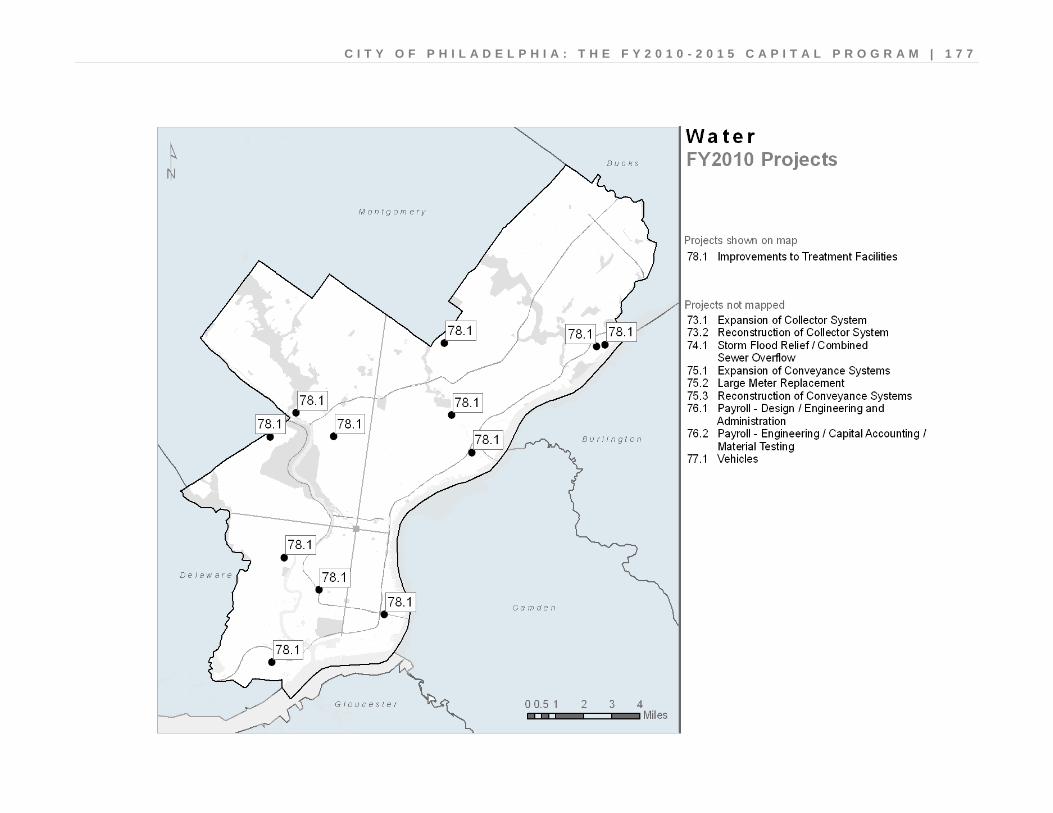
C I T Y O F P H I L A D E L P H I A : T H E F Y 2 0 1 0 - 2 0 1 5 C A P I T A L P R O G R A M | 1 7 7
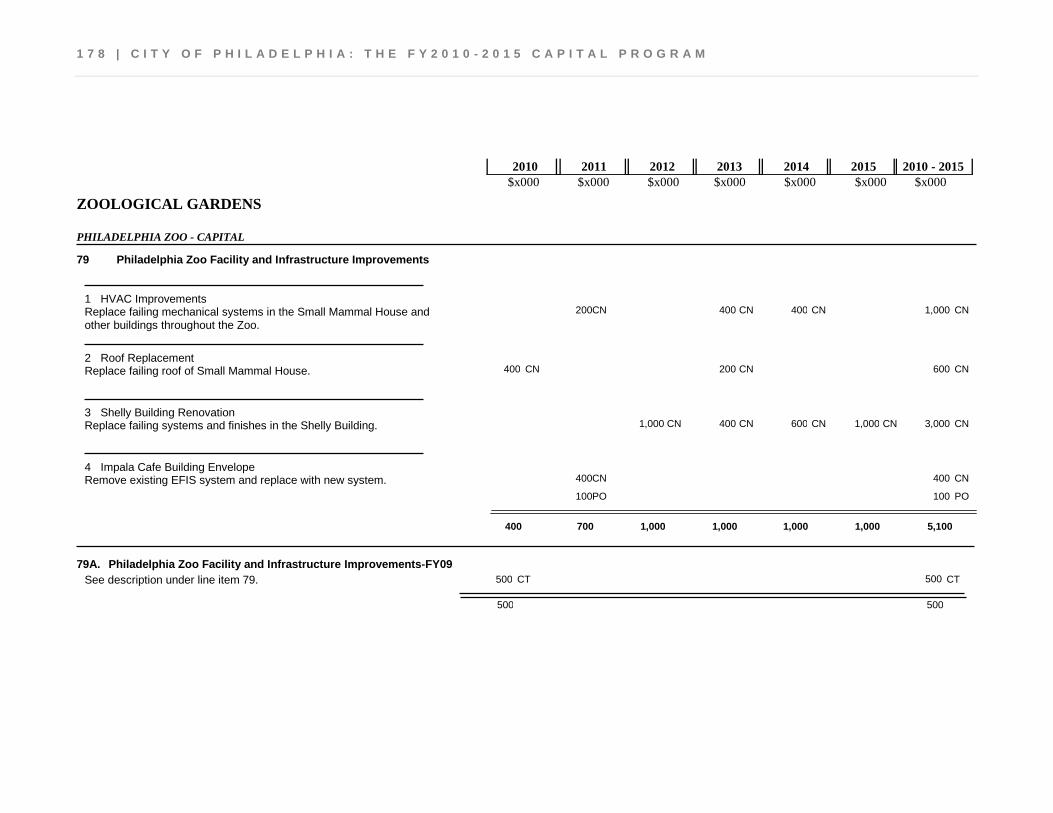
1 7 8 | C I T Y O F P H I L A D E L P H I A : T H E F Y 2 0 1 0 - 2 0 1 5 C A P I T A L P R O G R A M
$x000 $x000 $x000 $x000 $x000 $x000 $x000 2010 2011 2012 2013 2014 2015 2010 - 2015
ZOOLOGICAL GARDENS
PHILADELPHIA ZOO - CAPITAL
Philadelphia Zoo Facility and Infrastructure Improvements 79
1,000 400 400 200 CN CN CN CN Replace failing mechanical systems in the Small Mammal House and other buildings throughout the Zoo.
HVAC Improvements 1
600 200 400 CN CN CN Replace failing roof of Small Mammal House. Roof Replacement 2
3,000 1,000 600 400 1,000 CN CN CN CN CN Replace failing systems and finishes in the Shelly Building. Shelly Building Renovation 3
400 400 CN CN 100 100 PO PO
Remove existing EFIS system and replace with new system. Impala Cafe Building Envelope 4
400 1,000 1,000 1,000 1,000 700 5,100
79A. Philadelphia Zoo Facility and Infrastructure Improvements-FY09 500 500 CT CT
500 500
See description under line item 79.
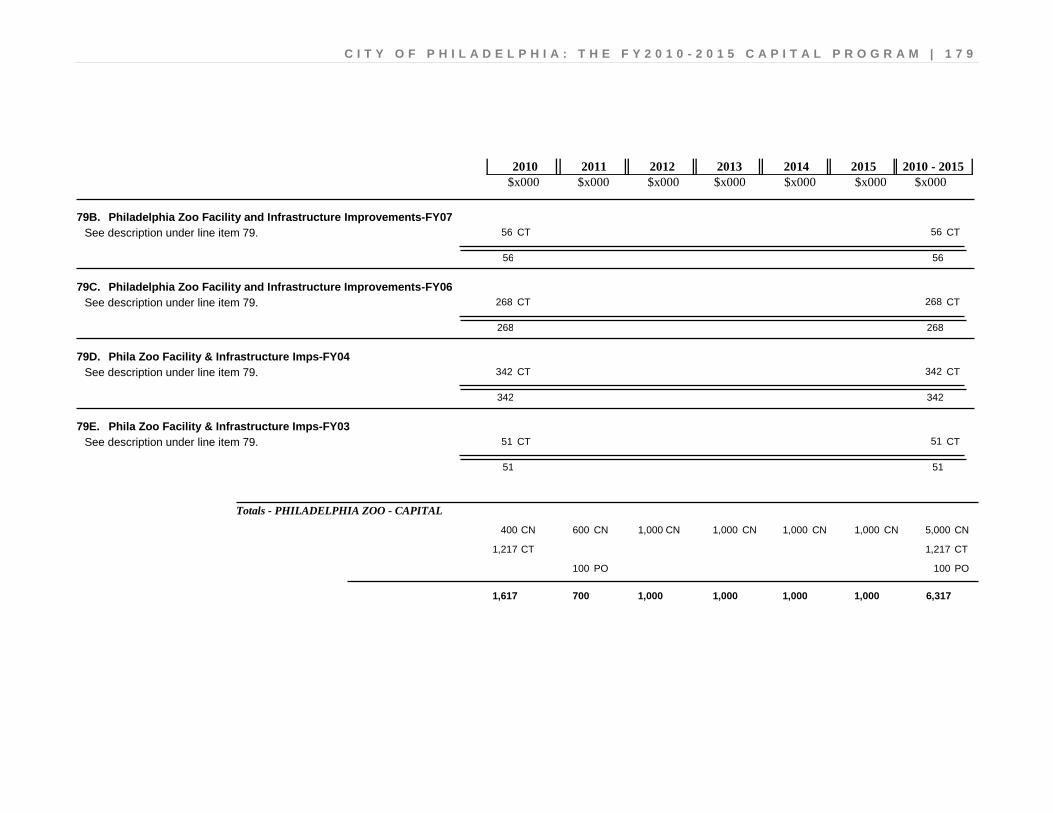
C I T Y O F P H I L A D E L P H I A : T H E F Y 2 0 1 0 - 2 0 1 5 C A P I T A L P R O G R A M | 1 7 9
$x000 $x000 $x000 $x000 $x000 $x000 $x000 2010 2011 2012 2013 2014 2015 2010 - 2015
79B. Philadelphia Zoo Facility and Infrastructure Improvements-FY07 56 56 CT CT
56 56
See description under line item 79.
79C. Philadelphia Zoo Facility and Infrastructure Improvements-FY06 268 268 CT CT
268 268
See description under line item 79.
79D. Phila Zoo Facility & Infrastructure Imps-FY04 342 342 CT CT
342 342
See description under line item 79.
79E. Phila Zoo Facility & Infrastructure Imps-FY03 51 51 CT CT
51 51
See description under line item 79.
Totals - PHILADELPHIA ZOO - CAPITAL
1,000 1,000 600 400 1,000 1,000 CN CN CN CN CN CN 5,000 CN
1,217 CT 1,217 CT
100 PO 100 PO
1,000 1,000 1,000 1,000 700 1,617 6,317
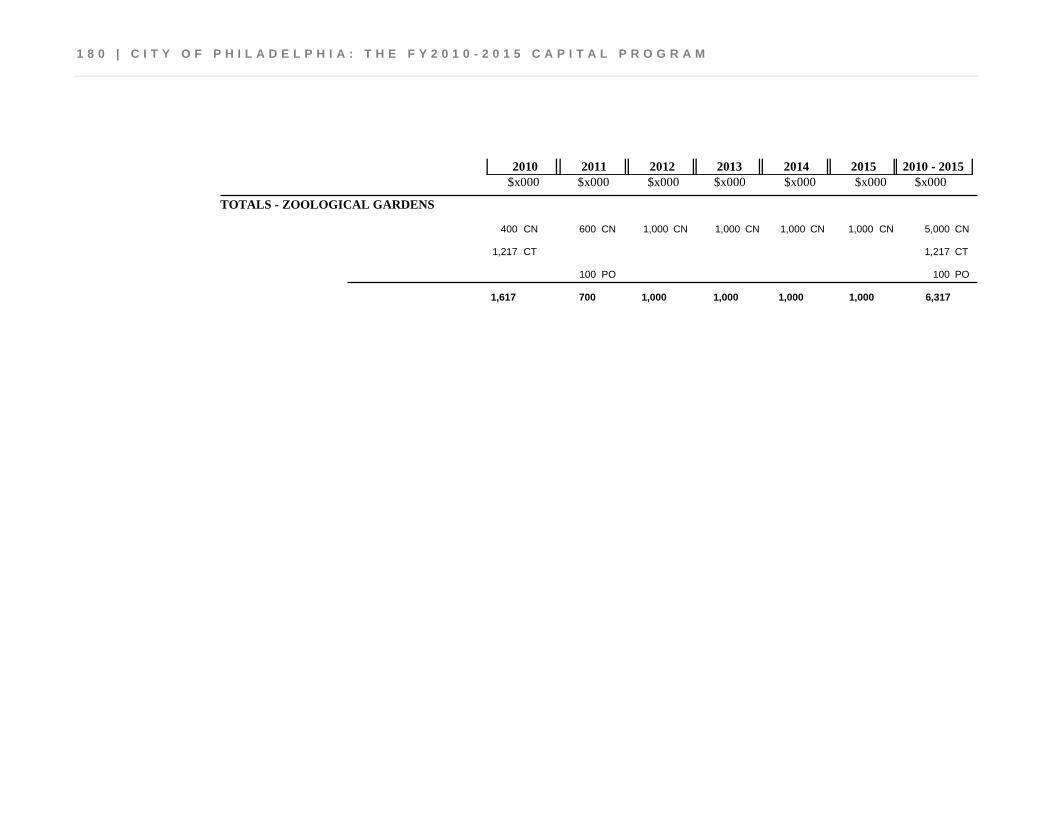
1 8 0 | C I T Y O F P H I L A D E L P H I A : T H E F Y 2 0 1 0 - 2 0 1 5 C A P I T A L P R O G R A M
$x000 $x000 $x000 $x000 $x000 $x000 $x000 2010 2011 2012 2013 2014 2015 2010 - 2015
TOTALS - ZOOLOGICAL GARDENS
1,000 1,000 600 400 1,000 1,000 CN CN CN CN CN CN 5,000 CN
1,217 CT 1,217 CT
100 PO 100 PO
1,000 1,000 1,000 1,000 700 1,617 6,317
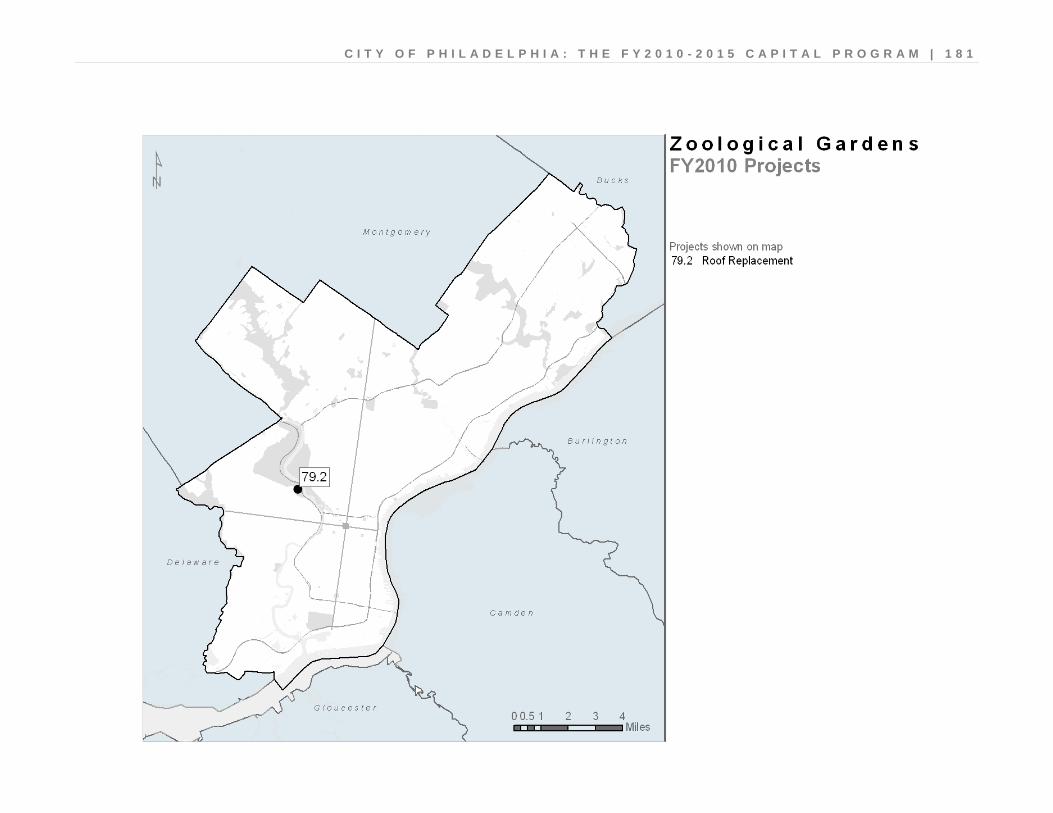
C I T Y O F P H I L A D E L P H I A : T H E F Y 2 0 1 0 - 2 0 1 5 C A P I T A L P R O G R A M | 1 8 1
Related Documents