City of Miami, Florida Monthly Financial Report June 2014 Prepared by City of Miami Staff

Welcome message from author
This document is posted to help you gain knowledge. Please leave a comment to let me know what you think about it! Share it to your friends and learn new things together.
Transcript

City of Miami, Florida
Monthly Financial Report June 2014
Prepared by City of Miami Staff
ajackson
Typewritten Text
ajackson
Typewritten Text
ajackson
Typewritten Text
ajackson
Typewritten Text
ajackson
Typewritten Text

TABLE OF CONTENTS Section 1 – General Fund 1 Financial Update – General Fund ..........................................................................................................................1-1 Annual Budget vs. Year to Date (YTD) Actual .................................................................................................... 1-2 Month-to-Month Comparison ................................................................................................................................1-3 Prior YTD vs. Current YTD .................................................................................................................................. 1-4 Section 2 – Special Revenue Funds 2 Financial Update – Special Revenue Funds ......................................................................................................... 2-1 Non-Reimbursable Expenditures of Grant Programs .........................................................................................2-3 Combining Balance Sheet .......................................................................................................................................2-4 Combining Statement of Revenues, Expenditures, and Changes in Fund Balance ..........................................2-9 Section 3 – Debt Service Funds 3 Financial Update – Debt Service Funds ................................................................................................................3-1 Combining Balance Sheet – Summary ................................................................................................. …………3-2 Combining Balance Sheet – Detail ........................................................................................................................ 3-3 Combining Statement of Revenues, Expenditures, and Changes in Fund Balance – Summary .................... 3-7 Combining Statement of Revenues, Expenditures, and Changes in Fund Balance – Detail ...........................3-10 Section 4 – Capital Project Funds 4 Financial Update – Capital Project Funds ........................................................................................................... 4-1 Combining Balance Sheet .......................................................................................................................................4-4 Combining Statement of Revenues, Expenditures, and Changes in Fund Balance ......................................... 4-7 Section 5 – Cash Position 5 Financial Update – Cash Position for all City of Miami Funds .......................................................................... 5-1 Cash Position – All Funds ....................................................................................................................................... 5-2 Section 6 – Investments 6 Financial Update – Investment Portfolio .............................................................................................................. 6-1 Portfolio – Interest Income ..................................................................................................................................... 6-2 Portfolio – Details .....................................................................................................................................................6-3 Total Investments Outstanding ...............................................................................................................................6-4 Section 7 – Cash Payments Received on Major Accounts Receivables 7 Financial Update – Accounts Receivable ............................................................................................................. 7-1 Cash Payments Received and Aging on Major Accounts Receivables ..............................................................7-2

Section 1 – General Fund
Financial Update – General Fund
Annual Budget vs. Year to Date (YTD) Actual
Month-to-Month Comparison
Prior YTD vs. Current YTD

1 - 1
Financial Update – General Fund Fiscal Year 2014 - For the Month of June
Property Tax revenues make up 38.88% of General
Fund collected revenue. As of June 30th, 2014
property taxes collected were $213,705,394. The
majority of property tax revenue is collected during
the months of December through February. To
achieve the annual budget of $225,733,400, an
additional $12.03 million needs to be collected.
Property Tax Revenues Collected Compared to Annual
Budget - Cumulative Collection Rate Month FY 12 FY 13
October 0.00 0.00
November 8.17% 10.26%
December 36.72% 43.00%
January 76.29% 76.50%
February 76.66% 80.67%
March 80.77 % 83.09%
April 82.86% 88.25%
May 88.97% 90.19%
June 91.21% 94.67%
July 94.72%
August 94.72%
Franchise Fee collections make up 11.32% of the
General Fund revenues collected, totaling
$62,195,996. To achieve the annual budget of
$99,587,900, an additional $37.39 million will need
to be collected. Franchise fees are collected on
electric, cable, telephone, gas services, local option
gas tax and community service taxes.
Business Tax Receipts (BTR) and Other Licenses
& Permits represent 6.36% of revenues collected.
As of June 30th, 2014, licensing and permitting
revenues collected totaled $34,942,040. To achieve
the annual budget of $44,156,500, an additional
$9.21 million needs to be collected. Many of these
revenues are billed and collected on an annual basis.
Business Tax Receipts represents 20% of the total
licensing and permitting budget.
Intergovernmental Revenues make up 5.54% of
collected revenues. As of June 30th, 2014,
intergovernmental revenues collected totaled
$30,448,412. To achieve the annual budget, an
additional $18.95 million needs to be collected. The
majority of these revenues come from sales tax, state
shared revenues and grants. State Shared Revenues
represents the largest share of Intergovernmental
Revenues.
Charges for Service is the second largest revenue
source of the General Fund making up 16.21% of
revenues collected. As of June 30th, 2014, charges
for services collected totaled $89,108,078. To
achieve the annual budget an additional $4.21
million needs to be collected. The largest component
of this category is the solid waste fee. The solid
waste charges are billed on the annual property tax
bill; therefore, the majority of these fees are
collected during the months of December through
February.
Fines and Forfeitures is one of the smallest
revenue sources of the General Fund, representing
1.38% of the revenues collected. As of June 30th,
2014, collections totaled $7,582,528. This includes
approximately $3.85 million in Red Light Camera
Revenues.
Interest Revenues are budgeted at $1,000,000. This
is approximately 0.15% of total budgeted revenues.
It includes gains and losses on the City’s
Investments. As of June 30th, 2014 the City has
interest revenue of $3,750,121.
Other Revenues include miscellaneous receipts that
cannot be categorized with another line item. It
represents 19.63% revenues collected. Other
revenues collected totaled $107,857,964. This
includes approximately $104.51 million in Internal
Service Fund Revenues that are payments that
departments make to cover their employee benefits,
IT and maintenance cost.
Total General Fund expenditures are $461,166,223
which represents 73.52% of the annual budget of
$627,281,700 million. This includes $118.63 million
in Internal Service Fund expenditures. The City
continues to monitor departmental budgetary
compliance.
BTR,
Licensing &
Permits 6.36%
Charges for
Services
16.21%
Interest
.68%
Property
Tax
38.88%
Other
19.63%
Franchise
11.32%
Fines
1.38%
Intergov't
5.54%
Transfer In
0.00%
General Fund Revenues Collected

Current Year to Date Year to Date
Budget** Month Actual* Actual* Variance
Revenues:
Property Tax 225,733,400 10,119,451.26 213,705,393.80 12,028,006
Franchise and Other Taxes*** 99,587,900 10,719,658 62,195,996 37,391,904
Business Tax Receipts 44,156,500 3,223,351 34,942,040 9,214,460
Fines and Forfeitures 10,869,200 846,885 7,582,528 3,286,672
Intergovernmental 49,397,200 3,587,695 30,448,412 18,948,788
Charges for Services 93,314,300 9,289,914 89,108,078 4,206,222
Interest 1,000,000 166,860 3,750,121 (2,750,121)
Other 148,259,500 14,734,797 107,857,964 40,401,536
Total Revenues 672,318,000 52,688,611 549,590,533 122,727,467
Expenditures:
Mayor 957,200 72,646 672,341 284,859
Board of Commissioners 2,489,100 202,965 1,896,822 592,278
Office of City Manager 2,924,700 265,351 2,182,790 741,910
Office of NET 3,376,000 269,021 2,345,765 1,030,235
Office of Code Enforcement 4,533,700 378,702 3,284,987 1,248,713
Office of City Clerk 1,508,500 126,555 1,009,263 499,237
Office of Civil Service 370,900 32,367 240,149 130,751
Office of Auditor General 1,078,200 80,563 732,073 346,127
Office of Communication 1,060,100 98,927 836,452 223,648
Office of City Attorney 6,393,900 514,425 4,514,375 1,879,525
Office of Equal Opportunity & Diversity Programs 329,400 21,293 180,069 149,331
Budget 1,823,600 145,360 1,313,016 510,584
Employee Relations 3,749,400 275,222 2,450,378 1,299,022
Finance 8,010,800 516,746 5,633,573 2,377,227
Capital Improvements Administration 5,121,100 207,595 3,303,103 1,817,997
Information Technology 12,845,100 792,903 7,302,467 5,542,633
Purchasing 1,567,000 123,226 1,060,698 506,302
Total General Government 58,138,700 4,123,868 38,958,322 19,180,378
Building 9,282,500 696,694 6,191,388 3,091,112
Planning 5,964,600 467,474 3,852,312 2,112,288
Total Planning and Development 15,247,100 1,164,167 10,043,700 5,203,400
General Service Administration 21,114,200 1,998,193 15,490,235 5,623,965
Public Works 16,351,400 1,825,609 11,700,278 4,651,122
Solid Waste 28,519,800 3,006,892 20,788,388 7,731,412
Total Public Works 65,985,400 6,830,695 47,978,900 18,006,500
Fire 103,181,900 8,886,345 75,953,086 27,228,814
Police 168,598,800 13,689,077 124,467,661 44,131,139
Total Public Safety 271,780,700 22,575,421 200,420,747 71,359,953
Public Facilities 6,465,400 597,030 4,211,832 2,253,568
Parks and Recreation 29,507,100 2,599,417 20,331,670 9,175,430
Risk Management 26,646,300 5,276,938 44,823,019 (18,176,719)
Risk - Group Benefits 44,182,900 2,946,782 4,074,478 40,108,422
Total Other 106,801,700 11,420,168 73,440,999 33,360,701
Office of Grants Administration 931,100 76,009 667,938 263,162
Non-Departmental 28,461,800 665,726 11,597,916 16,863,884
Total Non-Departmental 29,392,900 741,735 12,265,855 17,127,045
GESE & FIPO 79,935,200 58,627 78,057,699 1,877,501
Total Expenditures 627,281,700 46,914,681 461,166,223 166,115,477
Revenues Over (Under) Expenditures 45,036,300 5,773,930 88,424,310 (43,388,010)
Operating transfers in*** 12,366,000 - 440,059 11,925,941
Operating transfers out (57,402,300) (39,518,200) (39,518,200) (17,884,100)
Other Financing Sources/(Uses) (45,036,300) (39,518,200) (39,078,141) (5,958,159)
Total Revenues Over/(Under) Expenditures - (33,744,270) 49,346,169 (49,346,169)
* Unaudited, As adjusted through June 30, 2014
**Amounts obtained from Budget Dept
City of Miami
Monthly Financial Statement - General Fund Only
Annual Budget vs. YTD Actual
Year to Date June 30, 2014
1 - 2

Year to Date Year to Date
Budget Actual* Budget Actual* Budget Actual % Change
Revenues:
Property Tax 225,733,400 203,585,943 225,733,400 213,705,394 - 10,119,451 5%
Franchise and Other Taxes 99,587,900 51,476,338 99,587,900 62,195,996 - 10,719,658 21%
Business Tax Receipts 44,156,500 31,718,688 44,156,500 34,942,040 - 3,223,351 10%
Fines and Forfeitures 10,869,200 6,735,643 10,869,200 7,582,528 - 846,885 13%
Intergovernmental 49,397,200 26,860,717 49,397,200 30,448,412 - 3,587,695 13%
Charges for Services 93,314,300 79,818,164 93,314,300 89,108,078 - 9,289,914 12%
Interest 1,000,000 3,583,261 1,000,000 3,750,121 - 166,860 5%
Other 148,259,500 93,123,167 148,259,500 107,857,964 - 14,734,797 16%
Total Revenues 672,318,000 496,901,921 672,318,000 549,590,533 - 52,688,612
Expenditures:
Mayor 957,200 599,695 957,200 672,341 - 72,646 12%
Board of Commissioners 2,489,100 1,693,857 2,489,100 1,896,822 - 202,965 12%
Office of City Manager 2,924,700 1,917,439 2,924,700 2,182,790 - 265,351 14%
Office of NET 3,376,000 2,076,744 3,376,000 2,345,765 - 269,021 13%
Office of Code Enforcement 4,533,700 2,906,285 4,533,700 3,284,987 - 378,702 13%
Office of City Clerk 1,508,500 882,707 1,508,500 1,009,263 - 126,555 14%
Office of Civil Service 370,900 207,781 370,900 240,149 - 32,367 16%
Office of Auditor General 1,078,200 651,510 1,078,200 732,073 - 80,563 12%
Office of Communication 1,060,100 737,526 1,060,100 836,452 - 98,927 13%
Office of City Attorney 6,393,900 3,999,951 6,393,900 4,514,375 - 514,425 13%
Office of Equal Opportunity & Diversity Programs 329,400 158,776 329,400 180,069 - 21,293 13%
Budget 1,823,600 1,167,656 1,823,600 1,313,016 - 145,360 12%
Employee Relations 3,749,400 2,175,156 3,749,400 2,450,378 - 275,222 13%
Finance 8,010,800 5,116,827 8,010,800 5,633,573 - 516,746 10%
Capital Improvement Administration 5,121,100 3,095,509 5,121,100 3,303,103 - 207,595 7%
Information Technology 12,845,100 6,509,564 12,845,100 7,302,467 - 792,903 12%
Purchasing 1,567,000 937,472 1,567,000 1,060,698 - 123,226 13%
Total General Government 58,138,700 34,834,453 58,138,700 38,958,322 - 4,123,868
Building 9,282,500 5,494,694 9,282,500 6,191,388 - 696,694 13%
Planning 5,964,600 3,384,838 5,964,600 3,852,312 - 467,474 14%
Total Planning and Development 15,247,100 8,879,533 15,247,100 10,043,700 - 1,164,167
General Service Administration 21,114,200 13,492,042 21,114,200 15,490,235 - 1,998,193 15%
Public Works 16,351,400 9,874,668 16,351,400 11,700,278 - 1,825,609 18%
Solid Waste 28,519,800 17,781,496 28,519,800 20,788,388 - 3,006,892 17%
Total Public Works 65,985,400 41,148,206 65,985,400 47,978,900 - 6,830,695
Fire 103,181,900 67,066,741 103,181,900 75,953,086 - 8,886,345 13%
Police 168,598,800 110,778,585 168,598,800 124,467,661 - 13,689,077 12%
Total Public Safety 271,780,700 177,845,327 271,780,700 200,420,747 - 22,575,421
Public Facilities 6,465,400 3,614,802 6,465,400 4,211,832 - 597,030 17%
Parks and Recreation 29,507,100 17,732,253 29,507,100 20,331,670 - 2,599,417 15%
Risk Management 26,646,300 39,546,081 26,646,300 44,823,019 - 5,276,938 13%
Risk - Group Benefits 44,182,900 1,127,696 44,182,900 4,074,478 - 2,946,782 261%
Total Other 106,801,700 62,020,832 106,801,700 73,440,999 - 11,420,168
Office of Grants Administration 931,100 591,930 931,100 667,938 - 76,009 13%
Non-Departmental 28,461,800 10,932,190 28,461,800 11,597,916 - 665,726 6%
Total Non-Departmental 29,392,900 11,524,120 29,392,900 12,265,855 - 741,735
GESE & FIPO 79,935,200 77,999,072 79,935,200 78,057,699 - 58,627 0%
Total Expenditures 627,281,700 414,251,542 627,281,700 461,166,223 - 46,914,681
Revenues Over (Under) Expenditures 45,036,300 82,650,379 45,036,300 88,424,310 - 5,773,930
Operating transfers in 12,366,000 440,059 12,366,000 440,059 - - 0%
Operating transfers out (57,402,300) - (57,402,300) (39,518,200) - (39,518,200) 0%
Other Financing Sources/(Uses) (45,036,300) 440,059 (45,036,300) (39,078,141) - (39,518,200)
Total Revenues Over/(Under) Expenditures - 83,090,438 - 49,346,169 - (33,744,270)
* Unaudited, As adjusted through June 30, 2014
May 2014 June 2014 Variance
City of Miami
Monthly Financial Statement - General Fund Only
Comparative May 2014 to June 2014
1 - 3

Year to Date Year to Date
Budget Actual* Budget Actual* Budget Actual % Change
Revenues:
Property Tax 217,631,200 198,502,784 225,733,400 213,705,394 8,102,200 15,202,610 8%
Franchise and Other Taxes 98,570,700 60,931,199 99,587,900 62,195,996 1,017,200 1,264,797 2%
Business Tax Receipts 40,294,100 32,366,132 44,156,500 34,942,040 3,862,400 2,575,908 8%
Fines and Forfeitures 4,400,200 2,931,995 10,869,200 7,582,528 6,469,000 4,650,533 159%
Intergovernmental 44,984,600 33,120,631 49,397,200 30,448,412 4,412,600 (2,672,219) -8%
Charges for Services 88,397,000 81,494,056 93,314,300 89,108,078 4,917,300 7,614,023 9%
Interest 800,000 (4,387,973) 1,000,000 3,750,121 200,000 8,138,094 -185%
Other 11,050,000 9,250,248 148,259,500 107,857,964 137,209,500 98,607,716 1066%
Total Revenues 506,127,800 414,209,072 672,318,000 549,590,533 166,190,200 135,381,461
Expenditures:
Mayor 883,500 631,007 957,200 672,341 (73,700) (41,335) -7%
Board of Commissioners 2,416,100 1,762,571 2,489,100 1,896,822 (73,000) (134,250) -8%
Office of City Manager 2,847,000 1,950,177 2,924,700 2,182,790 (77,700) (232,613) -12%
Office of NET 3,495,800 2,471,910 3,376,000 2,345,765 119,800 126,145 5%
Office of Code Enforcement 4,417,300 3,221,626 4,533,700 3,284,987 (116,400) (63,361) -2%
Office of City Clerk 1,455,500 907,762 1,508,500 1,009,263 (53,000) (101,500) -11%
Office of Civil Service 393,700 305,065 370,900 240,149 22,800 64,916 21%
Office of Auditor General 1,071,400 673,820 1,078,200 732,073 (6,800) (58,253) -9%
Office of Communication 924,900 640,065 1,060,100 836,452 (135,200) (196,387) -31%
Office of City Attorney 5,768,800 4,221,520 6,393,900 4,514,375 (625,100) (292,855) -7%
Office of Equal Opportunity & Diversity Programs 314,200 211,540 329,400 180,069 (15,200) 31,471 15%
Budget 1,535,400 1,117,820 1,823,600 1,313,016 (288,200) (195,196) -17%
Employee Relations 3,087,800 2,141,709 3,749,400 2,450,378 (661,600) (308,669) -14%
Finance 7,743,200 5,383,112 8,010,800 5,633,573 (267,600) (250,461) -5%
Capital Improvement Administration 4,531,000 3,004,798 5,121,100 3,303,103 (590,100) (298,306) -10%
Information Technology 11,034,100 8,394,871 12,845,100 7,302,467 (1,811,000) 1,092,403 13%
Purchasing 1,440,300 1,015,895 1,567,000 1,060,698 (126,700) (44,802) -4%
Total General Government 53,360,000 38,055,269 58,138,700 38,958,322 (4,778,700) (903,053)
Building 7,711,500 5,298,826 9,282,500 6,191,388 (1,571,000) (892,562) -17%
Planning 4,781,500 3,448,367 5,964,600 3,852,312 (1,183,100) (403,945) -12%
Total Planning and Development 12,493,000 8,747,193 15,247,100 10,043,700 (2,754,100) (1,296,507)
General Service Administration 20,519,900 14,850,087 21,114,200 15,490,235 (594,300) (640,148) -4%
Public Works 16,907,700 11,358,642 16,351,400 11,700,278 556,300 (341,635) -3%
Solid Waste 26,852,500 18,208,123 28,519,800 20,788,388 (1,667,300) (2,580,265) -14%
Total Public Works 64,280,100 44,416,852 65,985,400 47,978,900 (1,705,300) (3,562,048)
Fire 99,804,800 72,669,315 103,181,900 75,953,086 (3,377,100) (3,283,771) -5%
Police 156,963,000 114,725,046 168,598,800 124,467,661 (11,635,800) (9,742,616) -8%
Total Public Safety 256,767,800 187,394,361 271,780,700 200,420,747 (15,012,900) (13,026,387)
Public Facilities 5,901,400 3,971,018 6,465,400 4,211,832 (564,000) (240,814) -6%
Parks and Recreation 29,002,100 20,660,426 29,507,100 20,331,670 (505,000) 328,756 2%
Risk Management 13,183,200 9,142,375 26,646,300 44,823,019 (13,463,100) (35,680,645) -390%
Risk - Group Benefits 382,300 301,643 44,182,900 4,074,478 (43,800,600) (3,772,835) -1251%
Total Other 48,469,000 34,075,461 106,801,700 73,440,999 (58,332,700) (39,365,538)
Office of Grants Administration 833,100 541,153 931,100 667,938 (98,000) (126,785) -23%
Non-Departmental 32,059,800 6,601,746 28,461,800 11,597,916 3,598,000 (4,996,170) -76%
Total Non-Departmental 32,892,900 7,142,900 29,392,900 12,265,855 3,500,000 (5,122,955)
GESE & FIPO 657,600 962,635 79,935,200 78,057,699 (79,277,600) (77,095,064) -8009%
Total Expenditures 468,920,400 320,794,671 627,281,700 461,166,223 (158,361,300) (28,215,083)
Revenues Over (Under) Expenditures 37,207,400 93,414,401 45,036,300 88,424,310 7,828,900 107,166,378
Operating transfers in 69,900 440,059 12,366,000 440,059 12,296,100 - 0%
Operating transfers out (37,277,300) (30,246,700) (57,402,300) (39,518,200) (20,125,000) (9,271,500) 31%
Other Financing Sources/(Uses) (37,207,400) (29,806,641) (45,036,300) (39,078,141) (7,828,900) (9,271,500)
Total Revenues Over/(Under) Expenditures - 63,607,760 - 49,346,169 - 97,894,878
* Unaudited, As adjusted through June 30, 2014
Favorable (Unfavorable)
City of Miami
Monthly Financial Statement - General Fund Only
Comparative June 2013 to June 2014
Current Year MTD vs Prior Year MTD
June 2013 June 2014 Year to Year Variance
1 - 4

Section 2 –
Special Revenue Funds
Financial Update – Special Revenue Fund
Non-Reimbursable Expenditures of Grant Program
Combining Balance Sheet
Combining Statement of Revenues, Expenditures, and
Changes in Fund Balance

2 - 1
Financial Update – Special Revenue Fund
Fiscal Year 2014 – For the Month of June
Staff has completed the reconciliation of the Special Revenue Funds (SRF). Through this process,
the following Special Revenue Funds have been defined and will be reported in the
Comprehensive Annual Financial Report (CAFR).The following are the SRF as of June 30, 2013:
Community Development Services
Community Redevelopment Area (CRA – OMNI)
Community Redevelopment Area (CRA – SEOPW)
Community Redevelopment Area (CRA – MIDTOWN)
Homeless
Economic Development & Planning Services
Fire Rescue Services
NET Offices
Parks and Recreation Services
Police Services
Law Enforcement Trust Fund
Public Works Services
City Clerk Services
Miami Ballpark Facilities
Emergency Funds
Community Development Services – SHIP
Community Development Services – Section 8 Voucher
General Special Revenue
Department Improvement Initiatives
Transportation and Transit
Public Facilities
Liberty City
Virginia Key
Civilian Investigative Panel

2 - 2
Revenues
Special revenue funds are used to account for the proceeds of specific revenue sources that are
legally restricted to expenditure for specified purpose. The primary sources of revenues for the
special revenues fund of the City of Miami consist of taxes, grants, assessments, and fees. As of
June 30, 2014, year to date revenues were $104,614,798. The revenues by fund are depicted in the
following chart:
As revealed by the chart, Community Development, Community Redevelopment Area (CRA-
SEOPW), and Fire Department contribute approximately 59% of total revenues for the City’s
special revenue funds. These funds show revenues of $24,929,497; $22,547,469; and $13,414,055
respectively.
Grant Revenues
The City receives the majority of its grant revenues from the Department of Housing and Urban
Development (HUD). The Community Development Block Grant (CDBG) and Housing
Opportunities for People with Aids (HOPWA) are the largest programs currently administered by
the City. As of June 30, 2014, the City received CDBG and HOPWA revenues of approximately
$10,048,558 and $8,083,815 respectively.
CRA-OMNI 11%
CRA-MIDTOWN 4%
CRA-SEOPW 22%
CD 24%
Homeless 1%
Fire 13%
General Special Revenue
1%
Public Facilities 5%
Econ Devel 1%
Parks 1%
Police 2%
Law Enf. Trust Fund 1%
Public Works 2%
Dept Improv 1%
Transp & Transit 7%
Miami Ballpark Parking Facilities
2% CD-SHIP 1%
Section 8 1%
Revenues by Fund

2 - 3
Expenditures
The expenditures for the SRF were $74,613,228 as of June 30, 2014. Community Development,
Fire Department, and Community Redevelopment Area (CRA-OMNI) funds have the highest
expenditures within the SRF. These funds represent approximately 62% of total expenditures as
demonstrated below:
Non-Reimbursable Expenditures of Grant Programs
The Finance Department is responsible for reporting expenses incurred which are not reimbursable
under grant programs per the Financial Integrity Principles, Chapter 18 of the Code of the City of
Miami.
For the month ending June 30, 2014, there are no non-reimbursable expenditures reported
CRA-OMNI 10%
CRA-MIDTOWN 4%
CRA-SEOPW 9%
CD 33%
Homeless 2%
Fire 19%
General Special Revenue
1%
Public Facilities 3%
Parks 2%
Police 6%
LETF 1%
Dept Improvement 2%
Transportation & Transit
3%
Miami Ballpark Parking Facilities
1%
Section 8 2%
Expenditures by Fund

City of Miami
Combining Balance Sheet
All Special Revenues Funds
As of June 30, 2014
Community
OMNI MIDTOWN SEOPW Development Homeless
Assets
103000 Cash With Fiscal Agent -$ -$ -$ -$ -$
104000 Equity In Pooled Cash 21,720,811 25,169 44,464,700 7,993,500 (142,133)
115000 Accounts Receivable 821,793 - - 745,499 29,988
115090 Unbilled Receivable 347,422 - - 1,523,263 38,676
117000 Allowance For Uncollectible - - - (467,852) -
128900 Notes Receivable-Non-Current - - - 1,794 -
135000 Interest And Dividends Recei 8,013 - 11,816 354 -
135100 Interest And Dividends Recei - - - 3,953 -
137000 Market Gain/Loss Investments (17,363) - (37,886) (345) -
155000 Prepaid Items - - - - -
199960 Project Clearing Account - - (664) - 764
199990 Clearing Account - - - (1,682) -
Total Assets 22,880,675$ 25,169$ 44,437,967$ 9,798,484$ (72,704)$
Liabilities and Fund Balance
Liabilities:
201000 Vouchers Payable -$ -$ -$ -$ -$
202000 Accounts Payable 17,015 - 66,971 12,458 2,146
205100 Retainage Payable 566,555 - 110,631 38,965 -
208000 Due To Other Governmental Un - - (3,287) 659,832 -
214000 Accrued Expenditure Payable - - - - -
216000 Accrued Wages Payable - - - 104,496 47,222
217000 Accrued Taxes Payable - - 140 - -
220000 Deposits - - - 1,729,805 -
223000 Deferred Revenue 33,603 - 446,117 188,804 -
223100 Deferred Revenue-PnG - - - 56,886 (1)
Total Liabilities 617,173 - 620,572 2,791,245 49,367
Fund Balance:
305000 Fund Balance-Reserved for En 1,344,898 - 3,549,348 867,042 7,049
315000 Fund Balance-Unreserved 20,918,604 25,169 40,003,558 6,129,752 (129,120)
316000 Retained Earnings-Unreserved - - 264,488 10,445 -
Total Fund Balance (Deficit) 22,263,502 25,169 43,817,395 7,007,239 (122,071)
Total Liabilities and Fund Balance (Deficit) 22,880,675$ 25,169$ 44,437,967$ 9,798,484$ (72,704)$
2 - 4

City of Miami
Combining Balance Sheet
All Special Revenues Funds
As of June 30, 2014
Assets
103000 Cash With Fiscal Agent
104000 Equity In Pooled Cash
115000 Accounts Receivable
115090 Unbilled Receivable
117000 Allowance For Uncollectible
128900 Notes Receivable-Non-Current
135000 Interest And Dividends Recei
135100 Interest And Dividends Recei
137000 Market Gain/Loss Investments
155000 Prepaid Items
199960 Project Clearing Account
199990 Clearing Account
Total Assets
Liabilities and Fund Balance
Liabilities:
201000 Vouchers Payable
202000 Accounts Payable
205100 Retainage Payable
208000 Due To Other Governmental Un
214000 Accrued Expenditure Payable
216000 Accrued Wages Payable
217000 Accrued Taxes Payable
220000 Deposits
223000 Deferred Revenue
223100 Deferred Revenue-PnG
Total Liabilities
Fund Balance:
305000 Fund Balance-Reserved for En
315000 Fund Balance-Unreserved
316000 Retained Earnings-Unreserved
Total Fund Balance (Deficit)
Total Liabilities and Fund Balance (Deficit)
General Econ NET &
Special Public Dev & Code
FIRE Revenue Facilities Plan Services Enforcement
-$ -$ 177,126$ -$ -$
(3,198,843) (763,642) 159,343 7,110,232 2,590,235
1,770,072 715,986 29,215 - 132,767
5,941,239 186,354 1,600 1,116 -
- - - - (130,864)
- - - - -
27 - - - -
- - - - -
(48) - - - -
21,897 - - - -
- - - - -
- - - - -
4,534,342$ 138,699$ 367,284$ 7,111,348$ 2,592,138$
-$ -$ -$ -$ -$
431,057 - 605 - -
- 71,458 - - 11,478
- - - - -
- - - - -
163,026 - 10,230 - -
- - - - -
- - - - 3,810
- - - - -
14,617 - - - -
608,700 71,458 10,835 - 15,288
327,642 96,622 1,646,179 36,359 57,701
3,598,001 (29,382) 28,484,248 7,074,989 2,519,149
- - (29,773,978) - -
3,925,643 67,241 356,449 7,111,348 2,576,850
4,534,342$ 138,699$ 367,284$ 7,111,348$ 2,592,138$
2 - 5

City of Miami
Combining Balance Sheet
All Special Revenues Funds
As of June 30, 2014
Assets
103000 Cash With Fiscal Agent
104000 Equity In Pooled Cash
115000 Accounts Receivable
115090 Unbilled Receivable
117000 Allowance For Uncollectible
128900 Notes Receivable-Non-Current
135000 Interest And Dividends Recei
135100 Interest And Dividends Recei
137000 Market Gain/Loss Investments
155000 Prepaid Items
199960 Project Clearing Account
199990 Clearing Account
Total Assets
Liabilities and Fund Balance
Liabilities:
201000 Vouchers Payable
202000 Accounts Payable
205100 Retainage Payable
208000 Due To Other Governmental Un
214000 Accrued Expenditure Payable
216000 Accrued Wages Payable
217000 Accrued Taxes Payable
220000 Deposits
223000 Deferred Revenue
223100 Deferred Revenue-PnG
Total Liabilities
Fund Balance:
305000 Fund Balance-Reserved for En
315000 Fund Balance-Unreserved
316000 Retained Earnings-Unreserved
Total Fund Balance (Deficit)
Total Liabilities and Fund Balance (Deficit)
Civilian
Investigative Public
Parks Police LETF Panel Works
-$ -$ -$ -$ -$
1,411,739 1,808,195 1,952,339 (166,791) 4,917,649
36,782 194,396 8 - -
- 535,221 - - -
(32,476) (3,470) (8) - -
- - - - -
1 4,170 406 - 376
(0) - - - -
- (7,588) (2,227) - (905)
- 3,144 - - -
(9,835) - - - -
220 - - - -
1,406,430$ 2,534,068$ 1,950,517$ (166,791)$ 4,917,121$
-$ 3,595$ -$ -$ -$
242,309 199,134 135,855 3,626 4,140
449 - - - -
- - - - -
- - - - -
63,414 203,176 - 9,925 -
- - - - -
- - 112,413 - -
- - - - -
- - - - -
306,172 405,905 248,268 13,551 4,140
695,475 844,262 205,934 40,133 704,415
404,783 1,283,902 1,496,316 (220,475) 4,208,566
- - - - -
1,100,258 2,128,163 1,702,250 (180,342) 4,912,981
1,406,430$ 2,534,068$ 1,950,517$ (166,791)$ 4,917,121$
2 - 6

City of Miami
Combining Balance Sheet
All Special Revenues Funds
As of June 30, 2014
Assets
103000 Cash With Fiscal Agent
104000 Equity In Pooled Cash
115000 Accounts Receivable
115090 Unbilled Receivable
117000 Allowance For Uncollectible
128900 Notes Receivable-Non-Current
135000 Interest And Dividends Recei
135100 Interest And Dividends Recei
137000 Market Gain/Loss Investments
155000 Prepaid Items
199960 Project Clearing Account
199990 Clearing Account
Total Assets
Liabilities and Fund Balance
Liabilities:
201000 Vouchers Payable
202000 Accounts Payable
205100 Retainage Payable
208000 Due To Other Governmental Un
214000 Accrued Expenditure Payable
216000 Accrued Wages Payable
217000 Accrued Taxes Payable
220000 Deposits
223000 Deferred Revenue
223100 Deferred Revenue-PnG
Total Liabilities
Fund Balance:
305000 Fund Balance-Reserved for En
315000 Fund Balance-Unreserved
316000 Retained Earnings-Unreserved
Total Fund Balance (Deficit)
Total Liabilities and Fund Balance (Deficit)
Dept.
City Improve Transp Liberty Virgina Key
Clerk Initiatives & Transit City Beach Park
-$ -$ -$ -$ 22,058$
523,249 2,654,917 11,378,893 89,076 117,802
1,237 474,776 - - 3,734
- 48,948 - - -
(1,212) (318,989) - - (3,734)
- - - - -
- - - 54 4
- - - - -
- - - (135) (148)
- - - - -
- - - 200 -
- - - - -
523,274$ 2,859,652$ 11,378,893$ 89,195$ 139,716$
-$ -$ -$ -$ -$
- 94,061 1,600 116 12,854
- - 27,793 - -
- - - - -
- - - - -
1,609 49,958 16,861 - -
- - - - -
- - - - -
- - - - -
- - - 4,000 -
1,609 144,019 46,255 4,116 12,854
24,454 960,548 1,926,071 1,814 21,675
497,211 1,755,085 9,406,567 83,264 105,187
- - - - -
521,665 2,715,633 11,332,638 85,079 126,862
523,274$ 2,859,652$ 11,378,893$ 89,195$ 139,716$
2 - 7

City of Miami
Combining Balance Sheet
All Special Revenues Funds
As of June 30, 2014
Assets
103000 Cash With Fiscal Agent
104000 Equity In Pooled Cash
115000 Accounts Receivable
115090 Unbilled Receivable
117000 Allowance For Uncollectible
128900 Notes Receivable-Non-Current
135000 Interest And Dividends Recei
135100 Interest And Dividends Recei
137000 Market Gain/Loss Investments
155000 Prepaid Items
199960 Project Clearing Account
199990 Clearing Account
Total Assets
Liabilities and Fund Balance
Liabilities:
201000 Vouchers Payable
202000 Accounts Payable
205100 Retainage Payable
208000 Due To Other Governmental Un
214000 Accrued Expenditure Payable
216000 Accrued Wages Payable
217000 Accrued Taxes Payable
220000 Deposits
223000 Deferred Revenue
223100 Deferred Revenue-PnG
Total Liabilities
Fund Balance:
305000 Fund Balance-Reserved for En
315000 Fund Balance-Unreserved
316000 Retained Earnings-Unreserved
Total Fund Balance (Deficit)
Total Liabilities and Fund Balance (Deficit)
Miami Total
Ballpark Emergency Special
Facilities Funds CD-Ship CD-Sect8 Revenue
-$ -$ -$ -$ 199,184$
587,088 2,149,225 785,796 186,317 108,354,865
- - - - 4,956,254
- - 31,816 - 8,655,654
- - - - (958,605)
- - - - 1,794
- - 154 (1) 25,375
- - - - 3,952
- - (664) (35) (67,343)
- - - - 25,041
- - - - (9,535)
- - - - (1,462)
587,088$ 2,149,225$ 817,102$ 186,282$ 121,185,173$
-$ -$ -$ -$ 3,595
- 1,535 - 3,065 1,228,547
- 3,182 - - 830,510
- - - - 656,545
- - - - -
- - - - 669,917
- - - - 140
- - - - 1,846,028
- - - - 668,524
- - - 837 76,339
- 4,716 - 3,902 5,980,145
2,437,877 17,749 0 295 15,813,541
(1,850,789) 2,126,759 817,102 182,085 128,890,532
- - - - (29,499,045)
587,088 2,144,508 817,102 182,380 115,205,028
587,088$ 2,149,225$ 817,102$ 186,282$ 121,185,173$
2 - 8

City of Miami
Combining Statement of Revenues, Expenditures
And Changes in Fund Balance
All Special Revenue Funds
Year to Date June 30, 2014
OMNI MIDTOWN
Budget Actual Variance Budget Actual Variance
Revenues:
Property Tax 29,797,300$ 10,906,630$ 18,890,670$ 3,365,777$ 3,365,826$ (49)$
Franchise and Other Taxes - - - - - -
Occupational Licenses and Permits - - - - - -
Fines and Forfeitures - - - - - -
Intergovernmental - 823,755 (823,755) - - -
Charges for Services - - - - 2 (2)
Interest - 72,873 (72,873) - - -
Impact Fees - - - - - -
Other - 14,500 (14,500) - - -
Total Revenues 29,797,300 11,817,757 17,979,543 3,365,777 3,365,828 (51)
Expenditures:
Personnel Expenses - 25,051 (25,051) - - -
Operating Expenses 4,012,400 3,898,059 114,341 3,361,645 3,333,659 27,986
Capital Expenses 16,501,200 3,236,773 13,264,427 - - -
Principal - - - - - -
Interest - - - - - -
Other Debt Service Costs - - - - - -
Grants in Aids 2,983,600 204,567 2,779,033 - - -
Advances - - - - - -
Other Financing Uses - - - - - -
Budget Reserve 100,000 - 100,000 - - -
Contingency Reserve - - - - - -
Other Uses - - - - - -
Total Expenditures 23,597,200 7,364,450 16,232,750 3,361,645 3,333,659 27,986
Revenues Over (Under) Expenditures 6,200,100 4,453,308 1,746,792 4,132 32,169 (28,037)
Other Financing Sources/(Uses)
Operating transfers in - - - - - -
Debt Proceeds including Re-financing - - - - - -
Operating transfers out (6,200,100) (1,253,596) (4,946,504) (4,132) - (4,132)
Total Other Financing Sources/(Uses) (6,200,100) (1,253,596) (4,946,504) (4,132) - (4,132)
Total Revenues Over/(Under) Expenditures -$ 3,199,712$ (3,199,712)$ -$ 32,169$ (32,169)$
2 - 9

City of Miami
Combining Statement of Revenues, Expenditures
And Changes in Fund Balance
All Special Revenue Funds
Year to Date June 30, 2014
Revenues:
Property Tax
Franchise and Other Taxes
Occupational Licenses and Permits
Fines and Forfeitures
Intergovernmental
Charges for Services
Interest
Impact Fees
Other
Total Revenues
Expenditures:
Personnel Expenses
Operating Expenses
Capital Expenses
Principal
Interest
Other Debt Service Costs
Grants in Aids
Advances
Other Financing Uses
Budget Reserve
Contingency Reserve
Other Uses
Total Expenditures
Revenues Over (Under) Expenditures
Other Financing Sources/(Uses)
Operating transfers in
Debt Proceeds including Re-financing
Operating transfers out
Total Other Financing Sources/(Uses)
Total Revenues Over/(Under) Expenditures
Community
SEOPW Development
Budget Actual Variance Budget Actual Variance
12,231,300$ 11,478,684$ 752,616$ -$ -$ -$
- - - - - -
- - - - - -
- - - - - -
80,200 695,036 (614,836) 50,527,800 24,240,025 26,287,775
- - - - 98,469 (98,469)
- 129,018 (129,018) - 5,122 (5,122)
- - - - - -
28,793,300 10,244,730 18,548,570 3,366,000 585,881 2,780,119
41,104,800 22,547,469 18,557,331 53,893,800 24,929,497 28,964,303
1,448,900 875,667 573,233 4,742,700 2,270,992 2,471,708
7,019,300 1,236,521 5,782,779 262,200 448,543 (186,343)
6,304,500 684,008 5,620,493 - 2,592,016 (2,592,016)
- - - - - -
- - - - - -
- - - - - -
26,070,300 3,618,082 22,452,218 50,848,600 19,441,503 31,407,097
- - - - - -
- - - - - -
356,500 - 356,500 - - -
- - - - - -
- - - - - -
41,199,500 6,414,277 34,785,223 55,853,500 24,753,053 31,100,447
(94,700) 16,133,192 (16,227,892) (1,959,700) 176,445 (2,136,145)
629,400 - 629,400 1,959,700 933,500 1,026,200
- - - - - -
(534,700) (440,059) (94,641) - - -
94,700 (440,059) 534,759 1,959,700 933,500 1,026,200
-$ 15,693,133$ (15,693,133)$ -$ 1,109,945$ (1,109,945)$
2 - 10

City of Miami
Combining Statement of Revenues, Expenditures
And Changes in Fund Balance
All Special Revenue Funds
Year to Date June 30, 2014
Revenues:
Property Tax
Franchise and Other Taxes
Occupational Licenses and Permits
Fines and Forfeitures
Intergovernmental
Charges for Services
Interest
Impact Fees
Other
Total Revenues
Expenditures:
Personnel Expenses
Operating Expenses
Capital Expenses
Principal
Interest
Other Debt Service Costs
Grants in Aids
Advances
Other Financing Uses
Budget Reserve
Contingency Reserve
Other Uses
Total Expenditures
Revenues Over (Under) Expenditures
Other Financing Sources/(Uses)
Operating transfers in
Debt Proceeds including Re-financing
Operating transfers out
Total Other Financing Sources/(Uses)
Total Revenues Over/(Under) Expenditures
Homeless Fire
Budget Actual Variance Budget Actual Variance
-$ -$ -$ -$ -$ -$
- - - - - -
- - - - - -
- - - - - -
1,716,026 1,034,982 681,044 15,542,683 13,406,241 2,136,442
- - - - 2,910 (2,910)
- - - - 317 (317)
- - - - - -
101,500 - 101,500 15,758,900 4,587 15,754,313
1,817,526 1,034,982 782,544 31,301,583 13,414,055 17,887,528
1,650,900 801,173 849,727 10,310,803 3,912,780 6,398,023
715,026 850,385 (135,359) 3,720,866 8,252,602 (4,531,736)
- - - 11,004,714 1,758,510 9,246,204
- - - - - -
- - - - - -
- - - - - -
- - - - 3,984 (3,984)
- - - - - -
- - - - - -
(161,600) - (161,600) 7,894,300 - 7,894,300
- - - - - -
- - - - - -
2,204,326 1,651,557 552,769 32,930,683 13,927,877 19,002,806
(386,800) (616,576) 229,776 (1,629,100) (513,821) (1,115,279)
386,800 187,000 199,800 1,629,100 - 1,629,100
- - - - - -
- - - - - -
386,800 187,000 199,800 1,629,100 - 1,629,100
-$ (429,576)$ 429,576$ -$ (513,821)$ 513,821$
2 - 11

City of Miami
Combining Statement of Revenues, Expenditures
And Changes in Fund Balance
All Special Revenue Funds
Year to Date June 30, 2014
Revenues:
Property Tax
Franchise and Other Taxes
Occupational Licenses and Permits
Fines and Forfeitures
Intergovernmental
Charges for Services
Interest
Impact Fees
Other
Total Revenues
Expenditures:
Personnel Expenses
Operating Expenses
Capital Expenses
Principal
Interest
Other Debt Service Costs
Grants in Aids
Advances
Other Financing Uses
Budget Reserve
Contingency Reserve
Other Uses
Total Expenditures
Revenues Over (Under) Expenditures
Other Financing Sources/(Uses)
Operating transfers in
Debt Proceeds including Re-financing
Operating transfers out
Total Other Financing Sources/(Uses)
Total Revenues Over/(Under) Expenditures
General Special Public
Revenue Facilities
Budget Actual Variance Budget Actual Variance
-$ -$ -$ -$ -$ -$
- - - - - -
- - - - - -
- - - - 20,363 (20,363)
830,100 635,426 194,674 - 65,113 (65,113)
- - - 7,132,300 4,987,710 2,144,590
- - - - - -
- - - - - -
134,700 - 134,700 225,000 383,222 (158,222)
964,800 635,426 329,374 7,357,300 5,456,408 1,900,892
25,300 17,197 8,103 492,500 463,732 28,768
903,600 412,003 491,597 3,805,800 1,935,800 1,870,000
26,900 (48,218) 75,118 - - -
- - - - - -
- - - - - -
- - - - - -
- - - - - -
- - - - - -
- (1,144) 1,144 - - -
9,000 - 9,000 150,000 - 150,000
- - - - - -
- - - - - -
964,800 379,839 584,961 4,448,300 2,399,532 2,048,768
- 255,587 (255,587) 2,909,000 3,056,876 (147,876)
- - - 3,410,200 3,106,200 304,000
- - - - - -
- - - (6,319,200) (5,984,386) (334,814)
- - - (2,909,000) (2,878,186) (30,814)
-$ 255,587$ (255,587)$ -$ 178,690$ (178,690)$
2 - 12

City of Miami
Combining Statement of Revenues, Expenditures
And Changes in Fund Balance
All Special Revenue Funds
Year to Date June 30, 2014
Revenues:
Property Tax
Franchise and Other Taxes
Occupational Licenses and Permits
Fines and Forfeitures
Intergovernmental
Charges for Services
Interest
Impact Fees
Other
Total Revenues
Expenditures:
Personnel Expenses
Operating Expenses
Capital Expenses
Principal
Interest
Other Debt Service Costs
Grants in Aids
Advances
Other Financing Uses
Budget Reserve
Contingency Reserve
Other Uses
Total Expenditures
Revenues Over (Under) Expenditures
Other Financing Sources/(Uses)
Operating transfers in
Debt Proceeds including Re-financing
Operating transfers out
Total Other Financing Sources/(Uses)
Total Revenues Over/(Under) Expenditures
Econ. Dev. & Code
Plan Services Enforcement
Budget Actual Variance Budget Actual Variance
-$ -$ -$ -$ -$ -$
- - - - - -
15,000 30,000 (15,000) - 197 (197)
- - - - 1,900 (1,900)
- - - - - -
1,350,400 680,976 669,424 300,000 209,835 90,165
- - - - 484 (484)
- - - - - -
6,012,200 - 6,012,200 2,462,100 500 2,461,600
7,377,600 710,976 6,666,624 2,762,100 212,916 2,549,184
399,500 29,787 369,713 - - -
- 4,500 (4,500) - 103,959 (103,959)
- - - 225,000 (6,750) 231,750
- - - - - -
- - - - - -
- - - - - -
- - - - - -
- - - - - -
- - - - - -
7,052,100 - 7,052,100 2,537,100 - 2,537,100
- - - - - -
- - - - - -
7,451,600 34,287 7,417,313 2,762,100 97,209 2,664,891
(74,000) 676,689 (750,689) - 115,707 (115,707)
74,000 747,456 (673,456) - - -
- - - - - -
- (325,000) 325,000 - - -
74,000 422,456 (348,456) - - -
-$ 1,099,145$ (1,099,145)$ -$ 115,707$ (115,707)$
2 - 13

City of Miami
Combining Statement of Revenues, Expenditures
And Changes in Fund Balance
All Special Revenue Funds
Year to Date June 30, 2014
Revenues:
Property Tax
Franchise and Other Taxes
Occupational Licenses and Permits
Fines and Forfeitures
Intergovernmental
Charges for Services
Interest
Impact Fees
Other
Total Revenues
Expenditures:
Personnel Expenses
Operating Expenses
Capital Expenses
Principal
Interest
Other Debt Service Costs
Grants in Aids
Advances
Other Financing Uses
Budget Reserve
Contingency Reserve
Other Uses
Total Expenditures
Revenues Over (Under) Expenditures
Other Financing Sources/(Uses)
Operating transfers in
Debt Proceeds including Re-financing
Operating transfers out
Total Other Financing Sources/(Uses)
Total Revenues Over/(Under) Expenditures
Parks Police
Budget Actual Variance Budget Actual Variance
-$ -$ -$ -$ -$ -$
- - - - - -
48,600 - 48,600 - - -
- - - - - -
1,477,900 738,747 739,153 6,667,691 2,085,340 4,582,351
216,400 181,825 34,575 766,000 215,842 550,158
- - - - 32,045 (32,045)
- - - - - -
2,297,800 509,964 1,787,836 13,416,200 - 13,416,200
4,040,700 1,430,537 2,610,163 20,849,891 2,333,227 18,516,664
1,180,700 1,055,698 125,002 9,144,838 3,393,744 5,751,094
1,424,600 670,456 754,144 2,170,031 703,278 1,466,753
404,600 22,736 381,864 1,232,122 196,390 1,035,732
- - - - - -
- - - - - -
- - - - - -
31,200 1,725 29,475 - - -
- - - - - -
- 437 (437) - - -
638,600 - 638,600 10,241,300 - 10,241,300
- - - - - -
- - - - - -
3,679,700 1,751,051 1,928,649 22,788,291 4,293,413 18,494,878
361,000 (320,514) 681,514 (1,938,400) (1,960,185) 21,785
139,000 - 139,000 2,408,400 179,521 2,228,879
- - - - - -
(500,000) (537,500) 37,500 (470,000) (350,000) (120,000)
(361,000) (537,500) 176,500 1,938,400 (170,479) 2,108,879
-$ (858,014)$ 858,014$ -$ (2,130,665)$ 2,130,665$
2 - 14

City of Miami
Combining Statement of Revenues, Expenditures
And Changes in Fund Balance
All Special Revenue Funds
Year to Date June 30, 2014
Revenues:
Property Tax
Franchise and Other Taxes
Occupational Licenses and Permits
Fines and Forfeitures
Intergovernmental
Charges for Services
Interest
Impact Fees
Other
Total Revenues
Expenditures:
Personnel Expenses
Operating Expenses
Capital Expenses
Principal
Interest
Other Debt Service Costs
Grants in Aids
Advances
Other Financing Uses
Budget Reserve
Contingency Reserve
Other Uses
Total Expenditures
Revenues Over (Under) Expenditures
Other Financing Sources/(Uses)
Operating transfers in
Debt Proceeds including Re-financing
Operating transfers out
Total Other Financing Sources/(Uses)
Total Revenues Over/(Under) Expenditures
Civil Investigative
LETF Panel
Budget Actual Variance Budget Actual Variance
-$ -$ -$ -$ -$ -$
- - - - - -
- - - - - -
1,290,900 510,213 780,687 - - -
- - - 564,000 - 564,000
- - - - - -
- 11,422 (11,422) - - -
- - - - - -
1,957,600 - 1,957,600 - - -
3,248,500 521,635 2,726,865 564,000 - 564,000
451,100 280,904 170,196 530,200 187,975 342,225
430,300 114,119 316,181 205,000 133,968 71,032
617,800 302,479 315,321 7,000 2,711 4,289
- - - - - -
- - - - - -
- - - - - -
300,800 100,800 200,000 - - -
- - - - - -
- - - - - -
1,448,500 - 1,448,500 - - -
- - - - - -
- - - - - -
3,248,500 798,303 2,450,197 742,200 324,654 417,546
- (276,668) 276,668 (178,200) (324,654) 146,454
- - - 178,200 - 178,200
- - - - - -
- - - - - -
- - - 178,200 - 178,200
-$ (276,668)$ 276,668$ -$ (324,654)$ 324,654$
2 - 15

City of Miami
Combining Statement of Revenues, Expenditures
And Changes in Fund Balance
All Special Revenue Funds
Year to Date June 30, 2014
Revenues:
Property Tax
Franchise and Other Taxes
Occupational Licenses and Permits
Fines and Forfeitures
Intergovernmental
Charges for Services
Interest
Impact Fees
Other
Total Revenues
Expenditures:
Personnel Expenses
Operating Expenses
Capital Expenses
Principal
Interest
Other Debt Service Costs
Grants in Aids
Advances
Other Financing Uses
Budget Reserve
Contingency Reserve
Other Uses
Total Expenditures
Revenues Over (Under) Expenditures
Other Financing Sources/(Uses)
Operating transfers in
Debt Proceeds including Re-financing
Operating transfers out
Total Other Financing Sources/(Uses)
Total Revenues Over/(Under) Expenditures
Public City
Works Clerk
Budget Actual Variance Budget Actual Variance
-$ -$ -$ -$ -$ -$
- - - - - -
- - - - - -
- - - - - -
- - - - - -
400,000 2,101,011 (1,701,011) 75,000 147,778 (72,778)
- 4,100 (4,100) - - -
- - - - - -
3,088,000 - 3,088,000 445,400 5,123 440,277
3,488,000 2,105,111 1,382,889 520,400 152,901 367,499
- - - 244,200 36,272 207,928
1,342,000 151,562 1,190,438 4,000 34,899 (30,899)
- - - - - -
- - - - - -
- - - - - -
- - - - - -
- - - - - -
- - - - - -
- - - - - -
2,146,000 - 2,146,000 415,100 - 415,100
- - - - - -
- - - - - -
3,488,000 151,562 3,336,438 663,300 71,171 592,129
- 1,953,549 (1,953,549) (142,900) 81,730 (224,630)
- - - 142,900 - 142,900
- - - - - -
- - - - - -
- - - 142,900 - 142,900
-$ 1,953,549$ (1,953,549)$ -$ 81,730$ (81,730)$
2 - 16

City of Miami
Combining Statement of Revenues, Expenditures
And Changes in Fund Balance
All Special Revenue Funds
Year to Date June 30, 2014
Revenues:
Property Tax
Franchise and Other Taxes
Occupational Licenses and Permits
Fines and Forfeitures
Intergovernmental
Charges for Services
Interest
Impact Fees
Other
Total Revenues
Expenditures:
Personnel Expenses
Operating Expenses
Capital Expenses
Principal
Interest
Other Debt Service Costs
Grants in Aids
Advances
Other Financing Uses
Budget Reserve
Contingency Reserve
Other Uses
Total Expenditures
Revenues Over (Under) Expenditures
Other Financing Sources/(Uses)
Operating transfers in
Debt Proceeds including Re-financing
Operating transfers out
Total Other Financing Sources/(Uses)
Total Revenues Over/(Under) Expenditures
Dept. Improve. Transp
Initiatives & Transit
Budget Actual Variance Budget Actual Variance
-$ -$ -$ -$ -$ -$
- - - - - -
- (3,272) 3,272 - - -
75,000 305,136 (230,136) - - -
1,567,900 963,289 604,611 14,275,100 7,639,237 6,635,863
- - - - - -
- 37,070 (37,070) - - -
- - - - - -
1,860,100 - 1,860,100 3,005,700 - 3,005,700
3,503,000 1,302,222 2,200,778 17,280,800 7,639,237 9,641,563
2,121,900 699,630 1,422,270 798,500 339,851 458,649
2,382,100 804,701 1,577,399 15,500 2,056,236 (2,040,736)
- 19,234 (19,234) 9,500 127,499 (117,999)
- - - - - -
- - - - - -
- - - - - -
554,200 17,701 536,499 - - -
- - - - - -
- - - - - -
125,500 - 125,500 5,751,000 - 5,751,000
- - - - - -
- - - - - -
5,183,700 1,541,266 3,642,434 6,574,500 2,523,586 4,050,914
(1,680,700) (239,044) (1,441,656) 10,706,300 5,115,651 5,590,649
1,680,700 890,200 790,500 - - -
- - - - - -
- (332,500) 332,500 (10,706,300) (11,206,200) 499,900
1,680,700 557,700 1,123,000 (10,706,300) (11,206,200) 499,900
-$ 318,656$ (318,656)$ -$ (6,090,549)$ 6,090,549$
2 - 17
City of Miami
Combining Statement of Revenues, Expenditures
And Changes in Fund Balance
All Special Revenue Funds
Year to Date June 30, 2014
Revenues:
Property Tax
Franchise and Other Taxes
Occupational Licenses and Permits
Fines and Forfeitures
Intergovernmental
Charges for Services
Interest
Impact Fees
Other
Total Revenues
Expenditures:
Personnel Expenses
Operating Expenses
Capital Expenses
Principal
Interest
Other Debt Service Costs
Grants in Aids
Advances
Other Financing Uses
Budget Reserve
Contingency Reserve
Other Uses
Total Expenditures
Revenues Over (Under) Expenditures
Other Financing Sources/(Uses)
Operating transfers in
Debt Proceeds including Re-financing
Operating transfers out
Total Other Financing Sources/(Uses)
Total Revenues Over/(Under) Expenditures
Liberty Virgina Key
City Beach Park
Budget Actual Variance Budget Actual Variance
-$ -$ -$ -$ -$ -$
- - - - - -
- - - - - -
- - - - - -
198,000 2,800 195,200 - - -
- - - 511,300 272,108 239,192
- 612 (612) - (70) 70
- - - - - -
130,000 4,830 125,170 10,000 156,796 (146,796)
328,000 8,242 319,758 521,300 428,834 92,466
149,100 100,336 48,764 283,500 183,788 99,712
35,900 23,846 12,054 209,700 141,406 68,294
- - - - - -
- - - - - -
- - - - - -
- - - - - -
- - - 28,100 - 28,100
- - - - - -
- - - - - -
143,000 - 143,000 - - -
- - - - - -
- - - - - -
328,000 124,182 203,818 521,300 325,193 196,107
- (115,941) 115,941 - 103,641 (103,641)
- - - - - -
- - - - - -
- - - - - -
- - - - - -
-$ (115,941)$ 115,941$ -$ 103,641$ (103,641)$
2 - 18

City of Miami
Combining Statement of Revenues, Expenditures
And Changes in Fund Balance
All Special Revenue Funds
Year to Date June 30, 2014
Revenues:
Property Tax
Franchise and Other Taxes
Occupational Licenses and Permits
Fines and Forfeitures
Intergovernmental
Charges for Services
Interest
Impact Fees
Other
Total Revenues
Expenditures:
Personnel Expenses
Operating Expenses
Capital Expenses
Principal
Interest
Other Debt Service Costs
Grants in Aids
Advances
Other Financing Uses
Budget Reserve
Contingency Reserve
Other Uses
Total Expenditures
Revenues Over (Under) Expenditures
Other Financing Sources/(Uses)
Operating transfers in
Debt Proceeds including Re-financing
Operating transfers out
Total Other Financing Sources/(Uses)
Total Revenues Over/(Under) Expenditures
Miami Ballpark Emergency
Parking Facilities Funds
Budget Actual Variance Budget Actual Variance
-$ -$ -$ -$ -$ -$
- - - - - -
- - - - - -
- - - - - -
- - - - 57,637 (57,637)
5,397,000 2,443,375 2,953,625 - - -
- - - - - -
- - - - - -
100,000 - 100,000 100,000 - 100,000
5,497,000 2,443,375 3,053,625 100,000 57,637 42,363
- - - - 26,836 (26,836)
2,872,300 684,423 2,187,877 - 42,104 (42,104)
- - - - - -
- - - - - -
- - - - - -
- - - - - -
- - - - - -
- - - - - -
- - - - - -
- - - 100,000 - 100,000
- - - - - -
- - - - - -
2,872,300 684,423 2,187,877 100,000 68,939 31,061
2,624,700 1,758,952 865,748 - (11,302) 11,302
- - - - - -
- - - - - -
(2,624,700) (2,624,700) - - - -
(2,624,700) (2,624,700) - - - -
-$ (865,748)$ 865,748$ -$ (11,302)$ 11,302$
2 - 19

City of Miami
Combining Statement of Revenues, Expenditures
And Changes in Fund Balance
All Special Revenue Funds
Year to Date June 30, 2014
Revenues:
Property Tax
Franchise and Other Taxes
Occupational Licenses and Permits
Fines and Forfeitures
Intergovernmental
Charges for Services
Interest
Impact Fees
Other
Total Revenues
Expenditures:
Personnel Expenses
Operating Expenses
Capital Expenses
Principal
Interest
Other Debt Service Costs
Grants in Aids
Advances
Other Financing Uses
Budget Reserve
Contingency Reserve
Other Uses
Total Expenditures
Revenues Over (Under) Expenditures
Other Financing Sources/(Uses)
Operating transfers in
Debt Proceeds including Re-financing
Operating transfers out
Total Other Financing Sources/(Uses)
Total Revenues Over/(Under) Expenditures
CD-Ship CD-Section8
Budget Actual Variance Budget Actual Variance
-$ -$ -$ -$ -$ -$
- - - - - -
- - - - - -
- - - - - -
- 705,165 (705,165) 1,850,000 1,310,906 539,094
- - - - - -
- 1,333 (1,333) - (31) 31
- - - - - -
246,700 49,154 197,546 - - -
246,700 755,652 (508,952) 1,850,000 1,310,875 539,125
- 29,711 (29,711) 147,600 77,738 69,862
- 1,000 (1,000) 2,400 4,133 (1,733)
- - - - - -
- - - - - -
- - - - - -
- - - - - -
246,700 123,124 123,576 1,700,000 1,364,040 335,960
- - - - - -
- - - - - -
- - - - - -
- - - - - -
- - - - - -
246,700 153,835 92,865 1,850,000 1,445,911 404,089
- 601,817 (601,817) - (135,036) 135,036
- - - - - -
- - - - - -
- - - - - -
- - - - - -
-$ 601,817$ (601,817)$ -$ (135,036)$ 135,036$
2 - 20

City of Miami
Combining Statement of Revenues, Expenditures
And Changes in Fund Balance
All Special Revenue Funds
Year to Date June 30, 2014
Revenues:
Property Tax
Franchise and Other Taxes
Occupational Licenses and Permits
Fines and Forfeitures
Intergovernmental
Charges for Services
Interest
Impact Fees
Other
Total Revenues
Expenditures:
Personnel Expenses
Operating Expenses
Capital Expenses
Principal
Interest
Other Debt Service Costs
Grants in Aids
Advances
Other Financing Uses
Budget Reserve
Contingency Reserve
Other Uses
Total Expenditures
Revenues Over (Under) Expenditures
Other Financing Sources/(Uses)
Operating transfers in
Debt Proceeds including Re-financing
Operating transfers out
Total Other Financing Sources/(Uses)
Total Revenues Over/(Under) Expenditures
Total Special Revenues
Budget Actual Variance
45,394,377$ 25,751,140$ 19,643,237$
- - -
63,600 26,924 36,676
1,365,900 837,612 528,288
95,297,400 54,403,699 40,893,701
16,148,400 11,341,841 4,806,559
- 294,295 (294,295)
- - -
83,511,200 11,959,287 71,551,913
241,780,877 104,614,798 137,166,079
34,122,241 14,808,862 19,313,379
34,894,668 26,042,162 8,852,506
36,333,336 8,887,388 27,445,948
- - -
- - -
- - -
82,763,500 24,875,524 57,887,976
- - -
- (707) 707
38,946,400 - 38,946,400
- - -
- - -
227,060,145 74,613,228 152,446,917
14,720,732 30,001,571 (15,280,839)
12,638,400 6,043,877 6,594,523
- - -
(27,359,132) (23,053,941) (4,305,191)
(14,720,732) (17,010,064) 2,289,332
-$ 12,991,506$ (12,991,506)$
2 - 21

Section 3 –
Debt Service Funds
Financial Update – Debt Service Funds
Combining Balance Sheet – Summary
Combining Balance Sheet – Detail
Combining Statement of Revenues, Expenditures, and
Changes in Fund Balance

3 - 1
Financial Update - Debt Service Funds
Fiscal Year 2014 – For the Month of June
The City of Miami has General Obligation, Special Obligation and Loans
outstanding as of June 30, 2014.
These can be broken down as follows:
Outstanding Debt
Loans
0%
Special
Obligation 66%
General
Obligation 34%
Type Outstanding Debt %
General Obligation $ 222,118,253 34%
Special Obligation 429,449,407 66%
Loans 1,708,864 0%
TOTAL $ 653,276,524 100%

City of Miami
Combining Balance Sheet - Summary
All Debt Funds
As of June 30, 2014
General Special CRA Other Total
Obligation Obligation Special Debt
Bonds Bonds Obligation Service
Assets
103000 Cash With Fiscal Agent 5,916,281$ 17,041,015$ -$ 22,957,296$
104000 Equity In Pooled Cash 7,144,350 6,346,008 - 13,490,358
104001 Equity In Pooled Cash-Restri - 20,950,982 - 20,950,982
115000 Accounts Receivable 512,463 - - 512,463
128900 Notes Receivable-Non-Current - 17,781,187 - 17,781,187
133000 Due From Other Governmental - - - -
Total Assets 13,573,095$ 62,119,192$ -$ 75,692,287$
Liabilities and Fund Balance
Liabilities:
202000 Accounts Payable -$ -$ -$ -$
223000 Deferred Revenue 512,463 17,781,187 - 18,293,650
Total Liabilities 512,463 17,781,187 - 18,293,650
Fund Balance (Deficit)
305000 Fund Balance-Reserved for En - - - -
315000 Fund Balance-Unreserved 13,060,631 44,338,005 - 57,398,637
Total Fund Balance (Deficit) 13,060,631 44,338,005 - 57,398,637
Total Liabilities and Fund Balance 13,573,095$ 62,119,192$ -$ 75,692,287$
3 - 2
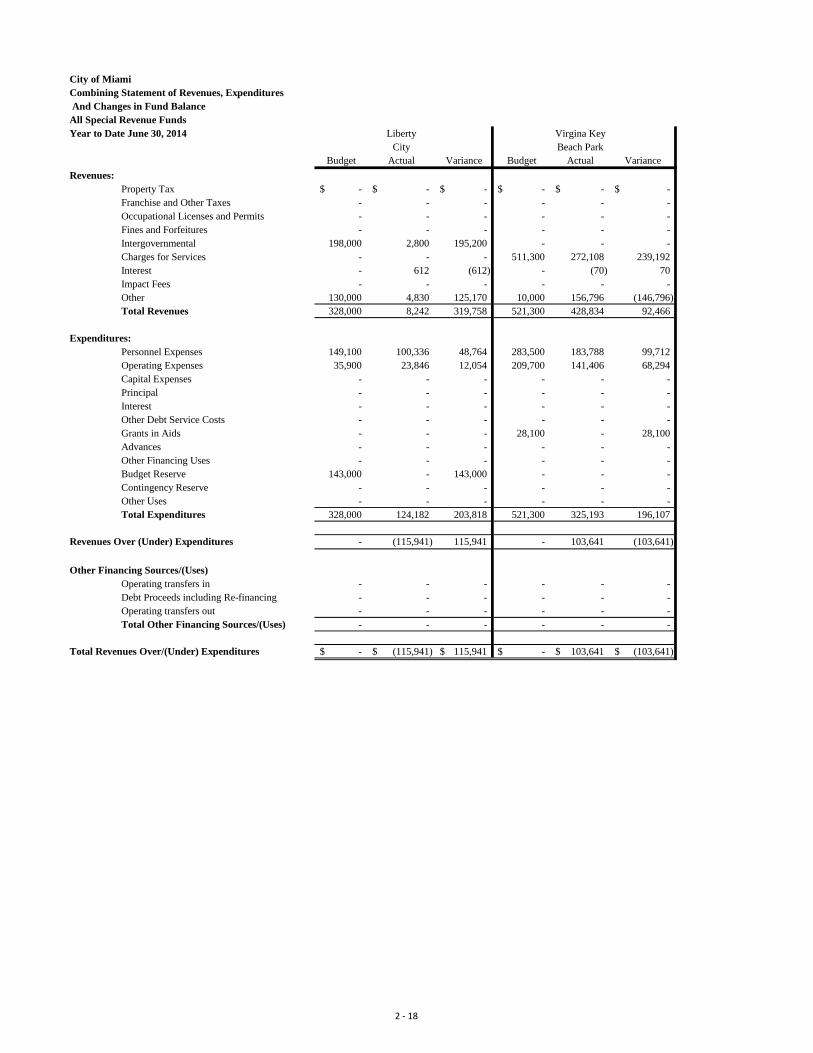
City of Miami
Combining Balance Sheet - Detail
All Debt Funds
As of June 30, 2014
GOB Total SOB
2002 GOB GOB Refinance
HD Various Funds 2002A
Assets
103000 Cash With Fiscal Agent -$ 5,916,281$ 5,916,281 247,988$
104000 Equity In Pooled Cash 246,967 6,897,383 7,144,350 2,729,144
104001 Equity In Pooled Cash-Restri - - - -
115000 Accounts Receivable - 512,463 512,463 -
128900 Notes Receivable-Non-Current - - - -
133000 Due From Other Governmental - - - -
Total Assets 246,967$ 13,326,128$ 13,573,095$ 2,977,132$
Liabilities and Fund Balance
Liabilities:
202000 Accounts Payable -$ -$ -$ -$
223000 Deferred Revenue - 512,463 512,463 -
Total Liabilities - 512,463 512,463 -
Fund Balance (Deficit)
305000 Fund Balance-Reserved for En - - - -
315000 Fund Balance-Unreserved 246,967 12,813,664 13,060,631 2,977,132
Total Fund Balance (Deficit) 246,967 12,813,664 13,060,631 2,977,132
Total Liabilities and Fund Balance 246,967$ 13,326,128$ 13,573,095$ 2,977,132$
3 - 3

City of Miami
Combining Balance Sheet - Detail
All Debt Funds
As of June 30, 2014
Assets
103000 Cash With Fiscal Agent
104000 Equity In Pooled Cash
104001 Equity In Pooled Cash-Restri
115000 Accounts Receivable
128900 Notes Receivable-Non-Current
133000 Due From Other Governmental
Total Assets
Liabilities and Fund Balance
Liabilities:
202000 Accounts Payable
223000 Deferred Revenue
Total Liabilities
Fund Balance (Deficit)
305000 Fund Balance-Reserved for En
315000 Fund Balance-Unreserved
Total Fund Balance (Deficit)
Total Liabilities and Fund Balance
SOB SOB Series 2007 SOB SOB
Refinance Str & Sidewalks Parking Garage Parking Garage
2002C Improvement 2010A 2010B
113,292$ 4,779,936$ 2,201,681$ 610,608$
(113,150) 3,502,184 1,242,150 (26,691)
2,694,450 5,870,698 4,028,023 801,888
- - - -
- - - -
- - - -
2,694,591$ 14,152,818$ 7,471,854$ 1,385,805$
-$ -$ -$ -$
- - - -
- - - -
- - - -
2,694,591 14,152,818 7,471,854 1,385,805
2,694,591 14,152,818 7,471,854 1,385,805
2,694,591$ 14,152,818$ 7,471,854$ 1,385,805$
3 - 4

City of Miami
Combining Balance Sheet - Detail
All Debt Funds
As of June 30, 2014
Assets
103000 Cash With Fiscal Agent
104000 Equity In Pooled Cash
104001 Equity In Pooled Cash-Restri
115000 Accounts Receivable
128900 Notes Receivable-Non-Current
133000 Due From Other Governmental
Total Assets
Liabilities and Fund Balance
Liabilities:
202000 Accounts Payable
223000 Deferred Revenue
Total Liabilities
Fund Balance (Deficit)
305000 Fund Balance-Reserved for En
315000 Fund Balance-Unreserved
Total Fund Balance (Deficit)
Total Liabilities and Fund Balance
SOB SOB SOB SOB
Miami Tunnel Jungle Isd 1987 JLK Bonds
2012 Loan Convention 10/02 - 9/05
-$ -$ 6,095,740$ 21,273$
26,641 - - 1,943,059
2,149,075 - - 1,750,975
- - - -
- 17,781,187 - -
- - - -
2,175,716$ 17,781,187$ 6,095,740$ 3,715,307$
-$ -$ -$ -$
- 17,781,187 - -
- 17,781,187 - -
- - - -
2,175,716 - 6,095,740 3,715,307
2,175,716 - 6,095,740 3,715,307
2,175,716$ 17,781,187$ 6,095,740$ 3,715,307$
3 - 5

City of Miami
Combining Balance Sheet - Detail
All Debt Funds
As of June 30, 2014
Assets
103000 Cash With Fiscal Agent
104000 Equity In Pooled Cash
104001 Equity In Pooled Cash-Restri
115000 Accounts Receivable
128900 Notes Receivable-Non-Current
133000 Due From Other Governmental
Total Assets
Liabilities and Fund Balance
Liabilities:
202000 Accounts Payable
223000 Deferred Revenue
Total Liabilities
Fund Balance (Deficit)
305000 Fund Balance-Reserved for En
315000 Fund Balance-Unreserved
Total Fund Balance (Deficit)
Total Liabilities and Fund Balance
SOB Total Total
Pension & SOB SOB Debt
Comp Abs Funds CRA Service
2,970,498$ 17,041,015$ -$ 22,957,296$
(2,957,329) 6,346,008 - 13,490,358
3,655,873 20,950,982 - 20,950,982
- - - 512,463
- 17,781,187 - 17,781,187
- - - -
3,669,042$ 62,119,192$ -$ 75,692,287$
-$ -$ -$ -$
- 17,781,187 - 18,293,650
- 17,781,187 - 18,293,650
- - - -
3,669,042 44,338,005 - 57,398,637
3,669,042 44,338,005 - 57,398,637
3,669,042$ 62,119,192$ -$ 75,692,287$
3 - 6

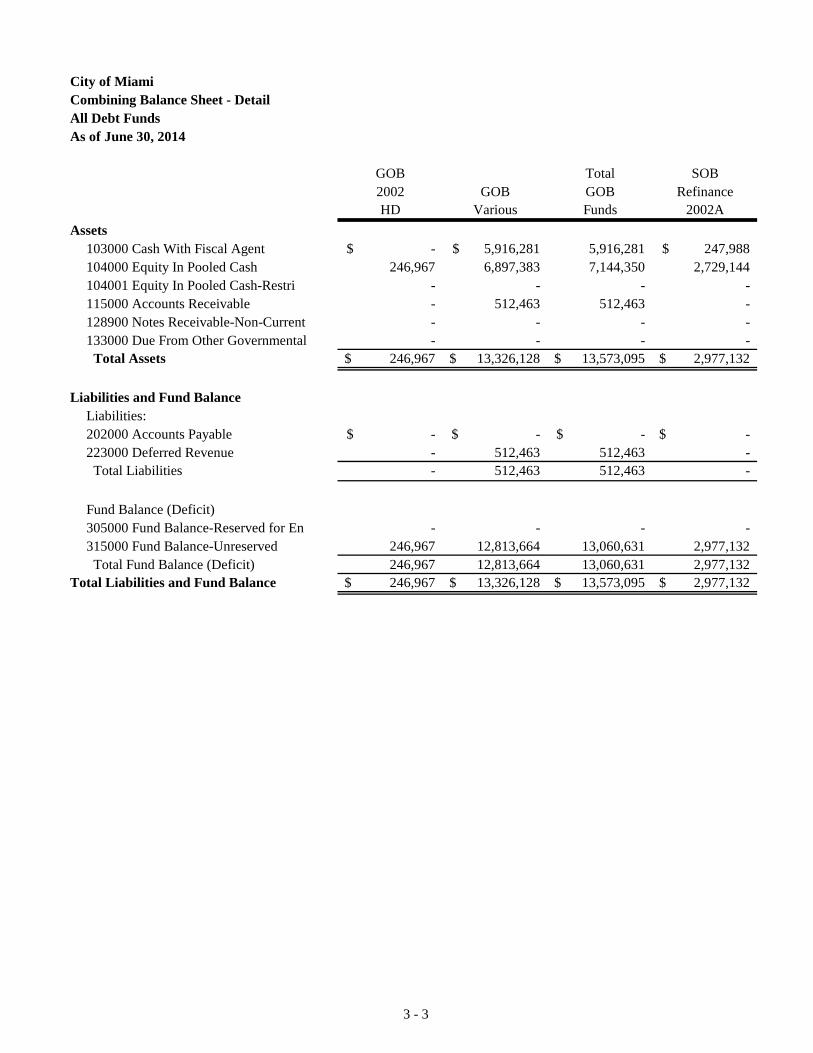
City of Miami
Combining Statement of Revenues, Expenditures
And Changes in Fund Balance - Summary
All Debt Funds
As of June 30, 2014
General Obligation Special Obligation
Bonds Bonds
Budget Actual Variance Budget Actual Variance
Revenues:
Property Tax 25,382,800.00$ 24,704,146.53$ 678,653$ -$ -$ -$
Franchise and Other Taxes - - - - - -
Occupational Licenses and Permits - - - - - -
Fines and Forfeitures - - - - - -
Intergovernmental - - - 3,000,000 2,000,000 1,000,000
Charges for Services - - - - - -
Interest - 17 (17) - 231 (231)
Impact Fees - - - - - -
Other 1,099,100 - 1,099,100 - - -
Total Revenues 26,481,900 24,704,163 1,777,737 3,000,000 2,000,231 999,769
Expenditures:
Personnel Expenses - - - - - -
Operating Expenses 208,500 9,508 198,992 6,500 - 6,500
Capital Expenses - - - - - -
Principal 11,592,600 6,852,519 4,740,082 12,861,200 10,256,160 2,605,040
Interest 13,780,800 8,370,871 5,409,929 38,286,500 18,869,459 19,417,041
Other Debt Service Costs - - - - - -
Grants in Aids - - - - - -
Advances - - - - - -
Other Financing Uses - - - - - -
Budget Reserve 900,000 - 900,000 - - -
Contingency Reserve - - - - - -
Other Uses - - - - - -
Total Expenditures 26,481,900 15,232,898 11,249,002 51,154,200 29,125,619 22,028,581
Revenues Over (Under) Expenditures - 9,471,266 (9,471,266) (48,154,200) (27,125,388) (21,028,812)
Other Financing Sources/(Uses):
Operating transfers in - - - 48,154,200 36,704,668 11,449,532
Debt Proceeds including Re-financing - - - - - -
Operating transfers out - - - - - -
Total Other Financing Sources/(Uses) - - - 48,154,200 36,704,668 11,449,532
Total Revenues Over/(Under) Expenditures -$ 9,471,266$ (9,471,266)$ -$ 9,579,280$ (9,579,280)$
3 - 7

City of Miami
Combining Statement of Revenues, Expenditures
And Changes in Fund Balance - Summary
All Debt Funds
As of June 30, 2014
Revenues:
Property Tax
Franchise and Other Taxes
Occupational Licenses and Permits
Fines and Forfeitures
Intergovernmental
Charges for Services
Interest
Impact Fees
Other
Total Revenues
Expenditures:
Personnel Expenses
Operating Expenses
Capital Expenses
Principal
Interest
Other Debt Service Costs
Grants in Aids
Advances
Other Financing Uses
Budget Reserve
Contingency Reserve
Other Uses
Total Expenditures
Revenues Over (Under) Expenditures
Other Financing Sources/(Uses):
Operating transfers in
Debt Proceeds including Re-financing
Operating transfers out
Total Other Financing Sources/(Uses)
Total Revenues Over/(Under) Expenditures
Total Debt Service
Budget Actual Variance
25,382,800$ 24,704,147$ 678,653$
- - -
- - -
- - -
3,000,000 2,000,000 1,000,000
- - -
- 247 (247)
- - -
1,099,100 - 1,099,100
29,481,900 26,704,394 2,777,506
- - -
215,000 9,508 205,492
- - -
24,453,800 17,108,679 7,345,122
52,067,300 27,240,329 24,826,971
- - -
- - -
- - -
- - -
900,000 - 900,000
- - -
- - -
77,636,100 44,358,516 33,277,584
(48,154,200) (17,654,122) (30,500,078)
48,154,200 36,704,668 11,449,532
- - -
- - -
48,154,200 36,704,668 11,449,532
-$ 19,050,546$ (19,050,546)$
3 - 8

City of Miami
Combining Statement of Revenues, Expenditures
And Changes in Fund Balance - Detail
All Debt Funds
As of June 30, 2014 GOB 2007A Refunding GOB 2007B HD2
Budget Actual Variance Budget Actual Variance
Revenues:
Property Tax 5,242,700$ 2,702,950$ 2,539,750$ 2,499,600$ 1,249,784$ 1,249,815.62$
Franchise and Other Taxes - - - - - -
Occupational Licenses and Permits - - - - - -
Fines and Forfeitures - - - - - -
Intergovernmental - - - - - -
Charges for Services - - - - - -
Interest - - - - - -
Impact Fees - - - - - -
Other - - - - - -
Total Revenues 5,242,700 2,702,950 2,539,750 2,499,600 1,249,784 1,249,816
Expenditures:
Personnel Expenses - - - - - -
Operating Expenses - - - - - -
Capital Expenses - - - - - -
Principal 160,000 160,000 - - - -
Interest 5,082,700 2,542,950 2,539,750 2,499,600 1,249,784 1,249,816
Other Debt Service Costs - - - - - -
Grants in Aids - - - - - -
Advances - - - - - -
Other Financing Uses - - - - - -
Budget Reserve - - - - - -
Contingency Reserve - - - - - -
Other Uses - - - - - -
Total Expenditures 5,242,700 2,702,950 2,539,750 2,499,600 1,249,784 1,249,816
Revenues Over (Under) Expenditures - - - - - -
Other Financing Sources/(Uses)
Operating transfers in - - - - - -
Debt Proceeds including Re-financing - - - - - -
Operating transfers out - - - - - -
Total Other Financing Sources/(Uses) - - - - - -
Total Revenues Over/(Under) Expenditures -$ -$ -$ -$ -$ -$
3 - 9

City of Miami
Combining Statement of Revenues, Expenditures
And Changes in Fund Balance - Detail
All Debt Funds
As of June 30, 2014
Revenues:
Property Tax
Franchise and Other Taxes
Occupational Licenses and Permits
Fines and Forfeitures
Intergovernmental
Charges for Services
Interest
Impact Fees
Other
Total Revenues
Expenditures:
Personnel Expenses
Operating Expenses
Capital Expenses
Principal
Interest
Other Debt Service Costs
Grants in Aids
Advances
Other Financing Uses
Budget Reserve
Contingency Reserve
Other Uses
Total Expenditures
Revenues Over (Under) Expenditures
Other Financing Sources/(Uses)
Operating transfers in
Debt Proceeds including Re-financing
Operating transfers out
Total Other Financing Sources/(Uses)
Total Revenues Over/(Under) Expenditures
GOB 2002 HD GOB 2009 HD3
Budget Actual Variance Budget Actual Variance
7,331,700$ 7,130,796$ 200,904$ 3,508,400$ 2,419,944$ 1,088,456$
- - - - - -
- - - - - -
- - - - - -
- - - - - -
- - - - - -
- - - - - -
- - - - - -
- - - - - -
7,331,700 7,130,796 200,904 3,508,400 2,419,944 1,088,456
- - - - - -
- - - - - -
- - - - - -
4,022,600 4,022,519 82 1,305,000 1,305,000 -
3,309,100 3,108,277 200,823 2,203,400 1,114,944 1,088,456
- - - - - -
- - - - - -
- - - - - -
- - - - - -
- - - - - -
- - - - - -
- - - - - -
7,331,700 7,130,796 200,904 3,508,400 2,419,944 1,088,456
- - - - - -
- - - - - -
- - - - - -
- - - - - -
- - - - - -
-$ -$ -$ -$ -$ -$
3 - 10

City of Miami
Combining Statement of Revenues, Expenditures
And Changes in Fund Balance - Detail
All Debt Funds
As of June 30, 2014
Revenues:
Property Tax
Franchise and Other Taxes
Occupational Licenses and Permits
Fines and Forfeitures
Intergovernmental
Charges for Services
Interest
Impact Fees
Other
Total Revenues
Expenditures:
Personnel Expenses
Operating Expenses
Capital Expenses
Principal
Interest
Other Debt Service Costs
Grants in Aids
Advances
Other Financing Uses
Budget Reserve
Contingency Reserve
Other Uses
Total Expenditures
Revenues Over (Under) Expenditures
Other Financing Sources/(Uses)
Operating transfers in
Debt Proceeds including Re-financing
Operating transfers out
Total Other Financing Sources/(Uses)
Total Revenues Over/(Under) Expenditures
GOB Various GOB Total
Budget Actual Variance Budget Actual Variance
6,800,400$ 11,200,673$ (4,400,273)$ 25,382,800$ 24,704,147$ 678,653$
- - - - - -
- - - - - -
- - - - - -
- - - - - -
- - - - - -
- 17 (17) - 16.92 (17)
- - - - - -
1,099,100 - 1,099,100 1,099,100 - 1,099,100
7,899,500 11,200,690 (3,301,190) 26,481,900 24,704,163 1,777,737
- - - - - -
208,500 9,508 198,992 208,500 9,508 198,992
- - - - - -
6,105,000 1,365,000 4,740,000 11,592,600 6,852,519 4,740,082
686,000 354,916 331,084 13,780,800 8,370,871 5,409,929
- - - - - -
- - - - - -
- - - - - -
- - - - - -
900,000 - 900,000 900,000 - 900,000
- - - - - -
- - - - - -
7,899,500 1,729,424 6,170,076 26,481,900 15,232,898 11,249,002
- 9,471,266 (9,471,266) - 9,471,266 (9,471,266)
- - - - - -
- - - - - -
- - - - - -
- - - - - -
-$ 9,471,266$ (9,471,266)$ -$ 9,471,266$ (9,471,266)$
3 - 11

City of Miami
Combining Statement of Revenues, Expenditures
And Changes in Fund Balance - Detail
All Debt Funds
As of June 30, 2014
Revenues:
Property Tax
Franchise and Other Taxes
Occupational Licenses and Permits
Fines and Forfeitures
Intergovernmental
Charges for Services
Interest
Impact Fees
Other
Total Revenues
Expenditures:
Personnel Expenses
Operating Expenses
Capital Expenses
Principal
Interest
Other Debt Service Costs
Grants in Aids
Advances
Other Financing Uses
Budget Reserve
Contingency Reserve
Other Uses
Total Expenditures
Revenues Over (Under) Expenditures
Other Financing Sources/(Uses)
Operating transfers in
Debt Proceeds including Re-financing
Operating transfers out
Total Other Financing Sources/(Uses)
Total Revenues Over/(Under) Expenditures
SOB Refinance 2002A SOB Refinance 2002C
Budget Actual Variance Budget Actual Variance
-$ -$ -$ -$ -$ -$
- - - - - -
- - - - - -
- - - - - -
- - - - - -
- - - - - -
- 5 (5) - - -
- - - - - -
- - - - - -
- 5 (5) - - -
- - - - - -
- - - - - -
- - - - - -
2,605,000 - 2,605,000 2,195,000 2,195,000 -
744,000 371,976 372,024 454,400 454,350 50
- - - - - -
- - - - - -
- - - - - -
- - - - - -
- - - - - -
- - - - - -
- - - - - -
3,349,000 371,976 2,977,024 2,649,400 2,649,350 50
(3,349,000) (371,970) (2,977,030) (2,649,400) (2,649,350) (50)
3,349,000 3,349,000 - 2,649,400 2,649,400 -
- - - - - -
- - - - - -
3,349,000 3,349,000 - 2,649,400 2,649,400 -
-$ 2,977,030 (2,977,030) -$ 50$ (50)$
3 - 12

City of Miami
Combining Statement of Revenues, Expenditures
And Changes in Fund Balance - Detail
All Debt Funds
As of June 30, 2014
Revenues:
Property Tax
Franchise and Other Taxes
Occupational Licenses and Permits
Fines and Forfeitures
Intergovernmental
Charges for Services
Interest
Impact Fees
Other
Total Revenues
Expenditures:
Personnel Expenses
Operating Expenses
Capital Expenses
Principal
Interest
Other Debt Service Costs
Grants in Aids
Advances
Other Financing Uses
Budget Reserve
Contingency Reserve
Other Uses
Total Expenditures
Revenues Over (Under) Expenditures
Other Financing Sources/(Uses)
Operating transfers in
Debt Proceeds including Re-financing
Operating transfers out
Total Other Financing Sources/(Uses)
Total Revenues Over/(Under) Expenditures
SOB Street & SOB
Sidewalks Improv Parking Garage 2010A
Budget Actual Variance Budget Actual Variance
-$ -$ -$ -$ -$ -$
- - - - - -
- - - - - -
- - - - - -
- - - 2,160,000 1,440,000 720,000
- - - - - -
- 224 (224) - - -
- - - - - -
- - - - - -
- 224 (224) 2,160,000 1,440,000 720,000
- - - - - -
- - - - - -
- - - - - -
2,660,000 2,660,000 - - - -
6,847,700 3,455,438 3,392,262 4,403,400 2,201,681 2,201,719
- - - - - -
- - - - - -
- - - - - -
- - - - - -
- - - - - -
- - - - - -
- - - - - -
9,507,700 6,115,438 3,392,262 4,403,400 2,201,681 2,201,719
(9,507,700) (6,115,214) (3,392,486) (2,243,400) (761,681) (1,481,719)
9,507,700 9,507,700 - 2,243,400 2,243,400 -
- - - - - -
- - - - - -
9,507,700 9,507,700 - 2,243,400 2,243,400 -
-$ 3,392,486$ (3,392,486)$ -$ 1,481,719$ (1,481,719)$
3 - 13

City of Miami
Combining Statement of Revenues, Expenditures
And Changes in Fund Balance - Detail
All Debt Funds
As of June 30, 2014
Revenues:
Property Tax
Franchise and Other Taxes
Occupational Licenses and Permits
Fines and Forfeitures
Intergovernmental
Charges for Services
Interest
Impact Fees
Other
Total Revenues
Expenditures:
Personnel Expenses
Operating Expenses
Capital Expenses
Principal
Interest
Other Debt Service Costs
Grants in Aids
Advances
Other Financing Uses
Budget Reserve
Contingency Reserve
Other Uses
Total Expenditures
Revenues Over (Under) Expenditures
Other Financing Sources/(Uses)
Operating transfers in
Debt Proceeds including Re-financing
Operating transfers out
Total Other Financing Sources/(Uses)
Total Revenues Over/(Under) Expenditures
SOB SOB
Parking Garage 2010B Miami Tunnel 2012
Budget Actual Variance Budget Actual Variance
-$ -$ -$ -$ -$ -$
- - - - - -
- - - - - -
- - - - - -
840,000 560,000 280,000 - - -
- - - - - -
- - - - - -
- - - - - -
- - - - - -
840,000 560,000 280,000 - - -
- - - - - -
- - - - - -
- - - - - -
- - - - - -
1,221,300 610,608 610,692 2,148,200 1,074,075 1,074,125
- - - - - -
- - - - - -
- - - - - -
- - - - - -
- - - - -
- - - - - -
- - - - - -
1,221,300 610,608 610,692 2,148,200 1,074,075 1,074,125
(381,300) (50,608) (330,692) (2,148,200) (1,074,075) (1,074,125)
381,300 381,300 - 2,148,200 1,074,075 1,074,125
- - - - - -
- - - - - -
381,300 381,300 - 2,148,200 1,074,075 1,074,125
-$ 330,692$ (330,692)$ -$ -$ -$
3 - 14

City of Miami
Combining Statement of Revenues, Expenditures
And Changes in Fund Balance - Detail
All Debt Funds
As of June 30, 2014
Revenues:
Property Tax
Franchise and Other Taxes
Occupational Licenses and Permits
Fines and Forfeitures
Intergovernmental
Charges for Services
Interest
Impact Fees
Other
Total Revenues
Expenditures:
Personnel Expenses
Operating Expenses
Capital Expenses
Principal
Interest
Other Debt Service Costs
Grants in Aids
Advances
Other Financing Uses
Budget Reserve
Contingency Reserve
Other Uses
Total Expenditures
Revenues Over (Under) Expenditures
Other Financing Sources/(Uses)
Operating transfers in
Debt Proceeds including Re-financing
Operating transfers out
Total Other Financing Sources/(Uses)
Total Revenues Over/(Under) Expenditures
SOB 1987 JLK SOB Bonds
Convention 10/02-9/05
Budget Actual Variance Budget Actual Variance
-$ -$ -$ -$ -$ -$
- - - - - -
- - - - - -
- - - - - -
- - - - - -
- - - - - -
- - - - 2 (2)
- - - - - -
- - - - - -
- - - - 2 (2)
- - - - - -
- - - - - -
- - - - - -
731,200 731,160 40 - - -
4,816,200 4,816,176 24 13,709,000 1,942,999 11,766,001
- - - - - -
- - - - - -
- - - - - -
- - - - - -
- - - - - -
- - - - - -
- - - - - -
5,547,400 5,547,336 64 13,709,000 1,942,999 11,766,001
(5,547,400) (5,547,336) (64) (13,709,000) (1,942,998) (11,766,002)
5,547,400 4,994,993 552,407 13,709,000 3,886,000 9,823,000
- - - - - -
- - - - - -
5,547,400 4,994,993 552,407 13,709,000 3,886,000 9,823,000
-$ (552,343)$ 552,343$ -$ 1,943,002$ (1,943,002)$
3 - 15

City of Miami
Combining Statement of Revenues, Expenditures
And Changes in Fund Balance - Detail
All Debt Funds
As of June 30, 2014
Revenues:
Property Tax
Franchise and Other Taxes
Occupational Licenses and Permits
Fines and Forfeitures
Intergovernmental
Charges for Services
Interest
Impact Fees
Other
Total Revenues
Expenditures:
Personnel Expenses
Operating Expenses
Capital Expenses
Principal
Interest
Other Debt Service Costs
Grants in Aids
Advances
Other Financing Uses
Budget Reserve
Contingency Reserve
Other Uses
Total Expenditures
Revenues Over (Under) Expenditures
Other Financing Sources/(Uses)
Operating transfers in
Debt Proceeds including Re-financing
Operating transfers out
Total Other Financing Sources/(Uses)
Total Revenues Over/(Under) Expenditures
SOB Pensions
& Comp Absences SOB Total
Budget Actual Variance Budget Actual Variance
-
-$ -$ -$ - - -
- - - - - -
- - - - - -
- - - - - -
- - - 3,000,000 2,000,000 1,000,000
- - - - - -
- - - - 231 (231)
- - - - - -
- - - - - -
- - - 3,000,000 2,000,231 999,769
- - - - - -
6,500 - 6,500 6,500 - 6,500
- - - - - -
4,670,000 4,670,000 - 12,861,200 10,256,160 2,605,040
3,942,300 3,942,156 144 38,286,500 18,869,459 19,417,041
- - - - - -
- - - - - -
- - - - - -
- - - - - -
- - - - - -
- - - - - -
- - - - - -
8,618,800 8,612,156 6,644 51,154,200 29,125,619 22,028,581
(8,618,800) (8,612,156) (6,644) (48,154,200) (27,125,388) (21,028,812)
8,618,800 8,618,800 - 48,154,200 36,704,668 11,449,532
- - - - - -
- - - - - -
8,618,800 8,618,800 - 48,154,200 36,704,668 11,449,532
-$ 6,644$ (6,644)$ -$ 9,579,280$ (9,579,280)$
3 - 16
City of Miami
Combining Statement of Revenues, Expenditures
And Changes in Fund Balance - Detail
All Debt Funds
As of June 30, 2014
Revenues:
Property Tax
Franchise and Other Taxes
Occupational Licenses and Permits
Fines and Forfeitures
Intergovernmental
Charges for Services
Interest
Impact Fees
Other
Total Revenues
Expenditures:
Personnel Expenses
Operating Expenses
Capital Expenses
Principal
Interest
Other Debt Service Costs
Grants in Aids
Advances
Other Financing Uses
Budget Reserve
Contingency Reserve
Other Uses
Total Expenditures
Revenues Over (Under) Expenditures
Other Financing Sources/(Uses)
Operating transfers in
Debt Proceeds including Re-financing
Operating transfers out
Total Other Financing Sources/(Uses)
Total Revenues Over/(Under) Expenditures
Total Debt Service
Budget Actual Variance
25,382,800.00$ 24,704,146.53$ 678,653$
- - -
- - -
- - -
3,000,000 2,000,000 1,000,000.00
- - -
- 247 (247.49)
- - -
1,099,100 - 1,099,100.00
29,481,900 26,704,394 2,777,506
- - -
215,000 9,508 205,492
- - -
24,453,800 17,108,679 7,345,122
52,067,300 27,240,329 24,826,971
- - -
- - -
- - -
- - -
900,000 - 900,000
- - -
- - -
77,636,100 44,358,516 33,277,584
(48,154,200) (17,654,122) (30,500,078)
48,154,200 36,704,668 11,449,532
- - -
- - -
48,154,200 36,704,668 11,449,532
-$ 19,050,546$ (19,050,546)$
3 - 17

Section 4 –
Capital Project Funds
Financial Update – Capital Project Funds
Combining Balance Sheet
Combining Statement of Revenues, Expenditures, and
Changes in Fund Balance
4 - 1
Financial Update – Capital Projects Funds
Fiscal Year 2014 - For the Month of June
Capital project funds are used to account for financial resources to be used for the acquisition or
construction of major capital facilities and infrastructure. The financial resources of capital projects
funds come from several different sources including general obligation bonds, state and federal
government grants, and appropriations from the general or special revenue funds.
The City of Miami has twelve capital project funds, as follows:
General Government - To account for the acquisition or construction of major capital facilities that
support the City’s police, fire, computers, communications, and general government operations.
Community Redevelopment Agency - To account for the acquisition or construction of
major capital facilities for community redevelopment in the defined Community Redevelopment
Area.
Public Safety - To account for the acquisition or construction of major capital facilities that support
the City of Miami’s Police and Fire Operations.
Street and Sidewalks - To account for expenditures incurred for street, sidewalks, and other traffic
related projects.
Sanitary Sewers - To account for expenditures incurred for the construction of sanitary sewers.
Storm Sewers - To account for expenditures incurred for the construction of storm sewers.
Solid Waste - To account for the acquisition of equipment or facility maintenance associated with
the collection and removal of solid waste.
Public Facilities - To account for the acquisition or construction of major capital facilities for public
use such as marinas and stadiums.
Parks & Recreation - To account for the acquisition, rehabilitation, or construction of major capital
facilities for cultural and recreational activities such parks, elderly and youth day care centers.
Disaster Recovery - To account for revenue received from the Federal Emergency Management
Agency, insurance, and other agencies as reimbursements for citywide disasters in the areas of debris
removal, roads and bridges, buildings and equipment, parks, marinas, stadiums, and other measures
of relief.
Mass Transit – To account for the expenditures related to mass transit.
Transportation and Transit – To account for the expenditures related to transportation projects

4 - 2
Revenues
As of June 30, 2014, the total revenues for the capital projects funds were $21,602,480. General
Government makes up the greatest source of revenues consisting of a total of $19,695,756. This fund
represents 91% of total revenues, as demonstrated below:
Expenditures
Total capital projects fund expenditures as of June 30, 2014 were $24,993,785. Street & Sidewalks,
Parks & Recreation, and General Government funds make up 65% of total expenditures for CIP.
The chart below depicts capital projects expenditures by fund as of June 2014.

4 - 3
Homeland Defense / Neighborhood Improvement Bond Program
During the 2005 fiscal year, the City authorized new issue of limited ad valorem tax bonds in the
amount of $255 million for the purpose of capital improvement projects. As of June 2014, the city
has $155 million issued and outstanding, and all have already been appropriated. The following
chart details the total expenditures, as follows:
The expenditures of bond proceeds for the construction of various capital improvements projects for
June 2014 were $457,180.36

City of Miami
Combining Balance Sheet
All Capital Projects Funds
As of June 30, 2014
General Public Sanitary Storm
Government CRA Safety Sewers Sewers
Assets
103000 Cash With Fiscal Agent -$ -$ (1)$ -$ -$
104000 Equity In Pooled Cash 71,802,844 1,813 13,481,786 15,823,883 10,713,037
115000 Accounts Receivable 1,212,142 - 42,608 - 318,914
115090 Unbilled Receivable - - 787 - (6,136)
117000 Allowance For Uncollectible (826,659) - - - -
133000 Due From Other Governmental - - - - -
135000 Interest And Dividends Recei 23,340 - - 4,125 -
137000 Market Gain/Loss Investments (49,348) - - - -
151900 Investments-Non-Current - - - - -
166900 Equipment And Furniture - - - - -
167900 Accumulated Depreciation Cre - - - - -
199960 Project Clearing Account - - - - -
Total Assets 72,162,319$ 1,813$ 13,525,181$ 15,828,008$ 11,025,814$
Liabilities and Fund Balance
Liabilities:
202000 Accounts Payable 160,623 - 28,745 - 101,193
205000 Contracts Payable - - - - -
205100 Retainage Payable 237,768 - 390,528 76,654 746,440
214000 Accrued Expenditure Payable - - - - -
216000 Accrued Wages Payable - - - - -
223000 Deferred Revenue - - 10,571,576 - -
223100 Deferred Revenue-PnG - - - - -
Total Liabilities 398,391 - 10,990,850 76,653.90 847,633
Fund Balance:
305000 Fund Balance-Reserved for En 4,677,448 - 5,195,596 1,157,442 4,078,215
315000 Fund Balance-Unreserved 67,086,480 1,813 (2,661,265) 14,593,912 6,099,965
316000 Retained Earnings-Unreserved - - - - -
Total Fund Balance 71,763,929 1,813 2,534,331 15,751,354 10,178,181
Total Liabilities and Fund Balance 72,162,319$ 1,813$ 13,525,181$ 15,828,008$ 11,025,814$
4 - 4

City of Miami
Combining Balance Sheet
All Capital Projects Funds
As of June 30, 2014
Assets
103000 Cash With Fiscal Agent
104000 Equity In Pooled Cash
115000 Accounts Receivable
115090 Unbilled Receivable
117000 Allowance For Uncollectible
133000 Due From Other Governmental
135000 Interest And Dividends Recei
137000 Market Gain/Loss Investments
151900 Investments-Non-Current
166900 Equipment And Furniture
167900 Accumulated Depreciation Cre
199960 Project Clearing Account
Total Assets
Liabilities and Fund Balance
Liabilities:
202000 Accounts Payable
205000 Contracts Payable
205100 Retainage Payable
214000 Accrued Expenditure Payable
216000 Accrued Wages Payable
223000 Deferred Revenue
223100 Deferred Revenue-PnG
Total Liabilities
Fund Balance:
305000 Fund Balance-Reserved for En
315000 Fund Balance-Unreserved
316000 Retained Earnings-Unreserved
Total Fund Balance
Total Liabilities and Fund Balance
Streets
Sidewalks & Solid Public Transportion
Bonds Waste Facilities Parks and Transit
-$ -$ -$ -$ -$
54,488,807 752,736 23,157,993 14,889,784 21,838,748
1,206,861 30,151 1,688,591 591,810 -
454,171 - 9,116 251,567 -
(102,915) (28,626) (1,344,651) - -
- - - - -
100,844 - - - -
(21,097) - - - -
1 - - - -
- - - - -
- - - - -
- - - - -
56,126,671$ 754,262$ 23,511,050$ 15,733,161$ 21,838,748$
189,830 2,508 116,050 162,348 -
- - - (10,986) -
1,091,250 - 223,361 225,863 -
- - - - -
- - - - -
- - 157,837 - -
- - (6,582) - -
1,281,079 2,508 490,666 377,224 -
12,710,529 458,716 8,487,194 11,382,829 -
42,135,062 293,037 13,640,111 3,921,149 21,838,748
- - 893,079 51,960 -
54,845,591 751,753 23,020,384 15,355,937 21,838,748
56,126,671$ 754,262$ 23,511,050$ 15,733,161$ 21,838,748$
4 - 5

City of Miami
Combining Balance Sheet
All Capital Projects Funds
As of June 30, 2014
Assets
103000 Cash With Fiscal Agent
104000 Equity In Pooled Cash
115000 Accounts Receivable
115090 Unbilled Receivable
117000 Allowance For Uncollectible
133000 Due From Other Governmental
135000 Interest And Dividends Recei
137000 Market Gain/Loss Investments
151900 Investments-Non-Current
166900 Equipment And Furniture
167900 Accumulated Depreciation Cre
199960 Project Clearing Account
Total Assets
Liabilities and Fund Balance
Liabilities:
202000 Accounts Payable
205000 Contracts Payable
205100 Retainage Payable
214000 Accrued Expenditure Payable
216000 Accrued Wages Payable
223000 Deferred Revenue
223100 Deferred Revenue-PnG
Total Liabilities
Fund Balance:
305000 Fund Balance-Reserved for En
315000 Fund Balance-Unreserved
316000 Retained Earnings-Unreserved
Total Fund Balance
Total Liabilities and Fund Balance
Total
Disaster Mass Capital
Recovery Transit Projects
-$ -$ (1)$
960,281 (698) 227,911,016
12,683 - 5,103,760
- - 709,505
- - (2,302,851)
- - -
- - 128,309
- - (70,446)
- - 1
- - -
- - -
- - -
972,964$ (698)$ 231,479,293$
1,037 - 762,334
- - (10,986)
65,948 - 3,057,811
- - -
- - -
1,882,911 - 12,612,324
- - (6,582)
1,949,896 - 16,414,901
281,147 46,226 48,475,344
(1,257,973) (46,924) 165,644,116
(106) - 944,932
(976,932) (698) 215,064,392
972,964$ (698)$ 231,479,293$
4 - 6

City of Miami
Combining Statement of Revenues, Expenditures
And Changes in Fund Balance
All Capital Projects
As of June 30, 2014
General Public Sanitary Storm
Government CRA Safety Sewers Sewers
Revenues:
Property Tax -$ -$ -$ -$ -$
Franchise and Other Taxes - - - - -
Occupational Licenses and Permits - - - - -
Fines and Forfeitures - - - - -
Intergovernmental 385,481 - 7,201 - 265,643
Charges for Services - - - - -
Interest 117,834 - - - -
Impact Fees 19,062,351 - - - -
Other 130,089 - - - -
Total Revenues 19,695,756 - 7,201 - 265,643
Expenditures:
Personnel Expenses 6,970 - - - 452
Operating Expenses 1,357,987 - 94,622 - 266,948
Capital Expenses 2,648,231 - 2,240,456 1,485,698 1,373,664
Principal - - - - -
Interest - - - - -
Other Debt Service Costs - - - - -
Grants in Aids - - - - -
Advances - - - - -
Other Financing Uses - - - - -
Budget Reserve - - - - -
Contingency Reserve - - - - -
Other Uses - - - - -
Total Expenditures 4,013,188 - 2,335,078 1,485,698 1,641,064
Revenues Over (Under) Expenditures 15,682,568 - (2,327,878) (1,485,698) (1,375,421)
Other Financing Sources/(Uses):
Operating transfers in 4,407,833 - 2,898,500 - 2,019,442
Debt Proceeds including Re-financing - - - - -
Operating transfers out (276,833) - - - -
Total Other Financing Sources/(Uses) 4,131,000 - 2,898,500 - 2,019,442
Total Revenues Over/(Under) Expenditures 19,813,568$ -$ 570,622$ (1,485,698)$ 644,021$
4 - 7

City of Miami
Combining Statement of Revenues, Expenditures
And Changes in Fund Balance
All Capital Projects
As of June 30, 2014
Revenues:
Property Tax
Franchise and Other Taxes
Occupational Licenses and Permits
Fines and Forfeitures
Intergovernmental
Charges for Services
Interest
Impact Fees
Other
Total Revenues
Expenditures:
Personnel Expenses
Operating Expenses
Capital Expenses
Principal
Interest
Other Debt Service Costs
Grants in Aids
Advances
Other Financing Uses
Budget Reserve
Contingency Reserve
Other Uses
Total Expenditures
Revenues Over (Under) Expenditures
Other Financing Sources/(Uses):
Operating transfers in
Debt Proceeds including Re-financing
Operating transfers out
Total Other Financing Sources/(Uses)
Total Revenues Over/(Under) Expenditures
Street
Sidewalks Solid Public Transportation
& Bonds Waste Facilities and Transit Parks
-$ -$ -$ -$ -$
- - - - -
- - - - -
- (30) - - -
805,203 - 373,439 - 208,986
- - - - 73,987
72,107 - 7,568 - -
755 - - - -
- 37 - - -
878,065 7 381,007 - 282,973
5,371 - (19,605) - 17,723
497,103 35,940 (555,805) - 240,895
7,265,373 527,580 3,017,071 - 4,256,106
- - - - -
- - - - -
- - - - -
- - - - -
- - - - -
- - - - -
- - - - -
- - - - -
- - - - -
7,767,847 563,520 2,441,661 - 4,514,724
(6,889,782) (563,514) (2,060,654) - (4,231,751)
1,677,558 606,600 1,104,300 4,678,700 2,723,300
- - - -
- - - (673,456)
1,677,558 606,600 1,104,300 4,678,700 2,049,844
(5,212,224)$ 43,086$ (956,354)$ 4,678,700$ (2,181,907)$
4 - 8

City of Miami
Combining Statement of Revenues, Expenditures
And Changes in Fund Balance
All Capital Projects
As of June 30, 2014
Revenues:
Property Tax
Franchise and Other Taxes
Occupational Licenses and Permits
Fines and Forfeitures
Intergovernmental
Charges for Services
Interest
Impact Fees
Other
Total Revenues
Expenditures:
Personnel Expenses
Operating Expenses
Capital Expenses
Principal
Interest
Other Debt Service Costs
Grants in Aids
Advances
Other Financing Uses
Budget Reserve
Contingency Reserve
Other Uses
Total Expenditures
Revenues Over (Under) Expenditures
Other Financing Sources/(Uses):
Operating transfers in
Debt Proceeds including Re-financing
Operating transfers out
Total Other Financing Sources/(Uses)
Total Revenues Over/(Under) Expenditures
Total
Disaster Mass Capital
Recovery Transit Projects
-$ -$ -$
- - -
- - -
- - (30)
12,683 79,146 2,137,781
- - 73,987
- - 197,509
- - 19,063,107
- - 130,126
12,683 79,146 21,602,480
- 49 10,960
- 10,653 1,948,343
217,231 3,072 23,034,481
- - -
- - -
- - -
- - -
- - -
- - -
- - -
- - -
- - -
217,231 13,773 24,993,785
(204,549) 65,372 (3,391,304)
- - 20,116,233
- - -
- - (950,289)
- - 19,165,944
(204,549)$ 65,372$ 15,774,640$
4 - 9
Section 5 –
Cash Position
Financial Update – Cash Position for all City of Miami Funds
Cash Position – All Funds

5 - 1
Financial Update – Cash Position for all Funds
Fiscal Year 2014 – For the Month of June
As of June 30, 2014, the City of Miami had a balance of cash in the bank of $523,582,348. This balance of cash
represents funds that are restricted, encumbered and appropriated along with other funds that are available for
general operations of the City.
Of the total balance of cash in the bank, the following amounts are restricted and cannot be used for General
Fund operations:
Special Revenue of $107,125,136. Special revenues are specific revenue sources that are legally restricted
for expenditure for particular purposes. Examples include Storm Water Fee, Miami-Dade Tourist Tax, etc.
Debt Service of $34,441,341. Debt Service funds represents those dollars that are required to be set aside to
pay interest and principal on bonds outstanding.
Capital projects of $227,911,016. Capital Projects represent those dollars that have been appropriated for
specific capital construction projects.
Trust and Agency of $0.0 Trust and Agency funds represent those dollars that are legally restricted for
expenditures. Example: Elected Officials Retirement Trust.
In addition, some of the cash in the bank is classified as deposits refundable or deferred items that cannot be
used. The amount of these funds as of June 30, 2014 is $15,345,208.
The remaining amount of the total balance of cash in the bank as of June 30, 2014 that is available for General
Fund Operations is $154,104,736.
Cash Balance as of 06-30-14
0
50
100
150
200
250
Gen Fund Spec Rev Debt Serv Cap Proj
FY-2013
FY-2014

City of Miami
Cash Position
All Funds
As of June 30, 2014
DESCRIPTION 6/1/2014 7/1/2014 Variance
GENERAL LEDGER CASH BALANCE 257,872,178$ 260,077,162$ 2,204,984$
LESS: O/S CHECKS AND PAYROLL LIABILITIES (3,907,875) (6,794,298) (2,886,423)
PLUS: OPERATING INVESTMENT PORTFOLIO 270,298,309 270,299,484 1,176
TOTAL POOLED CASH 524,262,611$ 523,582,348$ (680,263)$
RESTRICTED CASH
SPECIAL REVENUE 123,191,250$ 107,125,136$ (16,066,114)$
DEBT SERVICE 6,514,856 34,441,341 27,926,485
CAPITAL PROJECTS 213,034,926 227,911,016 14,876,090
TRUST & AGENCY - - -
GENERAL FUND CASH AVAIABLE FOR OPERATION 181,521,459$ 154,104,736$ (27,416,723)$
LESS: GENERAL FUND ENCUMBRANCES - - -
LESS: GENERAL FUND DEPOSITS REFUNDABLE (9,561,313) (10,357,486) (796,173)
LESS: GENERAL FUND DEFERRED ITEMS (4,987,722) (4,987,722) -
LESS: GENERAL FUND DESIGNATIONS
- -
- -
- -
NON SPENDABLE (5,743,954) (5,321,579)
ASSIGNED (50,403,318) (50,403,318)
TOTAL GENERAL FUND DESIGNATIONS (56,147,272) (55,724,897) 422,375
TOTAL GENERAL FUND CASH AVAILABLE NET OF OBLIGATIONS 110,825,152$ 83,034,631$ (27,790,521)$
5 - 2

Section 6 –
Investments
Financial Update – Investment Portfolio
Portfolio – Interest Income
Portfolio – Details
Total Investments Outstanding

6 - 1
Financial Update – Investment Portfolio
Fiscal Year 2014 - For the Month of June
The City of Miami’s Investment Portfolio is in compliance with the City’s Adopted Investment
Policy. The investment portfolio is comprised of the following:
US Treasury 0.00% 0.0000%
US Instruments/Agnecy 100.00% 0.8987%
Commercial Paper 0.00% 0.0000%
As of June 30, 2014 the rate of return was 0.8987%.
The largest portion of the portfolio, 100%, is invested in US Federal Instruments, which are
comprised of US Government Agencies including FHLB, FHLMC, FNMA, and FFCB.
Monthly yields for FY 2014 are as follows:
Investment Yield Treasury 1 Yr to 3 Yr Yield % Variance
October 2013 0.8814 0.5800 0.3014
November 2013 0.8412 0.5600 0.2812
December 2013 0.7935 0.7800 0.0135
January 2014 0.8827 0.6900 0.1927
February 2014 0.8827 0.6900 1.1927
March 2014 0.8818 0.9000 (0.0182)
April 2014 0.8987 0.8700 0.0287
May 2014 0.8987 0.7900 0.1087
June 2014 0.8987 0.8800 0.0187
Total 0.8723 0.7492 0.1230

A comparison of actual interest income for the nine months ended June 30, 2014
is represented as follows:
Interest
Budgeted Earned Cumulative % of Budget
General Fund
Oct-13 1,500,000 186,215 186,215 12.41%
Nov-13 183,073 369,287 12.20%
Dec-13 182,797 552,084 12.19%
Jan-14 186,855 738,939 12.46%
Feb-14 183,358 922,297 12.22%
Mar-14 144,983 1,067,280 9.67%
Apr-14 206,908 1,274,188 13.79%
May-14 189,999 1,464,187 12.67%
Jun-14 188,030 1,652,216 12.54%
Totals 1,500,000 1,652,216 110.15%
Special Revenue Fund
Oct-13 4,621 4,621
Nov-13 5,482 10,103
Dec-13 7,329 17,432
Jan-14 5,289 22,721
Feb-14 6,523 29,244
Mar-14 6,218 35,462
Apr-14 4,958 40,419
May-14 4,923 45,342
Jun-14 5,161 50,503
Totals - 50,503
Projection of General Fund Interest Income for FY 2013 - 2014
Cash Interest Monthly Interest Monthly Interest Monthly Cumulative
Month Balance Rate City Portfolio Non Gen Fund Total Total
Actual YTD 1,648,199 4,018 1,652,216
July 263,537,000 0.4000% 87,846 1,000 88,846 1,741,062
August 234,565,000 0.4000% 78,188 1,000 79,188 1,820,250
September 184,565,000 0.4000% 61,522 1,000 62,522 1,882,772
1,875,754 7,018 230,556
6 - 2

City of Miami
Cash Management Pool
Portfolio Characteristics
As of June 30, 2014
% of Portfolio Maturity
Actual Maximum Actual Maximum
Book Month During By Month During By Curr. Mon.
Investment Vehicle Value Market End Year Policy End Year Policy Rate of Return
Government Obilgations:
T Notes - - 0.00% 0.00% 100% 0 mos. 0 mos. 60 mos. 0.000%
T Bills - - 0.00% 0.00% 100% 0 mos. 0 mos. 60 mos. 0.000%
Government Obilgations - - 0.00% 0.000%
Federal Instruments:
FHLB 78,785,345 78,161,658 29.16% 29.16% 100% 49 mos. 57 mos. 60 mos. 0.8676%
FHLMC 51,492,970 50,944,280 19.05% 19.05% 100% 47 mos. 53 mos. 60 mos. 0.9604%
FNMA 81,471,169 80,889,449 30.14% 30.36% 100% 46 mos. 55 mos. 60 mos. 0.8834%
FFCB 58,550,000 58,204,685 21.66% 21.66% 100% 47 mos. 55 mos. 60 mos. 0.9073%
Federal Instruments 270,299,484 268,200,072 100.00% 0.8987%
Money Market: Treasury - - 0.00% 0.00% 100% mos. mos. 9 mos. 0.000%
State Board of Administration - - 0.00% 0.00% 100% mos. mos. 9 mos. 0.000%
Commercial Paper: 0.00% 0.00% 35% 0 mos. 1 mos. 9 mos. 0.0000%
Totals 270,299,484 268,200,072 100.00% 0.8987%
6 - 3

City of Miami
Investment Portfolio
Total Investments Outstanding
As of June 30, 2014
Original Accrued Total Cost
Date of CUSIP Coupon Call Maturity Par Cost of Interest of Interest Market Market
Purchase NUMBER Rate Date Date Value Investment Purchased Investment Receivable Book Value Rate Value Gain/(Loss)
U.S. GOVT. AGENCIES
11/5/2012 SO 3136G03Z2 0.500% 10/30/2017 7,000,000.00 7,000,000.00 486.11 7,000,000.00 8,895.83 7,000,000.00 100.06200000% 7,004,340.00 4,340.00
11/5/2012 SO2 3136G03Z2 0.500% 10/30/2017 4,000,000.00 4,000,000.00 277.78 4,000,277.78 5,083.33 4,000,000.00 100.06200000% 4,002,480.00 2,480.00
11/5/2012 SO2 3136G03Z2 0.500% 10/30/2017 7,200,000.00 7,200,000.00 500.00 7,200,500.00 9,150.00 7,200,000.00 100.06200000% 7,204,464.00 4,464.00
11/8/2012 3135G0QW6 1.000% 11/8/2017 3,665,000.00 3,665,000.00 - 3,665,000.00 5,395.69 3,665,000.00 99.22300000% 3,636,522.95 (28,477.05)
11/21/2012 3136G04S7 0.750% 2/21/2017 10,000,000.00 10,000,000.00 - 10,000,000.00 27,083.33 10,000,000.00 99.67000000% 9,967,000.00 (33,000.00)
11/21/2012 SO2 3136G04S7 0.750% 2/21/2017 14,200,000.00 14,200,000.00 14,200,000.00 38,458.33 14,200,000.00 99.67000000% 14,153,140.00 (46,860.00)
3/27/2013 3136G1GD5 1.100% 3/27/2018 10,000,000.00 10,000,000.00 - 10,000,000.00 28,722.22 10,000,000.00 98.83100000% 9,883,100.00 (116,900.00)
3/28/2013 3136G1GZ6 1.000% 3/28/2018 10,000,000.00 10,000,000.00 - 10,000,000.00 25,833.33 10,000,000.00 98.76600000% 9,876,600.00 (123,400.00)
4/30/2013 3136G1KD0 1.010% 4/30/2018 10,000,000.00 9,995,000.00 - 9,995,000.00 16,944.44 9,996,169.44 98.34900000% 9,834,900.00 (161,269.44)
5/23/2013 F80 3135G0XD0 1.000% 5/21/2018 3,665,000.00 3,665,000.00 203.61 3,665,203.61 4,072.22 3,665,000.00 98.46400000% 3,608,705.60 (56,294.40)
5/23/2013 F81 3135G0XD0 1.000% 5/21/2018 1,745,000.00 1,745,000.00 96.94 1,745,096.94 1,938.89 1,745,000.00 98.46400000% 1,718,196.80 (26,803.20)
FNMA NOTES 30.14% 81,475,000.00 81,470,000.00 1,564.44 81,471,078.33 171,577.61 81,471,169.44 80,889,449.35 (581,720.09)
10/11/2012 3133EA4H8 0.820% 7/11/2017 4,400,000.00 4,400,000.00 - 4,400,000.00 17,037.78 4,400,000.00 99.43400000% 4,375,096.00 (24,904.00)
10/11/2012 F60 3133EA4H8 0.820% 7/11/2017 10,000,000.00 10,000,000.00 - 10,000,000.00 38,722.22 10,000,000.00 99.43400000% 9,943,400.00 (56,600.00)
10/11/2012 B3 3133EA4H8 0.820% 7/11/2017 5,600,000.00 5,600,000.00 - 5,600,000.00 21,684.44 5,600,000.00 99.43400000% 5,568,304.00 (31,696.00)
3/12/2013 3133ECHS6 1.030% 3/12/2018 10,000,000.00 10,000,000.00 - 10,000,000.00 31,186.11 10,000,000.00 99.39200000% 9,939,200.00 (60,800.00)
3/14/2013 3133ECJ39 1.050% 3/14/2018 10,000,000.00 10,000,000.00 - 10,000,000.00 31,208.33 10,000,000.00 99.89900000% 9,989,900.00 (10,100.00)
4/25/2013 F83 3133ECMM3 0.600% 4/25/2017 2,700,000.00 2,700,000.00 - 2,700,000.00 2,970.00 2,700,000.00 99.73800000% 2,692,926.00 (7,074.00)
4/25/2013 F85 3133ECMM3 0.600% 4/25/2017 2,150,000.00 2,150,000.00 - 2,150,000.00 2,365.00 2,150,000.00 99.73800000% 2,144,367.00 (5,633.00)
5/8/2013 SO2 3133ECNY6 0.950% 5/8/2018 13,700,000.00 13,700,000.00 - 13,700,000.00 19,160.97 13,700,000.00 98.91600000% 13,551,492.00 (148,508.00)
FEDERAL FARM CREDIT BK NOTES 21.66% 58,550,000.00 58,550,000.00 - 58,550,000.00 164,334.85 58,550,000.00 58,204,685.00 (345,315.00)
1/8/2013 3134G32S8 0.750% 6/27/2017 5,000,000.00 5,000,000.00 1,145.83 5,001,145.83 416.67 5,000,000.00 99.25800000% 4,962,900.00 (37,100.00)
1/10/2013 3134G32Y5 0.900% 12/28/2017 10,000,000.00 9,993,000.00 3,000.00 9,996,000.00 750.00 9,992,969.80 98.96700000% 9,896,700.00 (96,269.80)
1/30/2013 3134G34K3 1.000% 1/30/2018 10,000,000.00 10,000,000.00 - 10,000,000.00 41,944.44 10,000,000.00 98.61700000% 9,861,700.00 (138,300.00)
3/4/2013 3134G33B4 1.000% 1/11/2018 10,000,000.00 10,000,000.00 14,722.22 10,014,722.22 47,222.22 10,000,000.00 99.14300000% 9,914,300.00 (85,700.00)
3/26/2013 3134G36H8 1.000% 3/26/2018 10,000,000.00 10,000,000.00 - 10,000,000.00 26,388.89 10,000,000.00 98.74200000% 9,874,200.00 (125,800.00)
4/2/2013 313463Z29 1.000% 12/11/2017 6,500,000.00 6,500,000.00 20,041.67 6,520,041.67 3,611.11 6,500,000.00 98.99200000% 6,434,480.00 (65,520.00)
FHLMC NOTES 19.05% 51,500,000.00 51,493,000.00 38,909.72 51,531,909.72 120,333.33 51,492,969.80 50,944,280.00 (548,689.80)
9/27/2012 31338OP27 0.870% 9/27/2017 15,000,000.00 15,000,000.00 15,000,000.00 34,075.00 15,000,000.00 99.27500000% 14,891,250.00 (108,750.00)
9/27/2012 SO 313380P27 0.870% 9/27/2017 5,000,000.00 5,000,000.00 - 5,000,000.00 11,358.33 5,000,000.00 99.27500000% 4,963,750.00 (36,250.00)
10/24/2012 F79 313380WR4 0.850% 7/24/2017 4,030,000.00 4,030,000.00 4,030,000.00 14,938.99 4,030,000.00 99.28000000% 4,000,984.00 (29,016.00)
1/8/2013 313381PK5 0.770% 6/27/2017 5,000,000.00 5,000,000.00 1,176.39 5,001,176.39 427.78 5,000,000.00 98.80000000% 4,940,000.00 (60,000.00)
1/25/2013 313381RY3 0.700% 1/25/2017 10,000,000.00 10,000,000.00 - 10,000,000.00 30,333.33 10,000,000.00 99.84100000% 9,984,100.00 (15,900.00)
2/14/2013 3133826J7 0.050% 8/14/2017 10,000,000.00 10,000,000.00 - 10,000,000.00 19,027.78 10,000,000.00 99.57000000% 9,957,000.00 (43,000.00)
3/27/2013 313382EH2 1.000% 12/27/2017 15,000,000.00 15,000,000.00 - 15,000,000.00 1,666.67 15,000,000.00 98.50500000% 14,775,750.00 (224,250.00)
3/27/2013 313382HE6 1.000% 12/27/2017 10,000,000.00 10,000,000.00 - 10,000,000.00 26,111.11 10,000,000.00 99.19000000% 9,919,000.00 (81,000.00)
6/13/2013 F12 313381NL5 1.160% 7/10/2018 4,800,000.00 4,743,696.00 23,664.00 4,767,360.00 26,448.00 4,755,345.10 98.53800000% 4,729,824.00 (25,521.10)
FHLB NOTES 29.16% 78,830,000.00 78,773,696.00 24,840.39 78,798,536.39 164,386.99 78,785,345.10 78,161,658.00 (623,687.10)
TOTAL U.S. GOVT AGENCIES 100.00% 270,355,000.00 270,286,696.00 65,314.55 270,351,524.44 620,632.78 270,299,484.34 268,200,072.35 (2,099,411.99)
GRAND TOTAL U.S. GOVT TREAS, AGENCIES, SBA
AND COMMERCIAL PAPER 100.00% 270,355,000.00 270,286,696.00 65,314.55 270,351,524.44 620,632.78 270,299,484.34 268,200,072.35 (2,099,411.99)
6 - 4

Section 7 – Cash Payments Received on Major
Accounts Receivables
Financial Update – Accounts Receivable
Cash Payments Received and Aging on Major Accounts
Receivable

7 - 1
Financial Update – Accounts Receivable
Fiscal Year 2014 - For the Month of June
The City currently records receivables when they are billed. The major receivables consist of
the different categories shown below, of which Business Tax Receipts represents 28% and
Certificate of Use represents 23%. The City of Miami billed the Certificate of Use for FY14
early in July-2013 for a total of $6,592,301.60. The Burglar Alarm for FY14 was billed in
August 8, 2013 for a total of $700,395.00. The Business Tax Receipts for FY14 were billed
early in July-2013 for a total of $7,510,026.50. All other major receivables are billed
throughout the year. The graph below depicts the percentage of each major category of
receivables (billings net of adjustments and cash receipts) as of June 30, 2014.

Accounts Accounts
Receivable YTD Receivable
Description Type 10/1/2013
Billings Net of
Adjustments Oct-13 Nov-13 Dec-13 Jan-14 Feb-14 Mar-14 Apr-14 May-14 Jun-14 Jul-14 Aug-14 YTD 6/30/2014
Trash Citation Lien- Code Enf. AL09 199,023.91 19,829.19 (3,561.64) (749.44) (6,214.64) (1,685.00) (4,222.00) (4,350.00) (5,316.47) (7,188.84) (4,395.00) (37,683.03) 181,170.07
Code Enf. Board-Hearing Fee
Monthly Revolving AL38 1,085,600.26 260,396.97 (27,043.83) (15,447.38) (30,980.40) (6,290.34) (26,169.21) (4,105.51) (18,776.60) (33,355.05) (29,560.87) (191,729.19) 1,154,268.04
Code Enforcement Ticketing AL82 538,428.34 86,679.99 (16,725.00) (8,690.00) (13,475.00) (17,474.99) (16,369.07) (15,575.00) (15,850.00) (14,031.31) (7,332.50) (125,522.87) 499,585.46
Trash Citation Lien Solid Waste Dept. AL9A 422,057.06 32,878.92 (10,661.28) (4,255.83) (6,668.39) (2,442.14) (5,782.56) (7,424.21) (12,614.43) (3,298.30) (6,471.02) (59,618.16) 395,317.82
Burglar Alarms BA11 255,651.97 (436.34) (78,166.10) (41,413.83) (26,494.12) (10,330.36) (8,952.47) (8,619.30) (7,507.00) (4,136.50) (2,944.50) (188,564.18) 66,651.45
Cert of Use/Supp Waste CU01 3,103,378.71 (509,627.50) (544,535.03) (275,674.52) (203,048.55) (101,252.28) (103,052.93) (108,880.49) (86,295.16) (69,877.14) (49,376.08) (1,541,992.18) 1,051,759.03
Business Tax Receipts BTR01 3,453,457.58 (418,345.81) (857,299.61) (239,059.16) (149,556.34) (89,229.53) (124,713.27) (78,553.77) (84,435.18) (50,321.58) (48,460.83) (1,721,629.27) 1,313,482.50
Totals 9,057,597.83 (528,624.58) (1,537,992.49) (585,290.16) (436,437.44) (228,704.64) (289,261.51) (227,508.28) (230,794.84) (182,208.72) (148,540.80) - - (3,866,738.88) 4,662,234.37
* The YTD Billing column represents any new licenses and adjustments for the current fiscal year
Receivable Aging Type Amount Under 30 30-59 60-89 90-119 120 & Over
Trash Citation Lien- Code Enf. AL09 181,170.07 1,656.00 344.84 600.92 785.85 177,782.46
Code Enf. Board-Hearing Fee
Monthly Revolving AL38 1,154,268.04 117,936.83 7,003.97 5,997.46 8,082.09 1,015,247.69
Code Enforcement Ticketing AL82 499,585.46 13,998.69 3,350.00 5,250.00 3,250.00 473,736.77
Trash Citation Lien Solid Waste Dept. AL9A 395,317.82 1,655.66 1,764.19 3,341.24 - 388,556.73
Burglar Alarms BA11 66,651.45 - - - - 66,651.45
Cert of Use/Supp Waste CU01 1,051,759.03 5,175.19 943.65 1,856.67 1,337.40 1,042,446.12
Business Tax Receipts BTR01 1,313,482.50 28,152.98 3,427.35 56.72 - 1,281,845.45
Totals 4,662,234.37 168,575.35 16,834.00 17,103.01 13,455.34 4,446,266.67
Note:
1) City of Miami's Reserve Policy is to fully reserve all receivables that are 60 Days due or older.
Aging Report
Collection
Collections
City of Miami
Cash Payments Received and Aging on Major Account Receivables
As of June 30, 2014
7 - 2
Related Documents