City of Clemson Comprehensive Plan HOUSING ELEMENT BACKGROUND DATA MARCH 12, 2014

City of Clemson Comprehensive Plan HOUSING ELEMENT BACKGROUND DATA MARCH 12, 2014.
Dec 16, 2015
Welcome message from author
This document is posted to help you gain knowledge. Please leave a comment to let me know what you think about it! Share it to your friends and learn new things together.
Transcript

City of ClemsonComprehensive PlanHOUSING ELEMENT
BACKGROUND DATA
MARCH 12, 2014
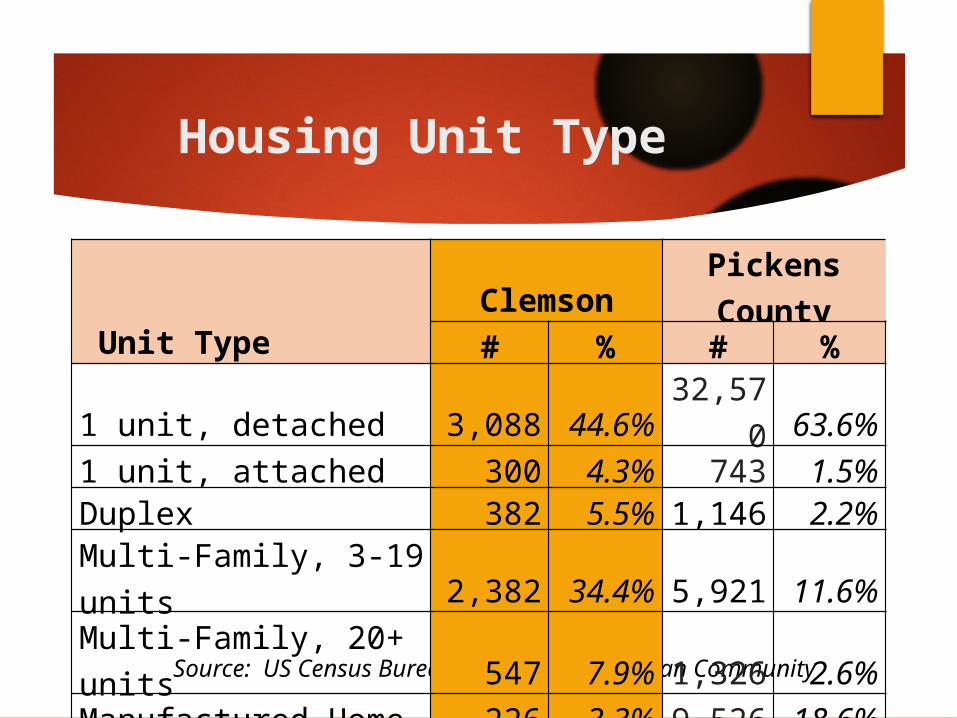
Housing Unit Type
Source: US Census Bureau, 2008-2012 American Community Survey
Unit TypeClemson Pickens County# % # %
1 unit, detached 3,088 44.6% 32,570 63.6%1 unit, attached 300 4.3% 743 1.5%Duplex 382 5.5% 1,146 2.2%Multi-Family, 3-19 units 2,382 34.4% 5,921 11.6%Multi-Family, 20+ units 547 7.9% 1,326 2.6%Manufactured Home 226 3.3% 9,526 18.6%Boat, RV, etc. 0 0.0% 0.0%Total Units 6,925 100.0% 51,239 100.0%

Median Number of Rooms per Housing Unit
Occupancy ClemsonPickens County
South Carolina
Owner-occupied 6.8 6.1 6.2Renter-occupied 4.2 4.5 4.6Total 5.2 5.6 5.7
Source: US Census Bureau, 2008-2012 American Community Survey

Median Year Residential Structure Built
Tenure ClemsonPickens County
South Carolina
Owner-occupied 1976 1982 1986Renter-occupied 1986 1985 1982Total 1981 1983 1984
Source: US Census Bureau, 2008-2012 American Community Survey

Year Housing Built
Year Unit Built
Clemson Pickens County South Carolina
# % # % # %Built 2010 or later* 61 0.9% 118 0.2% 9,089 0.4%Built 2000 to 2009 1,231 17.8% 8,861 17.3% 427,379 20.0%Built 1990 to 1999 1,252 18.1% 11,851 23.1% 435,631 20.4%Built 1980 to 1989 1,075 15.5% 7,794 15.2% 362,929 17.0%Built 1970 to 1979 1,216 17.6% 8,010 15.6% 344,753 16.2%Built 1960 to 1969 948 13.7% 5,195 10.1% 207,282 9.7%Built 1950 to 1959 772 11.1% 4,564 8.9% 163,433 7.7%Built 1940 to 1949 109 1.6% 1,676 3.3% 75,298 3.5%Built 1939 or earlier 261 3.8% 3,170 6.2% 108,662 5.1%Total Units 6,925 100.0% 51,239 100.0% 2,134,456 100.0%
Source: US Census Bureau, 2008-2012* American Community Survey
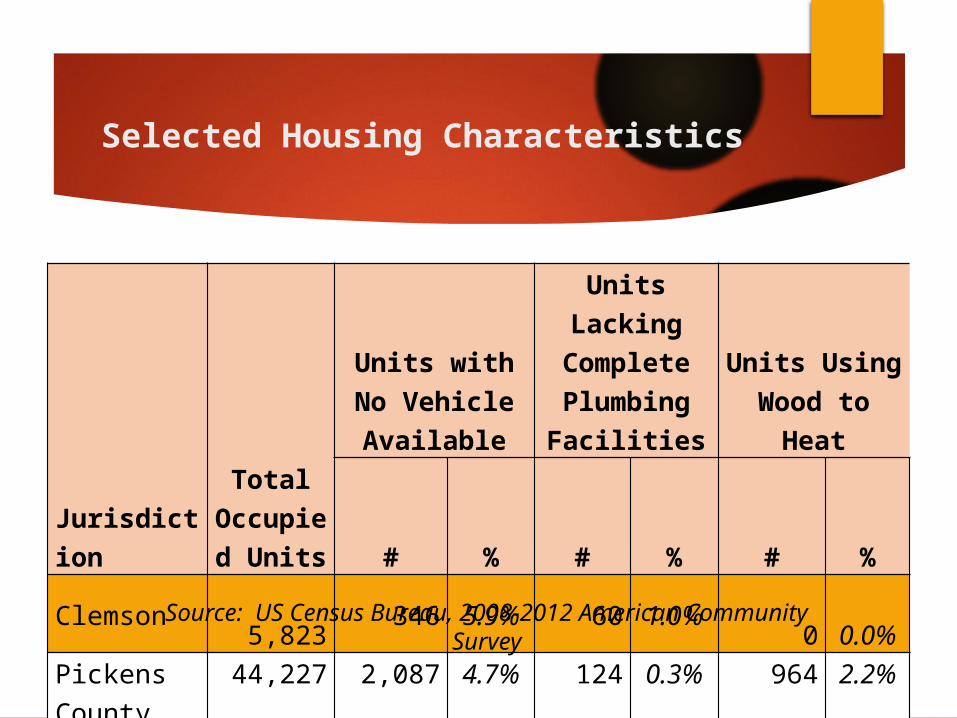
Selected Housing Characteristics
Jurisdiction
Total Occupied
Units
Units with No Vehicle
Available
Units Lacking Complete Plumbing Facilities
Units Using Wood to Heat
# % # % # %Clemson 5,823 346 5.9% 60 1.0% 0 0.0%Pickens County
44,227 2,087 4.7% 124 0.3% 964 2.2%
South Carolina
1,768,255 124,853 7.1% 8,012 0.5% 19,836 1.1%
Source: US Census Bureau, 2008-2012 American Community Survey

Persons Per Room – Occupied HU
2000 & 2012
Jurisdiction
2000 2012
Total Occupied
Units
Units with 1.01 or more Persons
per Room Total Occupied
Units
Units with 1.01 or more Persons
per Room
# % # %Clemson 5,122 84 1.6% 5,823 59 1.0%Pickens County 41,306 922 2.2% 44,227 585 1.3%South Carolina 1,533,854 49,338 3.2% 1,768,255 34,694 2.0%
Source: US Census Bureau, 2010 Census; 2008-2012 American Community Survey
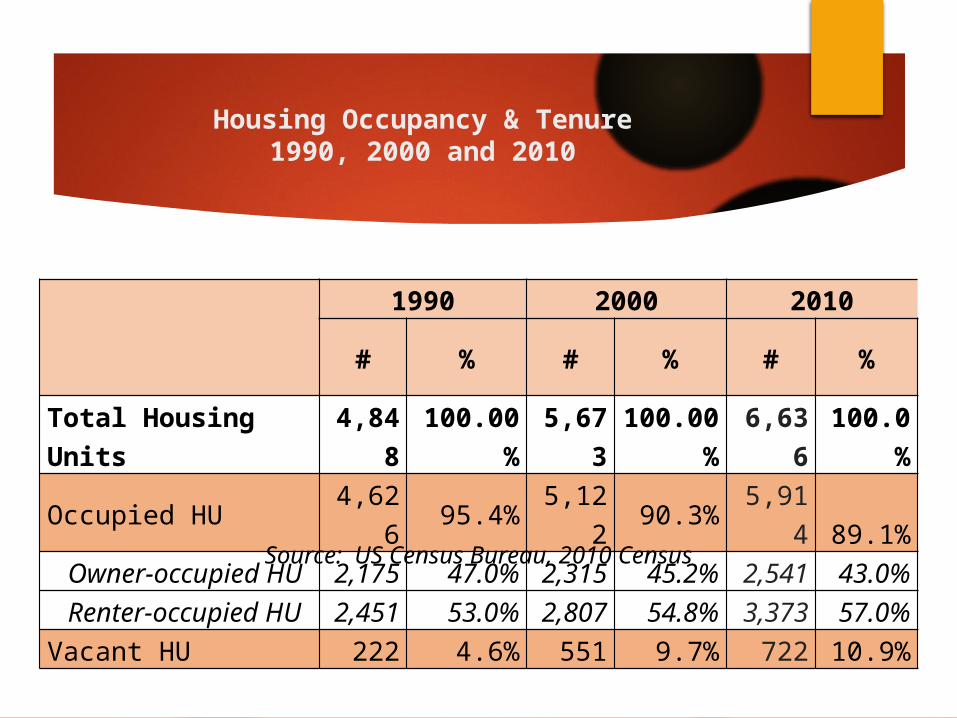
Housing Occupancy & Tenure1990, 2000 and 2010
1990 2000 2010
# % # % # %
Total Housing Units 4,848 100.00% 5,673 100.00% 6,636 100.0%Occupied HU 4,626 95.4% 5,122 90.3% 5,914 89.1% Owner-occupied HU 2,175 47.0% 2,315 45.2% 2,541 43.0% Renter-occupied HU 2,451 53.0% 2,807 54.8% 3,373 57.0%Vacant HU 222 4.6% 551 9.7% 722 10.9%
Source: US Census Bureau, 2010 Census
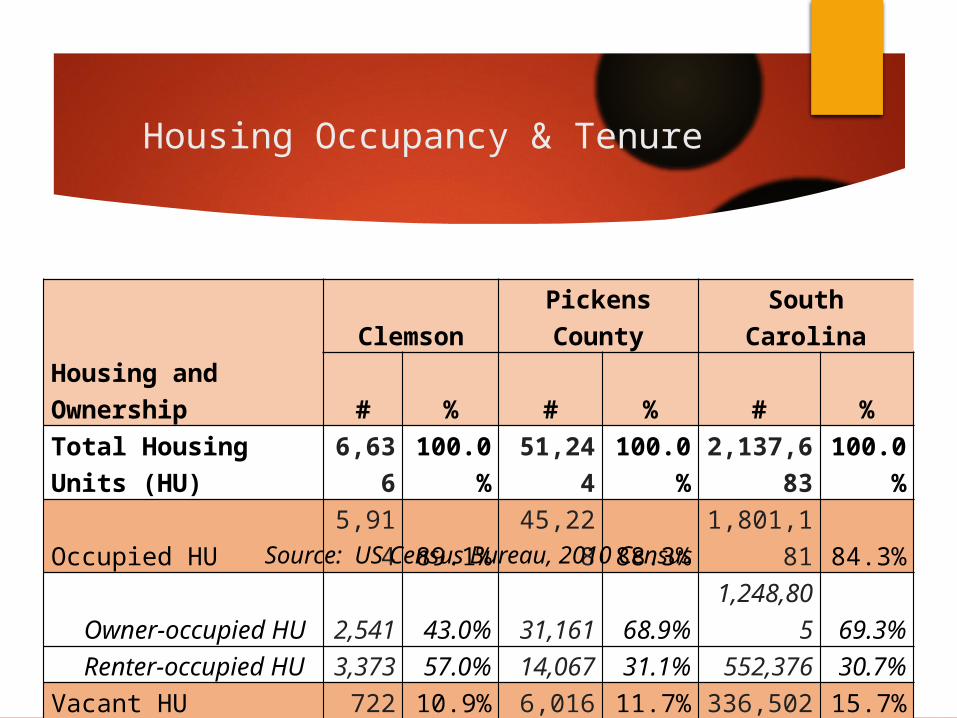
Housing Occupancy & Tenure
Housing and OwnershipClemson Pickens County South Carolina
# % # % # %Total Housing Units (HU) 6,636 100.0% 51,244 100.0% 2,137,683 100.0%Occupied HU 5,914 89.1% 45,228 88.3% 1,801,181 84.3% Owner-occupied HU 2,541 43.0% 31,161 68.9% 1,248,805 69.3% Renter-occupied HU 3,373 57.0% 14,067 31.1% 552,376 30.7%Vacant HU 722 10.9% 6,016 11.7% 336,502 15.7%
Source: US Census Bureau, 2010 Census

Percentage Renters by Block Group*, 2010
AndersonCounty
ClemsonUniversity
PickensCounty
112031
112033
112032
112043112041
112051
112042
112052
111025
112053
111024
112022
112042
107001
107002
111025
111011
Percentageof Renters
21.7% - 24.6%
24.7% - 46.1%
46.2% - 69.4%
69.5% - 86.9%
LakeHartwell
Roads
* Housing data for Census block groups includes areas outside of City

Average Household Size
Tenure ClemsonPickens County
South Carolina
Owner occupied 2.37 2.52 2.55Renter occupied 2.29 2.47 2.51Total Persons per Unit 2.33 2.51 2.54
Source: US Census Bureau, 2008-2012 American Community Survey

Age of Householder by Tenure
Age of Householder
Clemson Pickens County
% of Total Occupied
% of Owner
Occupied
% of Renter
Occupied% of Total Occupied
% of Owner
Occupied
% of Renter
Occupied15-24 years 27.9% 2.8% 50.9% 8.4% 1.5% 24.6%25-34 years 18.9% 14.2% 23.2% 14.6% 11.3% 22.3%35-64 years 33.0% 46.5% 20.6% 54.3% 59.0% 43.2%65+ years 20.3% 36.6% 5.3% 22.7% 9.9% 9.9%
Source: US Census Bureau, 2008-2012 American Community Survey
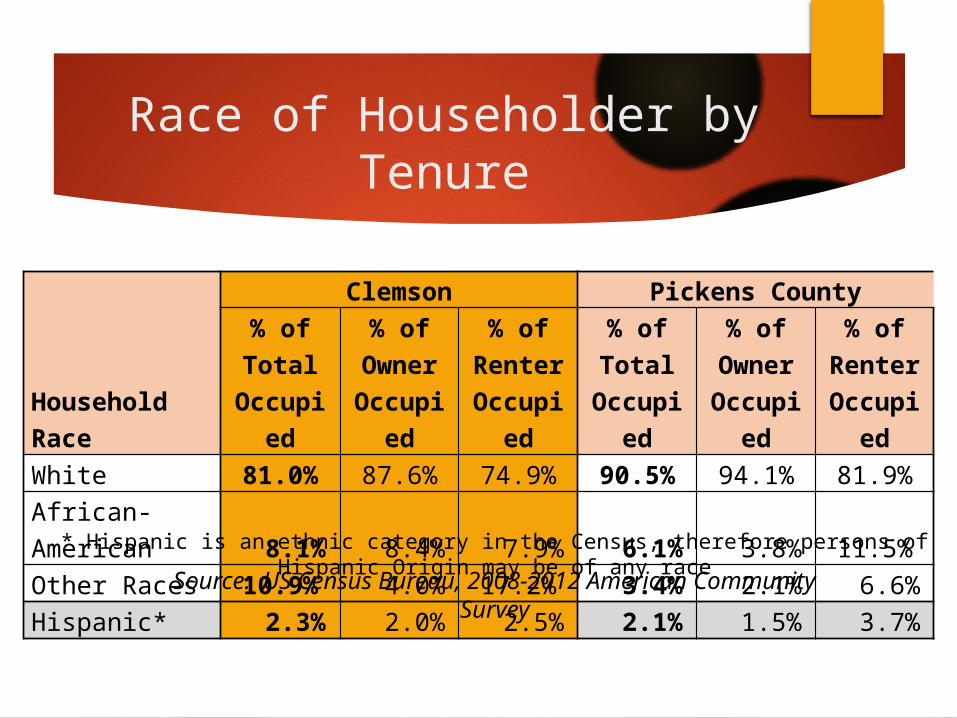
Race of Householder by Tenure
Household Race
Clemson Pickens County
% of Total Occupied
% of Owner
Occupied
% of Renter
Occupied% of Total Occupied
% of Owner
Occupied
% of Renter
OccupiedWhite 81.0% 87.6% 74.9% 90.5% 94.1% 81.9%African-American 8.1% 8.4% 7.9% 6.1% 3.8% 11.5%Other Races 10.9% 4.0% 17.2% 3.4% 2.1% 6.6%Hispanic* 2.3% 2.0% 2.5% 2.1% 1.5% 3.7%
Source: US Census Bureau, 2008-2012 American Community Survey
* Hispanic is an ethnic category in the Census, therefore persons of Hispanic Origin may be of any race

Median Value and Gross Rent of Occupied Housing Units
Jurisdiction
Owner-Occupied HU Renter-Occupied HU
Median Year Built
Median Value
Median Year Built
Median Monthly Gross
RentClemson 1976 $193,100 1986 $654Pickens County 1982 $124,000 1985 $692South Carolina 1986 $137,400 1982 $749
Source: US Census Bureau, 2008-2012 American Community Survey

Housing Values – Owner-Occupied HU
Housing Unit Value
Clemson Pickens County South Carolina
# % # % # %Less Than $20,000 0 0.0% 2,000 6.4% 73,720 6.0%$20,000 to $39,999 18 0.6% 1,726 5.6% 68,251 5.6%$40,000 to $59,999 164 5.9% 2,137 6.9% 77,857 6.3%$60,000 to $79,999 86 3.1% 2,458 7.9% 97,656 8.0%$80,000 to $99,999 107 3.8% 3,320 10.7% 112,455 9.2%$100,000 to $124,999 209 7.5% 4,051 13.0% 129,274 10.5%$125,000 to $149,999 143 5.1% 3,165 10.2% 111,145 9.0%$150,000 to $174,999 432 15.5% 3,097 10.0% 117,779 9.6%$175,000 to $199,999 324 11.6% 1,914 6.2% 73,334 6.0%$200,000 to $249,999 527 18.9% 2,496 8.0% 108,576 8.8%$250,000 to $299,999 275 9.9% 1,657 5.3% 74,387 6.1%$300,000 to $399,999 273 9.8% 1,678 5.4% 78,994 6.4%$400,000 to $499,999 160 5.7% 578 1.9% 35,795 2.9%$500,000 to $749,000 56 2.0% 465 1.5% 38,086 3.1%$750,000 or more 13 0.5% 305 1.0% 30,891 2.5%
Total Units 2,787 100.0% 31,047 100.0% 1,228,200 100.0%Source: US Census Bureau, 2008-2012 American Community Survey

Monthly Gross Rent
Monthly Gross Rent
Clemson Pickens County South Carolina
# % # % # %Less than $200 59 1.9% 172 1.3% 9,415 1.7%$200 to $349 30 1.0% 514 3.9% 27,395 5.1%$350 to $499 486 16.0% 1,625 12.3% 45,855 8.5%$500 to $749 1,283 42.3% 4,572 34.7% 160,017 29.6%$750 to $999 297 9.8% 2,559 19.4% 134,200 24.8%$1,000 to $1,499 521 17.2% 1,721 13.1% 84,282 15.6%$1,500 or more 216 7.1% 593 4.5% 23,386 4.3%No Cash Rent 144 4.7% 1,424 10.8% 55,505 10.3%Total Units 3,036 100.0% 13,180 100.0% 540,055 100.0%
Source: US Census Bureau, 2008-2012 American Community Survey
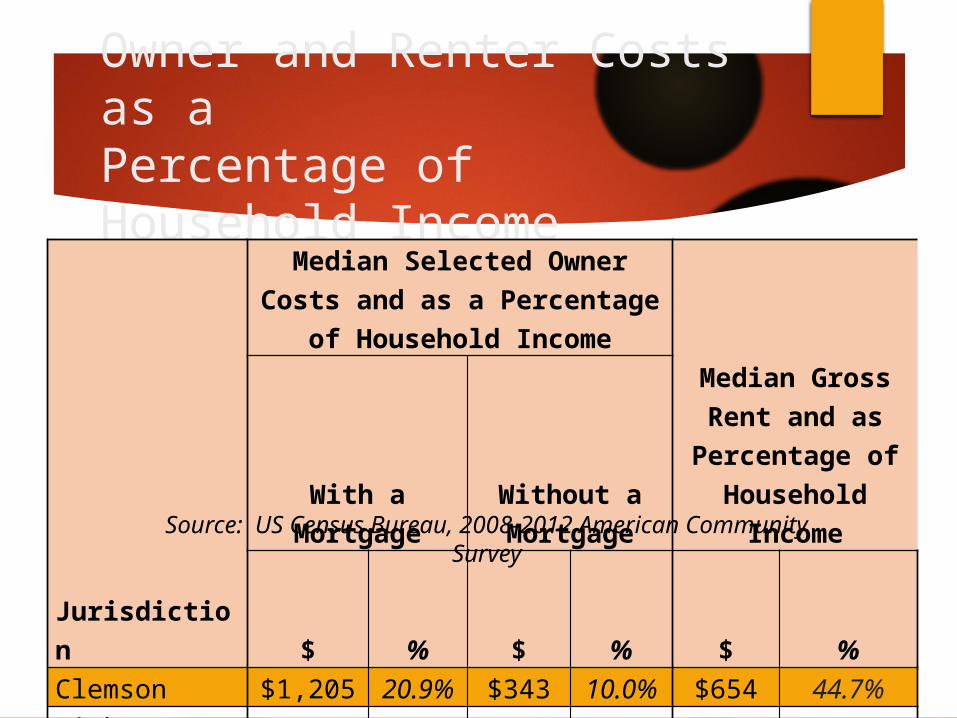
Owner and Renter Costs as aPercentage of Household Income
Jurisdiction
Median Selected Owner Costs and as a Percentage of Household Income
Median Gross Rent and as Percentage of Household IncomeWith a Mortgage
Without a Mortgage
$ % $ % $ %Clemson $1,205 20.9% $343 10.0% $654 44.7%Pickens County $1,062 21.4% $295 10.2% $692 34.4%South Carolina $1,208 23.1% $337 11.4% $749 30.3%Source: US Census Bureau, 2008-2012 American Community Survey

Selected Monthly Owner Costs and Gross Rent as a Percentage of
Household Income
Percentage of Household Income
Selected Monthly Costs for OwnersGross Rentfor Renters
All Housing Units
With a Mortgage
Without a Mortgage
% % % % % % % %Total All Units 2,787 100.0% 1,736 100.0% 1,051 100.0% 3,022 100.0%Less than 10% 815 29.2% 139 8.0% 676 64.3% 88 2.9%10 to 14.9% 547 19.6% 397 22.9% 150 14.3% 135 4.5%15 to 19.9% 316 11.3% 263 15.1% 53 5.0% 187 6.2%20 to 24.9% 409 14.7% 394 22.7% 15 1.4% 123 4.1%25 to 29.9% 153 5.5% 137 7.9% 16 1.5% 265 8.8%30 to 34.9% 194 7.0% 179 10.3% 15 1.4% 303 10.0%35 to 39.9% 42 1.5% 18 1.0% 24 2.3% 115 3.8%40 to 49.9% 99 3.6% 99 5.7% 0 0.0% 340 11.3%50% or more 212 7.6% 110 6.3% 102 9.7% 1,194 39.5%Not computed 0 0.0% 0 0.0% 0 0.0% 272 9.0%Paying 30% or more 547 19.6% 406 23.4% 141 13.4% 1,952 64.6%Source: US Census Bureau, 2008-2012 American Community Survey

Maximum Affordable Housing Cost - Pickens County and
South Carolina, 2013
Location
Housing WageWork Hours/Week
Necessary at Federal Min. Wage to Afford
Hourly Wage Needed to Afford
(@ 40 hours/week)
As % of Federal Minimum Wage(or $7.25/hour)
One Bedroom
Two Bedroom
One Bedroom
Two Bedroom
One Bedroom
Two Bedroom
FMR FMR FMR FMR FMR FMRPickens County $11.60 $13.75 160% 190% 64 76South Carolina $11.86 $14.34 164% 198% 65 79
Source: National Low Income Housing Coalition “Out of Reach,” 2013

Housing Unit Estimates and Projections
Jurisdiction20001
Census20101 Census
20142
Estimate20192
Projection
% Change 2010-2019
2023Projection
% Change 2014-2023
Clemson 5,731 6,636 6,646 6,960 4.9% 7,104 6.9%Pickens County
46,003 51,244 51,980 53,161 3.7% 54,013 3.9%
Sources: 1US Census Bureau - 2000 and 2010 Census; 2Nielsen Site Reports, December 17, 2013

Current Housing Element Mission Statement
“The City of Clemson will preserve and protect the neighborhood character and quality of life in residential neighborhoods; encourage a balanced range of housing type and opportunities; promote opportunities for clean, safe and affordable housing; and maintain safety, appearance, and harmony within neighborhoods.”

Current Housing Element Goals
Goal 1. Preserve and improve the character and quality of life in traditional single‐family neighborhoods.
Goal 2. Conduct a study of Clemson’s current and projected housing market.
Goal 3. Update the Zoning Ordinance and Land Development Regulations to address the City’s long‐term housing needs.

Current Housing Element Goals
Goal 4. Create neighborhood empowerment and engagement programs.
Goal 5. Designate historic or locally significant neighborhoods in Clemson.
Goal 6. Promote opportunities for clean, safe and affordable housing for all residents.
Related Documents


