Welcome message from author
This document is posted to help you gain knowledge. Please leave a comment to let me know what you think about it! Share it to your friends and learn new things together.
Transcript

City health profiles
A review of progress

EUR/ICP/CHDV 03 01 01/1English only
Text editing: David BreuerIllustrations: Martin DaviesTypesetting, layout and printing: International Publicitas Marketing Agency, Hungary
Target 14: settings for health promotionBy the year 2000, all settings of social life and activity, such as the city, school,
workplace, neighbourhood and home, should provide greater opportunities for promoting health.
ABSTRACTCity health profiles – a review of progress overviews health profiles by reviewing theliterature, looking at some common queries about the process of producing profilesand summarizing the review of the profiles produced by cities participating in theWHO Healthy Cities project. The book explores the different processes through whichprofiles can describe and address inequity at a local level with examples. A chapterreviews how information on lifestyles can be included in health profiles. The lastchapter examines community health profiles and what they mean. It also includesexamples of some methods used to develop them and how these profiles were used.
KeywordsURBAN HEALTHHEALTHY CITIESHEALTH STATUS INDICATORSHEALTH SURVEYSHEALTH PROMOTIONLIFESTYLECONSUMER PARTICIPATIONEUROPE
© World Health Organization 1998
All rights in this document are reserved by the WHO Regional Office for Europe. The document may nevertheless be freely reviewed, abstracted, reproduced ortranslated into any other language (but not for sale or for use in conjunction withcommercial purposes) provided that full acknowledgement is given to the source. Forthe use of the WHO emblem, permission must be sought from the WHO RegionalOffice. Any translation should include the words: The translator of this document isresponsible for the accuracy of the translation. The Regional Office would appreciatereceiving three copies of any translation. Any views expressed by named authors aresolely the responsibility of those authors.
ISBN 92 890 1286 2

Contents
Preface . . . . . . . . . . . . . . . . . . . . . . . . . . . . . . . . . . . . . . . . . . . . . . . . . . . . . . . . . . . . . . . . . . . i
1. City health profiles – an overview . . . . . . . . . . . . . . . . . . . . . . . . . . . . . . . . . . . . 1
2. Using city health profiles to help reduce inequity in health . . . . . . . 9
3. Lifestyles in city health profiles . . . . . . . . . . . . . . . . . . . . . . . . . . . . . . . . . . . . . 21
4. Community health profiles. . . . . . . . . . . . . . . . . . . . . . . . . . . . . . . . . . . . . . . . . . . 39


PrefaceCity health profiles have become an important tool in the work of creating healthycities. They have been produced in many different forms, reflecting the varied needsand different approaches of cities. Some cities have used existing models of publichealth reports, some have been developed based on collaboration between communityand technical perspectives and some have focused on specific groups within thepopulation.
This document draws on the experience of healthy cities in developing and usinghealth profiles and includes contributions from members of the WHO Healthy CitiesProject Technical Working Group on City Health Profiles and Indicators. PremilaWebster provides an overview of city health profiles produced by cities participating inthe WHO Healthy Cities network, assessing their strengths and weaknesses using astandard format. In Chapter 2, John Acres discusses how measures of inequality canbe used in profiles to promote change. Chapter 3, by Niels Kristian Rasmussen,reviews how information on lifestyles can be included in health profiles. In the finalchapter, Catherine Doyle describes how communities have been actively involved indeveloping profiles and assessing community health needs.
The WHO Healthy Cities project will continue to develop and use health profilesduring the third phase of the project (1998–2002). The project seeks to support citiesin acting to improve the health of their residents. This document provides informationthat can assist cities either in producing their first health profile or in updating theirprofile. There is more experience on making and using health profiles to createhealthy cities as a whole than is recorded here, and we expect that this experience willcontinue to be exchanged at meetings and through direct contact between cities.
Agis D. TsourosRegional Adviser for Urban Health PoliciesCoordinator, Healthy Cities projectHead, Urban Health CentreWHO Regional Office for Europe
i


Chapter 1
City health profiles – an overview


What is a city health profile?A city health profile is a public health report that brings together key pieces ofinformation on health and its determinants in the city and interprets and analyses theinformation. The main function of the profile is to stimulate action that will improvehealth. The WHO Healthy Cities Project Technical Working Group on City HealthProfiles and Indicators (1) defined city health profiles as reports that “identify inwriting and graphs health problems and their potential solutions in a specific city”.This city health profile can then form the basis of a city health plan that sets outstrategies and programmes of intervention to improve the health of the citypopulation (2).
How can city health profiles influence healthpolicy?Informing the public, policy-makers and politicians about health and its determinantsin their city is the key to ensuring that all relevant groups in the city truly understandthe ideas, problems and issues with which they are dealing. The city health profile isan ideal way of bringing together a wide range of health information to acquaintvarious groups with current health challenges. It may be useful to consider publichealth reports as “a visible manifestation of the public health function” (3). The role ofcity health profiles in influencing health policy includes:
• interesting, informing and educating the public, health professionals, politiciansand policy-makers and stimulating them to action;
• acting as a source of epidemiological information about the locality;• identifying health problems, high-risk groups and unmet needs;• being a critical component of health planning – indicating health priorities, the
preferred resource allocation and the direction of service development; and• providing a focus for intersectoral action.
Questions commonly asked about profiles
How often should the profile be updated?Profiles describe health and its determinants, and these are not static. Profiles are acontinuous process that should be used both to reflect the present state and to monitorprogress in the future. If profiles are fulfilling their role as tools in improving health, aseries of profiles will be needed both to monitor change and improvement in thepublic health and to identify new challenges that may prevent the achievement ofgood health.
One question often asked is whether there is a magic formula that determines theoptimum interval of time between profiles. The timing of the profiles depends on the
3

cycle the cities set for themselves. For example, if the city has planned a five-yearcycle for developing the profile, making recommendations and evolving plans basedon the profiles followed by monitoring any progress, then the profile would probablyhave to be updated to fit in with this cycle. In this situation the profiles probablyshould be updated after 3–5 years. Some profiles have their data available in anelectronic format. In these cases, it would not be too difficult or expensive to updatedata when new data become available. There is no simple answer, but profiles are acontinuous process, and the best people to decide how often and in what format andat what cost a profile should be updated are those who are closely involved in thisplanning process.
Can subprofiles replace a city health profile?Many cities have developed subprofiles that examine a community or a theme in greatdepth. Examples of subprofiles developed include profiles on women or on children’shealth in specific deprived areas. Although cities may consider it vital to developcommunity profiles or thematic profiles to highlight specific areas of need or explorecertain areas in depth (and this may be an important process to undertake followingspecific findings in the profile), these profiles cannot replace a comprehensive profileof the city. Subprofiles, although an important part of a city’s health profile, do notpaint the full picture. Gaining a comprehensive understanding of health and itsdeterminants in a city requires undertaking a complete city health profile.
City health profiles produced by cities in theHealthy Cities project networkSeveral of the cities in the Healthy City project network have produced city healthprofiles. As expected, the profiles produced had a wide range and variety. In 1995 thecity health profiles completed by the project cities were reviewed. The purpose of thisreview was to present a snapshot of profiles and to determine how comprehensivethey were and their impact.
MethodTwenty-one profiles from 15 countries were reviewed. The methods used to review theprofiles included:
• a structured, systematic content review by two independent reviewers; and• semistructured telephone interviews to obtain additional information, including
data on what impact the profiles had on health policy.
The framework for the content review was based on the guidance provided by Cityhealth profiles – how to report on health in your city (1). The areas covered in the reviewincluded:
• demography• health status• socioeconomic conditions• environment• inequalities• infrastructure• public health policies and services• recommendations • presentation.
4
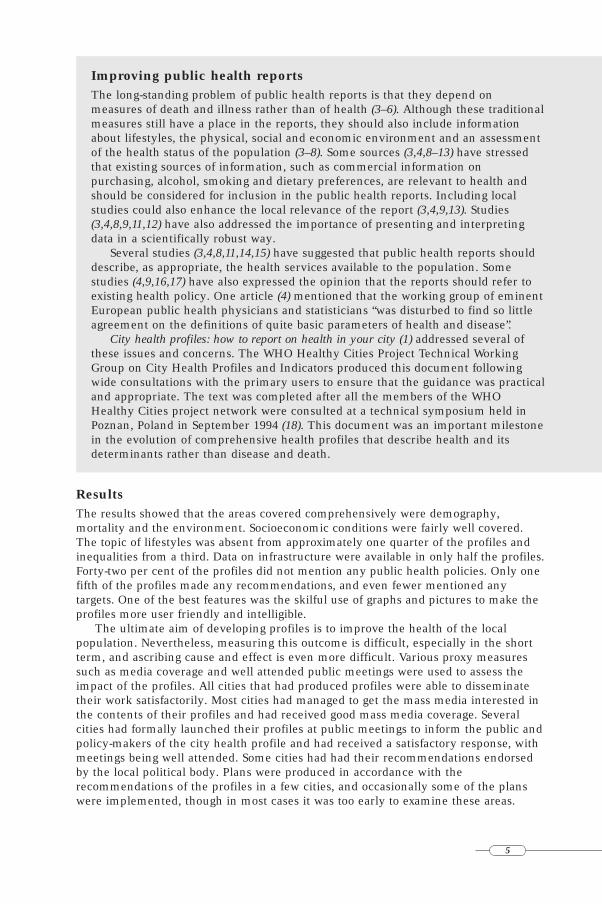
Improving public health reports The long-standing problem of public health reports is that they depend onmeasures of death and illness rather than of health (3–6). Although these traditionalmeasures still have a place in the reports, they should also include informationabout lifestyles, the physical, social and economic environment and an assessmentof the health status of the population (3–8). Some sources (3,4,8–13) have stressedthat existing sources of information, such as commercial information onpurchasing, alcohol, smoking and dietary preferences, are relevant to health andshould be considered for inclusion in the public health reports. Including localstudies could also enhance the local relevance of the report (3,4,9,13). Studies(3,4,8,9,11,12) have also addressed the importance of presenting and interpretingdata in a scientifically robust way.
Several studies (3,4,8,11,14,15) have suggested that public health reports shoulddescribe, as appropriate, the health services available to the population. Somestudies (4,9,16,17) have also expressed the opinion that the reports should refer toexisting health policy. One article (4) mentioned that the working group of eminentEuropean public health physicians and statisticians “was disturbed to find so littleagreement on the definitions of quite basic parameters of health and disease”.
City health profiles: how to report on health in your city (1) addressed several ofthese issues and concerns. The WHO Healthy Cities Project Technical WorkingGroup on City Health Profiles and Indicators produced this document followingwide consultations with the primary users to ensure that the guidance was practicaland appropriate. The text was completed after all the members of the WHOHealthy Cities project network were consulted at a technical symposium held inPoznan, Poland in September 1994 (18). This document was an important milestonein the evolution of comprehensive health profiles that describe health and itsdeterminants rather than disease and death.
ResultsThe results showed that the areas covered comprehensively were demography,mortality and the environment. Socioeconomic conditions were fairly well covered.The topic of lifestyles was absent from approximately one quarter of the profiles andinequalities from a third. Data on infrastructure were available in only half the profiles.Forty-two per cent of the profiles did not mention any public health policies. Only onefifth of the profiles made any recommendations, and even fewer mentioned anytargets. One of the best features was the skilful use of graphs and pictures to make theprofiles more user friendly and intelligible.
The ultimate aim of developing profiles is to improve the health of the localpopulation. Nevertheless, measuring this outcome is difficult, especially in the shortterm, and ascribing cause and effect is even more difficult. Various proxy measuressuch as media coverage and well attended public meetings were used to assess theimpact of the profiles. All cities that had produced profiles were able to disseminatetheir work satisfactorily. Most cities had managed to get the mass media interested inthe contents of their profiles and had received good mass media coverage. Severalcities had formally launched their profiles at public meetings to inform the public andpolicy-makers of the city health profile and had received a satisfactory response, withmeetings being well attended. Some cities had had their recommendations endorsedby the local political body. Plans were produced in accordance with therecommendations of the profiles in a few cities, and occasionally some of the planswere implemented, though in most cases it was too early to examine these areas.
5

Benefits of city health profilesAll cities interviewed felt that profiles were a vital planning instrument providingimportant baseline information that would not otherwise be available. They felt thatcity health profiles had integrated data from different sources in a way that had notbeen done previously. This had given them the opportunity and leverage to motivatepoliticians to address areas of need by providing information based on robust data.The production of city health profiles involved several players at different levels anddisciplines. Cities felt that this gave them the opportunity to use city health profiles asinstruments to stimulate and develop alliances.
Profiles – what next? City health profiles are expected to provide the evidence and credibility for seriousefforts to promote health at a local level. They are meant to be the basis for settingpriorities for health and be an integral part of local decision-making and the strategicplanning process. It is not sufficient to produce glossy reports on the problems facedby communities; what is vital is to use the information to campaign on behalf of thecommunity, involving people in their own local initiatives to improve health. Thisrequires that the profile-plan cycle be completed. Profiles gather the intelligence,which should be used to inform strategies to improve health. Profiles must thereforefeed into plans, and the city health plan must reflect the information gathered in acity health profile. This is necessary to realize the true potential of city health profiles.City health profiles are therefore not an end in themselves but an important elementin the process of improving health and thus moving closer to the reality of a healthycity.
Summary
• The prime objective of a city health profile is to stimulate action to improvepeople’s health.
• City health profiles should act as a source of epidemiological information aboutthe locality.
• Although city health profiles should still include traditional measures of deathand illness, they should also include information about lifestyles, the physical,social and economic environment and should assess the health status of thepopulation.
• The population described in the city health profile should be able to identifywith it.
• City health profiles should provide a focus for intersectoral action.• City health profiles will only achieve their true potential if they inform and feed
into plans.
6

References1. WHO Healthy Cities Project Technical Working Group on City Health Profiles and
Indicators. City health profiles – how to report on health in your city. Copenhagen,WHO Regional Office for Europe, 1995 (document ICP/HSIT/94/01 PB 02).
2. WHO Healthy Cities Project Office. City health planning: the framework.Copenhagen, WHO Regional Office for Europe, 1996 (document EUR/ICP/HCIT 9401/MT06/7).
3. Bruce, N. et al. A slow death or eternal life? Future directions for annual publichealth reports. Public health, 108: 439–446 (1994).
4. Development of guidelines for reports on public health. Report of a WHO WorkingGroup, Copenhagen 11–12 December 1990. Copenhagen, WHO Regional Office forEurope, 1991 (document EUR/ICP/HSC 016: 4324B).
5. Watt, I.S. et al. Annual reports of the directors of public health. British medicaljournal, 306: 1282–1283 (1993).
6. Gair, R. et al. Criteria for audit of annual reports on the public health: do theyexist? Journal of public health medicine, 14: 169–172 (1992).
7. Nossikov, A. Reporting on public health – needs and opportunities for better use.Copenhagen, WHO Regional Office for Europe, 1990 (document ICP/HSC 016/7).
8. Pencheon, D. & Gray, M., ed. Faculty of Public Health Medicine’s Working Party onAnnual Reports. Health measurement toolbox: measuring the health of populations andwriting a more effective annual report. 3rd ed. London, Faculty of Public HealthMedicine, 1991.
9. Farrow, S. et al. A content review of the annual reports on the health of the population.Bristol, Health Care Evaluation Unit, 1990.
10. National health survey systems in the European Economic Community. Luxembourg,European Commission, 1977.
11. Acheson, R.M. et al. Health information, planning, and monitoring. Seminars incommunity medicine, 2 (1976).
12. Bipsham, K. et al. Information for area health planning. In: McLachlan, G., ed.Challenges for change. Oxford, Oxford University Press, 1971, pp. 235–262.
13. Nakamura, K. & Takano, T. Image diagnosis of health in cities: Tokyo healthy city.In: Takano, T. et al., ed. Formulation and development of a research base forhealthy cities. Tokyo, Kyoisku Syoseki, 1992.
14. Van Oers, J.A. & Reelick, N.F. Quantitative indicators for a healthy city.International journal of epidemiology and community health, 46: 293–296 (1992).
15. Fitzpatrick, R. A pragmatic defence of health status measures. Health care analysis,4: 265–272 (1996).
16. Minowa, M. et al. Health information system. Journal of epidemiology, 6: S147–S157(1996).
17. Stone, D.H. Priorities for prevention: a discussion paper. In: McLachlan, G., ed.Framework and design for planning: uses of information in the NHS. Oxford, OxfordUniversity Press, 1977, pp. 95–146.
18. City health profiles – city health plans: report of a WHO Healthy Cities TechnicalSymposium, Poznan, Poland, 23–24 September 1994. Copenhagen, WHO RegionalOffice for Europe, 1994 (document EUR/ICP/HCIT 94 01 PB01).
7


Chapter 2
Using city health profiles to help reduce inequity in health


European regional health for all target 1: “By the year 2000, the differences in health statusbetween countries and between groups within countries should be reduced by at least 25%,by improving the level of health of disadvantaged nations and groups.”
IntroductionThe European regional targets for health for all were based on the significant variationin health both between countries and within countries when they were first agreed in1984. The purpose of target 1 is to focus on reducing these differences.
WHO formed a small Equity in Health Unit to take this forward, and itsprogramme was later combined with the work of the Country Health Policy Unit in1989. They produced various discussion papers (1–4) to develop policy, and in 1994 theWHO Regional Committee for Europe decided to focus its technical discussions onequity and ethics in health.
The Healthy Cities project is a powerful vehicle for introducing changes to reduceinequity in health.
City health profiles and changeThe purpose of the city health profile is to help the city introduce programmes thatwill reduce the differences in health that can be changed.
The profile is an important lever for change. Nevertheless, it is only one of severalcomponents needed to produce change. These include
• informed political commitment;• understanding of the causes of inequity;• knowledge of measures (policies, strategies, plans and programmes) that will
reduce inequity;• information to be able to decide which problems to address; and• a planned way of choosing the issues to be addressed, introducing changes, seeing
them through, monitoring them and reviewing plans.
These are linked as shown in Fig. 1.
Fig. 1. Change using city health profiles
If a city wants change, it is important to ensure that all these components are in place.
11
Assessing the available dataImplementing programmes
Collecting more data if neededConstructing plans Monitoring change
Analysing and interpretingthe data
Developing strategies
Formulating policy
1. Achieving politicalcommitment 2. Understanding equity and
its causes
3. Describing local inequity
4. Determining measuresthat will reduce inequity

What the profile might include to support the equity agenda
Understanding the causes of inequityHow do differences in people’s health arise?Differences in health arise from differences in the factors that influence health.Dahlgren & Whitehead (2) have illustrated these (Fig. 2), which can be summarized as
• age, sex and hereditary factors• individual lifestyle factors• social and community influences• living and working conditions• general socioeconomic, cultural and environmental conditions.
Fig. 2. Differences in health
What is inequity in health?Some factors causing differences in health are unavoidable and some are not. Forexample, differences in genetic make-up (including gender) and in age are associatedwith differences in health, and these factors cannot be avoided. Sometimes differencesarise as a result of very risky voluntary activities such as certain sports. Sometimestemporary differences arise as a result of health improvement measures adopted moreoften by one group of the population before another. Most people would not regardthese differences as inequity in health.
WHO uses equity and inequity to refer to “differences in health which are not onlyunnecessary and avoidable but, in addition, are considered unfair and unjust”. “Equity is...concerned with creating equal opportunities for health and with bringing healthdifferentials down to the lowest possible.” (1). Policies that aim to achieve this cover:
• health-damaging behaviour where the degree of choice of lifestyle is severelyrestricted;
• exposure to unhealthy and stressful living and working conditions;• inadequate access to essential health and other public services; and• situations in which health-related social mobility tends to make sick people lose
socioeconomic status.
12
GEN
ERA
LSO
CIOECONOMIC, CULTURAL AND ENVIRONMENTAL
CONDITIO
NS
SOCI
AL AND COMMUNITY NETWORKSIN
DIV
IDUAL LIFESTYLE FACTO
RS
Agricultureand food
production
Education
Workenvironment
Living and workingconditions
Unemployment
Water andsanitation
Health careservices
Housing
AG
E,SE
X
AND HEREDITARY
FACTO
RS
Source: Dahlgren & Whitehead (2)

Technical advice on collecting data on socioeconomic inequalities inhealth from Kunst & Mackenbach (3)• Socioeconomic inequalities in health can be defined as differences in the
prevalence or incidence of health problems between individual people of higherand lower socioeconomic status.
• The core of every monitoring system should be regular health interview surveysand a mortality registry. Several indicators of self-reported morbidity should beincluded in the health interview survey to cover various aspects of health.
• Whenever possible, socioeconomic status should be measured by threeindicators: occupational status, level of education and income level.
• A wide variety of measures can be used to summarize the magnitude ofsocioeconomic inequalities in health. Both relative and absolute differences ininequity should be considered.
Achieving political commitmentA profile that focuses solely on inequity and is rich in information and explanationwould be ideal. Nevertheless, even cities with no information about inequity can placeequity on the agenda. With or without supporting local information, the following willhelp gain political commitment:
• engaging the politicians in the process early on;• devoting a section of the report to equity;• ensuring that equity is identified in the table of contents;• highlighting the European regional health for all target 1 on equity;• describing the challenges associated with inequity;• pointing out the need for information to describe the local situation; and• recommending a work plan on equity and the production of a report within a
specified time period.
This will help to gain acceptance of equity as an issue and to prepare the basis for acoherent approach later.
Describing local inequityDescribing healthCity health profiles – how to report on health in your city (5) explains how to describe thehealth of people in a city. The profile describes who has what health problems. Theinformation required to highlight inequity is the same and includes:
• measures of health and ill health (mortality, morbidity and disability);• environmental factors related to health;• lifestyle-damaging and health-promoting behaviour;• uptake of preventive services; and• health and welfare services.
Information should be provided in a way that helps the city to target resourcestowards those in greater need. To do this, the information needs to be linked to:
• smaller geographical areas within the city (so that communities needing particularsupport can be identified); and
• population groups known to be vulnerable, such as ethnic minorities and peoplewith low income.
If this is done, the health of different population groups can be compared and inequitycan be identified. Collecting baseline information will also enable the change resultingfrom intervention programmes to be measured over time (see box).
13

Fig. 3. Three types of helpful information
Need Effectiveness
Existing services
Choosing priority problems Many factors affect the choice of priorities, especially assessment about what can beachieved in the local area and the views of local people. Nevertheless, three types ofinformation are helpful in deciding where most benefit is likely to be gained from aninvestment of resources (Fig. 3).
• need – an assessment of the extent and importance of the inequity and where it is;• effectiveness – knowledge of types of intervention that are effective (and therefore
useful) in reducing inequity and how much they cost; and• existing services – how many resources are currently devoted to addressing
inequity and where there might be shortfalls.
Intervention to reduce inequity: policies, strategies, plans and programmesPlanningIntervention to reduce inequity needs to be grounded in the available evidence ofeffectiveness. Implementing intervention in a planned way requires movement frompolicy to a strategy, plans and programmes of implementation.
Programmes need to be monitored to measure the changes brought about anddecide what needs to be changed to ensure that the programme is achieving itsobjective.
New interventions should be evaluated and published such that others can learnboth about good practice and new approaches that work.Intervention a city needs to include to reduce inequityApproaches that are used to reduce inequity in health can broadly be divided into fourdifferent levels (6). These are measures that
• strengthen individuals• strengthen communities• improve access to essential facilities and services• encourage macroeconomic and cultural change.
A city programme to address inequity is likely to require initiatives at all four levels. Gepkins & Gunning-Shepers (7) and Benzeval et al. (6) provide details of the researchon the effectiveness of interventions to reduce inequity.
Measures to strengthen individualsBroadly, measures to strengthen individuals can give rise to initiatives that focus on:
• individual behaviour• individual empowerment.
Individual behaviour. An example of this type of focus is simply disseminatinginformation to individuals. Disseminating information by itself, however, increasesinequity, as a larger number of advantaged people act on the information than dodisadvantaged people. There is more chance of reducing inequity if information issupplemented by personal support or structural changes that help make behavioural
14

Examples of what project cities have done to reduce inequity in health
The city health profile
Glasgow used a whole healthy city report to focus on inequalities in health anddescribed a model of health explaining the factors that lead to health and toinequity in health.
Measures of health
A general index of health can be useful in showing an overall measure of health orill health. Not all cities can do this, but:
• Dublin and Liverpool used the standardized mortality ratio;• Maribor used infant mortality; and• Lódz used average life expectancy.
These measures are more often used for defined geographical areas. When this isdone, the results can be compared with the overall results for the city or thecountry as a whole. Dublin, Liverpool and Glasgow provided information that enabled them to show thehealth measures in districts of the city and thus target resources to smallgeographical areas.
Environmental factors related to health
Various aspects of the physical environment have been used, including
• information on water, sewerage and noise (Lódz);• air and water quality data (Sumperk, Czech Republic);• views on air quality and noise (Padua); and• unemployment, type of housing, perceptions of health and irritating influences
(Sumperk).
Inner Nørrebro (a district of Copenhagen) used quality of life measures obtainedfrom a local survey.
Measures of deprivation
An overall measure can be used to show the geographical areas likely to be ingreater need. Various indicators can be selected to indicate an overall measure ofdeprivation, including:
• residential density (crowding) to reflect economic status used (Jerusalem);• crowding (Lódz);• neighbourhood type (Glasgow and Dublin); and• an index of social conditions or deprivation: unemployment, children in
households with low income, overcrowded dwellings, dwellings lacking basicamenities, households with no car and children in unsuitable accommodationsuch as high-rise flats (Liverpool).
Health-damaging and health-promoting behaviour
Surveys normally need to be carried out to gather this type of information. Lódz,however, gathered information on smoking and drug misuse, and Amadoracollected information on membership of sports clubs and cultural associations.Some have used the uptake of preventive services and the availability of health andwelfare services.
15
change easier and if the advice given is sensitive to the difficult circumstances inwhich many people live (6,7).
Examples where this combination of approaches have been used include:
• antenatal care (8)• smoking reduction programmes (9,10)• childhood accidents (11–13)• breastfeeding (14)• nutrition in childhood (15)• cervical and breast screening (16).
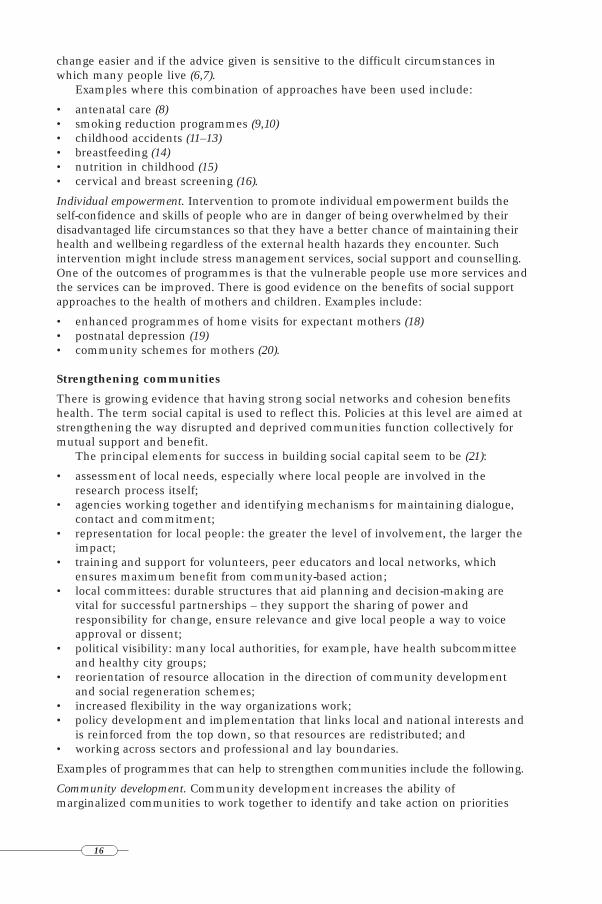
Individual empowerment. Intervention to promote individual empowerment builds theself-confidence and skills of people who are in danger of being overwhelmed by theirdisadvantaged life circumstances so that they have a better chance of maintaining theirhealth and wellbeing regardless of the external health hazards they encounter. Suchintervention might include stress management services, social support and counselling.One of the outcomes of programmes is that the vulnerable people use more services andthe services can be improved. There is good evidence on the benefits of social supportapproaches to the health of mothers and children. Examples include:
• enhanced programmes of home visits for expectant mothers (18)• postnatal depression (19)• community schemes for mothers (20).
Strengthening communities
There is growing evidence that having strong social networks and cohesion benefitshealth. The term social capital is used to reflect this. Policies at this level are aimed atstrengthening the way disrupted and deprived communities function collectively formutual support and benefit.
The principal elements for success in building social capital seem to be (21):
• assessment of local needs, especially where local people are involved in theresearch process itself;
• agencies working together and identifying mechanisms for maintaining dialogue,contact and commitment;
• representation for local people: the greater the level of involvement, the larger theimpact;
• training and support for volunteers, peer educators and local networks, whichensures maximum benefit from community-based action;
• local committees: durable structures that aid planning and decision-making arevital for successful partnerships – they support the sharing of power andresponsibility for change, ensure relevance and give local people a way to voiceapproval or dissent;
• political visibility: many local authorities, for example, have health subcommitteeand healthy city groups;
• reorientation of resource allocation in the direction of community developmentand social regeneration schemes;
• increased flexibility in the way organizations work;• policy development and implementation that links local and national interests and
is reinforced from the top down, so that resources are redistributed; and• working across sectors and professional and lay boundaries.
Examples of programmes that can help to strengthen communities include the following.
Community development. Community development increases the ability ofmarginalized communities to work together to identify and take action on priorities
16

the communities themselves define as important. An example of this is the Grantoncommunity development project in Scotland (22).
Community regeneration. Community regeneration strategies focus on multiplydeprived areas with typically 10 000 to 20 000 residents. Their aim is to improve socialconditions at the same time as stimulating the local economy, to provide moreemployment opportunities and tackle defects in the physical environment.
Improving access to essential facilities and services
The whole population. This includes providing the prerequisites for health. It addressesthe physical environment and disease prevention, health protection and health andwelfare services. It includes adequate housing, sanitation, clean water,uncontaminated food, education, employment and a safe and healthy workplace.Achieving these for everyone is an essential step in achieving equity. Structuralapproaches such as supplementing salt with iodine and water with fluoride can bepowerful ways of reducing certain types of inequity.
Approaches focused on settings. When a city has achieved the basic prerequisites forhealth for all its residents, then the city health profile should move on to addressspecific aspects of inequity. A settings approach may be particularly valuable here,and the health profile may want to draw attention to the well established HealthySchools, Health Promoting Hospitals and Healthy Workplace initiatives. Otherapproaches include
• community environments, including crime and the fear of crime and theavailability of recreational facilities;
• education, including focusing on how to overcome the educational disadvantagesassociated with growing up in poverty through such measures as child care, earlyeducation and intervention packages for children falling behind: Head Start (23)has been shown to be effective in doing this; and
• work: because so many people spend substantial time at work, the workplace is avaluable setting for policies to address inequity in health, which can be appliedequally to all members of staff, and improving health can become part of theorganizational culture.
Some cities may need to emphasize reducing the physical threats to health from theworking environment.
In well developed workplaces the emphasis may now be less on the physicalenvironment at work and more on the mental effects of work on health. The focusmay be more on a combination of individually based programmes, such as stressmanagement; improving communication and human relations with more opportunityfor personal control over work decisions; organizational changes in working practices;and changing the market conditions. The international labour report of 1992 (24)found that the risk of stress at work can be reduced by taking this type of approach.
Access to health services. For some cities a key equity challenge may be ensuring theavailability of basic health services for all. For cities where this has been achieved,then the equity focus may be more equal access to health services for equal need.Principles adopted here might include (6):
• ensuring that resources are distributed between local areas in proportion to theirrelative needs: for example, by a formula that takes account of the different healthcare needs of different areas;
• responding appropriately to the health care needs of different social groups: forexample, for immunization, screening, family planning and the uptake oftreatment services by different social groups; and
17

• taking the lead to encourage a wider and more strategic approach to developinghealthy public policies.
Macroeconomic and cultural change
Among industrialized countries, those with a more equitable income distribution havea more equitable distribution of health than do countries with a more inequitableincome distribution. Countries with increasing income disparity have a wideningdisparity in mortality (25).
Some of the key requirements at this level for preventing inequities in health are (6):
• income maintenance policies that provide adequate financial support for peoplewho fall into poverty;
• education and training policies that help prevent poverty in the long term; and• more equitable taxation and income distribution policies.
ConclusionSubstantial research describes inequity in health. Coordinated action is now neededwithin cities to reduce this inequity. The city health profile can be a powerful lever forchange to bring this about.
18

References1. Whitehead, M. Concepts and principles of equity and health. Copenhagen, WHO
Regional Office for Europe, 1990 (document EUR/ICP/RPD 414 7734r). 2. Dahlgren, G. & Whitehead, M. Policies and strategies to promote equity in health.
Copenhagen, WHO Regional Office for Europe, 1992 (EUR/ICP/RPD 414(2) 9866n).3. Kunst, A.E. & Mackenbach, J.P. Measuring socio-economic inequalities in health.
Copenhagen, WHO Regional Office for Europe, 1994 (EUR/ICP/RPD 416 12234).4. Dahlgren, G. Strategies for reducing social inequities in health - visions and reality.
In: Ollola, E. et al., ed. Equity in health through public policy. Report from an expertmeeting in Kellokoski, Finland. Helsinki, National Research and DevelopmentCentre for Welfare and Health (STAKES), 1996, pp. 23–53.
5. WHO Healthy Cities Project Technical Working Group on City Health Profiles andIndicators. City health profiles – how to report on health in your city. Copenhagen,WHO Regional Office for Europe, 1995 (document ICP/HSIT/94/01 PB 02).
6. Benzeval, M. et al., ed. Tackling inequalities in health – an agenda for action. London,Kings Fund, 1995.
7. Gepkins, A. & Gunning-Shepers, L.J. Interventions to reduce socio-economic healthdifferences. Amsterdam, Institute of Social Medicine, 1995.
8. Rush, D. et al. The national WIC evaluation: evaluation of the special supplementalfood program for women, infants and children. V. Longitudinal study of pregnantwomen. American journal of clinical nutrition, 48: 439–483 (1988).
9. Jamrozim, K. et al. Controlled trials of three different anti-smoking interventionsin general practice. British medical journal, 288: 1499–1503 (1984).
10. Windsor, R. et al. The effectiveness of smoking cessation methods for smokers inpublic health maternity clinics: a randomized trial. American journal of publichealth, 75: 1389–1392 (1985).
11. Colver, A. et al. Promoting children’s home safety. British medical journal, 285:1177–1180 (1982).
12. Liberato, C. et al. Safesmart safety seat intervention project: a successful programfor the medically indigent. Patient education and counseling, 13: 161–170 (1989).
13. Robitaille, Y. et al. Evaluation of an infant care seat program in a low-incomecommunity. American journal of disabled children, 144: 74–78 (1990).
14. Kistin, N. et al. Breast-feeding rates among black urban low-income women: effectof prenatal education. Paediatrics, 86: 741–746 (1990).
15. James, J. et al. Preventing iron deficiency anaemia in pre-school children byimplementing an educational and screening programme in an inner city practice.British medical journal, 299: 838–840 (1989).
16. Kegeles, S.S. A field experimental attempt to change beliefs and behaviour ofwomen in an urban ghetto. Journal of health and social behaviour, 10: 115–125(1969).
17. McKevoy, B.R. & Raza, R. Can health education increase uptake of cervical smeartesting among Asian women? British medical journal, 302: 833–836 (1991).
18. Olds, D. et al. Improving the life course development of socially disadvantagedmothers: a randomized trial of nurse home visitation. American journal of publichealth, 78: 1436–1445 (1988).
19. Oakley, A. Social support and motherhood: the natural history of a research project.Oxford, Blackwell, 1992.
20. Johnson, Z. et al. Community mothers programme: randomised controlled trial ofnon-professional intervention in parenting. British medical journal, 306: 1449–1452(1993).
21. Gillies P. Healthlines, issue 48: 11 (January 1998).22. Hunt, S. Community development and health promotion in a deprived area: final
19

report. Edinburgh, Research Unit in Health and Behavioural Change, 1989. 23. McKey, R. et al. The impact of Head Start on children, family and communities. Final
report of the Head Start Evaluation Synthesis and Utilization Project. Washington,DC, US Government Printing Office, 1985 (US Department of Health and HumanServices, Publication no. (OHDS)85-31193).
24. International Labour Office, ed. Preventing stress at work. Conditions of work digest,11(2) (1992).
25. Phillimore, P. et al. Widening inequalities of health in northern England,1981–1991. British medical journal, 308: 1125–1128 (1994).
20

Chapter 3
Lifestyles in health profiles


Lifestyles affect healthLifestyles have very important effects on the disease patterns and health status of thecountries of Europe. The largest groups of causes of premature deaths, cancer andcardiovascular diseases, mostly result from unhealthy lifestyles. Underlyingdifferences in lifestyle also cause a large proportion of the differences in health statusbetween regions, between urban and rural areas and between socioeconomic classesand other social categories.
WHO’s strategy for health for all in Europeincludes lifestylesLifestyle is a very important component of WHO’s European regional strategy forhealth for all. In addition to developments in prevention, treatment, care andrehabilitation and improving the environment, changes in lifestyles are required toachieve the 38 targets for health for all. Five of the targets are related to variousaspects of lifestyle:
• healthy public policy: intersectoral policies should support the promotion ofhealthy lifestyles, and systems should ensure public participation in policy-makingand implementation;
• settings for health promotion: all settings of social life and activity, such as thecity, school, workplace, neighbourhood and home, should provide greateropportunities for promoting health;
• health competence: accessible and effective education and training in healthpromotion should be available in order to improve public and professionalcompetence;
• healthy living: there should be continuous efforts to promote and support healthypatterns of living; and
• tobacco, alcohol and psychoactive drugs: consumption should be reducedsignificantly through policies and programmes.
These targets were chosen because experience and scientific knowledge show thatpeople’s lifestyles in general and healthy lifestyles in particular only indirectly andonly together with many other factors depend on whether people have or acquireknowledge about healthy and unhealthy lifestyles. The targets reflect the fact thatlifestyle encompasses more than such negative and very tangible components assmoking and alcohol use.
The dictionary defines lifestyle as: “the way in which an individual or a grouplives”. Thus, lifestyles are much more than the total factors related to health, illnessand disease. Health professionals, health promoters and others have tended to equatelifestyles, health habits, health behaviour and other similar names for health-relatedbehaviour. Nevertheless, the concept of lifestyles is much broader than the concept of
23

health behaviour. Lifestyles cover many other aspects of people’s daily lives andbehaviour than those that affect health.
Many factors and mechanisms contribute to shaping lifestyles in general andhealth-related lifestyles. Examples include the socialization during childhood of healthhabits, peer pressure among friends and in work groups, the perceived risks inherentin certain types of behaviour and the pleasure and joy of habits although they mightadversely affect health. All these factors and many more have an important role informing lifestyles.
This chapter does not exhaustively explain and present theories and hypothesesrelated to lifestyles. Factors at the levels of individual psychology and biology, socialand group psychology, social structure and economics and social culture have to beincluded simultaneously in understanding and explaining lifestyles. Consequently,intervention and health promotion activities should be directed towards all theselevels and towards the sectors and spheres of life that do not focus narrowly on health.
Types of data on lifestyles needed ina health profileHealth profiles serve several purposes in improving health in cities and in guidinghealth promotion work. First, they describe the baseline and challenges for the work:what is the magnitude of the various health challenges? Which ones should be givenhighest priority? Where in the city or community and among which groups are thehealth challenges to be taken up most prevalent? How can the health challenges bedescribed so that they become visible to the politicians and the citizens and can beused in political debate and decision-making?
Second, regularly conducted health profiles can serve as a measure for evaluation:were the targets achieved? What supported the success of the work and what were theobstacles and the causes of failures?
The debate on whether health profiles should use quantitative or qualitative datahas been heated. Distinguishing between quantitative and qualitative data is verydifficult. All data are qualitatively distinct. In some cases huge quantities of data arecollected and subjected to statistical calculation, and the results are presented ingraphs, tables and figures. In other cases a few data are collected and interpreted byvarious nonstatistical methods.
Some people understand the message inherent in the tables, graphs or figures andtherefore like and advocate quantitative methods. Other people better understand themessages of qualitative methods. Both approaches are necessary in understanding,planning and evaluating health promotion.
Quantitative data are required to estimate the magnitude of problems (How manypeople smoke?), to set priorities (deciding among disease-preventing measures thatcould increase overall life expectancy by different amounts) and to evaluate whethertargets have been achieved (such as increasing the percentage of nonsmokers amongadults to 80%).
Qualitative data are necessary to understand many of the crucial processes thatshape lifestyle patterns (How is peer pressure exerted and perceived? What are thenorms for alcohol use?) and to understand why some people are reluctant to supporthealth promotion actions. Qualitative methods and data are also needed in the stagesof developing a questionnaire for a health profile. If researchers cannot understandwhat the questionnaire means to the target subjects, they cannot understand the dataderived.
24

Available data on lifestylesVery few data on lifestyles are collected routinely for public statistics and are therebyavailable for profile purposes. Usually only sales figures or taxation figures on tobaccoand alcohol are available, and mostly only at the national level. Quantitative data onlifestyles therefore have to be collected through questionnaire or interview surveys ofsamples of the population.
The instruments used to collect data very seldom allow direct comparison betweendifferent surveys. If the questions are not worded identically, different responses areproduced that do not necessarily reflect real differences. When different cultures arecompared, even attempts to word the questionnaire identically in different languagesmight not suffice for obtaining comparability. If data cannot be compared with eachother or a reference point they have no meaning. Surveys for health profiles musttherefore use questionnaires that allow survey results to be compared.
The statisticians or researchers developing a questionnaire often find themselvesin a dilemma. Most existing questionnaires can be legitimately criticized, as they havebeen developed through a series of compromises balancing many different opinions. Aspecific questionnaire can produce biased results. The ambitious researcher cantherefore be tempted to develop a new questionnaire that will become the standard forall questionnaires. Nevertheless, this quest might produce a unique questionnaire thatdoes not allow comparison with anything. A questionnaire that does not reach 100%quality and validity gains if it has comparability. The WHO Regional Office for Europehas reviewed national health interview surveys (1), which can form a useful basis forlocal lifestyle surveys.
Lifestyle indicators in health profilesThe lifestyle indicators to be included must be considered carefully. They shouldindicate serious causes of health problems, such as smoking, alcohol consumption orother risk-taking behaviour, or serious results of such behaviour, such as lung canceror diseases of the circulatory system. The indicators should reflect themes in whichmeasurable changes can be anticipated and possibly changes resulting from healthpromotion activities and health policy. The ultimate explicit or implicit objective ofmost public health policies is to reduce mortality and thereby increase life expectancy.Nevertheless, measuring such changes and claiming with certainty and irrefutableevidence that the changes have been caused by a specific health promotion activity,much less by a city’s status as a “healthy city”, are usually difficult if not impossible.The further in time a cause is separated from its hypothetical effect, the more difficultit is to claim evidence for a causal relationship, especially in observational studies(ones that are not experimental with random allocation of intervention).
Researchers must therefore carefully consider which indicators can best indicatesuccess. Measuring public participation in health promotion programmes andactivities is often a realistic ambition. Indicators of public awareness and knowledge ofhealth hazards and contemplation of change in habits can also be chosen. Theassumption is that awareness and knowledge sooner or later will change people’sbehaviour and subsequently their health.
The success of an antismoking campaign does not need to be evaluated based onthe incidence of lung cancer: a decline in the prevalence of smoking suffices.Likewise, it could be argued that growing awareness of the health hazards of smoking,the establishment of nonsmoking norms and cultures and social pressure willeventually reduce the prevalence of smoking. A short-term evaluation shouldtherefore focus on changes in knowledge and attitudes rather than on behaviour.
25
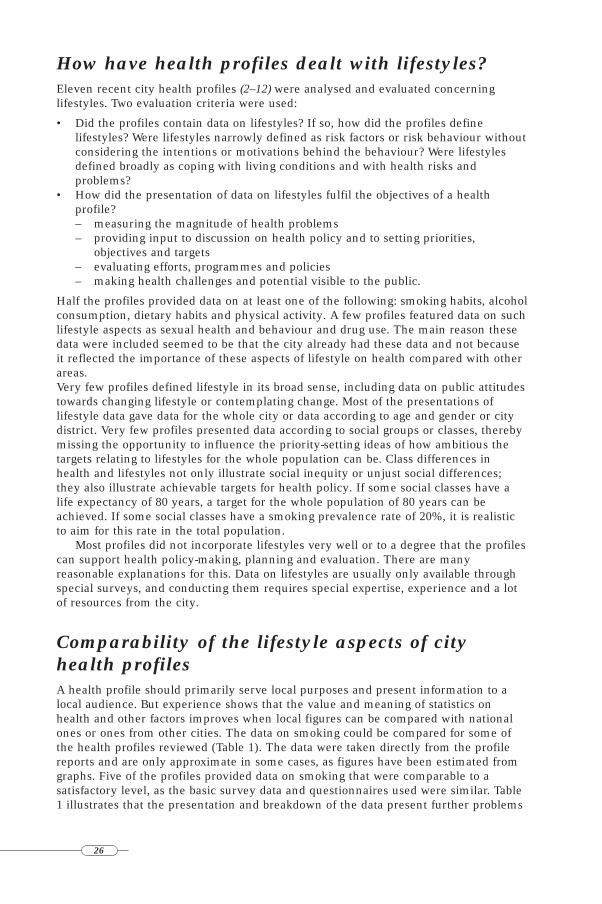
How have health profiles dealt with lifestyles?Eleven recent city health profiles (2–12) were analysed and evaluated concerninglifestyles. Two evaluation criteria were used:
• Did the profiles contain data on lifestyles? If so, how did the profiles definelifestyles? Were lifestyles narrowly defined as risk factors or risk behaviour withoutconsidering the intentions or motivations behind the behaviour? Were lifestylesdefined broadly as coping with living conditions and with health risks andproblems?
• How did the presentation of data on lifestyles fulfil the objectives of a healthprofile?– measuring the magnitude of health problems– providing input to discussion on health policy and to setting priorities,
objectives and targets – evaluating efforts, programmes and policies– making health challenges and potential visible to the public.
Half the profiles provided data on at least one of the following: smoking habits, alcoholconsumption, dietary habits and physical activity. A few profiles featured data on suchlifestyle aspects as sexual health and behaviour and drug use. The main reason thesedata were included seemed to be that the city already had these data and not becauseit reflected the importance of these aspects of lifestyle on health compared with otherareas.Very few profiles defined lifestyle in its broad sense, including data on public attitudestowards changing lifestyle or contemplating change. Most of the presentations oflifestyle data gave data for the whole city or data according to age and gender or citydistrict. Very few profiles presented data according to social groups or classes, therebymissing the opportunity to influence the priority-setting ideas of how ambitious thetargets relating to lifestyles for the whole population can be. Class differences inhealth and lifestyles not only illustrate social inequity or unjust social differences;they also illustrate achievable targets for health policy. If some social classes have alife expectancy of 80 years, a target for the whole population of 80 years can beachieved. If some social classes have a smoking prevalence rate of 20%, it is realisticto aim for this rate in the total population.
Most profiles did not incorporate lifestyles very well or to a degree that the profilescan support health policy-making, planning and evaluation. There are manyreasonable explanations for this. Data on lifestyles are usually only available throughspecial surveys, and conducting them requires special expertise, experience and a lotof resources from the city.
Comparability of the lifestyle aspects of cityhealth profilesA health profile should primarily serve local purposes and present information to alocal audience. But experience shows that the value and meaning of statistics onhealth and other factors improves when local figures can be compared with nationalones or ones from other cities. The data on smoking could be compared for some ofthe health profiles reviewed (Table 1). The data were taken directly from the profilereports and are only approximate in some cases, as figures have been estimated fromgraphs. Five of the profiles provided data on smoking that were comparable to asatisfactory level, as the basic survey data and questionnaires used were similar. Table1 illustrates that the presentation and breakdown of the data present further problems
26

for comparison even if the basic data are comparable.The overall smoking prevalence in Eindhoven is 38%, whereas it is 40% in Dublin
and approximately 30% in Sumperk. The health profile for inner Nørrebro (2) does notprovide the overall prevalence for Copenhagen, and the overall prevalence for Leiria isnot available.
The data from Eindhoven were distributed according to age groups and accordingto gender, and the results for Copenhagen were distributed according to an age-by-gender matrix. The data from Dublin were distributed according to gender in districtswith high or low mortality. In both Copenhagen and Eindhoven smoking is moreprevalent among men than among women, but in Copenhagen it is more prevalentamong women than men in the youngest age groups. In Dublin smoking is moreprevalent among women than among men.
The profiles leave numerous questions unanswered that could only have beenanswered if all cities had used the same presentation format.
Table 1. Smoking prevalence rates reported in various city health profiles (2–4,9,10)
City and population group All ages Age groups
14–24 yearsa 25–44 years 45–64 yearsb ≥65 yearsb
EindhovenTotal 38% 33% 44% 38% 24%Men 40%Women 35%
Leiriaa 35%Sumperk about 30%Copenhagenb
City of CopenhagenMen 28% 40% 53% 40%Women 32% 41% 44% 25%
Inner Nørrebro (district)Men 30% 46% 60% 37%Women 34% 44% 44% 20%
DublinTotal 40%District with high mortality
Men 50%Women 52%
District with low mortalityMen 27%Women 30%
aThe age group for Leiria was 15–19 years.bThe two oldest age groups for Copenhagen were 45–66 years and ≥67 years.
27

References1. de Bruin, A. et al., ed. Health interview surveys: towards international harmonization
of methods and instruments. Copenhagen, WHO Regional Office for Europe, 1996(WHO Regional Publications, European Series, No. 58).
2. Vreca, C. & Kersic, V. Maribor – healthy city. A report about performing healthprotection in the community of Maribor, Pesnica and Ruse. Maribor, Slovenia, MariborCommunity Government, 1991.
3. Your district – your health. Inner Nørrebro. Copenhagen, Copenhagen Healthy CitiesProject and Danish Institute for Clinical Epidemiology, 1992.
4. Hayes, C. et al., ed. Dublin 1992 – a healthy city? Dublin, Dublin Healthy CitiesProject, 1992.
5. van Nierop, P. et al. Epidemiologische en sociaal-demografische basisgegevens van deEindhovense bevolking [Epidemiological and sociodemographic baseline data for thepopulation of Eindhoven, the Netherlands]. Eindhoven, GemeentelijkeGezondheidsdienst Eindhoven (Eindhoven Health Services), 1994.
6. Wieczorek, H. et al. Healthy Lódz. Stategies – action – plans. Lódz, Poland,Department of Public Health, 1994.
7. Health profile of Amadora. Amadora, Portugal, City of Amadora, 1995.8. Draft of the healthy city profile 1995. Padua, Italy, Healthy City Project Office, 1995.9. Lancaster, T. Liverpool city health profile. Liverpool, Liverpool Healthy City Project,
1995.10. Suchanová, S. Sumperk city health profiles 1995. Sumperk, Czech Republic, Health
Promotion Centre, 1995. 11. Valente, C. & Marques, C. The health profile of Leiria. Leiria, Portugal, Leiria
Healthy City Project Office, 1995. 12. Waschitz, B. A profile of health and quality of life of Jerusalem and its residents.
Jerusalem, Jerusalem Healthy Cities Project, 1996.
28

Chapter 4
Community health profiles


IntroductionThe health and wellbeing of any population requires a holistic approach that includesthe involvement of many agencies and gives ownership to the communities involved.The traditional notion of top-down delivery of health care is no longer acceptable tocentral governments, who are seeking greater value for money. The increasing returnto the principles of public health signifies that a purely medical approach to healthcannot by itself resolve the many health problems in increasingly complex cities.Government health strategy documents increasingly recognize the importance of theviews of the people receiving services in needs-based service delivery and espouse theinvolvement of individuals and communities as a key objective in the future deliveryof health services (1):
To give people an effective voice in the shaping of the health services there needs to be a moveaway from one-off consultation towards ongoing involvement of local people....
Action on health issues at the community level has increased greatly in recent years,and local communities are now demanding a greater role in service provision anddelivery. New partnerships are emerging to plan and deliver services based on localarea needs. The Healthy Cities movement provides a focus for such partnerships.
Community involvement in health
Community development and healthCommunity development seeks to enable individuals and communities to grow andchange according to their own needs and priorities. Applied to health, this meansencouraging people to define their own health needs and seek their own solutions.Community development achieves empowerment through participation. Communitydevelopment can also aim to develop an awareness and understanding of the issuesand the structural causes of social and health problems. Farrant (2) speaks ofcommunity development as applied to health as:
...redressing inequalities in health by facilitating collective responses to community definedhealth needs and enabling powerless and disadvantaged groups to have an effective voice inquality decisions that effect their lives and health.
The core features of community development are (3):
• people identifying what is relevant to them;• collective action to influence or control change;• the development of skills, knowledge and confidence;• the sharing of power;• the creation of structures for genuine participation; and• raising awareness and confronting discrimination.
31

The key elements of this practice are equity, community participation andempowerment of local communities.
Community participation in healthDiscussions concerning the involvement of communities use a variety of terms suchas community consultation and sometimes participation, which can be individual orcollective. In reality, community participation in health can range from aquestionnaire being delivered through people’s doors and the results never becomingknown and acted upon to local people being involved in all stages of the process ofdeveloping policy and exerting control over the outcome. Wallerstein (4) highlights therole of empowerment as a health-enhancing strategy. She sees empowerment asmeaning “people assuming control and mastery over their lives in the context of thesocial and political environment. They participate in the democratic life of theircommunity for social change”. The concept of empowerment is one of the keystrategies employed by the Healthy Cities movement (5).
Local communities have a formal mechanism for being involved in assessing theirhealth needs through their participation in community health profiles.
What is a community health profile?A city health profile includes information on the health and disease status of itsinhabitants. A community health profile is a subprofile or microcosm of this. Cityhealth profiles use health indicators to define the population’s health in individualcities and to present information on the lifestyles, environmental and social factorsthat affect the health of a city’s residents (6). A community health profile is a social,environmental and economic description of a specific area that is used to inform localdecision-making.
The community profile model facilitates a more detailed data collection of health-related information within communities or subgroups within communities, such aswomen or travellers. Using the socioeconomic profile as background information, acommunity profile examines and describes qualitative issues. In addition to people’sperceptions of their own health needs, it will usually consider people’s own initiativestowards maintaining and improving their health, and especially suggestions abouthealth promotion initiatives – their own as well as those of the local authorities andhealth agencies. Hence, community profiling is a technique for involving local peoplein analysing their community needs and surveying the resources within a communitywith a view to using the information to construct new solutions.
Some examples of community profiles
BelfastBelfast has a very successful history of carrying out community profiles. The Moyardcommunity profile was carried out in 1986 and the Blackstaff project in 1991. Buildingon the experiences of both of these profiles, the Shankill Health Profile was carriedout in 1996.
North and West Belfast has long been recognized as an area of extreme socialdisadvantage and deprivation (7). A report on relative deprivation in Northern Irelandusing information from the 1991 census (8) reinforced the deprivation status andconfirmed that within a cluster of Protestant wards, the Shankill area, the level ofdeprivation and disadvantage had in fact worsened. The Shankill Women’s Centre andseveral other community representatives requested the Health Service to undertake a
32

health needs assessment of the area in collaboration with the community. A healthprofile of the Greater Shankill Area (9) quantified the extent of social and materialdeprivation locally.
The Shankill health profile had three major components:
• collection of relevant data to identify the health needs of the community;• the development of health promotion strategies to meet these health needs; and• the involvement and participation of the local community in the entire process.
The aim was to develop a suitable model to undertake a community health profile andto design an interagency action plan for a Healthy Shankill.
Method
The area consists of 15 000 households within 17 identical community districts. Arandom sample was drawn from the electoral register. In total 1885 households werecontacted by 27 interviewers. Of these, a number of addresses were uncontactable oruntraceable, leaving a contactable number of 1637. Following an intensiveinterviewing period of 14 weeks, 1025 households were interviewed, giving an overallresponse rate of 63%.
Extensive community consultation took place in the preliminary stages to ensurethat the survey instruments used were appropriate to the perceived needs of thecommunity, and local residents were recruited and trained as interviewers. While theresearch questionnaire was being designed, the project was publicized extensively.
The report was intended to be a practical descriptive response to be used by thecommunity in identifying and setting priorities for its own needs. It contained amixture of interview-based information and sociodemographic indicators derived fromcensus data.
The areas covered were:
• education• economic activity• financial situation• traditional health indicators and self-perception of health• lifestyle• social determinants• carers• lone elderly people• single parents.
The SF-36 Health Survey was used to assess self-perception of health. Validation wascompleted by the University of Ulster.
Process
The Steering Group had insisted that local residents be recruited as interviewers, as itwas hoped that they would be more acceptable to the local community members thanprofessional interviewers unknown to the local community. This proved to be thecase. The use of local residents also ensured that they could inform the researcher andcoordinator of the appropriateness of the data collection instruments during thetraining period and piloting phase of the survey.
Outcome
An information morning was held as soon as the preliminary results of the dataanalysis became available, and the results of the workshops held on that day providedan action plan. A framework for the delivery of the recommendation of the report wasprovided by setting up a Liaison Health Committee whose membership was made upof statutory, voluntary and community representatives.
33

A health profile of the Greater Shankill Area (9) provided a detailed assessment ofneed and was carried out in a cooperative spirit. It quantified the extent of social andmaterial deprivation locally. It developed a mechanism to enable detailed informationto be collected at the neighbourhood level that can also be compared with the resultsfrom larger-scale social surveys.
GlasgowThe poor health of many of the citizens of Glasgow has been recognized for a numberof years. Glasgow has the highest overall death rate in Scotland, 11% above theScottish average generally and 20% above the Scottish rate for people under 65. Sixty-five percent of the postcode areas in Scotland designated as deprived are in Glasgow.Within Glasgow there are marked inequalities in health between communities. The1991 census showed that Glasgow had more social deprivation than any city in theUnited Kingdom and that deprivation was increasing and concentrated in areas ofpublic sector housing.
The Glasgow Healthy City Project (10) drew up an outline for a pilot communityhealth profile and provided funding for a research student to carry it out in theGorbals/Oatlands area. The results of the pilot survey acted as the catalyst for thecommunity to obtain widespread support and funding to carry out a full participatorycommunity health profile in the area.
CopenhagenThe Healthy Cities Project in association with the Danish Institute for ClinicalEpidemiology carried out a community profile of a random sample of residents in theinner Nørrebro district (11). The aim of the inner Nørrebro profile was to provideinformation for local health-promoting activities in inner Nørrebro and to facilitateimproved dialogue between the local district and the City of Copenhagen about plansfor health-promoting activities. The results of this survey were supplemented byinformation from official statistics.
Inner Nørrebro is a small area of about 2 km2 with a high population density andabout 29 000 residents, 6% of the population of the City of Copenhagen. InnerNørrebro has a higher proportion of inhabitants aged 16–32 years than does the City ofCopenhagen as a whole, with few children and elderly people and a higher proportionof residents who are not Danish citizens. The unemployment rate is higher than thatof the City of Copenhagen as a whole. Most of the residents live close together in verysmall flats. Forty-four per cent of the buildings date from before 1900 and more thanone third of the dwellings are smaller than 60 m2. Inner Nørrebro has few recreationalareas and sports facilities. Heavy traffic is also a major problem.
Method
A questionnaire survey of 1800 randomly selected inhabitants over 18 years wascarried out.
People’s perceptions of their state of health were sought. Did they feel well enoughto do what they felt like doing? Did they suffer from stress in their everyday life or didthey have any current or chronic diseases? The responses were compared with resultsfor the entire City of Copenhagen.
Results
There were 755 replies to the survey, or a response rate of 42%. The biggestdifferences between the residents of inner Nørrebro and Copenhagen as a whole wereas follows.
• Middle-aged men suffered from stress considerably more than middle-aged womenand more than other people in Copenhagen.
34

• Men in inner Nørrebro aged 45–66 years consumed much more alcohol than asimilar group in the rest of Copenhagen.
• Loneliness was cited as a particular problem, as one third of the population livingin inner Nørrebro are single.
• Only 9% of parents in inner Nørrebro recognized that it is important for theirchildren to wear a safety helmet when cycling.
• Inhabitants were more exposed to air pollution from motor vehicle transport thanthe inhabitants in Copenhagen generally.
• Only 25% felt there were sufficient opportunities for leisure activities.
The biggest influences on health in inner Nørrebro were the old and still partlyinferior housing as well as busy traffic. Interestingly, although almost everybody ininner Nørrebro lives in a tenement block, people in inner Nørrebro were as satisfiedwith their dwellings as people in Copenhagen as a whole. People felt that the localauthorities could contribute by reducing the inconveniences caused by traffic. Theysuggested laying out parks, reducing direct pollution of common areas, increasingfacilities for sports and improving housing conditions.
Outcome
Only a few children live in the district, and most of those responding do not regardthis as a satisfactory area for children. Many people are deeply lonely and sufferedfrom stress and a comparatively poor state of health, and many are unemployed.There results were important in determining which health promotion initiativesshould be taken. In Nørrebro this means that health promotion initiatives must bedirected towards boosting employment and strengthening social networks. Effortsmust also be made to suppress unhealthy personal behaviour, the most conspicuoustype being excessive alcohol consumption.
GothenburgA summary profile on the overall health status of the residents of the City ofGothenburg has been prepared annually in recent years. This report has been basedon various aspects of health, including increasing vulnerability, unemployment,changes in social polices, lack of adult support among young people, risky behaviouramong young people, data on ill health, birth rates and mortality, tobacco smokingand accidents, infectious diseases and the utilization of health care as well as theresults obtained using the SF-36 Health Survey for that year.
The executive board of the City of Gothenburg decided in 1997 to establish publichealth programmes in each district, which would be operated locally by the 21 districtcouncils between 1998 and 2000. To support this work, special resources have beenset aside. A working model for the local work is based on five stages:
• the establishment of a local public health council• the production of a local public health profile and analysis• the production of a local public health programme• the implementation of the programme• evaluation and follow-up.
The local public health profile is based on three cornerstones: registry data,assessment of needs by the community and self-assessed health. Everyone who isinvolved professionally with public health in the city district, including schools, healthcare, the police force, the church, voluntary organizations and recreational leaders, isasked to describe their needs and wishes related to various activities. Between 1300and 2000 city residents are selected at random and asked to complete the SF-36 HealthSurvey relating to health and wellbeing.
35

The local health plans will be drawn up based on the local public health profilesand the local needs, but the City’s general public health programme and its prioritystrategies will also be integrated into these local programmes.
Before the end of 1998, all 21 district councils in Gothenburg will have set up localhealth councils and started work on their health profiles.
DublinWomen’s health profile in Clondalkin: health and quality of life
The networks of the Healthy Cities Project was used to carry out the Health andquality of life (12) survey by the Women’s Action Group in Neilstown, Clondalkin. NorthClondalkin has an estimated population of about 6300 (1991 census). In Neilstown80% of dwellings are provided by the local authority. In January 1993, NeilstownJunior School provided an adult learning course entitled “Towards a better quality oflife” under the umbrella of the Healthy Cities Project, and the group of women whocreated this report attended. Arising out of an enthusiastic response to issues raised atthe course, the women decided to conduct a health survey in their area as theircontribution towards achieving health for all. Their main objective was to be the voiceof the community in dialogue with statutory and voluntary bodies in increasingawareness of health issues, highlighting areas of concern and makingrecommendations for necessary changes in the area.
The project had three main strands:
• that health needs should be seen in a broader context than medical services alone;• that the community must determine and analyse its own health needs as planned
for the requirements of the residents in health promotion, disease prevention andcure and rehabilitation; and
• an equal commitment to the goal of a better quality of life, sought from externalstatutory and government bodies.
Nine local women developed the report; it was not intended to be an academicanalysis but rather a way of showing how dialogue between community and statutorybodies might benefit the area and society on a wider scale.
The Department of Public Health in the Health Board provided professionalassistance in questionnaire development, analysis and reporting. Before embarking onthe task, the authors completed an intensive course on group dynamics organized bythe Community Action Network. This enabled them to identify their strengths andweaknesses as a group and kept their energy and enthusiasm high and the aimfocused.
Method. All the questionnaires were administered in the interviewees’ homes. Theelectoral register was used to pick households for the survey. Every tenth household,beginning from a random point in the register, was chosen. The survey tried threeknocks per household: if no one was available at the first call, the people conductingthe surveys returned twice more at different times and on different days. If there wasstill no answer they proceeded to the house next door on the right. A pilot survey of50 households was carried out before the survey itself. The areas covered by thequestionnaire were:
• household details• availability of local facilities• crime and drugs• teenagers• education and employment• child care• local support groups
36

• personal health• involvement in local activities.
Results. The response rate was approximately 88%. Just over three quarters of therespondents were married women and almost 20% were from single-parent families.Ninety-two per cent of the respondents described themselves as being happy to live inthe area despite the key findings identified:
• lack of basic amenities (less than 40% households had a family car and only 60%had a telephone);
• lack of community facilities such as a supermarket, playground, bank, post officeand leisure facilities;
• crime: 78% said crime was a problem in the area and 33% had had a familymember affected by crime;
• drugs: 57% of the respondents thought that the area had a particular problem withdrugs, and 85% thought more should be done to deal with the drug problem;
• teenage pregnancy;• very high levels of smoking (55% of the women interviewed were current smokers,
which is more than twice the national average of 27%); and• lack of participation in local activities because of apathy.
Outcome. The group recognized that their area was seriously deprived but that it alsohad a highly motivated young and energetic community. They recognized the need toimprove self-esteem in the area and that the community itself must contribute to anysolutions.
Assessment of health needs in Tallaght
Tallaght is a new area of Dublin (population 67 000 in 1996) with a high proportion ofchildren, teenagers, young families and local authority housing. The TallaghtCommunity Health Project (13) trained local residents (all women) to conduct andanalyse a community health survey in 1995 and 1996. Health Board staff, publichealth nurses and mental health staff and the Department of Community Health atTrinity College provided assistance. The results highlighted some of the mainchallenges for the community as being:
• the need for a refuge and community response for the victims of domesticviolence;
• the need for a 24-hour emergency centre providing high-quality counselling;• the need for help to reduce smoking;• the need for a customer information service with leaflets and videos;• the need for a female general practitioner;• the need for more time at antenatal visits; and• the need for services suitable for people with physical and sensory disability.
The group was asked to rank their needs in order of priority. Many of the issues didnot involve significant expenditure but required a different way of working by somehealth and social care providers. The Health Board committed to formalizing therelationship and to addressing the identified issues systematically.
A full-time community work post dedicated to networking and resourcingcommunity involvement in the locality was created. The worker works with localcommunity groups to develop proposals for improving existing services and fordeveloping new services where necessary. Then they work to bring together localgroups with the relevant health services management to push for changes they haveidentified as priorities. The work seeks to involve groups who are marginalized andcreates alliances with supportive managers and with general practitioners.
37

Advantages of community profilesCommunity profiles in which official statistics, both demographic and healthindicators, are supplemented by interview-based survey data provide an importantbaseline for future dialogue about the health and social circumstances of the people ina district.
The process of conducting a profile encourages debate and raises awareness amongcommunity members about factors that influence the positive aspects of health. Itprovides a mechanism for statutory agencies to develop a community participationstrategy and for interagency cooperation.
Crowley (personal communication) has summarized these and other advantages ofcommunity profiles.
• They provide better information on local health care needs; the process facilitatesmore coherent and effective delivery of health care.
• They facilitate a more democratic approach to health needs assessment in keepingwith central government policies.
• They facilitate understanding by local residents that services have limitations andresources are finite.
• They result in empowerment of local communities.• A bottom-up approach is more sustainable than an imposed structure of
consultation.
Weaknesses of community profilesThe idea of working together is simple in theory: asking members of the communityto identify their health needs and involving them in finding practical solutions makessense for all concerned, but in practice it can present real challenges. Nevertheless,this can be overcome through commitment and building trust in the process, enablingresources to be used efficiently and effectively. Community profiling will not yield itsfull potential impact towards strategic change unless the statutory authorities make afull commitment. Crowley (personal communication) outlines some of the weaknessesof community profiling:
• local people may lack information about the factors affecting their health;• the responses may be dominated by more articulate people;• they are very costly to conduct;• sustaining community involvement is difficult in the face of other pressing
concerns;• they are of little value as a one-off process unless ongoing models for community
involvement in assessment of their health needs is sustained; and• health services have had a marginal impact on the root causes of ill health in
deprived areas.
OpportunitiesA healthy community has:
• wide community participation• broad intersectoral involvement• local government commitment• healthy public policy.
Providing information on local health needs should result in a healthy community
38

because:
• alliances can be formed between local health workers and the community to act asa powerful lobby for resources;
• services for marginalized and socially excluded people can be improved;• the community can be empowered; • resources can be coordinated better;• health professionals can better understand health problems; and • the relationships between local people and health professionals can improve.
ThreatsCommunity groups may disagree with one another or with health professionals aboutpriorities.
39
References1. National Health Service Management Executive. Local voices: the views of local
people in purchasing for health. London, HMSO, 1992.2. Farrant, W. Addressing the contradictions: health promotion and community health
action in the United Kingdom. International journal of health services, 21(3): 423–439(1991).
3. Shaw, M. Strengthening communities. Concept, 3(2): 22–24 (1993).4. Wallerstein, N. Powerlessness, empowerment and health: implications for health
promotion programs. American journal of health promotion, 6(3): 197–205 (1992). 5. Flynn, B.C. et al. Empowering communities: action research on healthy cities.
Health education quarterly, 21: 395–405 (1994).6. Garcia, P. & McCarthy, M. Measuring health: a step in the development of city health
profiles. Copenhagen, WHO Regional Office for Europe, 1996 (documentEUR/ICP/HCIT 94 01/PB03).
7. Belfast – areas of special social need. Belfast, HMSO, 1997.8. Relative deprivation in Northern Ireland. Belfast, Policy, Planning and Research Unit,
1994 (Occasional Paper No. 28).9. Dunwoody, M. A health profile of the Greater Shankill Area. Belfast, North and West
Belfast Social Services Trust, 1996.10. The health of the city – a shared concern. The Glasgow Healthy Cities Project, 4 years
on. Glasgow, Glasgow Healthy Cities Project, 1992.11. Your district – your health. Inner Nørrebro. Copenhagen, Copenhagen Healthy Cities
Project and Danish Institute for Clinical Epidemiology, 1992.12. Health and quality of life. Survey findings. Dublin, Women’s Action Group, Neilstown,
Clondalkin, 1994.13. Dunne, C. Local area development co-ordination. Benefits of inter-agency collaboration
and future strategies. Dublin, Eastern Health Board, 1997.
40

Related Documents