Citizens’ Perceptions of Urban Public Services Research Report No.97 2016 SOCIAL POLICY AND DEVELOPMENT CENTRE

Welcome message from author
This document is posted to help you gain knowledge. Please leave a comment to let me know what you think about it! Share it to your friends and learn new things together.
Transcript
Citizens’ Perceptions
of Urban Public Services
Research Report No.97
2016
SOCIAL POLICY AND DEVELOPMENT CENTRE

Research Report No.97
Citizens’ Perceptions
of Urban Public Services
Haroon Jamal
Zia-ul-Haque Khan
May 2016
__________________________________________________________________________________
DISCLAIMER: The views expressed in this research report are those of the author and do not necessarily
represent those of the Social Policy and Development Centre (SPDC). Research Reports describe research in
progress by the author and are published to elicit comments and initiate further debate.
© 2016 by Social Policy and Development Centre (SPDC)
Karachi, Pakistan
All rights reserved. No part of this publication may be reproduced,
stored in a retrieval system, or transmitted, in any form or by any means,
electronic, mechanical, photocopying, recording,
or otherwise without prior permission of SPDC.
Graphics and Layout: Muhammad Rizwanullah Khan
Published by Social Policy and Development Centre
Printed in Karachi
Citizens’ Perceptions
on Urban Public Services
ABSTRACT
Urban citizens’ perception survey on public service delivery was conducted by the Social
Policy and Development Centre (SPDC) in 2015. The purpose of the survey was to get
opinion of public service users regarding access, quality and reliability of service provision;
problems encountered and responsiveness of service providers in addressing these
problems. About 4000 households across Pakistan participated in this opinion survey.
Households were randomly selected from three tiers of local government: Municipal or
Metropolitan Corporations, Municipal Committees and Town Committees.
This research report is taken verbatim from chapter 5 of SPDC annual review “The State of
Social Development in Urban Pakistan”, 2014-15 and summarizes citizens’ rating and
opinion on six public services which were included in the SPDC opinion survey.
III
Citizens’ Perceptions of Urban Public Services Research Report No.97

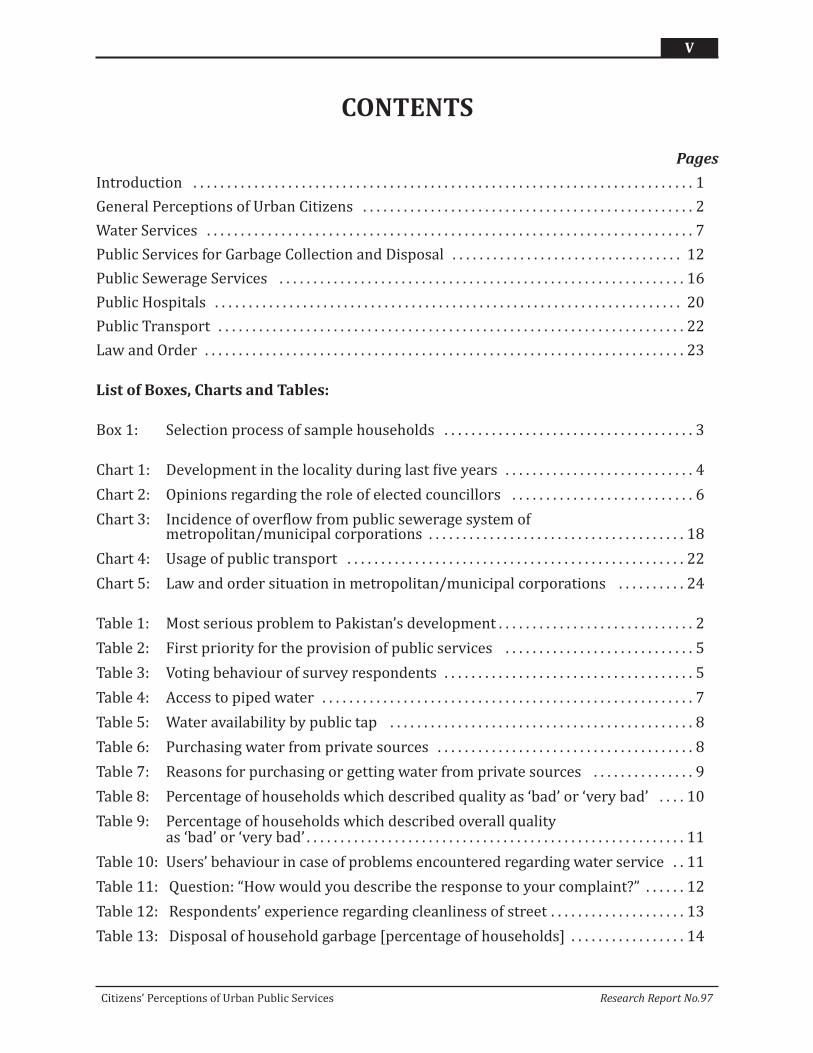
CONTENTS
Pages
Introduction . . . . . . . . . . . . . . . . . . . . . . . . . . . . . . . . . . . . . . . . . . . . . . . . . . . . . . . . . . . . . . . . . . . . . . . . . . 1
General Perceptions of Urban Citizens . . . . . . . . . . . . . . . . . . . . . . . . . . . . . . . . . . . . . . . . . . . . . . . . . 2
Water Services . . . . . . . . . . . . . . . . . . . . . . . . . . . . . . . . . . . . . . . . . . . . . . . . . . . . . . . . . . . . . . . . . . . . . . . . 7
Public Services for Garbage Collection and Disposal . . . . . . . . . . . . . . . . . . . . . . . . . . . . . . . . . . 12
Public Sewerage Services . . . . . . . . . . . . . . . . . . . . . . . . . . . . . . . . . . . . . . . . . . . . . . . . . . . . . . . . . . . . 16
Public Hospitals . . . . . . . . . . . . . . . . . . . . . . . . . . . . . . . . . . . . . . . . . . . . . . . . . . . . . . . . . . . . . . . . . . . . . 20
Public Transport . . . . . . . . . . . . . . . . . . . . . . . . . . . . . . . . . . . . . . . . . . . . . . . . . . . . . . . . . . . . . . . . . . . . . 22
Law and Order . . . . . . . . . . . . . . . . . . . . . . . . . . . . . . . . . . . . . . . . . . . . . . . . . . . . . . . . . . . . . . . . . . . . . . . 23
List of Boxes, Charts and Tables:
Box 1: Selection process of sample households . . . . . . . . . . . . . . . . . . . . . . . . . . . . . . . . . . . . . 3
Chart 1: Development in the locality during last five years . . . . . . . . . . . . . . . . . . . . . . . . . . . . 4
Chart 2: Opinions regarding the role of elected councillors . . . . . . . . . . . . . . . . . . . . . . . . . . . 6
Chart 3: Incidence of overflow from public sewerage system of metropolitan/municipal corporations . . . . . . . . . . . . . . . . . . . . . . . . . . . . . . . . . . . . . . 18
Chart 4: Usage of public transport . . . . . . . . . . . . . . . . . . . . . . . . . . . . . . . . . . . . . . . . . . . . . . . . . . 22
Chart 5: Law and order situation in metropolitan/municipal corporations . . . . . . . . . . 24
Table 1: Most serious problem to Pakistan’s development . . . . . . . . . . . . . . . . . . . . . . . . . . . . . 2
Table 2: First priority for the provision of public services . . . . . . . . . . . . . . . . . . . . . . . . . . . . 5
Table 3: Voting behaviour of survey respondents . . . . . . . . . . . . . . . . . . . . . . . . . . . . . . . . . . . . . 5
Table 4: Access to piped water . . . . . . . . . . . . . . . . . . . . . . . . . . . . . . . . . . . . . . . . . . . . . . . . . . . . . . . 7
Table 5: Water availability by public tap . . . . . . . . . . . . . . . . . . . . . . . . . . . . . . . . . . . . . . . . . . . . . 8
Table 6: Purchasing water from private sources . . . . . . . . . . . . . . . . . . . . . . . . . . . . . . . . . . . . . . 8
Table 7: Reasons for purchasing or getting water from private sources . . . . . . . . . . . . . . . 9
Table 8: Percentage of households which described quality as ‘bad’ or ‘very bad’ . . . . 10
Table 9: Percentage of households which described overall qualityas ‘bad’ or ‘very bad’ . . . . . . . . . . . . . . . . . . . . . . . . . . . . . . . . . . . . . . . . . . . . . . . . . . . . . . . . 11
Table 10: Users’ behaviour in case of problems encountered regarding water service . . 11
Table 11: Question: “How would you describe the response to your complaint?” . . . . . . 12
Table 12: Respondents’ experience regarding cleanliness of street . . . . . . . . . . . . . . . . . . . . 13
Table 13: Disposal of household garbage [percentage of households] . . . . . . . . . . . . . . . . . 14
V
Citizens’ Perceptions of Urban Public Services Research Report No.97
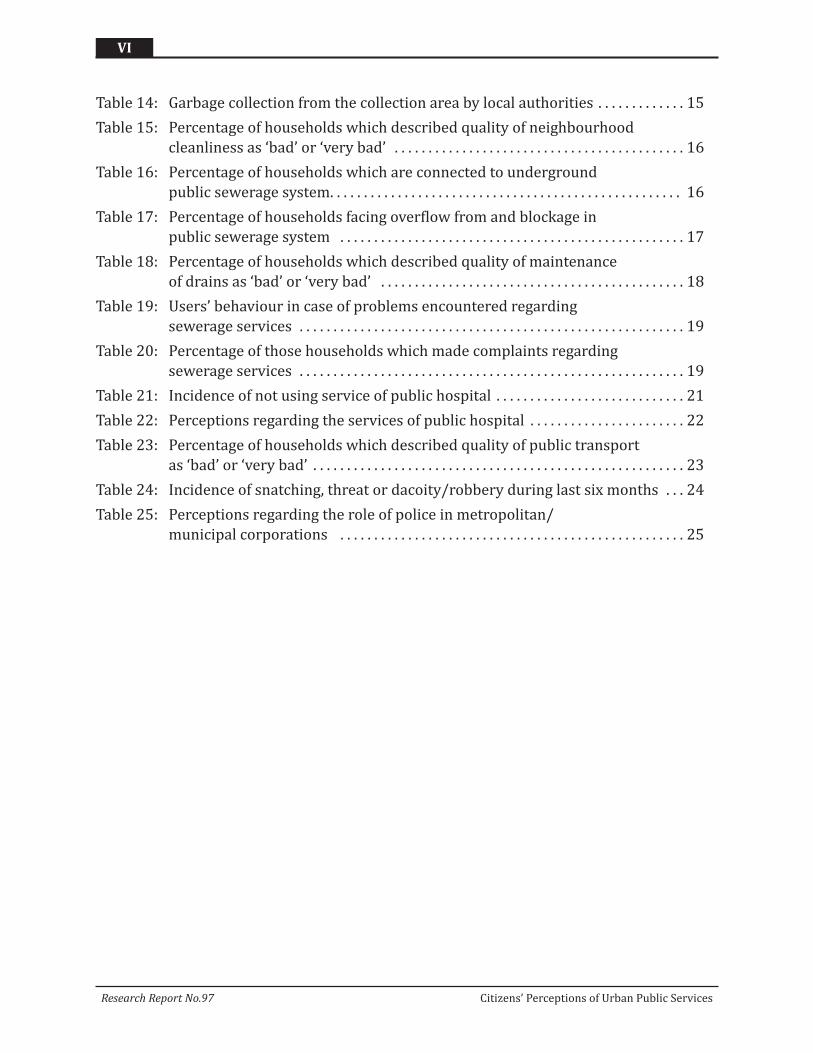
Table 14: Garbage collection from the collection area by local authorities . . . . . . . . . . . . . 15
Table 15: Percentage of households which described quality of neighbourhood
cleanliness as ‘bad’ or ‘very bad’ . . . . . . . . . . . . . . . . . . . . . . . . . . . . . . . . . . . . . . . . . . . 16
Table 16: Percentage of households which are connected to underground
public sewerage system. . . . . . . . . . . . . . . . . . . . . . . . . . . . . . . . . . . . . . . . . . . . . . . . . . . . 16
Table 17: Percentage of households facing overflow from and blockage in
public sewerage system . . . . . . . . . . . . . . . . . . . . . . . . . . . . . . . . . . . . . . . . . . . . . . . . . . . 17
Table 18: Percentage of households which described quality of maintenance
of drains as ‘bad’ or ‘very bad’ . . . . . . . . . . . . . . . . . . . . . . . . . . . . . . . . . . . . . . . . . . . . . 18
Table 19: Users’ behaviour in case of problems encountered regarding
sewerage services . . . . . . . . . . . . . . . . . . . . . . . . . . . . . . . . . . . . . . . . . . . . . . . . . . . . . . . . . 19
Table 20: Percentage of those households which made complaints regarding
sewerage services . . . . . . . . . . . . . . . . . . . . . . . . . . . . . . . . . . . . . . . . . . . . . . . . . . . . . . . . . 19
Table 21: Incidence of not using service of public hospital . . . . . . . . . . . . . . . . . . . . . . . . . . . . 21
Table 22: Perceptions regarding the services of public hospital . . . . . . . . . . . . . . . . . . . . . . . 22
Table 23: Percentage of households which described quality of public transport
as ‘bad’ or ‘very bad’ . . . . . . . . . . . . . . . . . . . . . . . . . . . . . . . . . . . . . . . . . . . . . . . . . . . . . . . 23
Table 24: Incidence of snatching, threat or dacoity/robbery during last six months . . . 24
Table 25: Perceptions regarding the role of police in metropolitan/
municipal corporations . . . . . . . . . . . . . . . . . . . . . . . . . . . . . . . . . . . . . . . . . . . . . . . . . . . 25
VI
Research Report No.97 Citizens’ Perceptions of Urban Public Services
1. INTRODUCTION
People’s participation of development issues is crucial for effective and efficient planning and
policy formulation. Whereas, citizens’ feedback on the performance of public services can be
helpful in improving the quality of public service delivery. This chapter is based on the
information provided by the citizens on the basis of their experience which may be useful for
the service providers; the urban planners; sectoral policy makers; regulatory bodies; and for
civil society.
About 4000 households across Pakistan participated in an opinion survey, conducted by the
Social Policy and Development Centre (SPDC) in 2015. The purpose was to collect perceptions
of public service users, about access, quality and reliability of service provision; problems
encountered by users; and responsiveness of service providers in addressing these problems.
Two public services, water and sewerage were thoroughly explored while solid waste
management, public hospitals, public transport and law and order sectors were investigated
only in terms of access and quality of services. The participants were randomly selected from
three tiers of local government: Municipal or Metropolitan Corporations, Municipal
Committees and Town Committees.
At the time of the household survey unelected local authorities were providing public services
in all the provinces. New ordinances for local governments had been formulated by all provincial
governments and local bodies polls were held in Balochistan and Khyber Pakhtunkhwa in 2013
and in May 2015 respectively under the new ordinances. However, elected councillors of
Balochistan were still struggling for their financial powers despite one-and-a-half years having
elapsed since they won the elections. Similarly, elected local bodies were not functional in
Khyber Pakhtunkhwa at the time of the SPDC household survey. In two other provinces, the
electoral process had been initiated and polls were scheduled by the end of 2015. Thus,
fortunately due to the timing of the SPDC survey, benchmark information of the performance
of essential public services will be available to the new elected local bodies.
While opinion surveys are effective social accountability tools, it is important to be aware of
their methodological limitations. These surveys typically focus on capturing the ‘demand’
perspectives of users rather than the ‘supply’ characteristics or perspectives of non-users.
Further, although these surveys provide insights about what respon dents think about service
delivery performance, they do not identify causal relationships; in other words, they do not
explain the reasons for people’s opinions.
This chapter summarizes citizens’ perceptions related to six public services included in the
SPDC opinion survey. A brief review of the sampling framework and methodology for selecting
1
Citizens’ Perceptions of Urban Public Services Research Report No.97
households is presented first to inform readers about the scientific approach adopted for this
study. Detail sectoral reviews follow after a section on general perceptions regarding local
development, priorities for public services and experience with the elected local government.
Methodology of the survey is described in Box 1.
GENERAL PERCEPTIONS OF URBAN CITIZENS
The sample of urban citizens selected for the survey is well represented in terms of socio-
economic characteristics. Among the total of 4,282 respondents which were enumerated across
four provinces of Pakistan to obtain perceptions and opinions on various dimensions of essential
public services, around 19 percent were female. About 35 percent of the respondents reported
studying up to secondary level (middle or matric). The number of illiterate constituted around
18 percent, primary level 11 percent, intermediate 12 percent and graduate and post graduate
17 percent. Around 24 percent of the respondents were working as employees, 36 percent were
self-employed, 21 percent were skilled own-account workers, and 12 percent unskilled
labourers. About 32 percent of the households in the sample reported expenditure below the
poverty line (Rs 3,100 per capita per month)2.
Before presenting the opinions on the specific public services included in the household survey,
it would be useful to briefly discuss the understanding of the urban residents on and about
national and local development; their priorities about the provision of public services; and how
they would like to see the governance of public service delivery.
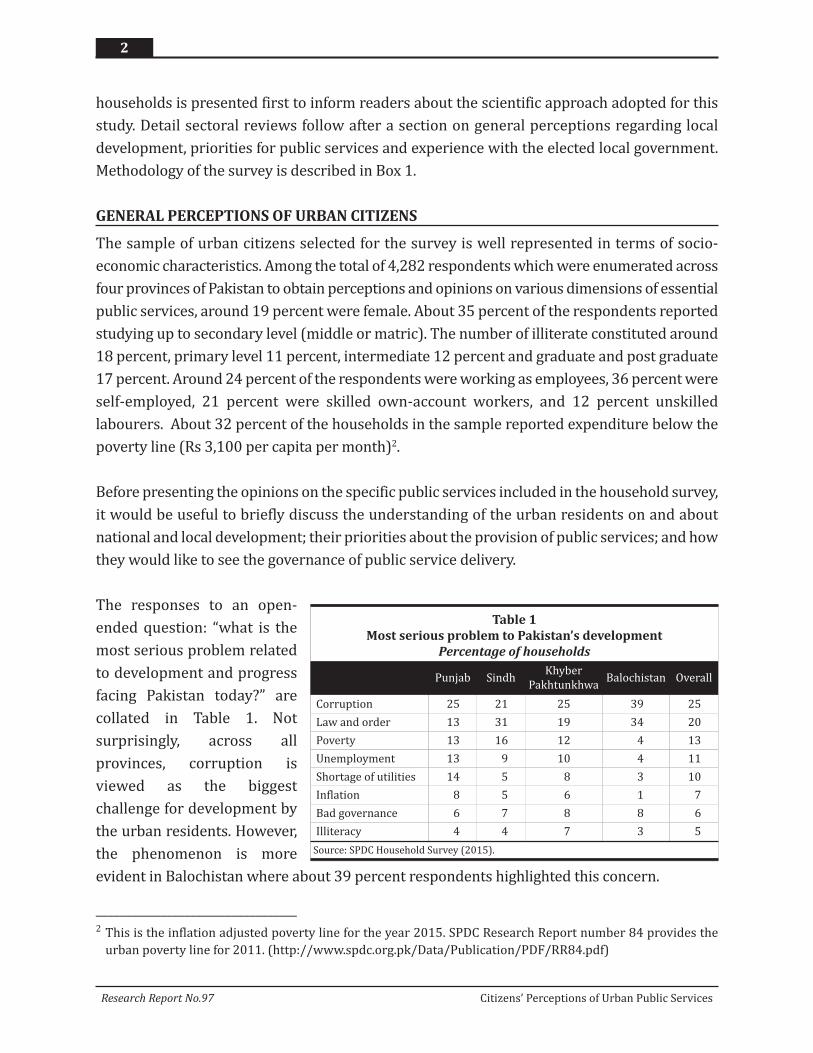
The responses to an open-
ended question: “what is the
most serious problem related
to development and progress
facing Pakistan today?” are
collated in Table 1. Not
surprisingly, across all
provinces, corruption is
viewed as the biggest
challenge for development by
the urban residents. However,
the phenomenon is more
evident in Balochistan where about 39 percent respondents highlighted this concern.
2
Research Report No.97 Citizens’ Perceptions of Urban Public Services
__________________________________2 This is the inflation adjusted poverty line for the year 2015. SPDC Research Report number 84 provides the
urban poverty line for 2011. (http://www.spdc.org.pk/Data/Publication/PDF/RR84.pdf)
Table 1
Most serious problem to Pakistan’s development
Percentage of households
Punjab SindhKhyber
PakhtunkhwaBalochistan Overall
Corruption 25 21 25 39 25
Law and order 13 31 19 34 20
Poverty 13 16 12 4 13
Unemployment 13 9 10 4 11
Shortage of utilities 14 5 8 3 10
Inflation 8 5 6 1 7
Bad governance 6 7 8 8 6
Illiteracy 4 4 7 3 5
Source: SPDC Household Survey (2015).
3
Citizens’ Perceptions of Urban Public Services Research Report No.97
Box 1
Selection process of sample households
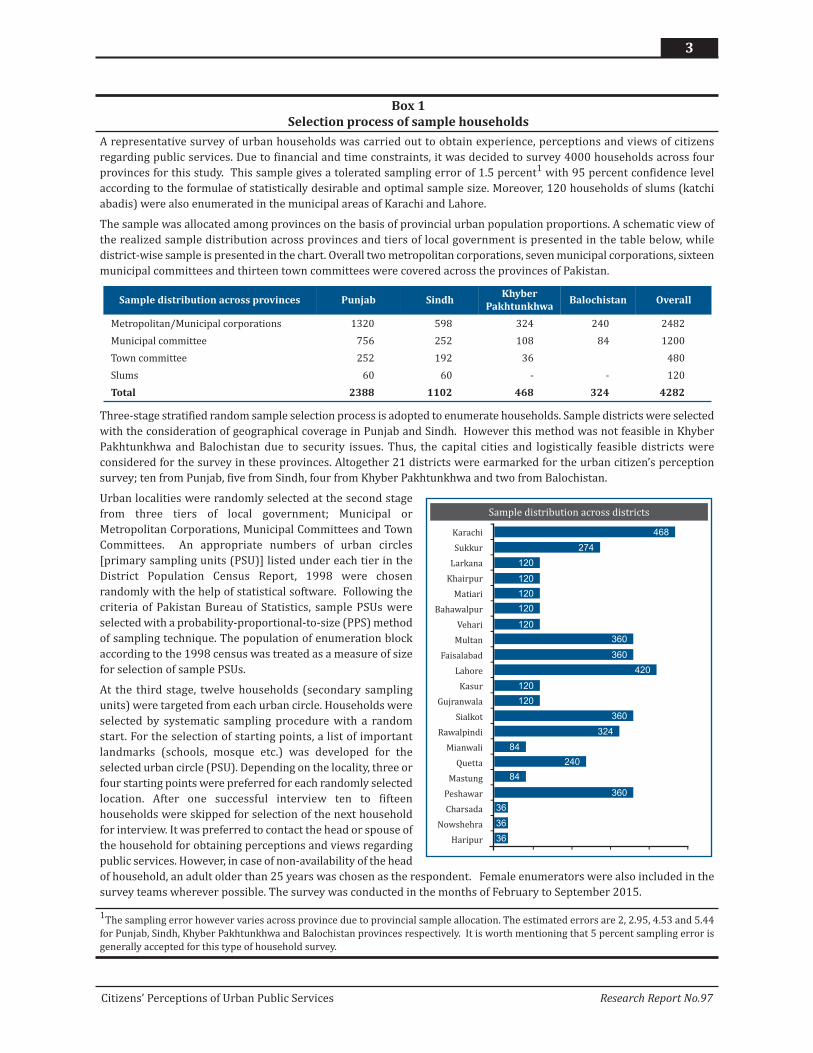
A representative survey of urban households was carried out to obtain experience, perceptions and views of citizens
regarding public services. Due to financial and time constraints, it was decided to survey 4000 households across four
provinces for this study. This sample gives a tolerated sampling error of 1.5 percent1 with 95 percent confidence level
according to the formulae of statistically desirable and optimal sample size. Moreover, 120 households of slums (katchi
abadis) were also enumerated in the municipal areas of Karachi and Lahore.
The sample was allocated among provinces on the basis of provincial urban population proportions. A schematic view of
the realized sample distribution across provinces and tiers of local government is presented in the table below, while
district-wise sample is presented in the chart. Overall two metropolitan corporations, seven municipal corporations, sixteen
municipal committees and thirteen town committees were covered across the provinces of Pakistan.
Three-stage stratified random sample selection process is adopted to enumerate households. Sample districts were selected
with the consideration of geographical coverage in Punjab and Sindh. However this method was not feasible in Khyber
Pakhtunkhwa and Balochistan due to security issues. Thus, the capital cities and logistically feasible districts were
considered for the survey in these provinces. Altogether 21 districts were earmarked for the urban citizen’s perception
survey; ten from Punjab, five from Sindh, four from Khyber Pakhtunkhwa and two from Balochistan.
Urban localities were randomly selected at the second stage
from three tiers of local government; Municipal or
Metropolitan Corporations, Municipal Committees and Town
Committees. An appropriate numbers of urban circles
[primary sampling units (PSU)] listed under each tier in the
District Population Census Report, 1998 were chosen
randomly with the help of statistical software. Following the
criteria of Pakistan Bureau of Statistics, sample PSUs were
selected with a probability-proportional-to-size (PPS) method
of sampling technique. The population of enumeration block
according to the 1998 census was treated as a measure of size
for selection of sample PSUs.
At the third stage, twelve households (secondary sampling
units) were targeted from each urban circle. Households were
selected by systematic sampling procedure with a random
start. For the selection of starting points, a list of important
landmarks (schools, mosque etc.) was developed for the
selected urban circle (PSU). Depending on the locality, three or
four starting points were preferred for each randomly selected
location. After one successful interview ten to fifteen
households were skipped for selection of the next household
for interview. It was preferred to contact the head or spouse of
the household for obtaining perceptions and views regarding
public services. However, in case of non-availability of the head
of household, an adult older than 25 years was chosen as the respondent. Female enumerators were also included in the
survey teams wherever possible. The survey was conducted in the months of February to September 2015.
1The sampling error however varies across province due to provincial sample allocation. The estimated errors are 2, 2.95, 4.53 and 5.44
for Punjab, Sindh, Khyber Pakhtunkhwa and Balochistan provinces respectively. It is worth mentioning that 5 percent sampling error is
generally accepted for this type of household survey.
Sample distribution across provinces Punjab SindhKhyber
PakhtunkhwaBalochistan Overall
Metropolitan/Municipal corporations 1320 598 324 240 2482
Municipal committee 756 252 108 84 1200
Town committee 252 192 36 480
Slums 60 60 - - 120
Total 2388 1102 468 324 4282
Sample distribution across districts
Karachi
Sukkur
Larkana
Khairpur
Matiari
Bahawalpur
Vehari
Multan
Faisalabad
Lahore
Kasur
Gujranwala
Sialkot
Rawalpindi
Mianwali
Quetta
Mastung
Peshawar
Charsada
Nowshehra
Haripur
468
274
120
120
120
120
120
120
120
360
360
360
324
84
84
36
3636
36
240
360
420
-
-
-
-
-
-
-
-
-
-
-
-
-
-
-
-
-
-
-
-
-
- - - - -
The situation of law and order is also a significant impediment, especially in Karachi (Sindh)
and Quetta (Balochistan). It is surprising that less than 10 percent households narrated shortage
of utilities as a major problem, except in Punjab. This is despite the enumerator’s introduction
at the start of the survey, where it was categorically stated that “this survey is being conducted
to find out how people feel and think about several important issues related to drinking water,
sanitation, health facilities, public transport etc.” Illiteracy is also ranked at the bottom of the
list; only 5 percent respondents believe this to be a major hurdle in the development of Pakistan.
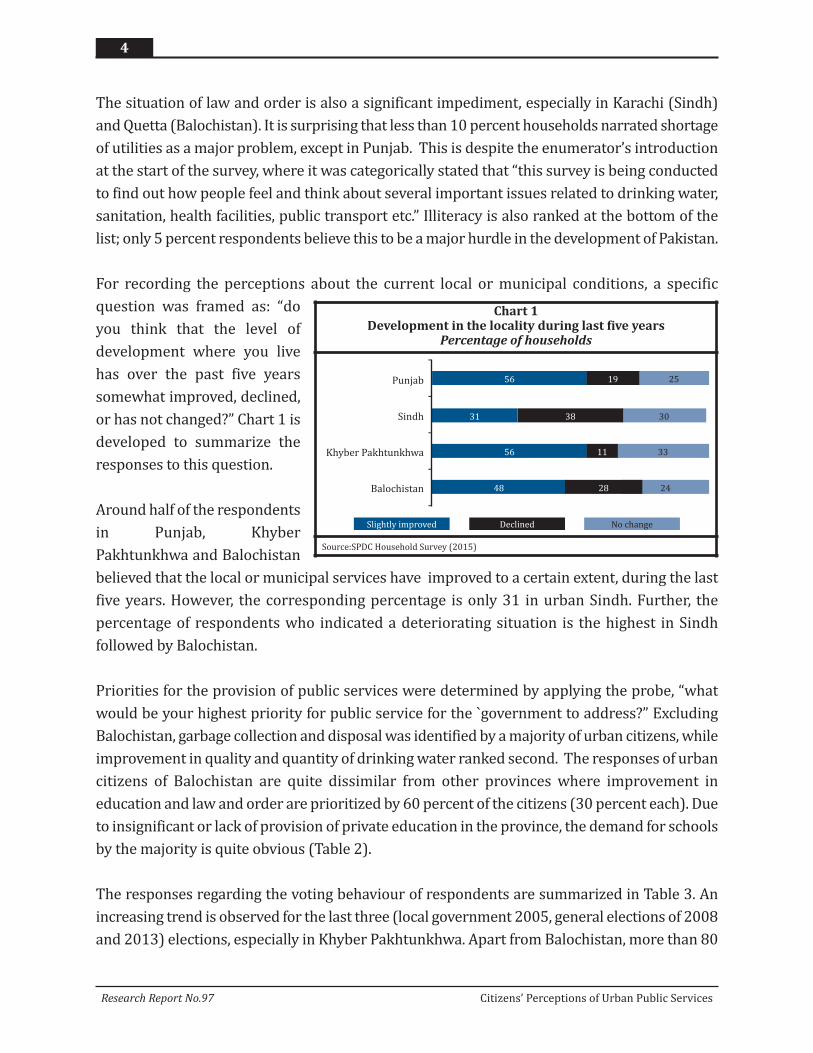
For recording the perceptions about the current local or municipal conditions, a specific
question was framed as: “do
you think that the level of
development where you live
has over the past five years
somewhat improved, declined,
or has not changed?” Chart 1 is
developed to summarize the
responses to this question.
Around half of the respondents
in Punjab, Khyber
Pakhtunkhwa and Balochistan
believed that the local or municipal services have improved to a certain extent, during the last
five years. However, the corresponding percentage is only 31 in urban Sindh. Further, the
percentage of respondents who indicated a deteriorating situation is the highest in Sindh
followed by Balochistan.
Priorities for the provision of public services were determined by applying the probe, “what
would be your highest priority for public service for the `government to address?” Excluding
Balochistan, garbage collection and disposal was identified by a majority of urban citizens, while
improvement in quality and quantity of drinking water ranked second. The responses of urban
citizens of Balochistan are quite dissimilar from other provinces where improvement in
education and law and order are prioritized by 60 percent of the citizens (30 percent each). Due
to insignificant or lack of provision of private education in the province, the demand for schools
by the majority is quite obvious (Table 2).
The responses regarding the voting behaviour of respondents are summarized in Table 3. An
increasing trend is observed for the last three (local government 2005, general elections of 2008
and 2013) elections, especially in Khyber Pakhtunkhwa. Apart from Balochistan, more than 80
4
Research Report No.97 Citizens’ Perceptions of Urban Public Services
Chart 1Development in the locality during last five years
Percentage of households
Source:SPDC Household Survey (2015)
Punjab
Sindh
Khyber Pakhtunkhwa
Balochistan
56 25
31 30
-
-
-
-
-
38
48 2428
Slightly improved No changeDeclined
19
56 3311
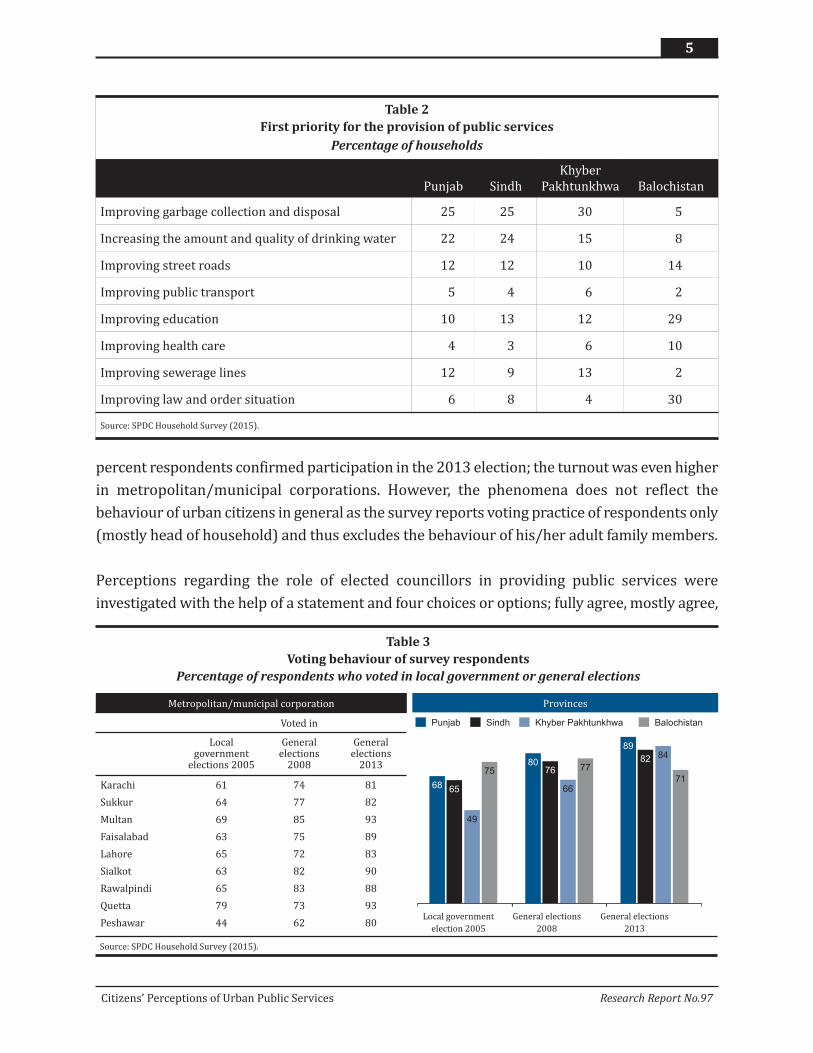
percent respondents confirmed participation in the 2013 election; the turnout was even higher
in metropolitan/municipal corporations. However, the phenomena does not reflect the
behaviour of urban citizens in general as the survey reports voting practice of respondents only
(mostly head of household) and thus excludes the behaviour of his/her adult family members.
Perceptions regarding the role of elected councillors in providing public services were
investigated with the help of a statement and four choices or options; fully agree, mostly agree,
5
Citizens’ Perceptions of Urban Public Services Research Report No.97
Table 2
First priority for the provision of public services
Percentage of households
Punjab Sindh
Khyber
Pakhtunkhwa Balochistan
Improving garbage collection and disposal 25 25 30 5
Increasing the amount and quality of drinking water 22 24 15 8
Improving street roads 12 12 10 14
Improving public transport 5 4 6 2
Improving education 10 13 12 29
Improving health care 4 3 6 10
Improving sewerage lines 12 9 13 2
Improving law and order situation 6 8 4 30
Source: SPDC Household Survey (2015).
Table 3
Voting behaviour of survey respondents
Percentage of respondents who voted in local government or general elections
68 65
49
7580
76
66
77
89
82 84
71
Sindh
Provinces
Punjab BalochistanKhyber Pakhtunkhwa
Metropolitan/municipal corporation
Voted in
Localgovernment
elections 2005
Generalelections
2008
Generalelections
2013
Karachi 61 74 81
Sukkur 64 77 82
Multan 69 85 93
Faisalabad 63 75 89
Lahore 65 72 83
Sialkot 63 82 90
Rawalpindi 65 83 88
Quetta 79 73 93
Peshawar 44 62 80
- -
Local government General elections General elections
election 2005 2008 2013
Source: SPDC Household Survey (2015).
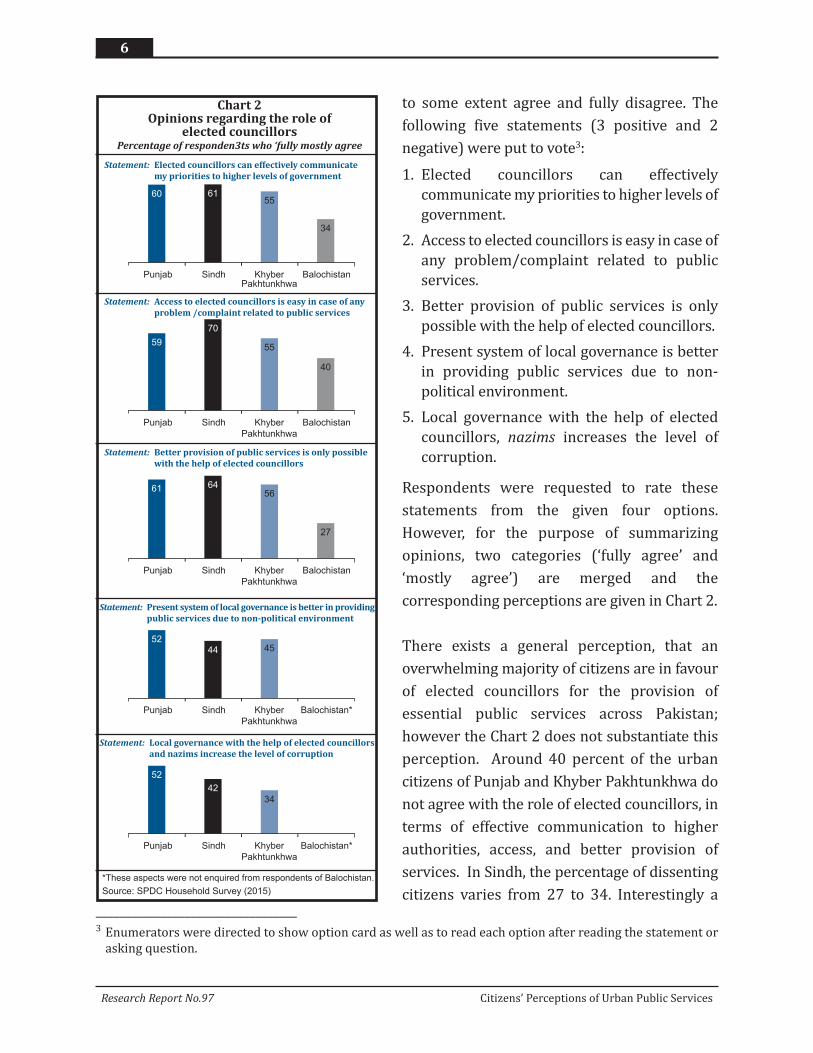
to some extent agree and fully disagree. The
following five statements (3 positive and 2
negative) were put to vote3:
1. Elected councillors can effectively
communicate my priorities to higher levels of
government.
2. Access to elected councillors is easy in case of
any problem/complaint related to public
services.
3. Better provision of public services is only
possible with the help of elected councillors.
4. Present system of local governance is better
in providing public services due to non-
political environment.
5. Local governance with the help of elected
councillors, nazims increases the level of
corruption.
Respondents were requested to rate these
statements from the given four options.
However, for the purpose of summarizing
opinions, two categories (‘fully agree’ and
‘mostly agree’) are merged and the
corresponding perceptions are given in Chart 2.
There exists a general perception, that an
overwhelming majority of citizens are in favour
of elected councillors for the provision of
essential public services across Pakistan;
however the Chart 2 does not substantiate this
perception. Around 40 percent of the urban
citizens of Punjab and Khyber Pakhtunkhwa do
not agree with the role of elected councillors, in
terms of effective communication to higher
authorities, access, and better provision of
services. In Sindh, the percentage of dissenting
citizens varies from 27 to 34. Interestingly a
6
Research Report No.97 Citizens’ Perceptions of Urban Public Services
__________________________________3 Enumerators were directed to show option card as well as to read each option after reading the statement or
asking question.
60 6155
34
Statement: Elected councillors can effectively communicate
my priorities to higher levels of government- - -
Punjab Sindh Khyber BalochistanPakhtunkhwa
59
70
55
40
Statement: Access to elected councillors is easy in case of any
problem /complaint related to public services
Statement: Better provision of public services is only possible
with the help of elected councillors
- - -
Punjab Sindh Khyber Balochistan
Pakhtunkhwa
61 6456
27
- - -
Punjab Sindh Khyber Balochistan
Pakhtunkhwa
5244 45
- - -
Punjab Sindh Khyber Balochistan*
Pakhtunkhwa
52
42
34
- - -
Punjab Sindh Khyber Balochistan*
Pakhtunkhwa
*These aspects were not enquired from respondents of Balochistan.
Source: SPDC Household Survey (2015)
Chart 2Opinions regarding the role of
elected councillorsPercentage of responden3ts who ‘fully mostly agree
Statement: Present system of local governance is better in providing
public services due to non-political environment
Statement: Local governance with the help of elected councillors
and nazims increase the level of corruption
significant majority of citizens of Balochistan (Quetta and Mastung) who are currently
experiencing elected local governance do not endorse the role of nazims/councillors in
communicating their priorities, ensuring free access and in providing better public services.
Around 66 percent respondents of Balochistan disagree with the statement that the elected
councillors can effectively communicate citizens’ priorities to higher levels of government, while
around 60 percent were not convinced regarding the access to elected councillors in case of any
problem related to public services.
The negative aspects of elected governance were further investigated in terms of political
partiality and corruption in three provinces where an unelected governance system was
operational. Around half of the urban citizens believe that unelected governance is better in
providing public services mainly due to a non-political environment. However, slight variations
in opinion across provinces do exist. In terms of corruption about 48, 58 and 66 percent urban
citizens of Punjab, Sindh and Khyber Pakhtunkhwa respectively do not agree with the perception
that ‘councillors/nazims increase the level of corruption’.
It is clear that about half the urban citizens do not support the elected governance system by
disagreeing with positive characteristics and agreeing with negative features. However, their
perceptions are based on the Pervez Musharraf’s Devolution Plan of 2000, while unelected
local authorities were providing public services at the time of the household survey.
WATER SERVICES
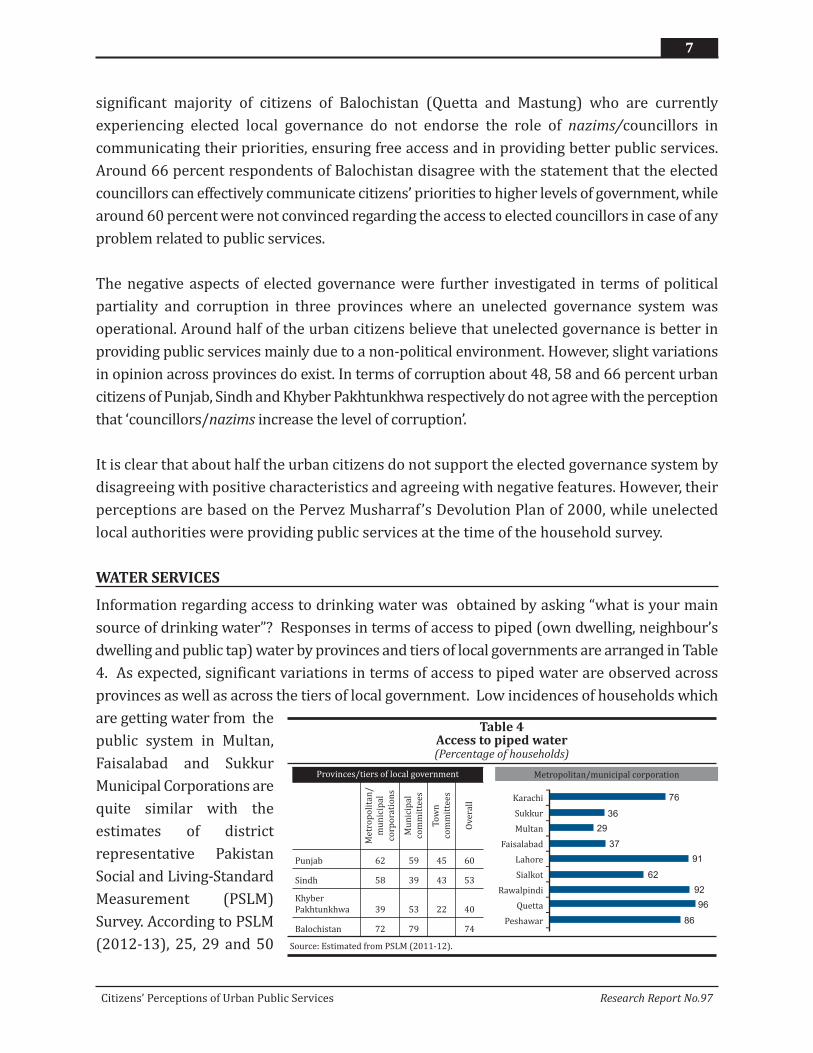
Information regarding access to drinking water was obtained by asking “what is your main
source of drinking water”? Responses in terms of access to piped (own dwelling, neighbour’s
dwelling and public tap) water by provinces and tiers of local governments are arranged in Table
4. As expected, significant variations in terms of access to piped water are observed across
provinces as well as across the tiers of local government. Low incidences of households which
are getting water from the
public system in Multan,
Faisalabad and Sukkur
Municipal Corporations are
quite similar with the
estimates of district
representative Pakistan
Social and Living-Standard
Measurement (PSLM)
Survey. According to PSLM
(2012-13), 25, 29 and 50
7
Citizens’ Perceptions of Urban Public Services Research Report No.97
Table 4Access to piped water(Percentage of households)
Source: Estimated from PSLM (2011-12).
Provinces/tiers of local government
Me
tro
po
lita
n/
mu
nic
ipa
l
corp
ora
tio
ns
Mu
nic
ipa
l
com
mit
tee
s
To
wn
com
mit
tee
s
Ov
era
ll
Punjab 62 59 45 60
Sindh 58 39 43 53
Khyber
Pakhtunkhwa 39 53 22 40
Balochistan 72 79 74
Metropolitan/municipal corporation
Karachi
Sukkur
Multan
Faisalabad
Lahore
Sialkot
Rawalpindi
Quetta
Peshawar
-
-
-
-
-
-
-
-
-
-
76
36
29
37
91
62
92
96
86
percent urban households in Multan, Faisalabad and Sukkur districts respectively were getting
water from the public system in 2013, while corresponding estimates of respective municipal
corporations4 are 29, 37 and 36. Similarly, high incidences of Balochistan and Khyber
Pakhtunkhwa are also in line with PSLM estimates.
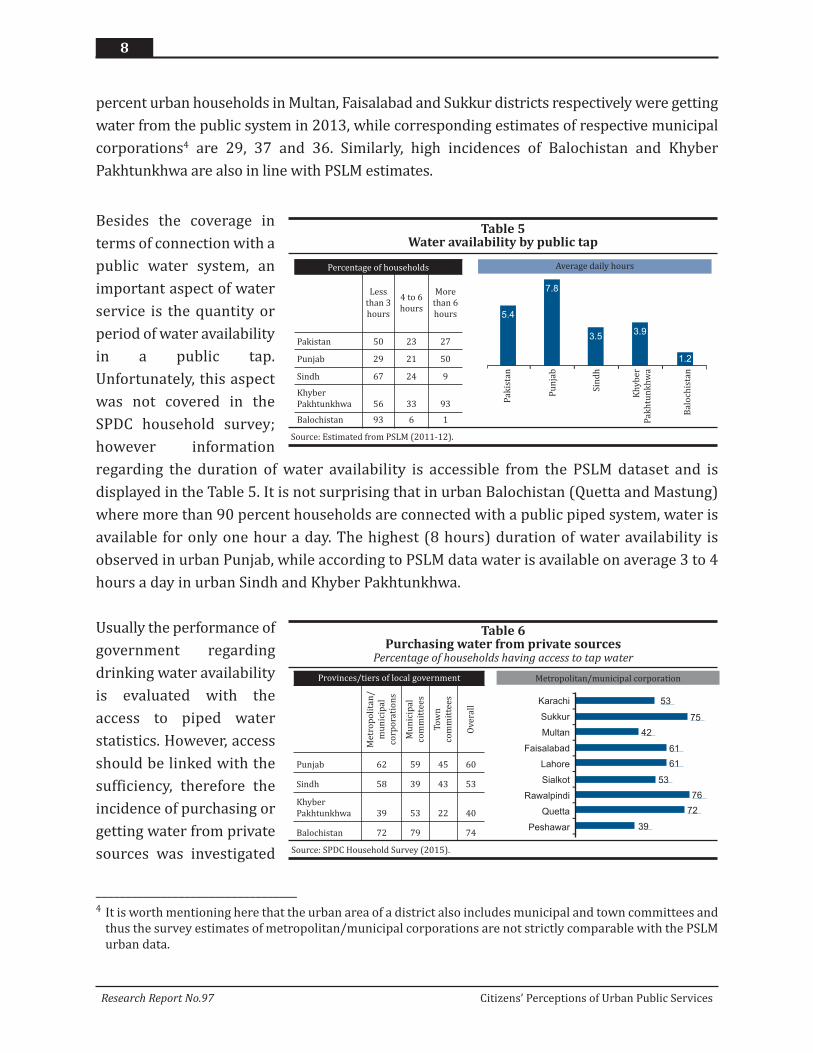
Besides the coverage in
terms of connection with a
public water system, an
important aspect of water
service is the quantity or
period of water availability
in a public tap.
Unfortunately, this aspect
was not covered in the
SPDC household survey;
however information
regarding the duration of water availability is accessible from the PSLM dataset and is
displayed in the Table 5. It is not surprising that in urban Balochistan (Quetta and Mastung)
where more than 90 percent households are connected with a public piped system, water is
available for only one hour a day. The highest (8 hours) duration of water availability is
observed in urban Punjab, while according to PSLM data water is available on average 3 to 4
hours a day in urban Sindh and Khyber Pakhtunkhwa.
Usually the performance of
government regarding
drinking water availability
is evaluated with the
access to piped water
statistics. However, access
should be linked with the
sufficiency, therefore the
incidence of purchasing or
getting water from private
sources was investigated
8
Research Report No.97 Citizens’ Perceptions of Urban Public Services
__________________________________4 It is worth mentioning here that the urban area of a district also includes municipal and town committees and
thus the survey estimates of metropolitan/municipal corporations are not strictly comparable with the PSLM
urban data.
Table 5Water availability by public tap
Source: Estimated from PSLM (2011-12).
Percentage of households
Less
than 3
hours
4 to 6
hours
More
than 6
hours
Pakistan 50 23 27
Punjab 29 21 50
Sindh 67 24 9
Khyber
Pakhtunkhwa 56 33 93
Balochistan 93 6 1
Average daily hours
5.4
3.53.9
1.2
7.8
- - - -
Pa
kis
tan
Pu
nja
b
Sin
dh
Kh
yb
er
Pa
kh
tun
kh
wa
Ba
loch
ista
n
Table 6Purchasing water from private sources
Percentage of households having access to tap water
Source: SPDC Household Survey (2015).
Provinces/tiers of local government
Me
tro
po
lita
n/
mu
nic
ipa
l
corp
ora
tio
ns
Mu
nic
ipa
l
com
mit
tee
s
To
wn
com
mit
tee
s
Ov
era
ll
Punjab 62 59 45 60
Sindh 58 39 43 53
Khyber
Pakhtunkhwa 39 53 22 40
Balochistan 72 79 74
Metropolitan/municipal corporation
Karachi
Sukkur
Multan
Faisalabad
Lahore
Sialkot
Rawalpindi
Quetta
Peshawar
-
-
-
-
-
-
-
-
-
-
53
75
42
61
61
53
76
72
39
in the household survey. The Table 6. disseminates this information by provinces and tiers of
local governments. High incidences of purchasing water by households which have access to
tap water are evident in the table. Overall, about 60, 53, 40 and 74 percent households
asserted the purchase of water in Punjab, Sindh, Khyber Pakhtunkhwa and Balochistan
respectively. Variations in the incidences however exist among different tiers of local
government. More than 70 percent households which have access to tap water in Sukkur,
Rawalpindi and Quetta Municipal Corporations and about 53 and 61 percent households of
Karachi and Lahore Metropolitan Corporations respectively confirmed purchasing water from
private sources.
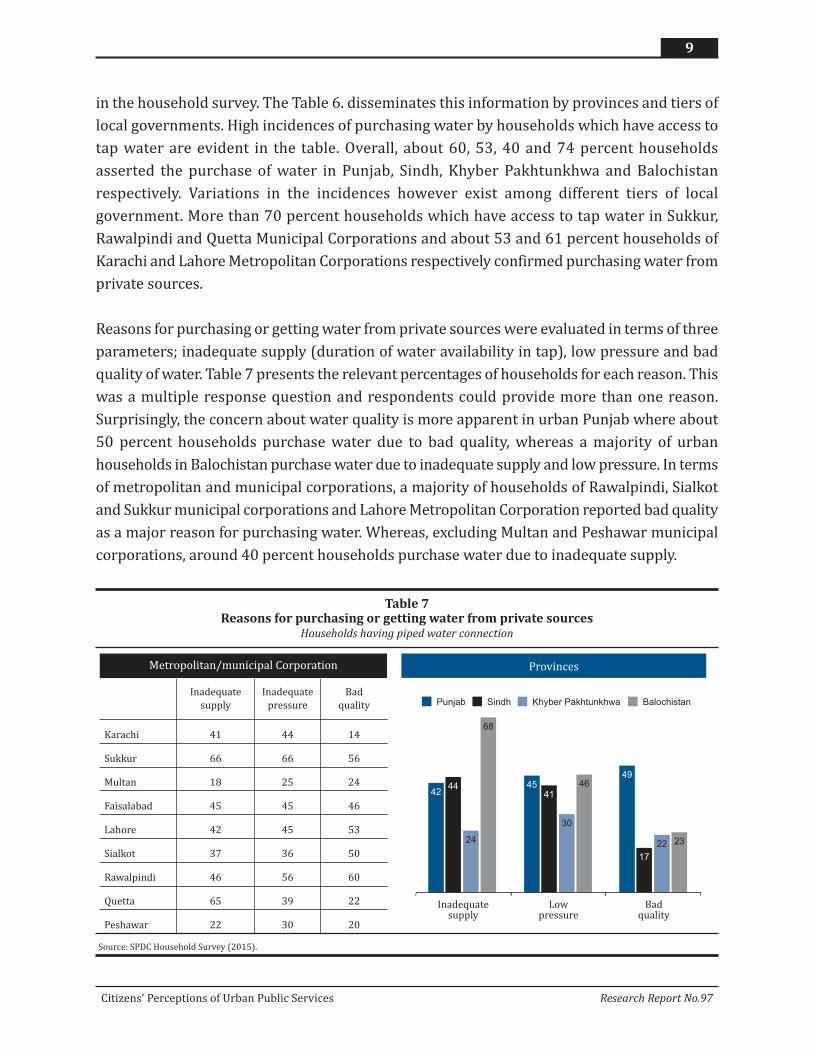
Reasons for purchasing or getting water from private sources were evaluated in terms of three
parameters; inadequate supply (duration of water availability in tap), low pressure and bad
quality of water. Table 7 presents the relevant percentages of households for each reason. This
was a multiple response question and respondents could provide more than one reason.
Surprisingly, the concern about water quality is more apparent in urban Punjab where about
50 percent households purchase water due to bad quality, whereas a majority of urban
households in Balochistan purchase water due to inadequate supply and low pressure. In terms
of metropolitan and municipal corporations, a majority of households of Rawalpindi, Sialkot
and Sukkur municipal corporations and Lahore Metropolitan Corporation reported bad quality
as a major reason for purchasing water. Whereas, excluding Multan and Peshawar municipal
corporations, around 40 percent households purchase water due to inadequate supply.
9
Citizens’ Perceptions of Urban Public Services Research Report No.97
Table 7Reasons for purchasing or getting water from private sources
Households having piped water connection
Source: SPDC Household Survey (2015).
4244
24
68
4541
30
4649
17
22 23
Sindh
Provinces
Punjab BalochistanKhyber Pakhtunkhwa
Metropolitan/municipal Corporation
Inadequate
supply
Inadequate
pressure
Bad
quality
Karachi 41 44 14
Sukkur 66 66 56
Multan 18 25 24
Faisalabad 45 45 46
Lahore 42 45 53
Sialkot 37 36 50
Rawalpindi 46 56 60
Quetta 65 39 22
Peshawar 22 30 20
- -
Inadequate Low Badsupply pressure quality
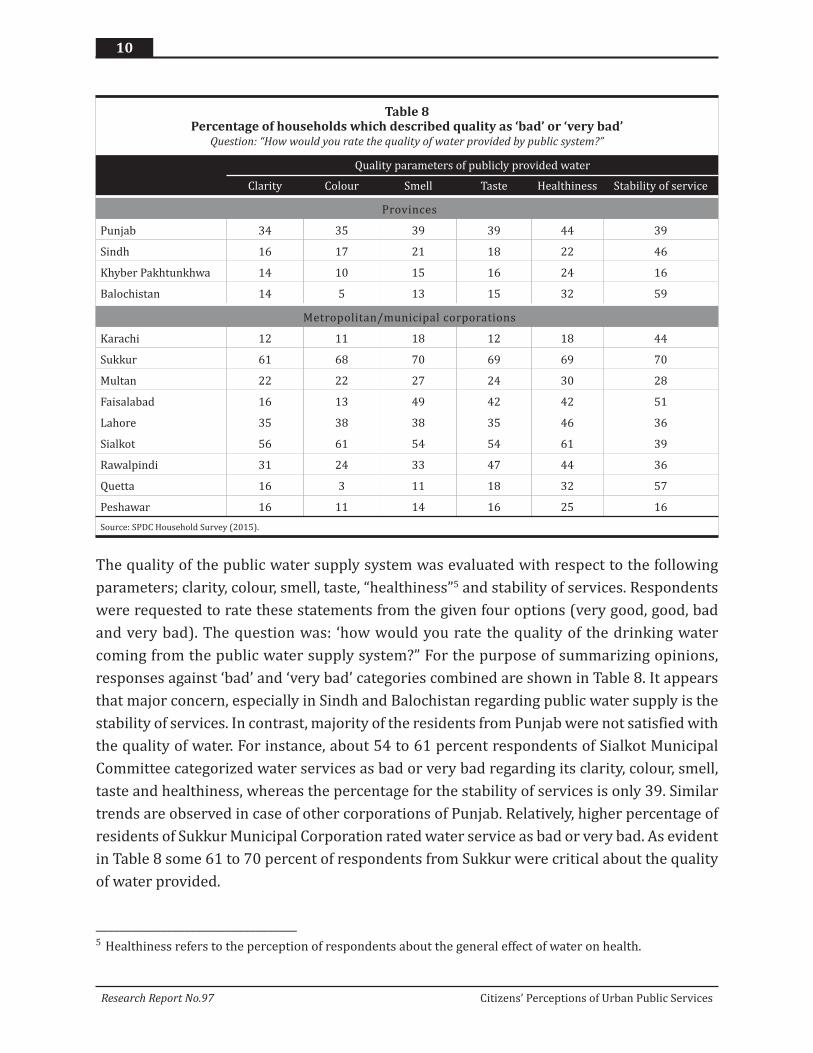
The quality of the public water supply system was evaluated with respect to the following
parameters; clarity, colour, smell, taste, “healthiness”5 and stability of services. Respondents
were requested to rate these statements from the given four options (very good, good, bad
and very bad). The question was: ‘how would you rate the quality of the drinking water
coming from the public water supply system?” For the purpose of summarizing opinions,
responses against ‘bad’ and ‘very bad’ categories combined are shown in Table 8. It appears
that major concern, especially in Sindh and Balochistan regarding public water supply is the
stability of services. In contrast, majority of the residents from Punjab were not satisfied with
the quality of water. For instance, about 54 to 61 percent respondents of Sialkot Municipal
Committee categorized water services as bad or very bad regarding its clarity, colour, smell,
taste and healthiness, whereas the percentage for the stability of services is only 39. Similar
trends are observed in case of other corporations of Punjab. Relatively, higher percentage of
residents of Sukkur Municipal Corporation rated water service as bad or very bad. As evident
in Table 8 some 61 to 70 percent of respondents from Sukkur were critical about the quality
of water provided.
10
Research Report No.97 Citizens’ Perceptions of Urban Public Services
__________________________________5 Healthiness refers to the perception of respondents about the general effect of water on health.
Table 8Percentage of households which described quality as ‘bad’ or ‘very bad’
Question: “How would you rate the quality of water provided by public system?”
Quality parameters of publicly provided water
Clarity Colour Smell Taste Healthiness Stability of service
Provinces
Punjab 34 35 39 39 44 39
Sindh 16 17 21 18 22 46
Khyber Pakhtunkhwa 14 10 15 16 24 16
Balochistan 14 5 13 15 32 59
Metropolitan/municipal corporations
Karachi 12 11 18 12 18 44
Sukkur 61 68 70 69 69 70
Multan 22 22 27 24 30 28
Faisalabad 16 13 49 42 42 51
Lahore 35 38 38 35 46 36
Sialkot 56 61 54 54 61 39
Rawalpindi 31 24 33 47 44 36
Quetta 16 3 11 18 32 57
Peshawar 16 11 14 16 25 16
Source: SPDC Household Survey (2015).
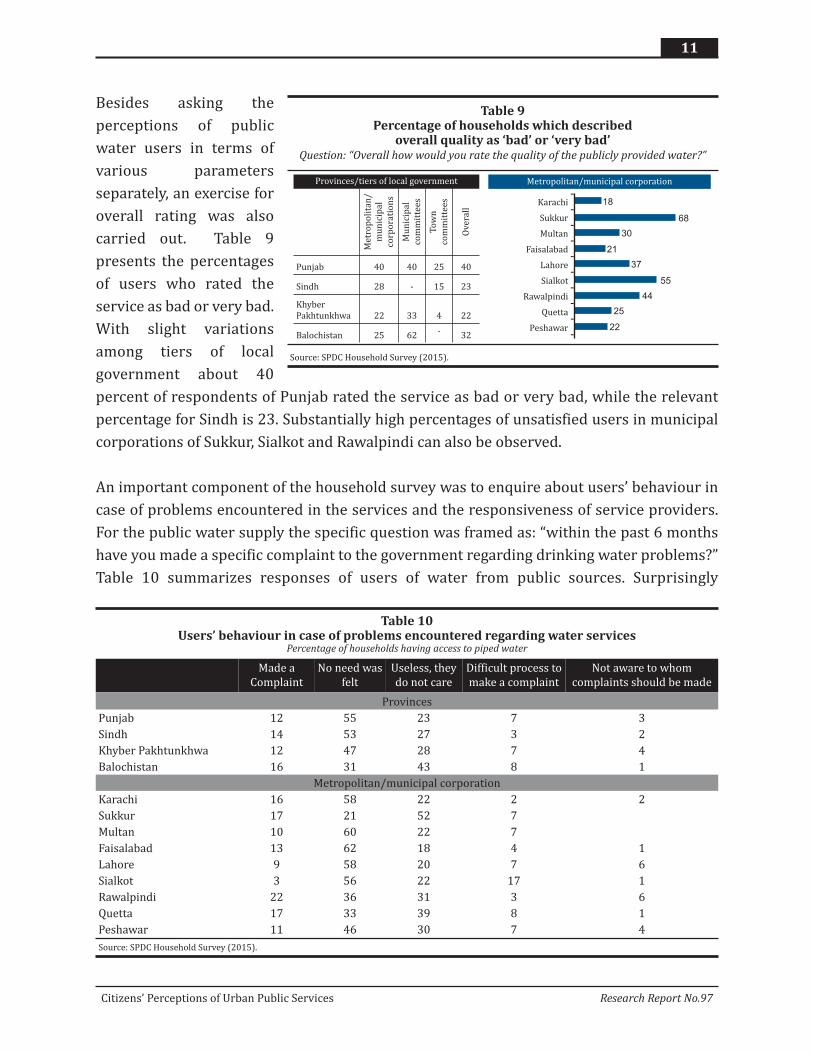
Besides asking the
perceptions of public
water users in terms of
various parameters
separately, an exercise for
overall rating was also
carried out. Table 9
presents the percentages
of users who rated the
service as bad or very bad.
With slight variations
among tiers of local
government about 40
percent of respondents of Punjab rated the service as bad or very bad, while the relevant
percentage for Sindh is 23. Substantially high percentages of unsatisfied users in municipal
corporations of Sukkur, Sialkot and Rawalpindi can also be observed.
An important component of the household survey was to enquire about users’ behaviour in
case of problems encountered in the services and the responsiveness of service providers.
For the public water supply the specific question was framed as: “within the past 6 months
have you made a specific complaint to the government regarding drinking water problems?”
Table 10 summarizes responses of users of water from public sources. Surprisingly
11
Citizens’ Perceptions of Urban Public Services Research Report No.97
Table 9Percentage of households which described
overall quality as ‘bad’ or ‘very bad’Question: “Overall how would you rate the quality of the publicly provided water?”
Source: SPDC Household Survey (2015).
Provinces/tiers of local government
Me
tro
po
lita
n/
mu
nic
ipa
l
corp
ora
tio
ns
Mu
nic
ipa
l
com
mit
tee
s
To
wn
com
mit
tee
s
Ov
era
ll
Punjab 40 40 25 40
Sindh 28 - 15 23
Khyber
Pakhtunkhwa 22 33 4 22
Balochistan 25 62 - 32
Metropolitan/municipal corporation
Karachi
Sukkur
Multan
Faisalabad
Lahore
Sialkot
Rawalpindi
Quetta
Peshawar
-
-
-
-
-
-
-
-
-
-
18
68
30
21
37
55
44
25
22
Table 10Users’ behaviour in case of problems encountered regarding water services
Percentage of households having access to piped water
Made a
Complaint
No need was
felt
Useless, they
do not care
Difficult process to
make a complaint
Not aware to whom
complaints should be made
Provinces
Punjab 12 55 23 7 3
Sindh 14 53 27 3 2
Khyber Pakhtunkhwa 12 47 28 7 4
Balochistan 16 31 43 8 1
Metropolitan/municipal corporation
Karachi 16 58 22 2 2
Sukkur 17 21 52 7
Multan 10 60 22 7
Faisalabad 13 62 18 4 1
Lahore 9 58 20 7 6
Sialkot 3 56 22 17 1
Rawalpindi 22 36 31 3 6
Quetta 17 33 39 8 1
Peshawar 11 46 30 7 4
Source: SPDC Household Survey (2015).
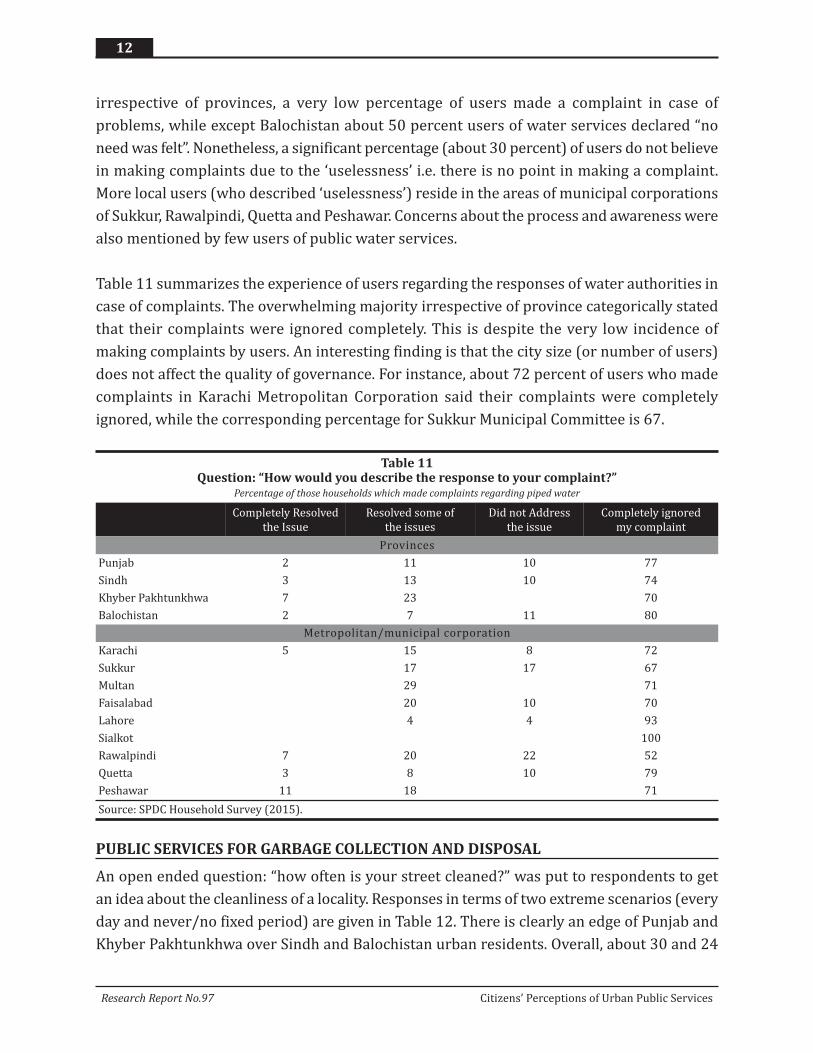
irrespective of provinces, a very low percentage of users made a complaint in case of
problems, while except Balochistan about 50 percent users of water services declared “no
need was felt”. Nonetheless, a significant percentage (about 30 percent) of users do not believe
in making complaints due to the ‘uselessness’ i.e. there is no point in making a complaint.
More local users (who described ‘uselessness’) reside in the areas of municipal corporations
of Sukkur, Rawalpindi, Quetta and Peshawar. Concerns about the process and awareness were
also mentioned by few users of public water services.
Table 11 summarizes the experience of users regarding the responses of water authorities in
case of complaints. The overwhelming majority irrespective of province categorically stated
that their complaints were ignored completely. This is despite the very low incidence of
making complaints by users. An interesting finding is that the city size (or number of users)
does not affect the quality of governance. For instance, about 72 percent of users who made
complaints in Karachi Metropolitan Corporation said their complaints were completely
ignored, while the corresponding percentage for Sukkur Municipal Committee is 67.
PUBLIC SERVICES FOR GARBAGE COLLECTION AND DISPOSAL
An open ended question: “how often is your street cleaned?” was put to respondents to get
an idea about the cleanliness of a locality. Responses in terms of two extreme scenarios (every
day and never/no fixed period) are given in Table 12. There is clearly an edge of Punjab and
Khyber Pakhtunkhwa over Sindh and Balochistan urban residents. Overall, about 30 and 24
12
Research Report No.97 Citizens’ Perceptions of Urban Public Services
Table 11Question: “How would you describe the response to your complaint?”
Percentage of those households which made complaints regarding piped water
Completely Resolved
the Issue
Resolved some of
the issues
Did not Address
the issue
Completely ignored
my complaint
Provinces
Punjab 2 11 10 77
Sindh 3 13 10 74
Khyber Pakhtunkhwa 7 23 70
Balochistan 2 7 11 80
Metropolitan/municipal corporation
Karachi 5 15 8 72
Sukkur 17 17 67
Multan 29 71
Faisalabad 20 10 70
Lahore 4 4 93
Sialkot 100
Rawalpindi 7 20 22 52
Quetta 3 8 10 79
Peshawar 11 18 71
Source: SPDC Household Survey (2015).
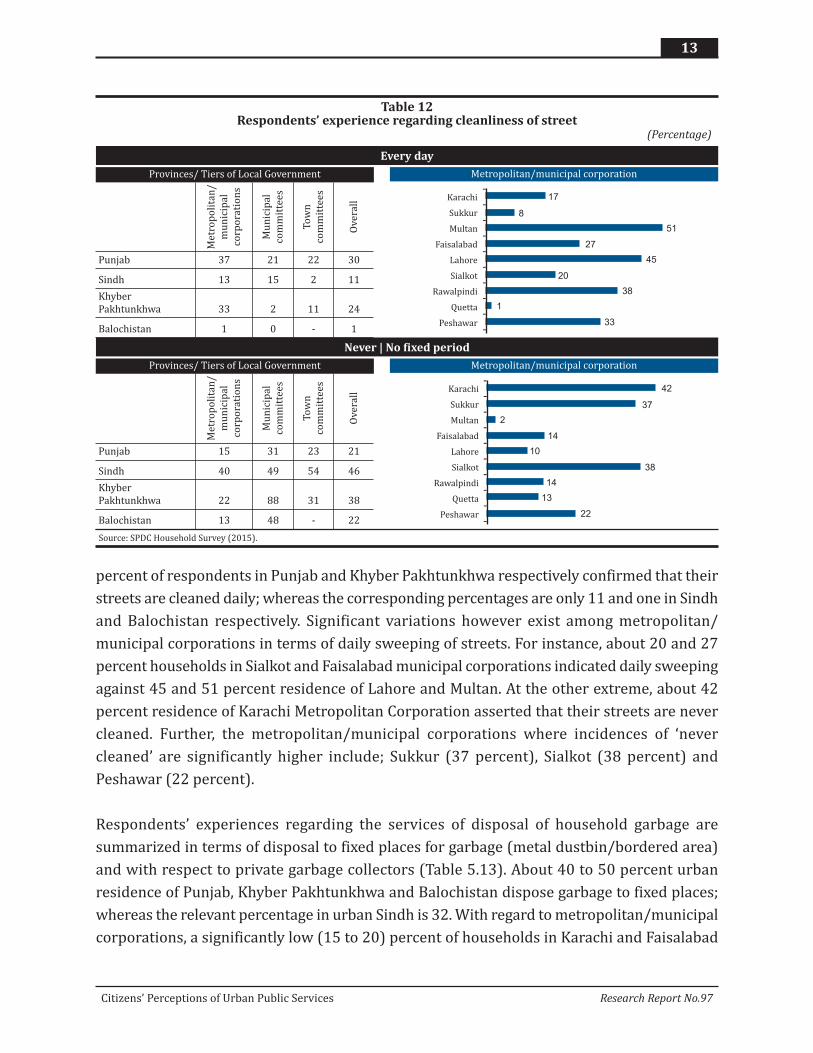
percent of respondents in Punjab and Khyber Pakhtunkhwa respectively confirmed that their
streets are cleaned daily; whereas the corresponding percentages are only 11 and one in Sindh
and Balochistan respectively. Significant variations however exist among metropolitan/
municipal corporations in terms of daily sweeping of streets. For instance, about 20 and 27
percent households in Sialkot and Faisalabad municipal corporations indicated daily sweeping
against 45 and 51 percent residence of Lahore and Multan. At the other extreme, about 42
percent residence of Karachi Metropolitan Corporation asserted that their streets are never
cleaned. Further, the metropolitan/municipal corporations where incidences of ‘never
cleaned’ are significantly higher include; Sukkur (37 percent), Sialkot (38 percent) and
Peshawar (22 percent).
Respondents’ experiences regarding the services of disposal of household garbage are
summarized in terms of disposal to fixed places for garbage (metal dustbin/bordered area)
and with respect to private garbage collectors (Table 5.13). About 40 to 50 percent urban
residence of Punjab, Khyber Pakhtunkhwa and Balochistan dispose garbage to fixed places;
whereas the relevant percentage in urban Sindh is 32. With regard to metropolitan/municipal
corporations, a significantly low (15 to 20) percent of households in Karachi and Faisalabad
13
Citizens’ Perceptions of Urban Public Services Research Report No.97
Table 12Respondents’ experience regarding cleanliness of street
(Percentage)
Every day
Never | No fixed period
Source: SPDC Household Survey (2015).
Provinces/ Tiers of Local Government
Me
tro
po
lita
n/
mu
nic
ipa
l
corp
ora
tio
ns
Mu
nic
ipa
l
com
mit
tee
s
To
wn
com
mit
tee
s
Ov
era
ll
Punjab 37 21 22 30
Sindh 13 15 2 11
Khyber
Pakhtunkhwa 33 2 11 24
Balochistan 1 0 - 1
Provinces/ Tiers of Local Government
Me
tro
po
lita
n/
mu
nic
ipa
l
corp
ora
tio
ns
Mu
nic
ipa
l
com
mit
tee
s
To
wn
com
mit
tee
s
Ov
era
ll
Punjab 15 31 23 21
Sindh 40 49 54 46
Khyber
Pakhtunkhwa 22 88 31 38
Balochistan 13 48 - 22
Metropolitan/municipal corporation
Metropolitan/municipal corporation
Karachi
Sukkur
Multan
Faisalabad
Lahore
Sialkot
Rawalpindi
Quetta
Peshawar
-
-
-
-
-
-
-
-
-
-
17
8
51
27
45
20
38
1
33
Karachi
Sukkur
Multan
Faisalabad
Lahore
Sialkot
Rawalpindi
Quetta
Peshawar
-
-
-
-
-
-
-
-
-
-
42
37
2
14
10
38
14
13
22
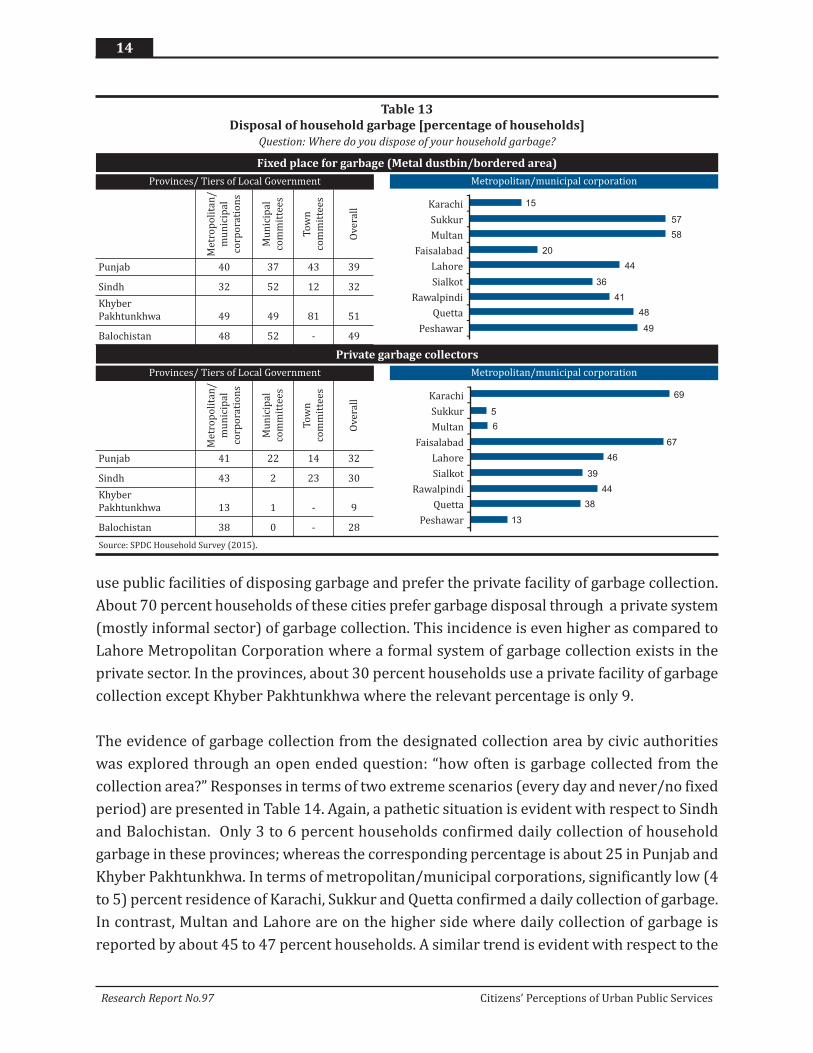
use public facilities of disposing garbage and prefer the private facility of garbage collection.
About 70 percent households of these cities prefer garbage disposal through a private system
(mostly informal sector) of garbage collection. This incidence is even higher as compared to
Lahore Metropolitan Corporation where a formal system of garbage collection exists in the
private sector. In the provinces, about 30 percent households use a private facility of garbage
collection except Khyber Pakhtunkhwa where the relevant percentage is only 9.
The evidence of garbage collection from the designated collection area by civic authorities
was explored through an open ended question: “how often is garbage collected from the
collection area?” Responses in terms of two extreme scenarios (every day and never/no fixed
period) are presented in Table 14. Again, a pathetic situation is evident with respect to Sindh
and Balochistan. Only 3 to 6 percent households confirmed daily collection of household
garbage in these provinces; whereas the corresponding percentage is about 25 in Punjab and
Khyber Pakhtunkhwa. In terms of metropolitan/municipal corporations, significantly low (4
to 5) percent residence of Karachi, Sukkur and Quetta confirmed a daily collection of garbage.
In contrast, Multan and Lahore are on the higher side where daily collection of garbage is
reported by about 45 to 47 percent households. A similar trend is evident with respect to the
14
Research Report No.97 Citizens’ Perceptions of Urban Public Services
Table 13
Disposal of household garbage [percentage of households]
Question: Where do you dispose of your household garbage?
Fixed place for garbage (Metal dustbin/bordered area)
Private garbage collectors
Source: SPDC Household Survey (2015).
Provinces/ Tiers of Local Government
Me
tro
po
lita
n/
mu
nic
ipa
l
corp
ora
tio
ns
Mu
nic
ipa
l
com
mit
tee
s
To
wn
com
mit
tee
s
Ov
era
ll
Punjab 40 37 43 39
Sindh 32 52 12 32
Khyber
Pakhtunkhwa 49 49 81 51
Balochistan 48 52 - 49
Provinces/ Tiers of Local Government
Me
tro
po
lita
n/
mu
nic
ipa
l
corp
ora
tio
ns
Mu
nic
ipa
l
com
mit
tee
s
To
wn
com
mit
tee
s
Ov
era
ll
Punjab 41 22 14 32
Sindh 43 2 23 30
Khyber
Pakhtunkhwa 13 1 - 9
Balochistan 38 0 - 28
Metropolitan/municipal corporation
Metropolitan/municipal corporation
Karachi
Sukkur
Multan
Faisalabad
Lahore
Sialkot
Rawalpindi
Quetta
Peshawar
-
-
-
-
-
-
-
-
-
-
15
57
58
20
44
36
41
48
49
Karachi
Sukkur
Multan
Faisalabad
Lahore
Sialkot
Rawalpindi
Quetta
Peshawar
-
-
-
-
-
-
-
-
-
-
69
5
6
67
46
39
44
38
13
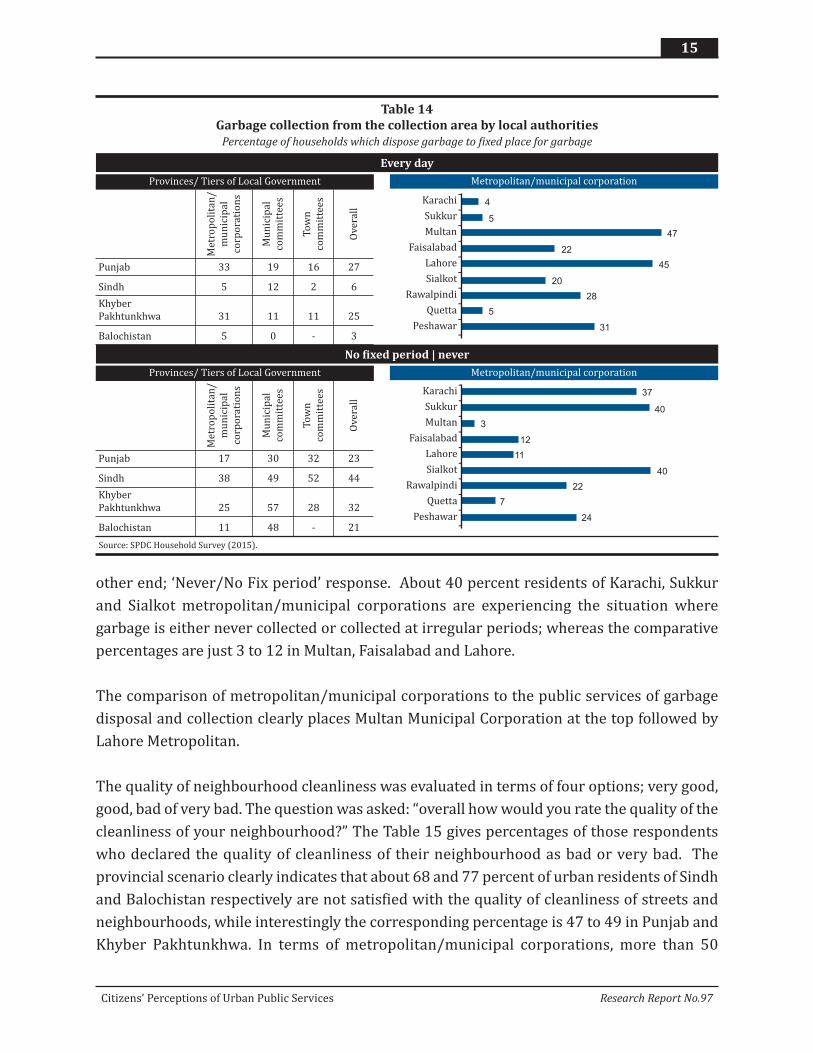
other end; ‘Never/No Fix period’ response. About 40 percent residents of Karachi, Sukkur
and Sialkot metropolitan/municipal corporations are experiencing the situation where
garbage is either never collected or collected at irregular periods; whereas the comparative
percentages are just 3 to 12 in Multan, Faisalabad and Lahore.
The comparison of metropolitan/municipal corporations to the public services of garbage
disposal and collection clearly places Multan Municipal Corporation at the top followed by
Lahore Metropolitan.
The quality of neighbourhood cleanliness was evaluated in terms of four options; very good,
good, bad of very bad. The question was asked: “overall how would you rate the quality of the
cleanliness of your neighbourhood?” The Table 15 gives percentages of those respondents
who declared the quality of cleanliness of their neighbourhood as bad or very bad. The
provincial scenario clearly indicates that about 68 and 77 percent of urban residents of Sindh
and Balochistan respectively are not satisfied with the quality of cleanliness of streets and
neighbourhoods, while interestingly the corresponding percentage is 47 to 49 in Punjab and
Khyber Pakhtunkhwa. In terms of metropolitan/municipal corporations, more than 50
15
Citizens’ Perceptions of Urban Public Services Research Report No.97
Table 14
Garbage collection from the collection area by local authorities
Percentage of households which dispose garbage to fixed place for garbage
Every day
No fixed period | never
Source: SPDC Household Survey (2015).
Provinces/ Tiers of Local Government
Me
tro
po
lita
n/
mu
nic
ipa
l
corp
ora
tio
ns
Mu
nic
ipa
l
com
mit
tee
s
To
wn
com
mit
tee
s
Ov
era
ll
Punjab 33 19 16 27
Sindh 5 12 2 6
Khyber
Pakhtunkhwa 31 11 11 25
Balochistan 5 0 - 3
Provinces/ Tiers of Local Government
Me
tro
po
lita
n/
mu
nic
ipa
l
corp
ora
tio
ns
Mu
nic
ipa
l
com
mit
tee
s
To
wn
com
mit
tee
s
Ov
era
ll
Punjab 17 30 32 23
Sindh 38 49 52 44
Khyber
Pakhtunkhwa 25 57 28 32
Balochistan 11 48 - 21
Metropolitan/municipal corporation
Metropolitan/municipal corporation
Karachi
Sukkur
Multan
Faisalabad
Lahore
Sialkot
Rawalpindi
Quetta
Peshawar
-
-
-
-
-
-
-
-
-
-
Karachi
Sukkur
Multan
Faisalabad
Lahore
Sialkot
Rawalpindi
Quetta
Peshawar
-
-
-
-
-
-
-
-
-
-
4
5
47
22
45
20
28
5
31
37
40
3
12
11
40
22
7
24
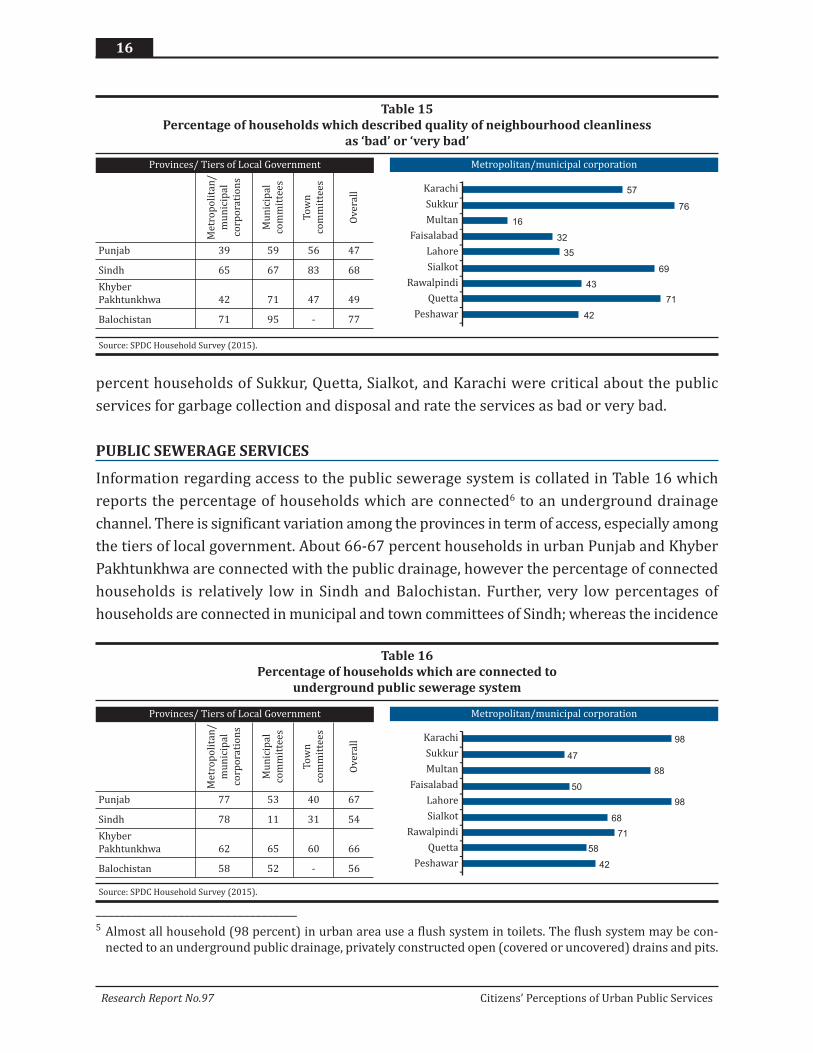
percent households of Sukkur, Quetta, Sialkot, and Karachi were critical about the public
services for garbage collection and disposal and rate the services as bad or very bad.
PUBLIC SEWERAGE SERVICES
Information regarding access to the public sewerage system is collated in Table 16 which
reports the percentage of households which are connected6 to an underground drainage
channel. There is significant variation among the provinces in term of access, especially among
the tiers of local government. About 66-67 percent households in urban Punjab and Khyber
Pakhtunkhwa are connected with the public drainage, however the percentage of connected
households is relatively low in Sindh and Balochistan. Further, very low percentages of
households are connected in municipal and town committees of Sindh; whereas the incidence
16
Research Report No.97 Citizens’ Perceptions of Urban Public Services
Table 15
Percentage of households which described quality of neighbourhood cleanliness
as ‘bad’ or ‘very bad’
Source: SPDC Household Survey (2015).
Table 16
Percentage of households which are connected to
underground public sewerage system
Source: SPDC Household Survey (2015).
Provinces/ Tiers of Local Government
Me
tro
po
lita
n/
mu
nic
ipa
l
corp
ora
tio
ns
Mu
nic
ipa
l
com
mit
tee
s
To
wn
com
mit
tee
s
Ov
era
ll
Punjab 39 59 56 47
Sindh 65 67 83 68
Khyber
Pakhtunkhwa 42 71 47 49
Balochistan 71 95 - 77
Metropolitan/municipal corporation
Karachi
Sukkur
Multan
Faisalabad
Lahore
Sialkot
Rawalpindi
Quetta
Peshawar
-
-
-
-
-
-
-
-
-
-
57
76
16
32
35
69
43
71
42
Provinces/ Tiers of Local Government
Me
tro
po
lita
n/
mu
nic
ipa
l
corp
ora
tio
ns
Mu
nic
ipa
l
com
mit
tee
s
To
wn
com
mit
tee
s
Ov
era
ll
Punjab 77 53 40 67
Sindh 78 11 31 54
Khyber
Pakhtunkhwa 62 65 60 66
Balochistan 58 52 - 56
Metropolitan/municipal corporation
Karachi
Sukkur
Multan
Faisalabad
Lahore
Sialkot
Rawalpindi
Quetta
Peshawar
-
-
-
-
-
-
-
-
-
-
__________________________________5 Almost all household (98 percent) in urban area use a flush system in toilets. The flush system may be con-
nected to an underground public drainage, privately constructed open (covered or uncovered) drains and pits.
98
47
88
50
98
68
71
58
42
is quite high in Khyber Pakhtunkhwa and Punjab. In terms of metropolitan/municipal
corporations, low incidences of household access to public drains are observed in Sukkur,
Faisalabad and Quetta.
The survey data reveals that a flush is connected to a pit in significant percentages of
households of Sukkur and Faisalabad cities, whereas a flush is connected to an open drain in
about 34 percent households of Quetta Municipal Corporation.
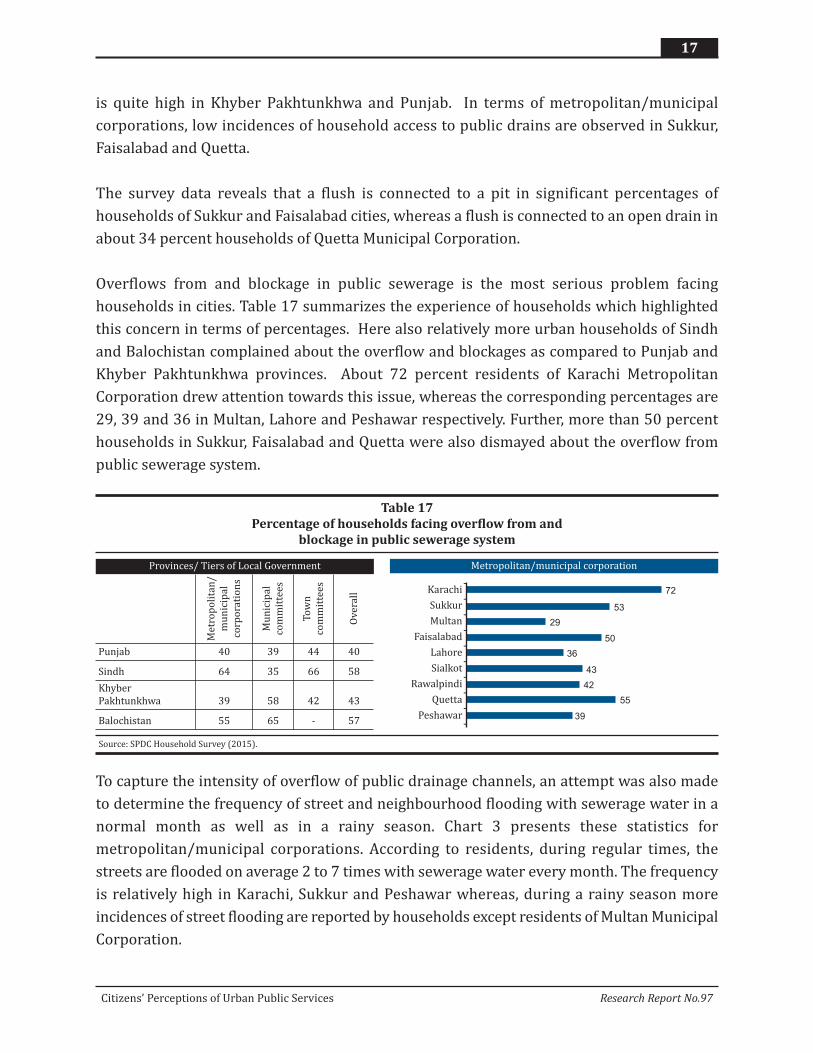
Overflows from and blockage in public sewerage is the most serious problem facing
households in cities. Table 17 summarizes the experience of households which highlighted
this concern in terms of percentages. Here also relatively more urban households of Sindh
and Balochistan complained about the overflow and blockages as compared to Punjab and
Khyber Pakhtunkhwa provinces. About 72 percent residents of Karachi Metropolitan
Corporation drew attention towards this issue, whereas the corresponding percentages are
29, 39 and 36 in Multan, Lahore and Peshawar respectively. Further, more than 50 percent
households in Sukkur, Faisalabad and Quetta were also dismayed about the overflow from
public sewerage system.
To capture the intensity of overflow of public drainage channels, an attempt was also made
to determine the frequency of street and neighbourhood flooding with sewerage water in a
normal month as well as in a rainy season. Chart 3 presents these statistics for
metropolitan/municipal corporations. According to residents, during regular times, the
streets are flooded on average 2 to 7 times with sewerage water every month. The frequency
is relatively high in Karachi, Sukkur and Peshawar whereas, during a rainy season more
incidences of street flooding are reported by households except residents of Multan Municipal
Corporation.
17
Citizens’ Perceptions of Urban Public Services Research Report No.97
Table 17
Percentage of households facing overflow from and
blockage in public sewerage system
Source: SPDC Household Survey (2015).
Provinces/ Tiers of Local Government
Me
tro
po
lita
n/
mu
nic
ipa
l
corp
ora
tio
ns
Mu
nic
ipa
l
com
mit
tee
s
To
wn
com
mit
tee
s
Ov
era
ll
Punjab 40 39 44 40
Sindh 64 35 66 58
Khyber
Pakhtunkhwa 39 58 42 43
Balochistan 55 65 - 57
Metropolitan/municipal corporation
Karachi
Sukkur
Multan
Faisalabad
Lahore
Sialkot
Rawalpindi
Quetta
Peshawar
-
-
-
-
-
-
-
-
-
-
72
53
29
50
36
43
42
55
39
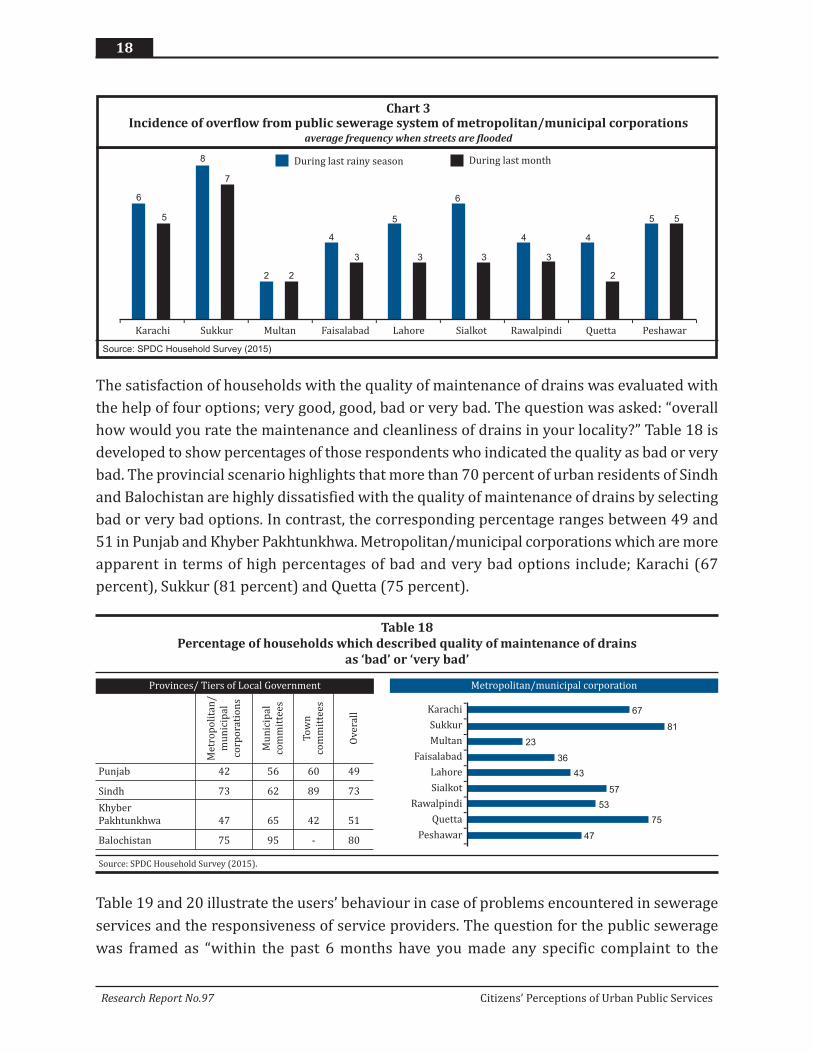
The satisfaction of households with the quality of maintenance of drains was evaluated with
the help of four options; very good, good, bad or very bad. The question was asked: “overall
how would you rate the maintenance and cleanliness of drains in your locality?” Table 18 is
developed to show percentages of those respondents who indicated the quality as bad or very
bad. The provincial scenario highlights that more than 70 percent of urban residents of Sindh
and Balochistan are highly dissatisfied with the quality of maintenance of drains by selecting
bad or very bad options. In contrast, the corresponding percentage ranges between 49 and
51 in Punjab and Khyber Pakhtunkhwa. Metropolitan/municipal corporations which are more
apparent in terms of high percentages of bad and very bad options include; Karachi (67
percent), Sukkur (81 percent) and Quetta (75 percent).
Table 19 and 20 illustrate the users’ behaviour in case of problems encountered in sewerage
services and the responsiveness of service providers. The question for the public sewerage
was framed as “within the past 6 months have you made any specific complaint to the
18
Research Report No.97 Citizens’ Perceptions of Urban Public Services
Source: SPDC Household Survey (2015)
Karachi Sukkur Multan Faisalabad Lahore Sialkot Rawalpindi Quetta Peshawar
- - - - - - - - - -
6
5
8
7
2 2
4
3
5
3
6
3
4
3
4
2
5 5
During last rainy season During last month
Chart 3Incidence of overflow from public sewerage system of metropolitan/municipal corporations
average frequency when streets are flooded
Table 18
Percentage of households which described quality of maintenance of drains
as ‘bad’ or ‘very bad’
Source: SPDC Household Survey (2015).
Provinces/ Tiers of Local Government
Me
tro
po
lita
n/
mu
nic
ipa
l
corp
ora
tio
ns
Mu
nic
ipa
l
com
mit
tee
s
To
wn
com
mit
tee
s
Ov
era
ll
Punjab 42 56 60 49
Sindh 73 62 89 73
Khyber
Pakhtunkhwa 47 65 42 51
Balochistan 75 95 - 80
Metropolitan/municipal corporation
Karachi
Sukkur
Multan
Faisalabad
Lahore
Sialkot
Rawalpindi
Quetta
Peshawar
-
-
-
-
-
-
-
-
-
-
67
81
23
36
43
57
53
75
47
19
Citizens’ Perceptions of Urban Public Services Research Report No.97
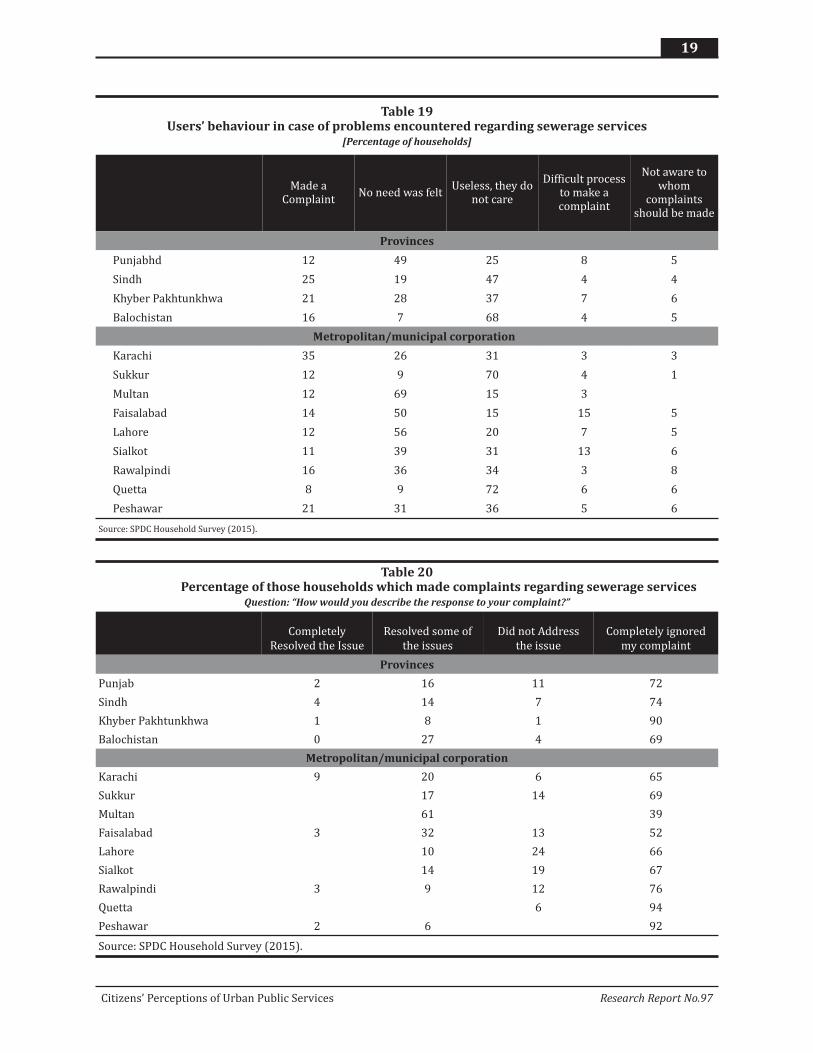
Table 19Users’ behaviour in case of problems encountered regarding sewerage services
[Percentage of households]
Made aComplaint
No need was feltUseless, they do
not care
Difficult processto make acomplaint
Not aware towhom
complaintsshould be made
Provinces
Punjabhd 12 49 25 8 5
Sindh 25 19 47 4 4
Khyber Pakhtunkhwa 21 28 37 7 6
Balochistan 16 7 68 4 5
Metropolitan/municipal corporation
Karachi 35 26 31 3 3
Sukkur 12 9 70 4 1
Multan 12 69 15 3
Faisalabad 14 50 15 15 5
Lahore 12 56 20 7 5
Sialkot 11 39 31 13 6
Rawalpindi 16 36 34 3 8
Quetta 8 9 72 6 6
Peshawar 21 31 36 5 6
Source: SPDC Household Survey (2015).
Table 20Percentage of those households which made complaints regarding sewerage services
Question: “How would you describe the response to your complaint?”
Completely
Resolved the Issue
Resolved some of
the issues
Did not Address
the issue
Completely ignored
my complaint
Provinces
Punjab 2 16 11 72
Sindh 4 14 7 74
Khyber Pakhtunkhwa 1 8 1 90
Balochistan 0 27 4 69
Metropolitan/municipal corporation
Karachi 9 20 6 65
Sukkur 17 14 69
Multan 61 39
Faisalabad 3 32 13 52
Lahore 10 24 66
Sialkot 14 19 67
Rawalpindi 3 9 12 76
Quetta 6 94
Peshawar 2 6 92
Source: SPDC Household Survey (2015).
government regarding drainage channels/sewerage lines problems?” As observed in the
section of water services, very low percentages of households asserted that they have made
a complaint during the last six months. A significant percentage of urban residents, especially
in Sindh and Balochistan do not believe in making complaints due to its ‘uselessness’ i.e. there
is no point in making a complaint; about 47 and 68 percent residents of Sindh and Balochistan
respectively believe that making a complaint is futile. Similarly, more than 70 percent
households in Sukkur and Quetta municipal corporations were not in favour of making
complaints regarding the civic problems to authorities. Lack of awareness regarding the
concerned authorities and complicated process were also mentioned as reasons for not
making complaints.
In terms of the experience of households who have made complaints, a significant majority
irrespective of province categorically stated that their complaints were ignored completely.
However, the percentage is relatively low in Balochistan where about 27 percent of those who
complained and claimed that some of their issues have been resolved. The percentage of
satisfied individuals is also high in Multan Municipal Corporation where about 61 percent of
those who complained confirmed action taken.
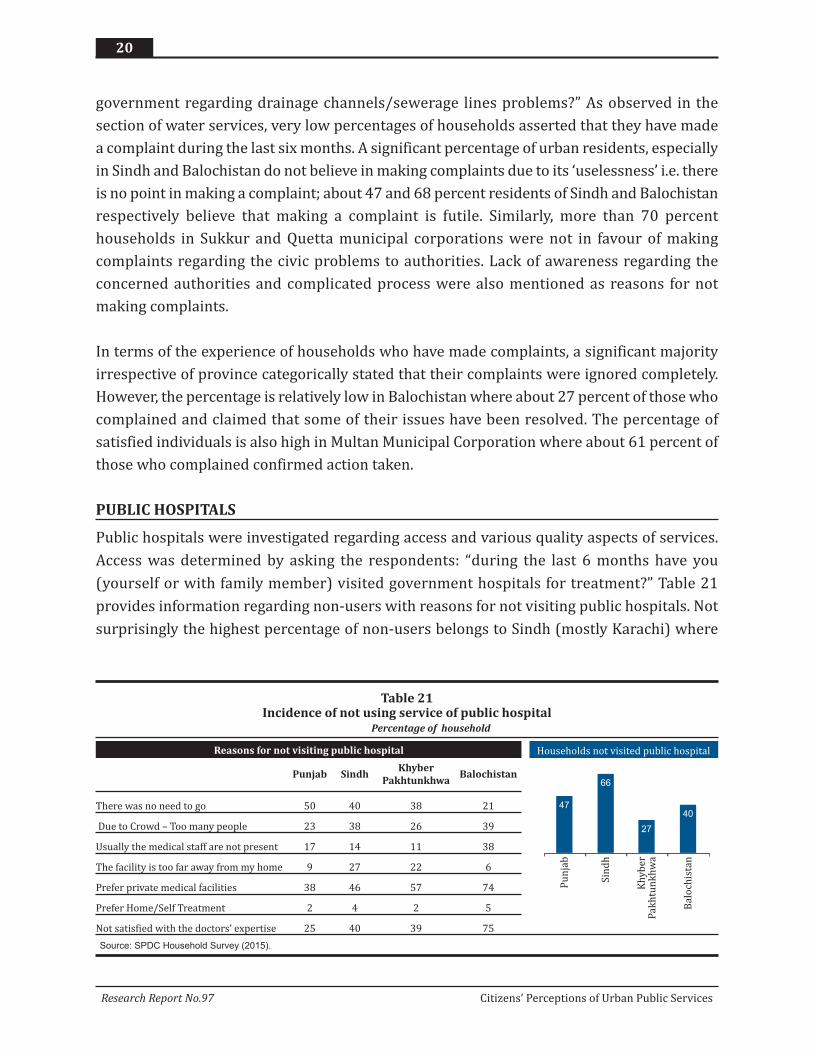
PUBLIC HOSPITALS
Public hospitals were investigated regarding access and various quality aspects of services.
Access was determined by asking the respondents: “during the last 6 months have you
(yourself or with family member) visited government hospitals for treatment?” Table 21
provides information regarding non-users with reasons for not visiting public hospitals. Not
surprisingly the highest percentage of non-users belongs to Sindh (mostly Karachi) where
20
Research Report No.97 Citizens’ Perceptions of Urban Public Services
Table 21Incidence of not using service of public hospital
Percentage of household
Reasons for not visiting public hospital Households not visited public hospital
Punjab SindhKhyber
PakhtunkhwaBalochistan
There was no need to go 50 40 38 21
Due to Crowd – Too many people 23 38 26 39
Usually the medical staff are not present 17 14 11 38
The facility is too far away from my home 9 27 22 6
Prefer private medical facilities 38 46 57 74
Prefer Home/Self Treatment 2 4 2 5
Not satisfied with the doctors’ expertise 25 40 39 75
Source: SPDC Household Survey (2015).
47
66
27
40
Pu
nja
b
Sin
dh
Kh
yb
er
Pa
kh
tun
kh
wa
Ba
loch
ista
n
- - -
private health facilities are abundant. In contrast, the highest (73 percent) incidence of using
public health services is estimated for Khyber Pakhtunkhwa. Reasons for not visiting
government hospitals vary among provinces. However in general two important reasons
which were mentioned are: “prefer private medical facilities” and “not satisfied with the
doctors’ expertise”. Comparatively few households described distance to public hospitals as
an obstacle for not preferring to use these services.
Perceptions regarding the quality of services of public hospitals were evaluated with the
help of a few statements. The services were rated by those respondents who visited public
hospitals during the last six months by asking “rate the following statements from fully
agree, mostly agree, mostly disagree and fully disagree options based on your most recent
visit to hospital”. The following nine statements (6 positive and 3 negative) were offered
for rating:
i) Satisfied with the length of waiting time;
ii) Hospital was at a convenient distance;
iii) Had all required medicines and supplies;
iv) Medical staff was courteous and helpful;
v) Building was well-maintained;
vi) I received good medical attention by qualified staff;
vii) I would get better service if I went to a private medical facility;
viii) If I had the money I would go to a private medical facility; and
ix) I would get better service if I paid an informal payment.
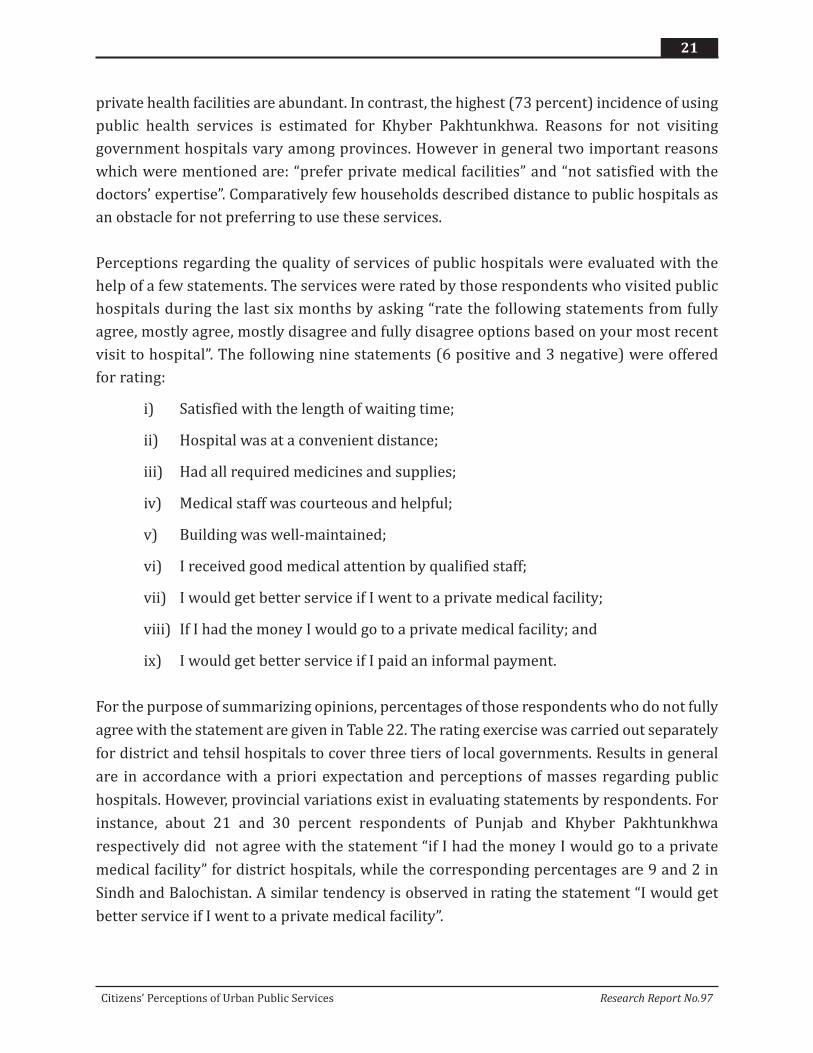
For the purpose of summarizing opinions, percentages of those respondents who do not fully
agree with the statement are given in Table 22. The rating exercise was carried out separately
for district and tehsil hospitals to cover three tiers of local governments. Results in general
are in accordance with a priori expectation and perceptions of masses regarding public
hospitals. However, provincial variations exist in evaluating statements by respondents. For
instance, about 21 and 30 percent respondents of Punjab and Khyber Pakhtunkhwa
respectively did not agree with the statement “if I had the money I would go to a private
medical facility” for district hospitals, while the corresponding percentages are 9 and 2 in
Sindh and Balochistan. A similar tendency is observed in rating the statement “I would get
better service if I went to a private medical facility”.
21
Citizens’ Perceptions of Urban Public Services Research Report No.97
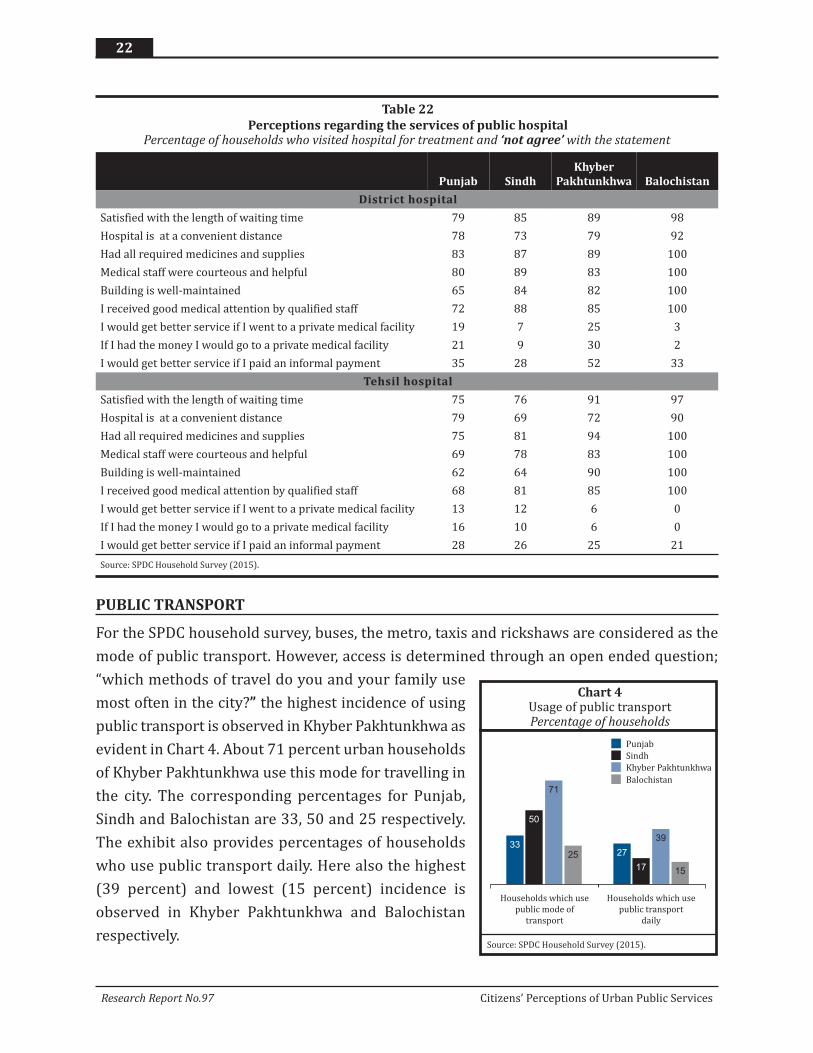
PUBLIC TRANSPORT
For the SPDC household survey, buses, the metro, taxis and rickshaws are considered as the
mode of public transport. However, access is determined through an open ended question;
“which methods of travel do you and your family use
most often in the city?” the highest incidence of using
public transport is observed in Khyber Pakhtunkhwa as
evident in Chart 4. About 71 percent urban households
of Khyber Pakhtunkhwa use this mode for travelling in
the city. The corresponding percentages for Punjab,
Sindh and Balochistan are 33, 50 and 25 respectively.
The exhibit also provides percentages of households
who use public transport daily. Here also the highest
(39 percent) and lowest (15 percent) incidence is
observed in Khyber Pakhtunkhwa and Balochistan
respectively.
22
Research Report No.97 Citizens’ Perceptions of Urban Public Services
Table 22
Perceptions regarding the services of public hospitalPercentage of households who visited hospital for treatment and ‘not agree’ with the statement
Punjab Sindh
Khyber
Pakhtunkhwa Balochistan
District hospital
Satisfied with the length of waiting time 79 85 89 98
Hospital is at a convenient distance 78 73 79 92
Had all required medicines and supplies 83 87 89 100
Medical staff were courteous and helpful 80 89 83 100
Building is well-maintained 65 84 82 100
I received good medical attention by qualified staff 72 88 85 100
I would get better service if I went to a private medical facility 19 7 25 3
If I had the money I would go to a private medical facility 21 9 30 2
I would get better service if I paid an informal payment 35 28 52 33
Tehsil hospital
Satisfied with the length of waiting time 75 76 91 97
Hospital is at a convenient distance 79 69 72 90
Had all required medicines and supplies 75 81 94 100
Medical staff were courteous and helpful 69 78 83 100
Building is well-maintained 62 64 90 100
I received good medical attention by qualified staff 68 81 85 100
I would get better service if I went to a private medical facility 13 12 6 0
If I had the money I would go to a private medical facility 16 10 6 0
I would get better service if I paid an informal payment 28 26 25 21
Source: SPDC Household Survey (2015).
Chart 4Usage of public transportPercentage of households
33
50
71
25 27
17
39
15
Sindh
Punjab
Balochistan
Khyber Pakhtunkhwa
-
Households which use Households which use
public mode of public transport
transport daily
Source: SPDC Household Survey (2015).
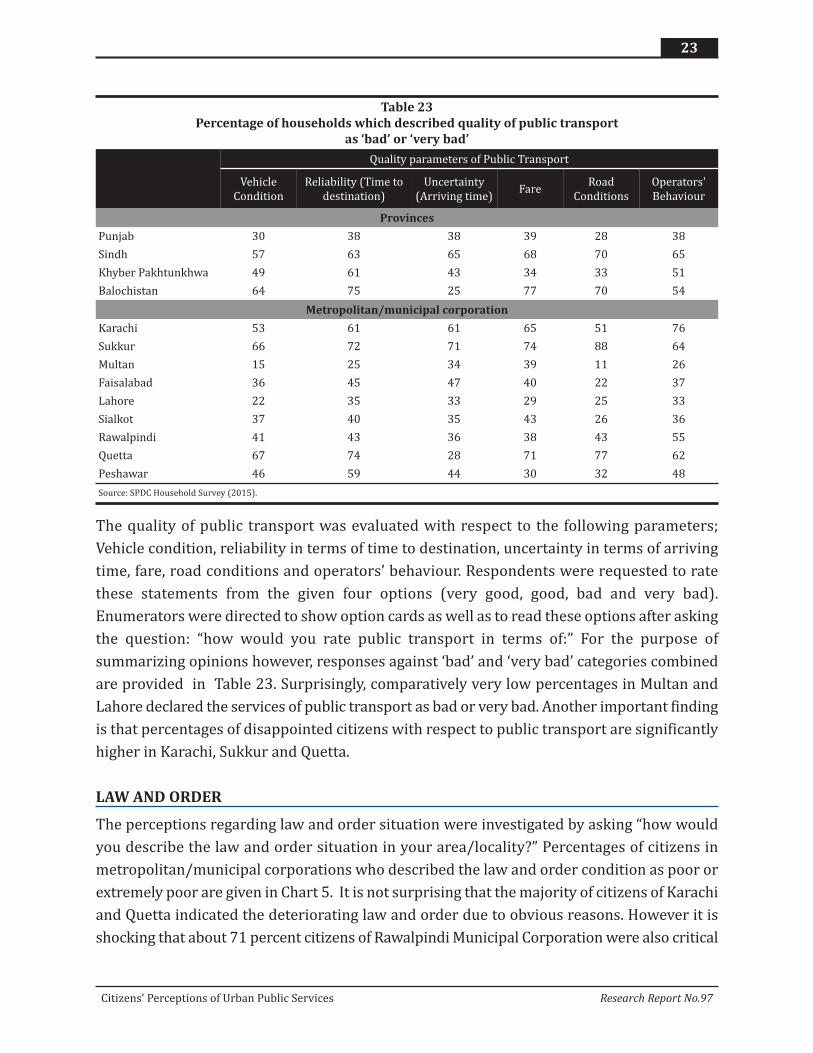
The quality of public transport was evaluated with respect to the following parameters;
Vehicle condition, reliability in terms of time to destination, uncertainty in terms of arriving
time, fare, road conditions and operators’ behaviour. Respondents were requested to rate
these statements from the given four options (very good, good, bad and very bad).
Enumerators were directed to show option cards as well as to read these options after asking
the question: “how would you rate public transport in terms of:” For the purpose of
summarizing opinions however, responses against ‘bad’ and ‘very bad’ categories combined
are provided in Table 23. Surprisingly, comparatively very low percentages in Multan and
Lahore declared the services of public transport as bad or very bad. Another important finding
is that percentages of disappointed citizens with respect to public transport are significantly
higher in Karachi, Sukkur and Quetta.
LAW AND ORDER
The perceptions regarding law and order situation were investigated by asking “how would
you describe the law and order situation in your area/locality?” Percentages of citizens in
metropolitan/municipal corporations who described the law and order condition as poor or
extremely poor are given in Chart 5. It is not surprising that the majority of citizens of Karachi
and Quetta indicated the deteriorating law and order due to obvious reasons. However it is
shocking that about 71 percent citizens of Rawalpindi Municipal Corporation were also critical
23
Citizens’ Perceptions of Urban Public Services Research Report No.97
Table 23
Percentage of households which described quality of public transport
as ‘bad’ or ‘very bad’
Quality parameters of Public Transport
Vehicle
Condition
Reliability (Time to
destination)
Uncertainty
(Arriving time)Fare
Road
Conditions
Operators'
Behaviour
Provinces
Punjab 30 38 38 39 28 38
Sindh 57 63 65 68 70 65
Khyber Pakhtunkhwa 49 61 43 34 33 51
Balochistan 64 75 25 77 70 54
Metropolitan/municipal corporation
Karachi 53 61 61 65 51 76
Sukkur 66 72 71 74 88 64
Multan 15 25 34 39 11 26
Faisalabad 36 45 47 40 22 37
Lahore 22 35 33 29 25 33
Sialkot 37 40 35 43 26 36
Rawalpindi 41 43 36 38 43 55
Quetta 67 74 28 71 77 62
Peshawar 46 59 44 30 32 48
Source: SPDC Household Survey (2015).
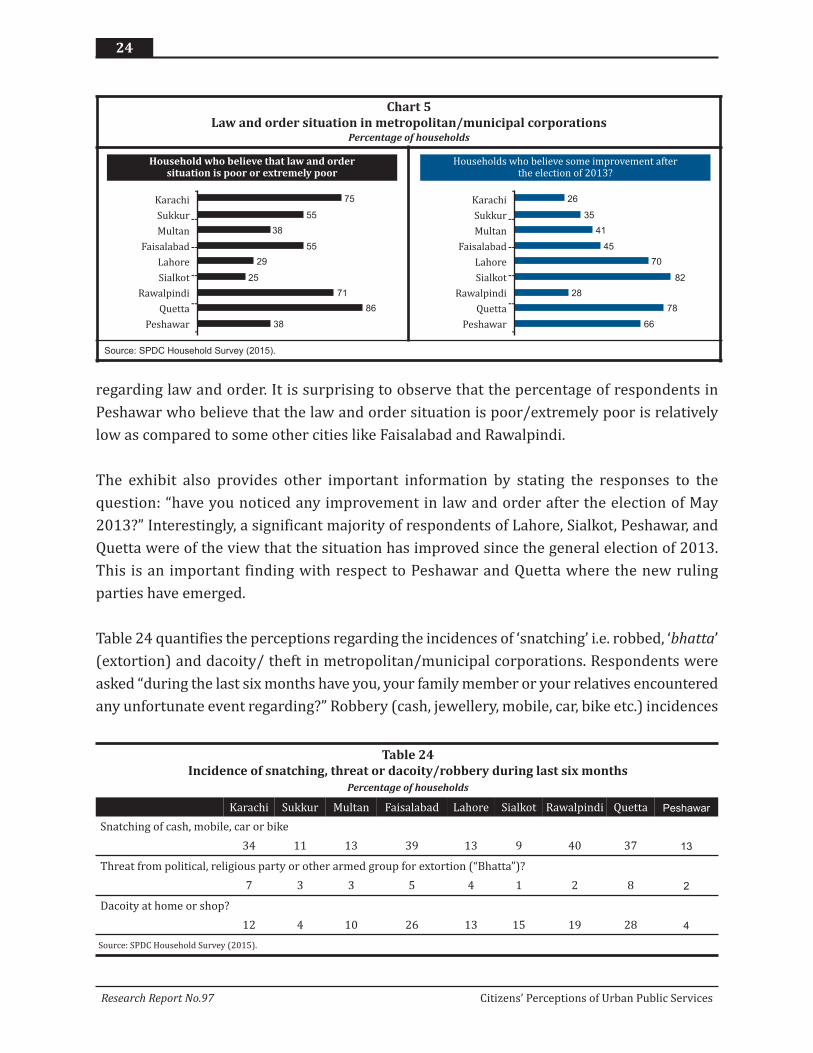
regarding law and order. It is surprising to observe that the percentage of respondents in
Peshawar who believe that the law and order situation is poor/extremely poor is relatively
low as compared to some other cities like Faisalabad and Rawalpindi.
The exhibit also provides other important information by stating the responses to the
question: “have you noticed any improvement in law and order after the election of May
2013?” Interestingly, a significant majority of respondents of Lahore, Sialkot, Peshawar, and
Quetta were of the view that the situation has improved since the general election of 2013.
This is an important finding with respect to Peshawar and Quetta where the new ruling
parties have emerged.
Table 24 quantifies the perceptions regarding the incidences of ‘snatching’ i.e. robbed, ‘bhatta’
(extortion) and dacoity/ theft in metropolitan/municipal corporations. Respondents were
asked “during the last six months have you, your family member or your relatives encountered
any unfortunate event regarding?” Robbery (cash, jewellery, mobile, car, bike etc.) incidences
24
Research Report No.97 Citizens’ Perceptions of Urban Public Services
Chart 5
Law and order situation in metropolitan/municipal corporationsPercentage of households
Source: SPDC Household Survey (2015).
Household who believe that law and ordersituation is poor or extremely poor
Karachi
Sukkur
Multan
Faisalabad
Lahore
Sialkot
Rawalpindi
Quetta
Peshawar
-
--
--
--
--
-
75
55
38
55
29
25
71
86
38
Households who believe some improvement afterthe election of 2013?
Karachi
Sukkur
Multan
Faisalabad
Lahore
Sialkot
Rawalpindi
Quetta
Peshawar
-
--
--
--
--
-
26
35
41
45
70
82
28
78
66
Table 24
Incidence of snatching, threat or dacoity/robbery during last six months
Percentage of households
Karachi Sukkur Multan Faisalabad Lahore Sialkot Rawalpindi Quetta Peshawar
Snatching of cash, mobile, car or bike
34 11 13 39 13 9 40 37 13
Threat from political, religious party or other armed group for extortion (“Bhatta”)?
7 3 3 5 4 1 2 8 2
Dacoity at home or shop?
12 4 10 26 13 15 19 28 4
Source: SPDC Household Survey (2015).

are reported in Karachi, Faisalabad, Rawalpindi and Quetta by about 34, 39, 40 and 37 percent
households. Karachi and Quetta cities are also significant for the ‘bhatta’ system, while
incidences of theft are reported relatively more by the households of Faisalabad and
Rawalpindi. In general, the worst condition of law and order in Karachi, Faisalabad,
Rawalpindi and Quetta is reported as compared with other sample cities.
The role of the police is evaluated with the help of the following four statements: police fail
to serve and respect the interests of all citizens; police serve the interests of selected pressure
groups/influential groups; police serve the interests of political leaders; and police fail to
protect the poor and common people.
Respondents’ perceptions or opinion about the police behaviour in general were gathered
after asking: “rate these statements from fully agree, mostly agree, mostly disagree and fully
disagree options based on your experience or belief”. However, for the purpose of
summarizing opinions, percentages of those respondents who disagree with the statement
are presented in Table 25. No wonder, results are according to a priori expectation and
general perceptions about the police. Almost all citizens agree with these negative features
about the police, however comparatively higher percentages (in double digits) in Peshawar,
Sialkot and Lahore indicate relatively better governance with respect to the police.
25
Citizens’ Perceptions of Urban Public Services Research Report No.97
Table 25
Perceptions regarding the role of police in metropolitan/municipal corporations
Percentage of respondents who disagree with the statement
Karachi Sukkur Multan Faisalabad Lahore Sialkot Rawalpindi Quetta Peshawar
Police fail to serve and respect the interests of all citizens
2 8 4 2 15 7 4 2 11
Police serve the interests of selected pressure groups /Influential groups
1 7 5 2 7 15 0 1 5
Police serve the interests of political leaders
1 11 5 2 10 7 2 3 6
Police fail to protect the poor and common people
1 6 7 2 6 10 1 5 17
Source: SPDC Household Survey (2015).


List of
SPDC’s Publications
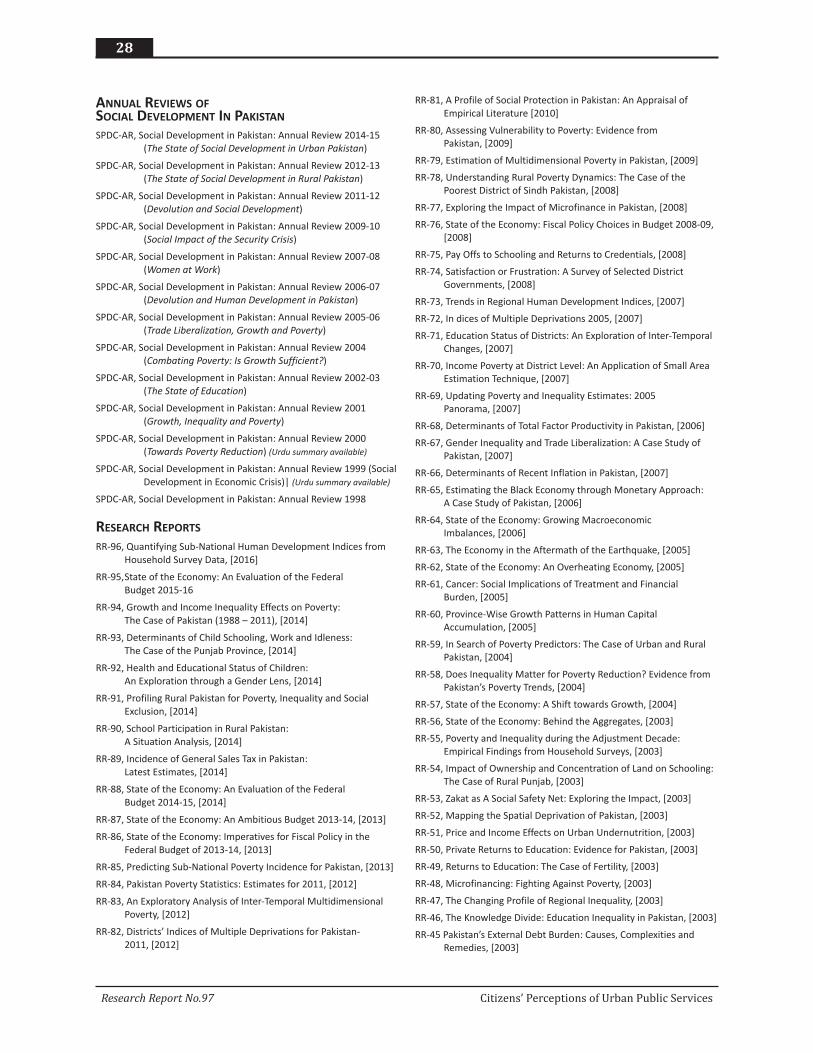
AnnuAl Reviews of
sociAl Development in pAkistAn
SPDC-AR, Social Development in Pakistan: Annual Review 2014-15
(The State of Social Development in Urban Pakistan)
SPDC-AR, Social Development in Pakistan: Annual Review 2012-13
(The State of Social Development in Rural Pakistan)
SPDC-AR, Social Development in Pakistan: Annual Review 2011-12
(Devolution and Social Development)
SPDC-AR, Social Development in Pakistan: Annual Review 2009-10
(Social Impact of the Security Crisis)
SPDC-AR, Social Development in Pakistan: Annual Review 2007-08
(Women at Work)
SPDC-AR, Social Development in Pakistan: Annual Review 2006-07
(Devolution and Human Development in Pakistan)
SPDC-AR, Social Development in Pakistan: Annual Review 2005-06
(Trade Liberalization, Growth and Poverty)
SPDC-AR, Social Development in Pakistan: Annual Review 2004
(Combating Poverty: Is Growth Sufficient?)
SPDC-AR, Social Development in Pakistan: Annual Review 2002-03
(The State of Education)
SPDC-AR, Social Development in Pakistan: Annual Review 2001
(Growth, Inequality and Poverty)
SPDC-AR, Social Development in Pakistan: Annual Review 2000
(Towards Poverty Reduction) (Urdu summary available)
SPDC-AR, Social Development in Pakistan: Annual Review 1999 (Social
Development in Economic Crisis)| (Urdu summary available)
SPDC-AR, Social Development in Pakistan: Annual Review 1998
ReseARch RepoRts
RR-96, Quantifying Sub-National Human Development Indices from
Household Survey Data, [2016]
RR-95,State of the Economy: An Evaluation of the Federal
Budget 2015-16
RR-94, Growth and Income Inequality Effects on Poverty:
The Case of Pakistan (1988 – 2011), [2014]
RR-93, Determinants of Child Schooling, Work and Idleness:
The Case of the Punjab Province, [2014]
RR-92, Health and Educational Status of Children:
An Exploration through a Gender Lens, [2014]
RR-91, Profiling Rural Pakistan for Poverty, Inequality and Social
Exclusion, [2014]
RR-90, School Participation in Rural Pakistan:
A Situation Analysis, [2014]
RR-89, Incidence of General Sales Tax in Pakistan:
Latest Estimates, [2014]
RR-88, State of the Economy: An Evaluation of the Federal
Budget 2014-15, [2014]
RR-87, State of the Economy: An Ambitious Budget 2013-14, [2013]
RR-86, State of the Economy: Imperatives for Fiscal Policy in the
Federal Budget of 2013-14, [2013]
RR-85, Predicting Sub-National Poverty Incidence for Pakistan, [2013]
RR-84, Pakistan Poverty Statistics: Estimates for 2011, [2012]
RR-83, An Exploratory Analysis of Inter-Temporal Multidimensional
Poverty, [2012]
RR-82, Districts’ Indices of Multiple Deprivations for Pakistan-
2011, [2012]
RR-81, A Profile of Social Protection in Pakistan: An Appraisal of
Empirical Literature [2010]
RR-80, Assessing Vulnerability to Poverty: Evidence from
Pakistan, [2009]
RR-79, Estimation of Multidimensional Poverty in Pakistan, [2009]
RR-78, Understanding Rural Poverty Dynamics: The Case of the
Poorest District of Sindh Pakistan, [2008]
RR-77, Exploring the Impact of Microfinance in Pakistan, [2008]
RR-76, State of the Economy: Fiscal Policy Choices in Budget 2008-09,
[2008]
RR-75, Pay Offs to Schooling and Returns to Credentials, [2008]
RR-74, Satisfaction or Frustration: A Survey of Selected District
Governments, [2008]
RR-73, Trends in Regional Human Development Indices, [2007]
RR-72, In dices of Multiple Deprivations 2005, [2007]
RR-71, Education Status of Districts: An Exploration of Inter-Temporal
Changes, [2007]
RR-70, Income Poverty at District Level: An Application of Small Area
Estimation Technique, [2007]
RR-69, Updating Poverty and Inequality Estimates: 2005
Panorama, [2007]
RR-68, Determinants of Total Factor Productivity in Pakistan, [2006]
RR-67, Gender Inequality and Trade Liberalization: A Case Study of
Pakistan, [2007]
RR-66, Determinants of Recent Inflation in Pakistan, [2007]
RR-65, Estimating the Black Economy through Monetary Approach:
A Case Study of Pakistan, [2006]
RR-64, State of the Economy: Growing Macroeconomic
Imbalances, [2006]
RR-63, The Economy in the Aftermath of the Earthquake, [2005]
RR-62, State of the Economy: An Overheating Economy, [2005]
RR-61, Cancer: Social Implications of Treatment and Financial
Burden, [2005]
RR-60, Province-Wise Growth Patterns in Human Capital
Accumulation, [2005]
RR-59, In Search of Poverty Predictors: The Case of Urban and Rural
Pakistan, [2004]
RR-58, Does Inequality Matter for Poverty Reduction? Evidence from
Pakistan’s Poverty Trends, [2004]
RR-57, State of the Economy: A Shift towards Growth, [2004]
RR-56, State of the Economy: Behind the Aggregates, [2003]
RR-55, Poverty and Inequality during the Adjustment Decade:
Empirical Findings from Household Surveys, [2003]
RR-54, Impact of Ownership and Concentration of Land on Schooling:
The Case of Rural Punjab, [2003]
RR-53, Zakat as A Social Safety Net: Exploring the Impact, [2003]
RR-52, Mapping the Spatial Deprivation of Pakistan, [2003]
RR-51, Price and Income Effects on Urban Undernutrition, [2003]
RR-50, Private Returns to Education: Evidence for Pakistan, [2003]
RR-49, Returns to Education: The Case of Fertility, [2003]
RR-48, Microfinancing: Fighting Against Poverty, [2003]
RR-47, The Changing Profile of Regional Inequality, [2003]
RR-46, The Knowledge Divide: Education Inequality in Pakistan, [2003]
RR-45 Pakistan’s External Debt Burden: Causes, Complexities and
Remedies, [2003]
28
Research Report No.97 Citizens’ Perceptions of Urban Public Services
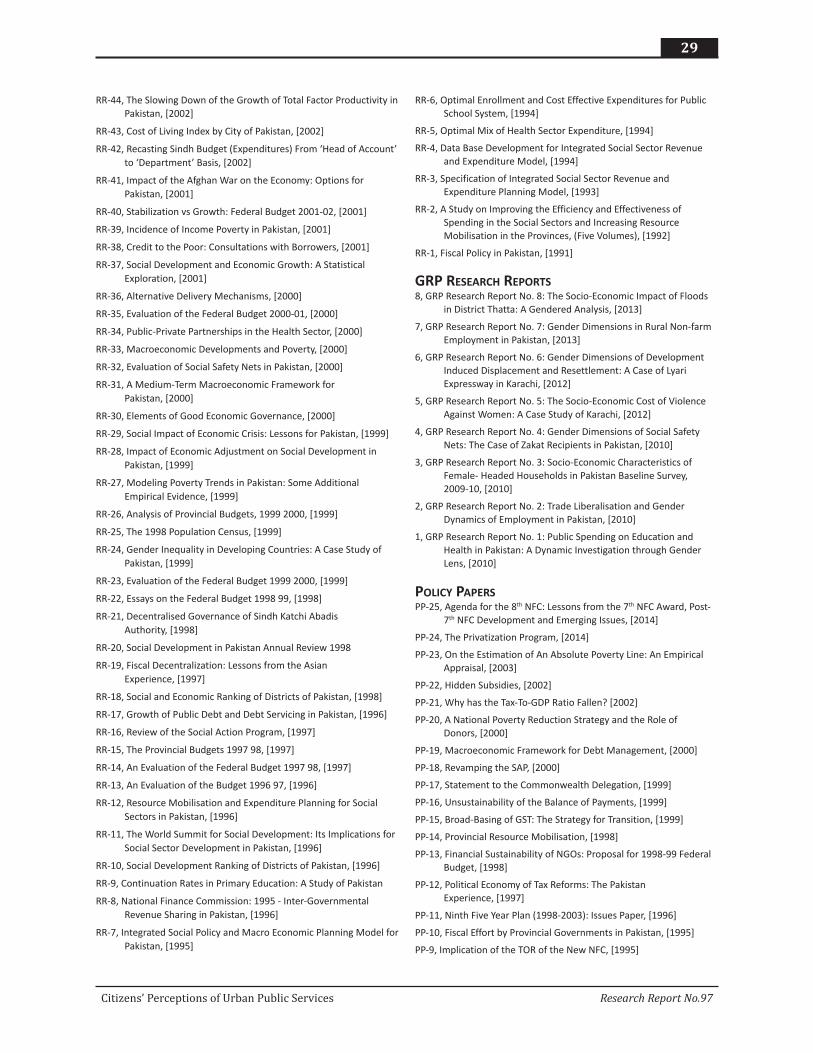
RR-44, The Slowing Down of the Growth of Total Factor Productivity in
Pakistan, [2002]
RR-43, Cost of Living Index by City of Pakistan, [2002]
RR-42, Recasting Sindh Budget (Expenditures) From ‘Head of Account’
to ‘Department’ Basis, [2002]
RR-41, Impact of the Afghan War on the Economy: Options for
Pakistan, [2001]
RR-40, Stabilization vs Growth: Federal Budget 2001-02, [2001]
RR-39, Incidence of Income Poverty in Pakistan, [2001]
RR-38, Credit to the Poor: Consultations with Borrowers, [2001]
RR-37, Social Development and Economic Growth: A Statistical
Exploration, [2001]
RR-36, Alternative Delivery Mechanisms, [2000]
RR-35, Evaluation of the Federal Budget 2000-01, [2000]
RR-34, Public-Private Partnerships in the Health Sector, [2000]
RR-33, Macroeconomic Developments and Poverty, [2000]
RR-32, Evaluation of Social Safety Nets in Pakistan, [2000]
RR-31, A Medium-Term Macroeconomic Framework for
Pakistan, [2000]
RR-30, Elements of Good Economic Governance, [2000]
RR-29, Social Impact of Economic Crisis: Lessons for Pakistan, [1999]
RR-28, Impact of Economic Adjustment on Social Development in
Pakistan, [1999]
RR-27, Modeling Poverty Trends in Pakistan: Some Additional
Empirical Evidence, [1999]
RR-26, Analysis of Provincial Budgets, 1999 2000, [1999]
RR-25, The 1998 Population Census, [1999]
RR-24, Gender Inequality in Developing Countries: A Case Study of
Pakistan, [1999]
RR-23, Evaluation of the Federal Budget 1999 2000, [1999]
RR-22, Essays on the Federal Budget 1998 99, [1998]
RR-21, Decentralised Governance of Sindh Katchi Abadis
Authority, [1998]
RR-20, Social Development in Pakistan Annual Review 1998
RR-19, Fiscal Decentralization: Lessons from the Asian
Experience, [1997]
RR-18, Social and Economic Ranking of Districts of Pakistan, [1998]
RR-17, Growth of Public Debt and Debt Servicing in Pakistan, [1996]
RR-16, Review of the Social Action Program, [1997]
RR-15, The Provincial Budgets 1997 98, [1997]
RR-14, An Evaluation of the Federal Budget 1997 98, [1997]
RR-13, An Evaluation of the Budget 1996 97, [1996]
RR-12, Resource Mobilisation and Expenditure Planning for Social
Sectors in Pakistan, [1996]
RR-11, The World Summit for Social Development: Its Implications for
Social Sector Development in Pakistan, [1996]
RR-10, Social Development Ranking of Districts of Pakistan, [1996]
RR-9, Continuation Rates in Primary Education: A Study of Pakistan
RR-8, National Finance Commission: 1995 - Inter-Governmental
Revenue Sharing in Pakistan, [1996]
RR-7, Integrated Social Policy and Macro Economic Planning Model for
Pakistan, [1995]
RR-6, Optimal Enrollment and Cost Effective Expenditures for Public
School System, [1994]
RR-5, Optimal Mix of Health Sector Expenditure, [1994]
RR-4, Data Base Development for Integrated Social Sector Revenue
and Expenditure Model, [1994]
RR-3, Specification of Integrated Social Sector Revenue and
Expenditure Planning Model, [1993]
RR-2, A Study on Improving the Efficiency and Effectiveness of
Spending in the Social Sectors and Increasing Resource
Mobilisation in the Provinces, (Five Volumes), [1992]
RR-1, Fiscal Policy in Pakistan, [1991]
GRp ReseARch RepoRts
8, GRP Research Report No. 8: The Socio-Economic Impact of Floods
in District Thatta: A Gendered Analysis, [2013]
7, GRP Research Report No. 7: Gender Dimensions in Rural Non-farm
Employment in Pakistan, [2013]
6, GRP Research Report No. 6: Gender Dimensions of Development
Induced Displacement and Resettlement: A Case of Lyari
Expressway in Karachi, [2012]
5, GRP Research Report No. 5: The Socio-Economic Cost of Violence
Against Women: A Case Study of Karachi, [2012]
4, GRP Research Report No. 4: Gender Dimensions of Social Safety
Nets: The Case of Zakat Recipients in Pakistan, [2010]
3, GRP Research Report No. 3: Socio-Economic Characteristics of
Female- Headed Households in Pakistan Baseline Survey,
2009-10, [2010]
2, GRP Research Report No. 2: Trade Liberalisation and Gender
Dynamics of Employment in Pakistan, [2010]
1, GRP Research Report No. 1: Public Spending on Education and
Health in Pakistan: A Dynamic Investigation through Gender
Lens, [2010]
policy pApeRs
PP-25, Agenda for the 8th NFC: Lessons from the 7th NFC Award, Post-
7th NFC Development and Emerging Issues, [2014]
PP-24, The Privatization Program, [2014]
PP-23, On the Estimation of An Absolute Poverty Line: An Empirical
Appraisal, [2003]
PP-22, Hidden Subsidies, [2002]
PP-21, Why has the Tax-To-GDP Ratio Fallen? [2002]
PP-20, A National Poverty Reduction Strategy and the Role of
Donors, [2000]
PP-19, Macroeconomic Framework for Debt Management, [2000]
PP-18, Revamping the SAP, [2000]
PP-17, Statement to the Commonwealth Delegation, [1999]
PP-16, Unsustainability of the Balance of Payments, [1999]
PP-15, Broad-Basing of GST: The Strategy for Transition, [1999]
PP-14, Provincial Resource Mobilisation, [1998]
PP-13, Financial Sustainability of NGOs: Proposal for 1998-99 Federal
Budget, [1998]
PP-12, Political Economy of Tax Reforms: The Pakistan
Experience, [1997]
PP-11, Ninth Five Year Plan (1998-2003): Issues Paper, [1996]
PP-10, Fiscal Effort by Provincial Governments in Pakistan, [1995]
PP-9, Implication of the TOR of the New NFC, [1995]
29
Citizens’ Perceptions of Urban Public Services Research Report No.97
PP-8, Provincial Budgets of 1995-96, [1995]
PP-7, Switchover to Ad Valorem Octroi Rates at Dry Ports, [1994]
PP-6, Rationalisation of Octroi Rates, [1994]
PP-5, User Charges in Health, [1994]
PP-4, Sindh Government Budget of 1993-94, [1994]
PP-3, User Charges in Education, [1994]
PP-2, Sales Taxation of Services by Provincial Governments, [1994]
PP-1, Rationalisation of Stamp Duties on Financial Assets and
Transactions, [1994]
policy BRief
Social Impact of the Security Crisis [ Rabia Sidat]
Policy Brief, December 2011
Women at Work [Samar Zuberi]
Policy Brief, July 2011
The Elimination of Textile Quotas and Pakistan-EU Trade
[Iffat Ara]
Policy Brief, April 2007
confeRence pApeRs
CP-63, Challenges and Responses for Democracy and Security:
Pakistan’s Perspective, [2009]
CP-62, Neo-Liberal Governance and Poverty in Pakistan, [2009]
CP-61, How External Shocks and Exchange Rate Depreciations Affect
Pakistan? Implications for Choice of an Exchange Rate
Regime, [2005]
CP-60, Agricultural Terms of Trade in Pakistan: Issues of Profitability
and Standard of Living of the Farmers, [2005]
CP-59, Is Pakistan’s Manufacturing Sector Competitive? [2005]
CP-58, The Plight of Working Mothers in Pakistan: Advantages and
Disadvantages of a Joint Family System, [2004]
CP-57, Macroeconomic Reforms and Return to Human Capital in
Pakistan, [2004]
CP-56, Burden of Stabilization on Provinces and Its Implication on
Social Sectors, [2004]
CP-55, Macroeconomic Reforms and Total Factor Productivity Growth
in Pakistan: An Empirical Analysis, [2003]
CP-54, Budgets and Fiscal Decentralization: A Case Study of Sindh, [2003]
CP-53, Districts Level of Development as Push and Pull Factor in Inter-
District Migration in Pakistan, [2002]
CP-52, Is Female Illiteracy a Determinant for Child Malnutrition: An
Analyses of Developing Countries, [2003]
CP-51, Tax Holidays, Cost of Capital and Investment Behaviour:
Jorgenson Approach, [2003]
CP-50, Why Private Investment in Pakistan has Collapsed and how can
it be Restored, [2003]
CP-49, Hidden Subsidies, [2003]
CP-48, Gender and Public Spending on Education in Pakistan: A Case
Study of Disaggregated Benefit Incidence, [2003]
CP-47, Nonprofit Sector in Pakistan: Government Policy and Future
Issues, [2003]
CP-46, The Income Tax Regime and the Non-Profit Sector: The Case of
Pakistan, [2003]
CP-45, The Long run and Short run Impact of Exchange Rate
Devaluation on Pakistan’s Trade Performance, [2002]
CP-44, Crowding Out Hypothesis in a Vector Error Correction
Framework: A Case Study of Pakistan, [2002]
CP-43, Dynamic Consequences of the1997 National Finance
Commission Award: Provincial Social Sector Expenditures, [2002]
CP-42, Political Economy of Fiscal Reforms in the 1990s, [2002]
CP-41, Stabilization Policy vs Growth Oriented Policy: Implication for
the Pakistan Economy, [2002]
CP-40, Internal Migration: The Case of Sindh Province, [2001]
CP-39, Some Issues of Governance in Pakistan, [2000]
CP-38, Governance, Decentralisation and Poverty: The Case of
Pakistan, [2001]
CP-37, Devolution and Fiscal Decentralisation, [2001]
CP-36, Brief on Annual Review of SPDC for 2000 on Towards Poverty
Reduction, [2000]
CP-35, Policy Research and Its Implementation: Pakistan and
Canada, [2000]
CP-34, Issues in Institutional Reform for Devolution, [2000]
CP-33, Issues in Fiscal Decentralisation, [2000]
CP-32, Public Expenditure Reform, [2000]
CP-31, Social Sector Policies Under SAP, [1999]
CP-30, Impediments to Social Development in Pakistan, [1999]
CP-29, Pakistan’s Ranking in Social Development: Have We Always
Been Backward, [1999]
CP-28, An Econometric Evaluation of Pakistan’s National Education
Policy 1998-2010, [1999]
CP-27, Impediments to Improvement of Social Sectors in Pakistan, [1998]
CP-26, Gender Differentials in the Cost of Primary Education: A Study
of Pakistan, [1996]
CP-25, Integrated Social-Sector Macroeconomic Model for Pakistan, [1996]
CP-24, Determinants of Rates of Octroi Tax in Pakistan, [1995]
CP-23, Social Development Ranking of Districts of Pakistan, [1996]
CP-22, The City of Karachi: Planning and Managing for Urban
Development, [1996]
CP-21, Sustainability of Public Debt in Pakistan, [1996]
CP-20, Has Poverty Returned to Pakistan? [1996]
CP-19, Improved Health Status and Economic Growth: Some Co-
integration Results from Developing Economies, [1996]
CP-18, Is There a Long-Run Relationship Between Economic Growth
and Human Development? Some Cross Country Evidence from
Developing Countries, [1996]
CP-17, Municipal Finance in Small Cities, [1995]
CP-16, Financial Development of Megacities, [1995]
CP-15, Is Public Sector Investment Productive? Some Evidence from
Pakistan, [1995]
CP-14, Is the Social Action Programme (SAP) in Pakistan Financially
Sustainable? [1995]
CP-13, Results of Policy Simulations, [1995]
CP-12, Software Development and Use of the Model, [1995]
CP-11, Specification of the Integrated Social Policy Macro Economic
Model, [1995]
CP-10, Overview of Integrated Revenue and Expenditure Planning
Model for Social Sectors, [1995]
CP-9, Development of Property Taxation, [1995]
30
Research Report No.97 Citizens’ Perceptions of Urban Public Services
CP-8, Prospects of Resource Mobilisation by the Provincial
Governments, [1995]
CP-7, Expenditure Planning Issues, [1993]
CP-6, Local Government Resource Mobilisation, [1993]
CP-5, Local Government Resource Mobilisation, [1993]
CP-4, Problems in Resource Mobilisation in Punjab, [1993]
CP-3, Provincial Government Resource Mobilisation in Punjab, [1993]
CP-2, Investment Strategy and Expenditure Requirements for Social
Development, [1993]
CP-1, The Implementation Environment of the Social Action
Programme, [1993]
confeRence pRoceeDinGs
CPP-4, Proceedings of the Seminar on Prospects and Policies for the
Future, [2000]
CPP-3, Proceedings of the Launching Ceremony of the Social
Development in Pakistan - Annual Review 1998, [1998]
CPP-2, Proceedings of the Second Conference on Resource
Mobilisation and Expenditure Planning, [1995]
CPP-1, Proceedings of the Conference on Resource Mobilisation and
Expenditure Planning, [1993]
DAtABAse RepoRts
DB-5, Data-Base Report 2013: Gender Disaggregated Indicators of the
Labour Market in Pakistan, [2013]
DB-4, Data-Base Report 2005: Socio-Economic Indicators by Gender: A
Regional Comparison for Pakistan, [2005]
DB-3, Data-Base Report 1997: Education Module, [1997]
DB-2, Data-Base Report 1997: Provincial Finance Module, [1997]
DB-1, Data-Base Report 1997: Federal Finance Module, [1997]
woRkinG pApeRs
WP-7, Proposed Agenda for Sustained Economic Revival, [2013]
WP-6, Has civil society failed in Pakistan? [2011]
WP-5, Provincial Accounts of Pakistan: Methodology and Estimates
1973-2000, [2005]
WP-4, Nonprofit Sector in Pakistan: Historical Background, [2004]
WP-3, Law and the Nonprofit Sector in Pakistan, [2002]
WP-2, Nonprofit Sector in Pakistan: Government Policy and Future
Issues, [2002]
WP-1, Dimensions of the Nonprofit Sector in Pakistan, [2002]
spDc Books
SPDC Book, In Search of Gendered Development:
A Compendium, [2014]
SPDC Book, Provincial Governments and the Social Sectors in
Pakistan, [1997]
SPDC Book, Resource Mobilisation and Expenditure Planning in the
Provinces of Pakistan, [1996]
otheR puBlicAtions
OP-3, Report of Interactive Discussion Session on Integrated Energy
Policy Formulation with Emphasis on Social Dimensions, [2012]
OP-2, Booklet: ABC of the Economics of Tariffs and Import Quotas,
[2007]
OP-1, Research Report: The Elimination of Textile Quotas and
Pakistan-EU Trade, [2007]
31
Citizens’ Perceptions of Urban Public Services Research Report No.97
Social Policy and Development Centre
Head Office: 15-Maqbool Co-operative Housing Society
Block 7 & 8, Karachi 75350, Pakistan
Tel: (92-21) 111-113-113 | Fax: (92-21) 3453-4285
E-mail: [email protected]
Islamabad Office: 209, 2nd Floor
Emirates Towers, F-7 Markaz
Islamabad
Tel: (92-51) 2099146
www.spdc.org.pk
Find us on
Related Documents


