Citizens Financial Group, Inc. Reports Third Quarter 2021 Net Income of $530 million and EPS of $1.18 Underlying Net Income of $546 million and EPS of $1.22* Key Financial Data 3Q21 2Q21 3Q20 Third Quarter 2021 Highlights Income Statement ($s in millions) ■ Underlying ROTCE of 14.2% and underlying EPS of $1.22 reflect broad-based strength across our businesses, including a rebound in Mortgage, along with excellent credit results ■ Underlying PPNR of $671 million reflects: – Strong results in Capital Markets, Wealth and Mortgage – Net interest income up 2% QoQ, given interest-earning asset growth with stable margin, higher day count – Interest-bearing deposit costs of 14 bps, down 2 bps QoQ ■ Credit provision benefit of $33 million reflects strong credit performance and macroeconomic improvement ■ Period-end loans up 1% (up 2% excluding PPP impact); average loans down 1% QoQ (up 1% excluding PPP) ■ Period-end LDR of 81.0% ■ Strong capital position with CET1 at 10.3% ■ TBV/share of $34.44, up 7% YoY Total revenue $1,659 $1,609 $1,791 Pre-provision profit 648 618 803 Underlying pre-provision profit 671 629 834 Provision for credit losses (33) (213) 428 Net income 530 648 314 Underlying net income 546 656 338 Balance Sheet & Credit Quality ($s in billions) Period-end loans and leases $123.3 $122.6 $124.1 Average loans and leases 122.6 123.5 124.9 Period-end deposits 152.2 150.6 142.9 Average deposits 151.9 150.3 141.4 Period-end loans-to-deposit ratio 81.0 % 81.4 % 86.8 % ACL to loans ratio 1.63 1.70 2.21 ACL to loans ratio, ex. PPP 1.65 1.75 2.29 NCO ratio 0.14 % 0.25 % 0.70 % Financial Metrics Diluted EPS $1.18 $1.44 $0.68 Underlying EPS 1.22 1.46 0.73 ROTCE 13.7 % 17.5 % 8.3 % Underlying ROTCE 14.2 17.7 9.0 Net interest margin, FTE 2.72 2.72 2.83 Efficiency ratio 61 62 55 Underlying efficiency ratio 60 61 53 CET1 10.3 % 10.3 % 9.8 % TBV/Share $34.44 $33.95 $32.24 Comments from Chairman and CEO Bruce Van Saun “We delivered strong results in the third quarter, paced by solid revenue growth across both net interest income and fees, which combined with excellent expense discipline resulted in positive sequential operating leverage in excess of 2%,” said Chairman and CEO Bruce Van Saun. “Integration planning for our recent acquisitions is going well, and we are excited about the franchise and synergy benefits as we look forward to 2022. While economic growth and loan demand in the second half have been affected by the pandemic, we maintain a positive outlook for a gradual, strong recovery through next year.” Citizens also announced today that its board of directors declared a fourth quarter 2021 common stock dividend of $0.39 per share. The dividend is payable on November 12, 2021 to shareholders of record at the close of business on October 29, 2021. *References in this release to "Underlying" results exclude notable items and are non-GAAP Financial Measures. For more details on non-GAAP Financial Measures see page 15 in this release. References in this release to balance sheet items are on an average basis and loans exclude loans held for sale (“LHFS”) unless otherwise noted. References to net interest margin are on a fully taxable equivalent (“FTE”) basis and all references to earnings per share represent fully diluted per common share. References to consolidated and/or commercial loans, loan growth, nonaccrual loans and allowance for loan losses include leases. The "Company" refers to Citizens. Current reporting-period regulatory capital ratios are preliminary. Select totals may not sum due to rounding.

Welcome message from author
This document is posted to help you gain knowledge. Please leave a comment to let me know what you think about it! Share it to your friends and learn new things together.
Transcript

Citizens Financial Group, Inc. Reports Third Quarter 2021 Net Income of $530 million and EPS of $1.18
Underlying Net Income of $546 million and EPS of $1.22*
Key Financial Data 3Q21 2Q21 3Q20 Third Quarter 2021 Highlights
Income Statement
($s in millions)
■ Underlying ROTCE of 14.2% and underlying EPS of $1.22 reflect broad-based strength across our businesses, including a rebound in Mortgage, along with excellent credit results
■ Underlying PPNR of $671 million reflects:
– Strong results in Capital Markets, Wealth and Mortgage
– Net interest income up 2% QoQ, given interest-earning asset growth with stable margin, higher day count
– Interest-bearing deposit costs of 14 bps, down 2 bps QoQ
■ Credit provision benefit of $33 million reflects strong credit performance and macroeconomic improvement
■ Period-end loans up 1% (up 2% excluding PPP impact); average loans down 1% QoQ (up 1% excluding PPP)
■ Period-end LDR of 81.0%
■ Strong capital position with CET1 at 10.3%
■ TBV/share of $34.44, up 7% YoY
Total revenue $ 1,659 $ 1,609 $ 1,791
Pre-provision profit 648 618 803
Underlying pre-provision profit 671 629 834
Provision for credit losses (33) (213) 428
Net income 530 648 314
Underlying net income 546 656 338
Balance Sheet
&Credit Quality
($s in billions)
Period-end loans and leases $ 123.3 $ 122.6 $ 124.1
Average loans and leases 122.6 123.5 124.9
Period-end deposits 152.2 150.6 142.9
Average deposits 151.9 150.3 141.4
Period-end loans-to-deposit ratio 81.0 % 81.4 % 86.8 %
ACL to loans ratio 1.63 1.70 2.21
ACL to loans ratio, ex. PPP 1.65 1.75 2.29
NCO ratio 0.14 % 0.25 % 0.70 %
Financial Metrics
Diluted EPS $ 1.18 $ 1.44 $ 0.68
Underlying EPS 1.22 1.46 0.73
ROTCE 13.7 % 17.5 % 8.3 %
Underlying ROTCE 14.2 17.7 9.0
Net interest margin, FTE 2.72 2.72 2.83
Efficiency ratio 61 62 55
Underlying efficiency ratio 60 61 53
CET1 10.3 % 10.3 % 9.8 %
TBV/Share $ 34.44 $ 33.95 $ 32.24
Comments from Chairman and CEO Bruce Van Saun
“We delivered strong results in the third quarter, paced by solid revenue growth across both net interest income and fees,
which combined with excellent expense discipline resulted in positive sequential operating leverage in excess of 2%,” said
Chairman and CEO Bruce Van Saun. “Integration planning for our recent acquisitions is going well, and we are excited about
the franchise and synergy benefits as we look forward to 2022. While economic growth and loan demand in the second half
have been affected by the pandemic, we maintain a positive outlook for a gradual, strong recovery through next year.”
Citizens also announced today that its board of directors declared a fourth quarter 2021 common stock dividend of $0.39 per
share. The dividend is payable on November 12, 2021 to shareholders of record at the close of business on October 29, 2021.
*References in this release to "Underlying" results exclude notable items and are non-GAAP Financial Measures. For more details on non-GAAP Financial Measures see page 15 in this release. References in this release to balance sheet items are on an average basis and loans exclude loans held for sale (“LHFS”) unless otherwise noted. References to net interest margin are on a fully taxable equivalent (“FTE”) basis and all references to earnings per share represent fully diluted per common share. References to consolidated and/or commercial loans, loan growth, nonaccrual loans and allowance for loan losses include leases. The "Company" refers to Citizens. Current reporting-period regulatory capital ratios are preliminary. Select totals may not sum due to rounding.

Discussion of results:
Net interest income 3Q21 change from
($s in millions) 3Q21 2Q21 3Q20 2Q21 3Q20$/bps % $/bps %
Interest income:
Interest and fees on loans and leases and loans held for sale $ 1,100 $ 1,084 $ 1,157 $ 16 1 % $ (57) (5) %
Investment securities 116 124 121 (8) (6) (5) (4)
Interest-bearing deposits in banks 6 3 2 3 100 4 200
Total interest income $ 1,222 $ 1,211 $ 1,280 $ 11 1 % $ (58) (5) %
Interest expense:
Deposits $ 35 $ 42 $ 89 $ (7) (17) % $ (54) (61) %
Short-term borrowed funds — — — — — — —
Long-term borrowed funds 42 45 54 (3) (7) (12) (22)
Total interest expense $ 77 $ 87 $ 143 $ (10) (11) % $ (66) (46) %
Net interest income $ 1,145 $ 1,124 $ 1,137 $ 21 2 % $ 8 1 %
Net interest margin, FTE 2.72 % 2.72 % 2.83 % — bps (11) bps
Third quarter 2021 vs. second quarter 2021
Net interest income of $1.145 billion increased 2% given interest-earning asset growth and higher day count, with stable net
interest margin.
• Net interest margin of 2.72% reflects the benefit of accelerated PPP forgiveness, as well as improved funding mix and
deposit pricing, partially offset by elevated cash balances given strong deposit flows, and lower earning-asset yields.
Interest-bearing deposit costs were down 2 basis points to 14 basis points.
Third quarter 2021 vs. third quarter 2020
Net interest income of $1.145 billion increased 1% reflecting 4% growth in interest-earning assets, largely offset by lower net
interest margin.
• Net interest margin of 2.72% decreased 11 basis points, primarily reflecting the impact of elevated cash balances and
the lower rate environment, partly offset by improved funding mix and deposit pricing and the benefit of accelerated
PPP loan forgiveness. Interest-bearing deposit costs decreased 21 basis points to 14 basis points.
Citizens Financial Group, Inc.
2

Noninterest Income 3Q21 change from($s in millions) 3Q21 2Q21 3Q20 2Q21 3Q20
$ % $ %
Mortgage banking fees $ 108 $ 85 $ 287 $ 23 27 % $ (179) (62) %
Service charges and fees 110 100 97 10 10 13 13
Capital markets fees 72 91 58 (19) (21) 14 24
Card fees 66 64 57 2 3 9 16
Trust and investment services fees 61 60 53 1 2 8 15
Letter of credit and loan fees 39 38 37 1 3 2 5
Foreign exchange and interest rate products 29 28 27 1 4 2 7
Securities gains, net 3 3 1 — — 2 200
Other income(1) 26 16 37 10 63 (11) (30)
Noninterest income $ 514 $ 485 $ 654 $ 29 6 % $ (140) (21) %1) Includes bank-owned life insurance income and other miscellaneous income for all periods presented.
Third quarter 2021 vs. second quarter 2021
Noninterest income of $514 million increased $29 million, or 6%, from $485 million.
• Mortgage banking fees increased $23 million, reflecting strong origination levels, the benefit of lower agency fees and
improved MSR hedge results ($14 million loss in second quarter compares with a $1 million gain in third quarter).
• Capital markets fees decreased $19 million from record levels reflecting seasonally lower activity, primarily
syndication fees, partially offset by higher M&A advisory fees.
• Service charges and fees increased $10 million and card fees increased $2 million, reflecting seasonality and the
benefit of economic recovery.
• Trust and investment services fees increased 2% reflecting an increase in assets under management from strong
inflows.
• Other income increased $10 million, reflecting the benefit of higher community development-related income and a
seasonal improvement in tax-advantaged investments.
Third quarter 2021 vs. third quarter 2020
Noninterest income of $514 million decreased $140 million, or 21%.
• Mortgage banking fees were down $179 million, driven by lower gain-on-sale margins and production volumes.
• Service charges and fees increased $13 million, reflecting recovery from COVID-19 impacts.
• Capital market fees were up $14 million, driven by higher loan syndication and M&A advisory fees.
• Card fees increased $9 million, given higher debit and credit card volumes given economic recovery.
• Trust and investment services fees, up $8 million, reflecting an increase in assets under management from higher
equity market levels and strong inflows.
• Letter of credit fees were up $2 million, reflecting higher commitment fees.
• Foreign exchange and interest rate products revenue increased $2 million, reflecting improved client foreign exchange
hedging activity.
• Other income decreased $11 million from the third quarter 2020 level which included a gain on sale of education
loans.
Citizens Financial Group, Inc.
3

Noninterest Expense 3Q21 change from
($s in millions) 3Q21 2Q21 3Q20 2Q21 3Q20
$ % $ %
Salaries and employee benefits $ 509 $ 524 $ 524 $ (15) (3) % $ (15) (3) %
Equipment and software 157 155 149 2 1 8 5
Outside services 144 137 139 7 5 5 4
Occupancy 77 82 81 (5) (6) (4) (5)
Other operating expense 124 93 95 31 33 29 31
Noninterest expense $ 1,011 $ 991 $ 988 $ 20 2 % $ 23 2 %
Notable items $ 23 $ 11 $ 31 $ 12 109 % $ (8) (26) %
Underlying, as applicable
Salaries and employee benefits $ 522 $ 524 $ 511 $ (2) — % $ 11 2 %
Equipment and software 150 151 148 (1) (1) 2 1
Outside services 132 133 123 (1) (1) 9 7
Occupancy 76 79 80 (3) (4) (4) (5)
Other operating expense 108 93 95 15 16 13 14
Underlying noninterest expense $ 988 $ 980 $ 957 $ 8 1 % $ 31 3 %
Third quarter 2021 vs. second quarter 2021
Noninterest expense of $1.0 billion, or $988 million on an Underlying basis, was up slightly reflecting strong expense discipline
and the benefit of efficiency initiatives. Other operating expense increased $15 million reflecting higher operational and travel
costs.
Third quarter 2021 vs. third quarter 2020
Noninterest expense of $1.0 billion remains well-controlled. On an Underlying basis, noninterest expense of $988 million
increased by $31 million, or 3%, given higher salaries and employee benefits reflecting revenue-based compensation and merit
increases, higher outside services tied to growth initiatives, and increased other operating expenses reflecting higher travel
and advertising costs.
Citizens Financial Group, Inc.
4

Interest-earning assets 3Q21 change from($s in millions) 3Q21 2Q21 3Q20 2Q21 3Q20Period-end interest-earning assets $ % $ %Investments $ 28,107 $ 27,976 $ 26,124 $ 131 — % $ 1,983 8 %Interest-bearing deposits in banks 12,860 12,007 8,640 853 7 4,220 49 Commercial loans and leases 57,955 59,083 62,362 (1,128) (2) (4,407) (7) Retail loans 65,363 63,498 61,709 1,865 3 3,654 6 Total loans and leases 123,318 122,581 124,071 737 1 (753) (1) Loans held for sale, at fair value 3,177 3,616 3,587 (439) (12) (410) (11) Other loans held for sale 93 82 127 11 13 (34) (27) Total loans and leases and loans held for sale 126,588 126,279 127,785 309 — (1,197) (1) Total period-end interest-earning assets $ 167,555 $ 166,262 $ 162,549 $ 1,293 1 % $ 5,006 3 %Average interest-earning assetsInvestments $ 27,468 $ 27,600 $ 24,658 $ (132) — % $ 2,810 11 %Interest-bearing deposits in banks 13,749 11,259 6,250 2,490 22 7,499 120 Commercial loans and leases 58,681 60,653 63,861 (1,972) (3) (5,180) (8) Retail loans 63,960 62,837 61,051 1,123 2 2,909 5 Total loans and leases 122,641 123,490 124,912 (849) (1) (2,271) (2) Loans held for sale, at fair value 3,299 3,751 3,295 (452) (12) 4 — Other loans held for sale 112 233 1,061 (121) (52) (949) (89) Total loans and leases and loans held for sale 126,052 127,474 129,268 (1,422) (1) (3,216) (2) Total average interest-earning assets $ 167,269 $ 166,333 $ 160,176 $ 936 1 % $ 7,093 4 %
Third quarter 2021 vs. second quarter 2021
Period-end interest-earning assets of $167.6 billion increased $1.3 billion, or 1%, given a $853 million increase in cash held in
interest-bearing deposits and a $737 million increase in loans and leases. Loan growth of 1% was driven by retail given strength
in mortgage, auto and education, partially offset by payoffs and PPP forgiveness in commercial. Excluding PPP, loan growth
was 2%.
Average interest-earning assets of $167.3 billion increased $936 million, or 1%, as elevated liquidity drove a $2.5 billion
increase in cash held in interest-bearing deposits. Results also reflect a $849 million, or 1%, decrease in loans driven by a $2.0
billion decrease in Commercial. These results were partially offset by a $1.1 billion increase in retail. Excluding PPP, average
loan growth was 1%.
The average effective duration of the securities portfolio was 3.9 years compared with 3.6 years at June 30, 2021.
Third quarter 2021 vs. third quarter 2020
Period-end interest-earning assets of $167.6 billion increased $5.0 billion, or 3%, as elevated liquidity drove a $4.2 billion
increase in cash held in interest-bearing deposits, and a $2.0 billion increase in investments. This was partially offset by a $753
million decrease in loans, primarily driven by commercial payoffs and a $2.8 billion decrease in PPP loans.
Average interest-earning assets of $167.3 billion increased $7.1 billion, or 4%, as elevated liquidity drove a $7.5 billion increase
in cash held in interest-bearing deposits, and a $2.8 billion increase in investments. Loans decreased $2.3 billion, or 2%, with a
$5.2 billion decrease in commercial reflecting payoffs and $1.9 billion decrease in PPP loans. Retail loans increased $2.9
billion, or 5%, driven by growth in education, residential mortgage and auto, partially offset by planned run off of personal
unsecured installment loans and a decrease in home equity.
The average effective duration of the securities portfolio was 2.8 years at September 30, 2020.
Citizens Financial Group, Inc.
5

Deposits 3Q21 change from($s in millions) 3Q21 2Q21 3Q20 2Q21 3Q20Period-end deposits $ % $ %Demand deposits $ 48,184 $ 47,480 $ 41,249 $ 704 1 % $ 6,935 17 %Checking with interest 27,985 28,074 27,141 (89) — 844 3 Savings 21,166 20,382 17,237 784 4 3,929 23 Money market accounts 48,935 48,150 46,400 785 2 2,535 5 Term deposits 5,951 6,550 10,894 (599) (9) (4,943) (45) Total period-end deposits $ 152,221 $ 150,636 $ 142,921 $ 1,585 1 % $ 9,300 7 %Average depositsDemand deposits $ 47,873 $ 46,630 $ 40,608 $ 1,243 3 % $ 7,265 18 %Checking with interest 27,965 27,278 26,638 687 3 1,327 5 Savings 20,803 20,077 16,902 726 4 3,901 23 Money market accounts 49,159 49,394 45,187 (235) — 3,972 9 Term deposits 6,071 6,970 12,032 (899) (13) (5,961) (50) Total average deposits $ 151,871 $ 150,349 $ 141,367 $ 1,522 1 % $ 10,504 7 %
Third quarter 2021 vs. second quarter 2021
Total period-end deposits of $152.2 billion increased $1.6 billion, or 1%, reflecting growth in money market accounts, savings
and demand deposits, partially offset by a decline in term deposits.
Citizens Access® deposits were $4.6 billion at September 30, 2021, down from $4.9 billion at June 30, 2021, primarily due to
rate reduction strategies that resulted in a decrease in term deposits.
Average deposits of $151.9 billion increased $1.5 billion, or 1%, as growth in demand deposits and savings and checking with
interest was partially offset by a decrease in term deposits and money market accounts.
Third quarter 2021 vs. third quarter 2020
Total period-end deposits of $152.2 billion increased $9.3 billion, or 7%, as a result of elevated liquidity tied to government
stimulus associated with the COVID-19 disruption. Growth in demand deposits, savings, money market accounts and checking
with interest was partially offset by a decrease in term deposits.
Average deposits of $151.9 billion increased $10.5 billion, or 7%, reflecting an increase in demand deposits, money market
accounts, savings and checking with interest, partially offset by a decrease in term deposits.
Citizens Financial Group, Inc.
6

Borrowed Funds 3Q21 change from($s in millions) 3Q21 2Q21 3Q20 2Q21 3Q20
Period-end borrowed funds $ % $ %
Short-term borrowed funds $ 8 $ 62 $ 252 $ (54) (87) % $ (244) (97) %
Long-term borrowed funds
FHLB advances 20 18 19 2 11 1 5
Senior debt 5,345 5,357 7,504 (12) — (2,159) (29)
Subordinated debt and other debt 1,582 1,582 1,586 — — (4) —
Total borrowed funds $ 6,955 $ 7,019 $ 9,361 $ (64) (1) % $ (2,406) (26) %
Average borrowed funds
Short-term borrowed funds $ 23 $ 69 $ 240 $ (46) (67) % $ (217) (90) %
Long-term borrowed funds
FHLB advances 19 18 6 1 6 13 217
Senior debt 5,356 5,834 7,515 (478) (8) (2,159) (29)
Subordinated debt and other debt 1,581 1,582 1,675 (1) — (94) (6) Total average borrowed funds $ 6,979 $ 7,503 $ 9,436 $ (524) (7) % $ (2,457) (26) %
Third quarter 2021 vs. second quarter 2021
• Period-end borrowed funds decreased $64 million, or 1%, and average borrowed funds decreased $524 million, or 7%,
as elevated liquidity enabled the pay down of senior debt.
Third quarter 2021 vs. third quarter 2020
• Period-end borrowed funds decreased $2.4 billion, or 26%, and average borrowed funds decreased $2.5 billion, or
26%, reflecting the pay down of senior debt and short-term borrowings given strong customer deposit inflows.
Citizens Financial Group, Inc.
7

Capital 3Q21 change from($s and shares in millions, except per share data) 3Q21 2Q21 3Q20 2Q21 3Q20Period-end capital $ % $ %
Stockholders' equity $ 23,423 $ 23,199 $ 22,469 $ 224 1 % $ 954 4 %
Stockholders' common equity 21,409 21,185 20,504 224 1 905 4
Tangible common equity 14,677 14,466 13,771 211 1 906 7
Tangible book value per common share $ 34.44 $ 33.95 $ 32.24 $ 0.49 1 % $ 2.20 7 %
Common shares - at end of period 426.2 426.1 427.1 0.1 — (0.9) —
Common shares - average (diluted) 427.8 427.6 428.0 0.3 — % (0.2) — %
Common equity tier 1 capital ratio(1) 10.3 % 10.3 % 9.8 %
Total capital ratio(1) 13.4 13.5 13.3
Tier 1 leverage ratio(1) 9.7 % 9.7 % 9.5 % 1) Current reporting-period regulatory capital ratios are preliminary.
Third quarter 2021
• Our Basel III capital ratios remain strong, with a CET1 capital ratio of 10.3% as of September 30, 2021 compared with
10.3% at June 30, 2021 and 9.8% at September 30, 2020.
• The acquisition of JMP Group LLC is expected to close in fourth quarter 2021 and have an approximate 5 basis point
impact on CET1. The acquisition of the HSBC East Coast branches and online deposits is targeted to close in first
quarter 2022 and have an approximate 24 basis point impact on CET1. The acquisition of Investors Bancorp, Inc. is
expected to close in early second quarter 2022 and be neutral to CET1.
• Total capital ratio of 13.4% compares with 13.5% at June 30, 2021 and 13.3% as of September 30, 2020. During the
second quarter 2021, the company issued $300 million of Series G preferred stock that qualifies as additional tier 1
capital. On July 6, 2021, the company redeemed its $250 million of outstanding Series A preferred stock.
• Tangible book value per common share of $34.44 increased 1% compared with second quarter 2021 and increased 7%
from third quarter 2020.
• Citizens paid $167 million in common dividends to shareholders during third quarter 2021. This compares with $168
million in common dividends in each of second quarter 2021 and third quarter 2020.
• In third quarter 2021, Citizens announced that it entered into a definitive agreement and plan of merger under which
Citizens will acquire all of the outstanding shares of Investors Bancorp, Inc. The transaction is targeted to close in early
second quarter 2022, subject to approval by the shareholders of Investors, the required regulatory approvals and other
customary closing conditions. The company is poised to resume common stock repurchases after the Investors
shareholder vote scheduled for November 19, 2021.
Citizens Financial Group, Inc.
8

Credit quality review 3Q21 change from
($s in millions) 3Q21 2Q21 3Q20 2Q21 3Q20$/bps % $/bps %
Nonaccrual loans and leases(1) $ 747 $ 779 $ 1,277 $ (32) (4) % $ (530) (42) %90+ days past due and accruing(2) 312 280 28 32 11 284 NMNet charge-offs 44 78 219 (34) (44) (175) (80) Provision for credit losses (33) (213) 428 180 85 (461) NMAllowance for credit losses $ 2,004 $ 2,081 $ 2,736 $ (77) (4) % (732) (27) %Nonaccrual loans and leases to loans and leases 0.61 % 0.64 % 1.03 % (3) bps (42) bpsNet charge-offs as a % of total loans and leases 0.14 0.25 0.70 (11) (56) Allowance for credit losses to loans and leases 1.63 1.70 2.21 (7) (58) Allowance for credit losses to loans and leases (ex. PPP) 1.65 1.75 2.29 (10) (64) Allowance for credit losses to nonaccrual loans and leases 268.3 % 267.0 % 214.2 % 132 bps 5,408 bps1) Loans fully or partially guaranteed by the FHA, VA and USDA are classified as accruing.
2) 90+ days past due and accruing includes $289 million, $266 million, and $11 million of loans fully or partially guaranteed by the FHA, VA, and USDA for September 30, 2021, June 30, 2021, and September 30, 2020, respectively.
Third quarter 2021 vs. second quarter 2021
• Nonaccrual loans of $747 million decreased $32 million, or 4%, reflecting a $35 million decrease in retail given
improvement in residential real estate-secured loans, partially offset by a $3 million increase in commercial.
• The nonaccrual loans to total loans ratio of 0.61% is down from 0.64% at June 30, 2021.
• Net charge-offs of $44 million decreased $34 million driven primarily by commercial.
• Net charge-offs were 14 basis points of average loans and leases, down from 25 basis points.
• Credit provision benefit of $33 million reflects strong credit performance across both retail and commercial, and
macroeconomic improvement. Second quarter 2021 credit provision benefit was $213 million.
• Allowance for credit losses ratio of 1.63%, or 1.65% before the impact of PPP loans, compares with 1.70% as of June 30,
2021, or 1.75% before the impact of PPP loans. The reduction reflects a reserve release of $77 million.
• The allowance for credit losses to nonaccrual loans and leases ratio of 268% compares with 267% as of June 30, 2021.
Third quarter 2021 vs. third quarter 2020
• Nonaccrual loans decreased $530 million, or 42%, primarily driven by a $491 million decrease in commercial given
charge-offs, loan sale activity and repayments.
• The nonaccrual loans to total loans ratio of 0.61% decreased from 1.03% at September 30, 2020.
• Net charge-offs of $44 million decreased $175 million reflecting a $156 million decrease in commercial given
economic recovery, and a $19 million decrease in retail, as consumers continue to benefit from government stimulus
and strong mortgage and auto collateral values.
• Net charge-offs of 14 basis points of average loans and leases compares with 70 basis points in third quarter 2020.
• Credit provision benefit of $33 million compares with a $428 million provision in third quarter 2020, reflecting strong
credit performance across the retail and commercial loan portfolios and improvement in the macroeconomic outlook.
• Allowance for credit losses of $2.0 billion compares with $2.7 billion at September 30, 2020. Allowance for credit
losses ratio of 1.63% as of September 30, 2021, or 1.65% before the impact of PPP loans, compares with 2.21% as of
September 30, 2020, or 2.29% before the impact of PPP loans.
• The allowance for credit losses to nonaccrual loans and leases ratio of 268% compares with 214% as of September 30,
2020.
Citizens Financial Group, Inc.
9

Earnings highlights: Quarterly Trends
3Q21 change from
($s in millions, except per share data) 3Q21 2Q21 3Q20 2Q21 3Q20
Earnings $/bps % $/bps %
Net interest income $ 1,145 $ 1,124 $ 1,137 $ 21 2 % $ 8 1 %
Noninterest income 514 485 654 29 6 (140) (21)
Total revenue 1,659 1,609 1,791 50 3 (132) (7)
Noninterest expense 1,011 991 988 20 2 23 2
Pre-provision profit 648 618 803 30 5 (155) (19)
Provision for credit losses (33) (213) 428 180 85 (461) NM
Net income 530 648 314 (118) (18) 216 69
Preferred dividends 26 32 25 (6) (19) 1 4
Net income available to common stockholders $ 504 $ 616 $ 289 $ (112) (18) % $ 215 74 %
After-tax notable Items 16 8 24 8 100 (8) (33)
Underlying net income $ 546 $ 656 $ 338 $ (110) (17) % $ 208 62 %
Underlying net income available to common stockholders $ 520 $ 624 $ 313 $ (104) (17) % $ 207 66 %
Average common shares outstanding
Basic (in millions) 426.1 425.9 426.8 0.1 — (0.8) —
Diluted (in millions) 427.8 427.6 428.0 0.3 — (0.2) —
Diluted earnings per share $ 1.18 $ 1.44 $ 0.68 $ (0.26) (18) % $ 0.5 74 %
Underlying diluted earnings per share $ 1.22 $ 1.46 $ 0.73 $ (0.24) (16) % $ 0.49 67 %
Performance metrics
Net interest margin 2.72 % 2.71 % 2.82 % 1 bp (10) bps
Net interest margin, FTE 2.72 2.72 2.83 — (11)
Effective income tax rate 22.4 22.0 16.1 39 625
Efficiency ratio 61 62 55 (71) 574
Underlying efficiency ratio 60 61 53 (137) 611
Return on average common equity 9.4 11.9 5.6 (246) 379
Return on average tangible common equity 13.7 17.5 8.3 (379) 538
Underlying return on average tangible common equity 14.2 17.7 9.0 (357) 517
Return on average total assets 1.13 1.41 0.70 (28) 43
Underlying return on average total tangible assets 1.21 % 1.48 % 0.79 % (27) bps 42 bps
Capital adequacy(1,2)
Common equity tier 1 capital ratio 10.3 % 10.3 % 9.8 %
Total capital ratio 13.4 13.5 13.3
Tier 1 leverage ratio 9.7 9.7 9.5
Allowance for credit losses to loans and leases 1.63 % 1.70 % 2.21 % (7) bps (58) bps
Asset quality(2)
Nonaccrual loans and leases to loans and leases 0.61 % 0.64 % 1.03 % (3) bps (42) bps
Allowance for credit losses to nonaccrual loans and leases 268 267 214 132 5,408
Net charge-offs as a % of average loans and leases 0.14 % 0.25 % 0.70 % (11) bps (56) bps1) Current reporting-period regulatory capital ratios are preliminary. 2) Capital adequacy and asset-quality ratios calculated on a period-end basis, except net charge-offs.
Citizens Financial Group, Inc.
10

Consolidated balance sheet review(1):
3Q21 change from($s in millions) 3Q21 2Q21 3Q20 2Q21 3Q20
$/bps % $/bps %Total assets $ 187,007 $ 185,104 $ 179,228 $ 1,903 1 % $ 7,779 4 %Total loans and leases 123,318 122,581 124,071 737 1 (753) (1) Total loans held for sale 3,270 3,698 3,714 (428) (12) (444) (12) Deposits 152,221 150,636 142,921 1,585 1 9,300 7 Stockholders' equity 23,423 23,199 22,469 224 1 954 4 Stockholders' common equity 21,409 21,185 20,504 224 1 905 4 Tangible common equity $ 14,677 $ 14,466 $ 13,771 $ 211 1 % $ 906 7 %Loans-to-deposit ratio (period-end(2) 81.0 % 81.4 % 86.8 % (37) bps (580) bpsLoans-to-deposit ratio (average)(2) 80.8 % 82.1 % 88.4 % (139) (761) 1) Represents period end unless otherwise noted.2) Excludes loans held for sale.
Citizens Financial Group, Inc.
11

The following table provides information on Underlying results which exclude the impact of notable items.
Underlying results:
Quarterly Trends
3Q21 change from
($s in millions, except per share data) 3Q21 2Q21 3Q20 2Q21 3Q20Net interest income $ 1,145 $ 1,124 $ 1,137 2 % 1 %Noninterest income 514 485 654 6 (21) Total revenue $ 1,659 $ 1,609 $ 1,791 3 % (7) %Noninterest expense 1,011 991 988 2 2 Notable items 23 11 31 109 (26)Underlying noninterest expense $ 988 $ 980 $ 957 1 % 3 %Underlying pre-provision profit 671 629 834 7 (20) Provision for credit losses (33) (213) 428 85 NMNet income available to common stockholders 504 616 289 (18) 74Underlying net income available to common stockholders $ 520 $ 624 $ 313 (17) % 66 %Performance metricsDiluted EPS $ 1.18 $ 1.44 $ 0.68 (18) % 74 %Underlying EPS $ 1.22 $ 1.46 $ 0.73 (16) % 67 %Efficiency ratio 61 % 62 % 55 % (71) bps 574 bpsUnderlying efficiency ratio 60 61 53 (137) 611 Return on average tangible common equity 13.7 17.5 8.3 (379) 538 Underlying return on average tangible common equity 14.2 % 17.7 % 9.0 % (357) bps 517 bpsOperating leverage 1.2 % (9.6) %Underlying operating leverage 2.3 % (10.6) %
Citizens Financial Group, Inc.
12
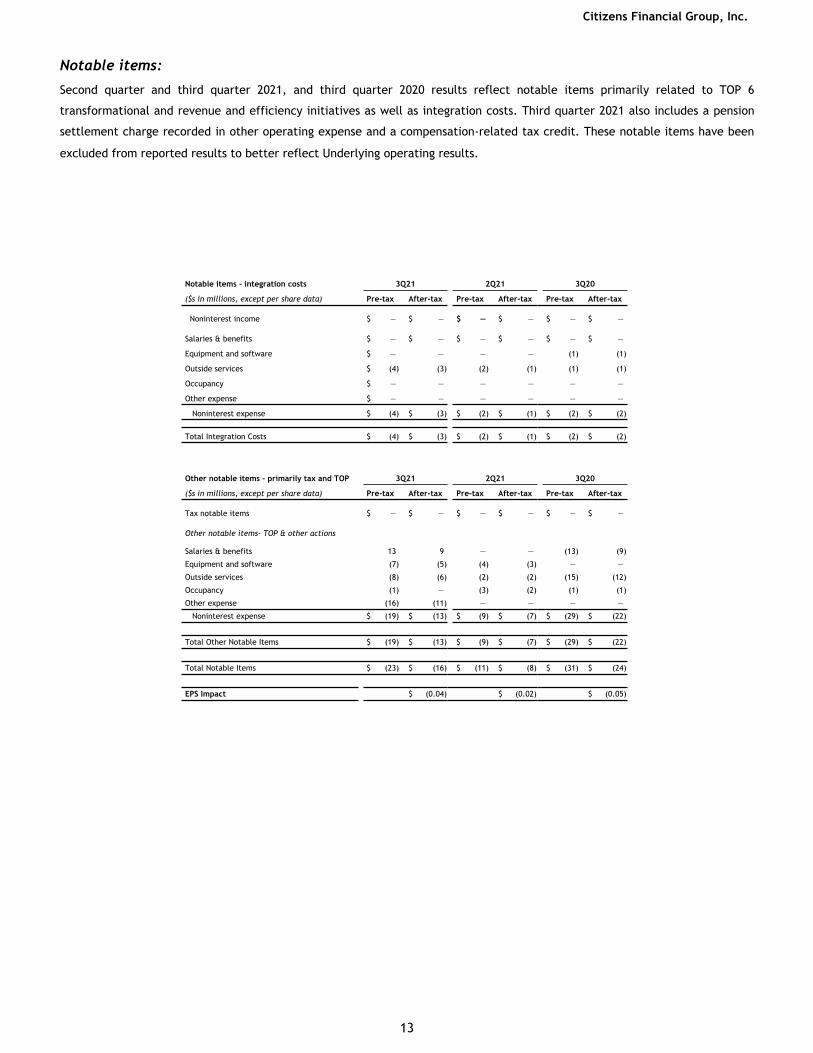
Notable items:
Second quarter and third quarter 2021, and third quarter 2020 results reflect notable items primarily related to TOP 6
transformational and revenue and efficiency initiatives as well as integration costs. Third quarter 2021 also includes a pension
settlement charge recorded in other operating expense and a compensation-related tax credit. These notable items have been
excluded from reported results to better reflect Underlying operating results.
Notable items - integration costs 3Q21 2Q21 3Q20
($s in millions, except per share data) Pre-tax After-tax Pre-tax After-tax Pre-tax After-tax
Noninterest income $ — $ — $ — $ — $ — $ —
Salaries & benefits $ — $ — $ — $ — $ — $ —
Equipment and software $ — — — — (1) (1)
Outside services $ (4) (3) (2) (1) (1) (1)
Occupancy $ — — — — — —
Other expense $ — — — — — —
Noninterest expense $ (4) $ (3) $ (2) $ (1) $ (2) $ (2)
Total Integration Costs $ (4) $ (3) $ (2) $ (1) $ (2) $ (2)
Other notable items - primarily tax and TOP 3Q21 2Q21 3Q20
($s in millions, except per share data) Pre-tax After-tax Pre-tax After-tax Pre-tax After-tax
Tax notable items $ — $ — $ — $ — $ — $ —
Other notable items- TOP & other actions
Salaries & benefits 13 9 — — (13) (9)
Equipment and software (7) (5) (4) (3) — —
Outside services (8) (6) (2) (2) (15) (12)
Occupancy (1) — (3) (2) (1) (1)
Other expense (16) (11) — — — —
Noninterest expense $ (19) $ (13) $ (9) $ (7) $ (29) $ (22)
Total Other Notable Items $ (19) $ (13) $ (9) $ (7) $ (29) $ (22)
Total Notable Items $ (23) $ (16) $ (11) $ (8) $ (31) $ (24)
EPS Impact $ (0.04) $ (0.02) $ (0.05)
Citizens Financial Group, Inc.
13

Corresponding Financial Tables and Information
Investors are encouraged to review the foregoing summary and discussion of Citizens’ earnings and financial condition in
conjunction with the detailed financial tables and other information available on the Investor Relations portion of the
company’s website at www.citizensbank.com/about-us.
Media: Peter Lucht - 781.655.2289
Investors: Kristin Silberberg - 203.900.6854
Conference Call
CFG management will host a live conference call today with details as follows:
Time: 9:00 am ET
Dial-in: (877) 336-4440, conference ID 6052001
Webcast/Presentation: The live webcast will be available at http://investor.citizensbank.com under Events & Presentations.
Replay Information: A replay of the conference call will be available beginning at 12:00 pm ET on October 20, 2021 through
November 20, 2021. Please dial (866) 207-1041 and enter access code 7904509. The webcast replay will be available at
http://investor.citizensbank.com under Events & Presentations.
About Citizens Financial Group, Inc.
Citizens Financial Group, Inc. is one of the nation’s oldest and largest financial institutions, with $187.0 billion in assets as of
September 30, 2021. Headquartered in Providence, Rhode Island, Citizens offers a broad range of retail and commercial banking
products and services to individuals, small businesses, middle-market companies, large corporations and institutions. Citizens
helps its customers reach their potential by listening to them and by understanding their needs in order to offer tailored advice,
ideas and solutions. In Consumer Banking, Citizens provides an integrated experience that includes mobile and online banking, a
24/7 customer contact center and the convenience of approximately 3,000 ATMs and approximately 1,000 branches in 11 states
in the New England, Mid-Atlantic and Midwest regions. Consumer Banking products and services include a full range of banking,
lending, savings, wealth management and small business offerings. In Commercial Banking, Citizens offers a broad complement
of financial products and solutions, including lending and leasing, deposit and treasury management services, foreign exchange,
interest rate and commodity risk management solutions, as well as loan syndication, corporate finance, merger and acquisition,
and debt and equity capital markets capabilities. More information is available at www.citizensbank.com or visit us on Twitter,
LinkedIn or Facebook.
Citizens Financial Group, Inc.
14

Non-GAAP Financial Measures and Reconciliations
Non-GAAP Financial Measures:
This document contains non-GAAP financial measures denoted as Underlying results and excluding elevated cash. In historical
periods, these results may have been referred to as Adjusted or Adjusted/Underlying results. Underlying results for any given
reporting period exclude certain items that may occur in that period which Management does not consider indicative of the
Company’s on-going financial performance. We believe these non-GAAP financial measures provide useful information to
investors because they are used by our Management to evaluate our operating performance and make day-to-day operating
decisions. In addition, we believe our Underlying results in any given reporting period reflect our on-going financial
performance in that period and, accordingly, are useful to consider in addition to our GAAP financial results. We further
believe the presentation of Underlying results increases comparability of period-to-period results. The Appendix presents
reconciliations of our non-GAAP measures to the most directly comparable GAAP financial measures. The following tables
present reconciliations of our non-GAAP measures to the most directly comparable GAAP financial measures.
Other companies may use similarly titled non-GAAP financial measures that are calculated differently from the way we
calculate such measures. Accordingly, our non-GAAP financial measures may not be comparable to similar measures used by
such companies. We caution investors not to place undue reliance on such non-GAAP financial measures, but to consider
them with the most directly comparable GAAP measures. Non-GAAP financial measures have limitations as analytical tools
and should not be considered in isolation or as a substitute for our results reported under GAAP.
Citizens Financial Group, Inc.
15

Non-GAAP financial measures and reconciliations(in millions, except share, per-share and ratio data)
QUARTERLY TRENDS
3Q21 Change
3Q21 2Q21 3Q20 2Q21 3Q20
$ % $ %
Total revenue, Underlying:
Total revenue (GAAP) A $1,659 $1,609 $1,791 $50 3% ($132) (7%)
Less: Notable items — — — — — — —
Total revenue, Underlying (non-GAAP) B $1,659 $1,609 $— $1,791 $50 3% ($132) (7%)
Noninterest expense, Underlying:
Noninterest expense (GAAP) C $1,011 $991 $988 $20 2% $23 2%
Less: Notable items 23 11 31 12 109 (8) (26)
Noninterest expense, Underlying (non-GAAP) D $988 $980 $957 $8 1% $31 3%
Pre-provision profit:
Total revenue (GAAP) A $1,659 $1,609 $1,791 $50 3% ($132) (7%)
Less: Noninterest expense (GAAP) C 1,011 991 988 20 2 23 2
Pre-provision profit (GAAP) $648 $618 $803 $30 5% ($155) (19%)
Pre-provision profit, Underlying:
Total revenue, Underlying (non-GAAP) B $1,659 $1,609 $1,791 $50 3% ($132) (7%)
Less: Noninterest expense, Underlying (non-GAAP) D 988 980 957 8 1 31 3
Pre-provision profit, Underlying (non-GAAP) $671 $629 $834 $42 7% ($163) (20%)
Income before income tax expense, Underlying:
Income before income tax expense (GAAP) E $681 $831 $375 ($150) (18%) $306 82%
Less: Expense before income tax benefit related to notable items (23) (11) (31) (12) (109) 8 26
Income before income tax expense, Underlying (non-GAAP) F $704 $842 $406 ($138) (16%) $298 73%
Income tax expense, Underlying:
Income tax expense (GAAP) G $151 $183 $61 ($32) (17%) $90 148%
Less: Income tax benefit related to notable items (7) (3) (7) (4) (133) — —
Income tax expense, Underlying (non-GAAP) H $158 $186 $68 ($28) (15%) $90 132%
Net income, Underlying:
Net income (GAAP) I $530 $648 $314 ($118) (18%) $216 69%
Add: Notable items, net of income tax benefit 16 8 24 8 100 (8) (33)
Net income, Underlying (non-GAAP) J $546 $656 $338 ($110) (17%) $208 62%
Net income available to common stockholders, Underlying:
Net income available to common stockholders (GAAP) K $504 $616 $289 ($112) (18%) $215 74%
Add: Notable items, net of income tax benefit 16 8 24 8 100 (8) (33)
Net income available to common stockholders, Underlying (non-GAAP) L $520 $624 $313 ($104) (17%) $207 66%
Citizens Financial Group, Inc.
16

Non-GAAP financial measures and reconciliations (continued)(in millions, except share, per-share and ratio data)
QUARTERLY TRENDS
3Q21 Change
3Q21 2Q21 3Q20 2Q21 3Q20
$/bps % $/bps %
Operating leverage:
Total revenue (GAAP) A $1,659 $1,609 $1,791 $50 3.11% ($132) (7.33%)
Less: Noninterest expense (GAAP) C 1,011 991 988 20 1.91 23 2.31
Operating leverage 1.20% (9.64%)
Operating leverage, Underlying:
Total revenue, Underlying (non-GAAP) B $1,659 $1,609 $1,791 $50 3.11% ($132) (7.33%)
Less: Noninterest expense, Underlying (non-GAAP) D 988 980 957 8 0.78 31 3.26
Operating leverage, Underlying (non-GAAP) 2.33% (10.59%)
Efficiency ratio and efficiency ratio, Underlying:
Efficiency ratio C/A 60.92 % 61.63% 55.18% (71) bps 574 bps
Efficiency ratio, Underlying (non-GAAP) D/B 59.55 60.92 53.44 (137) bps 611 bps
Effective income tax rate and effective income tax rate, Underlying:
Effective income tax rate G/E 22.35% 21.96% 16.10% 39 bps 625 bps
Effective income tax rate, Underlying (non-GAAP) H/F 22.45 22.01 16.79 44 bps 566 bps
Return on average common equity and return on average common equity, Underlying:
Average common equity (GAAP) M $21,326 $20,833 $20,534 $493 2% $792 4%
Return on average common equity K/M 9.39 % 11.85% 5.60% (246) bps 379 bps
Return on average common equity, Underlying (non-GAAP) L/M 9.70 12.02 6.05 (232) bps 365 bps
Return on average tangible common equity and return on average tangible common equity, Underlying:
Average common equity (GAAP) M $21,326 $20,833 $20,534 $493 2% $792 4%
Less: Average goodwill (GAAP) 7,055 7,050 7,050 5 — 5 —
Less: Average other intangibles (GAAP) 52 53 62 (1) (2) (10) (16)
Add: Average deferred tax liabilities related to goodwill (GAAP) 383 381 375 2 1 8 2
Average tangible common equity N $14,602 $14,111 $13,797 $491 3% $805 6%
Return on average tangible common equity K/N 13.71 % 17.50% 8.33% (379) bps 538 bps
Return on average tangible common equity, Underlying (non-GAAP) L/N 14.17 17.74 9.00 (357) bps 517 bps
Return on average total assets and return on average total assets, Underlying:
Average total assets (GAAP) O $186,108 $184,456 $177,675 $1,652 1% $8,433 5%
Return on average total assets I/O 1.13 % 1.41% 0.70% (28) bps 43 bps
Return on average total assets, Underlying (non-GAAP) J/O 1.16 1.43 0.76 (27) bps 40 bps
Return on average total tangible assets and return on average total tangible assets, Underlying:
Average total assets (GAAP) P $186,108 $184,456 $177,675 $1,652 1% $8,433 5%
Less: Average goodwill (GAAP) 7,055 7,050 7,050 5 — 5 —
Less: Average other intangibles (GAAP) 52 53 62 (1) (2) (10) (16)
Add: Average deferred tax liabilities related to goodwill (GAAP) 383 381 375 2 1 8 2
Average tangible assets Q $179,384 $177,734 $170,938 $1,650 1% $8,446 5%
Return on average total tangible assets I/Q 1.17 % 1.46% 0.73% (29) bps 44 bps
Return on average total tangible assets, Underlying (non-GAAP) J/Q 1.21 1.48 0.79 (27) bps 42 bps
Citizens Financial Group, Inc.
17

Non-GAAP financial measures and reconciliations (continued)(in millions, except share, per-share and ratio data)
QUARTERLY TRENDS
3Q21 Change
3Q21 2Q21 3Q20 2Q21 3Q20
$/bps % $/bps %
Tangible book value per common share:
Common shares - at period-end (GAAP) R 426,199,576 426,083,143 427,073,084 116,433 —% (873,508) —%
Common stockholders' equity (GAAP) $21,409 $21,185 $20,504 $224 1 $905 4
Less: Goodwill (GAAP) 7,065 7,050 7,050 15 — 15 —
Less: Other intangible assets (GAAP) 51 52 60 (1) (2) (9) (15)
Add: Deferred tax liabilities related to goodwill (GAAP) 384 383 377 1 — 7 2
Tangible common equity S $14,677 $14,466 $13,771 $211 1% $906 7%
Tangible book value per common share S/R $34.44 $33.95 $32.24 $0.49 1% $2.20 7%
Net income per average common share - basic and diluted and net income per average common share - basic and diluted, Underlying:
Average common shares outstanding - basic (GAAP) T 426,086,717 425,948,706 426,846,096 138,011 —% (759,379) —%
Average common shares outstanding - diluted (GAAP) U 427,840,964 427,561,572 427,992,349 279,392 — (151,385) —
Net income per average common share - basic (GAAP) K/T $1.18 $1.45 $0.68 ($0.27) (19) $0.50 74
Net income per average common share - diluted (GAAP) K/U 1.18 1.44 0.68 (0.26) (18) 0.50 74
Net income per average common share - basic, Underlying (non-GAAP) L/T 1.22 1.47 0.73 (0.25) (17) 0.49 67
Net income per average common share - diluted, Underlying (non-GAAP) L/U 1.22 1.46 0.73 (0.24) (16) 0.49 67
Citizens Financial Group, Inc.
18

Non-GAAP financial measures and reconciliations (continued)(in millions, except share, per-share and ratio data)
QUARTERLY TRENDS
3Q21 Change
3Q21 2Q21 3Q20 2Q21 3Q20
$/bps % $/bps %
Salaries and employee benefits, Underlying:
Salaries and employee benefits (GAAP) $509 $524 $524 ($15) (3%) ($15) (3%)
Less: Notable items (13) — 13 (13) (100) (26) (200)
Salaries and employee benefits, Underlying (non-GAAP) $522 $524 $511 ($2) —% $11 2%
Equipment and software, Underlying:
Equipment and software (GAAP) $157 $155 $149 $2 1% $8 5%
Less: Notable items 7 4 1 3 75 6 NM
Equipment and software, Underlying (non-GAAP) $150 $151 $148 ($1) (1%) $2 1%
Outside services, Underlying:
Outside services (GAAP) $144 $137 $139 $7 5% $5 4%
Less: Notable items 12 4 16 8 200 (4) (25)
Outside services, Underlying (non-GAAP) $132 $133 $123 ($1) (1%) $9 7%
Occupancy, Underlying:
Occupancy (GAAP) $77 $82 $81 ($5) (6%) ($4) (5%)
Less: Notable items 1 3 1 (2) (67) — —
Occupancy, Underlying (non-GAAP) $76 $79 $80 ($3) (4%) ($4) (5%)
Other operating expense, Underlying:
Other operating expense (GAAP) $124 $93 $95 $31 33% $29 31%
Less: Notable items 16 — — 16 100 16 100
Other operating expense, Underlying (non-GAAP) $108 $93 $95 $15 16% $13 14%
Citizens Financial Group, Inc.
19

Non-GAAP measures and reconciliations - Excluding the impact of PPP loans(in millions, except share, per-share and ratio data)
QUARTERLY TRENDS
3Q21 Change
3Q21 2Q21 3Q20 2Q21 3Q20
$/bps % $/bps %
Total loans, excluding the impact of PPP loans:
Total loans (GAAP) A $123,318 $122,581 $124,071 $737 1% ($753) (1%)
Less: PPP loans 1,903 3,479 4,653 (1,576) (45) (2,750) (59)
Total loans, excluding the impact of PPP loans (non-GAAP) B $121,415 $119,102 $119,418 $2,313 2% $1,997 2%
Total commercial loans, excluding the impact of PPP loans:
Total commercial loans (GAAP) C $57,955 $59,083 $62,362 ($1,128) (2%) ($4,407) (7%)
Less: PPP loans 1,903 3,479 4,653 (1,576) (45) (2,750) (59) Total commercial loans, excluding the impact of PPP loans (non-GAAP) D $56,052 $55,604 $57,709 $448 1% ($1,657) (3%)
Allowance for credit losses:
Allowance for credit losses (GAAP) E $2,004 $2,081 $2,736 ($77) (4%) ($732) (27%)
Average loans, excluding the impact of PPP loans:
Average loans (GAAP) F $122,641 $123,490 $124,912 ($849) (1%) ($2,271) (2%)
Less: PPP loans 2,770 4,603 4,709 (1,833) (40) (1,939) (41) Average loans, excluding the impact of PPP loans (non-GAAP) G $119,871 $118,887 $120,203 $984 1% ($332) —%
Ratios:
Allowance for credit losses to total loans (GAAP) E / A 1.63 % 1.70 % 2.21 % (7) bps (58) bps
Allowance for credit losses to total loans, excluding the impact of PPP loans (non-GAAP) E / B 1.65 % 1.75 % 2.29 % (10) bps (64) bps
Citizens Financial Group, Inc.
20

Forward-Looking Statements
This document contains forward-looking statements within the meaning of the Private Securities Litigation Reform Act of 1995. Statements regarding potential future share repurchases and future dividends as well as the potential effects of the COVID-19 pandemic and associated lockdowns on our business, operations, financial performance and prospects, are forward-looking statements. Also, any statement that does not describe historical or current facts is a forward-looking statement. These statements often include the words “believes,” “expects,” “anticipates,” “estimates,” “intends,” “plans,” “goals,” “targets,” “initiatives,” “potentially,” “probably,” “projects,” “outlook,” “guidance” or similar expressions or future conditional verbs such as “may,” “will,” “should,” “would,” and “could.”
Forward-looking statements are based upon the current beliefs and expectations of management, and on information currently available to management. Our statements speak as of the date hereof, and we do not assume any obligation to update these statements or to update the reasons why actual results could differ from those contained in such statements in light of new information or future events. We caution you, therefore, against relying on any of these forward-looking statements. They are neither statements of historical fact nor guarantees or assurances of future performance. While there is no assurance that any list of risks and uncertainties or risk factors is complete, important factors that could cause actual results to differ materially from those in the forward-looking statements include the following, without limitation:
• Negative economic and political conditions that adversely affect the general economy, housing prices, the job market, consumer confidence and spending habits which may affect, among other things, the level of nonperforming assets, charge-offs and provision expense;
• The rate of growth in the economy and employment levels, as well as general business and economic conditions, and changes in the competitive environment;
• Our ability to implement our business strategy, including the cost savings and efficiency components, and achieve our financial performance goals, including through the integration of Investors and the HSBC branches;
• The COVID-19 pandemic and associated lockdowns and their effects on the economic and business environments in which we operate;
• Our ability to meet heightened supervisory requirements and expectations;
• Liabilities and business restrictions resulting from litigation and regulatory investigations;
• Our capital and liquidity requirements under regulatory capital standards and our ability to generate capital internally or raise capital on favorable terms;
• The effect of changes in interest rates on our net interest income, net interest margin and our mortgage originations, mortgage servicing rights and mortgages held for sale;
• Changes in interest rates and market liquidity, as well as the magnitude of such changes, which may reduce interest margins, impact funding sources and affect the ability to originate and distribute financial products in the primary and secondary markets;
• The effect of changes in the level of checking or savings account deposits on our funding costs and net interest margin;
• Financial services reform and other current, pending or future legislation or regulation that could have a negative effect on our revenue and businesses;
• A failure in or breach of our operational or security systems or infrastructure, or those of our third party vendors or other service providers, including as a result of cyber-attacks;
• An inability to complete the acquisitions of Investors or the HSBC branches, or changes in the current anticipated timeframe, terms or manner of such acquisitions;
• Greater than expected costs or other difficulties related to the integration of our business and that of Investors and the relevant HSBC branches;
• The inability to retain existing Investors or HSBC clients and employees following the closings of the Investors and HSBC branch acquisitions;
• The occurrence of any event change or other circumstance that could give rise to the right of one or both parties to terminate (i) the agreement to acquire Investors or (ii) the agreement to acquire branches from HSBC; and
• Management’s ability to identify and manage these and other risks.
In addition to the above factors, we also caution that the actual amounts and timing of any future common stock dividends or share repurchases will be subject to various factors, including our capital position, financial performance, risk-weighted assets, capital impacts of strategic initiatives, market conditions and regulatory and accounting considerations, as well as any other factors that our Board of Directors deems relevant in making such a determination. Therefore, there can be no assurance that we will repurchase shares from or pay any dividends to holders of our common stock, or as to the amount of any such
Citizens Financial Group, Inc.
21

repurchases or dividends. Further, statements about the effects of the COVID-19 pandemic and associated lockdowns on our business, operations, financial performance and prospects may constitute forward-looking statements and are subject to the risk that the actual impacts may differ, possibly materially, from what is reflected in those forward-looking statements due to factors and future developments that are uncertain, unpredictable and in many cases beyond our control, including the scope and duration of the pandemic, actions taken by governmental authorities in response to the pandemic, and the direct and indirect impact of the pandemic on our customers, third parties and us. In addition, statements about our net charge-off guidance constitute forward-looking statements and are subject to the risk that the actual charge-offs may differ, possibly materially, from what is reflected in those statements due to, among other potential factors, the impact of the COVID-19 pandemic and the effectiveness of stimulus and forbearance programs in response, changes in economic conditions, and idiosyncratic events affecting our commercial loans. Statements about Citizens’ agreement and plan of merger, dated July 28, 2021 (the “Investors acquisition agreement”), with Investors Bancorp, Inc. (“Investors”) and CBNA's agreement, dated May 26, 2021 (“HSBC branch acquisition agreement”) with HSBC Bank U.S.A., N.A. (“HSBC”) to acquire certain branches from HSBC also constitute forward-looking statements and are subject to the risk that actual results could be materially different from those expressed in those statements, including if either or both transactions are not consummated in a timely manner or at all, or if integration is more costly or difficult than expected.
More information about factors that could cause actual results to differ materially from those described in the forward-looking statements can be found in in our Annual Report on form 10-K and our Quarterly Report on Form 10-Q for the quarter ended June 30, 2021.
Note: Per share amounts and ratios presented in this document are calculated using whole dollars.
CFG-IR
Citizens Financial Group, Inc.
22
Related Documents