See discussions, stats, and author profiles for this publication at: https://www.researchgate.net/publication/353851229 EV Friendly Cities: A Comparison of Policy and Infrastructure in Sixteen Global Cities Thesis · July 2021 DOI: 10.13140/RG.2.2.18239.02722 CITATIONS 0 READ 1 1 author: Romana Haque Suravi University of Washington Seattle 4 PUBLICATIONS 3 CITATIONS SEE PROFILE All content following this page was uploaded by Romana Haque Suravi on 12 August 2021. The user has requested enhancement of the downloaded file.

Welcome message from author
This document is posted to help you gain knowledge. Please leave a comment to let me know what you think about it! Share it to your friends and learn new things together.
Transcript

See discussions, stats, and author profiles for this publication at: https://www.researchgate.net/publication/353851229
EV Friendly Cities: A Comparison of Policy and Infrastructure in Sixteen Global
Cities
Thesis · July 2021
DOI: 10.13140/RG.2.2.18239.02722
CITATIONS
0READ
1
1 author:
Romana Haque Suravi
University of Washington Seattle
4 PUBLICATIONS 3 CITATIONS
SEE PROFILE
All content following this page was uploaded by Romana Haque Suravi on 12 August 2021.
The user has requested enhancement of the downloaded file.

© Copyright 2021
Romana Haque Suravi

EV Friendly Cities: A Comparison of Policy and Infrastructure in Sixteen Global
Cities
Romana Haque Suravi
A thesis
submitted in partial fulfillment of the
requirements for the degree of
Master of Urban Planning
University of Washington
2021
Committee:
Christine Bae
Edward McCormack
Program Authorized to Offer Degree:
Urban Design and Planning

University of Washington
Abstract
EV Friendly Cities: A Comparison of Policy and Infrastructure in Sixteen Global Cities
Romana Haque Suravi
Chair of the Supervisory Committee:
Associate Professor, Christine Bae
Urban Design and Planning
Electric vehicles, one of the emerging modes of transportation, are at the forefront of sustainable
mobility. In the past years, there has been a rapid rise in EVs, both as private and public
transportation modes. Private users are influenced by multiple factors while choosing electric cars
as their travel modes. Among them, policy and infrastructure are deemed to be the main influencers
globally. These policies and infrastructures vary in different cities. However, there is a lack of
research dealing with what parts of the policy and infrastructure are actually most effective in EV
adoption. This research presents a descriptive and quantitative evaluation as well as statistical
analysis to identify the most effective policies and infrastructure components in electric car
adoption as a personal transportation mode in sixteen selected cities; Seattle, Los Angeles, San
Francisco, San Jose, New York, Oslo, Bergen, London, Amsterdam, Stockholm, Berlin, Munich,
Paris, Shenzhen, Beijing and Tokyo. The cities are evaluated based on total electric vehicles on
road, EVs on household level and electrification ratio of the registered cars in conjunction with
household median income. Policy level incentives like electrification target, parking, toll, and lane
access benefits along with tax rebates, subsidies and other monetary incentives as part of the total
cost of ownership are also observed. Total number of public and residential charging points as well
as the EV supply equipment program are analyzed as part of EV infrastructure preparedness on

city level. Among the sample cities, Norway is the pioneer in the electric car integration into their
passenger car market. All the sample cities have active Zero Energy Vehicle mandates and
incentives for electric vehicles. Through secondary data collection via various online resources
and statistical observation with help of the existing literature, this study found high correlation
between EV ownership and incentives. Multilinear Regression Analysis model predicted 0.53%
increase in passenger electrification with every $100 incentive increase. The environmental
conditions of the sample cities are also evaluated to observe the impact of mass EV adoption in
the overall improvement in CO2 emission reduction. At the end of this paper, this research proposes
some policies to improve the EV adoption challenges present in the sample cities as well as the
cities aiming to turn towards this sustainable mode in the future.

University of Washington
Acknowledgement
Two years, that’s the length of my journey in the University of Washington’s Master of Urban
Planning program. Half of it was disrupted by COVID. But throughout this tough journey, I
received help from many people. And I would like to thank all of them for their continuous
support and help to make my grad school experience interesting and fruitful.
My academic supervisor, Professor Christine Bae, who was more than just the person to help me
in my academic performance; always inspired me to challenge myself, to try new things and to
break the boundaries. My thesis is a brainchild of Christine and my idea, which started as a small
class project and turned into a full-fledged thesis work. She was the mentor and my continuous
support throughout this journey, which was at times stressful due to the unprecedented situation
all of us faced due to the pandemic. Professor Ed McCormack relentlessly helped me understand
the thesis process and mentored me to do a better job at data analysis. The back-to-back revisions
developed my work to the way it is now. This thesis would not be complete without their
continuous guidance and support.
My mentor, Lizzie Moll, was also my consistent support, who not only provided me with
technical support, but also encouragement to sail through this difficult but enjoyable process. I
would also like to thank Diana Siembor for being the communicative and helpful person she is.
My grad life could not be as comfortable as it is without her help.
Lastly, I would like to thank my parents, who have always been encouraging me to move
towards my dream. From Bangladesh to Seattle, they have always had my back, even from
eleven thousand miles away. At the end of this process, I hope to realize my dream, that made
me start this challenging journey and work for the people who need my expertise. And make the
world a bit better, more equitable and livable.

TABLE OF CONTENTS
Glossary 1
Chapter 1. Introduction 2
Chapter 2. Literature Review 4
2.1 Electric Vehicles Around the World 4
2.2 EV Adoption and User Behavior 5
2.3 Policy, Subsidies and Other Benefits 7
2.4 EV-friendly Infrastructure 7
2.5 Environmental Cost of EV Adoption 9
2.5.1. Battery Life 9
Chapter 3. Methodology 11
Chapter 4. Study Design 13
4.1 Data Collection 17
4.2 Data Analysis Approach 18
4.2.1. City Demographic and Economic Profile 19
4.2.2. EV ownership Profile of the Cities 19
4.2.3. Policy Based Ranking 20
4.2.4. Total Cost of Ownership 20
4.2.4.a. Depreciation Calculation 23
4.2.4.b. Fuel Cost Calculation 23
4.2.4.c. Insurance Cost and Maintenance and Repair Cost 24
4.2.4.d.Tax and subsidies 24
4.2.5. Parking and Toll cost 28

4.2.6. Charging Facility 29
4.2.7 Environmental cost 30
4.3. Statistical Analysis Design 32
Chapter 5. Analysis And Result 33
5.1 City Demographic and Economic Profile 33
5.2 EV Profile of the cities 34
5.2.1 EV Adoption and Median Income 35
5.2.2 BEV and PHEV Breakdown in the Sample Cities 37
5.3 TCO Components Analysis 38
5.3.1 Purchase Price and EV Adoption Rate Analysis Result 38
5.3.2 Fuel Cost Analysis Result 40
5.3.3 Insurance Cost Analysis Result 43
5.4 Policy and EV growth 45
5.4.1 Active Policies in the Cities 45
5.4.2 Tax and Subsidy in the EV Friendly Cities 50
5.4.3 Policy, TCO and EV Density Analysis Result 52
5.5. Parking and Toll Exemption 55
5.6. Infrastructure and the Charging points 57
5.7. Multiple Regression Analysis Result 60
5.8. EV Infrastructure and Energy Consumption 61
5.9. EVs and Environmental Cost 63
Chapter 6. Findings Summary 68
Chapter 7. Limitations Of the Study 69
Chapter 8. Conclusion 71

Bibliography 73
Appendix 84

LIST OF TABLES
Table 1: Observation Elements for EV Friendly Cities 16
Table 2: Database Creation 17
Table 3: City based EV Density Data Collection Sheet Format 20
Table 4: Total Cost of Ownership Calculation Process 22
Table 5: Tax and Subsidies available in the sample cities 25
Table 6: CO2 emission coefficient from GREET model 30
Table 7: Battery End of Life Possible Situation 32
Table 8: EV ownership rank of the sample cities 34
Table 9 : EV Ownership Summary in the EV friendly cities 38
Table 10: Fuel Cost for EVs and Non-EVs in the selected cities 42
Table 11: Insurance Cost for EVs and Non-EVs in the selected cities 44
Table 12: ICE to ZEV phase out target and current stage in the sample cities / countries 47
Table 13: Presence of EV friendly Policies and Score in the Sample Cities 49
Table 14: EV vs Non-EV_ Tax and Subsidies Comparison in Sample Cities 51
Table 15: Total Cost of Ownership and Policy Component Summary in the EV friendly cities 52
Table 16: TCO, Policy Component and EV Density Linear Correlation Check 54
Table 17: Toll and other facilities for EVs 56
Table 18: EV Charger Availability in the Selected City 58

Table 19: TCO and Multiple Regression Analysis Result 60
Table 20: Power Demand for Charging in the Selected Cities 62
Table 21: Power Generation mix in the selected cities 63
Table 21: Environmental cost of the EV adoption 66
Table 22: Dead EV battery handling facility in EV friendly cities and the environmental impact 67

LIST OF FIGURES
Figure 1: Conceptual illustration of Well-to-Wheel analyses for efficiency and CO2 emissions 10
Figure 2: EV market share 14
Figure 3: Demographic and economic information of the 16 selected cities 33
Figure 4: Median income and car ownership comparison in sample cities 35
Figure 5: EV type and density comparison 37
Figure 6: EV vs Non-EV Purchase Price Comparison in sample cities 38
Figure 7: Fuel Cost Comparison in EV friendly cities 40
Figure 8: Insurance and maintenance Cost Comparison in the selected Cities 43
Figure 9: Tax and subsidy benefit for EVs and non EVs 50
Figure 10: TCO of electric and non-electric vehicles in the EV friendly cities 53
Figure 11: Annual parking cost comparison in sample cities 55
Figure 12: Charging infrastructure supply and demand in the sample cities 59
Figure 13: Current energy demand vs load and BEV vs PHEV proportion in sample cities 61
Figure 14: Carbon Footprint from EVs and Non EVs in EV friendly cities 64
Figure 15: Impact of electrification on CO2 emission in EV cities 65
APPENDIX
Appendix 1: EV ownership and City Profile 84
Appendix 2: EV vs Non EV Purchase Price and Depreciation in Different Cities 86
Appendix 3: Annual Fuel Cost: EV Charging Cost in EV friendly Cities 88
Appendix 4: Fuel Cost Comparison for 100-mile Drive 90
Appendix 5: Annual Insurance and Maintenance & Repair Cost Comparison in EV Friendly City 91
Appendix 6: EV vs Non-EV_ Tax and Subsidies Comparison in Sample Cities 93
Appendix 7: EV vs Non-EV_ TCO, Financial Return & Benefit Comparison 95
Appendix 8: EV Types and Charging Infrastructure in the Sample Cities 97
Appendix 9: EV Infrastructure and Energy Use in the Sample Cities 99
Appendix 10a: EV Well to Wheel Carbon Emission in the Sample Cities 101
Appendix 10b: Electrification and Carbon Footprint Reduction 103
Appendix 11: EV vs Non-EV Parking and Toll Cost Saving 105
Appendix 12: TCO, Policy Component and EV Density Correlation Check 107
Appendix 13: Charger availability and EV density correlation 108
Appendix 14: TCO and Multiple Regression Analysis Result 108

1
GLOSSARY:
BEV: Battery Electric Vehicle
GHG: Greenhouse Gas
GREET Model: The Greenhouse Gases, Regulated Emissions, and Energy Use in Technologies
Model by Argonne National Laboratory.
HEV: Hybrid Electric Vehicle
EVSE: Electric Vehicle Support Equipment
ICCT: International Council on Clean Transportation
ICE: Internal Combustion Engine
LCA: Life Cycle Analysis
NEV: New Energy Vehicle
NOAA: National Oceanic and Atmospheric Administration
PHEV: Plug-in Hybrid Vehicle
WTP: Well to Pump
WTW: Well to Wheel
ZEV: Zero Energy Vehicle

2
Chapter 1: INTRODUCTION
Over the past century, human mobility and transportation systems have developed rapidly.
With the growth of the transportation system, the rising pollution has also become a concern for
the world. GHG emissions from all the developing sectors are imploring concerned entities to look
for a solution to stop the avalanche, called global warming and environmental pollution.
Sustainable transportation is at the forefront of the solution to this ongoing concern. The
transportation sector itself is responsible for 29% GHG gas emission in the United States in 2019
(EPA, 2020) and approximately 24% globally (Center for Climate and Energy Solution, 2019).
Reducing the pollution in transportation operation, production and recycling; as well as the energy
sector is presented as the best method to reduce the greenhouse gas emission. Also, the dwindling
non-renewable energy source dependence has made transportation authorities look for alternative
fuel sources. Electric vehicles came to the forefront as a solution as a sustainable transportation
mode (Rougei et al., 2018).
Many cities have stepped up to take the mantle of electrifying their public transportation fleet
as well as the passenger cars and freight careers. To achieve this dream, various policies and
infrastructural initiatives are adopted in those cities to promote EVs as both personal and public
transportation modes. The majority of automobile companies and city authorities have taken up
the challenge to electrify the transportation sector (Sierzchula et al., 2012). Along with all this
development comes the question, what is making the consumers interested in adopting the electric
vehicles?
Different studies have proven that the consumers chose the electric mode as personal
transportation choice considering the vehicle price, fuel cost and safety issues as well as
environmental benefit (Caulfield et al., 2010; Lane and Potter, 2007). The existing studies have
looked at the issue from mainly one lens, or in one particular geographic location. The cities
observed were all EV friendly. How do we define EV friendliness? Different sources measured
EV friendliness based on different criteria. The ICCT (2017) report used the number of EVs
(cumulative electric vehicles sales through the year the data is observed, electric vehicle sales in
the target year, and 5% electric share of new light-duty vehicles sales) in the global cities to identify
the EV friendly ones. On the other hand, ChargePoint, an individual charging infrastructure
provider, scored the US cities based on the number of EVs on the road and the number of charging
3
stations available. This can show how the term ‘ EV friendliness’ can be defined from different
perspective. In general, EV friendly cities can be identified through the total electric vehicle share,
which reflects effective policies and infrastructure availability in the cities. The important question
is, are all these policy interventions and infrastructure having the similar effect on EV adoption
globally, or are they locally concentrated, with different ranges of impacts? This paper will
investigate this issue through the multiple lenses of policy intervention, infrastructural
development and environmental impact. In urban and transportation planning, it is of great
significance to track and analyze the impact of policies and infrastructure decisions on the target
population and environment.
To observe the situation holistically, three lenses should be adopted. And the lenses can be
manifested through the questions presented below-
a. What are the global cities already identified as EV friendly with a high EV adoption rate?
b. How is consumer behavior in different cities getting affected by different components, like
policy and infrastructure, in case of EV adoption?
c. What is the environmental cost of the EV adoption in cities, are they all positive?
d. Can this impact of policy and infrastructure be analyzed?
The answers to these questions can be multifold. But this can be a good starting point to
understand the effectiveness of the policies, incentives as well as the positive aspects of EVs in
the cities.
In order to find the answers to these questions step by step, the chapters are arranged in a
sequence to introduce the readers to the topic and its importance in the planning profession in the
current chapter, followed by exploring the existing literature on relevant topics that influence EV
adoption decisions in Chapter 2. In the next part, this research will explain the Methodology in
Chapter 3. Chapter 4 will present the study design as well as data collection and framing process.
The Analysis process and results will be part of the next section of the paper in Chapter 5 and
Chapter 6 will reiterate the findings and what they imply for the future planning decision makers.
Like all studies, this research also has limitations, which will be addressed in Chapter 7. This paper
will conclude with the suggestions on how this study can be used moving forward with some policy
suggestions in Chapter 8 based on the findings from the study.

4
Chapter 2 : LITERATURE REVIEW
The greenhouse gas emission rate all over the world has been a concern for a long time.
The continuous emission from different sectors has increased the concentration of GHG in 2018,
to almost 46% higher than the year 1750 according to NOAA (2018). Recent reports from the
World Meteorological Organization (2019) warned about the current CO2 emission situation.
Energy sector, industry, and transportation (at approximately 24%) are liable for most of these
emissions globally (Center for Climate and Energy Solution, 2019). To control the unprecedented
CO2 concentration, policy makers introduced electric cars as a sustainable solution through low
energy travel mode. As a response to this initiative, increased number of electric vehicle
manufacturing by the car companies (Sierzchula et al., 2012) is making the air and noise pollution
reduction possible in the urban environment (Brady and O’Mahony, 2011, Hawkins et al., 2013).
But this is not a one-way solution, rather part of an array of possible answers to the ongoing crisis.
Chapter 2.1 : Electric Vehicles Around the World
Electric vehicles are at the forefront of sustainable transportation technology. The
environmental impact of EVs is undeniable. Over a year, just one electric car on the roads can save
an average of 1.5 million grams of CO2 (Moses, 2020). Due to this reason, not only the USA, but
many countries all over the world are seeing a rise in EVs, especially plug-in ones. Electric cars,
which accounted for 2.6% of global car sales and about 1% of global car stock in 2019, registered
a 40% year-on-year increase (IEA, 2020). Currently, 2.2% of vehicles registered globally are
electric. The global market for electric vehicles (EVs) will see substantial growth (32% of new
vehicle sales within the decade) (Forbes, 2021). A McKinsey report from 2019 says worldwide
sales of EVs reached 2.1 million in 2018, with a growth rate of about 60% year-over-year. The
International Energy Agency (IEA) has said the global EV fleet will reach about 130 million by
2030, a sharp rise from just more than 5.1 million in 2018.
Forty percent of all the EV capita is concentrated in twenty of the cities, according to a
2017 report by ICCT. The cities are-
● Shanghai, Beijing, Shenzhen, Qingdao, Hangzhou, Tianjin, Taiyuan in China
● Oslo, Bergen,

5
● Amsterdam, Utrecht, Rotterdam, Hague
● Paris,
● London,
● Stockholm,
● Tokyo,
● Los Angeles, San Francisco, San Jose and New York.
Among the countries at the forefront of EV adoption globally, China is leading with the
highest number of new EV additions to their automobile population till 2019. With North America
and Europe following behind. Multiple factors are helping in this massive EV adoption and the
impact on infrastructure and environment is also versatile. This paper will introduce them in the
relevant chapters.
Chapter 2.2 : EV Adoption and User Behavior
In EV adoption as a personal vehicle on mass level, customer attitude towards the low
emission cars is a critical issue. Ajzen’s Planned Behavior Theory (TPB) (1991) explains
consumer behavior as a combination of values, beliefs, intentions, and attitudes. According to the
TPB, an individual will consider the alternatives and evaluate their outcomes based on their beliefs
relating to the actions and their effects when given a choice. The behavior in this case is the
indicator of the belief. Using this TPB theory, findings of different relevant studies can be
connected to the economic benefits and regulations present for the car buyers. Choo et al. (2004)
found that the customers are influenced by the ‘economic and regulatory environments, vehicle
performance and application and the existing fuel/road infrastructure’. On the other hand, this
behavior can be complex and dependent on multiple other factors. And different social–
psychological models can be able to explain them to some extent, if not completely (Lane and
Potter, 2007).
Electric vehicles on the other hand are still a new research topic in customer behavior
analysis. The novelty and uncertainty in EV life cycle cost analysis is one of the main deciding
factors in mass level adoption. Available literature found that the potential EV customers consider
different aspects like fuel costs, Vehicle Registration Tax and Carbon dioxide emissions decrease
while selecting electric cars as personal travel mode (Caulfield et al., 2010 ; Lane and Potter, 2007).

6
Bakker et al. (2012) found safety as well as the above-mentioned factors as the most observed
reasons for people choosing electric cars. Technology, money, tax and other benefits, social
environment as well as environmental improvement and employers providing extra benefits to the
EV owners, came to the forefront in a study conducted on the European electric car buyers recently
(New Motion Survey, 2020).
Though the monetary and environmental aspects were identified as influencing factors in
electric car buying, the issue is not always entirely clear to the consumers. In some cases, many of
them assumed that the alternative fuel vehicles were less dangerous than their fossil fuel
counterparts (Shell, 2004). Tesla, one of the leading electric car manufacturers, published data
about one vehicle fire for every 205 million miles traveled for their models in the USA for the
period of 2012 to 2020. This number is low compared to at least one vehicle fire for every 19
million miles traveled by conventional vehicles for the same time period as per the data provided
by the National Fire Protection Association & U.S. Department of Transportation (InsideEVs,
2021). Though it might be the case for this one company, in the recent years there have been
several reports of fire incidents in electric cars (CNN, 2020). There is also the issue of range
anxiety, where consumers think that hybrids have limited range and special power points to charge
them. A more recent survey has identified consumers prefer the electric cars when they do not
have to be concerned about running out of power mid journey along with the low cost of EV
operation and the driving satisfaction of these powerful cars (J.D. Power, 2021). All these factors
will keep on influencing car purchasing behavior for EV customers in the future as they are doing
now. This observation is still an ongoing process and various new issues are coming forward with
new studies.

7
Chapter 2.3 : Policy, Subsidies and Other Benefits
The relationship between policy incentives and EV adoption rate is still a topic of ongoing
research. There are multiple other variables in play while evaluating the impact. Different groups
of people might have different reactions to the policy. Most of the existing literature has tried to
understand the impact of EV friendly policies from only one particular policy or incentive. Zhang
et al. (2011) found a positive impact of policies on EV adoption overall. Bakker and Trip (2013)
identified some EV friendly policies which will help effective promotion of EVs in the urban
environment. Some of the key points of their findings are direct subsidies to the consumer, or local
business and car sharing; solving charging infrastructure and free parking dilemma; accessibility
to toll-roads, congestion charge exemption, and, if applicable, on ferries; regulatory measure is the
obligation to property developers to introduce charging facilities on their property; raising
awareness by govt initiative and test drive; cooperation between different levels of government
and public – private partnership to promote electric vehicles. EV policies can be purchased-based,
or use-based (Langbroek et al, 2016).
Langbroek et al. (2016) also investigated the effect of policy incentives on EV adoption.
Their study speculated that policy incentives overall have a positive influence on electric vehicle
adoption. And advanced stages-of-change to EV-adoption increases likelihood to adopt EVs as
consumers become less price sensitive. Consumers’ intentions to be more environmentally
responsible can also vastly influence the EV adoption. Along with these positive impacts, the
policies might have some side effects too. Whitehead et al. (2015) identified the probability of
congestion due to a convenient clean vehicle purchase and unchanged travel pattern. In many
cities, incentives, for example easy license plate adoption as well as parking fee and toll exemption,
have been criticized due to their impact on the economics of the cities. Easy charging point
availability might also increase VMT (Klöckner, 2013).
Chapter 2.4 : EV-friendly Infrastructure
Electric vehicles, both BEVs and PHEVs, need a certain amount of charging to operate.
Different electric vehicles have different charging demand, which influences charging behaviors.
And the range of electric vehicles plays a very important role in the VMT of the car (Nicholas et
al., 2017b). Due to the range restriction of BEVs, low range battery charging demand occurs

8
mostly within the region and metro areas, whereas long range BEVs would need to charge on long
distance travel corridors, and fast chargers can be most useful for range extension in these cases.
(Ji et al., 2015, Neaimeh et al., 2017). Easily available chargers can increase VMT and reduce
range anxiety (Axsen and Kurani, 2013, . Dong et al., 2014, He et al., 2016).
The chargers used for EVs can be classified as Level 1: the slowest charger found at
residential buildings; Level 2 : 208–240 V, medium charger with multiple range of charging and
can be found at home or public locations and DC fast chargers : the fastest charger found at the
fast-charging facilities with high power demand (Idaho National Laboratory, 2015). Charger
availability and charging behavior depend on geographic location, driver awareness, and driver
willingness to use the chargers (Tal et al., 2013)
Despite EV adoption, many consumers are not well aware of the charging system. (Axsen
et al., 2017). But there is a pattern observed among the consumers. While most charging occurs at
home, some of them occur at work, followed by DC fast and public locations. (California Air
Resources Board, 2017). Some studies found that the 3.4 ~ 8.3% of PEV journeys need the public
chargers, covering 30% to 40% of the VMT (Figenbaum and Kolbenstvedt, 2016).
The cost component of the charging also influences the charging behavior. Level 1
infrastructure has lower cost, making them most affordable and most available among the chargers
(Dong et al., 2014). On the other hand, costly DC chargers attract more customers when free to
use them rather than their counterpart home chargers. (Nicholas et al., 2017). Consumers with
BEVs will feel more comfortable charging at home and install the relevant facilities at their
residences, PHEV users might avoid doing so and charge at public chargers as they have the
alternative fuel mode. (Tal et al., 2013) But there are some drawbacks of uncontrolled charging. It
can increase load at the peak hour if not given the lower off-peak charging rate to the EV users
(Azadfar et al., 2015) Smart charging should also be implemented to avoid straining the grid (
Garcia-Villalobos et al., 2014). Overall, more infrastructure will increase the EV purchase as there
will be more charging facilities (Graham-Rowe et al., 2012). But this has to be done in a strategic
way to avoid the negative impact.

9
Chapter 2.5 : Environmental Cost of EV Adoption
Energy efficiency and positive environmental impacts are the most prominent selling
points of EVs. EVs can reduce fossil fuel consumption, which are one of the most degrading
elements for the environment. An EV is more energy efficient in the lifecycle analysis and the
energy consumption is approximately 44% less than the conventional vehicles (Xiao et al., 2019).
Electric vehicles can reduce the air and noise pollution in the cities (Brady and O’Mahony, 2011,
Hawkins et al., 2013).
While EVs do not emit harmful gases, there is a hidden cost for them which can offset the
positive impact. They can be identified as the battery production emission (Bater 2018) [Chapter
2.5.1], and battery-end life pollution [Chapter 4.2.7]. The cost of energy production can also be
taken as a hidden cost for Electric Vehicles. Kawamoto et al. (2019) suggested that the emission
reduction by EVs depends on the regions, power mix and battery production system.
Understanding these issues simultaneously is necessary in EV planning.
2.5.1. Battery Life
The lithium-ion battery introduction to the vehicles is a progress towards
sustainable transportation (Casals et al., 2017). The battery is efficient, and there is no
tailpipe emission, but is the life cycle considerably emission free? Many researchers have
asked the same question. The energy production source used to power the whole process
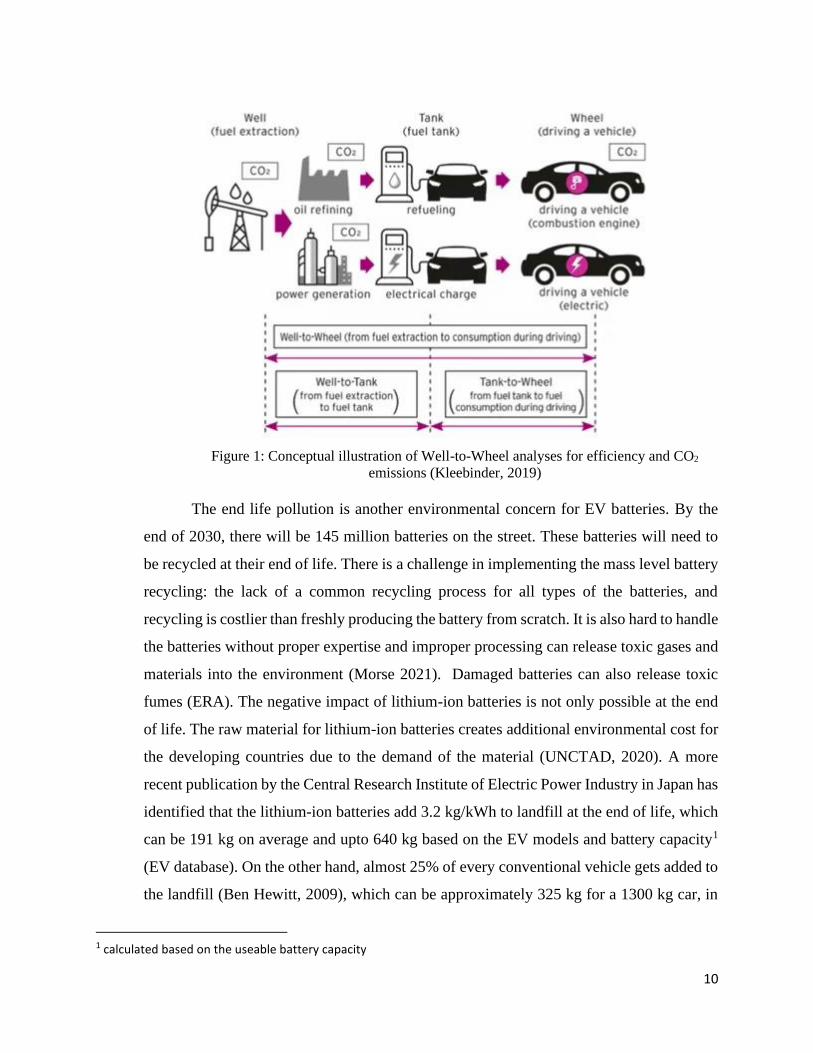
during the well-to-tank, (Figure 1) can be a major source of large carbon footprint (Bradley
and Frank 2009). The production phase of the electric car also has a 50% more carbon
footprint, and the battery part is responsible for almost 80% of it (Helms et al. 2010;
Campanari et al. 2009).
10
Figure 1: Conceptual illustration of Well-to-Wheel analyses for efficiency and CO2
emissions (Kleebinder, 2019)
The end life pollution is another environmental concern for EV batteries. By the
end of 2030, there will be 145 million batteries on the street. These batteries will need to
be recycled at their end of life. There is a challenge in implementing the mass level battery
recycling: the lack of a common recycling process for all types of the batteries, and
recycling is costlier than freshly producing the battery from scratch. It is also hard to handle
the batteries without proper expertise and improper processing can release toxic gases and
materials into the environment (Morse 2021). Damaged batteries can also release toxic
fumes (ERA). The negative impact of lithium-ion batteries is not only possible at the end
of life. The raw material for lithium-ion batteries creates additional environmental cost for
the developing countries due to the demand of the material (UNCTAD, 2020). A more
recent publication by the Central Research Institute of Electric Power Industry in Japan has
identified that the lithium-ion batteries add 3.2 kg/kWh to landfill at the end of life, which
can be 191 kg on average and upto 640 kg based on the EV models and battery capacity1
(EV database). On the other hand, almost 25% of every conventional vehicle gets added to
the landfill (Ben Hewitt, 2009), which can be approximately 325 kg for a 1300 kg car, in
1 calculated based on the useable battery capacity

11
turn contributing to landfill GHG emission. The recycling of the battery will use 2.8 to 11.2
kg-CO2/ kWh depending on the material recovery option (Ishihara et al. 2020). Another
study by Aichberger et al. (2020) found that recycling can reduce 20 kg CO2-eq/kWh in
the total lifecycle of EV batteries. Therefore, the battery recycling and disposal leads to a
waste management problem and a source of sustainable material extraction opportunity.
Chapter 3: METHODOLOGY
Electric vehicles, though have been a consideration for sustainable transportation mode and
mass produced since the mid nineteen nineties (Quiroga, 2009), still lack some comprehensive
analysis on the key factors. In the existing research on electric vehicles (specifically electric
passenger cars) adoption, the interrelationship between infrastructure, environment and policy and
public interest in EV adoption have not been observed holistically so far. Multiple research have
been conducted by several organizations, both academic and business entities, on these issues. But
most of them have concentrated on one or two of the aspects like consumer behavior, policy
components, infrastructure or environmental impacts of electric vehicles due to the comparative
novelty of the sector and lack of enough data. The geographic extent of the observation also
focused on certain countries or one or two cities, except for some sporadic publications from
organizations like the International Council on Clean Transportation.
This research is designed to have a comprehensive look at the current global scenario,
concentrating mostly on the American and European cities, in the EV adoption. The main aim of
the research is to investigate how different infrastructure and incentive policies influence the EV
adoption rate and resulting positive environmental impacts in the 16 cities. Different cities have
taken different measures and this research is an effort to observe them through a comprehensive
lens rather than analyzing them separately.
To achieve the goal of this study, a mixed method for research was adopted. As the topic
is still evolving, following a method that can provide the flexibility of analysis is most suitable for
this research. In general, the research followed a modified exploratory sequential method, Creswell
et al. (2018) explained the process as “three-phase exploratory sequential mixed methods is a
design in which the researcher first begins by exploring with qualitative data and analysis, then
builds a feature to be tested (e.g., a new survey instrument, experimental procedures, a website,

12
or new variables) and tests this feature in a quantitative third phase.” An initial qualitative phase
of data collection and analysis used case studies on the selected cities, followed by a quantitative
data collection and analysis phase. In the final phase, the two strands of data were integrated to
observe the correlation between the two parts. For understanding the topic of electric vehicle
adoption and the relationship between policy and infrastructure, the first step in this study was to
identify the cities, who have adopted EVs on a large scale along with a growing market share of
the new electric vehicles. The next step is conducting case study-based observation in those 16
global cities2 to comprehend the EV ready policies and scenarios [Chapter 4] and observing them
through both descriptive and statistical lens with the help of the cost of ownership and
environmental impact analysis. The second part is built on the information collected in step one
and worked on understanding the interrelationship among the selected variables (which will be
introduced in Chapter 4.1) quantitatively through statistical analysis. The process of analysis and
literature base will be explained in the relevant parts of the paper. The rationale behind choosing
the sixteen locations is their rapidly rising electric vehicle ownership. The main data sheet in Excel
was built based on the characteristics represented through the case studies and ideal EV policies
and Infrastructure scenarios observed in different countries as well as the literature reviewed
throughout the process.
2 USA = Seattle, San Francisco, Los Angeles, San Jose, New York ;
Norway = Oslo, Bergen ; UK = London; Germany = Berlin, Munich; Sweden = Stockholm; Netherlands = Amsterdam ; France = Paris ; China = Shenzhen, Beijing; Japan = Tokyo.
13
Chapter 4: STUDY DESIGN:
Different elements of EV adoption need to be observed as a whole. To connect the dots in
explaining the current scenario, the following research questions are addressed.
a. Which EV friendly cities are chosen globally; those are known for their high EV
adoption rate?
Specifically, cities which have already adopted Electric vehicles on a large scale. These
cities are spread all over the world, but concentrated mostly in Europe and some American
states, like California and New York. If the EV market share doubles every two years, it
will have 16% market share in 2025, and 64% in 2029. Even if the growth is half that rate,
plug-in vehicles will become 32% of new vehicle sales within the decade.(IHS Markit,
2021) For the convenience of selecting the target cities, the International Council on Clean
Transportation (ICCT) 2019 ranking for EV market share was followed as a starter. The
ranking was conducted based on the new vehicle share; not total EV adopted in the city.
But this is a good indicator which cities will have a large share of electric vehicles in a
decade. In addition, among the Chinese cities, only Beijing and Shenzhen were taken for
evaluation due to lack of transparent and available data on other Chinese cities. From the
American context, Seattle, with local vehicle share of 12% inside the US and global share
of 0.9% (ICCT 2020, SeattlePI 2020), Washington was added from outside the list as an
emerging EV friendly city in North America.

14
Figure 2 : EV market share in 14 selected cities (excluding Berlin and Munich) (ICCT, 2019; Seattle PI,
2020)
The German cities, Berlin, and Munich were selected based on the report by CleanTechnica
(2020) on the global EV share in different countries, where Germany showed a substantial
volume of BEVs and PHEVs (approx. 6% and 13%) among the EV friendly countries.
The cities selected for the final analysis are,
● The USA: Los Angeles, San Francisco, San Jose, New York, and Seattle.
● Europe: Oslo and Bergen in Norway, Berlin and Munich in Germany, London from
the UK, Paris in France, Stockholm from Sweden and Amsterdam in the
Netherlands.
● Asia: Shenzhen and Beijing in China, and Tokyo in Japan.
b. How is consumer behavior in different cities getting affected by different
components, like policy and infrastructure, in case of EV adoption ?
The relationship between policy incentives, infrastructure and EV adoption rate is
still a topic of ongoing research. There are multiple other variables in play while
understanding the impact. Different groups of people might have different reactions to
policy and infrastructure initiatives. The cost of ownership is a good indicator why people
buy electric cars. Various reports have identified it as a major catalyst in car purchasing

15
decisions (New motion, 2020). And the cost of ownership is influenced by the tax
incentives and subsidies. Langbroek et al. (2016) investigated the effect of policy
incentives on EV adoption. And found a significant relationship between policy and EV
Infrastructure is also an important part of the EV penetration in the car market. Charging
facility and electricity availability is important for reducing range anxiety among the
potential EV buyers (Funke et. al. 2016). For evaluating this relationship different variables
are identified for the next step, which is data collection.
c. What is the environmental cost of the EV adoption in cities, are they all positive?
While EVs do not emit harmful gases through tailpipes unlike their diesel or
gasoline counterparts, there is a hidden cost for EVs which can offset the positive impact.
They can be identified as the Battery production emission and Battery end-life pollution.
The cost of energy production can also be taken as a hidden cost for Electric Vehicles.
Understanding these issues simultaneously is necessary in EV planning. To study these
impacts, this paper has identified environmental cost as a significant element in EV impact
analysis.
d. Can this impact of policy and infrastructure be analyzed statistically?
Though there are not enough literature on statistical evidence of the
interrelationship between all the policies and infrastructure on EV adoption yet, which can
be attributed to the newness of the issue and the lack of data availability, On the very last
stage, this paper aims to conduct a statistical analysis with the significant variables to
identify which components have the most significant relationship the growth of Electric
cars and users in the selected cities. The hypothesis for the statistical analysis is, ‘Electric
vehicle adoption has a statistically significant relationship with cost of ownership (TCO),
policy and charging facilities.
To answer all the questions above, the study identified four observational dimensions,
which are

16
● the cost of ownership
o influenced by policy and incentives in different cities,
● infrastructure: evaluated through the availability of public charging station or points
available,
● the environmental cost of the EV passenger car usage through the carbon footprint
analysis. (See Table 1)
Table 1 : Observation Elements in EV Friendly Cities
Observation Criteria Observation Elements
Cost of Ownership Purchase price
Depreciation of purchase price
Maintenance and Repair Cost
Insurance Cost
Fuel Cost
Incentives
Policy Tax/ Rebate
Subsidies
Parking facilities
Access to HOV/ bus lanes
Other facilities (license plate)
Charging infrastructure subsidies
Infrastructure Public Charging Stations/ points
Residential charging facilities or related programs
Environmental cost Carbon footprint in the Energy production phase
CO2 emission in the EV operation phase
CO2 emission in the battery disposal phase
Based on the criteria stated above, we collected data and analyzed the interrelationship
between the related variables descriptively and statistically, appropriate variables and calculation
process will be introduced in relevant chapters.

17
Chapter 4.1: Data Collection
The data collection stage of this research depended on the myriad of publicly available
information on the internet and already published printed sources. All the data used here are
secondary data, extracted from the internet and printed sources. The sources are mostly
government or regional databases, with some exceptions of third-party sources due to the
unavailability or accessibility in some cases. Data modified or customized will be explained in the
appropriate sections and in the relevant Appendices along with the sources throughout the paper.
The target dataset was searched based on the table presented below.
Table 2: Database Creation
Attribute Data
Socio-demographic attribute
Demographic data Population (City)
Median household numbers
Median household income
Vehicle data Total registered passenger cars (city)
Total registered electric passenger cars (city)
Vehicle miles traveled
Electric Vehicle data Most popular EV model
Average fuel economy (kWh / 100 miles)
Non-Electric vehicle data Most popular gasoline car model
Average fuel economy (gallons / 100 miles)
Total Cost of Ownership (TCO)
Electric Vehicle Median purchase price (based on most popular model)
Resale price (based on most popular model)
Depreciation (for 3 years based on car model and annual 10,000 miles of
driving mileage),
Maintenance cost (average for the model selected)
Total fuel cost (charging cost)
Tax
Subsidies
Insurance cost
Non-Electric vehicle Median purchase price (based on most popular model)
Resale price (based on most popular model)
Depreciation
Maintenance cost (average for the model selected)
Total fuel cost (gallons)
Tax
Insurance cost
infrastructure Total Public Charging Stations/ points in the city
Residential charging facilities availability and type
Energy Total energy usage in the city

18
Total energy usage in the EV charging
Environmental cost Energy sources in the selected sixteen cities
CO2 emission from energy sources
CO2 emission by EVs (BEV and PHEV)
Battery disposal facility
Policies Existing programs
Target year and target level of electrification
National, state and city-based subsidies
Tax cuts, rebates, and credits, both the monetary amount and existence of the
provision in the EV initiatives in the cities.
Parking fees, tolls, and congestion fees exemption
Access to HOV/ bus lanes
Incentives for the residential chargers
Other facilities (license plate etc.)
Chapter 4.2: DATA ANALYSIS APPROACH:
Based on the data extracted in the Data Collection phase, this research followed the analysis
process derived from multiple literature sources. In some places, the analysis was customized to
accommodate the updated data due to the constantly changing nature of the information available
in different platforms. The most common modification is conducted to adjust the regional and
metropolitan data to city-based calculation. Some information on two Chinese cities, Beijing and
Shenzhen, needed the customization due to data asymmetry observed there. For example, in China,
the household level income for the cities is not publicly available. While inputting data in the data
sheet, we considered the median income for individuals in the city and calculated the median
household income based on total household size. The lack of vehicle miles travelled data was also
observed during data collection for China. This research used 2008 country based VMT data for
all the cities to ensure data similarity. In some European cities, like Oslo, Bergen, London and
Stockholm, the charger availability data was found to be different in different sources. In those
cities, we assumed the data on chargers per million population in the ICCT report to be acceptable
and the total charger number was calculated based on that value and total EVs in the city. The
other adjustments are explained in the relevant Appendices.
The formula and data analysis process followed throughout the paper is introduced in the
subsections here. Final analysis and findings will be presented in Chapter 5.
19
4.2.1. City Demographic and Economic Profile:
The demographic and economic profile of the selected cities are very important in
understanding the vehicle electrification process in the urban context. Transportation is the
second largest cost incurring component in a household level after housing. In the USA,
the cost is almost 50% of the total household expenditure for families earning less than
$25,000 annually. The percentage gradually decreases with the rise in income, with median
income households spending 16% of their income and higher income households spending
less than 10%. (ICCT, 2021; U.S. Bureau of Labor Statistics, 2020). Understanding the
correlation between the household median income and total cost of EV ownership in the
selected cities is important for unbiased evaluation of the scenario.
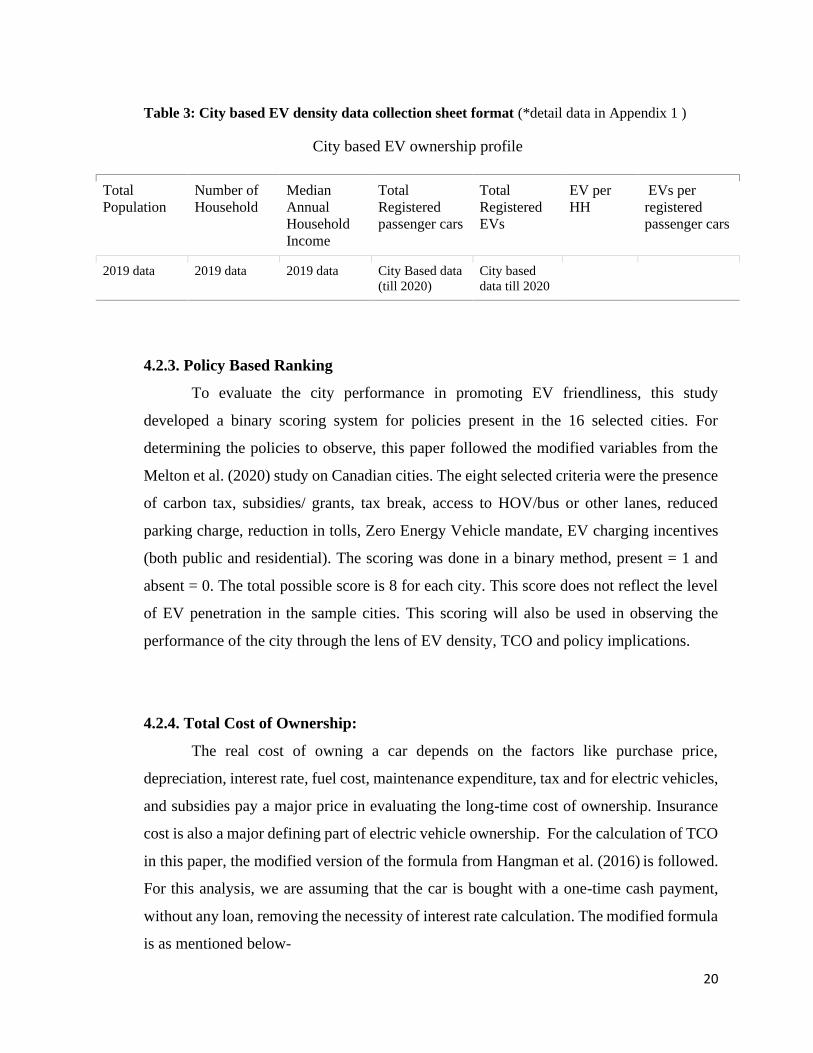
4.2.2. EV ownership Profile of the Cities:
The percentage of EV by household is an important indicator for evaluating electric
car penetration as a private mode of transportation in the urban households and future
demand of the other relevant facilities this will create (Farkas et al., 2018). The per capita
electric car ownership depends on the growing market share of EVs in different regions
and also on charger density and energy demand (Wang et al. 2019).
For better understanding of the process, this paper created the two variables for EV
availability on household level and EV concentration in registered cars. The city-based EV
ownership data compilation was done using the table presented below.
20
Table 3: City based EV density data collection sheet format (*detail data in Appendix 1 )
City based EV ownership profile
Total
Population
Number of
Household
Median
Annual
Household
Income
Total
Registered
passenger cars
Total
Registered
EVs
EV per
HH
EVs per
registered
passenger cars
2019 data 2019 data 2019 data City Based data
(till 2020)
City based
data till 2020
4.2.3. Policy Based Ranking
To evaluate the city performance in promoting EV friendliness, this study
developed a binary scoring system for policies present in the 16 selected cities. For
determining the policies to observe, this paper followed the modified variables from the
Melton et al. (2020) study on Canadian cities. The eight selected criteria were the presence
of carbon tax, subsidies/ grants, tax break, access to HOV/bus or other lanes, reduced
parking charge, reduction in tolls, Zero Energy Vehicle mandate, EV charging incentives
(both public and residential). The scoring was done in a binary method, present = 1 and
absent = 0. The total possible score is 8 for each city. This score does not reflect the level
of EV penetration in the sample cities. This scoring will also be used in observing the
performance of the city through the lens of EV density, TCO and policy implications.
4.2.4. Total Cost of Ownership:
The real cost of owning a car depends on the factors like purchase price,
depreciation, interest rate, fuel cost, maintenance expenditure, tax and for electric vehicles,
and subsidies pay a major price in evaluating the long-time cost of ownership. Insurance
cost is also a major defining part of electric vehicle ownership. For the calculation of TCO
in this paper, the modified version of the formula from Hangman et al. (2016) is followed.
For this analysis, we are assuming that the car is bought with a one-time cash payment,
without any loan, removing the necessity of interest rate calculation. The modified formula
is as mentioned below-
21
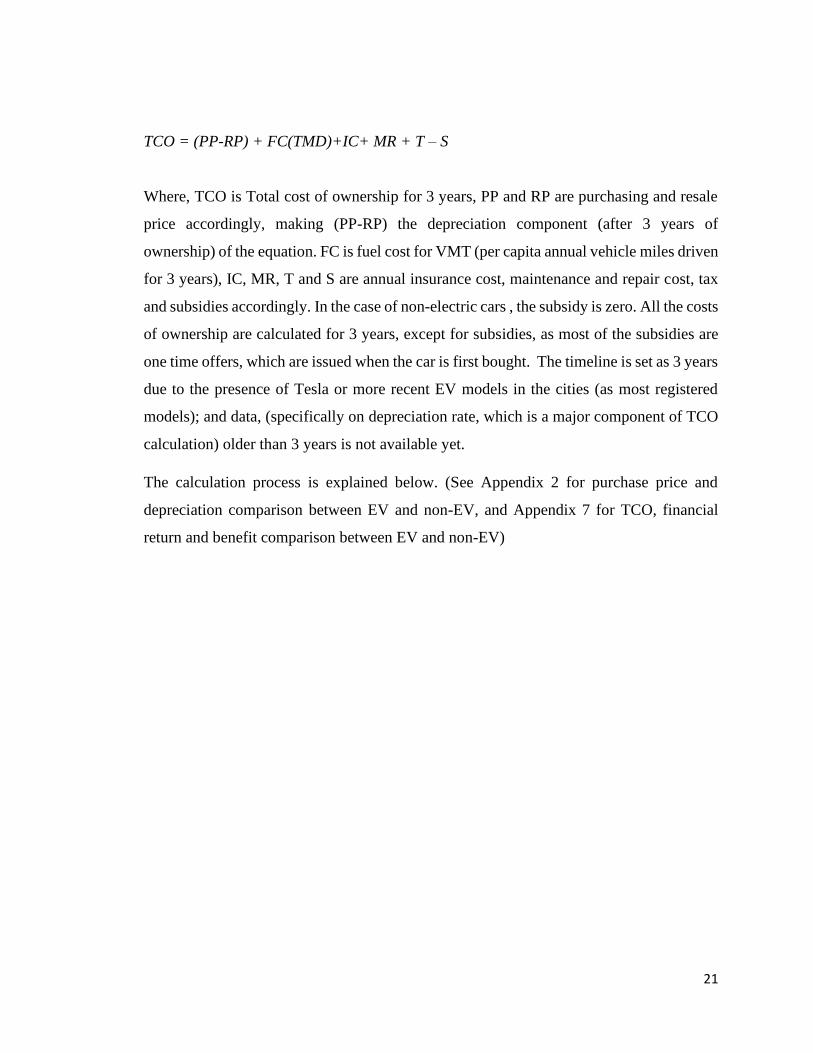
TCO = (PP-RP) + FC(TMD)+IC+ MR + T – S
Where, TCO is Total cost of ownership for 3 years, PP and RP are purchasing and resale
price accordingly, making (PP-RP) the depreciation component (after 3 years of
ownership) of the equation. FC is fuel cost for VMT (per capita annual vehicle miles driven
for 3 years), IC, MR, T and S are annual insurance cost, maintenance and repair cost, tax
and subsidies accordingly. In the case of non-electric cars , the subsidy is zero. All the costs
of ownership are calculated for 3 years, except for subsidies, as most of the subsidies are
one time offers, which are issued when the car is first bought. The timeline is set as 3 years
due to the presence of Tesla or more recent EV models in the cities (as most registered
models); and data, (specifically on depreciation rate, which is a major component of TCO
calculation) older than 3 years is not available yet.
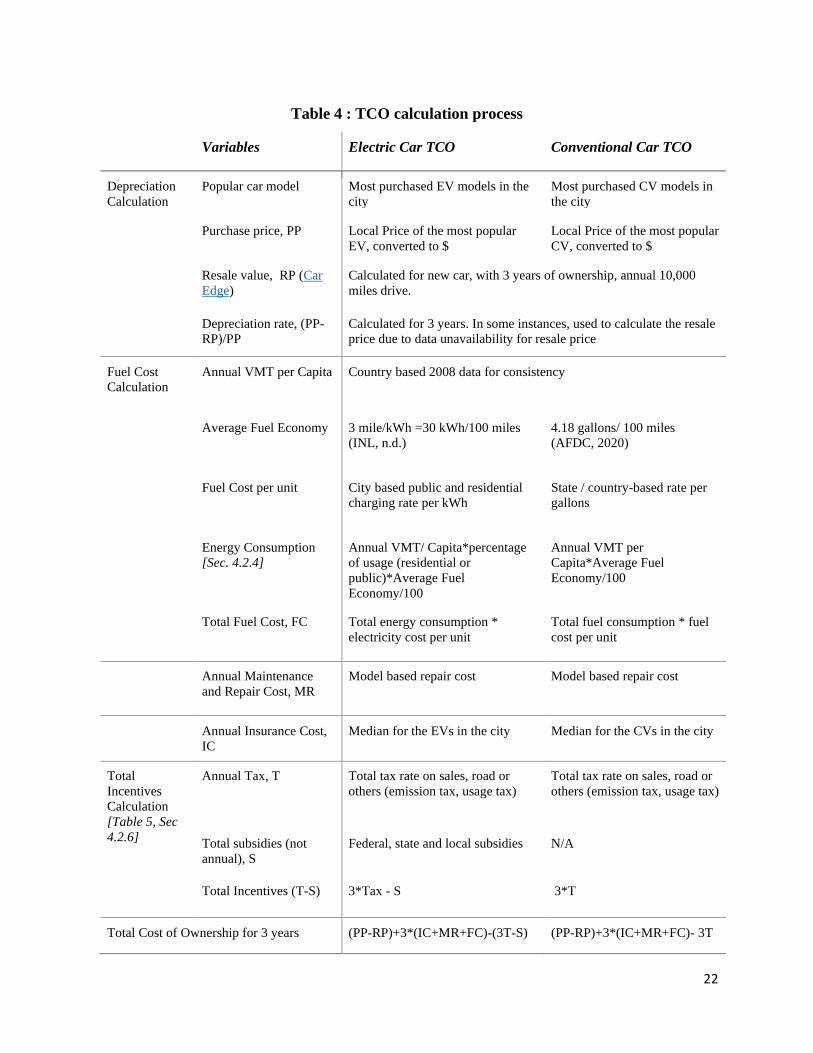
The calculation process is explained below. (See Appendix 2 for purchase price and
depreciation comparison between EV and non-EV, and Appendix 7 for TCO, financial
return and benefit comparison between EV and non-EV)
22
Table 4 : TCO calculation process
Variables Electric Car TCO Conventional Car TCO
Depreciation
Calculation
Popular car model Most purchased EV models in the
city
Most purchased CV models in
the city
Purchase price, PP Local Price of the most popular
EV, converted to $
Local Price of the most popular
CV, converted to $
Resale value, RP (Car
Edge)
Calculated for new car, with 3 years of ownership, annual 10,000
miles drive.
Depreciation rate, (PP-
RP)/PP
Calculated for 3 years. In some instances, used to calculate the resale
price due to data unavailability for resale price
Fuel Cost
Calculation
Annual VMT per Capita Country based 2008 data for consistency
Average Fuel Economy 3 mile/kWh =30 kWh/100 miles
(INL, n.d.)
4.18 gallons/ 100 miles
(AFDC, 2020)
Fuel Cost per unit City based public and residential
charging rate per kWh
State / country-based rate per
gallons
Energy Consumption
[Sec. 4.2.4]
Annual VMT/ Capita*percentage
of usage (residential or
public)*Average Fuel
Economy/100
Annual VMT per
Capita*Average Fuel
Economy/100
Total Fuel Cost, FC Total energy consumption *
electricity cost per unit
Total fuel consumption * fuel
cost per unit
Annual Maintenance
and Repair Cost, MR
Model based repair cost Model based repair cost
Annual Insurance Cost,
IC
Median for the EVs in the city Median for the CVs in the city
Total
Incentives
Calculation
[Table 5, Sec
4.2.6]
Annual Tax, T Total tax rate on sales, road or
others (emission tax, usage tax)
Total tax rate on sales, road or
others (emission tax, usage tax)
Total subsidies (not
annual), S
Federal, state and local subsidies N/A
Total Incentives (T-S) 3*Tax - S 3*T
Total Cost of Ownership for 3 years (PP-RP)+3*(IC+MR+FC)-(3T-S) (PP-RP)+3*(IC+MR+FC)- 3T

23
4.2.4.a. Depreciation Calculation:
Depreciation is a major part of total ownership cost calculation. For a typical new
vehicle bought, the depreciation rate is almost 48% in five years (Hagman, 2016). This cost
depends on the purchase price and resale price over a certain period of time. For this study,
the depreciation period is taken as three years and based on the purchase price and average
annual mileage of 10,0003 miles, the depreciation is calculated.
4.2.4.b Fuel Cost Calculation:
Fuel cost comprises almost one-fourth of the total cost of ownership (Hagman,
2016). For EVs, the fuel cost is calculated both for residential and public chargers. Most
of the charging (80%) are done at home (Office of Energy Efficiency & Renewable Energy,
n.d.). The average fuel economy is considered as 30 kWh/ 100 miles (Idaho National
Laboratory). The average fuel economy is considered for standardized results in all cities,
only with the VMT and per unit cost as the variable. .
Annual charging cost at home = 80% * Residential energy cost per unit (per kWh) *
Average fuel economy (30 kWh/ 100 mile) * VMT
Annual charging cost at public station = 20% * Public energy cost per unit (per kWh) *
Average fuel economy (30 kWh/ 100 mile) * VMT
Total cost of annual charging = Annual charging cost at home + Annual charging cost at
public station
For non-EVs, the fuel cost is calculated based on the average fuel economy of 4.13
gallons/ 100 miles (US Department of Energy, 2020). The fuel costs per gallon are city
3 The highest average VMT in all three regions is 9,555 miles (Asia) annually. The closest rounded mileage is
considered. See Appendix 3
24
based for the US, but some of the European and Asian fuel costs are collected on a country
level due to the data availability publicly.
Total fuel cost = Gasoline cost per unit (per gallons) * Average fuel economy (4.13 gallons
/ 100 mile) * VMT
4.2.4.c. Insurance cost and maintenance and repair cost:
Insurance is another major component of TCO after fuel cost. Insurance depends
on location and personal factors, in the USA, a credit score can significantly affect the
insurance rate (Bank rate, 2020). For this research, the average cost of insurance is
calculated for the countries. Insurance for electric cars is typically higher than the non-
electric counterpart, except in some cases. Taking this into consideration, the insurance
cost for electric and non-electric versions of the cars are calculated separately for three
years. In some countries, like Japan, insurance can be both the liability (mandatory) ones
along with optional insurance (Supermelf, n.d.). For the consistency of the analysis, only
liability/ mandatory insurances are considered in most cases. For maintenance and repair
cost, an average cost for the car model is used for calculation.
4.2.4.d. Tax and subsidies:
In car ownership cost, tax continues to have a larger impact over the years. And in
the case of electric cars, the introduction of tax rebates, credit and subsidies (grant or
benefits) can substantially offset the total cost of car operation over the years. For tax
calculation in different cities in the USA, the state tax rate and relevant fixed taxes like
road tax, user tax etc. are considered. In the case of other cities, country-based tax rates are
taken into consideration. For electric vehicles, the total reduced tax along with subsidies
are counted towards the final tax calculation. The table below is a list of taxes to be paid
as well as available rebates, subsidies, and incentives on passenger EVs in the sample cities.
For the calculation process, only car purchase is considered, leasing or used car scrapping
is not included.

25
Table 5: Tax and Subsidies available in the sample cities
City Electric Cars Conventional Cars
Tax Federal / National
Subsidy/ Incentives
State Subsidy/ Incentive City Subsidy/ Incentive Tax
Seattle $150 road tax $7500 tax credit N/A N/A 10.1% local tax + $54
registration fee
Los Angeles $100 road tax $7500 tax credit California Clean Fuel
Reward (CCFR) = $1,500
Clean Vehicle Assistance
Program (CVA Program) =
$ 2500
California Clean Vehicle
Rebate Project (CVRP) =
$800
$450 9.5% local tax
San Francisco $100 road tax $7500 tax credit Clean Cars for All (for
low-income residents4) =
$9500
8.5% local tax
San Jose $100 road tax $7500 tax credit San Jose Rebate = $3000 9.25% local tax
New York $61 registration
fee
$7500 tax credit The Drive Clean Rebate =
$2000
N/A 4.5% sales tax + $25
license plate fee + $50
certificate fee + annual
fees ( $140 weight-based
registration fee + use tax
$15 + $25
MCTD fee)
Oslo 100 % use tax
sales and
N/A N/A N/A 25% Vat+ Carbon
Emission Tax
4 Income based incentives are not included in the final calculator due to the inconsistency with the other cities.

26
Bergen emission tax
exemptions
Calculated from The
Norwegian Tax
Administration
London 100% emission
tax exemption
"Purchase grant: up to
35% purchase price (
£3,500 max.)
N/A N/A 20% Vat+ £140 + CO2
emission tax
Calculated from Vehicle
Certification Agency
Amsterdam 100% tax
Exemption
Calculated from
Transport
Styrelsen
Purchase/ Lease Grant :
1. New EV = 4,000 euro
2. used EV = 2,000 euro
N/A N/A Weight tax+ CO2 emission
tax + Diesel surcharge.
Calculated from Transport
Styrelsen
Stockholm Bonus Malus
scheme: 60,000
SEK (€6,000)
for up to 25%
of the car’s
purchase price
(new)
Supermiljobilspremie:
•SEK 20,000: Vehicles
with CO2 emissions
between 1-50g/km (plug-
in hybrids)
•SEK 40,000: Vehicles
with zero CO2 emissions
(electric vehicles)
N/A N/A 25% Vat + $236 annual
tax
Berlin Kfz-Steuer
(motor vehicle
tax) 10-year
exemption
Umweltbonus: For
vehicles priced up to
€40,000:
BEV: €9,000
PHEV: €6,750
For up to €65,000:
BEV: €7,500
PHEV: €5,625
N/A N/A 19% Vat + Annual Carbon
Tax + Weight Tax
Calculated from kfz-
steuer.wiki Munich

27
Paris Carte-Grise
€43
Purchase Grant : €7,000
based on CO2 emission
rate
Conversion bonus : Up to
€5,000
N/A N/A car registration fees €300 +
regional tax €46 + €818
Tokyo Exemption of
Shaken or
mandatory tax
Subsidy of ¥850,000 N/A additional subsidy of
approx. ¥330,000
Annual vehicle tax
¥30,000 ~ ¥80,000 +
Weight Tax ¥10,000 ~
¥80,000
Shenzhen 100% tax
exemption
RMB 10,000
(approximately $1,500) to
RMB 25,000
(approximately $3600)
N/A N/A 10% purchase cost +
$13000 license plate cost
Beijing 100% tax
exemption
N/A N/A
*Appendix 6 has details of the whole process. Relevant sources in Table 5 are added to the reference section and in the appendix 6.

28
4.2.5. Parking and Toll cost:
Parking charges control travel mode choice to a significant extent, and higher
parking charges can reduce the demand for car travel (Ding and Yung, 2020). Parking cost
has a significant impact on EV adoption. INRIX, an international transportation
consultation organization, found parking charges as a major cost incurring sector in car
ownership using the two-hour parking cost analysis within one mile of the city centers.
They conducted an analysis on the parking cost in three countries globally. The summary
result indicated that, on average, drivers pay $1304 annually only for parking.
As there is a wide variance in the parking cost analysis process and the scope is
limited in this study for observing the scenario in detail and accurately, a simple descriptive
analysis is conducted for this part. The basis for this analysis is to observe the variance in
annual parking cost for both EVs and non EVs in comparison with the global average.
For the annual parking cost calculation process, we considered only the on-street
parking. For this, we assumed that the on-street parking for the vehicles, both EV and non-
EV, would be available for two hours based on the parking regulation in most sample cities
and both the EV and non-EV driver will use the parking space at the same time and day.
This time limit can vary as long as four to five hours in some cases but based on the
regulations in the majority of the cities considered, it is counted as two hours on average
for two hundred sixty-one weekdays annually.
Annual Parking Cost = Hourly street parking rate on average * 2 hours * 261
workdays
Tolls are also a major cost for car drivers annually. The reduction in toll price or
access to HOV or bus lanes inspire potential EV buyers to select electric cars as their travel
mode (2020). As toll rates vary greatly in different cities, for the consistency of the
evaluation process, this study will use a binary method for indicating the presence or
absence of toll exemption in the 16 cities. Not all the cities have tolled highways. Germany
and Amsterdam do not have any toll roads anymore, except for some tolled bridges and
tunnels. Exemption on these bridges will be considered for evaluation in this study as those

29
bridges are part of the transportation network the EV users have to traverse for travel
purposes.
4.2.6. Charging facility:
Charging infrastructure is a major part of the EV scheme. Easy and available
charging points are the key to reducing the range anxiety of the EV drivers. The chargers
are classified as Level 1: the slowest charger found at residential buildings; Level 2: 208–
240 V, medium charger with multiple range of charging and can be found at home or public
locations and DC fast chargers : the fastest charger found at the fast-charging facilities with
high power demand (Idaho National Laboratory, 2015).
In the data collection phase, this research looked into the public charging points
available in the target cities. But in most cities the data on the number of Level 2 and DC
fast chargers are not publicly available. In those cases, the information from the ICCT
report from 20205 is used to find electric vehicles per charging point in the cities. Based on
those numbers, households per charging point and chargers per million people is calculated
(Chapter 5.6 for Infrastructure and the Public Charging points, Table 18 for EV Charger
Availability in the Selected City and Appendix 13 for sources).
5 Assumed from the graph presented on the report

30
4.2.7 Environmental cost:
In EV operation, the emission is mostly from the energy generation, which can be
calculated through the well-to-wheels (WTW) analysis (Liu. 2020, Xinyu. 2021) and the
non-electric miles driven by the PHEV and conventional vehicles. For BEV, the per mile
CO2 emission through the tailpipe is calculated to be zero, and 0.29 lb/ mile for non -
electric miles of PHEV. For non-electric miles of conventional vehicles is 0.48 lb/mile
(National Renewable Energy Laboratory, 2016). The emission from energy production
(Well-to-pump) is calculated using the coefficient from the GREET model. The list below
shows the coefficients used in this paper.
Table 6: CO2 emission coefficient from GREET model
Fuel Type Co2 Emissions (lb. per kWh)
Coal 2.23
Natural Gas 0.97
China Mix 1.59
CA mix 0.44
Japan mix 1.28
Nuclear 0
Wind 0
Solar 0
Water (Reservoir Hydropower) 0
For estimating a total annual carbon footprint of electric cars, the calculation is
divided into two parts: energy related emission and tailpipe emission.
Emission from energy sources = total energy used by the electric cars * {(percentage of
coal * 2.226 lb/ kWh) + (percentage of natural gas * 0.97 lb/ kWh) + (percentage of zero
emission of fuel * 0 lb/ kWh)}
For California, Japan and China, the respective Well-to-Tank emission rates are
used for calculation. The power mix varies greatly in different cities. For example, San
Jose Clean Energy and Pacific Gas & Electric both supply electricity in San Jose. But they
have different renewable and non-renewable sources, and it is not possible to identify
which EV charger is using which power source. To adjust the difference, the standardized

31
value of 0.44 lb CO2 emission per kWh electricity production is used for calculation rather
than calculating it from the power mix documented in Table 20 [Chapter 5.9]. Well-to-
Tank CO2 emissions for Japan and China are also derived in the similar process from the
GREET model value.
Emission from energy sources = total energy used by the electric cars * CA mix
Tailpipe emission = VMT * {(number of BEV * 0 lb/ kWh) + (number of PHEV * 0.29 lb/
kWh*300/326 miles)}
The mileage is divided by 326 as it was assumed that the electric range of the PHEV
will be 26 miles, and the non-electric mile is 300.
Dead Batteries:
For the end-of-life emission from dead batteries or cradle-to-grave carbon footprint
evaluation, this study tried to indicate if there is a recycling facility available in the city.
Due to the ongoing research on EV battery recycling and difference in carbon intensity of
different batteries, the CO2 emission is not calculated in the similar way as the WTW. For
example, the most recent study found that the disposed lithium-ion battery can add 3.2
kg/kWh to landfill without material recovery. On the other hand, the recycling can produce
2.8 kg-CO2/ kWh, which is equivalent to 2.1 kg-CO2 reduction per kWh if they were
produced from raw material (Ishihara et al., 2020). Another study by Aichberger et al.
(2020) found that recycling can reduce 20 kg CO2-eq/kWh in the total lifecycle.
This study did not use any standardized comparison for CO2 emission from dead
batteries in the cities due to the difference of CO2 emission of various types of disposed
batteries . To avoid inconsistency in data analysis, this emission or landfill addition by dead
batteries are separately evaluated based on the availability of proper recycling facilities in
the sample cities and what can be implied from the available data following the table below.

32
Table 7: Battery End of Life Possible Situation
Types of facilities available Landfill or CO2 Emission
Collection and Landfill 7.05 lb-landfill/kWh*60.5 kWh*number of EVs
Proper Recycling 6.17 lb-CO2/kWh* 60.5 kWh*number of EV
*60.5 kWh is used as an average usable battery capacity for this calculation (Electric Battery
Database)
Chapter 4.3: STATISTICAL ANALYSIS DESIGN
For the statistical analysis, the predictors will be selected during the observation phase in
Chapter 5 based on the simple correlation test. Variables with moderate values (r > 0.3) 6, will be
used to run the multiple regression analysis.
For example, if electric vehicles per 100 vehicles and EV per 100 households both had the potential
to become the dependent variable in checking the impact of policy on EV adoption through TCO
analysis, a correlation check would be conducted to find which has the highest chance of creating
a better model. Based on the rationale, the dependent and independent variables will be chosen in
the observation phase.
6 Considering r = 0.7 for significant value for sample size = 16 in social science and 0.3 to 0.7 as moderate.

33
Chapter 5: ANALYSIS AND RESULT
5.1. City Demographic and Economic Profile:
Figure 3 : Demographic and economic information of the 16 selected cities, 2019
The primary observation based on the collected data shows that the range of the median
household income of the 16 sample cities is approximately $40,000 to $110,000. The five cities in
the USA have the highest median household income ($88,000) followed by Europe ($48,000) and
Asia ($46,000). Among all the sample cities and also in Asia, Japan has the highest population and
number of households. Their median income is also the highest among the three cities in Asia
($64,000). New York, on the other hand, has the highest population as well as the number of
households among US cities selected for observation. In Europe, London is closer to New York
both in total population and households. Paris and Shenzhen have almost similar population and
household profiles.
Among the other US cities, San Francisco ($112,000) and San Jose ($109,000) have the
highest per household income. On the other hand, Oslo and Bergen, two of the high personal
income ($88,000 and $84,940) cities have considerably low median household income ($77,000)
based on available data calculation (Appendix 1). The small household size in Norway (2.1) can
be responsible for this low median household income.(OECD, 2011) The population and
households will work as a base information in extracting the variables in the calculation. The

34
interrelationship between the median income and EV density in the cities will be explored in the
later parts.
5.2. EV Profile of the cities:
Based on the analyzed data, the cities can be ranked according to the EV density in every
100 households and in every 100 registered passenger cars. While Berlin ranks highest in EV
density on household level, Oslo leads in the passenger car electrification sector. In the next
section, this will be explained in conjunction with median income.
Table 8: EV ownership rank of the sample cities
City Electric Cars per 100 HH EVs per 100 registered passenger cars
Oslo 18 87
Bergen 26 34
Paris 6 19
San Jose 33 17
Stockholm 13 16
Tokyo 7 16
Shenzhen 23 9
Amsterdam 4 8
Beijing 8 7
Munich 3 3
Seattle 4 3
Berlin 70 2
London 1 2
San Francisco 13 1
New York <1 <1
Los Angeles 8 1
35
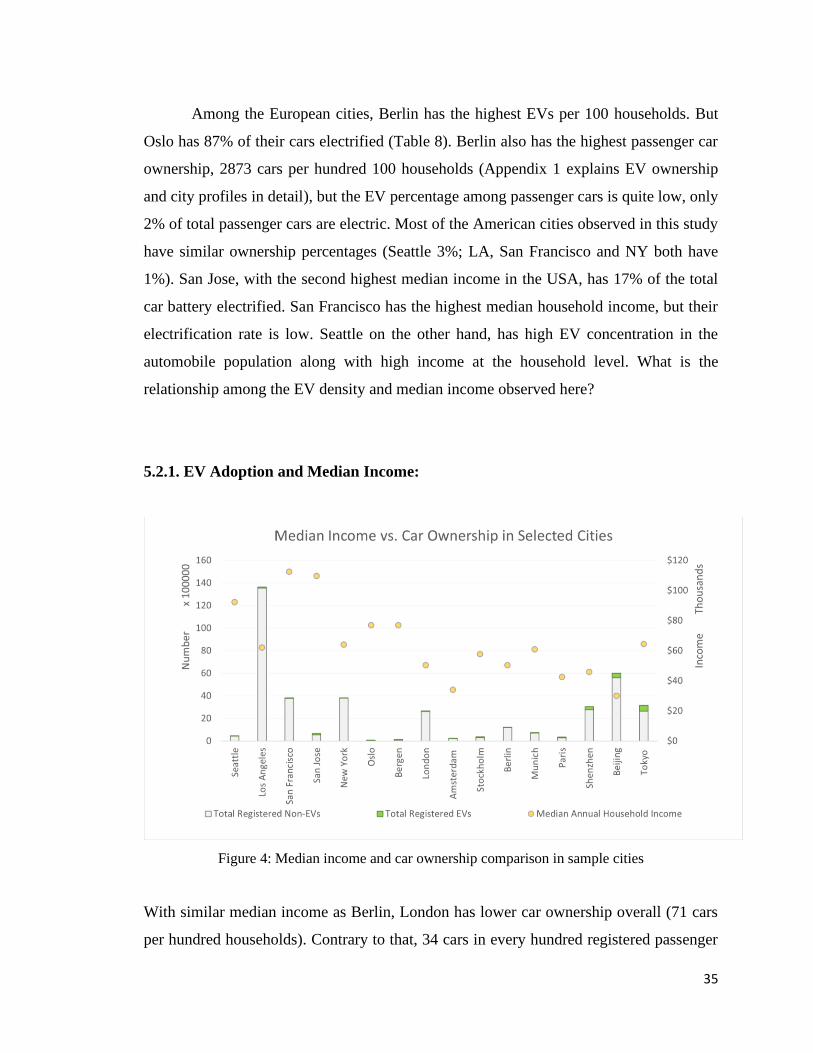
Among the European cities, Berlin has the highest EVs per 100 households. But
Oslo has 87% of their cars electrified (Table 8). Berlin also has the highest passenger car
ownership, 2873 cars per hundred 100 households (Appendix 1 explains EV ownership
and city profiles in detail), but the EV percentage among passenger cars is quite low, only
2% of total passenger cars are electric. Most of the American cities observed in this study
have similar ownership percentages (Seattle 3%; LA, San Francisco and NY both have
1%). San Jose, with the second highest median income in the USA, has 17% of the total
car battery electrified. San Francisco has the highest median household income, but their
electrification rate is low. Seattle on the other hand, has high EV concentration in the
automobile population along with high income at the household level. What is the
relationship among the EV density and median income observed here?
5.2.1. EV Adoption and Median Income:
Figure 4: Median income and car ownership comparison in sample cities
With similar median income as Berlin, London has lower car ownership overall (71 cars
per hundred households). Contrary to that, 34 cars in every hundred registered passenger

36
cars are electric in the Greater London region. The other cities in Europe have almost
similar total car ownership as London (Bergen 77, Amsterdam 50, Stockholm 77, and
Munich 89 cars per 100 households), except Paris (34) and Oslo (21). Not so surprisingly,
Oslo, the EV capital of the world, has 87% of their passenger cars electrified. This scenario
will be discussed in relation to the convenient policies available in those cities in the
coming chapters.
In the case of Asia, Tokyo has the highest median household income, but lowest
car ownership (45 cars per hundred households) compared to the selected Chinese cities (
Shenzhen 261 and Beijing 121). The ratio of passenger car electrification is also higher in
Tokyo at 16%, followed by Shenzhen (9%) with the second highest median income and
Beijing standing last in median income with 7% car electrification.
The irregular relationship between the total number of EVs and median income
presented above, while observed through a simple correlation check, (Appendix 12: TCO,
Policy Component and EV Density Linear Correlation Check) shows weak relation (r =
0.20). According to this value, in the sample cities, median household income was not
significant in electric car purchase decisions.

37
5.2.2. BEV and PHEV breakdown in the sample cities:
Figure 5: EV type and density comparison
In the sample cities, (Table 9) on average 55% EVs are BEVs, and the rest are PHEVs. A
region wise breakdown shows Asia, with the sample 3 cities having the highest percentage of
BEVs (69%) followed by the USA (48%) and Europe (37%). The highest concentration of BEVs
is in Beijing (95%), followed by Shenzhen and Seattle (75%). The concentration of BEVs in China
is partially due to the localized market and expertise the country has with auto production
(McKinsey, 2021). China’s tech city, Shenzhen, is the home to BYD, the electric vehicle company.
Along with attractive incentive packages like multiple EV registration facilities (Clean Technica,
2020) as well as aggressive electrification programs (Electrek, 2020) has led to a high percentage
of BEVs in the Chinese cities. In these cities, policies and infrastructures are also major players.
In the policy analysis result section (Chapter 5.4), this correlation will be explored in detail.
The high concentration of PHEVs in European cities is mostly due to the EU regulation to
promote low emission vehicles and their early transition to EVs. But this might change in the near
future as most European cities will stop labelling PHEVs as green vehicles (Electrive, 2021). Table
10 in Chapter 5.4.1 has listed the vehicle electrification policy initiation dates and target the cities

38
have for their phase out from the ICE to ZEV7 The information shows that Norway is one of the
earliest adopters of EV policies and China is one of the late adopters. The summary of the findings
globally and in the three different regions are presented in Table 9.
Table 9: EV Ownership Summary in the selected EV friendly cities
Average Sample Average (16) USA (5) Europe(8) Asia(3)
Total Registered EVs 1,13,422 56,108 44630 392388
Median Annual HH Income 60371 88089 48139 46791
EV per 100 HH 11 11 11 8
EVs per 100 registered passenger cars 14 4 21 11
Battery Electric Vehicle share 55% 48% 37% 69%
Plug-in Hybrid Electric Vehicle share 45% 52% 63% 31%
5.3. TCO Components Analysis:
5.3.1. Purchase Price and EV Adoption Rate Analysis Result
Figure 6: EV vs Non-EV Purchase Price (for most purchased model) comparison in sample cities
(Appendix 2)
7 ICE = Internal Combustion Engine, ZEV = Zero Energy Vehicle

39
The purchase price for the most popular conventional vehicle models is lower than most
popular EV models in all sample cities, except for Amsterdam ( -21%), where the CV
model selected has a higher price than the most popular EV model. But the rate of EV
adoption is comparatively low in that Dutch city. Among all the cities observed, Japan
showed the highest difference in purchase price (170%) between the two types of cars,
followed by Paris (127%), Stockholm (80%) and San Jose (65%). On the other hand, in
cities (Oslo 84 and Bergen 34) with the highest EV concentration in passenger cars, the EV
purchase price is 54% higher than that of the non-EV model.
From the observation, no clear relationship between EV adoption and purchase
price is found. In an effort to evaluate the situation statistically, a simple correlation check
was conducted which produced weak inverse correlation between the independent variable,
purchase price and dependent variables, total EVs in the city (r = -0.25), EV in 100
households (r = -0.18), and in 100 cars in all sample cities (r = 0.08). These values indicate
that rising EV price did not significantly influence auto users’ behavior negatively in the
sample cities but decreased the total electric cars on the city and household level. Consumer
behavior can be responsible for this, where the increasing car price means increased
expense for the urban households. And so, with the high EV price, families’ decision to
buy a new car, which might be an EV, was reflected in this value. On the other hand, for
auto users, there is a lower chance to adopt a new EV as the personal travel mode.
In another correlation analysis, the price difference between two types of cars, EV
and non-EVs, showed a different correlation with total EVs in the city (r = 0.31) and EV
density in 100 registered vehicles (r = 0.23). Based on the values, it can be assumed that
the purchase price itself did not affect the potential EV buyers significantly. But the impact,
if observed on larger sample size or in detail on different car models of wider price range,
might show significant change among consumers’ choice of EVs and the purchase price
difference among different EV models. This difference can influence consumers’
preference for a lower priced EV model than a higher priced one.
The impact of purchase price difference between EV and non-EV models, on the
other hand, is moderate. The increasing gap increased users. This can be better explained
through policy analysis. Some possible reasons might be the exemption of sales tax and

40
other incentive schemes. Due to the possibility of more benefits in the future as people are
aware of the EV friendly policies and incentives available to them, the initial purchase
price gap had a positive impact despite the common idea, a price gap increase will reduce
consumers. Import tax on the non-EV models or by reducing the vat and tax on EVs. but
greater than the change of EV use after the price decrease of EV models. The policy
analysis step along with the regression analysis will be used to better understand the
scenario in the later chapters.
5.3.2. Fuel Cost Analysis Result
*Charging cost per 100 miles is the average of 80% home charge and 20% public charging
Figure 7: Fuel Cost Comparison in EV friendly cities (Appendix 3: Annual Fuel Cost and
Appendix 4: Fuel Cost Comparison for 100-mile Drive )
Fuel cost is a very important factor in EV purchasing decisions as discussed in Chapter 2.2
and 4.2.4.b. In all the 16 cities, the charging cost for a 100-mile drive for EVs is substantially lower
than the conventional cars (Table 10), except for New York. On average the gasoline cost is $14
(245%) higher than electricity in all the selected cities. In European cities, the monetary amount is
41
the highest ($18; 263%)8, followed by the three Asian cities ($13; 277%) and the five cities in the
USA ($8; 256%).
Bergen ($25; 517%), Oslo ($20; 345%) and Amsterdam ($24; 284%) have the highest
difference in fuel costs in Europe. Norway and Netherlands, both countries are at the forefront of
EV friendly policies, which will be discussed in the policy analysis section. The high gasoline cost
can be an indicator of their inclination towards fossil fuel ban (Ausick, 2019). The cost difference
is lowest in Sweden ($14, 136%) and the two German cities ($15, approx. 152%). In Sweden, the
public charging cost is low, but home charging can be costly. On the other hand, in Germany,
electricity is the costliest (Statistica, 2021). Along with moderate gasoline price, the difference
remains lower in those two German cities.
In Asia, gasoline cost is 577% higher than electricity for a 100-mile drive in the two
Chinese cities. China, as one of the highest electricity users, has the lowest electricity price in
Shenzhen and Beijing. Gasoline prices are higher there than in the USA. The high gasoline price
and low electricity cost have an impact on the low EV fuel cost in these cities. On the other hand,
Tokyo has a similar gasoline price as China, but higher charging cost, making the cost difference
($11, 156%) lower than China, and closer to the German cities.
The USA, on the other hand, has the lowest cost difference among the three regions
considered. New York has the lowest fuel cost difference ($4, 50%). The low density of EVs in
New York (less than 1 car per 100 registered cars) might be an indication towards that. Due to the
high public charging cost from the distributor in New York (Utility Dive, 2020), and comparatively
lower gasoline price, it would become more convenient for the EV users to charge at home. Among
the other American cities, Seattle has the highest cost difference ($10; 217%), followed by San
Jose ($9; 161%) and Los Angeles ($9; 157%) and lastly, San Francisco ($7; 89%).
A correlation check (Appendix 12: TCO, Policy Component and EV Density Correlation
Check) on the number of electric cars in these 16 cities showed a low (r = -0.26), moderate (r = -
0.48) and strong (r = -0.74) inverse correlation respectively with residential, average (considering
80% residential and 20% public charge) and public charging cost per 100-mile drive; and a positive
relation with percentage difference between gasoline and fuel cost (r = 0.38). According to these
values, the number of EVs in these cities were more influenced by the public charging cost than
8 x; y = Cost difference between charging and gasoline, Percentage difference of fuel cost with charging cost.

42
the fuel cost difference particularly. With increasing public charging cost, the number of EVs
decreased. In the multiple regression analysis, the cost of public charging will be used to observe
the impact on EV density in the cities.
Table 10: Fuel Cost for EVs and Non-EVs in the selected cities
City Charging Cost
for100 mile
Gasoline cost
for100 mile
Difference in
fuel cost for EV
and non-EV
Cost difference in
percentage
(compared to
charging cost)
Seattle 5 14 10 217%
Los Angeles 6 15 9 157%
San Francisco 8 14 7 89%
San Jose 5 14 9 161%
New York 8 12 4 50%
Oslo 6 26 20 345%
Bergen 5 30 25 517%
London 7 24 17 247%
Amsterdam 9 33 24 284%
Stockholm 10 24 14 136%
Berlin 10 25 15 154%
Munich 10 26 15 151%
Paris 7 23 16 245%
Shenzhen 3 17 15 577%
Beijing 3 17 15 577%
Tokyo 7 18 11 156%

43
5.3.3. Insurance Cost Analysis result:
Figure 8: Insurance and maintenance Cost Comparison in the selected Cities
The average insurance cost for EVs in the 16 cities is $1048, with the USA having the
highest annual rate ($1,523), followed by Europe ($1,026) and Asia ($313). EV annual insurance
cost is lower than conventional vehicles on average ( by $92). (Appendix 5 explains annual
insurance and maintenance & repair cost comparison in EV friendly cities in details)
Among the selected American cities, Seattle, Los Angeles and San Francisco have a higher
(by $411) insurance cost for conventional vehicles. Whereas in San Jose and New York, the rate
is higher than conventional vehicles by $239. On average, for the 5 cities, this rate is $151 lower
for EVs.

44
Table 11: Insurance Cost for EVs and Non-EVs in the selected cities
City EV Non-EV Cost Difference non-
EV vs EV
% Difference non-
EV vs EV
Amsterdam 292 $2,609 -2317 -89%
Seattle 1263 $1,674 -411 -25%
Los Angeles 1263 $1,674 -411 -25%
San Francisco 1263 $1,674 -411 -25%
Berlin 1170 $1,522 -351 -23%
Munich 1170 $1,522 -351 -23%
London 784 $859 -75 -9%
Shenzhen 148 $148 0 0%
Beijing 148 $148 0 0%
New York 1913 $1,674 239 14%
San Jose 1913 $1,674 239 14%
Paris 612 $486 126 26%
Stockholm 1096 $660 436 66%
Oslo 1541 $820 721 88%
Bergen 1541 $820 721 88%
Tokyo 643 $274 368 134%
In Europe, surprisingly, EV insurance is higher in Norway than non EVs, (by 88%) despite
high concentration (87%) of electric cars in their automobile population. Stockholm (66%) and
Paris (23%) also have higher insurance rates for conventional vehicles than EVs. On the other
hand, Amsterdam offers 89% less insurance rate for EVs than conventional vehicles.
The correlation analysis found a moderate inverse relationship (r = -0.53) between
insurance cost and total number of EVs in the selected cities. This can be interpreted as, in the
sample cities, insurance cost negatively impacted EV adoption, both on the city level and in the
households (r = -0.43). In the multilinear regression analysis, this correlation will be observed in
relation with other cost components.

45
5.4. Policy and EV growth:
This part is divided into two sections, a point-based evaluation of existing EV friendly
policies in the sample cities and a qualitative analysis. As policy impact is not directly quantifiable,
for this research, we chose the Total Cost of Ownership (TCO) as a way to quantify the impact of
policy on electric vehicle ownership as it depends on incentives like subsidies and tax rebates. The
point allocation system is presented in the table below. This scoring system followed the criteria
presented in the Canadian EV policy study by Melton et al. (2020). As table 5 has already listed
the incentives, table 11 will only show the presence and absence of the facilities.
5.4.1 Active Policies in the Cities
Most of the cities (13) have at least 6 of the policies present, ZEV mandate is the
most common one among all, indicating all the selected cities are ready to move forward
with the transportation electrification (Table 13). Though the target year and level of
electrification are different for different countries and states, all of the selected cities have
started actively implementing the ZEV mandate they have set. The country, state and city-
based target achievement are also different (Table 12). Among the cities, Norway and
California are the forerunners, having adopted the targets in the beginning of the 1990s.
The newest members are the Netherlands and Sweden. Despite that, their EV adoption rate
is considerably high. City wise, they both already have 1% of global EV share as shown in
figure 1. [Chapter 4].
The country and city-based electrification target is set according to the availability
of the resources and based on local policies. Some of the earliest EV policy adopter
countries, like Japan, have a lower electrification rate than the German cities, who are
considerably the newest members in this process. Japan is one of the largest suppliers of
cars in the world market. This slow electric vehicle penetration in Japanese auto market is
happening due to the policymakers’ decision, who want to secure the auto industry against
rapid electrification (Dooley and Ueno, 2021). On the other hand, vehicle electrification
rate shows regional differences in the same country. For example, Norway has 17.2%
electric cars in their total car share, whereas Oslo (87%), the capital of Norway and Bergen
(34%), the western coastal city have different percentages, showing more concentration of
EVs in the capital city than the regional one. Similar pattern can be observed in Sweden,
46
which has 4% electric vehicles overall, and Stockholm, the capital, has achieved 16%
vehicle electrification, indicating that urban areas have more concentrated EVs. One other
example can be how China has achieved only 1.6% electric vehicles overall, whereas the
two selected cities, Shenzhen (9%) and Beijing (6.5%) have more concentrated EV share.
China’s region wise EV policies and mandates are responsible for that. In the subsequent
sections of this research, they will be explored in detail.
In the policy checklist presented in Table 13, following the mandate, is the charger
installation facility, both in public places and private houses. Tax exemption and rebate
along with subsidies are also prominent in these samples. Among all the cities, San Jose
has the highest number of policies active, and Seattle and Beijing have the lowest active
policies (Table 13). In the next part, this study will try to observe the impact of some of
these policies in combination with TCO and EV adoption.

47
Table 12: ICE to ZEV phase out target and current stage in the sample cities / countries
City % of EVs in
Vehicle Market
Target
Year
Initiation
Year
Remaining
Years to
Target
Completion
Name of the current initiative Target
WASHINGTON 4.1% 2030 2009 9 Clean Car 2030 100% ZEV sales after the target
year
Seattle 2.7% 2030 2009 9 Drive Clean Seattle 30% electrification of light duty
vehicles
CALIFORNIA 5.37% 2030 1990 9 Transportation Electrification
Framework
5 million ZEVs and 250,000
charging stations
Los Angeles 0.77% 2028 N/A 7 N/A 80% of all vehicle sales to be
ZEV
San Francisco 1.22% 2030 N/A 9 N/A Banning non-ZEV car sales
San Jose 16.57% 2030 N/A 9 N/A Banning non-ZEV car sales
NEW YORK 2.6% 2035 2010 14 Drive Change, Drive Electric 100% new ZEV sale after the
target date
NYC 0.24% 2035 2010 14 Drive Change, Drive Electric 100% new ZEV sale after the
target date
NORWAY 17.2% 2025 1990 4 N/A 100% electrification of new
vehicles
Oslo 87% N/A N/A N/A N/A N/A
Bergen 34% N/A N/A N/A N/A N/A
UK 1.38% 2030 2009 9 Road to Zero Strategy 100% new ZEV sale after the
target date

48
London 1.90% N/A N/A N/A N/A N/A
NETHERLANDS 3% 2030 2013 9 Mission Zero 100% new ZEV sale after the
target date
Amsterdam 8% N/A N/A N/A N/A N/A
SWEDEN 4% 2045 2011 24 Super Green Car Premium Becoming carbon neutral by the
target date
Stockholm 16.45% N/A N/A N/A N/A N/A
GERMANY 1.2% 2050 2010 29 Government Program for Electric
Mobility
100% electrification by target
date
Berlin 2.37% N/A N/A N/A N/A N/A
Munich 3.47% N/A N/A N/A N/A N/A
FRANCE 1.29% 2040 2008 19 Bonus Malus Scheme 100% electric cars on road
Paris 19.08% N/A N/A N/A N/A N/A
CHINA 1.75% 2035 2009 14 NEV subsidy program All new vehicles should be eco-
friendly
Shenzhen 9% N/A N/A N/A N/A N/A
Beijing 6.7% N/A N/A N/A N/A N/A
JAPAN 0.9% N/A N/A N/A N/A N/A
Tokyo 16% 2035 1996 14 Tokyo ZEV Promotion Strategy 100% new ZEV sale after target
date

49
Table 13 : Presence of EV friendly Policies in the Sample Cities
Carbon tax Subsidy/
Rebate
Tax
Cut/Rebate
Access to
HOV/ Bus/
Other lanes
Reduced
Parking
charges
Reduced Toll EVSE
Program
ZEV
mandate
Total Active
Policies
Seattle X X X X 4
Los Angeles X X X X X X X 7
San Francisco X X X X X X X 7
San Jose X X X X X X X X 8
New York X X X X X 5
Oslo X X X X X X X 7
Bergen X X X X X X X 7
London X X X X X X X 7
Amsterdam X X X X X X X 7
Stockholm X X X X X X 6
Berlin X X X X X X X 7
Munich X X X X X X X 7
Paris X X X X X X 6
Shenzhen X X X X X X 6
Beijing X X X X 4
Tokyo X X X X X X 6
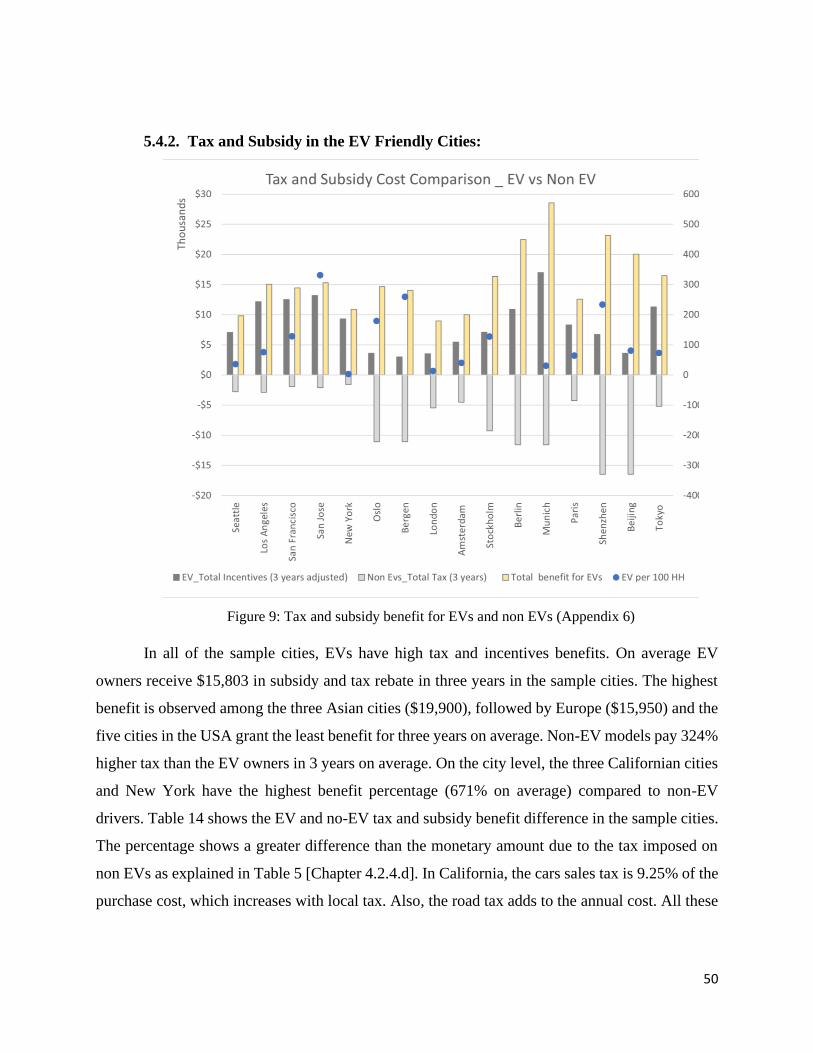
50
5.4.2. Tax and Subsidy in the EV Friendly Cities:
Figure 9: Tax and subsidy benefit for EVs and non EVs (Appendix 6)
In all of the sample cities, EVs have high tax and incentives benefits. On average EV
owners receive $15,803 in subsidy and tax rebate in three years in the sample cities. The highest
benefit is observed among the three Asian cities ($19,900), followed by Europe ($15,950) and the
five cities in the USA grant the least benefit for three years on average. Non-EV models pay 324%
higher tax than the EV owners in 3 years on average. On the city level, the three Californian cities
and New York have the highest benefit percentage (671% on average) compared to non-EV
drivers. Table 14 shows the EV and no-EV tax and subsidy benefit difference in the sample cities.
The percentage shows a greater difference than the monetary amount due to the tax imposed on
non EVs as explained in Table 5 [Chapter 4.2.4.d]. In California, the cars sales tax is 9.25% of the
purchase cost, which increases with local tax. Also, the road tax adds to the annual cost. All these
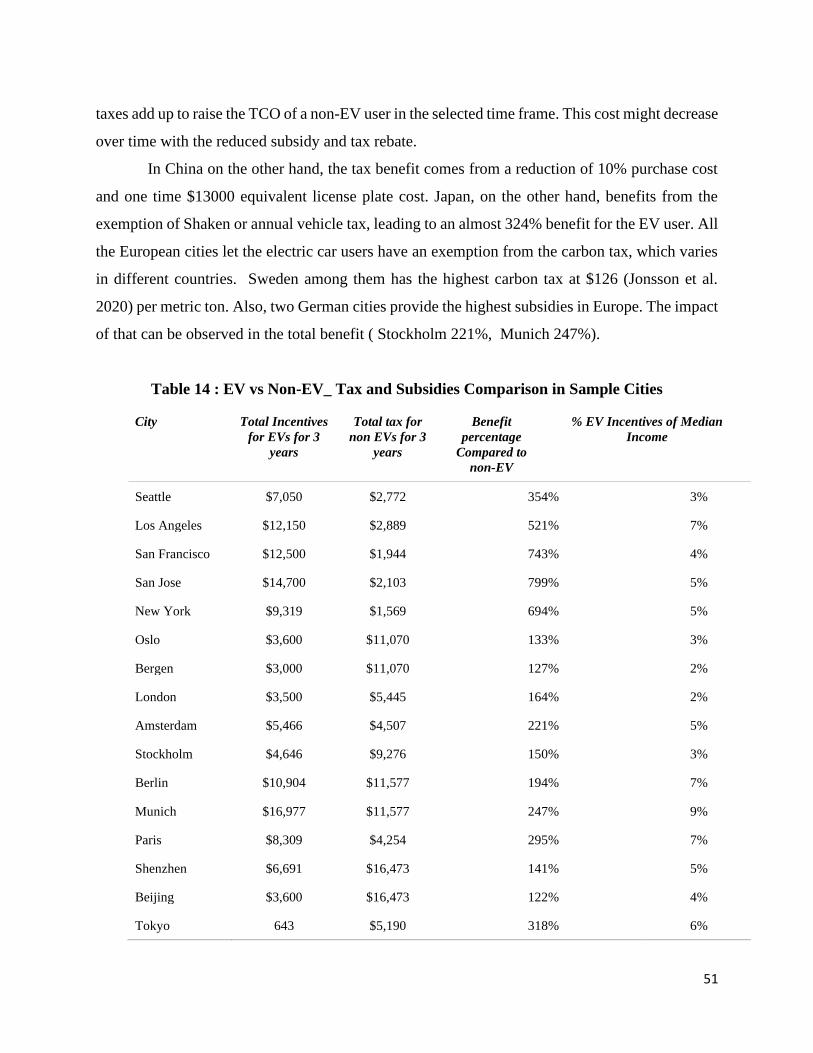
51
taxes add up to raise the TCO of a non-EV user in the selected time frame. This cost might decrease
over time with the reduced subsidy and tax rebate.
In China on the other hand, the tax benefit comes from a reduction of 10% purchase cost
and one time $13000 equivalent license plate cost. Japan, on the other hand, benefits from the
exemption of Shaken or annual vehicle tax, leading to an almost 324% benefit for the EV user. All
the European cities let the electric car users have an exemption from the carbon tax, which varies
in different countries. Sweden among them has the highest carbon tax at $126 (Jonsson et al.
2020) per metric ton. Also, two German cities provide the highest subsidies in Europe. The impact
of that can be observed in the total benefit ( Stockholm 221%, Munich 247%).
Table 14 : EV vs Non-EV_ Tax and Subsidies Comparison in Sample Cities
City Total Incentives
for EVs for 3
years
Total tax for
non EVs for 3
years
Benefit
percentage Compared to
non-EV
% EV Incentives of Median
Income
Seattle $7,050 $2,772 354% 3%
Los Angeles $12,150 $2,889 521% 7%
San Francisco $12,500 $1,944 743% 4%
San Jose $14,700 $2,103 799% 5%
New York $9,319 $1,569 694% 5%
Oslo $3,600 $11,070 133% 3%
Bergen $3,000 $11,070 127% 2%
London $3,500 $5,445 164% 2%
Amsterdam $5,466 $4,507 221% 5%
Stockholm $4,646 $9,276 150% 3%
Berlin $10,904 $11,577 194% 7%
Munich $16,977 $11,577 247% 9%
Paris $8,309 $4,254 295% 7%
Shenzhen $6,691 $16,473 141% 5%
Beijing $3,600 $16,473 122% 4%
Tokyo 643 $5,190 318% 6%
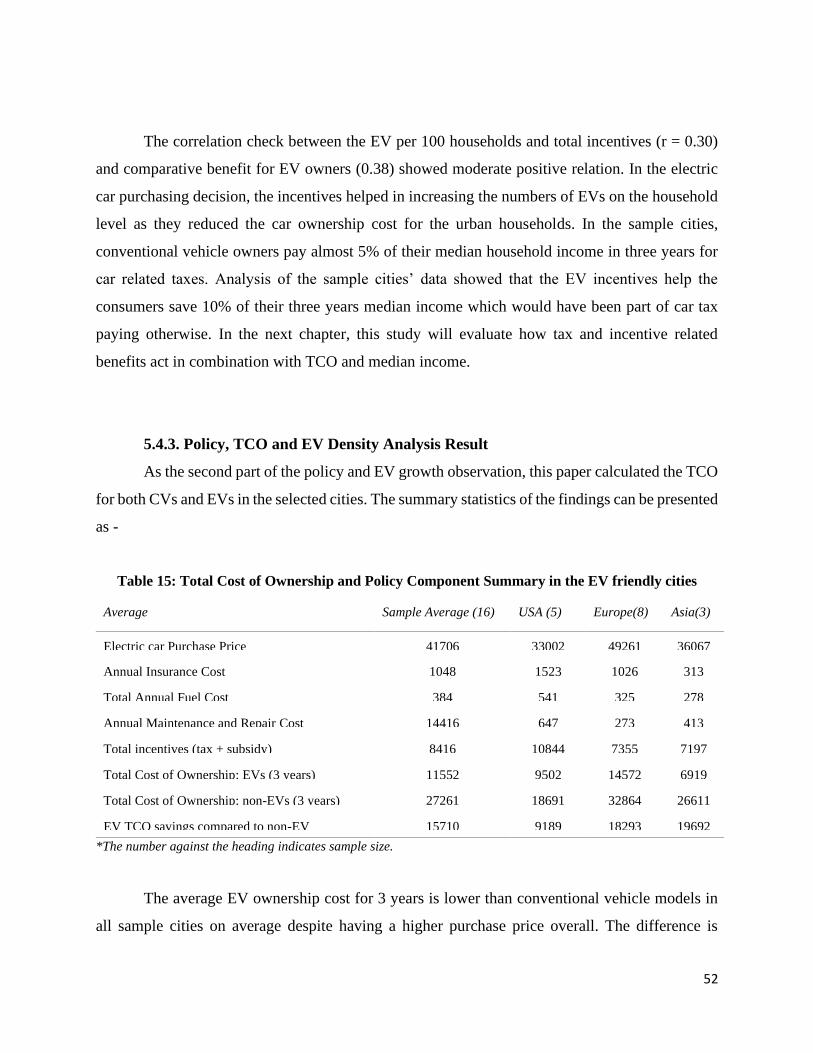
52
The correlation check between the EV per 100 households and total incentives (r = 0.30)
and comparative benefit for EV owners (0.38) showed moderate positive relation. In the electric
car purchasing decision, the incentives helped in increasing the numbers of EVs on the household
level as they reduced the car ownership cost for the urban households. In the sample cities,
conventional vehicle owners pay almost 5% of their median household income in three years for
car related taxes. Analysis of the sample cities’ data showed that the EV incentives help the
consumers save 10% of their three years median income which would have been part of car tax
paying otherwise. In the next chapter, this study will evaluate how tax and incentive related
benefits act in combination with TCO and median income.
5.4.3. Policy, TCO and EV Density Analysis Result
As the second part of the policy and EV growth observation, this paper calculated the TCO
for both CVs and EVs in the selected cities. The summary statistics of the findings can be presented
as -
Table 15: Total Cost of Ownership and Policy Component Summary in the EV friendly cities
Average Sample Average (16) USA (5) Europe(8) Asia(3)
Electric car Purchase Price 41706 33002 49261 36067
Annual Insurance Cost 1048 1523 1026 313
Total Annual Fuel Cost 384 541 325 278
Annual Maintenance and Repair Cost 14416 647 273 413
Total incentives (tax + subsidy) 8416 10844 7355 7197
Total Cost of Ownership: EVs (3 years) 11552 9502 14572 6919
Total Cost of Ownership: non-EVs (3 years) 27261 18691 32864 26611
EV TCO savings compared to non-EV 15710 9189 18293 19692
*The number against the heading indicates sample size.
The average EV ownership cost for 3 years is lower than conventional vehicle models in
all sample cities on average despite having a higher purchase price overall. The difference is

53
highest in Asia, and lowest in the USA. The city based quantitative analysis shows that Amsterdam
has the highest financial return (approx. $43 thousand) from EVs over the three years compared
to the non-electric counterparts. Their policy score (7) is high, but the EV density in the automobile
population is still low. In case of percentage-based comparison, San Jose has the most financial
return for their EV users, compared to the CV owners. The financial return for three years is 80%
higher for EV than CV. In the previous scoring San Jose also achieved perfect scores. Other high
scoring cities, Berlin (7), and Munich (7) also have high TCO for non-electric cars than the electric
ones, higher by $25,000 and 31,000 respectively. Oslo and Bergen have almost 50% higher cost
for non EVs, making them one of the EV friendly cities. In the USA, Californian cities are also
ahead in convenient EV policies, but still behind Chinese cities of Shenzhen and Beijing.
* The calculation is based on the most popular EV and non-EV models in the cities.
Figure 10: TCO of electric and non-electric vehicles in the EV friendly cities
A correlation check (Table 16) established moderate ( r = -0.47) inverse correlation between total
number of the EVs and the TCO for 3 years, but an insignificant correlation (r = 0.01) with the
TCO difference for EVs and Non EVs was observed in another correlation check, indicating that
with decreasing TCO for EVs, the total number of EVs in a city will increase. And the TCO is
influenced by various components as we have analyzed already. In the multiple regression analysis

54
part, this paper will try to understand which part of the ownership cost impacts the EV adoption
the most.
Table 16: TCO, Policy Component and EV Density Linear Correlation Check
Variables Total EVs EV per 100 HH EV per 100 cars
Median Annual Household Income -0.18 0.20 -0.23
Electric car Purchase price -0.25 -0.18 -0.08
EV and Non-EV Purchase Price Diff. 0.31 0.07 0.23
Annual Insurance Cost -0.53 -0.43 -0.23
Average charging cost for 100 miles -0.48 0.10 -0.16
Residential Charging Cost per 100 miles -0.26 0.07 -0.34
Public Charging Cost per 100 miles -0.74 0.09 0.45
Total Annual Fuel Cost -0.40 -0.23 -0.49
Difference in fuel and charging cost -0.12 0.12 0.45
Annual Maintenance and Repair Cost -0.05 -0.03 -0.34
Total Incentives 0.17 0.30 0.14
Total comparative benefit for EVs 0.29 0.38 0.08
Total Cost Of Ownership for 3 years -0.47 0.15 0.43
New TCO percentage of Purchase price -0.34 0.28 0.50
Difference in Cost _EV vs non EVs 0.01 -0.26 -0.26
Financial Return %of Purchase Price 0.34 -0.28 -0.50
Electric Car TCO % of median income -0.31 -0.23 -0.42
EV incentives comparative benefits % of median income
0.43 0.24 0.06

55
5.5. Parking and Toll Exemption:
Parking and toll cost analysis showed that a typical EV owner in these cities benefited from
the reduced parking cost and toll exemption. This cost is calculated as a separate indirect incentive
to understand the implication of reduced charges on EV owners’ finances, which in turn will
impact the consumers’ behavior.
*The annual parking cost is calculated for two hours on street parking for 261 workdays.
Figure 11: Annual parking cost comparison in sample cities (Appendix 11)
In the sample cities, most EV drivers pay less than the global average of 2 hours on street
parking cost ($1,304) annually (INRIX, 2020). The total annual savings on street parking in
London ($4,359), Oslo ($2,793) and Tokyo ($1,911) are higher than the other EV friendly cities.
London has a considerably high ($8.35 per hour) on street parking rate among all cities (City of
London). Berlin, Munich and Paris also help their EV owners to have less annual payment than
the non EVs. On the other hand, in Amsterdam, Stockholm, New York, San Francisco and Seattle,
the parking rate is the same for EVs and non EVs, making the EV drivers have no savings in
parking. In the correlation check, the saving in parking doesn’t show any direct relationship ( r =

56
0.00006) with total EV numbers in the city. But a low positive correlation (r = 0.28) was observed
in relation to the EV density in the automobile population in the city. Indicating that in the sample
cities, with increasing savings on parking, the electric car owner’s ratio among total auto
ownership increased.
Among all the cities, only three do not offer a toll break to the EV drivers. Seattle, Los
Angeles and Shenzhen are the ones who still don’t offer these facilities. In Seattle, EVs are not
eligible for toll exemption or HOV lane use as the Washington State DOT is concerned about the
congestion this might cause with rapidly increasing electric cars in the state (SeattlePI, 2011). In
Los Angeles, the toll exemption is no longer applicable for the electric vehicle owners. But they
can still use the SOV in the HOV lane with 15% exemption of the toll (Los Angeles Times, 2018).
In Beijing, EVs don’t have to pay tolls, but Shenzhen doesn't offer the same facility yet (ECNS.CN,
2015). On the other hand, while cities like Wuhan (Beggin, 2021) let EVs use HOV lanes, the two
cities considered here don't provide the same flexibility. The variation in facilities in combination
with other policies and incentives develop multiple different scenarios in these 16 cities. Due to
the limited scope in this research, this study will not explore this variability.
Table 17 : Toll and other facilities for EVs
City Reduced Toll Access to HOV/ Bus/ Other
Lanes
Seattle
Los Angeles X
San Francisco X X
San Jose X X
New York X X
Oslo X X
Bergen X X
London X X
Amsterdam X
Stockholm X X
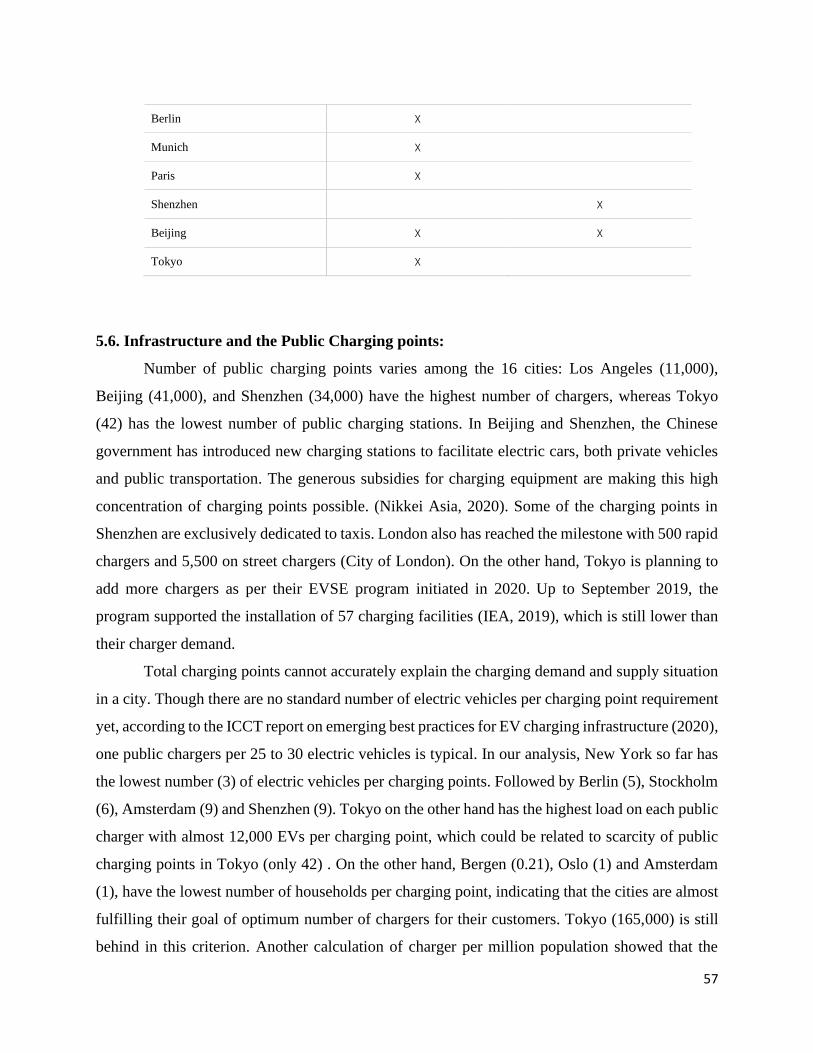
57
Berlin X
Munich X
Paris X
Shenzhen X
Beijing X X
Tokyo X
5.6. Infrastructure and the Public Charging points:
Number of public charging points varies among the 16 cities: Los Angeles (11,000),
Beijing (41,000), and Shenzhen (34,000) have the highest number of chargers, whereas Tokyo
(42) has the lowest number of public charging stations. In Beijing and Shenzhen, the Chinese
government has introduced new charging stations to facilitate electric cars, both private vehicles
and public transportation. The generous subsidies for charging equipment are making this high
concentration of charging points possible. (Nikkei Asia, 2020). Some of the charging points in
Shenzhen are exclusively dedicated to taxis. London also has reached the milestone with 500 rapid
chargers and 5,500 on street chargers (City of London). On the other hand, Tokyo is planning to
add more chargers as per their EVSE program initiated in 2020. Up to September 2019, the
program supported the installation of 57 charging facilities (IEA, 2019), which is still lower than
their charger demand.
Total charging points cannot accurately explain the charging demand and supply situation
in a city. Though there are no standard number of electric vehicles per charging point requirement
yet, according to the ICCT report on emerging best practices for EV charging infrastructure (2020),
one public chargers per 25 to 30 electric vehicles is typical. In our analysis, New York so far has
the lowest number (3) of electric vehicles per charging points. Followed by Berlin (5), Stockholm
(6), Amsterdam (9) and Shenzhen (9). Tokyo on the other hand has the highest load on each public
charger with almost 12,000 EVs per charging point, which could be related to scarcity of public
charging points in Tokyo (only 42) . On the other hand, Bergen (0.21), Oslo (1) and Amsterdam
(1), have the lowest number of households per charging point, indicating that the cities are almost
fulfilling their goal of optimum number of chargers for their customers. Tokyo (165,000) is still
behind in this criterion. Another calculation of charger per million population showed that the
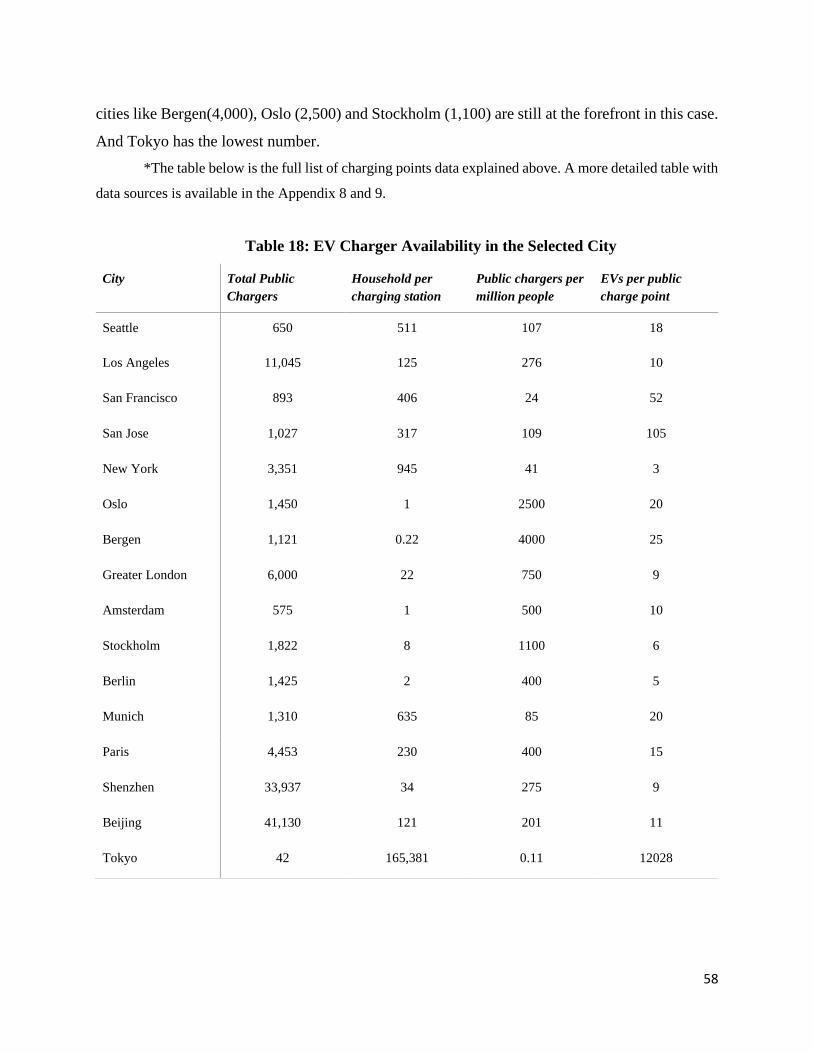
58
cities like Bergen(4,000), Oslo (2,500) and Stockholm (1,100) are still at the forefront in this case.
And Tokyo has the lowest number.
*The table below is the full list of charging points data explained above. A more detailed table with
data sources is available in the Appendix 8 and 9.
Table 18: EV Charger Availability in the Selected City
City Total Public
Chargers
Household per
charging station
Public chargers per
million people
EVs per public
charge point
Seattle 650 511 107 18
Los Angeles 11,045 125 276 10
San Francisco 893 406 24 52
San Jose 1,027 317 109 105
New York 3,351 945 41 3
Oslo 1,450 1 2500 20
Bergen 1,121 0.22 4000 25
Greater London 6,000 22 750 9
Amsterdam 575 1 500 10
Stockholm 1,822 8 1100 6
Berlin 1,425 2 400 5
Munich 1,310 635 85 20
Paris 4,453 230 400 15
Shenzhen 33,937 34 275 9
Beijing 41,130 121 201 11
Tokyo 42 165,381 0.11 12028

59
Figure 12: Charging infrastructure supply and demand in the sample cities
Overall, Tokyo and San Jose have the most charging infrastructure development demand.
Tokyo is at the lowest rank both from individual EV charging demand and household level
demand. New York and Amsterdam, along with Berlin, Stockholm and London are performing
better than the other cities public-charging-infrastructure wise. Shenzhen and Beijing are also
moving forward fast. All of these cities have the charging infrastructure development plan in place
already as indicated in Table 12 [ Chapter 5.4.3].
The charging point availability can be a potential reason for EV adoption. Though there is
a lack of statistical proof of electric vehicles adoption and the charging point availability. For this
study, this paper tried to observe that correlation. The simple linear regression analysis showed a
stronger correlation between the EV per 100 households and the other charging availability
variables shown in Appendix 13.
Among these variables, chargers per million population and EV per 100 registered cars
show the most significant (r = 0.66) relationship overall. The correlation between EV per 100 cars
and total public charger (r = 0.38) as well as charger per 100 households (r = 0.34) shows moderate
correlation. These coefficients indicate that the EV adoption is mostly influenced by the charger

60
availability per million population. Charger placement depends on multiple factors. The
dependence of EV density on charger per million population might be due to the complex factor
of locational decisions of chargers in urban areas. This will be explained in detail in the limitations
section. Overall EV adoption depends mostly on total charging facilities. The multiple regression
analysis conducted in the next chapter will use all these variables.
5.7. Multiple Regression Analysis Result
The multilinear regression model with seven predictors from the policy components ( R2
= 0.76, adjusted R = 0.49) found significance (P = 0.05) in the relationship (r = 0.0053) between
EV per 100 passenger cars and total incentives with a variance of 76% and 95% confidence
interval. The other predictors, median household income, purchase price, insurance and
maintenance cost and fuel cost do not show any statistically significant (p >> 0.05) correlation.
With this, we can assume that, with every unit (in this case US dollars as all calculations are done
in dollar amount) increase of the incentive, the EV density in every 100 registered cars will
increase by 0.0053. This will amount to 53 cars in every 1,000,000 cars in the urban area. Which
can also be explained as, with every 100-dollar incentive increase, there will be 53 electric cars in
every 10,000 cars.
Table 19: TCO and Multiple Regression Analysis Result
Multiple Regression Multiple R R Square Adjusted R Square Standard Error Observations
Regression Summary 0.87 0.76 0.49 15.27 16
Predictor Variables Coefficients Standard Error P-value
Intercept 10.56 24.45 0.68
Median Annual Household Income 0.0002 0.0003 0.60
Electric car Purchase price 0.0003 0.0005 0.57
Annual Insurance Cost -0.0011 0.0151 0.94
Total Annual Fuel Cost -0.0175 0.0603 0.78
Annual Maintenance and Repair Cost -0.0084 0.0412 0.84

61
Total Incentives 0.0053 0.0023 0.05
Total Cost of Ownership -0.0010 0.0013 0.47
5.8. EV Infrastructure and Energy Consumption:
The number of chargers put extra demand on the electricity grid. A simple calculation on
the energy demand for charging in the sixteen cities indicates that the energy used in charging is
considerably low in all of the cities. The calculation is conducted considering 80% charging
(Office of Energy Efficiency & Renewable Energy) is done at home and the rest at public charging
stations or workplaces. Some of the cities use the Time of Use (ToU) or peak and off-peak hour
charging.
Figure 13: Current energy demand vs load and BEV vs PHEV proportion in sample cities (Appendix 8)
Among the cities, San Jose is estimated to be consuming the highest percentage of electricity
(5.66%) for charging based on current demand and BEV and PHEV proportion, San Francisco
(2.24%), Tokyo (1.31%) and Los Angeles (1.20%) are following behind (Table19). This usage is
mostly influenced by the VMT, number of EVs and what is the overall power usage in a city. Most

62
of the cities use 1% ~ 0.01% energy for charging according to this estimation. For example,
Munich (0.01%) and London (0.02%) are estimated to use only a meager portion of their total
energy for EV charging. A study by McKinsey (2018) implied that 25% passenger vehicle
electrification will increase the demand in residential areas by 30% during peak hours. As most of
the EV friendly cities are already prepared to incorporate necessary electricity demand into their
grid, the challenge of power shortage might not be a problem in the future (US Drive, 2019).
Table 20 : Power Demand for Charging in the Selected Cities
City Annual VMT
per Capita
(2008)
Total Registered
passenger cars
(2020)
Total Annual
Power Usage
in City (TWh)
(2020)
Total Annual
Energy consumed
in Charging
(TWh)
Percentage of
power to the EV
Charging
Seattle 8699 432014 9 0.03 0.33%
Los Angeles 8699 13541827 23 0.28 1.20%
San Francisco 8699 3783300 6 0.12 2.16%
San Jose 8699 542490 5 0.29 5.71%
New York 8699 3791431 54 0.03 0.06%
Oslo 4039 10428 7 0.07 1.03%
Bergen 4039 77117 6 0.04 0.62%
Greater London 3884 2622169 269 0.05 0.02%
Amsterdam 3821 218479 7 0.02 0.27%
Stockholm 4350 301297 138 0.07 0.05%
Berlin 4350 1192546 65 0.03 0.05%
Munich 4350 714574 400 0.03 0.01%
Paris 3884 321787 65 0.07 0.11%
Shenzhen 13090 2768000 670 0.82 0.12%
Beijing 13090 5600000 117 1.21 1.04%
Tokyo 2485 2652113 26 0.34 1.32%
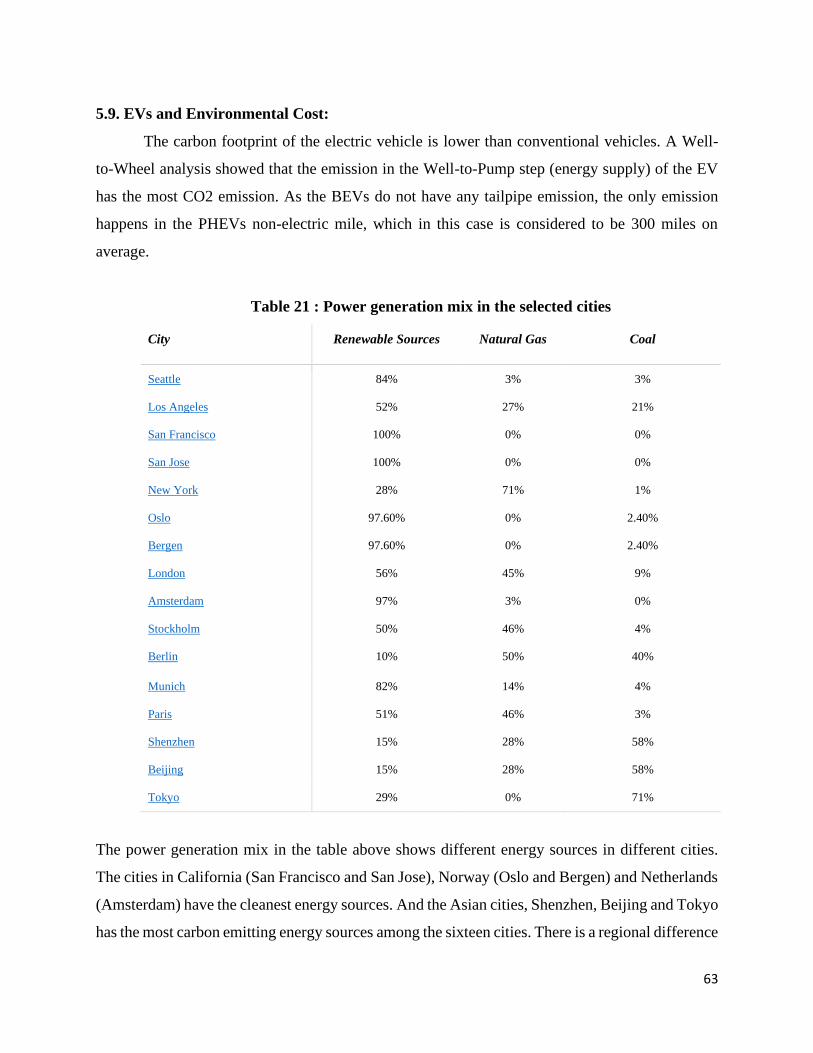
63
5.9. EVs and Environmental Cost:
The carbon footprint of the electric vehicle is lower than conventional vehicles. A Well-
to-Wheel analysis showed that the emission in the Well-to-Pump step (energy supply) of the EV
has the most CO2 emission. As the BEVs do not have any tailpipe emission, the only emission
happens in the PHEVs non-electric mile, which in this case is considered to be 300 miles on
average.
Table 21 : Power generation mix in the selected cities
City Renewable Sources Natural Gas Coal
Seattle 84% 3% 3%
Los Angeles 52% 27% 21%
San Francisco 100% 0% 0%
San Jose 100% 0% 0%
New York 28% 71% 1%
Oslo 97.60% 0% 2.40%
Bergen 97.60% 0% 2.40%
London 56% 45% 9%
Amsterdam 97% 3% 0%
Stockholm 50% 46% 4%
Berlin 10% 50% 40%
Munich 82% 14% 4%
Paris 51% 46% 3%
Shenzhen 15% 28% 58%
Beijing 15% 28% 58%
Tokyo 29% 0% 71%
The power generation mix in the table above shows different energy sources in different cities.
The cities in California (San Francisco and San Jose), Norway (Oslo and Bergen) and Netherlands
(Amsterdam) have the cleanest energy sources. And the Asian cities, Shenzhen, Beijing and Tokyo
has the most carbon emitting energy sources among the sixteen cities. There is a regional difference
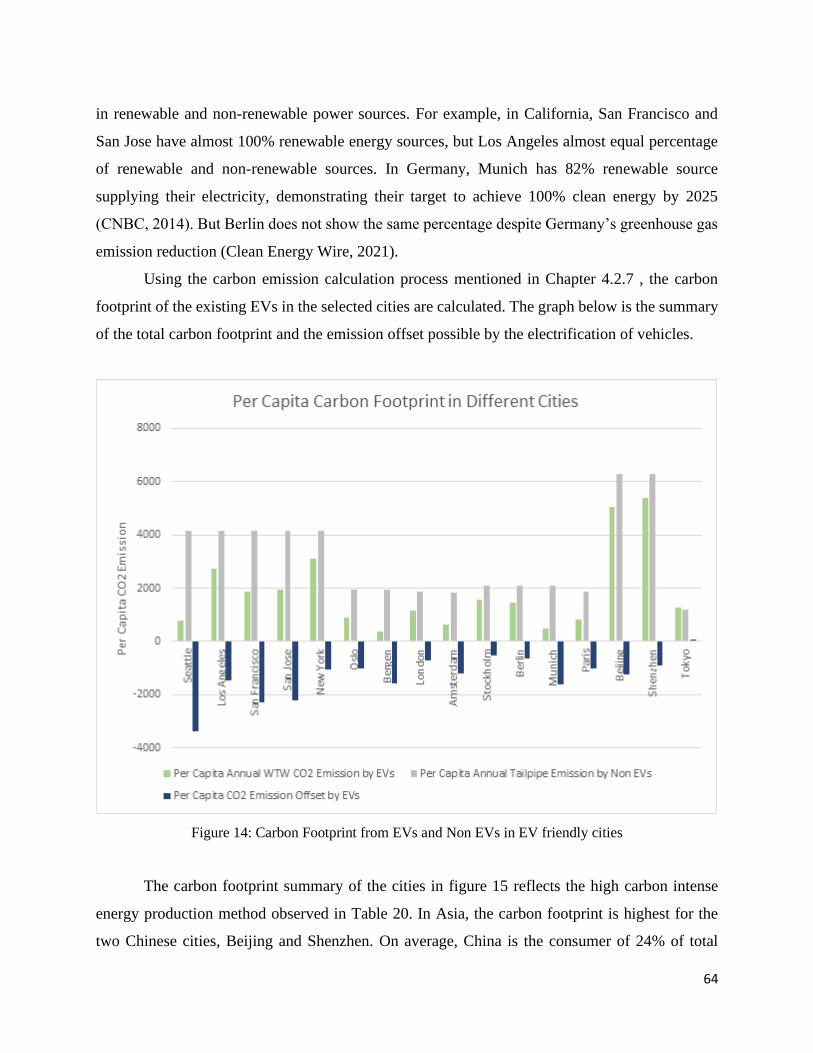
64
in renewable and non-renewable power sources. For example, in California, San Francisco and
San Jose have almost 100% renewable energy sources, but Los Angeles almost equal percentage
of renewable and non-renewable sources. In Germany, Munich has 82% renewable source
supplying their electricity, demonstrating their target to achieve 100% clean energy by 2025
(CNBC, 2014). But Berlin does not show the same percentage despite Germany’s greenhouse gas
emission reduction (Clean Energy Wire, 2021).
Using the carbon emission calculation process mentioned in Chapter 4.2.7 , the carbon
footprint of the existing EVs in the selected cities are calculated. The graph below is the summary
of the total carbon footprint and the emission offset possible by the electrification of vehicles.
Figure 14: Carbon Footprint from EVs and Non EVs in EV friendly cities
The carbon footprint summary of the cities in figure 15 reflects the high carbon intense
energy production method observed in Table 20. In Asia, the carbon footprint is highest for the
two Chinese cities, Beijing and Shenzhen. On average, China is the consumer of 24% of total

65
global energy in 2018 (BP, 2019). The carbon footprint is also higher in the Chinese cities due to
the use of a higher percentage of coal (58%) as their energy source. On the other hand, Europe’s
energy is much greener as most of the cities use renewable sources (67% on average). The impact
of this can be observed in the per capita carbon emission in European cities which are much lower
than the other two regions as well as the sample average. The carbon emission is offset by the EVs
to a considerable level. These results are also based on the assumptions made on average fuel
economy of the EV and non-EV models and charging scenario on household and public charger
level during the research. The outcome might be different in the real-life scenario.
In the case of 100% electrification, carbon emission decreases for all the countries. But the
change in percentage will be highest in the USA, followed by Europe. Asian cities on the other
hand will not have the same level of environmental benefit, specifically due to their energy
production system and the CO2 emission from the coal and gas-based energy production.
Figure 15: Impact of electrification on CO2 emission in EV cities (Appendix 10b)

66
Table 22: Environmental cost of the EV adoption
Average Sample Average (16) USA (5) Europe(8) Asia(3)
Current electrification of passenger cars 14% 4% 21% 11%
Total annual power usage in Charging (GWh) 220 150 49 789
Approx. WTP9 CO2 emission (million lb) 260 74 19 1218
Tailpipe emission (million lb) 61 50 25 172
Approx. WTW10 CO2 emission 321 124 44 1390
Per Capita emission by EVs (lb)11 1818 2093 924 3903
Per Capita tailpipe emission by non EVs (lb)12 3,146 4,176 1,963 4,587
Per Capita CO2 Emission Offset by EVs (lbs) 1,298 2,082 1,039 683
Per Capita CO2 emission change in case of 100%
electrification13
40% 49% 46% 9%
As shown in the table above, the simple observation shows that the carbon emission
decreases about 40% from the baseline carbon footprint due to electric vehicles. As mentioned
above, cleaning the energy sources can produce better results overall.
Next, battery recycling and reuse facilities are also observed in those cities. Most of them
lack proper facilities to handle dead batteries. Due to the lack of battery recycling, the dead
batteries will end up in the landfill, adding more landfill volume overall and will also emit toxic
fumes (See Chapter 4 for more) . But in the case of recycling, it will reduce 20% emission
compared to what might have emitted while producing the battery from scratch (Aichberger,
2020). Many cities are planning to add the facility to their scheme in the near future. Los Angeles,
Germany (early 2021) as well as Sweden (Northvolt’s recycling program by 2022) and Norway
(by late 2021) are looking forward to initiating their own battery recycling facility in the next two
years. Many other cities observed are planning to have their own recycling facilities by the next
decade (Energy Storage, 2021).
9 WTP = Well to Pump 10 WTW = Well to Wheel 11 Considering 0.29 lb/mile CO2 emission for PHEV non-electric miles, in this case 300 mile on average 12 Considering 0.48 lb/mile CO2 emission for Conventional vehicles 13 Considering the current number of vehicles without any increase.

67
Table 23: Dead EV battery handling facility in EV friendly cities and the environmental impact
Cities Types of Facilities available Total Landfill
increase
Unit
Seattle Collection by the city and probable Landfill 1150 Metric Ton
Los Angeles Collection by the city and probable Landfill 10090 Metric Ton
San Jose Collection by the city and probable Landfill 10336 Metric Ton
Oslo Collection by the city and probable Landfill 6502 Metric Ton
Bergen Collection by the city and probable Landfill 3764 Metric Ton
London Collection by the city and probable Landfill 4591 Metric Ton
Amsterdam Collection by the city and probable Landfill 1823 Metric Ton
Stockholm Collection by the city and probable Landfill 5692 Metric Ton
Berlin Collection by the city and probable Landfill 808 Metric Ton
Munich Collection by the city and probable Landfill 1082 Metric Ton
Paris Collection by the city and probable Landfill 6236 Metric Ton
CO2 emission reduction
San Francisco Collection by the startup and battery swapped 3917 Metric Ton -CO2
New York Collection by the manufacturer and proper disposal and
recycle 756 Metric Ton -CO2
Beijing Collection by the manufacturer and proper disposal and
recycle
33583 Metric Ton -CO2
Shenzhen Collection by the manufacturer and proper disposal and
recycle
22837 Metric Ton -CO2
Tokyo Collection by the manufacturer and proper disposal and
recycle
42413 Metric Ton -CO2
*Cities with proper recycling were evaluated based on total CO2 emission in recycling, and the cities with no recycling
facilities are evaluated by increased landfill size.
In table 22, the potential impact of dead batteries, either in landfill volume increase for per
kWh battery capacity or the emission of CO2 per kWh battery capacity during recycling, is listed
along with the current facilities available. The data indicate, increasing EVs and lack of proper
recycling, cities will keep on adding the dead batteries to their landfills. The two cities in
California, Los Angeles, and San Jose, will have the highest increase in landfill volume in a decade.
Unlike San Francisco, these two cities still lack proper battery recycling facilities, which will add
more dead batteries to their landfill after a decade as they have rapidly increasing number of EVs
on their roads. On the other hand, Asian cities like Shenzhen, Beijing and Tokyo, have different
types of battery recycling and handling facilities. In China, the battery swapping is already
available along with recycling facility. Japan has started recycling their dead batteries. Among the
US cities, New York has the mandate for the EV sellers and producers to provide recycling
facilities. Many of these facilities are still provided by private suppliers, without proper

68
government supported program. It is advisable for all the cities to adopt proper recycling facilities
to get the best outcome of vehicle electrification.
Chapter 6: FINDINGS SUMMARY
● The 16 sample cities have approximately 21% of the global share of 8.5 million (Statista,
2021) total EVs on road in 2020.
● In the sample cities, the median annual income is $60,000 on average, which is above global
median income (Washington Post, 2018).
● Berlin has the highest number of electric vehicles per capita, but Oslo has the highest level
of vehicle electrification at 87% of all vehicles.
● EV density in the sample cities does not show significant correlation with median income
in this study.
● BEV percentage in total electric passenger cars is higher than the PHEVs in the selected
cities. The increasing inclination towards battery electric vehicles can increase the demand
for more charging infrastructures at residences and public places (Tal et al. 2013).
● EV purchase price is higher for the selected models than the conventional vehicle models
in most of the sample cities. Despite that, the total cost of ownership for three years is less
for the EV users than the conventional vehicle owners due to the tax breaks and incentives.
● Among the TCO components, public charging cost and insurance cost have moderate
influence on EV percentage in the automobile population of the cities based on the
correlation check.
● Purchase price differences of different EV models can influence the users more than the
price gap between the EV and non-EVs in the sample cities as explained in Chapter 5.3.1.
● There is a moderate correlation among the policy component, namely incentives, and the
electric vehicle adoption in the sample cities. But these incentives also have different
impacts in different regions.
● Parking charge is found to be weakly correlated to electric vehicle adoption.
● From the EV friendly infrastructure analysis, Tokyo and San Jose were found to be in need
of more public charging infrastructure. Both of them have a high percentage of EVs per

69
charger (>>30 EV per charger as mentioned in Chapter 5.3) indicating a lack of enough
infrastructure. San Francisco also needs infrastructure development.
● A multilinear regression model with seven predictors from policy components found total
incentives to have statistically significant coefficient (r = 0.0053, p = 0.5) for the estimation
of electric vehicle increase in the total auto population. The coefficient indicates small
increase with per unit ($) incentive change for the current model.
● The environmental cost of the electrification of the cars in the sample cities is not null.
Though the per capita WTW carbon emission is still lower than the conventional diesel or
gasoline fueled vehicles. Due to the lack of green energy production in some of the cities,
the carbon footprint of electric cars is still large enough to be concerned. In case of cities
like China, who have high coal dependency, the carbon emission in a BEVs lifecycle can
still cause environmental damage.
● More vehicle electrification can reduce carbon emission in the long run.
● In most of the cities, the battery recycle facility is still not developed enough to recycle the
dead batteries on mass level. The disposed electric batteries will be liable for the increase
of landfill after their useful lifespan. As the situation is still new, most of the EVs have not
crossed their lifespan of 17 years (Cagatay, n.d.), this study could not use any real-life
example for comparison.
Chapter 7: LIMITATIONS OF THE STUDY:
The electrification of passenger cars in global cities aiming for sustainable transportation
is still evolving. The information and relevant studies or case studies are still relatively less
available than other features of sustainable transportation. This research tried to cover most aspects
of the EV policies and infrastructure, but there were still some limitations that we faced during the
process.
● The sample cities are only a part of the vast global EV friendly cities. The primary
selection was based on the market share of electric vehicles in those cities. Per
capita EV percentage can produce a different ranking.

70
● Data availability was one of the major challenges faced during the analysis. As
different cities present their data differently (city or regional level) to the public,
many data were extracted or calculated from regional data sources, as well as third
party sources and finally standardized for city level analysis.
● The policy varies in different cities and changes continuously. Also, the incentives
are largely different for different car models. The simplification of the data was not
able to cover most aspects of the pricing and subsidy scheme. A more extensive
and thorough analysis will be able to observe the range of variability in the policy
and pricing front.
● The infrastructure preparedness for EV adoption might be influenced by the budget
and economic ability of the city. Energy production capacity as well as land use or
public perception and value can also be deciding factors in this case. Many national
and local initiatives are also being adopted to improve the charging infrastructure.
This needs extensive study. Due to the scope limitation and lack of enough
evidence, this was not considered in this study. We can evaluate the cities based on
their existing EV infrastructure. But the standardization of what is necessary in
different cities might not be the perfect solution.
● The allocation of charging points follows different methods like land use-based
demand model, future demand-based model or user pattern-based model. All these
might be controlling factors for the location and availability of charging stations.
Extensive study will be able to capture the complexity of this location pattern and
their impact on electric car penetration in the cities. This study did not have the
scope to observe different methods followed in different cities.
● The environmental cost analysis in this research used the GREET model emission
rate to calculate the Well-to-Pump emission in different energy sectors. The
emission rate depends on the time of use greatly. This study did not use the timing
of charging in energy usage calculation. Also, the emission for battery production
is also not considered in this analysis as the main aim of the environmental impact
analysis was to observe the emission from the energy sources and tailpipe.
● The emission from battery disposal is still an ongoing research. This study used the
availability of recycling and reusing facilities as a marker to observe the city’s

71
preparation for sustainable electrification of the transportation. Due to the lack of
enough information, this study did not include the carbon footprint from the Life
Cycle Analysis.
● The policy incentives can have both advantageous and disadvantageous effects on
the EV adoption, making it difficult to define and measure them. For example, the
use of HOV lanes can create congestion when the city reaches a certain threshold
of EV ownership. So, the current incentives in many cities might not be a long
lasting one, but a good start for the promotion of EVs for the initial stage. This
study didn’t address them.
● China, with the most polluted power generation mix among the cities observed, has
started integrating Demand Response based power integration to their grid. In this
process, the EVs will depend on availability of clean energy in the grid and charge
with energy from renewable sources (Finamore, 2020). China is hoping to clean up
their power grid through this process. The Chinese government aims to reduce the
share of carbon-heavy fuel in national energy consumption to 20% by 2025 (CNBC,
2021). If this is successful, China will be able to reduce their carbon footprint by
2030 and the current carbon footprint will change greatly in the coming decades.
● The environmental cost also needs to address the life cycle analysis of the EV itself
to understand the real cost of the mass adoption. As observed in many analyses, the
EV in the long run might not be a completely sustainable transportation mode. But
based on the current available information, this study tried to address the factors
which might not change in the near future and will be essential for environmental
sustainability in EV adoption.
Chapter 8: CONCLUSION
Electric vehicles will be dominating the auto market scenario in the coming decades. This
research is an exploratory work to analyze the global scenario of vehicle electrification to prepare
for the mass adoption of EVs. The main takeaway from this research can be summarized as, the
availability of proper infrastructure, convenient policy incentives as well as positive environmental

72
impact, are the main focus of the EV friendly cities while supporting and planning for EV
integration in their auto market. From the analysis, it is observed that the sample cities successfully
implemented the public policy and charging infrastructure as the leaders in EV adoption. All the
sixteen cities have ongoing and future policies to accommodate more electric cars and going all
electric in the transportation sector. Cities in Europe have convenient incentive schemes as well as
sustainable energy sources, which are playing in favor of their GHG emission reduction through
vehicle electrification. On the other hand, Shenzhen, and Beijing, the two sample cities in China,
are representations of the country’s aggressive EV policies. Along with policy interventions,
ensuring sustainable energy production should be on the agenda for cities looking towards
reducing their emission through vehicle electrification. Dead battery handling facilities should also
be focused on in the cities aiming to achieve a better environmental return though EV adoption.
Vehicle electrification is a long process. The novelty of the situation adds challenges for
proper analysis of the situation, but at the same time creates opportunities for the improvements
of the developing parts. Based on the analysis conducted in this paper, the main policy related
suggestion would be to increase incentives, both in the cities with mass EV adoption rate or the
ones looking forward to electrifying their vehicles in the future. The parking charge and toll
exemption can encourage the regular car drivers to switch to EVs in the long run. Improving the
charging infrastructure through strategically placing more chargers as well as smart charging
facilities can solve the range anxiety, and also can make sure that the electricity grid is not
overburdened. Based on the findings in this study, publicly available (both city and private supplier
operated) chargers would be given priority. To achieve the maximum environmental benefit, along
with mass vehicle electrification, cities should improve their battery handling capacity.
The aim of this study was to understand the policies and initiatives quantitatively. The data
analyzed here are also used to conduct statistical analysis to get a better grasp of the performance
of different cities. On the last note, this analysis is not a complete one, but an initial effort to
encompass all the major factors contributing to EV adoption on planning level and connect the
dots through statistical analysis holistically. This can be expanded, modified, and reconstructed to
make use in a more standard situation.

73
BIBLIOGRAPHY
AFDC. 2020. Average Fuel Economy by Major Vehicles. afdc.energy.gov. https://afdc.energy.gov/data/10310
Aichberger, Christian & Jungmeier, Gerfried. (2020). Environmental Life Cycle Impacts of Automotive Batteries Based on a Literature Review. Energies. 13. 6345.
https://doi.org/10.3390/en13236345
Ajzen, I. 1991. The theory of planned behavior, Organizational Behavior and Human Decision Processes, Volume 50, Issue 2, Pages 179-211, ISSN 0749-5978,
https://doi.org/10.1016/0749-5978(91)90020-T Appunn, K.: Eriksen, F.: Wettengel, J. 2021. Germany’s greenhouse gas emissions and energy transition targets. Clean Energy Wire.
https://www.cleanenergywire.org/factsheets/germanys-greenhouse-gas-emissions-and-climate-targets
Arbetter, S. 2021. It’s 2035: Get ready to plug in your car. Spectrum News 1. https://spectrumlocalnews.com/nys/central-ny/capital-tonight/2021/04/26/it-s-2035--get-ready-to-plug-in-your-car#:~:text=4302).,be%20zero-emission%20by%202035
Ausick, P. 2019. This Is the Place With the Most Expensive Gas in the World. 247 Wall st. https://247wallst.com/energy-economy/2019/08/01/this-is-the-place-with-the-most-expensive-gas-in-the-world-2/
Azadfar, E.; Sreeram, V.; Harries, D. 2015. The investigation of the major factors influencing plug-in electric vehicle driving patterns and charging behaviour, Renewable and Sustainable Energy Reviews, Volume 42, 2015, Pages 1065-1076, ISSN 1364-0321,
https://doi.org/10.1016/j.rser.2014.10.058
Bakker, S.; Trip, J. 2013. Policy options to support the adoption of electric vehicles in the urban environment, Transportation Research Part D: Transport and Environment, Volume 25, 2013, Pages 18-23, ISSN 1361-9209,
https://doi.org/10.1016/j.trd.2013.07.005
Bauer, G.; Hsu, C. ; Lutsey, N. 2021. When might lower-income drivers benefit from electric vehicles? Quantifying the economic equity implications of electric vehicle adoption. ICCT.
https://theicct.org/sites/default/files/publications/EV-equity-feb2021.pdf
Bater, E. 2018. The environmental pros and cons of electric cars. Admiral.com. https://www.admiral.com/magazine/guides/motor/the-environmental-pros-and-cons-of-electric-cars
Beggin, R. 2021. Carpool Lanes Encourage EV Sales but Increase Inequity. Governing.
https://www.governing.com/community/carpool-lanes-encourage-ev-sales-but-increase-inequity.html Berman, B. 2020. China pursues local incentives to revive troubled EV market. Electrek.
https://electrek.co/2020/03/24/china-pursues-local-incentives-to-revive-troubled-ev-market/ Better Life Index. n.d. Netherlands.
http://www.oecdbetterlifeindex.org/countries/netherlands/
Blau, J. 2010. Berlin plugs in electric mobility strategy. DW.

74
https://www.dw.com/en/berlin-plugs-in-electric-mobility-strategy/a-5533192
BP. 2019. China’s energy market in 2018. bp.com. https://www.google.com/url?sa=t&rct=j&q=&esrc=s&source=web&cd=&cad=rja&uact=8&ved=2ahUKEwjo0PW5p-XwAhXUsZ4KHUnyB4IQFjABegQIAxAD&url=https%3A%2F%2Fwww.bp.com%2Fcontent%2Fdam%2Fbp%2Fbusiness-sites%2Fen%2Fglobal%Corporate%2Fpdfs%2f Energy-economics%2f Statistical-review%2Fbp-stats-review-2019-china-insights.pdf&usg=AOvVaw0Zpss05bJIn3KWhwkm5w3c
Bradley, TH.; Frank, AA; 2009 Design, demonstrations and sustainability impact assessments for plug-in hybrid electric vehicles. Renew Sustain Energy Rev 13:115–128 Brady, J., O’Mahony, M. 2011. Introduction of Electric Vehicles to Ireland: Socioeconomic Analysis. Transportation Research Record, 2242(1), 64–71. https://doi.org/10.3141/2242-08 Bui, A. Slowik, P. Lutsey, N. 2020. Update on electric vehicle adoption across U.S. cities. ICCT.
https://theicct.org/sites/default/files/publications/EV-cities-update-aug2020.pdf Cagatay, C. n.d. HOW LONG SHOULD AN ELECTRIC CAR’S BATTERY LAST? My EV.
https://www.google.com/url?sa=t&rct=j&q=&esrc=s&source=web&cd=&cad=rja&uact=8&ved=2ahUKEwjst_r58v3wAhXJqp4KHSS7ArQQFjAMegQIHhAD&url=https%3A%2F%2Fwww.myev.com%2Fresearch%2 Fev-101%2Fhow-long-should-an-electric-cars-battery-last&usg=AOvVaw3ohMl3-59cjjckkwGoXyc5
Cagatay, C. n.d. HOW LONG SHOULD AN ELECTRIC CAR’S BATTERY LAST? My EV.
https://www.google.com/url?sa=t&rct=j&q=&esrc=s&source=web&cd=&cad=rja&uact=8&ved=2ahUKEwjst_r58v3wAhXJqp4KHSS7ArQQFjAMegQIHhAD&url=https%3A%2F%2Fwww.myev.com%2Fresearch%2 Fev-101%2Fhow-long-should-an-electric-cars-battery-last&usg=AOvVaw3ohMl3-59cjjckkwGoXyc5
California Energy Commission. 2018. 2018 Total System Electric Generation. CA.gov.
https://www.energy.ca.gov/data-reports/energy-almanac/california-electricity-data/2019-total-system-electric-generation/2018
Campanari, S.; Manzolini, G.; Iglesia, F. 2009. Energy analysis of electric vehicles using batteries or fuel cells through well-to-wheel driving cycle simulations, Journal of Power Sources, Volume 186, Issue 2, 2009, Pages 464-477, ISSN 0378-7753,
https://doi.org/10.1016/j.jpowsour.2008.09.115
Car Edge. n.d. Car Depreciation Calculator. https://caredge.com/depreciation
Casals, L.C., García, B.A., Aguesse, F. et al. Second life of electric vehicle batteries: relation between materials degradation and environmental impact. Int J Life Cycle Assess 22, 82–93 (2017).
https://doi.org/10.1007/s11367-015-0918-3
Caulfield, B; Farrell, S.; McMahon,B. 2010. Examining individuals preferences for hybrid electric and alternatively fuelled vehicles, Transport Policy, Volume 17, Issue 6, 2010, Pages 381-387, ISSN 0967-070X,
https://doi.org/10.1016/j.tranpol.2010.04.005
Center for Climate and Energy Solution. n.d. Global Emission. c2es.org. Retrieved on 16 February 2020 from https://www.c2es.org/content/international-emissions/
Center for Climate and Energy Solution. n.d. Global Emissions. Retrieved on 16 February 2021 from

75
https://www.c2es.org/content/international-emissions/
Cheng, E. 2021. China has ‘no other choice’ but to rely on coal power for now, official says. CNBC. https://www.cnbc.com/2021/04/29/climate-china-has-no-other-choice-but-to-rely-on-coal-power-for-now.html
Choo, S. Mokhtarian, P. 2004. What type of vehicle do people drive? The role of attitude and lifestyle in influencing vehicle type choice, Transportation Research Part A: Policy and Practice, Volume 38, Issue 3, 2004, Pages 201-222, ISSN 0965-8564,
https://doi.org/10.1016/j.tra.2003.10.005 City of London. n.d. On street parking.
https://www.cityoflondon.gov.uk/services/parking/on-street-parking
Clean Technica. n.d.Electric Vehicle Sales Charts, Graphs, & Stats. https://cleantechnica.com/ev-sales-charts-graphs-stats/
Clemens Dabelstein, Philip Schäfer, Dennis Schwedhelm, Jingbo Wu, Ting Wu. 2021, Winning the Chinese BEV market: How leading international OEMs compete, McKinsey & Company.
https://www.mckinsey.com/industries/automotive-and-assembly/our-insights/winning-the-chinese-bev-market-how-leading-international-oems-compete
Colthorpe, A. 2021. Renewable-powered lithium-ion battery recycling plant in Norway begins construction. Energy Storage News.
https://www.energy-storage.news/news/renewable-powered-lithium-ion-battery-recycling-plant-in-norway-begins-cons
Creswell, J. W., & Creswell, J. D. (2018). Research design (5th ed.). SAGE Publications Crider, J. 2020. Shenzhen Gives Residents Incentives To Buy EVs — Tesla Included . CleanTechnica.
https://cleantechnica.com/2020/06/15/shenzhen-gives-residents-incentives-to-buy-evs-tesla-included/ Deventer. D. 2021. Average cost of car insurance in 2021. BankRate.
https://www.bankrate.com/insurance/car/average-cost-of-car-insurance/#:~:text=In%20the%20United%20States%2C%20the,your%20age%20and%20credit%20score
Ding, D; Yang,X.; 2020. The Response of Urban Travel Mode Choice to Parking Fees considering Travel Time Variability. Advances in Civil Engineering, vol. 2020, Article ID 8969202, 9 pages.
https://doi.org/10.1155/2020/8969202
Dooley, B. & Ueno, H. 2021. Why Japan Is Holding Back as the World Rushes Toward Electric Cars. The New York Times.
https://www.nytimes.com/2021/03/09/business/electric-cars-japan.html eia. 2019. New York Energy Consumption by End-Use Sector, 2019.
https://www.eia.gov/state/?sid=NY#tabs-2
Electric Battery Database. n.d. Useable battery capacity of full electric vehicles https://ev-database.org/cheatsheet/useable-battery-capacity-electric-car
Engel, H.; Hensley, R.; Knupfer, S.; Sahdev, S.; 2018. The potential impact of electric vehicles on global energy systems. McKinsey & Company.

76
https://www.mckinsey.com/industries/automotive-and-assembly/our-insights/the-potential-impact-of-electric-vehicles-on-global-energy-systems#
Energy UK, n.d. Energy Generation.
https://www.energy-uk.org.uk/our-work/generation/electricity-generation.html
EPA. n.d. Sources of Greenhouse Gas Emissions . Retrieved on 16 February 2020 from https://www.epa.gov/ghgemissions/sources-greenhouse-gas-emissions
ERA. n.d. Environmental Management Challenges With Electric Vehicle Batteries. https://www.era-environmental.com/blog/environmental-management-electric-vehicle-batteries
EV database. n.d. Usable battery capacity of full electric vehicles. EV database.org. https://ev-database.org/cheatsheet/useable-battery-capacity-electric-car Farkas, Andrew & Shin, Hyeonshic & Nickkar, Amirreza. (2018). Environmental Attributes of Electric Vehicle Ownership and Commuting Behavior in Maryland: Public Policy and Equity Considerations.
https://www.morgan.edu/Documents/ACADEMICS/CENTERS/NTC/Environmental%20Attributes%20of%20Electric%20Vehicle%20Ownership%20and%20Commuting%20Behavior%20in%20Maryland%20-%20Public%20Policy%20and%20Equity%20Considera.pdf
Finamore, B. (2020). How EV Charging Can Clean Up China's Electricity Grid. NRDC.
https://www.nrdc.org/experts/barbara-finamore/how-ev-charging-can-clean-chinas-electricity-grid Frangoul, A. 2014. Munich: The 100% clean electricity city? CNBC.
https://www.cnbc.com/2014/09/26/munich-the-100-clean-energy-city.html Funke, S. Spiel, F. Gnann, T. Plotz, P. 2016. How much charging infrastructure do electric vehicles need? A review of the evidence and international comparison. Transportation Research Part D: Transport and Environment, Vol 77 .
https://doi.org/10.1016/j.trd.2019.10.024 G. Tal, M. Nicholas, J. Davies, J. Woodjack. 2013. Charging behavior impacts on electric vehicle miles travel: who is not plugging in? Inst. Transp. Stud., 3 (2013), p. 21,
https://doi.org/10.3141/2454-07 García-Villalobos, J.; Zamora, I.; San Martín, J.I. ; Asensio, .J. ; Aperribay, V. 2014. Plug-in electric vehicles in electric distribution networks: A review of smart charging approaches, Renewable and Sustainable Energy Reviews, Volume 38, 2014, Pages 717-731, ISSN 1364-0321,
https://doi.org/10.1016/j.rser.2014.07.040 Graham-Rowe, E.; Gardner, B.; Abraham, C; Skippon,S.; Dittmar, Helga ; Hutchins, Rebecca; Stannard, J.2012. Mainstream consumers driving plug-in battery-electric and plug-in hybrid electric cars: A qualitative analysis of responses and evaluations, Transportation Research Part A: Policy and Practice, Volume 46, Issue 1, 2012, Pages 140-153, ISSN 0965-8564,
https://doi.org/10.1016/j.tra.2011.09.008 GREET. n.d. Argonne National Lab. https://greet.es.anl.gov/ Grid Integration Tech Team and Integrated Systems Analysis Tech Team. 2019. Summary Report on EVs at Scale and the U.S. Electric Power System. US Drive.
https://www.energy.gov/sites/prod/files/2019/12/f69/GITT%20ISATT%20EVs%20at%20Scale%20Grid%20Summary%20Report%20FINAL%20Nov2019.pdf

77
Hagman, J.; Ritzén, S.; Stier J.;, Susilo, Y . 2016. Total cost of ownership and its potential implications for battery electric vehicle diffusion, Research in Transportation Business & Management, Volume 18, 2016, Pages 11-17, ISSN 2210-5395.
https://doi.org/10.1016/j.rtbm.2016.01.003 Hale, D. Lutsey, N. 2020.EMERGING BEST PRACTICES FOR ELECTRIC VEHICLE CHARGING INFRASTRUCTURE. ICCT.
https://www.academia.edu/35939082/EMERGING_BEST_PRACTICES_FOR_ELECTRIC_VEHICLE_CHARGING_INFRASTRUCTURE_Dale_Hall_Nic_Lutsey?bulkDownload=thisPaper-topRelated-sameAuthor-citingThis-citedByThis-secondOrderCitations&from=cover_page
Hall, D. Cui, H. Bernard, R. LI, S. Lutsey, N. 2020. Electric vehicle capitals: Cities aim for all-electric mobility. ICCT.
https://theicct.org/publications/electric-vehicle-capitals-update-sept2020 Hall, D. Cui, D. Lutsey, N. 2017. Electric vehicle capitals of the world: What markets are leading the transition to electric? ICCT.
https://theicct.org/sites/default/files/publications/World-EV-capitals_ICCT-Briefing_08112017_vF.pdf Hall, D., Lutsey, N. 2020. Charging infrastructure in cities Metrics for evaluating future needs. ICCT.
https://theicct.org/sites/default/files/publications/EV-charging-metrics-aug2020.pdf Halverson, A. 2020. Report : Seattle is one of the top cities for electric car ownership. SeattlePi.
https://www.seattlepi.com/seattlenews/slideshow/electric-cars-seattle-portland-best-selling-210679.php Hauke Engel, Russell Hensley, Stefan Knupfer, Shivika Sahdev. 2018. The potential impact of electric vehicles on global energy systems. McKinsey & Company.
https://www.mckinsey.com/industries/automotive-and-assembly/our-insights/the-potential-impact-of-electric-vehicles-on-global-energy-systems#
Hawkins, T.R. ; Singh,B.; Majeau-Bettez, G. ; Strømman, A.H.2013. Comparative environmental life cycle assessment of conventional and electric vehicles. J. Ind. Ecol., 17 (1) (2013), pp. 53-64,
https://doi.org/10.1111/j.1530-9290.2012.00532.x Helms, H. & Pehnt, Martin & Lambrecht, U. & Liebich, Axel. (2010). Electric vehicle and plug-in hybrid energy efficiency and life cycle emissions. 18th International Symposium Transport and Air Pollution. Hertzke, P. ; Muller, N.; Schaufuss, P.; Schenk, S. ; Wu, T. 2019. Expanding electric-vehicle adoption despite early growing pains . McKinsey & Company.
https://www.mckinsey.com/industries/automotive-and-assembly/our-insights/expanding-electric-vehicle-adoption-despite-early-growing-pains
Hewitt, B. 2009. Where Your Car Goes to Die. Popular Mechanics.
https://www.popularmechanics.com/cars/a1481/4213384/
Idaho National Laboratory, 2015. Plugged In: How Americans Charge Their Electric Vehicles 1–24. https://avt.inl.gov/sites/default/files/pdf/arra/PluggedInSummaryReport.pdf
Idaho National Laboratory. n.d. Comparing Energy Costs per Mile for Electric and Gasoline-Fueled Vehicles. Advanced Vehicle Testing Activity.
https://avt.inl.gov/sites/default/files/pdf/fsev/costs.pdf
iea. 2019.Data and Statistics. https://www.iea.org/data-and-statistics/data-tables?country=FRANCE&energy=Electricity&year=2019

78
iea. 2020. Entering the decade of electric drive?. Global EV Outlook 2020.
https://www.iea.org/reports/global-ev-outlook-2020 iea. 2020. https://www.eia.gov/international/a.nalysis/country/CHN iea. n.d. Sweden. https://www.iea.org/countries/sweden INRIX. 2017. New INRIX Study Finds Parking is the Largest Cost of Driving.
https://inrix.com/press-releases/cod-us/
INRIX. n.d. Impact of Parking Pain in the US. https://inrix.com/wp-content/uploads/2017/07/INRIX_Parking_Pain_Infog_US_HR.pdf
Institute for European Environmental Policy. 2014. ENVIRONMENTAL TAX REFORM IN EUROPE: OPPORTUNITIES FOR THE FUTURE.
https://web.archive.org/web/20161009191722/http://www.ieep.eu/assets/1398/ETR_in_Europe_-_Annex_2_3_4.pdf
ISHIHARA, K.;IHIRA, N.; TERADA, N. and IWAHORI, T. 2020, Central Research Institute of Electric Power Industry,
https://www.electrochem.org/dl/ma/202/pdfs/0068.pdf J. Dong, C. Liu, Z. Lin, Charging infrastructure planning for promoting battery electric vehicles: an activity-based approach using multiday travel data, Transp. Res. Part C Emerg. Technol., 38 (2014), pp. 44-55,
https://doi.org/10.1016/j.trc.2013.11.001 J.D.Power. 2021. Electric Vehicle Experience (EVX) Ownership Study.
https://www.jdpower.com/business/automotive/electric-vehicle-experience-evx-ownership-study JARI. 2003. Incentives for EV & HEV. Evaap.org.http://www.evaap.org/pdf/incentive.pdf Jonsson, S. Ydstedt, A. Asen, E. 2020. Looking Back on 30 Years of Carbon Taxes in Sweden. Tax Foundation.
https://taxfoundation.org/sweden-carbon-tax-revenue-greenhouse-gas-emissions/#:~:text=rate—EU%20ETS.-,Sweden%20levies%20the%20highest%20carbon%20tax%20rate%20in%20the%20world,gas%20emissions%20by%2027%20percent.
Kane, M. 2021. Tesla Reveals How Often Its Cars Burn From Fire. InsideEVs.
https://insideevs.com/news/501729/number-tesla-vehicle-fires-2020/ Kawamoto, Ryuji & Mochizuki, Hideo & Moriguchi, Yoshihisa & Nakano, Takahiro & Motohashi, Masayuki & Sakai, Yuji & Inaba, Atsushi. (2019). Estimation of CO2 Emissions of Internal Combustion Engine Vehicle and Battery Electric Vehicle Using LCA. Sustainability. 11. 2690.
https://doi.org/10.3390/su11092690 Kleebinder, H. 2019. EFFICIENCY AND CO2 EMISSION ANALYSIS OF INTERNAL COMBUSTION ENGINES (ICE) AND ELECTRIC VEHICLES (EV). hpk. https://kleebinder.net/en/tag/lifecycle-assessment/ Klöckner, C. A., Nayum, A., & Mehmetoglu, M. (2013). Positive and negative spillover effects from electric car purchase to car use. Transportation Research Part D: Transport and Environment, 21, 32-38.
https://core.ac.uk/download/pdf/30873621.pdf

79
LAK. n.d. Zusammenstellung der Tabelle.
https://www.lak-energiebilanzen.de/eingabe-dynamisch/?a=e100 Lane,B.; Potter, S. 2007. The adoption of cleaner vehicles in the UK: exploring the consumer attitude–action gap, Journal of Cleaner Production, Volume 15, Issues 11–12, 2007, Pages 1085-1092, ISSN 0959-6526,
https://doi.org/10.1016/j.jclepro.2006.05.026 Langbroek, J. Franklin, J. Susilo, Y. 2016. The effect of policy incentives on electric vehicle adoption. Energy Policy, Vol 94
https://doi.org/10.1016/j.enpol.2016.03.050 LAURA J. NELSON. 2018. Commuters who drive alone in zero-emission cars will no longer get free trips in L.A.'s toll lanes. Los Angeles Times.
https://www.latimes.com/local/lanow/la-me-ln-toll-lane-zero-emission-20180426-story.html LifestyleDesk. 2011. Sweden Follows Suit with Electric Car Subsidy. The Global Herald.
https://web.archive.org/web/20111017103803/http://theglobalherald.com/sweden-follows-suit-with-electric-car-subsidy/24444/
Liping, G. 2015.Electric vehicles to be exempted of charges in parking and tollways. ECNS.CN.
http://www.ecns.cn/2015/07-16/173380.shtml Liu, X.; Reddi, K.; Elgowainy, A.; Lohse-Busch, H.; Wang, M.; Rustagi, N. 2020. Comparison of Well-to-Wheels Energy Use and Emissions of a Hydrogen Fuel Cell Electric Vehicle Relative to a Conventional Gasoline-Powered Internal Combustion Engine Vehicle. Int. J. Hydrogen Energy 2020, 45, 972– 983,
https://doi.org/10.1016/j.ijhydene.2019.10.192 Liu,X.; Elgowainy, A.; Vijayagopal, R.and Wang, M. 2021. Well-to-Wheels Analysis of Zero-Emission Plug-In Battery Electric Vehicle Technology for Medium- and Heavy-Duty Trucks.. Environmental Science & Technology 2021 55 (1), 538-546.
https://doi.org/10.1021/acs.est.0c02931 Long, H. Shapiro, L. 2018.Does $60,000 make you middle-class or wealthy on Planet Earth? Washington Post.
https://www.washingtonpost.com/business/2018/08/20/does-make-you-middle-class-or-wealthy-planet-earth/
Love, B. 2017. Paris plans to banish all but electric cars by 2030. Reuters.
https://www.reuters.com/article/us-france-paris-autos/paris-plans-to-banish-all-but-electric-cars-by-2030-idUSKBN1CH0SI
Manthey, N. 2021. Is this the end of plug-in hybrid sales in the EU? Electrive.
https://www.electrive.com/2021/04/14/is-this-the-end-of-plug-in-hybrids-in-the-eu Marquis, C.; Zhang, H.; Zhou, L.; 2013. China’s Quest to Adopt Electric Vehicles. Stanford Social Innovation Review.
https://www.hbs.edu/ris/Publication%20Files/Electric%20Vehicles_89176bc1-1aee-4c6e-829f-bd426beaf5d3.pdf
Mayor of London. 2021. London hits electric vehicle charging points milestone. London.Gov. UK. https://www.london.gov.uk/press-releases/mayoral/london-hits-electric-vehicle-charging-points-miles

80
Melton, N.; Axsen,J.; Moawad, B. 2020. Which plug-in electric vehicle policies are best? A multi-criteria evaluation framework applied to Canada, Energy Research & Social Science, Volume 64, 2020, 101411, ISSN 2214-6296,
https://doi.org/10.1016/j.erss.2019.101411 Mohamad Adam Bujang, Nurakmal Baharum. 2016. Sample Size Guideline for Correlation Analysis, World Journal of Social Science Research 3(1):37,
https://doi.org/10.22158/wjssr.v3n1p37
Morse, I.2021. Millions of electric cars are coming. What happens to all the dead batteries? Science Mag. https://www.sciencemag.org/news/2021/05/millions-electric-cars-are-coming-what-happens-all-dead-batteries
Moses, M. 2020. Benefits of electric cars on the environment. edf.
https://www.edfenergy.com/for-home/energywise/electric-cars-and-environment New Motion. 2020. EV Driver Survey Report 2020.
https://assets.ctfassets.net/ulfvrpf1itxm/3gNS3F5NPiiU2W7tA62QqH/f6269e4852bb147bc7e29709e2383989/EV_driver_survey_report_2020_EN.pdf
Nicholas, M., Tal, G., Turrentine, T.S., 2017b. Advanced plug-in electric vehicle travel and charging behavior interim report advanced plug in electric vehicle travel and charging behavior interim report. Inst. Transp. Stud. Ning Wang, Linhao Tang, Huizhong Pan, A global comparison and assessment of incentive policy on electric vehicle promotion, Sustainable Cities and Society, Volume 44, 2019, Pages 597-603, ISSN 2210-6707,
https://doi.org/10.1016/j.scs.2018.10.024 NOAA. 2018. NOAA’s greenhouse gas index up 41 percent since 1990. NOAA Research News. Retrieved on 16 February 2021 from
https://research.noaa.gov/article/ArtMID/587/ArticleID/2359/NOAA%E2%80%99s-greenhouse-gas-index-up-41-percent-since-1990
Noel Melton, Jonn Axsen, Barbar Moawad, Which plug-in electric vehicle policies are best? A multi-criteria evaluation framework applied to Canada, Energy Research & Social Science, Volume 64, 2020, 101411, ISSN 2214-6296,
https://doi.org/10.1016/j.erss.2019.101411 NREL. 2016. Emissions Associated with Electric Vehicle Charging: Impact of Electricity Generation Mix, Charging Infrastructure Availability, and Vehicle Type. EFDC.
https://afdc.energy.gov/files/u/publication/ev_emissions_impact.pdf Office of Energy Efficiency and Renewable Energy. n.d. Charging at Home.
https://www.energy.gov/eere/electricvehicles/charging-home#:~:text=Because%20residential%20 charging%20is%20 convenient,of%20their%20 charging%20at%20home
OECD. 2011. Five Family Facts. https://www.oecd.org/els/family/47710686.pdf Proctor, D. 2020. Driving Change on the Grid—The Impact of EV Adoption. Power.
https://www.powermag.com/driving-change-on-the-grid-the-impact-of-ev-adoption/

81
Quick 220 System. 2017. Environmental Impact of EVs over Lifecycle. https://www.quick220.com/blog/environmental-impact-of-evs-over-lifecycle/
Quiroga, Tony (August 2009). "Driving the Future". Car and Driver. Hachette Filipacchi Media U.S., Inc. p. 52 Raugei, M.; Hutchinson,A.; Morrey, D. 2018, Can electric vehicles significantly reduce our dependence on non-renewable energy? Scenarios of compact vehicles in the UK as a case in point. Journal of Cleaner Production, Volume 201, Pages 1043-1051, ISSN 0959-6526,
https://doi.org/10.1016/j.jclepro.2018.08.107 Rijksdienst voor Ondernemend Nederland. 2013. Cijfers Elektrisch Vervoer.
https://web.archive.org/web/20140531142953/http://www.bovag.nl/data/sitemanagement/media/2013_cijfers%20elektrisch%20vervoer%20tm%20december%202013.pdf
Rijksdienst voor Ondernemend Nederland. n.d. Mission Zero Powered by Holland .
https://www.rvo.nl/sites/default/files/2019/06/Misson%20Zero%20Powered%20by%20Holland.pdf San Francisco Water Power Sewer. n.d. Power. SFPUC.https://sfwater.org/index.aspx?page=70 San Jose Clean Energy. n.d. Your Choices. San Jose Clean Energy. org https://sanjosecleanenergy.org/your-choices/ SCOTT GUTIERREZ.2011. Getting There: Are hybrids allowed in HOV lanes at any time? SeattlePi.
https://www.seattlepi.com/local/transportation/article/Getting-There-Are-hybrids-allowed-in-HOV-lanes-888477.php
SCOTT GUTIERREZ.2011. Getting There: Are hybrids allowed in HOV lanes at any time? SeattlePi.
https://www.seattlepi.com/local/transportation/article/Getting-There-Are-hybrids-allowed-in-HOV-lanes-888477.php
Seattle City Light. n.d. Fuel Mix. Seattle.gov. Extracted on December 1, 2020.
https://www.seattle.gov/light/fuelmix/ SF Environment. n.d.The Benefits of Buying an Electric Car.
https://sfenvironment.org/buy-electric Shell. Consumer acceptance of new fuels and vehicle technologies. Cambridge MBA students’ study conducted on behalf of Shell. UK PowerPoint Presentation to the Low Carbon Vehicle Partnership, 2004. pp. 96–7. Sierzchula,W.; Bakker, S.; Maat, K. ; Van Wee, B. 2012. The competitive environment of electric vehicles: an analysis of prototype and production models. Environmental Innovation and Societal Transitions, 2 (2012), pp. 49-65.
https://doi.org/10.1016/j.eist.2012.01.004 Sönnichsen, N. 2021. Distribution of electricity production in Norway 2019, by source. Statista.
https://www.statista.com/statistics/1025497/distribution-of-electricity-production-in-norway-by-source/#:~:text=Almost%20all%20 electricity%20produced%20in,thermal%20power%20and%20wind%20power
Staff Writer. 2020. Tokyo one-ups rest of Japan with 2030 electric vehicle goal. Nikkei Asia.
https://asia.nikkei.com/Business/Automobiles/Tokyo-one-ups-rest-of-Japan-with-2030-electric-vehicle-goal#:~:text=Japan's%20 capital%20has%20already%20committed,the%20cost%20of%20these%20 cars

82
Statistica. 2021. Electricity prices for households in Germany 2010-2020, semi-annually. Extracted on May 31, 2021.
https://www.statista.com/statistics/418078/electricity-prices-for-households-in-germany/#:~:text=Germany%20is%20one%20of%20the,fees%20taking%20up%20end%20 costs
SuperMelf. n.d. Driving and Owning a Car in japan.
http://www.supermelf.com/japan/ajetdrivingbook/chap1.html Tabeta, S. 2020. China plans to phase out conventional gas-burning cars by 2035. Nikkei Asia.
https://asia.nikkei.com/Business/Automobiles/China-plans-to-phase-out-conventional-gas-burning-cars-by-2035
The city of New York and Empire Clean Cities. 2012. The New York City Electric Vehicle Readiness Plan: Unlocking Urban Demand. Energy. Gov.
https://cleancities.energy.gov/files/u/projects_and_partnerships/project_material/supporting_material/232/nyc_readiness_plan.pdf
The herald. 2009. Glasgow in the driving seat to take the lead in electric car revolution.
https://www.heraldscotland.com/default_content/12386945.glasgow-driving-seat-take-lead-electric-car-revolution/
UNCTAD. 2020. Developing countries pay environmental cost of electric car batteries. https://unctad.org/news/developing-countries-pay-environmental-cost-electric-car-batteries
U.S. Bureau of Labor Statistics. (2020). Consumer Expenditure Surveys. https://www.bls.gov/cex/ Valdes-Dapena, P. 2020. Electric car batteries are catching fire and that could be a big turnoff to buyers. CNN.
https://www.cnn.com/2020/11/10/success/electric-car-vehicle-battery-fires/index.html Wallbox. n.d.The Essential Guide To EV And EV Charger Incentives In Sweden.
https://blog.wallbox.com/en/sweden-ev-incentives/#:~:text=The%20Swedish%20 government%20has%20 set,sustain%20the%20increase%20in%20EVs
Walton, R. 2020. ConEd developing $13M curbside EV charging program with AddEnergie. Utility Dive.
https://www.utilitydive.com/news/coned-developing-13m-curbside-ev-charging-program-with-addenergie/572302/#:~:text=%22The%20%242.50%20per%20hour%20is,utility%20said%20in%20an%20email
Whitehead, J.; Franklin, J.; Washington,S. 2015. Transitioning to energy efficient vehicles: An analysis of the potential rebound effects and subsequent impact upon emissions, Transportation Research Part A: Policy and Practice, Volume 74, 2015, Pages 250-267, ISSN 0965-8564,
https://doi.org/10.1016/j.tra.2015.02.016
Winton, N. 2021. Electric Cars Are Coming And If You Don’t Like It, Tough. Forbes. https://www.forbes.com/sites/neilwinton/2021/03/09/electric-cars-are-coming-and-if-you-dont-like-it-tough/?sh=1c7ffd93698f
World Data. n.d. Energy Consumption in Japan.https://www.worlddata.info/asia/japan/energy-consumption.php World Meteorological Organization. 2019 concludes a decade of exceptional global heat and high‐impact weather. Retrieved on 16 February 2020 from

83
https://public.wmo.int/en/media/press‐release/2019‐concludes‐decade‐of‐exceptional‐global‐heat‐and‐high‐impact‐weather
WSDOT. n.d. High Occupancy Vehicle (HOV) lanes. wsdot.wa.gov.
https://wsdot.wa.gov/travel/highways-bridges/hov/home Xiao P, Wen Q. Environmental impact analysis of the whole life cycle of pure electric vehicles. IOP Publishing Conf Ser Earth Environ Sci. 2019;300:032053.
https://doi-org.offcampus.lib.washington.edu/10.1088/1755-1315/300/3/032053
Zhangyong, Q. 2020. Can China build enough EV charging infrastructure? Nikkei Asia. https://asia.nikkei.com/Business/Startups/Can-China-build-enough-EV-charging-infrastructure

84
Appendix 1: EV ownership and City Profile
Total
Population
Number of
Household
Median Annual
Household
Income
Total Registered
passenger cars
Total Registered
EVs
EV per 100
HH
EVs per 100
registered passenger
cars
2020 2019 2019 data Till 2020 Till 2020 2020 2020
USA Seattle 608,660 331,836 $92,263 444000 11,986 36 27
LA 3,998,280 1,383,869 $62,142 13647010 105,183 76 8
SF 3,792,621 362,354 $112,449 3829928 46,628 129 12
San Jose 945,942 325,114 $109,593 650228 107,738 331 166
New York 8,175,133 3,167,034 $63,998 3800436 9,005 2.84 2.37
Norway Oslo 580,000 378,017 $77,900 78210 67,782 179 867
Bergen 280,216 151,008 $77,900 116358 39,241 260 337
UK London 9,304,016 3,740,000 $50,422 2672927 50,758 1 2
Netherlands Amsterdam 1,149,000 475,368 $73,392 237479 19,000 4 8
Sweden Stockholm 1,656,571 465,949 $57,786 360635 59,338 13 16
Germany Berlin 3,562,038 41,507 $50,400 1221433 28,887 1 2
Munich 1,538,302 832,310 $60,824 740244 25,670 3 3
France Paris 11,017,230 1,025,721 $42,509 348745 66,365 6 19
https://www.sfmta.com/sites/default/files/reports-and-documents/2019/07/evroadmap_final_june2019.pdf

85
China Shenzhen 12,356,820 1,166,400 $45,885 3040000 272,000 7 9
Beijing 20,462,610 4,973,562 $30,039 6000000 400,000 8 7
Japan Tokyo 37,393,128 6,946,000 $64,450 3157277 505,164 7 16
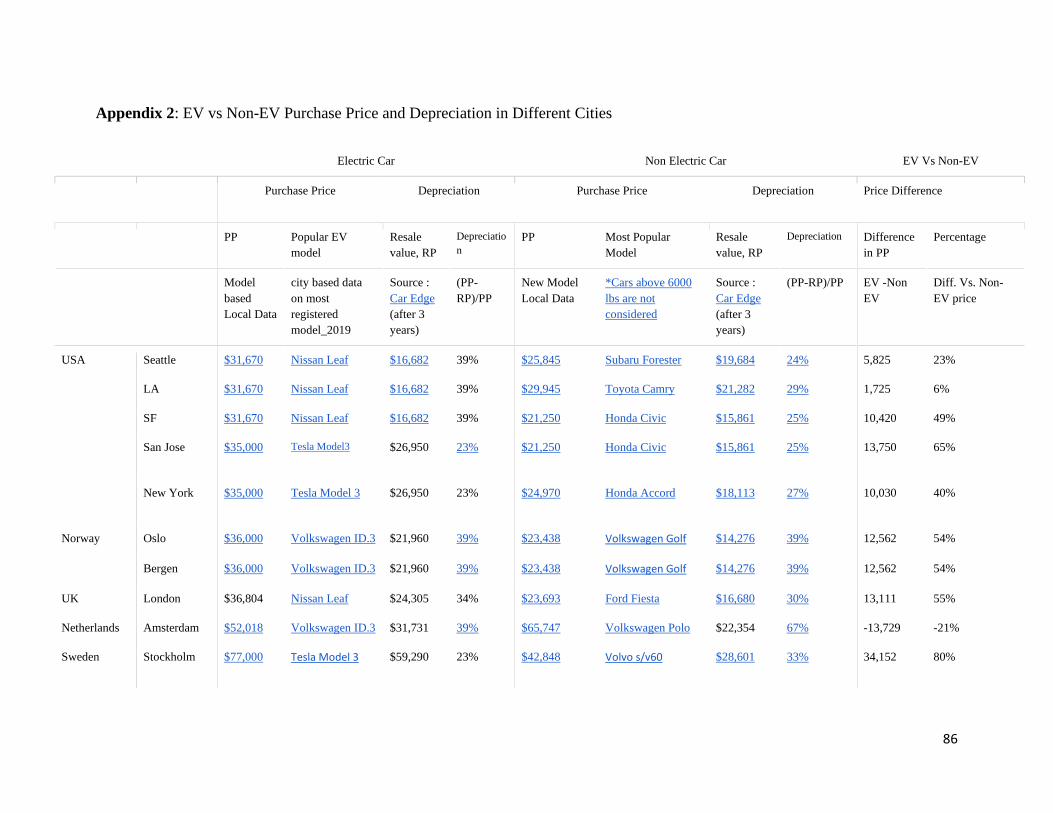
86
Appendix 2: EV vs Non-EV Purchase Price and Depreciation in Different Cities
Electric Car Non Electric Car EV Vs Non-EV
Purchase Price Depreciation Purchase Price Depreciation Price Difference
PP Popular EV
model
Resale
value, RP
Depreciatio
n
PP Most Popular
Model
Resale
value, RP
Depreciation Difference
in PP
Percentage
Model
based
Local Data
city based data
on most
registered
model_2019
Source :
Car Edge
(after 3
years)
(PP-
RP)/PP
New Model
Local Data
*Cars above 6000
lbs are not
considered
Source :
Car Edge
(after 3
years)
(PP-RP)/PP EV -Non
EV
Diff. Vs. Non-
EV price
USA Seattle $31,670 Nissan Leaf $16,682 39% $25,845 Subaru Forester $19,684 24% 5,825 23%
LA $31,670 Nissan Leaf $16,682 39% $29,945 Toyota Camry $21,282 29% 1,725 6%
SF $31,670 Nissan Leaf $16,682 39% $21,250 Honda Civic $15,861 25% 10,420 49%
San Jose $35,000 Tesla Model3 $26,950 23% $21,250 Honda Civic $15,861 25% 13,750 65%
New York $35,000 Tesla Model 3 $26,950 23% $24,970 Honda Accord $18,113 27% 10,030 40%
Norway Oslo $36,000 Volkswagen ID.3 $21,960 39% $23,438 Volkswagen Golf $14,276 39% 12,562 54%
Bergen $36,000 Volkswagen ID.3 $21,960 39% $23,438 Volkswagen Golf $14,276 39% 12,562 54%
UK London $36,804 Nissan Leaf $24,305 34% $23,693 Ford Fiesta $16,680 30% 13,111 55%
Netherlands Amsterdam $52,018 Volkswagen ID.3 $31,731 39% $65,747 Volkswagen Polo $22,354 67% -13,729 -21%
Sweden Stockholm $77,000 Tesla Model 3 $59,290 23% $42,848 Volvo s/v60 $28,601 33% 34,152 80%

87
Germany Berlin $58,896 Volkswagen ID.3 $35,927 39% $57,994 Volkswagen Golf $35,324 39% 902 2%
Munich $58,896 Volkswagen ID.3 $35,927 39% $57,994 Volkswagen Golf $35,324 39% 902 2%
France Paris $38,472 Renault Zoe $26,546 31% $16,952 Renault Clio $11,329 50% 21,520 127%
China Shenzhen $36,800 Tesla 3 $28,336 23% $24,856 Volkswagen Lavida
sedan
$15,140 39% 11,944 48%
Beijing $36,800 Tesla 3 $28,336 23% $24,856 Volkswagen Lavida
sedan
$15,140 39% 11,944 48%
Japan Tokyo $34,602 Nissan Leaf $18,215 47% $12,839 Honda N Box (K-
Car)
$9,583 25% 21,763 170%
* Local Price of Nissan Leaf in London is £26,000
For non EV prices in Amsterdam, the average diesel car €53,976 price is considered. And for the depreciation rate, a fixed depreciation table is used. Source is
provided in the relevant cells in the table.

88
Appendix 3: Annual Fuel Cost: EV Charging Cost in EV friendly Cities
EV FUEL COST CALCULATION NON-EV FUEL COST CALCULATION
Annual
VMT per
Capita
Average Fuel
Economy (kWh/
100 mile)
Annual
Energy
consumed
per EV
(residence)
80%
Annual
Energy
consumed
(public
charger)
20%
Total
Energy
Consumpti
on (kWh)
Residential
Electricity
Cost per
kWh ($)
Public
Charging
Electricity
Cost per
kWh ($)
Total
Annual
Fuel Cost
Average
Fuel
Economy
Fuel cost
per gallon
Total Fuel Cost
(country
based 2008
data for
consistency)
3 mile / kWh
= 0.3 kWh/ mile
= 30 kWh/100
mile
Annual VMT per Capita*percentage of
usage (residential or public)*Average Fuel
Economy/100
Level 1
Charger at
domestic
rate
Level 2
Charger at
peak hour
FC Gallons/
100 miles
Local Rate FC
Seattle 8699 30 2088 522 2,610 $0.11 $0.32 $397 4.13 $3.50 $1,257
Los Angeles 8699 30 2088 522 2,610 $0.18 $0.27 $517 4.13 $3.70 $1,329
San Francisco 8699 30 2088 522 2,610 $0.24 $0.30 $658 4.13 $3.46 $1,243
San Jose 8699 30 2088 522 2,610 $0.16 $0.25 $465 4.13 $3.38 $1,214
New York 8699 30 2088 522 2,610 $0.22 $0.40 $668 4.13 $2.79 $1,002
Oslo 4039 30 969 242 1,212 $0.10 $0.57 $235 4.13 $6.27 $1,046
Bergen 4039 30 969 242 1,212 $0.10 $0.42 $199 4.13 $7.35 $1,226
London 3884 30 932 233 1,165 $0.20 $0.35 $268 4.13 $5.79 $929

89
Amsterdam 3821 30 917 229 1,146 $0.26 $0.39 $328 4.13 $7.97 $1,258
Stockholm 4350 30 1044 261 1,305 $0.36 $0.25 $441 4.13 $5.80 $1,042
Berlin 4350 30 1044 261 1,305 $0.31 $0.40 $428 4.13 $6.04 $1,085
Munich 4350 30 1044 261 1,305 $0.31 $0.46 $444 4.13 $6.19 $1,112
Paris 3884 30 932 233 1,165 $0.21 $0.27 $257 4.13 $5.54 $889
Shenzhen 13090 30 3142 785 3,927 $0.08 $0.10 $331 4.13 $4.15 $2,244
Beijing 13090 30 3142 785 3,927 $0.08 $0.10 $331 4.13 $4.15 $2,244
Tokyo 2485 30 597 149 746 $0.25 $0.14 $170 4.13 $4.24 $435

90
Appendix 4: Fuel Cost Comparison for 100-mile Drive
Total
Registered
EVs
Electric Cars
per 100 HH
Electric
Cars per
registered
passenger
cars
Residential
Charging
Cost per 100
miles
Public
Charging
Cost per
100 miles
Charging
Cost per
100 miles
Gasoline
cost per
100 miles
Difference
in cost
Cost difference
in percentage
(compared to
charging cost)
USA Seattle 11986 4 3 3 10 5 14 10 217%
Los Angeles 105183 8 1 5 8 6 15 9 157%
San Francisco 46628 13 1 7 9 8 14 7 89%
San Jose 107738 33 17 5 8 5 14 9 161%
New York 9005 1 1 7 12 8 12 4 50%
Norway Oslo 67782 18 87 3 17 6 26 20 345%
Bergen 39241 26 34 3 13 5 30 25 517%
UK London 50758 1 2 6 11 7 24 17 247%
Netherland Amsterdam 19000 4 8 8 12 9 33 24 284%
Sweden Stockholm 59338 13 16 11 8 10 24 14 136%
Germany Berlin 28887 70 2 9 12 10 25 15 154%
Munich 25670 3 3 9 14 10 26 15 151%
France Paris 66365 6 19 6 8 7 23 16 245%
China Shenzhen 272000 23 9 2 3 3 17 15 577%
Beijing 400000 8 7 2 3 3 17 15 577%
Japan Tokyo 505164 7 16 8 4 7 18 11 156%

91
Appendix 5: Annual Insurance and Maintenance & Repair Cost Comparison in EV Friendly Cities
Total EVs Median Annual
Household Income
Annual Insurance Cost_EV Difference Annual Maintenance and Repair Cost Difference
City based data 2019 data EV Non-EV EV vs Non-EV EV Non EV EV vs non-EV
Seattle 11,986 $92,263 $1,263 $1,674 -$411 $748 $632 $116
Los Angeles 105,183 $62,142 $1,263 $1,674 -$411 $748 $388 $360
San Francisco 46,628 $112,449 $1,263 $1,674 -$411 $748 $368 $380
San Jose 107,738 $109,593 $1,913 $1,674 $239 $496 $368 $128
New York 9,005 $63,998 $1,913 $1,674 $239 $496 $400 $96
Oslo 67,782 $44,586 $1,541 $820 $721 $300 $300 $0
Bergen 39,241 $44,586 $1,541 $820 $721 $300 $300 $0
London 50,758 $50,422 $784 $859 -$75 $230 $230 $0
Amsterdam 19,000 $34,000 $292 $2,609 -$2,317 $300 $300 $0
Stockholm 59,338 $57,786 $1,096 $660 $436 $313 $313 $0
Berlin 28,887 $50,400 $1,170 $1,522 -$351 $300 $300 $0
Munich 25,670 $60,824 $1,170 $1,522 -$351 $300 $300 $0
https://www.sfmta.com/sites/default/files/reports-and-documents/2019/07/evroadmap_final_june2019.pdf

92
Paris 66,365 $42,509 $612 $486 $126 $141 $141 $0
Shenzhen 272,000 $45,885 $148 $148 $0 $496 $298 $198
Beijing 400,000 $30,039 $148 $148 $0 $496 $298 $198
Tokyo 505,164 $64,450 $643 $274 $368 $248 $248 $0

93
Appendix 6: EV vs Non-EV_ Tax and Subsidies Comparison in Sample Cities
Median
Income
EV_Tax
(Annual)
EV_Subsidies, S ( One time) EV Total
(3T-S)
Non EV
_Tax
Total Tax EV
Benefit
Benefit
percentage
% of Median Income
HH, 2019
Annual T National State City Total S For 3
years
Annual T For 3
years
EV Vs
Non EV
Compared
to non EV
EV
Incentives
EV
benefits
Seattle $92,263 $150 $7,500 $0 $0 $7,500 -$7,050 $924 $2,772 $9,822 354% 3% 4%
Los Angeles $62,142 $100 $7,500 $4,500 $450 $12,450 -$12,150 $963 $2,889 $15,039 521% 7% 8%
San Francisco $112,449 $100 $7,500 $4,500 $800 $12,800 -$12,500 $648 $1,944 $14,444 743% 4% 4%
San Jose $109,593 $100 $7,500 $4,500 $3,000 $15,000 -$14,700 $701 $2,103 $16,803 799% 5% 5%
New York $63,998 $61 $7,500 $2,000 $0 $9,500 -$9,319 $523 $1,569 $10,888 694% 5% 6%
Oslo $44,586 $0 $3,600 $0 $0 $3,600 -$3,600 $3,690 $11,070 $14,670 133% 3% 11%
Bergen $44,586 $0 $3,000 $0 $0 $3,000 -$3,000 $3,690 $11,070 $14,070 127% 2% 11%
London $50,422 $0 $3,500 $0 $0 $3,500 -$3,500 $1,815 $5,445 $8,945 164% 2% 6%
Amsterdam $34,000 $0 $4,858 $607 $0 $5,466 -$5,466 $1,502 $4,507 $9,973 221% 5% 10%
Stockholm $57,786 $43.33 $4,776 $0 $0 $4,776 -$4,646 $3,092 $9,276 $13,922 150% 3% 8%
Berlin $50,400 $0 $10,904 $0 $0 $10,904 -$10,904 $3,859 $11,577 $22,481 194% 7% 15%
https://dor.wa.gov/sites/default/files/legacy/Docs/forms/ExcsTx/LocSalUseTx/LSUFlyer_20_Q4_alpha.pdf
https://dmv.ny.gov/registration/registration-fees-use-taxes-and-supplemental-fees-passenger-vehicles

94
Munich $60,824 $0 $10,904 0 $6,073 $16,977 -$16,977 $3,859 $11,577 $28,554 247% 9% 16%
Paris $42,509 $53 $8,470 $0 $0 $8,470 -$8,309 $1,418 $4,254 $12,563 295% 7% 10%
Shenzhen $45,885 $0 $3,600 $3,091 $6,691 -$6,691 $5,491 $16,473 $23,164 141% 5% 17%
Beijing $30,039 $0 $3,600 $0 $0 $3,600 -$3,600 $5,491 $16,473 $20,073 122% 4% 22%
Tokyo $64,450 $0 $7,726 $0 $3,600 $11,326 -$11,326 $1,730 $5,190 $16,517 318% 6% 9
*The negative sign in EV Total indicates the benefit the EV users accumulate over the three year period. As tax is low or null for them in the cities selected, subsidies increase
financial benefit rather than decreasing them.

95
Appendix 7: EV vs Non-EV_ TCO, Financial Return & Benefit Comparison
EV TCO IC % of
TCO
MR %
of TCO
FC % of
TCO
Return
of PP
Return
% PP
Non-EV
TCO
IC % of
TCO
MR %
of TCO
FC % of
TCO
TCO
Diff.
EV TCO Non EV
TCO
EV
Benefit
Non EV
tax
In case of EV after 3 years In case of EV after 3 years EV -non
EV
% of median income
Seattle $15,161 24.99% 14.80% 7.85% $16,509 52.13% $19,623 25.59% 9.66% 19.22% $4,462 30% 39% 4% 1%
LA $10,421 36.36% 21.53% 14.88% $21,249 67.09% $21,726 23.12% 5.36% 18.36% $11,305 21% 43% 8% 2%
SF $10,494 36.11% 21.38% 18.80% $21,176 66.86% $17,188 29.22% 6.42% 21.70% $6,694 21% 34% 4% 1%
San Jose $3,471 72.07% 42.87% 40.15% $31,529 90.08% $17,261 29.09% 6.40% 21.11% $13,790 4% 21% 5% 1%
New York $7,963 72.07% 18.69% 25.17% $27,037 77.25% $17,655 28.44% 6.80% 17.03% $9,692 10% 22% 6% 1%
Oslo $16,668 27.74% 5.40% 4.23% $19,332 53.70% $26,729 9.20% 3.37% 11.74% $10,061 25% 41% 11% 8%
Bergen $17,159 26.94% 5.25% 3.47% $18,841 52.34% $27,269 9.02% 3.30% 13.49% $10,110 26% 41% 11% 8%
London $12,845 18.31% 5.37% 6.26% $23,959 65.10% $18,511 13.92% 3.73% 15.05% $5,666 18% 25% 6% 4%
Amsterdam $17,582 4.99% 5.12% 5.59% $34,436 66.20% $60,401 12.96% 1.49% 6.25% $42,819 18% 63% 10% 4%
Stockholm $16,177 20.33% 5.80% 8.18% $60,823 78.99% $29,566 6.70% 3.17% 10.57% $13,390 9% 17% 8% 5.4%
Berlin $17,761 19.77% 5.07% 7.23% $41,135 69.84% $42,967 10.63% 2.09% 7.58% $25,207 16% 40% 15% 7.7%

96
Munich $11,735 29.92% 7.67% 11.34% $47,161 80.08% $43,048 10.61% 2.09% 7.75% $31,314 11% 40% 16% 6.3%
Paris $6,647 27.62% 6.34% 11.62% $31,825 82.72% $14,422 10.11% 2.92% 18.48% $7,774 8% 18% 10% 3%
Shenzhen $4,698 9.42% 31.67% 21.17% $32,102 87.23% $34,256 1.29% 2.61% 19.65% $29,559 6% 40% 17% 12%
Beijing $7,789 5.68% 19.10% 12.77% $29,011 78.83% $34,256 1.29% 2.61% 19.65% $26,467 9% 40% 22% 18%
Tokyo $8,269 23.31% 9.00% 6.17% $26,333 76.10% $11,319 7.27% 6.57% 11.54% $3,050 15% 21% 9% 3%

97
Appendix 8: EV Types and Charging Infrastructure in the Sample Cities
EV TYPE AVAILABILITY IN CITIES CHARGING POINT DATA
Total EVs % of BEV % of PHEV Total Public
Chargers
Household per
charging station
Public charger per
million people
EVs per public
charge point
Seattle 11,986 75% 25% 650 511 107 18
Los Angeles 105,183 49% 51% 11,045 125 276 10
San Francisco 46,628 30% 70% 893 406 24 52
San Jose 107,738 34% 66% 1,027 317 109 105
New York 9,005 55% 45% 3,351 945 41 3
Oslo 67,782 19% 81% 1,450 1 3800 20
Bergen 39,241 71% 29% 1,121 0.22 4000 25
Greater London 50,758 42% 52% 6,000 22 650 9
Amsterdam 19,000 42% 58% 575 1 3900 10
Stockholm 59,338 16% 84% 1,822 8 1100 6
Berlin 28,887 17% 12% 1,425 2 400 5
Munich 25,670 22% 22% 1,310 635 85 20
Paris 66,365 67% 31% 4,453 230 400 15
https://www.sfmta.com/sites/default/files/reports-and-documents/2019/07/evroadmap_final_june2019.pdf

98
Shenzhen 272,000 75% 25% 33,937 34 275 9
Beijing 400,000 95% 5% 41,130 121 201 11
Tokyo 505,164 38% 62% 42 165381 0.11 12028
*In some cities, charger availability was calculated by using either EV per public chargers or Public chargers per million people. The cells are linked to the proper source.

99
Appendix 9: EV Infrastructure and Energy Use in the Sample Cities
ENERGY AND INFRASTRUCTURE IN CASE OF 100% ELECTRIFICATION
Annual Energy
consumed
(residence)
80%
Annual Energy
consumed
(public
charger) 10%
Total Annual
Energy
consumed in
Charging(kW)
Total Power
Usage in City
(GW)
Percentage of
power to the
EV Charging
Annual Energy
consumed
(residence)
80%
Annual Energy
consumed
(public
charger) 10%
Total Annual
Energy
consumed in
Charging
Total Power
Usage in
Charging
(GW)
Total Power
Demand
Increase for
Charging
Seattle 28,421,203 3,552,650 31,973,854 9 0.35% 926986400 231746600 1158733000 10 12%
LA 249,409,930 31,176,241 280,586,171 23 1.20% 28492325846 7123081461 35615407307 59 152%
SF 110,564,314 13,820,539 124,384,853 6 2.24% 7996151285 1999037821 9995189106 15 178%
San Jose 255,468,346 31,933,543 287,401,889 5 5.66% 1357550705 339387676 1696938382 6 28%
New York 2,669,082 24,021,738 26,690,820 54 0.05% 7934577674 1983644419 9918222093 64 18%
Oslo 65,703,744 8,212,968 73,916,712 7 1.09% 75812013 18953003 94765016 7 0%
Bergen 38,037,836 4,754,730 42,792,566 6 0.66% 112790361 28197590 140987952 7 2%
London 47,309,339 5,913,667 53,223,006 269 0.02% 2491319786 622829947 3114149733 272 1%
Amsterdam 2,178,217 19,603,951 21,782,168 7 0.30% 217802421 54450605 272253026 8 3%
Stockholm 61,943,147 7,742,893 69,686,040 138 0.05% 376468146 94117036 470585182 138 0%
Berlin 30,155,241 3,769,405 33,924,646 65 0.05% 1275058208 318764552 1593822760 67 2%
Munich 26,797,003 3,349,625 30,146,629 400 0.01% 772743317 193185829 965929147 401 0%

100
Paris 61,855,950 7,731,994 69,587,943 65 0.11% 325050149 81262537 406312686 65 1%
Shenzhen 730,135,976 91,266,997 821,402,973 670 0.12% 9550624355 2387656089 11938280444 681 2%
Beijing 1,073,729,376 134,216,172 1,207,945,548 117 1.04% 18849916491 4712479123 23562395613 139 19%
Tokyo 301,338,802 37,667,350 339,006,152 26 1.31% 1883367510 470841877 2354209387 28 8%

101
Appendix 10a: EV Well to Wheel Carbon Emission in the Sample Cities
Power generation Mix and Carbon Footprint CO2 Emission from the vehicle Emission by Non EVs
Total
(estimated)
power usage in
Charging
(kWh)
annually
Total CO2
Emission (per
kWh)
Total Carbon
footprint from
energy sector
For non electric range Total CO2
Emission by
EVs (lb)
Total CO2
Emission by
Energy Sector
+ EV
Per Capita
Annual WTW
CO2 Emission
by EVs
Tailpipe
emission by
non electric
cars
Per Capita
Annual
Tailpipe
Emission by
Non EVs
Public and
Residential
Chargers
WTP (Well to
pump) = total
annual charging
demand * per
kWh CO2
emission
Non electric =
300 mile
Total emission =
VMT * number
of
PHEV*300/326
Emission rate
= 0.29 lb/mile
Emission by
BEV + PHEV
Emission by
EV + (total
energy used in
charging * per
kWh CO2
emission)
Total CO2
emission/
number of
electric cars
0.48 lb
CO2/mile
lb
Seattle 31,973,854 0.077 2453062 24216322 7022733 7022733 9475795 791 1803923886 4176
Los Angeles 280,586,171 0.595 167018370 410932974 119170562 119170562 286188933 2721 56545448040 4176
San Francisco 124,384,853 0.441 54844391 111982678 32474977 32474977 87319368 1873 15797602020 4176
San Jose 287,401,889 0.441 126722678 289851363 84056895 84056895 210779573 1956 2265229065 4176
New York 26,690,820 0.705 18806282 32221718 9344298 9344298 28150580 3126 15831553941 4176
Oslo 73,916,712 0.038 2815922 203449711 59000416 59000416 61816338 912 20216537 1939
Bergen 42,792,566 0.038 1630220 42527524 12332982 12332982 13963202 356 149505050 1939
London 53,223,006 0.579 30836069 95031911 27559254 27559254 58395323 1150 4888020894 1864

102
Amsterdam 21,782,168 0.029 633883 38753551 11238530 11238530 11872413 625 400753373 1834
Stockholm 69,686,040 0.508 35415782 199398381 57825530 57825530 93241313 1571 629049998 2088
Berlin 33,924,646 1.119 37973419 14161544 4106848 4106848 42080267 1457 2489805934 2088
Munich 30,146,629 0.200 6028947 22367074 6486451 6486451 12515398 488 1491892628 2088
Paris 69,587,943 0.495 34426499 72577490 21047472 21047472 55473971 836 599847523 1864
Beijing 821,402,973 1.587 1303835938 240924291 69868044 69868044 1373703982 5050 17392189615 6283
Shenzhen 1,207,945,548 1.587 1917405791 819142588 237551350 237551350 2154957141 5387 35186510783 6283
Tokyo 339,006,152 1.279 433480766 722150119 209423534 209423534 642904301 1273 3164057798 1193
* In this table, only the carbon emitting segment is shown. The BEV and PHEV electric miles emission, which is zero, is not shown in the table.

103
Appendix 10b: Electrification and Carbon Footprint Reduction
Baseline Scenario 25% electrification 50% electrification 75% electrification 100 % electrification
Total CO2
emission by
all registered
passenger
cars
Per Capita
Emission
Total CO2
emission by
all registered
passenger
cars
Per Capita
Emission
Total CO2
emission by
all registered
passenger
cars
Per Capita
Emission
Total CO2
emission by
all registered
passenger
cars
Per Capita
Emission
Per Capita
CO2
Emission
Offset by
EVs
Per Capita
CO2
Emission
Offset by
EVs in %
In Metric Ton
Seattle 822544 1.85 670515 1.51 500082 1.13 329650 0.74 1.54 83%
Los Angeles 25778376 1.89 23596497 1.73 21345211 1.56 19093926 1.40 0.66 35%
SF 7205273 1.88 6253802 1.63 5253624 1.37 4253446 1.11 1.04 56%
San Jose 1123098 1.73 1067916 1.64 904284 1.39 740652 1.14 1.01 58%
New York 7193835 1.89 6745824 1.78 6293525 1.66 5841227 1.54 0.48 25%
Oslo 37209 0.48 59670 0.76 50564 0.65 41459 0.53 0.47 98%
Bergen 74148 0.64 81436 0.70 60551 0.52 39666 0.34 0.72 113%
London 2243655 0.84 2043775 0.76 1827465 0.68 1611155 0.60 0.32 39%
Amsterdam 187164 0.79 165018 0.69 132448 0.56 99879 0.42 0.55 70%
Stockholm 327626 0.91 320406 0.89 299285 0.83 278165 0.77 0.23 26%
Berlin 1148443 0.94 1069302 0.88 981891 0.80 894480 0.73 0.29 30%

104
Munich 682387 0.92 566691 0.77 432362 0.58 298033 0.40 0.73 79%
Paris 297249 0.77 282943 0.73 237685 0.61 192427 0.50 0.47 61%
Beijing 8512059 2.80 8239148 2.71 7814123 2.57 7389097 2.43 0.56 20%
Shenzhen 16937791 2.82 16490774 2.75 15881206 2.65 15271638 2.55 0.41 14%
Tokyo 1726808 0.55 1737071 0.55 1765582 0.56 1794092 0.57 -0.04 -7%

105
Appendix 11: EV vs Non-EV Parking and Toll Cost Saving
Average On
Street Parking
rate in central
city (per hour)
Total Annual
Parking cost
Difference
with global
average
parking cost
Average On
Street Parking
rate in central
city (per hour)
Total Annual
Parking cost
Difference
with global
average
parking cost
Parking
Seattle $5.00 $2,610 $1,306.00 $5.00 $2,610.00 $1,306.00 $0
Los Angeles $3.00 $1,566 $262.00 $0.00 $0.00 -$1,304.00 $1,566
San Francisco $3.00 $1,566 $262.00 $3.00 $1,566.00 $262.00 $0
San Jose $2.00 $1,044 -$260.00 $0.00 $0.00 -$1,304.00 $1,044
New York $4.00 $2,088 $784.00 $4.00 $2,088.00 $784.00 $0
Oslo $5.35 $2,793 $1,488.70 $0.00 $0.00 -$1,304.00 $2,793
Bergen $3.00 $1,566 $262.00 $1.50 $783.00 -$521.00 $783
London $8.35 $4,359 $3,054.70 $0.00 $0.00 -$1,304.00 $4,359
Amsterdam $4.23 $2,208 $904.06 $4.23 $2,208.06 $904.06 $0
Stockholm $5.47 $2,855 $1,551.34 $5.47 $2,855.34 $1,551.34 $0
Berlin $3.62 $1,890 $585.64 $0.00 $0.00 -$1,304.00 $1,890
Munich $3.62 $1,890 $585.64 $0.00 $0.00 -$1,304.00 $1,890

106
Paris $3.04 $1,587 $282.88 $0.00 $0.00 -$1,304.00 $1,587
Shenzhen $3.11 $1,623 $319.42 $1.55 $809.10 -$494.90 $814
Beijing $1.94 $1,013 -$291.32 $1.94 $1,012.68 -$291.32 $0
Tokyo $3.66 $1,911 $606.52 $0.00 $0.00 -$1,304.00 $1,911

107
Appendix 12: TCO, Policy Component and EV Density Linear Correlation Check
variables Total EVs EV per 100 HH EV per 100 cars
Median Annual Household Income -0.18 0.20 -0.23
Electric car Purchase price -0.25 -0.18 -0.08
EV and Non EV Purchase Price Diff. 0.31 0.07 0.23
Annual Insurance Cost -0.53 -0.43 -0.23
Average charging cost for 100 miles -0.48 0.10 -0.16
Residential Charging Cost per 100 mile -0.26 0.07 -0.34
Public Charging Cost per 100 mile -0.74 0.09 0.45
Total Annual Fuel Cost -0.40 -0.23 -0.49
Difference in fuel and charging cost -0.12 0.12 0.45
Annual Maintenance and Repair Cost -0.05 -0.03 -0.34
Total Incentives 0.17 0.30 0.14
Total comparative benefit for EVs 0.29 0.38 0.08
Total Cost Of Ownership for 3 years -0.47 0.15 0.43
New TCO percentage of Purchase price -0.34 0.28 0.50
Difference in Cost _EV vs non EVs 0.01 -0.26 -0.26
Financial Return %of Purchase Price 0.34 -0.28 -0.50
Electric Car TCO % of median income -0.31 -0.23 -0.42
EV incentives comparative benefits % of median income
0.43 0.24 0.06

108
Appendix 13: Charger availability and EV density correlation
Variables Total EVs EV per 100 HH EV per 100 cars
Total public charging point 0.0214655 -0.3121354 0.3832617
Charger per 100 household 0.2383757 -0.2732281 0.3390607
Public chargers per million people 0.0509553 -0.3647519 0.6584101
Charger per 100 EV -0.0560834 -0.2832962 0.1480695
Appendix 14: TCO and Multiple Regression Analysis Result
Multiple Regression Multiple R R Square Adjusted R Square Standard Error Observations
Regression Summary 0.87 0.76 0.49 15.27 16
Coefficients Standard Error P-value
Intercept 10.56 24.45 0.68
Median Annual Household Income 0.0002 0.0003 0.60
Electric car Purchase price 0.0003 0.0005 0.57
Annual Insurance Cost -0.0011 0.0151 0.94
Total Annual Fuel Cost -0.0175 0.0603 0.78
Annual Maintenance and Repair Cost -0.0084 0.0412 0.84
Total Incentives 0.0053 0.0023 0.05
Total Cost of Ownership -0.0010 0.0013 0.47
View publication statsView publication stats
Related Documents