1 | Page Cisco Stealthwatch 7.0 Deployment Lab LTRSEC-2240 Speakers: Peter Johnson Bob Baughman

Welcome message from author
This document is posted to help you gain knowledge. Please leave a comment to let me know what you think about it! Share it to your friends and learn new things together.
Transcript
1 | P a g e
Cisco Stealthwatch 7.0 Deployment Lab
LTRSEC-2240
Speakers:
Peter Johnson
Bob Baughman
2 | P a g e
About This Lab
The guide for this lab includes:
Task 1: The Stealthwatch Appliance Setup Tool
Task 2: Stealthwatch Central Management
Task 3: Appliance Post-Install Configuration, Verification, and Troubleshooting
Task 4: Additional SMC Interface Configuration
Task 5: Verifying Network Telemetry Data
Task 6: Define Host Groups
Task 7: Introduction to Policy Management
Task 8: Installing Stealthwatch Apps
Task 9: Creating a Custom Application
Task 10: Configuration Back-up
Appendix A: User Account Management
Appendix B: Enabling Cognitive Threat Analytics
Appendix C: Netflow Exporter Configuration
Appendix D: Sizing FPS with the UDP Director
Appendix E: Deploying Stealthwatch OVFs
Appendix F: Troubleshooting a Stalled Appliance
Appendix G: VM Requirements
Appendix H: Connecting to dCloud with Remote Desktop
Appendix I: Step by Step Appliance Configuration Process
3 | P a g e
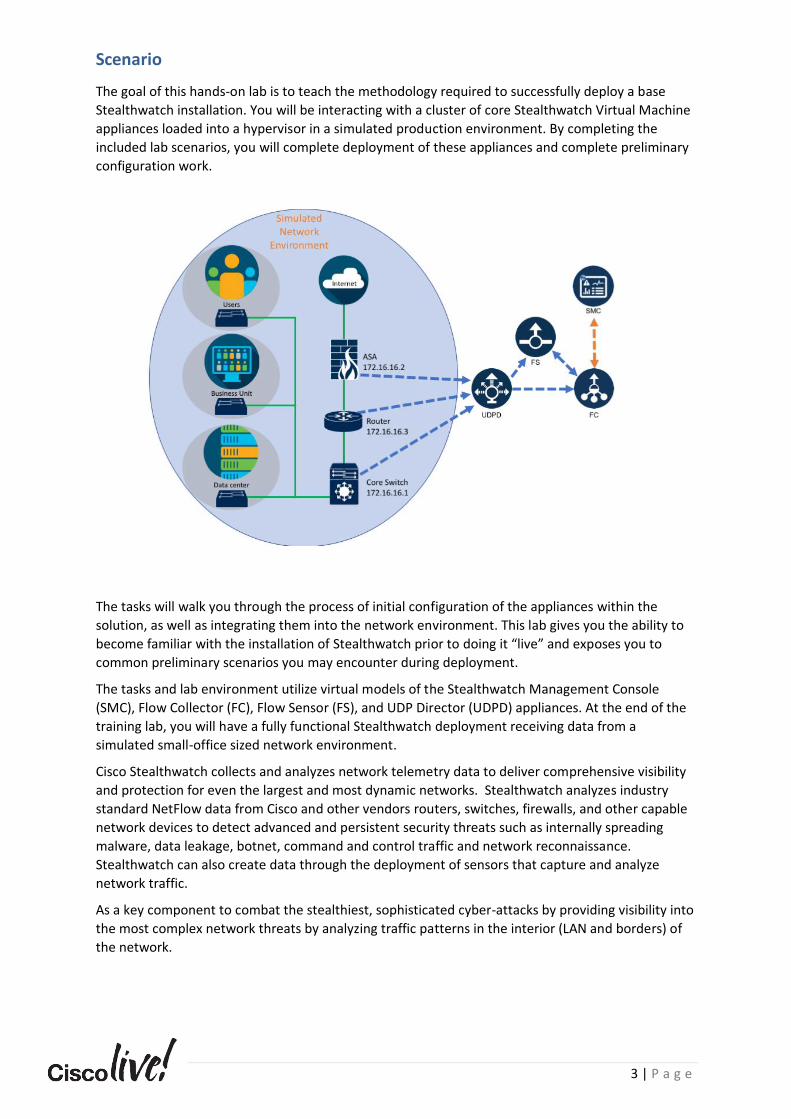
Scenario
The goal of this hands-on lab is to teach the methodology required to successfully deploy a base
Stealthwatch installation. You will be interacting with a cluster of core Stealthwatch Virtual Machine
appliances loaded into a hypervisor in a simulated production environment. By completing the
included lab scenarios, you will complete deployment of these appliances and complete preliminary
configuration work.
The tasks will walk you through the process of initial configuration of the appliances within the
solution, as well as integrating them into the network environment. This lab gives you the ability to
become familiar with the installation of Stealthwatch prior to doing it “live” and exposes you to
common preliminary scenarios you may encounter during deployment.
The tasks and lab environment utilize virtual models of the Stealthwatch Management Console
(SMC), Flow Collector (FC), Flow Sensor (FS), and UDP Director (UDPD) appliances. At the end of the
training lab, you will have a fully functional Stealthwatch deployment receiving data from a
simulated small-office sized network environment.
Cisco Stealthwatch collects and analyzes network telemetry data to deliver comprehensive visibility
and protection for even the largest and most dynamic networks. Stealthwatch analyzes industry
standard NetFlow data from Cisco and other vendors routers, switches, firewalls, and other capable
network devices to detect advanced and persistent security threats such as internally spreading
malware, data leakage, botnet, command and control traffic and network reconnaissance.
Stealthwatch can also create data through the deployment of sensors that capture and analyze
network traffic.
As a key component to combat the stealthiest, sophisticated cyber-attacks by providing visibility into
the most complex network threats by analyzing traffic patterns in the interior (LAN and borders) of
the network.
4 | P a g e
Stealthwatch Components Stealthwatch consists of several core and optional components. The core components of an on-
premise deployment are:
• Stealthwatch Management Console (SMC): Central managing appliance for a Stealtwatch
deployment and the primary interface for working with the collected network information
• Flow Collector (FC): Stores all flow data for processing, analysis and querying
Optional components and features of the system that provide additional flexibility in deployment and
visibility into areas of your network include the following:
• Flow Sensor (FS): Creates NetFlow records based on network traffic captured on its dedicated
capture interfaces and sends that data to the Flow Collector for processing
• UDP Director (UDPD): Takes flow data in from NetFlow exporters and forwards that to the
Flow Collector. Can be used to centrally aggregate netflow, syslog and SNMP traffic to a
central point and transparently forward it to as many collectors as needed
• Cognitive Threat Analytics (CTA): Adds an additional layer of cloud-based analysis against
suspicious web traffic and/or NetFlow and displays alerts if malicious activity is detected
• Proxy Ingestion: Enables Stealthwatch to collect syslog-based weblog telemetry from Cisco
WSA, Bluecoat, Squid and McAfee Web Gateway proxies
• Endpoint License: Enables Stealthwatch to collect endpoint telemetry from clients running
AnyConnect with NVM enabled, enriching collected network conversations with process,
hash, and user data
• Threat Feed License: Threat intelligence feed powered by Cisco Talos. It correlates suspicious
activity in the local network environment with data on thousands of known command-and-
control servers and campaigns

5 | P a g e
Limitations Certain parts of the deployment and configuration process were skipped, due to dCloud
environment restrictions.
• This lab skips the initial OVF deployment and assignment/configuration of management IP
addresses for the Stealthwatch appliances. The process for this is documented in Appendix
E.
• The process for licensing is not covered in this lab, due to lab and licensing architectural
considerations.
6 | P a g e
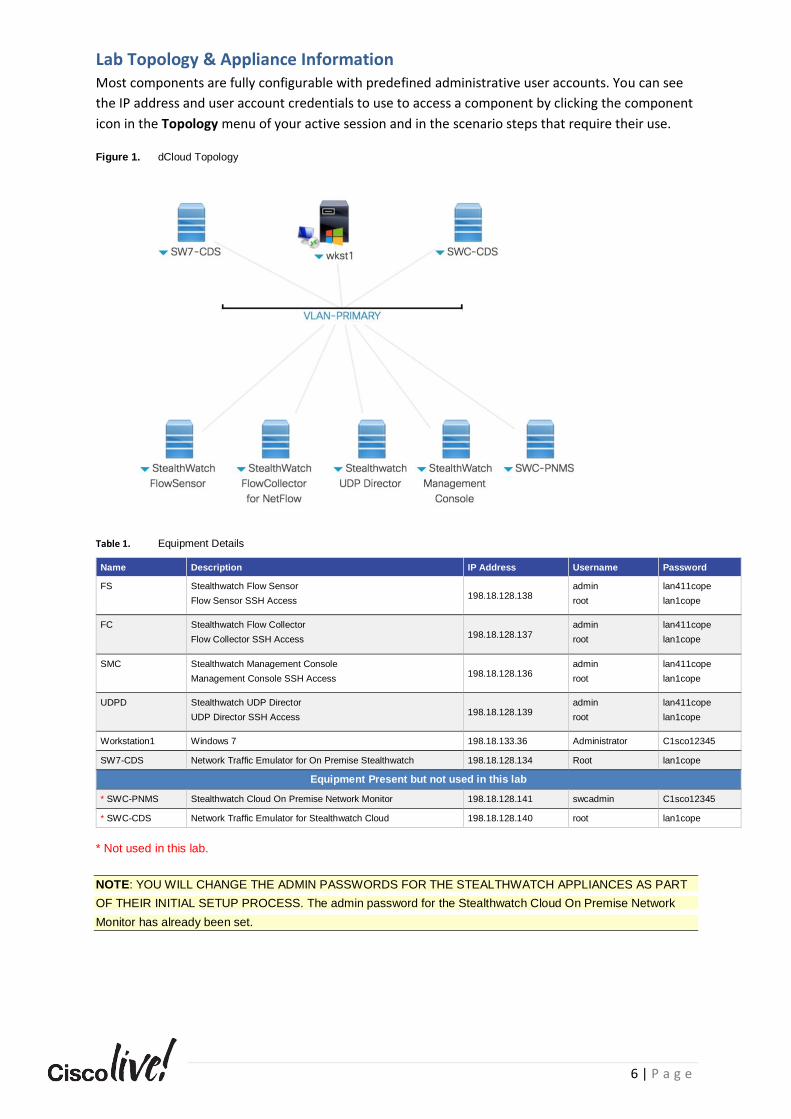
Lab Topology & Appliance Information Most components are fully configurable with predefined administrative user accounts. You can see
the IP address and user account credentials to use to access a component by clicking the component
icon in the Topology menu of your active session and in the scenario steps that require their use.
Figure 1. dCloud Topology
Table 1. Equipment Details
Name Description IP Address Username Password
FS Stealthwatch Flow Sensor
Flow Sensor SSH Access 198.18.128.138
admin
root
lan411cope
lan1cope
FC Stealthwatch Flow Collector
Flow Collector SSH Access 198.18.128.137
admin
root
lan411cope
lan1cope
SMC Stealthwatch Management Console
Management Console SSH Access 198.18.128.136
admin
root
lan411cope
lan1cope
UDPD Stealthwatch UDP Director
UDP Director SSH Access 198.18.128.139
admin
root
lan411cope
lan1cope
Workstation1 Windows 7 198.18.133.36 Administrator C1sco12345
SW7-CDS Network Traffic Emulator for On Premise Stealthwatch 198.18.128.134 Root lan1cope
Equipment Present but not used in this lab
* SWC-PNMS Stealthwatch Cloud On Premise Network Monitor 198.18.128.141 swcadmin C1sco12345
* SWC-CDS Network Traffic Emulator for Stealthwatch Cloud 198.18.128.140 root lan1cope
* Not used in this lab.
NOTE: YOU WILL CHANGE THE ADMIN PASSWORDS FOR THE STEALTHWATCH APPLIANCES AS PART
OF THEIR INITIAL SETUP PROCESS. The admin password for the Stealthwatch Cloud On Premise Network
Monitor has already been set.
7 | P a g e
Get Started
Follow these steps to access your lab environment.
Do you have a dCloud Account? If so, continue:
The easiest way to access your dCloud session’s work environment is to connect to the workstation
using the Cisco dCloud Remote Desktop client [Show Me How]. The dCloud Remote Desktop client
works best for accessing an active session with minimal interaction.
If you prefer to VPN to the session, and access the work environment’s workstation PC via Remote
Desktop, connect to the workstation with Cisco AnyConnect VPN [Show Me How] and the local RDP
client on your laptop [Show Me How]
• Workstation 1: 198.18.133.36
• Username: wkst1\Administrator
• Password: C1sco12345
Once you have connected to your session’s dCloud workstation, you need to launch the simulated
network environment to ensure network traffic telemetry is generated for your dCloud Stealthwatch
deployment.
Locate the Start Traffic shortcut on your workstation desktop. Double-click the shortcut to activate.
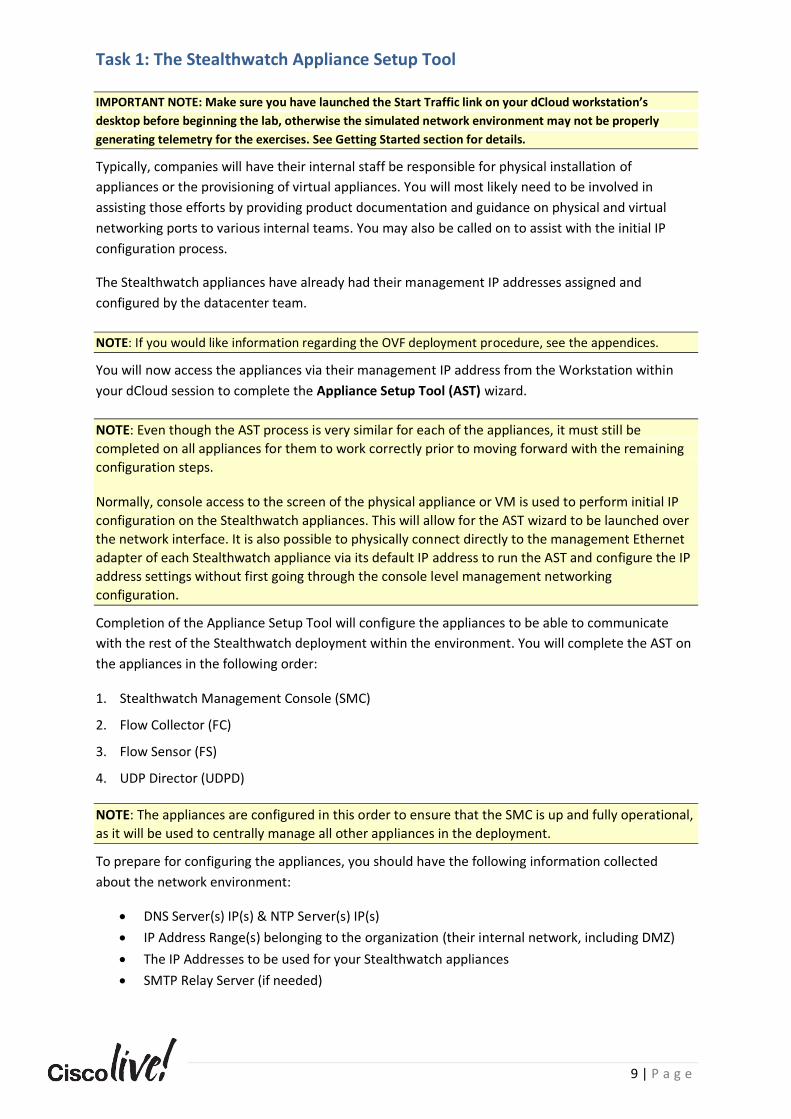
The traffic generation is working if you see a minimized Putty window in your workstation’s taskbar.
Leave this window open and begin working on the exercises.
If you do not have a dCloud account, click the link for this appendix and follow the
instructions to connect, and then return to this page to continue. You will need to talk to
the instructor to get the login information for this method.

8 | P a g e
Requirements
The table below outlines the requirements for this lab.
Table 2. Requirements
Required Optional
● Laptop
● dCloud Account or dCloud login
● Cisco AnyConnect®
9 | P a g e
Task 1: The Stealthwatch Appliance Setup Tool
IMPORTANT NOTE: Make sure you have launched the Start Traffic link on your dCloud workstation’s
desktop before beginning the lab, otherwise the simulated network environment may not be properly
generating telemetry for the exercises. See Getting Started section for details.
Typically, companies will have their internal staff be responsible for physical installation of
appliances or the provisioning of virtual appliances. You will most likely need to be involved in
assisting those efforts by providing product documentation and guidance on physical and virtual
networking ports to various internal teams. You may also be called on to assist with the initial IP
configuration process.
The Stealthwatch appliances have already had their management IP addresses assigned and
configured by the datacenter team.
NOTE: If you would like information regarding the OVF deployment procedure, see the appendices.
You will now access the appliances via their management IP address from the Workstation within
your dCloud session to complete the Appliance Setup Tool (AST) wizard.
NOTE: Even though the AST process is very similar for each of the appliances, it must still be
completed on all appliances for them to work correctly prior to moving forward with the remaining
configuration steps.
Normally, console access to the screen of the physical appliance or VM is used to perform initial IP
configuration on the Stealthwatch appliances. This will allow for the AST wizard to be launched over
the network interface. It is also possible to physically connect directly to the management Ethernet
adapter of each Stealthwatch appliance via its default IP address to run the AST and configure the IP
address settings without first going through the console level management networking
configuration.
Completion of the Appliance Setup Tool will configure the appliances to be able to communicate
with the rest of the Stealthwatch deployment within the environment. You will complete the AST on
the appliances in the following order:
1. Stealthwatch Management Console (SMC)
2. Flow Collector (FC)
3. Flow Sensor (FS)
4. UDP Director (UDPD)
NOTE: The appliances are configured in this order to ensure that the SMC is up and fully operational,
as it will be used to centrally manage all other appliances in the deployment.
To prepare for configuring the appliances, you should have the following information collected
about the network environment:
• DNS Server(s) IP(s) & NTP Server(s) IP(s)
• IP Address Range(s) belonging to the organization (their internal network, including DMZ)
• The IP Addresses to be used for your Stealthwatch appliances
• SMTP Relay Server (if needed)
10 | P a g e
• Lists of specific host IPs or ranges of IPs containing locations, server types, applications,
authorized network scanners, etc.
For purposes of this lab, that information is in the following box:
•
•
•
•
•
•
•
•
•
•
NOTE: KEEP THIS INFORMATION HANDY. YOU WILL BE USING IT TO COMPLETE THIS TASK IN THE
LAB.
THIS INFORMATION IS ALSO AVAILABLE IN THE LABIPs.TXT FILE ON THE WORKSTATION DESKTOP.
Steps
1. Connect to the Workstation within your dCloud session via Remote Desktop over the associated
VPN tunnel, or by using the Remote Desktop web-based capability included within dCloud.
2. Once on the remote workstation desktop, open the Chrome web browser by double-clicking on
the shortcut located on that system’s desktop.
NOTE: Setup the Stealthwatch appliances in the following order:
USE THESE VALUES FOR STEALTHWATCH APPLIANCE CONFIGURATION
• Network Domain:
o dCloud.Cisco
• DNS:
o 198.18.128.1
o 198.18.128.134
• NTP:
o 198.18.128.1
• IP Address Ranges:
o 10.0.0.0/8
o 192.168.0.0/16
o 172.16.0.0/12
o fc00::/7
• Stealthwatch Appliance IP Addresses:
o 198.18.128.136 (Management Console (SMC))
o 198.18.128.137 (Flow Collector (FC))
o 198.18.128.138 (Flow Sensor (FS))
o 198.18.128.139 (UDP Director (UDPD))
• SMTP Relay Server:
o 198.18.128.134
11 | P a g e
1. Stealthwatch Management Console (SMC)
2. Flow Collector (FC)
3. Flow Sensor (FS)
4. UDP Director (UDPD)
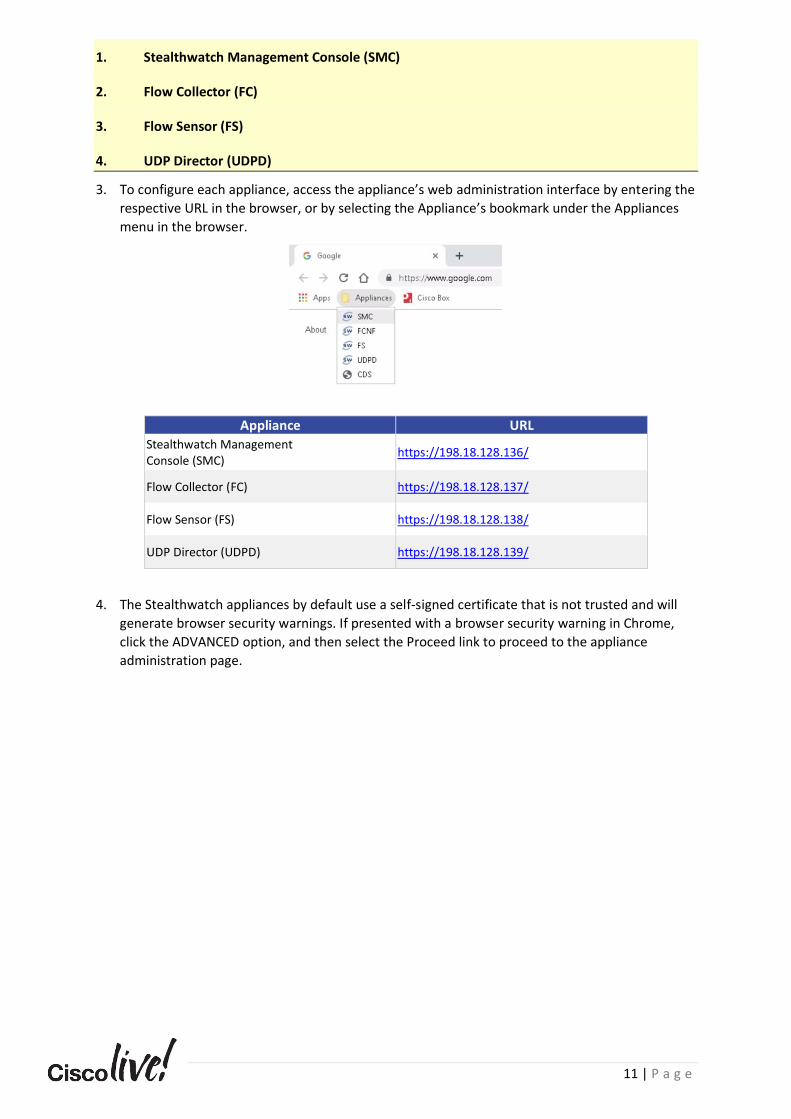
3. To configure each appliance, access the appliance’s web administration interface by entering the
respective URL in the browser, or by selecting the Appliance’s bookmark under the Appliances
menu in the browser.
Appliance URL
Stealthwatch Management Console (SMC)
https://198.18.128.136/
Flow Collector (FC) https://198.18.128.137/
Flow Sensor (FS) https://198.18.128.138/
UDP Director (UDPD) https://198.18.128.139/
4. The Stealthwatch appliances by default use a self-signed certificate that is not trusted and will
generate browser security warnings. If presented with a browser security warning in Chrome,
click the ADVANCED option, and then select the Proceed link to proceed to the appliance
administration page.
12 | P a g e
5. Login to the appliance using the Stealthwatch default username of admin, and the default
password of lan411cope:
a. Username: admin
b. Password: lan411cope
NOTE: If the AST wizard does not display after logging in to the appliance, manually enter the URL
https://198.18.128.13x/lc-ast (Note: Change “x” to the correct IP) into the browser address bar to
open the AST wizard.
6. The AST Welcome Page will now display.
7. Click the Continue button to proceed. Follow the wizard and enter the appropriate Stealthwatch
appliance configuration information from the box on page 10.
NOTE: For this lab, on the Password Management screen, change all the appliance passwords as
follows:
a. Appliance Admin Account:
i. Current Password: lan411cope
ii. New Password: C1sco12345
iii. Confirm New Password: C1sco12345
b. Root Account (for CLI access):
i. Current Password: lan1cope
ii. New Password: C1sco12345
iii. Confirm New Password: C1sco12345
c. SysAdmin Account:
i. Current Password: lan1cope
ii. New Password: C1sco12345
iii. Confirm New Password: C1sco12345
Do not change the appliance host names or network settings while going through the wizard.
These settings have already been configured in the lab environment for you. Any change to these
settings will cause a new certificate to be generated and will result in additional configuration.
When asked if you would like an appliance to be centrally managed, answer yes.
For step by step appliance configuration instructions, see Appendix I: Step by Step Appliance
Configuration Process
8. Repeat the AST Wizard for each appliance in order. When the AST has been completed and
every appliance has been reboot, you are done with this task.

13 | P a g e
Task Summary
You have successfully completed the Appliance Setup Tool (AST) for all of the appliances. The
process may be repetitive, but it is a requirement for a successful Stealthwatch deployment. You are
now ready to configure all of the appliances for Centralized Management, which allows you to
manage the Stealthwatch appliances from the SMC.
14 | P a g e
Task 2: Stealthwatch Central Management
Now that the basic appliance setup has been completed via the AST, you can configure settings that
allow you to centrally manage all appliances that are part of the Stealthwatch environment.
Stealthwatch Central Management provides an overview, access and the ability to configure all
joined appliances that belong to a Stealthwatch domain.
Before continuing, all Stealthwatch appliances must be online, must have had the AST completed on
them, and their login page must be accessible. During the setup of Central Management, each
appliance will attempt to communicate over the network to the SMC, and will be unable to
successfully connect if they are offline or unavailable.
NOTE: A Stealthwatch Domain is a collection of unique Stealthwatch appliances and IP addresses. It
does not have anything to do with a DNS domain or an Active Directory domain. Most production
environments will require only one domain within Stealthwatch. However, one reason for multiple
domains would be if duplicate IP address space exists within the environment. For example, if a
company merged with another company, and in both company networks, the 172.17.1.0/24
network was utilized, that would be considered duplicate IP space. Stealthwatch expects that when
a flow record involving an IP address is processed, it is coming from a single entity, and not that, for
example, 172.17.1.100 is assigned to both a laptop and a printer at the same time in different parts
of the network. In this scenario, a second domain could be created to contain the duplicate IP space
such that the flows for each unique device remain separate and are not merged within a single
database. For this reason, you should be aware that Flow Collectors are not shared across domains
and neither are any related configuration options such as host groups, services/applications,
documents, or flow data. Creating an additional domain requires an additional Flow Collector
appliance and should only be performed in very specific scenarios.
In the AST for the SMC, you created the first domain in Stealthwatch that will contain all of the
appliances and configuration for this deployment.
Note that it is not required for the UDPD and Flow Sensor to be Centrally Managed by the SMC;
these two appliances can function in a standalone state for use cases that require it.
A Flow Collector must be connected to and centrally managed by an SMC (required as of version
7.0).
As a general rule, adding all Stealthwatch appliances in a deployment to the Central Manager is best
practice in order to easily keep track of and keep up to date all deployed Stealthwatch assets.
Steps
Accessing Central Management on the SMC
1. Open another Chrome web browser, an additional tab within Chrome or return to the window
you were initially working with the Flow Collector in.
2. Access the appliance web administration interface by entering https://198.18.128.136/ in the
URL field or by selecting the Appliances > SMC bookmark.
NOTE: If you get a timeout, an unable to connect error message, or any other type of error screen,
the appliance has not finished rebooting. You can force the login screen to load when the appliance
has completed rebooting by selecting it from the Bookmarks or by re-entering its IP address
manually.
15 | P a g e
3. Login to the SMC using:
a. Username: admin
b. Password: C1sco12345
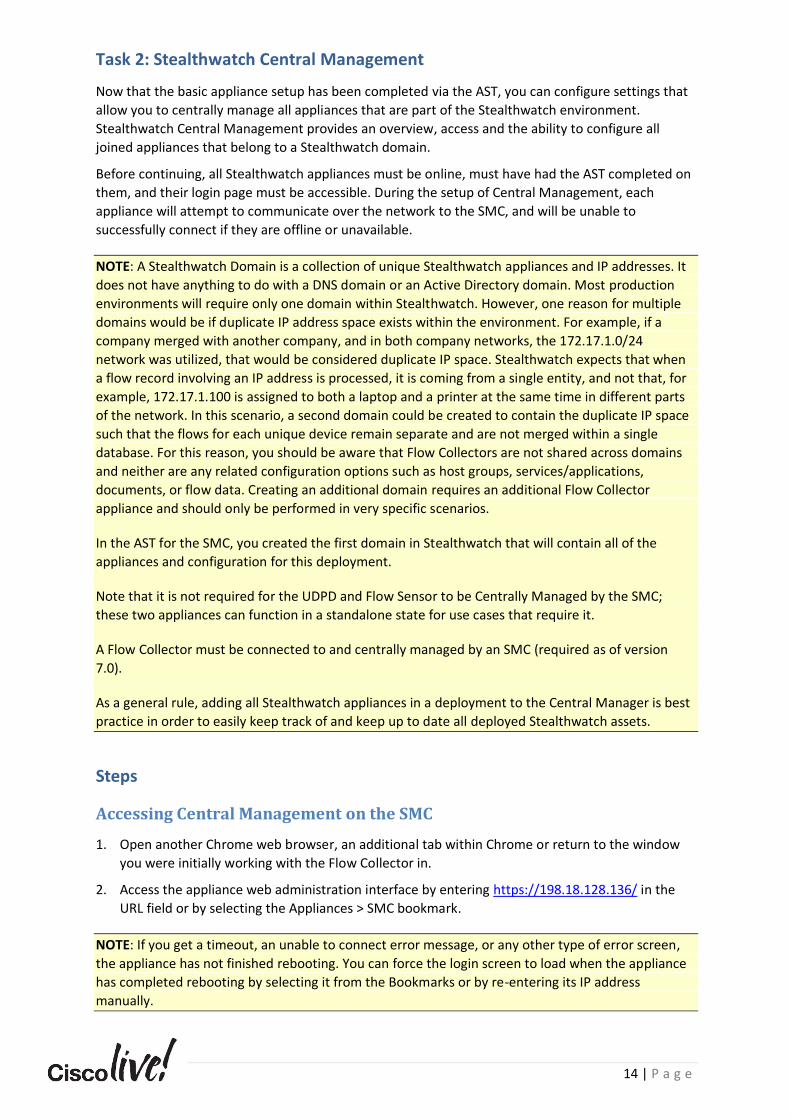
4. On the SMC’s dashboard, locate the gear icon in the upper right corner, click it and select Central
Management from the menu.
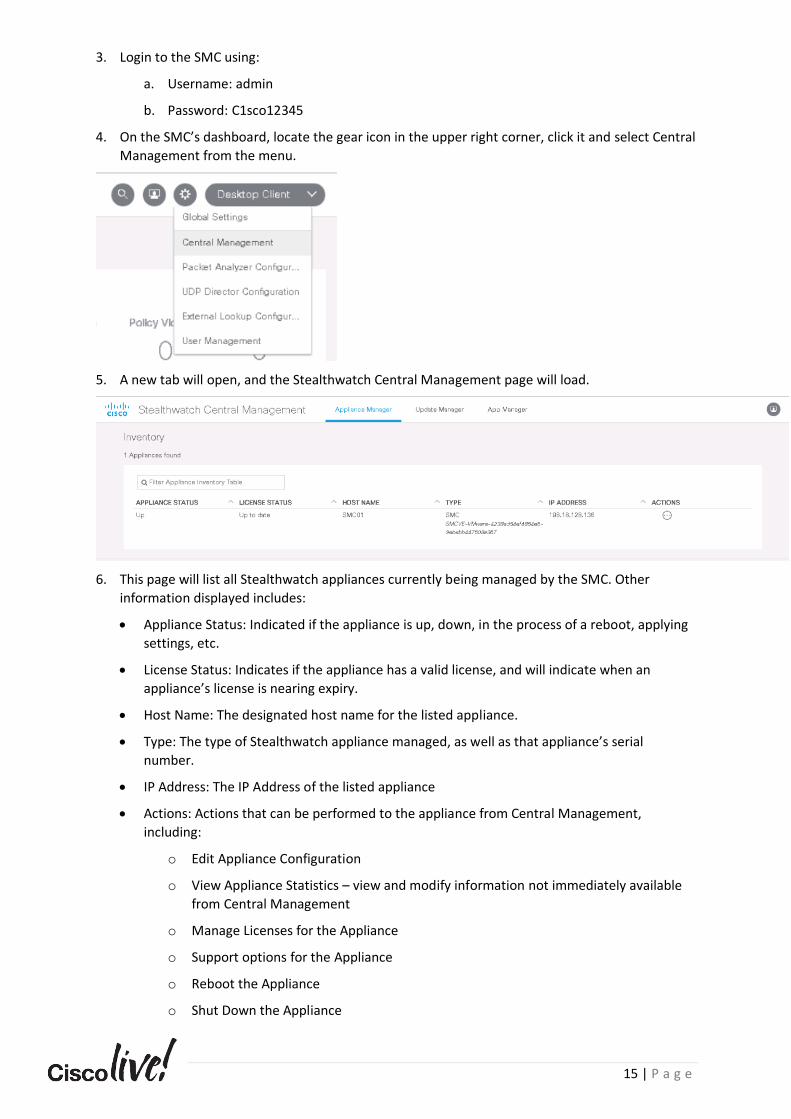
5. A new tab will open, and the Stealthwatch Central Management page will load.
6. This page will list all Stealthwatch appliances currently being managed by the SMC. Other
information displayed includes:
• Appliance Status: Indicated if the appliance is up, down, in the process of a reboot, applying
settings, etc.
• License Status: Indicates if the appliance has a valid license, and will indicate when an
appliance’s license is nearing expiry.
• Host Name: The designated host name for the listed appliance.
• Type: The type of Stealthwatch appliance managed, as well as that appliance’s serial
number.
• IP Address: The IP Address of the listed appliance
• Actions: Actions that can be performed to the appliance from Central Management,
including:
o Edit Appliance Configuration
o View Appliance Statistics – view and modify information not immediately available
from Central Management
o Manage Licenses for the Appliance
o Support options for the Appliance
o Reboot the Appliance
o Shut Down the Appliance
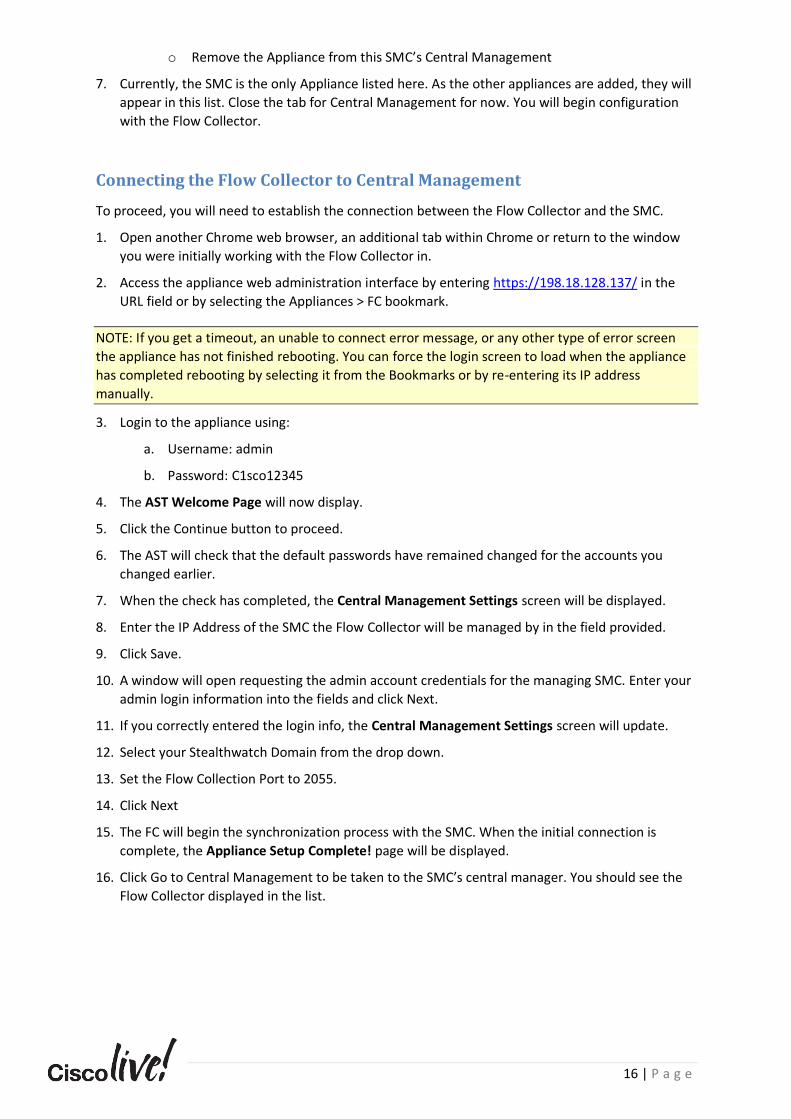
16 | P a g e
o Remove the Appliance from this SMC’s Central Management
7. Currently, the SMC is the only Appliance listed here. As the other appliances are added, they will
appear in this list. Close the tab for Central Management for now. You will begin configuration
with the Flow Collector.
Connecting the Flow Collector to Central Management
To proceed, you will need to establish the connection between the Flow Collector and the SMC.
1. Open another Chrome web browser, an additional tab within Chrome or return to the window
you were initially working with the Flow Collector in.
2. Access the appliance web administration interface by entering https://198.18.128.137/ in the
URL field or by selecting the Appliances > FC bookmark.
NOTE: If you get a timeout, an unable to connect error message, or any other type of error screen
the appliance has not finished rebooting. You can force the login screen to load when the appliance
has completed rebooting by selecting it from the Bookmarks or by re-entering its IP address
manually.
3. Login to the appliance using:
a. Username: admin
b. Password: C1sco12345
4. The AST Welcome Page will now display.
5. Click the Continue button to proceed.
6. The AST will check that the default passwords have remained changed for the accounts you
changed earlier.
7. When the check has completed, the Central Management Settings screen will be displayed.
8. Enter the IP Address of the SMC the Flow Collector will be managed by in the field provided.
9. Click Save.
10. A window will open requesting the admin account credentials for the managing SMC. Enter your
admin login information into the fields and click Next.
11. If you correctly entered the login info, the Central Management Settings screen will update.
12. Select your Stealthwatch Domain from the drop down.
13. Set the Flow Collection Port to 2055.
14. Click Next
15. The FC will begin the synchronization process with the SMC. When the initial connection is
complete, the Appliance Setup Complete! page will be displayed.
16. Click Go to Central Management to be taken to the SMC’s central manager. You should see the
Flow Collector displayed in the list.
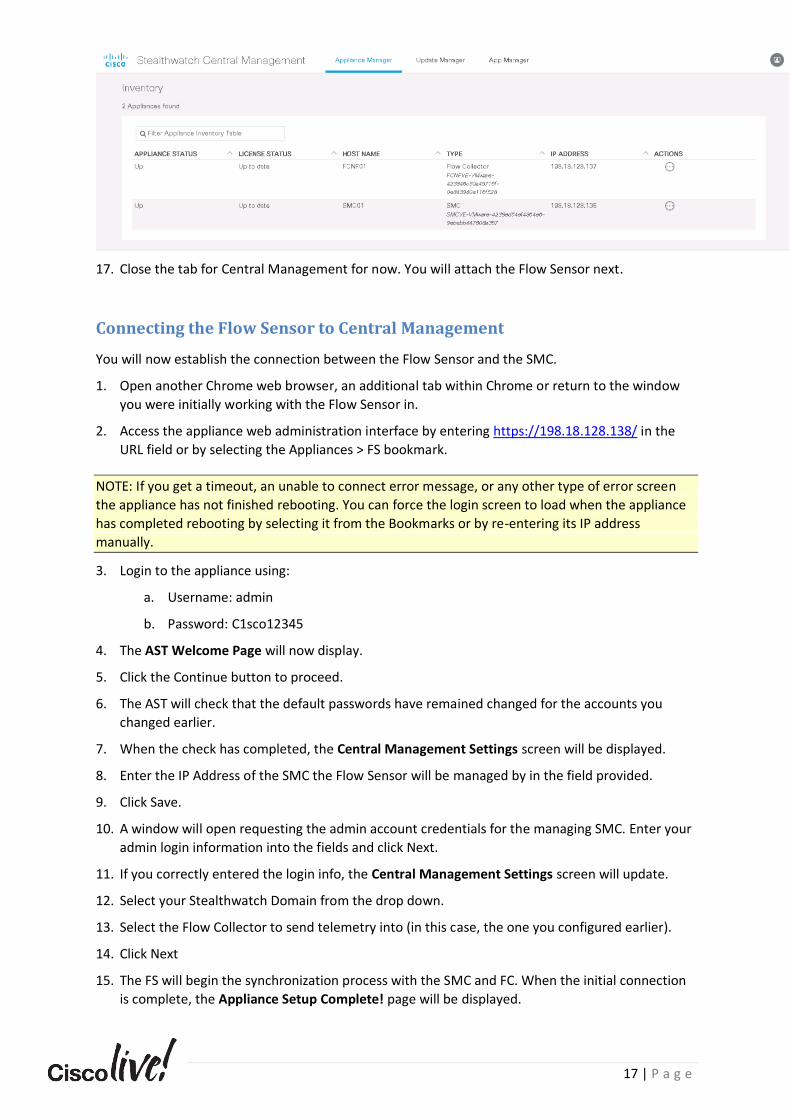
17 | P a g e
17. Close the tab for Central Management for now. You will attach the Flow Sensor next.
Connecting the Flow Sensor to Central Management
You will now establish the connection between the Flow Sensor and the SMC.
1. Open another Chrome web browser, an additional tab within Chrome or return to the window
you were initially working with the Flow Sensor in.
2. Access the appliance web administration interface by entering https://198.18.128.138/ in the
URL field or by selecting the Appliances > FS bookmark.
NOTE: If you get a timeout, an unable to connect error message, or any other type of error screen
the appliance has not finished rebooting. You can force the login screen to load when the appliance
has completed rebooting by selecting it from the Bookmarks or by re-entering its IP address
manually.
3. Login to the appliance using:
a. Username: admin
b. Password: C1sco12345
4. The AST Welcome Page will now display.
5. Click the Continue button to proceed.
6. The AST will check that the default passwords have remained changed for the accounts you
changed earlier.
7. When the check has completed, the Central Management Settings screen will be displayed.
8. Enter the IP Address of the SMC the Flow Sensor will be managed by in the field provided.
9. Click Save.
10. A window will open requesting the admin account credentials for the managing SMC. Enter your
admin login information into the fields and click Next.
11. If you correctly entered the login info, the Central Management Settings screen will update.
12. Select your Stealthwatch Domain from the drop down.
13. Select the Flow Collector to send telemetry into (in this case, the one you configured earlier).
14. Click Next
15. The FS will begin the synchronization process with the SMC and FC. When the initial connection
is complete, the Appliance Setup Complete! page will be displayed.
18 | P a g e
16. Click Go to Central Management to be taken to the SMC’s central manager. You should see the
Flow Sensor displayed in the list.
17. Close the tab for Central Management for now. You will connect the UDP Director next.
Connecting the UDP Director to Central Management
You will now establish the connection between the UDP Director and the SMC.
1. Open another Chrome web browser, an additional tab within Chrome or return to the window
you were initially working with the UDP Director in.
2. Access the appliance web administration interface by entering https://198.18.128.139/ in the
URL field or by selecting the Appliances > UDPD bookmark.
NOTE: If you get a timeout, an unable to connect error message, or any other type of error screen
the appliance has not finished rebooting. You can force the login screen to load when the appliance
has completed rebooting by selecting it from the Bookmarks or by re-entering its IP address
manually.
3. Login to the appliance using:
a. Username: admin
b. Password: C1sco12345
4. The AST Welcome Page will now display.
5. Click the Continue button to proceed.
6. The AST will check that the default passwords have remained changed for the accounts you
changed earlier.
7. When the check has completed, the Central Management Settings screen will be displayed.
8. Enter the IP Address of the SMC the UDP Director will be managed by in the field provided.
9. Click Save.
10. A window will open requesting the admin account credentials for the managing SMC. Enter your
admin login information into the fields and click Next.
11. The UDPD will begin the synchronization process with the SMC and FC. When the initial
connection is complete, the Appliance Setup Complete! page will be displayed.
12. Click Go to Central Management to be taken to the SMC’s central manager. You should see the
UDP Director displayed in the list.
19 | P a g e
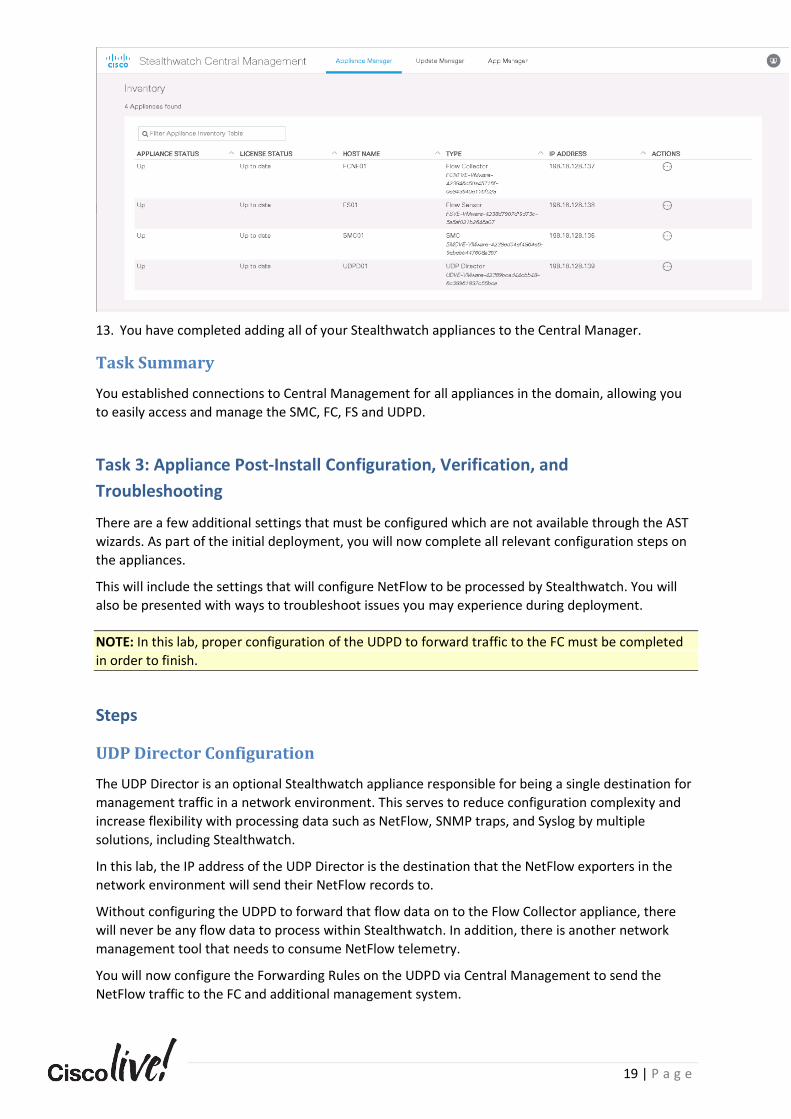
13. You have completed adding all of your Stealthwatch appliances to the Central Manager.
Task Summary
You established connections to Central Management for all appliances in the domain, allowing you
to easily access and manage the SMC, FC, FS and UDPD.
Task 3: Appliance Post-Install Configuration, Verification, and
Troubleshooting
There are a few additional settings that must be configured which are not available through the AST
wizards. As part of the initial deployment, you will now complete all relevant configuration steps on
the appliances.
This will include the settings that will configure NetFlow to be processed by Stealthwatch. You will
also be presented with ways to troubleshoot issues you may experience during deployment.
NOTE: In this lab, proper configuration of the UDPD to forward traffic to the FC must be completed
in order to finish.
Steps
UDP Director Configuration
The UDP Director is an optional Stealthwatch appliance responsible for being a single destination for
management traffic in a network environment. This serves to reduce configuration complexity and
increase flexibility with processing data such as NetFlow, SNMP traps, and Syslog by multiple
solutions, including Stealthwatch.
In this lab, the IP address of the UDP Director is the destination that the NetFlow exporters in the
network environment will send their NetFlow records to.
Without configuring the UDPD to forward that flow data on to the Flow Collector appliance, there
will never be any flow data to process within Stealthwatch. In addition, there is another network
management tool that needs to consume NetFlow telemetry.
You will now configure the Forwarding Rules on the UDPD via Central Management to send the
NetFlow traffic to the FC and additional management system.
20 | P a g e
1. Open another Chrome web browser, or an additional tab within Chrome.
2. Access the SMC appliance’s dashboard by entering https://198.18.128.136 in the URL field or by
selecting the Appliances > SMC bookmark.
3. If required, login to the appliance using the Stealthwatch default username of admin, and the
password of C1sco12345.
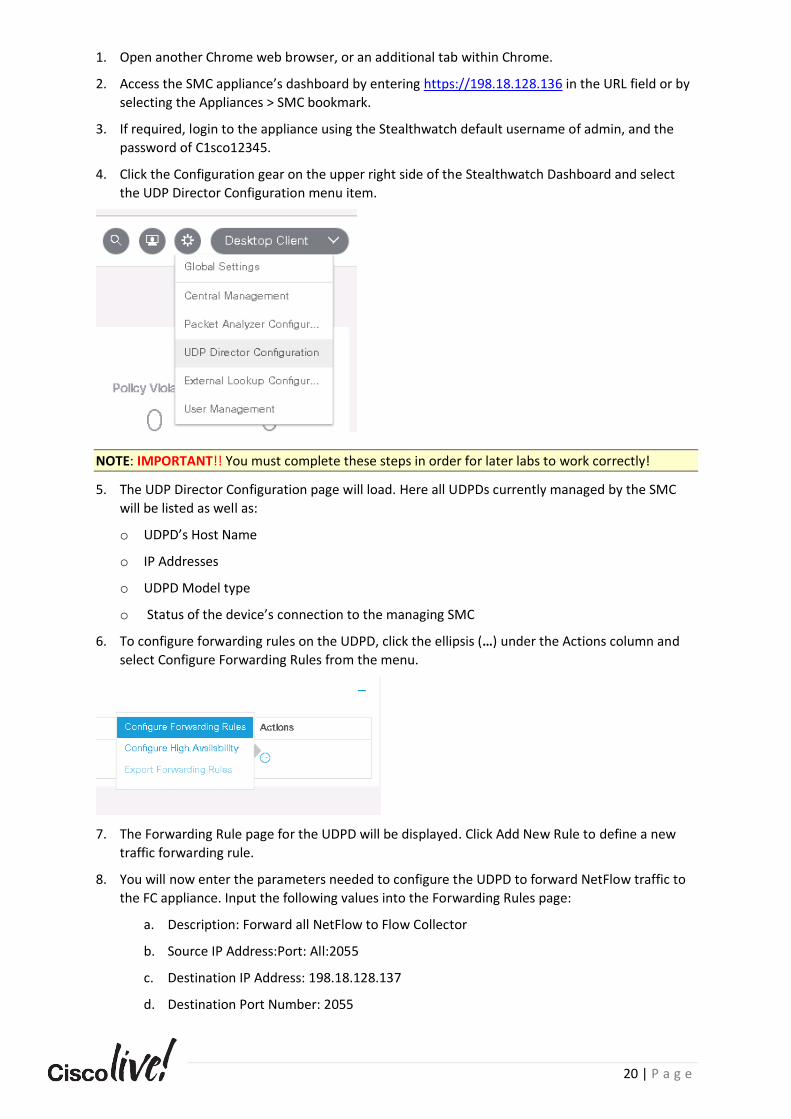
4. Click the Configuration gear on the upper right side of the Stealthwatch Dashboard and select
the UDP Director Configuration menu item.
NOTE: IMPORTANT!! You must complete these steps in order for later labs to work correctly!
5. The UDP Director Configuration page will load. Here all UDPDs currently managed by the SMC
will be listed as well as:
o UDPD’s Host Name
o IP Addresses
o UDPD Model type
o Status of the device’s connection to the managing SMC
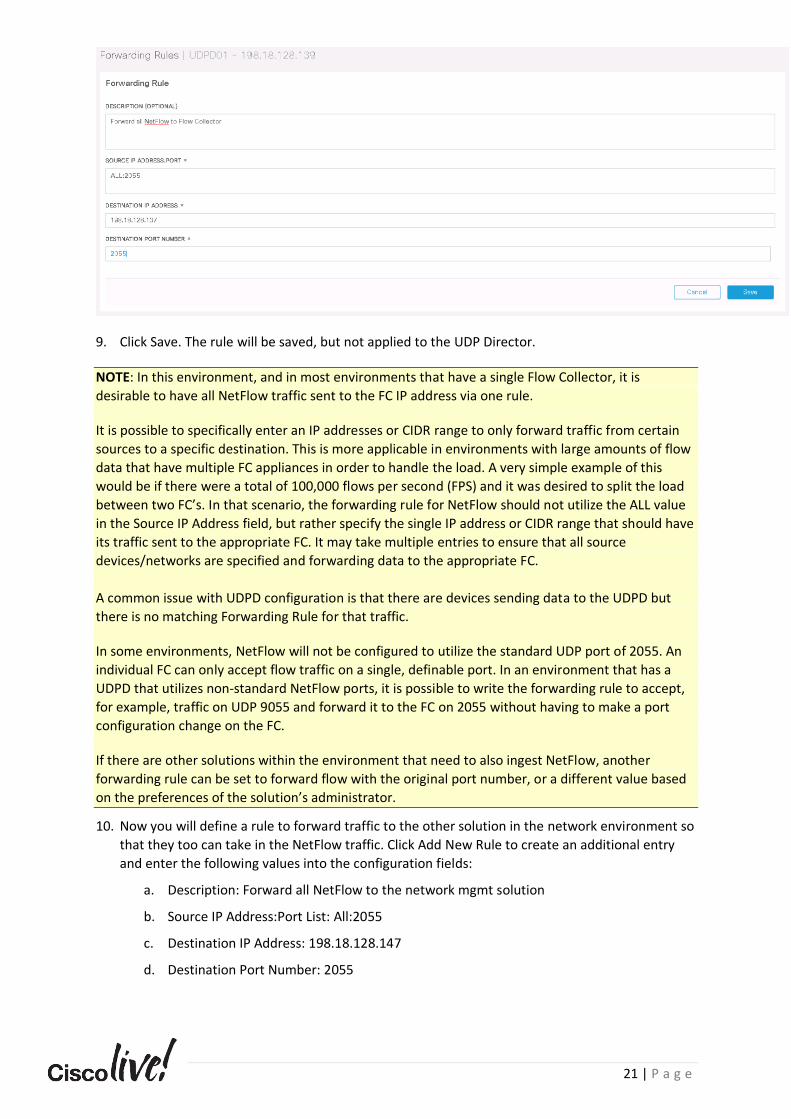
6. To configure forwarding rules on the UDPD, click the ellipsis (…) under the Actions column and
select Configure Forwarding Rules from the menu.
7. The Forwarding Rule page for the UDPD will be displayed. Click Add New Rule to define a new
traffic forwarding rule.
8. You will now enter the parameters needed to configure the UDPD to forward NetFlow traffic to
the FC appliance. Input the following values into the Forwarding Rules page:
a. Description: Forward all NetFlow to Flow Collector
b. Source IP Address:Port: All:2055
c. Destination IP Address: 198.18.128.137
d. Destination Port Number: 2055
21 | P a g e
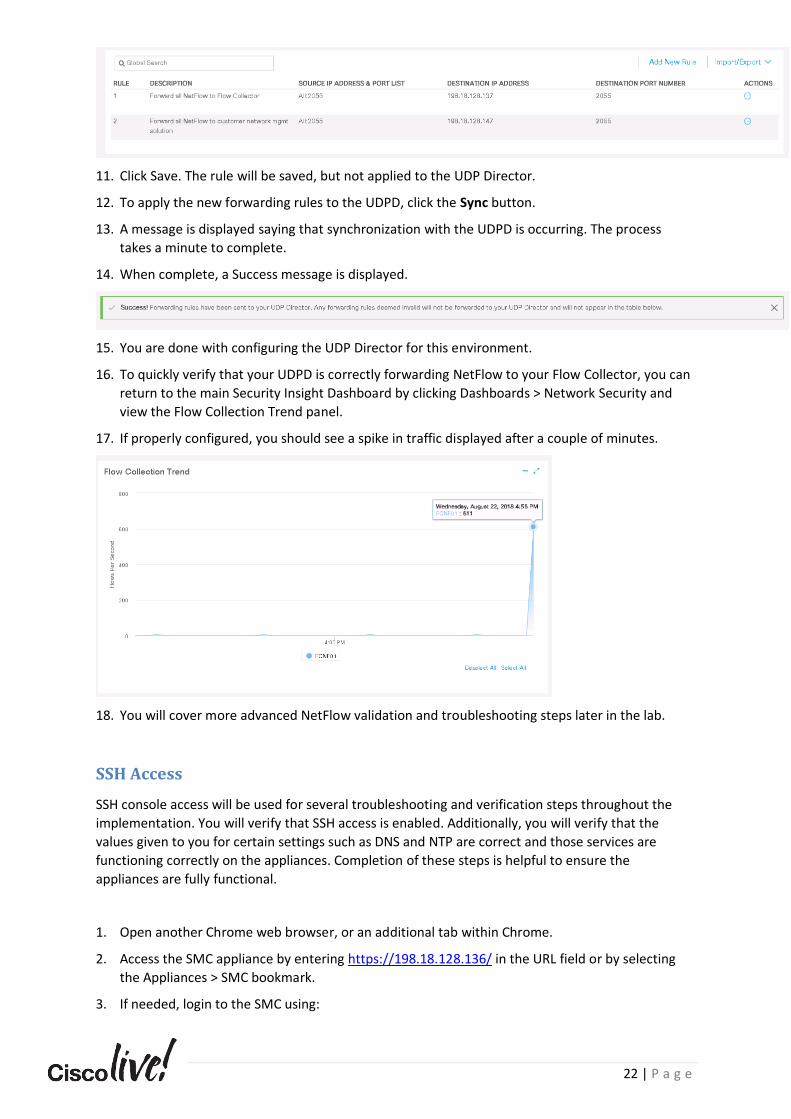
9. Click Save. The rule will be saved, but not applied to the UDP Director.
NOTE: In this environment, and in most environments that have a single Flow Collector, it is
desirable to have all NetFlow traffic sent to the FC IP address via one rule.
It is possible to specifically enter an IP addresses or CIDR range to only forward traffic from certain
sources to a specific destination. This is more applicable in environments with large amounts of flow
data that have multiple FC appliances in order to handle the load. A very simple example of this
would be if there were a total of 100,000 flows per second (FPS) and it was desired to split the load
between two FC’s. In that scenario, the forwarding rule for NetFlow should not utilize the ALL value
in the Source IP Address field, but rather specify the single IP address or CIDR range that should have
its traffic sent to the appropriate FC. It may take multiple entries to ensure that all source
devices/networks are specified and forwarding data to the appropriate FC.
A common issue with UDPD configuration is that there are devices sending data to the UDPD but
there is no matching Forwarding Rule for that traffic.
In some environments, NetFlow will not be configured to utilize the standard UDP port of 2055. An
individual FC can only accept flow traffic on a single, definable port. In an environment that has a
UDPD that utilizes non-standard NetFlow ports, it is possible to write the forwarding rule to accept,
for example, traffic on UDP 9055 and forward it to the FC on 2055 without having to make a port
configuration change on the FC.
If there are other solutions within the environment that need to also ingest NetFlow, another
forwarding rule can be set to forward flow with the original port number, or a different value based
on the preferences of the solution’s administrator.
10. Now you will define a rule to forward traffic to the other solution in the network environment so
that they too can take in the NetFlow traffic. Click Add New Rule to create an additional entry
and enter the following values into the configuration fields:
a. Description: Forward all NetFlow to the network mgmt solution
b. Source IP Address:Port List: All:2055
c. Destination IP Address: 198.18.128.147
d. Destination Port Number: 2055
22 | P a g e
11. Click Save. The rule will be saved, but not applied to the UDP Director.
12. To apply the new forwarding rules to the UDPD, click the Sync button.
13. A message is displayed saying that synchronization with the UDPD is occurring. The process
takes a minute to complete.
14. When complete, a Success message is displayed.
15. You are done with configuring the UDP Director for this environment.
16. To quickly verify that your UDPD is correctly forwarding NetFlow to your Flow Collector, you can
return to the main Security Insight Dashboard by clicking Dashboards > Network Security and
view the Flow Collection Trend panel.
17. If properly configured, you should see a spike in traffic displayed after a couple of minutes.
18. You will cover more advanced NetFlow validation and troubleshooting steps later in the lab.
SSH Access
SSH console access will be used for several troubleshooting and verification steps throughout the
implementation. You will verify that SSH access is enabled. Additionally, you will verify that the
values given to you for certain settings such as DNS and NTP are correct and those services are
functioning correctly on the appliances. Completion of these steps is helpful to ensure the
appliances are fully functional.
1. Open another Chrome web browser, or an additional tab within Chrome.
2. Access the SMC appliance by entering https://198.18.128.136/ in the URL field or by selecting
the Appliances > SMC bookmark.
3. If needed, login to the SMC using:
23 | P a g e
a. Username: admin
b. Password: C1sco12345
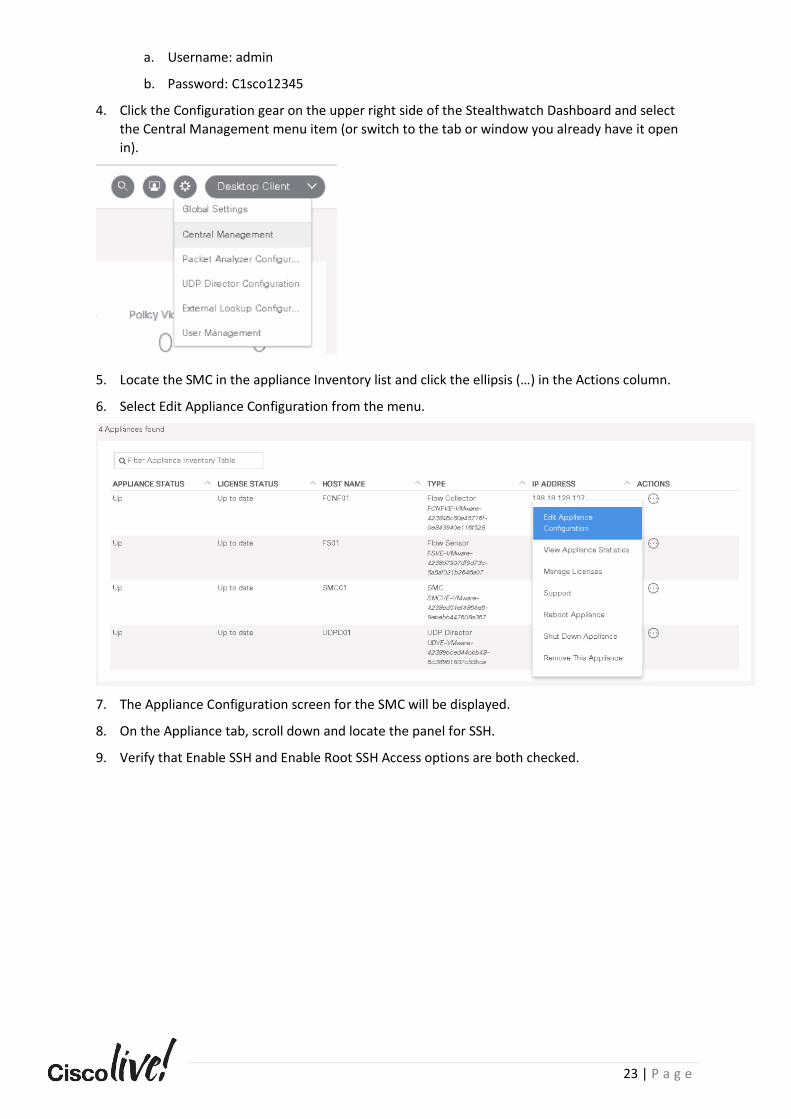
4. Click the Configuration gear on the upper right side of the Stealthwatch Dashboard and select
the Central Management menu item (or switch to the tab or window you already have it open
in).
5. Locate the SMC in the appliance Inventory list and click the ellipsis (…) in the Actions column.
6. Select Edit Appliance Configuration from the menu.
7. The Appliance Configuration screen for the SMC will be displayed.
8. On the Appliance tab, scroll down and locate the panel for SSH.
9. Verify that Enable SSH and Enable Root SSH Access options are both checked.
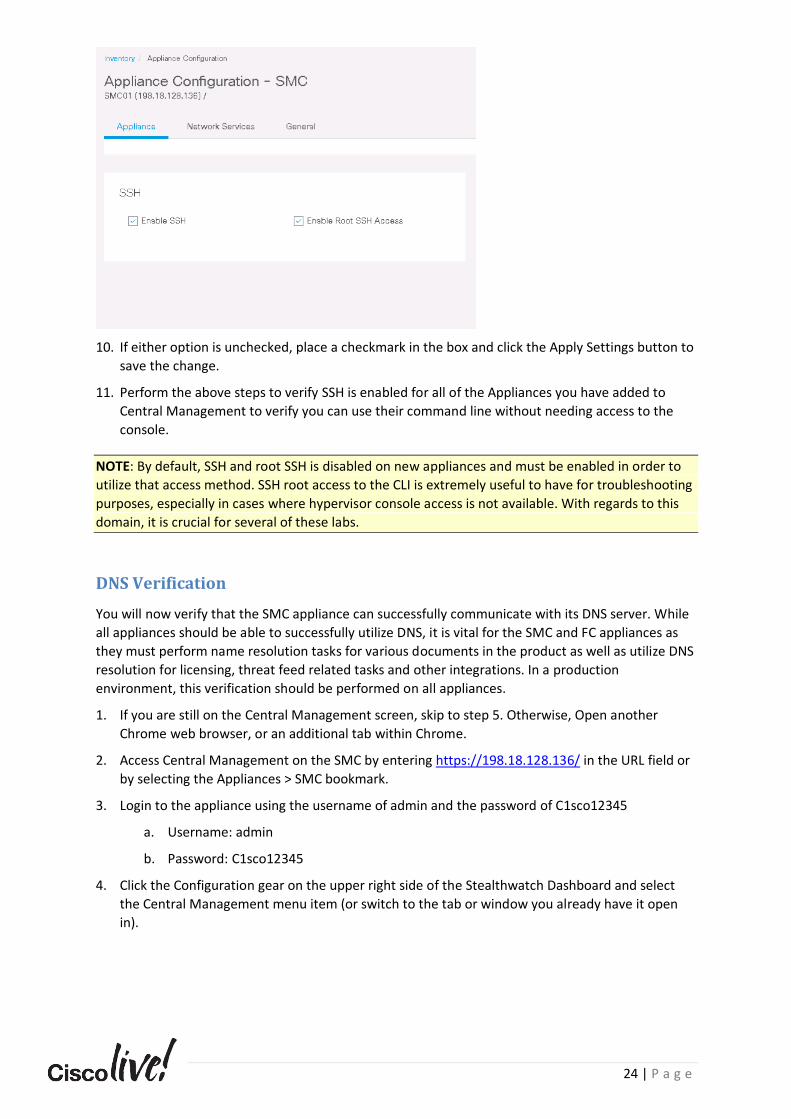
24 | P a g e
10. If either option is unchecked, place a checkmark in the box and click the Apply Settings button to
save the change.
11. Perform the above steps to verify SSH is enabled for all of the Appliances you have added to
Central Management to verify you can use their command line without needing access to the
console.
NOTE: By default, SSH and root SSH is disabled on new appliances and must be enabled in order to
utilize that access method. SSH root access to the CLI is extremely useful to have for troubleshooting
purposes, especially in cases where hypervisor console access is not available. With regards to this
domain, it is crucial for several of these labs.
DNS Verification
You will now verify that the SMC appliance can successfully communicate with its DNS server. While
all appliances should be able to successfully utilize DNS, it is vital for the SMC and FC appliances as
they must perform name resolution tasks for various documents in the product as well as utilize DNS
resolution for licensing, threat feed related tasks and other integrations. In a production
environment, this verification should be performed on all appliances.
1. If you are still on the Central Management screen, skip to step 5. Otherwise, Open another
Chrome web browser, or an additional tab within Chrome.
2. Access Central Management on the SMC by entering https://198.18.128.136/ in the URL field or
by selecting the Appliances > SMC bookmark.
3. Login to the appliance using the username of admin and the password of C1sco12345
a. Username: admin
b. Password: C1sco12345
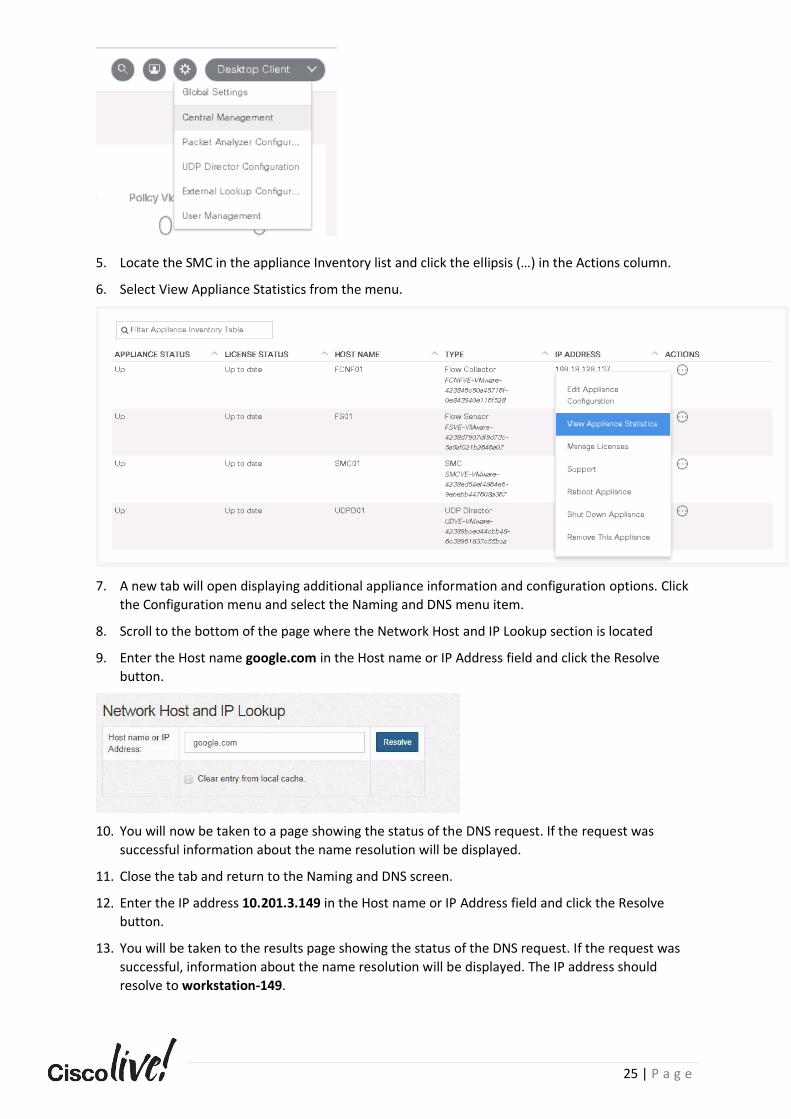
4. Click the Configuration gear on the upper right side of the Stealthwatch Dashboard and select
the Central Management menu item (or switch to the tab or window you already have it open
in).
25 | P a g e
5. Locate the SMC in the appliance Inventory list and click the ellipsis (…) in the Actions column.
6. Select View Appliance Statistics from the menu.
7. A new tab will open displaying additional appliance information and configuration options. Click
the Configuration menu and select the Naming and DNS menu item.
8. Scroll to the bottom of the page where the Network Host and IP Lookup section is located
9. Enter the Host name google.com in the Host name or IP Address field and click the Resolve
button.
10. You will now be taken to a page showing the status of the DNS request. If the request was
successful information about the name resolution will be displayed.
11. Close the tab and return to the Naming and DNS screen.
12. Enter the IP address 10.201.3.149 in the Host name or IP Address field and click the Resolve
button.
13. You will be taken to the results page showing the status of the DNS request. If the request was
successful, information about the name resolution will be displayed. The IP address should
resolve to workstation-149.
26 | P a g e
NOTE: This process should be repeated for all of the Flow Collector(s) in live deployments. For
purposes of this lab, it is unnecessary.
14. You have verified that the appliance was able to successfully communicate with a valid DNS
server. An unsuccessful request would not have shown a record. You can close the results tab in
your browser.
NTP Verification
You will now verify that the SMC appliance can successfully communicate with its NTP server. NTP is
a critical service for all Stealthwatch appliances. Alarms will be raised in the product if time
mismatches are discovered. In a production environment, this verification should be performed on
all appliances. Just because you’ve been given the IP address of an NTP server does not mean that it
is a valid NTP server or that the appliances can communicate with it even if it is valid. The Audit Log
is the simplest way to determine whether the appliance is receiving time updates successfully. There
are also some console commands available for more in depth troubleshooting if needed. You will
now use the appliance web administration page and the SSH console to verify NTP functionality.
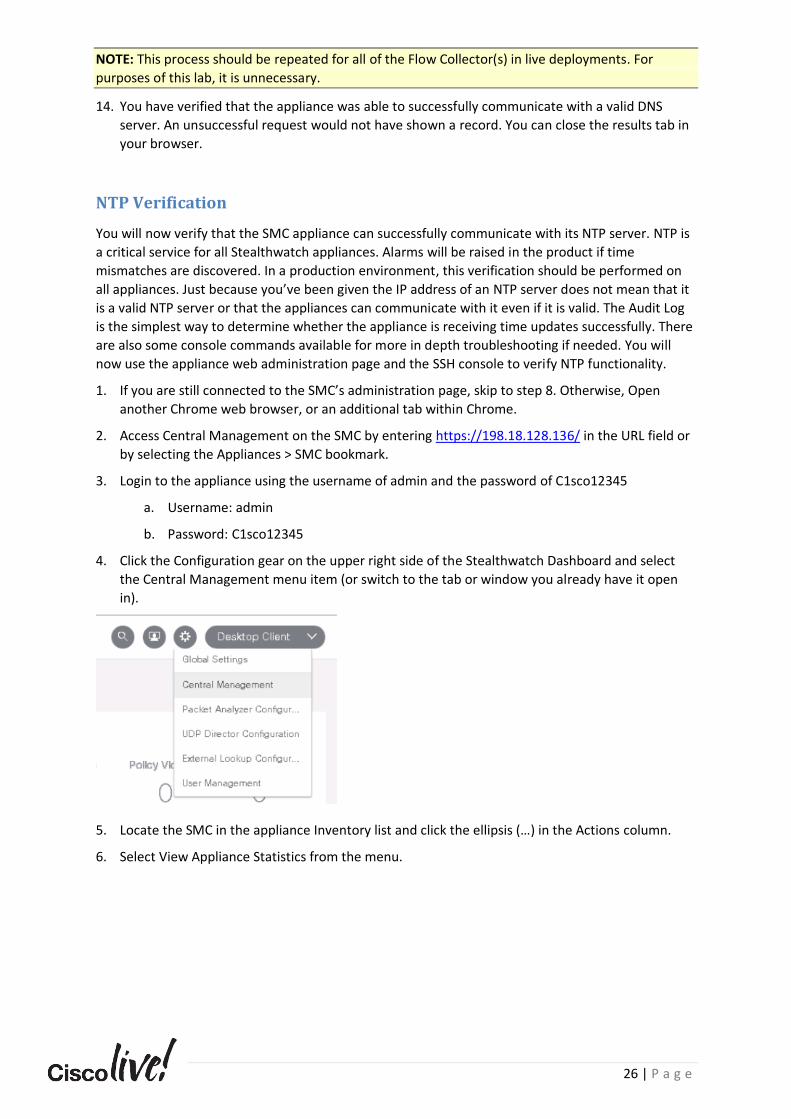
1. If you are still connected to the SMC’s administration page, skip to step 8. Otherwise, Open
another Chrome web browser, or an additional tab within Chrome.
2. Access Central Management on the SMC by entering https://198.18.128.136/ in the URL field or
by selecting the Appliances > SMC bookmark.
3. Login to the appliance using the username of admin and the password of C1sco12345
a. Username: admin
b. Password: C1sco12345
4. Click the Configuration gear on the upper right side of the Stealthwatch Dashboard and select
the Central Management menu item (or switch to the tab or window you already have it open
in).
5. Locate the SMC in the appliance Inventory list and click the ellipsis (…) in the Actions column.
6. Select View Appliance Statistics from the menu.
27 | P a g e
7. A new tab will open displaying additional appliance information and configuration options.
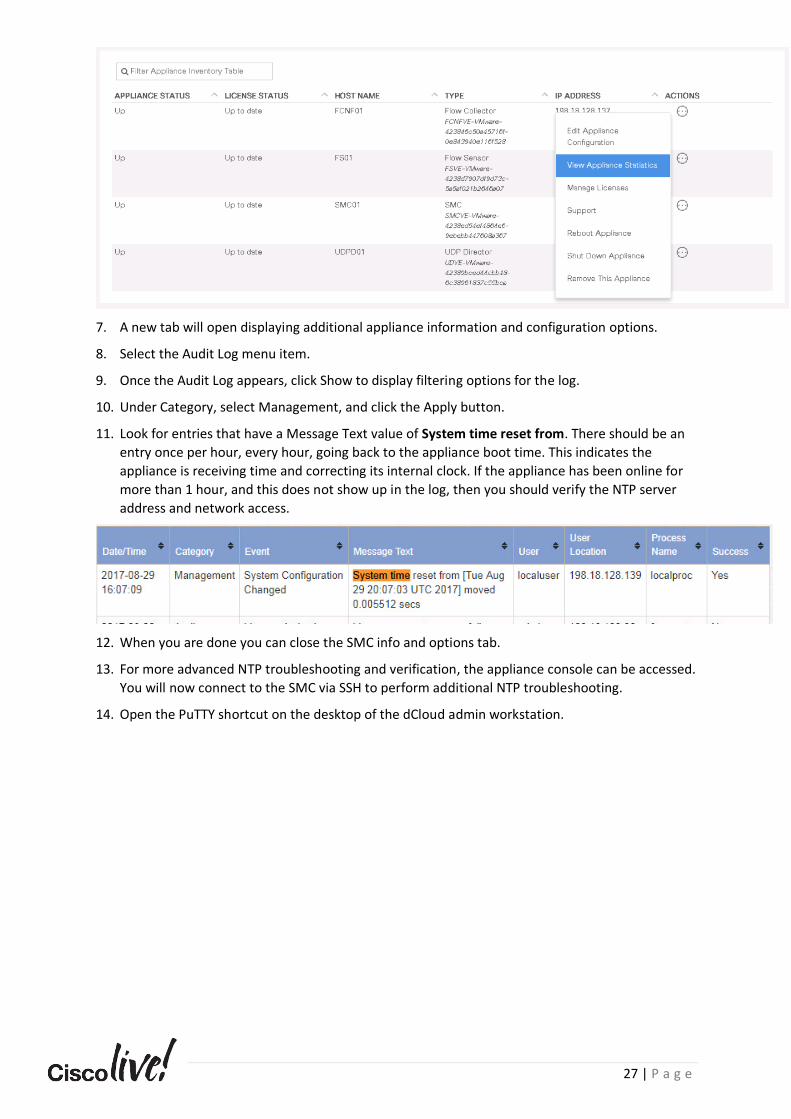
8. Select the Audit Log menu item.
9. Once the Audit Log appears, click Show to display filtering options for the log.
10. Under Category, select Management, and click the Apply button.
11. Look for entries that have a Message Text value of System time reset from. There should be an
entry once per hour, every hour, going back to the appliance boot time. This indicates the
appliance is receiving time and correcting its internal clock. If the appliance has been online for
more than 1 hour, and this does not show up in the log, then you should verify the NTP server
address and network access.
12. When you are done you can close the SMC info and options tab.
13. For more advanced NTP troubleshooting and verification, the appliance console can be accessed.
You will now connect to the SMC via SSH to perform additional NTP troubleshooting.
14. Open the PuTTY shortcut on the desktop of the dCloud admin workstation.
28 | P a g e
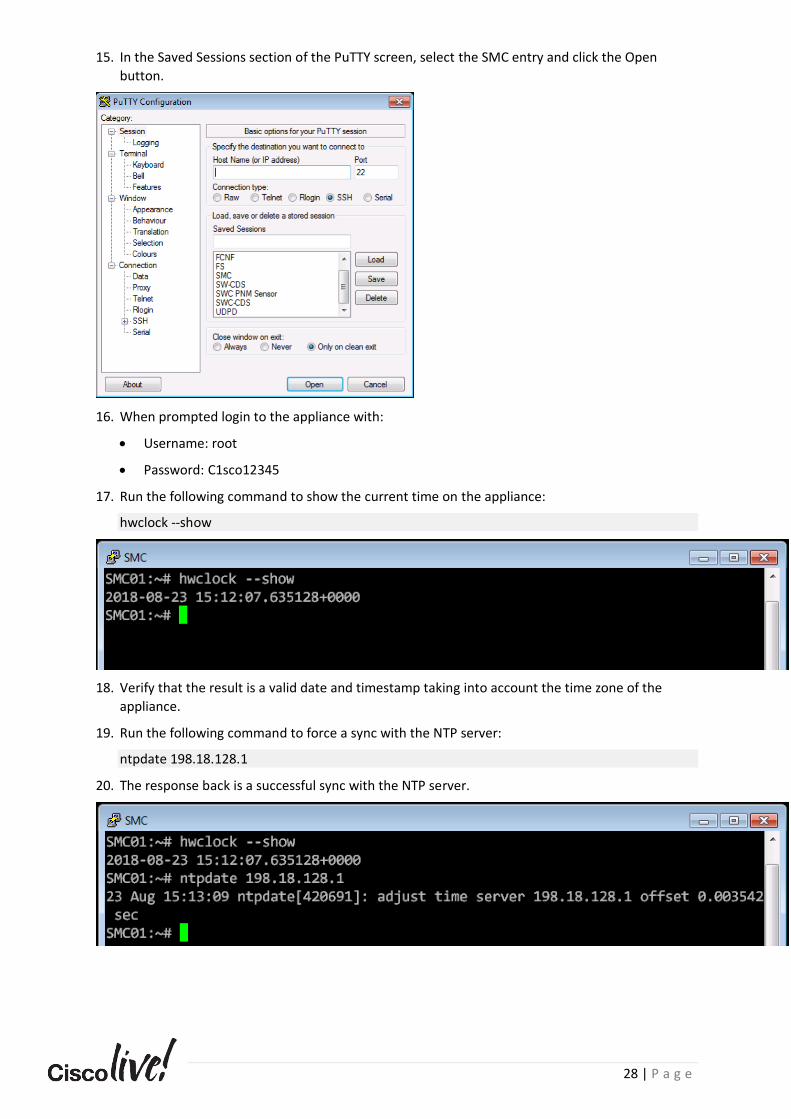
15. In the Saved Sessions section of the PuTTY screen, select the SMC entry and click the Open
button.
16. When prompted login to the appliance with:
• Username: root
• Password: C1sco12345
17. Run the following command to show the current time on the appliance:
hwclock --show
18. Verify that the result is a valid date and timestamp taking into account the time zone of the
appliance.
19. Run the following command to force a sync with the NTP server:
ntpdate 198.18.128.1
20. The response back is a successful sync with the NTP server.
29 | P a g e
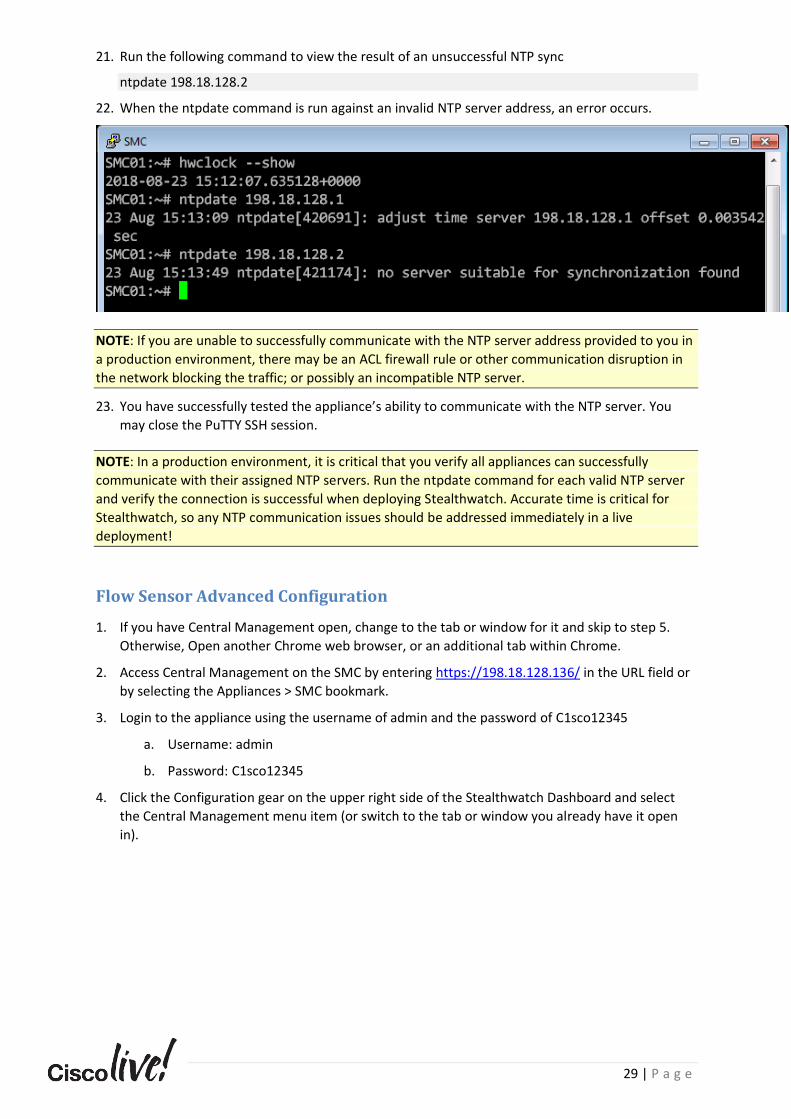
21. Run the following command to view the result of an unsuccessful NTP sync
ntpdate 198.18.128.2
22. When the ntpdate command is run against an invalid NTP server address, an error occurs.
NOTE: If you are unable to successfully communicate with the NTP server address provided to you in
a production environment, there may be an ACL firewall rule or other communication disruption in
the network blocking the traffic; or possibly an incompatible NTP server.
23. You have successfully tested the appliance’s ability to communicate with the NTP server. You
may close the PuTTY SSH session.
NOTE: In a production environment, it is critical that you verify all appliances can successfully
communicate with their assigned NTP servers. Run the ntpdate command for each valid NTP server
and verify the connection is successful when deploying Stealthwatch. Accurate time is critical for
Stealthwatch, so any NTP communication issues should be addressed immediately in a live
deployment!
Flow Sensor Advanced Configuration
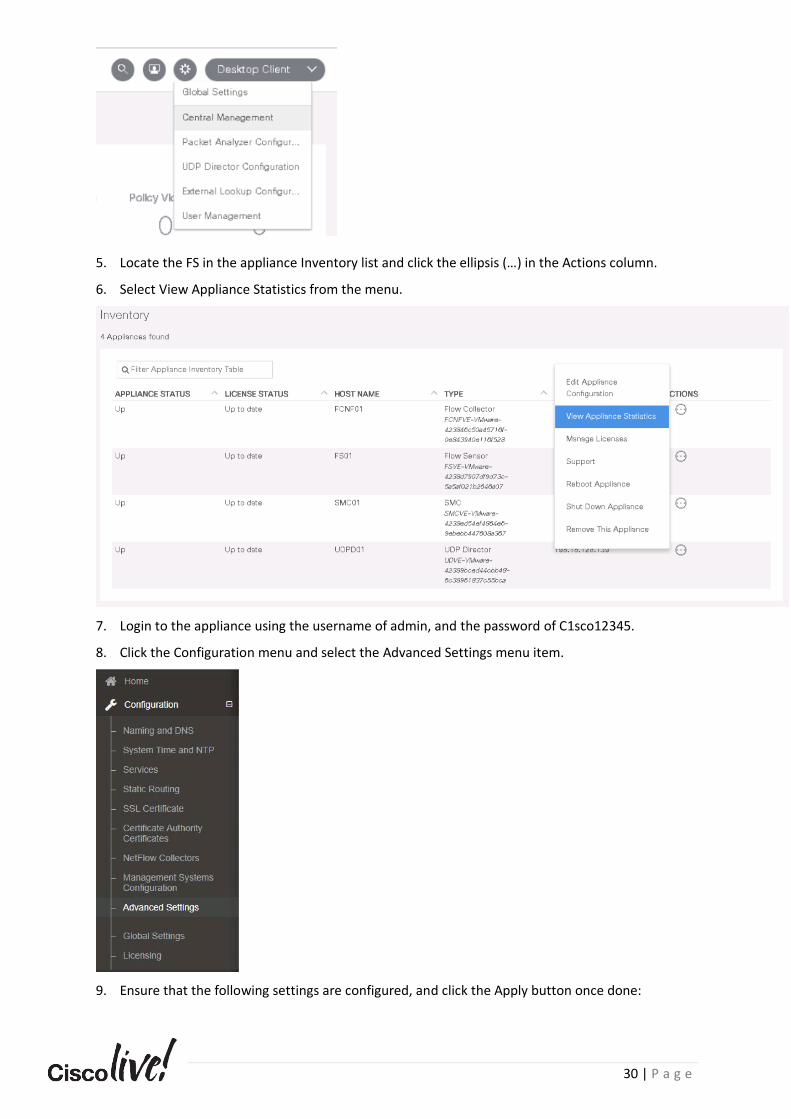
1. If you have Central Management open, change to the tab or window for it and skip to step 5.
Otherwise, Open another Chrome web browser, or an additional tab within Chrome.
2. Access Central Management on the SMC by entering https://198.18.128.136/ in the URL field or
by selecting the Appliances > SMC bookmark.
3. Login to the appliance using the username of admin and the password of C1sco12345
a. Username: admin
b. Password: C1sco12345
4. Click the Configuration gear on the upper right side of the Stealthwatch Dashboard and select
the Central Management menu item (or switch to the tab or window you already have it open
in).
30 | P a g e
5. Locate the FS in the appliance Inventory list and click the ellipsis (…) in the Actions column.
6. Select View Appliance Statistics from the menu.
7. Login to the appliance using the username of admin, and the password of C1sco12345.
8. Click the Configuration menu and select the Advanced Settings menu item.
9. Ensure that the following settings are configured, and click the Apply button once done:
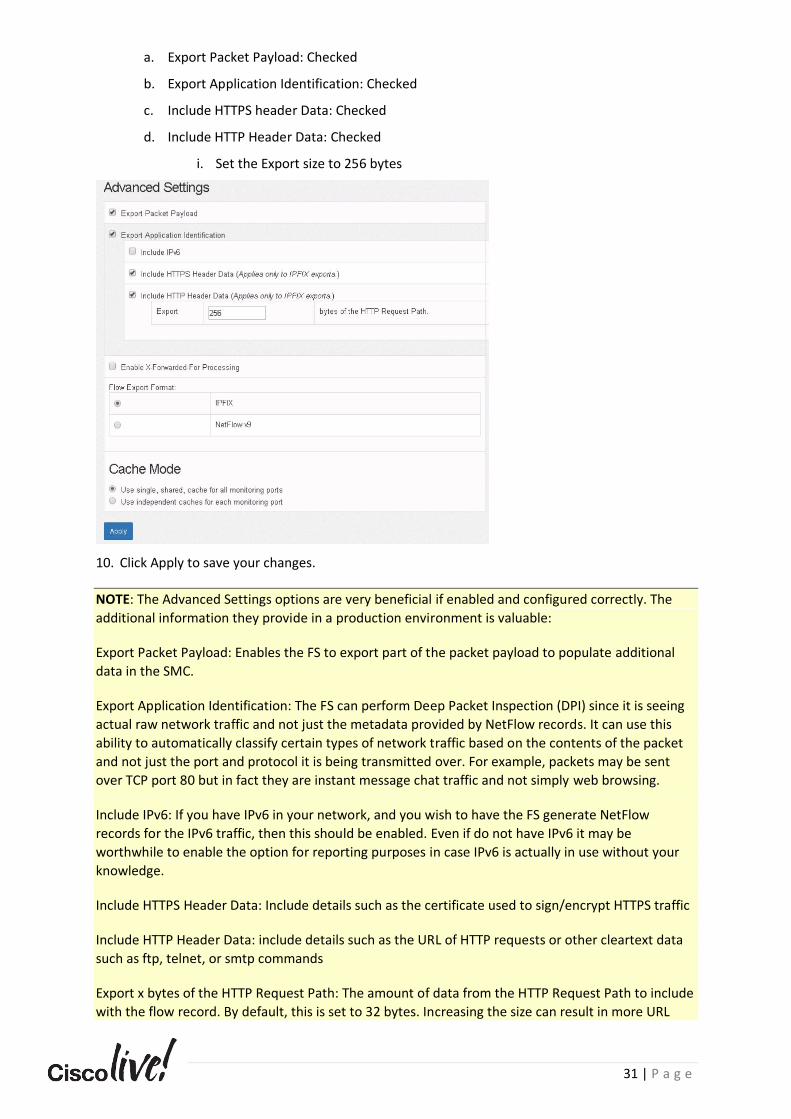
31 | P a g e
a. Export Packet Payload: Checked
b. Export Application Identification: Checked
c. Include HTTPS header Data: Checked
d. Include HTTP Header Data: Checked
i. Set the Export size to 256 bytes
10. Click Apply to save your changes.
NOTE: The Advanced Settings options are very beneficial if enabled and configured correctly. The
additional information they provide in a production environment is valuable:
Export Packet Payload: Enables the FS to export part of the packet payload to populate additional
data in the SMC.
Export Application Identification: The FS can perform Deep Packet Inspection (DPI) since it is seeing
actual raw network traffic and not just the metadata provided by NetFlow records. It can use this
ability to automatically classify certain types of network traffic based on the contents of the packet
and not just the port and protocol it is being transmitted over. For example, packets may be sent
over TCP port 80 but in fact they are instant message chat traffic and not simply web browsing.
Include IPv6: If you have IPv6 in your network, and you wish to have the FS generate NetFlow
records for the IPv6 traffic, then this should be enabled. Even if do not have IPv6 it may be
worthwhile to enable the option for reporting purposes in case IPv6 is actually in use without your
knowledge.
Include HTTPS Header Data: Include details such as the certificate used to sign/encrypt HTTPS traffic
Include HTTP Header Data: include details such as the URL of HTTP requests or other cleartext data
such as ftp, telnet, or smtp commands
Export x bytes of the HTTP Request Path: The amount of data from the HTTP Request Path to include
with the flow record. By default, this is set to 32 bytes. Increasing the size can result in more URL
32 | P a g e
data being available in Stealthwatch but may generate additional load on the FS appliance. The FS
performance should be monitored when increasing the size of the Export.
11. You have successfully completed the Advanced Flow Sensor configuration. Proceed to the next
step of the lab.
Task Summary You have successfully completed the configuration items dealing with the individual appliances prior to utilizing the SMC interface of the product. All tasks were focused on ensuring the appliance was optimally configured before processing flow data and to actually get the flow data flowing into the FC. SSH has been enabled/verified to ensure that advanced troubleshooting tasks can be accomplished. The ability of the appliances to reach their configured DNS servers has been verified. The ability of the appliances to reach their NTP servers has also been verified. Advanced settings on the Flow Sensor appliance have been configured. The UDPD and its forwarding rules have been configured so that flow data can be processed by Stealthwatch.
33 | P a g e
Task 4: Additional SMC Interface Configuration
The individual appliances have been fully configured at this point, but there is still additional
configuration to be performed. Much of the solution’s management capabilities exist within the
WebUI, but certain functions must still be initially configured in the Java Client. You will now utilize
the SMC’s Java Client to continue the configuration of Stealthwatch.
Steps
1. Return to your SMC’s Security Insight Dashboard page if you already have it open.
2. If not, you can access it by entering https://198.18.128.136 in the URL field or by selecting the
Appliances > SMC bookmark.
3. If prompted for authentication, login with Username: admin and Password: C1sco12345.
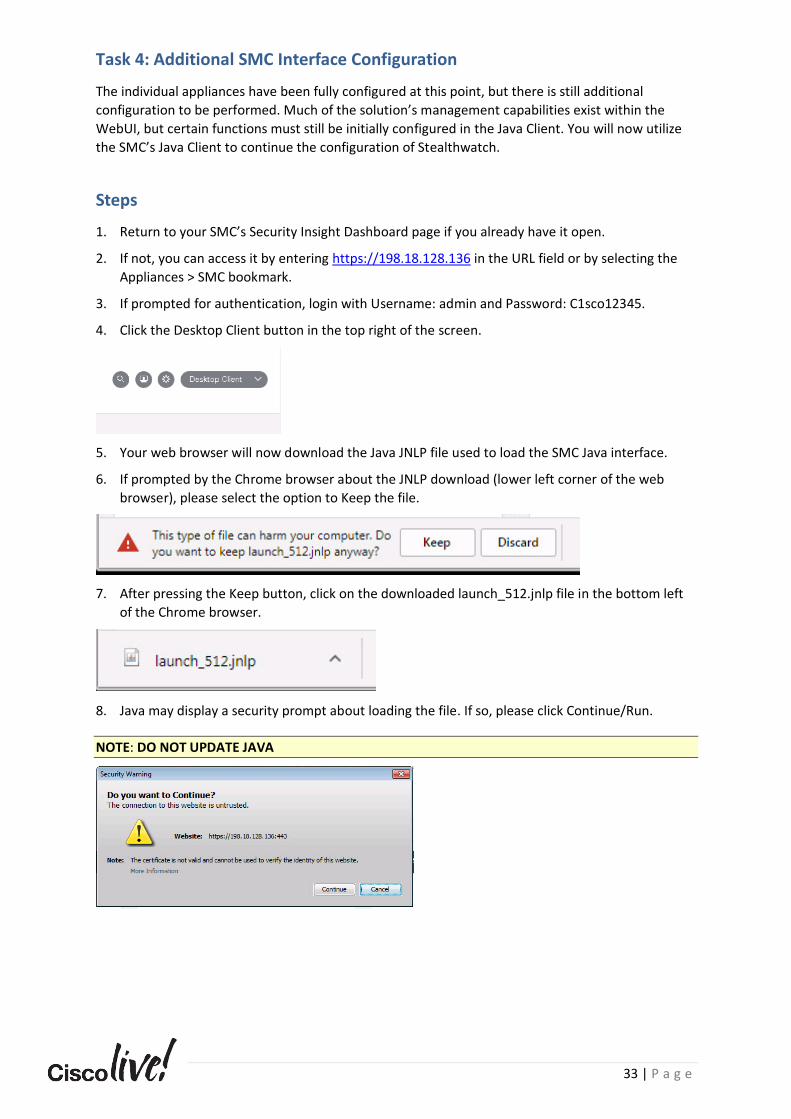
4. Click the Desktop Client button in the top right of the screen.
5. Your web browser will now download the Java JNLP file used to load the SMC Java interface.
6. If prompted by the Chrome browser about the JNLP download (lower left corner of the web
browser), please select the option to Keep the file.
7. After pressing the Keep button, click on the downloaded launch_512.jnlp file in the bottom left
of the Chrome browser.
8. Java may display a security prompt about loading the file. If so, please click Continue/Run.
NOTE: DO NOT UPDATE JAVA
34 | P a g e
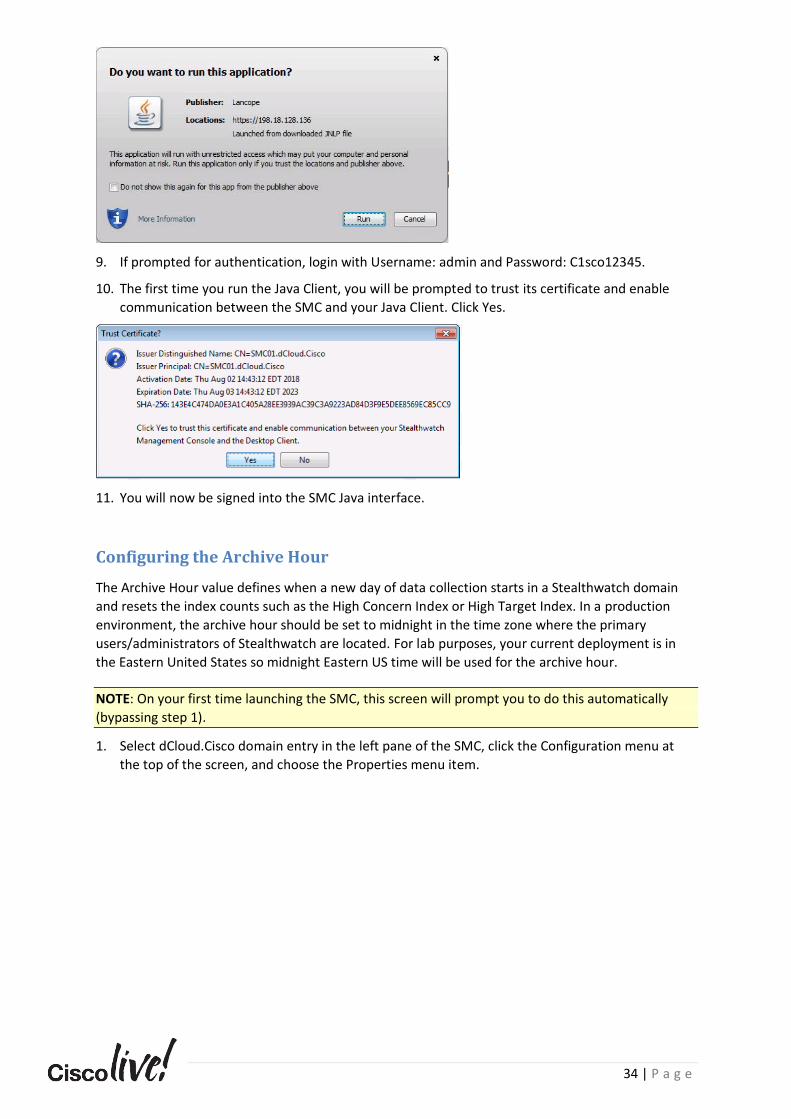
9. If prompted for authentication, login with Username: admin and Password: C1sco12345.
10. The first time you run the Java Client, you will be prompted to trust its certificate and enable
communication between the SMC and your Java Client. Click Yes.
11. You will now be signed into the SMC Java interface.
Configuring the Archive Hour
The Archive Hour value defines when a new day of data collection starts in a Stealthwatch domain
and resets the index counts such as the High Concern Index or High Target Index. In a production
environment, the archive hour should be set to midnight in the time zone where the primary
users/administrators of Stealthwatch are located. For lab purposes, your current deployment is in
the Eastern United States so midnight Eastern US time will be used for the archive hour.
NOTE: On your first time launching the SMC, this screen will prompt you to do this automatically
(bypassing step 1).
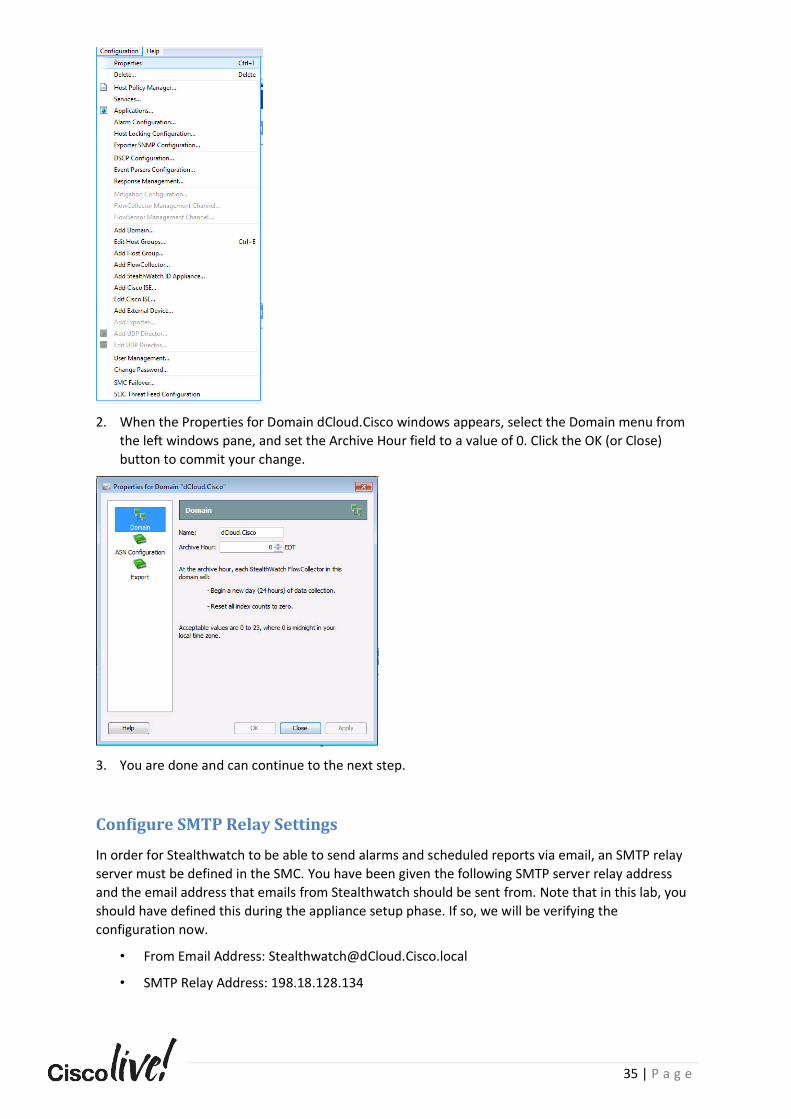
1. Select dCloud.Cisco domain entry in the left pane of the SMC, click the Configuration menu at
the top of the screen, and choose the Properties menu item.
35 | P a g e
2. When the Properties for Domain dCloud.Cisco windows appears, select the Domain menu from
the left windows pane, and set the Archive Hour field to a value of 0. Click the OK (or Close)
button to commit your change.
3. You are done and can continue to the next step.
Configure SMTP Relay Settings
In order for Stealthwatch to be able to send alarms and scheduled reports via email, an SMTP relay
server must be defined in the SMC. You have been given the following SMTP server relay address
and the email address that emails from Stealthwatch should be sent from. Note that in this lab, you
should have defined this during the appliance setup phase. If so, we will be verifying the
configuration now.
• From Email Address: [email protected]
• SMTP Relay Address: 198.18.128.134
36 | P a g e
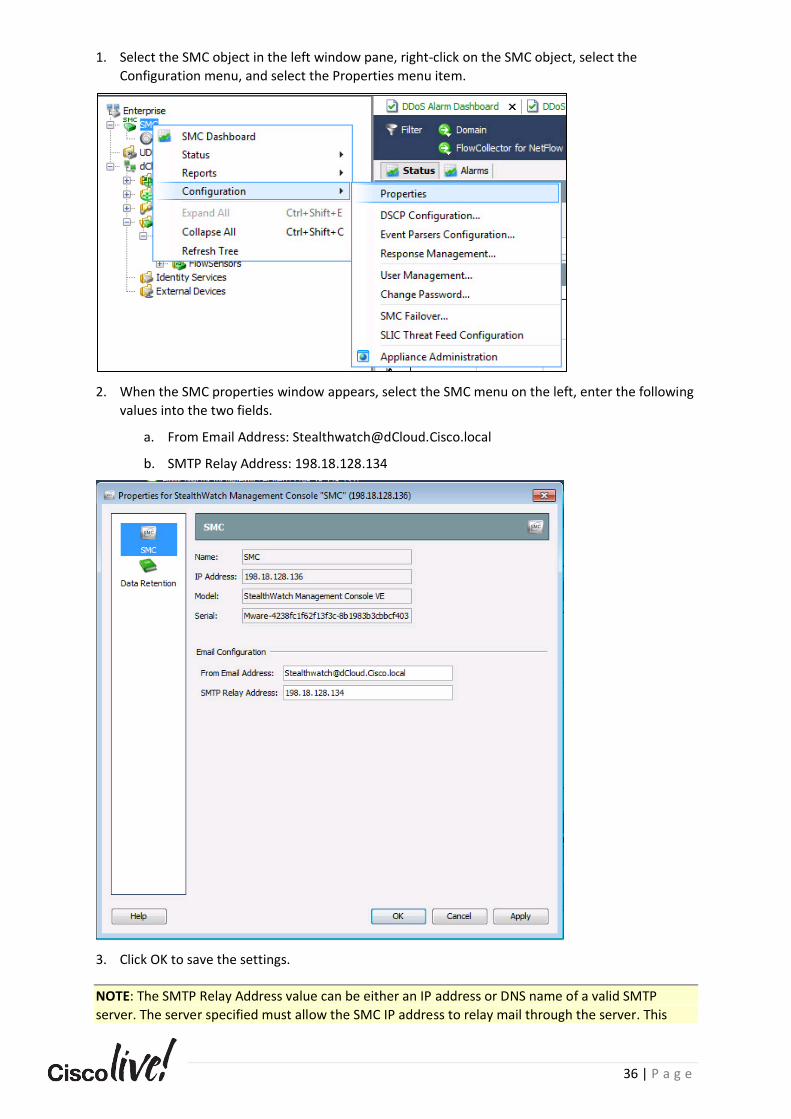
1. Select the SMC object in the left window pane, right-click on the SMC object, select the
Configuration menu, and select the Properties menu item.
2. When the SMC properties window appears, select the SMC menu on the left, enter the following
values into the two fields.
a. From Email Address: [email protected]
b. SMTP Relay Address: 198.18.128.134
3. Click OK to save the settings.
NOTE: The SMTP Relay Address value can be either an IP address or DNS name of a valid SMTP
server. The server specified must allow the SMC IP address to relay mail through the server. This
37 | P a g e
often requires a configuration change on the SMTP server. The From Email Address value does not
have to be a valid mailbox although it is recommended to have the domain name match the DNS
domain name for your email addresses. When the SMC sends emails, the value you enter in the
From Email Address field will be the sender of the scheduled reports and alarms sent by the SMC.
Exporter SNMP Configuration
Stealthwatch uses SNMP to obtain associated interface name, type, description, and speed of the
interfaces sending NetFlow to the Flow Collectors. Multiple SNMP community strings may be used
by Stealthwatch with different settings. You will now configure an SNMP community string on the
SMC, that it will use to poll your exporter devices.
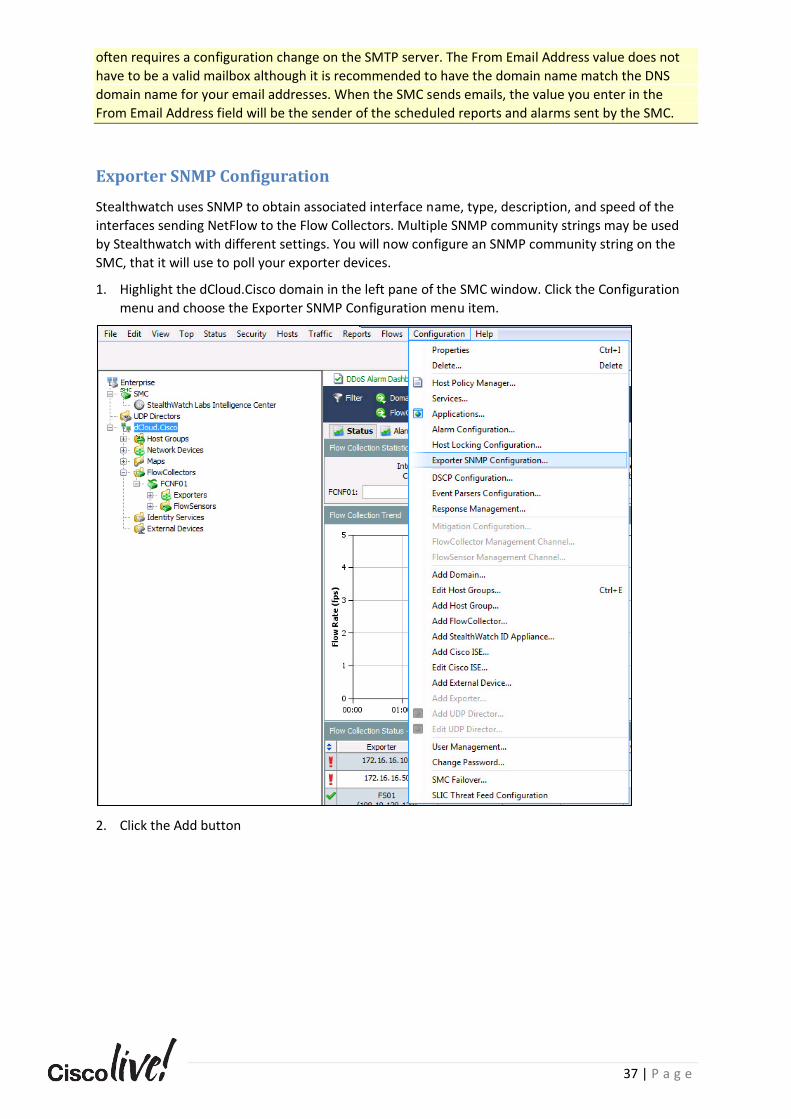
1. Highlight the dCloud.Cisco domain in the left pane of the SMC window. Click the Configuration
menu and choose the Exporter SNMP Configuration menu item.
2. Click the Add button
38 | P a g e
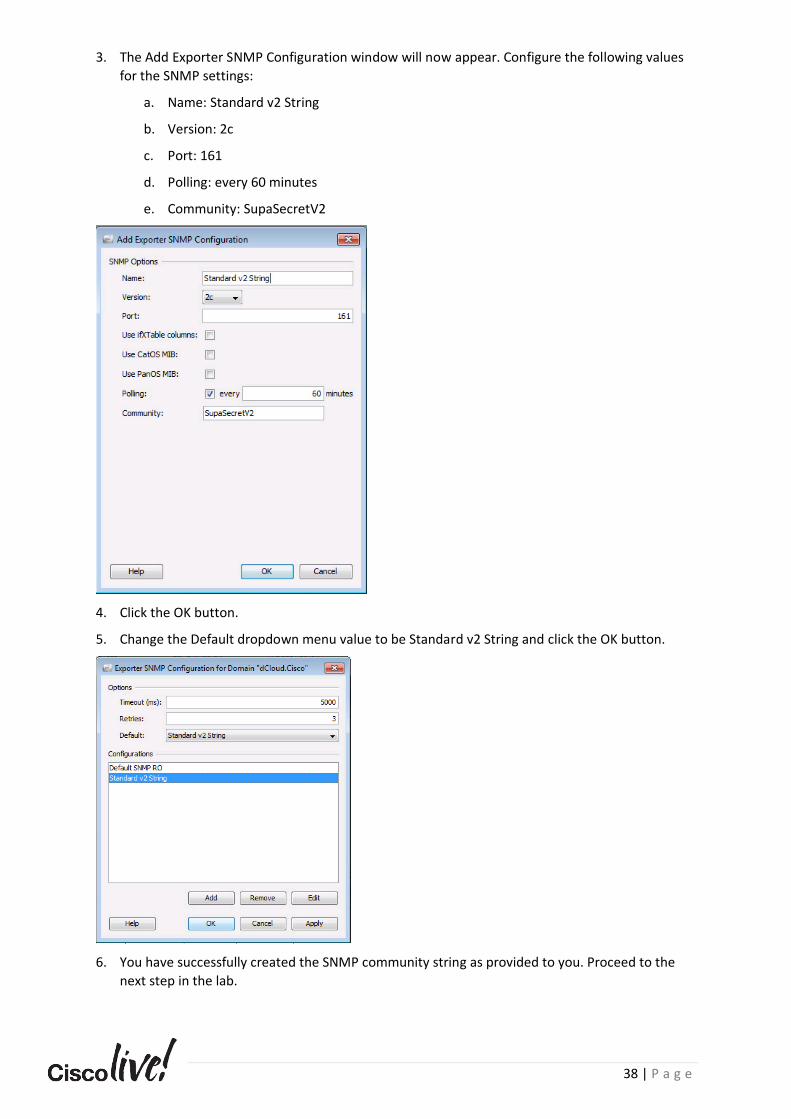
3. The Add Exporter SNMP Configuration window will now appear. Configure the following values
for the SNMP settings:
a. Name: Standard v2 String
b. Version: 2c
c. Port: 161
d. Polling: every 60 minutes
e. Community: SupaSecretV2
4. Click the OK button.
5. Change the Default dropdown menu value to be Standard v2 String and click the OK button.
6. You have successfully created the SNMP community string as provided to you. Proceed to the
next step in the lab.
39 | P a g e
NOTE: You may create multiple SNMP configurations in Stealthwatch. Very rarely will a network
have only one single SNMP community string in use for all network devices. Some devices may use
SNMP v2 while others have SNMP v3. All of these configurations are supported. Whichever
community string is the most prevalent should be selected as the default community string. The SMC
will attempt to communicate with all devices on the Default community string. Any devices that
require a different community string to be used can have their individual SNMP setting manually
configured per device in the SMC.
Verify Licenses in License Manager
You will now verify that the appropriate licenses and features are applied to the appliances. The
Web Interface’s Central Management Appliance Inventory is great to quickly see if all of the
managed appliances in your domain have a current, active license. The License Manager in the Java
Client provides additional details around licensing in a single place.
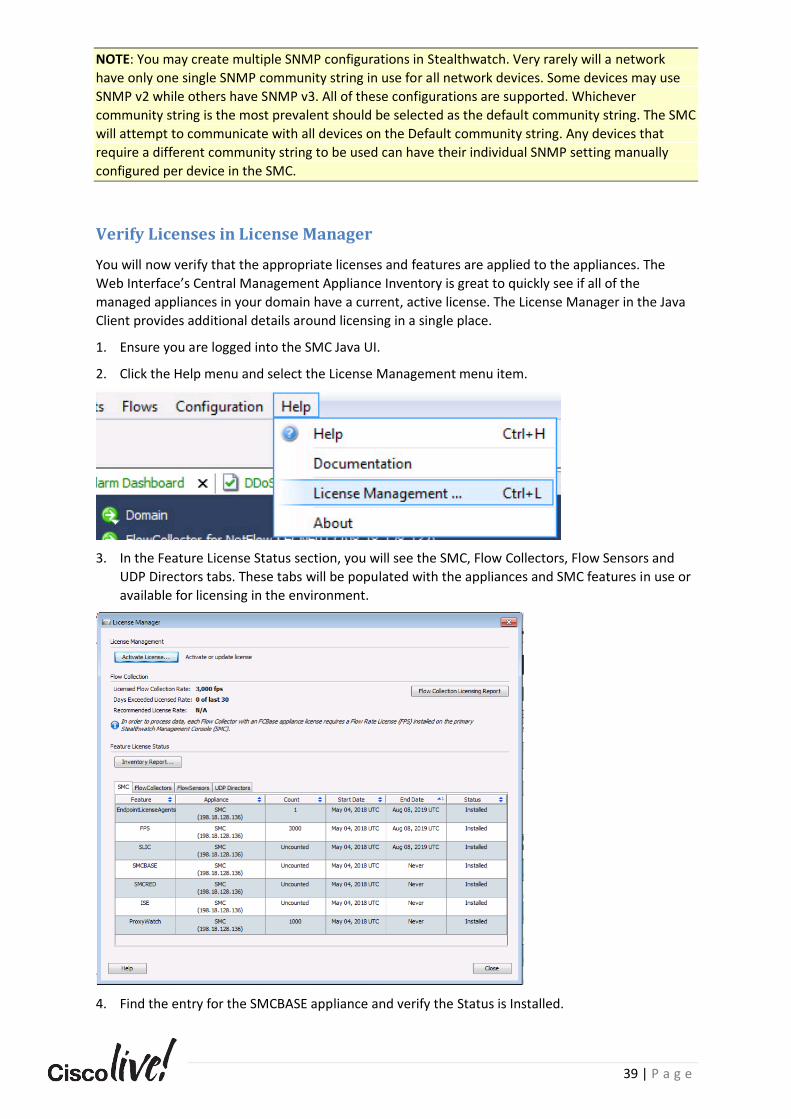
1. Ensure you are logged into the SMC Java UI.
2. Click the Help menu and select the License Management menu item.
3. In the Feature License Status section, you will see the SMC, Flow Collectors, Flow Sensors and
UDP Directors tabs. These tabs will be populated with the appliances and SMC features in use or
available for licensing in the environment.
4. Find the entry for the SMCBASE appliance and verify the Status is Installed.
40 | P a g e
5. Find the entry labeled FPS and notice the value of the count column. This denotes how many
Flows Per Second the installation is licensed for.
6. Find the entry labeled ISE. This denotes whether the installation is licensed for integrating with
Cisco ISE.
7. Find the entry labeled SLIC. This denotes whether the installation is licensed for the Stealthwatch
Threat Feed.
8. Click the Flow Collectors tab and verify the entry for the FCBASE has a status of Installed.
9. Click the Flow Sensors tab and verify the entry for the FSBASE has a status of Installed.
10. Click the UDP Directors tab and verify the entry for the UDVE (UDP Director Virtual Edition) has a
status of Installed.
NOTE: The UDP Director is not licensed through the SMC but is licensed on the appliance itself.
The licenses for all appliances can be managed through the appliance web interface under Central
Management > Actions > Manage Licenses.
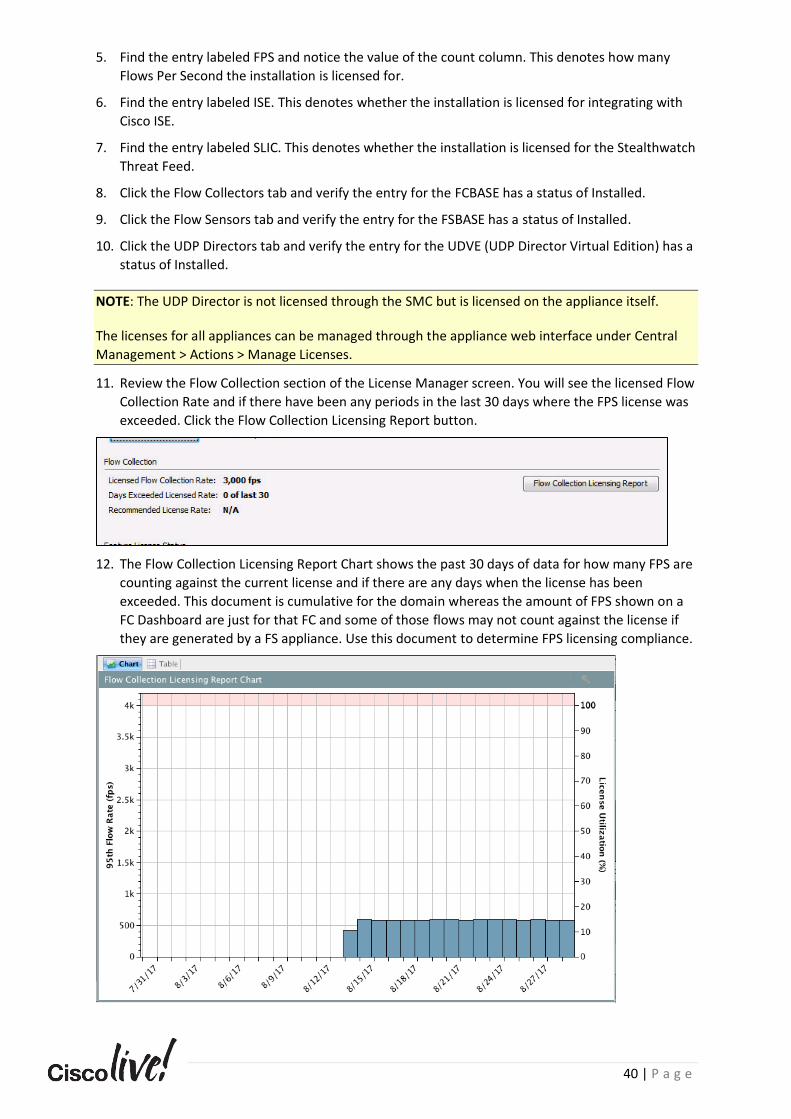
11. Review the Flow Collection section of the License Manager screen. You will see the licensed Flow
Collection Rate and if there have been any periods in the last 30 days where the FPS license was
exceeded. Click the Flow Collection Licensing Report button.
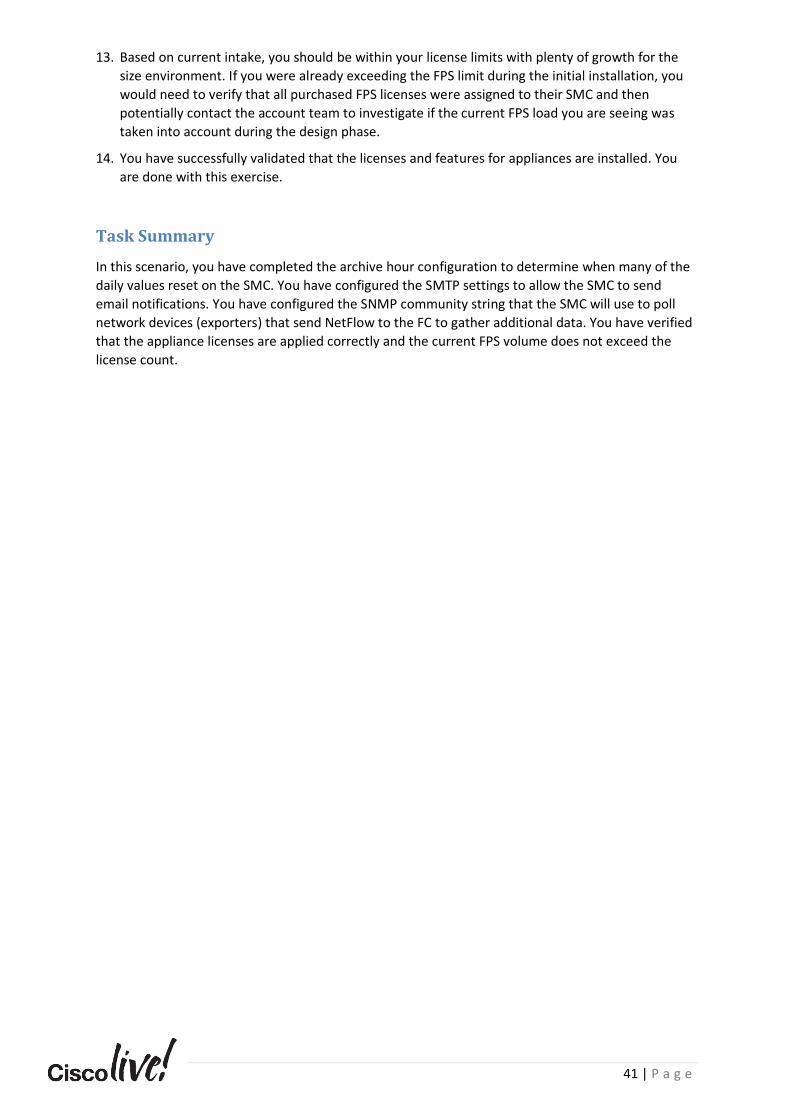
12. The Flow Collection Licensing Report Chart shows the past 30 days of data for how many FPS are
counting against the current license and if there are any days when the license has been
exceeded. This document is cumulative for the domain whereas the amount of FPS shown on a
FC Dashboard are just for that FC and some of those flows may not count against the license if
they are generated by a FS appliance. Use this document to determine FPS licensing compliance.
41 | P a g e
13. Based on current intake, you should be within your license limits with plenty of growth for the
size environment. If you were already exceeding the FPS limit during the initial installation, you
would need to verify that all purchased FPS licenses were assigned to their SMC and then
potentially contact the account team to investigate if the current FPS load you are seeing was
taken into account during the design phase.
14. You have successfully validated that the licenses and features for appliances are installed. You
are done with this exercise.
Task Summary
In this scenario, you have completed the archive hour configuration to determine when many of the
daily values reset on the SMC. You have configured the SMTP settings to allow the SMC to send
email notifications. You have configured the SNMP community string that the SMC will use to poll
network devices (exporters) that send NetFlow to the FC to gather additional data. You have verified
that the appliance licenses are applied correctly and the current FPS volume does not exceed the
license count.
42 | P a g e
Task 5: Verifying Network Telemetry Data
Now that you have successfully configured all Stealthwatch appliances, it is time to verify that
Stealthwatch is processing flow data from the environment. You will utilize the Flow Collector
dashboard document in the SMC to verify the FC is seeing NetFlow data from the exporter devices.
You will also look at the data from specific exporters to determine if it is formatted optimally for
Stealthwatch.
Steps
Exporter Health
It is important to verify that all in-scope network devices that should be sending flow data to
Stealthwatch show up as an Exporter in the SMC interface. If a network device that is on the
inventory does not appear in Stealthwatch, you may not have visibility into that are of the network.
This could be due to the device not being configured to send NetFlow data or something blocking
the NetFlow traffic to Stealthwatch.
Additionally, for devices that do show up in the SMC, it is important to verify that the flow data
being sent appears optimized for Stealthwatch. You will verify that the exporters (routers, switches,
firewalls, etc.) sending NetFlow data to the Flow Collector (by way of the UDPD in this instance)
appear to have an optimal NetFlow configuration.
You have been given a list of network devices that are in-scope for the Stealthwatch project that
should be sending NetFlow telemetry data. They are:
o 172.16.16.1
o 172.16.16.2
o 172.16.16.3
o 172.16.16.4
o 172.16.16.50
o 172.16.16.100
o 172.16.16.200
1. Open the SMC Java interface.
2. In the Enterprise Tree pane on the left side of the screen, expand the dCloud.Cisco domain,
expand the Flow Collectors container, and double-click on the FCNF01 Flow Collector.
3. The Flow Collector Dashboard document will now display.
43 | P a g e
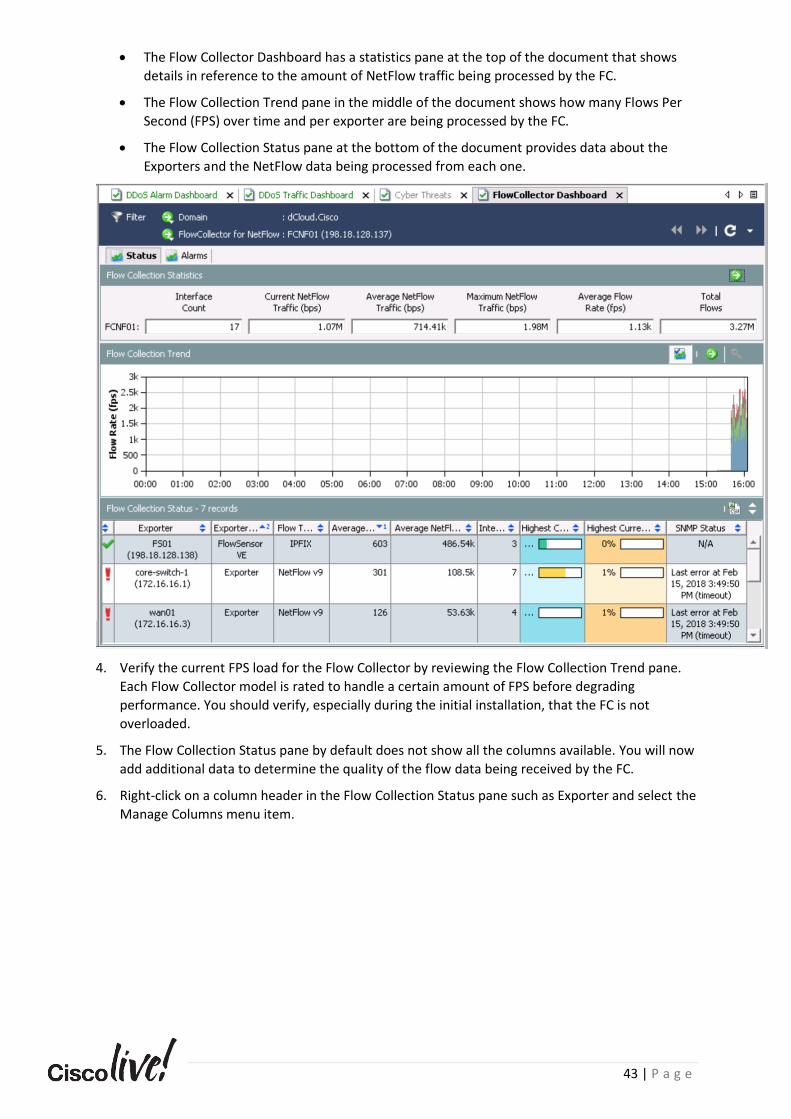
• The Flow Collector Dashboard has a statistics pane at the top of the document that shows
details in reference to the amount of NetFlow traffic being processed by the FC.
• The Flow Collection Trend pane in the middle of the document shows how many Flows Per
Second (FPS) over time and per exporter are being processed by the FC.
• The Flow Collection Status pane at the bottom of the document provides data about the
Exporters and the NetFlow data being processed from each one.
4. Verify the current FPS load for the Flow Collector by reviewing the Flow Collection Trend pane.
Each Flow Collector model is rated to handle a certain amount of FPS before degrading
performance. You should verify, especially during the initial installation, that the FC is not
overloaded.
5. The Flow Collection Status pane by default does not show all the columns available. You will now
add additional data to determine the quality of the flow data being received by the FC.
6. Right-click on a column header in the Flow Collection Status pane such as Exporter and select the
Manage Columns menu item.
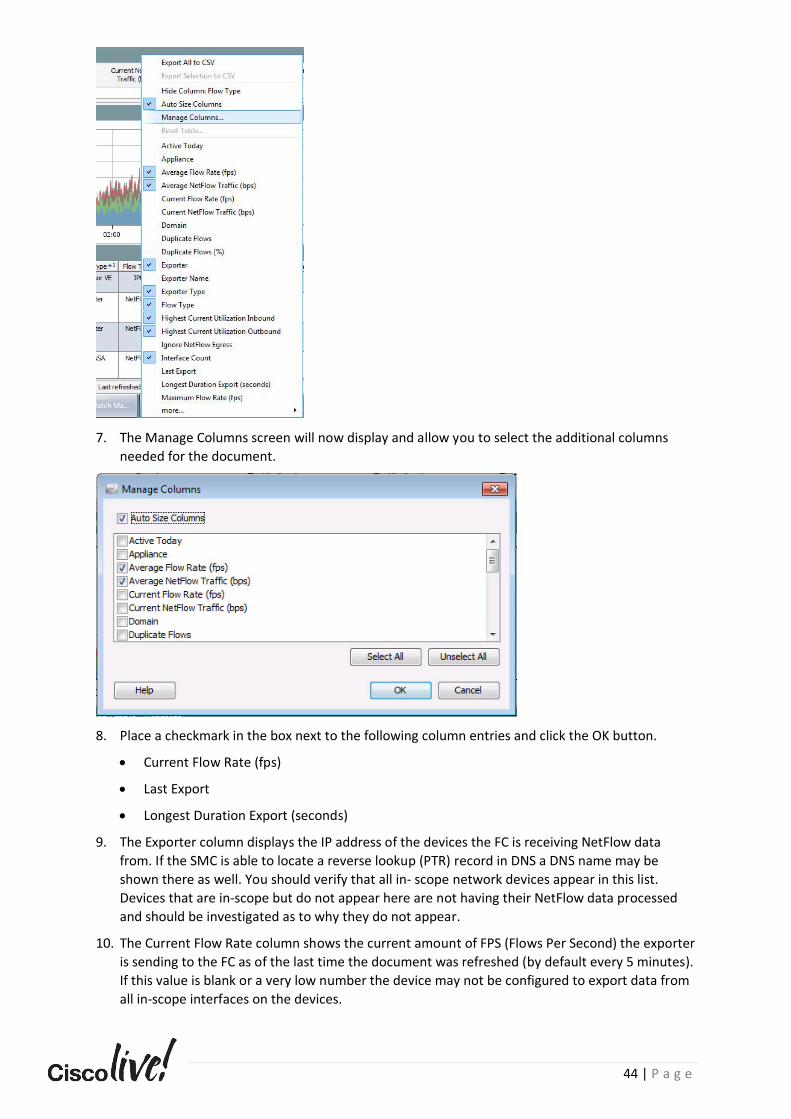
44 | P a g e
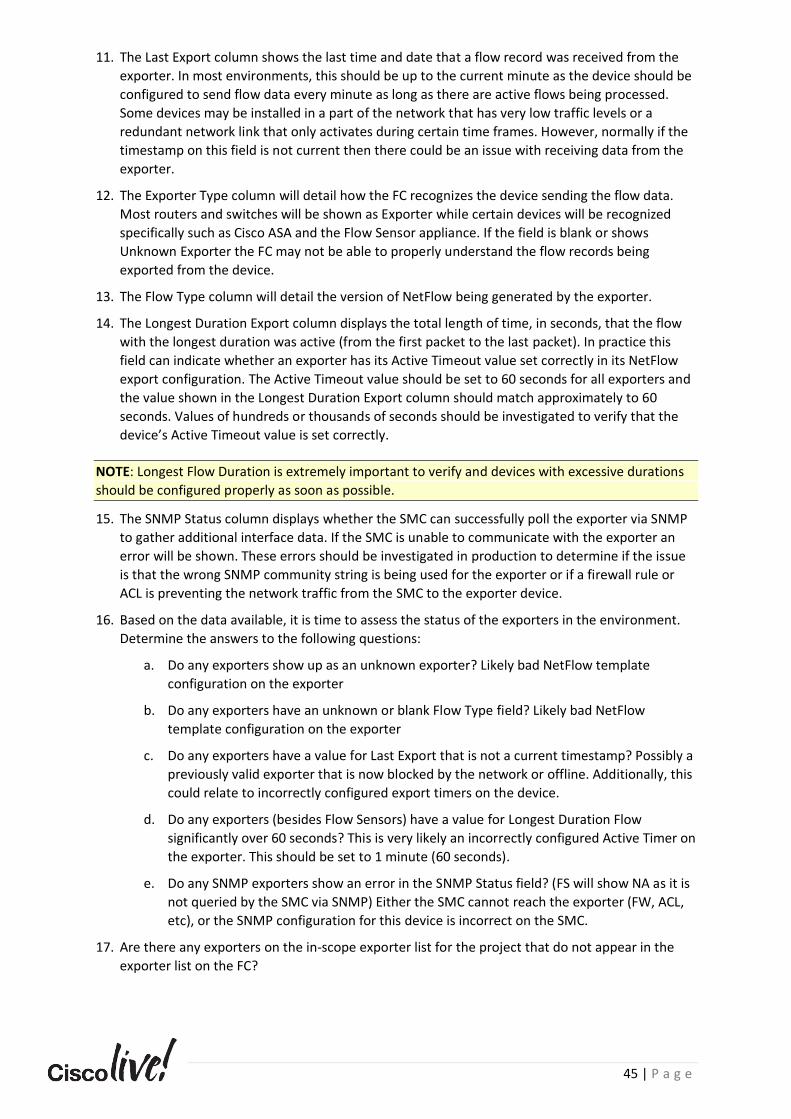
7. The Manage Columns screen will now display and allow you to select the additional columns
needed for the document.
8. Place a checkmark in the box next to the following column entries and click the OK button.
• Current Flow Rate (fps)
• Last Export
• Longest Duration Export (seconds)
9. The Exporter column displays the IP address of the devices the FC is receiving NetFlow data
from. If the SMC is able to locate a reverse lookup (PTR) record in DNS a DNS name may be
shown there as well. You should verify that all in- scope network devices appear in this list.
Devices that are in-scope but do not appear here are not having their NetFlow data processed
and should be investigated as to why they do not appear.
10. The Current Flow Rate column shows the current amount of FPS (Flows Per Second) the exporter
is sending to the FC as of the last time the document was refreshed (by default every 5 minutes).
If this value is blank or a very low number the device may not be configured to export data from
all in-scope interfaces on the devices.
45 | P a g e
11. The Last Export column shows the last time and date that a flow record was received from the
exporter. In most environments, this should be up to the current minute as the device should be
configured to send flow data every minute as long as there are active flows being processed.
Some devices may be installed in a part of the network that has very low traffic levels or a
redundant network link that only activates during certain time frames. However, normally if the
timestamp on this field is not current then there could be an issue with receiving data from the
exporter.
12. The Exporter Type column will detail how the FC recognizes the device sending the flow data.
Most routers and switches will be shown as Exporter while certain devices will be recognized
specifically such as Cisco ASA and the Flow Sensor appliance. If the field is blank or shows
Unknown Exporter the FC may not be able to properly understand the flow records being
exported from the device.
13. The Flow Type column will detail the version of NetFlow being generated by the exporter.
14. The Longest Duration Export column displays the total length of time, in seconds, that the flow
with the longest duration was active (from the first packet to the last packet). In practice this
field can indicate whether an exporter has its Active Timeout value set correctly in its NetFlow
export configuration. The Active Timeout value should be set to 60 seconds for all exporters and
the value shown in the Longest Duration Export column should match approximately to 60
seconds. Values of hundreds or thousands of seconds should be investigated to verify that the
device’s Active Timeout value is set correctly.
NOTE: Longest Flow Duration is extremely important to verify and devices with excessive durations
should be configured properly as soon as possible.
15. The SNMP Status column displays whether the SMC can successfully poll the exporter via SNMP
to gather additional interface data. If the SMC is unable to communicate with the exporter an
error will be shown. These errors should be investigated in production to determine if the issue
is that the wrong SNMP community string is being used for the exporter or if a firewall rule or
ACL is preventing the network traffic from the SMC to the exporter device.
16. Based on the data available, it is time to assess the status of the exporters in the environment.
Determine the answers to the following questions:
a. Do any exporters show up as an unknown exporter? Likely bad NetFlow template
configuration on the exporter
b. Do any exporters have an unknown or blank Flow Type field? Likely bad NetFlow
template configuration on the exporter
c. Do any exporters have a value for Last Export that is not a current timestamp? Possibly a
previously valid exporter that is now blocked by the network or offline. Additionally, this
could relate to incorrectly configured export timers on the device.
d. Do any exporters (besides Flow Sensors) have a value for Longest Duration Flow
significantly over 60 seconds? This is very likely an incorrectly configured Active Timer on
the exporter. This should be set to 1 minute (60 seconds).
e. Do any SNMP exporters show an error in the SNMP Status field? (FS will show NA as it is
not queried by the SMC via SNMP) Either the SMC cannot reach the exporter (FW, ACL,
etc), or the SNMP configuration for this device is incorrect on the SMC.
17. Are there any exporters on the in-scope exporter list for the project that do not appear in the
exporter list on the FC?
46 | P a g e
NOTE: The Flow Sensor appliance will appear as an exporter in the Flow Collection Status section but
one does not have to apply the same criteria as to whether it is properly working as other exporters.
Specifically, the Longest Duration Flow and SNMP Status can be disregarded.
NOTE: It is important to identify potential issues with exporters early in a deployment as it may take
an extended period of time to make changes to the configuration of the network devices in order to
correct the issue.
NOTE: In this simulated environment, there are no action items for you to correct on the exporters.
If this were a production environment, you should export the list of exporters to a CSV file and make
a list of the devices that should be investigated and for which reason.
18. There is a missing exporter; 172.16.16.4 is not appearing in the Flow Collector’s Dashboard. You
will now troubleshoot what the potential issue is.
Verify NetFlow Traffic to Flow Collector
Exporter 172.16.16.4 is not appearing in the Flow Collector Dashboard document as a source of flow
data. You must troubleshoot what the root cause of this issue is. You will run a packet capture on the
FC appliance to determine if the NetFlow traffic from the exporters is reaching the FC and not being
processed correctly or if the traffic not arriving at all.
1. If you have Central Management open, change to the tab or window for it and skip to step 5.
Otherwise, Open another Chrome web browser, or an additional tab within Chrome.
2. Access Central Management on the SMC by entering https://198.18.128.136/ in the URL field or
by selecting the Appliances > SMC bookmark.
3. Login to the appliance using the username of admin and the password of C1sco12345
a. Username: admin
b. Password: C1sco12345
4. Click the Configuration gear on the upper right side of the Stealthwatch Dashboard and select
the Central Management menu item (or switch to the tab or window you already have it open
in).
5. Locate the FC in the appliance Inventory list and click the ellipsis (…) in the Actions column.
6. Select View Appliance Statistics from the menu.
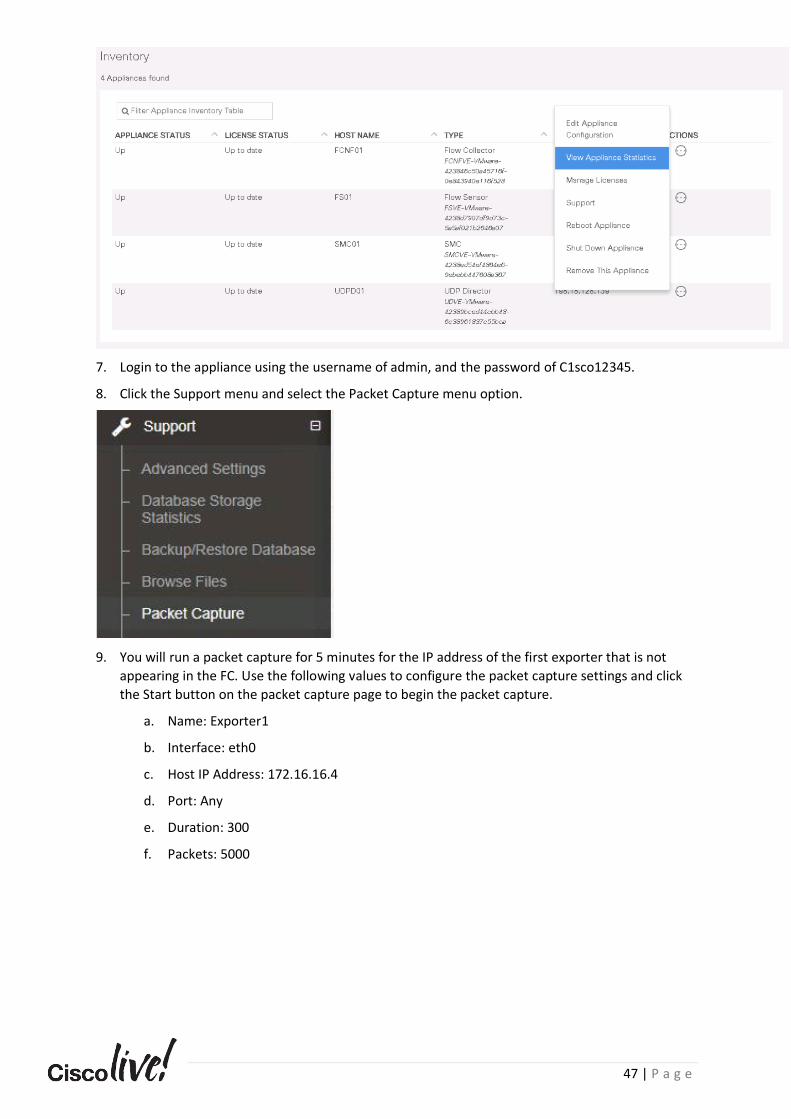
47 | P a g e
7. Login to the appliance using the username of admin, and the password of C1sco12345.
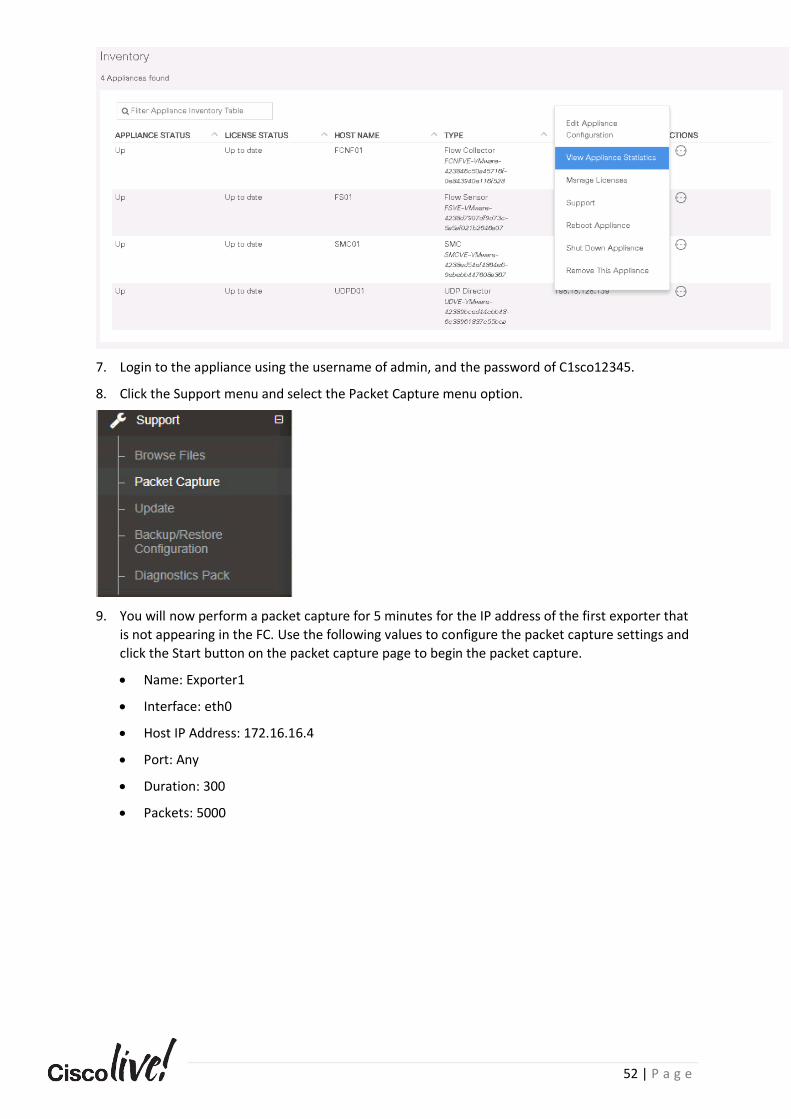
8. Click the Support menu and select the Packet Capture menu option.
9. You will run a packet capture for 5 minutes for the IP address of the first exporter that is not
appearing in the FC. Use the following values to configure the packet capture settings and click
the Start button on the packet capture page to begin the packet capture.
a. Name: Exporter1
b. Interface: eth0
c. Host IP Address: 172.16.16.4
d. Port: Any
e. Duration: 300
f. Packets: 5000
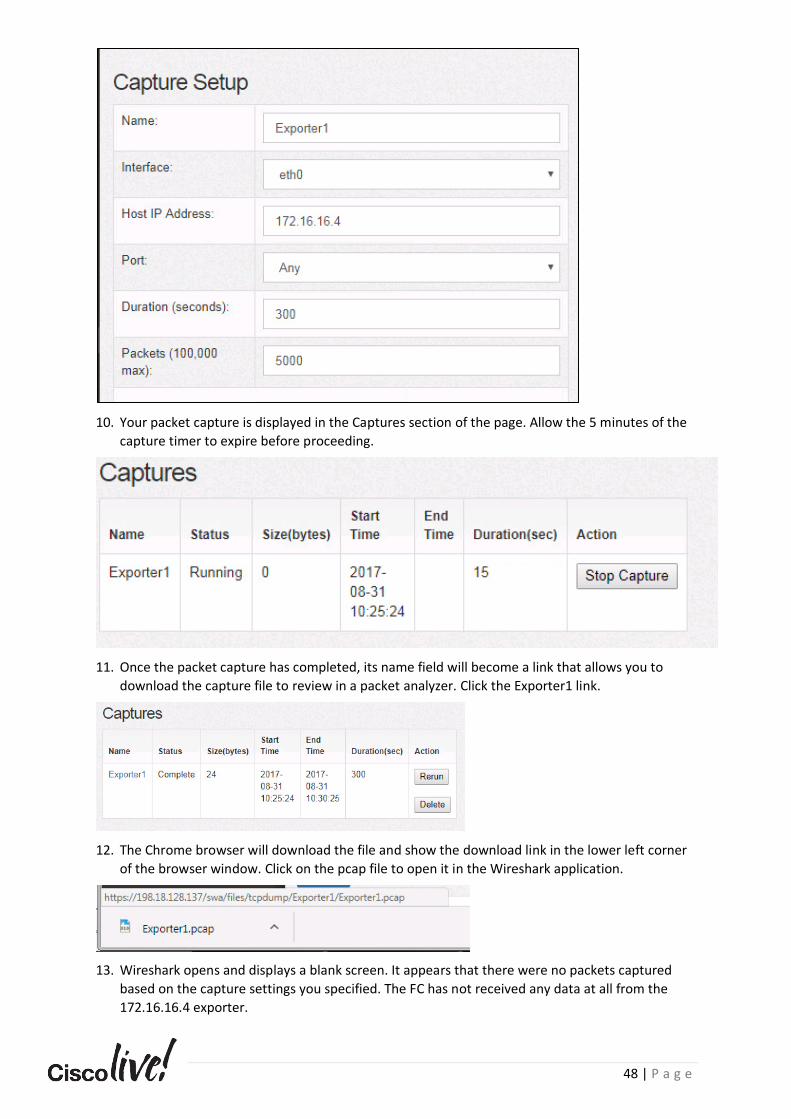
48 | P a g e
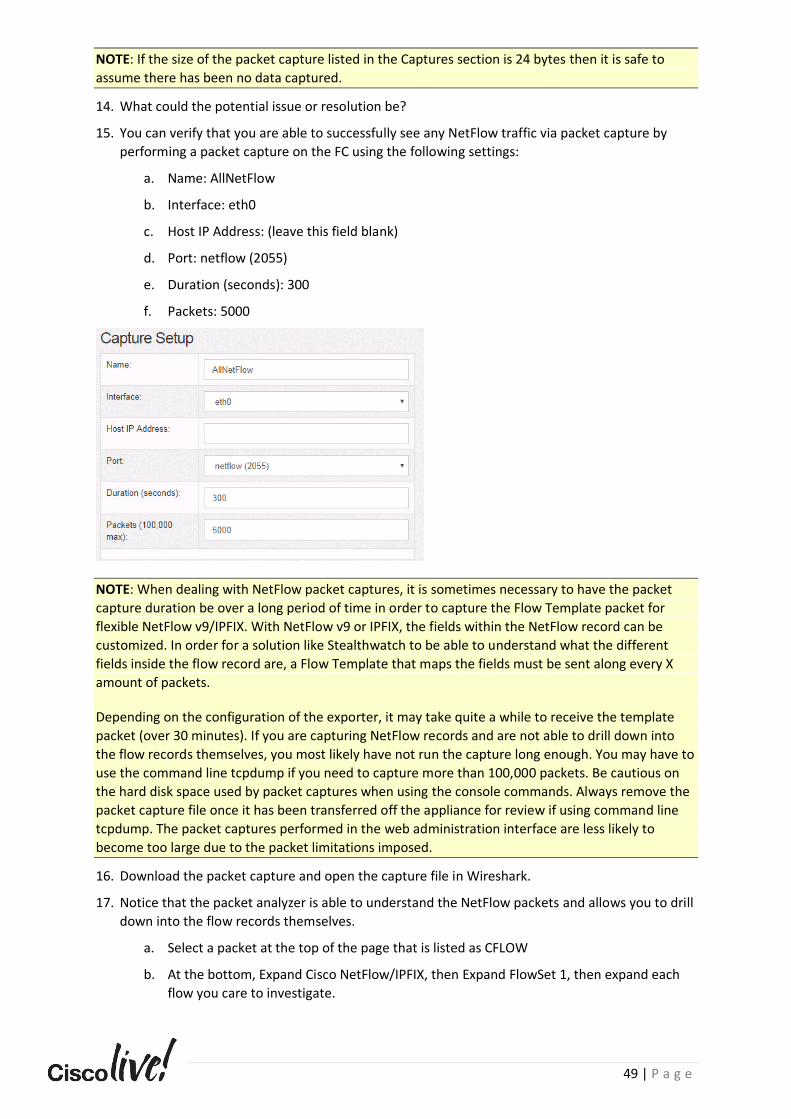
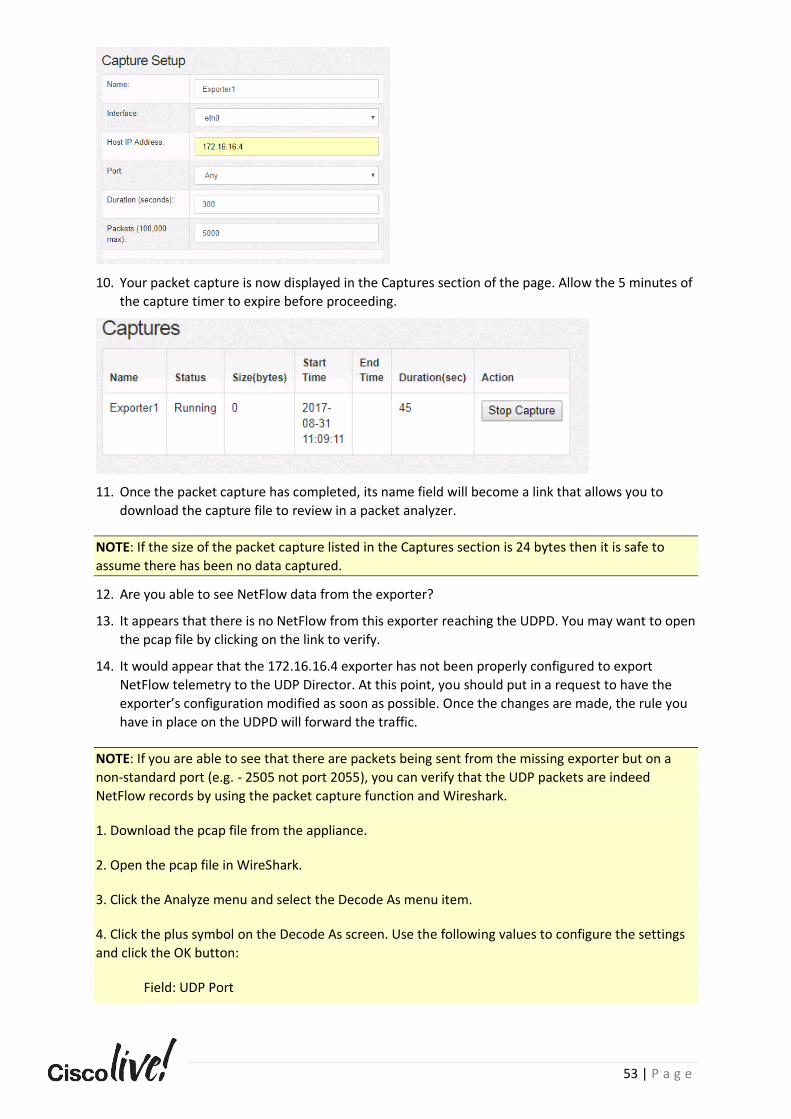
10. Your packet capture is displayed in the Captures section of the page. Allow the 5 minutes of the
capture timer to expire before proceeding.
11. Once the packet capture has completed, its name field will become a link that allows you to
download the capture file to review in a packet analyzer. Click the Exporter1 link.
12. The Chrome browser will download the file and show the download link in the lower left corner
of the browser window. Click on the pcap file to open it in the Wireshark application.
13. Wireshark opens and displays a blank screen. It appears that there were no packets captured
based on the capture settings you specified. The FC has not received any data at all from the
172.16.16.4 exporter.
49 | P a g e
NOTE: If the size of the packet capture listed in the Captures section is 24 bytes then it is safe to
assume there has been no data captured.
14. What could the potential issue or resolution be?
15. You can verify that you are able to successfully see any NetFlow traffic via packet capture by
performing a packet capture on the FC using the following settings:
a. Name: AllNetFlow
b. Interface: eth0
c. Host IP Address: (leave this field blank)
d. Port: netflow (2055)
e. Duration (seconds): 300
f. Packets: 5000
NOTE: When dealing with NetFlow packet captures, it is sometimes necessary to have the packet
capture duration be over a long period of time in order to capture the Flow Template packet for
flexible NetFlow v9/IPFIX. With NetFlow v9 or IPFIX, the fields within the NetFlow record can be
customized. In order for a solution like Stealthwatch to be able to understand what the different
fields inside the flow record are, a Flow Template that maps the fields must be sent along every X
amount of packets.
Depending on the configuration of the exporter, it may take quite a while to receive the template
packet (over 30 minutes). If you are capturing NetFlow records and are not able to drill down into
the flow records themselves, you most likely have not run the capture long enough. You may have to
use the command line tcpdump if you need to capture more than 100,000 packets. Be cautious on
the hard disk space used by packet captures when using the console commands. Always remove the
packet capture file once it has been transferred off the appliance for review if using command line
tcpdump. The packet captures performed in the web administration interface are less likely to
become too large due to the packet limitations imposed.
16. Download the packet capture and open the capture file in Wireshark.
17. Notice that the packet analyzer is able to understand the NetFlow packets and allows you to drill
down into the flow records themselves.
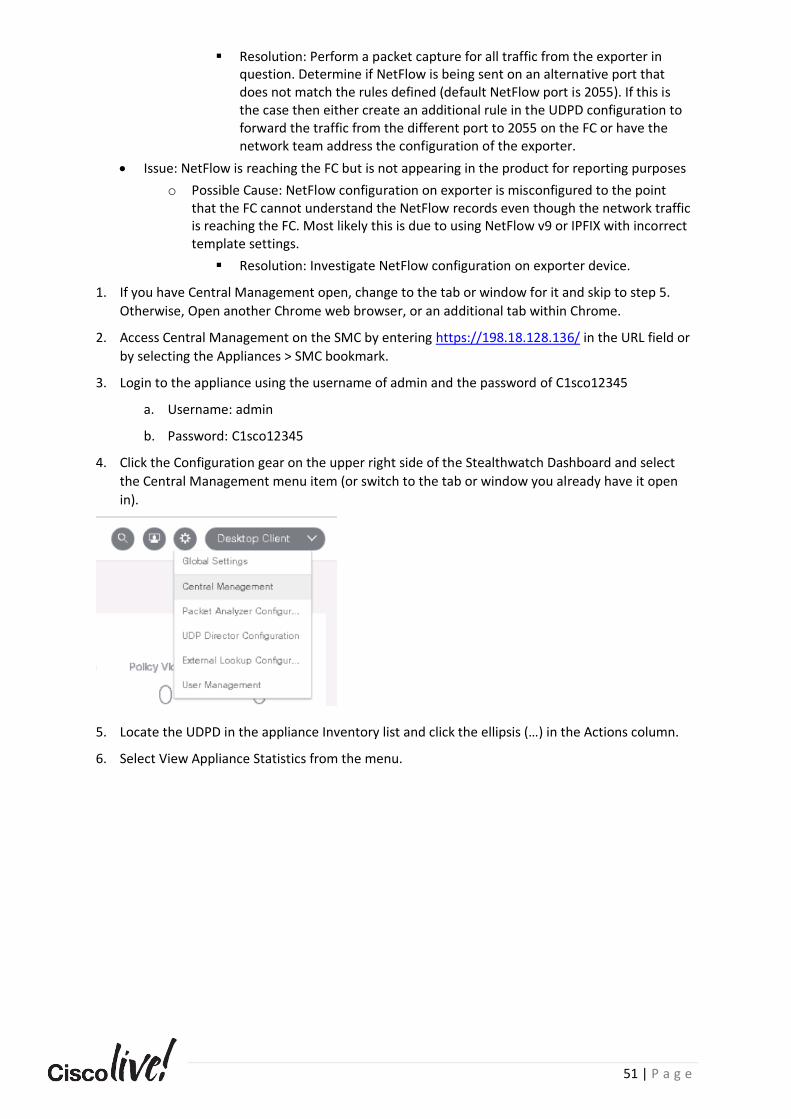
a. Select a packet at the top of the page that is listed as CFLOW
b. At the bottom, Expand Cisco NetFlow/IPFIX, then Expand FlowSet 1, then expand each
flow you care to investigate.
50 | P a g e
c. Notice that you can leverage this capture to see if all necessary fields are being sent
along to the Stealthwatch system or if the exporter configuration needs to be corrected.
18. You have verified that the exporter in question isn’t showing up in the packet capture but that
you are receiving NetFlow data from other devices. It is time to move on with the
troubleshooting process in order to determine what is wrong with the exporter that is missing.
Verify NetFlow Traffic to UDP Director
You have verified that the NetFlow traffic is not reaching the FC appliance IP address. The next step
in troubleshooting is to verify that the traffic is reaching the UDP Director. There could be several
potential issues including:
• Issue: NetFlow traffic not reaching the UDP Director at all
o Possible Cause: Exporter improperly configured
▪ Resolution: Produce packet capture showing no NetFlow traffic from exporter in question and request the network engineer staff verify NetFlow export configuration
o Possible Cause: ACL or firewall rule is blocking NetFlow traffic.
▪ Resolution: Produce packet capture showing no NetFlow traffic from exporter in question and request the network engineer staff trace network path and determine where the traffic is being blocked
• Issue: NetFlow traffic is reaching the UDP Director but is not reaching the FC
o Possible Cause: Exporter improperly configured or sending NetFlow to a port that does not match a Forwarding Rule in the UDPD configuration therefore the UDPD is not forwarding the traffic to the FC
51 | P a g e
▪ Resolution: Perform a packet capture for all traffic from the exporter in question. Determine if NetFlow is being sent on an alternative port that does not match the rules defined (default NetFlow port is 2055). If this is the case then either create an additional rule in the UDPD configuration to forward the traffic from the different port to 2055 on the FC or have the network team address the configuration of the exporter.
• Issue: NetFlow is reaching the FC but is not appearing in the product for reporting purposes
o Possible Cause: NetFlow configuration on exporter is misconfigured to the point that the FC cannot understand the NetFlow records even though the network traffic is reaching the FC. Most likely this is due to using NetFlow v9 or IPFIX with incorrect template settings.
▪ Resolution: Investigate NetFlow configuration on exporter device.
1. If you have Central Management open, change to the tab or window for it and skip to step 5.
Otherwise, Open another Chrome web browser, or an additional tab within Chrome.
2. Access Central Management on the SMC by entering https://198.18.128.136/ in the URL field or
by selecting the Appliances > SMC bookmark.
3. Login to the appliance using the username of admin and the password of C1sco12345
a. Username: admin
b. Password: C1sco12345
4. Click the Configuration gear on the upper right side of the Stealthwatch Dashboard and select
the Central Management menu item (or switch to the tab or window you already have it open
in).
5. Locate the UDPD in the appliance Inventory list and click the ellipsis (…) in the Actions column.
6. Select View Appliance Statistics from the menu.
52 | P a g e
7. Login to the appliance using the username of admin, and the password of C1sco12345.
8. Click the Support menu and select the Packet Capture menu option.
9. You will now perform a packet capture for 5 minutes for the IP address of the first exporter that
is not appearing in the FC. Use the following values to configure the packet capture settings and
click the Start button on the packet capture page to begin the packet capture.
• Name: Exporter1
• Interface: eth0
• Host IP Address: 172.16.16.4
• Port: Any
• Duration: 300
• Packets: 5000
53 | P a g e
10. Your packet capture is now displayed in the Captures section of the page. Allow the 5 minutes of
the capture timer to expire before proceeding.
11. Once the packet capture has completed, its name field will become a link that allows you to
download the capture file to review in a packet analyzer.
NOTE: If the size of the packet capture listed in the Captures section is 24 bytes then it is safe to
assume there has been no data captured.
12. Are you able to see NetFlow data from the exporter?
13. It appears that there is no NetFlow from this exporter reaching the UDPD. You may want to open
the pcap file by clicking on the link to verify.
14. It would appear that the 172.16.16.4 exporter has not been properly configured to export
NetFlow telemetry to the UDP Director. At this point, you should put in a request to have the
exporter’s configuration modified as soon as possible. Once the changes are made, the rule you
have in place on the UDPD will forward the traffic.
NOTE: If you are able to see that there are packets being sent from the missing exporter but on a
non-standard port (e.g. - 2505 not port 2055), you can verify that the UDP packets are indeed
NetFlow records by using the packet capture function and Wireshark.
1. Download the pcap file from the appliance.
2. Open the pcap file in WireShark.
3. Click the Analyze menu and select the Decode As menu item.
4. Click the plus symbol on the Decode As screen. Use the following values to configure the settings
and click the OK button:
Field: UDP Port
54 | P a g e
Value: 2505
Type: Integer, base 10 (none)
Current: CFLOW
5. The packet analyzer will attempt to interpret the packets as NetFlow (CFLOW). If the packets are
properly translated as NetFlow, then you have a misconfigured exporter. As a short-term solution, it
may be more expedient to make a UDPD rule addition to ensure that you are able to process as
much NetFlow traffic as possible early in the deployment, then removing the rule once the issue has
been addressed. Create the forwarding rule to take the data in and map it to the proper port while
requesting the modifcation the non-standard device to have its configuration changed as soon as
possible. When it finally is changed the standard rule on the UDPD will forward the traffic.
NOTE: There may be some environments that do not utilize a UDP Director at all but rather send all
NetFlow data directly to the FC. The FC can only process NetFlow on a single port at a time. In that
case the device configuration change to send on port 2055 would be required with no other
temporary workaround.
15. You have successfully verified that all in scope flow data is being processed by the UDP Director
and Flow Collector and that any missing exporters have been reported.
Verify Encrypted Traffic Analytics (ETA) Exporter Telemetry Configuration
Your company is testing a Cisco Catalyst 9300 switch, capable of exporting specialized encryption
related telemetry (or ETA) that Stealthwatch can consume and display. Configuring the switch to
export this encryption data requires extra configuration steps, which your network engineer has
reported is complete. A system has been plugged into the switch and used to produce some
encrypted traffic sessions. You will now use Stealthwatch to verify that the export configuration is
working and view the collected test traffic. The switch in question was assigned the IP address
172.16.16.200.
1. Open the SMC Java interface.
1. Go back to the Flow Collector Dashboard. If you have closed the tab, in the Enterprise Tree pane
on the left side of the screen, expand the dCloud.Cisco domain. Expand the Flow Collectors
container and double-click on the FCNF01 Flow Collector.
2. Recall that you previously verified that the exporter 172.16.16.200 was present in the exporters
list, indicating that Stealthwatch had successfully received telemetry from this switch. You can
verify again by locating it in the Flow Collection Status panel.
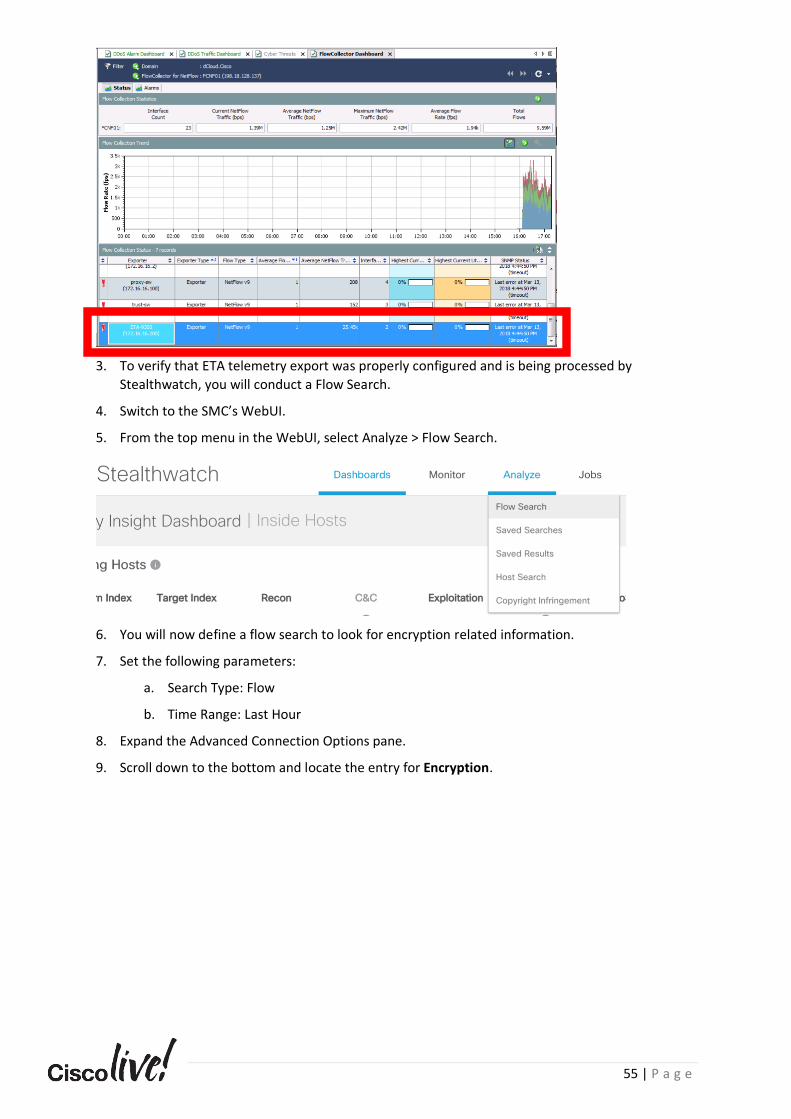
55 | P a g e
3. To verify that ETA telemetry export was properly configured and is being processed by
Stealthwatch, you will conduct a Flow Search.
4. Switch to the SMC’s WebUI.
5. From the top menu in the WebUI, select Analyze > Flow Search.
6. You will now define a flow search to look for encryption related information.
7. Set the following parameters:
a. Search Type: Flow
b. Time Range: Last Hour
8. Expand the Advanced Connection Options pane.
9. Scroll down to the bottom and locate the entry for Encryption.
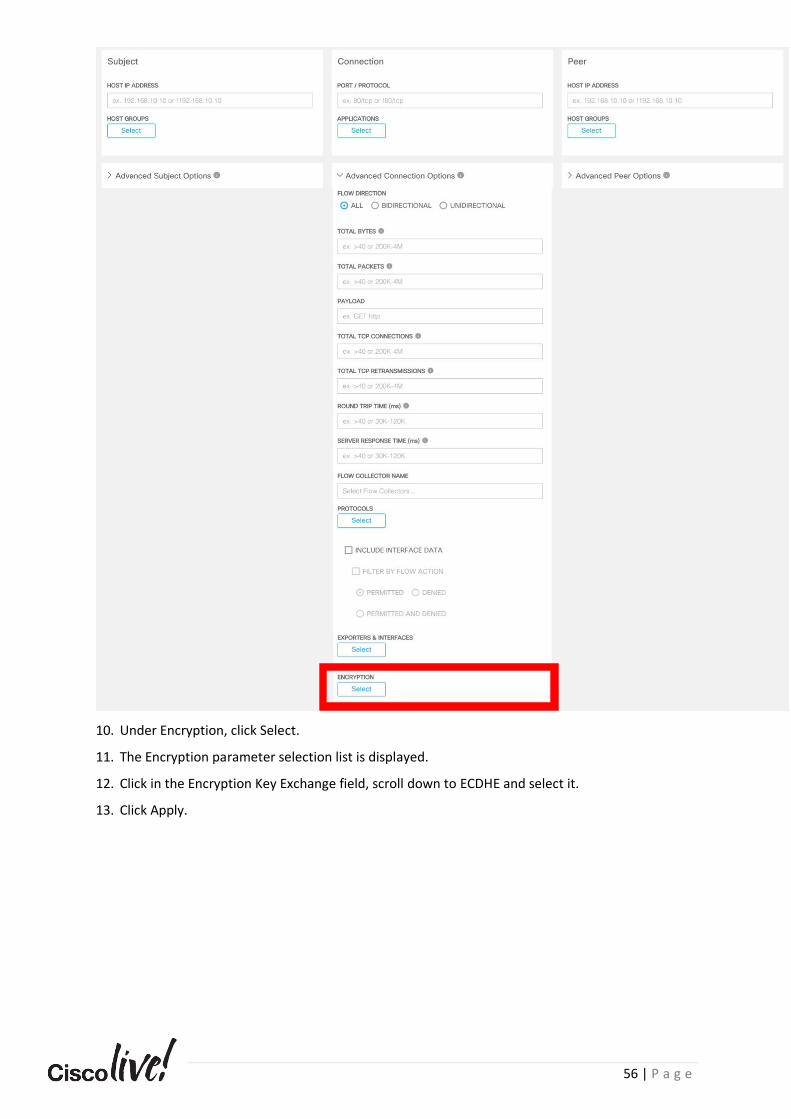
56 | P a g e
10. Under Encryption, click Select.
11. The Encryption parameter selection list is displayed.
12. Click in the Encryption Key Exchange field, scroll down to ECDHE and select it.
13. Click Apply.
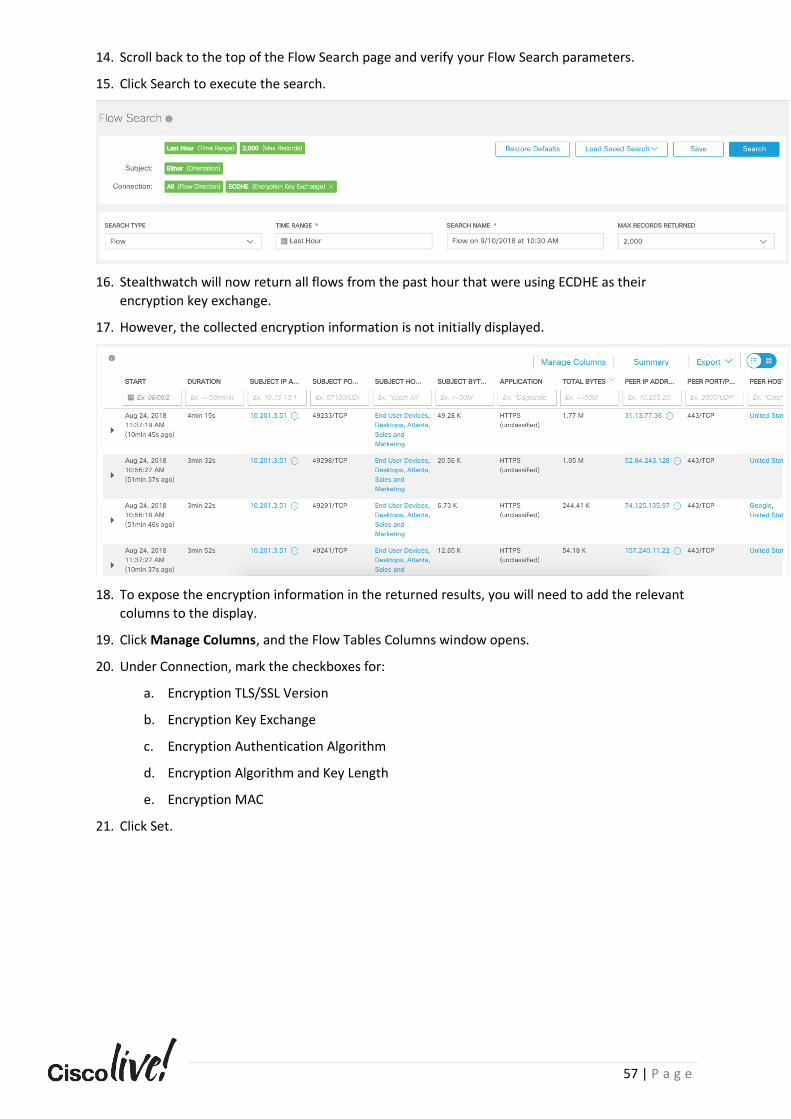
57 | P a g e
14. Scroll back to the top of the Flow Search page and verify your Flow Search parameters.
15. Click Search to execute the search.
16. Stealthwatch will now return all flows from the past hour that were using ECDHE as their
encryption key exchange.
17. However, the collected encryption information is not initially displayed.
18. To expose the encryption information in the returned results, you will need to add the relevant
columns to the display.
19. Click Manage Columns, and the Flow Tables Columns window opens.
20. Under Connection, mark the checkboxes for:
a. Encryption TLS/SSL Version
b. Encryption Key Exchange
c. Encryption Authentication Algorithm
d. Encryption Algorithm and Key Length
e. Encryption MAC
21. Click Set.
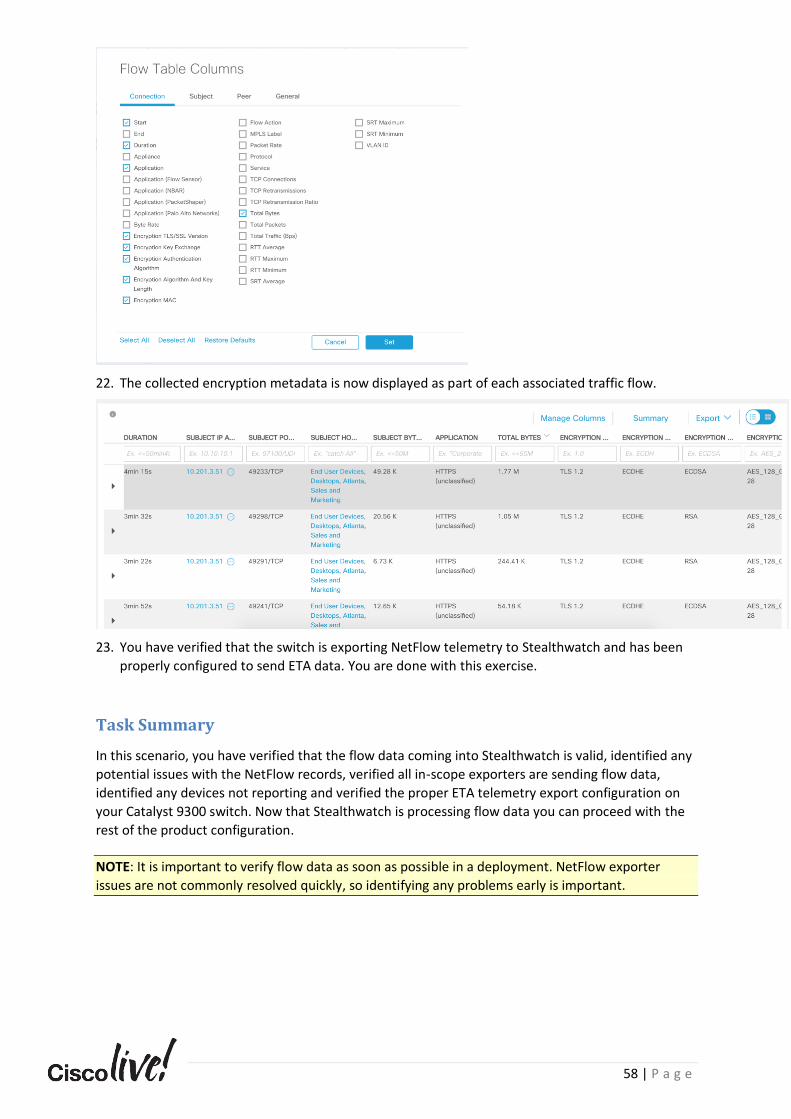
58 | P a g e
22. The collected encryption metadata is now displayed as part of each associated traffic flow.
23. You have verified that the switch is exporting NetFlow telemetry to Stealthwatch and has been
properly configured to send ETA data. You are done with this exercise.
Task Summary
In this scenario, you have verified that the flow data coming into Stealthwatch is valid, identified any
potential issues with the NetFlow records, verified all in-scope exporters are sending flow data,
identified any devices not reporting and verified the proper ETA telemetry export configuration on
your Catalyst 9300 switch. Now that Stealthwatch is processing flow data you can proceed with the
rest of the product configuration.
NOTE: It is important to verify flow data as soon as possible in a deployment. NetFlow exporter
issues are not commonly resolved quickly, so identifying any problems early is important.
59 | P a g e
Task 6: Define Host Groups
If you’ll recall, you were provided with a list of IP addresses and ranges containing locations, server
types, applications, public IP space, authorized network scanners, etc. at the beginning of the
project.
You will now input this IP data into the SMC and configure the appropriate host groups. Use the
table below when needed for IP data. Proceed with the instructions in the lab.
Table 3. IP Address Ranges
Description IP Address Range
DNS Server 10.10.30.15
DNS Server 10.10.30.16
Vulnerability Scanner 10.203.0.207
Mail Server 10.10.30.23
Time/NTP Server 10.10.30.10
Public IP Address Space 209.182.184.0/24
Atlanta Hosts 10.201.0.0/16
PCI Devices 10.203.0.212
Proxy Server 10.201.3.145
DMZ Servers
104.16.41.2
31.13.77.36
31.13.77.52
185.103.97.174
52.84.244.250
52.84.243.128
Steps
Configure Public IP Space
NOTE: Host groups can only contain IP address data (MAC addresses or DNS names are not
permitted). IP addresses can be entered in several different formats:
Single IP addresses can be entered such as 10.1.2.3.
Hyphenated ranges can be specified within an octet such as 192.168.1.1-57, 10.1-167.1.1, 172.22.0-
255.0-255. Do not specify a range in the format of full IP address – full IP address (192.168.1.1-
192.168.1.254). The range must be within an octet (192.168.1.1-254).
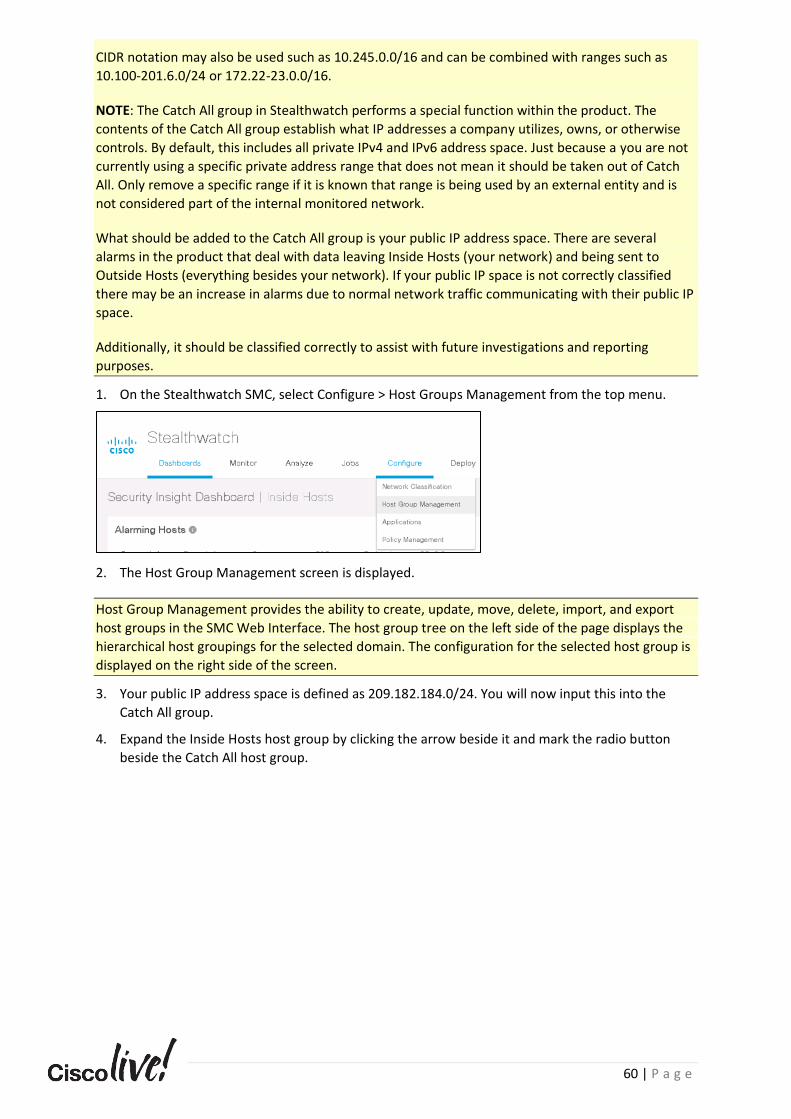
60 | P a g e
CIDR notation may also be used such as 10.245.0.0/16 and can be combined with ranges such as
10.100-201.6.0/24 or 172.22-23.0.0/16.
NOTE: The Catch All group in Stealthwatch performs a special function within the product. The
contents of the Catch All group establish what IP addresses a company utilizes, owns, or otherwise
controls. By default, this includes all private IPv4 and IPv6 address space. Just because a you are not
currently using a specific private address range that does not mean it should be taken out of Catch
All. Only remove a specific range if it is known that range is being used by an external entity and is
not considered part of the internal monitored network.
What should be added to the Catch All group is your public IP address space. There are several
alarms in the product that deal with data leaving Inside Hosts (your network) and being sent to
Outside Hosts (everything besides your network). If your public IP space is not correctly classified
there may be an increase in alarms due to normal network traffic communicating with their public IP
space.
Additionally, it should be classified correctly to assist with future investigations and reporting
purposes.
1. On the Stealthwatch SMC, select Configure > Host Groups Management from the top menu.
2. The Host Group Management screen is displayed.
Host Group Management provides the ability to create, update, move, delete, import, and export
host groups in the SMC Web Interface. The host group tree on the left side of the page displays the
hierarchical host groupings for the selected domain. The configuration for the selected host group is
displayed on the right side of the screen.
3. Your public IP address space is defined as 209.182.184.0/24. You will now input this into the
Catch All group.
4. Expand the Inside Hosts host group by clicking the arrow beside it and mark the radio button
beside the Catch All host group.
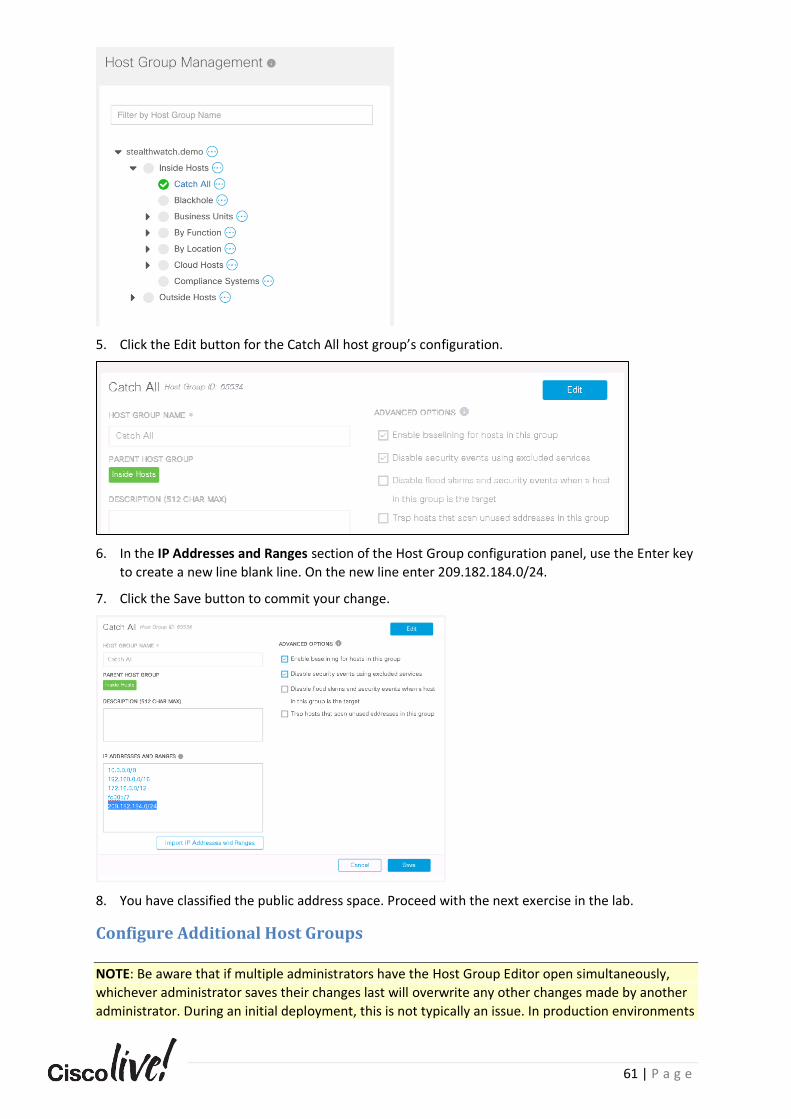
61 | P a g e
5. Click the Edit button for the Catch All host group’s configuration.
6. In the IP Addresses and Ranges section of the Host Group configuration panel, use the Enter key
to create a new line blank line. On the new line enter 209.182.184.0/24.
7. Click the Save button to commit your change.
8. You have classified the public address space. Proceed with the next exercise in the lab.
Configure Additional Host Groups
NOTE: Be aware that if multiple administrators have the Host Group Editor open simultaneously,
whichever administrator saves their changes last will overwrite any other changes made by another
administrator. During an initial deployment, this is not typically an issue. In production environments
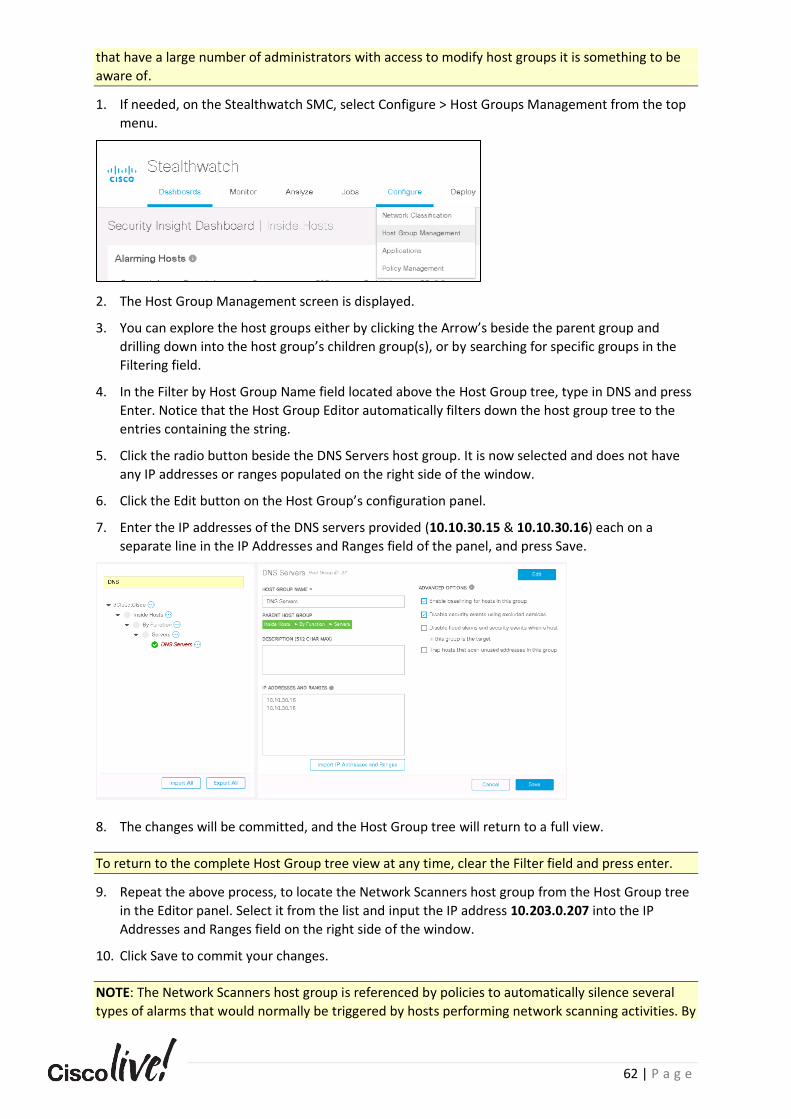
62 | P a g e
that have a large number of administrators with access to modify host groups it is something to be
aware of.
1. If needed, on the Stealthwatch SMC, select Configure > Host Groups Management from the top
menu.
2. The Host Group Management screen is displayed.
3. You can explore the host groups either by clicking the Arrow’s beside the parent group and
drilling down into the host group’s children group(s), or by searching for specific groups in the
Filtering field.
4. In the Filter by Host Group Name field located above the Host Group tree, type in DNS and press
Enter. Notice that the Host Group Editor automatically filters down the host group tree to the
entries containing the string.
5. Click the radio button beside the DNS Servers host group. It is now selected and does not have
any IP addresses or ranges populated on the right side of the window.
6. Click the Edit button on the Host Group’s configuration panel.
7. Enter the IP addresses of the DNS servers provided (10.10.30.15 & 10.10.30.16) each on a
separate line in the IP Addresses and Ranges field of the panel, and press Save.
8. The changes will be committed, and the Host Group tree will return to a full view.
To return to the complete Host Group tree view at any time, clear the Filter field and press enter.
9. Repeat the above process, to locate the Network Scanners host group from the Host Group tree
in the Editor panel. Select it from the list and input the IP address 10.203.0.207 into the IP
Addresses and Ranges field on the right side of the window.
10. Click Save to commit your changes.
NOTE: The Network Scanners host group is referenced by policies to automatically silence several
types of alarms that would normally be triggered by hosts performing network scanning activities. By
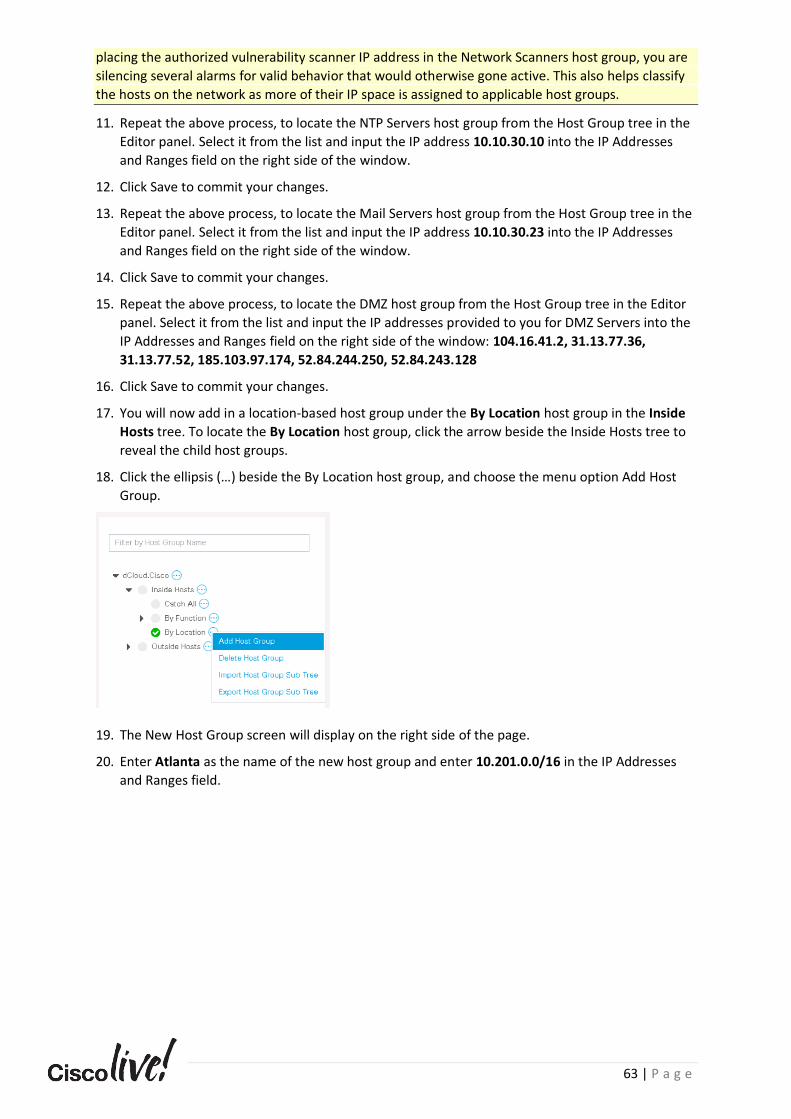
63 | P a g e
placing the authorized vulnerability scanner IP address in the Network Scanners host group, you are
silencing several alarms for valid behavior that would otherwise gone active. This also helps classify
the hosts on the network as more of their IP space is assigned to applicable host groups.
11. Repeat the above process, to locate the NTP Servers host group from the Host Group tree in the
Editor panel. Select it from the list and input the IP address 10.10.30.10 into the IP Addresses
and Ranges field on the right side of the window.
12. Click Save to commit your changes.
13. Repeat the above process, to locate the Mail Servers host group from the Host Group tree in the
Editor panel. Select it from the list and input the IP address 10.10.30.23 into the IP Addresses
and Ranges field on the right side of the window.
14. Click Save to commit your changes.
15. Repeat the above process, to locate the DMZ host group from the Host Group tree in the Editor
panel. Select it from the list and input the IP addresses provided to you for DMZ Servers into the
IP Addresses and Ranges field on the right side of the window: 104.16.41.2, 31.13.77.36,
31.13.77.52, 185.103.97.174, 52.84.244.250, 52.84.243.128
16. Click Save to commit your changes.
17. You will now add in a location-based host group under the By Location host group in the Inside
Hosts tree. To locate the By Location host group, click the arrow beside the Inside Hosts tree to
reveal the child host groups.
18. Click the ellipsis (…) beside the By Location host group, and choose the menu option Add Host
Group.
19. The New Host Group screen will display on the right side of the page.
20. Enter Atlanta as the name of the new host group and enter 10.201.0.0/16 in the IP Addresses
and Ranges field.
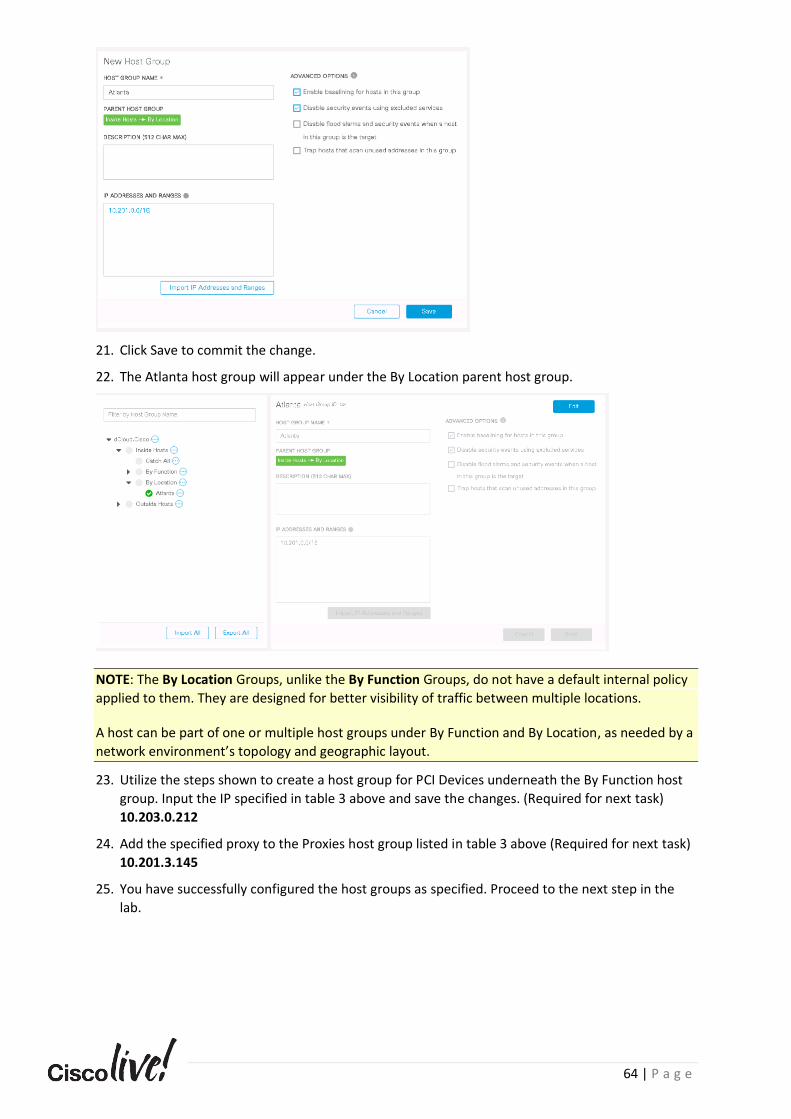
64 | P a g e
21. Click Save to commit the change.
22. The Atlanta host group will appear under the By Location parent host group.
NOTE: The By Location Groups, unlike the By Function Groups, do not have a default internal policy
applied to them. They are designed for better visibility of traffic between multiple locations.
A host can be part of one or multiple host groups under By Function and By Location, as needed by a
network environment’s topology and geographic layout.
23. Utilize the steps shown to create a host group for PCI Devices underneath the By Function host
group. Input the IP specified in table 3 above and save the changes. (Required for next task)
10.203.0.212
24. Add the specified proxy to the Proxies host group listed in table 3 above (Required for next task)
10.201.3.145
25. You have successfully configured the host groups as specified. Proceed to the next step in the
lab.

65 | P a g e
Scenario Summary
In this scenario, you have created host groups based on the IP address data the provided to you. You
have utilized the Host Group Management tool to add in the public IP space to the Catch All group to
mark it as being inside your control and you have created additional appropriate host groups.
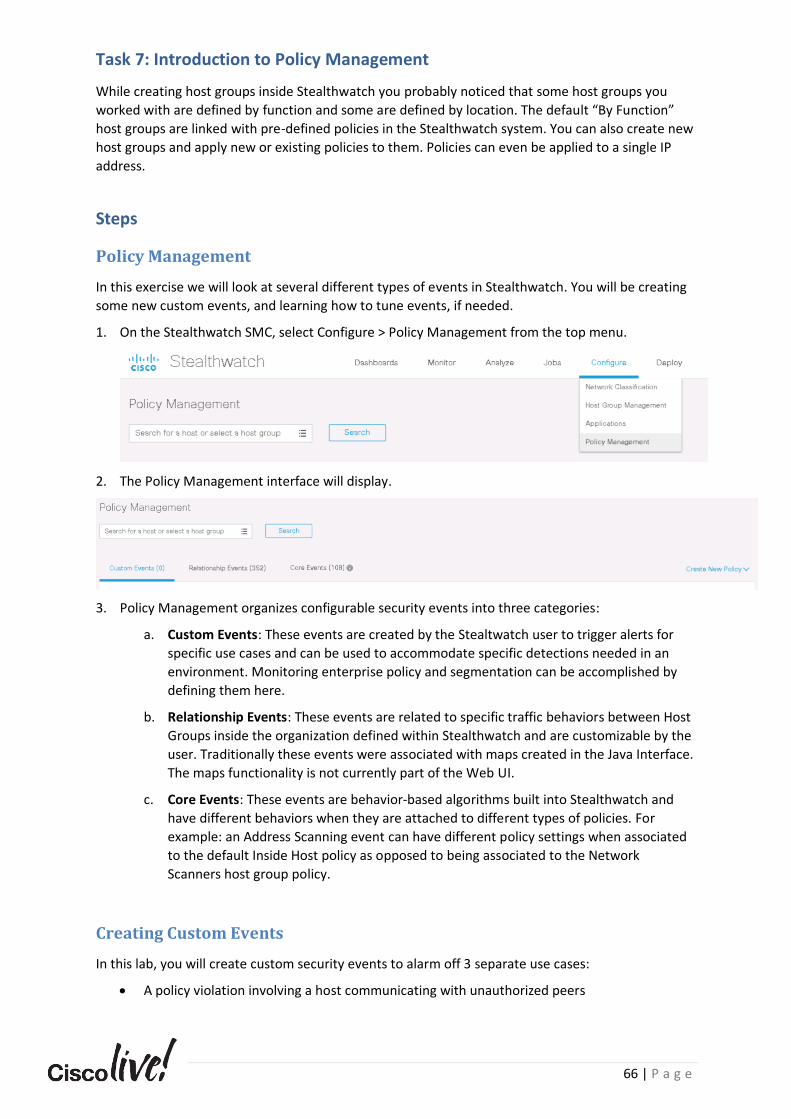
66 | P a g e
Task 7: Introduction to Policy Management
While creating host groups inside Stealthwatch you probably noticed that some host groups you
worked with are defined by function and some are defined by location. The default “By Function”
host groups are linked with pre-defined policies in the Stealthwatch system. You can also create new
host groups and apply new or existing policies to them. Policies can even be applied to a single IP
address.
Steps
Policy Management
In this exercise we will look at several different types of events in Stealthwatch. You will be creating
some new custom events, and learning how to tune events, if needed.
1. On the Stealthwatch SMC, select Configure > Policy Management from the top menu.
2. The Policy Management interface will display.
3. Policy Management organizes configurable security events into three categories:
a. Custom Events: These events are created by the Stealtwatch user to trigger alerts for
specific use cases and can be used to accommodate specific detections needed in an
environment. Monitoring enterprise policy and segmentation can be accomplished by
defining them here.
b. Relationship Events: These events are related to specific traffic behaviors between Host
Groups inside the organization defined within Stealthwatch and are customizable by the
user. Traditionally these events were associated with maps created in the Java Interface.
The maps functionality is not currently part of the Web UI.
c. Core Events: These events are behavior-based algorithms built into Stealthwatch and
have different behaviors when they are attached to different types of policies. For
example: an Address Scanning event can have different policy settings when associated
to the default Inside Host policy as opposed to being associated to the Network
Scanners host group policy.
Creating Custom Events
In this lab, you will create custom security events to alarm off 3 separate use cases:
• A policy violation involving a host communicating with unauthorized peers
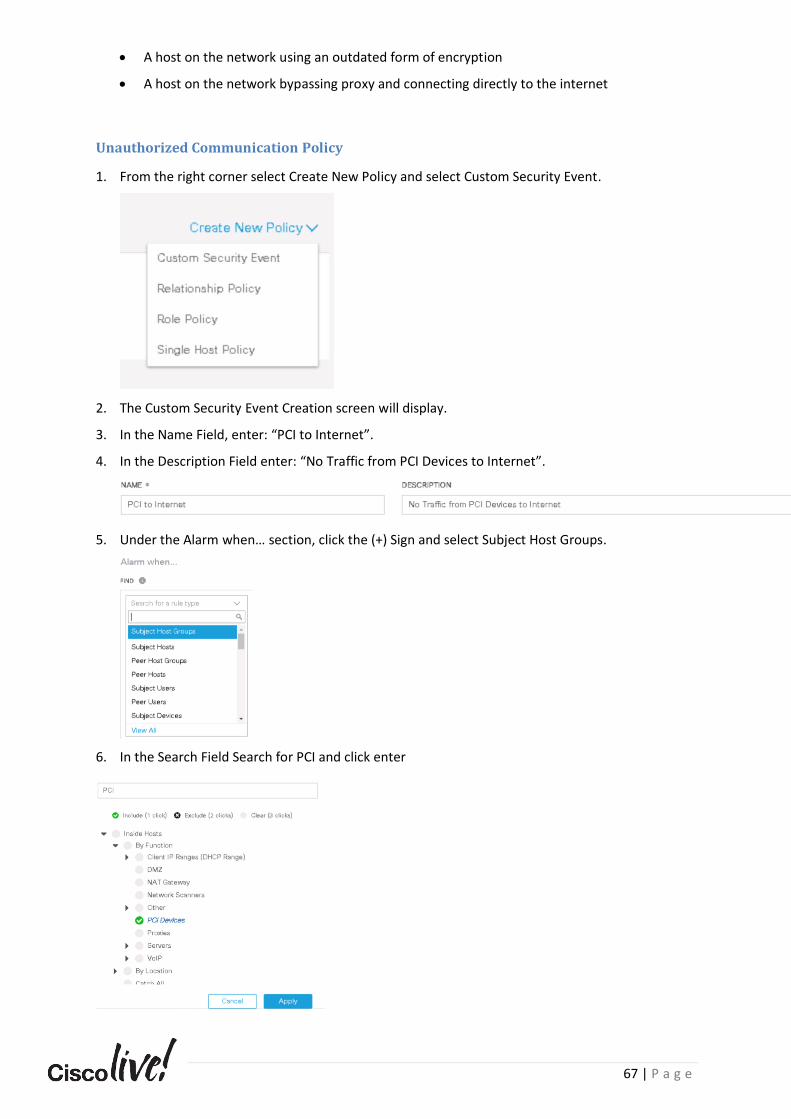
67 | P a g e
• A host on the network using an outdated form of encryption
• A host on the network bypassing proxy and connecting directly to the internet
Unauthorized Communication Policy
1. From the right corner select Create New Policy and select Custom Security Event.
2. The Custom Security Event Creation screen will display.
3. In the Name Field, enter: “PCI to Internet”.
4. In the Description Field enter: “No Traffic from PCI Devices to Internet”.
5. Under the Alarm when… section, click the (+) Sign and select Subject Host Groups.
6. In the Search Field Search for PCI and click enter
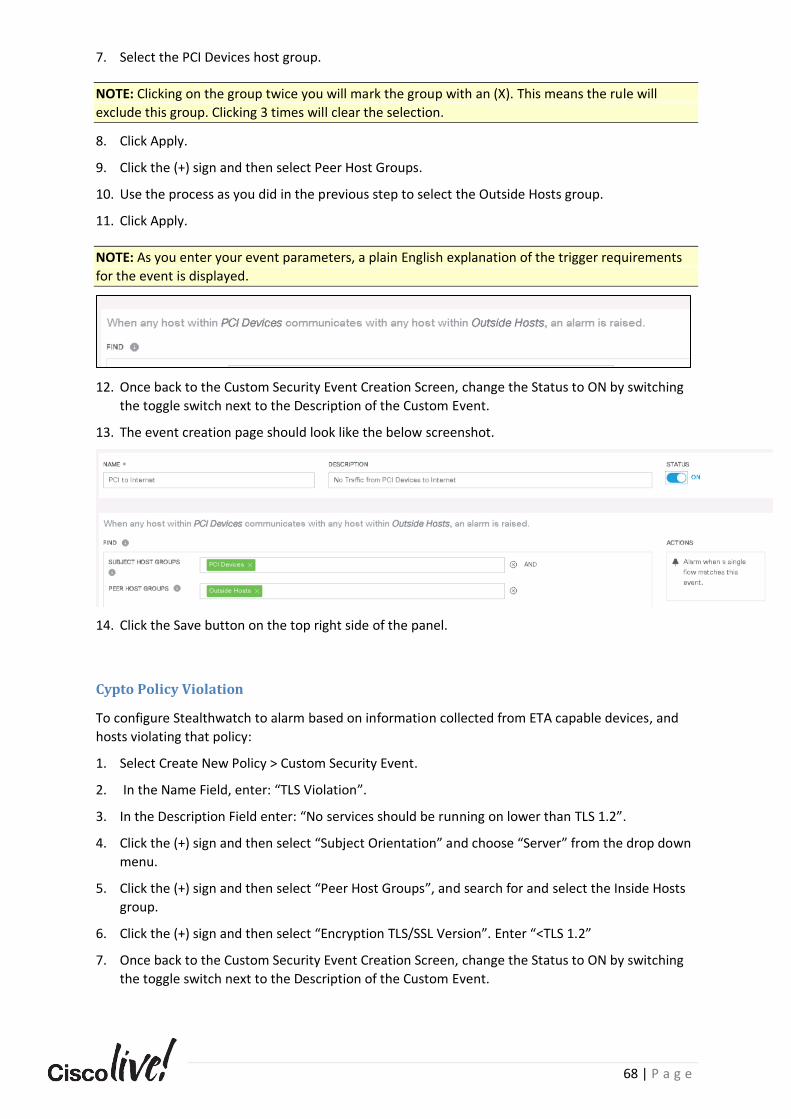
68 | P a g e
7. Select the PCI Devices host group.
NOTE: Clicking on the group twice you will mark the group with an (X). This means the rule will
exclude this group. Clicking 3 times will clear the selection.
8. Click Apply.
9. Click the (+) sign and then select Peer Host Groups.
10. Use the process as you did in the previous step to select the Outside Hosts group.
11. Click Apply.
NOTE: As you enter your event parameters, a plain English explanation of the trigger requirements
for the event is displayed.
12. Once back to the Custom Security Event Creation Screen, change the Status to ON by switching
the toggle switch next to the Description of the Custom Event.
13. The event creation page should look like the below screenshot.
14. Click the Save button on the top right side of the panel.
Cypto Policy Violation
To configure Stealthwatch to alarm based on information collected from ETA capable devices, and
hosts violating that policy:
1. Select Create New Policy > Custom Security Event.
2. In the Name Field, enter: “TLS Violation”.
3. In the Description Field enter: “No services should be running on lower than TLS 1.2”.
4. Click the (+) sign and then select “Subject Orientation” and choose “Server” from the drop down
menu.
5. Click the (+) sign and then select “Peer Host Groups”, and search for and select the Inside Hosts
group.
6. Click the (+) sign and then select “Encryption TLS/SSL Version”. Enter “<TLS 1.2”
7. Once back to the Custom Security Event Creation Screen, change the Status to ON by switching
the toggle switch next to the Description of the Custom Event.
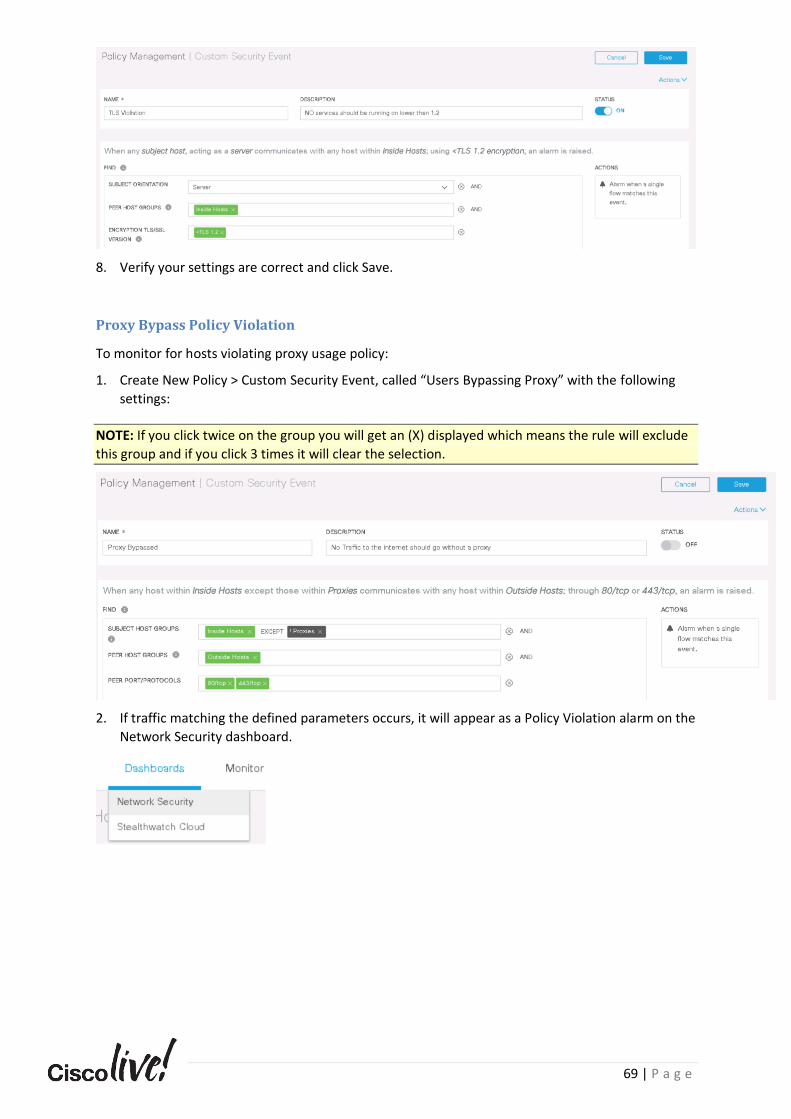
69 | P a g e
8. Verify your settings are correct and click Save.
Proxy Bypass Policy Violation
To monitor for hosts violating proxy usage policy:
1. Create New Policy > Custom Security Event, called “Users Bypassing Proxy” with the following
settings:
NOTE: If you click twice on the group you will get an (X) displayed which means the rule will exclude
this group and if you click 3 times it will clear the selection.
2. If traffic matching the defined parameters occurs, it will appear as a Policy Violation alarm on the
Network Security dashboard.
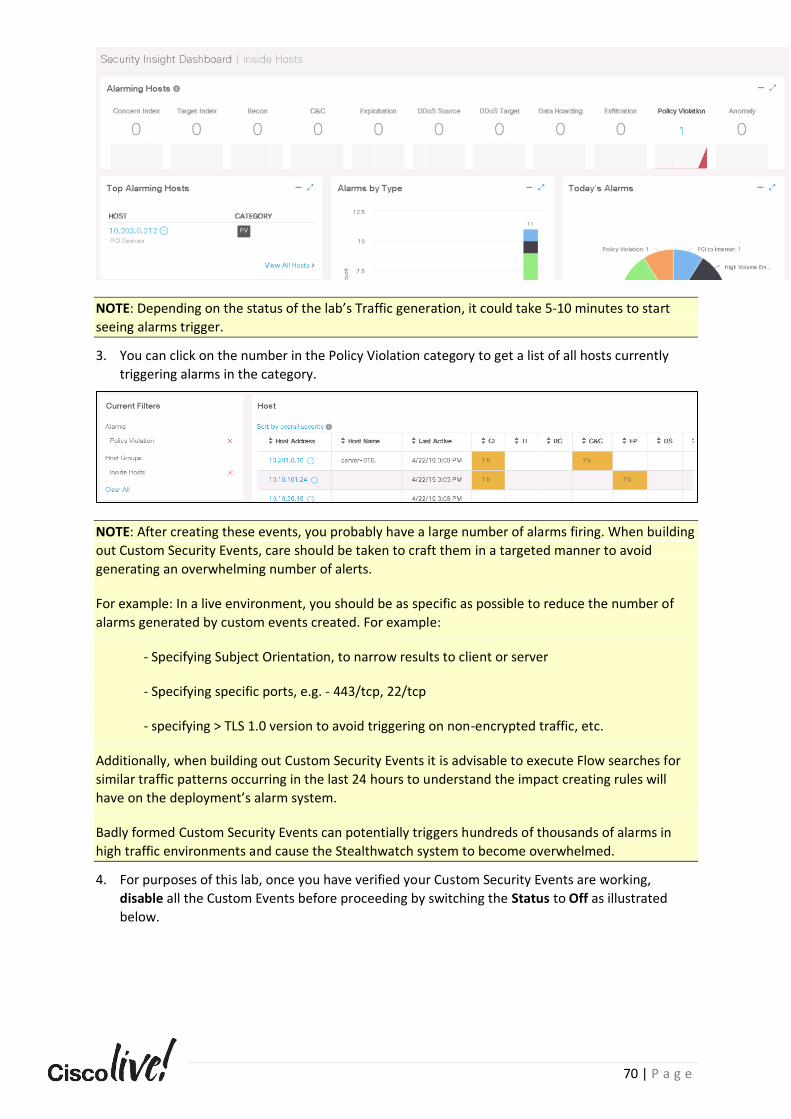
70 | P a g e
NOTE: Depending on the status of the lab’s Traffic generation, it could take 5-10 minutes to start
seeing alarms trigger.
3. You can click on the number in the Policy Violation category to get a list of all hosts currently
triggering alarms in the category.
NOTE: After creating these events, you probably have a large number of alarms firing. When building
out Custom Security Events, care should be taken to craft them in a targeted manner to avoid
generating an overwhelming number of alerts.
For example: In a live environment, you should be as specific as possible to reduce the number of
alarms generated by custom events created. For example:
- Specifying Subject Orientation, to narrow results to client or server
- Specifying specific ports, e.g. - 443/tcp, 22/tcp
- specifying > TLS 1.0 version to avoid triggering on non-encrypted traffic, etc.
Additionally, when building out Custom Security Events it is advisable to execute Flow searches for
similar traffic patterns occurring in the last 24 hours to understand the impact creating rules will
have on the deployment’s alarm system.
Badly formed Custom Security Events can potentially triggers hundreds of thousands of alarms in
high traffic environments and cause the Stealthwatch system to become overwhelmed.
4. For purposes of this lab, once you have verified your Custom Security Events are working,
disable all the Custom Events before proceeding by switching the Status to Off as illustrated
below.
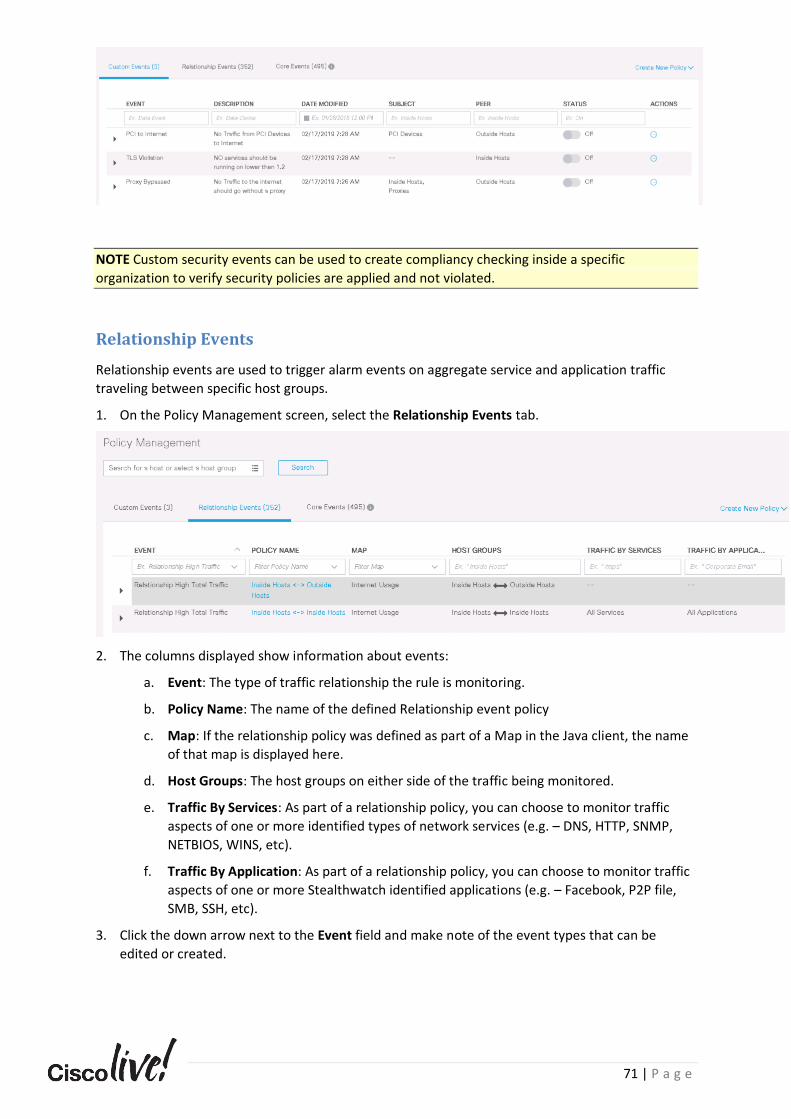
71 | P a g e
NOTE Custom security events can be used to create compliancy checking inside a specific
organization to verify security policies are applied and not violated.
Relationship Events
Relationship events are used to trigger alarm events on aggregate service and application traffic
traveling between specific host groups.
1. On the Policy Management screen, select the Relationship Events tab.
2. The columns displayed show information about events:
a. Event: The type of traffic relationship the rule is monitoring.
b. Policy Name: The name of the defined Relationship event policy
c. Map: If the relationship policy was defined as part of a Map in the Java client, the name
of that map is displayed here.
d. Host Groups: The host groups on either side of the traffic being monitored.
e. Traffic By Services: As part of a relationship policy, you can choose to monitor traffic
aspects of one or more identified types of network services (e.g. – DNS, HTTP, SNMP,
NETBIOS, WINS, etc).
f. Traffic By Application: As part of a relationship policy, you can choose to monitor traffic
aspects of one or more Stealthwatch identified applications (e.g. – Facebook, P2P file,
SMB, SSH, etc).
3. Click the down arrow next to the Event field and make note of the event types that can be
edited or created.
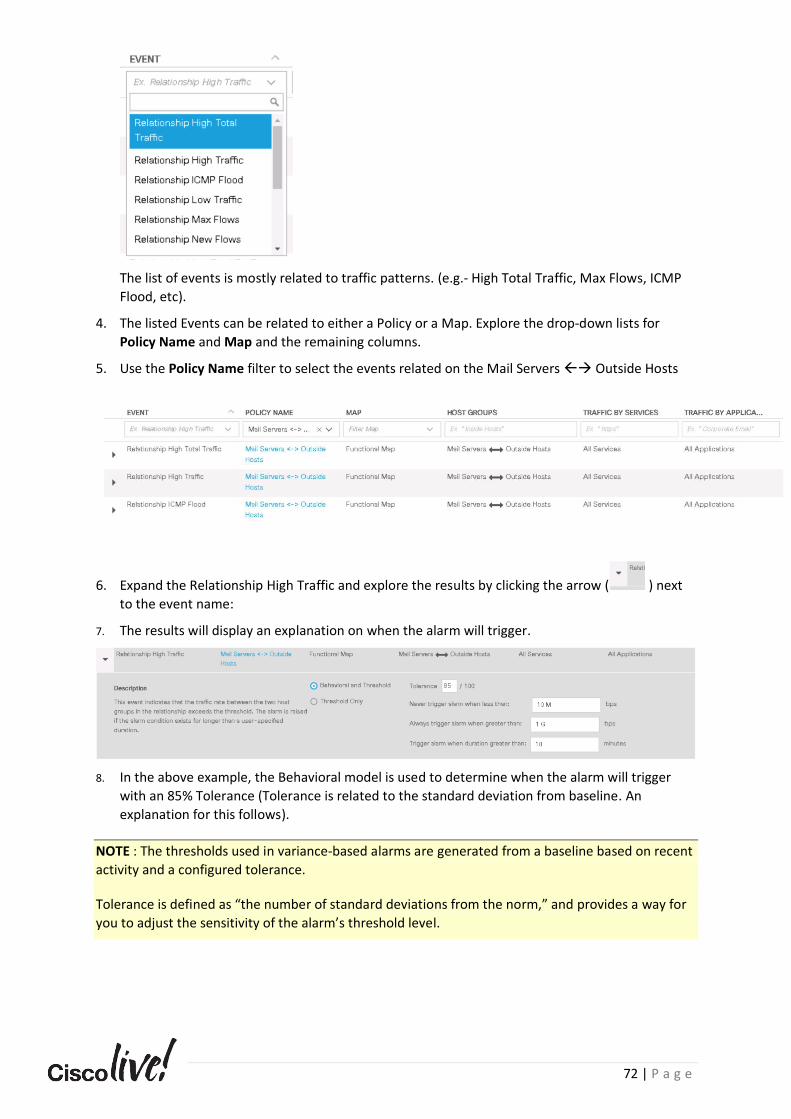
72 | P a g e
The list of events is mostly related to traffic patterns. (e.g.- High Total Traffic, Max Flows, ICMP
Flood, etc).
4. The listed Events can be related to either a Policy or a Map. Explore the drop-down lists for
Policy Name and Map and the remaining columns.
5. Use the Policy Name filter to select the events related on the Mail Servers → Outside Hosts
6. Expand the Relationship High Traffic and explore the results by clicking the arrow ( ) next
to the event name:
7. The results will display an explanation on when the alarm will trigger.
8. In the above example, the Behavioral model is used to determine when the alarm will trigger
with an 85% Tolerance (Tolerance is related to the standard deviation from baseline. An
explanation for this follows).
NOTE : The thresholds used in variance-based alarms are generated from a baseline based on recent
activity and a configured tolerance.
Tolerance is defined as “the number of standard deviations from the norm,” and provides a way for
you to adjust the sensitivity of the alarm’s threshold level.

73 | P a g e
Standard deviation is a widely-used measurement of variability or diversity used in statistics. It
shows how much variation there is from the average (i.e., mean, or expected value). A low standard
deviation indicates that the data points tend to be very close to the mean, whereas high standard
deviation indicates that the data points are spread out over a large range of values.
Behavioral and Threshold – When this option is selected, the dialog shows the tolerance setting, the
minimum threshold, and the maximum threshold.
Tolerance – A relative number between 0 and 100 that indicates how much to allow actual behavior
to exceed expected behavior before alarming. This allows the user to define what is “significantly
different”.
A tolerance of 0 means to alarm for any values over the expected value; it is very sensitive and will
result in a lot of alarms.
A tolerance of 100 is the highest level at which the alarm is tolerated. It greatly reduces the number
of times - A tolerance of 50 indicates that the host will ignore the lowest 50% of the values over the
expected value, but it will alarm on the ones above that value.
Never trigger alarm when less than: Also known as the minimum threshold, this is a static value that
indicates the lowest value to allow for triggering an alarm. The alarm will not trigger when the
observed value falls below this setting. In other words, even if a host is greatly over its expected
value, if it is not more than the minimum indicated in this dialog, then do not trigger an alarm.
Always trigger alarm when greater than: Also known as the maximum threshold, this is a static
value that indicates the highest value to allow without triggering an alarm. The alarm will trigger
when the observed value exceeds this setting. In other words, if a host’s value exceeds the
maximum indicated in this dialog, even if it is expected for that host, then trigger an alarm.
Threshold Only – When this option is selected, the dialog shows only the maximum threshold
setting.
9. Change the model to Threshold only and set the value to Always trigger alarm when greater
than: 1K
10. Click Save at the top of the table.
Only for the purpose of this lab would we want to change the value to be such a very low one to help
trigger the event. In typical production environments we typically would want to leave the baseline
enabled and modify tolerance or threshold, when applicable.
You can also create Relationship events based on custom host groups created for your own specific
network topology.
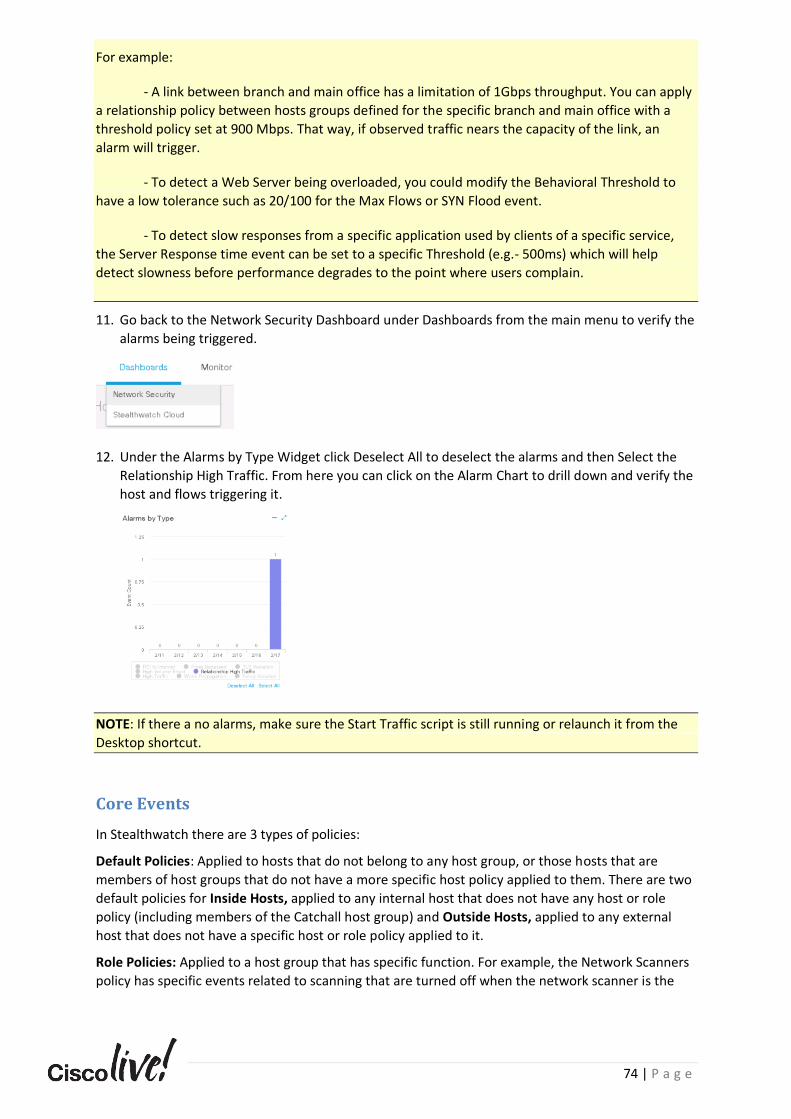
74 | P a g e
For example:
- A link between branch and main office has a limitation of 1Gbps throughput. You can apply
a relationship policy between hosts groups defined for the specific branch and main office with a
threshold policy set at 900 Mbps. That way, if observed traffic nears the capacity of the link, an
alarm will trigger.
- To detect a Web Server being overloaded, you could modify the Behavioral Threshold to
have a low tolerance such as 20/100 for the Max Flows or SYN Flood event.
- To detect slow responses from a specific application used by clients of a specific service,
the Server Response time event can be set to a specific Threshold (e.g.- 500ms) which will help
detect slowness before performance degrades to the point where users complain.
11. Go back to the Network Security Dashboard under Dashboards from the main menu to verify the
alarms being triggered.
12. Under the Alarms by Type Widget click Deselect All to deselect the alarms and then Select the
Relationship High Traffic. From here you can click on the Alarm Chart to drill down and verify the
host and flows triggering it.
NOTE: If there a no alarms, make sure the Start Traffic script is still running or relaunch it from the
Desktop shortcut.
Core Events
In Stealthwatch there are 3 types of policies:
Default Policies: Applied to hosts that do not belong to any host group, or those hosts that are
members of host groups that do not have a more specific host policy applied to them. There are two
default policies for Inside Hosts, applied to any internal host that does not have any host or role
policy (including members of the Catchall host group) and Outside Hosts, applied to any external
host that does not have a specific host or role policy applied to it.
Role Policies: Applied to a host group that has specific function. For example, the Network Scanners
policy has specific events related to scanning that are turned off when the network scanner is the
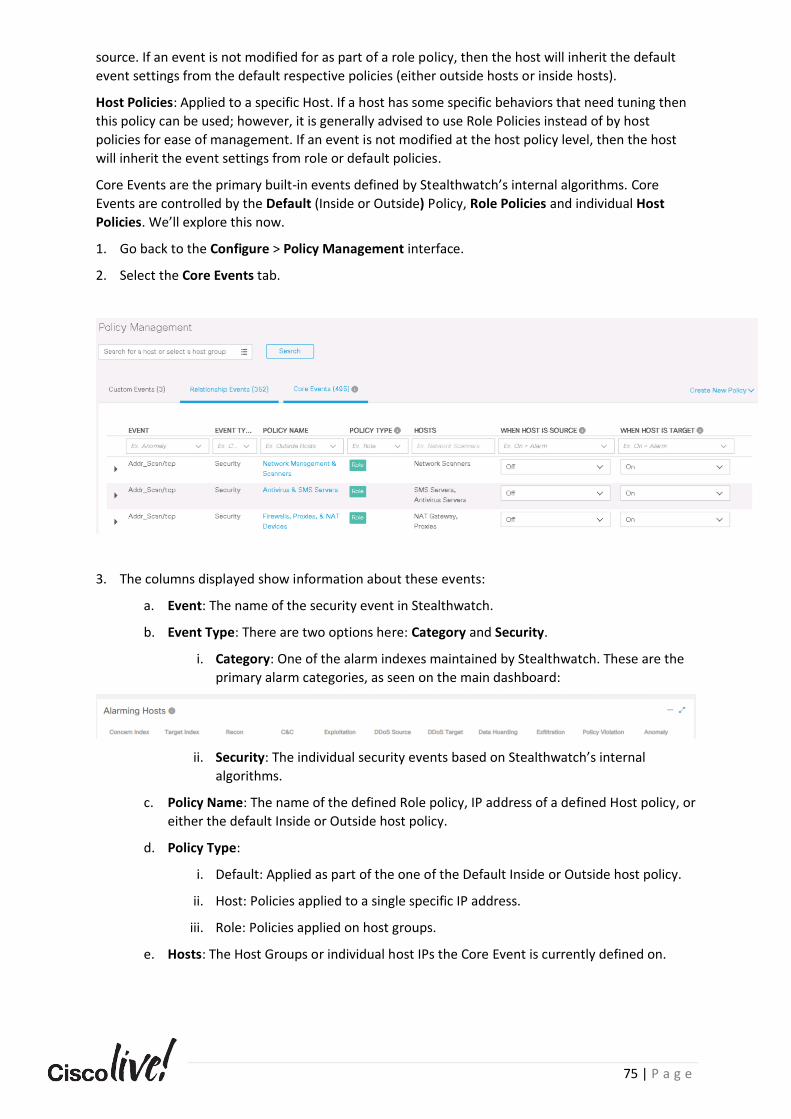
75 | P a g e
source. If an event is not modified for as part of a role policy, then the host will inherit the default
event settings from the default respective policies (either outside hosts or inside hosts).
Host Policies: Applied to a specific Host. If a host has some specific behaviors that need tuning then
this policy can be used; however, it is generally advised to use Role Policies instead of by host
policies for ease of management. If an event is not modified at the host policy level, then the host
will inherit the event settings from role or default policies.
Core Events are the primary built-in events defined by Stealthwatch’s internal algorithms. Core
Events are controlled by the Default (Inside or Outside) Policy, Role Policies and individual Host
Policies. We’ll explore this now.
1. Go back to the Configure > Policy Management interface.
2. Select the Core Events tab.
3. The columns displayed show information about these events:
a. Event: The name of the security event in Stealthwatch.
b. Event Type: There are two options here: Category and Security.
i. Category: One of the alarm indexes maintained by Stealthwatch. These are the
primary alarm categories, as seen on the main dashboard:
ii. Security: The individual security events based on Stealthwatch’s internal
algorithms.
c. Policy Name: The name of the defined Role policy, IP address of a defined Host policy, or
either the default Inside or Outside host policy.
d. Policy Type:
i. Default: Applied as part of the one of the Default Inside or Outside host policy.
ii. Host: Policies applied to a single specific IP address.
iii. Role: Policies applied on host groups.
e. Hosts: The Host Groups or individual host IPs the Core Event is currently defined on.
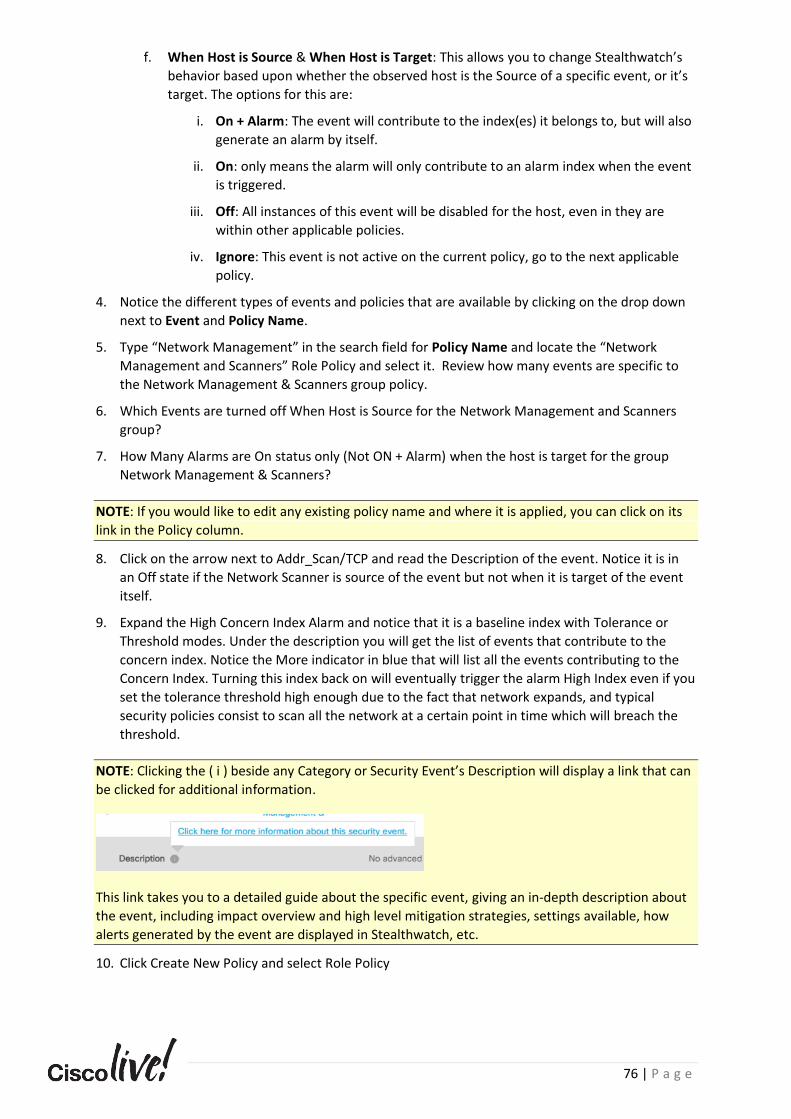
76 | P a g e
f. When Host is Source & When Host is Target: This allows you to change Stealthwatch’s
behavior based upon whether the observed host is the Source of a specific event, or it’s
target. The options for this are:
i. On + Alarm: The event will contribute to the index(es) it belongs to, but will also
generate an alarm by itself.
ii. On: only means the alarm will only contribute to an alarm index when the event
is triggered.
iii. Off: All instances of this event will be disabled for the host, even in they are
within other applicable policies.
iv. Ignore: This event is not active on the current policy, go to the next applicable
policy.
4. Notice the different types of events and policies that are available by clicking on the drop down
next to Event and Policy Name.
5. Type “Network Management” in the search field for Policy Name and locate the “Network
Management and Scanners” Role Policy and select it. Review how many events are specific to
the Network Management & Scanners group policy.
6. Which Events are turned off When Host is Source for the Network Management and Scanners
group?
7. How Many Alarms are On status only (Not ON + Alarm) when the host is target for the group
Network Management & Scanners?
NOTE: If you would like to edit any existing policy name and where it is applied, you can click on its
link in the Policy column.
8. Click on the arrow next to Addr_Scan/TCP and read the Description of the event. Notice it is in
an Off state if the Network Scanner is source of the event but not when it is target of the event
itself.
9. Expand the High Concern Index Alarm and notice that it is a baseline index with Tolerance or
Threshold modes. Under the description you will get the list of events that contribute to the
concern index. Notice the More indicator in blue that will list all the events contributing to the
Concern Index. Turning this index back on will eventually trigger the alarm High Index even if you
set the tolerance threshold high enough due to the fact that network expands, and typical
security policies consist to scan all the network at a certain point in time which will breach the
threshold.
NOTE: Clicking the ( i ) beside any Category or Security Event’s Description will display a link that can
be clicked for additional information.
This link takes you to a detailed guide about the specific event, giving an in-depth description about
the event, including impact overview and high level mitigation strategies, settings available, how
alerts generated by the event are displayed in Stealthwatch, etc.
10. Click Create New Policy and select Role Policy
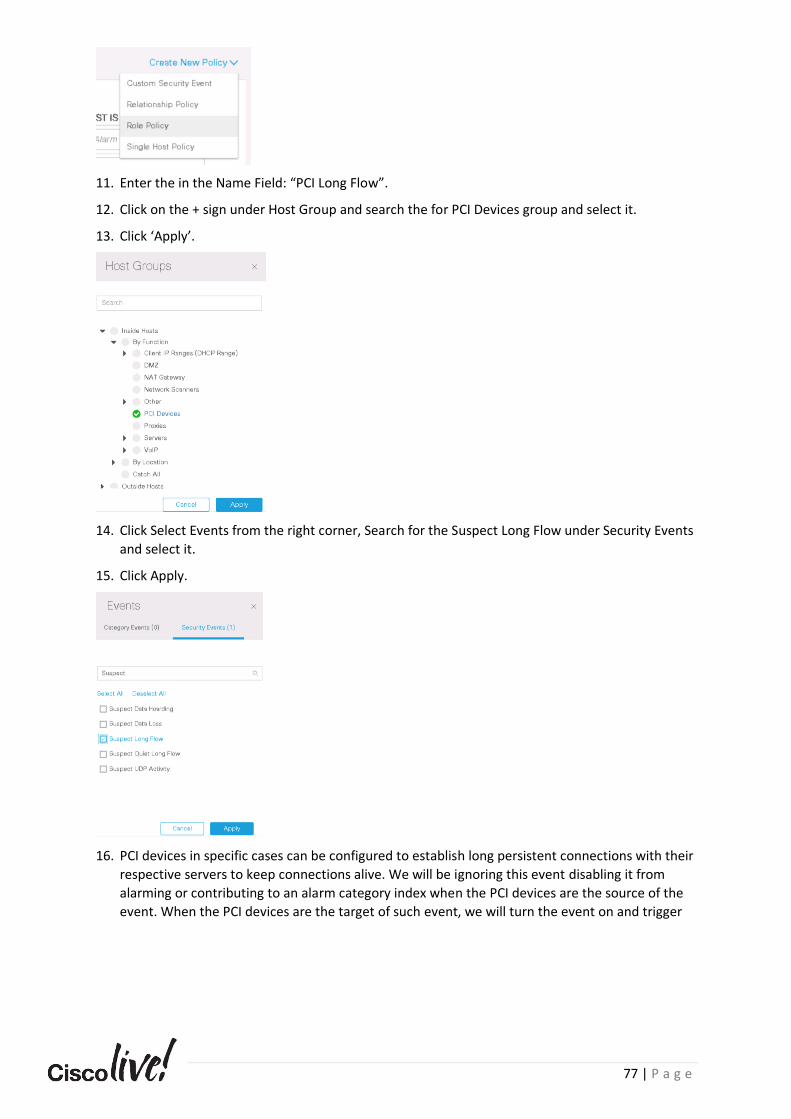
77 | P a g e
11. Enter the in the Name Field: “PCI Long Flow”.
12. Click on the + sign under Host Group and search the for PCI Devices group and select it.
13. Click ‘Apply’.
14. Click Select Events from the right corner, Search for the Suspect Long Flow under Security Events
and select it.
15. Click Apply.
16. PCI devices in specific cases can be configured to establish long persistent connections with their
respective servers to keep connections alive. We will be ignoring this event disabling it from
alarming or contributing to an alarm category index when the PCI devices are the source of the
event. When the PCI devices are the target of such event, we will turn the event on and trigger
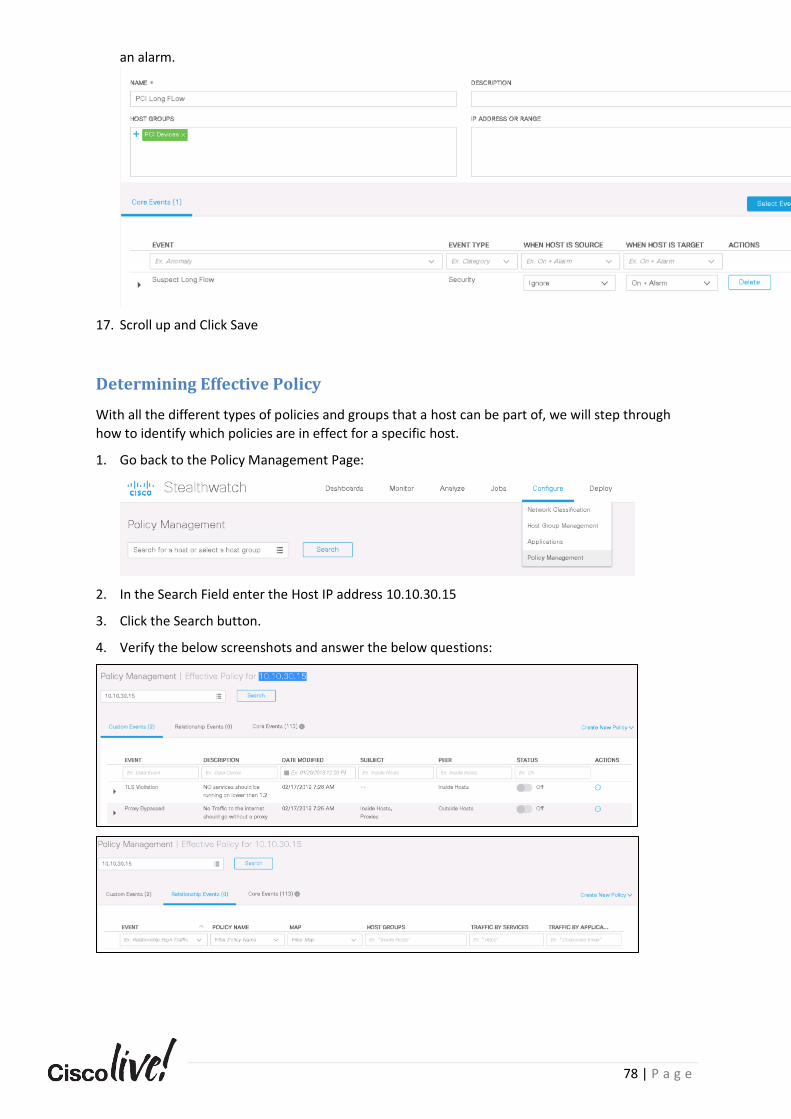
78 | P a g e
an alarm.
17. Scroll up and Click Save
Determining Effective Policy
With all the different types of policies and groups that a host can be part of, we will step through
how to identify which policies are in effect for a specific host.
1. Go back to the Policy Management Page:
2. In the Search Field enter the Host IP address 10.10.30.15
3. Click the Search button.
4. Verify the below screenshots and answer the below questions:
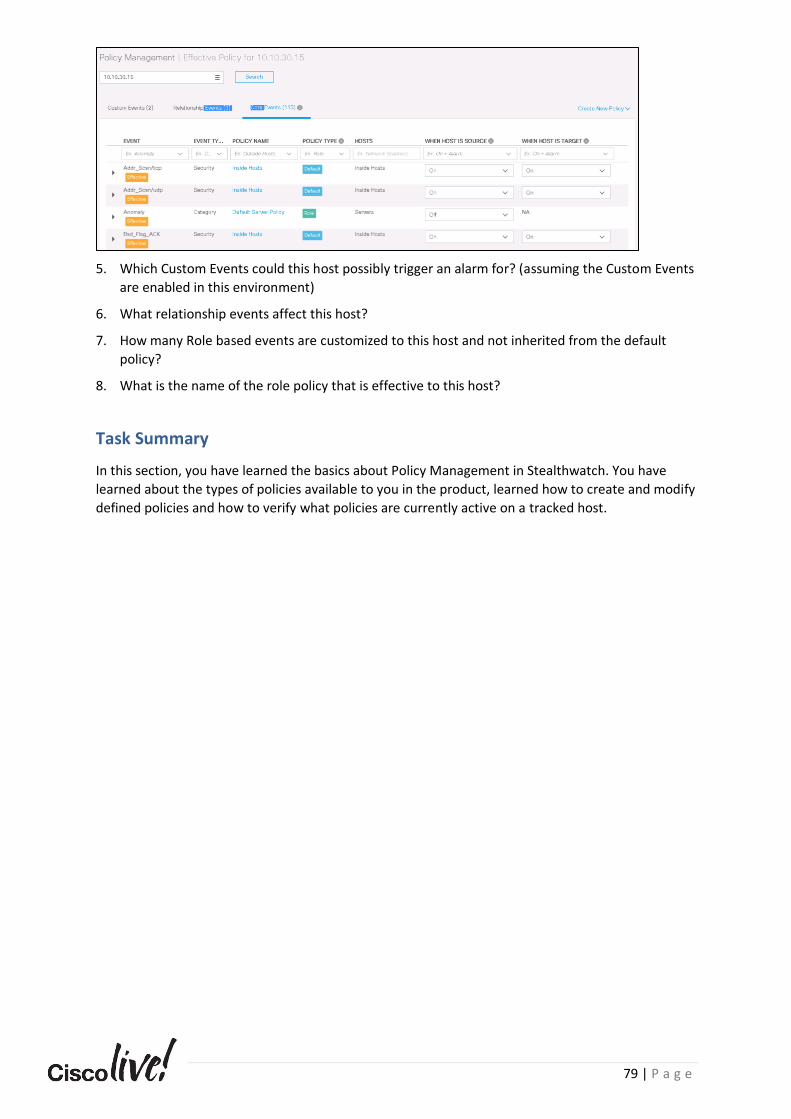
79 | P a g e
5. Which Custom Events could this host possibly trigger an alarm for? (assuming the Custom Events
are enabled in this environment)
6. What relationship events affect this host?
7. How many Role based events are customized to this host and not inherited from the default
policy?
8. What is the name of the role policy that is effective to this host?
Task Summary
In this section, you have learned the basics about Policy Management in Stealthwatch. You have
learned about the types of policies available to you in the product, learned how to create and modify
defined policies and how to verify what policies are currently active on a tracked host.
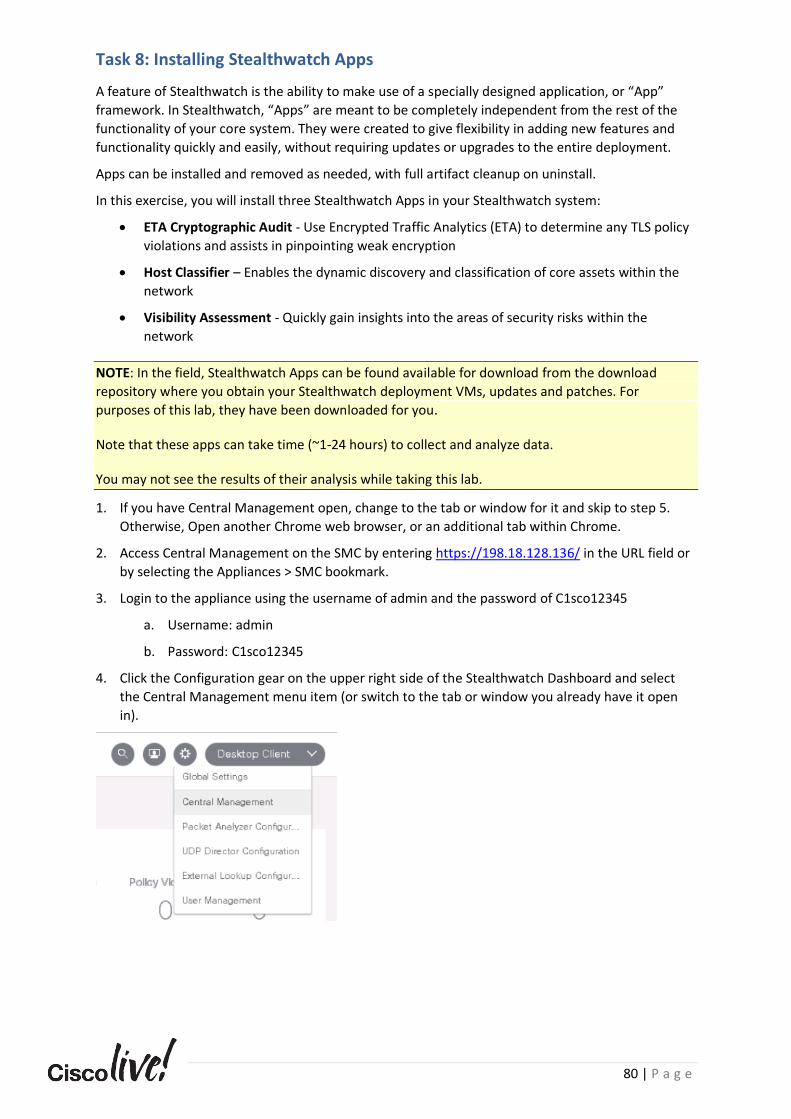
80 | P a g e
Task 8: Installing Stealthwatch Apps
A feature of Stealthwatch is the ability to make use of a specially designed application, or “App”
framework. In Stealthwatch, “Apps” are meant to be completely independent from the rest of the
functionality of your core system. They were created to give flexibility in adding new features and
functionality quickly and easily, without requiring updates or upgrades to the entire deployment.
Apps can be installed and removed as needed, with full artifact cleanup on uninstall.
In this exercise, you will install three Stealthwatch Apps in your Stealthwatch system:
• ETA Cryptographic Audit - Use Encrypted Traffic Analytics (ETA) to determine any TLS policy
violations and assists in pinpointing weak encryption
• Host Classifier – Enables the dynamic discovery and classification of core assets within the
network
• Visibility Assessment - Quickly gain insights into the areas of security risks within the
network
NOTE: In the field, Stealthwatch Apps can be found available for download from the download
repository where you obtain your Stealthwatch deployment VMs, updates and patches. For
purposes of this lab, they have been downloaded for you.
Note that these apps can take time (~1-24 hours) to collect and analyze data.
You may not see the results of their analysis while taking this lab.
1. If you have Central Management open, change to the tab or window for it and skip to step 5.
Otherwise, Open another Chrome web browser, or an additional tab within Chrome.
2. Access Central Management on the SMC by entering https://198.18.128.136/ in the URL field or
by selecting the Appliances > SMC bookmark.
3. Login to the appliance using the username of admin and the password of C1sco12345
a. Username: admin
b. Password: C1sco12345
4. Click the Configuration gear on the upper right side of the Stealthwatch Dashboard and select
the Central Management menu item (or switch to the tab or window you already have it open
in).
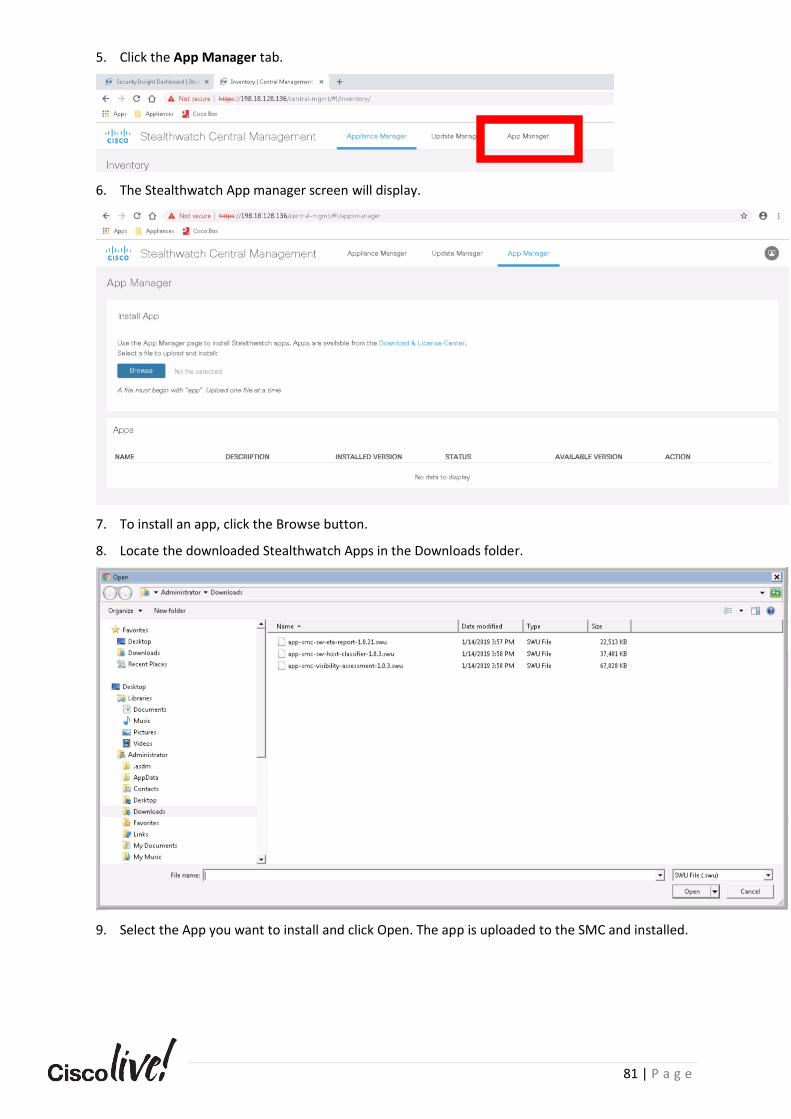
81 | P a g e
5. Click the App Manager tab.
6. The Stealthwatch App manager screen will display.
7. To install an app, click the Browse button.
8. Locate the downloaded Stealthwatch Apps in the Downloads folder.
9. Select the App you want to install and click Open. The app is uploaded to the SMC and installed.
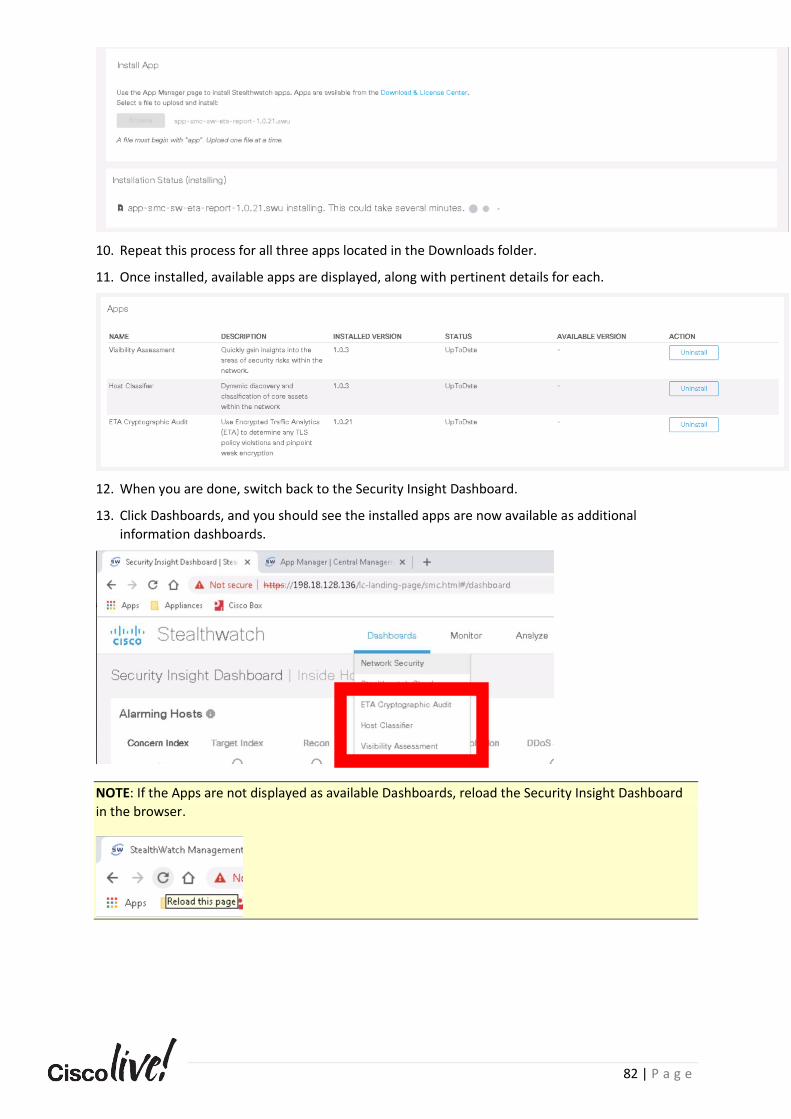
82 | P a g e
10. Repeat this process for all three apps located in the Downloads folder.
11. Once installed, available apps are displayed, along with pertinent details for each.
12. When you are done, switch back to the Security Insight Dashboard.
13. Click Dashboards, and you should see the installed apps are now available as additional
information dashboards.
NOTE: If the Apps are not displayed as available Dashboards, reload the Security Insight Dashboard
in the browser.

83 | P a g e
The Automatic Host Classifier App
1. The Host Classifier App provides dynamic discovery and classification of specific assets within
your network, assisting with the maintenance of the deployed system’s Host Groups. This is
important to the overall health and effectiveness of a Stealthwatch deployment, by maintaining
key “by function” types of servers. All analysis and classification activity is performed on the
deployed SMC appliance.
2. For each of the Host categories the App looks to classify, you can see the criteria in use in the
analysis by moving your mouse cursor over the beside the host group name.
3. You can enable and disable the App by toggling the associated button:
4. You can cycle through returned results and select hosts from the Suggested column to either
Confirm or Exclude. Confirming a host causes it to move to the Confirmed tab and will cause the
host to be added to the associated Host Group under the Inside Hosts > By Function > Servers.
NOTE: Once a host has been Confirmed or Excluded, you cannot change its status in the App. Before
you choose to confirm or exclude, be sure to investigate the host’s role and function. Also note that
decisions to Confirm or Exclude hosts are used to further train the machine learning processes used
by the App.
5. You can configure the App to automatically classify classified hosts into the relevant host group
by toggling the Auto Classification button to On.
NOTE: Turning on Auto Classification will cause all currently Suggested Hosts for each category to be
automatically added to the relevant host group. Additionally, all hosts detected in the future will also
be automatically added to the associated host group until Auto Classification is turned off.
Click on the Domain Controllers server list.
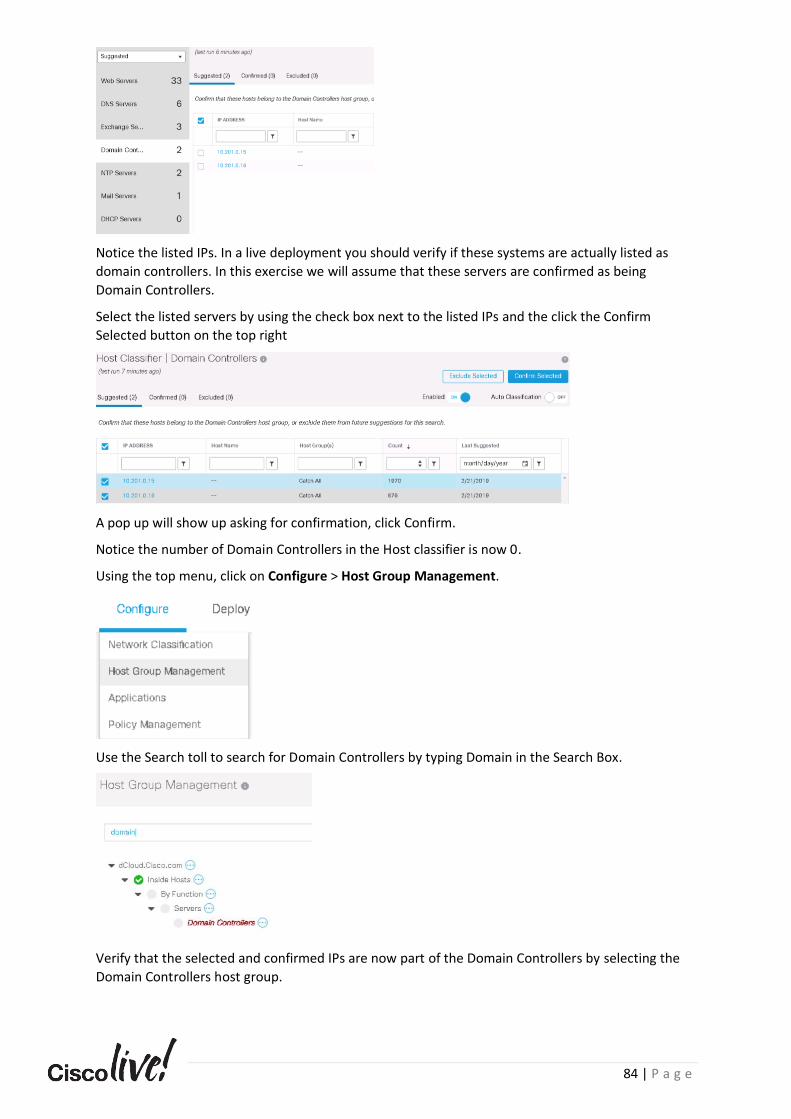
84 | P a g e
Notice the listed IPs. In a live deployment you should verify if these systems are actually listed as
domain controllers. In this exercise we will assume that these servers are confirmed as being
Domain Controllers.
Select the listed servers by using the check box next to the listed IPs and the click the Confirm
Selected button on the top right
A pop up will show up asking for confirmation, click Confirm.
Notice the number of Domain Controllers in the Host classifier is now 0.
Using the top menu, click on Configure > Host Group Management.
Use the Search toll to search for Domain Controllers by typing Domain in the Search Box.
Verify that the selected and confirmed IPs are now part of the Domain Controllers by selecting the
Domain Controllers host group.
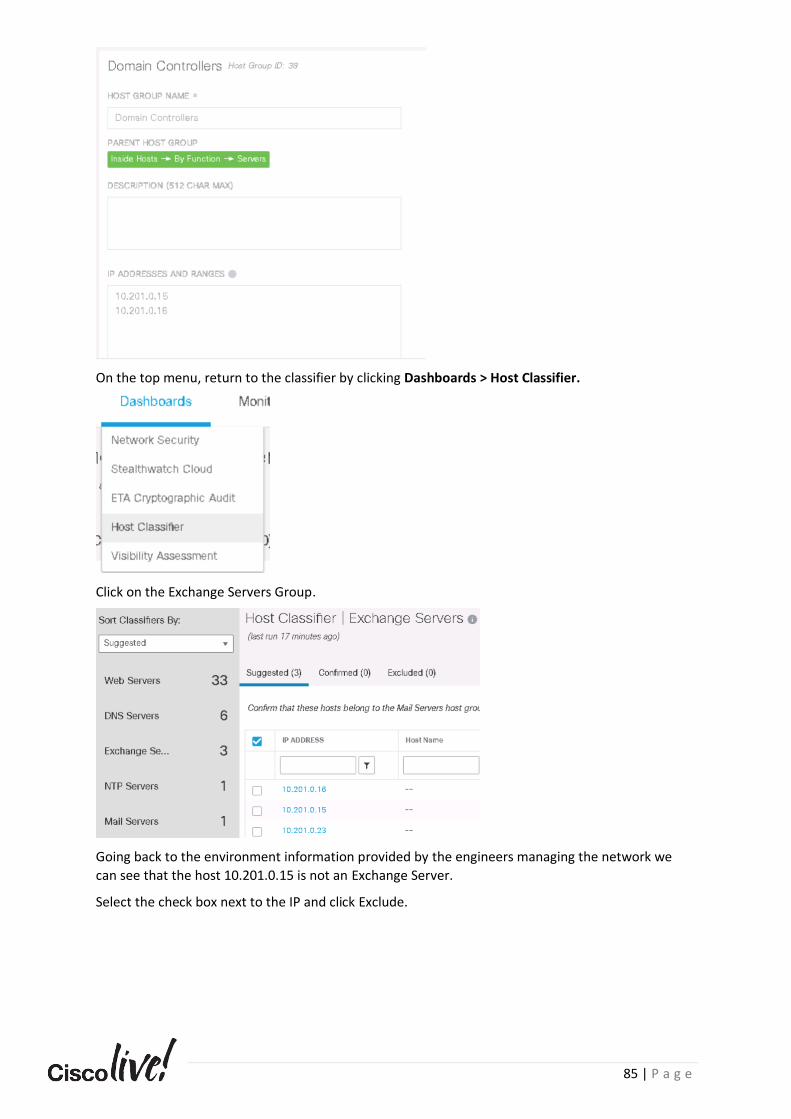
85 | P a g e
On the top menu, return to the classifier by clicking Dashboards > Host Classifier.
Click on the Exchange Servers Group.
Going back to the environment information provided by the engineers managing the network we
can see that the host 10.201.0.15 is not an Exchange Server.
Select the check box next to the IP and click Exclude.
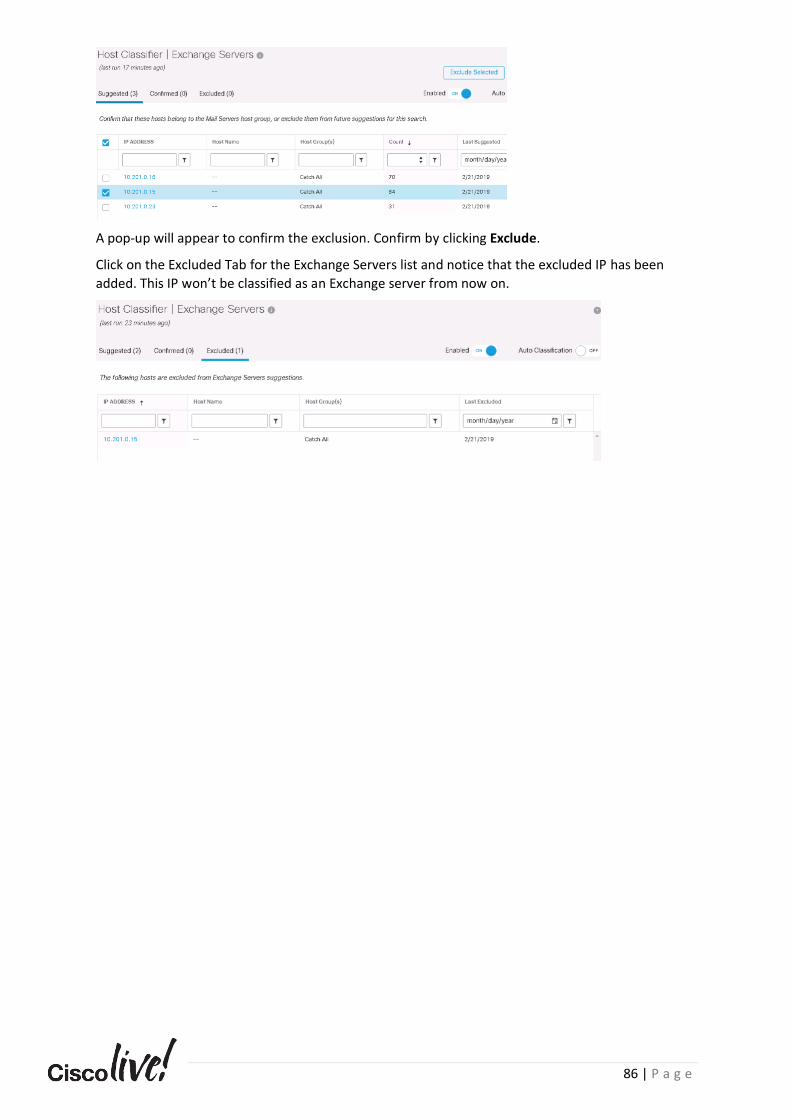
86 | P a g e
A pop-up will appear to confirm the exclusion. Confirm by clicking Exclude.
Click on the Excluded Tab for the Exchange Servers list and notice that the excluded IP has been
added. This IP won’t be classified as an Exchange server from now on.
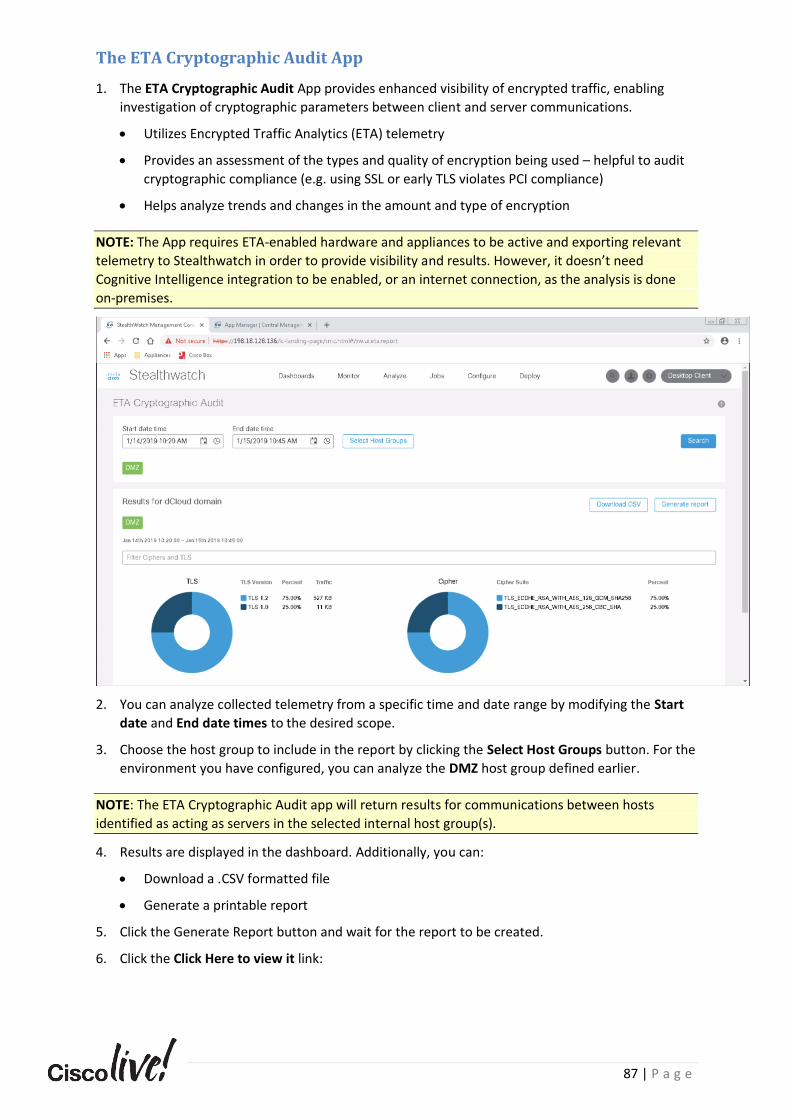
87 | P a g e
The ETA Cryptographic Audit App
1. The ETA Cryptographic Audit App provides enhanced visibility of encrypted traffic, enabling
investigation of cryptographic parameters between client and server communications.
• Utilizes Encrypted Traffic Analytics (ETA) telemetry
• Provides an assessment of the types and quality of encryption being used – helpful to audit
cryptographic compliance (e.g. using SSL or early TLS violates PCI compliance)
• Helps analyze trends and changes in the amount and type of encryption
NOTE: The App requires ETA-enabled hardware and appliances to be active and exporting relevant
telemetry to Stealthwatch in order to provide visibility and results. However, it doesn’t need
Cognitive Intelligence integration to be enabled, or an internet connection, as the analysis is done
on-premises.
2. You can analyze collected telemetry from a specific time and date range by modifying the Start
date and End date times to the desired scope.
3. Choose the host group to include in the report by clicking the Select Host Groups button. For the
environment you have configured, you can analyze the DMZ host group defined earlier.
NOTE: The ETA Cryptographic Audit app will return results for communications between hosts
identified as acting as servers in the selected internal host group(s).
4. Results are displayed in the dashboard. Additionally, you can:
• Download a .CSV formatted file
• Generate a printable report
5. Click the Generate Report button and wait for the report to be created.
6. Click the Click Here to view it link:
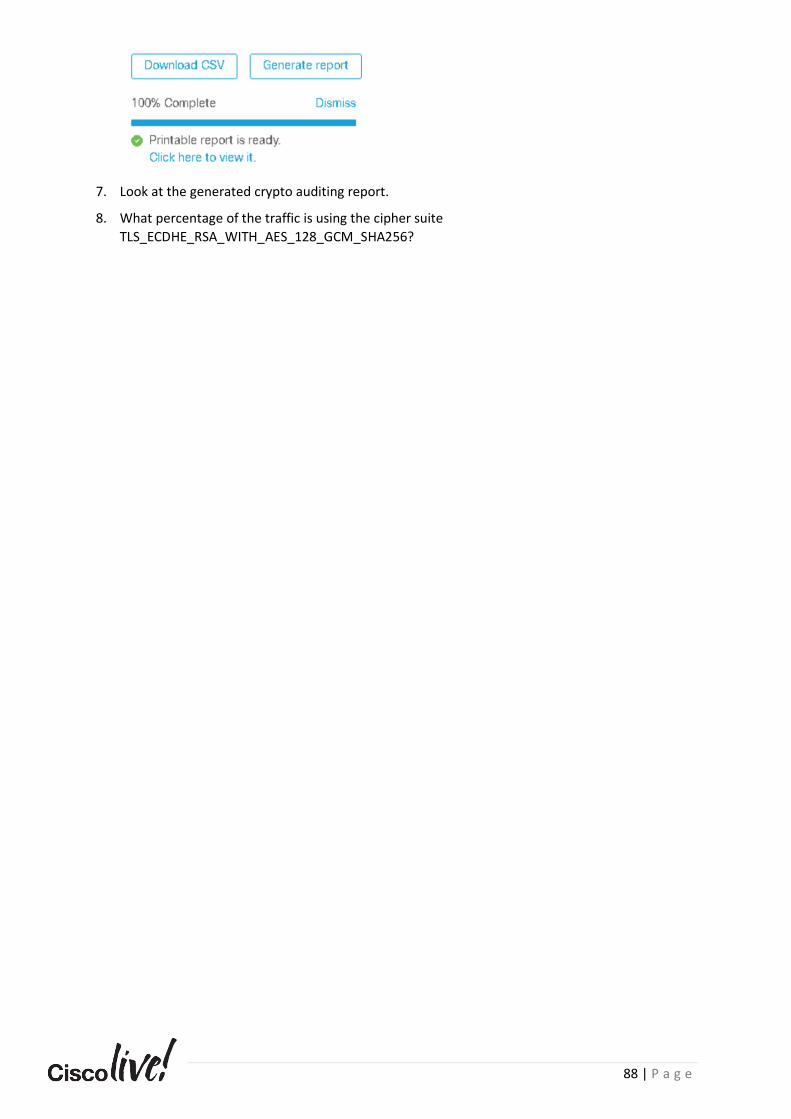
88 | P a g e
7. Look at the generated crypto auditing report.
8. What percentage of the traffic is using the cipher suite
TLS_ECDHE_RSA_WITH_AES_128_GCM_SHA256?
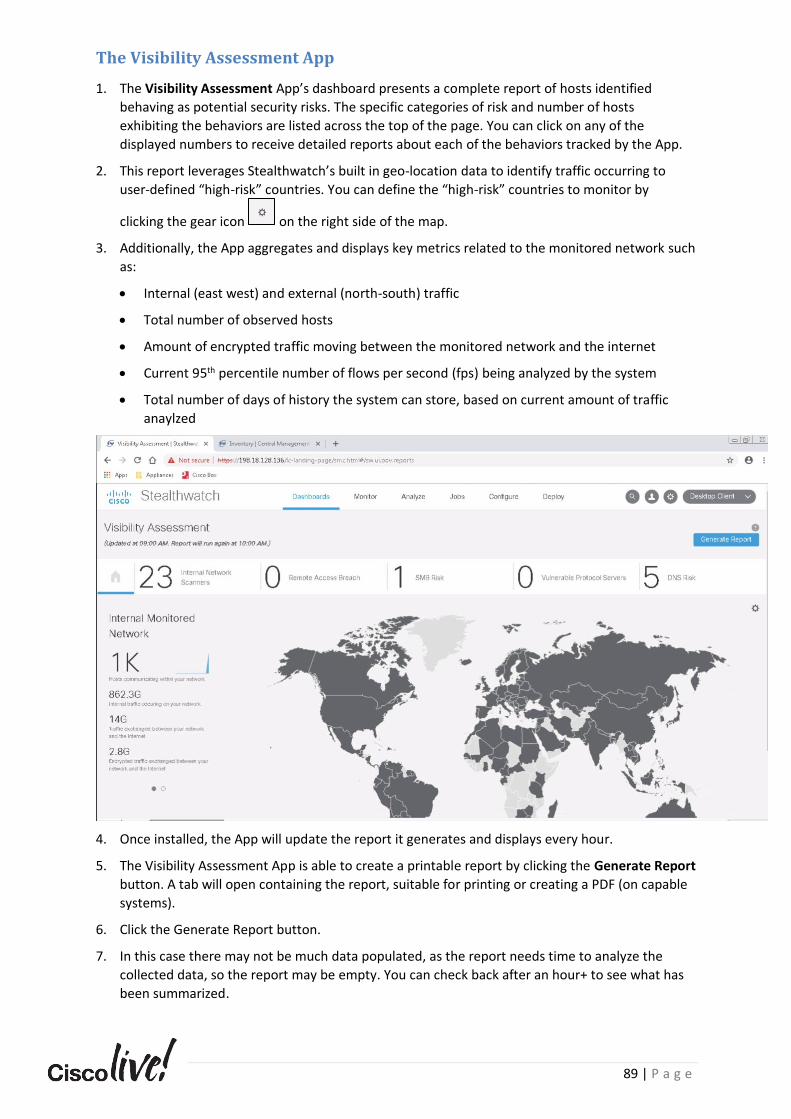
89 | P a g e
The Visibility Assessment App
1. The Visibility Assessment App’s dashboard presents a complete report of hosts identified
behaving as potential security risks. The specific categories of risk and number of hosts
exhibiting the behaviors are listed across the top of the page. You can click on any of the
displayed numbers to receive detailed reports about each of the behaviors tracked by the App.
2. This report leverages Stealthwatch’s built in geo-location data to identify traffic occurring to
user-defined “high-risk” countries. You can define the “high-risk” countries to monitor by
clicking the gear icon on the right side of the map.
3. Additionally, the App aggregates and displays key metrics related to the monitored network such
as:
• Internal (east west) and external (north-south) traffic
• Total number of observed hosts
• Amount of encrypted traffic moving between the monitored network and the internet
• Current 95th percentile number of flows per second (fps) being analyzed by the system
• Total number of days of history the system can store, based on current amount of traffic
anaylzed
4. Once installed, the App will update the report it generates and displays every hour.
5. The Visibility Assessment App is able to create a printable report by clicking the Generate Report
button. A tab will open containing the report, suitable for printing or creating a PDF (on capable
systems).
6. Click the Generate Report button.
7. In this case there may not be much data populated, as the report needs time to analyze the
collected data, so the report may be empty. You can check back after an hour+ to see what has
been summarized.
90 | P a g e
8. Examine the report and look at the 7 Sections listed below:
a. Internal Monitored Network:
This is section helps quantify the network, including:
i. Number of Hosts communicating on the network
ii. Amount of traffic occurring on the network
iii. Amount of traffic occurring between the network and the outside Internet
iv. Amount of encrypted traffic between the network and the outside Internet
v. The maximum flows per second observed
vi. Total number of flow records analyzed
vii. Amount of Data that can per stored for forensics
b. Internal Network Scanners:
i. Lists the Hosts on the network that are performing network reconnaissance
activities which can lead to attacks performed on the network
c. Remote Access Breach
i. Lists remote access connections from outside to inside the network using
remote access protocols such as RDP, PCAnywhere, VNC etc. The listed
communications indicate breaches in the network.
d. SMB Risk
i. Lists of Hosts with communication attempts from inside to outside using port
445 (SMB) which is used in multiple malware families such as ransomware.
e. Vulnerable Protocol Servers
i. Lists top internal servers communicating over clear text protocols like Telnet
which poses a risk of data and credential exposure.
f. DNS Risk
i. Lists top hosts using DNS to inside or outside with hosts that are not listed as
DNS servers. DNS is used in multiple attacks including DNS tunneling and DNS
Hijacking.
g. Traffic to High Risk Countries
i. Lists top countries as defined in the risk countries (configurable in the app) that
have communications with the internal network
9. List the ports used in Scanning and reported in the Internal Scanners section.
This report will help identify risks in the network and generate a report to elaborate the risk
detected, which can support you in a proof of value or assesment activity.
NOTE: If after 1 Hour you are still running the lab revisit the Visibility Assessment Dashboard to view
some more interesting data
Task Summary
In this scenario, you have installed Apps into Stealthwatch, giving the deployment additional
functionality and visibility into the network environment.

91 | P a g e
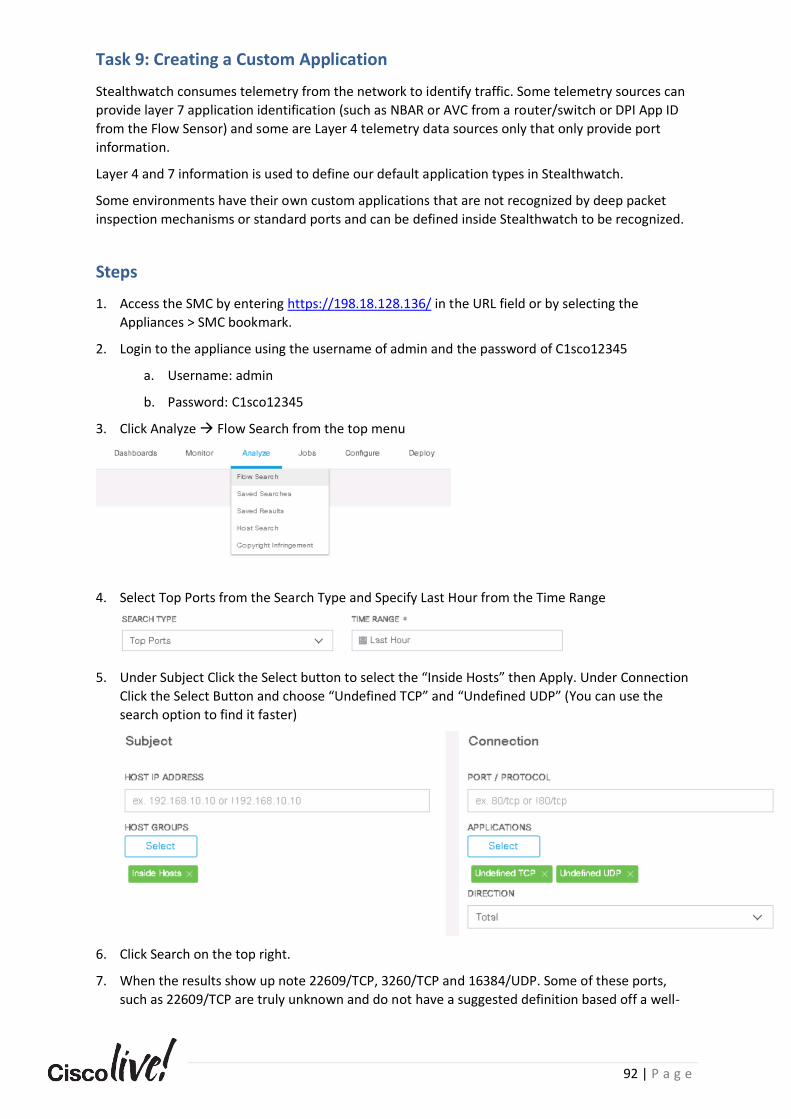
92 | P a g e
Task 9: Creating a Custom Application
Stealthwatch consumes telemetry from the network to identify traffic. Some telemetry sources can
provide layer 7 application identification (such as NBAR or AVC from a router/switch or DPI App ID
from the Flow Sensor) and some are Layer 4 telemetry data sources only that only provide port
information.
Layer 4 and 7 information is used to define our default application types in Stealthwatch.
Some environments have their own custom applications that are not recognized by deep packet
inspection mechanisms or standard ports and can be defined inside Stealthwatch to be recognized.
Steps
1. Access the SMC by entering https://198.18.128.136/ in the URL field or by selecting the
Appliances > SMC bookmark.
2. Login to the appliance using the username of admin and the password of C1sco12345
a. Username: admin
b. Password: C1sco12345
3. Click Analyze → Flow Search from the top menu
4. Select Top Ports from the Search Type and Specify Last Hour from the Time Range
5. Under Subject Click the Select button to select the “Inside Hosts” then Apply. Under Connection
Click the Select Button and choose “Undefined TCP” and “Undefined UDP” (You can use the
search option to find it faster)
6. Click Search on the top right.
7. When the results show up note 22609/TCP, 3260/TCP and 16384/UDP. Some of these ports,
such as 22609/TCP are truly unknown and do not have a suggested definition based off a well-
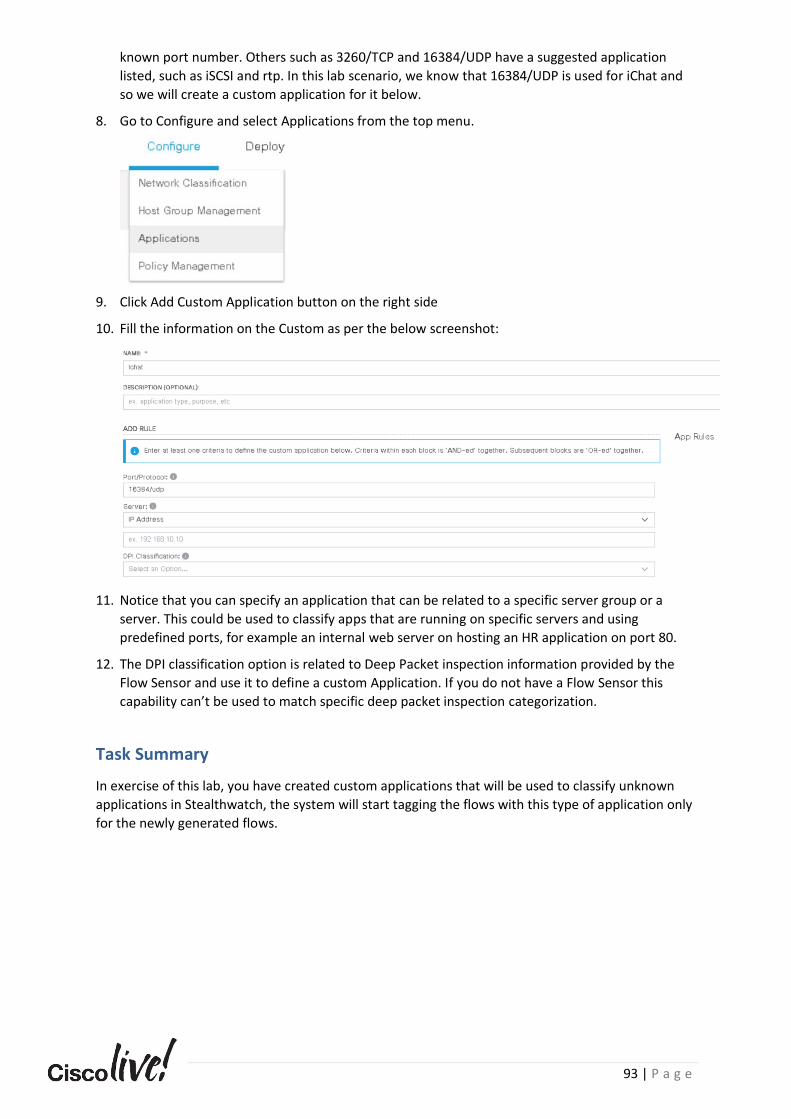
93 | P a g e
known port number. Others such as 3260/TCP and 16384/UDP have a suggested application
listed, such as iSCSI and rtp. In this lab scenario, we know that 16384/UDP is used for iChat and
so we will create a custom application for it below.
8. Go to Configure and select Applications from the top menu.
9. Click Add Custom Application button on the right side
10. Fill the information on the Custom as per the below screenshot:
11. Notice that you can specify an application that can be related to a specific server group or a
server. This could be used to classify apps that are running on specific servers and using
predefined ports, for example an internal web server on hosting an HR application on port 80.
12. The DPI classification option is related to Deep Packet inspection information provided by the
Flow Sensor and use it to define a custom Application. If you do not have a Flow Sensor this
capability can’t be used to match specific deep packet inspection categorization.
Task Summary
In exercise of this lab, you have created custom applications that will be used to classify unknown
applications in Stealthwatch, the system will start tagging the flows with this type of application only
for the newly generated flows.
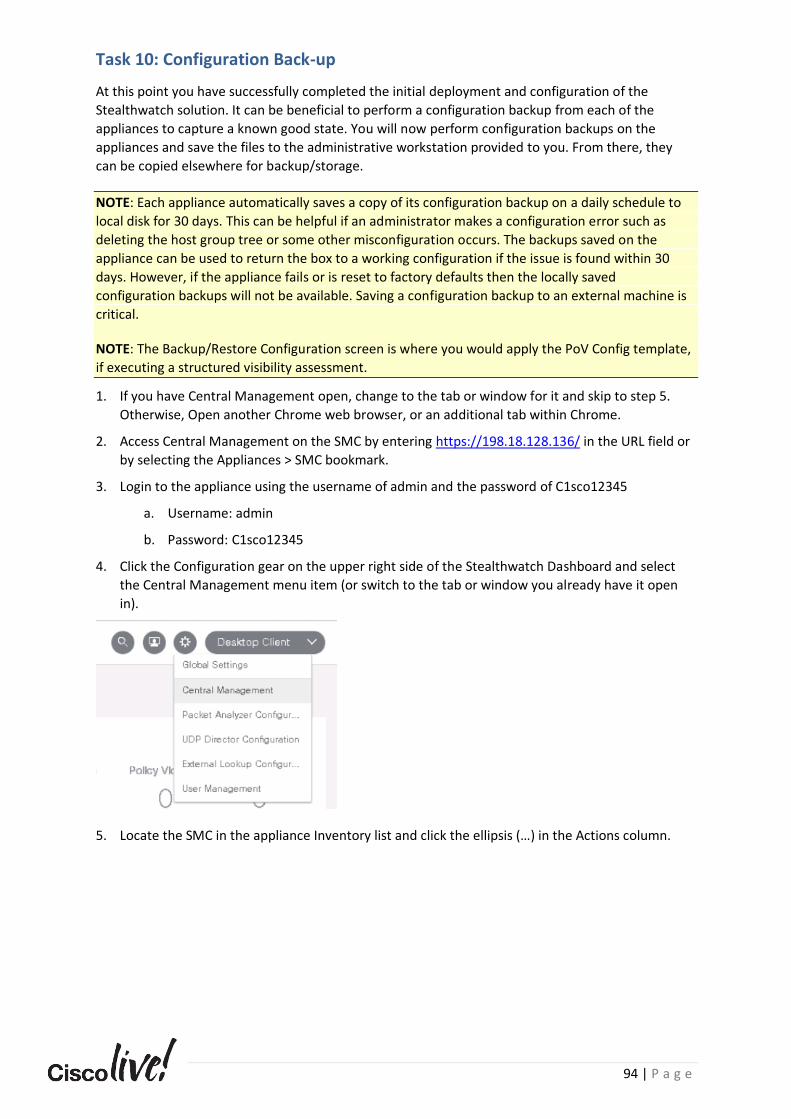
94 | P a g e
Task 10: Configuration Back-up
At this point you have successfully completed the initial deployment and configuration of the
Stealthwatch solution. It can be beneficial to perform a configuration backup from each of the
appliances to capture a known good state. You will now perform configuration backups on the
appliances and save the files to the administrative workstation provided to you. From there, they
can be copied elsewhere for backup/storage.
NOTE: Each appliance automatically saves a copy of its configuration backup on a daily schedule to
local disk for 30 days. This can be helpful if an administrator makes a configuration error such as
deleting the host group tree or some other misconfiguration occurs. The backups saved on the
appliance can be used to return the box to a working configuration if the issue is found within 30
days. However, if the appliance fails or is reset to factory defaults then the locally saved
configuration backups will not be available. Saving a configuration backup to an external machine is
critical.
NOTE: The Backup/Restore Configuration screen is where you would apply the PoV Config template,
if executing a structured visibility assessment.
1. If you have Central Management open, change to the tab or window for it and skip to step 5.
Otherwise, Open another Chrome web browser, or an additional tab within Chrome.
2. Access Central Management on the SMC by entering https://198.18.128.136/ in the URL field or
by selecting the Appliances > SMC bookmark.
3. Login to the appliance using the username of admin and the password of C1sco12345
a. Username: admin
b. Password: C1sco12345
4. Click the Configuration gear on the upper right side of the Stealthwatch Dashboard and select
the Central Management menu item (or switch to the tab or window you already have it open
in).
5. Locate the SMC in the appliance Inventory list and click the ellipsis (…) in the Actions column.
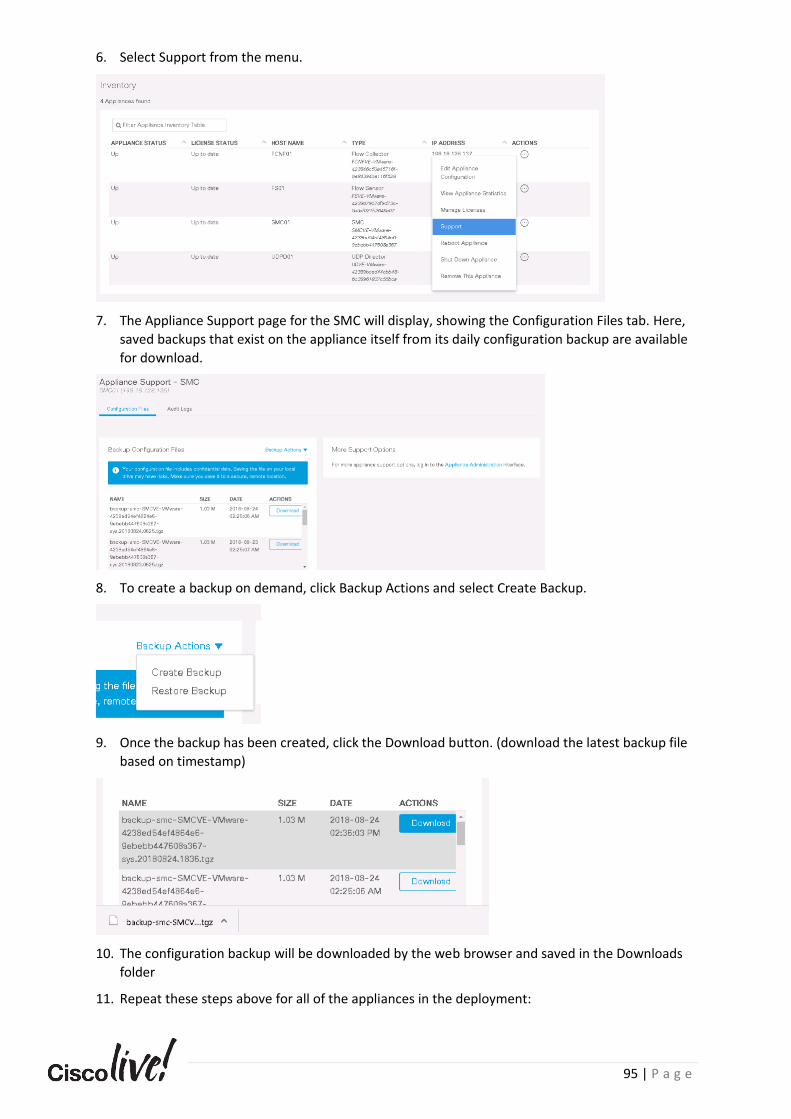
95 | P a g e
6. Select Support from the menu.
7. The Appliance Support page for the SMC will display, showing the Configuration Files tab. Here,
saved backups that exist on the appliance itself from its daily configuration backup are available
for download.
8. To create a backup on demand, click Backup Actions and select Create Backup.
9. Once the backup has been created, click the Download button. (download the latest backup file
based on timestamp)
10. The configuration backup will be downloaded by the web browser and saved in the Downloads
folder
11. Repeat these steps above for all of the appliances in the deployment:
96 | P a g e
a. Flow Collector
b. Flow Sensor
c. UDP Director
12. You have successfully performed configuration backups for the appliances.
Task Summary
In the exercise of this lab, you have created backups of all of the configuration work you have
performed across all of the devices in the deployment. This should always be done once deployment
is complete, as well as whenever significant configuration of the system occurs.
NOTE: Performing configuration backups is also part of the pre-upgrade process for the appliances.
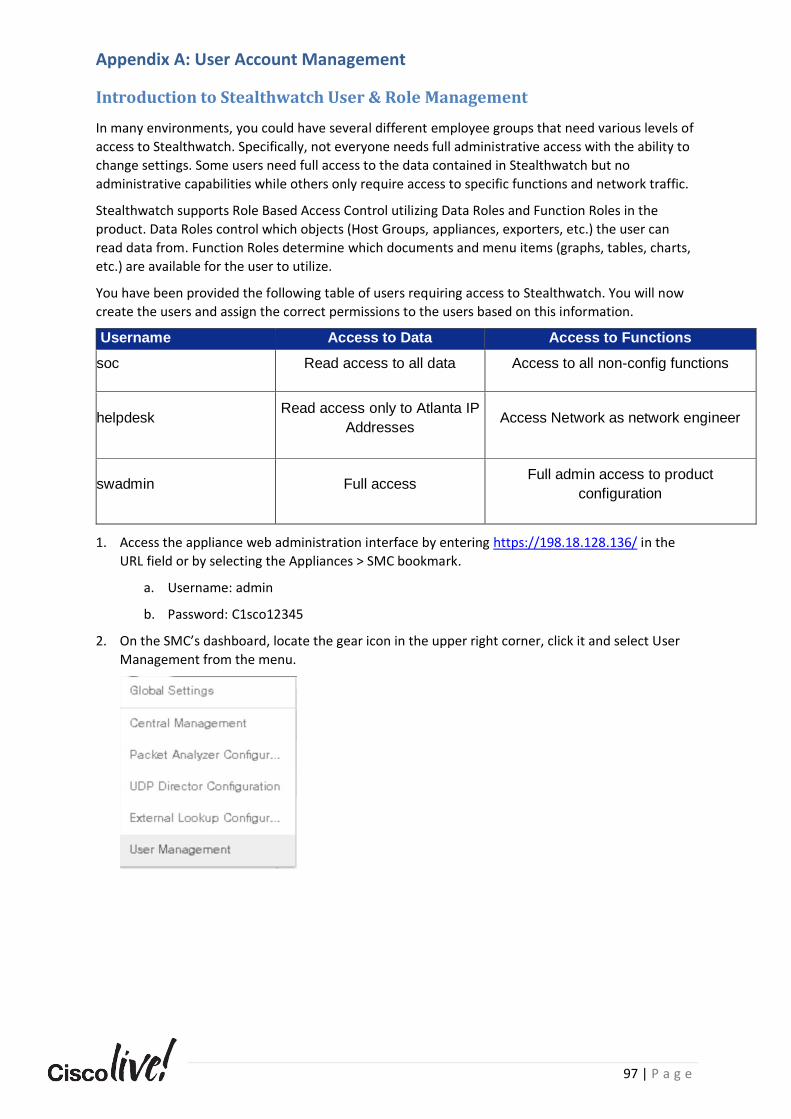
97 | P a g e
Appendix A: User Account Management
Introduction to Stealthwatch User & Role Management
In many environments, you could have several different employee groups that need various levels of
access to Stealthwatch. Specifically, not everyone needs full administrative access with the ability to
change settings. Some users need full access to the data contained in Stealthwatch but no
administrative capabilities while others only require access to specific functions and network traffic.
Stealthwatch supports Role Based Access Control utilizing Data Roles and Function Roles in the
product. Data Roles control which objects (Host Groups, appliances, exporters, etc.) the user can
read data from. Function Roles determine which documents and menu items (graphs, tables, charts,
etc.) are available for the user to utilize.
You have been provided the following table of users requiring access to Stealthwatch. You will now
create the users and assign the correct permissions to the users based on this information.
Username Access to Data Access to Functions
soc Read access to all data Access to all non-config functions
helpdesk Read access only to Atlanta IP
Addresses Access Network as network engineer
swadmin Full access Full admin access to product
configuration
1. Access the appliance web administration interface by entering https://198.18.128.136/ in the
URL field or by selecting the Appliances > SMC bookmark.
a. Username: admin
b. Password: C1sco12345
2. On the SMC’s dashboard, locate the gear icon in the upper right corner, click it and select User
Management from the menu.
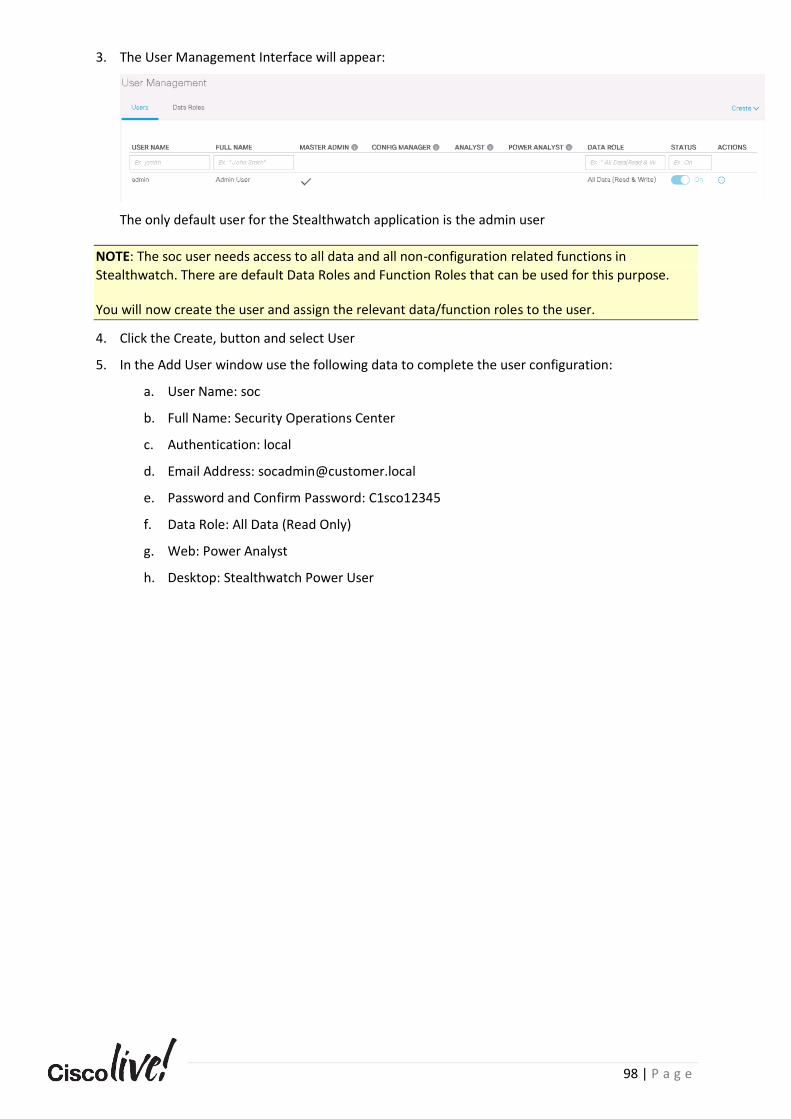
98 | P a g e
3. The User Management Interface will appear:
The only default user for the Stealthwatch application is the admin user
NOTE: The soc user needs access to all data and all non-configuration related functions in
Stealthwatch. There are default Data Roles and Function Roles that can be used for this purpose.
You will now create the user and assign the relevant data/function roles to the user.
4. Click the Create, button and select User
5. In the Add User window use the following data to complete the user configuration:
a. User Name: soc
b. Full Name: Security Operations Center
c. Authentication: local
d. Email Address: [email protected]
e. Password and Confirm Password: C1sco12345
f. Data Role: All Data (Read Only)
g. Web: Power Analyst
h. Desktop: Stealthwatch Power User
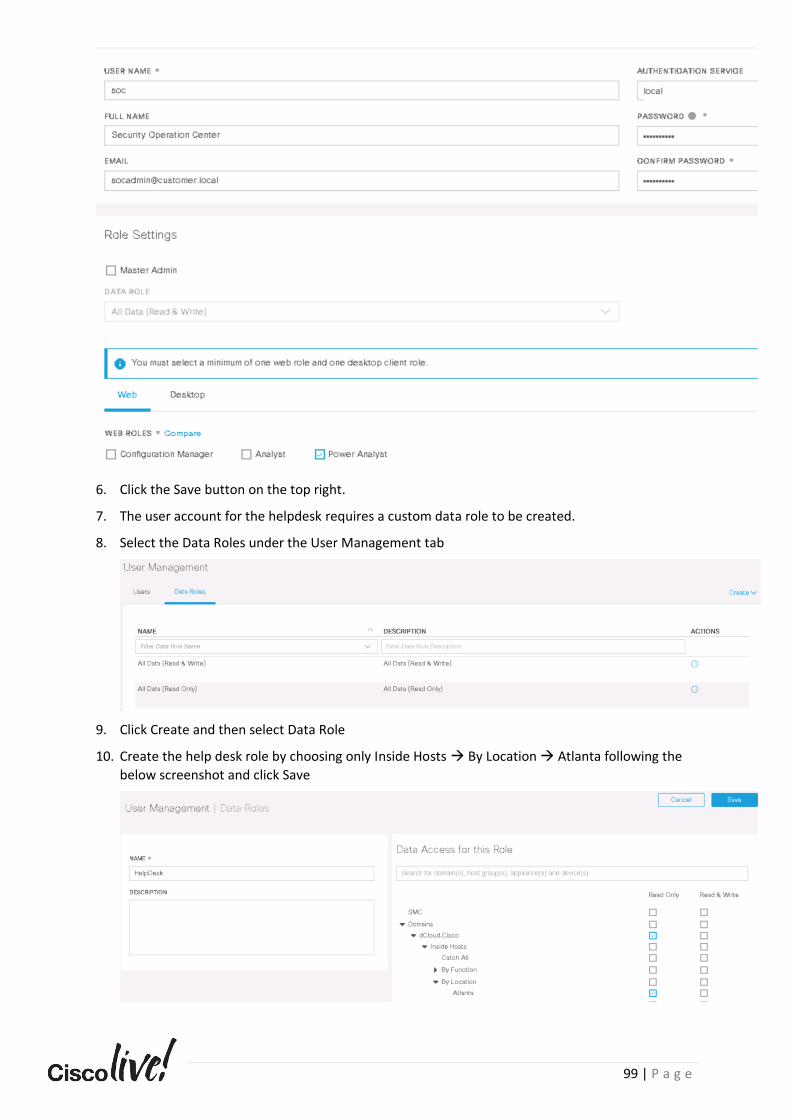
99 | P a g e
6. Click the Save button on the top right.
7. The user account for the helpdesk requires a custom data role to be created.
8. Select the Data Roles under the User Management tab
9. Click Create and then select Data Role
10. Create the help desk role by choosing only Inside Hosts → By Location → Atlanta following the
below screenshot and click Save
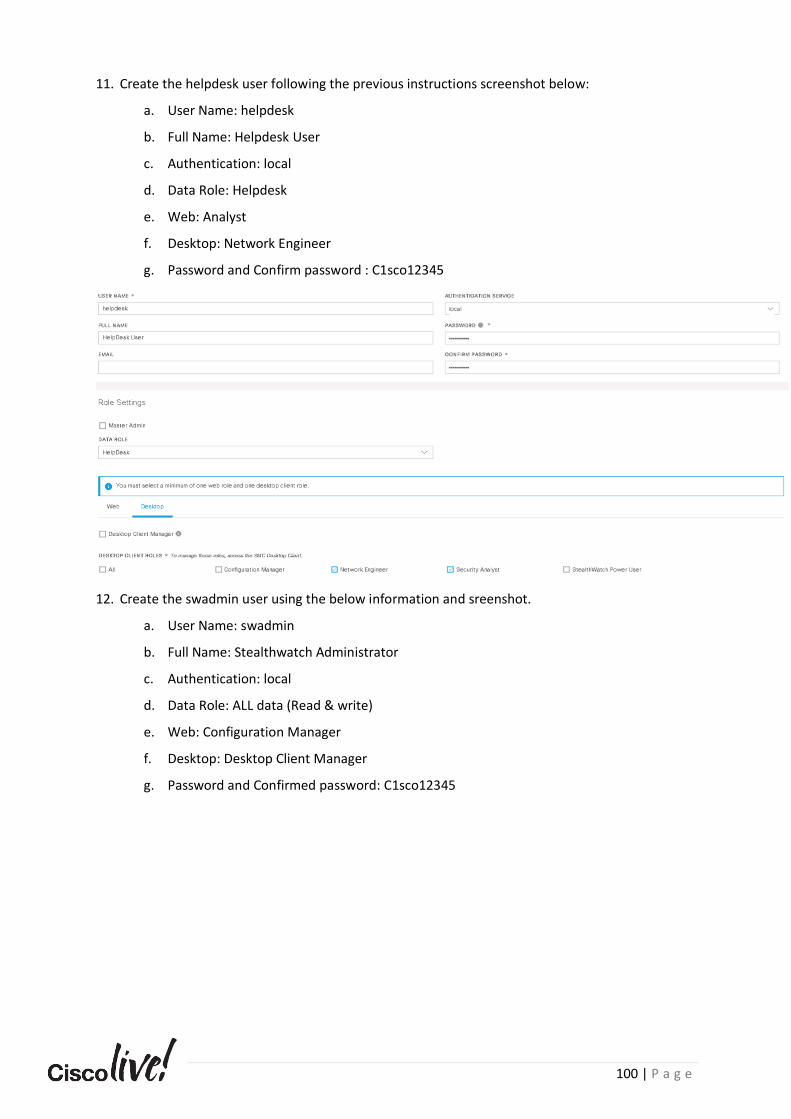
100 | P a g e
11. Create the helpdesk user following the previous instructions screenshot below:
a. User Name: helpdesk
b. Full Name: Helpdesk User
c. Authentication: local
d. Data Role: Helpdesk
e. Web: Analyst
f. Desktop: Network Engineer
g. Password and Confirm password : C1sco12345
12. Create the swadmin user using the below information and sreenshot.
a. User Name: swadmin
b. Full Name: Stealthwatch Administrator
c. Authentication: local
d. Data Role: ALL data (Read & write)
e. Web: Configuration Manager
f. Desktop: Desktop Client Manager
g. Password and Confirmed password: C1sco12345
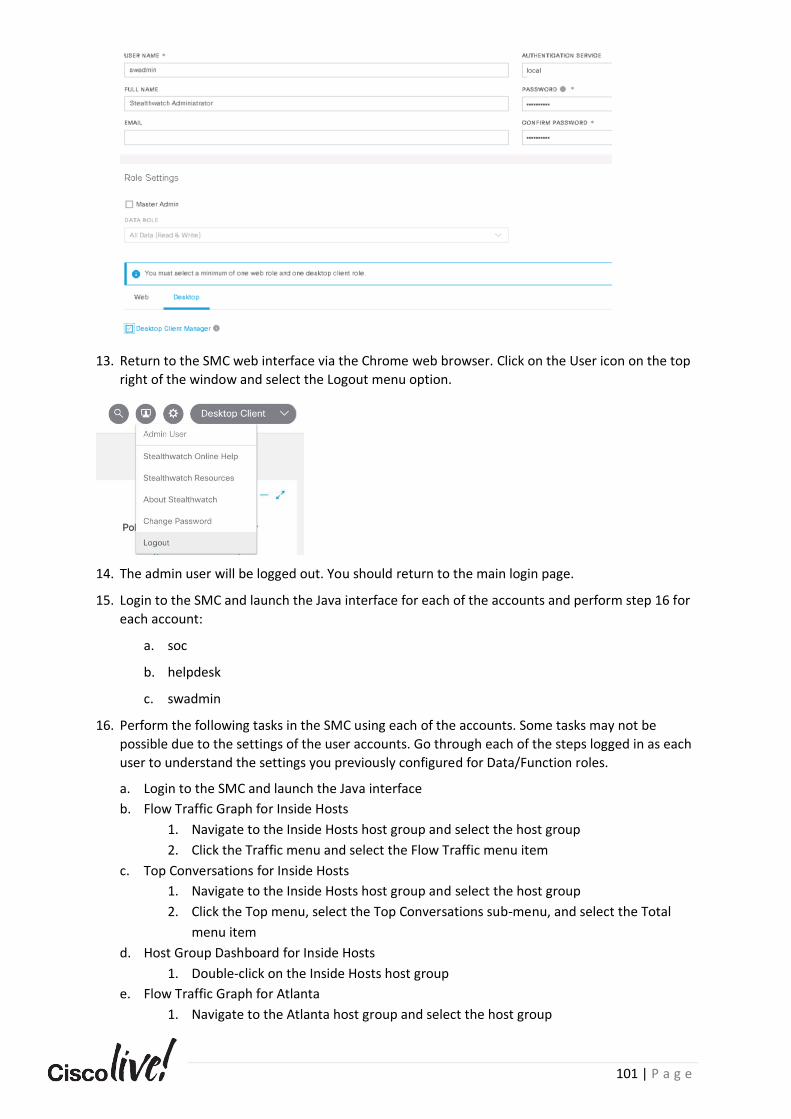
101 | P a g e
13. Return to the SMC web interface via the Chrome web browser. Click on the User icon on the top
right of the window and select the Logout menu option.
14. The admin user will be logged out. You should return to the main login page.
15. Login to the SMC and launch the Java interface for each of the accounts and perform step 16 for
each account:
a. soc
b. helpdesk
c. swadmin
16. Perform the following tasks in the SMC using each of the accounts. Some tasks may not be
possible due to the settings of the user accounts. Go through each of the steps logged in as each
user to understand the settings you previously configured for Data/Function roles.
a. Login to the SMC and launch the Java interface
b. Flow Traffic Graph for Inside Hosts
1. Navigate to the Inside Hosts host group and select the host group
2. Click the Traffic menu and select the Flow Traffic menu item
c. Top Conversations for Inside Hosts
1. Navigate to the Inside Hosts host group and select the host group
2. Click the Top menu, select the Top Conversations sub-menu, and select the Total
menu item
d. Host Group Dashboard for Inside Hosts
1. Double-click on the Inside Hosts host group
e. Flow Traffic Graph for Atlanta
1. Navigate to the Atlanta host group and select the host group
102 | P a g e
2. Click the Traffic menu and select the Flow Traffic menu item
f. Top Conversations for Atlanta
1. Navigate to the Atlanta host group and select the host group
2. Click the Top menu, select the Top Conversations sub-menu, and select the Total
menu item
g. Host Group Dashboard for Atlanta
1. Double-click on the Atlanta host group
h. Flow Collector – Toggle checkmark box for Flow Collector Data Deleted system alarm
1. Navigate to the FCNF01 Flow Collector in the Enterprise tree
2. Click the Configuration menu and select the Properties menu item
3. Choose the System Alarms menu on the left
4. Attempt to toggle the option for Data Deleted and save the change
i. Create new host group under By Location named Brisbane
1. Navigate to the By Location host group
2. Right-click on the By Location host group
3. Click the Configuration menu and select the Add Host Group menu item
Task Summary
You have successfully completed user provisioning. You have worked with different data and
function roles to see the effects of different permissions within the product.
103 | P a g e
Appendix B: Enabling Cognitive Threat Analytics
Cisco Cognitive Threat Analytics (CTA) adds an additional layer of analysis against suspicious web
traffic and/or NetFlow and displays alerts if malicious attempts to establish a presence in your
environment occur, as well as identifying attacks that are already under way. Stealthwatch sends
NetFlow data and proxy web log data (if available) to the CTA cloud for analysis once it is enabled on
the Stealthwatch System.
BE AWARE that enabling this feature in a production environment will send three categories of
data to the Cognitive Data Center in Ireland over SCP and HTTPS: perimeter NetFlow, select
internal DNS traffic and proxy web logs.
Web log data is only sent it you have Stealthwatch proxy ingestion configured.
Only enable this if you have permission. The feature is disabled by default.
To activate the feature, you must enable it on the SMC(s) and FC(s) present in the Stealthwatch
domain. These appliances also require access to hosts on the internet to transmit telemetry data and
receive analysis and alerts.
NOTE: You can enable the feature in this dCloud lab, but due to architecture considerations the
functionality will not work in this environment. These instructions are provided as a reference.
The SMC requires:
• Access to the following over port 443:
AWS Elastic IPs
34.242.41.248
34.242.94.137
34.251.54.105
Cisco Streamline IPs
146.112.59.0/24
208.69.38.0/24
The FC Requires:
• Access to the following over port 443:
AWS Elastic IPs
34.242.41.248
34.242.94.137
34.251.54.105
34.251.210.21
34.255.162.33
54.194.49.205
Cisco Streamline IPs
146.112.59.0/24
208.69.38.0/24
NOTE: If public DNS is not allowed, you will need to configure the resolution locally on the
Stealthwatch Management Console(s) and Flow Collector(s).
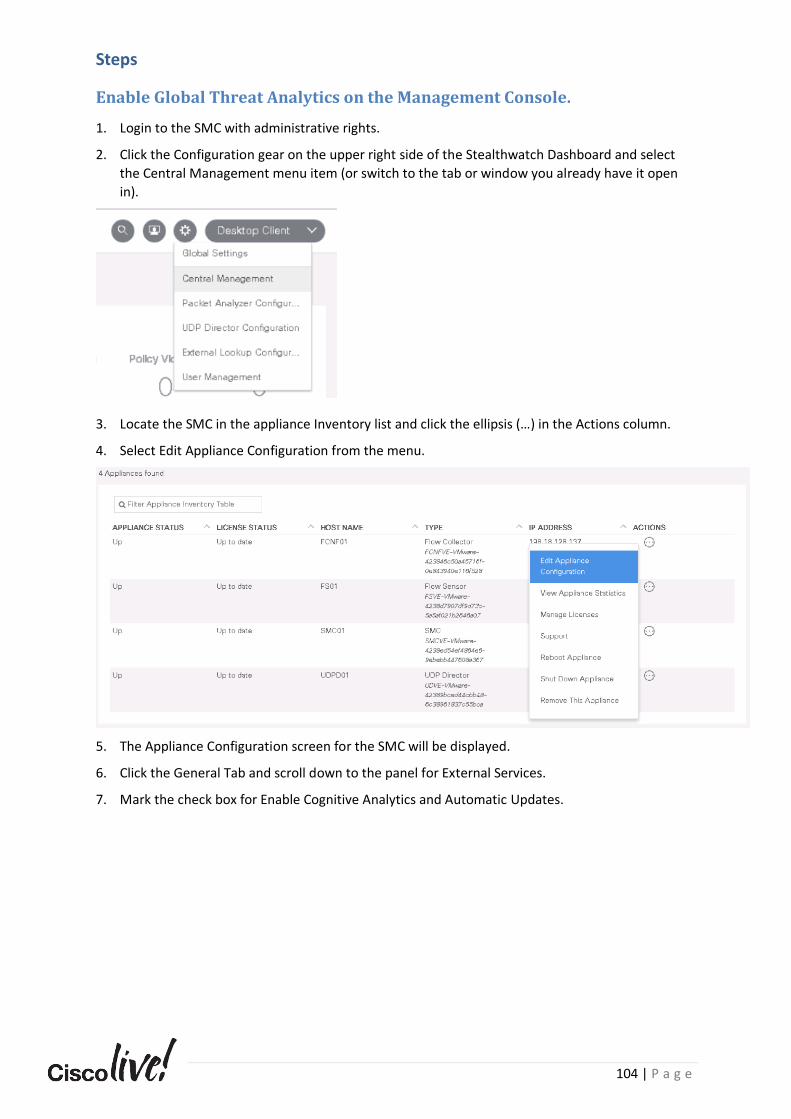
104 | P a g e
Steps
Enable Global Threat Analytics on the Management Console.
1. Login to the SMC with administrative rights.
2. Click the Configuration gear on the upper right side of the Stealthwatch Dashboard and select
the Central Management menu item (or switch to the tab or window you already have it open
in).
3. Locate the SMC in the appliance Inventory list and click the ellipsis (…) in the Actions column.
4. Select Edit Appliance Configuration from the menu.
5. The Appliance Configuration screen for the SMC will be displayed.
6. Click the General Tab and scroll down to the panel for External Services.
7. Mark the check box for Enable Cognitive Analytics and Automatic Updates.
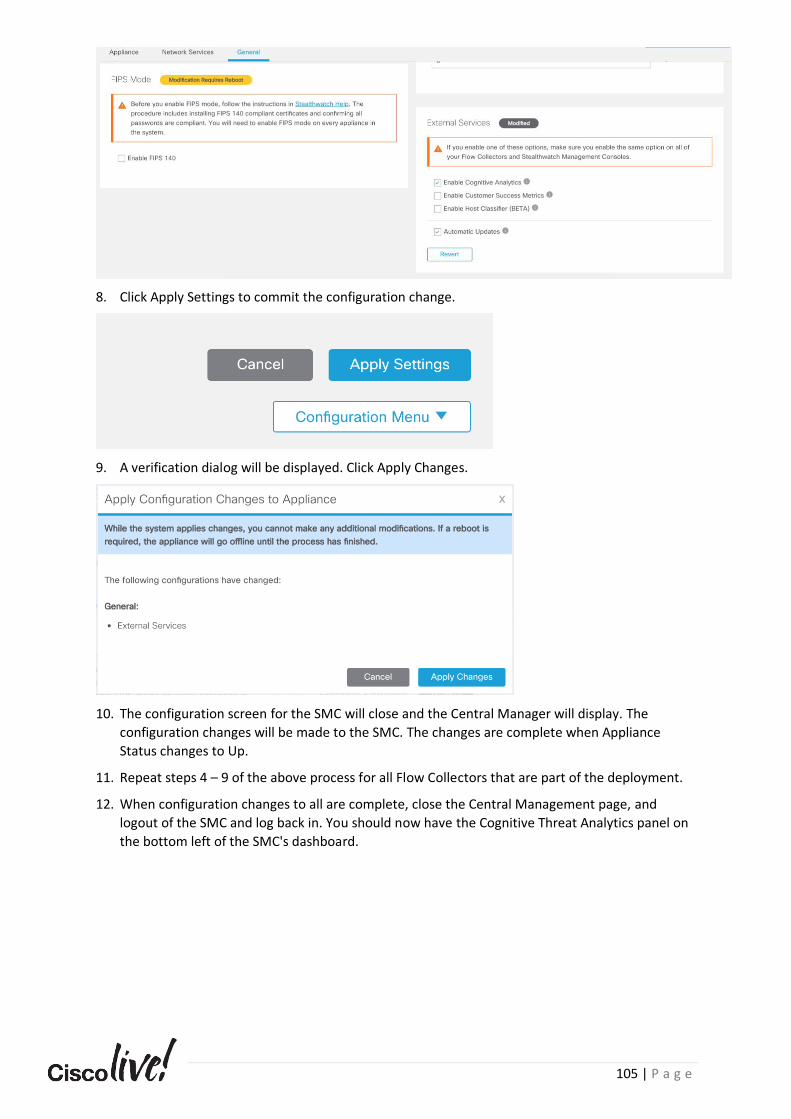
105 | P a g e
8. Click Apply Settings to commit the configuration change.
9. A verification dialog will be displayed. Click Apply Changes.
10. The configuration screen for the SMC will close and the Central Manager will display. The
configuration changes will be made to the SMC. The changes are complete when Appliance
Status changes to Up.
11. Repeat steps 4 – 9 of the above process for all Flow Collectors that are part of the deployment.
12. When configuration changes to all are complete, close the Central Management page, and
logout of the SMC and log back in. You should now have the Cognitive Threat Analytics panel on
the bottom left of the SMC's dashboard.
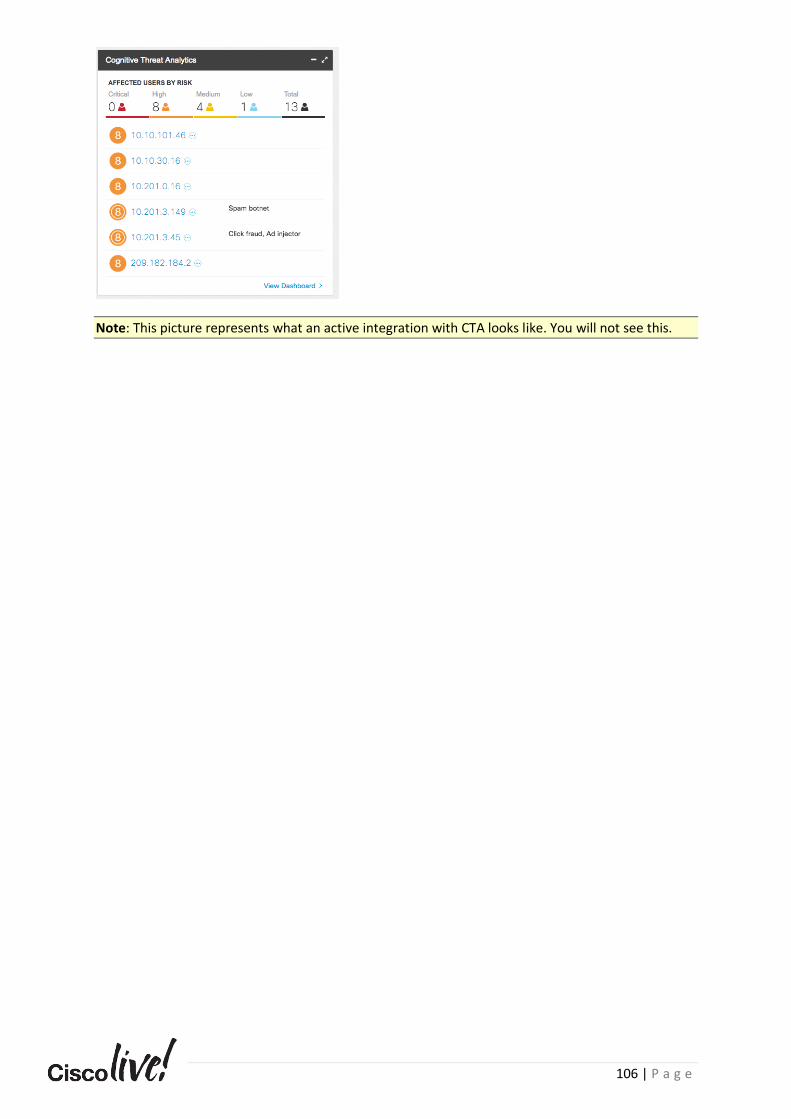
106 | P a g e
Note: This picture represents what an active integration with CTA looks like. You will not see this.
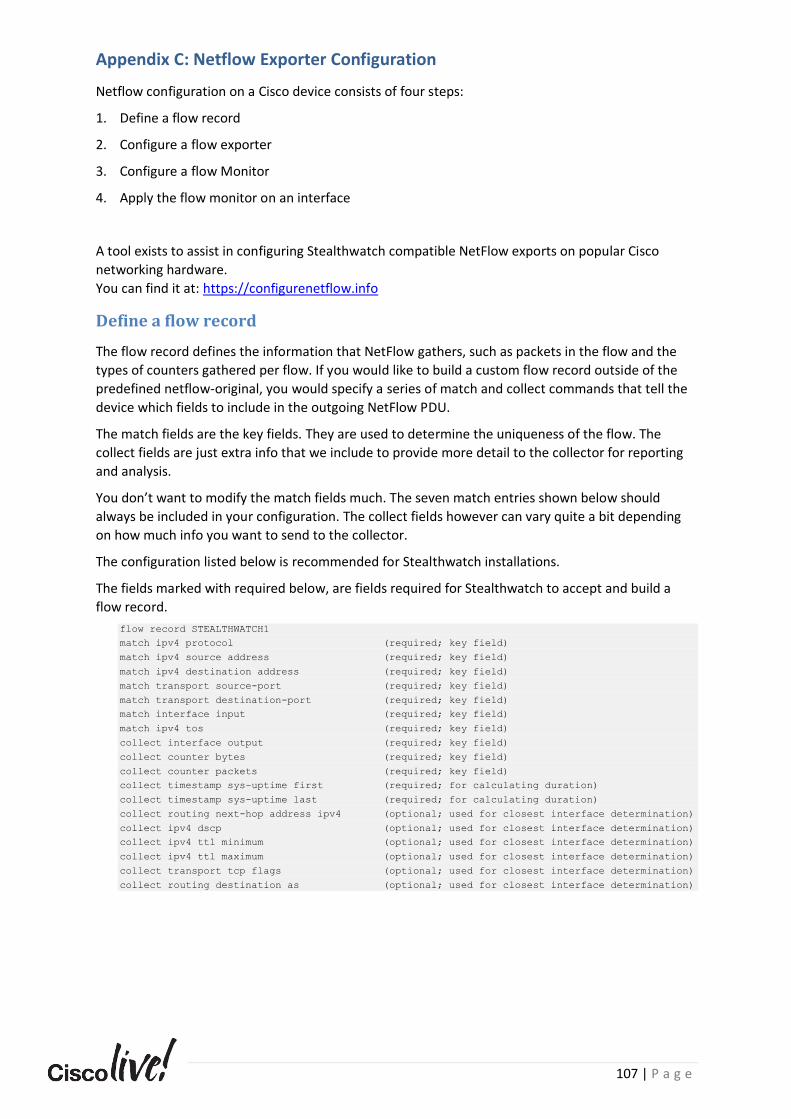
107 | P a g e
Appendix C: Netflow Exporter Configuration
Netflow configuration on a Cisco device consists of four steps:
1. Define a flow record
2. Configure a flow exporter
3. Configure a flow Monitor
4. Apply the flow monitor on an interface
A tool exists to assist in configuring Stealthwatch compatible NetFlow exports on popular Cisco
networking hardware.
You can find it at: https://configurenetflow.info
Define a flow record
The flow record defines the information that NetFlow gathers, such as packets in the flow and the
types of counters gathered per flow. If you would like to build a custom flow record outside of the
predefined netflow-original, you would specify a series of match and collect commands that tell the
device which fields to include in the outgoing NetFlow PDU.
The match fields are the key fields. They are used to determine the uniqueness of the flow. The
collect fields are just extra info that we include to provide more detail to the collector for reporting
and analysis.
You don’t want to modify the match fields much. The seven match entries shown below should
always be included in your configuration. The collect fields however can vary quite a bit depending
on how much info you want to send to the collector.
The configuration listed below is recommended for Stealthwatch installations.
The fields marked with required below, are fields required for Stealthwatch to accept and build a
flow record.
flow record STEALTHWATCH1
match ipv4 protocol (required; key field)
match ipv4 source address (required; key field)
match ipv4 destination address (required; key field)
match transport source-port (required; key field)
match transport destination-port (required; key field)
match interface input (required; key field)
match ipv4 tos (required; key field)
collect interface output (required; key field)
collect counter bytes (required; key field)
collect counter packets (required; key field)
collect timestamp sys-uptime first (required; for calculating duration)
collect timestamp sys-uptime last (required; for calculating duration)
collect routing next-hop address ipv4 (optional; used for closest interface determination)
collect ipv4 dscp (optional; used for closest interface determination)
collect ipv4 ttl minimum (optional; used for closest interface determination)
collect ipv4 ttl maximum (optional; used for closest interface determination)
collect transport tcp flags (optional; used for closest interface determination)
collect routing destination as (optional; used for closest interface determination)
108 | P a g e
Define the Flow Exporter
Once the Flow Record has been created you would tie it to a Flow exporter
Flow Exporter configuration defines the physical or virtual Flow Collector IP Address to which
NetFlow data is sent. It also defines the source interface from which the Flow Exporter device will
send NetFlow data, this can be a physical or logical address; it is also worth considering using a
Loopback interface to source NetFlow data from as a Loopback typically will remain up even when
other interfaces fail therefore enabling continuous transport (where routing permits) This is also
where the transport protocol (TCP or UDP) and destination port is defined; the destination port is
specific to the NetFlow Collector and in this case refers to the port used by the Stealthwatch Flow
Collector.
To define a Flow Exporter, follow these steps:
flow exporter Stealthwatch_Exporter
description Stealthwatch Export to Flow Collector
destination [Collector_IP_Address]
source [Physical_Interface | Logical_Interface]
transport udp 2055
Define the Flow Monitor
A Flow Monitor ties all of the construct together, referencing the Flow Exporter and the Flow
Record. To define a Flow Monitor, follow these steps:
flow monitor Stealthwatch_Monitor
description Stealthwatch Flow Monitor
exporter Stealthwatch_Exporter
cache timeout active 60
record STEALTHWATCH1
Note the cache timeout line above, this is the recommended setting for Stealthwatch. The default
setting on Cisco devices is 30 minutes which is too long for anomaly reporting.
The Flow Monitor configuration ties the previously configured Flow Exporter and Flow Record
together, the naming convention can be whatever you chose providing you refer to the correct
name; using context sensitive help in IOS will help as it will always show any previously configured
parameters.
See below for an example of how context sensitive help reminds you of configured Flow Records and
Flow Exporters as well as system default Records which are available.
BR_ASW1(config)#flow monitor STEALTHWATCH_MONITOR
BR_ASW1(config-flow-monitor)#record ?
STEALTHWATCH_RECORD User defined
wireless Templates for Wireless Traffic
BR_ASW1(config-flow-monitor)#exporter ?
STEALTHWATCH_EXPORTER Stealthwatch Export to Flow Collector
Finally, you need to apply all of the above NetFlow configuration to each interface on which you
require flow analysis with the following:
109 | P a g e
Apply the flow monitor to interfaces interface [Interface_ID]
ip flow monitor Stealthwatch_Monitor input
Below are examples of Netflow configurations:
Cisco NetFlow Configuration
Commands for configuring NetFlow record, fields may differ depending on platform.
flow record Stealthwatch_FlowRecord
description Flow Record for Export to Stealthwatch (optional)
match ipv4 source address
match ipv4 destination address
match ipv4 protocol
match ipv4 tos
match transport source-port
match transport destination-port
match interface input
match flow direction
collect routing next-hop address ipv4
collect ipv4 dscp
collect ipv4 ttl minimum
collect ipv4 ttl maximum
collect transport tcp flags
collect interface output
collect counter bytes
collect counter packets
collect timestamp sys-uptime first
collect timestamp sys-uptime last
TrustSec Specific Match Fields match flow cts source group-tag
match flow cts destination group-tag
NBAR2 Specific collection (where protocol pack is active on router) collect application name
collect application http url
collect application http host
AVC Specific fields collect connection initiator
collect connection new-connections
collect connection sum-duration
collect connection delay response to-server sum
collect connection delay response to-server min
collect connection delay response to-server max
collect connection server counter responses
collect connection delay response to-server histogram late
collect connection delay network to-server sum
collect connection delay network to-client sum
collect connection client counter packets retransmitted
collect connection delay network client-to-server sum
collect connection delay application sum
collect connection delay application min
collect connection delay application max
collect connection delay response client-to-server sum
collect connection transaction duration sum
collect connection transaction counter complete
collect connection server counter packets long
collect connection client counter packets long

110 | P a g e
collect connection client counter bytes retransmitted
collect connection server counter bytes network long
collect connection client counter bytes network long
collect connection delay network client-to-server num-samples
collect connection delay network to-server num-samples
collect connection delay network to-client num-samples
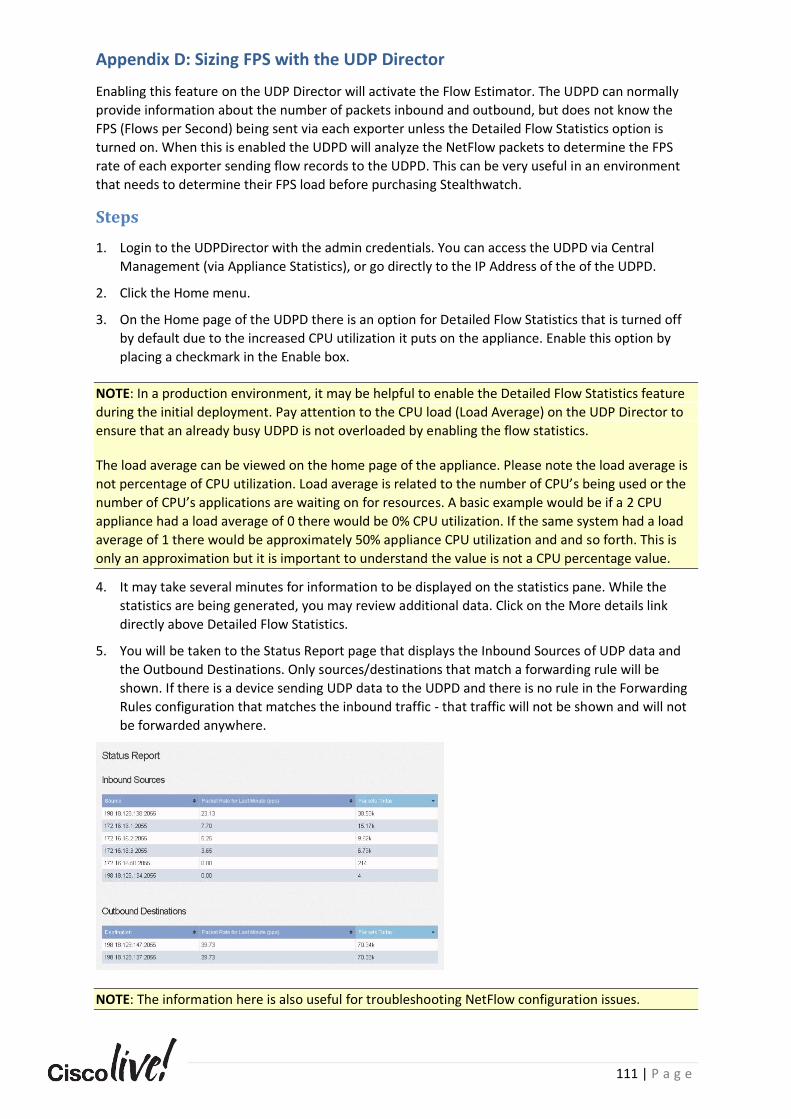
111 | P a g e
Appendix D: Sizing FPS with the UDP Director
Enabling this feature on the UDP Director will activate the Flow Estimator. The UDPD can normally
provide information about the number of packets inbound and outbound, but does not know the
FPS (Flows per Second) being sent via each exporter unless the Detailed Flow Statistics option is
turned on. When this is enabled the UDPD will analyze the NetFlow packets to determine the FPS
rate of each exporter sending flow records to the UDPD. This can be very useful in an environment
that needs to determine their FPS load before purchasing Stealthwatch.
Steps
1. Login to the UDPDirector with the admin credentials. You can access the UDPD via Central
Management (via Appliance Statistics), or go directly to the IP Address of the of the UDPD.
2. Click the Home menu.
3. On the Home page of the UDPD there is an option for Detailed Flow Statistics that is turned off
by default due to the increased CPU utilization it puts on the appliance. Enable this option by
placing a checkmark in the Enable box.
NOTE: In a production environment, it may be helpful to enable the Detailed Flow Statistics feature
during the initial deployment. Pay attention to the CPU load (Load Average) on the UDP Director to
ensure that an already busy UDPD is not overloaded by enabling the flow statistics.
The load average can be viewed on the home page of the appliance. Please note the load average is
not percentage of CPU utilization. Load average is related to the number of CPU’s being used or the
number of CPU’s applications are waiting on for resources. A basic example would be if a 2 CPU
appliance had a load average of 0 there would be 0% CPU utilization. If the same system had a load
average of 1 there would be approximately 50% appliance CPU utilization and and so forth. This is
only an approximation but it is important to understand the value is not a CPU percentage value.
4. It may take several minutes for information to be displayed on the statistics pane. While the
statistics are being generated, you may review additional data. Click on the More details link
directly above Detailed Flow Statistics.
5. You will be taken to the Status Report page that displays the Inbound Sources of UDP data and
the Outbound Destinations. Only sources/destinations that match a forwarding rule will be
shown. If there is a device sending UDP data to the UDPD and there is no rule in the Forwarding
Rules configuration that matches the inbound traffic - that traffic will not be shown and will not
be forwarded anywhere.
NOTE: The information here is also useful for troubleshooting NetFlow configuration issues.
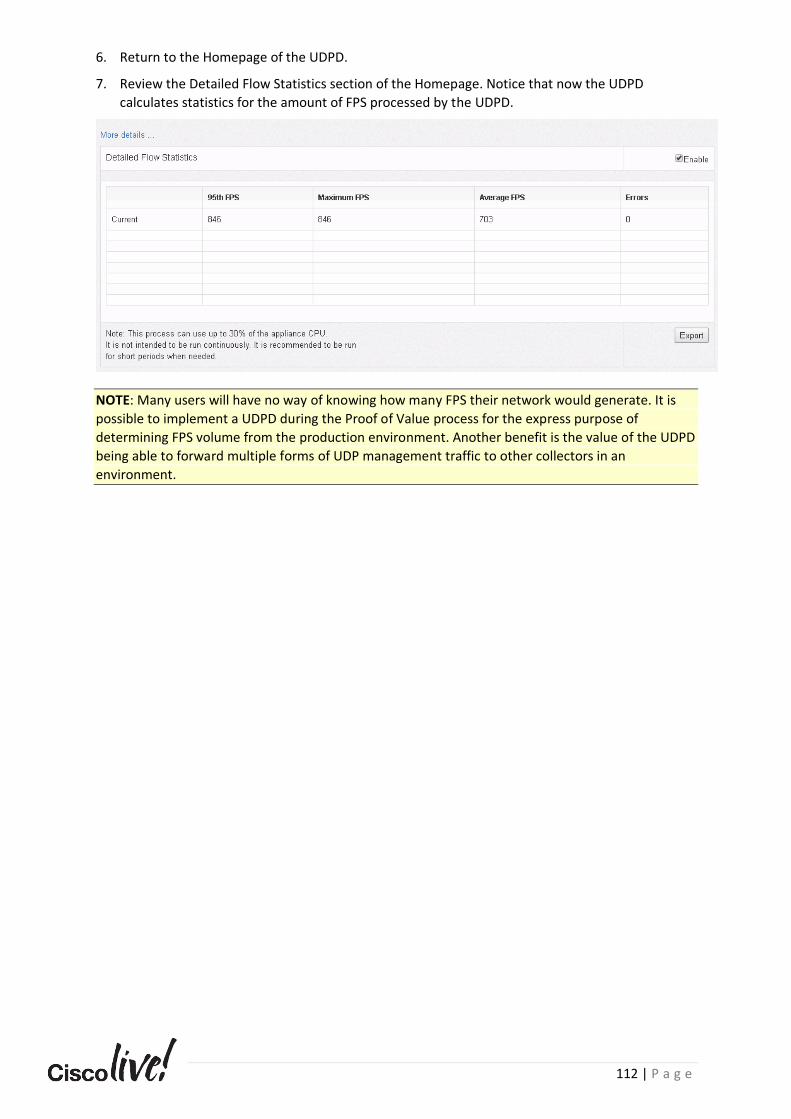
112 | P a g e
6. Return to the Homepage of the UDPD.
7. Review the Detailed Flow Statistics section of the Homepage. Notice that now the UDPD
calculates statistics for the amount of FPS processed by the UDPD.
NOTE: Many users will have no way of knowing how many FPS their network would generate. It is
possible to implement a UDPD during the Proof of Value process for the express purpose of
determining FPS volume from the production environment. Another benefit is the value of the UDPD
being able to forward multiple forms of UDP management traffic to other collectors in an
environment.
113 | P a g e
Appendix E: Deploying Stealthwatch OVFs
This lab skips the initial OVF deployment and assignment/configuration of management IP addresses
for the Stealthwatch appliances. Those steps are outlined here for your reference.
Steps
Adding the Resource Pool
To add a resource pool for a virtual appliance on the ESX server where it will reside, complete the
following steps:
1. Launch the VMware vSphere client software. The Login dialog opens.
2. Enter the IP address of the ESX server and your login credentials, and then click Login.
3. The Getting Started page opens.
4. In the Inventory tree on the left, right-click the ESX server IP address, and then select New
Resource Pool from the popup menu.
5. The Create Resource Pool dialog opens.
6. In the Name field, type the name you want to use to identify this resource group.
7. Do not change any of the settings in the CPU Resources section.
8. In the Memory Resources section, do the following:
9. Change the Limit field to at least 32 GB (40 GB recommended for SMC+FC duo, more if
implementing a larger scale installation. See the VM Requirements Appendix for guidance on
sizing the amount to reserve for appliances).
10. Click the Unlimited checkbox to clear it.
11. Click OK.
12. The resource pool appears beneath the ESX server on the Inventory tree.
13. Select the resource pool, and then click the Resource Allocation tab to review the CPU and
memory resource allocations.
Deploying the OVF
To install a virtual appliance on the ESX server and define the virtual appliance management and
monitoring ports, complete the following steps:
1. Unzip the virtual appliance software (OVF) file
2. On the vSphere client menu, click File > Deploy OVF Template.
a. The Deploy OVF Template wizard opens.
3. Click Browse, and then navigate to select the virtual appliance OVF file.
4. Click Next to display the OVF Template Details page.
5. Click Next. The End User License Agreement opens.
6. After reviewing the information, click Accept, and then click Next.
a. The Name and Location page opens.
7. If desired, change the name for the virtual appliance as it will appear in the Inventory tree, and
then click Next.

114 | P a g e
8. The Disk Format page opens.
9. On the Disk Format page, select Thick provisioned format, and then click Next.
10. Click Next.
a. The Ready to Complete page opens with a summary of the settings.
11. After reviewing the settings, click Finish.
a. A progress dialog opens.
12. When the deployment is completed, click Close to close the progress dialog.
a. The virtual appliance appears in the Inventory tree.
Configure Appliance IPs
To configure the IP addresses for a virtual appliance, complete the following steps:
1. Launch the vSphere Client software and log in.
a. The Getting Started page opens.
2. In the Inventory tree, select the Stealthwatch virtual appliance you want to configure.
3. On the Getting Started page, click the Power on the virtual machine link.
4. Click the Console tab. Allow the virtual appliance to finish booting up.
5. Login to the appliance with the default root credentials: root / lan1cope
6. On the command line, enter the command: SystemConfig
7. Select the Management menu option.
a. The virtual appliance Administrative IP Address page opens.
8. Click on the page, and then enter the IP address for the virtual appliance.
9. Select OK, and then press Enter.
a. The IP Netmask page opens with the default network mask IP address.
10. Do the following:
a. Accept the default value or enter a new one based on your environment.
b. Select OK and press Enter to continue.
c. The IP Broadcast Address page opens with the default broadcast IP address.
11. Do the following:
a. Accept the default value or enter a new one based on your environment.
b. Select OK and press Enter to continue.
c. The Gateway Address page opens with the default gateway server IP address.
12. Do the following:
a. Accept the default value or enter a new one based on your environment.
b. Select OK and press Enter to continue.
c. A page opens showing a summary of your entries.
13. Press Enter. The system restart page opens.
14. Press Enter.

115 | P a g e
a. The system restarts and implements the changes.
b. On completion, a login prompt appears.
For detailed installation directions, see the Online Stealthwatch Resources Appendix.
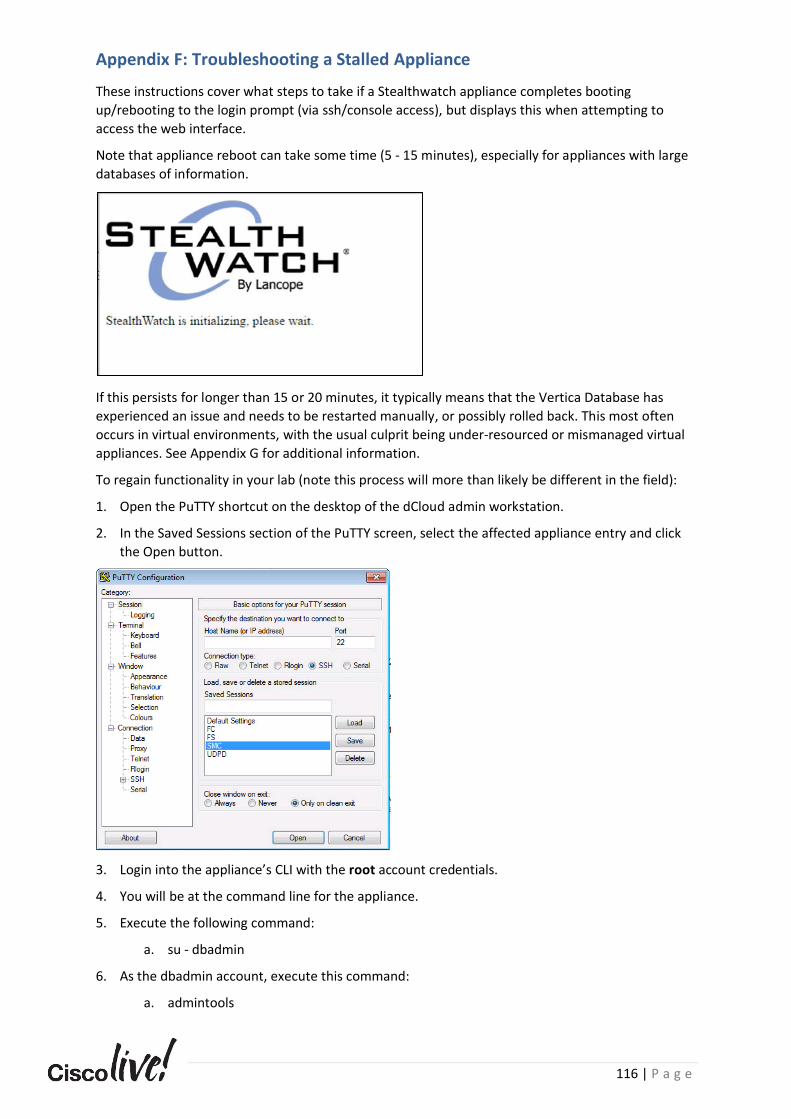
116 | P a g e
Appendix F: Troubleshooting a Stalled Appliance
These instructions cover what steps to take if a Stealthwatch appliance completes booting
up/rebooting to the login prompt (via ssh/console access), but displays this when attempting to
access the web interface.
Note that appliance reboot can take some time (5 - 15 minutes), especially for appliances with large
databases of information.
If this persists for longer than 15 or 20 minutes, it typically means that the Vertica Database has
experienced an issue and needs to be restarted manually, or possibly rolled back. This most often
occurs in virtual environments, with the usual culprit being under-resourced or mismanaged virtual
appliances. See Appendix G for additional information.
To regain functionality in your lab (note this process will more than likely be different in the field):
1. Open the PuTTY shortcut on the desktop of the dCloud admin workstation.
2. In the Saved Sessions section of the PuTTY screen, select the affected appliance entry and click
the Open button.
3. Login into the appliance’s CLI with the root account credentials.
4. You will be at the command line for the appliance.
5. Execute the following command:
a. su - dbadmin
6. As the dbadmin account, execute this command:
a. admintools
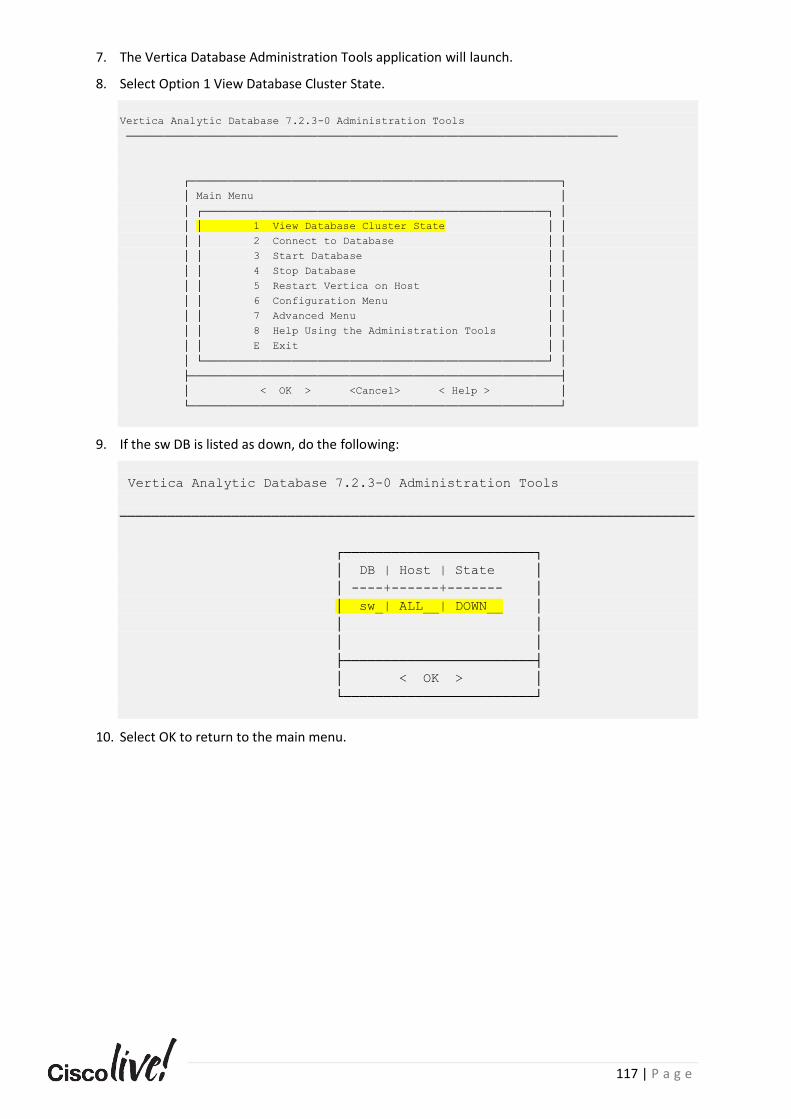
117 | P a g e
7. The Vertica Database Administration Tools application will launch.
8. Select Option 1 View Database Cluster State.
Vertica Analytic Database 7.2.3-0 Administration Tools
─────────────────────────────────────────────────────────────────────────────
┌──────────────────────────────────────────────────────────┐
│ Main Menu │
│ ┌──────────────────────────────────────────────────────┐ │
│ │ 1 View Database Cluster State │ │
│ │ 2 Connect to Database │ │
│ │ 3 Start Database │ │
│ │ 4 Stop Database │ │
│ │ 5 Restart Vertica on Host │ │
│ │ 6 Configuration Menu │ │
│ │ 7 Advanced Menu │ │
│ │ 8 Help Using the Administration Tools │ │
│ │ E Exit │ │
│ └──────────────────────────────────────────────────────┘ │
├──────────────────────────────────────────────────────────┤
│ < OK > <Cancel> < Help > │
└──────────────────────────────────────────────────────────┘
9. If the sw DB is listed as down, do the following:
Vertica Analytic Database 7.2.3-0 Administration Tools
────────────────────────────────────────────────────────────────────────
┌────────────────────────┐
│ DB | Host | State │
│ ----+------+------- │
│ sw_| ALL__| DOWN__ │
│ │
│ │
├────────────────────────┤
│ < OK > │
└────────────────────────┘
10. Select OK to return to the main menu.
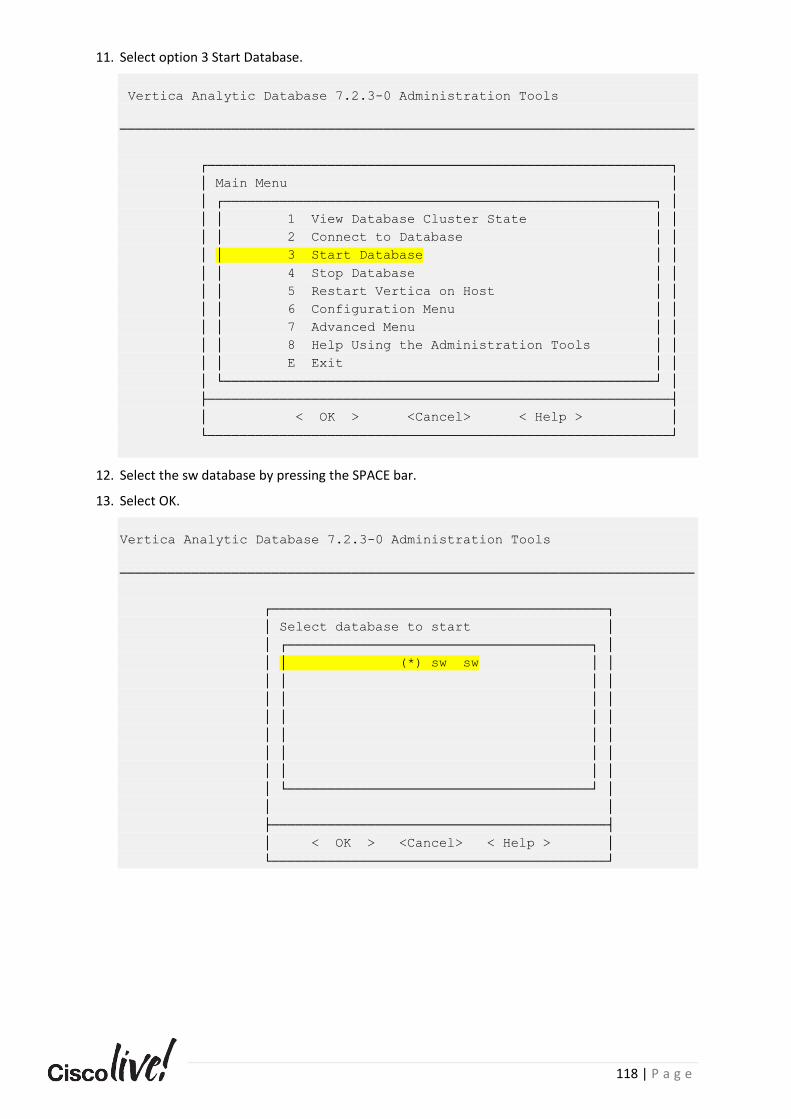
118 | P a g e
11. Select option 3 Start Database.
Vertica Analytic Database 7.2.3-0 Administration Tools
────────────────────────────────────────────────────────────────────────
┌──────────────────────────────────────────────────────────┐
│ Main Menu │
│ ┌──────────────────────────────────────────────────────┐ │
│ │ 1 View Database Cluster State │ │
│ │ 2 Connect to Database │ │
│ │ 3 Start Database │ │
│ │ 4 Stop Database │ │
│ │ 5 Restart Vertica on Host │ │
│ │ 6 Configuration Menu │ │
│ │ 7 Advanced Menu │ │
│ │ 8 Help Using the Administration Tools │ │
│ │ E Exit │ │
│ └──────────────────────────────────────────────────────┘ │
├──────────────────────────────────────────────────────────┤
│ < OK > <Cancel> < Help > │
└──────────────────────────────────────────────────────────┘
12. Select the sw database by pressing the SPACE bar.
13. Select OK.
Vertica Analytic Database 7.2.3-0 Administration Tools
────────────────────────────────────────────────────────────────────────
┌──────────────────────────────────────────┐
│ Select database to start │
│ ┌──────────────────────────────────────┐ │
│ │ (*) sw sw │ │
│ │ │ │
│ │ │ │
│ │ │ │
│ │ │ │
│ │ │ │
│ │ │ │
│ └──────────────────────────────────────┘ │
│ │
├──────────────────────────────────────────┤
│ < OK > <Cancel> < Help > │
└──────────────────────────────────────────┘
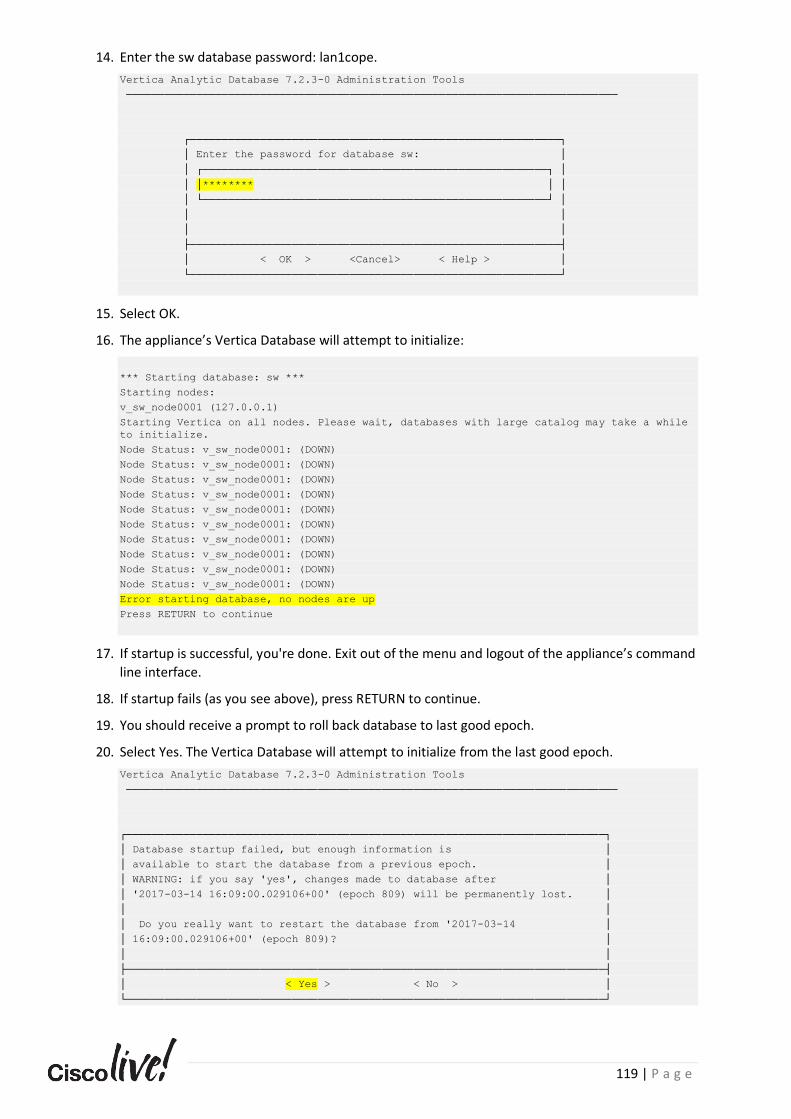
119 | P a g e
14. Enter the sw database password: lan1cope.
Vertica Analytic Database 7.2.3-0 Administration Tools
─────────────────────────────────────────────────────────────────────────────
┌──────────────────────────────────────────────────────────┐
│ Enter the password for database sw: │
│ ┌──────────────────────────────────────────────────────┐ │
│ │******** │ │
│ └──────────────────────────────────────────────────────┘ │
│ │
│ │
├──────────────────────────────────────────────────────────┤
│ < OK > <Cancel> < Help > │
└──────────────────────────────────────────────────────────┘
15. Select OK.
16. The appliance’s Vertica Database will attempt to initialize:
*** Starting database: sw ***
Starting nodes:
v_sw_node0001 (127.0.0.1)
Starting Vertica on all nodes. Please wait, databases with large catalog may take a while
to initialize.
Node Status: v_sw_node0001: (DOWN)
Node Status: v_sw_node0001: (DOWN)
Node Status: v_sw_node0001: (DOWN)
Node Status: v_sw_node0001: (DOWN)
Node Status: v_sw_node0001: (DOWN)
Node Status: v_sw_node0001: (DOWN)
Node Status: v_sw_node0001: (DOWN)
Node Status: v_sw_node0001: (DOWN)
Node Status: v_sw_node0001: (DOWN)
Node Status: v_sw_node0001: (DOWN)
Error starting database, no nodes are up
Press RETURN to continue
17. If startup is successful, you're done. Exit out of the menu and logout of the appliance’s command
line interface.
18. If startup fails (as you see above), press RETURN to continue.
19. You should receive a prompt to roll back database to last good epoch.
20. Select Yes. The Vertica Database will attempt to initialize from the last good epoch.
Vertica Analytic Database 7.2.3-0 Administration Tools
─────────────────────────────────────────────────────────────────────────────
┌───────────────────────────────────────────────────────────────────────────┐
│ Database startup failed, but enough information is │
│ available to start the database from a previous epoch. │
│ WARNING: if you say 'yes', changes made to database after │
│ '2017-03-14 16:09:00.029106+00' (epoch 809) will be permanently lost. │
│ │
│ Do you really want to restart the database from '2017-03-14 │
│ 16:09:00.029106+00' (epoch 809)? │
│ │
├───────────────────────────────────────────────────────────────────────────┤
│ < Yes > < No > │
└───────────────────────────────────────────────────────────────────────────┘
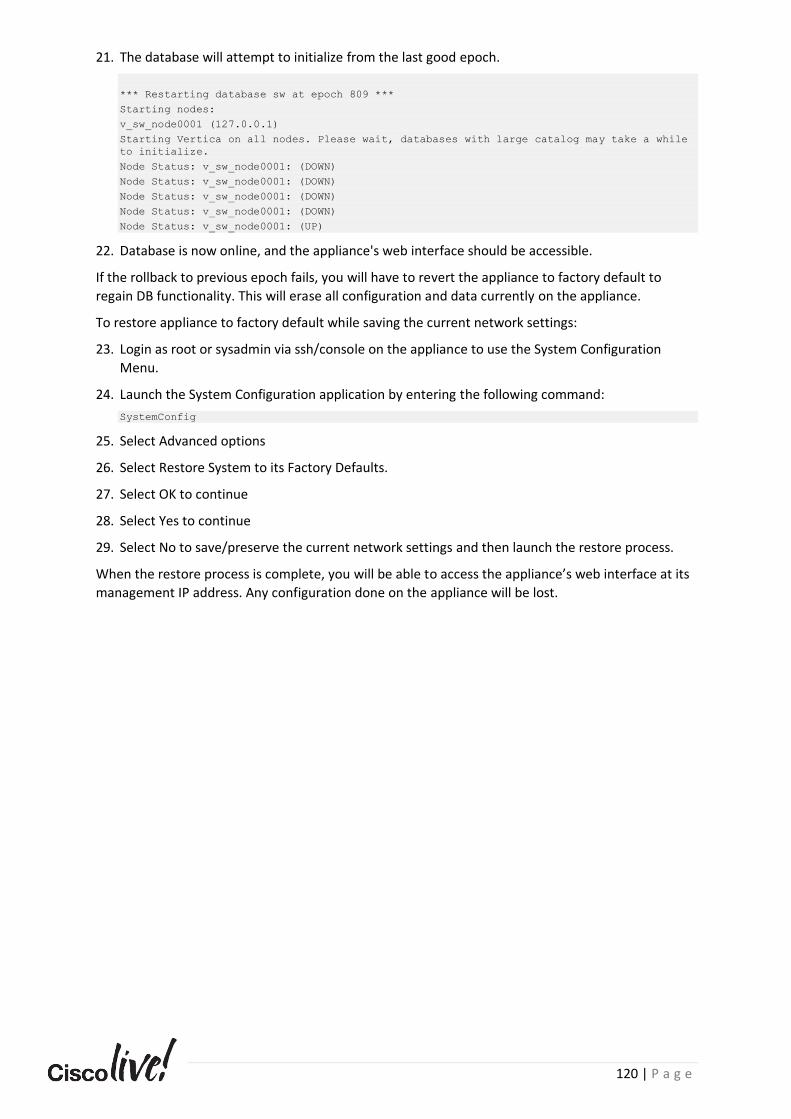
120 | P a g e
21. The database will attempt to initialize from the last good epoch.
*** Restarting database sw at epoch 809 ***
Starting nodes:
v_sw_node0001 (127.0.0.1)
Starting Vertica on all nodes. Please wait, databases with large catalog may take a while
to initialize.
Node Status: v_sw_node0001: (DOWN)
Node Status: v_sw_node0001: (DOWN)
Node Status: v_sw_node0001: (DOWN)
Node Status: v_sw_node0001: (DOWN)
Node Status: v_sw_node0001: (UP)
22. Database is now online, and the appliance's web interface should be accessible.
If the rollback to previous epoch fails, you will have to revert the appliance to factory default to
regain DB functionality. This will erase all configuration and data currently on the appliance.
To restore appliance to factory default while saving the current network settings:
23. Login as root or sysadmin via ssh/console on the appliance to use the System Configuration
Menu.
24. Launch the System Configuration application by entering the following command:
SystemConfig
25. Select Advanced options
26. Select Restore System to its Factory Defaults.
27. Select OK to continue
28. Select Yes to continue
29. Select No to save/preserve the current network settings and then launch the restore process.
When the restore process is complete, you will be able to access the appliance’s web interface at its
management IP address. Any configuration done on the appliance will be lost.
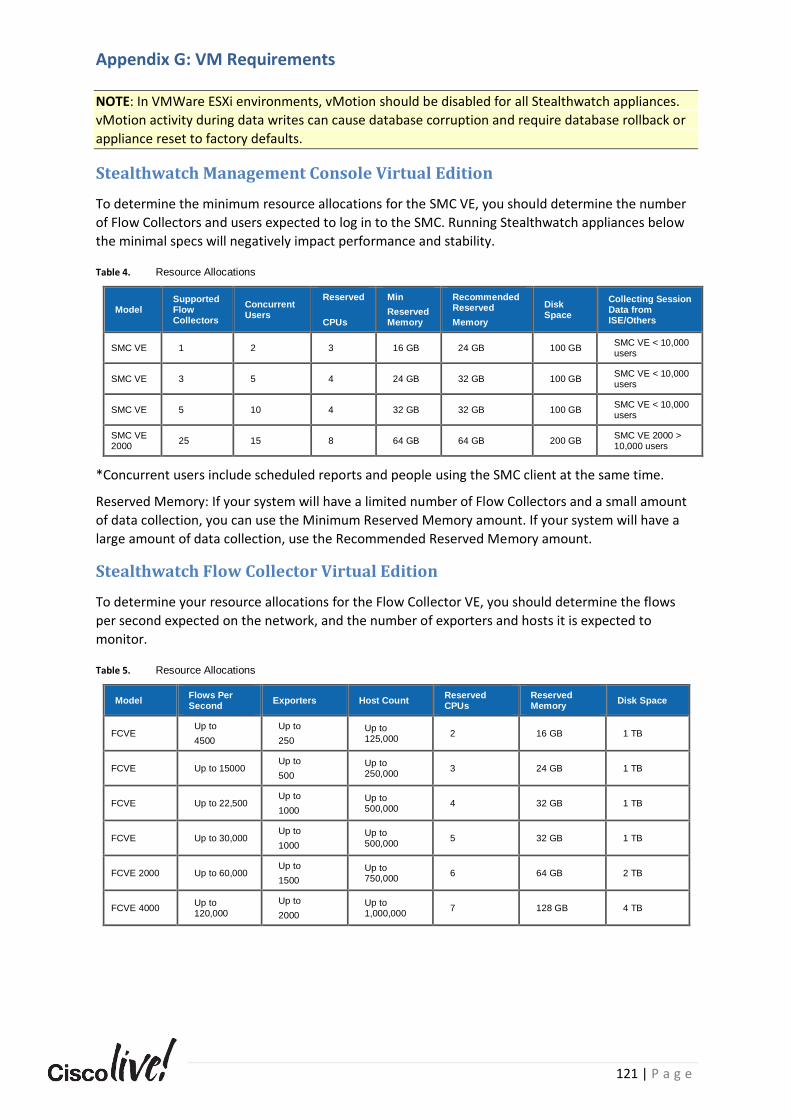
121 | P a g e
Appendix G: VM Requirements
NOTE: In VMWare ESXi environments, vMotion should be disabled for all Stealthwatch appliances.
vMotion activity during data writes can cause database corruption and require database rollback or
appliance reset to factory defaults.
Stealthwatch Management Console Virtual Edition
To determine the minimum resource allocations for the SMC VE, you should determine the number
of Flow Collectors and users expected to log in to the SMC. Running Stealthwatch appliances below
the minimal specs will negatively impact performance and stability.
Table 4. Resource Allocations
Model Supported Flow Collectors
Concurrent Users
Reserved
CPUs
Min
ReservedMemory
Recommended Reserved
Memory
Disk Space
Collecting Session Data from ISE/Others
SMC VE 1 2 3 16 GB 24 GB 100 GB SMC VE < 10,000 users
SMC VE 3 5 4 24 GB 32 GB 100 GB SMC VE < 10,000 users
SMC VE 5 10 4 32 GB 32 GB 100 GB SMC VE < 10,000 users
SMC VE 2000
25 15 8 64 GB 64 GB 200 GB SMC VE 2000 > 10,000 users
*Concurrent users include scheduled reports and people using the SMC client at the same time.
Reserved Memory: If your system will have a limited number of Flow Collectors and a small amount
of data collection, you can use the Minimum Reserved Memory amount. If your system will have a
large amount of data collection, use the Recommended Reserved Memory amount.
Stealthwatch Flow Collector Virtual Edition
To determine your resource allocations for the Flow Collector VE, you should determine the flows
per second expected on the network, and the number of exporters and hosts it is expected to
monitor.
Table 5. Resource Allocations
Model Flows Per Second
Exporters Host Count Reserved CPUs
Reserved Memory
Disk Space
FCVE Up to
4500
Up to
250
Up to 125,000
2 16 GB 1 TB
FCVE Up to 15000 Up to
500
Up to 250,000
3 24 GB 1 TB
FCVE Up to 22,500 Up to
1000
Up to 500,000
4 32 GB 1 TB
FCVE Up to 30,000 Up to
1000
Up to 500,000
5 32 GB 1 TB
FCVE 2000 Up to 60,000 Up to
1500
Up to 750,000
6 64 GB 2 TB
FCVE 4000 Up to 120,000
Up to
2000
Up to 1,000,000
7 128 GB 4 TB
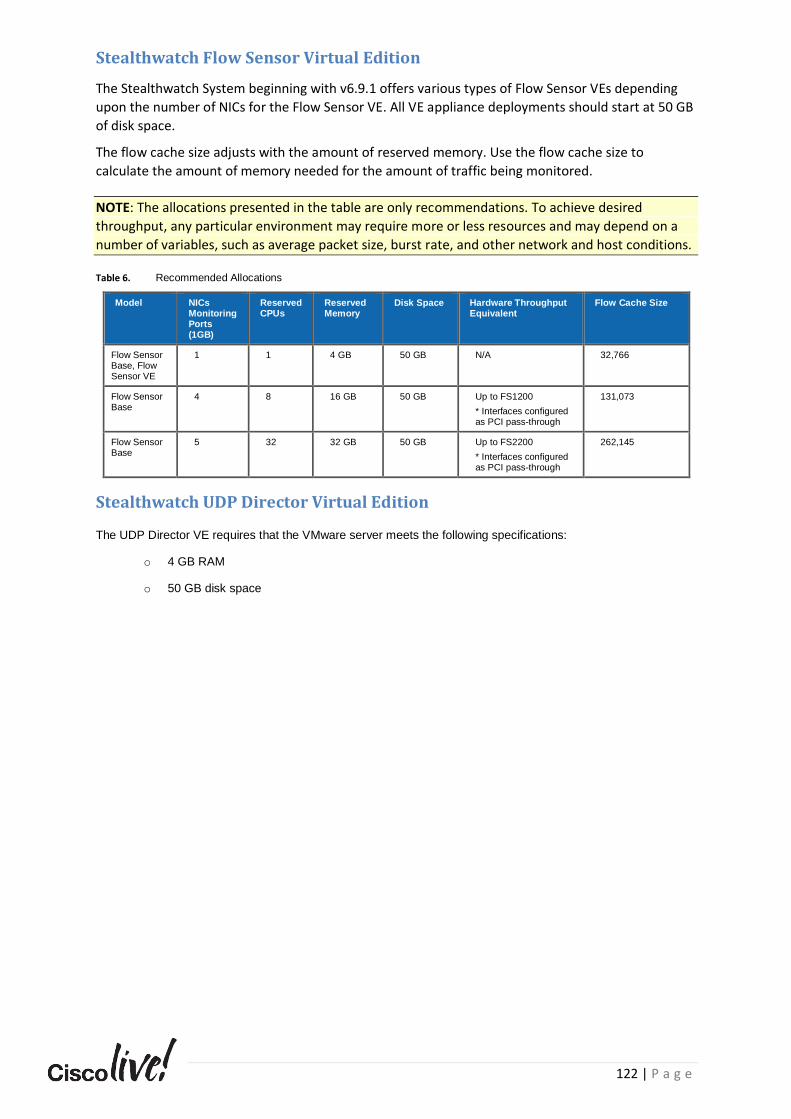
122 | P a g e
Stealthwatch Flow Sensor Virtual Edition
The Stealthwatch System beginning with v6.9.1 offers various types of Flow Sensor VEs depending
upon the number of NICs for the Flow Sensor VE. All VE appliance deployments should start at 50 GB
of disk space.
The flow cache size adjusts with the amount of reserved memory. Use the flow cache size to
calculate the amount of memory needed for the amount of traffic being monitored.
NOTE: The allocations presented in the table are only recommendations. To achieve desired
throughput, any particular environment may require more or less resources and may depend on a
number of variables, such as average packet size, burst rate, and other network and host conditions.
Table 6. Recommended Allocations
Model NICs Monitoring Ports (1GB)
Reserved CPUs
Reserved Memory
Disk Space Hardware Throughput Equivalent
Flow Cache Size
Flow Sensor Base, Flow Sensor VE
1 1 4 GB 50 GB N/A 32,766
Flow Sensor Base
4 8 16 GB 50 GB Up to FS1200
* Interfaces configured as PCI pass-through
131,073
Flow Sensor Base
5 32 32 GB 50 GB Up to FS2200
* Interfaces configured as PCI pass-through
262,145
Stealthwatch UDP Director Virtual Edition
The UDP Director VE requires that the VMware server meets the following specifications:
o 4 GB RAM
o 50 GB disk space
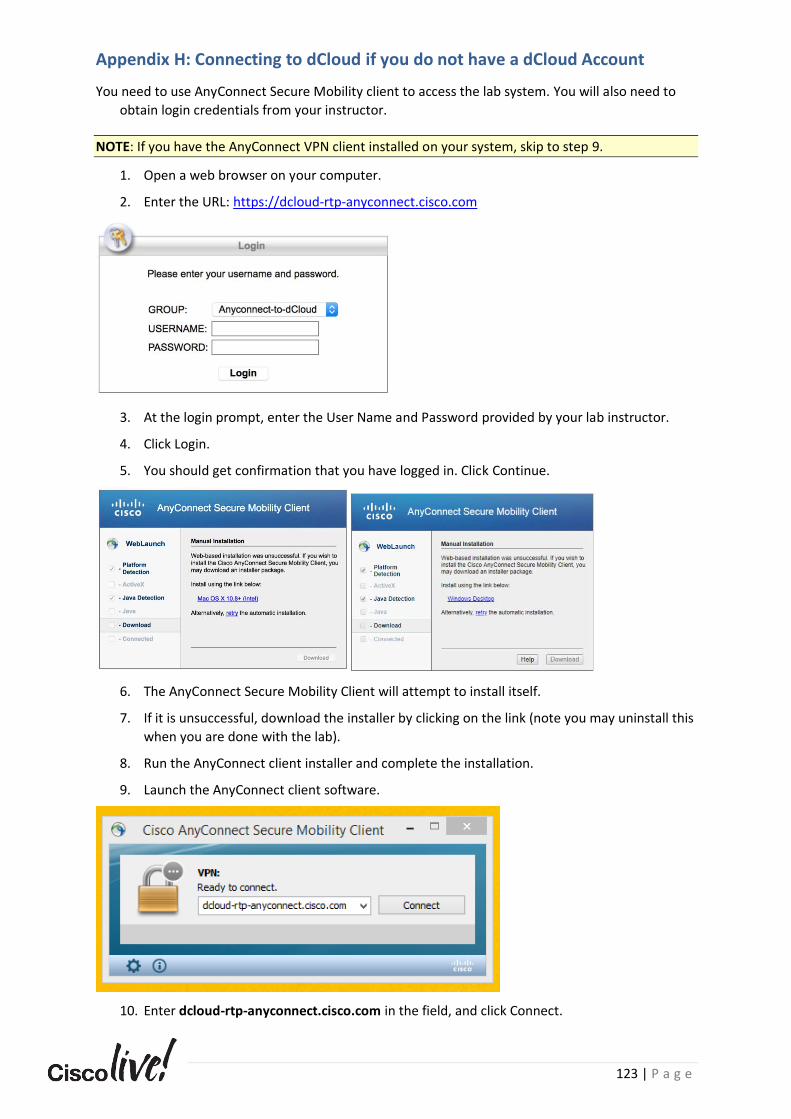
123 | P a g e
Appendix H: Connecting to dCloud if you do not have a dCloud Account
You need to use AnyConnect Secure Mobility client to access the lab system. You will also need to
obtain login credentials from your instructor.
NOTE: If you have the AnyConnect VPN client installed on your system, skip to step 9.
1. Open a web browser on your computer.
2. Enter the URL: https://dcloud-rtp-anyconnect.cisco.com
3. At the login prompt, enter the User Name and Password provided by your lab instructor.
4. Click Login.
5. You should get confirmation that you have logged in. Click Continue.
6. The AnyConnect Secure Mobility Client will attempt to install itself.
7. If it is unsuccessful, download the installer by clicking on the link (note you may uninstall this
when you are done with the lab).
8. Run the AnyConnect client installer and complete the installation.
9. Launch the AnyConnect client software.
10. Enter dcloud-rtp-anyconnect.cisco.com in the field, and click Connect.
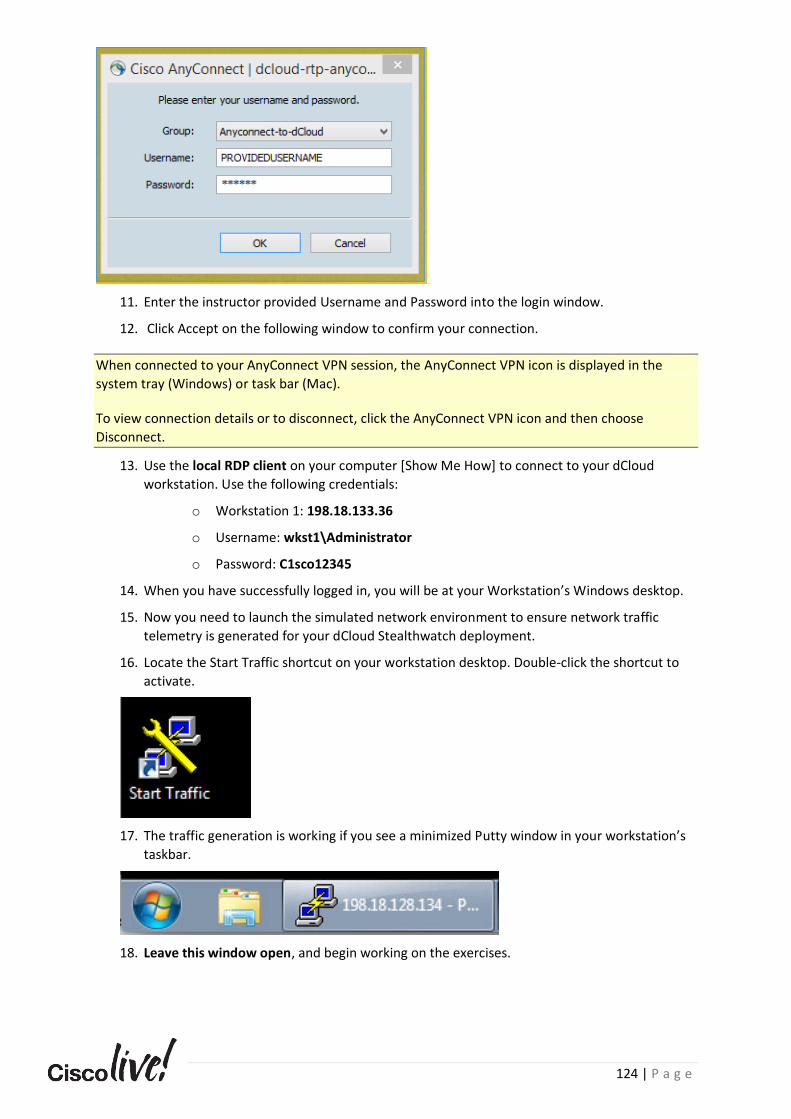
124 | P a g e
11. Enter the instructor provided Username and Password into the login window.
12. Click Accept on the following window to confirm your connection.
When connected to your AnyConnect VPN session, the AnyConnect VPN icon is displayed in the
system tray (Windows) or task bar (Mac).
To view connection details or to disconnect, click the AnyConnect VPN icon and then choose
Disconnect.
13. Use the local RDP client on your computer [Show Me How] to connect to your dCloud
workstation. Use the following credentials:
o Workstation 1: 198.18.133.36
o Username: wkst1\Administrator
o Password: C1sco12345
14. When you have successfully logged in, you will be at your Workstation’s Windows desktop.
15. Now you need to launch the simulated network environment to ensure network traffic
telemetry is generated for your dCloud Stealthwatch deployment.
16. Locate the Start Traffic shortcut on your workstation desktop. Double-click the shortcut to
activate.
17. The traffic generation is working if you see a minimized Putty window in your workstation’s
taskbar.
18. Leave this window open, and begin working on the exercises.
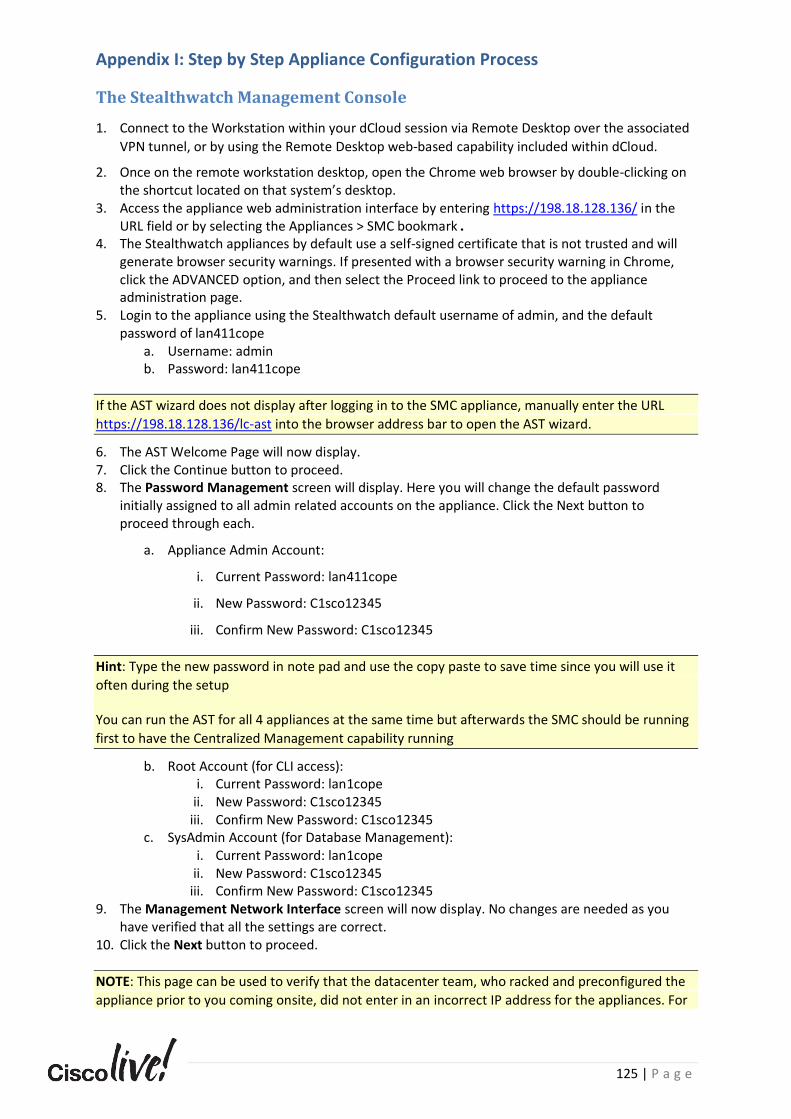
125 | P a g e
Appendix I: Step by Step Appliance Configuration Process
The Stealthwatch Management Console
1. Connect to the Workstation within your dCloud session via Remote Desktop over the associated
VPN tunnel, or by using the Remote Desktop web-based capability included within dCloud.
2. Once on the remote workstation desktop, open the Chrome web browser by double-clicking on the shortcut located on that system’s desktop.
3. Access the appliance web administration interface by entering https://198.18.128.136/ in the URL field or by selecting the Appliances > SMC bookmark.
4. The Stealthwatch appliances by default use a self-signed certificate that is not trusted and will generate browser security warnings. If presented with a browser security warning in Chrome, click the ADVANCED option, and then select the Proceed link to proceed to the appliance administration page.
5. Login to the appliance using the Stealthwatch default username of admin, and the default password of lan411cope
a. Username: admin b. Password: lan411cope
If the AST wizard does not display after logging in to the SMC appliance, manually enter the URL
https://198.18.128.136/lc-ast into the browser address bar to open the AST wizard.
6. The AST Welcome Page will now display. 7. Click the Continue button to proceed. 8. The Password Management screen will display. Here you will change the default password
initially assigned to all admin related accounts on the appliance. Click the Next button to proceed through each.
a. Appliance Admin Account:
i. Current Password: lan411cope
ii. New Password: C1sco12345
iii. Confirm New Password: C1sco12345
Hint: Type the new password in note pad and use the copy paste to save time since you will use it
often during the setup
You can run the AST for all 4 appliances at the same time but afterwards the SMC should be running
first to have the Centralized Management capability running
b. Root Account (for CLI access): i. Current Password: lan1cope
ii. New Password: C1sco12345 iii. Confirm New Password: C1sco12345
c. SysAdmin Account (for Database Management): i. Current Password: lan1cope
ii. New Password: C1sco12345 iii. Confirm New Password: C1sco12345
9. The Management Network Interface screen will now display. No changes are needed as you have verified that all the settings are correct.
10. Click the Next button to proceed.
NOTE: This page can be used to verify that the datacenter team, who racked and preconfigured the
appliance prior to you coming onsite, did not enter in an incorrect IP address for the appliances. For
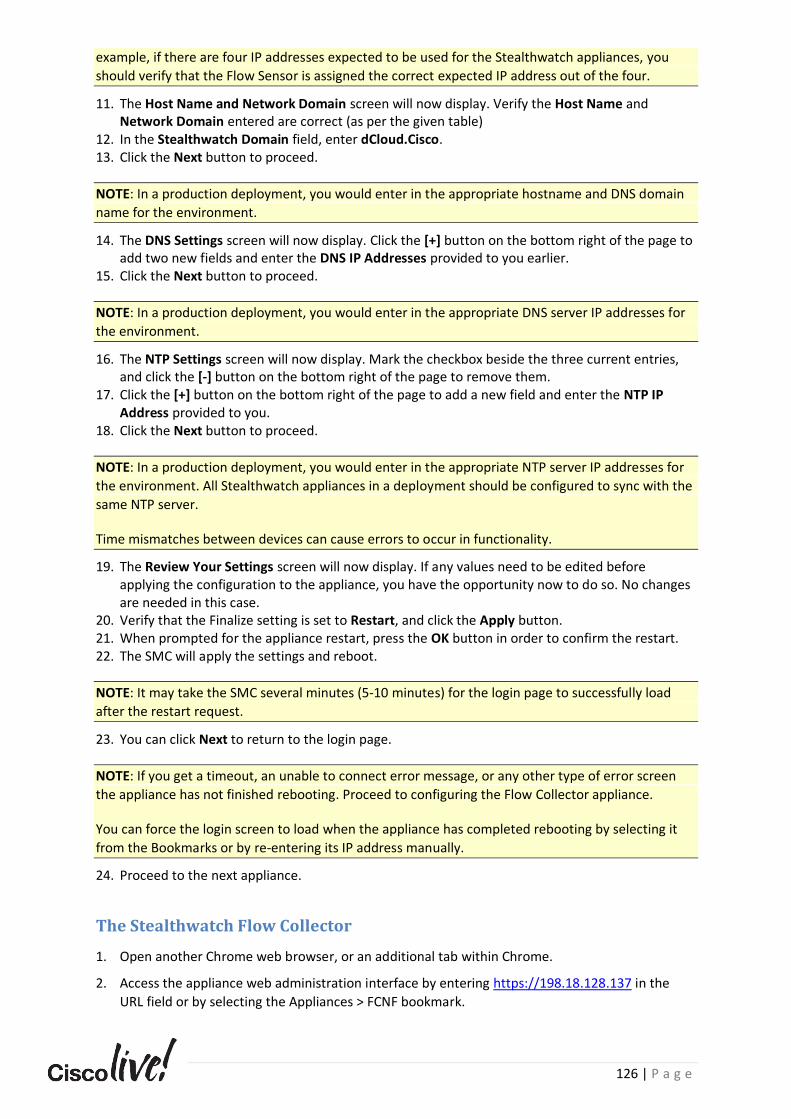
126 | P a g e
example, if there are four IP addresses expected to be used for the Stealthwatch appliances, you
should verify that the Flow Sensor is assigned the correct expected IP address out of the four.
11. The Host Name and Network Domain screen will now display. Verify the Host Name and Network Domain entered are correct (as per the given table)
12. In the Stealthwatch Domain field, enter dCloud.Cisco. 13. Click the Next button to proceed.
NOTE: In a production deployment, you would enter in the appropriate hostname and DNS domain
name for the environment.
14. The DNS Settings screen will now display. Click the [+] button on the bottom right of the page to add two new fields and enter the DNS IP Addresses provided to you earlier.
15. Click the Next button to proceed.
NOTE: In a production deployment, you would enter in the appropriate DNS server IP addresses for
the environment.
16. The NTP Settings screen will now display. Mark the checkbox beside the three current entries, and click the [-] button on the bottom right of the page to remove them.
17. Click the [+] button on the bottom right of the page to add a new field and enter the NTP IP Address provided to you.
18. Click the Next button to proceed.
NOTE: In a production deployment, you would enter in the appropriate NTP server IP addresses for
the environment. All Stealthwatch appliances in a deployment should be configured to sync with the
same NTP server.
Time mismatches between devices can cause errors to occur in functionality.
19. The Review Your Settings screen will now display. If any values need to be edited before applying the configuration to the appliance, you have the opportunity now to do so. No changes are needed in this case.
20. Verify that the Finalize setting is set to Restart, and click the Apply button. 21. When prompted for the appliance restart, press the OK button in order to confirm the restart. 22. The SMC will apply the settings and reboot.
NOTE: It may take the SMC several minutes (5-10 minutes) for the login page to successfully load
after the restart request.
23. You can click Next to return to the login page.
NOTE: If you get a timeout, an unable to connect error message, or any other type of error screen
the appliance has not finished rebooting. Proceed to configuring the Flow Collector appliance.
You can force the login screen to load when the appliance has completed rebooting by selecting it
from the Bookmarks or by re-entering its IP address manually.
24. Proceed to the next appliance.
The Stealthwatch Flow Collector
1. Open another Chrome web browser, or an additional tab within Chrome.
2. Access the appliance web administration interface by entering https://198.18.128.137 in the
URL field or by selecting the Appliances > FCNF bookmark.
127 | P a g e
3. The Stealthwatch appliances by default use a self-signed certificate that is not trusted and will
generate browser security warnings. If presented with a browser security warning in Chrome,
click the ADVANCED option, and then select the Proceed link to proceed to the appliance
administration page.
4. Login to the appliance using the default Stealthwatch username of admin, and the default
password of lan411cope
a. Username: admin
b. Password: lan411cope
5. The AST Welcome Page will now display.
6. Click the Continue button to proceed.
7. The Password Management screen will display.
NOTE: All Stealthwatch appliances have three built-in user accounts:
The admin user account is utilized for accessing the appliance’s web administration page and in the
case of the SMC it is used for accessing the product’s web and Java interfaces as well. The default
password for the admin account is lan411cope. The AST wizard (Appliance Setup Tool) forces a
change from the default password to a new value. You will be shown how to manually change the
password for the admin account through the appliance web administration page.
The root user account is a console/SSH only user account that has full access to the appliance
operating system. This account should be used with caution as the appliance could be made non-
operational through an improper command executed by the root user.
The sysadmin account is a console/SSH only account used for accessing the System Configuration
menu. The System Configuration menu is where the IP configuration of the appliance is changed as
well as certain other advanced settings. The sysadmin user does not have full shell access. The
default password of the sysadmin user is lan1cope.
8. Here you will change the default password initially assigned to all admin related accounts on the
appliance. Click the Next button to proceed through each.
a. Appliance Admin Account:
i. Current Password: lan411cope
ii. New Password: C1sco12345
iii. Confirm New Password: C1sco12345
b. Root Account (for CLI access):
i. Current Password: lan1cope
ii. New Password: C1sco12345
iii. Confirm New Password: C1sco12345
c. SysAdmin Account:
i. Current Password: lan1cope
ii. New Password: C1sco12345
iii. Confirm New Password: C1sco12345
9. The Management Network Interface screen will now display. No changes are needed as you
have verified that all the settings are correct.
128 | P a g e
10. Click the Next button to proceed.
NOTE: This page can be used to verify that the datacenter team, who racked and preconfigured the
appliance prior to you coming onsite, did not enter in an incorrect IP address for the appliances. For
example, if there are four IP addresses expected to be used for the Stealthwatch appliances, you
should verify that the Flow Sensor is assigned the correct expected IP address out of the four.
11. The Host Name and Domains screen will now display. Verify the Host Name and Network
Domain entered are correct.
12. Click the Next button to proceed.
NOTE: In a production deployment, you would enter in the appropriate hostname and DNS domain
name for the environment.
13. The DNS Settings screen will now display. Click the [+] button on the bottom right of the page to
add two new fields and enter the DNS IP Addresses provided to you earlier.
14. Click the Next button to proceed.
NOTE: In a production deployment, you would enter in the appropriate DNS server IP addresses for
the environment.
15. The NTP Settings screen will now display. Mark the checkbox beside the three current entries,
and click the [-] button on the bottom right of the page to remove them.
16. Click the [+] button on the bottom right of the page to add a new field and enter the NTP IP
Address provided to you.
17. Click the Next button to proceed.
NOTE: In a production deployment, you would enter in the appropriate NTP server IP addresses for
the environment. All Stealthwatch appliances in a deployment should be configured to sync with the
same NTP server.
Time mismatches between devices can cause errors to occur in functionality.
18. The Review and Restart window will appear. In case any values need to be edited before
applying the configuration to the appliance, you would have the opportunity now. No changes
are needed in this case.
19. Click Restart and Proceed.
20. When prompted for the appliance restart, press the OK button in order to confirm the restart.
21. The Flow Collector will reboot.
NOTE: If you get a timeout, an unable to connect error message, or any other type of error screen
the appliance has not finished rebooting. Proceed to the next appliance. You can force the login
screen to load when the appliance has completed rebooting by selecting it from the Bookmarks or
by re-entering its IP address manually.
22. You may now proceed to the next appliance to continue the AST configuration.
The Stealthwatch Flow Sensor
1. Open another Chrome web browser, or an additional tab within Chrome.
129 | P a g e
2. Access the appliance web administration interface by entering https://198.18.128.138 in the
URL field, or by selecting the Appliances > FS bookmark.
3. The Stealthwatch appliances by default use a self-signed certificate that is not trusted and will
generate browser security warnings. If presented with a browser security warning in Chrome,
click the ADVANCED option, and then select the Proceed link to proceed to the appliance
administration page.
4. Login to the appliance using the default Stealthwatch username of admin, and the default
password of lan411cope
a. Username: admin
b. Password: lan411cope
5. The AST Welcome Page will now display.
6. Click the Continue button to proceed.
7. The Password Management screen will display. Here you will change the default password
initially assigned to all admin related accounts on the appliance. Click the Next button to
proceed through each.
a. Appliance Admin Account:
i. Current Password: lan411cope
ii. New Password: C1sco12345
iii. Confirm New Password: C1sco12345
b. Root Account (for CLI access):
i. Current Password: lan1cope
ii. New Password: C1sco12345
iii. Confirm New Password: C1sco12345
c. SysAdmin Account:
i. Current Password: lan1cope
ii. New Password: C1sco12345
iii. Confirm New Password: C1sco12345
8. The Management Network Interface screen will now display. No changes are needed as you
have verified that all the settings are correct.
9. Click the Next button to proceed.
NOTE: This page can be used to verify that the datacenter team, who racked and preconfigured the
appliance prior to you coming onsite, did not enter in an incorrect IP address for the appliances. For
example, if there are four IP addresses expected to be used for the Stealthwatch appliances, you
should verify that the Flow Sensor is assigned the correct expected IP address out of the four.
10. The Host Name and Domains screen will now display. Verify the Host Name and Network
Domain entered are correct.
11. Click the Next button to proceed.
NOTE: In a production deployment, you would enter in the appropriate hostname and DNS domain
name for the environment.
130 | P a g e
12. The DNS Settings screen will now display. Click the [+] button on the bottom right of the page to
add two new fields and enter the DNS IP Addresses provided to you earlier.
13. Click the Next button to proceed.
NOTE: In a production deployment, you would enter in the appropriate DNS server IP addresses for
the environment.
14. The NTP Settings screen will now display. Mark the checkbox beside the three current entries,
and click the [-] button on the bottom right of the page to remove them.
15. Click the [+] button on the bottom right of the page to add a new field and enter the NTP IP
Address provided to you.
16. Click the Next button to proceed.
NOTE: In a production deployment, you would enter in the appropriate NTP server IP addresses for
the environment. All Stealthwatch appliances in a deployment should be configured to sync with the
same NTP server.
Time mismatches between devices can cause errors to occur in functionality.
17. Click the Next button to continue.
18. A window will appear asking if you would like to manage the device from an SMC. Click Yes.
19. The Review and Restart window will appear. In case any values need to be edited before
applying the configuration to the appliance, you would have the opportunity now. No changes
are needed in this case.
20. Click Restart and Proceed.
21. When prompted for the appliance restart, press the OK button in order to confirm the restart.
22. The Flow Sensor will reboot.
NOTE: If you get a timeout, an unable to connect error message, or any other type of error screen
the appliance has not finished rebooting. Proceed to the next appliance. You can force the login
screen to load when the appliance has completed rebooting by selecting it from the Bookmarks or
by re-entering its IP address manually.
23. You may now proceed to the next appliance to continue the AST configuration.
The Stealthwatch UDP Director
1. Open another Chrome web browser, or an additional tab within Chrome.
2. Access the appliance web administration interface by entering https://198.18.128.139 in the
URL field or by selecting the Appliances > UDPD bookmark
3. The Stealthwatch appliances by default use a self-signed certificate that is not trusted and will
generate browser security warnings. If presented with a browser security warning in Chrome,
click the ADVANCED option, and then select the Proceed link to proceed to the appliance
administration page.
4. Login to the appliance using the default Stealthwatch username of admin, and the default
password of lan411cope
a. Username: admin
131 | P a g e
b. Password: lan411cope
5. The AST Welcome Page will now display.
6. Click the Continue button to proceed.
7. The Password Management screen will display. Here you will change the default password
initially assigned to all admin related accounts on the appliance. Click the Next button to
proceed through each.
a. Appliance Admin Account:
i. Current Password: lan411cope
ii. New Password: C1sco12345
iii. Confirm New Password: C1sco12345
b. Root Account (for CLI access):
i. Current Password: lan1cope
ii. New Password: C1sco12345
iii. Confirm New Password: C1sco12345
c. SysAdmin Account:
i. Current Password: lan1cope
ii. New Password: C1sco12345
iii. Confirm New Password: C1sco12345
8. The Management Network Interface screen will now display. No changes are needed as you
have verified that all the settings are correct.
9. Click the Next button to proceed.
NOTE: This page can be used to verify that the datacenter team, who racked and preconfigured the
appliance prior to you coming onsite, did not enter in an incorrect IP address for the appliances. For
example, if there are four IP addresses expected to be used for the Stealthwatch appliances, you
should verify that the Flow Sensor is assigned the correct expected IP address out of the four.
10. The Host Name and Domains screen will now display. Verify the Host Name and Network
Domain entered are correct.
11. Click the Next button to proceed.
NOTE: In a production deployment, you would enter in the appropriate hostname and DNS domain
name for the environment.
12. The DNS Settings screen will now display. Click the [+] button on the bottom right of the page to
add two new fields and enter the DNS IP Addresses provided to you earlier.
13. Click the Next button to proceed.
NOTE: In a production deployment, you would enter in the appropriate DNS server IP addresses for
the environment.
14. The NTP Settings screen will now display. Mark the checkbox beside the three current entries,
and click the [-] button on the bottom right of the page to remove them.
15. Click the [+] button on the bottom right of the page to add a new field and enter the NTP IP
Address provided to you.
132 | P a g e
16. Click the Next button to proceed.
NOTE: In a production deployment, you would enter in the appropriate NTP server IP addresses for
the environment. All Stealthwatch appliances in a deployment should be configured to sync with the
same NTP server.
Time mismatches between devices can cause errors to occur in functionality.
17. A window will appear asking if you would like to manage the device from an SMC. Click Yes.
18. The Review and Restart window will appear. In case any values need to be edited before
applying the configuration to the appliance, you would have the opportunity now. No changes
are needed in this case.
19. Click Restart and Proceed.
20. When prompted for the appliance restart, press the OK button in order to confirm the restart.
21. The UDP Director will reboot.
NOTE: If you get a timeout, an unable to connect error message, or any other type of error screen
the appliance has not finished rebooting. Proceed to the next appliance. You can force the login
screen to load when the appliance has completed rebooting by selecting it from the Bookmarks or
by re-entering its IP address manually.
22. You have completed the AST process for the Stealthwatch appliances.
Next, you will configure them to be centrally managed by the SMC. To complete this process, return
to Task 2 – Stealthwatch Central Management.
133 | P a g e
Online Stealthwatch Resources
Stealthwatch Documentation on Cisco.com:
http://www.cisco.com/c/en/us/support/security/stealthwatch/tsd-products-support-series-
home.html
Install and Upgrade Guides:
http://www.cisco.com/c/en/us/support/security/stealthwatch/products-installation-guides-list.html
Configuration Guides
https://www.cisco.com/c/en/us/support/security/stealthwatch/products-installation-and-
configuration-guides-list.html
Technical References:
https://www.cisco.com/c/en/us/support/security/stealthwatch/products-technical-reference-
list.html
Netflow Configuration Tool:
https://configurenetflow.info
Related Documents