© 2012 Cisco and/or its affiliates. All rights reserved. This document is Cisco Public Information. Page 1 of 11 White Paper Cisco Nexus 3548 - Active Buffer Monitoring White Paper September 2012

Welcome message from author
This document is posted to help you gain knowledge. Please leave a comment to let me know what you think about it! Share it to your friends and learn new things together.
Transcript
© 2012 Cisco and/or its affiliates. All rights reserved. This document is Cisco Public Information. Page 1 of 11
White Paper
Cisco Nexus 3548 - Active Buffer Monitoring
White Paper
September 2012
© 2012 Cisco and/or its affiliates. All rights reserved. This document is Cisco Public Information. Page 2 of 11
Contents
What You Will Learn ................................................................................................................................................ 3
Nexus 3548 Architecture Overview ........................................................................................................................ 3
Active Buffer Monitoring - Need for It .................................................................................................................... 4
Active Buffer Monitoring - Implementation ........................................................................................................... 4
Active Buffer Monitoring - Data Access and Collection ....................................................................................... 5
Active Buffer Monitoring - Configuration .............................................................................................................. 6
Active Buffer Monitoring - Demonstration ............................................................................................................. 6
Active Buffer Monitoring - Microburst Detection .................................................................................................. 9
Conclusion ............................................................................................................................................................. 10
For More Information ............................................................................................................................................. 10
© 2012 Cisco and/or its affiliates. All rights reserved. This document is Cisco Public Information. Page 3 of 11
What You Will Learn
The Cisco Nexus 3500 platform contains the innovative Algorithm Boost (or Algo Boost) technology. Algo Boost
technology, built into the switch application specific integrated circuit (ASIC), allows the Nexus 3548 to achieve
exceptional Layer 2 and Layer 3 switching latencies of less than 200 nanoseconds (ns). In addition, Algo boost
brings an industry-leading innovation for performance analytics called active buffer monitoring.
Nexus 3548 is a cut-through switch, enabling line rate throughput with reduced need for buffering as compared to a
store and forward architecture. However, any practical production network experiences congestion due to a variety
of conditions including but not limited to many-to-one flows, speed mismatches, and bursty traffic. This congestion
can have a serious impact on the latency of packets traveling through the switch, as queued packets must wait for
the buffer to clear before they can be transmitted. For instance, a burst of 1.2MB would introduce latencies of over
1 millisecond - 5,000 times the nominal latency of the Nexus 3548! Today’s switches don’t adequately inform
administrators about the presence of congestion, the time when congestion occurred or how long congestion was
present, leaving them blind to address the conditions causing sub-optimal performance. Active buffer monitoring is
an advanced analytic framework that solves this challenge. This document covers this feature in more details.
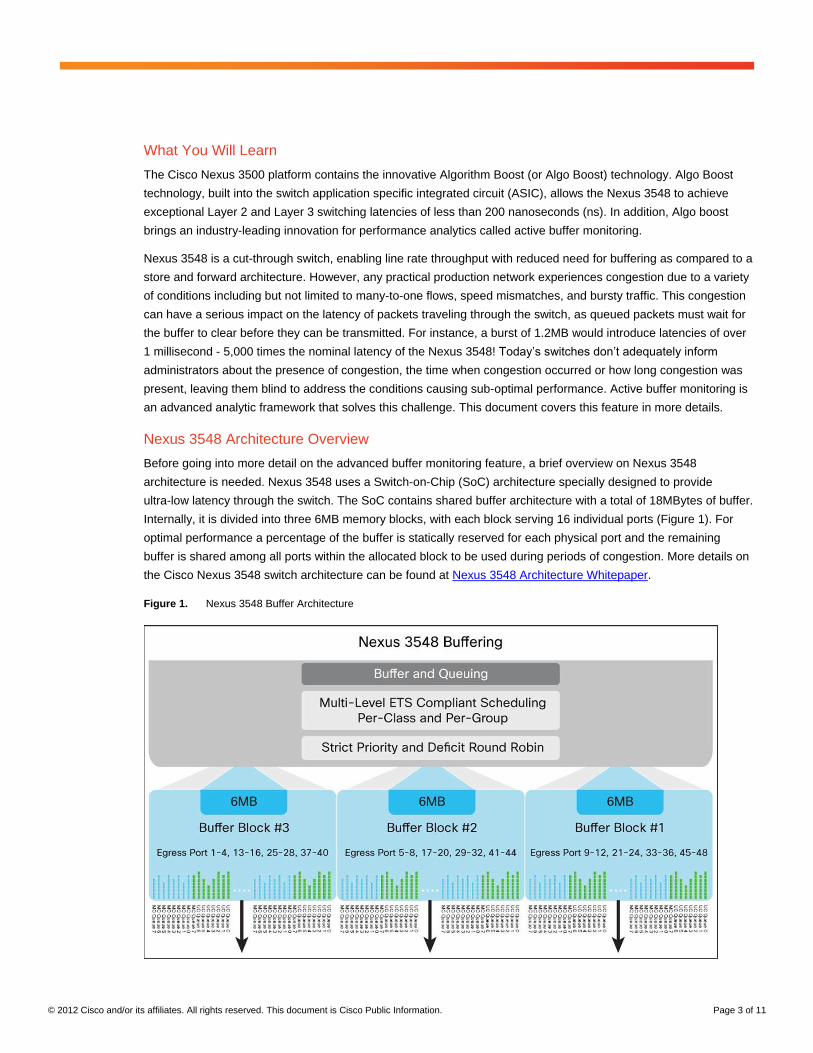
Nexus 3548 Architecture Overview
Before going into more detail on the advanced buffer monitoring feature, a brief overview on Nexus 3548
architecture is needed. Nexus 3548 uses a Switch-on-Chip (SoC) architecture specially designed to provide
ultra-low latency through the switch. The SoC contains shared buffer architecture with a total of 18MBytes of buffer.
Internally, it is divided into three 6MB memory blocks, with each block serving 16 individual ports (Figure 1). For
optimal performance a percentage of the buffer is statically reserved for each physical port and the remaining
buffer is shared among all ports within the allocated block to be used during periods of congestion. More details on
the Cisco Nexus 3548 switch architecture can be found at Nexus 3548 Architecture Whitepaper.
Figure 1. Nexus 3548 Buffer Architecture
© 2012 Cisco and/or its affiliates. All rights reserved. This document is Cisco Public Information. Page 4 of 11
Active Buffer Monitoring - Need for It
Active buffer monitoring provides granular buffer occupancy data providing better insight into possible hot-spots of
congestion. In contrast to previous buffer monitoring technologies that provide utilization snapshots and
watermarks, active buffer monitoring provides rich buffer histograms per port illustrating the percentage of time
switch buffers were empty, fully occupied, or anywhere in between, with up to ten nanosecond granularity.
This feature helps network administrators to:
● Proactively act on the network congestion which could impact the performance of the network, latency or
packet drops
● Go back in time to understand and correlate the network events using this granular buffer monitoring data
● Understand historical trending and identifying patterns of application traffic flow
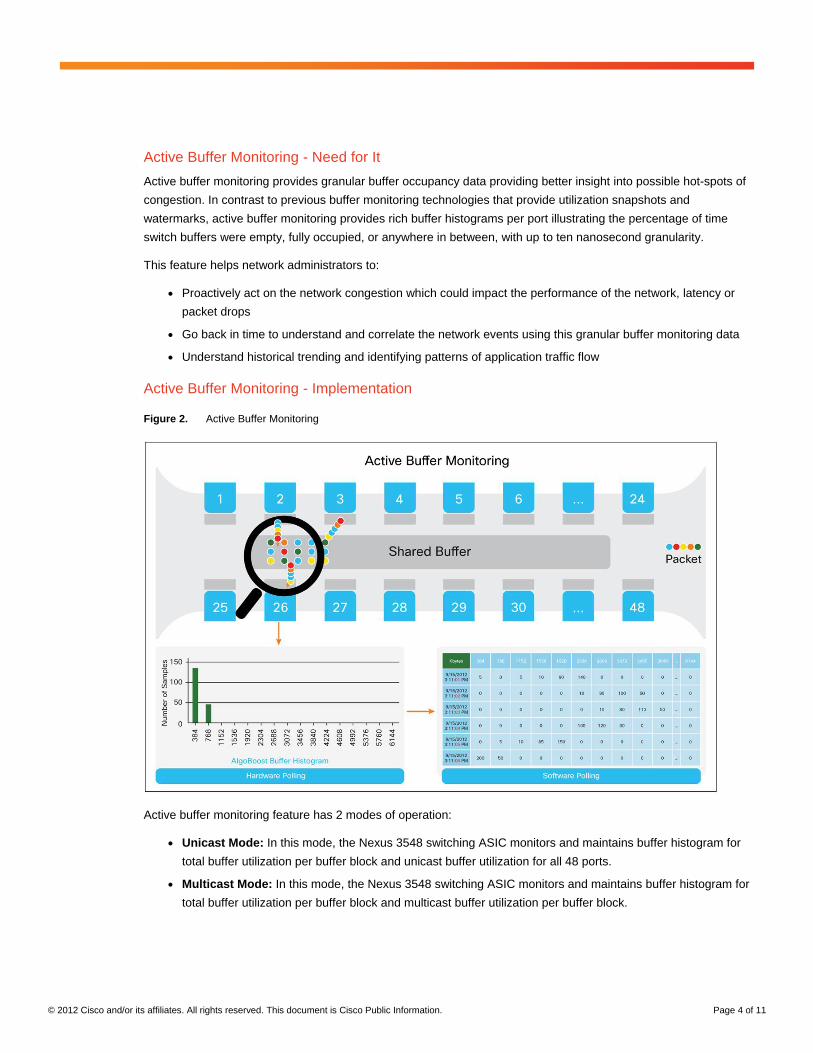
Active Buffer Monitoring - Implementation
Figure 2. Active Buffer Monitoring
Active buffer monitoring feature has 2 modes of operation:
● Unicast Mode: In this mode, the Nexus 3548 switching ASIC monitors and maintains buffer histogram for
total buffer utilization per buffer block and unicast buffer utilization for all 48 ports.
● Multicast Mode: In this mode, the Nexus 3548 switching ASIC monitors and maintains buffer histogram for
total buffer utilization per buffer block and multicast buffer utilization per buffer block.
© 2012 Cisco and/or its affiliates. All rights reserved. This document is Cisco Public Information. Page 5 of 11
The active buffer monitoring feature implementation has two types of polling interval - hardware and software. Each
works together as described below in detail:
● Each buffer histogram has 18 bucket counters spanning across the memory block. Each bucket
corresponds to equal-size ranges of buffer utilization e.g. (0-384KB), (385KB-768Kb), and so on (Figure 3
shows all buffer ranges).
● The Nexus 3548 switching ASIC polls the total buffer utilization and unicast buffer utilization for all ports
every 4 milliseconds (by default). This polling interval is configurable and can be as low as 10 nanoseconds.
● Based on the buffer utilization observed for each HW polling interval, the corresponding histogram bucket
counter incremented. For example: if port “ethernet 1/4” is consuming 500KB of buffer, bucket #2 (385-
768KB) counter for the port is incremented.
● Each buffer histogram counter is 8 bits wide. This means it can go up to a maximum value of 255. In order
to avoid counter overflow, by default, the Nexus 3548 hardware polling interval is set to 4 milliseconds and
the software polling interval is set to 1 second. At this software polling interval, the histogram data is
downloaded to system memory.
● NX-OS software maintains these histogram counters in the memory for last 60 minutes with 1-second
granularity.
● As a backup, after every hour NX-OS copies buffer histogram data from system memory to the bootflash.
Active Buffer Monitoring - Data Access and Collection
In order to help network administrators proactively identify and rectify sources of network congestion, NX-OS
includes the following options to access and consume the buffer histogram data:
● Device Console: Buffer histogram can be directly accessed from the device console, in real time, using
show commands. This allows administrators to access the last 1 hour of data in the system memory (refer
to the demonstration section for exact commands and output).
● On-switch scripting interface: NX-OS python scripting/feature scheduler can be used to copy the data to the
server regularly to have the historic data.
● Switch file system: The previous 1 hour of histogram data can be accessed from the switch bootflash.
Effectively, the switch maintains 2 hours of buffer histogram data, with the most recent hour in system
memory and second hour in the bootflash. This allows network management stations to periodically
download historic data via lightweight file transfer protocols like FTP.
● XML interface: All active buffer monitoring CLIs have XML equivalents, allowing network management
stations to automate the collection of this data at any interval desired.
Furthermore, NX-OS can notify the administrator with a syslog message when the buffer occupancy exceeds a
configured threshold (see configuration section for command to set the threshold).
© 2012 Cisco and/or its affiliates. All rights reserved. This document is Cisco Public Information. Page 6 of 11
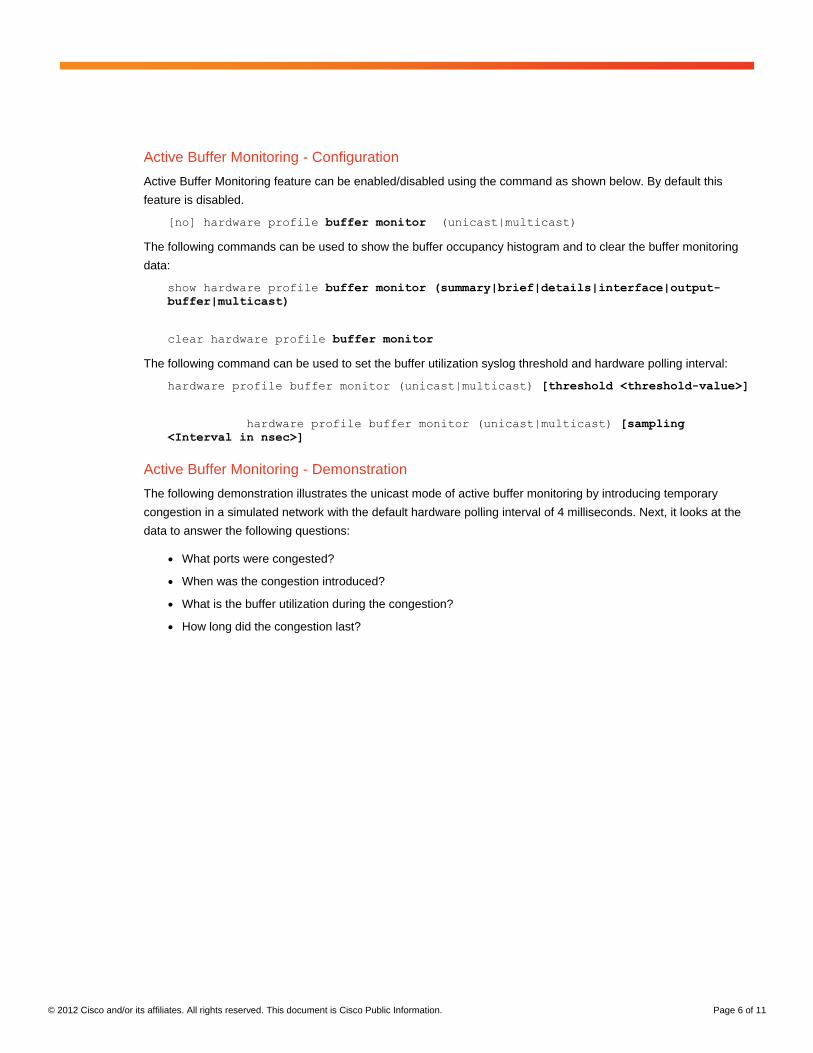
Active Buffer Monitoring - Configuration
Active Buffer Monitoring feature can be enabled/disabled using the command as shown below. By default this
feature is disabled.
[no] hardware profile buffer monitor (unicast|multicast)
The following commands can be used to show the buffer occupancy histogram and to clear the buffer monitoring
data:
show hardware profile buffer monitor (summary|brief|details|interface|output-
buffer|multicast)
clear hardware profile buffer monitor
The following command can be used to set the buffer utilization syslog threshold and hardware polling interval:
hardware profile buffer monitor (unicast|multicast) [threshold <threshold-value>]
hardware profile buffer monitor (unicast|multicast) [sampling
<Interval in nsec>]
Active Buffer Monitoring - Demonstration
The following demonstration illustrates the unicast mode of active buffer monitoring by introducing temporary
congestion in a simulated network with the default hardware polling interval of 4 milliseconds. Next, it looks at the
data to answer the following questions:
● What ports were congested?
● When was the congestion introduced?
● What is the buffer utilization during the congestion?
● How long did the congestion last?
© 2012 Cisco and/or its affiliates. All rights reserved. This document is Cisco Public Information. Page 7 of 11
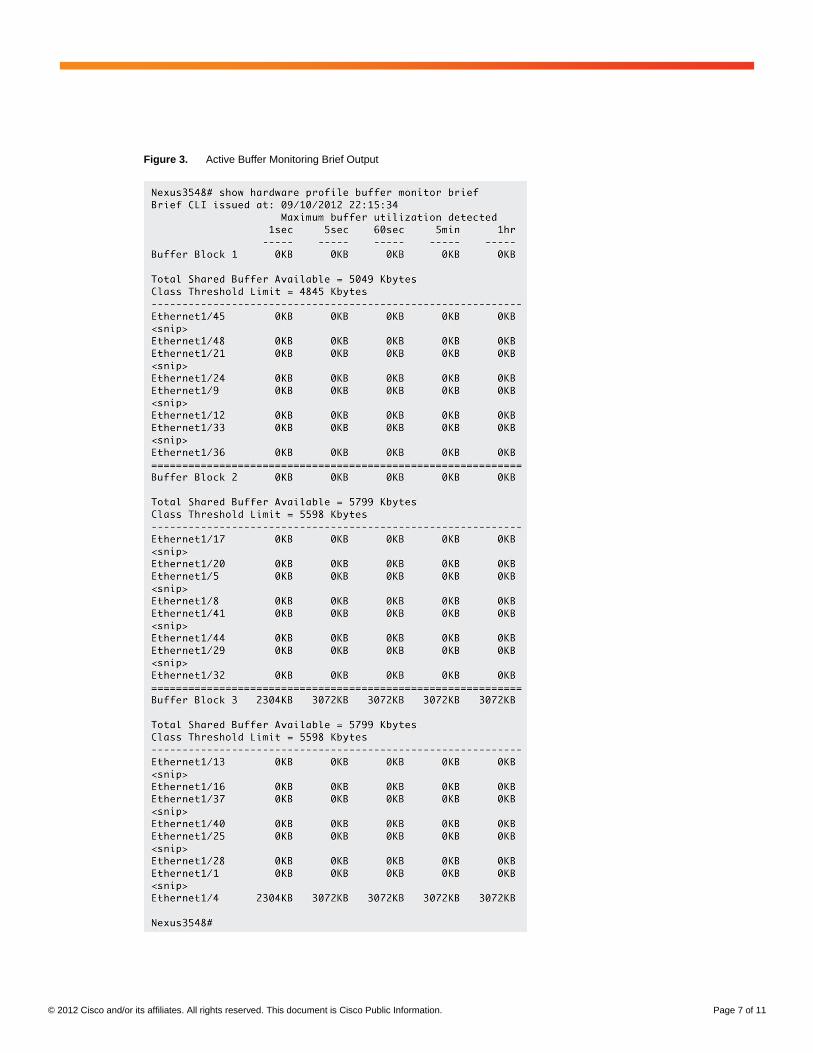
Figure 3. Active Buffer Monitoring Brief Output
© 2012 Cisco and/or its affiliates. All rights reserved. This document is Cisco Public Information. Page 8 of 11
Figure 3 shows the brief buffer occupancy output for every 6MB buffer block and all individual ports. As shown, it
indicates maximum buffer utilization seen for a variety of intervals - 1 second, 5 seconds, 1 minute, 5 minute, and
1 hour. This data can be used to identify what ports or buffer blocks have been congested and what was the
maximum buffer utilization for each.
In the example, ethernet port 1/4 (part of buffer block 3) was congested in last 5 seconds and max buffer utilization
reached was 3072KB. No other ports or buffer blocks have seen congestion in the last hour.
Once the network administrator knows which ports have been congested ports, he or she can drill down further per
port for more details about the congestion. Figure 4 illustrates the detailed buffer histogram for ethernet port 1/4.
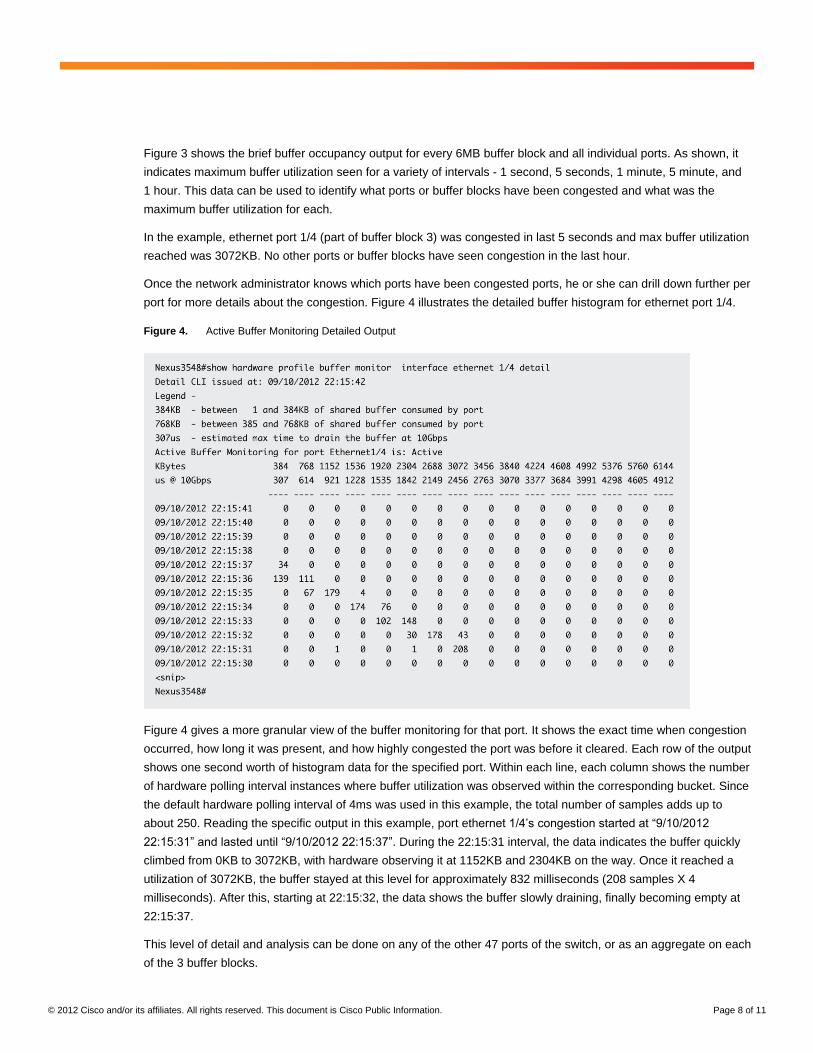
Figure 4. Active Buffer Monitoring Detailed Output
Figure 4 gives a more granular view of the buffer monitoring for that port. It shows the exact time when congestion
occurred, how long it was present, and how highly congested the port was before it cleared. Each row of the output
shows one second worth of histogram data for the specified port. Within each line, each column shows the number
of hardware polling interval instances where buffer utilization was observed within the corresponding bucket. Since
the default hardware polling interval of 4ms was used in this example, the total number of samples adds up to
about 250. Reading the specific output in this example, port ethernet 1/4’s congestion started at “9/10/2012
22:15:31” and lasted until “9/10/2012 22:15:37”. During the 22:15:31 interval, the data indicates the buffer quickly
climbed from 0KB to 3072KB, with hardware observing it at 1152KB and 2304KB on the way. Once it reached a
utilization of 3072KB, the buffer stayed at this level for approximately 832 milliseconds (208 samples X 4
milliseconds). After this, starting at 22:15:32, the data shows the buffer slowly draining, finally becoming empty at
22:15:37.
This level of detail and analysis can be done on any of the other 47 ports of the switch, or as an aggregate on each
of the 3 buffer blocks.
© 2012 Cisco and/or its affiliates. All rights reserved. This document is Cisco Public Information. Page 9 of 11
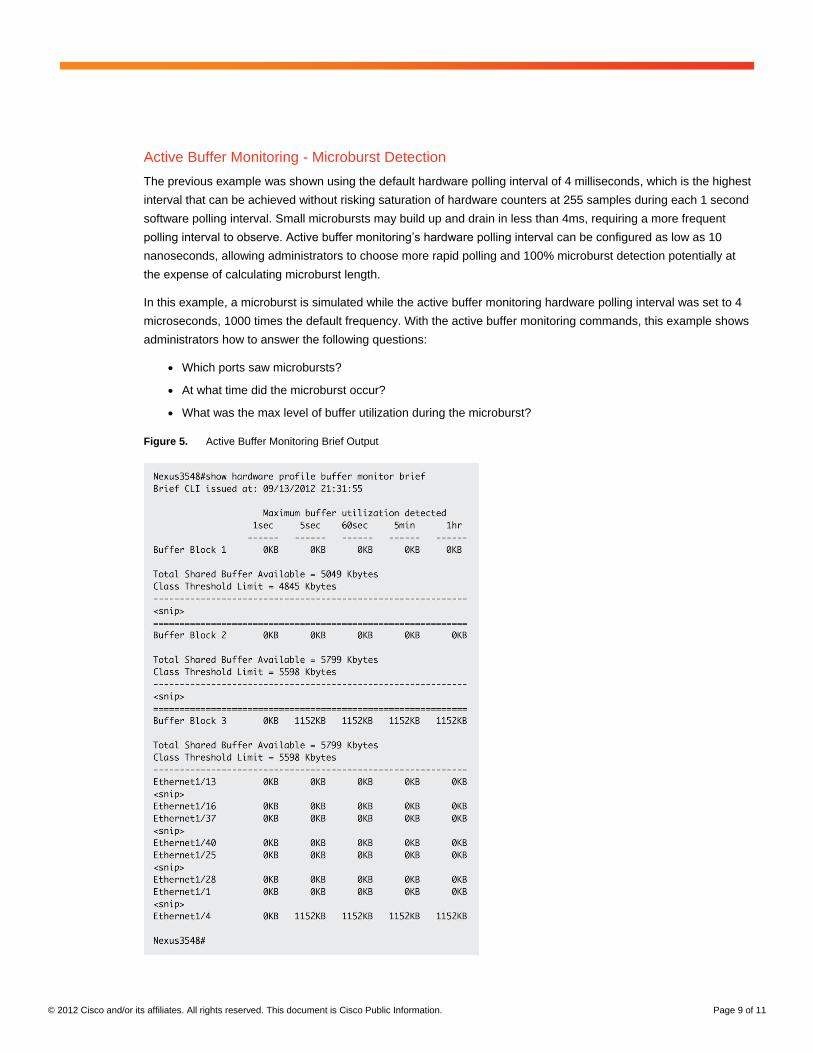
Active Buffer Monitoring - Microburst Detection
The previous example was shown using the default hardware polling interval of 4 milliseconds, which is the highest
interval that can be achieved without risking saturation of hardware counters at 255 samples during each 1 second
software polling interval. Small microbursts may build up and drain in less than 4ms, requiring a more frequent
polling interval to observe. Active buffer monitoring’s hardware polling interval can be configured as low as 10
nanoseconds, allowing administrators to choose more rapid polling and 100% microburst detection potentially at
the expense of calculating microburst length.
In this example, a microburst is simulated while the active buffer monitoring hardware polling interval was set to 4
microseconds, 1000 times the default frequency. With the active buffer monitoring commands, this example shows
administrators how to answer the following questions:
● Which ports saw microbursts?
● At what time did the microburst occur?
● What was the max level of buffer utilization during the microburst?
Figure 5. Active Buffer Monitoring Brief Output
© 2012 Cisco and/or its affiliates. All rights reserved. This document is Cisco Public Information. Page 10 of 11
From the brief buffer occupancy output in Figure 5, it is clear that there was congestion on the ethernet port 1/4,
which is part of buffer block 3. This congestion occurred during the last 5 seconds, but outside of the last 1 second,
and the max buffer utilization was 1152 KB. No other ports or buffer blocks have seen congestion in the last hour.
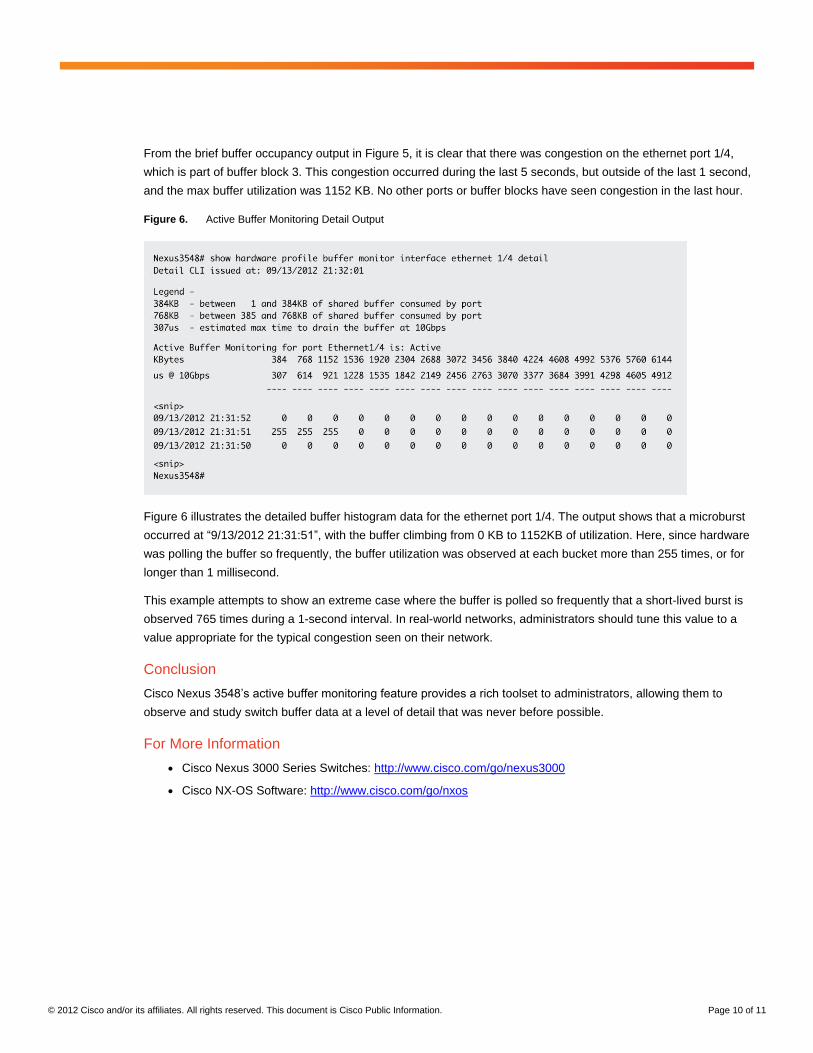
Figure 6. Active Buffer Monitoring Detail Output
Figure 6 illustrates the detailed buffer histogram data for the ethernet port 1/4. The output shows that a microburst
occurred at “9/13/2012 21:31:51”, with the buffer climbing from 0 KB to 1152KB of utilization. Here, since hardware
was polling the buffer so frequently, the buffer utilization was observed at each bucket more than 255 times, or for
longer than 1 millisecond.
This example attempts to show an extreme case where the buffer is polled so frequently that a short-lived burst is
observed 765 times during a 1-second interval. In real-world networks, administrators should tune this value to a
value appropriate for the typical congestion seen on their network.
Conclusion
Cisco Nexus 3548’s active buffer monitoring feature provides a rich toolset to administrators, allowing them to
observe and study switch buffer data at a level of detail that was never before possible.
For More Information
● Cisco Nexus 3000 Series Switches: http://www.cisco.com/go/nexus3000
● Cisco NX-OS Software: http://www.cisco.com/go/nxos

© 2012 Cisco and/or its affiliates. All rights reserved. This document is Cisco Public Information. Page 11 of 11
Printed in USA C11-715895-00 09/12
Related Documents