P/N 13999-003 Info Manual 5-1 Cirrus Design Section 5 SR20 Performance Data Section 5 Performance Data Table of Contents Introduction ..................................................................................... 5-3 Associated Conditions Affecting Performance............................. 5-3 Demonstrated Operating Temperature ........................................ 5-3 Airspeed Calibration: Normal Static Source .................................... 5-4 Airspeed Calibration: Alternate Static Source ................................. 5-5 Altitude Correction: Normal Static Source ...................................... 5-6 Altitude Correction: Alternate Static Source.................................... 5-7 Temperature Conversion ................................................................ 5-8 Outside Air Temperature for ISA Condition .................................... 5-9 Stall Speeds .................................................................................. 5-10 Wind Components ........................................................................ 5-11 Takeoff Distance ........................................................................... 5-12 Takeoff Distance: 3000 LB............................................................ 5-13 Takeoff Distance: 2500 LB............................................................ 5-14 Takeoff Climb Gradient ................................................................. 5-15 Takeoff Rate of Climb ................................................................... 5-16 Enroute Climb Gradient ................................................................ 5-17 Enroute Rate of Climb................................................................... 5-18 Enroute Rate of Climb Vs Density Altitude ................................... 5-19 Time, Fuel and Distance to Climb ................................................. 5-20 Cruise Performance ...................................................................... 5-21 Range / Endurance Profile ............................................................ 5-23 Range / Endurance Profile ............................................................ 5-24 Balked Landing Climb Gradient .................................................... 5-25 Balked Landing Rate of Climb ...................................................... 5-26 Landing Distance .......................................................................... 5-27 Landing Distance .......................................................................... 5-28 September 2011

Welcome message from author
This document is posted to help you gain knowledge. Please leave a comment to let me know what you think about it! Share it to your friends and learn new things together.
Transcript

P/N 13999-003 Info Manual 5-1
Cirrus Design Section 5SR20 Performance Data
Section 5Performance Data
Table of Contents
Introduction .....................................................................................5-3Associated Conditions Affecting Performance.............................5-3Demonstrated Operating Temperature........................................5-3
Airspeed Calibration: Normal Static Source....................................5-4Airspeed Calibration: Alternate Static Source.................................5-5Altitude Correction: Normal Static Source ......................................5-6Altitude Correction: Alternate Static Source....................................5-7Temperature Conversion ................................................................5-8Outside Air Temperature for ISA Condition ....................................5-9Stall Speeds..................................................................................5-10Wind Components ........................................................................5-11Takeoff Distance ...........................................................................5-12Takeoff Distance: 3000 LB............................................................5-13Takeoff Distance: 2500 LB............................................................5-14Takeoff Climb Gradient .................................................................5-15Takeoff Rate of Climb ...................................................................5-16Enroute Climb Gradient ................................................................5-17Enroute Rate of Climb...................................................................5-18Enroute Rate of Climb Vs Density Altitude ...................................5-19Time, Fuel and Distance to Climb.................................................5-20Cruise Performance ......................................................................5-21Range / Endurance Profile ............................................................5-23Range / Endurance Profile ............................................................5-24Balked Landing Climb Gradient ....................................................5-25Balked Landing Rate of Climb ......................................................5-26Landing Distance ..........................................................................5-27Landing Distance ..........................................................................5-28
September 2011
5-2 P/N 13999-003 Info Manual
Section 5 Cirrus DesignPerformance Data SR20
September 2011
Intentionally Left Blank

P/N 13999-003 Info Manual 5-3
Cirrus Design Section 5SR20 Performance Data
IntroductionPerformance data in this section are presented for operationalplanning so that you will know what performance to expect from theairplane under various ambient and field conditions. Performance dataare presented for takeoff, climb, and cruise (including range &endurance).
Associated Conditions Affecting Performance
Computed performance data in this section are based upon dataderived from actual flight testing with the airplane and engine in goodcondition and using average piloting techniques. Unless specificallynoted in the “Conditions” notes presented with each table, ambientconditions are for a standard day (refer to Section 1). Flap position aswell as power setting technique is similarly noted with each table.
The charts in this section provide data for ambient temperatures from–20° C (–4° F) to 40° C (104° F). If ambient temperature is below thechart value, use the lowest temperature shown to computeperformance. This will result in more conservative performancecalculations. If ambient temperature is above the chart value, useextreme caution as performance degrades rapidly at highertemperatures.
All fuel flow data for cruise is based on the recommended lean mixturesetting detailed in Section 4 – Normal Procedures.
Serials 1337 and subsequent with SRV standard configuration:Airplane performance is decreased without the nose landing gearfairing installed. Refer to performance tables for specific values.
Demonstrated Operating Temperature
Satisfactory engine cooling has been demonstrated for this airplanewith an outside air temperature 23° C above standard. The valuegiven is not considered an operating limitation. Reference should bemade to Section 2 for engine operating limitations.
September 2011

5-4 P/N 13999-003 Info Manual
Section 5 Cirrus DesignPerformance Data SR20
Figure 5-1
Airspeed Calibration: Normal Static Source
• Note •
Indicated airspeed values assume zero instrument error.
Conditions:
• Power for level flight or maximum continuous, whichever is less.
• Weight ........................................................................................................3000 LB
KIAS
KCAS
Flaps 0%
Flaps 50%
Flaps100%
50 49
60 60 60
70 72 71 71
80 81 81 81
90 91 91 91
100 101 101 101
110 111 111
120 120 120
130 130
140 140
150 150
160 160
170 170
180 180
190 190
200 200
September 2011

P/N 13999-003 Info Manual 5-5
Cirrus Design Section 5SR20 Performance Data
Airspeed Calibration: Alternate Static Source
• Note •
Indicated airspeed values assume zero instrument error.
Conditions:
• Power for level flight or maximum continuous, whichever is less.
• Heater, Defroster & Vents .................................................................................. ON
• Weight ........................................................................................................ 3000 LB
KIAS
KCAS
Flaps 0%
Flaps 50%
Flaps100%
50 45
60 59 56
70 70 69 67
80 80 79 78
90 90 89 88
100 100 99 98
110 110 109
120 120 118
130 130
140 140
150 150
160 161
170 171
180 182
190 192
200 203
Figure 5-2
September 2011

5-6 P/N 13999-003 Info Manual
Section 5 Cirrus DesignPerformance Data SR20
Figure 5-3
Altitude Correction: Normal Static Source
• Note •
Add correction to desired altitude to obtain indicated altitude to fly.
Indicated airspeed values assume zero instrument error.
Conditions:
• Power for level flight or maximum continuous, whichever is less.
• Weight ........................................................................................................3000 LB
Flaps PressAlt
CORRECTION TO BE ADDED - FEET
Normal Static Source - KIAS
60 70 80 90 100 120 140 160 180 200
0%
S.L -12 -11 -10 -9 -8 -5 -3 -3 -5 -10
5000 -14 -13 -12 -11 -9 -6 -4 -3 -5 -11
10000 -16 -15 -14 -12 -11 -7 -4 -4 -6 -13
15000 -19 -18 -16 -14 -12 -8 -5 -4 -7 -16
50%
S.L -2 -4 -5 -6 -5 +2
10000 -2 -4 -6 -7 -6 +2
15000 -2 -5 -7 -8 -7 +2
100%
S.L -1 -4 -6 -7 -5
10000 -1 -5 -7 -8 -6
15000 -1 -6 -9 -9 -6
September 2011

P/N 13999-003 Info Manual 5-7
Cirrus Design Section 5SR20 Performance Data
Altitude Correction: Alternate Static Source
• Note •
Add correction to desired altitude to obtain indicated altitude to fly.
Indicated airspeed values assume zero instrument error.
Conditions:
• Power for level flight or maximum continuous, whichever is less.
• Heater, Defroster & Vents .................................................................................. ON
• Weight ........................................................................................................ 3000 LB
Flaps PressAlt
CORRECTION TO BE ADDED - FEET
Normal Static Source - KIAS
60 70 80 90 100 120 140 160 180 200
0%
S.L -9 -10 -10 -11 -10 -7 -1 11 27 51
5000 -10 -11 -12 -12 -12 -9 -1 12 32 59
10000 -12 -13 -14 -14 -14 -10 -1 14 37 69
15000 -14 -15 -16 -17 -16 -12 -1 17 44 80
50%
S.L -11 -15 -18 -21 -22 -19
10000 -13 -18 -21 -24 -26 -22
15000 -15 -20 -25 -28 -30 -26
100%
S.L -20 -20 -20 -20 -18
10000 -23 -24 -23 -23 -21
15000 -27 -27 -27 -26 -25
Figure 5-4
September 2011

5-8 P/N 13999-003 Info Manual
Section 5 Cirrus DesignPerformance Data SR20
Figure 5-5
Temperature ConversionTo convert from Celsius (°C) to Fahrenheit (°F), find, in the shaded columns,the number representing the temperature value (°C) to be converted. Theequivalent Fahrenheit temperature is read to the right. EXAMPLE: 38°C = 100°F.
To convert from Fahrenheit (°F) to Celsius (°C), find in the shaded columnsarea, the number representing the temperature value (°F) to be converted.The equivalent Celsius temperature is read to the left. EXAMPLE: 38°F = 3°C.
Temp to Convert°C or °F
Temp to Convert°C or °F
Temp to Convert°C or °F
°C °F °C °F °C °F-50 -58 -72 -17 2 36 17 62 144-49 -56 -69 -16 4 39 18 64 147-48 -54 -65 -14 6 43 19 66 151-47 -52 -62 -13 8 46 20 68 154-46 -50 -58 -12 10 50 21 70 158-44 -48 -54 -11 12 54 22 72 162-43 -46 -51 -10 14 57 23 74 165-42 -44 -47 -9 16 61 24 76 169-41 -42 -44 -8 18 64 26 78 172-40 -40 -40 -7 20 68 27 80 176-39 -38 -36 -6 22 72 28 82 180-38 -36 -33 -4 24 75 29 84 183-37 -34 -29 -3 26 79 30 86 187-36 -32 -26 -2 28 82 31 88 190-34 -30 -22 -1 30 86 32 90 194-33 -28 -18 0 32 90 33 92 198-32 -26 -15 1 34 93 34 94 201-31 -24 -11 2 36 97 36 96 205-30 -22 -8 3 38 100 37 98 208-29 -20 -4 4 40 104 38 100 212-28 -18 0 6 42 108 39 102 216-27 -16 3 7 44 111 40 104 219-26 -14 7 8 46 115 41 106 223-24 -12 10 9 48 118 42 108 226-23 -10 14 10 50 122 43 110 230-22 -8 18 11 52 126 44 112 234-21 -6 21 12 54 129 46 114 237-20 -4 25 13 56 133 47 116 241-19 -2 28 14 58 136 48 118 244-18 0 32 16 60 140 49 120 248
September 2011

P/N 13999-003 Info Manual 5-9
Cirrus Design Section 5SR20 Performance Data
Outside Air Temperature for ISA Condition
PressAlt
Feet
ISA-40°C ISA-20°C ISA ISA+10°C ISA+20°C
°C °F °C °F °C °F °C °F °C °F
SL -25 -13 -5 23 15 59 25 77 35 95
1000 -27 -18 -7 18 13 54 23 72 33 90
2000 -29 -20 -9 16 11 52 21 70 31 88
3000 -31 -24 -11 12 9 48 19 66 29 84
4000 -33 -27 -13 9 7 45 17 63 27 81
5000 -35 -31 -15 5 5 41 15 59 25 77
6000 -37 -34 -17 2 3 38 13 56 23 74
7000 -39 -38 -19 -2 1 34 11 52 21 70
8000 -41 -42 -21 -6 -1 30 10 48 20 66
9000 -43 -45 -23 -9 -3 27 7 45 17 63
10000 -45 -49 -25 -13 -5 23 5 41 15 59
11000 -47 -52 -27 -16 -7 20 3 38 13 56
12000 -49 -56 -29 -20 -9 16 1 34 11 52
13000 -51 -59 -31 -23 -11 13 -1 31 9 49
14000 -53 -63 -33 -27 -13 9 -3 27 7 45
Figure 5-6
September 2011

5-10 P/N 13999-003 Info Manual
Section 5 Cirrus DesignPerformance Data SR20
Figure 5-7
Stall Speeds
• Note •
Altitude loss during wings level stall may be 250 feet or more.
KIAS values may not be accurate at stall.
Conditions:
• Weight ........................................................................................................3000 LB
• CG ..................................................................................................................Noted
• Power................................................................................................................. Idle
• Bank Angle .....................................................................................................Noted
Weight
LB
Bank Angle
Deg
STALL SPEEDS
Flaps 0%Full Up
Flaps 50%Flaps 100%Full Down
KIAS KCAS KIAS KCAS KIAS KCAS
3000
Most FWDC.G.
0 65 67 61 63 56 59
15 66 68 62 64 57 60
30 70 72 65 68 61 63
45 78 80 72 75 67 70
60 92 95 86 89 80 83
3000
MostAFTC.G.
0 64 66 59 62 54 57
15 65 67 60 63 55 58
30 69 71 64 66 58 61
45 76 78 71 73 64 68
60 90 93 84 87 76 81
September 2011

P/N 13999-003 Info Manual 5-11
Cirrus Design Section 5SR20 Performance Data
Wind Components
• Note •
The max demonstrated crosswind is 20 knots. Value not considered limiting.
Example:
• Runway Heading................................................................................................ 10°
• Wind Direction.................................................................................................... 60°
• Wind Velocity..............................................................................................15 Knots
10°
Hea
dwin
dT
ailw
ind
0°
ANGLE
BETW
EEN WIN
D DIR
ECTIO
N AND F
LIG
HT PATH
20°
30°
40°
50°
60°
70°
80°
90°
100°
110°
120°130°140°
150°
160°
170°
180°
VELOCITY
~KNO
TS
WIND
40
40302010
WIN
D C
OM
PO
NE
NT
S ~
KN
OT
S
CROSSWIND COMPONENT ~ KNOTS
-20
-10
0
10
20
40
30
SR22_FM05_1014
10
20
30
50
Figure 5-8
September 2011

5-12 P/N 13999-003 Info Manual
Section 5 Cirrus DesignPerformance Data SR20
Takeoff Distance
The following factors are to be applied to the computed takeoff distance forthe noted condition:
• Headwind - Subtract 10% from computed distance for each 12 knots headwind.
• Tailwind - Add 10% for each 2 knots tailwind up to 10 knots.
• Grass Runway, Dry - Add 20% to ground roll distance.
• Grass Runway, Wet - Add 30% to ground roll distance.
• Sloped Runway - Increase table distances by 22% of the ground roll distance at Sea Level, 30% of the ground roll distance at 5000 ft, 43% of the ground roll distance at 10,000 ft for each 1% of upslope. Decrease table distances by 7% of the ground roll distance at Sea Level, 10% of the ground roll distance at 5000 ft, and 14% of the ground roll distance at 10,000 ft for each 1% of downslope.
• Caution •
The above corrections for runway slope are required to be included herein.These corrections should be used with caution since published runway slopedata is usually the net slope from one end of the runway to the other. Manyrunways will have portions of their length at greater or lesser slopes than thepublished slope, lengthening (or shortening) takeoff ground roll estimatedfrom the table.
• If brakes are not held while applying power, distances apply from point where full throttle and mixture setting is complete.
• For operation in outside air temperatures colder than this table provides, use coldest data shown.
• For operation in outside air temperatures warmer than this table provides, use extreme caution.
Conditions:
• Winds................................................................................................................Zero
• Runway.........................................................................................Dry, Level, Paved
• Flaps................................................................................................................. 50%
• Power............................................................... Maximum, set before brake release
September 2011
P/N 13999-003 Info Manual 5-13
Cirrus Design Section 5SR20 Performance Data
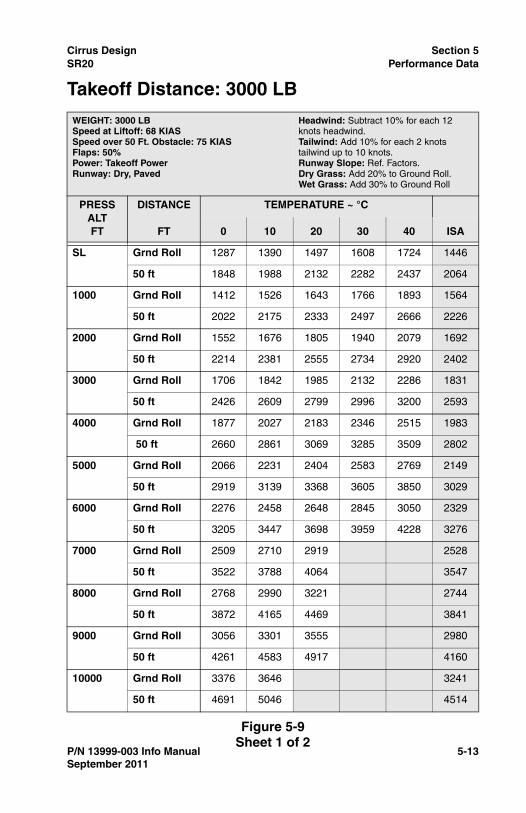
Takeoff Distance: 3000 LB
WEIGHT: 3000 LBSpeed at Liftoff: 68 KIASSpeed over 50 Ft. Obstacle: 75 KIASFlaps: 50%Power: Takeoff PowerRunway: Dry, Paved
Headwind: Subtract 10% for each 12 knots headwind.Tailwind: Add 10% for each 2 knots tailwind up to 10 knots.Runway Slope: Ref. Factors.Dry Grass: Add 20% to Ground Roll.Wet Grass: Add 30% to Ground Roll
PRESSALTFT
DISTANCE
FT
TEMPERATURE ~ °C
0 10 20 30 40 ISA
SL Grnd Roll 1287 1390 1497 1608 1724 1446
50 ft 1848 1988 2132 2282 2437 2064
1000 Grnd Roll 1412 1526 1643 1766 1893 1564
50 ft 2022 2175 2333 2497 2666 2226
2000 Grnd Roll 1552 1676 1805 1940 2079 1692
50 ft 2214 2381 2555 2734 2920 2402
3000 Grnd Roll 1706 1842 1985 2132 2286 1831
50 ft 2426 2609 2799 2996 3200 2593
4000 Grnd Roll 1877 2027 2183 2346 2515 1983
50 ft 2660 2861 3069 3285 3509 2802
5000 Grnd Roll 2066 2231 2404 2583 2769 2149
50 ft 2919 3139 3368 3605 3850 3029
6000 Grnd Roll 2276 2458 2648 2845 3050 2329
50 ft 3205 3447 3698 3959 4228 3276
7000 Grnd Roll 2509 2710 2919 2528
50 ft 3522 3788 4064 3547
8000 Grnd Roll 2768 2990 3221 2744
50 ft 3872 4165 4469 3841
9000 Grnd Roll 3056 3301 3555 2980
50 ft 4261 4583 4917 4160
10000 Grnd Roll 3376 3646 3241
50 ft 4691 5046 4514
Figure 5-9Sheet 1 of 2
September 2011

5-14 P/N 13999-003 Info Manual
Section 5 Cirrus DesignPerformance Data SR20
Figure 5-9
Takeoff Distance: 2500 LB
WEIGHT: 2500 LBSpeed at Liftoff: 65 KIASSpeed over 50 Ft Obstacle: 70 KIASFlaps: 50%Power: Takeoff PowerRunway: Dry, Paved
Headwind: Subtract 10% for each 12 knots headwind.Tailwind: Add 10% for each 2 knots tailwind up to 10 knots.Runway Slope: Ref. Factors.Dry Grass: Add 20% to Ground Roll.Wet Grass: Add 30% to Ground Roll.
PRESSALTFT
DISTANCE
FT
TEMPERATURE ~ °C
0 10 20 30 40 ISA
SL Grnd Roll 813 878 946 1016 1090 912
50 ft 1212 1303 1398 1496 1597 1350
1000 Grnd Roll 892 964 1038 1116 1196 986
50 ft 1326 1426 1529 1636 1747 1457
2000 Grnd Roll 980 1059 1141 1226 1314 1067
50 ft 1451 1561 1674 1791 1912 1572
3000 Grnd Roll 1078 1164 1254 1348 1445 1156
50 ft 1590 1709 1834 1962 2095 1697
4000 Grnd Roll 1185 1281 1380 1483 1590 1253
50 ft 1743 1874 2010 2151 2297 1835
5000 Grnd Roll 1305 1410 1519 1632 1750 1358
50 ft 1912 2056 2205 2360 2520 1985
6000 Grnd Roll 1438 1553 1673 1798 1928 1473
50 ft 2098 2256 2421 2590 2766 2140
7000 Grnd Roll 1585 1712 1845 1599
50 ft 2305 2479 2659 2324
8000 Grnd Roll 1749 1889 2035 1737
50 ft 2534 2725 2923 2517
9000 Grnd Roll 1931 2085 2247 1887
50 ft 2787 2997 3216 2727
10000 Grnd Roll 2133 2304 2050
50 ft 3068 3299 2986
Sheet 2 of 2
September 2011
P/N 13999-003 Info Manual 5-15
Cirrus Design Section 5SR20 Performance Data
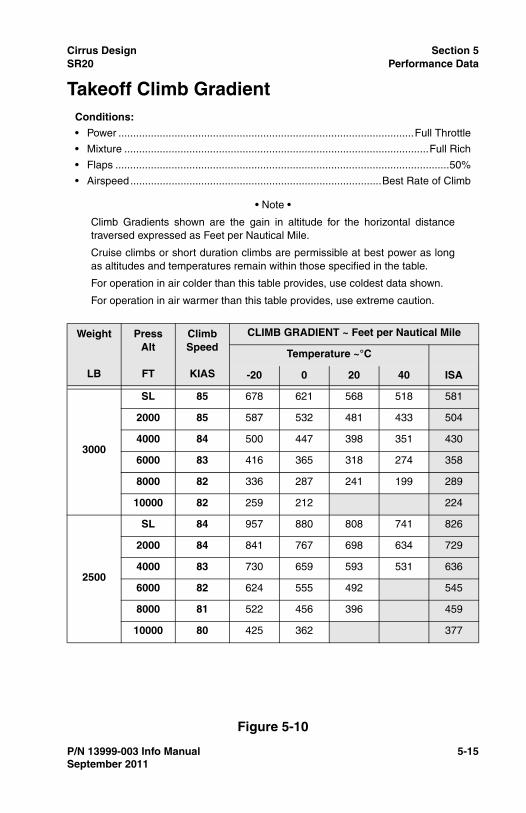
Takeoff Climb Gradient
• Note •
Climb Gradients shown are the gain in altitude for the horizontal distancetraversed expressed as Feet per Nautical Mile.
Cruise climbs or short duration climbs are permissible at best power as longas altitudes and temperatures remain within those specified in the table.
For operation in air colder than this table provides, use coldest data shown.
For operation in air warmer than this table provides, use extreme caution.
Conditions:
• Power ....................................................................................................Full Throttle
• Mixture .......................................................................................................Full Rich
• Flaps .................................................................................................................50%
• Airspeed.....................................................................................Best Rate of Climb
Weight
LB
Press Alt
FT
Climb Speed
KIAS
CLIMB GRADIENT ~ Feet per Nautical Mile
Temperature ~°C
-20 0 20 40 ISA
3000
SL 85 678 621 568 518 581
2000 85 587 532 481 433 504
4000 84 500 447 398 351 430
6000 83 416 365 318 274 358
8000 82 336 287 241 199 289
10000 82 259 212 224
2500
SL 84 957 880 808 741 826
2000 84 841 767 698 634 729
4000 83 730 659 593 531 636
6000 82 624 555 492 545
8000 81 522 456 396 459
10000 80 425 362 377
Figure 5-10
September 2011

5-16 P/N 13999-003 Info Manual
Section 5 Cirrus DesignPerformance Data SR20
Figure 5-11
Takeoff Rate of Climb
• Note •
Rate-of-Climb values shown are change in altitude for unit time expendedexpressed in Feet per Minute.
Cruise climbs or short duration climbs are permissible at best power as longas altitudes and temperatures remain within those specified in the table.
For operation in air colder than this table provides, use coldest data shown.
For operation in air warmer than this table provides, use extreme caution.
Conditions:
• Power.................................................................................................... Full Throttle
• Mixture....................................................................................................... Full Rich
• Flaps................................................................................................................. 50%
• Airspeed .................................................................................... Best Rate of Climb
Weight
LB
PressAltitude
FT
Climb Speed
KIAS
RATE OF CLIMB ~ Feet per Minute
Temperature ~°C
-20 0 20 40 ISA
3000
SL 85 905 862 817 771 828
2000 85 807 761 712 663 734
4000 84 707 657 606 554 639
6000 83 607 553 499 444 545
8000 82 504 447 390 333 450
10000 82 401 341 356
2500
SL 84 1256 1201 1144 1086 1158
2000 84 1136 1077 1017 955 1044
4000 83 1014 952 888 824 929
6000 82 892 825 758 815
8000 81 768 698 627 701
10000 80 643 569 587
September 2011

P/N 13999-003 Info Manual 5-17
Cirrus Design Section 5SR20 Performance Data
Enroute Climb Gradient
• Note •
Climb Gradients shown are the gain in altitude for the horizontal distancetraversed expressed as Feet per Nautical Mile.
Cruise climbs or short duration climbs are permissible at best power as longas altitudes and temperatures remain within those specified in the table.
For operation in air colder than this table provides, use coldest data shown.
For operation in air warmer than this table provides, use extreme caution.
The Maximum Operating Altitude of 17,500 feet MSL may be obtained if theairplane’s gross weight does not exceed 2900 lb and the ambient temperatureis -20° C or less.
Conditions:• Power ....................................................................................................Full Throttle• Mixture .......................................................................................................Full Rich• Flaps .......................................................................................................... 0% (UP)• Airspeed.....................................................................................Best Rate of Climb
Weight
LB
Press Alt
FT
Climb Speed
KIAS
CLIMB GRADIENT - Feet per Nautical Mile
Temperature ~ °C
-20 0 20 40 ISA
3000
SL 96 650 589 533 481 549
2000 95 560 502 448 398 474
4000 94 474 418 367 319 402
6000 93 392 338 289 244 332
8000 92 313 216 214 171 265
10000 91 237 188 200
12000 91 164 118 139
14000 90 95 51 80
2500
SL 93 846 777 712 652 728
2000 92 741 674 612 554 640
4000 92 640 576 516 461 555
6000 91 543 482 425 473
8000 90 451 392 337 395
10000 89 363 306 320
12000 88 279 224 248
14000 88 198 147 180
Figure 5-12
September 2011

5-18 P/N 13999-003 Info Manual
Section 5 Cirrus DesignPerformance Data SR20
Figure 5-13
Enroute Rate of Climb
• Note •
Rate-of-Climb values shown are change in altitude in feet per unit timeexpressed in Feet per Minute.
For operation in air colder than this table provides, use coldest data shown.
For operation in air warmer than this table provides, use extreme caution.
Cruise climbs or short duration climbs are permissible at best power as longas altitudes and temperatures remain within those specified in the table.
The Maximum Operating Altitude of 17,500 feet MSL may be obtained if theairplane’s gross weight does not exceed 2900 lb and the ambient temperatureis -20° C or less.
Conditions:• Power.................................................................................................... Full Throttle• Mixture....................................................................................................... Full Rich• Flaps...........................................................................................................0% (UP)• Airspeed .................................................................................... Best Rate of Climb
Weight
LB
Press Alt
FT
Climb Speed
KIAS
RATE OF CLIMB ~ Feet per Minute
Temperature ~ °C
-20 0 20 40 ISA
3000
SL 96 979 923 866 808 880
2000 95 868 808 748 688 775
4000 94 756 693 630 567 671
6000 93 642 576 510 445 566
8000 92 527 458 389 321 462
10000 91 411 339 357
12000 91 294 218 252
14000 90 175 97 148
2500
SL 93 1231 1175 1117 1058 1132
2000 92 1109 1050 988 926 1016
4000 92 987 923 858 793 900
6000 91 863 796 727 785
8000 90 738 667 595 670
10000 89 612 537 555
12000 88 484 405 440
14000 88 355 273 325
September 2011

P/N 13999-003 Info Manual 5-19
Cirrus Design Section 5SR20 Performance Data
Enroute Rate of Climb Vs Density AltitudeConditions:
• Power .................................................................................................... Full Throttle
• Mixture ....................................................................................................... Full Rich
• Flaps ...........................................................................................................0% (UP)
• Airspeed..................................................................................... Best Rate of Climb
1,000
2,000
3,000
4,000
5,000
6,000
7,000
8,000
9,000
10,000
11,000
12,000
13,000
14,000
15,000
100200
300400
500600
700800
9001000
11001200
2500 LB
3000 LB
Rate of Climb ~ Feet Per Minute
Figure 5-14
September 2011
Den
sity
Alt
itu
de
~ F
eet

5-20 P/N 13999-003 Info Manual
Section 5 Cirrus DesignPerformance Data SR20
Figure 5-15
Time, Fuel and Distance to Climb
• Note •
Taxi Fuel - Add 1 gallon for start, taxi, and takeoff.
Temperature - Add 10% to computed values for each 10º C above standard.
Cruise climbs or short duration climbs are permissible at best power as longas altitudes and temperatures remain within those specified in the table.
Conditions:
• Power.................................................................................................... Full Throttle
• Mixture....................................................................................................... Full Rich
• Weight ........................................................................................................3000 LB
• Winds................................................................................................................Zero
• Climb Airspeed ...............................................................................................Noted
Press Alt
FT
OAT(ISA)
°C
Climb Speed
KIAS
Rate OfClimb
FPM
TIME, FUEL, DISTANCE ~ From Sea Level
TimeMinutes
FuelU.S. Gal
DistanceNM
SL 15 96 880 0.0 0.0 0
1000 13 96 828 1.3 0.3 2
2000 11 95 775 2.4 0.6 4
3000 9 94 723 3.8 1.0 6
4000 7 94 671 5.2 1.3 8
5000 5 93 618 6.7 1.7 11
6000 3 93 566 8.4 2.0 14
7000 1 92 514 10.3 2.4 17
8000 -1 92 462 12.3 2.9 21
9000 -3 91 409 14.6 3.3 25
10000 -5 91 357 17.2 3.8 29
11000 -7 91 305 20.3 4.4 35
12000 -9 91 252 23.8 5.0 41
13000 -11 91 200 28.3 5.8 49
14000 -13 90 148 34.0 6.8 60
September 2011

P/N 13999-003 Info Manual 5-21
Cirrus Design Section 5SR20 Performance Data
Cruise Performance
• Note •
Subtract 10 KTAS if nose wheel pant and fairing removed. Lower KTAS by
10% if nose and main wheel pants & fairings are removed.
Conditions:
• Mixture ...................................................................................................Best Power
• Weight ........................................................................................................ 2600 LB
• Winds ............................................................................................................... Zero
• Shaded Cells: Cruise Pwr above 85% not recommended.
PressAlt
ISA - 30°C ISA ISA + 30°C
RPM MAP PWR KTAS GPH PWR KTAS GPH PWR KTAS GPH
2000 2700 27.8 101% 160 16.0 95% 160 15.0 91% 157 14.2
2500 27.8 90% 154 14.1 85% 154 13.4 81% 151 12.9
2500 26.6 85% 151 13.4 80% 151 12.8 76% 148 11.7
2500 25.4 80% 147 12.7 75% 147 11.6 72% 144 11.3
2500 24.1 74% 143 11.5 70% 143 11.1 67% 140 10.7
2500 22.9 69% 139 11.0 65% 139 10.6 62% 136 10.2
2500 22.0 65% 136 10.5 62% 136 10.2 59% 133 9.9
2500 19.7 55% 127 9.5 52% 127 9.20 50% 124 8.9
4000 2700 25.8 94% 159 14.8 89% 159 14.4 84% 157 13.4
2500 25.8 84% 153 13.3 79% 153 12.7 75% 150 11.7
2500 24.8 80% 150 12.7 75% 150 11.6 72% 147 11.2
2500 23.6 75% 146 11.5 70% 146 11.1 67% 143 10.8
2500 22.3 69% 141 10.9 65% 141 10.5 62% 138 10.2
2500 21.0 63% 136 10.3 60% 136 10.0 57% 133 9.7
2500 19.8 58% 131 9.8 55% 131 9.4 52% 129 9.2
6000 2700 24.0 88% 159 13.8 83% 159 13.1 79% 156 12.6
2500 24.0 79% 152 12.0 74% 152 11.5 71% 149 11.1
2500 23.0 74% 148 11.5 70% 148 11.1 67% 145 10.7
2500 21.8 69% 144 11.0 65% 144 10.6 62% 141 10.2
2500 20.8 65% 140 10.4 61% 140 10.0 58% 137 9.7
2500 19.4 59% 134 9.8 55% 134 9.5 53% 131 9.2
Figure 5-16Sheet 1 of 2
September 2011

5-22 P/N 13999-003 Info Manual
Section 5 Cirrus DesignPerformance Data SR20
Figure 5-16
8000 2700 22.2 82% 157 12.9 77% 157 11.6 73% 154 11.4
2500 22.2 73% 150 11.4 69% 150 11.0 65% 147 10.6
2500 21.2 69% 146 10.9 65% 146 10.5 62% 143 10.2
2500 20.1 64% 142 10.4 60% 142 10.0 57% 139 9.7
2500 18.9 59% 136 9.8 55% 136 9.5 52% 134 9.2
2500 17.7 53% 131 9.2 50% 131 8.9 48% 128 8.7
10000 2700 20.6 76% 155 11.7 72% 155 11.2 68% 152 10.9
2500 20.6 68% 148 10.8 64% 148 10.5 61% 145 10.1
2500 19.6 64% 144 10.4 60% 144 10.0 57% 141 9.7
2500 18.5 59% 139 9.8 55% 139 9.5 53% 136 9.2
2500 17.3 54% 134 9.3 50% 134 9.0 48% 131 8.7
12000 2700 19.0 70% 153 11.1 66% 153 10.7 63% 150 10.3
2500 19.0 63% 146 10.3 59% 146 9.9 56% 143 9.6
2500 18.0 59% 141 9.8 55% 141 9.5 52% 138 9.2
2500 16.8 53% 136 9.2 50% 136 8.9 47% 133 8.6
14000 2700 17.6 66% 151 10.5 62% 151 10.2 58% 148 9.8
2500 17.6 59% 144 9.8 55% 144 9.5 52% 141 9.2
2500 16.5 54% 142 9.3 50% 142 9.0 48% 139 8.7
PressAlt
ISA - 30°C ISA ISA + 30°C
RPM MAP PWR KTAS GPH PWR KTAS GPH PWR KTAS GPH
Sheet 2 of 2
September 2011
P/N 13999-003 Info Manual 5-23
Cirrus Design Section 5SR20 Performance Data
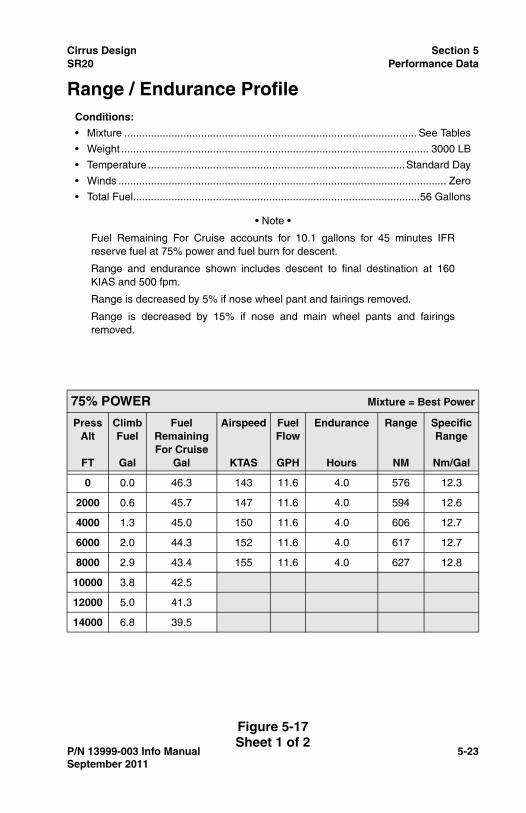
Range / Endurance Profile
• Note •
Fuel Remaining For Cruise accounts for 10.1 gallons for 45 minutes IFRreserve fuel at 75% power and fuel burn for descent.
Range and endurance shown includes descent to final destination at 160KIAS and 500 fpm.
Range is decreased by 5% if nose wheel pant and fairings removed.
Range is decreased by 15% if nose and main wheel pants and fairingsremoved.
Conditions:
• Mixture ................................................................................................... See Tables
• Weight ........................................................................................................ 3000 LB
• Temperature .......................................................................................Standard Day
• Winds ............................................................................................................... Zero
• Total Fuel.................................................................................................56 Gallons
75% POWER Mixture = Best Power
Press Alt
FT
ClimbFuel
Gal
FuelRemainingFor Cruise
Gal
Airspeed
KTAS
FuelFlow
GPH
Endurance
Hours
Range
NM
SpecificRange
Nm/Gal
0 0.0 46.3 143 11.6 4.0 576 12.3
2000 0.6 45.7 147 11.6 4.0 594 12.6
4000 1.3 45.0 150 11.6 4.0 606 12.7
6000 2.0 44.3 152 11.6 4.0 617 12.7
8000 2.9 43.4 155 11.6 4.0 627 12.8
10000 3.8 42.5
12000 5.0 41.3
14000 6.8 39.5
Figure 5-17Sheet 1 of 2
September 2011

5-24 P/N 13999-003 Info Manual
Section 5 Cirrus DesignPerformance Data SR20
Figure 5-17
Range / Endurance Profile
65% POWER Mixture = Best Power
Press Alt
FT
ClimbFuel
Gal
FuelRemainingFor Cruise
Gal
Airspeed
KTAS
FuelFlow
GPH
Endurance
Hours
Range
NM
SpecificRange
Nm/Gal
0 0.0 46.3 137 10.5 4.4 608 13.0
2000 0.6 45.7 139 10.5 4.4 620 13.1
4000 1.3 45.0 141 10.5 4.4 628 13.2
6000 2.0 44.3 143 10.5 4.4 635 13.2
8000 2.9 43.4 145 10.5 4.4 645 13.3
10000 3.8 42.5 147 10.5 4.4 654 13.3
12000 5.0 41.3 150 10.5 4.4 666 13.4
14000 6.8 39.5
55% POWER Mixture = Best Economy
Press Alt
FT
ClimbFuel
Gal
FuelRemainingFor Cruise
Gal
Airspeed
KTAS
FuelFlow
GPH
Endurance
Hours
Range
NM
SpecificRange
Nm/Gal
0 0.0 46.3 127 8.4 5.5 708 15.2
2000 0.6 45.7 130 8.4 5.5 726 15.5
4000 1.3 45.0 131 8.4 5.5 731 15.4
6000 2.0 44.3 134 8.4 5.5 745 15.6
8000 2.9 43.4 136 8.4 5.5 755 15.7
10000 3.8 42.5 139 8.4 5.4 768 15.9
12000 5.0 41.3 141 8.4 5.4 776 15.9
14000 6.8 39.5 144 8.4 5.4 785 16.0
Sheet 2 of 2
September 2011

P/N 13999-003 Info Manual 5-25
Cirrus Design Section 5SR20 Performance Data
Figure 5-18
September 2011
Balked Landing Climb Gradient
• Note •
Balked Landing Climb Gradients shown are the gain in altitude for thehorizontal distance traversed expressed as Feet per Nautical Mile.
Dashed cells in the table represent performance below the minimum balkedlanding climb requirements.
For operation in air colder than this table provides, use coldest data shown.
For operation in air warmer than this table provides, use extreme caution.
This chart is required data for certification. However, significantly betterperformance can be achieved by climbing at Best Rate of Climb speedsshown with flaps down or following the Go-Around / Balked Landingprocedure in Section 4.
Conditions:
• Power ....................................................................................................Full Throttle
• Mixture .......................................................................................................Full Rich
• Flaps ...................................................................................................... 100% (DN)
• Climb Airspeed...........................................................................Best Rate of Climb
Weight
LB
Press Alt
FT
Climb Speed
KIAS
CLIMB GRADIENT ~ Feet per Nautical Mile
Temperature ~ °C
-20 0 20 40 ISA
2900
SL 75 779 699 626 558 644
2000 74 664 585 515 449 547
4000 73 548 475 408 346 451
6000 72 440 369 305 - 359
8000 71 335 268 206 - 271
10000 70 235 170 - - 186
2500
SL 75 987 894 807 728 829
2000 74 851 762 679 603 716
4000 73 721 635 557 484 608
6000 72 596 514 439 - 502
8000 71 477 398 327 - 401
10000 70 362 287 - - 305

5-26 P/N 13999-003 Info Manual
Section 5 Cirrus DesignPerformance Data SR20
Figure 5-19
Balked Landing Rate of Climb
• Note •
Balked Landing Rate of Climb values shown are the full flaps change inaltitude for unit time expended expressed in Feet per Minute.
Dashed cells in the table represent performance below the minimum balkedlanding climb requirements.
For operation in air colder than this table provides, use coldest data shown.
For operation in air warmer than this table provides, use extreme caution.
This chart is required data for certification. However, significantly betterperformance can be achieved by climbing at Best Rate of Climb speedsshown with flaps down or following the Go-Around / Balked Landingprocedure in Section 4.
Conditions:
• Power.................................................................................................... Full Throttle
• Mixture....................................................................................................... Full Rich
• Flaps...................................................................................................... 100% (DN)
• Climb Airspeed ...............................................................................................Noted
Weight
LB
Press Alt
FT
Climb Speed
KIAS
RATE OF CLIMB - Feet per Minute
Temperature ~ °C
-20 0 20 40 ISA
2900
SL 75 905 845 785 724 800
2000 74 789 726 662 598 691
4000 73 671 604 538 471 581
6000 72 552 482 412 - 471
8000 71 432 359 286 - 362
10000 70 310 234 - - 252
2500
SL 75 1142 1076 1009 942 1026
2000 74 1011 942 872 801 904
4000 73 880 807 733 660 781
6000 72 747 670 593 - 658
8000 71 613 533 453 - 537
10000 70 478 394 - - 414
September 2011

P/N 13999-003 Info Manual 5-27
Cirrus Design Section 5SR20 Performance Data
Landing Distance
• Note •
The following factors are to be applied to the computed landing distance forthe noted condition:
• Headwind - Subtract 10% from table distances for each 13 knots headwind.
• Tailwind - Add 10% to table distances for each 2 knots tailwind up to 10 knots.
• Grass Runway, Dry - Add 20% to ground roll distance.
• Grass Runway, Wet - Add 60% to ground roll distance.
• Sloped Runway - Increase table distances by 27% of the ground roll distance for each 1% of downslope. Decrease table distances by 9% of the ground roll distance for each 1% of upslope.
• Caution •
The above corrections for runway slope are required to be included herein.These corrections should be used with caution since published runway slopedata is usually the net slope from one end of the runway to the other. Manyrunways will have portions of their length at greater or lesser slopes than thepublished slope, lengthening (or shortening) landing ground roll estimatedfrom the table.
• For operation in outside air temperatures colder than this table provides, use coldest data shown.
• For operation in outside air temperatures warmer than this table provides, use extreme caution.
Conditions:
• Technique .................................................................................................... Normal
• Winds ............................................................................................................... Zero
• Runway ........................................................................................ Dry, Level, Paved
• Flaps. ..............................................................................................................100%
• Power ........................................................................................ 3° Power Approachto 50 FT obstacle, then reduce power passing the estimated 50 foot point and smoothly continue power reduction to reach idle just prior to touchdown.
September 2011

5-28 P/N 13999-003 Info Manual
Section 5 Cirrus DesignPerformance Data SR20
Figure 5-20
Landing Distance
WEIGHT: 2900 LBSpeed over 50 Ft Obstacle: 75 KIASFlaps: 100%Power: IdleRunway: Dry, Level Paved Surface
Headwind: Subtract 10% per each 13 knots headwind.Tailwind: Add 10% for each 2 knots tailwind up to 10 knots.Runway Slope: Ref. Factors.Dry Grass: Add 20% to Ground RollWet Grass: Add 60% to Ground Roll
PRESSALTFT
DISTANCE
FT
TEMPERATURE ~ °C
0 10 20 30 40 ISA
SL Grnd Roll 962 997 1032 1067 1102 1014
Total 1972 2017 2063 2109 2156 2040
1000 Grnd Roll 997 1034 1070 1067 1143 1045
Total 2018 2065 2113 2161 2210 2079
2000 Grnd Roll 1034 1072 1110 1148 1186 1076
Total 2066 2116 2166 2217 2268 2121
3000 Grnd Roll 1073 1112 1151 1191 1230 1108
Total 2117 2169 2222 2275 2329 2164
4000 Grnd Roll 1113 1154 1195 1236 1142
Total 2170 2225 2281 2337 2209
5000 Grnd Roll 1156 1198 1240 1283 1177
Total 2227 2285 2343 2402 2256
6000 Grnd Roll 1200 1244 1288 1332 1214
Total 2287 2348 2409 2471 2306
7000 Grnd Roll 1246 1292 1337 1251
Total 2351 2415 2479 2358
8000 Grnd Roll 1295 1342 1389 1291
Total 2418 2485 2553 2412
9000 Grnd Roll 1345 1394 1444 1331
Total 2490 2560 2631 2470
10000 Grnd Roll 1398 1449 1373
Total 2565 2639 2529
September 2011
Related Documents