CIRP College Senior Survey 2011 Graduating Seniors Graduating Seniors National Data National Data N=21,055 N=21,055 Higher Education Research Institute, University of California at Los Angeles

Welcome message from author
This document is posted to help you gain knowledge. Please leave a comment to let me know what you think about it! Share it to your friends and learn new things together.
Transcript
CIRPCollege Senior Survey
2011
Graduating SeniorsGraduating Seniors
National DataNational DataN=21,055N=21,055
Higher Education Research Institute, University of California at Los Angeles

College Senior Survey
• The College Senior Survey examines the The College Senior Survey examines the impact of college by collecting impact of college by collecting information on important outcomes of information on important outcomes of college and the experiences and student college and the experiences and student traits that lead towards greater gains in traits that lead towards greater gains in both cognitive and affective areas.both cognitive and affective areas.
• This presentation is designed to provide This presentation is designed to provide a visual executive summary of the a visual executive summary of the results. results.
Higher Education Research Institute, University of California at Los Angeles

Return to contents 3
Presentation Summary• Demographics• Academic Outcomes
Habits of Mind (construct)Academic Self-Concept (construct)Academic Outcomes (theme)
• Academic EnvironmentFaculty Interaction: Mentorship (construct)Interaction with Faculty (theme)Academic Disengagement (construct)Active and Collaborative Learning (theme)Written and Oral Communication (theme)Academic Enhancement Experiences
(theme)
• SatisfactionOverall Satisfaction (construct)Satisfaction with Coursework (construct)Satisfaction with Academic Support and
Courses (theme)Satisfaction with Services and Community
(theme)
• Civic Engagement OutcomesCivic Awareness (construct)Social Agency (construct)Leadership (construct)
• Civic Engagement Experiences and Beliefs
Civic Engagement (theme)
• Diversity OutcomesPluralistic Orientation (construct)
• Diversity Experiences and BeliefsPositive Cross-Racial Interaction
(construct)
Negative Cross-Racial Interaction (construct)
Diversity (theme)
• Campus ClimateSense of Belonging (construct)
• Religiosity/SpiritualityReligiosity / Spirituality (theme)
• Health and WellnessHealth and Wellness (theme)
• Career PlanningCareer Planning (theme)
2011 College Senior SurveyHigher Education Research Institute
Return to contents 4
Demographics
2011 College Senior SurveyHigher Education Research Institute
Return to contents
2011 College Senior SurveyHigher Education Research Institute 5
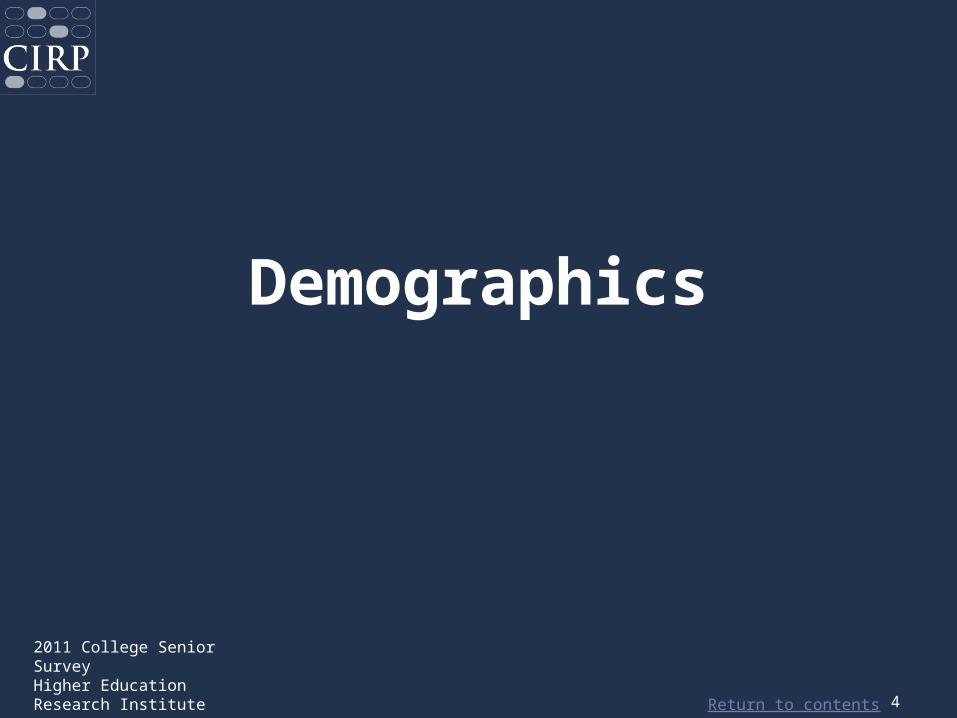
DemographicsRace/Ethnicity
(mark all that apply)
3.6%1.0%
3.6% 3.3%5.6%
82.0%
1.5% 0.8%
7.0%
0%
20%
40%
60%
80%
100%
African
American/
Black
Mexican
American
/Chicano
Am. Indian/
Alaska
Native
Native
Hawaiian
/Pacific
Islande
r
Asian
American
/Asian
Puerto
Rican
OtherOther
Latino
White/
Caucasian

Return to contents
2011 College Senior SurveyHigher Education Research Institute 6
DemographicsSex
Men36.3%
Women63.7%

Return to contents
2011 College Senior SurveyHigher Education Research Institute 7
DemographicsSince entering college have you transferred from a:
9.2%
84.2%
8.3%
0%
20%
40%
60%
80%
100%
did not transfer community college four-year college
Return to contents
2011 College Senior SurveyHigher Education Research Institute 8
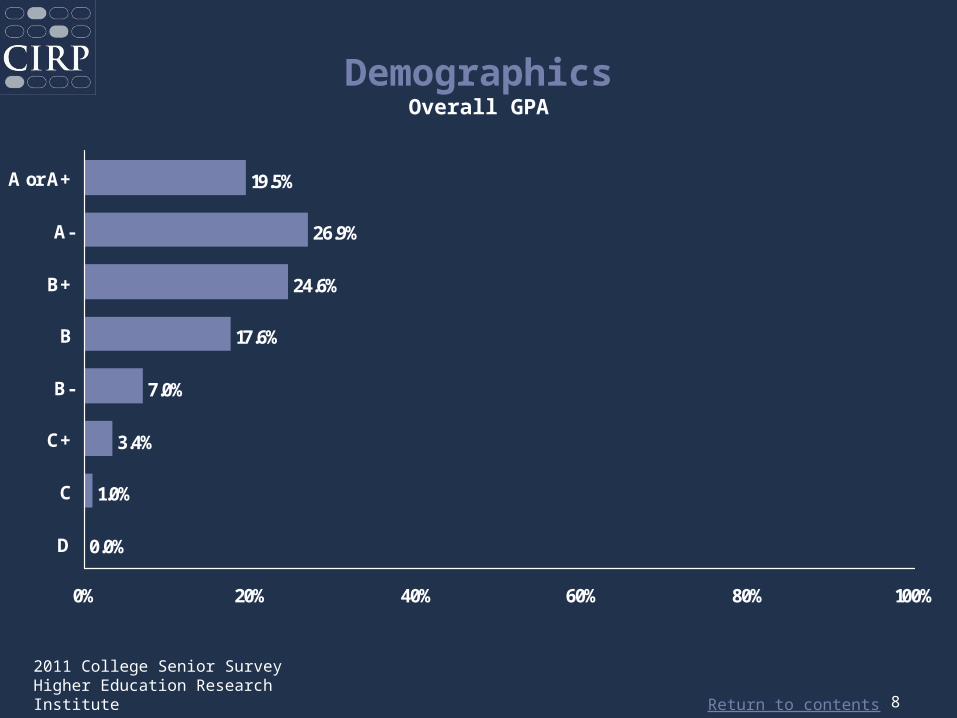
DemographicsOverall GPA
0.0%
1.0%
3.4%
7.0%
17.6%
24.6%
26.9%
19.5%
0% 20% 40% 60% 80% 100%
D
C
C+
B-
B
B+
A-
A or A+
Return to contents
2011 College Senior SurveyHigher Education Research Institute 9
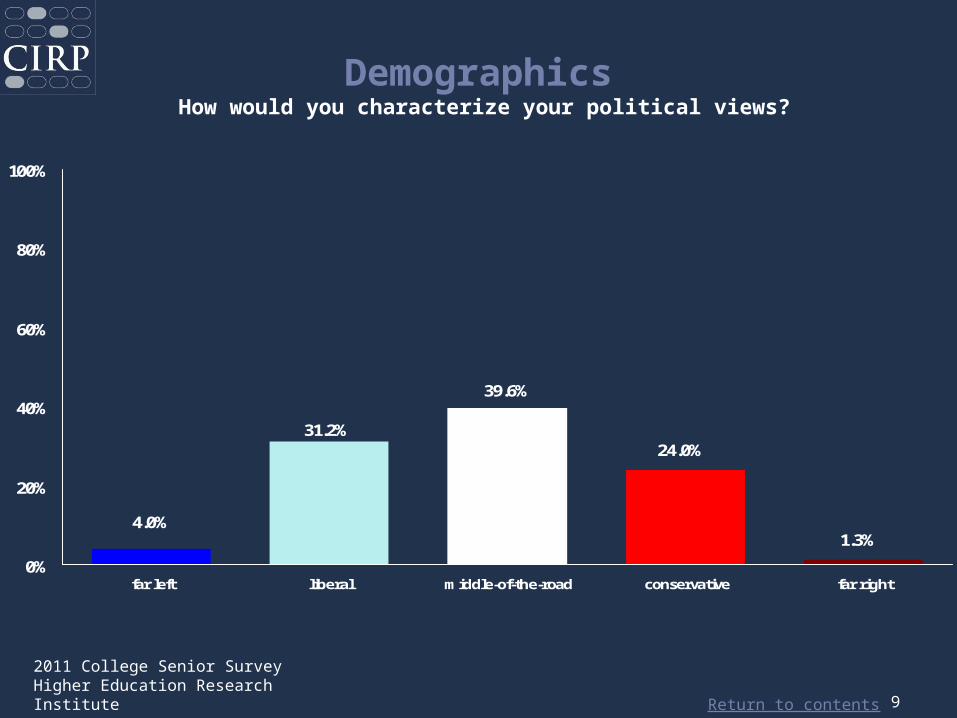
Demographics How would you characterize your political views?
24.0%
1.3%
39.6%
4.0%
31.2%
0%
20%
40%
60%
80%
100%
far left liberal middle-of-the-road conservative far right

Return to contents
2011 College Senior SurveyHigher Education Research Institute 10
58.5%
0%
20%
40%
60%
80%
100%
Borrowed money
Source for college expenses
17.7%
62.2%
75.3%
69.6%
84.5%
0% 20% 40% 60% 80% 100%
Other sources
Aid to be repaid
Aid not to berepaid
Personalresources
Family resources
Median Amount Borrowed
25,000
DemographicsFinances

Return to contents
2011 College Senior SurveyHigher Education Research Institute 11
Academic Outcomes

Return to contents
2011 College Senior SurveyHigher Education Research Institute 12
CIRP Construct
Habits of MindHabits of Mind is a unified measure of the behaviors and traits associated
with academic success. These learning behaviors are seen as the foundation for lifelong learning.
“High” represents students who scored one-half standard deviation or more above the mean (i.e., higher than 55).
High Habits of Mind
39.2%
39.7%
39.4%
0% 20% 40% 60% 80% 100%
Women
Men
All Students

Return to contents
2011 College Senior SurveyHigher Education Research Institute 13
CIRP Construct Survey Items
Habits of MindHow often in the past year did you:
33.7%
52.7%
49.8%
43.6%
54.7%
60.7%
58.4%
43.4%
46.5%
53.1%
42.3%
35.6%
0% 20% 40% 60% 80% 100%
Take a risk because you felt you had more to gain (1.39)
Ask questions in class (1.50)
Evaluate the quality or reliability of information you received(1.73)
Seek alternative solutions to a problem (1.90)
Seek solutions to problems and explain them to others (2.25)
Support your opinions with a logical argument (2.30)
■ occasionally ■ frequently

Return to contents
2011 College Senior SurveyHigher Education Research Institute 14
CIRP Construct Survey Items
Habits of MindHow often in the past year did you:
50.9%
46.4%
50.5%
38.5%
50.2%
46.9%
41.9%
43.7%
52.8%
46.1%
0% 20% 40% 60% 80% 100%
Accept mistakes as part of thelearning process (0.69)
Look up scientific researcharticles and resources (0.73)
Revise your papers to improveyour writing (1.15)
Explore topics on your own, eventhough it was not required for a
class (1.24)
Seek feedback on your academicwork (1.28)
■ occasionally ■ frequently

Return to contents
2011 College Senior SurveyHigher Education Research Institute 15
CIRP Construct
Academic Self-ConceptAcademic Self-Concept is a unified measure of students’ beliefs about their abilities and confidence in academic environments.
High Academic Self-Concept
26.1%
41.2%
31.6%
0% 20% 40% 60% 80% 100%
Women
Men
All Students
“High” represents students who scored one-half standard deviation or more above the mean (i.e., higher than 55).

Return to contents
2011 College Senior SurveyHigher Education Research Institute 16
CIRP Construct Survey Items
Academic Self-ConceptRate yourself on each of the following traits as compared
with the average person your age:
12.3%
37.8%
22.4%
28.9%
31.3%
42.8%
47.3%
51.6%
0% 20% 40% 60% 80% 100%
Mathematical ability (1.60)
Drive to achieve (1.63)
Self-confidence intellectual (1.86)
Academic ability (3.11)
■ above average ■ highest 10%
Return to contents
2011 College Senior SurveyHigher Education Research Institute 17
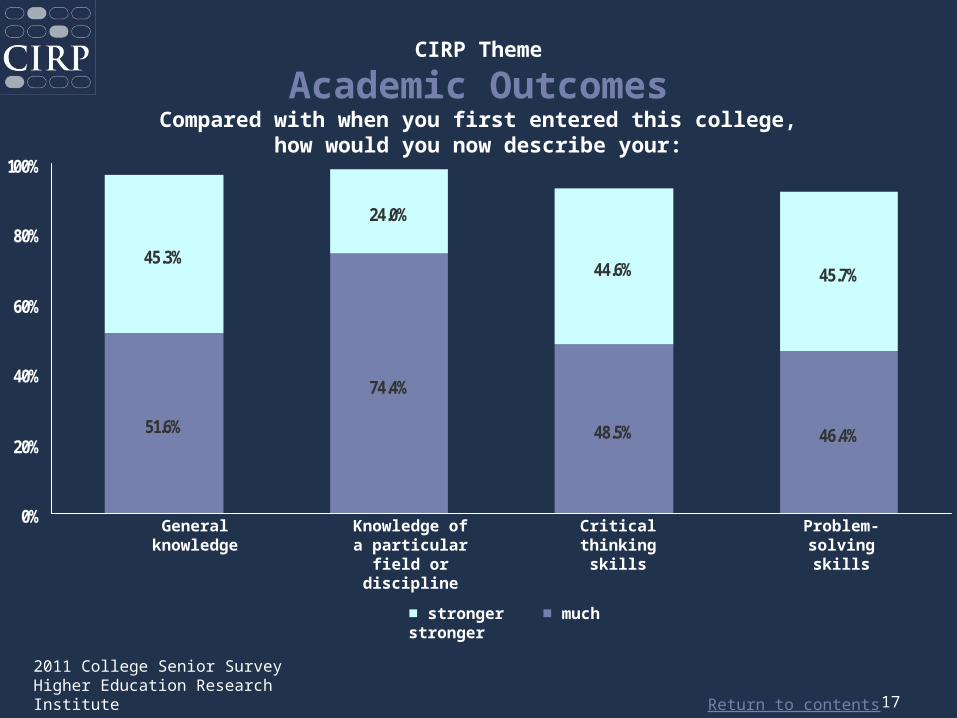
CIRP Theme
Academic OutcomesCompared with when you first entered this college,
how would you now describe your:
General knowledge
Knowledge of a
particular field or
discipline
Critical thinking
skills
Problem-solving skills
■ stronger ■ much stronger
51.6%
74.4%
46.4%
24.0%
44.6% 45.7%
48.5%
45.3%
0%
20%
40%
60%
80%
100%
Return to contents
2011 College Senior SurveyHigher Education Research Institute 18
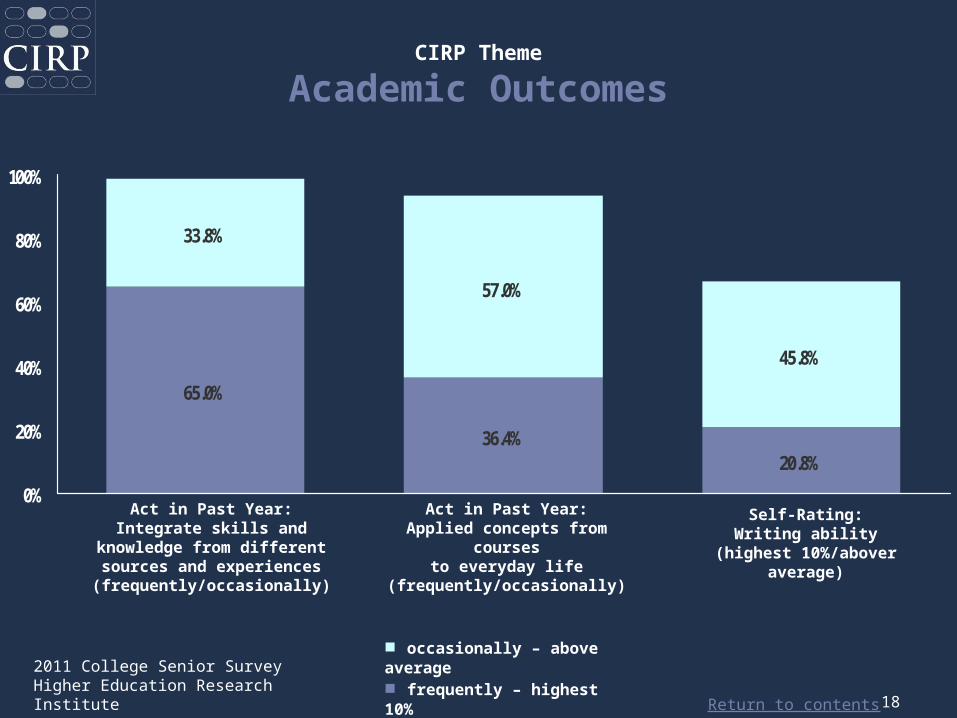
CIRP Theme
Academic Outcomes
65.0%
36.4%20.8%
33.8%
57.0%
45.8%
0%
20%
40%
60%
80%
100%
Act in Past Year:Applied concepts from
coursesto everyday life
(frequently/occasionally)
Self-Rating:Writing ability
(highest 10%/abover average)
■ occasionally – above average■ frequently – highest 10%
Act in Past Year:Integrate skills and
knowledge from different sources and experiences(frequently/occasionally)

Return to contents
2011 College Senior SurveyHigher Education Research Institute 19
Academic Environment

Return to contents
2011 College Senior SurveyHigher Education Research Institute 20
CIRP Construct
Faculty Interaction: MentorshipFaculty Interaction: Mentorship measures the extent to which students and faculty have mentoring relationships that foster support and guidance with
respect to both academic and personal domains.
“High” represents students who scored one-half standard deviation or more above the mean (i.e., higher than 55).
High Student-Faculty Interaction
36.3%
29.1%
33.7%
0% 20% 40% 60% 80% 100%
Women
Men
All Students

Return to contents
2011 College Senior SurveyHigher Education Research Institute 21
CIRP Construct Survey Items
Faculty Interaction: MentorshipHow often have your professors at your college provided you with:
51.8%
41.0%
32.6%
40.9%
39.0%
44.3%
49.7%
51.3%
51.3%
49.9%
0% 20% 40% 60% 80% 100%
An opportunity to discusscoursework outside of class ( 2.13)
Feedback on your academic work(outside of grades) (2.33)
Emotional support andencouragement (2.40)
Advice and guidance about youreducational program (2.89)
Help in achieving yourprofessional goals (3.32)
■ occasionally ■ frequently

Return to contents
2011 College Senior SurveyHigher Education Research Institute 22
CIRP Construct Survey Items
Student-Faculty InteractionHow often have your professors at your college provided you with:
24.5%
35.5%
33.1%
44.1%
44.6%
48.7%
51.6%
44.8%
0% 20% 40% 60% 80% 100%
An opportunity to work on aresearch project (1.09)
A letter of recommendation (1.71)
Help to improve your study skills(1.84)
Encouragement to pursuegraduate/professional study (1.91)
■ occasionally ■ frequently

Return to contents
2011 College Senior SurveyHigher Education Research Institute 23
CIRP Theme
Interaction with FacultyHow often have you:
5.8%
30.7%
10.7%
48.7%
62.4%
52.9%
24.1%
45.6%
8.4%
38.5%
0%
20%
40%
60%
80%
100%
■ occasionally ■ frequently
Have been a
guest in a professor’
s home
Asked a professor for advice
after class
Challenged a
professor’s idea in
class
Worked on a
professor’s
research project
Communicated
regularly with your professors

Return to contents
2011 College Senior SurveyHigher Education Research Institute 24
CIRP Theme
Interaction with FacultyPlease rate your satisfaction with your college in each area:
48.0%33.8%
40.1%
44.9%
0%
20%
40%
60%
80%
100%
■ satisfied ■ very satisfied
Amount of contact with faculty
Ability to find a faculty or staff mentor

Return to contents
2011 College Senior SurveyHigher Education Research Institute 25
CIRP Theme
Interaction with FacultyFor the activities listed below, please indicate how often you engaged in each
during the past year:
41.7% 45.8%
49.2%
37.7%
59.1%
52.8%
0%
20%
40%
60%
80%
100%
■ occasionally ■ frequently
Felt that faculty provided me with
feedback that helped me assess
my progress in class
Felt that my contributions were
valued in class
Felt that faculty encouraged me to ask questions and
participate in discussions

Return to contents
2011 College Senior SurveyHigher Education Research Institute 26
CIRP Theme
Interaction with FacultyPlease indicate the extent to which you agree or disagree with the following
statements :
25.2% 26.3%
65.0%
52.6%
41.4%
57.5%
0%
20%
40%
60%
80%
100%
Faculty showed concern about my
progress
Faculty empower me to learn here
Faculty believe in my potential to succeed
academically
■ agree ■ strongly agree

Return to contents
2011 College Senior SurveyHigher Education Research Institute 27
CIRP Theme
Interaction with FacultyPlease indicate the extent to which you agree or disagree with the following
statements :
4.0%
26.9%
60.2%
50.5%
41.6%22.6%
0%
20%
40%
60%
80%
100%
In class, I have heard faculty
express stereotypes based on
race/ethnicity, gender, sexual orientation, or
religious affiliation
Faculty encouraged me to meet with them
outside of class
At least one faculty member has taken an
interest in my development
■ agree ■ strongly agree

Return to contents
2011 College Senior SurveyHigher Education Research Institute 28
CIRP Theme
Interaction with FacultyHow often have your professors at your college provided you with:
■ occasionally ■ frequently
49.7%56.4%
10.3%
40.3%
51.2%
33.8%41.7%
45.7%
0%
20%
40%
60%
80%
100%
Honest feedback
about your skills and abilities
An opportunity
to apply learning to “real-life”
issues
Intellectual challenge
and stimulation
An opportunity to publish

Return to contents
2011 College Senior SurveyHigher Education Research Institute 29
CIRP Construct
Academic DisengagementAcademic Disengagement measures the extent to which students engage in
behaviorsthat are inconsistent with academic success.
“Low” represents students who scored one-half standard deviation or more below the mean (i.e., lower than 45).
Low Academic Disengagement
25.3%
19.3%
23.1%
0% 20% 40% 60% 80% 100%
Women
Men
All Students

Return to contents
2011 College Senior SurveyHigher Education Research Institute 30
CIRP Construct Survey Items
Academic DisengagementSince entering college, how often have you:
62.9%
47.6%
13.8%
32.9%
33.0%
48.3%
79.3%
59.6%
0% 20% 40% 60% 80% 100%
Fell asleep in class (1.00)
Failed to complete homework ontime (1.26)
Missed class for other reasons(1.76)
Came late to class (1.82)
■ occasionally ■ not at all

Return to contents
2011 College Senior SurveyHigher Education Research Institute 31
CIRP Theme
Active and Collaborative LearningSince entering college, indicate how often you have:
68.3%
46.2%
12.5%
49.0%
45.2%38.4%
13.4%
30.3%
0%
20%
40%
60%
80%
100%
■ occasionally ■ frequently
Discussed coursecontent with
studentsoutside of class
Studied with other students
Performed community service as
part of a class
Tutored another college student

Return to contents
2011 College Senior SurveyHigher Education Research Institute 32
CIRP Theme
Active and Collaborative LearningSince entering college, indicate how often you have:
8.4%
39.6%
70.6%
56.2%48.5%
28.3%
49.4%
52.9%
0%
20%
40%
60%
80%
100%
■ occasionally ■ frequently
Challenged a professor's ideas in
class
Worked with classmates on group projects during class
Worked with classmates on group projects outside of
class
Contributed to class discussions

Return to contents
2011 College Senior SurveyHigher Education Research Institute 33
CIRP Theme
Active and Collaborative LearningYes
Completed a culminating experience for your degree (e.g., capstone course/project, thesis, comp exam)
59.0%
52.7% 50.2%
46.1%
33.8%
65.0%
43.4%
0%
20%
40%
60%
80%
100%
Act in Past Year:Ask questions in
class
Act in Past Year:Seek feedback on your
academic work
Act in Past Year:Integrated skills and
knowledge from different sources and experiences
■ occasionally ■ frequently

Return to contents
2011 College Senior SurveyHigher Education Research Institute 34
CIRP Theme
Active and Collaborative LearningTo what extent have you experienced the following with students
from a racial/ethnic group other than your own:
18.2% 21.9%
27.5%24.3%
27.1%
22.7%
0%
20%
40%
60%
80%
100%
Had meaningful and honest
discussions about race/ethnic
relations outside of class
Had intellectual discussions outside
of class
Studied or prepared for class
■ often ■ very often
Return to contents
2011 College Senior SurveyHigher Education Research Institute 35
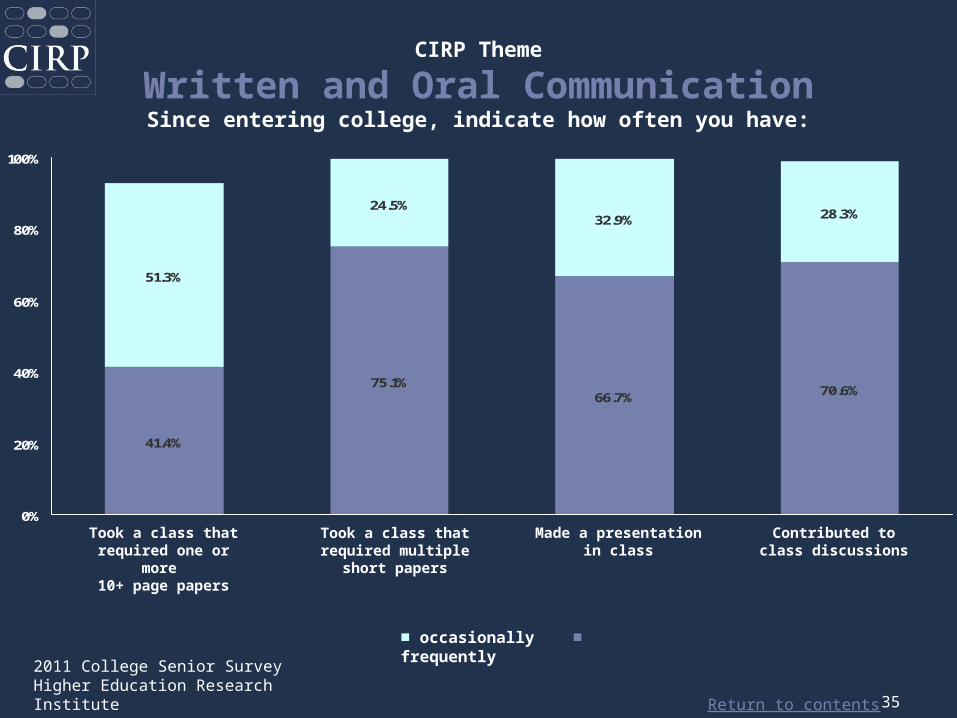
CIRP Theme
Written and Oral CommunicationSince entering college, indicate how often you have:
41.4%
75.1%70.6%
24.5%32.9% 28.3%
66.7%
51.3%
0%
20%
40%
60%
80%
100%
■ occasionally ■ frequently
Took a class that required one or
more 10+ page papers
Took a class that required multiple
short papers
Made a presentation in class
Contributed to class discussions
Return to contents
2011 College Senior SurveyHigher Education Research Institute 36
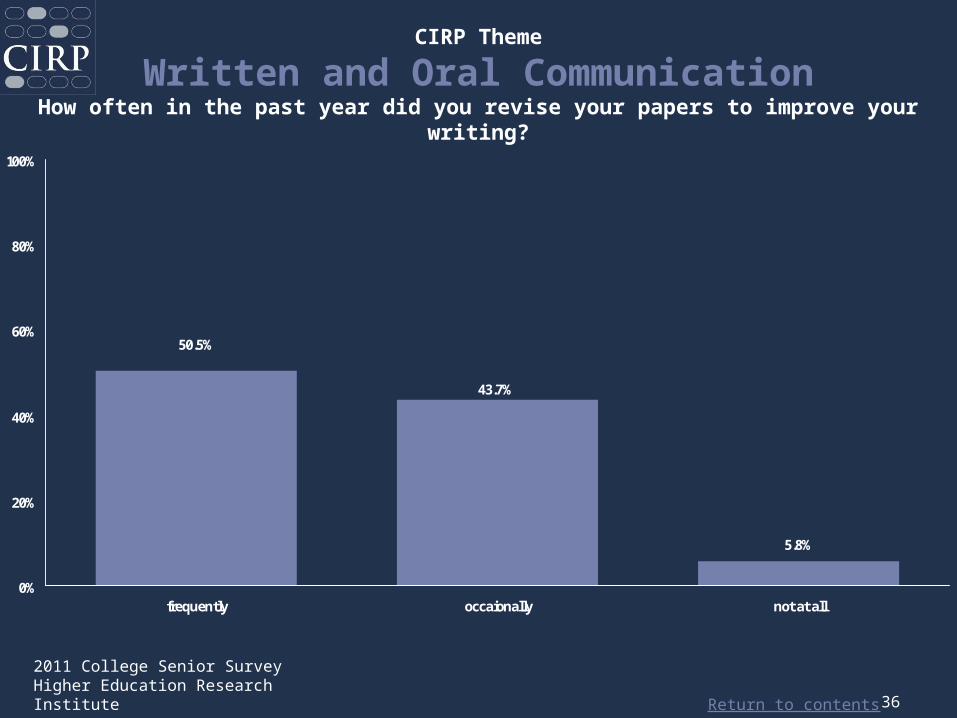
5.8%
50.5%
43.7%
0%
20%
40%
60%
80%
100%
frequently occaionally not at all
CIRP Theme
Written and Oral CommunicationHow often in the past year did you revise your papers to improve your writing?
Return to contents
2011 College Senior SurveyHigher Education Research Institute 37
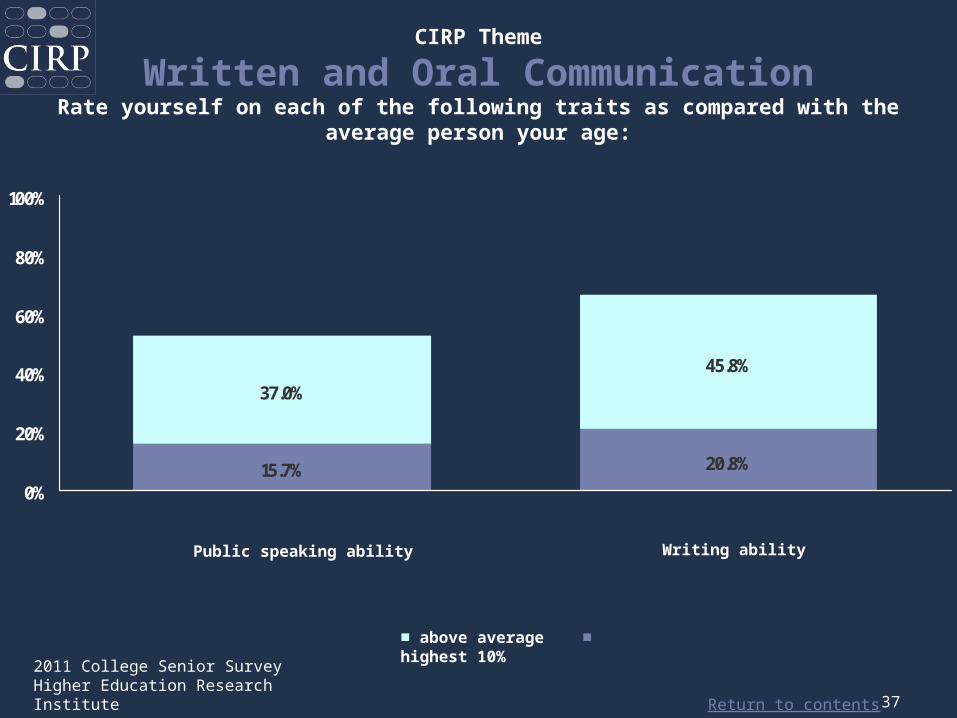
CIRP Theme
Written and Oral CommunicationRate yourself on each of the following traits as compared with the average
person your age:
15.7% 20.8%
37.0%
45.8%
0%
20%
40%
60%
80%
100%
Public speaking ability Writing ability
■ above average ■ highest 10%

Return to contents
2011 College Senior SurveyHigher Education Research Institute 38
CIRP Theme
Academic Enhancement ExperiencesSince entering college, indicate how often you have:
38.8%
12.5%
39.6%
38.4%
24.1%
56.2%
10.7%
41.0%
0%
20%
40%
60%
80%
100%
■ occasionally ■ frequently
Worked on independent study
projects
Worked on a professor's research
project
Worked with classmates on group projects during class
Tutored another student

Return to contents
2011 College Senior SurveyHigher Education Research Institute 39
CIRP Theme
Academic Enhancement ExperiencesSince entering college, indicate how often you have:
49.4%
66.7%
32.9% 28.3%
70.6%
48.5%
0%
20%
40%
60%
80%
100%
■ occasionally ■ frequently
Contributed to class discussions
Worked with classmates on group projects outside of class
Made a presentation in class
Return to contents
2011 College Senior SurveyHigher Education Research Institute 40
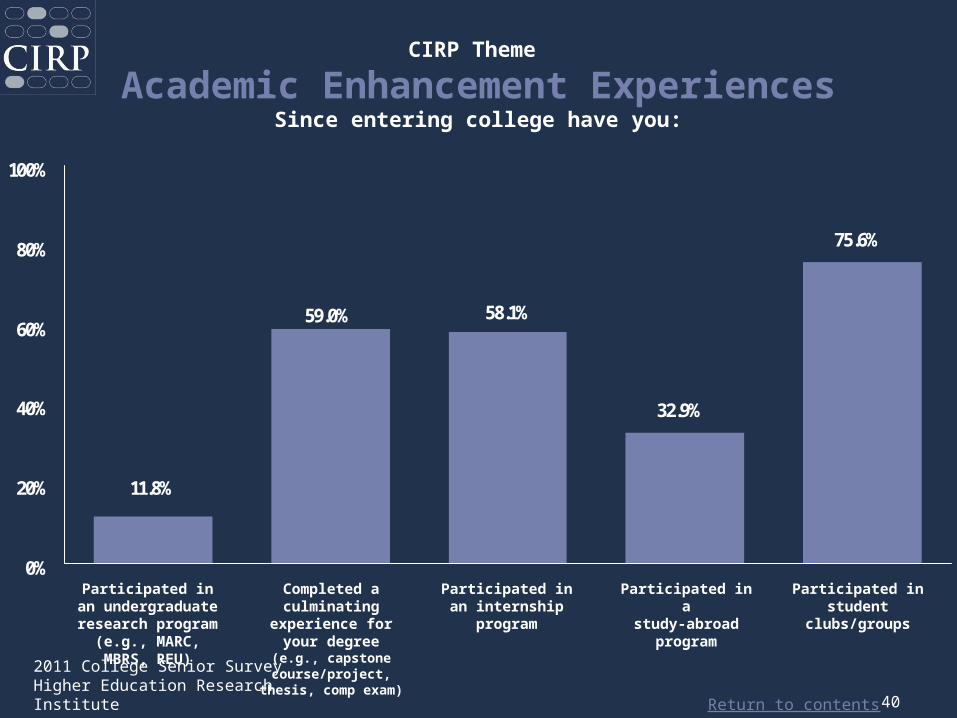
CIRP Theme
Academic Enhancement ExperiencesSince entering college have you:
59.0%
11.8%
58.1%
75.6%
32.9%
0%
20%
40%
60%
80%
100%
Participated in an internship
program
Participated in astudy-abroad
program
Completed a culminating
experience for your degree
(e.g., capstone course/project,
thesis, comp exam)
Participated instudent
clubs/groups
Participated in an undergraduate
research program (e.g., MARC, MBRS, REU)

Return to contents
2011 College Senior SurveyHigher Education Research Institute 41
Satisfaction

Return to contents
2011 College Senior SurveyHigher Education Research Institute 42
CIRP Construct
Overall SatisfactionOverall Satisfaction is a unified measure of students’ satisfaction with the
college experience.
“High” represents students who scored one-half standard deviation or more above the mean (i.e., higher than 55).
High Overall Satisfaction
40.1%
38.2%
39.4%
0% 20% 40% 60% 80% 100%
Women
Men
All Students

Return to contents
2011 College Senior SurveyHigher Education Research Institute 43
CIRP Construct Survey Items
Overall Satisfaction
39.8%
46.2%
43.9%
48.5%
36.0%
43.4%
0% 20% 40% 60% 80% 100%
Overall quality of instruction(1.69) - very satisfied/ satisfied
Would still choose to enroll atthis college (1.90) - definitely
yes/probably yes
Overall college experience(3.69) - very satisfied/ satisfied
■ satisfied – probably yes■ very satisfied – definitely yes

Return to contents
2011 College Senior SurveyHigher Education Research Institute 44
CIRP Construct
Satisfaction with CourseworkSatisfaction with Coursework measures the extent to which students see their
courseworkas relevant, useful and applicable to their academic success and future plans.
“High” represents students who scored one-half standard deviation or more above the mean (i.e., higher than 55).
High Satisfaction with Coursework
36.8%
33.7%
35.7%
0% 20% 40% 60% 80% 100%
Women
Men
All Students

Return to contents
2011 College Senior SurveyHigher Education Research Institute 45
CIRP Construct Survey Items
Satisfaction with CourseworkPlease rate your satisfaction with your college in each area:
24.0%
48.5%
28.8%
34.3%
53.2%
40.7%
48.8%
44.4%
0% 20% 40% 60% 80% 100%
General education or core curriculumcourses (0.92)
Courses in your major field (1.54)
Relevance of coursework to everydaylife (3.13)
Relevance of coursework to futurecareer plans (3.52)
■ satisfied ■ very satisfied
Return to contents
2011 College Senior SurveyHigher Education Research Institute 46
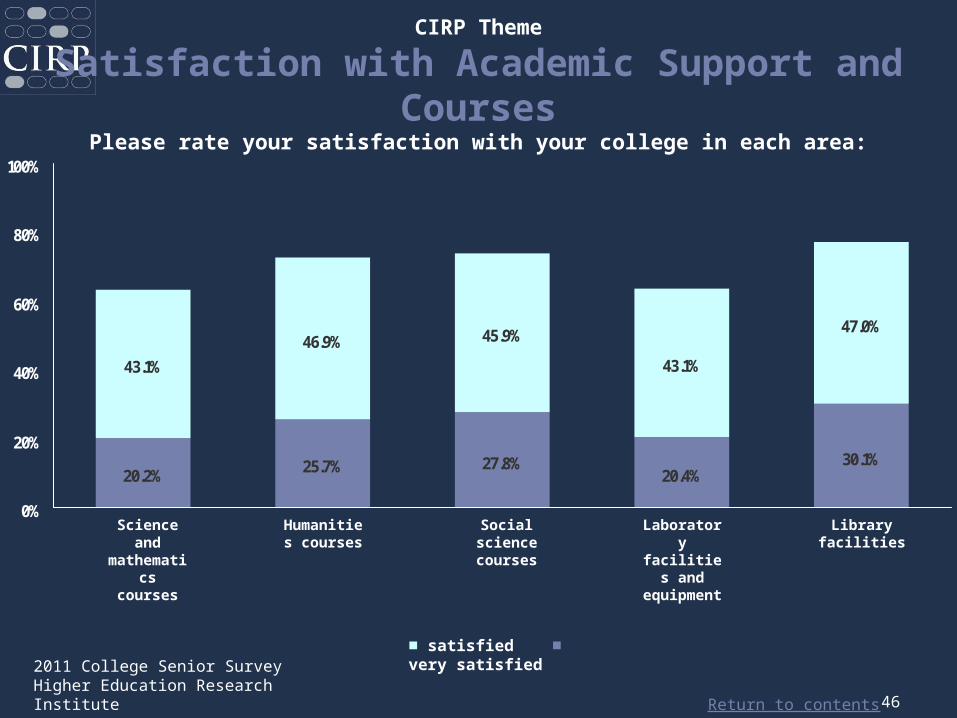
CIRP Theme
Satisfaction with Academic Support and Courses
Please rate your satisfaction with your college in each area:
■ satisfied ■ very satisfied
20.2% 25.7% 20.4%30.1%
46.9% 45.9%
43.1%
47.0%
27.8%
43.1%
0%
20%
40%
60%
80%
100%
Science and
mathematics
courses
Humanities
courses
Social science courses
Laboratory
facilities and
equipment
Library facilities

Return to contents
2011 College Senior SurveyHigher Education Research Institute 47
CIRP Theme
Satisfaction with Academic Support and Courses
Please rate your satisfaction with your college in each area:
■ satisfied ■ very satisfied
18.6% 19.1%
48.0% 49.6%
39.7%39.5%
40.1% 40.9%
24.2%
44.0%
0%
20%
40%
60%
80%
100%
Computing
assistance
Tutoring or other
academic assistanc
e
Academic advising
Amount of contact
with faculty
Class size
Return to contents
2011 College Senior SurveyHigher Education Research Institute 48
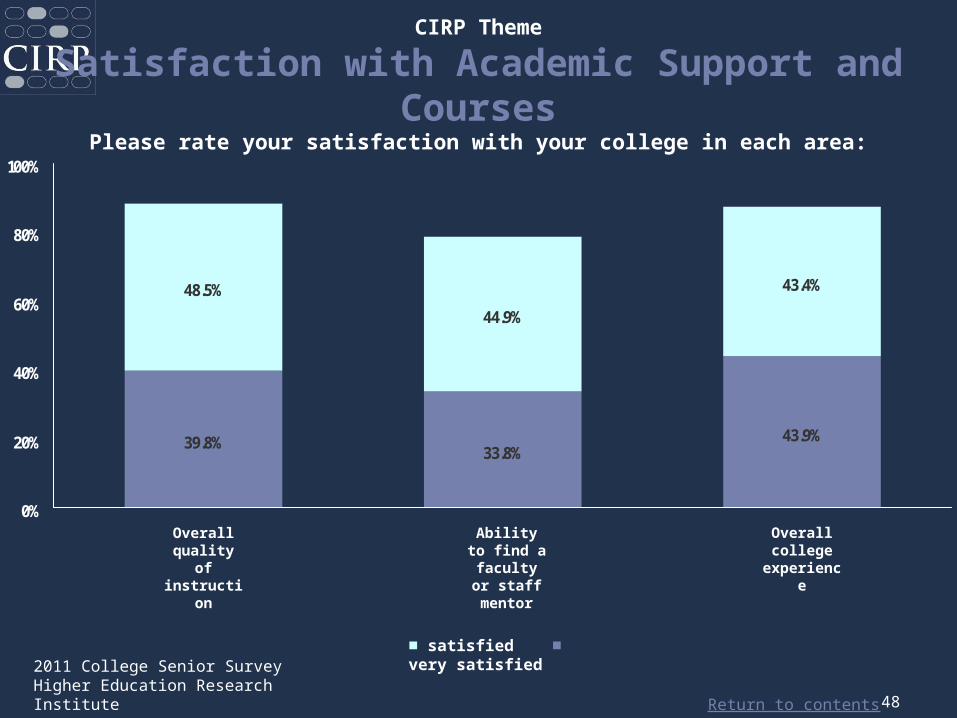
CIRP Theme
Satisfaction with Academic Support and Courses
Please rate your satisfaction with your college in each area:
■ satisfied ■ very satisfied
39.8%33.8%
44.9%
43.4%
43.9%
48.5%
0%
20%
40%
60%
80%
100%
Overall quality of instructio
n
Ability to find a
faculty or staff
mentor
Overall college
experience
Return to contents
2011 College Senior SurveyHigher Education Research Institute 49
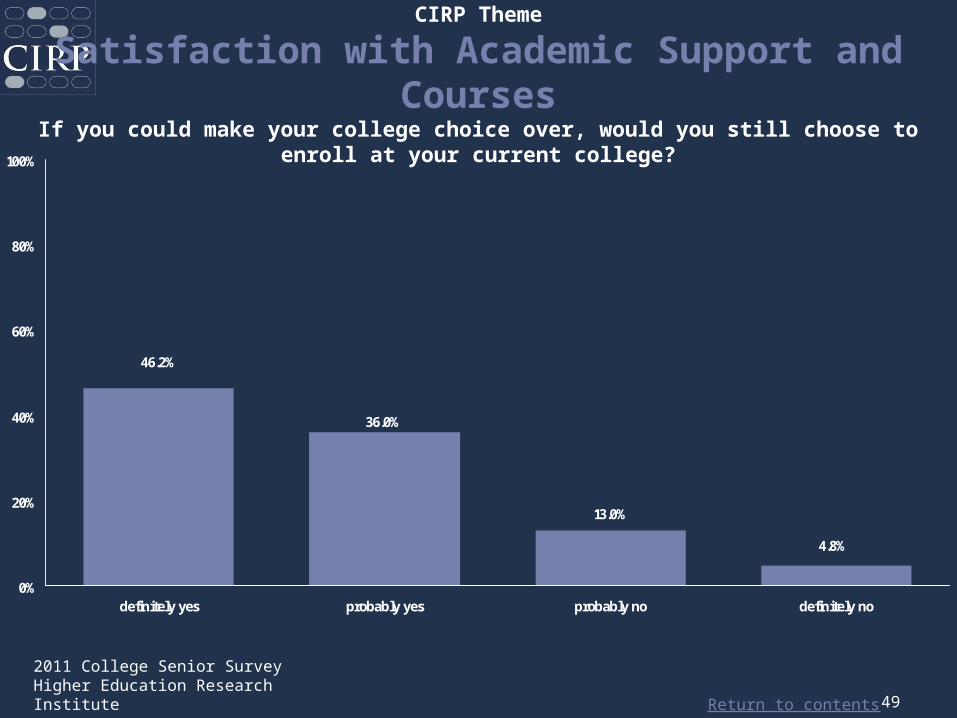
4.8%
13.0%
46.2%
36.0%
0%
20%
40%
60%
80%
100%
definitely yes probably yes probably no definitely no
CIRP Theme
Satisfaction with Academic Support and Courses
If you could make your college choice over, would you still choose to enroll at your current college?

Return to contents
2011 College Senior SurveyHigher Education Research Institute 50
CIRP Theme
Satisfaction with Services and CommunityPlease rate your satisfaction with your college in each area:
20.4% 16.2% 12.7% 13.1% 17.2%
40.6% 34.0%
29.5%37.1% 32.4%
19.3%
37.3%
0%
20%
40%
60%
80%
100%
Career counselin
g and advising
Student housing
Financial aid
package
Job placement services
for students
Student health
services
■ satisfied ■ very satisfied
Student psychologi
cal services

Return to contents
2011 College Senior SurveyHigher Education Research Institute 51
CIRP Theme
Satisfaction with Services and CommunityPlease rate your satisfaction with your college in each area:
33.7% 28.4%16.1%
43.9%
41.9% 44.2%
35.2%
43.4%
25.5%
41.8%
0%
20%
40%
60%
80%
100%
Overall sense of
community among
students
Availability of campus
social activities
Respect for the
expression of diverse
beliefs
Racial/ethnic
diversity of the
student body
■ satisfied ■ very satisfied
Overall college
experience

Return to contents
2011 College Senior SurveyHigher Education Research Institute 52
Civic EngagementOutcomes
Return to contents
2011 College Senior SurveyHigher Education Research Institute 53
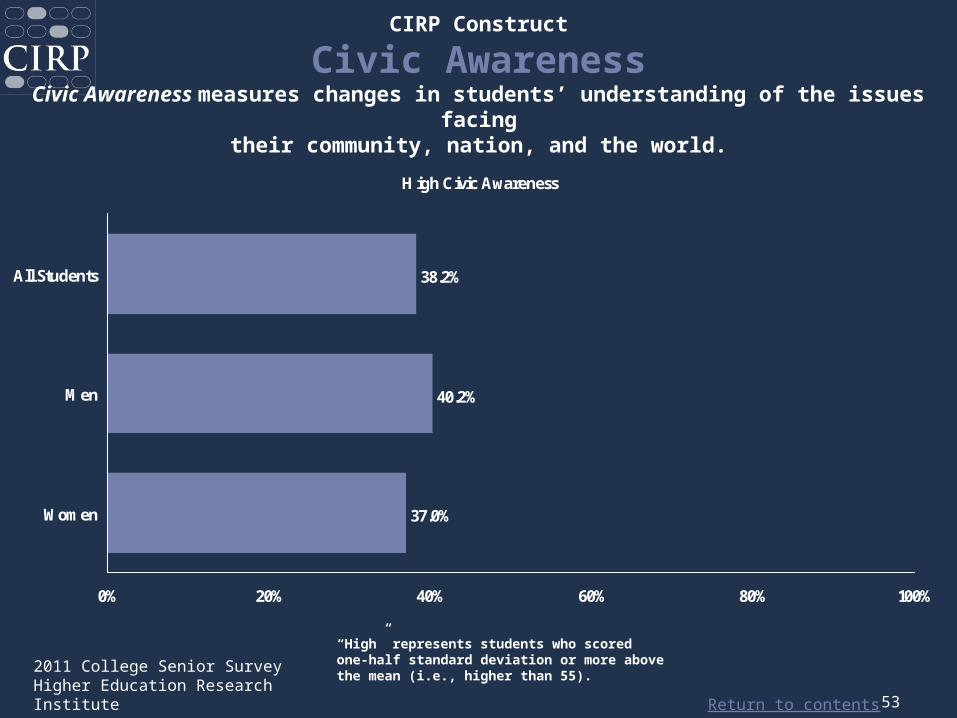
CIRP Construct
Civic AwarenessCivic Awareness measures changes in students’ understanding of the issues
facingtheir community, nation, and the world.
“High” represents students who scored one-half standard deviation or more above the mean (i.e., higher than 55).
High Civic Awareness
37.0%
40.2%
38.2%
0% 20% 40% 60% 80% 100%
Women
Men
All Students

Return to contents
2011 College Senior SurveyHigher Education Research Institute 54
CIRP Construct Survey Items
Civic AwarenessCompared with when you first entered this college, how would you now
describe your:
27.8%
31.0%
25.9%
51.1%
49.0%
51.0%
0% 20% 40% 60% 80% 100%
Understanding of theproblems facing your
community (2.09)
Understanding of globalissues (3.32)
Understanding of nationalissues (6.00)
■ stronger ■ much stronger

Return to contents
2011 College Senior SurveyHigher Education Research Institute 55
CIRP Construct
Social AgencySocial Agency measures the extent to which students’ value
political and social involvement as a personal goal.
“High” represents students who scored one-half standard deviation or more above the mean (i.e., higher than 55).
High Social Agency
43.9%
38.8%
42.1%
0% 20% 40% 60% 80% 100%
Women
Men
All Students

Return to contents
2011 College Senior SurveyHigher Education Research Institute 56
CIRP Construct Survey Items
Social AgencyIndicate the importance to you personally of each of the following:
35.2%
15.7%
15.6%
13.8%
12.8%
12.5%
45.5%
38.1%
32.2%
31.6%
28.6%
31.3%
0% 20% 40% 60% 80% 100%
Helping others who are in difficulty (1.61)
Influencing social values (1.75)
Keeping up to date with political affairs (1.76)
Becoming a community leader (2.27)
Helping to promote racial understanding (2.61)
Participating in a community action program (2.72)
■ very important ■ essential

Return to contents
2011 College Senior SurveyHigher Education Research Institute 57
CIRP Construct
LeadershipLeadership is a unified measure of students' beliefs about their leadership
developmentand capability and their experiences as a leader.
“High” represents students who scored one-half standard deviation or more above the mean (i.e., higher than 55).
High Leadership
44.6%
46.1%
45.1%
0% 20% 40% 60% 80% 100%
Women
Men
All Students

Return to contents
2011 College Senior SurveyHigher Education Research Institute 58
CIRP Construct Survey Items
Leadership
44.7%
26.2%
33.7%
29.2%
55.9%
41.6%
44.4%
49.0%
0% 20% 40% 60% 80% 100%
Leadership abilities (1.31) -much stronger/ stronger
Leadership ability (1.33) -highest 10%/above average
Participated in leadershiptraining (1.62) - yes
I have effectively led a group toa common purpose (1.79) -
strongly agree/agree
Been a leader in anorganization (2.30) - yes

Return to contents
2011 College Senior SurveyHigher Education Research Institute 59
Civic EngagementExperiences and Beliefs

Return to contents
2011 College Senior SurveyHigher Education Research Institute 60
CIRP Theme
Civic EngagementCompared with when you first entered this college, how would you now
describe your:
27.8% 25.9%
51.0%49.0%
31.0%
51.1%
0%
20%
40%
60%
80%
100%
Understanding of the problems facing your community
Understanding of national issues
Understanding of global issues
■ stronger ■ much stronger

Return to contents
2011 College Senior SurveyHigher Education Research Institute 61
CIRP Theme
Civic Engagement
87.6%
56.1%
0%
20%
40%
60%
80%
100%
Registered to vote Voted in the 2010 fall election

Return to contents
2011 College Senior SurveyHigher Education Research Institute 62
CIRP Theme
Civic EngagementSince entering college, indicate how often you:
24.6%
4.1%16.2%
22.8%
43.2% 39.9%
15.9%
44.3%
0%
20%
40%
60%
80%
100%
■ occasionally ■ frequently
Voted in a student election
Demonstratedfor a cause (e.g.,
boycott, rally, protest)
Helped raise money for a cause or
campaign
Publicly communicated your
opinion about a cause (e.g., blog, email, petition)

Return to contents
2011 College Senior SurveyHigher Education Research Institute 63
CIRP Theme
Civic EngagementPlease indicate how often you engaged in each during the past year:
20.8% 20.3%
1.0%
36.4%
56.7%
8.7% 7.0%
57.0%
2.0%
55.3%
0%
20%
40%
60%
80%
100%
■ occasionally ■ frequently
Performed volunteer or community
service work
Discussed politics
Worked on a local, state, or national political
campaign
Contributed money to a political campaign
Applied concepts
from courses to everyday
life
Return to contents
2011 College Senior SurveyHigher Education Research Institute 64
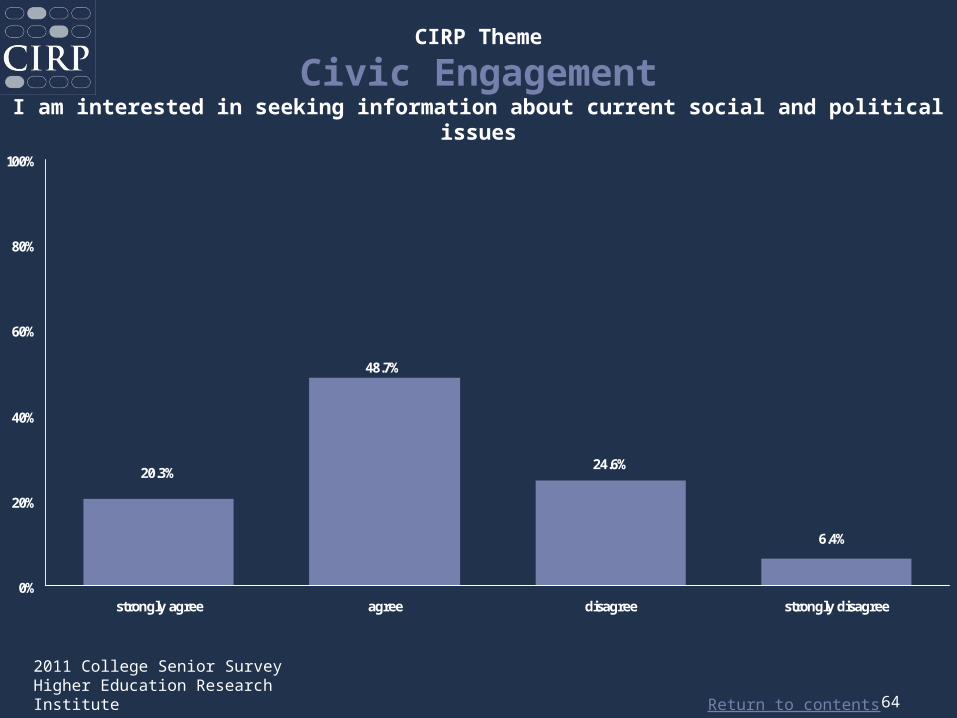
6.4%
24.6%20.3%
48.7%
0%
20%
40%
60%
80%
100%
strongly agree agree disagree strongly disagree
CIRP Theme
Civic EngagementI am interested in seeking information about current social and political
issues

Return to contents
2011 College Senior SurveyHigher Education Research Institute 65
CIRP Theme
Civic EngagementRate yourself on each of the following traits as compared with the average
person your age:
29.1% 30.7%23.0%
31.6%
50.9%
46.7%47.4%
50.9%
20.4%
51.7%
0%
20%
40%
60%
80%
100%
Ability to see the
world from someone
else’s perspective
Tolerance of others
with different beliefs
Openness to having my own views
challenged
Ability to discuss
and negotiate
controversial issues
Ability to work
cooperatively with diverse people
■ above average ■ highest 10%

Return to contents
2011 College Senior SurveyHigher Education Research Institute 66
15.7%
35.2%
12.8% 15.6% 13.8%
45.5%
31.3% 28.6%32.2% 31.6%
12.5%
38.1%
0%
20%
40%
60%
80%
100%
Influencing social values
Helping others
who are in
difficulty
Participating in a
community action
program
Helping to promote
racial understan
ding
Keeping up to date
with political affairs
Becoming a
community leader
CIRP Theme
Civic EngagementIndicate the importance to you personally of each of the following:
■ very important ■ essential

Return to contents
2011 College Senior SurveyHigher Education Research Institute 67
Diversity Outcomes

Return to contents
2011 College Senior SurveyHigher Education Research Institute 68
CIRP Construct
Pluralistic OrientationPluralistic Orientation measures skills and dispositions appropriate
for living and working in a diverse society.
“High” represents students who scored one-half standard deviation or more above the mean (i.e., higher than 55).
High Pluralistic Orientation
27.8%
34.5%
30.2%
0% 20% 40% 60% 80% 100%
Women
Men
All Students

Return to contents
2011 College Senior SurveyHigher Education Research Institute 69
CIRP Construct Survey Items
Pluralistic OrientationRate yourself on each of the following traits as compared with the average
person your age:
23.0%
29.1%
20.4%
31.6%
30.7%
47.4%
51.7%
46.7%
50.9%
50.9%
0% 20% 40% 60% 80% 100%
Ability to discuss and negotiatecontroversial issues (2.11)
Ability to see the world fromsomeone else's perspective (2.55)
Openness to having my viewschallenged (2.76)
Ability to work cooperativelywith diverse people (3.14)
Tolerance of others withdifferent beliefs (3.35)
■ above average ■ highest 10%
Return to contents
2011 College Senior SurveyHigher Education Research Institute 70
DiversityExperiences and Beliefs

Return to contents
2011 College Senior SurveyHigher Education Research Institute 71
CIRP Construct
Positive Cross-Racial InteractionPositive Cross-Racial Interaction is a unified measure of students’ level
of positive interaction with diverse peers.
“High” represents students who scored one-half standard deviation or more above the mean (i.e., higher than 55).
High Positive Cross-Racial Interaction
40.5%
38.3%
39.7%
0% 20% 40% 60% 80% 100%
Women
Men
All Students

Return to contents
2011 College Senior SurveyHigher Education Research Institute 72
CIRP Construct Survey Items
Positive Cross-Racial InteractionTo what extent have you experienced the following with students
from a racial/ethnic group other than your own:
25.2%
27.1%
18.2%
30.6%
19.1%
21.9%
27.9%
24.3%
22.7%
27.3%
25.9%
27.5%
0% 20% 40% 60% 80% 100%
Socialized or partied (2.12)
Studied or prepared for class (2.22)
Had meaningful and honest discussions about race/ ethnicrelations outside of class (2.46)
Dined or shared a meal (2.72)
Shared personal feelings and problems (3.52)
Had intellectual discussions outside of class (3.57)
■ often ■ very often

Return to contents
2011 College Senior SurveyHigher Education Research Institute 73
CIRP Construct
Negative Cross-Racial InteractionNegative Cross-Racial Interaction is a unified measure of students’ level
of negative interaction with diverse peers.
Low Negative Cross-Racial Interaction
22.9%
16.8%
20.7%
0% 20% 40% 60% 80% 100%
Women
Men
All Students
“Low” represents students who scored one-half standard deviation or more below the mean (i.e., lower than 45).

Return to contents
2011 College Senior SurveyHigher Education Research Institute 74
CIRP Construct Survey Items
Negative Cross-Racial InteractionTo what extent have you experienced the following with students
from a racial/ethnic group other than your own:
24.3%
66.5%
52.2%
35.5%
18.9%
27.2%
0% 20% 40% 60% 80% 100%
Had guarded interactions(2.10)
Felt insulted or threatenedbecause of your race/ ethnicity
(2.63)
Had tense, somewhat hostileinteractions (3.81)
■ seldom ■ never

Return to contents
2011 College Senior SurveyHigher Education Research Institute 75
CIRP Theme
DiversityCompared with when you first entered this college,
how would you now describe your:
28.9% 29.0%
48.2%35.3%
0%
20%
40%
60%
80%
100%
Knowledge of people fromdifferent races/cultures
Ability to get along with people of different
races/cultures
■ stronger ■ much stronger

Return to contents
2011 College Senior SurveyHigher Education Research Institute 76
CIRP Theme
DiversitySince entering college have you:
47.4%
34.0%
15.8%
0%
20%
40%
60%
80%
100%
Attended a racial/cultural
awareness workshop
Had a roommate of a different
race/ethnicity
Participated in an ethnic/racial student
organization

Return to contents
2011 College Senior SurveyHigher Education Research Institute 77
CIRP Theme
DiversityPlease rate your satisfaction with your college in each area:
■ satisfied ■ very satisfied
Respect for the expression of diverse
beliefs
Racial/ethnic diversity of the student body
25.5%16.1%
44.2%
35.2%
0%
20%
40%
60%
80%
100%
Return to contents
2011 College Senior SurveyHigher Education Research Institute 78
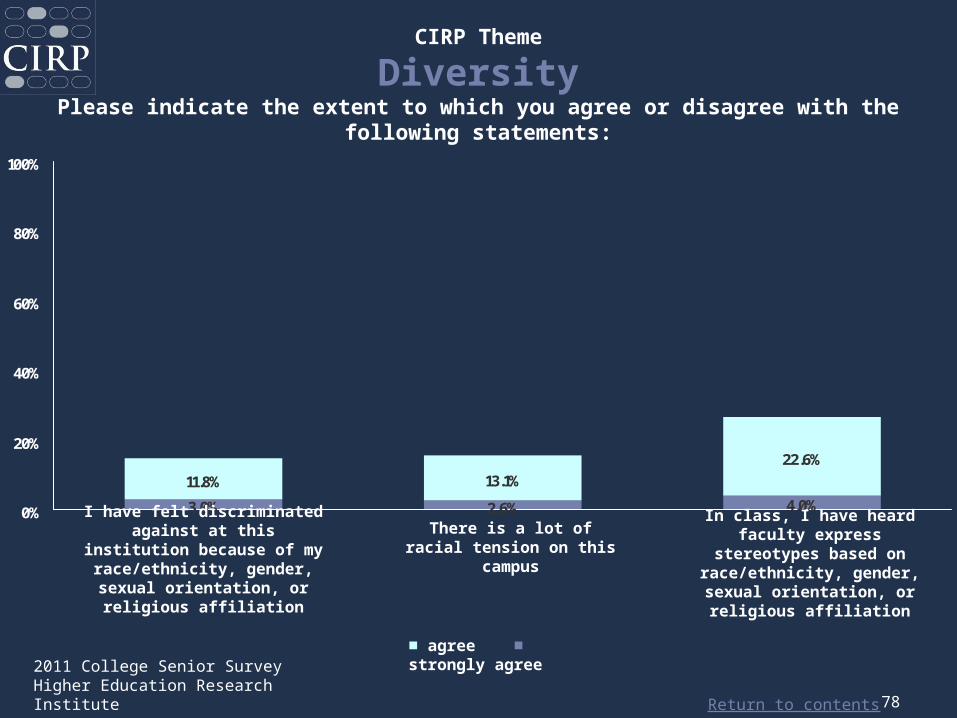
CIRP Theme
DiversityPlease indicate the extent to which you agree or disagree with the following
statements:
3.0% 2.6%
13.1%22.6%
4.0%
11.8%
0%
20%
40%
60%
80%
100%
■ agree ■ strongly agree
In class, I have heard faculty express
stereotypes based on race/ethnicity, gender, sexual orientation, or religious affiliation
There is a lot of racial tension on this campus
I have felt discriminated against at this institution
because of my race/ethnicity, gender, sexual orientation, or religious affiliation

Return to contents
2011 College Senior SurveyHigher Education Research Institute 79
CIRP Theme
DiversityImportance - “Improving my understanding of other countries and cultures”
39.3%
27.0% 28.5%
5.2%
0%
20%
40%
60%
80%
100%
Essential Very Important Somwhat Important Not Important
Return to contents
2011 College Senior SurveyHigher Education Research Institute 80
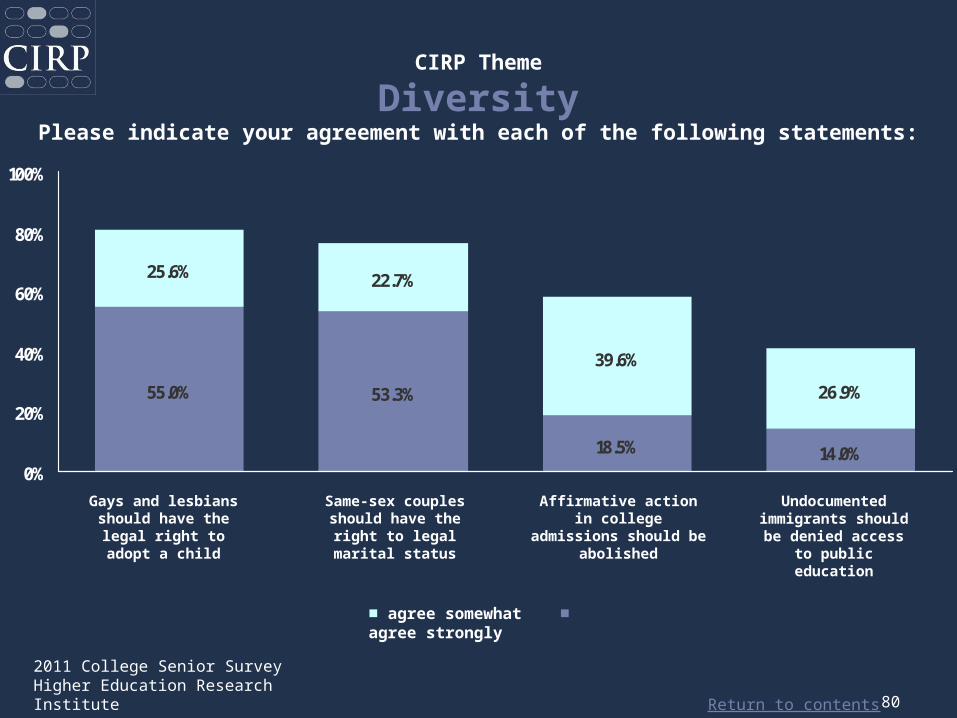
CIRP Theme
DiversityPlease indicate your agreement with each of the following statements:
55.0% 53.3%
18.5% 14.0%
25.6% 22.7%
39.6%
26.9%
0%
20%
40%
60%
80%
100%
■ agree somewhat ■ agree strongly
Gays and lesbians should have the
legal right to adopt a child
Same-sex couples should have the right
to legal marital status
Affirmative action in college admissions should be abolished
Undocumented immigrants should be denied access to
public education

Return to contents
2011 College Senior SurveyHigher Education Research Institute 81
Campus Climate

Return to contents
2011 College Senior SurveyHigher Education Research Institute 82
CIRP Construct
Sense of BelongingSense of Belonging measures the extent to which students feel a sense
of academic and social integration on campus.
“High” represents students who scored one-half standard deviation or more above the mean (i.e., higher than 55).
High Sense of Belonging
34.6%
34.7%
34.7%
0% 20% 40% 60% 80% 100%
Women
Men
All Students

Return to contents
2011 College Senior SurveyHigher Education Research Institute 83
CIRP Construct Survey Items
Sense of BelongingPlease indicate the extent to which you agree or disagree with the following
statements:
44.6%
24.7%
28.4%
36.4%
44.1%
59.0%
54.1%
52.8%
0% 20% 40% 60% 80% 100%
If asked, I would recommendthis college to others (2.33)
I see myself as part of thecampus community (3.13)
I feel a sense of belonging tothis college (4.62)
I feel I am a member of thiscollege (5.10)
■ agree ■ strongly agree

Return to contents
2011 College Senior SurveyHigher Education Research Institute 84
Campus ClimateIf you could make your college choice over,
would you still choose to enroll at your current college?
36.0%
46.2%
13.0%
4.8%
0%
20%
40%
60%
80%
100%
Definitely yes Probably yes Probably no Definitely no

Return to contents
2011 College Senior SurveyHigher Education Research Institute 85
Religiosity / Spirituality

Return to contents
2011 College Senior SurveyHigher Education Research Institute 86
CIRP Theme
Religiosity/Spirituality Current religious preference:
Baptist 5.9% Muslim 0.7%
Buddhist 1.1% Presbyterian 2.9%
Church of Christ
1.7% Quaker 0.3%
Eastern Orthodox
0.8% Roman Catholic 33.2%
Episcopalian 1.5%Seventh Day Adventist
0.2%
Hindu 0.5%United Church of Christ/Congregational
0.7%
Jewish 2.8% Other Christian 14.5%
LDS (Mormon) 0.3% Other Religion 2.5%
Lutheran 3.6% None 23.2%
Methodist 3.6%

Return to contents
2011 College Senior SurveyHigher Education Research Institute 87
Primary MajorTheology or
Religion
1.4%
CIRP Theme
Religiosity/Spirituality
Hours per Week: Prayer/ meditation
25.4%
41.4%
20.3%
4.6%8.3%
0%
20%
40%
60%
80%
100%
None Less than 1 hour 1-2 hours 3-5 hours 6 or more hours

Return to contents
2011 College Senior SurveyHigher Education Research Institute 88
CIRP Theme
Religiosity/Spirituality Please indicate how often you engaged in each during the past year :
25.9% 25.1%
35.9%
55.3%
0%
20%
40%
60%
80%
100%
Attended a religious service Discussed religion
■ occasionally ■ frequently
Return to contents
2011 College Senior SurveyHigher Education Research Institute 89
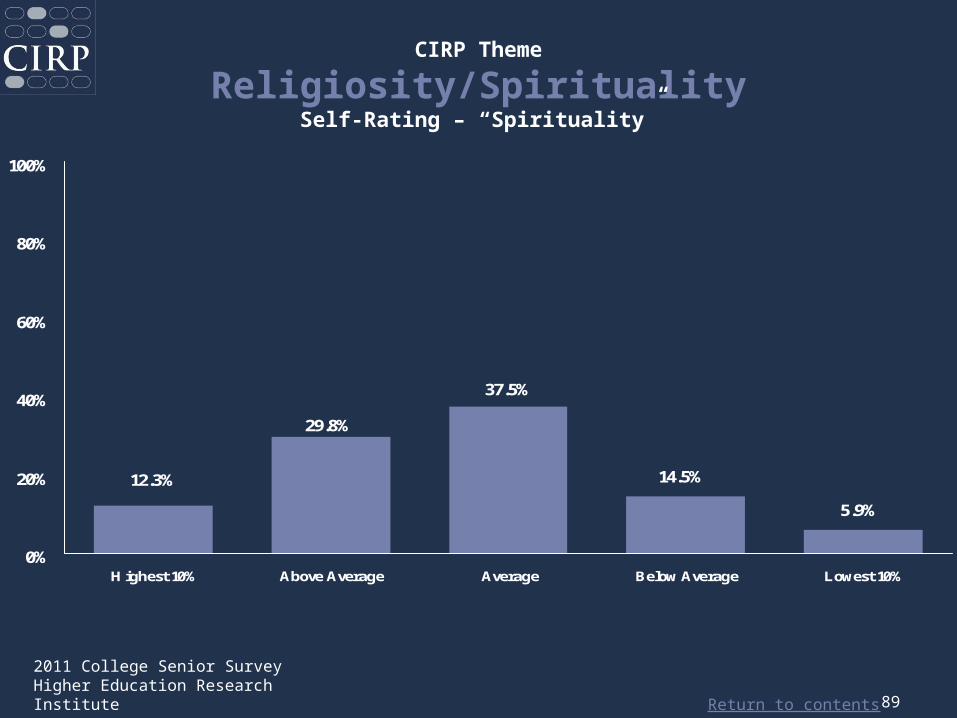
CIRP Theme
Religiosity/SpiritualitySelf-Rating – “Spirituality”
29.8%
12.3%
37.5%
5.9%
14.5%
0%
20%
40%
60%
80%
100%
Highest 10% Above Average Average Below Average Lowest 10%

Return to contents
2011 College Senior SurveyHigher Education Research Institute 90
CIRP Theme
Religiosity/SpiritualityOpinion – “I have felt discriminated against at this institution because of my
race/ethnicity, gender, sexual orientation, or religious affiliation”
11.8%3.0%
39.6%
45.7%
0%
20%
40%
60%
80%
100%
Strongly Agree Agree Disagree Strongly Disagree

Return to contents
2011 College Senior SurveyHigher Education Research Institute 91
CIRP Theme
Religiosity/SpiritualityIndicate the importance to you personally of each of the following:
28.5% 28.1%
35.1%24.9%
0%
20%
40%
60%
80%
100%
■ very important ■ essential
Developing a meaningful philosophy of life
Integrating spiritualityinto my life

Return to contents
2011 College Senior SurveyHigher Education Research Institute 92
Health and Wellness

Return to contents
2011 College Senior SurveyHigher Education Research Institute 93
CIRP Theme
Health and WellnessDuring the past year, how much time did you spend
during the typical week doing the following activities:
None < 1 hr1-2 hrs
3-5 hrs
6+ hrs
Exercising/sports 5.7% 10.6% 19.4% 29.8% 34.5%
Partying 18.4% 12.2% 16.2% 24.9% 28.2%
Return to contents
2011 College Senior SurveyHigher Education Research Institute 94
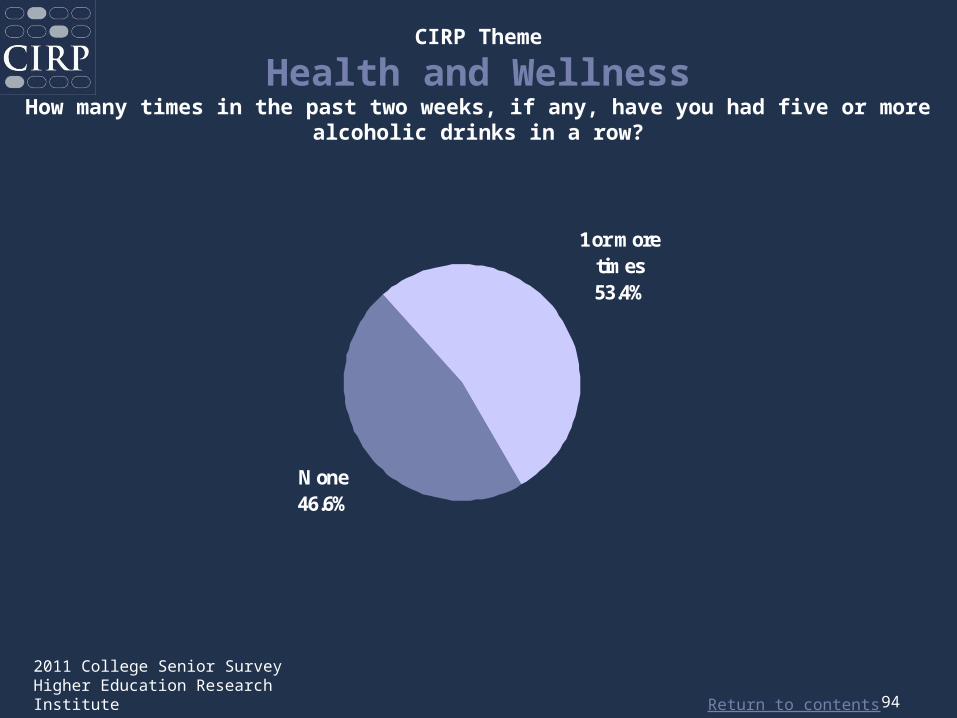
CIRP Theme
Health and WellnessHow many times in the past two weeks, if any, have you had five or more
alcoholic drinks in a row?
None46.6%
1 or more times53.4%

Return to contents
2011 College Senior SurveyHigher Education Research Institute 95
CIRP Theme
Health and WellnessPlease rate your satisfaction with your college in each area:
13.1% 17.2%
37.1% 32.4%
0%
20%
40%
60%
80%
100%
■ satisfied ■ very satisfied
Student health servicesStudent psychological
services

Return to contents
2011 College Senior SurveyHigher Education Research Institute 96
CIRP Theme
Health and WellnessPlease indicate how often you engaged in each during the past year:
5.1%
30.4%
43.3%53.9%
30.0%14.3%
0%
20%
40%
60%
80%
100%
■ occasionally ■ frequently
Smoked cigarettes Drank beer Drank wine or liquor

Return to contents
2011 College Senior SurveyHigher Education Research Institute 97
CIRP Theme
Health and WellnessPlease indicate how often you engaged in each during the past year:
8.2%
34.7%
57.2%
22.8%
5.3%
48.3%
0%
20%
40%
60%
80%
100%
■ occasionally ■ frequently
Felt depressed Felt overwhelmed by all I had to do
Sought personal counseling

Return to contents
2011 College Senior SurveyHigher Education Research Institute 98
CIRP Theme
Health and WellnessRate yourself on each of the following traits as compared with the average
person your age:
17.8% 16.9%
37.3% 36.3%
0%
20%
40%
60%
80%
100%
■ above average ■ highest 10%
Emotional health Physical health
Return to contents
2011 College Senior SurveyHigher Education Research Institute 99
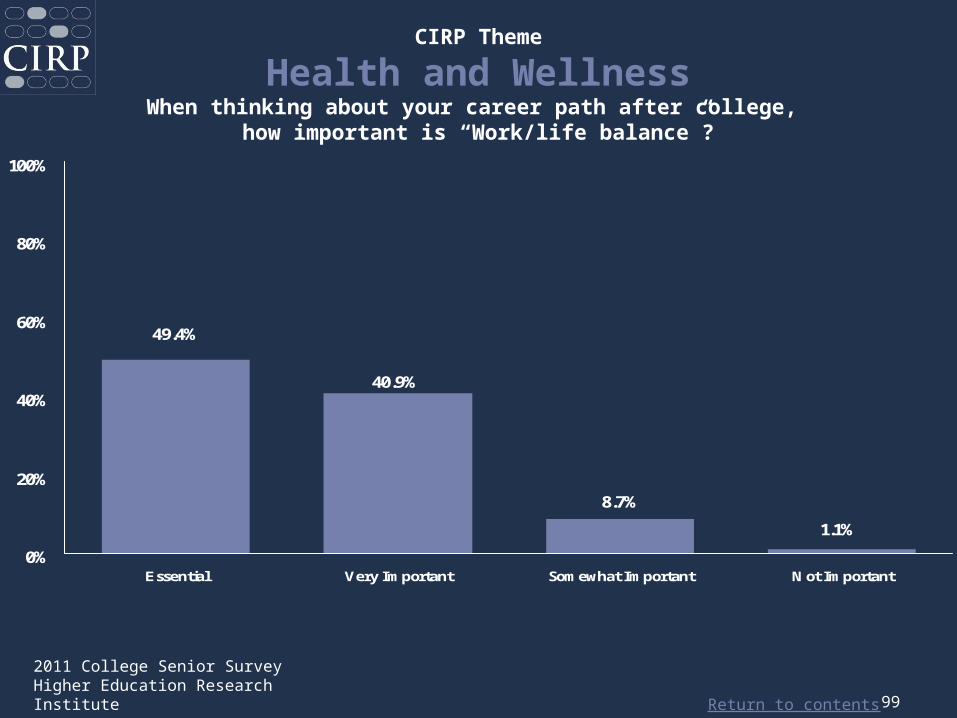
CIRP Theme
Health and WellnessWhen thinking about your career path after college,
how important is “Work/life balance”?
40.9%
49.4%
8.7%
1.1%
0%
20%
40%
60%
80%
100%
Essential Very Important Somewhat Important Not Important

Return to contents
2011 College Senior SurveyHigher Education Research Institute 10
0
Career Planning

Return to contents
2011 College Senior SurveyHigher Education Research Institute 10
1
CIRP Theme
Career PlanningCompared with when you first entered this college, how you would you now
describe your:
40.8% 45.9%
47.8% 44.1%
0%
20%
40%
60%
80%
100%
■ stronger ■ much stronger
Preparedness for employment after college
Preparedness for graduate or advanced
education

Return to contents
2011 College Senior SurveyHigher Education Research Institute 102
CIRP Theme
Career PlanningIndicate how often you “Met with an advisor/counselor about your career
plans”
60.8%
25.0%
14.2%
0%
20%
40%
60%
80%
100%
Frequently Occasionally Not at All

Return to contents
2011 College Senior SurveyHigher Education Research Institute 10
3
CIRP Theme
Career Planning Probable Career/Occupation
Artist 7.5% Health professional 4.7%
Business 18.9%Homemaker (full-time)
0.3%
Business (clerical) 1.1% Lawyer 4.5%
Clergy 0.8% Military (career) 1.0%
College teacher 2.3% Nurse 4.2%
Doctor (MD or DDS)
5.8% Research scientist 2.8%
Education (secondary)
5.5%Social, welfare, recreation worker
2.7%
Education (elementary)
5.1% Skilled worker 0.2%
Engineer 3.9% Other 20.0%
Farmer or forester 0.7% Undecided 8.1%

Return to contents
2011 College Senior SurveyHigher Education Research Institute 10
4
CIRP Theme
Career PlanningHours per Week: Career Planning (job searches, internships, etc.)
22.0%
12.2%
31.1%
14.2%
20.6%
0%
20%
40%
60%
80%
100%
None Less than 1 hour 1-2 hours 3-5 hours 6 or more hours

Return to contents
2011 College Senior SurveyHigher Education Research Institute 10
5
CIRP Theme
Career PlanningPlease rate your satisfaction with your college in each area:
20.4%12.7%
34.3%
37.3%
29.5%
44.4%
0%
20%
40%
60%
80%
100%
■ satisfied ■ very satisfied
Career counselingand advising
Relevance of coursework
to future career plans
Job placement services
for students

Return to contents
2011 College Senior SurveyHigher Education Research Institute 10
6
CIRP Theme
Career Planning Indicate the importance to you personally of each of the following:
22.1% 25.6%
6.5%16.5%
42.3% 37.5%
14.1%
24.0%
0%
20%
40%
60%
80%
100%
■ very important ■ essential
Becoming an authority in my
field
Becoming successful in a business of my
own
Making a theoretical
contribution to science
Being very well off financially
Return to contents
2011 College Senior SurveyHigher Education Research Institute 10
7
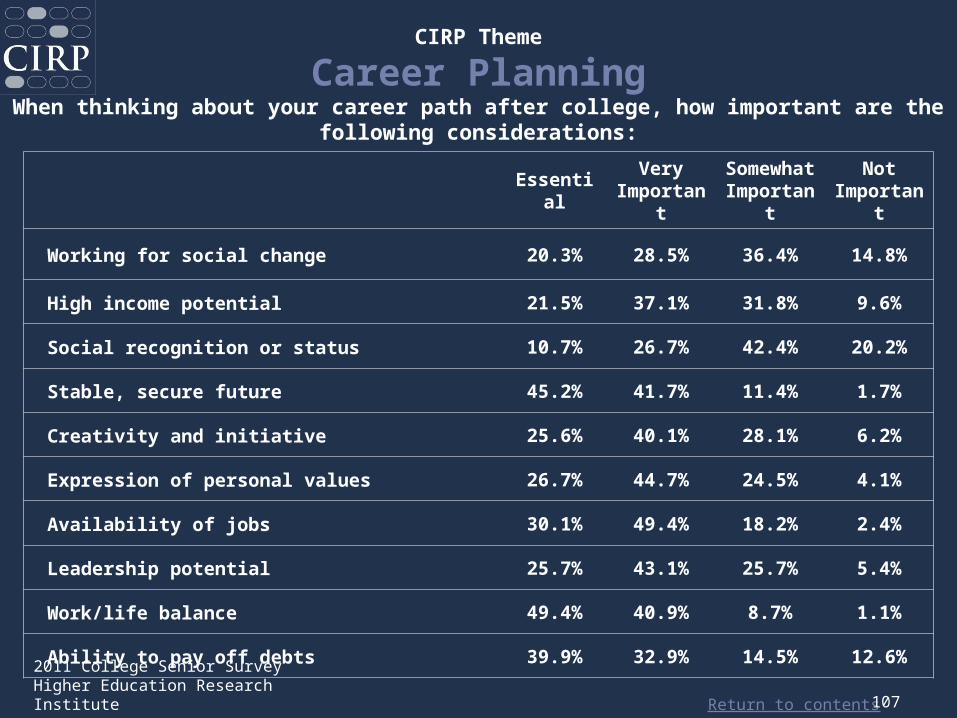
CIRP Theme
Career PlanningWhen thinking about your career path after college, how important are the
following considerations:
Essential
Very Importa
nt
Somewhat
Important
Not Importa
nt
Working for social change 20.3% 28.5% 36.4% 14.8%
High income potential 21.5% 37.1% 31.8% 9.6%
Social recognition or status 10.7% 26.7% 42.4% 20.2%
Stable, secure future 45.2% 41.7% 11.4% 1.7%
Creativity and initiative 25.6% 40.1% 28.1% 6.2%
Expression of personal values 26.7% 44.7% 24.5% 4.1%
Availability of jobs 30.1% 49.4% 18.2% 2.4%
Leadership potential 25.7% 43.1% 25.7% 5.4%
Work/life balance 49.4% 40.9% 8.7% 1.1%
Ability to pay off debts 39.9% 32.9% 14.5% 12.6%
Return to contents
2011 College Senior SurveyHigher Education Research Institute 10
8
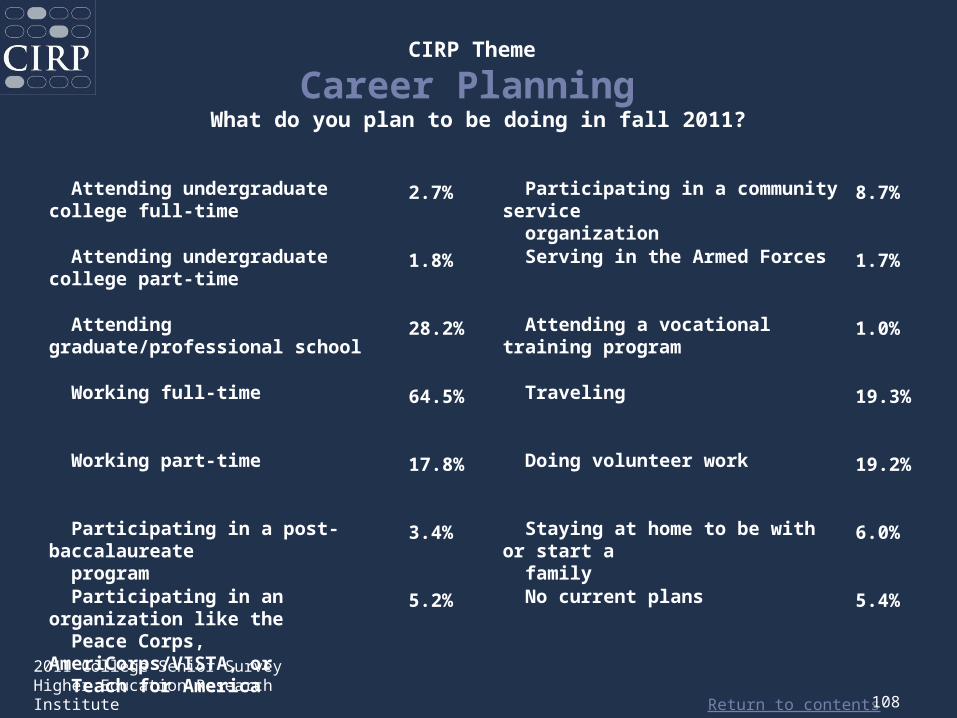
CIRP Theme
Career Planning What do you plan to be doing in fall 2011?
Attending undergraduate college full-time
2.7% Participating in a community service organization
8.7%
Attending undergraduate college part-time
1.8% Serving in the Armed Forces 1.7%
Attending graduate/professional school
28.2% Attending a vocational training program
1.0%
Working full-time 64.5% Traveling 19.3%
Working part-time 17.8% Doing volunteer work 19.2%
Participating in a post-baccalaureate program
3.4% Staying at home to be with or start a family
6.0%
Participating in an organization like the Peace Corps, AmeriCorps/VISTA, or Teach for America
5.2% No current plans 5.4%

Return to contents
2011 College Senior SurveyHigher Education Research Institute 10
9
CIRP Theme
Career PlanningIf you are planning on being employed after graduation,
which best describes the current state of your employment plans?
13.7%
41.7%
13.0%
1.8%
21.0%
8.8%
0%
20%
40%
60%
80%
100%
Not actively lookingfor a position
Looking, but nooffers yet
Received an offer fora position, but
declined
Currentlyconsidering an offer
Accepted an offer ofemployment
Not planning onemployment this fall

Return to contents
2011 College Senior SurveyHigher Education Research Institute 11
0
CIRP Theme
Career PlanningIf you are planning to attend graduate or professional school,
which of the following best estimates the current state of your educational plans?
45.4%
15.2%
1.3%
17.9%
1.0%
12.7%
6.5%
0%
20%
40%
60%
80%
100%
Accepted and willbe attending in
the fall
Accepted anddeferred
admission until alater date
Placed on waitinglist, no
acceptances
Still awaitingresponses, noacceptances
Will be applyingthis coming fall
Not applying thisfall, but might
apply at a futuredate
No plans to applyto school now or
in the future

Return to contents
2011 College Senior SurveyHigher Education Research Institute 11
1
CIRP Theme
Career PlanningHighest degree planned to complete at any institution
20.3%
7.2% 7.3%
0.6% 2.5%0.2%
1.5%0.1%
48.7%
11.7%
0%
20%
40%
60%
80%
100%
None Vocationalcertificate
Associate(A.A. orequiv.)
Bachelor's(B.A., B.S.,
etc.)
Master's(M.A., M.S.,
etc.)
Ph.D. orEd.D.
M.D., D.O.,D.D.S., orD.V.M.
LL.B. orJ.D. (Law)
B.D. orM.Div.
(Divinity)
Other

Return to contents
2011 College Senior SurveyHigher Education Research Institute 112
For more information about HERI/CIRP Surveys
The Freshmen SurveyYour First College Year Survey
Diverse Learning Environments SurveyCollege Senior Survey
The Faculty Survey
[email protected](310) 825-1925
www.heri.ucla.edu
Related Documents