Unicentre CH-1015 Lausanne http://serval.unil.ch Year : 2014 CIRCADIAN CLOCK ORCHESTRATION OF SIGNALING PATHWAYS INFLUENCES MOUSE METABOLISM JOUFFE Céline JOUFFE Céline, 2014, CIRCADIAN CLOCK ORCHESTRATION OF SIGNALING PATHWAYS INFLUENCES MOUSE METABOLISM Originally published at : Thesis, University of Lausanne Posted at the University of Lausanne Open Archive http://serval.unil.ch Document URN : urn:nbn:ch:serval-BIB_3C6DCEACA2365 Droits d’auteur L'Université de Lausanne attire expressément l'attention des utilisateurs sur le fait que tous les documents publiés dans l'Archive SERVAL sont protégés par le droit d'auteur, conformément à la loi fédérale sur le droit d'auteur et les droits voisins (LDA). A ce titre, il est indispensable d'obtenir le consentement préalable de l'auteur et/ou de l’éditeur avant toute utilisation d'une oeuvre ou d'une partie d'une oeuvre ne relevant pas d'une utilisation à des fins personnelles au sens de la LDA (art. 19, al. 1 lettre a). A défaut, tout contrevenant s'expose aux sanctions prévues par cette loi. Nous déclinons toute responsabilité en la matière. Copyright The University of Lausanne expressly draws the attention of users to the fact that all documents published in the SERVAL Archive are protected by copyright in accordance with federal law on copyright and similar rights (LDA). Accordingly it is indispensable to obtain prior consent from the author and/or publisher before any use of a work or part of a work for purposes other than personal use within the meaning of LDA (art. 19, para. 1 letter a). Failure to do so will expose offenders to the sanctions laid down by this law. We accept no liability in this respect.

Welcome message from author
This document is posted to help you gain knowledge. Please leave a comment to let me know what you think about it! Share it to your friends and learn new things together.
Transcript

Unicentre
CH-1015 Lausanne
http://serval.unil.ch
Year : 2014
CIRCADIAN CLOCK ORCHESTRATION OF SIGNALING
PATHWAYS INFLUENCES MOUSE METABOLISM
JOUFFE Céline
JOUFFE Céline, 2014, CIRCADIAN CLOCK ORCHESTRATION OF SIGNALING PATHWAYS INFLUENCES MOUSE METABOLISM Originally published at : Thesis, University of Lausanne Posted at the University of Lausanne Open Archive http://serval.unil.ch Document URN : urn:nbn:ch:serval-BIB_3C6DCEACA2365 Droits d’auteur L'Université de Lausanne attire expressément l'attention des utilisateurs sur le fait que tous les documents publiés dans l'Archive SERVAL sont protégés par le droit d'auteur, conformément à la loi fédérale sur le droit d'auteur et les droits voisins (LDA). A ce titre, il est indispensable d'obtenir le consentement préalable de l'auteur et/ou de l’éditeur avant toute utilisation d'une oeuvre ou d'une partie d'une oeuvre ne relevant pas d'une utilisation à des fins personnelles au sens de la LDA (art. 19, al. 1 lettre a). A défaut, tout contrevenant s'expose aux sanctions prévues par cette loi. Nous déclinons toute responsabilité en la matière. Copyright The University of Lausanne expressly draws the attention of users to the fact that all documents published in the SERVAL Archive are protected by copyright in accordance with federal law on copyright and similar rights (LDA). Accordingly it is indispensable to obtain prior consent from the author and/or publisher before any use of a work or part of a work for purposes other than personal use within the meaning of LDA (art. 19, para. 1 letter a). Failure to do so will expose offenders to the sanctions laid down by this law. We accept no liability in this respect.

1
Département de Pharmacologie et Toxicologie
Nestlé Institute of Health Sciences
CIRCADIAN CLOCK ORCHESTRATION OF SIGNALING
PATHWAYS INFLUENCES MOUSE METABOLISM
Thèse de doctorat ès sciences de la vie (PhD)
présentée à la
Faculté de biologie et de médecine
de l’Université de Lausanne
par
Céline JOUFFE
Master en Sciences Cellulaire et Moléculaire du Vivant de l’Université de Rennes 1 (France)
Jury
Prof. Luc Tappy - Président
Dr. Frédéric Gachon - Directeur de thèse
Prof. Thierry Pedrazzini - Co-directeur
Dr. Dmitri Firsov - Expert
Prof. Urs Albrecht - Expert
Prof. Robbie Loewith - Expert
Lausanne 2014

2


3
REMERCIEMENTS
Tout d’abord, je tiens à remercier Fred Gachon pour m’avoir donné l’opportunité d’effectuer
ces différents travaux au sein de son laboratoire. Je lui suis très reconnaissante pour sa
confiance, sa disponibilité, ses conseils et son sens critique qui m’ont beaucoup apportés tout
au long de ces cinq années de thèse.
Je tiens à remercier Gaspard Cretenet avec qui j’ai travaillé les deux premières années de ma
thèse et qui a été d’une grande aide notamment lors de mon arrivée dans le laboratoire. Un
grand merci également à Eva Martin qui a su m’apporter toute l’aide technique dont j’avais
besoin pour la réalisation de ces projets.
Je remercie toutes les personnes qui ont participé à l’élaboration de ces différents projets :
Laura Symul, Félix Naef, Mojgan Masoodi, Patrick Descombes ainsi que toutes les personnes
de la plateforme de génomique du NIHS.
Merci à Dmitri Firsov, Thierry Pedrazzini, Urs Albrecht, Robbie Loewith, et Luc Tappy pour
avoir accepté l’invitation à faire partie de mon jury.
Un grand merci à toute l’équipe « Circadian Rhythms », Daniel Mauvoisin, Florian Atger,
Eva Martin, Benjamin Weger, Cédric Gobet et Capucine Bolvin pour leur soutien, leurs
conseils et la bonne humeur apportés durant ces dernières années.
Je remercie les personnes que j’ai pu rencontrer tout au long de ma thèse au sein du DPT et du
NIHS et qui ont joué un rôle essentiel autant sur le plan scientifique que sur le plan moral :
Anne, Sabrina, Laurent, Daniel, Gab, Dmitri, Caroline, Chloé, Matthias, Sonia, Aurélie,
Laura, Alice, Armand, Julien, Jérôme.
Enfin, je remercie l’ensemble de ma famille qui constitue mon roc sur lequel je peux
m’appuyer en permanence et en toute circonstance.

4
ABSTRACT
Circadian clocks, present in organisms leaving in a rhythmic environment, constitute the
mechanisms allowing anticipation and adaptation of behavior and physiology in response to
these environmental variations. As a consequence, most aspects of metabolism and behavior
are under the control of this circadian clock. At a molecular level, in all the studied species,
the rhythmic expression of the genes involved are generated by interconnected transcriptional
and translational feedback loops. In mammals, the heterodimer composed of BMAL1 and its
partners CLOCK or NPAS2 constitutes a transcriptional activator regulating transcription of
Per and Cry genes. These genes encode for repressors of the activity of BMAL1:CLOCK or
BMAL1: NPAS2 heterodimers, thus closing a negative feedback loop that generates rhythms
of approximately 24 hours.
The aim of my doctoral work consisted in the investigation of the role of circadian clock in
the regulation of different aspects of mouse metabolism through the rhythmic activation of
signaling pathways.
First, we showed that one way how the circadian clock exerts its function as an oscillator is
through the regulation of mRNA translation. Indeed, we present evidence showing that
circadian clock influences the temporal translation of a subset of mRNAs involved in
ribosome biogenesis by controlling the transcription of translation initiation factors as well as
the clock-dependent rhythmic activation of signaling pathways involved in their regulation.
Moreover, the circadian oscillator regulates the transcription of ribosomal protein mRNAs

5
and ribosomal RNAs. Thus the circadian clock exerts a major role in coordinating
transcription and translation steps underlying ribosome biogenesis.
In the second part, we showed the involvement of the circadian clock in lipid metabolism.
Indeed, the three PAR bZip transcription factors DBP, TEF and HLF, are regulated by the
molecular clock and play key roles in the control of lipid metabolism. Here we present
evidence concerning the circadian expression and activity of PPARα via the circadian
transcription of genes involved in the release of fatty acids, natural ligands of PPARα. It leads
to the rhythmic activation of PPARα itself which could then play its role in the transcription
of genes encoding proteins involved in lipid, cholesterol and glucose metabolism. In addition,
we considered the possible role of lipid transporters, here SCP2, in the modulation of
circadian activation of signaling pathways such as TORC1, PPARα and SREBP, linked to
metabolism, and its feedback on the circadian clock.
In the last part of this work, we studied the effects of these circadian clock-orchestrated
pathways in physiology, as clock disruptions have been shown to be linked to metabolic
disorders. We performed in vivo experiments on genetically and high-fat induced obese mice
devoid of functional circadian clock. The results obtained showed that clock disruption leads
to impaired triglycerides and glucose homeostasis in addition to insulin secretion and
sensitivity.

6
RESUME
Les rythmes circadiens, présents chez tout organisme vivant dans un environnement
rythmique, constituent l’ensemble de mécanismes permettant des réponses comportementales
et physiologiques anticipées et adaptées aux variations environnementales. De ce fait, la
plupart des aspects liés au métabolisme et au comportement de ces organismes apparaissent
être sous le contrôle de l’horloge circadienne contrôlant ces rythmes. Au niveau moléculaire,
dans toutes les espèces étudiées, l’expression rythmique de gènes impliqués sont générés par
l’interconnexion de boucles de contrôle transcriptionnelles et traductionnelles. Chez les
mammifères, l’hétérodimère composé de BMAL1 et de ses partenaires CLOCK ou NPAS2
constitue un activateur transcriptionnel régulant la transcription des gènes Per et Cry. Ces
gènes codent pour des répresseurs de l’activité des hétérodimères BMAL1:CLOCK ou
BMAL1:NPAS2. Cela a pour effet de fermer la boucle négative, générant ainsi des rythmes
d’environ 24 heures.
Le but de mon travail de thèse a consisté en l’investigation du rôle de l’horloge circadienne
dans la régulation de certains aspects du métabolisme chez la souris via la régulation de
l’activation rythmique des voies de signalisation.
Nous avons tout d’abord montré que l’horloge circadienne exerce sa fonction d’oscillateur
notamment au niveau de la régulation de la traduction des ARNm. En effet, nous présentons
des preuves montrant que l’horloge circadienne influence la traduction temporelle d’un
groupe d’ARNm impliqués dans la biogénèse des ribosomes en contrôlant la transcription de
facteurs d’initiation de la traduction ainsi que l’activation rythmique des voies de signalisation
qui sont impliquées dans leur régulation. De plus, l’oscillateur circadien régule la

7
transcription d’ARNm codant pour les protéines ribosomales et d’ARN ribosomaux. De cette
façon, l’horloge circadienne exerce un rôle majeur dans la coordination des étapes de
transcription et traduction permettant la biogénèse des ribosomes.
Dans la deuxième partie, nous montrons les implications de l’horloge circadienne dans le
métabolisme des lipides. En effet, DBP, TEF et HLF, trois facteurs de transcription de la
famille des PAR bZip qui sont régulés par l’horloge circadienne, jouent un rôle clé dans le
contrôle du métabolisme des lipides par l’horloge circadienne. Nous apportons ici des preuves
concernant l’expression et l’activité rythmiques de PPARα via la transcription circadienne de
gènes impliqués dans le relargage d’acides gras, ligands naturels de PPARα, conduisant à
l’activation circadienne de PPARα lui-même, pouvant ainsi jouer son rôle de facteur de
transcription de gènes codant pour des protéines impliquées dans le métabolisme des lipides,
du cholestérol et du glucose. De plus, nous nous sommes penchés sur le rôle possible de
transporteurs de lipides, ici SCP2, dans la modulation de l’activation circadienne de voies de
signalisation, telles que TORC1, PPARα et SREBP, qui sont liées au métabolisme, ainsi que
son impact sur l’horloge elle-même.
Dans la dernière partie de ce travail, nous avons étudié les effets de l’activation de ces voies
de signalisation régulées par l’horloge circadienne dans le contexte physiologique puisqu’il a
été montré que la perturbation de l’horloge pouvait être associée à des désordres
métaboliques. Pour ce faire, nous avons fait des expériences in vivo sur des souris déficientes
pour l’horloge moléculaire pour lesquelles l’obésité est induite génétiquement ou induite par
la nourriture riche en lipides. Les résultats que nous obtenons montrent des dérèglements au
niveau de l’homéostasie des triglycérides et du glucose ainsi que sur l’expression et la réponse
à l’insuline.

8
RESUME POUR TOUT PUBLIC
Chaque être vivant soumis aux rythmes jour-nuit possède une horloge biologique appelé
horloge circadienne. Cette horloge permet aux organismes d’adapter et d’anticiper leur
métabolisme aux variations environnementales quotidiennes. Chez les mammifères, cette
horloge est présente à la fois dans le cerveau, mais également dans d’autres organes comme le
foie, les reins, le pancréas. Au niveau physiologique, en plus de contrôler l’alternance veille-
sommeil, cette horloge est impliquée dans la régulation d’autres mécanismes tels que la
température corporelle, la pression sanguine, la concentration des certaines hormones dans le
sang, ou encore l’activité digestive.
Au niveau moléculaire, des boucles de régulations interconnectées génèrent ces rythmes de 24
heures environ. Ces oscillations permettent ainsi la régulation du métabolisme en agissant sur
certaines protéines ou enzymes impliquées dans des voies de signalisations particulières.
Dans le cadre de ce travail, nous nous sommes intéressés aux implications de l’horloge
circadienne dans différents aspects du métabolisme. Nous montrons ainsi que l’horloge
moléculaire est responsable de l’orchestration de la biogénèse des ribosomes, structure
indispensable au mécanisme qui permet la production de protéines. Ce phénomène implique
ainsi l’activation coordonnée de plusieurs voies de signalisation au sein de la cellule. D’autre
part, nous présentons des résultats montrant le rôle de l’horloge circadienne dans la régulation
du métabolisme des lipides et son impact sur les voies de signalisation. Enfin, l’étude de
souris obèses nous a permis d’étudier le lien entre l’obésité et l’horloge circadienne.

9
TABLE OF CONTENT
REMERCIEMENTS 3
ABSTRACT 4
RESUME 6
RESUME POUR TOUT PUBLIC 8
LIST OF ABBREVIATIONS 12
CONTEXT OF DOCTORAL WORK 15
INTRODUCTION 16
I. General introduction 16
II. The circadian clock is hierarchically organized 18
A. The central pacemaker 19
B. Synchronization of peripheral clocks 21
III. The molecular circadian clock 22
A. The principal loop 22
1. The activator complex 22
2. The repressor complex 24
B. The stabilization loop 25
C. Post-transcriptional modifications 26
D. Post-translational modifications 28
1. Phosphorylations and dephosphorylations 28
2. Ubiquitinations 29
3. Sumoylations 29
4. Chromatin remodeling 30
IV. The translational mechanisms in mammals 31
A. Pre-initiation of the translation 32
1. Formation of pre-initiation complex 32
2. Regulation of TORC1 signaling pathway 32
3. Translation initiation regulated by TORC1 33
B. The different steps of translation initiation 35
1. Formation of 43S pre-initiation complex 35
2. Attachment of 43S complex to mRNA 35
3. Ribosome scanning of mRNA 5’UTR 37
4. Initiation of codon recognition 37
5. Commitment of ribosomes to start codon 38
6. Ribosomal subunit joining 38

10
C. Translation elongation 39
D. Termination of translation 39
E. Ribosome biogenesis 40
1. 40S subunit 41
2. 60S subunit 42
3. Nuclear export 43
V. Energy balance 44
A. SREBP signaling pathway 45
1. Activation of SREBPs 45
2. Transcriptional regulation of SREBP1c in liver 46
B. LXR signaling pathway 48
C. ChREB signaling pathway 49
1. Activation of ChREB 50
2. Alternative transactivation of ChREB in adipose tissue 51
D. PPAR signaling pathway 53
1. PPARα signaling pathway 54
2. PPARβ/δ signaling pathway 55
3. PPARγ signaling pathway 56
E. Involvement of the circadian clock 57
RESULTS 59
I. The circadian clock coordinates the ribosome biogenesis 59
II. Involvements of circadian clock in lipid metabolism 62
A. Modulation of PPARα signaling pathway in mouse liver 62
B. Sterol Carrier Protein 2 dependent diurnal lipid transport modulates
rhythmic activation of signaling pathways in mouse liver 63
III. Metabolic defects in Bmal1 knockout mice 66
A. Metabolic defects in genetically obese Bmal1 knockout mice 66
1. Bmal1 KO mice harboring the Ob mutation exhibit premature
death 66
2. ObKO mice exhibit an obese phenotype 68
3. Glucose homeostasis is impaired in ObKO mice 69
4. ObKO mice exhibit an impaired glucose clearance but are insulin
sensitive 74
5. ObKO mice exhibit low hepatosteatosis but high circulating
triglyceride concentration 76
B. Metabolic defects in diet-induced obese Bmal1 knockout mice 78
1. Bmal1 KO mice fed with high-fat diet become obese prematurely 78
2. Glucose homeostasis is impaired in diet-induced obese mice 80
3. Bmal1 KO liver exhibit less steatosis 81
4. Delayed glucose clearance in high-fat diet fed mice 83

11
DISCUSSION 86
I. Premature death for Bmal1 KO mice harboring Ob mutation 86
II. Involvement in bone metabolism 87
III. Food intake consequences 87
IV. Protective effect of Bmal1 deletion in obesity 88
V. Involvement of mitochondrial metabolism in insulin sensitivity 89
CONCLUSION 91
EXPERIMENTAL PROCEDURES 94
I. Animal experiments 94
A. Body composition analysis 94
B. Glycemia measurements 95
C. Glucose tolerance test 95
D. Insulin tolerance test 96
II. Serum chemistry analysis 96
III. Glycogen extraction 96
IV. Liver slices 97
REFERENCES 98

12
LIST OF ABBREVIATIONS
4E-BP1: 4E-binding protein 1
5’TOP: 5’ Terminal OligoPyrimidine
βTrCP: β Transducing repeat-Containing
Protein
ABCG5: ATP-Binding Cassette subfamily
G member 5
ACC: Acetyl-CoA Carboxylase
ACL: ATP-Citrate Lyase
ACOT: Acyl CoA Thioesterase
ACS: Acetyl-CoA Synthetase
AKT: serine/threonine protein kinase
AMPK: Adenoside MonoPhosphate-
activated protein Kinase
BCAA : Branched Chain Amino Acids
BMAL1: Brain and Muscle ARNT-Like
Protein 1
cAMP: cyclic AMP
ChREBP: Carbohydrate Response Element
Binding Protein
ChoRE: Carbohydrate-Response Elements
CK: Casein Kinase
CLOCK: Circadian Locomotor Output
Cycles Kaput
CREB: Cyclic AMP Response Binding
protein
CRY: CRYptochrome
DBP: D-box Binding Protein
eEF: eukaryotic Elongation Factor
eIF: eukaryotic translation Initiation Factor
eRF: eukaryotic Releasing Factor
ERK: Extracellular signal-Regulated
protein Kinase
FAS: Fatty Acid Synthase
FBXL: F-Box and Leucine-rich repeat
protein
FRQ: FReQuency
G6PC: Glucose 6 Phosphatase Catalytic
subunit
GAP: GTPase-Activating Protein
GPAT: Glycerol 3 Phosphate
AcylTransferase
13
GRACE: Glucose Response Activation
Conserved Element
GSK (Glycogen Synthetase Kinase)
HAT: Histone AcetylTransferase
HDAC: Histone DeACetylase
HDL: High Density Lipoproteins
HLF: Hepatic Leukemia Factor
HMGCR: 3-Hydroxy-3-MethylGlutaryl-
CoA Reductase
hnRBP: heterogenous nuclear RBP
INSIG: INSulin Induced Gene
IRE1: Inositol Requiring
IRS: Insulin-Receptor Substrates protein
JARID: JumonjiC and ARID domain-
containing histone lysine demethylase
L-PK: L-Pyruvate Kinase
LXR: Liver X Receptor
LXRE: Liver X Responsive Element
LID: Low-glucose Inhibitory Domain
MAPK: Mitogen-Activated Protein Kinase
MEF: Mouse Embryonic Fibroblast
miRNA: microRNA
MLX: Max-Like protein X
MNK: MAPK-interacting Kinase
NAD+: Nicotinamide Adenine
Dinucleotide
NAMPT: NicotinAMide Phosphorybosyl
Transferase
NEFA: Non Esterified Fatty Acids
NES: Nuclear Export Sequence
NPAS2 : Neural PAS domain protein 2
NRF2: Nuclear factor erythroid 2-Related
Factor 2
p70S6K: p70 ribosomal S6 Kinase
PACAP: Pituary Adenylate Cyclase-
Activating Polypeptide
PAR bZip: Proline- and Acidic amino
acid-Rich domain basic leucine Zipper
PER1: PERiod
PDK: 3-Phosphoinositide-Dependent
protein Kinase
PI3K: PhosphoInositide 3 Kinase
PKA: Protein Kinase A
PP1: Phosphatase Protein 1
PPAR: Peroxisome Proliferator-Activted
Receptor
PPRE: Peroxisome Proliferator hormone
Responsive Element
RBP: RNA Binding Protein

14
ROR: Receptor-related Orphan Receptor
ROS: Reactive Oxygen Species
RPS6K: Ribosomal Protein S6 Kinase
rRNA: ribosomal RNA
RXR: Retinoic X Receptor
SCD1: Stearoyl-CoA Desaturase 1
SCP: Sterol Carrier Protein 2
SIRTs: SIRTuins
SREBP: Sterol Regulatory Element
Binding Protein
SCN: SupraChiasmatic Nucleus
T2D: Type 2 Diabetes
TEF: Thyrotroph Embryonic Factor
TORC: Target Of Rapamycin Complex
TSC: Tuberous Sclerosis Complex
UBF: Upstream Binding Factor
UCP2: UnCoupling Protein 2
X5P: Xylulose 5-Phosphate
ZT: Zeitgeber Time

15
CONTEXT OF THE DOCTORAL WORK
Circadian rhythms, present in organisms exposed to daily light-dark cycles, constitute the
mechanisms allowing anticipated and adapted behavior and physiology responses to
environmental variations. Indeed, it has been shown that the accumulation of the PAR bZip
transcription factors DBP, TEF, and HLF in peripheral organs such as the kidney and liver is
circadian clock-dependent. Moreover, these factors control the expression of many enzymes
involved in detoxification and drug metabolism3. In a previous study recently realized in our
laboratory, it has been shown that reticulum endoplasmic IRE1α pathway is rhythmically
activated with a 12 hour-period. The loss of this rhythmic activation leads to impairment in
lipid metabolism resulting in aberrant activation of sterol-regulated SREBP transcription
factors4. These two studies are good examples of circadian clock-dependent orchestration of
metabolism at the transcriptional and post-translational levels. In this doctoral work we
investigated the influence of the circadian clock in the activation of signaling pathways
regulating metabolism. We also looked at the consequences of the circadian clock-dependent
activations in the context of metabolic disorders.

16
INTRODUCTION
I. General introduction
For centuries, it has been observed that organisms can and must adapt to environmental
changes like temperature or light/dark cycles. In the 18th
century, Jean-Jacques d’Ortous de
Mairan described for the first time in living organisms the existence of an endogenous clock.
He observed that mimosa leaves opened during the day and closed during the night.
Moreover, the movements of these leaves occurred even without access to the light (figure 1).
In 1832, Augustin de Candolle described for the first time evidence of the free running period
and the non-requirement for light to synchronize leaves’ movements. Indeed, the leaves’
movements, which still occur in constant light, exhibit an advanced phase of 2 hours. Similar
biological rhythms have been later described in most of the species: in primates and birds5, in
rodents, in insects, in drosophila6 and finally in humans
7.
Figure 1: The leaves’ movements still
occurred even in constant darkness.
Representation of de Mairan’s experiment
showing that while mimosa was placed in
constant darkness, the leaves still opened
during the subjective day.

17
These biological rhythms, qualified as “circadian rhythms” in 1959 by Franz Halberg, coming
from the Latin Circa and Diem, literally meaning “around the day”, were defined by
Pittendrigh in 19608 according to their specific characteristics. Circadian rhythms present a
period length of about 24 hours, corresponding to one of Earth’s rotations. They are
endogenous and self-sustained phenomena. They are almost independent on temperature and
light intensity, and can be entrained by environmental cues, such as light, called “Zeitgeber”.
Thanks to a 1935 study on beans driven by Bunning, it is known that circadian rhythms are
hereditary. Later, some specific mutations in Drosophila melanogaster resulted in shortened,
lengthened or abolished free period, have been described in 19719. These mutations have
been shown to be localized in the Per (Period) gene10
. Since the identification of the first
clock gene in Drosophila melanogaster, decades of studies allowed the identification and
characterization of other components of the core clock in most species.
In recent years, the number of studies concerning the regulation and involvement of the
circadian rhythms has increased significantly, reflecting how important the circadian rhythms
are in different metabolic phenomenon. In fact, disrupted circadian rhythms have been shown
to be associated with metabolic disorders such as diabetes, obesity11
, vascular diseases12
, and
psychiatric disorders13
.

18
Figure 2: Coordination of behavioral and metabolic processes by the circadian clock
according to time of day
Circadian clock coordinates appropriate metabolic response in peripheral tissues at the appropriate
time. This coordination, depending on sleep/ wake, fasting/feeding, and dark/light cycles, is essential
for maintaining the health of the organism14
.
II. The circadian clock is hierarchically organized
While most tissues, organs15
and individual cells contain a circadian clock16
, at the level of the
whole organism, mammals require a hierarchical organization of the clock with a central
pacemaker synchronizing the peripheral clocks (figure 3).

19
The central pacemaker A.
In mammals, there is a central pacemaker localized in the SCN (SupraChiasmatic Nucleus)
(figure 3). In mice, it is composed of two groups of about 10,000 neurons each and is
localized in the anterior hypothalamus above the optic chiasm and lateral to the third
ventricle17
. The first experiments showing the importance of this structure in circadian
rhythms have been realized in rodents. SCN have been ablated, resulting in a loss of the daily
rhythms like locomotor activity and drinking behavior18
. When SCN coming from donor with
a different period have been transplanted, the circadian rhythms are restored with a period
similar to the donor’s rhythms19
. The SCN has been shown to be involved in the regulation of
many phenomena such as body temperature, locomotor activity, drinking and feeding
rhythms, glucose metabolism, neuronal electrical firing, gene expression, and hormone
secretion.
As a central pacemaker, this structure also plays a role in the synchronization of the peripheral
clocks, such as the one in the liver, when environmental information such as light is detected
by photoreceptors located in the eyes via the retino-hypothalamus tract into the SCN20
.
Melanopsin, a photopigment present in specific retinal ganglion cells of the retino-
hypothalamus tract21
, is essential for the synchronization of the circadian rhythms by light22
.
The transmission of light information is done via the activation of melanopsin, followed by a
release of glutamate and PACAP (Pituary Adenylate Cyclase-Activating Polypeptide) leading
to molecular mechanisms that use the CREB (Cyclic AMP Response Binding protein)
pathway to finally activate the Per genes’ transcription in the SCN23, 24
.

20
Figure 3: Schematic hierarchical organization of the circadian clock
The SCN synchronized by light signals is able to directly synchronise peripheral clocks through the
sympathetic nervous system and humoral signals. In addition, rest-activity cycles driving body
temperature variations and feeding-fasting cycles leading to the release of hormones and metabolites
constitute indirect SCN-generated information participating in the synchronization of peripheral
clocks25
.

21
Synchronization of peripheral clocks B.
Peripheral clocks located in peripheral organs, e.g. the liver or kidneys, have been shown to
be rapidly desynchronized26
. Indeed experiments on tissue explants showed a persistence of
rhythms which became dampened due to progressive cellular desynchrony because of period
variation among cells. Peripheral tissues need thus to be synchronized every day to maintain
their daily rhythms27, 28
. While synchronization of SCN occurred through light as external cue
or Zeitgeber in peripheral organs it has been suggested that clock synchronization occurred
differently with zeitgebers other than light. Indeed, a study showed that circulating
metabolites and hormones in the blood could play the role of a zeitgeber for liver and kidney
clocks29
. Actually, daily fasting-feeding cycles appeared to be important zeitgebers for
peripheral clock synchronization, as it has been shown that inverted fasted-feeding cycles lead
to the uncoupling of synchronization of peripheral clocks from SCN30, 31
. These fasting-
feeding cycles lead to rhythmic circulating hormones, metabolites and elevations of
temperature, all of which are involved in the synchronization of peripheral clocks25
. In
addition, the SCN directly synchronizes the peripheral clocks via neuronal and humoral
outputs. For example, it has been shown that glucocorticoid hormone, which is secreted under
the control of SCN via the hypothalamic-pituary-adrenal axis32
, exhibits strong oscillations
that serve as strong zeitgeber. Moreover, the autonomic nervous system is involved in direct
synchronization as shown in surgical liver-denervated animals33, which exhibit an impaired
resetting after light exposure during the night compared to the control animals.
.

22
III. The molecular circadian clock
The molecular mechanism that generates a 24-hour oscillation even in absence of external
cues34, 35
is composed of interconnected transcriptional and translational feedback loops36
. The
molecular core clock in mammals is schematically described in the figure 4.
The principal loop A.
(1) The activator complex
The first component of the activator complex has been identified in 1994 by Vitaterna and
colleagues37
. They identified a mutation in a specific gene named Clock (Circadian
Locomotor Output Cycles Kaput) encoding for a transcription factor belonging to the basic
helix-loop-helix family38
. This mutation, identified in a splicing site, leads Clock mRNA to be
deleted from the exon 1938, and due to the alterations generated on circadian rhythms, this
mutation has been qualified as dominant negative. Indeed, mice harboring the mutation at the
heterozygous state exhibited a longer free running period than wild-type mice, and moreover
the mutation at the homozygous state confers on Clock Δ19
mice an arrhythmia after some
days in constant darkness37
. Later, Clock knockout mice were generated and the analysis of
their locomotor activity revealed that they still exhibit behavioral rhythmicity in constant
darkness but with a shorter free running period compared to heterozygote or wild-type mice39
.
The second component of the activator complex was identified by two groups of researchers
in 1998 using the two-hybrid technology in yeast40, 41
. BMAL1 (Brain and Muscle ARNT-
Like Protein 1), whose RNA expression has been described to be similar to Clock RNA
expression pattern41
, also belongs to the basic helix-loop-helix family of transcription factors

23
and has been shown to interact directly with CLOCK to form the activator complex.
Behavioral rhythmicity studies showed that Bmal1 knockout mice placed in a constant
darkness condition immediately exhibit a completely arrhythmic activity42
.
The activator complex composed of the heterodimerization of CLOCK and BMAL1 proteins
activates the transcription of the repressor complex factors by binding on specific sequences
(CACGTG) named E-BOX41, 43
.
Later, Garcia et al. identified the interaction of BMAL1 and NPAS2 (Neural PAS domain
protein 2), another basic helix-loop-helix transcription factor, in the mammalian forebrain44
.
This heterodimer has also been shown to be able to activate the transcription of the
components of the repressor complex. However, the rhythmic activity of Npas2 knockout
mice study revealed the same phenotype as that of Clock knockout mice, and they still exhibit
rhythmic locomotor activity in constant darkness45
. It thus seems that CLOCK and NPAS2
play a compensatory role for each other in circadian clock mechanisms. This suggestion was
later validated by a study of the rhythmicity of Clock/Npas2 double knockout mice. Indeed,
the authors showed that preserving one wild-type allele of Clock or Npas2 while the other
gene is completely deleted is sufficient to conserve the rhythmic activity, and complete
double knockout mice exhibit the same arrhythmic phenotype in constant darkness found in
Bmal1 knockout mice46
. BMAL2, identified as a basic helix-loop-helix transcription factor,
was cloned in mice in 2001, and while its expression pattern does not exhibit any oscillation47
,
BMAL2 is able to compensate for the absence of BMAL1 in restoring a rhythm in cell
culture48
.

24
Figure 4: The mammalian molecular clock
BMAL1:CLOCK heterodimers activate clock-controlled gene transcription by direct binding to E-box.
PER and CRY protein translation occurs during the night and causes repression of the activator dimer.
Degradation of PER and CRY through post-translational modifications provides a new circadian
cycle. In addition, REV-ERB and ROR proteins modulate the cycles by their respective inhibition and
activation of Bmal1 transcription through their binding to RRE (ROR Response Element) present in
Bmal1 promoter49
.
(2) The repressor complex
The repressor complex results in the heterodimerization of PER1 and PER2 (PERiod)
proteins50
and CRY1 and CRY2 (CRYptochrome) proteins51
. Per is the first clock gene
identified10
in Drosophila melanogaster. In 1997, the three mammalian Per homologs were
cloned24, 52-56
. Different studies have shown that in the SCN, the three Per RNAs are
expressed with a rhythmic pattern. In addition, light pulses promote an increase of Per1 and
Per2 expression during the subjective night24, 52, 53, 56
. Mutation in both Per1 and Per2 genes
leads to complete arrhythmia50
. The role of the protein CRY1 in the clock core has been
demonstrated for the first time in plants57
. In this study, the authors showed that CRY1 was
required to maintain the circadian rhythms in extended darkness. CRY1 and CRY2 proteins
were then described in mammals58, where they explored the role of CRY2 protein in the

25
regulation of the circadian rhythms. In their study, van der Horst et al. disrupted Cry1, Cry2
or both in mice, and the running wheel activity appeared to be arrhythmic in constant
darkness only for mice lacking both Cry genes, showing the importance of these genes in the
generation of the circadian rhythms51
.
The PER:CRY heterodimers act by negative feedback on their own expression by repressing
the transcriptional activity of CLOCK:BMAL159-61
. This feedback loop suggests rhythmic per
and cry mRNAs and proteins expression62-64
. Molecular mechanisms involved in repressed
CLOCK:BMAL1 activity by PER and CRY requires post-translational modifications.
However, recent evidences showed that CRY:PER repression is dependent on their entry into
nucleus. It appeared thus that PER facilitates the entry of CRY into nucleus where it acts as
repressor of CLOCK:BMAL1 activity65
.
The stabilisation loop B.
It appears that the core loop is not the only one involved in the generation of circadian
rhythms. Indeed, other genes are also involved in the molecular clock oscillation. This is the
case of the nuclear receptors REV-ERB α and β belonging to the REV-ERB family. Their
expression has been shown to follow a circadian pattern16, 66
. In addition, while deletion of
Rev-erbα or Rev-erbβ causes only subtle defect in circadian behavior, deletion of both genes
in mice resulted in complete disruption of locomotor activity66
. ROR (Receptor-related
Orphan Receptor) α, β, and γ belong to the ROR family. Both families of receptors have been
shown to be involved in the regulation of transcription via their binding on specific sequences
in gene promoters: the RRE (ROR Response Element) activate in an opposite way to RORs,
and REV-ERBs inhibit the transcription. In context of the regulation of the core oscillator,

26
RORs and REV-ERBs (expression of REV-ERBs is regulated by the heterodimer
CLOCK:BMAL1) activate and inhibit the transcription of Bmal167-70
, Npas271
, Clock72
and
Cry173
, respectively.
Post-transcriptional modifications C.
Once they are transcribed, mRNA can undergo several regulatory processes to adapt to the
needs of protein with respect to time-related functions. It has been suggested in Drosophila
melanogaster that Per mRNA stability could be regulated in a circadian manner as its half-life
changes around the clock74
. Several studies on mice demonstrated that Per1, Per2, Per3 and
Cry1 mRNAs are more stable during their rising phase74-76
. One aspect of this phenomenon
was described in a study where the authors showed the presence of an element involved in the
repression of its own expression in the 3’UTR of Per1 77
. The interaction of LARK1
(RBM4a), an RBP (RNA Binding Protein) acting as trans-factor and rhythmically expressed
in the SCN, together with the 3’UTR of Per1 has been shown to be involved in the activation
of Per1 mRNA expression78
. Other RBPs have also been showed to be involved in the
regulation of the core oscillator at the post transcriptional level: the hnRBP (heterogenous
nuclear RBP) I, D and Q. These particular hnRBP have been shown to interact with some
clock gene mRNA to promote instability. For example, hnRBP I promotes the degradation of
Per2 mRNA when it interacts with Per2 3’UTR75
. The same phenomenon occurs with the
interaction of hnRBP D and Cry1 3’UTR76
.
The stability of the mRNA can be conferred by the 3’ polyA tail stability. It has been shown,
first in Xenopus79
and then in mice80
, that one deadenylase named ‘NOCTURNIN’ promotes
the destabilization of the mRNA in a rhythmic manner by removing the 3’ adenosine residues
27
from the transcripts81
. Moreover it was recently shown that polyA tail length dynamic present
a rhythmic pattern, leading to rhythmic protein expression82
.
The alternative splicing is an important level of post-transcriptional regulation of gene
expression. It has mainly been demonstrated to be involved in the regulation of the core clock
in Drosphila melanogaster, induced by cold temperature and producing two different
isoforms of Per83
. The same phenomenon has been described in Neurospora Crassa for the
alternative splicing of frq84
. Recently, evidences demonstrated in mice the circadian control of
alternative splicing depending on tissue and that feeding/fasting cycles constitutes an
important zeitgeber in the regulation of alternative splicing85
. In addition, a recent study on
mouse brain and liver showed evidence of a light-inducible alternative splicing of U2AF26
involved in the regulation of Per186
.
More recently, some evidence has shown that miRNA (microRNA), post-transcriptional
regulators, play a role in the regulation of circadian rhythms. For example, the two brain-
specific miRNAs miR-219 and miR-132 have been described to be a CLOCK:BMAL
heterodimer target and a modulator of clock genes expression in mice SCN87, respectively. In
mice liver, miR-12288
has been shown to be regulated by REV-ERBα, and involved in the
regulation of clock gene output. In addition, it has been reported that the free-running period
in Dicer-deficient MEF (Mouse Embryonic Fibroblasts) was shorter due to lack of three
miRNAs (miR-24, miR-29a, miR-30a) involved in PER1 and PER2 translation regulation89
.
Recently, a study on Dicer knockout mice showed only a low impact on the liver core clock
as the free-running period was delayed by only 40 minutes. But miRNAs have an impact on
general rhythmic gene expression90
.

28
Post-translational modifications D.
Post-translational modifications on the core clock proteins play a very important role in
providing 24 hour-oscillation. These post-translational modifications vary in their nature as
the list includes phosphorylations, ubiquitinations, sumoylations, and acetylations.
(1) Phosphrylations and dephoshorylations
CK (Casein Kinase) 1 phosphorylates PER2 on the serine 659 leading to its nuclear retention
and stabilization91
, while other phosphorylations on PER proteins have been shown to be
involved in their degradation by the proteasome92, 93
. CK1 also phosphorylates BMAL1,
increasing its transcriptional activity94
. Another kinase, GSK (Glycogen Synthetase Kinase)
3β, acts on PERs and CRY2 proteins to favor their nuclear localization95, 96
. This kinase is
also known to stabilize REV-ERBα. As a consequence, it strengthens Bmal1 transcriptional
repression97
. AMPK (Adenoside MonoPhosphate-activated protein Kinase) has been shown to
phosphorylate CRY1 leading to its instability98
. In addition, phosphatases are also involved in
molecular circadian clock regulation. Indeed, Phosphatase Protein 1 (PP1) acts directly on
PER2 leading to the increase of its stability99, while PP5 regulates the inhibitory self-
phosphorylation of CK1 such that it is indirectly involved in the phosphorylation state of
PER2100
.

29
(2) Ubiquitinations
As mentioned above, some post-translational modifications are linked to degradation by the
proteasome. This mechanism requires poly-ubiquitinations on lysine residues of the proteins
to be addressed to proteasome 101
. SFC, a complex composed of several proteins, is involved
in the recognition and ubiquitination of phosphorylated proteins to be degraded by the
proteasome. PER and CRY proteins undergo degradation to prevent the inhibition of
BMAL:CLOCK transcription activity. FBXL (F-Box and Leucine-rich repeat protein) 3, a
component of SFC ubiquitin ligase complex, have been shown to be involved in AMPK- and
GSK3β-phosphorylated CRY proteins degradation102
. Two groups of researchers described
mutations in Fbxl3 gene, Overtime 103 and After-Hours
104, leading to very long free-running
period in constant darkness. In a recent study, FBXL21 has also been shown to be involved in
CRY ubiquitination105
. Fbxl21 knockout mice exhibit a normal running-wheel activity while
the free running period of Fbxl3 knockout mice is extremely long in constant darkness. In
addition, mice deleted for both Fbxl genes exhibit arrhythmia after few days of constant
darkness conditions reflecting their impact on circadian clock. Actually, FBXL21 stabilizes
CRYs in the cytoplasm while FBXL3 ubiquitination on CRYs in the nucleus leads to their
destabilization. In the same way, CK1-phosphorylated PER proteins undergo degradation via
polyubiquitination by βTrCP (β Transducing repeat-Containing Protein) 1 and 292, 93
.
(3) Sumoylations
Few examples of sumoylation have been reported, but recent evidence shows that
sumoylation is involved in the robustness of circadian rhythms. Indeed, sumoylation in
BMAL1 occurs on lysine 259 and is induced by CLOCK106
. This post-translational
30
modification is required for clock oscillation, as sumoylation of BMAL1 in the nuclear bodies
leads to its transactivation and its proteasomal degradation107
.
(4) Chromatin remodeling
Epigenetic factors also influence the circadian clock by modulating gene transcription via
chromatin remodeling factors. Indeed the regulation of the core clock mechanism in mice
liver is accompanied by rhythms in H3 histone acetylation on Per1, Per2 and Cry1
promoters108
. Moreover, CLOCK proteins have been described as Histone AcetylTransferase
(HAT) enzymes109
. This HAT activity is enhanced by the heterodimerisation with BMAL1.
More precisely, CLOCK acetylates BMAL1 leading to a facilitated interaction of BMAL1
with CRY proteins. This leads finally to an increase of the negative feedback by CRY
proteins110
. In addition, some circadian clock repressors are associated with Histone
DeACetylase (HDAC). For example, HDAC can bind Per1 promotor111
, and REV-ERBα can
associate with HDAC3 on Bmal1 promoter112
.
The methylation state of circadian gene promoters has also been reported to play an important
role in their expression regulation. Indeed, rhythmic methylation events of E-boxes present in
the circadian genes correlate with the cyclic binding of CLOCK:BMAL1113
. WDR5, a subunit
of histone methyl transferase complexes, has been identified as increasing PER-mediated
repression114
. In addition, it has been shown that JARID (JumonjiC and ARID domain-
containing histone lysine demethylase) 1a can associate with CLOCK:BMAL1 and bind Per2
promoter. It then results in an increased transcription by CLOCK:BMAL1115
.
More recently, SIRTs (SIRTuins), and more particularly SIRT1116, 117
and SIRT6118
, have
been reported to play a role in the control of circadian clock gene thanks to their function of

31
histone deacetylase. SIRTs, NAD+ (Nicotinamide Adenine Dinucleotide) -dependent enzymes
in which deacetylase activity is circadian, bind the BMAL1:CLOCK activator complex and
contribute to the regulation of PER2 stability116
. SIRT proteins are involved in metabolism,
and they thus provide a real link between the circadian clock and the coordination of the
metabolism by the circadian rhythms. Indeed, NAMPT (NicotinAMide Phosphorybosyl
Transferase), a rate-limiting enzyme involved in NAD+ biosynthesis, as consequence of
metabolic processes through SIRT1, has been reported to influence Per2 expression, as its
inhibition promotes BMAL1:CLOCK released from suppression by SIRT1. In turn, Nampt
mRNA expression is upregulated by CLOCK119
. More recently, Masri et al. reported SIRT6
as being involved in the coordination of SREBP1-dependent circadian transcription118
.
.
IV. The translational mechanisms in mammals
In eukaryote organisms, about 30% of the mass of cellular proteins produced is subject to
translational control120
. Thus, protein synthesis is accurately regulated at the post-
transcriptional level. Indeed, mRNAs harbor cis-acting elements involved in the recruitment
of trans-acting factors and the subsequent attachment of ribosomes that can scan and translate
the mRNA into protein. Essentially, translation is a four step initiation, elongation,
termination and recycling of ribosomes for a new translation initiation.

32
Pre-initiation of the translation A.
(1) Formation of pre-initiation translation complex
Translation initiation constitutes the limiting step of protein synthesis. During this step, the
small ribosome subunit is recruited to the 5’- end of mRNA and scans towards the start codon,
where the complete ribosome is subsequently assembled, and then the polypeptide can
begin121
. The eIF (eukaryotic translation Initiation Factor) 4F complex, composed of eIF4E,
eIF4G and eIF4A, is assembled on the 5’- cap structure of mRNA. This leads to the
recruitment of the small ribosomal subunit to mRNA. To assemble the eIF4F complex, eIF4E
binds to the 5’- cap and recruits eIF4G and eIF4A. 4E-binding protein 1 (4E-BP1; also known
as eIF4EBP1) inhibits eIF4G binding to eIF4E. mTORC1-mediated phosphorylation of 4E-
BP1 leads to its release from eIF4E, allowing the recruitment of eIF4G and eIF4A 122
.
(2) Regulation of TORC1 signaling pathway
Target Of Rapamycin (TOR) was first identified in 1991123
in yeast. TOR can associate with
different partners to compose two different TOR Complexes, TORC1 and TORC2. TORC1,
identified as a central sensor in the nutriment detection124
, is involved in the regulation of cell
growth and size by promoting protein synthesis125, 126
. TORC1 is regulated by extracellular
signals124, 126
(figure 5). Indeed, amino-acid, especially Branched Chain Amino Acids
(BCAA), availability is an important signal as they positively and directly regulate TORC1
signaling127-129
. It has also been shown that hormones or growth factors are involved in
TORC1 activation. Indeed, the binding of insulin or insulin-like growth factors to the
receptors leads to TORC1 activation via the PhosphoInositide 3 Kinase (PI3K) – AKT
33
pathway. Tuberous Sclerosis Complex (TSC) 1/2, whose activity inhibits TORC1 activity, is
inhibited by phosphorylation by AKT130
. More precisely, TSC1/2 has a GTPase-Activating
Protein (GAP) activity with respect to the small GTPases Rheb131
. This activity occurs by
stimulating the hydrolysis of GTP-bound Rheb leading to TORC1 inhibition132
. TORC1 also
responds to cellular energy variations. A low cellular energy activates AMPK pathway. In
these conditions, AMPK directly phosphorylates TSC2133
and one component of TORC1,
Raptor134
, leading to TORC1 inhibition. Finally, Extracellular signal-Regulated protein
Kinase (ERK)135
and Mitogen-Activated Protein Kinase (MAPK)-interacting Kinase (MNK)
RSK1136
pathways are involved in TORC1 regulation as, when activated by stress, they are
able to phosphorylate TSC2, leading to TORC1 activation.
(3) Translation initiation regulated by TORC1
mRNAs belonging to the 5’ Terminal OligoPyrimidine (5’TOP) mRNA family are
characterized by an identifiable pyrimidine-rich motif in the 5’ terminal sequence137
. This
motif corresponds to the core of the translational cis-regulatory element. Most of the products
of these mRNAs are components of the translation machinery, and their expression responds
to growth and nutritional stimuli137
. Indeed, TORC1 regulates the protein synthesis from
5’TOP mRNAs and more particularly the translation initiation complex formation via
Ribosomal Protein S6 Kinase (RPS6K) and EIF4E-Binding Protein (4E-BP)
phosphorylations126
. In its inactive state, this translation initiation complex is composed of the
mRNA cap-binding protein EIF4E bound to the hypophosphorylated form of 4E-BP that acts
as a translational repressor. After TORC1 phosphorylation of 4E-BP122
, it releases EIF4E,
which can then interact with the scaffold protein eIF4G and the rest of the EIF4F complex
(EIF4A, EIF4B, and EIF4H) to initiate the translation138
. In parallel, TORC1 phosphorylates

34
RPS6K, which then phosphorylates other substrates involved in EIF4F complex formation.
Indeed, this leads to the phosphorylation of EIF4B, inducing its own recruitment to EIF4A139
.
Figure 5: The translation initiation mediated by TORC1 is modulated by metabolism
linked signaling pathways.
Activated AKT and REK pathways lead to the activation of mTORC1, which phosphorylates its
targets 4E-BP1 and RPS6K, thus allowing the formation of the pre-initiation complex of the
translation. In contrast, the activated AMPK signaling pathway represses this formation through its
mTORC1 inhibition.
35
The different steps of translation initiation B.
mRNA scanning and the corresponding polypeptide synthesis is performed by 80S ribosome,
which contains a P-site where the initiation codon is base-paired with the anticodon loop of
the initiator tRNA (Met- tRNAiMet
)140
. Its recruitment requires several steps (figure 6) once
activated translation pre-initiation eIF4F complex binds 5’ end mRNA.
(1) Formation of 43S pre-initiation complex.
Translation is a cyclical process. Ribosomes undergo recycling at the end of translation
process. Indeed, the action of different factors (eIF1, eIF1A and eIF3) leads to the dissociation
of the different subunit composing 80S ribosome (60S and 40S subunits) and the release of
eRF (eukaryotic Releasing Factor) 1 and 3, mRNA and tRNA. During this recycling step, the
40S subunit is associated to eIF3, eIF1 and eIF1A preventing the 60S subunit from
associating again. Thus, eIF3, eIF1 and eIF1A are recruited to 40S subunits during recycling
and interact with eIF2–GTP–Met- tRNAiMet
to form 43S complexes. The position of eIF2–
GTP–Met- tRNAiMet
on 40S subunits has not been determined. However, in 43S complexes,
the Met- tRNAiMet
anticodon loop is probably not inserted as deeply into the P-site as in
ribosomal complexes with established codon–anticodon base pairing, and its acceptor end, to
which Met is linked, might be rotated towards the E-site 141-143
.
(2) Attachment of 43S complex to mRNA.
It has been shown that 43S complexes are intrinsically capable of 5′ end-dependent
attachment to model mRNAs with completely unstructured 5′ UTRs144
.

36
Figure 6: Molecular mechanisms of eukaryotic translation initiation
Translation initiation is constituted of several stages: recycling of ribosomal subunits, formation of
43S pre-initiation complex, attachment of 43S complexes to mRNA, ribosome scanning of mRNA 5′
UTRs, initiation of codon recognition, commitment of ribosomes to a start codon, ribosomal subunits
joining 138.

37
However, natural 5′ UTRs possess a sufficiently secondary structure for the loading of 43S
complexes onto them to require the cooperative action of eIF4F and eIF4B or eIF4H, which
unwind the 5′ cap-proximal region of mRNA to prepare it for ribosomal attachment. The
recruitment of the 43S complex is achieved by the interaction of cap-eIF4E-eIF4G with eIF3-
40S145
.
(3) Ribosome scanning of mRNA 5′ UTRs.
After attachment on capped mRNA, the 43S complex scans mRNA downstream of the cap to
the initiation codon. Scanning consists of two linked processes: unwinding of secondary
structures in the 5′ UTR and ribosomal movement along it. 43S complexes can scan
unstructured 5′ UTRs without factors associated with RNA unwinding and are thus capable of
movement along mRNA144
. This movement of 43S complexes requires the scanning-
competent conformation induced by eIF1 and eIF1A146
.
Concerning scanning directionality, it has been shown that initiation frequency at the 5′
proximal AUG is reduced by the presence of a nearby downstream AUG147. This suggests that
scanning may consist of forward (5′ to 3′) thrusts alternating with limited relaxation over
distances of a few nucleotides in the reverse direction.
(4) Initiation of codon recognition.
To ensure the fidelity of initiation, scanning complexes must have a mechanism that prevents
partial base pairing of triplets in the 5′ UTR with the Met- tRNAiMet
anticodon and promotes

38
recognition of the correct initiation codon: usually the first AUG triplet in an optimum
‘Kozak’ context (GCC(A/G)CCAUGG)148, 149
. This role in maintaining the fidelity of
initiation is done by eIF1. Indeed, this factor enables 43S complex to discriminate against
non-AUG triplets or AUG triplets in non-favorable. In addition, it is involved in cooperation
with eIF1A in the dissociation of the ribosomal complexes that aberrantly assemble with such
triplets144, 149, 150
.
.
(5) Commitment of ribosomes to a start codon.
Initiation codon recognition is followed by a step during which the arrested ribosome
becomes committed to initiation. The commitment step is mediated by eIF5, an eIF2-
specific GTPase-activating protein (GAP)140
. The molecular mechanism remains unclear, but
two hypothesis have been suggested. The first hypothesis proposes a binding of eIF5 to eIF2's
β-subunit but induces the GTPase activity of eIF2's γ-subunit only in eIF2–GTP–Met-
tRNAMet
complexes that are bound to 40S subunits151
. The second hypothesis suggests that
eIF5 derepresses eIF2γ's GTPase activity152
.
(6) Ribosomal subunit joining.
The joining of 60S subunits and dissociation of eIF1, eIF1A, eIF3 and residual eIF2–GDP are
mediated by eIF5B153, 154
. Moreover, hydrolysis of eIF5B-bound GTP is required for eIF5B
release from assembled 80S ribosomes140
. Interaction of eIF5B with eIF1A155, 156
is required
for efficient subunit joining and GTP hydrolysis by eIF5B.

39
Although those eIFs that bind to the interface of the 40S subunit must be released before or at
subunit joining, dissociation of eIF3 and eIF4G may be delayed to allow reinitiation following
short upstream ORFs157
.
Translation elongation C.
After translation initiation, 80S ribosome is poised on an mRNA with the anticodon of Met-
tRNAi in the P-site base-paired with the start codon. The second codon of the ORF is present
in the A-site (Acceptor-site) of the ribosome awaiting binding of the cognate aminoacyl-
tRNA. The eEF (eukaryotic Elongation Factor) 1A binds aminoacyl-tRNA in a GTP-
dependent manner and then directs the tRNA to the A-site of the ribosome158, 159
. Codon
recognition by the tRNA triggers GTP hydrolysis by eEF1A, releasing the factor and enabling
the aminoacyl-tRNA to be accommodated into the A-site160
. Next, peptide bond formation
with the P-site peptidyl-tRNA occurs rapidly with the help of the peptidyl transferase
center161
. Then the ribosomal subunits triggers movement of the tRNAs with the acceptor
ends of the tRNAs in the E- and P-sites and the anticodon loops remaining in the P- and A-
sites.
This translocation of the tRNAs to the canonical E- and P-sites requires eEF2162, whose
regulation involves the mTOR pathway through S6K phosphorylation163
.
Termination of the translation D.
It occurs when the end of the coding sequence is reached by the ribosome and a stop codon
(UAA, UGA or UAG) enters the A-site. In eukaryotes, it is catalyzed by two protein factors,

40
eRF1 and eRF3. eRF1 is responsible for high fidelity stop codon recognition and peptidyl-
tRNA hydrolysis, while eRF3 is involved in acceleration of peptide release and termination
efficiency at stop codons164, 165
. In the post-translocation state of the ribosome, a deacylated
tRNA occupies the E-site and the peptidyl-tRNA is in the P-site. The A-site is vacant and
available for binding of the next aminoacyl-tRNA in complex with eEF1A 166.
Ribosome biogenesis E.
Deep investigations of ribosome biogenesis have been performed on the yeast Saccharomyces
Cerevisiae. However, mammalian ribosome biogenesis remains unclear, and the following
descriptions refer to described mechanisms in yeast.
In eukaryotes, each ribosome is composed of a small 40S and large 60S subunit. Each subunit
itself contains different molecules: ribosomal RNA (rRNA) and ribosomal proteins (40S [18S
rRNA, 33 RPs]; 60S [25S, 5.8S, 5S rRNA, 46 RPs]). Ribosome biogenesis requires the
activity of all three RNA polymerases (figure 7): RNA polymerase II transcribes the pre-
mRNAs of ribosomal proteins and accessory factors involved in ribosome biogenesis167
, RNA
polymerase III produces the precursor to 5S rRNA168
, and RNA polymerase I, in part through
UBF (Upstream Binding Factor) 1 activation169, is involved in the transcription of the
common precursor to mature 5.8S, 18S and 25S rRNAs170
. Interestingly, mTOR has been
shown to regulate all three RNA polymerases2.

41
In yeast, the biogenesis of both subunits starts with the transcription of the common precursor,
the 35S pre-rRNA, by RNA polymerase I (Fig. 8). A large number of non-ribosomal factors
and snoRNAs modify nascent rRNA171, 172
, leading to pseudourydines formation. Upon
cleavage, which can occur co-transcriptionally, the early 40S pre-ribosome (figure 8, left side)
is separated from the remaining pre-rRNA, which assembles with large subunit ribosomal
proteins and non-ribosomal factors to form the earliest pre-60S ribosomal particles (figure 8,
right side)172
.
(1) 40S subunit assembly
The assembly of the first 40S precursor, the 90S particle, occurs co-transcriptionally and starts
with the incorporation of UTP-A, UTP-B, and UTP-C173
. Following cleavage at the U3
snoRNP-dependent sites A0, A1, and A2, which yield the 20S pre-rRNA, the composition of
the pre-40S particle changes dramatically. Indeed, most non-ribosomal factors dissociate and
a small set of novel biogenesis factors and further Rps proteins are recruited174
. This pre-40S
Figure 7: Influence of mTOR in
ribosome biogenesis
mTOR regulates the three RNA
polymerase I, II and III involved in
ribosome component transcription2,
the pre-rRNA, ribosomal proteins
mRNA and 5S rRNA respectively.

42
subunit is rapidly transported out of the nucleolus into the cytoplasm where the cleavage of
the 20S pre-rRNA at site D occurs, yielding the mature 18S rRNA 175, 176
.
(2) 60S subunit assembly
Ssf1, the earliest distinct pre-60S particle, contains a mixture of 27SA and 27SB pre-rRNA,
ribosomal proteins, and about 30 non-ribosomal proteins, including early diagnostic factors
like Noc1 and Rrp5 177, 178
. The next distinct intermediate is defined by the nucleolar Nsa1
particle 178
, since this particle almost exclusively contains the 27SB rRNA part of the 5S
subunit. The transition from the nucleolus (Nsa1 particle) to the nucleoplasm (Rix1 particle)
is accompanied by major compositional changes of partners 178
. At this step, the 27SB pre-
rRNA has been processed almost completely into 25S and 7S/5.8S rRNAs179, and its partners
prime the pre-60S particle for nuclear export180
. The final 5.8S processing occurs in the
Figure 8: Representation of the
major steps in pre-rRNA
processing involved in the
ribosome subunit formation.
After its transcription, the common pre-
rRNA undergo specific sequential
cleavages. This maturation leads to the
generation of rRNAs constituting the
small (green) and the large (blue)
subunits of the ribosome 1.

43
cytoplasm181, and the release of processing factors allows 60S subunits to be associated with
40S ribosomal subunits182
.
(3) Nuclear export
The nuclear export of both subunits depends on the general export factor Xpo1/Crm1, the
regulatory GTPase Ran183, 184
and NES (nuclear export sequence) adaptors. Indeed, for the
pre-60S subunits, Xpo1 binds to an NES of Nmd3 which interacts with the ribosomal
subunits185
. The heterodimer Mex67-Mtr2 also mediates the export of the pre-60S subunits,
since it binds 5S rRNA and Mex67, and Mtr2 mutants show impaired pre-60S export186
.
Finally, Arx1 also facilitates pre-60 subunit’s translocation through its interaction with
nucleoporins187
.
The export mechanism of the small subunit is still unclear. Despite the role of Xpo1 in the
export of pre-40S ribosomes, no NES-adaptor has been identified to date. However, depletion
of a few ribosomal proteins, namely, Rps15, Rps10, Rps26, Rps2, Rps0, and Rps3, were
found to cause strong export defects188
, suggesting a direct or indirect involvement in pre-40S
export.

44
V. Energy balance
Organisms must adapt to the fluctuation of nutrient availability. In mammals, surplus of
nutrients are mainly stored in adipose tissue as triglyceride. Carbohydrate ingestion
stimulates, in the liver, conversion of carbohydrate into triglyceride. Then, triglycerides are
mobilized from the liver to adipose tissue for long-term storage. High glucose levels in the
circulation after a high-carbohydrate meal leads to the activation of hepatic lipogenesis
through various mechanisms. Glucose and lipid metabolisms are thus interconnected, and
their fine regulation requires the action of the pancreatic hormones glucagon and insulin.
Essentially, glucose activates insulin secretion from pancreatic β-cells leading to the
stimulation of glucose uptake and its utilization, and promotion of the synthesis of glycogen
and lipogenesis in the liver. In addition, insulin inhibits hepatic glucose production, fat
oxidation and ketogenesis, thus shifting the balance to fat storage. Finally, glucose constitutes
an important signaling molecule in the regulation of genes encoding for enzymes involved in
glycolysis and lipogenesis189
.
Glucose, insulin and glucagon are involved in lipogenesis and glycolysis through the
regulation of transcription factors. SREBP (Sterol Regulatory Element Binding Protein) 1c, in
the liver, is one important transcriptional regulator of fatty acid and triglyceride synthesis in
response to insulin190-192
. Indeed, SREBP1c expression is low in fasted animals, but increases
greatly upon feeding, under insulin mediation193, 194
. In addition, evidence shows that insulin
activates SREBP1c at the post-translational level195, 196
leading to the expression of enzymes
playing a role in fatty acid and triglyceride synthesis as ATP-citrate lyase (ACL), acetyl-CoA
synthetase (ACS), acetyl-CoA carboxylase (ACC), fatty acid synthase (FAS), stearoyl-CoA
desaturase-1 (SCD1), and glycerol-3-phosphate acyltransferase (GPAT). In contrast to insulin
45
stimulation, glucagon inhibits the transcription of SREBP-1c mRNA through the cyclic
adenosine 3′,5′-monophosphate/protein kinase A signaling pathway 197, 198.
SREBP signaling pathway A.
(1) Activation of SREBPs
SREBPs are proteins belonging to the basic helix-loop-helix leucine zipper family of
transcription factors. In mammals, three isoforms, SREBP1a, SREBP1c and SREBP2, have
been described depending on their tissue localization and their regulatory functions in lipid
metabolism. In liver, SREBP1c is especially involved in fatty acids and triglycerides
metabolism, whereas SREBP2 plays an important role in the regulation of de novo cholesterol
biosynthesis as, among other regulating events, it participates in the regulation of the
transcription of Hmgcr (3-Hydroxy-3-MethylGlutaryl-CoAReductase)199
, which encodes for a
rate-limiting enzyme of the cholesterol biosynthesis.
As shown in the figure 9, SREBPs are basically membrane-bound proteins localized in the
endoplasmic reticulum. In the presence of sterols or oxysterols, SREBPs remain in the
endoplasmic reticulum with the SCAP (SREBP Cleavage-Activating Protein) and INSIG
(INSulin Induced Gene) proteins, with this situation corresponding to SREBPs inactive
state200, 201
. However, in the absence of sterols or oxysterols, SREBPs migrate to the Golgi
apparatus to undergo some proteolysis cleavages by Site-1 and Site-2 Proteases (S-1P and S-
2P)202, 203
, leading to the release of the N-terminal part of SREBPs204, which can play their
role of transcription factors in the nucleus on their respective target genes, of which Fasn
(Fatty Acid Synthase) for SREBP1c205
and Hmgcr for SREBP2 are two representative
examples.

46
Figure 9: Activation of SREBP as transcription factors
In its inactive state, SREBP remains associated at the membrane of the endoplasmic reticulum.
Activation of SREBP, in sterol deprivation conditions, leads to migration to Golgi apparatus where it
undergoes several proteolytic processes, thus releasing SREBP transcriptional part206
.
(2) Transcriptional regulation of SREBP1c in liver
Insulin interaction with its receptor at the cell surface induces the phosphorylation of IRS
(Insulin-Receptor Substrates protein). This initiates a signaling cascade (figure 10) leading to
the transcriptional suppression of gluconeogenesis and the activation of lipogenesis207, 208
.
Tyrosine phosphorylation of IRS by the insulin receptor recruits PI3K, which then
phosphorylates phosphatidylinositol (4,5) bisphosphate (PtdIns(4,5)P2) to produce
Ptd(3,4,5)P3 (PIP3). PI3P acts as second messenger and recruits AKT to the plasma

47
membrane. AKT is then activated by PDK (3-Phosphoinositide-Dependent protein Kinase)1
phosphorylation. As a consequence, AKT activates mTORC1 signaling pathway. Recently,
mTORC1 has been reported as an important regulator of SREBP-1c that activates both
SREBP-1c transcription209-211
and proteolytic processing in response to insulin stimulation210,
212-214. The inhibition of p70S6K (p70 ribosomal S6 Kinase), one of the major downstream
targets of mTORC1, does not present any effect on insulin-induced SREBP1c mRNA
expression211
. However, it inhibits SREBP1c proteolytic processes210
, demonstrating
SREBP1c regulation by mTORC1 through distinct mechanisms.
Figure 10: Regulation of SREBP by the insulin signaling pathway.
Insulin activates SREBP-1 through multiple mechanisms. Insulin stimulates SREBP-1c transcription,
promotes proteolytic processing, facilitates the nuclear import of the processed protein, and suppresses
the proteasomal degradation of SREBP-1215
.

48
LXR signaling pathway B.
LXRs belong to a nuclear receptor family of transcription factors. Both LXR isoforms, LXRα
mainly expressed in the liver and LXRβ, whose expression is ubiquitous216, 217
, play the role
of transcription factor when activated by the heterodimerization with RXR nuclear receptor217
and the binding of specific ligands belonging to the oxysterols family 216, 217
as shown in
figure 11.
Figure 11: Activation of LXR transcription factor
LXR associated to RXR binds LXRE on target gene promoter. At the basal state, the heterodimer is
bound by the repressor, preventing LXR from inducing transcription. In the presence of oxysterols and
co-activators, the heterodimer is activated, leading it to play its role of transcription factor218
.
As transcription factor, the LXR-RXR heterodimers bind to a specific DNA sequence named
‘LXRE’ (Liver X Responsive Element)219
present in the promoter of the LXR target genes as
Abcg5 or Abcg8 (ATP-binding cassette subfamily g member 5 and 8). LXR target genes
encode for proteins, especially transporters, involved in the regulation of a mechanism called
reverse cholesterol transport220
. This process allows the excess of cholesterol to return to the
liver as HDL (High Density Lipoproteins) to be eliminated in the bile219, 221, 222
.

49
LXR transcription factors also play an important role in fatty acid and triglyceride synthesis.
Indeed, LXRα is able to induce SREBP-1c expression via LXRE-bound transcription223-225
.
Thus, LXRα lipogenic activity is abrogated in SREBP-1c deficient mice195
, showing the role
of LXR in lipogenesis through SREBP-1c. In addition, LXRα deficient mice exhibit reduced
expression of SREBP1c in the liver and as a consequence, SREBP1c target genes encoding
for lipogenic factors such as SCD1 and FAS also present a decreased expression217, 224, 226, 227
.
In contrast, SREBP1c expression and lipogenesis increase under high-cholesterol diet217, 224,
226, 227. Importantly, disruption of LXR-binding sites on the SREBP-1c promoter abolished the
induction of promoter activity by insulin. This evidence suggests that SREBP-1c induction in
response to insulin is dependent on LXRα223
. However, no other LXR target genes have been
shown to be induced by insulin228, 229
. This process appears to be SREBP1c specific, and the
mechanism of this LXRα-activated SREBP1c by insulin remains unknown.
.
ChREB signaling pathway C.
ChREBP (Carbohydrate Response Element Binding Protein) was first identified as a glucose
responsive transcription factor involved in the regulation of glycolytic, gluconeogenic, and
lipogenic gene expression230, 231
. ChREBP activates the transcription of genes encoding for
important enzymes belonging to pathways such as L-PK (L-Pyruvate Kinase) for glycolysis,
G6PC (Glucose 6 Phosphatase Catalytic subunit) for gluconeogenesis, FAS (Fatty Acid
Synthase), ACC (Acetyl CoA Carboxylase) 1, and SCD (Stearyl CoA Desaturase) for
lipogenesis230
.

50
(1) Activation of ChREBP
ChREBP, a transcription factor belonging to the basic helix-loop-helix leucine zipper
family230-232
activated by glucose, is highly expressed in liver, pancreatic β-cells, brown and
white adipose tissues, and muscle. ChREBP and MLX (Max-like protein X) form
heterodimers233, 234
to activate transcription via the binding of ChoREs (Carbohydrate-
Response Elements). These response elements are composed of two E-box sequences and
have been identified in promoters of ChREBP target genes (figure 12).
Two isoforms of ChREBP, ChREBPα and ChREBPβ, have recently been identified235
.
ChREBPα is mainly located in the cytosol while ChREBPβ is located in the nucleus. Under
glucose stimulation, ChREBPα isoform is translocated into the nucleus where it binds to
ChoRE after its dephosphorylation by protein phosphorylase 2A, which is regulated by X5P
(Xylulose 5-Phosphate) in the pentose phosphate pathway 236
. Under starvation conditions,
glucagon increases cAMP levels leading to ChREBP phosphorylations by PKA (cAMP-
dependent Protein Kinase) and AMPK. It thus results it ChREBP inactivation 237
. In addition,
ChREBP activation can be modulated via acetylation by HAT (Histone Acetyl-Transferase)238
and O-GlcNAcylation, which is a nutrition-dependent post-translational modification239-241,
thus promoting ChREBP transactivation.
51
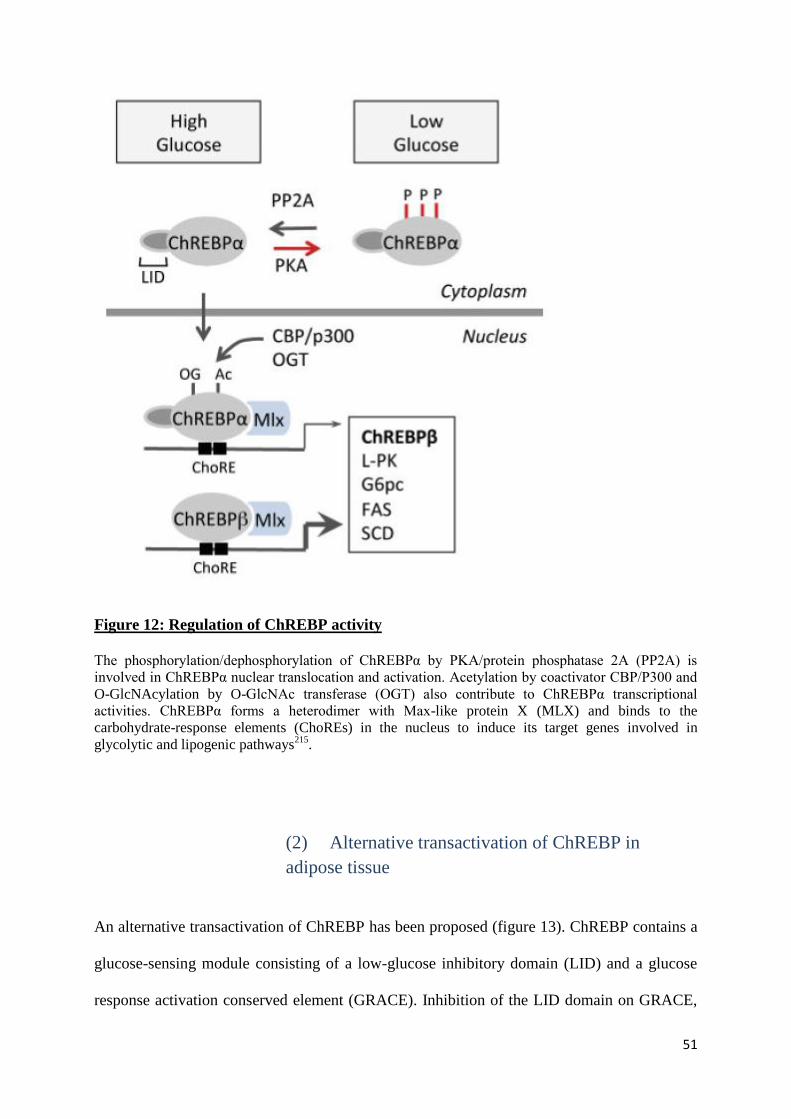
Figure 12: Regulation of ChREBP activity
The phosphorylation/dephosphorylation of ChREBPα by PKA/protein phosphatase 2A (PP2A) is
involved in ChREBPα nuclear translocation and activation. Acetylation by coactivator CBP/P300 and
O-GlcNAcylation by O-GlcNAc transferase (OGT) also contribute to ChREBPα transcriptional
activities. ChREBPα forms a heterodimer with Max-like protein X (MLX) and binds to the
carbohydrate-response elements (ChoREs) in the nucleus to induce its target genes involved in
glycolytic and lipogenic pathways215
.
(2) Alternative transactivation of ChREBP in
adipose tissue
An alternative transactivation of ChREBP has been proposed (figure 13). ChREBP contains a
glucose-sensing module consisting of a low-glucose inhibitory domain (LID) and a glucose
response activation conserved element (GRACE). Inhibition of the LID domain on GRACE,

52
leads ChREBP to remain in an unfavorable conformation for DNA binding and activation.
This can be reversed by high glucose242-245
. According to this model, deletion of the LID
domain produced a constitutively active ChREBP even under low-glucose conditions244
. The
involvement of the glucose-sensing module and conformational modulation has been
implicated in the regulation of ChREBP activity by glucose metabolites, such as glucose 6
phosphate (G6P)246, 247
. The mechanism of carbohydrate-mediated ChREBP activation may
involve feed-forward regulation, because changes of ChREBP activity can also be reflected
on ChREBP mRNA levels248, 249
.Recently, ChREBP was shown to be capable of self-
regulation in adipose tissue235
. ChREBPβ is transcribed from an alternative promoter,
differing from ChREBPα. ChREBPβ protein, which does not contain LID or nucleus export
signals, exhibits constitutively higher transactivation ability than ChREBPα244
. ChREBPβ
expression increases by cotransfection of ChREBPα and LMX in a glucose dose-dependent
manner. The ChoREs are also identified in the promoter region of ChREBPβ, and the deletion
of these elements completely abolishes the responsiveness of the ChREBPβ promoter to
ChREBPα/MLX235
. ChREBPα may thus be activated by high-glucose concentrations and
induce ChREBPβ expression as a feedforward regulation in adipose tissue.
As ChREBP directly regulates genes involved in both glucose and lipid metabolisms some
interconnections between ChREBP and PPAR pathways have been established in liver and
adipose tissues250
.

53
Figure 13: Schematic representation of the mechanisms regulating ChREBP
transactivities in adipose tissue
Glucose activates ChREBP-α through (1) posttranslational modification of ChREBP, and (2) an
intramolecular glucose sensing module. In turn, ChREBP-α induces ChREBP-β (3. feedforward
control). Some ChREBP target genes inhibit both ChREBP-α and β transactivities (4. feedback
control)251
.
PPAR signaling pathway D.
PPAR proteins are nuclear receptors playing the role of transcription factors activated by
different ligands, mostly fatty acids. The nature of the ligands depends on the metabolic
pathways the PPARs are involved in. Once PPARs interact with the specific ligands, they
translocate into the nucleus where they bind to the specific DNA sequence named PPRE
(Peroxisome-Proliferator hormone Responsive Element)252
to activate or repress target gene
transcription253, 254
. In the nucleus, PPAR proteins heterodimerize with RXR (Retinoic X

54
Receptor), another nuclear receptor. Other proteins, co-activators or co-repressors, interact
with this heterodimer, and depending on their nature, the effect of PPARs has been shown to
be the activation or the repression of the transcription, respectively.
Three isoforms of PPAR proteins, encoded by three different genes Nr1c1, Nr1c2, Nr1c3 255-
258, have been described: PPARα, PPARγ and PPARβ/δ
259. Even though all PPARs are
involved in the regulation of lipid metabolism and energy balance, each isoform has its own
specificity depending on the tissue where it is expressed and its own function on metabolism
regulation events260
.
(1) PPARα signaling pathway
PPARα (figure 14) is mainly expressed in liver, heart and skeletal muscle, tissues exhibiting a
high capacity for fatty acid oxidation. PPARα is also involved in glucose homeostasis and
insulin resistance development261
. The natural ligands of PPARα, fatty acids, control the
expression of genes involved in lipid metabolism. An increase in fatty acid concentration
leads to the activation of PPARα, which uptakes them under their oxidized form. Liver is the
main place where fatty acid oxidation occurs, as this process also has the property of
preventing steatosis. During fatty acid influx, transcription of PPARα target genes is activated
leading to the activation of omega- and beta- oxidations in microsomes, mitochondria and
peroxisomes 262, 263
. In liver, an increased PPARα activity sensing results in increased energy
burning and lower fat storage while ineffective PPARα sensing or fatty acid oxidation leads to
low energy burning. This results in a liver steatosis as observed in PPARα deficient mice264
.
Thus, PPARα plays a major role in lipid sensing and energy combustion in the liver where its
disruption or impairment can cause fatty liver pathogenesis.
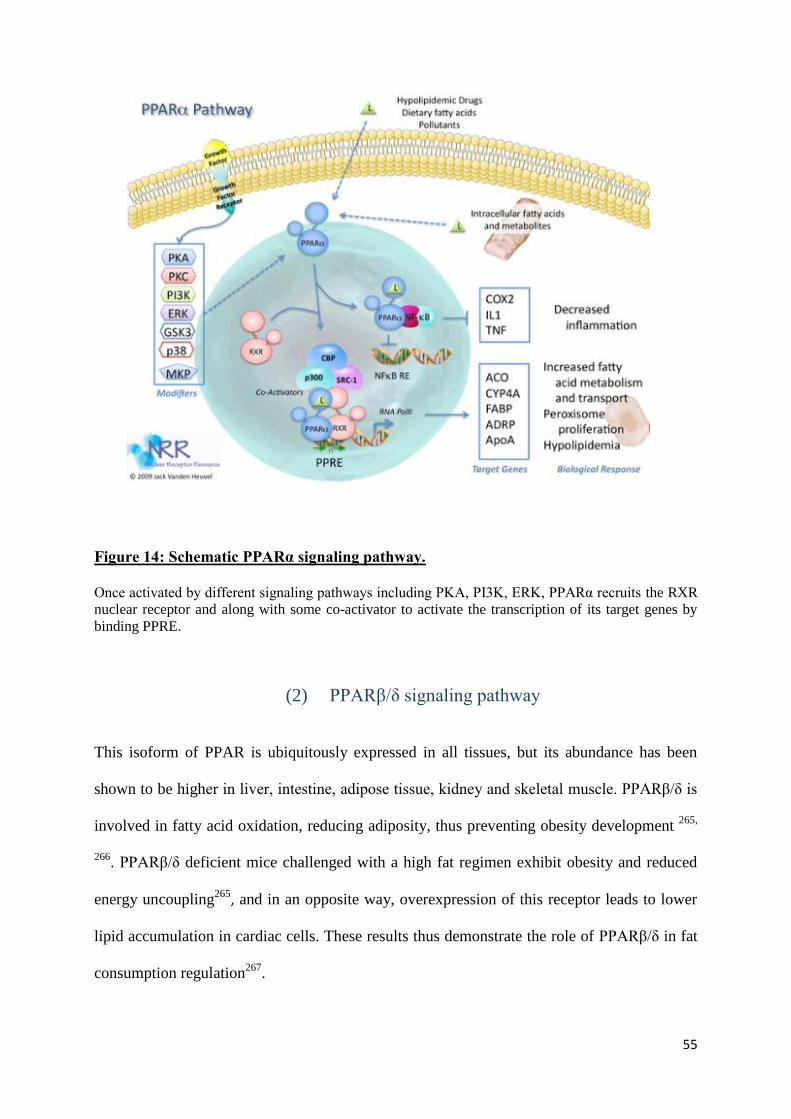
55
Figure 14: Schematic PPARα signaling pathway.
Once activated by different signaling pathways including PKA, PI3K, ERK, PPARα recruits the RXR
nuclear receptor and along with some co-activator to activate the transcription of its target genes by
binding PPRE.
(2) PPARβ/δ signaling pathway
This isoform of PPAR is ubiquitously expressed in all tissues, but its abundance has been
shown to be higher in liver, intestine, adipose tissue, kidney and skeletal muscle. PPARβ/δ is
involved in fatty acid oxidation, reducing adiposity, thus preventing obesity development 265,
266. PPARβ/δ deficient mice challenged with a high fat regimen exhibit obesity and reduced
energy uncoupling265, and in an opposite way, overexpression of this receptor leads to lower
lipid accumulation in cardiac cells. These results thus demonstrate the role of PPARβ/δ in fat
consumption regulation267
.

56
(3) PPARγ signaling pathway
PPARγ has been thoroughly investigated due to its role in macronutrient metabolism. This
receptor is abundantly expressed in adipose (white and brown) tissue where it is a central
factor in adipogenesis and lipid metabolism regulation. Three PPARγ isoforms have been
identified, and all of them play an important role in adipocyte differentiation and glucose
metabolism. However, it has been shown that PPARγ2 is regulated in response to nutrient
intake and obesity 268, 269
. Evidence found in in vivo experiments demonstrates that PPARγ2
deficiency decreases fat accumulation in obese mice. PPARγ2 isoform thus prevents
lipotoxicity in different mechanisms: promotion of adipose tissue expansion, augmentation of
lipid-buffering capacity in peripheral organs (liver, muscle, and pancreatic beta cells), and
proliferative response of ß-cells to insulin resistance270
. Activated PPARγ in adipocytes
guarantees a balanced and adequate secretion of adipocytokines (adiponectin and leptin),
mediators of insulin action in peripheral tissues. Insulin sensitivity of the whole body is thus
maintained271
.
PPARγ also plays an important role in lipid metabolism. Indeed, it is involved in release,
transport, and storage of fatty acids as a regulator of genes such as Lpl (Lipoprotein lipase) or
Cd36 268, 270, 272.

57
Figure 15: Activated PPARγ is involved in adipogenesis, lipid metabolism and
homeostasis.
Once activated PPARγ recruits RXR nuclear receptor and some co-activator to activate the
transcription of its target genes by binding PPRE273
.
Involvement of the circadian clock E.
It is established that PPARs are connected to the molecular clock by several links. Indeed,
PPAR proteins have been shown to be expressed rhythmically in several tissues274-276
. Pparα
has been described as a direct target of BMAL1:CLOCK heterodimer via the binding of E-
box present in its gene promoter277
. In a reciprocal way, the deficient PPARα and deficient
PPARγ mice exhibit alterations in core clock gene expression. Indeed, deficient PPARα mice
showed alterations in rhythmic Bmal1 and Per3 expressions in peripheral tissues277
without
affecting the rhythms in the SCN278
. At the molecular level, PPRE have been found in the
promoters of Bmal1 and Rev-erbα278, 279
and PPARα has been shown to be involved in the

58
regulation of Bmal1 expression by direct interaction with PER2280
. In addition, Rev-erbα has
been described as a target gene of PPARγ 281
. PPARβ/δ protein isoform have been less
studied in this context. However, Pparβ/δ mRNA have been described as a target of miR122
in the liver88
expression of which is regulated by REV-ERBα.
Recent evidence demonstrates that circadian rhythms are connected to lipid metabolism.
Indeed, REV-ERBα has been shown to be involved in the control of the accumulation of bile
acid, suggesting an impact on LXR target genes regulation282
. Moreover, Rev-erbα knockout
mice exhibit disrupted circadian accumulation of lipid in both plasma and liver. This
observation appears to be due to the impairment of the SREBP pathway and especially of
SREBP-1c in the liver282
. In the laboratory, it was previously shown that the circadian clock is
involved in the maturation of SREBPs, as it is impaired in ClockΔ19
dominant negative mutant
mice4. In addition, SIRT6 was recently shown to be involved in the circadian transcription of
SREBP-1c target genes by regulating the chromatin conformation via its deacetylase activity,
leading to the rhythmic recruitment of SREBP-1c on its target genes promoter.

59
RESULTS
During this doctoral work, we investigated how the circadian clock influence the different
metabolic aspects previously presented in the introduction. We thus present evidence of
impacts of the circadian clock on translational events and energy balance.
I. The circadian clock coordinates the ribosome biogenesis
Due to its oscillatory function, the circadian clock has been shown to orchestrate physiology
by the rhythmic activation of many key metabolic pathways. In the last decade, many efforts
have been made in the characterization of rhythmically expressed genes to determine the role
of clock controlled genes on rhythmic physiology14, 283
. Indeed, depending on the species and
organs, 5 to 10% of the genes have been shown to be rhythmically expressed68, 284-286
.
However, recent evidences suggest that transcriptional mechanisms are not sufficient to
completely explain rhythmic physiology. Indeed, some oscillating proteins have been shown
to be encoded by constantly expressed mRNA in mouse liver287-289
. In addition, among the
rhythmically expressed genes, we noticed the presence of several genes encoding proteins
involved in mRNA translation, including components of the translation initiation complex285,
290, suggesting a potential role of translation mechanisms in circadian coordination of
physiology.
In this study, we investigated the impact of the circadian clock on the translational events in
mouse liver. In the liver of wild-type mice, we first described the rhythmic transcription of
mRNAs of the components of the translation initiation complex such as Eif4a, Eif4b, Eif4g1
and Eif4bp1. While no rhythms were observed at the protein level, the phosphorylation of

60
these components, corresponding to their activation, was observed to be rhythmic throughout
the day. We also demonstrated coordinated rhythmic activation of several key pathways,
ERK/MAPK, AMPK via TSC2 phosphorylation, and PI3K/AKT, involved in regulating the
activation of the formation of the translation initiation complex, which occurs during the dark
phase. A microarray analysis on polysome-bound mRNAs and total RNAs in mouse liver led
us to identify mRNA that are associated with ribosomes in a diurnal manner. These mRNA,
targets of TORC1, belong to the 5’-TOP mRNA family and mostly encode for proteins
involved in translation such as the ribosomal proteins. This result demonstrates a dynamic
translation initiation of 5'-TOP mRNAs starting before the onset of the feeding period, with a
maximum in the beginning of the dark period. Western blot performed on cytosolic fractions
showed that newly synthesized ribosomal proteins exhibit a rhythmic accumulation during the
dark phase. In addition, we showed here that ribosomal proteins mRNA and rRNA exhibit a
rhythmic expression before the day-night transition. Moreover, UBF (Upstream Binding
Factor) 1, a 45S rRNA transcription regulator, presented rhythmic expression at both mRNA
and protein levels.
In Bmal1 and Cry1/2 knockout mice, both lacking a functional circadian clock, it appeared
that mRNA and protein UBF1 expression is impaired. We also showed that the transcriptional
state of the components of the ribosome and of the initiation translation complex is dependent
on the molecular clock, because their rhythmic transcription is impaired in deficient circadian
clock mice models. Concerning the phosphorylation state of the different factors of initiation
translation complex and the signaling pathways involved in their activation, the results
obtained revealed disruption in their coordinated activation when the molecular clock is not
functional.

61
Together, these results show the coordination of ribosome biogenesis by the circadian clock
via the modulation of rhythmic activation of key pathways regulating translation through the
TORC1 pathway, ribosomal proteins translation and finally ribosome biogenesis.
A coordinated rhythmic regulation of transcriptional and translational events for the
biogenesis of ribosomes has also been suggested for the filamentous fungus Neurospora
crassa291
and for plants292, 293
. Considering the fact that ribosome biogenesis is one of the
major energy consuming process in cells294
, it must be tightly controlled in order to reduce
interferences with other biological processes. It is thus clear that this energy-consuming
process must be confined to a time period when energy and nutriments are available in
sufficient amounts. In the case of rodents, this is during the night period when the animals are
active and consume food. All the elements required for this process must be ready to start
ribosome biogenesis during that time. This is achieved by increasing levels of rRNA and
ribosomal protein mRNA just before the onset of the night, synchronized with the
phosphorylation of EIF4E, which increases 5’-TOP mRNA translation295
. Activation of the
TORC1 pathway during this period promotes ribosomal protein synthesis, rRNA maturation
and ribosome assembly. Accordingly, orchestration of ribosome biogenesis by the circadian
clock represents a nice example of anticipation of an obligatory gated process through a
complex organization of transcriptional, translational and post-translational events.
.

The Circadian Clock Coordinates Ribosome BiogenesisCeline Jouffe1¤a. , Gaspard Cretenet1¤b. , Laura Symul2, Eva Martin1, Florian Atger1¤a, Felix Naef2,
Frederic Gachon1¤a*
1 Department of Pharmacology and Toxicology, University of Lausanne, Lausanne, Switzerland, 2 The Institute of Bioengineering, School of Life Sciences, Ecole
Polytechnique Federale de Lausanne, Lausanne, Switzerland
Abstract
Biological rhythms play a fundamental role in the physiology and behavior of most living organisms. Rhythmic circadianexpression of clock-controlled genes is orchestrated by a molecular clock that relies on interconnected negative feedbackloops of transcription regulators. Here we show that the circadian clock exerts its function also through the regulation ofmRNA translation. Namely, the circadian clock influences the temporal translation of a subset of mRNAs involved inribosome biogenesis by controlling the transcription of translation initiation factors as well as the clock-dependent rhythmicactivation of signaling pathways involved in their regulation. Moreover, the circadian oscillator directly regulates thetranscription of ribosomal protein mRNAs and ribosomal RNAs. Thus the circadian clock exerts a major role in coordinatingtranscription and translation steps underlying ribosome biogenesis.
Citation: Jouffe C, Cretenet G, Symul L, Martin E, Atger F, et al. (2013) The Circadian Clock Coordinates Ribosome Biogenesis. PLoS Biol 11(1): e1001455.doi:10.1371/journal.pbio.1001455
Academic Editor: Paul E. Hardin, Texas A&M, United States of America
Received June 26, 2012; Accepted November 9, 2012; Published January 3, 2013
Copyright: � 2013 Jouffe et al. This is an open-access article distributed under the terms of the Creative Commons Attribution License, which permitsunrestricted use, distribution, and reproduction in any medium, provided the original author and source are credited.
Funding: This research was supported by the Swiss National Science Foundation (through individual research grants to F.G. and F.N), the Canton of Vaud, theEuropean Research Council (through individual Starting Grant to F.G.), the Leenaards Foundation (to F.G. and F.N.) and the Novartis Stiftung fur medizinisch-biologische Forschung (to F.G.). The funders had no role in study design, data collection and analysis, decision to publish, or preparation of the manuscript.
Competing Interests: The authors have declared that no competing interests exist.
Abbreviations: AMPK, adenosine monophosphate-activated protein kinase; ERK, extracellular signal-regulated protein kinase; KO, knockout; PI3K,phosphoinositide 3-kinase; RP, ribosomal protein; RPS6, ribosomal protein S6; RT, reverse transcription; SCN, suprachiasmatic nucleus; TOP, terminaloligopyrimidine tract; TORC1, target of rapamycin complex 1; TSC, tuberous sclerosis protein complex; UBF, upstream binding factor; WT, wild type
* E-mail: [email protected]
¤a Current address: Nestle Institute of Health Sciences, Lausanne, Switzerland¤b Current address: Institut de Genetique Moleculaire de Montpellier, CNRS UMR 5535, Montpellier, France
. These authors contributed equally to this work.
Introduction
Circadian rhythms in behavior and physiology reflect the adaptation
of organisms exposed to daily light-dark cycles. As a consequence, most
aspects of metabolism and behaviour are under the control of these
rhythms [1]. At a molecular level, in all the studied species, the
rhythmic expression of the genes involved originates in the network of
interconnected transcriptional and translational feedback loops [2]. In
mammals, the heterodimer composed of BMAL1 and its partners
CLOCK or NPAS2 is a transcriptional activator that regulates
transcription of the Period (Per) and Cryptochrome (Cry) genes that code for
repressors of BMAL1 heterodimer activity, thus closing a negative
feedback loop that generates rhythms of approximately 24 h [1,2].
Many efforts during the last decade have characterized rhythmically
expressed genes and delimit the impact of the circadian clock on
physiology. Numerous circadian transcriptome studies in different
species and organs show that approximately 10% of the genes are
rhythmically expressed. The functions of these genes established the
role of the circadian clock in temporally gating rhythmic physiology
[1,3]. However, increasing evidence suggests that transcriptional
mechanisms are not sufficient to explain numerous observations. For
example, it has been shown that many oscillating proteins in mouse
liver are encoded by constantly expressed mRNAs [4].
Interestingly, among the rhythmically expressed genes in the
liver, we noticed the presence of several genes encoding proteins
involved in mRNA translation, including the components of the
translation pre-initiation complex [5,6]. In its inactive state, this
complex is composed of the mRNA cap-binding protein eukary-
otic translation initiation factor 4E (EIF4E) bound to the
hypophosphorylated form of EIF4E-binding protein (4E-BP) that
acts as a translational repressor. Upon stimulation, phosphoryla-
tion of 4E-BP releases EIF4E, which can then interact with the
scaffold protein eIF4G and the rest of the EIF4F complex (EIF4A,
EIF4B, and EIF4H) to initiate translation [7]. We therefore
investigated whether the circadian clock might coordinate
translation in mouse liver. Here we indeed show that the circadian
clock controls the transcription of translation initiation factors as
well as the rhythmic activation of signaling pathways involved in
their regulation. As a consequence, the circadian clock influences
the temporal translation of a subset of mRNAs mainly involved in
ribosome biogenesis. In addition, the circadian oscillator regulates
the transcription of ribosomal protein mRNAs and ribosomal
RNAs. These results demonstrate for the first time the major role
of the circadian clock in ribosome biogenesis.
Results
Rhythmic Expression and Activation of Components ofthe Translation Pre-initiation Complex
We investigated whether the circadian clock might coordinate
translation in mouse liver. Indeed, quantitative reverse transcrip-
PLOS Biology | www.plosbiology.org 1 January 2013 | Volume 11 | Issue 1 | e1001455
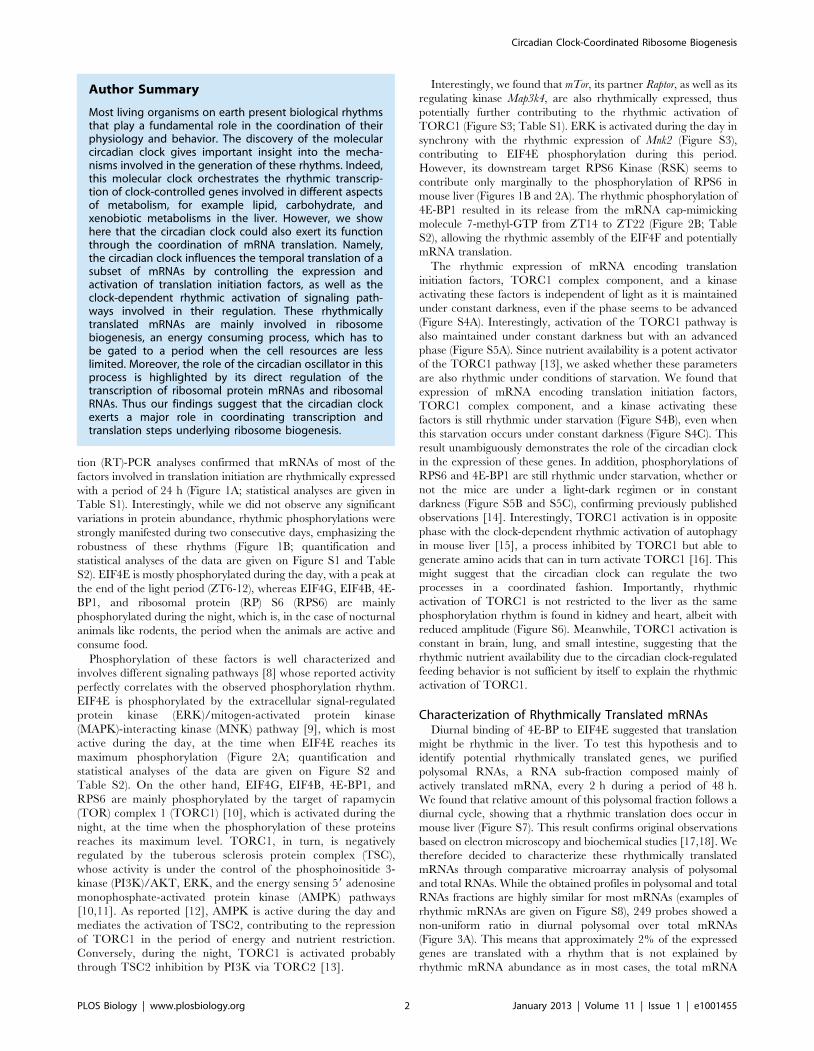
tion (RT)-PCR analyses confirmed that mRNAs of most of the
factors involved in translation initiation are rhythmically expressed
with a period of 24 h (Figure 1A; statistical analyses are given in
Table S1). Interestingly, while we did not observe any significant
variations in protein abundance, rhythmic phosphorylations were
strongly manifested during two consecutive days, emphasizing the
robustness of these rhythms (Figure 1B; quantification and
statistical analyses of the data are given on Figure S1 and Table
S2). EIF4E is mostly phosphorylated during the day, with a peak at
the end of the light period (ZT6-12), whereas EIF4G, EIF4B, 4E-
BP1, and ribosomal protein (RP) S6 (RPS6) are mainly
phosphorylated during the night, which is, in the case of nocturnal
animals like rodents, the period when the animals are active and
consume food.
Phosphorylation of these factors is well characterized and
involves different signaling pathways [8] whose reported activity
perfectly correlates with the observed phosphorylation rhythm.
EIF4E is phosphorylated by the extracellular signal-regulated
protein kinase (ERK)/mitogen-activated protein kinase
(MAPK)-interacting kinase (MNK) pathway [9], which is most
active during the day, at the time when EIF4E reaches its
maximum phosphorylation (Figure 2A; quantification and
statistical analyses of the data are given on Figure S2 and
Table S2). On the other hand, EIF4G, EIF4B, 4E-BP1, and
RPS6 are mainly phosphorylated by the target of rapamycin
(TOR) complex 1 (TORC1) [10], which is activated during the
night, at the time when the phosphorylation of these proteins
reaches its maximum level. TORC1, in turn, is negatively
regulated by the tuberous sclerosis protein complex (TSC),
whose activity is under the control of the phosphoinositide 3-
kinase (PI3K)/AKT, ERK, and the energy sensing 59 adenosine
monophosphate-activated protein kinase (AMPK) pathways
[10,11]. As reported [12], AMPK is active during the day and
mediates the activation of TSC2, contributing to the repression
of TORC1 in the period of energy and nutrient restriction.
Conversely, during the night, TORC1 is activated probably
through TSC2 inhibition by PI3K via TORC2 [13].
Interestingly, we found that mTor, its partner Raptor, as well as its
regulating kinase Map3k4, are also rhythmically expressed, thus
potentially further contributing to the rhythmic activation of
TORC1 (Figure S3; Table S1). ERK is activated during the day in
synchrony with the rhythmic expression of Mnk2 (Figure S3),
contributing to EIF4E phosphorylation during this period.
However, its downstream target RPS6 Kinase (RSK) seems to
contribute only marginally to the phosphorylation of RPS6 in
mouse liver (Figures 1B and 2A). The rhythmic phosphorylation of
4E-BP1 resulted in its release from the mRNA cap-mimicking
molecule 7-methyl-GTP from ZT14 to ZT22 (Figure 2B; Table
S2), allowing the rhythmic assembly of the EIF4F and potentially
mRNA translation.
The rhythmic expression of mRNA encoding translation
initiation factors, TORC1 complex component, and a kinase
activating these factors is independent of light as it is maintained
under constant darkness, even if the phase seems to be advanced
(Figure S4A). Interestingly, activation of the TORC1 pathway is
also maintained under constant darkness but with an advanced
phase (Figure S5A). Since nutrient availability is a potent activator
of the TORC1 pathway [13], we asked whether these parameters
are also rhythmic under conditions of starvation. We found that
expression of mRNA encoding translation initiation factors,
TORC1 complex component, and a kinase activating these
factors is still rhythmic under starvation (Figure S4B), even when
this starvation occurs under constant darkness (Figure S4C). This
result unambiguously demonstrates the role of the circadian clock
in the expression of these genes. In addition, phosphorylations of
RPS6 and 4E-BP1 are still rhythmic under starvation, whether or
not the mice are under a light-dark regimen or in constant
darkness (Figure S5B and S5C), confirming previously published
observations [14]. Interestingly, TORC1 activation is in opposite
phase with the clock-dependent rhythmic activation of autophagy
in mouse liver [15], a process inhibited by TORC1 but able to
generate amino acids that can in turn activate TORC1 [16]. This
might suggest that the circadian clock can regulate the two
processes in a coordinated fashion. Importantly, rhythmic
activation of TORC1 is not restricted to the liver as the same
phosphorylation rhythm is found in kidney and heart, albeit with
reduced amplitude (Figure S6). Meanwhile, TORC1 activation is
constant in brain, lung, and small intestine, suggesting that the
rhythmic nutrient availability due to the circadian clock-regulated
feeding behavior is not sufficient by itself to explain the rhythmic
activation of TORC1.
Characterization of Rhythmically Translated mRNAsDiurnal binding of 4E-BP to EIF4E suggested that translation
might be rhythmic in the liver. To test this hypothesis and to
identify potential rhythmically translated genes, we purified
polysomal RNAs, a RNA sub-fraction composed mainly of
actively translated mRNA, every 2 h during a period of 48 h.
We found that relative amount of this polysomal fraction follows a
diurnal cycle, showing that a rhythmic translation does occur in
mouse liver (Figure S7). This result confirms original observations
based on electron microscopy and biochemical studies [17,18]. We
therefore decided to characterize these rhythmically translated
mRNAs through comparative microarray analysis of polysomal
and total RNAs. While the obtained profiles in polysomal and total
RNAs fractions are highly similar for most mRNAs (examples of
rhythmic mRNAs are given on Figure S8), 249 probes showed a
non-uniform ratio in diurnal polysomal over total mRNAs
(Figure 3A). This means that approximately 2% of the expressed
genes are translated with a rhythm that is not explained by
rhythmic mRNA abundance as in most cases, the total mRNA
Author Summary
Most living organisms on earth present biological rhythmsthat play a fundamental role in the coordination of theirphysiology and behavior. The discovery of the molecularcircadian clock gives important insight into the mecha-nisms involved in the generation of these rhythms. Indeed,this molecular clock orchestrates the rhythmic transcrip-tion of clock-controlled genes involved in different aspectsof metabolism, for example lipid, carbohydrate, andxenobiotic metabolisms in the liver. However, we showhere that the circadian clock could also exert its functionthrough the coordination of mRNA translation. Namely,the circadian clock influences the temporal translation of asubset of mRNAs by controlling the expression andactivation of translation initiation factors, as well as theclock-dependent rhythmic activation of signaling path-ways involved in their regulation. These rhythmicallytranslated mRNAs are mainly involved in ribosomebiogenesis, an energy consuming process, which has tobe gated to a period when the cell resources are lesslimited. Moreover, the role of the circadian oscillator in thisprocess is highlighted by its direct regulation of thetranscription of ribosomal protein mRNAs and ribosomalRNAs. Thus our findings suggest that the circadian clockexerts a major role in coordinating transcription andtranslation steps underlying ribosome biogenesis.
Circadian Clock-Coordinated Ribosome Biogenesis
PLOS Biology | www.plosbiology.org 2 January 2013 | Volume 11 | Issue 1 | e1001455
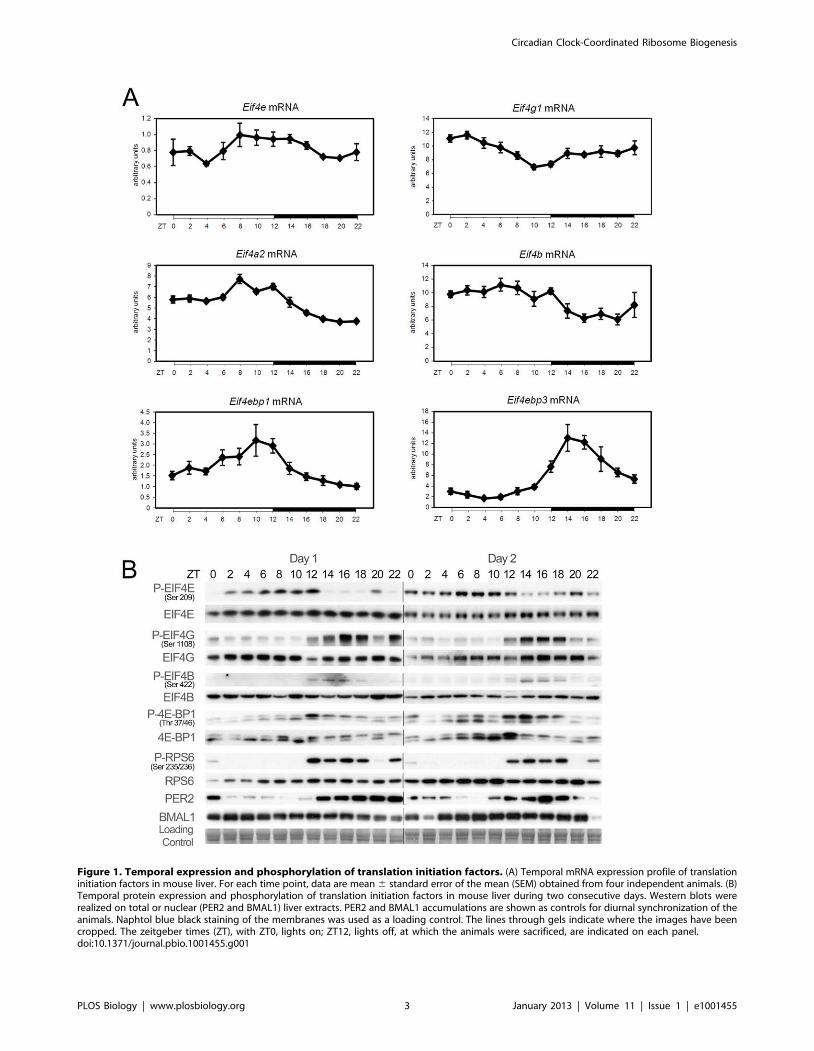
Figure 1. Temporal expression and phosphorylation of translation initiation factors. (A) Temporal mRNA expression profile of translationinitiation factors in mouse liver. For each time point, data are mean 6 standard error of the mean (SEM) obtained from four independent animals. (B)Temporal protein expression and phosphorylation of translation initiation factors in mouse liver during two consecutive days. Western blots wererealized on total or nuclear (PER2 and BMAL1) liver extracts. PER2 and BMAL1 accumulations are shown as controls for diurnal synchronization of theanimals. Naphtol blue black staining of the membranes was used as a loading control. The lines through gels indicate where the images have beencropped. The zeitgeber times (ZT), with ZT0, lights on; ZT12, lights off, at which the animals were sacrificed, are indicated on each panel.doi:10.1371/journal.pbio.1001455.g001
Circadian Clock-Coordinated Ribosome Biogenesis
PLOS Biology | www.plosbiology.org 3 January 2013 | Volume 11 | Issue 1 | e1001455

levels were constant while the polysomes-bound mRNA levels
fluctuated during the 24-h cycle (Figures 3B and S9). Among
translationally regulated genes, 70% were found in the polysomal
fraction during the same time interval, starting at ZT8 before the
onset of the feeding period and finishing at the end of the dark
period (Tables S3 and S4). Most of these genes belonged to the 59-
terminal oligopyrimidine tract (59-TOP) family, known to be
regulated by TORC1 [19], but also by the level and phosphor-
ylation state of EIF4E [20,21]. 59-TOP genes are themselves
involved in translation via ribosome biogenesis and translation
elongation (Table S4).
After confirmations of these results by quantitative RT-PCR
(Figure S10), we wished to validate the periodicity in the amount
of mRNAs purified in the different fractions obtain during
polysomes purification over a 24-h period. Whereas a constitu-
tively translated mRNA such as Gapdh is found all the time in the
polysomal fraction (with a small decrease in the middle of the light
period when overall translation decreases), mRNAs coding for RPs
are associated with the polysomal fraction only starting towards
the end of the light period (ZT8) and during the dark period
(Figure 3C). This result demonstrates a dynamic translation
initiation of 59-TOP mRNA starting before the onset of the
feeding period, with a maximum at the beginning of the dark
period.
Next, we wanted to confirm that this rhythmic translation had
an impact on the protein levels. With respect to RPs, while the
half-life of mature ribosomes is approximately 5 d in rodent liver
[22], newly synthesized RPs have a half-life of only a few hours, as
most of them are rapidly degraded after translation during the
ribosome assembly process in the nucleolus [23]. We thus expected
a rhythmic expression of this subpopulation of newly synthesized
RPs in the soluble cytosolic fraction depleted of ribosomes after
sedimentation. Indeed, under these conditions, RPs show a
rhythmic abundance with highest expression during the night
(Figure 3D; quantification and statistical analyses of the data are
given on Figure S11 and Table S2). In some cases, we noticed a
shallow decrease at ZT16-18, potentially reflecting transport of
RPs into the nucleolus for ribosome assembly. In addition to
translational regulation, we also observed a diurnal expression of
RP mRNAs, albeit with a small average peak to trough amplitude
of approximately 1.2. Taking into account their relatively long half-
life (11 h) [24], we hypothesized that this minor fluctuation might
reflect more pronounced rhythmic amplitudes in transcription as
amplitude decreases with half-life [25]. In addition, it has recently
been shown that the transcription of several RP mRNAs is directly
controlled by the molecular oscillator in Drosophila head [26].
Indeed, pre-mRNA accumulation of several RP exhibited a
rhythmic transcription, with an average amplitude of 3.5-fold with
a maximum at ZT8, just before the activation of their translation
(Figure 4A; statistical analyses are given in Table S1). In addition,
we found that the synthesis of the ribosome constituent precursor
45S rRNA is also rhythmic and synchronized with RP mRNAs
transcription, indicating that all elements involved in ribosome
biogenesis are transcribed in concert, then translated or matured.
In yeast [27] and Drosophila [28], transcription of RP mRNAs
appears to be coordinated with rRNA transcription, which is a rate
limiting step in ribosome biogenesis. On the other hand, in
mammals, rRNA transcription is highly regulated by the upstream
binding factor (UBF), which establishes and maintains an active
chromatin state [29]. Remarkably, we found that UBF1 is
rhythmically expressed in mouse liver at both mRNA and protein
levels (Figure 4B; quantification and statistical analyses of the data
are given in Figure S12A and Tables S1 and S2), in phase with RP
mRNAs and rRNAs transcription. In addition, rhythmic transcrip-
tion of Ubf1 and Rpl23 genes is also independent of light and food
(Figure S4).
To test whether Ubf1 transcription is regulated by the circadian
clock, we characterized its expression in arrhythmic Cry1/Cry2
knockout (KO) [30] and Bmal1 KO [31] mice, which are devoid of
a functional circadian clock. Indeed, these mice do exhibit an
Figure 2. Temporal activation of signaling pathways controlling translation initiation. (A) Temporal expression and phosphorylation ofrepresentative proteins of key signaling pathways regulating translation initiation in mouse liver during two consecutive days. Western blots wereperformed on total liver extracts. Naphtol blue black staining of the membranes was used as a loading control. (B) Temporal binding of EIF4E and 4E-BP1 to 7-methyl-GTP-sepharose during two consecutive days. Total liver extracts were incubated with 7-methyl-GTP beads mimicking the mRNA capstructure. After washing of the beads, bound proteins were analyzed by Western blotting. The zeitgeber times (ZT), with ZT0, lights on; ZT12, lightsoff, at which the animals were sacrificed, are indicated on each panel. The lines through gels indicate where the images have been cropped.doi:10.1371/journal.pbio.1001455.g002
Circadian Clock-Coordinated Ribosome Biogenesis
PLOS Biology | www.plosbiology.org 4 January 2013 | Volume 11 | Issue 1 | e1001455
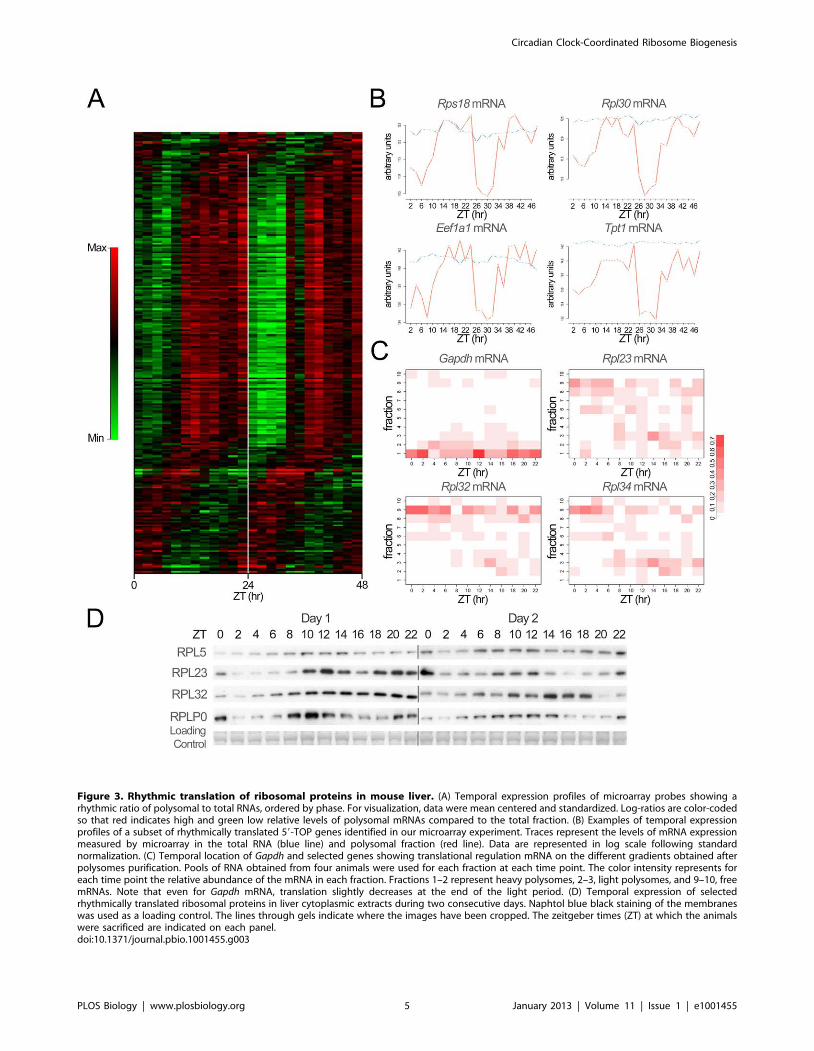
Figure 3. Rhythmic translation of ribosomal proteins in mouse liver. (A) Temporal expression profiles of microarray probes showing arhythmic ratio of polysomal to total RNAs, ordered by phase. For visualization, data were mean centered and standardized. Log-ratios are color-codedso that red indicates high and green low relative levels of polysomal mRNAs compared to the total fraction. (B) Examples of temporal expressionprofiles of a subset of rhythmically translated 59-TOP genes identified in our microarray experiment. Traces represent the levels of mRNA expressionmeasured by microarray in the total RNA (blue line) and polysomal fraction (red line). Data are represented in log scale following standardnormalization. (C) Temporal location of Gapdh and selected genes showing translational regulation mRNA on the different gradients obtained afterpolysomes purification. Pools of RNA obtained from four animals were used for each fraction at each time point. The color intensity represents foreach time point the relative abundance of the mRNA in each fraction. Fractions 1–2 represent heavy polysomes, 2–3, light polysomes, and 9–10, freemRNAs. Note that even for Gapdh mRNA, translation slightly decreases at the end of the light period. (D) Temporal expression of selectedrhythmically translated ribosomal proteins in liver cytoplasmic extracts during two consecutive days. Naphtol blue black staining of the membraneswas used as a loading control. The lines through gels indicate where the images have been cropped. The zeitgeber times (ZT) at which the animalswere sacrificed are indicated on each panel.doi:10.1371/journal.pbio.1001455.g003
Circadian Clock-Coordinated Ribosome Biogenesis
PLOS Biology | www.plosbiology.org 5 January 2013 | Volume 11 | Issue 1 | e1001455
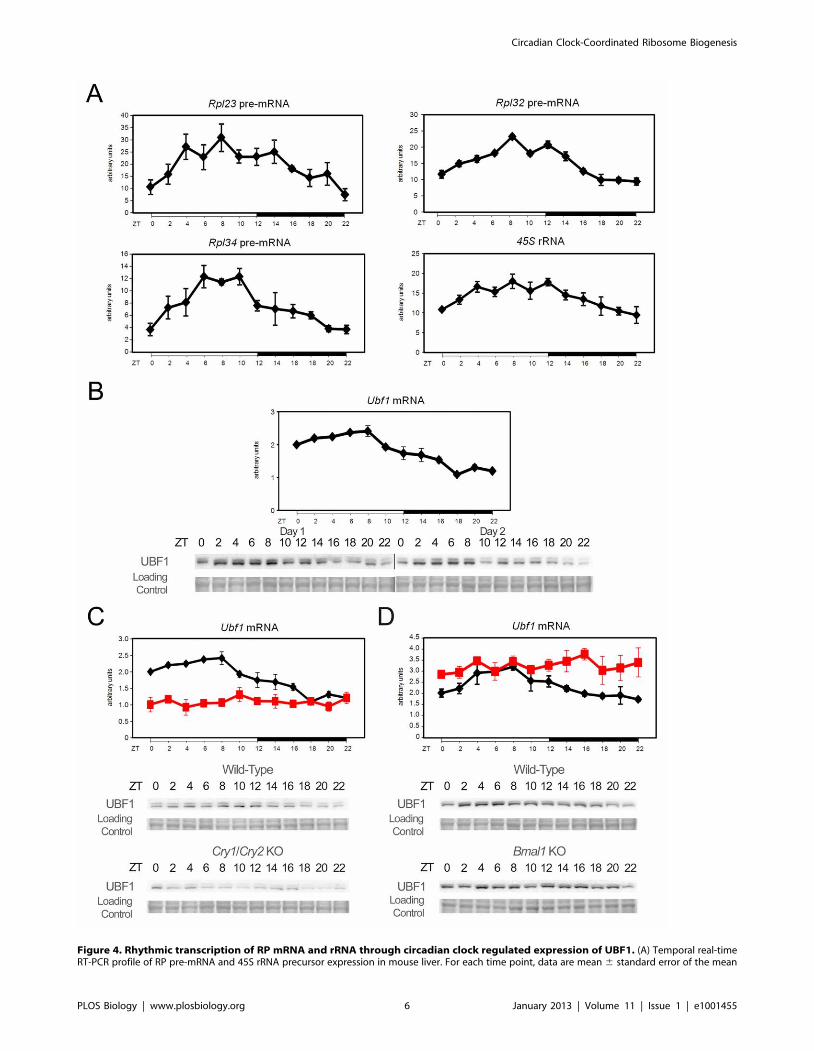
Figure 4. Rhythmic transcription of RP mRNA and rRNA through circadian clock regulated expression of UBF1. (A) Temporal real-timeRT-PCR profile of RP pre-mRNA and 45S rRNA precursor expression in mouse liver. For each time point, data are mean 6 standard error of the mean
Circadian Clock-Coordinated Ribosome Biogenesis
PLOS Biology | www.plosbiology.org 6 January 2013 | Volume 11 | Issue 1 | e1001455

arrhythmic pattern of activity under constant darkness, which is in
general correlated with an arrhythmic feeding behaviour. As
TORC1, as well as other signaling pathways, are in part regulated
by feeding through nutrient availability, we expect a temporally
discontinuous and erratic activation of these pathways in the KO
mice under unrestricted feeding. To verify this hypothesis, we
measured activation of the TORC1, AKT, and ERK pathways in
Cry1/Cry2 and Bmal1 KO kept in constant darkness. As shown in
Figure S13A, the rhythmic activation of these signaling pathways
is indeed lost under this condition, confirming their arrhythmic
activation. To highlight the role of the feeding regimen on this
activation, we kept Cry1/Cry2 KO mice in constant darkness and
sacrificed them at CT12. We found a strong inter-individual
variability in the activation of the TORC1, AKT, and ERK
pathways, reflecting the arrhythmic feeding rhythm of these
animals (Figure S13B). To circumvent this caveat and study the
rhythmic translation in mice devoid of a functional molecular
oscillator, we decided to place Cry1/Cry2 and Bmal1 KO under a
light-dark regimen to keep a normal diurnal feeding behaviour due
to masking. In addition, mice had access to food only during the
dark phase to eliminate the effect of a potential disturbed feeding
behaviour. Under these conditions, KO mice had a rhythmic
feeding behaviour and thus potential differences in protein levels
or pathway activity cannot be attributed to the arrhythmic feeding
behaviour of these animals. We indeed found that UBF1 rhythmic
expression is dependent on a functional circadian clock as it is
impaired in both animal models (Figure 4C and 4D; quantification
and statistical analyses of the data are given in Figure S12B and
Tables S5, S6, S7, S8). However, if UBF1 expression is persistently
low in Cry1/Cry2 KO mice, this expression is constantly high in
Bmal1 KO mice, suggesting the control of Ubf1 by a circadian
clock-regulated transcription repressor. In addition, we observed
that these animals lose also the synchrony and coordination of 45S
rRNA and RP pre-mRNAs transcription (Figures 5, S14, and S15;
statistical analyses of the data are given in Table S5 and S6).
Indeed, decreased UBF1 expression in Cry1/Cry2 KO mice is
correlated with lower 45S rRNA transcription, but higher and
delayed RP pre-mRNAs transcription. Interestingly, Bmal1 KO
mice present a complete arrhythmic transcription of RP pre-
mRNAs, highlighting the crucial role of the circadian clock in the
coordination of rRNA and RP mRNAs transcription.
The Circadian Clock Controls Expression and Activationof Components of the Translation Initiation Complex
Rhythmic expression of genes coding for components of the
translation initiation complex is strongly dampened or phase-
shifted in both KO models, in addition to an altered level of
expression (Figures 5, S14, and S15; statistical analyses of the data
are given in Tables S5 and S6). However, we did not observe in
general any significant variations in protein abundance, excepting
a slight increase in EIF4E expression in Cry1/Cry2 KO mice,
reflecting increased mRNA expression (Figure 6A and 6C;
quantification and statistical analyses of the data are given in
Figures S16, S17; Tables S7 and S8). The variations in EIF4G
levels reflect more the changes in its phosphorylation state, which
regulates its stability [32]. While most of the signaling pathways
are still rhythmic in Cry1/Cry2 KO mice, except for the ERK
pathway and the downstream phosphorylation of EIF4E, which
loses its rhythmic activation, the phase of the activation of the
TORC1 and AKT pathways are advanced in comparison to wild-
type (WT) mice (Figures 6A and S16; quantification and statistical
analyses of the data are given in Table S7). As a consequence, the
rhythmic expression of RPs is altered in Cry1/Cry2 KO mice
(Figure 6B; quantification and statistical analyses of the data are
given in Table S7), with an increased level of expression, likely
because of the increased RP pre-mRNAs and EIF4E levels [20],
and a delayed phase of expression. Most of the rhythmic activation
of the three pathways is also strongly altered in Bmal1 KO mice
(Figures 6C and S17; quantification and statistical analyses of the
data are given in Table S8). As shown in Figure 6D, the phase of
RPs rhythmic expression is severely advanced with a maximum of
expression in the middle of the day instead of the night (Figure 6D;
quantification and statistical analyses of the data are given in
Table S8).
Discussion
Regulation of Ribosome Biogenesis by the CircadianClock
The results presented here show that the molecular circadian
clock controls ribosome biogenesis through the coordination of
transcriptional, translational, and post-translational regulations.
Moreover, the data strongly suggest that a functional molecular
oscillator is required for a timely coordinated transcription of
translation initiation factors, RP mRNAs, and rRNAs. The clock
modulates the rhythmic activation of signaling pathways control-
ling translation through the TORC1 pathway, translation of RPs,
and ribosome biogenesis (Figure 7). Interestingly, it has been
reported that the size of the nucleolus, the site of rRNA
transcription and ribosome assembly, follows a diurnal pattern
with a maximum in the middle of the dark period [33], which thus
occurs in synchrony with the observed accumulation of RPs in the
liver. The observed rhythmic ribosome biogenesis is substantiated
by the previous observation showing that both size and
organization of the nucleolus are directly related to ribosome
production [34].
Remarkably, a coordinated rhythmic regulation of tran-
scriptional and translational events for the biogenesis of
ribosomes has also been suggested for the filamentous fungus
Neurospora crassa [35] and for plants [36,37]. Since ribosome
biogenesis is one of the major energy consuming process in
cells [38], its tight control is primordial to reduce interferences
with other biological processes. In the case of mouse liver, we
estimate that the decrease of translation during the light period
is equivalent to 20% of the total translation (Figure S7), in
agreement with previously published results [17]. Although
moderate, this decrease affects translation of housekeeping
genes like Gapdh (Figure 3C) and probably the translation of
other genes. It means that the increase in ribosome biogenesis
(SEM) obtained from four independent animals. (B) Temporal Ubf1 mRNA (upper panel) and protein (lower panel) expression in mouse liver. mRNAwere measured by real-time RT-PCR and, for each time point, data are mean 6 SEM obtained from four independent animals. UBF1 proteinexpression was measured by Western blot on nuclear extracts during two consecutive days. The lines through gels indicate where the images havebeen cropped. (C–D) Temporal Ubf1 expression in mice devoid of a functional circadian clock. Ubf1 expression was measured by real-time RT-PCRwith liver RNAs obtained from arrhythmic Cry1/Cry2 (C) and Bmal1 (D) KO mice and their control littermates (upper panel). Data are mean 6 SEMobtained from three and two animals, respectively. Black line corresponds to the WT animals and red line to the KO. Protein levels (lower panel) weremeasured by Western blot on nuclear extracts. The zeitgeber times (ZT) at which the animals were sacrificed are indicated on each panel. Naphtolblue black staining of the membranes was used as a loading control.doi:10.1371/journal.pbio.1001455.g004
Circadian Clock-Coordinated Ribosome Biogenesis
PLOS Biology | www.plosbiology.org 7 January 2013 | Volume 11 | Issue 1 | e1001455

Figure 5. Rhythmic RNA expression of factors involved in ribosomes biogenesis is disrupted in arrhythmic Cry1/Cry2 and Bmal1 KOmice. Temporal expression of factors involved in ribosomes biogenesis in Cry1/Cry2 (A) and Bmal1 (B) KO mice and their control littermates. Temporalreal-time RT-PCR expression profile of 45S rRNA precursor, Rpl23 pre-mRNA, and translation initiation factors expression in mouse liver. Black linecorresponds to the WT animals and red line to the KO. For each time point, data are mean 6 SEM obtained from three (A) and two (B) independentanimals. The zeitgeber times (ZT) at which the animals were sacrificed are indicated on each panel.doi:10.1371/journal.pbio.1001455.g005
Circadian Clock-Coordinated Ribosome Biogenesis
PLOS Biology | www.plosbiology.org 8 January 2013 | Volume 11 | Issue 1 | e1001455

Figure 6. Rhythmic expression and phosphorylation of actors of ribosomes biogenesis is disrupted in arrhythmic Cry1/Cry2 and Bmal1KO mice. (A–C) Temporal expression and phosphorylation of translation initiation factors and representative indicators of signaling pathwayscontrolling their activation in Cry1/Cry2 (A) and Bmal1 (C) KO mice and their control littermates. Western blots were realized on total or nuclear (PER2 andBMAL1) liver extracts from WT (left panel) and KO (right panel) animals. (B–D) Temporal expression of selected rhythmically translated ribosomal proteinsin liver from Cry1/Cry2 (B) and Bmal1 (D) KO mice and their control littermates. Western blots were realized on cytoplasmic extracts from WT (left panel)and KO (right panel) animals. The zeitgeber times (ZT) at which the animals were sacrificed are indicated on each panel. PER2 and BMAL1 accumulationsare shown as controls for diurnal synchronization of the animals. Naphtol blue black staining of the membranes was used as a loading control.doi:10.1371/journal.pbio.1001455.g006
Circadian Clock-Coordinated Ribosome Biogenesis
PLOS Biology | www.plosbiology.org 9 January 2013 | Volume 11 | Issue 1 | e1001455
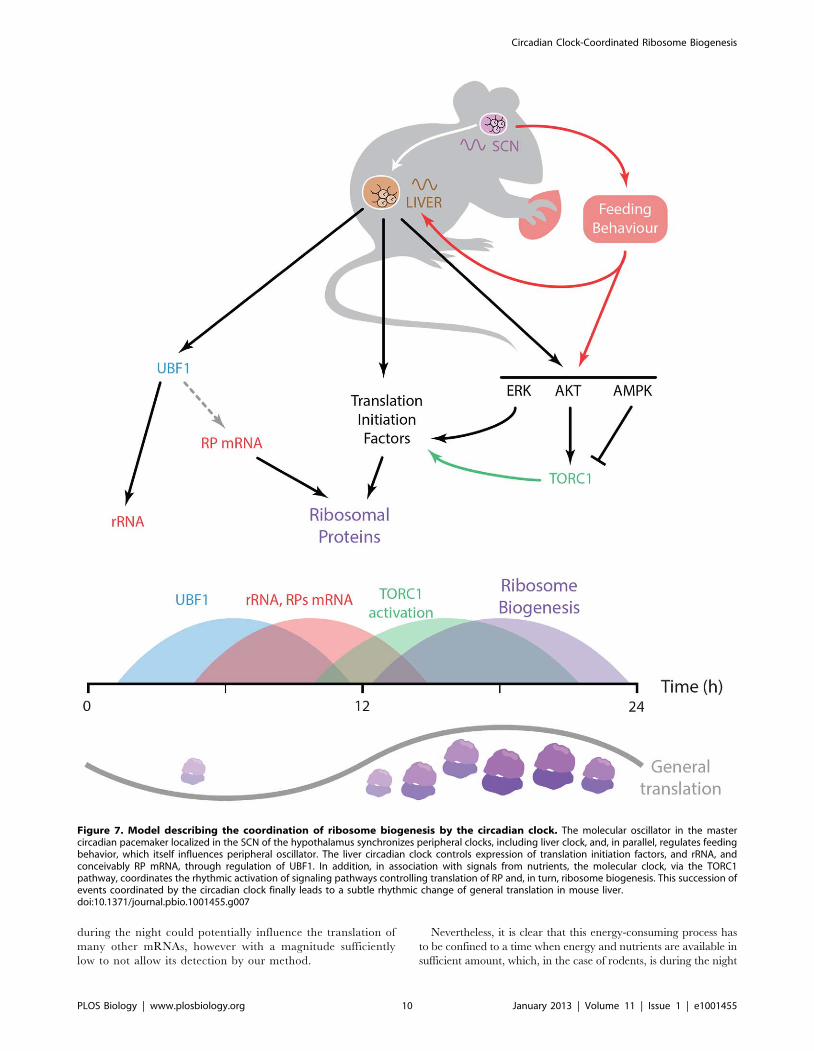
during the night could potentially influence the translation of
many other mRNAs, however with a magnitude sufficiently
low to not allow its detection by our method.
Nevertheless, it is clear that this energy-consuming process has
to be confined to a time when energy and nutrients are available in
sufficient amount, which, in the case of rodents, is during the night
Figure 7. Model describing the coordination of ribosome biogenesis by the circadian clock. The molecular oscillator in the mastercircadian pacemaker localized in the SCN of the hypothalamus synchronizes peripheral clocks, including liver clock, and, in parallel, regulates feedingbehavior, which itself influences peripheral oscillator. The liver circadian clock controls expression of translation initiation factors, and rRNA, andconceivably RP mRNA, through regulation of UBF1. In addition, in association with signals from nutrients, the molecular clock, via the TORC1pathway, coordinates the rhythmic activation of signaling pathways controlling translation of RP and, in turn, ribosome biogenesis. This succession ofevents coordinated by the circadian clock finally leads to a subtle rhythmic change of general translation in mouse liver.doi:10.1371/journal.pbio.1001455.g007
Circadian Clock-Coordinated Ribosome Biogenesis
PLOS Biology | www.plosbiology.org 10 January 2013 | Volume 11 | Issue 1 | e1001455
period when the animals are active and consume food. Hence, all
the elements required for translation have to be ready to start
ribosome biogenesis during that time. This is achieved by
increasing levels of rRNAs and RP pre-mRNAs just before the
onset of the night, synchronized with the phosphorylation of
EIF4E that increases 59-TOP mRNAs translation [21]. Activation
of the TORC1 pathway during this period promotes RPs
synthesis, rRNAs maturation, and ribosome assembly. In addition
activation of the ERK pathway correlates also with ribosome
biogenesis [39], strengthening the rhythmic nature of this process.
Accordingly, orchestration of ribosome biogenesis by the circadian
clock represents a nice example of anticipation of an obligatory
gated process through a complex organization of transcriptional,
translational, and post-translational events.
Coordination of Rhythmic Activation of Cellular SignalingPathways by the Circadian Clock
As described in the introduction, the mammalian molecular
circadian oscillator consists in interlocked feedback loops of
transcription factors that generate a complex network of rhyth-
mically expressed genes [3]. Within the core molecular clock,
increasing evidence shows that post-translational modifications
play a crucial role in the generation of circadian rhythms [40].
However, the circadian clock is also able to coordinate rhythmic
post-translational activation of signaling pathways not directly
involved in the molecular oscillator but rather in the sensing of the
environment. The first described example consisted in the
rhythmic activation of ERK in the suprachiasmatic nucleus
(SCN) of the hypothalamus where the master circadian pacemaker
is localized: if light stimulates ERK phosphorylation in the SCN in
a time-dependent fashion, circadian ERK phosphorylation con-
tinues also in constant darkness, suggesting a crucial role of the
circadian clock in this process [41]. Interestingly, the same
observations have been made for the TORC1 pathway in the
SCN [42,43], and for the PI3K/AKT pathway in the retina [44].
Considering the fact that these two pathways have been recently
identified as a potent regulators of circadian activity in Drosophila
[45], we expect that the role of the circadian clock-coordinated
signaling pathways on circadian physiology will probably be
emphasized in other organisms in the near future.
With respect to rhythmic activation of signaling pathways in the
liver, there are only few examples of such regulations. One
example is the rhythmic activation of the PI3K/AKT pathway
that is associated with food metabolism and rhythmic feeding
behavior [46]. Recently, we also described a circadian clock-
dependent rhythmic activation of the unfolded protein response
regulating liver lipid metabolism [47]. In addition, it has been
shown that the circadian clock is also able to regulate autophagy in
mouse liver [15]. In this context, our discovery of the rhythmic
ribosome biogenesis through coordination of the rhythmic
activation of signaling pathways constitutes an important new
element in this area of research.
Translation, Circadian Clock, and LongevityIt has long been known that caloric restriction or intermittent
fasting increases lifespan in a wide variety of models [48].
Increased lifespan has also been linked to the reduced activation
of the TORC1 pathway, which, in turn, provokes a reduced
mRNA translation [49,50]. The role of the TORC1 pathway in
this translation-dependent extension of lifespan has been geneti-
cally confirmed in Caenorhabditis elegans [51] and Drosophila [52,53].
A similar scenario is also considered in mice since treatment with
the TOR inhibitor rapamycin [54] or deletion of the TORC1
downstream protein kinase S6K1 [55] lead to increased lifespan.
In addition, downregulation of various components of the EIF4F
complex extends lifespan in C. elegans [56–59], whereas inhibition
of RPs genes expression extends lifespan in both Saccharomyces
cerevisiae [60] and C. elegans [56]. Hence, keeping ribosome
biogenesis, and translation in general, to their minimum levels
plays a major role in the regulation of longevity [61]. Interestingly,
all the genetically modified animal models presenting a disrupted
circadian clock [62–64] or mice subjected to chronic jet lag [65]
are subjected to premature aging and reduced lifespan. The
deregulation of many other circadian-clock regulated processes
can reduce life expectancy, like reduced xenobiotic detoxification
[66]. We thus believe that the potential role of disorganized
ribosome biogenesis on life expectancy, observed in animals
devoid of a circadian clock, will be an exciting subject for further
studies.
Material and Methods
Animal ExperimentsAll animal studies were conducted in accordance with our
regional committee for ethics in animal experimentation and the
regulations of the veterinary office of the Canton of Vaud.
C57Bl/6J mice were purchased from Janvier (Le Genest) or
Charles River Laboratory (L’Arbresle). Bmal1 floxed mice have
been previously described [67]. These mice were crossed with
mice expressing the CRE recombinase under the control of the
CMV promoter [68] to obtain Bmal1 KO mice. Cry1/Cry2 double
KO mice [30] in the C57Bl/6J genetic background have been
previously described [69]. In all experiments, male mice between
10 and 12 wk of age are used. Unless noted otherwise, mice were
maintained under standard animal housing conditions, with free
access to food and water and in 12-h light/12-h dark cycles.
However, for all experiments, animals were fed only at night
during 4 d before the experiment to reduce effects of feeding
rhythm. For experiments in constant darkness, mice were shifted
into complete darkness after the last dark period and then
sacrificed every 2 or 4 h during the next 48 h. For starvation
experiments, mice were deprived from food during one complete
night and then during the following 24 h, mice were sacrificed
every 2 or 4 h.
Polysome PurificationLivers were homogenized in lysis buffer containing 20 mM
HEPES (pH 7.6), 250 mM NaCl, 10 mM MgCl2, 10 mM DTT,
20 mg/ml cycloheximid, 10 U/ml RNase inhibitor, and a protease
inhibitor cocktail containing 0.5 mM PMSF, 10 mg/ml Aprotinin,
0.7 mg/ml Pepstatin A, and 0.7 mg/ml Leupeptin. The homoge-
nates were centrifuged 10 min at 9,500 g and 1 mg/ml heparin,
0.5% Na deoxycholate, and 0.5% Triton 6100 were added to the
supernatant. 50 mg of lysate were deposited on a 36 ml 7% to
47% sucrose gradient in a buffer containing 20 mM HEPES
(pH 7.6), 100 mM KCl, 5 mM MgCl2, and 1 mM DTT. After
4 h 30 min of centrifugation at 130,000 g and 4uC, the gradient
was divided in fractions of approximately 1 ml with a peristaltic
pump. Optic density of the fractions at 260 nm was measured to
establish the polysomal profile in the gradient. Fractions were
finally pooled in ten fractions. An example of polysome profile is
given on Figure S18. RNAs were then extracted according to the
protocol described by Clancy et al. [70] that we slightly modified.
Briefly, fractions were precipitated by the addition of three
volumes of ethanol and kept overnight at 280uC. After 30 min of
centrifugation at 5,200 g, RNAs were extracted from the non-
soluble fraction by classical protocol [71].
Circadian Clock-Coordinated Ribosome Biogenesis
PLOS Biology | www.plosbiology.org 11 January 2013 | Volume 11 | Issue 1 | e1001455

RNA Extraction and AnalysisLiver RNAs were extracted and analysed by real-time
quantitative RT-PCR, mostly as previously described [25]. Briefly,
0.5 mg of liver RNA was reverse transcribed using random
hexamers and SuperScript II reverse transcriptase (Life Technol-
ogies). The cDNAs equivalent to 20 ng of RNA were PCR
amplified in triplicate in an ABI PRISM 7700 Sequence Detection
System (Applied Biosystem) using the TaqMan or the SYBR
Green technologies. References and sequences of the probes are
given in Tables S9 and S10, respectively. Gapdh mRNA (total
RNA) or 28S rRNA (polysomal RNA) were used as controls.
Microarray ExperimentsLiver polysomal and total RNAs were extracted independently
from two mice sacrificed every 2 h during 48 h. For polysomal
RNAs, we pooled fractions 1 and 2 from the ten fractions obtained
during the extraction and containing heavy polysomes. 3 mg of
polysomal and total RNAs from each animal from each time point
were pooled. These 6 mg of polysomal and total RNAs were used
for the synthesis of biotinylated cRNAs according to Affymetrix
protocol, and hybridized to mouse Affymetrix Mouse Genome 430
2.0 arrays. The chips were washed and scanned, and the
fluorescence signal analysed with Affymetrix software. Data are
deposited on the Gene Expression Omnibus database under the
reference GSE33726 (http://www.ncbi.nlm.nih.gov/geo/query/
acc.cgi?token = rpwvtoqogkamwrm&acc = GSE33726).
The raw data of all 48 arrays were normalized together using
the robust multiarray average (RMA) method [72]. For the
analysis, we filtered out all probesets corresponding to introns
using the Ensembl annotation and then only kept genes with a
sufficient expression level (we kept genes whose probe signal in the
total fraction was above 5 in log2 scale). For the identification of
circadian probesets, the 24-h Fourier component (F24) and the
phase were computed using established methods [73]. The
associated p-value (p) was calculated using the Fisher test
(p = (12s)10) [73]. For the identification of rhythmically translated
genes, the difference between polysomal and total RNAs was
subjected to Fourier analysis and we selected probesets giving a p-
value inferior to 0.001. In addition, we requested that the peak to
trough amplitude in the polysomal signal be above 1.2-fold.
Nuclear and Cytoplasmic Protein Extractions and AnalysisNuclear and cytoplasmic proteins were extracted mostly as
described [25]. Briefly, liver were homogenized in sucrose
homogenization buffer containing 2.2 M sucrose, 15 mM KCl,
2 mM EDTA, 10 mM HEPES (pH 7.6), 0.15 mM spermin,
0.5 mM spermidin, 1 mM DTT, and the same protease inhibitor
cocktail as for polysomes extraction. Lysates were deposited on a
sucrose cushion containing 2.05 M sucrose, 10% glycerol, 15 mM
KCl, 2 mM EDTA, 10 mM HEPES (pH 7.6), 0.15 mM spermin,
0.5 mM spermidin, 1 mM DTT, and a protease inhibitor cocktail.
Tubes were centrifuged during 45 min at 105,000 g at 4uC. After
ultra-centrifugation, supernatants containing soluble cytoplasmic
proteins were harvested, homogenised, and centrifuged for 2 h at
200,000 g to remove ribosomes. These supernatants constitute
cytoplasmic extracts. The nucleus pellets were suspended in a
nucleus lysis buffer composed of 10 mM HEPES (pH 7.6),
100 mM KCl, 0.1 mM EDTA, 10% Glycerol, 0.15 mM sperm-
ine, 0.5 mM spermidine, 0.1 mM NaF, 0.1 mM sodium orthova-
nadate, 0.1 mM ZnSO4, 1 mM DTT, and the previously
described protease inhibitor cocktail. Nuclear extracts were
obtained by the addition of an equal volume of NUN buffer
composed of 2 M urea, 2% nonidet P-40, 600 mM NaCl, 50 mM
HEPES (pH 7.6), 1 mM DTT, and a cocktail of protease
inhibitor, and incubation 20 min on ice. After centrifugation
during 10 min at 21,000 g, the supernatants were harvested and
constitute nuclear extracts.
25 mg of nuclear or 12.5 mg cytoplasmic extracts were used for
western blotting. After migration, proteins were transferred to
PVDF membranes and Western blotting was realized according to
standard procedures. References for the antibodies are given in
Table S11.
Total Protein Extraction and AnalysisOrgans were homogenized in lysis buffer containing 20 mM
HEPES (pH 7.6), 100 mM KCl, 0.1 mM EDTA, 1 mM NaF,
1 mM sodium orthovanadate, 1% Triton X-100, 0.5% Nonidet P-
40, 0.15 mM spermin, 0.5 mM spermidin, 1 mM DTT, and a
protease inhibitor cocktail. After incubation 30 min on ice,
extracts were centrifuged 10 min at 21,000 g and the supernatants
were harvested to obtain total extracts.
65 mg of extract was used for Western blotting. After migration,
proteins were transferred to PVDF membranes and Western
blotting was realized according to standard procedures. Referenc-
es for the antibodies are given in Table S11.
7-methyl GTP Sepharose Affinity Protein Purification7-methyl GTP sepharose 4B beads (GE Healthcare) were
washed twice in the previously described liver lysis buffer. 250 mg
of liver protein extracts were diluted in 500 ml of lysis buffer
containing 1 mM DTT and a cocktail of protease inhibitor and
incubated for 2 h on a rotating wheel at 4uC with 20 ml of beads.
After incubation, cap-binding-proteins coated beads were washed
five times in 500 ml of liver lysis buffer containing 0.5 mM PMSF
and 1 mM DTT. 7-methyl GTP bound proteins were eluted by
SDS-PAGE loading buffer, separated by SDS-PAGE, transferred
to PVDF membranes, and analysed by Western blotting as
described.
Statistical Analysis of Genes and Proteins ExpressionMean and standard error of the mean were computed for each
time point. The rhythmic characteristics of the expression of each
gene or protein were assessed by a Cosinor analysis [74]. This
method characterizes a rhythm by the parameters of the fitted
cosine function best approximating the data. A period of 24 h was
a priori considered. The rhythm characteristics estimated by this
linear least squares method include the mesor (rhythm-adjusted
mean), the double amplitude (difference between minimum and
maximum of fitted cosine function), and the acrophase (time of
maximum in fitted cosine function). A rhythm was detected if the
null hypothesis was rejected with p,0.05. In such a case, the 95%
confidence limits of each parameter were computed. The Cosinor
2.3 software used in this study has been elaborated by the
Circadian Rhythm Laboratory at University of South Carolina
and is freely available at this address: http://www.circadian.org/
softwar.html. The statistical significance of differences in the mesor
was evaluated by a Student’s t-test.
Supporting Information
Figure S1 Temporal expression and phosphorylation oftranslation initiation factors in WT mice. Mean 6
standard error of the mean (SEM) (n = 3) densitometric values of
the Western blot data depicted in Figure 1B were represented
according to the zeitgeber time. Statistical analysis of these data is
given in Table S2.
(TIF)
Circadian Clock-Coordinated Ribosome Biogenesis
PLOS Biology | www.plosbiology.org 12 January 2013 | Volume 11 | Issue 1 | e1001455

Figure S2 Temporal expression and phosphorylation ofproteins involved in signaling pathways activation andtranslational initiation in WT mice. (A) Mean 6 standard
error of the mean (SEM) (n = 3) densitometric values of the
Western blot data depicted in Figure 2A were represented
according to the zeitgeber time. (B) Mean 6 SEM (n = 2)
densitometric values of the Western blot data depicted in
Figure 2B were represented according to the zeitgeber time.
Statistical analysis of these data is given in Table S2.
(TIF)
Figure S3 Temporal expression of TORC1 componentsand of kinases regulating TORC1 and EIF4E activities inWT mice. (A) Temporal expression of the TORC1 components
mTor and Raptor at the mRNA level (upper panel) and protein level
(lower panel) in mouse liver. mRNA expressions were measured by
real-time RT-PCR. For each time point, data are mean 6
standard error of the mean (SEM) obtained from four independent
animals. Expression of mTOR and RAPTOR and its phosphor-
ylation on Serine 792 were measured by Western blot on total
extracts. The phosphorylation of RAPTOR on Serine 792 by
AMPK has been shown to reduce TORC1 activity [75] and
contributes to the inhibition of TORC1 during the day. Naphtol
blue black staining of the membranes was used as a loading
control. (B) Temporal expression of Map4k3 (left panel) and Mnk2
mRNA (right panel) in mouse liver. mRNA expressions were
measured by real-time RT-PCR. For each time point, data are
mean 6 SEM obtained from four independent animals. MAP4K3
plays a role in the activation of TORC1 by amino acids [76],
whereas MNK2 is involved in the ERK signaling cascade leading
to the phosphorylation of EIF4E, which can play a role in 59-TOP
mRNA translation [9].
(TIF)
Figure S4 Rhythmic expression of mRNA encodingtranslation initiation factors (Eif4b, Eif4ebp3), theTORC1 complex component mTor, the kinase activatingthese factors Mnk2, and proteins involved in rRNAsynthesis (Ubf1) and ribosome biogenesis (Rpl23) isindependent of food and light. (A) Temporal expression in
constant darkness. (B) Temporal expression during starvation. (C)
Temporal expression during starvation in constant darkness.
mRNA expressions were measured by real-time RT-PCR. For
each time point, data are mean 6 SEM obtained from three
independent animals. The circadian (CT) or zeitgeber (ZT) times
at which the animals were sacrificed are indicated on the bottom
of the figures.
(TIF)
Figure S5 Rhythmic activation of TORC1 still occurs inconstant conditions. (A) Temporal phosphorylation of
TORC1 substrates during 48 h in constant darkness. The lines
through gels indicate where the images have been cropped. (B)
Temporal phosphorylation of TORC1 substrates during starva-
tion. As reported [14], the period of activation seems to be shorter
in these conditions. Interestingly, this activation is antiphasic with
the rhythmic activation of autophagy in mouse liver [15], a process
inhibited by TORC1 but able to generate amino acids that can in
turn activate TORC1 [16]. (C) Temporal phosphorylation of the
TORC1 substrate RPS6 during starvation in constant darkness.
Temporal expression and phosphorylation of RPS6 and 4E-BP1
were measured by Western blot on total extracts. Naphtol blue
black staining of the membranes was used as a loading control.The
circadian (CT) or zeitgeber (ZT) times at which the animals were
sacrificed are indicated on the top of the figures.
(TIF)
Figure S6 Rhythmic activation of TORC1 in differentmouse organs. Temporal activation of the TORC1 pathway in
mouse organs, revealed by phosphorylation of RPS6. As in the
liver, this rhythmic activation is kept in kidney and heart,
nevertheless with reduced amplitude (indicated by the blot with
a shortest exposure). However, TORC1 activation is constant in
brain, lung, and small intestine, suggesting that nutriment
availability due to rhythmic feeding is not sufficient to explain
this phenomenon. The zeitgeber times (ZT) at which the animals
were sacrificed are indicated on each panel. Naphtol blue black
staining of the membranes was used as a loading control.
(TIF)
Figure S7 The polysomal fraction is rhythmic in mouseliver. Temporal fraction of ribosomes in the polysomal fraction.
The percentage is obtained by dividing the optical density
obtained for the polysomal fraction by the total of optical density
obtained for polysomes and monosomes (n = 5). The rhythmic
nature of this fraction (and thus translation) is confirmed by
cosinor analysis (p#0.005, F[2,9] = 11.00, robustness = 61.3%,
Mesor = 76.24, amplitude = 5.50, and phase = 18.09 h). This
result confirms past biochemical [17] and morphometric [18]
studies describing a rhythmic polysomal fraction in rodent liver
with a nadir at ZT6. Interestingly, this time corresponds to the
maximum of activity of AMPK [12], which inhibits TORC1
activity through phosphorylation of TSC2 [77] and RAPTOR
[75]. The zeitgeber times (ZT) at which the animals were
sacrificed are indicated on the bottom of the figure.
(TIF)
Figure S8 The temporal profiles of polysomal mRNAsclosely follow that of total mRNAs for most circadiangenes, as exemplified by the Period genes. (A) Temporal
profiles ordered by phase in total (left panel) and polysomal RNA
(right panel) fractions of microarray probes presenting a rhythmic
profile in total mRNA fraction. Data were mean centered and
standardized. Log-ratios are color-coded so that red indicates high
and green low relative levels of mRNA. For most of the probes, the
profiles are strikingly similar in the two fractions, indicating
constant translational efficacy along the day. (B) Temporal
expression of Per1 (left panel) and Per2 (right panel) mRNAs in
polysomal (red line) and total (blue line) RNA fractions. Data are
represented in log scale without any additional normalization than
the one provided by the Affymetrix software. Although a
regulation of PER1 expression at the translational level has been
proposed [78,79], this hypothesis is not confirmed by our in vivo
data as the two profiles are extremely similar.
(TIF)
Figure S9 Comparative diurnal expression profile ofRNA in total and polysomal fractions. Temporal profiles of
total RNA (left panel) and polysomal RNA (right panel) fractions
of microarray probes presenting a rhythmic polysomal/total RNA
ratio. The profiles are ordered by the phase of the polysomal/total
ratio phase. Data were mean centered and standardized. Log-
ratios are color-coded so that red indicates high and green low
relative levels of mRNA.
(TIF)
Figure S10 Diurnal expression of selected 59-TOPmRNAs in total and polysomal fractions. Temporal real-
time RT-PCR profile of selected 59-TOP mRNA expression in the
total RNA (black line) and polysomal RNA (red line) fractions
from mouse liver. For each time point, data are mean 6 standard
error of the mean (SEM) obtained from four independent animals.
In addition to three ribosomal protein mRNA, which are known to
Circadian Clock-Coordinated Ribosome Biogenesis
PLOS Biology | www.plosbiology.org 13 January 2013 | Volume 11 | Issue 1 | e1001455

have a 59-TOP and be regulated by TORC1 [19], we selected also
Receptor of ACtivated protein Kinase C 1 (Rack1) or Guanine Nucleotide
Binding protein (G protein), Beta polypeptide 2-Like 1 (Gnb2l1), a
ribosome constituent [80] known to be regulated by TORC1 [81],
which also plays a role in circadian clock regulation [82].
However, a potential role of Rack1 rhythmic translation on the
circadian clock is not documented. The zeitgeber times (ZT) at
which the animals were sacrificed are indicated on each panel.
(TIF)
Figure S11 Temporal expression of ribosomal proteinsin mouse liver. Mean 6 standard error of the mean (SEM)
(n = 3) densitometric values of the Western blot data depicted in
Figure 3D were represented according to the zeitgeber time.
Statistical analysis of these data is given in Table S2.
(TIF)
Figure S12 Temporal expression of UBF1 in WT, and inCry1/Cry2 KO, and Bmal1 KO mouse liver. (A) Mean 6
standard error of the mean (SEM) (n = 3) densitometric values of
the Western blot data depicted in Figure 4B were represented
according to the zeitgeber time. Statistical analysis of these data is
given in Table S2. (B) Mean 6 SEM (n = 2) densitometric values of
the Western blot data depicted in Figure 4C (Cry1/Cry2 KO mice)
and 4D (Bmal1 KO mice) were represented according to the
zeitgeber time. Statistical analysis of these data is given in Tables
S7 and S8, respectively.
(TIF)
Figure S13 Activation of the TORC1, PI3K, and ERKpathways in Cry1/Cry2 and Bmal1 KO mice kept inconstant darkness. (A) Temporal phosphorylation of RPS6,
AKT, and ERK in mouse mutant liver. Cry1/Cry2 and Bmal1 KO
mice were placed in constant darkness for 3 d and then sacrificed
every 4 h during a 24-h period. Total liver extracts were used for
Western blotting. The circadian (CT) times at which the animals
were sacrificed are indicated on the top of the figures. As expected,
rhythmic activation of the three pathways is lost under these
conditions. (B) Six Cry1/Cry2 KO mice were kept in constant
darkness for one week and then sacrificed at CT12. Phosphory-
lation of RPS6, AKT and ERK were evaluated by Western
blotting on total liver extracts. We observed as expected in these
conditions a high degree of variability in the activation of the three
pathways, probably due to the arrhythmic food consumption of
the animals. However, the ERK pathway seems to be less affected.
A quantification of these data is given on the right part of the
figure. Naphtol blue black staining of the membranes was used as
a loading control.
(TIF)
Figure S14 Diurnal expression of genes encoding pro-teins involved in TORC1 complex, mRNA translationinitiation and RPs synthesis in WT and Cry1/Cry2 KOmice. Temporal real-time RT-PCR expression of genes encoding
proteins involved in TORC1 complex (mTor and Raptor), mRNA
translation initiation (Eif4b and Eif4ebp3), and RP synthesis (Rpl32
and Rpl34 pre-mRNA) in total RNA from WT (black line) and
Cry1/Cry2 KO (red line) mouse liver. For each time point, data are
mean 6 standard error of the mean (SEM) obtained from four
(WT) and three (KO) independent animals. The zeitgeber times
(ZT) at which the animals were sacrificed are indicated on each
panel.
(TIF)
Figure S15 Diurnal expression of genes encoding pro-teins involved in TORC1 complex, mRNA translationinitiation, and RP synthesis in WT and Bmal1 KO mice.
Temporal real-time RT-PCR expression of genes encoding
proteins involved in TORC1 complex (mTor and Raptor), mRNA
translation initiation (Eif4b and Eif4ebp3), and RP synthesis (Rpl32
and Rpl34 pre-mRNA) in total RNA from WT (black line) and
Bmal1 KO (red line) mouse liver. For each time point, data are
mean 6 standard error of the mean (SEM) obtained from two
independent animals. The zeitgeber times (ZT) at which the
animals were sacrificed are indicated on each panel.
(TIF)
Figure S16 Temporal expression and phosphorylationof proteins involved in translational initiation, signalingpathways activation, and ribosome biogenesis in Cry1/Cry2 KO mice. (A) Mean 6 standard error of the mean (SEM)
(n = 2) densitometric values of the Western blot data depicted in
Figure 6A were represented according to the zeitgeber time. (B)
Mean 6 SEM (n = 2) densitometric values of the Western blot data
depicted in Figure 6B were represented according to the zeitgeber
time. Statistical analysis of these data is given in Table S7. It is
interesting to note that expression of EIF4E is slightly increased in
the KO (Student’s t-test p#0.05), in agreement with the increased
mRNA expression. It is also the case for RPS6 whose expression
increase like most of the other RP proteins (Student’s t-test
p#361026).
(TIF)
Figure S17 Temporal expression and phosphorylationof proteins involved in translational initiation, signalingpathways activation, and ribosome biogenesis in Bmal1KO mice. (A) Mean 6 standard error of the mean (SEM) (n = 2)
densitometric values of the Western blot data depicted in
Figure 6C were represented according to the zeitgeber time. (B)
Mean 6 SEM (n = 2) densitometric values of the Western blot data
depicted in Figure 6D were represented according to the zeitgeber
time. Statistical analysis of these data is given in Table S8.
(TIF)
Figure S18 Example of polysomes purification profile.Optic density at 260 nm of the 45 sub-fractions obtained after
ultracentrifugation of liver extract from mouse sacrificed at ZT8.
These fractions are then pooled in ten fractions and the fractions 1
and 2 are pooled to obtain the polysomal fraction used in
microarray and RT-PCR experiments.
(TIF)
Table S1 Cosinor statistical values related to rhythmicmRNA expression of genes coding for proteins involvedin mRNA translation, TORC1 complex, and ribosomebiogenesis. A Cosinor statistical analysis was applied to the
rhythmic datasets corresponding to the respective expression of the
indicated mRNA measured by quantitative PCR in WT mice and
shown on Figures 1, 4, and S3.
(DOC)
Table S2 Cosinor statistical values related to rhythmicexpression and phosphorylations of proteins involved inmRNA translation, TORC1 complex, and ribosomebiogenesis. A Cosinor statistical analysis was applied to the
rhythmic datasets corresponding to the respective expression of the
indicated proteins measured by Western blots quantification in
WT mice and shown on Figures S1, S2, S11, and S12.
(DOC)
Table S3 Affymetrix microarray probes presenting arhythmic polysomal/total RNA ratio and in phase withTORC1 activation (complement to Figure 3A). Affymetrix
microarray probes presenting a rhythmic polysomal/total RNA
Circadian Clock-Coordinated Ribosome Biogenesis
PLOS Biology | www.plosbiology.org 14 January 2013 | Volume 11 | Issue 1 | e1001455
ratio and in phase with TORC1 activation were classified
according to the phase of the maximum value (all include between
ZT14 and ZT18).
(XLS)
Table S4 Functions of the genes presenting a rhythmictotal/polysomal RNA ratio. Most of the genes found
regulated at the translational level are known 59-TOP containing
genes. They include almost all the RP coding genes: 28 of the 32
small RP genes and 42 of the 47 large RP genes expressed in
mouse [83] are found on the list. The list also includes known 59-
TOP mRNA encoding proteins involved in the regulation of
translation: translation initiation factors of the class 2, 3, and 4,
first class of translation elongation factors, and poly-A binding
proteins [19]. In addition, the list contains genes encoding proteins
involved at different steps of translational regulation and ribosome
biogenesis: NPM1, a chaperone protein involved in ribosome
assembly and rRNA maturation [84]; CCT4, a member of the
chaperonin complex that plays a role in ribosome biogenesis [85];
TPT1, a guanine nucleotide exchanger that controls TORC1
activity through regulation of the RHEB GTPase [86]; IGBP1, a
regulatory subunit of protein phosphatase 2A that modulates
TORC1 activity [87]; PFDN5, a chaperone protein that
modulates MYC activity [88]; a transcription factor involved in
rRNA and RP mRNA transcription [89]; AHCY, a S-adenosyl
homocysteine hydrolase that regulates translation also through
modulation of MYC activity [90]; GNB2L1 or RACK1, a scaffold
protein that interacts with and modulates ribosome activity [80];
UBA52, a protein constitutes by the fusion of a ribosomal protein
and ubiquitin [91]; The remaining genes encode proteins with
unknown function in translation regulation.
(DOC)
Table S5 Cosinor statistical values related to rhythmicmRNA expression of genes coding for proteins involvedin mRNA translation, TORC1 complex, and ribosomebiogenesis in WT and Cry1/Cry2 KO mice. A Cosinor
statistical analysis was applied to the rhythmic datasets corre-
sponding to the respective expression of the indicated mRNA
measured by quantitative PCR in WT and Cry1/Cry2 KO mice
and shown on Figures 4, 5, and S14.
(DOC)
Table S6 Cosinor statistical values related to rhythmicmRNA expression of genes coding for proteins involvedin mRNA translation, TORC1 complex and ribosomebiogenesis in WT and Bmal1 KO mice. A Cosinor statistical
analysis was applied to the rhythmic datasets corresponding to the
respective expression of the indicated mRNA measured by
quantitative PCR in WT and Bmal1 KO mice and shown on
Figures 4, 5, and S15.
(DOC)
Table S7 Cosinor statistical values related to rhythmicexpression and phosphorylation of proteins involved inmRNA translation, TORC1 complex and ribosomebiogenesis in WT and Cry1/Cry2 KO mice. A Cosinor
statistical analysis was applied to the rhythmic datasets corre-
sponding to the respective expression of the indicated proteins
measured by Western blots quantification in WT and Cry1/Cry2
KO mice and shown on Figures S12 and S16.
(DOC)
Table S8 Cosinor statistical values related to rhythmicexpression and phosphorylation of proteins involved inmRNA translation, TORC1 complex, and ribosomebiogenesis in WT and Bmal1 KO mice. A Cosinor statistical
analysis was applied to the rhythmic datasets corresponding to the
respective expression of the indicated proteins measured by
Western blots quantification in WT and Bmal1 KO mice and
shown on Figures S12 and S17.
(DOC)
Table S9 Taqman probes used for real-time PCR(Applied Biosystems).(DOC)
Table S10 Sequences of the primers used for SYBRGreen real-time PCR.(DOC)
Table S11 References of the antibodies used for West-ern blotting [92,93].(DOC)
Acknowledgments
We thank Mikael Le Clech and Benjamin Bieche for their technical
assistance, and David Gatfield and Vjekoslav Dulic for critical reading of
the manuscript. Affymetrix microarrays were processed in the Microarray
Core Facility of the Institute of Research of Biotherapy, CHRU-INSERM-
UM1, Montpellier (France). We also extend our thanks to the Institut de
Genetique Humaine, CNRS UPR 1142, Montpellier (France), where a
part of this work was conducted, for generous support.
Author Contributions
The author(s) have made the following declarations about their
contributions: Conceived and designed the experiments: CJ GC FG.
Performed the experiments: CJ GC EM FA FG. Analyzed the data: LS FN
FG. Wrote the paper: FG FN.
References
1. Bass J, Takahashi JS (2010) Circadian integration of metabolism and energetics.
Science 330: 1349–1354.
2. Zhang EE, Kay SA (2010) Clocks not winding down: unravelling circadian
networks. Nat Rev Mol Cell Biol 11: 764–776.
3. Doherty CJ, Kay SA (2010) Circadian control of global gene expression patterns.
Annu Rev Genet 44: 419–444.
4. Reddy AB, Karp NA, Maywood ES, Sage EA, Deery M, et al. (2006) Circadian
orchestration of the hepatic proteome. Curr Biol 16: 1107–1115.
5. Panda S, Antoch MP, Miller BH, Su AI, Schook AB, et al. (2002) coordinated
transcription of key pathways in the mouse by the circadian clock. Cell 109: 307–320.
6. Hughes ME, DiTacchio L, Hayes KR, Vollmers C, Pulivarthy S, et al. (2009)
Harmonics of circadian gene transcription in mammals. PLoS Genet 5:
e1000442. doi:10.1371/journal.pgen.1000442
7. Jackson RJ, Hellen CUT, Pestova TV (2010) The mechanism of eukaryotic translation
initiation and principles of its regulation. Nat Rev Mol Cell Biol 11: 113–127.
8. Laplante M, Sabatini DM (2012) mTOR signaling in growth control and
disease. Cell 149: 274–293.
9. Silva RLA, Wendel H-G (2008) MNK, EIF4E and targeting translation for
therapy. Cell Cycle 7: 553–555.
10. Ma XM, Blenis J (2009) Molecular mechanisms of mTOR-mediated
translational control. Nat Rev Mol Cell Biol 10: 307–318.
11. Mendoza MC, Er EE, Blenis J (2011) The Ras-ERK and PI3K-mTOR
pathways: cross-talk and compensation. Trends Biochem Sci 36: 320–328.
12. Lamia KA, Sachdeva UM, DiTacchio L, Williams EC, Alvarez JG, et al. (2009)
AMPK regulates the circadian clock by cryptochrome phosphorylation and
degradation. Science 326: 437–440.
13. Zoncu R, Efeyan A, Sabatini DM (2011) mTOR: from growth signal integration
to cancer, diabetes and ageing. Nat Rev Mol Cell Biol 12: 21–35.
14. LeBouton A, Handler S (1971) Persistent circadian rhythmicity of protein
synthesis in the liver of starved rats. Experientia 27: 1031–1032.
15. Ma D, Panda S, Lin JD (2011) Temporal orchestration of circadian autophagy
rhythm by C/EBPb. EMBO J 30: 4642–4651.
16. Neufeld TP (2010) TOR-dependent control of autophagy: biting the hand that
feeds. Curr Opin Cell Biol 22: 157–168.
Circadian Clock-Coordinated Ribosome Biogenesis
PLOS Biology | www.plosbiology.org 15 January 2013 | Volume 11 | Issue 1 | e1001455

17. Fishman B, Wurtman RJ, Munro HN (1969) Daily rhythms in hepatic polysome
profiles and tyrosine transaminase activity: role of dietary protein. Proc Natl
Acad Sci U S A 64: 677–682.
18. Uchiyama Y, Asari A (1984) A morphometric study of the variations in
subcellular structures of rat hepatocytes during 24 hours. Cell Tissue Res 236:
305–315.
19. Meyuhas O, Dreazen A (2009) Ribosomal protein S6 kinase: from TOP mRNAs
to cell size. Prog Mol Biol Transl Sci 90: 109–153.
20. Mamane Y, Petroulakis E, Martineau Y, Sato T-A, Larsson O, et al. (2007)
Epigenetic activation of a subset of mRNAs by eIF4E explains its effects on cell
proliferation. PLoS ONE 2: e242. doi:10.1371/journal.pone.0000242
21. Bianchini A, Loiarro M, Bielli P, Busa R, Paronetto MP, et al. (2008)
Phosphorylation of eIF4E by MNKs supports protein synthesis, cell cycle
progression and proliferation in prostate cancer cells. Carcinogenesis 29: 2279–
2288.
22. Hirsch CA, Hiatt HH (1966) Turnover of liver ribosomes in fed and in fasted
rats. J Biol Chem 241: 5936–5940.
23. Lam YW, Lamond AI, Mann M, Andersen JS (2007) Analysis of nucleolar
protein dynamics reveals the nuclear degradation of ribosomal proteins. Curr
Biol 17: 749–760.
24. Geyer PK, Meyuhas O, Perry RP, Johnson LF (1982) Regulation of ribosomal
protein mRNA content and translation in growth-stimulated mouse fibroblasts.
Mol Cell Biol 2: 685–693.
25. Gachon F, Fleury Olela F, Schaad O, Descombes P, Schibler U (2006) The
circadian PAR-domain basic leucine zipper transcription factors DBP, TEF, and
HLF modulate basal and inducible xenobiotic detoxification. Cell Metab 4: 25–
36.
26. Abruzzi KC, Rodriguez J, Menet JS, Desrochers J, Zadina A, et al. (2011)
Drosophila CLOCK target gene characterization: implications for circadian
tissue-specific gene expression. Genes Dev 25: 2374–2386.
27. Laferte A, Favry E, Sentenac A, Riva M, Carles C, et al. (2006) The
transcriptional activity of RNA polymerase I is a key determinant for the level of
all ribosome components. Genes Dev 20: 2030–2040.
28. Grewal SS, Evans JR, Edgar BA (2007) Drosophila TIF-IA is required for
ribosome synthesis and cell growth and is regulated by the TOR pathway. J Cell
Biol 179: 1105–1113.
29. Sanij E, Hannan RD (2009) The role of UBF in regulating the structure and
dynamics of transcriptionally active rDNA chromatin. Epigenetics 4: 374–382.
30. van der Horst GTJ, Muijtjens M, Kobayashi K, Takano R, Kanno S-i, et al.
(1999) Mammalian Cry1 and Cry2 are essential for maintenance of circadian
rhythms. Nature 398: 627–630.
31. Bunger MK, Wilsbacher LD, Moran SM, Clendenin C, Radcliffe LA, et al.
(2000) Mop3 is an essential component of the master circadian pacemaker in
mammals. Cell 103: 1009–1017.
32. Berset C, Trachsel H, Altmann M (1998) The TOR (target of rapamycin) signal
transduction pathway regulates the stability of translation initiation factor eIF4G
in the yeast Saccharomyces cerevisiae. Proc Natl Acad Sci U S A 95: 4264–4269.
33. Seıte R, Pebusque M-J (1985) Chronobiological studies on the nucleolus.
Chronobiol Int 2: 69–91.
34. Hernandez-Verdun D (2006) The nucleolus: a model for the organization of
nuclear functions. Histochem Cell Biol 126: 135–148.
35. Dong W, Tang X, Yu Y, Nilsen R, Kim R, et al. (2008) Systems biology of the
clock in Neurospora crassa. PLoS ONE 3: e3105. doi:10.1371/journal.-
pone.0003105
36. Piques M, Schulze WX, Hohne M, Usadel B, Gibon Y, et al. (2009) Ribosome
and transcript copy numbers, polysome occupancy and enzyme dynamics in
Arabidopsis. Mol Syst Biol 5: 314.
37. Xu W, Yang R, Li M, Xing Z, Yang W, et al. (2011) Transcriptome phase
distribution analysis reveals diurnal regulated biological processes and key
pathways in rice flag leaves and seedling leaves. PLoS ONE 6: e17613.
doi:10.1371/journal.pone.0017613
38. Warner JR (1999) The economics of ribosome biosynthesis in yeast. Trends
Biochem Sci 24: 437–440.
39. Asmal M, Colgan J, Naef F, Yu B, Lee Y, et al. (2003) Production of ribosome
components in effector CD4+ T cells is accelerated by TCR stimulation and
coordinated by ERK-MAPK. Immunity 19: 535–548.
40. Reischl S, Kramer A (2011) Kinases and phosphatases in the mammalian
circadian clock. FEBS Lett 585: 1393–1399.
41. Obrietan K, Impey S, Storm DR (1998) Light and circadian rhythmicity
regulate MAP kinase activation in the suprachiasmatic nuclei. Nat Neurosci 1:
693–700.
42. Cao R, Anderson FE, Jung YJ, Dziema H, Obrietan K (2011) Circadian
regulation of mammalian target of rapamycin signaling in the mouse
suprachiasmatic nucleus. Neuroscience 181: 79–88.
43. Cao R, Lee B, Cho H-y, Saklayen S, Obrietan K (2008) Photic regulation of the
mTOR signaling pathway in the suprachiasmatic circadian clock. Mol Cell
Neurosci 38: 312–324.
44. Ko ML, Jian K, Shi L, Ko GY-P (2009) Phosphatidylinositol 3 kinase–Akt
signaling serves as a circadian output in the retina. J Neurochem 108: 1607–
1620.
45. Zheng X, Sehgal A (2010) AKT and TOR signaling set the pace of the circadian
pacemaker. Curr Biol 20: 1203–1208.
46. Vollmers C, Gill S, DiTacchio L, Pulivarthy SR, Le HD, et al. (2009) Time of
feeding and the intrinsic circadian clock drive rhythms in hepatic gene
expression. Proc Natl Acad Sci U S A 106: 21453–21458.
47. Cretenet G, Le Clech M, Gachon F (2010) Circadian clock-coordinated 12 hr
period rhythmic activation of the IRE1a pathway controls lipid metabolism in
mouse liver. Cell Metab 11: 47–57.
48. Bishop NA, Guarente L (2007) Genetic links between diet and lifespan: shared
mechanisms from yeast to humans. Nat Rev Genet 8: 835–844.
49. Honjoh S, Yamamoto T, Uno M, Nishida E (2009) Signalling through RHEB-1
mediates intermittent fasting-induced longevity in C. elegans. Nature 457: 726–
730.
50. Zid BM, Rogers AN, Katewa SD, Vargas MA, Kolipinski MC, et al. (2009) 4E-
BP extends lifespan upon dietary restriction by enhancing mitochondrial activity
in Drosophila. Cell 139: 149–160.
51. Vellai T, Takacs-Vellai K, Zhang Y, Kovacs AL, Orosz L, et al. (2003) Genetics:
influence of TOR kinase on lifespan in C. elegans. Nature 426: 620–620.
52. Kapahi P, Zid BM, Harper T, Koslover D, Sapin V, et al. (2004) regulation of
lifespan in drosophila by modulation of genes in the TOR signaling pathway.
Curr Biol 14: 885–890.
53. Luong N, Davies CR, Wessells RJ, Graham SM, King MT, et al. (2006)
Activated FOXO-mediated insulin resistance is blocked by reduction of TOR
activity. Cell Metab 4: 133–142.
54. Harrison DE, Strong R, Sharp ZD, Nelson JF, Astle CM, et al. (2009)
Rapamycin fed late in life extends lifespan in genetically heterogeneous mice.
Nature 460: 392–395.
55. Selman C, Tullet JMA, Wieser D, Irvine E, Lingard SJ, et al. (2009) Ribosomal
potein S6 kinase 1 signaling regulates mammalian life span. Science 326: 140–
144.
56. Hansen M, Taubert S, Crawford D, Libina N, Lee S-J, et al. (2007) Lifespan
extension by conditions that inhibit translation in Caenorhabditis elegans. Aging Cell
6: 95–110.
57. Pan KZ, Palter JE, Rogers AN, Olsen A, Chen D, et al. (2007) Inhibition of
mRNA translation extends lifespan in Caenorhabditis elegans. Aging Cell 6: 111–
119.
58. Rogers Aric N, Chen D, McColl G, Czerwieniec G, Felkey K, et al. (2011) Life
span extension via eIF4G inhibition is mediated by posttranscriptional
remodeling of stress response gene expression in C. elegans. Cell Metab 14: 55–66.
59. Syntichaki P, Troulinaki K, Tavernarakis N (2007) eIF4E function in somatic
cells modulates ageing in Caenorhabditis elegans. Nature 445: 922–926.
60. Steffen KK, MacKay VL, Kerr EO, Tsuchiya M, Hu D, et al. (2008) Yeast life
span extension by depletion of 60S ribosomal subunits is mediated by Gcn4. Cell
133: 292–302.
61. Kapahi P, Chen D, Rogers AN, Katewa SD, Li PW-L, et al. (2010) With TOR,
less is more: a key role for the conserved nutrient-sensing TOR pathway in
aging. Cell Metab 11: 453–465.
62. Dubrovsky YV, Samsa WE, Kondratov RV (2010) Deficiency of circadian
protein CLOCK reduces lifespan and increases age-related cataract develop-
ment in mice Aging (Albany NY) 2: 936–944.
63. Kondratov RV, Kondratova AA, Gorbacheva VY, Vykhovanets OV, Antoch
MP (2006) Early aging and age-related pathologies in mice deficient in BMAL1,
the core componentof the circadian clock. Genes Dev 20: 1868–1873.
64. Lee S, Donehower LA, Herron AJ, Moore DD, Fu L (2010) disrupting circadian
homeostasis of sympathetic signaling promotes tumor development in mice.
PLoS ONE 5: e10995. doi:10.1371/journal.pone.0010995
65. Davidson AJ, Sellix MT, Daniel J, Yamazaki S, Menaker M, et al. (2006)
Chronic jet-lag increases mortality in aged mice. Curr Biol 16: R914–R916.
66. Gachon F, Firsov D (2011) The role of circadian timing system on drug
metabolism and detoxification. Expert Opin Drug Metab Toxicol 7: 147–158.
67. Storch K-F, Paz C, Signorovitch J, Raviola E, Pawlyk B, et al. (2007) Intrinsic
circadian clock of the mammalian retina: importance for retinal processing of
visual information. Cell 130: 730–741.
68. Schwenk F, Baron U, Rajewsky K (1995) A cre-transgenic mouse strain for the
ubiquitous deletion of loxP-flanked gene segments including deletion in germ
cells. Nucleic Acids Res 23: 5080–5081.
69. Bur IM, Cohen-Solal AM, Carmignac D, Abecassis P-Y, Chauvet N, et al.
(2009) the circadian clock components CRY1 and CRY2 are necessary to
sustain sex dimorphism in mouse liver metabolism. J Biol Chem 284: 9066–
9073.
70. Clancy JL, Nousch M, Humphreys DT, Westman BJ, Beilharz TH, et al. (2007)
Methods to analyze microRNA-mediated control of mRNA translation. Jon L,
editor. Methods Enzymol: Academic Press. pp. 83–111.
71. Chomczynski P, Sacchi N (1987) Single-step method of RNA isolation by acid
guanidinium thiocyanate-phenol-chloroform extraction. Anal Biochem 162:
156–159.
72. Irizarry RA, Hobbs B, Collin F, Beazer-Barclay YD, Antonellis KJ, et al. (2003)
Exploration, normalization, and summaries of high density oligonucleotide array
probe level data. Biostatistics 4: 249–264.
73. Rey G, Cesbron F, Rougemont J, Reinke H, Brunner M, et al. (2011) Genome-
wide and phase-specific DNA-binding rhythms of BMAL1 control circadian
output functions in mouse liver. PLoS Biol 9: e1000595. doi:10.1371/
journal.pbio.1000595
74. Nelson W, Tong YL, Lee JK, Halberg F (1979) Methods for cosinor-
rhythmometry. Chronobiologia 6: 305–323.
Circadian Clock-Coordinated Ribosome Biogenesis
PLOS Biology | www.plosbiology.org 16 January 2013 | Volume 11 | Issue 1 | e1001455
75. Gwinn DM, Shackelford DB, Egan DF, Mihaylova MM, Mery A, et al. (2008)
AMPK phosphorylation of raptor mediates a metabolic checkpoint. Mol Cell 30:
214–226.
76. Yan L, Mieulet V, Burgess D, Findlay GM, Sully K, et al. (2010) PP2AT61e is an
inhibitor of MAP4K3 in nutrient signaling to mTOR. Mol Cell 37: 633–642.
77. Inoki K, Zhu T, Guan K-L (2003) TSC2 mediates cellular energy response to
control cell growth and survival. Cell 115: 577–590.
78. Kojima S, Matsumoto K, Hirose M, Shimada M, Nagano M, et al. (2007)
LARK activates posttranscriptional expression of an essential mammalian clock
protein, PERIOD1. Proc Natl Acad Sci U S A 104: 1859–1864.
79. Lee K-H, Woo K-C, Kim D-Y, Kim T-D, Shin J, et al. (2012) Rhythmic
interaction between Period1 mRNA and hnRNP Q leads to circadian time-
dependent translation. Mol Cell Biol 32: 717–728.
80. Nilsson J, Sengupta J, Frank J, Nissen P (2004) Regulation of eukaryotic
translation by the RACK1 protein: a platform for signalling molecules on the
ribosome. EMBO Rep 5: 1137–1141.
81. Loreni F, Iadevaia V, Tino E, Caldarola S, Amaldi F (2005) RACK1 mRNA
translation is regulated via a rapamycin-sensitive pathway and coordinated with
ribosomal protein synthesis. FEBS Lett 579: 5517–5520.
82. Robles MS, Boyault C, Knutti D, Padmanabhan K, Weitz CJ (2010)
Identification of RACK1 and protein kinase Ca as integral components of the
mammalian circadian clock. Science 327: 463–466.
83. Nakao A, Yoshihama M, Kenmochi N (2004) RPG: the ribosomal protein gene
database. Nucleic Acids Res 32: D168–D170.
84. Lindstrom MS (2011) NPM1/B23: a multifunctional chaperone in ribosome
biogenesis and chromatin remodeling. Biochem Res Int 2011.
85. Kabir MA, Sherman F (2008) Overexpressed ribosomal proteins suppress
defective chaperonins in Saccharomyces cerevisiae. FEMS Yeast Res 8: 1236–1244.86. Hsu Y-C, Chern JJ, Cai Y, Liu M, Choi K-W (2007) Drosophila TCTP is essential
for growth and proliferation through regulation of dRheb GTPase. Nature 445:
785–788.87. Grech G, Blazquez-Domingo M, Kolbus A, Bakker WJ, Mullner EW, et al.
(2008) Igbp1 is part of a positive feedback loop in stem cell factor–dependent,selective mRNA translation initiation inhibiting erythroid differentiation. Blood
112: 2750–2760.
88. Mori K, Maeda Y, Kitaura H, Taira T, Iguchi-Ariga SMM, et al. (1998) MM-1,a novel c-Myc-associating protein that represses transcriptional activity of c-Myc.
J Biol Chem 273: 29794–29800.89. van Riggelen J, Yetil A, Felsher DW (2010) MYC as a regulator of ribosome
biogenesis and protein synthesis. Nat Rev Cancer 10: 301–309.90. Fernandez-Sanchez ME, Gonatopoulos-Pournatzis T, Preston G, Lawlor MA,
Cowling VH (2009) S-Adenosyl homocysteine hydrolase is required for myc-
induced mRNA cap methylation, protein synthesis, and cell proliferation. MolCell Biol 29: 6182–6191.
91. Baker RT, Board PG (1991) The human ubiquitin-52 amino acid fusion proteingene shares several structural features with mammalian ribosomal protein genes.
Nucleic Acids Res 19: 1035–1040.
92. Brown SA, Ripperger J, Kadener S, Fleury-Olela F, Vilbois F, et al. (2005)PERIOD1-associated proteins modulate the negative limb of the mammalian
circadian oscillator. Science 308: 693–696.93. Preitner N, Damiola F, Luis-Lopez-Molina, Zakany J, Duboule D, et al. (2002)
The orphan nuclear receptor REV-ERBa controls circadian transcription withinthe positive limb of the mammalian circadian oscillator. Cell 110: 251–260.
Circadian Clock-Coordinated Ribosome Biogenesis
PLOS Biology | www.plosbiology.org 17 January 2013 | Volume 11 | Issue 1 | e1001455

0 2 4 6 8 10 12 14 16 18 20 22ZT
arb
itra
ry u
nits
EIF4G1
0
2
4
6
8
10
12P-EIF4G1
EIF4G1
0 2 4 6 8 10 12 14 16 18 20 22ZT
arb
itra
ry u
nits
EIF4B
0
2
4
6
8
10
12
14
16P-EIF4B
EIF4B
0 2 4 6 8 10 12 14 16 18 20 22ZT
arb
itra
ry u
nits
EIF4E
0
1
2
3
4
5
6
7P-EIF4E
EIF4E
0 2 4 6 8 10 12 14 16 18 20 22ZT
arb
itra
ry u
nits
4E-BP1
0
10
20
30
40
50
60
70
P-4E-BP1
4E-BP1
0 2 4 6 8 10 12 14 16 18 20 22ZT
arb
itrary
units
RPS6
0
20
40
60
80
100
120P-RPS6
RPS6
Figure S1

A
B
0 2 4 6 8 10 12 14 16 18 20 22ZT
arb
itra
ry u
nits
TSC2
0
2
4
6
8
10
12P-TSC2
TSC2
0 2 4 6 8 10 12 14 16 18 20 22ZT
arb
itra
ry u
nits
AKT
P-AKT
AKT
0
1
2
3
4
5
6
7
8
9
10
0 2 4 6 8 10 12 14 16 18 20 22ZT
arb
itra
ry u
nits
ERK
P-ERK
ERK
0
2
4
6
8
10
12
14
16
0 2 4 6 8 10 12 14 16 18 20 22ZT
arb
itra
ry u
nits
p90RSK
P-p90RSK
p90RSK
0
0.5
1.0
1.5
2.0
2.5
3.0
3.5
4.0
4.5
5.0
0 2 4 6 8 10 12 14 16 18 20 22ZT
arb
itrary
units
7Me-GTP binding
0
1
2
3
4
5
64E-BP1
EIF4E
Figure S2

Figure S3
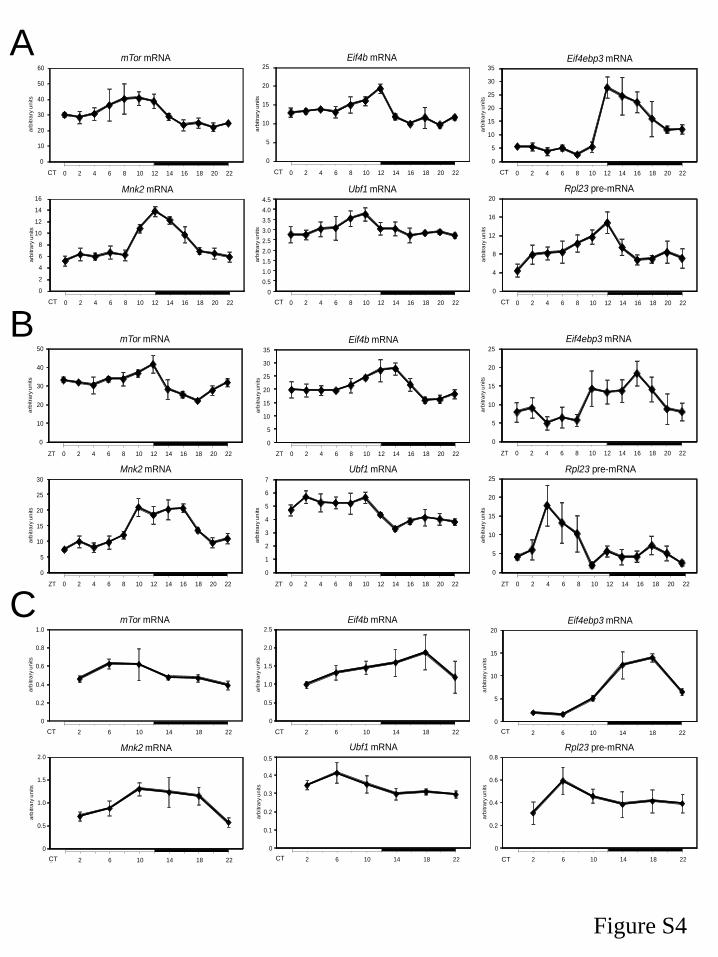
A
B
0 2 4 6 8 10 12 14 16 18 20 22ZT
arb
itra
ry u
nits
mTor mRNA
0
10
20
30
40
50
0 2 4 6 8 10 12 14 16 18 20 22ZT
arb
itra
ry u
nits
Eif4b mRNA
0
5
10
15
20
25
30
35
0 2 4 6 8 10 12 14 16 18 20 22ZT
arb
itra
ry u
nits
Eif4ebp3 mRNA
0
5
10
15
20
25
0 2 4 6 8 10 12 14 16 18 20 22ZT
arb
itra
ry u
nits
Mnk2 mRNA
0
5
10
15
20
25
30
0 2 4 6 8 10 12 14 16 18 20 22ZT
arb
itra
ry u
nits
Ubf1 mRNA
0
1
2
3
4
5
6
7
0 2 4 6 8 10 12 14 16 18 20 22ZT
arb
itra
ry u
nits
Rpl23 pre-mRNA
0
5
10
15
20
25
C
2 6 10 14 18 22ZT
arb
itra
ry u
nits
Eif4b mRNA
0
0.5
1.0
1.5
2.0
2.5
0 2 4 6 8 10 12 14 16 18 20 22ZT
arb
itra
ry u
nits
mTor mRNA
0
10
20
30
40
50
60
CT
arb
itra
ry u
nits
0 2 4 6 8 10 12 14 16 18 20 22ZT
Eif4b mRNA
0
5
10
15
20
25
CT 0 2 4 6 8 10 12 14 16 18 20 22ZT
arb
itra
ry u
nits
Eif4ebp3 mRNA
0
5
10
15
20
25
30
35
CT
0 2 4 6 8 10 12 14 16 18 20 22ZT
arb
itra
ry u
nits
Mnk2 mRNA
0
2
4
6
8
10
12
14
16
CT 0 2 4 6 8 10 12 14 16 18 20 22ZT
arb
itra
ry u
nits
Ubf1 mRNA
0
0.5
1.0
1.5
2.0
2.5
3.0
3.5
4.0
4.5
CT 0 2 4 6 8 10 12 14 16 18 20 22ZT
arb
itra
ry u
nits
Rpl23 pre-mRNA
0
4
8
12
16
20
CT
2 6 10 14 18 22ZT
arb
itra
ry u
nits
mTor mRNA
0
0.2
0.4
0.6
0.8
1.0
CT
arb
itra
ry u
nits
Eif4ebp3 mRNA
2 6 10 14 18 22ZT
0
5
10
15
20
CT
arb
itra
ry u
nits
Rpl23 pre-mRNA
2 6 10 14 18 22ZT
0
0.2
0.4
0.6
0.8
CT
arb
itra
ry u
nits
Ubf1 mRNA
2 6 10 14 18 22ZT
0
0.1
0.2
0.3
0.4
0.5
CT
CT
arb
itra
ry u
nits
Mnk2 mRNA
2 6 10 14 18 22ZT
0
0.5
1.0
1.5
2.0
CT
Figure S4

RDGachonFr
Typewritten text
Figure S5

Figure S6

0 2 4 6 8 10 12 14 16 18 20 22ZT
Po
lyso
me
ratio
(%
)
55
60
65
70
75
80
85
Figure S7

A
B Per1 mRNA Per2 mRNA
Figure S8

Figure S9

Rpl23 mRNA
0 2 4 6 8 10 12 14 16 18 20 22ZT
arb
itra
ry u
nits
0
20
40
60
80
100
120
140
Total RNA
Polysomal RNA
Rpl32 mRNA
0 2 4 6 8 10 12 14 16 18 20 22ZT
arb
itra
ry u
nits
0
20
40
60
80
100
120
140
0
20
40
60
80
100
120
140Rpl34 mRNA
0 2 4 6 8 10 12 14 16 18 20 22ZT
arb
itra
ry u
nits
Rack1 mRNA
0 2 4 6 8 10 12 14 16 18 20 22ZT
arb
itra
ry u
nits
0
20
40
60
80
100
120
140
Figure S10

0 2 4 6 8 10 12 14 16 18 20 22ZT
arb
itra
ry u
nits
RPL5
0
0.5
1.0
1.5
2.0
2.5
3.0
3.5
0 2 4 6 8 10 12 14 16 18 20 22ZT
arb
itra
ry u
nits
RPL23
0
1
2
3
4
5
0 2 4 6 8 10 12 14 16 18 20 22ZT
arb
itra
ry u
nits
RPL32
0
2
4
6
8
0 2 4 6 8 10 12 14 16 18 20 22ZT
arb
itra
ry u
nits
RPLP0
0
2
4
6
8
10
Figure S11

A
B
0 2 4 6 8 10 12 14 16 18 20 22ZT
arb
itrary
units
UBF1
0
1
2
3
4
0 2 4 6 8 10 12 14 16 18 20 22ZT
arb
itra
ry u
nits
UBF1
0
0.5
1.0
1.5
2.0
2.5
3.0
3.5
4.0
4.5
Cry KO
WT
0 2 4 6 8 10 12 14 16 18 20 22ZT
arb
itrary
units
UBF1
0
2
4
6
8
10
12
14
Bmal1 ko
WT
Figure S12
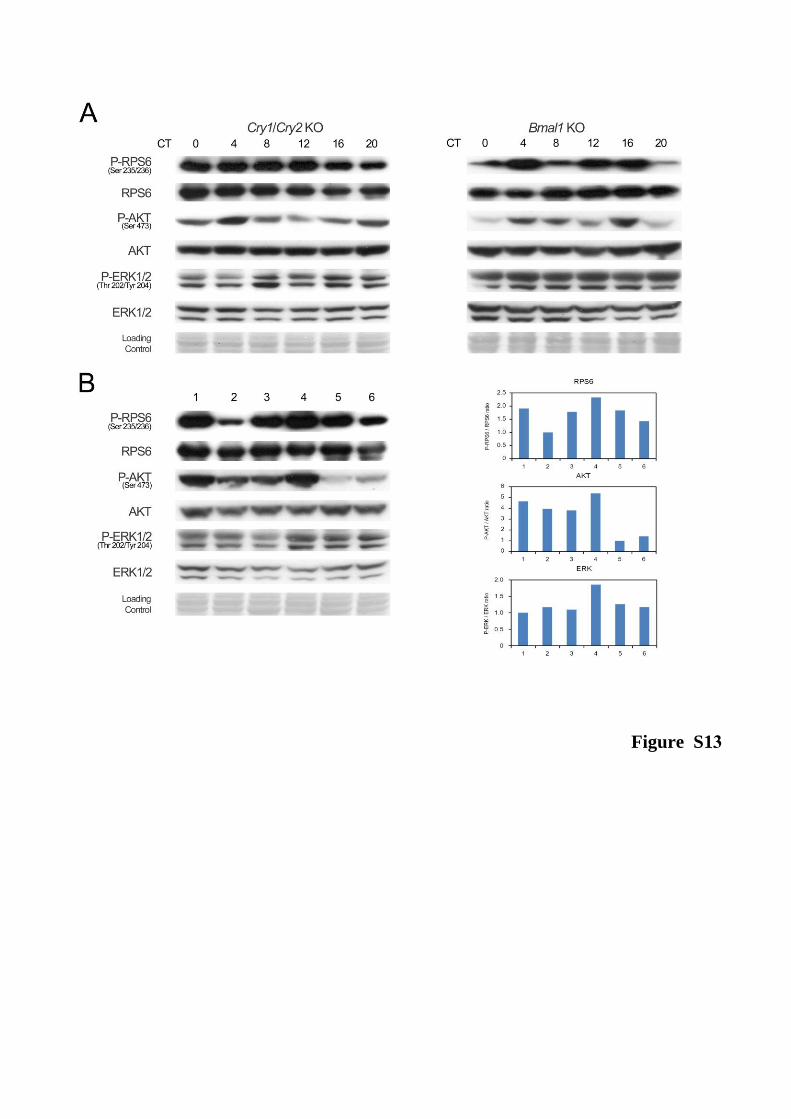
Figure S13

0 2 4 6 8 10 12 14 16 18 20 22ZT
arb
itra
ry u
nits
Tor mRNA
0
2
4
6
8
10
12
14
16
0 2 4 6 8 10 12 14 16 18 20 22ZT
arb
itra
ry u
nits
Raptor mRNA
0
2
4
6
8
10
12
14
0 2 4 6 8 10 12 14 16 18 20 22ZT
arb
itra
ry u
nits
Rpl32 pre- mRNA
0
5
10
15
20
25
0 2 4 6 8 10 12 14 16 18 20 22ZT
arb
itra
ry u
nits
Rpl34 pre-mRNA
0
5
10
15
20
25
30
0 2 4 6 8 10 12 14 16 18 20 22ZT
arb
itra
ry u
nits
Eif4b mRNA
0
0.2
0.4
0.6
0.8
1.0
1.2
1.4
0 2 4 6 8 10 12 14 16 18 20 22ZT
arb
itra
ry u
nits
Eif4ebp3 mRNA
0
2
4
6
8
10
12
WT
Cry1/Cry2 KO
Figure S14

WT
Bmal1 KO
0 2 4 6 8 10 12 14 16 18 20 22ZT
arb
itra
ry u
nits
mTor mRNA
0
1
2
3
4
5
6
7
0 2 4 6 8 10 12 14 16 18 20 22ZT
arb
itra
ry u
nits
Raptor mRNA
0
1
2
3
4
5
6
0 2 4 6 8 10 12 14 16 18 20 22ZT
arb
itra
ry u
nits
Eif4b mRNA
0
1
2
3
4
5
6
0 2 4 6 8 10 12 14 16 18 20 22ZT
arb
itra
ry u
nits
Eif4ebp3 mRNA
0
10
20
30
40
50
60
70
0 2 4 6 8 10 12 14 16 18 20 22ZT
arb
itra
ry u
nits
Rpl32 pre-mRNA
0
0.2
0.4
0.6
0.8
1.0
1.2
1.4
1.6
1.8
0 2 4 6 8 10 12 14 16 18 20 22ZT
arb
itra
ry u
nits
Rpl34 pre-mRNA
0
0.2
0.4
0.6
0.8
1.0
1.2
1.4
1.6
1.8
Figure S15

Cry1/Cry2 KO
WT
A
B
0 2 4 6 8 10 12 14 16 18 20 22ZT
arb
itra
ry u
nits
P-EIF4E
0
5
10
15
20
25
30
35
40
0 2 4 6 8 10 12 14 16 18 20 22ZT
arb
itra
ry u
nits
EIF4E
0
0.5
1.0
1.5
2.0
2.5
0 2 4 6 8 10 12 14 16 18 20 22ZT
arb
itra
ry u
nits
P-EIF4G1
0
20
40
60
80
100
120
140
0 2 4 6 8 10 12 14 16 18 20 22ZT
arb
itra
ry u
nits
EIF4G1
0
2
4
6
8
10
12
0 2 4 6 8 10 12 14 16 18 20 22ZT
arb
itra
ry u
nits
P-RPS6
0
50
100
150
200
250
300
350
400
450
500
0 2 4 6 8 10 12 14 16 18 20 22ZT
arb
itra
ry u
nits
RPS6
0
0.5
1.0
1.5
2.0
2.5
3.0
3.5
4.0
4.5
0 2 4 6 8 10 12 14 16 18 20 22ZT
arb
itra
ry u
nits
P-AKT
0
10
20
30
40
50
60
70
80
0 2 4 6 8 10 12 14 16 18 20 22ZT
arb
itra
ry u
nits
P-ERK
0
1
2
3
4
5
6
0 2 4 6 8 10 12 14 16 18 20 22ZT
arb
itra
ry u
nits
RPL5
0
1
2
3
4
5
6
7
0 2 4 6 8 10 12 14 16 18 20 22ZT
arb
itra
ry u
nits
RPL23
0
10
20
30
40
50
60
0 2 4 6 8 10 12 14 16 18 20 22ZT
arb
itra
ry u
nits
RPL32
0
2
4
6
8
10
12
14
0 2 4 6 8 10 12 14 16 18 20 22ZT
arb
itra
ry u
nits
RPLP0
0
1
2
3
4
5
6
7
8
Figure S16

Bmal1 ko
WT
A
B
0 2 4 6 8 10 12 14 16 18 20 22ZT
arb
itra
ry u
nits
P-EIF4E
0
1
2
3
4
5
6
7
8
0 2 4 6 8 10 12 14 16 18 20 22ZT
arb
itra
ry u
nits
P-EIF4G1
0
0.5
1.0
1.5
2.0
2.5
3.0
3.5
4.0
4.5
5.0
0 2 4 6 8 10 12 14 16 18 20 22ZT
arb
itra
ry u
nits
P-RPS6
0
50
100
150
200
250
0 2 4 6 8 10 12 14 16 18 20 22ZT
arb
itra
ry u
nits
P-AKT
0
5
10
15
20
25
30
0 2 4 6 8 10 12 14 16 18 20 22ZT
arb
itra
ry u
nits
P-ERK
0
0.5
1.0
1.5
2.0
2.5
3.0
3.5
0 2 4 6 8 10 12 14 16 18 20 22ZT
arb
itra
ry u
nits
RPL5
0
1
2
3
4
5
6
0 2 4 6 8 10 12 14 16 18 20 22ZT
arb
itra
ry u
nits
RPL23
0
1
2
3
4
5
6
0 2 4 6 8 10 12 14 16 18 20 22ZT
arb
itra
ry u
nits
RPL32
0
1
2
3
4
5
6
0 2 4 6 8 10 12 14 16 18 20 22ZT
arb
itra
ry u
nits
RPLP0
0
0.5
1.0
1.5
2.0
2.5
3.0
3.5
4.0
4.5
Figure S17

Figure S18

Table S1: Cosinor statistical values related to rhythmic mRNA expression of genes
coding for proteins involved in mRNA translation, TORC1 complex and ribosome
biogenesis
Gene p value F[2,9] Robustness (%) Mesor Amplitude Acrophase (h) Fold change
Eif4e 0.01500 6.945 47.6 0.83 0.121 11.3 1.566
Eif4g1 0.00249 13.215 66.1 9.26 1.615 0.7 1.678 Eif4a2 0.00109 17.680 72.9 5.52 1.562 8.1 2.085 Eif4b 0.00043 24.953 79.6 8.85 2.263 5.7 1.835 Eif4ebp1 0.00051 23.339 78.4 1.88 0.860 9.1 3.126 Eif4ebp3 0.00022 32.418 83.7 5.82 4.998 15.8 7.647 mTor 0.00089 19.010 74.5 10.75 2.391 5.3 1.790 Raptor 0.00222 13.753 67.1 10.14 1.954 3.2 1.598 Map4k3 0.00022 32.061 83.6 1.09 0.258 6.1 1.628 Mnk2 0.00026 29.933 82.6 2.45 1.065 11.7 2.929 pre-45S rRNA 0.00025 30.395 82.8 13.90 3.630 9.0 1.913 Pre-Rpl23 0.00222 13.752 67.1 19.53 8.189 9.3 4.141 Pre-Rpl32 0.00011 43.290 87.4 15.17 5.865 8.8 2.480 Pre-Rpl34 0.00044 24.724 79.5 7.51 3.914 8.5 3.348 Ubf1 0.00025 30.734 83.0 1.81 0.577 6.1 2.211

Table S2: Cosinor statistical values related to rhythmic phosphorylation and expression of
protein involved in mRNA translation, cell signaling and ribosome biogenesis
Protein p value F[2,9] Robustness (%) Mesor Amplitude Acrophase (h) Fold change
P-EIF4E 0.01231 7.478 49.9 3.40 2.04 7.51 5.89
P-EIF4G1 0.00185 14.662 68.7 4.21 3.68 16.73 9.69
P-EIF4B 0.01404 7.120 48.4 4.41 4.47 14.64 13.44
P-4E-BP1 0.00488 10.439 59.8 25.06 22.43 13.68 64.81
P-RPS6 0.00604 9.683 57.7 43.96 56.27 15.83 110.02
P-TSC2 0.00212 13.996 67.6 4.76 3.43 7.85 10.57
P-AKT 0.00212 13.993 67.6 3.51 2.63 14.69 8.37
P-ERK 0.00151 15.746 70.4 5.60 4.45 7.33 11.04
P-p90RSK 0.00044 24.711 79.5 2.34 1.51 6.39 4.28
Me-GTP 4E-BP1 0.00299 12.404 64.5 2.97 1.76 4.74 5.49
RPL5 0.01036 7.970 51.9 2.13 0.66 12.52 3.00
RPL23 0.04426 4.471 33.1 2.45 1.02 15.84 4.15
RPL32 0.00007 52.586 89.5 4.01 2.38 14.51 6.78
RPLP0 0.01075 7.864 51.5 3.57 2.20 10.93 7.57
UBF1 0.00328 12.009 63.7 2.57 1.01 6.49 3.71

Affy probes Genes Phase Amplitude p_value
1434523_x_at Eif3e 14.18 2.14 3.31E-04
1415716_a_at Rps27 15.09 3.49 1.08E-04
1450840_a_at Rpl39 15.18 4.35 3.02E-04
1454778_x_at Rps28 15.43 2.43 4.61E-04
1423763_x_at Rps28 15.44 2.47 2.24E-04
1426162_a_at Rpl7 15.45 2.67 8.68E-04
1415979_x_at Rpl7 15.56 2.05 3.81E-04
1416603_at Rpl22 15.60 3.78 1.26E-05
1453118_s_at Rpl22 15.62 3.54 8.58E-06
1416807_at Rpl36a 15.64 2.56 4.20E-05
1438655_a_at Rpl34 15.65 3.66 5.82E-05
1460543_x_at Rpl37a 15.66 2.87 2.95E-05
1415701_x_at Rpl23 15.71 2.03 1.67E-05
1435593_x_at Rps7 15.80 4.04 3.08E-05
1456628_x_at Rps24 15.82 4.38 3.42E-05
1422475_a_at Rps3a 15.83 2.93 6.32E-05
1460201_a_at Rpl24 15.83 1.68 6.74E-05
1433549_x_at Rps21 15.84 4.76 6.50E-04
1454859_a_at Rpl23 15.85 2.11 4.33E-05
1437975_a_at Rpl23a 15.86 2.94 8.83E-06
1451101_a_at Rps28 15.87 2.10 3.04E-05
1460680_a_at Rpl23 15.87 2.35 1.86E-04
1428530_x_at Rps24 15.88 3.94 5.47E-05
1455767_x_at Rpl21 15.90 2.77 5.11E-04
1455662_x_at Rps17 15.90 2.64 2.24E-05
1416277_a_at Rplp1 15.92 2.20 5.58E-04
1434872_x_at Rpl37 15.93 2.79 1.83E-05
1438986_x_at Rps17 15.95 2.72 2.61E-05
1429077_x_at Rpl21 15.95 2.12 1.42E-04
1453362_x_at Rps24 15.95 3.63 2.39E-05
1419364_a_at Rps7 15.96 3.26 3.62E-05
1434358_x_at Rps21 15.98 3.56 1.82E-04
1455364_a_at Rps7 15.99 4.11 5.77E-05
1416217_a_at Rpl37a 16.01 2.79 1.20E-05
1423665_a_at Rpl5 16.04 1.81 5.25E-04
1449255_a_at Rpl15 16.07 2.17 9.26E-04
1435712_a_at Rps18 16.11 4.21 9.52E-06
1437510_x_at Rps17 16.12 2.97 1.38E-05
1425183_a_at Rpl4 16.12 2.17 6.27E-04
1437976_x_at Rpl23a 16.12 2.12 2.44E-05
1416026_a_at Rpl12 16.14 4.10 2.49E-05
1415867_at Cct4 16.18 1.65 1.03E-04
1416453_x_at Rps12 16.19 4.44 3.60E-05
1448344_at Rps12 16.19 4.91 1.67E-05
1435725_x_at Rpl12 16.19 3.10 2.05E-05
1436064_x_at Rps24 16.20 2.94 3.77E-06
1428152_a_at Rpl18a 16.20 2.43 5.25E-06
1436586_x_at Rps14 16.21 2.53 4.89E-06

1435151_a_at Rps3 16.21 2.48 1.11E-04
1449196_a_at Rps27a 16.21 2.63 2.67E-05
1426659_a_at Rpl23a 16.21 2.76 1.33E-05
1433432_x_at Rps12 16.22 4.21 1.46E-05
1436995_a_at Rpl26 16.23 2.97 1.01E-05
1424766_at Ercc6l 16.24 1.91 4.07E-04
1453729_a_at Rpl37 16.24 2.41 5.41E-06
1459986_a_at Rps17 16.28 2.63 7.19E-06
1433721_x_at Rps21 16.30 3.10 1.67E-05
1417317_s_at Rpl35a 16.30 2.13 1.06E-05
1454856_x_at Rpl35 16.30 2.88 1.34E-05
1426660_x_at Rpl23a 16.30 2.40 1.86E-05
1434624_x_at Rps9 16.31 2.52 8.13E-04
1451068_s_at Rps25 16.32 2.70 1.68E-05
1416243_a_at Rpl35 16.33 2.79 2.23E-05
1460175_at Rps23 16.36 3.02 6.18E-06
1436822_x_at Rpl17 16.37 3.33 9.70E-05
1417615_a_at Rpl11 16.38 2.50 5.96E-06
1415736_at Pfdn5 16.38 2.24 1.00E-05
1420000_s_at Igbp1 16.39 2.28 1.51E-04
1418273_a_at Rpl30 16.39 3.84 6.21E-06
1434231_x_at Rpl35 16.40 2.91 8.00E-06
1416276_a_at Rps4x 16.41 2.98 9.17E-06
1433510_x_at Rpl36 16.41 3.18 5.51E-05
1416088_a_at Rps15 16.41 2.80 6.80E-04
1456373_x_at Rps20 16.42 3.44 1.69E-05
1448739_x_at Rps18 16.42 4.45 8.20E-06
1416099_at Rpl27 16.43 1.53 8.85E-04
1456436_x_at Rps20 16.46 3.43 1.22E-05
1454620_x_at Rps6 16.46 2.03 2.59E-04
1460637_s_at Pfdn5 16.47 2.55 1.05E-04
1428212_x_at Rpl31 16.48 2.81 1.14E-05
1453467_s_at Rps15a 16.50 2.92 1.96E-05
1416519_at Rpl36 16.50 2.60 3.28E-05
1430288_x_at Rps21 16.50 3.18 9.15E-06
1416420_a_at Rpl9 16.53 2.79 9.48E-05
1449243_a_at Rps19 16.53 5.79 3.12E-06
1455485_x_at Rpl13a 16.59 2.21 6.35E-06
1448109_a_at Rpl26 16.59 3.70 9.13E-06
1448157_s_at Rpl10 16.59 2.05 4.79E-05
1460008_x_at Rpl31 16.60 2.51 1.85E-05
1416642_a_at Tpt1 16.60 2.09 8.83E-05
1448245_at Rpsa 16.61 2.71 2.40E-05
1416054_at Rps5 16.62 4.26 3.92E-06
1455950_x_at Rpl35 16.62 2.85 6.60E-06
1416520_x_at Rpl36 16.62 2.80 1.72E-05
1426661_at Rpl27a 16.62 2.51 7.04E-06
1435897_at Rpl32 16.63 5.73 5.97E-06
1434377_x_at Rps6 16.63 1.75 2.02E-04
1455572_x_at Rps18 16.63 4.80 2.70E-06

1436840_x_at Rpl35 16.64 2.79 3.66E-05
1435791_x_at Rpl17 16.65 3.01 1.58E-04
1423666_s_at Rpl5 16.67 3.22 8.23E-05
1436924_x_at Rpl31 16.67 2.71 3.60E-05
1438626_x_at Rpl14 16.67 3.34 1.11E-04
1436760_a_at Rps8 16.68 2.52 1.01E-04
1443843_x_at Rpl9 16.68 2.12 5.70E-05
1427875_a_at Rpl34 16.69 2.71 4.80E-06
1416089_at Rps15 16.72 2.81 2.96E-04
1432264_x_at Cox7a2l 16.74 2.17 8.04E-04
1423855_x_at Rpl17 16.77 3.44 5.11E-05
1421772_a_at Cox7a2l 16.78 1.93 9.32E-04
1437196_x_at Rps16 16.78 2.24 8.63E-06
1455319_x_at Rps8 16.80 3.16 1.55E-04
1416074_a_at Rpl28 16.80 3.98 3.12E-04
1415942_at Rpl10 16.81 2.28 1.94E-04
1450150_a_at Rpl13 16.81 3.22 4.97E-04
1426793_a_at Rpl14 16.81 4.69 3.17E-04
1431177_a_at Rpl10a 16.83 3.27 6.36E-06
1416404_s_at Rps16 16.84 3.71 9.10E-06
1416141_a_at Rps6 16.86 1.62 1.58E-04
1435873_a_at Rpl13a 16.87 2.10 1.29E-05
1417608_a_at Rpl13a 16.87 2.93 1.75E-05
1416719_a_at Rps10 16.88 3.17 6.23E-05
1415962_at Eif3h 16.88 2.47 7.50E-04
1415839_a_at Npm1 16.89 2.78 6.31E-04
1455693_x_at Rps6 16.89 1.70 1.18E-04
1434854_a_at Rps10 16.89 3.32 4.11E-05
1448252_a_at Eef1b2 16.89 3.59 1.80E-05
1438507_x_at Rpl14 16.91 3.67 8.91E-05
1436688_x_at Rpl14 16.91 3.36 4.76E-05
1422859_a_at Rpl23 16.93 4.08 7.90E-05
1418062_at Eef1a2 16.98 2.25 3.25E-04
1417762_a_at Rpl8 17.00 2.32 4.90E-04
1455001_x_at Rpl13a 17.00 2.62 2.11E-05
1416546_a_at Rpl6 17.00 2.40 1.95E-05
1422613_a_at Rpl7a 17.04 2.72 2.83E-04
1456497_x_at Rps10 17.07 2.94 7.45E-05
1433928_a_at Rpl13a 17.07 4.12 7.97E-06
1432263_a_at Cox7a2l 17.10 2.06 6.74E-04
1416142_at Rps6 17.10 3.62 1.42E-04
1460575_at Eif2a 17.11 2.41 5.78E-04
1449323_a_at Rpl3 17.12 3.01 2.47E-06
1438723_a_at Rps10 17.12 2.73 9.59E-05
1433688_x_at Rpl14 17.13 3.59 6.32E-05
1452285_a_at Eif3f 17.16 2.90 3.52E-04
1455168_a_at Gnb2l1 17.17 2.90 9.28E-05
1419441_at Rplp0 17.19 3.68 2.36E-04
1433689_s_at Rps9 17.21 3.65 7.01E-04
1448846_a_at Rpl29 17.21 2.39 2.18E-04

1415876_a_at Rps26 17.22 2.26 9.53E-05
1433472_x_at Rpl38 17.27 2.35 2.70E-04
1455245_x_at Rpl13 17.27 2.47 7.76E-05
1437610_x_at Rps8 17.30 2.62 2.71E-04
1455600_at Rps3 17.35 3.66 1.34E-04
1436046_x_at Rpl29 17.36 2.44 2.07E-05
1419553_a_at Rabggtb 17.41 2.73 4.55E-04
1449506_a_at Eef1d 17.46 2.41 7.50E-04
1451077_at Rpl5 17.47 3.42 7.82E-04
1460581_a_at Rpl13 17.50 2.41 2.82E-04
1424635_at Eef1a1 17.55 1.93 1.63E-06
1455348_x_at Rpl29 17.56 2.18 1.17E-04
1431766_x_at Rps2 17.67 2.04 5.50E-04
1451296_x_at pabpc4 17.70 1.89 6.08E-04
1454627_a_at Rpl29 17.70 2.29 2.43E-05
1425026_at Sft2d2 17.72 1.66 4.68E-04
1417125_at Ahcy 17.74 1.45 1.28E-04
1431765_a_at Rps2 17.75 2.52 9.82E-04
1426379_at Eif4b 17.82 2.07 2.16E-04
1450934_at Eif4a2 17.82 3.62 8.87E-04
1417364_at Eef1g 17.99 2.79 2.40E-05
1416624_a_at Uba52 18.39 1.47 9.64E-04

Table S4: Functions of the genes presenting a rhythmic total / polysomal RNA ratio
Ribosomes small subunits
Ribosomes large subunits
Translation initiation factors
Translation elongation factors
Role in ribosome biogenesis
Other functions
Rpsa Rpl3 Eif2a Eef1a1 Npm1 Ercc6l
Rps2 Rpl4 Eif3e Eef1a2 Cct4 Rabggtb
Rps3 Rpl5 Eif3f Eef1b2 Tpt1 Sft2d2
Rps3a Rpl6 Eif3h Eef1d Igbp1 Cox7a2l
Rps4x Rpl7 Eif4a2 Eef1g Pfdn5
Rps5 Rpl7a Eif4b pabpc4 Ahcy
Rps6 Rpl8 Gnb2l1
Rps7 Rpl9 Uba52
Rps8 Rpl10
Rps9 Rpl10a
Rps10 Rpl11
Rps12 Rpl12
Rps14 Rpl13
Rps15 Rpl13a
Rps15a Rpl14
Rps16 Rpl15
Rps17 Rpl17
Rps18 Rpl18a
Rps19 Rpl21
Rps20 Rpl22
Rps21 Rpl23
Rps23 Rpl23a
Rps24 Rpl24
Rps25 Rpl26
Rps26 Rpl27
Rps27 Rpl27a
Rps27a Rpl28
Rps28 Rpl29
Rpl30
Rpl31
Rpl32
Rpl34
Rpl35
Rpl35a
Rpl36
Rpl36a
Rpl37
Rpl37a
Rpl38
Rpl39
Rplp0
Rplp1

Table S5: Cosinor statistical values related to rhythmic mRNA expression of genes coding
for proteins involved in mRNA translation, TORC1 complex and ribosome biogenesis in
wild-type and Cry1/Cry2 KO mice
Gene Genotype p value F[2,9] Robustness (%) Mesor Mesor p value Amplitude Acrophase (h)
Eif4e WT 0.01500 6.945 47.6 8.28 0.00000 1.21 11.26
KO n.s. 14.23
Eif4g1 WT 0.00249 13.215 66.1 9.26 0.00003 1.61 0.70
KO n.s. 6.95
Eif4a2 WT 0.00109 17.680 72.9 5.52 0.00736 1.56 8.06
KO n.s. 4.32
Eif4b WT 0.00043 24.953 79.6 0.88 0.02120 0.23 5.75
KO n.s. 0.74
Eif4ebp1 WT 0.00062 21.751 77.1 1.20 0.00000 0.55 9.20
KO n.s. 3.51
Eif4ebp3 WT 0.00013 39.929 86.5 4.24 n.s. 3.75 15.82
KO 0.00583 9.806 58.1 4.84 1.87 9.36
mTor WT 0.00089 19.010 74.5 10.75 0.00024 2.39 5.25
KO n.s. 7.87
Raptor WT 0.00222 13.753 67.1 10.14 0.00328 1.95 3.23
KO n.s. 8.31
pre-45S rRNA WT 0.00019 33.888 84.4 4.36 0.00022 1.29 9.12
KO 0.00525 10.172 59.1 2.91 0.60 9.42
Pre-Rpl23 WT 0.00571 9.877 58.3 2.46 0.00000 1.11 9.45
KO 0.00463 10.632 60.3 5.40 1.30 11.55
Pre-Rpl32 WT 0.00011 42.969 87.4 7.01 0.00003 2.72 8.77
KO 0.01468 7.002 47.8 12.83 3.34 12.97
Pre-Rpl34 WT 0.00068 20.978 76.5 8.41 0.00002 4.61 8.53
KO n.s. 15.89
Ubf1 WT 0.00025 30.734 83.0 1.81 0.00002 0.58 6.14
KO n.s. 1.08

Table S6: Cosinor statistical values related to rhythmic mRNA expression of genes coding
for proteins involved in mRNA translation, TORC1 complex and ribosome biogenesis in
wild-type and Bmal1 KO mice
Gene Genotype p value F[2,9] Robustness (%) Mesor Mesor p value Amplitude Acrophase (h)
Eif4e WT 0.01748 6.551 45.7 2.21 n.s. 0.49 12.39
KO n.s. 2.40
Eif4g1 WT 0.02316 5.868 42.1 10.36 0.00225 1.11 3.80
KO 0.04055 4.647 34.4 12.22 1.46 22.32
Eif4a2 WT 0.01083 7.842 51.4 13.82 0.00002 3.28 9.16
KO 0.00469 10.585 60.2 21.12 4.13 11.54
Eif4b WT 0.03973 4.689 34.7 2.11 0.00022 0.48 8.79
KO 0.03240 5.116 37.6 3.08 0.57 12.29
Eif4ebp1 WT 0.04749 4.333 32.1 9.50 0.00768 3.28 11.84
KO 0.00734 9.030 55.7 5.47 3.63 12.96
Eif4ebp3 WT 0.00099 18.321 73.7 15.74 n.s. 14.77 16.98
KO 0.01965 6.260 44.2 19.17 12.18 15.47
mTor WT 0.00317 12.153 64.0 4.04 0.01286 1.23 9.67
KO 0.00078 19.924 75.4 5.05 0.92 10.38
Raptor WT 0.00450 10.745 60.6 3.56 0.00007 0.62 6.86
KO n.s. 4.56
pre-45S rRNA WT 0.00031 28.143 81.6 13.30 0.00000 4.40 9.84
KO 0.04012 4.669 34.6 20.43 1.98 1.73
Pre-Rpl23 WT 0.03388 5.020 37.0 6.43 n.s. 2.07 14.17
KO 0.00338 11.879 63.4 7.38 1.84 17.48
Pre-Rpl32 WT 0.03375 5.029 37.0 0.61 n.s. 0.27 13.85
KO 0.03433 4.993 36.8 0.76 0.14 17.97
Pre-Rpl34 WT 0.04662 4.369 32.3 0.79 n.s. 0.29 13.23
KO n.s. 0.81
Ubf1 WT 0.00017 35.933 85.2 2.35 0.00002 0.62 7.49
KO n.s. 3.23
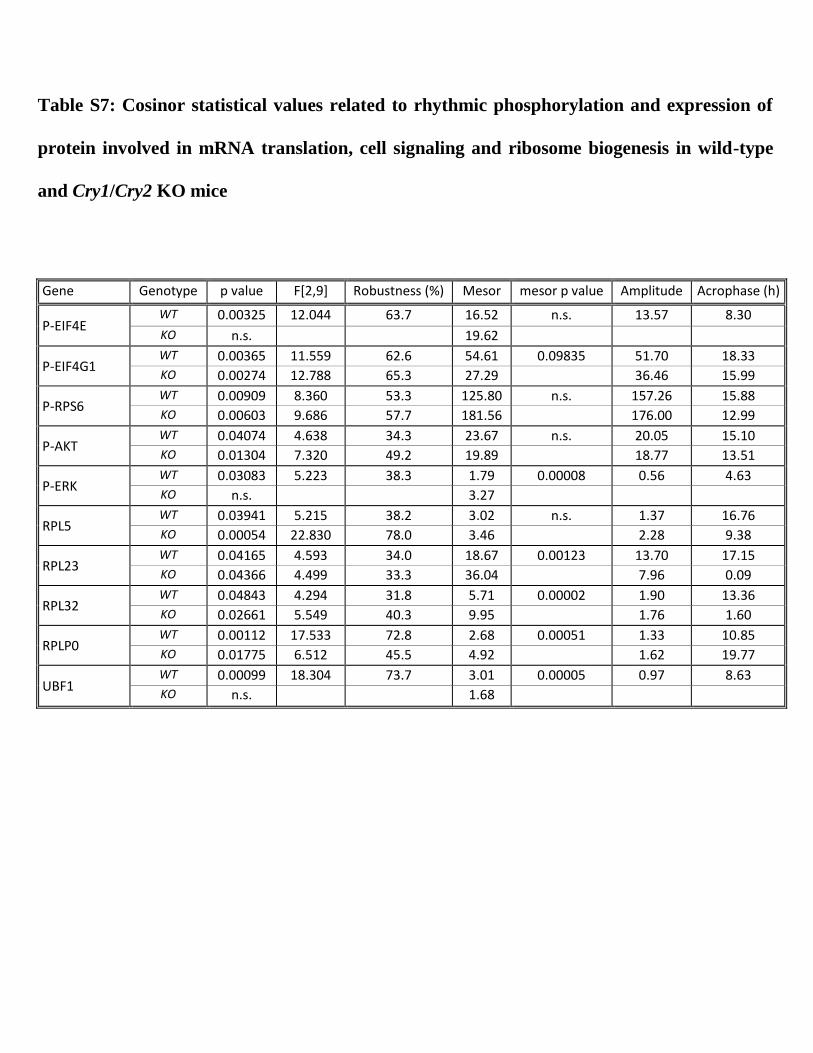
Table S7: Cosinor statistical values related to rhythmic phosphorylation and expression of
protein involved in mRNA translation, cell signaling and ribosome biogenesis in wild-type
and Cry1/Cry2 KO mice
Gene Genotype p value F[2,9] Robustness (%) Mesor mesor p value Amplitude Acrophase (h)
P-EIF4E WT 0.00325 12.044 63.7 16.52 n.s. 13.57 8.30
KO n.s. 19.62
P-EIF4G1 WT 0.00365 11.559 62.6 54.61 0.09835 51.70 18.33
KO 0.00274 12.788 65.3 27.29 36.46 15.99
P-RPS6 WT 0.00909 8.360 53.3 125.80 n.s. 157.26 15.88
KO 0.00603 9.686 57.7 181.56 176.00 12.99
P-AKT WT 0.04074 4.638 34.3 23.67 n.s. 20.05 15.10
KO 0.01304 7.320 49.2 19.89 18.77 13.51
P-ERK WT 0.03083 5.223 38.3 1.79 0.00008 0.56 4.63
KO n.s. 3.27
RPL5 WT 0.03941 5.215 38.2 3.02 n.s. 1.37 16.76
KO 0.00054 22.830 78.0 3.46 2.28 9.38
RPL23 WT 0.04165 4.593 34.0 18.67 0.00123 13.70 17.15
KO 0.04366 4.499 33.3 36.04 7.96 0.09
RPL32 WT 0.04843 4.294 31.8 5.71 0.00002 1.90 13.36
KO 0.02661 5.549 40.3 9.95 1.76 1.60
RPLP0 WT 0.00112 17.533 72.8 2.68 0.00051 1.33 10.85
KO 0.01775 6.512 45.5 4.92 1.62 19.77
UBF1 WT 0.00099 18.304 73.7 3.01 0.00005 0.97 8.63
KO n.s. 1.68

Table S8: Cosinor statistical values related to rhythmic phosphorylation and expression of
protein involved in mRNA translation, cell signaling and ribosome biogenesis in wild-type
and Bmal1 KO mice
Gene Genotype p value F[2,9] Robustness (%) Mesor mesor p value Amplitude Acrophase (h)
P-EIF4E WT 0.03271 5.096 37.5 4.69 n.s. 1.28 6.45
KO 0.02043 6.166 43.7 5.16 1.74 12.38
P-EIF4G1 WT 0.03883 4.736 35.0 2.33 n.s. 1.07 17.69
KO n.s. 2.63
P-RPS6 WT 0.00813 8.703 54.6 90.65 0.01235 94.45 17.79
KO n.s. 38.66
P-AKT WT 0.04379 4.493 33.3 17.83 0.00018 5.94 13.44
KO n.s. 6.88
P-ERK WT 0.00057 22.417 77.7 1.81 n.s. 0.75 8.97
KO n.s. 1.74
RPL5 WT 0.02301 5.883 42.2 2.05 n.s. 0.66 18.59
KO 0.00010 45.027 87.9 3.06 1.47 5.66
RPL23 WT 0.04263 4.547 33.7 2.02 n.s. 0.49 18.84
KO 0.00474 10.550 60.1 2.49 1.19 7.00
RPL32 WT 0.04760 4.328 32.0 2.32 0.00036 0.72 19.11
KO 0.00056 22.488 77.8 3.93 1.34 7.83
RPLP0 WT 0.04692 4.356 32.3 2.76 n.s. 0.82 21.80
KO 0.00520 10.211 59.2 2.77 0.99 6.63
UBF1 WT 0.02444 5.743 41.4 6.07 0.00013 3.33 7.03
KO n.s. 10.92

Table S9: Taqman probes used for real-time PCR (Applied Biosystems)
Gene Probe reference
Gapdh Mm 99999915_g1
28S rRNA Mm 03682676_s1
Eif4e Mm 00725633_s1
Eif4g1 Mm 00524099_m1
Eif4a2 Mm 00834357_g1
Eif4b Mm 00778003_s1
Eif4ebp1 Mm 01620026_g1
Eif4ebp3 Mm 01406408_m1
Rpl23 Mm 00787512_s1
Rpl32 Mm 02528467_g1
Rpl34 Mm 01318199_g1
mTor Mm 00444968_m1
Raptor Mm 00712676_m1
Map4k3 Mm 01232993_m1
Mknk2 Mm 00458026_m1
Ubf1 Mm 00456972_m1
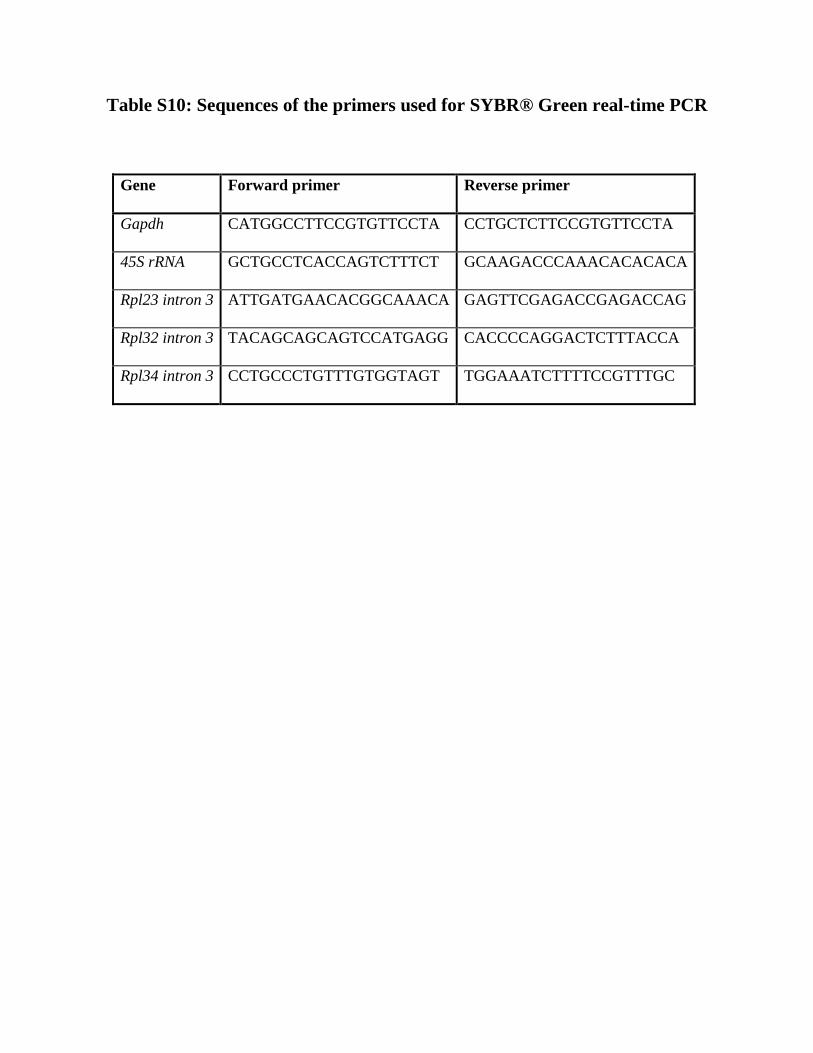
Table S10: Sequences of the primers used for SYBR® Green real-time PCR
Gene Forward primer Reverse primer
Gapdh CATGGCCTTCCGTGTTCCTA CCTGCTCTTCCGTGTTCCTA
45S rRNA GCTGCCTCACCAGTCTTTCT GCAAGACCCAAACACACACA
Rpl23 intron 3 ATTGATGAACACGGCAAACA GAGTTCGAGACCGAGACCAG
Rpl32 intron 3 TACAGCAGCAGTCCATGAGG CACCCCAGGACTCTTTACCA
Rpl34 intron 3 CCTGCCCTGTTTGTGGTAGT TGGAAATCTTTTCCGTTTGC

Table S11: References of the antibodies used for Western blotting
Protein Reference Company
P-EIF4E (Ser 209) 9741 Cell Signaling Technology
EIF4E 2067 Cell Signaling Technology
P-EIF4G (Ser 1108) 2441 Cell Signaling Technology
EIF4G 2469 Cell Signaling Technology
P-EIF4B (Ser 422) 3591 Cell Signaling Technology
EIF4B 3592 Cell Signaling Technology
P-4EBP1 (Thr 37/46) 2855 Cell Signaling Technology
4EBP1 9644 Cell Signaling Technology
P-RPS6 (Ser 235/236) 2211 Cell Signaling Technology
RPS6 2217 Cell Signaling Technology
P-TSC2 (Ser 1387) 5584 Cell Signaling Technology
TSC2 4308 Cell Signaling Technology
P-AKT (Ser 473) 4060 Cell Signaling Technology
AKT 4691 Cell Signaling Technology
P-p44/42 MAPK (ERK1/2)
(Thr202 / Tyr 204) 4376 Cell Signaling Technology
P44/42 MAPK (ERK1/2) 9102 Cell Signaling Technology
P-p90RSK (Thr 359/363) 9344 Cell Signaling Technology
p90RSK 9355 Cell Signaling Technology
P-RAPTOR (Ser 792) 2083 Cell Signaling Technology
RAPTOR 2280 Cell Signaling Technology
TOR 2983 Cell Signaling Technology
LP0 Ribosomal Protein 51019-2-AP ProteinTech Group
L5 Ribosomal Protein 15430-1-AP ProteinTech Group
L23 Ribosomal Protein 16086-1-AP ProteinTech Group
L32 Ribosomal Protein ARP-40219-T100 Aviva Systems Biology
UBF1 sc-9131 Santa Cruz Biotechnology
PER1 Brown et al., 2005
BMAL1 Preitner et al., 2002

62
II. Involvement of circadian clock in lipid metabolism
A. Modulation of PPARα signaling pathway in mouse liver
DBP (D-box Binding Protein), TEF (Thyrotroph Embryonic Factor), and HLF (Hepatic
Leukemia Factor) are three circadian clock-controlled PAR bZip (Proline- and Acidic amino
acid-Rich domain basic leucine Zipper) transcription factors113, 296
. These PAR bZip act by
binding to D-boxes present on target gene promoters297
. Studies in mice deficient for these
three transcription factors, PAR bZip KO mice, showed the impact of the circadian clock on
several metabolic pathways. Indeed, PAR bZip mice exhibit early aging phenotype, severe
epilepsy attacks298
, defect in liver xenobiotic detoxification3, cardiac hypertrophy and left
ventricular dysfunction associated with a low blood pressure299
.
In the present study300
, PAR bZip proteins as transcription factors are involved in the
rhythmic accumulation and activity of PPARα. Indeed, in mice depleted of the three PAR
bZip (PAR bZip 3KO mice) the expression of PPARα was damped, as well as Cyp4a10 and
Cyp4a14 mRNA, two PPARα target genes. PPARα activity is stimulated by the binding to
fatty acids. Fatty acids availability is driven by LPL (LipoProtein Lipase) and ACOTs (Acyl
CoA Thioesterase) enzymes. Here it is proposed that Acot gene expressions were under the
control of PAR bZip as their diurnal expression was impaired in PAR bZip 3KO mice.
However, in mice kept under free-fat diet, PPARα activity was rescue due to de novo fatty
acid synthesis as shown by the increased expression of Fasn (Fatty acid synthase) mRNA.
It appears thus that under normal diet, circadian PAR bZip control free fatty acids release
through the control of ACOTs expression. These free fatty acids then play their role of ligands
by stimulating PPARα activation. PPARα then stimulates transcription of Acot and Lpl, and in
a feed-forward loop reinforces its own expression and activity.
Proline- and acidic amino acid-rich basic leucinezipper proteins modulate peroxisome proliferator-activated receptor α (PPARα) activityFrédéric Gachona,b,1, Nicolas Leuenbergerc,2, Thierry Claudeld, Pascal Gosa, Céline Jouffeb, Fabienne Fleury Olelaa,Xavier de Mollerat du Jeue, Walter Wahlic, and Ueli Schiblera,1
aDepartment of Molecular Biology, National Center of Competence in Research “Frontiers in Genetics,” Sciences III, University of Geneva, CH-1211Geneva 4, Switzerland; bDepartment of Pharmacology and Toxicology, University of Lausanne, CH-1005 Lausanne, Switzerland; cCenter for IntegrativeGenomics, National Center of Competence in Research “Frontiers in Genetics,” University of Lausanne, CH-1015 Lausanne, Switzerland; dLaboratory ofExperimental and Molecular Hepatology, Division of Gastroenterology and Hepatology, Department of Medicine, Medical University Graz, A-8036 Graz,Austria; and eLife Technologies, Carlsbad, CA 92008
Edited by Steven L. McKnight, University of Texas Southwestern, Dallas, TX, and approved February 4, 2011 (received for review April 7, 2010)
In mammals, many aspects of metabolism are under circadiancontrol. At least in part, this regulation is achieved by core-clockor clock-controlled transcription factors whose abundance and/oractivity oscillate during the day. The clock-controlled proline-and acidic amino acid-rich domain basic leucine zipper proteinsD-site-binding protein, thyrotroph embryonic factor, and hepaticleukemia factor have previously been shown to participate inthe circadian control of xenobiotic detoxification in liver and otherperipheral organs. Here we present genetic and biochemical evi-dence that the three proline- and acidic amino acid-rich basicleucine zipper proteins also play a key role in circadian lipid meta-bolism by influencing the rhythmic expression and activity of thenuclear receptor peroxisome proliferator-activated receptor α(PPARα). Our results suggest that, in liver, D-site-binding protein,hepatic leukemia factor, and thyrotroph embryonic factor contri-bute to the circadian transcription of genes specifying acyl-CoAthioesterases, leading to a cyclic release of fatty acids from thioe-sters. In turn, the fatty acids act as ligands for PPARα, and theactivated PPARα receptor then stimulates the transcription ofgenes encoding proteins involved in the uptake and/or metabolismof lipids, cholesterol, and glucose metabolism.
circadian clock ∣ liver lipid metabolism ∣ nuclear receptors
In mammals, energy homeostasis demands that anabolic andcatabolic processes are coordinated with alternating periods
of feeding and fasting. There is increasing evidence that inputsfrom the circadian clock are required in addition to acute regu-latory mechanisms to adapt metabolic functions to an animal’sdaily needs. For example, mice with disrupted hepatocyte clocksdisplay a hypoglycemia during the postabsorptive phase, suppo-sedly because hepatic gluconeogenesis and glucose delivery intothe bloodstream are dysregulated in these animals (1).
The regulation of lipid metabolism is also governed by aninteraction between acute and circadian regulatory mechanisms,and the three peroxisome proliferator-activated receptors(PPARα, PPARβ/δ, and PPARγ) play particularly important rolesin these processes (2). Among them, PPARα acts as a molecularsensor of endogenous fatty acids (FAs) and regulates the tran-scription of genes involved in lipid uptake and catabolism. More-over, it accumulates according to a daily rhythm and reachesmaximal levels around the beginning of feeding time (3, 4). Forliver and many other peripheral tissues, feeding–fasting rhythmsare the most dominant zeitgebers (timing cues) (5, 6). This ob-servation underscores the importance of the cross-talk betweenmetabolic and circadian cycles.
Circadian oscillators in peripheral tissues can participate in thecontrol of rhythmic metabolism through circadian transcriptionfactors, which in turn regulate the cyclic transcription of metabo-lically relevant downstream genes. The three PAR-domain basic
leucine zipper (PAR bZip) proteins, D-site-binding protein(DBP), thyrotroph embryonic factor (TEF), and hepatic leuke-mia factor (HLF), are examples of such output mediators (forreview, see ref. 7). Mice deficient of only one or two membersof the PAR bZip gene family display rather mild phenotypes,suggesting that the three members execute partially redundantfunctions. However, mice deficient of all three PAR bZip genes(henceforth called PAR bZip 3KO mice) have a dramaticallyreduced life span due to epileptic seizures (8) and impairedxenobiotic detoxification (9).
Genome-wide transcriptome profiling of wild-type and PARbZip 3KO mice has revealed differentially expressed genesinvolved in lipid metabolism, many of which are targets of thenuclear receptor PPARα. Here we present evidence for a pathwayin which PAR bZip transcription factors connect the accumula-tion and activity of PPARα to circadian oscillators in liver.
ResultsPparα Expression in PAR bZip 3KO Mice. Genome-wide microarraytranscriptome profiling studies with liver RNA from wild-typeand PAR bZip 3KO mice revealed differentially expressed genesinvolved in xenobiotic detoxification (9) and lipid metabolism(this paper). The latter included Pparα, a gene specifying anuclear receptor that is well known as a regulator of lipidmetabolism, and many PPARα target genes (10) (Fig. S1A). Wevalidated the reduced accumulation of Pparα mRNA and tran-scripts issued by PPARα target genes by using quantitativeRT-PCR analysis (Fig. 1 A and B and Fig. S1B). The examinedPPARα target genes include Cyp4a10 and Cyp4a14, encodingenzymes involved in FA ω-oxidation (whose expression is stronglyreduced in Pparα KO mice, see Fig. S2A), and genes specifyingenzymes involved in FA β-oxidation (Fig. S1B). PPARα has alsobeen shown to activate transcription from its own promoter, whenactivated by PPARα agonists (11). To evaluate the relevance ofthis feed-forward loop in circadian Pparα transcription, we com-pared the temporal expression of Pparα pre-mRNA in the liver ofwild-type mice with that of nonproductive pre-mRNA transcriptsissued by the disrupted Pparα alleles in Pparα KO mice (12). As
Author contributions: F.G., N.L., T.C., X.d.M.d.J., W.W., and U.S. designed research; F.G.,N.L., T.C., P.G., C.J., and F.F.O. performed research; X.d.M.d.J. contributed new reagents/analytic tools; F.G., N.L., T.C., W.W., and U.S. analyzed data; and F.G., W.W., and U.S. wrotethe paper.
The authors declare no conflict of interest.
This article is a PNAS Direct Submission.1To whom correspondence may be addressed. E-mail: [email protected] [email protected].
2Present address: Swiss Laboratory for Doping Analysis, CH-1066 Epalinges, Switzerland.
This article contains supporting information online at www.pnas.org/lookup/suppl/doi:10.1073/pnas.1002862108/-/DCSupplemental.
4794–4799 ∣ PNAS ∣ March 22, 2011 ∣ vol. 108 ∣ no. 12 www.pnas.org/cgi/doi/10.1073/pnas.1002862108
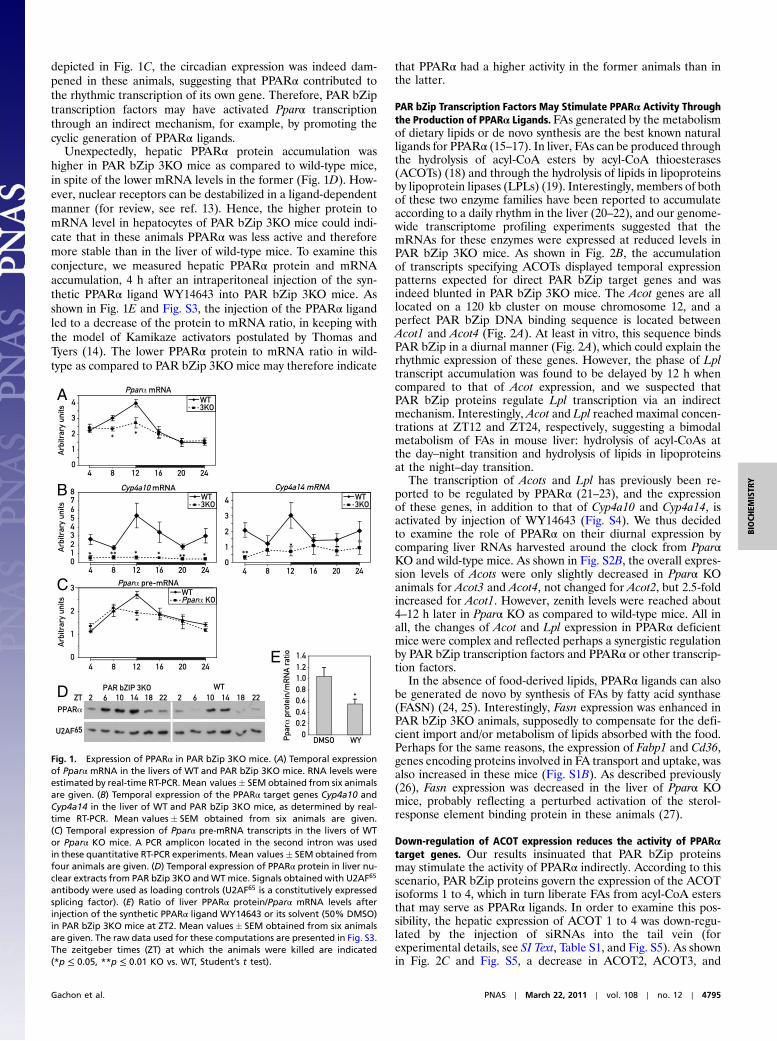
depicted in Fig. 1C, the circadian expression was indeed dam-pened in these animals, suggesting that PPARα contributed tothe rhythmic transcription of its own gene. Therefore, PAR bZiptranscription factors may have activated Pparα transcriptionthrough an indirect mechanism, for example, by promoting thecyclic generation of PPARα ligands.
Unexpectedly, hepatic PPARα protein accumulation washigher in PAR bZip 3KO mice as compared to wild-type mice,in spite of the lower mRNA levels in the former (Fig. 1D). How-ever, nuclear receptors can be destabilized in a ligand-dependentmanner (for review, see ref. 13). Hence, the higher protein tomRNA level in hepatocytes of PAR bZip 3KO mice could indi-cate that in these animals PPARα was less active and thereforemore stable than in the liver of wild-type mice. To examine thisconjecture, we measured hepatic PPARα protein and mRNAaccumulation, 4 h after an intraperitoneal injection of the syn-thetic PPARα ligand WY14643 into PAR bZip 3KO mice. Asshown in Fig. 1E and Fig. S3, the injection of the PPARα ligandled to a decrease of the protein to mRNA ratio, in keeping withthe model of Kamikaze activators postulated by Thomas andTyers (14). The lower PPARα protein to mRNA ratio in wild-type as compared to PAR bZip 3KO mice may therefore indicate
that PPARα had a higher activity in the former animals than inthe latter.
PAR bZip Transcription Factors May Stimulate PPARα Activity Throughthe Production of PPARα Ligands. FAs generated by the metabolismof dietary lipids or de novo synthesis are the best known naturalligands for PPARα (15–17). In liver, FAs can be produced throughthe hydrolysis of acyl-CoA esters by acyl-CoA thioesterases(ACOTs) (18) and through the hydrolysis of lipids in lipoproteinsby lipoprotein lipases (LPLs) (19). Interestingly, members of bothof these two enzyme families have been reported to accumulateaccording to a daily rhythm in the liver (20–22), and our genome-wide transcriptome profiling experiments suggested that themRNAs for these enzymes were expressed at reduced levels inPAR bZip 3KO mice. As shown in Fig. 2B, the accumulationof transcripts specifying ACOTs displayed temporal expressionpatterns expected for direct PAR bZip target genes and wasindeed blunted in PAR bZip 3KO mice. The Acot genes are alllocated on a 120 kb cluster on mouse chromosome 12, and aperfect PAR bZip DNA binding sequence is located betweenAcot1 and Acot4 (Fig. 2A). At least in vitro, this sequence bindsPAR bZip in a diurnal manner (Fig. 2A), which could explain therhythmic expression of these genes. However, the phase of Lpltranscript accumulation was found to be delayed by 12 h whencompared to that of Acot expression, and we suspected thatPAR bZip proteins regulate Lpl transcription via an indirectmechanism. Interestingly, Acot and Lpl reached maximal concen-trations at ZT12 and ZT24, respectively, suggesting a bimodalmetabolism of FAs in mouse liver: hydrolysis of acyl-CoAs atthe day–night transition and hydrolysis of lipids in lipoproteinsat the night–day transition.
The transcription of Acots and Lpl has previously been re-ported to be regulated by PPARα (21–23), and the expressionof these genes, in addition to that of Cyp4a10 and Cyp4a14, isactivated by injection of WY14643 (Fig. S4). We thus decidedto examine the role of PPARα on their diurnal expression bycomparing liver RNAs harvested around the clock from PparαKO and wild-type mice. As shown in Fig. S2B, the overall expres-sion levels of Acots were only slightly decreased in Pparα KOanimals for Acot3 and Acot4, not changed for Acot2, but 2.5-foldincreased for Acot1. However, zenith levels were reached about4–12 h later in Pparα KO as compared to wild-type mice. All inall, the changes of Acot and Lpl expression in PPARα deficientmice were complex and reflected perhaps a synergistic regulationby PAR bZip transcription factors and PPARα or other transcrip-tion factors.
In the absence of food-derived lipids, PPARα ligands can alsobe generated de novo by synthesis of FAs by fatty acid synthase(FASN) (24, 25). Interestingly, Fasn expression was enhanced inPAR bZip 3KO animals, supposedly to compensate for the defi-cient import and/or metabolism of lipids absorbed with the food.Perhaps for the same reasons, the expression of Fabp1 and Cd36,genes encoding proteins involved in FA transport and uptake, wasalso increased in these mice (Fig. S1B). As described previously(26), Fasn expression was decreased in the liver of Pparα KOmice, probably reflecting a perturbed activation of the sterol-response element binding protein in these animals (27).
Down-regulation of ACOT expression reduces the activity of PPARαtarget genes. Our results insinuated that PAR bZip proteinsmay stimulate the activity of PPARα indirectly. According to thisscenario, PAR bZip proteins govern the expression of the ACOTisoforms 1 to 4, which in turn liberate FAs from acyl-CoA estersthat may serve as PPARα ligands. In order to examine this pos-sibility, the hepatic expression of ACOT 1 to 4 was down-regu-lated by the injection of siRNAs into the tail vein (forexperimental details, see SI Text, Table S1, and Fig. S5). As shownin Fig. 2C and Fig. S5, a decrease in ACOT2, ACOT3, and
A
B
C
D
E
Fig. 1. Expression of PPARα in PAR bZip 3KO mice. (A) Temporal expressionof Pparα mRNA in the livers of WT and PAR bZip 3KO mice. RNA levels wereestimated by real-time RT-PCR. Mean values� SEM obtained from six animalsare given. (B) Temporal expression of the PPARα target genes Cyp4a10 andCyp4a14 in the liver of WT and PAR bZip 3KO mice, as determined by real-time RT-PCR. Mean values� SEM obtained from six animals are given.(C) Temporal expression of Pparα pre-mRNA transcripts in the livers of WTor Pparα KO mice. A PCR amplicon located in the second intron was usedin these quantitative RT-PCR experiments. Mean values� SEM obtained fromfour animals are given. (D) Temporal expression of PPARα protein in liver nu-clear extracts from PAR bZip 3KO andWTmice. Signals obtained with U2AF65
antibody were used as loading controls (U2AF65 is a constitutively expressedsplicing factor). (E) Ratio of liver PPARα protein/Pparα mRNA levels afterinjection of the synthetic PPARα ligand WY14643 or its solvent (50% DMSO)in PAR bZip 3KO mice at ZT2. Mean values� SEM obtained from six animalsare given. The raw data used for these computations are presented in Fig. S3.The zeitgeber times (ZT) at which the animals were killed are indicated(*p ≤ 0.05, **p ≤ 0.01 KO vs. WT, Student’s t test).
Gachon et al. PNAS ∣ March 22, 2011 ∣ vol. 108 ∣ no. 12 ∣ 4795
BIOCH
EMISTR
Y
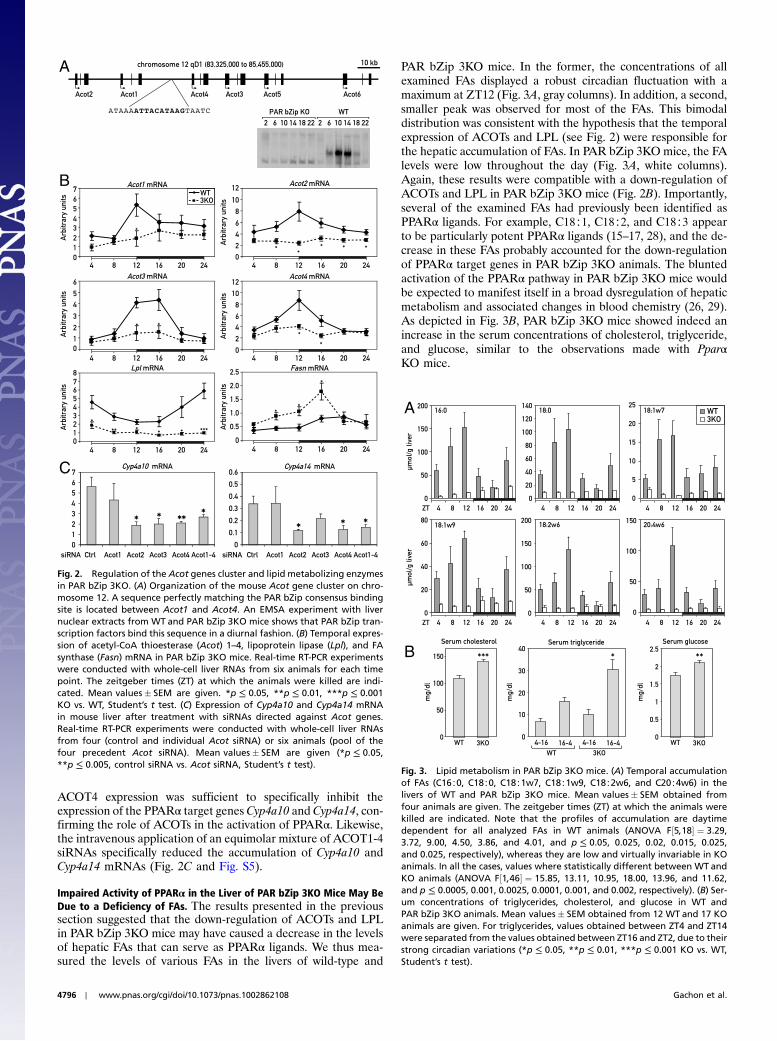
ACOT4 expression was sufficient to specifically inhibit theexpression of the PPARα target genesCyp4a10 and Cyp4a14, con-firming the role of ACOTs in the activation of PPARα. Likewise,the intravenous application of an equimolar mixture of ACOT1-4siRNAs specifically reduced the accumulation of Cyp4a10 andCyp4a14 mRNAs (Fig. 2C and Fig. S5).
Impaired Activity of PPARα in the Liver of PAR bZip 3KO Mice May BeDue to a Deficiency of FAs. The results presented in the previoussection suggested that the down-regulation of ACOTs and LPLin PAR bZip 3KO mice may have caused a decrease in the levelsof hepatic FAs that can serve as PPARα ligands. We thus mea-sured the levels of various FAs in the livers of wild-type and
PAR bZip 3KO mice. In the former, the concentrations of allexamined FAs displayed a robust circadian fluctuation with amaximum at ZT12 (Fig. 3A, gray columns). In addition, a second,smaller peak was observed for most of the FAs. This bimodaldistribution was consistent with the hypothesis that the temporalexpression of ACOTs and LPL (see Fig. 2) were responsible forthe hepatic accumulation of FAs. In PAR bZip 3KO mice, the FAlevels were low throughout the day (Fig. 3A, white columns).Again, these results were compatible with a down-regulation ofACOTs and LPL in PAR bZip 3KO mice (Fig. 2B). Importantly,several of the examined FAs had previously been identified asPPARα ligands. For example, C18∶1, C18∶2, and C18∶3 appearto be particularly potent PPARα ligands (15–17, 28), and the de-crease in these FAs probably accounted for the down-regulationof PPARα target genes in PAR bZip 3KO animals. The bluntedactivation of the PPARα pathway in PAR bZip 3KO mice wouldbe expected to manifest itself in a broad dysregulation of hepaticmetabolism and associated changes in blood chemistry (26, 29).As depicted in Fig. 3B, PAR bZip 3KO mice showed indeed anincrease in the serum concentrations of cholesterol, triglyceride,and glucose, similar to the observations made with PparαKO mice.
A
B
C
Fig. 2. Regulation of the Acot genes cluster and lipid metabolizing enzymesin PAR bZip 3KO. (A) Organization of the mouse Acot gene cluster on chro-mosome 12. A sequence perfectly matching the PAR bZip consensus bindingsite is located between Acot1 and Acot4. An EMSA experiment with livernuclear extracts from WT and PAR bZip 3KO mice shows that PAR bZip tran-scription factors bind this sequence in a diurnal fashion. (B) Temporal expres-sion of acetyl-CoA thioesterase (Acot) 1–4, lipoprotein lipase (Lpl), and FAsynthase (Fasn) mRNA in PAR bZip 3KO mice. Real-time RT-PCR experimentswere conducted with whole-cell liver RNAs from six animals for each timepoint. The zeitgeber times (ZT) at which the animals were killed are indi-cated. Mean values� SEM are given. *p ≤ 0.05, **p ≤ 0.01, ***p ≤ 0.001KO vs. WT, Student’s t test. (C) Expression of Cyp4a10 and Cyp4a14 mRNAin mouse liver after treatment with siRNAs directed against Acot genes.Real-time RT-PCR experiments were conducted with whole-cell liver RNAsfrom four (control and individual Acot siRNA) or six animals (pool of thefour precedent Acot siRNA). Mean values� SEM are given (*p ≤ 0.05,**p ≤ 0.005, control siRNA vs. Acot siRNA, Student’s t test).
A
B
Fig. 3. Lipid metabolism in PAR bZip 3KO mice. (A) Temporal accumulationof FAs (C16∶0, C18∶0, C18∶1w7, C18∶1w9, C18∶2w6, and C20∶4w6) in thelivers of WT and PAR bZip 3KO mice. Mean values� SEM obtained fromfour animals are given. The zeitgeber times (ZT) at which the animals werekilled are indicated. Note that the profiles of accumulation are daytimedependent for all analyzed FAs in WT animals (ANOVA F½5;18� ¼ 3.29,3.72, 9.00, 4.50, 3.86, and 4.01, and p ≤ 0.05, 0.025, 0.02, 0.015, 0.025,and 0.025, respectively), whereas they are low and virtually invariable in KOanimals. In all the cases, values where statistically different between WT andKO animals (ANOVA F½1;46� ¼ 15.85, 13.11, 10.95, 18.00, 13.96, and 11.62,and p ≤ 0.0005, 0.001, 0.0025, 0.0001, 0.001, and 0.002, respectively). (B) Ser-um concentrations of triglycerides, cholesterol, and glucose in WT andPAR bZip 3KO animals. Mean values� SEM obtained from 12 WT and 17 KOanimals are given. For triglycerides, values obtained between ZT4 and ZT14were separated from the values obtained between ZT16 and ZT2, due to theirstrong circadian variations (*p ≤ 0.05, **p ≤ 0.01, ***p ≤ 0.001 KO vs. WT,Student’s t test).
4796 ∣ www.pnas.org/cgi/doi/10.1073/pnas.1002862108 Gachon et al.

PAR bZip 3KO Mice Have an Impaired Capacity to Adapt to CaloricRestriction.A large number of genes induced by fasting are director indirect target genes of PPARα (30, 31), and Pparα KO micehave indeed difficulties in adapting to caloric restriction (29, 32–36). If the activation of the PPARα signaling was inhibited in PARbZip 3KO mice, one would expect that these animals would alsohave an impaired capacity to adjust their metabolism to reducedfood availability. In order to test this hypothesis, we exposed PARbZip 3KO mice to a feeding regimen in which the quantity offood was reduced to 60% of what these mice absorbed whenfood was offered ad libitum. As shown in Fig. S6, PAR bZip3KO mice subjected to this regimen suffered from a rapid anddramatic weight loss, as compared to wild-type mice. Howeverthis difference could not be attributed to a difference in energyexpenditure, as O2 consumption and CO2 production were nearlyidentical in wild-type and PAR bZip 3KO animals (Fig. S7). Wealso compared the food anticipatory activity (FAA) of wild-typeand PAR bZip 3KO mice (Fig. S8 A and B). FAA manifests itselfin the onset of enhanced locomotor activity (wheel-running) afew hours before the time when food becomes available. Whenfood availability was limited to a 6-h time span between ZT03to ZT09, PAR bZip 3KO mice displayed exacerbated FAA andactually shifted a large fraction of their wheel-running activityto this time window during the light phase. As expected, wild-typemice did show FAA but kept running the wheel mainly during thedark phase. These results suggested that the activity associatedwith food searching equaled or even dominated suprachiasmaticnucleus-driven locomotor activity in PAR bZip 3KO animalswhen food availability became limiting. Because PPARαKOmicedid not show enhanced FAA (Fig. S8C), the exacerbated FAAcannot have been caused solely by the impaired PPARαactivity in PAR bZip 3KO mice.
PPARα Ligands Can Be Generated from Food-Derived and de NovoSynthesized Lipids.As discussed above, PPARα ligands can be gen-erated from diet-derived lipids or de novo synthesis by FASN, andthe first pathway appeared to be deficient in PAR bZip 3KOmice. We wished to determine the expression of putative PPARαtarget genes and genes with key functions in the production ofPPARα ligands in wild-type and PAR bZip 3KO mice that werefed with a fat-free diet during an extended time span (5 wk). Un-der these conditions, FAs can be produced exclusively through denovo synthesis. As shown in Fig. 4A, the mRNAs of PPARα targetgenes Cyp4a10 andCyp4a14 accumulated to similar levels in wild-type and PAR bZip 3KO mice receiving a fat-free diet, unlikewhat had been observed in animals fed on normal chow. Thesimilar expression of these PPARα target genes in mice receivinga fat-free diet suggested that de novo synthesis of FAs servingas PPARα agonists was not affected by the absence PAR bZiptranscription factors, and Fasn mRNA was indeed expressedat similar levels in wild-type and PAR bZip 3KO mice receivingfat-free food. Hence, the fat-free diet rescued the deficiency ofPPARα activity in PAR bZip 3KO mice, presumably becausede novo synthesis of FAs in liver did not depend upon pathwaysrequiring the circadian PAR bZip proteins. This interpretationwas validated by our observation that the hepatic concentrationsof various FAs were similar in wild-type and PAR bZip 3KO miceexposed to a fat-free diet (Fig. S9). Interestingly, the expressionof Pparα and Acots was also rescued by the fat-free diet in PARbZip 3KO mice and, in keeping with earlier observations (11, 21,22), both of these genes were indeed activated by PPARα ligands.Lpl expression did not exhibit large differences between mice fedwith normal and fat-free chow. Similarly, blood glucose, choles-terol, and triglyceride levels were not significantly different be-tween wild-type and PAR bZip 3KO mice kept on a fat-freediet (Fig. 4B), unlike what we have observed for animals fed withnormal chow.
DiscussionPAR bZip Transcription Factors DBP, HLF, and TEF Regulate CircadianPPARα Activity. Here we present evidence for a metabolic clockoutput pathway operative in hepatocytes, which connects thePAR bZip transcription factors DBP, HLF, and TEF to the cir-cadian activity of PPARα. This nuclear receptor has long beenknown to play a key role in the coordination of lipid metabolismand, like several other nuclear receptors, it accumulates in a cir-cadian manner (3, 4). Our studies revealed that Pparα mRNAlevels were reduced in PAR bZip 3KO mice. However, PPARαprotein accumulated to higher than wild-type levels in theseanimals, presumably due to its reduced transactivation potential.
Our gene expression studies, combined with hepatic FAsmeasurements, offered a plausible biochemical pathway for thePAR bZip-dependent activation of PPARα , schematized in Fig. 5.PAR bZip proteins drive directly or indirectly the expressionof Acots and Lpl, which in turn release FAs from acyl-CoAesters and lipoproteins, respectively. FAs then serve as ligandsof PPARα and initiate a feed-forward loop, in which PPARαenhances transcription from its own gene. This scenario is sup-ported by our observation that the siRNA-mediated dampeningof ACOT2, ACOT3, and ACOT4 expression led to a down-reg-
Fig. 4. Effect of fat-free diet on PPARα target genes expression and serumbiochemistry (A) Mice were fed ad libitum during 5 wk with a fat-free diet.For each condition, four mice were killed at ZT0 and ZT12. Total liver RNAswere extracted and analyzed by real-time RT-PCR for the expression ofmRNAs specified by PPARα target genes and Fasn, a marker gene of lipogen-esis that is induced by the fat-free diet (#p ≤ 0.05, ##p ≤ 0.005, ###p ≤ 0.005fat-free vs. normal diet in 3KO; §p ≤ 0.05, §§p ≤ 0.01, §§§p ≤ 0.00005 fat-free vs normal diet in WT; *p ≤ 0.05 KO vs. WT, Student’s t test). (B) Serumconcentrations of triglycerides, cholesterol, and glucose were measured inWT and PAR bZip 3KO animals fed with regular or fat-free chow.Mean values� SEM obtained from eight WT and KO animals are given.For FAs, values obtained between ZT4 and ZT14 were separated from thevalues obtained between ZT16 and ZT2 (*p ≤ 0.05 fat-free vs. normal dietin 3KO).
Gachon et al. PNAS ∣ March 22, 2011 ∣ vol. 108 ∣ no. 12 ∣ 4797
BIOCH
EMISTR
Y

ulation of the expression of Cyp4a10 and Cyp4a14, two bona fidetarget genes of PPARα.
The accumulation cycles of Acots and Lpl mRNA had widelydifferent phases, yet both were strongly attenuated in PAR bZip3KO mice. Whereas the phase of Acot expression was compatiblewith that expected for direct PAR bZip target genes, Lpl mRNAreached maximal levels at a time (ZT24) when all three PAR bZipproteins were expressed at nadir values. We thus suspect thatLpl transcription was controlled by a complex pathway, in whichthe precise roles of PPARα and PAR bZip proteins remain tobe clarified. The temporal accumulation of most determinedFAs revealed a major peak at ZT12, when Acots were maximallyexpressed, and a minor peak at ZT24, when Lpl was maximallyexpressed. The control of FAs catabolism through oxidation andlipid uptake are major functions of PPARα. On first sight, the lowhepatic FAs levels in PAR bZip 3KO mice, in which PPARαactivity appeared to be blunted, was perhaps surprising. However,this apparent conundrum can be rationalized as follows. Free FAsare natural ligands for PPARα, and a minimal FA thresholdconcentration may thus be required for the activation of PPARα(15–17, 28). Moreover, acyl-CoA esters antagonize the activationof PPARα by free FAs (37, 38). Because, due to the reducedexpression of Acots in PAR bZip 3KO mice, these esters wereprobably less efficiently hydrolyzed, the ratio of free FAs toacyl-CoA esters is expected to be lower in these animals as com-pared to wild-type mice. The attenuation of PPARα activity inthe PAR bZip 3KO mice is expected to be associated with animpaired uptake of FAs from the blood (39–41).
PPARα expression has first been found to follow a daily rhythmby Lemberger et al. (3). Subsequently, Oishi et al. (42) demon-strated that the core-clock transcription factor CLOCK is re-quired for circadian Pparα transcription and that CLOCK bindsto a series of E-box sequences within the first intron. This regula-tion by CLOCK might explain why Pparα expression is stillcircadian in PAR bZip 3KO mice, albeit with reduced amplitudeand magnitude.
PPARα Target Gene Expression is Rescued in PAR bZip 3KO Mice Fedwith a Fat-Free Diet. In animals kept on a fat-free diet, hepatic FAsynthesis is strongly induced (43). We thus suspected that theintracellular availability of FAs rescued PPARα-mediated tran-
scription in PAR bZip 3KO mice. Indeed, the production ofmRNAs encoding enzymes implicated in FAs synthesis, such asFASN, was strongly induced in wild-type and PAR bZip 3KOmice receiving a fat-free diet. Furthermore, in contrast to micefed on a normal chow, PAR bZip 3KO and wild-type animals fedon a fat-free diet accumulated similar hepatic levels of mRNAsspecified by Pparα, and the putative PPARα target genes Cyp4a10and Cyp4a14. We did notice, however, that Acot expression,whose overall magnitude was only slightly changed in Pparα KOmice, was also rescued in PAR bZip 3KO mice kept on a fat-freediet. Hence, as previously suggested (21, 22), Acot transcriptionwas also augmented by PPARα, but probably required highconcentrations of natural ligands (i.e., FAs). It is noteworthythat 1-palmitoyl-2-oleoly-sn-glycerol-3-phosphocholine, whoseFASN-dependent synthesis was activated under a fat-free diet,has recently been discovered as a highly potent PPARα li-gand (24).
PAR bZip 3KO Mice Are Unable to Adapt to Restricted Feeding. Wild-type mice exposed to caloric restriction lost about 13% of theirbody mass during the first 3 wk and then kept their mass withinnarrow boundaries over several months. In contrast, PAR bZip3KO animals rapidly lost more than 20% of their weight andhad to be killed after about a week, because they probably wouldhave succumbed to wasting after this time period. At least in part,the failure of PAR bZip deficient mice may be due to a decreasedPPARα activity, as Pparα KO mice have been reported to adaptpoorly to calorie restriction (29, 32–36). However, not all pheno-types of PAR bZip 3KOmice related to feeding could be assignedto an impaired PPARα activity. Thus, in contrast to PAR bZip3KO mice, Pparα KO mice did not exhibit an exacerbated FAA.
The capacity to adapt activity and metabolism to feeding–fasting cycles is primary to an animal’s health and survival, andthe disruption of the circadian timing system has indeed beenlinked to obesity and other metabolic disorders (44–46).
Experimental ProceduresAnimal Housing Conditions. All animal studies were conducted inaccordance with the regulations of the veterinary office of theState of Geneva and of the State of Vaud. PAR bZip 3KO micewith disrupted Dbp, Tef, and Hlf genes (8) and mice with Pparαnull alleles (12) have been described previously. Mice were main-tained under standard animal housing conditions, with free accessto food and water, and a 12-h-light–12-h-dark cycle. Specifictreatments and feeding regimens are described in SI Text.
Blood Chemistry. Blood samples were harvested after decapitationof the animals, and sera were obtained by centrifugation ofcoagulated samples for 10 min at 2;000 × g at room temperature.The sera were stored at −20 °C until analyzed. Triglycerides andtotal cholesterol were measured using commercially available en-zymatic kits according to the manufacturer’s instructions (Trigly-ceride; Cholesterol; Roche/Hitachi Mannheim GmbH). Glucosewas measured using the glucose oxidase method adapted torodent (GO assay kit Sigma-Aldrich, Handels GmbH).
Liver FA Measurement: Mouse livers were homogenized in 0.5 mLof phosphate buffered saline and 0.5 mL of methanol. This pro-cedure inhibits triglycerides lipases and allows their elimination.Each sample was immediately spiked with 50 nmol of 15∶0 FAsas an internal standard. Subsequently, lipids were extractedaccording to Bligh and Dyer (47) and FAs were then measuredby GC-MS as described in SI Text.
RNA Isolation and Analysis. Livers were removed within 4 min afterdecapitation, frozen in liquid nitrogen, and stored at −70 °C untiluse. The extraction of whole-cell RNA and its analysis by real-time RT-PCR were conducted as described previously (8). The
Fig. 5. Model showing the regulation of PPARα bymetabolism and PAR bZiptranscription factors. (Left) Under normal diet conditions, the expression ofACOTs are under the control of circadian PAR bZip transcription factors.These transcription factors thus control the release of free FA from acyl-CoA thioesters, and the free FAs stimulate PPARα activity. The activatedPPARα then stimulates transcription of Acot and Lpl, and in a feed-forwardloop reinforces its own expression and activity. (Right) Under a fat-free diet,all free FAs are derived from the de novo synthesis pathway. Under theseconditions, PPARα activity is not dependent on PAR bZip transcription factors.
4798 ∣ www.pnas.org/cgi/doi/10.1073/pnas.1002862108 Gachon et al.

values were normalized to those obtained for Gapdh mRNA.Sequences of the oligonucleotides used are given in Table S2.
Preparation of Nuclear Protein Extracts and Western Blotting. Livernuclear proteins were prepared by using the NaCl-Urea-NP40procedure (48). Western blotting was carried out as described(9). The rabbit anti-PPARα and murine anti-U2AF65 antibodieswere purchased from Cayman Chemical and Sigma, respectively.
ACKNOWLEDGMENTS. We thank Nicolas Roggli for the artwork, and JoelGyger and Bernard Thorens from the Mouse Metabolic Facility of the Univer-sity of Lausanne for indirect calorimetry experiments. This research wassupported by the Swiss National Science Foundation through individualresearch grants (U.S., W.W., and F.G.) and the National Center of Competencein Research Program Frontiers in Genetics (U.S. and W.W.), the Cantons ofGeneva and Vaud, The Louis Jeantet Foundation of Medicine, the Bonizzi-Theler-Stiftung (U.S. and W.W.), and the Sixth European Framework ProjectEUCLOCK (U.S.).
1. Lamia KA, Storch K-F, Weitz CJ (2008) Physiological significance of a peripheral tissuecircadian clock. Proc Natl Acad Sci USA 105:15172–15177.
2. Desvergne B, Michalik L, Wahli W (2006) Transcriptional regulation of metabolism.Physiol Rev 86:465–514.
3. Lemberger T, et al. (1996) Expression of the peroxisome proliferator-activatedreceptor α gene is stimulated by stress and follows a diurnal rhythm. J Biol Chem271:1764–1769.
4. Yang X, et al. (2006) Nuclear receptor expression links the circadian clock to metabo-lism. Cell 126:801–810.
5. Damiola F, et al. (2000) Restricted feeding uncouples circadian oscillators in peripheraltissues from the central pacemaker in the suprachiasmatic nucleus. Genes Dev14:2950–2961.
6. Stokkan K-A, Yamazaki S, Tei H, Sakaki Y, Menaker M (2001) Entrainment of thecircadian clock in the liver by feeding. Science 291:490–493.
7. Gachon F (2007) Physiological function of PARbZip circadian clock-controlled transcrip-tion factors. Ann Med 39:562–571.
8. Gachon F, et al. (2004) The loss of circadian PAR bZip transcription factors results inepilepsy. Genes Dev 18:1397–1412.
9. Gachon F, Fleury Olela F, Schaad O, Descombes P, Schibler U (2006) The circadianPAR-domain basic leucine zipper transcription factors DBP, TEF, and HLF modulatebasal and inducible xenobiotic detoxification. Cell Metab 4:25–36.
10. Leuenberger N, Pradervand S,Wahli W (2009) Sumoylated PPARαmediates sex-specificgene repression and protects the liver from estrogen-induced toxicity in mice. J ClinInvest 119:3138–3148.
11. Pineda Torra I, Jamshidi Y, Flavell DM, Fruchart J-C, Staels B (2002) Characterization ofthe human PPARα promoter: Identification of a functional nuclear receptor responseelement. Mol Endocrinol 16:1013–1028.
12. Lee SS, et al. (1995) Targeted disruption of the α isoform of the peroxisome prolifera-tor-activated receptor gene in mice results in abolishment of the pleiotropic effects ofperoxisome proliferators. Mol Cell Biol 15:3012–3022.
13. Rochette-Egly C (2005) Dynamic combinatorial networks in nuclear receptor-mediatedtranscription. J Biol Chem 280:32565–32568.
14. Thomas D, Tyers M (2000) Transcriptional regulation: Kamikaze activators. Curr Biol 10:R341–R343.
15. Forman BM, Chen J, Evans RM (1997) Hypolipidemic drugs, polyunsaturated fattyacids, and eicosanoids are ligands for peroxisome proliferator-activated receptors αand δ. Proc Natl Acad Sci USA 94:4312–4317.
16. Kliewer SA, et al. (1997) Fatty acids and eicosanoids regulate gene expression throughdirect interactions with peroxisome proliferator-activated receptors α and γ. Proc NatlAcad Sci USA 94:4318–4323.
17. Krey G, et al. (1997) Fatty acids, eicosanoids, and hypolipidemic agents identifiedas ligands of peroxisome proliferator-activated receptors by coactivator-dependentreceptor ligand assay. Mol Endocrinol 11:779–791.
18. Hunt MC, Alexson SEH (2002) The role Acyl-CoA thioesterases play in mediatingintracellular lipid metabolism. Prog Lipid Res 41:99–130.
19. Ziouzenkova O, et al. (2003) Lipolysis of triglyceride-rich lipoproteins generates PPARligands: Evidence for an antiinflammatory role for lipoprotein lipase. Proc Natl AcadSci USA 100:2730–2735.
20. Benavides A, Siches M, Llobera M (1998) Circadian rhythms of lipoprotein lipaseand hepatic lipase activities in intermediate metabolism of adult rat. Am J Physiol275:R811–817.
21. Hunt MC, et al. (2000) Involvement of the peroxisome proliferator-activated receptorα in regulating long-chain acyl-CoA thioesterases. J Lipid Res 41:814–823.
22. Hunt MC, Solaas K, Kase BF, Alexson SEH (2002) Characterization of an Acyl-CoAthioesterase that functions as a major regulator of peroxisomal lipid metabolism.J Biol Chem 277:1128–1138.
23. Schoonjans K, et al. (1996) PPARα and PPARγ activators direct a distinct tissue-specific transcriptional response via a PPRE in the lipoprotein lipase gene. EMBO J15:5336–5348.
24. Chakravarthy MV, et al. (2009) Identification of a physiologically relevant endogenousligand for PPARα in liver. Cell 138:476–488.
25. ChakravarthyMV, et al. (2005) “New” hepatic fat activates PPARα to maintain glucose,lipid, and cholesterol homeostasis. Cell Metab 1:309–322.
26. Patel DD, Knight BL, Wiggins D, Humphreys SM, Gibbons GF (2001) Disturbances inthe normal regulation of SREBP-sensitive genes in PPARα-deficient mice. J Lipid Res42:328–337.
27. Knight BL, et al. (2005) A role for PPARα in the control of SREBP activity and lipidsynthesis in the liver. Biochem J 389:413–421.
28. Lin Q, Ruuska SE, Shaw NS, Dong D, Noy N (1999) Ligand selectivity of the peroxisomeproliferator-activated receptor α. Biochemistry 38:185–190.
29. Hashimoto T, et al. (2000) Defect in peroxisome proliferator-activated receptorα-inducible fatty acid oxidation determines the severity of hepatic steatosis inresponse to fasting. J Biol Chem 275:28918–28928.
30. Bauer M, et al. (2004) Starvation response in mouse liver shows strong correlationwith life-span-prolonging processes. Physiol Genomics 17:230–244.
31. Corton JC, et al. (2004)Mimetics of caloric restriction include agonists of lipid-activatednuclear receptors. J Biol Chem 279:46204–46212.
32. Badman MK, et al. (2007) Hepatic fibroblast growth factor 21 is regulated byPPARα and is a key mediator of hepatic lipid metabolism in ketotic states. Cell Metab5:426–437.
33. Inagaki T, et al. (2007) Endocrine regulation of the fasting response by PPARα-mediated induction of fibroblast growth factor 21. Cell Metab 5:415–425.
34. Kersten S, et al. (1999) Peroxisome proliferator-activated receptor α mediates theadaptive response to fasting. J Clin Invest 103:1489–1498.
35. Lee SST, et al. (2004) Requirement of PPARα in maintaining phospholipid andtriacylglycerol homeostasis during energy deprivation. J Lipid Res 45:2025–2037.
36. Leone TC, Weinheimer CJ, Kelly DP (1999) A critical role for the peroxisome prolifera-tor-activated receptor α (PPARα) in the cellular fasting response: The PPARα-nullmouse as a model of fatty acid oxidation disorders. Proc Natl Acad Sci USA96:7473–7478.
37. Elholm M, et al. (2001) Acyl-CoA esters antagonize the effects of ligands on peroxi-some proliferator-activated receptor α conformation DNA binding, and interactionwith co-factors. J Biol Chem 276:21410–21416.
38. Jørgensen C, et al. (2002) Opposing effects of fatty acids and Acyl-CoA esters on con-formation and cofactor recruitment of peroxisome proliferator-activated receptors.Ann N Y Acad Sci 967:431–439.
39. Bremer J (2001) The biochemistry of hypo- and hyperlipidemic fatty acid derivatives:Metabolism and metabolic effects. Prog Lipid Res 40:231–268.
40. Fruchart J-C, Duriez P (2006)Mode of action of fibrates in the regulation of triglycerideand HDL-cholesterol metabolism. Drugs Today 42:39–64.
41. Martin G, Schoonjans K, Lefebvre A-M, Staels B, Auwerx J (1997) Coordinate regula-tion of the expression of the fatty acid transport protein and Acyl-CoA synthetasegenes by PPARα and PPARγ activators. J Biol Chem 272:28210–28217.
42. Oishi K, Shirai H, Ishida N (2005) CLOCK is involved in the circadian transactivation ofperoxisome-proliferator-activated receptor α (PPARα) in mice. Biochem J 386:575–581.
43. Towle HC, Kaytor EN, Shih H-M (1997) Regulation of the expression of lipogenicenzyme genes by carbohydrate. Annu Rev Nutr 17:405–433.
44. Buijs RM, Kreier F (2006) The metabolic syndrome: A brain disease? J Neuroendocrinol18:715–716.
45. Staels B (2006) When the clock stops ticking, metabolic syndrome explodes. Nat Med12:54–55.
46. Turek FW, et al. (2005) Obesity and metabolic syndrome in circadian clock mutantmice. Science 308:1043–1045.
47. Bligh EG, DyerWJ (1959) A rapid method of total lipid extraction and purification. CanJ Biochem Physiol 37:911–917.
48. Lavery D, Schibler U (1993) Circadian transcription of the cholesterol 7 α hydroxylasegene may involve the liver-enriched bZIP protein DBP. Genes Dev 7:1871–1884.
Gachon et al. PNAS ∣ March 22, 2011 ∣ vol. 108 ∣ no. 12 ∣ 4799
BIOCH
EMISTR
Y

Supporting InformationGachon et al. 10.1073/pnas.1002862108SI Experimental ProceduresAnimal Experiments. WY14643 treatment by intraperitoneal injection.Two groups of six proline- and acidic amino acid-richdomain basic leucine zipper (PAR bZip) 3KO male mice wereinjected intraperitoneally at ZT2 with 100 mg∕Kg WY14643(Biomol International) (10 mg∕mL in 50% DMSO) or theequivalent volume of vehicle. Four hours after injection, micewere killed and livers were removed and snap-frozen in liquidnitrogen, or immediately processed for the purification of thenuclear proteins used in the immunoblot experiments.
In vivo siRNA treatment. Chemically modified Stealth RNAi™ siR-NA duplexes (Invitrogen) complementary to the four Acots geneswere complexed with Invivofectamine® 2.0 (Invitrogen) accord-ing to manufacturer recommendation before the injection. Foreach of the four examined acyl-CoA thioesterases (Acots 1–4),six siRNAs with different sequences were tested in two differentmice, and the one yielding maximal suppression was selected forthe experiments shown in Fig. 2C and Fig. S5. The sequences ofthese siRNA are given in Table S1. The solution containing con-trol siRNA (an siRNA with sequences that do not target any geneproduct that have been tested by microarray analysis and shownto have minimal effects on gene expression), individual Acot siR-NAs, or an equimolar mix of the four Acot siRNAs were injectedintravenously through the tail vein of 8-wk-old Balb/c mice atZT12 at a dose of 7 mg∕kg. Forty-eight hours after the injection,mice were killed and livers were removed and snap-frozen inliquid nitrogen, and stored at −70 °C before RNA was extracted.
Calorie restriction. PAR bZip 3KO mice and wild-type siblings(nine KOs and seven wild-type 7—9-wk-old male mice) were fedregular chow (ref 3800 from Provimi Kliba. Diet composition:24% protein, 47.5% carbohydrate, 4.9% fat) ad libitum forat least 3 mo. Mice were then separated (by placing them intoindividual cages) and fed with powdered food that was deliveredby a computer-driven feeding machine (1). Average food con-sumption was determined to be 4.2 g per day, per mouse foranimals fed ad libitum with regular chow, and this value was usedas the normal diet control value in the caloric restriction studies.The animals were then subjected to a calorie diet reduced by 40%(i.e., 2.52 g per day, per animal, distributed into 20 daily portionsdelivered every 30 min between ZT12 and ZT22). The animalswere weighed twice a week in the morning for 11 wk.
Temporally restricted feeding. Servings of 3.4 g powdered chow(80% of the normal diet control value) were offered in 12portions between ZT03 and ZT09 by a computer-driven feedingmachine (1). The wheel-running activities of the animals wererecorded as described previously (2).
Fat-free feeding regimen.Eight-week-old PAR bZip 3KO mice andwild-type siblings (four males and four females of each genotype)were fed with regular chow ad libitum for at least 3 mo. The foodwas then replaced by a fat-free diet (TD.03314 from HarlanTeklad. Diet composition: 20.1% protein, 62.9% carbohydrate,0% fat) for 5 wk.
Electromobility Shift Assay. The radiolabeled probe was preparedby annealing two oligonucleotides encompassing the PAR bZipbinding site present in the Acot genes cluster and by filling inthe 5′ overhang with [α-32P]dCTP and Klenow DNA polymerase.The sequences of these oligonucleotides were 5′-CCATAAAAT-TACATAAG-3′ and 5′-TTGATTACTTATGTAATTTTATGG-3′.Twenty micrograms of liver nuclear extract were incubated with100 fmol of the double-stranded oligonucleotide in a 20-μL reac-tion containing 25 mM Hepes (pH 7.6), 60 mM KCl, 5 mMMgCl2, 0.1 mM EDTA, 7.5% glycerol, 1 mM DTT, 1 μg∕μLsalmon sperm DNA. After an incubation of 10 min at roomtemperature, 2 μL of a 15% Ficoll solution were added, andthe protein–DNA complexes were separated on a 5% polyacry-lamide gel in 0.25 × TBE (90 mM Tris/64.6 mM boric acid/2.5mM EDTA, pH 8.3).
GC-MS Determination of Fatty Acids (FAs) Concentrations. Lipid ex-tracts were taken to dryness in a speed-vac evaporator and resus-pended in 240 μL of 50% wt/vol KOH and 800 μL ethanol for thealkaline hydrolysis of lipids. After a 60-min incubation at 75 °C,FAs were extracted with 1 mL of water and 2 mL of hexane. Thehexane phase was taken to dryness and redissolved in 50 μL of apentafluoro-benzyl bromide solution (3.4% in acetonitrile) and10 μL of N;N-diisopropyl ethanolamine. After 10 min of incuba-tion at room temperature, samples were evaporated under agentle stream of nitrogen and resuspended in 50 μL hexane.
A Trace-DSQ GC-MS (Thermo Scientific) equipped with aTR5MS 30-m column was used for the mass-spectrometric ana-lysis of lipids by gas chromatography. Helium was used as carriergas at 1 mL∕min in splitless mode at 300 °C injector temperature.The initial oven temperature of 150 °C was held for 1 min andthen the temperature first was ramped up to 200 °C at a rateof 25 °C∕min, which was followed by a ramp of 12.5 °C∕minup to 325 °C, where the temperature was held for another 2 min.The mass spectrometer was run in negative ion chemical ioniza-tion mode where the FAs were detected in full scan as carboxy-lates after loss of the pentafluoro-benzyl moiety. Methane wasused as CI gas, the source temperature was set to 250 °C, andthe transfer line temperature was 330 °C. Peak areas for FAs werecalculated by Xcalibur QuanBrowser and related to the internalstandard peak area.
1. van der Veen DR, et al. (2006) Impact of behavior on central and peripheral circadianclocks in the common vole Microtus arvalis, a mammal with ultradian rhythms. ProcNatl Acad Sci USA 103:3393–3398.
2. Lopez-Molina L, Conquet F, Dubois-Dauphin M, Schibler U (1997) The DBP geneis expressed according to a circadian rhythm in the suprachiasmatic nucleus andinfluences circadian behavior. EMBO J 16:6762–6771.
Gachon et al. www.pnas.org/cgi/doi/10.1073/pnas.1002862108 1 of 7

A
B
Fig. S1. Hepatic expression of peroxisome proliferator-activated receptors α (PPARα) target genes in PAR bZip 3KO mice. (A) Microarray data obtained withPAR bZip 3KO mouse liver RNA (1) were compared to data obtained with Pparα KOmouse liver RNA (2). Genes down-regulated in both genotypes with regardto their wild-type counterparts are listed. The table corresponds to the list of genes down-regulated more than 1.25-fold in at least one of the KO genotypes(when compared to strain-matched wild-type mice). (B) Temporal hepatic expression of genes coding for enzymes involved in peroxisomal FA β-oxidation[acyl-CoA oxidase 1 (Acox1) and acyl-CoA acyltransferase 1B or thiolase B (Acaa1b)], mitochondrial FA β-oxidation [carnitine palmitoyltransferase 1 (Cpt1)and mitochondrial medium-chain acyl-CoA dehydrogenase (Acadm)], and FA binding and transport [FA-binding protein 1 (Fabp1) or liver FA-binding protein(L-FABP)] and CD36 (Cd36)] in wild-type and PAR bZip 3KO mice, as determined by real-time RT-PCR. Mean values� SEM obtained from four animals are given(*p ≤ 0.05, **p ≤ 0.01, KO vs. WT, Student’s t test). As for Cyp4a genes, the PPARα target genes coding for enzymes involved in FA β-oxidation are also down-regulated [Acox1, Acaa1b (see also Fig. S1A for these genes) and Cpt1] or not changed (Acadm) in the liver of PAR bZip 3KO mice. Interestingly, the genescoding for proteins involved in the FA transport exhibit an increased expression in PAR bZip 3KO mice, confirming previously published microarray data (1).Similar to what has been observed for Fasn expression, the increased expression of these genes is probably an indirect consequence of the disrupted FAmetabolism in PAR bZip 3KO mice, perhaps to compensate for the deficient import and/or metabolism of lipids absorbed with the food.
1 Gachon F, Fleury Olela F, Schaad O, Descombes P, Schibler U (2006) The circadian PAR-domain basic leucine zipper transcription factors DBP, TEF, and HLF modulate basal and inducible
xenobiotic detoxification. Cell Metab 4:25–36.2 Leuenberger N, Pradervand S, Wahli W (2009) Sumoylated PPARa mediates sex-specific gene repression and protects the liver from estrogen-induced toxicity in mice. J Clin Invest
119:3138–3148.
Gachon et al. www.pnas.org/cgi/doi/10.1073/pnas.1002862108 2 of 7

A
B
Fig. S2. Temporal expression of the PPARα target genes Cyp4a10 and Cyp4a14 in the liver of Pparα KO andwild-type mice. (A) Temporal expression of Cyp4a10and Cyp4a14 in the liver of wild-type and PparαKOmice. (B) Temporal expression ofAcot 1–4, lipoprotein lipase (Lpl), and FA synthase (Fasn) mRNA in wild-typeand Pparα KO mice. Real-time RT-PCR experiments were conducted with whole-cell liver RNAs from four animals for each time point. The zeitgeber times (ZT)at which the animals were killed are indicated. Mean values� SEM obtained from four animals are given (*p ≤ 0.05, **p ≤ 0.01, ***p ≤ 0.001 KO vs. WT,Student’s t test).
Fig. S3. PPARα protein/mRNA ratio after the activation of PPARα by its synthetic ligandWY14643. Six PAR bZip 3KOmice were injected intraperitoneally withDMSO (Left) or PPARα ligand WY14643 (100 mg∕kg) (Right) at ZT2. Livers were harvested 4 h later, and nuclear proteins and whole-cell RNAs were extracted.The PPARα protein levels were quantified byWestern blot experiments (Upper), and PparαmRNAwas quantified by real-time RT-PCR (Center). Individual ratiosbetween liver PPARα protein and Pparα mRNA are plotted in the lower panel. The mean values� SEM are given in Fig. 1E.
Gachon et al. www.pnas.org/cgi/doi/10.1073/pnas.1002862108 3 of 7

Fig. S4. Activation of hepatic Cyp4a, Acots, and Lpl expression after injection of the PPARα activator WY14643. Six PAR bZip 3KO male mice were injectedintraperitoneally with DMSO or PPARα ligand WY14643 (100 mg∕kg) at ZT2. Livers were harvested 4 h later, and whole-cell RNAs wereextracted. ThemRNAs of the indicated genes were quantified by real-time RT-PCR. Mean values� SEM are given (*p ≤ 0.05, **p ≤ 0.005, ***p ≤ 0.0005DMSOvs. WY14643 injection, Student’s t test).
Fig. S5. Effect of ACOT siRNA on Acot genes and non-PPARα regulated genes expression. (A) Accumulation of Acot mRNAs in mouse liver 48 h after thetreatment with siRNA directed against Acot genes. The siRNAs act mainly by decreasing the levels of their target mRNA (1), and the cellular concentrations ofAcot1, Acot2, and Acot4mRNAwere indeed reduced to 10% to 50% after the injection of their respective siRNAs. None of the six examined Acot3 siRNAs (seeSI Experimental Procedures) reduced its target mRNA significantly, yet three of them did lower the expression of the PPARα target genes Cyp4a10 and Cyp4a14.A similar observation was made for the mix of the four Acot siRNAs. Indeed, it has recently be shown that siRNAs, similar to miRNAs, can also act by inhibitingtranslation of their target mRNA, without reducing the levels of their target mRNAs (2, 3). This phenomenon could explain the observation that Acot3 siRNAand the mix of the four Acot siRNAs strongly reduced the expression of Cyp4a10 and Cyp4a14. (B) Expression of genes involved in lipid metabolism (Srebp2 andLdlr), two transcripts whose levels were similar in wild-type and PPARα or PAR bZip 3KOmice (4–6). Note that neither individual Acot siRNAs nor the mix of thefour Acot siRNAs significantly affected the accumulation of Srebp2 and Ldlr mRNAs. These results support the specificity of the effect of the Acot siRNAs forPPARα target genes. Real-time RT-PCR experiments were conducted with whole-cell liver RNAs from four (control and individual Acot siRNAs) or six animals(pool of the four precedent Acot siRNAs). Mean values� SEM are given (*p ≤ 0.05, **p ≤ 0.01, ***p ≤ 0.001 control siRNA vs. Acot siRNAs, Student’s t test).
1 Guo H, Ingolia NT, Weissman JS, Bartel DP (2010) Mammalian microRNAs predominantly act to decrease target mRNA levels. Nature 466:835–840.
2 Davidson TJ, et al. (2004) Highly efficient small interfering RNA delivery to primary mammalian neurons induces microRNA-like effects before mRNA degradation. J Neurosci
24:10040–10046.3 Tang G (2005) siRNA and miRNA: An insight into RISCs. Trends Biochem Sci 30:106–114.4 Gachon F, Fleury Olela F, Schaad O, Descombes P, Schibler U (2006) The circadian PAR-domain basic leucine zipper transcription factors DBP, TEF, and HLF modulate basal and inducible
xenobiotic detoxification. Cell Metab 4:25–36.5 Knight BL, et al. (2005) A role for PPARa in the control of SREBP activity and lipid synthesis in the liver. Biochem J 389:413–421.6 Patel DD, Knight BL, Wiggins D, Humphreys SM, Gibbons GF (2001) Disturbances in the normal regulation of SREBP-sensitive genes in PPARa-deficient mice. J Lipid Res 42:328–337.
Gachon et al. www.pnas.org/cgi/doi/10.1073/pnas.1002862108 4 of 7

Fig. S6. Response of PAR bZip 3KO mice to caloric restriction. Wild-type (black line) and PAR bZip 3KO (dotted line) animals were fed with a diet containingonly 60% of the normal calorie consumption during 11 consecutive weeks. Animals were weighed twice a week during this period. Mean relative weightchanges� SEM obtained from seven wild-type and nine KO animals are given.
Fig. S7. PAR bZip 3KO mice display normal O2 consumption and CO2 production. Oxygen consumption (VO2) and carbon dioxide production (VCO2) weremeasured by indirect calorimetry with the Comprehensive Lab Animal Monitoring System (Columbus Instruments). After 3 d of accommodation, VO2 (A) andVCO2 (B) were recorded during a 24-h period. Mean values� SD obtained from four animals of each genotype are given.
Gachon et al. www.pnas.org/cgi/doi/10.1073/pnas.1002862108 5 of 7

A
B
C
Fig. S8. Food anticipatory activities (FAA) of wild-type, PAR bZip 3KO, and Pparα KO mice. (A) Examples of FAA recordings of wild-type (Left) and PAR bZip3KO (Right) mice. Animals received 80% of their normal food consumption between ZT3 and ZT9 for the duration of the experiment. (B) Percentage meanactivity during a 24-h period for animals subjected to temporally restricted feeding. Mean values� SEM obtained from four animals of each genotype(recorded between day 10 and day 20 after the onset of restricted feeding) are given. The areas under which values are significantly different (Student’st test p values ≤0.05) between PAR bZip 3KO and wild-type mice are indicated by black lines on top of the figure. (C) Examples of FAA of wild-type (Left)and Pparα KO (Right) mice. Animals received 80% of their normal food consumption between ZT3 and ZT9 for the duration of the experiment.
Gachon et al. www.pnas.org/cgi/doi/10.1073/pnas.1002862108 6 of 7

Fig. S9. Liver FA levels in mice exposed to a fat-free diet. Concentrations of FAs (C16∶0, C18∶0, C18∶1w9, C18∶1w11, C18∶2, and C20∶4) in the liver of wild-typeand PAR bZip 3KOmice at ZT0 and ZT12. Mean values� SEM obtained for four animals are given. In none of the cases did we detect statistically different valueswith regard to either daytime or genotype.
Table S1. Sequences of the primers used for real-time PCR
Gene Forward primer Reverse primer
Pparα intron 1 TGGCCCCAACAGTAGGGTAG TGGAGGGCAGAGACATAGGGCyp4a10 GGAGCTCCAATGTCTGAGAAGAGT TCTCTGGAGTATTCTTCTGAAAAAGGTCyp4a14 TCTCTGGCTTTTCTGTACTTTGCTT CAGAAAGATGAGATGACAGGACACAAcot1 GACTGGCGCATGCAGGAT CCAGTTTCCATAGAACGTGCTTTAcot2 CAAGCAGGTTGTGCCAACAG GAGCGGCGGAGGTACAAACAcot3 GGTGGGTGGTCCTGTCATCT TGTCTTCTTTTTGCCATCCAAATAcot4 GGCCTTGAACTCACAGGGATT AGGTAGGGCCGAGCCTTTAAAcox1 GGATGGTAGTCCGGAGAACA AGTCTGGATCGTTCAGAATCAAGAcaab1 (Thiolase B) TCCAGGACGTGAAGCTAAAGC CATTGCCCACGGAGATGTCCpt1 CCTGGGCATGATTGCAAAG ACGCCACTCACGATGTTCTTCAcadm (Mcad) AGCTGCTAGTGGAGCACCAAG TCGCCATTTCTGCGAGCFabp1 (L-Fabp) CCAGGAGAACTTTGAGCCATTC TGTCCTTCCCTTTCTGGATGACd36 GATGACGTGGCAAAGAACAG TCCTCGGGGTCCTGAGTTATSrebp2 GCGTTCTGGAGACCATGGA ACAAAGTTGCTCTGAAAACAAATCALdlr TGGGCTCCATAGGCTATCTG GCCACCACATTCTTCAGGTT
For the other genes, we used the following designed primers from Applied Biosystems: GapdhMm99999915_g1; Pparα Mm00440939_m1; Lpl Mm00434770_m1; Fasn Mm01253300_g1.
Table S2. Sequences of Acot siRNA
Gene Sequence
Acot1 AGCUCUUCUUGUCUACCAGAGGGCUAcot2 CCCAAGAGCAUAGAAACCAUGCACAAcot3 GAACCCGAACCGGAUGGCACCUACUAcot4 CAACGUCAUAGAAGUGGACUACUUU
Gachon et al. www.pnas.org/cgi/doi/10.1073/pnas.1002862108 7 of 7

63
B. Sterol Carrier Protein 2 dependent diurnal lipid transport
modulates rhythmic activation of signaling pathways in mouse
liver
Lipid trafficking and especially cholesterol trafficking is involved in the activation of TORC1
pathway301
. Cholesterol, major constituent of the cellular membranes, is known to confer
fluidity and impermeability on them. As an essential component of the lipid rafts/caveolae302
,
it is involved in signal transduction303
. These lipid rafts/caveolae are plasma membrane
microdomains highly dynamics and enriched in sphingolipids, strerols such as cholesterol and
certain lipid-anchored proteins304
. These lipid rafts/caveolae are involved in the
compartmentalized cellular processes305, as they are the preferential site of receptors whose
activation leads to the activation of different signaling pathways like the PI3K/AKT and
ERK/MAPK306-308
.
Cells have two sources of cholesterol301
. One source is endogen as the cholesterol can be
synthesized in the endoplasmic reticulum. The second cholesterol source is exogen, originates
by food intake, and results in the internalization of cholesterol mediated by the LDL (Low-
Density-Lipoproteins) endocytosis. Intracellular cholesterol trafficking of both sources
requires transport proteins to reach their action localization in the plasma membrane and more
precisely in microdomains termed lipid raft/caveolae. Here we will focus on SCP (Sterol
Carrier Protein) 2, also known as non-specific lipid transfer protein.
As mentioned above, de novo cholesterol is synthesized in endoplasmic reticulum and must
be transported to its action location at the inner leaflet of the plasma membrane309
. SCP2
exhibits a diurnal expression pattern310
. Its role in cholesterol metabolism is not completely
established but some evidence shows that SCP2 is localized in the cytoplasm and is involved

64
in de novo cholesterol transport from the endoplasmic reticulum to the plasma membrane311,
312.
In this study, we confirm SCP2 diurnal expression without exhibiting rhythmic mRNA
transcription or translation. This suggests that degradation of this protein could be
rhythmically in wild-type mouse liver. In Bmal1 knockout mice, Scp2 mRNA expression
appeared higher as well as its protein expression with an anticipated manner. Even Scp2
mRNA expression appeared similar in wild-type and Cry1/2 knockout mice, the differences
observed at the protein level showed the impact of the molecular clock for SCP2 expression in
mouse liver.
Investigations on the effects of Scp2 deletion on circadian physiology showed that Scp2 KO
mice present a longer period in locomotor activity accompanied by lower night and day
activities. In addition, while no significant differences appeared at both mRNA and protein
levels for most of the circadian machinery factors despite a delayed Dbp expression, we
described decreased amplitude of BMAL1 expression as well as higher and slightly delayed
PER2 expression in Scp2 knockout mice compared to wild-type mice. All together, these
results suggest that SCP2 could have an impact on the signaling pathways involved in the
post-translational modifications regulating the stability of the circadian clock molecules.
In addition, we showed that serum glucose and insulin concentrations were similar in both
wild-type and Scp2 knockout mice. However, Scp2 knockout mice exhibit less circulating
cholesterol, and lower but still rhythmic serum triglyceride. In Scp2 knockout mice liver,
lipids content analyses showed disturbed rhythmic lipid accumulation. These results led us to
the investigation of signaling pathways regulated by lipids like PPARα, SREBP or LXR. Both
PPARα- and SREBP-regulated genes appeared up-regulated in Scp2 knockout mice while no
effect was observed in LXR target genes. We showed here that despite the fact that lipid

65
metabolism and UPR activation can be linked, it is not done via SCP2-dependent mechanisms
as the UPR activation was not affected in Scp2 knockout mice. We also investigate the
possible involvement of SCP2 in TORC1 activated mechanism and the upstream TORC1
activating signaling pathways. We showed that even their mRNA expression did not differ,
the different components of the translation initiation complex undergo significant difference
in their activation by phosphorylation especially for EIF4B. In addition, AKT and ERK
pathways exhibit a disturbed phosphorylation leading to disturbances in TORC1 activation in
Scp2 knockout mice.
All together, these results demonstrate new evidences of the orchestration of signaling
pathways activation by circadian clock.

1
Sterol Carrier Protein 2 dependent diurnal lipid transport
modulates rhythmic activation of signaling pathways in mouse liver
Céline Jouffe1,2
, Cédric Gobet2, Eva Martin
2, Mojgan Masoodi
3, and Frédéric Gachon
1,2
E-mails: [email protected]
Affiliation:
1Department of Pharmacology and Toxicology, University of Lausanne, Lausanne, CH-1005, Switzerland
2Department of Diabetes and Circadian Rhythms, Nestlé Institute of Health Sciences, CH-1015 Lausanne, Switzerland
3Department of Molecular Biomarkers, Nestlé Institute of Health Sciences, CH-1015 Lausanne, Switzerland
Keywords:
Circadian clock, Target Of Rapamycin, mRNA translation, Peroxisome Proliferator Associated Receptor, Endoplasmic Reticulum
stress, serum responsive element binding protein
2
Contacts:
Frédéric Gachon
Nestlé Institute of Health Sciences
EPFL Innovation Park
CH-1015 Lausanne
Switzerland
Tel: (00 41) 21 692 53 64
Fax: (00 41) 21 692 53 55
E-mail: [email protected]
Abbreviations:
SCP2: Sterol Carrier Protein 2
TORC1: Target Of Rapamycin Complex 1
UPR: Unfolded Protein Response
PPAR: Peroxisome Proliferator-Activated Receptor
LXR: Liver X Receptor
SREBP: Sterol Regulatory Element-Binding Protein
SCN: SupraChiasmatic Nucleus
PI3K: PhosphatidylInositol-4,5-bisphosphate 3-Kinase
ERK: Extracellular-signal-Regulated Kinases
AMPK: 5' Adenosine Monophosphate-activated Protein Kinase
KO: KnockOut
Bmal1: Brain and Muscle Aryl hydrocarbon receptor nuclear translocator-Like 1
Cry: Cryptochrome
Per: Period
Dbp: D site of albumin promoter Binding Protein
TAG: TriAcylGlyceride
DAG: DiAcylGlyceride
SE: Sterol Esther
PC: PhosphatidylCholine
3
Cer: Ceramide
PG: PhosphatidylGlycerol
PE: PhosphatidylEthanolamin
PI: PhosphatidylInositol
Cyp4a14: Cytochrome P450, family 4, subfamily a, polypeptide 14
Acox1: peroxisomal Acyl-coenzyme A Oxidase 1
Lpl: LipoProtein Lipase
Cd36: Cluster of Differentiation 36
ER: Endoplasmic Reticulum
Hmgcr: 3-Hydroxy-3-MethylGlutaryl-CoA Reductase
Fasn: Fatty Acid Synthase
4E-BP1: eukaryotic translation initiation factor 4E-Binding Protein 1
EIF4G: Eukaryotic translation Initiation Factor 4G
EIF4B: Eukaryotic translation Initiation Factor 4B
RPS6: Ribosomal Protein S6
CK1: Casein Kinase 1
NPC1: Niemann-Pick disease, type C1
Financial Support:
This research was supported by the Swiss National Science Foundation (grant 31003A_129940/1), the European Research Council
(grant ERC-2010-StG-260988), and the Canton of Vaud.
4
Abstract
Most of the living species on earth have evolutionary acquired a time keeper system to anticipate daily changes caused by the
light-dark cycle caused the rotation of the earth. This pacemaker is based in all the system on a molecular
transcriptional/translational negative feedback loop able to generate rhythmic gene expression with a 24 hours period. Recent
evidences suggest that post-transcriptional regulations play also a fundamental role at different steps of the process, fine tuning in
this way the time keeping system and linking it to animal physiology. Systemic cues can indeed activate specific signaling
pathways controlling gene expression at the transcriptional and post-transcriptional level. Among this signals, we consider here the
possible role of lipid transport in this system, and more particularly the SCP2-dependent lipid transport. Indeed mice with a
deletion of the Scp2 gene coding for a rhythmic lipid transporter present a modulated rhythmic activation of the lipid regulated
transcription factors PPAR and SREBP. Moreover, these mice present a perturbed rhythmic activation of TORC1 and its
upstream pathways, whereas rhythmic UPR activation is not affected. Finally, this defect in signaling pathways activation
feedbacks on the clock by lengthening the circadian period of animals through post-translational regulation of core clock
regulators. Conclusion: We show here that the rhythmic lipid transporter SCP2 modulates rhythmic activation of several signaling
pathways in mouse liver, becoming in this way a new player involved in the establishment of the rhythmic mRNA and protein
expression landscape.

5
Introduction
As a result of living in an environment subject to light-dark cycles caused by Earth’s rotation, organisms from bacteria to
mammals acquired during evolution a timing system allowing their anticipation of these diurnal variations. In mammals, this timer
is called the circadian clock, circadian meaning about a day, and influences most aspects of physiology and behavior (1). As a
consequence, perturbations or misalignments of the circadian clock in human, like for example in the case of shift-workers, lead to
diverse pathologies including metabolic disorders and obesity (2), vascular diseases (3), and psychiatric disorders (4). If the
oscillatory timing system is cell-autonomous, timing at the organism scale is based on a hierarchal organization. Indeed, a “master
clock” within the SCN of the hypothalamus, which is daily resynchronized through light input via ganglionar cells of the retina,
communicates timing signals to “slave” oscillators in other peripheral tissues which are more sensitive to systemic signals like
metabolic signals coming from food (5).
In mammals, the molecular oscillator consists in interconnected transcriptional and translational feedback loops with additional
layers of control including temporal post-transcriptional and post-translational regulations (6). This additional layer of regulation
is largely regulated by systemic signals coming from circadian clock and/or feeding coordinated rhythmic metabolism allowing in
this way the adjustment of the molecular clockwork with the metabolic state of the cell (7). At least in part, this effect is mediated
through the rhythmic activation of signaling pathways. In parallel, these signaling pathways also feedback on metabolism. We
have for example recently shown that circadian-clock orchestrated liver metabolism regulate rhythmic activation of UPR (8) and
mRNA translation through rhythmic activation of TORC1 pathway and the upstream pathways PI3K, ERK, and AMPK (9).
To gain more insight about the metabolic pathways involved in this process, we speculate about the potential role of rhythmic lipid
transport. Indeed, recent evidences show that lipid metabolism and transport is involved in the activation of the UPR (10), TORC1
(11), or ERK (12) pathways. This activation often involved lipid-dependent organization of membrane proteins in lipid rafts (13)
which produced changes in their structure and potential activation (14). In parallel, several signaling pathways are directly
regulated by lipid metabolism. It is for example the case for PI3K/AKT (15, 16), LXR (17), PPAR (18), or SREBP (19).
Interestingly, the two last one present a rhythmic activation caused by interconnection between circadian clock and rhythmic lipid
metabolism (20, 21).
In this context, we want to study the potential influence of rhythmic liver lipid transport on the activation of this pathway. Until
now, SCP2 is the only intracellular lipid transporter that presents a diurnal expression in mouse liver. However, this rhythmic
expression at the protein level is regulated at the post-transcriptional level as Scp2 mRNA does not present rhythmic expression
(22, 23). SCP2 is involved in the transfer of many lipid species from the endoplasmic reticulum where they are synthesized to the
plasma membrane (24), affecting in this way the formation of lipid rafts and cell signaling (for a review see (25)). The Scp2 locus

6
also encodes the Scpx mRNA through alternative transcription start site usage, the later encoded protein presenting peroxisomal 3-
ketoacyl-CoA thiolase activity involved in the oxidation of branched-chain lipids (26). As a consequence, lipid metabolism (27)
and expression of proteins at the plasma membrane in lipid raft domains is perturbed in Scp2 deficient animals (28, 29). If the
differential role of the two proteins encoded by the Scp2 locus in the process is not clearly established yet, in vitro experiments
suggest that the lipid transport activity of SCP2 is required (30).
We thus speculate that SCP2 could affect liver rhythmic lipid metabolism and transport and, as a consequence, rhythmic activation
of signaling pathways through modification of the distribution of proteins in lipid rafts at the plasma membrane. We indeed show
that rhythmic lipid content is affected in the liver of Scp2 KO mice which present also a perturbed rhythmic activation of several
signaling pathways including PPAR, SREBP and TORC1 which also appeared to feedback on the molecular clock itself. If
increasing evidences show that lipid metabolism and accumulation in mouse liver follow a diurnal rhythm controlled by feeding
and the circadian clock (31, 32), we show for the first time that this rhythmic lipid metabolism and transport in turn affect
activation of signaling pathways and participates in the global rhythmic transcriptome of the mouse liver.

7
Experimental Procedures
Animal experiments
All animal studies were conducted in accordance with the regulations of the veterinary office of the Canton of Vaud. Eight-week-
old male C57Bl/6J mice were purchased from Charles River Laboratory (L'Arbresle). Scp2 KO mice have been previously
described (27) and have been acquired from Jackson Laboratory. In all experiments, male mice between 10 and 12 weeks of age
are used. Unless noted otherwise, mice were maintained under standard animal housing conditions, with free access to food and
water and in 12 hours light/12 hours dark cycles. However, for all experiments, animals were fed only at night during 4 days
before the sacrifice to reduce effects of feeding rhythm and mice were sacrificed every 2 hours.
The running-wheel activity has been monitored as previously described (33). Briefly, the mice were housed individually in cages
equipped with running-wheel. The activity has been measured during 5 days in light-dark cycles followed by 18 days in constant
darkness. Data were acquired and analysed with the Clocklab software (Actimetrics).
RNA extraction and analysis
Liver RNA were extracted and analysed by real-time quantitative RT-PCR, mostly as previously described (34). Briefly, 0.5 µg of
liver RNA was reverse transcribed using random hexamers and SuperScript® II reverse transcriptase (Life Technologies). The
cDNAs equivalent to 20 ng of RNA were PCR amplified in a LightCycler® 480 II System (Roche) using the TaqMan® or the
SYBR® Green technologies. References and sequences of the probes are given in the tables. In each case, averages from at least
three independent experiments are given, using Gapdh mRNA as controls. Probes references are given in Supplemental table X.
Nuclear protein extractions and analysis
Nuclear proteins were extracted mostly as described (34). Briefly, liver were homogenized in sucrose homogenization buffer
containing 2.2 M sucrose, 15 mM KCl, 2 mM EDTA, 10 mM HEPES (pH7.6), 0.15 mM spermin, 0.5 mM spermidin, 1 mM DTT,
and a protease inhibitor cocktail containing 0.5 mM PMSF, 10 μg/ml Aprotinin, 0.7 μg/ml Pepstatin A, and 0.7 μg/ml Leupeptin.
Lysates were deposited on a sucrose cushion containing 2.05 M sucrose, 10 % glycerol, 15 mM KCl, 2 mM EDTA, 10 mM
HEPES (pH7.6), 0.15 mM spermin, 0.5 mM spermidin, 1 mM DTT, and a protease inhibitor cocktail. Tubes were centrifuged
during 45 min at 105 000 g at 4 °C. After ultra-centrifugation, the nucleus pellets were suspended in a nucleus lysis buffer
composed of 10 mM HEPES (pH7.6), 100 mM KCl, 0.1 mM EDTA, 10 % Glycérol, 0.15 mM spermin, 0.5 mM spermidin, 0.1
mM NaF, 0.1 mM sodium orthovanadate, 0.1 mM ZnSO4, 1 mM DTT, and the previously described protease inhibitor cocktail.
Nuclear extracts were obtained by the addition of an equal volume of NUN buffer composed of 2 M urea, 2 % Nonidet P-40, 600

8
mM NaCl, 50 mM HEPES (pH7.6), 1 mM DTT and a cocktail of protease inhibitors, and incubation 20 min on ice. After
centrifugation during 10 min at 21 000 g, the supernatants were harvested and constitute nuclear extracts.
12.5 μg nuclear extracts were used for western blotting. After migration, proteins were transferred to PVDF membranes and
western blotting was realized according to standard procedures. References for the antibodies are given in the table.
Total protein extractions and analysis
Frozen organs were homogenized in lysis buffer containing 20 mM HEPES (pH 7.6), 100 mM KCl, 0.1 mM EDTA, 1 mM NaF, 1
mM sodium orthovanadate, 1 % Triton X-100, 0.5% Nonidet P-40, 0.15 mM spermin, 0.5 mM spermidin, 1 mM DTT, and the
same protease inhibitor cocktail as for nuclear protein extractions. After incubation 30 min on ice, extracts were centrifuged 10
min at 21 000 g and the supernatants were harvested to obtain total extracts.
65 μg of extract was used for western blotting. After migration, proteins were transferred to PVDF membranes and western
blotting was realized according to standard procedures. References for the antibodies are given in Table Y.
Serum chemistry analysis
Blood samples are collected every 2 hrs and sera are obtained after a centrifugation of 10 min at 10 000 rpm at room temperature.
Sera are kept at -80°C until analysis. Insulin, glucose, cholesterol and triglycerides are respectively measured accordingly with the
protocols of the Mouse Insulin ELISA kit (Mercodia), and the Glucose, Cholesterol, Triglycerides LabAssay kits (Wako).

9
Results
SCP2 diurnal expression is regulated at the post-translational level but orchestrated by the circadian clock
Diurnal expression of SCP2 has been originally described in rat liver in 1984 with an increased expression in the dark period (23).
Post-transcriptional regulation has been suggested as neither Scp2 mRNA nor its translation appeared rhythmic in these conditions
(22). We confirmed the rhythmic expression of SCP2 in mouse liver but with a different phase as the maximum of expression
takes place around ZT 9 (Fig. 1A). As previously described, this rhythmic accumulation is not due to the rhythmic expression of
Scp2 mRNA (Fig. 1B) or its translation evaluated by the presence of the mRNA in the polysomes (Fig. 1C). Non-characterized
post-translational modifications of SCP2, and more particularly degradation, are thus probably involved in the rhythmic
expression of SCP2, as suggested by the numerous SCP2 ubiquitylation sites characterized in mouse liver (35).
We are nevertheless interested by the fact that the molecular circadian clock can regulate rhythmic SCP2 expression. To study this
possibility, we measured SCP2 expression at both mRNA and protein levels in Bmal1 (36) and Cry1/Cry2 (37) KO which present
a non-functional molecular oscillator and an arrhythmic behavior in constant darkness. A shown in Fig. 1D, Bmal1 KO mice
present an increased expression of Scp2 mRNA at all the time points, whereas no changes were observed in Cry1/Cry2 KO.
However, at the protein level, it appears that the clock affects the rhythmic accumulation of SCP2: SCP2 accumulates at high level
and high amplitude in Bmal1 KO mice, whereas its rhythmic expression is phase advanced and with lower amplitude in Cry1/Cry2
KO mice. This result demonstrates that if the circadian clock does not regulate directly SCP2 expression, it influences its stability,
potentially through the regulation of lipid metabolism by the clock. Indeed, SCP2 accumulation exactly follows triglycerides
levels in mouse liver (31), suggesting a possible stabilization of SCP2 by triglycerides.
SCP2 influences circadian physiology and diurnal lipid metabolism
Scp2 KO mice (27) were used to study the potential role of SCP2 on rhythmic liver lipid physiology and cell signaling. To control
that circadian behavior is not altered in these animals, we measured their running wheel activity in constant darkness. As shown in
Fig. 2A, Scp2 KO mice present a period longer by 16 min compared to wild-type mice and reduced locomotor activity that did not
affect their day-night difference (around 1% activity during the day). Interestingly, the Scp2 locus has been linked to dystonia and
motor neuropathy in human, pathology that can explain this reduced activity (38).
To study the possible influence of Scp2 deletion on circadian genes expression, we measured their rhythmic expression in mouse
liver. As shown in Fig. 2B, diurnal expression of Bmal1, Cry1, and Per2 are not significantly different between Scp2 KO and
wild-type animals, whereas Dbp expression is slightly delayed. However, at the protein level, BMAL1 expression presents
decreased amplitude and an advanced phase in KO animals, whereas PER2 presents an increased expression and a delayed phase

10
(Fig. 2C). As accumulation of these proteins is strongly under the control of post-translational modifications (39), this differences
may reflect changes in the rhythmic activation of signaling pathways that controls their stability and can explain delayed phase of
the circadian activity and Dbp expression (see below).
As SCP2 played an important role in liver lipid metabolism and transport (27), we investigated general diurnal metabolic
parameters in Scp2 KO mice. As shown in Fig. 3A, diurnal serum glucose concentration is identical between WT and KO animals,
whereas diurnal insulin concentration presents only a mild delay (Fig. 3B). However, diurnal serum triglyceride (Fig. 3C) and
cholesterol (Fig. 3D) concentrations are significantly decreased and present a lower amplitude in KO compare to WT. It strongly
suggests that diurnal lipid metabolism is perturbed in Scp2 KO mice. To gain insight into this perturbed metabolism in the liver,
we analyze the diurnal concentration of several lipid species in WT and KO mice. As show in Figure 3D, lipidomic analysis
revealed that several lipid species identified and quantified in both species presents a rhythmic pattern in agreement with the
previously published data (31): TAG, DAG and SE reach their maximum during the day, PC and Cer at the day-night transition,
and PG, PE, and PI during the night (Fig. 3E). Among them, around 25 %, mostly TAG and SE, are not rhythmic in Scp2 KO mice
liver, showing perturbed rhythmic lipid transport and metabolism in these animals.
Diurnal activation of lipids regulated pathways is perturbed in Scp2 KO mice
Several signaling pathways are directly regulated by lipids. For example the nuclear receptor PPAR, directly binds lipid
molecules and activates its target genes implied in different physiological pathways including lipid metabolism (18). PPARhas
been described as regulated in part by the circadian clock via its interaction with PER2(40, 41). However, we have previously
shown that Ppar transcription and activation is under the control of the circadian clock and its output pathways through direct
transcriptional control and synthesis of its ligands (20). As availability of these ligands, through control of their transport and
synthesis, is potentially under the control of SCP2, we investigated diurnal activation of PPAR in Scp2 KO mice. As shown in
Fig. 4A, the PPAR target genes Cyp4a14, Acox1, Lpl, and Cd36 present all an increased expression throughout the diurnal cycle,
indicating an overall increase activation of the PPAR pathway. This is in accordance with the previously, but not explained,
proliferation of peroxisomes in the liver of Scp2 KO mice (27). Interestingly, Ppar itself presents an increased and delayed
expression probably as a consequence of the regulation of the Ppar promoter by PPAR itself (42).
SREPB is another lipid regulated transcription factor: SREBP is an ER membrane bound protein that, under low sterol conditions,
translocates to the Golgi to be cleaved. The remaining peptide is released and migrates to the nucleus where it activates the
transcription of genes coding for enzymes involved in cholesterol and fatty acid metabolism (19). As shown in Fig. 4B, the
SREBP target genes Hmgcr and Fasn are upregulated in KO, especially Hmgcr. Interestingly, if Fasn is mostly regulated by

11
SREBP1, Hmgcr is regulated by both isoforms of SREBP (43), suggesting a prominent activation of SREBP2 in Scp2 KO mice.
Remarkably Srebp2 diurnal expression is upregulated at the transcriptional level in Scp2 KO mice, confirming this hypothesis.
Diurnal activation of several signaling pathways is perturbed in SCP2 KO mice
We have previously shown that several signaling pathways are rhythmically activated in mouse liver. Among them, UPR presents
a 12 hours period rhythmic activation orchestrated by the circadian clock (8). As shown in Fig. 5, rhythmic maturation of Xbp1and
nuclear expression of XBP1 are identical in WT and KO animals, as well expression of the UPR regulated genes Bip and Chop.
Despite published linked between lipid metabolism and UPR activation (10), this pathway is not affected by SCP2 deficiency.
However, rhythmic activation of the TORC1 pathway is clearly altered, probably as a consequence of the disturbed activation of
the pathways involved in its activation. Indeed, TORC1 activation depends on several upstream kinases activation: AMPK inhibits
TORC1 through the phosphorylation of TSC2 whereas TSC2 phosphorylation AKT activates TORC1 (44). Once activated,
TORC1 activation leads to translational activation through the phosphorylation of 4E-BP1, EIF4G, EIF4B, and RPS6 (45). In
parallel, phosphorylation of EIF4E is mediated through activation of the ERK pathway (46). As shown in Fig. 6, rhythmic
phosphorylation of the TORC1 targets RPS6, EIF4B, and EIF4G is perturbed in Scp2 KO mice with, in addition to the normal
maximum of phosphorylation that appeared in the beginning of the night in WT mice (9), a second peak of phosphorylation in the
beginning of the day. In addition, phosphorylation of 4E-BP1 and EIF4B present an overall high phosphorylation level.
Interestingly, differences are observed only at post-translational modifications as no differences are observed at the protein and
mRNA expression levels, except for EIF4G which protein stability is linked to phosphorylation state (47) (Fig. 6 and S1).
Concerning the upstream pathways, AKT rhythmic activation during the night (9) is preserved in Scp2 KO mice but with a high
level of activation throughout the time (Fig. 7). By contrast, rhythmic ERK activation during the day (9, 48) is lost in Scp2 KO
mice, which present a high activation throughout the time. These data converge in a perturbed activation of the TORC1 pathway in
Scp2 KO mice, at rhythmic parameters and activation level, which can lead to perturbed rhythmic ribosome biogenesis.

12
Discussion
Interplay between the circadian clock and SCP2-regulated lipid transport in mouse liver
If lipid synthesis and accumulation follow a diurnal rhythm in mouse liver controlled by feeding and the circadian clock-regulated
lipid metabolism (31, 32), we show here that rhythmic lipid transport regulated by SCP2 contributes to this diurnal accumulation.
Rhythmic SCP2 accumulation seems to be controlled by a clock-orchestrated mechanism occurring at the post-translational level.
Interestingly, SCP2 and TAG accumulate in the liver with the same rhythmic pattern (Fig 1A and 3E), suggesting a possible
stabilization of SCP2 through TAG binding. Protein stabilization through lipid binding is well known for membrane protein (49),
but has been also described for lipid-bound cytosolic protein like Perilipin (50). Considering the modification of rhythmic lipid
content in circadian clock mutant mice (31, 51), it is thus conceivable that circadian clock-controlled lipid metabolism adjust
rhythmic SCP2 half-life through formation of stable SCP2-TAG complexes. This will constitute according to our knowledge the
first example of a rhythmic protein induced by protein-metabolite interaction. Considering the crucial role of post-translational
regulations in the establishment of the rhythmic liver proteome (52, 53), it will be not surprising that such kinds of regulation will
be described in a near future.
The consequence of this disturbed lipid accumulation on rhythmic activation of signaling pathways seems also feedback on the
clock itself. Indeed, Scp2 KO mice present an increased and delayed PER2 expression regulated at the post-translational level, in
addition to a lengthening of the free running period. Interestingly, stabilization of PER2, for example through the inhibition of
CK1 activity which controls PER2 degradation (54), leads also to period lengthening. It is thus conceivable that SCP2 regulated
signaling pathways perturbed in Scp2 KO animals are involved in this period lengthening through the regulation of PER2
degradation. If no clear regulation of CK1 by lipids has been demonstrated despite a possible regulation by PI (55), it has been
shown that PPAR (56), AKT (57), and mTOR (57-59) pathways interfere with circadian clock genes expression and/or circadian
behavior and physiology. In parallel, high fat diet has been linked also to modification of clock genes expression and circadian
behavior (60). Taken together, these data suggest that lipid transport and metabolism, which are themselves regulated by the clock,
are potentially important regulator of circadian clock function.
Rhythmic activation of cell signaling by lipid metabolism and transport in mouse liver
Increasing evidences link lipid metabolism and transport and cell signaling through different ways. Lipid metabolism can affect
directly the activation of lipid-regulated proteins involved in several signaling pathways. It is for example the case for the nuclear
receptors PPAR and LXR for which the rhythmic activation is directly regulated by the rhythmic activation of their respective
ligands (20, 21). Interestingly, these pathways are also regulated by lipid intracellular transport which facilitates direct interaction

13
between these lipids and their ligands through appropriate intracellular transport (61). However, in other cases, lipid metabolism
acts through the regulation of the cellular localization of the signaling molecules which influence in this way their maturation (for
example in the case of SREBP (19)) or their potential activation by second signaling pathways through their correct localization in
a favorable environment or conformation at the plasma membranes, for example in lipid rafts (13, 14). As expected, perturbation
of lipid metabolism and transport also affect this pathway in all cases (15, 62, 63). Some interconnections between these two
pathways are possible since for example LXR-regulated cholesterol metabolism perturbed AKT activation through perturbation of
its localization in lipid rafts (64). Nevertheless, no rhythmic activation of signaling pathway by this mechanism has been reported
yet. In this condition, our result showing that SCP2-regulated rhythmic lipid transport is involved in the rhythmic activation of
signaling pathways is the first description of such regulation.
However, involvement of other lipid transporter in this mechanism is not excluded. For example, the NPC1 protein, which is
specifically involved in intracellular cholesterol transporter, is involved in the regulation of several signaling pathway (65).
Indeed, NPC1 inhibition interfere with lipid rafts formation and, as a consequence, activation of the LXR and SREBP (66),
PI3K/AKT (67), Insulin Receptor (68), and MAPK (69) pathways. Interestingly, we report here that NPC1 expression is rhythmic
at both mRNA and protein levels and regulated by the circadian clock in mouse liver through transcriptional and post-
transcriptional regulations (Fig. S2), suggesting a potential role of NPC1 in diurnal activation of signaling pathways. Further
experiments are however required to characterize the importance of these two, or additional, lipid transporters in rhythmic
activation of signaling pathways.

14
References
1. Bass J. Circadian topology of metabolism. Nature 2012;491:348-356.
2. Garaulet M, Gomez-Abellan P. Chronobiology and obesity. Nutr Hosp 2013;28 Suppl 5:114-120.
3. Vyas MV, Garg AX, Iansavichus AV, Costella J, Donner A, Laugsand LE, Janszky I, et al. Shift
work and vascular events: systematic review and meta-analysis. BMJ 2012;345:e4800.
4. Baron KG, Reid KJ. Circadian misalignment and health. Int Rev Psychiatry 2014;26:139-154.
5. Mohawk JA, Green CB, Takahashi JS. Central and peripheral circadian clocks in mammals. Annu
Rev Neurosci 2012;35:445-462.
6. Feng D, Lazar MA. Clocks, metabolism, and the epigenome. Mol Cell 2012;47:158-167.
7. Asher G, Schibler U. Crosstalk between components of circadian and metabolic cycles in mammals.
Cell Metab 2011;13:125-137.
8. Cretenet G, Le Clech M, Gachon F. Circadian clock-coordinated 12 Hr period rhythmic activation of
the IRE1alpha pathway controls lipid metabolism in mouse liver. Cell Metab 2010;11:47-57.
9. Jouffe C, Cretenet G, Symul L, Martin E, Atger F, Naef F, Gachon F. The circadian clock
coordinates ribosome biogenesis. PLoS Biol 2013;11:e1001455.
10. Fu S, Yang L, Li P, Hofmann O, Dicker L, Hide W, Lin X, et al. Aberrant lipid metabolism disrupts
calcium homeostasis causing liver endoplasmic reticulum stress in obesity. Nature 2011;473:528-531.
11. Xu J, Dang Y, Ren YR, Liu JO. Cholesterol trafficking is required for mTOR activation in
endothelial cells. Proc Natl Acad Sci U S A 2010;107:4764-4769.
12. Nada S, Hondo A, Kasai A, Koike M, Saito K, Uchiyama Y, Okada M. The novel lipid raft adaptor
p18 controls endosome dynamics by anchoring the MEK-ERK pathway to late endosomes. EMBO J
2009;28:477-489.
13. Lingwood D, Simons K. Lipid rafts as a membrane-organizing principle. Science 2010;327:46-50.
14. Laganowsky A, Reading E, Allison TM, Ulmschneider MB, Degiacomi MT, Baldwin AJ, Robinson
CV. Membrane proteins bind lipids selectively to modulate their structure and function. Nature
2014;510:172-175.
15. Sanchez-Wandelmer J, Davalos A, Herrera E, Giera M, Cano S, de la Pena G, Lasuncion MA, et al.
Inhibition of cholesterol biosynthesis disrupts lipid raft/caveolae and affects insulin receptor activation in
3T3-L1 preadipocytes. Biochim Biophys Acta 2009;1788:1731-1739.
16. Vanhaesebroeck B, Guillermet-Guibert J, Graupera M, Bilanges B. The emerging mechanisms of
isoform-specific PI3K signalling. Nat Rev Mol Cell Biol 2010;11:329-341.
17. Hong C, Tontonoz P. Liver X receptors in lipid metabolism: opportunities for drug discovery. Nat
Rev Drug Discov 2014;13:433-444.
18. Rakhshandehroo M, Knoch B, Muller M, Kersten S. Peroxisome proliferator-activated receptor alpha
target genes. PPAR Res 2010;2010.
19. Jeon TI, Osborne TF. SREBPs: metabolic integrators in physiology and metabolism. Trends
Endocrinol Metab 2012;23:65-72.
20. Gachon F, Leuenberger N, Claudel T, Gos P, Jouffe C, Fleury Olela F, de Mollerat du Jeu X, et al.
Proline- and acidic amino acid-rich basic leucine zipper proteins modulate peroxisome proliferator-activated
receptor alpha (PPARalpha) activity. Proc Natl Acad Sci U S A 2011;108:4794-4799.
21. Le Martelot G, Claudel T, Gatfield D, Schaad O, Kornmann B, Lo Sasso G, Moschetta A, et al.
REV-ERBalpha participates in circadian SREBP signaling and bile acid homeostasis. PLoS Biol
2009;7:e1000181.
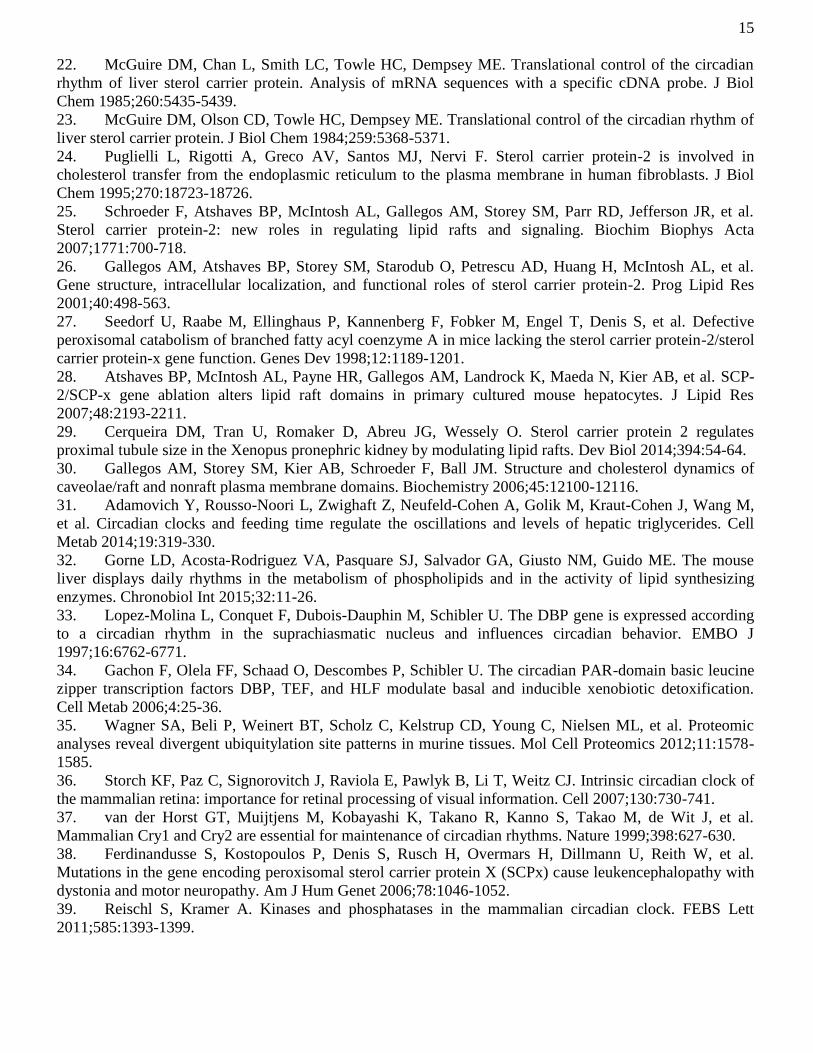
15
22. McGuire DM, Chan L, Smith LC, Towle HC, Dempsey ME. Translational control of the circadian
rhythm of liver sterol carrier protein. Analysis of mRNA sequences with a specific cDNA probe. J Biol
Chem 1985;260:5435-5439.
23. McGuire DM, Olson CD, Towle HC, Dempsey ME. Translational control of the circadian rhythm of
liver sterol carrier protein. J Biol Chem 1984;259:5368-5371.
24. Puglielli L, Rigotti A, Greco AV, Santos MJ, Nervi F. Sterol carrier protein-2 is involved in
cholesterol transfer from the endoplasmic reticulum to the plasma membrane in human fibroblasts. J Biol
Chem 1995;270:18723-18726.
25. Schroeder F, Atshaves BP, McIntosh AL, Gallegos AM, Storey SM, Parr RD, Jefferson JR, et al.
Sterol carrier protein-2: new roles in regulating lipid rafts and signaling. Biochim Biophys Acta
2007;1771:700-718.
26. Gallegos AM, Atshaves BP, Storey SM, Starodub O, Petrescu AD, Huang H, McIntosh AL, et al.
Gene structure, intracellular localization, and functional roles of sterol carrier protein-2. Prog Lipid Res
2001;40:498-563.
27. Seedorf U, Raabe M, Ellinghaus P, Kannenberg F, Fobker M, Engel T, Denis S, et al. Defective
peroxisomal catabolism of branched fatty acyl coenzyme A in mice lacking the sterol carrier protein-2/sterol
carrier protein-x gene function. Genes Dev 1998;12:1189-1201.
28. Atshaves BP, McIntosh AL, Payne HR, Gallegos AM, Landrock K, Maeda N, Kier AB, et al. SCP-
2/SCP-x gene ablation alters lipid raft domains in primary cultured mouse hepatocytes. J Lipid Res
2007;48:2193-2211.
29. Cerqueira DM, Tran U, Romaker D, Abreu JG, Wessely O. Sterol carrier protein 2 regulates
proximal tubule size in the Xenopus pronephric kidney by modulating lipid rafts. Dev Biol 2014;394:54-64.
30. Gallegos AM, Storey SM, Kier AB, Schroeder F, Ball JM. Structure and cholesterol dynamics of
caveolae/raft and nonraft plasma membrane domains. Biochemistry 2006;45:12100-12116.
31. Adamovich Y, Rousso-Noori L, Zwighaft Z, Neufeld-Cohen A, Golik M, Kraut-Cohen J, Wang M,
et al. Circadian clocks and feeding time regulate the oscillations and levels of hepatic triglycerides. Cell
Metab 2014;19:319-330.
32. Gorne LD, Acosta-Rodriguez VA, Pasquare SJ, Salvador GA, Giusto NM, Guido ME. The mouse
liver displays daily rhythms in the metabolism of phospholipids and in the activity of lipid synthesizing
enzymes. Chronobiol Int 2015;32:11-26.
33. Lopez-Molina L, Conquet F, Dubois-Dauphin M, Schibler U. The DBP gene is expressed according
to a circadian rhythm in the suprachiasmatic nucleus and influences circadian behavior. EMBO J
1997;16:6762-6771.
34. Gachon F, Olela FF, Schaad O, Descombes P, Schibler U. The circadian PAR-domain basic leucine
zipper transcription factors DBP, TEF, and HLF modulate basal and inducible xenobiotic detoxification.
Cell Metab 2006;4:25-36.
35. Wagner SA, Beli P, Weinert BT, Scholz C, Kelstrup CD, Young C, Nielsen ML, et al. Proteomic
analyses reveal divergent ubiquitylation site patterns in murine tissues. Mol Cell Proteomics 2012;11:1578-
1585.
36. Storch KF, Paz C, Signorovitch J, Raviola E, Pawlyk B, Li T, Weitz CJ. Intrinsic circadian clock of
the mammalian retina: importance for retinal processing of visual information. Cell 2007;130:730-741.
37. van der Horst GT, Muijtjens M, Kobayashi K, Takano R, Kanno S, Takao M, de Wit J, et al.
Mammalian Cry1 and Cry2 are essential for maintenance of circadian rhythms. Nature 1999;398:627-630.
38. Ferdinandusse S, Kostopoulos P, Denis S, Rusch H, Overmars H, Dillmann U, Reith W, et al.
Mutations in the gene encoding peroxisomal sterol carrier protein X (SCPx) cause leukencephalopathy with
dystonia and motor neuropathy. Am J Hum Genet 2006;78:1046-1052.
39. Reischl S, Kramer A. Kinases and phosphatases in the mammalian circadian clock. FEBS Lett
2011;585:1393-1399.

16
40. Schmutz I, Ripperger JA, Baeriswyl-Aebischer S, Albrecht U. The mammalian clock component
PERIOD2 coordinates circadian output by interaction with nuclear receptors. Genes Dev 2010;24:345-357.
41. Chappuis S, Ripperger JA, Schnell A, Rando G, Jud C, Wahli W, Albrecht U. Role of the circadian
clock gene Per2 in adaptation to cold temperature. Mol Metab 2013;2:184-193.
42. Pineda Torra I, Jamshidi Y, Flavell DM, Fruchart JC, Staels B. Characterization of the human
PPARalpha promoter: identification of a functional nuclear receptor response element. Mol Endocrinol
2002;16:1013-1028.
43. Horton JD, Shah NA, Warrington JA, Anderson NN, Park SW, Brown MS, Goldstein JL. Combined
analysis of oligonucleotide microarray data from transgenic and knockout mice identifies direct SREBP
target genes. Proc Natl Acad Sci U S A 2003;100:12027-12032.
44. Laplante M, Sabatini DM. mTOR signaling in growth control and disease. Cell 2012;149:274-293.
45. Ma XM, Blenis J. Molecular mechanisms of mTOR-mediated translational control. Nat Rev Mol
Cell Biol 2009;10:307-318.
46. Silva RL, Wendel HG. MNK, EIF4E and targeting translation for therapy. Cell Cycle 2008;7:553-
555.
47. Berset C, Trachsel H, Altmann M. The TOR (target of rapamycin) signal transduction pathway
regulates the stability of translation initiation factor eIF4G in the yeast Saccharomyces cerevisiae. Proc Natl
Acad Sci U S A 1998;95:4264-4269.
48. Tsuchiya Y, Minami I, Kadotani H, Todo T, Nishida E. Circadian clock-controlled diurnal oscillation
of Ras/ERK signaling in mouse liver. Proc Jpn Acad Ser B Phys Biol Sci 2013;89:59-65.
49. White SH, Wimley WC. Membrane protein folding and stability: physical principles. Annu Rev
Biophys Biomol Struct 1999;28:319-365.
50. Hall AM, Brunt EM, Chen Z, Viswakarma N, Reddy JK, Wolins NE, Finck BN. Dynamic and
differential regulation of proteins that coat lipid droplets in fatty liver dystrophic mice. J Lipid Res
2010;51:554-563.
51. Paschos GK, Ibrahim S, Song WL, Kunieda T, Grant G, Reyes TM, Bradfield CA, et al. Obesity in
mice with adipocyte-specific deletion of clock component Arntl. Nat Med 2012;18:1768-1777.
52. Mauvoisin D, Wang J, Jouffe C, Martin E, Atger F, Waridel P, Quadroni M, et al. Circadian clock-
dependent and -independent rhythmic proteomes implement distinct diurnal functions in mouse liver. Proc
Natl Acad Sci U S A 2014;111:167-172.
53. Robles MS, Cox J, Mann M. In-vivo quantitative proteomics reveals a key contribution of post-
transcriptional mechanisms to the circadian regulation of liver metabolism. PLoS Genet 2014;10:e1004047.
54. Hirota T, Lee JW, Lewis WG, Zhang EE, Breton G, Liu X, Garcia M, et al. High-throughput
chemical screen identifies a novel potent modulator of cellular circadian rhythms and reveals CKIalpha as a
clock regulatory kinase. PLoS Biol 2010;8:e1000559.
55. Brockman JL, Anderson RA. Casein kinase I is regulated by phosphatidylinositol 4,5-bisphosphate in
native membranes. J Biol Chem 1991;266:2508-2512.
56. Canaple L, Rambaud J, Dkhissi-Benyahya O, Rayet B, Tan NS, Michalik L, Delaunay F, et al.
Reciprocal regulation of brain and muscle Arnt-like protein 1 and peroxisome proliferator-activated receptor
alpha defines a novel positive feedback loop in the rodent liver circadian clock. Mol Endocrinol
2006;20:1715-1727.
57. Zheng X, Sehgal A. AKT and TOR signaling set the pace of the circadian pacemaker. Curr Biol
2010;20:1203-1208.
58. Cao R, Robinson B, Xu H, Gkogkas C, Khoutorsky A, Alain T, Yanagiya A, et al. Translational
control of entrainment and synchrony of the suprachiasmatic circadian clock by mTOR/4E-BP1 signaling.
Neuron 2013;79:712-724.
59. Cornu M, Oppliger W, Albert V, Robitaille AM, Trapani F, Quagliata L, Fuhrer T, et al. Hepatic
mTORC1 controls locomotor activity, body temperature, and lipid metabolism through FGF21. Proc Natl
Acad Sci U S A 2014;111:11592-11599.
17
60. Kohsaka A, Laposky AD, Ramsey KM, Estrada C, Joshu C, Kobayashi Y, Turek FW, et al. High-fat
diet disrupts behavioral and molecular circadian rhythms in mice. Cell Metab 2007;6:414-421.
61. Schroeder F, Petrescu AD, Huang H, Atshaves BP, McIntosh AL, Martin GG, Hostetler HA, et al.
Role of fatty acid binding proteins and long chain fatty acids in modulating nuclear receptors and gene
transcription. Lipids 2008;43:1-17.
62. Zhu X, Owen JS, Wilson MD, Li H, Griffiths GL, Thomas MJ, Hiltbold EM, et al. Macrophage
ABCA1 reduces MyD88-dependent Toll-like receptor trafficking to lipid rafts by reduction of lipid raft
cholesterol. J Lipid Res 2010;51:3196-3206.
63. Zhang J, Dudley-Rucker N, Crowley JR, Lopez-Perez E, Issandou M, Schaffer JE, Ory DS. The
steroidal analog GW707 activates the SREBP pathway through disruption of intracellular cholesterol
trafficking. J Lipid Res 2004;45:223-231.
64. Pommier AJ, Alves G, Viennois E, Bernard S, Communal Y, Sion B, Marceau G, et al. Liver X
Receptor activation downregulates AKT survival signaling in lipid rafts and induces apoptosis of prostate
cancer cells. Oncogene 2010;29:2712-2723.
65. Karten B, Peake KB, Vance JE. Mechanisms and consequences of impaired lipid trafficking in
Niemann-Pick type C1-deficient mammalian cells. Biochim Biophys Acta 2009;1791:659-670.
66. Ishibashi M, Masson D, Westerterp M, Wang N, Sayers S, Li R, Welch CL, et al. Reduced VLDL
clearance in Apoe(-/-)Npc1(-/-) mice is associated with increased Pcsk9 and Idol expression and decreased
hepatic LDL-receptor levels. J Lipid Res 2010;51:2655-2663.
67. Bi X, Liu J, Yao Y, Baudry M, Lynch G. Deregulation of the phosphatidylinositol-3 kinase signaling
cascade is associated with neurodegeneration in Npc1-/- mouse brain. Am J Pathol 2005;167:1081-1092.
68. Vainio S, Bykov I, Hermansson M, Jokitalo E, Somerharju P, Ikonen E. Defective insulin receptor
activation and altered lipid rafts in Niemann-Pick type C disease hepatocytes. Biochem J 2005;391:465-472.
69. Yang SR, Kim SJ, Byun KH, Hutchinson B, Lee BH, Michikawa M, Lee YS, et al. NPC1 gene
deficiency leads to lack of neural stem cell self-renewal and abnormal differentiation through activation of
p38 mitogen-activated protein kinase signaling. Stem Cells 2006;24:292-298.
Figures legends
Figure 1: Temporal mRNA and protein expressions of Sterol Carrier Protein 2
A. F. G. Temporal protein expression of SCP2 in wild-type (A), Bmal1 knockout and control
(F) and Cry 1/2 double knockout and control (G) mouse liver. Western blots were realized on
total liver extracts. Naphtol blue black staining of the membranes was used as a loading
control. Each graph corresponds to the mean densitometric values of the western blot data
associated.
B. F. E. Temporal mRNA expression profile of Scp2 in wild-type (B), Bmal1 knockout and
control (D) and Cry 1/2 double knockout and control (E) mouse liver.
C. Temporal localization of Scp2 mRNA in the polysomal fraction.
The zeitgeber times (ZT), with ZT0: lights on, ZT12: lights off, at which the animals were
sacrificed, are indicated on each panel. For each time point, data are Mean ± SEM obtained
from three independent animals.
Figure 2: Influence of SCP2 in the circadian physiology
A. Circadian locomotor (running-wheel) activity of Scp2 knockout (right panel) and wild-type
(left panel) mice.
B. Temporal mRNA expression profile of Bmal1, Cry1, Dbp and Per2 in Scp2 knockout
(dotted line) and wild-type (solid line) mouse liver.
C. Temporal protein expression of BMAL1 and PER2 in Scp2 knockout (right panel) and
wild-type (left panel) mouse liver. Western blots were realized on nuclear liver extracts.
Naphtol blue black staining of the membranes was used as a loading control. Each graph
corresponds to the mean densitometric values of the western blot data associated.
The zeitgeber times (ZT), with ZT0: lights on, ZT12: lights off, at which the animals were
sacrificed, are indicated on each panel. For each time point, data are Mean ± SEM obtained
from three independent animals.
Figure 3: Perturbation of the diurnal lipid metabolism in Scp2 knockout mice
A-D. Temporal serum concentration of glucose (A), insulin (B), triglycerides (C) and
cholesterol (D) in Scp2 knockout (dotted line) and wild-type (solid line) mouse.
E. F. Heatmap of the abundance of cycling (E) or non-cycling (F) lipid species in Scp2
knockout mice.
The zeitgeber times (ZT), with ZT0: lights on, ZT12: lights off, at which the animals were
sacrificed, are indicated on each panel. For each time point, data are Mean ± SEM obtained
from three independent animals.
Figure 4: Alteration of the activation of lipids regulated pathways in Scp2 knockout
mice
A. Temporal mRNA expression profile of PPARα target genes Cyp4a14, Acox1, Lpl, Cd36
and Pparα in Scp2 knockout (dotted line) and wild-type (solid line) mouse liver.

B. Temporal mRNA expression profile of SREBP target genes Hmgcr, Fasn, Srebp1c and
Srebp2 in Scp2 knockout (dotted line) and wild-type (solid line) mouse liver.
C. Temporal protein expression of SREBP1 and SREBP2 in Scp2 knockout (right panels) and
wild-type (left panels) mouse liver. Western blots were realized on nuclear liver extracts.
Naphtol blue black staining of the membranes was used as a loading control. Each graph
corresponds to the mean densitometric values of the western blot data associated.
The zeitgeber times (ZT), with ZT0: lights on, ZT12: lights off, at which the animals were
sacrificed, are indicated on each panel. For each time point, data are Mean ± SEM obtained
from three independent animals.
Figure 5: The regulation of the UPR stress pathway is not affected in Scp2 knockout
mice
A. Temporal mRNA expression profile of genes involved in the regulation of the UPR stress
Bip, Chop, and sXbp1 in Scp2 knockout (dotted line) and wild-type (solid line) mouse liver.
B. Temporal protein expression of sXBP1 in Scp2 knockout (right panel) and wild-type (left
panel) mouse liver. Western blots were realized on nuclear liver extracts. Naphtol blue black
staining of the membranes was used as a loading control. Each graph corresponds to the mean
densitometric values of the western blot data associated.
The zeitgeber times (ZT), with ZT0: lights on, ZT12: lights off, at which the animals were
sacrificed, are indicated on each panel. For each time point, data are Mean ± SEM obtained
from three independent animals.

Figure 6: The rhythmic phosphorylation of translation initiation factors is altered in
Scp2 knockout mice
Temporal protein expression and phosphorylation profile of translation initiation factors in
Scp2 knockout (right panel) and wild-type (left panel) mouse liver. Western blots were
realized on total liver extracts. Naphtol blue black staining of the membranes was used as a
loading control. Each graph corresponds to the mean densitometric values of the western blot
data associated.
The zeitgeber times (ZT), with ZT0: lights on, ZT12: lights off, at which the animals were
sacrificed, are indicated on each panel. For each time point, data are Mean ± SEM obtained
from three independent animals.
Figure 7: The rhythmic activation of signaling pathways controlling translation
initiation is altered in Scp2 knockout mice
Temporal protein expression and phosphorylation profile of representative proteins of key
signaling pathways involved in the regulation of translation initiation in Scp2 knockout (right
panel) and wild-type (left panel) mouse liver. Western blots were realized on total liver
extracts. Naphtol blue black staining of the membranes was used as a loading control. Each
graph corresponds to the mean densitometric values of the western blot data associated.
The zeitgeber times (ZT), with ZT0: lights on, ZT12: lights off, at which the animals were
sacrificed, are indicated on each panel. For each time point, data are Mean ± SEM obtained
from three independent animals.
Figure S1: Temporal expression of translation initiation complex factors
Temporal expression of factors involved in translation initiation in Scp2 KO mice and their
control littermates. Temporal real-time RT-PCR expression profile translation initiation
factors in mouse liver. For each time point, data are Mean ± SEM obtained from three
independent animals. The Zeitgeber times (ZT), with ZT0: lights on, ZT12: lights off, at
which the animals were sacrificed, are indicated on each panel.
Figure S2: Rhythmic expression of NPC1 is circadian clock dependent.
A. Npc1 expression was measured by real-time RT-PCR on liver RNAs obtained from
arrhythmic Bmal1 (left panel) and Cry1/Cry2 (right panel) KO mice and their control
littermates. Data are Mean ± SEM obtained from three independent animals. B. Protein levels
were assessed by western-blot on total extracts in Bmal1 (upper panel) and Cry1/Cry2 (lower
panel) KO mice and their control littermates. Naphtol blue black staining of the membranes
was used as a loading control. The Zeitgeber times (ZT), with ZT0: lights on, ZT12: lights
off, at which the animals were sacrificed, are indicated on each panel.
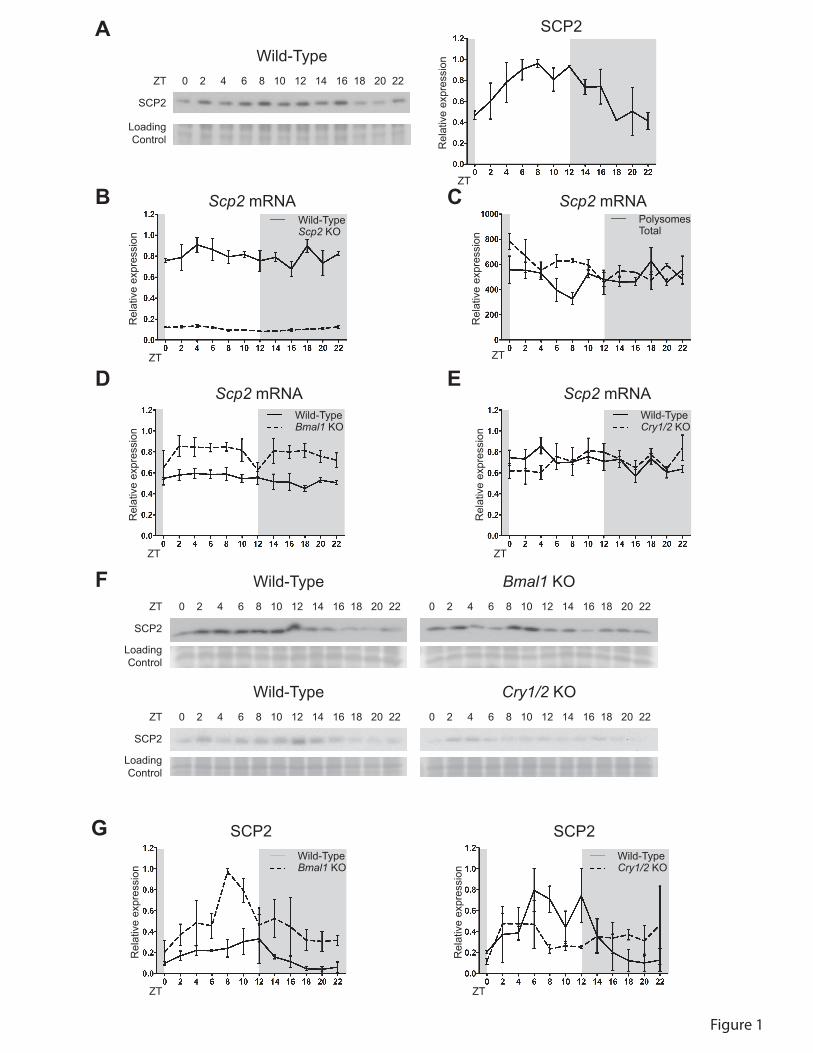
Rel
ativ
e ex
pres
sion
Scp2 mRNAWild-TypeScp2 KO
ZT
Rel
ativ
e ex
pres
sion
Scp2 mRNAWild-TypeCry1/2 KO
ZT
Rel
ativ
e ex
pres
sion
Scp2 mRNAWild-TypeBmal1 KO
ZT
Rel
ativ
e ex
pres
sion
PolysomesTotal
ZT
Scp2 mRNA
Wild-Type 0 2 4 6 8 10 12 14 16 18 20 22ZT
SCP2
LoadingControl R
elat
ive
expr
essi
on
SCP2
ZT
A
B C
ED
Wild-Type Bmal1 KO 0 2 4 6 8 10 12 14 16 18 20 22 0 2 4 6 8 10 12 14 16 18 20 22ZT
SCP2
LoadingControl
Wild-Type Cry1/2 KO 0 2 4 6 8 10 12 14 16 18 20 22 0 2 4 6 8 10 12 14 16 18 20 22ZT
SCP2
LoadingControl
F
G
Rel
ativ
e ex
pres
sion
SCP2
ZT
Wild-TypeBmal1 KO
Rel
ativ
e ex
pres
sion
SCP2
ZT
Wild-TypeCry1/2 KO
Figure 1

Day activityNight activityPeriod
Bmal1 mRNA Cry1 mRNA
Dbp mRNA Per2 mRNA
A
*
** **
Wild-TypeScp2 KO
B
Wild-Type Scp2 KO 0 2 4 6 8 10 12 14 16 18 20 22 0 2 4 6 8 10 12 14 16 18 20 22ZT
BMAL1
PER2
LoadingControl
CZT
Hou
rs
Cou
nts
Cou
nts
Rla
tive
expr
essi
on
Rel
ativ
e ex
pres
sion
Rel
ativ
e ex
pres
sion
Rel
ativ
e ex
pres
sion
ZT
ZTZT
Wild-TypeScp2 KO
ZT
BMAL1
Rel
ativ
e ex
pres
sion
PER2
Rel
ativ
e ex
pres
sion
ZT
Wild-TypeScp2 KO
Wild-Type Scp2 KO
LD
DD
LD
DD
Figure 2

Serum glucose Serum insulin
Serum triglycerides Serum cholesterol
ZT ZT
ZT ZT
Wild-TypeScp2 KO
A B
C D
E
Con
cent
ratio
n (m
g/m
L)
Con
cent
ratio
n (m
g/m
L)C
once
ntra
tion
(mg/
mL)
Con
cent
ratio
n (m
g/m
L)
Figure 3
F
Wild-type mice Wild-type miceScp2 KO mice Scp2 KO mice

Cyp4a14 mRNA
ZTR
elat
ive
expr
essi
on
Acox1 mRNA
ZT
Rel
ativ
e ex
pres
sion
Ppara mRNA
ZT
Rel
ativ
e ex
pres
sion
Wild-TypeScp2 KO
ZT
Rel
ativ
e ex
pres
sion
Cd36 mRNA
A
B
Srebp1c mRNA
Rel
ativ
e ex
pres
sion
ZT
Srebp2 mRNA
Rel
ativ
e ex
pres
sion
ZT
Hmgcr mRNA
Rel
ativ
e ex
pres
sion
ZT
Fasn mRNA
Rel
ativ
e ex
pres
sion
ZT
Wild-TypeScp2 KO
Lpl mRNA
Rel
ativ
e ex
pres
sion
ZT
Figure 4

B Wild-Type Scp2 KO 0 2 4 6 8 10 12 14 16 18 20 22 0 2 4 6 8 10 12 14 16 18 20 22ZT
sXBP1
LoadingControl
A
sXbp1 mRNAR
elat
ive
expr
essi
on
ZT
Rel
ativ
e ex
pres
sion
sXBP1
ZT
Wild-TypeScp2 KO
Wild-TypeScp2 KO
Bip mRNA Chop mRNA
Rel
ativ
e ex
pres
sion
Rel
ativ
e ex
pres
sion
ZT ZT
Figure 5
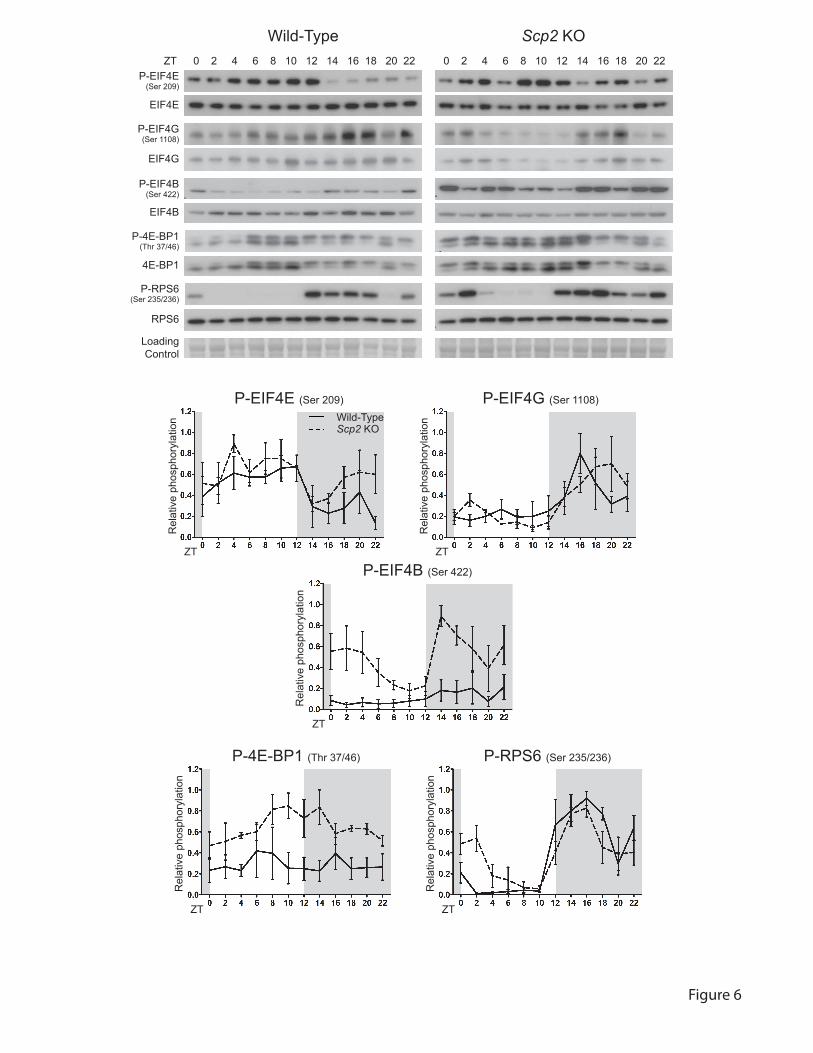
Wild-Type Scp2 KO 0 2 4 6 8 10 12 14 16 18 20 22 0 2 4 6 8 10 12 14 16 18 20 22ZT
P-EIF4G(Ser 1108)
EIF4G
P-EIF4E(Ser 209)
EIF4E
P-EIF4B(Ser 422)
EIF4B
LoadingControl
ZT
P-4E-BP1 (Thr 37/46)
Rel
ativ
e ph
osph
oryl
atio
n
ZT
Rel
ativ
e ph
osph
oryl
atio
n
P-RPS6 (Ser 235/236)
ZT
P-EIF4E (Ser 209)
Rel
ativ
e ph
osph
oryl
atio
n
ZT
Rel
ativ
e ph
osph
oryl
atio
n
P-EIF4G (Ser 1108)
Rel
ativ
e ph
osph
oryl
atio
n
P-EIF4B (Ser 422)
ZT
Wild-TypeScp2 KO
P-RPS6(Ser 235/236)
RPS6
P-4E-BP1(Thr 37/46)
4E-BP1
Figure 6

Wild-Type Scp2 KO 0 2 4 6 8 10 12 14 16 18 20 22 0 2 4 6 8 10 12 14 16 18 20 22ZT
Rel
ativ
e ph
osph
oryl
atio
n
P-ERK1/2 (Thr 202/Tyr 204)
ZTZT
Rel
ativ
e ph
osph
oryl
atio
n
P-AKT (Ser 473)
Wild-TypeScp2 KO
P-AKT(Ser 473)
AKT
P-ERK1/2(Thr 202/Tyr 204)
ERK1/2
LoadingControl
Figure 7

Eif4e mRNA Eif4g1 mRNA
Eif4b mRNA Eif4a2 mRNA
ZT
Rla
tive
expr
essi
on
Rel
ativ
e ex
pres
sion
Rel
ativ
e ex
pres
sion
Rel
ativ
e ex
pres
sion
ZT
ZTZT
Wild-TypeScp2 KO
Eif4ebp3 mRNA
ZT
Rel
ativ
e ex
pres
sion
Figure S1

Rel
ativ
e ex
pres
sion
Npc1 mRNAWild-TypeCry1/2 KO
ZT
Rel
ativ
e ex
pres
sion
Npc1mRNAWild-TypeBmal1 KO
ZT
A
Wild-Type Bmal1 KO 0 2 4 6 8 10 12 14 16 18 20 22 0 2 4 6 8 10 12 14 16 18 20 22ZT
NPC1
LoadingControl
Wild-Type Cry1/2 KO 0 2 4 6 8 10 12 14 16 18 20 22 0 2 4 6 8 10 12 14 16 18 20 22ZT
NPC1
LoadingControl
B
Figure S2

Table S1 : Cosinor statistical values related to rhythmic mRNA expression involved inthe circadian clock and signaling pathways in Scp2 KO and wild-type mice
Genotype p value F(2,9) robustness(%)
Mesor Amplitude Acrophase(h)
fold change
Scp2 KO 0.000177 35.129 84.9 0.1074 0.022 1.26 1.613074418WT 0.589938 0.992 0 1.340930239
Bmal1 KO 0.000121 41.208 86.9 0.4332 0.384 0.07 12.61631342WT 0.000068 53.309 89.6 0.3804 0.2672 23.32 10.40495458
Cry1 KO 0.000022 94.51 93.9 0.4488 0.3437 20.58 8.547864226WT 0.000051 61.04 90.8 0.4574 0.3293 20.56 7.427079148
Dbp KO 0.000272 29.608 82.4 0.2977 0.3832 10.92 103.9179487WT 0.0048 10.456 59.9 0.2789 0.3881 10.04 77.63975155
Per2 KO 0.001026 18.074 73.4 0.3157 0.3327 15.28 19.99675886WT 0.000309 28.166 81.6 0.3726 0.3529 15.06 13.07585266
Cyp4a14 KO 0.010681 7.881 51.5 0.4512 0.1803 3.66 4.723795676WT 0.903592 0.102 0 16.26319397
Acox1 KO 0.868388 0.143 0 1.437809548WT 0.000325 27.636 81.3 0.3653 0.0805 10.74 1.777709226
Lpl KO 0.003978 11.219 61.8 0.6235 20.95 5.92 2.74628662WT 0.000165 36.21 85.3 0.3261 0.1627 4.1 3.560435931
Cd36 KO 0.124428 2.641 16 1.689982604WT 0.045111 4.434 32.8 0.2017 0.0499 9.14 2.412037037
Ppara KO 0.001166 17.265 72.4 0.5497 0.28 11.44 2.751498133WT 0.001987 14.308 68.1 0.3715 0.1705 10.24 2.989282697
Hmgcr KO 0.049291 4.26 31.5 0.5061 0.1816 17.5 3.50465868WT 0.101446 2.97 19.7 3.936582196
Fasn KO 0.028951 5.361 39.2 0.4667 0.1847 20.24 4.327027666WT 0.023321 5.852 42 0.3698 0.153 20.45 5.043459365
Srebp1c KO 0.025914 5.609 40.6 0.3913 0.0876 17.49 2.082407166WT 0.011033 7.788 51.2 0.4562 0.1824 17.35 4.7716141
Srebp2 KO 0.125254 2.63 15.9 1.722547904WT 0.157798 2.276 11.4 1.986686232
Bip KO 0.392926 1.044 0 4.097817103WT 0.155558 2.297 11.7 4.749656285
Chop KO 0.515685 0.721 0 3.404024186WT 0.717126 0.35 0 2.99215582
sXbp1 KO 0.072583 3.542 25.4 2.349473251WT 0.513584 0.789 0 3.139220905

Table S2 : Cosinor statistical values related to rhythmic phosphorylation and expressionprotein involved in the circadian clock and signaling pathways in Scp2 KO and wild-type mice
Genotype p value F(2,9) robustness(%)
Mesor Amplitude Acrophase (h) foldchange
SCP2 WT 0.000183 34.679 84.7 0.6877 0.2565 9.15 2.328796
BMAL1 KO 0.001085 17.718 73 0.5631 0.1071 5.02 1.562068WT 0.001149 17.357 72.5 0.6008 0.2196 8.11 4.327242
PER2 KO 0.002614 12.996 65.7 0.3992 0.3437 18.48 20.46211WT 0.013169 7.293 49.1 0.1716 0.1775 17.06 50.78053
sXBP1 KO 0.280083 1.47 0 3.996046WT 0.589666 0.568 0 11.51941
P-EIF4E KO 0.144284 2.411 13.2 2.798669WT 0.007071 9.152 56 0.4462 0.2009 7.37 4.925861
P-EIF4G KO 0.001123 17.499 72.7 0.3367 0.2584 19.33 7.857111WT 0.023242 5.859 42.1 0.3209 0.1865 16.93 4.94066
P-EIF4B KO 0.18052 2.077 8.8 5.035737WT 0.015436 6.869 47.2 0.11 0.0645 17.43 4.713967
P-4EBP1
KO 0.00182 14.754 68.8 0.6445 0.1565 11.54 1.806493
WT 0.564615 0.617 0 1.837553P-RPS6 KO 0.044081 4.48 33.2 0.3932 0.2396 18.07 14.56473
WT 0.001068 17.818 73.1 0.371 0.4352 16.6 71.2969P-AKT KO 0.006582 9.384 56.8 0.4645 0.25 17.2 5.245264
WT 0.000314 27.99 81.5 0.1417 0.0952 16.17 3.710415P-ERK KO 0.064351 3.759 27.4 1.846368
WT 0.000174 35.391 85 0.3925 0.1403 6.87 2.503327
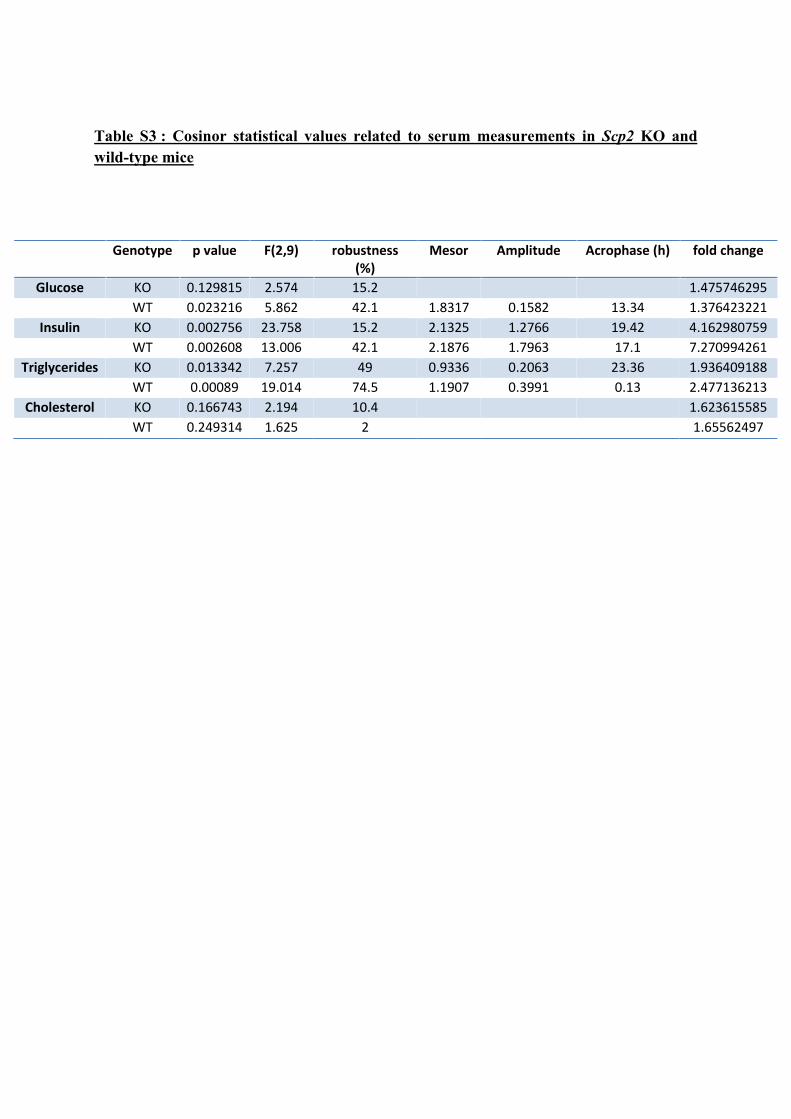
Table S3 : Cosinor statistical values related to serum measurements in Scp2 KO andwild-type mice
Genotype p value F(2,9) robustness(%)
Mesor Amplitude Acrophase (h) fold change
Glucose KO 0.129815 2.574 15.2 1.475746295WT 0.023216 5.862 42.1 1.8317 0.1582 13.34 1.376423221
Insulin KO 0.002756 23.758 15.2 2.1325 1.2766 19.42 4.162980759WT 0.002608 13.006 42.1 2.1876 1.7963 17.1 7.270994261
Triglycerides KO 0.013342 7.257 49 0.9336 0.2063 23.36 1.936409188WT 0.00089 19.014 74.5 1.1907 0.3991 0.13 2.477136213
Cholesterol KO 0.166743 2.194 10.4 1.623615585WT 0.249314 1.625 2 1.65562497

References of the antibodies used for Western blotting
Protein Reference Company
P-EIF4E (Ser 209)EIF4EP-EIF4G (Ser 1108)EIF4GP-EIF4B (Ser 422)EIF4BP-4EBP1 (Thr 37/46)4EBP1P-RPS6 (Ser 235/236)RPS6P-TSC2 (Ser 1387)TSC2P-AKT (Ser 473)AKTP-p44/42 MAPK (Erk1/2)(The 202 / Tyr 204)P44/42 MAPK (Erk1/2)SCP2sXBP1BMAL1PER2NPC1
974120672441246935913592285596442211221755844308406046914376
9102HPA027101Sc-7160Preitner et al., 2002Brown et al., 2005Ab36983
Cell Signaling TechnologyCell Signaling TechnologyCell Signaling TechnologyCell Signaling TechnologyCell Signaling TechnologyCell Signaling TechnologyCell Signaling TechnologyCell Signaling TechnologyCell Signaling TechnologyCell Signaling TechnologyCell Signaling TechnologyCell Signaling TechnologyCell Signaling TechnologyCell Signaling TechnologyCell Signaling Technology
Cell Signaling TechnologySigmaSanta Cruz Biotechnology
Abcam
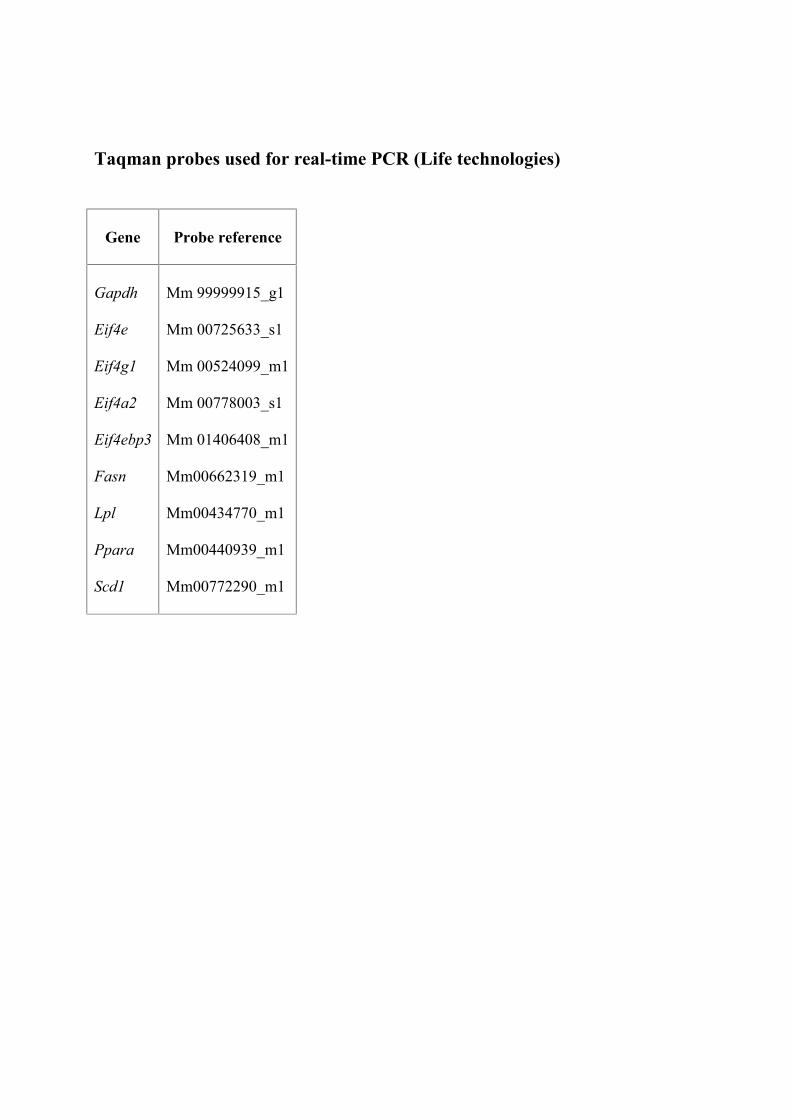
Taqman probes used for real-time PCR (Life technologies)
Gene Probe reference
Gapdh
Eif4e
Eif4g1
Eif4a2
Eif4ebp3
Fasn
Lpl
Ppara
Scd1
Mm 99999915_g1
Mm 00725633_s1
Mm 00524099_m1
Mm 00778003_s1
Mm 01406408_m1
Mm00662319_m1
Mm00434770_m1
Mm00440939_m1
Mm00772290_m1

Sequences of the primers used for real-time PCR
Gene Forward primer Reverse primer
Gapdh
Scp2
Bip
Chop
sXbp1
Cyp4a14
Acox1
Cd36
Hmgcr
Srebp1c
Srebp2
Npc1
Bmal1
Cry1
Dbp
Per2
CATGGCCTTCCGTGTTCCTA
GGCCTTCTTTCAAGGGAAAC
GAAAGGATGGTTAATGATGCTGAG
CATACACCACCACACCTGAAAG
CTGAGTCCGAATCAGGTGCAG
TCTCTGGCTTTTCTGTACTTTGCTT
GGATGGTAGTCCGGAGAACA
GATGACGTGGCAAAGAACAG
AGCTTGCCCGAATTGTATGTG
GGAGCCATGGATTGCACATT
GCGTTCTGGAGACCATGGA
TGAATGCGGTCTCCTTGGTC
GCATTCTTGATCCTTCTTTGGT
CTGGCGTGGAAGTCATCGT
CGTGGAGGTGCTTAATGACCTTT
ATGCTCGCCATCCACAAGA
CCTGCTCTTCCGTGTTCCTA
CTAAGCCCTGACGACGAGAC
GTCTTCAATGTCCGCATCCTG
CCGTTTCCTAGTTCTTCCTTGC
TGGCCGGGTCTGCTGAGTCCG
CAGAAAGATGAGATGACAGGACACA
AGTCTGGATCGTTCAGAATCAAG
TCCTCGGGGTCCTGAGTTAT
TCTGTTGTGAACCATGTGACTTC
GGCCCGGGAAGTCACTGT
ACAAAGTTGCTCTGAAAACAAATCA
CTCACTGGCTTCCTTTGGTA
CCAAGAAGGTATGGACACAGACAAA
CTGTCCGCCATTGAGTTCTATG
CATGGCCTGGAATGCTTGA
GCGGAATCGAATGGGAGAAT

66
III. Metabolic defects in Bmal1 knockout mice
Deficiency in the molecular circadian clock has been shown to be involved in metabolic
syndromes and obesity. Indeed, several studies present evidence of impaired glucose and
insulin metabolism in various clock deficient mice models66, 313-315
. Some characteristics
observed in circadian clock genes deficient mice, such as glucose intolerance defect and
hyperglycemia were also observed in obesity mice models as Ob/Ob and Db/Db mice316
.
Feeding is also an important parameter involved in metabolic defects. Indeed, feeding/fasting
cycle constitutes an external cue involved in the synchronization of peripheral organs like the
liver. Mice challenged with a high-fat diet exhibit obesity characteristics, but it has been
shown that their molecular circadian clock was also disrupted because of changes in feeding
behaviour317
. However, mice fed a high-fat diet in restricted conditions exhibit a normal
circadian clock function without presented metabolic disorders318
.
To investigate involvement of the circadian clock in metabolic disorders, we used two
approaches. First, obesity has been induced by the Ob mutation in the gene encoding for
leptin. Second, it was induced by a high-fat challenge in Bmal1 knockout mice.
Metabolic defects in genetically obese Bmal1 KO mice A.
(1) Bmal1 KO mice harboring the Ob mutation
exhibit premature death.
We generated a new mice line that is deficient in a functional circadian clock and obese. To
this end we used Bmal1 KO and Ob mice that carry a mutation in the gene encoding for leptin
(Ob mutation). Because both Bmal1 KO and Ob/Ob mice are infertile319, 320
, we crossed mice

67
expressing both knockout and mutation at the heterozygote state: Bmal1KO/WT
ObOb/WT
and the
littermates were used as control in this study. As shown in figure 16A, the proportions of each
of the 9 genotypes obtained of the born pups are in accordance with the theorical Mendelian
proportions. This first result means that this crossing did not generate embryonic lethality.
However, we did observe some dead mice after birth. It appeared that these deaths were
genotype-related, as we estimated 45% of Bmal1KO/KO
ObOb/WT
and 60% of Bmal1KO/KO
ObOb/Ob
mice died (figure 16B) between 4 and 5 weeks after birth (figure 16C).
Figure 16: Obese Bmal1 knockout mice died prematurely.
A. Proportions of each genotype of born mice (filled bars) compared to the theorical Mendelian
proportions (streaked bars). B. Proportions of death for each genotype. C. Repartition of dead
Bmal1KO/KO
ObOb/WT
and Bmal1KO/KO
ObOb/Ob
mice depending on their age.
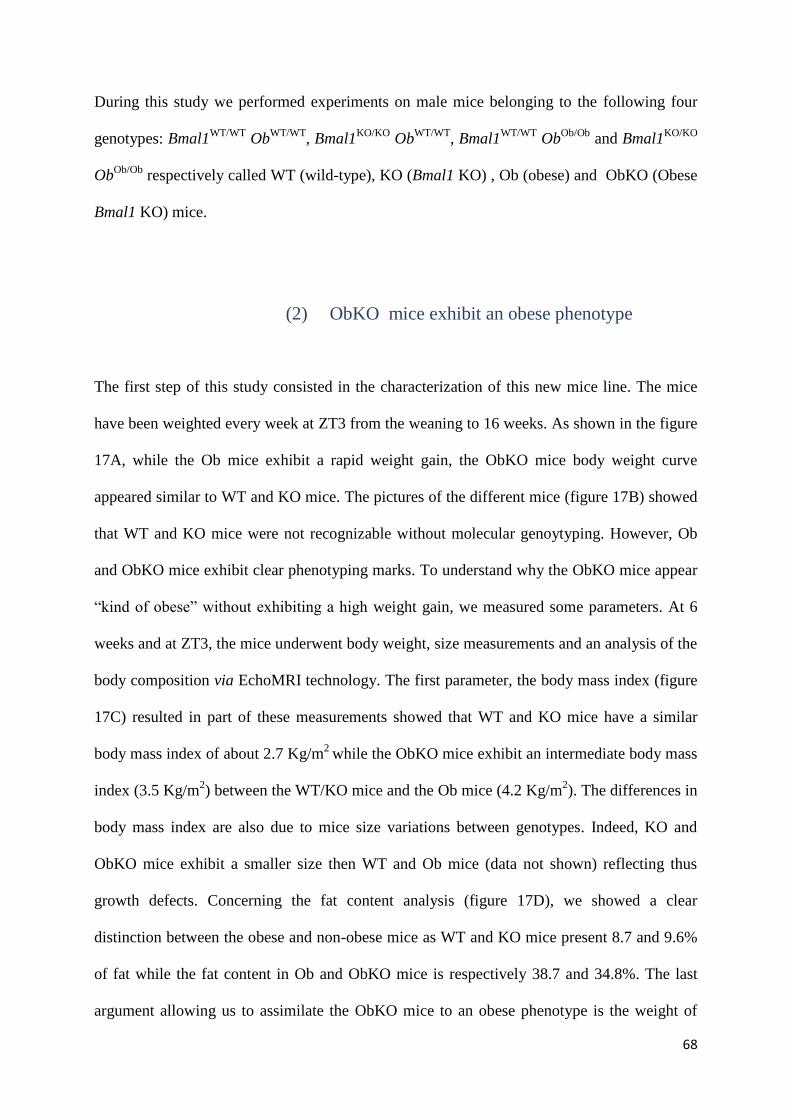
68
During this study we performed experiments on male mice belonging to the following four
genotypes: Bmal1WT/WT
ObWT/WT
, Bmal1KO/KO
ObWT/WT
, Bmal1WT/WT
ObOb/Ob
and Bmal1KO/KO
ObOb/Ob
respectively called WT (wild-type), KO (Bmal1 KO) , Ob (obese) and ObKO (Obese
Bmal1 KO) mice.
(2) ObKO mice exhibit an obese phenotype
The first step of this study consisted in the characterization of this new mice line. The mice
have been weighted every week at ZT3 from the weaning to 16 weeks. As shown in the figure
17A, while the Ob mice exhibit a rapid weight gain, the ObKO mice body weight curve
appeared similar to WT and KO mice. The pictures of the different mice (figure 17B) showed
that WT and KO mice were not recognizable without molecular genoytyping. However, Ob
and ObKO mice exhibit clear phenotyping marks. To understand why the ObKO mice appear
“kind of obese” without exhibiting a high weight gain, we measured some parameters. At 6
weeks and at ZT3, the mice underwent body weight, size measurements and an analysis of the
body composition via EchoMRI technology. The first parameter, the body mass index (figure
17C) resulted in part of these measurements showed that WT and KO mice have a similar
body mass index of about 2.7 Kg/m2
while the ObKO mice exhibit an intermediate body mass
index (3.5 Kg/m2) between the WT/KO mice and the Ob mice (4.2 Kg/m
2). The differences in
body mass index are also due to mice size variations between genotypes. Indeed, KO and
ObKO mice exhibit a smaller size then WT and Ob mice (data not shown) reflecting thus
growth defects. Concerning the fat content analysis (figure 17D), we showed a clear
distinction between the obese and non-obese mice as WT and KO mice present 8.7 and 9.6%
of fat while the fat content in Ob and ObKO mice is respectively 38.7 and 34.8%. The last
argument allowing us to assimilate the ObKO mice to an obese phenotype is the weight of

69
different organs as liver or white adipose tissue. Indeed, in WT and KO mice, liver weight
represented from to 3 to 4% of the total mice weight while it represented a significant higher
percentage in Ob and ObKO mice (figure 17F). The same observation was done concerning
the proportion of white adipose tissue as it represented less than 2% of the body weight in WT
and KO mice while the proportion of this tissue reached 8.8 and 6.7% of the whole mouse
weight in Ob and ObKO mice respectively.
(3) Glucose homeostasis is impaired in ObKO mice
Ob/Ob mice are described as hyperglycemic and insulin resistant, that is why they are
frequently used as model for studies on diabetes. Recent evidences shown that pancreatic
molecular circadian clock coordinates insulin release. Deficient molecular clock is sufficient
to generate diabetes mellitus313
. We hypothesized here that mice harboring both Ob mutation
and molecular clock deficiency could undergo severe diabetes which may explain the
premature death of ObKO mice previously described (figure 16).

70
Figure 17: ObKO mice exhibit obese phenotype.
A. Body weight curves corresponding to WT (blue), KO (green), Ob (red) and ObKO (purple) mice.
Each mouse is weighted from 3 to 16 weeks after birth at ZT6. B. Representative pictures of mice of
interest. The mice are all 12 week-old. C. Body Mass Index of each 6 week-old mice of interest. D.
Proportion of fat content for each mice of interest. The fat content is given by the EchoMRI analyser
on 6 week-old fed mice at ZT3. E. Body weight of fed mice before the sacrifice at ZT12. F. Proportion
of organs. Liver and white adipose tissues (WAT) were weighted after dissection. Data are Mean ±
SEM obtained from 7 to 10 independent animals for each genotype. The Zeitgeber Times (ZT) are
defined as followed: ZT0 lights on; ZT12: lights off. Statistical analysis were done with the t-test (**
P< 0.01 and * P<0.05 compared to other genotypes).

71
We first measured the glycemia on the 10 week-old mice after 15 hour-starvation (ZT3) and
then after 6 hour-refeeding (ZT9). In WT mice, the glycemia after starvation is 6 mmol/l and
after refeeding the glycemia increased to reach 10.3 mmol/l (figure 18A). The KO mice
exhibit a higher glycemia after starvation (8.3 mmol/l) than WT mice, but the glycemia did
not increase as much as we could expect after the refeeding period (9.9 mmol/l). KO mice are
thus insulin-sensitive. It may thus suggest a defect in enzymes, such as amylases, catalyzing
glucose release from the food. The food intake, leading to activation of insulin-related
signaling pathways, allows the glucose entry into cells through different glucose transporters.
Indeed, glucose entry in hepatocytes and pancreatic β-islets is mediated by GLUT2321
while
GLUT4 is responsible for glucose internalization in adipose tissue and skeletal muscles322
. Ob
and ObKO mice exhibit starved glycemia a little higher (respectively 7.2 and 7.7 mmol/l)
compared to WT mice, but glycemia after refeeding reaches a very high level (respectively
15.7 and 12 mmol/l). In these mice, the post-prandial glycemia may reflect impairment in
insulin-activated pathways leading defects in glucose clearance.
Glucose and insulin concentrations measurements in the serum at ZT12 on 13 week-old mice
(figure 18 B and C) showed that WT and KO mice exhibit the same behavior: their serum
glucose concentration at this time point was 12 mmol/l and their serum insulin concentration
was about 2 µg/l. In Ob mice the glucose concentration in the serum was the double (22
mmol/l) and the serum insulin concentration was more than 6 times higher than the WT and
KO mice (12.9 µg/l). These results are in accordance with hyperglycemic and
hyperinsulinemic phenotype of Ob/Ob mice. Leptin deficient mice eat much more which can
explain the hyperglycemia and insulin resistance. The hyperinsulinemia is the result of insulin
resistance. ObKO mice exhibit also a high serum glucose (18 mmol/l), certainly due to high
food intake. However, their serum insulin concentration was quite low (4.4 µg/l) oppositely to
Ob mice. This result can be explained by low pancreatic insulin secretion.

72
The glycogen accumulation in the liver reflects the glucose storage. GSK (Glycogen Synthase
Kinase) 3 is a key enzyme involved in glucose conversion to glycogen. The glycogen
accumulates rhythmically in the liver in WT mice, the lower accumulation corresponding time
point occurring at ZT12. Moreover, this rhythm seems to be dependent on the molecular clock
as it is impaired in Bmal1 KO mice liver (figure 18D, left panel). In addition, Bmal1 KO mice
exhibit a lower glycogen accumulation (almost the half) throughout the entire day compared
to WT mice (figure 18E, right panel). We extracted the glycogen from liver samples of the 13
week-old mice sacrificed at ZT12 (figure 18F). In WT mice liver, the glycogen concentration
was 19 µg/mg of tissue. The glycogen proportion in KO mice liver (39.6 µg/mg of tissue)
doubled compared to the one in WT mice liver. The glycogen accumulation in Ob mice liver
appeared to be intermediate (28.9 µg/mg of tissue) compared to the WT and KO mice liver.
ObKO mice exhibit a liver glycogen accumulation 1.5 fold higher than in obese mice liver
(45.2 µg/mg of tissue). High glycogen accumulation through over-activation of GSK3 has
been linked to insulin resistance. It was thus surprising to observe high glycogen
accumulation in ObKO mice while they are apparently insulin-sensitive. Considering the fact
that ZT12 corresponds to the highest glycogen accumulation in Bmal1 KO mice compared to
WT, we may suppose that at ZT20 or ZT0, glycogen accumulation would be still the same
than at ZT12 in ObKO mice while it would be much higher in Ob mice.

73
Figure 18: The glucose homeostasis is impaired in obese knockout mice.
A. Glycemia measurements after 15 hour starvation (filled bars) and after 6 hour-refeeding (streaked
bars) on 10 week-old mice. B and C. Serum glucose (B) and insulin (C) measurements performed on
13 week-old mice at ZT12. D. Temporal glycogen accumulation in Bmal1 wild-type (blue) and
knockout (green) mice liver (left panel) and whole day glycogen accumulation corresponding(right
panel). E. Glycogen accumulation in the liver of 13 week-old mice at ZT12. Data are Mean ± SEM
obtained from 6 to 8 independent animals for each genotype of interest. The Zeitgeber Times (ZT) are
defined as followed: ZT0 lights on; ZT12: lights off. Statistical analysis were done with the t-test (**
P< 0.01 and * P<0.05 compared to other genotypes; ## P< 0.01 comparison between starved and refed
conditions).

74
(4) ObKO mice exhibit an impaired glucose
clearance but are insulin sensitive.
We performed both glucose and insulin tolerance tests on 11 and 12 week-old mice
respectively. We choose to perform these experiments at ZT3 because it appeared to be the
most responding time-point323
.
After glucose injection, all the mice exhibit an increased glycemia (figure 19A, right panel).
However, in WT mice, after 15 min the glycemia stabilizes and starts to decrease after 30 min
to reach the basal glycemic level at 90 minutes after the glucose injection. In KO, Ob and
ObKO mice, the glycemia continues to increase until 30 minutes after the injection. The curve
slopes (figure 19A, left panel) reflect the capacity of glucose elimination from the blood
called glucose clearance. We can observe that KO and ObKO mice exhibit faster clearance
than wild-type mice. Ob mice can be qualified as glucose resistant because of their lower
glucose clearance capacity.
Concerning insulin tolerance tests, we show here (figure 19B) that all the mice exhibit a
decreased glycemia after insulin injection except the Ob mice which revealed insulin
intolerance or resistance. We can also observe that KO mice are highly insulin sensitive as the
glycemia did not reach the basal level even after 180 min. In ObKO mice, we can observe a
similar effect even the basal glycemia was higher.

75
Figure 19: Glucose and insulin tolerance tests.
A. Glucose tolerance test realized on 11 week-old mice at ZT3 after 15 hour-starvation (left panel) and
the clearance slopes (right panel) associated. The mice underwent intra-peritoneal injection of glucose
(1g/Kg of mice). B. Insulin tolerance test realized on 12 week-old mice at ZT3. The mice underwent
intra-peritoneal injection of insulin (1UI/Kg of mice). Data are Mean ± SEM obtained from 6 to 10
independent animals for each genotype of interest.
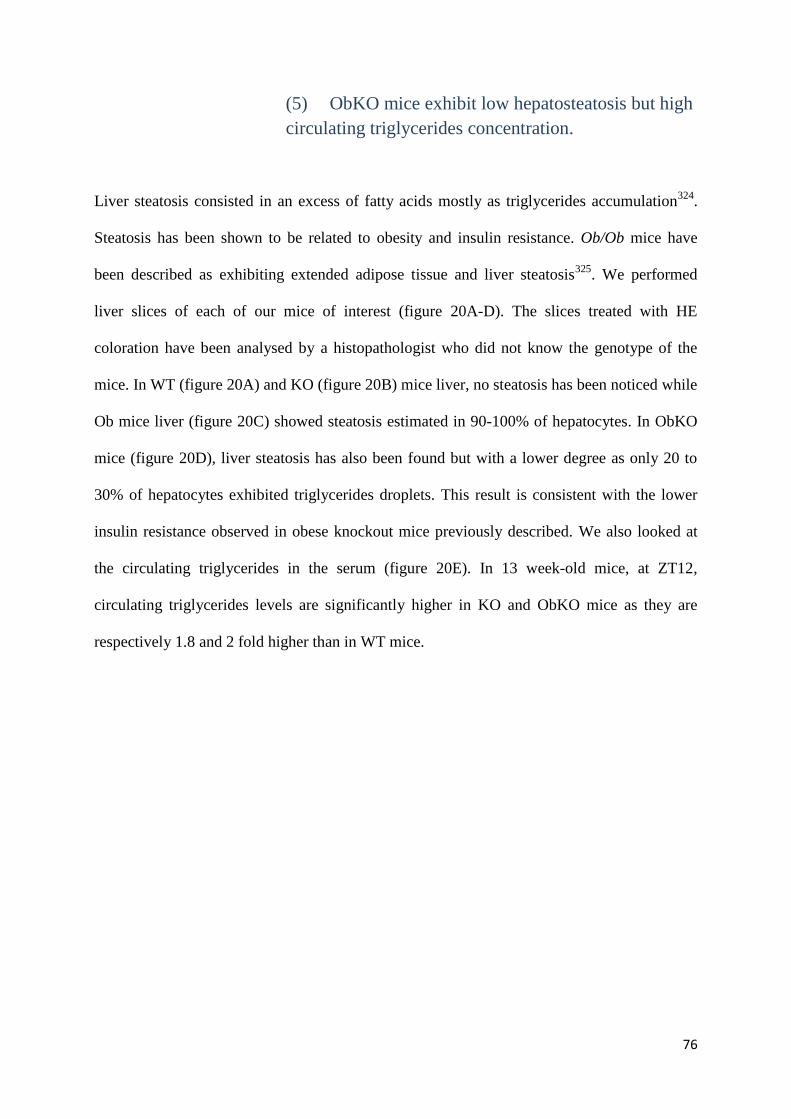
76
(5) ObKO mice exhibit low hepatosteatosis but high
circulating triglycerides concentration.
Liver steatosis consisted in an excess of fatty acids mostly as triglycerides accumulation324
.
Steatosis has been shown to be related to obesity and insulin resistance. Ob/Ob mice have
been described as exhibiting extended adipose tissue and liver steatosis325
. We performed
liver slices of each of our mice of interest (figure 20A-D). The slices treated with HE
coloration have been analysed by a histopathologist who did not know the genotype of the
mice. In WT (figure 20A) and KO (figure 20B) mice liver, no steatosis has been noticed while
Ob mice liver (figure 20C) showed steatosis estimated in 90-100% of hepatocytes. In ObKO
mice (figure 20D), liver steatosis has also been found but with a lower degree as only 20 to
30% of hepatocytes exhibited triglycerides droplets. This result is consistent with the lower
insulin resistance observed in obese knockout mice previously described. We also looked at
the circulating triglycerides in the serum (figure 20E). In 13 week-old mice, at ZT12,
circulating triglycerides levels are significantly higher in KO and ObKO mice as they are
respectively 1.8 and 2 fold higher than in WT mice.

77
Figure 20: Triglyceride homeostasis in obese Bmal1 knockout mice.
A-D. Representative histology of WT (A), KO (B), Ob (C) and ObKO (D) mice liver. Liver
slices have been realized from 15 week-old mice. The slices were treated with
Hematoxylin/Eosin coloration. The scale bars are indicated on the pictures (50 µm) and the
objective used is 10X. The arrows showed lipid droplets. E. Serum triglyceride concentration
on 13 week-old mice at ZT12. Data are Mean ± SEM obtained from 6 independent animals
for each genotype of interest. The Zeitgeber Times (ZT) are defined as followed: ZT0 lights
on; ZT12: lights off. Statistical analysis were done with the t-test (** P< 0.01 ; * P<0.05).

78
B. Metabolic defects in diet-induced obese Bmal1 KO mice
In order to study the evolution of obesity induced by the food in molecular circadian clock
deficient mice, we fed 8 week-old Bmal1 KO and WT mice with high-fat and control diet
during 12 weeks. The mice are weight before starting the experimentation and then every
week until the sacrifice time. From the 4th
week of the experiment, mice underwent different
in vivo measurements as analysis of the body composition via EchoMRI technology, starved
and refed glycemia measurements, glucose and insulin tolerance tests.
(1) Bmal1 KO mice fed with high-fat diet become
obese prematurely
It appeared that the mice fed with control diet, whatever their genotype, exhibit similar gain of
weight (figure 21A), body mass index (figure 21B), but the fat content of Bmal1 knockout
mice is a little higher than wild-type mice during the first weeks of the experiment to become
similar at the end (figure 21C). While no difference in the organs weight ratio was observe at
the sacrifice time (figure 21E), it appeared however that the Bmal1 KO mice fed with control
diet exhibit a lighter body weight compared to the wild-type (figure 21D). Concerning the
mice fed with high-fat diet, more differences were observed. Indeed, the weight gain (figure
21A), the increased of the body mass index (figure 21B) and the proportion of fat (figure 21C)
appeared faster in Bmal1 knockout mice than in wild-type mice. However, at the end of the
experiment, they reach the same level for each of these characteristics. We can notice that
liver/body ratio appeared lower for WT mice fed with high-fat diet compared to control diet
fed WT mice (figure 21E, right panel), but liver mass is actually higher. This can be explained
by the difference of their body weight measured at the sacrifice time (figure 21D).

79
Figure 21: Bmal1 knockout mice present obese phenotype.
A. Relative gain of weight of each group of mice. Each mouse is weighted from 8 (beginning
of the experiment) to 20 weeks after birth at ZT6. B. Evolution of the Body Mass Index of the
mice. D. Proportion of fat content for each group of mice. The fat content is given by the
EchoMRI analyser on fed mice at ZT3. D. Body weight of fed mice before the sacrifice at
ZT12. E. Proportion of organs (right panel) and organs weight (left panel). Liver and white
adipose tissues (WAT) were weighted after dissection. Data are Mean ± SEM obtained from 6
to 10 independent animals for each condition. The Zeitgeber Times (ZT) are defined as
followed: ZT0 lights on; ZT12: lights off. Statistical analysis were done with the t-test (** P<
0.01 ; * P<0.05).

80
WT mice fed with high-fat regimen become obese but the mice were not fed long enough to
observe a significant increase in liver weight ratio.
(2) Glucose homeostasis is impaired in diet-induced
obese mice
Before starting the feeding experiment, we measured the glycemia on the 8 week-old mice
after 15 hour-starvation (ZT3) and then after 6 hour-refeeding (ZT9).The results obtained are
in accordance with the ones observed on wild-type and knockout mice coming from the
Ob.Bmal1 mice line. Indeed, in wild-type mice, the glycemia after starvation is 5 mmol/l and
after refeeding the glycemia increased to reach 10.5 mmol/l (figure 22A). The knockout mice
exhibit a higher glycemia after starvation (6.8 mmol/l) than wild-type mice. But the glycemia
did not increase as much as we could expect after the refeeding period (9.3 mmol/l). During
the experiment (figure 22B) the glycemia after starvation in control diet fed mice did not
change. However, after refeeding, their glycemia tended to decrease at the end of the
experiment expecially in wild-type mice. Concerning the high-fat fed mice, Bmal1 knockout
mice exhibit higher glycemia after starvation than the wild-type, but at the end of the
experiment, Bmal1 knockout mice exhibit a decreased gylcemia to present the same glycemia
than the wild-type mice. The same observation was done on glycemia measured after
refeeding.

81
Figure 22: Impairment of glucose homeostasis in mice fed with high-fat diet.
A. B. Glycemia measurements after 15 hour starvation (filled bars or lines) and after 6 hour-
refeeding (streaked bars or dashed lines) on 8 week-old wild-type and Bmal1 knockout mice
before the beginning of the feeding experiment(A) and every 3 weeks during the experiment
(B). Data are Mean ± SEM obtained from 6 to 8 independent animals for each genotype of
interest. The Zeitgeber Times (ZT) are defined as followed: ZT0 lights on; ZT12: lights off.
Statistical analysis were done with the t-test (** P< 0.01 ; * P<0.05 compared to other
genotypes; ## P< 0.01; # P< 0.05 comparison between starved and refed conditions).
(3) Bmal1 KO liver exhibit less steatosis
We performed liver slices of mice in each condition (figure 23). Both control diet fed wild-
type (figure 23A) and Bmal1 knockout mice (figure 23B) present normal liver without

82
steatosis. When wild-type mice are fed with high-fat diet during 12 weeks, we can notice the
presence of lipid droplets in hepatocytes. This steatosis is however very low compared to
obese mice previously described (figure 20C). In contrast, high-fat diet fed Bmal1 knockout
mice liver exhibit much less lipid droplets than the high-fat diet mice liver. In this condition,
Bmal1 deletion prevents triglycerides accumulation in liver leading to hepatosteatosis.
Figure 23: Triglyceride homeostasis in obese Bmal1 knockout mice.
A-D. Representative histology of WT CD (A), KO CD (B), WT HFD (C) and KO HFD (D) mice liver.
Liver slices have been realized from 21 week-old mice. The slices were treated with
Hematoxylin/Eosin coloration. The scale bars are indicated on the pictures (50 µm) and the objective
used is 10X. The arrows showed lipid droplets.

83
(4) Delayed glucose clearance in high-fat diet fed
mice
During the feeding experiment, we followed the evolution of the response of the mice to
glucose injection. It appeared that the way organisms manage the excess of circulating
glucose did not change so much weeks after weeks (figure 24, left panels). In addition, it is
clear that we have two different groups depending on the feeding. Indeed, high-fat diet mice
exhibit a delayed glucose clearance as it started 30 to 60 minutes after the injection. However,
the slopes reflecting glucose clearance showed increased glucose intolerance in wild-type
mice fed with high fat diet (figure 24, right panels) in function of the time. Indeed, while the
glucose clearance do not change in control diet fed mice and in high fat diet Bmal1 knockout
fed mice, the speed of glucose elimination from the blood is low at 13 weeks and became
even lower.
Concerning the insulin tolerance test, we show here (figure 25) that all the mice exhibit a
decreased glycemia after insulin injection. However the wild-type mice fed with high-fat diet
exhibit less important insulin sensitivity. While they were fed with high-fat diet, Bmal1
knockout mice remained still very sensitive to insulin even it was clear that this sensitivity
appeared less important than in mice fed with control diet expecially during the first weeks of
the experiment.

84
Figure 24: Evolution of the glucose clearance.
A-C Glucose tolerance tests performed on 13 (A), 16 (B) and 19 (C) week-old mice at ZT3 after 15
hour-starvation. The mice underwent intra-peritoneal injection of glucose (1g/Kg of mice). Right
panels correspond to the clearance slopes for each experiment. Data are Mean ± SEM obtained from 6
to 10 independent animals for each genotype of interest. The Zeitgeber Times (ZT) are defined as
followed: ZT0 lights on; ZT12: lights off.

85
Figure 25: Evolution of the
insulin sensitivity.
A-C Insulin tolerance tests
performed on 14 (A), 17 (B) and
20 (C) week-old mice at ZT3. The
mice underwent intra-peritoneal
injection of insulin (0.5UI/Kg of
mice). Data are Mean ± SEM
obtained from 6 to 10 independent
animals for each genotype of
interest. The Zeitgeber Times
(ZT) are defined as followed: ZT0
lights on; ZT12: lights off.

86
DISCUSSION
Circadian rhythms involvement in metabolism consists in activation of the right signaling
pathway at the right time to ensure an adapted physiology. To study metabolic defects due to
misalignments of circadian clock, we used both genetic and diet-induced obesity models as
previously described.
I. Premature death for Bmal1 KO mice harboring Ob mutation
As both Ob/Ob and Bmal1 KO mice are infertile319, 320
, it is thus neceassary to cross
heterozygotes to generate these mice. For both mice lines, no embryonic or premature death
has been reported. It was thus surprising to observe 45% and 60% of dead ObOb/+
Bmal1KO/KO
and ObOb/Ob
Bmal1KO/KO
mice respectively. Ob mutation in one allele is thus sufficient to
cause death Bmal1 deficient mice. Experiments on ObOb/+
Bmal1KO/KO
mice did not show any
differences with Bmal1 KO mice concerning the glucose homeostasis, and glucose and insulin
tolenrence. However, Leptin deficiency in one allele in Bmal1 KO mice leads to increasing fat
percentage (data not shown). This is in accordance with intermediate obese phenotype already
described in Ob/+ mice326
. It seems thus that BMAL1 and Leptin may directly or indirectly
interact in a critical physiological process. In addition, most of these deaths occurs during a
particular 2-3 weeks period after weaning but after this critical period, obese knockout mice
do not exhibit significant mortality until 13 weeks after birth, age of the sacrifices. We thus
have no information concerning their ageing.

87
II. Involvement in bone metabolism
In our experiments, to calculate the body mass index of each mice, we measured their size.
Wild-type and obese mice measured 8.5 and 8.3 cm respectively while knockout and obese
knockout mice exhibit significant smaller size (8.1 and 7.6 cm respectively).
Recently, circadian clock327
and leptin328
have been shown to be involved in bone metabolism
at different levels. Indeed, synchronized by glucocorticoids releasing, the clock resided in
osteoclasts contributes to circadian expression of osteoclast-related genes327
. In addition,
osteoblasts number and activity are increased by leptin through peripheral pathways328
. The
disruption of circadian clock through Bmal1 deletion associated with leptin defect created
smaller size of the mice revealing their importance in bone metabolism.
III. Food intake consequences
During our experiments, we did not measure food intake. However, leptin defect leads to
increasing food intake especially during the light phase compared to wild-type mice. High-fat
diet can also influence time and amount of food intake. Indeed, wild-type mice under high-fat
regimen exhibit higher food intake during the light (about 20% of total food intake) phase
compared to control animals317
. This abnormal feeding behaviour impacts on regulation of
circadian clock as fasting/feeding cycles which are considered as a strong Zeitgeber. This
leads to consequences at the metabolic level. Indeed, activation of SREBP1c in liver has been
linked to feeding behaviour329
. When fasting/feeding cycles are altered by disrupted light/dark
cycles, clock genes deletion, leptin deficiency, or induced by high-fat regimen, this leads to
abnormal activation of the lipogenesis through SREBP1c signaling pathway, leading as a

88
consequence to obesity. In addition, mice fed with high-fat diet only during the night exhibit
restored circadian gene oscillations. They also exhibit alteration in fatty acid and glucose
metabolisms preventing thus obesity and liver steatosis and glucose tolerance318
.
IV. Protective effect of Bmal1 deletion in obesity
Insulin resistance, a consequence of T2D (Type 2 Diabetes), is characterized by high serum
glucose and insulin levels due to high pancreatic insulin secretion. In addition, animal liver
exhibits steatosis and high glycogen accumulation. We show here that genetic obese mice
exhibit hyperglycemia, hyperinsulinemia, liver steatosis, glucose and insulin resistances. In
contrast, while they exhibit an obese phenotype, genetic and diet-induced obese Bmal1 KO
mice present characteristics of insulin sensitivity such as low steatosis in liver and low insulin
levels in the serum. It has been recently reported in Bmal1 KO and ClockΔ19
mutant mice that
pancreatic insulin secretion was impaired313, 323
. In these studies, the authors demonstrated
that circadian clock is involved in both size and proliferation of pancreatic β islets. In
addition, as islet insulin content does no vary between wild-type and ClockΔ19
mutant mice,
the low pancreatic insulin secretion may thus be explained mainly by defects in size,
proliferation and function (insulin exocytosis) of the endocrine part of pancreas. They also
reported the same defect in pancreas-specific Bmal1 KO mice which activity and feeding
behaviour and body composition are not affected. ClockΔ19
mutant mice have been described
as developing metabolic syndrome under high-fat diet330
. As both mice models present the
same defect in insulin secretion, it thus suggests that disruption of core clock in pancreas is
sufficient to generate defect in insulin secretion independently to adipogenesis.

89
Interestingly, Ob/Ob mice which both Lxrα and Lxrβ genes are deleted (LOKO mice) 331
present a similar phenotype than ObKO mice without exhibiting mortality. Indeed, these
LOKO mice are clearly obese, but protected from hepatosteatosis. In addition, LOKO mice
are insulin-sensitive, β cell expansion is impaired and de novo lipogenesis occurs especially in
adipose tissue. Rhythmic LXR activation has been proposed282
. Indeed, rhythmic REV-ERBα
accumulation in hepatocytes leads to rhythmic activation of SREBP pathway which thus
rhythmically activates LXR pathway. As REV-ERBα expression is activated by
CLOCK:BMAL1 heterodimer, the similar phenotypes observed in LOKO and obese Bmal1
knockout mice may thus suggests circadian clock control of LXR pathway via REV-ERBα.
V. Involvement of mitochondrial metabolism in insulin
sensitivity
Ob/Ob mice exhibit higher levels of plasma NEFA (Non Esterified Fatty Acids) 332. UCP
(UnCoupling Protein) 2 is a mitochondrial protein involved in oxidative phosphorylation. Its
activity has been shown to be increased by fatty acid333
and ROS (Reactive Oxygen Species)
which are generated during oxidative phosphorylation334
. UCP2 plays a role in insulin
secretion in β-islets 332, 335-337. Several in vivo studies of the role of UCP2 in insulin secretion
lead to controversial results335, 336
. However, the hypothesis of insulin secretion inhibition by
UCP2 has been shown by UCP2 overexpression or inhibition in isolated pancreatic β-cells337
.
In addition to insulin secretion, UCP2 has also been reported to be involved in glucagon
secretion from pancreatic α-islets338
. Indeed, deletion of UCP2 in α-islets leads to impaired
glucagon secretion during fasting.
90
Recently, β-islets specific Bmal1 knockout mice exhibit high accumulation of ROS and as a
consequence high UCP2 activity. Nrf2 (Nuclear factor erythroid 2-related factor 2), a
regulator of antioxidant, has been shown to be a direct target of Bmal1. In this model, its own
expression and antioxidant Nrf2-induced expression are disrupted contributing in ROS
accumulation314
. In addition, oxidative phosphorylation has been reported to be dependent on
circadian clock339
. Mitochondrial fatty acid oxidation exhibits a circadian oscillation in wild-
type mice. This phenomenon has been shown to be dependent on clock gene in MEF (Mouse
Embryonic Fibroblast) deleted of Clock, or Bmal1 or Cry1/2. It appears thus that
mitochondria and circadian clock play interconnected role in insulin resistance and as a
consequence in type 2 diabetes.
91
CONCLUSION AND FURTHER WORK
During this doctoral work, we were interested in the influence of circadian clock on
metabolism. We thus present evidences of circadian clock orchestrated activation of signaling
pathways. Indeed, AMPK, PI3K/AKT, ERK pathways are rhythmically activated leading to
rhythmic modulation of TORC1. We showed that TORC1 downstream targets, 4EBP1 and
RPS6, exhibit also rhythmic phosphorylation leading to rhythmic translation initiation. The
study of these mechanisms in circadian clock deficient mice (Bmal1 and Cry1/2 KO mice) led
us to clearly link them to circadian core clock. As a consequence, we demonstrated major role
of circadian clock in ribosome biogenesis which occurs mostly at the beginning of the dark
phase when energy and nutrients are available in sufficient amount, which is during the night
in rodents340
.
We reported also that signaling pathways activation depends on circadian clock indirectly.
Indeed, SCP2, a lipid transporter from the endoplasmic reticulum to the lipid rafts localized in
plasma membrane, is rhythmically expressed in liver. SCP2 deficiency leads to defects in the
activation of PI3K/AKT and ERK signaling pathways in mice liver. It may suggest thus that
ribosome biogenesis could be also influenced by circadian clock controlled-lipid trafficking
but this remains to be investigated. In addition, Scp2 KO mice exhibit impairments in insulin,
triglycerides and cholesterol concentration in serum. As these mice present a longer free
running period, it is possible to envisage a shift in feeding behavior. As a consequence of
Scp2 deletion, PPARα and SREBP target genes expressions are impaired in liver, reflecting
thus its impacts in lipid homeostasis. Rhythmic PPARα activation has been shown to be

92
dependent on the circadian clock via PAR bZip-dependent fatty acids release 300
.
Interestingly, while PPARα itself and its target genes are down regulated in PAR bZip KO
mice liver, SCP2 deficiency leads to their up regulation. As both PAR bZip and SCP2
expressions are circadian clock controlled, it suggests that PPARα pathway activation is
restricted at a precise time controlled by circadian clock. SREBP signaling pathway is
stimulated by insulin dependent PI3K/AKT – TORC1 pathways215
. We thus suppose that
delayed circulating insulin in Scp2 KO mice may lead to upreglation of PI3K/AKT – TORC1
pathways and in fine SREBP activation. Further genomic analysis may help in the
understanding of SCP2 controlled PPARα and SREBP pathways hyper activation.
Plasma membrane lipid rafts, as preferential site of receptors, have been linked to promotion
of signaling pathways activation for example PI3K/AKT and ERK/MAPK306-308
. While SCP2
is involved in lipid rafts formation, we surprisingly found signaling pathways hyperactivation
in Scp2 deleted mice liver. SCP2 is one intracellular lipid transporter among others in the cell.
SCP2 deficiency may thus provoke compensatory effects leading to upregulation of other
lipid transporters which lipid specificity would be different. As a consequence, this
phenomenon may lead to changes in the nature of components constituting lipid rafts. To
answer this question, investigation of lipid raft composition would be helpful.
All these signaling pathways play crucial role in metabolic processes. For example,
PI3K/AKT signaling pathway activation via insulin is involved in lipogenesis through SREBP
activation215
. Abnormal high insulin levels in serum could thus induce abnormal lipogenesis
and as a consequence deregulated glucose/lipid homeostasis. This is what happens in case of
insulin resistance caused by metabolic defects. In order to better understand involvements of
circadian clock in metabolic defects, we generated and characterized genetic obese Bmal1 KO

93
mice. Besides premature death of ObOb/+
Bmal1KO/KO
and ObOb/Ob
Bmal1KO/KO
(ObKO) mice
which remains unexplained, ObKO mice exhibit obese phenotype accompanied with
hyperglycemia, glucose resistance, but insulin sensitivity and reduced liver steatosis. In
parallel, diet-induced obese Bmal1 KO mice present the same characteristics, showing thus a
protectived effect of Bmal1 deletion against insulin resistance. To further investigate how
BMAL1 is involved in this phenomenon, it would be interesting first to characterized feeding
and drinking behavior of both obese Bmal1 KO mice models. It has been shown, both Bmal1
KO and ClockΔ19
mutant mice present defects in pancreatic insulin secretion313, 323
. Glucose
stimulated-insulin secretion assay in β-islets of our models would give us more precise
information on endocrine pancreatic function. As oxidation level through ROS detection314
and the activity of UCP2330, 333-335
have been linked to defect of pancreatic insulin secretion,
further investigation of mitochondrial function may give answers in understanding of insulin
resistance mechanisms. Energy balance regulation is appealing different tissues such as liver,
adipose tissues, muscles, and pancreas. Genomic and proteomic studies on these different
tissues are necessary to have information on regulation of signaling pathways involved in
energy balance.

94
EXPERIMENTAL PROCEDURES
I. Animal experiments
All animal studies were conducted in accordance with our regional committee for ethics in the
regulations of the veterinary office of the Canton of Vaud.
The generation of obese Bmal1 knockout mice resulted in crossing ObOb/+
Bmal1KO/+
mice.
The male mice harboring the following genotyping were used for the experiments: Ob+/+
Bmal1+/+
, Ob+/+
Bmal1KO/KO
, ObOb/+
Bmal1KO/KO
, ObOb/Ob
Bmal1+/+
, and ObOb/Ob
Bmal1KO/KO
.
Bmal1 floxed mice, previously described (Storch et al, 2007) were crossed with the mice
expressing the CRE recombinase under the control of the CMV promoter (Schweng et al,
1995) to obtain Bmal1 knockout mice. Eight-week-old Bmal1 wild-type and knockout male
mice were fed with high-fat or control diets for 12 weeks to study the diet-induced obesity.
In all experiments, unless noted otherwise, mice are maintained under standard animal
housing conditions, with free access to the food and water and in a 12 hours light / 12 hours
dark cycles. Mice were weighted every week and were sacrificed at ZT0 and ZT12.
Body composition analysis A.
For Ob.Bmal1 KO mice, echoMRI experiments are done at 6 weeks and Bmal1 WT and KO
mice in high fat and control diets undergo EchoMRI at 12, 15 and 18 weeks. These
measurements to determine the body composition are performed at ZT3. Mice are weighted
95
and their size between the snout and the tail base was measured in order to determine the body
mass index (BMI).
Glycemia measurements B.
For Ob.Bmal1 KO mice, the experiment is done at 10 weeks and Bmal1 WT and KO mice in
high fat and control diets undergo these glycemia measurements at 12, 15 and 18 weeks. Mice
undergo glycemia measurements (Breeze2 system, Bayer) after 15 hours of starvation (ZT3)
and after 6 hours of refeeding (ZT9). At both time-points, blood samples from the vain tail are
collected and sera are obtained after a 10 minute-centrifugation at 10 000 rpm at room
temperature. Sera are kept at -80°C until analysis.
Glucose tolerance test C.
At 11 weeks, Ob.Bmal1 KO mice undergo a glucose tolerance test at ZT3. Concerning the
Bmal1 WT and KO mice put under high-fat or control diet, glucose tolerance tests are
performed at 13, 16 and 19 weeks. The glucose tolerance test is performed after 15 hours of
starvation (ZT3). Glycemia measurements (Breeze2 system, Bayer) occurred 0, 15, 30, 60, 90,
120 and 180 minutes after the intra-peritoneal injection of glucose (1g/Kg).

96
Insulin tolerance test D.
At 12 weeks, Ob.Bmal1 KO mice undergo an insulin tolerance test at ZT3. Concerning the
Bmal1 WT and KO mice put under high-fat or control diet, glucose tolerance tests are
performed at 14, 17 and 20 weeks. At ZT3, glycemia measurements (Breeze2 system, Bayer)
occurred 0, 15, 30, 60, 90, 120 and 180 minutes after the intra-peritoneal injection of insulin
(1UI/Kg for the Ob.Bmal1 KO mice line and 0.5UI/Kg for Bmal1 WT and KO mice put under
high-fat or control diet).
II. Serum chemistry analysis
Blood samples are collected every 2 hrs and sera are obtained after a centrifugation of 10 min
at 10 000 rpm at room temperature. Sera are kept at -80°C until analysis. Insulin, glucose,
cholesterol and triglycerides are respectively measured accordingly with the protocols of the
Mouse Insulin ELISA kit (Mercodia), and the Glucose, Cholesterol, Triglycerides LabAssay
kits (Wako).
III. Glycogen extraction
The tissue glycogen extractions have been previously described341
. Briefly, frozen tissues
were incubated 20 minutes at 100°C in KOH solution. Ethanol 95% solution is added and a
20 minutes centrifugation at 840g at 4°C allows the precipitation of glycogen in a pellet. The

97
glycogen is then diluted in water. Glycogen measurements are performed in phenol 5% and
sulphuric acid solutions. The optic density used is 490 nm.
IV. Liver slices
Liver pieces were fixed overnight in 10% formalin solution. Pieces were then washed three
times in PBS solution. Liver slices underwent standard Hematoxylin/Eosin coloration.

98
REFERENCES
1. Kressler D, Hurt E, Bassler J. Driving ribosome assembly. Biochimica et biophysica acta.
2010;1803:673-683
2. Mayer C, Grummt I. Ribosome biogenesis and cell growth: Mtor coordinates transcription by
all three classes of nuclear rna polymerases. Oncogene. 2006;25:6384-6391
3. Gachon F, Olela FF, Schaad O, Descombes P, Schibler U. The circadian par-domain basic
leucine zipper transcription factors dbp, tef, and hlf modulate basal and inducible xenobiotic
detoxification. Cell metabolism. 2006;4:25-36
4. Cretenet G, Le Clech M, Gachon F. Circadian clock-coordinated 12 hr period rhythmic
activation of the ire1alpha pathway controls lipid metabolism in mouse liver. Cell metabolism.
2010;11:47-57
5. Simpson S, Galbraith JJ. An investigation into the diurnal variation of the body temperature of
nocturnal and other birds, and a few mammals. The Journal of physiology. 1905;33:225-238
6. Pittendrigh CS. On temperature independence in the clock system controlling emergence time
in drosophila. Proceedings of the National Academy of Sciences of the United States of
America. 1954;40:1018-1029
7. Aschoff J. Circadian rhythms in man. Science. 1965;148:1427-1432
8. Pittendrigh CS. Circadian rhythms and the circadian organization of living systems. Cold
Spring Harbor symposia on quantitative biology. 1960;25:159-184
9. Konopka RJ, Benzer S. Clock mutants of drosophila melanogaster. Proceedings of the
National Academy of Sciences of the United States of America. 1971;68:2112-2116
10. Bargiello TA, Young MW. Molecular genetics of a biological clock in drosophila.
Proceedings of the National Academy of Sciences of the United States of America.
1984;81:2142-2146
11. Garaulet M, Gomez-Abellan P. Chronobiology and obesity. Nutricion hospitalaria. 2013;28
Suppl 5:114-120
12. Vyas MV, Garg AX, Iansavichus AV, Costella J, Donner A, Laugsand LE, Janszky I,
Mrkobrada M, Parraga G, Hackam DG. Shift work and vascular events: Systematic review
and meta-analysis. Bmj. 2012;345:e4800
13. Baron KG, Reid KJ. Circadian misalignment and health. Int Rev Psychiatry. 2014;26:139-154
14. Bass J, Takahashi JS. Circadian integration of metabolism and energetics. Science.
2010;330:1349-1354
15. Yagita K, Tamanini F, van Der Horst GT, Okamura H. Molecular mechanisms of the
biological clock in cultured fibroblasts. Science. 2001;292:278-281
16. Balsalobre A, Damiola F, Schibler U. A serum shock induces circadian gene expression in
mammalian tissue culture cells. Cell. 1998;93:929-937
17. Klein DC, Moore, R.Y., and Reppert, S.M. . Suprachiasmatic nucleus: Themind's clock. 1991
18. Stephan FK, Zucker I. Circadian rhythms in drinking behavior and locomotor activity of rats
are eliminated by hypothalamic lesions. Proceedings of the National Academy of Sciences of
the United States of America. 1972;69:1583-1586
19. Ralph MR, Foster RG, Davis FC, Menaker M. Transplanted suprachiasmatic nucleus
determines circadian period. Science. 1990;247:975-978
20. Berson DM. Strange vision: Ganglion cells as circadian photoreceptors. Trends in
neurosciences. 2003;26:314-320
21. Hannibal J, Hindersson P, Knudsen SM, Georg B, Fahrenkrug J. The photopigment
melanopsin is exclusively present in pituitary adenylate cyclase-activating polypeptide-
containing retinal ganglion cells of the retinohypothalamic tract. The Journal of neuroscience :
the official journal of the Society for Neuroscience. 2002;22:RC191
22. Hattar S, Liao HW, Takao M, Berson DM, Yau KW. Melanopsin-containing retinal ganglion
cells: Architecture, projections, and intrinsic photosensitivity. Science. 2002;295:1065-1070
23. Tischkau SA, Mitchell JW, Tyan SH, Buchanan GF, Gillette MU. Ca2+/camp response
element-binding protein (creb)-dependent activation of per1 is required for light-induced

99
signaling in the suprachiasmatic nucleus circadian clock. The Journal of biological chemistry.
2003;278:718-723
24. Shigeyoshi Y, Taguchi K, Yamamoto S, Takekida S, Yan L, Tei H, Moriya T, Shibata S,
Loros JJ, Dunlap JC, Okamura H. Light-induced resetting of a mammalian circadian clock is
associated with rapid induction of the mper1 transcript. Cell. 1997;91:1043-1053
25. Dibner C, Schibler U, Albrecht U. The mammalian circadian timing system: Organization and
coordination of central and peripheral clocks. Annual review of physiology. 2010;72:517-549
26. Liu AC, Welsh DK, Ko CH, Tran HG, Zhang EE, Priest AA, Buhr ED, Singer O, Meeker K,
Verma IM, Doyle FJ, 3rd, Takahashi JS, Kay SA. Intercellular coupling confers robustness
against mutations in the scn circadian clock network. Cell. 2007;129:605-616
27. Guo H, Brewer JM, Lehman MN, Bittman EL. Suprachiasmatic regulation of circadian
rhythms of gene expression in hamster peripheral organs: Effects of transplanting the
pacemaker. The Journal of neuroscience : the official journal of the Society for Neuroscience.
2006;26:6406-6412
28. Yoo SH, Yamazaki S, Lowrey PL, Shimomura K, Ko CH, Buhr ED, Siepka SM, Hong HK,
Oh WJ, Yoo OJ, Menaker M, Takahashi JS. Period2::Luciferase real-time reporting of
circadian dynamics reveals persistent circadian oscillations in mouse peripheral tissues.
Proceedings of the National Academy of Sciences of the United States of America.
2004;101:5339-5346
29. Guo H, Brewer JM, Champhekar A, Harris RB, Bittman EL. Differential control of peripheral
circadian rhythms by suprachiasmatic-dependent neural signals. Proceedings of the National
Academy of Sciences of the United States of America. 2005;102:3111-3116
30. Damiola F, Le Minh N, Preitner N, Kornmann B, Fleury-Olela F, Schibler U. Restricted
feeding uncouples circadian oscillators in peripheral tissues from the central pacemaker in the
suprachiasmatic nucleus. Genes & development. 2000;14:2950-2961
31. Stokkan KA, Yamazaki S, Tei H, Sakaki Y, Menaker M. Entrainment of the circadian clock in
the liver by feeding. Science. 2001;291:490-493
32. Oster H, Damerow S, Kiessling S, Jakubcakova V, Abraham D, Tian J, Hoffmann MW,
Eichele G. The circadian rhythm of glucocorticoids is regulated by a gating mechanism
residing in the adrenal cortical clock. Cell metabolism. 2006;4:163-173
33. Cailotto C, Lei J, van der Vliet J, van Heijningen C, van Eden CG, Kalsbeek A, Pevet P, Buijs
RM. Effects of nocturnal light on (clock) gene expression in peripheral organs: A role for the
autonomic innervation of the liver. PloS one. 2009;4:e5650
34. Lowrey PL, Takahashi JS. Genetics of the mammalian circadian system: Photic entrainment,
circadian pacemaker mechanisms, and posttranslational regulation. Annual review of genetics.
2000;34:533-562
35. Albrecht U. The mammalian circadian clock: A network of gene expression. Frontiers in
bioscience : a journal and virtual library. 2004;9:48-55
36. Zhang EE, Kay SA. Clocks not winding down: Unravelling circadian networks. Nature
reviews. Molecular cell biology. 2010;11:764-776
37. Vitaterna MH, King DP, Chang AM, Kornhauser JM, Lowrey PL, McDonald JD, Dove WF,
Pinto LH, Turek FW, Takahashi JS. Mutagenesis and mapping of a mouse gene, clock,
essential for circadian behavior. Science. 1994;264:719-725
38. King DP, Zhao Y, Sangoram AM, Wilsbacher LD, Tanaka M, Antoch MP, Steeves TD,
Vitaterna MH, Kornhauser JM, Lowrey PL, Turek FW, Takahashi JS. Positional cloning of
the mouse circadian clock gene. Cell. 1997;89:641-653
39. Debruyne JP, Noton E, Lambert CM, Maywood ES, Weaver DR, Reppert SM. A clock shock:
Mouse clock is not required for circadian oscillator function. Neuron. 2006;50:465-477
40. Hogenesch JB, Gu YZ, Jain S, Bradfield CA. The basic-helix-loop-helix-pas orphan mop3
forms transcriptionally active complexes with circadian and hypoxia factors. Proceedings of
the National Academy of Sciences of the United States of America. 1998;95:5474-5479
41. Gekakis N, Staknis D, Nguyen HB, Davis FC, Wilsbacher LD, King DP, Takahashi JS, Weitz
CJ. Role of the clock protein in the mammalian circadian mechanism. Science.
1998;280:1564-1569

100
42. Bunger MK, Wilsbacher LD, Moran SM, Clendenin C, Radcliffe LA, Hogenesch JB, Simon
MC, Takahashi JS, Bradfield CA. Mop3 is an essential component of the master circadian
pacemaker in mammals. Cell. 2000;103:1009-1017
43. Ueda HR, Hayashi S, Chen W, Sano M, Machida M, Shigeyoshi Y, Iino M, Hashimoto S.
System-level identification of transcriptional circuits underlying mammalian circadian clocks.
Nature genetics. 2005;37:187-192
44. Garcia JA, Zhang D, Estill SJ, Michnoff C, Rutter J, Reick M, Scott K, Diaz-Arrastia R,
McKnight SL. Impaired cued and contextual memory in npas2-deficient mice. Science.
2000;288:2226-2230
45. Dudley CA, Erbel-Sieler C, Estill SJ, Reick M, Franken P, Pitts S, McKnight SL. Altered
patterns of sleep and behavioral adaptability in npas2-deficient mice. Science. 2003;301:379-
383
46. DeBruyne JP, Weaver DR, Reppert SM. Clock and npas2 have overlapping roles in the
suprachiasmatic circadian clock. Nature neuroscience. 2007;10:543-545
47. Okano T, Sasaki M, Fukada Y. Cloning of mouse bmal2 and its daily expression profile in the
suprachiasmatic nucleus: A remarkable acceleration of bmal2 sequence divergence after bmal
gene duplication. Neuroscience letters. 2001;300:111-114
48. Shi S, Hida A, McGuinness OP, Wasserman DH, Yamazaki S, Johnson CH. Circadian clock
gene bmal1 is not essential; functional replacement with its paralog, bmal2. Current biology :
CB. 2010;20:316-321
49. Masri S, Sassone-Corsi P. Plasticity and specificity of the circadian epigenome. Nature
neuroscience. 2010;13:1324-1329
50. Zheng B, Albrecht U, Kaasik K, Sage M, Lu W, Vaishnav S, Li Q, Sun ZS, Eichele G,
Bradley A, Lee CC. Nonredundant roles of the mper1 and mper2 genes in the mammalian
circadian clock. Cell. 2001;105:683-694
51. van der Horst GT, Muijtjens M, Kobayashi K, Takano R, Kanno S, Takao M, de Wit J,
Verkerk A, Eker AP, van Leenen D, Buijs R, Bootsma D, Hoeijmakers JH, Yasui A.
Mammalian cry1 and cry2 are essential for maintenance of circadian rhythms. Nature.
1999;398:627-630
52. Albrecht U, Sun ZS, Eichele G, Lee CC. A differential response of two putative mammalian
circadian regulators, mper1 and mper2, to light. Cell. 1997;91:1055-1064
53. Shearman LP, Zylka MJ, Weaver DR, Kolakowski LF, Jr., Reppert SM. Two period
homologs: Circadian expression and photic regulation in the suprachiasmatic nuclei. Neuron.
1997;19:1261-1269
54. Sun ZS, Albrecht U, Zhuchenko O, Bailey J, Eichele G, Lee CC. Rigui, a putative mammalian
ortholog of the drosophila period gene. Cell. 1997;90:1003-1011
55. Tei H, Okamura H, Shigeyoshi Y, Fukuhara C, Ozawa R, Hirose M, Sakaki Y. Circadian
oscillation of a mammalian homologue of the drosophila period gene. Nature. 1997;389:512-
516
56. Zylka MJ, Shearman LP, Levine JD, Jin X, Weaver DR, Reppert SM. Molecular analysis of
mammalian timeless. Neuron. 1998;21:1115-1122
57. Zhong HH, Resnick AS, Straume M, Robertson McClung C. Effects of synergistic signaling
by phytochrome a and cryptochrome1 on circadian clock-regulated catalase expression. The
Plant cell. 1997;9:947-955
58. Thresher RJ, Vitaterna MH, Miyamoto Y, Kazantsev A, Hsu DS, Petit C, Selby CP, Dawut L,
Smithies O, Takahashi JS, Sancar A. Role of mouse cryptochrome blue-light photoreceptor in
circadian photoresponses. Science. 1998;282:1490-1494
59. Kiyohara YB, Tagao S, Tamanini F, Morita A, Sugisawa Y, Yasuda M, Yamanaka I, Ueda
HR, van der Horst GT, Kondo T, Yagita K. The bmal1 c terminus regulates the circadian
transcription feedback loop. Proceedings of the National Academy of Sciences of the United
States of America. 2006;103:10074-10079
60. Kume K, Zylka MJ, Sriram S, Shearman LP, Weaver DR, Jin X, Maywood ES, Hastings MH,
Reppert SM. Mcry1 and mcry2 are essential components of the negative limb of the circadian
clock feedback loop. Cell. 1999;98:193-205

101
61. Sato TK, Yamada RG, Ukai H, Baggs JE, Miraglia LJ, Kobayashi TJ, Welsh DK, Kay SA,
Ueda HR, Hogenesch JB. Feedback repression is required for mammalian circadian clock
function. Nature genetics. 2006;38:312-319
62. Oishi K, Sakamoto K, Okada T, Nagase T, Ishida N. Antiphase circadian expression between
bmal1 and period homologue mrna in the suprachiasmatic nucleus and peripheral tissues of
rats. Biochemical and biophysical research communications. 1998;253:199-203
63. Field MD, Maywood ES, O'Brien JA, Weaver DR, Reppert SM, Hastings MH. Analysis of
clock proteins in mouse scn demonstrates phylogenetic divergence of the circadian clockwork
and resetting mechanisms. Neuron. 2000;25:437-447
64. Shearman LP, Sriram S, Weaver DR, Maywood ES, Chaves I, Zheng B, Kume K, Lee CC,
van der Horst GT, Hastings MH, Reppert SM. Interacting molecular loops in the mammalian
circadian clock. Science. 2000;288:1013-1019
65. Ye R, Selby CP, Chiou YY, Ozkan-Dagliyan I, Gaddameedhi S, Sancar A. Dual modes of
clock:Bmal1 inhibition mediated by cryptochrome and period proteins in the mammalian
circadian clock. Genes & development. 2014;28:1989-1998
66. Cho H, Zhao X, Hatori M, Yu RT, Barish GD, Lam MT, Chong LW, DiTacchio L, Atkins
AR, Glass CK, Liddle C, Auwerx J, Downes M, Panda S, Evans RM. Regulation of circadian
behaviour and metabolism by rev-erb-alpha and rev-erb-beta. Nature. 2012;485:123-127
67. Akashi M, Takumi T. The orphan nuclear receptor roralpha regulates circadian transcription
of the mammalian core-clock bmal1. Nature structural & molecular biology. 2005;12:441-448
68. Ueda HR, Chen W, Adachi A, Wakamatsu H, Hayashi S, Takasugi T, Nagano M, Nakahama
K, Suzuki Y, Sugano S, Iino M, Shigeyoshi Y, Hashimoto S. A transcription factor response
element for gene expression during circadian night. Nature. 2002;418:534-539
69. Sato TK, Panda S, Miraglia LJ, Reyes TM, Rudic RD, McNamara P, Naik KA, FitzGerald
GA, Kay SA, Hogenesch JB. A functional genomics strategy reveals rora as a component of
the mammalian circadian clock. Neuron. 2004;43:527-537
70. Preitner N, Damiola F, Lopez-Molina L, Zakany J, Duboule D, Albrecht U, Schibler U. The
orphan nuclear receptor rev-erbalpha controls circadian transcription within the positive limb
of the mammalian circadian oscillator. Cell. 2002;110:251-260
71. Crumbley C, Wang Y, Kojetin DJ, Burris TP. Characterization of the core mammalian clock
component, npas2, as a rev-erbalpha/roralpha target gene. The Journal of biological chemistry.
2010;285:35386-35392
72. Crumbley C, Burris TP. Direct regulation of clock expression by rev-erb. PloS one.
2011;6:e17290
73. Takeda Y, Jothi R, Birault V, Jetten AM. Rorgamma directly regulates the circadian
expression of clock genes and downstream targets in vivo. Nucleic acids research.
2012;40:8519-8535
74. So WV, Rosbash M. Post-transcriptional regulation contributes to drosophila clock gene mrna
cycling. The EMBO journal. 1997;16:7146-7155
75. Woo KC, Kim TD, Lee KH, Kim DY, Kim W, Lee KY, Kim KT. Mouse period 2 mrna
circadian oscillation is modulated by ptb-mediated rhythmic mrna degradation. Nucleic acids
research. 2009;37:26-37
76. Woo KC, Ha DC, Lee KH, Kim DY, Kim TD, Kim KT. Circadian amplitude of cryptochrome
1 is modulated by mrna stability regulation via cytoplasmic hnrnp d oscillation. Molecular and
cellular biology. 2010;30:197-205
77. Kojima S, Hirose M, Tokunaga K, Sakaki Y, Tei H. Structural and functional analysis of 3'
untranslated region of mouse period1 mrna. Biochemical and biophysical research
communications. 2003;301:1-7
78. Kojima S, Ina K, Futamura Y, Ito Y, Hibi S, Nagaoka M, Yuasa S, Kawai M, Nagao S,
Kataoka T. [a phase i study of modified folfox 6 therapy for advanced colorectal cancer]. Gan
to kagaku ryoho. Cancer & chemotherapy. 2007;34:203-206
79. Dupressoir A, Morel AP, Barbot W, Loireau MP, Corbo L, Heidmann T. Identification of four
families of yccr4- and mg2+-dependent endonuclease-related proteins in higher eukaryotes,
and characterization of orthologs of yccr4 with a conserved leucine-rich repeat essential for
hcaf1/hpop2 binding. BMC genomics. 2001;2:9

102
80. Green CB, Besharse JC. Identification of a novel vertebrate circadian clock-regulated gene
encoding the protein nocturnin. Proceedings of the National Academy of Sciences of the
United States of America. 1996;93:14884-14888
81. Stubblefield JJ, Terrien J, Green CB. Nocturnin: At the crossroads of clocks and metabolism.
Trends in endocrinology and metabolism: TEM. 2012;23:326-333
82. Kojima S, Sher-Chen EL, Green CB. Circadian control of mrna polyadenylation dynamics
regulates rhythmic protein expression. Genes & development. 2012;26:2724-2736
83. Majercak J, Sidote D, Hardin PE, Edery I. How a circadian clock adapts to seasonal decreases
in temperature and day length. Neuron. 1999;24:219-230
84. Diernfellner AC, Schafmeier T, Merrow MW, Brunner M. Molecular mechanism of
temperature sensing by the circadian clock of neurospora crassa. Genes & development.
2005;19:1968-1973
85. McGlincy NJ, Valomon A, Chesham JE, Maywood ES, Hastings MH, Ule J. Regulation of
alternative splicing by the circadian clock and food related cues. Genome biology.
2012;13:R54
86. Preussner M, Wilhelmi I, Schultz AS, Finkernagel F, Michel M, Moroy T, Heyd F. Rhythmic
u2af26 alternative splicing controls period1 stability and the circadian clock in mice.
Molecular cell. 2014;54:651-662
87. Cheng HY, Papp JW, Varlamova O, Dziema H, Russell B, Curfman JP, Nakazawa T, Shimizu
K, Okamura H, Impey S, Obrietan K. Microrna modulation of circadian-clock period and
entrainment. Neuron. 2007;54:813-829
88. Gatfield D, Le Martelot G, Vejnar CE, Gerlach D, Schaad O, Fleury-Olela F, Ruskeepaa AL,
Oresic M, Esau CC, Zdobnov EM, Schibler U. Integration of microrna mir-122 in hepatic
circadian gene expression. Genes & development. 2009;23:1313-1326
89. Chen R, D'Alessandro M, Lee C. Mirnas are required for generating a time delay critical for
the circadian oscillator. Current biology : CB. 2013;23:1959-1968
90. Du NH, Arpat AB, De Matos M, Gatfield D. Micrornas shape circadian hepatic gene
expression on a transcriptome-wide scale. eLife. 2014;3:e02510
91. Vanselow K, Vanselow JT, Westermark PO, Reischl S, Maier B, Korte T, Herrmann A,
Herzel H, Schlosser A, Kramer A. Differential effects of per2 phosphorylation: Molecular
basis for the human familial advanced sleep phase syndrome (fasps). Genes & development.
2006;20:2660-2672
92. Shirogane T, Jin J, Ang XL, Harper JW. Scfbeta-trcp controls clock-dependent transcription
via casein kinase 1-dependent degradation of the mammalian period-1 (per1) protein. The
Journal of biological chemistry. 2005;280:26863-26872
93. Eide EJ, Woolf MF, Kang H, Woolf P, Hurst W, Camacho F, Vielhaber EL, Giovanni A,
Virshup DM. Control of mammalian circadian rhythm by ckiepsilon-regulated proteasome-
mediated per2 degradation. Molecular and cellular biology. 2005;25:2795-2807
94. Eide EJ, Vielhaber EL, Hinz WA, Virshup DM. The circadian regulatory proteins bmal1 and
cryptochromes are substrates of casein kinase iepsilon. The Journal of biological chemistry.
2002;277:17248-17254
95. Harada Y, Sakai M, Kurabayashi N, Hirota T, Fukada Y. Ser-557-phosphorylated mcry2 is
degraded upon synergistic phosphorylation by glycogen synthase kinase-3 beta. The Journal
of biological chemistry. 2005;280:31714-31721
96. Iitaka C, Miyazaki K, Akaike T, Ishida N. A role for glycogen synthase kinase-3beta in the
mammalian circadian clock. The Journal of biological chemistry. 2005;280:29397-29402
97. Yin L, Wang J, Klein PS, Lazar MA. Nuclear receptor rev-erbalpha is a critical lithium-
sensitive component of the circadian clock. Science. 2006;311:1002-1005
98. Lamia KA, Sachdeva UM, DiTacchio L, Williams EC, Alvarez JG, Egan DF, Vasquez DS,
Juguilon H, Panda S, Shaw RJ, Thompson CB, Evans RM. Ampk regulates the circadian
clock by cryptochrome phosphorylation and degradation. Science. 2009;326:437-440
99. Gallego M, Kang H, Virshup DM. Protein phosphatase 1 regulates the stability of the
circadian protein per2. The Biochemical journal. 2006;399:169-175

103
100. Partch CL, Shields KF, Thompson CL, Selby CP, Sancar A. Posttranslational regulation of the
mammalian circadian clock by cryptochrome and protein phosphatase 5. Proceedings of the
National Academy of Sciences of the United States of America. 2006;103:10467-10472
101. Kornitzer D, Ciechanover A. Modes of regulation of ubiquitin-mediated protein degradation.
Journal of cellular physiology. 2000;182:1-11
102. Busino L, Bassermann F, Maiolica A, Lee C, Nolan PM, Godinho SI, Draetta GF, Pagano M.
Scffbxl3 controls the oscillation of the circadian clock by directing the degradation of
cryptochrome proteins. Science. 2007;316:900-904
103. Siepka SM, Yoo SH, Park J, Song W, Kumar V, Hu Y, Lee C, Takahashi JS. Circadian
mutant overtime reveals f-box protein fbxl3 regulation of cryptochrome and period gene
expression. Cell. 2007;129:1011-1023
104. Godinho SI, Maywood ES, Shaw L, Tucci V, Barnard AR, Busino L, Pagano M, Kendall R,
Quwailid MM, Romero MR, O'Neill J, Chesham JE, Brooker D, Lalanne Z, Hastings MH,
Nolan PM. The after-hours mutant reveals a role for fbxl3 in determining mammalian
circadian period. Science. 2007;316:897-900
105. Hirano A, Yumimoto K, Tsunematsu R, Matsumoto M, Oyama M, Kozuka-Hata H,
Nakagawa T, Lanjakornsiripan D, Nakayama KI, Fukada Y. Fbxl21 regulates oscillation of
the circadian clock through ubiquitination and stabilization of cryptochromes. Cell.
2013;152:1106-1118
106. Cardone L, Hirayama J, Giordano F, Tamaru T, Palvimo JJ, Sassone-Corsi P. Circadian clock
control by sumoylation of bmal1. Science. 2005;309:1390-1394
107. Lee J, Lee Y, Lee MJ, Park E, Kang SH, Chung CH, Lee KH, Kim K. Dual modification of
bmal1 by sumo2/3 and ubiquitin promotes circadian activation of the clock/bmal1 complex.
Molecular and cellular biology. 2008;28:6056-6065
108. Etchegaray JP, Lee C, Wade PA, Reppert SM. Rhythmic histone acetylation underlies
transcription in the mammalian circadian clock. Nature. 2003;421:177-182
109. Doi M, Hirayama J, Sassone-Corsi P. Circadian regulator clock is a histone acetyltransferase.
Cell. 2006;125:497-508
110. Hirayama J, Sahar S, Grimaldi B, Tamaru T, Takamatsu K, Nakahata Y, Sassone-Corsi P.
Clock-mediated acetylation of bmal1 controls circadian function. Nature. 2007;450:1086-
1090
111. Naruse Y, Oh-hashi K, Iijima N, Naruse M, Yoshioka H, Tanaka M. Circadian and light-
induced transcription of clock gene per1 depends on histone acetylation and deacetylation.
Molecular and cellular biology. 2004;24:6278-6287
112. Yin L, Lazar MA. The orphan nuclear receptor rev-erbalpha recruits the n-cor/histone
deacetylase 3 corepressor to regulate the circadian bmal1 gene. Molecular endocrinology.
2005;19:1452-1459
113. Ripperger JA, Schibler U. Rhythmic clock-bmal1 binding to multiple e-box motifs drives
circadian dbp transcription and chromatin transitions. Nature genetics. 2006;38:369-374
114. Brown SA, Ripperger J, Kadener S, Fleury-Olela F, Vilbois F, Rosbash M, Schibler U.
Period1-associated proteins modulate the negative limb of the mammalian circadian oscillator.
Science. 2005;308:693-696
115. DiTacchio L, Le HD, Vollmers C, Hatori M, Witcher M, Secombe J, Panda S. Histone lysine
demethylase jarid1a activates clock-bmal1 and influences the circadian clock. Science.
2011;333:1881-1885
116. Asher G, Gatfield D, Stratmann M, Reinke H, Dibner C, Kreppel F, Mostoslavsky R, Alt FW,
Schibler U. Sirt1 regulates circadian clock gene expression through per2 deacetylation. Cell.
2008;134:317-328
117. Nakahata Y, Kaluzova M, Grimaldi B, Sahar S, Hirayama J, Chen D, Guarente LP, Sassone-
Corsi P. The nad+-dependent deacetylase sirt1 modulates clock-mediated chromatin
remodeling and circadian control. Cell. 2008;134:329-340
118. Masri S, Rigor P, Cervantes M, Ceglia N, Sebastian C, Xiao C, Roqueta-Rivera M, Deng C,
Osborne TF, Mostoslavsky R, Baldi P, Sassone-Corsi P. Partitioning circadian transcription
by sirt6 leads to segregated control of cellular metabolism. Cell. 2014;158:659-672
104
119. Ramsey KM, Yoshino J, Brace CS, Abrassart D, Kobayashi Y, Marcheva B, Hong HK,
Chong JL, Buhr ED, Lee C, Takahashi JS, Imai S, Bass J. Circadian clock feedback cycle
through nampt-mediated nad+ biosynthesis. Science. 2009;324:651-654
120. Komar AA, Mazumder B, Merrick WC. A new framework for understanding ires-mediated
translation. Gene. 2012;502:75-86
121. Pestova TV, Kolupaeva VG, Lomakin IB, Pilipenko EV, Shatsky IN, Agol VI, Hellen CU.
Molecular mechanisms of translation initiation in eukaryotes. Proceedings of the National
Academy of Sciences of the United States of America. 2001;98:7029-7036
122. Gingras AC, Raught B, Sonenberg N. Eif4 initiation factors: Effectors of mrna recruitment to
ribosomes and regulators of translation. Annual review of biochemistry. 1999;68:913-963
123. Heitman J, Movva NR, Hall MN. Targets for cell cycle arrest by the immunosuppressant
rapamycin in yeast. Science. 1991;253:905-909
124. Wullschleger S, Loewith R, Hall MN. Tor signaling in growth and metabolism. Cell.
2006;124:471-484
125. Fingar DC, Salama S, Tsou C, Harlow E, Blenis J. Mammalian cell size is controlled by mtor
and its downstream targets s6k1 and 4ebp1/eif4e. Genes & development. 2002;16:1472-1487
126. Hay N, Sonenberg N. Upstream and downstream of mtor. Genes & development.
2004;18:1926-1945
127. Hara K, Yonezawa K, Weng QP, Kozlowski MT, Belham C, Avruch J. Amino acid
sufficiency and mtor regulate p70 s6 kinase and eif-4e bp1 through a common effector
mechanism. The Journal of biological chemistry. 1998;273:14484-14494
128. Kimball SR, Shantz LM, Horetsky RL, Jefferson LS. Leucine regulates translation of specific
mrnas in l6 myoblasts through mtor-mediated changes in availability of eif4e and
phosphorylation of ribosomal protein s6. The Journal of biological chemistry.
1999;274:11647-11652
129. Xu G, Kwon G, Cruz WS, Marshall CA, McDaniel ML. Metabolic regulation by leucine of
translation initiation through the mtor-signaling pathway by pancreatic beta-cells. Diabetes.
2001;50:353-360
130. Manning BD. Balancing akt with s6k: Implications for both metabolic diseases and
tumorigenesis. The Journal of cell biology. 2004;167:399-403
131. Li Y, Corradetti MN, Inoki K, Guan KL. Tsc2: Filling the gap in the mtor signaling pathway.
Trends in biochemical sciences. 2004;29:32-38
132. Long X, Lin Y, Ortiz-Vega S, Yonezawa K, Avruch J. Rheb binds and regulates the mtor
kinase. Current biology : CB. 2005;15:702-713
133. Inoki K, Zhu T, Guan KL. Tsc2 mediates cellular energy response to control cell growth and
survival. Cell. 2003;115:577-590
134. Gwinn DM, Shackelford DB, Egan DF, Mihaylova MM, Mery A, Vasquez DS, Turk BE,
Shaw RJ. Ampk phosphorylation of raptor mediates a metabolic checkpoint. Molecular cell.
2008;30:214-226
135. Ma L, Chen Z, Erdjument-Bromage H, Tempst P, Pandolfi PP. Phosphorylation and
functional inactivation of tsc2 by erk implications for tuberous sclerosis and cancer
pathogenesis. Cell. 2005;121:179-193
136. Roux PP, Ballif BA, Anjum R, Gygi SP, Blenis J. Tumor-promoting phorbol esters and
activated ras inactivate the tuberous sclerosis tumor suppressor complex via p90 ribosomal s6
kinase. Proceedings of the National Academy of Sciences of the United States of America.
2004;101:13489-13494
137. Meyuhas O. Synthesis of the translational apparatus is regulated at the translational level.
European journal of biochemistry / FEBS. 2000;267:6321-6330
138. Jackson RJ, Hellen CU, Pestova TV. The mechanism of eukaryotic translation initiation and
principles of its regulation. Nature reviews. Molecular cell biology. 2010;11:113-127
139. Magnuson B, Ekim B, Fingar DC. Regulation and function of ribosomal protein s6 kinase
(s6k) within mtor signalling networks. The Biochemical journal. 2012;441:1-21
140. Pestova D, Macek M, Elena Martinez Perez M. Ciliates and their picophytoplankton-feeding
activity in a high-altitude warm-monomictic saline lake. European journal of protistology.
2008;44:13-25
105
141. Lomakin IB, Kolupaeva VG, Marintchev A, Wagner G, Pestova TV. Position of eukaryotic
initiation factor eif1 on the 40s ribosomal subunit determined by directed hydroxyl radical
probing. Genes & development. 2003;17:2786-2797
142. Simonetti A, Marzi S, Myasnikov AG, Fabbretti A, Yusupov M, Gualerzi CO, Klaholz BP.
Structure of the 30s translation initiation complex. Nature. 2008;455:416-420
143. Allen GS, Zavialov A, Gursky R, Ehrenberg M, Frank J. The cryo-em structure of a
translation initiation complex from escherichia coli. Cell. 2005;121:703-712
144. Pestova TV, Kolupaeva VG. The roles of individual eukaryotic translation initiation factors in
ribosomal scanning and initiation codon selection. Genes & development. 2002;16:2906-2922
145. LeFebvre AK, Korneeva NL, Trutschl M, Cvek U, Duzan RD, Bradley CA, Hershey JW,
Rhoads RE. Translation initiation factor eif4g-1 binds to eif3 through the eif3e subunit. The
Journal of biological chemistry. 2006;281:22917-22932
146. Passmore LA, Schmeing TM, Maag D, Applefield DJ, Acker MG, Algire MA, Lorsch JR,
Ramakrishnan V. The eukaryotic translation initiation factors eif1 and eif1a induce an open
conformation of the 40s ribosome. Molecular cell. 2007;26:41-50
147. Matsuda D, Dreher TW. Close spacing of aug initiation codons confers dicistronic character
on a eukaryotic mrna. RNA. 2006;12:1338-1349
148. Kozak M. Structural features in eukaryotic mrnas that modulate the initiation of translation.
The Journal of biological chemistry. 1991;266:19867-19870
149. Pisarev AV, Kolupaeva VG, Pisareva VP, Merrick WC, Hellen CU, Pestova TV. Specific
functional interactions of nucleotides at key -3 and +4 positions flanking the initiation codon
with components of the mammalian 48s translation initiation complex. Genes & development.
2006;20:624-636
150. Pestova TV, Shatsky IN, Fletcher SP, Jackson RJ, Hellen CU. A prokaryotic-like mode of
cytoplasmic eukaryotic ribosome binding to the initiation codon during internal translation
initiation of hepatitis c and classical swine fever virus rnas. Genes & development.
1998;12:67-83
151. Paulin FE, Campbell LE, O'Brien K, Loughlin J, Proud CG. Eukaryotic translation initiation
factor 5 (eif5) acts as a classical gtpase-activator protein. Current biology : CB. 2001;11:55-59
152. Marintchev A, Wagner G. Translation initiation: Structures, mechanisms and evolution.
Quarterly reviews of biophysics. 2004;37:197-284
153. Pestova TV, Lomakin IB, Lee JH, Choi SK, Dever TE, Hellen CU. The joining of ribosomal
subunits in eukaryotes requires eif5b. Nature. 2000;403:332-335
154. Unbehaun A, Borukhov SI, Hellen CU, Pestova TV. Release of initiation factors from 48s
complexes during ribosomal subunit joining and the link between establishment of codon-
anticodon base-pairing and hydrolysis of eif2-bound gtp. Genes & development.
2004;18:3078-3093
155. Olsen DS, Savner EM, Mathew A, Zhang F, Krishnamoorthy T, Phan L, Hinnebusch AG.
Domains of eif1a that mediate binding to eif2, eif3 and eif5b and promote ternary complex
recruitment in vivo. The EMBO journal. 2003;22:193-204
156. Marintchev A, Kolupaeva VG, Pestova TV, Wagner G. Mapping the binding interface
between human eukaryotic initiation factors 1a and 5b: A new interaction between old
partners. Proceedings of the National Academy of Sciences of the United States of America.
2003;100:1535-1540
157. Poyry TA, Kaminski A, Jackson RJ. What determines whether mammalian ribosomes resume
scanning after translation of a short upstream open reading frame? Genes & development.
2004;18:62-75
158. Reed VS, Wastney ME, Yang DC. Mechanisms of the transfer of aminoacyl-trna from
aminoacyl-trna synthetase to the elongation factor 1 alpha. The Journal of biological
chemistry. 1994;269:32932-32936
159. Carvalho MD, Carvalho JF, Merrick WC. Biological characterization of various forms of
elongation factor 1 from rabbit reticulocytes. Archives of biochemistry and biophysics.
1984;234:603-611
160. Browne GJ, Proud CG. Regulation of peptide-chain elongation in mammalian cells. European
journal of biochemistry / FEBS. 2002;269:5360-5368

106
161. Yonath A. Ribosomal crystallography: Peptide bond formation, chaperone assistance and
antibiotics activity. Molecules and cells. 2005;20:1-16
162. Taylor DJ, Nilsson J, Merrill AR, Andersen GR, Nissen P, Frank J. Structures of modified
eef2 80s ribosome complexes reveal the role of gtp hydrolysis in translocation. The EMBO
journal. 2007;26:2421-2431
163. Wang X, Li W, Williams M, Terada N, Alessi DR, Proud CG. Regulation of elongation factor
2 kinase by p90(rsk1) and p70 s6 kinase. The EMBO journal. 2001;20:4370-4379
164. Zhouravleva G, Frolova L, Le Goff X, Le Guellec R, Inge-Vechtomov S, Kisselev L, Philippe
M. Termination of translation in eukaryotes is governed by two interacting polypeptide chain
release factors, erf1 and erf3. The EMBO journal. 1995;14:4065-4072
165. Alkalaeva EZ, Pisarev AV, Frolova LY, Kisselev LL, Pestova TV. In vitro reconstitution of
eukaryotic translation reveals cooperativity between release factors erf1 and erf3. Cell.
2006;125:1125-1136
166. Nierhaus KH. The allosteric three-site model for the ribosomal elongation cycle: Features and
future. Biochemistry. 1990;29:4997-5008
167. Powers T, Walter P. Regulation of ribosome biogenesis by the rapamycin-sensitive tor-
signaling pathway in saccharomyces cerevisiae. Molecular biology of the cell. 1999;10:987-
1000
168. Grandi P, Rybin V, Bassler J, Petfalski E, Strauss D, Marzioch M, Schafer T, Kuster B,
Tschochner H, Tollervey D, Gavin AC, Hurt E. 90s pre-ribosomes include the 35s pre-rrna,
the u3 snornp, and 40s subunit processing factors but predominantly lack 60s synthesis
factors. Molecular cell. 2002;10:105-115
169. Hannan KM, Brandenburger Y, Jenkins A, Sharkey K, Cavanaugh A, Rothblum L, Moss T,
Poortinga G, McArthur GA, Pearson RB, Hannan RD. Mtor-dependent regulation of
ribosomal gene transcription requires s6k1 and is mediated by phosphorylation of the carboxy-
terminal activation domain of the nucleolar transcription factor ubf. Molecular and cellular
biology. 2003;23:8862-8877
170. Schneider DA, Michel A, Sikes ML, Vu L, Dodd JA, Salgia S, Osheim YN, Beyer AL,
Nomura M. Transcription elongation by rna polymerase i is linked to efficient rrna processing
and ribosome assembly. Molecular cell. 2007;26:217-229
171. Fromont-Racine M, Senger B, Saveanu C, Fasiolo F. Ribosome assembly in eukaryotes. Gene.
2003;313:17-42
172. Henras AK, Soudet J, Gerus M, Lebaron S, Caizergues-Ferrer M, Mougin A, Henry Y. The
post-transcriptional steps of eukaryotic ribosome biogenesis. Cellular and molecular life
sciences : CMLS. 2008;65:2334-2359
173. Perez-Fernandez J, Roman A, De Las Rivas J, Bustelo XR, Dosil M. The 90s preribosome is a
multimodular structure that is assembled through a hierarchical mechanism. Molecular and
cellular biology. 2007;27:5414-5429
174. Schafer T, Maco B, Petfalski E, Tollervey D, Bottcher B, Aebi U, Hurt E. Hrr25-dependent
phosphorylation state regulates organization of the pre-40s subunit. Nature. 2006;441:651-655
175. Fatica A, Oeffinger M, Dlakic M, Tollervey D. Nob1p is required for cleavage of the 3' end of
18s rrna. Molecular and cellular biology. 2003;23:1798-1807
176. Granneman S, Nandineni MR, Baserga SJ. The putative ntpase fap7 mediates cytoplasmic 20s
pre-rrna processing through a direct interaction with rps14. Molecular and cellular biology.
2005;25:10352-10364
177. Fatica A, Cronshaw AD, Dlakic M, Tollervey D. Ssf1p prevents premature processing of an
early pre-60s ribosomal particle. Molecular cell. 2002;9:341-351
178. Kressler D, Roser D, Pertschy B, Hurt E. The aaa atpase rix7 powers progression of ribosome
biogenesis by stripping nsa1 from pre-60s particles. The Journal of cell biology.
2008;181:935-944
179. Nissan TA, Bassler J, Petfalski E, Tollervey D, Hurt E. 60s pre-ribosome formation viewed
from assembly in the nucleolus until export to the cytoplasm. The EMBO journal.
2002;21:5539-5547

107
180. Ulbrich C, Diepholz M, Bassler J, Kressler D, Pertschy B, Galani K, Bottcher B, Hurt E.
Mechanochemical removal of ribosome biogenesis factors from nascent 60s ribosomal
subunits. Cell. 2009;138:911-922
181. Ansel KM, Pastor WA, Rath N, Lapan AD, Glasmacher E, Wolf C, Smith LC, Papadopoulou
N, Lamperti ED, Tahiliani M, Ellwart JW, Shi Y, Kremmer E, Rao A, Heissmeyer V. Mouse
eri1 interacts with the ribosome and catalyzes 5.8s rrna processing. Nature structural &
molecular biology. 2008;15:523-530
182. Senger B, Lafontaine DL, Graindorge JS, Gadal O, Camasses A, Sanni A, Garnier JM,
Breitenbach M, Hurt E, Fasiolo F. The nucle(ol)ar tif6p and efl1p are required for a late
cytoplasmic step of ribosome synthesis. Molecular cell. 2001;8:1363-1373
183. Hurt E, Hannus S, Schmelzl B, Lau D, Tollervey D, Simos G. A novel in vivo assay reveals
inhibition of ribosomal nuclear export in ran-cycle and nucleoporin mutants. The Journal of
cell biology. 1999;144:389-401
184. Moy TI, Silver PA. Nuclear export of the small ribosomal subunit requires the ran-gtpase
cycle and certain nucleoporins. Genes & development. 1999;13:2118-2133
185. Ho JH, Kallstrom G, Johnson AW. Nascent 60s ribosomal subunits enter the free pool bound
by nmd3p. RNA. 2000;6:1625-1634
186. Yao W, Roser D, Kohler A, Bradatsch B, Bassler J, Hurt E. Nuclear export of ribosomal 60s
subunits by the general mrna export receptor mex67-mtr2. Molecular cell. 2007;26:51-62
187. Bradatsch B, Katahira J, Kowalinski E, Bange G, Yao W, Sekimoto T, Baumgartel V, Boese
G, Bassler J, Wild K, Peters R, Yoneda Y, Sinning I, Hurt E. Arx1 functions as an unorthodox
nuclear export receptor for the 60s preribosomal subunit. Molecular cell. 2007;27:767-779
188. Ferreira-Cerca S, Poll G, Gleizes PE, Tschochner H, Milkereit P. Roles of eukaryotic
ribosomal proteins in maturation and transport of pre-18s rrna and ribosome function.
Molecular cell. 2005;20:263-275
189. Towle HC. Glucose as a regulator of eukaryotic gene transcription. Trends in endocrinology
and metabolism: TEM. 2005;16:489-494
190. Shimomura I, Bashmakov Y, Ikemoto S, Horton JD, Brown MS, Goldstein JL. Insulin
selectively increases srebp-1c mrna in the livers of rats with streptozotocin-induced diabetes.
Proceedings of the National Academy of Sciences of the United States of America.
1999;96:13656-13661
191. Azzout-Marniche D, Becard D, Guichard C, Foretz M, Ferre P, Foufelle F. Insulin effects on
sterol regulatory-element-binding protein-1c (srebp-1c) transcriptional activity in rat
hepatocytes. The Biochemical journal. 2000;350 Pt 2:389-393
192. Yabe D, Komuro R, Liang G, Goldstein JL, Brown MS. Liver-specific mrna for insig-2 down-
regulated by insulin: Implications for fatty acid synthesis. Proceedings of the National
Academy of Sciences of the United States of America. 2003;100:3155-3160
193. Horton JD, Bashmakov Y, Shimomura I, Shimano H. Regulation of sterol regulatory element
binding proteins in livers of fasted and refed mice. Proceedings of the National Academy of
Sciences of the United States of America. 1998;95:5987-5992
194. Kim JB, Sarraf P, Wright M, Yao KM, Mueller E, Solanes G, Lowell BB, Spiegelman BM.
Nutritional and insulin regulation of fatty acid synthetase and leptin gene expression through
add1/srebp1. The Journal of clinical investigation. 1998;101:1-9
195. Liang G, Yang J, Horton JD, Hammer RE, Goldstein JL, Brown MS. Diminished hepatic
response to fasting/refeeding and liver x receptor agonists in mice with selective deficiency of
sterol regulatory element-binding protein-1c. The Journal of biological chemistry.
2002;277:9520-9528
196. Horton JD, Shah NA, Warrington JA, Anderson NN, Park SW, Brown MS, Goldstein JL.
Combined analysis of oligonucleotide microarray data from transgenic and knockout mice
identifies direct srebp target genes. Proceedings of the National Academy of Sciences of the
United States of America. 2003;100:12027-12032
197. Foretz M, Pacot C, Dugail I, Lemarchand P, Guichard C, Le Liepvre X, Berthelier-Lubrano C,
Spiegelman B, Kim JB, Ferre P, Foufelle F. Add1/srebp-1c is required in the activation of
hepatic lipogenic gene expression by glucose. Molecular and cellular biology. 1999;19:3760-
3768

108
198. Tang X, Ma H, Shen Z, Zou S, Xu X, Lin C. Dehydroepiandrosterone activates cyclic
adenosine 3',5'-monophosphate/protein kinase a signalling and suppresses sterol regulatory
element-binding protein-1 expression in cultured primary chicken hepatocytes. The British
journal of nutrition. 2009;102:680-686
199. Vallett SM, Sanchez HB, Rosenfeld JM, Osborne TF. A direct role for sterol regulatory
element binding protein in activation of 3-hydroxy-3-methylglutaryl coenzyme a reductase
gene. The Journal of biological chemistry. 1996;271:12247-12253
200. Nohturfft A, Yabe D, Goldstein JL, Brown MS, Espenshade PJ. Regulated step in cholesterol
feedback localized to budding of scap from er membranes. Cell. 2000;102:315-323
201. Yang T, Espenshade PJ, Wright ME, Yabe D, Gong Y, Aebersold R, Goldstein JL, Brown
MS. Crucial step in cholesterol homeostasis: Sterols promote binding of scap to insig-1, a
membrane protein that facilitates retention of srebps in er. Cell. 2002;110:489-500
202. Rawson RB, Zelenski NG, Nijhawan D, Ye J, Sakai J, Hasan MT, Chang TY, Brown MS,
Goldstein JL. Complementation cloning of s2p, a gene encoding a putative metalloprotease
required for intramembrane cleavage of srebps. Molecular cell. 1997;1:47-57
203. Sakai J, Rawson RB, Espenshade PJ, Cheng D, Seegmiller AC, Goldstein JL, Brown MS.
Molecular identification of the sterol-regulated luminal protease that cleaves srebps and
controls lipid composition of animal cells. Molecular cell. 1998;2:505-514
204. Goldstein JL, DeBose-Boyd RA, Brown MS. Protein sensors for membrane sterols. Cell.
2006;124:35-46
205. Magana MM, Osborne TF. Two tandem binding sites for sterol regulatory element binding
proteins are required for sterol regulation of fatty-acid synthase promoter. The Journal of
biological chemistry. 1996;271:32689-32694
206. Ikonen E. Cellular cholesterol trafficking and compartmentalization. Nature reviews.
Molecular cell biology. 2008;9:125-138
207. Manning BD, Cantley LC. Akt/pkb signaling: Navigating downstream. Cell. 2007;129:1261-
1274
208. Lizcano JM, Alessi DR. The insulin signalling pathway. Current biology : CB. 2002;12:R236-
238
209. Porstmann T, Santos CR, Griffiths B, Cully M, Wu M, Leevers S, Griffiths JR, Chung YL,
Schulze A. Srebp activity is regulated by mtorc1 and contributes to akt-dependent cell growth.
Cell metabolism. 2008;8:224-236
210. Owen JL, Zhang Y, Bae SH, Farooqi MS, Liang G, Hammer RE, Goldstein JL, Brown MS.
Insulin stimulation of srebp-1c processing in transgenic rat hepatocytes requires p70 s6-
kinase. Proceedings of the National Academy of Sciences of the United States of America.
2012;109:16184-16189
211. Li S, Brown MS, Goldstein JL. Bifurcation of insulin signaling pathway in rat liver: Mtorc1
required for stimulation of lipogenesis, but not inhibition of gluconeogenesis. Proceedings of
the National Academy of Sciences of the United States of America. 2010;107:3441-3446
212. Hegarty BD, Bobard A, Hainault I, Ferre P, Bossard P, Foufelle F. Distinct roles of insulin
and liver x receptor in the induction and cleavage of sterol regulatory element-binding protein-
1c. Proceedings of the National Academy of Sciences of the United States of America.
2005;102:791-796
213. Yellaturu CR, Deng X, Cagen LM, Wilcox HG, Mansbach CM, 2nd, Siddiqi SA, Park EA,
Raghow R, Elam MB. Insulin enhances post-translational processing of nascent srebp-1c by
promoting its phosphorylation and association with copii vesicles. The Journal of biological
chemistry. 2009;284:7518-7532
214. Yecies JL, Zhang HH, Menon S, Liu S, Yecies D, Lipovsky AI, Gorgun C, Kwiatkowski DJ,
Hotamisligil GS, Lee CH, Manning BD. Akt stimulates hepatic srebp1c and lipogenesis
through parallel mtorc1-dependent and independent pathways. Cell metabolism. 2011;14:21-
32
215. Xu X, So JS, Park JG, Lee AH. Transcriptional control of hepatic lipid metabolism by srebp
and chrebp. Seminars in liver disease. 2013;33:301-311
216. Peet DJ, Janowski BA, Mangelsdorf DJ. The lxrs: A new class of oxysterol receptors. Current
opinion in genetics & development. 1998;8:571-575

109
217. Peet DJ, Turley SD, Ma W, Janowski BA, Lobaccaro JM, Hammer RE, Mangelsdorf DJ.
Cholesterol and bile acid metabolism are impaired in mice lacking the nuclear oxysterol
receptor lxr alpha. Cell. 1998;93:693-704
218. Hong C, Tontonoz P. Liver x receptors in lipid metabolism: Opportunities for drug discovery.
Nature reviews. Drug discovery. 2014;13:433-444
219. Repa JJ, Turley SD, Lobaccaro JA, Medina J, Li L, Lustig K, Shan B, Heyman RA, Dietschy
JM, Mangelsdorf DJ. Regulation of absorption and abc1-mediated efflux of cholesterol by rxr
heterodimers. Science. 2000;289:1524-1529
220. Yu L, Hammer RE, Li-Hawkins J, Von Bergmann K, Lutjohann D, Cohen JC, Hobbs HH.
Disruption of abcg5 and abcg8 in mice reveals their crucial role in biliary cholesterol
secretion. Proceedings of the National Academy of Sciences of the United States of America.
2002;99:16237-16242
221. Repa JJ, Berge KE, Pomajzl C, Richardson JA, Hobbs H, Mangelsdorf DJ. Regulation of atp-
binding cassette sterol transporters abcg5 and abcg8 by the liver x receptors alpha and beta.
The Journal of biological chemistry. 2002;277:18793-18800
222. Tarling EJ, Edwards PA. Atp binding cassette transporter g1 (abcg1) is an intracellular sterol
transporter. Proceedings of the National Academy of Sciences of the United States of America.
2011;108:19719-19724
223. Chen G, Liang G, Ou J, Goldstein JL, Brown MS. Central role for liver x receptor in insulin-
mediated activation of srebp-1c transcription and stimulation of fatty acid synthesis in liver.
Proceedings of the National Academy of Sciences of the United States of America.
2004;101:11245-11250
224. Repa JJ, Liang G, Ou J, Bashmakov Y, Lobaccaro JM, Shimomura I, Shan B, Brown MS,
Goldstein JL, Mangelsdorf DJ. Regulation of mouse sterol regulatory element-binding
protein-1c gene (srebp-1c) by oxysterol receptors, lxralpha and lxrbeta. Genes & development.
2000;14:2819-2830
225. Yoshikawa T, Shimano H, Amemiya-Kudo M, Yahagi N, Hasty AH, Matsuzaka T, Okazaki
H, Tamura Y, Iizuka Y, Ohashi K, Osuga J, Harada K, Gotoda T, Kimura S, Ishibashi S,
Yamada N. Identification of liver x receptor-retinoid x receptor as an activator of the sterol
regulatory element-binding protein 1c gene promoter. Molecular and cellular biology.
2001;21:2991-3000
226. Zhang Y, Breevoort SR, Angdisen J, Fu M, Schmidt DR, Holmstrom SR, Kliewer SA,
Mangelsdorf DJ, Schulman IG. Liver lxralpha expression is crucial for whole body cholesterol
homeostasis and reverse cholesterol transport in mice. The Journal of clinical investigation.
2012;122:1688-1699
227. Kalaany NY, Gauthier KC, Zavacki AM, Mammen PP, Kitazume T, Peterson JA, Horton JD,
Garry DJ, Bianco AC, Mangelsdorf DJ. Lxrs regulate the balance between fat storage and
oxidation. Cell metabolism. 2005;1:231-244
228. Kok T, Wolters H, Bloks VW, Havinga R, Jansen PL, Staels B, Kuipers F. Induction of
hepatic abc transporter expression is part of the pparalpha-mediated fasting response in the
mouse. Gastroenterology. 2003;124:160-171
229. Bloks VW, Bakker-Van Waarde WM, Verkade HJ, Kema IP, Wolters H, Vink E, Groen AK,
Kuipers F. Down-regulation of hepatic and intestinal abcg5 and abcg8 expression associated
with altered sterol fluxes in rats with streptozotocin-induced diabetes. Diabetologia.
2004;47:104-112
230. Iizuka K, Bruick RK, Liang G, Horton JD, Uyeda K. Deficiency of carbohydrate response
element-binding protein (chrebp) reduces lipogenesis as well as glycolysis. Proceedings of the
National Academy of Sciences of the United States of America. 2004;101:7281-7286
231. Yamashita H, Takenoshita M, Sakurai M, Bruick RK, Henzel WJ, Shillinglaw W, Arnot D,
Uyeda K. A glucose-responsive transcription factor that regulates carbohydrate metabolism in
the liver. Proceedings of the National Academy of Sciences of the United States of America.
2001;98:9116-9121
232. Cairo S, Merla G, Urbinati F, Ballabio A, Reymond A. Wbscr14, a gene mapping to the
williams--beuren syndrome deleted region, is a new member of the mlx transcription factor
network. Human molecular genetics. 2001;10:617-627

110
233. Stoeckman AK, Ma L, Towle HC. Mlx is the functional heteromeric partner of the
carbohydrate response element-binding protein in glucose regulation of lipogenic enzyme
genes. The Journal of biological chemistry. 2004;279:15662-15669
234. Ishii S, Iizuka K, Miller BC, Uyeda K. Carbohydrate response element binding protein
directly promotes lipogenic enzyme gene transcription. Proceedings of the National Academy
of Sciences of the United States of America. 2004;101:15597-15602
235. Herman MA, Peroni OD, Villoria J, Schon MR, Abumrad NA, Bluher M, Klein S, Kahn BB.
A novel chrebp isoform in adipose tissue regulates systemic glucose metabolism. Nature.
2012;484:333-338
236. Kabashima T, Kawaguchi T, Wadzinski BE, Uyeda K. Xylulose 5-phosphate mediates
glucose-induced lipogenesis by xylulose 5-phosphate-activated protein phosphatase in rat
liver. Proceedings of the National Academy of Sciences of the United States of America.
2003;100:5107-5112
237. Kawaguchi T, Takenoshita M, Kabashima T, Uyeda K. Glucose and camp regulate the l-type
pyruvate kinase gene by phosphorylation/dephosphorylation of the carbohydrate response
element binding protein. Proceedings of the National Academy of Sciences of the United
States of America. 2001;98:13710-13715
238. Bricambert J, Miranda J, Benhamed F, Girard J, Postic C, Dentin R. Salt-inducible kinase 2
links transcriptional coactivator p300 phosphorylation to the prevention of chrebp-dependent
hepatic steatosis in mice. The Journal of clinical investigation. 2010;120:4316-4331
239. Guinez C, Filhoulaud G, Rayah-Benhamed F, Marmier S, Dubuquoy C, Dentin R, Moldes M,
Burnol AF, Yang X, Lefebvre T, Girard J, Postic C. O-glcnacylation increases chrebp protein
content and transcriptional activity in the liver. Diabetes. 2011;60:1399-1413
240. Sakiyama H, Fujiwara N, Noguchi T, Eguchi H, Yoshihara D, Uyeda K, Suzuki K. The role of
o-linked glcnac modification on the glucose response of chrebp. Biochemical and biophysical
research communications. 2010;402:784-789
241. Ido-Kitamura Y, Sasaki T, Kobayashi M, Kim HJ, Lee YS, Kikuchi O, Yokota-Hashimoto H,
Iizuka K, Accili D, Kitamura T. Hepatic foxo1 integrates glucose utilization and lipid
synthesis through regulation of chrebp o-glycosylation. PloS one. 2012;7:e47231
242. Sakiyama H, Wynn RM, Lee WR, Fukasawa M, Mizuguchi H, Gardner KH, Repa JJ, Uyeda
K. Regulation of nuclear import/export of carbohydrate response element-binding protein
(chrebp): Interaction of an alpha-helix of chrebp with the 14-3-3 proteins and regulation by
phosphorylation. The Journal of biological chemistry. 2008;283:24899-24908
243. Davies MN, O'Callaghan BL, Towle HC. Activation and repression of glucose-stimulated
chrebp requires the concerted action of multiple domains within the mondoa conserved region.
American journal of physiology. Endocrinology and metabolism. 2010;299:E665-674
244. Li MV, Chang B, Imamura M, Poungvarin N, Chan L. Glucose-dependent transcriptional
regulation by an evolutionarily conserved glucose-sensing module. Diabetes. 2006;55:1179-
1189
245. Li MV, Chen W, Poungvarin N, Imamura M, Chan L. Glucose-mediated transactivation of
carbohydrate response element-binding protein requires cooperative actions from mondo
conserved regions and essential trans-acting factor 14-3-3. Molecular endocrinology.
2008;22:1658-1672
246. McFerrin LG, Atchley WR. A novel n-terminal domain may dictate the glucose response of
mondo proteins. PloS one. 2012;7:e34803
247. Dentin R, Tomas-Cobos L, Foufelle F, Leopold J, Girard J, Postic C, Ferre P. Glucose 6-
phosphate, rather than xylulose 5-phosphate, is required for the activation of chrebp in
response to glucose in the liver. Journal of hepatology. 2012;56:199-209
248. Iizuka K, Takeda J, Horikawa Y. Hepatic overexpression of dominant negative mlx improves
metabolic profile in diabetes-prone c57bl/6j mice. Biochemical and biophysical research
communications. 2009;379:499-504
249. Iizuka K, Wu W, Horikawa Y, Takeda J. Role of glucose-6-phosphate and xylulose-5-
phosphate in the regulation of glucose-stimulated gene expression in the pancreatic beta cell
line, ins-1e. Endocrine journal. 2013;60:473-482

111
250. Iizuka K, Wu W, Horikawa Y, Saito M, Takeda J. Feedback looping between chrebp and
pparalpha in the regulation of lipid metabolism in brown adipose tissues. Endocrine journal.
2013;60:1145-1153
251. Iizuka K. Recent progress on the role of chrebp in glucose and lipid metabolism. Endocrine
journal. 2013;60:543-555
252. Berger J, Moller DE. The mechanisms of action of ppars. Annual review of medicine.
2002;53:409-435
253. Rogue A, Lambert C, Josse R, Antherieu S, Spire C, Claude N, Guillouzo A. Comparative
gene expression profiles induced by ppargamma and pparalpha/gamma agonists in human
hepatocytes. PloS one. 2011;6:e18816
254. Rogue A, Spire C, Brun M, Claude N, Guillouzo A. Gene expression changes induced by ppar
gamma agonists in animal and human liver. PPAR research. 2010;2010:325183
255. Issemann I, Green S. Activation of a member of the steroid hormone receptor superfamily by
peroxisome proliferators. Nature. 1990;347:645-650
256. Gottlicher M, Widmark E, Li Q, Gustafsson JA. Fatty acids activate a chimera of the clofibric
acid-activated receptor and the glucocorticoid receptor. Proceedings of the National Academy
of Sciences of the United States of America. 1992;89:4653-4657
257. Zhu Y, Alvares K, Huang Q, Rao MS, Reddy JK. Cloning of a new member of the
peroxisome proliferator-activated receptor gene family from mouse liver. The Journal of
biological chemistry. 1993;268:26817-26820
258. Tontonoz P, Hu E, Graves RA, Budavari AI, Spiegelman BM. Mppar gamma 2: Tissue-
specific regulator of an adipocyte enhancer. Genes & development. 1994;8:1224-1234
259. Kliewer SA, Forman BM, Blumberg B, Ong ES, Borgmeyer U, Mangelsdorf DJ, Umesono K,
Evans RM. Differential expression and activation of a family of murine peroxisome
proliferator-activated receptors. Proceedings of the National Academy of Sciences of the
United States of America. 1994;91:7355-7359
260. Sertznig P, Seifert M, Tilgen W, Reichrath J. Present concepts and future outlook: Function of
peroxisome proliferator-activated receptors (ppars) for pathogenesis, progression, and therapy
of cancer. Journal of cellular physiology. 2007;212:1-12
261. Fruchart JC, Staels B, Duriez P. The role of fibric acids in atherosclerosis. Current
atherosclerosis reports. 2001;3:83-92
262. Rao MS, Papreddy K, Musunuri S, Okonkwo A. Prevention/reversal of choline deficiency-
induced steatohepatitis by a peroxisome proliferator-activated receptor alpha ligand in rats. In
vivo. 2002;16:145-152
263. Rao MS, Reddy JK. Pparalpha in the pathogenesis of fatty liver disease. Hepatology.
2004;40:783-786
264. Ip E, Farrell GC, Robertson G, Hall P, Kirsch R, Leclercq I. Central role of pparalpha-
dependent hepatic lipid turnover in dietary steatohepatitis in mice. Hepatology. 2003;38:123-
132
265. Wang YX, Lee CH, Tiep S, Yu RT, Ham J, Kang H, Evans RM. Peroxisome-proliferator-
activated receptor delta activates fat metabolism to prevent obesity. Cell. 2003;113:159-170
266. Berger J, Leibowitz MD, Doebber TW, Elbrecht A, Zhang B, Zhou G, Biswas C, Cullinan
CA, Hayes NS, Li Y, Tanen M, Ventre J, Wu MS, Berger GD, Mosley R, Marquis R, Santini
C, Sahoo SP, Tolman RL, Smith RG, Moller DE. Novel peroxisome proliferator-activated
receptor (ppar) gamma and ppardelta ligands produce distinct biological effects. The Journal
of biological chemistry. 1999;274:6718-6725
267. Yu BC, Chang CK, Ou HY, Cheng KC, Cheng JT. Decrease of peroxisome proliferator-
activated receptor delta expression in cardiomyopathy of streptozotocin-induced diabetic rats.
Cardiovascular research. 2008;80:78-87
268. Ren D, Collingwood TN, Rebar EJ, Wolffe AP, Camp HS. Ppargamma knockdown by
engineered transcription factors: Exogenous ppargamma2 but not ppargamma1 reactivates
adipogenesis. Genes & development. 2002;16:27-32
269. Werman A, Hollenberg A, Solanes G, Bjorbaek C, Vidal-Puig AJ, Flier JS. Ligand-
independent activation domain in the n terminus of peroxisome proliferator-activated receptor

112
gamma (ppargamma). Differential activity of ppargamma1 and -2 isoforms and influence of
insulin. The Journal of biological chemistry. 1997;272:20230-20235
270. Medina-Gomez G, Gray SL, Yetukuri L, Shimomura K, Virtue S, Campbell M, Curtis RK,
Jimenez-Linan M, Blount M, Yeo GS, Lopez M, Seppanen-Laakso T, Ashcroft FM, Oresic M,
Vidal-Puig A. Ppar gamma 2 prevents lipotoxicity by controlling adipose tissue expandability
and peripheral lipid metabolism. PLoS genetics. 2007;3:e64
271. Kintscher U, Law RE. Ppargamma-mediated insulin sensitization: The importance of fat
versus muscle. American journal of physiology. Endocrinology and metabolism.
2005;288:E287-291
272. Lehrke M, Lazar MA. The many faces of ppargamma. Cell. 2005;123:993-999
273. Ahmadian M, Suh JM, Hah N, Liddle C, Atkins AR, Downes M, Evans RM. Ppargamma
signaling and metabolism: The good, the bad and the future. Nature medicine. 2013;19:557-
566
274. Lemberger T, Saladin R, Vazquez M, Assimacopoulos F, Staels B, Desvergne B, Wahli W,
Auwerx J. Expression of the peroxisome proliferator-activated receptor alpha gene is
stimulated by stress and follows a diurnal rhythm. The Journal of biological chemistry.
1996;271:1764-1769
275. Yang X, Downes M, Yu RT, Bookout AL, He W, Straume M, Mangelsdorf DJ, Evans RM.
Nuclear receptor expression links the circadian clock to metabolism. Cell. 2006;126:801-810
276. Wang N, Yang G, Jia Z, Zhang H, Aoyagi T, Soodvilai S, Symons JD, Schnermann JB,
Gonzalez FJ, Litwin SE, Yang T. Vascular ppargamma controls circadian variation in blood
pressure and heart rate through bmal1. Cell metabolism. 2008;8:482-491
277. Oishi K, Shirai H, Ishida N. Clock is involved in the circadian transactivation of peroxisome-
proliferator-activated receptor alpha (pparalpha) in mice. The Biochemical journal.
2005;386:575-581
278. Canaple L, Rambaud J, Dkhissi-Benyahya O, Rayet B, Tan NS, Michalik L, Delaunay F,
Wahli W, Laudet V. Reciprocal regulation of brain and muscle arnt-like protein 1 and
peroxisome proliferator-activated receptor alpha defines a novel positive feedback loop in the
rodent liver circadian clock. Molecular endocrinology. 2006;20:1715-1727
279. Gervois P, Chopin-Delannoy S, Fadel A, Dubois G, Kosykh V, Fruchart JC, Najib J, Laudet
V, Staels B. Fibrates increase human rev-erbalpha expression in liver via a novel peroxisome
proliferator-activated receptor response element. Molecular endocrinology. 1999;13:400-409
280. Schmutz I, Ripperger JA, Baeriswyl-Aebischer S, Albrecht U. The mammalian clock
component period2 coordinates circadian output by interaction with nuclear receptors. Genes
& development. 2010;24:345-357
281. Fontaine C, Dubois G, Duguay Y, Helledie T, Vu-Dac N, Gervois P, Soncin F, Mandrup S,
Fruchart JC, Fruchart-Najib J, Staels B. The orphan nuclear receptor rev-erbalpha is a
peroxisome proliferator-activated receptor (ppar) gamma target gene and promotes
ppargamma-induced adipocyte differentiation. The Journal of biological chemistry.
2003;278:37672-37680
282. Le Martelot G, Claudel T, Gatfield D, Schaad O, Kornmann B, Lo Sasso G, Moschetta A,
Schibler U. Rev-erbalpha participates in circadian srebp signaling and bile acid homeostasis.
PLoS biology. 2009;7:e1000181
283. Doherty CJ, Kay SA. Circadian control of global gene expression patterns. Annual review of
genetics. 2010;44:419-444
284. Akhtar RA, Reddy AB, Maywood ES, Clayton JD, King VM, Smith AG, Gant TW, Hastings
MH, Kyriacou CP. Circadian cycling of the mouse liver transcriptome, as revealed by cdna
microarray, is driven by the suprachiasmatic nucleus. Current biology : CB. 2002;12:540-550
285. Panda S, Antoch MP, Miller BH, Su AI, Schook AB, Straume M, Schultz PG, Kay SA,
Takahashi JS, Hogenesch JB. Coordinated transcription of key pathways in the mouse by the
circadian clock. Cell. 2002;109:307-320
286. Storch KF, Lipan O, Leykin I, Viswanathan N, Davis FC, Wong WH, Weitz CJ. Extensive
and divergent circadian gene expression in liver and heart. Nature. 2002;417:78-83
113
287. Reddy AB, Karp NA, Maywood ES, Sage EA, Deery M, O'Neill JS, Wong GK, Chesham J,
Odell M, Lilley KS, Kyriacou CP, Hastings MH. Circadian orchestration of the hepatic
proteome. Current biology : CB. 2006;16:1107-1115
288. Mauvoisin D, Wang J, Jouffe C, Martin E, Atger F, Waridel P, Quadroni M, Gachon F, Naef
F. Circadian clock-dependent and -independent rhythmic proteomes implement distinct
diurnal functions in mouse liver. Proceedings of the National Academy of Sciences of the
United States of America. 2014;111:167-172
289. Robles MS, Cox J, Mann M. In-vivo quantitative proteomics reveals a key contribution of
post-transcriptional mechanisms to the circadian regulation of liver metabolism. PLoS
genetics. 2014;10:e1004047
290. Hughes ME, DiTacchio L, Hayes KR, Vollmers C, Pulivarthy S, Baggs JE, Panda S,
Hogenesch JB. Harmonics of circadian gene transcription in mammals. PLoS genetics.
2009;5:e1000442
291. Dong W, Tang X, Yu Y, Nilsen R, Kim R, Griffith J, Arnold J, Schuttler HB. Systems biology
of the clock in neurospora crassa. PloS one. 2008;3:e3105
292. Xu W, Yang R, Li M, Xing Z, Yang W, Chen G, Guo H, Gong X, Du Z, Zhang Z, Hu X,
Wang D, Qian Q, Wang T, Su Z, Xue Y. Transcriptome phase distribution analysis reveals
diurnal regulated biological processes and key pathways in rice flag leaves and seedling
leaves. PloS one. 2011;6:e17613
293. Piques M, Schulze WX, Hohne M, Usadel B, Gibon Y, Rohwer J, Stitt M. Ribosome and
transcript copy numbers, polysome occupancy and enzyme dynamics in arabidopsis.
Molecular systems biology. 2009;5:314
294. Warner JR. The economics of ribosome biosynthesis in yeast. Trends in biochemical sciences.
1999;24:437-440
295. Bianchini A, Loiarro M, Bielli P, Busa R, Paronetto MP, Loreni F, Geremia R, Sette C.
Phosphorylation of eif4e by mnks supports protein synthesis, cell cycle progression and
proliferation in prostate cancer cells. Carcinogenesis. 2008;29:2279-2288
296. Ripperger JA, Shearman LP, Reppert SM, Schibler U. Clock, an essential pacemaker
component, controls expression of the circadian transcription factor dbp. Genes &
development. 2000;14:679-689
297. Falvey E, Marcacci L, Schibler U. DNA-binding specificity of par and c/ebp leucine zipper
proteins: A single amino acid substitution in the c/ebp DNA-binding domain confers par-like
specificity to c/ebp. Biological chemistry. 1996;377:797-809
298. Gachon F, Fonjallaz P, Damiola F, Gos P, Kodama T, Zakany J, Duboule D, Petit B, Tafti M,
Schibler U. The loss of circadian par bzip transcription factors results in epilepsy. Genes &
development. 2004;18:1397-1412
299. Wang Q, Maillard M, Schibler U, Burnier M, Gachon F. Cardiac hypertrophy, low blood
pressure, and low aldosterone levels in mice devoid of the three circadian par bzip
transcription factors dbp, hlf, and tef. American journal of physiology. Regulatory, integrative
and comparative physiology. 2010;299:R1013-1019
300. Gachon F, Leuenberger N, Claudel T, Gos P, Jouffe C, Fleury Olela F, de Mollerat du Jeu X,
Wahli W, Schibler U. Proline- and acidic amino acid-rich basic leucine zipper proteins
modulate peroxisome proliferator-activated receptor alpha (pparalpha) activity. Proceedings of
the National Academy of Sciences of the United States of America. 2011;108:4794-4799
301. Xu J, Dang Y, Ren YR, Liu JO. Cholesterol trafficking is required for mtor activation in
endothelial cells. Proceedings of the National Academy of Sciences of the United States of
America. 2010;107:4764-4769
302. Parton RG. Caveolae and caveolins. Current opinion in cell biology. 1996;8:542-548
303. Simons K, Ikonen E. Functional rafts in cell membranes. Nature. 1997;387:569-572
304. Silvius JR. Role of cholesterol in lipid raft formation: Lessons from lipid model systems.
Biochimica et biophysica acta. 2003;1610:174-183
305. Michel V, Bakovic M. Lipid rafts in health and disease. Biology of the cell / under the
auspices of the European Cell Biology Organization. 2007;99:129-140
306. Patra SK. Dissecting lipid raft facilitated cell signaling pathways in cancer. Biochimica et
biophysica acta. 2008;1785:182-206

114
307. George KS, Wu S. Lipid raft: A floating island of death or survival. Toxicology and applied
pharmacology. 2012;259:311-319
308. Gao X, Lowry PR, Zhou X, Depry C, Wei Z, Wong GW, Zhang J. Pi3k/akt signaling requires
spatial compartmentalization in plasma membrane microdomains. Proceedings of the National
Academy of Sciences of the United States of America. 2011;108:14509-14514
309. Seedorf U, Ellinghaus P, Roch Nofer J. Sterol carrier protein-2. Biochimica et biophysica
acta. 2000;1486:45-54
310. McGuire DM, Olson CD, Towle HC, Dempsey ME. Translational control of the circadian
rhythm of liver sterol carrier protein. The Journal of biological chemistry. 1984;259:5368-
5371
311. Puglielli L, Rigotti A, Greco AV, Santos MJ, Nervi F. Sterol carrier protein-2 is involved in
cholesterol transfer from the endoplasmic reticulum to the plasma membrane in human
fibroblasts. The Journal of biological chemistry. 1995;270:18723-18726
312. Schroeder F, Atshaves BP, McIntosh AL, Gallegos AM, Storey SM, Parr RD, Jefferson JR,
Ball JM, Kier AB. Sterol carrier protein-2: New roles in regulating lipid rafts and signaling.
Biochimica et biophysica acta. 2007;1771:700-718
313. Marcheva B, Ramsey KM, Buhr ED, Kobayashi Y, Su H, Ko CH, Ivanova G, Omura C, Mo
S, Vitaterna MH, Lopez JP, Philipson LH, Bradfield CA, Crosby SD, JeBailey L, Wang X,
Takahashi JS, Bass J. Disruption of the clock components clock and bmal1 leads to
hypoinsulinaemia and diabetes. Nature. 2010;466:627-631
314. Lee J, Moulik M, Fang Z, Saha P, Zou F, Xu Y, Nelson DL, Ma K, Moore DD, Yechoor VK.
Bmal1 and beta-cell clock are required for adaptation to circadian disruption, and their loss of
function leads to oxidative stress-induced beta-cell failure in mice. Molecular and cellular
biology. 2013;33:2327-2338
315. Zhang EE, Liu Y, Dentin R, Pongsawakul PY, Liu AC, Hirota T, Nusinow DA, Sun X,
Landais S, Kodama Y, Brenner DA, Montminy M, Kay SA. Cryptochrome mediates circadian
regulation of camp signaling and hepatic gluconeogenesis. Nature medicine. 2010;16:1152-
1156
316. Amitani M, Asakawa A, Amitani H, Inui A. The role of leptin in the control of insulin-glucose
axis. Frontiers in neuroscience. 2013;7:51
317. Kohsaka A, Laposky AD, Ramsey KM, Estrada C, Joshu C, Kobayashi Y, Turek FW, Bass J.
High-fat diet disrupts behavioral and molecular circadian rhythms in mice. Cell metabolism.
2007;6:414-421
318. Hatori M, Vollmers C, Zarrinpar A, DiTacchio L, Bushong EA, Gill S, Leblanc M, Chaix A,
Joens M, Fitzpatrick JA, Ellisman MH, Panda S. Time-restricted feeding without reducing
caloric intake prevents metabolic diseases in mice fed a high-fat diet. Cell metabolism.
2012;15:848-860
319. Alvarez JD, Hansen A, Ord T, Bebas P, Chappell PE, Giebultowicz JM, Williams C, Moss S,
Sehgal A. The circadian clock protein bmal1 is necessary for fertility and proper testosterone
production in mice. Journal of biological rhythms. 2008;23:26-36
320. Ingalls AM, Dickie MM, Snell GD. Obese, a new mutation in the house mouse. The Journal
of heredity. 1950;41:317-318
321. Thorens B, Sarkar HK, Kaback HR, Lodish HF. Cloning and functional expression in bacteria
of a novel glucose transporter present in liver, intestine, kidney, and beta-pancreatic islet cells.
Cell. 1988;55:281-290
322. James DE, Strube M, Mueckler M. Molecular cloning and characterization of an insulin-
regulatable glucose transporter. Nature. 1989;338:83-87
323. Sadacca LA, Lamia KA, deLemos AS, Blum B, Weitz CJ. An intrinsic circadian clock of the
pancreas is required for normal insulin release and glucose homeostasis in mice. Diabetologia.
2011;54:120-124
324. Bradbury MW, Berk PD. Lipid metabolism in hepatic steatosis. Clinics in liver disease.
2004;8:639-671, xi
325. Anstee QM, Goldin RD. Mouse models in non-alcoholic fatty liver disease and steatohepatitis
research. International journal of experimental pathology. 2006;87:1-16

115
326. Chung WK, Belfi K, Chua M, Wiley J, Mackintosh R, Nicolson M, Boozer CN, Leibel RL.
Heterozygosity for lep(ob) or lep(rdb) affects body composition and leptin homeostasis in
adult mice. The American journal of physiology. 1998;274:R985-990
327. Fujihara Y, Kondo H, Noguchi T, Togari A. Glucocorticoids mediate circadian timing in
peripheral osteoclasts resulting in the circadian expression rhythm of osteoclast-related genes.
Bone. 2014;61:1-9
328. Turner RT, Kalra SP, Wong CP, Philbrick KA, Lindenmaier LB, Boghossian S, Iwaniec UT.
Peripheral leptin regulates bone formation. Journal of bone and mineral research : the official
journal of the American Society for Bone and Mineral Research. 2013;28:22-34
329. Matsumoto E, Ishihara A, Tamai S, Nemoto A, Iwase K, Hiwasa T, Shibata S, Takiguchi M.
Time of day and nutrients in feeding govern daily expression rhythms of the gene for sterol
regulatory element-binding protein (srebp)-1 in the mouse liver. The Journal of biological
chemistry. 2010;285:33028-33036
330. Turek FW, Joshu C, Kohsaka A, Lin E, Ivanova G, McDearmon E, Laposky A, Losee-Olson
S, Easton A, Jensen DR, Eckel RH, Takahashi JS, Bass J. Obesity and metabolic syndrome in
circadian clock mutant mice. Science. 2005;308:1043-1045
331. Beaven SW, Matveyenko A, Wroblewski K, Chao L, Wilpitz D, Hsu TW, Lentz J, Drew B,
Hevener AL, Tontonoz P. Reciprocal regulation of hepatic and adipose lipogenesis by liver x
receptors in obesity and insulin resistance. Cell metabolism. 2013;18:106-117
332. Saleh MC, Wheeler MB, Chan CB. Endogenous islet uncoupling protein-2 expression and
loss of glucose homeostasis in ob/ob mice. The Journal of endocrinology. 2006;190:659-667
333. Beck V, Jaburek M, Demina T, Rupprecht A, Porter RK, Jezek P, Pohl EE. Polyunsaturated
fatty acids activate human uncoupling proteins 1 and 2 in planar lipid bilayers. FASEB journal
: official publication of the Federation of American Societies for Experimental Biology.
2007;21:1137-1144
334. Echtay KS, Esteves TC, Pakay JL, Jekabsons MB, Lambert AJ, Portero-Otin M, Pamplona R,
Vidal-Puig AJ, Wang S, Roebuck SJ, Brand MD. A signalling role for 4-hydroxy-2-nonenal in
regulation of mitochondrial uncoupling. The EMBO journal. 2003;22:4103-4110
335. Zhang CY, Baffy G, Perret P, Krauss S, Peroni O, Grujic D, Hagen T, Vidal-Puig AJ, Boss O,
Kim YB, Zheng XX, Wheeler MB, Shulman GI, Chan CB, Lowell BB. Uncoupling protein-2
negatively regulates insulin secretion and is a major link between obesity, beta cell
dysfunction, and type 2 diabetes. Cell. 2001;105:745-755
336. Pi J, Bai Y, Daniel KW, Liu D, Lyght O, Edelstein D, Brownlee M, Corkey BE, Collins S.
Persistent oxidative stress due to absence of uncoupling protein 2 associated with impaired
pancreatic beta-cell function. Endocrinology. 2009;150:3040-3048
337. Pi J, Collins S. Reactive oxygen species and uncoupling protein 2 in pancreatic beta-cell
function. Diabetes, obesity & metabolism. 2010;12 Suppl 2:141-148
338. Allister EM, Robson-Doucette CA, Prentice KJ, Hardy AB, Sultan S, Gaisano HY, Kong D,
Gilon P, Herrera PL, Lowell BB, Wheeler MB. Ucp2 regulates the glucagon response to
fasting and starvation. Diabetes. 2013;62:1623-1633
339. Peek CB, Affinati AH, Ramsey KM, Kuo HY, Yu W, Sena LA, Ilkayeva O, Marcheva B,
Kobayashi Y, Omura C, Levine DC, Bacsik DJ, Gius D, Newgard CB, Goetzman E, Chandel
NS, Denu JM, Mrksich M, Bass J. Circadian clock nad+ cycle drives mitochondrial oxidative
metabolism in mice. Science. 2013;342:1243417
340. Jouffe C, Cretenet G, Symul L, Martin E, Atger F, Naef F, Gachon F. The circadian clock
coordinates ribosome biogenesis. PLoS biology. 2013;11:e1001455
341. Lo S, Russell JC, Taylor AW. Determination of glycogen in small tissue samples. Journal of
applied physiology. 1970;28:234-236
Related Documents