1 Equity Research through Technical Analysis CORPORATE INTERNSHIP PROGRAM PROJECT REPORT SUBMITTED IN PARTIAL FULFILMENT OF PGDM PROGRAM 2014-16 Submitted By Name: Deepesh Sharma Roll No: 108 Company Mentor Faculty Mentor Name: Mr. Raj Bardhan Kr. Singh Name: Dr Sharad Chaturvedi Designation: Sr. Manager- Research Designation: Associate Professor (Technical & Derivatives) Company: Bajaj Capital Delhi

Welcome message from author
This document is posted to help you gain knowledge. Please leave a comment to let me know what you think about it! Share it to your friends and learn new things together.
Transcript

1
Equity Research through Technical Analysis
CORPORATE INTERNSHIP PROGRAM PROJECT REPORT
SUBMITTED IN PARTIAL FULFILMENT OF PGDM PROGRAM 2014-16
Submitted By
Name: Deepesh Sharma
Roll No: 108
Company Mentor Faculty Mentor
Name: Mr. Raj Bardhan Kr. Singh Name: Dr Sharad Chaturvedi
Designation: Sr. Manager- Research Designation: Associate Professor
(Technical & Derivatives)
Company: Bajaj Capital
Delhi

2
Certificate from Company
This is to certify that Deepesh Sharma, a student of PGDM
Programme, (2014-16) Batch of Fortune Institute of International
Business, and Delhi has undertaken the Corporate Internship
Training at Bajaj Capital during 20/04/2015 to 20/06/2015 under my
supervision & guidance. He has conducted a study & completed the
Project on “Equity Research through Technical
Analysis________________________
During Training his/her work was ___________________
Seal of Organization Signature of Company
Mentor
Date: Name of Company Mentor
Designation of Company
Mentor

3
Certificate from Faculty Mentor
This is to certify that the Project Report titled “Equity Research
through Technical Analysis is a bonfire work carried out by
Deepesh Sharma of PGDM (2014-16) Batch of Fortune Institute of
International Business, Delhi as a fulfillment of PGDM Programme.
He has worked under my guidance and satisfactorily completed
his/her project work.
Date:
Name and Signature of Faculty Mentor
Dr Sharad Chaturvedi

4
Declaration by the Student
I, hereby, declare that the work presented in this report, entitled “Equity Research through
Technical Analysis” in fulfillment of the requirements for PGDM Programme, submitted
to Fortune Institute of International Business, Delhi is an authentic record of my own work
and is free from any type of plagiarism, carried out under the supervision of Mr. Raj
Bardhan Kr. Singh
I also declare that the work embodied in the present report
(i) Is my original work and has not been copied from any source, and
(ii) Has not been submitted for any other Degree or Diploma of any university/Institution.
Name and Signature of Student
Roll No.

5
Acknowledgement
“It is not possible to prepare a project report without the assistance & encouragement of
other people. This one is certainly no exception.”
On the very outset of this report, I would like to extend my sincere & heartfelt obligation
towards all the personages who have helped me in this endeavor. Without their active
guidance, help, cooperation & encouragement, I would not have made headway in the
project.
I am ineffably indebted to Mr. Raj Bardhan Kumar Singh for conscientious guidance and
encouragement to accomplish this assignment. I am also thankful to Miss ITI Verma
I am extremely thankful and pay my gratitude to my faculty Dr. Sharad Chutervedi for her
valuable guidance and support on completion of this project.
I extend my gratitude to Fortune Institute of International Business for giving me this
opportunity.
I also acknowledge with a deep sense of reverence, my gratitude towards my parents and
member of my family, who has always supported me morally as well as economically.
At last but not least gratitude goes to all of my friends who directly or indirectly helped me
to complete this project report.
Deepesh Sharma (108)

6
Executive Summary
The Indian Equity market is divided in to two parts Primary market - where the share is
first issued in the form of IPO and after issuing the share it gets listed on exchange and
these share are traded on exchange where shares can be bought and sold this is secondary
market. In India mainly there are two exchange -NSE (National Stock Exchange) BSE
(Bombay Stock Exchange). BSE is the oldest exchange in India that started in 1875
whereas NSE started operation on 1994.
The equity market is studied in types i.e. technical analysis looks at the price movement of
a security and uses this data to predict its future price movements. Fundamental analysis,
on the other hand, looks at economic factors, known as fundamentals. Technical analysis
really just studies supply and demand in a market in an attempt to determine what
direction, or trend, will continue in the future. In other words, technical analysis attempts
to understand the emotions in the market by studying the market itself, as opposed to its
components. If you understand the benefits and limitations of technical analysis, it can give
you a new set of tools or skills that will enable you to be a better trader or investor.
Technical analysis is a method of evaluating securities by analyzing the statistics generated
by market activity, such as past prices and volume. Technical analysts do not attempt to
measure a security's intrinsic value, but instead use charts and other tools to identify
patterns that can suggest future activity The Technical Approach to investment is
essentially a reflection of the idea that prices moves in a trend that are determined by the
changing attitude of investor’s toward a variety of economic, monetary, political and
psychological forces. The art of technical analysis, for it is an art, is to identify a trend
reversal at a relatively early stage and ride on that trend until the weight of the evidence
shows or proves the trend has reversed. Charts are often used to ease understanding of
large quantities of data and the relationships between parts of the data. Charts can usually
be read more quickly than the raw data that they are produced from. The foundation of
technical analysis is the charts. Financial market is a head on head battle between the Bulls
(buyers) and the Bears (Sellers), bulls pushes the prices higher and bears pushes the prices
lower. The direction of price movement revels who’s winning the battle. Support and
resistance represent key points where the demand and supply meet. The market generally
moves in two directions i.e. uptrend and downtrend.
7
Technical analysis really just studies supply and demand in a market in an attempt to
determine what direction, or trend, will continue in the future. In other words, technical
analysis attempts to understand the emotions in the market by studying the market itself, as
opposed to its components. If you understand the benefits and limitations of technical
analysis, it can give you a new set of tools or skills that will enable you to be a better trader
or investor. Technical analysis is a method of evaluating securities by analyzing the
statistics generated by market activity, such as past prices and volume. Technical analysts
do not attempt to measure a security's intrinsic value, but instead use charts and other tools
to identify patterns that can suggest future activity The Technical Approach to investment
is essentially a reflection of the idea that prices moves in a trend that are determined by the
changing attitude of investor’s toward a variety of economic, monetary, political and
psychological forces. The art of technical analysis, for it is an art, is to identify a trend
reversal at a relatively early stage and ride on that trend until the weight of the evidence
shows or proves the trend has reversed.
During the period of one month the buy calls were based on strong support level,
Indicators buy signal, chart patterns and candlestick patterns. Some of the shares were
picked on basis of news, quarterly result announcement, government announcements.
Technical analysis helped to predict the future price movement of share to an accuracy of
69%. As warren buffet implies that we can’t predict the future price movements but this
study proves that the market can be studied with the help of technical analysis. Technical
analysis is used to do trading i.e. investment for short term and fundamental analysis is
used for investment purpose i.e. for long term.

8
Table of Contents
S.No. Chapter
No.
Contents Page
No.
1 Title Page
2 Company Certificate
3 Faculty Mentor Certificate
4 Declaration
5 Acknowledgement
6 Executive Summary I-II
7 Table of Contents / List of Illustrations III-V
8 Chapter 1 Introduction to the Sector/ Company 1-32
9 Company profile 1-2
10 Introduction- Equity Market India 2-3
12 Introduction Equity Market Analysis 4-5
13 Technical analysis and fundamental analysis 6-7
14 Introduction-Charts 8-9
15 Introduction- Support & Resistance 10-12
16 Introduction-Trend 12-13
17 Technical Analysis Chart Patterns 13-18
18 Japanese candlestick Introduction 18-26
19 Technical Analysis Indicators 27-32
11 Chapter 2 Review of Literature 33-34
20 Chapter 3 Project Objectives 35
21 Chapter 4 Project Methodology Adopted 36-37
22 Chapter 5 Data Analysis & Interpretation / Description of the Work
Performed
38-51
23 Chapter 6 Findings 52
24 Chapter 7 Recommendations 53
25 Chapter 8 References 54
26 Annexures 55-57

9
List of Illustrations
Figures
S.No. Title of the Figure/Photograph Page No.
Figure 1.1 Price moves in a trend 4
Figure 1.2 History tend to repeat itself 5
Figure 1.3 Line Charts 8
Figure 1.4 Bar charts 8
Figure 1.5 Volume bar charts 9
Figure 1.6 Candlestick diagram 9
Figure 1.7 Support 10
Figure 1.8 Resistance 11
Figure 1.9 Support and resistance 12
Figure 1.10 Uptrend 12
Figure 1.11 Downtrend 13
Figure 1.12 Head and shoulder 14
Figure 1.13 Triangle formation 16
Figure 1.14 Flag formation 17
Figure 1.15 Gaps 17
Figure 1.16 Round Bottom 18
Figure 1.17 Hammer candlestick 19
Figure 1.18 Engulfing pattern 20
Figure 1.19 Dark Cloud and Piercing pattern 21
Figure 1.20 Stars 22
Figure 1.21 Morning Star 22
Figure 1.22 Evening Star 23
Figure 1.23 Inverted hammer and Shooting star 24
Figure 1.24 Harami Pattern 25
Figure 1.25 Belt hold pattern 26
Figure 1.26 MACD 27
Figure 1.27 RSI 29
Figure 1.28 Momentum 30
Figure 1.29 Stochastic oscillator 31
Figure 1.30 Volume Graph 31
Figure 1.31 Bollinger bands 32
Figure 5.1 ONGC 26/05/2015 38
Figure 5.2 BHARTIARTL 26/05/2015 39
Figure 5.3 BHEL 26/05/2015 40
Figure 5.4 TCS 26/05/2015 41
Figure 5.5 BANKBARODA 27/05/2015 42
Figure 5.6 UCOBANK 28/05/2015 43
Figure 5.7 RAMCOIND 28/05/2015 44
Figure 5.8 M&M 29/05/2015 45

10
Figure 5.9 IDFC 29/05/2015 46
Figure 5.10 BAYERCROPS 03/06/2015 47
Figure 5.11 BIOCON 05/06/2015 48
Figure 5.12 CASTROLIND 10/06/2015 49
Figure 5.13 CHENNPETRO 10/06/2015 50
Figure 5.14 CIPLA 15/06/2015 51
11
Chapter-1
Introduction to the Sector/ Company

12
Chapter 1
Introduction to the Sector/ Company
Company profile
Bajaj Capital Limited ("Bajaj Capital") is India's premier "Investment Services" Company,
with nearly 50 years of experience in helping people protect and grow their wealth. We've
helped to create more millionaires than any other firm in India. But it's our deep personal
relationships with clients that truly sets us apart.
No other firm can match the depth of our experience and our dedication to personal
service. The markets may fluctuate, but our dependability never does.
Bajaj Capital holds the Certificate of Registration to act as Merchant Banker (Cat-I),
Underwriter, Stock Broker of BSE Limited [Cash Segment], Depository Participant of
NSDL, granted by the Securities and Exchange Board of India. Further, Bajaj Capital is an
AMFI Registered ARN holder and has also been granted the Certificate of Registration to
act as Point of Presence by the Pension Fund Regulatory Authority for the NPS Schemes.
Mission Statement: - Bajaj Capital aims to be the most useful, reliable and efficient
provider of Financial Services. It is our continuous endeavor to be a trustworthy partner to
our clients, helping them protect and grow their wealth, and achieve their life goals.
Aim:-Bajaj capital aim are as
To serve our clients with utmost dedication and integrity so that we exceed their
expectations and build enduring relationships
To offer unparalleled quality of service through complete knowledge of products,
constant innovation in services and use of the latest technology.
To always give honest and unbiased financial solutions and earn our client’s
everlasting trust.
To serve the community by educating individuals on the merits of investments and
in turn help shape a financially responsible citizen
To create value for all stake holders by ensuring profitable growth.
13
To build an amicable environment that accords respect to every individual and
permits their personal growth.
To utilize the power of teamwork to function as a family and build a seamless
organization.
Vision Statement:- Our vision is to be the most preferred Investment Services Company
in India by providing clients with informed choices of lasting value, protect and grow
wealth for them, to make their tomorrow better than today.
Introduction- Equity Market India
The Indian Equity market is divided in to two parts Primary market - where the share is
first issued in the form of IPO and after issuing the share it gets listed on exchange and
these share are traded on exchange where shares can be bought and sold this is secondary
market. In India mainly there are two exchange -NSE (National Stock Exchange) BSE
(Bombay Stock Exchange). BSE is the oldest exchange in India that started in 1875
whereas NSE started operation on 1994.
Before 2000 shares was held in Physical form but the main difficulty with Physical shares
is method of transaction which is open outcry system and process is not transparent to
investor also Physical shares were prone to duplication and fraud. So in 2000 NSE
introduced the electronic screen based trading system further the introduction of
Dematerialization (Conversion of physical share in to electronic form) and depository
(where the electronic form of share is kept) revolutionized the Indian Stock market.
Currently there are mainly two Depository (DP) -NSDL and CDSL and these DP are like
bank of share. Individual/Firm can deal through Broker (who is registered and have
membership in Exchanges and Depository) for buying and selling securities. Today NSE
outpaced BSE in volume of trade.
Index is the barometer of stock exchange for e.g. in NSE there are about 1350 listed
companies listed and it cannot be said in general form market was up or down without
fully looking all companies. INDEX serve this purpose. INDEX is constructed by taking
top companies across different sector in different weightage and INDEX movement will
reflect the overall movement of market. So if NIFTY or SENSEX is up we can generally
assume market was up (does not mean all shares was up) and vice versa. Now there are
index in some sectors which can catch the movement of that sector like CNXIT-IT sector,
14
BANKNIFTY-Banking sector etc. General purpose of Stock Market is for Investment but
bulk of activities done in market is day trading. Day trading means Buying/selling of
shares and offsetting the position on same day. Day traders serves the purpose of bringing
the liquidity to market and they help the market movement and more than 80% of the
volume from market is coming from day trading. Introduction of derivative market had
made the day trading to grow more and introduction of advanced day trading technique.
The main tool for Stock market investment/trading are Fundamental analysis -which
studies about the fundamental of companies and economy and Technical Analysis-which
studies the market by analyzing the past movement of share and market. The investment
scenario in India is now is at par with global Market. The introduction of Derivative,
Currency, Commodity market now helped the Indian Investor to Invest in almost anything
like Share, Commodity, Currency, Bonds and complex thing like Interest rate future,
Weather Derivative, Volatility Index and more and Stock market are giving various
product to invest in with various amount of risk like bonds, Gold ETF, Equity and
Preference Share, Commodities (metal and Agriculture) Currency to high risk Derivative
product.
What really Stock market does is it serves the company by providing company the finance
for long term needs and for investor an opportunity to park their savings in corporate world
and in turn give their hand in Nation's development so stock exchange have a very vital
role in country's economic development.
SENSEX and NIFTY are Index of BSE and NSE Blue chip share. SENSEX consist of 30
share and NIFTY 50 share (of top most companies). NSE has a market capitalization of
more than US$1.65 trillion, making it the world’s 12th-largest stock exchange as of 23
January 2015. NSE's flagship index, the CNX Nifty, the 50 stock index, is used extensively
by investors in India and around the world as a barometer of the Indian capital markets.
BSE was established in 1875, BSE is considered to be one of Asia’s fastest stock
exchanges, with a speed of 200 microseconds and one of India’s leading exchange groups
and the oldest stock exchange in the South Asia region. Bombay Stock Exchange is the
world's 10th largest stock market by market capitalization at $1.7 trillion as of 23 January
2015. More than 5,174 companies are listed on BSE.

15
Introduction Equity Market Analysis
The Method to analyze securities and make decision fall into two very broad categories
fundamental analysis and technical analysis. Fundamental analysis involves analyzing the
characteristics of a company in order to estimate its value. Technical analysis takes a
completely different approach, it doesn’t care a bit about the value of the company or the
commodity. Technicians are only interested in the price movements in the market.
Technical analysis studies the supply and demand in the market in an attempt to determine
what direction, or trend will continue in the future. In other words it attempts to understand
the emotions in the market by study the market.
The study is based on three assumptions
1. Market discounts everything- The major criticism of technical analysis is that it
only considers price movement ignoring the fundamental factor of the company.
However, technical analysis assumes that at any given time, a stock price reflects
everything that has or could affect the company- including fundamental factors.
Technical analysts believe that company's fundamentals, along with broader
economic factors and market psychology, are all priced into the stock, removing the
need to actually consider these factors separately. This only leaves the analysis of
price movement, which technical theory views as a product of the supply and
demand for a particular stock in the market.
2. Price move in trends- In technical analysis, price movements are believed to
follow trends. This means that after a trend has been established, the future price
movement is more likely to be in the same direction as the trend than to be against
it. Most technical trading strategies are based on this assumption.
Figure 1.1 Price moves in a trend Source: www.bazarternd.com

16
3. History tend to repeat itself- Another important idea in technical analysis is that
history tends to repeat itself, mainly in terms of price movement. The repetitive
nature of price movements is attributed to market psychology; in other words,
market participants tend to provide a consistent reaction to similar market stimuli
over time. Technical analysis uses chart patterns to analyze market movements and
understand trends. Although many of these charts have been used for more than
100 years, they are still believed to be relevant because they illustrate patterns in
price movements that often repeat themselves.
Figure 1.2 History tend to repeat itself Source: www.bazartrend.com
Technical analysis and fundamental analysis
Technical analysis and fundamental analysis are the two main schools of thought in the
financial markets. As we've mentioned, technical analysis looks at the price movement of a
security and uses this data to predict its future price movements. Fundamental analysis, on
the other hand, looks at economic factors, known as fundamentals. Let's get into the details
of how these two approaches differ, the criticisms against technical analysis and how
technical and fundamental analysis can be used together to analyze securities.
Fundamental analysis is the analysis of the company’s fundamentals i.e. the annual reports.
In fundamental analysis the companies balance sheet and ratio analysis. Fundamental
analysis is done for investment purpose for long term where as technical analysis is done
for trading and is short term.
17
The Differences
1. Charts vs. Financial Statements
At the most basic level, a technical analyst approaches a security from the charts, while a
fundamental analyst starts with the financial statements. (For further reading, see
Introduction to Fundamental Analysis and Advanced Financial Statement Analysis.) By
looking at the balance sheet, cash flow statement and income statement, a fundamental
analyst tries to determine a company's value. In financial terms, an analyst attempts to
measure a company's intrinsic value. In this approach, investment decisions are fairly easy
to make - if the price of a stock trades below its intrinsic value, it's a good investment.
Although this is an oversimplification (fundamental analysis goes beyond just the financial
statements) for the purposes of this tutorial, this simple tenet holds true.
Technical traders, on the other hand, believe there is no reason to analyze a company's
fundamentals because these are all accounted for in the stock's price. Technicians believe
that all the information they need about a stock can be found in its charts.
2. Time Horizon
Fundamental analysis takes a relatively long-term approach to analyzing the market
compared to technical analysis. While technical analysis can be used on a timeframe of
weeks, days or even minutes, fundamental analysis often looks at data over a number of
years. The different timeframes that these two approaches use is a result of the nature of
the investing style to which they each adhere. It can take a long time for a company's value
to be reflected in the market, so when a fundamental analyst estimates intrinsic value, a
gain is not realized until the stock's market price rises to its "correct" value. This type of
investing is called value investing and assumes that the short-term market is wrong, but
that the price of a particular stock will correct itself over the long run. This "long run" can
represent a timeframe of as long as several years, in some cases. (For more insight, read
Warren Buffett: How He Does It and What Is Warren Buffett's Investing Style?)
Furthermore, the numbers that a fundamentalist analyzes are only released over long
periods of time. Financial statements are filed quarterly and changes in earnings per share
don't emerge on a daily basis like price and volume information. Also remember that
fundamentals are the actual characteristics of a business. New management can't
implement sweeping changes overnight and it takes time to create new products, marketing
18
campaigns, supply chains, etc. Part of the reason that fundamental analysts use a long-term
timeframe, therefore, is because the data they use to analyze a stock is generated much
more slowly than the price and volume data used by technical analysts.
3. Trading Versus Investing
Not only is technical analysis more short term in nature than fundamental analysis, but the
goals of a purchase (or sale) of a stock are usually different for each approach. In general,
technical analysis is used for a trade, whereas fundamental analysis is used to make an
investment. Investors buy assets they believe can increase in value, while traders buy
assets they believe they can sell to somebody else at a greater price. The line between a
trade and an investment can be blurry, but it does characterize a difference between the two
schools.
Although technical analysis and fundamental analysis are seen by many as polar opposites
- the oil and water of investing - many market participants have experienced great success
by combining the two. For example, some fundamental analysts use technical analysis
techniques to figure out the best time to enter into an undervalued security. Oftentimes, this
situation occurs when the security is severely oversold. By timing entry into a security, the
gains on the investment can be greatly improved. Alternatively, some technical traders
might look at fundamentals to add strength to a technical signal. For example, if a sell
signal is given through technical patterns and indicators, a technical trader might look to
reaffirm his or her decision by looking at some key fundamental data. Oftentimes, having
both the fundamentals and technical on your side can provide the best-case scenario for a
trade. While mixing some of the components of technical and fundamental analysis is not
well received by the most devoted groups in each school, there are certainly benefits to at
least understanding both schools of thought.

19
Introduction-Charts
Charts are often used to ease understanding of large quantities of data and the relationships
between parts of the data. Charts can usually be read more quickly than the raw data that
they are produced from. The foundation of technical analysis is the charts. Analyst study
these charts and identify the price trends. There are different types of charts used such as
line chart, bar chart, candlestick charts, volume bar charts, etc.
1. Line Charts: - line charts are created by connecting series of data points together
with line. This is the most basic type of chart used in finance and it is generally
created by connecting a series of past prices together with a line.
Figure 1.3 Line Charts (Source: www.bazartrend.com)
2. Bar Chart: - The top of the vertical line indicates the highest price a security
traded at during the day, and the bottom represents the lowest price. The closing
price is displayed on the right side of the bar, and the opening price is shown on the
left side of the bar. A single bar like the one below represents one day of trading
Figure 1.4 Bar chart (Source: www.bazartrend.com)

20
3. Volume Bar chart: - Figure displays zero based volume. This means the bottom of
each volume bar represents the value of zero. Whenever there is a fluctuations in
volume the volatility of the market has increased.
Figure 1.5 Volume bar chart (Source: www.bazartrend.com)
4. Candlestick diagram- Candlesticks reflect the impact of investors' emotions on
security prices and are used by technical analysts to determine when to enter and
exit trades. Candlestick charting is based on a technique developed in Japan in the
1700s for tracking the price of rice. A candlestick displays the high, low, opening
and closing prices for a security for a single day. The wide part of the candlestick is
called the "real body" and tells investors whether the closing price was higher or
lower than the opening price (black/red if the stock closed lower, white/green if the
stock closed higher). The candlestick's shadows show the day's high and lows and
how they compare to the open and close. A candlestick's shape varies based on the
relationship between the day's high, low, opening and closing prices.
Figure 1.6 Candlestick diagram (Source: www.moneycontrol.com)

21
Introduction- Support & Resistance
Financial market is a head on head battle between the Bulls (buyers) and the Bears
(Sellers), bulls pushes the prices higher and bears pushes the prices lower. The direction of
price movement revels who’s winning the battle. Support and resistance represent key
points where the demand and supply meet. In financial market the price of security
depends upon these two factors when there is excessive supply the bears rule the market
and when the demand is high the bulls rule the market. As demand increases the price
advances and as supply excesses demand the prices declines, when demand is equal to
supply the market moves sideways as bull and bears loose the control. The resistance level
and support level depends upon the analyst view how they view the market and what is the
process the determine it. It could be through Fibonacci retracement, trend lines, etc.
Figure 1.7 Support (Source: www.icharts.in)
Support level are usually below the current prices, it is the level the prices tends to find
support as it is going down. This means as the prices are likely to bounce as it touches the
support level. Support is the price level at which demand is thought to be strong enough to
prevent the price from declining further. When the price declines, there will be more
demand for the particular share. When price reaches a particular level (called support
level), it is believed that demand will overcome supply to buy the script at lower prices and
prevent the price from falling below support. As we can in case of NIFTY, 8000 act as a
support level and for 6 times in the last one year NIFTY touches 8000 and bounce back
preventing it to fall further.

22
Resistance level are usually above the current market prices and is opposite of the support
level, at this level the prices tends hard to break through. A Resistance is the price level at
which selling is thought to be strong enough to prevent the price from rising further. The
demand and supply theory suggests that, as the price advances, sellers become more
inclined to sell and buyers become less inclined to buy. As we know everyone tries to earn
profit as much as possible, By the time the price reaches a particular level (called the
resistance level) it is believed that supply(everyone selling to earn higher profit) will
overcome demand( less or no buyers as the prices are higher) and prevent the price from
rising above resistance. As we can see in case of NIFTY, whenever the prices touched the
resistance level (the red line) it bounced back.
Figure 1.8 Resistance (Source: www.icharts.in)
It’s not always necessary that resistance level act as resistance always or support level act
as support always, in the figure as we can see before 777 was the support level for Asian
paints for almost 4 months and then when prices broke this support level and now it work
as the resistance level for Asian paints. Whenever the prices breaks the support or
resistance level it signals that the relationship between the supply and demand has
changed.

23
Figure 1.9 Support and Resistance (Source: www.icharts.in)
Introduction-Trend
A trend represents a consistence change in prices. There are uptrend and downtrend.
1. Uptrend
An uptrend line is plotted connecting the higher bottoms, as is evident from the PAGEIND
chart. Though it is mathematically possible to connect two data points to create a line, it is
better to have at least three data points to form a trend line. It's the third point that actually
confirms the trend. Since these trend lines are formed connecting higher bottoms, it will
slope upwards. As we can see in case of PAGEIND the share is in uptrend making new
higher lows each time it touches the trend line. A good trading strategy is to buy close to
trend line and place stop loss placed on the trend line.
Figure 1.10 Uptrend (Source: www.icharts.in)
24
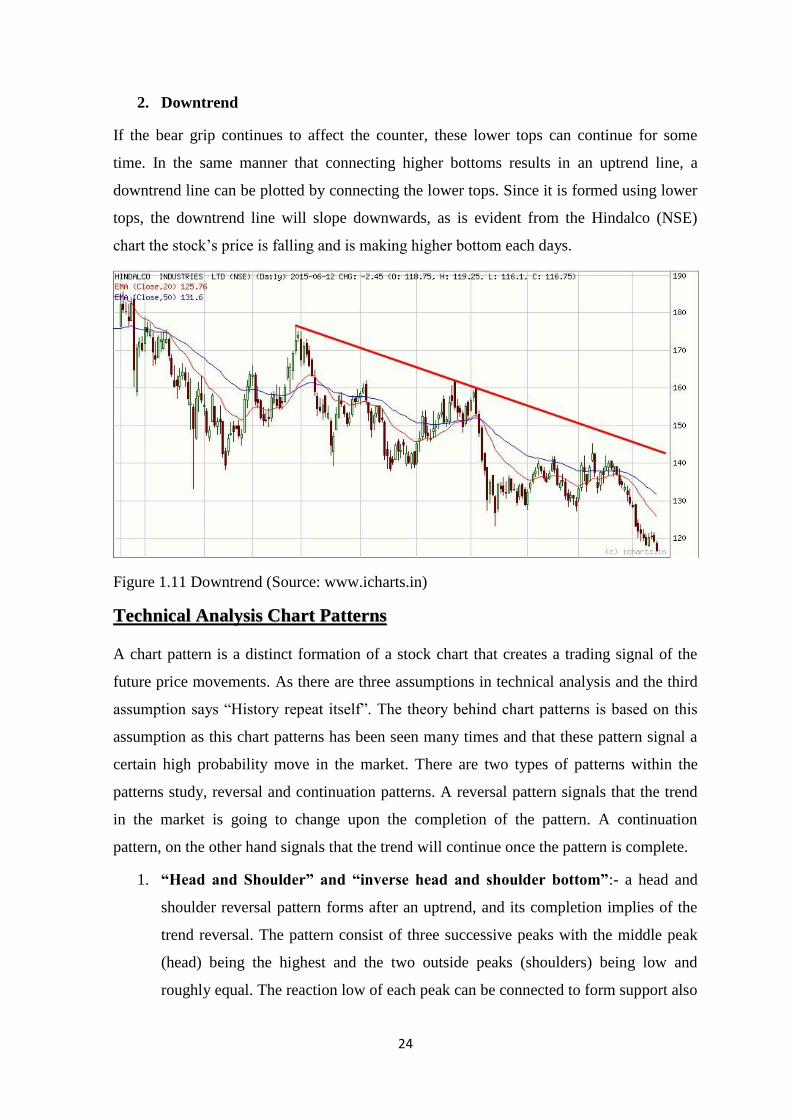
2. Downtrend
If the bear grip continues to affect the counter, these lower tops can continue for some
time. In the same manner that connecting higher bottoms results in an uptrend line, a
downtrend line can be plotted by connecting the lower tops. Since it is formed using lower
tops, the downtrend line will slope downwards, as is evident from the Hindalco (NSE)
chart the stock’s price is falling and is making higher bottom each days.
Figure 1.11 Downtrend (Source: www.icharts.in)
Technical Analysis Chart Patterns
A chart pattern is a distinct formation of a stock chart that creates a trading signal of the
future price movements. As there are three assumptions in technical analysis and the third
assumption says “History repeat itself”. The theory behind chart patterns is based on this
assumption as this chart patterns has been seen many times and that these pattern signal a
certain high probability move in the market. There are two types of patterns within the
patterns study, reversal and continuation patterns. A reversal pattern signals that the trend
in the market is going to change upon the completion of the pattern. A continuation
pattern, on the other hand signals that the trend will continue once the pattern is complete.
1. “Head and Shoulder” and “inverse head and shoulder bottom”:- a head and
shoulder reversal pattern forms after an uptrend, and its completion implies of the
trend reversal. The pattern consist of three successive peaks with the middle peak
(head) being the highest and the two outside peaks (shoulders) being low and
roughly equal. The reaction low of each peak can be connected to form support also

25
called as neckline the slope of the neckline affects the pattern’s degree of
bearishness. It’s important for Head and shoulder diagram to occur in an uptrend.
As head and shoulder pattern unfolds, volume plays an important role in
confirmation of the pattern volume during the advance of the left shoulder should
be higher than during the advance of the head. This decrease in volume and the new
high of the head, together, serve as a warning sign. The next warning sign comes
when volume increases on the decline from the peak of the head. Final
confirmation comes when volume further increases during the decline of the right
shoulder. The pattern is confirmed when the price breaks the neckline. After
breaking neckline support, the projected price decline is found by measuring the
distance from the neckline to the top of the head. This distance is then subtracted
from the neckline to reach a price target.
The inverse head and shoulder pattern is the exact opposite of the head and
shoulder top as it signals that the security is set to make an upward move. This
pattern often occurs in a downtrend.
Figure 1.12 Head and Shoulder (Source: www.bazartrend.com)
26
As we can in the charts of AMBUJACEM the prices formed two lower highs and one
higher high and then after forming the last lower high the prices fall and then broke the
neckline which confirmed the chart formation and confirmed the continuation of bearish
market ahead.
2. Cup and Handel: - The cup with handle is a bullish continuation pattern that mark
a consolidation period followed by breakout. There are two pattern the cup and the
handle. The cup forms after an advance and looks like a bows or rounding bottom.
As the cup is completed the prices moves sideward and forms a handle, a breakout
from the handle’s trading range signals a continuation of the prior trend. This
patterns usually takes few weeks to few months, a perfect pattern would have equal
highs on both sides of the cup. There should be a substantial increase in volume on
breakout above the handle. The projected advance after breakout can be estimated
by measuring the distance from the right peak of the cup to the bottom of the cup.
3. Double top and bottoms: - The Double Bottom Reversal is a bullish reversal
pattern. As its name implies, the pattern is made up of two consecutive troughs that
are roughly equal, with a moderate peak in-between.
4. Triangles: - triangle also referred as coil and is a continuation pattern. The pattern
contains at least two lower highs and two higher lows. When these points are
connected, the lines converge as they are extended and the symmetrical triangle
takes shape. The volume during the formation of triangle would diminish. The
future of the market is determined on the breakout, it could be bullish if the
breakout is higher and can be bearish if the breakout is lower than the price. The
price target is determined by extending a parallel line in the direction of breakout
all the points on the line are potential targets.

27
Figure 1.13 Triangle formation (Source: www.bazartrend.com)
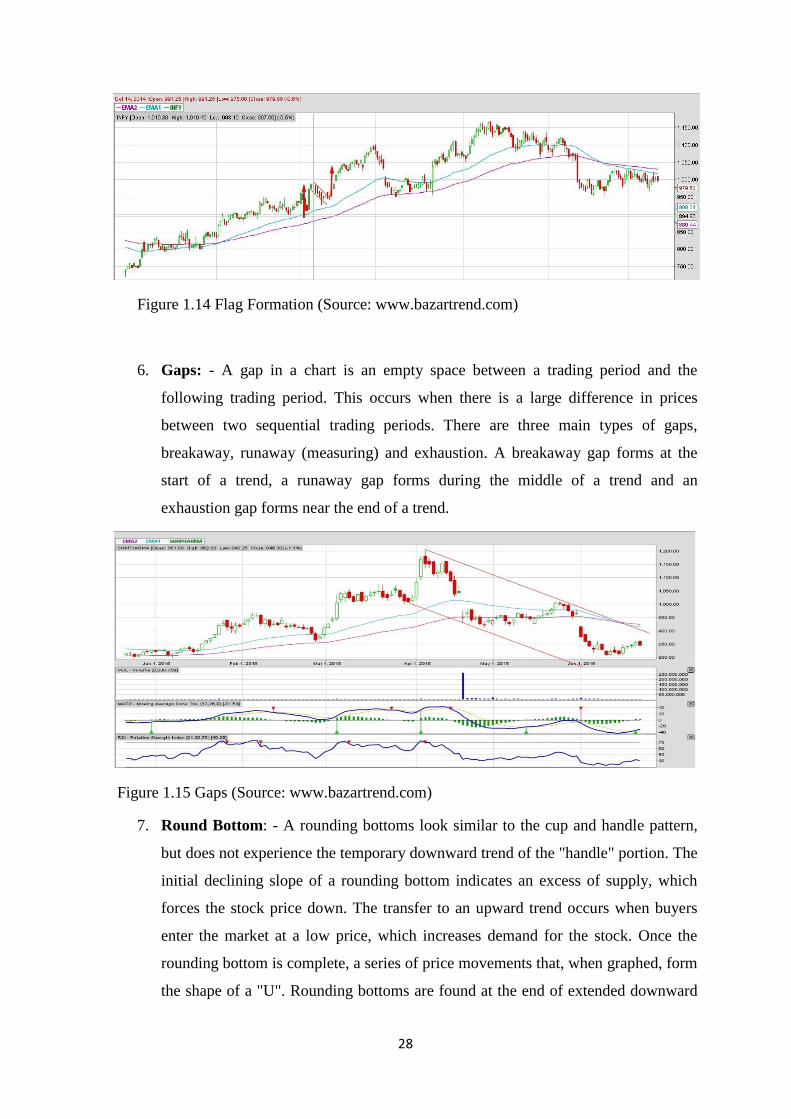
5. Flag and pennant: - These two short-term chart patterns are continuation patterns
that are formed when there is a sharp price movement followed by a generally
sideways price movement. This pattern is then completed upon another sharp price
movement in the same direction as the move that started the trend. The patterns are
generally thought to last from one to three weeks.
28
Figure 1.14 Flag Formation (Source: www.bazartrend.com)
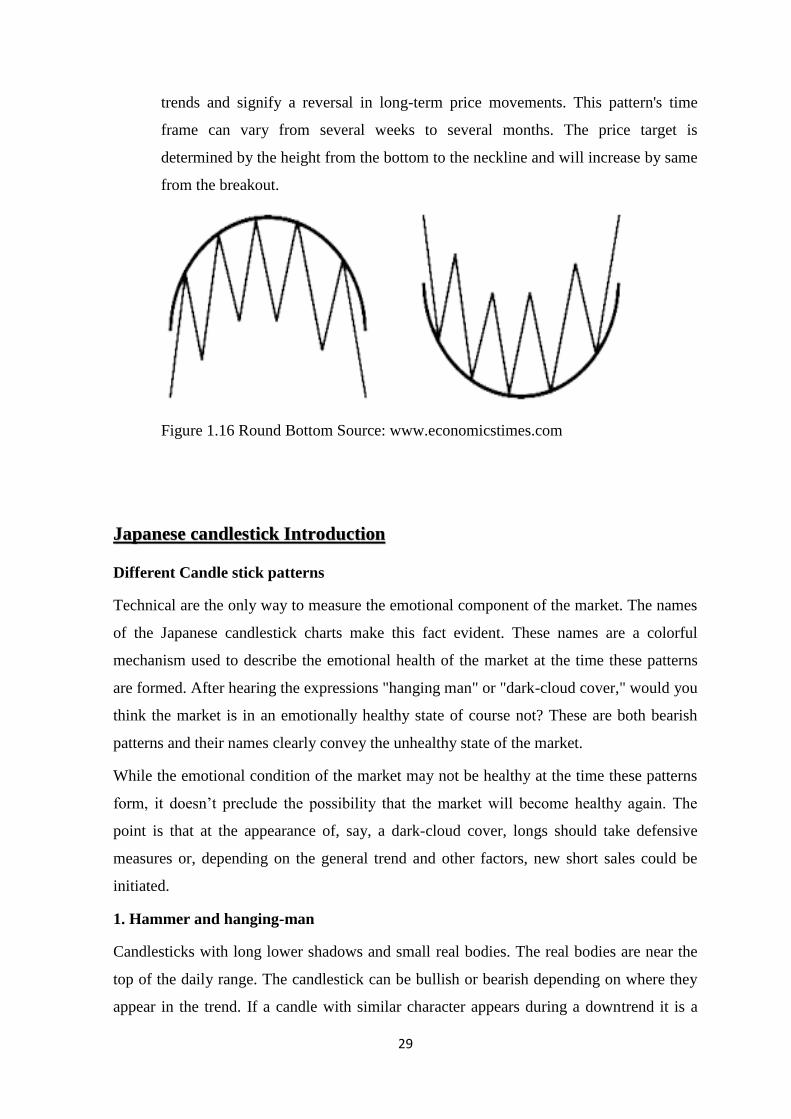
6. Gaps: - A gap in a chart is an empty space between a trading period and the
following trading period. This occurs when there is a large difference in prices
between two sequential trading periods. There are three main types of gaps,
breakaway, runaway (measuring) and exhaustion. A breakaway gap forms at the
start of a trend, a runaway gap forms during the middle of a trend and an
exhaustion gap forms near the end of a trend.
Figure 1.15 Gaps (Source: www.bazartrend.com)
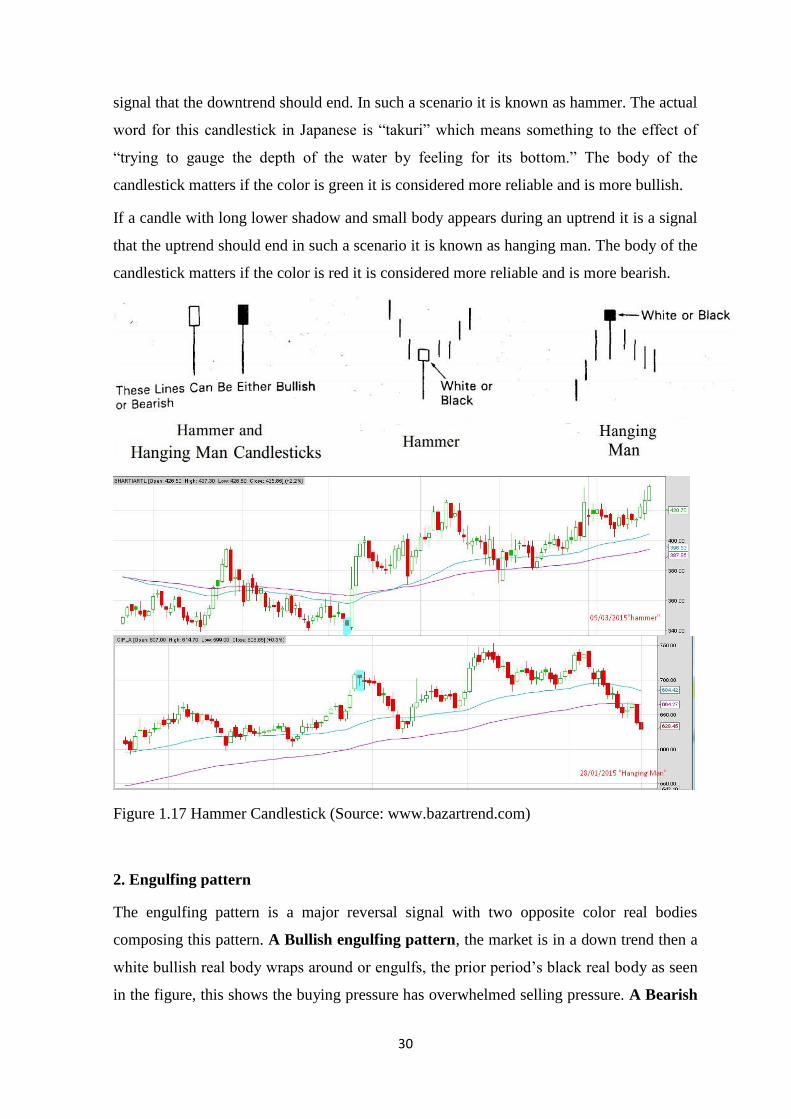
7. Round Bottom: - A rounding bottoms look similar to the cup and handle pattern,
but does not experience the temporary downward trend of the "handle" portion. The
initial declining slope of a rounding bottom indicates an excess of supply, which
forces the stock price down. The transfer to an upward trend occurs when buyers
enter the market at a low price, which increases demand for the stock. Once the
rounding bottom is complete, a series of price movements that, when graphed, form
the shape of a "U". Rounding bottoms are found at the end of extended downward
29
trends and signify a reversal in long-term price movements. This pattern's time
frame can vary from several weeks to several months. The price target is
determined by the height from the bottom to the neckline and will increase by same
from the breakout.
Figure 1.16 Round Bottom Source: www.economicstimes.com
Japanese candlestick Introduction
Different Candle stick patterns
Technical are the only way to measure the emotional component of the market. The names
of the Japanese candlestick charts make this fact evident. These names are a colorful
mechanism used to describe the emotional health of the market at the time these patterns
are formed. After hearing the expressions "hanging man" or "dark-cloud cover," would you
think the market is in an emotionally healthy state of course not? These are both bearish
patterns and their names clearly convey the unhealthy state of the market.
While the emotional condition of the market may not be healthy at the time these patterns
form, it doesn’t preclude the possibility that the market will become healthy again. The
point is that at the appearance of, say, a dark-cloud cover, longs should take defensive
measures or, depending on the general trend and other factors, new short sales could be
initiated.
1. Hammer and hanging-man
Candlesticks with long lower shadows and small real bodies. The real bodies are near the
top of the daily range. The candlestick can be bullish or bearish depending on where they
appear in the trend. If a candle with similar character appears during a downtrend it is a
30
signal that the downtrend should end. In such a scenario it is known as hammer. The actual
word for this candlestick in Japanese is “takuri” which means something to the effect of
“trying to gauge the depth of the water by feeling for its bottom.” The body of the
candlestick matters if the color is green it is considered more reliable and is more bullish.
If a candle with long lower shadow and small body appears during an uptrend it is a signal
that the uptrend should end in such a scenario it is known as hanging man. The body of the
candlestick matters if the color is red it is considered more reliable and is more bearish.
Figure 1.17 Hammer Candlestick (Source: www.bazartrend.com)
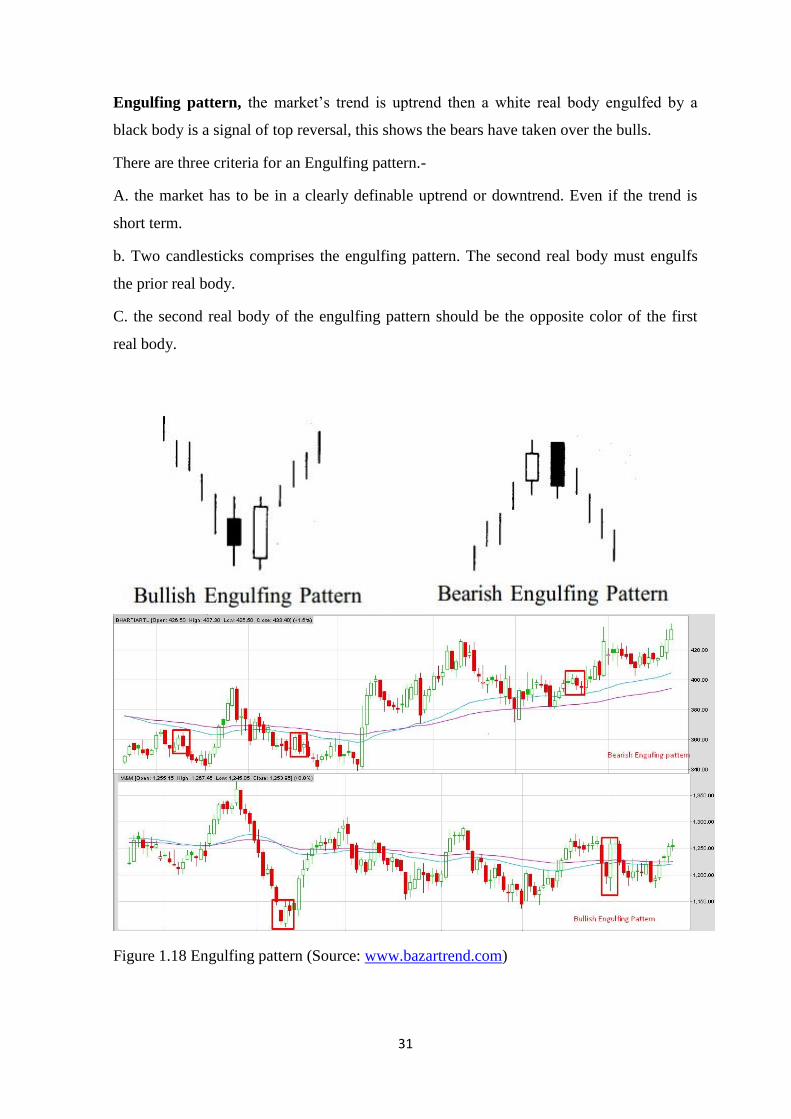
2. Engulfing pattern
The engulfing pattern is a major reversal signal with two opposite color real bodies
composing this pattern. A Bullish engulfing pattern, the market is in a down trend then a
white bullish real body wraps around or engulfs, the prior period’s black real body as seen
in the figure, this shows the buying pressure has overwhelmed selling pressure. A Bearish
31
Engulfing pattern, the market’s trend is uptrend then a white real body engulfed by a
black body is a signal of top reversal, this shows the bears have taken over the bulls.
There are three criteria for an Engulfing pattern.-
A. the market has to be in a clearly definable uptrend or downtrend. Even if the trend is
short term.
b. Two candlesticks comprises the engulfing pattern. The second real body must engulfs
the prior real body.
C. the second real body of the engulfing pattern should be the opposite color of the first
real body.
Figure 1.18 Engulfing pattern (Source: www.bazartrend.com)

32
3. Dark Cloud Cover
It is a two candlestick pattern that is a top reversal after an uptrend or, at times at the top of
a congestion band. The first day of this two candlestick pattern is a strong white real body.
The second day’s price opens above the prior sessions high. However by the end of the
second day’s session, the market closes near the low of the day and well within the prior
days white body. The greater the degree of penetration into the white real body the greater
will be the surety.
Figure 1.19 Dark cloud and Piercing pattern (Source: www.bazartrend.com)
4. STARS: - Stars are of many types and are strong reversal pattern. A star is a small real
body that gaps away from the large real body preceding it. It is still a star as long as the
star’s real body doesn’t overlaps the prior real body. The color of the star is not important.
33
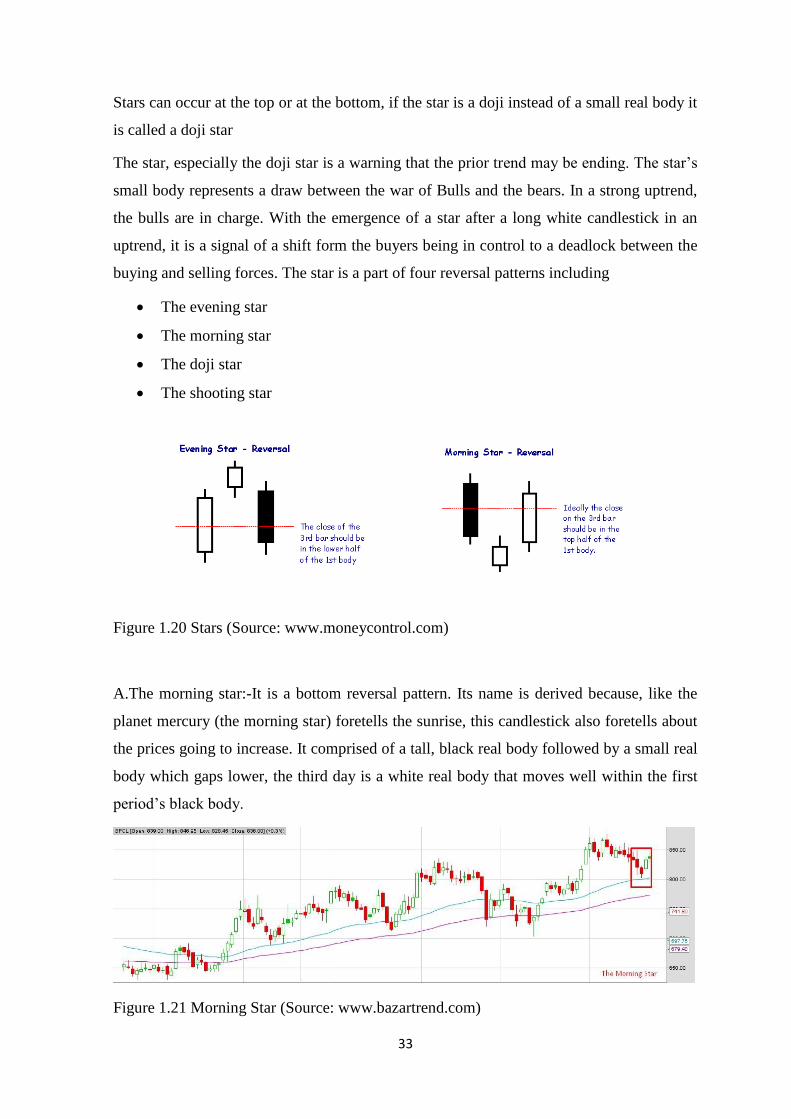
Stars can occur at the top or at the bottom, if the star is a doji instead of a small real body it
is called a doji star
The star, especially the doji star is a warning that the prior trend may be ending. The star’s
small body represents a draw between the war of Bulls and the bears. In a strong uptrend,
the bulls are in charge. With the emergence of a star after a long white candlestick in an
uptrend, it is a signal of a shift form the buyers being in control to a deadlock between the
buying and selling forces. The star is a part of four reversal patterns including
The evening star
The morning star
The doji star
The shooting star
Figure 1.20 Stars (Source: www.moneycontrol.com)
A.The morning star:-It is a bottom reversal pattern. Its name is derived because, like the
planet mercury (the morning star) foretells the sunrise, this candlestick also foretells about
the prices going to increase. It comprised of a tall, black real body followed by a small real
body which gaps lower, the third day is a white real body that moves well within the first
period’s black body.
Figure 1.21 Morning Star (Source: www.bazartrend.com)
34
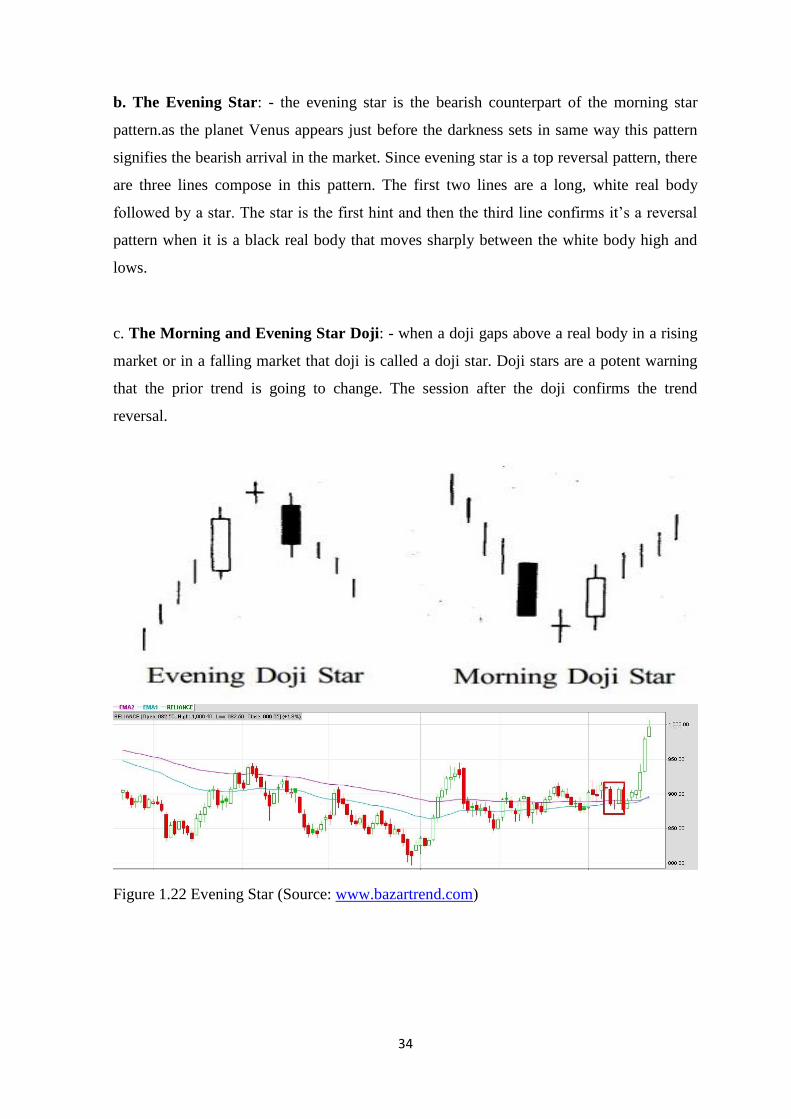
b. The Evening Star: - the evening star is the bearish counterpart of the morning star
pattern.as the planet Venus appears just before the darkness sets in same way this pattern
signifies the bearish arrival in the market. Since evening star is a top reversal pattern, there
are three lines compose in this pattern. The first two lines are a long, white real body
followed by a star. The star is the first hint and then the third line confirms it’s a reversal
pattern when it is a black real body that moves sharply between the white body high and
lows.
c. The Morning and Evening Star Doji: - when a doji gaps above a real body in a rising
market or in a falling market that doji is called a doji star. Doji stars are a potent warning
that the prior trend is going to change. The session after the doji confirms the trend
reversal.
Figure 1.22 Evening Star (Source: www.bazartrend.com)
35
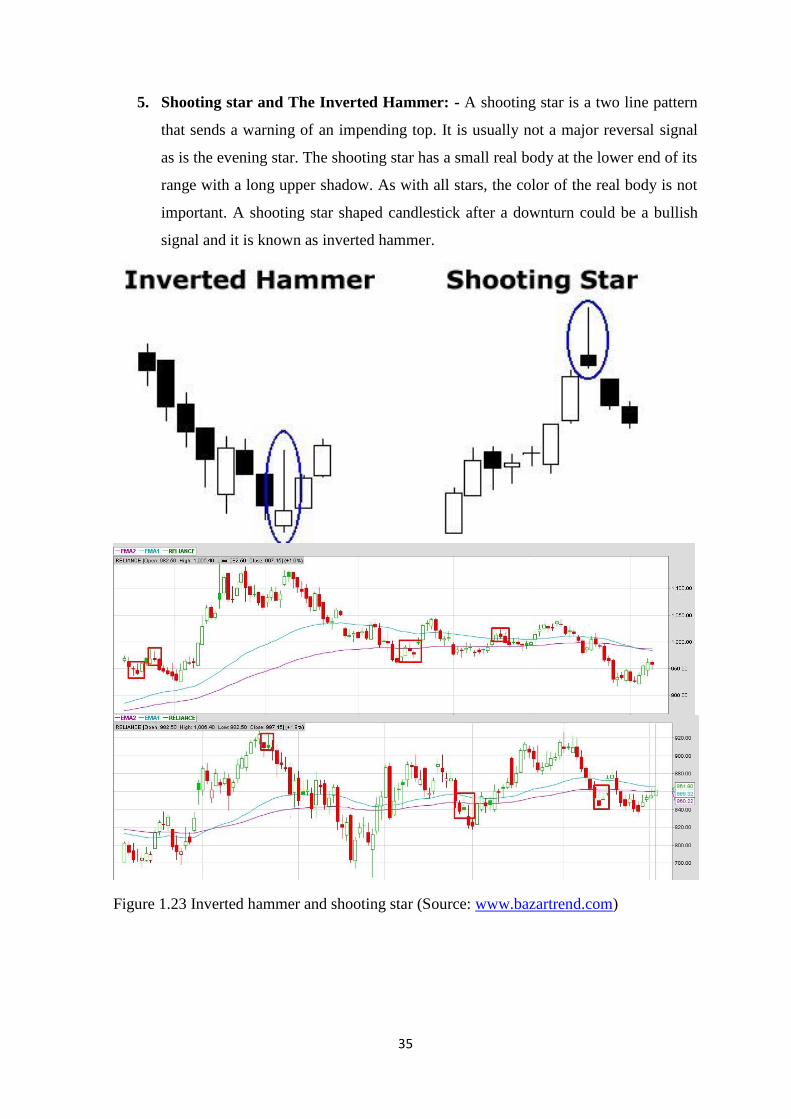
5. Shooting star and The Inverted Hammer: - A shooting star is a two line pattern
that sends a warning of an impending top. It is usually not a major reversal signal
as is the evening star. The shooting star has a small real body at the lower end of its
range with a long upper shadow. As with all stars, the color of the real body is not
important. A shooting star shaped candlestick after a downturn could be a bullish
signal and it is known as inverted hammer.
Figure 1.23 Inverted hammer and shooting star (Source: www.bazartrend.com)

36
6. HE Harami Pattern: - Ke Harami pattern is a small real body which is confined
within a prior relatively long real body. “Harami” is an old Japanese word for
“pregnant”. The long candlestick is the mother and the small candlestick is the baby
or the fetus. The Harami pattern is the reverse of the engulfing pattern. For the
Harami, a small real body follows a usually long real body. For the two candlestick
of the engulfing pattern the color of the real bodies should be opposite to one
another this is not necessary for the Harami.
Figure 1.24 Harami pattern (Source: www.bazartrend.com)
7. Belt-Hold Lines: - the belt hold is an individual candlestick line which can be
either bullish or bearish. The bullish belt hold is a strong white candlestick which
opens on the low of the day and moves higher for rest of the day. The bullish belt is
also called a white opening shaven bottom. The bearish belt hold is a long black
candlestick which opens on the high of the session and continues lower through the
session. The bearish belt-hold line is sometimes called black opening shaven head.
The longer the height of the belt0hold candlestick line, the more significant it
becomes. The actual Japanese name for this pattern sumo wrestling term “Yorikiri”
which means pushing your opponent out of the ring while holding onto his belt. A

37
close above a black bearish belt hold line should mean a resumption of uptrend and
a close under the white bullish belt line means renewal of selling pressure.
Figure 1.25 Belt Hold pattern Source: www.bazartrend.com

38
Technical Analysis Indicators
Indicators are calculations based on the price and the volume of a security that measure the
money flow, momentum, and volatility of the security. The result is a value that is used to
anticipate the future value of the security. Indicators as used as a secondary measure to the
actual price movements and add the information of indicators to analyze the securities
efficiently. Indicators are of two types leading and lagging indicators. Leading indicators
are those which gives signals before the price movement while lagging indicators confirms
the price movement and gives signal after the trend has started. There are also two type of
indicator constructions. Those that fall in a bounded range and other that don’t. Those who
are bound to range are called oscillators, they have a range for instance between zero and
hundred, zero being oversold zone and hundred being oversold zone. The two main ways
that indicators are used to form buy and sell signals is through crossovers and divergence.
When two different moving averages cross each other it is known as crossover and it could
be a buy or a sell decision on the basis of the situation or the way the crossover has
occurred. The second way indicators are used is through divergence, which happens when
the direction of the price trend and the direction of the indicator trend are moving in the
opposite direction. This signals to indicator users that the direction of the price trend is
weakening. Some of the indicators that are used are MACD, RSI, Moving average,
MACD: -
The MACD (Moving Average Convergence/Divergence) is a trend following momentum
indicator that shows the relationship between two moving averages of price. It shows the
change in strength, direction, momentum in the stock price. The MACD was developed by
Gerald Appel, publisher of system and forecasts.
Figure 1.26 MACD (Source: www.bazartrend.com)

39
The MACD is the difference between 26-day and 12day exponential moving average. A 9-
day exponential moving average is trigger also known as signal line plotted on top of the
MACD to show the buy/sell opportunities.
Interpretation: - The MACD is most effective in wide swinging markets. There are ways to
use MACD. Crossovers, overbought/oversold conditions and divergence. The basic
MACD rule is to sell when MACD falls below its signal line and buy when MACD goes
above or below zero. The MACD is also useful as an overbought/oversold indicator. When
the distance between the 26-day and 12-day moving average extends it means that the
security prices are over extending and would soon return to a realistic value. MACD
oversold and overbought conditions differs from security to security. When security prices
and MACD direction is in different direction it signifies that the trend is going to change.
As we can see in the chart of M&M whenever the MACD crossover from below the buy
signal is given and whenever the MACD crossover from above the Sell signal is given and
in each case buy signal is given in low prices and sell signal is given when prices are high.
RSI
RSI is a popular oscillator, first introduced by Welles Wilder in an article in Commodities
Magazine in June 1978. The name “Relative Strength Index” is slightly misleading as RSI
doesn’t compare the relative strength of two securities rather it compares the internal
strength of the security. The RSI is a price following oscillator that range between 0 and
100. There are mainly two zones in RSI which are 70 which is oversold zone and 20 which
is overbought zone. The RSI often forms chart pattern such as head and shoulder or
triangle which may or may not be visible on price patterns. Divergence occurs when the
price are making new high/low while RSI is opposite to price it suggests that the trend is
going to change.

40
Figure 1.27 RSI (Source: www.bazartrend.com)
As we can in the diagram when RSI crosses 20(oversold) region from below buy signal is
given and after that the prices rises, the share hasn’t yet given sell signal as we can see the
prices are rising still.
Momentum: -
The momentum indictor measures the amount that a security’s price change. Momentum is
displays rate of change of security prices as a ratio. There are basically two ways
momentum indicator is used. Firstly it can we used as MACD buy when the indicator
bottoms and turns up, and sell when indicator peaks and turns down. If the momentum
indicator reaches extreme high or low related to its historical values, it is assumed as a
continuation of the current trend. Secondly Momentum indicator can also be used a leading
indicator, this method assumes that market tops are typically identified by a rapid price
increase and market bottoms ends with rapid price decline.
41
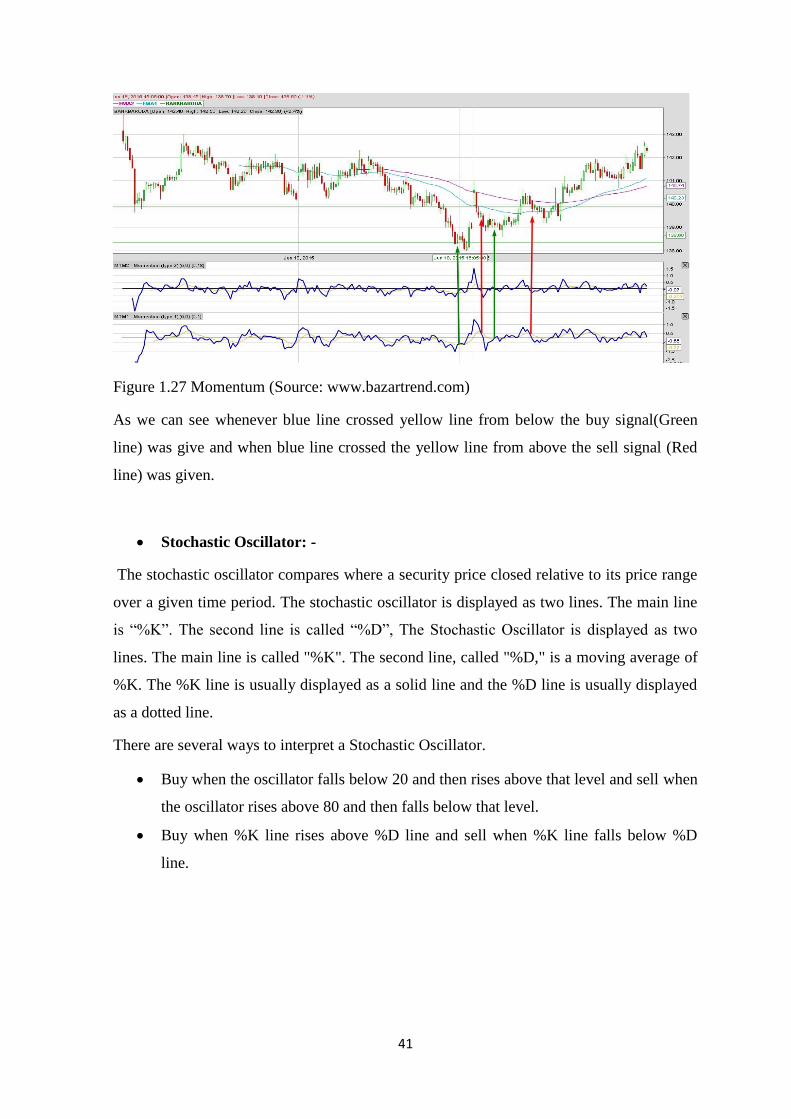
Figure 1.27 Momentum (Source: www.bazartrend.com)
As we can see whenever blue line crossed yellow line from below the buy signal(Green
line) was give and when blue line crossed the yellow line from above the sell signal (Red
line) was given.
Stochastic Oscillator: -
The stochastic oscillator compares where a security price closed relative to its price range
over a given time period. The stochastic oscillator is displayed as two lines. The main line
is “%K”. The second line is called “%D”, The Stochastic Oscillator is displayed as two
lines. The main line is called "%K". The second line, called "%D," is a moving average of
%K. The %K line is usually displayed as a solid line and the %D line is usually displayed
as a dotted line.
There are several ways to interpret a Stochastic Oscillator.
Buy when the oscillator falls below 20 and then rises above that level and sell when
the oscillator rises above 80 and then falls below that level.
Buy when %K line rises above %D line and sell when %K line falls below %D
line.

42
Figure 1.27 stochastic oscillator (Source: www.bazartrend.com)
a) Volume: -
Volume is simply the number of shares traded during a specified time frame (e.g., hour,
day, week, month, etc.). The analysis of volume is a basic yet very important element of
technical analysis. Volume provides clues as to the intensity of a given price move. Low
volume levels are characteristic of the indecisive expectations that typically occur during
consolidation periods. Low volume also often occurs during the indecisive period during
market bottoms. High volume levels are characteristic of market tops when there is a
strong expectations that prices will move higher. High volume levels are also very
common at the beginning of new trends (i.e., when prices break out of a trading range).
Just before market bottoms, volume will often increase due to panic in the market and
profit book.
Figure 1.28 Volume graph (Source: www.bazartrend.com)
43
As we can see when the triangle was breakout the volume increased, that confirmed the
prices would increase in future. Volume plays an important role in confirming the future
prices.
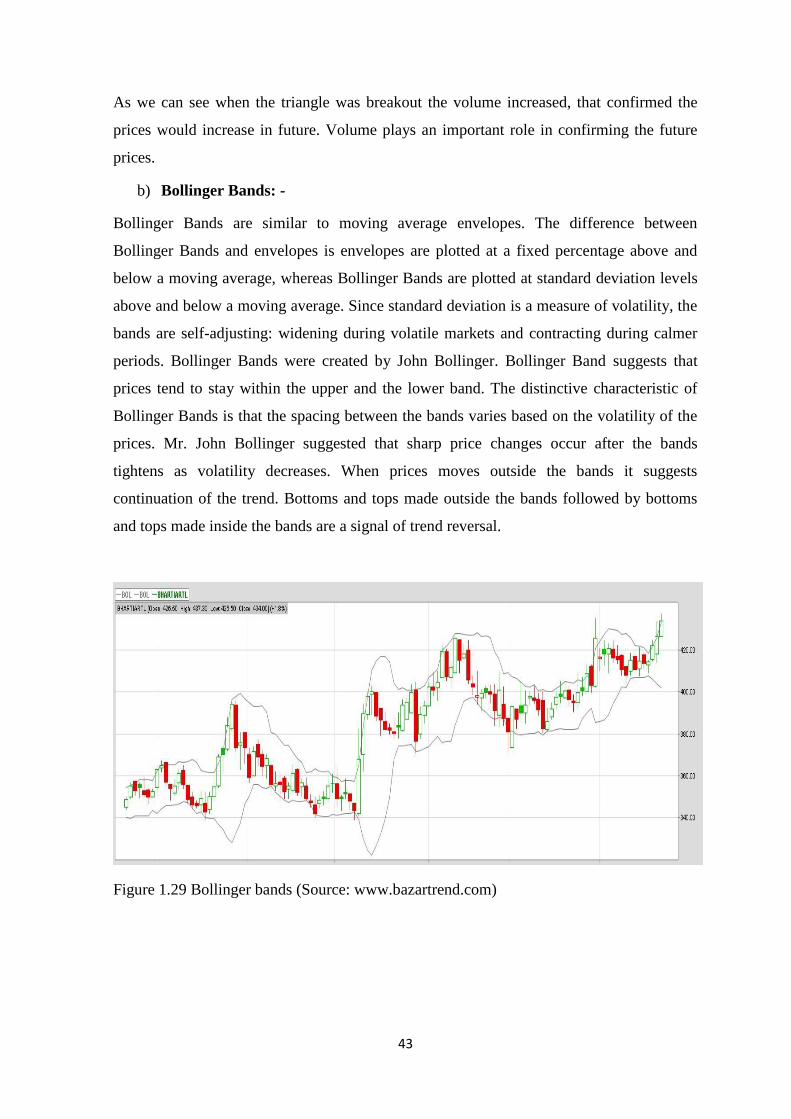
b) Bollinger Bands: -
Bollinger Bands are similar to moving average envelopes. The difference between
Bollinger Bands and envelopes is envelopes are plotted at a fixed percentage above and
below a moving average, whereas Bollinger Bands are plotted at standard deviation levels
above and below a moving average. Since standard deviation is a measure of volatility, the
bands are self-adjusting: widening during volatile markets and contracting during calmer
periods. Bollinger Bands were created by John Bollinger. Bollinger Band suggests that
prices tend to stay within the upper and the lower band. The distinctive characteristic of
Bollinger Bands is that the spacing between the bands varies based on the volatility of the
prices. Mr. John Bollinger suggested that sharp price changes occur after the bands
tightens as volatility decreases. When prices moves outside the bands it suggests
continuation of the trend. Bottoms and tops made outside the bands followed by bottoms
and tops made inside the bands are a signal of trend reversal.
Figure 1.29 Bollinger bands (Source: www.bazartrend.com)

44
Chapter-2
Review of Literature

45
Chapter 2
Review of Literature
Hagstrom, R. G. (1997). The Warren Buffett way: Investment strategies of the world's greatest
investor. John Wiley & Sons.
For years academicians and investment professionals have debated the validity of what has
come to be known as the efficient market theory. This controversial theory suggest that
analyzing stock is waste of time because all available information is reflected in current
prices. those who adhere to this theory claim, only partly in jest, that investment
professionals could throw darts at a page of stock quotes and pick winners just as
successfully as seasoned financial analyst who spent hours poring over latest annual
reports. Yet the success of some individuals who continually beat the major indices most
notably Warren Buffet suggests that the efficient market theory is flawed. Efficient market
theoreticians counter that it is not the theory that is flawed. Rather, individuals like Buffet
think technical analysis is not helpful rather Fundamental matters a lot.
Edwards, R. D., Magee, J., & Bassetti, W. H. C. (2007). Technical analysis of stock trends. CRC
Press.
Few human activities have been so exhaustively studied during the past century, from so
many angles and by so many different sorts of people, as has the buying and selling of
corporate securities. The rewards which the stock market holds out to those who read it
right are enormous are calamitous. No wonder it has attracted some of the world’s most
astute accountants, analysts, and researchers. In the course of years of stock market study,
two quite distinct schools of thought have arisen, two radically different methods of
arriving at the answer to the trader’s problem of what and when. In the parlance of “the
street” one of these is commonly referred as to fundamental or statistical and the other is
technical(in the recent years a third approach the cyclical, has made rapid progress and
although still beset by a “lunatic fringe”, it promises to contribute a great deal to our
understanding of economic trend.)

46
Samal, K. C. (1997). Emerging equity market in India: role of foreign institutional
investors. Economic and Political Weekly, 2729-2732.
In recent years, particularly in developing countries including india, there has been
increased liberalization of domestic financial and capital markets, and on opening up of the
FII. The main emerging feature of India’s equity market is its gradual integration with the
global market and its consequent problems due to the hot money movement by FIIs.
Therefore, policy measure to ‘develop’ equity market should aim to encourage small
domestic investors to participate in it and counter the tendency of the FIIs to destabilize the
emerging equity market.
Blume, L., Easley, D., & O'hara, M. (1994). Market statistics and technical analysis: The role of
volume. The Journal of Finance, 49(1), 153-181.
We investigate the informational role of volume and its applicability for technical analysis.
We develop a new equilibrium model in which aggregate supply is fixed and traders
receive signals with differing quality. We show that volume provides information on
information quality that cannot be deduced from the price statistic. We show how volume,
information precision, and price movements relate, and demonstrate how sequences of
volume and prices can be informative. We also show that traders who use information
contained in market statistics do better than traders who do not. Technical analysis thus
arises as a natural component of the agents' learning process.

47
Chapter-3
Project Objectives

48
Chapter 3
Project Objectives
The objective before preparing this project was:-
To understand Technical Analysis and its role in equity market
To analysis the impact of news in the movement of stocks
Analysis of selected charts for developing a model for investment

49
Chapter-4
Project Methodology Adopted

50
Chapter 4
Project Methodology Adopted
While doing the technical analysis of the equity market there are many parameters to study
while selecting the stocks, targets and the stop loss. The study can be done in many ways
as there are a numbers of indicators and charts selection of these depends upon the analyst
preference. While doing this research indicators such as MACD, RSI, Volume Graph,
trend analysis and candlestick graph were mostly used. As the charts are available of
different time horizon such as 5 min, 10 min, hourly, daily, weekly, monthly and yearly are
available but while doing this research daily charts of the last 6-12 months were used. As
we know equity markets trend depends upon various factors such as news, company
results, and government announcements so some shares were also selected on basis of
these factors too.
1. Criteria
As there are predefined buy and sell signals for the indicators, such as MACD provides
buy and sell signal when the two average lines cross each other. RSI provides buy signal
when the RSI line is rising from below and crosses 20 or 50 and gives sell signal when it
touched 80 or is falling. Volume graph helps to identify the trend i.e. if the graph is
forming trend patterns such as triangle, cup and a handle, etc. volume graph helps in
identifying the breakout when the volume increases.
Candlestick diagram has many patterns such as hammer, Harami, engulfing patterns, doji,
etc. these patterns helps to identifying the future prices and trend of the stock being
studied.
While selecting stocks there are many parameters, stocks are generally selected with the
help of combination of candlestick graph and the indicators. Sometimes when companies
results are declared that affect the share future prices too so the shares were also selected
on basis of company results, government announcements, and international news.
2. Tools used
The share graph that used in the study are taken from various sources such as
www.ichart.in , www.bazartrend.com , Spider EOD software, FCharts Software.
51
3. Selection Of stocks
There are more than 5000 stocks that are traded in security market it’s essential for the
analyst to study them and provide and efficient target. In this report the shares were many
selected form the NSE 50 companies because these companies fundamental i.e. the annual
reports are strong in term of the capital structure and had performed well in the previous
years. As we know a perfect market is that which discounts every news and reflects the
effect of news on prices of the security, so some of the companies were selected because of
various news such as company results, RBI decreasing the interest rate, Government
announcement to increase the import duty, Merger and Acquisition, Company launching
new product, etc.
4. Portfolio Criteria
The study of equity matter can only be measured in terms of the return one is able to
achieve in a particular time frame using a predefined sum of money and an efficient analyst
is that can manage the funds and knows the risk and reward ratio.
A sum of 1,00,000 to be the initial investment for the portfolio.
Only 10% of the initial investment is to be invested in each share.
The risk and reward ratio should be 1:2 i.e. the reward (target) should be two times
the risk (stop loss).
5. Criteria BUY:-
a. Chart formations
b. RSI rising and above 20
c. MACD Crossover
d. News And government announcement
e. Volume Graph
52
Chapter-5
Data Analysis & Interpretation / Description
of the Work Performed

53
Chapter 5
Data Analysis & Interpretation / Description of the Work
Performed
1. ONGC 26/05/2015
Decision – Buy
Reason - Meeting the criteria a, b and c
Buy 31 ONGC at the rate of 326 on 26/05/2015 The price patterns of ONGC formed a
triangle chart pattern and gave a breakout and at the same time MACD also gave the buy
signal, while RSI also rising and gave buy signal few days earlier.
Figure 5.1 ONGC 26/05/2015 (Source: www.bazartrend.com)

54
2. BHARTIAIRTEL 26/05/2015
Decision – Buy
Reason - Meeting the criteria a, b and c
Buy 25 BHARTIARTL at the rate of 400.85 on 26/05/2015 The price patterns of
BHARTIAIRTL formed a triangle chart pattern and gave a breakout with a series of
hammer candlestick chart pattern which acts as strong support and few days before MACD
also gave the buy signal, while RSI also rising and is a positive sign for future price
movements.
Figure 5.2 BHARTIARTL 26/05/2015 (Source: www.bazartrend.com)
55
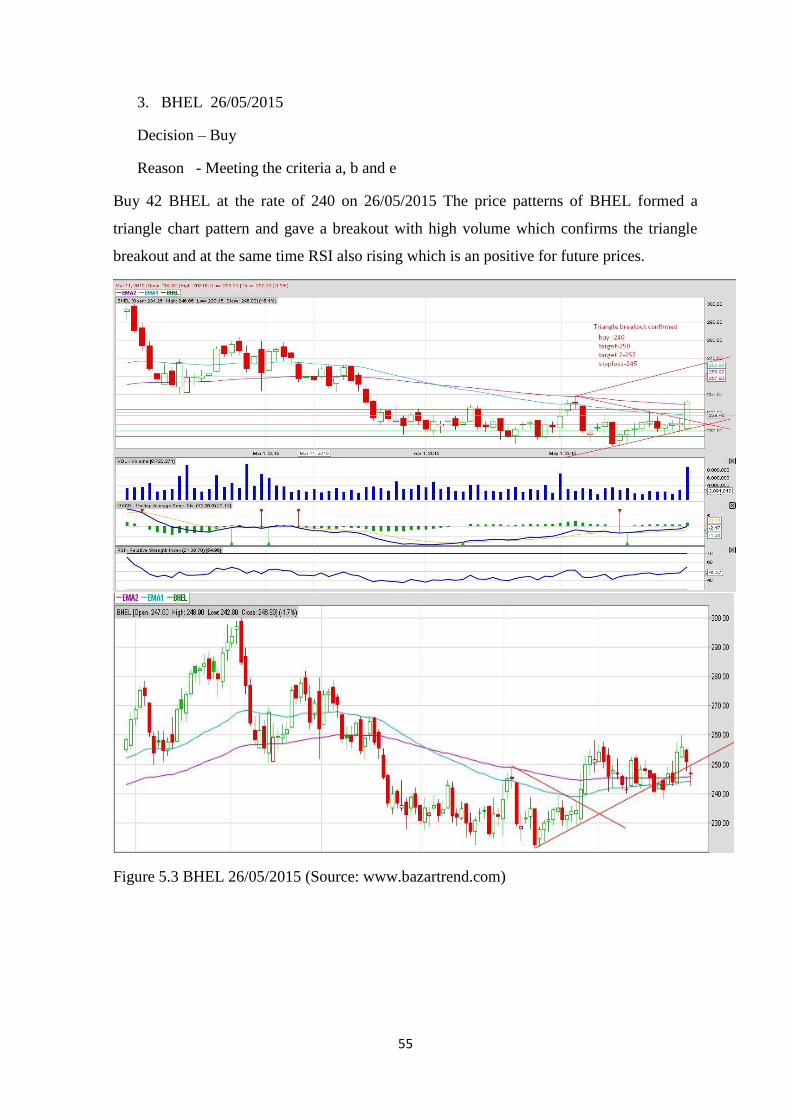
3. BHEL 26/05/2015
Decision – Buy
Reason - Meeting the criteria a, b and e
Buy 42 BHEL at the rate of 240 on 26/05/2015 The price patterns of BHEL formed a
triangle chart pattern and gave a breakout with high volume which confirms the triangle
breakout and at the same time RSI also rising which is an positive for future prices.
Figure 5.3 BHEL 26/05/2015 (Source: www.bazartrend.com)

56
4. TCS 26/05/2015
Decision – Buy
Reason - Meeting the criteria a
Buy 4 TCS at the rate of 2608.85 on 26/05/2015 the price patterns of TCS formed a
triangle chart pattern and is following a long term channel and a short term channel too.
Figure 5.4 TCS 26/05/2015 (Source: www.bazartrend.com)
57
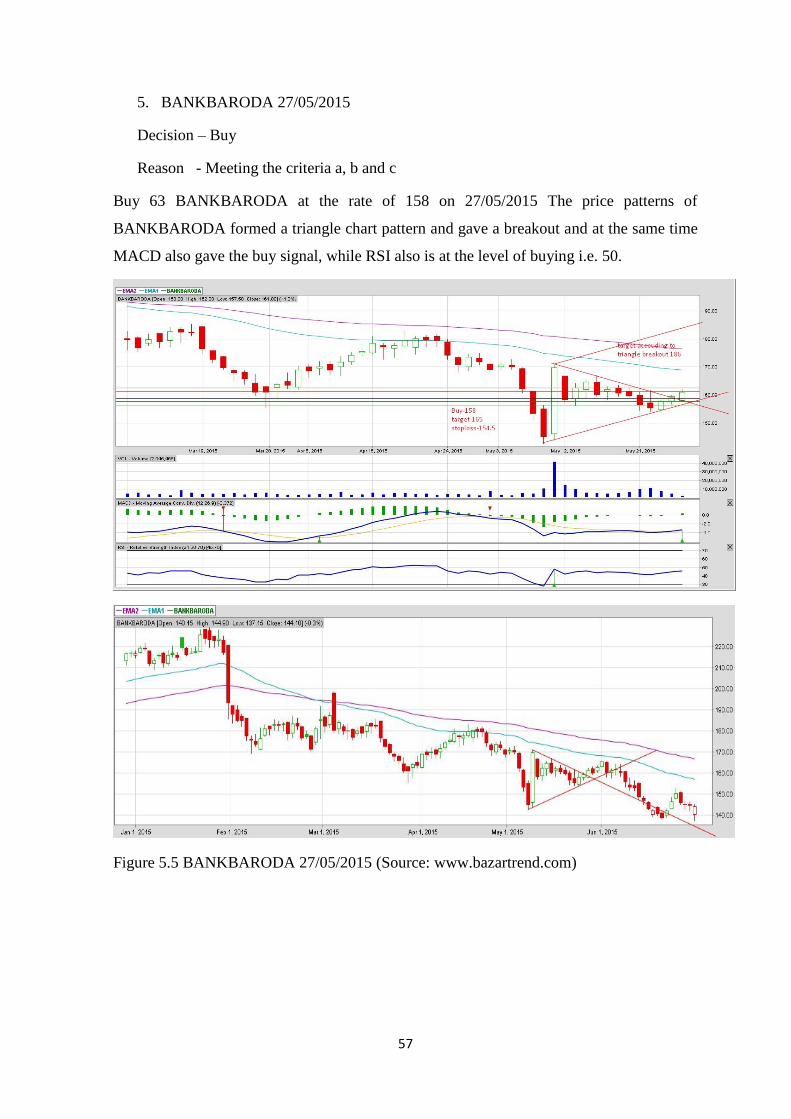
5. BANKBARODA 27/05/2015
Decision – Buy
Reason - Meeting the criteria a, b and c
Buy 63 BANKBARODA at the rate of 158 on 27/05/2015 The price patterns of
BANKBARODA formed a triangle chart pattern and gave a breakout and at the same time
MACD also gave the buy signal, while RSI also is at the level of buying i.e. 50.
Figure 5.5 BANKBARODA 27/05/2015 (Source: www.bazartrend.com)

58
6. UCOBANK 28/05/2015
Decision – Buy
Reason - Meeting the criteria a and b
Buy 161 UCOBANK at the rate of 62.1 on 28/05/2015 the price patterns of UCOBANK
formed a triangle chart pattern and gave a breakout with a hammer which acts as a support
and signifies the future bull.
Figure 5.6 UCOBANK 25/05/2015 (Source: www.bazartrend.com)

59
7. RAMCOIND 28/05/2015
Decision – Buy
Reason - Meeting the criteria a, b and c
Buy 120 RAMCOIND at the rate of 84 on 28/05/2015 The price patterns of RAMCOIND
formed a triangle chart pattern and gave a breakout with the inverted hammer which is a
signal of bull market and at the same time MACD also gave the buy signal, while RSI also
rising and gave buy signal few days earlier.
Figure 5.7 RAMCOIND 28/05/2015 (Source: www.bazartrend.com)

60
8. M&M 29/05/2015
Decision – Buy
Reason - Meeting the criteria a, b and d
Buy 10 M&M at the rate of 1210 on 29/05/2015 The price patterns of M&M seems to be
following a channel and is at support and at the same time gave bullish piercing pattern
candle stick chart pattern. When we see the MACD and RSI both gave sell signals. On
29/05/2015 there was a news about annual results of M&M and there was positive
sentiments in the market.
Figure 5.8 M&M 29/05/2015 (Source: www.bazartrend.com)

61
9. IDFC 29/05/2015
Decision – Buy
Reason - Meeting the criteria a, b, c and d
Buy 64 IDFC at the rate of 154.55 on 29/05/2015 The price patterns of IDFC formed a
symmetrical triangle chart pattern and gave a breakout with the high volume which is a
signal of confirmation of breakout and at the same time MACD also gave the buy signal,
while RSI also rising and gave buy signal few days earlier.
Figure 5.9 IDFC 29/05/2015 (Source: www.bazartrend.com)

62
10. BAYERCROPS 3/06/2015
Decision – Buy
Reason - Meeting the criteria a, b and c
Buy 3 BAYERCROPS at the rate of 3681 on 3/06/2015 The price patterns of
BAYERCROPS formed a symmetrical triangle chart pattern and gave a breakout with the
series of bullish price trend which is a signal of bull market and at the same time MACD
also gave the buy signal, while RSI also rising and gave buy signal few days earlier.
Figure 5.10 BAYERCROPS 03/06/2015 (Source: www.bazartrend.com)

63
11. BIOCON 05/06/2015
Decision – Buy
Reason - Meeting the criteria a and b
Buy 23 BIOCON at the rate of 440 on 05/06/2015 the price patterns of BIOCON is
following a channel and a hammer candlestick appear which suggests a strong support,
while RSI also rising and gave buy.
Figure 5.11 BIOCON 05/06/2015 (Source: www.bazartrend.com)
64
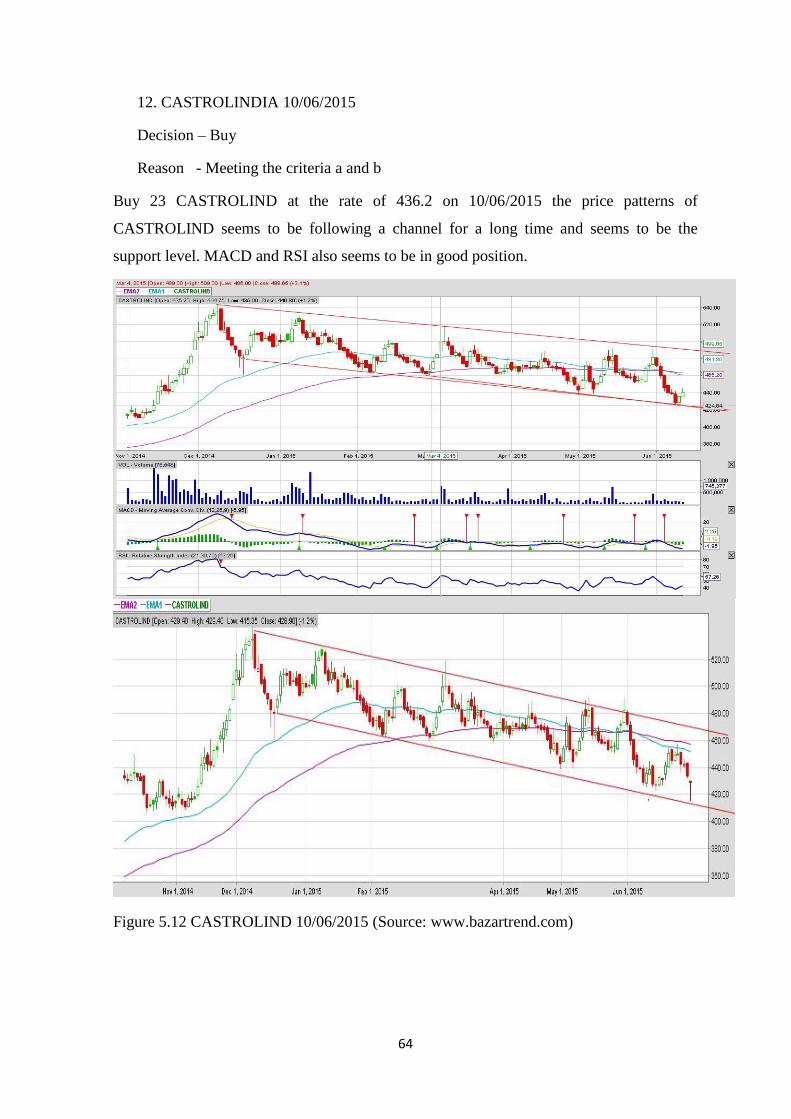
12. CASTROLINDIA 10/06/2015
Decision – Buy
Reason - Meeting the criteria a and b
Buy 23 CASTROLIND at the rate of 436.2 on 10/06/2015 the price patterns of
CASTROLIND seems to be following a channel for a long time and seems to be the
support level. MACD and RSI also seems to be in good position.
Figure 5.12 CASTROLIND 10/06/2015 (Source: www.bazartrend.com)
65
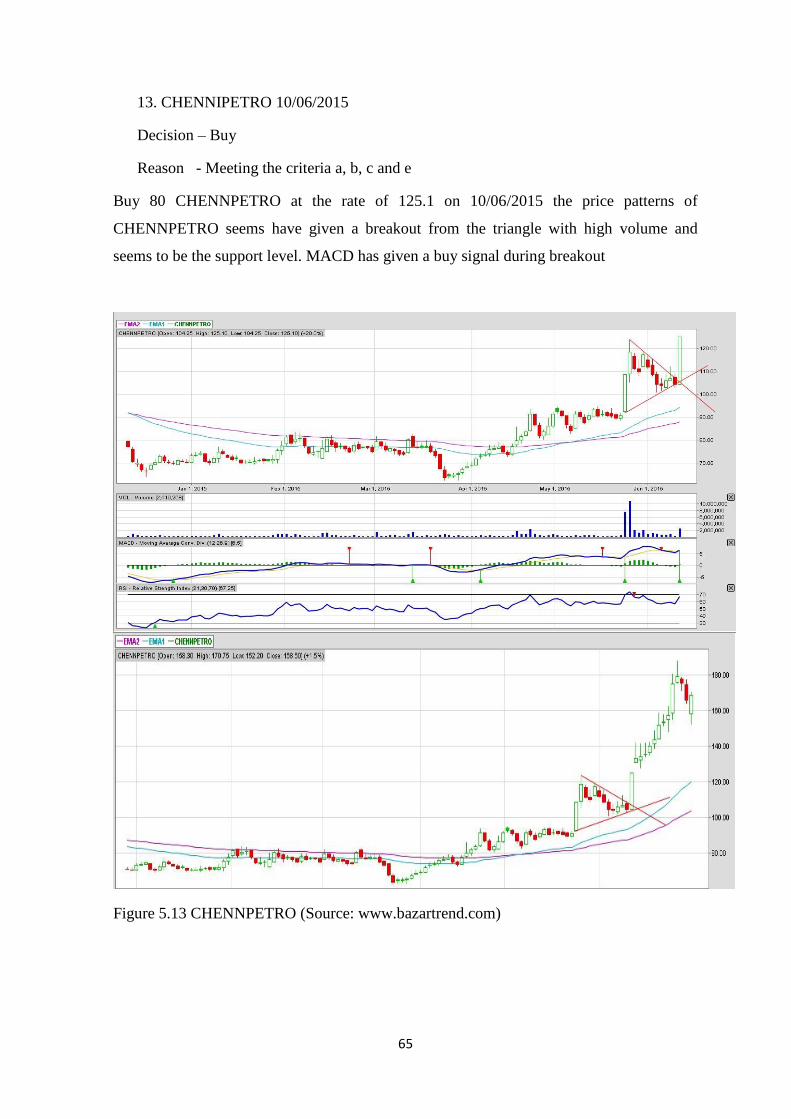
13. CHENNIPETRO 10/06/2015
Decision – Buy
Reason - Meeting the criteria a, b, c and e
Buy 80 CHENNPETRO at the rate of 125.1 on 10/06/2015 the price patterns of
CHENNPETRO seems have given a breakout from the triangle with high volume and
seems to be the support level. MACD has given a buy signal during breakout
Figure 5.13 CHENNPETRO (Source: www.bazartrend.com)

66
14. CIPLA 15/06/2015
Decision – Buy
Reason - Meeting the criteria a, b, c and d
Buy 18 CIPLA at the rate of 590 on 15/06/2015 when Fibonacci retracement is applied to
the price patterns it fits the level and seems that the prices will be bull in near future as the
prices are in correction and at a good support level and MACD and RSI also seems to be
good
Figure 5.14 CIPLA 15/06/2015(Source: www.bazartrend.com)

67
Chapter-6
Findings

68
Chapter 6
Findings
NIFTY before 8489 and down by almost 5.8% but portfolio was up by 8% during
the market crash after announcement of RBI announcement of decrease in interest
by 25 basis points and low monsoon.
Technical analysis just helps to find the psychological movement of price but is not
always correct about the market movements.
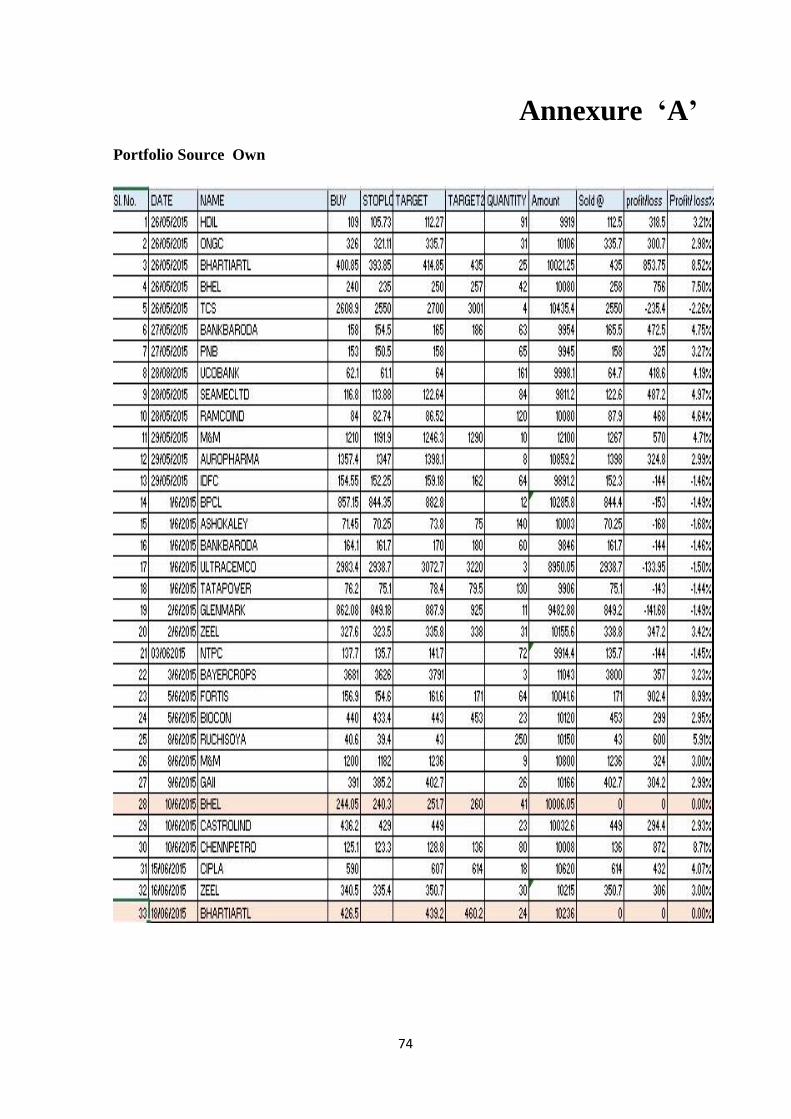
There were total 33 call to buy but only 23 calls were accurate with and accuracy of
69%.
Ememi share price increased by almost 3% after the acquisition of kesh king
Adani enterprise share crashed by 83% when the news came about demerger of
ports.
Nestle India share crashed after the news about Maggie ban in different states.
Bajaj auto share price fall because of the news about monsoon being less than
expected.
Just dial shares were up by almost 8% when the board member accepted on the
buyback of shares.
Steel manufacturing companies share prices increase by almost 2-3% when
government increased the import duty on steel to stop the dumping of Chinese steel
in India.

69
Chapter-7
Recommendations
70
Chapter 7
Recommendations
As warren buffet studies fundamental of companies as he believes in long-term
investments but doesn’t believes in technical analysis, but this report proves that
technical analysis is helpful in predicting the short term movements in the market.
Fundamental analysis is helpful for trading in the market and is helpful for short
term trading.
While studying the market with the help of technical analysis one has keep track of
company’s news and economic news because news has a greater impact on the
various market such as equity market.
Various market such as commodity, bond, currency and equity markets are
depended on each other hence one should invest accordingly i.e. when equity
market declines commodity and currency market booms.

71
References
72
References
Murphy, John J. "Intermarket Technical Analysis." New York (1991).
Lee, K. H., and G. S. Jo. "Expert system for predicting stock market timing using a
candlestick chart." Expert Systems with Applications 16.4 (1999): 357-364.
Websites:
http://www.bazaartrend.com/nsecharts/intraday-free.php http://economictimes.indiatimes.com/
www.icharts.in/jcharts.html

73
Annexures
74
Annexure ‘A’
Portfolio Source Own
75
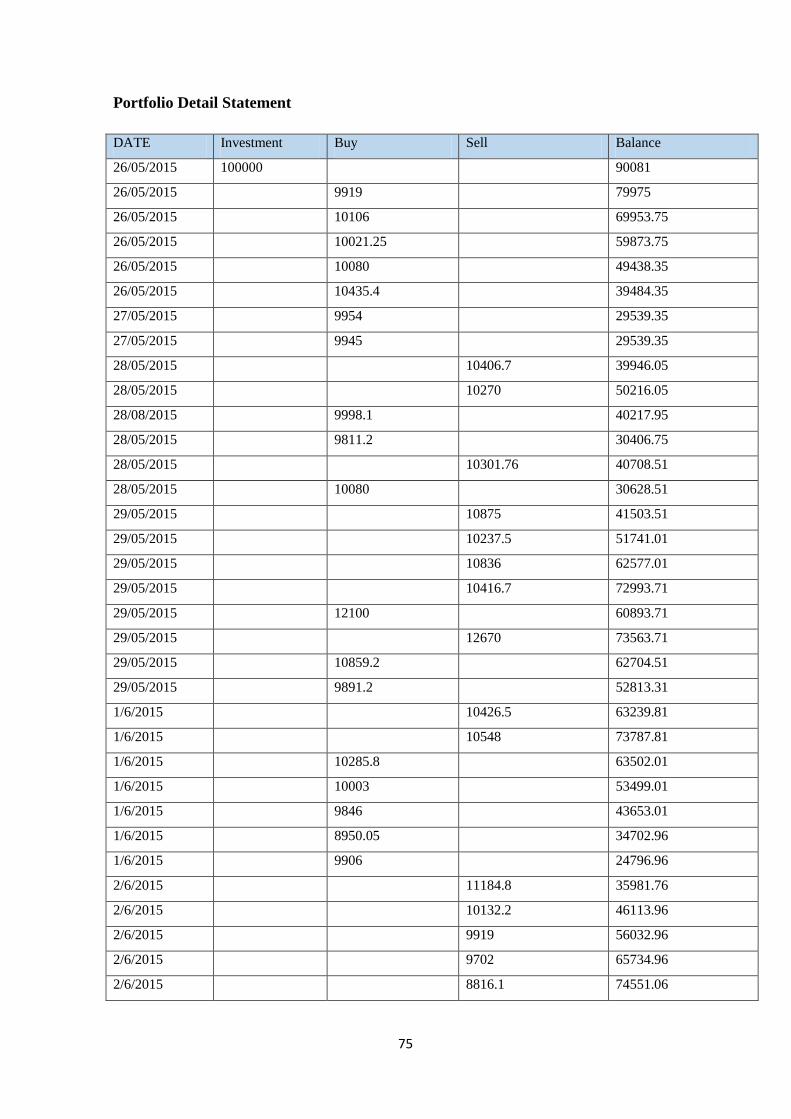
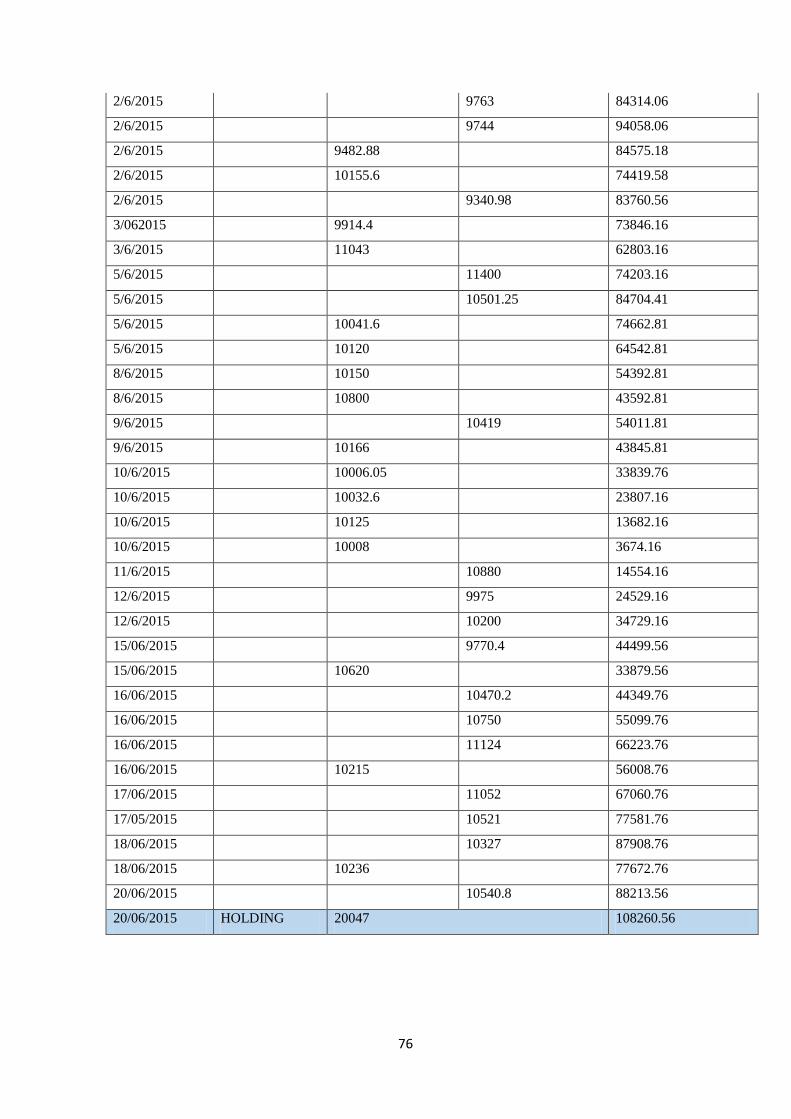
Portfolio Detail Statement
DATE Investment Buy Sell Balance
26/05/2015 100000 90081
26/05/2015 9919 79975
26/05/2015 10106 69953.75
26/05/2015 10021.25 59873.75
26/05/2015 10080 49438.35
26/05/2015 10435.4 39484.35
27/05/2015 9954 29539.35
27/05/2015 9945 29539.35
28/05/2015 10406.7 39946.05
28/05/2015 10270 50216.05
28/08/2015 9998.1 40217.95
28/05/2015 9811.2 30406.75
28/05/2015 10301.76 40708.51
28/05/2015 10080 30628.51
29/05/2015 10875 41503.51
29/05/2015 10237.5 51741.01
29/05/2015 10836 62577.01
29/05/2015 10416.7 72993.71
29/05/2015 12100 60893.71
29/05/2015 12670 73563.71
29/05/2015 10859.2 62704.51
29/05/2015 9891.2 52813.31
1/6/2015 10426.5 63239.81
1/6/2015 10548 73787.81
1/6/2015 10285.8 63502.01
1/6/2015 10003 53499.01
1/6/2015 9846 43653.01
1/6/2015 8950.05 34702.96
1/6/2015 9906 24796.96
2/6/2015 11184.8 35981.76
2/6/2015 10132.2 46113.96
2/6/2015 9919 56032.96
2/6/2015 9702 65734.96
2/6/2015 8816.1 74551.06
76
2/6/2015 9763 84314.06
2/6/2015 9744 94058.06
2/6/2015 9482.88 84575.18
2/6/2015 10155.6 74419.58
2/6/2015 9340.98 83760.56
3/062015 9914.4 73846.16
3/6/2015 11043 62803.16
5/6/2015 11400 74203.16
5/6/2015 10501.25 84704.41
5/6/2015 10041.6 74662.81
5/6/2015 10120 64542.81
8/6/2015 10150 54392.81
8/6/2015 10800 43592.81
9/6/2015 10419 54011.81
9/6/2015 10166 43845.81
10/6/2015 10006.05 33839.76
10/6/2015 10032.6 23807.16
10/6/2015 10125 13682.16
10/6/2015 10008 3674.16
11/6/2015 10880 14554.16
12/6/2015 9975 24529.16
12/6/2015 10200 34729.16
15/06/2015 9770.4 44499.56
15/06/2015 10620 33879.56
16/06/2015 10470.2 44349.76
16/06/2015 10750 55099.76
16/06/2015 11124 66223.76
16/06/2015 10215 56008.76
17/06/2015 11052 67060.76
17/05/2015 10521 77581.76
18/06/2015 10327 87908.76
18/06/2015 10236 77672.76
20/06/2015 10540.8 88213.56
20/06/2015 HOLDING 20047 108260.56
Related Documents


![Full Project [FK-1628 - Deepesh]](https://static.cupdf.com/doc/110x72/577d360f1a28ab3a6b920d7c/full-project-fk-1628-deepesh.jpg)