CII SR Quarterly Update Chemicals and Fertilisers 1 CII Southern Region Industry and Economic Update Chemicals and Fertilisers October-December 2009

Welcome message from author
This document is posted to help you gain knowledge. Please leave a comment to let me know what you think about it! Share it to your friends and learn new things together.
Transcript
CII SR Quarterly Update
Chemicals and Fertilisers
1
CII Southern Region
Industry and Economic Update
Chemicals and Fertilisers
October-December 2009

CII SR Quarterly Update
Chemicals and Fertilisers
2
TABLE OF CONTENTS
INDUSTRY UPDATE....................................................................................................................... 3 RECENT DEVELOPMENTS ........................................................................................................................... 3
POLICY DEVELOPMENTS ............................................................................................................... 3 FERTILISERS ............................................................................................................................................ 3 PETROCHEMICALS .................................................................................................................................... 4
INDUSTRY UPDATE....................................................................................................................... 4 CHEMICALS INDUSTRY IN INDIA .................................................................................................................. 4 FERTILISERS INDUSTRY IN INDIA .................................................................................................................. 6 RECENT DEVELOPMENTS ........................................................................................................................... 8 PERFORMANCE OF FERTILISER COMPANIES DURING Q2FY2010 ..................................................................... 15 CHEMICALS – MAJOR SEGMENTS ............................................................................................................. 15 ORGANIC CHEMICALS INDUSTRY IN INDIA ................................................................................................... 18 INORGANIC CHEMICALS .......................................................................................................................... 21 ALKALI CHEMICALS ................................................................................................................................. 24 PERFORMANCE OF ALKALI MANUFACTURING COMPANIES DURING Q2FY2010 ................................................. 24 PESTICIDES ........................................................................................................................................... 25 DYE AND DYESTUFF ................................................................................................................................ 25 EXPORTS AND IMPORTS .......................................................................................................................... 26
INVESTMENTS AND PROJECTS .................................................................................................... 26 COMPANY DEVELOPMENTS ..................................................................................................................... 35
REVIEW OF FINANCIAL PERFORMANCE ....................................................................................... 35 CHEMICALS INDUSTRY IN SOUTHERN REGION .............................................................................................. 36 CHEMICALS INDUSTRY IN INDIA ................................................................................................................ 39 FERTILISERS INDUSTRY IN SOUTHERN REGION ............................................................................................. 40 FERTILISERS INDUSTRY IN INDIA ................................................................................................................ 43
PRIMARY SURVEY CONCLUSIONS ............................................................................................... 44 SHORT-TERM OUTLOOK ............................................................................................................. 44

CII SR Quarterly Update
Chemicals and Fertilisers
3
INDUSTRY UPDATE
Recent Developments
The fertiliser sector, which is currently operating under several constraints including policy-related
issues, is likely to see an immediate investment flow of about Rs. 35,000 crore or US$ 7.5 billion. This
amount is towards the creation of additional capacities once the government decontrols the sector.
The capacity creation is expected to happen in urea and DAP segments as the country is currently
importing these two varieties due to shortfall in the domestic market.
Currently, the country is importing about 12 million tonnes (MT) of fertilisers, including 6 MT of urea
and another 6 MT of DAP. Immediate investments of these two varieties are expected to happen once
the government decontrols the sector.
On decontrolling the sector, the additional capacities would be ready for production in about 24-36
months. The fertiliser sector is currently under the control of the government and all elements of the
sector, including the cost of production and the price of fertilisers, are directly controlled by the
central government.
The Board for Reconstruction of Public Sector Enterprises (BRPSE) has proposed to the government a
revival of five sick fertiliser units, which will involve an investment of over Rs 50,000 crore.
The Centre would launch a scheme that would enable farmers get fertiliser subsidy directly. The direct
fertiliser subsidy scheme would be introduced initially in two districts, including Madurai, in Tamil
Nadu.
POLICY DEVELOPMENTS
Fer t i l isers
The Government has set up a Group of Ministers under the Finance Minister to take up the issue of
overhauling the fertiliser subsidy policy and shifting towards a regime of providing the dole-out
directly to farmers. The Budget 2009-10 had announced moving towards a regime where subsidy
would be granted on nutrients (like N, P, K that go into the making of fertilisers) instead of the current
practice of providing dole-out on prices of fertilisers. It had also proposed the government's long-term
goal of supplying fertiliser subsidy directly to farmers instead of routing it through the industry. The
GoM will decide on when to shift to the new subsidy regime and also the time frame for moving to
the system of direct subsidy to farmers.
The DoF notified in July 2009 modifications in certain elements of the concession scheme for P & K
fertilisers. These inter-alia include the following:
The concession rate for DAP, MAP, TSP and MOP will now be based on the average
international price of the month preceding the last month (as against the earlier practice of
preceding month) or the actual weighted average of C&F landed price of the current month,
whichever is lower w.e.f April 1, 2009.

CII SR Quarterly Update
Chemicals and Fertilisers
4
The Tariff Commission is reviewing the factors of escalations/de-escalations in the nutrient
price for complex fertilisers. Updation in these factors w.e.f. 1st April, 2009 will be carried out
in consultation with the Department of Expenditure; Ministry of Finance after the Tariff
Commission's recommendation is received by Government.
For computation of concession for complex fertilisers, N price based on four groups (natural
gas, naphtha, urea, imported ammonia mix and imported ammonia) as adopted by
Government based on recommendations of Tariff Commission will be used w.e.f. 1st April,
2009 as against the earlier practice of adopting different price of N for each complex for each
company.
Petrochemicals
Government-owned Indian Oil Corporation (IOC) is aiming to have 15 per cent of its revenue from
petrochemicals in the next three years. This is part of a strategy to invest around Rs 60,000 crore in
capacity-building in the next five years.
INDUSTRY UPDATE
Chemicals Indust ry in Ind ia
The Chemicals Industry is one of the oldest industries in India, which contributes significantly towards
industrial and economic growth of the nation. It is highly science based and provides valuable
chemicals for various end products such as textiles, paper, paints and varnishes, leather etc., which
are required in almost all aspects of life.
The Chemical Manufacturing subsector is based on the transformation of organic and inorganic raw
materials by a chemical process and the formulation of products. This subsector distinguishes the
production of basic chemicals that comprise the first industry group from the production of
intermediate and end products produced by further processing of basic chemicals that make up the
remaining industry groups.
India manufactures over 70,000 chemicals and is the 12th largest producer of chemicals in the world.
Chemicals industry size is estimated to be around 160,000 crore or US$35 billion1. The industry
constitutes about 3% of GDP and 18% of manufacturing sector. The chemicals industry employs
around 1 million people.
The Indian Chemicals Market Segment
Segment Market Value (billion US$)
Basic Chemicals 20
Specialty Chemicals 9
High End / Knowledge Segment 6
Total 35 Source: Department of Chemicals and Petrochemicals
1 Department of Chemicals and Petrochemicals and Investment Commission of India

CII SR Quarterly Update
Chemicals and Fertilisers
5
Gujarat,51%
Maharashtra, 7%
Uttar Pradesh, 8%
Punjab, 4%
Rajasthan, 4%
Madhya Pradesh , 4%
Tamil Nadu, 6%
Andhra Pradesh, 4%
Others, 12%
State-wise share in production of chemicals
State-wise Share in Production of Chemicals
Source: Ministry of Chemicals & Fertilisers, IMaCS Analysis
Production of Major Chemicals In ‘000 MT
Year Alkali Chemicals Other inorganic
chemicals
Organic
chemicals
Pesticides Dyes &
dyes
Total
major
chemicals
2005-06 5475 544 1545 82 30 7676
2006-07 5269 602 1545 85 33 7534
2007-08 5443 609 1546 83 44 7725
2008-09 5430 504 1212 74 31 7251
Source: Department of Chemicals and Petrochemicals
Key Players in the Indian Chemicals Industry
1 Reliance Industries Limited (RIL)
2 Gas Authority of India Limited (GAIL)
3 Haldia Petrochemicals Limited
4 Tata Chemicals
5 Ciba
6 Rallis
7 Hindustan Organic Chemicals (HOCL)
8 Gujarat Narmada Valley Fertilisers Corporation
Source: IMaCS Analysis
CII SR Quarterly Update
Chemicals and Fertilisers
6
Fer t i l isers Indust ry in India
Fertiliser is generally defined as "any material, organic or inorganic, natural or synthetic, which
supplies one or more of the chemical elements required for the plant growth". The Indian fertiliser
industry concerns itself with providing the three main nutrients – Nitrogen, Phosphorous and
Potassium. Besides, being used as fertilisers themselves, these three nutrients are combined to
produce several complex fertilisers.
India is the third largest producer and consumer of fertilisers in the world.
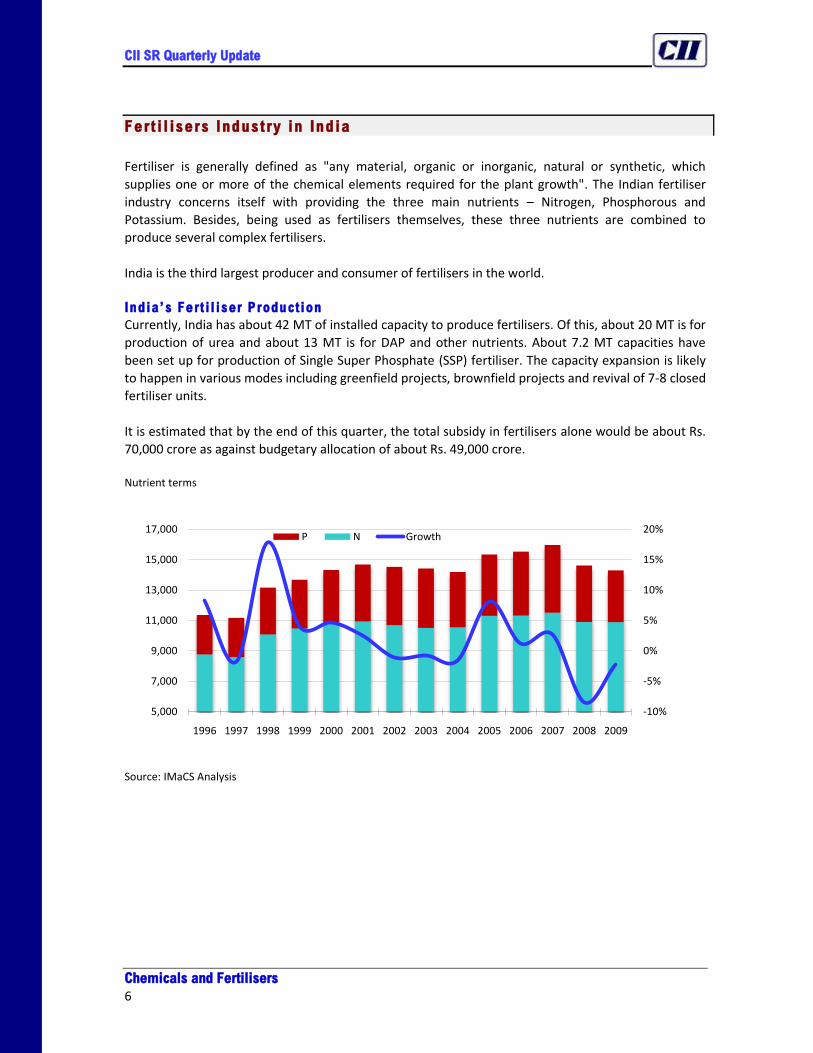
India’s Fert i l iser Production
Currently, India has about 42 MT of installed capacity to produce fertilisers. Of this, about 20 MT is for
production of urea and about 13 MT is for DAP and other nutrients. About 7.2 MT capacities have
been set up for production of Single Super Phosphate (SSP) fertiliser. The capacity expansion is likely
to happen in various modes including greenfield projects, brownfield projects and revival of 7-8 closed
fertiliser units.
It is estimated that by the end of this quarter, the total subsidy in fertilisers alone would be about Rs.
70,000 crore as against budgetary allocation of about Rs. 49,000 crore.
Nutrient terms
Source: IMaCS Analysis
-10%
-5%
0%
5%
10%
15%
20%
5,000
7,000
9,000
11,000
13,000
15,000
17,000
1996 1997 1998 1999 2000 2001 2002 2003 2004 2005 2006 2007 2008 2009
P N Growth
CII SR Quarterly Update
Chemicals and Fertilisers
7
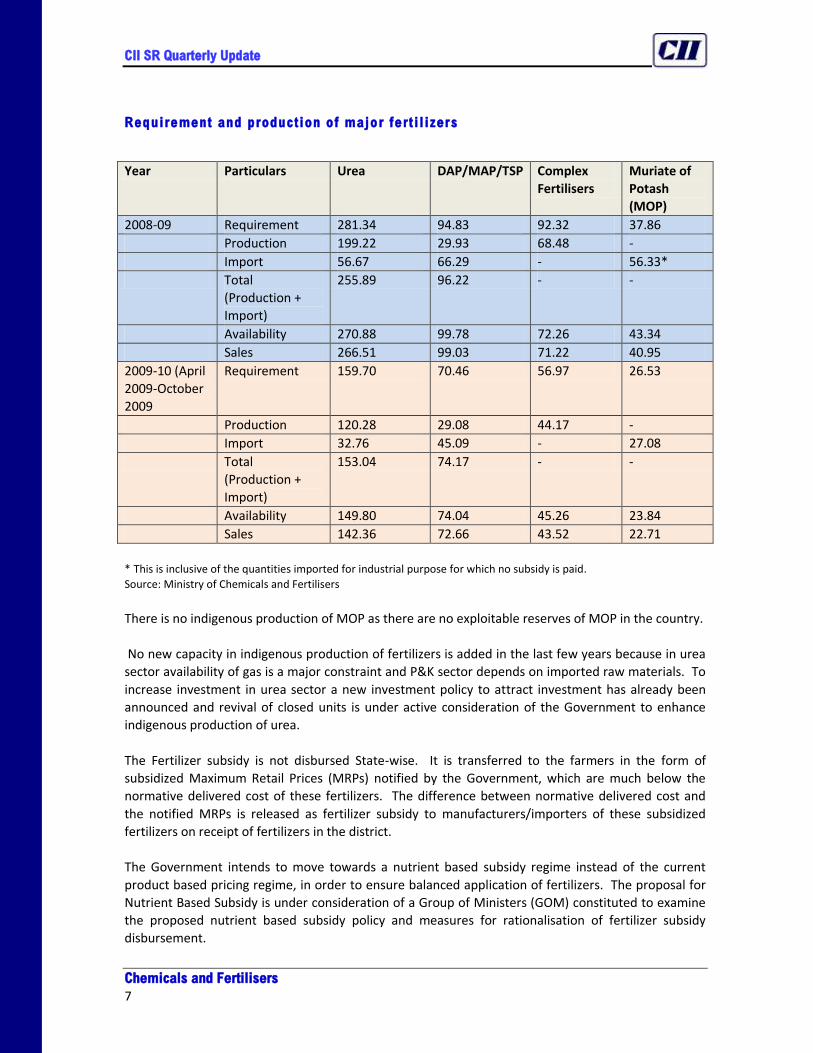
Requirement and production of major fert i l izers
Year Particulars Urea DAP/MAP/TSP Complex
Fertilisers
Muriate of
Potash
(MOP)
2008-09 Requirement 281.34 94.83 92.32 37.86
Production 199.22 29.93 68.48 -
Import 56.67 66.29 - 56.33*
Total
(Production +
Import)
255.89 96.22 - -
Availability 270.88 99.78 72.26 43.34
Sales 266.51 99.03 71.22 40.95
2009-10 (April
2009-October
2009
Requirement 159.70 70.46 56.97 26.53
Production 120.28 29.08 44.17 -
Import 32.76 45.09 - 27.08
Total
(Production +
Import)
153.04 74.17 - -
Availability 149.80 74.04 45.26 23.84
Sales 142.36 72.66 43.52 22.71
* This is inclusive of the quantities imported for industrial purpose for which no subsidy is paid.
Source: Ministry of Chemicals and Fertilisers
There is no indigenous production of MOP as there are no exploitable reserves of MOP in the country.
No new capacity in indigenous production of fertilizers is added in the last few years because in urea
sector availability of gas is a major constraint and P&K sector depends on imported raw materials. To
increase investment in urea sector a new investment policy to attract investment has already been
announced and revival of closed units is under active consideration of the Government to enhance
indigenous production of urea.
The Fertilizer subsidy is not disbursed State-wise. It is transferred to the farmers in the form of
subsidized Maximum Retail Prices (MRPs) notified by the Government, which are much below the
normative delivered cost of these fertilizers. The difference between normative delivered cost and
the notified MRPs is released as fertilizer subsidy to manufacturers/importers of these subsidized
fertilizers on receipt of fertilizers in the district.
The Government intends to move towards a nutrient based subsidy regime instead of the current
product based pricing regime, in order to ensure balanced application of fertilizers. The proposal for
Nutrient Based Subsidy is under consideration of a Group of Ministers (GOM) constituted to examine
the proposed nutrient based subsidy policy and measures for rationalisation of fertilizer subsidy
disbursement.

CII SR Quarterly Update
Chemicals and Fertilisers
8
The quantum of subsidy disbursed by Government on fertiliser during the last three years and the
expenditure on subsidy for the current year till 13th November, 2009 is as below: Quantum of Subsidy Disbursed by the Government
(Rs. in billion)
Period Amount of concession
disbursed on
decontrolled fertilisers
(indigenous + imported)
Amount of subsidy disbursed on urea
Indigenous
urea
Imported
urea
Total for
urea
Total of all
fertilisers
2006-07 10298.12 12650.37 5071.06 17721.43 28019.55
2007-08 16933.80 16450.37 9934.99 26385.36 43319.16
2008-09 65554.79 20968.74 12971.18 33939.92 99494.71
2009-10
(Expenditure
upto 13.11.09)
24037.34 10410.81 4311.54 14722.35 38759.69
TOTAL 116824.05 60480.29 32288.77 92769.06 209593.11
Source: Ministry of Chemicals and Fertilisers
Since the fertiliser subsidy is transferred to farmers through subsidised MRPs, small and marginal
farmers are also benefited to the extent they use fertilisers in their fields. Further the Government is
looking into various possibilities for delivery of fertilisers’ subsidy to the farmers. However, no final
decision has been taken on any alternative mode of disbursal of subsidy inter-alia including direct
subsidy to farmers according to their economic status or targeted subsidy to small and marginal
farmers.
Recent Developments
In the Post-Monsoon season, cumulative rainfall received for the country as a whole during
the period 1st October to 9th December, 2009 was 128.5 mm which is 9% above the L.P.A.
The Government has revised kharif rice output estimates by over 3% or 2.2 million tonnes.
Even after this revision, the country’s kharif rice output would still be lower by over 15%
compared to last year’s output of 84.58 million tonnes. The sowing and productivity this
kharif season was affected by the worst monsoon in 37 years. Accordingly, the production
estimates of kharif cereals and food grains also stand revised to 94.41 million tonnes and
98.83 million tonnes.

CII SR Quarterly Update
Chemicals and Fertilisers
9
Week-By-Week Progress of Cumulative Seasonal Rainfall Percent below normal (-)/above normal (+)
Country as a
whole
North-west
India
Central India South
Peninsula
North East
India
01.07.09 -46 -45 -59 -31 -41
08.07.09 -36 -50 -40 -18 -34
15.07.09 -27 -43 -15 -12 -40
22.07.09 -19 -38 3 -6 -43
29.07.09 -19 -33 1 -15 -39
05.08.09 -25 -40 -13 -18 -36
12.08.09 -29 -43 -19 -23 -36
19.08.09 -26 -37 -22 -20 -27
26.08.09 -25 -40 -20 -14 -25
02.09.09 -23 -39 -17 -11 -26
09.09.09 -20 -34 -15 -8 -23
16.09.09 -21 -32 -17 -8 -26
23.09.09 -22 -34 -19 -8 -25
30.09.09 -23 -36 -20 -4 -27
Source: IMD, Ministry of Earth Sciences
Weekly and Cumulative Rainfall in four regions of the country
Region Week Ending (16.12.09) Cumulative (1.10.09 to 16.12.09)
(in mm) Deviation
(%)
Category (in mm) Deviation
(%)
Category
Actual Normal Actual Normal
North West 3.1 6.2 -51 D 49.1 50.0 -2 N
Central India 0.0 1.7 -99 S 115.4 77.6 49 E
South
Peninsular
India
9.8 7.8 26 E 274.8 259.7 6 N
North-East
India
0.1 4.1 -99 S 128.6 156.1 -18 N
Country as a
whole
2.9 4.7 -38 D 128.5 117.4 9 N
E: Excess, N: Normal, D: Deficient, S: Scanty, NR: No Rain
Source: IMD
CII SR Quarterly Update
Chemicals and Fertilisers
10
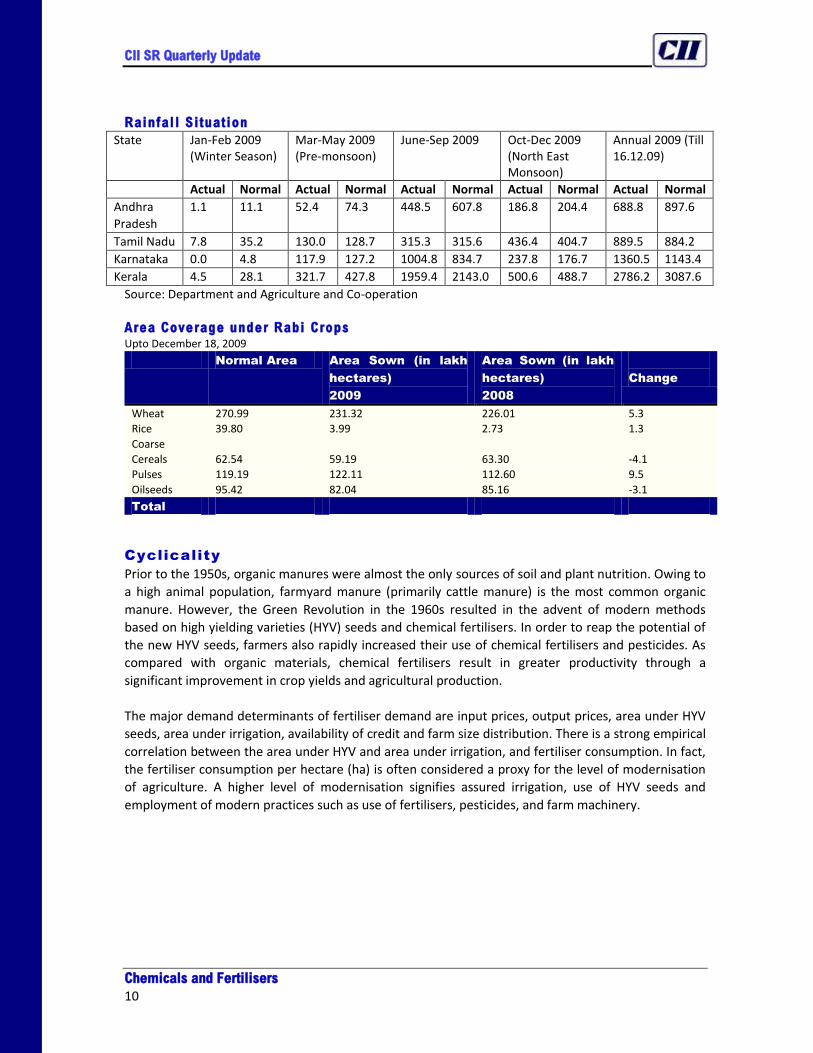
Rainfall Situation
State Jan-Feb 2009 (Winter Season)
Mar-May 2009 (Pre-monsoon)
June-Sep 2009 Oct-Dec 2009 (North East Monsoon)
Annual 2009 (Till 16.12.09)
Actual Normal Actual Normal Actual Normal Actual Normal Actual Normal
Andhra
Pradesh
1.1 11.1 52.4 74.3 448.5 607.8 186.8 204.4 688.8 897.6
Tamil Nadu 7.8 35.2 130.0 128.7 315.3 315.6 436.4 404.7 889.5 884.2
Karnataka 0.0 4.8 117.9 127.2 1004.8 834.7 237.8 176.7 1360.5 1143.4
Kerala 4.5 28.1 321.7 427.8 1959.4 2143.0 500.6 488.7 2786.2 3087.6
Source: Department and Agriculture and Co-operation
Area Coverage under Rabi Crops Upto December 18, 2009
Normal Area Area Sown (in lakh
hectares)
2009
Area Sown (in lakh
hectares)
2008
Change
Wheat 270.99 231.32 226.01 5.3
Rice 39.80 3.99 2.73 1.3
Coarse
Cereals 62.54 59.19 63.30 -4.1
Pulses 119.19 122.11 112.60 9.5
Oilseeds 95.42 82.04 85.16 -3.1
Total
Cyclicality
Prior to the 1950s, organic manures were almost the only sources of soil and plant nutrition. Owing to
a high animal population, farmyard manure (primarily cattle manure) is the most common organic
manure. However, the Green Revolution in the 1960s resulted in the advent of modern methods
based on high yielding varieties (HYV) seeds and chemical fertilisers. In order to reap the potential of
the new HYV seeds, farmers also rapidly increased their use of chemical fertilisers and pesticides. As
compared with organic materials, chemical fertilisers result in greater productivity through a
significant improvement in crop yields and agricultural production.
The major demand determinants of fertiliser demand are input prices, output prices, area under HYV
seeds, area under irrigation, availability of credit and farm size distribution. There is a strong empirical
correlation between the area under HYV and area under irrigation, and fertiliser consumption. In fact,
the fertiliser consumption per hectare (ha) is often considered a proxy for the level of modernisation
of agriculture. A higher level of modernisation signifies assured irrigation, use of HYV seeds and
employment of modern practices such as use of fertilisers, pesticides, and farm machinery.

CII SR Quarterly Update
Chemicals and Fertilisers
11
Nutrient Consumption of Fert i l isers and Share
Consumption
(thousand tonnes)
Share
FY N P K N P K
1994 8,788 2,669 909 71.1% 21.6% 7.3%
1999 11,354 4,112 1,332 67.6% 24.5% 7.9%
2003 10,474 4,019 1,601 65.1% 25.0% 9.9%
2004 11,077 4,124 1,598 65.9% 24.6% 9.5%
2005 11,714 4,624 2,061 63.7% 25.1% 11.2%
2006 12,723 5,204 2,413 62.6% 25.6% 11.9%
2007 13,773 5,543 2,335 63.6% 25.6% 10.8%
2008 14,419 5,515 2,636 63.9% 24.4% 11.7%
2009 15,222 6,572 3,358 60.5% 26.1% 13.4%
Source: Ministry of Chemicals and Fertilisers and IMaCS Analysis
Fertiliser demand is at 520.45 lakh tonnes for the year 2009-10. The demand during Kharif
2009-10 is estimated at 254.70 lakh tonnes and 265.75 lakh tonnes for Rabi.
India’s Installed Capacity and Production of Fert i l isers Thousand tonnes of nutrients
FY 2003 2004 2005 2006 2007 2008 2009
Capacity 17,571 17,568 17,688 17,748 18,020 18,143
N 12,238 12,166 12,208 12,288 12,284 12,284
Straight N 10,007 10,007 9,956 10,066 10,066 10,066
Of which urea 9,588 9,588 9,567 9,677 9,677 9,677
Through NP/NPKs 2,231 2,159 2,252 2,222 2,218 2,218
P 5,333 5,402 5,480 5,460 5,736 5,859
Straight P205 964 980 982 1,068 1,076 1,204
Through NP/NPKs 4,369 4,421 4,499 4,391 4,661 4,655
Production 14,415 14,183 15,343 15,536 15,965 14,617 14,292
N 10,508 10,557 11,305 11,333 11,525 10,903 10,894
Straight N 8,741 8,936 9,504 9,430 9,510 9,259 9,310
Through NP/NPKs 1,767 1,621 1,801 1,903 2,015 1,644 1,584
P 3,908 3,627 4,038 4,203 4,440 3,714 3,397
Straight P205 385 407 394 447 476 359 388
Through NP/NPKs 3,523 3,220 3,645 3,755 3,965 3,355 3,009
Compiled by IMACS
Production continued to increase at a low rate mainly due to shortage of natural gas (NG) and raw
materials (mainly phosphoric acid). However, after many months of decline, production increased in
March 2009 with yoy increase in production of all major fertilisers.

CII SR Quarterly Update
Chemicals and Fertilisers
12
Growth in Fert i l iser Production year on year (yoy)
During FY2009, the contributions of Nitrogen, Phosphorus and Potassium to the total nutrient
consumption of 25.15 mt in the country were 60.5%, 26.1% and 13.4%, respectively. The high share of
Nitrogen fertiliser consumption is primarily because of the fact that nitrogen deficiency in Indian soils
is almost universal. In the Indo-Gangetic plains, medium-high yields cannot be obtained anywhere
without Nitrogen application. Phosphorus deficiencies are also high with Phosphorus fertility being
low or medium in nearly 95% of districts. Potassium deficiencies have also increased because of
depletion of soil potassium, especially in the Indo-Gangetic plains. Sulphur deficiency is also an
important problem in many states and soils in large number of districts of the Indo-Gangetic Plains are
considered to be suffering from Sulphur deficiency to varying extents.
During August 2009, the production of Nitrogen fertilisers registered a yoy growth of 8.5%, while
phosphatic fertilises production registered a yoy growth of 5.8%.
-80%
-60%
-40%
-20%
0%
20%
40%
60%
80%
0
200
400
600
800
1,000
1,200
1,400
1,600
Jan
-05
Mar
-05
May
-05
Jul-
05
Sep
-05
No
v-0
5
Jan
-06
Mar
-06
May
-06
Jul-
06
Sep
-06
No
v-0
6
Jan
-07
Mar
-07
May
-07
Jul-
07
Sep
-07
No
v-0
7
Jan
-08
Mar
-08
May
-08
Jul-
08
Sep
-08
No
v-0
8
Jan
-09
Mar
-09
May
-09
Jul-
09
Phosphatic fertilisers Nitrogenous fertilisers
Change in growth of nitrogenous fertilisers Change in growth of phosphatic fertilisers
CII SR Quarterly Update
Chemicals and Fertilisers
13
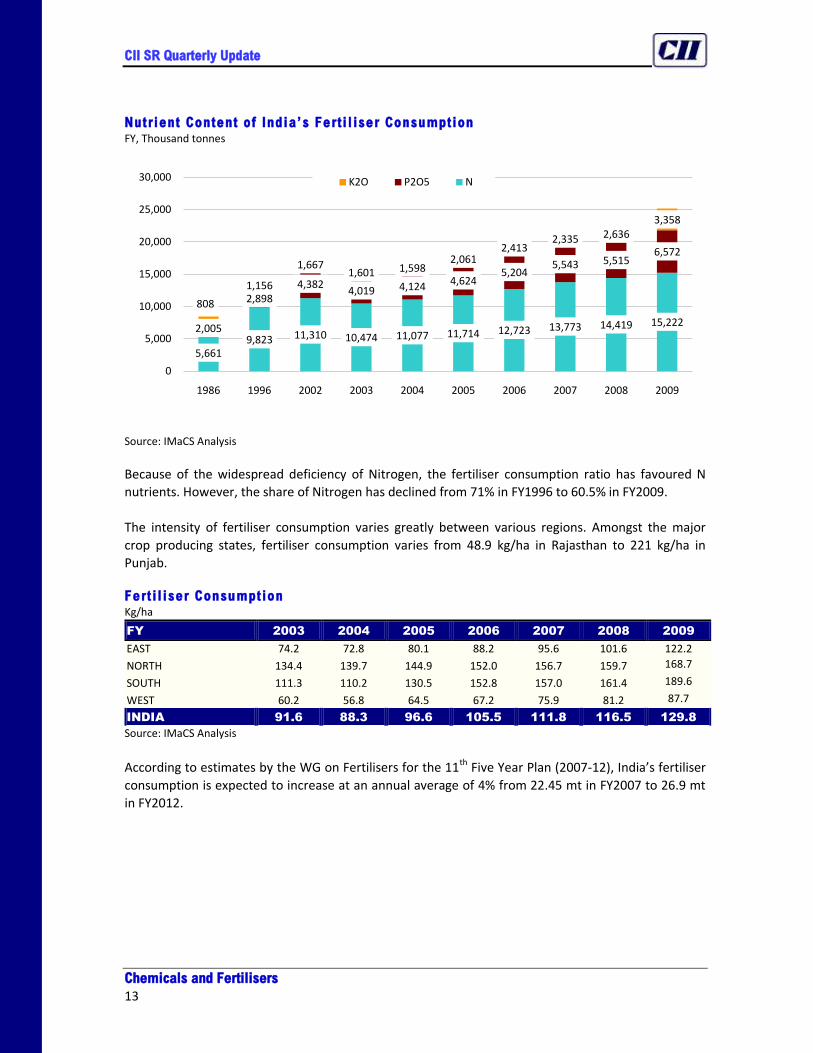
Nutrient Content of India’s Fert i l iser Consumption FY, Thousand tonnes
Source: IMaCS Analysis
Because of the widespread deficiency of Nitrogen, the fertiliser consumption ratio has favoured N
nutrients. However, the share of Nitrogen has declined from 71% in FY1996 to 60.5% in FY2009.
The intensity of fertiliser consumption varies greatly between various regions. Amongst the major
crop producing states, fertiliser consumption varies from 48.9 kg/ha in Rajasthan to 221 kg/ha in
Punjab. Fert i l iser Consumption Kg/ha
FY 2003 2004 2005 2006 2007 2008 2009
EAST 74.2 72.8 80.1 88.2 95.6 101.6 122.2
NORTH 134.4 139.7 144.9 152.0 156.7 159.7 168.7
SOUTH 111.3 110.2 130.5 152.8 157.0 161.4 189.6
WEST 60.2 56.8 64.5 67.2 75.9 81.2 87.7
INDIA 91.6 88.3 96.6 105.5 111.8 116.5 129.8
Source: IMaCS Analysis
According to estimates by the WG on Fertilisers for the 11th Five Year Plan (2007-12), India’s fertiliser
consumption is expected to increase at an annual average of 4% from 22.45 mt in FY2007 to 26.9 mt
in FY2012.
5,6619,823 11,310 10,474 11,077 11,714 12,723 13,773 14,419 15,222
2,005
2,8984,382
4,019 4,124 4,6245,204
5,543 5,5156,572
808
1,156
1,6671,601 1,598
2,0612,413
2,335 2,6363,358
0
5,000
10,000
15,000
20,000
25,000
30,000
1986 1996 2002 2003 2004 2005 2006 2007 2008 2009
K2O P2O5 N

CII SR Quarterly Update
Chemicals and Fertilisers
14
India’s Region -wise N Ferti l isers’ Capacity, Production and Consumption
Volume
(thousand tonnes)
Growth
FY 2004 2005 2006 2007 2008 2009 2009 2007-09
Capacity 12,166 12,208 12,288 12,284 12,290 12,290 0.0% 0.0%
East 863 863 953 953 953 953 0.0% 0.0%
North 3,742 3,742 3,742 3,742 3,742 3,742 0.0% 0.0%
South 2,191 2,254 2,254 2,199 2,206 2,206 0.0% -0.7%
West 5,418 5,418 5,340 5,390 5,390 5,390 0.0% 0.3%
Production 10,557 11,305 11,333 11,525 10,903 10,900 0.0% -1.3%
East 420 466 485 634 630 583 -7.5% 6.3%
North 3,320 3,470 3,480 3,514 3,578 3,682 2.9% 1.9%
South 1,807 2,016 2,040 2,039 1,510 1,538 1.8% -9.0%
West 5,010 5,352 5,329 5,338 5,184 5,097 -1.7% -1.5%
Consumption 11,077 11,714 12,723 13,773 14,419 15,222 5.6% 6.2%
East 1,608 1,658 1,750 1,969 2,106 2,353 11.7% 10.4%
North 4,494 4,548 4,722 5,074 5,211 5,316 2.0% 4.0%
South 2,118 2,407 2,941 2,921 3,008 3,360 11.7% 4.5%
West 2,857 3,101 3,311 3,808 4,094 4,193 2.4% 8.2%
Gap -520 -409 -1,390 -2,248 -3,516 -4,321 22.9% 45.9%
East -1,187 -1,192 -1,264 -1,335 -1,476 -1,769 19.9% 11.9%
North -1,174 -1,078 -1,242 -1,560 -1,633 -1,634 0.0% 9.6%
South -311 -390 -901 -882 -1,497 -1,822 21.7% 26.4%
West 2,152 2,251 2,017 1,530 1,090 903 -17.1% -23.5%
Compiled by IMACS
Key Players in the Indian Ferti l isers Industry
(In random order)
Source: IMaCS analysis
1 United Phosphorous
2 Rallis India
3 Tata Chemicals
4 Chambal Fertilisers
5 RCF
6 Advanta India
7 Coromandel Fertilizers
8 Aries Agro Ltd.
9 DCM Shriram
10 Gujarat State Fertilisers and Chemicals
11 Zuari Industries
12 National Fertilisers

CII SR Quarterly Update
Chemicals and Fertilisers
15
Performance o f fer t i l iser companies dur ing Q2FY2010
During the quarter, almost all the leading companies reported a double-digit fall in the total income.
Although, the industry reported a sharp fall in total income, its performance was satisfactory on the
profitability front.
During Q2FY2010, 12 companies managed to improve their PBDIT margin due to a huge fall in raw
material expenses when compared to the total income. The improved PBDIT margin along with a
sharp decline in the interest expenses and tax provisions has enabled the fertiliser companies to raise
their PAT margins. Eight companies reported higher PAT margins. During the quarter, three
companies – Fertiliser and Chemicals, Travancore (FACT), Khaitan Chemicals & Fertilisers and VBC
Industries – turned into loss making units. FACT was the only leading company reporting a growth of
4% in its topline.
Chemicals – Ma jor Segments
The major sub-segments of the chemical industry are as follows:-
Petrochemicals
Organic Chemicals
Inorganic Chemicals
Alkali Chemicals
Pesticides
Dye and Dyestuff
Income
(Rs. Cr.)
Sales (Rs.
Cr.)
PBDIT/Income (%) PAT/Income (%)
Q2FY2009 Q2FY2010 Q2FY2009 Q2FY2010
Rashtriya
Chemicals and
Fertilisers
1,803.0 1,792.0 6.5 6.2 3.2 2.7
Coromandel
Fertilisers
1,711.4 1,685.2 8.8 19.6 5.3 11.0
Tata Chemicals 1,385.6 1,256.9 10.7 21.6 5.9 12.0
Chambal
Fertilisers and
Chemicals
978.1 963.8 9.5 19.1 2.7 6.6
Gujarat State
Fertilisers and
Chemicals
973.4 952.2 15.8 16.6 9.0 7.9
Zuari Industries 850.8 825.5 4.4 11.1 2.4 7.7
National
Fertilisers
1,477.0 1,470.7 7.4 8.1 3.2 3.9

CII SR Quarterly Update
Chemicals and Fertilisers
16
Petrochemicals
Petrochemicals are chemical products made from raw materials of petroleum (hydrocarbon) origin.
The distillation of crude oil yields naphtha, gas oil, natural gas (NG), and petroleum gases which are
mainly used as feedstock by the petrochemicals industry. The petrochemical industry mainly
comprises of synthetic fibres, polymers, elastomers, synthetic detergents intermediates and
performance plastics.
Petrochemical industry structure
Source: Planning commission
Petrochemical products permeate the entire spectrum of daily use items and cover almost every
aspect of life, ranging from clothing, housing, construction, furniture, automobiles, household items,
toys, agriculture, horticulture, irrigation, packaging to medical appliances etc. There are three
naphtha-based and three gas-based cracker complexes in the country with a combined ethylene
annual capacity of 2.9 million MT. Besides, there are four aromatic complexes also with a combined
Xylenes capacity of 2.9 million MT.
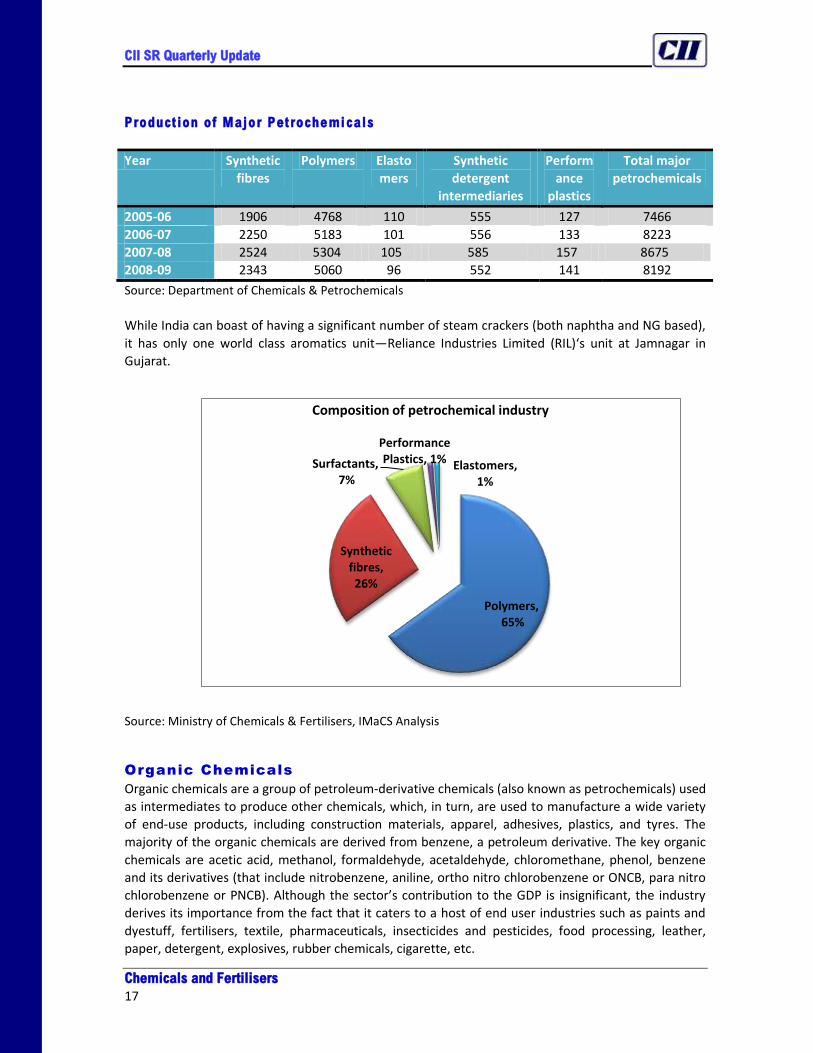
The production of polymers accounted for almost 62% of the total production of major
petrochemicals during 2008-09. The domestic capacity of polymers was 5.72 million MT during 2008-
09. With 88.5% capacity utilisation, production of polymers during 2008-09 at the level of 5.06 million
MT was attained. The domestic production capacity of synthetic fibres was 3.46 million MT during
2008-09. With capacity utilisation of about 73%, production at the level of 2.52 million MT was
achieved2.
2 Economic Survey 2008-09
CII SR Quarterly Update
Chemicals and Fertilisers
17
Polymers,65%
Synthetic fibres, 26%
Surfactants,7%
Performance Plastics, 1% Elastomers,
1%
Composition of petrochemical industry
Production of Major Petrochemicals
Year Synthetic
fibres
Polymers Elasto
mers
Synthetic
detergent
intermediaries
Perform
ance
plastics
Total major
petrochemicals
2005-06 1906 4768 110 555 127 7466
2006-07 2250 5183 101 556 133 8223
2007-08 2524 5304 105 585 157 8675
2008-09 2343 5060 96 552 141 8192
Source: Department of Chemicals & Petrochemicals
While India can boast of having a significant number of steam crackers (both naphtha and NG based),
it has only one world class aromatics unit—Reliance Industries Limited (RIL)‘s unit at Jamnagar in
Gujarat.
Source: Ministry of Chemicals & Fertilisers, IMaCS Analysis
Organic Chemicals
Organic chemicals are a group of petroleum-derivative chemicals (also known as petrochemicals) used
as intermediates to produce other chemicals, which, in turn, are used to manufacture a wide variety
of end-use products, including construction materials, apparel, adhesives, plastics, and tyres. The
majority of the organic chemicals are derived from benzene, a petroleum derivative. The key organic
chemicals are acetic acid, methanol, formaldehyde, acetaldehyde, chloromethane, phenol, benzene
and its derivatives (that include nitrobenzene, aniline, ortho nitro chlorobenzene or ONCB, para nitro
chlorobenzene or PNCB). Although the sector’s contribution to the GDP is insignificant, the industry
derives its importance from the fact that it caters to a host of end user industries such as paints and
dyestuff, fertilisers, textile, pharmaceuticals, insecticides and pesticides, food processing, leather,
paper, detergent, explosives, rubber chemicals, cigarette, etc.

CII SR Quarterly Update
Chemicals and Fertilisers
18
Organic Chemicals Indust ry in Ind ia
Cyclicality
There is a moderate amount of cyclicality in the industry (especially in the bulk chemicals business) as
reflected by the significant year on year variation in production and consumption of four key organic
chemicals—acetic acid, methanol, acetic acid, formaldehyde and phenol.
India’s organic chemicals production was estimated at around 1,736 kilotonnes (kt) or 1.74 million
tonnes (mt) during FY2008.
Production of Major Organic Chemicals ‘000 MT
2003 2004 2005 2006 2007 2008
Methanol 362 389 392 387 396 377
Acetic Acid 252 308 288 306 288 373
Formaldehyde 182 199 196 249 235 274
Acataldehyde 126 127 140 159 164 208
Chloromethanes 79 90 92 94 92 99
Source : Ministry of Chemicals and Fertilisers, IMaCS analysis
Monthly Production Growth of Major Organic Chemicals
Compiled by IMACS
Acetic acid is an important chemical reagent and industrial chemical that is used in the production of
polyethylene terephthalate mainly used in soft drink bottles; cellulose acetate, mainly for
photographic film; and polyvinyl acetate for wood glue, as well as many synthetic fibres and fabrics. In
the food industry, acetic acid is used under the food additive code as an acidity regulator. In the form
of vinegar, acetic acid solutions (typically 5-18% acetic acid) are used directly as a condiment, and also
in the pickling of vegetables and other foodstuffs.
-100%
-50%
0%
50%
100%
150%
200%
Jan
-05
Mar
-05
May
-05
Jul-
05
Sep
-05
No
v-0
5
Jan
-06
Mar
-06
May
-06
Jul-
06
Sep
-06
No
v-0
6
Jan
-07
Mar
-07
May
-07
Jul-
07
Sep
-07
No
v-0
7
Jan
-08
Mar
-08
May
-08
Jul-
08
Sep
-08
No
v-0
8
Jan
-09
Mar
-09
May
-09
Jul-
09
Acetic Acid Formaldehyde Methanol Phenol

CII SR Quarterly Update
Chemicals and Fertilisers
19
Most formaldehyde is used in the production of polymers and other chemicals. When combined with
phenol, urea, or melamine; formaldehyde produces a hard thermoset resin commonly used in
permanent adhesives, such as those used in plywood or carpeting. It is used as the wet-strength resin
added to sanitary paper products, facial tissue, table napkins, and roll towels. They are also foamed to
make insulation, or cast into moulded products. Production of formaldehyde resins accounts for more
than half of formaldehyde consumption. Formaldehyde is also used to make numerous other
chemicals, used in personal care products such as toothpaste.
Phenol has antiseptic properties, and is one of the main components of the antiseptic trichlorophenol
(TCP). Phenol is also used in the production of drugs (it is the starting material in the industrial
production of aspirin), weedkiller, and synthetic resins. It is also used in cosmetic surgery as an
exfoliant, to remove layers of dead skin.
Methanol is frequently used as a denaturant additive for ethanol manufactured for industrial uses. It
is also used in manufacture of formaldehyde, DMT, methylamines, methylchloride, and methyl
methacrylate. It is also used as a solvent for many industries.
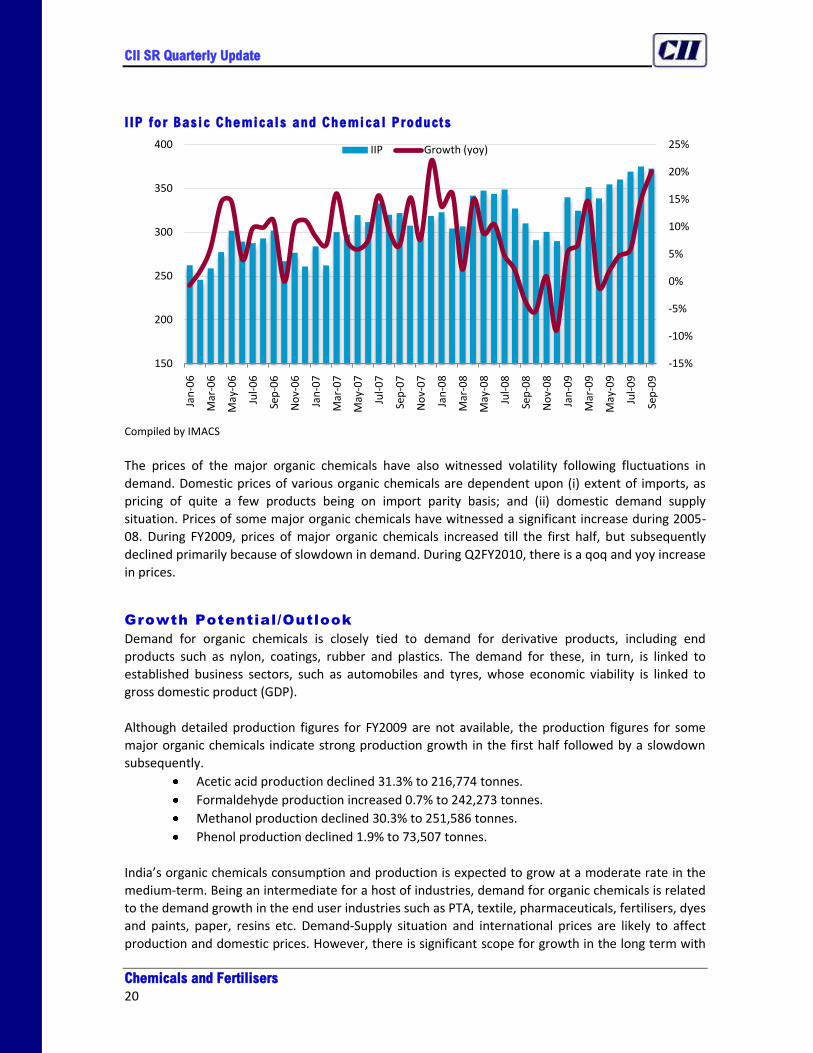
Overall the index of industrial production (IIP) for basic chemicals increased only 2.5% during FY2009,
compared with 10.6% in FY2008, 9.6% in FY2007, and 8.3% during FY2006. Growth in IIP—Basic Chemicals & Chemical Products and Ov erall FY
Compiled by IMACS
The IIP for basic chemicals was 345.2 during October 2009 and had achieved a yoy growth of 18.7%
between October 2009 and the previous year and a 9.1% growth between April-October 2009.
0%
2%
4%
6%
8%
10%
12%
14%
16%
1996 1997 1998 1999 2000 2001 2002 2003 2004 2005 2006 2007 2008 2009
Chemicals & Chemical products Overall
CII SR Quarterly Update
Chemicals and Fertilisers
20
I IP for Basic Chemicals and Chemica l Products
Compiled by IMACS
The prices of the major organic chemicals have also witnessed volatility following fluctuations in
demand. Domestic prices of various organic chemicals are dependent upon (i) extent of imports, as
pricing of quite a few products being on import parity basis; and (ii) domestic demand supply
situation. Prices of some major organic chemicals have witnessed a significant increase during 2005-
08. During FY2009, prices of major organic chemicals increased till the first half, but subsequently
declined primarily because of slowdown in demand. During Q2FY2010, there is a qoq and yoy increase
in prices.
Growth Potential/Outlook
Demand for organic chemicals is closely tied to demand for derivative products, including end
products such as nylon, coatings, rubber and plastics. The demand for these, in turn, is linked to
established business sectors, such as automobiles and tyres, whose economic viability is linked to
gross domestic product (GDP).
Although detailed production figures for FY2009 are not available, the production figures for some
major organic chemicals indicate strong production growth in the first half followed by a slowdown
subsequently.
Acetic acid production declined 31.3% to 216,774 tonnes.
Formaldehyde production increased 0.7% to 242,273 tonnes.
Methanol production declined 30.3% to 251,586 tonnes.
Phenol production declined 1.9% to 73,507 tonnes.
India’s organic chemicals consumption and production is expected to grow at a moderate rate in the
medium-term. Being an intermediate for a host of industries, demand for organic chemicals is related
to the demand growth in the end user industries such as PTA, textile, pharmaceuticals, fertilisers, dyes
and paints, paper, resins etc. Demand-Supply situation and international prices are likely to affect
production and domestic prices. However, there is significant scope for growth in the long term with
-15%
-10%
-5%
0%
5%
10%
15%
20%
25%
150
200
250
300
350
400
Jan
-06
Mar
-06
May
-06
Jul-
06
Sep
-06
No
v-0
6
Jan
-07
Mar
-07
May
-07
Jul-
07
Sep
-07
No
v-0
7
Jan
-08
Mar
-08
May
-08
Jul-
08
Sep
-08
No
v-0
8
Jan
-09
Mar
-09
May
-09
Jul-
09
Sep
-09
IIP Growth (yoy)

CII SR Quarterly Update
Chemicals and Fertilisers
21
Carbon Black, 70%
Calcium Carbide,
15%
Titanium Dioxide,
11%
Others, 4%
Constitutents of inorganic chemical industry
the per capita chemicals consumption being only 5 kg per annum, much lower than the comparable
figures in the developed markets.
Inorgan ic Chemica ls
Overview
The key inorganic chemicals are titanium dioxide, carbon black, and calcium carbide. Titanium dioxide
is used as white pigment in paints, paper, rubber, and plastics. It is also used in cosmetics, ceramics,
enamels, printing inks, etc. Carbon black is used mainly as a reinforcing material in the rubber
industry. Other user areas include inks, paints, plastic and paper. Calcium Carbide is used in the
production of Acetylene, which in turn is used in the manufacture of poly vinyl chloride (PVC). The
production of Calcium Carbide involves power intensive process and there is only one unit engaged in
the manufacture of Calcium Carbide. Calcium carbide is also used in carbide lamps, which find use in
coal mines.
Other inorganic chemicals include aluminium fluoride, potassium chlorate, red phosphorous, and
sodium chlorate. Potassium chlorate is used mainly as oxidising agent in chemical processes. It is also
used in explosives, pyrotechnics, matches, textiles, printing, paper, etc. Red phosphorous is used in
the manufacture of safety matches and phosphorus compounds.
Although the sector’s contribution to the GDP may appear to be insignificant, the industry derives its
importance from the fact that it caters to a host of end user industries such as paints and dyestuff,
tyres, leather, paper, detergent, explosives, rubber chemicals, cigarette, etc.
India’s Inorganic chemicals production was around 690 kilotonnes (kt) or 0.69 million tonnes (mt)
during FY2008.
Source: Ministry of Chemicals & Fertilisers, IMaCS Analysis

CII SR Quarterly Update
Chemicals and Fertilisers
22
Cyclicality
There is a moderate amount of cyclicality in the industry (especially in the bulk chemicals business) as
reflected by the significant year on year variation in production of key inorganic chemicals—titanium
dioxide, carbon black, and calcium carbide. These three chemicals account for around 96% of India’s
production of inorganic chemicals.
Growth in WPI for Major Inorganic Chemicals
Compiled by IMACS
Growth Potential/Outlook
During FY2009, production continued to grow at a strong rate in the first half, but subsequently
declined.
Titanium dioxide production declined 11.7% (yoy) to 55,063 tonnes.
Carbon black production declined 10.9% to 382,004 tonnes.
Calcium carbide production declined 30.4% (yoy) to 67,826 tonnes.
-10%
-5%
0%
5%
10%
15%
20%
25%
30%
1996 1997 1998 1999 2000 2001 2002 2003 2004 2005 2006 2007 2008 2009
Titanium Dioxide Carbon Black

CII SR Quarterly Update
Chemicals and Fertilisers
23
Growth in Production of Major Inorganic Chemicals
Compiled by IMACS
Being an intermediate for a host of industries, demand for inorganic chemicals is related to the
demand growth in the end user industries such as paints and tyres.
Carbon black is the largest segment of the inorganic chemicals industry. Production and consumption
of carbon black has increased at a high rate in recent years because of increased tyre production. The
tyre industry presently consumes around 65% of total production. Carbon black, which accounts for
35% by weight and 16% by the value of raw materials used for making automobile tyres, follows the
growth trends in the tyre industry. India’s tyre production is estimated to have increased only 1.2% in
FY2009, as compared with a 3-year CAGR of 10.5% during FY2006-08. Tyre production growth is
expected to be stagnant in the first half of FY2010. Future growth in tyre production is expected to be
healthy driven by moderate growth in automotive production, increased replacement demand, and
higher exports.
Titanium dioxide has been witnessing fluctuating production trends since March 2009 onwards.
The third major inorganic chemical—calcium carbide—has witnessed reduced production over the last
few years. It is used in carbide lamps, in which water drips on carbide and the formed acetylene is
ignited. The lamps found extensive use in coal mines, but most have now been replaced by electric
lamps. Carbide lamps are still used by some cavers exploring caves and other underground areas.
In recent years, India has significantly boosted its chemicals exports. In the future, because of
environmental concerns and stricter regulation, chemicals production is expected to shift from
developed to developing countries. This is because the level of occupational and environmental
protection in developing countries is lower than in developed countries.
Threat of Imports/Substitutes/Unorganised sector
Imports as a percentage of total consumption for certain bulk chemicals are significantly high. Further,
imports as percentage of consumption have increased from 14% in FY2002 to around 23% in FY2008.
-100%
-50%
0%
50%
100%
150%
200%
Jan
-05
Mar
-05
May
-05
Jul-
05
Sep
-05
No
v-0
5
Jan
-06
Mar
-06
May
-06
Jul-
06
Sep
-06
No
v-0
6
Jan
-07
Mar
-07
May
-07
Jul-
07
Sep
-07
No
v-0
7
Jan
-08
Mar
-08
May
-08
Jul-
08
Sep
-08
No
v-0
8
Jan
-09
Mar
-09
May
-09
Jul-
09
Carbon Black Titanium Dioxide Calcium Carbide

CII SR Quarterly Update
Chemicals and Fertilisers
24
As can be seen from the table below, continued reduction in import duty tariffs has resulted in
proliferation of imports, especially of titanium dioxide from China. A small measure of protection is
available in the form of Anti Dumping (AD) Duty on Anatase Titanium Dioxide imports from China,
imposed by the GoI in March 2004. The AD duty is the difference between US$1,227/tonne or t and
landed value of imports. Red phosphorous production is capital intensive and higher power costs have
resulted in reduced domestic production and higher imports. Imports of select chemicals into the
country have affected the pricing power of domestic manufacturers.
Imports of Inorganic Chemicals tonnes
FY 2003 2004 2005 2006 2007 2008 3-year
CAGR
Aluminium Fluoride 679 2,627 1,519 5,134 8,960 13,286 48.3%
Calcium Carbide 66,931 45,720 44,356 45,446 49,026 56,000 14.2%
Carbon Black 18,715 52,042 32,013 54,855 41,323 73,003 76.7%
Potassium Chlorate 280 232 908 49 109 203 85.9%
Sodium Chlorate 5,429 8,450 8,892 10,100 15,255 14,399 -5.6%
Titanium Dioxide 6,653 7,074 11,478 15,126 17,583 19,424 10.5%
Red Phosphorous 173 181 255 172
Total 98,860 116,326 99,421 130,882 132,257 176,315 33.3%
Compiled by IMACS
Alka l i Chemica ls
The Chloro Alkali industry consists of Soda Ash, Caustic soda and liquid chlorine. Glass manufacturing
is the largest application for soda ash. Caustic soda, finds use in various applications, such as, finishing
operations in textiles, manufacture of soaps and detergents, control of pH (softening) of water for
various applications and general cleansing / bleaching applications. Liquid chlorine is used primarily
for various bleaching applications, across paper and pulp, textiles and other industries.
Production of Alkali Chemicals
Chemical Production (2008) (In ‘000 MT)
Soda Ash 2024.7
Caustic Soda 2160.3
Chlorine 1914
Source: Alkali Manufacturers’ Association of India
Performance o f a lka l i manufac tur ing companies dur ing Q2FY2010
During Q2FY2010, the alkali industry’s aggregate sales fell by over 14%. Total expenses fell by 8% and
thus net profit of the industry fell by over 60%, and the margins nearly halved to 5.5%. The fall in
revenues was due to the fall in the price of soda ash and caustic soda.
While sales fell by 14%, the raw material costs fell by only 6.5%. The PBDIT of the sector fell by 35%. A
sharp increase in the interest and depreciation charges resulted in the fall in profit. Aggregate PAT fell
by 62% during this quarter.

CII SR Quarterly Update
Chemicals and Fertilisers
25
The alkali companies registered a dismal financial performance during Q2FY2010. Net sales of seven
companies fell by double digits.
Pest ic ides
The pesticides/agrochemicals industry (PAC) is a moderately important sector of the Indian economy.
The PAC industry primarily consists of insecticides, herbicides and fungicides. India is one of the most
dynamic generic pesticide manufacturers in the world with more than 60 technical grade pesticide
being manufactured indigenously by 125 producers consisting of large and medium scale enterprises
(including about 10 multinational companies) and more than 500 pesticide formulators spread over
the country. India is the 4th largest producer of agrochemicals after USA, Japan and China. The
agrochemicals market in India is Rs. 45,000 million or US$978 million.
The Indian PAC industry primarily comprises of insecticides, fungicides, and herbicides/weedicides.
Insecticides dominate consumption with around 62% of estimated consumption of PAC, followed by
herbicides/weedicides (18%), fungicides (15%), and others (4%). Insecticides are used mainly for rice,
cotton and vegetables; herbicides for rubber, oil palm, tea, and coffee; and fungicides for tobacco,
vegetables, and bananas. Cotton, paddy/rice, vegetables and fruits account for over 80% of the
pesticide consumption in the country.
The pesticide consumption in India for every hectare is 0.33 kg. In comparison, the pesticide
consumption in France is 3.07 kg a hectare, 4.17 kg in France, 13.1 kg in Japan and over 15 kg in the
US, the UK and Canada3.
Dye and Dyestu f f
The Dyestuff sector is one of the important segments of the chemicals industry in India, having
forward and backward linkages with a variety of sectors like textiles, leather, paper, plastics, printing
inks and foodstuffs. The textile industry accounts for the largest consumption of dyestuffs and thus
the consumption of Dyes and Dyestuffs is closely related to the performance of the textile industry.
India has emerged as a global supplier of dyestuffs and dye intermediates, particularly for reactives,
acid, vat and direct dyes. India accounts for 7% of the world production. Organic pigment colours
account for the largest share of dye industry followed by sulphur dyes and Azo dyes.
3 Business Line dated May 29, 2009

CII SR Quarterly Update
Chemicals and Fertilisers
26
Organic Pigment Colours,
50%Sulphur
Dyes/Sulphur Black,
18%
Azo Dyes, 11%
Others, 21%
Composition of dye and dyestuff industry
Source: Ministry of Chemicals & Fertilisers, IMaCS Analysis
Expor ts and Impor ts
(Value in Rs. lakh)
Commodity 2007-08 2008-09 (Apr-Dec)
Exports
Inorganic Chemicals
Organic Chemicals
Fertilisers
331,671.89
2,886,978.42
10,437.32
422,691.52
2,582,867.77
14,092.37
Imports
Inorganic Chemicals
Organic Chemicals
Fertilisers
1,139,278.25
3,264,193.88
1,845,410.33
1,838,291.26
3,017,282.78
4,934,398.66
Source: Directorate General of Foreign Trade
INVESTMENTS AND PROJECTS
FDI Flows in Chemicals (except fert i l isers) In Rs. Billion
Year/Industry 2006-07 (Apr-
Mar)
2007-08
(Apr-Mar)
2008-09
(Apr-Mar)
2009-10
(Apr-Oct’09)
Cumulative Inflows
(Apr’00-Oct’09)
Chemicals
(other than
fertilisers)
9.3 9.2 34.3 9.2 104.9
Source: Department of Industrial Policy & Promotion

CII SR Quarterly Update
Chemicals and Fertilisers
27
Investments
The project costs of many of the Investments in chemicals and fertiliser projects in the five southern
states of Andhra Pradesh, Karnataka, Kerala, Tamil Nadu and Pondicherry are not available. These
investments include existing, planned, projects under execution and those deferred. Ownership wise,
it is the private sector firms that own a large portion of 90% of the total investments.
Of these, investments by Indian entities account for about 93% while the balance is from foreign
firms. State governments have a small share of investments of about 4%. Although, investment values
of over half of the projects are unavailable, going by the number of projects, it is the private sector
that dominates total investment in the sector.
About 31% of the investments are in the planning stage. They have been announced by the private
sector, state and central government sectors. These projects in the planning stage are located, mainly,
in Andhra Pradesh. Karnataka and Tamil Nadu have almost the same number of projects. Chemicals and Ferti l iser Project Investments in Southern India Number of Projects
Completed Deferred Planning
Stalled Under
Execution
Total
AP 25 12 33 2 20 92
Kerala 5 3 3 - - 11
TN & Pondy 24 1 14 1 6 46
Karnataka 20 1 11 - 8 40
Total 74 17 61 3 34 189
As can be seen from the above table, about 18% of the investments are under execution. About 39%
of the projects have been completed and 32% of the investments are under planning stage. The
numbers of deferred and stalled investments are very less at 11%.
As can be seen from the tables below, quite some projects with substantial investments have been
deferred for the time being. However, many major expansion projects are still being implemented. Major Chemicals and Ferti l isers Projects in Southern States
Project Name Promoter Cost
(Rs. Million)
Implementation Stage
Karnataka

CII SR Quarterly Update
Chemicals and Fertilisers
28
Naphtha Cracker Project Videocon International Ltd. 4,8000.00 Deferred
Oxygen Gas Project Phase II Jindal Praxair Oxygen Co. Ltd. 6,000.00 Completed
Distillery (Kerkalmatti) Project Shree Kedarnath Sugar & Agro Products Ltd.
2,050.00 Under Execution
Distillery (Karnataka) Project Chamundi Winery & Distilleries Pvt. Ltd.
1,200.00 Under Execution
Liquid Oxygen (Bangalore) Project Rail Wheel Factory 746.6 Planning
Distillery (Davangere) Project - Expansion
Samsons Distilleries Pvt. Ltd. 550.00 Planning
Oxychlorination (Panambur) Project Mangalore Chemicals & Fertilizers Ltd.
530.00 Completed
Distillery (Raichur) Project - Expansion Sovereign Distilleries Ltd. 500.00 Completed
Ethanol (Bagalkot) Project Karthik Glucons Pvt. Ltd. 450.00 Under Execution
Distillery (Badami) Project Karthik Agro Industries Pvt. Ltd. 450.00 Under Execution
Distillery (Krishnanagar) Project Nandi Sahakari Sakkare Karkhane Niyamit
400.00 Planning
Industrial Alcohol (Alaganchi) Project
Bannari Amman Sugars Ltd. 306.00 Completed
Extra Neutral Alcohol (Bagalkot) Project Jamkhandi Sugars Ltd. 300.00 Planning
Distillery (Duggavathi) Project Shamanur Sugars Ltd. 300.00 Planning
Ethanol (Gokak) Project Satish Sugars Ltd. 243.5 Completed
Distillery (Madbhavi) Project - Expansion Athani Farmers' Sugar Factory Ltd.
240.00 Partially Completed

CII SR Quarterly Update
Chemicals and Fertilisers
29
Source: Compiled by IMaCS
Project Name Promoter Cost (Rs. Million) Implementation Stage
Tamil Nadu
Arochem Project Spic Petrochemicals Ltd. 32,300.00 Stalled
Caustic Soda (Mettur) Project Chemplast Sanmar Ltd. 3,000.00 Completed
Neutral Alcohol (Cuddalore) Project Elite Distilleries Pvt. Ltd. 1,250.00 Planning
Ethanol (Koppa) Project - Expansion SCM Sugars Ltd. 220.00 Planning
Extra Neutral Alcohol (Koguoor) Dollex Industries Ltd. 210.00 Completed
Chemicals (Bidar) Project - Expansion Vivimed Labs Ltd. 20.00 Under Execution
Ethanol (Gulbarga) Project - Expansion Dollex Industries Ltd. 200.00 Completed
Sulphuric Acid (Panambur) Project Mangalore Chemicals & Fertilizers Ltd.
120.00 Completed
Aroma Chemical Plant (Tumkur) Organica Aromatics (Bangalore) Pvt. Ltd.
50.00 Completed
Chemicals (Thandya) Project SVP Industries 45.0 Planning
Colour Oil (Motebennur) Project Kancor Colours Ltd. 15.0 Completed
Process Treatment Chemicals (Hoskote) Project
Hercules Inc. 14.1 Completed

CII SR Quarterly Update
Chemicals and Fertilisers
30
Carbon Black (Gummidipoondi) Project - Expansion
Aditya Birla Nuvo Ltd. 1,050.00 Completed
Aluminium Fluoride (Sivaganga) Project Sterlite Industries (India) Ltd. 1,000.00 Planning
Distillery (Sathamangalam) Project Kothari Sugars & Chemicals Ltd.
750.00 Planning
Ethanol (Kalayanallur) Project Dharani Sugars & Chemicals Ltd.
710.00 Under Execution
Rectified Spirit (Erode) Project Ponni Sugars (Erode) Ltd. 700.00 Planning
Carbon Black Project - Expansion Aditya Birla Nuvo Ltd. 600.00 Completed
Hydrogen Gas Project Praxair India Pvt. Ltd. 600.00 Completed
Fatty Acids (Chittarkottai) Project EID-Parry (India) Ltd. 500.00 Completed
Distillery (Cheyyar) Project Cheyyar Co-operative Sugar Mills Ltd.
360.00 Planning
Distillery (Chidambaram) Project M R Krishnamurty Co-operative Sugar Mills Ltd.
360.00 Planning
Oxychlorination Project Chemplast Sanmar Ltd. 230.00 Completed
Thermal Spray Coatings (Palladam) Project Praxair India Pvt. Ltd. 150.00 Completed

CII SR Quarterly Update
Chemicals and Fertilisers
31
Leather Chemicals Project Stahl India Pvt. Ltd. 150.00 Completed
Stable Bleaching Powder (Tamil Nadu) Project
DCW Ltd. 110.00 Deferred
Maleic Anhydride Project Thirumalai Chemicals Ltd. 100.00 Completed
Carbon Dioxide (Mambakkam) Project Sicgil Industrial Gases Ltd. 70.00 Under Execution
Enzyme Project Esvin Bio-Systems Ltd. 60.00 Completed
Emulsion Explosives (Christianpet) Project Tamil Nadu Industrial Explosives Ltd.
51.70 Completed
Helium Extraction (Kuthalam) Project Oil & Natural Gas Corpn. Ltd. 50.00 Completed
Aromatic Chemical Project Emkay Aromatics Ltd. 49.3 Completed
L-Cystine Project Protchem Industries (India) Ltd.
45.0 Completed
Bio-methanation Plant Project Tamil Nadu Newsprint & Papers Ltd.
40.00 Completed
__________________________________________________________________________________________
Source: Compiled by IMaCS
Project Name Promoter Cost (Rs. Million) Implementation Stage
Pondicherry

CII SR Quarterly Update
Chemicals and Fertilisers
32
Polybutene Project - Debottlenecking Kothari Sugars & Chemicals Ltd. Not Available Completed
Caustic Soda (Karaikal) Project - Expansion Chemplast Sanmar Ltd.
Not Available Completed
Organics Chemicals (Kalapet) Project - Expansion Chemfab Alkalis Ltd.
Not Available Under Execution
Chlorates & Perchlorates (Melakasakudi) Project - Expansion Mepco Industries Ltd.
Not Available Under Execution
_____________________________________________________________________________________________
Source: Compiled by IMaCS

CII SR Quarterly Update
Chemicals and Fertilisers
33
Project Name Promoter Cost (Rs. Million) Implementation Stage
Andhra Pradesh
Carbon Black (Visakhapatnam) Project Continental Carbon India Ltd. 5,000.00 Planning
Caustic Soda (Chowdavaram) Project Durgasri Alkalies Pvt. Ltd. 5,000.00 Planning
Oxo Alcohol (Visakhapatnam) Project - Expansion
Andhra Petrochemicals Ltd. 3,000.00 Under Execution
Chemicals (Visakhapatnam) Project Kanoria Chemicals & Industries Ltd.
2,000.00 Under Execution
Ethanol (Gandepalli) Project Sentini Bioproducts Pvt. Ltd. 1,300.00 Completed
Ethanol (Nellore) Project Rusni Distilleries Pvt. Ltd. 1,200.00 Planning
Ethanol (Andhra Pradesh) Project - Expansion
Sentini Bioproducts Pvt. Ltd. 1,000.00 Completed
Chemical Complex (Visakhapatnam) Vivimed Labs Ltd. 1,000.00 Planning
Sulphur Compounds (Saggonda) Project Bhagyanagar Chlorides Pvt. Ltd.
1,000.00 Under Execution
R&D Centre (Hyderabad) E.I.DuPont India Pvt. Ltd. 1,000.00 Completed
Methyl Chloride (Kurnool) Project Sree Rayalaseema Alkalies & Allied Chemicals Ltd.
950.00 Planning
Carbon Dioxide (Kakinada) Project Nagarjuna Fertilizers & Chemicals Ltd.
900.00 Completed
Extra Neutral Alcohol (Jaggaiahpet) Project
Laxmi & Company 800.00 Deferred
Ethyl Alcohol (Krishna) Project SKC Projects 800.00 Deferred
Extra Neutral Alcohol (Nandiyal) Project S P Agro Industries Ltd. 800.00 Under Execution
Extra Neutral Alcohol (Vijayawada) Project
Bharati Industries 800.00 Abandoned
Distillery (Nellore) Project - Expansion Empee Sugars & Chemicals Ltd.
760.00 Completed
Distillery (Nandikandi) Project - Expansion
Gayatri Starchkem Ltd. 700.00 Planning

CII SR Quarterly Update
Chemicals and Fertilisers
34
Extra Neutral Alcohol (Sankarampet) Project
Alcrain Chemicals Pvt. Ltd. 580.00 Planning
Distillery (Medak) Project - Expansion Rusni Distilleries Pvt. Ltd. 550.00 Planning
Distillery (East Godavari) Project Sri Vishnu Biotech Ltd. 540.00 Deferred
Distillery (Avapadu) Project Auroma Biotech Pvt.Ltd. 525.7 Under Execution
Ethanol (Srikakulam) Project - Expansion
GMR Industries Ltd. 500.00 Planning
Chemicals (Achuthapuram) Project Nagarjuna Agrichem Ltd. 500.00 Under Execution
Distillery (Annadevarapeta) Project Bio Ethanol India Ltd. 500.00 Under Execution
Alcohols (Parlapalli) Project Haritha Bio Products India Pvt. Ltd.
500.00 Planning
Extra Neutral Alcohol (Nalgonda) Project Bossa Distillery Pvt. Ltd. 500.00 Planning
Ferric Oxide Project NMDC Ltd. 500.00 Completed
Ethyl Alcohol (Ranga Reddy) Project Empee Distilleries Ltd. 400.00 Under Execution
Distillery (G Kothapalli) Project Vasista Fermentations Pvt. Ltd. 390.00 Deferred
Industrial Gases (Gudur) Project Goyal MG Gases Pvt. Ltd. 350.00 Planning
Distillery (Krishna) Project - Expansion KCP Sugar & Industries Corpn. Ltd.
350.00 Completed
Sulphuric Acid Project Godavari Fertilisers & Chemicals Ltd.
340.00 Deferred
Chemicals (Kovvur) Project - Expansion Andhra Sugars Ltd. 320.00 Planning
Sulphuric Acid (Biccavolu) Project K P R Fertilisers Pvt. Ltd. 300.00 Completed
Chemicals (Visakhapatnam) Project SNF India Pvt. Ltd. 300.00 Planning
Distillery (Kamareddy) Project Gayatri Sugars Ltd. 260.00 Completed
Organic Chemicals (Medak) Project - Expansion
Virchow Petrochemical Pvt. Ltd.
250.00 Under Execution

CII SR Quarterly Update
Chemicals and Fertilisers
35
Project Name Promoter Cost (Rs. Million) Implementation Stage
Kerala
Petrochemical Complex (Kochi) Project GAIL (India) Ltd. 70,000.00 Deferred
Carbon Black (Karimugol) Project - Expansion Philips Carbon Black Ltd. 1,500.00 Deferred
Ethyl Alcohol (Palakkad) Project Empee Distilleries Ltd. 400.00 Planning
Caustic Soda (Udyogmandal) Project Travancore-Cochin Chemicals Ltd.
220.00 Completed
Garbage Treatment Plant (Vilappinsala) Government of Kerala 90.00 Completed
Garbage Treatment Plant Excel Industries Ltd. 90.00 Completed
______________________________________________________________________________________________
Source: Compiled by IMaCS
Company Developments
Construction chemicals industry to get together to lobby government and set standards.
Tata Chemicals unveils unique water purifier for masses.
Tata Chemicals has planned an expansion of its ammonia-urea plant at Babrala in Uttar
Pradesh. The plant is to be expanded by installing an additional line at Babrala.
Indian companies keen to tie-up LNG and participate in E&P in Africa.
BASF India Limited has announced the sale of the company’s Dadra site to Sonachi Industries
Limited for a consideration of Rs. 51.5 million.
REVIEW OF FINANCIAL PERFORMANCE
The financial performance chemicals and fertilisers industry in India have suffered during FY2009,
especially in the last two quarters, despite a healthy increase in operating income. The main reason
for the poor performance can be associated with the increased operating costs and increased interest
burden. The situation has however improved a little in Q2FY2010.

CII SR Quarterly Update
Chemicals and Fertilisers
36
Chemicals Indust ry in Southern Reg ion
During Q2FY2010, 18 listed companies in the chemicals sector with registered offices in the
Southern Region reported a 3% increase in operating income (OI) to Rs. 4.9 billion. OI (yoy) growth
was healthy at 12.4% in Q1FY2009, which increased drastically to 34.2% in Q2FY2009, but reduced to
13.7% in Q3FY2009 and further reduced to 5.4% in Q4FY2009 as signs of recession became evident.
However the operating income has displayed a 3% increase during Q2FY2010. On a qoq basis
however, OI growth has increased by 8.2% during Q2FY2010, from negative 5.4% in Q1FY2009 and
negative 12.1% in Q3FY2009, but has improved to 6.9% increase in Q1FY2010. Even on a yoy basis, OI
growth seems to have followed a decline and keep reducing every quarter after peaking in Q2FY2009,
but has picked up pace again in Q1FY2010, reducing again this quarter.
Trends in Operating Income Growth —Southern Region
Source: Compiled by IMaCS
During Q2FY2010 raw material costs have increased by 7.6% qoq.
-15%
-10%
-5%
0%
5%
10%
15%
20%
25%
30%
0%
5%
10%
15%
20%
25%
30%
35%
40%
Q1FY09 Q2FY09 Q3FY09 Q4FY09 Q1FY10 Q2FY10
Yoy Growth-LS
QoQ Growth-RS

CII SR Quarterly Update
Chemicals and Fertilisers
37
Trends in Raw Material Costs—Southern Region
Source: Compiled by IMaCS
The following tables provide a quarterly performance comparison of listed chemicals companies in the
Southern region.
Financial Performance—Southern Region Percent of OI
FY2008 FY2009 FY2010
Q1 Q2 Q3 Q4 Q1 Q2 Q3 Q4 Q1 Q2
Net Sales/OI 100 100 100 100 100 100.0 100 100 100 100
Raw Material Cost 60.6 60.4 60.2 62.2 64.3 61.9 53.4 59.4 59.4 59.0
Employee Costs 4.8 5.1 5.0 4.5 5.0 4.5 5.5 5.8 5.1 5.1
Power & Fuel Costs 4.3 3.9 4.2 3.9 3.6 3.9 4.6 4.4 3.9 3.5
Other Operating
Costs 15.6 15.2 16.1 18.7 13.9 14.6 25.1 19.5 16.7 16.6
Cost of Sales 85.4 84.6 85.4 89.3 86.8 84.9 88.6 89.1 85.0 84.2
OPBDIT 14.6 15.4 14.6 10.7 13.2 15.1 11.4 10.9 15.0 15.8
Interest 2.9 2.5 2.8 2.8 3.4 3.5 4.8 3.1 3.7 3.8
Depreciation 3.8 3.7 3.8 3.9 3.8 3.0 4.0 3.9 3.8 3.6
OPBT 8 9.2 8 4 6.0 8.6 2.6 3.9 7.5 8.5
Other Income 3 14.5 1.4 1.5 1.1 1.4 2.0 2.0 0.7 0.5
PBT 11 23.7 9.4 5.5 7.1 9.9 4.6 5.9 8.2 9.0
Tax 2.8 3.3 2.5 2.2 1.8 3.3 2.1 2.7 2.4 3.3
PAT 8.2 20.4 6.9 3.3 5.2 6.7 2.4 3.2 5.8 5.7
Source: Compiled by IMaCS
-30%
-25%
-20%
-15%
-10%
-5%
0%
5%
10%
15%
20%
25%
-5%
0%
5%
10%
15%
20%
25%
30%
35%
40%
Q1FY09 Q2FY09 Q3FY09 Q4FY09 Q1FY10 Q2FY10
Yoy Growth-LS
QoQ Growth-RS

CII SR Quarterly Update
Chemicals and Fertilisers
38
Financial Performance—Southern Region Rs. million
FY2008 FY2009 FY2010
Q1 Q2 Q3 Q4 Q1 Q2 Q3 Q4 Q1 Q2
Net Sales/OI 3,393 3,557 3,688 4,030 3,813 4,772 4,193 4,248 4,541 4,914
Raw Material Cost 2,058 2,148 2,222 2,517 2,452 2,954 2,239 2,524 2,696 2,901
Employee Costs 163 180 183 181 191 214 229 248 230 249
Power & Fuel Costs 147 139 154 158 135 185 195 185 179 173
Other Operating
Costs 529 541 592 763 532 699 1,054 830 757 814
Cost of Sales 2,898 3,008 3,152 3,619 3,310 4,052 3,716 3,786 3,862 4,137
OPBDIT 496 549 537 411 503 721 476 461 679 776
Interest 97 90 103 117 129 168 201 130 166 186
Depreciation 129 133 139 157 146 145 168 165 171 175
OPBT 270 327 295 137 228 408 107 167 342 416
Other Income 103 515 52 61 41 66 85 85 30 25
PBT 373 842 347 198 269 475 192 251 372 441
Tax 94 116 93 91 70 157 89 115 110 163
PAT 280 726 254 108 200 317 102 136 263 278
Source: Compiled by IMaCS
As can be seen from the table above, the sharp increase in operating costs resulted in a steep decline
in operating margins during FY2009. But there seems to be some recovery since Q4FY2009, after
which in Q1FY2010 and Q2FY2010, the operating margins are higher than what they were during the
same quarter in the previous two fiscals. Financial Performance—Southern Region Rs. Million, except percentages
Rs. Million Change
(%)
% of OI
Q2FY 2010 2009 2010 2009
Net Sales/OI 4,914 4,772 3.0 100.0 100.0
Raw Material Cost 2,901 2,954 -1.8 59.0 61.9
Employee Costs 249 214 16.4 5.1 4.5
Power & Fuel 173 185 -6.2 3.5 3.9
Other Operating Costs 814 699 16.5 16.6 14.6
Cost of Sales 4,137 4,052 2.1 84.2 84.9
OPBDIT 776 721 7.7 15.8 15.1
Interest 186 168 10.7 3.8 3.5
Depreciation 175 145 20.8 3.6 3.0
OPBT 416 408 1.8 8.5 8.6
Other Income 25 66 -62.7 0.5 1.4
PBT 441 475 -7.2 9.0 9.9
Tax 163 157 3.4 3.3 3.3
PAT 278 317 -12.4 5.7 6.7
Source: Compiled by IMaCS

CII SR Quarterly Update
Chemicals and Fertilisers
39
The operating costs have increased in Q2FY2010 when compared to the previous quarter, each of the
individual costs increasing over 20% year on year, but still the operating margins are higher in
Q2FY2010 due to increase in sales. Trends in Operating Income and Operating Margins (Southern India)
Source: Compiled by IMaCS
On a quarterly basis in southern India, operating margins declined from 15% in Q2FY2009 to 11.4% in
Q3FY2009, and to 10.9% in Q4FY2009. But they have improved to 15% in Q1FY2010 and 15.8% during
Q2FY2010.
Chemicals Indust ry in Ind ia
During FY2009, the all India chemicals sector net sales increased by 12.2% compared to the previous
year but in Q2FY2010 they reduced by 13.2% yoy. Although there was a decline in the operating
expenses and a 23% rise in the interest cost led to an overall decline in the profit after tax by 23.4% in
Q1FY2010.
0%
2%
4%
6%
8%
10%
12%
14%
16%
18%
0
1,000
2,000
3,000
4,000
5,000
6,000
Q1FY08 Q2FY08 Q3FY08 Q4FY08 Q1FY09 Q2FY09 Q3FY09 Q4FY09 Q1FY10 Q2FY10
OI (Rs. million) Operating Margin

CII SR Quarterly Update
Chemicals and Fertilisers
40
Financial Performance of the Chemical Sector (All India) Rs. Million, except percentages
Rs. Million Change
(%)
% of OI
Q2FY 2010 2009 2010 2009
Net Sales/OI 50,142 57,788 -13.2 100.0 100.0
Raw Material Cost 31,151 38,673 -19.4 62.1 66.9
Employee Costs 2,826 2,690 5.0 5.6 4.7
Power & Fuel 994 1,474 -32.6 2.0 2.5
Other Operating Costs 8,345 8,304 0.5 16.6 14.4
Cost of Sales 43,316 51,140 -15.3 86.4 88.5
OPBDIT 6,827 6,649 2.7 13.6 11.5
Interest 1,850 1,742 6.2 3.7 3.0
Depreciation 1,801 1,674 7.6 3.6 2.9
OPBT 3,177 3,233 -1.8 6.3 5.6
Other Income 1,685 715 135.7 3.4 1.2
PBT 4,861 3,948 23.1 9.7 6.8
Tax 1,235 1,420 -13.1 2.5 2.5
PAT 3,626 2,528 43.5 7.2 4.4
Source: Compiled by IMaCS
On a quarterly basis in all India, operating margins declined from 13.2% in Q1FY2009 to 11.5% in
Q2FY2009, and to 3.2% in Q3FY2009 but recovered to 6.7% in Q4FY2009. They further recovered to
13.2% in Q1FY2010 and 13.6% in Q2FY2010.
Trends in Operating Income and Operating Margins (All India)
Source: Compiled by IMaCS
Fer t i l isers Indust ry in Southern Region
During Q2FY2010, 7 listed fertiliser companies with registered offices in the Southern Region
reported a 5.8% decline in operating income (OI) to Rs. 38.6 billion. OI (yoy) growth registered a
negative growth of 37.9% during Q2FY2010, from a negative growth of 5.8% during the previous
2%
4%
6%
8%
10%
12%
14%
16%
0
10,000
20,000
30,000
40,000
50,000
60,000
70,000
Q1FY08 Q2FY08 Q3FY08 Q4FY08 Q1FY09 Q2FY09 Q3FY09 Q4FY09 Q1FY10 Q2FY10
OI (Rs. million) Operating Margin
CII SR Quarterly Update
Chemicals and Fertilisers
41
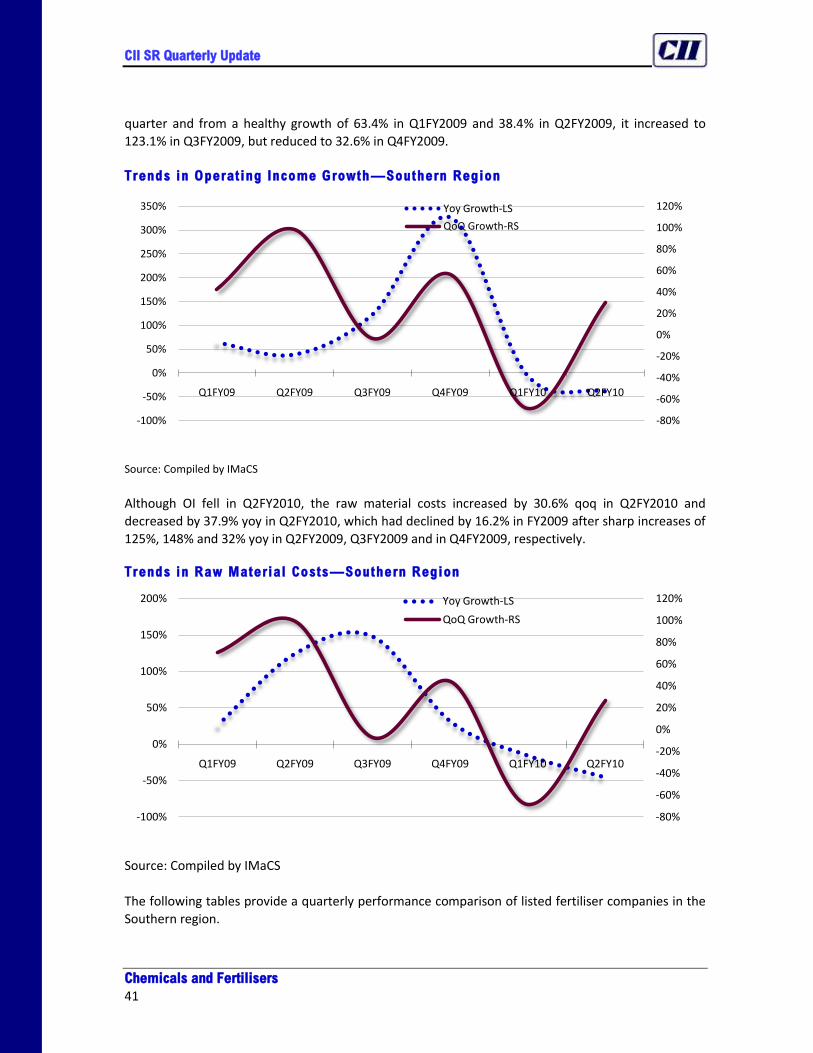
quarter and from a healthy growth of 63.4% in Q1FY2009 and 38.4% in Q2FY2009, it increased to
123.1% in Q3FY2009, but reduced to 32.6% in Q4FY2009.
Trends in Operating Income Growth —Southern Region
Source: Compiled by IMaCS
Although OI fell in Q2FY2010, the raw material costs increased by 30.6% qoq in Q2FY2010 and
decreased by 37.9% yoy in Q2FY2010, which had declined by 16.2% in FY2009 after sharp increases of
125%, 148% and 32% yoy in Q2FY2009, Q3FY2009 and in Q4FY2009, respectively. Trends in Raw Material Costs—Southern Region
Source: Compiled by IMaCS
The following tables provide a quarterly performance comparison of listed fertiliser companies in the
Southern region.
-80%
-60%
-40%
-20%
0%
20%
40%
60%
80%
100%
120%
-100%
-50%
0%
50%
100%
150%
200%
250%
300%
350%
Q1FY09 Q2FY09 Q3FY09 Q4FY09 Q1FY10 Q2FY10
Yoy Growth-LS
QoQ Growth-RS
-80%
-60%
-40%
-20%
0%
20%
40%
60%
80%
100%
120%
-100%
-50%
0%
50%
100%
150%
200%
Q1FY09 Q2FY09 Q3FY09 Q4FY09 Q1FY10 Q2FY10
Yoy Growth-LS
QoQ Growth-RS

CII SR Quarterly Update
Chemicals and Fertilisers
42
Financial Performance—Southern Region Rs. million
FY2008 FY2009 FY2010
Q1 Q2 Q3 Q4 Q1 Q2 Q3 Q4 Q1 Q2
Net Sales/OI 19,215 44,949 27,030 22,085 31,401 62,252 60,315 94,084 29,576 38,632
Raw Material Cost 19,612 21,642 18,231 14,406 24,640 48,937 45,259 65,325 20,644 26,200
Employee Costs 1,049 1,142 1,063 1,130 1,110 1,155 1,250 4,174 1,282 1,389
Power & Fuel Costs 2,419 2,429 3,022 2,990 3,044 4,674 3,447 8,357 2,544 3,297
Other Operating Costs -5,493 16,589 2,515 4,353 -182 2,815 10,187 13,732 3,571 3,227
Cost of Sales 17,587 41,803 24,831 22,879 28,612 57,581 60,143 91,589 28,040 34,112
OPBDIT 1,627 3,147 2,199 -795 2,789 4,671 172 2,495 1,536 4,519
Interest 1,751 1,615 1,468 2,013 1,840 1,851 1,719 3,053 1,245 1,313
Depreciation 912 929 925 873 906 907 915 2,807 924 956
OPBT -1,036 603 -194 -3,681 44 1,913 -2,462 -3,365 -633 2,251
Other Income 202 455 216 2,310 1,810 477 1,041 3,406 380 400
PBT -834 1,058 22 -1,371 1,854 2,390 -1,421 42 -254 2,650
Tax 321 938 530 164 1,191 1,023 907 1,925 380 1,191
PAT -1,155 120 -509 -1,535 663 1,367 -2,328 -1,883 -633 1,460
Source: Compiled by IMaCS
As can be seen from the table above, improvement in operating margins during Q2FY2010 is primarily
attributable to the increase in sales. The overall profitability of fertiliser companies in the southern
region have declined by 195.5% in Q1FY2010 compared to Q1FY2009. Financial Performance—Southern Region Rs. Million, except percentages
Rs. Million Change
(%)
% of OI
Q2FY 2010 2009 2010 2009
Net Sales/OI 38,632 62,252 -37.9 100.0 100.0
Raw Material Cost 26,200 48,937 -46.5 67.8 78.6
Employee Costs 1,389 1,155 20.3 3.6 1.9
Power & Fuel 3,297 4,674 -29.5 8.5 7.5
Other Operating Costs 3,227 2,815 14.6 8.4 4.5
Cost of Sales 34,112 57,581 -40.8 88.3 92.5
OPBDIT 4,519 4,671 -3.2 11.7 7.5
Interest 1,313 1,851 -29.1 3.4 3.0
Depreciation 956 907 5.4 2.5 1.5
OPBT 2,251 1,913 17.7 5.8 3.1
Other Income 400 477 -16.2 1.0 0.8
PBT 2,650 2,390 10.9 6.9 3.8
Tax 1,191 1,023 16.4 3.1 1.6
PAT 1,460 1,367 6.8 3.8 2.2
Source: Compiled by IMaCS
On a quarterly basis in southern India, operating margins declined from 8.9% in Q1FY2009 to 7.4% in
Q2FY2009, and to 0.3% in Q3FY2009. They became (-) 6.1% in Q4FY2009 but have improved to 5.2%
in Q1FY2010 and 11.7% in Q2FY2010.

CII SR Quarterly Update
Chemicals and Fertilisers
43
Trends in Operating Income and Operating Margins (Southern India)
Source: Compiled by IMaCS
Fer t i l isers Indust ry in India
During Q2FY2010, the all India fertiliser sector net sales declined by 41.8% compared to the previous
year. Although there was a decline in operating costs, the operating profit declined by 23.0% in
Q2FY2010. The overall decline in net profits was 18.5% in Q2FY2010 compared to Q2FY2009. Financial Performance of the Ferti l isers Sector (All India) Rs. Million, except percentages
Rs. Million Change
(%)
% of OI
Q2FY 2010 2009 2010 2009
Net Sales/OI 124,702 214,448 -41.8 100.0 100.0
Raw Material Cost 80,419 149,121 -46.1 64.5 69.5
Employee Costs 5,418 5,400 0.3 4.3 2.5
Power & Fuel 10,557 15,692 -32.7 8.5 7.3
Other Operating Costs 14,220 25,945 -45.2 11.4 12.1
Cost of Sales 110,615 196,158 -43.6 88.7 91.5
OPBDIT 14,087 18,290 -23.0 11.3 8.5
Interest 2,493 3,674 -32.1 2.0 1.7
Depreciation 3,506 3,286 6.7 2.8 1.5
OPBT 8,087 11,331 -28.6 6.5 5.3
Other Income 2,577 1,776 45.1 2.1 0.8
PBT 10,664 13,107 -18.6 8.6 6.1
Tax 3,667 4,520 -18.9 2.9 2.1
PAT 6,997 8,588 -18.5 5.6 4.0
Source: Compiled by IMaCS
-6%
-4%
-2%
0%
2%
4%
6%
8%
10%
12%
14%
0
10,000
20,000
30,000
40,000
50,000
60,000
70,000
80,000
90,000
100,000
Q1FY08 Q2FY08 Q3FY08 Q4FY08 Q1FY09 Q2FY09 Q3FY09 Q4FY09 Q1FY10 Q2FY10
OI (Rs. million) Operating Margin

CII SR Quarterly Update
Chemicals and Fertilisers
44
On a quarterly basis in all India, operating margins declined from 12.8% in Q3FY2008 to 4.9% in
Q3FY2009 but recovered marginally to 5.9% in Q4FY2009. It further recovered to 7.3% in Q1FY2010
and 11.3% in Q2FY2010.
Trends in Operating Income and Operating Margins (All India)
Source: Compiled by IMaCS
PRIMARY SURVEY CONCLUSIONS
Following are the conclusions from the primary survey of chemicals and fertilisers companies with
emphasis on the situation during Q2FY2010: -
The overall demand situation has begun to improve and the demand has improved by 20% in
the southern region.
There has been a negative impact on factors such as access to bank credit (hurdles in getting
them), government taxes and regulations (have become stringent) and shortage of both
skilled and unskilled labour.
The capacity utilisation and operating profit margins have improved when compared to the
preceding two quarters.
The wage rate during this quarter has increased compared to the last two quarters.
Quantitative analysis
o Expenditure pattern over the last three quarters (Q4FY2009, Q1FY2010, and
Q2FY2010):- Input costs have reduced by over 25% during this quarter. Employee
costs have increased by 10%, selling and administration expenses have increased by
3%, and total costs have come down by 7%. The operating profit has increased by
15% and the profit has increased by 10%.
SHORT-TERM OUTLOOK
A fall in sales is expected to continue during Q3FY2010. The delayed monsoon is expected to affect
kharif output this year. Availability of gas from Reliance basin is expected to help companies increase
their output to a certain extent. Lower input cost and interest expenses will help the industry improve
its profit margins during 2009-10, which are expected to be in the range of 3-4%.
2%
4%
6%
8%
10%
12%
14%
0
50,000
100,000
150,000
200,000
250,000
Q1FY08 Q2FY08 Q3FY08 Q4FY08 Q1FY09 Q2FY09 Q3FY09 Q4FY09 Q1FY10 Q2FY10
OI (Rs. million) Operating Margin

CII SR Quarterly Update
Chemicals and Fertilisers
45
Production of fertilisers is expected to clock a healthy 8.5% growth in 2009-10 due to availability of
natural gas from the KG-basin project. A fall in the raw material prices with moderation in imports
would reduce the Government’s burden in 2009-10. With a fall in subsidy, net sales of the industry are
also expected to witness a slower growth in the coming quarters.
Being an intermediate for a host of industries, demand for organic chemicals is related to the demand
growth in the end user industries such as PTA, textile, pharmaceuticals, fertilisers, dyes and paints,
paper, resins etc. Weak demand-Supply situation and lower prices are likely to affect production, sales
growth, and profitability during 2009-10. However, there is a significant scope for growth in the long
term with the per capita chemicals consumption being only 5 kg per annum, much lower than the
comparable figures in the developed markets. Commodity nature of the bulk chemicals industry and
fluctuations in prices subjects the revenues and profits of the players to volatility. Thus, there are
concerns on sustainability of the earnings for pure bulk chemicals players.
The demand for titanium dioxide is dependent on the paints sector. Paints industry is expected to
display moderate growth in the medium term backed by improved volumes in both the decorative
and industrial paints segment. A healthy (but lower) growth in GDP, access to housing finance and
fiscal incentives to housing sector may provide impetus to the housing activity may continue to drive
growth in decorative paints business.
With the shift in emphasis on product innovation, branch building and environmental friendliness, the
chemicals industry is increasingly moving towards greater customer orientation. Even though India
enjoys an abundant supply of basic raw materials, it will have to build upon technical services and
marketing capabilities to face global competition and increase its share of exports.
The demand for fertilisers is expected to continue to grow moderately over the short to medium
term. However, over the longer term, significant increase in agricultural production would be required
which would require significantly higher level of fertiliser consumption than the current levels. For
Indian fertiliser manufacturers, securing supplies to a cost-effective feedstock holds the key to future
growth. Under the new concession scheme for fertilisers, factors for increasing shareholder value
include effective feedstock management, increased energy efficiency, large capacity sizes, effective
location of plant, and high capacity utilisation.

CII SR Quarterly Update
Chemicals and Fertilisers
46
Industry and Economic Update has been prepared by ICRA Management Consulting Services Limited
(IMaCS) for the Confederation of Indian Industry (CII).
The information and opinions contained in this document have been compiled or arrived at from
sources believed to be reliable, but no representation or warranty expressed is made to their
accuracy, completeness or correctness. This document is for information purposes only. The
information contained in this document is published for the assistance of the recipient but is not to
be relied upon as authoritative or taken in substitution for the exercise of judgment by any
recipient. This document is not intended to be a substitute for professional, technical or legal advice.
All opinions expressed in this document are subject to change without notice.
Neither IMaCS nor CII, nor other legal entities in the group to which it belongs, accept any liability
whatsoever for any direct or consequential loss howsoever arising from any use of this document or
its contents or otherwise arising in connection herewith.
Related Documents