CIFOR Occasional Paper No. 47 Center for International Forestry Research William D. Sunderlin | Sonya Dewi | Atie Puntodewo Poverty and forests Multi-country analysis of spatial association and proposed policy solutions

Welcome message from author
This document is posted to help you gain knowledge. Please leave a comment to let me know what you think about it! Share it to your friends and learn new things together.
Transcript

CIFOR Occasional Paper No. 47
C e n t e r f o r I n t e r n a t i o n a l F o r e s t r y R e s e a r c hC e n t e r f o r I n t e r n a t i o n a l F o r e s t r y R e s e a r c h
CIFOR is one of the 15 centres of the Consultative Group on International Agricultural Research (CGIAR)
The CIFOR Occasional Paper series publishes research results that are particularly significant to tropical forestry. The content of each paper is peer reviewed internally and externally, and simultaneously published in print and on the web (www.cifor.cgiar.org/publications/papers).
To request a copy, please contact publications at [email protected]
CIFOR is a leading international forestry research organisation established in 1993 in response to global concerns about the social, environmental, and economic consequences of forest loss and degradation. CIFOR is dedicated to developing policies and technologies for sustainable use and management of forests, and for enhancing the well-being of people in developing countries who rely on tropical forests for their livelihoods. CIFOR is one of the 15 centres of the Consultative Group on International Agricultural Research (CGIAR). With headquarters in Bogor, Indonesia, CIFOR has offices in Brazil, Bolivia, Burkina Faso, Cameroon, Ethiopia, India, Zambia and Zimbabwe, and it works in over 30 other countries around the world.
William D. Sunderlin | Sonya Dewi | Atie Puntodewo
Poverty and forestsMulti-country analysis of spatial association and proposed policy solutions
DonorsCIFOR receives its major funding from governments, international organizations, private foundations and regional organizations. In 2006, CIFOR received financial support from Australia, Asian Development Bank (ADB), African Wildlife Foundation, Belgium, Canada, Carrefour, Cecoforma, China, Centre de coopération internationale en recherche agronomique pour le développement (CIRAD), Convention on Biological Diversity, Cordaid, Conservation International Foundation (CIF), European Commission, Finland, Food and Agriculture Organization of the United Nations (FAO), Ford Foundation, France, German Agency for Technical Cooperation (GTZ), German Federal Ministry for Economic Cooperation and Development (BMZ), German Foundation for International Cooperation, Global Forest Watch, Indonesia, Innovative Resource Management (IRM), International Institute for Environment and Development, International Development Research Centre (IDRC), International Fund for Agricultural Development (IFAD), International Tropical Timber Organization (ITTO), Israel, Italy, the World Conservation Union (IUCN), Japan, Korea, MacArthur Foundation, Netherlands, Norway, Netherlands Development Organization, Overseas Development Institute (ODI), Peruvian Secretariat for International Cooperation (RSCI), Philippines, Spain, Sweden, Swedish University of Agricultural Sciences (SLU), Switzerland, The Overbrook Foundation, The Tinker Foundation Incorporated, The Nature Conservancy (TNC), Tropical Forest Foundation, Tropenbos International, United States, United Kingdom, United Nations Environment Programme (UNEP), United Nations Educational, Scientific and Cultural Organization (UNESCO), United Nations Forum on Forests (UNFF), Wageningen International, World Bank, World Resources Institute (WRI) and World Wide Fund for Nature (WWF).
Sunderlin, W.D. Poverty and forests: multi-country analysis of spatial association and proposed policy solutions/by W.D. Sunderlin, Sonya Dewi and Atie Puntodewo. Bogor, Indonesia: CIFOR, 2007.
ISSN 0854-9818 ISBN 978-979-14-1221-644p. (CIFOR Occasional Paper No. 47)
CABI thesaurus: 1. poverty 2. poverty alleviation 3. forest resources 4. spatial distribution 5. spatial variation 6. policy 7. land ownership 8. forest products 9. markets 10. community forestry 11. companies 12. partnerships 13. Brazil 14. Honduras 15. Malawi 16. Mozambique 17.Uganda 18. Indonesia 19. Vietnam
I. Dewi, S. II. Puntodewo, A. III. Title
The findings, interpretations, and conclusions expressed in this paper do not necessarily reflect the views of the Executive Directors of The World Bank or the governments they represent. The World Bank does not guarantee the accuracy of the data included in this work. The boundaries, colors, denominations, and other information shown on any map in this work do not imply any judgment on the part of The World Bank concerning the legal status of any territory or the endorsement or acceptance of such boundaries.
© 2007 by Center for International Forestry ResearchRevised Edition, March 2008All rights reservedPrinted by Indonesia Printer, Jakarta
Maps by Atie PuntodewoCover photos by Wendy Miles, Christian Cossalter, Widya Prajanthi, Douglas Sheil, Misa Kishi, Eko Prianto, Ani Adiwinata Nawir
Published by Center for International Forestry ResearchMailing address: P.O. Box 0113 BOCBD, Bogor 16000, IndonesiaOffice address: Jl. CIFOR, Situ Gede, Bogor Barat 16115, IndonesiaTel.: +62 (251) 622622; Fax: +62 (251) 622100E-mail: [email protected] Web site: http://www.cifor.cgiar.org

Poverty and forestsMulti-country analysis of spatial association and proposed policy solutions
William D. SunderlinSenior Researcher, Rights and Resources Group, 1238 Wisconsin Avenue, Suite 204, Washington, DC 20007, USA and Senior Research Associate, Center for International Forestry Research, Bogor, Indonesia.
Sonya Dewi Scientist, Spatial Analysis Unit, World Agroforestry Centre, Bogor, Indonesia.
Atie PuntodewoGIS Specialist, Information Services Group, Center for International Forestry Research, Bogor, Indonesia.

Abbreviations, acronyms and glossary iiiAcknowledgements vAbstract vi
1. Introduction 1
2. Is there a relationship in the location of poverty and forests? 2 2.1 Evidence of the spatial coincidence of poverty and forests 2 2.2 Objectives of the study 3 2.3 Methods 3 2.4 Findings 7 2.4.1 Verification of expected spatial patterns 8 2.4.2 Aggregated findings 16
3. Reasons for the coincidence of poverty and forests 19 3.1 Primordial poverty in forested areas 19 3.2 The powerlessness of people in forested areas 20 3.3 Forests as a magnet for migrants 20 3.4 Low investment in remote areas 21 3.5 Summary 21
4. Poverty alleviation in forested areas: What are the policy implications? 22 4.1 ‘Forest-based poverty alleviation’ defined 22 4.2 Paths out of poverty in the forest 22 4.3 Can economic growth and laissez-faire be relied on? 23 4.4 Forest-based paths out of poverty 24 4.4.1 Tenure transfer 25 4.4.2 Promote market access 27 4.4.3 Community forestry 28 4.4.4 Payments for environmental services 31
5. Summary of findings and recommendations 32
References 34
Annexes 40 Annex I. Sources of socioeconomic data used in LISA analysis 40 Annex II. Experimentation with narrow and wide definitions of forest 43
Contents

iii
Abbreviations, acronyms and glossary
ADB-RETA Asian Development Bank Regional Technical Assistance
A/R afforestation/reforestation
AVHRR Advanced Very High Resolution Radiometer
BID Banco Interamericano de Desarrollo (Inter-American Development Bank)
BPS Badan Pusat Statistik (Central Statistics Agency, Indonesia)
CDM Clean Development Mechanism (Kyoto Protocol)
CD-ROM compact disk – read only memory
CFE community forest enterprise
CIFOR Center for International Forestry Research
CPRC Chronic Poverty Research Centre
EFI European Forest Institute
ES environmental service
FAO Food and Agriculture Organization of the United Nations
FBPA forest-based poverty alleviation
FOMACOP Forest Management and Conservation Project
GDP gross domestic product
GSO General Statistical Office (Vietnam)
GTZ Deutsche Gesellschaft für Technische Zusammenarbeit (German Agency for Technical Cooperation)
HCR head count ratio
HH high forest cover and high poverty (rate or density)
HIS Integrated Household Survey(s) (Malawi)
HL high forest cover and low poverty (rate or density)
HVF High Value Forest
IBGE Instituto Brasileiro de Geografia e Estatística (Brazilian Institute of Geography and Statistics)
IDB Inter-American Development Bank
IFPRI International Food Policy Research Institute
IHS Integrated Household Survey
IIPA Indian Institute of Public Administration
ILRI International Livestock Research Institute
INE Instituto Nacional des Estadistica (National Institute of Statistics, Honduras)
IPEA Instituto de Pesquisa Econômia Aplicada (Institute of Applied Economic Research, Brazil)
IUCN The World Conservation Union
km kilometre(s)
laissez-faire a policy of noninterference, especially abstention by governments from interfering in the workings of the free market

iv
LH low forest cover and high poverty (rate or density)
LISA Local Indicators of Spatial Association
LL low forest cover and low poverty (rate or density)
LSMS Living Standards Measurement Study (World Bank)
MECOVI Programa para el Mejoramiento de las Encuestas y la Medición de las Condiciones de Vida en América Latina (Program for the Improvement of Surveys and the Measurement of Living Conditions in Latin America and the Caribbean)
mestizo people of mixed European and indigenous non-European ancestry (term of Spanish origin)
MRC Mekong River Commission
NGO nongovernmental organisation
NTFP non-timber forest product
PAC Partnership to Assist the Poorest Communes
PDR People’s Democratic Republic (Laos)
PES payment(s) for environmental service(s)
PHC Population and Housing Census
PREM Poverty Reduction and Environmental Management
PROFAFOR Programa Face de Forestación
R$ Brazilian real (currency)
RECOFTC Regional Community Forestry Training Center for Asia and the Pacific
rentismo expropriation of economic rents by the powerful at the expense of the rest of the population (Latin American term)
S.D. standard deviation
SIDA Swedish International Development Cooperation Agency
SMFEs small and medium-sized forest enterprises
SMRP Sustainable Management of Resources Project
SUSENAS National Socioeconomic Survey (Indonesia)
TA Traditional Authority
VA Virginia (USA)
VND Vietnamese dong (currency)

v
Acknowledgements
This report was written as a background paper for a World Bank Policy Research Report by Kenneth Chomitz and colleagues, entitled At Loggerheads? Agricultural Expansion, Poverty Reduction, and Environment in Tropical Forests (Chomitz et al. 2007). This work was supported in part by the Trust Fund for Environmentally and Socially Sustainable Development.
We owe a debt of gratitude to Ken Chomitz and Arild Angelsen (author of a separate background paper, Angelsen 2007) for helpful guidance in conceptualising this paper and for making insightful comments on an early draft. We also express our thanks to Peter Dewees, David Kaimowitz, Bruce McKenney, Daniel Müller, Jeff Sayer and Luca Tacconi for excellent comments on a draft of this paper. Guy Manners was painstaking, thorough, and very professional in copy-editing our draft. We alone are responsible for any errors that may remain in the finished product.

vi
This paper examines poverty and deforestation in developing countries as linked problems and focuses on policies that can favour poverty alleviation in forested regions. The paper encompasses two elements: analysis of the spatial coincidence between poverty and forests, and proposed policy options for reducing poverty in forested areas.
It is assumed that three key frames of reference must be borne in mind in order to produce the best possible policies: (1) the location of the rural poor and types and levels of poverty in relation to forest resources; (2) variations in the density of forest cover in relation to distance from urban areas (the von Thünen scale); and (3) variations in forest cover over time (high, low, then partial restoration) in relation to a country’s forest transition experience.
There are three main conclusions linked to these frames of reference. (1) Although relatively few people live in areas of high forest cover, they tend to be characterised by high rates of poverty and they are among the ‘poorest of the poor’. (2) Four policy approaches are recommended for lifting people out of poverty: transfer of ownership of forest lands from governments to forest dwellers; facilitation of access to forest product markets; promotion of commercial-scale community forestry and company–community partnerships; and establishment of payments for forest environmental services that are pro-poor. Implementation of these four strategies must take into account the implications of the four von Thünen zones (periurban, agricultural mosaic, forest frontier, and relatively undisturbed forests). (3) One cannot place blind faith in economic growth and laissez-faire for reducing poverty in forested areas. Strategic policy interventions are necessary to assist the process of livelihood improvement.
Abstract

1Poverty and forests: Multi-country analysis of spatial association and proposed policy solutions
1. Introduction
Human wellbeing and forest cover should be examined as joint problems because of mutual causal links. Throughout the ages, changes in levels of living standards have affected forests and, reciprocally, changes in forest cover have affected wellbeing for better or worse.
Sunderlin et al. (2005, pp. 1384–1385) contend that there is a link between the problems of poverty and deforestation that tends to go unnoticed, yet is fundamental to conceptualising solutions to the joint problems: areas of poverty and areas of remaining natural forest in developing countries appear to have a tendency towards shared overlapping space. This overlap is far from being a perfect match: there are hundreds of millions of poor people in developing countries who do not live in forested areas; moreover, there are areas of remaining natural forest where people are not poor. Nevertheless, on the basis of theory and anecdotal evidence, this paper tests the hypothesis that there is a statistically significant tendency for areas of high poverty incidence and high remaining forest cover to coincide.
If indeed such a spatial coincidence exists, then it has potentially important policy implications. If true, this coincidence could add to our understanding of why the poor tend to be more reliant than the nonpoor on forest resources. Most explanations of this high reliance tend to focus on the ‘pro-poor’ qualities of forested landscapes (e.g. the open access tenure of some forests) and of forest resources (e.g. the ‘safety net’ functions of forest resources) rather than on geographical factors. Moreover, if the coincidence is true, and if it signifies a tendency towards relatively high dependence on forest resources at the local level, then it increases the relevance of forest resources in poverty alleviation strategies.
In addition to gaining a better understanding of the relative locations of the rural poor and forests in developing countries, it is also vital to take into account the reasons for the variations in forest cover across space and time. The spatial variation of forests is best explained by the theories of von Thünen (1826), which explain how land rent, and its variation in relation to distance from cities and towns, can
determine land uses. A forestry application of von Thünen’s theories postulates that forests increase in density as a function of distance from urban centres. Forests are usually scarce in periurban areas, more abundant in areas that form ‘mosaics’ with agricultural fields, denser still at the ‘forest frontier’ where active forest conversion is occurring, and most dense in relatively undisturbed forests that are far from cities. There are important exceptions to this general pattern. For example, in cases where there is urban demand for forest products and transport costs for distant timber and wood are too high, there is deliberate planting of periurban trees and forests.1
The variation of forest cover across time is explained in writings on the forest transition, which hold that a country’s forests tend to be relatively abundant at the early stage of socioeconomic development, are converted to other land uses as the process of development proceeds, and then are at least partly restored (though partly as forest plantations) at higher levels of per capita income (see, for example, Rudel 1998, 2005). In the latter stages of the forest transition, rural to urban migration, agricultural intensification, substitution of wood products (e.g. replacement of fuelwood and charcoal by fossil fuels), and other processes can lead to stabilisation of forest cover loss and partial forest cover restoration. Indeed, this is a pattern that has been documented in various high income countries and several developing countries. For a more in-depth explanation of both the von Thünen and forest transition theories, see Angelsen (2007) and Chomitz et al. (2007) written in conjunction with this report.
It can be argued that the von Thünen and forest transition theories are functionally analogous, that is, that they are merely spatial and temporal representations of the same phenomenon. After all, as explained insightfully by Chomitz et al. (2007), a journey away from the city to
1 Other notable exceptions include, for example: dense forests in downtown Nairobi that date back 100 years; the fact that Addis Ababa in Ethiopia never had forests originally, but at the beginning of the twentieth century eucalypts were introduced and now form a ring around the city; and the fact that some developing country cities were never established in forested areas to begin with (Dewees personal communication).

2 CIFOR Occasional Paper No. 47 William D. Sunderlin, Sonya Dewi and Atie Puntodewo
the depths of the countryside is like going back in time. One tends to see more forests, and in doing so, one is seeing a landscape that is more like the one that existed a hundred years back. But it is important to bear in mind the differences between the two models. The von Thünen model does not postulate a restoration of forest cover, even in periurban or even urban areas—a key premise of forest transition theory. This is why both frames of reference are necessary to complete our theoretical backdrop.
This paper addresses three linked sets of questions:
1. Is there an empirically discernible correlation between the areas where the poor live and areas of forest at the national level? If such patterns exist, how do they vary within a country and among countries?
2. Assuming such a correlation exists, what
are the historical, socioeconomic and geographical factors that explain a spatial overlap of poverty and forest cover? What explains why forest dwellers are poor, and conversely, why many poor are forest dwellers?
3. How does understanding these determinants of forest-based poverty help us formulate better poverty alleviation policies? What are the principal policy options available for poverty alleviation in forested areas? To what extent do these options depend on forest resources? How do they vary in terms of the von Thünen categories and in terms of the stages of forest transition?
The paper is composed of the following sections. Section 2 examines whether there is a correlation between the location of poverty and forests in developing countries through seven country case studies. Section 3 discusses the historical, socioeconomic and geographical factors that explain the location of poor people and forests in developing countries. Section 4 puts the findings in a policy context, looking at the potential of forest-based poverty alleviation strategies judged to be key: forest tenure transfer; market access; community forestry; and payments for environmental services. Section 5 summarises the key findings and policy recommendations.
2. Is there a relationship in the location of poverty and forests?
In this section, we first review the country-level observations suggesting a spatial coincidence of poverty and forests. We then describe the objectives and methods used for empirically testing the coincidence in seven country case studies (Brazil, Honduras, Malawi, Mozambique, Uganda, Indonesia, Vietnam), and then present the findings.
2.1 Evidence of the spatial coincidence of poverty and forests
There is strong evidence for supposing that many of the poorest of the poor in developing countries live in or near forested areas. This makes intuitive sense because some of the poorest of the poor in developing countries tend to live in remote rural areas, and remaining natural forests are found in remote rural areas as well.
Various country-level observations have been made of the tendency for the rural poor to be disproportionately located in or near forests. In China, there is an observed overlap between the counties categorised as being severely poor and the counties with abundant forest resources (Zhou and Veeck 1999, p. 82). Poffenberger et al. (1996, cited in Khare et al. 2000, p. 25) found that there is a strong association between the location of tribal people (tending to be among the poorest in India) and the location of forests. Approximately 275 million people in India’s rural areas depend on forests for at least a portion of their income; forest dwellers, who are disproportionately tribal, are among the poorest and most vulnerable people in India (World Bank 2006a, p. viii). About one half of India’s 350 million poor people are concentrated in three states where natural, physical, social and human capital are low, and the greatest poverty is experienced among people in forest-based economies; 84% of India’s ‘tribal’ ethnic minorities live in forested areas (Mehta and Shah 2003, pp. 499, 501). Shah and Guru (2004, p. 8) explain that the ‘incidence of poverty, reflected by head count ratio (HCR), is higher than the all-India estimates for the majority of forest based states. Compared to this,

3Poverty and forests: Multi-country analysis of spatial association and proposed policy solutions
the incidence of poverty is substantially lower among dryland states except Maharashtra. The pattern is more or less the same during 1993–94 and 1999–2000’.
The association between poverty and forest cover in both China and India is important globally, among other reasons because these two countries together have 583 million people living on less than US$ 1 per day, which is almost half the world total of 1.2 billion people living on less than US$ 1 per day.2
Three recent country case studies deepen our understanding of the spatial coincidence of poverty and forests by quantifying the patterns, by disaggregating poverty by type (rate and density), and by discussing the factor of distance from urban areas. ‘Poverty rate’ is the proportion of people who are poor in a given area, whereas ‘poverty density’ is the absolute number of poor in a given area.
Chomitz and Nelson’s (2003) case study of Nicaragua finds that ‘remoteness from towns and markets is associated with high poverty rates, high forest cover, and low population density. This results in a strong correlation between poverty rates and standing forests, and also a strong correlation between past deforestation and poverty density’. Similarly, Müller et al.’s (2006) case study of Vietnam demonstrates, through bivariate LISA (Local Indicators of Spatial Association) analysis, a strong statistical correlation among the location of low poverty density, high poverty rate (and poverty severity) and high forest cover in remote areas where ethnic minorities tend to be dominant. Conversely, the study finds a high correlation among areas of high poverty density, low poverty rate and low forest cover in urban and periurban areas and in the Mekong delta. Consistent with the findings of Chomitz and Nelson (2003) and Müller et al. (2006), Dasgupta et al. (2005, p. 623) show that poverty density in Cambodia tends to be high in areas of low forest cover, and low in areas of high forest cover.
2.2 Objectives of the studyThe general objective of this part of the study is to increase understanding of the spatial association of poverty and forests through multiple case studies in Latin America, Africa
and Asia. National- and local-level spatial data are analysed to achieve the following specific objectives.
1. To find patterns of spatial association between measures of poverty and forest cover, and identify regions within countries where particular relationships between poverty and forest hold. The patterns found in the Vietnam case study of Müller et al. (2006) are to be compared with those of other countries. The specific patterns being verified are a correlation of high poverty rate, low poverty density and high forest cover on one hand, and low poverty rate, high poverty density and low forest cover on the other hand.
2. To draw lessons learned across the seven case studies.
2.3 MethodsThis section describes and evaluates the methods used in measuring the strength of the association between measures of poverty and forest cover in multiple country case studies. Attention is given to: case selection and data sources; techniques used; drawbacks and limitations of the approach; and comparisons of the results among countries.
Case selection and data sourcesCountry case studies were chosen that met the following minimum data requirements:
• Forest cover is non-negligible; • Availability of relatively recent and reliable
population and poverty data at a relatively fine level of disaggregation;
• The population and poverty data are specified at the level of the district and can be attributed to the georeferenced district map.
On the basis of these criteria, the following seven countries were chosen for analysis: Brazil, Honduras, Malawi, Mozambique, Uganda, Indonesia and Vietnam. Although the Vietnam case has been done already by Müller et al. (2006) using higher resolution forest-cover maps, it was inserted into this data set for the
2 This was calculated on the basis of information in World Bank (2004, pp. 1, 256–258).

4 CIFOR Occasional Paper No. 47 William D. Sunderlin, Sonya Dewi and Atie Puntodewo
purpose of comparison and contrast. The specific sources for the socioeconomic data used for each country case are shown in Annex I.
Forest cover data were obtained from the Continuous Fields 1 km Tree Cover map produced by DeFries et al. (2000a, b) from Advanced Very High Resolution Radiometer (AVHRR) imageries for the period 1992-93. The map represents estimates of canopy density as a percentage within 1 km2 cells. We produced a new map of vegetation classes based on reclassification of the values as follows: 0–10% crown cover = nonforest; 10–40% crown cover = open forest; and 40–100% crown cover = closed forest. The coarse-resolution Tree Cover map was used in spite of some limitations (see below), because it provides relatively recent forest cover data for all the country cases, and because the uniformity of the data collection method and of the forest class definitions applied enables a degree of comparability among the countries studied.
The statistical techniques used for analysing spatial associationBefore we explain the techniques used, it is important for us to convey a theoretical point concerning methods. In addition to examining spatial variation on the von Thünen scale, two other issues need to be taken into consideration when trying to understand the link between poverty and forest through an empirical approach. First, we acknowledge that there are many exogenous factors that shape the relationship between poverty and forests that we do not deal with explicitly in this study. These factors might or might not operate at different spatial scales. It is important that our study address poverty and forest measures at a fine enough level of disaggregation to be able to capture the relevant patterns. The problem of modifiable area units that may result in arbitrary conclusions due to the arbitrary division of space is well-known (Fotheringham and Wong 1991). Second, the first law of geography, spatial dependence, most likely holds where spatial units are fine enough and areas of interest are large enough. Such spatial dependence, i.e. neighbouring areas being more similar to each other than distant areas, needs to be taken into account when running statistical analyses.
The empirical part of this paper aims only to explore and visualise spatial patterns of association between poverty and forest. We
do not aim to explain or predict causality. We use several techniques, including scatter diagrams and correlation tests, mapping, and univariate and bivariate global and local spatial association tests. The scattergram and Pearson correlation tests try to reveal if there are any general, national patterns of relationships between poverty and forests. These techniques only address spatial variation and not spatial dependence. We used Moran’s I, which is widely used in various applications as the indicator of spatial association. Univariate global Moran’s I was used to test the strength of spatial dependence of poverty and forest, using simple adjacency to define neighbourhood. We then explore the relationships between poverty and forest at the national level, taking into account spatial dependence, using bivariate global Moran’s I. Further, local Moran’s I (Local Indicators of Spatial Association or LISA) analysis was conducted in order to identify regions within a country where different patterns of relationship between poverty and forest hold. Visualisation of the results on maps greatly assists interpretation of the results, and serves as the basis for the qualitative discussion of causality in Section 3. LISA analysis has been widely used for various applications. Müller et al. (2006) use LISA in their spatial analysis of poverty and forests in Vietnam.
The bivariate local spatial autocorrelation measure using the Moran’s I statistic, derived from Anselin’s formula (1995, p. 98), is written as:
∑j=1,
N
WijZxiI l = Zyjj≠i
Where x and y are the two variables for district i and the neighbouring district j, zx and zy are the standardized z-scores of variables x and y, respectively. The spatial weight matrix wij is a binary contiguity matrix that defines the spatial structure for the locations that are included in the calculation of the local Moran’s I. If observations share a common border wij = 1, otherwise wij = 0. The diagonal elements in the matrix are zero and the off-diagonal elements represent the specified neighbourhood around the observation i. The matrix choice is based on logical insights and therefore involves an

5Poverty and forests: Multi-country analysis of spatial association and proposed policy solutions
arbitrary component. In this study, a first-order queen contiguity matrix defines the spatial extent of the observations included. The queen criteria considers all surrounding neighbours (districts) that have a common border or common vertices with the observation of interest. The averages of all local Moran indices over all observations (districts) N are proportional to the global Moran’s I (Anselin 1995).
All LISA indicators were calculated using GeoDaTM (Anselin 2005). To create the maps, a randomisation approach of 999 permutations is used to avoid large sensitivities in the results. The randomisation assumes the location of the values and their spatial arrangement to be irrelevant. Based on the randomisation, different theoretical standard deviations for the Moran’s I are obtained, each yielding a different p-value as a pseudo-significance. The threshold value of 0.01 defines significance. The p-values follow an asymptotically standard-normal distribution that allows judging their significance level by comparing them to a reference distribution (Anselin 1995).
Application of the LISA method to the studyIn this study, we seek to understand how magnitudes of poverty (low or high poverty rate or density) are spatially related to densities (low or high) of forest cover at the level of the district within the seven case study countries. In applying the bivariate LISA method in this study, spatial clusters were produced that measure the relationships between two variables: (1) a correlation of forest cover and poverty rate (proportion of people who are poor in a given area) in the surrounding area; and (2) a correlation of forest cover and poverty density (absolute number of poor people in a given area) in the surrounding area.
Poverty is defined as the poverty rate or density per district area, and forest cover is defined as the proportion of closed forest (40–100% crown cover) per district area. In conducting our LISA analysis of forest and poverty, we limited our definition of ‘forest’ to ‘closed forest’ for reasons that we explain later in this paper (see Annex II). For each district, we calculated the district forest fraction by dividing the area of closed forest by the area of the district. For each country case, we took the average of the district forest
fractions and used this as the country-specific cut-off point to distinguish ‘high’ and ‘low’ forest cover—thus, a district with a forest fraction larger than the cut-off point is labelled as ‘high’ forest, and a district with a forest fraction smaller than the cut-off point is labelled as ‘low’ forest. So, for example, for districts in which correlations of forest cover and poverty rate are significant, the associated maps will display the correlations using the following labels:
• HIGH–HIGH (HH) [dark red] = high forest cover and high poverty rate
• LOW–LOW (LL) [dark blue] = low forest cover and low poverty rate
• HIGH–LOW (HL) [light red] = high forest cover and low poverty rate
• LOW–HIGH (LH) [light blue] = low forest cover and high poverty rate.
In the case of the maps of poverty rate, the expected patterns are statistically verified in areas of the map showing dark red (HH) or dark blue (LL). In other words, in these maps, dark red indicates the areas where forest cover is high and the poverty rate in surrounding districts is high, and dark blue indicates areas where forest cover is low and the poverty rate in surrounding districts is low. Similarly, in the case of the maps of poverty density, the patterns are verified in areas of the map showing light blue and light red. In these maps, light blue indicates the expected area of low forest cover and high poverty density in surrounding districts, and light red indicates the expected area of high forest cover and low poverty density in surrounding districts. Parts of the map in light yellow indicate areas where no statistically significant association was found in the bivariate analysis. Measures of poverty and forest cover each exhibit the potential for spatial autocorrelation. For example, univariate Moran’s I calculations show that percentages of forest cover tend to be similar in area units that are close to one another. In applying the bivariate Moran’s I statistic to the case study data, autocorrelations of poverty and forest data are discerned and classified. Districts with significant Ii values are grouped into four categories as explained above: high forest – high poverty (HH); high forest – low poverty (HL); low forest – high poverty (LH); and low forest – low poverty (LL) relative to the mean of forest and poverty, respectively, within

� CIFOR Occasional Paper No. 47 William D. Sunderlin, Sonya Dewi and Atie Puntodewo
the country. For example, a district classified as HH means that it is characterised as having a high level of forest cover and is surrounded by districts that have a high poverty measure.
In the LISA analysis, the categorisation into four groups is conducted on the basis of three criteria. For example, for a district i to be classified as HL, the following three conditions must hold:
1. The bivariate local Moran’s Ii is significantly different from zero and negative (if it is HH or LL, then it is significantly different from zero and positive)
2. The forest cover of district i is greater than the national mean for forest cover
3. The mean of poverty of the neighbouring districts of i is less than the national mean for poverty.
These rules apply equally whether the poverty measure is rate or density.
Each of the figures displaying the findings shows four maps: (1) forest cover and major urban areas; (2) population density; (3) LISA analysis of poverty rate and forest cover; and (4) LISA analysis of poverty density and forest cover. The juxtaposition of the maps showing urban areas and population density (Maps 1 and 2) to the maps showing the LISA results (Maps 3 and 4) is important because it helps us understand—albeit only visually—the relationship between remoteness (defined simply as distance from urban centres) and the patterns of association between poverty and forests as revealed in the LISA analysis.
Justification for the techniques usedThe main justifications for measuring and testing global and local spatial autocorrelation in studying the relationship between poverty and forest cover are as follows. The global Moran’s I technique provides the means to test the hypothesis that spatial variation and spatial dependence are important in assessing the relationship between poverty and forests. We assume not only that spatial variation will be discernible in each univariate case of poverty and forest cover (i.e. that poverty and forest cover vary from place to place), but also that there are spatial variations in the relationships
between forest cover and poverty. Identifying these variations spatially will enable us to explore causalities between the two in the context of other exogenous factors.
The LISA method provides an efficient way of detecting correlations at the local level that are not readily discernible when pooling data at the national level. Furthermore, the visualisation facility in LISA analysis displays the results in a spatial format. This is important because—for lack of a measure of remoteness in the study—remoteness is discerned by juxtaposing the LISA map results onto a national map showing major urban areas and population density.
Drawbacks and limitations of the methods usedAlthough we believe the methods applied are appropriate to the objectives of the study, there are important drawbacks and limitations that should be flagged.
1. Looking at just two variables (poverty and forest) runs the risk of producing over-simplified and perhaps even misleading conclusions about their relationship to one another. There are numerous variables that can affect the relationship between poverty and forest cover, including degree of remoteness from urban areas, topography, the presence or absence of roads and markets, and soil quality. Nevertheless, it is useful to measure the strength of the association between poverty and forests to test and verify anecdotal information about their spatial relationship, and also to set the stage for more sophisticated studies using a multivariate approach.
2. For lack of time series data on poverty and forest cover, we restrict ourselves to a static measure of the relationship between the two variables. This restricts our ability to draw definitive conclusions about cause and effect patterns between the two, and also restricts us to educated guesses about where the relationship is heading over time.
3. AVHRR data are coarse and this risks inaccuracy in capturing vegetation reflectance. Depending on the landscape patterns, under- and over-estimation of vegetation density can be significant. This

�Poverty and forests: Multi-country analysis of spatial association and proposed policy solutions
can be especially problematic in areas of the country cases that have ample forest–savannah transition zones or highly fragmented mosaic-type landscapes. However, at least in the case of Vietnam, which has some dry forests, this proved not to be a problem. Müller et al. (2006) used finer resolution forest cover data for Vietnam than were available for the other six countries in this study, while this study used the AVHRR data for Vietnam and the results were consistent with their findings.
4. Another problem concerns the arbitrariness of the cut-off points in defining ‘forest’ as ‘closed forest’ (that is, 40–100% crown cover, as per FAO’s system of classification; FAO 2001, Appendix 2). This narrow definition of forest has the benefit of omitting from the ‘forest’ category large areas of shrubs and other vegetative cover in the humid tropics that one would not properly consider as ‘forest’ in the tropical context. Moreover, this narrow definition of forest, with its correspondingly narrow definition of ‘high’ forest, more strongly equates with the core attributes of remoteness (distance from urban areas and roads, presence of indigenous people, lack of market access, etc.), making some of our observations about the link between remoteness, poverty rate and forests stand out in bolder relief. However, there is a severe drawback in using this restrictive definition. In dry and subtropical countries (e.g. the Miombo countries), large areas of sparser woodlands and shrublands, which can be properly called forests and upon which large segments of the population can depend for their livelihoods, might not be considered as forested areas if crown cover is less than 40%. We experimented with the approach of defining ‘forest’ either narrowly or widely, and decided that we had to choose one definition or the other to avoid the awkwardness of applying different definitions of forest across the seven case studies. We ended up deciding that the benefits of the narrow definition outweighed its disadvantages (see Appendix II for an explanation).
Comparisons among country casesComparisons and contrasts among the case study countries are possible in spite of the
fact that they are crude. While use of AVHRR data helps standardise forest cover measures among countries, the shortcomings of AVHRR data use (see above) tends to weaken the basis for comparison. The basis for comparison is also weakened by the fact that methods for measuring poverty are different among countries. Nevertheless, if one assumes that all countries apply broadly similar assumptions about what constitutes adequate or inadequate human wellbeing, the comparisons are at least minimally legitimate and useful.
2.4 FindingsThe Pearson test results show that district-level correlations between poverty rate and forest cover are weak at the national level (low correlation coefficients) even though in four cases they are significant at the 0.001 level (see Table 1). The Brazilian case shows an unexpected sign of correlation: districts with a lower poverty rate tend to associate with higher forest cover. These patterns confirm our view about the existence of exogenous factors that shape the relationships. Similarly, when we take into account spatial dependence, the bivariate patterns do not really differ markedly from those without spatial dependence, at the national level. However, these should not be used to judge the deficiency of spatial dependence. The last two columns in the table show that most Moran’s I values for poverty rate and forest cover are significant, positive and quite large, indicating that there is indeed strong spatial dependence among districts in most of the country cases, except Uganda and Vietnam (for poverty rate). Scattergrams of the poverty and forest data, by district, at the national level, also revealed no patterns. These Pearson correlation findings would lead us to conclude that there is hardly any relationship to speak of between poverty and forests in a given country, since relationships of this kind tend to be disguised in national-level data.
We now consider the findings of the LISA analysis, which examine the association of poverty and forest cover at the local (subnational) level. The findings of local analysis are presented using maps for the seven case studies (Figures 1–7). We first discuss the verification of the four expected spatial patterns related to poverty rate and

� CIFOR Occasional Paper No. 47 William D. Sunderlin, Sonya Dewi and Atie Puntodewo
poverty density. We conclude by discussing the aggregated findings as displayed in Figures 8 and 9.
2.4.1 Verification of expected spatial patterns
BrazilBrazil strongly demonstrates some of the expected patterns but not others (Figure 1). Forest cover is predominantly in the remote, western half of the country and population is concentrated in the eastern, coastal, more urban part of the country. There is a strong association between the area of high forest in the west and high poverty rate (dark red zone on poverty rate map) and low poverty density (light red zone on poverty density map). As expected, there are areas of correlation between low forest cover and low poverty rate in the urban areas (dark blue on the poverty rate map), though there is an even stronger correspondence between low forest cover and high poverty rate (light blue). One would expect the urban areas (Brasilia, Belo Horizonte, Rio de Janeiro, Sao Paolo and Bahia [northeast costal area]) to be mostly low forest and high poverty density (light blue), but most show no statistical correlations.
While demonstrating some of the basic spatial patterns that would be expected, the Brazil country case also demonstrates some of the important limitations of the LISA approach using AVHRR data. It is necessary to take into account the different biomes in Brazil (Amazonian forest, savannah, Atlantic forest) and to distinguish between cerrado areas, where natural woodlands will have low tree
density, and Atlantic forest, where low tree density at the municipal level reflects patchy survival of forest fragments. The method does not make these crucial distinctions. The validity of the spatial interpretations can be questionable in areas where rainforest and savannahs are combined.
HondurasThe Honduras case, among all the cases, has the least evidence of the expected patterns (Figure 2). Population density is highest in the west and forest cover is highest in the east. By and large, the densest forest areas in the east show a low (light red) rather than high (dark red) poverty rate. It is possible that the low poverty rate in most of the eastern half of the country reflects a relatively high population of nonpoor ranchers and livelihood improvement at the agricultural frontier.3 However, conforming to the expected pattern, in the dense forest area in the east there is a correlation between high forest cover and low poverty density (light red in the poverty density map). The strong association between low forest cover and both high poverty rate (light blue) and poverty density (light blue) in the area of Choluteca (southernmost part of the country between the capital Tegucigalpa and Nicaragua) is to be expected. This is an area characterised by hillside farming, heavy deforestation, and high population density. There are no statistically significant clusters in the vicinity of the capital, Tegucigalpa.
3 See for example Godoy et al.’s (1996) discussion of the positive rates of return from cattle ranching among Amerindians in eastern Honduras.
Table 1. Pearson correlation test, and bivariate and univariate Global Moran’s I calculations, on poverty rate and forest data in the seven case study countries.
Country No. districts Mean district area
(km2)
S.D. district area (km2)
Pearson correlation
Bivariate Global
Moran’s I
Poverty rate Global
Moran’s I
Forest cover Global
Moran’s I
Brazil 5507 1553.34 5746.82 -0.1139 ** -0.0983 ** 0.4842 ** 0.8554 **Honduras 292 383.94 914.27 0.1250 * 0.0588 0.4586 ** 0.3902 **Indonesia 351 5424.34 10652.99 0.2780 ** 0.1268 ** 0.5015 ** 0.6609 **Malawi 368 260.22 360.68 0.2142 ** 0.0895 ** 0.3658 ** 0.3928 **Mozambique 146 5359.85 4078.16 0.0428 0.0664 0.3510 ** 0.4809 **Uganda 34 1409.10 1013.26 -0.3641 -0.2236 * 0.4415 ** 0.3093 *Vietnam 601 554.51 559.34 0.5710 ** 0.4365 ** 0.6843 ** 0.7538 **
** = significant at 0.01 level, * = significant at 0.05 level

�Poverty and forests: Multi-country analysis of spatial association and proposed policy solutions
Figure 1. Brazil maps of: forest and major urban areas; population density; LISA analysis of forest cover by poverty rate; LISA analysis of forest cover by poverty density.

10 CIFOR Occasional Paper No. 47 William D. Sunderlin, Sonya Dewi and Atie Puntodewo
Figu
re 2
. H
ondu
ras
map
s of
: for
est
and
maj
or u
rban
are
as; p
opul
atio
n de
nsity
; LI
SA a
naly
sis
of fo
rest
cov
er b
y po
vert
y ra
te;
LISA
ana
lysi
s of
fore
st c
over
by
pove
rty
dens
ity.

11Poverty and forests: Multi-country analysis of spatial association and proposed policy solutions
MalawiThe Malawi case mostly conforms to expectations (Figure 3). Most of the forest cover is on the western side of the lake that stretches north to south for two thirds of the length of the country. Population density is concentrated in the south and west, outside the forest, in the capital city Lilongwe and also in the southern third of the country. There is a statistical correlation between high forest cover and high poverty rate (dark red on poverty rate map) and between high forest cover and low poverty density (light red area on poverty density map). Although there are areas in the southern high population area where there is the expected association between low forest cover and low poverty rate (dark blue on poverty rate map) and between low forest cover and high poverty density (light blue on poverty density map), most of this region shows no statistical correlation. Malawi has experienced one of the highest rates of deforestation in southern Africa, resulting from a combination of high population density, forest reliance, agricultural expansion, and high demand for wood, especially fuelwood (Minde et al. 2001; Fisher 2004, p. 136; Jumbe 2005, pp. 1–2).
MozambiqueMozambique is a case of moderate conformity to the Vietnam pattern (Figure 4). Forests are predominantly in the northern two thirds of the country. The capital city Maputo is at the far southern end of the country. Unlike in most of the country cases, there are areas of relatively high population density in the northern forest zone. The poverty rate map demonstrates an expected correlation between high forest cover and high poverty rate (dark red), but in less than half the forest area. The same map shows the expected association between low forest cover and low poverty rate in the vicinity of Maputo. However, the counter-hypothetical area of low forest and high poverty rate (light blue) is larger. The poverty density map also demonstrates this nonconformity. Most of the nonforested area in the south near Maputo has low poverty density. This is explained by the very low population density in most of the southern third of the country, especially the non-coastal area (see population density map). The areas with a high poverty rate (dark red and light blue on the poverty rate map) are almost all rural. This squares with the fact that 82% of the poor in
Mozambique live in rural areas (Cuco et al. 2003, p. 160).
UgandaThe Uganda case shows medium conformity with expectations. Forest cover is scattered mostly throughout the western half of the country (Figure 5). Although the forest and major urban areas map (Figure 5) gives the impression that there is low forest cover in the north and east of the country, it is in fact dominated by woodlands and bushlands at 20–60% of land cover (Okwi et al. 2005, p. 23).4 The highest population densities are in the southern half of the country in the zone bordering Lake Victoria. The capital Kampala is on the lake and is bordered on the west and east by forests. The dense forests directly to the west of Kampala show the expected correlation with high poverty rate (dark red on poverty rate map) and low poverty density (light red on poverty density map). However, most of the high forest zone shows no statistical correlation (yellow area on both the poverty rate and poverty density maps). The remote northern and eastern half of the country appears to be contrary to the Vietnam case (light blue area in the northeast on the LISA poverty rate map) because, although it has a high poverty rate and low poverty density, it appears to have no forest. As mentioned above, however, it is dominated by woodlands and bush. The low poverty density in this area is directly related to low population density (see population density map). This in turn is partly related to security problems in the northern portion of the country dating back to the 1980s (Okwi et al. 2005, p. 4). The high poverty rate characteristic of most of the eastern half of the country is correlated with lack of access to roads, the proportion of land under commercial farms, woodland, and the proportion of degraded forests (Okwi et al. 2005, p. 14).
IndonesiaThe Indonesia country case conforms moderately to the expected pattern. Forest cover is low on the densely populated island of Java and in the areas of high population density in southern
4 This is a good illustration of the drawback of relying on AVHRR forest cover data mentioned in the methods section. The AVHRR data tend to render sparser forests and woodlands invisible.

12 CIFOR Occasional Paper No. 47 William D. Sunderlin, Sonya Dewi and Atie Puntodewo
Figure 3. Malawi maps of: forest and major urban areas; population density ; LISA analysis of forest cover by poverty rate; LISA analysis of forest cover by poverty density.

13Poverty and forests: Multi-country analysis of spatial association and proposed policy solutions
Figure 4. Mozambique maps of: forest and major urban areas; population density; LISA analysis of forest cover by poverty rate; LISA analysis of forest cover by poverty density.

14 CIFOR Occasional Paper No. 47 William D. Sunderlin, Sonya Dewi and Atie Puntodewo
Figu
re 5
. U
gand
a m
aps
of: f
ores
t and
maj
or u
rban
are
as; p
opul
atio
n de
nsity
; LIS
A a
naly
sis
of fo
rest
cov
er b
y po
vert
y ra
te;
LISA
ana
lysi
s of
fore
st c
over
by
pove
rty
dens
ity.

15Poverty and forests: Multi-country analysis of spatial association and proposed policy solutions
Figu
re �
. In
done
sia
map
s of:
fore
st a
nd m
ajor
urb
an a
reas
; pop
ulat
ion
dens
ity ; L
ISA
ana
lysi
s of f
ores
t cov
er b
y po
vert
y ra
te;
LISA
ana
lysi
s of
fore
st c
over
by
pove
rty
dens
ity.

1� CIFOR Occasional Paper No. 47 William D. Sunderlin, Sonya Dewi and Atie Puntodewo
Sumatra, the western and southern tips of Kalimantan, and southwestern Sulawesi (Figure 6). Forest cover is patchy in the northern half of Sumatra, and relatively dense in Kalimantan, Sulawesi (excluding its southwest portion) and Irian Jaya. The poverty rate map shows the expected correlation between high forest cover and high poverty rate in most of the forest area (dark red area). An important deviation is Kalimantan, where most of the high forest is correlated with a low poverty rate. On the same map, there is an expected association between low forest cover and low poverty rate in west Java in the vicinity of the Indonesian capital Jakarta. However, there are also some counter-hypothetical areas of light blue (low forest cover, high poverty rate) in southernmost Sumatra and parts of central and east Java. The poverty density map shows the expected outcome for most of the high forest area, i.e. low poverty density (light red area). On the same map, most of the area of Java shows the expected pattern, i.e. low forest cover and high poverty density (light blue). However, southernmost Sumatra and west Java are contrary to expectation, namely, low forest cover and low population density (dark blue). Tacconi and Kurniawan (2006) observed that the incidence of poverty in Indonesia is positively correlated with forest cover, and poverty incidence is negatively correlated with agricultural suitability of land, suggesting that converting forests to agriculture can assist poverty reduction.
Why is there a correlation between high forest cover and low poverty rate in Kalimantan? This relationship is also observed by Murdiyarso et al. (2006, p. 10). Although the reasons are not clear, it might be related to the high natural resource endowment in parts of the region. For example, in East Kalimantan there are high rates of oil, coal and timber extraction, and correspondingly high local public spending (Limberg personal communication). It might also be related to large numbers of men obtaining employment income across the border in Malaysia (Colfer personal communication). Using a composite index of wealth, health and education in measuring the poverty rate in 73 villages in East Kalimantan, Dewi et al. (2005) demonstrated that the relatively low poverty rate in Kalimantan might be at least partly related to forest dwellers’ direct access to forest resources. They explain that ‘Higher levels of forest
resources and suitable land for agroforestry are also associated with higher welfare. Relatively remote, well endowed forest villages with limited economic alternatives show a high well-being relative to other villages in the area being studied’ (Dewi et al. 2005, p. 1431). This is an important deviation from the assumption that remoteness, poverty rate and forest cover are always positively associated. Note however that, generally speaking for their study area, local people were highly disadvantaged, and had ‘little opportunity to benefit from the rich natural resources in the areas where they lived’ (Dewi et al. 2005, p. 1431).
VietnamVietnam, the archetypal case, demonstrates the expected patterns. Forest cover is predominantly in the western half of north Vietnam, and in all but the eastern coast zone in the central area stretching south to Ho Chi Minh City (Figure 7). Population density is a mirror image of forest cover. It is concentrated in the eastern half of north Vietnam (cities of Hanoi and Haiphong and outlying areas), the easternmost area of central Vietnam, and in the Mekong delta to the south of Ho Chi Minh City. The map of the poverty rate shows a strong correlation between high forest cover and high poverty rate (dark red), and a moderate correlation between low forest cover and low poverty rate (dark blue). The map of poverty density demonstrates a strong correlation between high forest cover and low poverty density (light red area) and a moderate correlation between low forest cover and high poverty density (light blue area).
2.4.2 Aggregated findingsFigures 8 and 9 take the data in the ‘forest versus poverty rate’ map for each case study country (Figures 1–7) and classify them according to the percentage area of closed forest (Figure 8) and the percentage of the total number of poor people (Figure 9) in each country. This enables us to understand the relevance of the findings in terms of our key objects of concern—area of closed forest and numbers of poor people.
In Figure 8 we see that, in Brazil, a little more than 70% of the closed forest area has high forest cover and a high rate of poverty, and a strong local correlation between forest cover and poverty rate (dark red); the remainder of the closed forest area (less than 30%) comprises

1�Poverty and forests: Multi-country analysis of spatial association and proposed policy solutions
Figure �. Vietnam maps of: forest and major urban areas; population density; LISA analysis of forest cover by poverty rate; LISA analysis of forest cover by poverty density.

18 CIFOR Occasional Paper No. 47 William D. Sunderlin, Sonya Dewi and Atie Puntodewo
all other clusters. Conversely, Honduras shows only a small portion of closed forest area (about 10%) where high forest cover is associated with a high poverty rate; about 40% of its closed forest is characterised by no statistical correlation between forest cover and poverty rate at the district level. Most country cases are between these two extremes. On average, about a third of total closed forest area in the seven case study countries shows a high poverty rate, and a strong local correlation between forest cover and poverty rate.
Figure 9 shows that only a small percentage of the countries’ populations of poor people live in areas characterised as high forest and high
poverty rate (dark red). The range is from a low of about 3% for Uganda and Indonesia to about 12% for Vietnam. For all countries with the exception of Mozambique, there are as many or more poor people in the ‘low forest – high poverty rate’ zone (light blue) as there are in the ‘high forest – high poverty rate’ zone (dark red).
Superficially, these findings appear to suggest that forests are not important for poverty alleviation. At least for these seven countries, a relatively small percentage of the poor live in high forest areas. But, in fact, forests are potentially very important for national poverty alleviation strategies for the following five reasons.
Forest vs Poverty Rate
0%10%20%30%40%50%60%70%80%90%
100%
Brazil
Hondu
ras
Malawi
Mozam
bique
Ugand
a
Indon
esia
Vietna
m
Prop
ortio
n of
poo
r peo
ple
Not significantHigh forest - Low povertyLow forest - High povertyLow forest - Low poverty High forest - High poverty
Forest vs Poverty Rate
0%10%20%30%40%50%60%70%80%90%
100%
Brazil
Hondu
ras
Malawi
Mozam
bique
Ugand
a
Indon
esia
Vietna
m
Clo
sed
fore
st a
rea
Not significantHigh forest - Low povertyLow forest - High povertyLow forest - Low poverty High forest - High poverty
Figure 8. Distribution of LISA “forest versus poverty rate” findings by percentage of closed forest area.
Figure 9. Distribution of LISA “forest versus poverty rate” findings by percentage of poor people.

1�Poverty and forests: Multi-country analysis of spatial association and proposed policy solutions
First, there are millions poor living in so-called ‘low’ forest areas (light blue in Figures 8 and 9) who rely on forests for a portion of their income. This fact is all the more important when we consider that population densities tend to be higher in open forest than in closed forest, and when we consider that the majority of forest dwellers in China, India and southern Africa (among other countries and regions) live in open forests.
Second, high poverty rate is often linked with high severity of poverty (high poverty gap) and long duration of poverty (chronic poverty). So, if there is a national programme to eradicate nodes of poverty that are the most difficult to address, then it may make sense to target high forest areas (among other areas), because their inhabitants are likely to exhibit these kinds of poverty.
Third, although the proportion of all poor people living in high forest areas may be low (Figure 9), the absolute numbers will be high in some countries. If only 10% of all poor people in China and India live in high forest areas, this would amount to more than 50 million people.
Fourth, there is likely a relatively high dependence on forests for livelihoods in areas of high forest and high poverty rate, so it may make sense to promote forest resources as a part of the poverty alleviation strategy in those places. Promising opportunities of this kind are in places where nonforest livelihood alternatives are few (e.g. migration is difficult or not sought, or agricultural land quality is low) and where sustainable use of forest resources is possible, among other preconditions.
Fifth, the high poverty rate characteristic of wide areas of forest in some countries (e.g. Brazil and Vietnam, Figure 8) can lend itself to some efficiency gains in addressing poverty. While it is undoubtedly challenging to reduce poverty in remote forested areas (high cost of public investment per capita, among other problems), there will at least be low rates of ‘leakage’ (benefits absorbed by the nonpoor) in such areas.
It is important to bear in mind that lands without forest are potentially important for tree-based poverty alleviation strategies. The reason is that
some areas without forest—especially periurban zones—are often wood-deficit areas where the poor can base their livelihoods on supplying the need for timber, firewood, charcoal and wood crafts through smallholder plantations and small-scale industries. The poor who live in areas of low forest and high poverty rate (light blue area in Figure 9) are potential beneficiaries of investments in such strategies.
3. Reasons for the coincidence of poverty and forests
Why are many people living in or near forests in developing countries poor? And why are rates and severity of poverty disproportionately high in forest areas in some countries? This section shows that there are several components to the explanation.
3.1 Primordial poverty in forested areas
Ten thousand years ago, there was a lot more forest and many fewer people. Almost all people were poor by modern standards. The primary modes of living were hunting and gathering. Since that time, forest cover has decreased by almost half from 62 million km2 to 33 million km2, and most of this loss has happened since the 1970s (Bryant et al. 1997, pp. 1, 9). The development of agriculture and pastoralism, the creation of urban centres and the nation state signified the beginning of what would ultimately be a large-scale transformation of much of the forested landscape. As people made the transition from hunting and gathering, to swidden cultivation, to permanent agriculture (one of several transitions), their level of appropriation of natural resources increased in energetic terms and their standards of living rose. In relation to this pattern, forest cover recedes. The history of the growth and spread of permanent agriculture—and linked population growth and average per capita income—is directly linked to the dramatic disappearance of forest cover.
Some forest-dwelling peoples in developing countries have been relatively untouched by the transformation described above. Many

20 CIFOR Occasional Paper No. 47 William D. Sunderlin, Sonya Dewi and Atie Puntodewo
of them are indigenous people or ethnic minorities who have remained in the forest environment. In this sense their poverty can be described as primordial. Although many such people may have experienced livelihood and lifestyle changes resulting from contact with the market economy and the ‘outside world’, the fact remains that many such people are among the ‘poorest of the poor’ in their countries.5 On average, their levels of resource extraction probably have not changed all that much over time and, likewise, the forests that are their home have not changed all that much. And the reason for the relatively slow pace of change for the forest dwellers and their forests is the same. They are in a remote location, relatively far from big cities, large paved roads and ports, and are therefore relatively out of reach of the lifestyle- and landscape-changing effects of the modern economy.
So, in effect, many areas where the poorest people in the world reside (especially ethnic minorities and tribal peoples) and where natural forest remain are ‘islands’ that have been relatively untouched by the history of economic development and the market economy.
On the von Thünen scale, they live in the ‘relatively undisturbed’ forests. Even though the country they are living in may have experienced the forest transition, they themselves might not have witnessed this transition in any meaningful sense.
3.2 The powerlessness of people in forested areas
Forest dwellers are often relatively powerless compared to other groups in the national setting and this perpetuates poverty. Fisher et al. (1997, pp. 4, 8) remark that forest dwellers in Asia and the Pacific, who are often indigenous people or ethnic minorities, tend to be outside the political and economic mainstream and the dominant culture, and are therefore relatively powerless and vulnerable to outsiders.
The relative powerlessness and low bargaining power of forest dwellers is partly related to their relative isolation from the national political and economic structures, but it is often imposed. In order to establish and maintain privileged access to timber and other natural resources,
entrepreneurs and the military have used force and intimidation, and have established laws and regulations designed to constrain economic options (land ownership, rights to timber) and this has been a strong factor in powerlessness. Their powerlessness is increased by lack of education and literacy. Roberts and Thanos (2003, pp. 167–172) explain that most of Latin America’s and the Caribbean’s 40 million indigenous people depend directly on natural resources for their subsistence, and that megaprojects, motivated in part by government servicing of foreign debt, are laying claim to natural resources on indigenous lands, including tropical forests. For this reason, indigenous people tend to be disenfranchised within the states in which they live (Roberts and Thanos 2003, p. 171). There are important exceptions. For example, indigenous Guiraní people in the 3.5 million ha Gran Chaco National Park in Bolivia share primary administrative responsibility in the park with the national government (Redford and Painter 2006, p. 3).
It should be kept in mind that the powerlessness of forest dwellers is relative and variable. For example, in recent years some indigenous groups have acquired title to large areas of forest.
3.3 Forests as a magnet for migrantsForests are places often inhabited by the poor in part because they exhibit characteristics that have made them a frequent destination for migration. One characteristic is that they are often an open access resource. Even if natural forests are formally the property of the state, the state is often unable to enforce exclusionary laws, in part because of the remoteness of some forests. Forests are also a target for migration because they often overlie fertile agricultural lands or pasture that can be converted by colonists. Another attractive characteristic is the pro-poor qualities of timber and non-
5 Research conducted in Latin America shows a strong correlation between belonging to an indigenous group and poverty indices: the vast majority of indigenous people fall within the poorest strata (IDB 2006, p. 5). Although research on this topic has not been conducted in Asia on the scale done in Latin America, there is at least one country case (Vietnam) demonstrating a clear link between ethnicity and poverty (van de Walle and Gunewardena 2001; Plant 2002, pp. 29–30).

21Poverty and forests: Multi-country analysis of spatial association and proposed policy solutions
timber forest products (NTFPs). These are often important in helping to fulfil basic household needs, provide gap-filler income, and serve as an economic safety net.
Although some people who migrate to forests are poor, some are not, and it is unlikely that most experience severe poverty at the time of migration. Most economic migrants are not the poorest of the poor by definition. Most kinds of migration to the forest require savings and the means to displace oneself and to endure a waiting period prior to a first harvest. At the Ecuadorian forest frontier, for example, it is not the poorest or the landless who drive the colonisation process, but instead people with at least a minimal level of means (Wunder 2000, pp. 154–155). In fact, the low poverty rate in some of the light red areas in the LISA analysis (high forest and low poverty) might conceivably be explained by the presence of colonists with moderate means or a positive livelihood outcome in the colonisation process. This important exception notwithstanding, there are clearly some poor people who migrate to natural forests, but the proportion has not been documented.
One category of migration merits special attention. Forests have a high presence of poor people in some countries because they have served as a refuge for people fleeing persecution, conflict and war. Forests have historically served as a refuge because of the qualities that make them a good hiding place: remoteness from urban areas and therefore from the military and police; their open access quality and their capacity to fulfil basic needs; and foliage serving to disguise the presence of inhabitants from land and also from the air.
The information in this section appears to make a convincing case that poor people can benefit if they dwell in or near forests. If this is the case, why are there not more people who live in forests? There are three main reasons for this. First, more lucrative opportunities clearly exist outside of forests, so forests are often, in fact, an opportunity of last resort for migrants. Moreover, as the modern economy and globalisation begin to reach into remote forests, some members of indigenous groups seek prosperity by leaving the forest (see, for example, Levang et al. 2005). Second, there is considerable variation in the
quality of forests; some qualities of certain forests (e.g. excessive remoteness, lack of roads and markets, absence of fertile soil) may make them an unattractive destination. Third, some forests that were ‘empty’ are now at the limit of their carrying capacity, which reduces the attractiveness of their pro-poor qualities.
3.4 Low investment in remote areasYet another reason for poverty in forested areas is that, even if the national government is interested in eliminating poverty in remote areas, it is often difficult to do so. One important reason is the relatively low population density in remote areas, which in turn is often related to constraints on agricultural development potential. (Recall that in the case studies above, low poverty density tends to coincide with high forest cover.) This means that the expenditure required to (say) build a school or a healthcare centre can be less cost effective than average in remote areas. For economies of scale, schools and healthcare centres are sited in relatively populated areas, and these can be far from where many of the poor live. Other attributes of remoteness can compound the problem. It is unacceptably costly to build a road if it services few people, all the more so if the rocky or hilly terrain significantly adds to the costs of construction. Yet another reason for low government investment in remote forest areas is that, because of their relative powerlessness (see section 3.2 above), forest dwellers often do not have the bargaining power required to get a favourable decision from people in cities making decisions on public investments.
3.5 SummaryThis section discusses the main reasons why people living in forests in developing countries tend to be poor. These reasons have to do with the relatively unchanged level of living of indigenous and ethnic minority forest dwellers over the course of history; the relative powerlessness of forest people; the qualities of forests that attract migrants, some of whom are poor; and the fact that governments often give less attention to poverty alleviation in remote as compared to other regions.
Over the millennia, by and large, progressive increases in material wellbeing at the level of

22 CIFOR Occasional Paper No. 47 William D. Sunderlin, Sonya Dewi and Atie Puntodewo
society have driven the process of increasing forest cover conversion. There are, of course, cases where local immiseration6 contributes to the factors that drive deforestation, but this tends to be an exception that reinforces the general rule. In effect, persistent poverty largely explains the survival of pockets of natural forests in areas where poverty and forests occupy the same space.
4. Poverty alleviation in forested areas: What are the policy options?
This section discusses some of the leading policy options for improving the wellbeing of the poor in developing countries through the use of forests. Before these options are discussed, background information is presented on: the meaning of the term ‘poverty alleviation’ and its sub-definitions in relation to forest resources and the paths out of poverty using forest resources; the ways in which forests have served to enable an exit from poverty from the past to the present; and why we need to consider implementing policies to alleviate poverty. This last topic, in particular, asks whether economic growth and laissez-faire can be relied upon as a path out of poverty in forested areas. Future policy options are then discussed focusing on forest tenure, marketing arrangements, community forestry, and payments for environmental services.
4.1 ‘Forest-based poverty alleviation’ defined
In this paper, the term ‘forest-based poverty alleviation’ (FBPA) denotes ‘the use of forest resources for the purpose of lessening deprivation of wellbeing on either a temporary or lasting basis’ (Sunderlin et al. 2005, p. 1386). FBPA is a term that comprises two sub-definitions: poverty mitigation or avoidance; and poverty elimination. ‘Poverty mitigation or avoidance’ involves the use of forest resources to meet household subsistence needs, to fulfil a safety net function in times of emergency, or to serve as a ‘gap filler’ in seasonal periods of low income, in order to lessen the degree of poverty experienced or to avoid falling into poverty (Sunderlin et al. 2005, p. 1386). The term ‘poverty
elimination’ refers to ‘the use of forest resources to help lift the household out of poverty by functioning as a source of savings, investment, accumulation, asset building, and lasting increases in income and wellbeing’ (Sunderlin et al. 2005, p. 1386). For both types of FBPA, it is assumed that in almost all cases households are relying not just on forest resources, but also on income from outside the forest sector. FBPA is seldom a standalone process.
4.2 Paths out of poverty in the forest
The main way that forests have served as a basis for poverty elimination, which is to say, as a ‘path out of poverty’, is undoubtedly conversion of forests to agriculture, which has enabled people living in or near forests to achieve the transition from being poor (however defined) to nonpoor. Historically, the transition from hunting and gathering, to swidden cultivation, to permanent agriculture and pastoralism has enabled dramatic increases in per capita appropriation of energy and corresponding increases in natural resource use and income. The establishment and growth of permanent agriculture have enabled not only orders of magnitude increases in worldwide per capita income (not to mention enabling the founding of cities and industry), but have also provided the basis for dramatic human population growth.
The path out of poverty through agricultural conversion has been an exceedingly uneven one. In some cases, felling of forests and the establishment of agriculture or pastoralism have led to relatively short-term livelihood enhancement. For example, forest colonisation in the Brazilian Amazon resulted in ‘surprising agricultural and developmental success’ (Schneider 1995, pp. vi–vii). According to Andersen et al. (2002), in Brazil there have been clear economic benefits from deforestation, both for the majority of the people who engage in it and for the Brazilian economy at the macro level. On farms at the forest frontier
6 ‘Immiseration’ is the idea, formerly advocated by Marxists, that the real wages of the working classes will constantly decline as they become increasingly alienated from the means of production. Here, a much looser definition is applied.

23Poverty and forests: Multi-country analysis of spatial association and proposed policy solutions
in Bolivia, some farmers faced a ‘fallow crisis’ in which shortened forest fallow periods, land degradation, decreasing agricultural yields in swidden systems, increased forest land clearing, weed invasions, and overintensification are associated with decreasing household income. Some farmers would escape the crisis by converting land use to pasture and specialising in livestock production, or by mechanising agricultural production, thereby obtaining substantially higher incomes (Thiele 1993).
By contrast, there are many examples of deforestation leading to lower incomes, at least temporarily, and particularly in cases where there was a combination of high local population pressure, land scarcity, declining soil fertility, few off-farm income options or opportunities for migration. For example, deforestation in the wetlands of southern Sumatra through the use of fire has resulted in falling incomes and fewer livelihood options (Chokkalingam et al. 2007). Sometimes, maintenance of traditional, forest-based modes of living can be better than imposed alternatives. For example in Lao PDR, efforts to relocate swidden cultivators forced many into poverty (Chamberlain 2002). By and large, however, there is a clear overall relationship between conversion of forest cover and increased per capita income.
There are several reasons why future conversion of natural forests to permanent agriculture will not continue to serve as a key impetus for average per capita income increases. One is the diminishing supply of land. Although forested land is still abundant, a lot of it cannot be converted to agriculture because of its inaccessibility, low quality or vulnerability to erosion (Evans 1998, pp. 2, 200). Most future gains in agricultural production will have to come from increased yields on existing farmlands and not from increased area of farmland (Dyson 1996, p. 117). Another factor constraining forest land conversion is increasing worldwide concern about the consequences of species extinction and loss of terrestrial biodiversity, and the diminishing capacity of forests to absorb atmospheric carbon and help contain the process of global warming.
Another leading path out of poverty has probably been migration away from the forest
as nonforest and nonagricultural income opportunities emerge.7 It is not known on what scale exit from forested environments has also enabled an exit from poverty. It is not known how many people have become nonpoor through converting forests to agriculture as compared to those who have done so by emigrating from the forest environment. This comparison is important among other reasons because land conversion eliminates forest cover, whereas migration out of the forest tends to slow deforestation and possibly restore forest cover.
Small-scale harvesting and marketing of timber or NTFPs and, through this, the creation of assets, savings and investment capital, thereby enabling an escape from poverty has probably occurred for a small subset of forest dwellers. The potential of this mode of forest resource use will be discussed later on.
4.3 Can economic growth and laissez-faire be relied on?
In addressing rural poverty in forested areas, why do we need to think about implementing any specific FBPA policies at all? After all, if economic growth and socioeconomic development unfolds in poorer countries in the way it has in richer ones, then eventually high rates of rural poverty, even in remote areas, will likely be substantially reduced.
One reason to be sceptical of a laissez-faire approach towards poverty alleviation in forested areas is that some developing countries are mired either in negative income growth or in stagnation. In those countries, it makes no sense to wait years for an economic turnaround before taking action on poverty in forest environments. Another reason is that, even in countries experiencing high average per capita economic growth, it is possible for
7 For example, the rural population of South America as a whole declined in the period 1984 to 1994, because of lower rural fertility and net rural to urban migration. In Brazil, where the rural population decreased 16% in the period 1966 to 1994, many migrants encountered hardship, abandoned their farms in forested areas, and sought alternative employment in the timber or mining sectors or moved to cities (Bilsborrow and Carr 2001, pp. 43, 51).
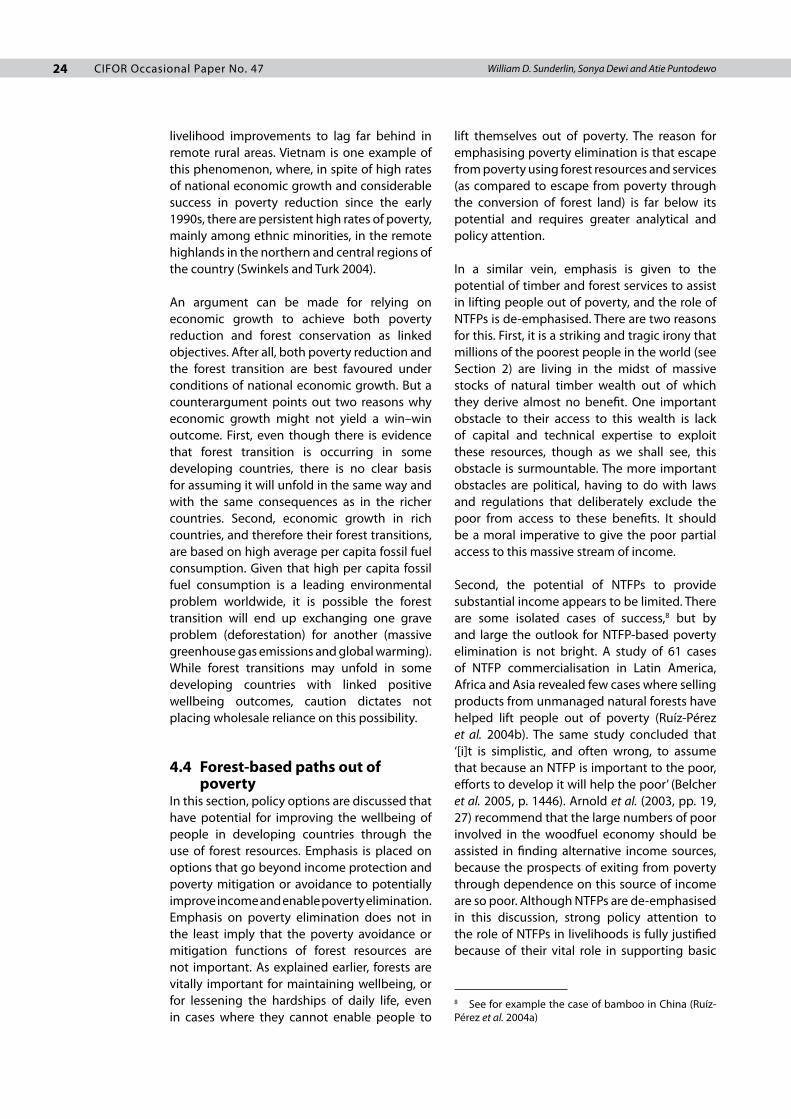
24 CIFOR Occasional Paper No. 47 William D. Sunderlin, Sonya Dewi and Atie Puntodewo
livelihood improvements to lag far behind in remote rural areas. Vietnam is one example of this phenomenon, where, in spite of high rates of national economic growth and considerable success in poverty reduction since the early 1990s, there are persistent high rates of poverty, mainly among ethnic minorities, in the remote highlands in the northern and central regions of the country (Swinkels and Turk 2004).
An argument can be made for relying on economic growth to achieve both poverty reduction and forest conservation as linked objectives. After all, both poverty reduction and the forest transition are best favoured under conditions of national economic growth. But a counterargument points out two reasons why economic growth might not yield a win–win outcome. First, even though there is evidence that forest transition is occurring in some developing countries, there is no clear basis for assuming it will unfold in the same way and with the same consequences as in the richer countries. Second, economic growth in rich countries, and therefore their forest transitions, are based on high average per capita fossil fuel consumption. Given that high per capita fossil fuel consumption is a leading environmental problem worldwide, it is possible the forest transition will end up exchanging one grave problem (deforestation) for another (massive greenhouse gas emissions and global warming). While forest transitions may unfold in some developing countries with linked positive wellbeing outcomes, caution dictates not placing wholesale reliance on this possibility.
4.4 Forest-based paths out of poverty
In this section, policy options are discussed that have potential for improving the wellbeing of people in developing countries through the use of forest resources. Emphasis is placed on options that go beyond income protection and poverty mitigation or avoidance to potentially improve income and enable poverty elimination. Emphasis on poverty elimination does not in the least imply that the poverty avoidance or mitigation functions of forest resources are not important. As explained earlier, forests are vitally important for maintaining wellbeing, or for lessening the hardships of daily life, even in cases where they cannot enable people to
lift themselves out of poverty. The reason for emphasising poverty elimination is that escape from poverty using forest resources and services (as compared to escape from poverty through the conversion of forest land) is far below its potential and requires greater analytical and policy attention.
In a similar vein, emphasis is given to the potential of timber and forest services to assist in lifting people out of poverty, and the role of NTFPs is de-emphasised. There are two reasons for this. First, it is a striking and tragic irony that millions of the poorest people in the world (see Section 2) are living in the midst of massive stocks of natural timber wealth out of which they derive almost no benefit. One important obstacle to their access to this wealth is lack of capital and technical expertise to exploit these resources, though as we shall see, this obstacle is surmountable. The more important obstacles are political, having to do with laws and regulations that deliberately exclude the poor from access to these benefits. It should be a moral imperative to give the poor partial access to this massive stream of income.
Second, the potential of NTFPs to provide substantial income appears to be limited. There are some isolated cases of success,8 but by and large the outlook for NTFP-based poverty elimination is not bright. A study of 61 cases of NTFP commercialisation in Latin America, Africa and Asia revealed few cases where selling products from unmanaged natural forests have helped lift people out of poverty (Ruíz-Pérez et al. 2004b). The same study concluded that ‘[i]t is simplistic, and often wrong, to assume that because an NTFP is important to the poor, efforts to develop it will help the poor’ (Belcher et al. 2005, p. 1446). Arnold et al. (2003, pp. 19, 27) recommend that the large numbers of poor involved in the woodfuel economy should be assisted in finding alternative income sources, because the prospects of exiting from poverty through dependence on this source of income are so poor. Although NTFPs are de-emphasised in this discussion, strong policy attention to the role of NTFPs in livelihoods is fully justified because of their vital role in supporting basic
8 See for example the case of bamboo in China (Ruíz-Pérez et al. 2004a)
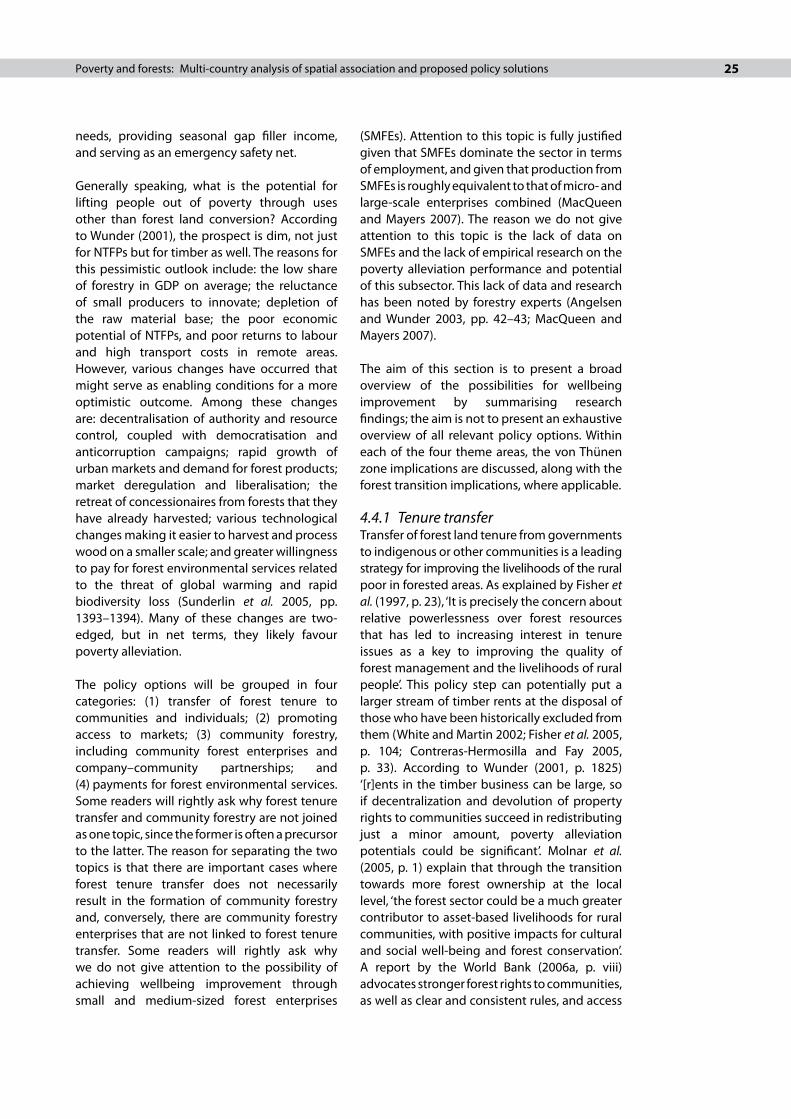
25Poverty and forests: Multi-country analysis of spatial association and proposed policy solutions
needs, providing seasonal gap filler income, and serving as an emergency safety net.
Generally speaking, what is the potential for lifting people out of poverty through uses other than forest land conversion? According to Wunder (2001), the prospect is dim, not just for NTFPs but for timber as well. The reasons for this pessimistic outlook include: the low share of forestry in GDP on average; the reluctance of small producers to innovate; depletion of the raw material base; the poor economic potential of NTFPs, and poor returns to labour and high transport costs in remote areas. However, various changes have occurred that might serve as enabling conditions for a more optimistic outcome. Among these changes are: decentralisation of authority and resource control, coupled with democratisation and anticorruption campaigns; rapid growth of urban markets and demand for forest products; market deregulation and liberalisation; the retreat of concessionaires from forests that they have already harvested; various technological changes making it easier to harvest and process wood on a smaller scale; and greater willingness to pay for forest environmental services related to the threat of global warming and rapid biodiversity loss (Sunderlin et al. 2005, pp. 1393–1394). Many of these changes are two-edged, but in net terms, they likely favour poverty alleviation.
The policy options will be grouped in four categories: (1) transfer of forest tenure to communities and individuals; (2) promoting access to markets; (3) community forestry, including community forest enterprises and company–community partnerships; and (4) payments for forest environmental services. Some readers will rightly ask why forest tenure transfer and community forestry are not joined as one topic, since the former is often a precursor to the latter. The reason for separating the two topics is that there are important cases where forest tenure transfer does not necessarily result in the formation of community forestry and, conversely, there are community forestry enterprises that are not linked to forest tenure transfer. Some readers will rightly ask why we do not give attention to the possibility of achieving wellbeing improvement through small and medium-sized forest enterprises
(SMFEs). Attention to this topic is fully justified given that SMFEs dominate the sector in terms of employment, and given that production from SMFEs is roughly equivalent to that of micro- and large-scale enterprises combined (MacQueen and Mayers 2007). The reason we do not give attention to this topic is the lack of data on SMFEs and the lack of empirical research on the poverty alleviation performance and potential of this subsector. This lack of data and research has been noted by forestry experts (Angelsen and Wunder 2003, pp. 42–43; MacQueen and Mayers 2007).
The aim of this section is to present a broad overview of the possibilities for wellbeing improvement by summarising research findings; the aim is not to present an exhaustive overview of all relevant policy options. Within each of the four theme areas, the von Thünen zone implications are discussed, along with the forest transition implications, where applicable.
4.4.1 Tenure transferTransfer of forest land tenure from governments to indigenous or other communities is a leading strategy for improving the livelihoods of the rural poor in forested areas. As explained by Fisher et al. (1997, p. 23), ‘It is precisely the concern about relative powerlessness over forest resources that has led to increasing interest in tenure issues as a key to improving the quality of forest management and the livelihoods of rural people’. This policy step can potentially put a larger stream of timber rents at the disposal of those who have been historically excluded from them (White and Martin 2002; Fisher et al. 2005, p. 104; Contreras-Hermosilla and Fay 2005, p. 33). According to Wunder (2001, p. 1825) ‘[r]ents in the timber business can be large, so if decentralization and devolution of property rights to communities succeed in redistributing just a minor amount, poverty alleviation potentials could be significant’. Molnar et al. (2005, p. 1) explain that through the transition towards more forest ownership at the local level, ‘the forest sector could be a much greater contributor to asset-based livelihoods for rural communities, with positive impacts for cultural and social well-being and forest conservation’. A report by the World Bank (2006a, p. viii) advocates stronger forest rights to communities, as well as clear and consistent rules, and access

2� CIFOR Occasional Paper No. 47 William D. Sunderlin, Sonya Dewi and Atie Puntodewo
to favourable markets, as a key to substantially raising the poverty alleviation potential of forests in India. Ribot et al. (2006) make an important cautionary note, pointing out that, on the basis of case study research in six countries (Bolivia, Nicaragua, Senegal, Uganda, Indonesia and Nepal), decentralisation in the forest sector has been attenuated by insufficient power transfer to the local level, and by inappropriate local institutional arrangements.
Since the late 1980s, some governments of major forest countries have transferred large areas of forest. White and Martin (2002, p. 7) report that, in developing countries, according to government statistics, approximately 8% of the area of forests is reserved for community and indigenous groups and 14% is owned by community and indigenous groups. The three reasons for forest tenure transfer are: (1) government awareness that tenure arrangements are discriminatory, along with pressure from international conventions and national political movements; (2) realisation that tenure transfer could improve forest management and make forests economically productive assets; and (3) recognition that government-led forest management has failed (White and Martin 2002, pp. 2–3).
Documentation of the wellbeing consequences of the trend towards forest tenure transfer is scarce. The available evidence shows a mixed picture. In China, massive transfer of forest to individuals has been concurrent with rising rural incomes and a 35% increase in forest cover between 1978 and 1998 (Hyde et al. 2003, p. 6; Yin 2003). In spite of this, it is claimed that devolution of forest resources has not succeeded in lifting poorer households out of poverty in forested areas (Liu and Edmunds 2003, pp. 34–35). In Mexico, the titling of large areas of forests to indigenous communities has led to the establishment of hundreds of community forestry enterprises that have delivered economic equity and environmental protection (Antinori and Bray 2005, p. 1529).
The best documentation of the livelihood consequences of forest decentralisation is a Ph.D. dissertation by Palmer (2005) concerning 65 communities in East Kalimantan, Indonesia. In these 65 communities, customary land rights were traded for a share of timber rents
from companies operating concessions in the communities. Ironically, this appears to be tenure transfer in reverse (away from the communities), but the net result has been a perception of increased ownership and control of local forests by the communities. Although property rights in these communities continue to be uncertain, the communities have been granted legal recognition of their land claims short of formal land title (Palmer 2005, p. 147). In effect, of the 700 households surveyed in the study, the proportion perceiving that they own their local forests increased from 25% prior to the implementation of decentralisation to 90% afterwards (Palmer 2005, p. 154). The study results show that, by and large, households obtained financial and non-monetary benefits from forest decentralisation, although with large variation across the sample of communities and households, and with problems in the distribution of timber rents within communities (Palmer 2005, pp. i, 148, 156; Engel and Palmer 2006).
Although a full and formal tenure transfer appears not to have been necessary for liveli-hood improvement in the case documented by Palmer (2005), it may well be necessary in other cases. In commercial use of natural forests in the Northern Atlantic Autonomous region of Nicaragua, based on company–community partnerships or direct marketing, villagers derive a small fraction of the value of forest products they collect (Roper 2003, pp. 73–74).9 In spite of current low income, there is reason to believe that there will be future improvement, because the indigenous people own the land, because of abundant local forest resources, because community members know how to operate chainsaws and some of their forms of livelihoods can be improved with low investment, and because the government is in the process of finalising a forestry law and an indigenous land tenure law which might improve possibilities for forestry and investment (Roper 2003, p. 74). In spite of this, there are significant obstacles to future success, the most important of which is that, although the indigenous population
9 The Autonomous Region was created in 1987 through the Autonomy Law of the Atlantic coast as part of a Sandinista Government effort to reconcile conflicts with Miskito Indians (Roper 2003, p. 13).

2�Poverty and forests: Multi-country analysis of spatial association and proposed policy solutions
owns the land, they do not yet own titles to the land. There are overlapping land claims that legally restrict communities from exploiting their forests (Roper 2003, p. 74). Other important obstacles to success include poor regional markets, difficulty in getting access to international markets, and degradation of some forest areas (Roper 2003, pp. 8, 74). The processes of devolution of forest management and transfer of forest tenure have been fraught with problems. If it is to be ultimately successful in providing major livelihood gains for the rural poor in developing countries, attention must be given to various pressing issues, among them:
• Improve documentation of forest tenure claims made by indigenous and other people living in forests (White and Martin 2002, p. 22);
• Assist community networks to engage more effectively in key regional and global dialogues and institutions (Molnar et al. 2005, p. 28);
• Recognise the tendency of governments to decentralise management for the most degraded and least valuable forests (Capistrano and Colfer 2005, pp. 297–298) and advocate that more valuable forests be transferred to communities;
• Be aware of the problem of elite capture, that is, those with power and wealth taking advantage of new opportunities to advance their standing (Capistrano and Colfer 2005, p. 298), and devise ways to avert or minimise this problem;
• Avoid outcomes where decentralisation ends up causing forest destruction (Mayers and Bass 2004, p. xv);
• Recognise that local security of resource tenure is not enough, in and of itself, to ensure long-term sustainable forest management (Mayers and Bass 2004, p. xviii).
von Thünen zone implicationsTenure transfer of natural forests will be most effective for poverty elimination in areas far from urban centres (i.e. at the forest frontier and in undisturbed forests), because that is where standing and potentially productive forests are located, that is where indigenous groups reside who have long contested government
control over ‘their’ forests, and these are zones where tenure tends to be contested and weak. Nevertheless, transfer of tenure of more degraded forests closer to urban areas is also potentially important, among other reasons because land tenure security is sometimes weak in periurban areas and because near-market areas present some of the best opportunities for low-income people to earn a living from forest resources.
4.4.2 Promote market accessThe rural poor are often at a considerable disadvantage when trying to improve their wellbeing through the marketing of forest resources and forest environmental services. The constraints concern their relative powerlessness in the larger social and economic order, their lack of assets and knowledge, certain ‘anti-poor’ characteristics of forest resources, their vulnerability to better-endowed competitors, and a legal framework that is stacked against them. If the poor are to be able to benefit from rising demand for forest products, they require policy assistance.
A policy brief on Making markets work for forest communities (Scherr et al. 2002) and a related study on Making markets work for low-income producers (Scherr et al. 2004) specify the policy steps that must be followed and divide them into two categories, namely, ‘removing policy barriers’ and ‘developing forest enterprises’. The key recommendations are summarised as follows.
Removing policy barriers• Secure forest access and ownership rights
of local people.• Remove regulatory barriers and excessive
state regulation.• Level the playing field by revoking policies
that discriminate against small producers, because most governments subsidise or provide privileged access to large-scale producers.
• Involve local producers in policy negotiations.
• Create a mechanism that protects the poorest by (for example) assuring that local forests retain their safety net function (Scherr et al. 2002, pp. 11–12).

2� CIFOR Occasional Paper No. 47 William D. Sunderlin, Sonya Dewi and Atie Puntodewo
Develop forest enterprises• Aid small producers in responding to
consumer preferences and in developing market strategies.
• Strengthen producer organisations so that they can make capital investments, engage in value-added processing, negotiate deals, and establish production controls.
• Promote strategic partnerships between communities and businesses.
• Establish business services that include technical assistance, insurance, and marketing and financial assistance.
• Conduct education and training so that community enterprises can adapt to new trends in production, processing and management (Scherr et al. 2002, pp. 6–11).
Forest laws and regulations in developing countries often disadvantage small-scale users, tend to be framed to favour dominant interests, and are often selectively applied in favour of large-scale forestry (Colchester et al. 2006, pp. x–xii). Kaimowitz (2003) argues that removal of policy barriers must involve not just rescinding or ceasing to enforce laws that undermine the wellbeing of small producers, but also enforcing those laws (e.g. laws against illegal logging) that can greatly favour the interests of small producers. Cambodia is a case in point illustrating the importance of these two points. In the High Value Forests (HVF) of Cambodia, thousands of poor people obtain about half their income through a wide variety of activities, some of which are prohibited by the government. Their livelihoods are being threatened by rampant illegal logging. The authors of a case study on this issue explain that reform of the regulatory framework to permit the activities of small producers could help lift villages out of poverty.10 Conversely, if the commercial activities of outsiders are allowed to continue, they will move villages further into poverty (McKenney et al. 2004, pp. 5–9).
Scherr et al. (2002, p. 2) make a persuasive case for the importance of marketing strategy, pointing out that for many poor people, commercial forest product markets are among the few options to overcome their poverty. They explain that poor producers have some competitive advantages that potentially enable them to participate successfully in the market. Among these advantages are that: indigenous
and rural communities now own or administer about one quarter of the forest estate in the most forested developing countries; low-income producers near population centres tend to have lower transport costs and know local preferences; and low-income producers can supply small quantities and can sometimes supply products at a lower price, because they have lower opportunity costs for land and labour (Scherr et al. 2002, pp. 4–5). They state that ‘it is unlikely that any large-scale conservation can be achieved without engaging local people in marketing their forest products and services’ (Scherr et al. 2002, p. 2).
von Thünen zone implicationsMarket-oriented strategies are relevant across all the von Thünen zones. In more remote areas, people may be able to make money because the natural rents from standing timber, particularly high-value timber, are sufficiently high to compensate for the high transportation costs. Closer to urban areas, the standing timber is likely to be gone and people will probably have to grow trees and manage small natural forests more intensively. They will not benefit from the natural resource rents, but the rents related to proximity to urban markets may be sufficient to justify the costs of planting and managing trees.
4.4.3 Community forestryCommunity forestry is defined as ‘an umbrella term denoting a wide range of activities which link rural people with forests and trees, and the products and benefits to be derived from them. If there is one dimension to be stressed above all others it is the range and diversity of these linkages, and the span of different disciplines which are engaged in aspects of community forestry’ (Arnold 1992, p. 25).
It is important to specify two sub-definitions. ‘Traditional community forestry’ refers to a local system of forest management, often dating back many years, that was created spontaneously in a community and that was not introduced from the outside. Traditional community
10 A similar point is made by Gockowski et al. (2006, p. 15) concerning the illegal marketing of timber by rural people in the Lekié region of Cameroon. Legalising the marketing of this timber would raise its value to US$ 1460 per ha over 35 000 ha. The difference between the economic and the distorted prices is US$ 55 million.

2�Poverty and forests: Multi-country analysis of spatial association and proposed policy solutions
forestry is often aimed at establishing rules for village-level forest access and resource consumption through consensual agreement and at mobilising against external claimants of local resources. ‘Introduced’ models of community forestry are relatively recent and are growing rapidly; the term refers to a system of forest management presented from outside the community by the government, by an international agency, or by a local NGO, or some combination of the three (Sunderlin 2004, p. 3). One of the main motivations for establishing introduced community forestry is to reduce pressure on forest resources and biodiversity. Although livelihood improvement has always been a stated goal of introduced community forestry, its scope has largely been at the level of poverty avoidance and mitigation rather than poverty elimination, and its implementation has sometimes been subordinate to and circumscribed by resource management goals. In recent years, livelihood improvement and poverty alleviation have assumed a growing profile in introduced community forestry initiatives. Distinguishing between these two models is important, among other reasons, because introduced models are often superimposed on existing traditional ones.
Community forestry (of both types) is potentially a key vehicle for lifting rural people out of poverty in forested areas, particularly if it is implemented on the basis of tenure transfer and enhanced marketing opportunities as presented in the two previous sections. Community forestry is potentially a powerful policy vehicle because it can increase the bargaining power of otherwise unorganised and weak local producers vis-à-vis more powerful interests, and it can create competitive advantages through economies of scale.
The known performance of community forestry in improving wellbeing in developing countries is quite mixed, though much of its performance is unresearched and therefore unknown. Fisher (2003, p. 18) claims that real devolution of decision making power to communities is an essential precursor for improving livelihoods through community forestry.
Research on cases of devolution and community forestry reveals important shortcomings. Cameroon’s 1994 revision of its forestry law
created the opportunity for villages bordering on forests to earn 10% of timber fees. The assessments of this new community forestry arrangement are uniformly negative. Oyono (2005, p. 1) reports that the new system in Cameroon has produced no economic benefits and has increased forest degradation, while generating internal conflicts, increasing social stratification, and marginalising traditional authorities. Logo (2003) observes that the system has been administered in an authoritarian manner by the government and ignores the needs and expectations of communities. A village case study by Mvondo (2006) demonstrates that there are substantial timber rents to be earned by villagers, but these rents tend to be misappropriated by village authorities. One potential pitfall of introduced community forestry is the creation of forest rules and regulations that can be easily circumvented by a portion of the community, allowing them to reap most of the forest use benefits. This problem is illustrated in case studies from Malawi (Jumbe and Angelsen 2006) and Honduras (Nygren 2005).
Additional reasons for the poor record of livelihood improvements at some community forestry sites include the following attributes:
• Deliberate siting of projects on degraded forest lands
• The livelihood improvement goal in community forestry is often subordinate to, and overruled by, the environmental management goal or other goals
• Non-community entities (e.g. the government) appropriating either all or the lion’s share of local forest resources.
In this section, we focus on a subset of community forestry activities that have potential for substantially improving the livelihoods of participants: commercially-oriented natural timber management at the community level; and company–community partnerships. We summarise information on two cases of community-based marketing of timber (Mexico and Lao PDR) and the findings of a study on company–community partnerships.
Mexico’s community forest enterprisesIn Mexico, there are hundreds of community forest enterprises (CFEs) producing timber on

30 CIFOR Occasional Paper No. 47 William D. Sunderlin, Sonya Dewi and Atie Puntodewo
a commercial scale from forests managed as common property resources. This is an unusual phenomenon, considering that in most of the world community forestry management is sited on degraded forest lands or involves the production of NTFPs on government lands (Bray et al. 2005, p. 3).11 Although there have been many challenges and deficiencies in Mexico’s CFEs, they have the potential to deliver significant economic and social benefits and have advantages for environmental stewardship (Antinori and Bray 2005, p. 1540).
Research was conducted in Quintana Roo on 200 households in six communities to determine whether Mexican CFEs have the potential to lift participants out of poverty. The six communities were stratified by their level of commercial timber production (high, medium, low) and ethnicity (mestizo or Mayan). In the two communities with high timber production, average annual household income from timber was 34% in one village and 54% in the other. In the two communities with moderate timber production, average annual household income from timber was 7% in one village and 21% in the other. (There was no timber production in the other two communities.) Analysis of the level of community timber production and the daily mean income per person, in each community, in relation to three different types of poverty lines (nutritional, development, asset) shows that timber in CFEs can alleviate poverty if the resource is large enough (Bray and Tardanico 2005).
As explained by Bray (2005, p. 341), ‘Mexican CFEs represent a unique global case, where hundreds of communities are managing common property forests for the commercial production of timber. As such, it is a model for many other forest communities in developing countries… The strength of CFEs in Mexico shows that assets can be accumulated at the community level (public goods), and not just at the household level’. It is important that in CFEs communities are allowed to receive the full market price of their timber and not a government-set stumpage fee (Bray et al. 2005, p. 10). With the establishment of large numbers of CFEs at the beginning of the 1970s, and the end of the concession system in the 1980s, almost all forest communities were permitted to sell their timber at full value. Although
some communities still sell their timber for its stumpage value at the equivalent of full market value (in theory), it can be said that the rentismo exploitation of the past has virtually disappeared (Bray 2005, p. 335). The government imposes a maximum allowable cut on Mexican CFEs (Antinori 2000, p. 150).
There are various aspects of the Mexican national context that are unique and this makes it impossible to transfer the Mexican CFE model to other countries. Nevertheless, because it shows such promise, Mexico’s community forestry model should serve as a guidepost for experimentation in other countries. Case studies by Molnar et al. (2007, pp. 7-8) on CFEs in 14 developing countries, while not focused on poverty alleviation, find that CFEs are potentially very profitable, yet their emergence is constrained by both internal barriers and also regulatory and policy barriers such as insecure tenure and political instability.
FOMACOP in Lao PDRIn the period 1995–2000, the pilot phase of the Forest Management and Conservation Project (FOMACOP) was implemented in Lao PDR with funding from the World Bank. Through this project, 41 villages covering 100 000 ha in the provinces of Khammouane and Savannakhet were involved in community-based management of natural timber through a benefit sharing arrangement with the government. By the end of the pilot phase, the project had yielded US$ 3400 for each village on the basis of a low-intensity, sustainable yield approach. Although the income appears to be low, it was high by the standards of the region (Katila 2000, p. 3). And although FOMACOP is little known, it is noteworthy because it demonstrated the capacity of relatively uneducated, poor villagers to comanage a sophisticated, commercial-scale natural timber enterprise.
Company–community partnershipsCommunities can benefit economically by forming partnerships with forest product companies. They can obtain capital, marketing channels, information and expertise that would
11 While this may be technically true, it is important to bear in mind that there are increasing examples of community forestry that involve timber rent benefits and that are not sited on degraded lands.

31Poverty and forests: Multi-country analysis of spatial association and proposed policy solutions
otherwise be unavailable. Companies involved in such partnerships can gain access to labour and land that would otherwise be unavailable. Examples of company–community partnerships in the forest sector include outgrower schemes, intercropping agreements, joint ventures, plantation protection services, and access and compensation agreements (Mayers and Vermeulen 2002, p. i).
Mayers and Vermeulen (2002) conducted research on 57 company–community partnerships in the forest sector. Among their main results were the following:
• Main positive impacts: contribution to the security of land rights of some communities and individuals and better job opportunities (p. viii);
• Unproven or neutral impacts: for most communities, partnerships are supplementary rather than central to livelihoods; in South Africa, company–community partnerships were unable to lift people out of poverty; working conditions have not improved; there is little evidence of increased bargaining power (p. ix);
• Problems encountered: high transaction costs on both sides; perpetuation of low-wage labour and inequitable land distribution which tends to entrench existing patterns of control (p. ix).
In spite of what seems like a gloomy assessment, Mayers and Vermeulen (2002, p. xv) reach an optimistic conclusion, pointing out that if such arrangements are made with defensible property rights, then companies and communities can collaborate for mutual gains and broader benefits.
von Thünen zone implicationsThe ‘centre of gravity’ of natural timber community forest possibilities will be in the agricultural mosaic and forest frontier zones. In the periurban zone, natural timber is likely to be too scarce. In the undisturbed zone, there might be possibilities for commercial timber forestry, but this depends on the reasons for the ‘undisturbed’ quality of the forests. Conceivably, the forests are ‘undisturbed’ because they are too remote for exploitation, because they are in a protected forest area, or both.
Company–community partnerships can conceivably occur in all four zones, though they are least likely in the undisturbed forest zone. Partnerships related to plantations are likely to be closer to the urban zone.
4.4.4 Payments for environmental services
As mentioned earlier, increasing concern about global warming, forest cover and biodiversity loss creates an opportunity for livelihood improvement in forest areas. If forest dwellers are compensated to keep forests standing or to restore them, both they and those seeking to maintain or rehabilitate the public good function of forests can gain.
Payments for environmental services (PES) are defined by Wunder (2005, p. 3) as ‘a voluntary transaction where a well-defined ES [environmental service] (or a land use likely to secure that service) is being “bought” by a (minimum one) ES buyer from a (minimum one) ES provider, if and only if the ES provider secures [the] ES provision (conditionality)’. There are four types of PES related to forests: (1) carbon sequestration storage schemes; (2) biodiversity protection; (3) watershed protection; and (4) protection of landscape beauty (Wunder 2005, p. 2).
To what extent can PES actually lift the rural poor out of poverty? In principle, the potential is large, because of the large numbers of poor residing in or near forests in the process of being degraded, and the growing interest in compensating these people to protect forests and watersheds. But there are some inherent problems. PES are based on transactions with rural landholders and, in some locations, the poorest of the poor will be landless or will have little land. Moreover, deals struck with few large landowners are usually more cost efficient than those struck with many small landowners. Smallholder transaction costs (Grieg-Gran et al. 2005, p. 1514) and trade-offs between social benefits and effectiveness (Smith and Scherr 2003, p. 2143) are important considerations in forging effective PES.
An assessment of the performance of eight carbon sequestration and watershed protection PES in Latin America found that there were

32 CIFOR Occasional Paper No. 47 William D. Sunderlin, Sonya Dewi and Atie Puntodewo
some positive local income effects and some improvement in land tenure security, but some negative effects as well (Grieg-Gran et al. 2005, p. 1511). There are three frames of references for evaluating the effectiveness of PES in assisting the poor: (1) the degree to which the poor participate in such schemes as compared to the nonpoor; (2) the extent to which poor participants in PES benefit; and (3) how PES schemes affect poor people who do not participate in the project (Grieg-Gran et al. 2005; Wunder 2005, pp. 16–20). A draft World Bank (2006b, p. xi) report makes a cautionary note, pointing out that ‘Although poverty reduction is usually an objective of watershed management programs, empirical evidence of poverty reduction impacts is weak’. The report adds that targeting only the poor is difficult, as efficient watershed management has to be inclusive of all stakeholders in the watershed (World Bank 2006b, p. 48).
von Thünen zone implicationsIn Latin America, PES can be found in all four von Thünen zones (Wunder personal communication). For example, in the periurban zones there are watershed protection schemes for big cities and some recreation sites. In agricultural mosaics, there are few PES, but they are increasing in number. Among them are payments for shade coffee production in Colombia and El Salvador, silvipastoral schemes in Colombia, Costa Rica and Nicaragua, and carbon schemes in degraded areas (e.g. the PROFAFOR project in Ecuador). In the forest frontier zone, some PES are frequently implemented for the purpose of restraining agricultural expansion into the forest, such as the Pimampiro watershed protection scheme in Ecuador. There are few PES in undisturbed forests, although one example is Conservation International’s effort to protect forests prior to logging in Guyana.
Forest transition implicationsTransfer payments for PES in developing countries originate both from domestic government budgets and from sources abroad at an early stage in the transition. If economic development is on an upward swing as a country proceeds towards a forest transition, a larger share of payments are likely to originate within the country. PES will presumably eventually
become unnecessary in cases where a fullscale transition ‘takes over’ the role of protecting and restoring forests.
5. Summary of findings and recommendations
In developing countries there is an important association between the location of the poor and forests. Although most poor people live outside highly forested areas, there is a general tendency—though with some important exceptions—for populations living in or near forests to have a high poverty rate and, similarly, to experience severe poverty and chronic poverty. They are often among the poorest of the poor and they tend to be disproportionately dependent on forest resources. Conversely, there is general tendency for poverty density to be high outside of high forest areas and closer to cities. These patterns of association between poverty and forests are examined through case studies on Brazil, Honduras, Malawi, Mozambique, Uganda, Indonesia and Vietnam.
There are various reasons for the spatial coincidence of high poverty rate and forests. First, natural forests in remote areas and people who inhabit them are often comparatively untouched by the modern market economy and its capacity to transform levels of living and landscapes. Natural forests are often the ancestral homes of ethnic minorities and traditional peoples. Second, forest dwellers are often relatively powerless and this is often reinforced by low levels of education and literacy. Third, forests are magnets for migration for economic reasons (colonisation of new lands) and for political reasons (taking refuge from persecution or conflict). Fourth, there tends to be low government expenditure for development in remote forest areas for economic reasons (high absolute and per capita investment costs and low profit opportunities) and political reasons (the powerlessness of many forest dwellers to influence investment priorities).
Viewed through the lens of the von Thünen classification of landscape zones, the association of poverty and forests can be

33Poverty and forests: Multi-country analysis of spatial association and proposed policy solutions
understood as follows. The density of natural forest cover tends to increase with distance from urban areas, that is, as we travel from the periurban zone, through the agricultural mosaic zone and the forest frontier, to the undisturbed forest zone. The analysis of the seven country case studies shows that the poverty rate tends to increase with distance from the periurban zone, and poverty density tends to be lower, though with significant exceptions.
How can people living in forest areas exit from poverty? Continuation of the historic pattern of forest land conversion to sedentary agriculture will provide a path out of poverty for some, but there are diminishing returns to this process over time. For some, the route to economic wellbeing will involve migrating out of the forest, but for many, the means or the will to leave ancestral homes do not exist.
Economic growth at the national level offers the prospect of eventual prosperity to some rural poor, but growth is slow, stagnant or negative in some developing countries. Even in countries where economic growth occurs, remote rural areas are often the last to experience its benefits. Similarly, the classic pattern of the forest transition offers the possibility of slowing deforestation and restoring forest cover, but for some countries, this is a distant or forlorn hope.
This paper argues that poverty in forest areas must be addressed by policy measures that are not wholly predicated on the ‘helping hand’ of economic growth. There are four key policy approaches for lifting people out of poverty in forested areas. These policies not only favour poverty alleviation, but potentially also have forest conserving outcomes.
1. Continuation of the process of massive tenure transfer of forests to indigenous and other rural communities. Among other benefits, this can place a portion of timber rents within reach of the poorest of the poor.
2. Assist the poor in marketing the natural forest wealth in their midst. Key steps in this process are to level the playing field by annulling anti-poor forest laws and regulations, enforcing forest laws that can assist the poor (e.g. stopping illegal logging), and assisting the poor in creating businesses.
3. Implement community forestry models that are designed to lift people out of poverty. Community forestry to date has not provided a meaningful way to overcome poverty in most cases, but it could become a powerful vehicle to this end if it is founded on secure land and forest resource tenure (no. 1 above) and on a level playing field and solid business practices (no. 2 above). Successful community forest enterprises in Mexico make it clear that this kind of policy step is not just a pipedream. A related and potentially promising approach is company–community partnerships, provided that defects in current arrangements can be overcome.
4. Establish pro-poor payments for forest environmental services. This strategy holds some potential because it can wed growing international interest in carbon sequestration and other environmental services with the ability of forest dwellers to serve as custodians of standing forests. In order to maximise participation of the poor in such schemes, it is necessary to proactively nurture the interest and capability of marginal landowners and to devise ways to minimise transaction costs.
These four policy approaches for exiting from poverty through use of forest resources differ across the von Thünen zones. A summary of the key insights follows.
• Forest tenure transfer is most relevant in the more forested zones (forest frontier and undisturbed forests), among other reasons because it is often contested and weak in these two zones.
• Marketing approaches are relevant in all zones, but their character will be shaped strongly by factors that favour proximity to urban zones (e.g. high product demand, lower transportation costs, assistance from support organisations) and factors that favour distance from urban zones (e.g. access to raw material supplies).
• The ‘centre of gravity’ of commercially-oriented community forestry will be in the agricultural mosaic and forest frontier zones. Timber is scarce or nonexistent in the periurban zone; timber might be unmarketable in the undisturbed forest

34 CIFOR Occasional Paper No. 47 William D. Sunderlin, Sonya Dewi and Atie Puntodewo
zone for reasons of legal protection or inaccessibility. Company–community partnerships can occur in all zones, but are least likely in the undisturbed forest zone.
• Information on Latin American PES cases shows that they take place in all zones, but they vary by type across the zones. For example, watershed protection PES are often implemented near big cities, and schemes for restraining agricultural expansion are located in the forest frontier zone.
References
Andersen, L.E., Granger, C.W.J., Reis, E.J., Weinhold, D. and Wunder, S. (eds.) 2002 The dynamics of deforestation and economic growth in the Brazilian Amazon. Cambridge University Press, Cambridge, UK.
Angelsen, A.R. 2007. Forest cover change in space and time: combining von Thünen and the forest transition. Policy Research Working Paper No. 4117. World Bank, Washington, DC.
Angelsen, A. and Wunder, S. 2003 Exploring the forest-poverty link: key concepts, issues and research implications. CIFOR Occasional Paper No. 40. Center for International Forestry Research, Bogor, Indonesia.
Anselin, L. 1988 Spatial econometrics: methods and models. Kluwer Academic Publishers, Dordrecht.
Anselin, L. 1995 Local indicators of spatial association: LISA. Geographical Analysis 27(2): 93–115.
Anselin, L. 2005 Exploring spatial data with GeoDaTM: a workbook. Spatial Analysis Laboratory, Department of Geography, University of Illinois, Urbana-Champaign, Illinois.
Antinori, C. 2000 Vertical integration in Mexican common property forests. Ph.D. dissertation, Agricultural and Resource Economics, University of California, Berkeley.
Antinori, C. and Bray, D.B. 2005. Community forest enterprises as entrepreneurial firms: economic and institutional perspectives from Mexico. World Development 33(9): 1529–1543.
Arnold, J.E.M. 1992 Community forestry: ten years in review. Revised ed. Community
Forestry Note 7. Food and Agriculture Organization of the United Nations, Rome.
Arnold, M., Köhlin, G., Persson, R. and Shepherd, G. 2003 Fuelwood revisited: what has changed in the last decade? CIFOR Occasional Paper No. 39. Center for International Forestry Research, Bogor, Indonesia.
Belcher, B., Pérez, M.R. and Achdiawan, R. 2005 Global patterns and trends in the use and management of commercial NTFPs: implications for livelihoods and conservation. World Development 33(9): 1435–1452.
Benson, T. 2002 Malawi: an atlas of social statistics. Government Statistical Office, Government of Malawi, Zomba, Malawi, and International Food Policy Research Institute (IFPRI), Washington, DC.
Bilsborrow, R.E. and Carr, D.L. 2001 Population, agricultural land use, and the environment in developing countries. In: Lee, D.R. and Barrett, C.B. (eds.) Tradeoffs or synergies?: agricultural intensification, economic development and the environment. CABI Publishing, Wallingford, UK and New York.
BPS (Badan Pusat Statistik) 2000 SUSENAS (National Socioeconomic Survey) 2000. BPS, Jakarta, Indonesia.
Bray, D.B. 2005 Community forestry in Mexico: twenty lessons learned and four future pathways. In: Bray, D.B., Merino-Pérez, L. and Barry, D. (eds.) The community forests of Mexico: managing for sustainable landscapes, 335–349. University of Texas Press, Austin, Texas.
Bray, D.B. and Tardanico, R. 2005 Can community forest management for timber production alleviate poverty and conserve forests? Presentation to 6th Open Meeting of the Human Dimensions of Global Environmental Change Research Community, University of Bonn, Bonn, Germany, 9–13 October 2005.
Bray, D.B., Merino-Pérez, L. and Barry, D. 2005 Community managed in the strong sense of the phrase: the community forests of Mexico. In: Bray, D.B., Merino-Pérez, L. and Barry, D. (eds.) The community forests of Mexico: managing for sustainable landscapes, 3–26. University of Texas Press, Austin, Texas.
Bryant, D., Nielsen, D. and Tangley, L. 1997 The last frontier forests: ecosystems and

35Poverty and forests: Multi-country analysis of spatial association and proposed policy solutions
economies on the edge. World Resources Institute, Washington, DC.
Capistrano, D. and Colfer, C.J.P. 2005 Decentralization: issues, lessons, and reflections. In: Capistrano, D. and Colfer, C.J.P. (eds.) The politics of decentralization: forests, power, and people, 296–313. Earthscan, London and Sterling, VA.
Chamberlain, J.R. 2002 The relationship of poverty to the forests in the Lao PDR. Paper to the international workshop on ‘Forestry and Poverty Alleviation in Lao PDR’, 17–18 December 2002, Vientiane: Ministry of Agriculture and Forestry, FAO, SIDA.
Chokkalingam, U., Suyanto, Permana, R.P., Kurniawan, I., Mannes, J., Darmawan, A., Khususyiah, N. and Susanto, R.H. 2007 Community fire use, resource change, and livelihood impacts: the downward spiral in the wetlands of southern Sumatra. Mitigation and Adaptation Strategies for Global Change 12(1): 75–100.
Chomitz, K.M. and Nelson, A. 2003 The geographical poverty gradient in Nicaragua and its implications for rural development strategy. Paper repared for the ‘Drivers of Rural Growth’ study. Unpublished manuscript.
Chomitz, K.M., Buys, P., De Luca, G., Thomas, T.S. and Wertz-Kanounnikoff, S. 2007 At loggerheads? Agricultural expansion, poverty reduction, and environment in tropical forests. World Bank Policy Research Report. The World Bank, Washington, DC.
Colchester, M., Boscolo, M., Contreras-Hermosilla, A., Del Gatto, F., Dempsey, J., Lescuyer, G., Obidzinski, K., Pommier, D., Richards, M., Sembiring, S.N. et al. 2006 Justice in the forest: rural livelihoods and forest law enforcement. Forest Perspectives 3. Center for International Forestry Research, Bogor, Indonesia.
Contreras-Hermosilla, A. and Fay, C. 2005 Strengthening forest management in Indonesia through land tenure reform: issues and framework for action. Forest Trends, Washington, DC, and World Agroforestry Centre, Bogor, Indonesia.
Cuco, A., Songane, F. and Matusse, C. 2003 Building linkages between poverty reduction and national forestry programme: the case of Mozambique. In: Oksanen, T., Pajari, B. and Tuomasjukka, T. (eds.) Forests
in poverty reduction strategies: capturing the potential. EFI Proceedings No. 47. European Forest Institute (EFI), Brill, The Netherlands.
Dasgupta, S., Deichmann, U., Meisner, C. and Wheeler, D. 2005 Where is the poverty-environment nexus?: evidence from Cambodia, Lao PDR, and Vietnam. World Development 33(4): 617–638.
DeFries, R.H., M., Townshend, J.R.G., Janetos, A.C. and Loveland, T.R. 2000a Continuous fields 1 km tree cover. Version: 1.0. The Global Land Cover Facility, College Park, Maryland.
DeFries, R.H., M., Townshend, J.R.G., Janetos, A.C. and Loveland, T.R. 2000b A new global 1 km data set of percent tree cover derived from remote sensing. Global Change Biology 6: 247–254.
Dewi, S., Belcher, B. and Puntodewo, A. 2005 Village economic opportunity, forest dependence, and rural livelihoods in East Kalimantan, Indonesia. World Development 33(9): 1419–1434.
Dyson, T. 1996 Population and food: global trends and future prospects. Routledge, London and New York.
Engel, S. and Palmer, C. 2006. Who owns the right?: the determinants of community benefits from logging in Indonesia. Forest Policy and Economics 8: 434–446.
Evans, L.T. 1998 Feeding the ten billion: plants and population growth. Cambridge University Press, Cambridge, UK.
FAO 2001 Global forest resource assessment. FAO Forestry Paper 140. Food and Agriculture Organization of the United Nations (FAO), Rome.
Fisher, R.J. 2003 Innovations, persistence and change: reflection on the state of community forestry. In: RECOFTC and FAO (eds.) Community forestry: current innovations and experiences, 16–29. CD-ROM. Regional Community Forestry Training Center for Asia and the Pacific (RECOFTC) and FAO, Bangkok, Thailand.
Fisher, M. 2004 Household welfare and forest dependence in southern Malawi. Environment and Development Economics 9: 135–154.
Fisher, R.J., Srimongkontip, S., Veer, C., Victor, M. and Kijtewachakul, N. 1997 People and forests in Asia and the Pacific: situation

3� CIFOR Occasional Paper No. 47 William D. Sunderlin, Sonya Dewi and Atie Puntodewo
and prospects. Asia-Pacific Forestry Sector Outlook Study Working Paper Series. Working Paper No: APFSOS/WP/27. Forestry Policy and Planning Division, FAO, Rome, and Regional Office for Asia and the Pacific, FAO, Bangkok.
Fisher, R.J., Maginnis, S., Jackson, W.J., Barrow, E. and Jeanrenaud, S. 2005 Poverty and conservation: landscapes, people and power. Landscape and Livelihoods Series No. 2. International Union for the Conservation of Nature, Gland, Switzerland and Cambridge, UK.
Fotheringham, A.S. and Wong, D.W. 1991 The modifiable areal unit problem and multivariate analysis. Environment and Planning A 23: 1025–1044.
Gockowski, J., Tchatat, M., Dondjang, J.-P., Hietet, G., Moulende-Fouda, T. and Moneye, J.J. 2006 The value of biodiversity in the Beti cocoa agroforests of southern Cameroon. Paper to biannual conference of the International Society of Tropical Foresters, Yale University, USA, 7 April 2006.
Godoy, R., Brokaw, N., Wilkie, D., Cruz, G., Cubas, A., Demmer, J., McSweeney, K. and Overman, H. 1996 Rates of return on investments in cattle among Amerindians of the rain forest in Honduras. Human Ecology 24(3): 395–399.
Grieg-Gran, M., Porras, I. and Wunder, S. 2005 How can market mechanisms for forest environmental services help the poor?: preliminary lessons from Latin America. World Development 33(9): 1511–1528.
Hyde, W.F., Xu, J. and Belcher, B. 2003 Introduction. In: Hyde, W.F., Belcher, B. and Xu, J. (eds.) China’s forests: global lessons from market reforms, 1–26. Resources for the Future, Washington, DC, and Center for International Forestry Research, Bogor, Indonesia.
IDB 2006 Strategy for indigenous development. Sustainable Development Department, Indigenous Peoples and Community Development Unit, Inter-American Development Bank (IDB), Washington, DC. http://idbdocs.iadb.org/wsdocs/getdocument.aspx?docnum=691275 (16 Mar. 2006).
ILRI 2005 Poverty targeting tool, strategic analysis and knowledge support system (SAKSS). CD-ROM (beta version).
International Livestock Research Institute (ILRI), Nairobi.
IPEA (Institute of Applied Economics Research). População estimada para as areas geográficas dos municipios existents em 2000 – Annual – Habitante. http://ipeadata.gov.br/ (Nov. 2005).
Jumbe, C.B.L. 2005 Community forest management, poverty and energy use in Malawi. Ph.D. dissertation, Norwegian University of Life Sciences, Ås, Norway.
Jumbe, C.B.L. and Angelsen, A. 2006 Do the poor benefit from devolution policies? Evidence from forest co-management in Malawi. Land Economics 82(4): 562–581.
Kaimowitz, D. 2003 Forest law enforcement and rural livelihoods. International Forestry Review 5(3): 199–210.
Katila, M. 2000 Village forestry experiences in FOMACOP: from piloting to expansion. Paper to the Workshop on ‘Community-Based Forest Management in the Mekong River Basin: Strategies and Tools for Community Forest Management Support’, organised by SMRP (GTZ-MRC) and the Asia Forest Network, Ho Chi Minh City, Vietnam, 27–29 March 2000.
Khare, A., Sarin, M., Saxena, N.C., Palit, S., Bathla, S., Vania, F. and Sayanayarana, M. 2000 Joint forest management: policy, practice, and prospects. Policy That Works for Forest and People Series No. 3. World Wide Fund for Nature, India, and International Institute for Environment and Development, UK.
Levang, P., Dounias, E. and Sitorus, S. 2005 Out of the forest, out of poverty? Forests, Trees and Livelihoods 15(2): 211–236.
Liu, D. and Edmunds, D. 2003 Devolution as a means of expanding local forest management in south China: lessons from the past 20 years. In: Hyde, W.F., Belcher, B. and Xu, J. (eds.) China’s forests: global lessons from market reforms, 27–44. Resources for the Future, Washington, DC, and Center for International Forestry Research, Bogor, Indonesia.
Logo, P.B. 2003 The decentralized forestry taxation system in Cameroon: local management and state logic. Working Paper No. 10. The World Resource Institute, Washington, DC. http://pubs.wri.org/pubs_description.cfm?PubID=3917 (19 Mar. 2006).

3�Poverty and forests: Multi-country analysis of spatial association and proposed policy solutions
MacQueen D.J. and Mayers, J. 2007 Forestry’s messy middle: a review of the role of small and medium forest enterprises in sustainable development. International Institute for Environment and Development, London.
Mayers, J. and Bass, S. 2004 Policy that works for forests and people: real prospects for governance and livelihoods. Earthscan, Sterling, VA.
Mayers, J. and Vermeulen, S. 2002 Company-community forestry partnerships: from raw deals to mutual gains? International Institute for Environment and Development, London.
McKenney, B., Chea, Y., Tola, P. and Evans, T. 2004 Focusing on Cambodia’s high value forests: livelihoods and management. Special Report. Cambodian Development Resource Institute and Wildlife Conservation Society, Phnom Penh.
Mehta, A.K. and Shah, A. 2003 Chronic poverty in India: incidence, causes and policies. In: Hulme, D. and Shepherd, A. (eds.) Special issue on ‘Chronic poverty and development policy’. World Development 31(3): 491–511.
Minde, I.J., Kowero, G., D. Ngugi and Luhanga, J. 2001 Agricultural land expansion and deforestation in Malawi. Forests, Trees, and Livelihoods 11: 167–182.
Minot, N., Baulch, B. and Epprecht, M. 2003. Poverty and inequality in Vietnam: spatial patterns and geographical determinants. International Food Policy Research Institute (IFPRI), Washington, DC, and Institute of Development Studies, Brighton, UK.
Molnar, A., White, A. and Khare, A. 2005 Forest rights and asset based livelihoods: catalyzing rural economies and forest conservation through policy reform and collective action. Draft working paper produced for the World Bank conference on ‘New Frontiers of Social Policy: Development in a Globalizing World’, 12–15 December 2005.
Molnar, A., Liddle, M., Bracer, C., Khare, A., White, A. and Bull, J. 2007 Community-based forest enterprises in tropical forest countries: status and potential. International Timber Trade Organization, Yokohama, Japan.
Müller, D., Epprecht, M. and Sunderlin, W.D. 2006 Where are the poor and where are the
trees?: targeting of poverty reduction and forest conservation in Vietnam. Working Paper No. 34. Center for International Forestry Research, Bogor, Indonesia.
Murdiyarso, D., Puntodewo, A., Widayati, A. and van Noordwijk, M. 2006 Determination of eligible lands for A/R CDM project activities and of priority districts for project development support in Indonesia. Center for International Forestry Research, Bogor, Indonesia.
Mvondo, S.A. 2006 Forestry income management and poverty reduction: empirical findings from Kongo, Cameroon. Development in Practice 16(1): 68–73.
Nygren, A. 2005 Community-based forest management within the context of institutional decentralization in Honduras. World Development 33(4): 639–655.
Okwi, P.O., Hoogeveen, J.G., Emwanu, T., Linderhof, V. and Begumana, J. 2005 Welfare and environment in rural Uganda: results from a small-area estimation approach. Poverty Reduction and Environmental Management (PREM) Working Paper 05/04. Institute for Environmental Studies, Amsterdam.
Oyono, P.R. 2005 Profiling local-level outcomes of environmental decentralization: the case of Cameroon’s forests in the Congo basin. Journal of Environment and Development 14(2): 1–21.
Palmer, C.E. 2005 The outcomes and their determinants from negotiations for logging agreements between communities and companies in Indonesia. Ph.D. dissertation, Center for Development Research, University of Bonn, Germany.
Plant, R. 2002. Indigenous peoples/ethnic minorities and poverty reduction – regional report. Asian Development Bank, Manila, The Philippines. http://www.adb.org/Documents/Reports/Indigenous_Peoples/REG/default.asp (16 Mar. 2006).
Poffenberger, M., Bhattacharya, P., Khare, A., Rai, A., Roy, S.B., Singh, N. and Singh, K. 1996 Grassroots forest protection: eastern Indian experiences. Research Network Report No. 7. Asian Forest Network, Berkeley.
Redford, K.H. and Painter, M. 2006 Natural alliances between conservationists and indigenous peoples. Working Paper No. 25. Wildlife Conservation Society, New York.

3� CIFOR Occasional Paper No. 47 William D. Sunderlin, Sonya Dewi and Atie Puntodewo
Ribot, J.C., Agrawal, A. and Larson, A.M. 2006 Recentralizing while decentralizing: how national governments reappropriate forest resources. World Development 34(11): 1864–1886.
Roberts, J.T. and Thanos, N.D. 2003 Trouble in paradise: globalization and environmental crises in Latin America. Routledge, New York and London.
Robles, M. 2003 Estimación de indicadores de pobreza y desigualdad a nivel municipal en Honduras. BID/MECOVI – INE, Honduras.
Roper, J.M. 2003 An assessment of indigenous participation in commercial forestry markets: the case of Nicaragua’s North Atlantic Autonomous Region. Draft report. Forest Trends, Washington DC. http://forest-trends.org/documents/publications/Nicaragua%20Report_final.pdf (16 Mar. 2006).
Rudel, T.K. 1998 Is there a forest transition?: deforestation, reforestation, and development. Rural Sociology 63(4): 533–552.
Rudel, T.K. 2005 Tropical forests: regional paths of destruction and regeneration in the late twentieth century. Columbia University Press, New York.
Ruíz-Pérez, M., Belcher, B., Fu, M. and Yang, X. 2004a Looking through the bamboo curtain: an analysis of the changing role of forest and farm income in rural livelihoods in China. International Forestry Review 6(3–4): 306–316.
Ruíz-Pérez, M., Belcher, B., Achdiawan, R., Alexiades, M., Aubertin, C., Caballero, J., Campbell, B., Clement, C., Cunningham, T., Fantini, A. et al. 2004b Markets drive the specialization strategies of forest peoples. Ecology and Society 9(2): 4. http://www.ecologyandsociety.org/vol9/iss2/art4/main.html (19 Mar. 2006).
Scherr, S.J., White, A. and Kaimowitz, D. 2002 Making markets work for forest communities: policy brief. Forest Trends, Washington, DC, and Center for International Forestry Research, Bogor, Indonesia.
Scherr, S.J., White, A. and Kaimowitz, D. 2004 A new agenda for forest conservation and poverty reduction: making markets work for low-income producers. Forest Trends, Washington, DC, Center for International
Forestry Research, Bogor, Indonesia, and IUCN, Gland, Switzerland.
Schneider, R.R. 1995 Government and the economy on the Amazon frontier. World Bank Environment Paper No. 11. The World Bank, Washington, DC.
Shah, A. and Guru, B. 2004 Poverty in remote rural areas in India: a review of evidence and issues. CPRC-IIPA Working Paper No. 21. Indian Institute of Public Administration (IIPA), New Delhi.
Simler, K.R. and Nhate, V. 2005 Poverty, inequality, and geographic targeting: evidence from small-area estimates in Mozambique. (Discussion Paper.) International Food Policy Research Institute (IFPRI), Washington, DC.
Smith, J. and Scherr, S. 2003 Capturing the value of forest carbon for local livelihoods. World Development 31(12): 2143–2160.
Sunderlin, W.D. 2004 Community forestry and poverty alleviation in Cambodia, Lao-PDR, and Vietnam: an agenda for research. A position paper to the Regional Consultation Workshop for ADB-RETA 6115: ‘Poverty Reduction in Upland Communities in the Mekong Region through Improved Community and Industrial Forestry’, Bangkok, Thailand.
Sunderlin, W.D., Angelsen, A., Belcher, B., Burgers, P., Nasi, R., Santoso, L. and Wunder, S. 2005 Livelihoods, forests, and conservation in developing countries: an overview. World Development 33(9): 1383–1402.
Swinkels, R. and Turk, C. 2004 Poverty and remote areas: evidence from new data and questions for the future. Background paper for the PAC Conference, Hanoi, Vietnam, 24–26 November 2004.
Tacconi, L. and Kurniawan, I. 2006 Forests, agriculture, poverty and land reform: the case of the Indonesian Outer Islands. Occasional Paper No. 9. Australian National University, Asia Pacific School of Economics and Government, Canberra, Australia.
Thiele, G. 1993 The dynamics of farm development in the Amazon: the Barbecho crisis model. Agricultural Systems 42: 179–197.
van de Walle, D. and Gunewardena, D. 2001 Sources of ethnic inequality in Viet Nam. Journal of Development Economics 65(1): 177–207.

3�Poverty and forests: Multi-country analysis of spatial association and proposed policy solutions
von Thünen, J.H. 1826 Der Isolierte Staat in Beziehung auf Landwirtschaft und Nationaloekonomie. Scientia Verlag, Aalen.
White, A. and Martin, A. 2002 Who owns the world’s forests?: forest tenure and public forests in transition. Forest Trends and Center for International Environmental Law, Washington, DC.
World Bank 2004 World development report 2005: a better investment climate for everyone. The World Bank, Washington, DC, and Oxford University Press, New York.
World Bank 2006a India: unlocking opportunities for forest-dependent people in India. Agriculture and Rural Development Sector Unit, South Asia Region. Report No. 34481-IN. The World Bank, Washington, DC.
World Bank 2006b Watershed management approaches, policies and operations: lessons for scaling-up. Draft (October 10, 2006). Agriculture and Rural Development Department, The Water-For-Food Team, The World Bank, Washington, DC.
Wunder, S. 2000 The economics of deforestation: the example of Ecuador. Saint Anthony’s Series, Oxford.
Wunder, S. 2001 Poverty alleviation and tropical forests—what scope for synergies? World Development 29(11): 1817–1833.
Wunder, S. 2005 Payments for environmental services: some nuts and bolts. CIFOR Occasional Paper No. 42. Center for International Forestry Research (CIFOR), Bogor, Indonesia.
Yin, R. 2003 Central characteristics of reform: measures of the effects of improved property rights, a stable policy environment, and environmental protection. In: Hyde, W.F., Belcher, B. and Xu, J. (eds.) China’s forests: global lessons from market reforms, 59–84. Resources for the Future, Washington, DC, and Center for International Forestry Research, Bogor, Indonesia.
Zhou, L. and Veeck, G. 1999 Forest resource use and rural poverty in China. Forestry Economics 4(1): 80–92.

40 CIFOR Occasional Paper No. 47 William D. Sunderlin, Sonya Dewi and Atie Puntodewo
Annexes
Annex I. Sources of socioeconomic data used in LISA analysis
Brazil
Poverty data: From: ‘Intensidade da pobreza: linha de R$ 37.75’.Period: decennial. Unit: percentage. Year: 2000.Measurement at the level of the municipality: 5508 municipalities.
Source: Instituto de Pesquisa Econômica Aplicada (IPEA, Institute of Applied Economic Research), Brazil. http://ipeadata.gov.br/ (Nov. 2005).
Commentary: Distance that separates average per capita household income inferior to the poverty line of R$ 37.75, measured in terms of percentage of the value of this poverty line. To get more information on the methods access: www.undp.org.br.
Population data: From: ‘População estimada para as áreas geográficas dos municípios existentes em 2000’.Period: annual. Unit: Inhabitants. Year: 2000.Measurement at the level of the municipality: 5508 municipalities.
Source: Instituto Brasileiro de Geografia e Estatística (IBGE, Brazilian Institute of Geography and Statistics). http://ipeadata.gov.br/ (Nov. 2005).
Commentary: Counting of the population. (See www.sidra.ibge.gov.) The cities in the table are defined by IBGE in the tax survey.
Honduras
Poverty and population data:From: ‘Estimación de indicadores de pobreza y desigualdad a nivel municipal en Honduras’ Robles, M., BID/MECOVI – INE Honduras, Noviembre 2003.
Year: 2001. Measurement at the level of the district: 298 districts.
Source: Instituto Nacional des Estadistica (INE, National Institute of Statistics), Honduras. http://www.ine-hn.org/ (8 Jun. 2007).
Commentary: The poverty data were obtained through the 23rd multiple purpose household survey carried out in May 2001. The survey was based on a sample of 7000 households throughout the country.
Malawi
Poverty and population data:From: Benson (2002).
Year: 1998. Unit: TA (Traditional Authority). Number of TA: 350.Source: National Statistics Office, Government of Malawi.
Commentary: The poverty analysis was based on the Integrated Household Surveys (HIS) that were held in 1997–1998. Poverty in this research is defined as a level of consumption and expenditure by individuals in a household that has been calculated to be insufficient to meet their basic needs. This definition excludes from consideration several important components of personal and household wellbeing, including physical security, level of participation in networks of support and affection, access to important public social infrastructure such as health and educational services, and whether or not one can exercise one’s human rights.
Mozambique
Poverty and population data:From: Simler and Nhate (2005).
Year: 1998. Unit: District. Number of districts: 146.

41Poverty and forests: Multi-country analysis of spatial association and proposed policy solutions
Commentary: The survey data used in the analysis are from the ‘Inquérito Nacional aos Agregados Familiares sobre as Condições de Vida, 1996–97’ (National Household Survey of Living Conditions). The survey is a multipurpose household and community survey, in the same vein as the World Bank’s Living Standards Measurement Study (LSMS) surveys, and was designed and implemented by the National Institute of Statistics. Data collection took place from February 1996 through April 1997, covering 8250 households living throughout Mozambique. The sample was designed to be nationally representative. It is also representative of each of the 11 sample strata (the 10 provinces plus the city of Maputo) and along the rural–urban dimension. It is the first survey of living conditions in Mozambique with national coverage and a welfare measure based on comprehensive income or expenditure data.
Uganda
Poverty and population data:From: ILRI (2005).
Year: 1999. Unit: district. Number of districts: 36.Source: Strategic Analysis and Knowledge Support System (SAKSS) prototype CD, ILRI, Nairobi.
Commentary: Knowledge of the geographic dimensions of wellbeing matters to the extent that these differ within and among small geographical localities and administrative areas. Previously, comprehensive representative data on the spatial distribution of the poor in Uganda was available only for a few major urban centres and for rural areas at the regional level. This information was collected via specially designed sample surveys, the principal source of data on household expenditures necessary for determining levels of wellbeing. More detailed spatial dimensions of wellbeing based on such surveys are not feasible because of sample size limitations. The problem was circumvented by implementing a recently developed approach that enables combining detailed information on wellbeing from the 1992–93 Integrated Household Survey (IHS) with the complete
geographic coverage provided by the 1991 Population and Housing Census (PHC). Briefly, this newly developed approach involves the following steps. First, the IHS data estimates regressions relating to household expenditures to a number of socioeconomic variables such as household size, education levels, housing characteristics, and access to basic services. While the Census does not contain household expenditure data, it does contain these socioeconomic variables. Therefore, it is possible to statistically infer Census household expenditures by applying the survey-based estimated relationship together with the Census socioeconomic variables. This in turn allows for estimation of measures of wellbeing for very small geographical areas using statistical simulation techniques. The principal advantage of applying this new technique is that we can now provide poverty estimates for the rural and urban areas not only for all Regions and Districts, but also for Counties and Subcounties. However, one principal stipulation applies: it is critical to recognise and underscore that the results generated are not exact measures, but statistical estimates of poverty subject to precision bounds that widen the further one spatially disaggregates. In other words, estimates of wellbeing for larger and more populous areas, such as Regions and Districts, are more precise than those for smaller and less populated areas, such as Counties and Subcounties. It is critical for potential users to show consideration for the precision bounds associated with these poverty estimates.
Indonesia
Poverty and population data:From: SUSENAS (National Socioeconomic Survey) 2000. Badan Pusat Statistics (BPS), Jakarta.
Year: 2000. Unit: district. Number of districts: 390.Source: Central Bureau of Statistics (BPS).
Commentary: Indicators of poverty were obtained from the National Socioeconomic Survey (SUSENAS) data. They are based on detailed household consumption data from the

42 CIFOR Occasional Paper No. 47 William D. Sunderlin, Sonya Dewi and Atie Puntodewo
Consumption Module of SUSENAS, conducted once every 3 years. The main limitation of these poverty statistics is, however, that they are representative only for a large area, which is the urban or rural area of a province. Therefore, they are deemed less useful for practical programme targeting or budget allocation purposes. To overcome this limitation of too broad an area of representation, BPS also calculated district-level poverty statistics based on annual Core SUSENAS data. The main weakness of these district poverty statistics, however, lies in the data itself. The Core SUSENAS only collects data on the value of household consumption of several aggregated consumption items. This means that district-level poverty lines cannot be directly calculated from the data, as there is no information on prices and quantities of consumed items. BPS approximates the district-level poverty lines from the province-level poverty lines adjusted by food-share of average district-level consumption. Despite the apparent weaknesses, this district-level poverty map is widely used by government agencies for both programme targeting and budget allocation purposes.
Vietnam
Poverty and population data:From: Minot et al. (2003).
Year: 1999. Unit: district. Number of districts: 591.
Commentary: The official poverty measure used by the General Statistical Office (GSO) is the poverty headcount, measuring the percentage of people living below the national poverty line. The Vietnamese poverty line is based on the expenditures required to purchase the equivalent of 2100 kCal per person per day using the food basket of households in the third quintile, plus a nonfood allowance corresponding to the non-food expenditures of these households. The poverty line is equal to 1,789,871 Vietnamese Dong (VND) per person per year, plus adjustments using price indices to compensate for differences in the cost of living over the course of the survey and across regions (Minot et al. 2003).

43Poverty and forests: Multi-country analysis of spatial association and proposed policy solutions
In arriving at a decision on how to define ‘forest’ in our statistical analysis, we tried two different approaches. In the approach that we called ‘version 1’, we equated ‘forest’ with FAO’s ‘closed forest’ (that is, forest with crown cover of 40–100%). In ‘version 2’, we equated ‘forest’ with FAO’s ‘open forest’ (10–40% crown cover) and ‘closed forest’ (40–100% crown cover) together.
When we compared the results from version 1 and version 2, we could see that:
1. Countries with predominantly tropical and subtropical dry and moist broadleaf forests tended to show relatively consistent LISA results with different forest definitions (version 1 and version 2). Indonesia, Brazil and Vietnam are in this category.
2. A country with mixed broadleaf and coniferous forests (Honduras is the only country in this category) showed a decrease in the number of districts with significant correlations between forest and poverty rate when going from version 1 to version 2.
3. Countries dominated by savannah also showed a decrease in the number of districts showing significant correlations between forest cover and poverty rate when going from version 1 to version 2.
In general, we can say that the number of districts that show a significant relationship between forest cover and poverty rate is reduced by broadening the forest definition. This is probably due to the fact that, in applying version 2, forest cover is no longer a dominant factor explaining poverty. Other factors, including road infrastructure and elevation, are probably stronger explanatory variables in these cases.
The number of districts belonging to the LH (low forest – high poverty) and LL (low forest – low poverty) categories decreases when moving from version 1 to version 2. This is a direct consequence of recategorising districts which previously were in the low forest cover category (version 1) to the high forest cover category (version 2).
Annex II. Experimentation with narrow and wide definitions of forest


CIFOR Occasional Paper No. 47
C e n t e r f o r I n t e r n a t i o n a l F o r e s t r y R e s e a r c hC e n t e r f o r I n t e r n a t i o n a l F o r e s t r y R e s e a r c h
CIFOR is one of the 15 centres of the Consultative Group on International Agricultural Research (CGIAR)
The CIFOR Occasional Paper series publishes research results that are particularly significant to tropical forestry. The content of each paper is peer reviewed internally and externally, and simultaneously published in print and on the web (www.cifor.cgiar.org/publications/papers).
To request a copy, please contact publications at [email protected]
CIFOR is a leading international forestry research organisation established in 1993 in response to global concerns about the social, environmental, and economic consequences of forest loss and degradation. CIFOR is dedicated to developing policies and technologies for sustainable use and management of forests, and for enhancing the well-being of people in developing countries who rely on tropical forests for their livelihoods. CIFOR is one of the 15 centres of the Consultative Group on International Agricultural Research (CGIAR). With headquarters in Bogor, Indonesia, CIFOR has offices in Brazil, Bolivia, Burkina Faso, Cameroon, Ethiopia, India, Zambia and Zimbabwe, and it works in over 30 other countries around the world.
William D. Sunderlin | Sonya Dewi | Atie Puntodewo
Poverty and forestsMulti-country analysis of spatial association and proposed policy solutions
Related Documents