ASD-TDR42-203 Part II CID KINETICS OF OXIDATION OF REFRACTORY METALS AND ALLOYS AT 1000 0 -2000 0 C TECHNICAL DOCUMENTARY REPORT NO. ASD-TDR-62-203, Part II March 1963 Directorate of Materials and Processes C'. Aeronautical Systems Division Air Force Systems Command Wright-Patterson Air Force Base, Ohio DDC Project No. 7350, Task No. 735001 j MAY 4 1963 uISIA (Prepared under Contract No. AF 33(616)-6154 by Arthur D. Little, Inc., Cambridge, Massachusetts; J. B. Berkowitz-Mattuck, author.)

Welcome message from author
This document is posted to help you gain knowledge. Please leave a comment to let me know what you think about it! Share it to your friends and learn new things together.
Transcript
ASD-TDR42-203
Part II
CID KINETICS OF OXIDATION OF REFRACTORY
METALS AND ALLOYS AT 10000-20000C
TECHNICAL DOCUMENTARY REPORT NO. ASD-TDR-62-203, Part II
March 1963
Directorate of Materials and Processes
C'. Aeronautical Systems Division
Air Force Systems CommandWright-Patterson Air Force Base, Ohio
DDC
Project No. 7350, Task No. 735001 j MAY 4 1963
uISIA
(Prepared under Contract No. AF 33(616)-6154 byArthur D. Little, Inc., Cambridge, Massachusetts;
J. B. Berkowitz-Mattuck, author.)

NOTICES
When Government drawings, specifications, or other data are used for anypurpose other than in connection with a definitely related Government procure-ment operation, the United States Government thereby incurs no responsibilitynor any obligation whatsoever; and the fact that the Government may haveformulated, furnished, or in any way suppliedthe said drawings, specifications,or other data, is not to be regarded by implication or otherwise as in anymanner licensing the holder or any other person or corporation, or conveyingany rights or permission to manufacture, use, or sell any patented inventionthat may in any way be related thereto.
Qualified requesters may obtain copies of this report from the ArmedServices Technical Information Agency, (ASTIA), Arlington Hall Station,Arlington 12, Virginia.
This report has been released to the Office of Technical Services, U.S.Department of Commerce, Washington 25, D.C., in stock quantities for saleto the general public.
Copies of this report should not be returned to the Aeronautical SystemsDivision unless return is required by security considerations, c9ntractualobligations, or notice on a specific document.
BU6-617C. W00, 3o1-6$
FOREM0RD
This report was prepared by Arthur D. Little, Inc., under USAPContract No. AF 33( 6 16 )- 6 154. This contract was initiated underProject No. 7350, 'Refractory,. Inorganic and Non-Metallic Materials,"Task 735001 "Non-Graphitic." This work was administered under thedirection of the Directorate of Materials and Processes, Deputy forTechnology, Aeronautical Systems Division, with Mr. Fred Vahldiekacting as project engineer.
This report covers the period of work from September 1959 toJuly 1962.
Personnel participating in the work included J. Berkowitz-Mattuck,J. T. Larson, R. F. Quigley, and W. Christiansen.

ABSTRACT
SECTION It OXIDATION OF COPPER
An apparatus is described for continuous measurement of the rate of
oxidation of metallic materials at temperatures between 900* and 2100eC.
The samples, enclosed in an all-glass constant pressure flow system, are
heated inductively and a thermal conductivity cell of the type employed in
vapor phase chromatography is used to compare the oxygen concentration in
a helium stream before and after removal of a portion of the oxygen by
reaction with the heated specimens. Quantitative results obtained by thie
technique for the oxidation of copper between 9750 and lOIO•C at oxygen
partial pressures of 2-10 mm are in good agreement with previously reported
values, obtained by conventional methods.
SECTION 11: OXIDATION OF CARBIDES
For the highest carbides of the metals of Groups IV-A (Ti, Zr, Hf),
V-A (V, Nb, Ta), and VI-A (Cr, Mo, W) of the periodic table, the results
of calculations of the pressures of carbon monoxide and carbon dioxide over
an equilibrium mixture of metal carbide and the corresponding metal oxide
are given. On the basis of thermodynamics, a coherent oxide film on the
carbide surfaces would be ruptured by evolution of CO(g) and 002 (g) fro the
carbide/oxide interface at temperatures above: 12300C for TiO2 (rut.) on
TiC, 1730°C for Zr0 2 on ZrC, 1730°C for Hf0 2 on HfC, 1230°C for V203 on VC,
8W•'Po er Nb0 2 on NbC, 10300C for Ta.05 on TaC, 11300C for CrO3 on Cr.C2,
and 7300C for W02 on WC. These are maximum temperatures for oxidation
resistance of the carbides. Experimental data obtained under thIs contract
and in other laboratories indicates that many of the carbides oxidize
rapidly at even lower temperatures due to the poor adherence between oxide
and substrate. The most promising refractory carbide is HfC.
iii
SECTION III: OXIDATION OF MOLYBIDNUM SILICIIES
The oxidation of Mo.Si, Mo.Si3, and MoSi 2 between 13000 and 2100eK at
oxygen pressures of 2-20 Torr was studied by oxygen consumption and metallo-
graphic techniques.
SECTION IV: OXIDATION OF MISCELLANEOUS MATERIALS
The oxidation of W5 Si 3 and WSi 2 was studied by the thermal conductivity
method at temperatures between 1600* and 2030eK.
A measurement of the rate of oxygen consumption of Ta 2 Be 17 was made at
16640K and an oxygen partial pressure of 8.4 Torr.
This report has been reviewed and is approved.
W. G. RamkeChief, Ceramics and Graphite BranchMetals and Ceramics LaboratoryMaterials Central
iv

TABLE OF COATES
PAGE
SECTION I - OXIDATION OF COPPER 1
1. JI21fDU1CTION 1
2. UE.I'RIMENTAL 2a 3 Apparatus 2b Calibration 4c) Procedure 8
3. ANALYSIS OF FLOW SYSTDm 9
-4. OXIDATION OF COPPER 12
5. CONCLUSIONS 22
REPMFENCES 24
SECTION II - OXIDATION OF CARBIDES 26
1. INTRODUCTION 26
2. THEo OF WEBB, ORTON, and WAGM (WNIwP) 26
3. APPIICATION OF THE WNW TRHAMW TO THE HIGH T•( tTUME 28OXIDATION OF CARBIDES OF GROUPS IV-A, V-A, and VI-A
a) Titanium Carbide, TiC 29b) Zirconium Carbide, ZrC 314c Hafnium Carbide, HfC 45d Vanadium Carbide, VC 47e Niobium Carbide, NbC 51f Tantalum Carbide, TaC 53g Chromium Carbide, Cr3C2 57h Molybdenum Carbide, MoC 63i Tungsten Carbide, WC 63
4. CONCLUSIONS 65
RERENCES 71
V
TABLE OF COTERTS (Cont'd)
PAGE
SECTIOA III - OXIDATION OF Ik BEOMD SILICIDE 73
1. INTRODCTION 73
2. ISOTHIRMAL M OF ECOW OF OXIDATION vs TIME 73
3. PRESBURE MMU OF O DATION RATE 78
4. xuALLRAPBIC WENxAmTIOj OF OXIDE FYILm 81a No-,Ai81
b oSi3 86C •2 89
S~92
SECTzON IV - OXiDATION OF MISCEEA,0US MATERIALS 93
1. Tom= s ncT 93) vSi2 93
Comrison between Molybdenum and Tungsten 103Silicides
2. TAMALM EL.ThH, Ta2 Be 17 103
107
vi

LIST CF FIGURES
FIGURE PAGE
SECTION I1 Schematic Diagram of the Apparatus 3
2 Recorder Tracing for a Single Calibration Point 5
3 Calibration Curve for a Burreli 340-148 Thermal 7Conductivity Cell
4 Total Oxygen Consumption vs Time for Cu 14
5 Parabolic Plot for the Oxidation of Cu, (d) vs t 16
6 Plot of (a) vs for oxidation of cu 20
7 Pressure Dependence of Rate of Oxidation of Cu 23
SECTION II
1 Oxidation of TiC 32
2 Oxidation of TiC 33
3 Arrhenius Plot of Parabolic Rate Constants for 35TiC and Ti
4 Oxidation of ZrC at 1126*K, P02 22.9 Torr 41
5 Oxidation of ZrC at 15590K, P0 2 21.2 Torr 42
6 Oxidation of ZrC at 1969eK, P0 2 25.9 Torr 43
7 Oxidation nf ZrC at 2165eK, P02 8.9 Torr 44
8 Oxidation of HfC at 2305"K, pOe 4.2 Torr 48
9 Oxidation of HfC at 23050K, Po0 4.2 Torr 49
10 Oxidation of TaC at 24320K, P02 6.8 1orr 58
11 Parabolic Plot for Oxidation of Cr3C2 and Cr in 61Oxygen
12 Linear Plot for Oxidation of WC and W in Oxygen 66
vii

LIST OF FIGURES (Cont'd)
FIGURE PAGE
SECTION III
1 Oxidation of Mo3Si as a Function of Temperature 74
2 Oxidation of Mo5 Si3 75
3 Oxidation of MoSt2 76
4 Oxidation of MoSi 2 above the Melting Point of Silica 79
5 MosSi, as polished, 90X
6 Cross-sections of Mo3 Si Oxidized at 15640K 83
7 Cross-sections of Mo_Si Oxidized at 15640K 84
8 Cross-sections of Mo3Si Oxidized at 1856-K 85
9 Cross-sections of Mo5Si 3 Oxidized at 1651eK 87
10 Cross-sections of Mo5Si 3 Oxidized at 18850K 88
ii Cross-sectious of MoSi 2 Oxidized at 1627@K 90
12 Cross-sections of MoSi2 Oxidized at 19810K 91
SECTION IV
1 Oxidation of W5 Si, (XI-20) at 1635"K 94
2 Oxidation of WsSi, (xi-18) at 17630K 95
3 Oxidation of W5Si3 (XI-10) at 18710K 96
4 Oxidation of WsSi3 (X-32) at 19690K 97
5 Oxidation of W5 Si3 (xi-4) at 2001"K 98
6 Oxidation of WSi 2 (XI-30) at 1693°K 99
7 Oxidation of WSi 2 (XI-28) at 1793eK 100
8 Oxidation of WSi 2 (XI-26) at 1902°K 101
viii
LIST OF FIGURE8 (Cont'd)
----- PAGE
SECTION IV9 Oxidation of WSi 2 (XI-23) at 20-30K 102
10 Oxidation of Ta2Be17 (XI-51) at 1664°K 104
ui Oxidation of Ta2Be17 (XI-51) at 166 4-K 105
ix

LIST OF' TABLEU
TABLE PAGE
SECTION I1 Thickness of Oxide that must form on Cu before 17
Parabolic Rate Law is Followed
2 Values of the Parabolic Rate Constant, k p(mg2 /cm4-hr) 19
SECTION nI1 Activity of Ti over TiC-C and Thermodynamic Data 30
for TiC-TiO2
2 Activity of Zr over ZrC-C and Thermodynamic Data 36for ZrC-Zr02
3 Sumary of Results on ZrC 39
4 Activity of Hf over HfC-C and Thermodynamic Data 46for HfC-Hf0 2
5 Activity of V over VC-C and Thermodynamic Data 50for VC-V 2 0,
6 Activity of fib over NbC-C and Thermodynamic Data 52for NbC-Nb0 2
7 Activity of Ta over TaC-C and Thermodynamic Data 54for TaC-Ta2 05
8 Activity of Cr over Cr5C2 -C and Thermodynamic Data 59for Cr3C2 -Cr2O,
9 Summary of Results on CrC 2 62
10 Activity of W over WC-C and Thermodynamic Data 64for WC-VD2
Ui Potentiality of Carbides for Oxidation Resistance 67
SECTION I=1 Rnirical Equation for the Oxidation of Molybdenum 77
Sulicides
x
KIETICS OF OXIDATION OF REFRACTORY MNiALS AND ALWYSAT I000"-2000*C
SECTION I - OXIDATION OF COPPER
1. IMTWOEJCTION
In the past 30 years, extensive studies have been made of the oxidation
of metals and alloys in the 300-1000C range, where the Wagner mechanism•I)
is frequently applicable after the first few minutes of reaction. A major
experimental tool for this work has been the vacuum microbalance, (2) which
permits continuous measurement of weight changes during oxidation, with a sen-
sitivity of 3xlO" 7 g. Supplementary measurements of the electrical properties
of oxide films and diffusion through the oxide layers have given firm support
to Wagner's ideas. More recently, with the development of electron microscopy
and electron probe analysis, attention has been directed toward the
earliest stages of oxidation, where Mott's•" theory for the growth of thin
films can be tested, but interest has again centered on pure metals attemperatures below 1000C.
The growing need for structural materials for space and technological
applications in the 10000 and 3000C range has emphasized the importance of
fundamental studies of the oxidation process at higher temperatures. Theoreti-
cal extrapolations from oxidation behavior at low temperatures is, for the most
part, not possible, due largely to the enhanced volatility of alloy constitu-
ents and product oxides as the temperature is raised. Experimentally, many of
the low temperature techniques are either difficult to adapt or inapplicable,
and new methods must be developed.
As temperature increases, rates of chemical reactions are greatly
accelerated, and the possible container materials in which a reaction can be
studied become more and more limited. If the sample is a metallic conductor,
induction heating provides an excellent means for maintaining it at a high
temperature, while keeping non-conducting walls and supports relatively cool.
The choice of induction heating, however, almost precludes the use of
continuous weighing techniques for following an oxidation reaction, since the
r.f. field generates an upward force on the heated sample. In this paper, the
Manuscript released by the author July 1962 for publication as an ABD TechnicalDocumeatary Report. 1

use of a thermal conductivity bridge, of the type employed in vapor phase
chromatography, to compare the oxygen concentration in a helium stream before
and after reaction with an inductively heated sample pellet is described. The
method gives rates of oxidation directly and continuously with a sensitivity
of about 10- g/min-millivolt, where voltage differences of the order of 0.01
millivolt are readily detectable. Although the general technique was first
suggested by E. R. Weaver of the National Bureau of Standards4)" in 1951, it
has received little attention for physical chemical studies 5) and has
apparently never been applied to oxidation kinetics.
2. MGMAL
(a) &
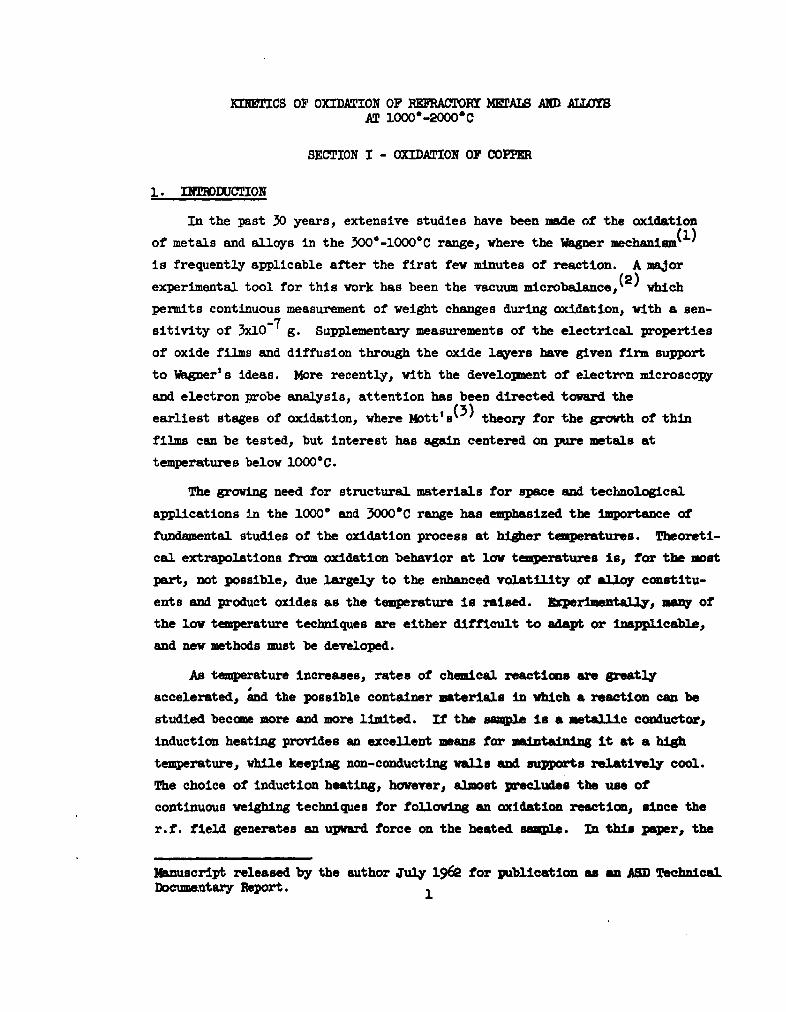
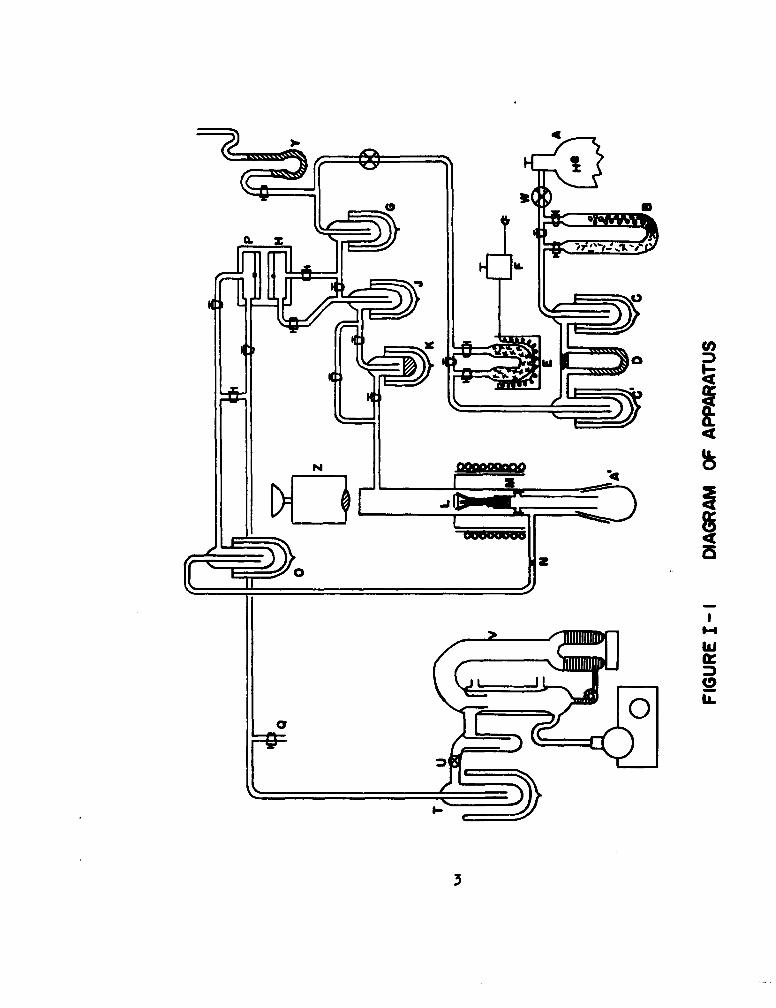
A schematic diagram of the apparatus in operation in this laboratory
is shown in Figure 1. Samples under study are machined in the form of cylin-
ders, 0.8 cm in diameter and 0.3 cm in height, and are mounted by point
contact with three alumina or thoria rods, 3 cm in length (L). The ceramic
support rods are in turn fastened with gold wire to an aluminum sample holder.
A screw at the bottom of the sample holder permits positioning of the pellet
optimally with respect to the concentrator and r.f. coils of a Sylvania 5 kw
induction unit. The samples are completely enclosed in a constant pressure
flow system, constructed entirely of pyrex, except for a short length of quartz
tubing in the immediate neighborhood of the pellet.
The flow system is of conventional design. Helium from tank A flows
through a purification train of magnesium perchlorate, Ascarite, drierite, and
glass wool, B, that removes water vapor, carbon dioxide, and dust. Flow rate
is measured with a dibutylphthalate capillary flow meter, D, flanked by liquid
nitrogen traps C and C'. Oxygen can be introduced into the helium stream at
partial pressures between 0 and 20 - by allowing the helium to flow through
heated CuOP (E). The helium-oxygen mixture passes through a cold trap, G, at
dry-ice acetone temperature (-80*C), and enters the reference side of the
thermal conductivity cell at H. The stream flows through a second -80"C cold
trap at J, and over the hot refractory button L, where a portion of the
oxygen is removed by chemical reaction. The gas stream, depleted in oxygen,
2
ad.
8:4L

flown across a coarse glass frit N, that reonves particulate matter, through
a dry-ice acetone trap, 0, and enters the sampling side of the therma con-
ductivity cell, P. The stresa is ultimately vented to the atmosphere at Q.
The two sides of the therml conductivity cell, P and N, fora two
arm of a Wheatstone bridge whse output is fed into a recorder.(6) The
recorder signal is, of course, proportional to the difference in oxygen con-
centration in the two sides of the cell1 or to the rate of oxygen consumption
by the heated sample.
(b)Cairto
(1) Optical Pyroeter and Flouw Mter
An optical flat ins blaon onto the system at R, and temperatures
are measured by sighting an optical Wrmeter on en Image of the sample pellet
in a plane mirror. The pyrometer is calibrated against a General Electric
standardized tungsten filament lam, vieved through the same optical flat as
the heated naples. Observed temperatures are corrected for sample emi•sivities,
on the basis of literature data, if possible. In cases where emissivities are
unknown , they can be measured by comparing observed temperatures of the surface
of oxidized and unoxidized sample pellets with those of a blackbody cavity
drilled ultrasonically in the specimen. It insImportant to recognize that the
emissivity correction is larg•j it amounts to 85C, for w le, for an observed
temperature of 16000C on a sample with an emissivity of 0.6. Surface
temperatures on the inductively heated specimens are uniform to -t 5"C.
The flow meter can be calibrated in situ over the range 0 to
100 cc/min by water displacement from a Ibriotte flask. (8)
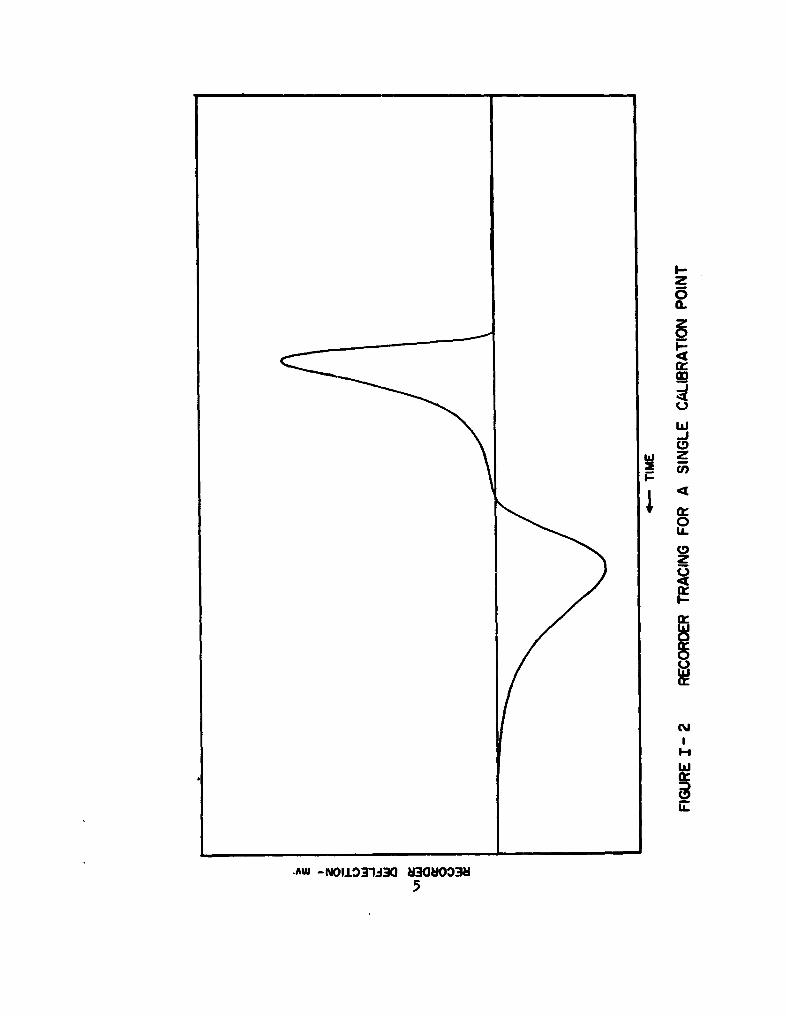
(2) Thermal Conductivity Apustux
To establish the relationship between recorder deflection and
oxygen concentration differences in the two sides of the thermal conductivity
cell, measured slugs of oxygen can be Introduced into the helium stream by
means of a manetric device () blown onto the main flow system at Z
(Figure 1). A typical recorder tracing for a single calibration point is
shown in Figure 2. The first peek occurs as the oxygen slug passes through
w-JCD
I-
U)4
Cur
IAW -NJOU±3j31O3 8308003H
5
the reference side of the thermal conductivity cell, while the sampling side
is filled with pure helium. The first peak declines and a reverse peak is
observed when the reference side is once more filled with pure helium, and
the oxygen slug passes through the sampling side. The area under either peak
is proportional to the total weight of oxygen that was introduced. From the
area calibration factor in gu 2 and the measured recorder speed in am/min,
peak heights can be related to rates of change of oxygen concentration in the
sampling cell in g/min for constant oxygen concentration in the reference
cell.
A calibration curve for a Burrell 34o-148(lo) thermal conduc-
tivity cell operated fro a 6 volt storage battery with a current of 300 ma
and a helium flow rate of 95 ml/min is given in Figure 3. The curve is seen
to be linear, and to pass through the origin as expected. Separate calibrations
are required for each flow rate and current setting. For the conditions
described here, a signal of one millivolt (full scale, 256 am) corresponds to
an oxidation rate of about 1.3 x 10⁻⁴ g/min. A calibration is reproducible to
+ 3.5%. The sensitivity is approximately proportional to the square of the
current, and to the reciprocal of the flow rate. Gow-MIc (11) hot wire and
thermistor cells have also been used successfully in work in this laboratory.
The calibration given in Figure 3 was checked by using heated
CuO(s) in equilibrium with CugO(s) as a source of oxygen. The free energy of
decomposition of CuO to Cu2O and oxygen is known to + 0.-5 kcal in the range
298*-3000K, (12) so that the equilibrium pressure of oxygen at a given tempera-
ture is readily calculated. Up to 1300°K, the further decomposition of CugO
to Cu is comparatively insignificant. In order to determine whether equilibrium
conditions prevail in the CuO tube the helium-oxygen stream was passed from
the thermal conductivity apparatus into a Minoxo unit (13) which measures small
partial pressures of oxygen electrolytically. (14) Experimental oxygen pressures
were in agreement with calculated pressures to .+ 5%.
6

0-
-00~ 00
0 0 0
itocu*
aww - V3o74
(a) Procedure
Samples are weighed, measured with a micrometer and placed on the
refractory fingers. The mounted pellet is positioned for maximum temperature
uniformity, so that its upper surface is slightly higher than the top of the
concentrator, and so that it rests eccentrically in a quartz tube, close to
the concentrator slit. The ground glass Joint A' is replaced, and the system
evacuated with the mercury diffusion pump, V. When the leak rate in the
system is less than 5K/hour, a flow of pure helium is started. The r.f.
power supply is turned on, and the sample pellet is heated, in order to degas
it, at a temperature slightly higher than that planned for the oxidation run.
The degassing procedure is monitored with the thermal conductivity bridge,
and a negative peak generally appears shortly after degassing begins, corres-
ponding to pure helium in the reference cell and released permanent gases in
the sampling cell. When degassing has stopped, the signal from the thermal
conductivity apparatus drops to zero, and the power supply is turned off to
cool the pellet.
The sample is reweighed and remeasured after the degassing procedure,
and the apparatus is once again pumped out. The helium flow is started and
the stream is diverted through the heated CuO. As the stream containing the
helium-oxygen mixture goes through the reference side of the thermal conducti-
vity cell, a peak is seen with a broad plateau, whose height is characteristic
of the pressure of oxygen in equilibrium with CuO at the temperature of the
copper oxide tube. The peak height serves as a daily check on calibration.
When both sides of the thermal conductivity cell become filled with the same
helium-oxygen mixture, the signal from the bridge drops to zero, and the
oxidation run is started. The sample is heated rapidly by induction to a
predetermined temperature, and an unbalance is observed in the thermal conduc-
tivity bridge indicative of the rate of oxygen pick-up by the sample. When
reaction has proceeded for a definite length of time, the sample is cooled
rapidly at room temperature, weighed, measured, and X-rayed. The highest tem-
perature oxidation rims in this laboratory have been made with HfC at 21000C.
8
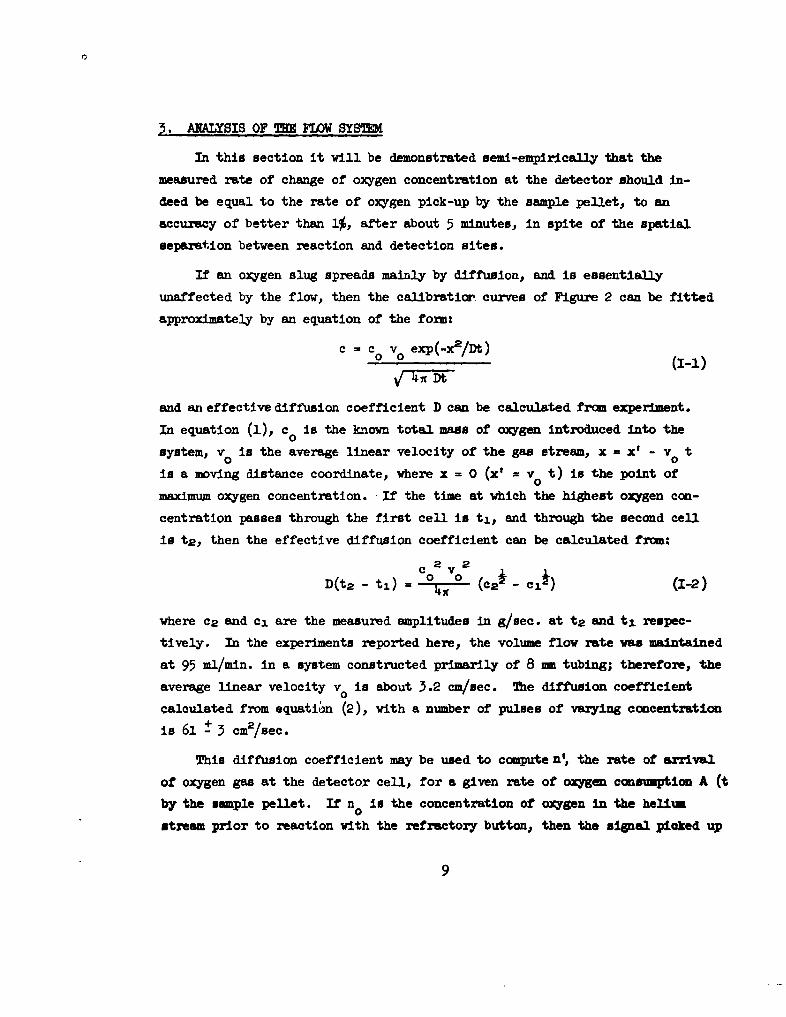
5. ANALYSIS OF TE FLOW SYSE(
In this section it will be demonstrated semi-empirically that the
measured rate of change of oxygen concentration at the detector should in-
deed be equal to the rate of oxygen pick-up by the sample pellet, to an
accuracy of better than 1%, after about 5 minutes, in spite of the spatial
separation between reaction and detection sites.
If an oxygen slug spreads mainly by diffusion, and is essentially
unaffected by the flow, then the calibratior. curves of Figure 2 can be fitted
approximately by an equation of the form:
C = C0 v 0exp(-x2/Dt)
V 4r7I7 _Dt
and an effective diffusion coefficient D can be calculated from experiment.
In equation (1), co is the known total mass of oxygen introduced into the
system, vo0 is the average linear velocity of the gas stream, x = xI - v0 t
is a moving distance coordinate, where x = 0 (x' = v t) is the point ofo
maximum oxygen concentration. If the time at which the highest oxygen con-
centration passes through the first cell is tj, and through the second cell
is t 2 , then the effective diffusion coefficient can be calculated from:
ac2 v 2
D(t 2 - tI) 07(-- (C2' - CJ~) (1-2)
where C2 and ca are the measured amplitudes in g/sec. at t 2 and tx respec-
tively. In the experiments reported here, the volume flow rate was maintained
at 95 ml/min. in a system constructed primarily of 8 mm tubing; therefore, the
average linear velocity v0 is about 3.2 cm/sec. The diffusion coefficient
calculated from equation (2), with a number of pulses of varying concentration
is 61 t 3 cm2/sec.
This diffusion coefficient may be used to compute n, the rate of arrival
of oxygen gas at the detector cell, for a given rate of oxygen conswiption A (t
by the sample pellet. If n0 is the concentration of oxygen in the helium
stream prior to reaction with the refractory button, then the signal picked up
9

by the recorder is proportional to (no - n'). The unreacted oxygen may be
looked upon as a continuous series of sharp pulses emitted from the sample
region into the flowing stream. A sharp pulse of amplitude n.(t 1 ) = no -
A(ti) that leaves the vicinity of the pellet at time t1 will spread out by
diffusion, so that its concentration at a later time t at a distance x
downstream from the source will be given by:
n = nx(ti) e-(X - v0t + Votl) 2 /4D(t - t1 ) (I-3)
Since the pulses diffuse into one another, the rate of arrival of oxygen at
the detector call at any time t is the sum of contributions from all pulses
that left the pellet region between time zero, when the experiment started
and time t,; i.e.
n t= t ni(ti) e - v t + V t)- 2/4D(t - ti)dt ( )n' t= 0 V~ ~~ t (1-4)
Jt= 0 J4 nS(t -t 1 )
where I is the distance between pellet and detector. Since the integration
in (4) is generally difficult, it is convenient to substitute a square wave
for the exponential factor:
e- v- 0t + v0ti)2 /iD(t - t3) 0 for 0 < (t - t1 ) <A-
-0, - < (t -2. <5 +8
0 for (t - tj) > -+8VV
where 8 - V'(Ds)Iv0 . Substituting (5) in (4), the observed sigal should
be eqtm to
10

t-(7A- ) 8
In - A(t 1 )dt1 = k A(t - - y)dy (1-6)no-n' /+ 2+ 8 -o02 ft - (LV-•-• 25
o 0
If A(t - - y) can be expressed by a Taylor's series expansion in y, then:10
A (2m) (t A
no -n' AA(t- ) + 0 ' ((o) -7)
vhere AC2')(t - Al/ ) denotes the 2mth drtie of A (t - i/vo) vith respect
to (t - J/v). ,Thus, if the summation in (7) is small, the signal at the
detector will be directly proportional to the rate of oxidation of the ua
pellet, but vidl be retarded by the time J/v 0 that it takes a slug of gs to
travel from pellet to detector.
If the sample oxidizes according to a simple rate lai, (7) can be used
to estimate the magnitude of the experimental error in the detector signal.
For example, if A(t) - constant, (linear oxidation), all of the derivatives
in (7) vanish and the correct oxidation rate should be observed. If the
sample oxidizes parabolically, A(t) = k./J, where k is the parabolic rate
constant, then (7) becomes:
no - f- kV(t - L)- + r O (L)2 )0 - 2 (2,+,),( ))+/ :80 3i]2~ 2uQ)(t 4 L) ,31/ 2 vo
The error will be less than 1% of the signal at times (t - L) that satisfy
the relation: 0
00 (.-l)(4.m-)...(Wk 1 2)
M- .. ()• <0.01 ktI/( - o)½ v 0
11
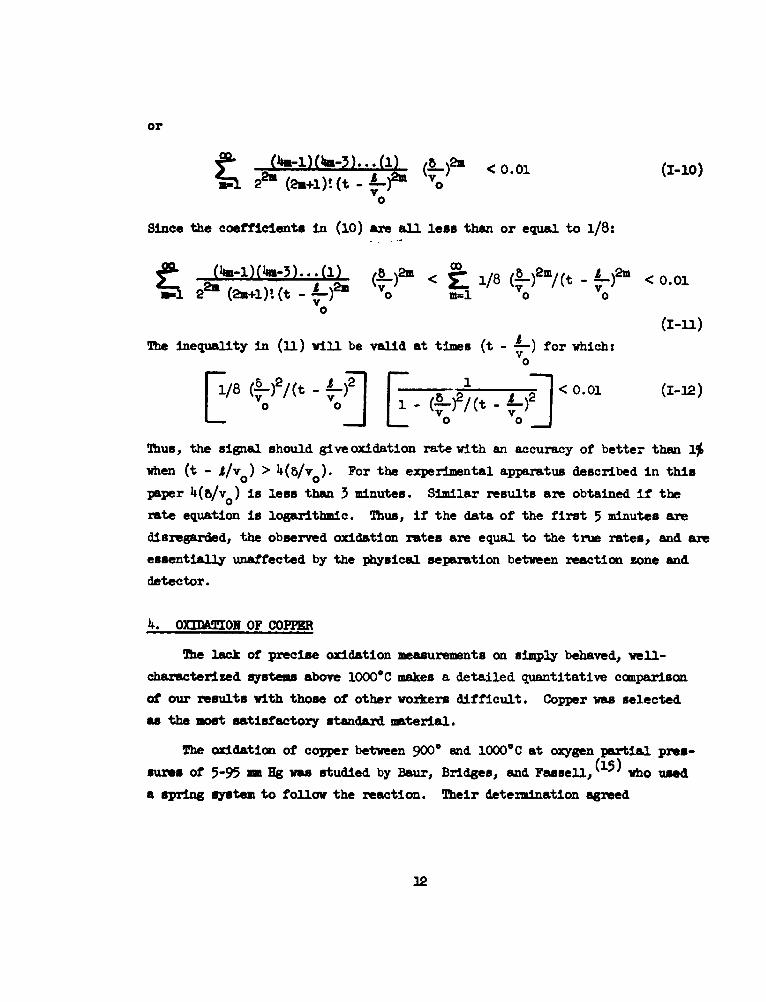
or
S(h-1) (ka-3)... (1) -(L_)2z <001(-02 2 (2a+l)! (t- _ ) 1 )2m < .O -O
0V
Since the coefficients in (10) are all less than or equal to 1/8:
(4m-l) O t-3)... (1) (7)2 < 2 m 1/8( )2m/(t _o)2m <0.01(2a" •.)'. (t v M- 10"0
(I-11)The inequality in (3-) will be valid at times (t - A-) for which:
0
8(&7 )2/ (t -] [ -8 2 i -. ] < 0.01 (1-12)
Thus, the signal should give oxidation rate with an accuracy of better than 1%
when (t - i/vo) > 4(5/vo). For the experimental apparatus described in this
paper 4(5/V ) is less than 3 minutes. Similar results are obtained if the
rate equation is logarithmic. Thus, if the data of the first 5 minutes are
disregarded, the observed oxidation rates are equal to the true rates, and are
essentially unaffected by the physical separation between reaction zone and
detector.
4. OXIDATION OF COPFER
The lack of precise oxidation measurements on simply behaved, well-
characterized systems above 10000C makes a detailed quantitative comparison
of our results with those of other workers difficult. Copper was selected
as the most satisfactory standard material.
The oxidation of copper between 900 and 10000C at oxygen partial pres-
sures of 5-95 m- Hg was studied by Baur, Bridges, and Fassell, (15) who used
a spring system to follow the reaction. Their determination agreed
12
satisfactorily with previous studies.(16,17) In our experiments, rates of
oxygen pick-up are measured directly, and hence the integral under the
thermal conductivity curve from time zero up to time t is proportional to
the total oxygen consumed up to that point. The results of thermal conduc-
tivity measurements of the kinetics of oxidation of pure copper between
9770C and 10):40C at oxygen partial pressures between 1.7 and 10 -m, are
plotted in Figure 4 as total oxygen consumption vs time. Included in the
same figure are weight change data of Baur, Bridges, and Fassel (BBF),
GrInewald and Wagner (GW), and Feitknecht (F), who worked in the same tem-
perature and pressure range. For the oxidation of copper, rate of change in
weight is precisely equivalent to rate of oxygen consumption, since neither
CuO nor CugO is volatile at the temperatures of interest. Our results at
10440C and an oxygen partial pressure of 10 mm are in good agreement with
those of (F) at 10200C and 7.6 m. Our results at 9900C and 10 -= are very
close to the (BBF) results at 1000C and 10 mm. Our results at 9770C and
3.0 mm are similar to the findings of (GW) at a higher temperature 1000C
and lower pressure, 0.23 mm, and both lie above our results at 990*C and
1.7 "m. If errors in weighing, in the determination of the zero of time, and
in the measurement of temperature and pressure are taken into account, as
well as the average precision of results from a given laboratory of t 10%,
agreement in the experimental data frao the four groups can be considered
very good. The data suggest that the rate of oxidation of copper increases
with both increasing temperature and increasing pressure.
According to Jost, "If copper is oxidized at oxygen pressures below the
equilibrium pressure for the formation of CuO a uniform film of CugO is
formd, its rate of growth obeying the quadratic law except for the very
early stagdh of reaction." The equilibrium oxygen pressure for dissociation
of CaO is 10.86 ma at 900C, 34.2 m at 950%C and 92 m at 1000*C. Mwre-
fore, all of the experiments listed in Figure 4 were perfozmd under
conditions where CuaO should be the sole oxidation product. If the rate of
growth of CugO obeys the quadratic law, (18) then:
23

BAUR, BRIDGES & FASSELL
28- 0 OO 1009 0mm& 950OC 10mmn
26 FEITKNECHTV 1020*C 7.6mm
24- GRCMJWALD & WAGNER
22- 0 000c Q23mmA I000C 11 mm
p.0- I~ 0000C 1.7mmBERI(OWITZ
06 2 90 40 60 0 0
14-IM -90 MIN.m
10-I

d('6)
d~t kp2(A)(1-1.3)
where Lm is measured weight change, A is specimen stirface area, t is time,
and k is a temperature dependent proportionality constant (parabolic ratepconstant). In general, equation (13) should hold if the rate determining
step in the oxidation of copper is diffusion of copper or oxygen through a
Cu2O(s) layer, and if Fick's first law describes the diffusion process.(19)
It is clear that at time zero, when the metal is devoid of an oxide layer,
solid-phase diffusion cannot be the rate controlling step. Therefore, equa-
tion (13) is not expected to apply in the earliest stages of oxidation.
However, it might be applicable after a time t when the oxide layer has
built up to a thickness t , corresponding to a weight gain per unit area
(6 ,.) Integrating (13) between limits (to, A ) and (t, 4), one finds:
(!) 2 = kpt + [.)o - k§P] (1-14)
It must be remembered that equation (14) holds only for times t > to; the
fitting of data from time zero to an equation of the form -(a)2 = k t + B,where B is an empirically determined constant, (18) is not justified on the
basis of the quadratic rate equation. However, if the quadratic rate law is
obeyed once a suitable thickness of oxide has been built up on the surface
of the metal, then a plot of (f-) vs t should be a straight line providedLm2 m2 Am 2(T) > (T!)o and t > , but nothing can be said about the form of the )2
vs t plot up to time to. The data in Figure 4 are replotted as(7)2 vs t
in Figure 5, and it seems that they fit well to straight lines after times
that vary between 10 and 60 minutes, depending upon the temperature and pres-
sure. Table 1 lists approximate values of to, (r)o' Joy and k computed byleast squaring the data in Figure 5 for the last 15 minutes of each rim, and
adding points up to the time that the computed slope differs from the final
slope by 1%. The last point added was taken as (t, (!)o), and k was taken0loAe0 p
as the average of the computed slopes back to that point. It is seen that a
layer of CNAO(N), 50,000-100,000 R thick, must be built up during the oxidation
15

300- BAUR, BRIDGES & FASSELL0 1000C 10mmo 950"C 1Omm
FEITKNECHT260- o 10200C 76mm
GRUNEWALD & WAGNER
Z" IO0C 0.23amm
220 -& " 00C IImmBERKOWITZ
"E -- 0 10440C IOmmRA 990rC 10mm
W 80 --s 977 C 3.0mm //
V 9900C 1.7mm /Nw.
S140-
I-iz
60-
20-
0 20 40 so so I00 120
TIME - MIN.
FIGURE 1- 5 PARABOLIC PLOT FOR THE OXIDATION OF Cu,AM 2- versus t
16

TABLE 1
"TIMCIESS OF OXIDE THAT MUST FORM ON CuBEFORE PARABOLIC RAT LAW IS FOLLOWED
(F) 1020 7.6 20.0 6.6 110,000 16q.7This work 1044 10 7.9 3.08 51,000 156.0(GW) 1000 11 26.o 7.5 125,000 159.4(GW) 1000 1.71 16.67 5.0 83,400 n4.8Ths work 990 10 lO.6 2.85 47,500 1iO.4(IM F) 1000 10 25.0 5.84 97,400 1o,6.7(mw) 950 10 30.0o 5.41 90, 300 76.2•mis work 977 1.5 30.4 3.42 57,000 66.oThis work 990 0.87 92.3 7.66 128,000 64.o(GW) 1000 0.23 41.6 4.875 81,200 53.6
17
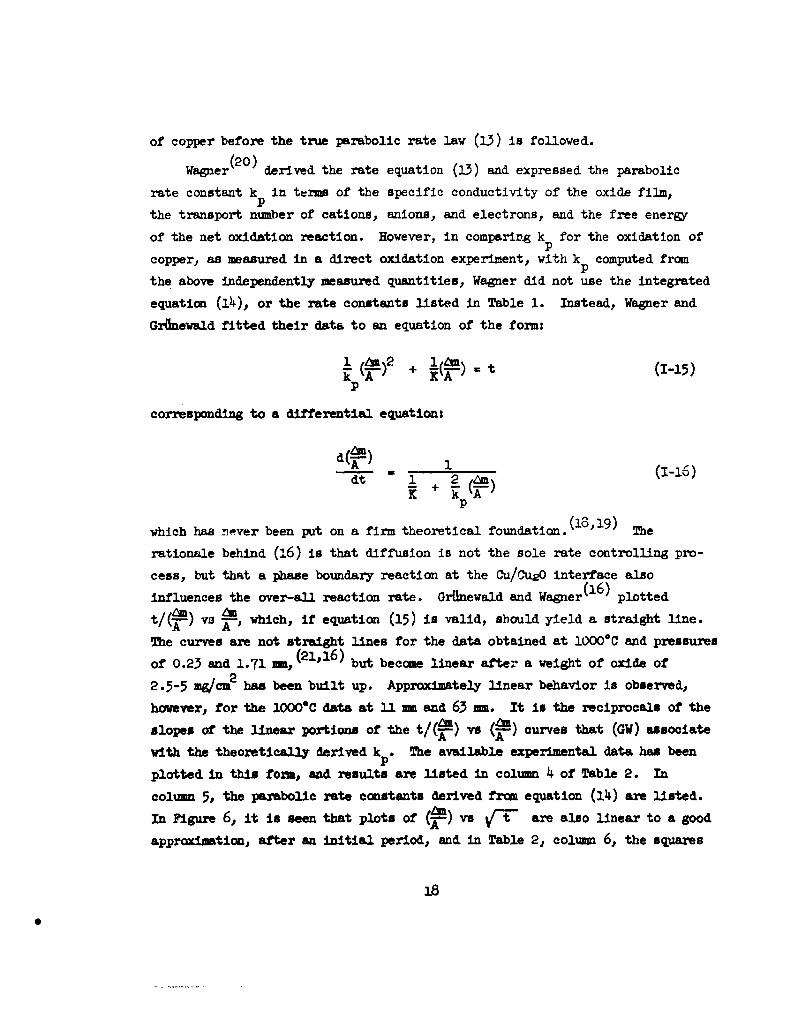
of copper before the true parabolic rate law (13) is followed.
Wagner(20) derived the rate equation (13) and expressed the parabolic
rate constant k in terms of the specific conductivity of the oxide film,pthe transport number of cations, anions, and electrons, and the free energy
of the net oxidation reaction. However, in comparing k for the oxidation ofPcopper, as measured in a direct oxidation experiment, with k computed frompthe above independently measured quantities, Wagner did not use the integrated
equation (14), or the rate constants listed in Table 1. Instead, Wagner and
GrOnewald fitted their data to an equation of the form:
1 + = t (-15)
p
corresponding to a differential equation:
d(r) 1dt 1 2n-k + T)
p
which has never been put on a firm theoretical foundation.(1,319) The
rationale behind (16) is that diffusion is not the sole rate controlling pro-
cess, but that a phase boundary reaction at the Cu/Cu2O interface also
influences the over-all reaction rate. Grinewald and Wagner(16) plotted
t/f ) vs A-, which, if equation (15) is valid, should yield a straight line.
The curves are not straight lines for the data obtained at 10000C and pressures
of 0.23 and 1.71 -M, (21,16) but become linear after a weight of oxide of
2.5-5 mg/cm 2 has been built up. Approximately linear behavior is observed,
hovever, for the 10000C data at 11 mm and 63 mm. It is the reciprocals of the
slopes of the linear portions of the t/(f) v (I) curves that (GW) associate
with the theoretically derived k p The available experimental data has been
plotted in this form, and results are listed in column 4 of Table 2. In
column 5, the parabolic rate constants derived frcm equation (14) are listed.
In Figure 6, it is seen that plots of (T) vs V are also linear to a good
approximation, after an initial period, and in Table 2, column 6, the squares
S1

TABIZ 2
VALUES OF TH PARABOLIC RATE CONSTANT, k (ig2/c,'-l!)
+,.-41
(F) 1020 7.6 - 169.7 +17. 196.8 132.4
This work 1044 10 158.9 156.o - 15.6 161.6 144.8(Gw) iooo U1 178.0 159.4 ± 15.9 179.4 3-34.o(GW) i000 1.71 122.8 u4.8 ± 11.5 127.8 93.6This work 990 10 123.0 110.4 U 11.0 122.4 127.0
(BBF) 1000 10 142.8 106.7 ± 10.7 127.8 130.8
(EBF) 950 10 81.5 76.2 7 7.6 83.4 102.3
This work 977 1.5 10io.9 66.0 o 6.6 99.6 84.3This work 990 0.87 131.8 64.0 - 6.4 9e.4 80.0
(Giw) 1000 0.23 79.1 53.6 - 5.4 72.6 62.9
19

BAURs BRIDGES a FASSELL
16- 0 1000 C 10 mm
& 9w 0C 10 mm
FEITKNECHT14 0 10200C 76mm
GRUNEWALD aWAGNER..le IO000C 0.23mm
12 k IOOO*C If mm12 l 1000C 1.7mmn
2 BERKOWITZ00 10440C Khmm
~, 0 A 990 C 10mm1 U 9770C L5 mmV 990C; 0.87mm
16-~
4-5
2-
0[ A
02 4 6mg V8 10 12
(TIE),I (MIN)
FIGRE1- POTOF(47) versus r7 FOR OXIDATION OF Cu20
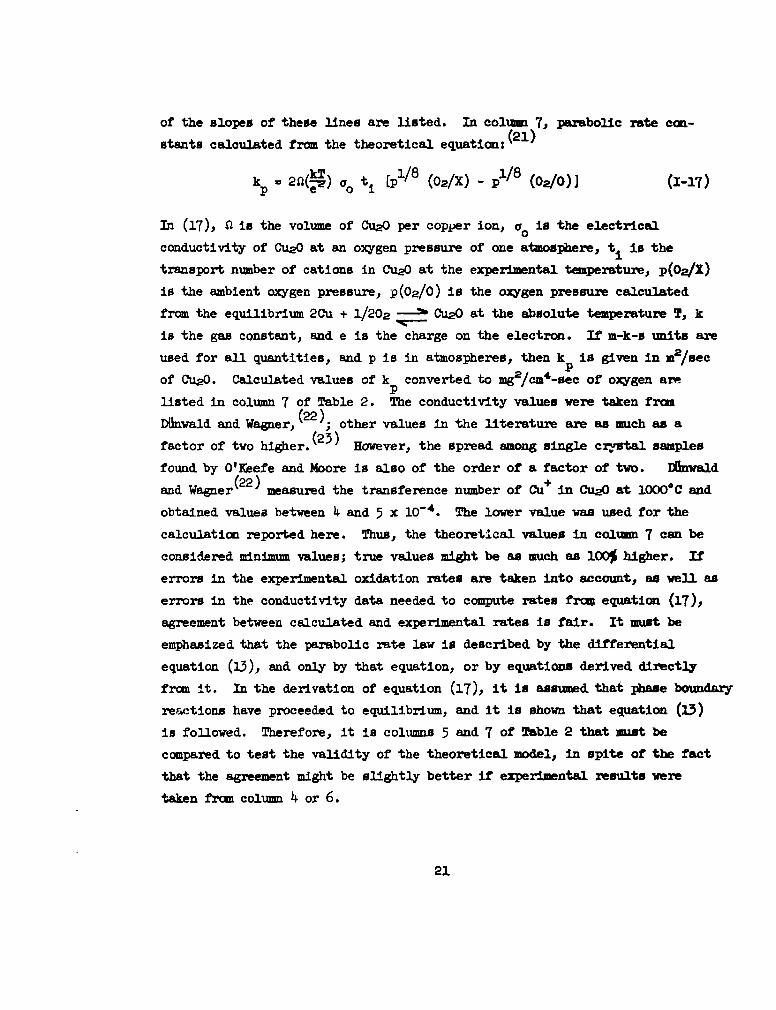
of the slopes of these lines are listed. In column 7, parabolic rate con-
stants calculated from the theoretical equation: (21)
k 2D o tk [l8 (02 /X) - p (02/0)] (1-17)
In (17), n is the volume of Cu2 O per copper ion, a° is the electrical
conductivity of Cu2O at an oxygen pressure of one atmosphere, ti is the
transport number of cations in Cu2O at the experimental temperature, p(Oa/X)
is the ambient oxygen pressure, p(02/0) is the oxygen pressure calculated
from the equilibrium 20u. + 1/202 Cu0O at the absolute temperature T, k
is the gas constant, and e is the charge on the electron. If r-k-s units are
used for all quantities, and p is in atmospheres, then k is given in m2/secp
of Cu20. Calculated values of k converted to mg2 /cm4-sec of oxygen areplisted in column 7 of Table 2. The conductivity values were taken from
Ddnwald and Wagner, (22); other values in the literature are as much as a
factor of two higher. (23) However, the spread among single crystal samples
found by 0'Keefe and Moore is also of the order of a factor of two. fInwald
and Wagner(22) measured the transference number of Cu+ in CugO at 10000C and
obtained values between 4 and 5 x 10⁻⁴. The lower value was used for the
calculation reported here. Thus, the theoretical values in column 7 can be
considered minimum values; true values might be as much as 100% higher. If
errors in the experimental oxidation rates are taken into account, as well as
errors in the conductivity data needed to compute rates from equation (17),
agreement between calculated and experimental rates is fair. It must be
emphasized that the parabolic rate law is described by the differential
equation (13), and only by that equation, or by equations derived directly
from it. In the derivation of equation (17), it is assumed that phase boundary
reactions have proceeded to equilibrium, and it is shown that equation (13)
is followed. Therefore, it is columns 5 and 7 of Table 2 that must be
compared to test the validity of the theoretical model, in spite of the fact
that the agreement might be slightly better if experimental results were
taken from column 4 or 6.
21

Equation (17) predicts that at constant temperature, k should be a
linear function of p 1/ 8 (O2 /X), with k - 0 when pl/8(0 2 /X) • pl/ 8 (02/O).
The original (OW) k data, listed in column 4 showed a perfect linear
dependence on pl/7(O2 X) with intercept at pl/7 (0/0). This was considered,
at the time, adequate agreement with the theoretical prediction. However,
(BBF) failed to confirm the 1/7 power dependence, as seen in Figure 7, where
both sets of data are plotted. In point of fact, probable experimental
errors of t 10% effectively mask differences in pressure dependence between
pl/4o (/X) and pl/ 8(0/X) at the present time.
5.- OONMAtBIONS
2he thermal conductivity detector provides a convenient method for
monitoring oxidation reactions in a constant pressure flow system. It is
particularly wcll suited for continuous measurement of rates of oxygen con-
sumption by inductively heated samples, since the reaction zone can be
maintained at temperatures between 1000 and 21000C, while the remainder of
the apparatus is kept at low temperatures.
In cases where both volatile and non-volatile products form during
oxidation, a single measurement of weight change or oxygen consumption does
not suffice to define the reaction completely. For such systems, microbalance
and thermal conductivity techniques should provide supplementary data.
22

0
230- 0
00
210
190 0
0170
0'0El.
06010.
0
110- 0 BAUIR, BRIDGES a FASSELL
0 GRtNEWALD a WAGNER
90
70
50. I0.6 O 1.0 12 L4 L6 1.8
p"
FIGURE 1-7 PRESSURE DEPENDENCE OF RATES OFOXIDATION OF Cu
23
SIMON I - TWME
(1) C. Wagner, Z. Phys. Chem. (B) 21, 25 (1933).
(2) 1. A. Guibransen, Trans. Electrochem. Soo. 8_1_, 327 (1942).
(3) N. F. Mott, Trans. Faraday Soc. 43, 429 (1947).
(4) E. R. Weaver in W. G. Berl, "Physical Methods in Chemical Analysis,"Vol. II, p. 387, Academic Press, N. Y. (1951).
(5) F. M. Nelsen and F. T. gertsen, Anal. Chem. 30, 1387 (1958).
(6) H. P. Burchfield and I. R. Storrs, "Biochemical Applications of GasCormatograpby," Academic Press, N. Y. (1962), p. 53.
(7) Am. Institute of Physics Handbook, Table 6 g-8, p. 6-75, McGraw-Hill,
N. Y. (1957).
(8) G. W. Sith, mnd. Rag. Chem., Awl. Ed. _, 244 (1932).
(9) C. Littm n and J. B. Berkowitz-Nattuck, Rev. Sci. Inst. 2b, f54 (1961).
(10) Burrell Corporation, Pittsburgh, Pa.
(11) 0ov-Mac, 100 Kings •a•d, Madison, New Jersey.
(12) 0. Kubascbewvki and E. Ll. Evans, "Metallurgical Ihermochemiutry,"Pargmcm Press, N. Y. (1958).
(13) Baker Compspny, Sm Jersey.
(14) P. Hersch, Dechea Monographien, ?1, 299 (1956).
(15) J. P. Baur, D. W. Bridges, and W. X. Fassell, Jr., J. Electrochem. Soc.10, 273 (1956).
(16) C. Wagner and K. Grfnevald, z. Phys. Chem. (B) 1!2, 455 (1938).
(17) W. Feitknecht, Z. Electrochem. 2 152 (199).
(18) 0. Kubaschevaki and, B. 1. Hopkins, "Oxidation of Metals and Alloys,"Acadlc Press, N. Y. (1962).
(19) C. Wagner, "Kinetics in Metallurgy," M.I.T. Course 3.63(M.I.T., Spring (1955)).
24
(20) C. Wagner, Z. Phys. Chem. (B) 32, 447 (1936).
(21) T. B. Grimley, Ch. 14 in W. E. Garner, "Chemiastry of the Solid State,"Academic Press, N. Y. (1956).
(22) H. IVnwald and C. Wagner, Z. Phys. Chem. (B) V2, 212 (1933).
(23) M. o'Keeffe and W. J. Moore, J. Chem. Phy. _2, 1324 (1961).
25

CO OF OXIDATION OF MUMMCZOY )MTALS AND AUlOYSAT 1000-2000°C
S moXN f - aXIATION OF CAR3IDS
1. 'IIINDCMIN
The high melting points of the carbides of groups IV-A, V-A, and VI-A
of the periodic table make these materials potentially attractive for high
temperature structural applications. The practical usefulness of the
carbideo, however, depends to a large extent upon their stability in oxygen-
containing atmospheres. A valuable thermodynamic basis for selection of
carbides with the greatest promise for good oxidation resistance was published
by Webb, Norton, and Wagner-in 1956. In the present report, the Webb, Norton,
Wagner criteria are applied to a prediction of the behavior of the carbides
of groups IY-A (TIC, ZrC, and HfC), V-A (VC, NbC, and TaC), and VI-A (Cr3C2,
WoC, and WC) in oxygen atmospheres at temperatures between 1000" and 20000K.
The available experimental evidence is presented, and discussed in the light
of the theoretical considerations.
2. M TIMM~ OF WMBB, NOM~'N, and WA0NKR (WNWj)(1)
In general, a metal carbide will show good oxidation resistance only if
a dense adherent oxide film forms on the carbide surface and acts to restrict
oxygen access to the alloy. Since the oxides of carbon are permanent gases,
it is clear that protection can only be afforded by the formation of an oxide
of the metallic element. Webb, Norton, and Wagner, therefore, consider the
syrtem of a metal carbide JfeCx in contact with metal oxide JkOyT in the pre-
sence of oxygen:
NeC I Ny I O
If the metallic oxide reacts with the carbide to form 00(g) or 0O0(g) at the
MeCzMeOy phase boumdary, and if the resultant gas pressure is sufficiently
high, then the oxide my be ruptured and thereby lose its effectiveness as a
barrier to further oxidation of the alloy. At high temperatures. equilibrium
might be expected to be attained rapidly at the alloy/oxide interface, and in
26

this case, the 00(g) and. OOa(g) pressures, pco and P0 02' can be computed from
the standard free energies MFe() and '*(2) of the reactions:_I(i) a -~ Co f t
C (alloy) + 1160. (a) = 00(g) + I M (alloy) (n-i)
C (alloy) + ý W () = C00(g) + He (alloy) (X1-2)y y y
Thus, P oo a* /y
ac
AFo 0 2/y
(2)x a .
where aMe and aC are metal and carbon activities respectivelyv at the alloy/
oxide interface.
The position of equilibrium will obviously depend upon the relative
stabilities of the solid metallic oxide and the gaseous carbon oxides. If
O0(g) and C02(g) are very much more stable than MeO y(s), so that the sum of
the equilibrium pressures, (PCO + PC0 2)' is higher than the ambient pressure,
then the outburst of CO(g) and C02(g) is very likely to rupture the oxide
film. If this happens, oxidation of the carbide in likely to proceed more
rapidly than oxidation of the corresponding pure metal.
If the metallic oxide is very much more stable than the carbon oxides,
then reactions (1) and (2) will not proceed to the right to any large extent.
In this case, the carbide may be oxidized more or less rapidly than the
corresponding metal depending upon the specific oxidation mechanism. If the
metallic element in the alloy is oxidized preferentially, then the activity
of carbon at the alloy/oxide interface may become higher than the activity of
carbon in the bulk alloy. The resultant activity gradient may provide the
driving force for diffusion of carbon backward into the bulk alloy, possibly
with the formation of new carbide phases. The net oxidation rate should not
be very different in this case from the oxidation rate of the pure metal,
except for a s=mll effect due to lowered metal activity, provided, of course,
that the cohesion between oxide and substrate is equally good for metal and
27

carbide. If unreacted carbon remains at the oxide/alloy interface, then its
activity my increase sufficiently with time to shift the equilibria in (1)
and (2) towards the right. In fact, rupture of the oxide film might even
occur after a time. The evolution of 00(g) and 002(g) might stop, however,
as the carbon activity was lowered once again. If carbon is soluble in the
oxide lattice, then carbon at the oxide/alloy interface might migrate across
the oxide layer, and evolution of 00(g) or 002(g) could occur at the oxide/
oxygen interface without destruction of the protective oxide film adjacent
to the alloy. The effect of carbon on the defect concentration in the oxide
would determine whether the observed oxidation rate would be greater or less
than that for the pure metal.
3. APPLICATON OF T WNW TMM49NT T H T P RGH ATE= OXIDATION
OF CARBMZS OF MOWS IV-A, V-A, and VI-A
Equations (1) and (2) are difficult to apply precisely due to the lack
of experimental data for the activities of metal and carbon across the homo-
geneity range of the carbide phases. It is therefore assumed in the calcula-
tions that the carbide composition is that of the alloy in equilibrium with
pure graphite. The carbon activity in the original alloy may therefore be
taken as unity. TIe pressures of CO(g) and C00(g) calculated from equations
(3) and (4) on this assumption are therefore maximum permanent gas pressures.
If the actual carbon activity in the alloy is less than one, then it becomes
more probable that the carbide will show a degree of oxidation resistance.
The metal activity is given by the ratio /pey , where is the vapor
pressure of metal over the NeC-C two phase region, i.e. the equilibrium metal
pressure calculated from the equation:
.. meC(s) -- Ne(g) + C(s) (11-5)
and p°me is the vapor pressure of metal over pure metal at the same
temperature t
We(s) -+Ne(g) (n-6)
The standard free energies of reactions (5) and (6) are therefore given
respectively by:
28

we'(5) -" - n P- W(n7
•'( 6 )= "rlnP- (8)
Therefore:
'(5) " WO(6) m "•'6Ff,MeC W •• •(-9)
where *F fMeC is the integral free energy of formation of the metal carbide.
(a) Titanium Carbide, TIC
The free energy of formation of TIC, an given by Kubasohewski andEvans,(2) and the activity of titanium over the TiC-C two phase region
calculated from equation (9), is tabulated as a function of temperature in
columns 2 and 3 of Table 1. Columns 4., 5, and 6 give free energies of
formation of 00(g). (3) O•,(g) (3) and Tio(s),)" while colums 7 and 8 givethe equilibrium pressures of 00(g) and C02(g) calculated from equations (3)
and (4) with MeOy () = Ti0 2 (rut.), and a. = 1. It in clear that if a dense
coherent rutile film forms on the surface of TiC, it will not be ruptured by
evolution of CO(g) and 002(g) up to about 1500eK.
Quantitative experimental data is available only up to 1000eC
(12736K). However, there is general agreement(5' 6 '7) that the oxidation of
TiC is parabolic, to a good approximation, above 700eC, and that the rate is
controlled by diffusion of oxygen across a layer of Ti02 of the rutile struc-ture. It is extremely interesting that although the formation of CO(g) or002(g) at- the oxide/metal interface is thermodynamically unfavorable, carbonis consumed at the same rate as titanium. (1) It was suggested by Webb,
Norton., and Wagner•1) that carbon from the alloy dissolves in the oxide atthe TiC/TiOj interface, diffuses through the TiOg, and is oxidized at the
TiO2/02 interface. Since Ti02(S) is an oxgen deficient sema-cond.ctor, (8)
and TIC and TiO are known to be mutually soluble, it van not unreasonable to
postulate noae carbon solubility in the TiO lattice. By chemical analysis
of the oxide film formed on TiC at 10000C in pure oxyen at 760 Torr,
Nikolaioki(5) showed the presence of about 0.16% C in the Tion layer.
29
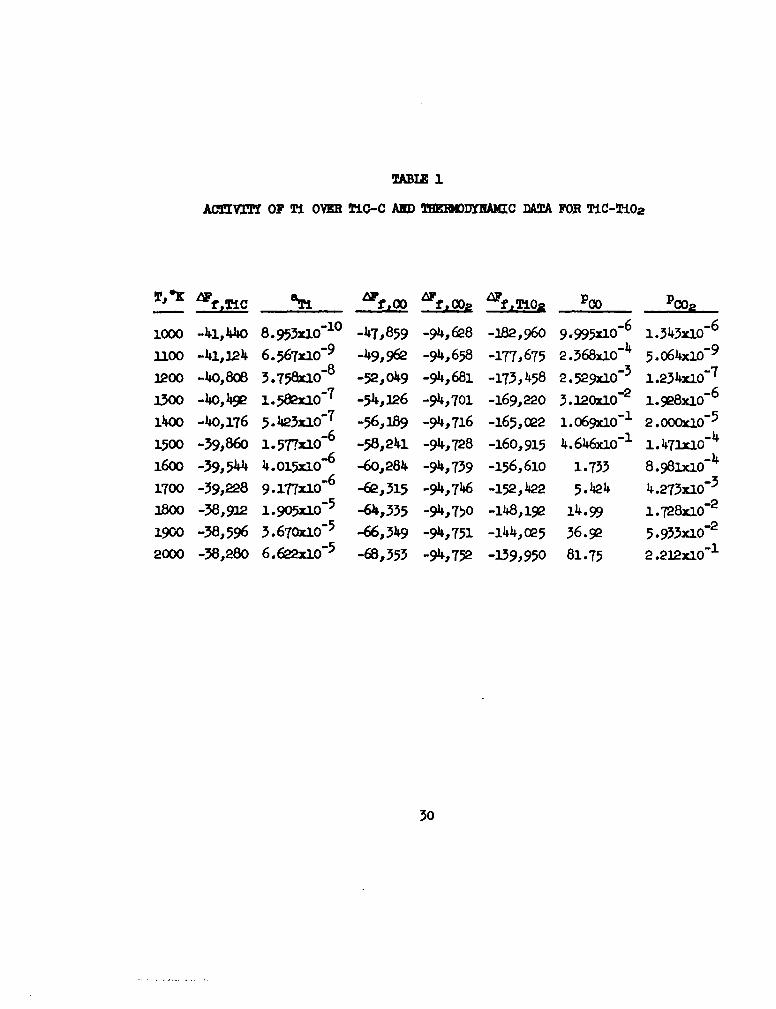
TABLE 1
ACTVINT OF Ti OVER TiG-C AND TMEODYNAXIC DATA FOR TiC-TiO2
T.. __ ______ &LV fi wi 6 f, 024 TiO2 PO OO p02
1000 -41,44o 8.953,10"10 -47,859 -94,628 -182,960 9.995x10⁻⁶ 1.343x10o6
1100 -41,124 6.567x10- 9 -49,962 -94,658 -177,675 2.368x10⁻⁴ 5.064xi0-9
1200 -40,808 3.758x1O"8 -52,o4g9 -94,681 -173,458 2.529xlO-3 1.234x30-7
13oo -4o,49 1.53a0o" -54,126 -94,701 -169,220 3.12 0" 1.928x1o 6
14OO -40,176 5.423x1 O"7 -56,189 -94,716 -165,022 1.069x10-I 2.000x10⁻⁵
1500 -39,860 1.577.x0"6 -58,241 -94,728 -160,915 4.646xi.-&1 1.471xiO"4
1600 -39,544 4.015r10"6 -60,284 -94,739 -156,610 1.733 8.981xi0-4
1700 -39,228 9.177x10⁻⁶ -62,315 -94,746 -152,e22 5.424 4.273x10⁻³
1800 -38,912 1.905xiO05 -64,335 -94,750 -148,192 14.99 1.728xi0-2
1900 -38,596 3.670xi0-5 -66,349 -94,751 -144,025 36.92 5.933x10"
2000 -38,280 6.622xio05 -6B,353 -94,752 -139,950 81.75 2.212xi0-1
30

However, a complete study of the diffusion of carbon through TiO2 remains to be
done. The most direct method to demonstrate the significance of carbon diffu-
sion in the oxidation process would be to oxidize a sample of C14 enriched TiC.
An autoradiograph of the oxidized surface would indicate whether diffusion of
carbon occurs primarily by grain boundary or bulk diffusion, while a stripping
and counting procedure could be developed for quantitative measurements.
Oxidation isotherms obtained in a number of laboratories are plotted
in Figures 1 and 2, as weight gain per unit area squared vs time. *Results ob-
tained by three investigators in times less than seven hours are shown in Figure
1. The excellent agreement between Miinster(6) and Nikolaiski(5) may be due in
part to the fact that both sets of measurements were done in the same laboratory.
Samsonov and Golubeva(7) reported their data in terms of thickness of the solid
oxide film. This was converted into (weight gain/area)2 prior to plotting in
Figure 1 by multiplying the density of rutile. Agreement among the three workers
is good at 900*C. At 800*C, Saasonov's measured rate of oxidation is lower than
that found by Nikolalski and Mfinster; at 1000lC, Samsonov's rate is also well
below the rate measured by Anster or Nikolaiski at even lower temperatures, 9e5*
and 950C. In spite of the discrepancies in the quantitative rates, there is
concurrence that the oxidation of TiC(s) is parabolic between 800 and 1000C
at times up to 7 hours. The parabolic rate constants derived from the slopes of
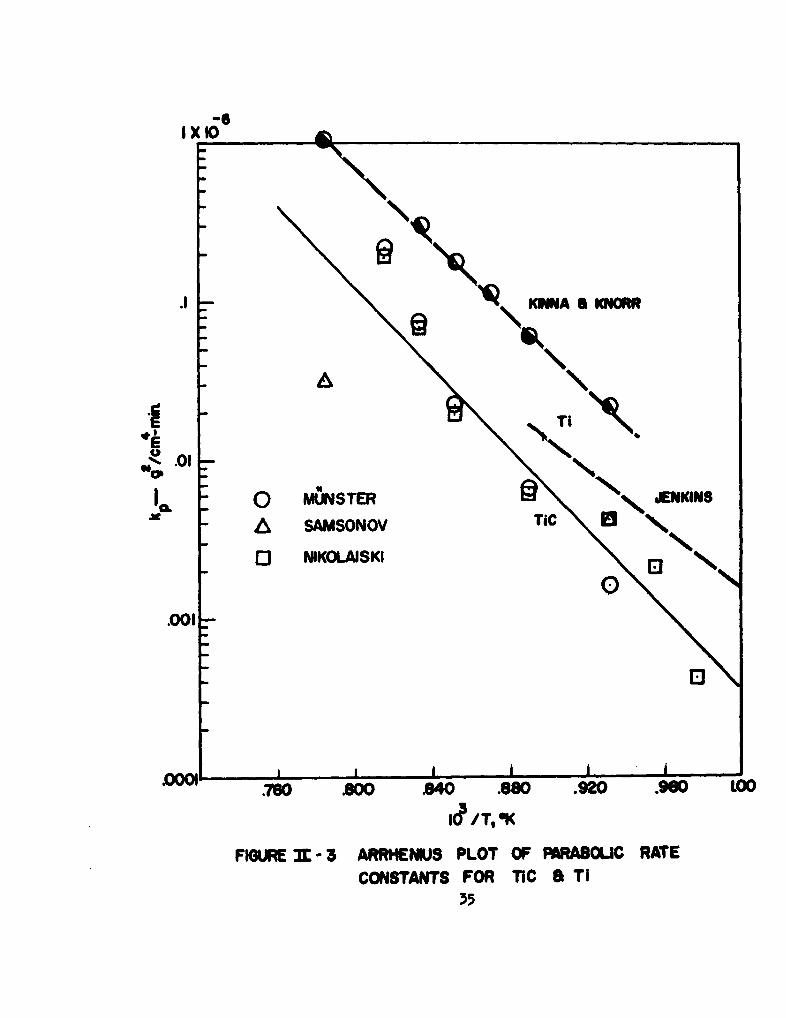
the lines in Figure 1 are plotted againal the reciprocal of absolute temperature
in Figure 3. The activation energy for oxidation calculated from all of the
points of this Arrhenius plot is 58.6 kcal/mole. The smaller activation energy
(46.1 kcal/mole) reported in Nikolaiski's paper is the result of including points
taken at 600e and 650eC.
In Figure 2 are plotted the results of experiments that extended to
times of 10-300 hours. At the longer times, significant departures from parabolic
behavior are in evidence. Nikolaiski's data have been transferred from Figure 1
to Figure 2 and extrapolated as straight lines for purpose of ccmparison. Thereis good agreement between Nikolslski(5) and Macdonald and 1ansley(9) and betweenNikolaiski(5) and Webb, Norton, and Wagner(l) at 900*C, up to about 4000 minutes.
There is considerable disagreement, however, between the last two groups andMacdonald and Bmnsley•9) on the rate of oxidation at 9000C. The weight changes
found by Macdonald and Ransley at 900eC exceed those measured by Nikolaiski at ge5*C.31

1000 950 925 900 850 •00 T, OC
8.0/ - 0 ±0 V M&O!t7X!A J Scamsonovj
7.0-
6.0o
I- /4, 5.0
/4.0
3D
2! •
.0
TIME - MiN.
FIGURE 9-1 OXIDAT•N OF TIC
0

cc 6
~E0 2 s.
0
0
o 0
•@IL
0, 0
!o ,
o - I I -
U J33q'

At 1000OC, agreement between Maodonald and lansley and Webb, Norton, and
Wagner in good, although the latter group used a TiC0 .63 composition and
the former group presumably used a starting material closer to stolchio-
metric TiC. The (WIN) data for stoichiametric TiC at 1000*C seem anomalous
in view of the fact that the observed rate is initially lover than that
reported by Nikolaiski at 950eC. Furthermore, it is not clear why the rate
of oxidation of the carbon rich TiC should be lover than that for the carbon
deficient TIC0 . 6 3 . The oxidation rate of the pure metal (carbon free) is
about the same as that of the TIC0.63 carbide at 1000. (1) The values ofkp for pure titanium are included on the Arrhenius plot in Figure 3. The
upper curve was constructed from the data of Kinna and Knorr, (10) taken in
pure oxgen at 760 Torr. The lover curve is that -of Jenkins(11) at an
oxygen pressure of 3 Torr. Although k in g2 /cm4-min in somewhat smallerpfor the carbide than for the pure metal, it must be remembered that the net
weight gain of Tic(s) is compounded of a weight loss due to evolution of
00(g) and C00(g) as well as a weight gain due to formation of TiO2 (s). Only
the latter process occurs in the oxidation of the pure metal. Therefore,
the total number of moles per unit area of metal or alloy consumed per unit
time is very similar for both Ti(s) and TiC(s). The similar temperature
dependence of the parabolic rate constants for oxidation of Ti(s) and TiC(s)
suggests a similar rate controlling step for the oxidation of metal and car-
bide, probably diffusion of oxygen through TiO0 (rut.).
(b) Zirconium Carbide, ZrC
Columns 2 and 3 of Table 2 give the activities of carbon and zir-
conium over ZrC as a function of temperature, computed from extrapolation of112)the vapor pressure data of Coffman, Kibler, and Riethof'% on ZrC, combined
with data for the pure elements from Stull and Sinke. (13) The free energies
of formation of 00(g) and C00(g) are listed in columns 4 and 5.0() The free
energy of formation of ZrOU, computed from the data given by Kubaschewski
and Evans, (2) is given in column 6. In column 7 are tabulated the equilibrium
pressures of 00(g) and 00g(g) at the ZrC/ZrOa phase boundary, calculated from
equations (3) and ( 4 ) with the Zr activity given in column 3 and a carbon
activity of one. Up to 2000"K, a ZrO2(s) film formed on the surface of ZrC
-6IXO I
.1 .N0
§@Ag Tic
EE
ACON SAMSONOV TIC & T
r-0 NIKOLAISKI3
.ool -
.760 800 34 .860 .920 .960O LO0
I0? /T, 'K
FIGURE -n"--3 ARRHENMUS PLOT OF PARA8OLIC RATE
CONSTANTS FOR TIC a TI35

TABLE 2
ACTIVXTY OF Zr OVER ZrC-C AND TU1I )DYNANIC DAT!A FOR ZrC-ZrO2
T. a0car -Mf o Ff 0 L~F f a0 0 _ P
1000 '3.128x1O-3 4.2cY7xlO-7 -47,859 -94,628 -213,530 2.105x10⁻¹ 0 2.6oixo-20
1100 1.c2lxlo-2 1.7117x116 _419,962 -94,658 -209,156 1.089x3(f 8 1.o'r1xlo'17
3.200 1.241110 2 5.970x1106 -52,049 -94,681 -204,808 2.8i8xio-7 1.535x11015
1300o 1.462x10 2 1.698xlo-5 -54,i26 -94,.701 -200,483 4.365x1106 1.O07x10-3-
1400 1.674x110- 4.i.4oxio-5 -56,1i89 -94,716 -196,179 4.529xlo-5 3.622xio10
1500 1.905110- 8.995xi10 5 -58,241 -94,728 -191,896 3.112Qx10- 7.980110-111600 2.118x1102 1.774x10⁻⁴ -60,284 -94,739 -187,651 1.99ox1103 1.189XJo-9
1700 2.344x11102 3.228x1o- _62,315 -94,74i6 -183,385 9.375x10⁻³ 1.279x0-8
1800 2.558x1102 5.52xOx1~ -4 64,335 -94,750 -179,153 3.775x1102 1.o47x1o-7
1900 2.782x1 - 8.974x10- -66,349 -94,751 -174,.680 1.2921101 7. 447x,0-7
2000 2 .992x10 2 1.383xlOcf 3 -68,353 -94,752 -170,737 3.732x1101 3 .664x10 -
36

would not be ruptured by evolution of 00(g) or CO2(g) at the alloy-oxide
interface.
The experimental results on the oxidation of ZrC unfortunately
indicate that a compact adherent film of ZrO is not formed on the surface
of the alloy, and that the oxidation is therefore not diffusion controlled.
The rate of oxidation of ZrC powders was measured as a function of oxygen
pressure and temperature as part of a doctoral dissertation of R.W. Bartlett. (14)
Above 450OC, the oxidation rates were found to be linear, with an activation
energy of 45.7 kcal/mole. The principal solid oxidation product was cubic
ZrO2, although minor amounts of the monoclinic phase were found as well.
Nothing is said in the abstract about the rate of carbon loss during oxidation,
and the thesis, although ordered, has not yet arrived.
Watt, Cockett, and Hall (20) made a single weight change measurement
of 49.8 mg/cm2 on a solid sample of Zrc of density 6.20 g/cc and 4.8% porosity
exposed to a stream of dry air flowing at 5.3 cm/sec, for 30 minutes at 8oo0C.
No conclusions could be drawn with respect to oxidation mechanism.
In the course of the present contract, the oxidation of ZrC vas
studied at temperatures between 1326 and 2200"K at oxygen partial pressures
in helium of 2 to 26 Torr. me cylindrical samples, 0.8 cm in diameter and
0.3 cm in height, were fabricated from the elements by a process of sintering
and zone melting. (15) The material had a density, measured from total mass
and geometric volume, of 6.0 t 0.4, compared to a theoretical X-ray density
of 6.44 g/cc.(16 )
The experimental apparatus used for oxidation studies at high tem-
peratures in this laboratory has been described in detail in fart I of this
report. However, modifications were required for the study of refractory
carbides. Normally, the stream of helium and oxygen is passed through the
reference side of a thermal conductivity cell, over the hot refractory pellet,where some of the oxygen is removed by reaction, and through the sampling
side of the thermal conductivity cell. The signal is thus proportional to
the rate of oxidation of the sample pellet. In the case of carbides, not only
is the stream that emerges from the reaction zone depleted in oxygen; it
37

is also enriched in 00(g) and 002(g), both of which will contribute to the
bridge signal. A weighed Ascarite trap for the removal of 002(g) was inter-
posed between the reaction site and the sampling side of the thermal
conductivity bridge. Thus, a mixture of CO(g) and 02(g) entered the thermal
conductivity cell, and the signal from the bridge was proportional to the
rate of oxygen consumption minus the rate of evolution of 00(g). (The signal
is called positive when the concentration of gas is higher in the reference
cell than in the sampling cell, and negative when the situation is reversed.)
The exit stream from the thermal conductivity cell was passed over CuO
turnings at 7006C to oxidize the CO(g) to C02(g), and the 002(g) so produced
was adsorbed in a weighed Ascarite bulb. Finally, additional information was
obtained by weighing the pellets before and after oxidation.
The data obtained is suimarized in Table 3. The first column
identifies each sample pellet. The second column gives the weight of each
pellet after it had been degassed at 2200*K in pure helium until the signal
from the thermal conductivity cell indicated that no permanent gases were being
evolved. The third column gives geometric surface areas, calculated from
micrometer measurements of the height and diameter of the cylindrical pellets.
The fourth column records sample densities, computed from weights after degas-
sing and pellet dimensions. Columns 5, 6, and 7 record the pellet temperature,
assuming an emissivity of 0.7, oxygen partial pressure, and carrier gas flow
rate, respectively, for each oxidation run. The duration of the experiment is
given in column Ui, and the net weight change, total CO(g) produced, and total
002(g) produced in this time are given in columns 8, 9 and 10, respectively.
From the measured quantities in columns 8-10, the derived quantities,
total carbon consumed and total zirconium consumed, in columns 12-14 can be
computed, if the nature of the oxidation products is assumed. From the observed
weight changes in the Ascarite bulbs, it is known that both CO(g) and 002(g)
form during oxidation. In addition, a white nonadherent oxide, with X-ray pat-
tern of monoclinic ZrO2, is visible on the surface of the sample pellets after
reaction. If it is assumed that the only oxidation products are 002(g), CO(g),
and ZrO2(s), then the total carbon consumed, c, is calculated from the measured
weights WY0 2 and WOO of CO,(g) and00(g), respectively.
38 .

I I I U, \ -t
CO \ýo CO In
CU CU \, wU \D 0 cLrH % \ c ' I-
la-M f aur~~~ztH co m 0 -r0UN ~ NH N A ?9 0
a\ 0 a 1-ý0 I\O 141 " 0
zoo 0 00000
'o gýgý Lt9 '0 l' S ', 8
lpa~0 00 00 0 0 0 00 0
0n~ \"D co-0 \ -*-, Cu
00
0~ ~ 1 ,S oC oCU\ N T% 9\ L
.W j;0 0 0 0 0 00iaLA if
H H H a Scu N lUI. .co F " .
ugga~~xd \16c A'oo'c
r4 0
;3 s Ul1\ ' rIsx oj l !P\_t C * L\0 r p
4/'~UG A A 4 A A AK~
I~~~~i U''r4' ~O' ~OUN- U'GO K
IH HQ' t-'D -Uj Im Ký jI

0
where the symbols in brackets represent molecular weights. The total weight
of zirconium, z. that has been converted to oxide is calculated from the
measured weight change, W0 , and the derived carbon consumption:
Z = fir ( + ci ilu
The ratio of the number of grams of zirconium consumed to the number of grams
of carbon consumed during oxidation is given in column 14 of table 3. The
ratio is seen to have an approximately constant value of 7.5 - 0.2. Since the
corresponding ratio in the ZrC starting material is 7.6, it would appear that
the oxidation of ZrC is stoichiometric and non-preferential. That is, for
each zirconium atom converted to oxide, a single carbon atom is also converted
to oxide. In column 15, the rate of oxidation is seen to be highest for pellet
XII-1. In all of the other runs where weight data is given, more than 90% of
the oxygen passed over the refractory pellet reacted with it, and the reaction
was probably controlled, therefore, by the rate of arrival of oxygen gas at
the sample surface. For XII-I, the supply of oxygen was sufficient to permit
a significant determination of oxidation rate.
Weight change data is not given for pellets XII-8, XII-5, and XII-3
because at the relatively low temperatures of these experiments the pellets
were broken apart by the oxidation process. At the end of each experiment,
the grain boundaries of ZrC were seen to be outlined by a white material, pro-
bably Zr02. The growth of the oxide in pre-existing cracks and grain boundaries
of ZrC undoubtedly creates enough stress to fracture the carbide. Bartlett (14)
indicates that oxygen diffuses substitutionally for carbon in the ZrC lattice.
The oxygen may then segregate to grain boundaries and precipitate as Zr02(s).
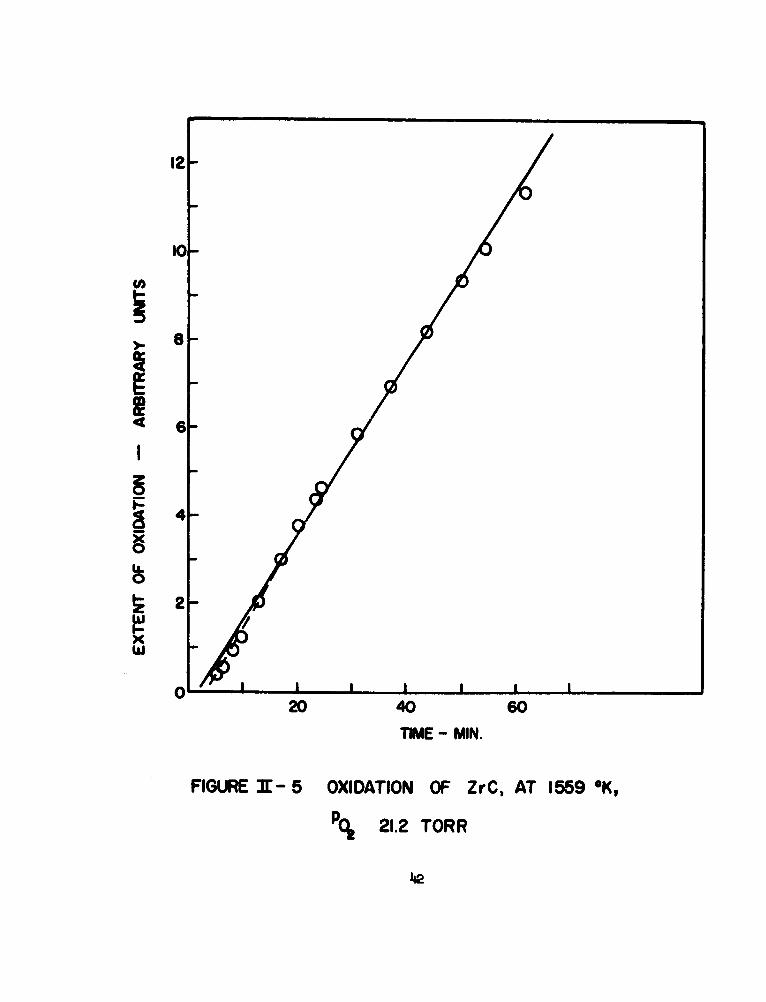
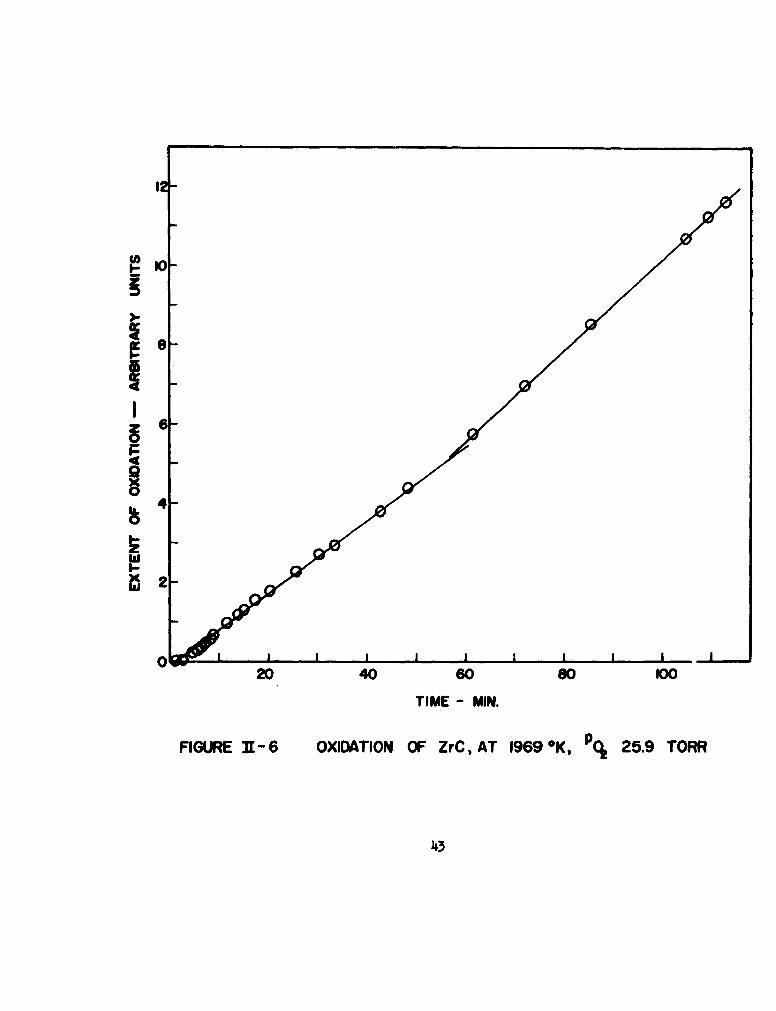
Typical curves of extent of oxidation vs time constructed from the
thermal conductivity data are reproduced in Figures 4-7. The ordinate in each
case is proportional to the number of grams of oxygen consumed to form 00(g),
002(g), and ZrO2(s) minus the number of grams of CO(g) produced at the same
40

6-
05 0
(I)
4 4-
I 3-z0
0I--zwIxlx
010 20 30 40 50 60
TIME - MIN
FIGURE 31" - 4 OXIDATION OF ZrC, AT 1126 K,
POg 22.9 TORR
iii
I0-
< 6-
0
IL0
wxw
0 C I I I I I I
20 40 60
TIME - MIN.
FIGURE 3n- 5 OXIDATION OF ZrC, AT 1559 *K,
p 21.2 TORR
1I2
I
0
lo-
20 40 60 6 00
TIME - MIN.
FIGURE 31-6 OXIDATION OF ZrC, AT 1969 *K, P0j 25.9 TORR
43

S
4-
0
z
x
20 40 60 80 100 12
TIME - MIN.
FIGURE 31 - 7 OXIDATION OF ZrC, AT 2165°K, Pj 8.9 TORR
44

time. Since neither zirconium nor carbon appears to be oxidized preferen-
tially, the rate of formation of ZrOa(s) must be equal to the sum of the
rates of formation of 00(g) and O02(g). If, in addition, the ratio of 00(g)
to 002(g) in the product gas stream is independent of time, then the ordinate
will be proportional to the number of grams of oxygen consumed or to the
number of grams of Zr02(s) or C0(g) or C00(g) produced. In any case, a linear
rate law appears to be followed under the conditions of the present experi-
ments. The lack of oxidation resistance of ZrC is due, not to the rupture of
a protecti- e film by the evolution of 00(g) or 002(g), but to the failure of
a dense, coherent, protective film to form at all.
The oxidation of pure metallic zirconium is described by a cubic
equation between 575* and 9500eC, at an oxygen pressure of 760 Torr, while
the oxidation of ZrC seems to be linear under similar conditions. (14)
Furthermore, the oxidation product on Zr is monoclinic ZrO2, (17) while on ZrC,
the cubic modification of the oxide is formed. (14) In 30 minutes at 800eC,
metallic zirconium would be expected to show a weight gain of 1.75 mg/cm2 ,compared to the weight gain of 49.8 mg/lm 2 observed for ZrC. (20) At 1126"K,
the oxidation of ZrC, as shown in Figure 4 is linear; the oxidation of Zr is
cubic.
(c) Hafnium Carbide, HfC
The general similarity between hafnium and zirconium might be
expected to extend to the behavior of the respective carbides in oxygen at
high temperatures.
The free energy of formation of HfC(s) and the activity of hafnium
over the HfC-C two phase region is given in columns 2 and 3 respectively of
Table 4. The thermodynamic data for HfC were entimsated by Thomas and Hayes, (18)
and the activity of hafnium was computed from equation (9). The free energy
of formation of Hf02 (s), also estimated by Thomas and Hayes, (18) in tabulated
in column 6, and the calculated equilibrium pressures of 00(g) and C02(g) at
a f C/lf02 phase boundary are given in columns 7 and 8 respectively. Again,
as in the case of the other group IV-A carbides, TiC and ZrC, a film of HrOe
would be thermodynamically stable over HfC well above 1000*K. However, a
45

TABiZ 4
A01'VIT OF Hr OVER ETC-C AND TUDIOUMNA1C D=T FOR Hf C-HfO2
T,-K AF _______ am - tfo wf 100 6F~ fHf02 PO PC02
1000 -43,4100 3.3 02x10 -47,859 -94.,628 -22)1, 700 9. 6 60xio10 5.3 8 2x10 19
U.oo, -43.,300 2.543x1O-9 -4i9,962 -94,658 -217,500 4.250x1108 1.628x10⁻¹⁶
3L200 -43,100 1.4,8xi108 -52,049 -94,681 -2:131400 9.41oi.9010 1.71i2x10-14
1,00 -43,000 5.9981.10 8 -54,326 -94.,701 -209,200 1.360x,0o5 9.804x,0-1 3
11100 -412,800 2.11.3xl10 -56,189 -94,716 -205,200 1.257x110 2.781xl310
1500 -112,600 6.296x1Cf 7 -58,241 -94,728 -201,100 8.748xl10 5.214x10⁻¹
1600 -412,500 1.586x10- -60,284 -94,739 -197,100 4.764x10'3 6.781wi09
1700 -112,300 3.691z10o-6 -62,315 -94,74i6 -193,100 2.087x10O2 6.320x10⁻⁸
1800 -~42,100 7.822x10O- -64,337 -4.5 -189,100 1.292l- .9x102-71900 -112,000 1.491110-5 -66,349 -94,751 -185,100 2.525x10 1l 3.147x1&-6
2000 -41,800 2.733x10- -68,353 -94,752 -181,200 7.1-17x10- 1.336x10 5
416

sufficient 00(g) pressure to rupture the oxide film might be generated at the
HfC/Hf02 interface at temperatures around 20000K.
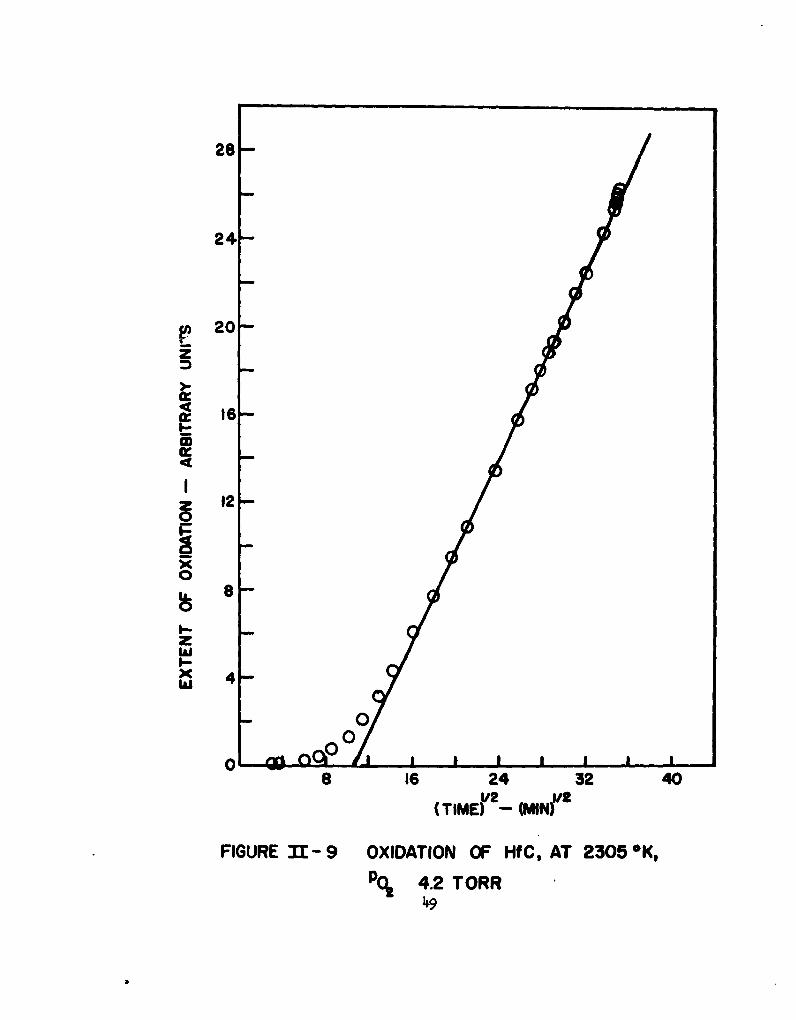
Data on the oxidation of HfC(s) are extremely sparse. In the course
of the present program, a single run was made at 2305*K at an oxygen partial
pressure of 4.2 Torr in helium, with a total pressure of 760 Torr. The
reaction was monitored with the thermal conductivity bridge, but no attempt
was made to determine separately the oxides of carbon in the product gas stream.
A net weight gain of 0.0189 g was observed in a period of 98 minutes, for a
sample with a geometric surface area of 1.850 cm2. In Figures 8 and 9, the
abscissa is proportional to the total number of grams of oxygen consumed in
the formation of Hf0 2 (a), CO(g), and C02(g), minus the number of grams of
CO(g) and C02(g) evolved. The ordinate is time in Figure 8 and-t'- in
Figure 9. If the rate of oxidation of hafnium from the alloy is equal to the
rate of oxidation of carbon from the alloy, and if the ratio of 00(g) to C02(g)
is constant with time at a given temperature of oxidation, then the abscissa
in the figures is proportional to the rate of conversion of the alloy to the
oxides of the constituents. The oxidation rate appears to be parabolic,
although it may prove to be linear if carried to longer times. Further work
with HfC was postponed because the available cienrcial samples were porous
and contaminated from the start with Hf02, while at the same time, a synthesis
program begun in this laboratory(15) promises to provide better specimens inthe near future.
(d) Vanadium Carbide, VC
Columns 2 and 3 of Table 5 give the free energy .of formation of
Va(s) and the activity of vanadium over carbon rich VC. For VC(s), baf,298
and "298 were taken from KNbaschewski and Evans; (2) heat capacity data were
taken from Kelley. (19 For the elements, Stull and Sinke's tables were used.(13)
Column 6 of Table 4 gives the free energy of formation of V203 (s), as calcu-
lated from Kubaschewski and Evans' tables, (2) and columns 7 and 8 give theequilibrium pressures of 00(g) and 002(g) at an assumed VC/Vg03 phase boundary.
It is clear that above 1500*K, V20: in contact with VC is unstable with respect
to decomposition to V(s) and 00(g), and rupture of a dense film of V2 03(s),
if it formed, would be likely to occur as a result of interaction.
47

28'
24-
20-
~I--
I-
zo1200
F 0
0 0
00IL 0
00
401 0
20 40 60 80 100
TIME- MIN.
FIGURE 3T - 8 OXIDATION OF HfC, AT 2305 OK, P 4.2 TORR
4R8
28-
24-
ip 20-
_ to
OF
4-
00
a: 166--34I-
2• -/2(TIME- WMIN)
FIGURE 31I- 9 OXIDATION OF IltC, AT 2305 OK9
Pq4.2 TORR"49
S

TABIZ 5
ACMIVITY OF V OVER VC-C AND TMERWDYF-AMIC DATA FOR VC-V 203
T,'K AFp0 ____ F 0 tr F M co p co0
1000 -13,243 1.285x1o"3 _47,859 -94,628 -237,400 1.257x1O"5 9.119x1o-11
1100 -13,093 2.519x1o-3 -49,962 -94,658 -231,785 2.O6Ox1O-4 4.309xio09
1200 -12,908 4.481xlO-3 -52,049 -94,681 -226,170 2.084xi0"3 8.398x10⁻⁸
1300 -12,730 7.277x1o"3 -54,126 -94,701 -220,555 1.474xlO 1.150xlo-6
14oo -12,550 1.103x1o -56,189 -94,716 -214,940 7.823xlO 1.08ox1o-5
1500 -12,357 1.589xio- -58,241 -94,728 -209,325 3.314xiO1& 7.480xlo" 5
1600 -12,200 2.164x10 2 -60,284 -94,739 -203,710 1.162 4.i26xi0"4
1700 -12,000 2.876x16- 2 -62,315 -94,746 -198,095 3.549 1.828x1o-0
1800 -11,786 3.719110 -2 -64,337 -94,750 -192,480 14.71 6.824x10⁻³
1900 -11,585 4.663x10i2 -66,349 -94,751 -186,865 22.60 2.227xi0"2
2000 -11,340 5.781xi0-2 -68,353 -94,752 -181,250 49.16 6.357xi0-2
50
The available datum is semi-quantitative in nature, (20) and con-
sists of a single measurement of the weight change of a VC(s) specimen after
one-half hour in flowing dry air at 1073"K. The sample was prepared in the
form of a cylinder, 0.64 cm in diameter and about equally long, by hot
pressing. The material contained 13.5-14% total carbon, of which about 1%
was free carbon, compared to a theoretical weight percentage of 19.05% carbon
for stoichiometric VC(s). The hot pressed material had a density of 5.04 g/cc,
a 6.2% porosity, and a surface area of 1.76 cm2 . The specimen was heated at
1073°K in a quartz tube in a stream of dry air flowing with a linear velocity
of 5.3 cm/sec. The observed weight gain after 30 minutes was 41.7 mg/cm2 .
The authors do not indicate whether CO(g) or C02(g) was evolved, cr whether
a dense solid oxide formed on the surface of the sample. The net weight
change, however, was approximately the same as that observed by the authors
for ZrC(s) exposed under similar conditions.
The oxidation of pure vanadium metal has only been investigated
between 400e and 600C. If the data(17) is extrapolated to 8000C, a weight
gain of 1.1 mg/cm2 is predicted in a period of 30 minutes. The carbide thus
appears to be oxidized more rapidly than the corresponding metal, although an
extrapolation over 2000C must be accepted only with greatest reservation.
(e) Niobium Carbide, NbC
Free energy of formation and activity data for NbC(s) are given in
colum-s 2 and 3 of Table 6. Column 6 gives the free energy of formation of
NbO2(8), and columns 7 and 8 give the equilibrium CO(g) and C02(g) pressures
for reactions (1) and (2) with Me.0 = Nb0 2 . Thermodynamic data for NbC andy (2
NbO2 were taken from Kubaschewski and Evans. ) A diffusion barrier of NbO2(s)
might be built up on a surface of NbC at temperatures up to 1100IK, but above
this temperature, rupture of the NbOa(s) film would destroy its effectiveness
in reducing the rate of oxidation of carbide.
Again, the only available experimental datum is that of Watt,
Cockett, and Hall, (20) vho used a hot pressed sample with a density of
7.51 g/cc and a porosity of 3.9%. The observed net weight change after 30
minutes at 1073"K in dry air, flowing at 5.5 cm/saec, was 56.8 mg/cm2 . No
conclusions about oxidation mechanism can be drawn from this single measurement.
51
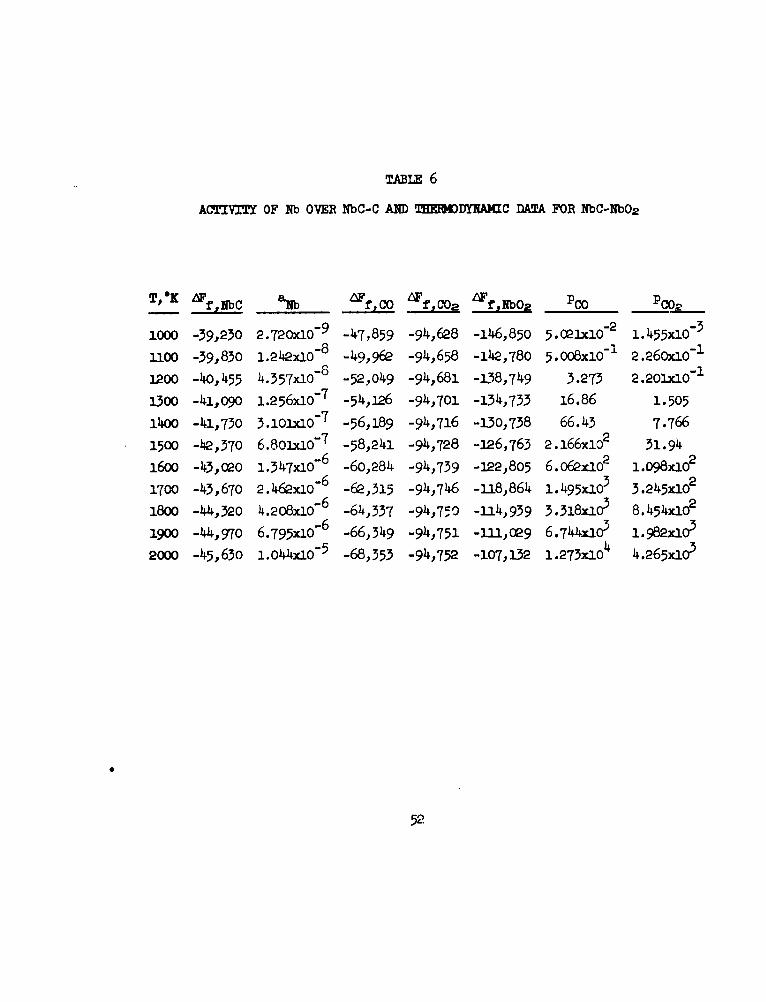
TABLE 6
ACTIVITM OF Nb OVER NbC-C AND THEEDYNAMC DATA FOR NbC-Nb• 2
SfbCco 'OF fCO 4 fNb02 pco Po 0
1000 -39,230 2.720xi0-9 -47,859 -94,628 -146,850 5.021xlo02 1.455x10⁻³
100 -39,830 1.242x10⁻⁸ _49,962 -94,658 -142,780 5.008xi0-I 2.260xi0-I
1200 -4o,455 4.357x10⁻⁸ -52,049 -94,681 -138,749 3.273 2.201xi0"I
1300 -41,090 1.256xi0-7 -54,126 -94,701 -134,733 16.86 1.505
14oo -41,730 3.10ixlO-7 -56,189 -94,716 -130,738 66.43 7.766
1500 -42,37o 6.801x10⁻⁷ -58,241 -94,728 -126,763 2.166x10² 31.94
1600 -43,020 1.347xi0-6 _60,284 -94,739 -122,805 6.062xI02 1.098xlO2
1700 -43,670 2.462x10⁻⁶ -62,315 -94,746 -118,864 1.495x10³ 3.245x10²
1800 -44,320 4.208x10⁻⁶ -64,337 -94,750 -114,939 3.318x10³ 8.454x10²
1900 -44,970 6.795x10"6 -66,349 -94,751 -111,029 6.744x10 1.982xi&
2000 -45,63o 1.44AxlO-5 -68,353 -94,752 -107,132 1.273x10⁴ 4.265x10'
52

However, the pure metal under the same conditions would have shown a weight
gain of about 9.9 mg/cm2.(21) Therefore, the carbide does indeed seem to
oxidize more rapidly than the metal.
(f) Tantalum Carbide, TaC
Columns 2, 3, 4, 5, 6, 7, and 8 of Table 7 give, respectively, the
free energy of formation of TaC, (2) the activity of Ta over carbon rich TaC,
the free energies of formation of CO(g),(3) CO2(g), (3) and Ta 2 O5 , (2) and the
equilibrium pressures of CO(g) and C02(g) for the interaction between Ta 2 O5 (s)
and TaC(s). On the basis of the WNW criteria, a film of Ta*05 on TaC would
be ruptured by evolution of CO(g) and C02(g) at temperatures above 1300"K.
No extensive measurements are available on the kinetics of oxidation
of TaC. A single weight change determination at 8O*C was made by Watt,
Cockett, and Hall(20) in the course of their survey of the oxidation resistance
of carbides, and a measurement of weight changes, CO(g), and C02(g) evolution
at 21590 was made during the course of the present contract.
At I073*K, on the basis of the WIrW criterion, a protective film of
Tas2 0 5 (s) might be stable on the surface of TaC(s). A hot-pressed TaC sample
with a density of 13.10 g/cc and a porosity of 6.8% was heated in a quartz
tube at 1073*K in a stream of dry air, flowing at 5.3 cm/sec, for 30 minutes.
The net observed weight gain was 103 mg/cm2 , about twice that observed for
ZrC, VC, and NbC, exposed under similar conditions. However, it must be re-
membered that Zr and Nb form dioxides, Zr02 and NbO2 , V forms a lower oxide,
VOI.-, while Ta forms a higher oxide, TaO2 .5 . Therefore, the number of moles
of metal consumed per square centimeter during oxidation of the carbides is
in the ratio of 4.1:2.8:2.8:2.5 for Ti.C:VC:NbC:ZrC, assuming similar weight
losses due to evolution of CO(g) and C02(g) for all four materials. The
experimental data does not indicate whether a film of Ta,,O•(s) was built upon the carbide surface, but the implication in that oxidation was rapid andnon-protective. Pure tantalum would have shown a weight change of about
U1 mg/cm under the same conditions. (22)
At 2432*K, Ta 2 0 (s) would be expected to undergo extensive reaction
with TaC(s) to form Co(g), COR(g) and Ta Calloy). A hot pressed TaC~s)pellet, (23) with a density of .1.48 g/cc and a surface area of 1.754 cua, wva
53
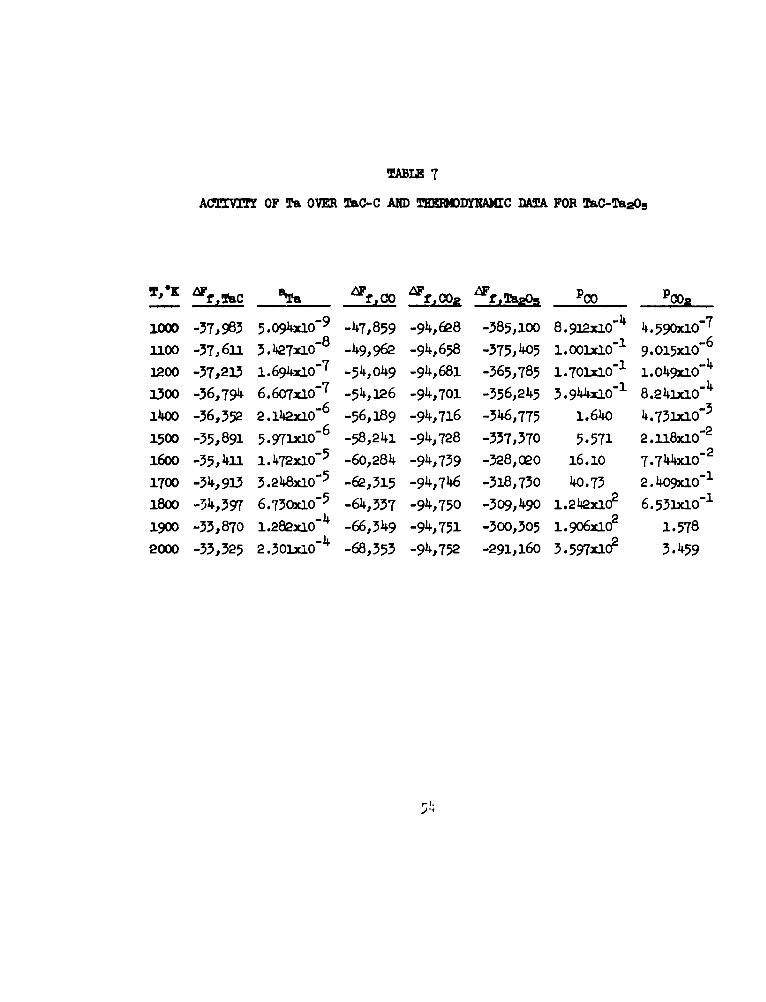
TABLE 7
ACTIVITL OF Ta OVER TaC-C AND TBMODYIAWaC DMTA FOR TaC-Ta 2 05
TOKMf, TaC aTa 6FCO4 f ,002 m fC , "coOOp 0
1000 -37,983 5.094xlO"9 -47,859 -94,628 -385,10o 8.912xiO"4 4.590x10⁻⁷
11oo -37,611 3.427xlO-8 -49,962 -94,658 -375,405 1.o01xlO0" 9.015x10"6
1200 -37,213 1.694x1O- 7 -54,049 -94,681 -365,785 1.701xlO"I 1.O49gxO"4
13o0 -36,794 6.607xiO- 7 -54,126 -94,701 -356,245 3.9•4x10"I 8.241xlO"1
i1o0 -36,352 2.i2xio-6 -56,189 -94,716 -346,775 1.640 4.731xlO"3
1500 -35,891 5.971xi0-6 -58,241 -94,728 -337,370 5.571 2.118xi0o2
1600 -35,411 1.472x10⁻⁵ -60,284 -94,739 -328,020 16.10 7.744xo"2
1700 -34,913 3.248x10"5 -62,315 -94,746 -318,730 40.73 2.409x10"1
1800 -34,397 6.730x10⁻⁵ -64,337 -94,750 -309,490 1.242xlo2 6.531xi0o-
1900 -33,870 1.282xi0-4 -66,349 -94,751 -300,305 1.906x10² 1.578
2000 -33,325 2.301x0- -68,353 -94,752 -291,160 3.597xC02 3.459

heated for 108 minutes at 24320K in a stream of dried helium and oxygen, at
a total pressure of 760 Torr, oxygen partial pressure of 6.8 Torr, and flow
rate of 58.6 ml/min. A net weight loss of 0.0399 g/cm2 was observed, while
the amounts of CO(g) and C02(g) evolved were 0.659 g/cm2 and 0.0359 g/cm2 ,
respectively. The ratio of pressures of CO(g) and C02(g) found experimentally
was therefore PcotPco2 = 28.8.1. The corresponding ratio for CO(g) and C02(g)
in equilibrium with TaC(s) and Ta 2 0 5 (s) is larger than 100:1. It therefore
seems likely that some oxidation of CO(g) to C02(g) occurred in the gas phase.
For the equilibrium:
CO(g) + 02(g) = 002(g)
the ratio of PCO:Pc0 2 at 298"K and an oxygen partial pressure of 6.8 Torr is
1044', while at 2400"K, the corresponding ratio is 0.2 at equilibrium.
The total carbon loss from the TaC sample due to vaporization of
CO(g) and C02(g) was 0,0242 g/cm2 , while the net observed weight loss was
0.0399 g/cm2 . Therefore there must have been a minimum tantalum loss of
0.0107 g/cm2 during the course of oxidation. The vaporization behavior of
Ta 2 05 (s) in the presence of oxygen has not been investigated. The vaporiza-
tior of TaO(g) or TaOs2(g) by reaction of Ta 2 O5 (s) with Ta (alloy) or C
(alloy) at the alloy/oxide interface would not account for the observed rate
of tantalum weight loss. The existence of a Ta e O5 (g) species in the vapor has
not been demonstrated but is certainly possible at high oxygen pressures.
If the oxidation of TaC were non-preferential It could be expressed
at any time t by a stoichlometric relationship of the form:
TaC + (2 - b) 02 - TaS2Os(s) + bOO(g) + (1 - b) 002(g) (11-12)
where b is an unknown number of moles. For simplicity, we denote:
y = number of g/ca2 of TaaOs(s) formed between time zero and time
z = number of g/o=2 of Oo(g) formed between time zero and time t
x - number of g/•c 2 of 002(g) formed between time zero and time t
55

Then, we assume that the rate of formation of ThaOs(s) is governed by a simple
layz
Sk f(y) (1-15)dt
where k is a .ate constant, and f(y) is some function of y, commnly a con-
stant (linear growth) or l/y (parabolic growth). Since stoichiometry always
obtains, we must have:
S2b k y(n-14)
and
dx= 2(1-b) k f(y) 102 W(1-15)
where the symbols in brackets are molecular weights.
The signal from the thermal conductivity bridge in the carbide
experiments is given by:
Signal =A + 0 I + (20- -x
where A is a proportionality constant to convert millivolts to g/cm2 -aec, and
the instrument sensitivity is assumed equal for 00(g) and 02(g). Substituting
the rate expressions in (13), (14), and (15) into (16), one findst
Signal = -Af {)[501 + 2b [CO] + 2(1-b) (20] - 2b (001 (11-17)
Introducing molecular weights into (17), the signal is given finally by:
Signal 144+ - 88b]I
Since b must be smaller than or equal to one, the signal would have to be
positive if the reaction were stoichiometric. Since the signal was negative
during the entire experimentý the oxidation of TaC(s) cannot proceed, under
56

the conditions described, so that the rate of oxidation of tantalum is
exactly equal to the rate of oxidation of carbon. There must be preferential
oxidation of one component. Free energy considerations suggest that there
should be preferential oxidation of carbon. Since TaC has a wide range of
homogeneity, extending from TaC0 . 8 5 to TaC1 .0 (2), diffusion of carbon from the
bulk alloy to the alloy oxide interface, under the activity gradient created
as the carbon becomes depleted through oxidation, is highly probable.
PL1T~BJ L00J L002 JtThe abscissa are obtained by integration of the signal between times zero and
t. After about 25 minutes, the data can be approximated by a straight line,
which could indicate that the rates of formation of both Ta 2 O5 (s) and the
carbon oxides are diffusion controlled, although the net rate of oxidation of
carbon is larger than the rate of oxidation of Ta. X-ray analysis of the
oxidized pellet surface revealed lines for a- and P- Ta 2 05 , as well as lines
for pure Ta metal, serving to confirm the assumption of preferential oxidation
of carbon.
(g) Chromium Carbidc, CrC2
Table 8 gives the free energy of formation of CrC2, (2,19) the
activity of Cr over carbon rich Cr3C2, the free energies of formation of 0O(g),()
02, (3) and Cr20,(s)(2,19) and the equilibrium pressures of 00(g) and COa(g),
for the interactions between Cr203 (s) aed CrC2(s). At an ambient pressure of
one atmosphere, rupture of a potentially protective Cr203(s) film would be
likely at temperatures above 1400'K.
Kosolapova and Samsonov(24) measured the oxidation rates of powdered
and hot-pressed Cr3 C2(s) in oxygen at temperatures between 400" and 10000C.
For the powdered samples, the rate of oxidation was followed by measuring the
amount of C02(g) evolved during exposure in a flowing oxygen stream. The rate
of G evolution was approximately parabolic with time. The authors fail to
indicate whether 00(g) was also generated, and whether a solid oxide formed
as well. Since the surface areas of the powdered specimens are not known, the
results on powders cannot be directly compared to results on dense fabricated
samples. With hot-pressed cylinders, no weight changes could be detected
in two-hour exposures between 800e and l1006,• but the authors do not state
57

i -s--7-
< -5-
P4 -4-0x0
I,-z
xhi -2-
0
0
-I• 0
00 .
0
2 4 6 8 10
TIME -MIN.
FIGURE 71-- 10 OXIDATION OF ToC, AT 2432 K, P 6.8 TORR58

TABLE 8
ACTIVITY OF Cr OVER Cr3C2-C AND THEIDYXNAMIC DATA FOR Cr3C2-Cr203
T,__KK LFf ,Cr3 Cs a Cr 4Ff,00 f fC02 4Ff, cr-0C3 POO P002
-2 -4,5 9,2 4 -1000 -19,890 3.570xi0 -47,859 -94,EQ8 -205,650 2.801xi0 4.536xi0-8
1100 -19,550 5.087x10 -49,96E -94,658 -199,440 3.834x0- 1.324xi0
1200 -19,048 6.993xi102 _52,049 -94,681 -193,230 3.321xi0-2 2.132xi0-5
2300 -18,458 9.259X10 -54,126 -94,701 -187,020 2.039xi0"1 2.201xi0-4
1400 -17,716 1.199xi0"I -56,189 -94,716 -180,810 9.498x10-I 1.587xi0-3
1500 -16,890 1.515x10"1 -58,241 -94,728 -174,600 3.567 8.672xi0-3
1600 -16,029 1.866xi0-I -60,284 -94,739 -168,120 3-1.49 4.052xI0-2
1700 -15,-021 2.27411xi-I -62,315 -94,746 -I1,18o 30.83 1.38oxi0-I
1800 -14,912 2.495xI0"I -64,337 -94,750 -155,970 79.34 4.833xi01o
1900 -13,6I 3.008xi0"I -66,349 -94,751 -149,760 1.721xi02 1.291
2000 -12,295 3.569x..0" -68o353 -94,752 -143,550 3.440x10² .13
59

whether a thin protective film of Cr2O9(s) was responsible for the observed
behavior. Watt, Cockett, and Hall (20) also failed to detect a weight change
in a Cr 3 C2 sample that had been treated for 30 minutes in oxygen at 800c.
However, they do report the formation of a green film of Cr20o(s) on the
carbide surface.
Quantitative weight change measurements on hot-pressed samples of
CrC2 at 900 and 10000C are plotted in Figure 11(20) as (wt. gain/area) 2 vs
time. The points are transcribed from a small and sparsely ruled graph.
The material used for the experiments contained 13% total carbon and 84-86%
chroium, compared to theoretical values of 13.3% and 86.7% Cr. The specimens
had a density of 6.31 g/cc and a porosity of 5.4%. The experiment consisted
of heating the samples in a quartz tube, and passing dry air over them at a
rate of 5.3 cm/sec. Unfortunately, the authors obtained no information on
the important question of carbon loss as 00(g) or 002(g). Included in Figure
ii are the weight change curves for pure chromium metal under similar condi-
tions. The carbide is seen to show somewhat greater oxidation resistance than
the metal, possibly because of the lowered metal activity, possibly because of
a better adhesion of the oxide to the substrate.
Above 11000C, the oxidation resistance of Cr 3 C2(s) is expected to
bz •k down due to rupture of the Cr2O3 (s) film by evolution of 00(g) and
C02(g). During the present contract, the oxidation of dense samples of
Cr3C2 (25) was studied at temperatures between 16600 and 19000K and oxygen
pressures of 4 to 9 Torr. Results were indeed very different from those at
the lower temperatures. A siumary of the data obtained is given in Table 9.
Column I simply identifies the sample, column 2 gives the original weight of
the unoxidized pellet after heat treatment at 1870"K for a sufficient time to
remove permanent gas impurities; columns 3 and 4 give surface areas and
densities of the samples calculated from micrometer dimensions and weights;
colvis 5 and 6 give the temperature of the pellet (assuming =n emissivity of
0.6) and the oxygen partial pressure during the oxidation experiment; column 7
gives the volume flow rate of the helium-oxygen mixture; columns 8, 9, and 10
give the net weight change of the pellet, weight of CO(g) evolved, and weight
of 002(g) evolved after oxidation for the times listed in column 11. Column 12
60
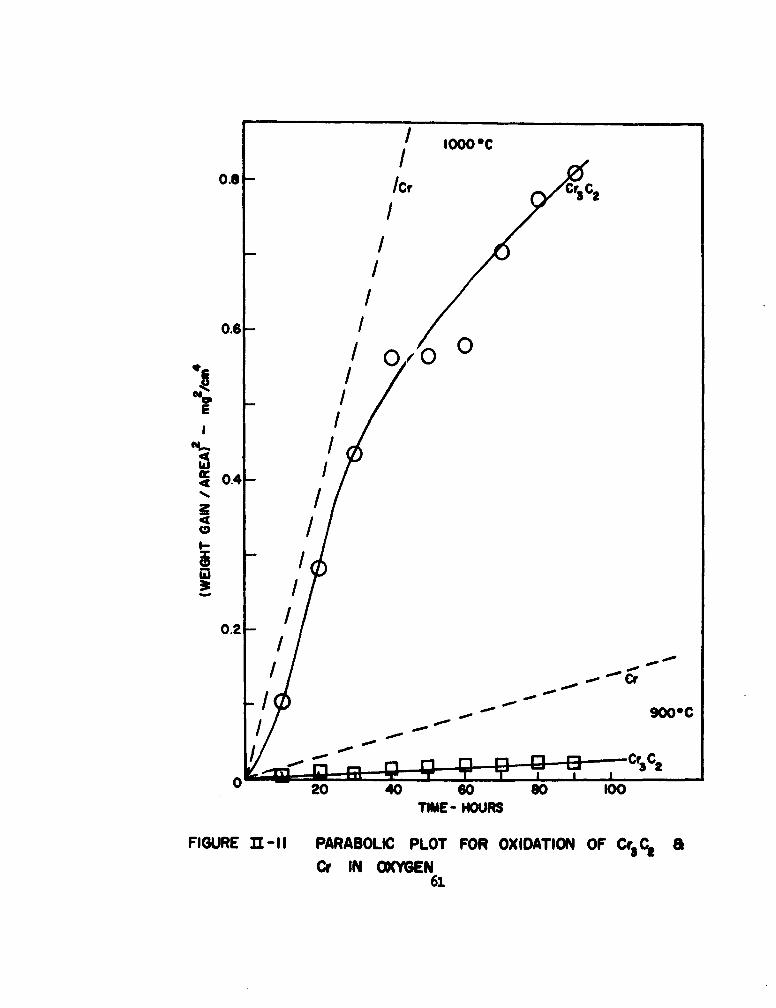
/ / O000 C
0.9 - /c, criC/
0.6 Ion 0 0!I
0.4 I
0.2 /
0 20 40 60 so 100
TIME" -HURS
FIGURE n~-11 PARABOLIC PLOT FOR OXIDATION OF Cr$Cl a1C- IN OMEN
61

I u\ 1 %
I I I r
o C;
HC2 HP=J()-o
000
ITR/ 0 'q I' Iý L U-I$ \ Hf \ U\ W
\0 C
0 C 0 0
U E/S I d .C W,\ -4 CU '. t
\, \Z m U \6 U;
LZO1 8jd *l r-4
Q ui C4iC4AoA4 o'iC\ a\ apW\ iJ'e C\
H 0\ a&uu\2TK%00 00
C? (U TU CV
62

gives the total number of grams of carbon oxidized in each experiment,
calculated from the measured weights of C0(g) and C02(g).
For pellet X-23, at 1662*K, if we assume that the only products
are 00(g), C02(g) and Cr2O,(s), then the net weight change is given by the
number of grams of oxygen picked up to form Cr2O3 (s) less the number of
grams of carbon lost as CO(g) or C00(g). From the data, we calculate, then,
that 0.0087 of chromium were consumed in experiment X-23. Thus, the chromium
to carbon weight ratio in the product oxides is 3.3, compared to a ratio of
6.5 for the chromium to carbon ratio in CrC2. Thus, carbon appears to be
oxidized preferentially in Cr 3 C2 at 1662*K at an oxygen pressure 8.9 Torr.
X-ray analysis of the oxidized surface revealed the presence of the lower
carbide Cr7C.3 , as well as Cr2O,. Above 1770*K, the net weight loss is very
much larger than the loss in weight due to vaporization of CO(g) and C02(g).
Therefore, some chromium must obviously enter the vapor, probably as an oxide,
but possibly, to some extent, as the metal, which subsequently becomes
oxidized in the gas ]hase. The experimental CO/002 ratio in the product gas
stream is very much smaller than the equilit.4 -ium ratio over a Cr2O3-Cr 3 C2
mixture. This is probably due to oxidation of 00(g) in the vapor.
(h) Molybdenum Carbide, MoC
Neither thermodynamic data nor kinetic data are available for the
monocarbide of molybdenum, and insufficient data is available for calculation
of activities over the Mo2 C phase. One might guess that the oxidation
behavior of MoC should be very much like that of WC.
(i) Tungsten Carbide, WC
Table 10 gives, in successive columns, the free energy of formation
of WC (2), the activity of W over carbon rich WC, the free energies of forma-
tion of 0(g),(3) 002(g), (3) and W02(s),(25) and the equilibrium pressures of
CO(g) and 002(g) for the interaction between W02 (8) and WC(s). Even at
emperatures as low as 700eC, it is clear that W02(s) is not thermodynamically
Etable in the presence of WC(s), and high pressures of 00(g) and C02(g) are
e.:pected at the alloy/oxide interface. The same conclusion obtains for W03 (s)
in contact with WC(s).
63

TABLE 10
ACTIVIM OF W OVER WC-C AND TEWDYNXAIC DATA FOR WC-WOg
Tj, K AF f£C a mfC F L~omJF jO POp02
1000 -8,700 1.260xi0-2 _47,859 -94,628 -97,350 5.904 19.72
uioo -8,660 1.910xi0"2 _49, 962 -94,658 -93,250 33.25 99.54
1200 -8,620 2.701xi0 -52,049 -94,681 -89,150 1.393x10 3.758x10²
1300 -8,580 3.622x10 -54,126 -94,701 -85,050 4.666x10² 1.153x10³
ICO -8,540 4.643xio0 -56,189 -94,716 -81,050 1.285xi03 2. 9 04x103
1500 -8,500 5.79x10- 2 -58,241 -94,728 -77,050 3.083xi& 6.456xi03
1600 -8,460 7.006xi0 -60,284 -94,739 -73,100 6.546xi0 3 1.282xi0 4
1700 -8,1420 8.291x10"2 _62,315 -94,746 -69,150 1.270xi04 2.333xiO 4
1800 -8,380 9.627x10 -64,337 -94,750 -65,250 2.259xi0 3.935xI04
1900 -8,340 ll.OlxlO"2 -66,349 -94,751 -61,400 3.758xlO4 6.186xi04
2000 -8,300 12.41x1o0 -2_68,353 -94,752 -57,600 5.9o2xlo4 9.162xo 4
64

Data on the oxidation of WC(s) were reported in the original paper
of Webb, Norton, and Wagner,(1) and are reproduced. in Figure 312. Linear
oxidation behavior was fouud at 7000 and 10006C. A comparison of the observed
weight changes with the measured carbon loss as C0(g) or C02(g) indicated
stoichiometric oxidation behavior (i.e. for every atom of carbon converted to
oxide, an atom of tungsten was also converted). The principal tungsten oxide
formed seemed. to be the yellow W03(s). No evidence was found for the presence
of W02(s), the principal oxide formed on pure tungsten in the same temperature
range. The rate of oxidation of the carbide is higher than that for the pure
metal under comparable conditions, due, perhaps, to rupture of a potentially
protective oxide film by evolution of CO(g) and C02(g).
4. CONCLUSIONS
For the highest carbides of the metals of Groups IV-A, V-A, and VI-A of
the periodic table, calculations have been made of the pressures of carbon
monoxide and carbon dioxide over an equilibrium mixture of metal carbide and
the corresponding metal oxide. Table 11 summarizes the practical results. The
carbides considered are listed in groups of three in column 1 and their melting
points are tabulated in column 2. On the basis of melting point alone, one is
justified in considering all of the refractory carbides (except for Cr3 C2) for
applications up to 2500*C. ZrC is potentially useful up to at least 3000*C,
NbC and TaC up to 3500%C, and HfC up to at least 3800°C. In the presence of
oxygen, however, not a single one of the pure carbides holds any promise of dis-
playing oxidation resistance above 20000C. In fact, only ZrC and HfC have the
potential of sustaining a protective metal oxide film at temperatures above
1250"C.
In column 3 of Table 11, the oxides which cmmonly form on the surface of
the pure metals at high temperatures are listed. If the se oxides were to
form on the carbide surfaces, reaction between the oxide and carbon in the
alloy substrate might result in the formation of 00(g) and O02(g) in sufficient
quantities to rupture the oxide film. On the assumption that equilibrium in
established in finite time at the carbide/oxide interface, the pressures of
00(g) and Co0(g) to be expected at the ph"e boundary can be calculated from
known thermodeamic data. In oolumm 4, the temperatures are listed at which
65

0
I !8
-M z
if 2
N 0
88
0. 0 0 •
Ioo .W2
W, zQ
0
0 7
eQ0 0 0 0 0 0 0
66

TABLE 1i
POEMIALITY OF CAf•IMES FOR OXIDATION ESISTANCE
Most comon oxide Maximum temperatureformed on the metal of stability of
Carbide Melting Point during oxidation oxide on carbideOC
IV-A
TiC 3140 TiO2 (rut) 1230ZrC 3540 Zr0 2 >1730
f C 4160 HfO2 1730
V-A
vc 2810 V2 03 1230NbC ca. 3900 Nb0 2 830
TaC 3880 Ta2O5 1030
VI-A
CrC 2 1890 Cr2O3 1130
Moc - MoO2 -
wc 2870 W02 730
67

the sum of the pressures, PCO + PC02, for the oxide in column 3 in equilibrium
with the carbide of column 1, become approximately eqpal to one atmosphere.
Above these temperatures an oxide film would be ruptured by evolution of CO(g)
and C02(g) and would therefore not serve as an effective diffusion barrier to
protect the carbide surface against rapid oxidation. If equilibrium is
established at the carbide/oxide interface, and the chances are good that it
will be established rapidly particularly as the temperature of interest in-
creases, then the temperatures in column 4 are really maximu temperatures
at which the pure carbide can be used in oxygen-containing atmospheres. Thus,
it would be fruitless to try to improve the oxidation resistance of TiC at
2000e, for example, by improving the adhesion between TiO2 (s) and the substrate.
For ZrC, on the other hand, it might be worthwhile to learn to grow dense,
coherent, non-porous films of Zr02, and to bond them in some way to alloy.
Such films do not grow naturally on ZrC, but if they could be formed, they
should be thermodynamically stable to above 2000*C, and could make it possible
to use ZrC in oxidizing atmospheres for high temperature applications.
The extent of reaction between oxide and carbide to form the volatile
oxides of carbon defines an upper limit for the usefulness of carbides in
oxidizing atmospheres, provided of course, that phase boundary equilibrium is
established. If there is a kinetic barrier to the attainment of equilibrium
at the carbide/oxide interface, then the carbide may be stable in oxygen at
higher temperatures than the ones given in column 4 of Table 11. Interaction
between oxide and carbide might be slow, for example, if the metal-carbon or
metal-oxygen bonds can be broken only with great difficulty. Alternatively,
a slow reaction might be due to a steric barrier at the interface to the forma-
tion of the activated complex intermediate between reactants and products.
While failure to reach equilibrium might force an upward revision of soe
of the temperatures of maximum stability given in column 4, the more usual
situation is that, for a number of reasons, the carbides will react rapidly
with oxygen at temperatures below the listed ones. The oxidation of TiC can
be described by a parabolic rate law up to 10000C, but it has not been studied
above 32306C where rupture of the rutile surface film should occur. ZrC
appears to oxidize according to a linear rate law at temperatures above 450eC.
68
Thus, ZrC displays none of the oxidation resistance that would be predicted on
the basis of the thermodynamic stability of ZrO2(s) over ZrC. The reason is
undoubtedly that the ZrO2(s) film which forms on the surface of ZrC is porous
and non-adherent. HfC, on the other hand, should be investigated in further
detail, since both the WNW criteria, and the preliminary experimental work
that was done in our laboratory suggest that a protective oxide film might be
formed up to high temperatures.
All of the Group V-A carbides oxidize more rapidly than the corresponding
pure metals, even at temperatures as low as 8000C. This again is probably due
more to the morphology of the oxide film than to the rupture of a potentially
protective film by gas evolution.
The oxidation behavior of the Group VI-A carbides is substantially as
predicted on thermodynamic grounds. Cr 3 C2 shows excellent oxidation resistance
up to at least 10000C, and in fact, oxidizes somewhat less rapidly than pure
metallic chromium. Above 1300*C, the green Cr2O3 (s) no longer protects the
carbide surface from oxidation, and 00(g) and O2(g) are evolved in substantial
quantity. WC oxidiMes linearly at 700"C and above, at a rate higher than that
for the pure metal.
From the point of view of understanding carbide oxidation, further work
is needed on CO(g) and CO2(g) evolution, as well as net weight change, in the
neighborhood of the temperatures of maximum stability given in Table ll. In
the temperature range where parabolic behavior is in evidence, oxidation studies
should be made on C14 enriched carbides to determine whether carbon dissolves
in the oxide lattice during the course of oxidation. Better thermodynamic data
for the activity of metal and carbon across the homogeneity range of the car-
bides of interest would permit more accurate calculations and predictions.
From the point of view of application, EfC is the only refractory hard
metal carbide that holds any promise in oxygen above 1400"C, where the steels
begin to fail. The other carbides would have to be protected with coatings.
ZrC might be protected with ZrO2, if it could be applied satisfactorily, and
if the phase transition did not destroy its effectiveness. The other carbides
would have to be protected with oxides or mixtures of oxides of foreign
69

elements; VC for example cannot be protected by VaO, at 15000C, no matter
vhat the morphologr of the oxide in. Thus, from thermodynsaic considerations,
a selection can be made of the useful directions for kinetic and costing
studies.
70

SECTION II - REFERENCES
(i)' W. W. Webb, J. T. Norton, and. C. Wagaer, J. Electrochem. Soc. 103, 112(1956).__
(2) 0. Kubaschewski. and E. Li. Evans, "Metallurgical Thermocheniistry,"Pergamon, N. Y. (1958).
(3) JANAF Thermochemical Tables, U.S. AF 35(616)-6149, prepared by D. R.Stull, Project Director for Dow Chemical Co., Midland, Michigan.
(4) G. N. Lewis and M. Randall, "Thermodynamics," revised by K. S. Pitzerand L. Brewer, McGraw-Hill, N. Y. (1961).
(5) E. Nikolaiski, Z. Pbysik. Chem. (Frankfort), 24, ~405 (1960).
(6) A. Ihinster, Z. ffir Elektrochemie 63., 807 (1959).
(7) G. V. Samsonov and N. K. Golubeva, Zhurnal Fizicheskoi IKiimii 30, 3258(1956).
(8) W. Kinna and 0. R~ldiger, Archly. fur das Elsenhfitten 24,, 535 (1953).
(9) N. F. Macd~onald and C. E. Ransley, Powder Metallu~rgy (London) 3., 172(1959).
(10) W. Kinna, and W. Knorr, Z. Netalik. ý, 594 (1956).
(11) A. E. Jenkins, i. Inat. of metals, 84, 1 (1955).
(12) J. A. Coffman, G. M. Kibler, and. T. R. Riethof, NP-9791 (1960).
(13) D. R. Stull and G. C. Sinke, "Thermodynamic Properties of the Elements,"American Chemical Society, Washington, D. C. (1956).
(114) R. W. Bartlett (Univ. of Utah, 1961), Dissertation Abstr. 22 (11), 3973(1961-62).
15) G. Feick, Technical Documentary Report No. AsD-TDR-62-204 Part I,Aeronautical Systems Division, Wright-Patterson Air Force Base, Ohio,April, 1962.
(16) P. Schvarzkopf and R. Kieffer, "Refractory Hard Metals," Macmillan Co.,*N. Y. (1953).
(17) 0. Kubaschevski and B. E. Hopkins, "Oxiddation of Metals and Alloys,"Academi a Press., N. Y. (1962).
71
(18) D. E. Thaws and E. T. Wares, "The Metallurgy of Rafnium," U.S. At. En.Corn.
(19) K. K. Kelley, Contributions to the Data on Theoretical Metallurgy,"Bureau of Kies Bulletin 584 (1960).
(20) W. Watt, G. H. Cockett, and A. R. Hall, Metaux 28 222 (1953).
(21) W. D. Ilopp, C. T. Sims, and R. I. Taffee, Trans. Amer. Soc. Metals 5,28 (1959).
(22) G. L. Miller, "Tantalum and Niobium," Academic Press, N. Y. (1959).
(23) Supplied by Technical Research Group, Yonkers, N. Y.
(21) T. Ya. Kosolapov, and G. V. Seamsonov, Russian J. of PAys. Chem. 2_o 175(1961) Enaish Translation.
(25) 1. G. King, W. W. Weller, and A. U. Christensen, Thermodynamics of SomeOxides of Molybdenum and Tungsten, Bureau of Mines Report of Investiga-tions, R. 1. 5664 (1960).
72

KINETICS OF OXIDATION OF REFRACTORY METAIS AfD ALLOYS
AT 1000o-20o00C
SECTION III - OXIDATION OF MOLYBDENUM SILICIMES
1. IMTDUCTION
A si ry of the experimental work on the oxidation of molybdenum sili-
cides completed under the present contract and reported in ASD-TDR-62-203(l)
and in our Quarterly Report No. 8(2) is included in this section. Misprints
and errata that have been found in the latter report are corrected in this
one.
2. ISOTHE1OAL MEASURH0E9 S OF EXTENT OF OXIDATION vs TIME
Curves of total oxygen consumption per unit initial sample surface area
at temperatures between 1300* and 2100eK are given for MoSi, Mo5Si3 and
MoSia in Figures 1, 2, and 3, respectively. Tne curves can be fitted approxi-
mately by an equation of the form:
Q =Qo(l _e )
where Q is total oxygen consumption per unit area up to time t, and Qo and a
are temperature and composition dependent parameters. Values of Qo and acalculated from the experimental data are given in Table 1 for each of the
molybdenum silicides. The initial oxidation rate is given by (Qoa), since for
short times t, Q - Qrt. The axiami oxygen pick-up after infinite time is
Q0 " From the point of view of experimental masurement, the larger the value
of a, the more rapidly is the limti'tg rate approached.
For each of the uilicides, Q decreases with increasing temperature
between 1300° and 2000*K, and a increases. That is, the higher the temperature,
the more rapidly in a protective glass built up on the silicide surface, and
the lower are both the net weight loss and the total oxygen consumed. Although
the final limting rates are as low for Mo3Si and for MosSi 3 as for MoSia at
the highest temperatures the net extent of oxidation prior to formation of a
73
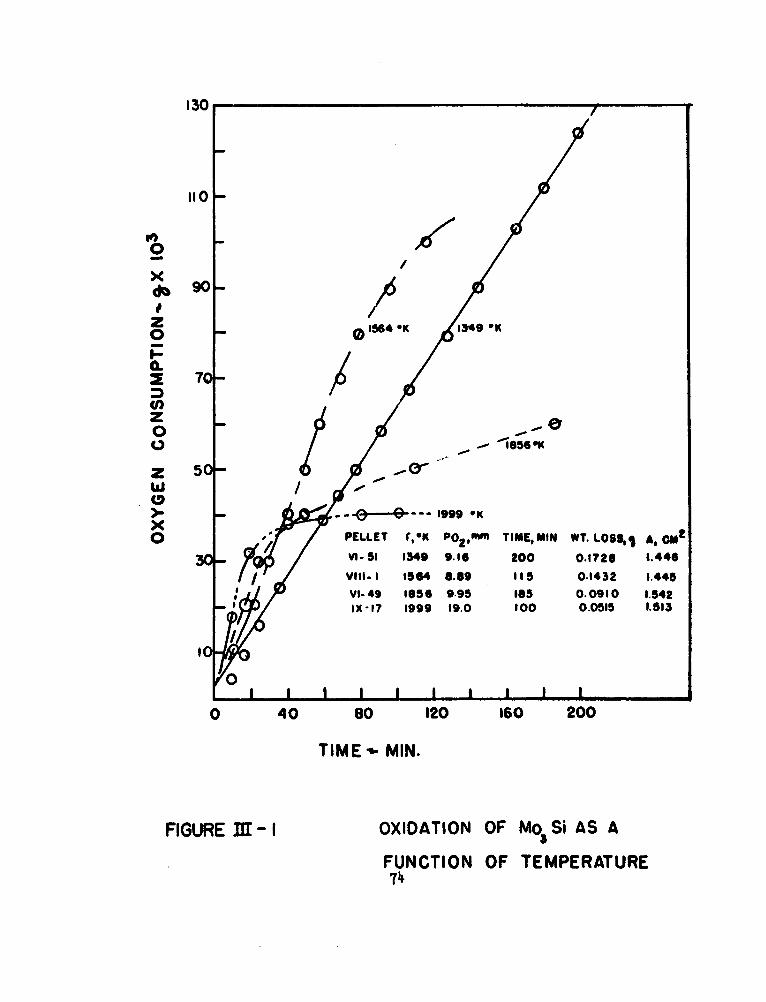
130
110
/xdo90 7
-0 1564 OK 1349 o
(0
zS0
o / -'1656-K
w - --1 --- I•D°Z0 0
- -~G~* 999 -Kx0 PELLET r,eK P0 2,1" TIME,MIN WT. LOSSl A, CM2
30-VA- 51 1349 9.16 200 0.1728 1.446
VIII. I 1564 8.89 115 0.1432 1.445
Vi- 49 1656 9.95 185 0.0910 1.542
IX-17 1999 19.0 100 0.0515 1.513
10
0 40 80 120 160 200
TIME -% MIN.
FIGURE MI[-I OXIDATION OF Mo Si AS A
FUNCTION OF TEMPERATURE74

, ///
25 -- 19AK e- 3/ I
1406 ex20-
0
x
SPELLET T,oK P2,om TIME,MIN WT.LOSS,- 7 A, M2
fI-. 'V1-3 165 8.50 so 0.0243 1.4610.m1-36 i66 4.61 60 0.0051 1.572IX -15 2071 19.2 90 0.0053 1.370ýo 1o - ,.o 0,061 1oo.72
z
0 20 40 60 80
TIME - MIN.
FIGURE 3I1 - 2 OXIDATION OF Mos~is7,
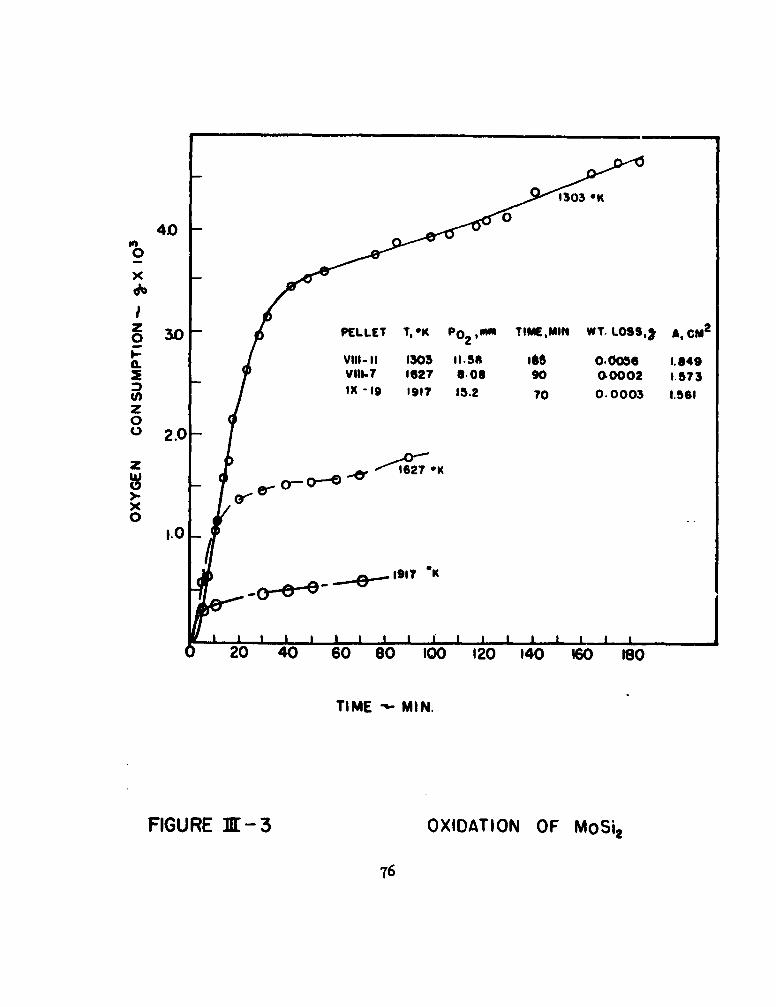
40040
0
x
z•2o 10 PELLET T,*K Po 2 *WA TIME~MIN WT. L0SS.3r A,CM2
1.0
V 0i4l0 803 1.58 140 0.0056 1.849Vill-? 1627 6.06 90 0.0002 1.573ix -19 1917 15.2 70 0.0003 1.561
z0t) 2.0-
z ~ ~ o I-C ý127
x0
I.0-
1917 *K
20 40 60 60 100 120 140 W6 180
TIME -~ MIN.
FIGURE 311- 3 OXIDATION OF MoSit
76
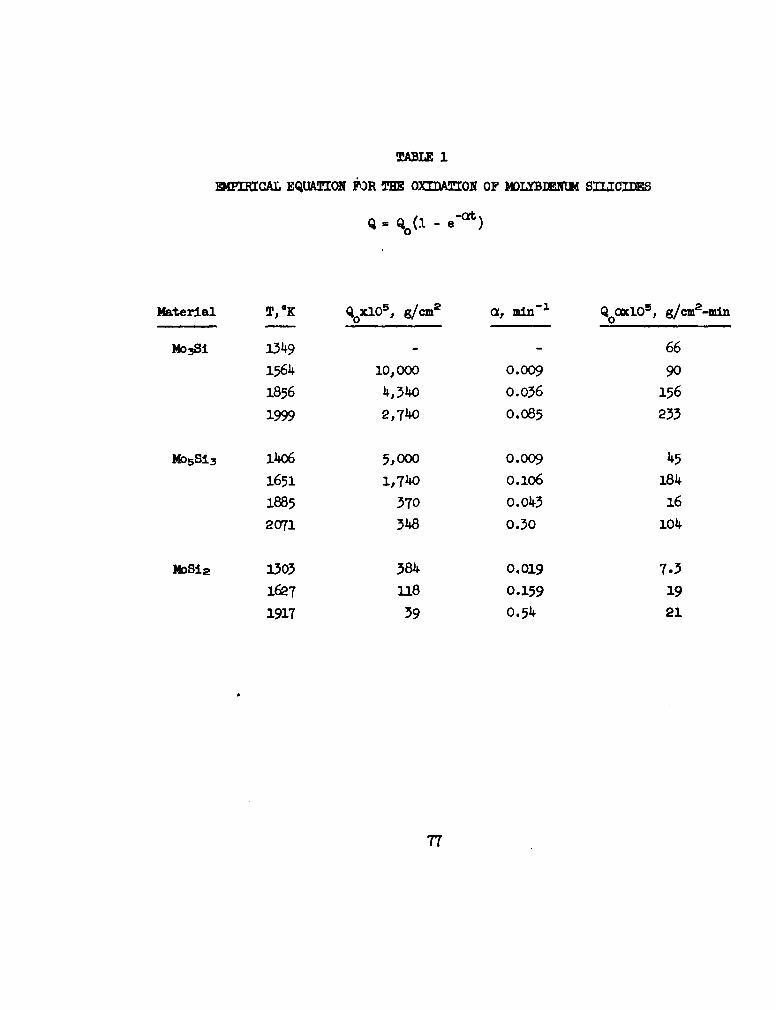
TABLE 1
MeIRICAL EQUATION ]\)R THE OXIDATION OF MOLYBDEUtN SILICIDE
Q =Q 0( - e -C
Material T,OK Q X10 5, g/CM2 a, mi 6=105, g/CM2 _..in
No3 Si 1349 - 66
1564 10,000 0.009 90
1856 4,340 O.036 156
1999 2,740 0.085 233
M05Si3 1406 5,000 0.009 45
1651 1,740 o.1o6 184
1885 370 0.043 16
2071 348 0.30 104
MDSi2 1303 384 0.019 7.3
1627 U8 0.159 191917 39 0.54 21
77

protective film in highest for Mo3Si, less by a factor of about six for
Mo)Si 3 , and reduced by another factor of about six for MoSi.
Figure 4 shows the oxidation of MoSi 2 at 2000*K, where the condensed
oxide is almost certainly a liquid. A protective oxide layer has indeed
formed, but five times more oxide has been consumed prior to the bend than
at 1627TK, and the protection does not last. A sudden increase in oxida-
tion rate occurs after about 100 minutes, followed by the re-establishment of
a protective layer.
3. PIRSSUE DEMMCE OF OXIDATION RATE
At sufficiently low oxygen partial pressures, a protective glass will
not be stable in contact with the molybdenum silicides due to vaporization
of SiO(g) according to the reaction:
½ Si(asi) + j SiO2 (s) = SiO(g) (I.l-i)
where asi is the activity of silicon in the silicide alloy. The importance
of reaction (1) in the oxidation of silicon alloyswas pointed out by Wagner.
Oxygen molecules striking a silicide surface are expected to react rapidly,
particularly at high temperatures. Therefore, the oxygen pressure at the
alloy/gas interface, P02' will be very much less than the oxygen pressure in
the bulk of the gas phase, p 0 . The rate of transport of oxygen towards the
silicon surface, under the concentration gradient created by the reaction, is:
= 2 D0 2 Po0 2/B0
where D is the diffusion coefficient for oxygen molecules and 502 is the
effective thickness of the boundary layer for oxygen diffusion. A similar
equation obtains for the transport of SiO(g) away from the alloy into the
bulk gas. According to Wagner, a steady state will be established in which
the transport of oxygen towards the alloy as 02(g) will exactly balance the
transport of oxygen away from the alloy surface as SiO(g). Since the ratio
of 5Si0 to 802 can be expressed in terms of the corresponding gas phase
78
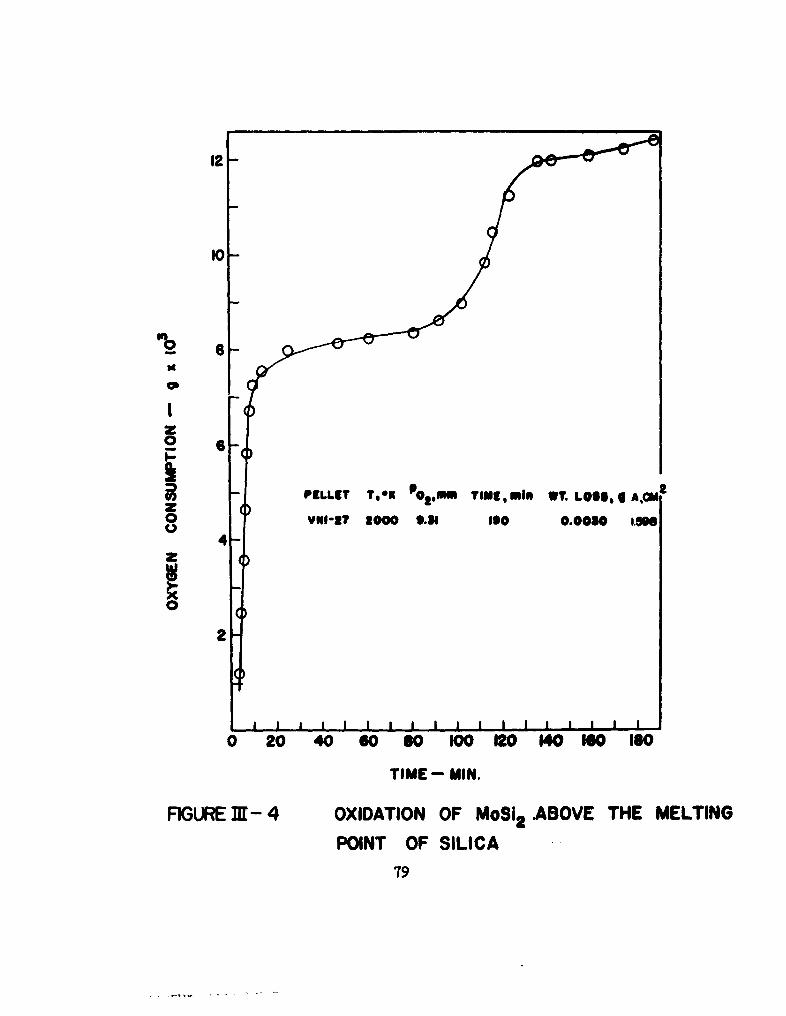
I0
w~6
z0 6-
PELLET T,-K 902 UWU T109, MON WT. LOSS,g ACM2
zo VNI-27 2000 9.56 190 0@0050 Me600
z
0
0 20 40 60 80 100 120 140 160 1S0
TIME- MIN.
FIGURE lIE- 4 OXIDATION OF MoS12 ABOVE THE MELTINGPOINT OF SILICA
7(9

diffusion coefficients, one finds a relationship between the SiO(g) pressure
at the alloy-gas interface, paiO and the bulk oxygen pressure, :
026062 D sio (XI2
SiO2 (s) can only form on a silicide surface if pSiO is larger than the equili-
brium pressure PSiO(eq.) for reaction (I) at the experimental temperature.
Equivalently, from equation (2), Si02 (s) will be stable on a silicide surface
only at ambient oxygen pressures greater than '(DsidDO2)i PSio(eq.)" The
ratio of diffusion coefficients is approximately 0.64. With a silicon activity
of unity at the alloy-gas interface, an ambient oxygen pressure of 4.6 mm
should be necessary for formation of an Si0 2 (s) layer on the silicide surface
at 14oOC. At 1600eC, the calculated oxygen pressure needed for formation of
SiO2 (s) is 23 mm. If the silicon activity in the alloy is less than unity
(as it generally will be), then the theoretically required oxygen pressures
for formation of a protective glass will be lowered correspondingly.
In the course of the present study, an MOSi2(s) pellet was heated to
16830C in a flowing stream of helium-oxygen at a total pressure of 760 Torr,
oxygen partial pressure of 1.6 Torr. Oxidation was linear over a period of
an hour, and there was no evidence for formation of a glassy layer of Si02 (s)
on the silicide surface. The net observed weight los1 during the experiment
was 0.0116 g, and the total oxygen consumed was 0.00867 g. If the correct
oxidation reaction were:
MOSi 2 (s) + 1 02(g) -+ MoO,(g) + 2 SiO(g)
then the ratio of net weight loss to total oxygen consumption would be 1.9.
The experimentally measured ratio is 1.3. The discrepancy is probably due to
oxidation of SiO(g) in the gas phase to Si02 (s), which condenses on cool walls
in the reaction chamber.
The sharp change in oxidation mechanism at low oxygen pressures was
corroborated by Perkins, et. al.,(4) in work on MoSi2 coated molybdenum.
80

They failed to see a continuous glassy protective oxide at pressures below
5 Torr.
4. )MTALIOGRAPHC EXAMINATON OF OxI3) p1MB
(a) MO3Si
The surface of an Mo3Si sample prior to oxidation is shown in
Figure 5, and gives evidence for the presence of a second phase, probably the
a-solid solution of silicon in molybdenum. Figures 6 and 7 show polished
cross-sections of the same sample after oxidation at 1564K at an oxygen par-
tial pressure of 9 Torr for -15 minutes . In Figure 6a, the second phase is
still plainly visible in both substrate and the oxide. The growth of the
oxide around the second phase inclusions is clearly seen in Figure 6. This
configuration could hardly have been observed unless the oxide grows, at
least in part, by diffusion of oxygen inward from the atmosphere towards the
oxide-alloy interface. Thus, the a-phase appears to have served as an inert
marker during the course of the experiment.
After oxidation, the Mo3 Si pellet was covered with a flaky white
oxide, which constituted the bulk of the product. However, the outer scale
was not adherent, and much of it was lost during the preparation of the sample
for microscopic examination. In Figure 7a, an attempt is made to focus on a
portion of the outermost scale separated by a crack from a more adherent oxide.
Figure 7c focuses on the subscale once more and indicates the uniform thickness
that was obtained over most of the surface of the sample. The clear abrupt
break in the oxide layer has not been explained. Figures 7b and 7d, at higher
magnification, show the morphology of the subscale -- areas of columnar growth
interspersed among apparently amorphous areas. Figure 7e shows a portion of
the oxide that has grown into the substrate to a considerable extent.
In Figure 8 photomicrographs of cross-sections of MoSi oxidized at
1856*K are shown. A smooth outer oxide, and an inner columnar one are visible
in Figures 8& and 8b. In Figures 8c and 8d, regions of amorphous oxide that
have grown around second phase inclusions in the alloy are shown in addition
to the smooth and columnar regions.
81
FIGURE -- 5 Mo.Si , AS POLISHED, 90X
82

a b.
c. d.
FIGURE X- 6 CROSS - SECTIONS OF Mo3 Si OXIDIZED AT 15641K
(400X)
8,

a. 170X b. 400X
c. 750X d. 750X
e. 750X
FIGURE 311 - 7 CROSS- SECTIONS OF Mo. Si OXIDIZED AT 1564 °K84
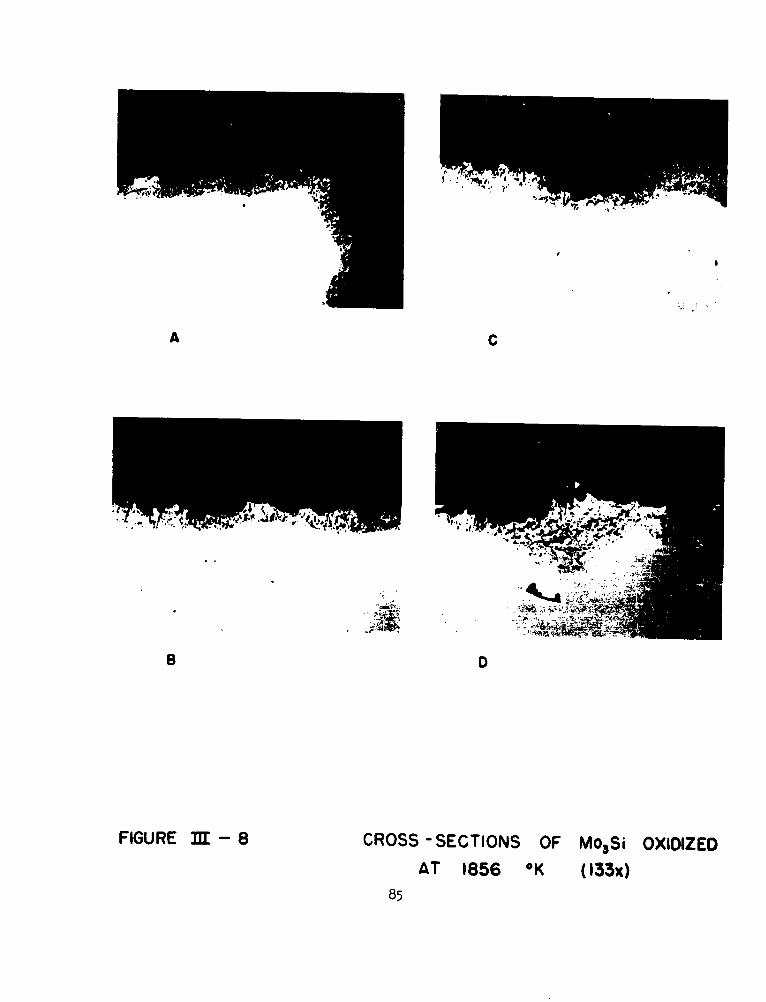
A C
B D
FIGURE MT - 8 CROSS -SECTIONS OF M0 3 Si OXIDIZED
AT 1856 OK (133x)
85

The X-ray patterns of the sample surface after degassing at 16000C
showed lines for molybdenun. After oxidation, the samples exposed at 1349*
and 15640K showed the strongest lines of SiO2 as well as those of Mo, while
the sample exposed at 1856*K showed only the lines for Mo. The failure to
observe Si02 in X-ray at the highest temperature is undoubtedly due to the
glassy nature of the film, rather than to the absence of silica.
A metallographic examination was made of the Mo5 Si:5 sample oxidized
at 1651"K, oxygen pressure of 8.5 Torr. Figure 9a is a view of the sample
Immediately after sectioning, and before polishing. A thick outer scale and
a dense cohe-._•nt inner one are visible. It is evident that oxidation has been
most extensive at the edge of the sample pellet; an originally sharp edge is
plainly rounded after reaction. Figure 9b shows the opposite corner, after
polishing, at higher magnification. The inner and outer scales are now brought
out sharply. The bright layer immediately adjacent to the alloy surface is
probably not a separate oxide phase, but belongs to the inner oxide layer. In
Figure 9, c and d, both oxide layers can again be seen, and the uniform thick-
ness of the inner scale is striking. The second phase inclusions seem to
oxidize at the same rate as the bulk of the sample. It is interesting to note
that oxide does not appear to have grown down into all of the cracks in the
specimen, even those that intersect the surface.
Photomicrographs of Mo5 Si 3 , oxidized at 18850K are reproduced in
Figure 10. Here there appears to be an outer granular oxide, and a layer of
smooth oxide growing into the alloy. Figure 1Oa, particularly interesting,
shows the growth of smooth oxide into a crack to a depth identical to that in
the surrounding sound alloy.
X-ray analysis of the samples after degassing showed the lines for
Mo3 Si. After oxidation at 1651 0 K, a dark glassy layer covered the sample
surface, and X-ray lines for Si02 and Mo were picked up. At 18850K, a dark
grey glassy layer again covered the surface, and the strongest X-ray lines
for Mo, Mo3 Si, and SiO2 were found.
86
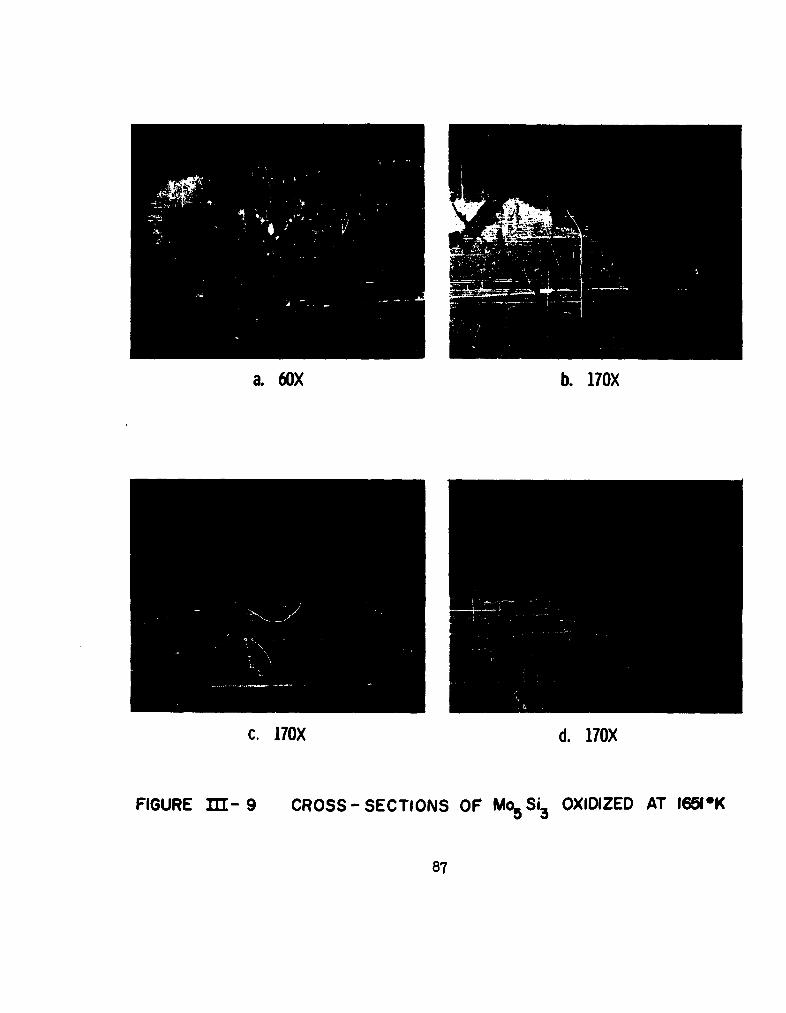
a. 60X b. 170X
c. 170X d. 170X
FIGURE 11- 9 CROSS-SECTIONS OF Mo5 i53 OXIDIZED AT 16510K
87

A 1267E) C WI•)
a 467 s 0 1o0o0)
FIGURE 31I - 10 CROSS- SECTIONS OF MosSi. OXIDIZEDAT 1885 *K
88
(a) M'OSi2
Mletallographic examination of the MoSi 2 sample oxidized at 16270K
failed to reveal any oxide layer, although the surface of the sample was glassy
in appearance, and gave X-ray lines for Si02 , as well as MoSi 2 and Mo 5Si3.
Cross-sections of the oxidized samples are shown in Figure 11. The apparent
surface layer does not look like an oxide, and may be a silicon deficient
region that develops during degassing. Cracks that seem to intersect Lhe
surface show no evidence of having been filled in with oxide.
In Figure 12, photomicrographs of MoSi 2 oxidized at 19816K are
shown. In this case, the rate of supply of oxygen was smaller than the
reaction rate in the early stages of exposure, and therefore the extent of
oxidation prior to formation of a diffusion barrier was higher than usual
for this temperature. Regions of smooth oxide and regions of alloy inter-
spersed with oxide grains are seen in both 12a and 12b. In 12b, smooth oxide
is seen to partially fill cracks in several places.
89

a.170X
b. 170X
FIGURE I - I CROSS -SECTIONS OF MoSi 2 OXIDIZED
AT 1627@OK90
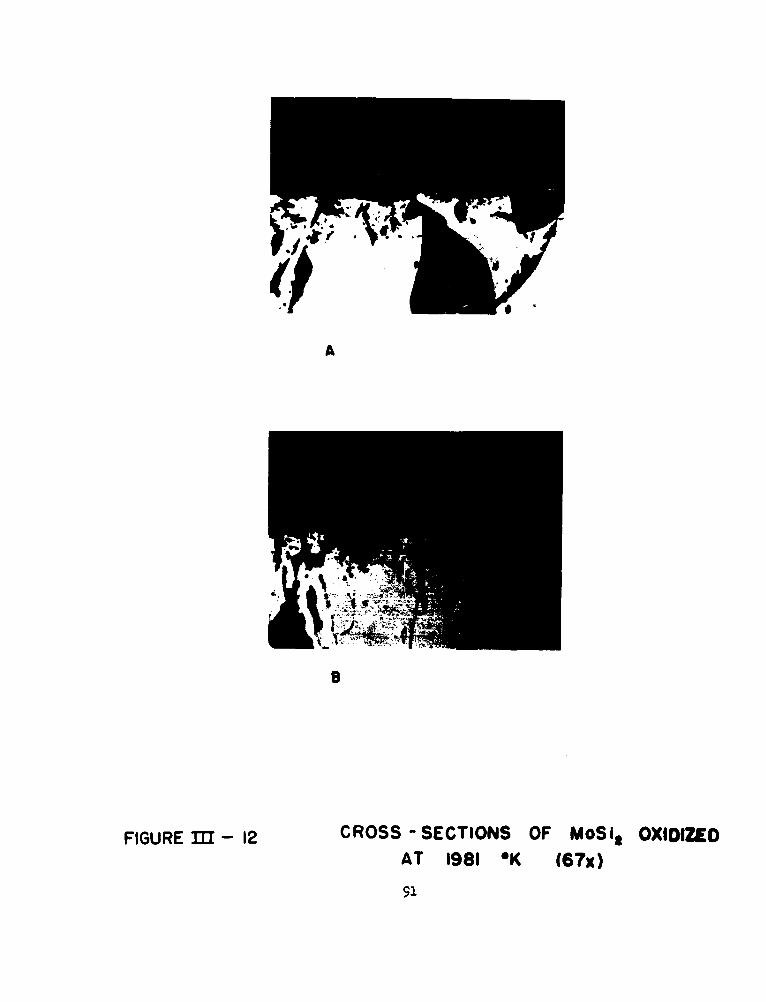
A
FIGURE Ila - 12 CROSS -SECTIONS OF MOS Is OXIDIZEDAT 1981 OK (67x)
91

S=CON =n -
(1) J. Berkowitz. Ninetice of Oxidation in the No-Si System, TechnicalDocumentary lelport No. ASD-TDR-62-203 Part I, Aeronautical SystemDivision, Wright-Patterson Air Force Base, Ohio, Nay, 1962.
(2) Quarterly 11eport No. 8, A. D. Little, Inc., to Wright Air Development
Center, Contract AF 33(616)-6 154.
(3) Carl Wagner, J. Electrochem. Soc. 105 627 (1956).
(4) R. A. Perkins and D. D. Crooks, J. Mtals 4 90 (1961).
...
KINETICS OF OXIDATION OF REFRACTORY METALS ARD ALLOYS
AT 10000-20006C
SECTION IV - CXIDA•ION OF MISCELLAMUS MATERIALS
1. TUNGSTEN SILIC ES
(a) WEMi2
Curves of oxygen consumption vs time for W5Si3 at temperatures of
1635", 17630, 18710, and 2001"K are shown in Figures 1-5. At 1635"K, the
degree of oxidation was greatest and formation of a protective glass was notapparent. However, since the rate of oxidation did fall from 22.6 x 10⁻⁵
g/min-cm2 after 60 minutes to 12.1 x 10⁻⁵ g/min-cm2 after 120 minutes, a
diffusion barrier might be built up in longer exposure times. In Figures 2-5
the oxidation behavior is seen to be approximately independent of temperature.
The limiting oxygen pick-up is 4.3 t 0.9 g/cm2 in the plateau region. The
pattern, familiar from the work on molybdenum silioides, of rapid initial
oxidation rate that levels off to an imperceptible value after 40-60 minutes
is in evidence. The rates in the final stages are below the limit of detecta-
bility of the thermal conductivity method, or less than 10-6 g/min.
(b) WSi 2
The oxLdation beha-ior of WSi 2 was studied at 16930, 1793, 1902%,and 2030*K with the results shown in Figures 6-9. At the three lower tem-
peratures, curves of the customary form, indicative of protective oxidation,are obtained. Final rates of oxidation were once again too small to be
measured. The limiting total oxygen pick-up is 1.1 - 0.5 g/cm-. In general,
net weight losses and total Oxygen consumed were somewhat less for WS12 than
for W5 Si3. At 2030*K, the integrated curve of Figure 9 does not show a
plateau region. The thermal conductivity curve of oxidation rate vs time at
2030"K clearly shows that the rate of oxidation is initially high, drops
rapidly and fluctuates randomly about a low average value. The increases and
decreases of oxidation rate in this region may be correlated with a rupture
of the glassy film due to evolution of SiO(g), and subsequent repair or
93
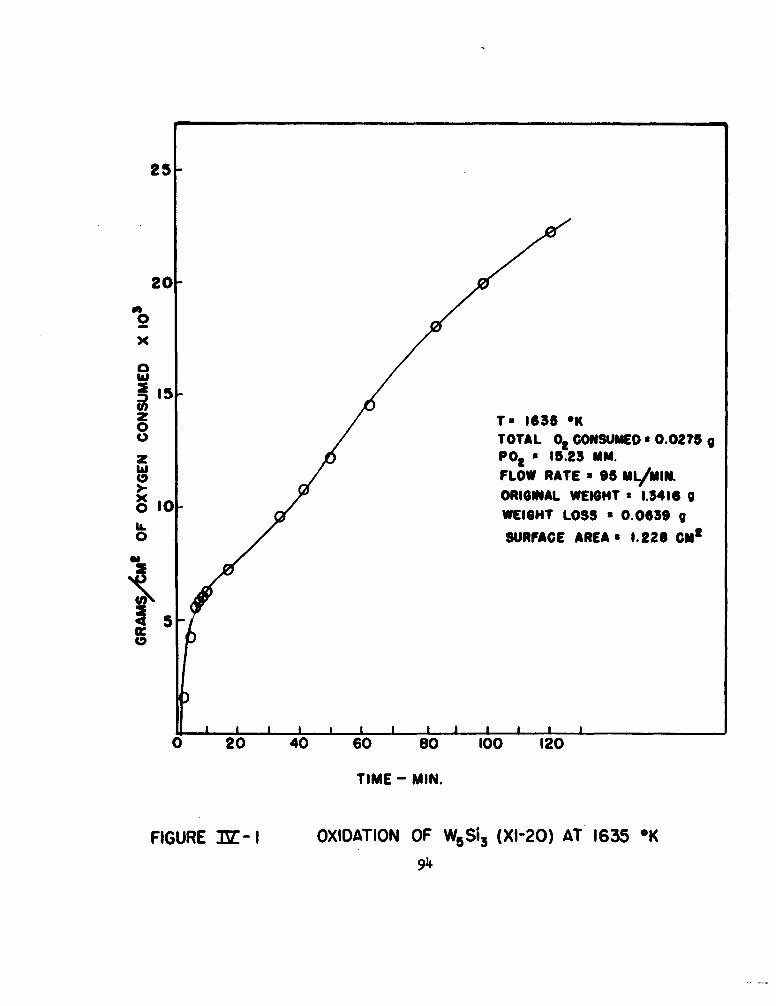
25-
20"0
x
0
Z Tm 1635 OK00 TOTAL % CONSUMED 0.0275 g
z PO s 15.23 MM.FLOW RATE s 95 ML/m.
x ORIGINAL WEIGHT s 1.3416 g0 10 WEIGHT LOSS 2 0.0639 g
0 SURFACE AREA 1 1.226 CM2
5-
0 20 40 60 80 100 120
TIME - MIN.
FIGURE 3'- I OXIDATION OF W5Si3 (XI-20) AT 1635 *K
94

4.0- e 9 e
S3.5x
w 3L0O
ST "1763 OK
U TOTAL 0A CONSUMEDA 0.0050 C
20 406085-0 2
0 Pt" 19.$7 MM.Z FLOW RATE T 9E MO IR.J2.0- ORIGINAL WEIGHT a--I.3239 gx0 WEIGHT LOSS. aO.0141g2
FIUR SURFACE AREA •1.219 CA0.9
S.0
0 20 40 60 so 100 120
TIME - MIN.
FIGURE X[$Z- 2 OXIDATION OF W3Si3 (XI-18) AT 1763 *K
95
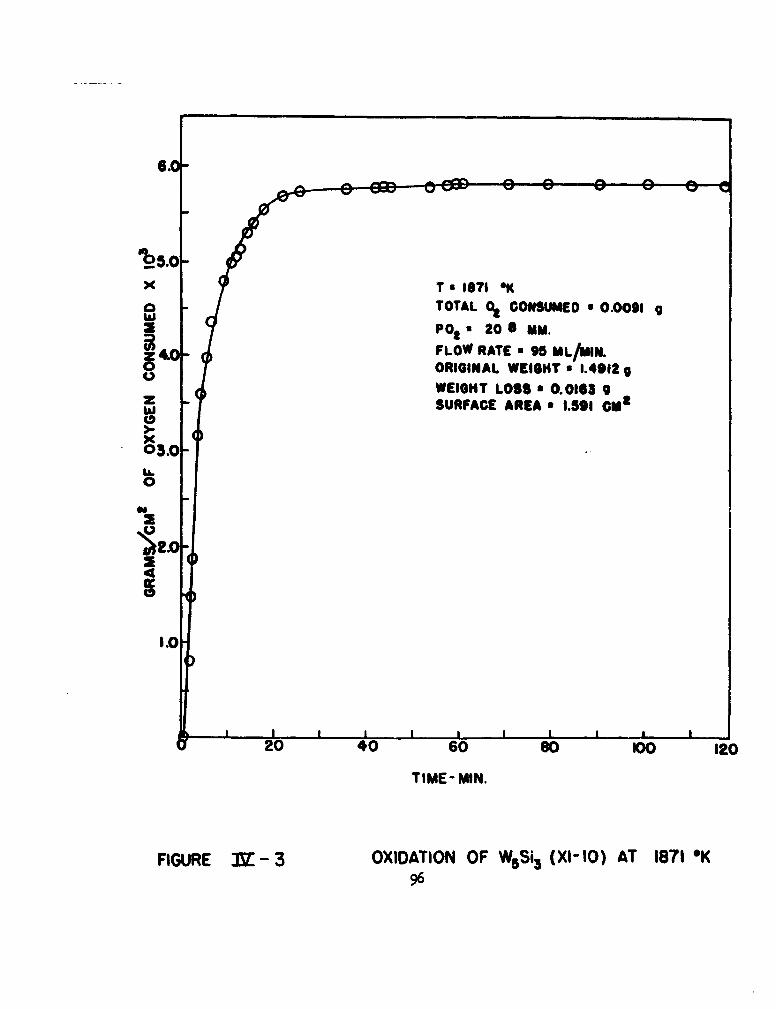
6.0
'2_5.0-
X T a 1871 OK
a TOTAL 0% CONSUMED a 0.0091 gSPO " 20 6 MM.
FLOW RATE • 95 ML/MIN.zORIGINAL WEIGHT4A 1.492 g
WEIGHT LOSS a 0.0163 gz SURFACE AREA a 1.591 cutwx
03.0IL0
I.0)
I I I I I I I I I I
20 40 60 80 00 120
TIME- MIN.
FIGURE J - 3 OXIDATION OF W5Si3 (XI-IO) AT 1871 *K96

3.0-
2.6a02.0 Ta 1969 OKz TOTAL 0% CONSUMED 0.0027 g
SP , .8 11. M u.x0 FLOW RATE a 95 ML/MIN.&L IORIGINAL WEIGHT a 0.9446 g
WEIGHT LOSS a 0.0027 gSUIRFACE AREA a 0.974 OMu
0
0.5 )
0 20 40 60 80 100TE- -K
FIGURE 3N- 4 OXIDATION OF W5SSi (X- 32) AT 1969 *K97

40- To 201K
TOTAL 03 CONSUMED. 0.0065
"P02 a 27.1 MM.FLOW RATE x 95 ML/MIN.
x ORIGINAL WEIGHT a 1.5381 g0 WEIGHT LOSS a 0.0166 g
SURFACE AREA • 1.381 CM3
z 2.5-
x0
2.O-tL0U)I&
1.0
x
0.5
i I I I I
0 20 40 60
TIME -MIN.
FIGURE 3Z-5 OXIDATION OF W5 Si3 (XI-4) AT 2001 *K98
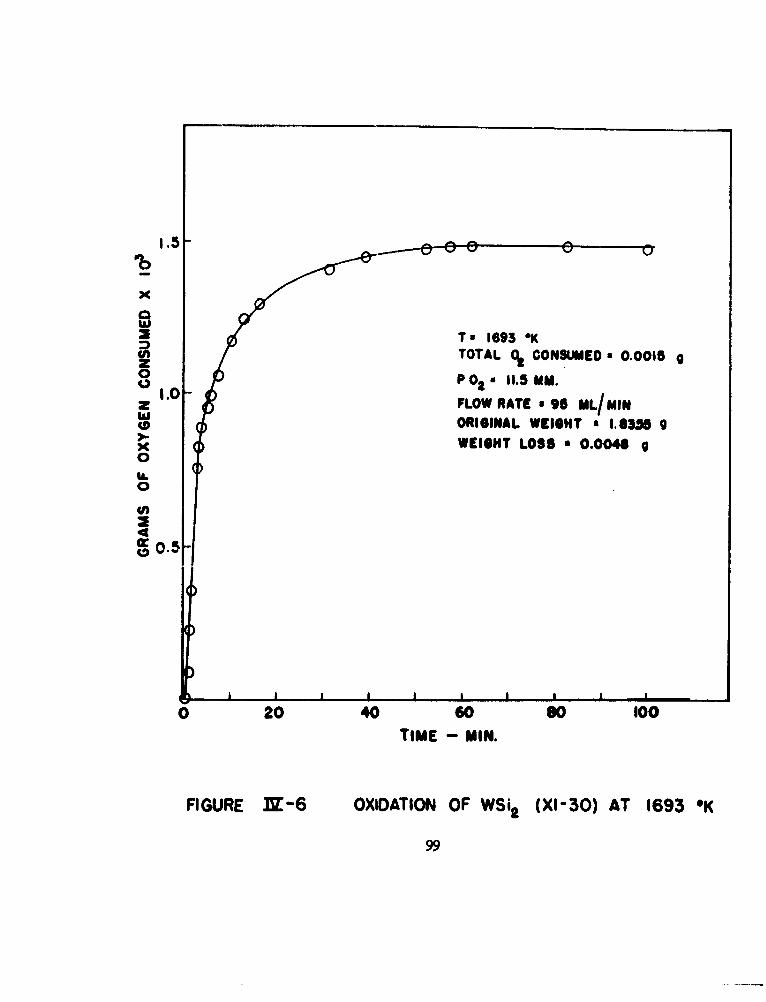
1.5 30"0 0 LI
x0
T 1693 *KTOTAL % CONSUMED a 0.0015 g
z0 P0', 11.5 MM.
. FLOW RATE 95 ML/MINW ORIGINAL WEIGHT a 1.3138 g
x) 1 WEIGHT LOSS• 0.0040 g0
0
0 20 40 60 80 100TIME - MIN.
FIGURE N7-6 OXIDATION OF WSi2 (XI-30) AT 1693 *K
99

00
x
0w
00 T •1793 *K
STOTAL 01 CONSUMED 0.0004 g!)PPOt! a 10. 4 Mm.
0 FLOW RATE a 95 ML/mIN.) .ORIGINAL WEIGHT , 1.0138 g
0 WEIGHT LOSS a 0.0017 9SURFACE AREA 1.309 CM
2
0 20 40 60 80
TIME- MIN.
FIGURE 3ZN- 7 OXIDATION OF WSi 2 (XI-28) AT 1793 *K100
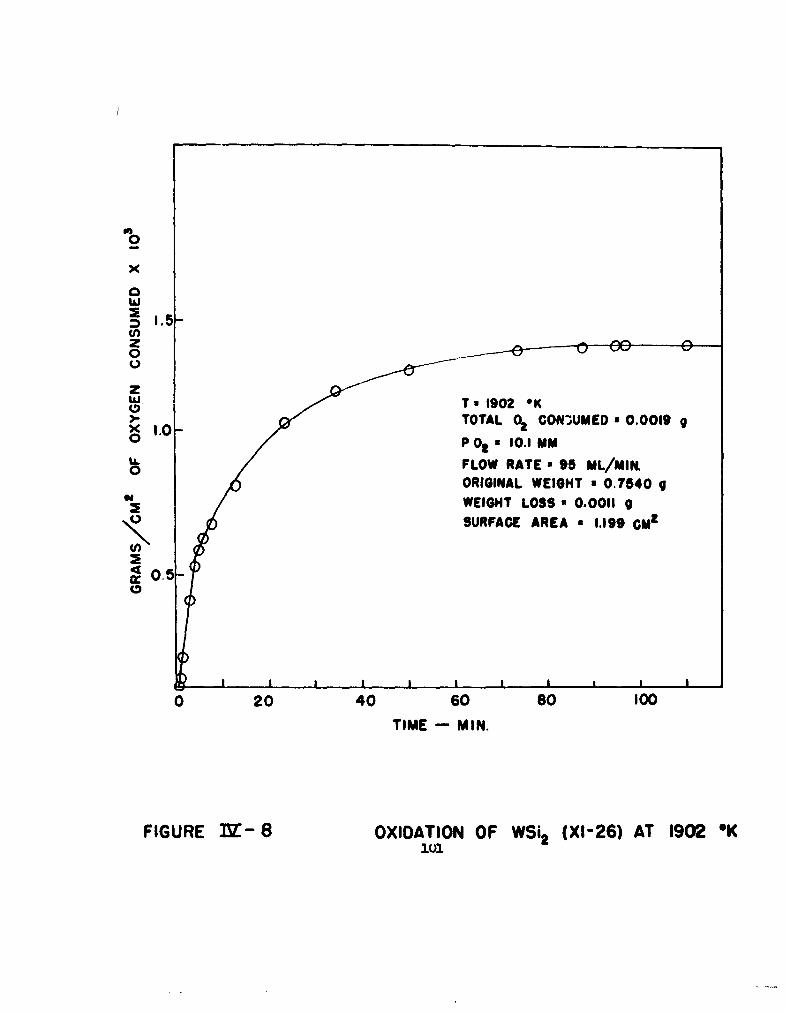
0
x0w
Z 0
zWý To 1902 OKx .0 -
0 ~P 02a 10.1 mmL. FLOW RATE a 95 ML/MIN.
0 ~ORIGINAL WEIGHT a 0.7540g* WEIGHT LOSS a 0.0011 g
SURFACE AREA a 1.199 CMa
0.5
0 20 40 60 s0 100TIME -MIN.
FIGURE IT- 8 OXIDATION OF WSI2 (XI-26) AT 1902 *K101

8.(
0
x T Z --2030 *K6.0 TOTAL 0z CONSUMED - 0.0122 g0
w P 0t a 13.28 MM.FLOW RATE x 95 ML/MIN.
Z ORIGINAL WEIGHT .0.8437 g00 WEIGHT LOSS a 0.0083 9z SURFACE AREA • 1.450 CM2
z'jJ
>-4x0
U.0
2.0
)
0 40 60 120
TIME-- MIN.
FIGURE "7-9 OXIDATION OF WSi. (XI-23) AT 20300K102

self-healing. Small brown mushroom-like projections on the surface of the
glass after oxidation pro-ride further evidence for this type of mechanism.
(a) Comparison between Molybdenum and Tungsten Silicides
Between 1700* and 2000*K rates of oxygen consumption after one
hour's exposure are lower for both W5Si_3 and WSi than for MoSi2, the most
oxidation resistant molybdenum silicide. Net weight changes on oxidation,
however, are higher for the tungsten compounds than for MoSi2 under comparable
conditions. Previous weight change measurements (1,2) suggested that WSi 2 is
inferior in its oxidation resistance to MoSi 2 . In point of fact, the tungsten
compounds are as good or superior to the molybdenum compounds, and the higher
weight changes for WS1i and W5Si3 reflect the higher molecular weight of W
and the higher density of the tungsten silicides.
X-ray lines for Si02 (s) were detected after oxidation of all of the
tungsten silicide samples, but were picked up only occasionally for molybdenum
silicide samples, when a protective oxide had formed during exposure. The
barrier oxide may therefore be more crystalline over W5Si3 and WSi 2 than over
MoSi 2 . For MoMi2 , total oxidation decreases markedly with increasing
temperature, below the melting point of silica. For the tungsten silicides,
the temperature dependence is not pronounced.
2. TAMTALU( BERYLLIDE. Ta2Be i
A pellet of Ta2Be2 7 was kindly supplied by the Brush Beryllium Co.,(3)
and a single measurement of oxygen consumption vs time was made at a temperature
of 1664"K (assuming an emissivity of 0.6), and an oxygen partial pressure of
8.4 Torr. Results are plotted as oxygen consumption vs time in Figure 10, and
as oxygen consumption vs the square root of time in Figure U1. It is clear
that the rate of oxidation does decrease with time, and that therefore a pro-
tective oxide is probably developing on the beryllide surface as reaction
proceeds. However, there is insufficient data to determine definitely whether
oxidation becomes diffusion controlled once a sufficiently thick layer of
solid oxide has been built up, or whether a rate law slower than the parabolic
103

35-
30-
x 25-Ta164*a25 TOTAL 02 CONSUMED x O.0365g
wP 0 8.4 mm
S2-OR IG IN A L W E IG H T = 0 .9 617 08 •SURFACE AREA .Ocm t
zw0
IL0
40 g0 120 160 200
TIME- MIN
FIGURE 3Z - 10 OXIDATION OF Tot Beim (XI -51) AT 1664 OK101.o

40'
35-
30-
00
x 2 5 -
o T~ 1664 1KTOTAL 02 CONSUMED 0365 g
z20- 0 PO2 x 8.4 mm
0 ORIGINAL WEIGHT a 0.9617g
5 0 SURFACE AREA , 2 .0 cOJ00
S15- 0
La.0
10-4 0
CD 0
50
0
0 L g I2 4 6 8 10 12 14
TIME- MIN
FIGURE 3- I I OXIDATION OF TBar? (XI- 51) AT 1664 OK105

might fit the data over a longer period of time. Because of the limited
facilities for handling beryllium compounds in this Laboratory, no attempt
was made to characterize the oxide fIlm by X-ray or metallographic examina-
tion. Although the observed total oxygen consumption of 0.0365 g in a period
of 186 minutes, for a solid sample with original weight of 0.9617 g, is
considerably higher than that observed for MoSi 2 under comparable conditions,
nonetheless, the protective nature of the oxidation process makes Ta2Be 1 7
a promising material for further study.
106

SECTION IV - FERENCES
(i) R. Kieffer and E. Cerwenka, Z. f. Metallk. 43, 101 (1952).
(2) R. Kieffer, F. Benesovsky, E. Gallistl, Z. Metalik. 43, 284 (1952).
(3) Brush Beryllium Co., Cleveland, Ohio
107

43n 0.
VO 4(F4 01
w''~ V V, U
'.4~~ 40. 0
>4Y% 0 -H 00-I',~. oS~ ij 041Nd '00 0
R. .0 IV "u u p % -- o 04
'~ 410'J ~,-1 W -1 0F14 ) 4 0W.
010 S.1 0.~. .H 14 4
*q 0
,
id04
10 0 r.0o a a4
S 14) 4 04)1
*4 44 .
~ 0*0 * 4I41
4J0
0 4. cm 4, I 4g 0 8 +
1-10 164ato4f11 !.'ouI IV 'A~~li~4
Related Documents