CUMULATIVE IMPACT & CARRYING CAPACITY STUDY OF DIBANG SUB BASIN IN BRAHMAPUTRA RIVER VALLEY FINAL REPORT Volume I July 2016 Prepared for: MINISTRY OF ENVIRONMENT, FOREST AND CLIMATE CHANGE GOVERNMENT OF INDIA Indira Paryavaran Bhavan, Jorbagh Road, New Delhi - 110 003 Prepared by: R. S. Envirolink Technologies Pvt. Ltd. 402, BESTECH CHAMBER COMMERCIAL PLAZA, B-BLOCK, SUSHANT LOK-I, GURGAON PH. +91-124-4295383, www.rstechnologies.co.in

Welcome message from author
This document is posted to help you gain knowledge. Please leave a comment to let me know what you think about it! Share it to your friends and learn new things together.
Transcript
CUMULATIVE IMPACT & CARRYING CAPACITY STUDY OF DIBANG SUB BASIN IN BRAHMAPUTRA
RIVER VALLEY
FINAL REPORT
Volume I July 2016
Prepared for:
MINISTRY OF ENVIRONMENT, FOREST AND CLIMATE CHANGE
GOVERNMENT OF INDIA Indira Paryavaran Bhavan, Jorbagh Road, New Delhi - 110 003
Prepared by:
R. S. Envirolink Technologies Pvt. Ltd. 402, BESTECH CHAMBER COMMERCIAL PLAZA,
B-BLOCK, SUSHANT LOK-I, GURGAON
PH. +91-124-4295383, www.rstechnologies.co.in
CONTENTS
VOLUME-I
Page No.
EXECUTIVE SUMMARY 1-19
CHAPTER 1: INTRODUCTION
1.1 BACKGROUND 1.1
1.2 SCOPE OF WORK 1.2
1.3 OUTCOME OF THE STUDY 1.2
1.4 OUTLINE OF DRAFT FINAL REPORT 1.2
CHAPTER 2: HYDROPOWER DEVELOPMENT IN DIBANG BASIN
2.1 HYDROPOWER POTENTIAL 2.1
2.2 HYDROPOWER PROJECTS IN DIBANG BASIN 2.1
2.3 PROJECTS DESCRIPTION 2.2
CHAPTER 3: METHODOLOGY
3.1 LAND USE/ LAND COVER MAPPING 3.1
3.1.1 Classification Scheme 3.1
3.2 FOREST TYPES 3.2
3.3 COMMUNITY STRUCTURE 3.3
3.4 SAMPLING LOCATIONS AND METHODOLOGY 3.3
3.5 FAUNAL ELEMENTS 3.6
3.6 AQUATIC ECOLOGY 3.7
3.7 SAMPLING LOCATIONS & SITE DESCRIPTION 3.7
3.8 METHODOLOGY 3.8
3.8.1 Physico-chemical Parameters 3.8
3.8.2 Sampling of Phytoplankton & Periphyton - Benthic (Epilithic) Diatoms
and Zooplankton 3.9
3.8.3 Identification of Benthic (Epilithic) Diatoms & Zooplankton 3.11
3.8.4 Sampling & Identification of Macro-invertebrates 3.11
3.9 PHYSICO-CHEMICAL WATER QUALITY 3.11
3.10 BIOLOGICAL WATER QUALITY INDEX 3.12
3.11 FISH AND FISHERIES 3.13
CHAPTER 4: BASIN CHARACTERISTICS
4.1 INTRODUCTION 4.1
4.2 DRAINAGE 4.2
4.2.1 Dri River 4.2
4.2.1.1 Dri River up to Mathun Confluence 4.2
4.2.1.2 Ange River 4.3
4.2.1.3 Mathun River 4.4
4.2.1.4 Dri River after Mathun Confluence 4.4
4.2.2 Talo (Tangon) River 4.4
4.2.2.1 Anon Pani Nala 4.4
4.2.3 Right Bank Tributaries of Dibang River 4.4
4.2.3.1 Emra River 4.4
4.2.3.2 Ahi River 4.5
4.2.3.3 Sissiri River 4.5
4.2.4 Left Bank Tributaries of Dibang River 4.5
4.2.4.1 Ithun River 4.5
4.2.4.2 Ashu Pani River 4.6
4.2.4.3 Deopani River 4.6
4.2.4.4 Kundli River 4.6
4.3 TOPOGRAPHY & RELIEF 4.6
4.4 SLOPE 4.8
4.5 GEOLOGY & GEO-MORPHOLOGY 4.9
4.6 SEISMO-TECTONICS 4.11
4.6.1 Tectono-Stratigraphic Set up 4.12
4.6.2 Tectonic Setting 4.12
4.6.3 Seismicity of the Region 4.13
4.7 SOILS 4.14
CHAPTER 5: HYDRO-METEOROLOGY
5.1 METEOROLOGY 5.1
5.1.1 Precipitation Characteristics 5.1
5.1.2 Precipitation Data Network 5.2
5.1.3 Temperature 5.4
5.1.4 Humidity 5.6
5.1.5 Cloud Cover 5.6
5.1.6 Wind 5.6
5.1.7 Special Weather Phenomena 5.6
5.2 WATER DISCHARGE AND AVAILABILITY 5.6
CHAPTER 6: TERRESTRIAL ECOLOGY
6.1 LAND USE/ LAND COVER 6.1
6.2 FOREST COVER IN STATE, DIBANG VALLEY & DIBANG VALLEY DISTRICTS 6.1
6.2.1 Forest Cover in Dibang Basin 6.2
6.3 FOREST TYPES 6.2
6.3.1 Upper Assam Valley Tropical Evergreen Forest
(Tropical Evergreen Forest) (1B/C2) 6.4
6.3.2 Eastern sub-montane Semi-evergreen Forest
(Tropical Semi-evergreen forest) – (2B/C1b) 6.4
6.3.3 East Himalayan moist mixed deciduous forests
(Sub tropical Broadleaved Forests) – (3/C3b) 6.4
6.3.4 Assam Sub-tropical Pine Forests – (9/C2) 6.5
6.3.5 East Himalayan Wet Temperate Forests
(Temperate Broadleaved Forests) – (11B/C1) 6.5
6.3.6 East Himalayan Mixed Coniferous Forest
(Temperate Conifer Forests) – (12/C3a) 6.5
6.3.7 Alpine Pastures (Alpine Forests) – 15/C3) 6.5
6.3.8 Secondary Forests (1B/2S) 6.5
6.3.8.1 Degraded Forests 6.5
6.3.8.2 Bamboo and Musa Forests 6.6
6.3.8.3 Grasslands 6.6
6.4 FLORISTICS 6.6
6.4.1 Taxonomic Diversity 6.6
6.4.1.1 Angiosperms 6.6
6.4.1.2 Gymnosperms 6.7
6.4.1.3 Pteridophytes 6.7
6.4.1.4 Bryophytes 6.11
6.4.1.5 Lichens 6.11
6.4.2 Predominant Plant Groups in the Basin 6.11
6.4.2.1 Orchids 6.12
6.4.2.2 Rhododendrons 6.17
6.4.2.3 Bamboos & Canes 6.18
6.4.3 Threatened & Endemic Plant Species 6.19
6.4.4 Endemic Plant Species 6.20
6.4.5 Medicinal Plants 6.21
6.4.6 Community Structure 6.25
6.4.5.1 Density, Diversity & Evenness 6.53
6.5 FAUNAL RESOURCES 6.54
6.5.1 Mammals 6.54
6.5.1.1 Primates 6.55
6.5.1.2 Carnivora 6.55
6.5.1.3 Proboscidae 6.55
6.5.1.4 Artiodactyla 6.55
6.5.1.5 Lagomorpha 6.56
6.5.1.6 Pholidota 6.56
6.5.1.7 Rodentia 6.56
6.5.1.8 Chiroptera 6.56
6.5.1.9 Scandentia & Soricomorpha 6.56
6.5.1.10 Conservation Status 6.56
6.5.2 Avi-fauna 6.57
6.5.2.1 Conservation Status 6.63
6.5.3 Butterflies 6.63
6.5.4 Herpetofauna 6.63
6.5.4.1 Reptiles 6.67
6.5.4.2 Amphibia 6.67
6.6 PROTECTED AREAS 6.67
6.6.1 Dibang Wildlife Sanctuary 6.68
6.6.2 Mehao Wildlife Sanctuary 6.68
6.6.3 Dibang Dihang Biosphere Reserve 6.70
CHAPTER 7: AQUATIC ECOLOGY
7.1 WATER QUALITY 7.1
7.1.1 Physico-Chemical Water Quality 7.1
7.1.1.1 Dibang River & its Tributaries: 7.1
7.1.2 Biological Water Quality 7.6
7.1.2.1 Phytoplankton 7.6
7.1.2.2 Phytobenthos 7.7
7.1.2.3 Zooplankton 7.15
7.1.2.4 Macro-invertebrates 7.15
7.1.2.5 Biological Water Quality Assessment 7.15
7.2 FISH AND FISHERIES 7.18
CHAPTER 8: ENVIRONMENTAL FLOWS
8.1 INTRODUCTION 8.1
8.2 CURRENT NORMS BEING FOLLOWED FOR ENVIRONMENTAL FLOW 8.1
8.3 DESCRIPTION OF VARIOUS METHODOLOGIES FOR E-FLOW 8.1
8.3.1 Hydrological Methodologies 8.2
8.3.2 Hydraulic Rating Methodologies 8.5
8.3.3 Habitat Simulation or Micro-Habitat Modelling Methodologies 8.5
8.3.4 Holistic Methodologies 8.6
8.3.4.1 The Building Block Methodology (BBM) 8.6
8.3.4.2 The Downstream Response to Imposed Flow Transformations
Methodology 8.7
8.4 ADOPTED METHODOLOGY TO ESTABLISH ENVIRONMENTAL FLOW 8.7
8.4.1 Basics of Environmental Flow Assessment Methods 8.7
8.5 HYDRO-DYNAMIC MODELLING 8.9
8.5.1 MIKE 11 Model 8.9
8.5.2 Hydropower Projects considered for Modelling 8.9
8.5.3 Discharge Data 8.10
8.5.4 River cross sections 8.13
8.5.5 Manning’s roughness coefficient 8.13
8.5.6 MIKE 11 Model set up 8.14
8.5.7 Model Outputs 8.14
8.6 ENVIRONMENTAL FLOW ASSESSMENT 8.23
8.6.1 Project Specific Recommendation for Environment Flow 8.25
8.6.2 Summary of Environmental Flow Release Recommendations 8.28
CHAPTER 9: DOWNSTREAM IMPACTS DUE TO HYDRO DEVELOPMENT
9.1 INTRODUCTION 9.1
9.2 APPROACH ADOPTED 9.1
9.3 MIKE11 MODEL 9.2
9.4 MIKE11 MODEL SET UP FOR IMPACT STUDY 9.3
9.5 FLOW SIMULATION RESULTS IN NATURAL CONDITION OF RIVER 9.4
9.6 FLOW SIMULATION RESULTS FOR PEAKING RELEASE FROM DIBANG MULTIPURPOSE
PROJECT 9.5
9.6.1 Flow simulation results at 45 downstream of Dibang Multipurpose Project
(before Lohit confluence; near Assam border) for peaking release from
Dibang Multipurpose Project 9.5
9.6.2 Flow simulation results at 61 downstream of Dibang Multipurpose Project
(just before Dibang-Lohit confluence) for peaking release from Dibang
Multipurpose Project 9.6
9.6.3 Flow simulation results at Dibru - Saikhowa National Park for peaking
release from Dibang Multipurpose Project 9.9
9.6.4 Flow simulation results at Brahmaputra river near Dibrugarh and for
peaking release from Dibang Multipurpose Project 9.11
9.6.5 Flow simulation results at Brahmaputra river near Bokaghat (Kaziranga
National Park) for peaking release from Dibang Multipurpose Project 9.12
9.6.6 Flow simulation results at Brahmaputra river near Tezpur for peaking
release from Dibang Multipurpose Project 9.20
9.6.7 Flow simulation results at Brahmaputra river near Guwahati for peaking
release from Dibang Multipurpose Project 9.21
9.7 COMPARISON OF DISCHARGE AND WATER LEVEL PATTERN OF DIFFERENT
SIMULATIONS 9.25
9.8 CONCLUSIONS 9.25
CHAPTER 10: CUMULATIVE IMPACT ASSESSMENT
10.1 INTRDUCTION 10.1
10.2 IMPACTS ON TERRESTRIAL ECOLOGY 10.1
10.2.1 Direct Forest Cover Loss 10.3
10.2.2 Forest Cover Loss due to Nibbling effect/ loss 10.3
10.2.3 Impact of Spatial and Temporal crowding 10.4
10.2.4 Impacts on Wildlife 10.5
10.2.5 Impact on RET & Endemic Species 10.7
10.3 IMPACTS ON AQUATIC ECOLOGY 10.7
10.3.1 Loss of Riparian Habitats 10.8
10.3.2 Impact on Free Riverrine Stretch 10.8
10.3.3 Impacts of Damming of River 10.11
10.3.4 Direct Impacts of Reservoir based projects 10.12
10.3.5 Impact on Fish Populations 10.12
10.3.6 Impact on Fish Migration 10.14
10.3.7 Major Impact on Fishes 10.14
10.3.8 Impacts on Tributaries 10.17
10.4 CUMULATIVE IMPACT ASSESSMENT 10.17
10.4.1 Impact on Biodiversity Values 10.19
10.4.2 Impact due to Modification of Flow Regime 10.25
10.5 DOWNSTREAM AREAS 10.25
10.6 DOWNSTREAM IMPACTS 10.27
10.6.1 Impact on Terrestrial Biodiversity 10.28
10.6.2 Impact on Fish Fauna 10.29
10.7 CONSTRUCTION PHASE IMPACTS 10.30
10.7.1 Human Interference 10.30
10.7.2 Sourcing, Storing and Transportation of Construction Material 10.31
10.7.3 Operation of Construction Plant and Machinery 10.32
10.7.4 Muck Disposal 10.32
CHAPTER 11: CONCLUSION AND RECOMMENDATIONS
11.1 INTRODUCTION 11.1
11.2 PROJECT STATUS 11.1
11.3 PROJECTS PLANNED ON DIBANG/DRI RIVER AND TRIBUTARIES 11.2
11.4 PROJECTS ON TALO RIVER 11.3
11.5 PROJECTS ON MATHUN RIVER 11.3
11.6 PROJECTS ON EMRA RIVER 11.3
11.7 PROJECTS ON ITHUN RIVER 11.4
11.8 SINGLE PROJECTS ON TRIBUTARIES 11.4
11.9 PROJECT SPECIFIC RECOMMENDATIONS 11.4
11.9.1 Dibang Multipurpose Project 11.4
11.9.2 Etalin and Attunli HEPs 11.5
11.9.3 Emra I and Emra II HEPs 11.5
11.9.4 Malinye, Elango, Agoline and Etabue HEPs 11.5
11.9.5 Mihumdon, Amulin, Emini, Ithun I and Ithun II HEPs 11.5
11.9.6 Anonpani and Ithipani HEPs 11.5
11.9.7 Ashupani HEP 11.6
11.9.8 Sissiri HEP 11.6
11.10 ENVIRONMENT FLOW RELEASE RECOMMENDATIONS 11.6
LIST OF TABLES
Table 2.1: Comprehensive List of Hydropower Projects in Dibang Basin 2.1
Table 2.2: Salient Features of Mihumdon HEP (400 MW) 2.4
Table 2.3: Salient Features of Etabue HEP (165 MW) 2.6
Table 2.4: Salient Features of Agoline HEP (375 MW) 2.8
Table 2.5: Salient Features of Etalin (3097 MW) 2.9
Table 2.6: Salient Features of Dibang Multipurpose HEP (2880 MW) 2.11
Table 2.7: Salient Features of Amulin HEP (420 MW) 2.13
Table 2.8: Salient Features of Emini HEP (500 MW) 2.15
Table 2.9: Salient Features of Attunli HEP (680 MW) 2.17
Table 2.10: Salient Features of Anonpani SHEP (22 MW) 2.19
Table 2.11: Salient Features of Emra-I HEP (600 MW) 2.21
Table 2.12: Salient Features of Emra-II HEP (315 MW) 2.23
Table 2.13: Salient Features of Ithun-I HEP (86 MW) 2.25
Table 2.14: Salient Features of Ithun-II HEP (48 MW) 2.27
Table 2.15: Salient Features of Ithi Pani SHEP (22 MW) 2.29
Table 2.16: Salient Features of Ashupani SHEP (30 MW) 2.31
Table 2.17: Salient Features of Sissiri HEP (100 MW) 2.33
Table 3.1: Sampling sites and their locations for vegetation sampling in Dibang basin 3.4
Table 3.2: No. of quadrats studied for each vegetation component 3.5
Table 3.3: Details of sampling locations for the water sampling 3.8
Table 4.1: Description and Area under different Slope Categories in Dibang Basin 4.9
Table 4.2: Litho-Tectonic succession in Dibang Basin from north to south 4.11
Table 4.3: Description and Area under different Soil Units in Dibang Basin 4.14
Table 5.1: Status of Precipitation Data 5.2
Table 5.2: Average Monthly Rainfall (mm) in Dibang Basin from 1998-2001 5.3
Table 5.3: Average Annual Rainfall (mm) in Dibang Basin 5.3
Table 5.4: Average Annual Rainfall (mm) in Dibang Basin from 2009-2013 5.4
Table 5.5: Observed Temperature and Humidity Data at Hunli 5.4
Table 5.6: Observed Temperature and Humidity Data at Elopa 5.5
Table 5.7: Maximum & Minimum Temperature (°C) at Anini 5.5
Table 5.8: 90% Dependable Year Discharge Data for Etalin, Attunli HEPs and Dibang
Multipurpose project 5.7
Table 5.9: 90% Dependable Year Discharge Data for Amulin, Emini, Mihumdon, Etabue &
Agoline projects 5.7
Table 5.10: 90% Dependable Year Discharge Data for Emra II, Ithun I, Ithun II, Ashu Pani,
Sissiri projects and 75% Dependable Year Discharge Data for Anon Pani and
Ithi Pani Projects 5.8
Table 5.11: 90% Dependable Year Discharge Data for Sissiri Project 5.9
Table 6.1: Area under different forest classes in Arunachal Pradesh 6.1
Table 6.2: Area under different forest cover classes as per FSI data (2013 & 2015) in two
districts covering Dibang basin in Arunachal Pradesh 6.2
Table 6.3: Area under different land use/ land cover categories in Dibang basin 6.2
Table 6.4: Summary of number plants species in Dibang basin 6.6
Table 6.5: List of Gymnosperms reported from Dibang basin 6.7
Table 6.6: List of Pteridophytes reported from Dibang basin 6.7
Table 6.7: List of Bryophytes reported from Dibang basin 6.11
Table 6.8: List of lichens reported from Dibang basin 6.11
Table 6.9: Species of Orchids reported from Dibang basin 6.12
Table 6.10: Species of Rhododendrons reported from Dibang basin 6.17
Table 6.11: Species of bamboos and canes reported from Dibang basin 6.18
Table 6.12: RET plant species reported from Dibang basin 6.19
Table 6.13: Plant species endemic to Arunachal Pradesh reported from Dibang basin 6.20
Table 6.14: Locally used plants, plant parts for medicinal purposes 6.21
Table 6.15: Conservation Status Assessment of prioritused Medicinal plant species
reported from Dibang basin based upon CAMP Workshop (2003) - FRLHT,
Bangalore 6.25
Table 6.16: Community structure –Site-V1 (Trees & Shrubs) 6.26
Table 6.17: Community structure –Site-V1 (Herbs) 6.26
Table 6.18: Community structure –Site-V2 (Trees and Shrubs) 6.27
Table 6.19: Community structure –Site V2 (Herbs) 6.28
Table 6.20: Community structure –Site-V3 (Trees and Shrubs) 6.29
Table 6.21: Community structure –Site-V3 (Herbs) 6.29
Table 6.22: Community structure –Site V4 (Trees and Shrubs) 6.30
Table 6.23: Community structure –Site V4 (Herbs) 6.31
Table 6.24: Community structure –Site V5 (Trees and Shrubs) 6.31
Table 6.25: Community structure –Site V5 (Herbs) 6.32
Table 6.26: Community structure –Site V6 (Trees and Shrubs) 6.32
Table 6.27: Community structure –Site V6 (Herbs) 6.33
Table 6.28: Community structure –Site V7 (Trees and Shrubs) 6.34
Table 6.29: Community structure –Site V7 (Herbs) 6.34
Table 6.30: Community structure –Site V8 (Trees and Shrubs) 6.35
Table 6.31: Community structure –Site 8 (Herbs) 6.36
Table 6.32: Community structure –Site V9 (Trees and Shrubs) 6.36
Table 6.33: Community structure –Site V9 (Herbs) 6.37
Table 6.34: Community structure –Site V10 (Trees and Shrubs) 6.38
Table 6.35: Community structure –Site V10 (Herbs) 6.38
Table 6.36: Community structure –Site V11 (Trees and Shrubs) 6.39
Table 6.37: Community structure –Site 11 (Herbs) 6.40
Table 6.38: Community structure –Site V12 (Trees and Shrubs) 6.40
Table 6.39: Community structure –Site V12 (Herbs) 6.41
Table 6.40: Community structure –Site V13 (Trees and Shrubs) 6.42
Table 6.41: Community structure –Site V13 (Herbs) 6.42
Table 6.42: Community structure – Site V14 (Trees and Shrubs) 6.43
Table 6.43: Community structure – Site V14 (Herbs) 6.44
Table 6.44: Community structure – Site V15 (Trees and Shrubs) 6.44
Table 6.45: Community structure – Site V15 (Herbs) 6.45
Table 6.46: Community structure – Site V16 (Tree and Shrubs) 6.45
Table 6.47: Community structure – Site V16 (Herbs) 6.46
Table 6.48: Community structure – Site V17 (Tree and Shrubs) 6.47
Table 6.49: Community structure – Site V17 (Herbs) 6.47
Table 6.50: Community structure – Site V18 (Tree and Shrubs) 6.48
Table 6.51: Community structure – Site V18 (Herbs) 6.49
Table 6.52: Community structure –Site V19 (Trees & Shrubs) 6.49
Table 6.53: Community structure –Site V19 (Herbs) 6.50
Table 6.54: Community structure –Site V20 (Trees & Shrubs) 6.51
Table 6.55: Community structure –Site V20 (Herbs) 6.51
Table 6.56: Community structure –Site V21 (Trees & Shrubs) 6.52
Table 6.57: Community structure –Site V21 (Herbs) 6.52
Table 6.58: Density of plant species (no. of individuals/ha) in Dibang basin 6.53
Table 6.59: Shannon-Weiner Diversity Index (H’) of plant species in Dibang basin 6.54
Table 6.60: Important Birding areas in Dibang basin 6.57
Table 6.61: List of mammals reportedly found in Dibang basin 6.58
Table 6.62: Avi-fauna recorded from Dibang basin during surveys 6.64
Table 6.63: List of herepetofauna reported from Dibang basin 6.67
Table 7.1: Tolerance Limits for Inland Surface Waters (as per IS:2296:1982) 7.1
Table 7.2: Drinking Water Quality Standards (as per IS:10500:2012) 7.2
Table 7.3: Physico-chemical characteristics of Dibang river and its tributaries 7.4
Table 7.4: WQI of Dibang river & its tributaries 7.6
Table 7.5: Phytoplankton species recorded from Dibang river and its tributaries 7.8
Table 7.6: Species of Phytobenthos recorded from Dibang river and its tributaries 7.11
Table 7.7: Species of Zooplankton recorded in Dibang river and its tributaries 7.14
Table 7.8: Percent composition of Macro-invertebrates recorded from Dibang river and
Its tributaries at different sampling sites 7.16
Table 7.9: Biological Water Quality at different locations in Dibang river and its
tributaries 7.18
Table 7.10: List of Fish Species reported from the Dibang Basin 7.19
Table 8.1: Environment Management Classes 8.5
Table 8.2: HEPs covered for Hydrodynamic Modelling 8.10
Table 8.3: 90% DY Average Discharge Data for Dibang, Etalin and Attunli projects 8.11
Table 8.4: 90% DY Average Discharge Data for Mihumdon, Emini, Amunlin and
Emra I projects 8.11
Table 8.5: 90% DY Average Discharge Data for Emra II, Ithun I, Ithun II and Sissiri projects 8.12
Table 8.6: Manning’s roughness coefficient 8.13
Table 8.7: Model Output for Different Release Scenarios for Dibang Multipurpose Project 8.14
Table 8.8: Model Output for Different Release Scenarios for Etalin (Dri Limb) HEP 8.18
Table 8.9: Model Output for Different Release Scenarios Etalin (Talo Limb) HEP 8.18
Table 8.10: Model Output for Different Release Scenarios for Attunli HEP 8.19
Table 8.11: Model Output for Different Release Scenarios for Mihumdon HEP 8.19
Table 8.12: Model Output for Different Release Scenarios for Emini HEP 8.20
Table 8.13: Model Output for Different Release Scenarios for Amulin HEP 8.20
Table 8.14: Model Output for Different Release Scenarios Emra-I HEP 8.21
Table 8.15: Model Output for Different Release Scenarios Emra-II HEP 8.21
Table 8.16: Model Output for Different Release Scenarios for Ithun-I HEP 8.22
Table 8.17: Model Output for Different Release Scenarios for Ithun-II HEP 8.22
Table 8.18: Model Output for Different Release Scenarios Sissiri HEP 8.23
Table 8.19: Summary of Environment Flow Release Recommendations 8.29
Table 9.1: Lean season release and peaking discharge 9.1
Table 9.2: Distributed average Lean season flow of river Dibang/Brahmaputra 9.3
Table 9.3: Water level at salient locations in natural condition of Dibang river for
average Lean season discharge 9.4
Table 9.4: Release from Dibang Multipurpose Project and resulting discharge/water level
series at chainage 45 km near Assam border before confluence of Dibang and
Lohit Rivers 9.5
Table 9.5: Release from Dibang Multipurpose Project and resulting discharge/water level
series at chainage 61 km just before confluence of Dibang and Lohit Rivers 9.7
Table 9.6: Release from Dibang Multipurpose Project along with stablised flow pattern at
Dibru – Saikhowa National Park 9.9
Table 9.7: Water level pattern of Dibang river at different locations along Dibru – Saikhowa
National Park 9.10
Table 9.8: Release from Dibang Multipurpose Project and resulting discharge/water level
series in Brahmaputra near Dibrugarh 9.11
Table 9.9: Release from Dibang Multipurpose Project and resulting discharge/water level
series in Brahmaputra near Bokaghat 9.19
Table 9.10: Release from Dibang Multipurpose Project and resulting discharge/water level
series in Brahmaputra near Tezpur 9.20
Table 9.11: Release from Dibang Multipurpose Project and resulting discharge/water level
series in Brahmaputra near Guwahati 9.21
Table 9.12: Comparison of discharge and water level pattern at salient location for
different simulations 9.25
Table 10.1: River Reach likely to be affected 10.9
Table 10.2: Forest Cover (%) in Direct Impact Zones of proposed Projects in Dibang Basin 10.20
Table 10.3: Percent Area under Biological Richness Index in Direct Impact Zones of
proposed Projects in Dibang Basin 10.20

Table 10.4: Percent Area under Fragmentation Index in Direct Impact Zones of proposed
Projects in Dibang Basin 10.20
Table 10.5: Environmental sensitivity parameters & Bio-diversity values of proposed
Projects in Dibang Basin 10.22
Table 10.6: Relative Impact Scoring 10.24

LIST OF FIGURES
Figure 2.1: Planned Hydro-Development in Dibang Basin 2.3
Figure 2.2: Layout Map of Mihumdon HEP (as per PFR by NHPC Ltd.) 2.5
Figure 2.3: Layout Map of Etabue HEP (as per PFR by NHPC Ltd.) 2.7
Figure 2.4: Layout Map of Etalin HEP (as per Project Developer) 2.10
Figure 2.5: Layout Map of Dibang MPP (as per Project Developer) 2.12
Figure 2.6: Layout Map of Amulin HEP (as per PFR by NHPC Ltd.) 2.14
Figure 2.7: Layout Map of Emini HEP (as per PFR by NHPC Ltd.) 2.16
Figure 2.8: Layout Map of Attunli HEP (as per Project Developer) 2.18
Figure 2.9: Layout Map of Anonpani SHEP (as per Project Developer) 2.20
Figure 2.10: Layout Map of Emra-I HEP (as per Project Developer) 2.22
Figure 2.11: Layout Map of Emra-II HEP (as per Project Developer) 2.24
Figure 2.12: Layout Map of Ithun-I HEP (as per Project Developer) 2.26
Figure 2.13: Layout Map of Ithun-II HEP (as per Project Developer) 2.28
Figure 2.16: Layout Map of Ithi Pani SHEP (as per Project Developer) 2.30
Figure 2.17: Layout Map of Ashupani HEP (as per PFR by NHPC Ltd.) 2.32
Figure 2.18: Layout Map of Sissiri HEP (as per Developer) 2.34
Figure 3.1: False Color Composite (FCC) of Dibang basin prepared from LISS-III
IRS- P6 Data 3.2
Figure 3.2: Sampling sites/locations for terrestrial ecology in Dibang basin 3.6
Figure 3.3: Location of sampling sites for aquatic ecology in Dibang basin 3.10
Figure 4.1: Location Map of Dibang Basin 4.2
Figure 4.2: Drainage Map of Dibang Basin 4.3
Figure 4.3: Elevation Map of Dibang Basin 4.7
Figure 4.4: Relief Map of Dibang Basin 4.8
Figure 4.5: Slope Map of Dibang Basin 4.10
Figure 4.6: Soil Map of Dibang Basin 4.16
Figure 5.1: Rainfall Scenario of Dibang Basin 5.2
Figure 6.1: Forest cover map of Dibang basin based upon FSI data (2013) 6.3
Figure 6.2: Map of Dibang Wildlife Sanctuary and proposed hydropower projects in
its vicinity 6.69
Figure 6.3: Map of Mehao Wildlife Sanctuary and location proposed Ashupani HE project 6.70
Figure 6.4: Map of Dihang Dibang Biosphere Reserve 6.71
Figure 8.1: Location of various surveyed river cross sections in Dibang river basin (A typical
MIKE 11 model set-up) 8.16
Figure 8.2: A typical view of surveyed river cross section considered for hydro-dynamic
modeling (A typical MIKE 11 model set-up) 8.17
Figure 9.1: MIKE11 model set up for the Study 9.8
Figure 9.2: Plot of release from Dibang Multipurpose Project and resulting discharge/
water level series at Chainage 45 km (before its confluence with Lohit river
and near Assam border) 9.13
Figure 9.3: Plot of release from Dibang Multipurpose Project and resulting discharge/
water level series at Chainage 61 km (just before its confluence with
Lohit river) 9.14
Figure 9.4(a): Plot of release from Dibang Multipurpose Project and resulting discharge/
water level series at Dibru – Saikhowa National Park 9.15
Figure 9.4(b): Plot of release from Dibang Multipurpose Project and resulting discharge/
water level series at Dibru – Saikhowa National Park 9.16
Figure 9.5: Plot of release from Dibang Multipurpose Project and resulting discharge/
water level series in Brahmaputra near Dibrugarh 9.17
Figure 9.6: Plot of release from Dibang Multipurpose Project and resulting discharge/
water level series in Brahmaputra near Bokaghat (Kaziranga National Park) 9.18
Figure 9.7: Plot of release from Dibang Multipurpose Project and resulting discharge/
water level series in Brahmaputra near Tezpur 9.23
Figure 9.8: Plot of release from Dibang Multipurpose Project and resulting discharge/
water level series in Brahmaputra near Guwahati 9.24
Figure 10.1: Area under different forest cover classes in Dibang basin 10.3
Figure 10.2: Vegetation/Forest types map of Dibang basin 10.4
Figure 10.3: Biological Richness Index map of Dibang Basin 10.5
Figure 10.4: Fragmentation Index map of Dibang Basin 10.6
Figure 10.5: L-section of Dibang river along Dri river stretch 10.10
Figure 10.6: L-section of Talo river 10.10
Figure 10.7: L-section of Mathun river up to its confluence with Dri river 10.10
Figure 10.8: L-section of Emra river 10.11
Figure 10.9: L-section of Ithun river 10.11
Figure 10.10: Downstream area of Dibang river showing Dibang and Karim RFs 10.27
References i-x
Photo Plates 1-6
VOLUME-II
LIST OF ANNEXURES
Annexure I: List of Hydro Power Projects in Dibang Basin of Arunachal Pradesh provided by
Department of Hydro Power Development, Arunachal Pradesh 1-5
Annexure II: List of Angiosperms species reported from Dibang Basin compiled from
secondary sources and field surveys 6-28
Annexure III: List of Plant species recorded during field surveys from sampling sites in
Dibang Basin 29-33
Annexure IV: List of Bird Species Reported from the Dibang Basin 34-51
Annexure V: List of Butterflies Species Reported from the Dibang Basin 52-58
Annexure VI: Model Outputs 59-133
Annexure VII: CEA Letter regarding Sissiri HEP dated July 01, 2011 134-135
Annexure VIII: Letter from Department of Hydropower Development (Monitoring),
Government of Arunachal Pradesh dated May 09, 2016 regarding Emra I
& Emra-II HEPs capacity 136-137
Cumulative EIA- Dibang Basin Executive Summary
1
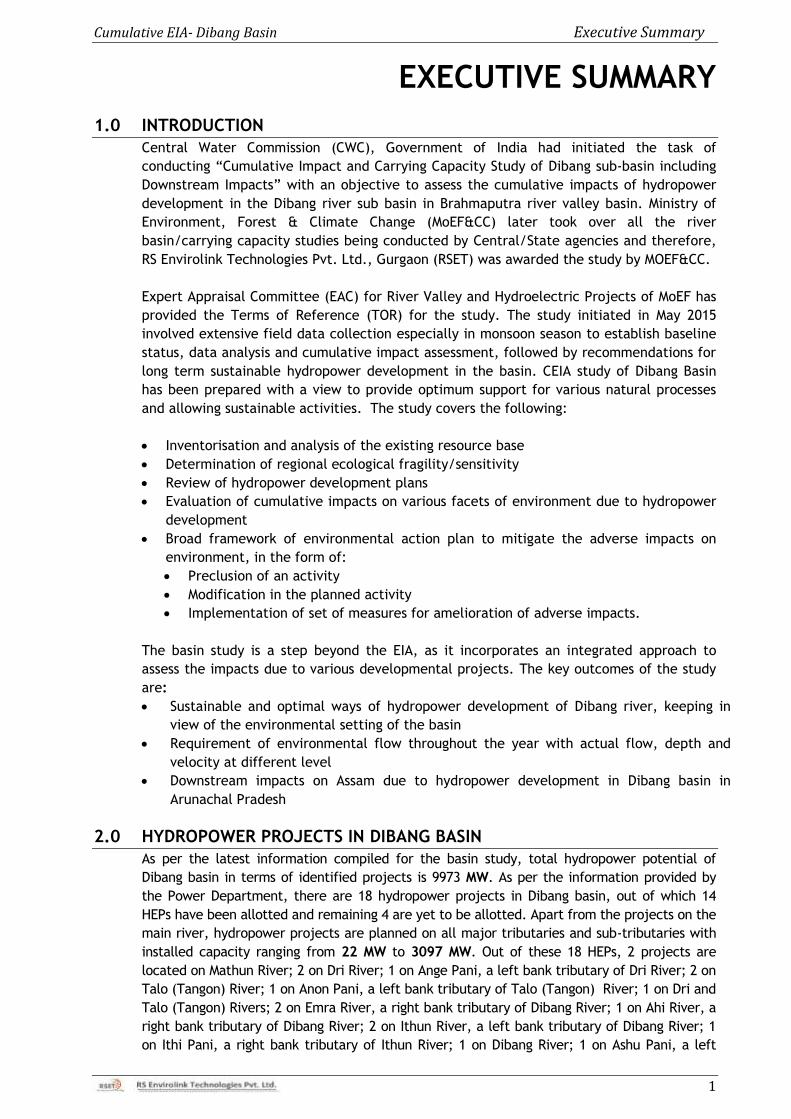
EXECUTIVE SUMMARY
1.0 INTRODUCTION
Central Water Commission (CWC), Government of India had initiated the task of
conducting “Cumulative Impact and Carrying Capacity Study of Dibang sub-basin including
Downstream Impacts” with an objective to assess the cumulative impacts of hydropower
development in the Dibang river sub basin in Brahmaputra river valley basin. Ministry of
Environment, Forest & Climate Change (MoEF&CC) later took over all the river
basin/carrying capacity studies being conducted by Central/State agencies and therefore,
RS Envirolink Technologies Pvt. Ltd., Gurgaon (RSET) was awarded the study by MOEF&CC.
Expert Appraisal Committee (EAC) for River Valley and Hydroelectric Projects of MoEF has
provided the Terms of Reference (TOR) for the study. The study initiated in May 2015
involved extensive field data collection especially in monsoon season to establish baseline
status, data analysis and cumulative impact assessment, followed by recommendations for
long term sustainable hydropower development in the basin. CEIA study of Dibang Basin
has been prepared with a view to provide optimum support for various natural processes
and allowing sustainable activities. The study covers the following:
Inventorisation and analysis of the existing resource base
Determination of regional ecological fragility/sensitivity
Review of hydropower development plans
Evaluation of cumulative impacts on various facets of environment due to hydropower
development
Broad framework of environmental action plan to mitigate the adverse impacts on
environment, in the form of:
Preclusion of an activity
Modification in the planned activity
Implementation of set of measures for amelioration of adverse impacts.
The basin study is a step beyond the EIA, as it incorporates an integrated approach to
assess the impacts due to various developmental projects. The key outcomes of the study
are:
Sustainable and optimal ways of hydropower development of Dibang river, keeping in
view of the environmental setting of the basin
Requirement of environmental flow throughout the year with actual flow, depth and
velocity at different level
Downstream impacts on Assam due to hydropower development in Dibang basin in
Arunachal Pradesh
2.0 HYDROPOWER PROJECTS IN DIBANG BASIN
As per the latest information compiled for the basin study, total hydropower potential of
Dibang basin in terms of identified projects is 9973 MW. As per the information provided by
the Power Department, there are 18 hydropower projects in Dibang basin, out of which 14
HEPs have been allotted and remaining 4 are yet to be allotted. Apart from the projects on the
main river, hydropower projects are planned on all major tributaries and sub-tributaries with
installed capacity ranging from 22 MW to 3097 MW. Out of these 18 HEPs, 2 projects are
located on Mathun River; 2 on Dri River; 1 on Ange Pani, a left bank tributary of Dri River; 2 on
Talo (Tangon) River; 1 on Anon Pani, a left bank tributary of Talo (Tangon) River; 1 on Dri and
Talo (Tangon) Rivers; 2 on Emra River, a right bank tributary of Dibang River; 1 on Ahi River, a
right bank tributary of Dibang River; 2 on Ithun River, a left bank tributary of Dibang River; 1
on Ithi Pani, a right bank tributary of Ithun River; 1 on Dibang River; 1 on Ashu Pani, a left
Cumulative EIA- Dibang Basin Executive Summary
2
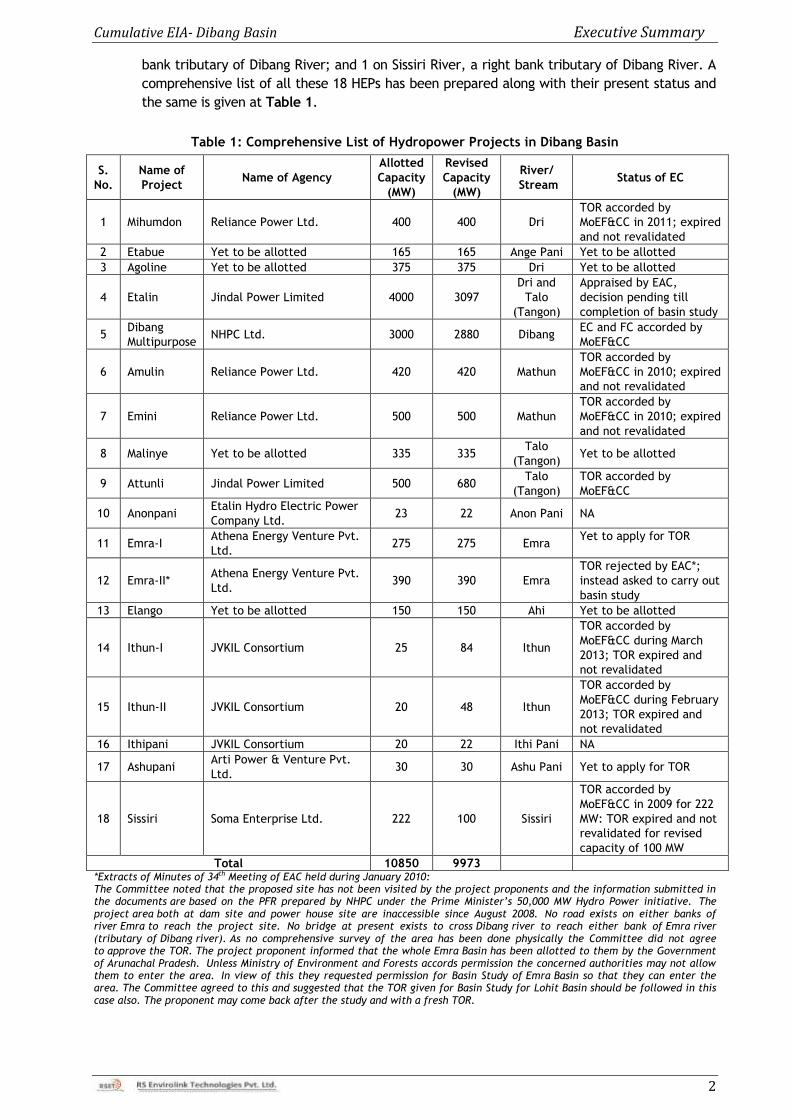
bank tributary of Dibang River; and 1 on Sissiri River, a right bank tributary of Dibang River. A
comprehensive list of all these 18 HEPs has been prepared along with their present status and
the same is given at Table 1.
Table 1: Comprehensive List of Hydropower Projects in Dibang Basin
S.
No.
Name of
Project Name of Agency
Allotted
Capacity
(MW)
Revised
Capacity
(MW)
River/
Stream Status of EC
1 Mihumdon Reliance Power Ltd. 400 400 Dri
TOR accorded by
MoEF&CC in 2011; expired
and not revalidated
2 Etabue Yet to be allotted 165 165 Ange Pani Yet to be allotted
3 Agoline Yet to be allotted 375 375 Dri Yet to be allotted
4 Etalin Jindal Power Limited 4000 3097
Dri and
Talo
(Tangon)
Appraised by EAC,
decision pending till
completion of basin study
5 Dibang
Multipurpose NHPC Ltd. 3000 2880 Dibang
EC and FC accorded by
MoEF&CC
6 Amulin Reliance Power Ltd. 420 420 Mathun
TOR accorded by
MoEF&CC in 2010; expired
and not revalidated
7 Emini Reliance Power Ltd. 500 500 Mathun
TOR accorded by
MoEF&CC in 2010; expired
and not revalidated
8 Malinye Yet to be allotted 335 335 Talo
(Tangon) Yet to be allotted
9 Attunli Jindal Power Limited 500 680 Talo
(Tangon)
TOR accorded by
MoEF&CC
10 Anonpani Etalin Hydro Electric Power
Company Ltd. 23 22 Anon Pani NA
11 Emra-I Athena Energy Venture Pvt.
Ltd. 275 275 Emra
Yet to apply for TOR
12 Emra-II* Athena Energy Venture Pvt.
Ltd. 390 390 Emra
TOR rejected by EAC*;
instead asked to carry out
basin study
13 Elango Yet to be allotted 150 150 Ahi Yet to be allotted
14 Ithun-I JVKIL Consortium 25 84 Ithun
TOR accorded by
MoEF&CC during March
2013; TOR expired and
not revalidated
15 Ithun-II JVKIL Consortium 20 48 Ithun
TOR accorded by
MoEF&CC during February
2013; TOR expired and
not revalidated
16 Ithipani JVKIL Consortium 20 22 Ithi Pani NA
17 Ashupani Arti Power & Venture Pvt.
Ltd. 30 30 Ashu Pani Yet to apply for TOR
18 Sissiri Soma Enterprise Ltd. 222 100 Sissiri
TOR accorded by
MoEF&CC in 2009 for 222
MW: TOR expired and not
revalidated for revised
capacity of 100 MW
Total 10850 9973
*Extracts of Minutes of 34th Meeting of EAC held during January 2010: The Committee noted that the proposed site has not been visited by the project proponents and the information submitted in the documents are based on the PFR prepared by NHPC under the Prime Minister’s 50,000 MW Hydro Power initiative. The project area both at dam site and power house site are inaccessible since August 2008. No road exists on either banks of river Emra to reach the project site. No bridge at present exists to cross Dibang river to reach either bank of Emra river (tributary of Dibang river). As no comprehensive survey of the area has been done physically the Committee did not agree to approve the TOR. The project proponent informed that the whole Emra Basin has been allotted to them by the Government of Arunachal Pradesh. Unless Ministry of Environment and Forests accords permission the concerned authorities may not allow them to enter the area. In view of this they requested permission for Basin Study of Emra Basin so that they can enter the area. The Committee agreed to this and suggested that the TOR given for Basin Study for Lohit Basin should be followed in this case also. The proponent may come back after the study and with a fresh TOR.
Cumulative EIA- Dibang Basin Executive Summary
3
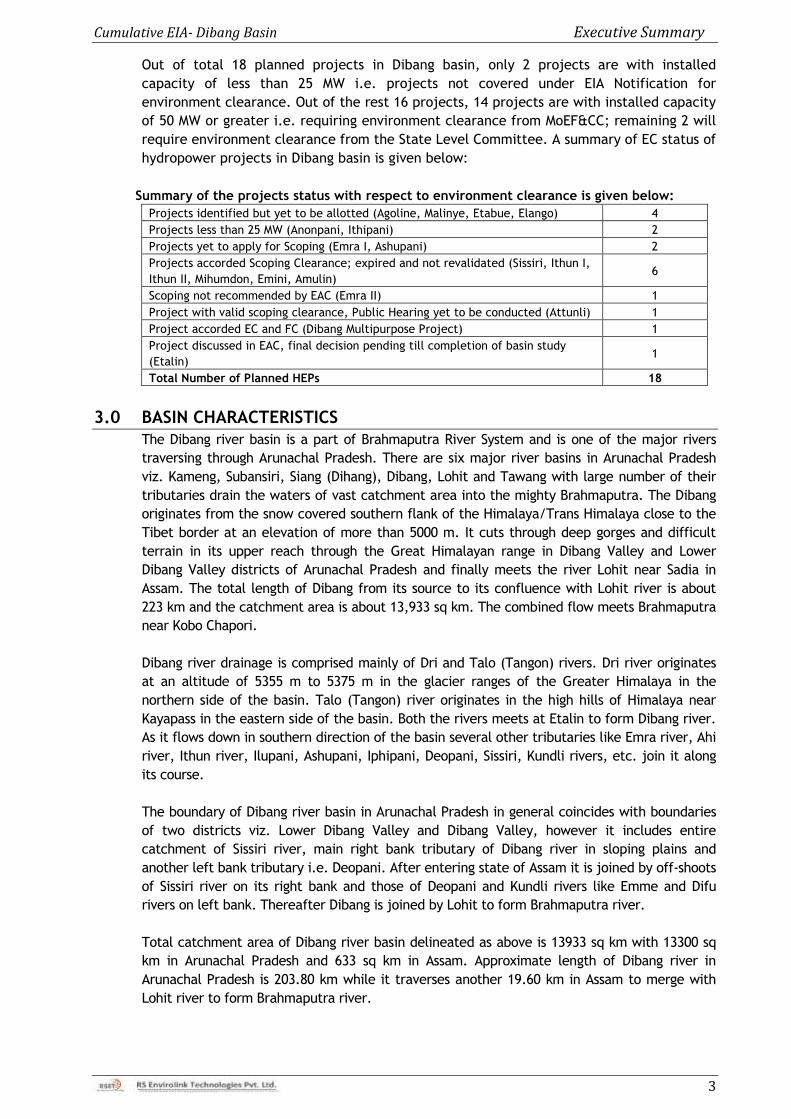
Out of total 18 planned projects in Dibang basin, only 2 projects are with installed
capacity of less than 25 MW i.e. projects not covered under EIA Notification for
environment clearance. Out of the rest 16 projects, 14 projects are with installed capacity
of 50 MW or greater i.e. requiring environment clearance from MoEF&CC; remaining 2 will
require environment clearance from the State Level Committee. A summary of EC status of
hydropower projects in Dibang basin is given below:
Summary of the projects status with respect to environment clearance is given below:
Projects identified but yet to be allotted (Agoline, Malinye, Etabue, Elango) 4
Projects less than 25 MW (Anonpani, Ithipani) 2
Projects yet to apply for Scoping (Emra I, Ashupani) 2
Projects accorded Scoping Clearance; expired and not revalidated (Sissiri, Ithun I,
Ithun II, Mihumdon, Emini, Amulin) 6
Scoping not recommended by EAC (Emra II) 1
Project with valid scoping clearance, Public Hearing yet to be conducted (Attunli) 1
Project accorded EC and FC (Dibang Multipurpose Project) 1
Project discussed in EAC, final decision pending till completion of basin study
(Etalin) 1
Total Number of Planned HEPs 18
3.0 BASIN CHARACTERISTICS
The Dibang river basin is a part of Brahmaputra River System and is one of the major rivers
traversing through Arunachal Pradesh. There are six major river basins in Arunachal Pradesh
viz. Kameng, Subansiri, Siang (Dihang), Dibang, Lohit and Tawang with large number of their
tributaries drain the waters of vast catchment area into the mighty Brahmaputra. The Dibang
originates from the snow covered southern flank of the Himalaya/Trans Himalaya close to the
Tibet border at an elevation of more than 5000 m. It cuts through deep gorges and difficult
terrain in its upper reach through the Great Himalayan range in Dibang Valley and Lower
Dibang Valley districts of Arunachal Pradesh and finally meets the river Lohit near Sadia in
Assam. The total length of Dibang from its source to its confluence with Lohit river is about
223 km and the catchment area is about 13,933 sq km. The combined flow meets Brahmaputra
near Kobo Chapori.
Dibang river drainage is comprised mainly of Dri and Talo (Tangon) rivers. Dri river originates
at an altitude of 5355 m to 5375 m in the glacier ranges of the Greater Himalaya in the
northern side of the basin. Talo (Tangon) river originates in the high hills of Himalaya near
Kayapass in the eastern side of the basin. Both the rivers meets at Etalin to form Dibang river.
As it flows down in southern direction of the basin several other tributaries like Emra river, Ahi
river, Ithun river, Ilupani, Ashupani, Iphipani, Deopani, Sissiri, Kundli rivers, etc. join it along
its course.
The boundary of Dibang river basin in Arunachal Pradesh in general coincides with boundaries
of two districts viz. Lower Dibang Valley and Dibang Valley, however it includes entire
catchment of Sissiri river, main right bank tributary of Dibang river in sloping plains and
another left bank tributary i.e. Deopani. After entering state of Assam it is joined by off-shoots
of Sissiri river on its right bank and those of Deopani and Kundli rivers like Emme and Difu
rivers on left bank. Thereafter Dibang is joined by Lohit to form Brahmaputra river.
Total catchment area of Dibang river basin delineated as above is 13933 sq km with 13300 sq
km in Arunachal Pradesh and 633 sq km in Assam. Approximate length of Dibang river in
Arunachal Pradesh is 203.80 km while it traverses another 19.60 km in Assam to merge with
Lohit river to form Brahmaputra river.
Cumulative EIA- Dibang Basin Executive Summary
4
4.0 BIODIVERSITY PROFILE OF DIBANG BASIN
4.1 Terrestrial Ecology
4.1.1 Forest Cover
Total forest cover in Dibang basin covering mainly two districts of Arunachal Pradesh i.e.
Dibang Valley and Lower Dibang Valley is 9321 sq km (71.54%) as compared to state‟s
average forest cover of 80.30%. Total Dense forest cover is about 51.19% of which Very
Dense Forest covers 13.02% of area while Moderately Dense forests cover 38.17% of its
area.
4.1.2 Forest Types
The forests in Dibang basin fall under Eastern Circle with headquarters at Teju whereas
the Protected Areas in the basin are under the administrative control of Addl. Principal
Chief Conservator Forests (Wildlife & Biodiversity), Itanagar. The two Protected Areas in
the basin are Dibang Wildlife Sanctuary and Mehao Wildlife Sanctuary. The details of forest
types in the basin are primarily based upon Working Plans of the Roing Forest Division and
Anini Social Forest Division, Management Plans of Dibang Wildlife Sanctuary and Mehao
Wildlife Sanctuary and information provided by the Department of Environment and Forests,
Government of Arunachal Pradesh. Their distribution in the basin is also described as per
Forest Working Plans as well as supplemented with information gathered during field surveys
in the area. The major forest types encountered in the area have been described based on
the classification of Champion and Seth (1968).
Upper Assam Valley Tropical Evergreen Forest (Tropical Evergreen Forest) (1B/C2)
Eastern sub-montane Semi-evergreen Forest (Tropical Semi-evergreen forest) – (2B/C1b)
Low hills and plains semi-evergreen forest
Riverine semi-evergreen forest
East Himalayan moist mixed deciduous forests (Sub tropical Broadleaved Forests) –
(3/C3b)
Assam Sub-tropical Pine Forests – (9/C2)
East Himalayan Wet Temperate Forests (Temperate Broadleaved Forests) – (11B/C1)
East Himalayan Mixed Coniferous Forest (Temperate Conifer Forests) – (12/C3a)
Alpine Pastures (Alpine Forests) – 15/C3)
Secondary Forests (1B/2S)
Degraded Forests
Bamboo and Musa Forests
Grasslands
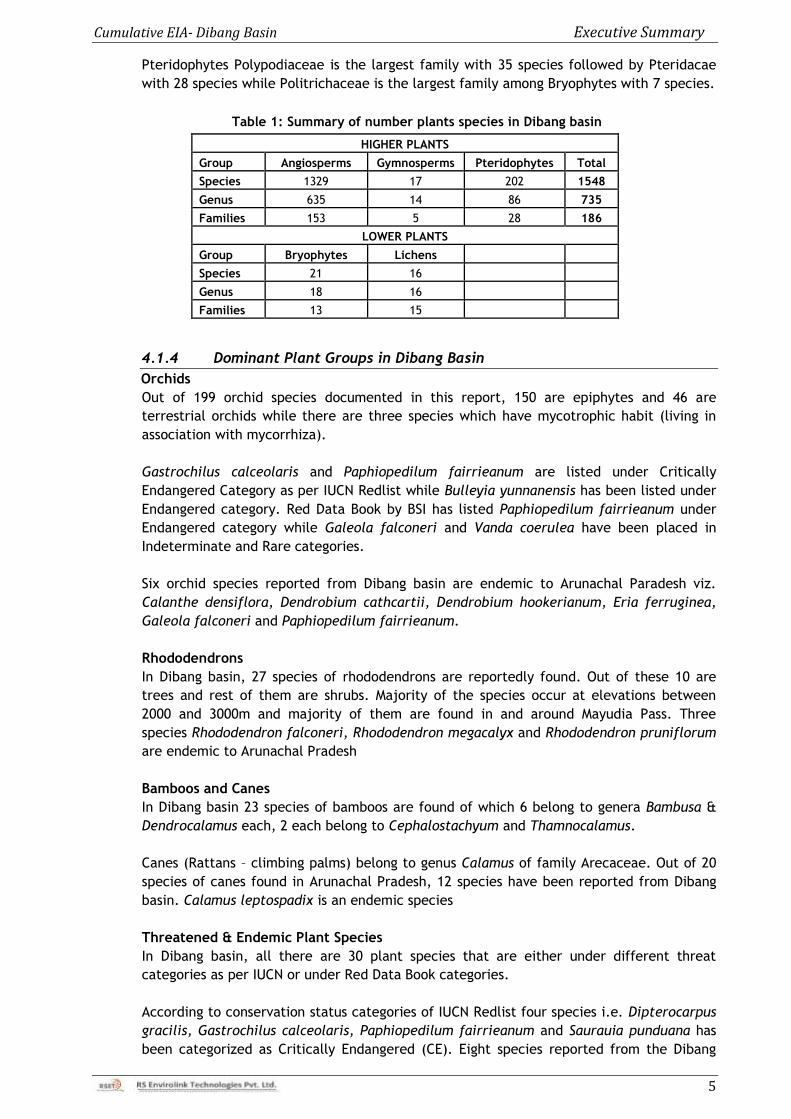
4.1.3 Floristics
In all 1548 higher plant species belonging to 186 families have been documented which
include 1329 Angiosperms, 17 Gymnosperms and 202 Pteridophytes. Among the lower
plants bryophytes are represented by 21 species and lichens are represented by 16 species
(Table 2). Amongst angiosperms orchids, bamboos, canes and rhododendrons are the
important plant groups that are predominantly found in the basin. Orchidaceae is
represented by 199 species, rhododendrons by 27 species and bamboos and canes together
are represented by 43 species.
Angiosperms is the largest group wherein the dominant family in the basin is Orchidaceae
with 199 species followed by Poaceae with 85 species, Asteraceae with 53 species,
Ericaceae with 42 species, Lamiaceae with 40 species and Fabaceae with 34 species.
Among Gymnosperms Pinaceae is the largest family with 9 species and amongst
Cumulative EIA- Dibang Basin Executive Summary
5
Pteridophytes Polypodiaceae is the largest family with 35 species followed by Pteridacae
with 28 species while Politrichaceae is the largest family among Bryophytes with 7 species.
Table 1: Summary of number plants species in Dibang basin
HIGHER PLANTS
Group Angiosperms Gymnosperms Pteridophytes Total
Species 1329 17 202 1548
Genus 635 14 86 735
Families 153 5 28 186
LOWER PLANTS
Group Bryophytes Lichens
Species 21 16
Genus 18 16
Families 13 15
4.1.4 Dominant Plant Groups in Dibang Basin
Orchids
Out of 199 orchid species documented in this report, 150 are epiphytes and 46 are
terrestrial orchids while there are three species which have mycotrophic habit (living in
association with mycorrhiza).
Gastrochilus calceolaris and Paphiopedilum fairrieanum are listed under Critically
Endangered Category as per IUCN Redlist while Bulleyia yunnanensis has been listed under
Endangered category. Red Data Book by BSI has listed Paphiopedilum fairrieanum under
Endangered category while Galeola falconeri and Vanda coerulea have been placed in
Indeterminate and Rare categories.
Six orchid species reported from Dibang basin are endemic to Arunachal Paradesh viz.
Calanthe densiflora, Dendrobium cathcartii, Dendrobium hookerianum, Eria ferruginea,
Galeola falconeri and Paphiopedilum fairrieanum.
Rhododendrons
In Dibang basin, 27 species of rhododendrons are reportedly found. Out of these 10 are
trees and rest of them are shrubs. Majority of the species occur at elevations between
2000 and 3000m and majority of them are found in and around Mayudia Pass. Three
species Rhododendron falconeri, Rhododendron megacalyx and Rhododendron pruniflorum
are endemic to Arunachal Pradesh
Bamboos and Canes
In Dibang basin 23 species of bamboos are found of which 6 belong to genera Bambusa &
Dendrocalamus each, 2 each belong to Cephalostachyum and Thamnocalamus.
Canes (Rattans – climbing palms) belong to genus Calamus of family Arecaceae. Out of 20
species of canes found in Arunachal Pradesh, 12 species have been reported from Dibang
basin. Calamus leptospadix is an endemic species
Threatened & Endemic Plant Species
In Dibang basin, all there are 30 plant species that are either under different threat
categories as per IUCN or under Red Data Book categories.
According to conservation status categories of IUCN Redlist four species i.e. Dipterocarpus
gracilis, Gastrochilus calceolaris, Paphiopedilum fairrieanum and Saurauia punduana has
been categorized as Critically Endangered (CE). Eight species reported from the Dibang
Cumulative EIA- Dibang Basin Executive Summary
6
basin are under Endangered (EN) category, five species are under Vulnerable (VU) and
three species are under Near Threatened (NT) category of IUCN ver 3.1.
According to Red Data Book of published by Botanical Survey of India (BSI), out of 33
species reported from Arunachal Praedsh under various categories, twelve species are
reported from Dibang basin. Acer oblongum, Paphiopedilum fairrieanum, Livistona
jenkinsiana has been categoreis under Endangered (EN) category, Coptis teeta and
Diplomeris hirsuta are categories under Vulnerable (VU) category, six species are under
rare category
Endemic Plant Species
Fifty three plant species that are endemic to Arunachal Pradesh have been recorded from
Dibang basin. These belong to 28 families and 42 genera. These species predominantly
attributed to six plant families (i.e., Orchidaceae – 6 species; Gesneriaceae – 5 species,
Balsaminaceae - 4 species; and Ericaceae, Rubiaceae, Begoniaceae and Acanthaceae
represented by 3 species each). Three of these species viz. Acer oblongum, Livistona
jenkinsiana and Paphiopedilum fairrieanum are under Endangered category according to
BSI Red Data Book while Begonia scintillans and Sapria himalayana are under Rare
category. IUCN has placed Coptis teeta and Paphiopedilum fairrieanum under Endangered
and Critically Endangered categories.
Medicinal Plants
This region harbours a wide range of medicinal plants used in Ayurvedic, Homoeopathic
and Unani medicines or used by the local people. An inventory of medicinal plant species
used by local tribal people was prepared from data collected through literature survey
(Rehty et al., 2010; Nimasow et al., 2012) Some of the medicinal plants of Dibang basin
like Acorus calamus, Adiantum capillus-veneris, Ageratum conyzoides, Artemisia
nilagirica, Angiopteris evecta, Bauhinia purpurea, Breonia chinensis, Calamus spp.,
Cannabis sativa, Cinnamomum spp., Curcuma spp., are quite common in the tropical and
sub-tropical parts of Dibang basin. Hedychium spicatum, Coptis teeta, Phyllanthus
amarus, Rhus chinensis, Senna alata, Solanum spp., Tamarindus indica and Zanthoxylum
spp., are some other important medicinal plants of the region used by local populace in
their daily life. These plants are used internally for treating stomachic diarrhea,
dysentery, cough, cold, fever and asthma and externally for rheumatism, skin diseases,
cuts, boils and injuries.
4.1.5 Faunal Elements
Mammals & Birds
A list of 158 mammalian fauna reported from the dibang basin prepared from published
literature and data provided by Zoological Survey of India (ZSI), Department of Environment
and Forests, Government of Arunachal Pradesh i.e. Fauna of Arunachal Pradesh, State Fauna
Series, 13 (2006). Family Muridae is the largest family represented by 25 species while
Vespertilionidae is represented by 19 species, Sciuridae by 13 species and Rhinolophidae,
Mustelidae and Felidae is represented by 9 species each.
Dibang basin too is a good representative of avian diversity harbouring more than 650
species of birds. Three Birding areas have been identified in Dibang basin by IBA Important
Birding Areas
inventory of the birds reportedly found in entire Dibang basin was prepared based upon
IBA‟s checklist and the data provided by Zoological Survey of India (ZSI) i.e. Fauna of
Arunachal Pradesh, State Fauna Series, 13 (2006). According to it 679 species of birds
belonging to 90 families.
Cumulative EIA- Dibang Basin Executive Summary
7
Butterflies
Based upon the data compiled from field surveys and secondary sources, Forest Working
Plans, Management Plans of Protected areas, etc. a list of butterflies was prepared.
According to it total of 373 species of butterflies are found in the basin. These species
belong to seven families – Hesperiidae, Lycaenidae, Hesperidae, Nymphalidae,
Papilionidae, Pieridae, Riodinidae and Satyridae. Nymphalidae was most dominant family
represented by 141 species. Great Mormon, De Nicéville's Windmill, Eastern Courtier,
Broad-banded Sailer, Pale Hockeystick Sailer, Pale Hockeystick Sailer, Scarce White
Commodore, Bamboo Treebrown, Autumn Leaf, Common Duffer, Khaki Silverline and
Common Pierrot are categorised as Schedule I species (WPA, 1972)..
Herpetofauna
Herpetofauna comprise of amphibians that include frogs, toads, newts, salamanders, etc.
and reptiles which include snakes, lizards, turtles, terrapins, tortoises, etc. An inventory
of herpetofauna comprising reptiles and amphibians was prepared from the Forest Working
Plans, management plans of Protected Area and Fauna of Arunachal Pradesh Vol. I. Total
23 species are reported from the Dibang basin of which 17 species are of reptiles and6
species are of amphibians.
Reptiles
Reptilian fauna is comprised of 17 species belonging to 12 families. Colubridae is the
largest family represented by six species followed by Agamidae and Elapidae with 3
species each. IUCN Red List has kept Burmese Python (Python molurus bivittatus), King
Cobra (Ophiophagus hannah) under Vulnerable category. Five species are under least
concern category and rest of the species is not evaluated under IUCN Red List
Amphibia
In Dibang basin 6 species of Amphibians are reportedly found which belong to 3 families,
which comprises of toads and frogs. Ranidae is the largest family with 3 species followed by
Bufonidae with 2 species. All species of frog falls in IUCN Red List Least Concern category.
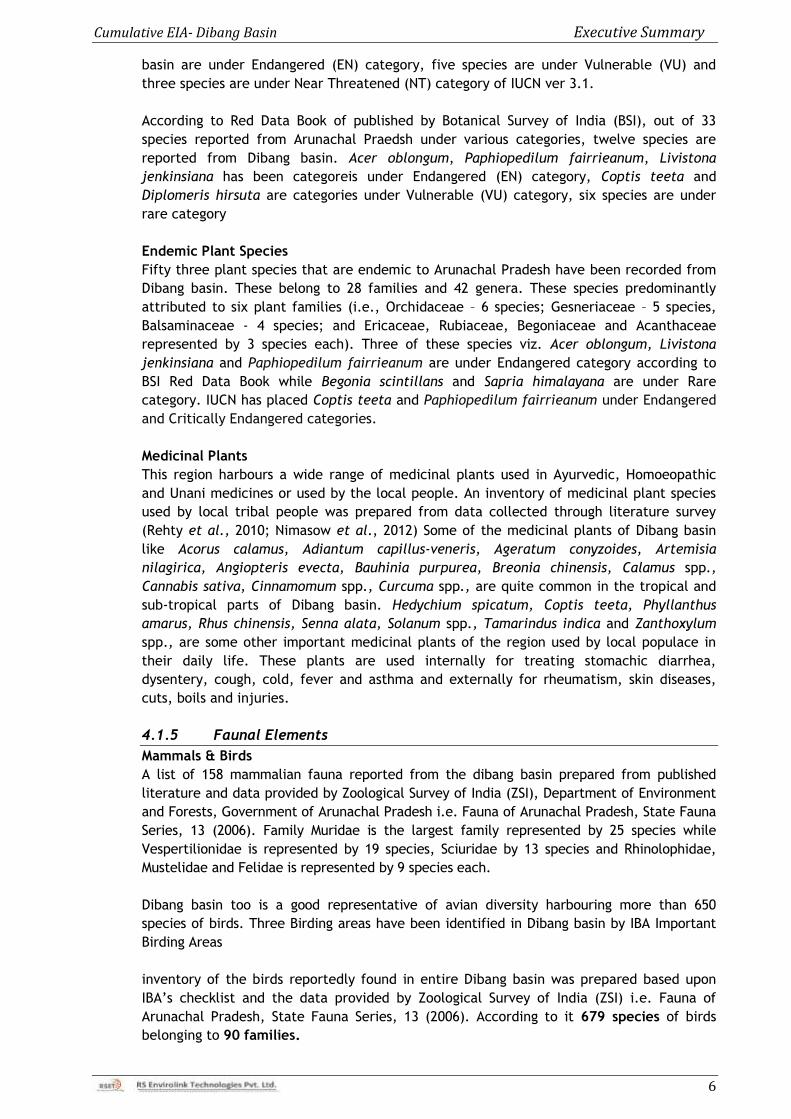
4.1.6 Protected Areas
There are two Sanctuaries i.e. Dibang Wildlife Sanctuary and Mehao WLS in Dibang Basin. In
addition Dibang Dihang Biosphere Reserve covers parts of Dibang Valley district.
Protected Area Area (Sq km)
Dibang Wildlife Sanctuary 4149.00
Mehao Wildlife Sanctuary 281.50
Dibang Dihang Biosphere Reserve
5112.50
Core Area = 4094.80;
Buffer Area = 1016.70
4.2 Aquatic Ecology
4.2.1 Physico-Chemical Water Quality
In order to assess the overall water quality of Dibang river and its tributary streams a
Water Quality Index was used which has been developed at Washington State Department
of Ecology, Environmental assessment Programme. The water quality of various streams of
Dibang basin during sampling is good to excellent in general as WQI remained above 87.
4.2.2 Biological Water Quality
Phytoplankton
In all total, 86 species of phytoplankton were identified in the samples collected from
various sampling locations in the study area. The phytoplankton community comprised of
Cumulative EIA- Dibang Basin Executive Summary
8
47 species of Bacillariophyceae, 24 species of Cyanophyceae, 8 species of Chlorophyceae
and 4 species of Conjugatophyceae, 2 species of Ulvophyceae and one species of
Euglenophyceae. Most common species are Achnanthes crenulata, Achnanthes exigua var.
exigua, Achnanthidium biasolettianum var. biasolettiana, Cocconeis placentula var.
lineata, Ceratoneis arcus var. recta, Encyonema silisiacum, Gomphonema olivaceum,
Navicula cryptotenella, Navicula radiosaffalax, Surirella angusta, Gloeocapsa punctata,
Anabaena aequalis, Rivularia angulosa, Cladophora sp. and Nitzschia linearis.
Phytobenthos
In all total 70 species of Phytobenthos were identified from all the locations during surveys
comprised of 5 classes with Bacillariophyceae as dominant class in the study area having 45
species, followed by Cyanophyceae with 15 species. Other classes recorded from the area
are Chlorophyceae, Coleochaetophyceae and Conjugatophyceae. The genus Cymbella was
the most dominant genus represented by 6 species followed by Navicula with 5 species.
Achnanthes crenulata are most common and abundant species as they were recorded from
19 sampling sites during all samplings. Other common species recorded from the all
sampling sites area Oscillatoria sp., Cymbella excisa var. angusta, Achnanthidium
biasolettianum, Didymosphenia geminate, Scytonema sp., Gloeocapsa sp., Pediastrum sp.,
Navicula radiosaffalax, Navicula radiosaffalax, Planothidium lanceolata var. elliptica,
Achnanthidium subhudsonis and Achnanthidium biasolettiana var. biasolettiana.
Zooplankton
Zooplankton were represented by protozoa, rotifer and crustacean (copepods and
cladoceran). Among protozoans Actinophrys and Arcella genera were observed at most of
the sites in Dibang Basin, The Rotifers are represented by species of Keratella, Brachionus,
Epiphanes, Philodina, and Asplanchna. Among Crustaceans Daphnia and Bosmina species of
order Cladocera were found, whereas Copepods were represented by Cyclopes sp. (water
fleas) only.
Macro-invertebrates
Macro-invertebrates are widely used to determine biological conditions and acts as an in-
line monitoring system for pollution. They are important part of food chain especially for
fish. During the study, macro–invertebrate fauna comprised of 25 species falling under 5
orders belonging to 24 families. Ephemeropterawas the dominant order representing six
families and 11 genera followed by order Diptera with 4 families and 5 genra. Psephenus
herricki was the most abundant species and was recorded from 12 sampling sites during
the surveys followed by Hydropsyche sp., Heptagenia sp., Acroneuria sp., Caenis sp. and
Centroptilum sp.
Biological Water Quality
The water quality assessment of Dibang river and its tributories were assessed by
calculating BMWP and ASPT values which are an indicative of river water qualiy. BMWP
score calculated varied from 44 to 81 when the river flow is very high. Therefore water
quality of Dibang river and its tributaries is good to excellent throughout the basin
Fish and Fisheries
In order to understand the fishery resources of Dibang basin information was collected
from State Fishery Department, Itanagar which was supplemented with published. Nath &
Dey, 2000 had reported 45 species of fishes from Dibang river system. During the field
survey experimental fishing was done. According to it Dibang basin harbours 74 species of
fishes belonging to 8 Orders and 26 families. Cyprinidae is largest family with 36 species
accounting for nearly 50% of total fish fauna while Cobitidae and Sisoridae are the next
largest families with 5 and 4 species each and families like Balitoridae and Ambassidae are
represented by 3 species each.
Cumulative EIA- Dibang Basin Executive Summary
9
Seven species are under Endangered category according to CAMP report (1998) of which 3
are under globally Endangered category while 4 species are categorized as nationally
„Endangered‟ species. Five species are placed under global „Vulnerable‟ while 8 species
are under „Vulnerable‟ category nationally. Schizothorax richardsonii (Snow trout) has
been placed under „Vulnerable‟ category an important species of cold waters where it is
the predominant species of trouts. However key species of warmer waters are Mahseers
(Tor tor and Tor putotora). The category of „Near Threatened‟ only one species is listed.
According of list of threatened freshwater fish species prepared by National Bureau of Fish
Genetic Resources (NBFGR, 2010), 5 species have been categorized as Endangered while 12
species are placed in Vulnerable category. According to IUCN criterion Tor putitora while 4
species are under Vulnerable category. Golden mahseer has been declared as Arunachal
Pradesh State fish (Anon, 2011).
5.0 ENVIRONMENTAL FLOWS
The environmental flow is an important aspect in the development of hydropower
projects. Release of environmental flow is to be ensured immediately downstream of the
diversion structure at all times to sustain the ecology and environment of project area.
For assessment of environmental flow focus is on the characteristic features of the natural
flow regime of the river. The most important of these are degree of perenniality;
magnitude of base flows in the dry and wet season; magnitude, timing and duration of
floods in the wet season; and small pulses of higher flow, that occur between dry and wet
months. Attention is then given to which flow features are considered most important for
maintaining or achieving the desired future condition of the river, and thus should not be
eradicated during development of the river‟s water resources.
Fish assemblages often include a range of species and reflect the integrated effects of
environmental changes. Their presence is used to infer the presence of other aquatic
organisms, since the adult fish occupy the top of the food chain in most aquatic systems.
Fish species in river can guide to prepare specification of the flows necessary to meet their
needs, and be useful in the monitoring and management of those flows. It is often
surmised that if management of flows for fish maintenance is successful, then flow
requirements for aquatic invertebrates will also be satisfied. This is because of the larger
scale of fish habitat.
Therefore, the approach adopted for environmental flow assessment is based on meeting the
needs of dominant fish species with larger habitat requirement. Entire Dibang basin has been
divided in two predominant fish zones viz. Mahseer Zone and Trout Zone. Mahseer being a
large fish requires more flow in all the seasons and this aspect has been kept in mind while
recommending environment flow for projects in Mahseer zone. Mahseer zone covers the
main Dibang river below confluence of Dri and Talo (Tangon) rivers Projects fall in Mahseer
zone are Dibang, Ashupani, Ithun – I, Ithun – II, Ithipani, Elango, Emra – I & Emra – II HEPs.
Rest of the basin where remaining HEPs are located falls in trout zone.
A minimum depth requirement of 40 cm and 50 cm is considered for trout and mahseer
zones respectively to assess the environmental flow requirement in lean season. Higher
depth is considered for intermediate period and monsoon period to ensure mimicking of
natural discharge pattern. For intermediate period in Mahseer zone, a depth range of 60-
75 cm is considered and for monsoon season a depth range of 85-100 cm is considered.
Similarly, for intermediate period in trout zone, a depth range of 55-65 cm is considered
and for monsoon season in trout zone, a depth range of 70-80 cm is considered as
minimum requirement.
Cumulative EIA- Dibang Basin Executive Summary
10
As the depth is calculated at the deepest point and cannot be the only criteria for the
habitat requirement; a second level assessment is done to check the reduction in river top
width. If the reduction in top width is more than 50%, then next higher percentage is
recommended to ensure that reduction in top width is not reduced more than half the
original width under natural discharge condition in different seasons/period.
The most critical reach for assessing release of environmental flow is immediately
downstream of diversion structure till first significant tributary meets river. To assess
environmental flow requirements, a flow simulation study has been carried out using one
dimensional mathematical model MIKE 11 developed by Danish Hydraulic Institute, Denmark.
There are 18 hydro projects being planned in the Dibang river basin on different
tributaries. Two projects are less than 25 MW i.e. they do not fall under the purview of EIA
notification; therefore they are not covered for the modeling exercise.
None of the projects have started construction; only some of the projects are at various
stages of survey and investigation and remaining projects have yet to start the survey and
investigation work as well and therefore data availability of such projects is very limited.
Out of 16 projects, which are of installed capacity greater than or equal to 25 MW; 4
projects viz. Agoline, Etabue, Elango and Malinye HEPs have not yet been allotted to
anyone. Reliable discharge data and river cross sections are not available for these
projects, therefore, they have been excluded from modeling exercise. For one more
projects, Ashupani HEP (30 MW), discharge data/river cross sections are not available,
therefore it could not be included in the modeling exercise. Hence 11 projects have been
chosen for simulation modeling based on data availability and to ensure that major
tributaries and main Dibang river are covered in this modeling exercise. As Etalin project
has diversion structure on Dri River as well as Talo (Tangon) River, for the purpose of
Environmental flow assessment these two have been studied separately.
Out of the full year flow series (90% DY), three average values have been calculated
viz.four leanest months, four monsoon months and remaining four months (pre and post
monsoon).
Flow simulations have been carried out for 10%, 15%, 20%, 25%, 30%, 40%, 50% and 100%
releases of the average discharge for each of above three scenarios. Various key
parameters for establishing habitat requirement have been calculated which include water
depth, flow velocity and top width of waterway.
Keeping in view the EAC/MoEF&CC‟s requirement of minimum release in lean season as
20% of average discharge in four leanest months in 90% dependable year of discharge
series, the same has been considered as the minimum for lean season. Even if the
modeling results show that the lesser value can meet the habitat requirement in any
period/season, 20% of the average discharge in four leanest months has been kept as the
minimum value.
For projects such as Dibang Valley and Sissiri HEPs which have dam toe powerhouses and
intermediate river stretch is very small, continuous running of at least one turbine has
been found a better way to ensure that river does not run dry and environmental flow
requirements are adequately met with.
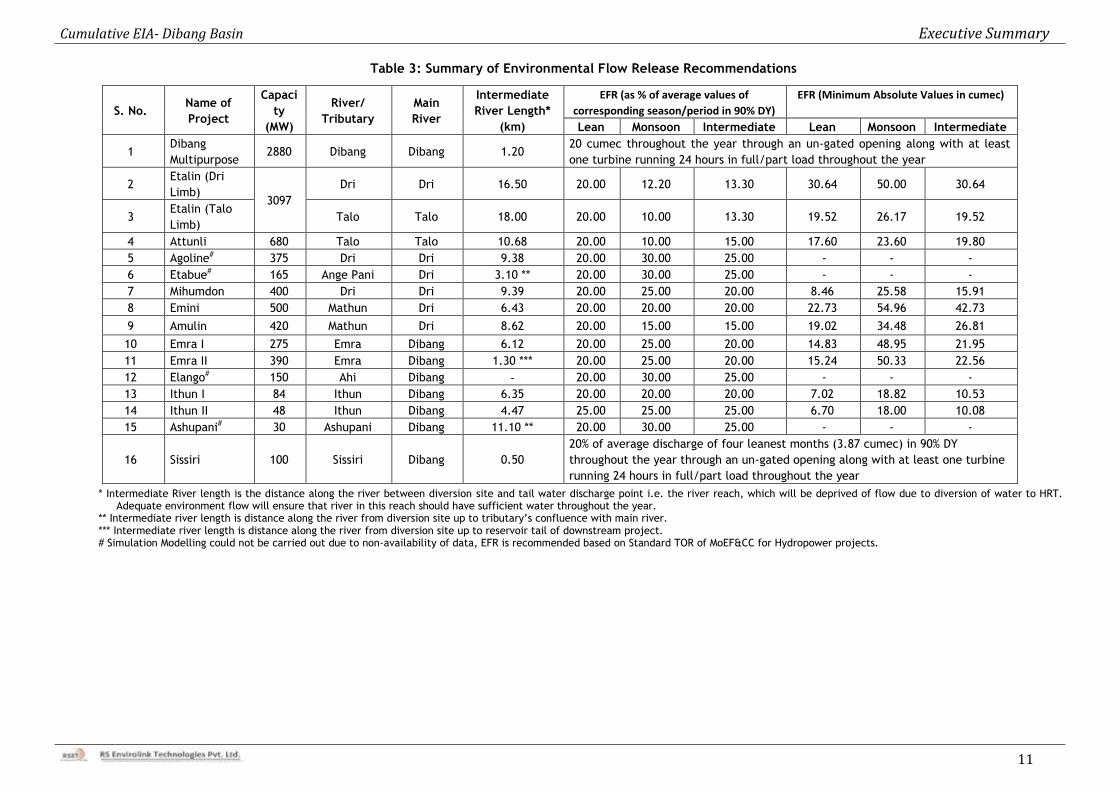
Based on the above criteria, environmental flow requirements have been established for
each project separately and final recommendations are given in Table 3 as below:
Cumulative EIA- Dibang Basin Executive Summary
11
Table 3: Summary of Environmental Flow Release Recommendations
S. No. Name of
Project
Capaci
ty
(MW)
River/
Tributary
Main
River
Intermediate
River Length*
(km)
EFR (as % of average values of
corresponding season/period in 90% DY)
EFR (Minimum Absolute Values in cumec)
Lean Monsoon Intermediate Lean Monsoon Intermediate
1 Dibang
Multipurpose 2880 Dibang Dibang 1.20
20 cumec throughout the year through an un-gated opening along with at least
one turbine running 24 hours in full/part load throughout the year
2 Etalin (Dri
Limb) 3097
Dri Dri 16.50 20.00 12.20 13.30 30.64 50.00 30.64
3 Etalin (Talo
Limb) Talo Talo 18.00 20.00 10.00 13.30 19.52 26.17 19.52
4 Attunli 680 Talo Talo 10.68 20.00 10.00 15.00 17.60 23.60 19.80
5 Agoline# 375 Dri Dri 9.38 20.00 30.00 25.00 - - -
6 Etabue# 165 Ange Pani Dri 3.10 ** 20.00 30.00 25.00 - - -
7 Mihumdon 400 Dri Dri 9.39 20.00 25.00 20.00 8.46 25.58 15.91
8 Emini 500 Mathun Dri 6.43 20.00 20.00 20.00 22.73 54.96 42.73
9 Amulin 420 Mathun Dri 8.62 20.00 15.00 15.00 19.02 34.48 26.81
10 Emra I 275 Emra Dibang 6.12 20.00 25.00 20.00 14.83 48.95 21.95
11 Emra II 390 Emra Dibang 1.30 *** 20.00 25.00 20.00 15.24 50.33 22.56
12 Elango# 150 Ahi Dibang - 20.00 30.00 25.00 - - -
13 Ithun I 84 Ithun Dibang 6.35 20.00 20.00 20.00 7.02 18.82 10.53
14 Ithun II 48 Ithun Dibang 4.47 25.00 25.00 25.00 6.70 18.00 10.08
15 Ashupani# 30 Ashupani Dibang 11.10 ** 20.00 30.00 25.00 - - -
16 Sissiri 100 Sissiri Dibang 0.50
20% of average discharge of four leanest months (3.87 cumec) in 90% DY
throughout the year through an un-gated opening along with at least one turbine
running 24 hours in full/part load throughout the year
* Intermediate River length is the distance along the river between diversion site and tail water discharge point i.e. the river reach, which will be deprived of flow due to diversion of water to HRT. Adequate environment flow will ensure that river in this reach should have sufficient water throughout the year.
** Intermediate river length is distance along the river from diversion site up to tributary‟s confluence with main river. *** Intermediate river length is distance along the river from diversion site up to reservoir tail of downstream project. # Simulation Modelling could not be carried out due to non-availability of data, EFR is recommended based on Standard TOR of MoEF&CC for Hydropower projects.
Cumulative EIA- Dibang Basin Executive Summary
12
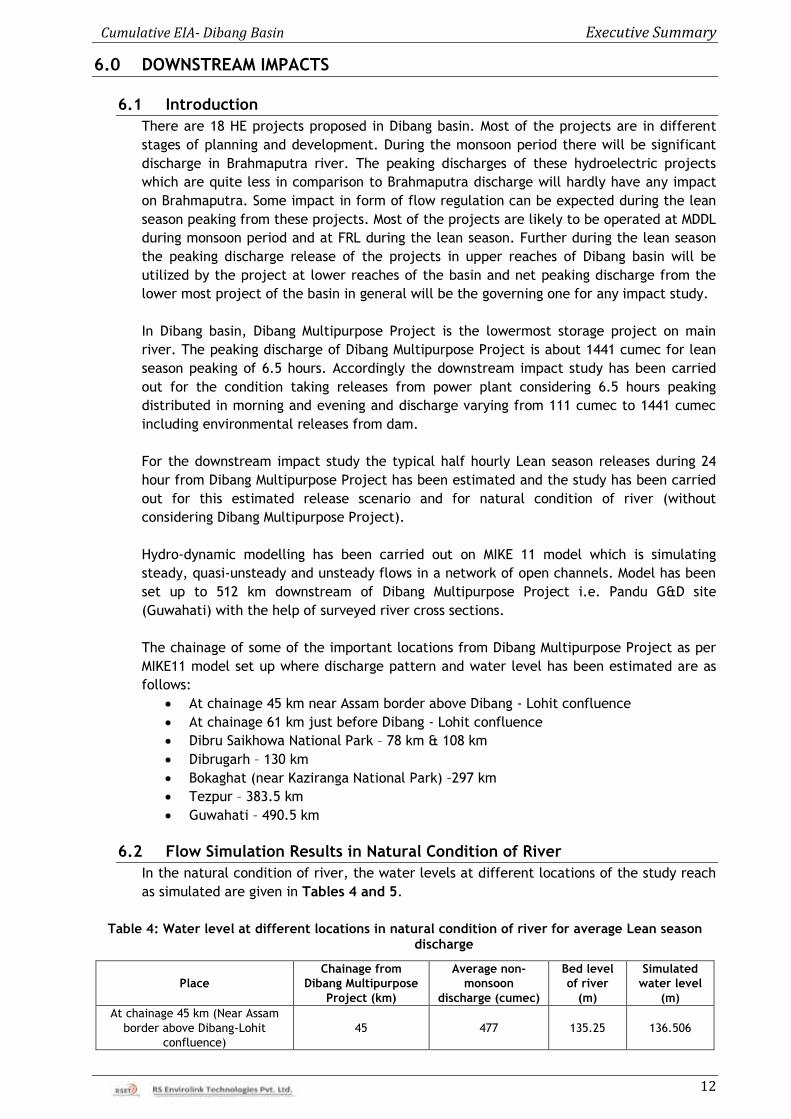
6.0 DOWNSTREAM IMPACTS
6.1 Introduction
There are 18 HE projects proposed in Dibang basin. Most of the projects are in different
stages of planning and development. During the monsoon period there will be significant
discharge in Brahmaputra river. The peaking discharges of these hydroelectric projects
which are quite less in comparison to Brahmaputra discharge will hardly have any impact
on Brahmaputra. Some impact in form of flow regulation can be expected during the lean
season peaking from these projects. Most of the projects are likely to be operated at MDDL
during monsoon period and at FRL during the lean season. Further during the lean season
the peaking discharge release of the projects in upper reaches of Dibang basin will be
utilized by the project at lower reaches of the basin and net peaking discharge from the
lower most project of the basin in general will be the governing one for any impact study.
In Dibang basin, Dibang Multipurpose Project is the lowermost storage project on main
river. The peaking discharge of Dibang Multipurpose Project is about 1441 cumec for lean
season peaking of 6.5 hours. Accordingly the downstream impact study has been carried
out for the condition taking releases from power plant considering 6.5 hours peaking
distributed in morning and evening and discharge varying from 111 cumec to 1441 cumec
including environmental releases from dam.
For the downstream impact study the typical half hourly Lean season releases during 24
hour from Dibang Multipurpose Project has been estimated and the study has been carried
out for this estimated release scenario and for natural condition of river (without
considering Dibang Multipurpose Project).
Hydro-dynamic modelling has been carried out on MIKE 11 model which is simulating
steady, quasi-unsteady and unsteady flows in a network of open channels. Model has been
set up to 512 km downstream of Dibang Multipurpose Project i.e. Pandu G&D site
(Guwahati) with the help of surveyed river cross sections.
The chainage of some of the important locations from Dibang Multipurpose Project as per
MIKE11 model set up where discharge pattern and water level has been estimated are as
follows:
At chainage 45 km near Assam border above Dibang - Lohit confluence
At chainage 61 km just before Dibang - Lohit confluence
Dibru Saikhowa National Park – 78 km & 108 km
Dibrugarh – 130 km
Bokaghat (near Kaziranga National Park) –297 km
Tezpur – 383.5 km
Guwahati – 490.5 km
6.2 Flow Simulation Results in Natural Condition of River
In the natural condition of river, the water levels at different locations of the study reach
as simulated are given in Tables 4 and 5.
Table 4: Water level at different locations in natural condition of river for average Lean season
discharge
Place
Chainage from
Dibang Multipurpose
Project (km)
Average non-
monsoon
discharge (cumec)
Bed level
of river
(m)
Simulated
water level
(m)
At chainage 45 km (Near Assam
border above Dibang-Lohit
confluence)
45 477 135.25 136.506
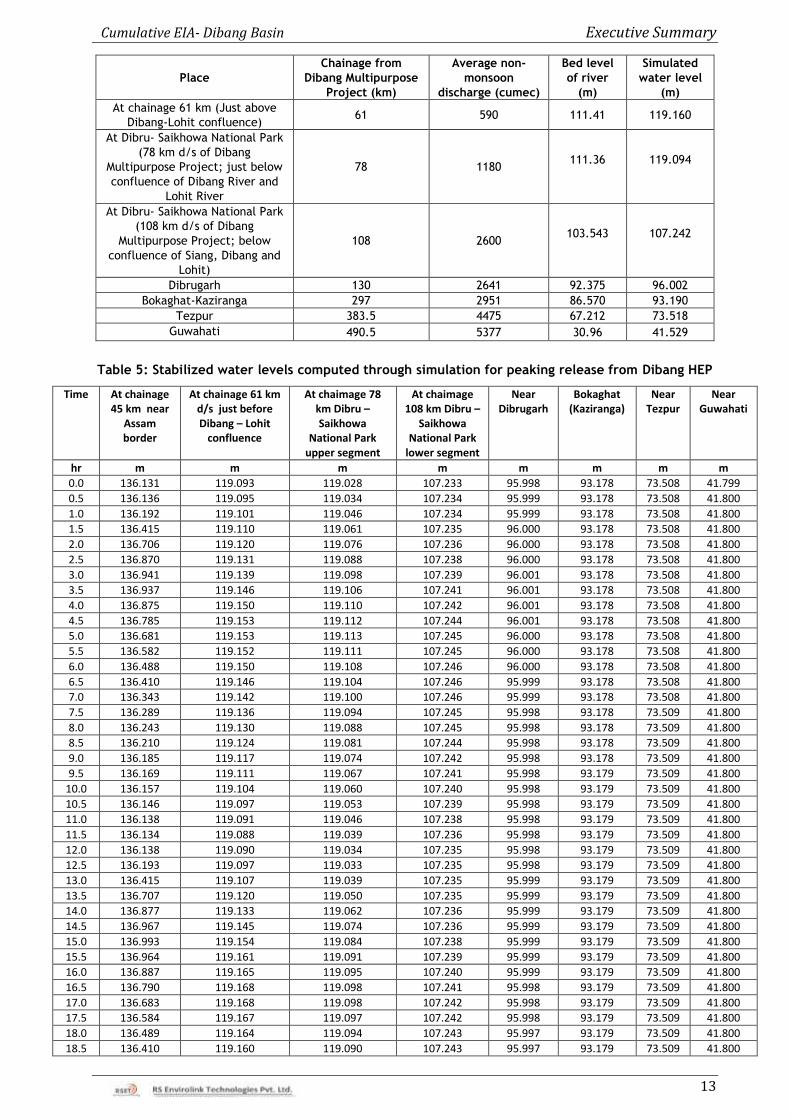
Cumulative EIA- Dibang Basin Executive Summary
13
Place
Chainage from
Dibang Multipurpose
Project (km)
Average non-
monsoon
discharge (cumec)
Bed level
of river
(m)
Simulated
water level
(m)
At chainage 61 km (Just above
Dibang-Lohit confluence) 61 590 111.41 119.160
At Dibru- Saikhowa National Park
(78 km d/s of Dibang
Multipurpose Project; just below
confluence of Dibang River and
Lohit River
78 1180 111.36
119.094
At Dibru- Saikhowa National Park
(108 km d/s of Dibang
Multipurpose Project; below
confluence of Siang, Dibang and
Lohit)
108 2600 103.543
107.242
Dibrugarh 130 2641 92.375 96.002
Bokaghat-Kaziranga 297 2951 86.570 93.190
Tezpur 383.5 4475 67.212 73.518
Guwahati 490.5 5377 30.96 41.529
Table 5: Stabilized water levels computed through simulation for peaking release from Dibang HEP
Time At chainage 45 km near
Assam border
At chainage 61 km d/s just before Dibang – Lohit
confluence
At chaimage 78 km Dibru – Saikhowa
National Park upper segment
At chaimage 108 km Dibru –
Saikhowa National Park
lower segment
Near Dibrugarh
Bokaghat (Kaziranga)
Near Tezpur
Near Guwahati
hr m m m m m m m m
0.0 136.131 119.093 119.028 107.233 95.998 93.178 73.508 41.799
0.5 136.136 119.095 119.034 107.234 95.999 93.178 73.508 41.800
1.0 136.192 119.101 119.046 107.234 95.999 93.178 73.508 41.800
1.5 136.415 119.110 119.061 107.235 96.000 93.178 73.508 41.800
2.0 136.706 119.120 119.076 107.236 96.000 93.178 73.508 41.800
2.5 136.870 119.131 119.088 107.238 96.000 93.178 73.508 41.800
3.0 136.941 119.139 119.098 107.239 96.001 93.178 73.508 41.800
3.5 136.937 119.146 119.106 107.241 96.001 93.178 73.508 41.800
4.0 136.875 119.150 119.110 107.242 96.001 93.178 73.508 41.800
4.5 136.785 119.153 119.112 107.244 96.001 93.178 73.508 41.800
5.0 136.681 119.153 119.113 107.245 96.000 93.178 73.508 41.800
5.5 136.582 119.152 119.111 107.245 96.000 93.178 73.508 41.800
6.0 136.488 119.150 119.108 107.246 96.000 93.178 73.508 41.800
6.5 136.410 119.146 119.104 107.246 95.999 93.178 73.508 41.800
7.0 136.343 119.142 119.100 107.246 95.999 93.178 73.508 41.800
7.5 136.289 119.136 119.094 107.245 95.998 93.178 73.509 41.800
8.0 136.243 119.130 119.088 107.245 95.998 93.178 73.509 41.800
8.5 136.210 119.124 119.081 107.244 95.998 93.178 73.509 41.800
9.0 136.185 119.117 119.074 107.242 95.998 93.178 73.509 41.800
9.5 136.169 119.111 119.067 107.241 95.998 93.179 73.509 41.800
10.0 136.157 119.104 119.060 107.240 95.998 93.179 73.509 41.800
10.5 136.146 119.097 119.053 107.239 95.998 93.179 73.509 41.800
11.0 136.138 119.091 119.046 107.238 95.998 93.179 73.509 41.800
11.5 136.134 119.088 119.039 107.236 95.998 93.179 73.509 41.800
12.0 136.138 119.090 119.034 107.235 95.998 93.179 73.509 41.800
12.5 136.193 119.097 119.033 107.235 95.998 93.179 73.509 41.800
13.0 136.415 119.107 119.039 107.235 95.999 93.179 73.509 41.800
13.5 136.707 119.120 119.050 107.235 95.999 93.179 73.509 41.800
14.0 136.877 119.133 119.062 107.236 95.999 93.179 73.509 41.800
14.5 136.967 119.145 119.074 107.236 95.999 93.179 73.509 41.800
15.0 136.993 119.154 119.084 107.238 95.999 93.179 73.509 41.800
15.5 136.964 119.161 119.091 107.239 95.999 93.179 73.509 41.800
16.0 136.887 119.165 119.095 107.240 95.999 93.179 73.509 41.800
16.5 136.790 119.168 119.098 107.241 95.998 93.179 73.509 41.800
17.0 136.683 119.168 119.098 107.242 95.998 93.179 73.509 41.800
17.5 136.584 119.167 119.097 107.242 95.998 93.179 73.509 41.800
18.0 136.489 119.164 119.094 107.243 95.997 93.179 73.509 41.800
18.5 136.410 119.160 119.090 107.243 95.997 93.179 73.509 41.800
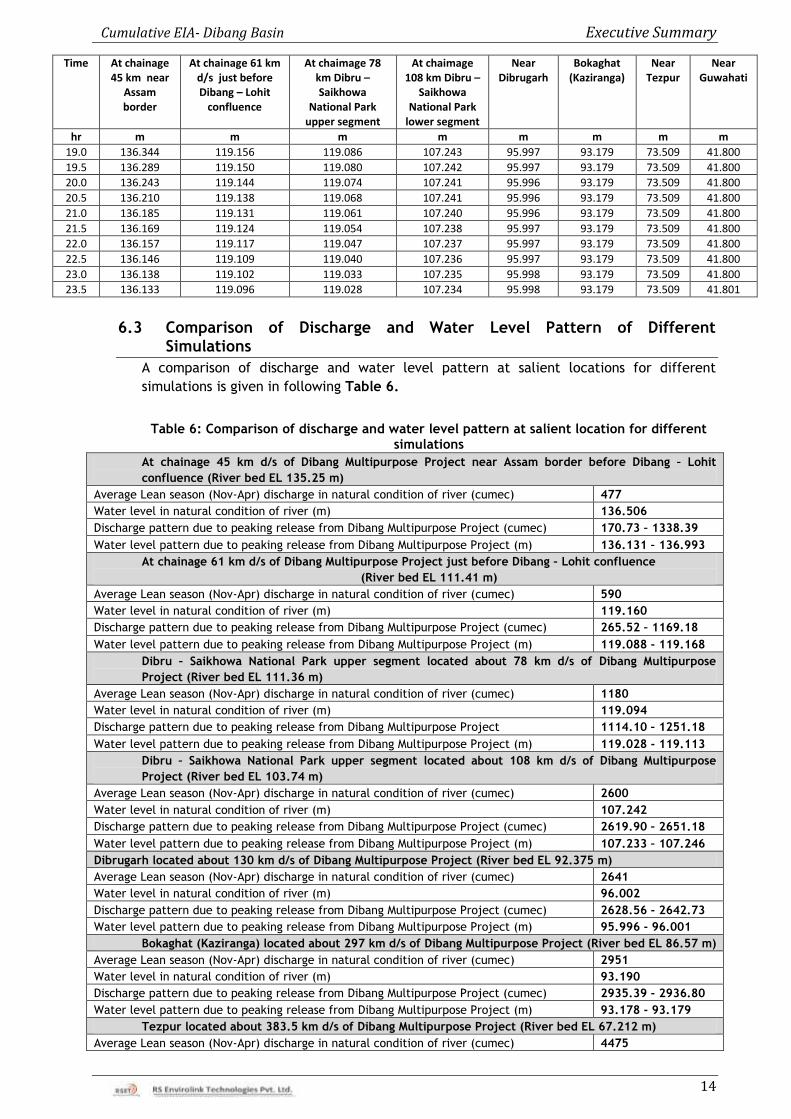
Cumulative EIA- Dibang Basin Executive Summary
14
Time At chainage 45 km near
Assam border
At chainage 61 km d/s just before Dibang – Lohit
confluence
At chaimage 78 km Dibru – Saikhowa
National Park upper segment
At chaimage 108 km Dibru –
Saikhowa National Park
lower segment
Near Dibrugarh
Bokaghat (Kaziranga)
Near Tezpur
Near Guwahati
hr m m m m m m m m
19.0 136.344 119.156 119.086 107.243 95.997 93.179 73.509 41.800
19.5 136.289 119.150 119.080 107.242 95.997 93.179 73.509 41.800
20.0 136.243 119.144 119.074 107.241 95.996 93.179 73.509 41.800
20.5 136.210 119.138 119.068 107.241 95.996 93.179 73.509 41.800
21.0 136.185 119.131 119.061 107.240 95.996 93.179 73.509 41.800
21.5 136.169 119.124 119.054 107.238 95.997 93.179 73.509 41.800
22.0 136.157 119.117 119.047 107.237 95.997 93.179 73.509 41.800
22.5 136.146 119.109 119.040 107.236 95.997 93.179 73.509 41.800
23.0 136.138 119.102 119.033 107.235 95.998 93.179 73.509 41.800
23.5 136.133 119.096 119.028 107.234 95.998 93.179 73.509 41.801
6.3 Comparison of Discharge and Water Level Pattern of Different Simulations
A comparison of discharge and water level pattern at salient locations for different
simulations is given in following Table 6.
Table 6: Comparison of discharge and water level pattern at salient location for different simulations
At chainage 45 km d/s of Dibang Multipurpose Project near Assam border before Dibang – Lohit
confluence (River bed EL 135.25 m)
Average Lean season (Nov-Apr) discharge in natural condition of river (cumec) 477
Water level in natural condition of river (m) 136.506
Discharge pattern due to peaking release from Dibang Multipurpose Project (cumec) 170.73 – 1338.39
Water level pattern due to peaking release from Dibang Multipurpose Project (m) 136.131 – 136.993
At chainage 61 km d/s of Dibang Multipurpose Project just before Dibang – Lohit confluence
(River bed EL 111.41 m)
Average Lean season (Nov-Apr) discharge in natural condition of river (cumec) 590
Water level in natural condition of river (m) 119.160
Discharge pattern due to peaking release from Dibang Multipurpose Project (cumec) 265.52 – 1169.18
Water level pattern due to peaking release from Dibang Multipurpose Project (m) 119.088 - 119.168
Dibru – Saikhowa National Park upper segment located about 78 km d/s of Dibang Multipurpose
Project (River bed EL 111.36 m)
Average Lean season (Nov-Apr) discharge in natural condition of river (cumec) 1180
Water level in natural condition of river (m) 119.094
Discharge pattern due to peaking release from Dibang Multipurpose Project 1114.10 – 1251.18
Water level pattern due to peaking release from Dibang Multipurpose Project (m) 119.028 - 119.113
Dibru – Saikhowa National Park upper segment located about 108 km d/s of Dibang Multipurpose
Project (River bed EL 103.74 m)
Average Lean season (Nov-Apr) discharge in natural condition of river (cumec) 2600
Water level in natural condition of river (m) 107.242
Discharge pattern due to peaking release from Dibang Multipurpose Project (cumec) 2619.90 – 2651.18
Water level pattern due to peaking release from Dibang Multipurpose Project (m) 107.233 – 107.246
Dibrugarh located about 130 km d/s of Dibang Multipurpose Project (River bed EL 92.375 m)
Average Lean season (Nov-Apr) discharge in natural condition of river (cumec) 2641
Water level in natural condition of river (m) 96.002
Discharge pattern due to peaking release from Dibang Multipurpose Project (cumec) 2628.56 - 2642.73
Water level pattern due to peaking release from Dibang Multipurpose Project (m) 95.996 - 96.001
Bokaghat (Kaziranga) located about 297 km d/s of Dibang Multipurpose Project (River bed EL 86.57 m)
Average Lean season (Nov-Apr) discharge in natural condition of river (cumec) 2951
Water level in natural condition of river (m) 93.190
Discharge pattern due to peaking release from Dibang Multipurpose Project (cumec) 2935.39 - 2936.80
Water level pattern due to peaking release from Dibang Multipurpose Project (m) 93.178 - 93.179
Tezpur located about 383.5 km d/s of Dibang Multipurpose Project (River bed EL 67.212 m)
Average Lean season (Nov-Apr) discharge in natural condition of river (cumec) 4475
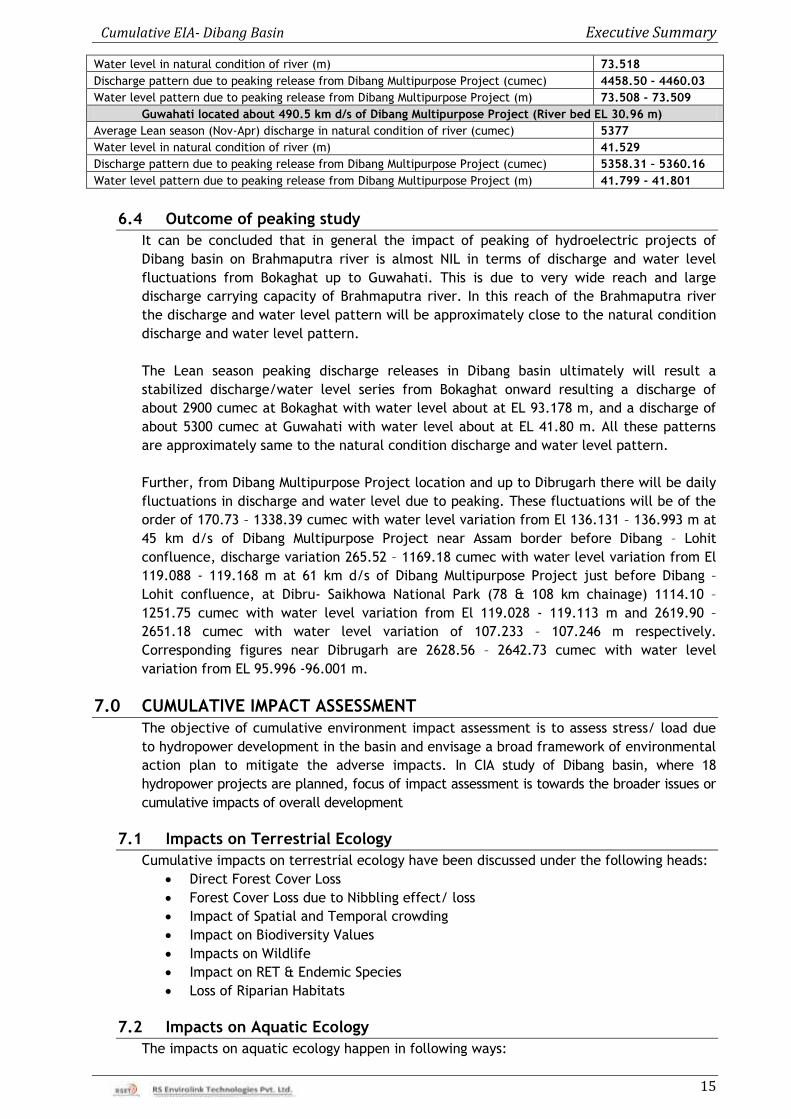
Cumulative EIA- Dibang Basin Executive Summary
15
Water level in natural condition of river (m) 73.518
Discharge pattern due to peaking release from Dibang Multipurpose Project (cumec) 4458.50 - 4460.03
Water level pattern due to peaking release from Dibang Multipurpose Project (m) 73.508 - 73.509
Guwahati located about 490.5 km d/s of Dibang Multipurpose Project (River bed EL 30.96 m)
Average Lean season (Nov-Apr) discharge in natural condition of river (cumec) 5377
Water level in natural condition of river (m) 41.529
Discharge pattern due to peaking release from Dibang Multipurpose Project (cumec) 5358.31 – 5360.16
Water level pattern due to peaking release from Dibang Multipurpose Project (m) 41.799 - 41.801
6.4 Outcome of peaking study
It can be concluded that in general the impact of peaking of hydroelectric projects of
Dibang basin on Brahmaputra river is almost NIL in terms of discharge and water level
fluctuations from Bokaghat up to Guwahati. This is due to very wide reach and large
discharge carrying capacity of Brahmaputra river. In this reach of the Brahmaputra river
the discharge and water level pattern will be approximately close to the natural condition
discharge and water level pattern.
The Lean season peaking discharge releases in Dibang basin ultimately will result a
stabilized discharge/water level series from Bokaghat onward resulting a discharge of
about 2900 cumec at Bokaghat with water level about at EL 93.178 m, and a discharge of
about 5300 cumec at Guwahati with water level about at EL 41.80 m. All these patterns
are approximately same to the natural condition discharge and water level pattern.
Further, from Dibang Multipurpose Project location and up to Dibrugarh there will be daily
fluctuations in discharge and water level due to peaking. These fluctuations will be of the
order of 170.73 – 1338.39 cumec with water level variation from El 136.131 – 136.993 m at
45 km d/s of Dibang Multipurpose Project near Assam border before Dibang – Lohit
confluence, discharge variation 265.52 – 1169.18 cumec with water level variation from El
119.088 - 119.168 m at 61 km d/s of Dibang Multipurpose Project just before Dibang –
Lohit confluence, at Dibru- Saikhowa National Park (78 & 108 km chainage) 1114.10 –
1251.75 cumec with water level variation from El 119.028 - 119.113 m and 2619.90 –
2651.18 cumec with water level variation of 107.233 – 107.246 m respectively.
Corresponding figures near Dibrugarh are 2628.56 – 2642.73 cumec with water level
variation from EL 95.996 -96.001 m.
7.0 CUMULATIVE IMPACT ASSESSMENT
The objective of cumulative environment impact assessment is to assess stress/ load due
to hydropower development in the basin and envisage a broad framework of environmental
action plan to mitigate the adverse impacts. In CIA study of Dibang basin, where 18
hydropower projects are planned, focus of impact assessment is towards the broader issues or
cumulative impacts of overall development
7.1 Impacts on Terrestrial Ecology
Cumulative impacts on terrestrial ecology have been discussed under the following heads:
Direct Forest Cover Loss
Forest Cover Loss due to Nibbling effect/ loss
Impact of Spatial and Temporal crowding
Impact on Biodiversity Values
Impacts on Wildlife
Impact on RET & Endemic Species
Loss of Riparian Habitats
7.2 Impacts on Aquatic Ecology
The impacts on aquatic ecology happen in following ways:
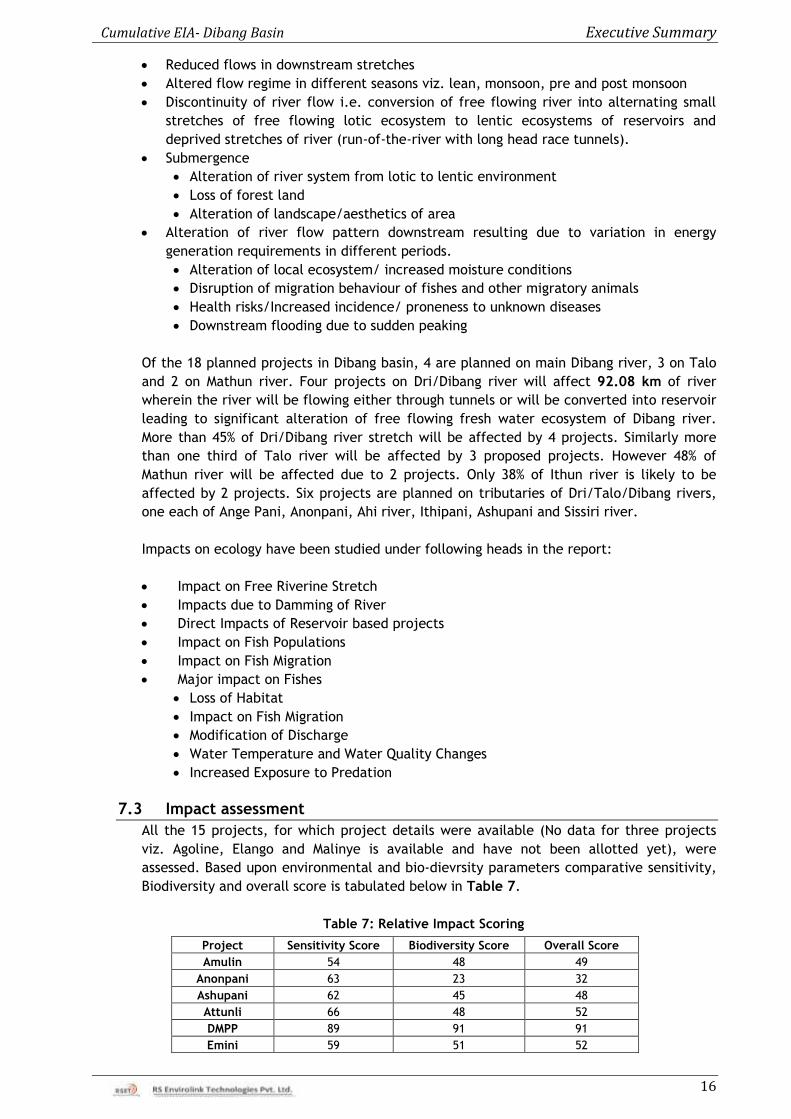
Cumulative EIA- Dibang Basin Executive Summary
16
Reduced flows in downstream stretches
Altered flow regime in different seasons viz. lean, monsoon, pre and post monsoon
Discontinuity of river flow i.e. conversion of free flowing river into alternating small
stretches of free flowing lotic ecosystem to lentic ecosystems of reservoirs and
deprived stretches of river (run-of-the-river with long head race tunnels).
Submergence
Alteration of river system from lotic to lentic environment
Loss of forest land
Alteration of landscape/aesthetics of area
Alteration of river flow pattern downstream resulting due to variation in energy
generation requirements in different periods.
Alteration of local ecosystem/ increased moisture conditions
Disruption of migration behaviour of fishes and other migratory animals
Health risks/Increased incidence/ proneness to unknown diseases
Downstream flooding due to sudden peaking
Of the 18 planned projects in Dibang basin, 4 are planned on main Dibang river, 3 on Talo
and 2 on Mathun river. Four projects on Dri/Dibang river will affect 92.08 km of river
wherein the river will be flowing either through tunnels or will be converted into reservoir
leading to significant alteration of free flowing fresh water ecosystem of Dibang river.
More than 45% of Dri/Dibang river stretch will be affected by 4 projects. Similarly more
than one third of Talo river will be affected by 3 proposed projects. However 48% of
Mathun river will be affected due to 2 projects. Only 38% of Ithun river is likely to be
affected by 2 projects. Six projects are planned on tributaries of Dri/Talo/Dibang rivers,
one each of Ange Pani, Anonpani, Ahi river, Ithipani, Ashupani and Sissiri river.
Impacts on ecology have been studied under following heads in the report:
Impact on Free Riverine Stretch
Impacts due to Damming of River
Direct Impacts of Reservoir based projects
Impact on Fish Populations
Impact on Fish Migration
Major impact on Fishes
Loss of Habitat
Impact on Fish Migration
Modification of Discharge
Water Temperature and Water Quality Changes
Increased Exposure to Predation
7.3 Impact assessment
All the 15 projects, for which project details were available (No data for three projects
viz. Agoline, Elango and Malinye is available and have not been allotted yet), were
assessed. Based upon environmental and bio-dievrsity parameters comparative sensitivity,
Biodiversity and overall score is tabulated below in Table 7.
Table 7: Relative Impact Scoring
Project Sensitivity Score Biodiversity Score Overall Score
Amulin 54 48 49
Anonpani 63 23 32
Ashupani 62 45 48
Attunli 66 48 52
DMPP 89 91 91
Emini 59 51 52
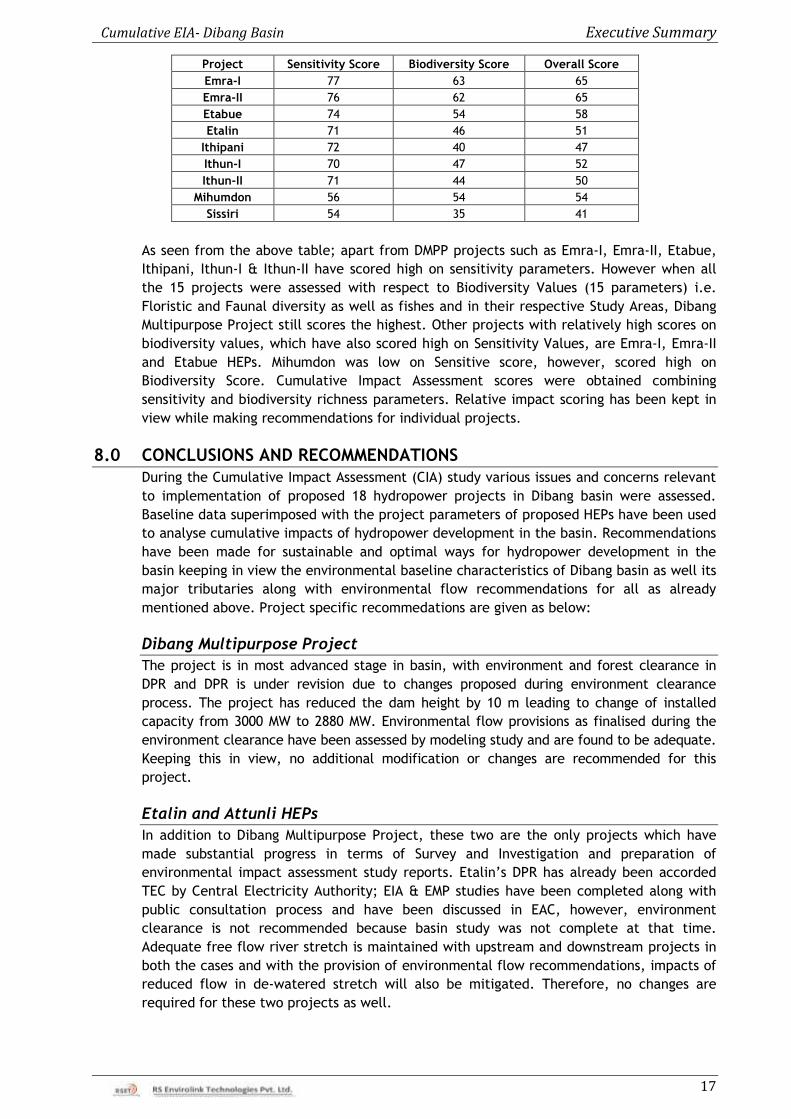
Cumulative EIA- Dibang Basin Executive Summary
17
Project Sensitivity Score Biodiversity Score Overall Score
Emra-I 77 63 65
Emra-II 76 62 65
Etabue 74 54 58
Etalin 71 46 51
Ithipani 72 40 47
Ithun-I 70 47 52
Ithun-II 71 44 50
Mihumdon 56 54 54
Sissiri 54 35 41
As seen from the above table; apart from DMPP projects such as Emra-I, Emra-II, Etabue,
Ithipani, Ithun-I & Ithun-II have scored high on sensitivity parameters. However when all
the 15 projects were assessed with respect to Biodiversity Values (15 parameters) i.e.
Floristic and Faunal diversity as well as fishes and in their respective Study Areas, Dibang
Multipurpose Project still scores the highest. Other projects with relatively high scores on
biodiversity values, which have also scored high on Sensitivity Values, are Emra-I, Emra-II
and Etabue HEPs. Mihumdon was low on Sensitive score, however, scored high on
Biodiversity Score. Cumulative Impact Assessment scores were obtained combining
sensitivity and biodiversity richness parameters. Relative impact scoring has been kept in
view while making recommendations for individual projects.
8.0 CONCLUSIONS AND RECOMMENDATIONS
During the Cumulative Impact Assessment (CIA) study various issues and concerns relevant
to implementation of proposed 18 hydropower projects in Dibang basin were assessed.
Baseline data superimposed with the project parameters of proposed HEPs have been used
to analyse cumulative impacts of hydropower development in the basin. Recommendations
have been made for sustainable and optimal ways for hydropower development in the
basin keeping in view the environmental baseline characteristics of Dibang basin as well its
major tributaries along with environmental flow recommendations for all as already
mentioned above. Project specific recommedations are given as below:
Dibang Multipurpose Project
The project is in most advanced stage in basin, with environment and forest clearance in
DPR and DPR is under revision due to changes proposed during environment clearance
process. The project has reduced the dam height by 10 m leading to change of installed
capacity from 3000 MW to 2880 MW. Environmental flow provisions as finalised during the
environment clearance have been assessed by modeling study and are found to be adequate.
Keeping this in view, no additional modification or changes are recommended for this
project.
Etalin and Attunli HEPs
In addition to Dibang Multipurpose Project, these two are the only projects which have
made substantial progress in terms of Survey and Investigation and preparation of
environmental impact assessment study reports. Etalin‟s DPR has already been accorded
TEC by Central Electricity Authority; EIA & EMP studies have been completed along with
public consultation process and have been discussed in EAC, however, environment
clearance is not recommended because basin study was not complete at that time.
Adequate free flow river stretch is maintained with upstream and downstream projects in
both the cases and with the provision of environmental flow recommendations, impacts of
reduced flow in de-watered stretch will also be mitigated. Therefore, no changes are
required for these two projects as well.
Cumulative EIA- Dibang Basin Executive Summary
18
Emra I and Emra II HEPs
Emra I and Emra II projects have been allotted to M/s Athena Energy by GoAP vide MoA
dated 02/02/2008 with the provision of developing Emra river in two or more
schemes/stages. Survey and investigation have not made any significant progress.
Environment clearance process has yet to start from scoping clearance stage. These two
projects have been considered on the basis of the desktop information provided by the
developer; however, whether more projects in the Emra basin can be sustainably develop,
cannot be assessed based on the limited information. Therefore, it is recommended that
development of Emra basin should remain limited to two schemes in the present form. No
more projects should be considered on Emra River unless a detailed basin study
eshtablishes their sustainability.
Malinye, Elango, Agoline and Etabue HEPs
These four projects have not been allotted yet, and therefore, not much information is
available for a detailed assessment. Malinye HEP falls within Dibang Wildlife Sanctuary and
there is no possibility of shifting the project downstream in order to avoid falling within
the sanctuary and there is no free stretch between Malinye and Attunli HEPs according to
the tail water level of the project provided by the state government matches with the FRL
of Attunli HEP. Therefore based upon the location of Malinye HEP is recommended to be
dropped.
Etabue HEPs diversion site is on Ange Pani and powerhouse is planned on left bank of Dri
river downstream of Mihumdon HEP powerhouse (on right bank) and upstream of Agoline
HEP. Diversion on Ange Pani will reduce the contribution of intermediate catchment
downstream of Mihumdon diversion. As the project features are not yet final, it is
recommended that at least one kilometre of free flow stretch should be maintained
between FRL of Agoline and TWL of Etabue. As Agoline HEP is also not allotted, based on
limited available features, it TWL is approximately giving a 970m free river stretch with
Etalin FRL on Dri river. A minimum of one kilometer free flow stretch is recommended to
be maintained by Agoline from the FRL of Etalin HEP.
Mihumdon, Amulin, Emini, Ithun I and Ithun II HEPs
Mihumdon, Emini and Amulin HEPs are with Reliance Power and Ithun I and Ithun II are
with JVKIL consortium. All these five projects have taken scoping clearance which have
lapsed and have not been applied for revalidation/extension by developers. No significant
progress is made on DPR preparation as well. Projects have been considered and reviewed
based on the PFR information and scoping clearance issued by MoEF&CC. Environmental
flows have been assessed and recommended for individual project and should be
incorporated in DPR during its preparation and finalisation.
Anonpani and Ithipani HEPs
Anonpani and Ithipani are two small projects i.e. less than 25 MW installed capacity and
therefore are not covered under EIA notification. Anonpani is in advance stage and is
making progress whereas Ithipani is only at PFR stage. Projects are found to be sustainable
based on the present project features and environmental baseline setting, therefore, no
specific recommendations have been made.
Ashupani HEP
Ashupani is a 30 MW proposed project on Ashupani river and the features available as of
date are from PFR prepared by NHPC under 50,000 MW initiative. Project was allotted to
Arti Power & Ventures Pvt. Ltd. in 2013 and no progress is made till date. Reservoir tail
appears to be encroaching in the Mehao Wildlife Sanctuary. Detailed project features are
not available to verify this fact. Project is planned as inter-basin transfer where water of
Cumulative EIA- Dibang Basin Executive Summary
19
Ashupani will be diverted to a powerhouse on the bank of Digi Nala. This will make about
11 km of the Ashupani river, downstream of dam up to confluence with Dibang, dry but for
the environmental flow. Catchment area at diversion site is only 67 sq km. It is
recommended that project should be planned keeping it completely outside the boundary
of Mehao Wildlife Sanctuary. Environmental flow provisions are very critical for this
project where out of 28 km of the total Ashupani river length, about 11 km will be left
with environmental flow only. Therefore, the environmental flow recommendations should
be strictly implemented and provisions should be made in the project design in DPR itself.
Sissiri HEP
Sissiri HEP‟s installed capacity has already been reduced to from 222 MW to 100 MW and
revised DPR is under preparation. Scoping clearance obtained in 2009 has lapsed and never
applied again for re-issue/revalidation. Environmental flow provisions have been assessed
and same needs to be incorporated to make project environmentally sustainable. It is
recommended that environment flow provisions are incorporated in the DPR at this stage
as it may require some changes in terms of turbine configuration/features. It is further
recommended that developer should proceed with fresh scoping clearance and
environment study.
Cumulative EIA- Dibang Basin Final Report – Chapter 1
1.1
CHAPTER-1
INTRODUCTION
1.1 BACKGROUND
Central Water Commission (CWC), Government of India had initiated the tendering process for
selection of consultant to undertake Environmental Impact Assessment (EIA) Study for Dibang
river sub basin in Brahmaputra river valley with an objective to assess the cumulative impacts
of hydropower development in the basin. RS Envirolink Technologies Pvt. Ltd., Gurgaon had
been selected to undertake the task on completion of the bidding process. Ministry of
Environment, Forest & Climate Change (MoEF&CC) later took over all the river basin/carrying
capacity studies being conducted by Central/State agencies and therefore, RS Envirolink
Technologies Pvt Ltd, Gurgaon (RSET) was awarded the study by MOEF&CC.
Expert Appraisal Committee (EAC) for River Valley and Hydroelectric Projects of MoEF&CC has
provided the Terms of Reference (TOR) for the study. The study initiated during May 2015
involved extensive field data collection especially in monsoon season to establish baseline
status, data analysis and cumulative impact assessment, followed by recommendations for long
term sustainable hydropower development in the basin.
As per MoEF&CC’s OM dated 28 May, 2013, Cumulative Impact Assessment Studies and carrying
capacity studies are linked to Environment Clearance and Forest Clearance process and are
pre-requisite for considering EC/FC cases for individual projects of any river basin. Therefore,
it was felt important that CIA/Carrying capacity studies should be completed as early as
possible without compromising the quality of the study. The matter was deliberated in 86th
Meeting of the Expert Appraisal Committee for River Valley and Hydroelectric Projects held on
24-25th August, 2015 with a view to reduce the time frame of basin studies without
compromising on the quality of work.
The Ministry informed EAC that a meeting was held with BSI, ZSI and CWC to understand the
data availability and whether such data available with them can be used for basin studies and
baseline data collection can be optimised /done away with. ZSI and BSI have confirmed that
they have substantial amount of published as well as un-published data, which can be shared
for the study. The Consultants engaged for the purpose of the studies can review the suitability
of the data. Hydrological data is always provided by the CWC and they will provide full support
to the study. EAC observed that there should not be any issue with quality of data provided by
BSI and ZSI. This data will be very useful for defining the basin level setup. However, such data
may not be site specific as will be needed for the study. For this purpose, EIA studies carried
out in the basin in the recent time can also be used for sourcing the project specific data. EAC
also observed that consultants should take the responsibility of defining the baseline to meet
the study requirement and they should supplement BSI/ZSI data with data from other
secondary sources as well. Further, EAC recommended that one season data should be
collected by consultants as per the terms of reference issued earlier for these studies and since
monsoon is critical season for such studies, the field data can be collected in the month of
September 2015. This would reduce the time frame of the study from 21 months to 12 months
without compromising on the quality of the study.
The Dibang sub-basin or Dibang basin, as the term is generally used in the report, has about
10000 MW of hydropower potential, which is planned to be harnessed by setting up 18
hydropower projects spread throughout the basin. Department of Hydro Power Development,
Government of Arunachal Pradesh has allotted 14 projects, which are at various stages of
Cumulative EIA- Dibang Basin Final Report – Chapter 1
1.2
survey and investigation. Four projects are yet to be allotted which are Agoline, Malinye,
Etabue and Elango HEPs.
Such a large-scale development expected to take place over a period of next 10-15 years in
otherwise pristine area, can cause serious environmental impacts and will exert tremendous
pressure on carrying capacity of Dibang basin. EIA notification of September 2006, issued under
Environmental Protection Act, 1986, has the provision of evaluating the impacts of individual
projects of capacities 25 MW or more by SEAC/EAC before issuing environmental clearances.
However, in a situation in Dibang basin where several projects are planned in cascade utilising
the same natural resource; assessment of cumulative impacts and carrying capacity study of
the entire basin is essential to plan development in environmental friendly manner and to
mitigate and manage the impact comprehensively. Therefore, the present study “Cumulative
Impact and Carrying Capacity Study of Dibang sub-basin” shall be prepared with a view to
provide optimum support for various natural processes and allowing sustainable activities
within carrying capacity of Dibang sub-basin.
The study covers the following:
Inventorisation and analysis of the existing resource base
Determination of regional ecological fragility/sensitivity
Review of hydropower development plans
Evaluation of cumulative impacts on various facets of environment due to hydropower
development
Broad framework of environmental action plan to mitigate the adverse impacts on
environment, in the form of:
o Preclusion of an activity
o Modification in the planned activity
o Implementation of set of measures for amelioration of adverse impacts.
The basin study is a step beyond the EIA, as it incorporates an integrated approach to assess
the impacts due to various developmental projects.
1.2 SCOPE OF WORK
The scope of work has been defined by CWC based on Terms of Reference provided by EAC and
same is being followed for the study. The scope of work, with respect to baseline data
collection and use of secondary data, with a view to reduce the time frame of the study has
been modified based on the discussion in 86th EAC meeting and intimated to us by MoEF&CC
vide their letter dated November 03, 2015. The study area is entire Dibang Basin up to the
confluence of Siang, Dibang and Lohit to form Brahamputra.
1.3 OUTCOME OF THE STUDY
The key outcomes of the study are:
Sustainable and optimal ways of hydropower development of Diabng river, keeping in view
of the carrying capacity and environmental setting of the basin
Requirement of environmental flow throughout the year with actual flow, depth and
velocity at different level
Downstream impacts on Assam up to Guwahati due to hydropower development in Dibang
basin in Arunachal Pradesh
1.4 OUTLINE OF PRESENT DRAFT FINAL REPORT
The present draft final Report shall cover following:
- Chapter 1: Introduction; covers general background and introduction of the study, expected
outcomes of the study, study area and information on coverage of the present report.
Cumulative EIA- Dibang Basin Final Report – Chapter 1
1.3
- Chapter 2: Hydro power development in Dibang basin; provides information of existing and
planned hydro power development in Dibang river basin of Arunachal Pradesh.
- Chapter 3: Methodology adopted for the study, information on various sampling locations, etc.
- Chapter 4: Basin characteristics of the study area
- Chapter 5: Hydro-meteorology provides data on flows and meteorological observations
- Chapter 6: Environmental baseline data for terrestrial ecology covers information on forest
types, floristic and faunal diversity of study area through secondary sources and primary survey
data
- Chapter 7: Environmental baseline data for aquatic ecology covers physico-chemical and
biological characteristics as well as information of fish and fisheries from primary and
secondary sources
- Chapter 8: Environmental flows: This chapter covers literature survey for different available
methodologies nationally or internationally for environmental flow assessment as well as flow
releases to be considered for various simulations.
- Chapter 9: Downstream impacts due to hydro development; Chapter covers assessment of
downstream impacts up to Assam with the help of hydro-dynamic modelling due to peaking.
- Chapter 10: Cumulative Impact Assessment: assesses impacts due to planned hydro
development in basin.
- Chapter 11: Conclusion & Recommendations
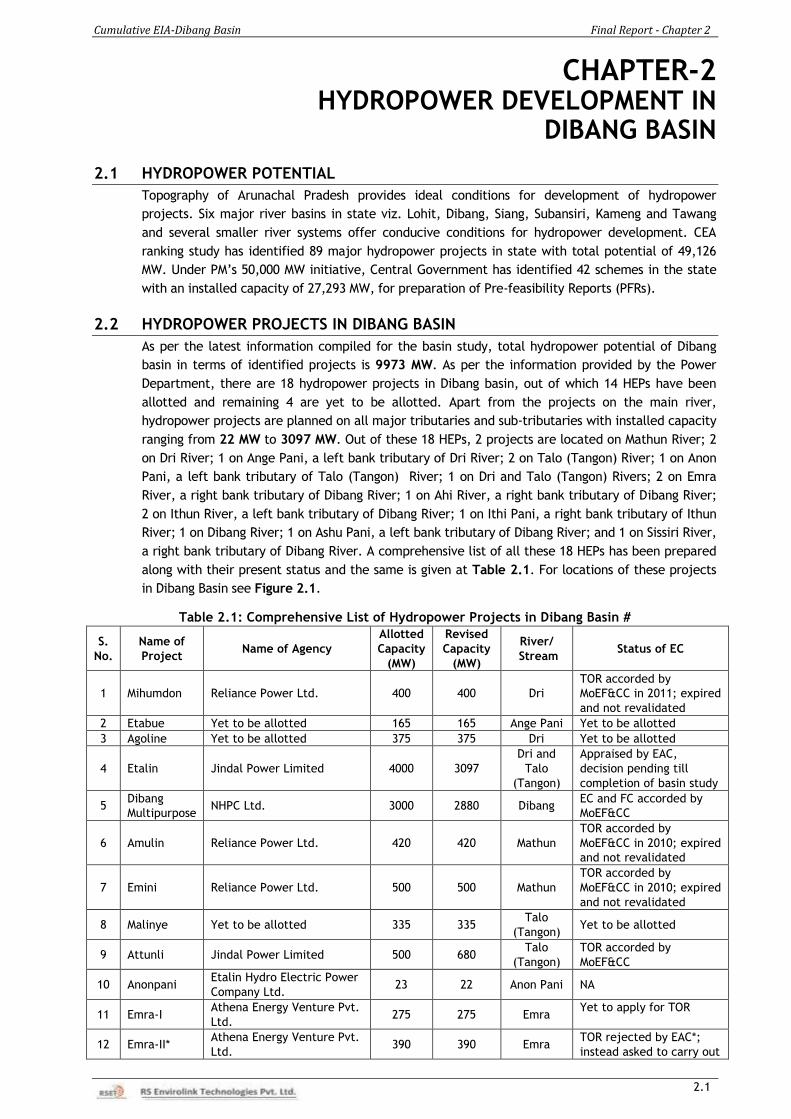
Cumulative EIA-Dibang Basin Final Report - Chapter 2
2.1
CHAPTER-2 HYDROPOWER DEVELOPMENT IN
DIBANG BASIN
2.1 HYDROPOWER POTENTIAL
Topography of Arunachal Pradesh provides ideal conditions for development of hydropower
projects. Six major river basins in state viz. Lohit, Dibang, Siang, Subansiri, Kameng and Tawang
and several smaller river systems offer conducive conditions for hydropower development. CEA
ranking study has identified 89 major hydropower projects in state with total potential of 49,126
MW. Under PM’s 50,000 MW initiative, Central Government has identified 42 schemes in the state
with an installed capacity of 27,293 MW, for preparation of Pre-feasibility Reports (PFRs).
2.2 HYDROPOWER PROJECTS IN DIBANG BASIN
As per the latest information compiled for the basin study, total hydropower potential of Dibang
basin in terms of identified projects is 9973 MW. As per the information provided by the Power
Department, there are 18 hydropower projects in Dibang basin, out of which 14 HEPs have been
allotted and remaining 4 are yet to be allotted. Apart from the projects on the main river,
hydropower projects are planned on all major tributaries and sub-tributaries with installed capacity
ranging from 22 MW to 3097 MW. Out of these 18 HEPs, 2 projects are located on Mathun River; 2
on Dri River; 1 on Ange Pani, a left bank tributary of Dri River; 2 on Talo (Tangon) River; 1 on Anon
Pani, a left bank tributary of Talo (Tangon) River; 1 on Dri and Talo (Tangon) Rivers; 2 on Emra
River, a right bank tributary of Dibang River; 1 on Ahi River, a right bank tributary of Dibang River;
2 on Ithun River, a left bank tributary of Dibang River; 1 on Ithi Pani, a right bank tributary of Ithun
River; 1 on Dibang River; 1 on Ashu Pani, a left bank tributary of Dibang River; and 1 on Sissiri River,
a right bank tributary of Dibang River. A comprehensive list of all these 18 HEPs has been prepared
along with their present status and the same is given at Table 2.1. For locations of these projects
in Dibang Basin see Figure 2.1.
Table 2.1: Comprehensive List of Hydropower Projects in Dibang Basin #
S.
No.
Name of
Project Name of Agency
Allotted
Capacity
(MW)
Revised
Capacity
(MW)
River/
Stream Status of EC
1 Mihumdon Reliance Power Ltd. 400 400 Dri
TOR accorded by
MoEF&CC in 2011; expired
and not revalidated
2 Etabue Yet to be allotted 165 165 Ange Pani Yet to be allotted
3 Agoline Yet to be allotted 375 375 Dri Yet to be allotted
4 Etalin Jindal Power Limited 4000 3097
Dri and
Talo
(Tangon)
Appraised by EAC,
decision pending till
completion of basin study
5 Dibang
Multipurpose NHPC Ltd. 3000 2880 Dibang
EC and FC accorded by
MoEF&CC
6 Amulin Reliance Power Ltd. 420 420 Mathun
TOR accorded by
MoEF&CC in 2010; expired
and not revalidated
7 Emini Reliance Power Ltd. 500 500 Mathun
TOR accorded by
MoEF&CC in 2010; expired
and not revalidated
8 Malinye Yet to be allotted 335 335 Talo
(Tangon) Yet to be allotted
9 Attunli Jindal Power Limited 500 680 Talo
(Tangon)
TOR accorded by
MoEF&CC
10 Anonpani Etalin Hydro Electric Power
Company Ltd. 23 22 Anon Pani NA
11 Emra-I Athena Energy Venture Pvt.
Ltd. 275 275 Emra
Yet to apply for TOR
12 Emra-II* Athena Energy Venture Pvt.
Ltd. 390 390 Emra
TOR rejected by EAC*;
instead asked to carry out
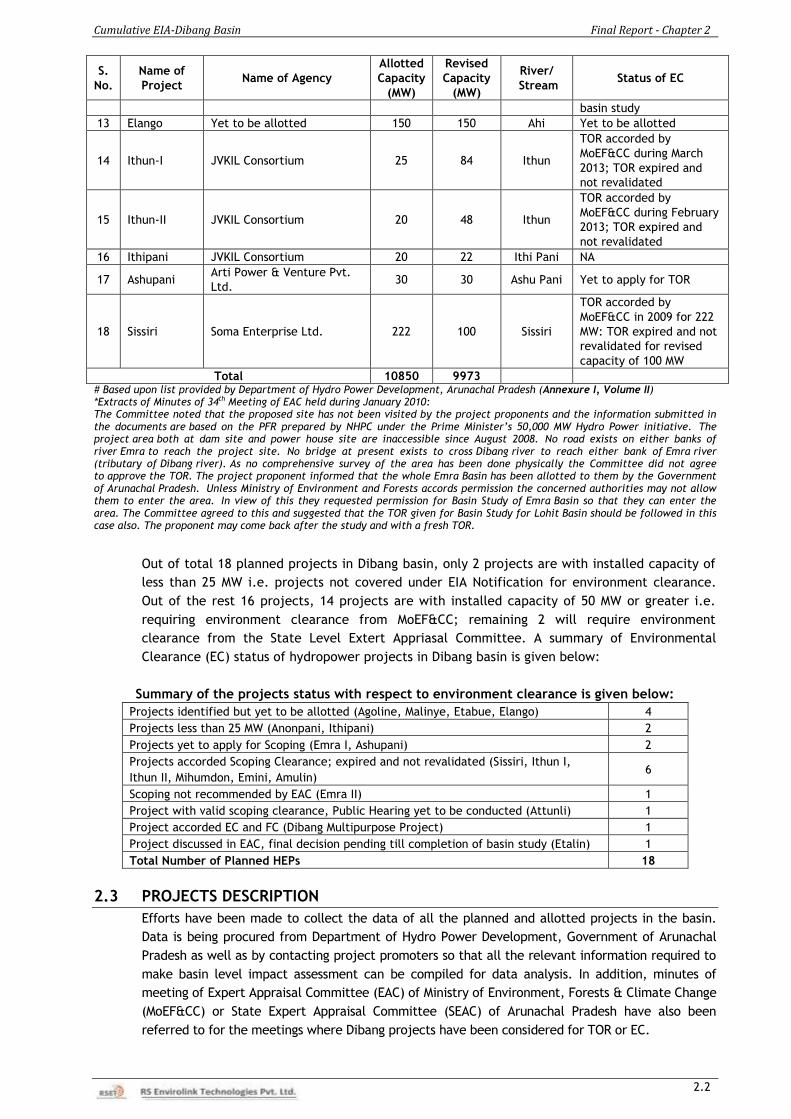
Cumulative EIA-Dibang Basin Final Report - Chapter 2
2.2
S.
No.
Name of
Project Name of Agency
Allotted
Capacity
(MW)
Revised
Capacity
(MW)
River/
Stream Status of EC
basin study
13 Elango Yet to be allotted 150 150 Ahi Yet to be allotted
14 Ithun-I JVKIL Consortium 25 84 Ithun
TOR accorded by
MoEF&CC during March
2013; TOR expired and
not revalidated
15 Ithun-II JVKIL Consortium 20 48 Ithun
TOR accorded by
MoEF&CC during February
2013; TOR expired and
not revalidated
16 Ithipani JVKIL Consortium 20 22 Ithi Pani NA
17 Ashupani Arti Power & Venture Pvt.
Ltd. 30 30 Ashu Pani Yet to apply for TOR
18 Sissiri Soma Enterprise Ltd. 222 100 Sissiri
TOR accorded by
MoEF&CC in 2009 for 222
MW: TOR expired and not
revalidated for revised
capacity of 100 MW
Total 10850 9973
# Based upon list provided by Department of Hydro Power Development, Arunachal Pradesh (Annexure I, Volume II) *Extracts of Minutes of 34th Meeting of EAC held during January 2010: The Committee noted that the proposed site has not been visited by the project proponents and the information submitted in the documents are based on the PFR prepared by NHPC under the Prime Minister’s 50,000 MW Hydro Power initiative. The project area both at dam site and power house site are inaccessible since August 2008. No road exists on either banks of river Emra to reach the project site. No bridge at present exists to cross Dibang river to reach either bank of Emra river (tributary of Dibang river). As no comprehensive survey of the area has been done physically the Committee did not agree to approve the TOR. The project proponent informed that the whole Emra Basin has been allotted to them by the Government of Arunachal Pradesh. Unless Ministry of Environment and Forests accords permission the concerned authorities may not allow them to enter the area. In view of this they requested permission for Basin Study of Emra Basin so that they can enter the area. The Committee agreed to this and suggested that the TOR given for Basin Study for Lohit Basin should be followed in this case also. The proponent may come back after the study and with a fresh TOR.
Out of total 18 planned projects in Dibang basin, only 2 projects are with installed capacity of
less than 25 MW i.e. projects not covered under EIA Notification for environment clearance.
Out of the rest 16 projects, 14 projects are with installed capacity of 50 MW or greater i.e.
requiring environment clearance from MoEF&CC; remaining 2 will require environment
clearance from the State Level Extert Appriasal Committee. A summary of Environmental
Clearance (EC) status of hydropower projects in Dibang basin is given below:
Summary of the projects status with respect to environment clearance is given below:
Projects identified but yet to be allotted (Agoline, Malinye, Etabue, Elango) 4
Projects less than 25 MW (Anonpani, Ithipani) 2
Projects yet to apply for Scoping (Emra I, Ashupani) 2
Projects accorded Scoping Clearance; expired and not revalidated (Sissiri, Ithun I,
Ithun II, Mihumdon, Emini, Amulin) 6
Scoping not recommended by EAC (Emra II) 1
Project with valid scoping clearance, Public Hearing yet to be conducted (Attunli) 1
Project accorded EC and FC (Dibang Multipurpose Project) 1
Project discussed in EAC, final decision pending till completion of basin study (Etalin) 1
Total Number of Planned HEPs 18
2.3 PROJECTS DESCRIPTION
Efforts have been made to collect the data of all the planned and allotted projects in the basin.
Data is being procured from Department of Hydro Power Development, Government of Arunachal
Pradesh as well as by contacting project promoters so that all the relevant information required to
make basin level impact assessment can be compiled for data analysis. In addition, minutes of
meeting of Expert Appraisal Committee (EAC) of Ministry of Environment, Forests & Climate Change
(MoEF&CC) or State Expert Appraisal Committee (SEAC) of Arunachal Pradesh have also been
referred to for the meetings where Dibang projects have been considered for TOR or EC.
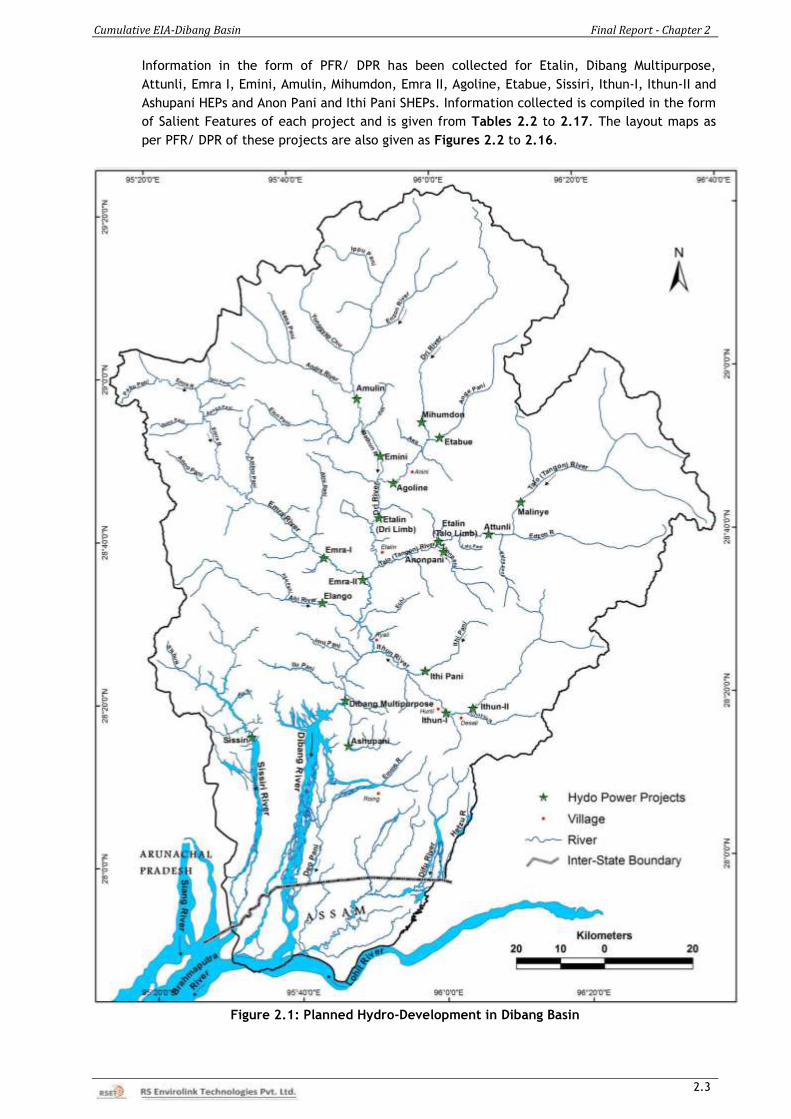
Cumulative EIA-Dibang Basin Final Report - Chapter 2
2.3
Information in the form of PFR/ DPR has been collected for Etalin, Dibang Multipurpose,
Attunli, Emra I, Emini, Amulin, Mihumdon, Emra II, Agoline, Etabue, Sissiri, Ithun-I, Ithun-II and
Ashupani HEPs and Anon Pani and Ithi Pani SHEPs. Information collected is compiled in the form
of Salient Features of each project and is given from Tables 2.2 to 2.17. The layout maps as
per PFR/ DPR of these projects are also given as Figures 2.2 to 2.16.
Figure 2.1: Planned Hydro-Development in Dibang Basin
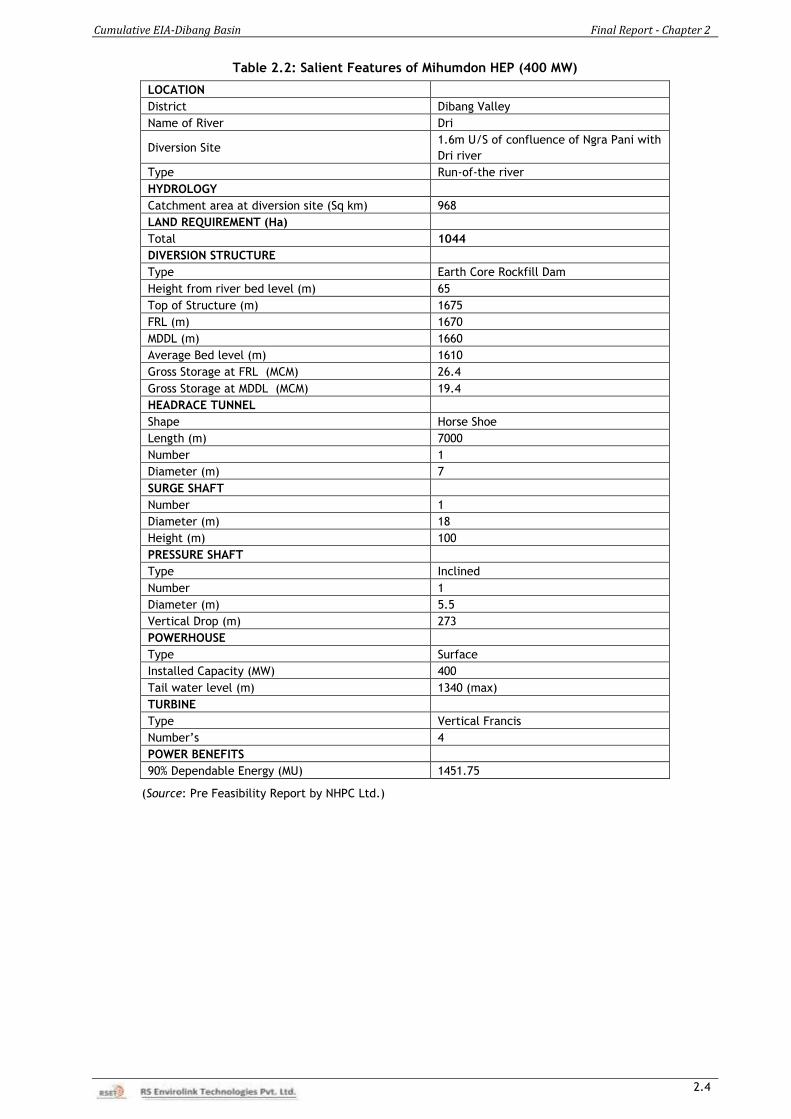
Cumulative EIA-Dibang Basin Final Report - Chapter 2
2.4
Table 2.2: Salient Features of Mihumdon HEP (400 MW)
LOCATION
District Dibang Valley
Name of River Dri
Diversion Site 1.6m U/S of confluence of Ngra Pani with
Dri river
Type Run-of-the river
HYDROLOGY
Catchment area at diversion site (Sq km) 968
LAND REQUIREMENT (Ha)
Total 1044
DIVERSION STRUCTURE
Type Earth Core Rockfill Dam
Height from river bed level (m) 65
Top of Structure (m) 1675
FRL (m) 1670
MDDL (m) 1660
Average Bed level (m) 1610
Gross Storage at FRL (MCM) 26.4
Gross Storage at MDDL (MCM) 19.4
HEADRACE TUNNEL
Shape Horse Shoe
Length (m) 7000
Number 1
Diameter (m) 7
SURGE SHAFT
Number 1
Diameter (m) 18
Height (m) 100
PRESSURE SHAFT
Type Inclined
Number 1
Diameter (m) 5.5
Vertical Drop (m) 273
POWERHOUSE
Type Surface
Installed Capacity (MW) 400
Tail water level (m) 1340 (max)
TURBINE
Type Vertical Francis
Number’s 4
POWER BENEFITS
90% Dependable Energy (MU) 1451.75
(Source: Pre Feasibility Report by NHPC Ltd.)
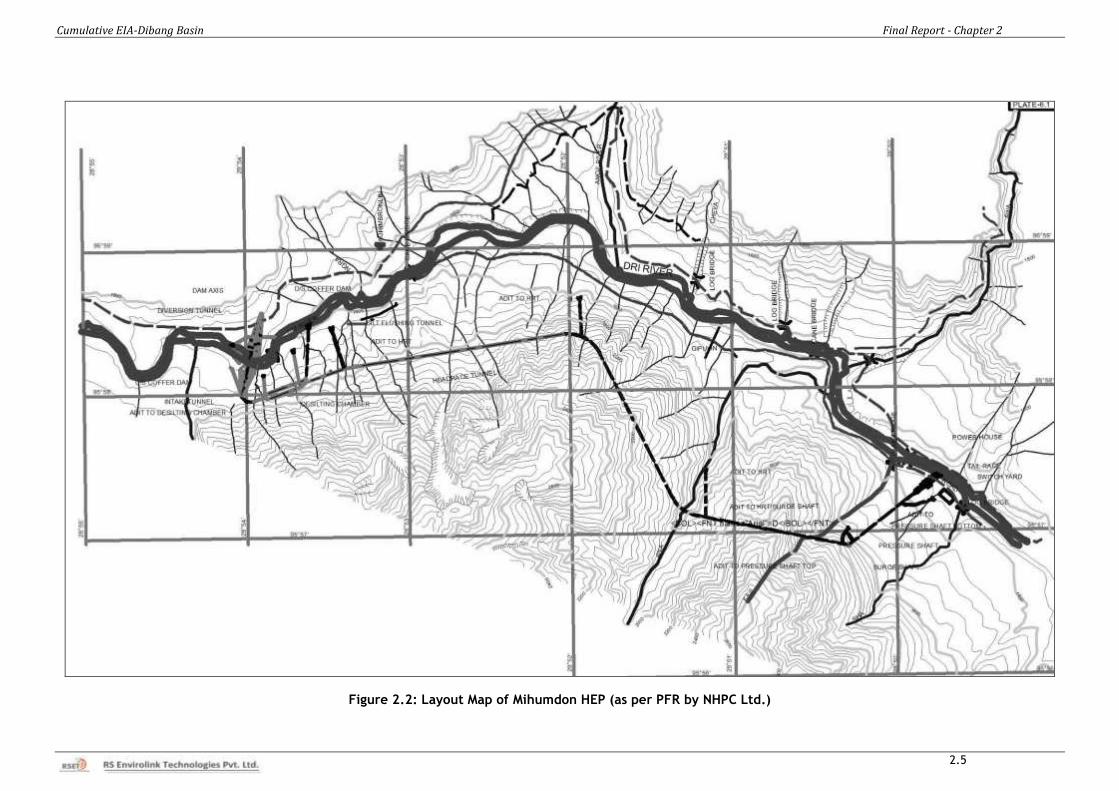
Cumulative EIA-Dibang Basin Final Report - Chapter 2
2.5
Figure 2.2: Layout Map of Mihumdon HEP (as per PFR by NHPC Ltd.)
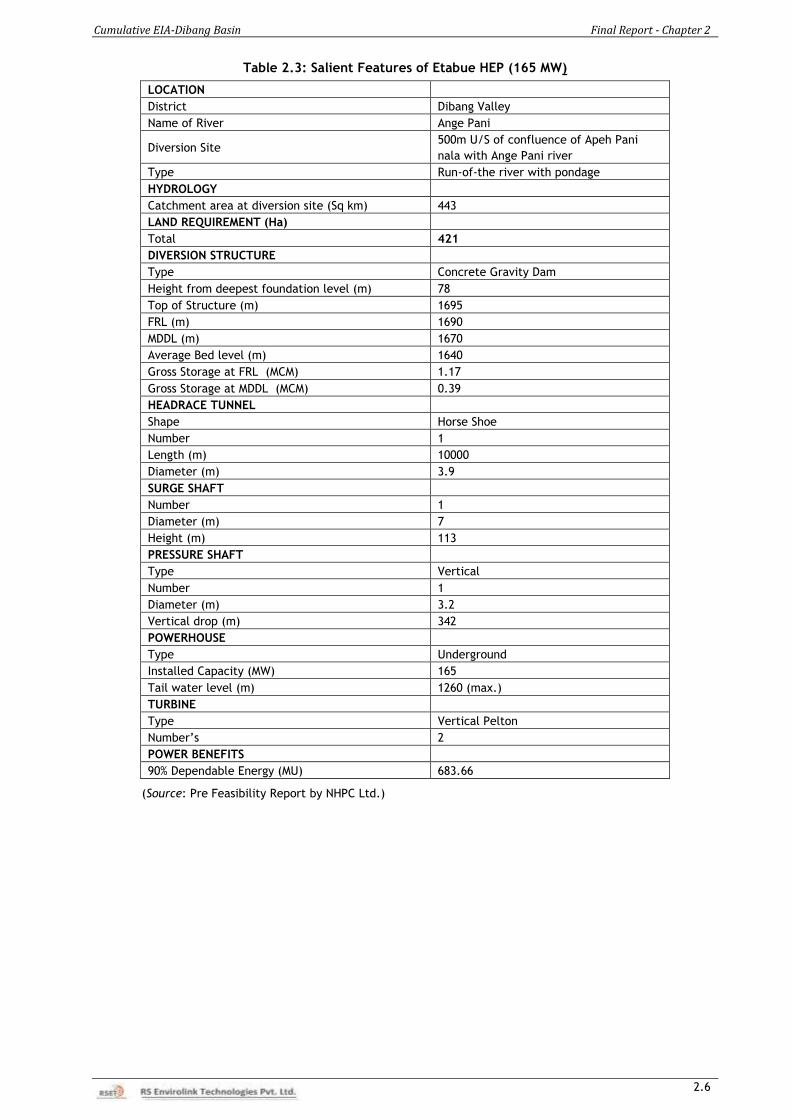
Cumulative EIA-Dibang Basin Final Report - Chapter 2
2.6
Table 2.3: Salient Features of Etabue HEP (165 MW)
LOCATION
District Dibang Valley
Name of River Ange Pani
Diversion Site 500m U/S of confluence of Apeh Pani
nala with Ange Pani river
Type Run-of-the river with pondage
HYDROLOGY
Catchment area at diversion site (Sq km) 443
LAND REQUIREMENT (Ha)
Total 421
DIVERSION STRUCTURE
Type Concrete Gravity Dam
Height from deepest foundation level (m) 78
Top of Structure (m) 1695
FRL (m) 1690
MDDL (m) 1670
Average Bed level (m) 1640
Gross Storage at FRL (MCM) 1.17
Gross Storage at MDDL (MCM) 0.39
HEADRACE TUNNEL
Shape Horse Shoe
Number 1
Length (m) 10000
Diameter (m) 3.9
SURGE SHAFT
Number 1
Diameter (m) 7
Height (m) 113
PRESSURE SHAFT
Type Vertical
Number 1
Diameter (m) 3.2
Vertical drop (m) 342
POWERHOUSE
Type Underground
Installed Capacity (MW) 165
Tail water level (m) 1260 (max.)
TURBINE
Type Vertical Pelton
Number’s 2
POWER BENEFITS
90% Dependable Energy (MU) 683.66
(Source: Pre Feasibility Report by NHPC Ltd.)
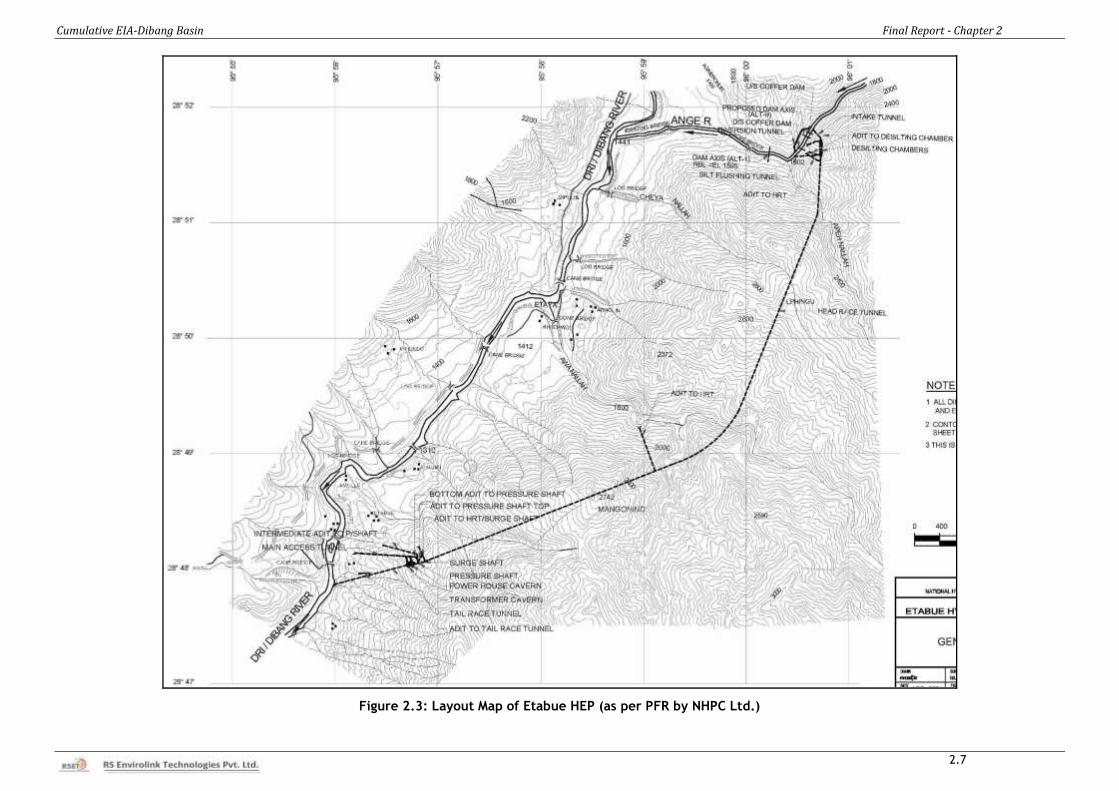
Cumulative EIA-Dibang Basin Final Report - Chapter 2
2.7
Figure 2.3: Layout Map of Etabue HEP (as per PFR by NHPC Ltd.)
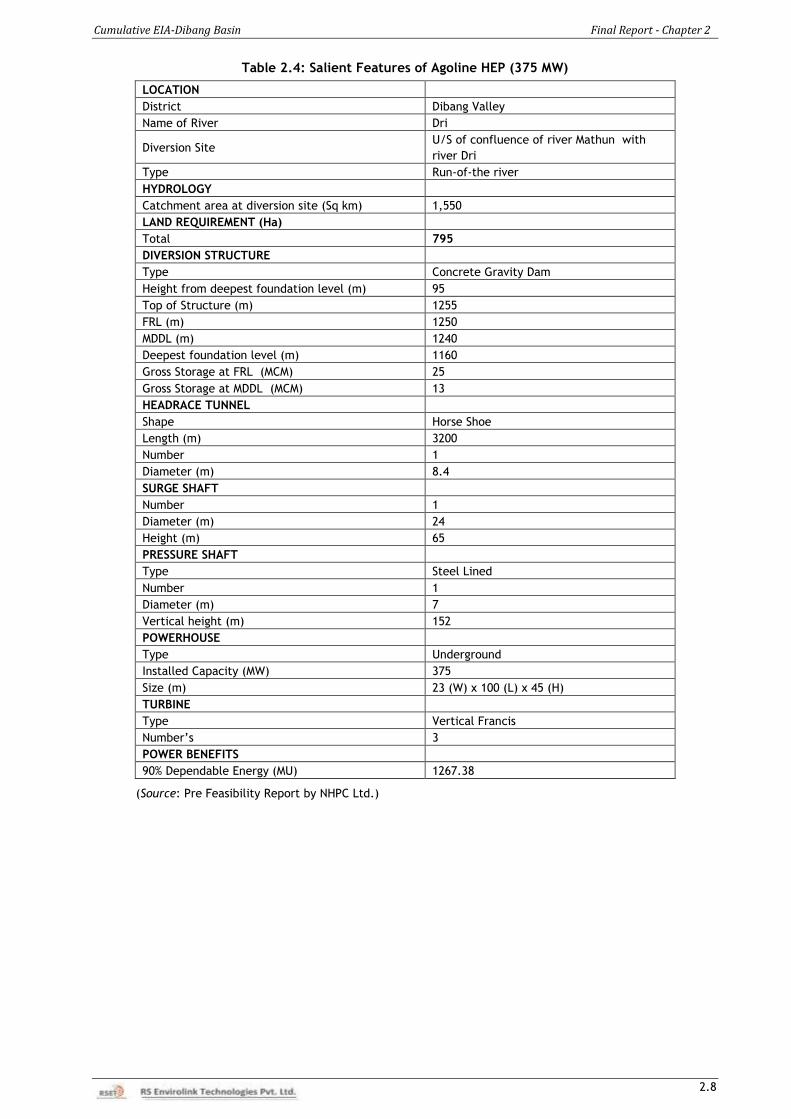
Cumulative EIA-Dibang Basin Final Report - Chapter 2
2.8
Table 2.4: Salient Features of Agoline HEP (375 MW)
LOCATION
District Dibang Valley
Name of River Dri
Diversion Site U/S of confluence of river Mathun with
river Dri
Type Run-of-the river
HYDROLOGY
Catchment area at diversion site (Sq km) 1,550
LAND REQUIREMENT (Ha)
Total 795
DIVERSION STRUCTURE
Type Concrete Gravity Dam
Height from deepest foundation level (m) 95
Top of Structure (m) 1255
FRL (m) 1250
MDDL (m) 1240
Deepest foundation level (m) 1160
Gross Storage at FRL (MCM) 25
Gross Storage at MDDL (MCM) 13
HEADRACE TUNNEL
Shape Horse Shoe
Length (m) 3200
Number 1
Diameter (m) 8.4
SURGE SHAFT
Number 1
Diameter (m) 24
Height (m) 65
PRESSURE SHAFT
Type Steel Lined
Number 1
Diameter (m) 7
Vertical height (m) 152
POWERHOUSE
Type Underground
Installed Capacity (MW) 375
Size (m) 23 (W) x 100 (L) x 45 (H)
TURBINE
Type Vertical Francis
Number’s 3
POWER BENEFITS
90% Dependable Energy (MU) 1267.38
(Source: Pre Feasibility Report by NHPC Ltd.)
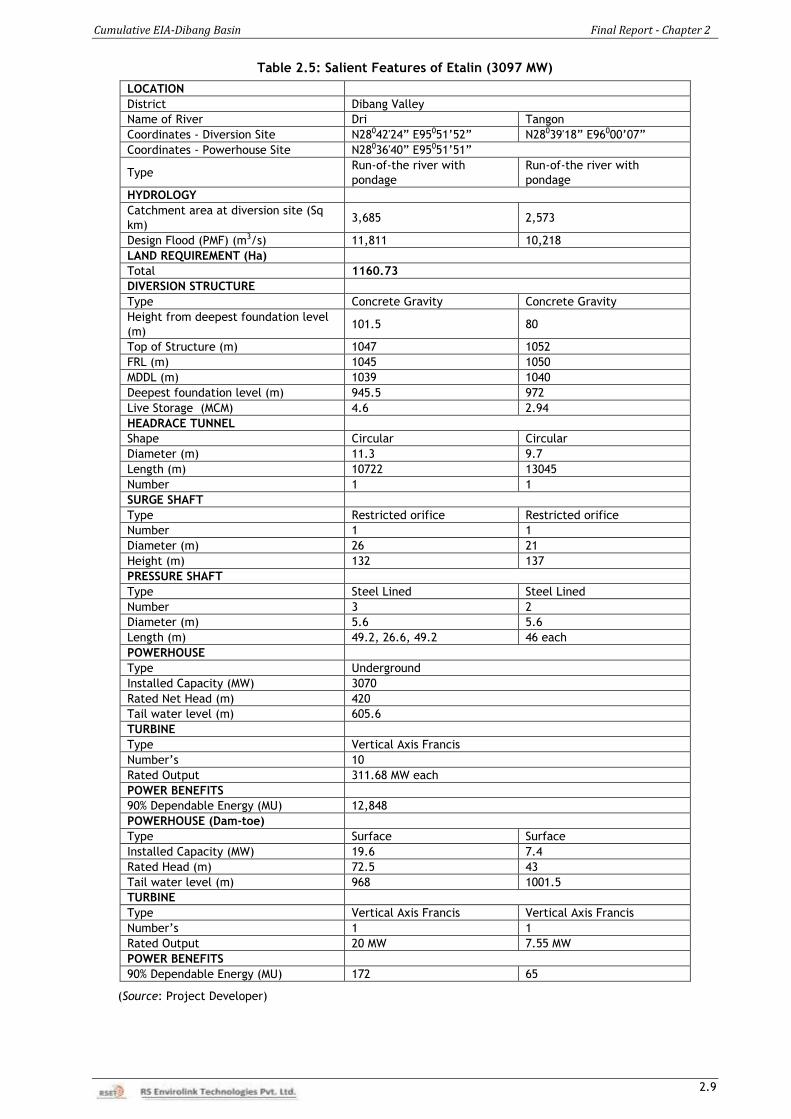
Cumulative EIA-Dibang Basin Final Report - Chapter 2
2.9
Table 2.5: Salient Features of Etalin (3097 MW)
LOCATION
District Dibang Valley
Name of River Dri Tangon
Coordinates - Diversion Site N28042'24” E95051’52” N28039'18” E96000’07”
Coordinates - Powerhouse Site N28036'40” E95051’51”
Type Run-of-the river with
pondage
Run-of-the river with
pondage
HYDROLOGY
Catchment area at diversion site (Sq
km) 3,685 2,573
Design Flood (PMF) (m3/s) 11,811 10,218
LAND REQUIREMENT (Ha)
Total 1160.73
DIVERSION STRUCTURE
Type Concrete Gravity Concrete Gravity
Height from deepest foundation level
(m) 101.5 80
Top of Structure (m) 1047 1052
FRL (m) 1045 1050
MDDL (m) 1039 1040
Deepest foundation level (m) 945.5 972
Live Storage (MCM) 4.6 2.94
HEADRACE TUNNEL
Shape Circular Circular
Diameter (m) 11.3 9.7
Length (m) 10722 13045
Number 1 1
SURGE SHAFT
Type Restricted orifice Restricted orifice
Number 1 1
Diameter (m) 26 21
Height (m) 132 137
PRESSURE SHAFT
Type Steel Lined Steel Lined
Number 3 2
Diameter (m) 5.6 5.6
Length (m) 49.2, 26.6, 49.2 46 each
POWERHOUSE
Type Underground
Installed Capacity (MW) 3070
Rated Net Head (m) 420
Tail water level (m) 605.6
TURBINE
Type Vertical Axis Francis
Number’s 10
Rated Output 311.68 MW each
POWER BENEFITS
90% Dependable Energy (MU) 12,848
POWERHOUSE (Dam-toe)
Type Surface Surface
Installed Capacity (MW) 19.6 7.4
Rated Head (m) 72.5 43
Tail water level (m) 968 1001.5
TURBINE
Type Vertical Axis Francis Vertical Axis Francis
Number’s 1 1
Rated Output 20 MW 7.55 MW
POWER BENEFITS
90% Dependable Energy (MU) 172 65
(Source: Project Developer)
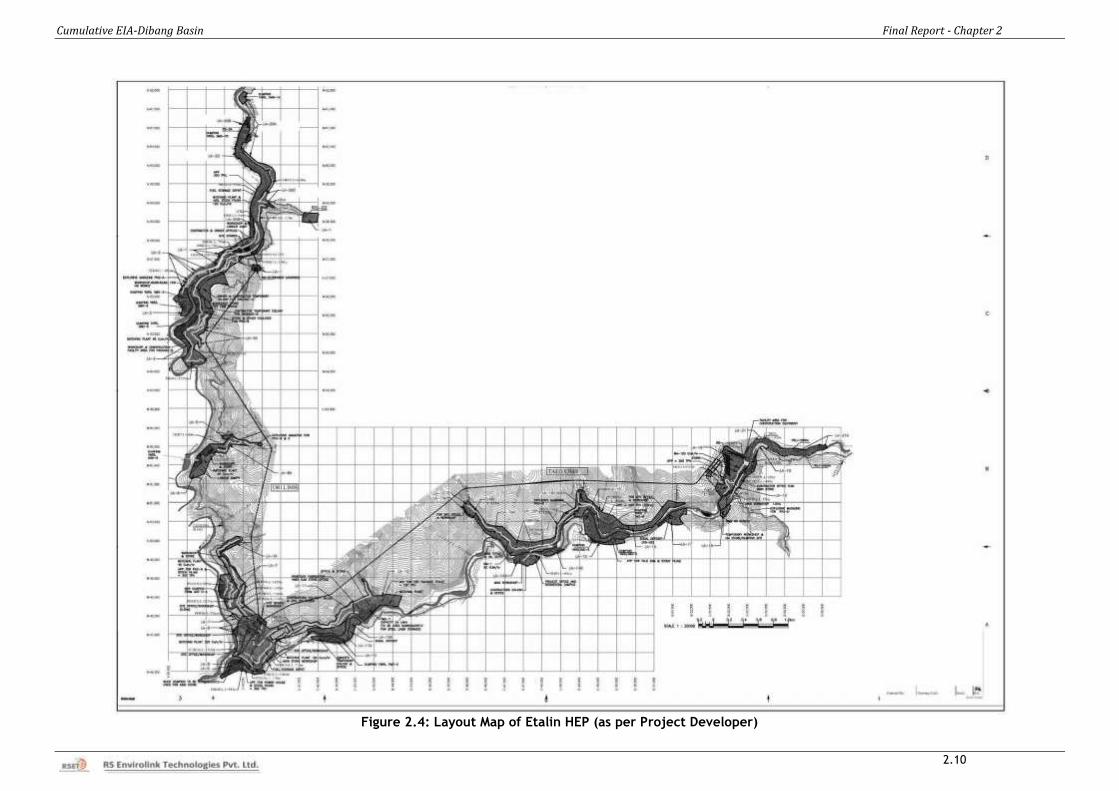
Cumulative EIA-Dibang Basin Final Report - Chapter 2
2.10
Figure 2.4: Layout Map of Etalin HEP (as per Project Developer)
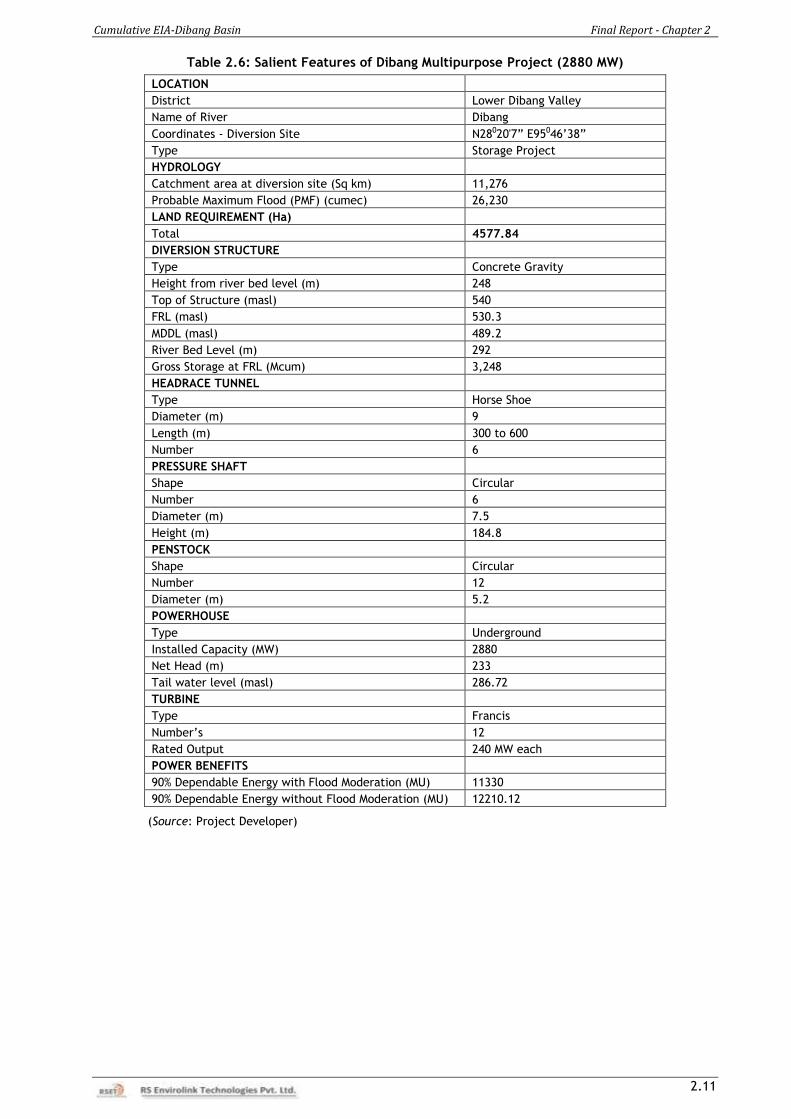
Cumulative EIA-Dibang Basin Final Report - Chapter 2
2.11
Table 2.6: Salient Features of Dibang Multipurpose Project (2880 MW)
LOCATION
District Lower Dibang Valley
Name of River Dibang
Coordinates - Diversion Site N28020'7” E95046’38”
Type Storage Project
HYDROLOGY
Catchment area at diversion site (Sq km) 11,276
Probable Maximum Flood (PMF) (cumec) 26,230
LAND REQUIREMENT (Ha)
Total 4577.84
DIVERSION STRUCTURE
Type Concrete Gravity
Height from river bed level (m) 248
Top of Structure (masl) 540
FRL (masl) 530.3
MDDL (masl) 489.2
River Bed Level (m) 292
Gross Storage at FRL (Mcum) 3,248
HEADRACE TUNNEL
Type Horse Shoe
Diameter (m) 9
Length (m) 300 to 600
Number 6
PRESSURE SHAFT
Shape Circular
Number 6
Diameter (m) 7.5
Height (m) 184.8
PENSTOCK
Shape Circular
Number 12
Diameter (m) 5.2
POWERHOUSE
Type Underground
Installed Capacity (MW) 2880
Net Head (m) 233
Tail water level (masl) 286.72
TURBINE
Type Francis
Number’s 12
Rated Output 240 MW each
POWER BENEFITS
90% Dependable Energy with Flood Moderation (MU) 11330
90% Dependable Energy without Flood Moderation (MU) 12210.12
(Source: Project Developer)
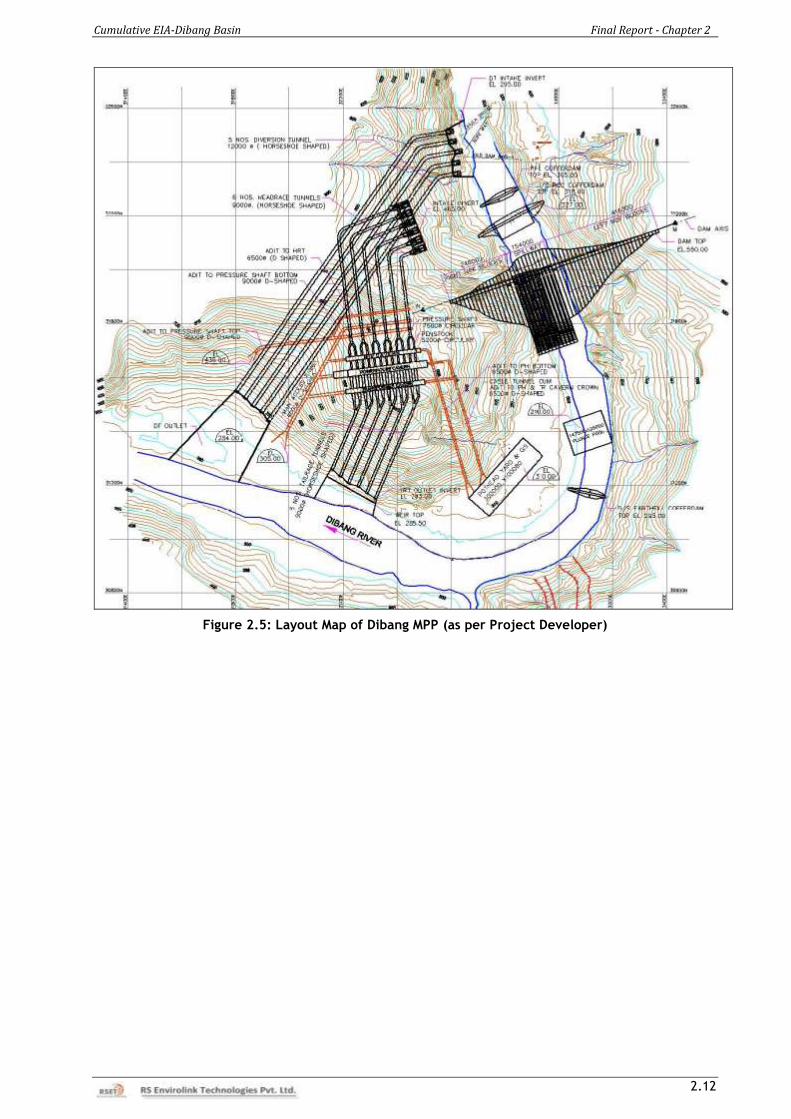
Cumulative EIA-Dibang Basin Final Report - Chapter 2
2.12
Figure 2.5: Layout Map of Dibang MPP (as per Project Developer)
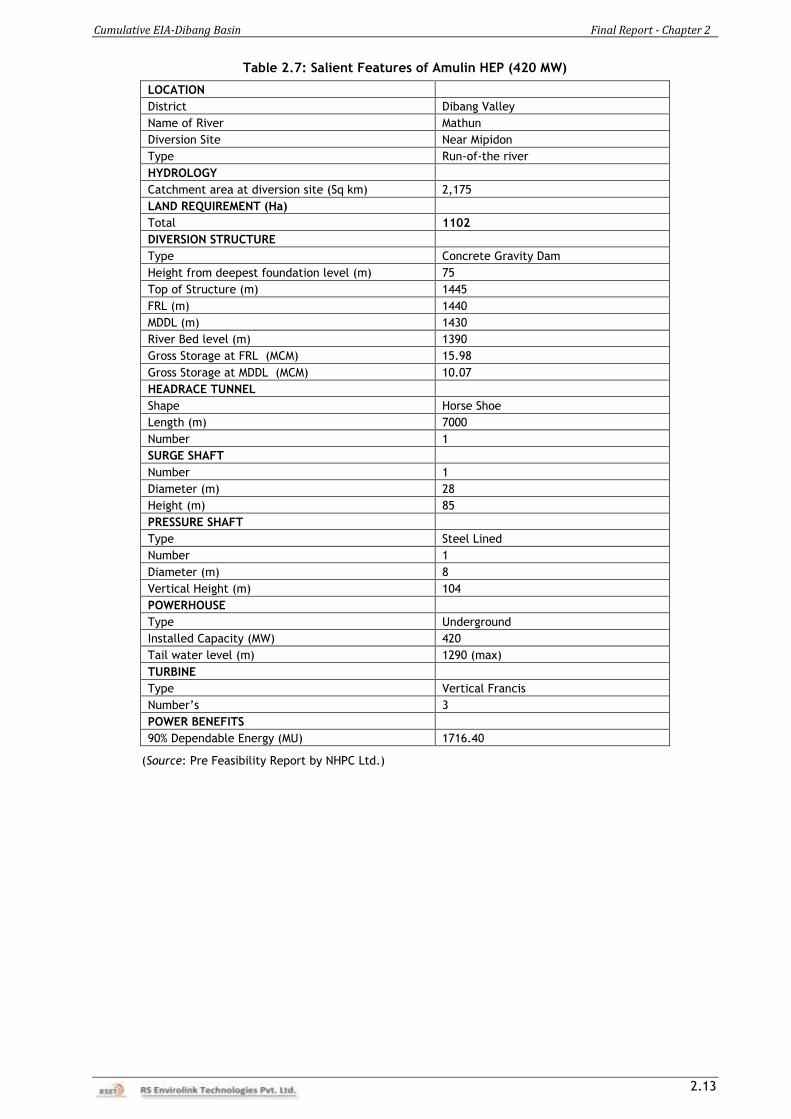
Cumulative EIA-Dibang Basin Final Report - Chapter 2
2.13
Table 2.7: Salient Features of Amulin HEP (420 MW)
LOCATION
District Dibang Valley
Name of River Mathun
Diversion Site Near Mipidon
Type Run-of-the river
HYDROLOGY
Catchment area at diversion site (Sq km) 2,175
LAND REQUIREMENT (Ha)
Total 1102
DIVERSION STRUCTURE
Type Concrete Gravity Dam
Height from deepest foundation level (m) 75
Top of Structure (m) 1445
FRL (m) 1440
MDDL (m) 1430
River Bed level (m) 1390
Gross Storage at FRL (MCM) 15.98
Gross Storage at MDDL (MCM) 10.07
HEADRACE TUNNEL
Shape Horse Shoe
Length (m) 7000
Number 1
SURGE SHAFT
Number 1
Diameter (m) 28
Height (m) 85
PRESSURE SHAFT
Type Steel Lined
Number 1
Diameter (m) 8
Vertical Height (m) 104
POWERHOUSE
Type Underground
Installed Capacity (MW) 420
Tail water level (m) 1290 (max)
TURBINE
Type Vertical Francis
Number’s 3
POWER BENEFITS
90% Dependable Energy (MU) 1716.40
(Source: Pre Feasibility Report by NHPC Ltd.)
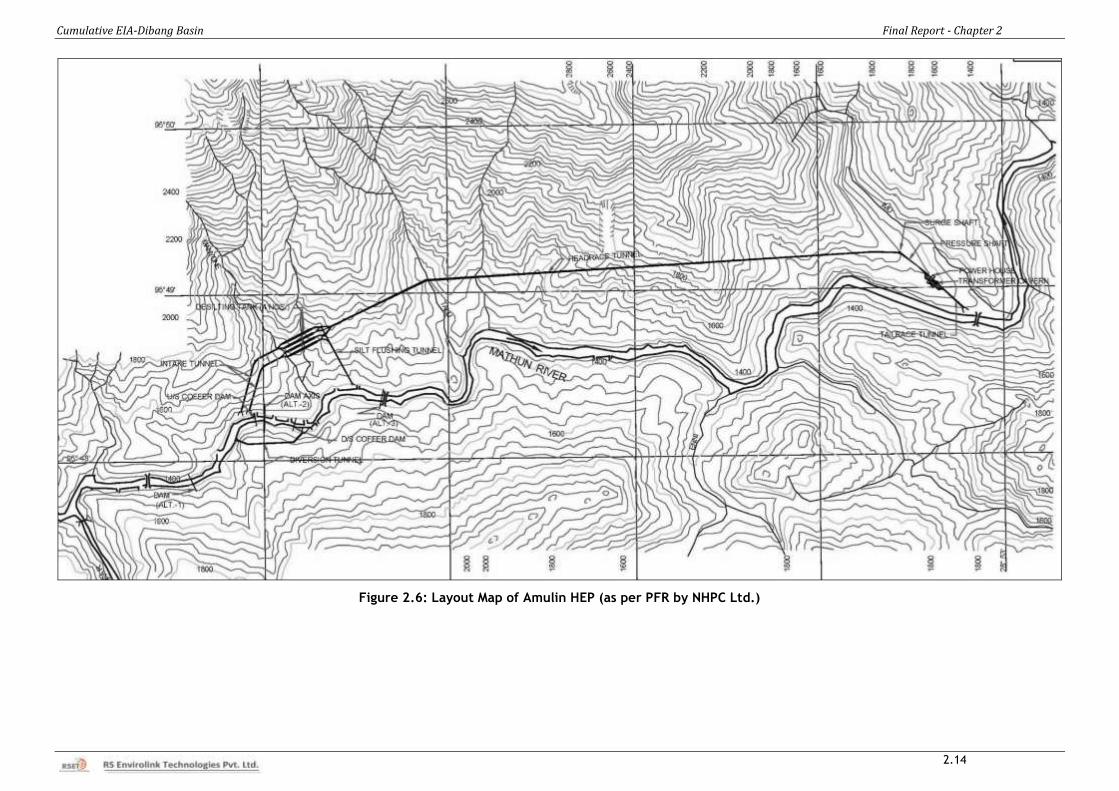
Cumulative EIA-Dibang Basin Final Report - Chapter 2
2.14
Figure 2.6: Layout Map of Amulin HEP (as per PFR by NHPC Ltd.)
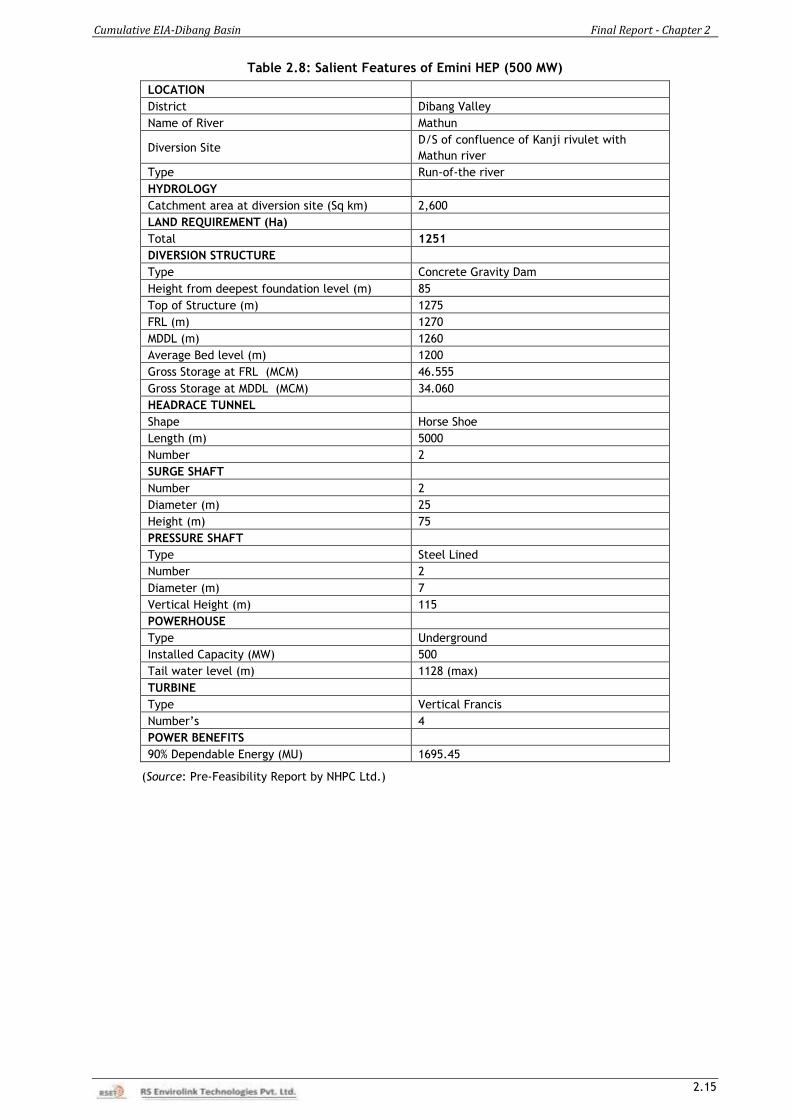
Cumulative EIA-Dibang Basin Final Report - Chapter 2
2.15
Table 2.8: Salient Features of Emini HEP (500 MW)
LOCATION
District Dibang Valley
Name of River Mathun
Diversion Site D/S of confluence of Kanji rivulet with
Mathun river
Type Run-of-the river
HYDROLOGY
Catchment area at diversion site (Sq km) 2,600
LAND REQUIREMENT (Ha)
Total 1251
DIVERSION STRUCTURE
Type Concrete Gravity Dam
Height from deepest foundation level (m) 85
Top of Structure (m) 1275
FRL (m) 1270
MDDL (m) 1260
Average Bed level (m) 1200
Gross Storage at FRL (MCM) 46.555
Gross Storage at MDDL (MCM) 34.060
HEADRACE TUNNEL
Shape Horse Shoe
Length (m) 5000
Number 2
SURGE SHAFT
Number 2
Diameter (m) 25
Height (m) 75
PRESSURE SHAFT
Type Steel Lined
Number 2
Diameter (m) 7
Vertical Height (m) 115
POWERHOUSE
Type Underground
Installed Capacity (MW) 500
Tail water level (m) 1128 (max)
TURBINE
Type Vertical Francis
Number’s 4
POWER BENEFITS
90% Dependable Energy (MU) 1695.45
(Source: Pre-Feasibility Report by NHPC Ltd.)
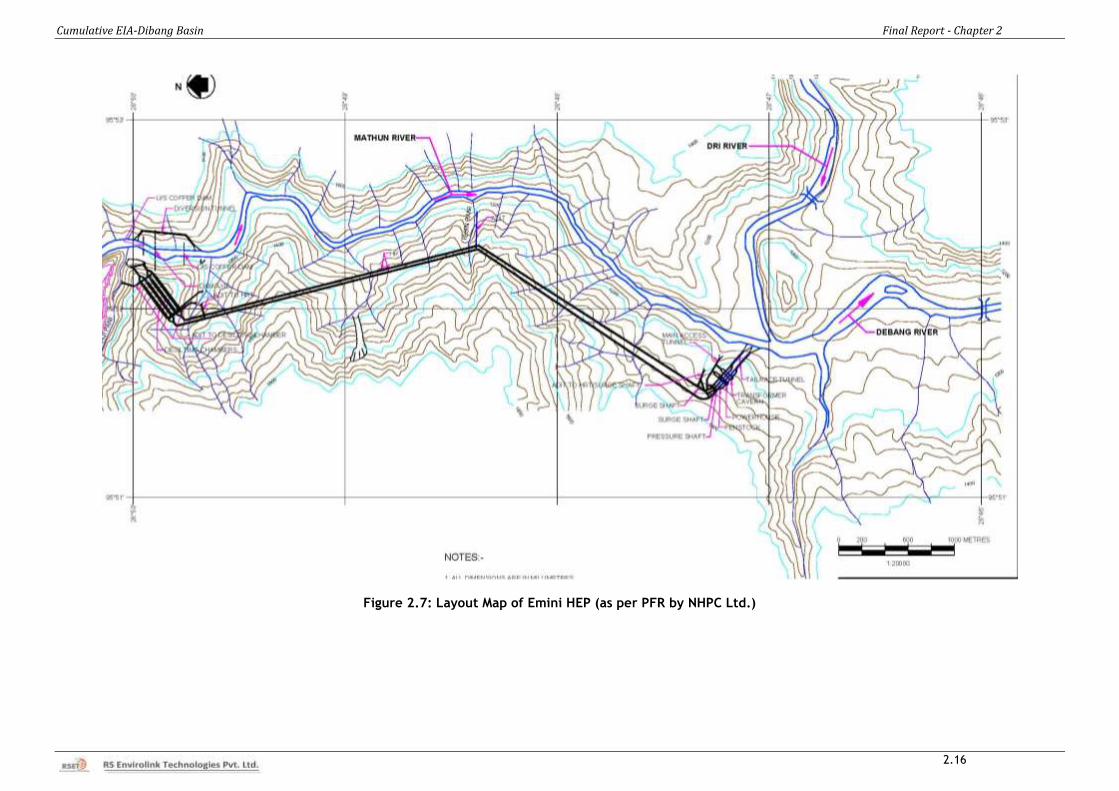
Cumulative EIA-Dibang Basin Final Report - Chapter 2
2.16
Figure 2.7: Layout Map of Emini HEP (as per PFR by NHPC Ltd.)
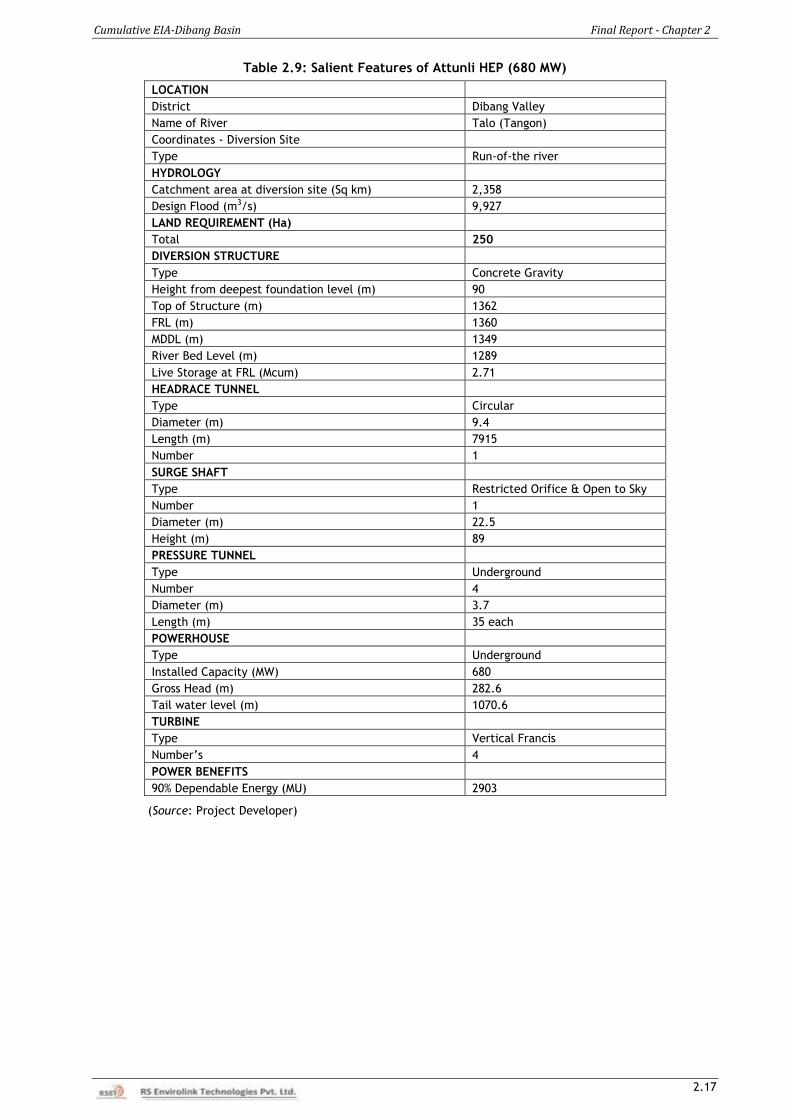
Cumulative EIA-Dibang Basin Final Report - Chapter 2
2.17
Table 2.9: Salient Features of Attunli HEP (680 MW)
LOCATION
District Dibang Valley
Name of River Talo (Tangon)
Coordinates - Diversion Site
Type Run-of-the river
HYDROLOGY
Catchment area at diversion site (Sq km) 2,358
Design Flood (m3/s) 9,927
LAND REQUIREMENT (Ha)
Total 250
DIVERSION STRUCTURE
Type Concrete Gravity
Height from deepest foundation level (m) 90
Top of Structure (m) 1362
FRL (m) 1360
MDDL (m) 1349
River Bed Level (m) 1289
Live Storage at FRL (Mcum) 2.71
HEADRACE TUNNEL
Type Circular
Diameter (m) 9.4
Length (m) 7915
Number 1
SURGE SHAFT
Type Restricted Orifice & Open to Sky
Number 1
Diameter (m) 22.5
Height (m) 89
PRESSURE TUNNEL
Type Underground
Number 4
Diameter (m) 3.7
Length (m) 35 each
POWERHOUSE
Type Underground
Installed Capacity (MW) 680
Gross Head (m) 282.6
Tail water level (m) 1070.6
TURBINE
Type Vertical Francis
Number’s 4
POWER BENEFITS
90% Dependable Energy (MU) 2903
(Source: Project Developer)
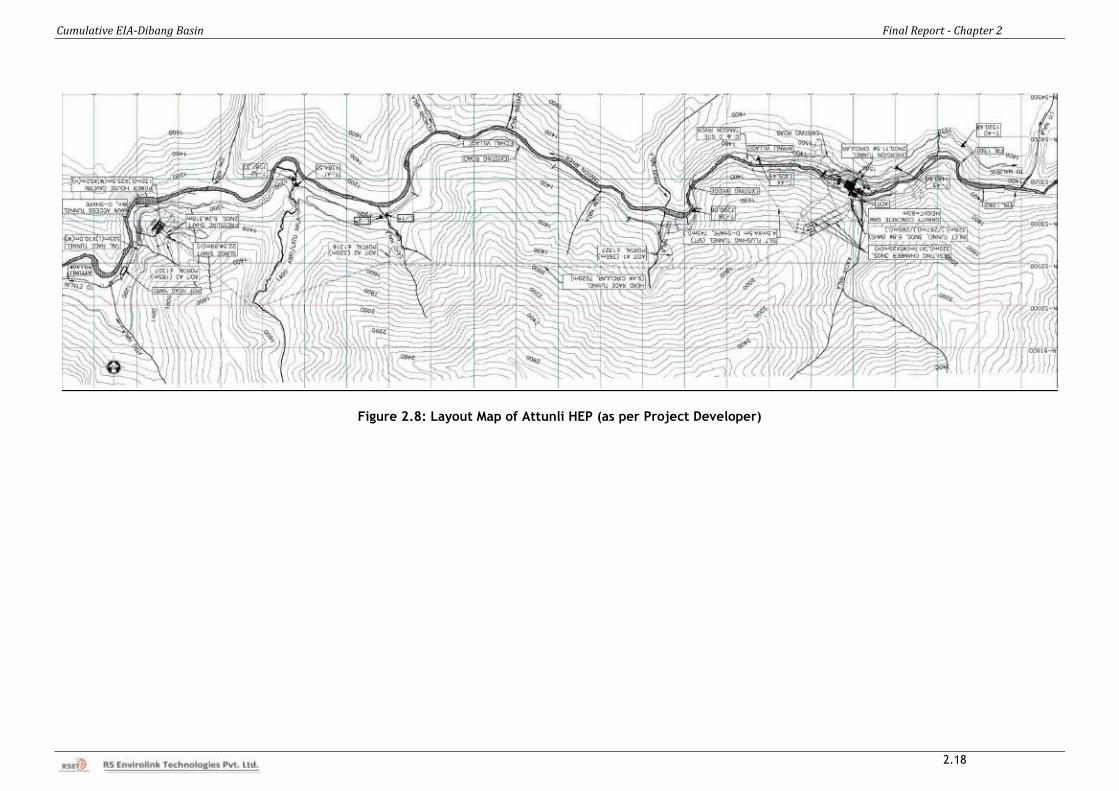
Cumulative EIA-Dibang Basin Final Report - Chapter 2
2.18
Figure 2.8: Layout Map of Attunli HEP (as per Project Developer)
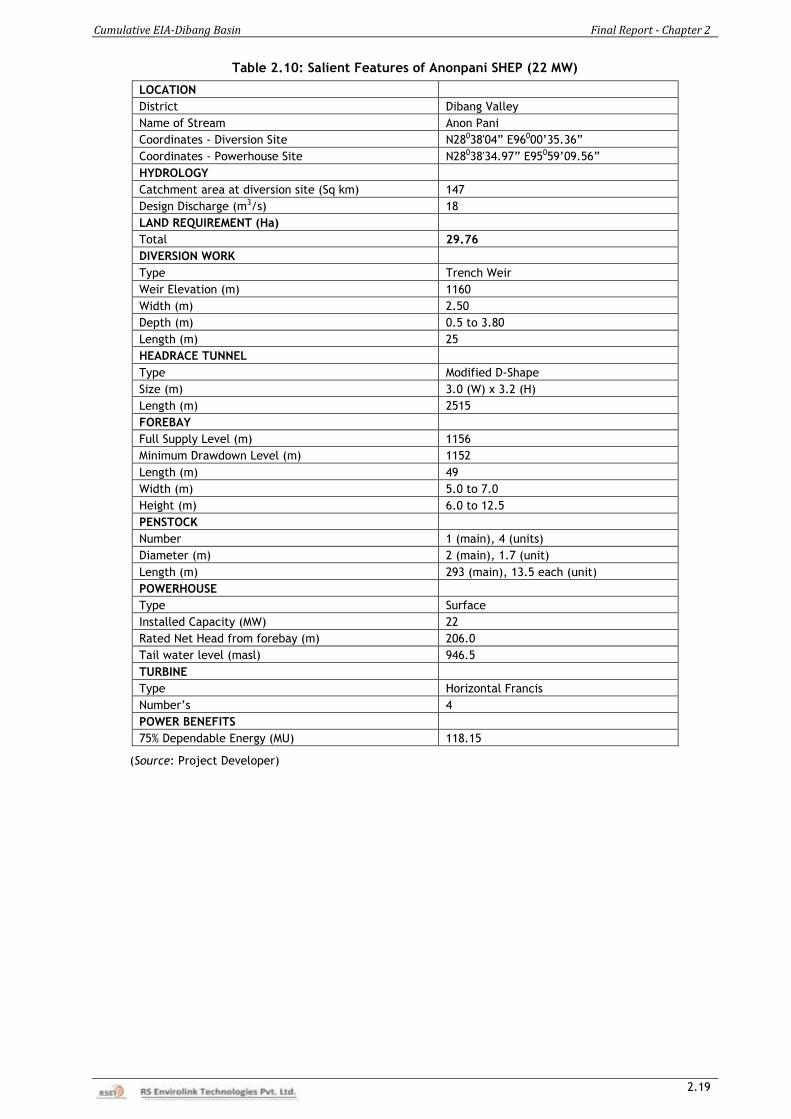
Cumulative EIA-Dibang Basin Final Report - Chapter 2
2.19
Table 2.10: Salient Features of Anonpani SHEP (22 MW)
LOCATION
District Dibang Valley
Name of Stream Anon Pani
Coordinates - Diversion Site N28038'04” E96000’35.36”
Coordinates - Powerhouse Site N28038'34.97” E95059’09.56”
HYDROLOGY
Catchment area at diversion site (Sq km) 147
Design Discharge (m3/s) 18
LAND REQUIREMENT (Ha)
Total 29.76
DIVERSION WORK
Type Trench Weir
Weir Elevation (m) 1160
Width (m) 2.50
Depth (m) 0.5 to 3.80
Length (m) 25
HEADRACE TUNNEL
Type Modified D-Shape
Size (m) 3.0 (W) x 3.2 (H)
Length (m) 2515
FOREBAY
Full Supply Level (m) 1156
Minimum Drawdown Level (m) 1152
Length (m) 49
Width (m) 5.0 to 7.0
Height (m) 6.0 to 12.5
PENSTOCK
Number 1 (main), 4 (units)
Diameter (m) 2 (main), 1.7 (unit)
Length (m) 293 (main), 13.5 each (unit)
POWERHOUSE
Type Surface
Installed Capacity (MW) 22
Rated Net Head from forebay (m) 206.0
Tail water level (masl) 946.5
TURBINE
Type Horizontal Francis
Number’s 4
POWER BENEFITS
75% Dependable Energy (MU) 118.15
(Source: Project Developer)
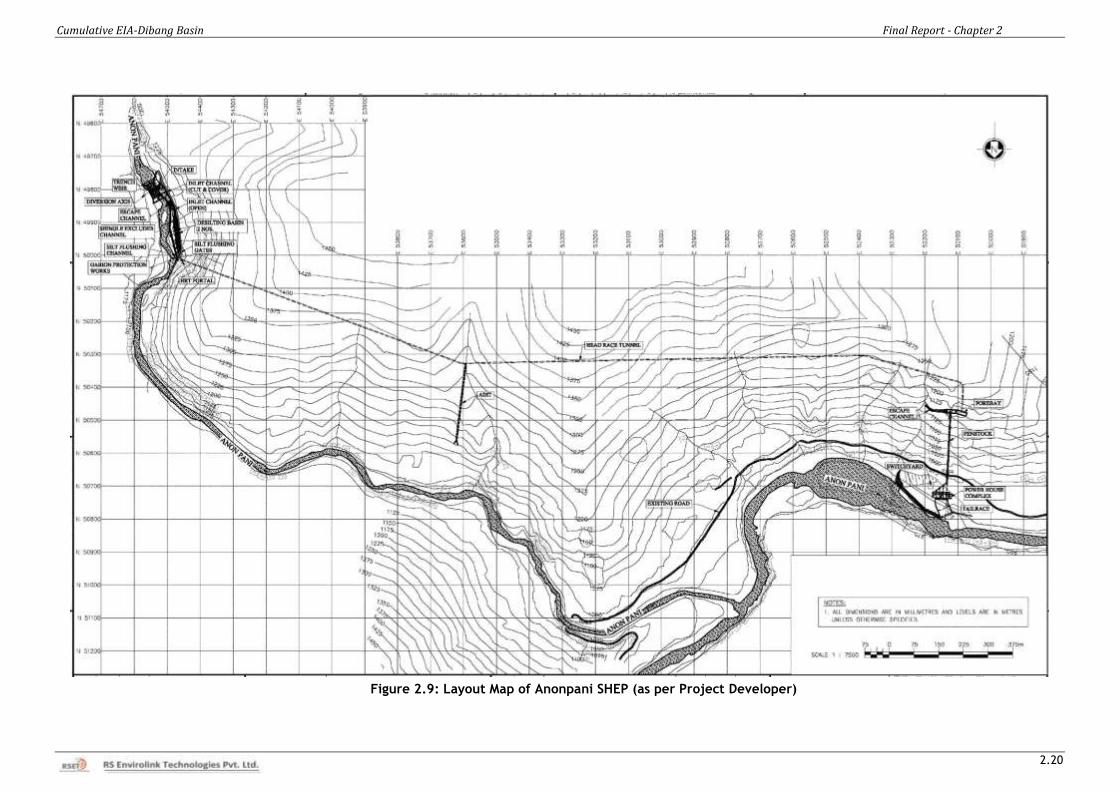
Cumulative EIA-Dibang Basin Final Report - Chapter 2
2.20
Figure 2.9: Layout Map of Anonpani SHEP (as per Project Developer)
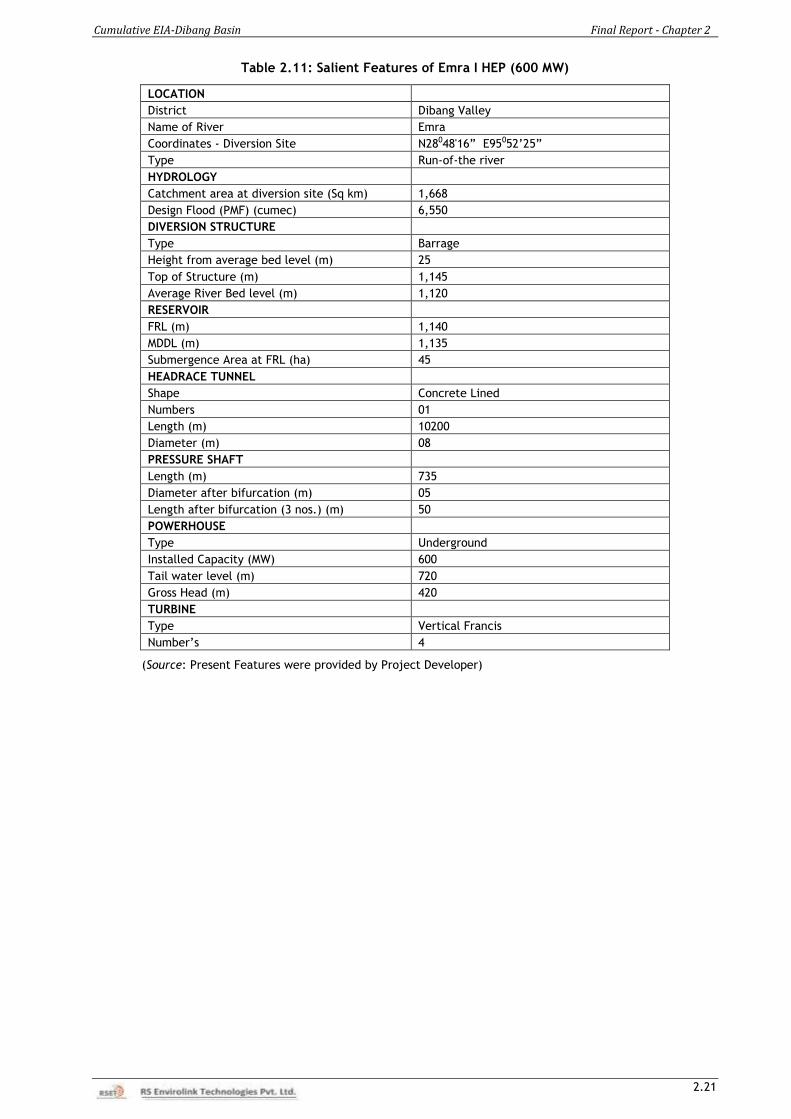
Cumulative EIA-Dibang Basin Final Report - Chapter 2
2.21
Table 2.11: Salient Features of Emra I HEP (600 MW)
LOCATION
District Dibang Valley
Name of River Emra
Coordinates - Diversion Site N28048'16” E95052’25”
Type Run-of-the river
HYDROLOGY
Catchment area at diversion site (Sq km) 1,668
Design Flood (PMF) (cumec) 6,550
DIVERSION STRUCTURE
Type Barrage
Height from average bed level (m) 25
Top of Structure (m) 1,145
Average River Bed level (m) 1,120
RESERVOIR
FRL (m) 1,140
MDDL (m) 1,135
Submergence Area at FRL (ha) 45
HEADRACE TUNNEL
Shape Concrete Lined
Numbers 01
Length (m) 10200
Diameter (m) 08
PRESSURE SHAFT
Length (m) 735
Diameter after bifurcation (m) 05
Length after bifurcation (3 nos.) (m) 50
POWERHOUSE
Type Underground
Installed Capacity (MW) 600
Tail water level (m) 720
Gross Head (m) 420
TURBINE
Type Vertical Francis
Number’s 4
(Source: Present Features were provided by Project Developer)
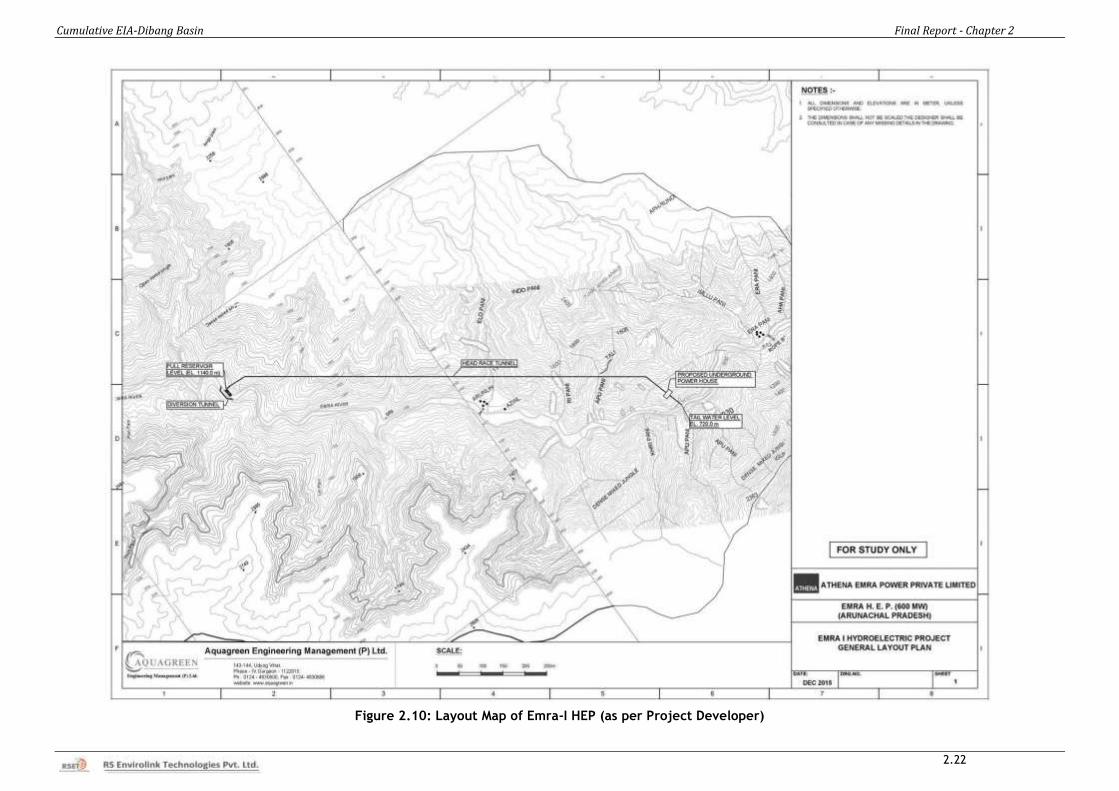
Cumulative EIA-Dibang Basin Final Report - Chapter 2
2.22
Figure 2.10: Layout Map of Emra-I HEP (as per Project Developer)
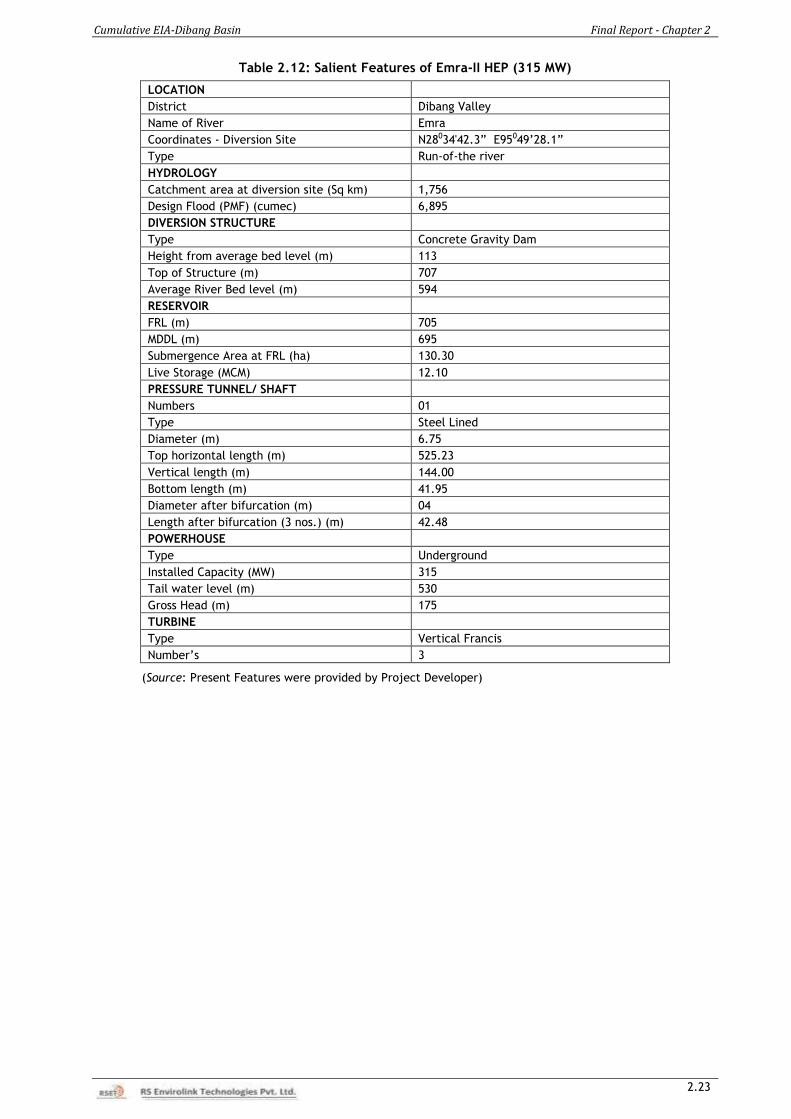
Cumulative EIA-Dibang Basin Final Report - Chapter 2
2.23
Table 2.12: Salient Features of Emra-II HEP (315 MW)
LOCATION
District Dibang Valley
Name of River Emra
Coordinates - Diversion Site N28034'42.3” E95049’28.1”
Type Run-of-the river
HYDROLOGY
Catchment area at diversion site (Sq km) 1,756
Design Flood (PMF) (cumec) 6,895
DIVERSION STRUCTURE
Type Concrete Gravity Dam
Height from average bed level (m) 113
Top of Structure (m) 707
Average River Bed level (m) 594
RESERVOIR
FRL (m) 705
MDDL (m) 695
Submergence Area at FRL (ha) 130.30
Live Storage (MCM) 12.10
PRESSURE TUNNEL/ SHAFT
Numbers 01
Type Steel Lined
Diameter (m) 6.75
Top horizontal length (m) 525.23
Vertical length (m) 144.00
Bottom length (m) 41.95
Diameter after bifurcation (m) 04
Length after bifurcation (3 nos.) (m) 42.48
POWERHOUSE
Type Underground
Installed Capacity (MW) 315
Tail water level (m) 530
Gross Head (m) 175
TURBINE
Type Vertical Francis
Number’s 3
(Source: Present Features were provided by Project Developer)
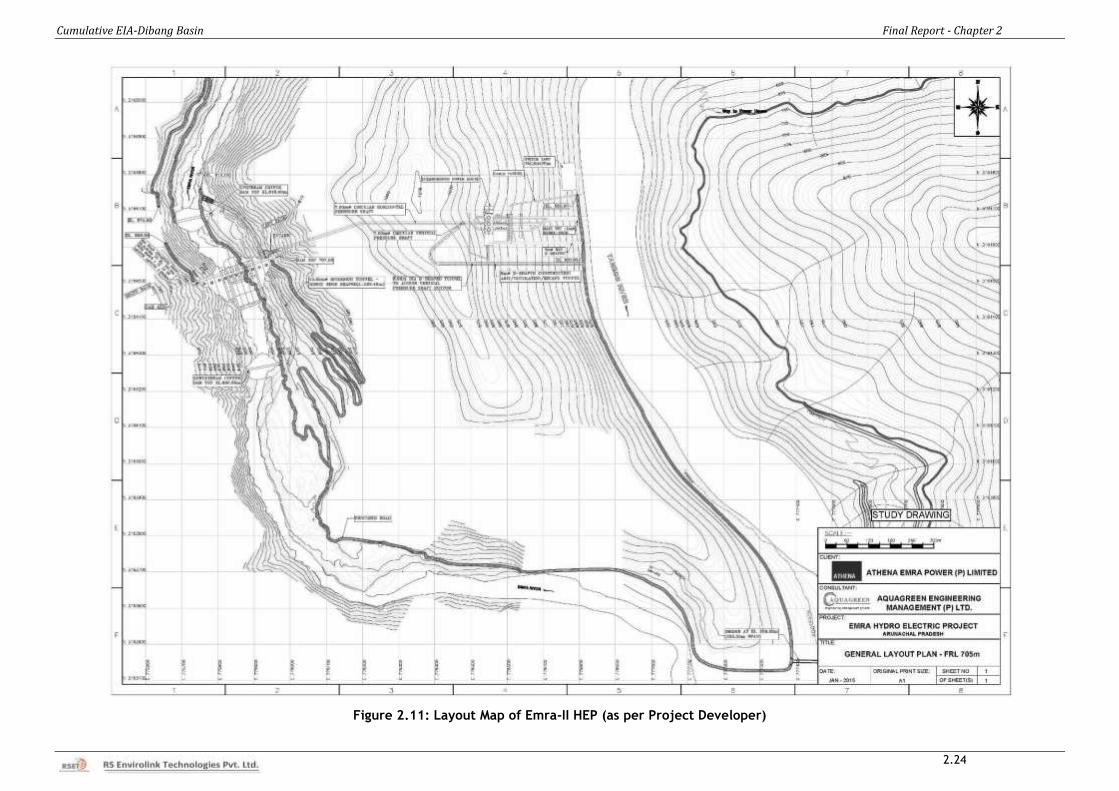
Cumulative EIA-Dibang Basin Final Report - Chapter 2
2.24
Figure 2.11: Layout Map of Emra-II HEP (as per Project Developer)
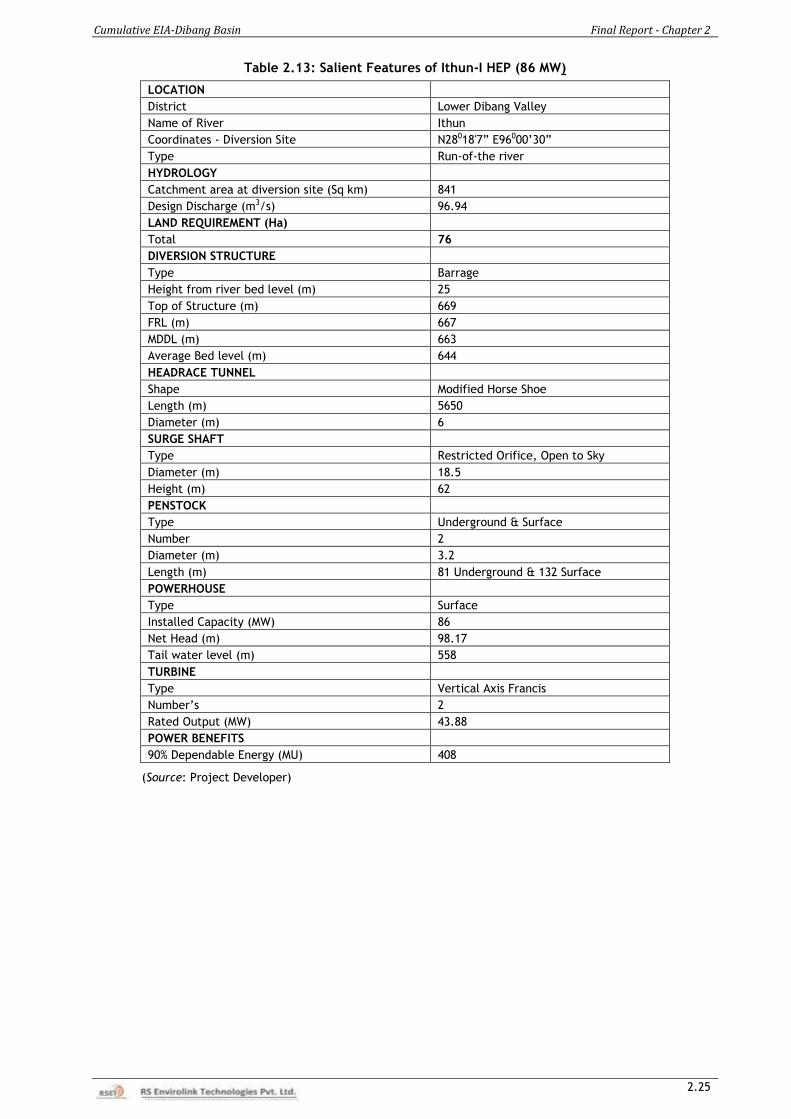
Cumulative EIA-Dibang Basin Final Report - Chapter 2
2.25
Table 2.13: Salient Features of Ithun-I HEP (86 MW)
LOCATION
District Lower Dibang Valley
Name of River Ithun
Coordinates - Diversion Site N28018'7” E96000’30”
Type Run-of-the river
HYDROLOGY
Catchment area at diversion site (Sq km) 841
Design Discharge (m3/s) 96.94
LAND REQUIREMENT (Ha)
Total 76
DIVERSION STRUCTURE
Type Barrage
Height from river bed level (m) 25
Top of Structure (m) 669
FRL (m) 667
MDDL (m) 663
Average Bed level (m) 644
HEADRACE TUNNEL
Shape Modified Horse Shoe
Length (m) 5650
Diameter (m) 6
SURGE SHAFT
Type Restricted Orifice, Open to Sky
Diameter (m) 18.5
Height (m) 62
PENSTOCK
Type Underground & Surface
Number 2
Diameter (m) 3.2
Length (m) 81 Underground & 132 Surface
POWERHOUSE
Type Surface
Installed Capacity (MW) 86
Net Head (m) 98.17
Tail water level (m) 558
TURBINE
Type Vertical Axis Francis
Number’s 2
Rated Output (MW) 43.88
POWER BENEFITS
90% Dependable Energy (MU) 408
(Source: Project Developer)
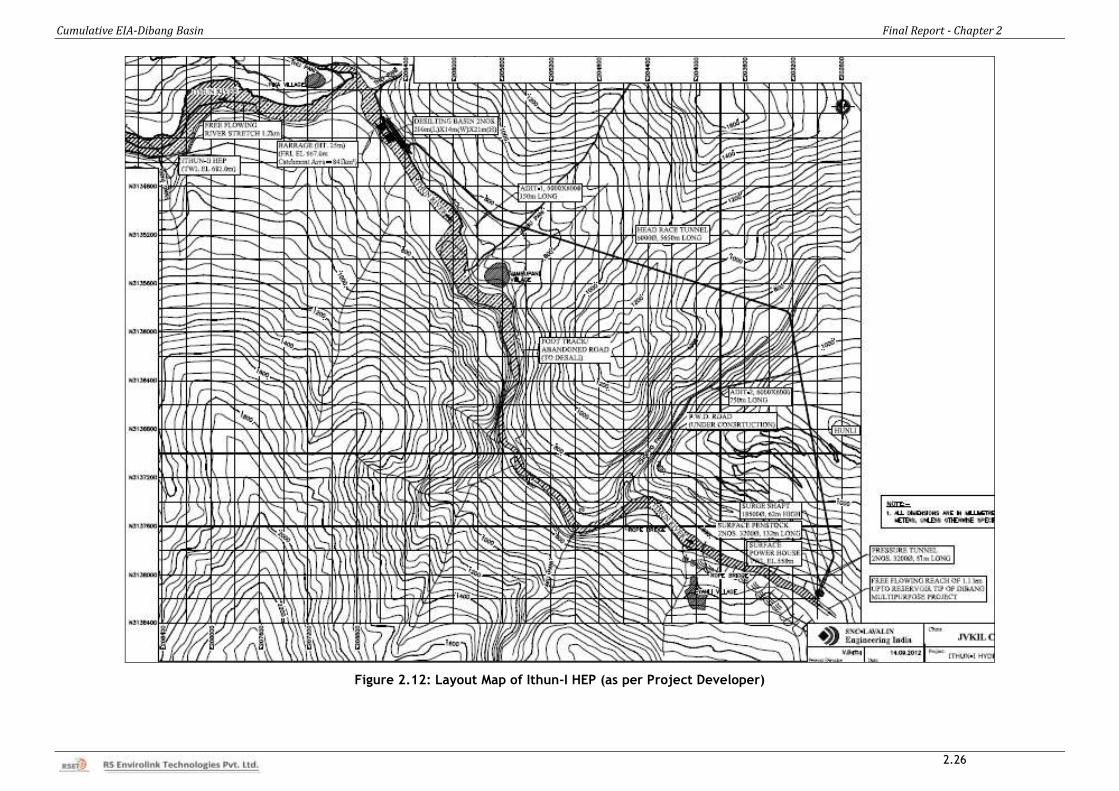
Cumulative EIA-Dibang Basin Final Report - Chapter 2
2.26
Figure 2.12: Layout Map of Ithun-I HEP (as per Project Developer)
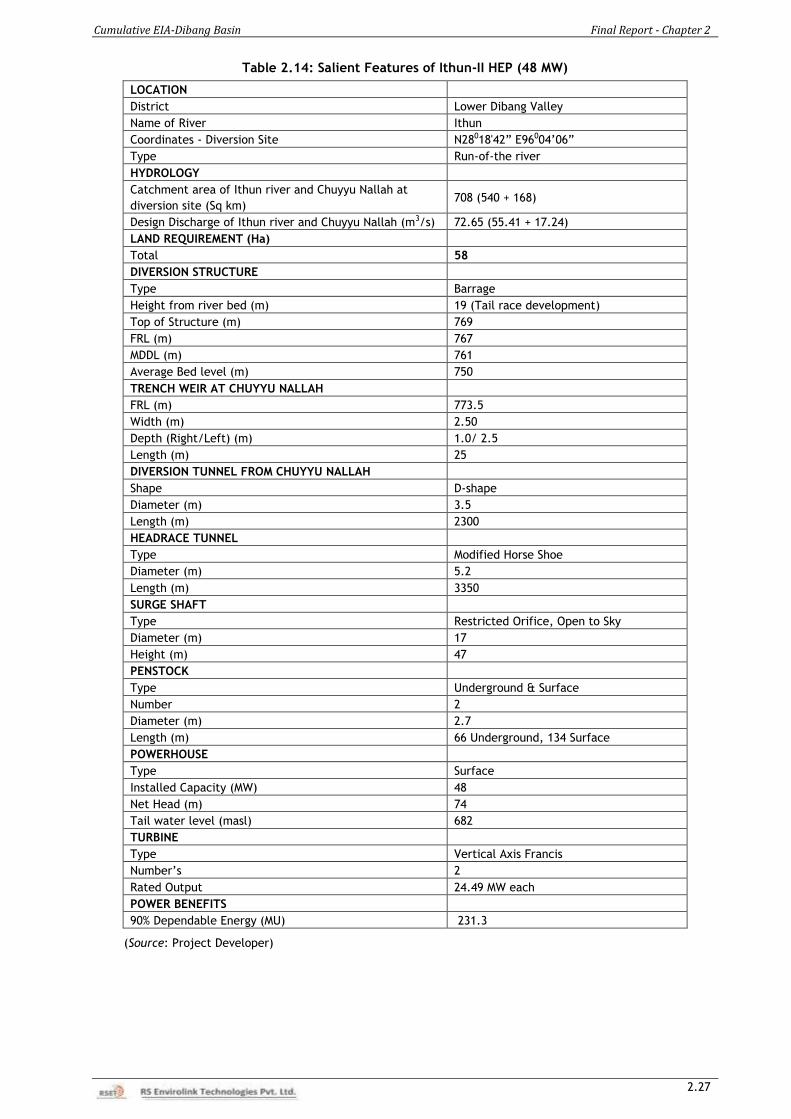
Cumulative EIA-Dibang Basin Final Report - Chapter 2
2.27
Table 2.14: Salient Features of Ithun-II HEP (48 MW)
LOCATION
District Lower Dibang Valley
Name of River Ithun
Coordinates - Diversion Site N28018'42” E96004’06”
Type Run-of-the river
HYDROLOGY
Catchment area of Ithun river and Chuyyu Nallah at
diversion site (Sq km) 708 (540 + 168)
Design Discharge of Ithun river and Chuyyu Nallah (m3/s) 72.65 (55.41 + 17.24)
LAND REQUIREMENT (Ha)
Total 58
DIVERSION STRUCTURE
Type Barrage
Height from river bed (m) 19 (Tail race development)
Top of Structure (m) 769
FRL (m) 767
MDDL (m) 761
Average Bed level (m) 750
TRENCH WEIR AT CHUYYU NALLAH
FRL (m) 773.5
Width (m) 2.50
Depth (Right/Left) (m) 1.0/ 2.5
Length (m) 25
DIVERSION TUNNEL FROM CHUYYU NALLAH
Shape D-shape
Diameter (m) 3.5
Length (m) 2300
HEADRACE TUNNEL
Type Modified Horse Shoe
Diameter (m) 5.2
Length (m) 3350
SURGE SHAFT
Type Restricted Orifice, Open to Sky
Diameter (m) 17
Height (m) 47
PENSTOCK
Type Underground & Surface
Number 2
Diameter (m) 2.7
Length (m) 66 Underground, 134 Surface
POWERHOUSE
Type Surface
Installed Capacity (MW) 48
Net Head (m) 74
Tail water level (masl) 682
TURBINE
Type Vertical Axis Francis
Number’s 2
Rated Output 24.49 MW each
POWER BENEFITS
90% Dependable Energy (MU) 231.3
(Source: Project Developer)
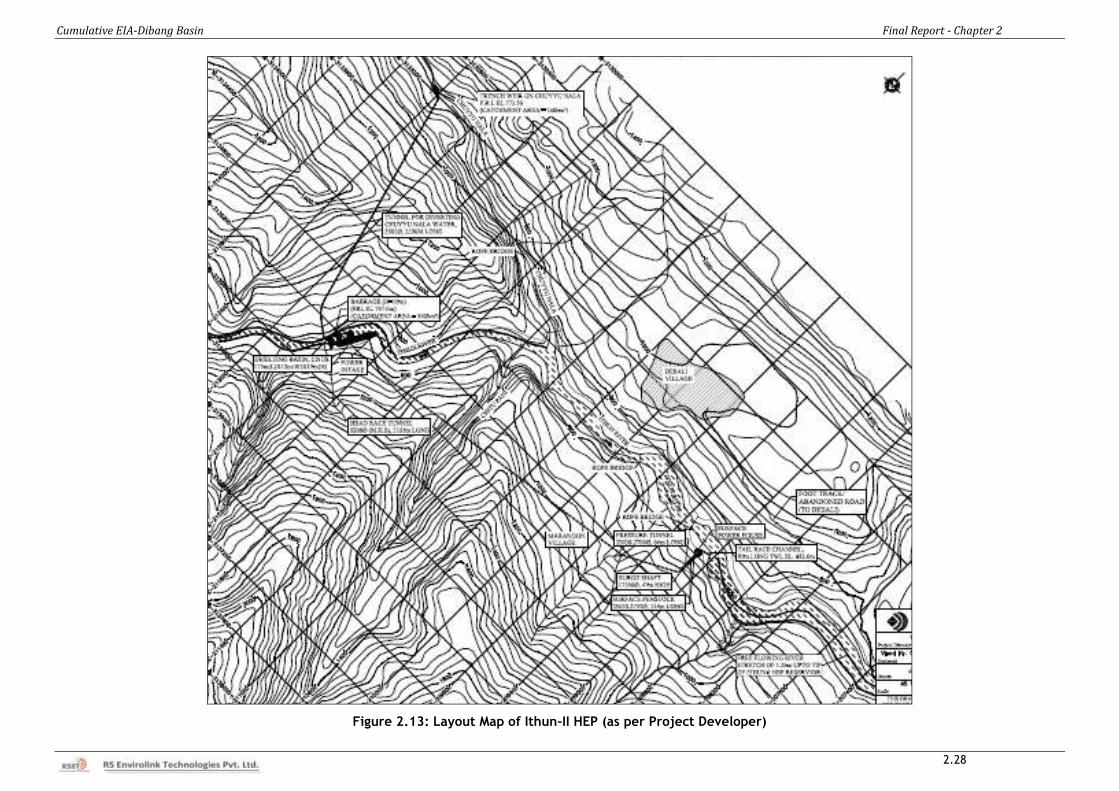
Cumulative EIA-Dibang Basin Final Report - Chapter 2
2.28
Figure 2.13: Layout Map of Ithun-II HEP (as per Project Developer)
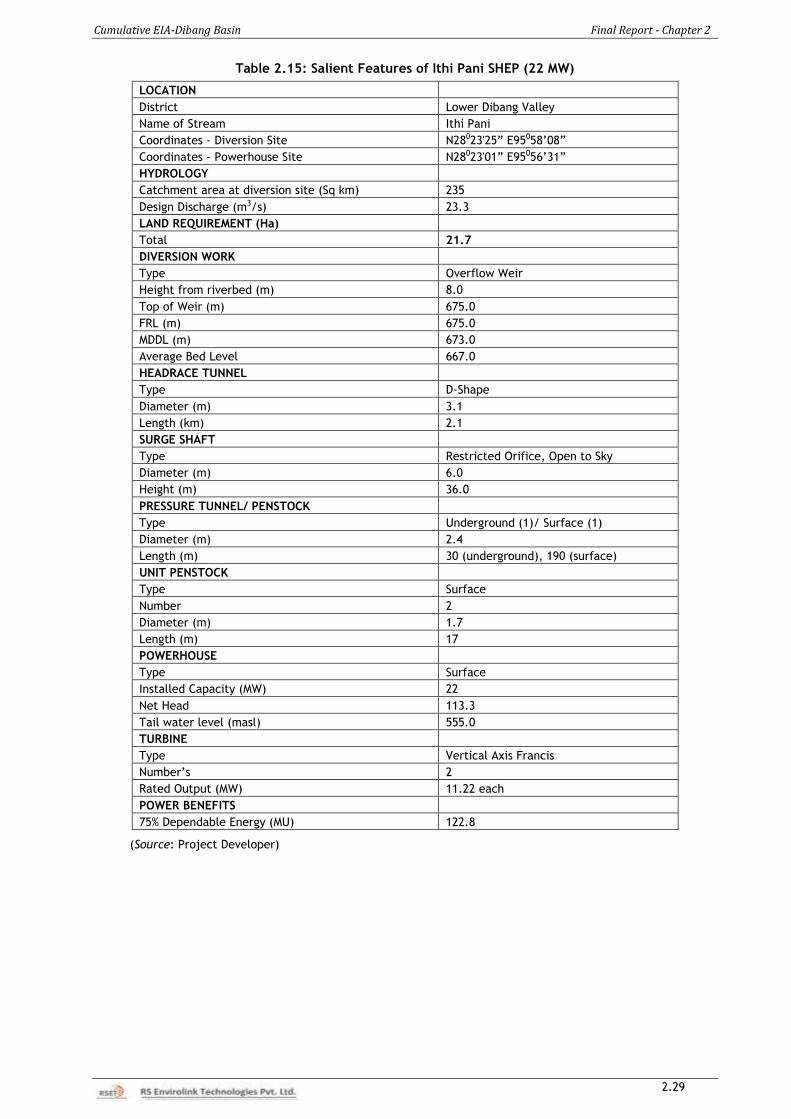
Cumulative EIA-Dibang Basin Final Report - Chapter 2
2.29
Table 2.15: Salient Features of Ithi Pani SHEP (22 MW)
LOCATION
District Lower Dibang Valley
Name of Stream Ithi Pani
Coordinates - Diversion Site N28023'25” E95058’08”
Coordinates - Powerhouse Site N28023'01” E95056’31”
HYDROLOGY
Catchment area at diversion site (Sq km) 235
Design Discharge (m3/s) 23.3
LAND REQUIREMENT (Ha)
Total 21.7
DIVERSION WORK
Type Overflow Weir
Height from riverbed (m) 8.0
Top of Weir (m) 675.0
FRL (m) 675.0
MDDL (m) 673.0
Average Bed Level 667.0
HEADRACE TUNNEL
Type D-Shape
Diameter (m) 3.1
Length (km) 2.1
SURGE SHAFT
Type Restricted Orifice, Open to Sky
Diameter (m) 6.0
Height (m) 36.0
PRESSURE TUNNEL/ PENSTOCK
Type Underground (1)/ Surface (1)
Diameter (m) 2.4
Length (m) 30 (underground), 190 (surface)
UNIT PENSTOCK
Type Surface
Number 2
Diameter (m) 1.7
Length (m) 17
POWERHOUSE
Type Surface
Installed Capacity (MW) 22
Net Head 113.3
Tail water level (masl) 555.0
TURBINE
Type Vertical Axis Francis
Number’s 2
Rated Output (MW) 11.22 each
POWER BENEFITS
75% Dependable Energy (MU) 122.8
(Source: Project Developer)
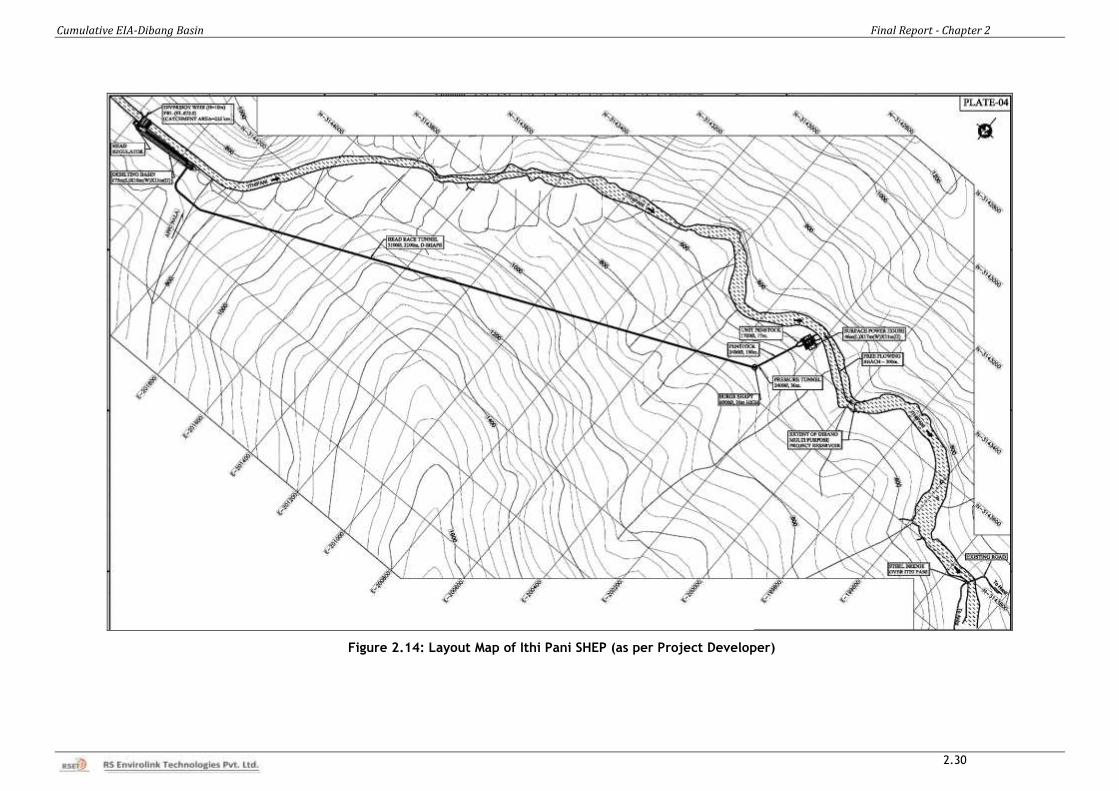
Cumulative EIA-Dibang Basin Final Report - Chapter 2
2.30
Figure 2.14: Layout Map of Ithi Pani SHEP (as per Project Developer)
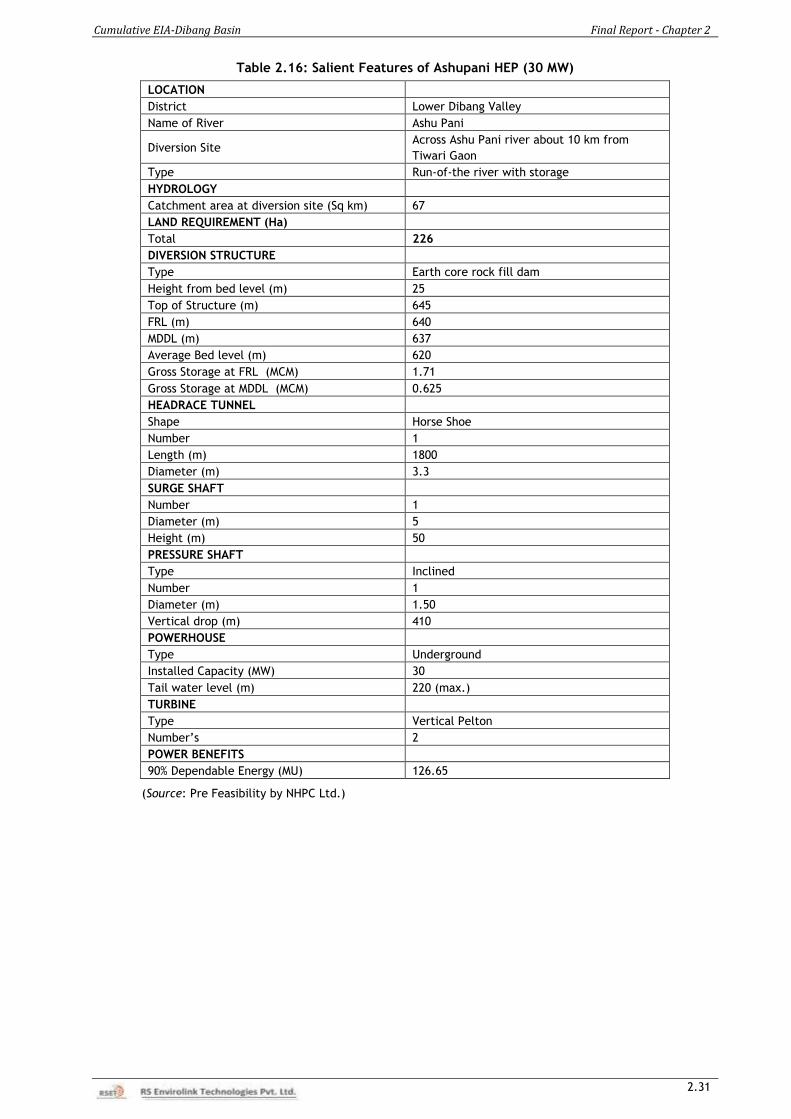
Cumulative EIA-Dibang Basin Final Report - Chapter 2
2.31
Table 2.16: Salient Features of Ashupani HEP (30 MW)
LOCATION
District Lower Dibang Valley
Name of River Ashu Pani
Diversion Site Across Ashu Pani river about 10 km from
Tiwari Gaon
Type Run-of-the river with storage
HYDROLOGY
Catchment area at diversion site (Sq km) 67
LAND REQUIREMENT (Ha)
Total 226
DIVERSION STRUCTURE
Type Earth core rock fill dam
Height from bed level (m) 25
Top of Structure (m) 645
FRL (m) 640
MDDL (m) 637
Average Bed level (m) 620
Gross Storage at FRL (MCM) 1.71
Gross Storage at MDDL (MCM) 0.625
HEADRACE TUNNEL
Shape Horse Shoe
Number 1
Length (m) 1800
Diameter (m) 3.3
SURGE SHAFT
Number 1
Diameter (m) 5
Height (m) 50
PRESSURE SHAFT
Type Inclined
Number 1
Diameter (m) 1.50
Vertical drop (m) 410
POWERHOUSE
Type Underground
Installed Capacity (MW) 30
Tail water level (m) 220 (max.)
TURBINE
Type Vertical Pelton
Number’s 2
POWER BENEFITS
90% Dependable Energy (MU) 126.65
(Source: Pre Feasibility by NHPC Ltd.)
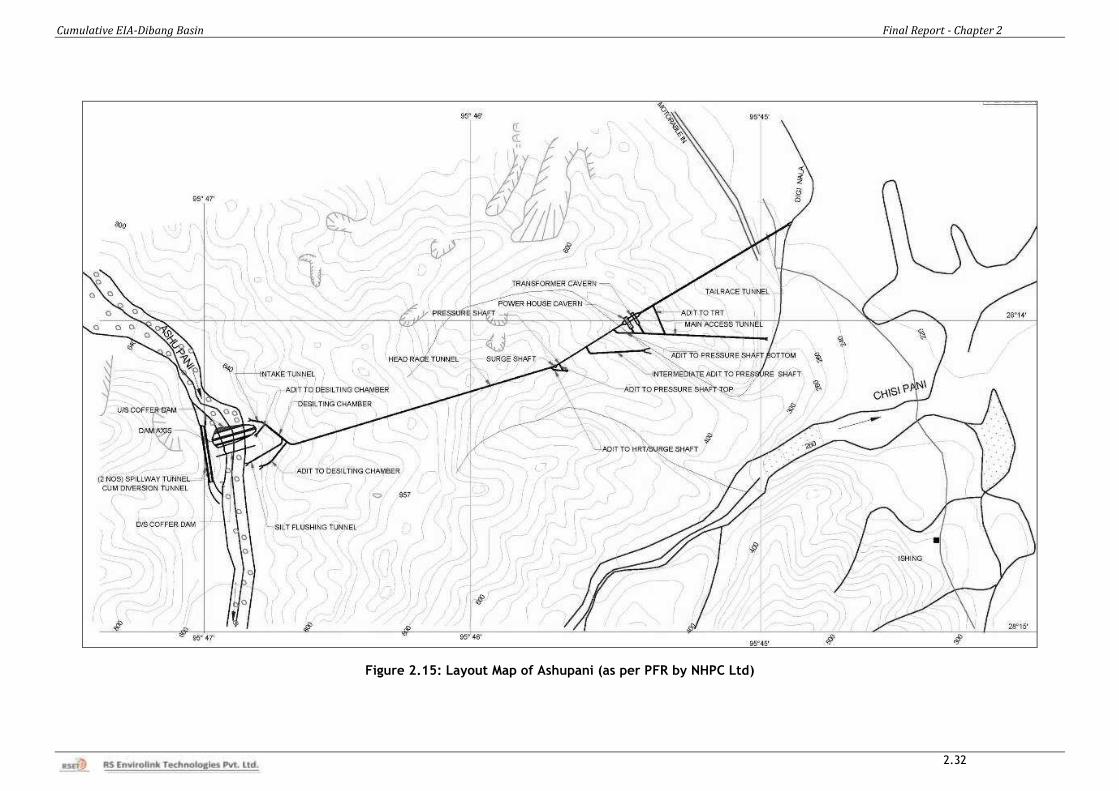
Cumulative EIA-Dibang Basin Final Report - Chapter 2
2.32
Figure 2.15: Layout Map of Ashupani (as per PFR by NHPC Ltd)
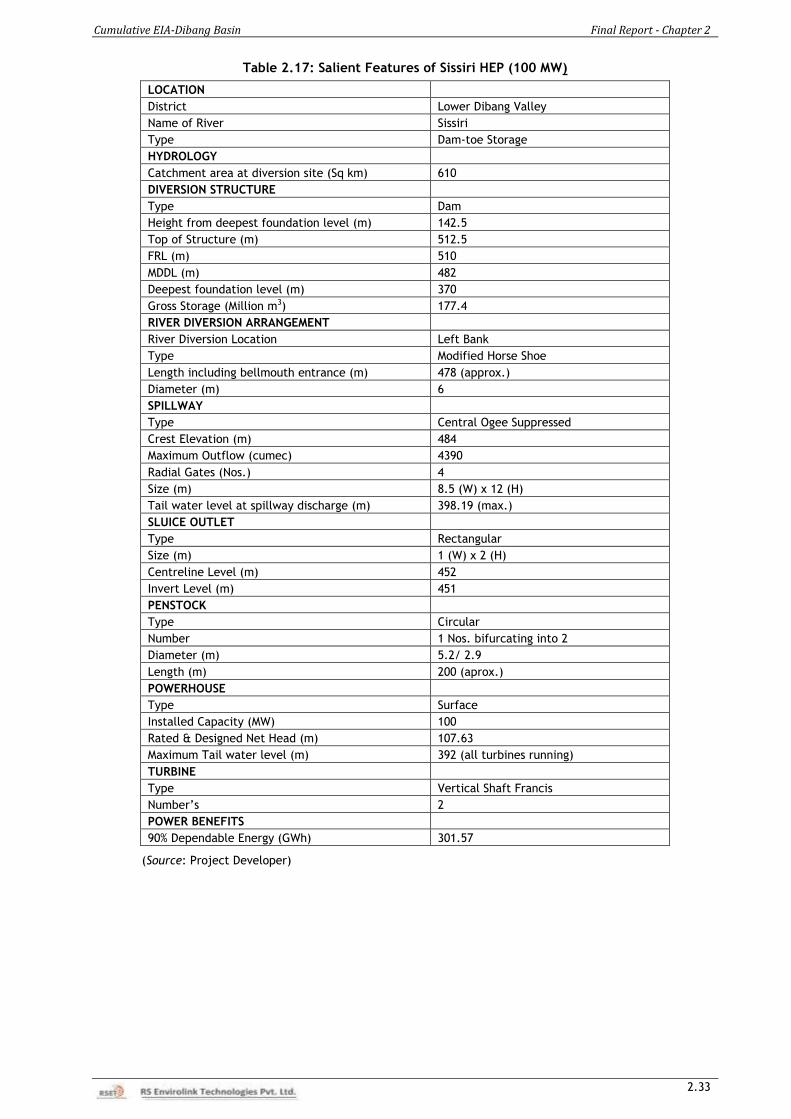
Cumulative EIA-Dibang Basin Final Report - Chapter 2
2.33
Table 2.17: Salient Features of Sissiri HEP (100 MW)
LOCATION
District Lower Dibang Valley
Name of River Sissiri
Type Dam-toe Storage
HYDROLOGY
Catchment area at diversion site (Sq km) 610
DIVERSION STRUCTURE
Type Dam
Height from deepest foundation level (m) 142.5
Top of Structure (m) 512.5
FRL (m) 510
MDDL (m) 482
Deepest foundation level (m) 370
Gross Storage (Million m3) 177.4
RIVER DIVERSION ARRANGEMENT
River Diversion Location Left Bank
Type Modified Horse Shoe
Length including bellmouth entrance (m) 478 (approx.)
Diameter (m) 6
SPILLWAY
Type Central Ogee Suppressed
Crest Elevation (m) 484
Maximum Outflow (cumec) 4390
Radial Gates (Nos.) 4
Size (m) 8.5 (W) x 12 (H)
Tail water level at spillway discharge (m) 398.19 (max.)
SLUICE OUTLET
Type Rectangular
Size (m) 1 (W) x 2 (H)
Centreline Level (m) 452
Invert Level (m) 451
PENSTOCK
Type Circular
Number 1 Nos. bifurcating into 2
Diameter (m) 5.2/ 2.9
Length (m) 200 (aprox.)
POWERHOUSE
Type Surface
Installed Capacity (MW) 100
Rated & Designed Net Head (m) 107.63
Maximum Tail water level (m) 392 (all turbines running)
TURBINE
Type Vertical Shaft Francis
Number’s 2
POWER BENEFITS
90% Dependable Energy (GWh) 301.57
(Source: Project Developer)
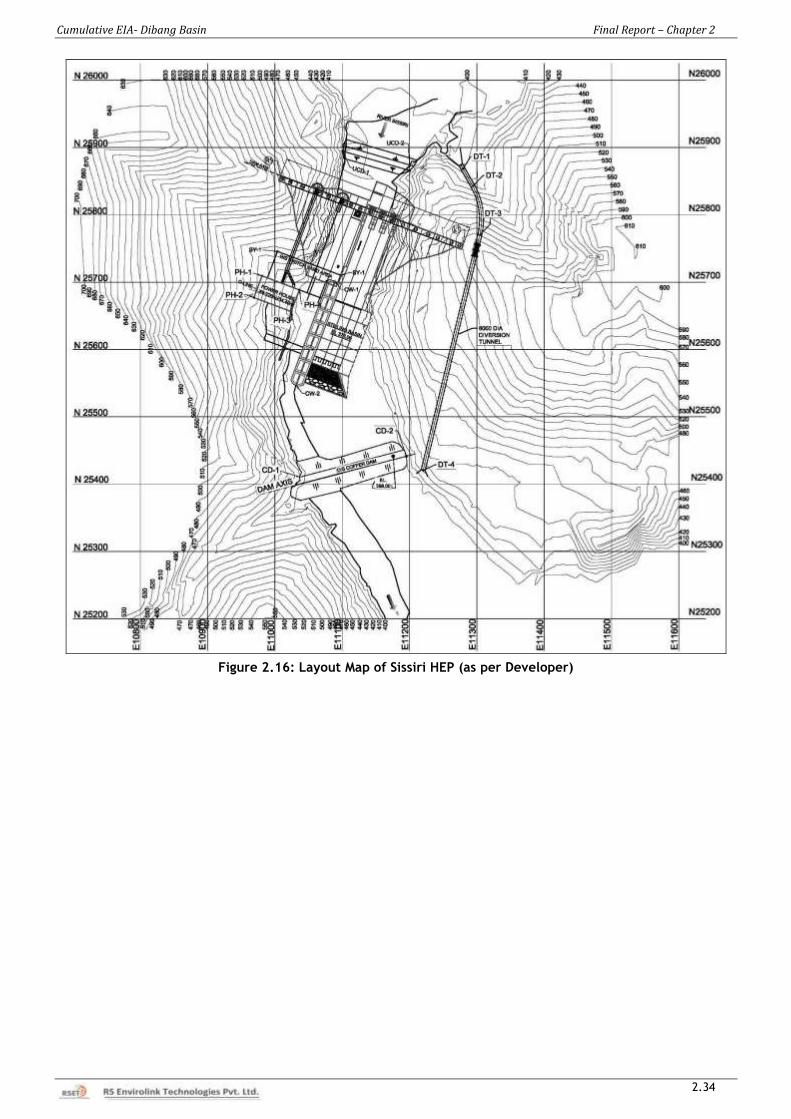
Cumulative EIA- Dibang Basin Final Report – Chapter 2
2.34
Figure 2.16: Layout Map of Sissiri HEP (as per Developer)
Cumulative EIA- Dibang Basin Final Report – Chapter 3
3.1
CHAPTER-3
METHODOLOGY
In order to undertake Cumulative Environment Impact Assessment (CEIA) study of Dibang river
basin, present environmental baseline setting of different components was assessed primarily
through documentation, collection, compilation of data available with different Central
Government agencies like Botanical Survey of India (BSI), Kolkata, Zoological Survey of India
(ZSI), Kolkata, Forest Survey of India (FSI), Dehradun, Indian Institute of Remote Sensing (IIRS),
Dehradun and Department of Environment & Forests, Itanagar, Government of Arunachal
Pradesh (GoAP). In addition data/ information was also collected from published reports,
research articles, trip reports, etc. The data on terrestrial ecology and aquatic ecology was
further supplemented with one season (monsoon) field surveys and sampling undertaken at
various locations spread over the entire Dibang basin essentially covering sites nearby the
proposed hydropower projects as mandated by EAC at MoEF&CC, GoI. Salient features of all the
proposed hydropower projects were obtained from Department of Hydropower Development,
GoAP. In this chapter, methodology for the collection of data on different environmental
baseline parameters has been given.
3.1 LAND USE/ LAND COVER MAPPING
Land use and land cover map of the basin was prepared from the data of 2013 was procured
from Forest Survey of India (FSI). It was further refined by ground checks carried out during the
field surveys. For this purpose FCC of the entire study area was generated from digital satellite
data of LISS-III, IRS-P6.
False Color Composite (FCC) covering the entire Dibang basin was prepared using enhanced
data of Bands 2, 3 and 4 of LISS III, IRS-P6 as well from LANDSAT ETM+ data. The image was
interpreted digitally using various digital image-processing techniques. The data procured from
FSI was downloaded and further processed to generate mosaic of entire Dibang basin (see
Figure 3.1).
3.1.1 Classification Scheme
In order to understand the extent of forest cover in particular, the classification scheme
suggested by Forest Survey of India, Dehradun was adopted for the preparation of land
use/land cover map of the basin. Three forest density classes were interpreted for the forest
cover mapping. The forests with >70% canopy cover has been demarcated as Very Dense Forest,
between 40% and 70% canopy cover was delineated as Moderately Dense Forest and between
10% and 40% crown density as Open Forest. Furthermore, degraded forests, grass covered
slopes with canopy density <10% were delineated as Scrubs. The area not included in any of the
above classes is delineated as Non-forest land cover.
Data Set Used
Forest Surveys of India : The Status of Forest Survey of India (2013)
Projection and Datum : UTM and WGS 84; 46 North
Satellite Data : IRS P6 LISS 3 and LANDSAT ETM+
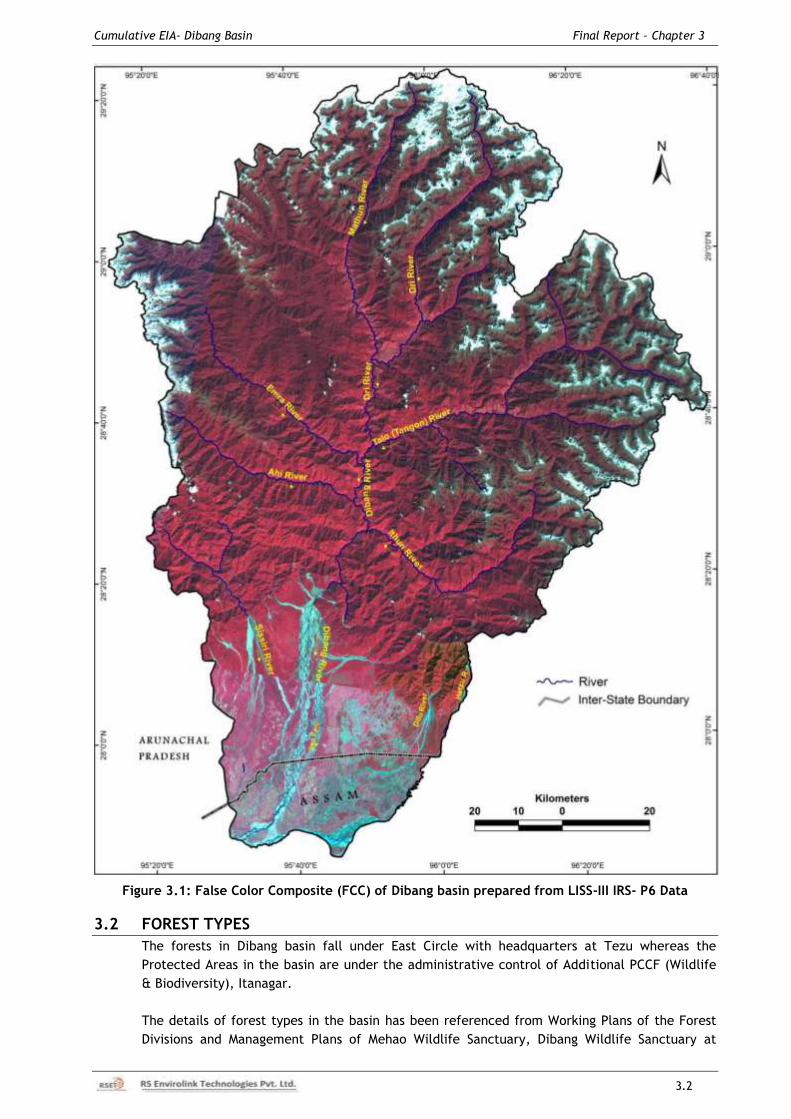
Cumulative EIA- Dibang Basin Final Report – Chapter 3
3.2
Figure 3.1: False Color Composite (FCC) of Dibang basin prepared from LISS-III IRS- P6 Data
3.2 FOREST TYPES
The forests in Dibang basin fall under East Circle with headquarters at Tezu whereas the
Protected Areas in the basin are under the administrative control of Additional PCCF (Wildlife
& Biodiversity), Itanagar.
The details of forest types in the basin has been referenced from Working Plans of the Forest
Divisions and Management Plans of Mehao Wildlife Sanctuary, Dibang Wildlife Sanctuary at
Cumulative EIA- Dibang Basin Final Report – Chapter 3
3.3
Roing and Anini social forestry division headquarter at Anini, information provided by the
Department of Environment & Forests, Government of Arunachal Pradesh. However the forest
type classification of Champion and Seth (1968) has been followed in the report.
3.3 COMMUNITY STRUCTURE
The objectives of the phytosociological surveys to study community structure are as follows:
To prepare an inventory of various groups plants (Angiosperms, Gymnosperms,
Pteridophytes, Bryophytes and Lichens) in the basin
To assess the plant species composition and other ecological parameters like
frequency, density, basal area, and
Diversity and dominance indices like Shannon Wiener Diversity Index, Evenness Index
and Importance value Index
In order to understand the community structure/species composition, vegetation sampling was
done at 21 different locations in the Dibang basin during monsoon in September, 2015 covering
forests in and around locations of structures like dam site and submergence area, power house
site of the proposed hydropower projects. The list of sampling locations is given in Table 3.1
their location on the map of Dibang basin has been marked and is shown in Figure 3.2.
3.4 SAMPLING LOCATIONS AND METHODOLOGY
The size and number of quadrats needed were determined using the species-area curve (Misra,
1968). The data on vegetation were quantitatively analyzed for abundance, density, frequency as
per the methodology given in Curtis & McIntosh (1950). The Importance Value Index (IVI) for trees
was determined as the sum of relative density, relative frequency and relative dominance
(Curtis, 1959).
Sampling Site Selection
The sampling locations were selected on the basis of the area located in the vicinity of
proposed projects and its components. Entire Dibang basin has been covered i.e. 21 sampling
location were selected for the study. Sampling locations were identified to capture the
baseline status and depending upon the anticipated changes in the topography, vegetation,
forest types, water quality, aquatic ecology, etc. so as to capture the representative baseline
of the area. Proposed project locations were also kept in mind while identifying the sampling
locations, as these locations will be direct impact areas during project construction and
operation. Hydropower projects can spread over several km along river stretches and cannot be
represented by a single point sampling locations. Reach of project is considered from tip of the
FRL to the tail water outfall point. Therefore, for projects in cascade each sampling location
can represent more than one project also. Moreover, sampling locations vegetation as well as
aquatic ecology wherein sampling sites sometimes extend over a distance of 2-3 km for the
collection of composite water sample while terrestrial ecology sampling sites were invariably
spread over an area of 4-5 sq km over which 10-14 number of 10mx10m quadrats were laid to
capture the vegetation structure.
A good representation of baseline has been done focusing more on the locations where changes
are expected in vegetation profile. Sampling locations were selected keeping in mind the
project locations and their accessibility also.
Twenty one sampling sites located within the basin were selected for carrying out phyto-
sociological surveys of the vegetation and in addition an inventory of various floristic elements
was also prepared by walking along different transects around these sampling sites. In order to
understand the composition of the vegetation, most of the plant species were identified in the
field itself whereas the species that could not be identified, the photographs of different plant
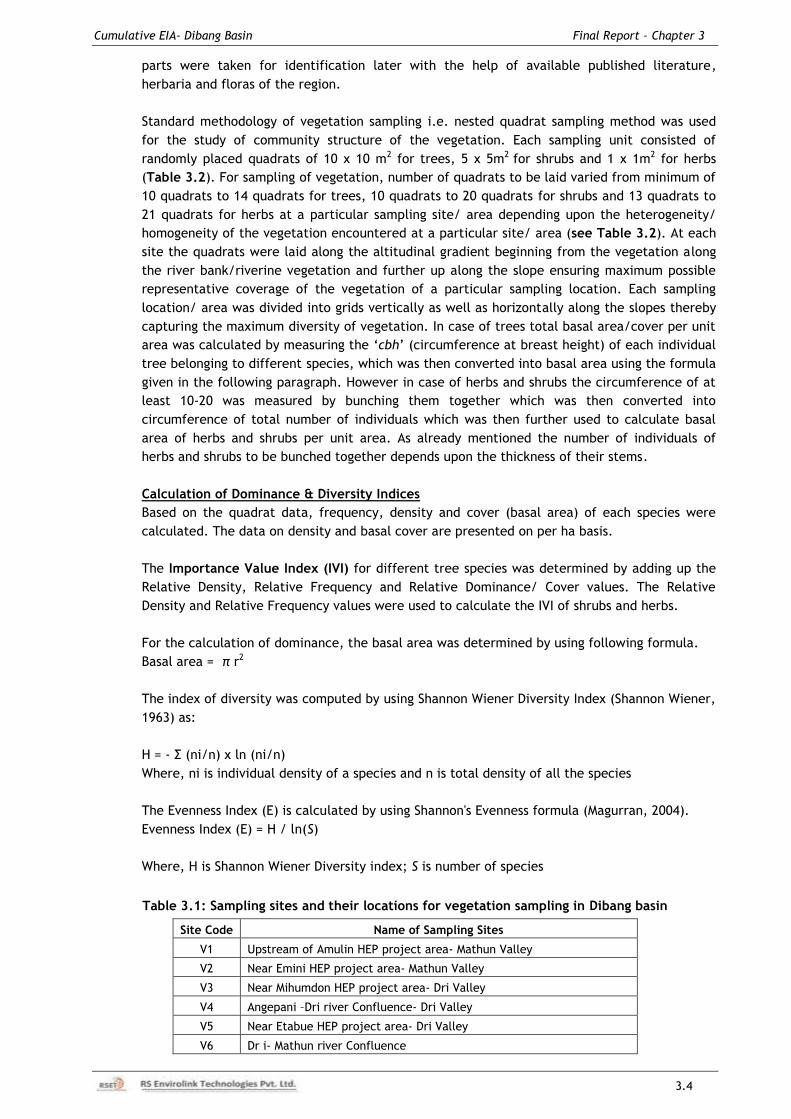
Cumulative EIA- Dibang Basin Final Report – Chapter 3
3.4
parts were taken for identification later with the help of available published literature,
herbaria and floras of the region.
Standard methodology of vegetation sampling i.e. nested quadrat sampling method was used
for the study of community structure of the vegetation. Each sampling unit consisted of
randomly placed quadrats of 10 x 10 m2 for trees, 5 x 5m2 for shrubs and 1 x 1m2 for herbs
(Table 3.2). For sampling of vegetation, number of quadrats to be laid varied from minimum of
10 quadrats to 14 quadrats for trees, 10 quadrats to 20 quadrats for shrubs and 13 quadrats to
21 quadrats for herbs at a particular sampling site/ area depending upon the heterogeneity/
homogeneity of the vegetation encountered at a particular site/ area (see Table 3.2). At each
site the quadrats were laid along the altitudinal gradient beginning from the vegetation along
the river bank/riverine vegetation and further up along the slope ensuring maximum possible
representative coverage of the vegetation of a particular sampling location. Each sampling
location/ area was divided into grids vertically as well as horizontally along the slopes thereby
capturing the maximum diversity of vegetation. In case of trees total basal area/cover per unit
area was calculated by measuring the ‘cbh’ (circumference at breast height) of each individual
tree belonging to different species, which was then converted into basal area using the formula
given in the following paragraph. However in case of herbs and shrubs the circumference of at
least 10-20 was measured by bunching them together which was then converted into
circumference of total number of individuals which was then further used to calculate basal
area of herbs and shrubs per unit area. As already mentioned the number of individuals of
herbs and shrubs to be bunched together depends upon the thickness of their stems.
Calculation of Dominance & Diversity Indices
Based on the quadrat data, frequency, density and cover (basal area) of each species were
calculated. The data on density and basal cover are presented on per ha basis.
The Importance Value Index (IVI) for different tree species was determined by adding up the
Relative Density, Relative Frequency and Relative Dominance/ Cover values. The Relative
Density and Relative Frequency values were used to calculate the IVI of shrubs and herbs.
For the calculation of dominance, the basal area was determined by using following formula.
Basal area = π r2
The index of diversity was computed by using Shannon Wiener Diversity Index (Shannon Wiener,
1963) as:
H = - Σ (ni/n) x ln (ni/n)
Where, ni is individual density of a species and n is total density of all the species
The Evenness Index (E) is calculated by using Shannon's Evenness formula (Magurran, 2004).
Evenness Index (E) = H / ln(S)
Where, H is Shannon Wiener Diversity index; S is number of species
Table 3.1: Sampling sites and their locations for vegetation sampling in Dibang basin
Site Code Name of Sampling Sites
V1 Upstream of Amulin HEP project area- Mathun Valley
V2 Near Emini HEP project area- Mathun Valley
V3 Near Mihumdon HEP project area- Dri Valley
V4 Angepani –Dri river Confluence- Dri Valley
V5 Near Etabue HEP project area- Dri Valley
V6 Dr i- Mathun river Confluence
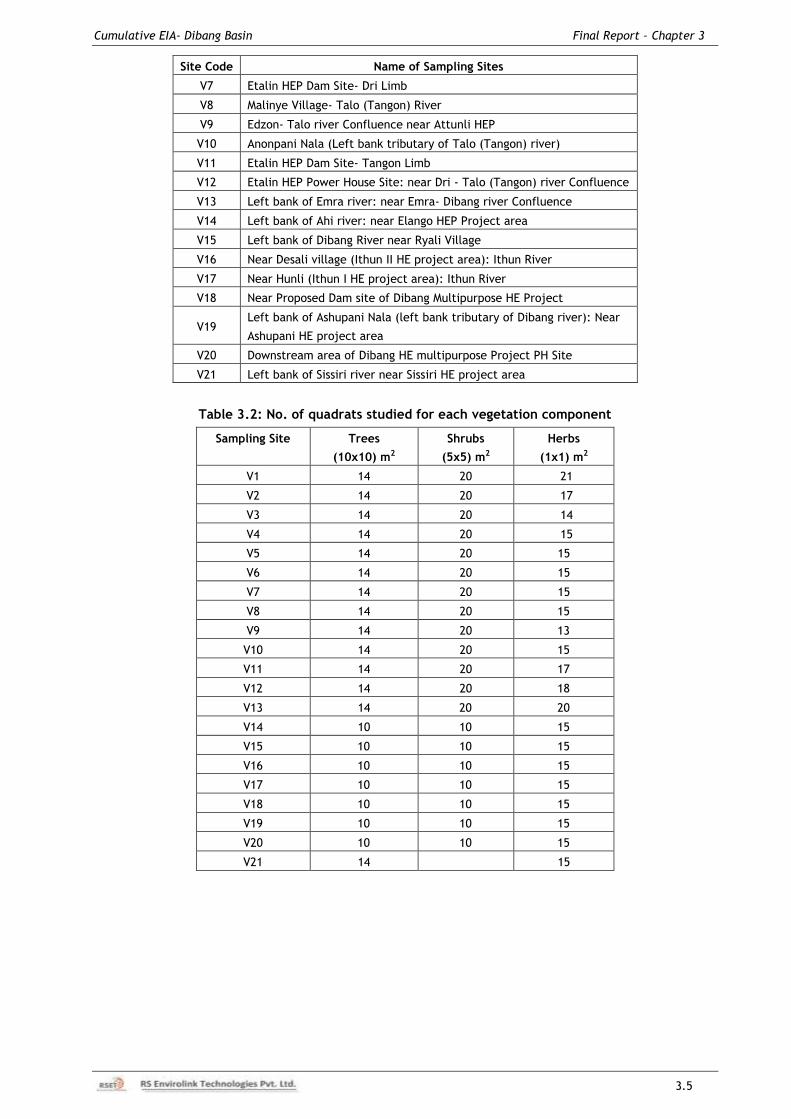
Cumulative EIA- Dibang Basin Final Report – Chapter 3
3.5
Site Code Name of Sampling Sites
V7 Etalin HEP Dam Site- Dri Limb
V8 Malinye Village- Talo (Tangon) River
V9 Edzon- Talo river Confluence near Attunli HEP
V10 Anonpani Nala (Left bank tributary of Talo (Tangon) river)
V11 Etalin HEP Dam Site- Tangon Limb
V12 Etalin HEP Power House Site: near Dri - Talo (Tangon) river Confluence
V13 Left bank of Emra river: near Emra- Dibang river Confluence
V14 Left bank of Ahi river: near Elango HEP Project area
V15 Left bank of Dibang River near Ryali Village
V16 Near Desali village (Ithun II HE project area): Ithun River
V17 Near Hunli (Ithun I HE project area): Ithun River
V18 Near Proposed Dam site of Dibang Multipurpose HE Project
V19 Left bank of Ashupani Nala (left bank tributary of Dibang river): Near
Ashupani HE project area
V20 Downstream area of Dibang HE multipurpose Project PH Site
V21 Left bank of Sissiri river near Sissiri HE project area
Table 3.2: No. of quadrats studied for each vegetation component
Sampling Site Trees
(10x10) m2
Shrubs
(5x5) m2
Herbs
(1x1) m2
V1 14 20 21
V2 14 20 17
V3 14 20 14
V4 14 20 15
V5 14 20 15
V6 14 20 15
V7 14 20 15
V8 14 20 15
V9 14 20 13
V10 14 20 15
V11 14 20 17
V12 14 20 18
V13 14 20 20
V14 10 10 15
V15 10 10 15
V16 10 10 15
V17 10 10 15
V18 10 10 15
V19 10 10 15
V20 10 10 15
V21 14 15
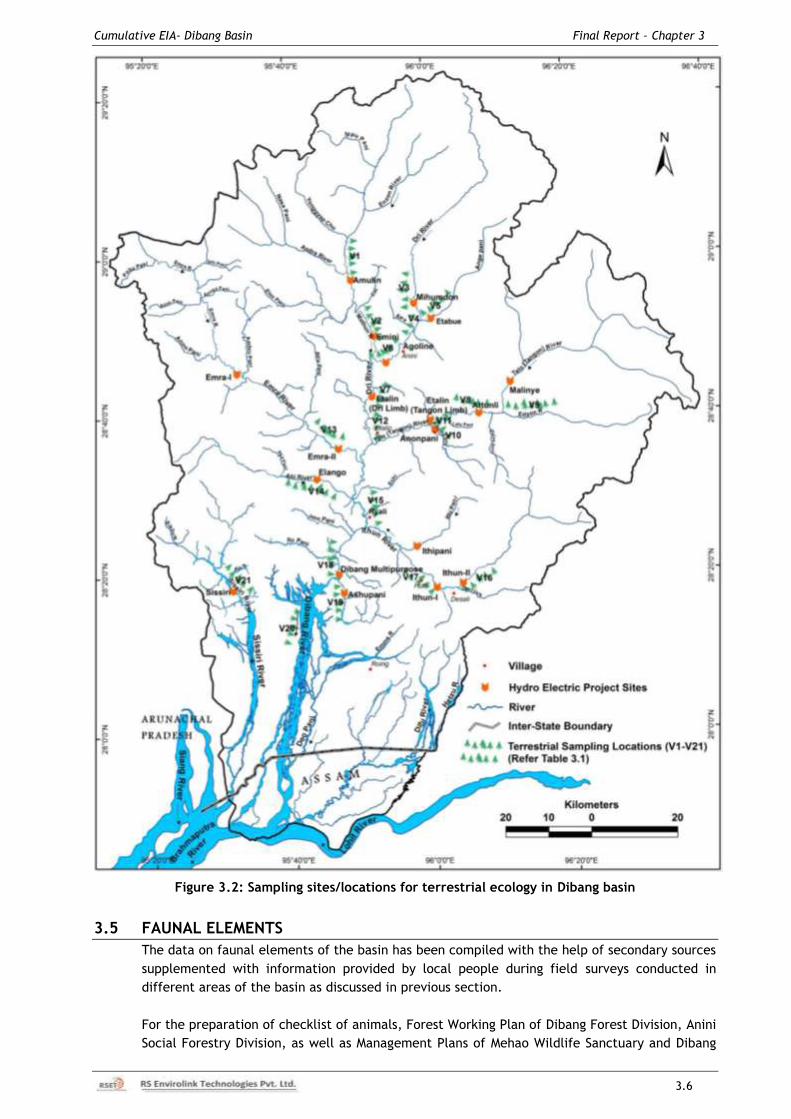
Cumulative EIA- Dibang Basin Final Report – Chapter 3
3.6 3.6
Figure 3.2: Sampling sites/locations for terrestrial ecology in Dibang basin
3.5 FAUNAL ELEMENTS
The data on faunal elements of the basin has been compiled with the help of secondary sources
supplemented with information provided by local people during field surveys conducted in
different areas of the basin as discussed in previous section.
For the preparation of checklist of animals, Forest Working Plan of Dibang Forest Division, Anini
Social Forestry Division, as well as Management Plans of Mehao Wildlife Sanctuary and Dibang
Cumulative EIA- Dibang Basin Final Report – Chapter 3
3.7 3.7
Wildlife Sanctuary were consulted. In addition data was compiled from published literature like
Fauna of Arunachal Pradesh, Vol.-1 & 2 (2006), Arunachal Forest News Journal, Vol. 19 (2001),
Ali & Ripley (1983), Grimmett et al. (1998, 2011), Fleming (2006).
The study area was divided into different strata based on vegetation and topography. Sampling
for habitat and animals was done in each strata. As the normal systematic transects for
mammals and birds were not possible in this study area due to difficult terrain, therefore trails
were used for faunal sampling. In addition to the field sampling the data/ information was also
collected as follows.
Direct sighting and indirect evidences such as calls, signs and trophies of mammals
were recorded along the survey routes taking aid from Prater (1980).
Interviews of local villagers for the presence and relative abundance of various animal
species within each locality.
Data collection on habitat condition, animal presence by direct sighting and indirect
evidences by forest personnel and villagers.
The checklist of mammalian fauna of the basin has been compiled with the help of data
provided by Zoological Survey of India (ZSI) supplemented with information provided by local
people during field surveys.
For the compilation of checklist of birds, butterflies and herpetofauna found in the Dibang
basin, published literature was consulted along with Management Plans of Dibang Wildlife
Sanctuary and Mehao Wildlife Sanctuary and working plans of forest divisions. In addition
published research papers by Gogoi (2012), Singh et al. (2003), Choudhury et al. (2003), Pawar
and Birand (2001), and Daniel Mize (2014) were also consulted.
3.6 AQUATIC ECOLOGY
Data on physico-chemical water quality, and aquatic biodiversity i.e. Plankton (phytoplankton
and zooplankton), benthic macro-invertebrates, aquatic plants and fish was collected through
water sampling in major rivers/steams at different locations in the basin.
3.7 SAMPLING LOCATIONS & SITE DESCRIPTION
Selection of Sampling Sites
Sampling was carried out at 20 different locations and their details and locations are given at
Table 3.3 & Figure 3.3, respectively. The sampling sites were located near the area where
major project components are proposed like dam site, powerhouse site, working area, near the
confluence of major tributaries with the main channel and near settlements.
The sampling was carried out in Dibang river and its major tributaries like Mathun, Dri, Talo
(Tangon), Anonpani, Emra, Ahi, Ithun and Sissiri in the basin. Water samples were collected and
analyzed for physico-chemical and biological parameters. The sampling location with site
description are given below:
Mathun River
The topography of the Mathun Valley is undulating which is the part of Mishmi hills. In this
valley, 2 water samples were collected from Mathun river (right bank tributary of Dri river), i)
near dam site of proposed Amulin HEP and ii) Power house site of proposed Emini HEP.
Dri River
Dri river is the right bank tributary of Dibang river, the area is completely undulating covering
thick forest in the surroundings. In this area, 4 water samples were collected at various
locations viz. Upstream of proposed Mihumdon HE project (Dri River), Agolin HEP near Anini,
proposed Etalin dam site, and proposed Etalin Power house site.
Cumulative EIA- Dibang Basin Final Report – Chapter 3
3.8 3.8
Ange Pani Nala
This nala is the right bank tributary of Dri river, water sample was collected near the upstream
of the confluence point of Dri and Ange Pani Nala.
Talo (Tangon) River
In Talo river (also known as Tangon river) water samples were collected from i) Talo (Tangon)
river: Near proposed Malinye HEP ii) upstream of proposed Attulni HEP, iii) near proposed
Attunli Dam site and iv) at Anonpani- Talo confluence.
Anonpani Nala
One water sample was collected at proposed dam site of Anonpani SHEP.
Dibang River
Dibang river formed after the confluence of two major river called as Dri river and Talo rivers.
Here, one water sample was collected near proposed Etalin Power house site.
Emra River
Emra is the right bank tributary of Dibang river. Two sampling sites were selected, one near
Dam site and another one near power house site of Emra II HEP.
Ahi River
One sample was taken from the Ahi river which is the right bank tributary of Dibang river.
Ithun River
Ithun river is the left bank tributary of Dibang river. Two sampling sites were selected one near
Desali village and other near Hunli village.
Ashupani Nala
One sampling site was selected near dam site of proposed Ashupani HEP.
Sissiri River
One sampling site was located near dam site of proposed Sissiri HEP.
3.8 METHODOLOGY
The composite water samples from the river were taken in triplicates at each site and average values
were computed for the results. The details of sampling sites and their location along with coordinates
are given in Table 3.3 and locations of sampling sites are marked on map is given in Figure 3.3.
3.8.1 Physico-chemical Parameters
The analysis of physico-chemical parameters include pH, temperature, electrical conductivity, TSS,
whereas the chemical parameters includes alkalinity, hardness, DO, BOD, COD, nitrite, phosphate,
chloride, sulphate, sodium, potassium, calcium, magnesium, silica, oil and grease, phenolic
compounds, residual sodium carbonate. Bacteriological parameters included Total Coliform and
heavy metals included Pb, As, Hg, Cd, Cr-6, total Chromium, Cu, Zn, and Fe. The samples were
taken in the replicates at each site of the river and composite samples were then analysed.
Table 3.3: Details of sampling locations for the water sampling
Sampling Code Name of Sampling Site Mathun River: Right Bank tributary of Dri river
W1 Near proposed Amulin HEP W2 Near proposed Emini HEP
Dri River W3 Dri river: Upstream of proposed Mihumdon HE project W4 Downstream of Ange Pani- Dri river Confluence W5 Near proposed Dam Site of Etalin HEP (Dri Limb)
Cumulative EIA- Dibang Basin Final Report – Chapter 3
3.9 3.9
Sampling Code Name of Sampling Site W6 Near proposed Power House Site of Etalin HEP
Talo (Tangon) River W7 Talo (Tangon) river: Near proposed Malinye HEP W8 Attunli HEP dam site: near Tangon - Edzon River Confluence W9 Anonpani Nala: left bank tributary of Tangon river W10 Near proposed Dam Site of Etalin HEP (Tangon Limb)
Emra river: Right bank tributary of Dibang river W11 Proposed Dam Site of Emra II HEP at Emra River
Dibang river W12 Dibang River D/S of Emra- Dibang Confluence W13 Dibang River D/S of Dibang- Ithun Confluence W14 Dibang Multipurpose Dam Site W15 Dibang Multipurpose PH Site
Ahi river: Right Bank tributary of Dibang river W16 Ahi River
Ithun River: Left bank tributary of Dibang river W17 Ithun River near Desali village W18 Ithun River Near Hunli village
Ashupani : Left bank tributary of Dibang river W18 Ashupani Nala
Sissiri River: Right Bank tributary of Dibang river W20 Sissiri River
Some of the physico-chemical parameters of water necessary for the ecological studies were
measured in the field with the help of different instruments. The water temperature was measured
with the help of graduated mercury thermometer. The hydrogen ion concentration (pH), electrical
conductivity and total dissolved solids were recorded with the help of a pH, EC and TDS probes of
Hanna instruments (Model HI 98130) in the field. Dissolved oxygen was measured with the help of
Digital Dissolved Oxygen meter (Eutech ECDO 602K). Total coliforms were assessed by
Presence/absence techniques using media method. For the analysis of rest of the parameters the
water samples were collected in polypropylene bottles from the different sampling sites and
brought to the laboratory for further analysis after adding formalin as preservative. The turbidity
was measured with the help of Digital Turbidity meter and other parameters such as total
alkalinity, total hardness, DO, BOD, COD, nitrite, phosphate, chloride, sulphate, sodium, potassium,
calcium, magnesium, silica, oil and grease, phenolic compounds, residual sodium carbonate and
heavy metals included Pb, As, Hg, Cd, Cr-6, total Chromium, Cu, Zn, and Fe were analyzed at the
Hitech Labs Limited, Okhla, New Delhi. These parameters were analysed as per the standard
procedures given by Adoni (1980) and APHA (1992) and Bureau of Indian Standards (BIS):IS 3025
(Indian Standard: methods of sampling and test (physical and chemical) for water used in industry).
3.8.2 Sampling of Phytoplankton & Periphyton - Benthic (Epilithic) Diatoms and
Zooplankton
For the quantification of phytoplankton and zooplankton 50 liters of water for each community
was filtered at each site by using plankton net made up of fine silk cloth (mesh size 25 m).
The study was repeated three times at each site and samples were pooled. The filtrate
collected for phytoplankton was preserved in 1% Lugol’s Iodine solution.
For periphyton the sampling was performed across width of stream at a depth of 15 - 30 cm. The
samples were taken from the accessible banks only. The cobbles (64 -128 mm size) usually 4 - 5 in
number, were picked from the riffle and pools, in apparently different flows such as stones above and
below gushing waters, swift flow and slow flow conditions so as to obtain a representative sample.
Benthic diatom samples were collected by scratching the pebbles with a brush of hard bristles in order
to dislodge benthos from crevices and minute cavities on the boulder surface from an area of 3 x 3
cm2, using a sharp edged razor. The scrapings from each cobble were collected in 25µ mesh and
transferred to storage vials. The samples were preserved in 1% Lugol’s iodine solution.
Acid treatment according to Reimer (1962) method, adopted also by Nautiyal & Nautiyal (1999,
2002), was followed to process the samples for light microscopy. The treated samples were
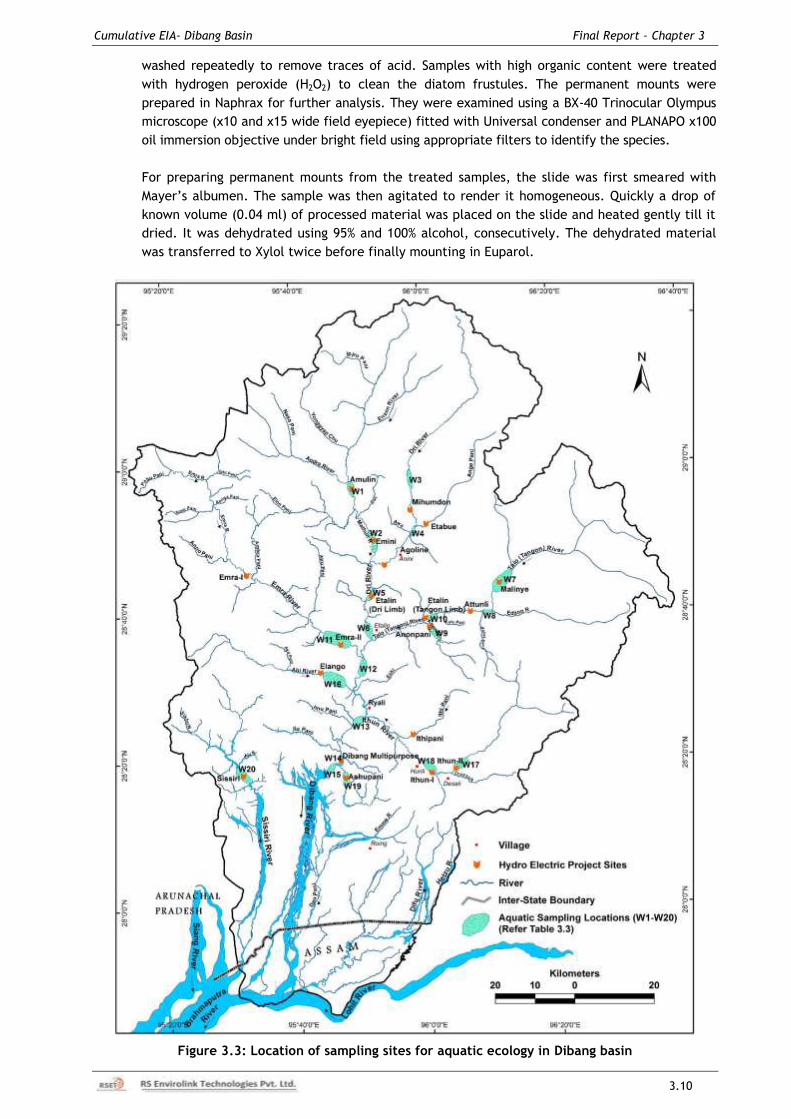
Cumulative EIA- Dibang Basin Final Report – Chapter 3
3.10 3.10
washed repeatedly to remove traces of acid. Samples with high organic content were treated
with hydrogen peroxide (H2O2) to clean the diatom frustules. The permanent mounts were
prepared in Naphrax for further analysis. They were examined using a BX-40 Trinocular Olympus
microscope (x10 and x15 wide field eyepiece) fitted with Universal condenser and PLANAPO x100
oil immersion objective under bright field using appropriate filters to identify the species.
For preparing permanent mounts from the treated samples, the slide was first smeared with
Mayer’s albumen. The sample was then agitated to render it homogeneous. Quickly a drop of
known volume (0.04 ml) of processed material was placed on the slide and heated gently till it
dried. It was dehydrated using 95% and 100% alcohol, consecutively. The dehydrated material
was transferred to Xylol twice before finally mounting in Euparol.
Figure 3.3: Location of sampling sites for aquatic ecology in Dibang basin
Cumulative EIA- Dibang Basin Final Report – Chapter 3
3.11
3.8.3 Identification of Benthic (Epilithic) Diatoms & Zooplankton
The permanent mounts were then subjected to analysis under a phase contrast binocular
microscope using an oil immersion lens of x100 magnification. For identifying the various
diatom species, varieties and forms, the morphological characteristics used included length,
width (µm), number of striae, raphe, axial area, central area, terminal and central nodules.
Identifications were made according to standard literature viz. Schmidt 1914 -1954, Hustedt
1943, Hustedt 1985, Krammer & Lange - Bertalot 1986, 1991, 1999, 2000 a & b, Lange -
Bertalot, H. Krammer, K. 2002, Metzeltin & Lange - Bertalot 2002, Krammer 2000, 2003, Lange
Bertalot et al., 2003, Werum & Lange - Bertalot 2004, Metzeltin et al., 2005. Sarode & Kamat
(1984), Prasad (1992) and Gandhi (1998) were also consulted for the oriental species.
The identification of zooplankton was made with the help of Ward and Whipple (1959) and
Battish (1992).
3.8.4 Sampling & Identification of Macro-invertebrates
For Macro-invertebrate samples were collected from 1 sq ft area by lifting of stones and sieving
of substratum from the wadeable portion of the river. The material was sieved through 125 µm
sieve and preserved in 70% ethyl alcohol. Samples were collected in three replicates and
pooled for further analysis. The organisms obtained were then counted after identifying them
up to family level. Standard keys were used for the identification of macro invertebrate
samples (Pennek 1953; Edmondson 1959; Macan 1979; Edington and Hildrew 1995).
3.9 PHYSICO-CHEMICAL WATER QUALITY
The water quality objectives for freshwaters focus on a core indicator set that reflects their
importance along a river stretch in a valley/basin. The core indicators pH, turbidity, electrical
conductivity and dissolved oxygen are addressed in this report.
In order to assess the water quality of Dibang river and its tributary streams a Water Quality
Index was used which has been developed at Washington State Department of Ecology,
Environmental assessment Programme. The Water Quality Index (WQI) used in the report is a
unitless number ranging from 1 to 100. A higher number is indicative of better water quality.
For temperature, pH, faecal coliform bacteria and dissolved oxygen, the index expresses
results relative to levels required to maintain beneficial uses (based on criteria in Washington’s
Water Quality Standards, WAC 173-201A).
Water quality index is a 100 point scale that summarizes results from a total of nine different
measurements viz.
pH,
Dissolved Oxygen
Turbidity
Faecal Coliform
Biochemical Oxygen Demand
Total Phosphates
Nitrates, and
Total Suspended Solids
During the Water Quality analysis number of other parameters were also analysed from the
water samples collected from different locations during the field surveys. These are as follows:
Electrical conductivity (EC) Magnesium
Total Dissolved Solids (TDS) Silica
Total Alkalinity Oil & Grease
Total Hardness Phenolic Compounds
Dissolved Oxygen (DO) Residual Sodium Carbonate
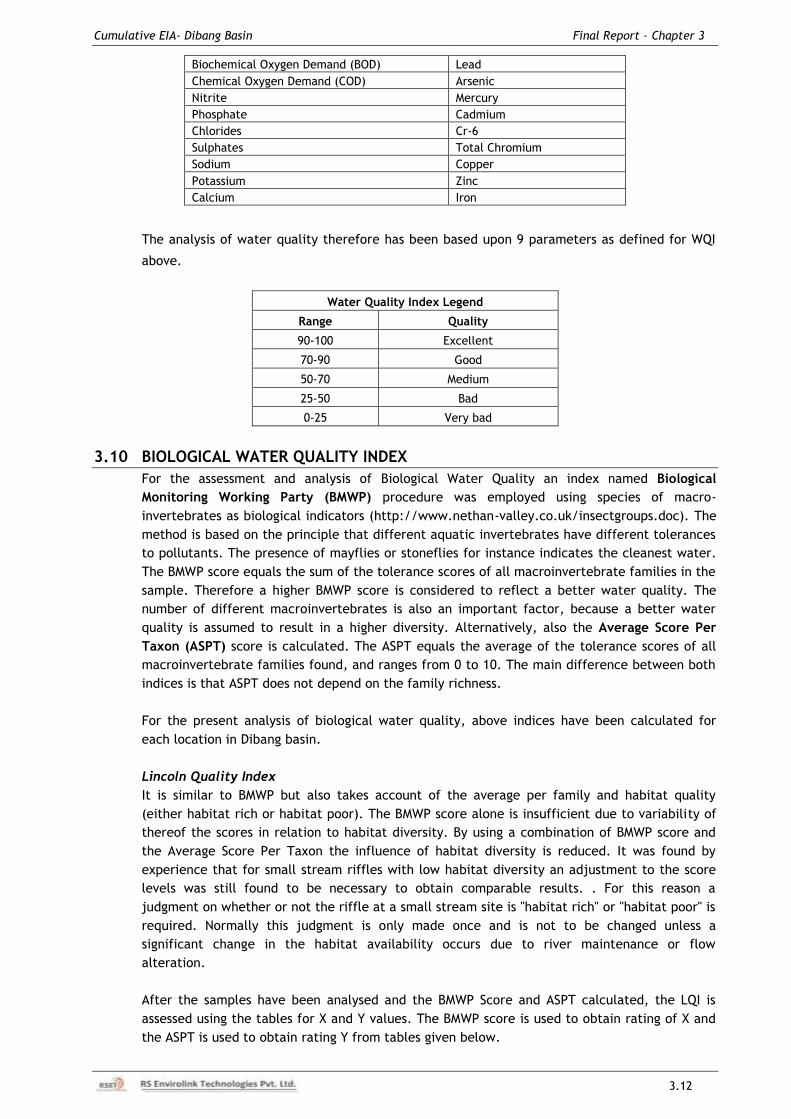
Cumulative EIA- Dibang Basin Final Report – Chapter 3
3.12
Biochemical Oxygen Demand (BOD) Lead
Chemical Oxygen Demand (COD) Arsenic
Nitrite Mercury
Phosphate Cadmium
Chlorides Cr-6
Sulphates Total Chromium
Sodium Copper
Potassium Zinc
Calcium Iron
The analysis of water quality therefore has been based upon 9 parameters as defined for WQI
above.
Water Quality Index Legend
Range Quality
90-100 Excellent
70-90 Good
50-70 Medium
25-50 Bad
0-25 Very bad
3.10 BIOLOGICAL WATER QUALITY INDEX
For the assessment and analysis of Biological Water Quality an index named Biological
Monitoring Working Party (BMWP) procedure was employed using species of macro-
invertebrates as biological indicators (http://www.nethan-valley.co.uk/insectgroups.doc). The
method is based on the principle that different aquatic invertebrates have different tolerances
to pollutants. The presence of mayflies or stoneflies for instance indicates the cleanest water.
The BMWP score equals the sum of the tolerance scores of all macroinvertebrate families in the
sample. Therefore a higher BMWP score is considered to reflect a better water quality. The
number of different macroinvertebrates is also an important factor, because a better water
quality is assumed to result in a higher diversity. Alternatively, also the Average Score Per
Taxon (ASPT) score is calculated. The ASPT equals the average of the tolerance scores of all
macroinvertebrate families found, and ranges from 0 to 10. The main difference between both
indices is that ASPT does not depend on the family richness.
For the present analysis of biological water quality, above indices have been calculated for
each location in Dibang basin.
Lincoln Quality Index
It is similar to BMWP but also takes account of the average per family and habitat quality
(either habitat rich or habitat poor). The BMWP score alone is insufficient due to variability of
thereof the scores in relation to habitat diversity. By using a combination of BMWP score and
the Average Score Per Taxon the influence of habitat diversity is reduced. It was found by
experience that for small stream riffles with low habitat diversity an adjustment to the score
levels was still found to be necessary to obtain comparable results. . For this reason a
judgment on whether or not the riffle at a small stream site is "habitat rich" or "habitat poor" is
required. Normally this judgment is only made once and is not to be changed unless a
significant change in the habitat availability occurs due to river maintenance or flow
alteration.
After the samples have been analysed and the BMWP Score and ASPT calculated, the LQI is
assessed using the tables for X and Y values. The BMWP score is used to obtain rating of X and
the ASPT is used to obtain rating Y from tables given below.
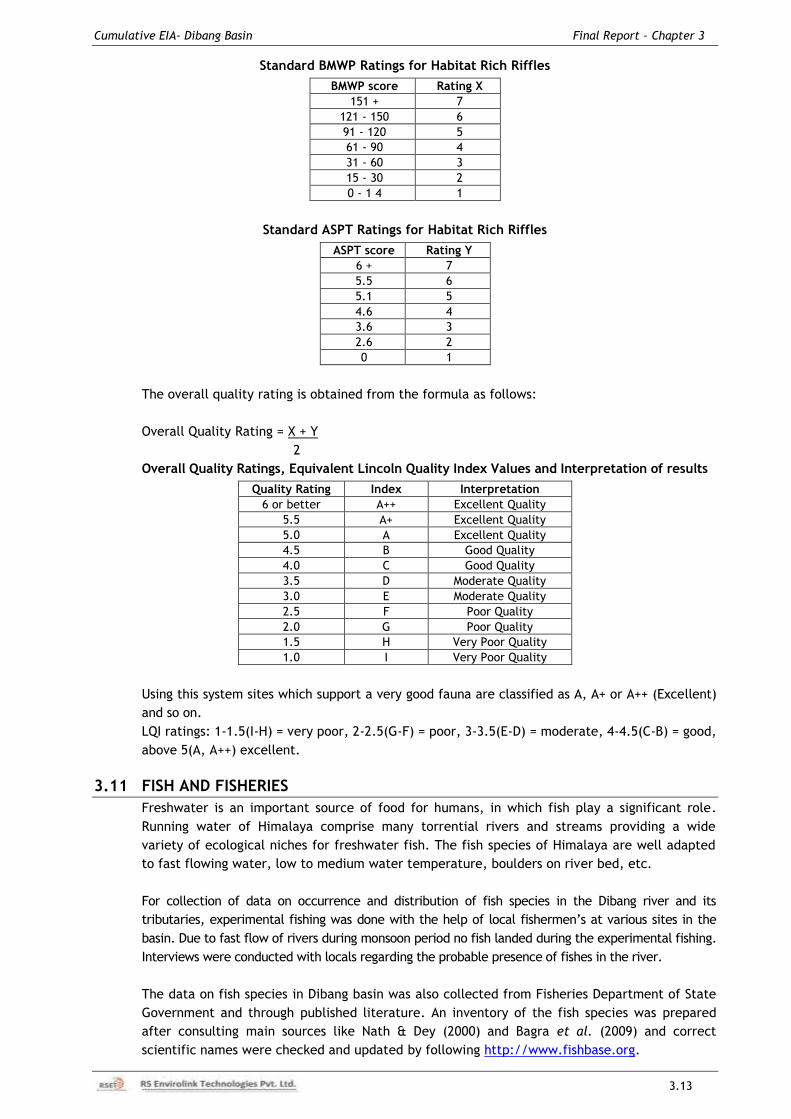
Cumulative EIA- Dibang Basin Final Report – Chapter 3
3.13
Standard BMWP Ratings for Habitat Rich Riffles
BMWP score Rating X
151 + 7
121 - 150 6
91 - 120 5
61 - 90 4
31 - 60 3
15 - 30 2
0 - 1 4 1
Standard ASPT Ratings for Habitat Rich Riffles
ASPT score Rating Y
6 + 7
5.5 6
5.1 5
4.6 4
3.6 3
2.6 2
0 1
The overall quality rating is obtained from the formula as follows:
Overall Quality Rating = X + Y
2
Overall Quality Ratings, Equivalent Lincoln Quality Index Values and Interpretation of results
Quality Rating Index Interpretation
6 or better A++ Excellent Quality
5.5 A+ Excellent Quality
5.0 A Excellent Quality
4.5 B Good Quality
4.0 C Good Quality
3.5 D Moderate Quality
3.0 E Moderate Quality
2.5 F Poor Quality
2.0 G Poor Quality
1.5 H Very Poor Quality
1.0 I Very Poor Quality
Using this system sites which support a very good fauna are classified as A, A+ or A++ (Excellent)
and so on.
LQI ratings: 1-1.5(I-H) = very poor, 2-2.5(G-F) = poor, 3-3.5(E-D) = moderate, 4-4.5(C-B) = good,
above 5(A, A++) excellent.
3.11 FISH AND FISHERIES
Freshwater is an important source of food for humans, in which fish play a significant role.
Running water of Himalaya comprise many torrential rivers and streams providing a wide
variety of ecological niches for freshwater fish. The fish species of Himalaya are well adapted
to fast flowing water, low to medium water temperature, boulders on river bed, etc.
For collection of data on occurrence and distribution of fish species in the Dibang river and its
tributaries, experimental fishing was done with the help of local fishermen’s at various sites in the
basin. Due to fast flow of rivers during monsoon period no fish landed during the experimental fishing.
Interviews were conducted with locals regarding the probable presence of fishes in the river.
The data on fish species in Dibang basin was also collected from Fisheries Department of State
Government and through published literature. An inventory of the fish species was prepared
after consulting main sources like Nath & Dey (2000) and Bagra et al. (2009) and correct
scientific names were checked and updated by following http://www.fishbase.org.
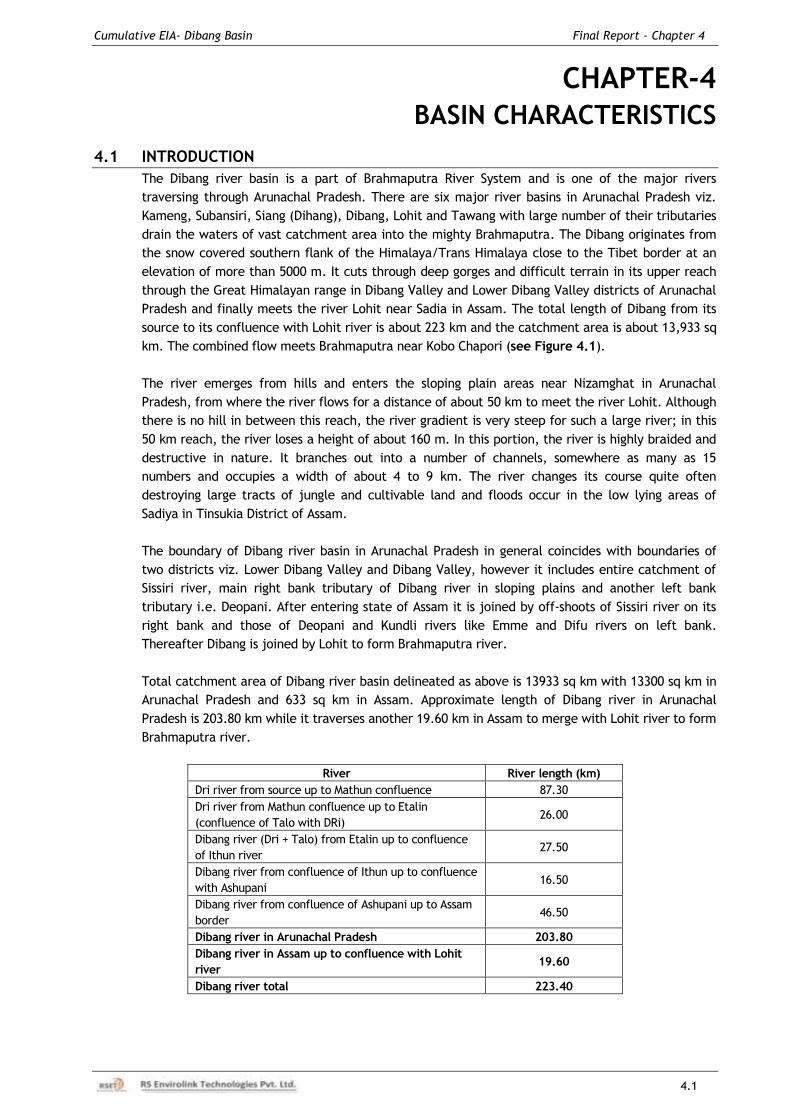
Cumulative EIA- Dibang Basin Final Report – Chapter 4
4.1
CHAPTER-4
BASIN CHARACTERISTICS
4.1 INTRODUCTION
The Dibang river basin is a part of Brahmaputra River System and is one of the major rivers
traversing through Arunachal Pradesh. There are six major river basins in Arunachal Pradesh viz.
Kameng, Subansiri, Siang (Dihang), Dibang, Lohit and Tawang with large number of their tributaries
drain the waters of vast catchment area into the mighty Brahmaputra. The Dibang originates from
the snow covered southern flank of the Himalaya/Trans Himalaya close to the Tibet border at an
elevation of more than 5000 m. It cuts through deep gorges and difficult terrain in its upper reach
through the Great Himalayan range in Dibang Valley and Lower Dibang Valley districts of Arunachal
Pradesh and finally meets the river Lohit near Sadia in Assam. The total length of Dibang from its
source to its confluence with Lohit river is about 223 km and the catchment area is about 13,933 sq
km. The combined flow meets Brahmaputra near Kobo Chapori (see Figure 4.1).
The river emerges from hills and enters the sloping plain areas near Nizamghat in Arunachal
Pradesh, from where the river flows for a distance of about 50 km to meet the river Lohit. Although
there is no hill in between this reach, the river gradient is very steep for such a large river; in this
50 km reach, the river loses a height of about 160 m. In this portion, the river is highly braided and
destructive in nature. It branches out into a number of channels, somewhere as many as 15
numbers and occupies a width of about 4 to 9 km. The river changes its course quite often
destroying large tracts of jungle and cultivable land and floods occur in the low lying areas of
Sadiya in Tinsukia District of Assam.
The boundary of Dibang river basin in Arunachal Pradesh in general coincides with boundaries of
two districts viz. Lower Dibang Valley and Dibang Valley, however it includes entire catchment of
Sissiri river, main right bank tributary of Dibang river in sloping plains and another left bank
tributary i.e. Deopani. After entering state of Assam it is joined by off-shoots of Sissiri river on its
right bank and those of Deopani and Kundli rivers like Emme and Difu rivers on left bank.
Thereafter Dibang is joined by Lohit to form Brahmaputra river.
Total catchment area of Dibang river basin delineated as above is 13933 sq km with 13300 sq km in
Arunachal Pradesh and 633 sq km in Assam. Approximate length of Dibang river in Arunachal
Pradesh is 203.80 km while it traverses another 19.60 km in Assam to merge with Lohit river to form
Brahmaputra river.
River River length (km)
Dri river from source up to Mathun confluence 87.30
Dri river from Mathun confluence up to Etalin
(confluence of Talo with DRi) 26.00
Dibang river (Dri + Talo) from Etalin up to confluence
of Ithun river 27.50
Dibang river from confluence of Ithun up to confluence
with Ashupani 16.50
Dibang river from confluence of Ashupani up to Assam
border 46.50
Dibang river in Arunachal Pradesh 203.80
Dibang river in Assam up to confluence with Lohit
river 19.60
Dibang river total 223.40
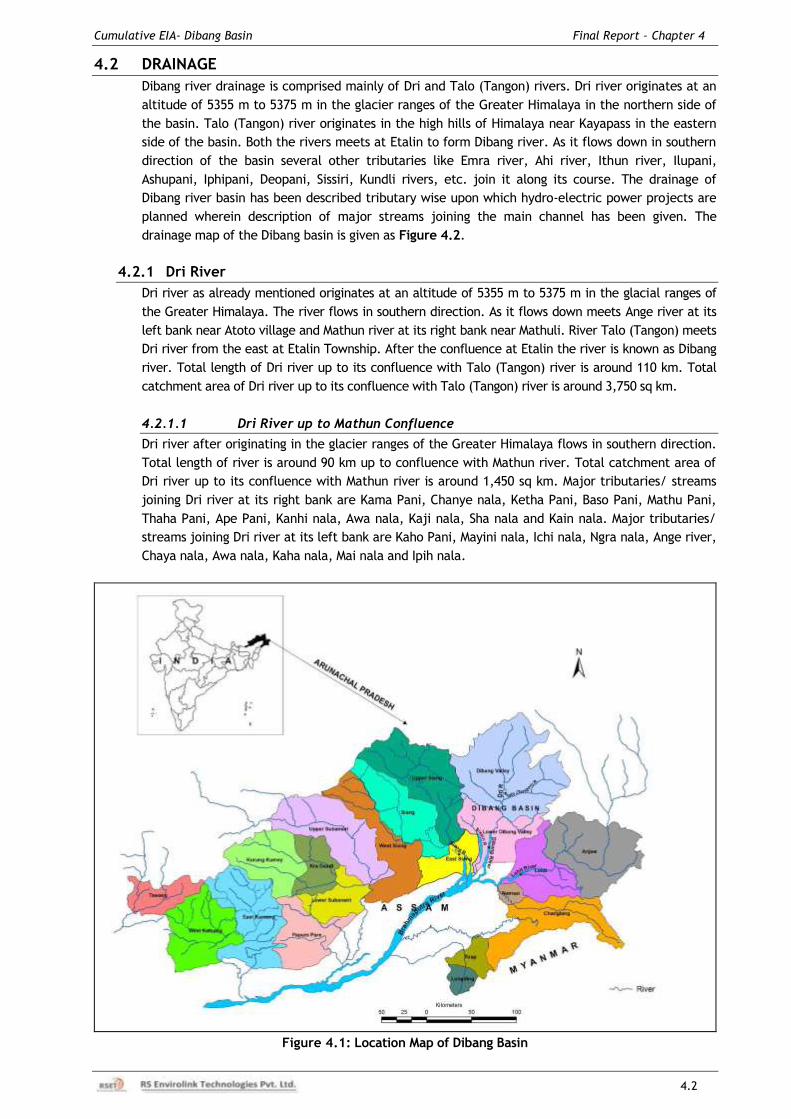
Cumulative EIA- Dibang Basin Final Report – Chapter 4
4.2
4.2 DRAINAGE
Dibang river drainage is comprised mainly of Dri and Talo (Tangon) rivers. Dri river originates at an
altitude of 5355 m to 5375 m in the glacier ranges of the Greater Himalaya in the northern side of
the basin. Talo (Tangon) river originates in the high hills of Himalaya near Kayapass in the eastern
side of the basin. Both the rivers meets at Etalin to form Dibang river. As it flows down in southern
direction of the basin several other tributaries like Emra river, Ahi river, Ithun river, Ilupani,
Ashupani, Iphipani, Deopani, Sissiri, Kundli rivers, etc. join it along its course. The drainage of
Dibang river basin has been described tributary wise upon which hydro-electric power projects are
planned wherein description of major streams joining the main channel has been given. The
drainage map of the Dibang basin is given as Figure 4.2.
4.2.1 Dri River
Dri river as already mentioned originates at an altitude of 5355 m to 5375 m in the glacial ranges of
the Greater Himalaya. The river flows in southern direction. As it flows down meets Ange river at its
left bank near Atoto village and Mathun river at its right bank near Mathuli. River Talo (Tangon) meets
Dri river from the east at Etalin Township. After the confluence at Etalin the river is known as Dibang
river. Total length of Dri river up to its confluence with Talo (Tangon) river is around 110 km. Total
catchment area of Dri river up to its confluence with Talo (Tangon) river is around 3,750 sq km.
4.2.1.1 Dri River up to Mathun Confluence
Dri river after originating in the glacier ranges of the Greater Himalaya flows in southern direction.
Total length of river is around 90 km up to confluence with Mathun river. Total catchment area of
Dri river up to its confluence with Mathun river is around 1,450 sq km. Major tributaries/ streams
joining Dri river at its right bank are Kama Pani, Chanye nala, Ketha Pani, Baso Pani, Mathu Pani,
Thaha Pani, Ape Pani, Kanhi nala, Awa nala, Kaji nala, Sha nala and Kain nala. Major tributaries/
streams joining Dri river at its left bank are Kaho Pani, Mayini nala, Ichi nala, Ngra nala, Ange river,
Chaya nala, Awa nala, Kaha nala, Mai nala and Ipih nala.
Figure 4.1: Location Map of Dibang Basin
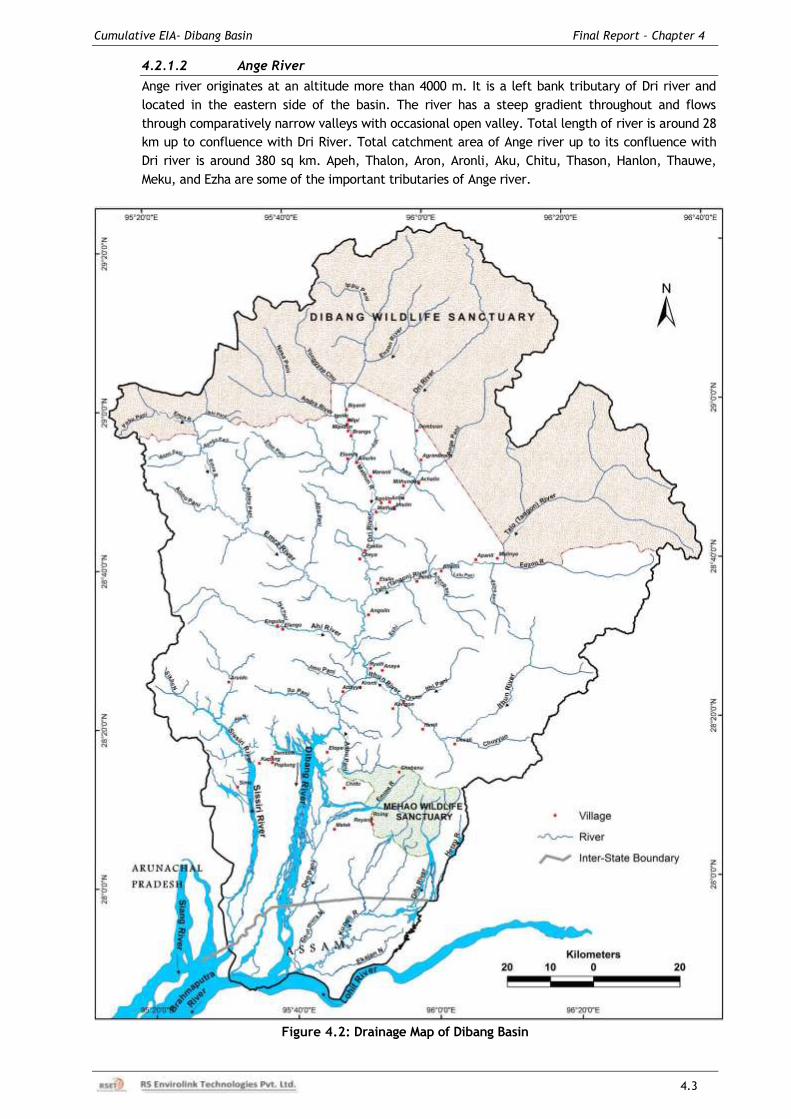
Cumulative EIA- Dibang Basin Final Report – Chapter 4
4.3
4.2.1.2 Ange River
Ange river originates at an altitude more than 4000 m. It is a left bank tributary of Dri river and
located in the eastern side of the basin. The river has a steep gradient throughout and flows
through comparatively narrow valleys with occasional open valley. Total length of river is around 28
km up to confluence with Dri River. Total catchment area of Ange river up to its confluence with
Dri river is around 380 sq km. Apeh, Thalon, Aron, Aronli, Aku, Chitu, Thason, Hanlon, Thauwe,
Meku, and Ezha are some of the important tributaries of Ange river.
Figure 4.2: Drainage Map of Dibang Basin
Cumulative EIA- Dibang Basin Final Report – Chapter 4
4.4
4.2.1.3 Mathun River
Mathun river originates from high ranges of Himalaya and meets Dri river at its right bank near
Mathuli. The river flows in southern direction. The gradient of the river is sufficiently steep and flows
though narrow valley and is subjected to heavy rainfall. The total length of the river is about 80 km
up to confluence with Dri River. Total catchment area of Mathun river up to its confluence with Dri
river is around 2,000 sq km. In the upper reaches, Ippu Pani and Enzon river joins it at right bank and
left bank respectively. As it flows down meets Yonggyap Chu, Andra river, Enni nala, Chingu nala, Elon
Pani, Kanji nala and Issin nala at its right bank and Kamu nala, Chelu nala, Manyone nala, Talli nala,
Tahu nala, Kathi nala, Imu nala, Bu nala, Malone nala, Maron nala at its left bank.
4.2.1.4 Dri River after Mathun Confluence
After the confluence of Dri river with Mathun river, the river continue to flow in south direction and
meets Talo (Tangon) river near Etalin to form Dibang river. The elevation drops from around 1100m
to below 600m between this stretch. During its course several big and small tributaries join the
river at both the banks. Most of the settlement can be found on the left bank. Total length of Dri
river from its confluence with Mathun and up to its confluence with Talo (Tangon) river is around 20
km. Total catchment area of Dri river from its confluence with Mathun and up to its confluence
with Talo (Tangon) river is around 300 sq km. The major tributaries/ streams joining Dri river at its
right bank are Igu nala, Imu Pani, Ei Pani, Duko Pani, Emi Pani, Ayu Pani, Api Pani, Chika Pani, Ano
Pani and Nigi Pani. The major tributaries/ streams joining Dri river at its left bank are Tho Pani,
Manu Pani, Kamba Pani, Kita Pani, Aiyo Pani, Inu Pani, Ari Pani, Kabo Pani, Ru Pani and Chambo
Pani.
4.2.2 Talo (Tangon) River
Talo (Tangon) river as already mentioned originates in the high hills of Himalaya near Kayapass. The
river flows from east to west from its source till Makhri river meets it at its right bank. From the
confluence point with Makhri river till the confluence point with Edzon river near Maliney the river
flows from north to south. From the confluence point with Edzon river the river takes a western
turn and flows from east to west till it meets Dri river at Etalin. After the confluence at Etalin the
river is known as Dibang river. The river flows in a sufficiently deep and narrow river basin. The
total length of Talo river is about 91 km. Total catchment area of Talo (Tangon) river up to its
confluence with Dri river is around 2,500 sq km. Major tributaries joining the river at its left bank
are Aku nala, Awa nala, Andre nala, Davu nala, Eko nala, Chippu nala, Edzon river, Ela nala, Kachi
nala, Achcha nala, Goye nala, Tum nala, Layo nala, Lalu Pani, Attu nala, Anon Pani, Chan nala, Non
nala, Makri nala, Ahru nala, Noh nala and Aru nala while the major tributaries joining the river at
its right bank are Makhri, Ipi Pani, Emo Pani, Emuni nala, Ahun nala, Chippa nala, Echcha nala, Chi
nala, Dogon nala, Kun nala, Shu nala, Ron nala, Mir nala and Math nala.
4.2.2.1 Anon Pani Nala
Anonpani nala is a major left bank tributary of Talo (Tangon) river. This nala originates from El
4,785 m and flows in northwest direction. It joins Talo (Tangon) river at an elevation of around El
1,200 m near Awonli village. From its origin to its confluence with Talo (Tangon) river many
unnamed streams joins the nala from the banks. The total length of the nala is about 21 km. Total
catchment area of Anon Pani nala up to its confluence with Talo (Tangon) river is around 145 sq km.
4.2.3 Right Bank Tributaries of Dibang River
4.2.3.1 Emra River
Emra river originates at an altitude of around El 4000 m and meets Dibang river at its right bank
near Agoline. The river is located in the western side of the basin. The total length of the river is
about 93 km. Total catchment area of Emra river up to its confluence with Dibang river is around
1,500 sq km. The river flows from west to east direction. Chandro Pani, Iphi river, Yan Pani, Apoga
Pani, Apogayaro Pani, Apili Pani, Au Pani, Si Pani, Li Pani, Arha Pani, Aoo Pani, Ehan Pani, Ara Pani,
Cumulative EIA- Dibang Basin Final Report – Chapter 4
4.5
Arun Pani, Amu Pani, Inga Pani, Aru Pani, Su Pani, Elo Pani, Ri Pani, Apu Pani, Imliu Pani, Era Pani and
Aha Pani are the important left bank tributaries of Emra river. Important right bank tributaries of
Emra river are Pabu Pani, Chiciyakuni Pani, Maha Pani, Pubu Pani, Ekunji Pani, Apusu Pani, Anno Pani,
Chichango Pani, Chichi Pani, Ekra Pani, Na Pani, Ri Pani, Amu Pani, Ithiu Pani, Mu Pani, Chan Pani,
Poh Pani, Thun Pani, Un Pani, Inoin Pani, Imi Pani, Ema Pani, Aron Pani, Apu Pani and Igu Pani.
4.2.3.2 Ahi River
Ahi river originates at an altitude of around El. 3500m and meets Dibang river at its right bank just
downstream of Anelih village. The river is located in the western side of the basin. The total length
of the river is about 60 km. Total catchment area of Ahi river up to its confluence with Dibang river
is around 640 sq km. The river flows from west to east direction Major tributaries joining the river
at its left bank are Imni Pani, Ahuni Pani, Iri Pani, Ri Pani, Ya Pani, Alan Pani, Duni Pani, Dua Pani,
Ashar Pani, Aha Pani, Amu Pani, Ayu Pani, Irhi Pani, Ichi Pani Payi Pani, Ruh Pani, Ingu Pani, Ane
Pani, etc. while the major tributaries joining the river at its right bank are Abro Pani, Enzon Pani,
Atani Pani, Ataya Pani, Iyu Pani, Apul Pani, Apru Pani, Thru Pani, Alo Pani, Yama Pani, Agi Pani, Bri
Pani, Ni Pani, Na Pani, Yama Pani, Chhan Pani, Lohi Pani, Kru Pani, Kron Pani etc.
4.2.3.3 Sissiri River
The river Sissiri is one of the important right bank tributaries of Dibang river. The Sissiri catchment
is sandwiched between Dibang basin in east and north and Siang basin in west. The main stem of
the river known as Sissiri or Ihi Nadi originates from Ihimbon peak of Dimuin Hill at El.3694m in
Lower Dibang Valley district of Arunachal Pradesh. From its origin it flows in a general south-
westerly direction for a length of about 19 km up to its confluence with Senzen Nala from where it
flows in a southern to south-westerly direction for a length of about 10 km up to its confluence with
Sikhu Nala, its largest right bank tributary. It then takes a turn and flows in almost south-easterly
direction for a length of about 14 km before entering the plains. The river then flows in an almost
southerly direction for a length of about 26 km before bifurcating in two channels. The right
channel flows in a south-westerly to almost westerly direction before joining the river Sibia. The
left channel or the main channel continues to flow in southerly direction and is joined by a branch
of Dibang River.
During its course, the river Sissiri is joined by number of small and large streams, the principal
among them being Aphuru, Ewama, Sikhu, Riru, Yenga and Egadi Korong from the right and Bee,
Ane, Senzen, Alu and Kambo from the left. The general flow direction of the tributaries is west to
east on the right and east to west on the left. The river runs within narrow deep gorges in the hills
with its gradients varying from 1:7 in upper part to 1:18 in middle portion to 1:80 just before
entering the plains. The river meanders a lot after entering the plains. The river suddenly flares up
after entering the plains and at places the bank to bank river width is more than 1500 m.
4.2.4 Left Bank Tributaries of Dibang River
4.2.4.1 Ithun River
Ithun river originates at an altitude of about El. 5000m and meets Dibang river on its left bank near
Ipu village. The river is located in the eastern part of the basin. The total length of the river is
about 77 km. Total catchment area of Ithun river up to its confluence with Dibang river is around
1,340 sq km. It travels westwards before it is joined by Mayi Pani at 2090m on its right bank, after
its confluence with Mayi Pani and till its confluence with Chuyyu nala on its left bank the river flows
from north to south. From its confluence with Chuyyu nala to confluence with Thu Pani on its left
bank the river flows from east to west for a small distance of about 5 km. Further downstream, till
it meets Dibang river the river flows in north west direction. Major right bank tributaries are Mayi
Pani, Chemia Pani, Machisi Pani, Pikhari Pani, Pri Pani, Se Pani, Iphi Pani, Chitu Pani, Enno Pani,
Aku Pani, Ithi Pani, Ni nala and Chilu nala. Major left bank tributaries are Mau Pani, Thri Nala, Ru
Pani, Emme Pani, Asan Pani, Chuyyu nala, Thu Pani, Chuppu Machi, Era nala and Ithu nala.
Cumulative EIA- Dibang Basin Final Report – Chapter 4
4.6
4.2.4.2 Ashu Pani River
Ashu Pani river originates from Mayudia range of mountain at an elevation of 2500 m and meets
Dibang river at its left bank. The river is located in the eastern side of the basin. The total length of
the river is about 28 km and the total catchment area of the river is about 110 sq. km. Initially it
moves from north to south and on the way numerous mountain streams join the river. After flowing
for about 10 km, the river takes a right angle turn and flows towards west. The river has a wide
valley at this portion. After flowing for another 9-10 km it takes another acute angle turn and flows
backward towards high mountain ranges and after flowing further for about 10-12 km in this
direction meets the river Dibang.
4.2.4.3 Deopani River
Deopani R. is formed by the confluence of Emme and Eje rivers which emerge nearby Mehao lake
area. After this it travels mainly in plains joining Dibang near Loikhopurgaon.
4.2.4.4 Kundli River
It emerges as Difu river draining catchment of Mehao Wildlife Sanctuary. Thereafter it travels
in plains as Kundli river near Kundli Bazar.
4.3 TOPOGRAPHY & RELIEF
Arunachal Pradesh could be divided into four distinct physiographic segments:
a) Arunachal Himalayan Ranges, that occurs as a "gigantic crescent",
b) Mishmi Hills, the northern continuation of the Proterozoic succession of Northern Myanmar,
c) Naga-Patkai Ranges, the eastern extension of Shillong Plateau, and
d) Brahmaputra Plains.
Further, the Arunachal Himalayan ranges extended from the eastern border of Bhutan to the Dibang
and Lohit Valleys, abutting against Mishmi Hills, This part is sub-divided into four parallel linear zones:
a) Tethys or Tibetan Himalaya to the north,
b) Higher Himalaya,
c) Lesser Himalaya, and
d) Sub-Himalaya to the south.
The hills and mountains in the Tethys Himalaya and Higher Himalaya are made up of Palaeo
Proterozoic and Meso Proterozoic rocks, where as those of Lesser Himalaya and Sub-Himalaya are
made up of Palaeozoic, Mesozoic, Cenozoic rocks and Noozone - Early Quaternary sediments.
The Dibang Basin has a very severe and rigorous topographic feature. Its elevation ranges from 121 m
in the outer Siwalik type hills rising from plains of Assam to as high as 5500 m in the Greater
Himalaya, bordering China (see Figure 4.3). The upper catchment area is characterized by rugged
physiography and can be delineated into Denude Structural Mountains (DSM) and Denudational
Mountains (DM). The Piedment Zone is mostly located below EI 400 m, is a stretch of alluvial plains
occurring along the foot hills formed by coalescence of several alluvial fans consisting of boulders,
stones, pebbles, sand and silt. The Flood Plains are strips of relatively smooth, adjacent to river
channels, seasonally flooded, consisting of unconsolidated sediments. The width of the Piedmont
Zone, together with Flood Plains, is mostly limit to 12 to 15 km. The Basin has a catchment area of
12,015 sq km. As per Agroclimatic Zone, the area falls within (i) Alpine Zone, and (ii) Mild Tropical
Plain Zone.
In order to understand the terrain morphology Digital Elevation Model (DEM) of the basin has
been prepared from Shuttle Radar Topography Mission (SRTM) 3 Arc-Second Global Digital
Terrain Elevation Model (DTED) data. In order to understand the relief profile of the basin it
has been divided into 500 m elevation zones. The relief maps thus prepared for Dibang Basin
and have been given at Figure 4.4.

Cumulative EIA- Dibang Basin Final Report – Chapter 4
4.7
Around 60% of the basin area is below the elevation range of 3000m and around 28% of the area
lies between 3000 and 4000m elevation range. Considerable amount of basin area i.e. around
15% lies below the elevation of 500m. Out of the 18 allotted/ planned hydro-electric power
projects, 2 projects are located below 500m elevation, 7 projects are between 500 and 1000m
elevation range, 6 projects are between 1000 and 1500m elevation range and the rest of the 3
projects are located between 1500 and 2000m elevation range.
Figure 4.3: Elevation Map of Dibang Basin
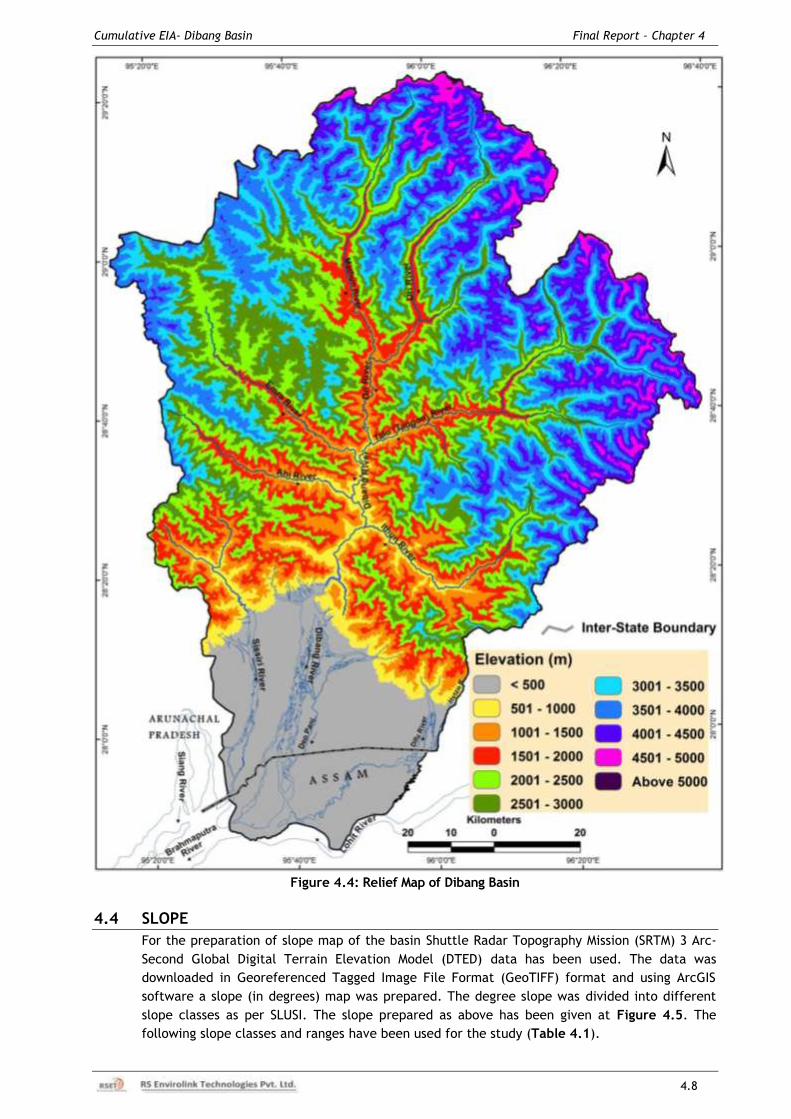
Cumulative EIA- Dibang Basin Final Report – Chapter 4
4.8
Figure 4.4: Relief Map of Dibang Basin
4.4 SLOPE
For the preparation of slope map of the basin Shuttle Radar Topography Mission (SRTM) 3 Arc-
Second Global Digital Terrain Elevation Model (DTED) data has been used. The data was
downloaded in Georeferenced Tagged Image File Format (GeoTIFF) format and using ArcGIS
software a slope (in degrees) map was prepared. The degree slope was divided into different
slope classes as per SLUSI. The slope prepared as above has been given at Figure 4.5. The
following slope classes and ranges have been used for the study (Table 4.1).
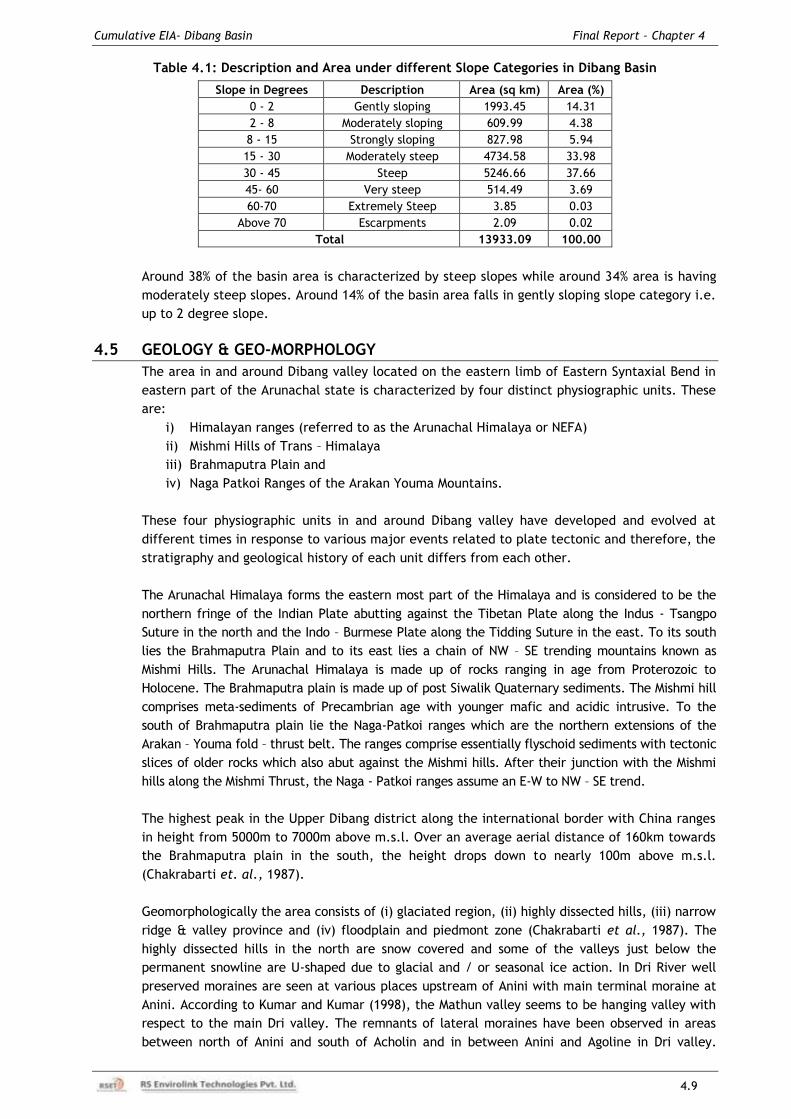
Cumulative EIA- Dibang Basin Final Report – Chapter 4
4.9
Table 4.1: Description and Area under different Slope Categories in Dibang Basin
Slope in Degrees Description Area (sq km) Area (%)
0 - 2 Gently sloping 1993.45 14.31
2 - 8 Moderately sloping 609.99 4.38
8 - 15 Strongly sloping 827.98 5.94
15 - 30 Moderately steep 4734.58 33.98
30 - 45 Steep 5246.66 37.66
45- 60 Very steep 514.49 3.69
60-70 Extremely Steep 3.85 0.03
Above 70 Escarpments 2.09 0.02
Total 13933.09 100.00
Around 38% of the basin area is characterized by steep slopes while around 34% area is having
moderately steep slopes. Around 14% of the basin area falls in gently sloping slope category i.e.
up to 2 degree slope.
4.5 GEOLOGY & GEO-MORPHOLOGY
The area in and around Dibang valley located on the eastern limb of Eastern Syntaxial Bend in
eastern part of the Arunachal state is characterized by four distinct physiographic units. These
are:
i) Himalayan ranges (referred to as the Arunachal Himalaya or NEFA)
ii) Mishmi Hills of Trans – Himalaya
iii) Brahmaputra Plain and
iv) Naga Patkoi Ranges of the Arakan Youma Mountains.
These four physiographic units in and around Dibang valley have developed and evolved at
different times in response to various major events related to plate tectonic and therefore, the
stratigraphy and geological history of each unit differs from each other.
The Arunachal Himalaya forms the eastern most part of the Himalaya and is considered to be the
northern fringe of the Indian Plate abutting against the Tibetan Plate along the Indus - Tsangpo
Suture in the north and the Indo – Burmese Plate along the Tidding Suture in the east. To its south
lies the Brahmaputra Plain and to its east lies a chain of NW – SE trending mountains known as
Mishmi Hills. The Arunachal Himalaya is made up of rocks ranging in age from Proterozoic to
Holocene. The Brahmaputra plain is made up of post Siwalik Quaternary sediments. The Mishmi hill
comprises meta-sediments of Precambrian age with younger mafic and acidic intrusive. To the
south of Brahmaputra plain lie the Naga-Patkoi ranges which are the northern extensions of the
Arakan – Youma fold – thrust belt. The ranges comprise essentially flyschoid sediments with tectonic
slices of older rocks which also abut against the Mishmi hills. After their junction with the Mishmi
hills along the Mishmi Thrust, the Naga - Patkoi ranges assume an E-W to NW – SE trend.
The highest peak in the Upper Dibang district along the international border with China ranges
in height from 5000m to 7000m above m.s.l. Over an average aerial distance of 160km towards
the Brahmaputra plain in the south, the height drops down to nearly 100m above m.s.l.
(Chakrabarti et. al., 1987).
Geomorphologically the area consists of (i) glaciated region, (ii) highly dissected hills, (iii) narrow
ridge & valley province and (iv) floodplain and piedmont zone (Chakrabarti et al., 1987). The
highly dissected hills in the north are snow covered and some of the valleys just below the
permanent snowline are U-shaped due to glacial and / or seasonal ice action. In Dri River well
preserved moraines are seen at various places upstream of Anini with main terminal moraine at
Anini. According to Kumar and Kumar (1998), the Mathun valley seems to be hanging valley with
respect to the main Dri valley. The remnants of lateral moraines have been observed in areas
between north of Anini and south of Acholin and in between Anini and Agoline in Dri valley.
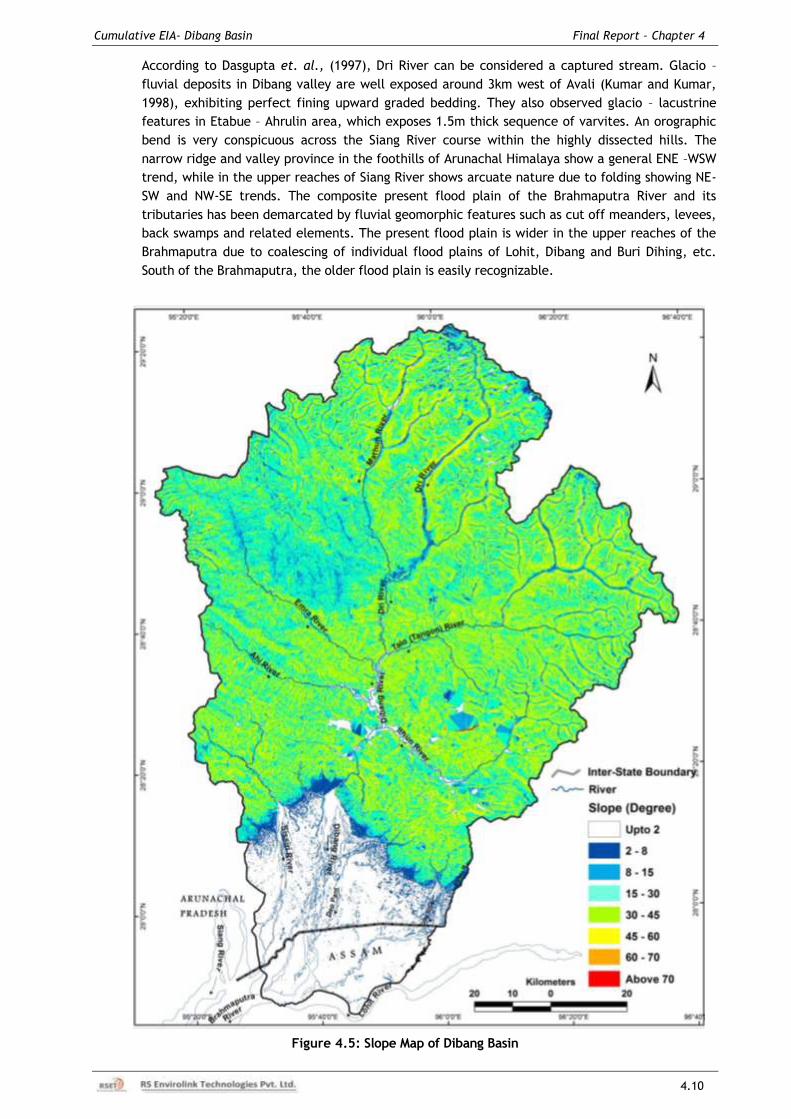
Cumulative EIA- Dibang Basin Final Report – Chapter 4
4.10
According to Dasgupta et. al., (1997), Dri River can be considered a captured stream. Glacio –
fluvial deposits in Dibang valley are well exposed around 3km west of Avali (Kumar and Kumar,
1998), exhibiting perfect fining upward graded bedding. They also observed glacio – lacustrine
features in Etabue – Ahrulin area, which exposes 1.5m thick sequence of varvites. An orographic
bend is very conspicuous across the Siang River course within the highly dissected hills. The
narrow ridge and valley province in the foothills of Arunachal Himalaya show a general ENE –WSW
trend, while in the upper reaches of Siang River shows arcuate nature due to folding showing NE-
SW and NW-SE trends. The composite present flood plain of the Brahmaputra River and its
tributaries has been demarcated by fluvial geomorphic features such as cut off meanders, levees,
back swamps and related elements. The present flood plain is wider in the upper reaches of the
Brahmaputra due to coalescing of individual flood plains of Lohit, Dibang and Buri Dihing, etc.
South of the Brahmaputra, the older flood plain is easily recognizable.
Figure 4.5: Slope Map of Dibang Basin
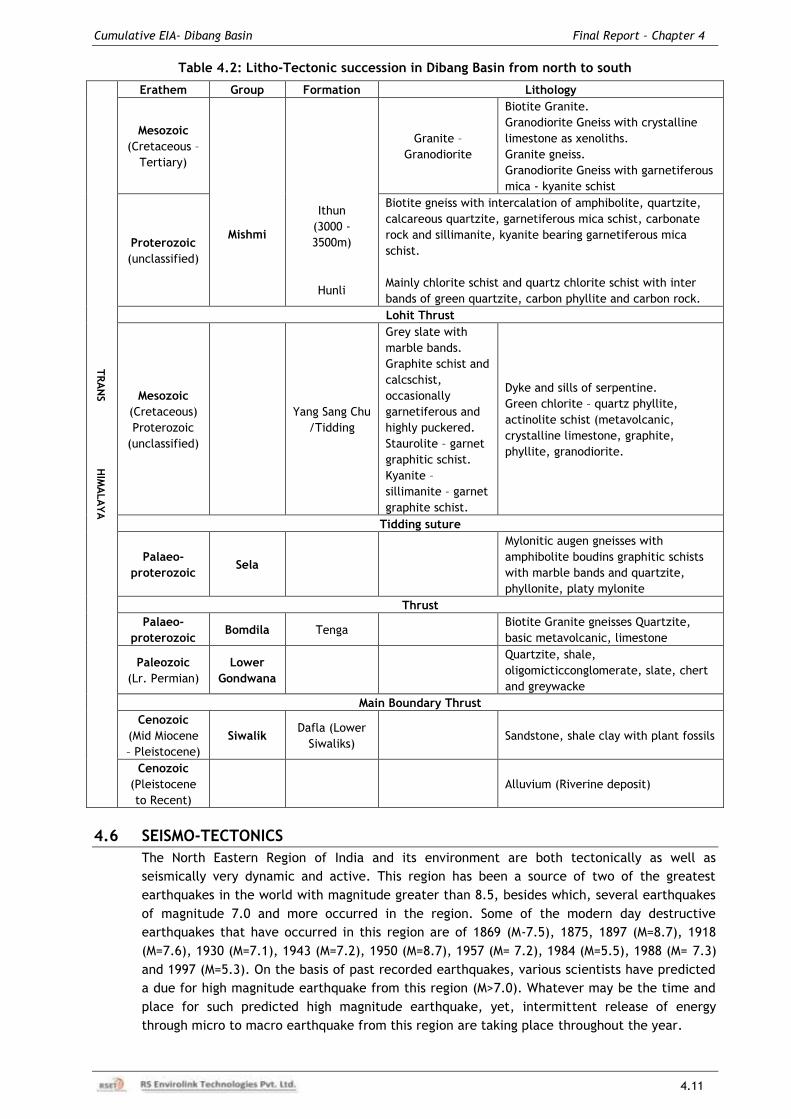
Cumulative EIA- Dibang Basin Final Report – Chapter 4
4.11
Table 4.2: Litho-Tectonic succession in Dibang Basin from north to south
TR
AN
S H
IMA
LA
YA
Erathem Group Formation Lithology
Mesozoic
(Cretaceous –
Tertiary)
Mishmi
Ithun
(3000 -
3500m)
Hunli
Granite –
Granodiorite
Biotite Granite.
Granodiorite Gneiss with crystalline
limestone as xenoliths.
Granite gneiss.
Granodiorite Gneiss with garnetiferous
mica - kyanite schist
Proterozoic
(unclassified)
Biotite gneiss with intercalation of amphibolite, quartzite,
calcareous quartzite, garnetiferous mica schist, carbonate
rock and sillimanite, kyanite bearing garnetiferous mica
schist.
Mainly chlorite schist and quartz chlorite schist with inter
bands of green quartzite, carbon phyllite and carbon rock.
Lohit Thrust
Mesozoic
(Cretaceous)
Proterozoic
(unclassified)
Yang Sang Chu
/Tidding
Grey slate with
marble bands.
Graphite schist and
calcschist,
occasionally
garnetiferous and
highly puckered.
Staurolite – garnet
graphitic schist.
Kyanite –
sillimanite – garnet
graphite schist.
Dyke and sills of serpentine.
Green chlorite – quartz phyllite,
actinolite schist (metavolcanic,
crystalline limestone, graphite,
phyllite, granodiorite.
Tidding suture
Palaeo-
proterozoic Sela
Mylonitic augen gneisses with
amphibolite boudins graphitic schists
with marble bands and quartzite,
phyllonite, platy mylonite
Thrust
Palaeo-
proterozoic Bomdila Tenga
Biotite Granite gneisses Quartzite,
basic metavolcanic, limestone
Paleozoic
(Lr. Permian)
Lower
Gondwana
Quartzite, shale,
oligomicticconglomerate, slate, chert
and greywacke
Main Boundary Thrust
Cenozoic
(Mid Miocene
– Pleistocene)
Siwalik Dafla (Lower
Siwaliks)
Sandstone, shale clay with plant fossils
Cenozoic
(Pleistocene
to Recent)
Alluvium (Riverine deposit)
4.6 SEISMO-TECTONICS
The North Eastern Region of India and its environment are both tectonically as well as
seismically very dynamic and active. This region has been a source of two of the greatest
earthquakes in the world with magnitude greater than 8.5, besides which, several earthquakes
of magnitude 7.0 and more occurred in the region. Some of the modern day destructive
earthquakes that have occurred in this region are of 1869 (M-7.5), 1875, 1897 (M=8.7), 1918
(M=7.6), 1930 (M=7.1), 1943 (M=7.2), 1950 (M=8.7), 1957 (M= 7.2), 1984 (M=5.5), 1988 (M= 7.3)
and 1997 (M=5.3). On the basis of past recorded earthquakes, various scientists have predicted
a due for high magnitude earthquake from this region (M>7.0). Whatever may be the time and
place for such predicted high magnitude earthquake, yet, intermittent release of energy
through micro to macro earthquake from this region are taking place throughout the year.
Cumulative EIA- Dibang Basin Final Report – Chapter 4
4.12
4.6.1 Tectono-Stratigraphic Set up
Regional tectonics and seismic history of the North Eastern Region is highly significant. It
constitutes active, unparallel relief, complex geological set up and anomalous crustal
structure, which are attributed to the direct collision between Indian plate (Himalaya) and
China / Tibet plate in the north and Indo- Burma subduction plate tectonics in the south east.
This continent collision and subduction tectonics has developed juxtaposition of three tectonic
blocks, viz N.E. projection of Indian shield with Himalayan thrust front, Eastern syntaxis of
Mishmi block and the thrust imbricated Indo-Burmese block as well as the intervening
Brahmaputra and Surma Valley.
In the Himalayan belt, a few well defined techno geologic domains extend over a distance of
2500 km from Nanga Parbat in the west to Namcha-Barwa in the east. In the north of Arunachal
Himalaya, the southern margin of Eurasian plate is marked by Indus Tsangpo Suture Zone (ITZ).
The 15 to 20 km wide Tsangpo ophiolite melange occurs along the Tsangpo river course and
extends beyond the Siang fracture and the serpentinites of Mishmi block occurring in association
with actinolite tremolite schists as well as crystalline limestone. The diorite-granodiorite complex
of Mishmi block is thrusted over the frontal metamorphics, consisting of high to low grade
metamorphic rocks with serpentinites along the NW Lohit thrust. The metamorphics in turn over
ride the Neogene folded rocks of the Burmese arc by the Mishmi thrust in Noa Dihing Valley.
The highest axial zone of Himalaya is occupied by the Proterozoic crystalline rocks delimited to
the south by the Main Central Thrust (MCT). The Neogene granites are common along the
contact of the crystallines and the Tethyan sediments. The well-defined Lesser Himalayan belt
between MCT and MBT, in all probability, may represent the tectonised northern extension of
the Indian shield with both fresh water and marine sediments and ortho-quartzite dolomite
sequence. South of the MBT, all along the foot hills, occur the folded and thrusted belt of
Upper Tertiary molassic Siwalik sediments with slices of Gondwana and Eocene rocks at some
places. South of the Siwalik belt is the Brahmaputra alluvial plain.
The Meghalaya plateau and Mikir hills consisting mostly of Archean gneissic complex and
Proterozoic intercratonic sediments of Shillong Group intruded by Upper Proterozoic granite
batholith and basic igneous rocks, represents a positive shield element. This block occupies a
crucial position between the Himalaya in the north and North West and Burmese arc in the east
and south east. The Dauki fault at the southern margin of the plateau separates it from the
Sylhet plain of Surma Basin. Cretaceous Tertiary shelf sediments occur along the southern
margin of the plateau. The Upper Assam Valley forms a fore deep for the Himalaya and the
Burmese arc.
The Naga Patkoi belt is composed of thick sediments of Eocene flysh, coal bearing Barails,
uncomfortably overlain by middle and upper Tertiary rocks consisting of sandstone, clay shale
and pebble beds. The ultra-basic ophiolites occur along Indo- Burmese border. The belt of
schuppen consists of several thrust slices, viz. Haflong thrust, Disang thrust, Margherita thrust,
Naga thrust, are some prominent features, which are mostly over thrust with some overlap.
4.6.2 Tectonic Setting
The East West structural trend of the Himalaya has- taken a sharp bend towards North East -
North in the Siang Valley, Arunachal Pradesh The available geological information do not
indicate physical continuity of the Himalayan rock units across the Siang fracture (Nandy, 1980)
into the Mishmi block, rather the north east trending elements of Arunachal Himalaya with its
thrust sheets abut against the north-west trending structural grain of the Mishmi block. The
MGT and the MBT are the two major crustal discontinuity extending west to east throughout
Himalaya, but these do not represent single dislocation plane. The MBT is well exposed all
along the southern margin of Arunachal Himalaya up to Siang river, while MCT is yet doubtful
Cumulative EIA- Dibang Basin Final Report – Chapter 4
4.13
about its extension. Thrusting along the MBT is a late event involving the youngest Siwalik rocks
of Pliocene to Pleistocene age. Besides these longitudinal thrusts / faults, many oblique to
transverse faults lineaments cut across the Himalaya, some of which are regionally extensive
and traverse from fore deep to ITZ through Himalaya. Few of these caused noticeable off sets
on MBT & MCT in the Siang fracture zone.
The most prominent and significant tectonic feature around the project site are apparently
parallel NW trending Mishmi thrust and Lohit Thrust. This tectonic block over rides the NW and
SE dipping thrust packets of Himalaya and Burmese arc, respectively. The northern boundary of
this block is Po Chu Fault. The frontal Mishmi thrust in this zone show late Neogene thrusting
over the Upper Assam alluvial plain while recent seismic activity indicates predominant right
lateral shear.
Amongst the N-S trending fault, Bame fault has affected other tectonic features in Arunachal
Himalaya. Bame fault is connected with the Eastern syntaxis and appears to be related to the
refolding of rocks due to collision of Burmese plate with the Indian plate during Post Lower
Eocene time. The Great Assam Earthquake of 1950 (M=8.7), originating from this domain,
illustrates similar right lateral sense of displacement (Ben-Menahem et. al., 1974). The
southern corner of this domain is at present most active where ENE thrust sheets of Burmese
arc intersects the NW Mishmi and Lohit thrust.
In addition to the above tectonic lineaments of Arunachal Pradesh, other regionally extended
prominent tectonic features of the region are:
a) Dauki fault in the south of Shillong plateau separating Shillong massif from the Surma basin
of Bangladesh.
b) NE trending Sylhet fault extending from Bangladesh and merging with Haflong Disang fault.
c) N-S trending Jamuna fault demarcating western boundary of Shillong plateau from the
Rajmahal gap.
d) Hidden, conjugate Brahmaputra lineament.
e) N-S trending Chidrang, Oudhnai, Krishnai, Kulsi, Kopili fault.
4.6.3 Seismicity of the Region
Tile study of distribution of all available earthquake epicenters of the region shows that the
dispersion is not uniform in space. However, close view reveals that some of the epicenters do
not follow major lineaments in true sense. But considering cut off magnitude and accuracy of
data acquisition, some correlation can be made with probable source. In a very generalized
way epicenter clustering can be visualized around (1) Western part of Shillong Plateau, (2)
Central Assam & Western Arunachal Pradesh, (3) Indo Burma Border, and (4) North Eastern part
of Arunachal Pradesh. The Upper Assam Valley area shows less epicenter distribution, which
was designated as Assam Gap area by Khattri (1987). Further, in this gap area only a few small
magnitudes of earthquakes have generated. But it is established that this area is in fact a
seismic and not a seismic gap area.
Dibang basin falls in Seismic Zone-V as per Seismic zoning map of India.
The epicenter map considering ISC data source and 84 reliable shallow events of M > or = 4.9
for a period of 1963-84 along with recorded events (M>or = 7.0) of pre 1963, when
superimposed on a tectonic map revealed the following.
a) In the north of Suture Zone only a few seismic events are located.
b) Seismic events are mostly located between MBT & MCT in the lesser Himalaya domain.
c) Earthquakes occurring between MBT & MCT are evenly distributed along the Himalayan
front and tend to concentrate in areas traversed by fractures/ faults across the strike of
the Himalaya.
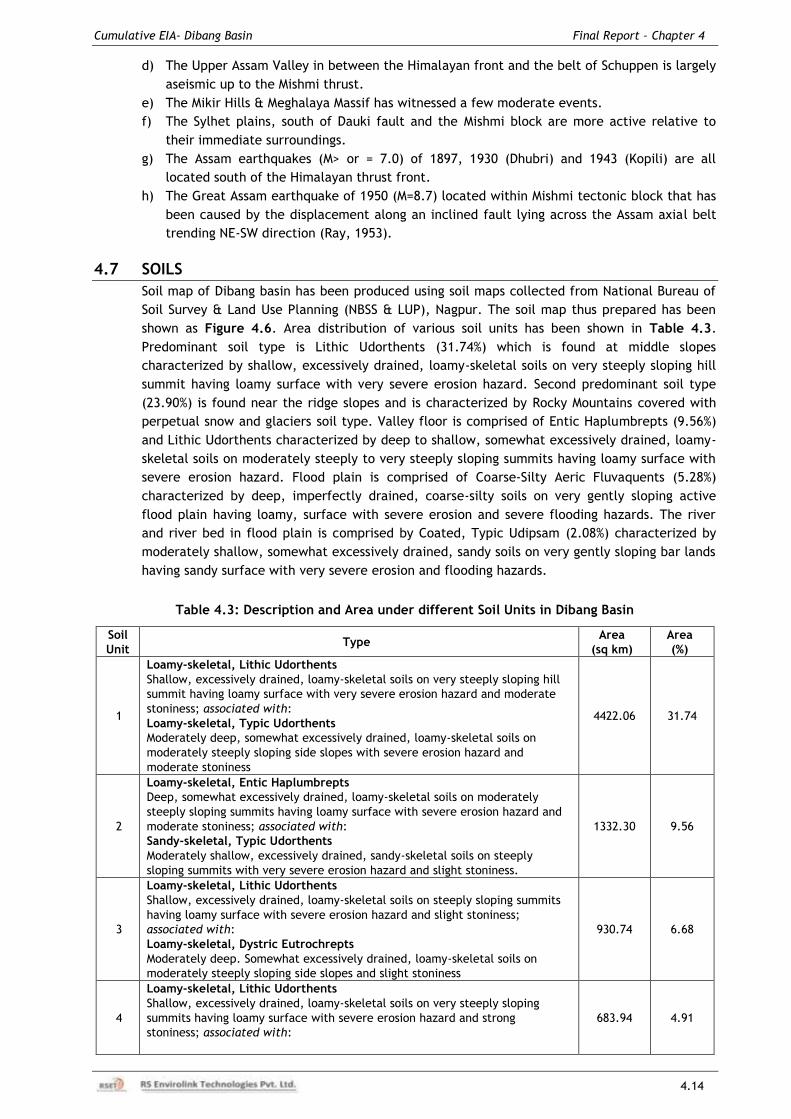
Cumulative EIA- Dibang Basin Final Report – Chapter 4
4.14
d) The Upper Assam Valley in between the Himalayan front and the belt of Schuppen is largely
aseismic up to the Mishmi thrust.
e) The Mikir Hills & Meghalaya Massif has witnessed a few moderate events.
f) The Sylhet plains, south of Dauki fault and the Mishmi block are more active relative to
their immediate surroundings.
g) The Assam earthquakes (M> or = 7.0) of 1897, 1930 (Dhubri) and 1943 (Kopili) are all
located south of the Himalayan thrust front.
h) The Great Assam earthquake of 1950 (M=8.7) located within Mishmi tectonic block that has
been caused by the displacement along an inclined fault lying across the Assam axial belt
trending NE-SW direction (Ray, 1953).
4.7 SOILS
Soil map of Dibang basin has been produced using soil maps collected from National Bureau of
Soil Survey & Land Use Planning (NBSS & LUP), Nagpur. The soil map thus prepared has been
shown as Figure 4.6. Area distribution of various soil units has been shown in Table 4.3.
Predominant soil type is Lithic Udorthents (31.74%) which is found at middle slopes
characterized by shallow, excessively drained, loamy-skeletal soils on very steeply sloping hill
summit having loamy surface with very severe erosion hazard. Second predominant soil type
(23.90%) is found near the ridge slopes and is characterized by Rocky Mountains covered with
perpetual snow and glaciers soil type. Valley floor is comprised of Entic Haplumbrepts (9.56%)
and Lithic Udorthents characterized by deep to shallow, somewhat excessively drained, loamy-
skeletal soils on moderately steeply to very steeply sloping summits having loamy surface with
severe erosion hazard. Flood plain is comprised of Coarse-Silty Aeric Fluvaquents (5.28%)
characterized by deep, imperfectly drained, coarse-silty soils on very gently sloping active
flood plain having loamy, surface with severe erosion and severe flooding hazards. The river
and river bed in flood plain is comprised by Coated, Typic Udipsam (2.08%) characterized by
moderately shallow, somewhat excessively drained, sandy soils on very gently sloping bar lands
having sandy surface with very severe erosion and flooding hazards.
Table 4.3: Description and Area under different Soil Units in Dibang Basin
Soil
Unit Type
Area
(sq km)
Area
(%)
1
Loamy-skeletal, Lithic Udorthents
Shallow, excessively drained, loamy-skeletal soils on very steeply sloping hill
summit having loamy surface with very severe erosion hazard and moderate
stoniness; associated with:
Loamy-skeletal, Typic Udorthents
Moderately deep, somewhat excessively drained, loamy-skeletal soils on
moderately steeply sloping side slopes with severe erosion hazard and
moderate stoniness
4422.06 31.74
2
Loamy-skeletal, Entic Haplumbrepts
Deep, somewhat excessively drained, loamy-skeletal soils on moderately
steeply sloping summits having loamy surface with severe erosion hazard and
moderate stoniness; associated with:
Sandy-skeletal, Typic Udorthents
Moderately shallow, excessively drained, sandy-skeletal soils on steeply
sloping summits with very severe erosion hazard and slight stoniness.
1332.30 9.56
3
Loamy-skeletal, Lithic Udorthents
Shallow, excessively drained, loamy-skeletal soils on steeply sloping summits
having loamy surface with severe erosion hazard and slight stoniness;
associated with:
Loamy-skeletal, Dystric Eutrochrepts
Moderately deep. Somewhat excessively drained, loamy-skeletal soils on
moderately steeply sloping side slopes and slight stoniness
930.74 6.68
4
Loamy-skeletal, Lithic Udorthents
Shallow, excessively drained, loamy-skeletal soils on very steeply sloping
summits having loamy surface with severe erosion hazard and strong
stoniness; associated with:
683.94 4.91
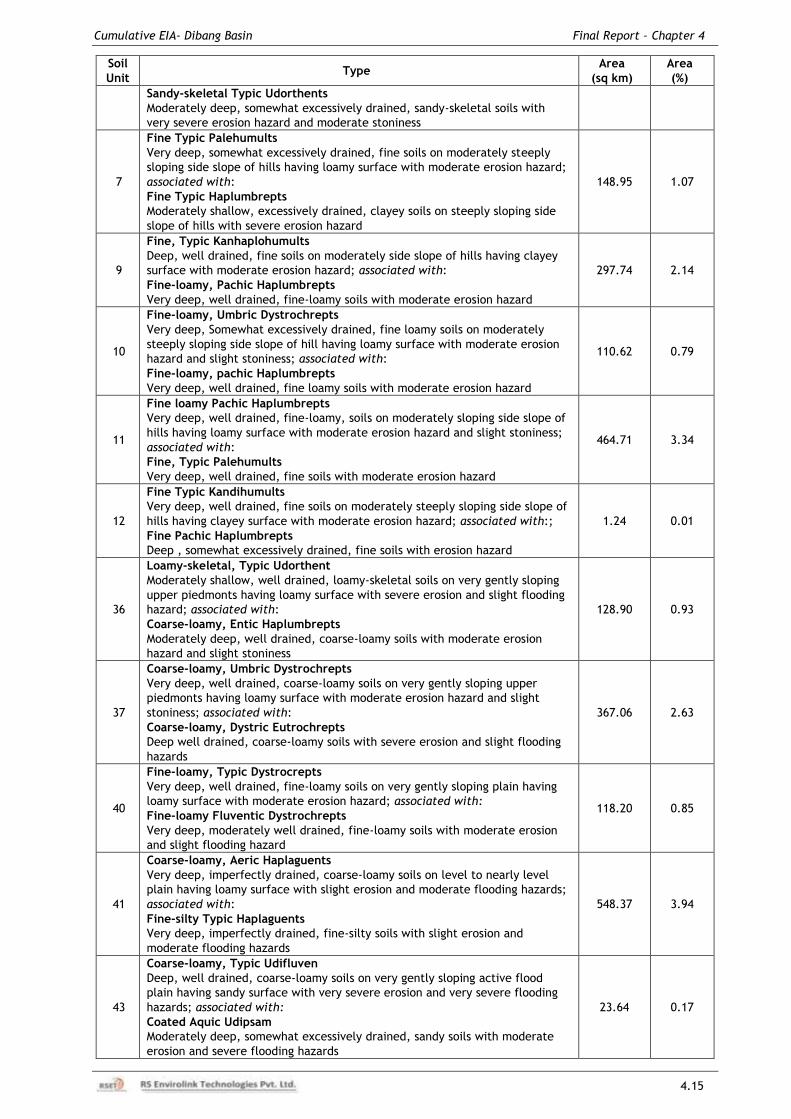
Cumulative EIA- Dibang Basin Final Report – Chapter 4
4.15
Soil
Unit Type
Area
(sq km)
Area
(%)
Sandy-skeletal Typic Udorthents
Moderately deep, somewhat excessively drained, sandy-skeletal soils with
very severe erosion hazard and moderate stoniness
7
Fine Typic Palehumults
Very deep, somewhat excessively drained, fine soils on moderately steeply
sloping side slope of hills having loamy surface with moderate erosion hazard;
associated with:
Fine Typic Haplumbrepts
Moderately shallow, excessively drained, clayey soils on steeply sloping side
slope of hills with severe erosion hazard
148.95 1.07
9
Fine, Typic Kanhaplohumults
Deep, well drained, fine soils on moderately side slope of hills having clayey
surface with moderate erosion hazard; associated with:
Fine-loamy, Pachic Haplumbrepts
Very deep, well drained, fine-loamy soils with moderate erosion hazard
297.74 2.14
10
Fine-loamy, Umbric Dystrochrepts
Very deep, Somewhat excessively drained, fine loamy soils on moderately
steeply sloping side slope of hill having loamy surface with moderate erosion
hazard and slight stoniness; associated with:
Fine-loamy, pachic Haplumbrepts
Very deep, well drained, fine loamy soils with moderate erosion hazard
110.62 0.79
11
Fine loamy Pachic Haplumbrepts
Very deep, well drained, fine-loamy, soils on moderately sloping side slope of
hills having loamy surface with moderate erosion hazard and slight stoniness;
associated with:
Fine, Typic Palehumults
Very deep, well drained, fine soils with moderate erosion hazard
464.71 3.34
12
Fine Typic Kandihumults
Very deep, well drained, fine soils on moderately steeply sloping side slope of
hills having clayey surface with moderate erosion hazard; associated with:;
Fine Pachic Haplumbrepts
Deep , somewhat excessively drained, fine soils with erosion hazard
1.24 0.01
36
Loamy-skeletal, Typic Udorthent
Moderately shallow, well drained, loamy-skeletal soils on very gently sloping
upper piedmonts having loamy surface with severe erosion and slight flooding
hazard; associated with:
Coarse-loamy, Entic Haplumbrepts
Moderately deep, well drained, coarse-loamy soils with moderate erosion
hazard and slight stoniness
128.90 0.93
37
Coarse-loamy, Umbric Dystrochrepts
Very deep, well drained, coarse-loamy soils on very gently sloping upper
piedmonts having loamy surface with moderate erosion hazard and slight
stoniness; associated with:
Coarse-loamy, Dystric Eutrochrepts
Deep well drained, coarse-loamy soils with severe erosion and slight flooding
hazards
367.06 2.63
40
Fine-loamy, Typic Dystrocrepts
Very deep, well drained, fine-loamy soils on very gently sloping plain having
loamy surface with moderate erosion hazard; associated with:
Fine-loamy Fluventic Dystrochrepts
Very deep, moderately well drained, fine-loamy soils with moderate erosion
and slight flooding hazard
118.20 0.85
41
Coarse-loamy, Aeric Haplaguents
Very deep, imperfectly drained, coarse-loamy soils on level to nearly level
plain having loamy surface with slight erosion and moderate flooding hazards;
associated with:
Fine-silty Typic Haplaguents
Very deep, imperfectly drained, fine-silty soils with slight erosion and
moderate flooding hazards
548.37 3.94
43
Coarse-loamy, Typic Udifluven
Deep, well drained, coarse-loamy soils on very gently sloping active flood
plain having sandy surface with very severe erosion and very severe flooding
hazards; associated with:
Coated Aquic Udipsam
Moderately deep, somewhat excessively drained, sandy soils with moderate
erosion and severe flooding hazards
23.64 0.17
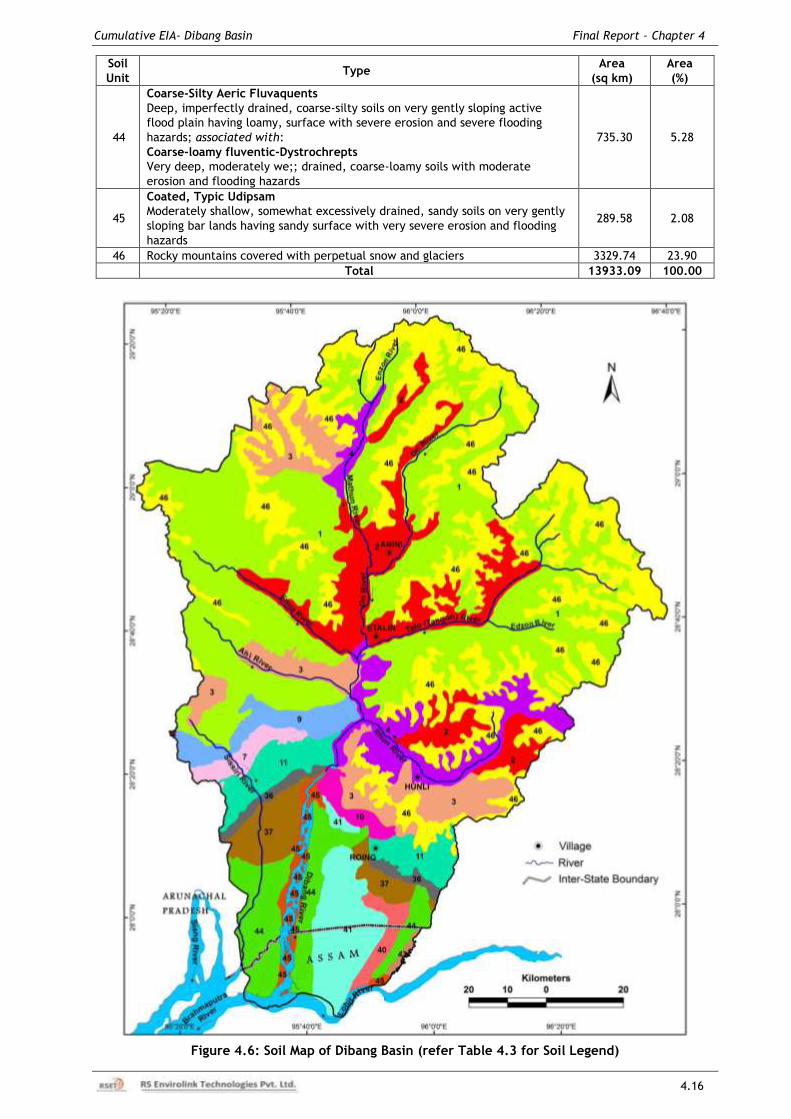
Cumulative EIA- Dibang Basin Final Report – Chapter 4
4.16
Soil
Unit Type
Area
(sq km)
Area
(%)
44
Coarse-Silty Aeric Fluvaquents
Deep, imperfectly drained, coarse-silty soils on very gently sloping active
flood plain having loamy, surface with severe erosion and severe flooding
hazards; associated with:
Coarse-loamy fluventic-Dystrochrepts
Very deep, moderately we;; drained, coarse-loamy soils with moderate
erosion and flooding hazards
735.30 5.28
45
Coated, Typic Udipsam
Moderately shallow, somewhat excessively drained, sandy soils on very gently
sloping bar lands having sandy surface with very severe erosion and flooding
hazards
289.58 2.08
46 Rocky mountains covered with perpetual snow and glaciers 3329.74 23.90
Total 13933.09 100.00
Figure 4.6: Soil Map of Dibang Basin (refer Table 4.3 for Soil Legend)
Cumulative EIA- Dibang Basin Final Report – Chapter 5
5.1
CHAPTER-5 HYDRO-METEOROLOGY
5.1 METEOROLOGY
Two distinct climatic conditions prevail over the entire Dibang Catchment. The upper reach starts
from the Indo-Tibet border up to Mayudiya Hill Range and the lower reach starts from Mayudiya Hill
range to the confluence of Lohit. In the upper catchment, rainfall is comparatively less and the
region is very cool during winter and comfortable during summer. The lower part maintains tropical
climate. Rainfall is very high and the climate remains very humid.
5.1.1 Precipitation Characteristics
Annual rainfall in the Lower Dibang Valley district varies from 3500 mm to 5000 mm. The
normal annual rainfall in Roing area is 3990 mm. Most of the rainfall is received during the
monsoon period (June to September). Heavy rainfall is received during summer and occasional
rainfall during winter and Pre-monsoon period. January and February are the driest months.
The rainfall received during summer is under the spell of South - West monsoon. The onset of
South-West monsoon occurs by the end of May or the first week of June and withdraws by late
September or early October.
The Dibang Valley district falls under heavy rainfall belt, which varies from 3000 mm to 5000
mm. In 2004, the district HQ Anini recorded average annual rainfall of 3281.33 mm. Generally,
the monsoon starts from March and continues up to last part of September, but winter rains are
not infrequent. However, period from January to February may be considered as pre-monsoon
period and October to December as post-monsoon period.
The rainfall in the basin is mainly influenced by the mountain system and occurs due to the
Southwest monsoon, which sets in by the second week of May and continues upto the middle of
October. On the basis of the available data, average rainfall in the basin has been estimated to be
4405 mm. However, the major portion of the rainfall occurs during the period from June to August.
The status of rain gauge stations in Dibang basin and rainfall stations established by NHPC is given in
Table 5.1. The average monthly rainfall data from the year 1998 to 2001 at various stations in
Dibang basin is given in Table 5.2. The average annual rainfall data at various stations in Dibang
basin for different years is given in Table 5.3. In addition to that, arithmatic averages of annual
rainfall at stations in the Dibang Valley and Lower Dibang Valley districts from the year 2009 to
2013 are given in Table 5.4.
In addition, the rainfall scenario of Dibang basin has been studied and analyzed using TRMM
data which is shown in Figure 5.1. The Tropical Rainfall Measuring Mission (TRMM) is a joint
mission between NASA and the Japan Aerospace Exploration Agency (JAXA) designed to
measure rainfall for weather and climate research. TRMM is designed to measure tropical
precipitation and its variation from a low-inclination orbit combining a suite of sensors to
overcome many of the limitations of remote sensors previously used for such measurements
from space. TRMM is a comprehensive and systematic program designed to increase the extent
and accuracy of tropical rainfall measurement. The TRMM science program consists of a broad
research effort which includes development of cloud models, rain retrieval algorithms for the
space sensors, use of TRMM measurements with other satellite data to improve sampling, a
surface-based verification system, and a TRMM science data and information system (TSDIS).
The average annual rainfall for the period 1998-2009 is available for the tropic region in Geotiff
format which gives a fairly good assessment of hypsometric variation in rainfall in Himalayan
region and same has been presented as Figure 5.1, which shows that in Dibang basin area,
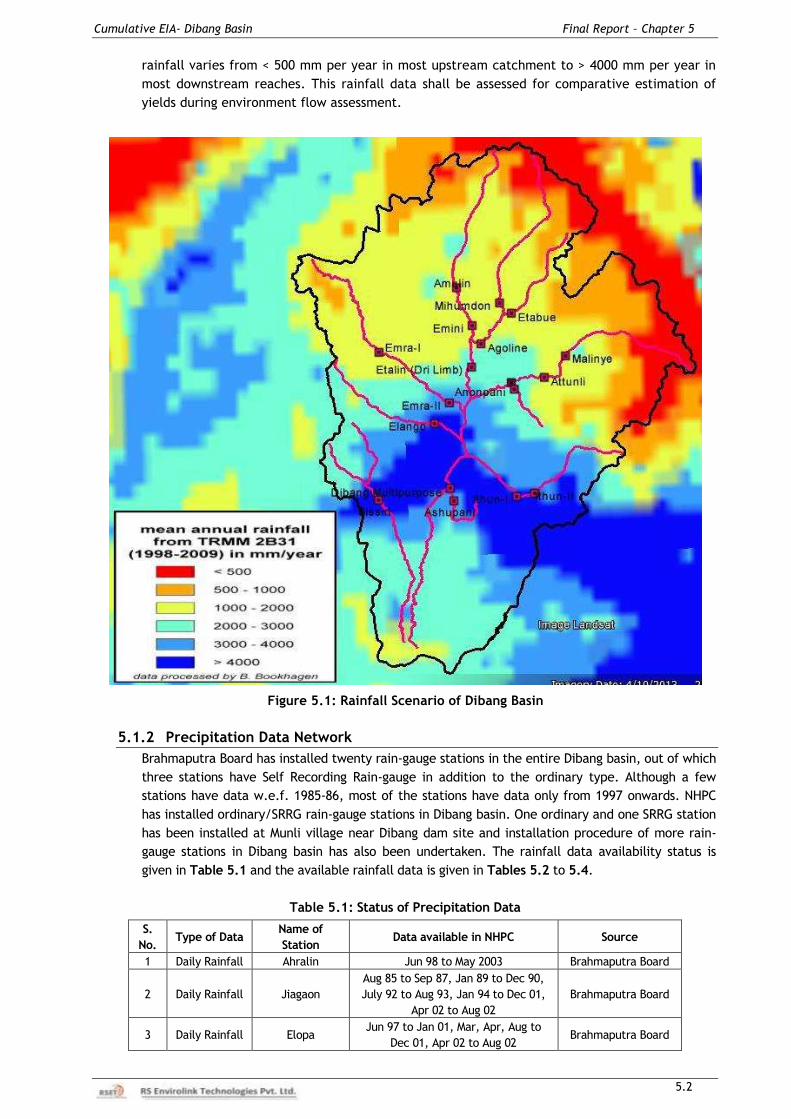
Cumulative EIA- Dibang Basin Final Report – Chapter 5
5.2
rainfall varies from < 500 mm per year in most upstream catchment to > 4000 mm per year in
most downstream reaches. This rainfall data shall be assessed for comparative estimation of
yields during environment flow assessment.
Figure 5.1: Rainfall Scenario of Dibang Basin
5.1.2 Precipitation Data Network
Brahmaputra Board has installed twenty rain-gauge stations in the entire Dibang basin, out of which
three stations have Self Recording Rain-gauge in addition to the ordinary type. Although a few
stations have data w.e.f. 1985-86, most of the stations have data only from 1997 onwards. NHPC
has installed ordinary/SRRG rain-gauge stations in Dibang basin. One ordinary and one SRRG station
has been installed at Munli village near Dibang dam site and installation procedure of more rain-
gauge stations in Dibang basin has also been undertaken. The rainfall data availability status is
given in Table 5.1 and the available rainfall data is given in Tables 5.2 to 5.4.
Table 5.1: Status of Precipitation Data
S.
No. Type of Data
Name of
Station Data available in NHPC Source
1 Daily Rainfall Ahralin Jun 98 to May 2003 Brahmaputra Board
2 Daily Rainfall Jiagaon
Aug 85 to Sep 87, Jan 89 to Dec 90,
July 92 to Aug 93, Jan 94 to Dec 01,
Apr 02 to Aug 02
Brahmaputra Board
3 Daily Rainfall Elopa Jun 97 to Jan 01, Mar, Apr, Aug to
Dec 01, Apr 02 to Aug 02 Brahmaputra Board
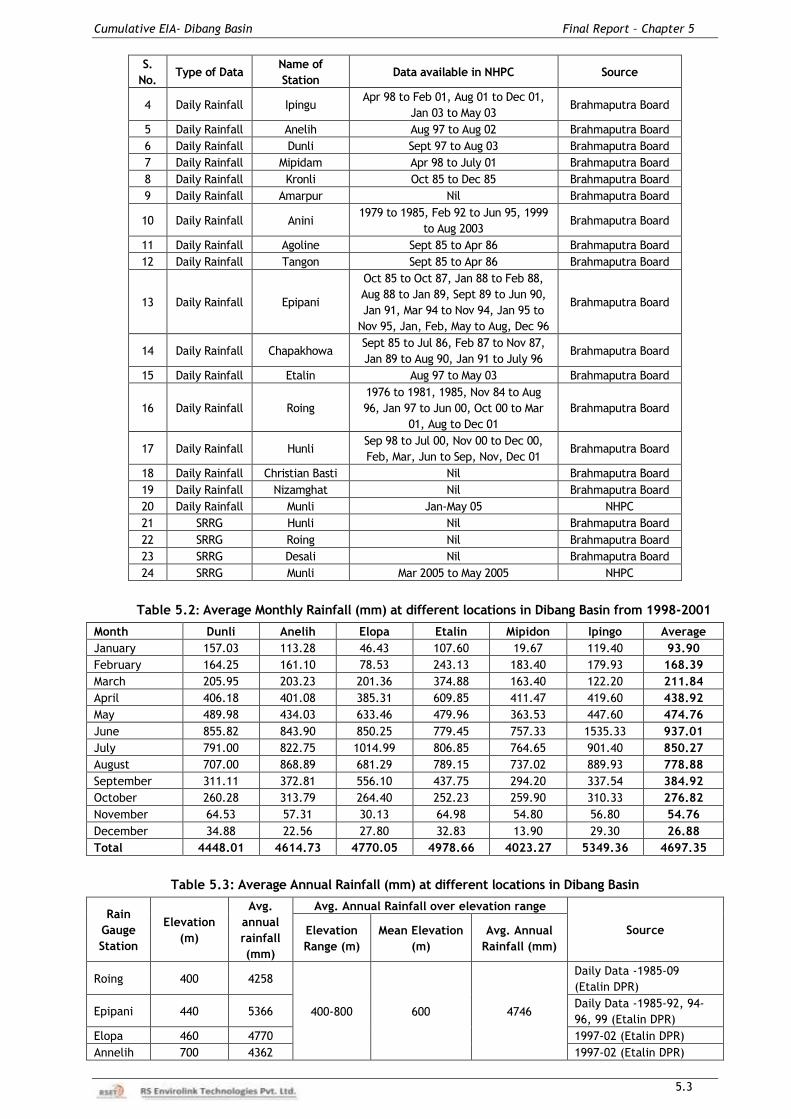
Cumulative EIA- Dibang Basin Final Report – Chapter 5
5.3
S.
No. Type of Data
Name of
Station Data available in NHPC Source
4 Daily Rainfall Ipingu Apr 98 to Feb 01, Aug 01 to Dec 01,
Jan 03 to May 03 Brahmaputra Board
5 Daily Rainfall Anelih Aug 97 to Aug 02 Brahmaputra Board
6 Daily Rainfall Dunli Sept 97 to Aug 03 Brahmaputra Board
7 Daily Rainfall Mipidam Apr 98 to July 01 Brahmaputra Board
8 Daily Rainfall Kronli Oct 85 to Dec 85 Brahmaputra Board
9 Daily Rainfall Amarpur Nil Brahmaputra Board
10 Daily Rainfall Anini 1979 to 1985, Feb 92 to Jun 95, 1999
to Aug 2003 Brahmaputra Board
11 Daily Rainfall Agoline Sept 85 to Apr 86 Brahmaputra Board
12 Daily Rainfall Tangon Sept 85 to Apr 86 Brahmaputra Board
13 Daily Rainfall Epipani
Oct 85 to Oct 87, Jan 88 to Feb 88,
Aug 88 to Jan 89, Sept 89 to Jun 90,
Jan 91, Mar 94 to Nov 94, Jan 95 to
Nov 95, Jan, Feb, May to Aug, Dec 96
Brahmaputra Board
14 Daily Rainfall Chapakhowa Sept 85 to Jul 86, Feb 87 to Nov 87,
Jan 89 to Aug 90, Jan 91 to July 96 Brahmaputra Board
15 Daily Rainfall Etalin Aug 97 to May 03 Brahmaputra Board
16 Daily Rainfall Roing
1976 to 1981, 1985, Nov 84 to Aug
96, Jan 97 to Jun 00, Oct 00 to Mar
01, Aug to Dec 01
Brahmaputra Board
17 Daily Rainfall Hunli Sep 98 to Jul 00, Nov 00 to Dec 00,
Feb, Mar, Jun to Sep, Nov, Dec 01 Brahmaputra Board
18 Daily Rainfall Christian Basti Nil Brahmaputra Board
19 Daily Rainfall Nizamghat Nil Brahmaputra Board
20 Daily Rainfall Munli Jan-May 05 NHPC
21 SRRG Hunli Nil Brahmaputra Board
22 SRRG Roing Nil Brahmaputra Board
23 SRRG Desali Nil Brahmaputra Board
24 SRRG Munli Mar 2005 to May 2005 NHPC
Table 5.2: Average Monthly Rainfall (mm) at different locations in Dibang Basin from 1998-2001
Month Dunli Anelih Elopa Etalin Mipidon Ipingo Average
January 157.03 113.28 46.43 107.60 19.67 119.40 93.90
February 164.25 161.10 78.53 243.13 183.40 179.93 168.39
March 205.95 203.23 201.36 374.88 163.40 122.20 211.84
April 406.18 401.08 385.31 609.85 411.47 419.60 438.92
May 489.98 434.03 633.46 479.96 363.53 447.60 474.76
June 855.82 843.90 850.25 779.45 757.33 1535.33 937.01
July 791.00 822.75 1014.99 806.85 764.65 901.40 850.27
August 707.00 868.89 681.29 789.15 737.02 889.93 778.88
September 311.11 372.81 556.10 437.75 294.20 337.54 384.92
October 260.28 313.79 264.40 252.23 259.90 310.33 276.82
November 64.53 57.31 30.13 64.98 54.80 56.80 54.76
December 34.88 22.56 27.80 32.83 13.90 29.30 26.88
Total 4448.01 4614.73 4770.05 4978.66 4023.27 5349.36 4697.35
Table 5.3: Average Annual Rainfall (mm) at different locations in Dibang Basin
Rain
Gauge
Station
Elevation
(m)
Avg.
annual
rainfall
(mm)
Avg. Annual Rainfall over elevation range
Source Elevation
Range (m)
Mean Elevation
(m)
Avg. Annual
Rainfall (mm)
Roing 400 4258
400-800 600 4746
Daily Data -1985-09
(Etalin DPR)
Epipani 440 5366 Daily Data -1985-92, 94-
96, 99 (Etalin DPR)
Elopa 460 4770 1997-02 (Etalin DPR)
Annelih 700 4362 1997-02 (Etalin DPR)
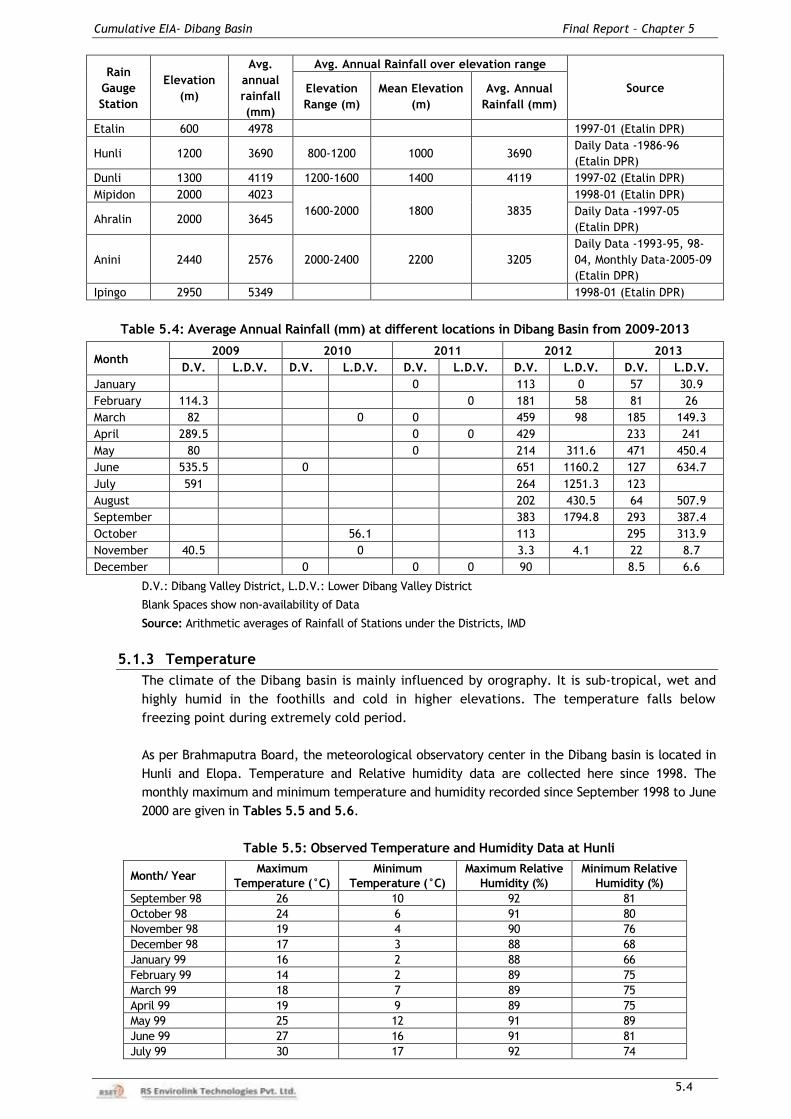
Cumulative EIA- Dibang Basin Final Report – Chapter 5
5.4
Rain
Gauge
Station
Elevation
(m)
Avg.
annual
rainfall
(mm)
Avg. Annual Rainfall over elevation range
Source Elevation
Range (m)
Mean Elevation
(m)
Avg. Annual
Rainfall (mm)
Etalin 600 4978 1997-01 (Etalin DPR)
Hunli 1200 3690 800-1200 1000 3690 Daily Data -1986-96
(Etalin DPR)
Dunli 1300 4119 1200-1600 1400 4119 1997-02 (Etalin DPR)
Mipidon 2000 4023
1600-2000 1800 3835
1998-01 (Etalin DPR)
Ahralin 2000 3645 Daily Data -1997-05
(Etalin DPR)
Anini 2440 2576 2000-2400 2200 3205
Daily Data -1993-95, 98-
04, Monthly Data-2005-09
(Etalin DPR)
Ipingo 2950 5349
1998-01 (Etalin DPR)
Table 5.4: Average Annual Rainfall (mm) at different locations in Dibang Basin from 2009-2013
Month 2009 2010 2011 2012 2013
D.V. L.D.V. D.V. L.D.V. D.V. L.D.V. D.V. L.D.V. D.V. L.D.V.
January
0
113 0 57 30.9
February 114.3
0 181 58 81 26
March 82
0 0
459 98 185 149.3
April 289.5
0 0 429
233 241
May 80
0
214 311.6 471 450.4
June 535.5
0
651 1160.2 127 634.7
July 591
264 1251.3 123
August
202 430.5 64 507.9
September
383 1794.8 293 387.4
October
56.1
113
295 313.9
November 40.5
0
3.3 4.1 22 8.7
December
0
0 0 90
8.5 6.6
D.V.: Dibang Valley District, L.D.V.: Lower Dibang Valley District
Blank Spaces show non-availability of Data
Source: Arithmetic averages of Rainfall of Stations under the Districts, IMD
5.1.3 Temperature
The climate of the Dibang basin is mainly influenced by orography. It is sub-tropical, wet and
highly humid in the foothills and cold in higher elevations. The temperature falls below
freezing point during extremely cold period.
As per Brahmaputra Board, the meteorological observatory center in the Dibang basin is located in
Hunli and Elopa. Temperature and Relative humidity data are collected here since 1998. The
monthly maximum and minimum temperature and humidity recorded since September 1998 to June
2000 are given in Tables 5.5 and 5.6.
Table 5.5: Observed Temperature and Humidity Data at Hunli
Month/ Year Maximum
Temperature (°C)
Minimum
Temperature (°C)
Maximum Relative
Humidity (%)
Minimum Relative
Humidity (%)
September 98 26 10 92 81
October 98 24 6 91 80
November 98 19 4 90 76
December 98 17 3 88 68
January 99 16 2 88 66
February 99 14 2 89 75
March 99 18 7 89 75
April 99 19 9 89 75
May 99 25 12 91 89
June 99 27 16 91 81
July 99 30 17 92 74
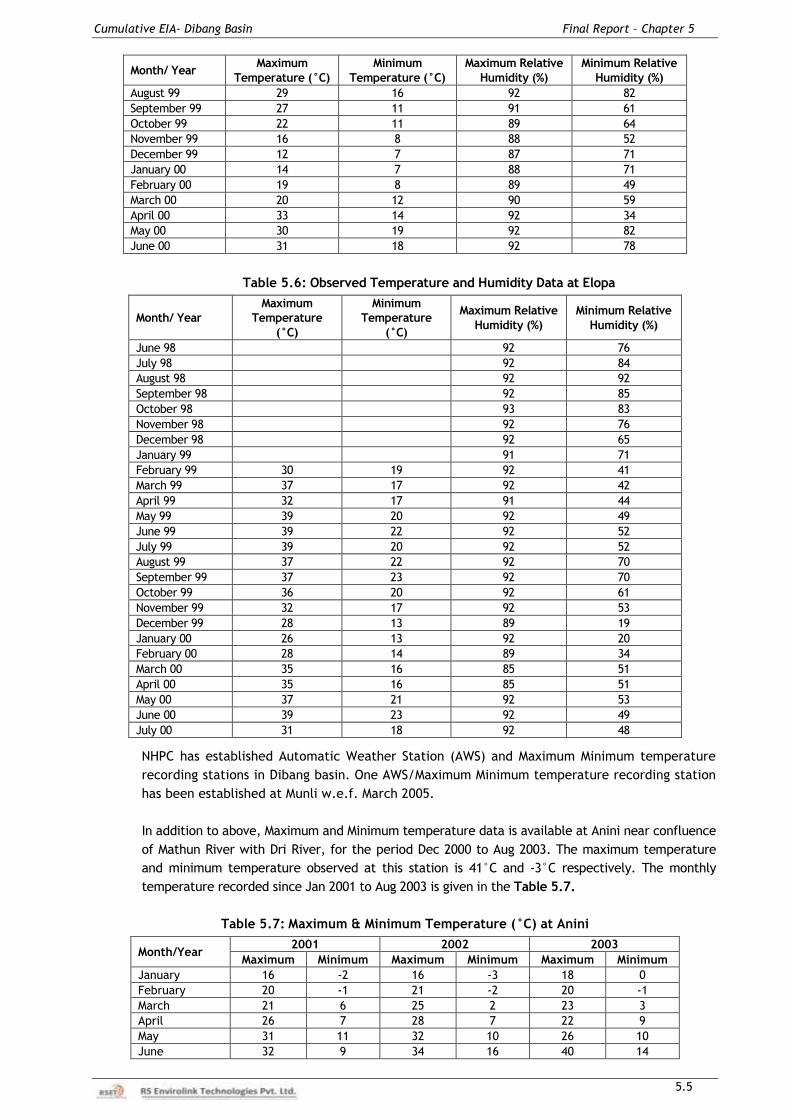
Cumulative EIA- Dibang Basin Final Report – Chapter 5
5.5
Month/ Year Maximum
Temperature (°C)
Minimum
Temperature (°C)
Maximum Relative
Humidity (%)
Minimum Relative
Humidity (%)
August 99 29 16 92 82
September 99 27 11 91 61
October 99 22 11 89 64
November 99 16 8 88 52
December 99 12 7 87 71
January 00 14 7 88 71
February 00 19 8 89 49
March 00 20 12 90 59
April 00 33 14 92 34
May 00 30 19 92 82
June 00 31 18 92 78
Table 5.6: Observed Temperature and Humidity Data at Elopa
Month/ Year
Maximum
Temperature
(°C)
Minimum
Temperature
(°C)
Maximum Relative
Humidity (%)
Minimum Relative
Humidity (%)
June 98 92 76
July 98 92 84
August 98 92 92
September 98 92 85
October 98 93 83
November 98 92 76
December 98 92 65
January 99 91 71
February 99 30 19 92 41
March 99 37 17 92 42
April 99 32 17 91 44
May 99 39 20 92 49
June 99 39 22 92 52
July 99 39 20 92 52
August 99 37 22 92 70
September 99 37 23 92 70
October 99 36 20 92 61
November 99 32 17 92 53
December 99 28 13 89 19
January 00 26 13 92 20
February 00 28 14 89 34
March 00 35 16 85 51
April 00 35 16 85 51
May 00 37 21 92 53
June 00 39 23 92 49
July 00 31 18 92 48
NHPC has established Automatic Weather Station (AWS) and Maximum Minimum temperature
recording stations in Dibang basin. One AWS/Maximum Minimum temperature recording station
has been established at Munli w.e.f. March 2005.
In addition to above, Maximum and Minimum temperature data is available at Anini near confluence
of Mathun River with Dri River, for the period Dec 2000 to Aug 2003. The maximum temperature
and minimum temperature observed at this station is 41°C and -3°C respectively. The monthly
temperature recorded since Jan 2001 to Aug 2003 is given in the Table 5.7.
Table 5.7: Maximum & Minimum Temperature (°C) at Anini
Month/Year 2001 2002 2003
Maximum Minimum Maximum Minimum Maximum Minimum
January 16 -2 16 -3 18 0
February 20 -1 21 -2 20 -1
March 21 6 25 2 23 3
April 26 7 28 7 22 9
May 31 11 32 10 26 10
June 32 9 34 16 40 14
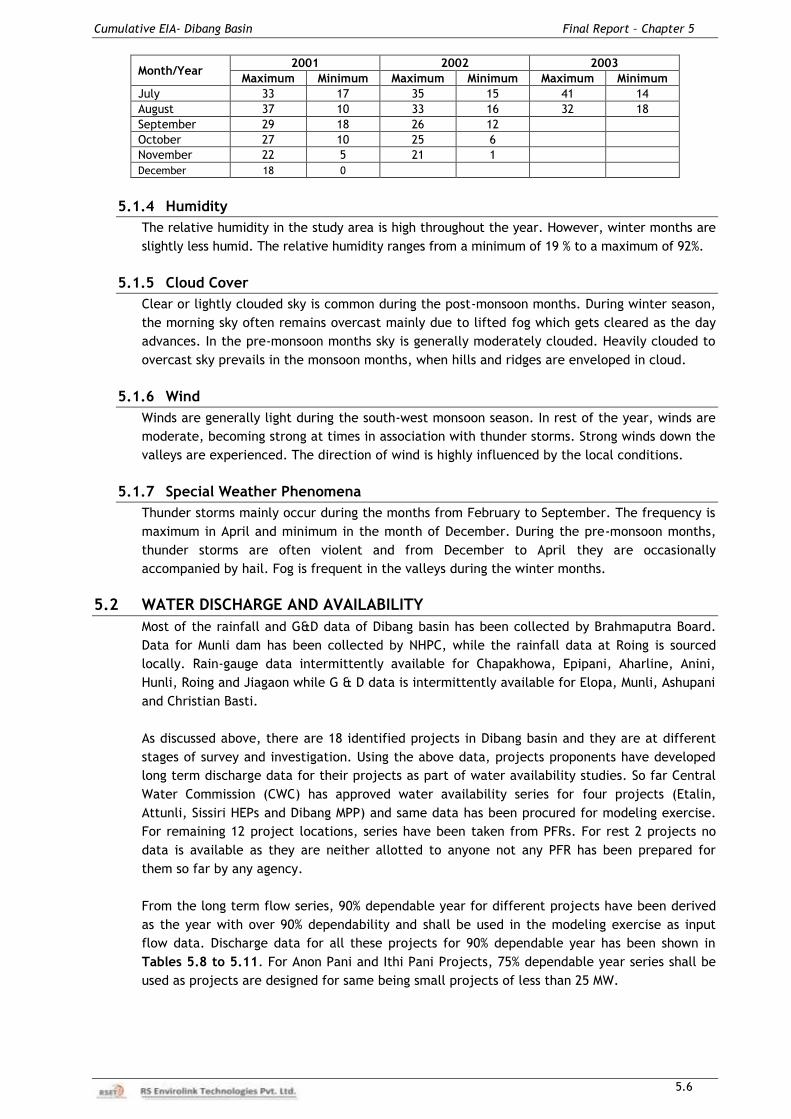
Cumulative EIA- Dibang Basin Final Report – Chapter 5
5.6
Month/Year 2001 2002 2003
Maximum Minimum Maximum Minimum Maximum Minimum
July 33 17 35 15 41 14
August 37 10 33 16 32 18
September 29 18 26 12
October 27 10 25 6
November 22 5 21 1
December 18 0
5.1.4 Humidity
The relative humidity in the study area is high throughout the year. However, winter months are
slightly less humid. The relative humidity ranges from a minimum of 19 % to a maximum of 92%.
5.1.5 Cloud Cover
Clear or lightly clouded sky is common during the post-monsoon months. During winter season,
the morning sky often remains overcast mainly due to lifted fog which gets cleared as the day
advances. In the pre-monsoon months sky is generally moderately clouded. Heavily clouded to
overcast sky prevails in the monsoon months, when hills and ridges are enveloped in cloud.
5.1.6 Wind
Winds are generally light during the south-west monsoon season. In rest of the year, winds are
moderate, becoming strong at times in association with thunder storms. Strong winds down the
valleys are experienced. The direction of wind is highly influenced by the local conditions.
5.1.7 Special Weather Phenomena
Thunder storms mainly occur during the months from February to September. The frequency is
maximum in April and minimum in the month of December. During the pre-monsoon months,
thunder storms are often violent and from December to April they are occasionally
accompanied by hail. Fog is frequent in the valleys during the winter months.
5.2 WATER DISCHARGE AND AVAILABILITY
Most of the rainfall and G&D data of Dibang basin has been collected by Brahmaputra Board.
Data for Munli dam has been collected by NHPC, while the rainfall data at Roing is sourced
locally. Rain-gauge data intermittently available for Chapakhowa, Epipani, Aharline, Anini,
Hunli, Roing and Jiagaon while G & D data is intermittently available for Elopa, Munli, Ashupani
and Christian Basti.
As discussed above, there are 18 identified projects in Dibang basin and they are at different
stages of survey and investigation. Using the above data, projects proponents have developed
long term discharge data for their projects as part of water availability studies. So far Central
Water Commission (CWC) has approved water availability series for four projects (Etalin,
Attunli, Sissiri HEPs and Dibang MPP) and same data has been procured for modeling exercise.
For remaining 12 project locations, series have been taken from PFRs. For rest 2 projects no
data is available as they are neither allotted to anyone not any PFR has been prepared for
them so far by any agency.
From the long term flow series, 90% dependable year for different projects have been derived
as the year with over 90% dependability and shall be used in the modeling exercise as input
flow data. Discharge data for all these projects for 90% dependable year has been shown in
Tables 5.8 to 5.11. For Anon Pani and Ithi Pani Projects, 75% dependable year series shall be
used as projects are designed for same being small projects of less than 25 MW.
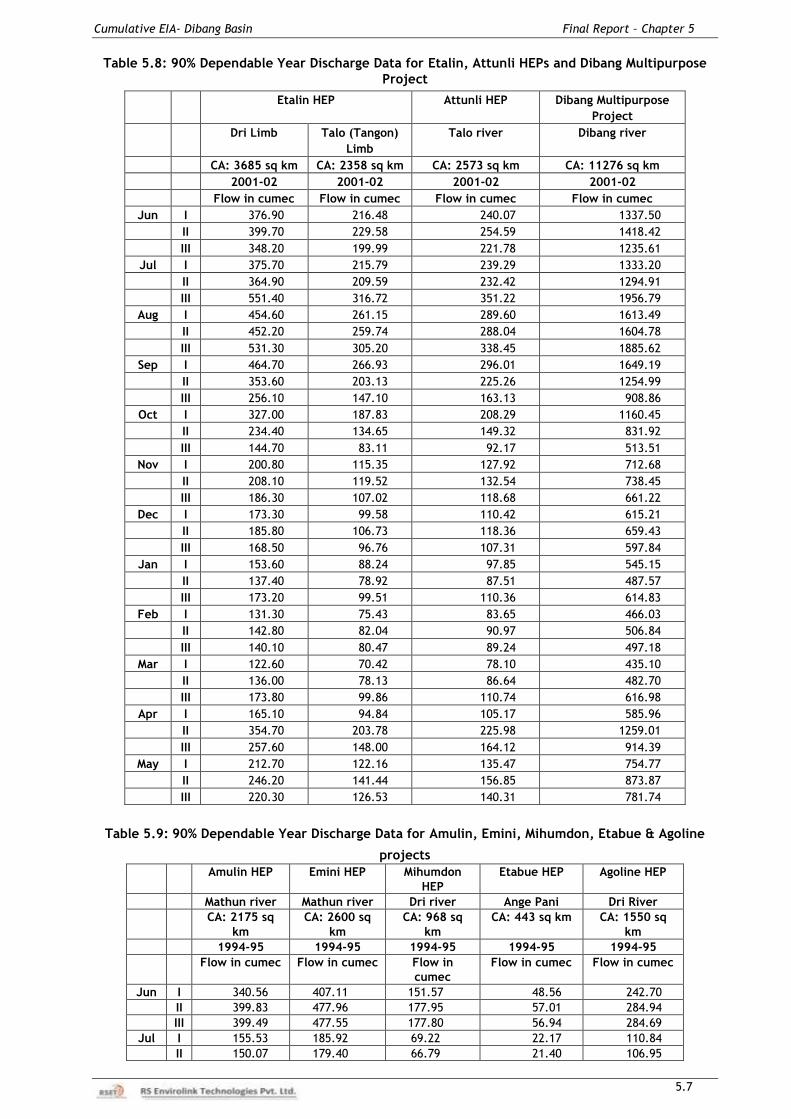
Cumulative EIA- Dibang Basin Final Report – Chapter 5
5.7
Table 5.8: 90% Dependable Year Discharge Data for Etalin, Attunli HEPs and Dibang Multipurpose
Project
Etalin HEP Attunli HEP Dibang Multipurpose
Project
Dri Limb Talo (Tangon)
Limb
Talo river Dibang river
CA: 3685 sq km CA: 2358 sq km CA: 2573 sq km CA: 11276 sq km
2001-02 2001-02 2001-02 2001-02
Flow in cumec Flow in cumec Flow in cumec Flow in cumec
Jun I 376.90 216.48 240.07 1337.50
II 399.70 229.58 254.59 1418.42
III 348.20 199.99 221.78 1235.61
Jul I 375.70 215.79 239.29 1333.20
II 364.90 209.59 232.42 1294.91
III 551.40 316.72 351.22 1956.79
Aug I 454.60 261.15 289.60 1613.49
II 452.20 259.74 288.04 1604.78
III 531.30 305.20 338.45 1885.62
Sep I 464.70 266.93 296.01 1649.19
II 353.60 203.13 225.26 1254.99
III 256.10 147.10 163.13 908.86
Oct I 327.00 187.83 208.29 1160.45
II 234.40 134.65 149.32 831.92
III 144.70 83.11 92.17 513.51
Nov I 200.80 115.35 127.92 712.68
II 208.10 119.52 132.54 738.45
III 186.30 107.02 118.68 661.22
Dec I 173.30 99.58 110.42 615.21
II 185.80 106.73 118.36 659.43
III 168.50 96.76 107.31 597.84
Jan I 153.60 88.24 97.85 545.15
II 137.40 78.92 87.51 487.57
III 173.20 99.51 110.36 614.83
Feb I 131.30 75.43 83.65 466.03
II 142.80 82.04 90.97 506.84
III 140.10 80.47 89.24 497.18
Mar I 122.60 70.42 78.10 435.10
II 136.00 78.13 86.64 482.70
III 173.80 99.86 110.74 616.98
Apr I 165.10 94.84 105.17 585.96
II 354.70 203.78 225.98 1259.01
III 257.60 148.00 164.12 914.39
May I 212.70 122.16 135.47 754.77
II 246.20 141.44 156.85 873.87
III 220.30 126.53 140.31 781.74
Table 5.9: 90% Dependable Year Discharge Data for Amulin, Emini, Mihumdon, Etabue & Agoline
projects
Amulin HEP Emini HEP Mihumdon
HEP
Etabue HEP Agoline HEP
Mathun river Mathun river Dri river Ange Pani Dri River
CA: 2175 sq
km
CA: 2600 sq
km
CA: 968 sq
km
CA: 443 sq km CA: 1550 sq
km
1994-95 1994-95 1994-95 1994-95 1994-95
Flow in cumec Flow in cumec Flow in
cumec
Flow in cumec Flow in cumec
Jun I 340.56 407.11 151.57 48.56 242.70
II 399.83 477.96 177.95 57.01 284.94
III 399.49 477.55 177.80 56.94 284.69
Jul I 155.53 185.92 69.22 22.17 110.84
II 150.07 179.40 66.79 21.40 106.95
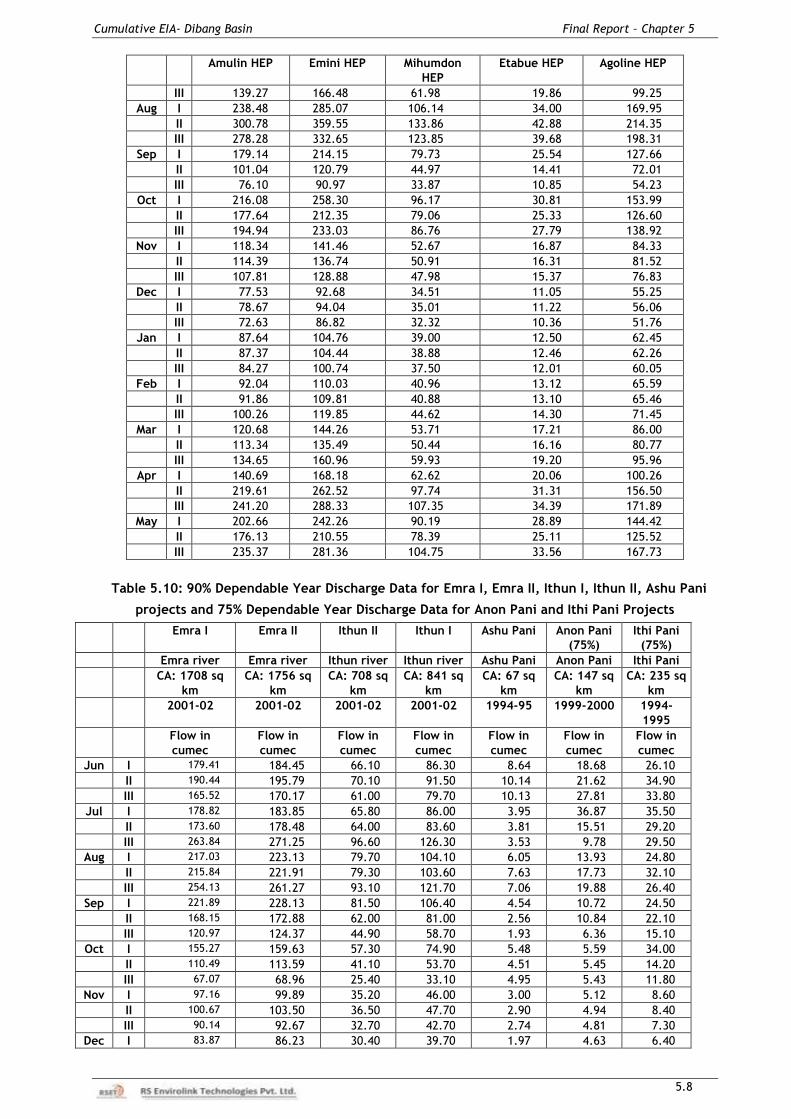
Cumulative EIA- Dibang Basin Final Report – Chapter 5
5.8
Amulin HEP Emini HEP Mihumdon
HEP
Etabue HEP Agoline HEP
III 139.27 166.48 61.98 19.86 99.25
Aug I 238.48 285.07 106.14 34.00 169.95
II 300.78 359.55 133.86 42.88 214.35
III 278.28 332.65 123.85 39.68 198.31
Sep I 179.14 214.15 79.73 25.54 127.66
II 101.04 120.79 44.97 14.41 72.01
III 76.10 90.97 33.87 10.85 54.23
Oct I 216.08 258.30 96.17 30.81 153.99
II 177.64 212.35 79.06 25.33 126.60
III 194.94 233.03 86.76 27.79 138.92
Nov I 118.34 141.46 52.67 16.87 84.33
II 114.39 136.74 50.91 16.31 81.52
III 107.81 128.88 47.98 15.37 76.83
Dec I 77.53 92.68 34.51 11.05 55.25
II 78.67 94.04 35.01 11.22 56.06
III 72.63 86.82 32.32 10.36 51.76
Jan I 87.64 104.76 39.00 12.50 62.45
II 87.37 104.44 38.88 12.46 62.26
III 84.27 100.74 37.50 12.01 60.05
Feb I 92.04 110.03 40.96 13.12 65.59
II 91.86 109.81 40.88 13.10 65.46
III 100.26 119.85 44.62 14.30 71.45
Mar I 120.68 144.26 53.71 17.21 86.00
II 113.34 135.49 50.44 16.16 80.77
III 134.65 160.96 59.93 19.20 95.96
Apr I 140.69 168.18 62.62 20.06 100.26
II 219.61 262.52 97.74 31.31 156.50
III 241.20 288.33 107.35 34.39 171.89
May I 202.66 242.26 90.19 28.89 144.42
II 176.13 210.55 78.39 25.11 125.52
III 235.37 281.36 104.75 33.56 167.73
Table 5.10: 90% Dependable Year Discharge Data for Emra I, Emra II, Ithun I, Ithun II, Ashu Pani
projects and 75% Dependable Year Discharge Data for Anon Pani and Ithi Pani Projects
Emra I Emra II Ithun II Ithun I Ashu Pani Anon Pani
(75%)
Ithi Pani
(75%)
Emra river Emra river Ithun river Ithun river Ashu Pani Anon Pani Ithi Pani
CA: 1708 sq
km
CA: 1756 sq
km
CA: 708 sq
km
CA: 841 sq
km
CA: 67 sq
km
CA: 147 sq
km
CA: 235 sq
km
2001-02 2001-02 2001-02 2001-02 1994-95 1999-2000 1994-
1995
Flow in
cumec
Flow in
cumec
Flow in
cumec
Flow in
cumec
Flow in
cumec
Flow in
cumec
Flow in
cumec
Jun I 179.41 184.45 66.10 86.30 8.64 18.68 26.10
II 190.44 195.79 70.10 91.50 10.14 21.62 34.90
III 165.52 170.17 61.00 79.70 10.13 27.81 33.80
Jul I 178.82 183.85 65.80 86.00 3.95 36.87 35.50
II 173.60 178.48 64.00 83.60 3.81 15.51 29.20
III 263.84 271.25 96.60 126.30 3.53 9.78 29.50
Aug I 217.03 223.13 79.70 104.10 6.05 13.93 24.80
II 215.84 221.91 79.30 103.60 7.63 17.73 32.10
III 254.13 261.27 93.10 121.70 7.06 19.88 26.40
Sep I 221.89 228.13 81.50 106.40 4.54 10.72 24.50
II 168.15 172.88 62.00 81.00 2.56 10.84 22.10
III 120.97 124.37 44.90 58.70 1.93 6.36 15.10
Oct I 155.27 159.63 57.30 74.90 5.48 5.59 34.00
II 110.49 113.59 41.10 53.70 4.51 5.45 14.20
III 67.07 68.96 25.40 33.10 4.95 5.43 11.80
Nov I 97.16 99.89 35.20 46.00 3.00 5.12 8.60
II 100.67 103.50 36.50 47.70 2.90 4.94 8.40
III 90.14 92.67 32.70 42.70 2.74 4.81 7.30
Dec I 83.87 86.23 30.40 39.70 1.97 4.63 6.40
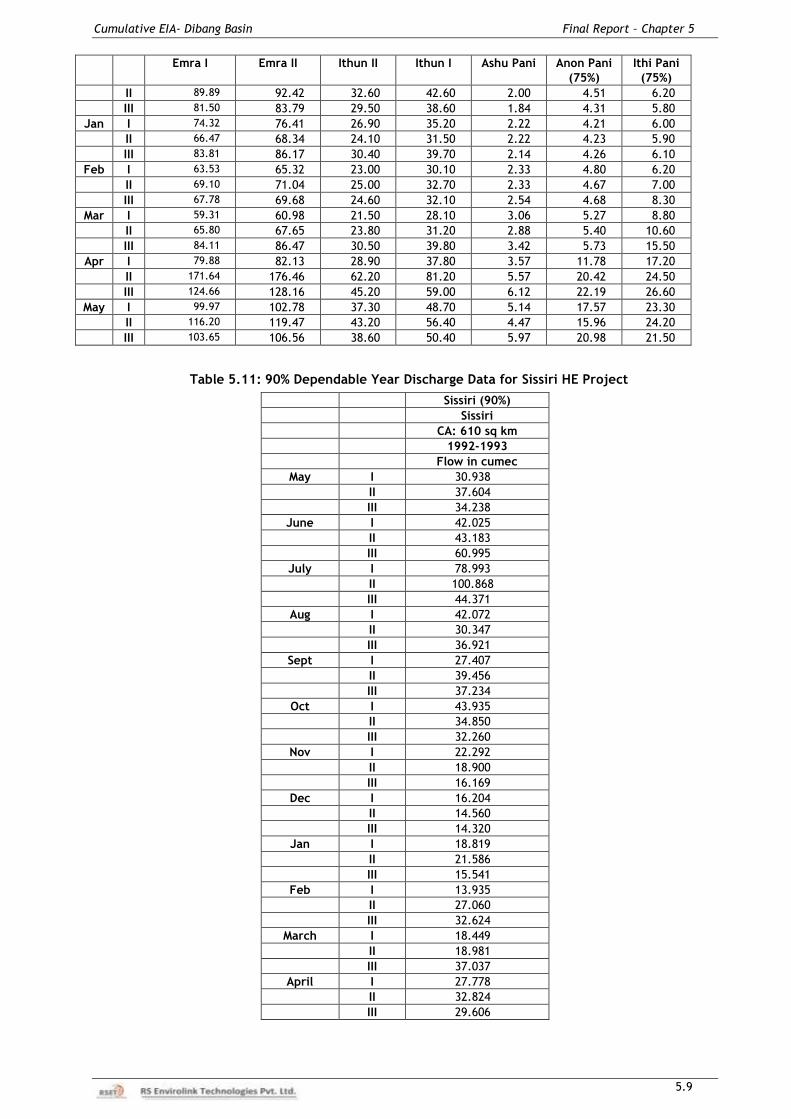
Cumulative EIA- Dibang Basin Final Report – Chapter 5
5.9
Emra I Emra II Ithun II Ithun I Ashu Pani Anon Pani
(75%)
Ithi Pani
(75%)
II 89.89 92.42 32.60 42.60 2.00 4.51 6.20
III 81.50 83.79 29.50 38.60 1.84 4.31 5.80
Jan I 74.32 76.41 26.90 35.20 2.22 4.21 6.00
II 66.47 68.34 24.10 31.50 2.22 4.23 5.90
III 83.81 86.17 30.40 39.70 2.14 4.26 6.10
Feb I 63.53 65.32 23.00 30.10 2.33 4.80 6.20
II 69.10 71.04 25.00 32.70 2.33 4.67 7.00
III 67.78 69.68 24.60 32.10 2.54 4.68 8.30
Mar I 59.31 60.98 21.50 28.10 3.06 5.27 8.80
II 65.80 67.65 23.80 31.20 2.88 5.40 10.60
III 84.11 86.47 30.50 39.80 3.42 5.73 15.50
Apr I 79.88 82.13 28.90 37.80 3.57 11.78 17.20
II 171.64 176.46 62.20 81.20 5.57 20.42 24.50
III 124.66 128.16 45.20 59.00 6.12 22.19 26.60
May I 99.97 102.78 37.30 48.70 5.14 17.57 23.30
II 116.20 119.47 43.20 56.40 4.47 15.96 24.20
III 103.65 106.56 38.60 50.40 5.97 20.98 21.50
Table 5.11: 90% Dependable Year Discharge Data for Sissiri HE Project
Sissiri (90%)
Sissiri
CA: 610 sq km
1992-1993
Flow in cumec
May I 30.938
II 37.604
III 34.238
June I 42.025
II 43.183
III 60.995
July I 78.993
II 100.868
III 44.371
Aug I 42.072
II 30.347
III 36.921
Sept I 27.407
II 39.456
III 37.234
Oct I 43.935
II 34.850
III 32.260
Nov I 22.292
II 18.900
III 16.169
Dec I 16.204
II 14.560
III 14.320
Jan I 18.819
II 21.586
III 15.541
Feb I 13.935
II 27.060
III 32.624
March I 18.449
II 18.981
III 37.037
April I 27.778
II 32.824
III 29.606
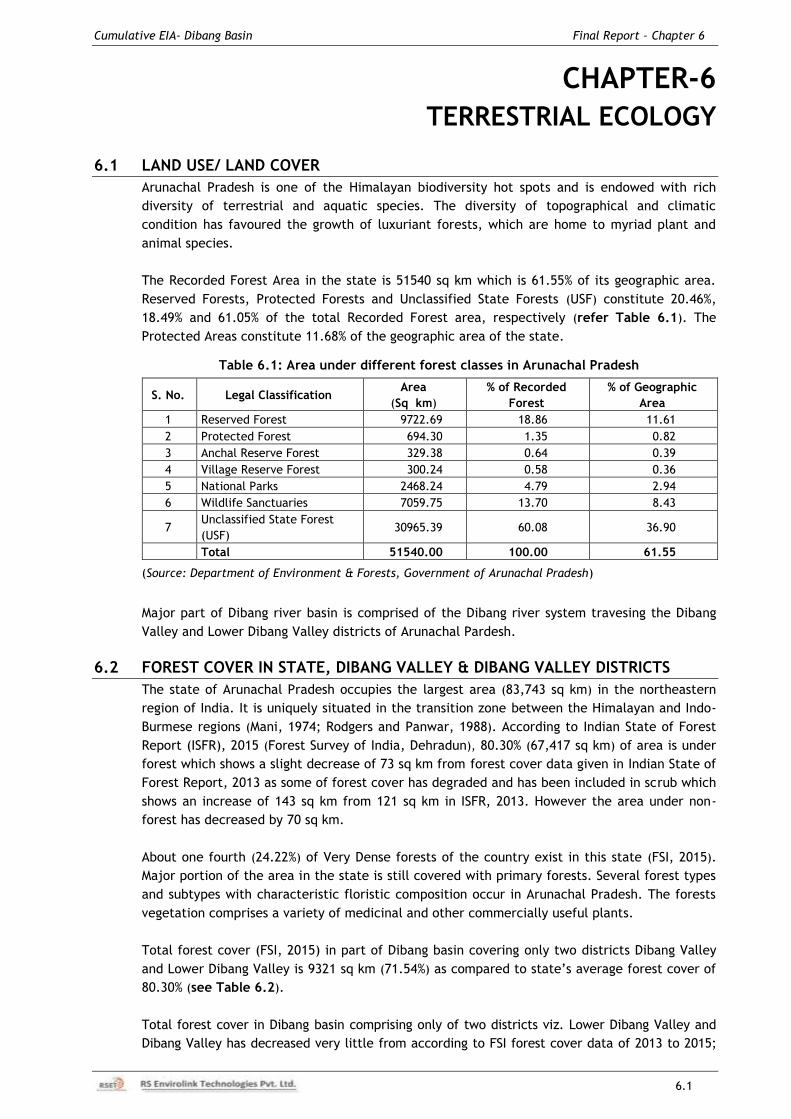
Cumulative EIA- Dibang Basin Final Report – Chapter 6
6.1
CHAPTER-6
TERRESTRIAL ECOLOGY
6.1 LAND USE/ LAND COVER
Arunachal Pradesh is one of the Himalayan biodiversity hot spots and is endowed with rich
diversity of terrestrial and aquatic species. The diversity of topographical and climatic
condition has favoured the growth of luxuriant forests, which are home to myriad plant and
animal species.
The Recorded Forest Area in the state is 51540 sq km which is 61.55% of its geographic area.
Reserved Forests, Protected Forests and Unclassified State Forests (USF) constitute 20.46%,
18.49% and 61.05% of the total Recorded Forest area, respectively (refer Table 6.1). The
Protected Areas constitute 11.68% of the geographic area of the state.
Table 6.1: Area under different forest classes in Arunachal Pradesh
S. No. Legal Classification Area
(Sq km)
% of Recorded
Forest
% of Geographic
Area
1 Reserved Forest 9722.69 18.86 11.61
2 Protected Forest 694.30 1.35 0.82
3 Anchal Reserve Forest 329.38 0.64 0.39
4 Village Reserve Forest 300.24 0.58 0.36
5 National Parks 2468.24 4.79 2.94
6 Wildlife Sanctuaries 7059.75 13.70 8.43
7 Unclassified State Forest
(USF) 30965.39 60.08 36.90
Total 51540.00 100.00 61.55
(Source: Department of Environment & Forests, Government of Arunachal Pradesh)
Major part of Dibang river basin is comprised of the Dibang river system travesing the Dibang
Valley and Lower Dibang Valley districts of Arunachal Pardesh.
6.2 FOREST COVER IN STATE, DIBANG VALLEY & DIBANG VALLEY DISTRICTS
The state of Arunachal Pradesh occupies the largest area (83,743 sq km) in the northeastern
region of India. It is uniquely situated in the transition zone between the Himalayan and Indo-
Burmese regions (Mani, 1974; Rodgers and Panwar, 1988). According to Indian State of Forest
Report (ISFR), 2015 (Forest Survey of India, Dehradun), 80.30% (67,417 sq km) of area is under
forest which shows a slight decrease of 73 sq km from forest cover data given in Indian State of
Forest Report, 2013 as some of forest cover has degraded and has been included in scrub which
shows an increase of 143 sq km from 121 sq km in ISFR, 2013. However the area under non-
forest has decreased by 70 sq km.
About one fourth (24.22%) of Very Dense forests of the country exist in this state (FSI, 2015).
Major portion of the area in the state is still covered with primary forests. Several forest types
and subtypes with characteristic floristic composition occur in Arunachal Pradesh. The forests
vegetation comprises a variety of medicinal and other commercially useful plants.
Total forest cover (FSI, 2015) in part of Dibang basin covering only two districts Dibang Valley
and Lower Dibang Valley is 9321 sq km (71.54%) as compared to state‟s average forest cover of
80.30% (see Table 6.2).
Total forest cover in Dibang basin comprising only of two districts viz. Lower Dibang Valley and
Dibang Valley has decreased very little from according to FSI forest cover data of 2013 to 2015;
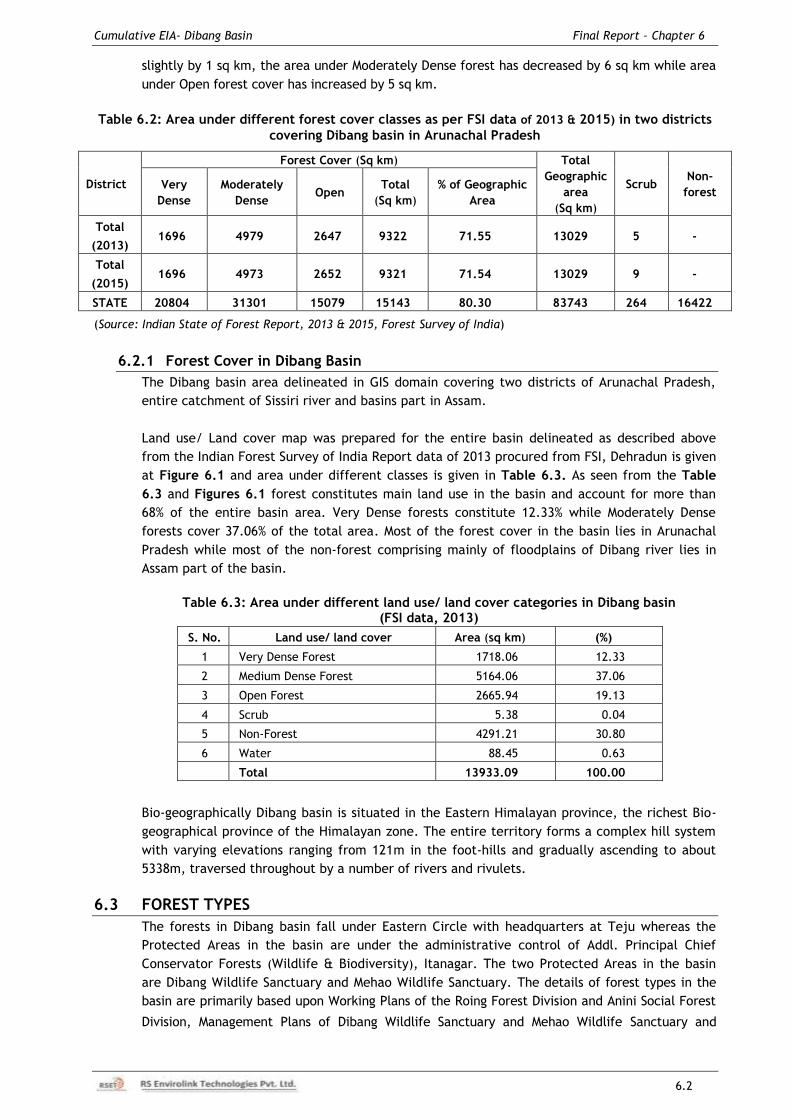
Cumulative EIA- Dibang Basin Final Report – Chapter 6
6.2
slightly by 1 sq km, the area under Moderately Dense forest has decreased by 6 sq km while area
under Open forest cover has increased by 5 sq km.
Table 6.2: Area under different forest cover classes as per FSI data of 2013 & 2015) in two districts
covering Dibang basin in Arunachal Pradesh
District
Forest Cover (Sq km) Total
Geographic
area
(Sq km)
Scrub Non-
forest Very
Dense
Moderately
Dense Open
Total
(Sq km)
% of Geographic
Area
Total
(2013) 1696 4979 2647 9322 71.55 13029 5 -
Total
(2015) 1696 4973 2652 9321 71.54 13029 9 -
STATE 20804 31301 15079 15143 80.30 83743 264 16422
(Source: Indian State of Forest Report, 2013 & 2015, Forest Survey of India)
6.2.1 Forest Cover in Dibang Basin
The Dibang basin area delineated in GIS domain covering two districts of Arunachal Pradesh,
entire catchment of Sissiri river and basins part in Assam.
Land use/ Land cover map was prepared for the entire basin delineated as described above
from the Indian Forest Survey of India Report data of 2013 procured from FSI, Dehradun is given
at Figure 6.1 and area under different classes is given in Table 6.3. As seen from the Table
6.3 and Figures 6.1 forest constitutes main land use in the basin and account for more than
68% of the entire basin area. Very Dense forests constitute 12.33% while Moderately Dense
forests cover 37.06% of the total area. Most of the forest cover in the basin lies in Arunachal
Pradesh while most of the non-forest comprising mainly of floodplains of Dibang river lies in
Assam part of the basin.
Table 6.3: Area under different land use/ land cover categories in Dibang basin
(FSI data, 2013)
S. No. Land use/ land cover Area (sq km) (%)
1 Very Dense Forest 1718.06 12.33
2 Medium Dense Forest 5164.06 37.06
3 Open Forest 2665.94 19.13
4 Scrub 5.38 0.04
5 Non-Forest 4291.21 30.80
6 Water 88.45 0.63
Total 13933.09 100.00
Bio-geographically Dibang basin is situated in the Eastern Himalayan province, the richest Bio-
geographical province of the Himalayan zone. The entire territory forms a complex hill system
with varying elevations ranging from 121m in the foot-hills and gradually ascending to about
5338m, traversed throughout by a number of rivers and rivulets.
6.3 FOREST TYPES
The forests in Dibang basin fall under Eastern Circle with headquarters at Teju whereas the
Protected Areas in the basin are under the administrative control of Addl. Principal Chief
Conservator Forests (Wildlife & Biodiversity), Itanagar. The two Protected Areas in the basin
are Dibang Wildlife Sanctuary and Mehao Wildlife Sanctuary. The details of forest types in the
basin are primarily based upon Working Plans of the Roing Forest Division and Anini Social Forest
Division, Management Plans of Dibang Wildlife Sanctuary and Mehao Wildlife Sanctuary and
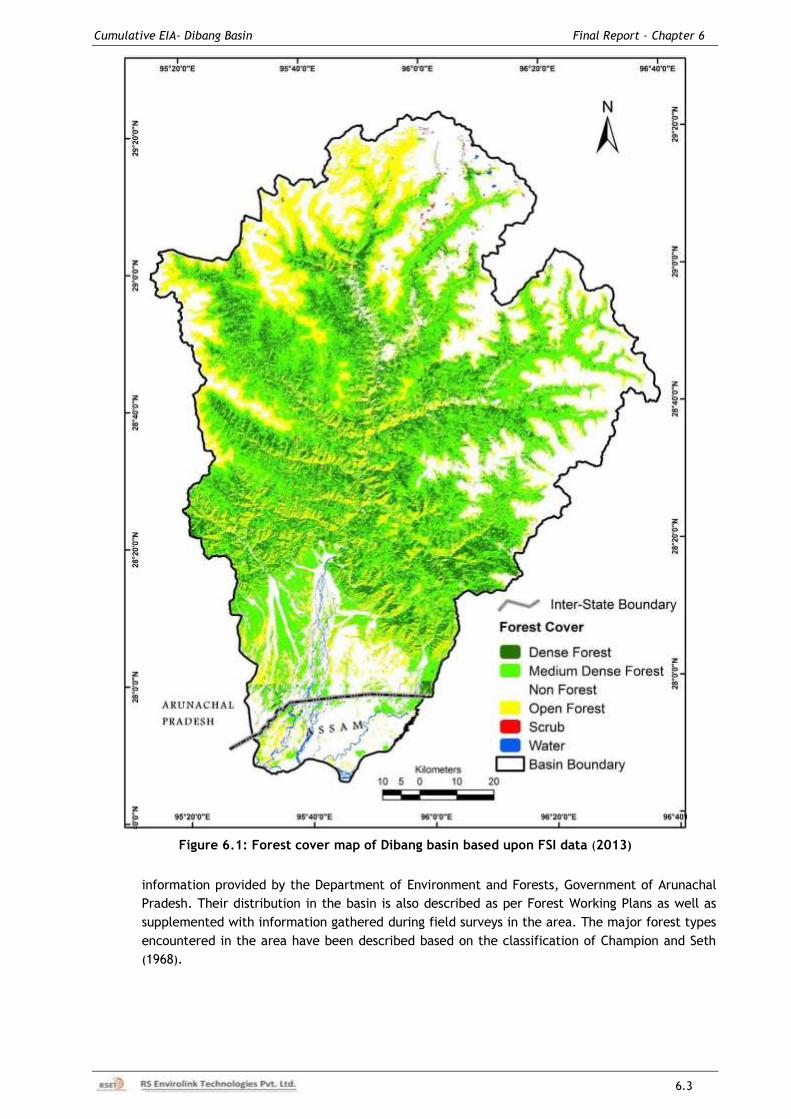
Cumulative EIA- Dibang Basin Final Report – Chapter 6
6.3
Figure 6.1: Forest cover map of Dibang basin based upon FSI data (2013)
information provided by the Department of Environment and Forests, Government of Arunachal
Pradesh. Their distribution in the basin is also described as per Forest Working Plans as well as
supplemented with information gathered during field surveys in the area. The major forest types
encountered in the area have been described based on the classification of Champion and Seth
(1968).
Cumulative EIA- Dibang Basin Final Report – Chapter 6
6.4
6.3.1 Upper Assam Valley Tropical Evergreen Forest (Tropical Evergreen Forest)
(1B/C2)
The species composition is classified into top storey representing tall trees like Altingia excelsa,
Castanopsis indica, Duabanga grandiflora and Terminalia myriocarpa. Trees are heavily covered
with lichens and climbers and epiphytes of the numerous lianas like Pericamphylus glaucus,
Stephania elegans, Parabaena sagitata and species of Bauhinia, Derris, Entada, Gnetum,
Hodgsonia, Piper and Raphidophora. The second storey mainly consists of medium to small trees
and shrubs viz. Actiphila excelsa, Ardisia crispa, Bauhinia pupurea, Grewia disperma, Gynocardia
odorata, Leea robusta, Michelia doltsopa, and Mussaenda roxburghii. Salacca secunda and
Wallichia densiflora are found on the drier hill slopes, whereas Angiopteris evecta, Cyathea
spinulosa, and Pandanus nepalensis are found along the shaded gorges. Calamus erectus, Calamus
leptospadix and various other species of similar plants occur along the swampy areas and form
extensive thickets. Arenga pinnata, Caryota obtusa, Livistona jenkinsiana, and Phoenix rupicola are
the palms that occur in these forests. The epiphytic flora is very rich, some of the common
epiphytes are the species of Aerides, Cymbidium, Eria and Pholidota.
Along the hills slopes wild species of Musa comprising Musa acuminata, M. balbisiana and M.
rosacea is prominent feature of the vegetation.
6.3.2 Eastern sub-montane Semi-evergreen Forest (Tropical Semi-evergreen forest) –
(2B/C1b)
These types of forests occur on slopes in the vicinity of dam as well as powerhouse area and
also on foothills and river bank. The upper storey consists of deciduous trees as well as
evergreen trees. The shrubs, climbers and lianas constitute the rest. Depending on its species
contents Tropical Semi-evergreen forests are further divided into two subtypes.
i) Low hills and plains semievergreen forest
In this forest the upper storey is dominated by tall trees like Altingia excelsa, Bombax ceiba,
Canarium strictum, Elaeocarpus rugosus, Phoebe lanceolata and Terminalia myriocarpa
followed by small trees and shrubs. The ground flora is dominated by species of Colocacia,
Costus and Phrynium. Among the climbers and lianas Disocorea alata, Thunbergia coccinea and
Thunbergia grandiflora are common. There are number of epiphytic species of orchids like
Dendrobium, Pholidota, Eria, and Hoya balaensis and several species of ferns in these forests.
ii) Riverine semi-evergreen forest
The top storey is dominated by Bombax ceiba, Bischofia javanica, Canarium strictum,
Dalbergia sissoo, Duabanga grandiflora, and Lagerstroemia parviflora. The next storey is
represented by the species of Calamus, Ficus, Meliosma, Murraya and Randia. These species
are closely associated with species of Phragmitis, Saccharum and Hedychium.
6.3.3 East Himalayan moist mixed deciduous forests (Sub tropical Broadleaved
Forests) – (3/C3b)
The subtropical broadleaved forests occur between 900 and 1200 m and are basically are of
evergreen and dense in nature. The canopy layer consists of Castanopsis indica, Quercus
spicata, Q. lemellosa, Alnus nepalensis, Ulmus lancifolia, Engelhardtia spicata, and Schima
khasiana. The middle storey is comprised mainly of Schefflera, Turpinia, Rhus, Hydrangea sp.,
Vernonia arborea, Eurya acuminata, Symplocos racemosa, and Viburnum foetidum. Shrub and
herb layers include number of species of Ardisia humilis, Oxyspora paniculata, Chasalia
curviflora, Rubus ellipticus, Lobelia rhynchopetalum, Begonia palmata and Potentilla
nepalensis. Lianas are not very frequent but climbers are represented by Clematis gauriana,
Senecio densiflorus, Crawfurdia speciosa, Jasminum officinale and Holboelia latifolia.
Epiphytes are found growing luxuriantly and comprised mainly of orchids and ferns.
Cumulative EIA- Dibang Basin Final Report – Chapter 6
6.5
6.3.4 Assam Sub-tropical Pine Forests – (9/C2)
These forests occur between 1200 and 1800 m, the Pine forest is common in catchment area of
Dri and Talo (Tangon) Rivers. The dominant species is Pinus merkusii. There is no middle
storey. However, the shrub and herb layer is gregarious. The main species in this layer is
Imperata cylindrica, Rubus ellipticus, Artemisia nilagirica, Pteridium aquilinum, Polygonum
amplexicaule, Osbeckia stellata, and Desmodium laxiflorum. A few broad-leaved species found
associated are Lyonia ovalifoila, Rhododendron arboreum, Quercus lemellosa, Rhus javanica,
and Albizia mollis.
6.3.5 East Himalayan Wet Temperate Forests (Temperate Broadleaved Forests) –
(11B/C1)
They are found in elevation of 1800 – 2800 m and are generally dense in nature. These forests
are dominated by members of Fagaceae and Lauraceae families. Canopy trees are represented
by Qurecus lamellosa, Michelia doltstopa, Acer laevigatum, Populus ciliata, Exbucklandia
populnea, Carpinus viminea, Rhododendron spp., Tetracentron sinensis, Magnolia campbellii,
and Amentotaxus assamica. Middle canopy is composed of Lyonia ovalifolia, Vaccinium
donianum, Corylopsis himalayana, Rhododendron arboreum, Myrsine semiserrata, Spiraea
callosa, Berberis wallichii, and Mahonia nepalensis. Herbaceous layer is usually gregarious and
abundant. The shrub layer is represented by Potentilla polyphylla, Fragaria nubicola, Sedum
spp., Desmodium caudatum and Rubus ellipticus. Herbs are comprised of Anaphalis busua,
Daphne papyracea and Ranunculus sceleratus. Epiphytes are represented by Vaccinium
chaetothrix, Aeschynanthus bracteatus and Hoya parasitica. Lichens and ferns are few. These
types of forests occur over Mithumna-Mailang ridge, Chaglagam area and Malinja-Simbi area.
6.3.6 East Himalayan Mixed Coniferous Forest (Temperate Conifer Forests) – (12/C3a)
These forests are seen above the elevation of temperate broadleaved forests. Among the
conifers Abies densa, Abies spectabilis are more extensive than other species. The shrubs are
represented by different species of Berberis, Viburnum, Lonicera, Gaultheria, Rosa, Rubus,
and Hydrangea. The herb layer consists of species of Anaphalis, Hypericum, Podophyllum,
Primula, Polygonum, Rumex, Rheum, Pilea, Potentilla, Plectranthus, and Ranunculus. Climbers
are scanty and epiphytic flora is comprised of lichens.
6.3.7 Alpine Pastures (Alpine Forests) – 15/C3)
These forests occupy the highest altitude, 3500 - 5500m and lack tree cover. The main feature
here is that the area is under snow cover for a longer period resulting in a very brief growing
season. Even the occasional trees seen here are stunted in growth and are bushy or crooked in
appearance. They include Rhododendron spp., Juniperus spp., Betula alnoides and Acer
oblongum. The shrubs include Berberis wallichiana, Rubus niveus, and Lonicera angustifolia.
The herbs include various species of Pedicularis, Rheum, Rumex, Polygonum, Anaphalis,
Cypripedium, Hypericum, Ranunculus, Sedum, Saxifraga, Delphinium, and Selinum.
6.3.8 Secondary Forests (1B/2S)
The primary forest due to impact of various adverse biotic and abiotic factors like shifting
cultivation or “Jhumming”, development activities and urbanization, landslides, fires, etc., are
destroyed and develop into secondary forests. The secondary forests divided into the three
following types.
6.3.8.1 Degraded Forests
As compared to the original primary forest these degraded ones have very low species diversity
and generally dominated by shrubs and small trees. Among the predominant trees are the
species of Bauhinia, Callicarpa, Glochidium and Mallotus whereas species of Capparis,
Clerodendrum, Eurya and Randia are the commonly occurring shrubs along with species of
weeds like Ageratum, Eupatorium and Mikania.
Cumulative EIA- Dibang Basin Final Report – Chapter 6
6.6
6.3.8.2 Bamboo and Musa Forests
This type of secondary forests mostly occurs in the areas which are abandoned after „jhum‟
cultivation. The common bamboo species are Arundina graminifolia, Bambusa pallida,
Bambusa tulda, Chimonobambusa callosa, Dendrocalamus hamiltonia, Dendrocalamus hookeri
and Dendrocalamus strictus. Musa comprising Musa acuminata, Musa balbisiana and Musa
rosacea are commonly found.
6.3.8.3 Grasslands
Generally formed due to practice of „jhum‟ cultivation or sometimes due to fires or over-grazing
and also on sun facing slopes on the hill tops. The more common species of grasses are Arundinella
bengalensis, Chrysopogon aciculatus, Imperata cylindrica, Saccharum spontaneum, Themeda
villosa, Thysanolaena maxima with sedges like Cyperus brevifolius and Fimbristylis bisumbellata.
6.4 FLORISTICS
The varied climate and the altitude have greatly influenced the rich diversity of vegetation in
this region. The state is known for its verdant rainforest and rich vegetation with unique
ecosystem ranging from tropical belt to the snow clad alpine mountains. The vegetation of the
state is rich and diverse abounding in spectacular flora including some of the tallest trees in
India, ferns, orchids, primulas and a variety of colourful rhododendrons.
Arunachal Pradesh falls in the richest Botanical Province with nearly 50% ofthe flora of the
Indian Subcontinent. Chowhdery et al. (1996) have enumerated 4117 species of flowering plants
belonging to 1295 genera and 192 families of flowering plants from the state. The Dibang basin
area has good vegetation with predominant subtropical evergreen, bamboo mixed, temperate
mixed broad leaved and coniferous forests at higher elevations.
6.4.1 Taxonomic Diversity
For the documentation of floristics of Dibang basin data was collected during the field surveys
as well as secondary data made available by Botanical Survey of India (BSI) through MoEF&CC
and also collected from other secondary sources like published reports, research articles and
literature. An inventory of different plant groups was prepared based upon the data collected
as above. According to this 1548 species of higher plants have been documented so far from
the study area. A brief overview of number of plant species in various taxonomic groups is
given in Table 6.4 and discussed in following paragraphs.
Table 6.4: Summary of number plants species in Dibang basin
HIGHER PLANTS
Group Angiosperms Gymnosperms Pteridophytes Total
Species 1329 17 202 1548
Genus 635 14 86 735
Families 153 5 28 186
LOWER PLANTS
Group Bryophytes Lichens
Species 21 16
Genus 18 16
Families 13 15
6.4.1.1 Angiosperms
In all total 1329 species of angiosperms were recorded. These angiosperm species belong to 635
genera and 153 families. Dominant family in the basin is Orchidaceae with 199 species followed
by Poaceae with 85 species, Asteraceae with 53 species, Ericaceae 42 species, Lamiaceae with
40 species and Fabaceae with 34 species. The plant names and families are based upon
http://www.theplantlist.org. Detail list of angiosperms are given in Annexure – II, Volume II.
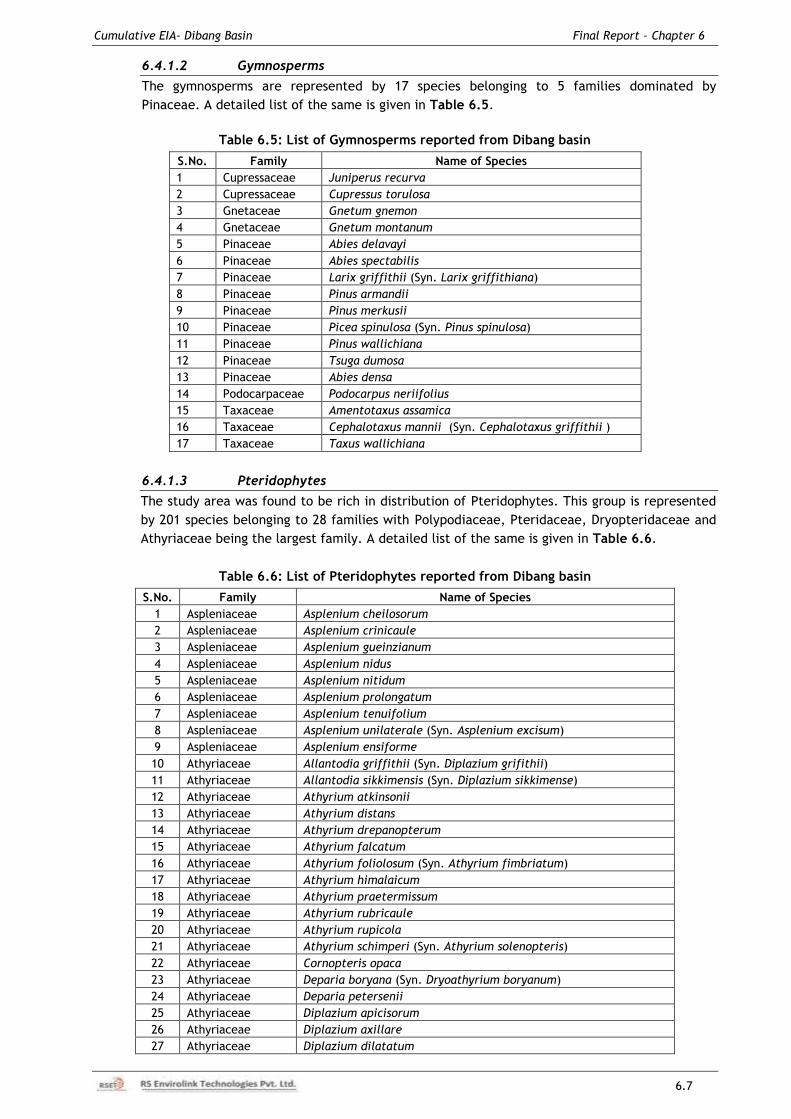
Cumulative EIA- Dibang Basin Final Report – Chapter 6
6.7
6.4.1.2 Gymnosperms
The gymnosperms are represented by 17 species belonging to 5 families dominated by
Pinaceae. A detailed list of the same is given in Table 6.5.
Table 6.5: List of Gymnosperms reported from Dibang basin
S.No. Family Name of Species
1 Cupressaceae Juniperus recurva
2 Cupressaceae Cupressus torulosa
3 Gnetaceae Gnetum gnemon
4 Gnetaceae Gnetum montanum
5 Pinaceae Abies delavayi
6 Pinaceae Abies spectabilis
7 Pinaceae Larix griffithii (Syn. Larix griffithiana)
8 Pinaceae Pinus armandii
9 Pinaceae Pinus merkusii
10 Pinaceae Picea spinulosa (Syn. Pinus spinulosa)
11 Pinaceae Pinus wallichiana
12 Pinaceae Tsuga dumosa
13 Pinaceae Abies densa
14 Podocarpaceae Podocarpus neriifolius
15 Taxaceae Amentotaxus assamica
16 Taxaceae Cephalotaxus mannii (Syn. Cephalotaxus griffithii )
17 Taxaceae Taxus wallichiana
6.4.1.3 Pteridophytes
The study area was found to be rich in distribution of Pteridophytes. This group is represented
by 201 species belonging to 28 families with Polypodiaceae, Pteridaceae, Dryopteridaceae and
Athyriaceae being the largest family. A detailed list of the same is given in Table 6.6.
Table 6.6: List of Pteridophytes reported from Dibang basin
S.No. Family Name of Species
1 Aspleniaceae Asplenium cheilosorum
2 Aspleniaceae Asplenium crinicaule
3 Aspleniaceae Asplenium gueinzianum
4 Aspleniaceae Asplenium nidus
5 Aspleniaceae Asplenium nitidum
6 Aspleniaceae Asplenium prolongatum
7 Aspleniaceae Asplenium tenuifolium
8 Aspleniaceae Asplenium unilaterale (Syn. Asplenium excisum)
9 Aspleniaceae Asplenium ensiforme
10 Athyriaceae Allantodia griffithii (Syn. Diplazium grifithii)
11 Athyriaceae Allantodia sikkimensis (Syn. Diplazium sikkimense)
12 Athyriaceae Athyrium atkinsonii
13 Athyriaceae Athyrium distans
14 Athyriaceae Athyrium drepanopterum
15 Athyriaceae Athyrium falcatum
16 Athyriaceae Athyrium foliolosum (Syn. Athyrium fimbriatum)
17 Athyriaceae Athyrium himalaicum
18 Athyriaceae Athyrium praetermissum
19 Athyriaceae Athyrium rubricaule
20 Athyriaceae Athyrium rupicola
21 Athyriaceae Athyrium schimperi (Syn. Athyrium solenopteris)
22 Athyriaceae Cornopteris opaca
23 Athyriaceae Deparia boryana (Syn. Dryoathyrium boryanum)
24 Athyriaceae Deparia petersenii
25 Athyriaceae Diplazium apicisorum
26 Athyriaceae Diplazium axillare
27 Athyriaceae Diplazium dilatatum
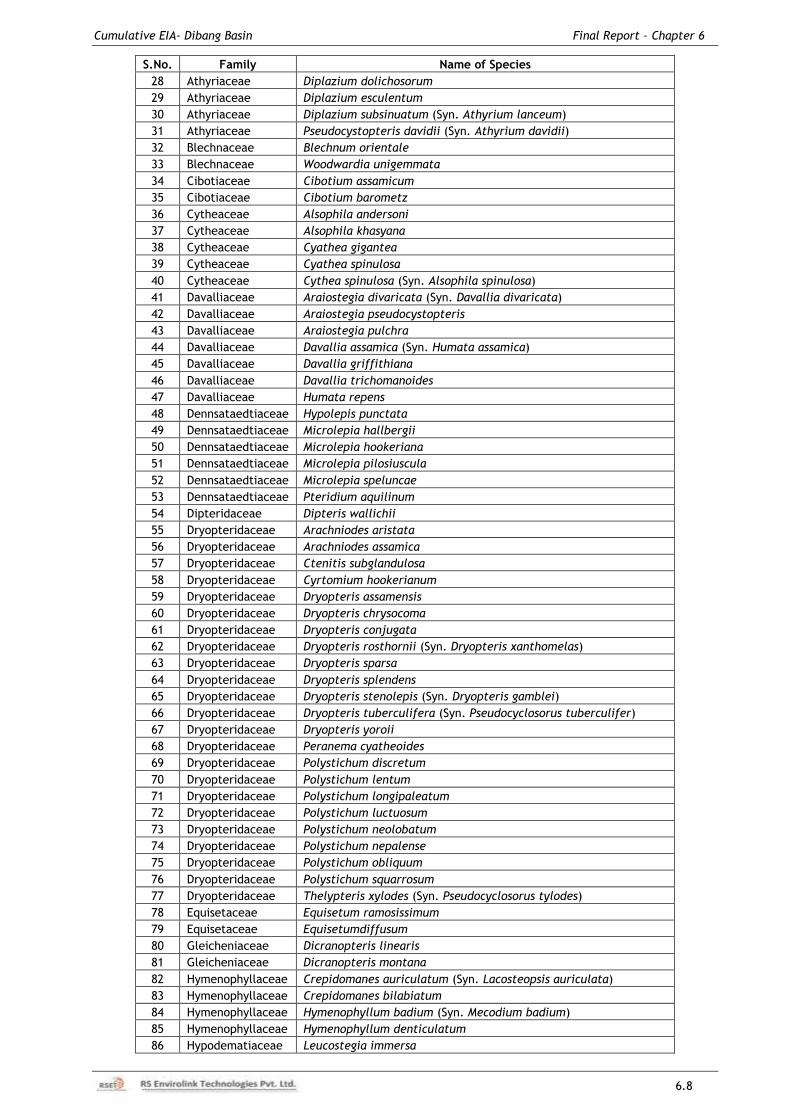
Cumulative EIA- Dibang Basin Final Report – Chapter 6
6.8
S.No. Family Name of Species
28 Athyriaceae Diplazium dolichosorum
29 Athyriaceae Diplazium esculentum
30 Athyriaceae Diplazium subsinuatum (Syn. Athyrium lanceum)
31 Athyriaceae Pseudocystopteris davidii (Syn. Athyrium davidii)
32 Blechnaceae Blechnum orientale
33 Blechnaceae Woodwardia unigemmata
34 Cibotiaceae Cibotium assamicum
35 Cibotiaceae Cibotium barometz
36 Cytheaceae Alsophila andersoni
37 Cytheaceae Alsophila khasyana
38 Cytheaceae Cyathea gigantea
39 Cytheaceae Cyathea spinulosa
40 Cytheaceae Cythea spinulosa (Syn. Alsophila spinulosa)
41 Davalliaceae Araiostegia divaricata (Syn. Davallia divaricata)
42 Davalliaceae Araiostegia pseudocystopteris
43 Davalliaceae Araiostegia pulchra
44 Davalliaceae Davallia assamica (Syn. Humata assamica)
45 Davalliaceae Davallia griffithiana
46 Davalliaceae Davallia trichomanoides
47 Davalliaceae Humata repens
48 Dennsataedtiaceae Hypolepis punctata
49 Dennsataedtiaceae Microlepia hallbergii
50 Dennsataedtiaceae Microlepia hookeriana
51 Dennsataedtiaceae Microlepia pilosiuscula
52 Dennsataedtiaceae Microlepia speluncae
53 Dennsataedtiaceae Pteridium aquilinum
54 Dipteridaceae Dipteris wallichii
55 Dryopteridaceae Arachniodes aristata
56 Dryopteridaceae Arachniodes assamica
57 Dryopteridaceae Ctenitis subglandulosa
58 Dryopteridaceae Cyrtomium hookerianum
59 Dryopteridaceae Dryopteris assamensis
60 Dryopteridaceae Dryopteris chrysocoma
61 Dryopteridaceae Dryopteris conjugata
62 Dryopteridaceae Dryopteris rosthornii (Syn. Dryopteris xanthomelas)
63 Dryopteridaceae Dryopteris sparsa
64 Dryopteridaceae Dryopteris splendens
65 Dryopteridaceae Dryopteris stenolepis (Syn. Dryopteris gamblei)
66 Dryopteridaceae Dryopteris tuberculifera (Syn. Pseudocyclosorus tuberculifer)
67 Dryopteridaceae Dryopteris yoroii
68 Dryopteridaceae Peranema cyatheoides
69 Dryopteridaceae Polystichum discretum
70 Dryopteridaceae Polystichum lentum
71 Dryopteridaceae Polystichum longipaleatum
72 Dryopteridaceae Polystichum luctuosum
73 Dryopteridaceae Polystichum neolobatum
74 Dryopteridaceae Polystichum nepalense
75 Dryopteridaceae Polystichum obliquum
76 Dryopteridaceae Polystichum squarrosum
77 Dryopteridaceae Thelypteris xylodes (Syn. Pseudocyclosorus tylodes)
78 Equisetaceae Equisetum ramosissimum
79 Equisetaceae Equisetumdiffusum
80 Gleicheniaceae Dicranopteris linearis
81 Gleicheniaceae Dicranopteris montana
82 Hymenophyllaceae Crepidomanes auriculatum (Syn. Lacosteopsis auriculata)
83 Hymenophyllaceae Crepidomanes bilabiatum
84 Hymenophyllaceae Hymenophyllum badium (Syn. Mecodium badium)
85 Hymenophyllaceae Hymenophyllum denticulatum
86 Hypodematiaceae Leucostegia immersa
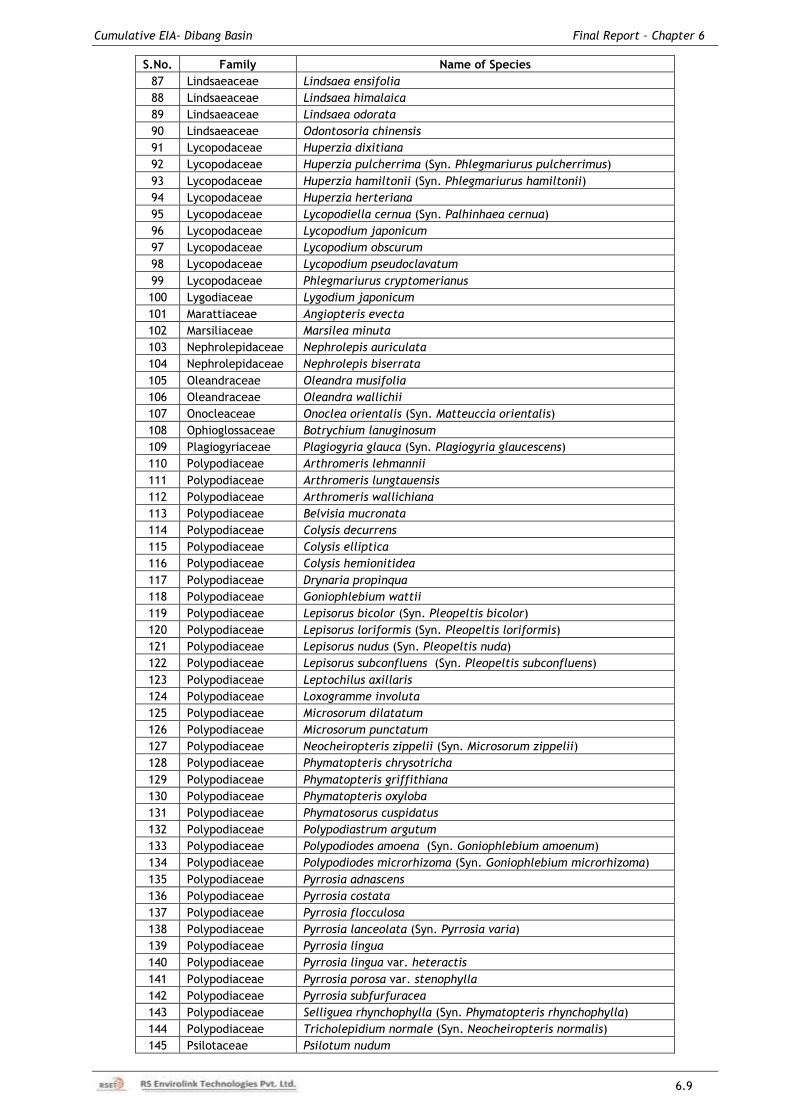
Cumulative EIA- Dibang Basin Final Report – Chapter 6
6.9
S.No. Family Name of Species
87 Lindsaeaceae Lindsaea ensifolia
88 Lindsaeaceae Lindsaea himalaica
89 Lindsaeaceae Lindsaea odorata
90 Lindsaeaceae Odontosoria chinensis
91 Lycopodaceae Huperzia dixitiana
92 Lycopodaceae Huperzia pulcherrima (Syn. Phlegmariurus pulcherrimus)
93 Lycopodaceae Huperzia hamiltonii (Syn. Phlegmariurus hamiltonii)
94 Lycopodaceae Huperzia herteriana
95 Lycopodaceae Lycopodiella cernua (Syn. Palhinhaea cernua)
96 Lycopodaceae Lycopodium japonicum
97 Lycopodaceae Lycopodium obscurum
98 Lycopodaceae Lycopodium pseudoclavatum
99 Lycopodaceae Phlegmariurus cryptomerianus
100 Lygodiaceae Lygodium japonicum
101 Marattiaceae Angiopteris evecta
102 Marsiliaceae Marsilea minuta
103 Nephrolepidaceae Nephrolepis auriculata
104 Nephrolepidaceae Nephrolepis biserrata
105 Oleandraceae Oleandra musifolia
106 Oleandraceae Oleandra wallichii
107 Onocleaceae Onoclea orientalis (Syn. Matteuccia orientalis)
108 Ophioglossaceae Botrychium lanuginosum
109 Plagiogyriaceae Plagiogyria glauca (Syn. Plagiogyria glaucescens)
110 Polypodiaceae Arthromeris lehmannii
111 Polypodiaceae Arthromeris lungtauensis
112 Polypodiaceae Arthromeris wallichiana
113 Polypodiaceae Belvisia mucronata
114 Polypodiaceae Colysis decurrens
115 Polypodiaceae Colysis elliptica
116 Polypodiaceae Colysis hemionitidea
117 Polypodiaceae Drynaria propinqua
118 Polypodiaceae Goniophlebium wattii
119 Polypodiaceae Lepisorus bicolor (Syn. Pleopeltis bicolor)
120 Polypodiaceae Lepisorus loriformis (Syn. Pleopeltis loriformis)
121 Polypodiaceae Lepisorus nudus (Syn. Pleopeltis nuda)
122 Polypodiaceae Lepisorus subconfluens (Syn. Pleopeltis subconfluens)
123 Polypodiaceae Leptochilus axillaris
124 Polypodiaceae Loxogramme involuta
125 Polypodiaceae Microsorum dilatatum
126 Polypodiaceae Microsorum punctatum
127 Polypodiaceae Neocheiropteris zippelii (Syn. Microsorum zippelii)
128 Polypodiaceae Phymatopteris chrysotricha
129 Polypodiaceae Phymatopteris griffithiana
130 Polypodiaceae Phymatopteris oxyloba
131 Polypodiaceae Phymatosorus cuspidatus
132 Polypodiaceae Polypodiastrum argutum
133 Polypodiaceae Polypodiodes amoena (Syn. Goniophlebium amoenum)
134 Polypodiaceae Polypodiodes microrhizoma (Syn. Goniophlebium microrhizoma)
135 Polypodiaceae Pyrrosia adnascens
136 Polypodiaceae Pyrrosia costata
137 Polypodiaceae Pyrrosia flocculosa
138 Polypodiaceae Pyrrosia lanceolata (Syn. Pyrrosia varia)
139 Polypodiaceae Pyrrosia lingua
140 Polypodiaceae Pyrrosia lingua var. heteractis
141 Polypodiaceae Pyrrosia porosa var. stenophylla
142 Polypodiaceae Pyrrosia subfurfuracea
143 Polypodiaceae Selliguea rhynchophylla (Syn. Phymatopteris rhynchophylla)
144 Polypodiaceae Tricholepidium normale (Syn. Neocheiropteris normalis)
145 Psilotaceae Psilotum nudum
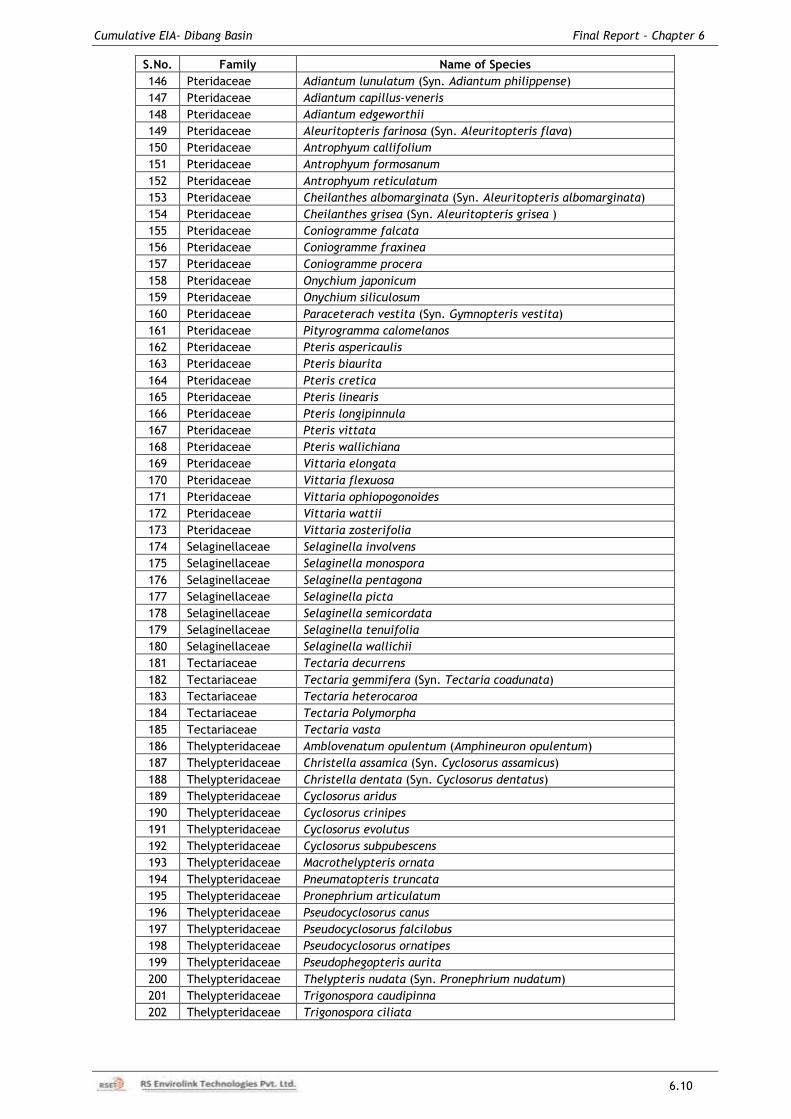
Cumulative EIA- Dibang Basin Final Report – Chapter 6
6.10
S.No. Family Name of Species
146 Pteridaceae Adiantum lunulatum (Syn. Adiantum philippense)
147 Pteridaceae Adiantum capillus-veneris
148 Pteridaceae Adiantum edgeworthii
149 Pteridaceae Aleuritopteris farinosa (Syn. Aleuritopteris flava)
150 Pteridaceae Antrophyum callifolium
151 Pteridaceae Antrophyum formosanum
152 Pteridaceae Antrophyum reticulatum
153 Pteridaceae Cheilanthes albomarginata (Syn. Aleuritopteris albomarginata)
154 Pteridaceae Cheilanthes grisea (Syn. Aleuritopteris grisea )
155 Pteridaceae Coniogramme falcata
156 Pteridaceae Coniogramme fraxinea
157 Pteridaceae Coniogramme procera
158 Pteridaceae Onychium japonicum
159 Pteridaceae Onychium siliculosum
160 Pteridaceae Paraceterach vestita (Syn. Gymnopteris vestita)
161 Pteridaceae Pityrogramma calomelanos
162 Pteridaceae Pteris aspericaulis
163 Pteridaceae Pteris biaurita
164 Pteridaceae Pteris cretica
165 Pteridaceae Pteris linearis
166 Pteridaceae Pteris longipinnula
167 Pteridaceae Pteris vittata
168 Pteridaceae Pteris wallichiana
169 Pteridaceae Vittaria elongata
170 Pteridaceae Vittaria flexuosa
171 Pteridaceae Vittaria ophiopogonoides
172 Pteridaceae Vittaria wattii
173 Pteridaceae Vittaria zosterifolia
174 Selaginellaceae Selaginella involvens
175 Selaginellaceae Selaginella monospora
176 Selaginellaceae Selaginella pentagona
177 Selaginellaceae Selaginella picta
178 Selaginellaceae Selaginella semicordata
179 Selaginellaceae Selaginella tenuifolia
180 Selaginellaceae Selaginella wallichii
181 Tectariaceae Tectaria decurrens
182 Tectariaceae Tectaria gemmifera (Syn. Tectaria coadunata)
183 Tectariaceae Tectaria heterocaroa
184 Tectariaceae Tectaria Polymorpha
185 Tectariaceae Tectaria vasta
186 Thelypteridaceae Amblovenatum opulentum (Amphineuron opulentum)
187 Thelypteridaceae Christella assamica (Syn. Cyclosorus assamicus)
188 Thelypteridaceae Christella dentata (Syn. Cyclosorus dentatus)
189 Thelypteridaceae Cyclosorus aridus
190 Thelypteridaceae Cyclosorus crinipes
191 Thelypteridaceae Cyclosorus evolutus
192 Thelypteridaceae Cyclosorus subpubescens
193 Thelypteridaceae Macrothelypteris ornata
194 Thelypteridaceae Pneumatopteris truncata
195 Thelypteridaceae Pronephrium articulatum
196 Thelypteridaceae Pseudocyclosorus canus
197 Thelypteridaceae Pseudocyclosorus falcilobus
198 Thelypteridaceae Pseudocyclosorus ornatipes
199 Thelypteridaceae Pseudophegopteris aurita
200 Thelypteridaceae Thelypteris nudata (Syn. Pronephrium nudatum)
201 Thelypteridaceae Trigonospora caudipinna
202 Thelypteridaceae Trigonospora ciliata
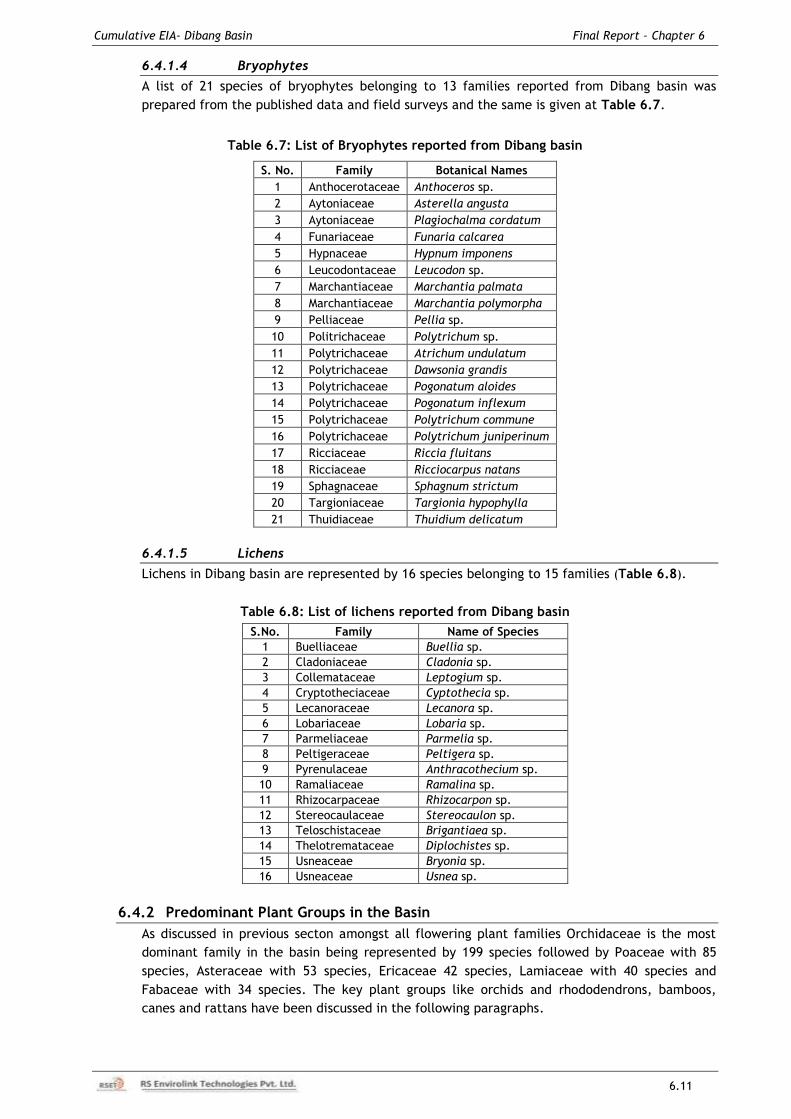
Cumulative EIA- Dibang Basin Final Report – Chapter 6
6.11
6.4.1.4 Bryophytes
A list of 21 species of bryophytes belonging to 13 families reported from Dibang basin was
prepared from the published data and field surveys and the same is given at Table 6.7.
Table 6.7: List of Bryophytes reported from Dibang basin
S. No. Family Botanical Names
1 Anthocerotaceae Anthoceros sp.
2 Aytoniaceae Asterella angusta
3 Aytoniaceae Plagiochalma cordatum
4 Funariaceae Funaria calcarea
5 Hypnaceae Hypnum imponens
6 Leucodontaceae Leucodon sp.
7 Marchantiaceae Marchantia palmata
8 Marchantiaceae Marchantia polymorpha
9 Pelliaceae Pellia sp.
10 Politrichaceae Polytrichum sp.
11 Polytrichaceae Atrichum undulatum
12 Polytrichaceae Dawsonia grandis
13 Polytrichaceae Pogonatum aloides
14 Polytrichaceae Pogonatum inflexum
15 Polytrichaceae Polytrichum commune
16 Polytrichaceae Polytrichum juniperinum
17 Ricciaceae Riccia fluitans
18 Ricciaceae Ricciocarpus natans
19 Sphagnaceae Sphagnum strictum
20 Targioniaceae Targionia hypophylla
21 Thuidiaceae Thuidium delicatum
6.4.1.5 Lichens
Lichens in Dibang basin are represented by 16 species belonging to 15 families (Table 6.8).
Table 6.8: List of lichens reported from Dibang basin
S.No. Family Name of Species
1 Buelliaceae Buellia sp.
2 Cladoniaceae Cladonia sp.
3 Collemataceae Leptogium sp.
4 Cryptotheciaceae Cyptothecia sp.
5 Lecanoraceae Lecanora sp.
6 Lobariaceae Lobaria sp.
7 Parmeliaceae Parmelia sp.
8 Peltigeraceae Peltigera sp.
9 Pyrenulaceae Anthracothecium sp.
10 Ramaliaceae Ramalina sp.
11 Rhizocarpaceae Rhizocarpon sp.
12 Stereocaulaceae Stereocaulon sp.
13 Teloschistaceae Brigantiaea sp.
14 Thelotremataceae Diplochistes sp.
15 Usneaceae Bryonia sp.
16 Usneaceae Usnea sp.
6.4.2 Predominant Plant Groups in the Basin
As discussed in previous secton amongst all flowering plant families Orchidaceae is the most
dominant family in the basin being represented by 199 species followed by Poaceae with 85
species, Asteraceae with 53 species, Ericaceae 42 species, Lamiaceae with 40 species and
Fabaceae with 34 species. The key plant groups like orchids and rhododendrons, bamboos,
canes and rattans have been discussed in the following paragraphs.
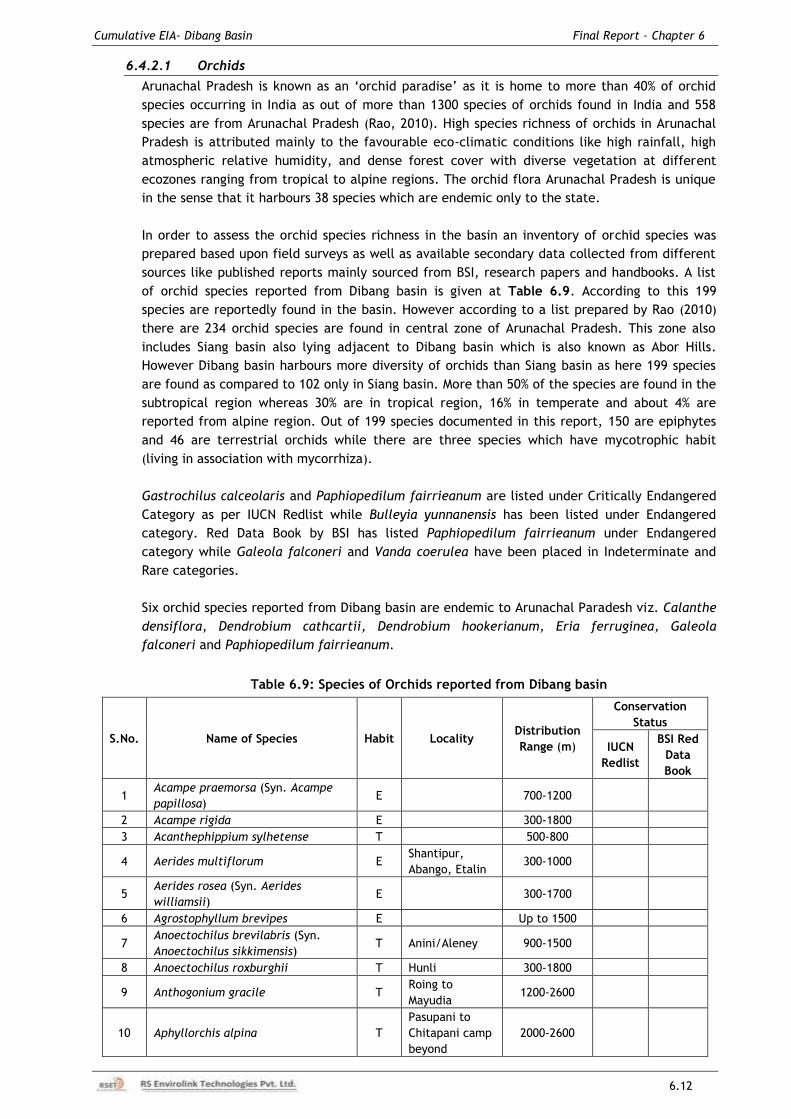
Cumulative EIA- Dibang Basin Final Report – Chapter 6
6.12
6.4.2.1 Orchids
Arunachal Pradesh is known as an „orchid paradise‟ as it is home to more than 40% of orchid
species occurring in India as out of more than 1300 species of orchids found in India and 558
species are from Arunachal Pradesh (Rao, 2010). High species richness of orchids in Arunachal
Pradesh is attributed mainly to the favourable eco-climatic conditions like high rainfall, high
atmospheric relative humidity, and dense forest cover with diverse vegetation at different
ecozones ranging from tropical to alpine regions. The orchid flora Arunachal Pradesh is unique
in the sense that it harbours 38 species which are endemic only to the state.
In order to assess the orchid species richness in the basin an inventory of orchid species was
prepared based upon field surveys as well as available secondary data collected from different
sources like published reports mainly sourced from BSI, research papers and handbooks. A list
of orchid species reported from Dibang basin is given at Table 6.9. According to this 199
species are reportedly found in the basin. However according to a list prepared by Rao (2010)
there are 234 orchid species are found in central zone of Arunachal Pradesh. This zone also
includes Siang basin also lying adjacent to Dibang basin which is also known as Abor Hills.
However Dibang basin harbours more diversity of orchids than Siang basin as here 199 species
are found as compared to 102 only in Siang basin. More than 50% of the species are found in the
subtropical region whereas 30% are in tropical region, 16% in temperate and about 4% are
reported from alpine region. Out of 199 species documented in this report, 150 are epiphytes
and 46 are terrestrial orchids while there are three species which have mycotrophic habit
(living in association with mycorrhiza).
Gastrochilus calceolaris and Paphiopedilum fairrieanum are listed under Critically Endangered
Category as per IUCN Redlist while Bulleyia yunnanensis has been listed under Endangered
category. Red Data Book by BSI has listed Paphiopedilum fairrieanum under Endangered
category while Galeola falconeri and Vanda coerulea have been placed in Indeterminate and
Rare categories.
Six orchid species reported from Dibang basin are endemic to Arunachal Paradesh viz. Calanthe
densiflora, Dendrobium cathcartii, Dendrobium hookerianum, Eria ferruginea, Galeola
falconeri and Paphiopedilum fairrieanum.
Table 6.9: Species of Orchids reported from Dibang basin
S.No. Name of Species Habit Locality Distribution
Range (m)
Conservation
Status
IUCN
Redlist
BSI Red
Data
Book
1 Acampe praemorsa (Syn. Acampe
papillosa) E 700-1200
2 Acampe rigida E 300-1800
3 Acanthephippium sylhetense T 500-800
4 Aerides multiflorum E Shantipur,
Abango, Etalin 300-1000
5 Aerides rosea (Syn. Aerides
williamsii) E 300-1700
6 Agrostophyllum brevipes E Up to 1500
7 Anoectochilus brevilabris (Syn.
Anoectochilus sikkimensis) T Anini/Aleney 900-1500
8 Anoectochilus roxburghii T Hunli 300-1800
9 Anthogonium gracile T Roing to
Mayudia 1200-2600
10 Aphyllorchis alpina T
Pasupani to
Chitapani camp
beyond
2000-2600
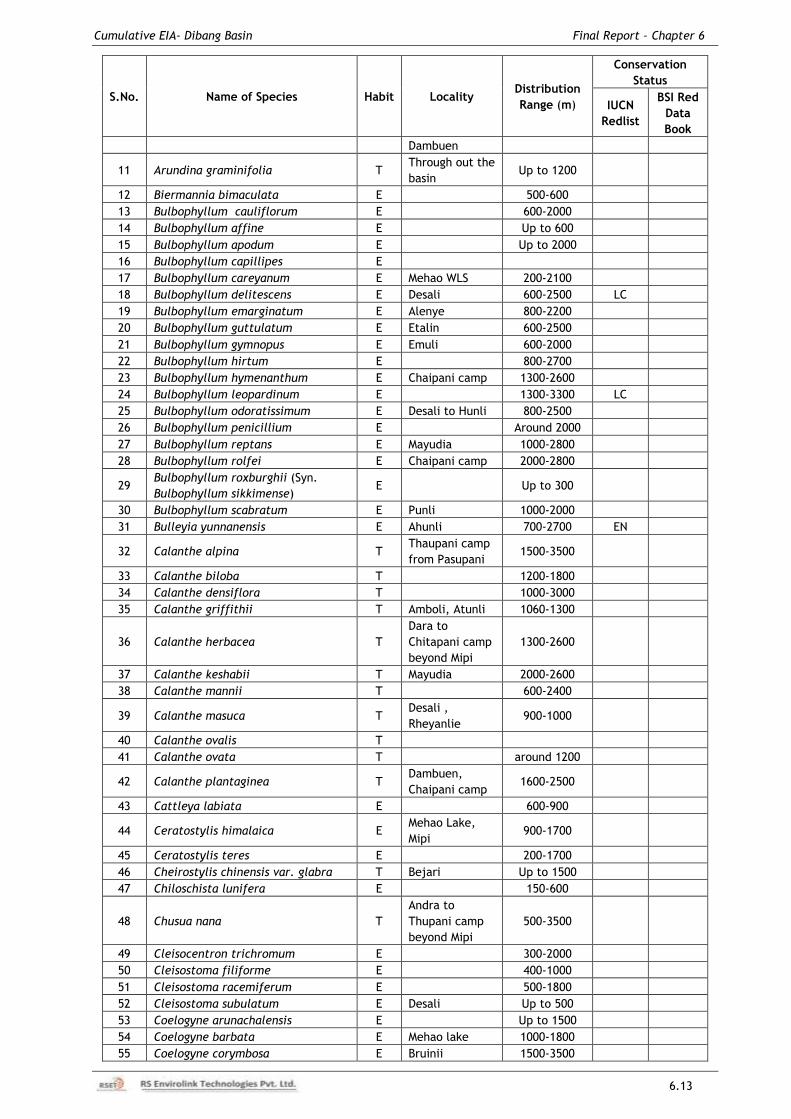
Cumulative EIA- Dibang Basin Final Report – Chapter 6
6.13
S.No. Name of Species Habit Locality Distribution
Range (m)
Conservation
Status
IUCN
Redlist
BSI Red
Data
Book
Dambuen
11 Arundina graminifolia T Through out the
basin Up to 1200
12 Biermannia bimaculata E 500-600
13 Bulbophyllum cauliflorum E 600-2000
14 Bulbophyllum affine E Up to 600
15 Bulbophyllum apodum E Up to 2000
16 Bulbophyllum capillipes E
17 Bulbophyllum careyanum E Mehao WLS 200-2100
18 Bulbophyllum delitescens E Desali 600-2500 LC
19 Bulbophyllum emarginatum E Alenye 800-2200
20 Bulbophyllum guttulatum E Etalin 600-2500
21 Bulbophyllum gymnopus E Emuli 600-2000
22 Bulbophyllum hirtum E 800-2700
23 Bulbophyllum hymenanthum E Chaipani camp 1300-2600
24 Bulbophyllum leopardinum E 1300-3300 LC
25 Bulbophyllum odoratissimum E Desali to Hunli 800-2500
26 Bulbophyllum penicillium E Around 2000
27 Bulbophyllum reptans E Mayudia 1000-2800
28 Bulbophyllum rolfei E Chaipani camp 2000-2800
29 Bulbophyllum roxburghii (Syn.
Bulbophyllum sikkimense) E Up to 300
30 Bulbophyllum scabratum E Punli 1000-2000
31 Bulleyia yunnanensis E Ahunli 700-2700 EN
32 Calanthe alpina T Thaupani camp
from Pasupani 1500-3500
33 Calanthe biloba T 1200-1800
34 Calanthe densiflora T 1000-3000
35 Calanthe griffithii T Amboli, Atunli 1060-1300
36 Calanthe herbacea T
Dara to
Chitapani camp
beyond Mipi
1300-2600
37 Calanthe keshabii T Mayudia 2000-2600
38 Calanthe mannii T 600-2400
39 Calanthe masuca T Desali ,
Rheyanlie 900-1000
40 Calanthe ovalis T
41 Calanthe ovata T around 1200
42 Calanthe plantaginea T Dambuen,
Chaipani camp 1600-2500
43 Cattleya labiata E 600-900
44 Ceratostylis himalaica E Mehao Lake,
Mipi 900-1700
45 Ceratostylis teres E 200-1700
46 Cheirostylis chinensis var. glabra T Bejari Up to 1500
47 Chiloschista lunifera E 150-600
48 Chusua nana T
Andra to
Thupani camp
beyond Mipi
500-3500
49 Cleisocentron trichromum E 300-2000
50 Cleisostoma filiforme E 400-1000
51 Cleisostoma racemiferum E 500-1800
52 Cleisostoma subulatum E Desali Up to 500
53 Coelogyne arunachalensis E Up to 1500
54 Coelogyne barbata E Mehao lake 1000-1800
55 Coelogyne corymbosa E Bruinii 1500-3500
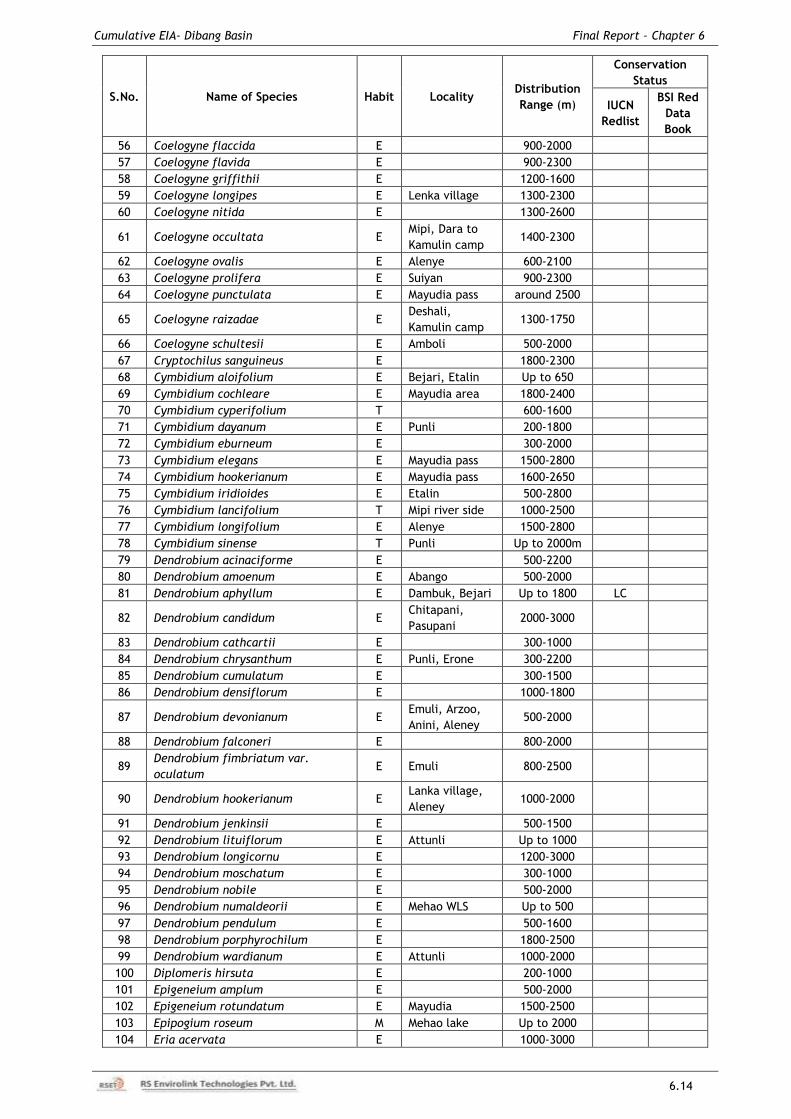
Cumulative EIA- Dibang Basin Final Report – Chapter 6
6.14
S.No. Name of Species Habit Locality Distribution
Range (m)
Conservation
Status
IUCN
Redlist
BSI Red
Data
Book
56 Coelogyne flaccida E 900-2000
57 Coelogyne flavida E 900-2300
58 Coelogyne griffithii E 1200-1600
59 Coelogyne longipes E Lenka village 1300-2300
60 Coelogyne nitida E 1300-2600
61 Coelogyne occultata E Mipi, Dara to
Kamulin camp 1400-2300
62 Coelogyne ovalis E Alenye 600-2100
63 Coelogyne prolifera E Suiyan 900-2300
64 Coelogyne punctulata E Mayudia pass around 2500
65 Coelogyne raizadae E Deshali,
Kamulin camp 1300-1750
66 Coelogyne schultesii E Amboli 500-2000
67 Cryptochilus sanguineus E 1800-2300
68 Cymbidium aloifolium E Bejari, Etalin Up to 650
69 Cymbidium cochleare E Mayudia area 1800-2400
70 Cymbidium cyperifolium T 600-1600
71 Cymbidium dayanum E Punli 200-1800
72 Cymbidium eburneum E 300-2000
73 Cymbidium elegans E Mayudia pass 1500-2800
74 Cymbidium hookerianum E Mayudia pass 1600-2650
75 Cymbidium iridioides E Etalin 500-2800
76 Cymbidium lancifolium T Mipi river side 1000-2500
77 Cymbidium longifolium E Alenye 1500-2800
78 Cymbidium sinense T Punli Up to 2000m
79 Dendrobium acinaciforme E 500-2200
80 Dendrobium amoenum E Abango 500-2000
81 Dendrobium aphyllum E Dambuk, Bejari Up to 1800 LC
82 Dendrobium candidum E Chitapani,
Pasupani 2000-3000
83 Dendrobium cathcartii E 300-1000
84 Dendrobium chrysanthum E Punli, Erone 300-2200
85 Dendrobium cumulatum E 300-1500
86 Dendrobium densiflorum E 1000-1800
87 Dendrobium devonianum E Emuli, Arzoo,
Anini, Aleney 500-2000
88 Dendrobium falconeri E 800-2000
89 Dendrobium fimbriatum var.
oculatum E Emuli 800-2500
90 Dendrobium hookerianum E Lanka village,
Aleney 1000-2000
91 Dendrobium jenkinsii E 500-1500
92 Dendrobium lituiflorum E Attunli Up to 1000
93 Dendrobium longicornu E 1200-3000
94 Dendrobium moschatum E 300-1000
95 Dendrobium nobile E 500-2000
96 Dendrobium numaldeorii E Mehao WLS Up to 500
97 Dendrobium pendulum E 500-1600
98 Dendrobium porphyrochilum E 1800-2500
99 Dendrobium wardianum E Attunli 1000-2000
100 Diplomeris hirsuta E 200-1000
101 Epigeneium amplum E 500-2000
102 Epigeneium rotundatum E Mayudia 1500-2500
103 Epipogium roseum M Mehao lake Up to 2000
104 Eria acervata E 1000-3000
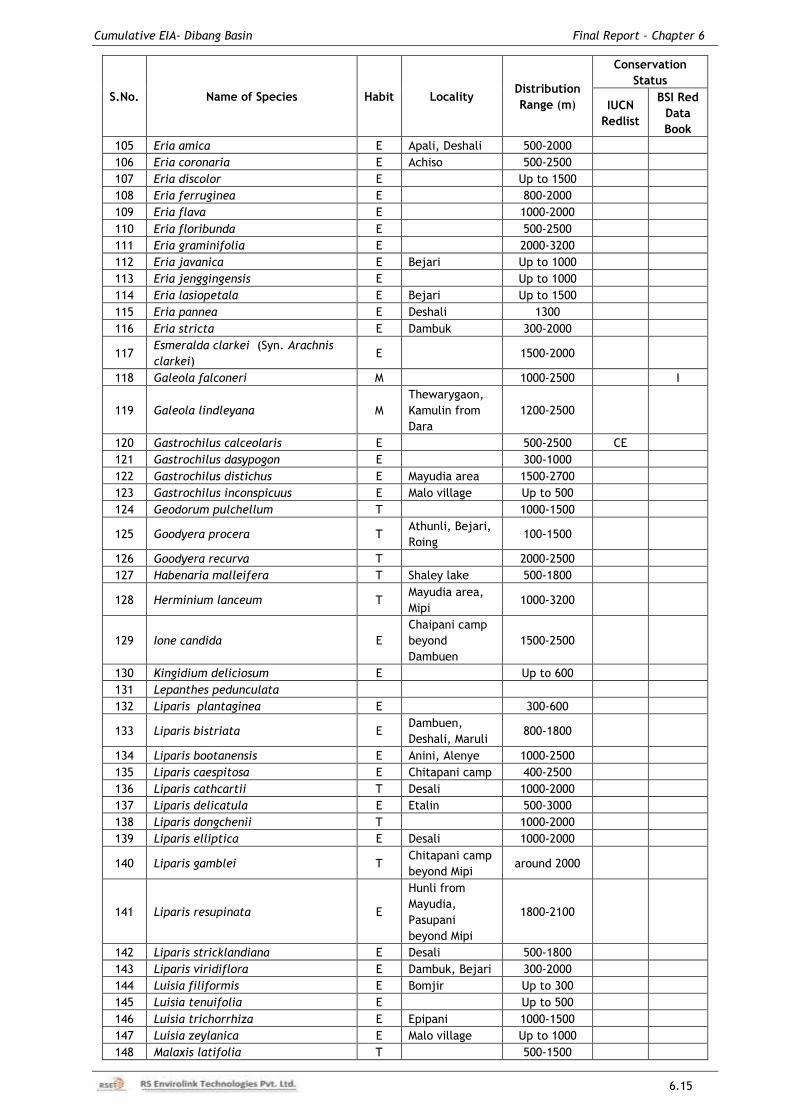
Cumulative EIA- Dibang Basin Final Report – Chapter 6
6.15
S.No. Name of Species Habit Locality Distribution
Range (m)
Conservation
Status
IUCN
Redlist
BSI Red
Data
Book
105 Eria amica E Apali, Deshali 500-2000
106 Eria coronaria E Achiso 500-2500
107 Eria discolor E Up to 1500
108 Eria ferruginea E 800-2000
109 Eria flava E 1000-2000
110 Eria floribunda E 500-2500
111 Eria graminifolia E 2000-3200
112 Eria javanica E Bejari Up to 1000
113 Eria jenggingensis E Up to 1000
114 Eria lasiopetala E Bejari Up to 1500
115 Eria pannea E Deshali 1300
116 Eria stricta E Dambuk 300-2000
117 Esmeralda clarkei (Syn. Arachnis
clarkei) E 1500-2000
118 Galeola falconeri M 1000-2500
I
119 Galeola lindleyana M
Thewarygaon,
Kamulin from
Dara
1200-2500
120 Gastrochilus calceolaris E 500-2500 CE
121 Gastrochilus dasypogon E 300-1000
122 Gastrochilus distichus E Mayudia area 1500-2700
123 Gastrochilus inconspicuus E Malo village Up to 500
124 Geodorum pulchellum T 1000-1500
125 Goodyera procera T Athunli, Bejari,
Roing 100-1500
126 Goodyera recurva T 2000-2500
127 Habenaria malleifera T Shaley lake 500-1800
128 Herminium lanceum T Mayudia area,
Mipi 1000-3200
129 Ione candida E
Chaipani camp
beyond
Dambuen
1500-2500
130 Kingidium deliciosum E Up to 600
131 Lepanthes pedunculata
132 Liparis plantaginea E 300-600
133 Liparis bistriata E Dambuen,
Deshali, Maruli 800-1800
134 Liparis bootanensis E Anini, Alenye 1000-2500
135 Liparis caespitosa E Chitapani camp 400-2500
136 Liparis cathcartii T Desali 1000-2000
137 Liparis delicatula E Etalin 500-3000
138 Liparis dongchenii T 1000-2000
139 Liparis elliptica E Desali 1000-2000
140 Liparis gamblei T Chitapani camp
beyond Mipi around 2000
141 Liparis resupinata E
Hunli from
Mayudia,
Pasupani
beyond Mipi
1800-2100
142 Liparis stricklandiana E Desali 500-1800
143 Liparis viridiflora E Dambuk, Bejari 300-2000
144 Luisia filiformis E Bomjir Up to 300
145 Luisia tenuifolia E Up to 500
146 Luisia trichorrhiza E Epipani 1000-1500
147 Luisia zeylanica E Malo village Up to 1000
148 Malaxis latifolia T 500-1500
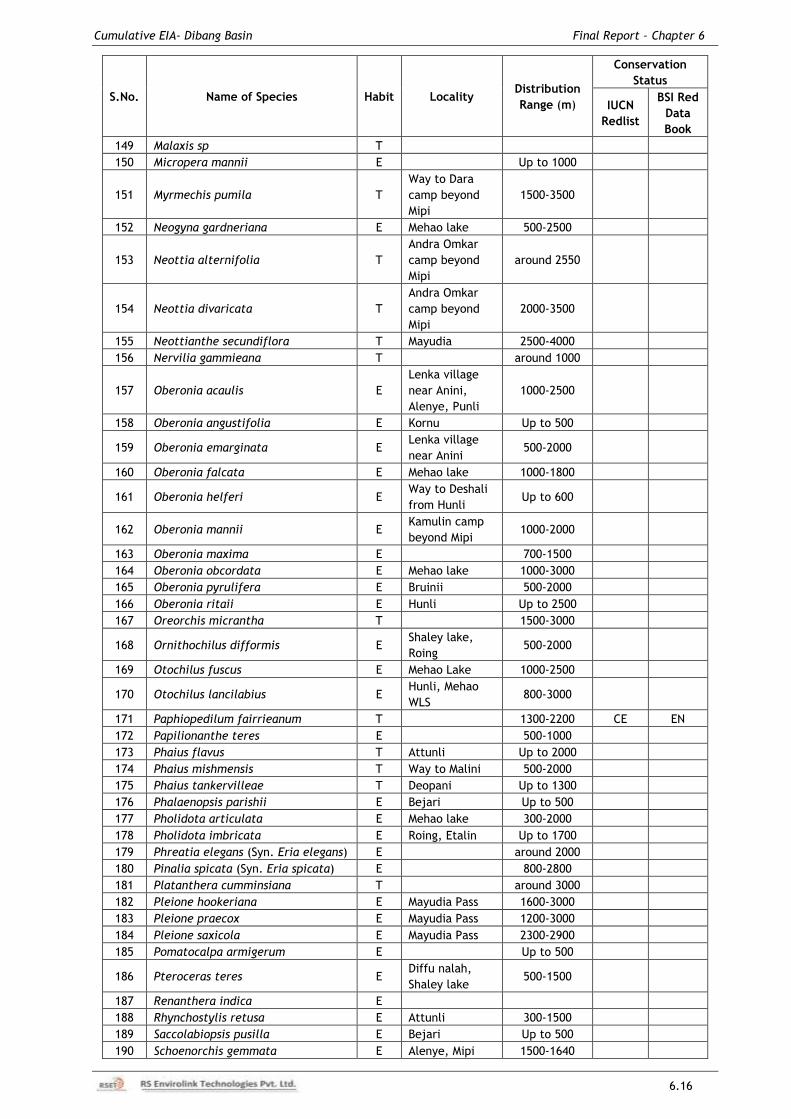
Cumulative EIA- Dibang Basin Final Report – Chapter 6
6.16
S.No. Name of Species Habit Locality Distribution
Range (m)
Conservation
Status
IUCN
Redlist
BSI Red
Data
Book
149 Malaxis sp T
150 Micropera mannii E Up to 1000
151 Myrmechis pumila T
Way to Dara
camp beyond
Mipi
1500-3500
152 Neogyna gardneriana E Mehao lake 500-2500
153 Neottia alternifolia T
Andra Omkar
camp beyond
Mipi
around 2550
154 Neottia divaricata T
Andra Omkar
camp beyond
Mipi
2000-3500
155 Neottianthe secundiflora T Mayudia 2500-4000
156 Nervilia gammieana T around 1000
157 Oberonia acaulis E
Lenka village
near Anini,
Alenye, Punli
1000-2500
158 Oberonia angustifolia E Kornu Up to 500
159 Oberonia emarginata E Lenka village
near Anini 500-2000
160 Oberonia falcata E Mehao lake 1000-1800
161 Oberonia helferi E Way to Deshali
from Hunli Up to 600
162 Oberonia mannii E Kamulin camp
beyond Mipi 1000-2000
163 Oberonia maxima E 700-1500
164 Oberonia obcordata E Mehao lake 1000-3000
165 Oberonia pyrulifera E Bruinii 500-2000
166 Oberonia ritaii E Hunli Up to 2500
167 Oreorchis micrantha T 1500-3000
168 Ornithochilus difformis E Shaley lake,
Roing 500-2000
169 Otochilus fuscus E Mehao Lake 1000-2500
170 Otochilus lancilabius E Hunli, Mehao
WLS 800-3000
171 Paphiopedilum fairrieanum T 1300-2200 CE EN
172 Papilionanthe teres E 500-1000
173 Phaius flavus T Attunli Up to 2000
174 Phaius mishmensis T Way to Malini 500-2000
175 Phaius tankervilleae T Deopani Up to 1300
176 Phalaenopsis parishii E Bejari Up to 500
177 Pholidota articulata E Mehao lake 300-2000
178 Pholidota imbricata E Roing, Etalin Up to 1700
179 Phreatia elegans (Syn. Eria elegans) E around 2000
180 Pinalia spicata (Syn. Eria spicata) E 800-2800
181 Platanthera cumminsiana T around 3000
182 Pleione hookeriana E Mayudia Pass 1600-3000
183 Pleione praecox E Mayudia Pass 1200-3000
184 Pleione saxicola E Mayudia Pass 2300-2900
185 Pomatocalpa armigerum E Up to 500
186 Pteroceras teres E Diffu nalah,
Shaley lake 500-1500
187 Renanthera indica E
188 Rhynchostylis retusa E Attunli 300-1500
189 Saccolabiopsis pusilla E Bejari Up to 500
190 Schoenorchis gemmata E Alenye, Mipi 1500-1640
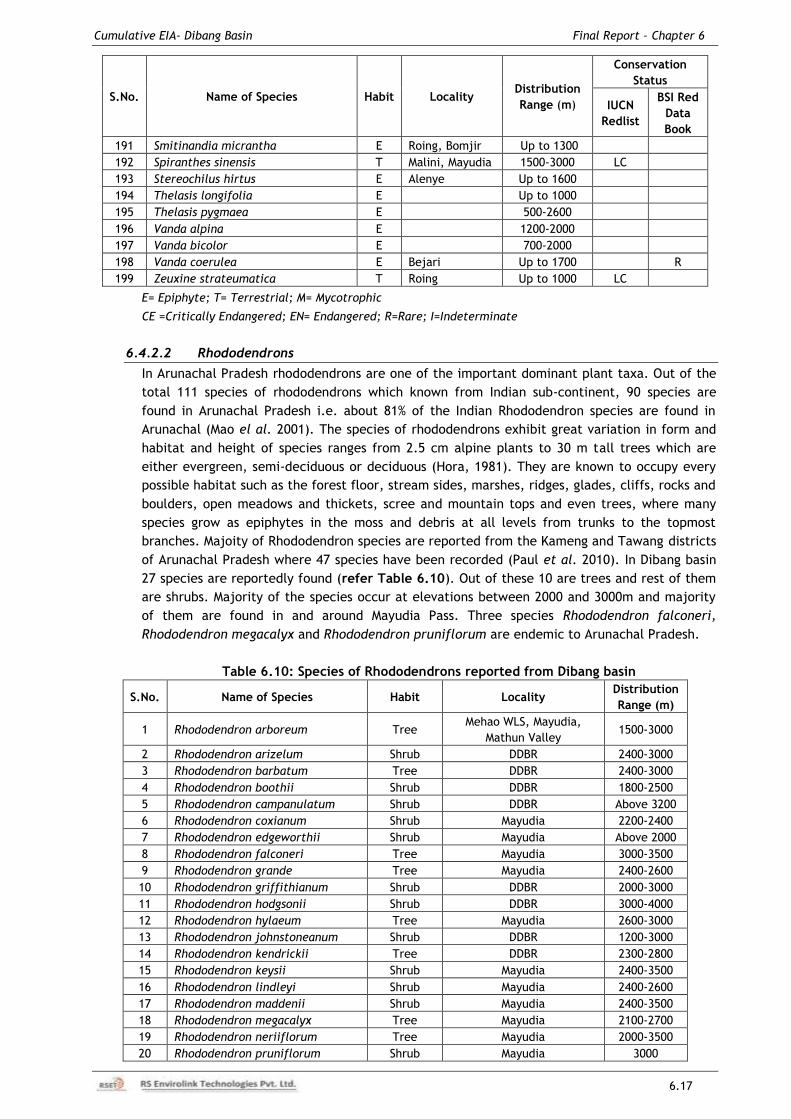
Cumulative EIA- Dibang Basin Final Report – Chapter 6
6.17
S.No. Name of Species Habit Locality Distribution
Range (m)
Conservation
Status
IUCN
Redlist
BSI Red
Data
Book
191 Smitinandia micrantha E Roing, Bomjir Up to 1300
192 Spiranthes sinensis T Malini, Mayudia 1500-3000 LC
193 Stereochilus hirtus E Alenye Up to 1600
194 Thelasis longifolia E Up to 1000
195 Thelasis pygmaea E 500-2600
196 Vanda alpina E 1200-2000
197 Vanda bicolor E 700-2000
198 Vanda coerulea E Bejari Up to 1700
R
199 Zeuxine strateumatica T Roing Up to 1000 LC
E= Epiphyte; T= Terrestrial; M= Mycotrophic
CE =Critically Endangered; EN= Endangered; R=Rare; I=Indeterminate
6.4.2.2 Rhododendrons
In Arunachal Pradesh rhododendrons are one of the important dominant plant taxa. Out of the
total 111 species of rhododendrons which known from Indian sub-continent, 90 species are
found in Arunachal Pradesh i.e. about 81% of the Indian Rhododendron species are found in
Arunachal (Mao el al. 2001). The species of rhododendrons exhibit great variation in form and
habitat and height of species ranges from 2.5 cm alpine plants to 30 m tall trees which are
either evergreen, semi-deciduous or deciduous (Hora, 1981). They are known to occupy every
possible habitat such as the forest floor, stream sides, marshes, ridges, glades, cliffs, rocks and
boulders, open meadows and thickets, scree and mountain tops and even trees, where many
species grow as epiphytes in the moss and debris at all levels from trunks to the topmost
branches. Majoity of Rhododendron species are reported from the Kameng and Tawang districts
of Arunachal Pradesh where 47 species have been recorded (Paul et al. 2010). In Dibang basin
27 species are reportedly found (refer Table 6.10). Out of these 10 are trees and rest of them
are shrubs. Majority of the species occur at elevations between 2000 and 3000m and majority
of them are found in and around Mayudia Pass. Three species Rhododendron falconeri,
Rhododendron megacalyx and Rhododendron pruniflorum are endemic to Arunachal Pradesh.
Table 6.10: Species of Rhododendrons reported from Dibang basin
S.No. Name of Species Habit Locality Distribution
Range (m)
1 Rhododendron arboreum Tree Mehao WLS, Mayudia,
Mathun Valley 1500-3000
2 Rhododendron arizelum Shrub DDBR 2400-3000
3 Rhododendron barbatum Tree DDBR 2400-3000
4 Rhododendron boothii Shrub DDBR 1800-2500
5 Rhododendron campanulatum Shrub DDBR Above 3200
6 Rhododendron coxianum Shrub Mayudia 2200-2400
7 Rhododendron edgeworthii Shrub Mayudia Above 2000
8 Rhododendron falconeri Tree Mayudia 3000-3500
9 Rhododendron grande Tree Mayudia 2400-2600
10 Rhododendron griffithianum Shrub DDBR 2000-3000
11 Rhododendron hodgsonii Shrub DDBR 3000-4000
12 Rhododendron hylaeum Tree Mayudia 2600-3000
13 Rhododendron johnstoneanum Shrub DDBR 1200-3000
14 Rhododendron kendrickii Tree DDBR 2300-2800
15 Rhododendron keysii Shrub Mayudia 2400-3500
16 Rhododendron lindleyi Shrub Mayudia 2400-2600
17 Rhododendron maddenii Shrub Mayudia 2400-3500
18 Rhododendron megacalyx Tree Mayudia 2100-2700
19 Rhododendron neriiflorum Tree Mayudia 2000-3500
20 Rhododendron pruniflorum Shrub Mayudia 3000
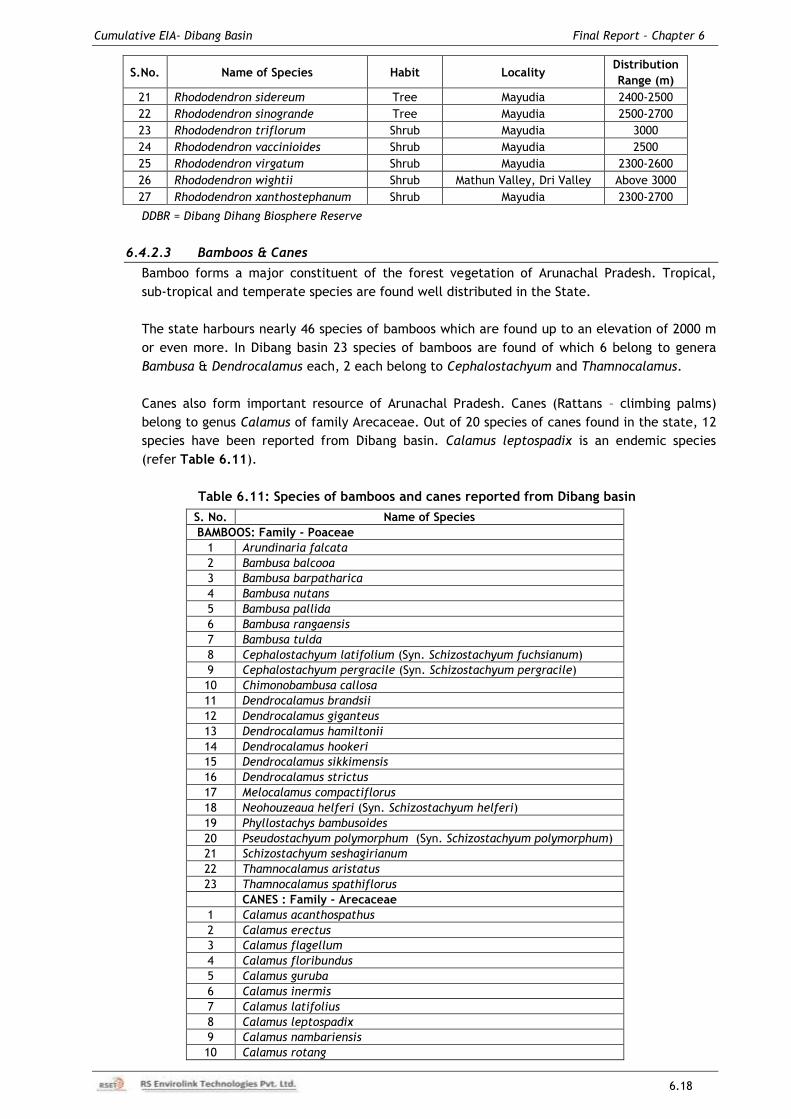
Cumulative EIA- Dibang Basin Final Report – Chapter 6
6.18
S.No. Name of Species Habit Locality Distribution
Range (m)
21 Rhododendron sidereum Tree Mayudia 2400-2500
22 Rhododendron sinogrande Tree Mayudia 2500-2700
23 Rhododendron triflorum Shrub Mayudia 3000
24 Rhododendron vaccinioides Shrub Mayudia 2500
25 Rhododendron virgatum Shrub Mayudia 2300-2600
26 Rhododendron wightii Shrub Mathun Valley, Dri Valley Above 3000
27 Rhododendron xanthostephanum Shrub Mayudia 2300-2700
DDBR = Dibang Dihang Biosphere Reserve
6.4.2.3 Bamboos & Canes
Bamboo forms a major constituent of the forest vegetation of Arunachal Pradesh. Tropical,
sub-tropical and temperate species are found well distributed in the State.
The state harbours nearly 46 species of bamboos which are found up to an elevation of 2000 m
or even more. In Dibang basin 23 species of bamboos are found of which 6 belong to genera
Bambusa & Dendrocalamus each, 2 each belong to Cephalostachyum and Thamnocalamus.
Canes also form important resource of Arunachal Pradesh. Canes (Rattans – climbing palms)
belong to genus Calamus of family Arecaceae. Out of 20 species of canes found in the state, 12
species have been reported from Dibang basin. Calamus leptospadix is an endemic species
(refer Table 6.11).
Table 6.11: Species of bamboos and canes reported from Dibang basin
S. No. Name of Species
BAMBOOS: Family - Poaceae
1 Arundinaria falcata
2 Bambusa balcooa
3 Bambusa barpatharica
4 Bambusa nutans
5 Bambusa pallida
6 Bambusa rangaensis
7 Bambusa tulda
8 Cephalostachyum latifolium (Syn. Schizostachyum fuchsianum)
9 Cephalostachyum pergracile (Syn. Schizostachyum pergracile)
10 Chimonobambusa callosa
11 Dendrocalamus brandsii
12 Dendrocalamus giganteus
13 Dendrocalamus hamiltonii
14 Dendrocalamus hookeri
15 Dendrocalamus sikkimensis
16 Dendrocalamus strictus
17 Melocalamus compactiflorus
18 Neohouzeaua helferi (Syn. Schizostachyum helferi)
19 Phyllostachys bambusoides
20 Pseudostachyum polymorphum (Syn. Schizostachyum polymorphum)
21 Schizostachyum seshagirianum
22 Thamnocalamus aristatus
23 Thamnocalamus spathiflorus
CANES : Family - Arecaceae
1 Calamus acanthospathus
2 Calamus erectus
3 Calamus flagellum
4 Calamus floribundus
5 Calamus guruba
6 Calamus inermis
7 Calamus latifolius
8 Calamus leptospadix
9 Calamus nambariensis
10 Calamus rotang
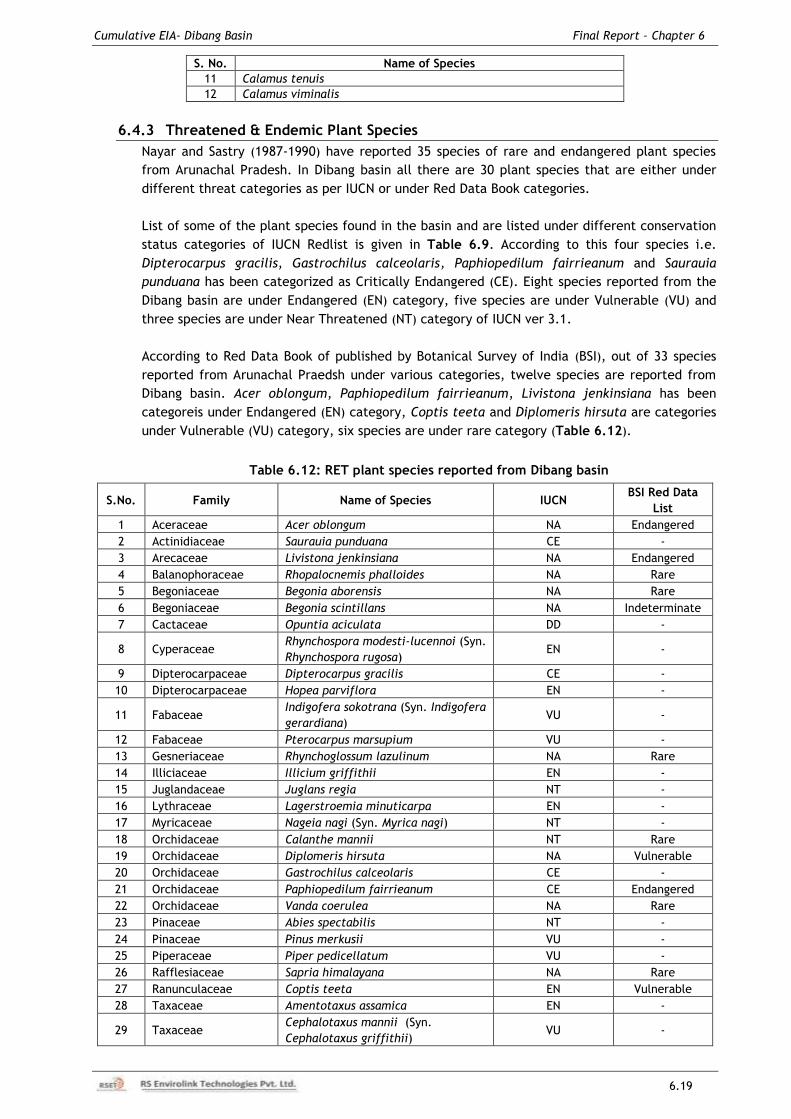
Cumulative EIA- Dibang Basin Final Report – Chapter 6
6.19
S. No. Name of Species
11 Calamus tenuis
12 Calamus viminalis
6.4.3 Threatened & Endemic Plant Species
Nayar and Sastry (1987-1990) have reported 35 species of rare and endangered plant species
from Arunachal Pradesh. In Dibang basin all there are 30 plant species that are either under
different threat categories as per IUCN or under Red Data Book categories.
List of some of the plant species found in the basin and are listed under different conservation
status categories of IUCN Redlist is given in Table 6.9. According to this four species i.e.
Dipterocarpus gracilis, Gastrochilus calceolaris, Paphiopedilum fairrieanum and Saurauia
punduana has been categorized as Critically Endangered (CE). Eight species reported from the
Dibang basin are under Endangered (EN) category, five species are under Vulnerable (VU) and
three species are under Near Threatened (NT) category of IUCN ver 3.1.
According to Red Data Book of published by Botanical Survey of India (BSI), out of 33 species
reported from Arunachal Praedsh under various categories, twelve species are reported from
Dibang basin. Acer oblongum, Paphiopedilum fairrieanum, Livistona jenkinsiana has been
categoreis under Endangered (EN) category, Coptis teeta and Diplomeris hirsuta are categories
under Vulnerable (VU) category, six species are under rare category (Table 6.12).
Table 6.12: RET plant species reported from Dibang basin
S.No. Family Name of Species IUCN BSI Red Data
List
1 Aceraceae Acer oblongum NA Endangered
2 Actinidiaceae Saurauia punduana CE -
3 Arecaceae Livistona jenkinsiana NA Endangered
4 Balanophoraceae Rhopalocnemis phalloides NA Rare
5 Begoniaceae Begonia aborensis NA Rare
6 Begoniaceae Begonia scintillans NA Indeterminate
7 Cactaceae Opuntia aciculata DD -
8 Cyperaceae Rhynchospora modesti-lucennoi (Syn.
Rhynchospora rugosa) EN -
9 Dipterocarpaceae Dipterocarpus gracilis CE -
10 Dipterocarpaceae Hopea parviflora EN -
11 Fabaceae Indigofera sokotrana (Syn. Indigofera
gerardiana) VU -
12 Fabaceae Pterocarpus marsupium VU -
13 Gesneriaceae Rhynchoglossum lazulinum NA Rare
14 Illiciaceae Illicium griffithii EN -
15 Juglandaceae Juglans regia NT -
16 Lythraceae Lagerstroemia minuticarpa EN -
17 Myricaceae Nageia nagi (Syn. Myrica nagi) NT -
18 Orchidaceae Calanthe mannii NT Rare
19 Orchidaceae Diplomeris hirsuta NA Vulnerable
20 Orchidaceae Gastrochilus calceolaris CE -
21 Orchidaceae Paphiopedilum fairrieanum CE Endangered
22 Orchidaceae Vanda coerulea NA Rare
23 Pinaceae Abies spectabilis NT -
24 Pinaceae Pinus merkusii VU -
25 Piperaceae Piper pedicellatum VU -
26 Rafflesiaceae Sapria himalayana NA Rare
27 Ranunculaceae Coptis teeta EN Vulnerable
28 Taxaceae Amentotaxus assamica EN -
29 Taxaceae Cephalotaxus mannii (Syn.
Cephalotaxus griffithii) VU -
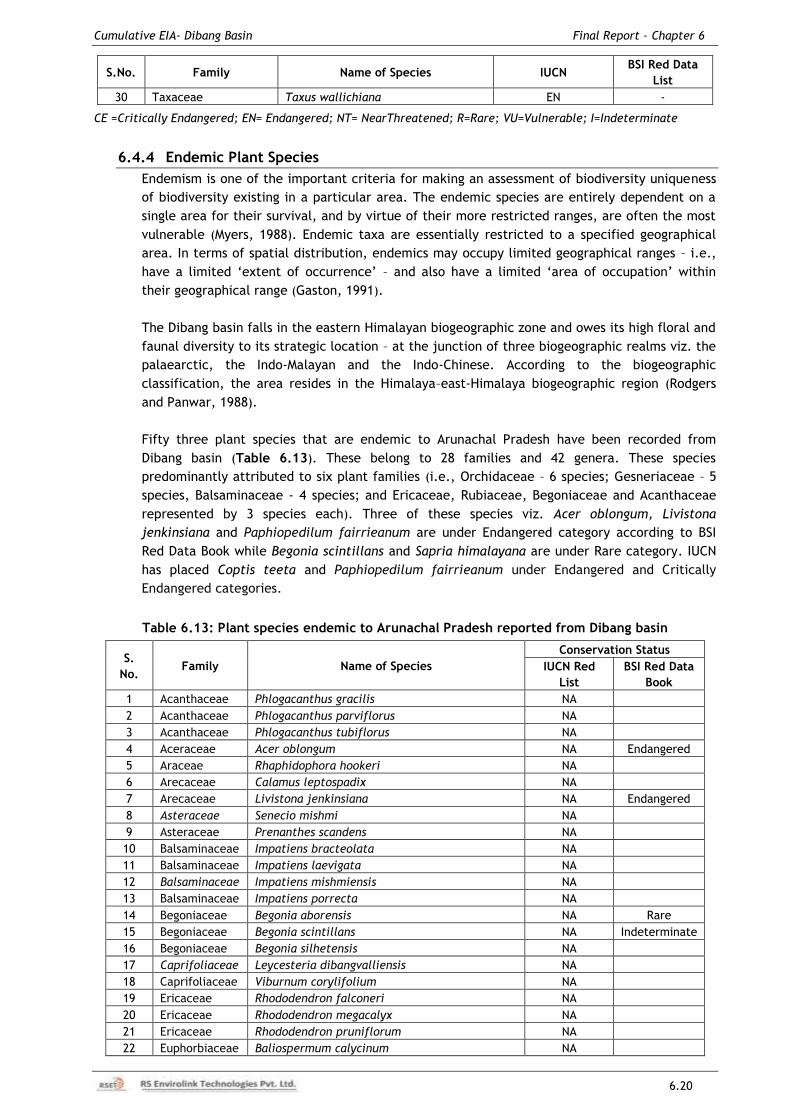
Cumulative EIA- Dibang Basin Final Report – Chapter 6
6.20
S.No. Family Name of Species IUCN BSI Red Data
List
30 Taxaceae Taxus wallichiana EN -
CE =Critically Endangered; EN= Endangered; NT= NearThreatened; R=Rare; VU=Vulnerable; I=Indeterminate
6.4.4 Endemic Plant Species
Endemism is one of the important criteria for making an assessment of biodiversity uniqueness
of biodiversity existing in a particular area. The endemic species are entirely dependent on a
single area for their survival, and by virtue of their more restricted ranges, are often the most
vulnerable (Myers, 1988). Endemic taxa are essentially restricted to a specified geographical
area. In terms of spatial distribution, endemics may occupy limited geographical ranges – i.e.,
have a limited „extent of occurrence‟ – and also have a limited „area of occupation‟ within
their geographical range (Gaston, 1991).
The Dibang basin falls in the eastern Himalayan biogeographic zone and owes its high floral and
faunal diversity to its strategic location – at the junction of three biogeographic realms viz. the
palaearctic, the Indo-Malayan and the Indo-Chinese. According to the biogeographic
classification, the area resides in the Himalaya–east-Himalaya biogeographic region (Rodgers
and Panwar, 1988).
Fifty three plant species that are endemic to Arunachal Pradesh have been recorded from
Dibang basin (Table 6.13). These belong to 28 families and 42 genera. These species
predominantly attributed to six plant families (i.e., Orchidaceae – 6 species; Gesneriaceae – 5
species, Balsaminaceae - 4 species; and Ericaceae, Rubiaceae, Begoniaceae and Acanthaceae
represented by 3 species each). Three of these species viz. Acer oblongum, Livistona
jenkinsiana and Paphiopedilum fairrieanum are under Endangered category according to BSI
Red Data Book while Begonia scintillans and Sapria himalayana are under Rare category. IUCN
has placed Coptis teeta and Paphiopedilum fairrieanum under Endangered and Critically
Endangered categories.
Table 6.13: Plant species endemic to Arunachal Pradesh reported from Dibang basin
S.
No. Family Name of Species
Conservation Status
IUCN Red
List
BSI Red Data
Book
1 Acanthaceae Phlogacanthus gracilis NA
2 Acanthaceae Phlogacanthus parviflorus NA
3 Acanthaceae Phlogacanthus tubiflorus NA
4 Aceraceae Acer oblongum NA Endangered
5 Araceae Rhaphidophora hookeri NA
6 Arecaceae Calamus leptospadix NA
7 Arecaceae Livistona jenkinsiana NA Endangered
8 Asteraceae Senecio mishmi NA
9 Asteraceae Prenanthes scandens NA
10 Balsaminaceae Impatiens bracteolata NA
11 Balsaminaceae Impatiens laevigata NA
12 Balsaminaceae Impatiens mishmiensis NA
13 Balsaminaceae Impatiens porrecta NA
14 Begoniaceae Begonia aborensis NA Rare
15 Begoniaceae Begonia scintillans NA Indeterminate
16 Begoniaceae Begonia silhetensis NA
17 Caprifoliaceae Leycesteria dibangvalliensis NA
18 Caprifoliaceae Viburnum corylifolium NA
19 Ericaceae Rhododendron falconeri NA
20 Ericaceae Rhododendron megacalyx NA
21 Ericaceae Rhododendron pruniflorum NA
22 Euphorbiaceae Baliospermum calycinum NA
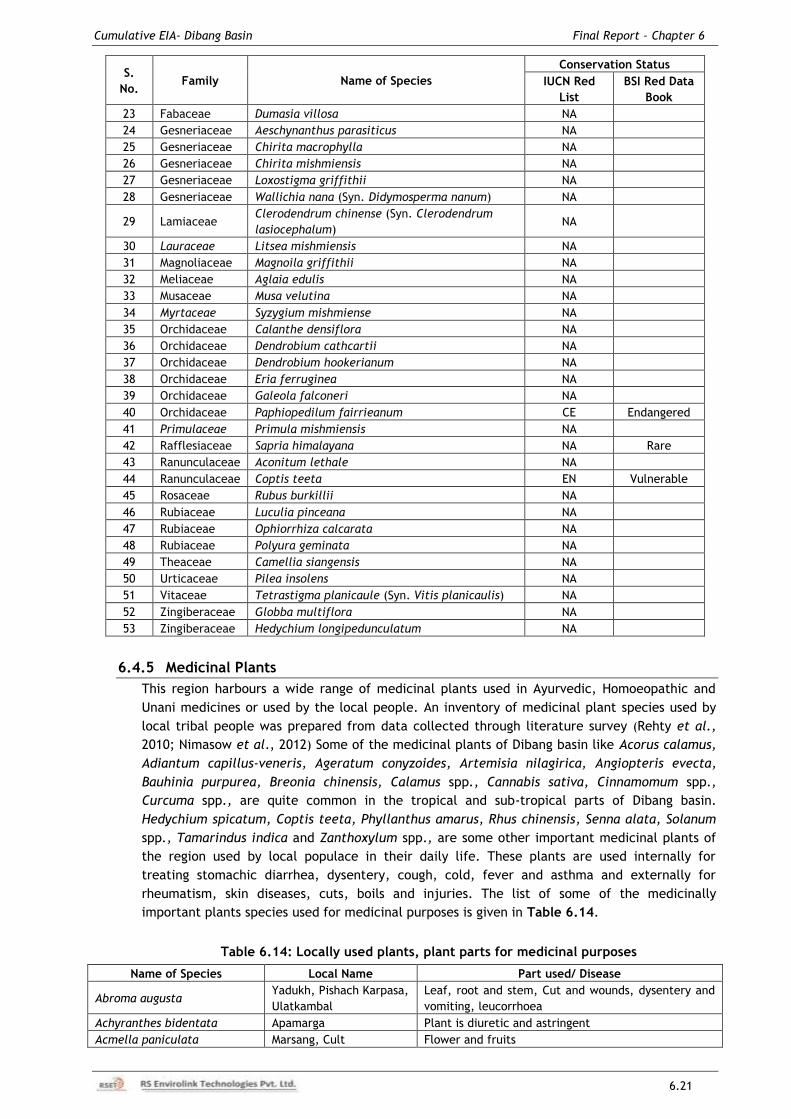
Cumulative EIA- Dibang Basin Final Report – Chapter 6
6.21
S.
No. Family Name of Species
Conservation Status
IUCN Red
List
BSI Red Data
Book
23 Fabaceae Dumasia villosa NA
24 Gesneriaceae Aeschynanthus parasiticus NA
25 Gesneriaceae Chirita macrophylla NA
26 Gesneriaceae Chirita mishmiensis NA
27 Gesneriaceae Loxostigma griffithii NA
28 Gesneriaceae Wallichia nana (Syn. Didymosperma nanum) NA
29 Lamiaceae Clerodendrum chinense (Syn. Clerodendrum
lasiocephalum) NA
30 Lauraceae Litsea mishmiensis NA
31 Magnoliaceae Magnoila griffithii NA
32 Meliaceae Aglaia edulis NA
33 Musaceae Musa velutina NA
34 Myrtaceae Syzygium mishmiense NA
35 Orchidaceae Calanthe densiflora NA
36 Orchidaceae Dendrobium cathcartii NA
37 Orchidaceae Dendrobium hookerianum NA
38 Orchidaceae Eria ferruginea NA
39 Orchidaceae Galeola falconeri NA
40 Orchidaceae Paphiopedilum fairrieanum CE Endangered
41 Primulaceae Primula mishmiensis NA
42 Rafflesiaceae Sapria himalayana NA Rare
43 Ranunculaceae Aconitum lethale NA
44 Ranunculaceae Coptis teeta EN Vulnerable
45 Rosaceae Rubus burkillii NA
46 Rubiaceae Luculia pinceana NA
47 Rubiaceae Ophiorrhiza calcarata NA
48 Rubiaceae Polyura geminata NA
49 Theaceae Camellia siangensis NA
50 Urticaceae Pilea insolens NA
51 Vitaceae Tetrastigma planicaule (Syn. Vitis planicaulis) NA
52 Zingiberaceae Globba multiflora NA
53 Zingiberaceae Hedychium longipedunculatum NA
6.4.5 Medicinal Plants
This region harbours a wide range of medicinal plants used in Ayurvedic, Homoeopathic and
Unani medicines or used by the local people. An inventory of medicinal plant species used by
local tribal people was prepared from data collected through literature survey (Rehty et al.,
2010; Nimasow et al., 2012) Some of the medicinal plants of Dibang basin like Acorus calamus,
Adiantum capillus-veneris, Ageratum conyzoides, Artemisia nilagirica, Angiopteris evecta,
Bauhinia purpurea, Breonia chinensis, Calamus spp., Cannabis sativa, Cinnamomum spp.,
Curcuma spp., are quite common in the tropical and sub-tropical parts of Dibang basin.
Hedychium spicatum, Coptis teeta, Phyllanthus amarus, Rhus chinensis, Senna alata, Solanum
spp., Tamarindus indica and Zanthoxylum spp., are some other important medicinal plants of
the region used by local populace in their daily life. These plants are used internally for
treating stomachic diarrhea, dysentery, cough, cold, fever and asthma and externally for
rheumatism, skin diseases, cuts, boils and injuries. The list of some of the medicinally
important plants species used for medicinal purposes is given in Table 6.14.
Table 6.14: Locally used plants, plant parts for medicinal purposes
Name of Species Local Name Part used/ Disease
Abroma augusta Yadukh, Pishach Karpasa,
Ulatkambal
Leaf, root and stem, Cut and wounds, dysentery and
vomiting, leucorrhoea
Achyranthes bidentata Apamarga Plant is diuretic and astringent
Acmella paniculata Marsang, Cult Flower and fruits
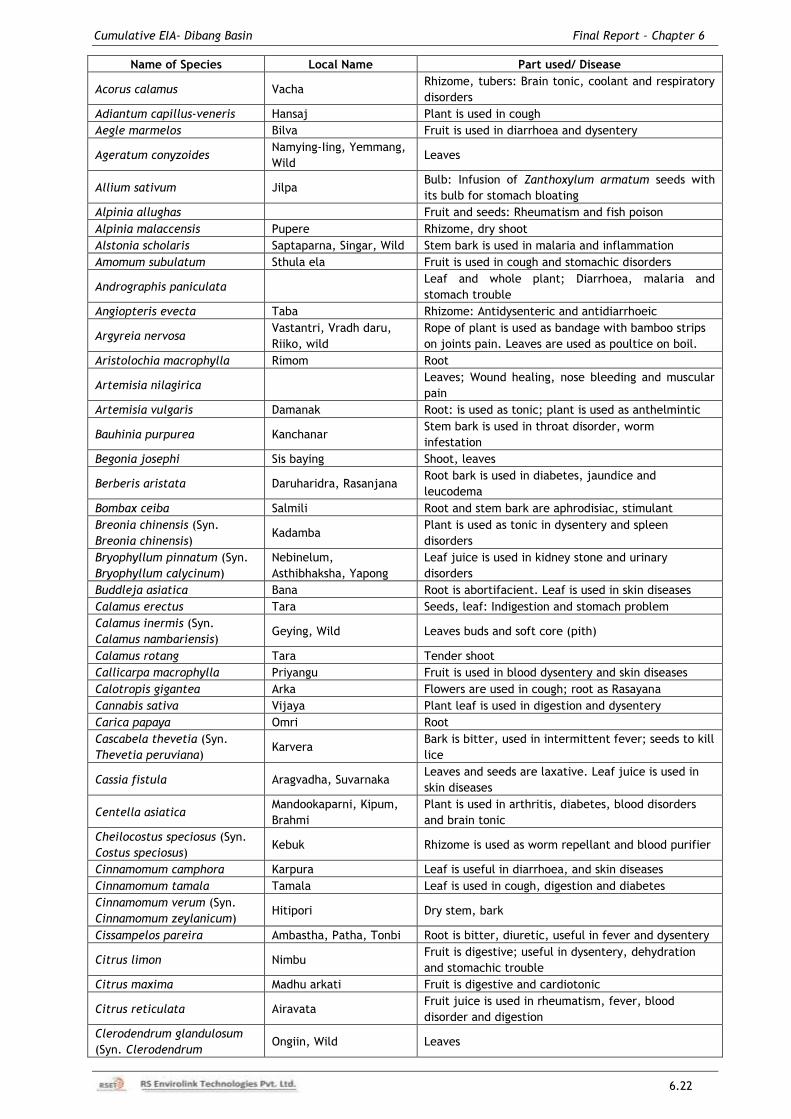
Cumulative EIA- Dibang Basin Final Report – Chapter 6
6.22
Name of Species Local Name Part used/ Disease
Acorus calamus Vacha Rhizome, tubers: Brain tonic, coolant and respiratory
disorders
Adiantum capillus-veneris Hansaj Plant is used in cough
Aegle marmelos Bilva Fruit is used in diarrhoea and dysentery
Ageratum conyzoides Namying-Iing, Yemmang,
Wild Leaves
Allium sativum Jilpa Bulb: Infusion of Zanthoxylum armatum seeds with
its bulb for stomach bloating
Alpinia allughas Fruit and seeds: Rheumatism and fish poison
Alpinia malaccensis Pupere Rhizome, dry shoot
Alstonia scholaris Saptaparna, Singar, Wild Stem bark is used in malaria and inflammation
Amomum subulatum Sthula ela Fruit is used in cough and stomachic disorders
Andrographis paniculata Leaf and whole plant; Diarrhoea, malaria and
stomach trouble
Angiopteris evecta Taba Rhizome: Antidysenteric and antidiarrhoeic
Argyreia nervosa Vastantri, Vradh daru,
Riiko, wild
Rope of plant is used as bandage with bamboo strips
on joints pain. Leaves are used as poultice on boil.
Aristolochia macrophylla Rimom Root
Artemisia nilagirica Leaves; Wound healing, nose bleeding and muscular
pain
Artemisia vulgaris Damanak Root: is used as tonic; plant is used as anthelmintic
Bauhinia purpurea Kanchanar Stem bark is used in throat disorder, worm
infestation
Begonia josephi Sis baying Shoot, leaves
Berberis aristata Daruharidra, Rasanjana Root bark is used in diabetes, jaundice and
leucodema
Bombax ceiba Salmili Root and stem bark are aphrodisiac, stimulant
Breonia chinensis (Syn.
Breonia chinensis) Kadamba
Plant is used as tonic in dysentery and spleen
disorders
Bryophyllum pinnatum (Syn.
Bryophyllum calycinum)
Nebinelum,
Asthibhaksha, Yapong
Leaf juice is used in kidney stone and urinary
disorders
Buddleja asiatica Bana Root is abortifacient. Leaf is used in skin diseases
Calamus erectus Tara Seeds, leaf: Indigestion and stomach problem
Calamus inermis (Syn.
Calamus nambariensis) Geying, Wild Leaves buds and soft core (pith)
Calamus rotang Tara Tender shoot
Callicarpa macrophylla Priyangu Fruit is used in blood dysentery and skin diseases
Calotropis gigantea Arka Flowers are used in cough; root as Rasayana
Cannabis sativa Vijaya Plant leaf is used in digestion and dysentery
Carica papaya Omri Root
Cascabela thevetia (Syn.
Thevetia peruviana) Karvera
Bark is bitter, used in intermittent fever; seeds to kill
lice
Cassia fistula Aragvadha, Suvarnaka Leaves and seeds are laxative. Leaf juice is used in
skin diseases
Centella asiatica Mandookaparni, Kipum,
Brahmi
Plant is used in arthritis, diabetes, blood disorders
and brain tonic
Cheilocostus speciosus (Syn.
Costus speciosus) Kebuk Rhizome is used as worm repellant and blood purifier
Cinnamomum camphora Karpura Leaf is useful in diarrhoea, and skin diseases
Cinnamomum tamala Tamala Leaf is used in cough, digestion and diabetes
Cinnamomum verum (Syn.
Cinnamomum zeylanicum) Hitipori Dry stem, bark
Cissampelos pareira Ambastha, Patha, Tonbi Root is bitter, diuretic, useful in fever and dysentery
Citrus limon Nimbu Fruit is digestive; useful in dysentery, dehydration
and stomachic trouble
Citrus maxima Madhu arkati Fruit is digestive and cardiotonic
Citrus reticulata Airavata Fruit juice is used in rheumatism, fever, blood
disorder and digestion
Clerodendrum glandulosum
(Syn. Clerodendrum Ongiin, Wild Leaves
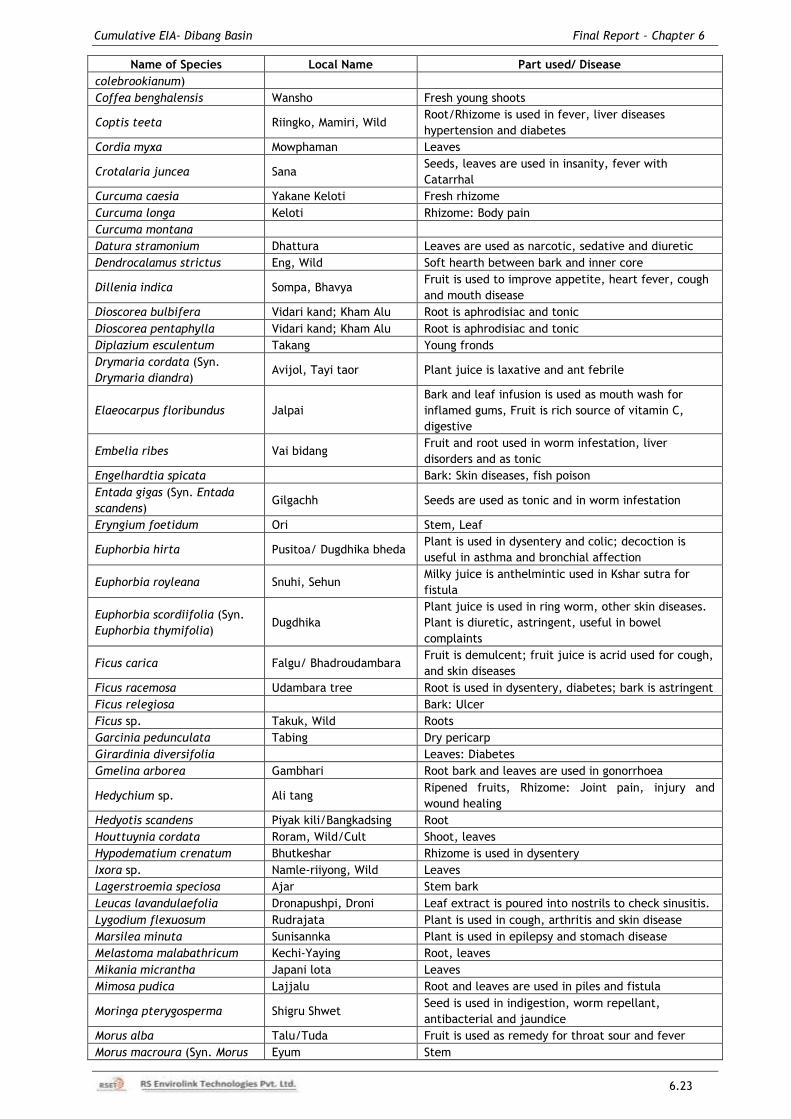
Cumulative EIA- Dibang Basin Final Report – Chapter 6
6.23
Name of Species Local Name Part used/ Disease
colebrookianum)
Coffea benghalensis Wansho Fresh young shoots
Coptis teeta Riingko, Mamiri, Wild Root/Rhizome is used in fever, liver diseases
hypertension and diabetes
Cordia myxa Mowphaman Leaves
Crotalaria juncea Sana Seeds, leaves are used in insanity, fever with
Catarrhal
Curcuma caesia Yakane Keloti Fresh rhizome
Curcuma longa Keloti Rhizome: Body pain
Curcuma montana
Datura stramonium Dhattura Leaves are used as narcotic, sedative and diuretic
Dendrocalamus strictus Eng, Wild Soft hearth between bark and inner core
Dillenia indica Sompa, Bhavya Fruit is used to improve appetite, heart fever, cough
and mouth disease
Dioscorea bulbifera Vidari kand; Kham Alu Root is aphrodisiac and tonic
Dioscorea pentaphylla Vidari kand; Kham Alu Root is aphrodisiac and tonic
Diplazium esculentum Takang Young fronds
Drymaria cordata (Syn.
Drymaria diandra) Avijol, Tayi taor Plant juice is laxative and ant febrile
Elaeocarpus floribundus Jalpai
Bark and leaf infusion is used as mouth wash for
inflamed gums, Fruit is rich source of vitamin C,
digestive
Embelia ribes Vai bidang Fruit and root used in worm infestation, liver
disorders and as tonic
Engelhardtia spicata Bark: Skin diseases, fish poison
Entada gigas (Syn. Entada
scandens) Gilgachh Seeds are used as tonic and in worm infestation
Eryngium foetidum Ori Stem, Leaf
Euphorbia hirta Pusitoa/ Dugdhika bheda Plant is used in dysentery and colic; decoction is
useful in asthma and bronchial affection
Euphorbia royleana Snuhi, Sehun Milky juice is anthelmintic used in Kshar sutra for
fistula
Euphorbia scordiifolia (Syn.
Euphorbia thymifolia) Dugdhika
Plant juice is used in ring worm, other skin diseases.
Plant is diuretic, astringent, useful in bowel
complaints
Ficus carica Falgu/ Bhadroudambara Fruit is demulcent; fruit juice is acrid used for cough,
and skin diseases
Ficus racemosa Udambara tree Root is used in dysentery, diabetes; bark is astringent
Ficus relegiosa Bark: Ulcer
Ficus sp. Takuk, Wild Roots
Garcinia pedunculata Tabing Dry pericarp
Girardinia diversifolia Leaves: Diabetes
Gmelina arborea Gambhari Root bark and leaves are used in gonorrhoea
Hedychium sp. Ali tang Ripened fruits, Rhizome: Joint pain, injury and
wound healing
Hedyotis scandens Piyak kili/Bangkadsing Root
Houttuynia cordata Roram, Wild/Cult Shoot, leaves
Hypodematium crenatum Bhutkeshar Rhizome is used in dysentery
Ixora sp. Namle-riiyong, Wild Leaves
Lagerstroemia speciosa Ajar Stem bark
Leucas lavandulaefolia Dronapushpi, Droni Leaf extract is poured into nostrils to check sinusitis.
Lygodium flexuosum Rudrajata Plant is used in cough, arthritis and skin disease
Marsilea minuta Sunisannka Plant is used in epilepsy and stomach disease
Melastoma malabathricum Kechi-Yaying Root, leaves
Mikania micrantha Japani lota Leaves
Mimosa pudica Lajjalu Root and leaves are used in piles and fistula
Moringa pterygosperma Shigru Shwet Seed is used in indigestion, worm repellant,
antibacterial and jaundice
Morus alba Talu/Tuda Fruit is used as remedy for throat sour and fever
Morus macroura (Syn. Morus Eyum Stem
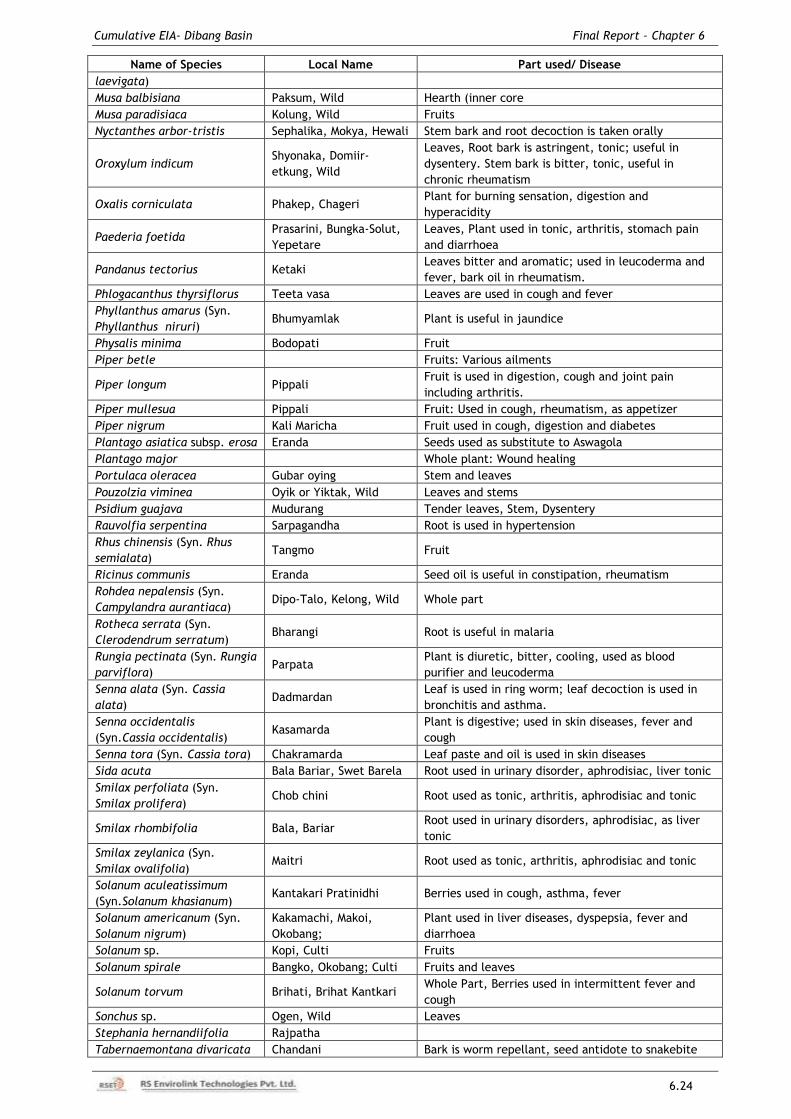
Cumulative EIA- Dibang Basin Final Report – Chapter 6
6.24
Name of Species Local Name Part used/ Disease
laevigata)
Musa balbisiana Paksum, Wild Hearth (inner core
Musa paradisiaca Kolung, Wild Fruits
Nyctanthes arbor-tristis Sephalika, Mokya, Hewali Stem bark and root decoction is taken orally
Oroxylum indicum Shyonaka, Domiir-
etkung, Wild
Leaves, Root bark is astringent, tonic; useful in
dysentery. Stem bark is bitter, tonic, useful in
chronic rheumatism
Oxalis corniculata Phakep, Chageri Plant for burning sensation, digestion and
hyperacidity
Paederia foetida Prasarini, Bungka-Solut,
Yepetare
Leaves, Plant used in tonic, arthritis, stomach pain
and diarrhoea
Pandanus tectorius Ketaki Leaves bitter and aromatic; used in leucoderma and
fever, bark oil in rheumatism.
Phlogacanthus thyrsiflorus Teeta vasa Leaves are used in cough and fever
Phyllanthus amarus (Syn.
Phyllanthus niruri) Bhumyamlak Plant is useful in jaundice
Physalis minima Bodopati Fruit
Piper betle Fruits: Various ailments
Piper longum Pippali Fruit is used in digestion, cough and joint pain
including arthritis.
Piper mullesua Pippali Fruit: Used in cough, rheumatism, as appetizer
Piper nigrum Kali Maricha Fruit used in cough, digestion and diabetes
Plantago asiatica subsp. erosa Eranda Seeds used as substitute to Aswagola
Plantago major Whole plant: Wound healing
Portulaca oleracea Gubar oying Stem and leaves
Pouzolzia viminea Oyik or Yiktak, Wild Leaves and stems
Psidium guajava Mudurang Tender leaves, Stem, Dysentery
Rauvolfia serpentina Sarpagandha Root is used in hypertension
Rhus chinensis (Syn. Rhus
semialata) Tangmo Fruit
Ricinus communis Eranda Seed oil is useful in constipation, rheumatism
Rohdea nepalensis (Syn.
Campylandra aurantiaca) Dipo-Talo, Kelong, Wild Whole part
Rotheca serrata (Syn.
Clerodendrum serratum) Bharangi Root is useful in malaria
Rungia pectinata (Syn. Rungia
parviflora) Parpata
Plant is diuretic, bitter, cooling, used as blood
purifier and leucoderma
Senna alata (Syn. Cassia
alata) Dadmardan
Leaf is used in ring worm; leaf decoction is used in
bronchitis and asthma.
Senna occidentalis
(Syn.Cassia occidentalis) Kasamarda
Plant is digestive; used in skin diseases, fever and
cough
Senna tora (Syn. Cassia tora) Chakramarda Leaf paste and oil is used in skin diseases
Sida acuta Bala Bariar, Swet Barela Root used in urinary disorder, aphrodisiac, liver tonic
Smilax perfoliata (Syn.
Smilax prolifera) Chob chini Root used as tonic, arthritis, aphrodisiac and tonic
Smilax rhombifolia Bala, Bariar Root used in urinary disorders, aphrodisiac, as liver
tonic
Smilax zeylanica (Syn.
Smilax ovalifolia) Maitri Root used as tonic, arthritis, aphrodisiac and tonic
Solanum aculeatissimum
(Syn.Solanum khasianum) Kantakari Pratinidhi Berries used in cough, asthma, fever
Solanum americanum (Syn.
Solanum nigrum)
Kakamachi, Makoi,
Okobang;
Plant used in liver diseases, dyspepsia, fever and
diarrhoea
Solanum sp. Kopi, Culti Fruits
Solanum spirale Bangko, Okobang; Culti Fruits and leaves
Solanum torvum Brihati, Brihat Kantkari Whole Part, Berries used in intermittent fever and
cough
Sonchus sp. Ogen, Wild Leaves
Stephania hernandiifolia Rajpatha
Tabernaemontana divaricata Chandani Bark is worm repellant, seed antidote to snakebite
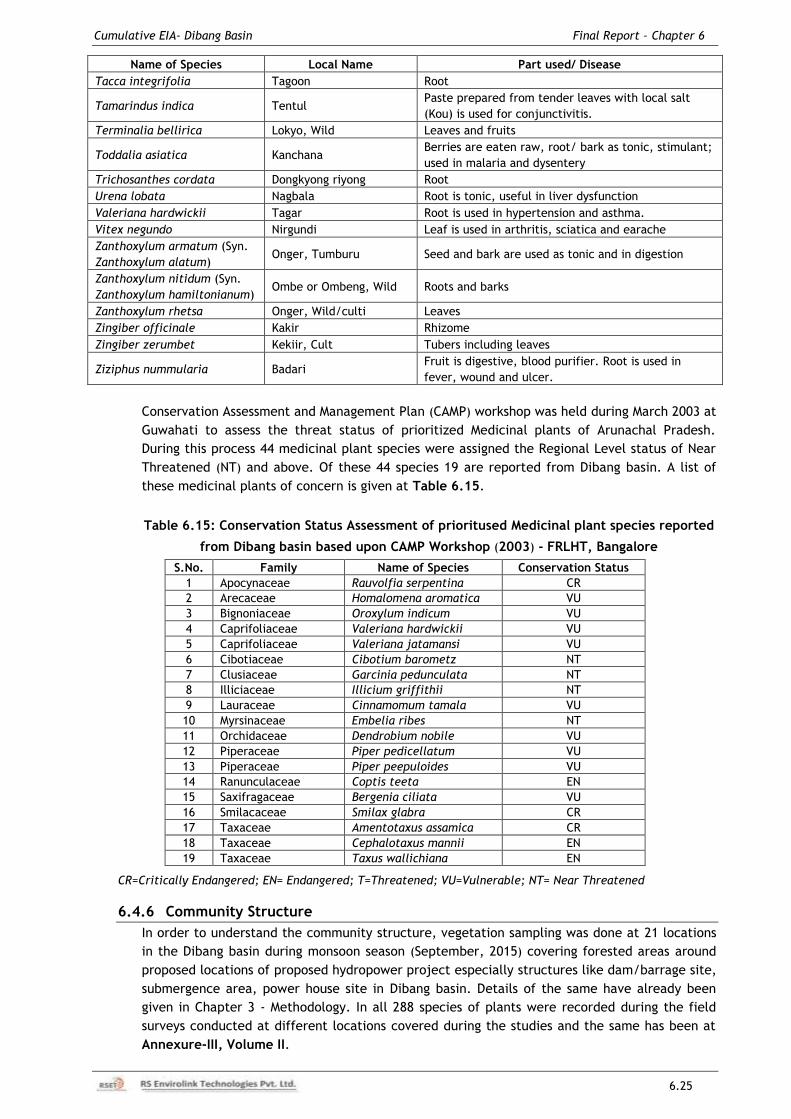
Cumulative EIA- Dibang Basin Final Report – Chapter 6
6.25
Name of Species Local Name Part used/ Disease
Tacca integrifolia Tagoon Root
Tamarindus indica Tentul Paste prepared from tender leaves with local salt
(Kou) is used for conjunctivitis.
Terminalia bellirica Lokyo, Wild Leaves and fruits
Toddalia asiatica Kanchana Berries are eaten raw, root/ bark as tonic, stimulant;
used in malaria and dysentery
Trichosanthes cordata Dongkyong riyong Root
Urena lobata Nagbala Root is tonic, useful in liver dysfunction
Valeriana hardwickii Tagar Root is used in hypertension and asthma.
Vitex negundo Nirgundi Leaf is used in arthritis, sciatica and earache
Zanthoxylum armatum (Syn.
Zanthoxylum alatum) Onger, Tumburu Seed and bark are used as tonic and in digestion
Zanthoxylum nitidum (Syn.
Zanthoxylum hamiltonianum) Ombe or Ombeng, Wild Roots and barks
Zanthoxylum rhetsa Onger, Wild/culti Leaves
Zingiber officinale Kakir Rhizome
Zingiber zerumbet Kekiir, Cult Tubers including leaves
Ziziphus nummularia Badari Fruit is digestive, blood purifier. Root is used in
fever, wound and ulcer.
Conservation Assessment and Management Plan (CAMP) workshop was held during March 2003 at
Guwahati to assess the threat status of prioritized Medicinal plants of Arunachal Pradesh.
During this process 44 medicinal plant species were assigned the Regional Level status of Near
Threatened (NT) and above. Of these 44 species 19 are reported from Dibang basin. A list of
these medicinal plants of concern is given at Table 6.15.
Table 6.15: Conservation Status Assessment of prioritused Medicinal plant species reported
from Dibang basin based upon CAMP Workshop (2003) - FRLHT, Bangalore
S.No. Family Name of Species Conservation Status
1 Apocynaceae Rauvolfia serpentina CR
2 Arecaceae Homalomena aromatica VU
3 Bignoniaceae Oroxylum indicum VU
4 Caprifoliaceae Valeriana hardwickii VU
5 Caprifoliaceae Valeriana jatamansi VU
6 Cibotiaceae Cibotium barometz NT
7 Clusiaceae Garcinia pedunculata NT
8 Illiciaceae Illicium griffithii NT
9 Lauraceae Cinnamomum tamala VU
10 Myrsinaceae Embelia ribes NT
11 Orchidaceae Dendrobium nobile VU
12 Piperaceae Piper pedicellatum VU
13 Piperaceae Piper peepuloides VU
14 Ranunculaceae Coptis teeta EN
15 Saxifragaceae Bergenia ciliata VU
16 Smilacaceae Smilax glabra CR
17 Taxaceae Amentotaxus assamica CR
18 Taxaceae Cephalotaxus mannii EN
19 Taxaceae Taxus wallichiana EN
CR=Critically Endangered; EN= Endangered; T=Threatened; VU=Vulnerable; NT= Near Threatened
6.4.6 Community Structure
In order to understand the community structure, vegetation sampling was done at 21 locations
in the Dibang basin during monsoon season (September, 2015) covering forested areas around
proposed locations of proposed hydropower project especially structures like dam/barrage site,
submergence area, power house site in Dibang basin. Details of the same have already been
given in Chapter 3 - Methodology. In all 288 species of plants were recorded during the field
surveys conducted at different locations covered during the studies and the same has been at
Annexure-III, Volume II.
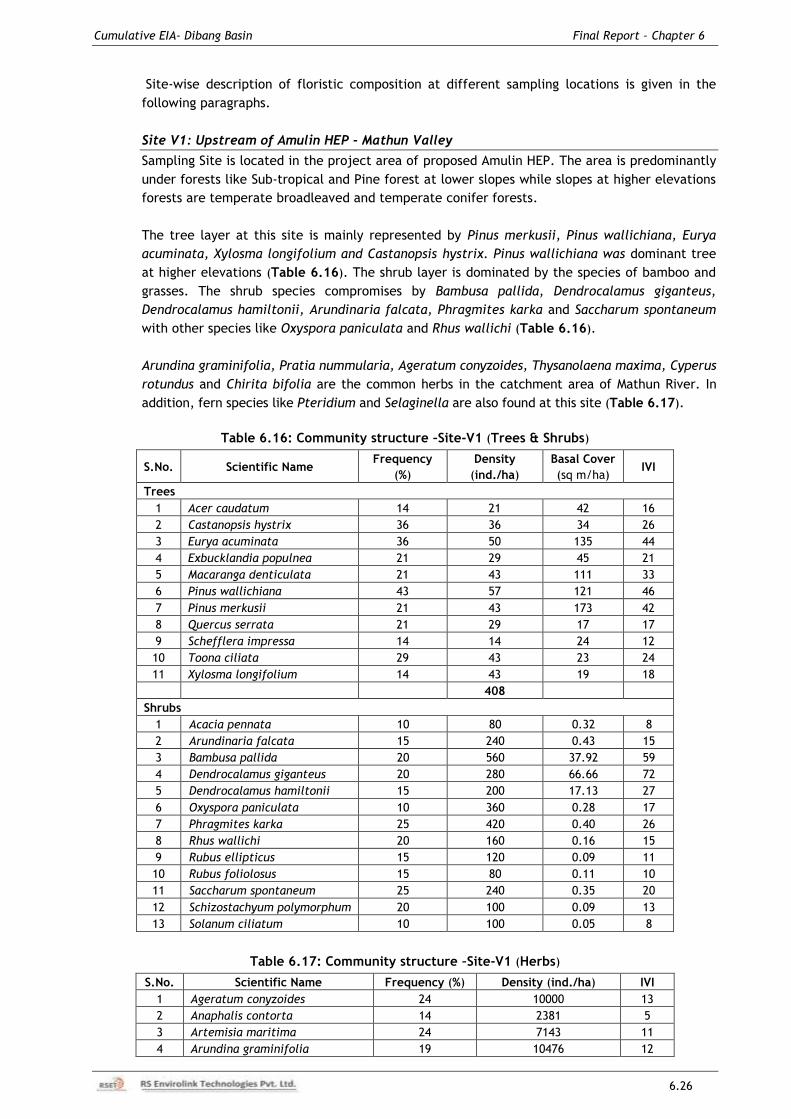
Cumulative EIA- Dibang Basin Final Report – Chapter 6
6.26
Site-wise description of floristic composition at different sampling locations is given in the
following paragraphs.
Site V1: Upstream of Amulin HEP - Mathun Valley
Sampling Site is located in the project area of proposed Amulin HEP. The area is predominantly
under forests like Sub-tropical and Pine forest at lower slopes while slopes at higher elevations
forests are temperate broadleaved and temperate conifer forests.
The tree layer at this site is mainly represented by Pinus merkusii, Pinus wallichiana, Eurya
acuminata, Xylosma longifolium and Castanopsis hystrix. Pinus wallichiana was dominant tree
at higher elevations (Table 6.16). The shrub layer is dominated by the species of bamboo and
grasses. The shrub species compromises by Bambusa pallida, Dendrocalamus giganteus,
Dendrocalamus hamiltonii, Arundinaria falcata, Phragmites karka and Saccharum spontaneum
with other species like Oxyspora paniculata and Rhus wallichi (Table 6.16).
Arundina graminifolia, Pratia nummularia, Ageratum conyzoides, Thysanolaena maxima, Cyperus
rotundus and Chirita bifolia are the common herbs in the catchment area of Mathun River. In
addition, fern species like Pteridium and Selaginella are also found at this site (Table 6.17).
Table 6.16: Community structure –Site-V1 (Trees & Shrubs)
S.No. Scientific Name Frequency
(%)
Density
(ind./ha)
Basal Cover
(sq m/ha) IVI
Trees
1 Acer caudatum 14 21 42 16
2 Castanopsis hystrix 36 36 34 26
3 Eurya acuminata 36 50 135 44
4 Exbucklandia populnea 21 29 45 21
5 Macaranga denticulata 21 43 111 33
6 Pinus wallichiana 43 57 121 46
7 Pinus merkusii 21 43 173 42
8 Quercus serrata 21 29 17 17
9 Schefflera impressa 14 14 24 12
10 Toona ciliata 29 43 23 24
11 Xylosma longifolium 14 43 19 18
408
Shrubs
1 Acacia pennata 10 80 0.32 8
2 Arundinaria falcata 15 240 0.43 15
3 Bambusa pallida 20 560 37.92 59
4 Dendrocalamus giganteus 20 280 66.66 72
5 Dendrocalamus hamiltonii 15 200 17.13 27
6 Oxyspora paniculata 10 360 0.28 17
7 Phragmites karka 25 420 0.40 26
8 Rhus wallichi 20 160 0.16 15
9 Rubus ellipticus 15 120 0.09 11
10 Rubus foliolosus 15 80 0.11 10
11 Saccharum spontaneum 25 240 0.35 20
12 Schizostachyum polymorphum 20 100 0.09 13
13 Solanum ciliatum 10 100 0.05 8
Table 6.17: Community structure –Site-V1 (Herbs)
S.No. Scientific Name Frequency (%) Density (ind./ha) IVI
1 Ageratum conyzoides 24 10000 13
2 Anaphalis contorta 14 2381 5
3 Artemisia maritima 24 7143 11
4 Arundina graminifolia 19 10476 12
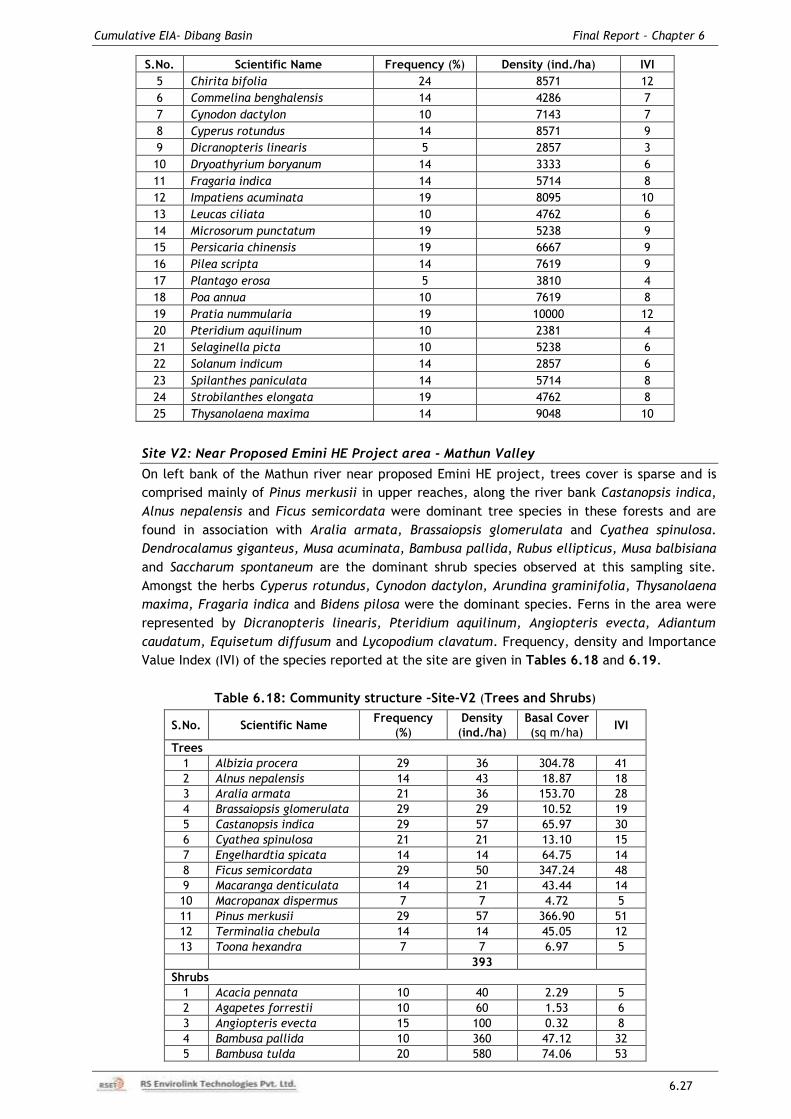
Cumulative EIA- Dibang Basin Final Report – Chapter 6
6.27
S.No. Scientific Name Frequency (%) Density (ind./ha) IVI
5 Chirita bifolia 24 8571 12
6 Commelina benghalensis 14 4286 7
7 Cynodon dactylon 10 7143 7
8 Cyperus rotundus 14 8571 9
9 Dicranopteris linearis 5 2857 3
10 Dryoathyrium boryanum 14 3333 6
11 Fragaria indica 14 5714 8
12 Impatiens acuminata 19 8095 10
13 Leucas ciliata 10 4762 6
14 Microsorum punctatum 19 5238 9
15 Persicaria chinensis 19 6667 9
16 Pilea scripta 14 7619 9
17 Plantago erosa 5 3810 4
18 Poa annua 10 7619 8
19 Pratia nummularia 19 10000 12
20 Pteridium aquilinum 10 2381 4
21 Selaginella picta 10 5238 6
22 Solanum indicum 14 2857 6
23 Spilanthes paniculata 14 5714 8
24 Strobilanthes elongata 19 4762 8
25 Thysanolaena maxima 14 9048 10
Site V2: Near Proposed Emini HE Project area - Mathun Valley
On left bank of the Mathun river near proposed Emini HE project, trees cover is sparse and is
comprised mainly of Pinus merkusii in upper reaches, along the river bank Castanopsis indica,
Alnus nepalensis and Ficus semicordata were dominant tree species in these forests and are
found in association with Aralia armata, Brassaiopsis glomerulata and Cyathea spinulosa.
Dendrocalamus giganteus, Musa acuminata, Bambusa pallida, Rubus ellipticus, Musa balbisiana
and Saccharum spontaneum are the dominant shrub species observed at this sampling site.
Amongst the herbs Cyperus rotundus, Cynodon dactylon, Arundina graminifolia, Thysanolaena
maxima, Fragaria indica and Bidens pilosa were the dominant species. Ferns in the area were
represented by Dicranopteris linearis, Pteridium aquilinum, Angiopteris evecta, Adiantum
caudatum, Equisetum diffusum and Lycopodium clavatum. Frequency, density and Importance
Value Index (IVI) of the species reported at the site are given in Tables 6.18 and 6.19.
Table 6.18: Community structure –Site-V2 (Trees and Shrubs)
S.No. Scientific Name Frequency
(%)
Density
(ind./ha)
Basal Cover
(sq m/ha) IVI
Trees
1 Albizia procera 29 36 304.78 41
2 Alnus nepalensis 14 43 18.87 18
3 Aralia armata 21 36 153.70 28
4 Brassaiopsis glomerulata 29 29 10.52 19
5 Castanopsis indica 29 57 65.97 30
6 Cyathea spinulosa 21 21 13.10 15
7 Engelhardtia spicata 14 14 64.75 14
8 Ficus semicordata 29 50 347.24 48
9 Macaranga denticulata 14 21 43.44 14
10 Macropanax dispermus 7 7 4.72 5
11 Pinus merkusii 29 57 366.90 51
12 Terminalia chebula 14 14 45.05 12
13 Toona hexandra 7 7 6.97 5
393
Shrubs
1 Acacia pennata 10 40 2.29 5
2 Agapetes forrestii 10 60 1.53 6
3 Angiopteris evecta 15 100 0.32 8
4 Bambusa pallida 10 360 47.12 32
5 Bambusa tulda 20 580 74.06 53
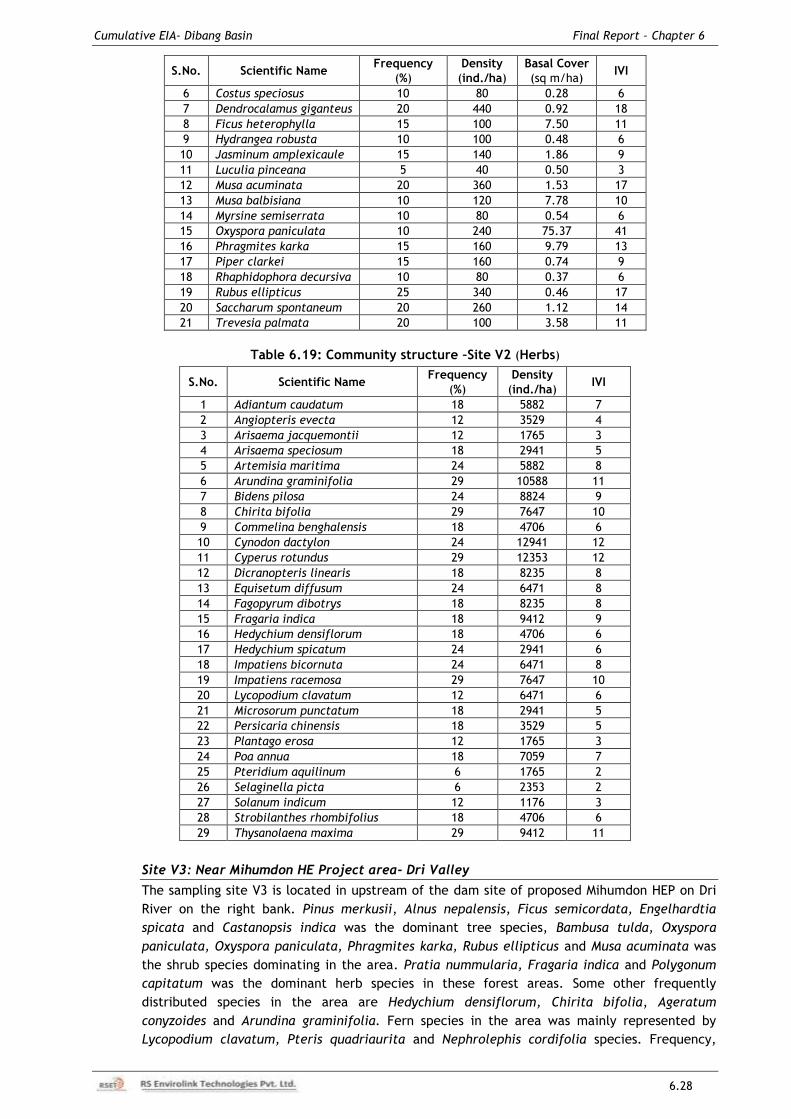
Cumulative EIA- Dibang Basin Final Report – Chapter 6
6.28
S.No. Scientific Name Frequency
(%)
Density
(ind./ha)
Basal Cover
(sq m/ha) IVI
6 Costus speciosus 10 80 0.28 6
7 Dendrocalamus giganteus 20 440 0.92 18
8 Ficus heterophylla 15 100 7.50 11
9 Hydrangea robusta 10 100 0.48 6
10 Jasminum amplexicaule 15 140 1.86 9
11 Luculia pinceana 5 40 0.50 3
12 Musa acuminata 20 360 1.53 17
13 Musa balbisiana 10 120 7.78 10
14 Myrsine semiserrata 10 80 0.54 6
15 Oxyspora paniculata 10 240 75.37 41
16 Phragmites karka 15 160 9.79 13
17 Piper clarkei 15 160 0.74 9
18 Rhaphidophora decursiva 10 80 0.37 6
19 Rubus ellipticus 25 340 0.46 17
20 Saccharum spontaneum 20 260 1.12 14
21 Trevesia palmata 20 100 3.58 11
Table 6.19: Community structure –Site V2 (Herbs)
S.No. Scientific Name Frequency
(%)
Density
(ind./ha) IVI
1 Adiantum caudatum 18 5882 7
2 Angiopteris evecta 12 3529 4
3 Arisaema jacquemontii 12 1765 3
4 Arisaema speciosum 18 2941 5
5 Artemisia maritima 24 5882 8
6 Arundina graminifolia 29 10588 11
7 Bidens pilosa 24 8824 9
8 Chirita bifolia 29 7647 10
9 Commelina benghalensis 18 4706 6
10 Cynodon dactylon 24 12941 12
11 Cyperus rotundus 29 12353 12
12 Dicranopteris linearis 18 8235 8
13 Equisetum diffusum 24 6471 8
14 Fagopyrum dibotrys 18 8235 8
15 Fragaria indica 18 9412 9
16 Hedychium densiflorum 18 4706 6
17 Hedychium spicatum 24 2941 6
18 Impatiens bicornuta 24 6471 8
19 Impatiens racemosa 29 7647 10
20 Lycopodium clavatum 12 6471 6
21 Microsorum punctatum 18 2941 5
22 Persicaria chinensis 18 3529 5
23 Plantago erosa 12 1765 3
24 Poa annua 18 7059 7
25 Pteridium aquilinum 6 1765 2
26 Selaginella picta 6 2353 2
27 Solanum indicum 12 1176 3
28 Strobilanthes rhombifolius 18 4706 6
29 Thysanolaena maxima 29 9412 11
Site V3: Near Mihumdon HE Project area- Dri Valley
The sampling site V3 is located in upstream of the dam site of proposed Mihumdon HEP on Dri
River on the right bank. Pinus merkusii, Alnus nepalensis, Ficus semicordata, Engelhardtia
spicata and Castanopsis indica was the dominant tree species, Bambusa tulda, Oxyspora
paniculata, Oxyspora paniculata, Phragmites karka, Rubus ellipticus and Musa acuminata was
the shrub species dominating in the area. Pratia nummularia, Fragaria indica and Polygonum
capitatum was the dominant herb species in these forest areas. Some other frequently
distributed species in the area are Hedychium densiflorum, Chirita bifolia, Ageratum
conyzoides and Arundina graminifolia. Fern species in the area was mainly represented by
Lycopodium clavatum, Pteris quadriaurita and Nephrolephis cordifolia species. Frequency,
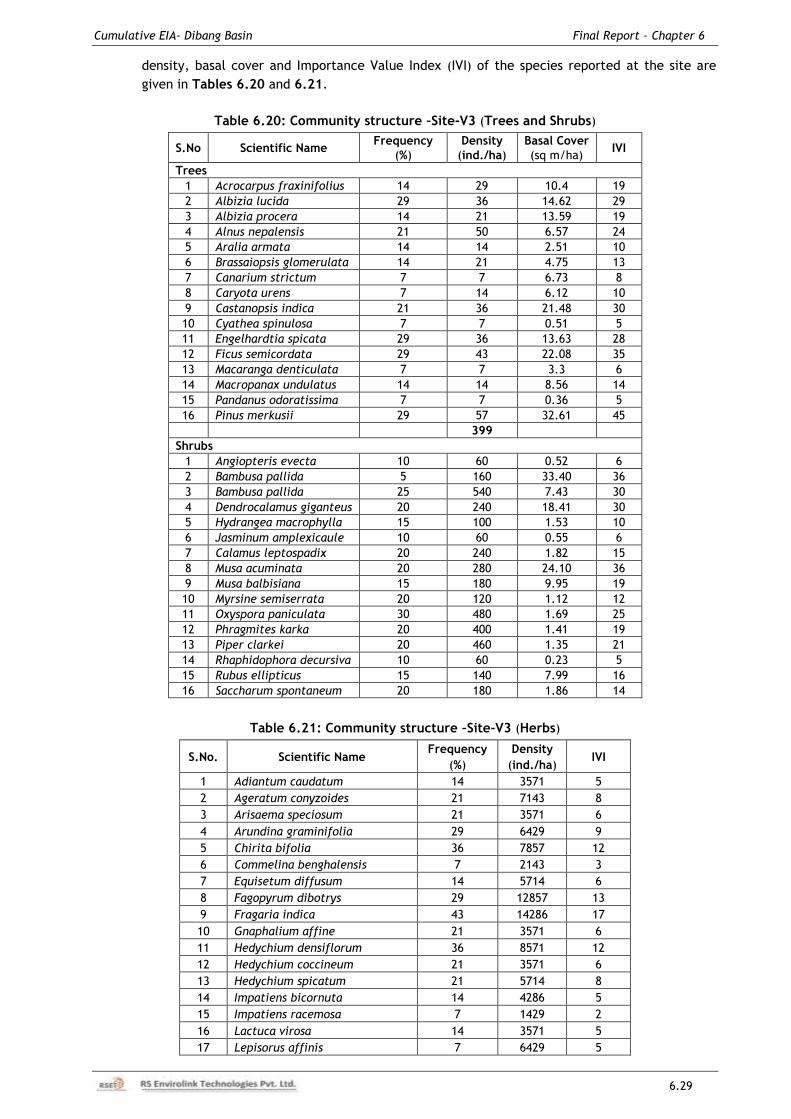
Cumulative EIA- Dibang Basin Final Report – Chapter 6
6.29
density, basal cover and Importance Value Index (IVI) of the species reported at the site are
given in Tables 6.20 and 6.21.
Table 6.20: Community structure –Site-V3 (Trees and Shrubs)
S.No Scientific Name Frequency
(%)
Density
(ind./ha)
Basal Cover
(sq m/ha) IVI
Trees
1 Acrocarpus fraxinifolius 14 29 10.4 19
2 Albizia lucida 29 36 14.62 29
3 Albizia procera 14 21 13.59 19
4 Alnus nepalensis 21 50 6.57 24
5 Aralia armata 14 14 2.51 10
6 Brassaiopsis glomerulata 14 21 4.75 13
7 Canarium strictum 7 7 6.73 8
8 Caryota urens 7 14 6.12 10
9 Castanopsis indica 21 36 21.48 30
10 Cyathea spinulosa 7 7 0.51 5
11 Engelhardtia spicata 29 36 13.63 28
12 Ficus semicordata 29 43 22.08 35
13 Macaranga denticulata 7 7 3.3 6
14 Macropanax undulatus 14 14 8.56 14
15 Pandanus odoratissima 7 7 0.36 5
16 Pinus merkusii 29 57 32.61 45
399
Shrubs
1 Angiopteris evecta 10 60 0.52 6
2 Bambusa pallida 5 160 33.40 36
3 Bambusa pallida 25 540 7.43 30
4 Dendrocalamus giganteus 20 240 18.41 30
5 Hydrangea macrophylla 15 100 1.53 10
6 Jasminum amplexicaule 10 60 0.55 6
7 Calamus leptospadix 20 240 1.82 15
8 Musa acuminata 20 280 24.10 36
9 Musa balbisiana 15 180 9.95 19
10 Myrsine semiserrata 20 120 1.12 12
11 Oxyspora paniculata 30 480 1.69 25
12 Phragmites karka 20 400 1.41 19
13 Piper clarkei 20 460 1.35 21
14 Rhaphidophora decursiva 10 60 0.23 5
15 Rubus ellipticus 15 140 7.99 16
16 Saccharum spontaneum 20 180 1.86 14
Table 6.21: Community structure –Site-V3 (Herbs)
S.No. Scientific Name Frequency
(%)
Density
(ind./ha) IVI
1 Adiantum caudatum 14 3571 5
2 Ageratum conyzoides 21 7143 8
3 Arisaema speciosum 21 3571 6
4 Arundina graminifolia 29 6429 9
5 Chirita bifolia 36 7857 12
6 Commelina benghalensis 7 2143 3
7 Equisetum diffusum 14 5714 6
8 Fagopyrum dibotrys 29 12857 13
9 Fragaria indica 43 14286 17
10 Gnaphalium affine 21 3571 6
11 Hedychium densiflorum 36 8571 12
12 Hedychium coccineum 21 3571 6
13 Hedychium spicatum 21 5714 8
14 Impatiens bicornuta 14 4286 5
15 Impatiens racemosa 7 1429 2
16 Lactuca virosa 14 3571 5
17 Lepisorus affinis 7 6429 5
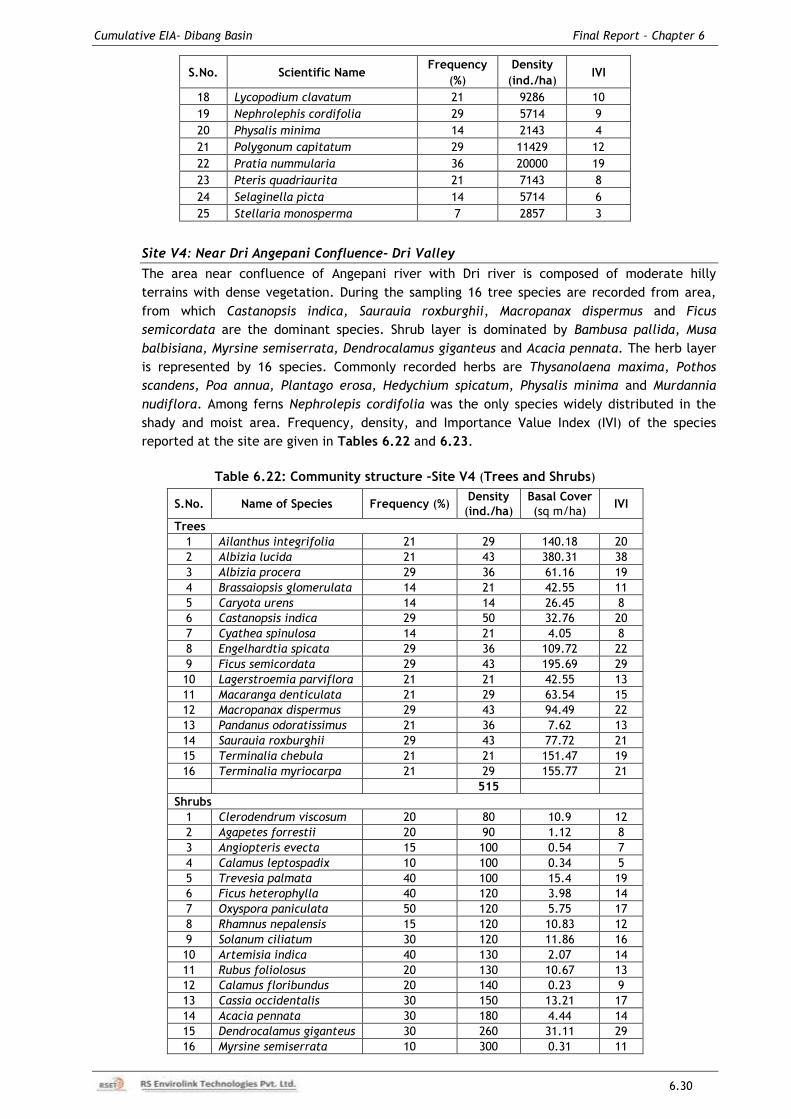
Cumulative EIA- Dibang Basin Final Report – Chapter 6
6.30
S.No. Scientific Name Frequency
(%)
Density
(ind./ha) IVI
18 Lycopodium clavatum 21 9286 10
19 Nephrolephis cordifolia 29 5714 9
20 Physalis minima 14 2143 4
21 Polygonum capitatum 29 11429 12
22 Pratia nummularia 36 20000 19
23 Pteris quadriaurita 21 7143 8
24 Selaginella picta 14 5714 6
25 Stellaria monosperma 7 2857 3
Site V4: Near Dri Angepani Confluence- Dri Valley
The area near confluence of Angepani river with Dri river is composed of moderate hilly
terrains with dense vegetation. During the sampling 16 tree species are recorded from area,
from which Castanopsis indica, Saurauia roxburghii, Macropanax dispermus and Ficus
semicordata are the dominant species. Shrub layer is dominated by Bambusa pallida, Musa
balbisiana, Myrsine semiserrata, Dendrocalamus giganteus and Acacia pennata. The herb layer
is represented by 16 species. Commonly recorded herbs are Thysanolaena maxima, Pothos
scandens, Poa annua, Plantago erosa, Hedychium spicatum, Physalis minima and Murdannia
nudiflora. Among ferns Nephrolepis cordifolia was the only species widely distributed in the
shady and moist area. Frequency, density, and Importance Value Index (IVI) of the species
reported at the site are given in Tables 6.22 and 6.23.
Table 6.22: Community structure –Site V4 (Trees and Shrubs)
S.No. Name of Species Frequency (%) Density
(ind./ha)
Basal Cover
(sq m/ha) IVI
Trees
1 Ailanthus integrifolia 21 29 140.18 20
2 Albizia lucida 21 43 380.31 38
3 Albizia procera 29 36 61.16 19
4 Brassaiopsis glomerulata 14 21 42.55 11
5 Caryota urens 14 14 26.45 8
6 Castanopsis indica 29 50 32.76 20
7 Cyathea spinulosa 14 21 4.05 8
8 Engelhardtia spicata 29 36 109.72 22
9 Ficus semicordata 29 43 195.69 29
10 Lagerstroemia parviflora 21 21 42.55 13
11 Macaranga denticulata 21 29 63.54 15
12 Macropanax dispermus 29 43 94.49 22
13 Pandanus odoratissimus 21 36 7.62 13
14 Saurauia roxburghii 29 43 77.72 21
15 Terminalia chebula 21 21 151.47 19
16 Terminalia myriocarpa 21 29 155.77 21
515
Shrubs
1 Clerodendrum viscosum 20 80 10.9 12
2 Agapetes forrestii 20 90 1.12 8
3 Angiopteris evecta 15 100 0.54 7
4 Calamus leptospadix 10 100 0.34 5
5 Trevesia palmata 40 100 15.4 19
6 Ficus heterophylla 40 120 3.98 14
7 Oxyspora paniculata 50 120 5.75 17
8 Rhamnus nepalensis 15 120 10.83 12
9 Solanum ciliatum 30 120 11.86 16
10 Artemisia indica 40 130 2.07 14
11 Rubus foliolosus 20 130 10.67 13
12 Calamus floribundus 20 140 0.23 9
13 Cassia occidentalis 30 150 13.21 17
14 Acacia pennata 30 180 4.44 14
15 Dendrocalamus giganteus 30 260 31.11 29
16 Myrsine semiserrata 10 300 0.31 11
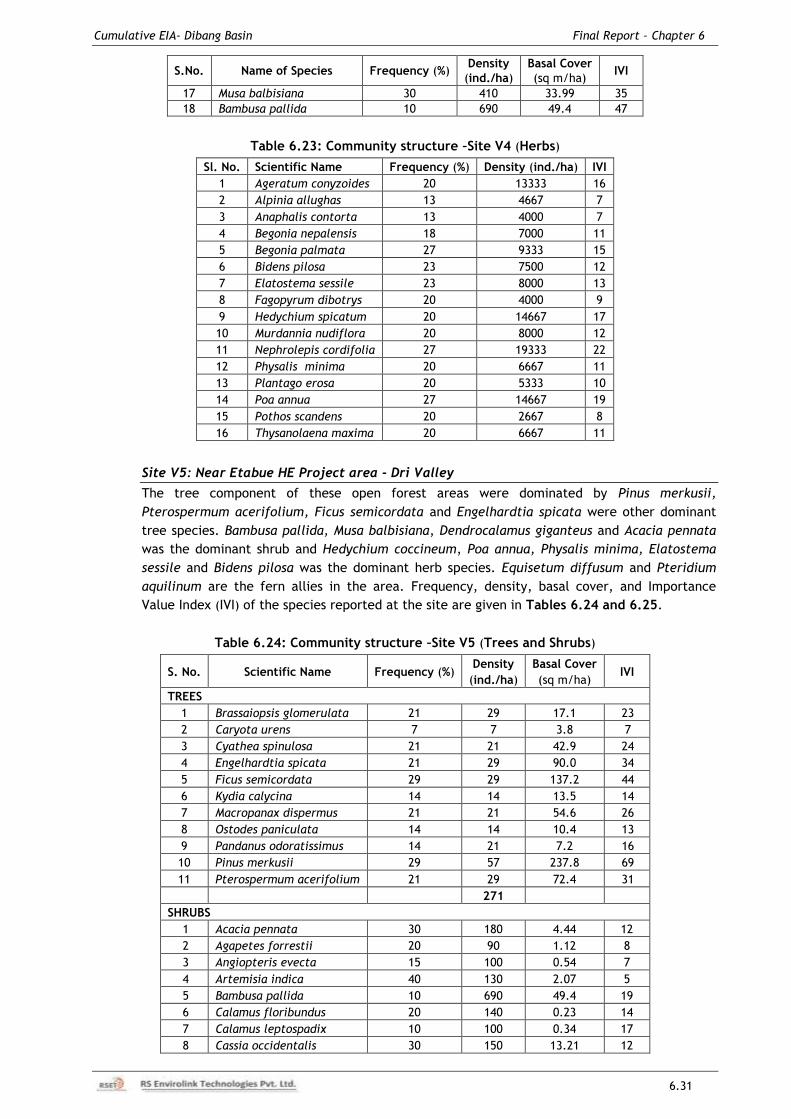
Cumulative EIA- Dibang Basin Final Report – Chapter 6
6.31
S.No. Name of Species Frequency (%) Density
(ind./ha)
Basal Cover
(sq m/ha) IVI
17 Musa balbisiana 30 410 33.99 35
18 Bambusa pallida 10 690 49.4 47
Table 6.23: Community structure –Site V4 (Herbs)
Sl. No. Scientific Name Frequency (%) Density (ind./ha) IVI
1 Ageratum conyzoides 20 13333 16
2 Alpinia allughas 13 4667 7
3 Anaphalis contorta 13 4000 7
4 Begonia nepalensis 18 7000 11
5 Begonia palmata 27 9333 15
6 Bidens pilosa 23 7500 12
7 Elatostema sessile 23 8000 13
8 Fagopyrum dibotrys 20 4000 9
9 Hedychium spicatum 20 14667 17
10 Murdannia nudiflora 20 8000 12
11 Nephrolepis cordifolia 27 19333 22
12 Physalis minima 20 6667 11
13 Plantago erosa 20 5333 10
14 Poa annua 27 14667 19
15 Pothos scandens 20 2667 8
16 Thysanolaena maxima 20 6667 11
Site V5: Near Etabue HE Project area - Dri Valley
The tree component of these open forest areas were dominated by Pinus merkusii,
Pterospermum acerifolium, Ficus semicordata and Engelhardtia spicata were other dominant
tree species. Bambusa pallida, Musa balbisiana, Dendrocalamus giganteus and Acacia pennata
was the dominant shrub and Hedychium coccineum, Poa annua, Physalis minima, Elatostema
sessile and Bidens pilosa was the dominant herb species. Equisetum diffusum and Pteridium
aquilinum are the fern allies in the area. Frequency, density, basal cover, and Importance
Value Index (IVI) of the species reported at the site are given in Tables 6.24 and 6.25.
Table 6.24: Community structure –Site V5 (Trees and Shrubs)
S. No. Scientific Name Frequency (%) Density
(ind./ha)
Basal Cover
(sq m/ha) IVI
TREES
1 Brassaiopsis glomerulata 21 29 17.1 23
2 Caryota urens 7 7 3.8 7
3 Cyathea spinulosa 21 21 42.9 24
4 Engelhardtia spicata 21 29 90.0 34
5 Ficus semicordata 29 29 137.2 44
6 Kydia calycina 14 14 13.5 14
7 Macropanax dispermus 21 21 54.6 26
8 Ostodes paniculata 14 14 10.4 13
9 Pandanus odoratissimus 14 21 7.2 16
10 Pinus merkusii 29 57 237.8 69
11 Pterospermum acerifolium 21 29 72.4 31
271
SHRUBS
1 Acacia pennata 30 180 4.44 12
2 Agapetes forrestii 20 90 1.12 8
3 Angiopteris evecta 15 100 0.54 7
4 Artemisia indica 40 130 2.07 5
5 Bambusa pallida 10 690 49.4 19
6 Calamus floribundus 20 140 0.23 14
7 Calamus leptospadix 10 100 0.34 17
8 Cassia occidentalis 30 150 13.21 12
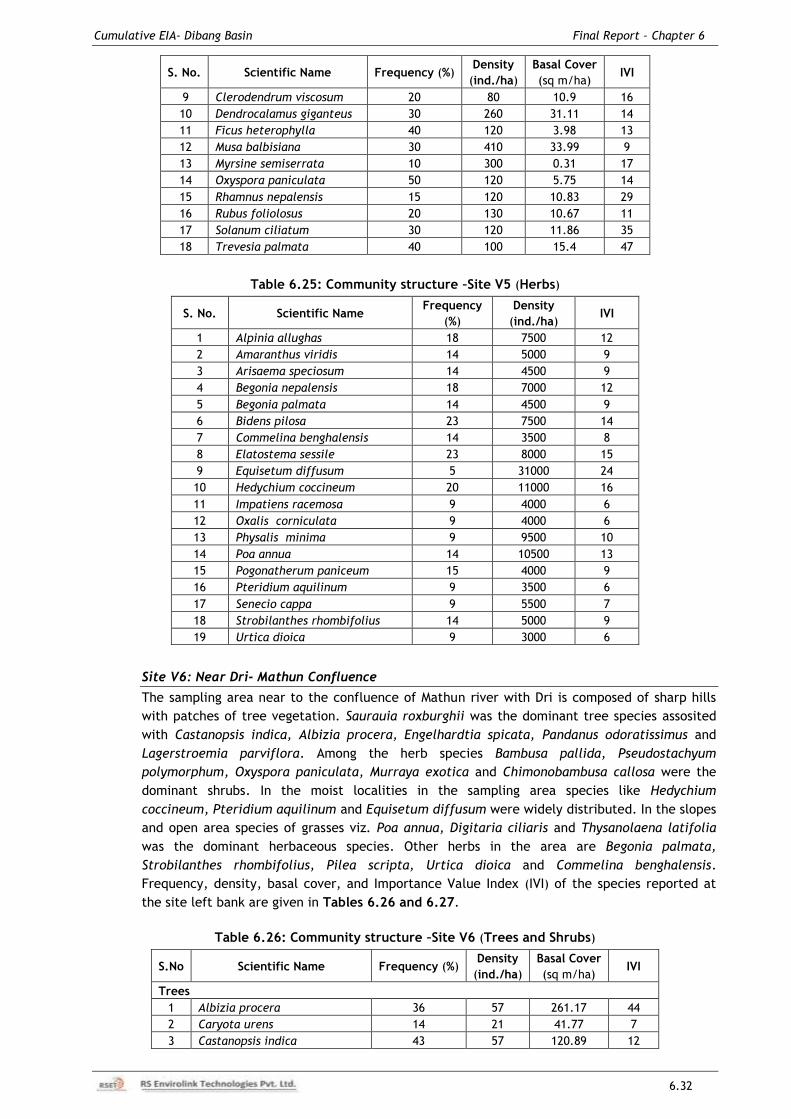
Cumulative EIA- Dibang Basin Final Report – Chapter 6
6.32
S. No. Scientific Name Frequency (%) Density
(ind./ha)
Basal Cover
(sq m/ha) IVI
9 Clerodendrum viscosum 20 80 10.9 16
10 Dendrocalamus giganteus 30 260 31.11 14
11 Ficus heterophylla 40 120 3.98 13
12 Musa balbisiana 30 410 33.99 9
13 Myrsine semiserrata 10 300 0.31 17
14 Oxyspora paniculata 50 120 5.75 14
15 Rhamnus nepalensis 15 120 10.83 29
16 Rubus foliolosus 20 130 10.67 11
17 Solanum ciliatum 30 120 11.86 35
18 Trevesia palmata 40 100 15.4 47
Table 6.25: Community structure –Site V5 (Herbs)
S. No. Scientific Name Frequency
(%)
Density
(ind./ha) IVI
1 Alpinia allughas 18 7500 12
2 Amaranthus viridis 14 5000 9
3 Arisaema speciosum 14 4500 9
4 Begonia nepalensis 18 7000 12
5 Begonia palmata 14 4500 9
6 Bidens pilosa 23 7500 14
7 Commelina benghalensis 14 3500 8
8 Elatostema sessile 23 8000 15
9 Equisetum diffusum 5 31000 24
10 Hedychium coccineum 20 11000 16
11 Impatiens racemosa 9 4000 6
12 Oxalis corniculata 9 4000 6
13 Physalis minima 9 9500 10
14 Poa annua 14 10500 13
15 Pogonatherum paniceum 15 4000 9
16 Pteridium aquilinum 9 3500 6
17 Senecio cappa 9 5500 7
18 Strobilanthes rhombifolius 14 5000 9
19 Urtica dioica 9 3000 6
Site V6: Near Dri- Mathun Confluence
The sampling area near to the confluence of Mathun river with Dri is composed of sharp hills
with patches of tree vegetation. Saurauia roxburghii was the dominant tree species assosited
with Castanopsis indica, Albizia procera, Engelhardtia spicata, Pandanus odoratissimus and
Lagerstroemia parviflora. Among the herb species Bambusa pallida, Pseudostachyum
polymorphum, Oxyspora paniculata, Murraya exotica and Chimonobambusa callosa were the
dominant shrubs. In the moist localities in the sampling area species like Hedychium
coccineum, Pteridium aquilinum and Equisetum diffusum were widely distributed. In the slopes
and open area species of grasses viz. Poa annua, Digitaria ciliaris and Thysanolaena latifolia
was the dominant herbaceous species. Other herbs in the area are Begonia palmata,
Strobilanthes rhombifolius, Pilea scripta, Urtica dioica and Commelina benghalensis.
Frequency, density, basal cover, and Importance Value Index (IVI) of the species reported at
the site left bank are given in Tables 6.26 and 6.27.
Table 6.26: Community structure –Site V6 (Trees and Shrubs)
S.No Scientific Name Frequency (%) Density
(ind./ha)
Basal Cover
(sq m/ha) IVI
Trees
1 Albizia procera 36 57 261.17 44
2 Caryota urens 14 21 41.77 7
3 Castanopsis indica 43 57 120.89 12
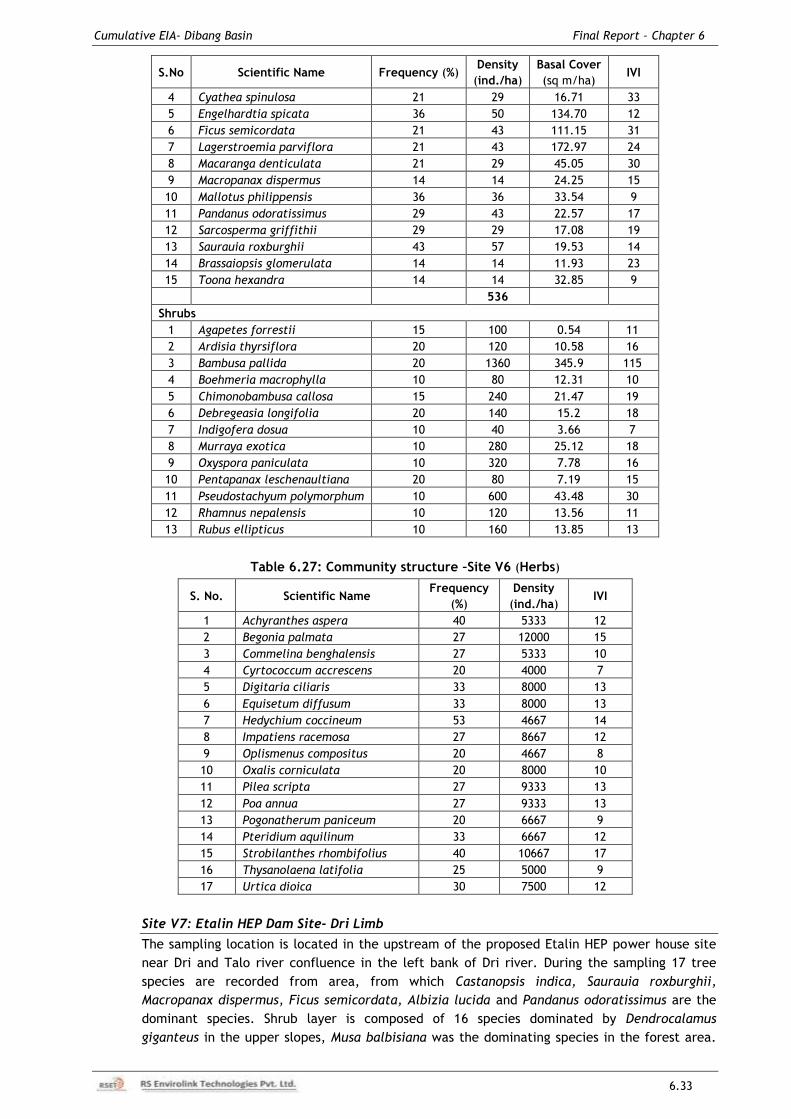
Cumulative EIA- Dibang Basin Final Report – Chapter 6
6.33
S.No Scientific Name Frequency (%) Density
(ind./ha)
Basal Cover
(sq m/ha) IVI
4 Cyathea spinulosa 21 29 16.71 33
5 Engelhardtia spicata 36 50 134.70 12
6 Ficus semicordata 21 43 111.15 31
7 Lagerstroemia parviflora 21 43 172.97 24
8 Macaranga denticulata 21 29 45.05 30
9 Macropanax dispermus 14 14 24.25 15
10 Mallotus philippensis 36 36 33.54 9
11 Pandanus odoratissimus 29 43 22.57 17
12 Sarcosperma griffithii 29 29 17.08 19
13 Saurauia roxburghii 43 57 19.53 14
14 Brassaiopsis glomerulata 14 14 11.93 23
15 Toona hexandra 14 14 32.85 9
536
Shrubs
1 Agapetes forrestii 15 100 0.54 11
2 Ardisia thyrsiflora 20 120 10.58 16
3 Bambusa pallida 20 1360 345.9 115
4 Boehmeria macrophylla 10 80 12.31 10
5 Chimonobambusa callosa 15 240 21.47 19
6 Debregeasia longifolia 20 140 15.2 18
7 Indigofera dosua 10 40 3.66 7
8 Murraya exotica 10 280 25.12 18
9 Oxyspora paniculata 10 320 7.78 16
10 Pentapanax leschenaultiana 20 80 7.19 15
11 Pseudostachyum polymorphum 10 600 43.48 30
12 Rhamnus nepalensis 10 120 13.56 11
13 Rubus ellipticus 10 160 13.85 13
Table 6.27: Community structure –Site V6 (Herbs)
S. No. Scientific Name Frequency
(%)
Density
(ind./ha) IVI
1 Achyranthes aspera 40 5333 12
2 Begonia palmata 27 12000 15
3 Commelina benghalensis 27 5333 10
4 Cyrtococcum accrescens 20 4000 7
5 Digitaria ciliaris 33 8000 13
6 Equisetum diffusum 33 8000 13
7 Hedychium coccineum 53 4667 14
8 Impatiens racemosa 27 8667 12
9 Oplismenus compositus 20 4667 8
10 Oxalis corniculata 20 8000 10
11 Pilea scripta 27 9333 13
12 Poa annua 27 9333 13
13 Pogonatherum paniceum 20 6667 9
14 Pteridium aquilinum 33 6667 12
15 Strobilanthes rhombifolius 40 10667 17
16 Thysanolaena latifolia 25 5000 9
17 Urtica dioica 30 7500 12
Site V7: Etalin HEP Dam Site- Dri Limb
The sampling location is located in the upstream of the proposed Etalin HEP power house site
near Dri and Talo river confluence in the left bank of Dri river. During the sampling 17 tree
species are recorded from area, from which Castanopsis indica, Saurauia roxburghii,
Macropanax dispermus, Ficus semicordata, Albizia lucida and Pandanus odoratissimus are the
dominant species. Shrub layer is composed of 16 species dominated by Dendrocalamus
giganteus in the upper slopes, Musa balbisiana was the dominating species in the forest area.
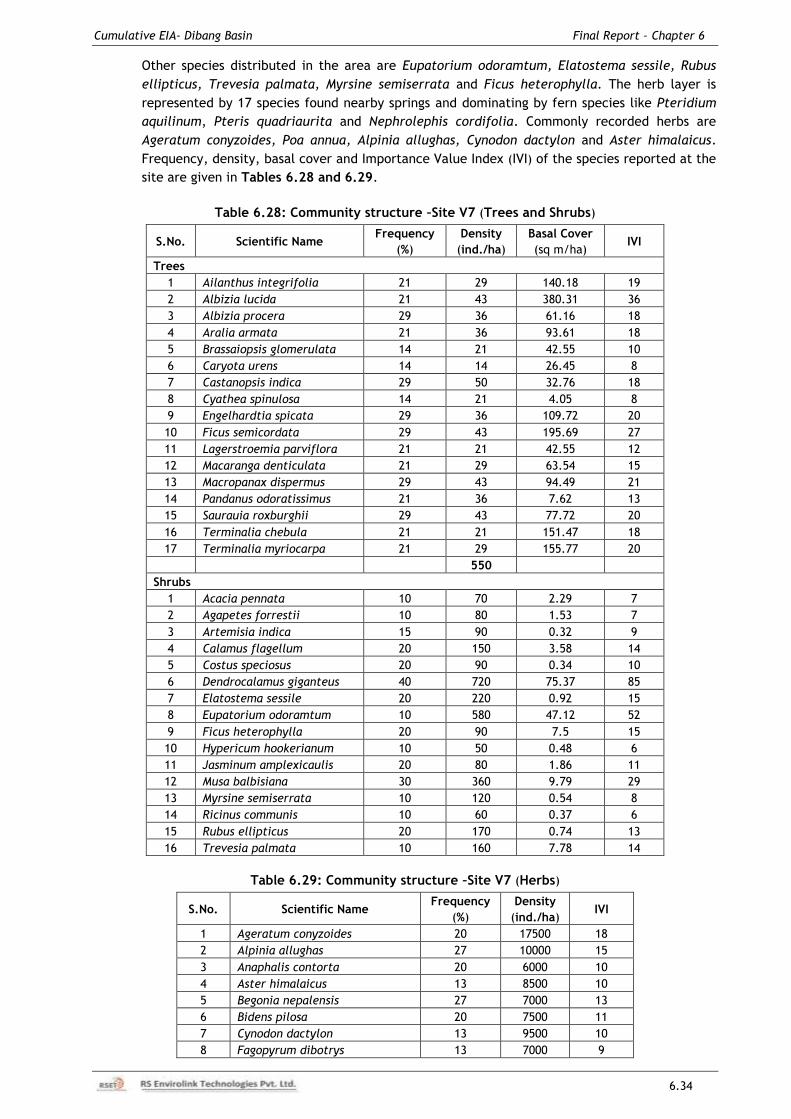
Cumulative EIA- Dibang Basin Final Report – Chapter 6
6.34
Other species distributed in the area are Eupatorium odoramtum, Elatostema sessile, Rubus
ellipticus, Trevesia palmata, Myrsine semiserrata and Ficus heterophylla. The herb layer is
represented by 17 species found nearby springs and dominating by fern species like Pteridium
aquilinum, Pteris quadriaurita and Nephrolephis cordifolia. Commonly recorded herbs are
Ageratum conyzoides, Poa annua, Alpinia allughas, Cynodon dactylon and Aster himalaicus.
Frequency, density, basal cover and Importance Value Index (IVI) of the species reported at the
site are given in Tables 6.28 and 6.29.
Table 6.28: Community structure –Site V7 (Trees and Shrubs)
S.No. Scientific Name Frequency
(%)
Density
(ind./ha)
Basal Cover
(sq m/ha) IVI
Trees
1 Ailanthus integrifolia 21 29 140.18 19
2 Albizia lucida 21 43 380.31 36
3 Albizia procera 29 36 61.16 18
4 Aralia armata 21 36 93.61 18
5 Brassaiopsis glomerulata 14 21 42.55 10
6 Caryota urens 14 14 26.45 8
7 Castanopsis indica 29 50 32.76 18
8 Cyathea spinulosa 14 21 4.05 8
9 Engelhardtia spicata 29 36 109.72 20
10 Ficus semicordata 29 43 195.69 27
11 Lagerstroemia parviflora 21 21 42.55 12
12 Macaranga denticulata 21 29 63.54 15
13 Macropanax dispermus 29 43 94.49 21
14 Pandanus odoratissimus 21 36 7.62 13
15 Saurauia roxburghii 29 43 77.72 20
16 Terminalia chebula 21 21 151.47 18
17 Terminalia myriocarpa 21 29 155.77 20
550
Shrubs
1 Acacia pennata 10 70 2.29 7
2 Agapetes forrestii 10 80 1.53 7
3 Artemisia indica 15 90 0.32 9
4 Calamus flagellum 20 150 3.58 14
5 Costus speciosus 20 90 0.34 10
6 Dendrocalamus giganteus 40 720 75.37 85
7 Elatostema sessile 20 220 0.92 15
8 Eupatorium odoramtum 10 580 47.12 52
9 Ficus heterophylla 20 90 7.5 15
10 Hypericum hookerianum 10 50 0.48 6
11 Jasminum amplexicaulis 20 80 1.86 11
12 Musa balbisiana 30 360 9.79 29
13 Myrsine semiserrata 10 120 0.54 8
14 Ricinus communis 10 60 0.37 6
15 Rubus ellipticus 20 170 0.74 13
16 Trevesia palmata 10 160 7.78 14
Table 6.29: Community structure –Site V7 (Herbs)
S.No. Scientific Name Frequency
(%)
Density
(ind./ha) IVI
1 Ageratum conyzoides 20 17500 18
2 Alpinia allughas 27 10000 15
3 Anaphalis contorta 20 6000 10
4 Aster himalaicus 13 8500 10
5 Begonia nepalensis 27 7000 13
6 Bidens pilosa 20 7500 11
7 Cynodon dactylon 13 9500 10
8 Fagopyrum dibotrys 13 7000 9
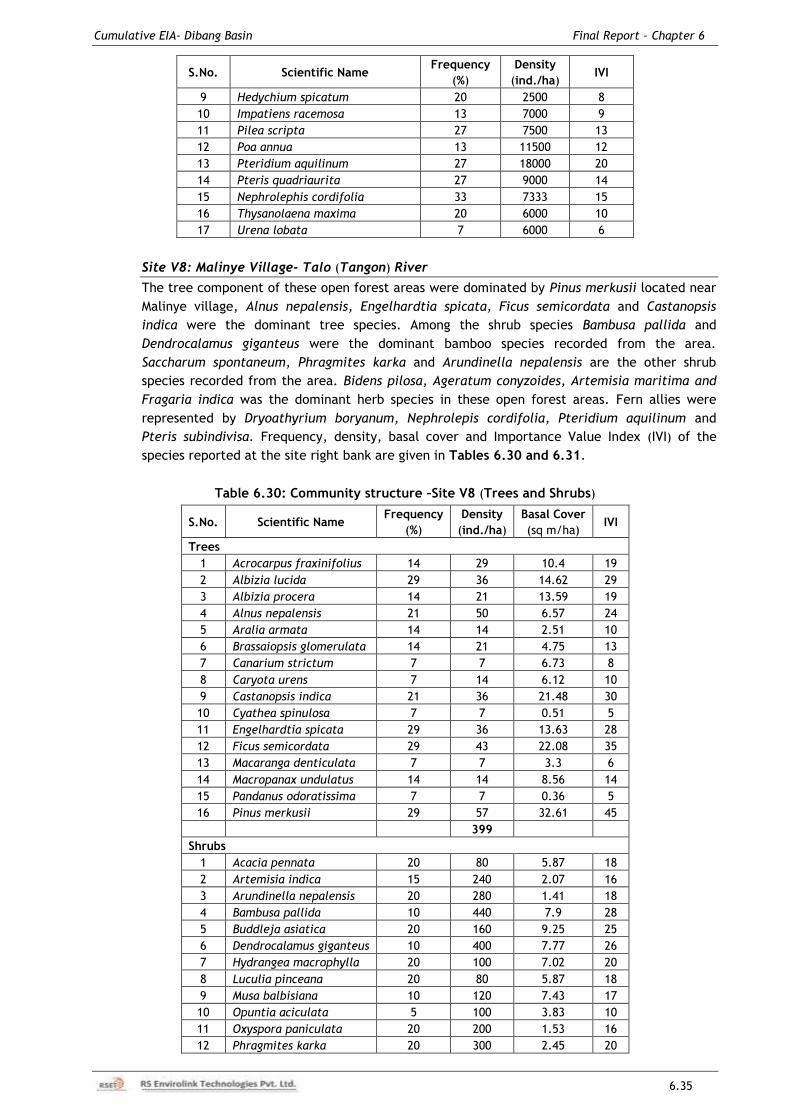
Cumulative EIA- Dibang Basin Final Report – Chapter 6
6.35
S.No. Scientific Name Frequency
(%)
Density
(ind./ha) IVI
9 Hedychium spicatum 20 2500 8
10 Impatiens racemosa 13 7000 9
11 Pilea scripta 27 7500 13
12 Poa annua 13 11500 12
13 Pteridium aquilinum 27 18000 20
14 Pteris quadriaurita 27 9000 14
15 Nephrolephis cordifolia 33 7333 15
16 Thysanolaena maxima 20 6000 10
17 Urena lobata 7 6000 6
Site V8: Malinye Village- Talo (Tangon) River
The tree component of these open forest areas were dominated by Pinus merkusii located near
Malinye village, Alnus nepalensis, Engelhardtia spicata, Ficus semicordata and Castanopsis
indica were the dominant tree species. Among the shrub species Bambusa pallida and
Dendrocalamus giganteus were the dominant bamboo species recorded from the area.
Saccharum spontaneum, Phragmites karka and Arundinella nepalensis are the other shrub
species recorded from the area. Bidens pilosa, Ageratum conyzoides, Artemisia maritima and
Fragaria indica was the dominant herb species in these open forest areas. Fern allies were
represented by Dryoathyrium boryanum, Nephrolepis cordifolia, Pteridium aquilinum and
Pteris subindivisa. Frequency, density, basal cover and Importance Value Index (IVI) of the
species reported at the site right bank are given in Tables 6.30 and 6.31.
Table 6.30: Community structure –Site V8 (Trees and Shrubs)
S.No. Scientific Name Frequency
(%)
Density
(ind./ha)
Basal Cover
(sq m/ha) IVI
Trees
1 Acrocarpus fraxinifolius 14 29 10.4 19
2 Albizia lucida 29 36 14.62 29
3 Albizia procera 14 21 13.59 19
4 Alnus nepalensis 21 50 6.57 24
5 Aralia armata 14 14 2.51 10
6 Brassaiopsis glomerulata 14 21 4.75 13
7 Canarium strictum 7 7 6.73 8
8 Caryota urens 7 14 6.12 10
9 Castanopsis indica 21 36 21.48 30
10 Cyathea spinulosa 7 7 0.51 5
11 Engelhardtia spicata 29 36 13.63 28
12 Ficus semicordata 29 43 22.08 35
13 Macaranga denticulata 7 7 3.3 6
14 Macropanax undulatus 14 14 8.56 14
15 Pandanus odoratissima 7 7 0.36 5
16 Pinus merkusii 29 57 32.61 45
399
Shrubs
1 Acacia pennata 20 80 5.87 18
2 Artemisia indica 15 240 2.07 16
3 Arundinella nepalensis 20 280 1.41 18
4 Bambusa pallida 10 440 7.9 28
5 Buddleja asiatica 20 160 9.25 25
6 Dendrocalamus giganteus 10 400 7.77 26
7 Hydrangea macrophylla 20 100 7.02 20
8 Luculia pinceana 20 80 5.87 18
9 Musa balbisiana 10 120 7.43 17
10 Opuntia aciculata 5 100 3.83 10
11 Oxyspora paniculata 20 200 1.53 16
12 Phragmites karka 20 300 2.45 20
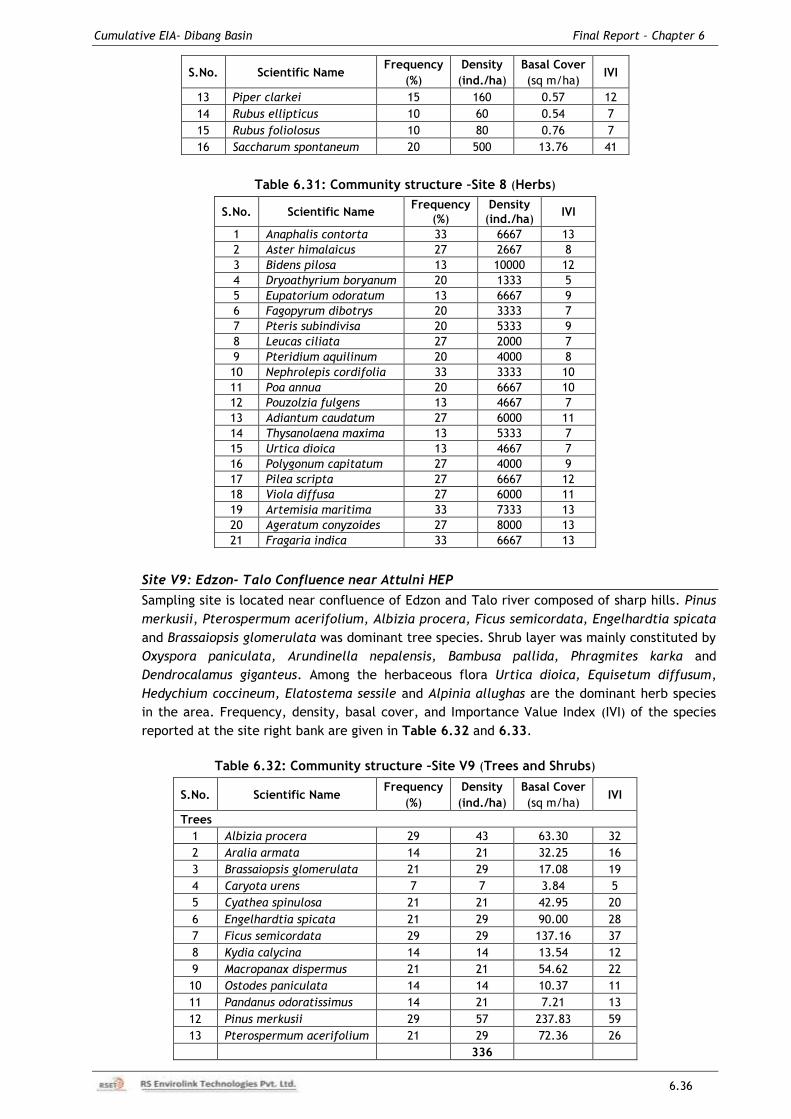
Cumulative EIA- Dibang Basin Final Report – Chapter 6
6.36
S.No. Scientific Name Frequency
(%)
Density
(ind./ha)
Basal Cover
(sq m/ha) IVI
13 Piper clarkei 15 160 0.57 12
14 Rubus ellipticus 10 60 0.54 7
15 Rubus foliolosus 10 80 0.76 7
16 Saccharum spontaneum 20 500 13.76 41
Table 6.31: Community structure –Site 8 (Herbs)
S.No. Scientific Name Frequency
(%)
Density
(ind./ha) IVI
1 Anaphalis contorta 33 6667 13
2 Aster himalaicus 27 2667 8
3 Bidens pilosa 13 10000 12
4 Dryoathyrium boryanum 20 1333 5
5 Eupatorium odoratum 13 6667 9
6 Fagopyrum dibotrys 20 3333 7
7 Pteris subindivisa 20 5333 9
8 Leucas ciliata 27 2000 7
9 Pteridium aquilinum 20 4000 8
10 Nephrolepis cordifolia 33 3333 10
11 Poa annua 20 6667 10
12 Pouzolzia fulgens 13 4667 7
13 Adiantum caudatum 27 6000 11
14 Thysanolaena maxima 13 5333 7
15 Urtica dioica 13 4667 7
16 Polygonum capitatum 27 4000 9
17 Pilea scripta 27 6667 12
18 Viola diffusa 27 6000 11
19 Artemisia maritima 33 7333 13
20 Ageratum conyzoides 27 8000 13
21 Fragaria indica 33 6667 13
Site V9: Edzon- Talo Confluence near Attulni HEP
Sampling site is located near confluence of Edzon and Talo river composed of sharp hills. Pinus
merkusii, Pterospermum acerifolium, Albizia procera, Ficus semicordata, Engelhardtia spicata
and Brassaiopsis glomerulata was dominant tree species. Shrub layer was mainly constituted by
Oxyspora paniculata, Arundinella nepalensis, Bambusa pallida, Phragmites karka and
Dendrocalamus giganteus. Among the herbaceous flora Urtica dioica, Equisetum diffusum,
Hedychium coccineum, Elatostema sessile and Alpinia allughas are the dominant herb species
in the area. Frequency, density, basal cover, and Importance Value Index (IVI) of the species
reported at the site right bank are given in Table 6.32 and 6.33.
Table 6.32: Community structure –Site V9 (Trees and Shrubs)
S.No. Scientific Name Frequency
(%)
Density
(ind./ha)
Basal Cover
(sq m/ha) IVI
Trees
1 Albizia procera 29 43 63.30 32
2 Aralia armata 14 21 32.25 16
3 Brassaiopsis glomerulata 21 29 17.08 19
4 Caryota urens 7 7 3.84 5
5 Cyathea spinulosa 21 21 42.95 20
6 Engelhardtia spicata 21 29 90.00 28
7 Ficus semicordata 29 29 137.16 37
8 Kydia calycina 14 14 13.54 12
9 Macropanax dispermus 21 21 54.62 22
10 Ostodes paniculata 14 14 10.37 11
11 Pandanus odoratissimus 14 21 7.21 13
12 Pinus merkusii 29 57 237.83 59
13 Pterospermum acerifolium 21 29 72.36 26
336
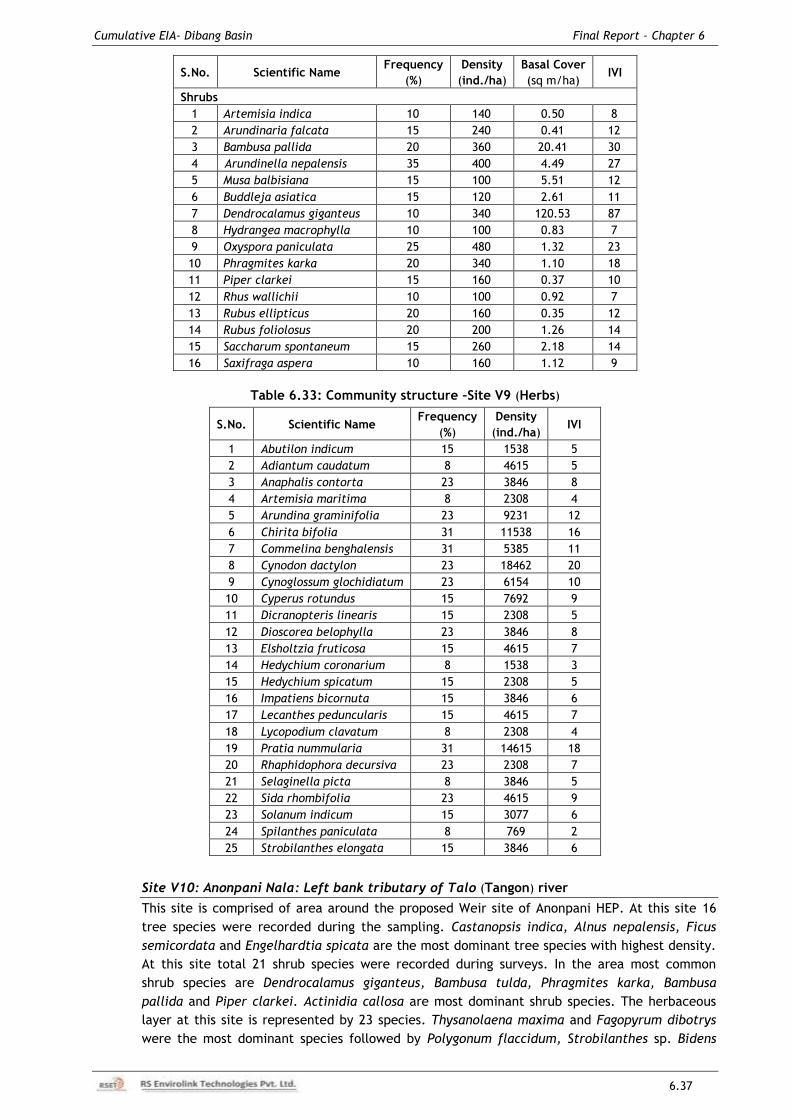
Cumulative EIA- Dibang Basin Final Report – Chapter 6
6.37
S.No. Scientific Name Frequency
(%)
Density
(ind./ha)
Basal Cover
(sq m/ha) IVI
Shrubs
1 Artemisia indica 10 140 0.50 8
2 Arundinaria falcata 15 240 0.41 12
3 Bambusa pallida 20 360 20.41 30
4 Arundinella nepalensis 35 400 4.49 27
5 Musa balbisiana 15 100 5.51 12
6 Buddleja asiatica 15 120 2.61 11
7 Dendrocalamus giganteus 10 340 120.53 87
8 Hydrangea macrophylla 10 100 0.83 7
9 Oxyspora paniculata 25 480 1.32 23
10 Phragmites karka 20 340 1.10 18
11 Piper clarkei 15 160 0.37 10
12 Rhus wallichii 10 100 0.92 7
13 Rubus ellipticus 20 160 0.35 12
14 Rubus foliolosus 20 200 1.26 14
15 Saccharum spontaneum 15 260 2.18 14
16 Saxifraga aspera 10 160 1.12 9
Table 6.33: Community structure –Site V9 (Herbs)
S.No. Scientific Name Frequency
(%)
Density
(ind./ha) IVI
1 Abutilon indicum 15 1538 5
2 Adiantum caudatum 8 4615 5
3 Anaphalis contorta 23 3846 8
4 Artemisia maritima 8 2308 4
5 Arundina graminifolia 23 9231 12
6 Chirita bifolia 31 11538 16
7 Commelina benghalensis 31 5385 11
8 Cynodon dactylon 23 18462 20
9 Cynoglossum glochidiatum 23 6154 10
10 Cyperus rotundus 15 7692 9
11 Dicranopteris linearis 15 2308 5
12 Dioscorea belophylla 23 3846 8
13 Elsholtzia fruticosa 15 4615 7
14 Hedychium coronarium 8 1538 3
15 Hedychium spicatum 15 2308 5
16 Impatiens bicornuta 15 3846 6
17 Lecanthes peduncularis 15 4615 7
18 Lycopodium clavatum 8 2308 4
19 Pratia nummularia 31 14615 18
20 Rhaphidophora decursiva 23 2308 7
21 Selaginella picta 8 3846 5
22 Sida rhombifolia 23 4615 9
23 Solanum indicum 15 3077 6
24 Spilanthes paniculata 8 769 2
25 Strobilanthes elongata 15 3846 6
Site V10: Anonpani Nala: Left bank tributary of Talo (Tangon) river
This site is comprised of area around the proposed Weir site of Anonpani HEP. At this site 16
tree species were recorded during the sampling. Castanopsis indica, Alnus nepalensis, Ficus
semicordata and Engelhardtia spicata are the most dominant tree species with highest density.
At this site total 21 shrub species were recorded during surveys. In the area most common
shrub species are Dendrocalamus giganteus, Bambusa tulda, Phragmites karka, Bambusa
pallida and Piper clarkei. Actinidia callosa are most dominant shrub species. The herbaceous
layer at this site is represented by 23 species. Thysanolaena maxima and Fagopyrum dibotrys
were the most dominant species followed by Polygonum flaccidum, Strobilanthes sp. Bidens
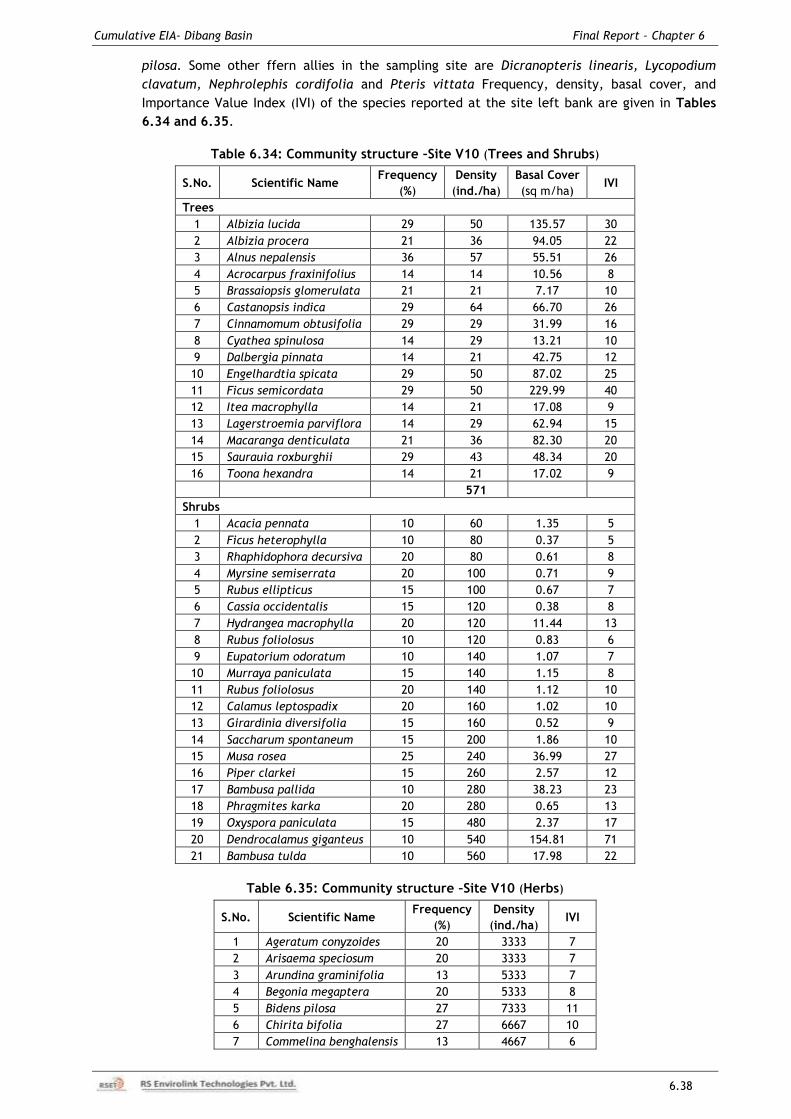
Cumulative EIA- Dibang Basin Final Report – Chapter 6
6.38
pilosa. Some other ffern allies in the sampling site are Dicranopteris linearis, Lycopodium
clavatum, Nephrolephis cordifolia and Pteris vittata Frequency, density, basal cover, and
Importance Value Index (IVI) of the species reported at the site left bank are given in Tables
6.34 and 6.35.
Table 6.34: Community structure –Site V10 (Trees and Shrubs)
S.No. Scientific Name Frequency
(%)
Density
(ind./ha)
Basal Cover
(sq m/ha) IVI
Trees
1 Albizia lucida 29 50 135.57 30
2 Albizia procera 21 36 94.05 22
3 Alnus nepalensis 36 57 55.51 26
4 Acrocarpus fraxinifolius 14 14 10.56 8
5 Brassaiopsis glomerulata 21 21 7.17 10
6 Castanopsis indica 29 64 66.70 26
7 Cinnamomum obtusifolia 29 29 31.99 16
8 Cyathea spinulosa 14 29 13.21 10
9 Dalbergia pinnata 14 21 42.75 12
10 Engelhardtia spicata 29 50 87.02 25
11 Ficus semicordata 29 50 229.99 40
12 Itea macrophylla 14 21 17.08 9
13 Lagerstroemia parviflora 14 29 62.94 15
14 Macaranga denticulata 21 36 82.30 20
15 Saurauia roxburghii 29 43 48.34 20
16 Toona hexandra 14 21 17.02 9
571
Shrubs
1 Acacia pennata 10 60 1.35 5
2 Ficus heterophylla 10 80 0.37 5
3 Rhaphidophora decursiva 20 80 0.61 8
4 Myrsine semiserrata 20 100 0.71 9
5 Rubus ellipticus 15 100 0.67 7
6 Cassia occidentalis 15 120 0.38 8
7 Hydrangea macrophylla 20 120 11.44 13
8 Rubus foliolosus 10 120 0.83 6
9 Eupatorium odoratum 10 140 1.07 7
10 Murraya paniculata 15 140 1.15 8
11 Rubus foliolosus 20 140 1.12 10
12 Calamus leptospadix 20 160 1.02 10
13 Girardinia diversifolia 15 160 0.52 9
14 Saccharum spontaneum 15 200 1.86 10
15 Musa rosea 25 240 36.99 27
16 Piper clarkei 15 260 2.57 12
17 Bambusa pallida 10 280 38.23 23
18 Phragmites karka 20 280 0.65 13
19 Oxyspora paniculata 15 480 2.37 17
20 Dendrocalamus giganteus 10 540 154.81 71
21 Bambusa tulda 10 560 17.98 22
Table 6.35: Community structure –Site V10 (Herbs)
S.No. Scientific Name Frequency
(%)
Density
(ind./ha) IVI
1 Ageratum conyzoides 20 3333 7
2 Arisaema speciosum 20 3333 7
3 Arundina graminifolia 13 5333 7
4 Begonia megaptera 20 5333 8
5 Bidens pilosa 27 7333 11
6 Chirita bifolia 27 6667 10
7 Commelina benghalensis 13 4667 6
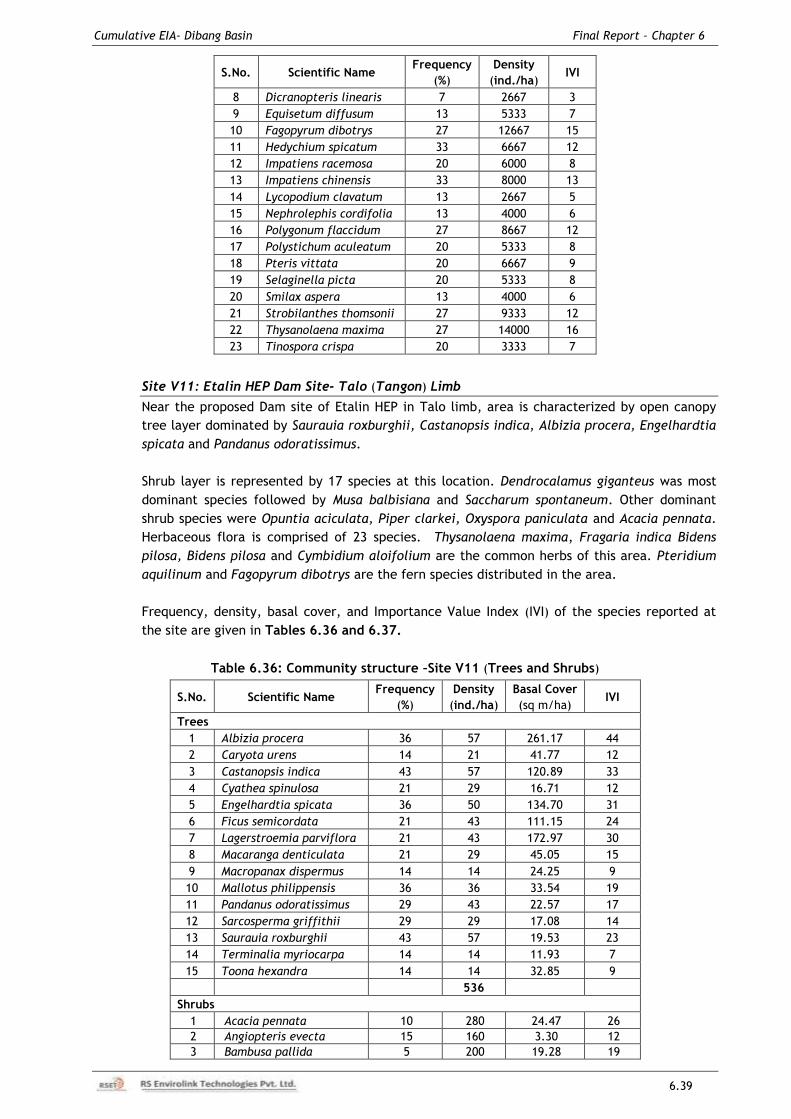
Cumulative EIA- Dibang Basin Final Report – Chapter 6
6.39
S.No. Scientific Name Frequency
(%)
Density
(ind./ha) IVI
8 Dicranopteris linearis 7 2667 3
9 Equisetum diffusum 13 5333 7
10 Fagopyrum dibotrys 27 12667 15
11 Hedychium spicatum 33 6667 12
12 Impatiens racemosa 20 6000 8
13 Impatiens chinensis 33 8000 13
14 Lycopodium clavatum 13 2667 5
15 Nephrolephis cordifolia 13 4000 6
16 Polygonum flaccidum 27 8667 12
17 Polystichum aculeatum 20 5333 8
18 Pteris vittata 20 6667 9
19 Selaginella picta 20 5333 8
20 Smilax aspera 13 4000 6
21 Strobilanthes thomsonii 27 9333 12
22 Thysanolaena maxima 27 14000 16
23 Tinospora crispa 20 3333 7
Site V11: Etalin HEP Dam Site- Talo (Tangon) Limb
Near the proposed Dam site of Etalin HEP in Talo limb, area is characterized by open canopy
tree layer dominated by Saurauia roxburghii, Castanopsis indica, Albizia procera, Engelhardtia
spicata and Pandanus odoratissimus.
Shrub layer is represented by 17 species at this location. Dendrocalamus giganteus was most
dominant species followed by Musa balbisiana and Saccharum spontaneum. Other dominant
shrub species were Opuntia aciculata, Piper clarkei, Oxyspora paniculata and Acacia pennata.
Herbaceous flora is comprised of 23 species. Thysanolaena maxima, Fragaria indica Bidens
pilosa, Bidens pilosa and Cymbidium aloifolium are the common herbs of this area. Pteridium
aquilinum and Fagopyrum dibotrys are the fern species distributed in the area.
Frequency, density, basal cover, and Importance Value Index (IVI) of the species reported at
the site are given in Tables 6.36 and 6.37.
Table 6.36: Community structure –Site V11 (Trees and Shrubs)
S.No. Scientific Name Frequency
(%)
Density
(ind./ha)
Basal Cover
(sq m/ha) IVI
Trees
1 Albizia procera 36 57 261.17 44
2 Caryota urens 14 21 41.77 12
3 Castanopsis indica 43 57 120.89 33
4 Cyathea spinulosa 21 29 16.71 12
5 Engelhardtia spicata 36 50 134.70 31
6 Ficus semicordata 21 43 111.15 24
7 Lagerstroemia parviflora 21 43 172.97 30
8 Macaranga denticulata 21 29 45.05 15
9 Macropanax dispermus 14 14 24.25 9
10 Mallotus philippensis 36 36 33.54 19
11 Pandanus odoratissimus 29 43 22.57 17
12 Sarcosperma griffithii 29 29 17.08 14
13 Saurauia roxburghii 43 57 19.53 23
14 Terminalia myriocarpa 14 14 11.93 7
15 Toona hexandra 14 14 32.85 9
536
Shrubs
1 Acacia pennata 10 280 24.47 26
2 Angiopteris evecta 15 160 3.30 12
3 Bambusa pallida 5 200 19.28 19
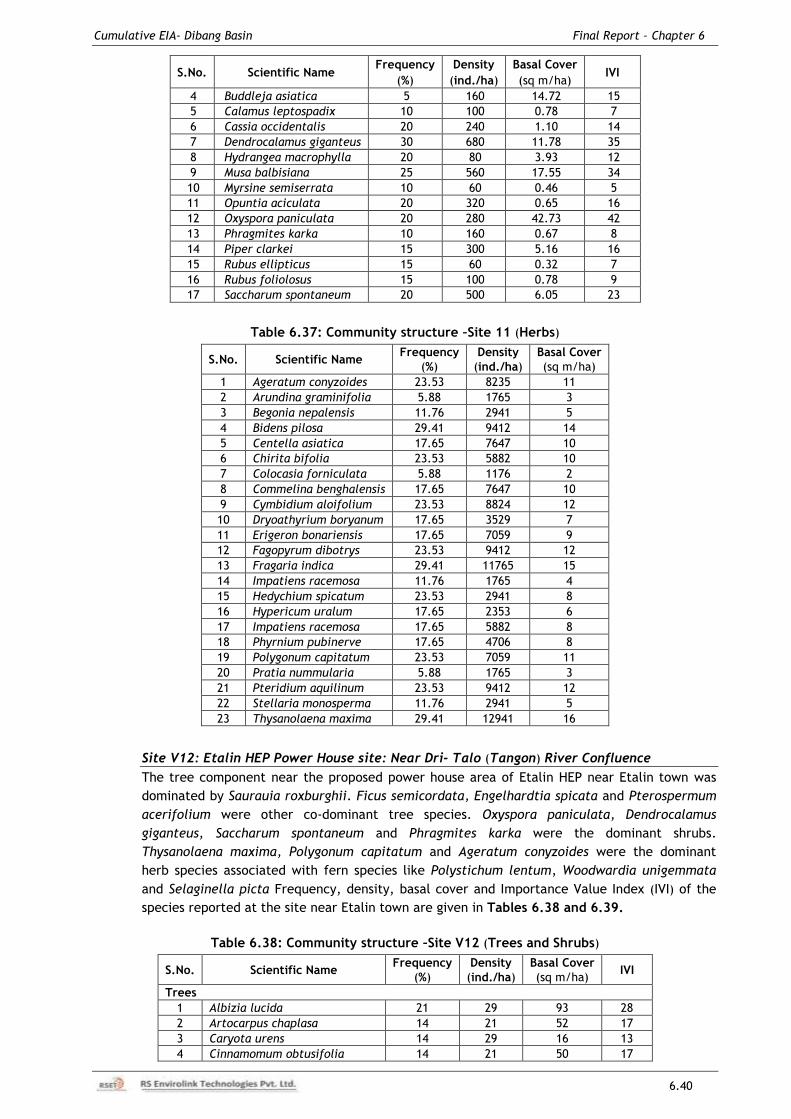
Cumulative EIA- Dibang Basin Final Report – Chapter 6
6.40
S.No. Scientific Name Frequency
(%)
Density
(ind./ha)
Basal Cover
(sq m/ha) IVI
4 Buddleja asiatica 5 160 14.72 15
5 Calamus leptospadix 10 100 0.78 7
6 Cassia occidentalis 20 240 1.10 14
7 Dendrocalamus giganteus 30 680 11.78 35
8 Hydrangea macrophylla 20 80 3.93 12
9 Musa balbisiana 25 560 17.55 34
10 Myrsine semiserrata 10 60 0.46 5
11 Opuntia aciculata 20 320 0.65 16
12 Oxyspora paniculata 20 280 42.73 42
13 Phragmites karka 10 160 0.67 8
14 Piper clarkei 15 300 5.16 16
15 Rubus ellipticus 15 60 0.32 7
16 Rubus foliolosus 15 100 0.78 9
17 Saccharum spontaneum 20 500 6.05 23
Table 6.37: Community structure –Site 11 (Herbs)
S.No. Scientific Name Frequency
(%)
Density
(ind./ha)
Basal Cover
(sq m/ha)
1 Ageratum conyzoides 23.53 8235 11
2 Arundina graminifolia 5.88 1765 3
3 Begonia nepalensis 11.76 2941 5
4 Bidens pilosa 29.41 9412 14
5 Centella asiatica 17.65 7647 10
6 Chirita bifolia 23.53 5882 10
7 Colocasia forniculata 5.88 1176 2
8 Commelina benghalensis 17.65 7647 10
9 Cymbidium aloifolium 23.53 8824 12
10 Dryoathyrium boryanum 17.65 3529 7
11 Erigeron bonariensis 17.65 7059 9
12 Fagopyrum dibotrys 23.53 9412 12
13 Fragaria indica 29.41 11765 15
14 Impatiens racemosa 11.76 1765 4
15 Hedychium spicatum 23.53 2941 8
16 Hypericum uralum 17.65 2353 6
17 Impatiens racemosa 17.65 5882 8
18 Phyrnium pubinerve 17.65 4706 8
19 Polygonum capitatum 23.53 7059 11
20 Pratia nummularia 5.88 1765 3
21 Pteridium aquilinum 23.53 9412 12
22 Stellaria monosperma 11.76 2941 5
23 Thysanolaena maxima 29.41 12941 16
Site V12: Etalin HEP Power House site: Near Dri- Talo (Tangon) River Confluence
The tree component near the proposed power house area of Etalin HEP near Etalin town was
dominated by Saurauia roxburghii. Ficus semicordata, Engelhardtia spicata and Pterospermum
acerifolium were other co-dominant tree species. Oxyspora paniculata, Dendrocalamus
giganteus, Saccharum spontaneum and Phragmites karka were the dominant shrubs.
Thysanolaena maxima, Polygonum capitatum and Ageratum conyzoides were the dominant
herb species associated with fern species like Polystichum lentum, Woodwardia unigemmata
and Selaginella picta Frequency, density, basal cover and Importance Value Index (IVI) of the
species reported at the site near Etalin town are given in Tables 6.38 and 6.39.
Table 6.38: Community structure –Site V12 (Trees and Shrubs)
S.No. Scientific Name Frequency
(%)
Density
(ind./ha)
Basal Cover
(sq m/ha) IVI
Trees
1 Albizia lucida 21 29 93 28
2 Artocarpus chaplasa 14 21 52 17
3 Caryota urens 14 29 16 13
4 Cinnamomum obtusifolia 14 21 50 17
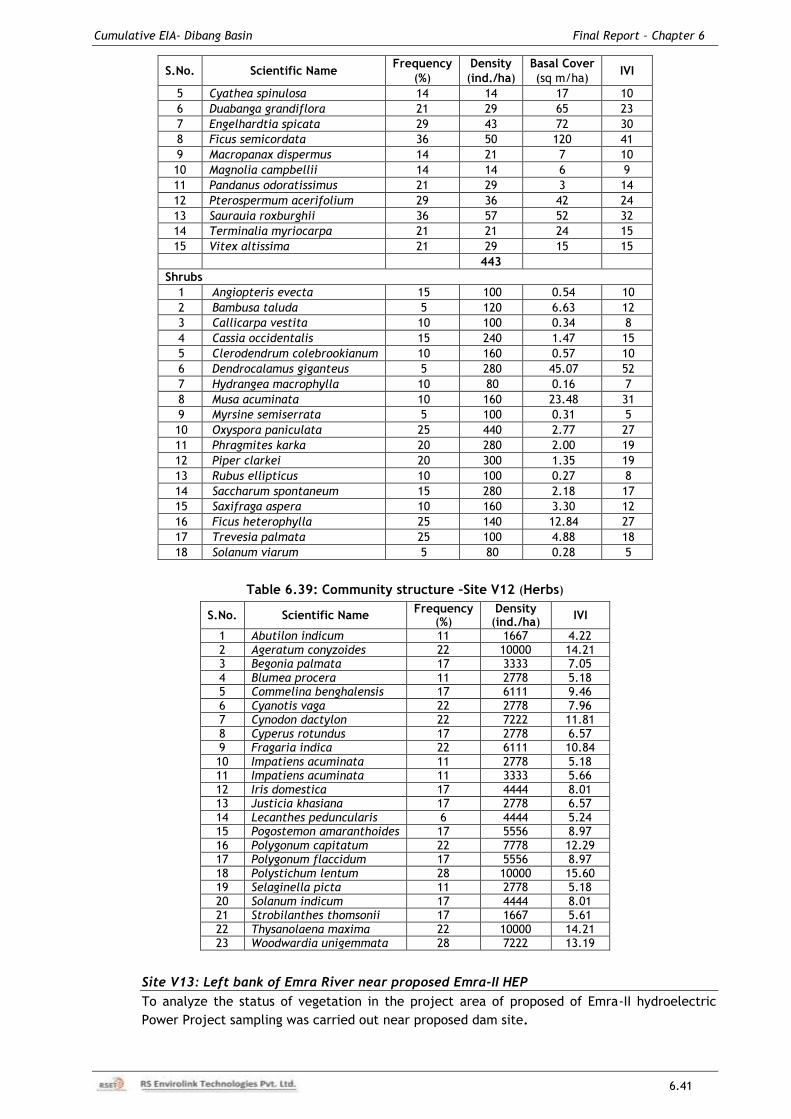
Cumulative EIA- Dibang Basin Final Report – Chapter 6
6.41
S.No. Scientific Name Frequency
(%)
Density
(ind./ha)
Basal Cover
(sq m/ha) IVI
5 Cyathea spinulosa 14 14 17 10
6 Duabanga grandiflora 21 29 65 23
7 Engelhardtia spicata 29 43 72 30
8 Ficus semicordata 36 50 120 41
9 Macropanax dispermus 14 21 7 10
10 Magnolia campbellii 14 14 6 9
11 Pandanus odoratissimus 21 29 3 14
12 Pterospermum acerifolium 29 36 42 24
13 Saurauia roxburghii 36 57 52 32
14 Terminalia myriocarpa 21 21 24 15
15 Vitex altissima 21 29 15 15
443
Shrubs
1 Angiopteris evecta 15 100 0.54 10
2 Bambusa taluda 5 120 6.63 12
3 Callicarpa vestita 10 100 0.34 8
4 Cassia occidentalis 15 240 1.47 15
5 Clerodendrum colebrookianum 10 160 0.57 10
6 Dendrocalamus giganteus 5 280 45.07 52
7 Hydrangea macrophylla 10 80 0.16 7
8 Musa acuminata 10 160 23.48 31
9 Myrsine semiserrata 5 100 0.31 5
10 Oxyspora paniculata 25 440 2.77 27
11 Phragmites karka 20 280 2.00 19
12 Piper clarkei 20 300 1.35 19
13 Rubus ellipticus 10 100 0.27 8
14 Saccharum spontaneum 15 280 2.18 17
15 Saxifraga aspera 10 160 3.30 12
16 Ficus heterophylla 25 140 12.84 27
17 Trevesia palmata 25 100 4.88 18
18 Solanum viarum 5 80 0.28 5
Table 6.39: Community structure –Site V12 (Herbs)
S.No. Scientific Name Frequency
(%) Density
(ind./ha) IVI
1 Abutilon indicum 11 1667 4.22 2 Ageratum conyzoides 22 10000 14.21 3 Begonia palmata 17 3333 7.05 4 Blumea procera 11 2778 5.18 5 Commelina benghalensis 17 6111 9.46 6 Cyanotis vaga 22 2778 7.96 7 Cynodon dactylon 22 7222 11.81 8 Cyperus rotundus 17 2778 6.57 9 Fragaria indica 22 6111 10.84 10 Impatiens acuminata 11 2778 5.18 11 Impatiens acuminata 11 3333 5.66 12 Iris domestica 17 4444 8.01 13 Justicia khasiana 17 2778 6.57 14 Lecanthes peduncularis 6 4444 5.24 15 Pogostemon amaranthoides 17 5556 8.97 16 Polygonum capitatum 22 7778 12.29 17 Polygonum flaccidum 17 5556 8.97 18 Polystichum lentum 28 10000 15.60 19 Selaginella picta 11 2778 5.18 20 Solanum indicum 17 4444 8.01 21 Strobilanthes thomsonii 17 1667 5.61 22 Thysanolaena maxima 22 10000 14.21 23 Woodwardia unigemmata 28 7222 13.19
Site V13: Left bank of Emra River near proposed Emra-II HEP
To analyze the status of vegetation in the project area of proposed of Emra-II hydroelectric
Power Project sampling was carried out near proposed dam site.
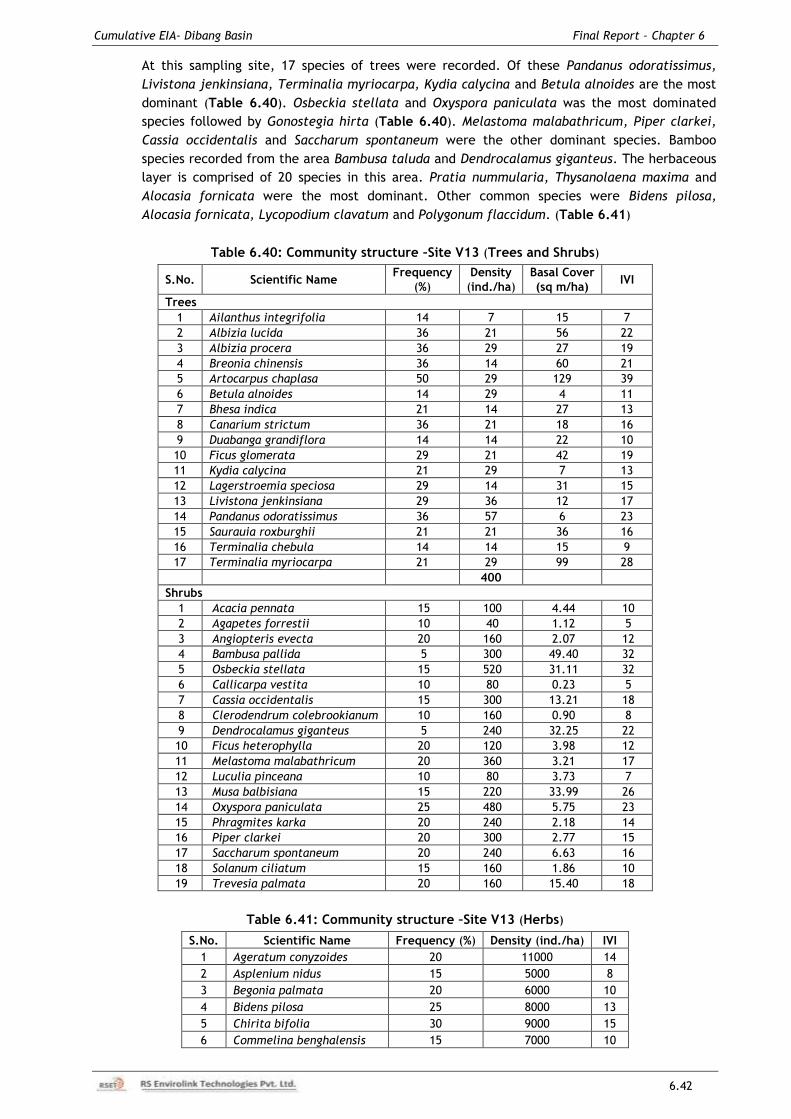
Cumulative EIA- Dibang Basin Final Report – Chapter 6
6.42
At this sampling site, 17 species of trees were recorded. Of these Pandanus odoratissimus,
Livistona jenkinsiana, Terminalia myriocarpa, Kydia calycina and Betula alnoides are the most
dominant (Table 6.40). Osbeckia stellata and Oxyspora paniculata was the most dominated
species followed by Gonostegia hirta (Table 6.40). Melastoma malabathricum, Piper clarkei,
Cassia occidentalis and Saccharum spontaneum were the other dominant species. Bamboo
species recorded from the area Bambusa taluda and Dendrocalamus giganteus. The herbaceous
layer is comprised of 20 species in this area. Pratia nummularia, Thysanolaena maxima and
Alocasia fornicata were the most dominant. Other common species were Bidens pilosa,
Alocasia fornicata, Lycopodium clavatum and Polygonum flaccidum. (Table 6.41)
Table 6.40: Community structure –Site V13 (Trees and Shrubs)
S.No. Scientific Name Frequency
(%)
Density
(ind./ha)
Basal Cover
(sq m/ha) IVI
Trees
1 Ailanthus integrifolia 14 7 15 7
2 Albizia lucida 36 21 56 22
3 Albizia procera 36 29 27 19
4 Breonia chinensis 36 14 60 21
5 Artocarpus chaplasa 50 29 129 39
6 Betula alnoides 14 29 4 11
7 Bhesa indica 21 14 27 13
8 Canarium strictum 36 21 18 16
9 Duabanga grandiflora 14 14 22 10
10 Ficus glomerata 29 21 42 19
11 Kydia calycina 21 29 7 13
12 Lagerstroemia speciosa 29 14 31 15
13 Livistona jenkinsiana 29 36 12 17
14 Pandanus odoratissimus 36 57 6 23
15 Saurauia roxburghii 21 21 36 16
16 Terminalia chebula 14 14 15 9
17 Terminalia myriocarpa 21 29 99 28
400
Shrubs
1 Acacia pennata 15 100 4.44 10
2 Agapetes forrestii 10 40 1.12 5
3 Angiopteris evecta 20 160 2.07 12
4 Bambusa pallida 5 300 49.40 32
5 Osbeckia stellata 15 520 31.11 32
6 Callicarpa vestita 10 80 0.23 5
7 Cassia occidentalis 15 300 13.21 18
8 Clerodendrum colebrookianum 10 160 0.90 8
9 Dendrocalamus giganteus 5 240 32.25 22
10 Ficus heterophylla 20 120 3.98 12
11 Melastoma malabathricum 20 360 3.21 17
12 Luculia pinceana 10 80 3.73 7
13 Musa balbisiana 15 220 33.99 26
14 Oxyspora paniculata 25 480 5.75 23
15 Phragmites karka 20 240 2.18 14
16 Piper clarkei 20 300 2.77 15
17 Saccharum spontaneum 20 240 6.63 16
18 Solanum ciliatum 15 160 1.86 10
19 Trevesia palmata 20 160 15.40 18
Table 6.41: Community structure –Site V13 (Herbs)
S.No. Scientific Name Frequency (%) Density (ind./ha) IVI
1 Ageratum conyzoides 20 11000 14
2 Asplenium nidus 15 5000 8
3 Begonia palmata 20 6000 10
4 Bidens pilosa 25 8000 13
5 Chirita bifolia 30 9000 15
6 Commelina benghalensis 15 7000 10
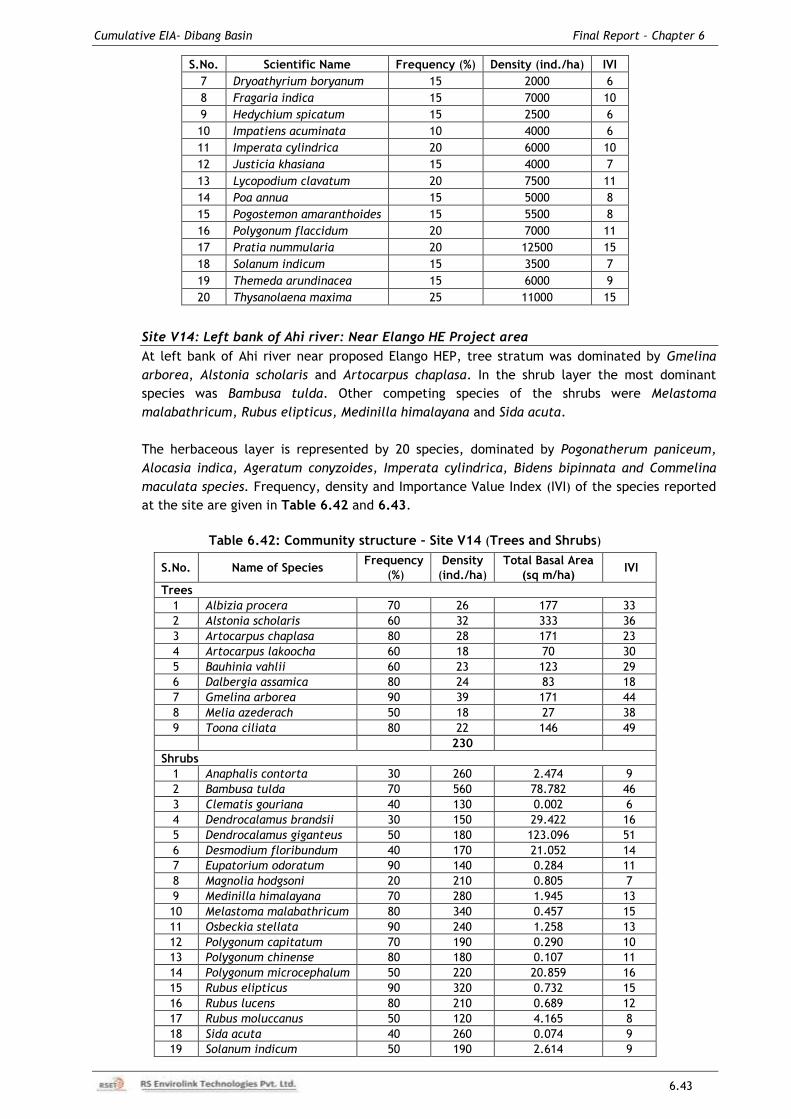
Cumulative EIA- Dibang Basin Final Report – Chapter 6
6.43
S.No. Scientific Name Frequency (%) Density (ind./ha) IVI
7 Dryoathyrium boryanum 15 2000 6
8 Fragaria indica 15 7000 10
9 Hedychium spicatum 15 2500 6
10 Impatiens acuminata 10 4000 6
11 Imperata cylindrica 20 6000 10
12 Justicia khasiana 15 4000 7
13 Lycopodium clavatum 20 7500 11
14 Poa annua 15 5000 8
15 Pogostemon amaranthoides 15 5500 8
16 Polygonum flaccidum 20 7000 11
17 Pratia nummularia 20 12500 15
18 Solanum indicum 15 3500 7
19 Themeda arundinacea 15 6000 9
20 Thysanolaena maxima 25 11000 15
Site V14: Left bank of Ahi river: Near Elango HE Project area
At left bank of Ahi river near proposed Elango HEP, tree stratum was dominated by Gmelina
arborea, Alstonia scholaris and Artocarpus chaplasa. In the shrub layer the most dominant
species was Bambusa tulda. Other competing species of the shrubs were Melastoma
malabathricum, Rubus elipticus, Medinilla himalayana and Sida acuta.
The herbaceous layer is represented by 20 species, dominated by Pogonatherum paniceum,
Alocasia indica, Ageratum conyzoides, Imperata cylindrica, Bidens bipinnata and Commelina
maculata species. Frequency, density and Importance Value Index (IVI) of the species reported
at the site are given in Table 6.42 and 6.43.
Table 6.42: Community structure – Site V14 (Trees and Shrubs)
S.No. Name of Species Frequency
(%)
Density
(ind./ha)
Total Basal Area
(sq m/ha) IVI
Trees
1 Albizia procera 70 26 177 33
2 Alstonia scholaris 60 32 333 36
3 Artocarpus chaplasa 80 28 171 23
4 Artocarpus lakoocha 60 18 70 30
5 Bauhinia vahlii 60 23 123 29
6 Dalbergia assamica 80 24 83 18
7 Gmelina arborea 90 39 171 44
8 Melia azederach 50 18 27 38
9 Toona ciliata 80 22 146 49
230
Shrubs
1 Anaphalis contorta 30 260 2.474 9
2 Bambusa tulda 70 560 78.782 46
3 Clematis gouriana 40 130 0.002 6
4 Dendrocalamus brandsii 30 150 29.422 16
5 Dendrocalamus giganteus 50 180 123.096 51
6 Desmodium floribundum 40 170 21.052 14
7 Eupatorium odoratum 90 140 0.284 11
8 Magnolia hodgsoni 20 210 0.805 7
9 Medinilla himalayana 70 280 1.945 13
10 Melastoma malabathricum 80 340 0.457 15
11 Osbeckia stellata 90 240 1.258 13
12 Polygonum capitatum 70 190 0.290 10
13 Polygonum chinense 80 180 0.107 11
14 Polygonum microcephalum 50 220 20.859 16
15 Rubus elipticus 90 320 0.732 15
16 Rubus lucens 80 210 0.689 12
17 Rubus moluccanus 50 120 4.165 8
18 Sida acuta 40 260 0.074 9
19 Solanum indicum 50 190 2.614 9
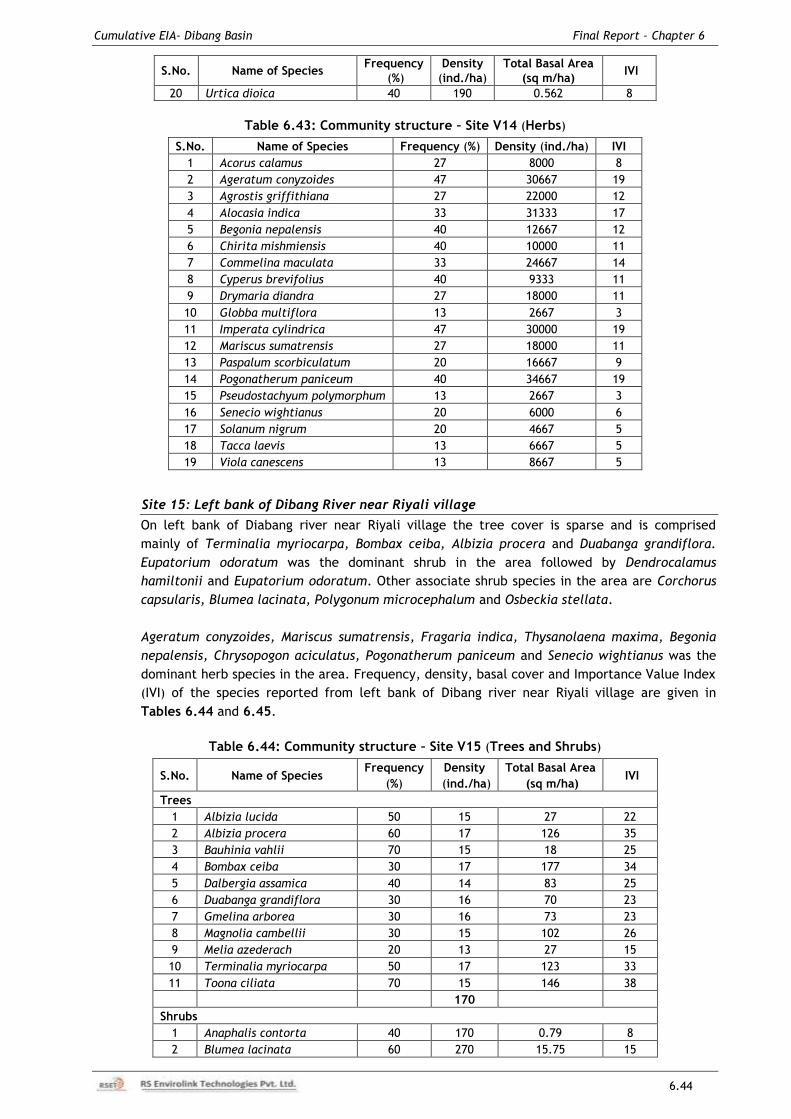
Cumulative EIA- Dibang Basin Final Report – Chapter 6
6.44
S.No. Name of Species Frequency
(%)
Density
(ind./ha)
Total Basal Area
(sq m/ha) IVI
20 Urtica dioica 40 190 0.562 8
Table 6.43: Community structure – Site V14 (Herbs)
S.No. Name of Species Frequency (%) Density (ind./ha) IVI
1 Acorus calamus 27 8000 8
2 Ageratum conyzoides 47 30667 19
3 Agrostis griffithiana 27 22000 12
4 Alocasia indica 33 31333 17
5 Begonia nepalensis 40 12667 12
6 Chirita mishmiensis 40 10000 11
7 Commelina maculata 33 24667 14
8 Cyperus brevifolius 40 9333 11
9 Drymaria diandra 27 18000 11
10 Globba multiflora 13 2667 3
11 Imperata cylindrica 47 30000 19
12 Mariscus sumatrensis 27 18000 11
13 Paspalum scorbiculatum 20 16667 9
14 Pogonatherum paniceum 40 34667 19
15 Pseudostachyum polymorphum 13 2667 3
16 Senecio wightianus 20 6000 6
17 Solanum nigrum 20 4667 5
18 Tacca laevis 13 6667 5
19 Viola canescens 13 8667 5
Site 15: Left bank of Dibang River near Riyali village
On left bank of Diabang river near Riyali village the tree cover is sparse and is comprised
mainly of Terminalia myriocarpa, Bombax ceiba, Albizia procera and Duabanga grandiflora.
Eupatorium odoratum was the dominant shrub in the area followed by Dendrocalamus
hamiltonii and Eupatorium odoratum. Other associate shrub species in the area are Corchorus
capsularis, Blumea lacinata, Polygonum microcephalum and Osbeckia stellata.
Ageratum conyzoides, Mariscus sumatrensis, Fragaria indica, Thysanolaena maxima, Begonia
nepalensis, Chrysopogon aciculatus, Pogonatherum paniceum and Senecio wightianus was the
dominant herb species in the area. Frequency, density, basal cover and Importance Value Index
(IVI) of the species reported from left bank of Dibang river near Riyali village are given in
Tables 6.44 and 6.45.
Table 6.44: Community structure – Site V15 (Trees and Shrubs)
S.No. Name of Species Frequency
(%)
Density
(ind./ha)
Total Basal Area
(sq m/ha) IVI
Trees
1 Albizia lucida 50 15 27 22
2 Albizia procera 60 17 126 35
3 Bauhinia vahlii 70 15 18 25
4 Bombax ceiba 30 17 177 34
5 Dalbergia assamica 40 14 83 25
6 Duabanga grandiflora 30 16 70 23
7 Gmelina arborea 30 16 73 23
8 Magnolia cambellii 30 15 102 26
9 Melia azederach 20 13 27 15
10 Terminalia myriocarpa 50 17 123 33
11 Toona ciliata 70 15 146 38
170
Shrubs
1 Anaphalis contorta 40 170 0.79 8
2 Blumea lacinata 60 270 15.75 15
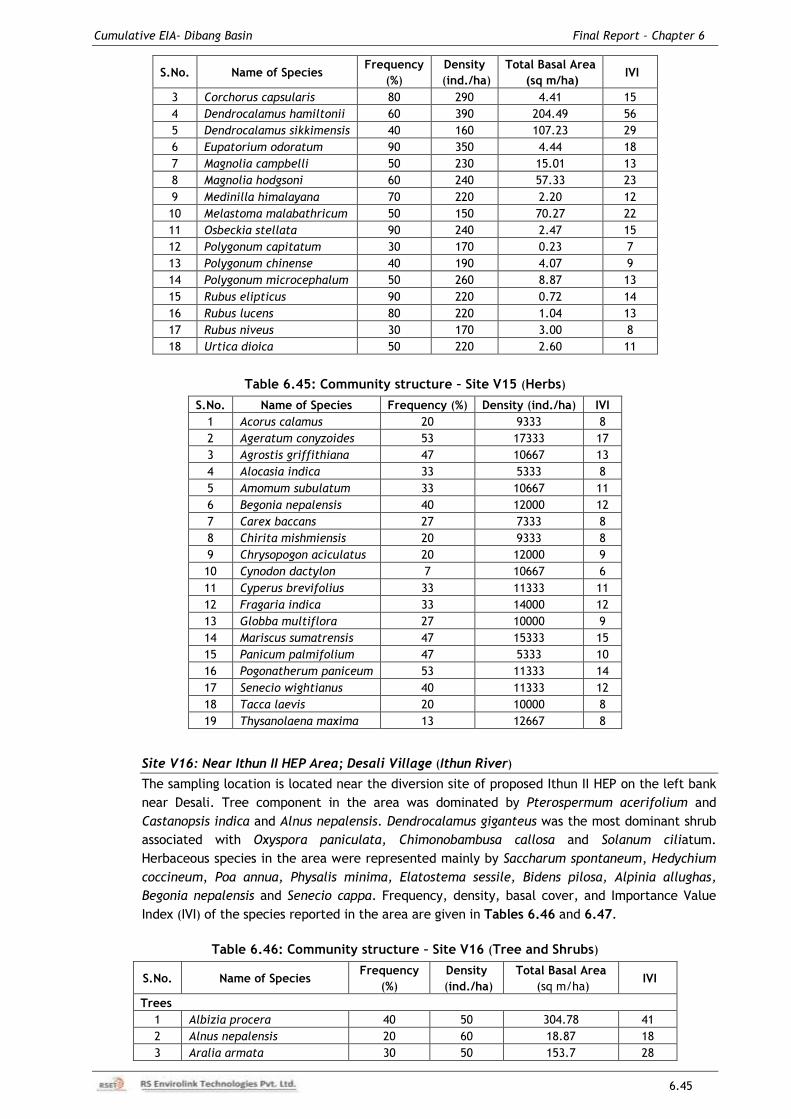
Cumulative EIA- Dibang Basin Final Report – Chapter 6
6.45
S.No. Name of Species Frequency
(%)
Density
(ind./ha)
Total Basal Area
(sq m/ha) IVI
3 Corchorus capsularis 80 290 4.41 15
4 Dendrocalamus hamiltonii 60 390 204.49 56
5 Dendrocalamus sikkimensis 40 160 107.23 29
6 Eupatorium odoratum 90 350 4.44 18
7 Magnolia campbelli 50 230 15.01 13
8 Magnolia hodgsoni 60 240 57.33 23
9 Medinilla himalayana 70 220 2.20 12
10 Melastoma malabathricum 50 150 70.27 22
11 Osbeckia stellata 90 240 2.47 15
12 Polygonum capitatum 30 170 0.23 7
13 Polygonum chinense 40 190 4.07 9
14 Polygonum microcephalum 50 260 8.87 13
15 Rubus elipticus 90 220 0.72 14
16 Rubus lucens 80 220 1.04 13
17 Rubus niveus 30 170 3.00 8
18 Urtica dioica 50 220 2.60 11
Table 6.45: Community structure – Site V15 (Herbs)
S.No. Name of Species Frequency (%) Density (ind./ha) IVI
1 Acorus calamus 20 9333 8
2 Ageratum conyzoides 53 17333 17
3 Agrostis griffithiana 47 10667 13
4 Alocasia indica 33 5333 8
5 Amomum subulatum 33 10667 11
6 Begonia nepalensis 40 12000 12
7 Carex baccans 27 7333 8
8 Chirita mishmiensis 20 9333 8
9 Chrysopogon aciculatus 20 12000 9
10 Cynodon dactylon 7 10667 6
11 Cyperus brevifolius 33 11333 11
12 Fragaria indica 33 14000 12
13 Globba multiflora 27 10000 9
14 Mariscus sumatrensis 47 15333 15
15 Panicum palmifolium 47 5333 10
16 Pogonatherum paniceum 53 11333 14
17 Senecio wightianus 40 11333 12
18 Tacca laevis 20 10000 8
19 Thysanolaena maxima 13 12667 8
Site V16: Near Ithun II HEP Area; Desali Village (Ithun River)
The sampling location is located near the diversion site of proposed Ithun II HEP on the left bank
near Desali. Tree component in the area was dominated by Pterospermum acerifolium and
Castanopsis indica and Alnus nepalensis. Dendrocalamus giganteus was the most dominant shrub
associated with Oxyspora paniculata, Chimonobambusa callosa and Solanum ciliatum.
Herbaceous species in the area were represented mainly by Saccharum spontaneum, Hedychium
coccineum, Poa annua, Physalis minima, Elatostema sessile, Bidens pilosa, Alpinia allughas,
Begonia nepalensis and Senecio cappa. Frequency, density, basal cover, and Importance Value
Index (IVI) of the species reported in the area are given in Tables 6.46 and 6.47.
Table 6.46: Community structure – Site V16 (Tree and Shrubs)
S.No. Name of Species Frequency
(%)
Density
(ind./ha)
Total Basal Area
(sq m/ha) IVI
Trees
1 Albizia procera 40 50 304.78 41
2 Alnus nepalensis 20 60 18.87 18
3 Aralia armata 30 50 153.7 28
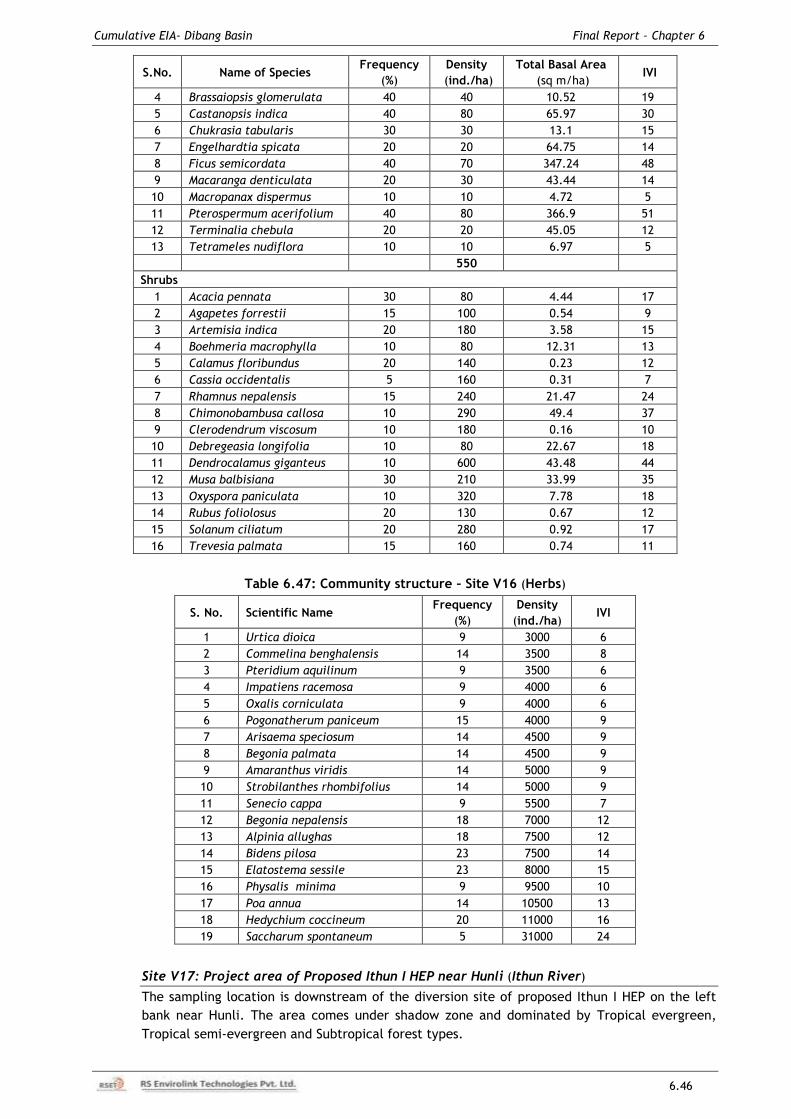
Cumulative EIA- Dibang Basin Final Report – Chapter 6
6.46
S.No. Name of Species Frequency
(%)
Density
(ind./ha)
Total Basal Area
(sq m/ha) IVI
4 Brassaiopsis glomerulata 40 40 10.52 19
5 Castanopsis indica 40 80 65.97 30
6 Chukrasia tabularis 30 30 13.1 15
7 Engelhardtia spicata 20 20 64.75 14
8 Ficus semicordata 40 70 347.24 48
9 Macaranga denticulata 20 30 43.44 14
10 Macropanax dispermus 10 10 4.72 5
11 Pterospermum acerifolium 40 80 366.9 51
12 Terminalia chebula 20 20 45.05 12
13 Tetrameles nudiflora 10 10 6.97 5
550
Shrubs
1 Acacia pennata 30 80 4.44 17
2 Agapetes forrestii 15 100 0.54 9
3 Artemisia indica 20 180 3.58 15
4 Boehmeria macrophylla 10 80 12.31 13
5 Calamus floribundus 20 140 0.23 12
6 Cassia occidentalis 5 160 0.31 7
7 Rhamnus nepalensis 15 240 21.47 24
8 Chimonobambusa callosa 10 290 49.4 37
9 Clerodendrum viscosum 10 180 0.16 10
10 Debregeasia longifolia 10 80 22.67 18
11 Dendrocalamus giganteus 10 600 43.48 44
12 Musa balbisiana 30 210 33.99 35
13 Oxyspora paniculata 10 320 7.78 18
14 Rubus foliolosus 20 130 0.67 12
15 Solanum ciliatum 20 280 0.92 17
16 Trevesia palmata 15 160 0.74 11
Table 6.47: Community structure – Site V16 (Herbs)
S. No. Scientific Name Frequency
(%)
Density
(ind./ha) IVI
1 Urtica dioica 9 3000 6
2 Commelina benghalensis 14 3500 8
3 Pteridium aquilinum 9 3500 6
4 Impatiens racemosa 9 4000 6
5 Oxalis corniculata 9 4000 6
6 Pogonatherum paniceum 15 4000 9
7 Arisaema speciosum 14 4500 9
8 Begonia palmata 14 4500 9
9 Amaranthus viridis 14 5000 9
10 Strobilanthes rhombifolius 14 5000 9
11 Senecio cappa 9 5500 7
12 Begonia nepalensis 18 7000 12
13 Alpinia allughas 18 7500 12
14 Bidens pilosa 23 7500 14
15 Elatostema sessile 23 8000 15
16 Physalis minima 9 9500 10
17 Poa annua 14 10500 13
18 Hedychium coccineum 20 11000 16
19 Saccharum spontaneum 5 31000 24
Site V17: Project area of Proposed Ithun I HEP near Hunli (Ithun River)
The sampling location is downstream of the diversion site of proposed Ithun I HEP on the left
bank near Hunli. The area comes under shadow zone and dominated by Tropical evergreen,
Tropical semi-evergreen and Subtropical forest types.
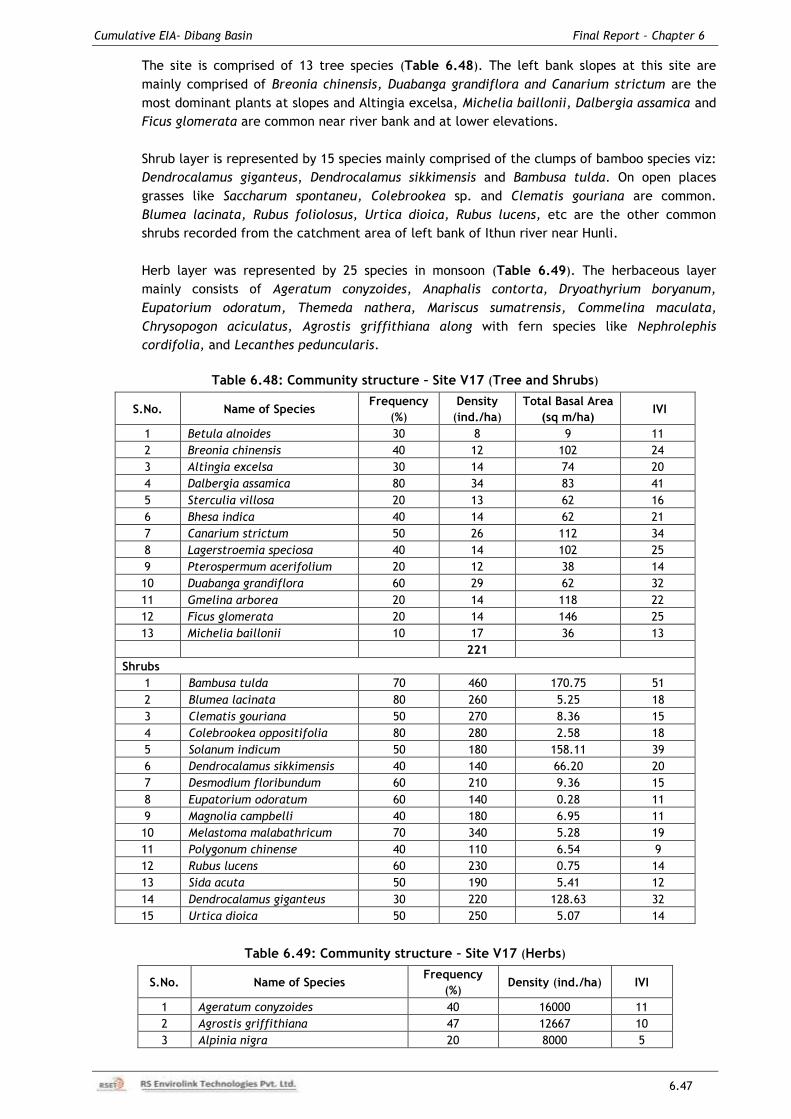
Cumulative EIA- Dibang Basin Final Report – Chapter 6
6.47
The site is comprised of 13 tree species (Table 6.48). The left bank slopes at this site are
mainly comprised of Breonia chinensis, Duabanga grandiflora and Canarium strictum are the
most dominant plants at slopes and Altingia excelsa, Michelia baillonii, Dalbergia assamica and
Ficus glomerata are common near river bank and at lower elevations.
Shrub layer is represented by 15 species mainly comprised of the clumps of bamboo species viz:
Dendrocalamus giganteus, Dendrocalamus sikkimensis and Bambusa tulda. On open places
grasses like Saccharum spontaneu, Colebrookea sp. and Clematis gouriana are common.
Blumea lacinata, Rubus foliolosus, Urtica dioica, Rubus lucens, etc are the other common
shrubs recorded from the catchment area of left bank of Ithun river near Hunli.
Herb layer was represented by 25 species in monsoon (Table 6.49). The herbaceous layer
mainly consists of Ageratum conyzoides, Anaphalis contorta, Dryoathyrium boryanum,
Eupatorium odoratum, Themeda nathera, Mariscus sumatrensis, Commelina maculata,
Chrysopogon aciculatus, Agrostis griffithiana along with fern species like Nephrolephis
cordifolia, and Lecanthes peduncularis.
Table 6.48: Community structure – Site V17 (Tree and Shrubs)
S.No. Name of Species Frequency
(%)
Density
(ind./ha)
Total Basal Area
(sq m/ha) IVI
1 Betula alnoides 30 8 9 11
2 Breonia chinensis 40 12 102 24
3 Altingia excelsa 30 14 74 20
4 Dalbergia assamica 80 34 83 41
5 Sterculia villosa 20 13 62 16
6 Bhesa indica 40 14 62 21
7 Canarium strictum 50 26 112 34
8 Lagerstroemia speciosa 40 14 102 25
9 Pterospermum acerifolium 20 12 38 14
10 Duabanga grandiflora 60 29 62 32
11 Gmelina arborea 20 14 118 22
12 Ficus glomerata 20 14 146 25
13 Michelia baillonii 10 17 36 13
221
Shrubs
1 Bambusa tulda 70 460 170.75 51
2 Blumea lacinata 80 260 5.25 18
3 Clematis gouriana 50 270 8.36 15
4 Colebrookea oppositifolia 80 280 2.58 18
5 Solanum indicum 50 180 158.11 39
6 Dendrocalamus sikkimensis 40 140 66.20 20
7 Desmodium floribundum 60 210 9.36 15
8 Eupatorium odoratum 60 140 0.28 11
9 Magnolia campbelli 40 180 6.95 11
10 Melastoma malabathricum 70 340 5.28 19
11 Polygonum chinense 40 110 6.54 9
12 Rubus lucens 60 230 0.75 14
13 Sida acuta 50 190 5.41 12
14 Dendrocalamus giganteus 30 220 128.63 32
15 Urtica dioica 50 250 5.07 14
Table 6.49: Community structure – Site V17 (Herbs)
S.No. Name of Species Frequency
(%) Density (ind./ha) IVI
1 Ageratum conyzoides 40 16000 11
2 Agrostis griffithiana 47 12667 10
3 Alpinia nigra 20 8000 5
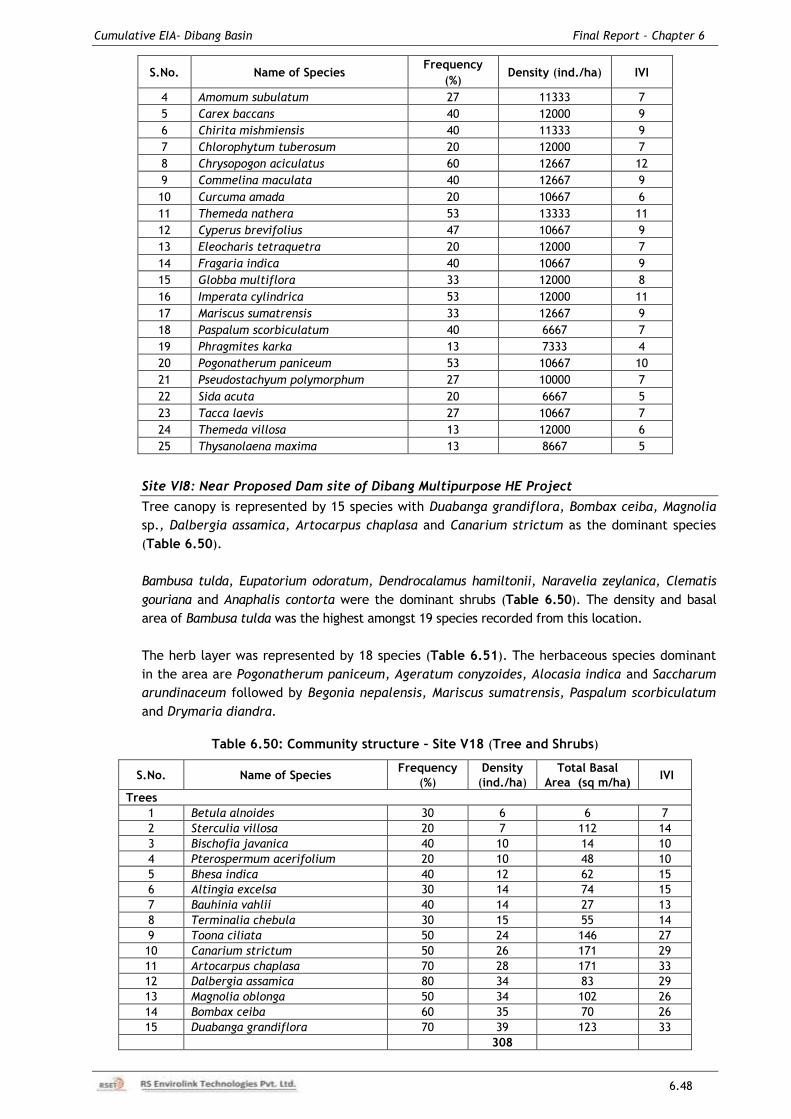
Cumulative EIA- Dibang Basin Final Report – Chapter 6
6.48
S.No. Name of Species Frequency
(%) Density (ind./ha) IVI
4 Amomum subulatum 27 11333 7
5 Carex baccans 40 12000 9
6 Chirita mishmiensis 40 11333 9
7 Chlorophytum tuberosum 20 12000 7
8 Chrysopogon aciculatus 60 12667 12
9 Commelina maculata 40 12667 9
10 Curcuma amada 20 10667 6
11 Themeda nathera 53 13333 11
12 Cyperus brevifolius 47 10667 9
13 Eleocharis tetraquetra 20 12000 7
14 Fragaria indica 40 10667 9
15 Globba multiflora 33 12000 8
16 Imperata cylindrica 53 12000 11
17 Mariscus sumatrensis 33 12667 9
18 Paspalum scorbiculatum 40 6667 7
19 Phragmites karka 13 7333 4
20 Pogonatherum paniceum 53 10667 10
21 Pseudostachyum polymorphum 27 10000 7
22 Sida acuta 20 6667 5
23 Tacca laevis 27 10667 7
24 Themeda villosa 13 12000 6
25 Thysanolaena maxima 13 8667 5
Site VI8: Near Proposed Dam site of Dibang Multipurpose HE Project
Tree canopy is represented by 15 species with Duabanga grandiflora, Bombax ceiba, Magnolia
sp., Dalbergia assamica, Artocarpus chaplasa and Canarium strictum as the dominant species
(Table 6.50).
Bambusa tulda, Eupatorium odoratum, Dendrocalamus hamiltonii, Naravelia zeylanica, Clematis
gouriana and Anaphalis contorta were the dominant shrubs (Table 6.50). The density and basal
area of Bambusa tulda was the highest amongst 19 species recorded from this location.
The herb layer was represented by 18 species (Table 6.51). The herbaceous species dominant
in the area are Pogonatherum paniceum, Ageratum conyzoides, Alocasia indica and Saccharum
arundinaceum followed by Begonia nepalensis, Mariscus sumatrensis, Paspalum scorbiculatum
and Drymaria diandra.
Table 6.50: Community structure – Site V18 (Tree and Shrubs)
S.No. Name of Species Frequency
(%)
Density
(ind./ha)
Total Basal
Area (sq m/ha) IVI
Trees
1 Betula alnoides 30 6 6 7
2 Sterculia villosa 20 7 112 14
3 Bischofia javanica 40 10 14 10
4 Pterospermum acerifolium 20 10 48 10
5 Bhesa indica 40 12 62 15
6 Altingia excelsa 30 14 74 15
7 Bauhinia vahlii 40 14 27 13
8 Terminalia chebula 30 15 55 14
9 Toona ciliata 50 24 146 27
10 Canarium strictum 50 26 171 29
11 Artocarpus chaplasa 70 28 171 33
12 Dalbergia assamica 80 34 83 29
13 Magnolia oblonga 50 34 102 26
14 Bombax ceiba 60 35 70 26
15 Duabanga grandiflora 70 39 123 33
308
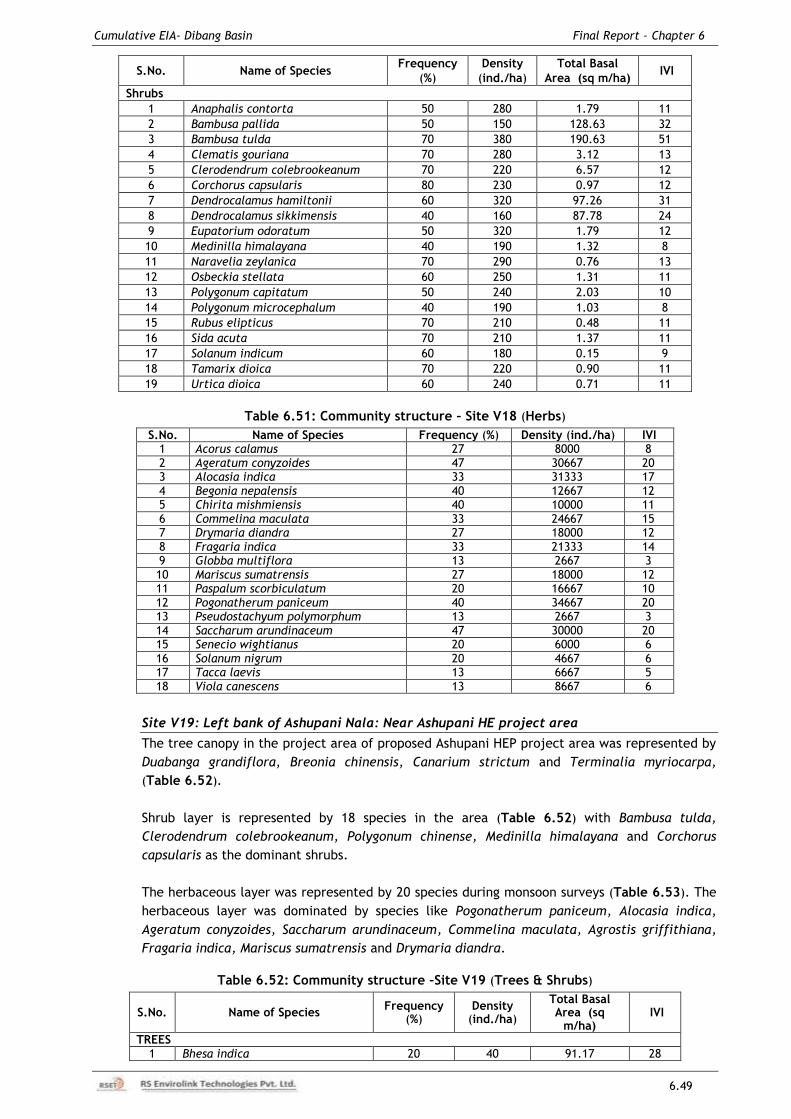
Cumulative EIA- Dibang Basin Final Report – Chapter 6
6.49
S.No. Name of Species Frequency
(%)
Density
(ind./ha)
Total Basal
Area (sq m/ha) IVI
Shrubs
1 Anaphalis contorta 50 280 1.79 11
2 Bambusa pallida 50 150 128.63 32
3 Bambusa tulda 70 380 190.63 51
4 Clematis gouriana 70 280 3.12 13
5 Clerodendrum colebrookeanum 70 220 6.57 12
6 Corchorus capsularis 80 230 0.97 12
7 Dendrocalamus hamiltonii 60 320 97.26 31
8 Dendrocalamus sikkimensis 40 160 87.78 24
9 Eupatorium odoratum 50 320 1.79 12
10 Medinilla himalayana 40 190 1.32 8
11 Naravelia zeylanica 70 290 0.76 13
12 Osbeckia stellata 60 250 1.31 11
13 Polygonum capitatum 50 240 2.03 10
14 Polygonum microcephalum 40 190 1.03 8
15 Rubus elipticus 70 210 0.48 11
16 Sida acuta 70 210 1.37 11
17 Solanum indicum 60 180 0.15 9
18 Tamarix dioica 70 220 0.90 11
19 Urtica dioica 60 240 0.71 11
Table 6.51: Community structure – Site V18 (Herbs)
S.No. Name of Species Frequency (%) Density (ind./ha) IVI 1 Acorus calamus 27 8000 8 2 Ageratum conyzoides 47 30667 20 3 Alocasia indica 33 31333 17 4 Begonia nepalensis 40 12667 12 5 Chirita mishmiensis 40 10000 11 6 Commelina maculata 33 24667 15 7 Drymaria diandra 27 18000 12 8 Fragaria indica 33 21333 14 9 Globba multiflora 13 2667 3 10 Mariscus sumatrensis 27 18000 12 11 Paspalum scorbiculatum 20 16667 10 12 Pogonatherum paniceum 40 34667 20 13 Pseudostachyum polymorphum 13 2667 3 14 Saccharum arundinaceum 47 30000 20 15 Senecio wightianus 20 6000 6 16 Solanum nigrum 20 4667 6 17 Tacca laevis 13 6667 5 18 Viola canescens 13 8667 6
Site V19: Left bank of Ashupani Nala: Near Ashupani HE project area
The tree canopy in the project area of proposed Ashupani HEP project area was represented by
Duabanga grandiflora, Breonia chinensis, Canarium strictum and Terminalia myriocarpa,
(Table 6.52).
Shrub layer is represented by 18 species in the area (Table 6.52) with Bambusa tulda,
Clerodendrum colebrookeanum, Polygonum chinense, Medinilla himalayana and Corchorus
capsularis as the dominant shrubs.
The herbaceous layer was represented by 20 species during monsoon surveys (Table 6.53). The
herbaceous layer was dominated by species like Pogonatherum paniceum, Alocasia indica,
Ageratum conyzoides, Saccharum arundinaceum, Commelina maculata, Agrostis griffithiana,
Fragaria indica, Mariscus sumatrensis and Drymaria diandra.
Table 6.52: Community structure –Site V19 (Trees & Shrubs)
S.No. Name of Species Frequency
(%) Density
(ind./ha)
Total Basal Area (sq
m/ha) IVI
TREES 1 Bhesa indica 20 40 91.17 28
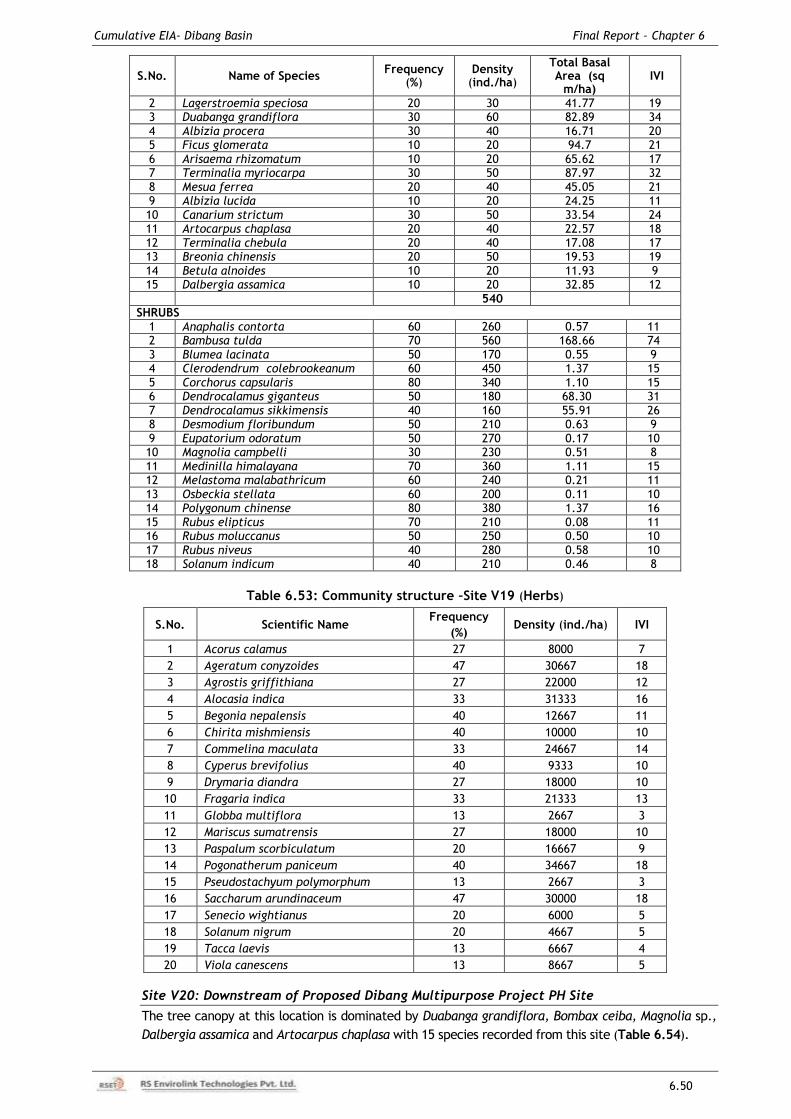
Cumulative EIA- Dibang Basin Final Report – Chapter 6
6.50
S.No. Name of Species Frequency
(%) Density
(ind./ha)
Total Basal Area (sq
m/ha) IVI
2 Lagerstroemia speciosa 20 30 41.77 19 3 Duabanga grandiflora 30 60 82.89 34 4 Albizia procera 30 40 16.71 20 5 Ficus glomerata 10 20 94.7 21 6 Arisaema rhizomatum 10 20 65.62 17 7 Terminalia myriocarpa 30 50 87.97 32 8 Mesua ferrea 20 40 45.05 21 9 Albizia lucida 10 20 24.25 11 10 Canarium strictum 30 50 33.54 24 11 Artocarpus chaplasa 20 40 22.57 18 12 Terminalia chebula 20 40 17.08 17 13 Breonia chinensis 20 50 19.53 19 14 Betula alnoides 10 20 11.93 9 15 Dalbergia assamica 10 20 32.85 12 540
SHRUBS 1 Anaphalis contorta 60 260 0.57 11 2 Bambusa tulda 70 560 168.66 74 3 Blumea lacinata 50 170 0.55 9 4 Clerodendrum colebrookeanum 60 450 1.37 15 5 Corchorus capsularis 80 340 1.10 15 6 Dendrocalamus giganteus 50 180 68.30 31 7 Dendrocalamus sikkimensis 40 160 55.91 26 8 Desmodium floribundum 50 210 0.63 9 9 Eupatorium odoratum 50 270 0.17 10 10 Magnolia campbelli 30 230 0.51 8 11 Medinilla himalayana 70 360 1.11 15 12 Melastoma malabathricum 60 240 0.21 11 13 Osbeckia stellata 60 200 0.11 10 14 Polygonum chinense 80 380 1.37 16 15 Rubus elipticus 70 210 0.08 11 16 Rubus moluccanus 50 250 0.50 10 17 Rubus niveus 40 280 0.58 10 18 Solanum indicum 40 210 0.46 8
Table 6.53: Community structure –Site V19 (Herbs)
S.No. Scientific Name Frequency
(%) Density (ind./ha) IVI
1 Acorus calamus 27 8000 7
2 Ageratum conyzoides 47 30667 18
3 Agrostis griffithiana 27 22000 12
4 Alocasia indica 33 31333 16
5 Begonia nepalensis 40 12667 11
6 Chirita mishmiensis 40 10000 10
7 Commelina maculata 33 24667 14
8 Cyperus brevifolius 40 9333 10
9 Drymaria diandra 27 18000 10
10 Fragaria indica 33 21333 13
11 Globba multiflora 13 2667 3
12 Mariscus sumatrensis 27 18000 10
13 Paspalum scorbiculatum 20 16667 9
14 Pogonatherum paniceum 40 34667 18
15 Pseudostachyum polymorphum 13 2667 3
16 Saccharum arundinaceum 47 30000 18
17 Senecio wightianus 20 6000 5
18 Solanum nigrum 20 4667 5
19 Tacca laevis 13 6667 4
20 Viola canescens 13 8667 5
Site V20: Downstream of Proposed Dibang Multipurpose Project PH Site
The tree canopy at this location is dominated by Duabanga grandiflora, Bombax ceiba, Magnolia sp.,
Dalbergia assamica and Artocarpus chaplasa with 15 species recorded from this site (Table 6.54).
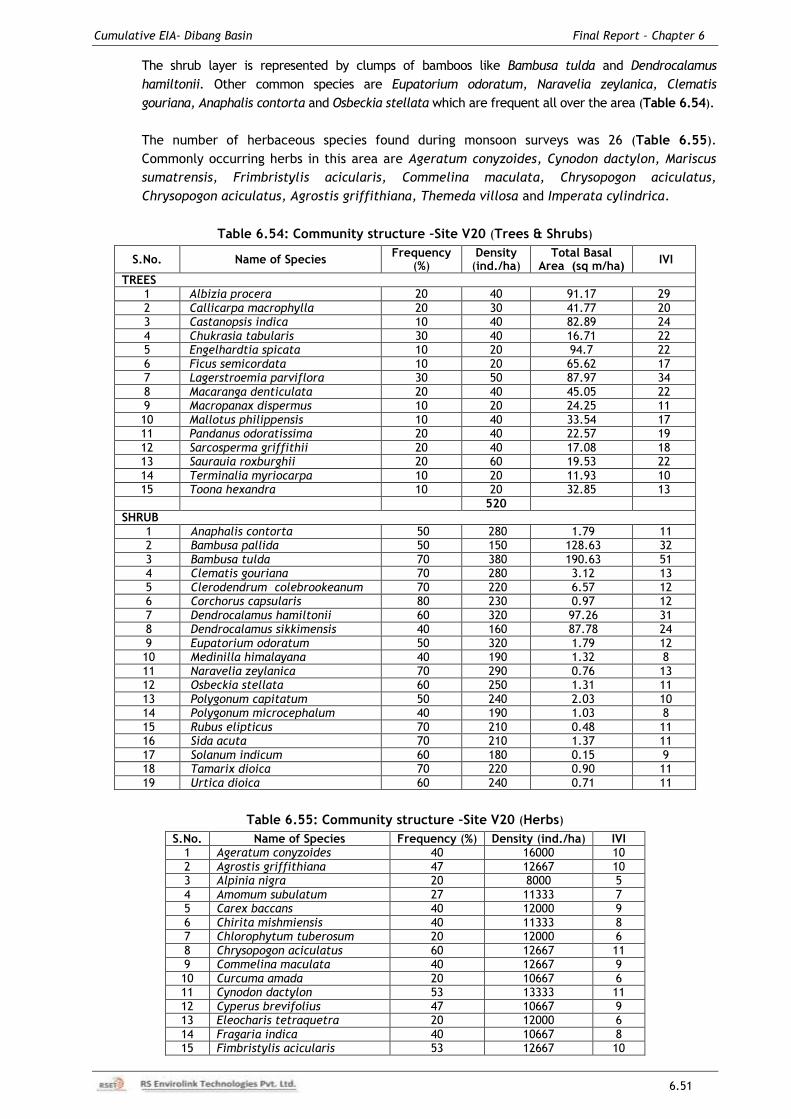
Cumulative EIA- Dibang Basin Final Report – Chapter 6
6.51
The shrub layer is represented by clumps of bamboos like Bambusa tulda and Dendrocalamus
hamiltonii. Other common species are Eupatorium odoratum, Naravelia zeylanica, Clematis
gouriana, Anaphalis contorta and Osbeckia stellata which are frequent all over the area (Table 6.54).
The number of herbaceous species found during monsoon surveys was 26 (Table 6.55).
Commonly occurring herbs in this area are Ageratum conyzoides, Cynodon dactylon, Mariscus
sumatrensis, Frimbristylis acicularis, Commelina maculata, Chrysopogon aciculatus,
Chrysopogon aciculatus, Agrostis griffithiana, Themeda villosa and Imperata cylindrica.
Table 6.54: Community structure –Site V20 (Trees & Shrubs)
S.No. Name of Species Frequency
(%) Density
(ind./ha) Total Basal
Area (sq m/ha) IVI
TREES 1 Albizia procera 20 40 91.17 29 2 Callicarpa macrophylla 20 30 41.77 20 3 Castanopsis indica 10 40 82.89 24 4 Chukrasia tabularis 30 40 16.71 22 5 Engelhardtia spicata 10 20 94.7 22 6 Ficus semicordata 10 20 65.62 17 7 Lagerstroemia parviflora 30 50 87.97 34 8 Macaranga denticulata 20 40 45.05 22 9 Macropanax dispermus 10 20 24.25 11 10 Mallotus philippensis 10 40 33.54 17 11 Pandanus odoratissima 20 40 22.57 19 12 Sarcosperma griffithii 20 40 17.08 18 13 Saurauia roxburghii 20 60 19.53 22 14 Terminalia myriocarpa 10 20 11.93 10 15 Toona hexandra 10 20 32.85 13 520
SHRUB 1 Anaphalis contorta 50 280 1.79 11 2 Bambusa pallida 50 150 128.63 32 3 Bambusa tulda 70 380 190.63 51 4 Clematis gouriana 70 280 3.12 13 5 Clerodendrum colebrookeanum 70 220 6.57 12 6 Corchorus capsularis 80 230 0.97 12 7 Dendrocalamus hamiltonii 60 320 97.26 31 8 Dendrocalamus sikkimensis 40 160 87.78 24 9 Eupatorium odoratum 50 320 1.79 12 10 Medinilla himalayana 40 190 1.32 8 11 Naravelia zeylanica 70 290 0.76 13 12 Osbeckia stellata 60 250 1.31 11 13 Polygonum capitatum 50 240 2.03 10 14 Polygonum microcephalum 40 190 1.03 8 15 Rubus elipticus 70 210 0.48 11 16 Sida acuta 70 210 1.37 11 17 Solanum indicum 60 180 0.15 9 18 Tamarix dioica 70 220 0.90 11 19 Urtica dioica 60 240 0.71 11
Table 6.55: Community structure –Site V20 (Herbs)
S.No. Name of Species Frequency (%) Density (ind./ha) IVI 1 Ageratum conyzoides 40 16000 10 2 Agrostis griffithiana 47 12667 10 3 Alpinia nigra 20 8000 5 4 Amomum subulatum 27 11333 7 5 Carex baccans 40 12000 9 6 Chirita mishmiensis 40 11333 8 7 Chlorophytum tuberosum 20 12000 6 8 Chrysopogon aciculatus 60 12667 11 9 Commelina maculata 40 12667 9 10 Curcuma amada 20 10667 6 11 Cynodon dactylon 53 13333 11 12 Cyperus brevifolius 47 10667 9 13 Eleocharis tetraquetra 20 12000 6 14 Fragaria indica 40 10667 8 15 Fimbristylis acicularis 53 12667 10
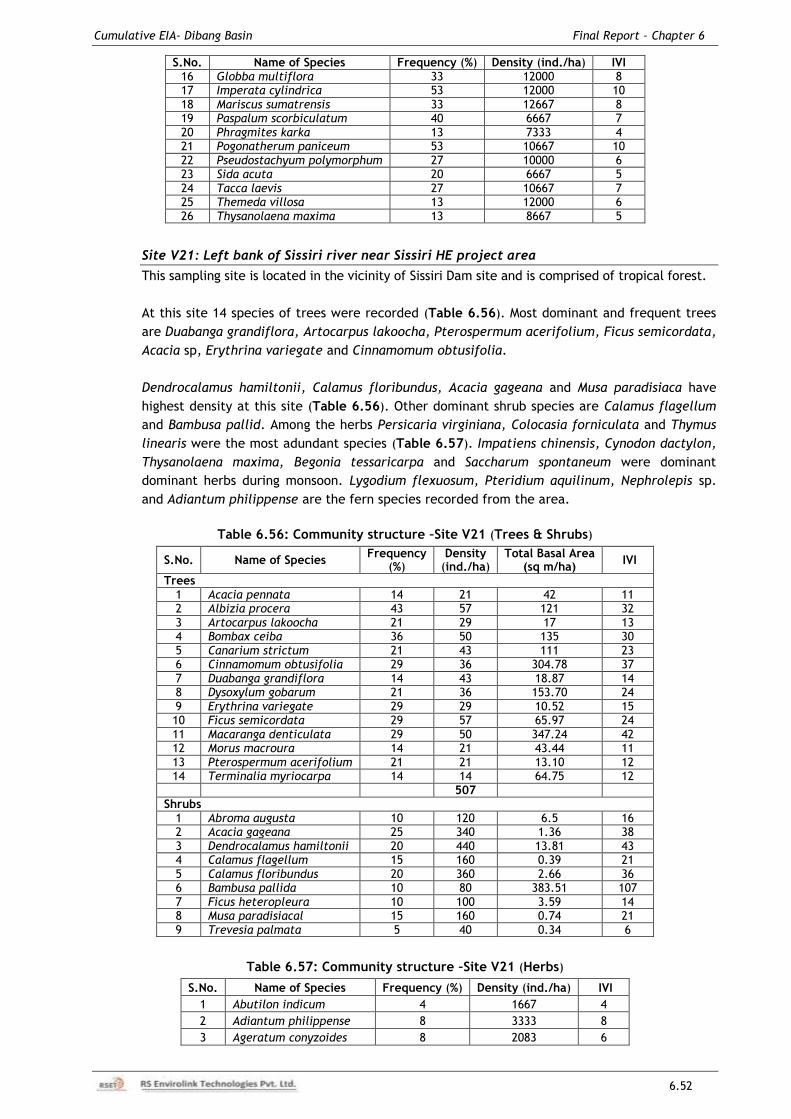
Cumulative EIA- Dibang Basin Final Report – Chapter 6
6.52
S.No. Name of Species Frequency (%) Density (ind./ha) IVI 16 Globba multiflora 33 12000 8 17 Imperata cylindrica 53 12000 10 18 Mariscus sumatrensis 33 12667 8 19 Paspalum scorbiculatum 40 6667 7 20 Phragmites karka 13 7333 4 21 Pogonatherum paniceum 53 10667 10 22 Pseudostachyum polymorphum 27 10000 6 23 Sida acuta 20 6667 5 24 Tacca laevis 27 10667 7 25 Themeda villosa 13 12000 6 26 Thysanolaena maxima 13 8667 5
Site V21: Left bank of Sissiri river near Sissiri HE project area
This sampling site is located in the vicinity of Sissiri Dam site and is comprised of tropical forest.
At this site 14 species of trees were recorded (Table 6.56). Most dominant and frequent trees
are Duabanga grandiflora, Artocarpus lakoocha, Pterospermum acerifolium, Ficus semicordata,
Acacia sp, Erythrina variegate and Cinnamomum obtusifolia.
Dendrocalamus hamiltonii, Calamus floribundus, Acacia gageana and Musa paradisiaca have
highest density at this site (Table 6.56). Other dominant shrub species are Calamus flagellum
and Bambusa pallid. Among the herbs Persicaria virginiana, Colocasia forniculata and Thymus
linearis were the most adundant species (Table 6.57). Impatiens chinensis, Cynodon dactylon,
Thysanolaena maxima, Begonia tessaricarpa and Saccharum spontaneum were dominant
dominant herbs during monsoon. Lygodium flexuosum, Pteridium aquilinum, Nephrolepis sp.
and Adiantum philippense are the fern species recorded from the area.
Table 6.56: Community structure –Site V21 (Trees & Shrubs)
S.No. Name of Species Frequency
(%) Density
(ind./ha) Total Basal Area
(sq m/ha) IVI
Trees 1 Acacia pennata 14 21 42 11 2 Albizia procera 43 57 121 32 3 Artocarpus lakoocha 21 29 17 13 4 Bombax ceiba 36 50 135 30 5 Canarium strictum 21 43 111 23 6 Cinnamomum obtusifolia 29 36 304.78 37 7 Duabanga grandiflora 14 43 18.87 14 8 Dysoxylum gobarum 21 36 153.70 24 9 Erythrina variegate 29 29 10.52 15 10 Ficus semicordata 29 57 65.97 24 11 Macaranga denticulata 29 50 347.24 42 12 Morus macroura 14 21 43.44 11 13 Pterospermum acerifolium 21 21 13.10 12 14 Terminalia myriocarpa 14 14 64.75 12 507
Shrubs 1 Abroma augusta 10 120 6.5 16 2 Acacia gageana 25 340 1.36 38 3 Dendrocalamus hamiltonii 20 440 13.81 43 4 Calamus flagellum 15 160 0.39 21 5 Calamus floribundus 20 360 2.66 36 6 Bambusa pallida 10 80 383.51 107 7 Ficus heteropleura 10 100 3.59 14 8 Musa paradisiacal 15 160 0.74 21 9 Trevesia palmata 5 40 0.34 6
Table 6.57: Community structure –Site V21 (Herbs)
S.No. Name of Species Frequency (%) Density (ind./ha) IVI
1 Abutilon indicum 4 1667 4
2 Adiantum philippense 8 3333 8
3 Ageratum conyzoides 8 2083 6
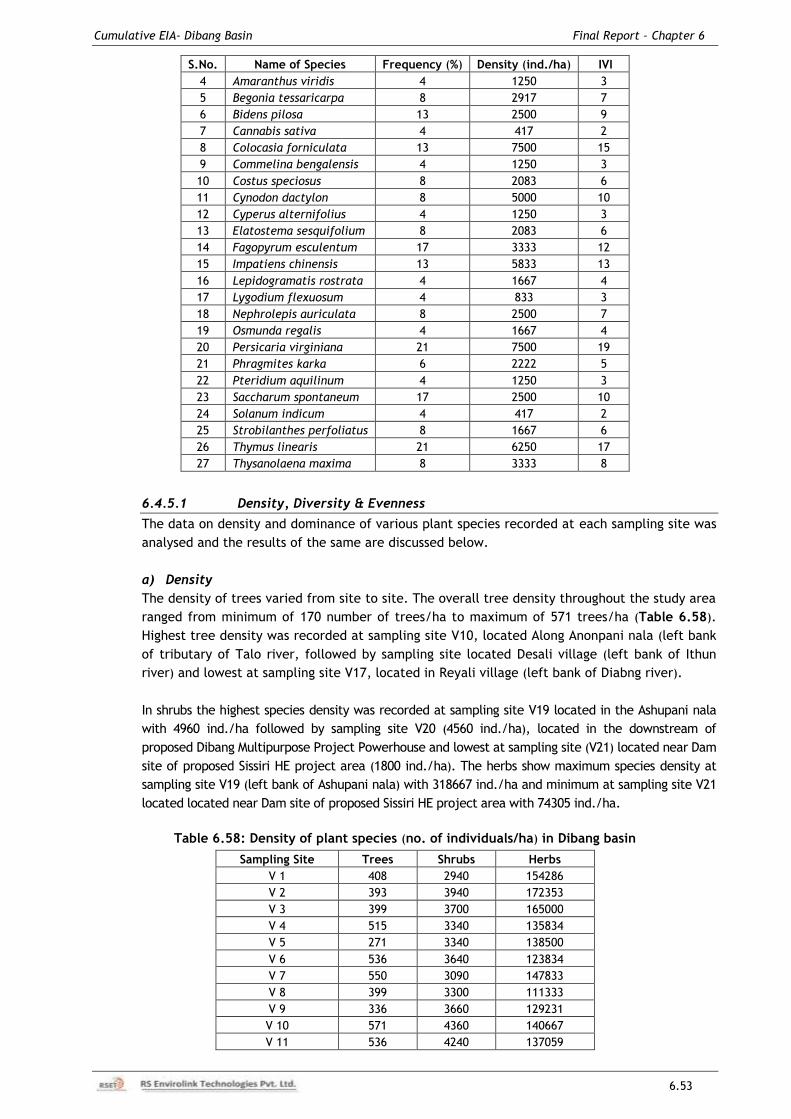
Cumulative EIA- Dibang Basin Final Report – Chapter 6
6.53
S.No. Name of Species Frequency (%) Density (ind./ha) IVI
4 Amaranthus viridis 4 1250 3
5 Begonia tessaricarpa 8 2917 7
6 Bidens pilosa 13 2500 9
7 Cannabis sativa 4 417 2
8 Colocasia forniculata 13 7500 15
9 Commelina bengalensis 4 1250 3
10 Costus speciosus 8 2083 6
11 Cynodon dactylon 8 5000 10
12 Cyperus alternifolius 4 1250 3
13 Elatostema sesquifolium 8 2083 6
14 Fagopyrum esculentum 17 3333 12
15 Impatiens chinensis 13 5833 13
16 Lepidogramatis rostrata 4 1667 4
17 Lygodium flexuosum 4 833 3
18 Nephrolepis auriculata 8 2500 7
19 Osmunda regalis 4 1667 4
20 Persicaria virginiana 21 7500 19
21 Phragmites karka 6 2222 5
22 Pteridium aquilinum 4 1250 3
23 Saccharum spontaneum 17 2500 10
24 Solanum indicum 4 417 2
25 Strobilanthes perfoliatus 8 1667 6
26 Thymus linearis 21 6250 17
27 Thysanolaena maxima 8 3333 8
6.4.5.1 Density, Diversity & Evenness
The data on density and dominance of various plant species recorded at each sampling site was
analysed and the results of the same are discussed below.
a) Density
The density of trees varied from site to site. The overall tree density throughout the study area
ranged from minimum of 170 number of trees/ha to maximum of 571 trees/ha (Table 6.58).
Highest tree density was recorded at sampling site V10, located Along Anonpani nala (left bank
of tributary of Talo river, followed by sampling site located Desali village (left bank of Ithun
river) and lowest at sampling site V17, located in Reyali village (left bank of Diabng river).
In shrubs the highest species density was recorded at sampling site V19 located in the Ashupani nala
with 4960 ind./ha followed by sampling site V20 (4560 ind./ha), located in the downstream of
proposed Dibang Multipurpose Project Powerhouse and lowest at sampling site (V21) located near Dam
site of proposed Sissiri HE project area (1800 ind./ha). The herbs show maximum species density at
sampling site V19 (left bank of Ashupani nala) with 318667 ind./ha and minimum at sampling site V21
located located near Dam site of proposed Sissiri HE project area with 74305 ind./ha.
Table 6.58: Density of plant species (no. of individuals/ha) in Dibang basin
Sampling Site Trees Shrubs Herbs
V 1 408 2940 154286
V 2 393 3940 172353
V 3 399 3700 165000
V 4 515 3340 135834
V 5 271 3340 138500
V 6 536 3640 123834
V 7 550 3090 147833
V 8 399 3300 111333
V 9 336 3660 129231
V 10 571 4360 140667
V 11 536 4240 137059
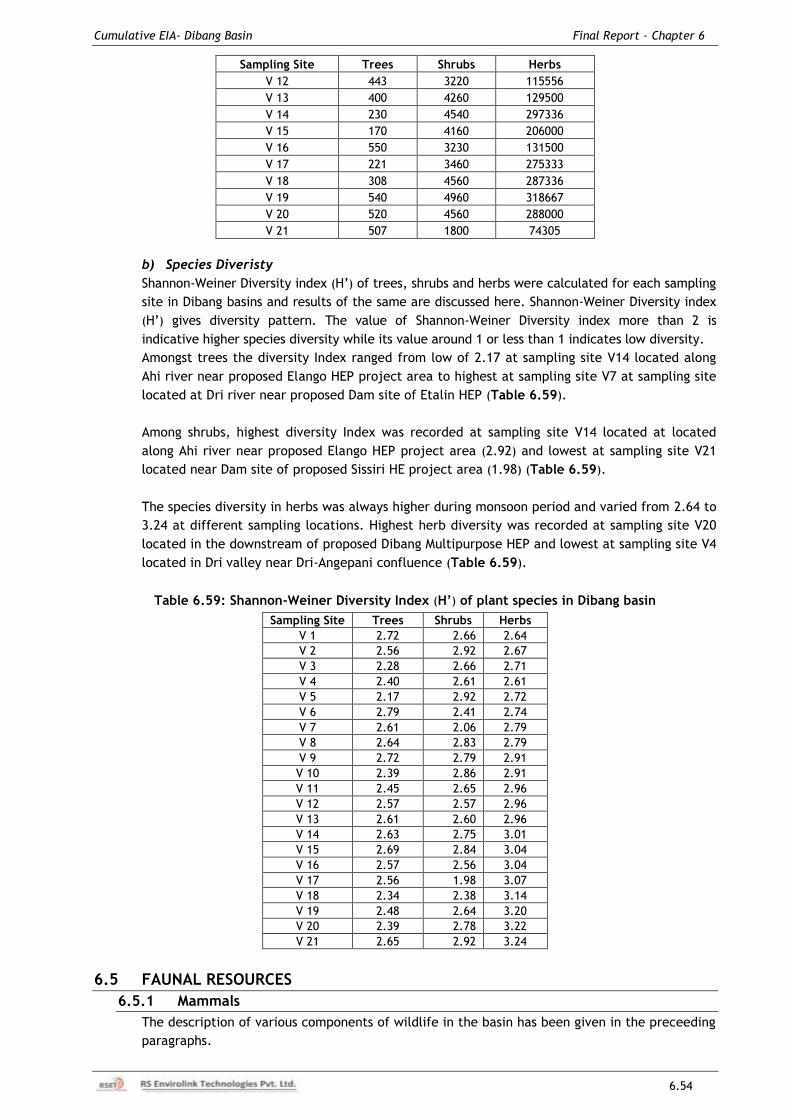
Cumulative EIA- Dibang Basin Final Report – Chapter 6
6.54
Sampling Site Trees Shrubs Herbs
V 12 443 3220 115556
V 13 400 4260 129500
V 14 230 4540 297336
V 15 170 4160 206000
V 16 550 3230 131500
V 17 221 3460 275333
V 18 308 4560 287336
V 19 540 4960 318667
V 20 520 4560 288000
V 21 507 1800 74305
b) Species Diveristy
Shannon-Weiner Diversity index (H‟) of trees, shrubs and herbs were calculated for each sampling
site in Dibang basins and results of the same are discussed here. Shannon-Weiner Diversity index
(H‟) gives diversity pattern. The value of Shannon-Weiner Diversity index more than 2 is
indicative higher species diversity while its value around 1 or less than 1 indicates low diversity.
Amongst trees the diversity Index ranged from low of 2.17 at sampling site V14 located along
Ahi river near proposed Elango HEP project area to highest at sampling site V7 at sampling site
located at Dri river near proposed Dam site of Etalin HEP (Table 6.59).
Among shrubs, highest diversity Index was recorded at sampling site V14 located at located
along Ahi river near proposed Elango HEP project area (2.92) and lowest at sampling site V21
located near Dam site of proposed Sissiri HE project area (1.98) (Table 6.59).
The species diversity in herbs was always higher during monsoon period and varied from 2.64 to
3.24 at different sampling locations. Highest herb diversity was recorded at sampling site V20
located in the downstream of proposed Dibang Multipurpose HEP and lowest at sampling site V4
located in Dri valley near Dri-Angepani confluence (Table 6.59).
Table 6.59: Shannon-Weiner Diversity Index (H’) of plant species in Dibang basin
Sampling Site Trees Shrubs Herbs
V 1 2.72 2.66 2.64
V 2 2.56 2.92 2.67
V 3 2.28 2.66 2.71
V 4 2.40 2.61 2.61
V 5 2.17 2.92 2.72
V 6 2.79 2.41 2.74
V 7 2.61 2.06 2.79
V 8 2.64 2.83 2.79
V 9 2.72 2.79 2.91
V 10 2.39 2.86 2.91
V 11 2.45 2.65 2.96
V 12 2.57 2.57 2.96
V 13 2.61 2.60 2.96
V 14 2.63 2.75 3.01
V 15 2.69 2.84 3.04
V 16 2.57 2.56 3.04
V 17 2.56 1.98 3.07
V 18 2.34 2.38 3.14
V 19 2.48 2.64 3.20
V 20 2.39 2.78 3.22
V 21 2.65 2.92 3.24
6.5 FAUNAL RESOURCES
6.5.1 Mammals
The description of various components of wildlife in the basin has been given in the preceeding
paragraphs.
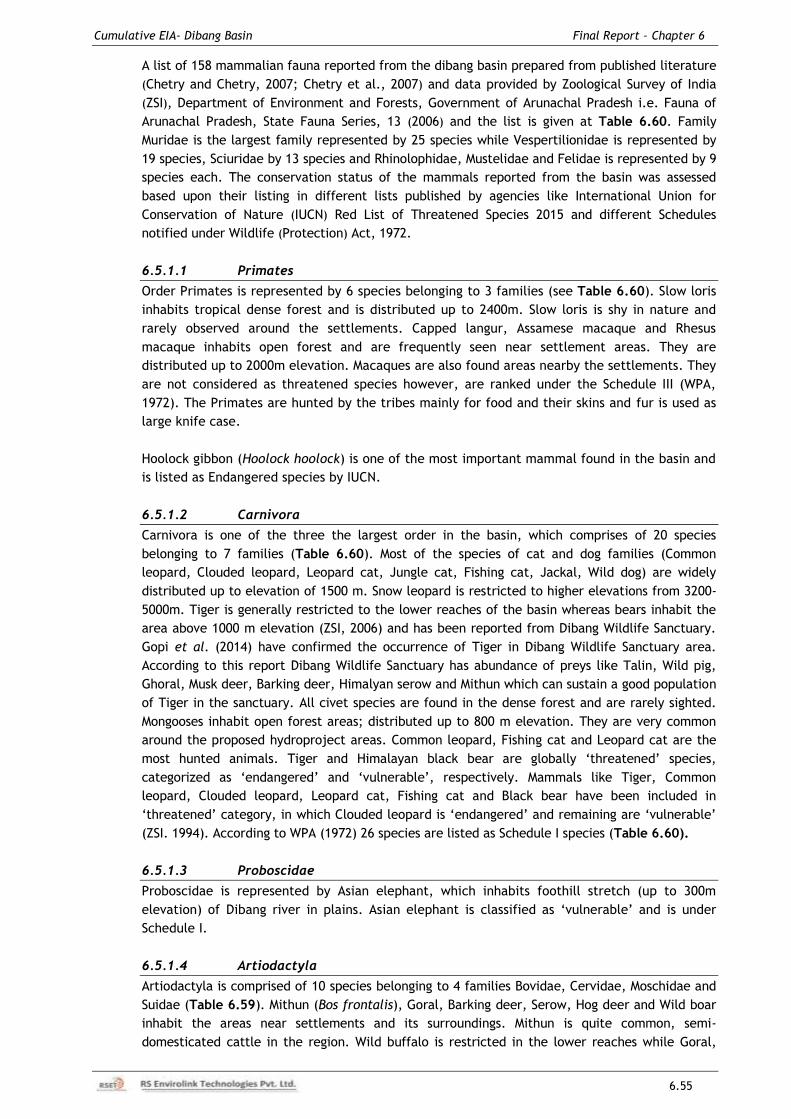
Cumulative EIA- Dibang Basin Final Report – Chapter 6
6.55
A list of 158 mammalian fauna reported from the dibang basin prepared from published literature
(Chetry and Chetry, 2007; Chetry et al., 2007) and data provided by Zoological Survey of India
(ZSI), Department of Environment and Forests, Government of Arunachal Pradesh i.e. Fauna of
Arunachal Pradesh, State Fauna Series, 13 (2006) and the list is given at Table 6.60. Family
Muridae is the largest family represented by 25 species while Vespertilionidae is represented by
19 species, Sciuridae by 13 species and Rhinolophidae, Mustelidae and Felidae is represented by 9
species each. The conservation status of the mammals reported from the basin was assessed
based upon their listing in different lists published by agencies like International Union for
Conservation of Nature (IUCN) Red List of Threatened Species 2015 and different Schedules
notified under Wildlife (Protection) Act, 1972.
6.5.1.1 Primates
Order Primates is represented by 6 species belonging to 3 families (see Table 6.60). Slow loris
inhabits tropical dense forest and is distributed up to 2400m. Slow loris is shy in nature and
rarely observed around the settlements. Capped langur, Assamese macaque and Rhesus
macaque inhabits open forest and are frequently seen near settlement areas. They are
distributed up to 2000m elevation. Macaques are also found areas nearby the settlements. They
are not considered as threatened species however, are ranked under the Schedule III (WPA,
1972). The Primates are hunted by the tribes mainly for food and their skins and fur is used as
large knife case.
Hoolock gibbon (Hoolock hoolock) is one of the most important mammal found in the basin and
is listed as Endangered species by IUCN.
6.5.1.2 Carnivora
Carnivora is one of the three the largest order in the basin, which comprises of 20 species
belonging to 7 families (Table 6.60). Most of the species of cat and dog families (Common
leopard, Clouded leopard, Leopard cat, Jungle cat, Fishing cat, Jackal, Wild dog) are widely
distributed up to elevation of 1500 m. Snow leopard is restricted to higher elevations from 3200-
5000m. Tiger is generally restricted to the lower reaches of the basin whereas bears inhabit the
area above 1000 m elevation (ZSI, 2006) and has been reported from Dibang Wildlife Sanctuary.
Gopi et al. (2014) have confirmed the occurrence of Tiger in Dibang Wildlife Sanctuary area.
According to this report Dibang Wildlife Sanctuary has abundance of preys like Talin, Wild pig,
Ghoral, Musk deer, Barking deer, Himalyan serow and Mithun which can sustain a good population
of Tiger in the sanctuary. All civet species are found in the dense forest and are rarely sighted.
Mongooses inhabit open forest areas; distributed up to 800 m elevation. They are very common
around the proposed hydroproject areas. Common leopard, Fishing cat and Leopard cat are the
most hunted animals. Tiger and Himalayan black bear are globally „threatened‟ species,
categorized as „endangered‟ and „vulnerable‟, respectively. Mammals like Tiger, Common
leopard, Clouded leopard, Leopard cat, Fishing cat and Black bear have been included in
„threatened‟ category, in which Clouded leopard is „endangered‟ and remaining are „vulnerable‟
(ZSI. 1994). According to WPA (1972) 26 species are listed as Schedule I species (Table 6.60).
6.5.1.3 Proboscidae
Proboscidae is represented by Asian elephant, which inhabits foothill stretch (up to 300m
elevation) of Dibang river in plains. Asian elephant is classified as „vulnerable‟ and is under
Schedule I.
6.5.1.4 Artiodactyla
Artiodactyla is comprised of 10 species belonging to 4 families Bovidae, Cervidae, Moschidae and
Suidae (Table 6.59). Mithun (Bos frontalis), Goral, Barking deer, Serow, Hog deer and Wild boar
inhabit the areas near settlements and its surroundings. Mithun is quite common, semi-
domesticated cattle in the region. Wild buffalo is restricted in the lower reaches while Goral,
Cumulative EIA- Dibang Basin Final Report – Chapter 6
6.56
Barking deer, Serow, Hog deer and Wild boar are distributed up to 1000 m elevation. Mishmi
Takin and Musk deer are found in the high altitudes of the catchment; Takin inhabits the
elevation range between 2100 m and 3000 m whereas Musk deer is found above 3000 m elevation
range. All species of Artiodactyla are considered as game animals. The criterion used by
Zoological Survey of India (ZSI) publication of 1994 for assessing conservation status includes Musk
deer and Wild boar under the „Endangered‟ category and Serow as „vulnerable‟ (Table 6.60).
Only Takin is considered as endemic to Eastern Himalaya. Asiatic buffalo (Bubalus arnee) and Hog
deer (Axis purnicus) are found in the foothills in the wide riverbed area of Dibang river in plains.
6.5.1.5 Lagomorpha
Lagomorpha is represented by five species belonging to 2 families. Indian hare and Hispid hare are
under Leporidae family. These inhabit scrubs forest and distributed from foothills to 1200 m. Hispid
hare is a Schedule-I mammal while Indian hare is a game animal hunted by tribals for its skin. It is
categorized under the Schedule IV. Family Ochotonidae is represented by 3 species Ochotona
roylei, O. thibetana and O. forresti. All these are listed under Least Concern categories by IUCN.
6.5.1.6 Pholidota
This Order is represented by 2 species i.e. Chinese pangolin and Indian pangolin which are
reported from the lower reaches of the basin. Both species belong to the family Manidae. They
are found up to 300 m. Indian pangolin is locally „vulnerable‟ species (ZSI, 1994) whereas
Chinese pangolin has been placed under the Schedule I (WPA, 1972).
6.5.1.7 Rodentia
Rodentia is comprised of rats, porcupine, squirrels and shrews and is represented by 44 species
belonging to 4 families. Rats are widely distributed and are quite common around the settlement
areas. Indian porcupine is found up to 1000 m elevation and inhabits open areas. Squirrels
(Tamiops macClelland, Petaurista magnificus, Petaurista petaurista and Hylopetes alboniger)
and shrew (Tupaia belangeri and Soriculus leucops) inhabit dense forests. They are very common
around the habitations. None of the rodent species is globally and locally threatened. Most of
them have been placed under the Schedule V and considered as „vermin‟ (pest).
6.5.1.8 Chiroptera
Order Chiroptera is represented by 39 species belonging to 7 families. All bat species are
restricted to the lower reaches. They are nocturnal and invade citrus orchards in the region.
They have been placed under the Schedule V.
6.5.1.9 Scandentia & Soricomorpha
These two Orders are represented by shrews where Scandentia covers tree shrews. They are
represented by 9 species wherein Scandentia is represented by lone species i.e. Northern tree
shrew.
6.5.1.10 Conservation Status
As already discussed in previous Sections the conservation status of the mammals reported
from the basin was assessed based upon their listing in different lists published by agencies like
IUCN Red List of Threatened Species 2015 and different Schedules notified under Wildlife
(Protection) Act, 1972 and the same has been given in Table 6.61.
Twenty seven species of mammals have been included in Schedule-I according to WPA 1972,
another 26 species in Schedule-II and rest of the species are either under Schedule- III, IV or V.
According to IUCN Red List 12 species under Endangered category like Manis pentadactyla,
Cuon alpinus, Bubalus arnee, Axis pornicus and Caprolagus hispidus. In addition there are 14
more species which are under Vulnerable category viz. Capricornis sumatraensis, Budorcas
taxicolor, Helarctos malayanus, Ursus thibetanus, Melursus ursinus and Trachypithecus
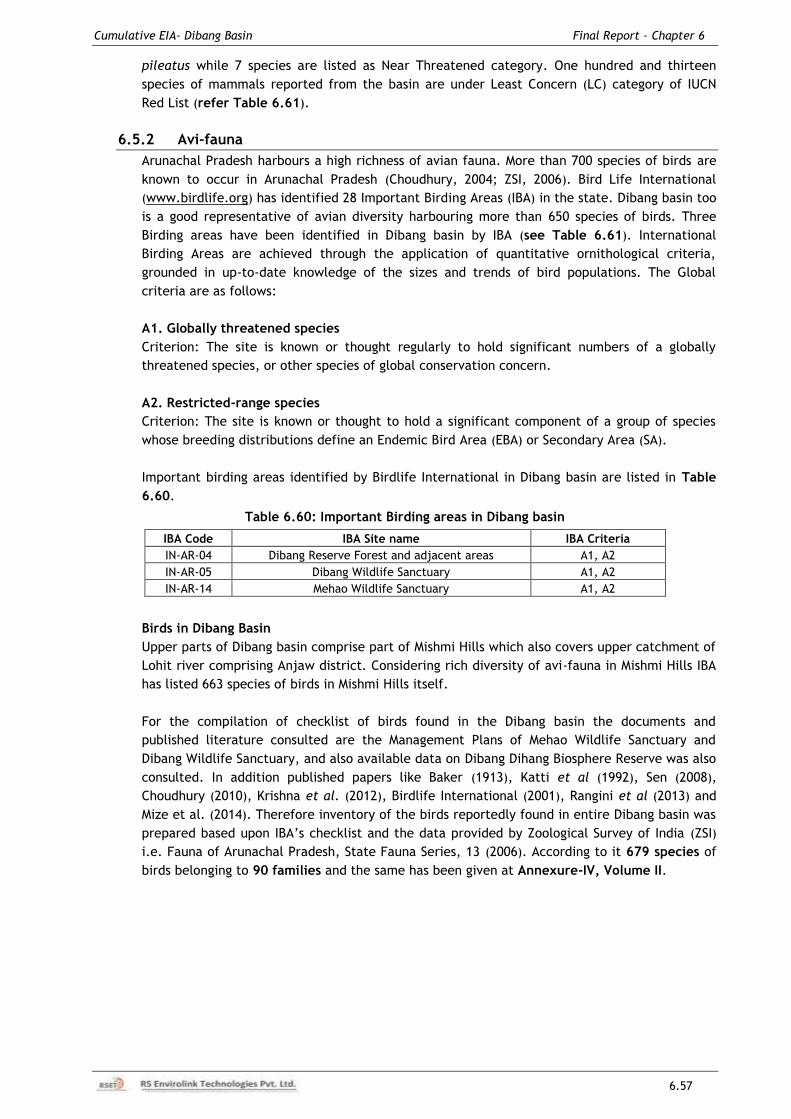
Cumulative EIA- Dibang Basin Final Report – Chapter 6
6.57
pileatus while 7 species are listed as Near Threatened category. One hundred and thirteen
species of mammals reported from the basin are under Least Concern (LC) category of IUCN
Red List (refer Table 6.61).
6.5.2 Avi-fauna
Arunachal Pradesh harbours a high richness of avian fauna. More than 700 species of birds are
known to occur in Arunachal Pradesh (Choudhury, 2004; ZSI, 2006). Bird Life International
(www.birdlife.org) has identified 28 Important Birding Areas (IBA) in the state. Dibang basin too
is a good representative of avian diversity harbouring more than 650 species of birds. Three
Birding areas have been identified in Dibang basin by IBA (see Table 6.61). International
Birding Areas are achieved through the application of quantitative ornithological criteria,
grounded in up-to-date knowledge of the sizes and trends of bird populations. The Global
criteria are as follows:
A1. Globally threatened species
Criterion: The site is known or thought regularly to hold significant numbers of a globally
threatened species, or other species of global conservation concern.
A2. Restricted-range species
Criterion: The site is known or thought to hold a significant component of a group of species
whose breeding distributions define an Endemic Bird Area (EBA) or Secondary Area (SA).
Important birding areas identified by Birdlife International in Dibang basin are listed in Table
6.60.
Table 6.60: Important Birding areas in Dibang basin
IBA Code IBA Site name IBA Criteria
IN-AR-04 Dibang Reserve Forest and adjacent areas A1, A2
IN-AR-05 Dibang Wildlife Sanctuary A1, A2
IN-AR-14 Mehao Wildlife Sanctuary A1, A2
Birds in Dibang Basin
Upper parts of Dibang basin comprise part of Mishmi Hills which also covers upper catchment of
Lohit river comprising Anjaw district. Considering rich diversity of avi-fauna in Mishmi Hills IBA
has listed 663 species of birds in Mishmi Hills itself.
For the compilation of checklist of birds found in the Dibang basin the documents and
published literature consulted are the Management Plans of Mehao Wildlife Sanctuary and
Dibang Wildlife Sanctuary, and also available data on Dibang Dihang Biosphere Reserve was also
consulted. In addition published papers like Baker (1913), Katti et al (1992), Sen (2008),
Choudhury (2010), Krishna et al. (2012), Birdlife International (2001), Rangini et al (2013) and
Mize et al. (2014). Therefore inventory of the birds reportedly found in entire Dibang basin was
prepared based upon IBA‟s checklist and the data provided by Zoological Survey of India (ZSI)
i.e. Fauna of Arunachal Pradesh, State Fauna Series, 13 (2006). According to it 679 species of
birds belonging to 90 families and the same has been given at Annexure-IV, Volume II.
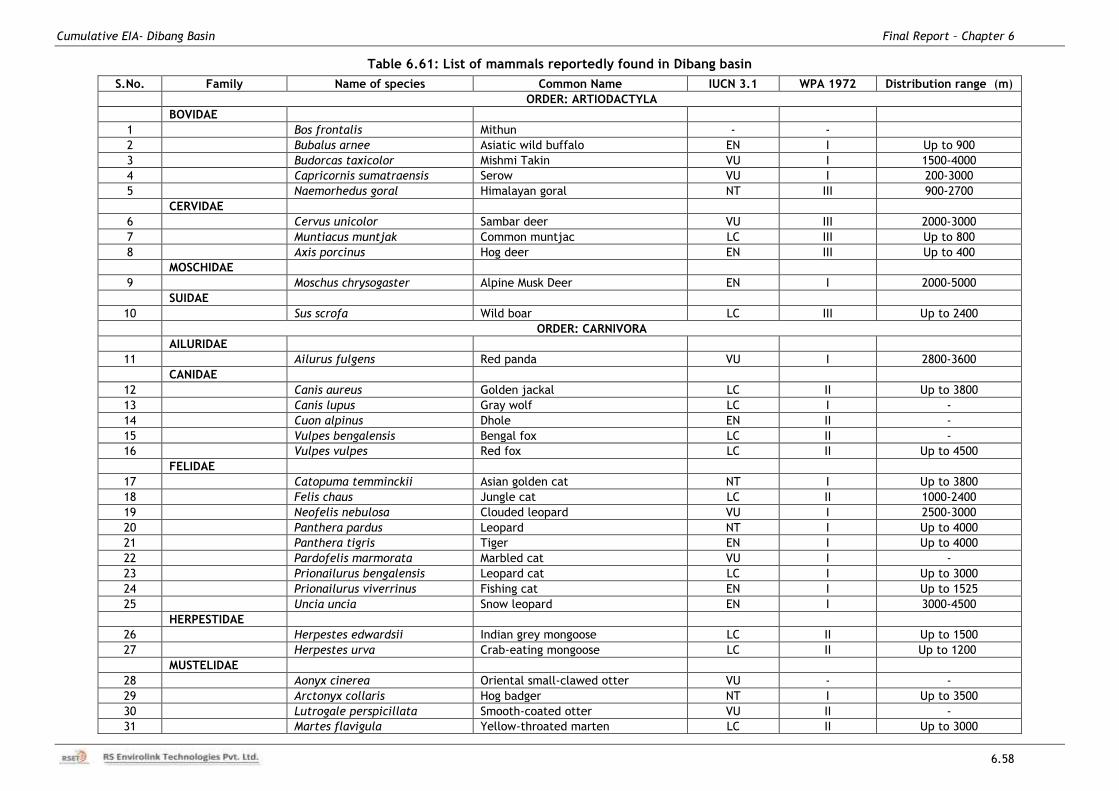
Cumulative EIA- Dibang Basin Final Report – Chapter 6
6.58
Table 6.61: List of mammals reportedly found in Dibang basin
S.No. Family Name of species Common Name IUCN 3.1 WPA 1972 Distribution range (m)
ORDER: ARTIODACTYLA
BOVIDAE
1
Bos frontalis Mithun - -
2 Bubalus arnee Asiatic wild buffalo EN I Up to 900
3 Budorcas taxicolor Mishmi Takin VU I 1500-4000
4 Capricornis sumatraensis Serow VU I 200-3000
5 Naemorhedus goral Himalayan goral NT III 900-2700
CERVIDAE
6
Cervus unicolor Sambar deer VU III 2000-3000
7 Muntiacus muntjak Common muntjac LC III Up to 800
8 Axis porcinus Hog deer EN III Up to 400
MOSCHIDAE
9
Moschus chrysogaster Alpine Musk Deer EN I 2000-5000
SUIDAE
10
Sus scrofa Wild boar LC III Up to 2400
ORDER: CARNIVORA
AILURIDAE
11
Ailurus fulgens Red panda VU I 2800-3600
CANIDAE
12
Canis aureus Golden jackal LC II Up to 3800
13 Canis lupus Gray wolf LC I -
14 Cuon alpinus Dhole EN II -
15 Vulpes bengalensis Bengal fox LC II -
16 Vulpes vulpes Red fox LC II Up to 4500
FELIDAE
17
Catopuma temminckii Asian golden cat NT I Up to 3800
18 Felis chaus Jungle cat LC II 1000-2400
19 Neofelis nebulosa Clouded leopard VU I 2500-3000
20 Panthera pardus Leopard NT I Up to 4000
21 Panthera tigris Tiger EN I Up to 4000
22 Pardofelis marmorata Marbled cat VU I -
23 Prionailurus bengalensis Leopard cat LC I Up to 3000
24 Prionailurus viverrinus Fishing cat EN I Up to 1525
25 Uncia uncia Snow leopard EN I 3000-4500
HERPESTIDAE
26
Herpestes edwardsii Indian grey mongoose LC II Up to 1500
27 Herpestes urva Crab-eating mongoose LC II Up to 1200
MUSTELIDAE
28
Aonyx cinerea Oriental small-clawed otter VU - -
29 Arctonyx collaris Hog badger NT I Up to 3500
30 Lutrogale perspicillata Smooth-coated otter VU II -
31 Martes flavigula Yellow-throated marten LC II Up to 3000
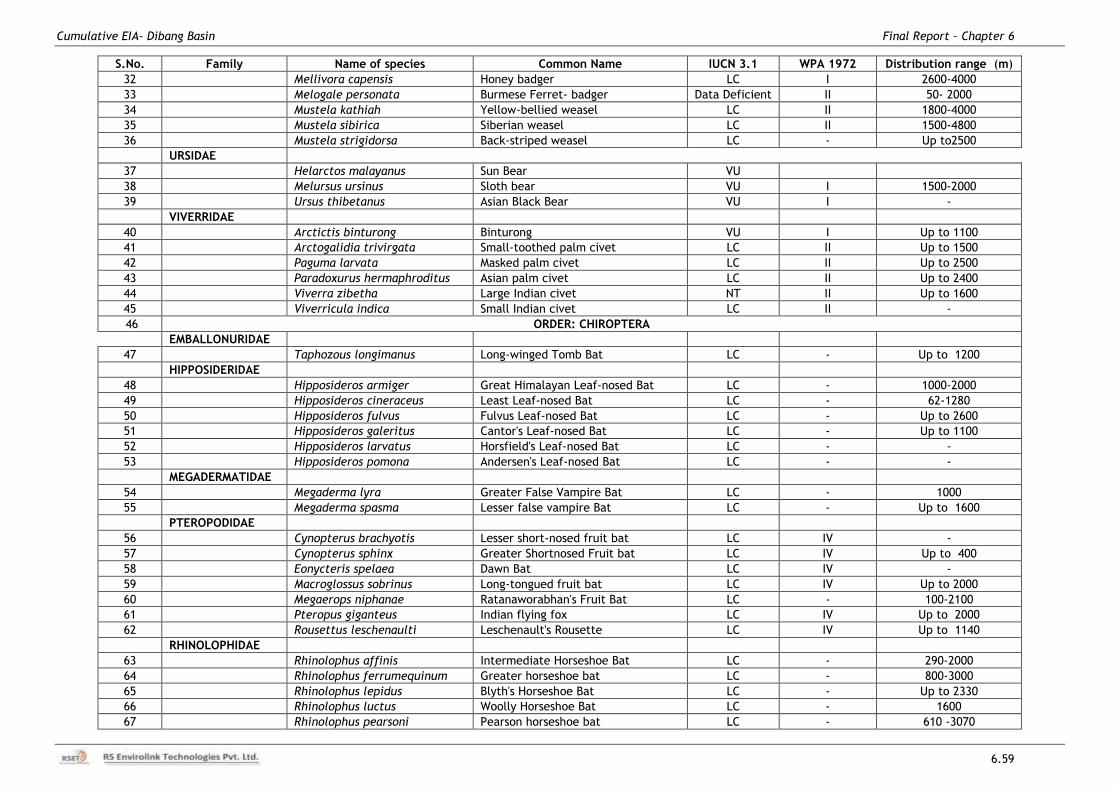
Cumulative EIA- Dibang Basin Final Report – Chapter 6
6.59
S.No. Family Name of species Common Name IUCN 3.1 WPA 1972 Distribution range (m)
32 Mellivora capensis Honey badger LC I 2600-4000
33 Melogale personata Burmese Ferret- badger Data Deficient II 50- 2000
34 Mustela kathiah Yellow-bellied weasel LC II 1800-4000
35 Mustela sibirica Siberian weasel LC II 1500-4800
36 Mustela strigidorsa Back-striped weasel LC - Up to2500
URSIDAE
37 Helarctos malayanus Sun Bear VU
38 Melursus ursinus Sloth bear VU I 1500-2000
39 Ursus thibetanus Asian Black Bear VU I -
VIVERRIDAE
40
Arctictis binturong Binturong VU I Up to 1100
41 Arctogalidia trivirgata Small-toothed palm civet LC II Up to 1500
42 Paguma larvata Masked palm civet LC II Up to 2500
43 Paradoxurus hermaphroditus Asian palm civet LC II Up to 2400
44 Viverra zibetha Large Indian civet NT II Up to 1600
45 Viverricula indica Small Indian civet LC II -
46 ORDER: CHIROPTERA
EMBALLONURIDAE
47
Taphozous longimanus Long-winged Tomb Bat LC - Up to 1200
HIPPOSIDERIDAE
48
Hipposideros armiger Great Himalayan Leaf-nosed Bat LC - 1000-2000
49 Hipposideros cineraceus Least Leaf-nosed Bat LC - 62-1280
50 Hipposideros fulvus Fulvus Leaf-nosed Bat LC - Up to 2600
51 Hipposideros galeritus Cantor's Leaf-nosed Bat LC - Up to 1100
52 Hipposideros larvatus Horsfield's Leaf-nosed Bat LC - -
53 Hipposideros pomona Andersen's Leaf-nosed Bat LC - -
MEGADERMATIDAE
54
Megaderma lyra Greater False Vampire Bat LC - 1000
55 Megaderma spasma Lesser false vampire Bat LC - Up to 1600
PTEROPODIDAE
56
Cynopterus brachyotis Lesser short-nosed fruit bat LC IV -
57 Cynopterus sphinx Greater Shortnosed Fruit bat LC IV Up to 400
58 Eonycteris spelaea Dawn Bat LC IV -
59 Macroglossus sobrinus Long-tongued fruit bat LC IV Up to 2000
60 Megaerops niphanae Ratanaworabhan's Fruit Bat LC - 100-2100
61 Pteropus giganteus Indian flying fox LC IV Up to 2000
62 Rousettus leschenaulti Leschenault's Rousette LC IV Up to 1140
RHINOLOPHIDAE
63
Rhinolophus affinis Intermediate Horseshoe Bat LC - 290-2000
64 Rhinolophus ferrumequinum Greater horseshoe bat LC - 800-3000
65 Rhinolophus lepidus Blyth's Horseshoe Bat LC - Up to 2330
66 Rhinolophus luctus Woolly Horseshoe Bat LC - 1600
67 Rhinolophus pearsoni Pearson horseshoe bat LC - 610 -3070
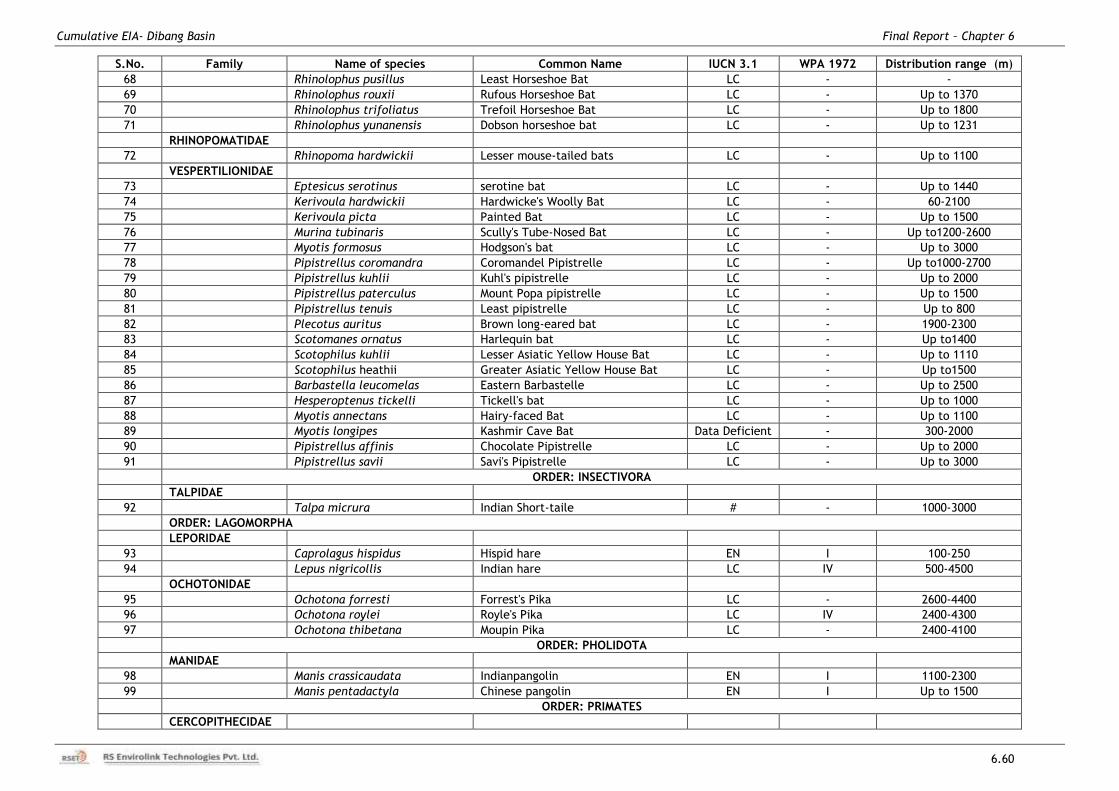
Cumulative EIA- Dibang Basin Final Report – Chapter 6
6.60
S.No. Family Name of species Common Name IUCN 3.1 WPA 1972 Distribution range (m)
68 Rhinolophus pusillus Least Horseshoe Bat LC - -
69 Rhinolophus rouxii Rufous Horseshoe Bat LC - Up to 1370
70 Rhinolophus trifoliatus Trefoil Horseshoe Bat LC - Up to 1800
71 Rhinolophus yunanensis Dobson horseshoe bat LC - Up to 1231
RHINOPOMATIDAE
72
Rhinopoma hardwickii Lesser mouse-tailed bats LC - Up to 1100
VESPERTILIONIDAE
73
Eptesicus serotinus serotine bat LC - Up to 1440
74 Kerivoula hardwickii Hardwicke's Woolly Bat LC - 60-2100
75 Kerivoula picta Painted Bat LC - Up to 1500
76 Murina tubinaris Scully's Tube-Nosed Bat LC - Up to1200-2600
77 Myotis formosus Hodgson's bat LC - Up to 3000
78 Pipistrellus coromandra Coromandel Pipistrelle LC - Up to1000-2700
79 Pipistrellus kuhlii Kuhl's pipistrelle LC - Up to 2000
80 Pipistrellus paterculus Mount Popa pipistrelle LC - Up to 1500
81 Pipistrellus tenuis Least pipistrelle LC - Up to 800
82 Plecotus auritus Brown long-eared bat LC - 1900-2300
83 Scotomanes ornatus Harlequin bat LC - Up to1400
84 Scotophilus kuhlii Lesser Asiatic Yellow House Bat LC - Up to 1110
85 Scotophilus heathii Greater Asiatic Yellow House Bat LC - Up to1500
86 Barbastella leucomelas Eastern Barbastelle LC - Up to 2500
87 Hesperoptenus tickelli Tickell's bat LC - Up to 1000
88 Myotis annectans Hairy-faced Bat LC - Up to 1100
89 Myotis longipes Kashmir Cave Bat Data Deficient - 300-2000
90 Pipistrellus affinis Chocolate Pipistrelle LC - Up to 2000
91 Pipistrellus savii Savi's Pipistrelle LC - Up to 3000
ORDER: INSECTIVORA
TALPIDAE
92
Talpa micrura Indian Short-taile # - 1000-3000
ORDER: LAGOMORPHA
LEPORIDAE
93
Caprolagus hispidus Hispid hare EN I 100-250
94 Lepus nigricollis Indian hare LC IV 500-4500
OCHOTONIDAE
95
Ochotona forresti Forrest's Pika LC - 2600-4400
96 Ochotona roylei Royle's Pika LC IV 2400-4300
97 Ochotona thibetana Moupin Pika LC - 2400-4100
ORDER: PHOLIDOTA
MANIDAE
98
Manis crassicaudata Indianpangolin EN I 1100-2300
99 Manis pentadactyla Chinese pangolin EN I Up to 1500
ORDER: PRIMATES
CERCOPITHECIDAE
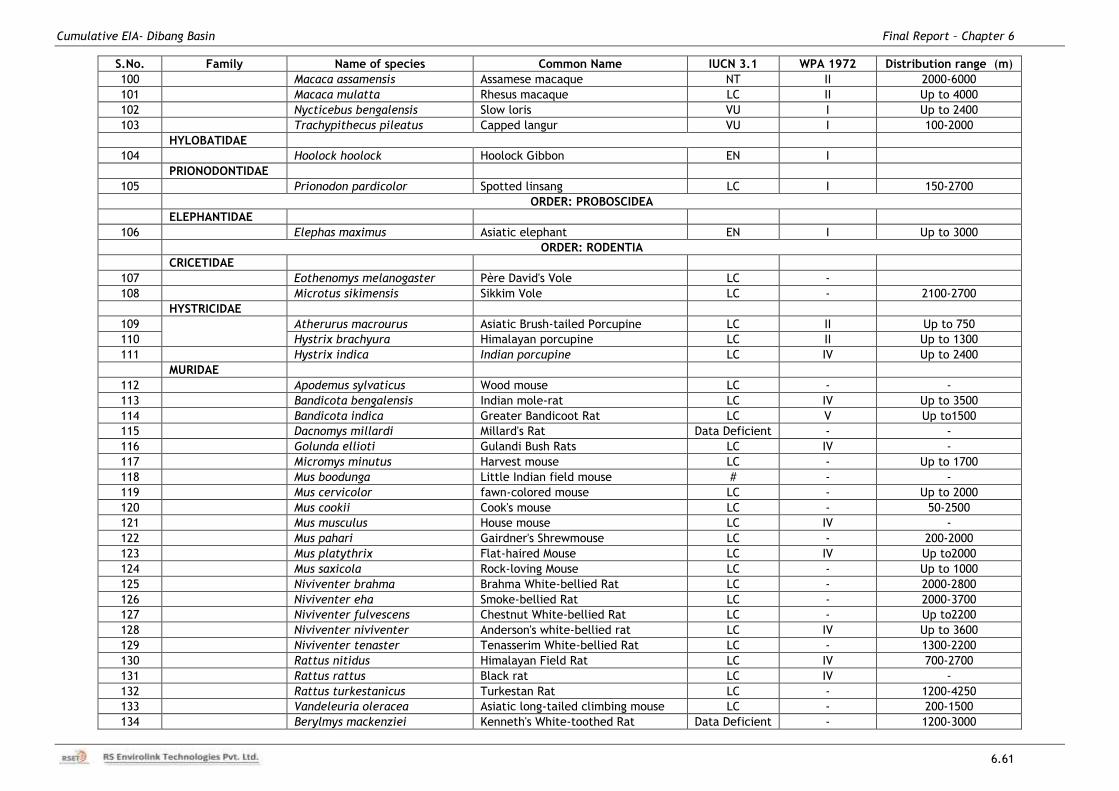
Cumulative EIA- Dibang Basin Final Report – Chapter 6
6.61
S.No. Family Name of species Common Name IUCN 3.1 WPA 1972 Distribution range (m)
100
Macaca assamensis Assamese macaque NT II 2000-6000
101 Macaca mulatta Rhesus macaque LC II Up to 4000
102 Nycticebus bengalensis Slow loris VU I Up to 2400
103 Trachypithecus pileatus Capped langur VU I 100-2000
HYLOBATIDAE
104 Hoolock hoolock Hoolock Gibbon EN I
PRIONODONTIDAE
105
Prionodon pardicolor Spotted linsang LC I 150-2700
ORDER: PROBOSCIDEA
ELEPHANTIDAE
106
Elephas maximus Asiatic elephant EN I Up to 3000
ORDER: RODENTIA
CRICETIDAE
107
Eothenomys melanogaster Père David's Vole LC -
108 Microtus sikimensis Sikkim Vole LC - 2100-2700
HYSTRICIDAE
109
Atherurus macrourus Asiatic Brush-tailed Porcupine LC II Up to 750
110
Hystrix brachyura Himalayan porcupine LC II Up to 1300
111 Hystrix indica Indian porcupine LC IV Up to 2400
MURIDAE
112
Apodemus sylvaticus Wood mouse LC - -
113 Bandicota bengalensis Indian mole-rat LC IV Up to 3500
114 Bandicota indica Greater Bandicoot Rat LC V Up to1500
115 Dacnomys millardi Millard's Rat Data Deficient - -
116 Golunda ellioti Gulandi Bush Rats LC IV -
117 Micromys minutus Harvest mouse LC - Up to 1700
118 Mus boodunga Little Indian field mouse # - -
119 Mus cervicolor fawn-colored mouse LC - Up to 2000
120 Mus cookii Cook's mouse LC - 50-2500
121 Mus musculus House mouse LC IV -
122 Mus pahari Gairdner's Shrewmouse LC - 200-2000
123 Mus platythrix Flat-haired Mouse LC IV Up to2000
124 Mus saxicola Rock-loving Mouse LC - Up to 1000
125 Niviventer brahma Brahma White-bellied Rat LC - 2000-2800
126 Niviventer eha Smoke-bellied Rat LC - 2000-3700
127 Niviventer fulvescens Chestnut White-bellied Rat LC - Up to2200
128 Niviventer niviventer Anderson's white-bellied rat LC IV Up to 3600
129 Niviventer tenaster Tenasserim White-bellied Rat LC - 1300-2200
130 Rattus nitidus Himalayan Field Rat LC IV 700-2700
131 Rattus rattus Black rat LC IV -
132 Rattus turkestanicus Turkestan Rat LC - 1200-4250
133 Vandeleuria oleracea Asiatic long-tailed climbing mouse LC - 200-1500
134 Berylmys mackenziei Kenneth's White-toothed Rat Data Deficient - 1200-3000
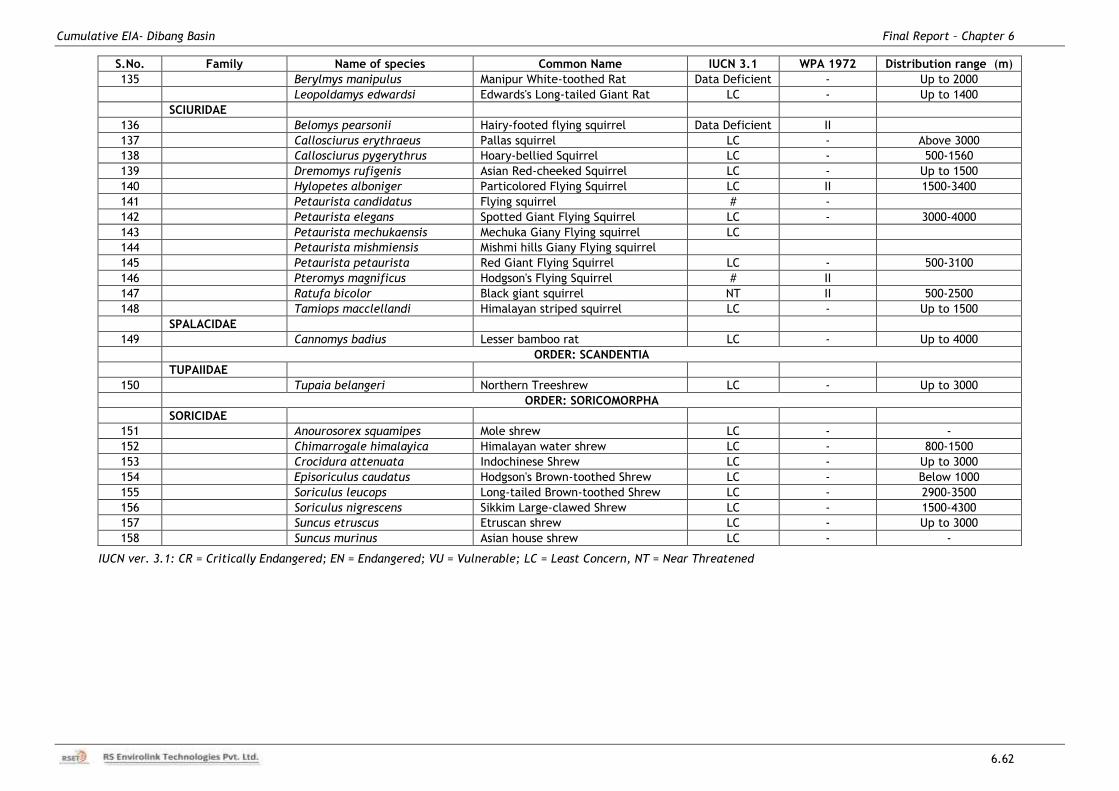
Cumulative EIA- Dibang Basin Final Report – Chapter 6
6.62
S.No. Family Name of species Common Name IUCN 3.1 WPA 1972 Distribution range (m)
135 Berylmys manipulus Manipur White-toothed Rat Data Deficient - Up to 2000
Leopoldamys edwardsi Edwards's Long-tailed Giant Rat LC - Up to 1400
SCIURIDAE
136
Belomys pearsonii Hairy-footed flying squirrel Data Deficient II
137 Callosciurus erythraeus Pallas squirrel LC - Above 3000
138 Callosciurus pygerythrus Hoary-bellied Squirrel LC - 500-1560
139 Dremomys rufigenis Asian Red-cheeked Squirrel LC - Up to 1500
140 Hylopetes alboniger Particolored Flying Squirrel LC II 1500-3400
141 Petaurista candidatus Flying squirrel # -
142 Petaurista elegans Spotted Giant Flying Squirrel LC - 3000-4000
143 Petaurista mechukaensis Mechuka Giany Flying squirrel LC
144 Petaurista mishmiensis Mishmi hills Giany Flying squirrel
145 Petaurista petaurista Red Giant Flying Squirrel LC - 500-3100
146 Pteromys magnificus Hodgson's Flying Squirrel # II
147 Ratufa bicolor Black giant squirrel NT II 500-2500
148 Tamiops macclellandi Himalayan striped squirrel LC - Up to 1500
SPALACIDAE
149
Cannomys badius Lesser bamboo rat LC - Up to 4000
ORDER: SCANDENTIA
TUPAIIDAE
150
Tupaia belangeri Northern Treeshrew LC - Up to 3000
ORDER: SORICOMORPHA
SORICIDAE
151
Anourosorex squamipes Mole shrew LC - -
152 Chimarrogale himalayica Himalayan water shrew LC - 800-1500
153 Crocidura attenuata Indochinese Shrew LC - Up to 3000
154 Episoriculus caudatus Hodgson's Brown-toothed Shrew LC - Below 1000
155 Soriculus leucops Long-tailed Brown-toothed Shrew LC - 2900-3500
156 Soriculus nigrescens Sikkim Large-clawed Shrew LC - 1500-4300
157 Suncus etruscus Etruscan shrew LC - Up to 3000
158 Suncus murinus Asian house shrew LC - -
IUCN ver. 3.1: CR = Critically Endangered; EN = Endangered; VU = Vulnerable; LC = Least Concern, NT = Near Threatened
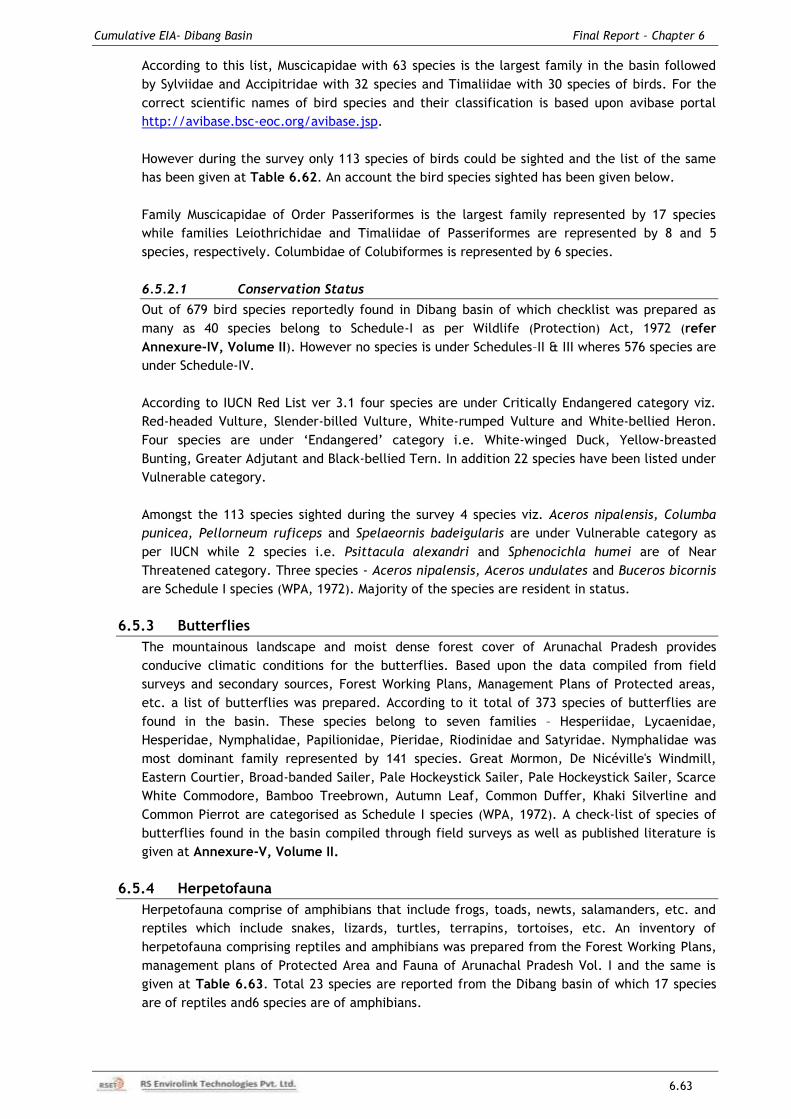
Cumulative EIA- Dibang Basin Final Report – Chapter 6
6.63
According to this list, Muscicapidae with 63 species is the largest family in the basin followed
by Sylviidae and Accipitridae with 32 species and Timaliidae with 30 species of birds. For the
correct scientific names of bird species and their classification is based upon avibase portal
http://avibase.bsc-eoc.org/avibase.jsp.
However during the survey only 113 species of birds could be sighted and the list of the same
has been given at Table 6.62. An account the bird species sighted has been given below.
Family Muscicapidae of Order Passeriformes is the largest family represented by 17 species
while families Leiothrichidae and Timaliidae of Passeriformes are represented by 8 and 5
species, respectively. Columbidae of Colubiformes is represented by 6 species.
6.5.2.1 Conservation Status
Out of 679 bird species reportedly found in Dibang basin of which checklist was prepared as
many as 40 species belong to Schedule-I as per Wildlife (Protection) Act, 1972 (refer
Annexure-IV, Volume II). However no species is under Schedules–II & III wheres 576 species are
under Schedule-IV.
According to IUCN Red List ver 3.1 four species are under Critically Endangered category viz.
Red-headed Vulture, Slender-billed Vulture, White-rumped Vulture and White-bellied Heron.
Four species are under „Endangered‟ category i.e. White-winged Duck, Yellow-breasted
Bunting, Greater Adjutant and Black-bellied Tern. In addition 22 species have been listed under
Vulnerable category.
Amongst the 113 species sighted during the survey 4 species viz. Aceros nipalensis, Columba
punicea, Pellorneum ruficeps and Spelaeornis badeigularis are under Vulnerable category as
per IUCN while 2 species i.e. Psittacula alexandri and Sphenocichla humei are of Near
Threatened category. Three species - Aceros nipalensis, Aceros undulates and Buceros bicornis
are Schedule I species (WPA, 1972). Majority of the species are resident in status.
6.5.3 Butterflies
The mountainous landscape and moist dense forest cover of Arunachal Pradesh provides
conducive climatic conditions for the butterflies. Based upon the data compiled from field
surveys and secondary sources, Forest Working Plans, Management Plans of Protected areas,
etc. a list of butterflies was prepared. According to it total of 373 species of butterflies are
found in the basin. These species belong to seven families – Hesperiidae, Lycaenidae,
Hesperidae, Nymphalidae, Papilionidae, Pieridae, Riodinidae and Satyridae. Nymphalidae was
most dominant family represented by 141 species. Great Mormon, De Nicéville's Windmill,
Eastern Courtier, Broad-banded Sailer, Pale Hockeystick Sailer, Pale Hockeystick Sailer, Scarce
White Commodore, Bamboo Treebrown, Autumn Leaf, Common Duffer, Khaki Silverline and
Common Pierrot are categorised as Schedule I species (WPA, 1972). A check-list of species of
butterflies found in the basin compiled through field surveys as well as published literature is
given at Annexure-V, Volume II.
6.5.4 Herpetofauna
Herpetofauna comprise of amphibians that include frogs, toads, newts, salamanders, etc. and
reptiles which include snakes, lizards, turtles, terrapins, tortoises, etc. An inventory of
herpetofauna comprising reptiles and amphibians was prepared from the Forest Working Plans,
management plans of Protected Area and Fauna of Arunachal Pradesh Vol. I and the same is
given at Table 6.63. Total 23 species are reported from the Dibang basin of which 17 species
are of reptiles and6 species are of amphibians.
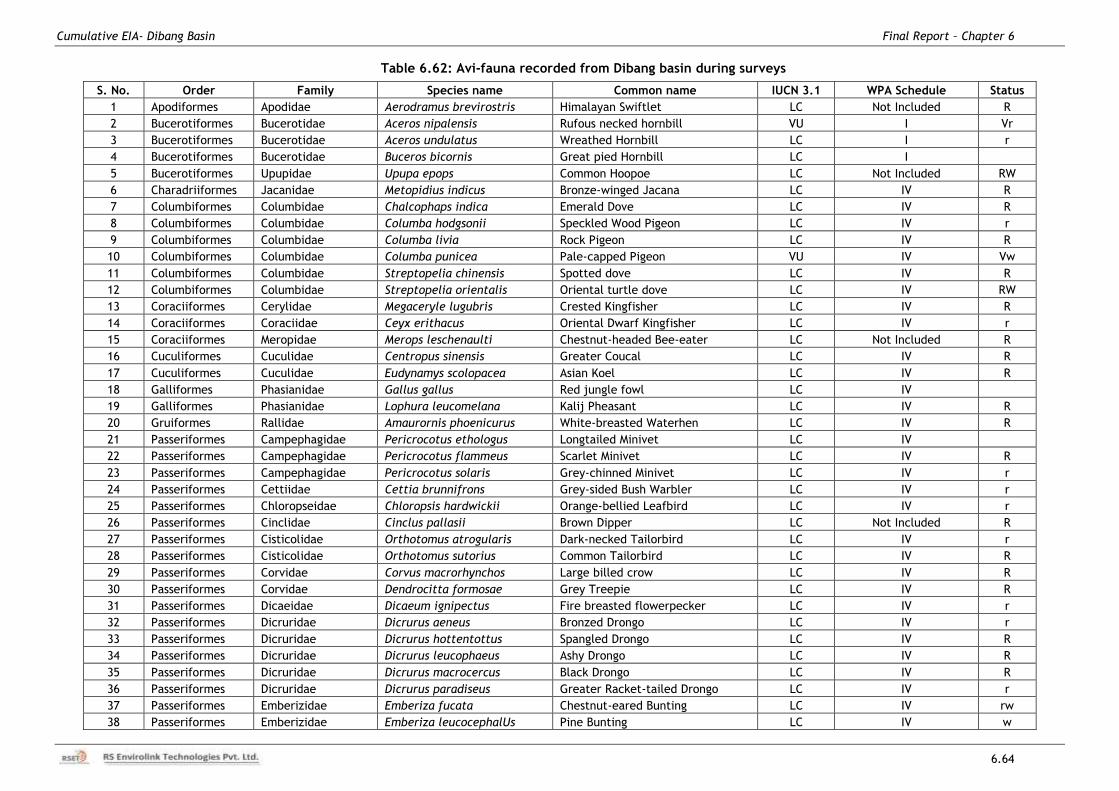
Cumulative EIA- Dibang Basin Final Report – Chapter 6
6.64
Table 6.62: Avi-fauna recorded from Dibang basin during surveys
S. No. Order Family Species name Common name IUCN 3.1 WPA Schedule Status
1 Apodiformes Apodidae Aerodramus brevirostris Himalayan Swiftlet LC Not Included R
2 Bucerotiformes Bucerotidae Aceros nipalensis Rufous necked hornbill VU I Vr
3 Bucerotiformes Bucerotidae Aceros undulatus Wreathed Hornbill LC I r
4 Bucerotiformes Bucerotidae Buceros bicornis Great pied Hornbill LC I
5 Bucerotiformes Upupidae Upupa epops Common Hoopoe LC Not Included RW
6 Charadriiformes Jacanidae Metopidius indicus Bronze-winged Jacana LC IV R
7 Columbiformes Columbidae Chalcophaps indica Emerald Dove LC IV R
8 Columbiformes Columbidae Columba hodgsonii Speckled Wood Pigeon LC IV r
9 Columbiformes Columbidae Columba livia Rock Pigeon LC IV R
10 Columbiformes Columbidae Columba punicea Pale-capped Pigeon VU IV Vw
11 Columbiformes Columbidae Streptopelia chinensis Spotted dove LC IV R
12 Columbiformes Columbidae Streptopelia orientalis Oriental turtle dove LC IV RW
13 Coraciiformes Cerylidae Megaceryle lugubris Crested Kingfisher LC IV R
14 Coraciiformes Coraciidae Ceyx erithacus Oriental Dwarf Kingfisher LC IV r
15 Coraciiformes Meropidae Merops leschenaulti Chestnut-headed Bee-eater LC Not Included R
16 Cuculiformes Cuculidae Centropus sinensis Greater Coucal LC IV R
17 Cuculiformes Cuculidae Eudynamys scolopacea Asian Koel LC IV R
18 Galliformes Phasianidae Gallus gallus Red jungle fowl LC IV
19 Galliformes Phasianidae Lophura leucomelana Kalij Pheasant LC IV R
20 Gruiformes Rallidae Amaurornis phoenicurus White-breasted Waterhen LC IV R
21 Passeriformes Campephagidae Pericrocotus ethologus Longtailed Minivet LC IV
22 Passeriformes Campephagidae Pericrocotus flammeus Scarlet Minivet LC IV R
23 Passeriformes Campephagidae Pericrocotus solaris Grey-chinned Minivet LC IV r
24 Passeriformes Cettiidae Cettia brunnifrons Grey-sided Bush Warbler LC IV r
25 Passeriformes Chloropseidae Chloropsis hardwickii Orange-bellied Leafbird LC IV r
26 Passeriformes Cinclidae Cinclus pallasii Brown Dipper LC Not Included R
27 Passeriformes Cisticolidae Orthotomus atrogularis Dark-necked Tailorbird LC IV r
28 Passeriformes Cisticolidae Orthotomus sutorius Common Tailorbird LC IV R
29 Passeriformes Corvidae Corvus macrorhynchos Large billed crow LC IV R
30 Passeriformes Corvidae Dendrocitta formosae Grey Treepie LC IV R
31 Passeriformes Dicaeidae Dicaeum ignipectus Fire breasted flowerpecker LC IV r
32 Passeriformes Dicruridae Dicrurus aeneus Bronzed Drongo LC IV r
33 Passeriformes Dicruridae Dicrurus hottentottus Spangled Drongo LC IV R
34 Passeriformes Dicruridae Dicrurus leucophaeus Ashy Drongo LC IV R
35 Passeriformes Dicruridae Dicrurus macrocercus Black Drongo LC IV R
36 Passeriformes Dicruridae Dicrurus paradiseus Greater Racket-tailed Drongo LC IV r
37 Passeriformes Emberizidae Emberiza fucata Chestnut-eared Bunting LC IV rw
38 Passeriformes Emberizidae Emberiza leucocephalUs Pine Bunting LC IV w
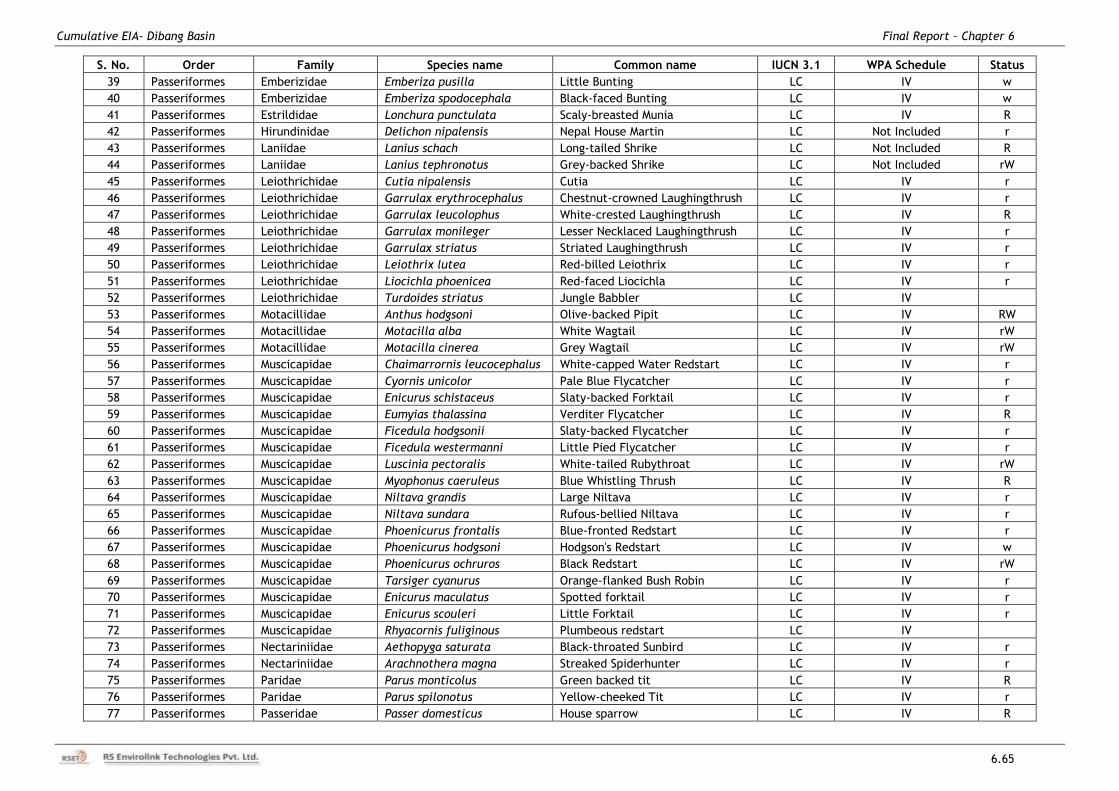
Cumulative EIA- Dibang Basin Final Report – Chapter 6
6.65
S. No. Order Family Species name Common name IUCN 3.1 WPA Schedule Status
39 Passeriformes Emberizidae Emberiza pusilla Little Bunting LC IV w
40 Passeriformes Emberizidae Emberiza spodocephala Black-faced Bunting LC IV w
41 Passeriformes Estrildidae Lonchura punctulata Scaly-breasted Munia LC IV R
42 Passeriformes Hirundinidae Delichon nipalensis Nepal House Martin LC Not Included r
43 Passeriformes Laniidae Lanius schach Long-tailed Shrike LC Not Included R
44 Passeriformes Laniidae Lanius tephronotus Grey-backed Shrike LC Not Included rW
45 Passeriformes Leiothrichidae Cutia nipalensis Cutia LC IV r
46 Passeriformes Leiothrichidae Garrulax erythrocephalus Chestnut-crowned Laughingthrush LC IV r
47 Passeriformes Leiothrichidae Garrulax leucolophus White-crested Laughingthrush LC IV R
48 Passeriformes Leiothrichidae Garrulax monileger Lesser Necklaced Laughingthrush LC IV r
49 Passeriformes Leiothrichidae Garrulax striatus Striated Laughingthrush LC IV r
50 Passeriformes Leiothrichidae Leiothrix lutea Red-billed Leiothrix LC IV r
51 Passeriformes Leiothrichidae Liocichla phoenicea Red-faced Liocichla LC IV r
52 Passeriformes Leiothrichidae Turdoides striatus Jungle Babbler LC IV
53 Passeriformes Motacillidae Anthus hodgsoni Olive-backed Pipit LC IV RW
54 Passeriformes Motacillidae Motacilla alba White Wagtail LC IV rW
55 Passeriformes Motacillidae Motacilla cinerea Grey Wagtail LC IV rW
56 Passeriformes Muscicapidae Chaimarrornis leucocephalus White-capped Water Redstart LC IV r
57 Passeriformes Muscicapidae Cyornis unicolor Pale Blue Flycatcher LC IV r
58 Passeriformes Muscicapidae Enicurus schistaceus Slaty-backed Forktail LC IV r
59 Passeriformes Muscicapidae Eumyias thalassina Verditer Flycatcher LC IV R
60 Passeriformes Muscicapidae Ficedula hodgsonii Slaty-backed Flycatcher LC IV r
61 Passeriformes Muscicapidae Ficedula westermanni Little Pied Flycatcher LC IV r
62 Passeriformes Muscicapidae Luscinia pectoralis White-tailed Rubythroat LC IV rW
63 Passeriformes Muscicapidae Myophonus caeruleus Blue Whistling Thrush LC IV R
64 Passeriformes Muscicapidae Niltava grandis Large Niltava LC IV r
65 Passeriformes Muscicapidae Niltava sundara Rufous-bellied Niltava LC IV r
66 Passeriformes Muscicapidae Phoenicurus frontalis Blue-fronted Redstart LC IV r
67 Passeriformes Muscicapidae Phoenicurus hodgsoni Hodgson's Redstart LC IV w
68 Passeriformes Muscicapidae Phoenicurus ochruros Black Redstart LC IV rW
69 Passeriformes Muscicapidae Tarsiger cyanurus Orange-flanked Bush Robin LC IV r
70 Passeriformes Muscicapidae Enicurus maculatus Spotted forktail LC IV r
71 Passeriformes Muscicapidae Enicurus scouleri Little Forktail LC IV r
72 Passeriformes Muscicapidae Rhyacornis fuliginous Plumbeous redstart LC IV
73 Passeriformes Nectariniidae Aethopyga saturata Black-throated Sunbird LC IV r
74 Passeriformes Nectariniidae Arachnothera magna Streaked Spiderhunter LC IV r
75 Passeriformes Paridae Parus monticolus Green backed tit LC IV R
76 Passeriformes Paridae Parus spilonotus Yellow-cheeked Tit LC IV r
77 Passeriformes Passeridae Passer domesticus House sparrow LC IV R
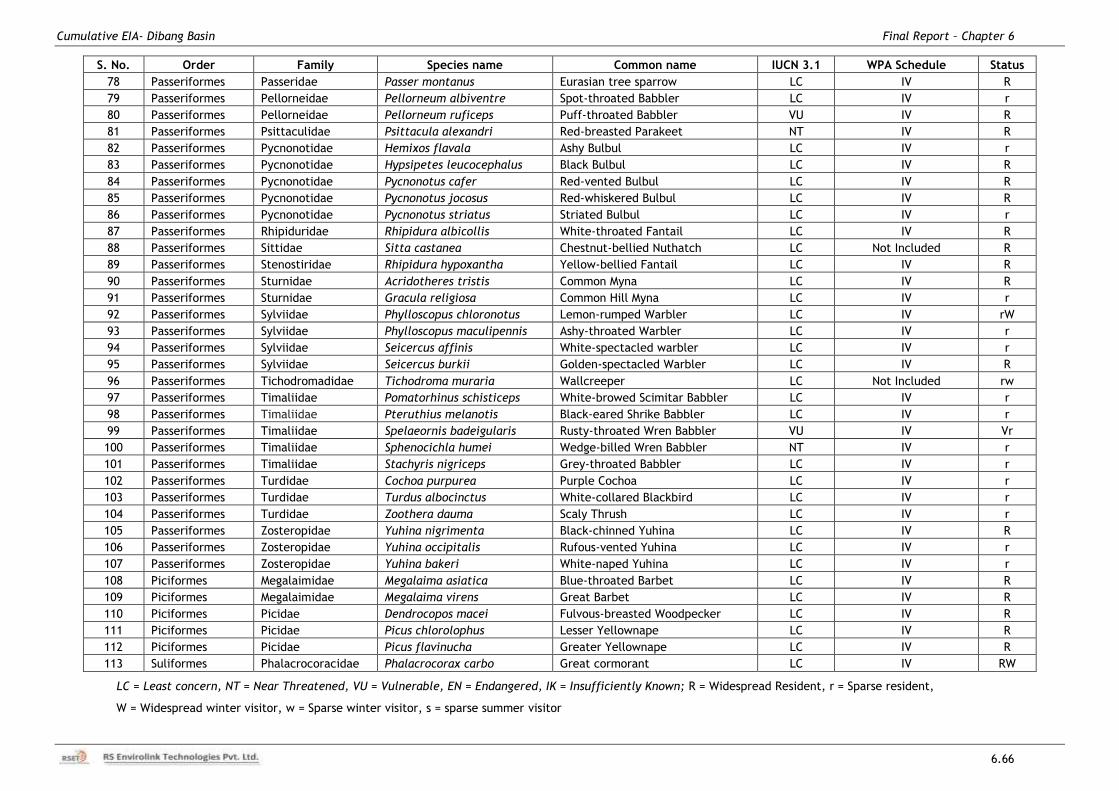
Cumulative EIA- Dibang Basin Final Report – Chapter 6
6.66
S. No. Order Family Species name Common name IUCN 3.1 WPA Schedule Status
78 Passeriformes Passeridae Passer montanus Eurasian tree sparrow LC IV R
79 Passeriformes Pellorneidae Pellorneum albiventre Spot-throated Babbler LC IV r
80 Passeriformes Pellorneidae Pellorneum ruficeps Puff-throated Babbler VU IV R
81 Passeriformes Psittaculidae Psittacula alexandri Red-breasted Parakeet NT IV R
82 Passeriformes Pycnonotidae Hemixos flavala Ashy Bulbul LC IV r
83 Passeriformes Pycnonotidae Hypsipetes leucocephalus Black Bulbul LC IV R
84 Passeriformes Pycnonotidae Pycnonotus cafer Red-vented Bulbul LC IV R
85 Passeriformes Pycnonotidae Pycnonotus jocosus Red-whiskered Bulbul LC IV R
86 Passeriformes Pycnonotidae Pycnonotus striatus Striated Bulbul LC IV r
87 Passeriformes Rhipiduridae Rhipidura albicollis White-throated Fantail LC IV R
88 Passeriformes Sittidae Sitta castanea Chestnut-bellied Nuthatch LC Not Included R
89 Passeriformes Stenostiridae Rhipidura hypoxantha Yellow-bellied Fantail LC IV R
90 Passeriformes Sturnidae Acridotheres tristis Common Myna LC IV R
91 Passeriformes Sturnidae Gracula religiosa Common Hill Myna LC IV r
92 Passeriformes Sylviidae Phylloscopus chloronotus Lemon-rumped Warbler LC IV rW
93 Passeriformes Sylviidae Phylloscopus maculipennis Ashy-throated Warbler LC IV r
94 Passeriformes Sylviidae Seicercus affinis White-spectacled warbler LC IV r
95 Passeriformes Sylviidae Seicercus burkii Golden-spectacled Warbler LC IV R
96 Passeriformes Tichodromadidae Tichodroma muraria Wallcreeper LC Not Included rw
97 Passeriformes Timaliidae Pomatorhinus schisticeps White-browed Scimitar Babbler LC IV r
98 Passeriformes Timaliidae Pteruthius melanotis Black-eared Shrike Babbler LC IV r
99 Passeriformes Timaliidae Spelaeornis badeigularis Rusty-throated Wren Babbler VU IV Vr
100 Passeriformes Timaliidae Sphenocichla humei Wedge-billed Wren Babbler NT IV r
101 Passeriformes Timaliidae Stachyris nigriceps Grey-throated Babbler LC IV r
102 Passeriformes Turdidae Cochoa purpurea Purple Cochoa LC IV r
103 Passeriformes Turdidae Turdus albocinctus White-collared Blackbird LC IV r
104 Passeriformes Turdidae Zoothera dauma Scaly Thrush LC IV r
105 Passeriformes Zosteropidae Yuhina nigrimenta Black-chinned Yuhina LC IV R
106 Passeriformes Zosteropidae Yuhina occipitalis Rufous-vented Yuhina LC IV r
107 Passeriformes Zosteropidae Yuhina bakeri White-naped Yuhina LC IV r
108 Piciformes Megalaimidae Megalaima asiatica Blue-throated Barbet LC IV R
109 Piciformes Megalaimidae Megalaima virens Great Barbet LC IV R
110 Piciformes Picidae Dendrocopos macei Fulvous-breasted Woodpecker LC IV R
111 Piciformes Picidae Picus chlorolophus Lesser Yellownape LC IV R
112 Piciformes Picidae Picus flavinucha Greater Yellownape LC IV R
113 Suliformes Phalacrocoracidae Phalacrocorax carbo Great cormorant LC IV RW
LC = Least concern, NT = Near Threatened, VU = Vulnerable, EN = Endangered, IK = Insufficiently Known; R = Widespread Resident, r = Sparse resident,
W = Widespread winter visitor, w = Sparse winter visitor, s = sparse summer visitor
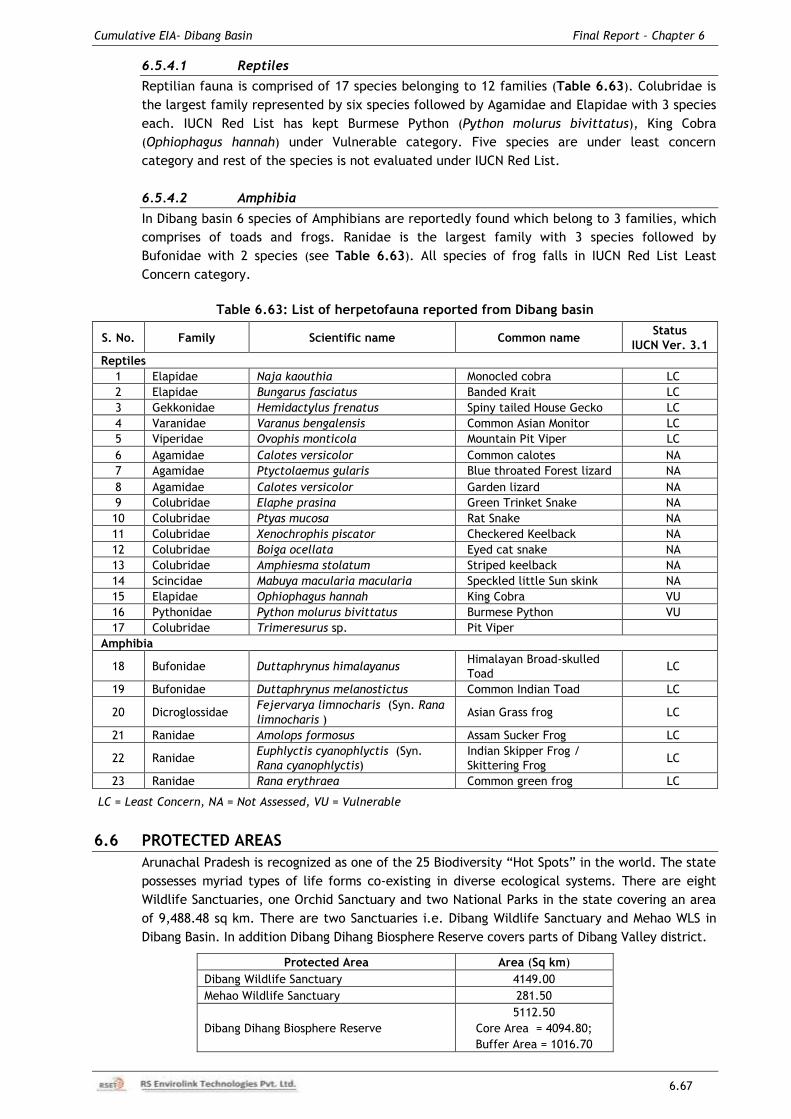
Cumulative EIA- Dibang Basin Final Report – Chapter 6
6.67
6.5.4.1 Reptiles
Reptilian fauna is comprised of 17 species belonging to 12 families (Table 6.63). Colubridae is
the largest family represented by six species followed by Agamidae and Elapidae with 3 species
each. IUCN Red List has kept Burmese Python (Python molurus bivittatus), King Cobra
(Ophiophagus hannah) under Vulnerable category. Five species are under least concern
category and rest of the species is not evaluated under IUCN Red List.
6.5.4.2 Amphibia
In Dibang basin 6 species of Amphibians are reportedly found which belong to 3 families, which
comprises of toads and frogs. Ranidae is the largest family with 3 species followed by
Bufonidae with 2 species (see Table 6.63). All species of frog falls in IUCN Red List Least
Concern category.
Table 6.63: List of herpetofauna reported from Dibang basin
S. No. Family Scientific name Common name Status
IUCN Ver. 3.1
Reptiles
1 Elapidae Naja kaouthia Monocled cobra LC
2 Elapidae Bungarus fasciatus Banded Krait LC
3 Gekkonidae Hemidactylus frenatus Spiny tailed House Gecko LC
4 Varanidae Varanus bengalensis Common Asian Monitor LC
5 Viperidae Ovophis monticola Mountain Pit Viper LC
6 Agamidae Calotes versicolor Common calotes NA
7 Agamidae Ptyctolaemus gularis Blue throated Forest lizard NA
8 Agamidae Calotes versicolor Garden lizard NA
9 Colubridae Elaphe prasina Green Trinket Snake NA
10 Colubridae Ptyas mucosa Rat Snake NA
11 Colubridae Xenochrophis piscator Checkered Keelback NA
12 Colubridae Boiga ocellata Eyed cat snake NA
13 Colubridae Amphiesma stolatum Striped keelback NA
14 Scincidae Mabuya macularia macularia Speckled little Sun skink NA
15 Elapidae Ophiophagus hannah King Cobra VU
16 Pythonidae Python molurus bivittatus Burmese Python VU
17 Colubridae Trimeresurus sp. Pit Viper
Amphibia
18 Bufonidae Duttaphrynus himalayanus Himalayan Broad-skulled
Toad LC
19 Bufonidae Duttaphrynus melanostictus Common Indian Toad LC
20 Dicroglossidae Fejervarya limnocharis (Syn. Rana
limnocharis ) Asian Grass frog LC
21 Ranidae Amolops formosus Assam Sucker Frog LC
22 Ranidae Euphlyctis cyanophlyctis (Syn.
Rana cyanophlyctis)
Indian Skipper Frog /
Skittering Frog LC
23 Ranidae Rana erythraea Common green frog LC
LC = Least Concern, NA = Not Assessed, VU = Vulnerable
6.6 PROTECTED AREAS
Arunachal Pradesh is recognized as one of the 25 Biodiversity “Hot Spots” in the world. The state
possesses myriad types of life forms co-existing in diverse ecological systems. There are eight
Wildlife Sanctuaries, one Orchid Sanctuary and two National Parks in the state covering an area
of 9,488.48 sq km. There are two Sanctuaries i.e. Dibang Wildlife Sanctuary and Mehao WLS in
Dibang Basin. In addition Dibang Dihang Biosphere Reserve covers parts of Dibang Valley district.
Protected Area Area (Sq km)
Dibang Wildlife Sanctuary 4149.00
Mehao Wildlife Sanctuary 281.50
Dibang Dihang Biosphere Reserve
5112.50
Core Area = 4094.80;
Buffer Area = 1016.70
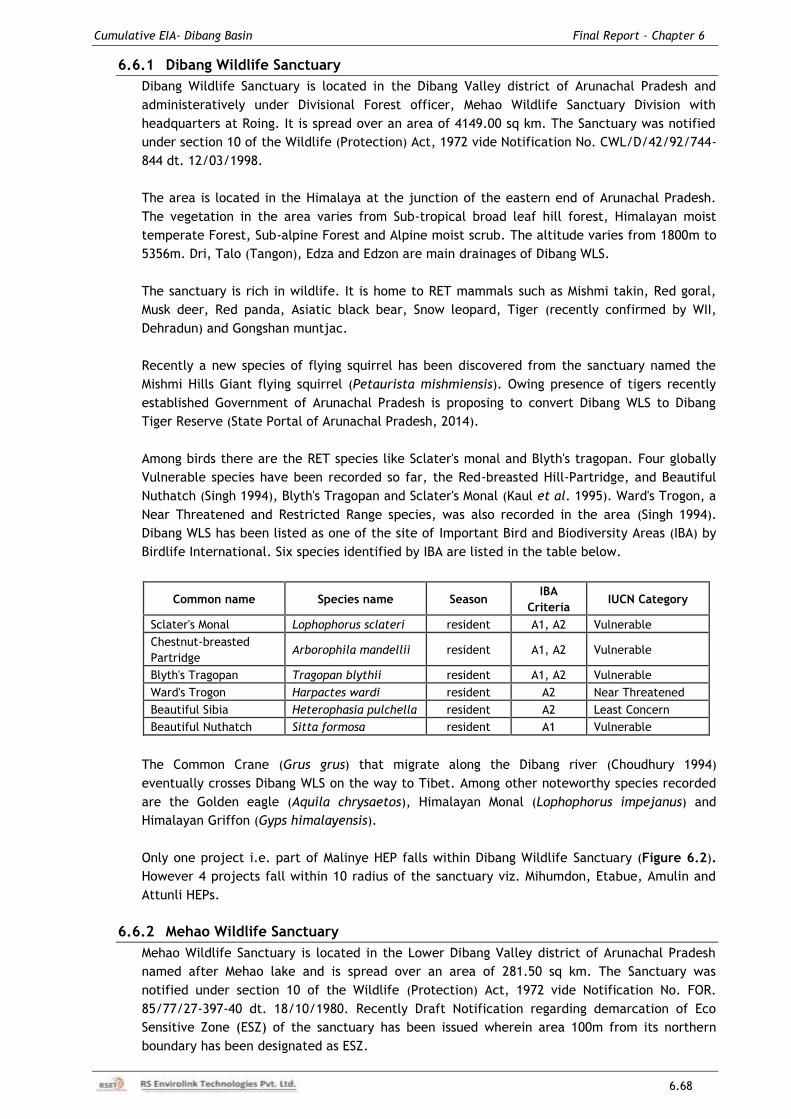
Cumulative EIA- Dibang Basin Final Report – Chapter 6
6.68
6.6.1 Dibang Wildlife Sanctuary
Dibang Wildlife Sanctuary is located in the Dibang Valley district of Arunachal Pradesh and
administeratively under Divisional Forest officer, Mehao Wildlife Sanctuary Division with
headquarters at Roing. It is spread over an area of 4149.00 sq km. The Sanctuary was notified
under section 10 of the Wildlife (Protection) Act, 1972 vide Notification No. CWL/D/42/92/744-
844 dt. 12/03/1998.
The area is located in the Himalaya at the junction of the eastern end of Arunachal Pradesh.
The vegetation in the area varies from Sub-tropical broad leaf hill forest, Himalayan moist
temperate Forest, Sub-alpine Forest and Alpine moist scrub. The altitude varies from 1800m to
5356m. Dri, Talo (Tangon), Edza and Edzon are main drainages of Dibang WLS.
The sanctuary is rich in wildlife. It is home to RET mammals such as Mishmi takin, Red goral,
Musk deer, Red panda, Asiatic black bear, Snow leopard, Tiger (recently confirmed by WII,
Dehradun) and Gongshan muntjac.
Recently a new species of flying squirrel has been discovered from the sanctuary named the
Mishmi Hills Giant flying squirrel (Petaurista mishmiensis). Owing presence of tigers recently
established Government of Arunachal Pradesh is proposing to convert Dibang WLS to Dibang
Tiger Reserve (State Portal of Arunachal Pradesh, 2014).
Among birds there are the RET species like Sclater's monal and Blyth's tragopan. Four globally
Vulnerable species have been recorded so far, the Red-breasted Hill-Partridge, and Beautiful
Nuthatch (Singh 1994), Blyth's Tragopan and Sclater's Monal (Kaul et al. 1995). Ward's Trogon, a
Near Threatened and Restricted Range species, was also recorded in the area (Singh 1994).
Dibang WLS has been listed as one of the site of Important Bird and Biodiversity Areas (IBA) by
Birdlife International. Six species identified by IBA are listed in the table below.
Common name Species name Season IBA
Criteria IUCN Category
Sclater's Monal Lophophorus sclateri resident A1, A2 Vulnerable
Chestnut-breasted
Partridge Arborophila mandellii resident A1, A2 Vulnerable
Blyth's Tragopan Tragopan blythii resident A1, A2 Vulnerable
Ward's Trogon Harpactes wardi resident A2 Near Threatened
Beautiful Sibia Heterophasia pulchella resident A2 Least Concern
Beautiful Nuthatch Sitta formosa resident A1 Vulnerable
The Common Crane (Grus grus) that migrate along the Dibang river (Choudhury 1994)
eventually crosses Dibang WLS on the way to Tibet. Among other noteworthy species recorded
are the Golden eagle (Aquila chrysaetos), Himalayan Monal (Lophophorus impejanus) and
Himalayan Griffon (Gyps himalayensis).
Only one project i.e. part of Malinye HEP falls within Dibang Wildlife Sanctuary (Figure 6.2).
However 4 projects fall within 10 radius of the sanctuary viz. Mihumdon, Etabue, Amulin and
Attunli HEPs.
6.6.2 Mehao Wildlife Sanctuary
Mehao Wildlife Sanctuary is located in the Lower Dibang Valley district of Arunachal Pradesh
named after Mehao lake and is spread over an area of 281.50 sq km. The Sanctuary was
notified under section 10 of the Wildlife (Protection) Act, 1972 vide Notification No. FOR.
85/77/27-397-40 dt. 18/10/1980. Recently Draft Notification regarding demarcation of Eco
Sensitive Zone (ESZ) of the sanctuary has been issued wherein area 100m from its northern
boundary has been designated as ESZ.
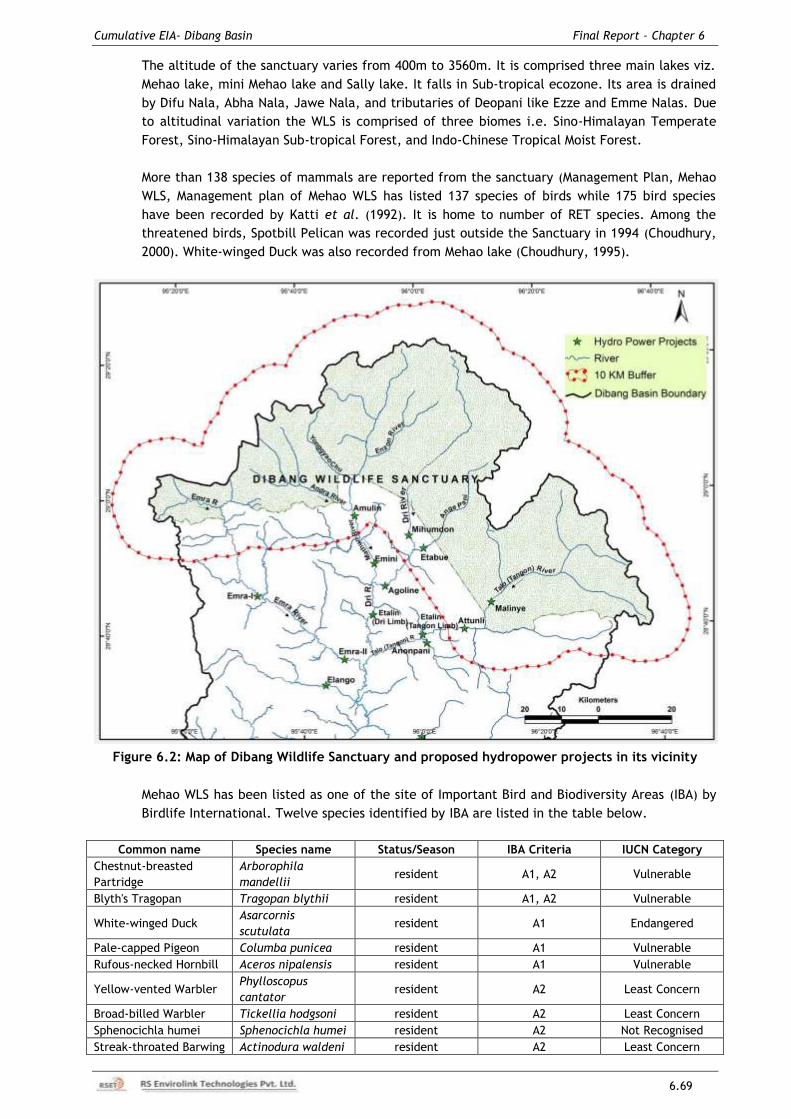
Cumulative EIA- Dibang Basin Final Report – Chapter 6
6.69
The altitude of the sanctuary varies from 400m to 3560m. It is comprised three main lakes viz.
Mehao lake, mini Mehao lake and Sally lake. It falls in Sub-tropical ecozone. Its area is drained
by Difu Nala, Abha Nala, Jawe Nala, and tributaries of Deopani like Ezze and Emme Nalas. Due
to altitudinal variation the WLS is comprised of three biomes i.e. Sino-Himalayan Temperate
Forest, Sino-Himalayan Sub-tropical Forest, and Indo-Chinese Tropical Moist Forest.
More than 138 species of mammals are reported from the sanctuary (Management Plan, Mehao
WLS, Management plan of Mehao WLS has listed 137 species of birds while 175 bird species
have been recorded by Katti et al. (1992). It is home to number of RET species. Among the
threatened birds, Spotbill Pelican was recorded just outside the Sanctuary in 1994 (Choudhury,
2000). White-winged Duck was also recorded from Mehao lake (Choudhury, 1995).
Figure 6.2: Map of Dibang Wildlife Sanctuary and proposed hydropower projects in its vicinity
Mehao WLS has been listed as one of the site of Important Bird and Biodiversity Areas (IBA) by
Birdlife International. Twelve species identified by IBA are listed in the table below.
Common name Species name Status/Season IBA Criteria IUCN Category
Chestnut-breasted
Partridge
Arborophila
mandellii resident A1, A2 Vulnerable
Blyth's Tragopan Tragopan blythii resident A1, A2 Vulnerable
White-winged Duck Asarcornis
scutulata resident A1 Endangered
Pale-capped Pigeon Columba punicea resident A1 Vulnerable
Rufous-necked Hornbill Aceros nipalensis resident A1 Vulnerable
Yellow-vented Warbler Phylloscopus
cantator resident A2 Least Concern
Broad-billed Warbler Tickellia hodgsoni resident A2 Least Concern
Sphenocichla humei Sphenocichla humei resident A2 Not Recognised
Streak-throated Barwing Actinodura waldeni resident A2 Least Concern
Cumulative EIA- Dibang Basin Final Report – Chapter 6
6.70
Common name Species name Status/Season IBA Criteria IUCN Category
Ludlow's Fulvetta Alcippe ludlowi resident A2 Least Concern
Beautiful Sibia Heterophasia
pulchella resident A2 Least Concern
White-naped Yuhina Yuhina bakeri resident A2 Least Concern
The Wedge-billed Wren-Babbler, a Restricted Range species, and one of the least known Indian
species, has been recorded from this Sanctuary (Katti et al. 1992). It has been collected only
three times in the last century, in 1905 by Stevens (1914), in 1938 by Lightfoot (1940) and in
1988 by Ripley et al. (1991). It occurs in two races: humei and roberti. Rasmussen and Anderton
(in press) have elevated these races to full species: Sphenocichla humei and Sphenocichla
roberti. Ali and Ripley (1987) have also considered both subspecies as very rare residents.
Stattersfield et al. (1998) have identified endemic bird areas EBA) of the world and listed
Restricted Range species found in each EBA. In the Eastern Himalayas EBA, 21 species are found
in India, out of which 10 have been reported from this IBA. There are not many IBAs in this EBA
where so many Restricted Range species are found.
Part of reservoir of Ashupani HEP falls within the Sanctuary. However Dibang Multipurpose
Project, Ithun-I and Ithun-II are located outside the sanctuary i.e. at a distance of more than
10 km from the sanctuary.
Figure 6.3: Map of Mehao Wildlife Sanctuary and location proposed Ashupani HE project
6.6.3 Dibang Dihang Biosphere Reserve
There is one Biosphere Reserve (BR) in the basin which is spread across Dibang and Siang
basins. Biosphere Reserve (BR) is an international designation by UNESCO for representative
parts of natural and cultural landscapes extending over large area of terrestrial or
coastal/marine ecosystems or a combination thereof. These areas are internationally
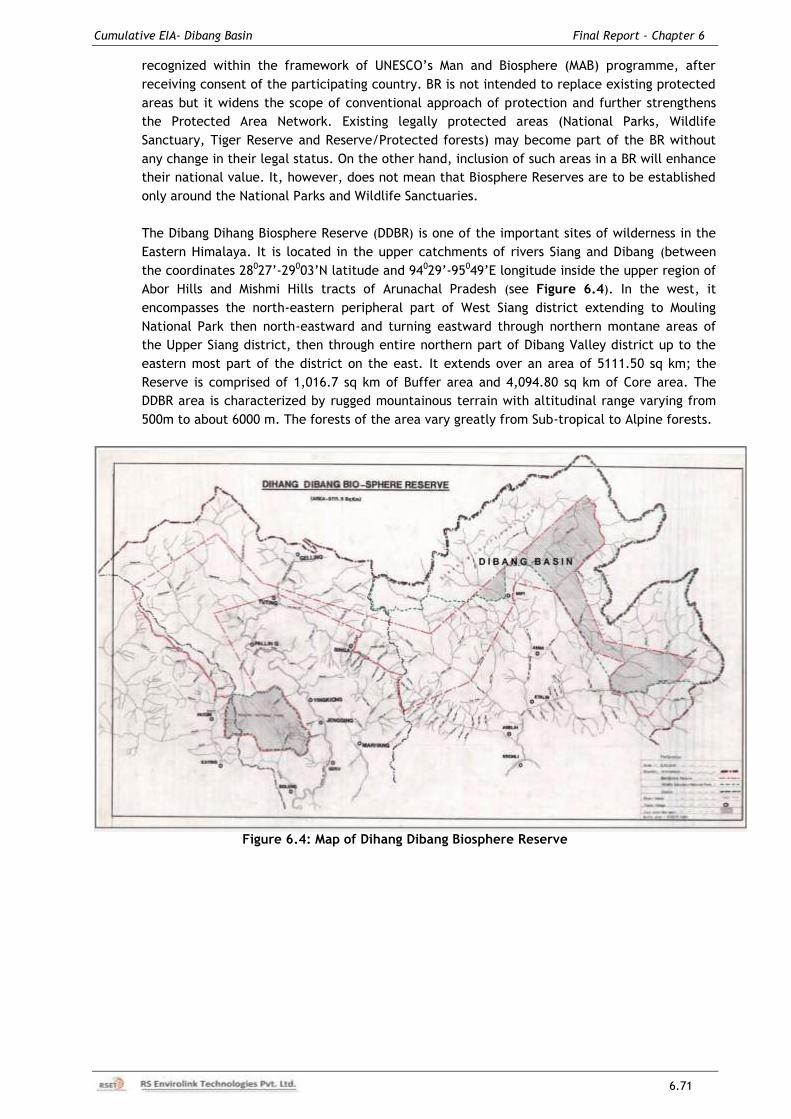
Cumulative EIA- Dibang Basin Final Report – Chapter 6
6.71
recognized within the framework of UNESCO‟s Man and Biosphere (MAB) programme, after
receiving consent of the participating country. BR is not intended to replace existing protected
areas but it widens the scope of conventional approach of protection and further strengthens
the Protected Area Network. Existing legally protected areas (National Parks, Wildlife
Sanctuary, Tiger Reserve and Reserve/Protected forests) may become part of the BR without
any change in their legal status. On the other hand, inclusion of such areas in a BR will enhance
their national value. It, however, does not mean that Biosphere Reserves are to be established
only around the National Parks and Wildlife Sanctuaries.
The Dibang Dihang Biosphere Reserve (DDBR) is one of the important sites of wilderness in the
Eastern Himalaya. It is located in the upper catchments of rivers Siang and Dibang (between
the coordinates 28027‟-29003‟N latitude and 94029‟-95049‟E longitude inside the upper region of
Abor Hills and Mishmi Hills tracts of Arunachal Pradesh (see Figure 6.4). In the west, it
encompasses the north-eastern peripheral part of West Siang district extending to Mouling
National Park then north-eastward and turning eastward through northern montane areas of
the Upper Siang district, then through entire northern part of Dibang Valley district up to the
eastern most part of the district on the east. It extends over an area of 5111.50 sq km; the
Reserve is comprised of 1,016.7 sq km of Buffer area and 4,094.80 sq km of Core area. The
DDBR area is characterized by rugged mountainous terrain with altitudinal range varying from
500m to about 6000 m. The forests of the area vary greatly from Sub-tropical to Alpine forests.
Figure 6.4: Map of Dihang Dibang Biosphere Reserve
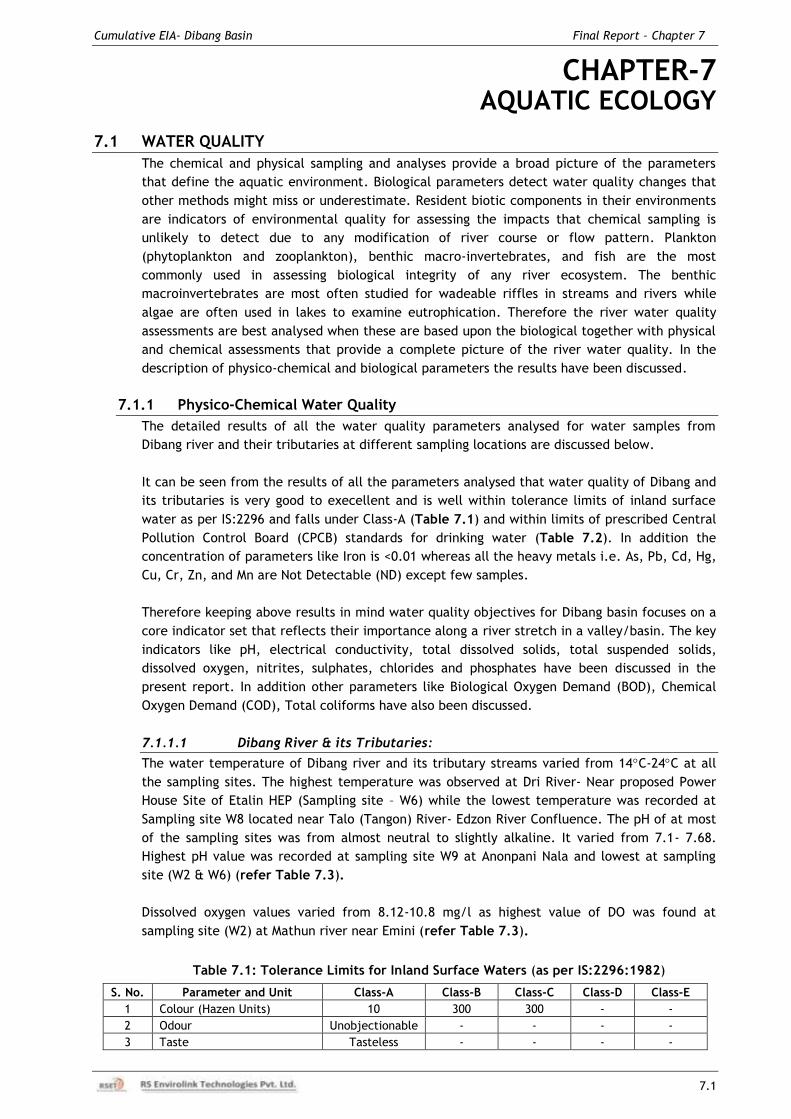
Cumulative EIA- Dibang Basin Final Report – Chapter 7
7.1
CHAPTER-7 AQUATIC ECOLOGY
7.1 WATER QUALITY
The chemical and physical sampling and analyses provide a broad picture of the parameters
that define the aquatic environment. Biological parameters detect water quality changes that
other methods might miss or underestimate. Resident biotic components in their environments
are indicators of environmental quality for assessing the impacts that chemical sampling is
unlikely to detect due to any modification of river course or flow pattern. Plankton
(phytoplankton and zooplankton), benthic macro-invertebrates, and fish are the most
commonly used in assessing biological integrity of any river ecosystem. The benthic
macroinvertebrates are most often studied for wadeable riffles in streams and rivers while
algae are often used in lakes to examine eutrophication. Therefore the river water quality
assessments are best analysed when these are based upon the biological together with physical
and chemical assessments that provide a complete picture of the river water quality. In the
description of physico-chemical and biological parameters the results have been discussed.
7.1.1 Physico-Chemical Water Quality
The detailed results of all the water quality parameters analysed for water samples from
Dibang river and their tributaries at different sampling locations are discussed below.
It can be seen from the results of all the parameters analysed that water quality of Dibang and
its tributaries is very good to execellent and is well within tolerance limits of inland surface
water as per IS:2296 and falls under Class-A (Table 7.1) and within limits of prescribed Central
Pollution Control Board (CPCB) standards for drinking water (Table 7.2). In addition the
concentration of parameters like Iron is <0.01 whereas all the heavy metals i.e. As, Pb, Cd, Hg,
Cu, Cr, Zn, and Mn are Not Detectable (ND) except few samples.
Therefore keeping above results in mind water quality objectives for Dibang basin focuses on a
core indicator set that reflects their importance along a river stretch in a valley/basin. The key
indicators like pH, electrical conductivity, total dissolved solids, total suspended solids,
dissolved oxygen, nitrites, sulphates, chlorides and phosphates have been discussed in the
present report. In addition other parameters like Biological Oxygen Demand (BOD), Chemical
Oxygen Demand (COD), Total coliforms have also been discussed.
7.1.1.1 Dibang River & its Tributaries:
The water temperature of Dibang river and its tributary streams varied from 14C-24C at all
the sampling sites. The highest temperature was observed at Dri River- Near proposed Power
House Site of Etalin HEP (Sampling site – W6) while the lowest temperature was recorded at
Sampling site W8 located near Talo (Tangon) River- Edzon River Confluence. The pH of at most
of the sampling sites was from almost neutral to slightly alkaline. It varied from 7.1- 7.68.
Highest pH value was recorded at sampling site W9 at Anonpani Nala and lowest at sampling
site (W2 & W6) (refer Table 7.3).
Dissolved oxygen values varied from 8.12-10.8 mg/l as highest value of DO was found at
sampling site (W2) at Mathun river near Emini (refer Table 7.3).
Table 7.1: Tolerance Limits for Inland Surface Waters (as per IS:2296:1982)
S. No. Parameter and Unit Class-A Class-B Class-C Class-D Class-E
1 Colour (Hazen Units) 10 300 300 - -
2 Odour Unobjectionable - - - -
3 Taste Tasteless - - - -
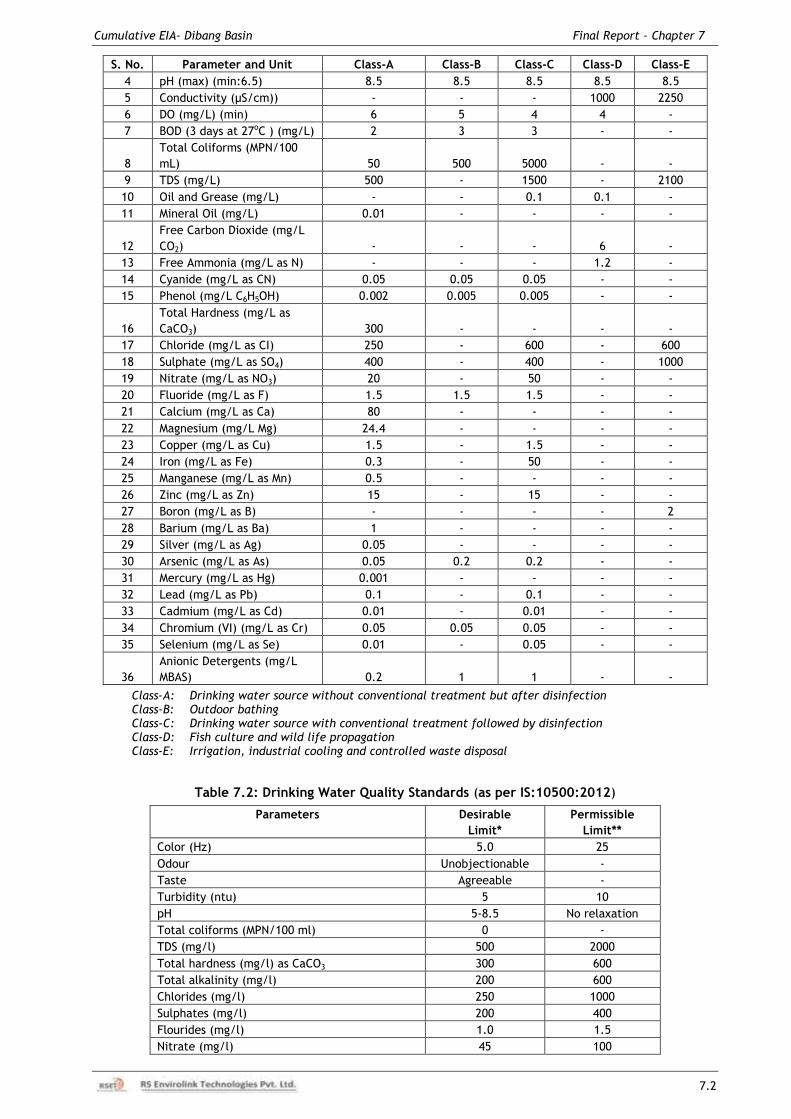
Cumulative EIA- Dibang Basin Final Report – Chapter 7
7.2
S. No. Parameter and Unit Class-A Class-B Class-C Class-D Class-E
4 pH (max) (min:6.5) 8.5 8.5 8.5 8.5 8.5
5 Conductivity (μS/cm)) - - - 1000 2250
6 DO (mg/L) (min) 6 5 4 4 -
7 BOD (3 days at 27oC ) (mg/L) 2 3 3 - -
8
Total Coliforms (MPN/100
mL) 50 500 5000 - -
9 TDS (mg/L) 500 - 1500 - 2100
10 Oil and Grease (mg/L) - - 0.1 0.1 -
11 Mineral Oil (mg/L) 0.01 - - - -
12
Free Carbon Dioxide (mg/L
CO2) - - - 6 -
13 Free Ammonia (mg/L as N) - - - 1.2 -
14 Cyanide (mg/L as CN) 0.05 0.05 0.05 - -
15 Phenol (mg/L C6H5OH) 0.002 0.005 0.005 - -
16
Total Hardness (mg/L as
CaCO3) 300 - - - -
17 Chloride (mg/L as CI) 250 - 600 - 600
18 Sulphate (mg/L as SO4) 400 - 400 - 1000
19 Nitrate (mg/L as NO3) 20 - 50 - -
20 Fluoride (mg/L as F) 1.5 1.5 1.5 - -
21 Calcium (mg/L as Ca) 80 - - - -
22 Magnesium (mg/L Mg) 24.4 - - - -
23 Copper (mg/L as Cu) 1.5 - 1.5 - -
24 Iron (mg/L as Fe) 0.3 - 50 - -
25 Manganese (mg/L as Mn) 0.5 - - - -
26 Zinc (mg/L as Zn) 15 - 15 - -
27 Boron (mg/L as B) - - - - 2
28 Barium (mg/L as Ba) 1 - - - -
29 Silver (mg/L as Ag) 0.05 - - - -
30 Arsenic (mg/L as As) 0.05 0.2 0.2 - -
31 Mercury (mg/L as Hg) 0.001 - - - -
32 Lead (mg/L as Pb) 0.1 - 0.1 - -
33 Cadmium (mg/L as Cd) 0.01 - 0.01 - -
34 Chromium (VI) (mg/L as Cr) 0.05 0.05 0.05 - -
35 Selenium (mg/L as Se) 0.01 - 0.05 - -
36
Anionic Detergents (mg/L
MBAS) 0.2 1 1 - -
Class-A: Drinking water source without conventional treatment but after disinfection Class-B: Outdoor bathing Class-C: Drinking water source with conventional treatment followed by disinfection Class-D: Fish culture and wild life propagation Class-E: Irrigation, industrial cooling and controlled waste disposal
Table 7.2: Drinking Water Quality Standards (as per IS:10500:2012)
Parameters Desirable
Limit*
Permissible
Limit**
Color (Hz) 5.0 25
Odour Unobjectionable -
Taste Agreeable -
Turbidity (ntu) 5 10
pH 5-8.5 No relaxation
Total coliforms (MPN/100 ml) 0 -
TDS (mg/l) 500 2000
Total hardness (mg/l) as CaCO3 300 600
Total alkalinity (mg/l) 200 600
Chlorides (mg/l) 250 1000
Sulphates (mg/l) 200 400
Flourides (mg/l) 1.0 1.5
Nitrate (mg/l) 45 100
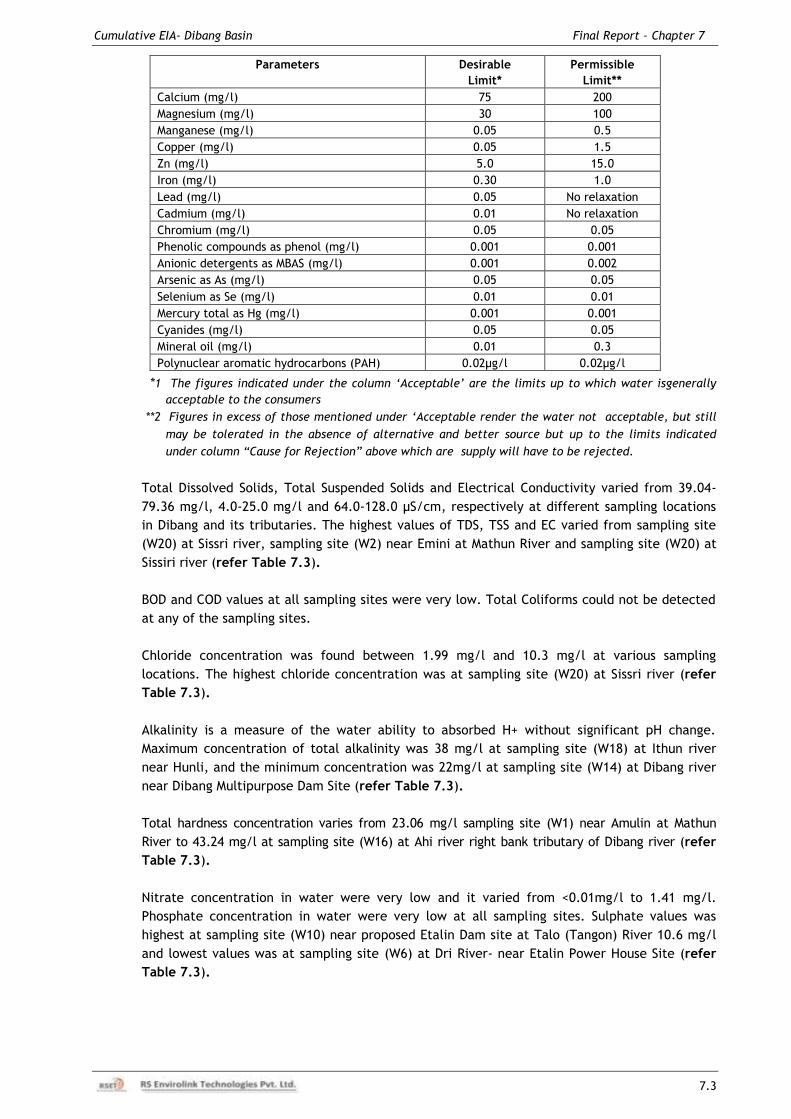
Cumulative EIA- Dibang Basin Final Report – Chapter 7
7.3
Parameters Desirable
Limit*
Permissible
Limit**
Calcium (mg/l) 75 200
Magnesium (mg/l) 30 100
Manganese (mg/l) 0.05 0.5
Copper (mg/l) 0.05 1.5
Zn (mg/l) 5.0 15.0
Iron (mg/l) 0.30 1.0
Lead (mg/l) 0.05 No relaxation
Cadmium (mg/l) 0.01 No relaxation
Chromium (mg/l) 0.05 0.05
Phenolic compounds as phenol (mg/l) 0.001 0.001
Anionic detergents as MBAS (mg/l) 0.001 0.002
Arsenic as As (mg/l) 0.05 0.05
Selenium as Se (mg/l) 0.01 0.01
Mercury total as Hg (mg/l) 0.001 0.001
Cyanides (mg/l) 0.05 0.05
Mineral oil (mg/l) 0.01 0.3
Polynuclear aromatic hydrocarbons (PAH) 0.02μg/l 0.02μg/l
*1 The figures indicated under the column „Acceptable‟ are the limits up to which water isgenerally
acceptable to the consumers
**2 Figures in excess of those mentioned under „Acceptable render the water not acceptable, but still
may be tolerated in the absence of alternative and better source but up to the limits indicated
under column “Cause for Rejection” above which are supply will have to be rejected.
Total Dissolved Solids, Total Suspended Solids and Electrical Conductivity varied from 39.04-
79.36 mg/l, 4.0-25.0 mg/l and 64.0-128.0 μS/cm, respectively at different sampling locations
in Dibang and its tributaries. The highest values of TDS, TSS and EC varied from sampling site
(W20) at Sissri river, sampling site (W2) near Emini at Mathun River and sampling site (W20) at
Sissiri river (refer Table 7.3).
BOD and COD values at all sampling sites were very low. Total Coliforms could not be detected
at any of the sampling sites.
Chloride concentration was found between 1.99 mg/l and 10.3 mg/l at various sampling
locations. The highest chloride concentration was at sampling site (W20) at Sissri river (refer
Table 7.3).
Alkalinity is a measure of the water ability to absorbed H+ without significant pH change.
Maximum concentration of total alkalinity was 38 mg/l at sampling site (W18) at Ithun river
near Hunli, and the minimum concentration was 22mg/l at sampling site (W14) at Dibang river
near Dibang Multipurpose Dam Site (refer Table 7.3).
Total hardness concentration varies from 23.06 mg/l sampling site (W1) near Amulin at Mathun
River to 43.24 mg/l at sampling site (W16) at Ahi river right bank tributary of Dibang river (refer
Table 7.3).
Nitrate concentration in water were very low and it varied from <0.01mg/l to 1.41 mg/l.
Phosphate concentration in water were very low at all sampling sites. Sulphate values was
highest at sampling site (W10) near proposed Etalin Dam site at Talo (Tangon) River 10.6 mg/l
and lowest values was at sampling site (W6) at Dri River- near Etalin Power House Site (refer
Table 7.3).
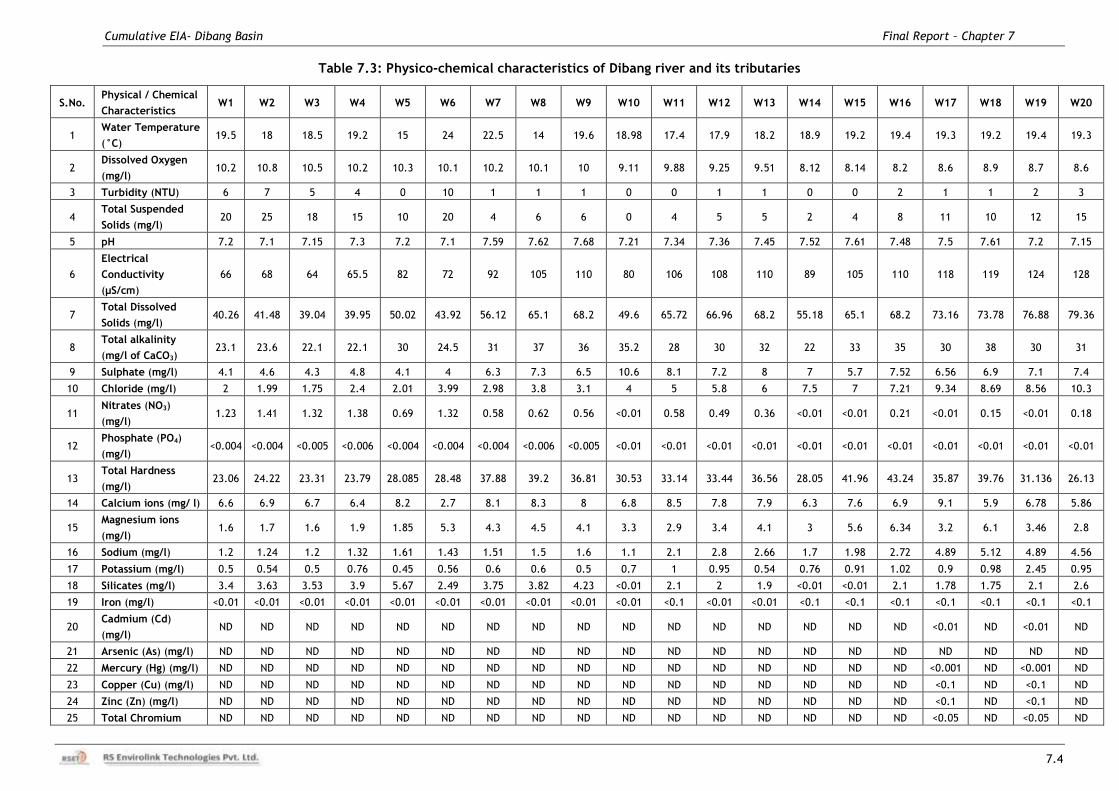
Cumulative EIA- Dibang Basin Final Report – Chapter 7
7.4
Table 7.3: Physico-chemical characteristics of Dibang river and its tributaries
S.No. Physical / Chemical
Characteristics W1 W2 W3 W4 W5 W6 W7 W8 W9 W10 W11 W12 W13 W14 W15 W16 W17 W18 W19 W20
1 Water Temperature
(°C) 19.5 18 18.5 19.2 15 24 22.5 14 19.6 18.98 17.4 17.9 18.2 18.9 19.2 19.4 19.3 19.2 19.4 19.3
2 Dissolved Oxygen
(mg/l) 10.2 10.8 10.5 10.2 10.3 10.1 10.2 10.1 10 9.11 9.88 9.25 9.51 8.12 8.14 8.2 8.6 8.9 8.7 8.6
3 Turbidity (NTU) 6 7 5 4 0 10 1 1 1 0 0 1 1 0 0 2 1 1 2 3
4 Total Suspended
Solids (mg/l) 20 25 18 15 10 20 4 6 6 0 4 5 5 2 4 8 11 10 12 15
5 pH 7.2 7.1 7.15 7.3 7.2 7.1 7.59 7.62 7.68 7.21 7.34 7.36 7.45 7.52 7.61 7.48 7.5 7.61 7.2 7.15
6
Electrical
Conductivity
(μS/cm)
66 68 64 65.5 82 72 92 105 110 80 106 108 110 89 105 110 118 119 124 128
7 Total Dissolved
Solids (mg/l) 40.26 41.48 39.04 39.95 50.02 43.92 56.12 65.1 68.2 49.6 65.72 66.96 68.2 55.18 65.1 68.2 73.16 73.78 76.88 79.36
8 Total alkalinity
(mg/l of CaCO3) 23.1 23.6 22.1 22.1 30 24.5 31 37 36 35.2 28 30 32 22 33 35 30 38 30 31
9 Sulphate (mg/l) 4.1 4.6 4.3 4.8 4.1 4 6.3 7.3 6.5 10.6 8.1 7.2 8 7 5.7 7.52 6.56 6.9 7.1 7.4
10 Chloride (mg/l) 2 1.99 1.75 2.4 2.01 3.99 2.98 3.8 3.1 4 5 5.8 6 7.5 7 7.21 9.34 8.69 8.56 10.3
11 Nitrates (NO3)
(mg/l) 1.23 1.41 1.32 1.38 0.69 1.32 0.58 0.62 0.56 <0.01 0.58 0.49 0.36 <0.01 <0.01 0.21 <0.01 0.15 <0.01 0.18
12 Phosphate (PO4)
(mg/l) <0.004 <0.004 <0.005 <0.006 <0.004 <0.004 <0.004 <0.006 <0.005 <0.01 <0.01 <0.01 <0.01 <0.01 <0.01 <0.01 <0.01 <0.01 <0.01 <0.01
13 Total Hardness
(mg/l) 23.06 24.22 23.31 23.79 28.085 28.48 37.88 39.2 36.81 30.53 33.14 33.44 36.56 28.05 41.96 43.24 35.87 39.76 31.136 26.13
14 Calcium ions (mg/ l) 6.6 6.9 6.7 6.4 8.2 2.7 8.1 8.3 8 6.8 8.5 7.8 7.9 6.3 7.6 6.9 9.1 5.9 6.78 5.86
15 Magnesium ions
(mg/l) 1.6 1.7 1.6 1.9 1.85 5.3 4.3 4.5 4.1 3.3 2.9 3.4 4.1 3 5.6 6.34 3.2 6.1 3.46 2.8
16 Sodium (mg/l) 1.2 1.24 1.2 1.32 1.61 1.43 1.51 1.5 1.6 1.1 2.1 2.8 2.66 1.7 1.98 2.72 4.89 5.12 4.89 4.56
17 Potassium (mg/l) 0.5 0.54 0.5 0.76 0.45 0.56 0.6 0.6 0.5 0.7 1 0.95 0.54 0.76 0.91 1.02 0.9 0.98 2.45 0.95
18 Silicates (mg/l) 3.4 3.63 3.53 3.9 5.67 2.49 3.75 3.82 4.23 <0.01 2.1 2 1.9 <0.01 <0.01 2.1 1.78 1.75 2.1 2.6
19 Iron (mg/l) <0.01 <0.01 <0.01 <0.01 <0.01 <0.01 <0.01 <0.01 <0.01 <0.01 <0.1 <0.01 <0.01 <0.1 <0.1 <0.1 <0.1 <0.1 <0.1 <0.1
20 Cadmium (Cd)
(mg/l) ND ND ND ND ND ND ND ND ND ND ND ND ND ND ND ND <0.01 ND <0.01 ND
21 Arsenic (As) (mg/l) ND ND ND ND ND ND ND ND ND ND ND ND ND ND ND ND ND ND ND ND
22 Mercury (Hg) (mg/l) ND ND ND ND ND ND ND ND ND ND ND ND ND ND ND ND <0.001 ND <0.001 ND
23 Copper (Cu) (mg/l) ND ND ND ND ND ND ND ND ND ND ND ND ND ND ND ND <0.1 ND <0.1 ND
24 Zinc (Zn) (mg/l) ND ND ND ND ND ND ND ND ND ND ND ND ND ND ND ND <0.1 ND <0.1 ND
25 Total Chromium ND ND ND ND ND ND ND ND ND ND ND ND ND ND ND ND <0.05 ND <0.05 ND
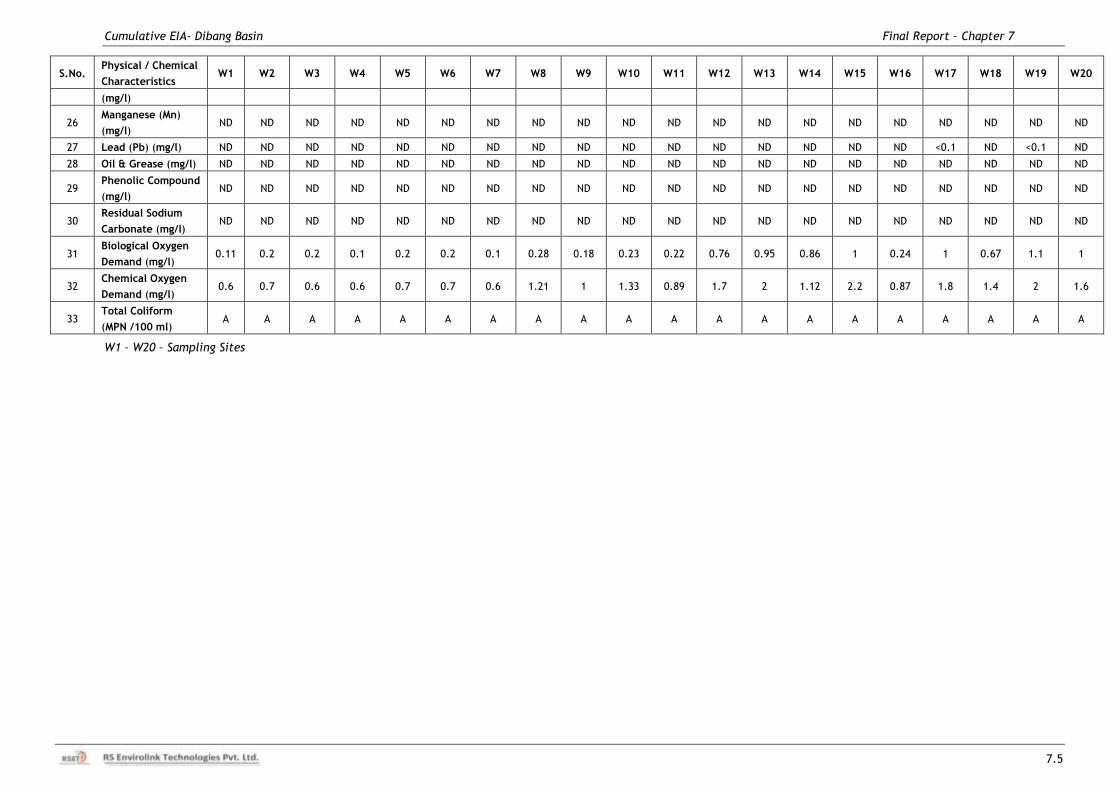
Cumulative EIA- Dibang Basin Final Report – Chapter 7
7.5
S.No. Physical / Chemical
Characteristics W1 W2 W3 W4 W5 W6 W7 W8 W9 W10 W11 W12 W13 W14 W15 W16 W17 W18 W19 W20
(mg/l)
26 Manganese (Mn)
(mg/l) ND ND ND ND ND ND ND ND ND ND ND ND ND ND ND ND ND ND ND ND
27 Lead (Pb) (mg/l) ND ND ND ND ND ND ND ND ND ND ND ND ND ND ND ND <0.1 ND <0.1 ND
28 Oil & Grease (mg/l) ND ND ND ND ND ND ND ND ND ND ND ND ND ND ND ND ND ND ND ND
29 Phenolic Compound
(mg/l) ND ND ND ND ND ND ND ND ND ND ND ND ND ND ND ND ND ND ND ND
30 Residual Sodium
Carbonate (mg/l) ND ND ND ND ND ND ND ND ND ND ND ND ND ND ND ND ND ND ND ND
31 Biological Oxygen
Demand (mg/l) 0.11 0.2 0.2 0.1 0.2 0.2 0.1 0.28 0.18 0.23 0.22 0.76 0.95 0.86 1 0.24 1 0.67 1.1 1
32 Chemical Oxygen
Demand (mg/l) 0.6 0.7 0.6 0.6 0.7 0.7 0.6 1.21 1 1.33 0.89 1.7 2 1.12 2.2 0.87 1.8 1.4 2 1.6
33 Total Coliform
(MPN /100 ml) A A A A A A A A A A A A A A A A A A A A
W1 – W20 – Sampling Sites
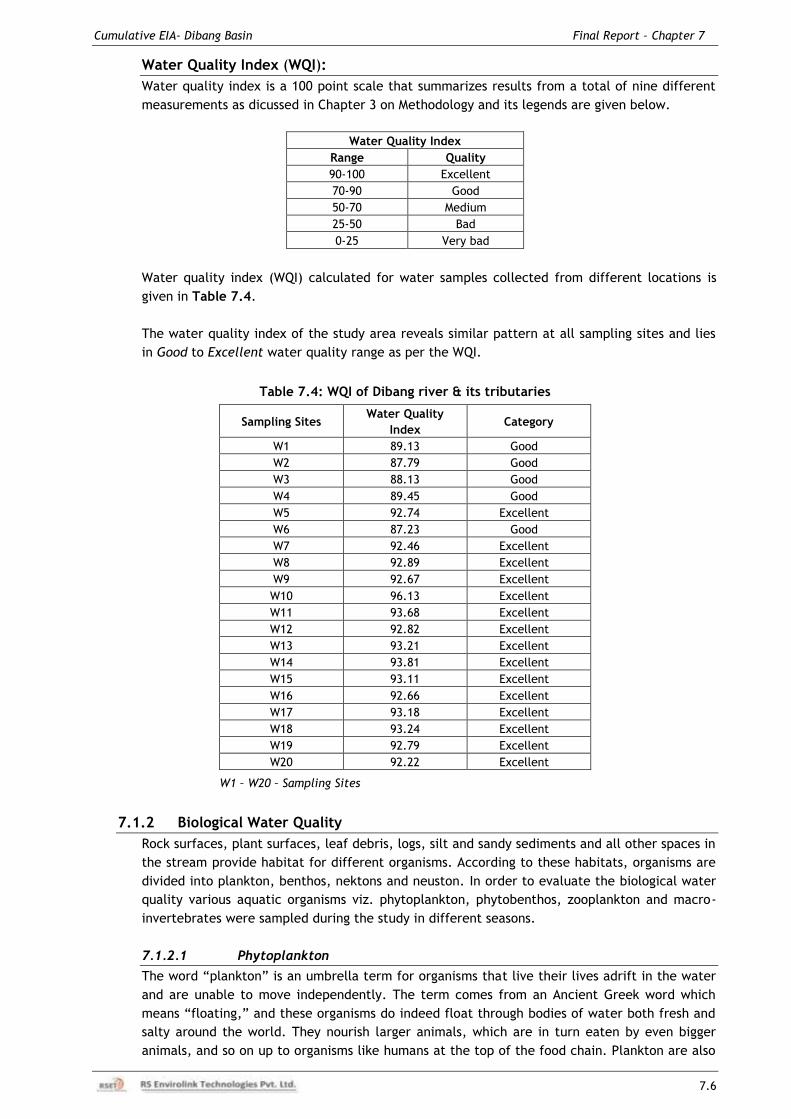
Cumulative EIA- Dibang Basin Final Report – Chapter 7
7.6
Water Quality Index (WQI):
Water quality index is a 100 point scale that summarizes results from a total of nine different
measurements as dicussed in Chapter 3 on Methodology and its legends are given below.
Water Quality Index
Range Quality
90-100 Excellent
70-90 Good
50-70 Medium
25-50 Bad
0-25 Very bad
Water quality index (WQI) calculated for water samples collected from different locations is
given in Table 7.4.
The water quality index of the study area reveals similar pattern at all sampling sites and lies
in Good to Excellent water quality range as per the WQI.
Table 7.4: WQI of Dibang river & its tributaries
Sampling Sites Water Quality
Index Category
W1 89.13 Good
W2 87.79 Good
W3 88.13 Good
W4 89.45 Good
W5 92.74 Excellent
W6 87.23 Good
W7 92.46 Excellent
W8 92.89 Excellent
W9 92.67 Excellent
W10 96.13 Excellent
W11 93.68 Excellent
W12 92.82 Excellent
W13 93.21 Excellent
W14 93.81 Excellent
W15 93.11 Excellent
W16 92.66 Excellent
W17 93.18 Excellent
W18 93.24 Excellent
W19 92.79 Excellent
W20 92.22 Excellent
W1 – W20 – Sampling Sites
7.1.2 Biological Water Quality
Rock surfaces, plant surfaces, leaf debris, logs, silt and sandy sediments and all other spaces in
the stream provide habitat for different organisms. According to these habitats, organisms are
divided into plankton, benthos, nektons and neuston. In order to evaluate the biological water
quality various aquatic organisms viz. phytoplankton, phytobenthos, zooplankton and macro-
invertebrates were sampled during the study in different seasons.
7.1.2.1 Phytoplankton
The word “plankton” is an umbrella term for organisms that live their lives adrift in the water
and are unable to move independently. The term comes from an Ancient Greek word which
means “floating,” and these organisms do indeed float through bodies of water both fresh and
salty around the world. They nourish larger animals, which are in turn eaten by even bigger
animals, and so on up to organisms like humans at the top of the food chain. Plankton are also
Cumulative EIA- Dibang Basin Final Report – Chapter 7
7.7
responsible for the Earth's atmosphere, thanks to the efforts of billions of photosynthesizing
phytoplankton. The phytoplankton comprise of diatoms, dinoflagellates, cyanobacteria, and
other groups of unicellular algae.
The damming of rivers for of hydropower invariably has profound impact on the planktonic
communities as the planktonic organisms are forced to inhabit regulated stream/s with cascades
of reservoirs. The species composition of two conditions as a result of damming of river i.e. lake
conditions and free flowing river conditions are different. Hence, prior to dam construction it is
necessary to know the species composition, density and diversity of phytoplankton.
In all total, 86 species of phytoplankton were identified in the samples collected from various
sampling locations in the study area. The phytoplankton community comprised of 47 species of
Bacillariophyceae, 24 species of Cyanophyceae, 8 species of Chlorophyceae and 4 species of
Conjugatophyceae, 2 species of Ulvophyceae and one species of Euglenophyceae (Table 7.5).
Most common species are Achnanthes crenulata, Achnanthes exigua var. exigua,
Achnanthidium biasolettianum var. biasolettiana, Cocconeis placentula var. lineata,
Ceratoneis arcus var. recta, Encyonema silisiacum, Gomphonema olivaceum, Navicula
cryptotenella, Navicula radiosaffalax, Surirella angusta, Gloeocapsa punctata, Anabaena
aequalis, Rivularia angulosa, Cladophora sp. and Nitzschia linearis.
7.1.2.2 Phytobenthos
Benthos is the community of organisms that live on or in the river bed also known as benthic
zone. The main food sources for the benthos are algae and organic runoff from land. The depth
of water, temperature and salinity, and type of local substrate all affect what benthos is
present. Phytobenthos comprises the plants belonging to the benthos, mainly benthic diatoms.
In all total 70 species of Phytobenthos were identified from all the locations during surveys
comprised of 5 classes with Bacillariophyceae as dominant class in the study area having 45
species, followed by Cyanophyceae with 15 species. Other classes recorded from the area are
Chlorophyceae, Coleochaetophyceae and Conjugatophyceae. Highest number of species was
recoded at sampling site (W1) near Amulin. Site-wise detailed list of all the phytobenthos
species has been given at Table 7.6. The genus Cymbella was the most dominant genus
represented by 6 species followed by Navicula with 5 species. Achnanthes crenulata are most
common and abundant species as they were recorded from 19 sampling sites during all
samplings. Other common species recorded from the all sampling sites area Oscillatoria sp.,
Cymbella excisa var. angusta, Achnanthidium biasolettianum, Didymosphenia geminate,
Scytonema sp., Gloeocapsa sp., Pediastrum sp., Navicula radiosaffalax, Navicula radiosaffalax,
Planothidium lanceolata var. elliptica, Achnanthidium subhudsonis and Achnanthidium
biasolettiana var. biasolettiana.
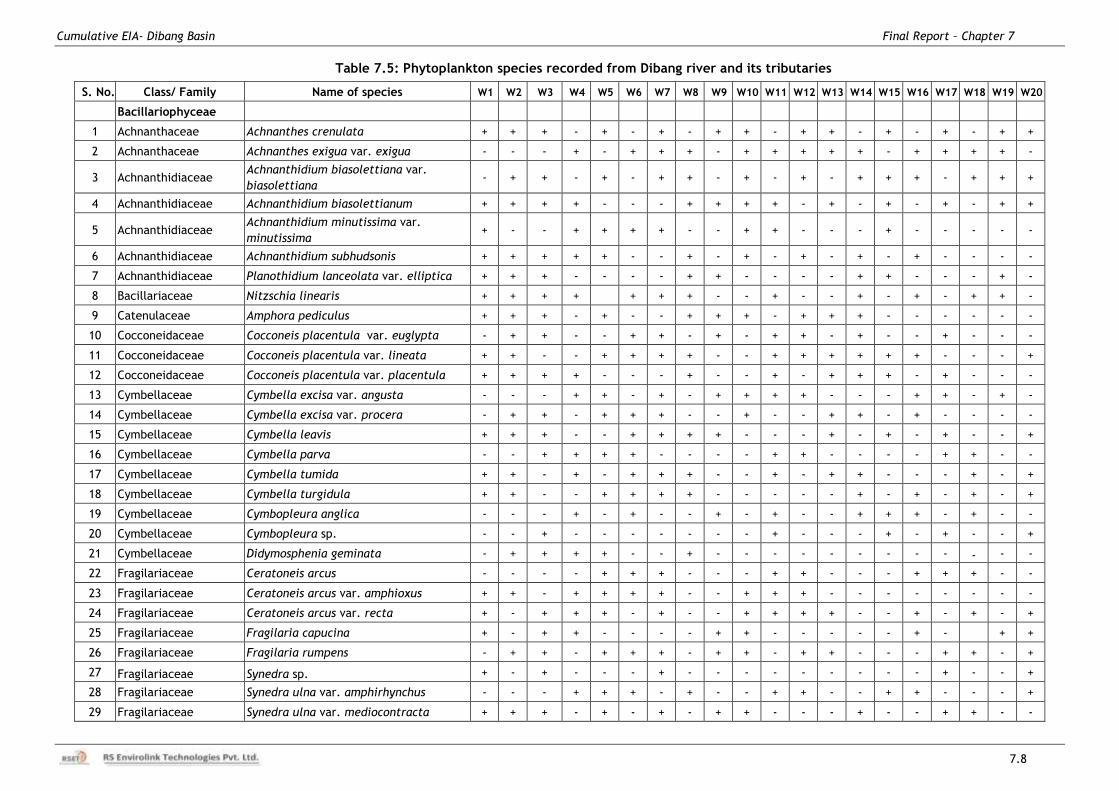
Cumulative EIA- Dibang Basin Final Report – Chapter 7
7.8
Table 7.5: Phytoplankton species recorded from Dibang river and its tributaries
S. No. Class/ Family Name of species W1 W2 W3 W4 W5 W6 W7 W8 W9 W10 W11 W12 W13 W14 W15 W16 W17 W18 W19 W20
Bacillariophyceae
1 Achnanthaceae Achnanthes crenulata + + + - + - + - + + - + + - + - + - + +
2 Achnanthaceae Achnanthes exigua var. exigua - - - + - + + + - + + + + + - + + + + -
3 Achnanthidiaceae Achnanthidium biasolettiana var.
biasolettiana - + + - + - + + - + - + - + + + - + + +
4 Achnanthidiaceae Achnanthidium biasolettianum + + + + - - - + + + + - + - + - + - + +
5 Achnanthidiaceae Achnanthidium minutissima var.
minutissima + - - + + + + - - + + - - - + - - - - -
6 Achnanthidiaceae Achnanthidium subhudsonis + + + + + - - + - + - + - + - + - - - -
7 Achnanthidiaceae Planothidium lanceolata var. elliptica + + + - - - - + + - - - - + + - - - + -
8 Bacillariaceae Nitzschia linearis + + + +
+ + + - - + - - + - + - + + -
9 Catenulaceae Amphora pediculus + + + - + - - + + + - + + + - - - - - -
10 Cocconeidaceae Cocconeis placentula var. euglypta - + + - - + + - + - + + - + - - + - - -
11 Cocconeidaceae Cocconeis placentula var. lineata + + - - + + + + - - + + + + + + - - - +
12 Cocconeidaceae Cocconeis placentula var. placentula + + + + - - - + - - + - + + + - + - - -
13 Cymbellaceae Cymbella excisa var. angusta - - - + + - + - + + + + - - - + + - + -
14 Cymbellaceae Cymbella excisa var. procera - + + - + + + - - + - - + + - + - - - -
15 Cymbellaceae Cymbella leavis + + + - - + + + + - - - + - + - + - - +
16 Cymbellaceae Cymbella parva - - + + + + - - - - + + - - - - + + - -
17 Cymbellaceae Cymbella tumida + + - + - + + + - - + - + + - - - + - +
18 Cymbellaceae Cymbella turgidula + + - - + + + + - - - - - + - + - + - +
19 Cymbellaceae Cymbopleura anglica - - - + - + - - + - + - - + + + - + - -
20 Cymbellaceae Cymbopleura sp. - - + - - - - - - - + - - - + - + - - +
21 Cymbellaceae Didymosphenia geminata - + + + + - - + - - - - - - - - - - - -
22 Fragilariaceae Ceratoneis arcus - - - - + + + - - - + + - - - + + + - -
23 Fragilariaceae Ceratoneis arcus var. amphioxus + + - + + + + - - + + + - - - - - - - -
24 Fragilariaceae Ceratoneis arcus var. recta + - + + + - + - - + + + + - - + - + - +
25 Fragilariaceae Fragilaria capucina + - + + - - - - + + - - - - - + -
+ +
26 Fragilariaceae Fragilaria rumpens - + + - + + + - + + - + + - - - + + - +
27 Fragilariaceae Synedra sp. + - + - - - + - - - - - - - - - + - - +
28 Fragilariaceae Synedra ulna var. amphirhynchus - - - + + + - + - - + + - - + + - - - +
29 Fragilariaceae Synedra ulna var. mediocontracta + + + - + - + - + + - - - + - - + + - -
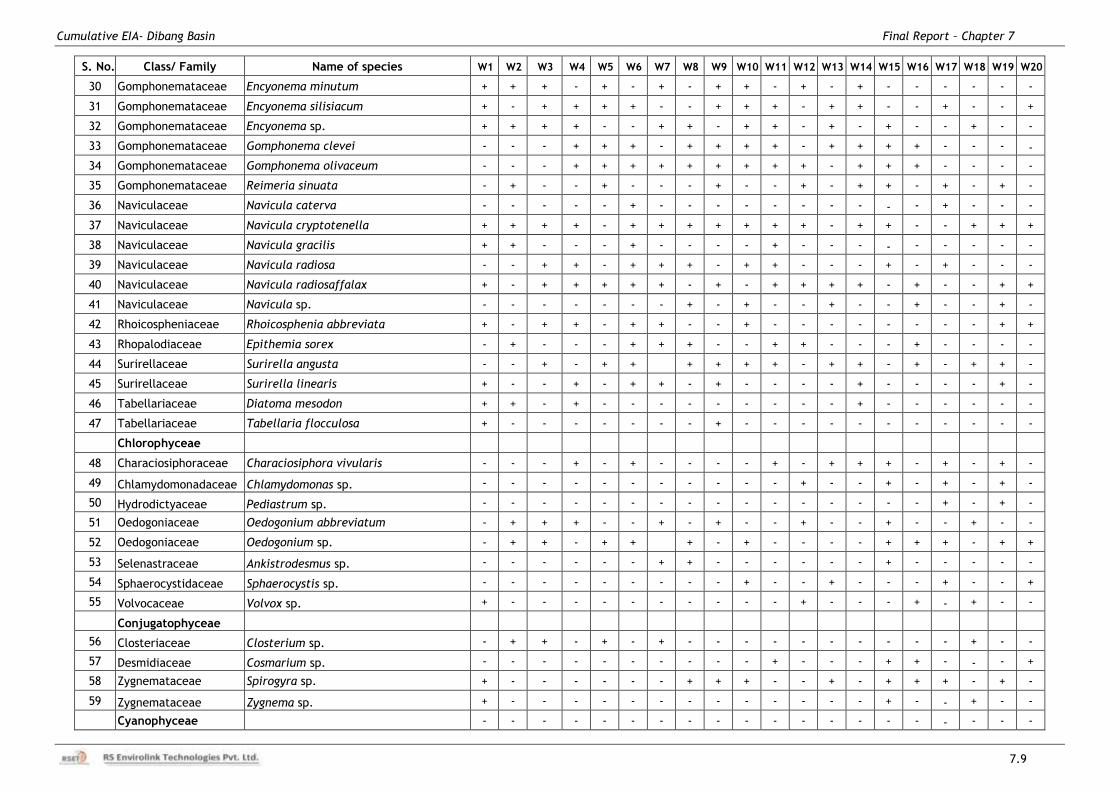
Cumulative EIA- Dibang Basin Final Report – Chapter 7
7.9
S. No. Class/ Family Name of species W1 W2 W3 W4 W5 W6 W7 W8 W9 W10 W11 W12 W13 W14 W15 W16 W17 W18 W19 W20
30 Gomphonemataceae Encyonema minutum + + + - + - + - + + - + - + - - - - - -
31 Gomphonemataceae Encyonema silisiacum + - + + + + - - + + + - + + - - + - - +
32 Gomphonemataceae Encyonema sp. + + + + - - + + - + + - + - + - - + - -
33 Gomphonemataceae Gomphonema clevei - - - + + + - + + + + - + + + + - - - -
34 Gomphonemataceae Gomphonema olivaceum - - - + + + + + + + + + - + + + - - - -
35 Gomphonemataceae Reimeria sinuata - + - - + - - - + - - + - + + - + - + -
36 Naviculaceae Navicula caterva - - - - - + - - - - - - - - - - + - - -
37 Naviculaceae Navicula cryptotenella + + + + - + + + + + + + - + + - - + + +
38 Naviculaceae Navicula gracilis + + - - - + - - - - + - - - - - - - - -
39 Naviculaceae Navicula radiosa - - + + - + + + - + + - - - + - + - - -
40 Naviculaceae Navicula radiosaffalax + - + + + + + - + - + + + + - + - - + +
41 Naviculaceae Navicula sp. - - - - - - - + - + - - + - - + - - + -
42 Rhoicospheniaceae Rhoicosphenia abbreviata + - + + - + + - - + - - - - - - - - + +
43 Rhopalodiaceae Epithemia sorex - + - - - + + + - - + + - - - + - - - -
44 Surirellaceae Surirella angusta - - + - + +
+ + + + - + + - + - + + -
45 Surirellaceae Surirella linearis + - - + - + + - + - - - - + - - - - + -
46 Tabellariaceae Diatoma mesodon + + - + - - - - - - - - - + - - - - - -
47 Tabellariaceae Tabellaria flocculosa + - - - - - - - + - - - - - - - - - - -
Chlorophyceae
48 Characiosiphoraceae Characiosiphora vivularis - - - + - + - - - - + - + + + - + - + -
49 Chlamydomonadaceae Chlamydomonas sp. - - - - - - - - - - - + - - + - + - + -
50 Hydrodictyaceae Pediastrum sp. - - - - - - - - - - - - - - - - + - + -
51 Oedogoniaceae Oedogonium abbreviatum - + + + - - + - + - - + - - + - - + - -
52 Oedogoniaceae Oedogonium sp. - + + - + +
+ - + - - - - + + + - + +
53 Selenastraceae Ankistrodesmus sp. - - - - - - + + - - - - - - + - - - - -
54 Sphaerocystidaceae Sphaerocystis sp. - - - - - - - - - + - - + - - - + - - +
55 Volvocaceae Volvox sp. + - - - - - - - - - - + - - - + - + - -
Conjugatophyceae
56 Closteriaceae Closterium sp. - + + - + - + - - - - - - - - - - + - -
57 Desmidiaceae Cosmarium sp. - - - - - - - - - - + - - - + + - - - +
58 Zygnemataceae Spirogyra sp. + - - - - - - + + + - - + - + + + - + -
59 Zygnemataceae Zygnema sp. + - - - - - - - - - - - - - + - - + - -
Cyanophyceae - - - - - - - - - - - - - - - - - - - -
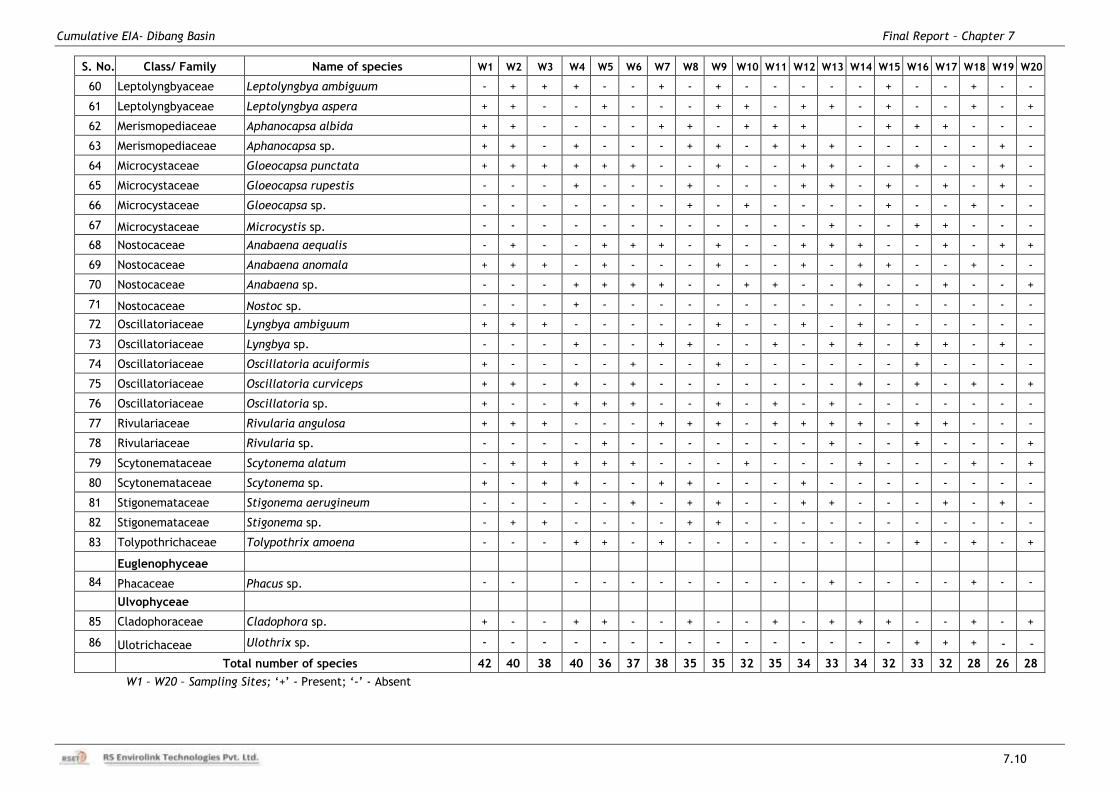
Cumulative EIA- Dibang Basin Final Report – Chapter 7
7.10
S. No. Class/ Family Name of species W1 W2 W3 W4 W5 W6 W7 W8 W9 W10 W11 W12 W13 W14 W15 W16 W17 W18 W19 W20
60 Leptolyngbyaceae Leptolyngbya ambiguum - + + + - - + - + - - - - - + - - + - -
61 Leptolyngbyaceae Leptolyngbya aspera + + - - + - - - + + - + + - + - - + - +
62 Merismopediaceae Aphanocapsa albida + + - - - - + + - + + +
- + + + - - -
63 Merismopediaceae Aphanocapsa sp. + + - + - - - + + - + + + - - - - - + -
64 Microcystaceae Gloeocapsa punctata + + + + + + - - + - - + + - - + - - + -
65 Microcystaceae Gloeocapsa rupestis - - - + - - - + - - - + + - + - + - + -
66 Microcystaceae Gloeocapsa sp. - - - - - - - + - + - - - - + - - + - -
67 Microcystaceae Microcystis sp. - - - - - - - - - - - - + - - + + - - -
68 Nostocaceae Anabaena aequalis - + - - + + + - + - - + + + - - + - + +
69 Nostocaceae Anabaena anomala + + + - + - - - + - - + - + + - - + - -
70 Nostocaceae Anabaena sp. - - - + + + + - - + + - - + - - + - - +
71 Nostocaceae Nostoc sp. - - - + - - - - - - - - - - - - - - - -
72 Oscillatoriaceae Lyngbya ambiguum + + + - - - - - + - - + - + - - - - - -
73 Oscillatoriaceae Lyngbya sp. - - - + - - + + - - + - + + - + + - + -
74 Oscillatoriaceae Oscillatoria acuiformis + - - - - + - - + - - - - - - + - - - -
75 Oscillatoriaceae Oscillatoria curviceps + + - + - + - - - - - - - + - + - + - +
76 Oscillatoriaceae Oscillatoria sp. + - - + + + - - + - + - + - - - - - - -
77 Rivulariaceae Rivularia angulosa + + + - - - + + + - + + + + - + + - - -
78 Rivulariaceae Rivularia sp. - - - - + - - - - - - - + - - + - - - +
79 Scytonemataceae Scytonema alatum - + + + + + - - - + - - - + - - - + - +
80 Scytonemataceae Scytonema sp. + - + + - - + + - - - + - - - - - - - -
81 Stigonemataceae Stigonema aerugineum - - - - - + - + + - - + + - - - + - + -
82 Stigonemataceae Stigonema sp. - + + - - - - + + - - - - - - - - - - -
83 Tolypothrichaceae Tolypothrix amoena - - - + + - + - - - - - - - - + - + - +
Euglenophyceae
84 Phacaceae Phacus sp. - -
- - - - - - - - - + - - - - + - -
Ulvophyceae
85 Cladophoraceae Cladophora sp. + - - + + - - + - - + - + + + - - + - +
86 Ulotrichaceae Ulothrix sp. - - - - - - - - - - - - - - - + + + - -
Total number of species 42 40 38 40 36 37 38 35 35 32 35 34 33 34 32 33 32 28 26 28
W1 – W20 – Sampling Sites; „+‟ - Present; „-‟ - Absent
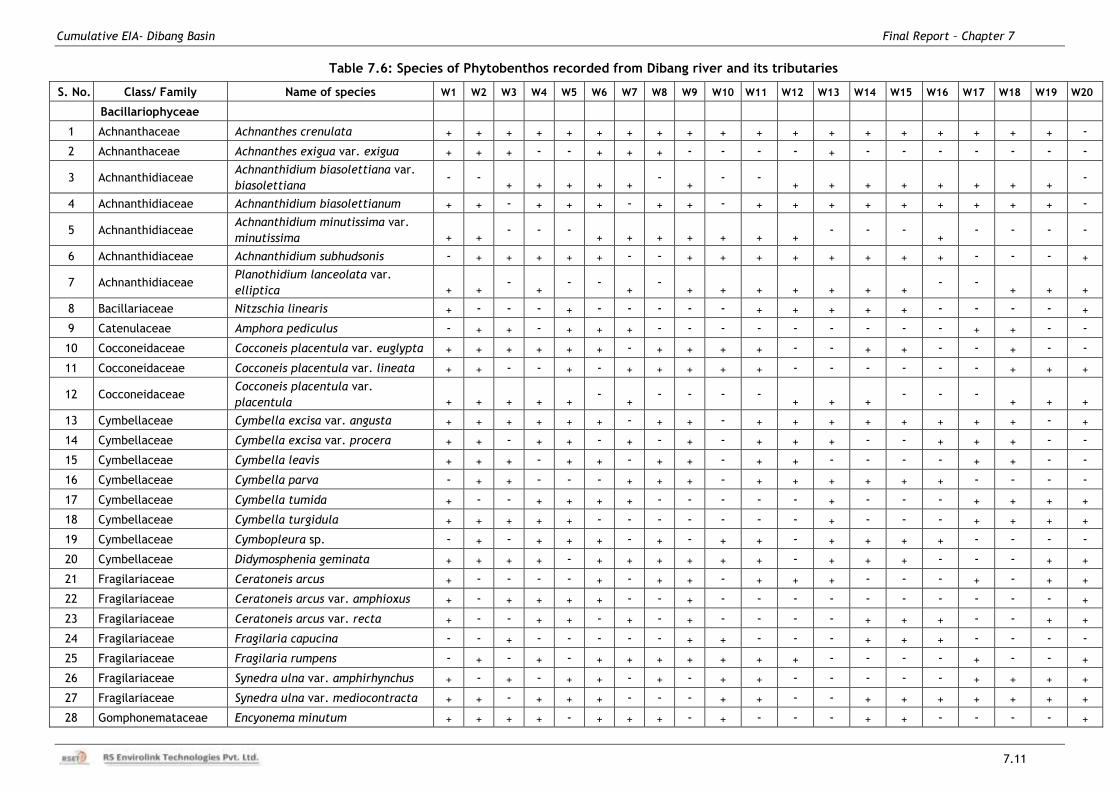
Cumulative EIA- Dibang Basin Final Report – Chapter 7
7.11
Table 7.6: Species of Phytobenthos recorded from Dibang river and its tributaries
S. No. Class/ Family Name of species W1 W2 W3 W4 W5 W6 W7 W8 W9 W10 W11 W12 W13 W14 W15 W16 W17 W18 W19 W20
Bacillariophyceae
1 Achnanthaceae Achnanthes crenulata + + + + + + + + + + + + + + + + + + + -
2 Achnanthaceae Achnanthes exigua var. exigua + + + - - + + + - - - - + - - - - - - -
3 Achnanthidiaceae Achnanthidium biasolettiana var.
biasolettiana - -
+ + + + + -
+ - -
+ + + + + + + + -
4 Achnanthidiaceae Achnanthidium biasolettianum + + - + + + - + + - + + + + + + + + + -
5 Achnanthidiaceae Achnanthidium minutissima var.
minutissima + + - - -
+ + + + + + + - - -
+ - - - -
6 Achnanthidiaceae Achnanthidium subhudsonis - + + + + + - - + + + + + + + + - - - +
7 Achnanthidiaceae Planothidium lanceolata var.
elliptica + + -
+ - -
+ -
+ + + + + + + - -
+ + +
8 Bacillariaceae Nitzschia linearis + - - - + - - - - - + + + + + - - - - +
9 Catenulaceae Amphora pediculus - + + - + + + - - - - - - - - - + + - -
10 Cocconeidaceae Cocconeis placentula var. euglypta + + + + + + - + + + + - - + + - - + - -
11 Cocconeidaceae Cocconeis placentula var. lineata + + - - + - + + + + + - - - - - - + + +
12 Cocconeidaceae Cocconeis placentula var.
placentula + + + + + -
+ - - - -
+ + + - - -
+ + +
13 Cymbellaceae Cymbella excisa var. angusta + + + + + + - + + - + + + + + + + + - +
14 Cymbellaceae Cymbella excisa var. procera + + - + + - + - + - + + + - - + + + - -
15 Cymbellaceae Cymbella leavis + + + - + + - + + - + + - - - - + + - -
16 Cymbellaceae Cymbella parva - + + - - - + + + - + + + + + + - - - -
17 Cymbellaceae Cymbella tumida + - - + + + + - - - - - + - - - + + + +
18 Cymbellaceae Cymbella turgidula + + + + + - - - - - - - + - - - + + + +
19 Cymbellaceae Cymbopleura sp. - + - + + + - + - + + - + + + + - - - -
20 Cymbellaceae Didymosphenia geminata + + + + - + + + + + + - + + + - - - + +
21 Fragilariaceae Ceratoneis arcus + - - - - + - + + - + + + - - - + - + +
22 Fragilariaceae Ceratoneis arcus var. amphioxus + - + + + + - - + - - - - - - - - - - +
23 Fragilariaceae Ceratoneis arcus var. recta + - - + + - + - + - - - - + + + - - + +
24 Fragilariaceae Fragilaria capucina - - + - - - - - + + - - - + + + - - - -
25 Fragilariaceae Fragilaria rumpens - + - + - + + + + + + + - - - - + - - +
26 Fragilariaceae Synedra ulna var. amphirhynchus + - + - + + - + - + + - - - - - + + + +
27 Fragilariaceae Synedra ulna var. mediocontracta + + - + + + - - - + + - - + + + + + + +
28 Gomphonemataceae Encyonema minutum + + + + - + + + - + - - - + + - - - - +
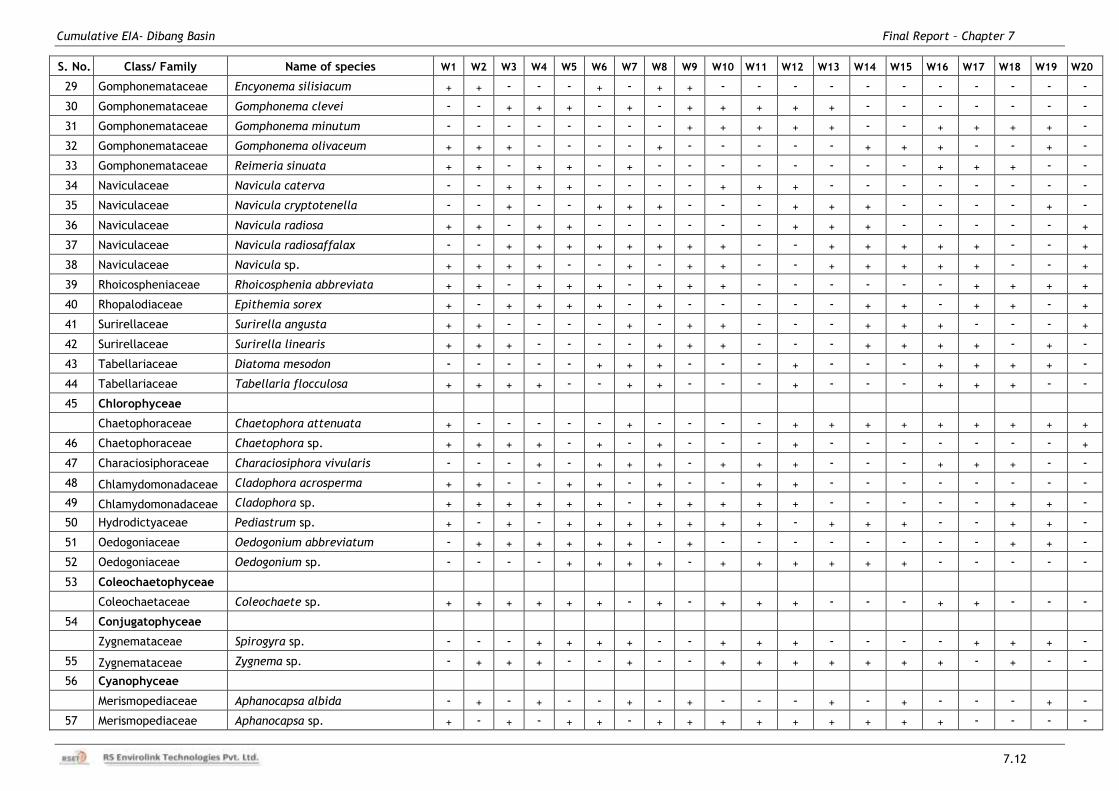
Cumulative EIA- Dibang Basin Final Report – Chapter 7
7.12
S. No. Class/ Family Name of species W1 W2 W3 W4 W5 W6 W7 W8 W9 W10 W11 W12 W13 W14 W15 W16 W17 W18 W19 W20
29 Gomphonemataceae Encyonema silisiacum + + - - - + - + + - - - - - - - - - - -
30 Gomphonemataceae Gomphonema clevei - - + + + - + - + + + + + - - - - - - -
31 Gomphonemataceae Gomphonema minutum - - - - - - - - + + + + + - - + + + + -
32 Gomphonemataceae Gomphonema olivaceum + + + - - - - + - - - - - + + + - - + -
33 Gomphonemataceae Reimeria sinuata + + - + + - + - - - - - - - - + + + - -
34 Naviculaceae Navicula caterva - - + + + - - - - + + + - - - - - - - -
35 Naviculaceae Navicula cryptotenella - - + - - + + + - - - + + + - - - - + -
36 Naviculaceae Navicula radiosa + + - + + - - - - - - + + + - - - - - +
37 Naviculaceae Navicula radiosaffalax - - + + + + + + + + - - + + + + + - - +
38 Naviculaceae Navicula sp. + + + + - - + - + + - - + + + + + - - +
39 Rhoicospheniaceae Rhoicosphenia abbreviata + + - + + + - + + + - - - - - - + + + +
40 Rhopalodiaceae Epithemia sorex + - + + + + - + - - - - - + + - + + - +
41 Surirellaceae Surirella angusta + + - - - - + - + + - - - + + + - - - +
42 Surirellaceae Surirella linearis + + + - - - - + + + - - - + + + + - + -
43 Tabellariaceae Diatoma mesodon - - - - - + + + - - - + - - - + + + + -
44 Tabellariaceae Tabellaria flocculosa + + + + - - + + - - - + - - - + + + - -
45 Chlorophyceae
Chaetophoraceae Chaetophora attenuata + - - - - - + - - - - + + + + + + + + +
46 Chaetophoraceae Chaetophora sp. + + + + - + - + - - - + - - - - - - - +
47 Characiosiphoraceae Characiosiphora vivularis - - - + - + + + - + + + - - - + + + - -
48 Chlamydomonadaceae Cladophora acrosperma + + - - + + - + - - + + - - - - - - - -
49 Chlamydomonadaceae Cladophora sp. + + + + + + - + + + + + - - - - - + + -
50 Hydrodictyaceae Pediastrum sp. + - + - + + + + + + + - + + + - - + + -
51 Oedogoniaceae Oedogonium abbreviatum - + + + + + + - + - - - - - - - - + + -
52 Oedogoniaceae Oedogonium sp. - - - - + + + + - + + + + + + - - - - -
53 Coleochaetophyceae
Coleochaetaceae Coleochaete sp. + + + + + + - + - + + + - - - + + - - -
54 Conjugatophyceae
Zygnemataceae Spirogyra sp. - - - + + + + - - + + + - - - - + + + -
55 Zygnemataceae Zygnema sp. - + + + - - + - - + + + + + + + - + - -
56 Cyanophyceae
Merismopediaceae Aphanocapsa albida - + - + - - + - + - - - + - + - - - + -
57 Merismopediaceae Aphanocapsa sp. + - + - + + - + + + + + + + + + - - - -
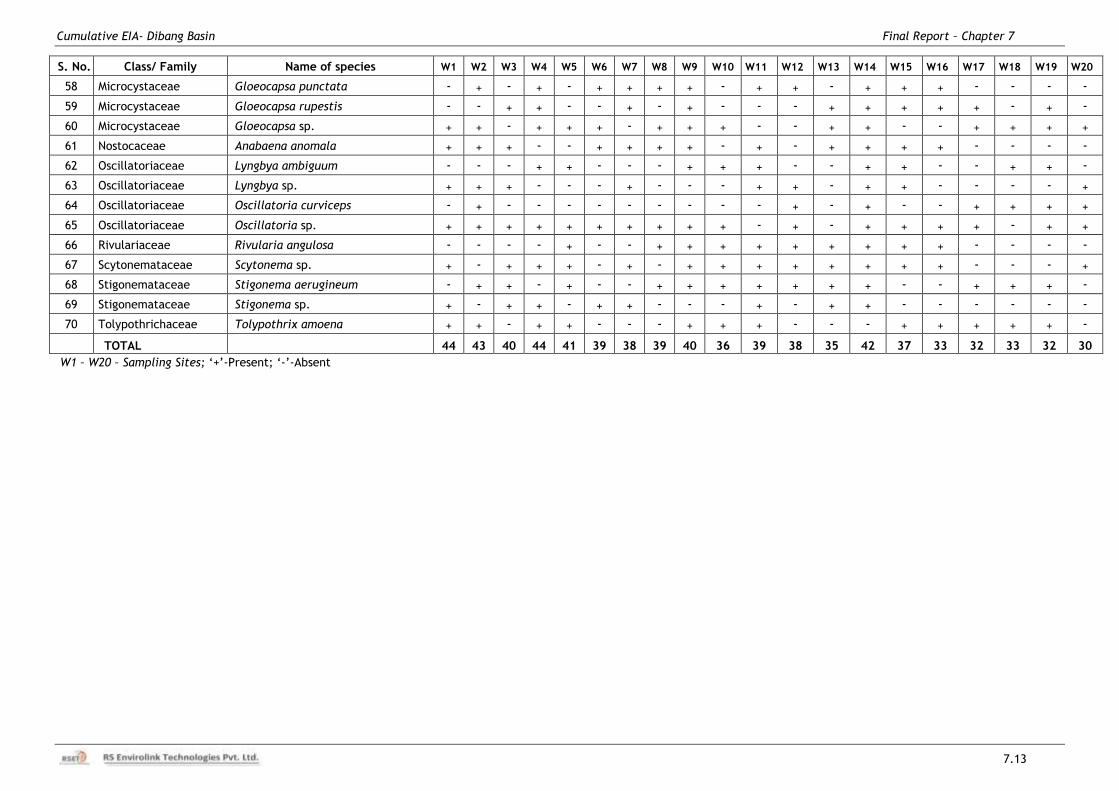
Cumulative EIA- Dibang Basin Final Report – Chapter 7
7.13
S. No. Class/ Family Name of species W1 W2 W3 W4 W5 W6 W7 W8 W9 W10 W11 W12 W13 W14 W15 W16 W17 W18 W19 W20
58 Microcystaceae Gloeocapsa punctata - + - + - + + + + - + + - + + + - - - -
59 Microcystaceae Gloeocapsa rupestis - - + + - - + - + - - - + + + + + - + -
60 Microcystaceae Gloeocapsa sp. + + - + + + - + + + - - + + - - + + + +
61 Nostocaceae Anabaena anomala + + + - - + + + + - + - + + + + - - - -
62 Oscillatoriaceae Lyngbya ambiguum - - - + + - - - + + + - - + + - - + + -
63 Oscillatoriaceae Lyngbya sp. + + + - - - + - - - + + - + + - - - - +
64 Oscillatoriaceae Oscillatoria curviceps - + - - - - - - - - - + - + - - + + + +
65 Oscillatoriaceae Oscillatoria sp. + + + + + + + + + + - + - + + + + - + +
66 Rivulariaceae Rivularia angulosa - - - - + - - + + + + + + + + + - - - -
67 Scytonemataceae Scytonema sp. + - + + + - + - + + + + + + + + - - - +
68 Stigonemataceae Stigonema aerugineum - + + - + - - + + + + + + + - - + + + -
69 Stigonemataceae Stigonema sp. + - + + - + + - - - + - + + - - - - - -
70 Tolypothrichaceae Tolypothrix amoena + + - + + - - - + + + - - - + + + + + -
TOTAL 44 43 40 44 41 39 38 39 40 36 39 38 35 42 37 33 32 33 32 30
W1 – W20 – Sampling Sites; „+‟-Present; „-‟-Absent
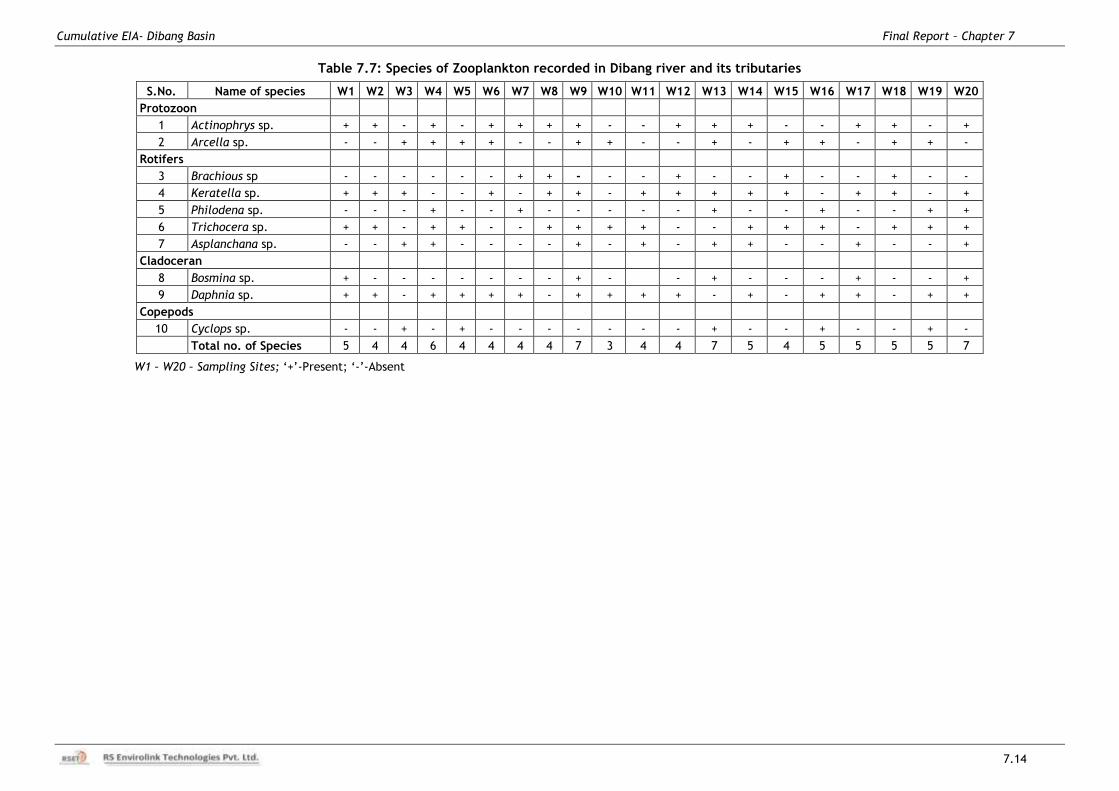
Cumulative EIA- Dibang Basin Final Report – Chapter 7
7.14
Table 7.7: Species of Zooplankton recorded in Dibang river and its tributaries
S.No. Name of species W1 W2 W3 W4 W5 W6 W7 W8 W9 W10 W11 W12 W13 W14 W15 W16 W17 W18 W19 W20
Protozoon
1 Actinophrys sp. + + - + - + + + + - - + + + - - + + - +
2 Arcella sp. - - + + + + - - + + - - + - + + - + + -
Rotifers
3 Brachious sp - - - - - - + + - - - + - - + - - + - -
4 Keratella sp. + + + - - + - + + - + + + + + - + + - +
5 Philodena sp. - - - + - - + - - - - - + - - + - - + +
6 Trichocera sp. + + - + + - - + + + + - - + + + - + + +
7 Asplanchana sp. - - + + - - - - + - + - + + - - + - - +
Cladoceran
8 Bosmina sp. + - - - - - - - + -
- + - - - + - - +
9 Daphnia sp. + + - + + + + - + + + + - + - + + - + +
Copepods
10 Cyclops sp. - - + - + - - - - - - - + - - + - - + -
Total no. of Species 5 4 4 6 4 4 4 4 7 3 4 4 7 5 4 5 5 5 5 7
W1 – W20 – Sampling Sites; „+‟-Present; „-‟-Absent
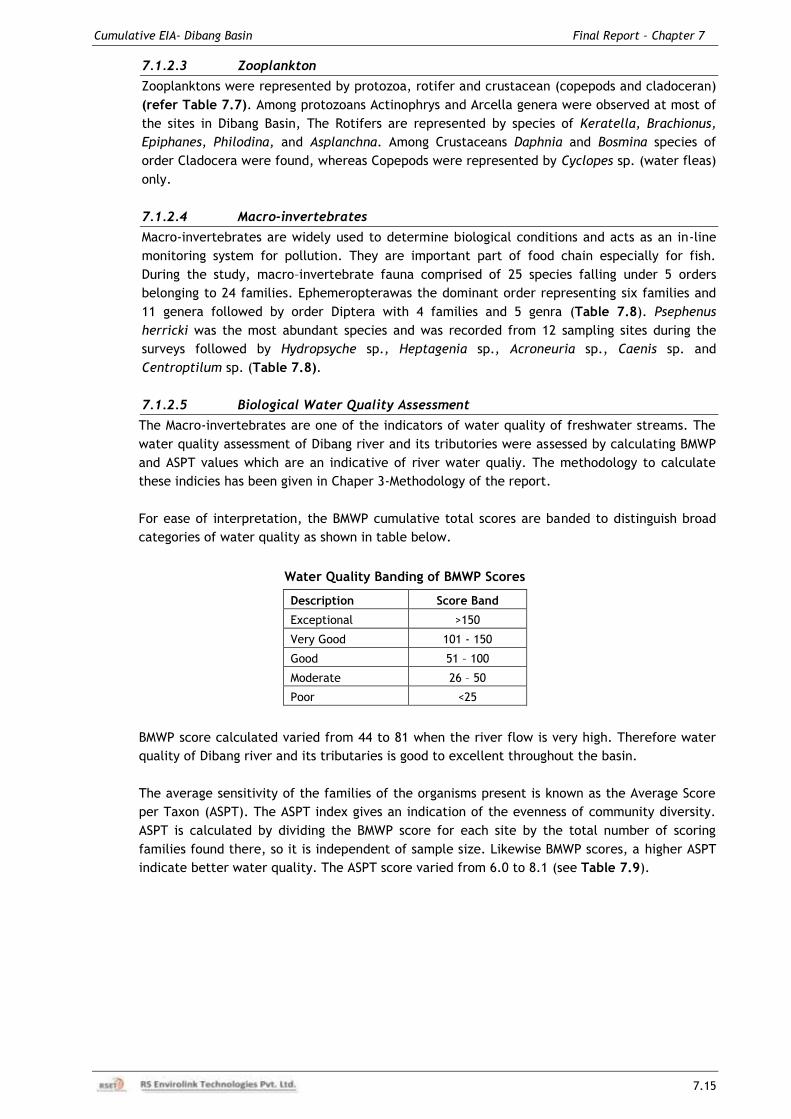
Cumulative EIA- Dibang Basin Final Report – Chapter 7
7.15
7.1.2.3 Zooplankton
Zooplanktons were represented by protozoa, rotifer and crustacean (copepods and cladoceran)
(refer Table 7.7). Among protozoans Actinophrys and Arcella genera were observed at most of
the sites in Dibang Basin, The Rotifers are represented by species of Keratella, Brachionus,
Epiphanes, Philodina, and Asplanchna. Among Crustaceans Daphnia and Bosmina species of
order Cladocera were found, whereas Copepods were represented by Cyclopes sp. (water fleas)
only.
7.1.2.4 Macro-invertebrates
Macro-invertebrates are widely used to determine biological conditions and acts as an in-line
monitoring system for pollution. They are important part of food chain especially for fish.
During the study, macro–invertebrate fauna comprised of 25 species falling under 5 orders
belonging to 24 families. Ephemeropterawas the dominant order representing six families and
11 genera followed by order Diptera with 4 families and 5 genra (Table 7.8). Psephenus
herricki was the most abundant species and was recorded from 12 sampling sites during the
surveys followed by Hydropsyche sp., Heptagenia sp., Acroneuria sp., Caenis sp. and
Centroptilum sp. (Table 7.8).
7.1.2.5 Biological Water Quality Assessment
The Macro-invertebrates are one of the indicators of water quality of freshwater streams. The
water quality assessment of Dibang river and its tributories were assessed by calculating BMWP
and ASPT values which are an indicative of river water qualiy. The methodology to calculate
these indicies has been given in Chaper 3-Methodology of the report.
For ease of interpretation, the BMWP cumulative total scores are banded to distinguish broad
categories of water quality as shown in table below.
Water Quality Banding of BMWP Scores
Description Score Band
Exceptional >150
Very Good 101 - 150
Good 51 – 100
Moderate 26 – 50
Poor <25
BMWP score calculated varied from 44 to 81 when the river flow is very high. Therefore water
quality of Dibang river and its tributaries is good to excellent throughout the basin.
The average sensitivity of the families of the organisms present is known as the Average Score
per Taxon (ASPT). The ASPT index gives an indication of the evenness of community diversity.
ASPT is calculated by dividing the BMWP score for each site by the total number of scoring
families found there, so it is independent of sample size. Likewise BMWP scores, a higher ASPT
indicate better water quality. The ASPT score varied from 6.0 to 8.1 (see Table 7.9).
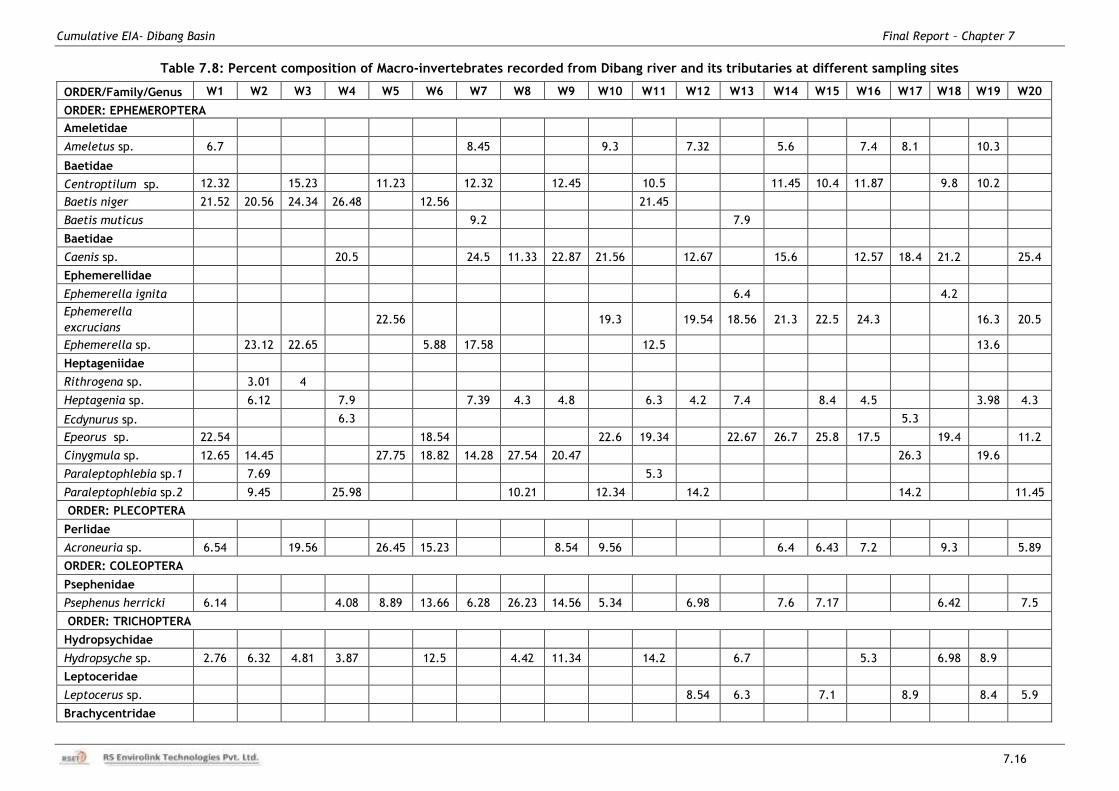
Cumulative EIA- Dibang Basin Final Report – Chapter 7
7.16
Table 7.8: Percent composition of Macro-invertebrates recorded from Dibang river and its tributaries at different sampling sites
ORDER/Family/Genus W1 W2 W3 W4 W5 W6 W7 W8 W9 W10 W11 W12 W13 W14 W15 W16 W17 W18 W19 W20
ORDER: EPHEMEROPTERA
Ameletidae
Ameletus sp. 6.7
8.45
9.3
7.32
5.6
7.4 8.1
10.3
Baetidae
Centroptilum sp. 12.32
15.23
11.23
12.32
12.45
10.5
11.45 10.4 11.87
9.8 10.2
Baetis niger 21.52 20.56 24.34 26.48
12.56
21.45
Baetis muticus
9.2
7.9
Baetidae
Caenis sp.
20.5
24.5 11.33 22.87 21.56
12.67
15.6
12.57 18.4 21.2
25.4
Ephemerellidae
Ephemerella ignita
6.4
4.2
Ephemerella
excrucians 22.56
19.3
19.54 18.56 21.3 22.5 24.3
16.3 20.5
Ephemerella sp.
23.12 22.65
5.88 17.58
12.5
13.6
Heptageniidae
Rithrogena sp.
3.01 4
Heptagenia sp.
6.12
7.9
7.39 4.3 4.8
6.3 4.2 7.4
8.4 4.5
3.98 4.3
Ecdynurus sp.
6.3
5.3
Epeorus sp. 22.54
18.54
22.6 19.34
22.67 26.7 25.8 17.5
19.4
11.2
Cinygmula sp. 12.65 14.45
27.75 18.82 14.28 27.54 20.47
26.3
19.6
Paraleptophlebia sp.1
7.69
5.3
Paraleptophlebia sp.2
9.45
25.98
10.21
12.34
14.2
14.2
11.45
ORDER: PLECOPTERA
Perlidae
Acroneuria sp. 6.54
19.56
26.45 15.23
8.54 9.56
6.4 6.43 7.2
9.3
5.89
ORDER: COLEOPTERA
Psephenidae
Psephenus herricki 6.14
4.08 8.89 13.66 6.28 26.23 14.56 5.34
6.98
7.6 7.17
6.42
7.5
ORDER: TRICHOPTERA
Hydropsychidae
Hydropsyche sp. 2.76 6.32 4.81 3.87
12.5
4.42 11.34
14.2
6.7
5.3
6.98 8.9
Leptoceridae
Leptocerus sp.
8.54 6.3
7.1
8.9
8.4 5.9
Brachycentridae
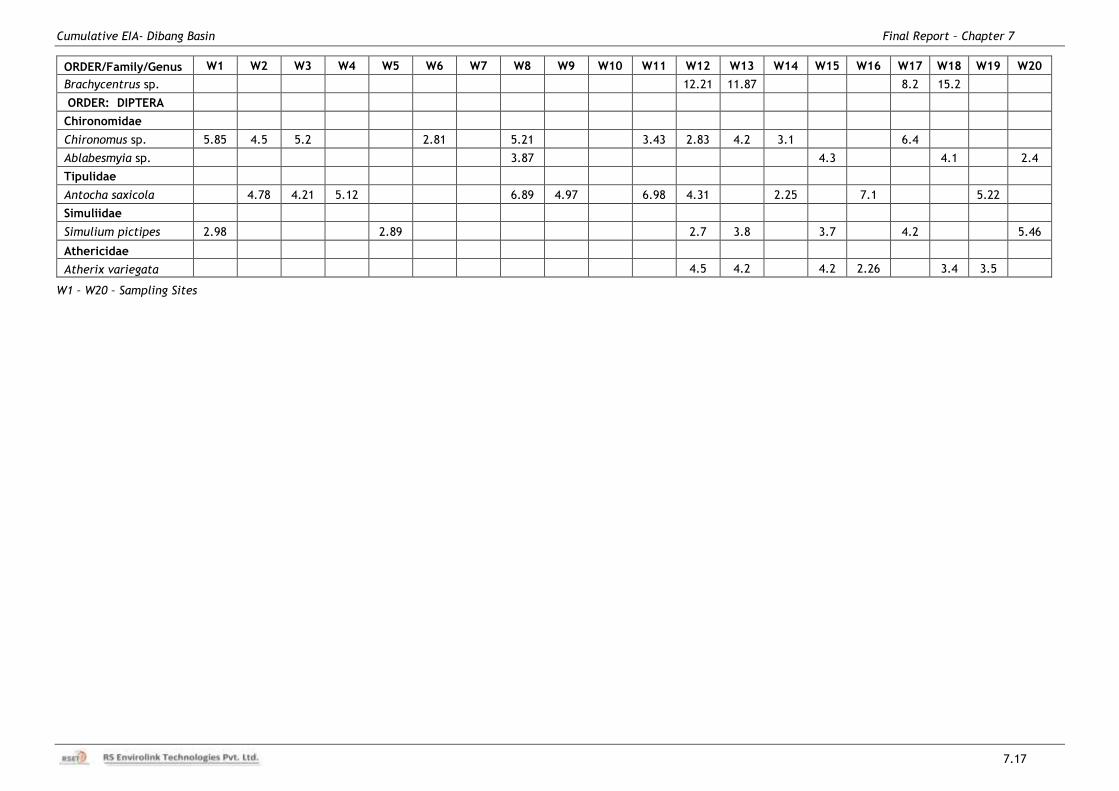
Cumulative EIA- Dibang Basin Final Report – Chapter 7
7.17
ORDER/Family/Genus W1 W2 W3 W4 W5 W6 W7 W8 W9 W10 W11 W12 W13 W14 W15 W16 W17 W18 W19 W20
Brachycentrus sp.
12.21 11.87
8.2 15.2
ORDER: DIPTERA
Chironomidae
Chironomus sp. 5.85 4.5 5.2
2.81
5.21
3.43 2.83 4.2 3.1
6.4
Ablabesmyia sp.
3.87
4.3
4.1
2.4
Tipulidae
Antocha saxicola
4.78 4.21 5.12
6.89 4.97
6.98 4.31
2.25
7.1
5.22
Simuliidae
Simulium pictipes 2.98
2.89
2.7 3.8
3.7
4.2
5.46
Athericidae
Atherix variegata
4.5 4.2
4.2 2.26
3.4 3.5
W1 – W20 – Sampling Sites
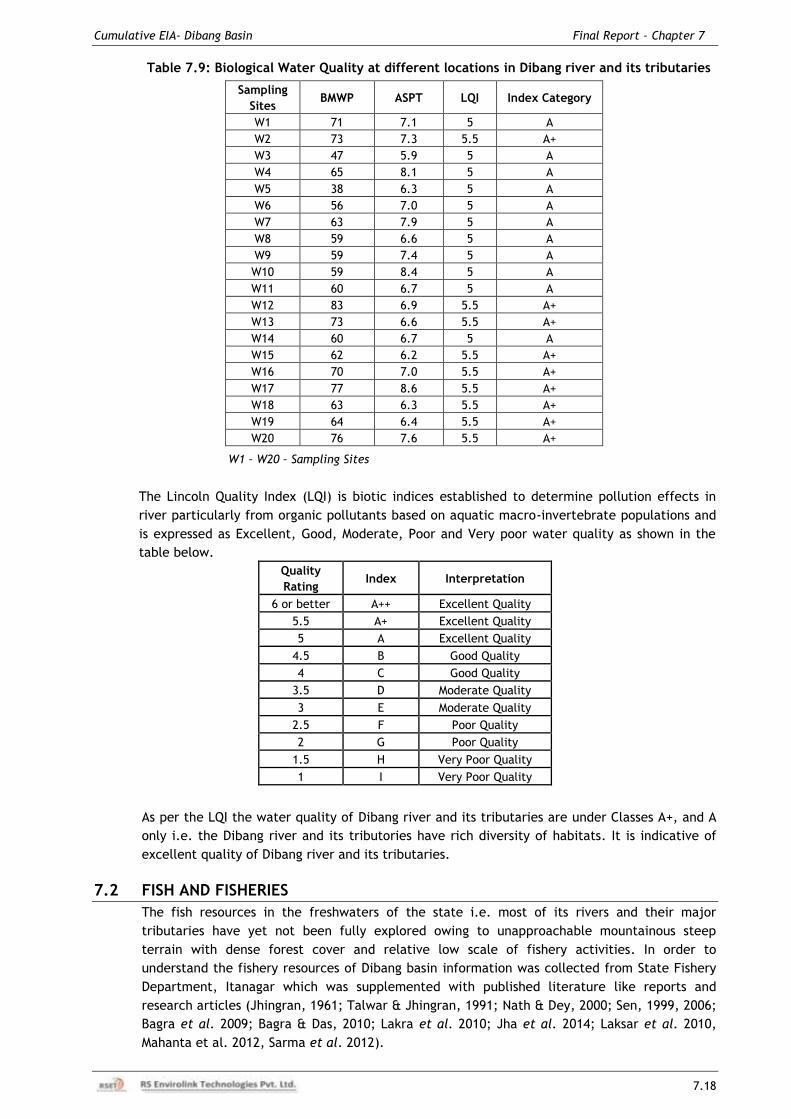
Cumulative EIA- Dibang Basin Final Report – Chapter 7
7.18
Table 7.9: Biological Water Quality at different locations in Dibang river and its tributaries
Sampling
Sites BMWP ASPT LQI Index Category
W1 71 7.1 5 A
W2 73 7.3 5.5 A+
W3 47 5.9 5 A
W4 65 8.1 5 A
W5 38 6.3 5 A
W6 56 7.0 5 A
W7 63 7.9 5 A
W8 59 6.6 5 A
W9 59 7.4 5 A
W10 59 8.4 5 A
W11 60 6.7 5 A
W12 83 6.9 5.5 A+
W13 73 6.6 5.5 A+
W14 60 6.7 5 A
W15 62 6.2 5.5 A+
W16 70 7.0 5.5 A+
W17 77 8.6 5.5 A+
W18 63 6.3 5.5 A+
W19 64 6.4 5.5 A+
W20 76 7.6 5.5 A+
W1 – W20 – Sampling Sites
The Lincoln Quality Index (LQI) is biotic indices established to determine pollution effects in
river particularly from organic pollutants based on aquatic macro-invertebrate populations and
is expressed as Excellent, Good, Moderate, Poor and Very poor water quality as shown in the
table below. Quality
Rating Index Interpretation
6 or better A++ Excellent Quality
5.5 A+ Excellent Quality
5 A Excellent Quality
4.5 B Good Quality
4 C Good Quality
3.5 D Moderate Quality
3 E Moderate Quality
2.5 F Poor Quality
2 G Poor Quality
1.5 H Very Poor Quality
1 I Very Poor Quality
As per the LQI the water quality of Dibang river and its tributaries are under Classes A+, and A
only i.e. the Dibang river and its tributories have rich diversity of habitats. It is indicative of
excellent quality of Dibang river and its tributaries.
7.2 FISH AND FISHERIES
The fish resources in the freshwaters of the state i.e. most of its rivers and their major
tributaries have yet not been fully explored owing to unapproachable mountainous steep
terrain with dense forest cover and relative low scale of fishery activities. In order to
understand the fishery resources of Dibang basin information was collected from State Fishery
Department, Itanagar which was supplemented with published literature like reports and
research articles (Jhingran, 1961; Talwar & Jhingran, 1991; Nath & Dey, 2000; Sen, 1999, 2006;
Bagra et al. 2009; Bagra & Das, 2010; Lakra et al. 2010; Jha et al. 2014; Laksar et al. 2010,
Mahanta et al. 2012, Sarma et al. 2012).
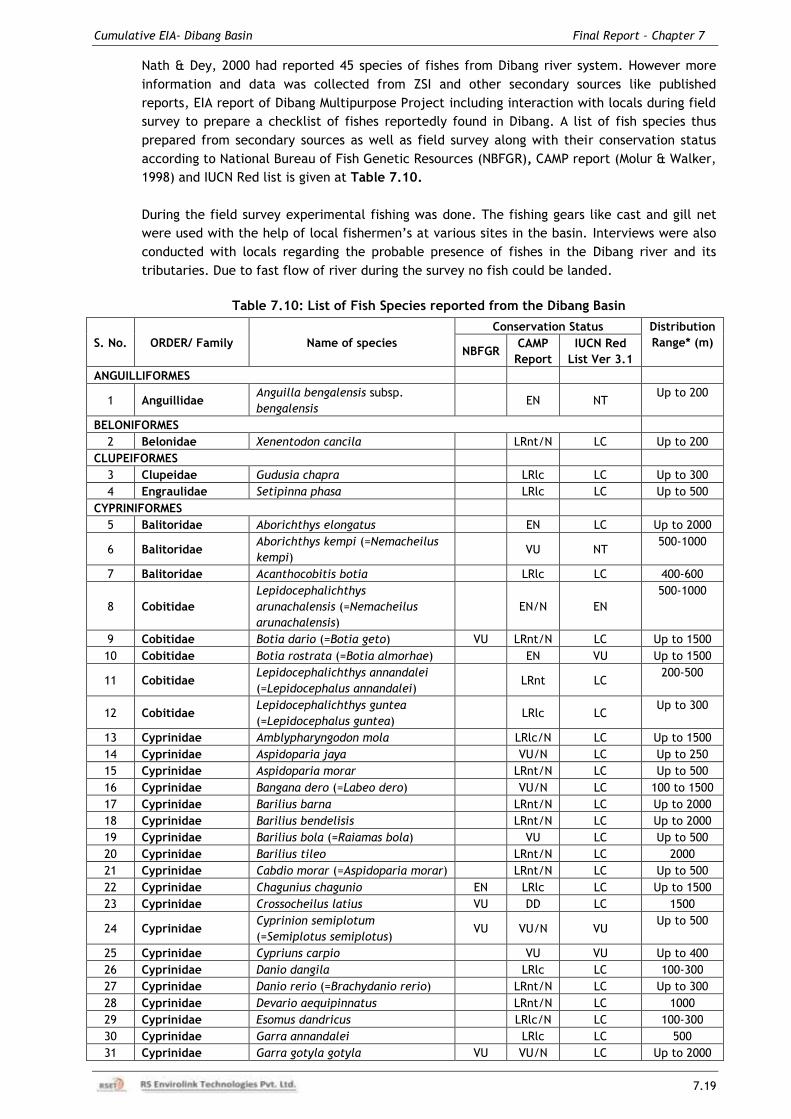
Cumulative EIA- Dibang Basin Final Report – Chapter 7
7.19
Nath & Dey, 2000 had reported 45 species of fishes from Dibang river system. However more
information and data was collected from ZSI and other secondary sources like published
reports, EIA report of Dibang Multipurpose Project including interaction with locals during field
survey to prepare a checklist of fishes reportedly found in Dibang. A list of fish species thus
prepared from secondary sources as well as field survey along with their conservation status
according to National Bureau of Fish Genetic Resources (NBFGR), CAMP report (Molur & Walker,
1998) and IUCN Red list is given at Table 7.10.
During the field survey experimental fishing was done. The fishing gears like cast and gill net
were used with the help of local fishermen‟s at various sites in the basin. Interviews were also
conducted with locals regarding the probable presence of fishes in the Dibang river and its
tributaries. Due to fast flow of river during the survey no fish could be landed.
Table 7.10: List of Fish Species reported from the Dibang Basin
S. No. ORDER/ Family Name of species
Conservation Status Distribution
Range* (m) NBFGR
CAMP
Report
IUCN Red
List Ver 3.1
ANGUILLIFORMES
1 Anguillidae Anguilla bengalensis subsp.
bengalensis EN NT
Up to 200
BELONIFORMES
2 Belonidae Xenentodon cancila
LRnt/N LC Up to 200
CLUPEIFORMES
3 Clupeidae Gudusia chapra
LRlc LC Up to 300
4 Engraulidae Setipinna phasa
LRlc LC Up to 500
CYPRINIFORMES
5 Balitoridae Aborichthys elongatus EN LC Up to 2000
6 Balitoridae Aborichthys kempi (=Nemacheilus
kempi) VU NT
500-1000
7 Balitoridae Acanthocobitis botia LRlc LC 400-600
8 Cobitidae
Lepidocephalichthys
arunachalensis (=Nemacheilus
arunachalensis)
EN/N EN
500-1000
9 Cobitidae Botia dario (=Botia geto) VU LRnt/N LC Up to 1500
10 Cobitidae Botia rostrata (=Botia almorhae) EN VU Up to 1500
11 Cobitidae Lepidocephalichthys annandalei
(=Lepidocephalus annandalei) LRnt LC
200-500
12 Cobitidae Lepidocephalichthys guntea
(=Lepidocephalus guntea) LRlc LC
Up to 300
13 Cyprinidae Amblypharyngodon mola LRlc/N LC Up to 1500
14 Cyprinidae Aspidoparia jaya VU/N LC Up to 250
15 Cyprinidae Aspidoparia morar LRnt/N LC Up to 500
16 Cyprinidae Bangana dero (=Labeo dero) VU/N LC 100 to 1500
17 Cyprinidae Barilius barna LRnt/N LC Up to 2000
18 Cyprinidae Barilius bendelisis LRnt/N LC Up to 2000
19 Cyprinidae Barilius bola (=Raiamas bola) VU LC Up to 500
20 Cyprinidae Barilius tileo LRnt/N LC 2000
21 Cyprinidae Cabdio morar (=Aspidoparia morar) LRnt/N LC Up to 500
22 Cyprinidae Chagunius chagunio EN LRlc LC Up to 1500
23 Cyprinidae Crossocheilus latius VU DD LC 1500
24 Cyprinidae Cyprinion semiplotum
(=Semiplotus semiplotus) VU VU/N VU
Up to 500
25 Cyprinidae Cypriuns carpio VU VU Up to 400
26 Cyprinidae Danio dangila LRlc LC 100-300
27 Cyprinidae Danio rerio (=Brachydanio rerio) LRnt/N LC Up to 300
28 Cyprinidae Devario aequipinnatus LRnt/N LC 1000
29 Cyprinidae Esomus dandricus LRlc/N LC 100-300
30 Cyprinidae Garra annandalei LRlc LC 500
31 Cyprinidae Garra gotyla gotyla VU VU/N LC Up to 2000
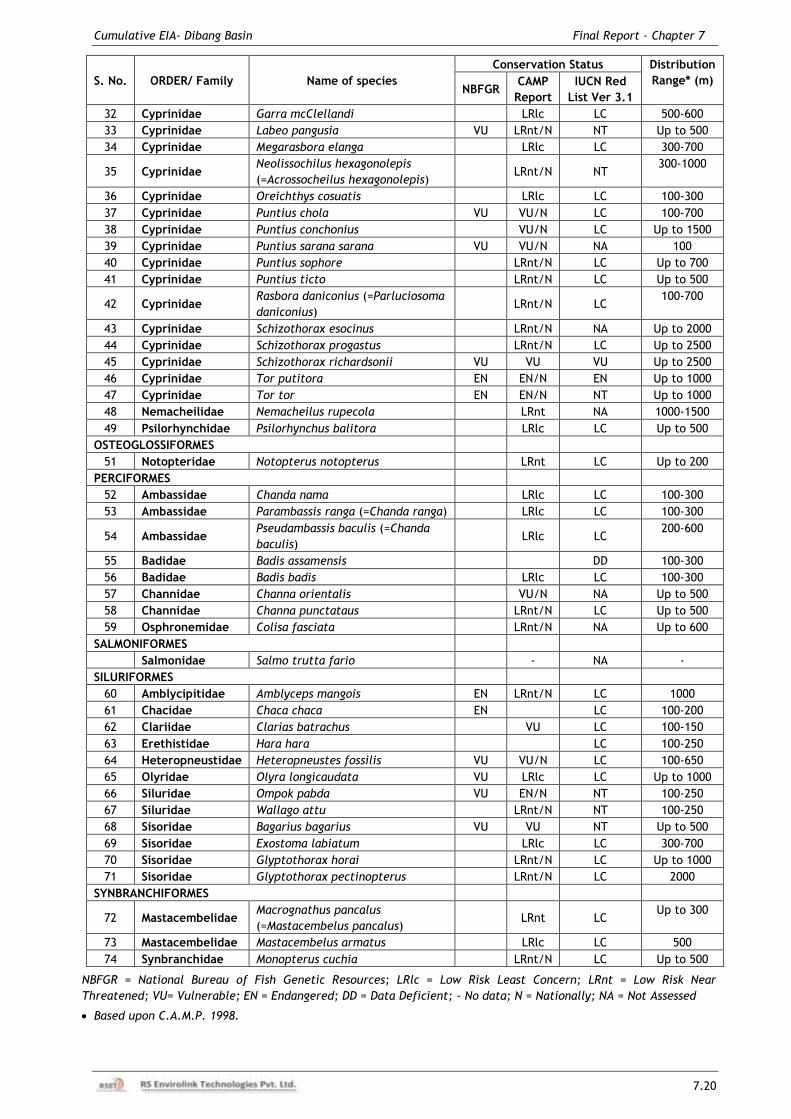
Cumulative EIA- Dibang Basin Final Report – Chapter 7
7.20
S. No. ORDER/ Family Name of species
Conservation Status Distribution
Range* (m) NBFGR
CAMP
Report
IUCN Red
List Ver 3.1
32 Cyprinidae Garra mcClellandi LRlc LC 500-600
33 Cyprinidae Labeo pangusia VU LRnt/N NT Up to 500
34 Cyprinidae Megarasbora elanga LRlc LC 300-700
35 Cyprinidae Neolissochilus hexagonolepis
(=Acrossocheilus hexagonolepis) LRnt/N NT
300-1000
36 Cyprinidae Oreichthys cosuatis LRlc LC 100-300
37 Cyprinidae Puntius chola VU VU/N LC 100-700
38 Cyprinidae Puntius conchonius VU/N LC Up to 1500
39 Cyprinidae Puntius sarana sarana VU VU/N NA 100
40 Cyprinidae Puntius sophore LRnt/N LC Up to 700
41 Cyprinidae Puntius ticto LRnt/N LC Up to 500
42 Cyprinidae Rasbora daniconius (=Parluciosoma
daniconius) LRnt/N LC
100-700
43 Cyprinidae Schizothorax esocinus LRnt/N NA Up to 2000
44 Cyprinidae Schizothorax progastus LRnt/N LC Up to 2500
45 Cyprinidae Schizothorax richardsonii VU VU VU Up to 2500
46 Cyprinidae Tor putitora EN EN/N EN Up to 1000
47 Cyprinidae Tor tor EN EN/N NT Up to 1000
48 Nemacheilidae Nemacheilus rupecola LRnt NA 1000-1500
49 Psilorhynchidae Psilorhynchus balitora LRlc LC Up to 500
OSTEOGLOSSIFORMES
51 Notopteridae Notopterus notopterus
LRnt LC Up to 200
PERCIFORMES
52 Ambassidae Chanda nama
LRlc LC 100-300
53 Ambassidae Parambassis ranga (=Chanda ranga)
LRlc LC 100-300
54 Ambassidae Pseudambassis baculis (=Chanda
baculis) LRlc LC
200-600
55 Badidae Badis assamensis
DD 100-300
56 Badidae Badis badis
LRlc LC 100-300
57 Channidae Channa orientalis
VU/N NA Up to 500
58 Channidae Channa punctataus
LRnt/N LC Up to 500
59 Osphronemidae Colisa fasciata
LRnt/N NA Up to 600
SALMONIFORMES
Salmonidae Salmo trutta fario
- NA -
SILURIFORMES
60 Amblycipitidae Amblyceps mangois EN LRnt/N LC 1000
61 Chacidae Chaca chaca EN
LC 100-200
62 Clariidae Clarias batrachus
VU LC 100-150
63 Erethistidae Hara hara
LC 100-250
64 Heteropneustidae Heteropneustes fossilis VU VU/N LC 100-650
65 Olyridae Olyra longicaudata VU LRlc LC Up to 1000
66 Siluridae Ompok pabda VU EN/N NT 100-250
67 Siluridae Wallago attu
LRnt/N NT 100-250
68 Sisoridae Bagarius bagarius VU VU NT Up to 500
69 Sisoridae Exostoma labiatum
LRlc LC 300-700
70 Sisoridae Glyptothorax horai LRnt/N LC Up to 1000
71 Sisoridae Glyptothorax pectinopterus
LRnt/N LC 2000
SYNBRANCHIFORMES
72 Mastacembelidae Macrognathus pancalus
(=Mastacembelus pancalus) LRnt LC
Up to 300
73 Mastacembelidae Mastacembelus armatus
LRlc LC 500
74 Synbranchidae Monopterus cuchia
LRnt/N LC Up to 500
NBFGR = National Bureau of Fish Genetic Resources; LRlc = Low Risk Least Concern; LRnt = Low Risk Near
Threatened; VU= Vulnerable; EN = Endangered; DD = Data Deficient; - No data; N = Nationally; NA = Not Assessed
Based upon C.A.M.P. 1998.
Cumulative EIA- Dibang Basin Final Report – Chapter 7
7.21
According to it Dibang basin harbours 74 species of fishes belonging to 8 Orders and 26 families.
Cyprinidae is largest family with 36 species accounting for nearly 50% of total fish fauna while
Cobitidae and Sisoridae are the next largest families with 5 and 4 species each and families like
Balitoridae and Ambassidae are represented by 3 species each.
Following C.A.M.P. (1998) guidelines all the 76 fish species were assessed for their conservation
status (see Table 7.10). Seven species are under Endangered category according to CAMP
report (1998) of which 3 are under globally Endangered category viz. Anguilla bengalensis
subsp. bengalensis, Botia rostrata (=Botia almorhae), Aborichthys elongatus while 4 species
viz. Tor tor, Tor putitora, Lepidocephalichthys arunachalensis (=Nemacheilus arunachalensis)
and Ompok pabda are categorized as nationally „Endangered‟ species. Five species are placed
under global „Vulnerable‟ category (Barilius bola (=Raiamas bola), Schizothorax richardsonii,
Aborichthys kempi (=Nemacheilus kempi), Clarias batrachus and Bagarius bagarius while 8
species are under „Vulnerable‟ category nationally (Aspidoparia jaya, Bangana dero (=Labeo
dero), Cyprinion semiplotum (= Semiplotus semiplotus), Garra gotyla gotyla, Puntius chola,
Puntius sarana sarana, Channa orientalis and Heteropneustes fossilis). Schizothorax
richardsonii (Snow trout) has been placed under „Vulnerable‟ category an important species of
cold waters where it is the predominant species of trouts. However key species of warmer
waters are Mahseers (Tor tor and Tor putotora). The category of „Near Threatened‟ only one
species Aborichthys kempi is listed.
According of list of threatened freshwater fish species prepared by National Bureau of Fish
Genetic Resources (NBFGR, 2010), 5 species have been categorized as Endangered while 12
species are placed in Vulnerable category (refer Table 7.10).
According to IUCN criterion Tor putitora while 4 species are under Vulnerable category (see
Table 7.10). These are Cyprinus carpio, Schizothorax richardsonii, Botia rostrata and
Cyprinion semiplotum (=Semiplotus semiplotus).
Golden mahseer has been declared as Arunachal Pradesh State fish (Anon, 2011).
Cumulative EIA- Dibang Basin Final Report – Chapter 8
8.1
CHAPTER-8
ENVIRONMENTAL FLOWS
8.1 INTRODUCTION
The environmental flow is an important aspect in the development of hydropower projects. Release
of environmental flow is to be ensured immediately downstream of the diversion structure at all
times to sustain the ecology and environment of project area. Protecting and maintaining river flow
regimes and hence the ecosystems they support by providing adequate environmental flows have
become a critical aspect of hydropower development. Ecological systems supported by the rivers
are too complicated to be summarized by a single minimum flow requirement but require
comprehensive environmental flow regimes to be defined. "Environmental flow regime" means a
schedule of flow quantities that reflects seasonal fluctuations and should be adequate to support a
sound ecological environment to maintain productivity, extent, and persistence of key aquatic
habitats in and along the affected water bodies.
The aquatic biota in Himalayan glacier-fed rivers has adapted to annual flow pulses, which vary
from a gradual increase in discharge in summer, through floods in the monsoon period, and reduce
to low flows in winter. During the dry season, the waters become clear, allowing algae (primarily
diatoms) to obtain necessary light and carbon dioxide for photosynthesis. Effective quantification of
flow includes the ecologically important range of flow magnitudes (low flows, high flow pulses, and
floods), as well as the timing, duration, frequency, and rate of change of these flow conditions.
Globally, these flows are most commonly referred to as “environmental flows”.
The most critical reach for assessing release of environmental flow is immediately downstream
of diversion structure till first significant tributary meets river.
8.2 CURRENT NORMS BEING FOLLOWED FOR ENVIRONMENTAL FLOW
There are no set norms for minimum releases to be maintained at all times on account of
ecology and environment and to address issues concerning riparian rights, drinking water,
health, aquatic life, wildlife, fisheries, silt and even to honour the sensitive religious issues like
cremation and other religious rites, etc. on the river banks.
Expert Appraisal Committee (EAC) for River Valley and Hydroelectric Projects of Ministry of
Environment, Forests and Climate Change (MoEF&CC) recommends minimum environmental
flow during lean season as 20% of the average discharge in four leanest months in 90%
dependable year of the water availability series used to design the project. Lately, they have
also started discussing the requirement of varied environmental flow during monsoon and other
months as discharge available in the river and flow requirement cannot be the same as that of
lean season. In absence of any site specific study or unless a site specific study specifies
otherwise, EAC has been recommending ecological releases for monsoon months should be
maintained as 30% of flows in monsoon months of 90% dependable year and for non-lean and
non-monsoon months, environmental flow provision should be kept between 20-30%.
Scope of present study requires suggesting approach to be adopted for determining
environmental flows and to determine environmental releases for various planned projects and
river reaches in the Dibang basin.
8.3 DESCRIPTION OF VARIOUS METHODOLOGIES FOR E-FLOW There are four relatively discrete types of environmental flow methodologies: (1) hydrological,
(2) hydraulic rating, (3) habitat simulation and (4) holistic methodologies; among other
techniques occasionally applied during Environmental flow Assessment. The four types are
briefly described below.
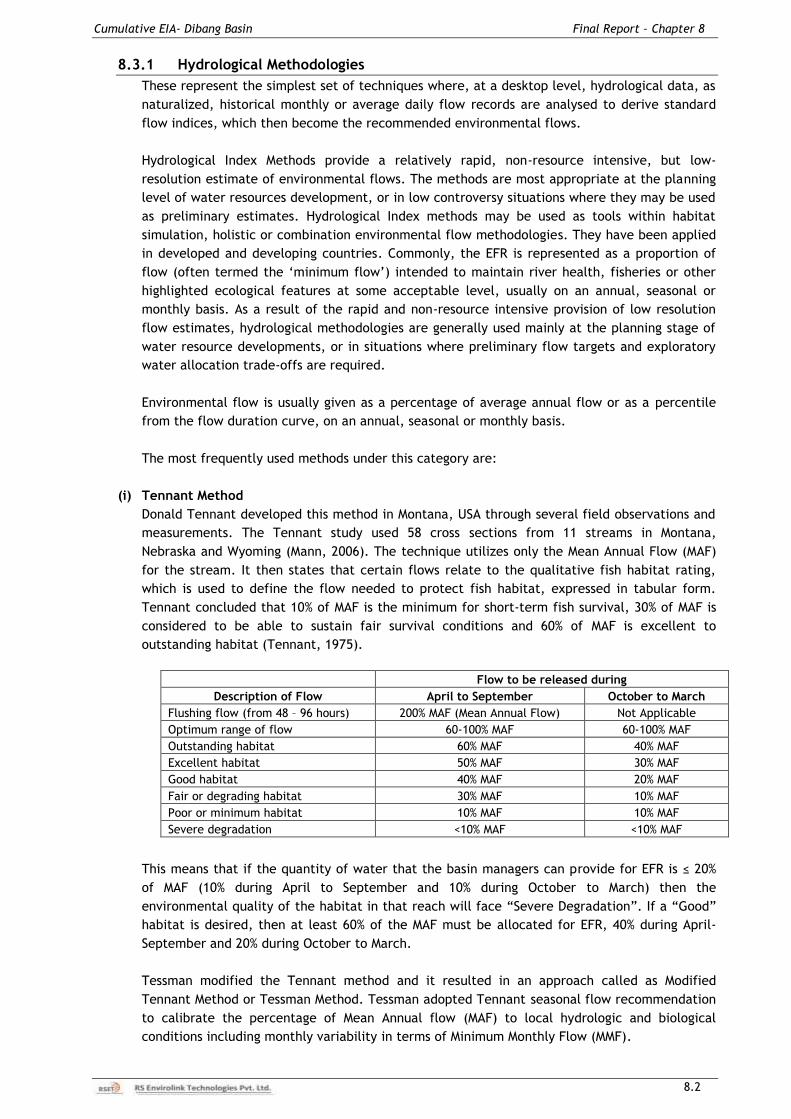
Cumulative EIA- Dibang Basin Final Report – Chapter 8
8.2
8.3.1 Hydrological Methodologies
These represent the simplest set of techniques where, at a desktop level, hydrological data, as
naturalized, historical monthly or average daily flow records are analysed to derive standard
flow indices, which then become the recommended environmental flows.
Hydrological Index Methods provide a relatively rapid, non-resource intensive, but low-
resolution estimate of environmental flows. The methods are most appropriate at the planning
level of water resources development, or in low controversy situations where they may be used
as preliminary estimates. Hydrological Index methods may be used as tools within habitat
simulation, holistic or combination environmental flow methodologies. They have been applied
in developed and developing countries. Commonly, the EFR is represented as a proportion of
flow (often termed the „minimum flow‟) intended to maintain river health, fisheries or other
highlighted ecological features at some acceptable level, usually on an annual, seasonal or
monthly basis. As a result of the rapid and non-resource intensive provision of low resolution
flow estimates, hydrological methodologies are generally used mainly at the planning stage of
water resource developments, or in situations where preliminary flow targets and exploratory
water allocation trade-offs are required.
Environmental flow is usually given as a percentage of average annual flow or as a percentile
from the flow duration curve, on an annual, seasonal or monthly basis.
The most frequently used methods under this category are:
(i) Tennant Method
Donald Tennant developed this method in Montana, USA through several field observations and
measurements. The Tennant study used 58 cross sections from 11 streams in Montana,
Nebraska and Wyoming (Mann, 2006). The technique utilizes only the Mean Annual Flow (MAF)
for the stream. It then states that certain flows relate to the qualitative fish habitat rating,
which is used to define the flow needed to protect fish habitat, expressed in tabular form.
Tennant concluded that 10% of MAF is the minimum for short-term fish survival, 30% of MAF is
considered to be able to sustain fair survival conditions and 60% of MAF is excellent to
outstanding habitat (Tennant, 1975).
Flow to be released during
Description of Flow April to September October to March
Flushing flow (from 48 – 96 hours) 200% MAF (Mean Annual Flow) Not Applicable
Optimum range of flow 60-100% MAF 60-100% MAF
Outstanding habitat 60% MAF 40% MAF
Excellent habitat 50% MAF 30% MAF
Good habitat 40% MAF 20% MAF
Fair or degrading habitat 30% MAF 10% MAF
Poor or minimum habitat 10% MAF 10% MAF
Severe degradation <10% MAF <10% MAF
This means that if the quantity of water that the basin managers can provide for EFR is ≤ 20%
of MAF (10% during April to September and 10% during October to March) then the
environmental quality of the habitat in that reach will face “Severe Degradation”. If a “Good”
habitat is desired, then at least 60% of the MAF must be allocated for EFR, 40% during April-
September and 20% during October to March.
Tessman modified the Tennant method and it resulted in an approach called as Modified
Tennant Method or Tessman Method. Tessman adopted Tennant seasonal flow recommendation
to calibrate the percentage of Mean Annual flow (MAF) to local hydrologic and biological
conditions including monthly variability in terms of Minimum Monthly Flow (MMF).
Cumulative EIA- Dibang Basin Final Report – Chapter 8
8.3
Under these changes, the following rules were formulated.
If MMF < 40% of MAF, then monthly minimum equals the MMF
If MMF > 40% MAF, then monthly minimum equals 40% MAF
If 40% MMF > 40% MAF, then monthly minimum equals 40% MAF
The flushing flow criterion is still a requirement to be met on an annual basis.
(ii) Index Method
This method defined the value of the Minimum In-stream Flow (MIF) that must be maintained
downstream of water diversion in order to maintain vital conditions of ecosystem functionality
and quality (Maran, 2007). Based on Q355 (the flow not exceeded more than 355 days per year)
this means that, on average, the natural flow is less than Q355 value only for 10 days in a year
(Maran, 2007).
MIF = Ka*Kb*Kc* Q355 where:
Ka is corrective coefficient for different environmental sensitive of the interested river
stretch [0.7 to 1.0]
Kb = implementation factor [0.25 to 1.0]
Kc is corrective coefficient to account for different level of protection due to the
naturalistic value of the interested area [1.0 to 1.5].
The concept of “environmental sensitive” is linked with Flow Duration Curve (FDC). When the
slope of the FDC is flat, for example when Q90 ≥ 30% AAF, the flow in the river is very stable
thought the year, and the ecosystem is getting used to have a constant rate of flow in the river
most of the time. This type of ecosystem is more sensitive to any change in river flow regime
and the value of Ka will be taken as 1 (one). On other hand, when the FDC slope is steep, say
Q90 < 10% AAF, the river flow is very unstable and present high extreme values (floods and
droughts). Under this condition, ecosystem is getting used to water scarcity during some
periods of the year, therefore this ecosystem is less sensitive to changes in flow regime,
because the river naturally present a wide variability in flow regime. In this case, the value of
Ka can be taken as 0.7.
The implementation factor refers to upgrade a degraded river condition, in which the quantity
of water in the river is very low, due to abstractions made for different purposes (domestic,
industrial, agriculture, etc.). The recovery of natural conditions of the river flow must be done
gradually, because another uses of water will be affected. In this case, the value of Kb could
be 0.25. In the case of no significant abstractions, the value of Kb will be 1.
The Kc factor increases the value of MIF, for protection of special conditions in the river
ecosystem like naturalistic and tourism values, fisheries development and medicinal or
religious issues.
(iii) Desktop Analysis
Desktop analysis can be sub-divided into (i) those based purely on hydrological data, and (ii)
those that employ both hydrological and ecological data.
Desktop methods based on hydrological data
(a) Flow Duration Curve Based Method
A flow duration curve (FDC) is a plot of flow vs. percentage time equalled or exceeded. FDC
can be prepared using the entire time series data of flow or the flow data pertaining to a
specific period (such as a month) in different years. Further, it can be developed for a
particular site or combining data for different sites on per unit catchment area basis in a hydro
meteorologically homogeneous region.
Cumulative EIA- Dibang Basin Final Report – Chapter 8
8.4
(b) Environmental Management Class (EMC) based FDC Approach
Smakhtin and Anputhas (2006) reviewed various hydrology based environmental flow
assessment methodologies and their applicability in Indian context. Based on the study, they
suggested a flow duration curve based approach which links environmental flow requirement
with environmental management classes.
This EFA method is built around a period-of-record FDC and includes several subsequent steps.
The first step is the calculation of a representative FDC for each site where the environmental
water requirement (EWR) is to be calculated. In this study, the sites where EF is calculated
coincide with the major flow diversion. The sites with observed flow data are further referred
to as „source‟ sites. The sites where reference FDC and time series are needed for the EF
estimation are referred to as „destination‟ sites. All FDCs are represented by a table of flows
corresponding to the 17 fixed percentage points. For each destination site, a FDC table was
calculated using a source FDC table from either the nearest or the only available observation
flow station upstream. To account for land-use impacts, flow withdrawal, etc., and for the
differences between the size of a source and a destination basin, the source FDC is scaled up
by the ratio of „natural‟ long term mean annual run-off (MAR) at the outlet and the actual MAR
calculated from the source record.
(c) Defining Environmental Management Classes
EF aim to maintain an ecosystem in, or upgrade it to, some prescribed or negotiated condition/
status also referred to as “desired future state”, “environmental management class”/
“ecological management category”, “level of environmental protection”, etc. (e.g., Acreman
and Dunbar 2004; DWAF 1997). This report uses the term „environmental management class‟
(EMC). The higher the EMC, the more water will need to be allocated for ecosystem
maintenance or conservation and more flow variability will need to be preserved. Ideally, these
classes should be based on empirical relationships between flow and ecological
status/conditions associated with clearly identifiable thresholds. However, so far there is
insufficient evidence for such thresholds (e.g., Beecher, 1990; Puckridge et al. 1998). These
categories are therefore a management concept, which has been developed and used in the
world because of a need to make decisions in the conditions of limited lucid knowledge.
Placing a river into a certain EMC is normally accomplished by expert judgment using a scoring
system. Alternatively, the EMCs may be used as default „scenarios‟ of environmental protection
and corresponding EWR and EF - as „scenarios‟ of environmental water demand. Six EMCs are
used generally and six corresponding default levels of EWR may be defined. The set of EMCs
starts with the unmodified and largely natural conditions (rivers in classes A and B), where no
or limited modification is present or should be allowed from the management perspective. In
moderately modified river ecosystems (class C rivers), the modifications are such that they
generally have not (or will not – from the management perspective) affected the ecosystem
integrity. Largely modified ecosystems (class D rivers) correspond to considerable modification
from the natural state where the sensitive biota is reduced in numbers and extent. Seriously
and critically modified ecosystems (classes E and F) are normally in poor conditions where
most of the ecosystem‟s functions and services are lost. Rivers which fall into classes C to F
would normally be present in densely populated areas with multiple man-induced impacts.
Poor ecosystem conditions (classes E or F) are sometimes not considered acceptable from the
management perspective and the management intention is always to “move” such rivers up to
the least acceptable class D through river rehabilitation measures (DWAF 1997). This restriction
is not however applied here, primarily because the meaning of every EMC is somewhat
arbitrary and needs to be filled with more ecological substance in the future. Some studies use
transitional EMCs (e.g., A/B, B/C, etc.) to allow for more flexibility in EWR determinations. It
can be noted, however, that ecosystems in class F are likely to be those which have been
modified beyond rehabilitation to anything approaching a natural condition. It is possible to
estimate EWR corresponding to all or any of the above EMCs and then consider which one is
best suited/feasible for the river in question, given existing and future basin developments. On
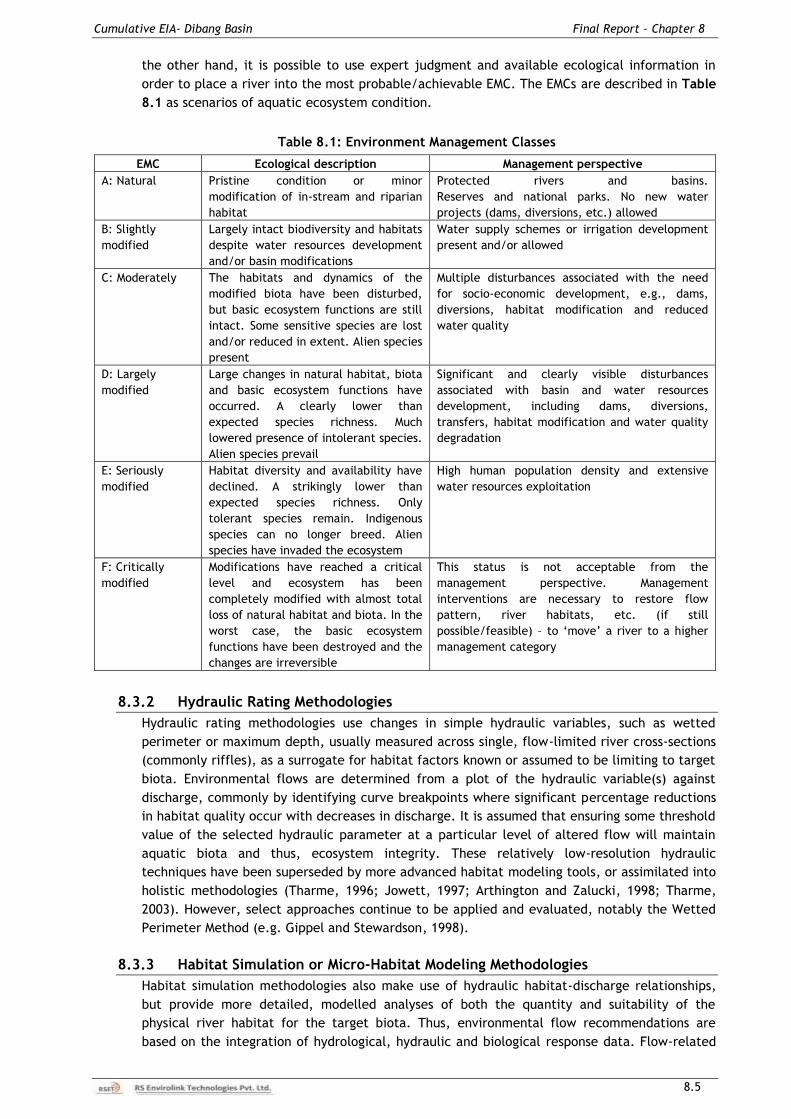
Cumulative EIA- Dibang Basin Final Report – Chapter 8
8.5
the other hand, it is possible to use expert judgment and available ecological information in
order to place a river into the most probable/achievable EMC. The EMCs are described in Table
8.1 as scenarios of aquatic ecosystem condition.
Table 8.1: Environment Management Classes
EMC Ecological description Management perspective
A: Natural Pristine condition or minor
modification of in-stream and riparian
habitat
Protected rivers and basins.
Reserves and national parks. No new water
projects (dams, diversions, etc.) allowed
B: Slightly
modified
Largely intact biodiversity and habitats
despite water resources development
and/or basin modifications
Water supply schemes or irrigation development
present and/or allowed
C: Moderately The habitats and dynamics of the
modified biota have been disturbed,
but basic ecosystem functions are still
intact. Some sensitive species are lost
and/or reduced in extent. Alien species
present
Multiple disturbances associated with the need
for socio-economic development, e.g., dams,
diversions, habitat modification and reduced
water quality
D: Largely
modified
Large changes in natural habitat, biota
and basic ecosystem functions have
occurred. A clearly lower than
expected species richness. Much
lowered presence of intolerant species.
Alien species prevail
Significant and clearly visible disturbances
associated with basin and water resources
development, including dams, diversions,
transfers, habitat modification and water quality
degradation
E: Seriously
modified
Habitat diversity and availability have
declined. A strikingly lower than
expected species richness. Only
tolerant species remain. Indigenous
species can no longer breed. Alien
species have invaded the ecosystem
High human population density and extensive
water resources exploitation
F: Critically
modified
Modifications have reached a critical
level and ecosystem has been
completely modified with almost total
loss of natural habitat and biota. In the
worst case, the basic ecosystem
functions have been destroyed and the
changes are irreversible
This status is not acceptable from the
management perspective. Management
interventions are necessary to restore flow
pattern, river habitats, etc. (if still
possible/feasible) – to „move‟ a river to a higher
management category
8.3.2 Hydraulic Rating Methodologies
Hydraulic rating methodologies use changes in simple hydraulic variables, such as wetted
perimeter or maximum depth, usually measured across single, flow-limited river cross-sections
(commonly riffles), as a surrogate for habitat factors known or assumed to be limiting to target
biota. Environmental flows are determined from a plot of the hydraulic variable(s) against
discharge, commonly by identifying curve breakpoints where significant percentage reductions
in habitat quality occur with decreases in discharge. It is assumed that ensuring some threshold
value of the selected hydraulic parameter at a particular level of altered flow will maintain
aquatic biota and thus, ecosystem integrity. These relatively low-resolution hydraulic
techniques have been superseded by more advanced habitat modeling tools, or assimilated into
holistic methodologies (Tharme, 1996; Jowett, 1997; Arthington and Zalucki, 1998; Tharme,
2003). However, select approaches continue to be applied and evaluated, notably the Wetted
Perimeter Method (e.g. Gippel and Stewardson, 1998).
8.3.3 Habitat Simulation or Micro-Habitat Modeling Methodologies
Habitat simulation methodologies also make use of hydraulic habitat-discharge relationships,
but provide more detailed, modelled analyses of both the quantity and suitability of the
physical river habitat for the target biota. Thus, environmental flow recommendations are
based on the integration of hydrological, hydraulic and biological response data. Flow-related
Cumulative EIA- Dibang Basin Final Report – Chapter 8
8.6
changes in physical microhabitat are modelled in various hydraulic programs, typically using
data on depth, velocity, substratum composition and cover; and more recently, complex
hydraulic indices (e.g. benthic shear stress), collected at multiple cross-sections within each
representative river reach. Simulated information on available habitat is linked with seasonal
information on the range of habitat conditions used by target fish or invertebrate species (or
life-history stages, assemblages and/or activities), commonly using habitat suitability index
curves (e.g. Groshens and Orth, 1994). The resultant outputs, in the form of habitat-discharge
relationships for specific biota, or extended as habitat time and exceedance series, are used to
derive optimum environmental flows. The habitat simulation-modeling package PHABSIM
(Bovee, 1982, 1998; Milhous, 1998, 1982; Milhous et al., 1989; Stalnaker et al., 1994), housed
within the In-stream Flow Incremental Methodology (IFIM), is the pre-eminent modeling
platform of this type.
8.3.4 Holistic Methodologies
Over the past decade, river ecologists have increasingly made the case for a broader approach
to the definition of environmental flows to sustain and conserve river ecosystems, rather than
focusing on just a few target fish species (Arthington and Pusey, 1993; King and Tharme, 1994;
Sparks, 1992, 1995; Richter et al., 1996; Poff et al., 1997). From the conceptual foundations of
a holistic ecosystem approach, a wide range of holistic methodologies has been developed and
applied, initially in Australia and South Africa and later in the United Kingdom. This type of
approach reasons that if certain features of the natural hydrological regime can be identified
and adequately incorporated into a modified flow regime, then, all other things being equal,
the extant biota and functional integrity of the ecosystem should be maintained (Arthington et
al., 1992; King and Tharme 1994). Importantly, holistic methodologies aim to address the water
requirements of the entire “riverine ecosystem” rather than the needs of only a few taxa
(usually fish or invertebrates). These methodologies share a common objective - to maintain or
restore the flow related biophysical components and ecological processes of in-stream and
groundwater systems, floodplains and downstream receiving waters (e.g. terminal lakes and
wetlands, estuaries and near-shore marine ecosystems). Ecosystem components that are
commonly considered in holistic assessments include geomorphology, hydraulic habitat, water
quality, riparian and aquatic vegetation, macro-invertebrates, fish and other vertebrates with
some dependency upon the river/riparian ecosystem (i.e. amphibians, reptiles, birds,
mammals). Each of these components can be evaluated using a range of field and desktop
techniques and their flow requirements are then incorporated into EFA recommendations, using
various systematic approaches.
Holistic approaches have been described as either „bottom-up‟ methods, which are designed to
„construct‟ a modified flow regime by adding flow components to a baseline of zero flows; or
„top-down‟ methods i.e. by assessing how much a river‟s flow regime can be modified before
the aquatic ecosystem begins to noticeably change or degrade.
8.3.4.1 The Building Block Methodology (BBM)
The BBM is introduced in King & Tharme (1994) and King (1996), and is comprehensively
described in Tharme & King (1998), and King & Louw (1998). The methodology is under on going
development, and has been applied routinely in South Africa, with some application in
Australia and UK. The methodology is based on the concept that some flows within the
complete hydrological regime of a river are more important than others for maintenance of the
riverine ecosystem, and that these flows can be identified, and described in terms of their
magnitude, duration, timing, and frequency. In combination, these flows constitute the EFR as
a river-specific modified flow regime, linked to a predetermined future state. A number of
specialists in a workshop situation use hydrological base flow and flood data, including various
hydrological indices, cross-section based hydraulic data, and information on the flow-related
needs of ecosystem components, to identify specific flow elements for the EFR.

Cumulative EIA- Dibang Basin Final Report – Chapter 8
8.7
8.3.4.2 The Downstream Response to Imposed Flow Transformations Methodology
The DRIFT Methodology was developed in southern Africa for use in the Palmiet IFR study
(Brown et al., 2000) and Lesotho Highlands Water Project (Brown & King, 1999, 2000). It is an
interactive, top-down holistic approach based on the same conceptual tenets and
multidisciplinary, workshop-based interaction as the BBM and Holistic Approach. However, it
focuses on the identification of a series of river water levels associated with a particular set of
biophysical functions and of specific hydrological and hydraulic character. Specialists in each
discipline describe the consequences of reducing discharges through these identified flow
bands and their thresholds, in terms of deterioration in biotic and abiotic condition. The
identification of the „minimum degradation‟ reduction level and its consequences typically
provides the starting point for the process. Once a wide range of flow reductions has been
assessed, there is considerable scope for the comparative evaluation of a vast number of EFR
scenarios, each reflecting the presence or absence of different flow bands with attendant
consequences.
Holistic methodologies exhibit several advantages over other types of environmental flow
methodology, most importantly in that they can potentially be used to address all components
of the riverine ecosystem and have strong links with the natural hydrological regime. Also, they
incorporate biological, geomorphological and hydrological data, and consider all aspects of the
flow regime, such as the magnitude and timing of both base flow and flood events. However,
holistic methodologies rely to a considerable extent on professional judgment, so care must be
taken to apply them in a rigorous, well-structured manner, in order to ensure sufficiently
reproducible results. The methodologies are firmly based on South African and Australian
experiences of variable climate and hydrology, heterogeneous geomorphology, and of limited
available information on biological flow dependencies of riverine biota (Growns & Kotlash,
1994; Tharme, 1996). As with most other current environmental flow methodologies, there are
few applications of holistic methodologies other than in their place of origin.
For the purpose of environmental flow assessment in Dibang basin, hydraulic modeling and
habitat simulation methodologies is considered to be best suited as discussed in the following
section.
8.4 ADOPTED METHODOLOGY TO ESTABLISH ENVIRONMENTAL FLOW
8.4.1 Basics of Environmental Flow Assessment Methods
Environmental flows (EF) are an ecologically acceptable flow regime designed to maintain a
river in an agreed or predetermined state. Therefore, EF are a compromise between hydro
development, on one hand, and river maintenance in a healthy or at least reasonable
condition, on the other. Difficulties in the actual estimation of EF values arise primarily due to
the inherent lack of both the understanding of and quantitative data on relationships between
river flows and multiple components of river ecology. The major criteria for determining EF
should include the maintenance of both spatial and temporal patterns of river flow, i.e., the
flow variability, which affect the structural and functional diversity of rivers, and which in turn
influence the species diversity of the river. All components of the hydrological regime have
certain ecological significance. High flows of different frequency are important for channel
maintenance, bird breeding, wetland flooding and maintenance of riparian vegetation.
Moderate flows are critical for cycling of organic matter from river banks and for fish
migration, while low flows of different magnitudes are important for algae control, water
quality maintenance and the use of the river by local people. Therefore, many elements of
flow variability have to be maintained in a modified-EF-regime.
Cumulative EIA- Dibang Basin Final Report – Chapter 8
8.8
The focus on maintenance of flow variability has several important implications. First, it moves
away from a „minimum flow attitude‟ to aquatic environment. Second, it effectively considers
that aquatic environment is also „held accountable‟ and valued similarly to other sectors – to
allow informed trade-offs to be made in water deprived conditions. Because wetland and river
ecosystems are naturally subjected to droughts or low flow periods and can recover from
those, then building this variability into the picture of EFA may be seen as environmental water
demand management. This brings us back to the issue of „compromise‟ and implies that EF is a
very pragmatic concept: it does not accept a bare minimum, but it is for a trade. Bunn and
Arthington (2002) have formulated four basic principles that emphasize the role of flow regime
in structuring aquatic life and show the link between flow and ecosystem changes:
Flow is a major determinant of physical habitat in rivers, which in turn is the major
determinant of biotic composition. Therefore, river flow modifications eventually lead to
changes in the composition and diversity of aquatic communities.
Aquatic species have evolved life history strategies primarily in response to the natural
flow regimes. Therefore, flow regime alterations can lead to loss of biodiversity of native
species.
Maintenance of natural patterns of longitudinal and lateral connectivity in river systems
determines the ability of many aquatic species to move between the main river and its
tributaries. Loss of longitudinal and lateral connectivity can lead to local extinction of
species.
In this report, hydraulic rating methodologies and habitat simulations or micro-habitat
modeling methodologies have been used. The primary reason for using this method is
objectivity of the methodology, availability of data including surveyed river cross-sections and
limited timeframe available for the study.
Main reasons for not using Hydrological Index Methods is that though these provide a relatively
rapid, non-resource intensive, but give low resolution estimate of environmental flows. The
methods are only appropriate at the planning level where they may be used as preliminary
estimates. These methods may be used as tools within habitat simulation, holistic or
combination environmental flow methodologies. Commonly, the EFR is represented as a
proportion of flow (often termed the „minimum flow‟) intended to maintain river health,
fisheries or other highlighted ecological features at some acceptable level, usually on an
annual, seasonal or monthly basis.
Building Block Method (BBM) could not be used because of following reasons:
The BBM is essentially a prescriptive approach, designed to construct a flow regime for
maintaining a river in a predetermined condition. Building Block Method can use detailed
data from different sectors and have the provision of consultation among the experts and
stakeholders. However, application of BBM for large number of sites requires a lot of time
and resources.
The BBM has advanced the field of environmental flow assessment and being a holistic
methodology it addresses the health (structure and functioning) of all components of the
riverine ecosystem, rather than focusing on selected group or species. But in context of
Dibang basin study, the major stakeholder is only riverine ecology and fish. Hence adopting
such rigorous exercise is neither needed nor practical within a limited time frame and
resources.
Cumulative EIA- Dibang Basin Final Report – Chapter 8
8.9
Environmental flow regime has been worked out keeping annual occurrence of following main
seasons in this region. These are:
(a) Season I: This season is considered as low or lean or dry flow season which covers the
months from December to March. However, in case of Sissiri HEP, November to February
covers low or lean or dry flow season.
(b) Season II: It is considered as high flow season influenced by monsoon. It covers the months
from June to September. However, in case of Sissiri HEP, May to August covers high flow
season influenced by monsoon.
(c) Season III: This season is considered as average flow period, covers the months of April,
May and October, November. However, in case of Sissiri HEP, this period covers the months
of March, April and September, October.
8.5 HYDRO-DYNAMIC MODELING
To assess environmental flow requirements, a flow simulation study has been carried out using
one dimensional mathematical model MIKE 11 developed by Danish Hydraulic Institute of
Denmark.
8.5.1 MIKE 11 Model
MIKE 11 is an integrated system of software, designed for interactive use in a multi-tasking
environment. The system is comprised of a graphical user interface, separate hydraulic analysis
components, data storage and management capabilities, graphics and reporting facilities. The
core of the MIKE 11 system consists of the HD (hydrodynamic) module, which is capable of
simulating unsteady flows in a network of open channels. The results of a HD simulation
consist of time series of water levels, discharges, flow velocities, water widths etc. MIKE 11
hydrodynamic module is an implicit, finite difference model for unsteady flow computation.
The model can describe sub-critical as well as supercritical flow conditions through a numerical
description, which is altered according to the local flow conditions in time and space. The MIKE
11 system contains three one-dimensional hydraulic components for: i) Steady flow surface
profile computations; ii) quasi-unsteady flow simulation and iii) unsteady flow simulation. The
steady/unsteady flow components are capable of modeling subcritical, supercritical, and mixed
flow regime water surface profiles. The system can handle a full network of channels, a
dendritic system, or a single river reach. The basic computational procedure is based on the
solution of one-dimensional energy equation. Energy losses are evaluated by friction (Manning‟s
equation) and contraction/expansion (coefficient multiplied by the velocity head). The
momentum equation is utilized in situations where the water surface profile is rapidly varied.
The graphics include X-Y plots of the river system schematic, cross-sections, profiles, rating
curves, hydrographs, and many other hydraulic variables. Users can select from pre-defined
tables or develop their own customized tables. All graphical and tabular output can be
displayed on the screen, sent directly to a printer, or passed through the Windows clipboard to
other software, such as word processor or spread sheet. Reports can be customized as to the
amount and type of information desired..
The following approach has been used for various data inputs:
8.5.2 Hydropower Projects considered for Modeling
There are 18 hydro projects being planned in the Dibang river basin on different tributaries and
their details and status is discussed in Chapter 2. Two projects are less than 25 MW i.e. they do
not fall under the purview of EIA notification; therefore they are not covered for the modeling
exercise.
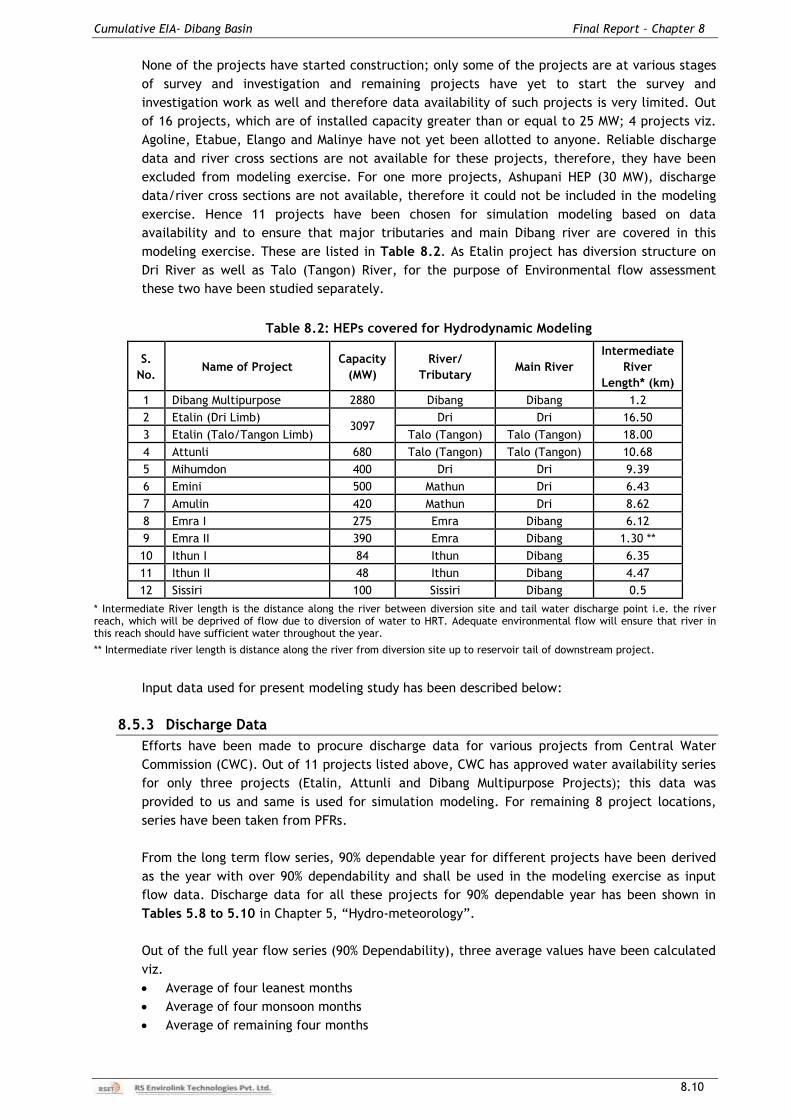
Cumulative EIA- Dibang Basin Final Report – Chapter 8
8.10
None of the projects have started construction; only some of the projects are at various stages
of survey and investigation and remaining projects have yet to start the survey and
investigation work as well and therefore data availability of such projects is very limited. Out
of 16 projects, which are of installed capacity greater than or equal to 25 MW; 4 projects viz.
Agoline, Etabue, Elango and Malinye have not yet been allotted to anyone. Reliable discharge
data and river cross sections are not available for these projects, therefore, they have been
excluded from modeling exercise. For one more projects, Ashupani HEP (30 MW), discharge
data/river cross sections are not available, therefore it could not be included in the modeling
exercise. Hence 11 projects have been chosen for simulation modeling based on data
availability and to ensure that major tributaries and main Dibang river are covered in this
modeling exercise. These are listed in Table 8.2. As Etalin project has diversion structure on
Dri River as well as Talo (Tangon) River, for the purpose of Environmental flow assessment
these two have been studied separately.
Table 8.2: HEPs covered for Hydrodynamic Modeling
S.
No. Name of Project
Capacity
(MW)
River/
Tributary Main River
Intermediate
River
Length* (km)
1 Dibang Multipurpose 2880 Dibang Dibang 1.2
2 Etalin (Dri Limb) 3097
Dri Dri 16.50
3 Etalin (Talo/Tangon Limb) Talo (Tangon) Talo (Tangon) 18.00
4 Attunli 680 Talo (Tangon) Talo (Tangon) 10.68
5 Mihumdon 400 Dri Dri 9.39
6 Emini 500 Mathun Dri 6.43
7 Amulin 420 Mathun Dri 8.62
8 Emra I 275 Emra Dibang 6.12
9 Emra II 390 Emra Dibang 1.30 **
10 Ithun I 84 Ithun Dibang 6.35
11 Ithun II 48 Ithun Dibang 4.47
12 Sissiri 100 Sissiri Dibang 0.5
* Intermediate River length is the distance along the river between diversion site and tail water discharge point i.e. the river reach, which will be deprived of flow due to diversion of water to HRT. Adequate environmental flow will ensure that river in this reach should have sufficient water throughout the year.
** Intermediate river length is distance along the river from diversion site up to reservoir tail of downstream project.
Input data used for present modeling study has been described below:
8.5.3 Discharge Data
Efforts have been made to procure discharge data for various projects from Central Water
Commission (CWC). Out of 11 projects listed above, CWC has approved water availability series
for only three projects (Etalin, Attunli and Dibang Multipurpose Projects); this data was
provided to us and same is used for simulation modeling. For remaining 8 project locations,
series have been taken from PFRs.
From the long term flow series, 90% dependable year for different projects have been derived
as the year with over 90% dependability and shall be used in the modeling exercise as input
flow data. Discharge data for all these projects for 90% dependable year has been shown in
Tables 5.8 to 5.10 in Chapter 5, “Hydro-meteorology”.
Out of the full year flow series (90% Dependability), three average values have been calculated
viz.
Average of four leanest months
Average of four monsoon months
Average of remaining four months
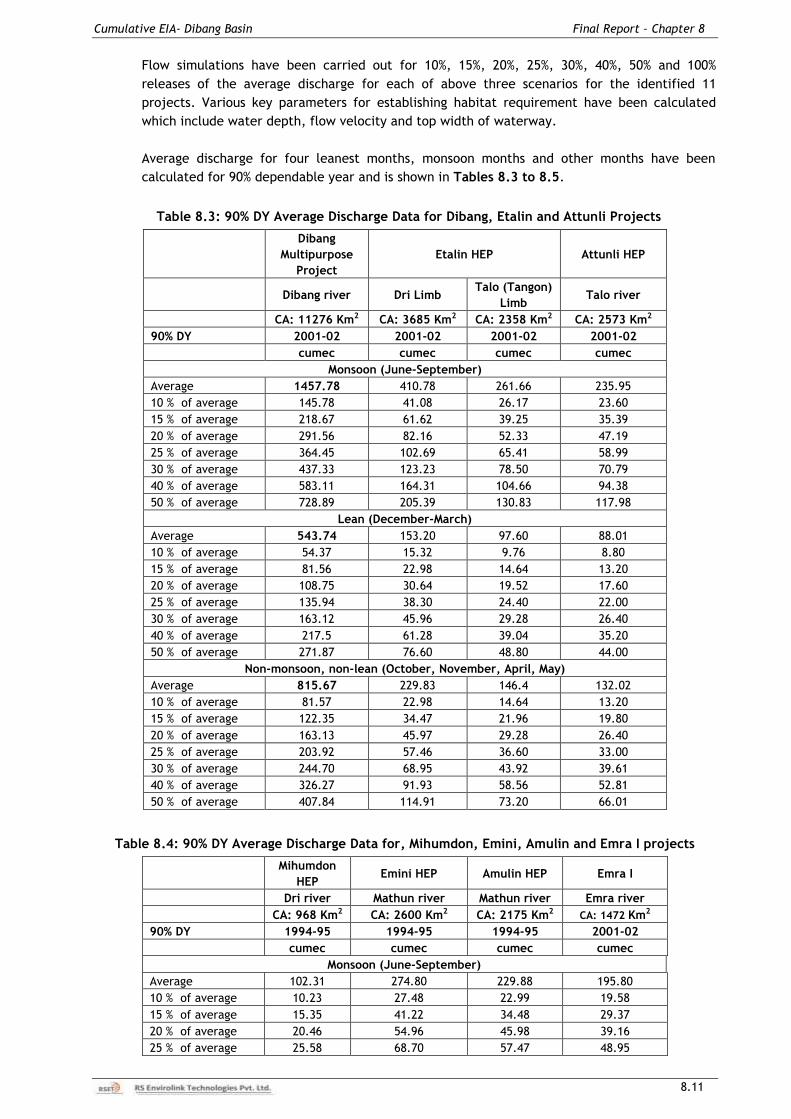
Cumulative EIA- Dibang Basin Final Report – Chapter 8
8.11
Flow simulations have been carried out for 10%, 15%, 20%, 25%, 30%, 40%, 50% and 100%
releases of the average discharge for each of above three scenarios for the identified 11
projects. Various key parameters for establishing habitat requirement have been calculated
which include water depth, flow velocity and top width of waterway.
Average discharge for four leanest months, monsoon months and other months have been
calculated for 90% dependable year and is shown in Tables 8.3 to 8.5.
Table 8.3: 90% DY Average Discharge Data for Dibang, Etalin and Attunli Projects
Dibang
Multipurpose
Project
Etalin HEP Attunli HEP
Dibang river Dri Limb
Talo (Tangon)
Limb Talo river
CA: 11276 Km2 CA: 3685 Km2 CA: 2358 Km2 CA: 2573 Km2
90% DY 2001-02 2001-02 2001-02 2001-02
cumec cumec cumec cumec
Monsoon (June-September)
Average 1457.78 410.78 261.66 235.95
10 % of average 145.78 41.08 26.17 23.60
15 % of average 218.67 61.62 39.25 35.39
20 % of average 291.56 82.16 52.33 47.19
25 % of average 364.45 102.69 65.41 58.99
30 % of average 437.33 123.23 78.50 70.79
40 % of average 583.11 164.31 104.66 94.38
50 % of average 728.89 205.39 130.83 117.98
Lean (December-March)
Average 543.74 153.20 97.60 88.01
10 % of average 54.37 15.32 9.76 8.80
15 % of average 81.56 22.98 14.64 13.20
20 % of average 108.75 30.64 19.52 17.60
25 % of average 135.94 38.30 24.40 22.00
30 % of average 163.12 45.96 29.28 26.40
40 % of average 217.5 61.28 39.04 35.20
50 % of average 271.87 76.60 48.80 44.00
Non-monsoon, non-lean (October, November, April, May)
Average 815.67 229.83 146.4 132.02
10 % of average 81.57 22.98 14.64 13.20
15 % of average 122.35 34.47 21.96 19.80
20 % of average 163.13 45.97 29.28 26.40
25 % of average 203.92 57.46 36.60 33.00
30 % of average 244.70 68.95 43.92 39.61
40 % of average 326.27 91.93 58.56 52.81
50 % of average 407.84 114.91 73.20 66.01
Table 8.4: 90% DY Average Discharge Data for, Mihumdon, Emini, Amulin and Emra I projects
Mihumdon
HEP Emini HEP Amulin HEP Emra I
Dri river Mathun river Mathun river Emra river
CA: 968 Km2 CA: 2600 Km2 CA: 2175 Km2 CA: 1472 Km2
90% DY 1994-95 1994-95 1994-95 2001-02
cumec cumec cumec cumec
Monsoon (June-September)
Average 102.31 274.80 229.88 195.80
10 % of average 10.23 27.48 22.99 19.58
15 % of average 15.35 41.22 34.48 29.37
20 % of average 20.46 54.96 45.98 39.16
25 % of average 25.58 68.70 57.47 48.95
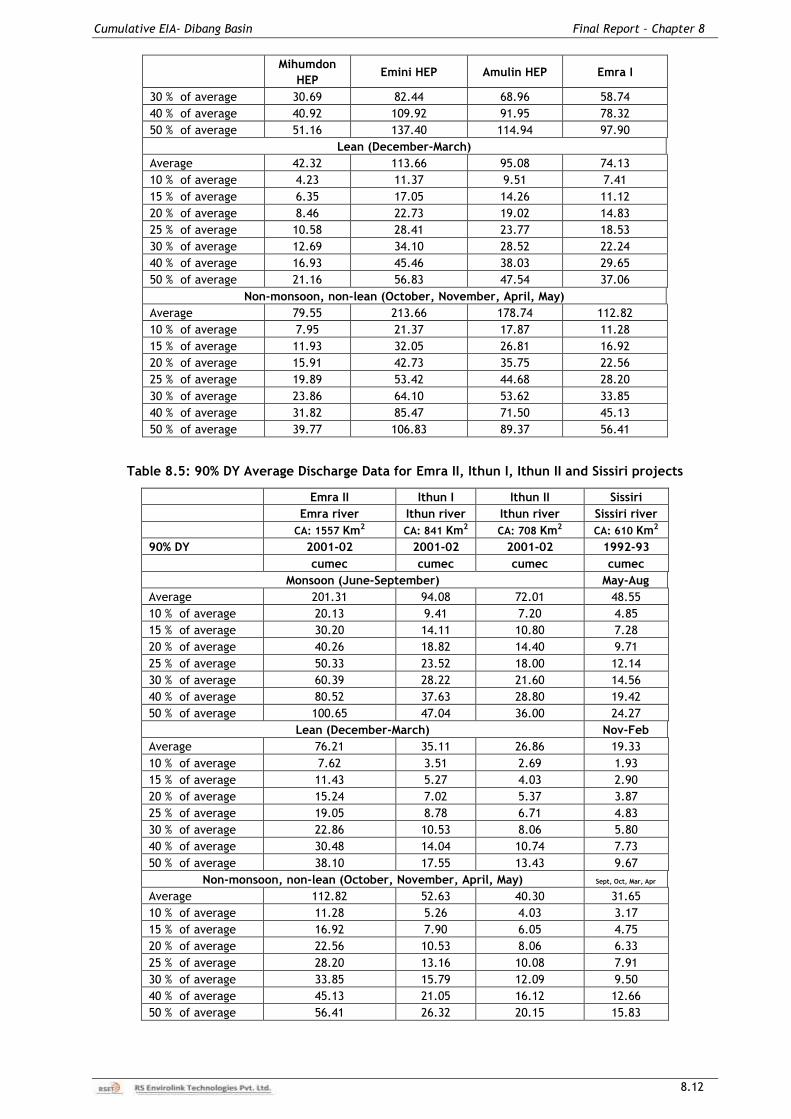
Cumulative EIA- Dibang Basin Final Report – Chapter 8
8.12
Mihumdon
HEP Emini HEP Amulin HEP Emra I
30 % of average 30.69 82.44 68.96 58.74
40 % of average 40.92 109.92 91.95 78.32
50 % of average 51.16 137.40 114.94 97.90
Lean (December-March)
Average 42.32 113.66 95.08 74.13
10 % of average 4.23 11.37 9.51 7.41
15 % of average 6.35 17.05 14.26 11.12
20 % of average 8.46 22.73 19.02 14.83
25 % of average 10.58 28.41 23.77 18.53
30 % of average 12.69 34.10 28.52 22.24
40 % of average 16.93 45.46 38.03 29.65
50 % of average 21.16 56.83 47.54 37.06
Non-monsoon, non-lean (October, November, April, May)
Average 79.55 213.66 178.74 112.82
10 % of average 7.95 21.37 17.87 11.28
15 % of average 11.93 32.05 26.81 16.92
20 % of average 15.91 42.73 35.75 22.56
25 % of average 19.89 53.42 44.68 28.20
30 % of average 23.86 64.10 53.62 33.85
40 % of average 31.82 85.47 71.50 45.13
50 % of average 39.77 106.83 89.37 56.41
Table 8.5: 90% DY Average Discharge Data for Emra II, Ithun I, Ithun II and Sissiri projects
Emra II Ithun I Ithun II Sissiri
Emra river Ithun river Ithun river Sissiri river
CA: 1557 Km2 CA: 841 Km2
CA: 708 Km2 CA: 610 Km2
90% DY 2001-02 2001-02 2001-02 1992-93
cumec cumec cumec cumec
Monsoon (June-September) May-Aug
Average 201.31 94.08 72.01 48.55
10 % of average 20.13 9.41 7.20 4.85
15 % of average 30.20 14.11 10.80 7.28
20 % of average 40.26 18.82 14.40 9.71
25 % of average 50.33 23.52 18.00 12.14
30 % of average 60.39 28.22 21.60 14.56
40 % of average 80.52 37.63 28.80 19.42
50 % of average 100.65 47.04 36.00 24.27
Lean (December-March) Nov-Feb
Average 76.21 35.11 26.86 19.33
10 % of average 7.62 3.51 2.69 1.93
15 % of average 11.43 5.27 4.03 2.90
20 % of average 15.24 7.02 5.37 3.87
25 % of average 19.05 8.78 6.71 4.83
30 % of average 22.86 10.53 8.06 5.80
40 % of average 30.48 14.04 10.74 7.73
50 % of average 38.10 17.55 13.43 9.67
Non-monsoon, non-lean (October, November, April, May) Sept, Oct, Mar, Apr
Average 112.82 52.63 40.30 31.65
10 % of average 11.28 5.26 4.03 3.17
15 % of average 16.92 7.90 6.05 4.75
20 % of average 22.56 10.53 8.06 6.33
25 % of average 28.20 13.16 10.08 7.91
30 % of average 33.85 15.79 12.09 9.50
40 % of average 45.13 21.05 16.12 12.66
50 % of average 56.41 26.32 20.15 15.83
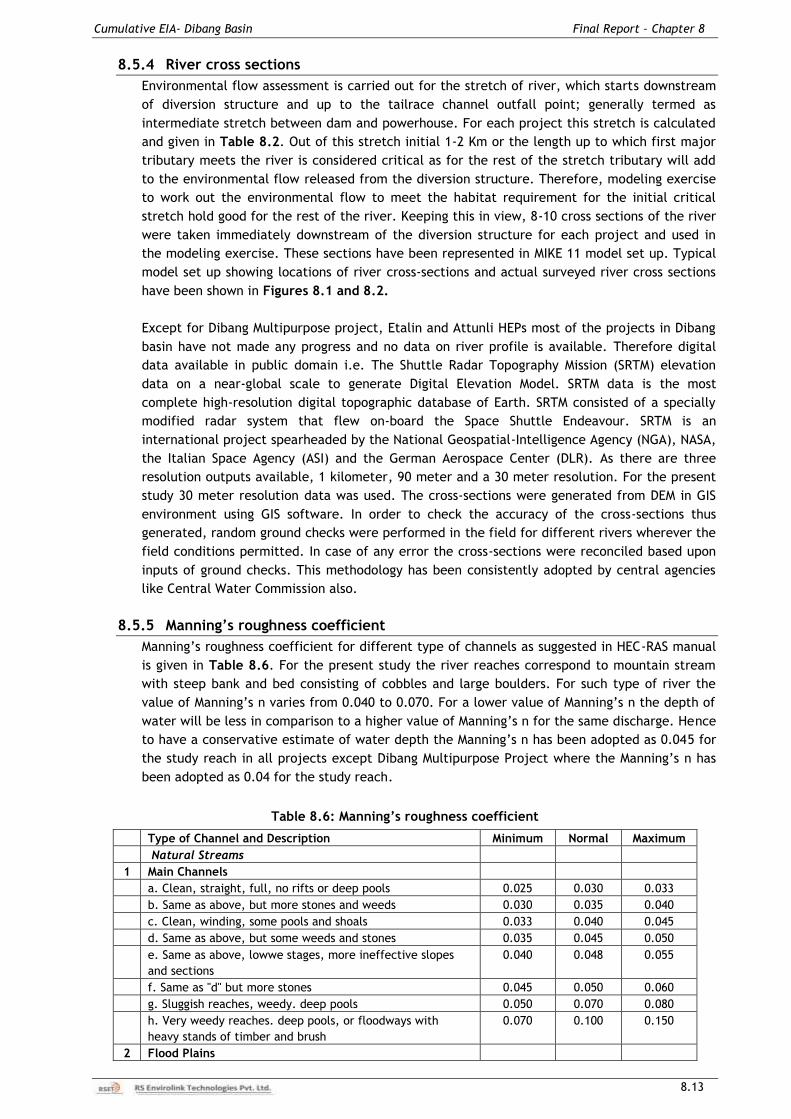
Cumulative EIA- Dibang Basin Final Report – Chapter 8
8.13
8.5.4 River cross sections
Environmental flow assessment is carried out for the stretch of river, which starts downstream
of diversion structure and up to the tailrace channel outfall point; generally termed as
intermediate stretch between dam and powerhouse. For each project this stretch is calculated
and given in Table 8.2. Out of this stretch initial 1-2 Km or the length up to which first major
tributary meets the river is considered critical as for the rest of the stretch tributary will add
to the environmental flow released from the diversion structure. Therefore, modeling exercise
to work out the environmental flow to meet the habitat requirement for the initial critical
stretch hold good for the rest of the river. Keeping this in view, 8-10 cross sections of the river
were taken immediately downstream of the diversion structure for each project and used in
the modeling exercise. These sections have been represented in MIKE 11 model set up. Typical
model set up showing locations of river cross-sections and actual surveyed river cross sections
have been shown in Figures 8.1 and 8.2.
Except for Dibang Multipurpose project, Etalin and Attunli HEPs most of the projects in Dibang
basin have not made any progress and no data on river profile is available. Therefore digital
data available in public domain i.e. The Shuttle Radar Topography Mission (SRTM) elevation
data on a near-global scale to generate Digital Elevation Model. SRTM data is the most
complete high-resolution digital topographic database of Earth. SRTM consisted of a specially
modified radar system that flew on-board the Space Shuttle Endeavour. SRTM is an
international project spearheaded by the National Geospatial-Intelligence Agency (NGA), NASA,
the Italian Space Agency (ASI) and the German Aerospace Center (DLR). As there are three
resolution outputs available, 1 kilometer, 90 meter and a 30 meter resolution. For the present
study 30 meter resolution data was used. The cross-sections were generated from DEM in GIS
environment using GIS software. In order to check the accuracy of the cross-sections thus
generated, random ground checks were performed in the field for different rivers wherever the
field conditions permitted. In case of any error the cross-sections were reconciled based upon
inputs of ground checks. This methodology has been consistently adopted by central agencies
like Central Water Commission also.
8.5.5 Manning’s roughness coefficient
Manning‟s roughness coefficient for different type of channels as suggested in HEC-RAS manual
is given in Table 8.6. For the present study the river reaches correspond to mountain stream
with steep bank and bed consisting of cobbles and large boulders. For such type of river the
value of Manning‟s n varies from 0.040 to 0.070. For a lower value of Manning‟s n the depth of
water will be less in comparison to a higher value of Manning‟s n for the same discharge. Hence
to have a conservative estimate of water depth the Manning‟s n has been adopted as 0.045 for
the study reach in all projects except Dibang Multipurpose Project where the Manning‟s n has
been adopted as 0.04 for the study reach.
Table 8.6: Manning’s roughness coefficient
Type of Channel and Description Minimum Normal Maximum
Natural Streams
1 Main Channels
a. Clean, straight, full, no rifts or deep pools 0.025 0.030 0.033
b. Same as above, but more stones and weeds 0.030 0.035 0.040
c. Clean, winding, some pools and shoals 0.033 0.040 0.045
d. Same as above, but some weeds and stones 0.035 0.045 0.050
e. Same as above, lowwe stages, more ineffective slopes
and sections
0.040 0.048 0.055
f. Same as "d" but more stones 0.045 0.050 0.060
g. Sluggish reaches, weedy. deep pools 0.050 0.070 0.080
h. Very weedy reaches. deep pools, or floodways with
heavy stands of timber and brush
0.070 0.100 0.150
2 Flood Plains
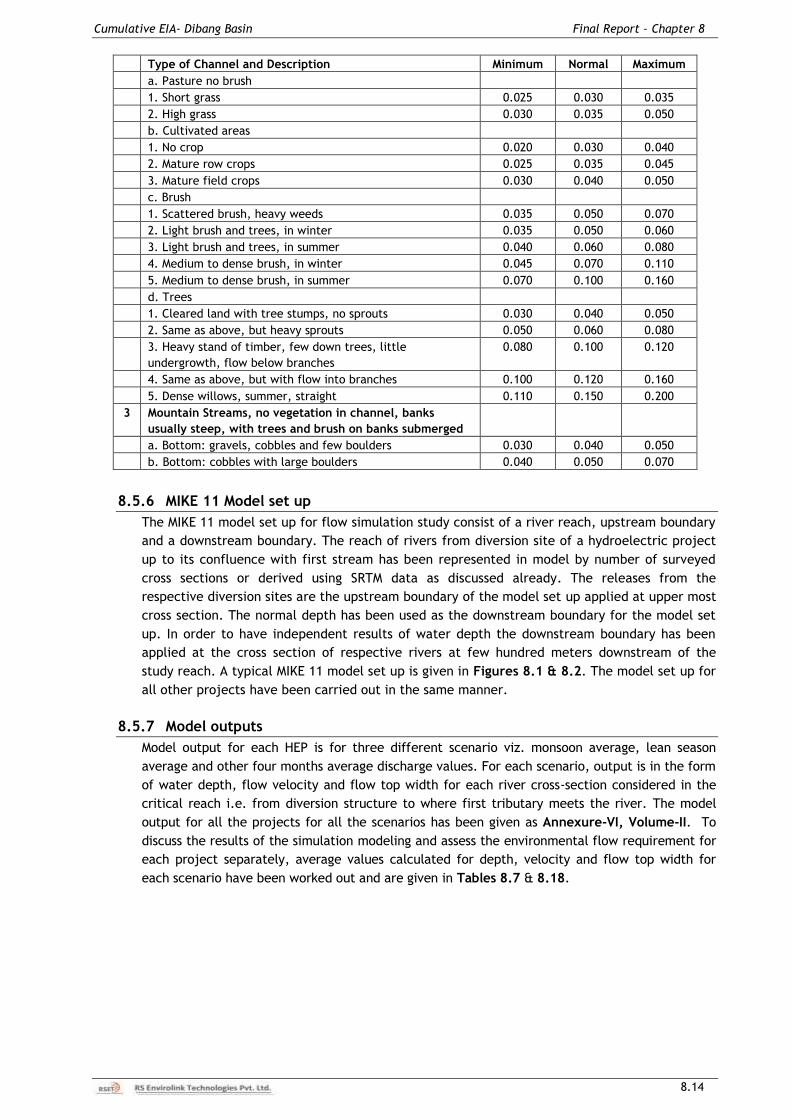
Cumulative EIA- Dibang Basin Final Report – Chapter 8
8.14
Type of Channel and Description Minimum Normal Maximum
a. Pasture no brush
1. Short grass 0.025 0.030 0.035
2. High grass 0.030 0.035 0.050
b. Cultivated areas
1. No crop 0.020 0.030 0.040
2. Mature row crops 0.025 0.035 0.045
3. Mature field crops 0.030 0.040 0.050
c. Brush
1. Scattered brush, heavy weeds 0.035 0.050 0.070
2. Light brush and trees, in winter 0.035 0.050 0.060
3. Light brush and trees, in summer 0.040 0.060 0.080
4. Medium to dense brush, in winter 0.045 0.070 0.110
5. Medium to dense brush, in summer 0.070 0.100 0.160
d. Trees
1. Cleared land with tree stumps, no sprouts 0.030 0.040 0.050
2. Same as above, but heavy sprouts 0.050 0.060 0.080
3. Heavy stand of timber, few down trees, little
undergrowth, flow below branches
0.080 0.100 0.120
4. Same as above, but with flow into branches 0.100 0.120 0.160
5. Dense willows, summer, straight 0.110 0.150 0.200
3 Mountain Streams, no vegetation in channel, banks
usually steep, with trees and brush on banks submerged
a. Bottom: gravels, cobbles and few boulders 0.030 0.040 0.050
b. Bottom: cobbles with large boulders 0.040 0.050 0.070
8.5.6 MIKE 11 Model set up
The MIKE 11 model set up for flow simulation study consist of a river reach, upstream boundary
and a downstream boundary. The reach of rivers from diversion site of a hydroelectric project
up to its confluence with first stream has been represented in model by number of surveyed
cross sections or derived using SRTM data as discussed already. The releases from the
respective diversion sites are the upstream boundary of the model set up applied at upper most
cross section. The normal depth has been used as the downstream boundary for the model set
up. In order to have independent results of water depth the downstream boundary has been
applied at the cross section of respective rivers at few hundred meters downstream of the
study reach. A typical MIKE 11 model set up is given in Figures 8.1 & 8.2. The model set up for
all other projects have been carried out in the same manner.
8.5.7 Model outputs
Model output for each HEP is for three different scenario viz. monsoon average, lean season
average and other four months average discharge values. For each scenario, output is in the form
of water depth, flow velocity and flow top width for each river cross-section considered in the
critical reach i.e. from diversion structure to where first tributary meets the river. The model
output for all the projects for all the scenarios has been given as Annexure-VI, Volume-II. To
discuss the results of the simulation modeling and assess the environmental flow requirement for
each project separately, average values calculated for depth, velocity and flow top width for
each scenario have been worked out and are given in Tables 8.7 & 8.18.
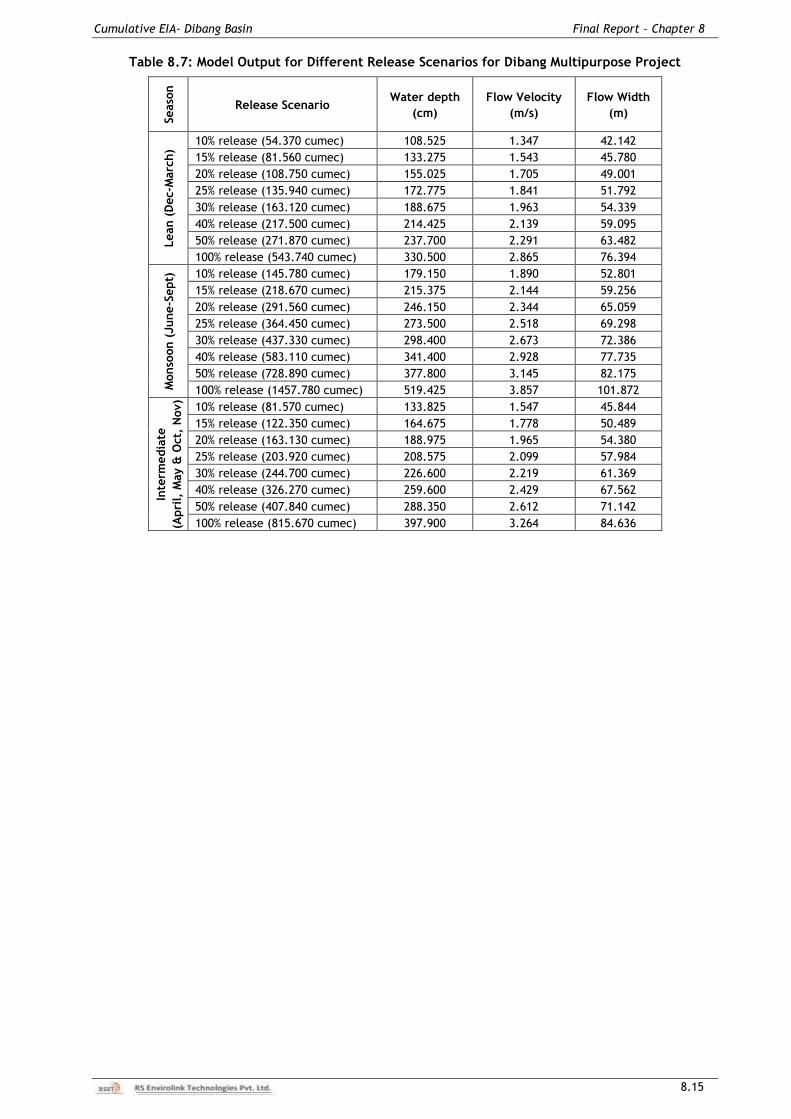
Cumulative EIA- Dibang Basin Final Report – Chapter 8
8.15
Table 8.7: Model Output for Different Release Scenarios for Dibang Multipurpose Project
Seaso
n
Release Scenario Water depth
(cm)
Flow Velocity
(m/s)
Flow Width
(m)
Lean (
Dec-M
arc
h)
10% release (54.370 cumec) 108.525 1.347 42.142
15% release (81.560 cumec) 133.275 1.543 45.780
20% release (108.750 cumec) 155.025 1.705 49.001
25% release (135.940 cumec) 172.775 1.841 51.792
30% release (163.120 cumec) 188.675 1.963 54.339
40% release (217.500 cumec) 214.425 2.139 59.095
50% release (271.870 cumec) 237.700 2.291 63.482
100% release (543.740 cumec) 330.500 2.865 76.394
Monso
on (
June-S
ept)
10% release (145.780 cumec) 179.150 1.890 52.801
15% release (218.670 cumec) 215.375 2.144 59.256
20% release (291.560 cumec) 246.150 2.344 65.059
25% release (364.450 cumec) 273.500 2.518 69.298
30% release (437.330 cumec) 298.400 2.673 72.386
40% release (583.110 cumec) 341.400 2.928 77.735
50% release (728.890 cumec) 377.800 3.145 82.175
100% release (1457.780 cumec) 519.425 3.857 101.872
Inte
rmedia
te
(Apri
l, M
ay &
Oct,
Nov)
10% release (81.570 cumec) 133.825 1.547 45.844
15% release (122.350 cumec) 164.675 1.778 50.489
20% release (163.130 cumec) 188.975 1.965 54.380
25% release (203.920 cumec) 208.575 2.099 57.984
30% release (244.700 cumec) 226.600 2.219 61.369
40% release (326.270 cumec) 259.600 2.429 67.562
50% release (407.840 cumec) 288.350 2.612 71.142
100% release (815.670 cumec) 397.900 3.264 84.636
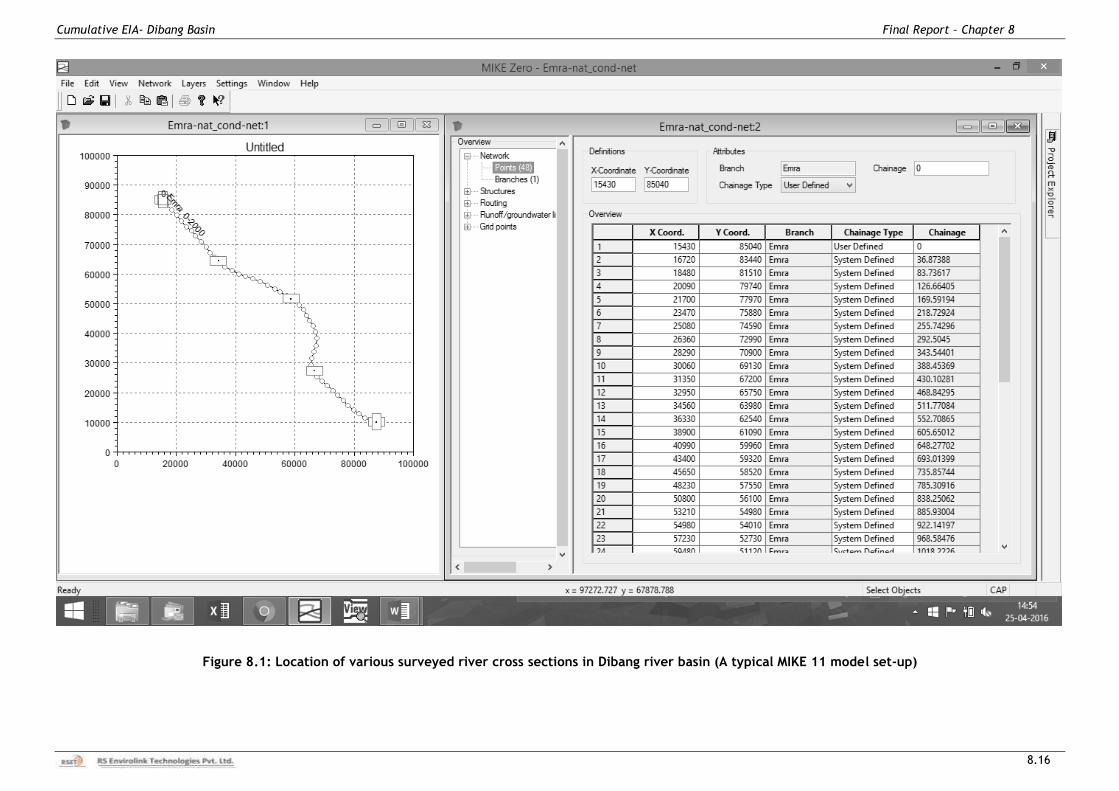
Cumulative EIA- Dibang Basin Final Report – Chapter 8
8.16
Figure 8.1: Location of various surveyed river cross sections in Dibang river basin (A typical MIKE 11 model set-up)
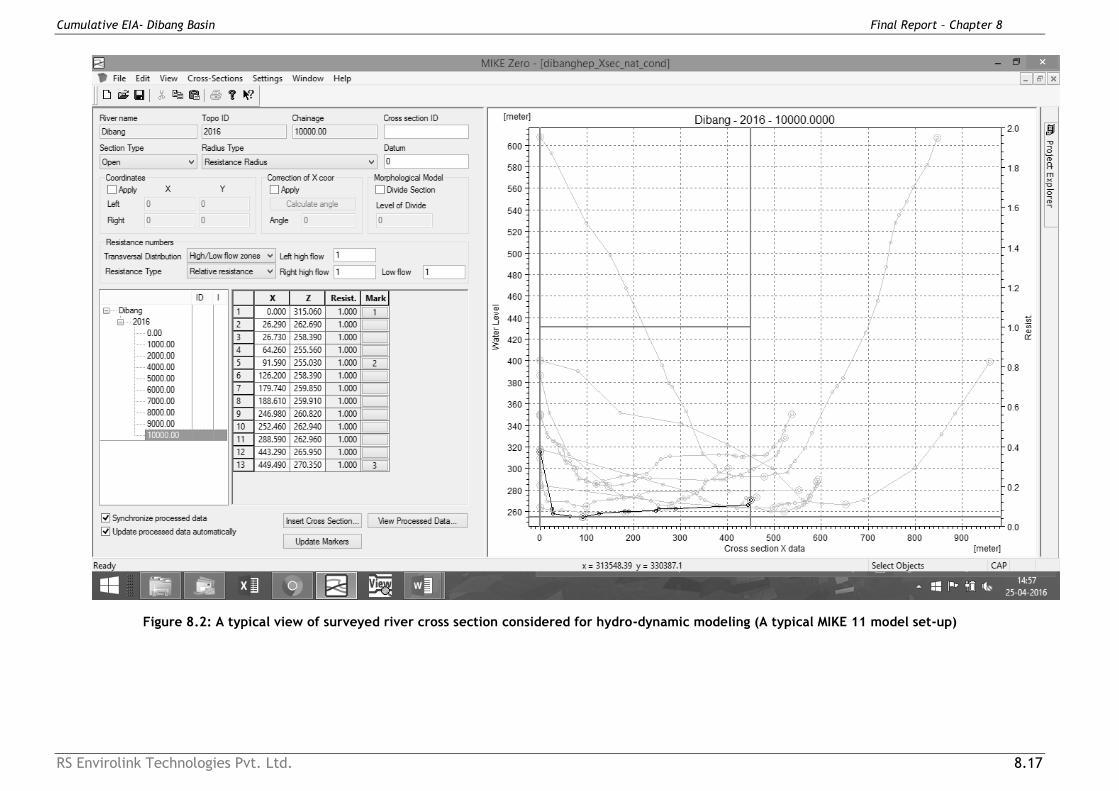
Cumulative EIA- Dibang Basin Final Report – Chapter 8
RS Envirolink Technologies Pvt. Ltd. 8.17
Figure 8.2: A typical view of surveyed river cross section considered for hydro-dynamic modeling (A typical MIKE 11 model set-up)
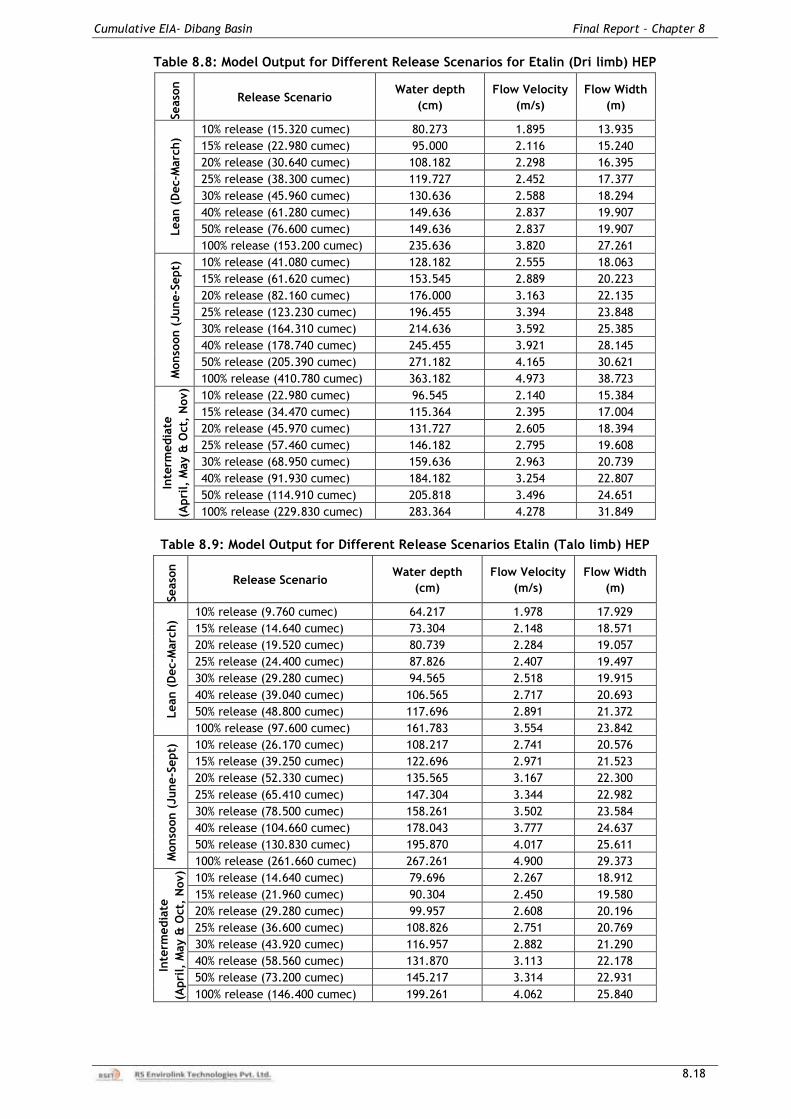
Cumulative EIA- Dibang Basin Final Report – Chapter 8
8.18
Table 8.8: Model Output for Different Release Scenarios for Etalin (Dri limb) HEP
Seaso
n
Release Scenario Water depth
(cm)
Flow Velocity
(m/s)
Flow Width
(m)
Lean (
Dec-M
arc
h)
10% release (15.320 cumec) 80.273 1.895 13.935
15% release (22.980 cumec) 95.000 2.116 15.240
20% release (30.640 cumec) 108.182 2.298 16.395
25% release (38.300 cumec) 119.727 2.452 17.377
30% release (45.960 cumec) 130.636 2.588 18.294
40% release (61.280 cumec) 149.636 2.837 19.907
50% release (76.600 cumec) 149.636 2.837 19.907
100% release (153.200 cumec) 235.636 3.820 27.261
Monso
on (
June-S
ept)
10% release (41.080 cumec) 128.182 2.555 18.063
15% release (61.620 cumec) 153.545 2.889 20.223
20% release (82.160 cumec) 176.000 3.163 22.135
25% release (123.230 cumec) 196.455 3.394 23.848
30% release (164.310 cumec) 214.636 3.592 25.385
40% release (178.740 cumec) 245.455 3.921 28.145
50% release (205.390 cumec) 271.182 4.165 30.621
100% release (410.780 cumec) 363.182 4.973 38.723
Inte
rmedia
te
(Apri
l, M
ay &
Oct,
Nov)
10% release (22.980 cumec) 96.545 2.140 15.384
15% release (34.470 cumec) 115.364 2.395 17.004
20% release (45.970 cumec) 131.727 2.605 18.394
25% release (57.460 cumec) 146.182 2.795 19.608
30% release (68.950 cumec) 159.636 2.963 20.739
40% release (91.930 cumec) 184.182 3.254 22.807
50% release (114.910 cumec) 205.818 3.496 24.651
100% release (229.830 cumec) 283.364 4.278 31.849
Table 8.9: Model Output for Different Release Scenarios Etalin (Talo limb) HEP
Seaso
n
Release Scenario Water depth
(cm)
Flow Velocity
(m/s)
Flow Width
(m)
Lean (
Dec-M
arc
h)
10% release (9.760 cumec) 64.217 1.978 17.929
15% release (14.640 cumec) 73.304 2.148 18.571
20% release (19.520 cumec) 80.739 2.284 19.057
25% release (24.400 cumec) 87.826 2.407 19.497
30% release (29.280 cumec) 94.565 2.518 19.915
40% release (39.040 cumec) 106.565 2.717 20.693
50% release (48.800 cumec) 117.696 2.891 21.372
100% release (97.600 cumec) 161.783 3.554 23.842
Monso
on (
June-S
ept)
10% release (26.170 cumec) 108.217 2.741 20.576
15% release (39.250 cumec) 122.696 2.971 21.523
20% release (52.330 cumec) 135.565 3.167 22.300
25% release (65.410 cumec) 147.304 3.344 22.982
30% release (78.500 cumec) 158.261 3.502 23.584
40% release (104.660 cumec) 178.043 3.777 24.637
50% release (130.830 cumec) 195.870 4.017 25.611
100% release (261.660 cumec) 267.261 4.900 29.373
Inte
rmedia
te
(Apri
l, M
ay &
Oct,
Nov)
10% release (14.640 cumec) 79.696 2.267 18.912
15% release (21.960 cumec) 90.304 2.450 19.580
20% release (29.280 cumec) 99.957 2.608 20.196
25% release (36.600 cumec) 108.826 2.751 20.769
30% release (43.920 cumec) 116.957 2.882 21.290
40% release (58.560 cumec) 131.870 3.113 22.178
50% release (73.200 cumec) 145.217 3.314 22.931
100% release (146.400 cumec) 199.261 4.062 25.840
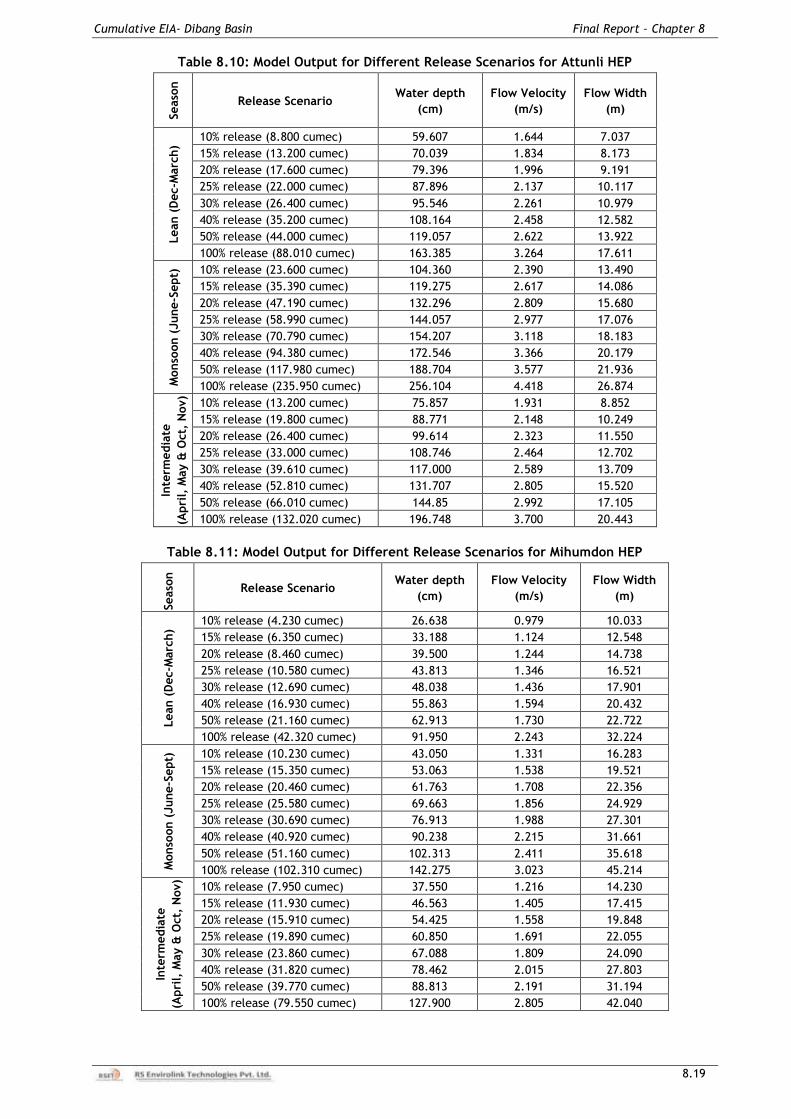
Cumulative EIA- Dibang Basin Final Report – Chapter 8
8.19
Table 8.10: Model Output for Different Release Scenarios for Attunli HEP
Seaso
n
Release Scenario Water depth
(cm)
Flow Velocity
(m/s)
Flow Width
(m)
Lean (
Dec-M
arc
h)
10% release (8.800 cumec) 59.607 1.644 7.037
15% release (13.200 cumec) 70.039 1.834 8.173
20% release (17.600 cumec) 79.396 1.996 9.191
25% release (22.000 cumec) 87.896 2.137 10.117
30% release (26.400 cumec) 95.546 2.261 10.979
40% release (35.200 cumec) 108.164 2.458 12.582
50% release (44.000 cumec) 119.057 2.622 13.922
100% release (88.010 cumec) 163.385 3.264 17.611
Monso
on (
June-S
ept)
10% release (23.600 cumec) 104.360 2.390 13.490
15% release (35.390 cumec) 119.275 2.617 14.086
20% release (47.190 cumec) 132.296 2.809 15.680
25% release (58.990 cumec) 144.057 2.977 17.076
30% release (70.790 cumec) 154.207 3.118 18.183
40% release (94.380 cumec) 172.546 3.366 20.179
50% release (117.980 cumec) 188.704 3.577 21.936
100% release (235.950 cumec) 256.104 4.418 26.874
Inte
rmedia
te
(Apri
l, M
ay &
Oct,
Nov)
10% release (13.200 cumec) 75.857 1.931 8.852
15% release (19.800 cumec) 88.771 2.148 10.249
20% release (26.400 cumec) 99.614 2.323 11.550
25% release (33.000 cumec) 108.746 2.464 12.702
30% release (39.610 cumec) 117.000 2.589 13.709
40% release (52.810 cumec) 131.707 2.805 15.520
50% release (66.010 cumec) 144.85 2.992 17.105
100% release (132.020 cumec) 196.748 3.700 20.443
Table 8.11: Model Output for Different Release Scenarios for Mihumdon HEP
Seaso
n
Release Scenario Water depth
(cm)
Flow Velocity
(m/s)
Flow Width
(m)
Lean (
Dec-M
arc
h)
10% release (4.230 cumec) 26.638 0.979 10.033
15% release (6.350 cumec) 33.188 1.124 12.548
20% release (8.460 cumec) 39.500 1.244 14.738
25% release (10.580 cumec) 43.813 1.346 16.521
30% release (12.690 cumec) 48.038 1.436 17.901
40% release (16.930 cumec) 55.863 1.594 20.432
50% release (21.160 cumec) 62.913 1.730 22.722
100% release (42.320 cumec) 91.950 2.243 32.224
Monso
on (
June-S
ept)
10% release (10.230 cumec) 43.050 1.331 16.283
15% release (15.350 cumec) 53.063 1.538 19.521
20% release (20.460 cumec) 61.763 1.708 22.356
25% release (25.580 cumec) 69.663 1.856 24.929
30% release (30.690 cumec) 76.913 1.988 27.301
40% release (40.920 cumec) 90.238 2.215 31.661
50% release (51.160 cumec) 102.313 2.411 35.618
100% release (102.310 cumec) 142.275 3.023 45.214
Inte
rmedia
te
(Apri
l, M
ay &
Oct,
Nov)
10% release (7.950 cumec) 37.550 1.216 14.230
15% release (11.930 cumec) 46.563 1.405 17.415
20% release (15.910 cumec) 54.425 1.558 19.848
25% release (19.890 cumec) 60.850 1.691 22.055
30% release (23.860 cumec) 67.088 1.809 24.090
40% release (31.820 cumec) 78.462 2.015 27.803
50% release (39.770 cumec) 88.813 2.191 31.194
100% release (79.550 cumec) 127.900 2.805 42.040
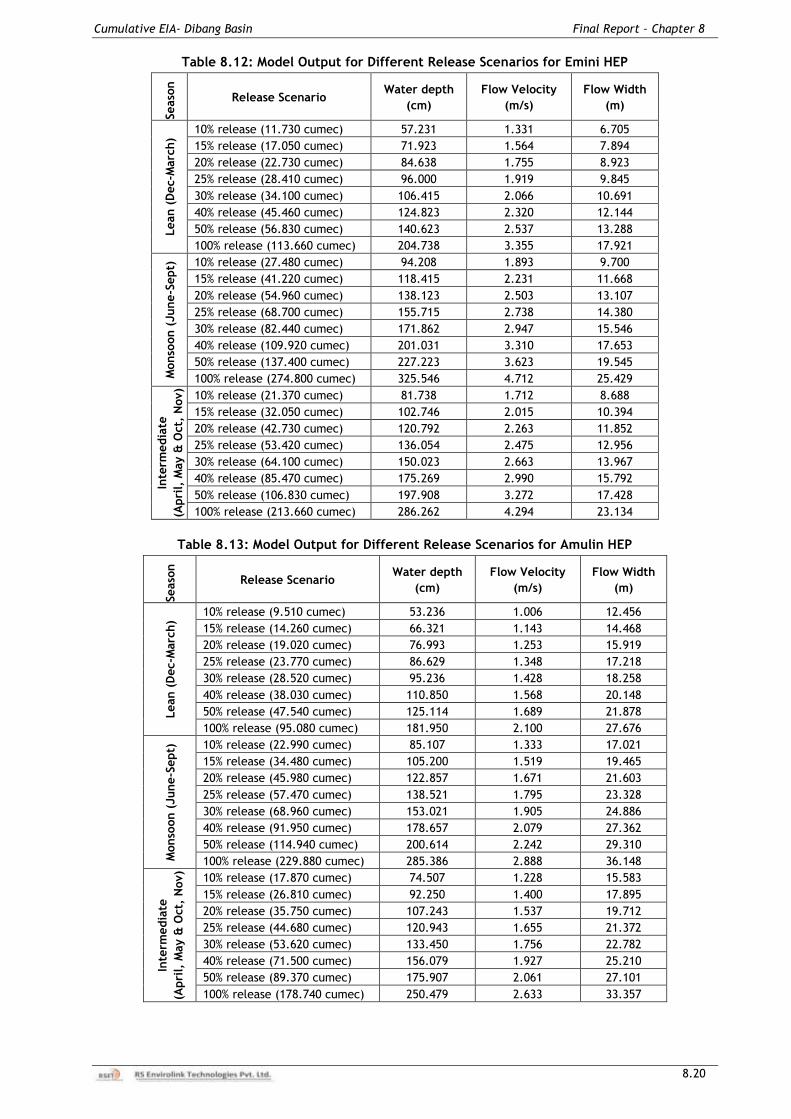
Cumulative EIA- Dibang Basin Final Report – Chapter 8
8.20
Table 8.12: Model Output for Different Release Scenarios for Emini HEP
Seaso
n
Release Scenario Water depth
(cm)
Flow Velocity
(m/s)
Flow Width
(m)
Lean (
Dec-M
arc
h)
10% release (11.730 cumec) 57.231 1.331 6.705
15% release (17.050 cumec) 71.923 1.564 7.894
20% release (22.730 cumec) 84.638 1.755 8.923
25% release (28.410 cumec) 96.000 1.919 9.845
30% release (34.100 cumec) 106.415 2.066 10.691
40% release (45.460 cumec) 124.823 2.320 12.144
50% release (56.830 cumec) 140.623 2.537 13.288
100% release (113.660 cumec) 204.738 3.355 17.921
Monso
on (
June-S
ept)
10% release (27.480 cumec) 94.208 1.893 9.700
15% release (41.220 cumec) 118.415 2.231 11.668
20% release (54.960 cumec) 138.123 2.503 13.107
25% release (68.700 cumec) 155.715 2.738 14.380
30% release (82.440 cumec) 171.862 2.947 15.546
40% release (109.920 cumec) 201.031 3.310 17.653
50% release (137.400 cumec) 227.223 3.623 19.545
100% release (274.800 cumec) 325.546 4.712 25.429
Inte
rmedia
te
(Apri
l, M
ay &
Oct,
Nov)
10% release (21.370 cumec) 81.738 1.712 8.688
15% release (32.050 cumec) 102.746 2.015 10.394
20% release (42.730 cumec) 120.792 2.263 11.852
25% release (53.420 cumec) 136.054 2.475 12.956
30% release (64.100 cumec) 150.023 2.663 13.967
40% release (85.470 cumec) 175.269 2.990 15.792
50% release (106.830 cumec) 197.908 3.272 17.428
100% release (213.660 cumec) 286.262 4.294 23.134
Table 8.13: Model Output for Different Release Scenarios for Amulin HEP
Seaso
n
Release Scenario Water depth
(cm)
Flow Velocity
(m/s)
Flow Width
(m)
Lean (
Dec-M
arc
h)
10% release (9.510 cumec) 53.236 1.006 12.456
15% release (14.260 cumec) 66.321 1.143 14.468
20% release (19.020 cumec) 76.993 1.253 15.919
25% release (23.770 cumec) 86.629 1.348 17.218
30% release (28.520 cumec) 95.236 1.428 18.258
40% release (38.030 cumec) 110.850 1.568 20.148
50% release (47.540 cumec) 125.114 1.689 21.878
100% release (95.080 cumec) 181.950 2.100 27.676
Monso
on (
June-S
ept)
10% release (22.990 cumec) 85.107 1.333 17.021
15% release (34.480 cumec) 105.200 1.519 19.465
20% release (45.980 cumec) 122.857 1.671 21.603
25% release (57.470 cumec) 138.521 1.795 23.328
30% release (68.960 cumec) 153.021 1.905 24.886
40% release (91.950 cumec) 178.657 2.079 27.362
50% release (114.940 cumec) 200.614 2.242 29.310
100% release (229.880 cumec) 285.386 2.888 36.148
Inte
rmedia
te
(Apri
l, M
ay &
Oct,
Nov)
10% release (17.870 cumec) 74.507 1.228 15.583
15% release (26.810 cumec) 92.250 1.400 17.895
20% release (35.750 cumec) 107.243 1.537 19.712
25% release (44.680 cumec) 120.943 1.655 21.372
30% release (53.620 cumec) 133.450 1.756 22.782
40% release (71.500 cumec) 156.079 1.927 25.210
50% release (89.370 cumec) 175.907 2.061 27.101
100% release (178.740 cumec) 250.479 2.633 33.357
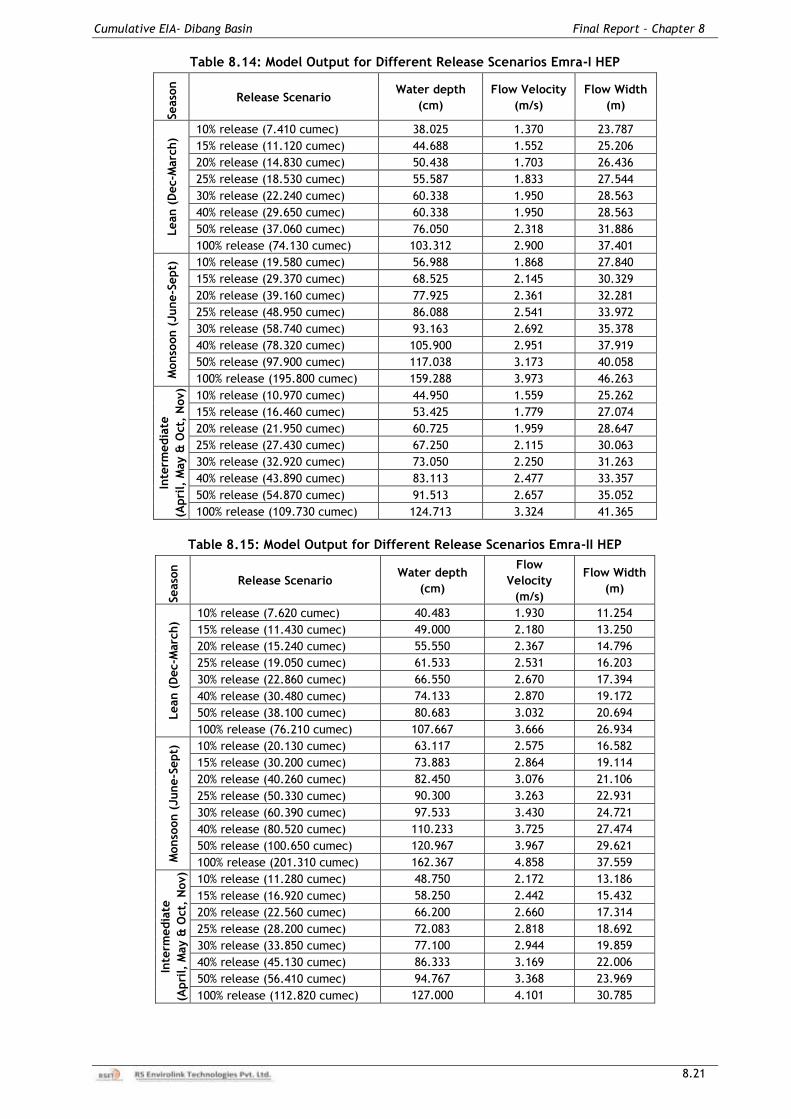
Cumulative EIA- Dibang Basin Final Report – Chapter 8
8.21
Table 8.14: Model Output for Different Release Scenarios Emra-I HEP
Seaso
n
Release Scenario Water depth
(cm)
Flow Velocity
(m/s)
Flow Width
(m)
Lean (
Dec-M
arc
h)
10% release (7.410 cumec) 38.025 1.370 23.787
15% release (11.120 cumec) 44.688 1.552 25.206
20% release (14.830 cumec) 50.438 1.703 26.436
25% release (18.530 cumec) 55.587 1.833 27.544
30% release (22.240 cumec) 60.338 1.950 28.563
40% release (29.650 cumec) 60.338 1.950 28.563
50% release (37.060 cumec) 76.050 2.318 31.886
100% release (74.130 cumec) 103.312 2.900 37.401
Monso
on (
June-S
ept)
10% release (19.580 cumec) 56.988 1.868 27.840
15% release (29.370 cumec) 68.525 2.145 30.329
20% release (39.160 cumec) 77.925 2.361 32.281
25% release (48.950 cumec) 86.088 2.541 33.972
30% release (58.740 cumec) 93.163 2.692 35.378
40% release (78.320 cumec) 105.900 2.951 37.919
50% release (97.900 cumec) 117.038 3.173 40.058
100% release (195.800 cumec) 159.288 3.973 46.263
Inte
rmedia
te
(Apri
l, M
ay &
Oct,
Nov)
10% release (10.970 cumec) 44.950 1.559 25.262
15% release (16.460 cumec) 53.425 1.779 27.074
20% release (21.950 cumec) 60.725 1.959 28.647
25% release (27.430 cumec) 67.250 2.115 30.063
30% release (32.920 cumec) 73.050 2.250 31.263
40% release (43.890 cumec) 83.113 2.477 33.357
50% release (54.870 cumec) 91.513 2.657 35.052
100% release (109.730 cumec) 124.713 3.324 41.365
Table 8.15: Model Output for Different Release Scenarios Emra-II HEP
Seaso
n
Release Scenario Water depth
(cm)
Flow
Velocity
(m/s)
Flow Width
(m)
Lean (
Dec-M
arc
h)
10% release (7.620 cumec) 40.483 1.930 11.254
15% release (11.430 cumec) 49.000 2.180 13.250
20% release (15.240 cumec) 55.550 2.367 14.796
25% release (19.050 cumec) 61.533 2.531 16.203
30% release (22.860 cumec) 66.550 2.670 17.394
40% release (30.480 cumec) 74.133 2.870 19.172
50% release (38.100 cumec) 80.683 3.032 20.694
100% release (76.210 cumec) 107.667 3.666 26.934
Monso
on (
June-S
ept)
10% release (20.130 cumec) 63.117 2.575 16.582
15% release (30.200 cumec) 73.883 2.864 19.114
20% release (40.260 cumec) 82.450 3.076 21.106
25% release (50.330 cumec) 90.300 3.263 22.931
30% release (60.390 cumec) 97.533 3.430 24.721
40% release (80.520 cumec) 110.233 3.725 27.474
50% release (100.650 cumec) 120.967 3.967 29.621
100% release (201.310 cumec) 162.367 4.858 37.559
Inte
rmedia
te
(Apri
l, M
ay &
Oct,
Nov)
10% release (11.280 cumec) 48.750 2.172 13.186
15% release (16.920 cumec) 58.250 2.442 15.432
20% release (22.560 cumec) 66.200 2.660 17.314
25% release (28.200 cumec) 72.083 2.818 18.692
30% release (33.850 cumec) 77.100 2.944 19.859
40% release (45.130 cumec) 86.333 3.169 22.006
50% release (56.410 cumec) 94.767 3.368 23.969
100% release (112.820 cumec) 127.000 4.101 30.785
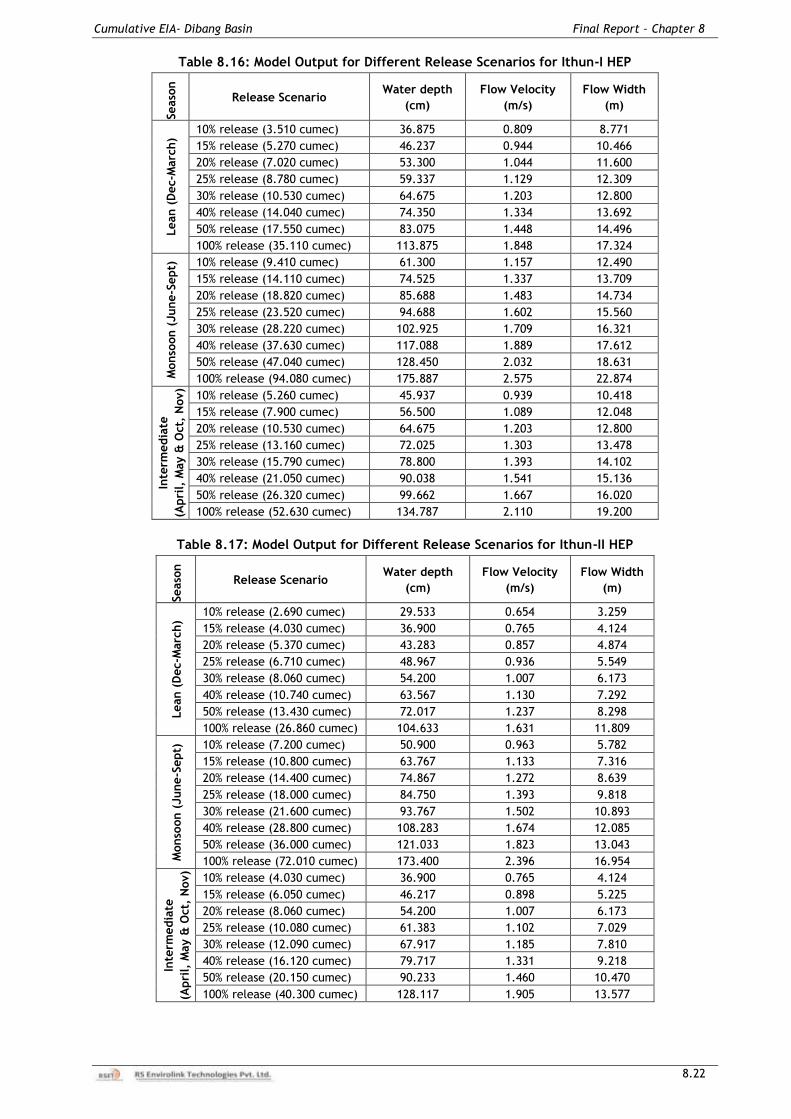
Cumulative EIA- Dibang Basin Final Report – Chapter 8
8.22
Table 8.16: Model Output for Different Release Scenarios for Ithun-I HEP
Seaso
n
Release Scenario Water depth
(cm)
Flow Velocity
(m/s)
Flow Width
(m)
Lean (
Dec-M
arc
h)
10% release (3.510 cumec) 36.875 0.809 8.771
15% release (5.270 cumec) 46.237 0.944 10.466
20% release (7.020 cumec) 53.300 1.044 11.600
25% release (8.780 cumec) 59.337 1.129 12.309
30% release (10.530 cumec) 64.675 1.203 12.800
40% release (14.040 cumec) 74.350 1.334 13.692
50% release (17.550 cumec) 83.075 1.448 14.496
100% release (35.110 cumec) 113.875 1.848 17.324
Monso
on (
June-S
ept)
10% release (9.410 cumec) 61.300 1.157 12.490
15% release (14.110 cumec) 74.525 1.337 13.709
20% release (18.820 cumec) 85.688 1.483 14.734
25% release (23.520 cumec) 94.688 1.602 15.560
30% release (28.220 cumec) 102.925 1.709 16.321
40% release (37.630 cumec) 117.088 1.889 17.612
50% release (47.040 cumec) 128.450 2.032 18.631
100% release (94.080 cumec) 175.887 2.575 22.874
Inte
rmedia
te
(Apri
l, M
ay &
Oct,
Nov)
10% release (5.260 cumec) 45.937 0.939 10.418
15% release (7.900 cumec) 56.500 1.089 12.048
20% release (10.530 cumec) 64.675 1.203 12.800
25% release (13.160 cumec) 72.025 1.303 13.478
30% release (15.790 cumec) 78.800 1.393 14.102
40% release (21.050 cumec) 90.038 1.541 15.136
50% release (26.320 cumec) 99.662 1.667 16.020
100% release (52.630 cumec) 134.787 2.110 19.200
Table 8.17: Model Output for Different Release Scenarios for Ithun-II HEP
Seaso
n
Release Scenario Water depth
(cm)
Flow Velocity
(m/s)
Flow Width
(m)
Lean (
Dec-M
arc
h)
10% release (2.690 cumec) 29.533 0.654 3.259
15% release (4.030 cumec) 36.900 0.765 4.124
20% release (5.370 cumec) 43.283 0.857 4.874
25% release (6.710 cumec) 48.967 0.936 5.549
30% release (8.060 cumec) 54.200 1.007 6.173
40% release (10.740 cumec) 63.567 1.130 7.292
50% release (13.430 cumec) 72.017 1.237 8.298
100% release (26.860 cumec) 104.633 1.631 11.809
Monso
on (
June-S
ept)
10% release (7.200 cumec) 50.900 0.963 5.782
15% release (10.800 cumec) 63.767 1.133 7.316
20% release (14.400 cumec) 74.867 1.272 8.639
25% release (18.000 cumec) 84.750 1.393 9.818
30% release (21.600 cumec) 93.767 1.502 10.893
40% release (28.800 cumec) 108.283 1.674 12.085
50% release (36.000 cumec) 121.033 1.823 13.043
100% release (72.010 cumec) 173.400 2.396 16.954
Inte
rmedia
te
(Apri
l, M
ay &
Oct,
Nov)
10% release (4.030 cumec) 36.900 0.765 4.124
15% release (6.050 cumec) 46.217 0.898 5.225
20% release (8.060 cumec) 54.200 1.007 6.173
25% release (10.080 cumec) 61.383 1.102 7.029
30% release (12.090 cumec) 67.917 1.185 7.810
40% release (16.120 cumec) 79.717 1.331 9.218
50% release (20.150 cumec) 90.233 1.460 10.470
100% release (40.300 cumec) 128.117 1.905 13.577
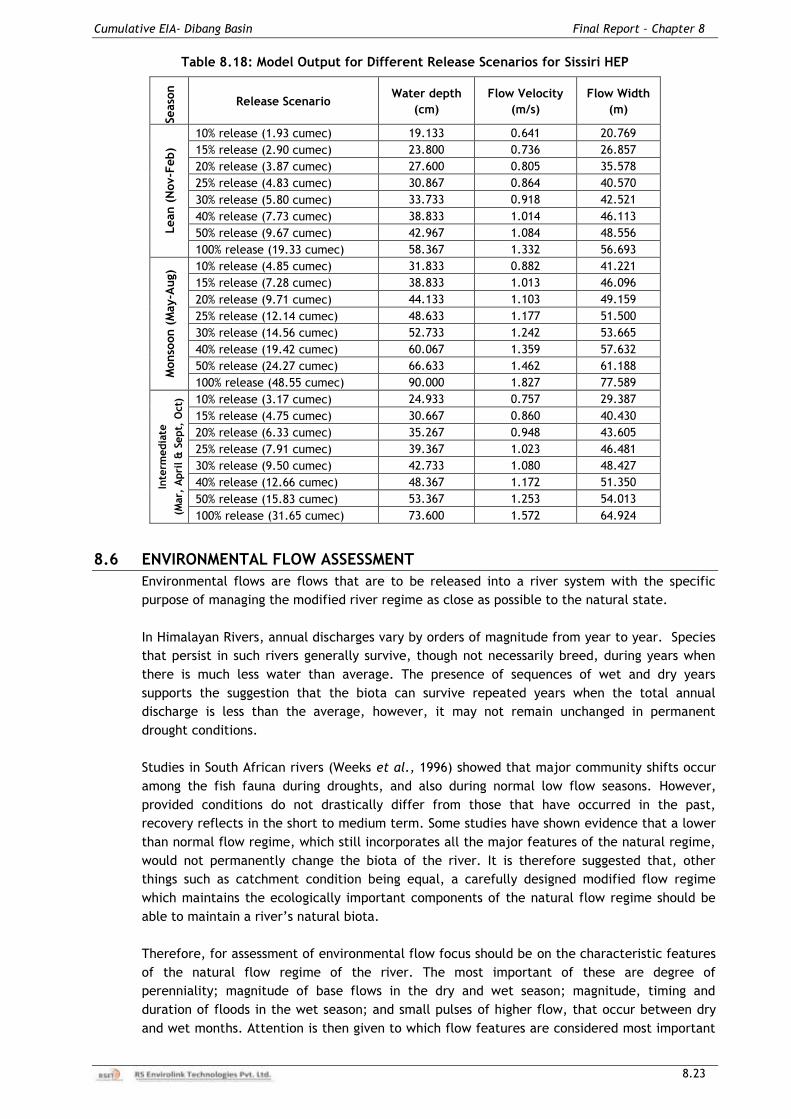
Cumulative EIA- Dibang Basin Final Report – Chapter 8
8.23
Table 8.18: Model Output for Different Release Scenarios for Sissiri HEP
Seaso
n
Release Scenario Water depth
(cm)
Flow Velocity
(m/s)
Flow Width
(m)
Lean (
Nov-F
eb)
10% release (1.93 cumec) 19.133 0.641 20.769
15% release (2.90 cumec) 23.800 0.736 26.857
20% release (3.87 cumec) 27.600 0.805 35.578
25% release (4.83 cumec) 30.867 0.864 40.570
30% release (5.80 cumec) 33.733 0.918 42.521
40% release (7.73 cumec) 38.833 1.014 46.113
50% release (9.67 cumec) 42.967 1.084 48.556
100% release (19.33 cumec) 58.367 1.332 56.693
Monso
on (
May-A
ug) 10% release (4.85 cumec) 31.833 0.882 41.221
15% release (7.28 cumec) 38.833 1.013 46.096
20% release (9.71 cumec) 44.133 1.103 49.159
25% release (12.14 cumec) 48.633 1.177 51.500
30% release (14.56 cumec) 52.733 1.242 53.665
40% release (19.42 cumec) 60.067 1.359 57.632
50% release (24.27 cumec) 66.633 1.462 61.188
100% release (48.55 cumec) 90.000 1.827 77.589
Inte
rmedia
te
(Mar,
Apri
l &
Sept,
Oct)
10% release (3.17 cumec) 24.933 0.757 29.387
15% release (4.75 cumec) 30.667 0.860 40.430
20% release (6.33 cumec) 35.267 0.948 43.605
25% release (7.91 cumec) 39.367 1.023 46.481
30% release (9.50 cumec) 42.733 1.080 48.427
40% release (12.66 cumec) 48.367 1.172 51.350
50% release (15.83 cumec) 53.367 1.253 54.013
100% release (31.65 cumec) 73.600 1.572 64.924
8.6 ENVIRONMENTAL FLOW ASSESSMENT
Environmental flows are flows that are to be released into a river system with the specific
purpose of managing the modified river regime as close as possible to the natural state.
In Himalayan Rivers, annual discharges vary by orders of magnitude from year to year. Species
that persist in such rivers generally survive, though not necessarily breed, during years when
there is much less water than average. The presence of sequences of wet and dry years
supports the suggestion that the biota can survive repeated years when the total annual
discharge is less than the average, however, it may not remain unchanged in permanent
drought conditions.
Studies in South African rivers (Weeks et al., 1996) showed that major community shifts occur
among the fish fauna during droughts, and also during normal low flow seasons. However,
provided conditions do not drastically differ from those that have occurred in the past,
recovery reflects in the short to medium term. Some studies have shown evidence that a lower
than normal flow regime, which still incorporates all the major features of the natural regime,
would not permanently change the biota of the river. It is therefore suggested that, other
things such as catchment condition being equal, a carefully designed modified flow regime
which maintains the ecologically important components of the natural flow regime should be
able to maintain a river‟s natural biota.
Therefore, for assessment of environmental flow focus should be on the characteristic features
of the natural flow regime of the river. The most important of these are degree of
perenniality; magnitude of base flows in the dry and wet season; magnitude, timing and
duration of floods in the wet season; and small pulses of higher flow, that occur between dry
and wet months. Attention is then given to which flow features are considered most important
Cumulative EIA- Dibang Basin Final Report – Chapter 8
8.24
for maintaining or achieving the desired future condition of the river, and thus should not be
eradicated during development of the river‟s water resources.
Fish assemblages often include a range of species and reflect the integrated effects of
environmental changes. Their presence is used to infer the presence of other aquatic
organisms, since the adult fish occupy the top of the food chain in most aquatic systems. They
also pass through most trophic levels above the primary producer stage during their
development from larvae to adults. Fish can thus be regarded as reflecting the integrated
environmental health of a river (Karr et al., 1986). Fish species in river can guide to prepare
specification of the flows necessary to meet their needs, and be useful in the monitoring and
management of those flows. It is often surmised that if management of flows for fish
maintenance is successful, then flow requirements for aquatic invertebrates will also be
satisfied. This is because of the larger scale of fish habitat.
Therefore, the approach adopted for environmental flow assessment is based on the meeting
the needs of dominant fish species with larger habitat requirement. Baseline data on fish fauna
in Dibang basin is discussed in Chapter – 7, Section 7.2.6, where entire Dibang basin can be
divided in two predominant fish zones viz. Mahseer Zone and Trout Zone. Mahseer being a large
fish requires more flow in all the seasons and this aspect has been kept in mind while
recommending environmental flow for projects in Mahseer zone.
Mahseer zone covers the main Dibang river below confluence of Dri and Talo (Tangon) rivers
Projects fall in Mahseer zone are Dibang, Ashupani, Ithun – I, Ithun – II, Ithipani, Elango, Emra –
I & Emra – II HEPs. Rest of the basin where remaining HEPs are located falls in trout zone.
Therefore, environmental flow assessment should be based on meeting its habitat requirement
in lean, monsoon and pre/post monsoon period.
A minimum depth requirement of 40 cm and 50 cm is considered for trout and mahseer zones
respectively to assess the environmental flow requirement in lean season. Higher depth is
considered for intermediate period and monsoon period to ensure mimicking of natural
discharge pattern. For intermediate period in Mahseer zone, a depth range of 60-75 cm is
considered and for monsoon season a depth range of 85-100 cm is considered. Similarly, for
intermediate period in trout zone, a depth range of 55-65 cm is considered and for monsoon
season in trout zone, a depth range of 70-80 cm is considered as minimum requirement.
As the depth is calculated at the deepest point and cannot be the only criteria for the habitat
requirement; a second level assessment is done to check the reduction in river top width. If
the reduction in top width is more than 50%, then next higher percentage is recommended to
ensure that reduction in top width is not reduced more than half the original width under
natural discharge condition in different seasons/period.
Keeping in view the EAC/MoEF&CC‟s requirement of minimum release in lean season as 20% of
average discharge in four leanest months in 90% dependable year of discharge series, the same
has been considered as the minimum for lean season. Even if the modeling results show that
the lesser value can meet the habitat requirement in any period/season, 20% of the average
discharge in four leanest months has been kept as the minimum value.
For projects such as Dibang Valley and Sissiri HEPs which have dam toe powerhouses and
intermediate river stretch is very small, continuous running of at least one turbine has been
found a better way to ensure that river does not run dry and environmental flow requirements
are adequately met with.
Based on the above criteria, environmental flow requirements have been established for each
project separately and final recommendations are discussed below.
Cumulative EIA- Dibang Basin Final Report – Chapter 8
8.25
8.6.1 Project Specific Recommendation for Environmental flow
Dibang Multipurpose Project
As can be seen from modeling output for Dibang Multipurpose Project (Table 8.7), 10% of
release in lean, monsoon and intermediate period is giving a depth of 108.52 cm, 179.15 cm
and 133.82 cm respectively and these are adequately meeting the habitat requirement.
Reduction in river top width is also checked and is less than 50% in all the seasons for 10%
release scenario. Further, keeping in view, MoEF&CC/EAC requirement, 20% of average
discharge in four leanest months in 90% dependable year is considered as the minimum release.
This works out to be a release of 108.75 cumec in lean, 145.78 cumec in monsoon and 108.75
cumec in intermediate period.
Dibang Multipurpose Project has already been granted environment clearance (EC) as well as
forest clearance (FC). MoEF&CC has recommended that minimum environmental flow of 20
cumec shall be maintained throughout the year through an un-gated opening. Moreover, at
least one turbine out of 12 turbines shall be operated 24 hours in full/part load throughout the
year, which shall provide the sufficient discharge downstream of TRT outlet with adequate
depth and velocity of water for sustenance of aquatic life in the downstream.
Design discharge to run one turbine at full load is 119.5 cumec, this along with 20 cumec of un-
gated release works out to be 139.5 cumec; which is more than what is worked out based on
habitat simulation modeling for lean and intermediate period. During monsoon, more than one
turbine will be running all the time and hence adequate discharge will be available in the river.
Therefore, EC condition should prevail and same is kept as environmental flow
recommendation for Dibang Multipurpose Project.
Etalin HEP
It can be seen from modeling output for Etalin HEP –Dri Limb (Table 8.8), 10% of release in
lean, monsoon and intermediate period is resulting in a depth of 80.27 cm, 128.20 cm and 96.5
cm, respectively and these are adequately meeting the aquatic habitat requirement. River
width reduction is more than 50% in monsoon, therefore slightly higher value (12.5%) needs to
be recommended for monsoon. Further, keeping in view, MoEF&CC/EAC requirement, 20% of
average discharge in four leanest months in 90% dependable year is considered as the minimum
release. This works out to be a release of 30.64 cumec in lean, 50 cumec in monsoon and 30.64
cumec in intermediate period.
Similarly modeling output for Etalin HEP –Talo (Tangon) Limb (Table 8.9) show, 10% of release
in lean, monsoon and intermediate period is giving a depth of 64.21 cm, 108.21 cm and 79.69
cm, respectively and these are adequately meeting the habitat requirement in terms of depth
as well as width. Further, keeping in view, MoEF&CC/EAC requirement, 20% of average
discharge in four leanest months in 90% dependable year is considered as the minimum release.
This works out to be a release of 19.52 cumec in lean, 26.17 cumec in monsoon and 19.52
cumec in intermediate period.
Etalin HEP has already been considered for appraisal, however, EAC‟s final recommendation on
environment clearance is pending till completion of Dibang Basin study. Environmental flow
study for Etalin HEP has been carried out by CIFRI, Barrackpore and season-wise
recommendations have been made for Dri and Talo limbs separately. The matter was discussed
in 82nd EAC meeting held during February 2015, where it is recommended “Project proponent
must follow the recommendations of CIFRI on minimum environmental flow & also obtain
approval of CEA for any increase in IC from the two dam toe powerhouses”. Minutes of 82nd
EAC meeting also mentioned in detail CIFRI‟s recommendations to be adopted by Etalin HEP for
environmental flow:
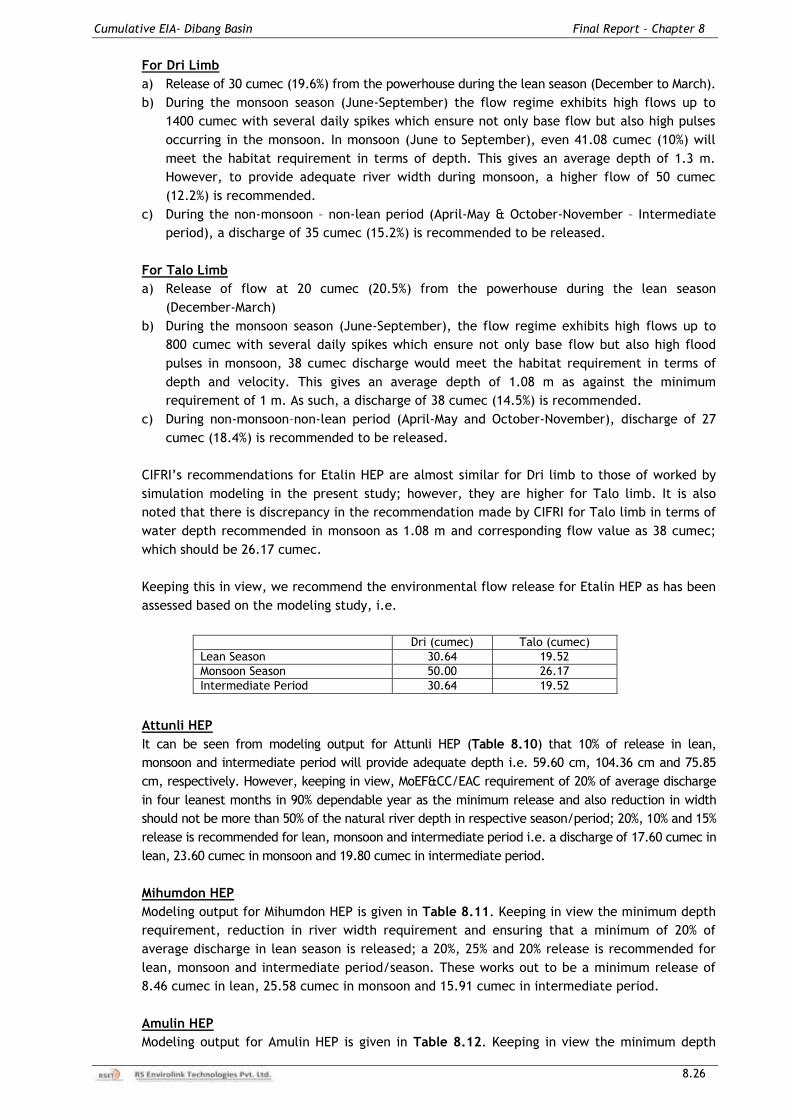
Cumulative EIA- Dibang Basin Final Report – Chapter 8
8.26
For Dri Limb
a) Release of 30 cumec (19.6%) from the powerhouse during the lean season (December to March).
b) During the monsoon season (June-September) the flow regime exhibits high flows up to
1400 cumec with several daily spikes which ensure not only base flow but also high pulses
occurring in the monsoon. In monsoon (June to September), even 41.08 cumec (10%) will
meet the habitat requirement in terms of depth. This gives an average depth of 1.3 m.
However, to provide adequate river width during monsoon, a higher flow of 50 cumec
(12.2%) is recommended.
c) During the non-monsoon – non-lean period (April-May & October-November – Intermediate
period), a discharge of 35 cumec (15.2%) is recommended to be released.
For Talo Limb
a) Release of flow at 20 cumec (20.5%) from the powerhouse during the lean season
(December-March)
b) During the monsoon season (June-September), the flow regime exhibits high flows up to
800 cumec with several daily spikes which ensure not only base flow but also high flood
pulses in monsoon, 38 cumec discharge would meet the habitat requirement in terms of
depth and velocity. This gives an average depth of 1.08 m as against the minimum
requirement of 1 m. As such, a discharge of 38 cumec (14.5%) is recommended.
c) During non-monsoon–non-lean period (April-May and October-November), discharge of 27
cumec (18.4%) is recommended to be released.
CIFRI‟s recommendations for Etalin HEP are almost similar for Dri limb to those of worked by
simulation modeling in the present study; however, they are higher for Talo limb. It is also
noted that there is discrepancy in the recommendation made by CIFRI for Talo limb in terms of
water depth recommended in monsoon as 1.08 m and corresponding flow value as 38 cumec;
which should be 26.17 cumec.
Keeping this in view, we recommend the environmental flow release for Etalin HEP as has been
assessed based on the modeling study, i.e.
Dri (cumec) Talo (cumec)
Lean Season 30.64 19.52
Monsoon Season 50.00 26.17
Intermediate Period 30.64 19.52
Attunli HEP
It can be seen from modeling output for Attunli HEP (Table 8.10) that 10% of release in lean,
monsoon and intermediate period will provide adequate depth i.e. 59.60 cm, 104.36 cm and 75.85
cm, respectively. However, keeping in view, MoEF&CC/EAC requirement of 20% of average discharge
in four leanest months in 90% dependable year as the minimum release and also reduction in width
should not be more than 50% of the natural river depth in respective season/period; 20%, 10% and 15%
release is recommended for lean, monsoon and intermediate period i.e. a discharge of 17.60 cumec in
lean, 23.60 cumec in monsoon and 19.80 cumec in intermediate period.
Mihumdon HEP
Modeling output for Mihumdon HEP is given in Table 8.11. Keeping in view the minimum depth
requirement, reduction in river width requirement and ensuring that a minimum of 20% of
average discharge in lean season is released; a 20%, 25% and 20% release is recommended for
lean, monsoon and intermediate period/season. These works out to be a minimum release of
8.46 cumec in lean, 25.58 cumec in monsoon and 15.91 cumec in intermediate period.
Amulin HEP
Modeling output for Amulin HEP is given in Table 8.12. Keeping in view the minimum depth
Cumulative EIA- Dibang Basin Final Report – Chapter 8
8.27
requirement, reduction in river width requirement and ensuring that a minimum of 20% of
average discharge in lean season is released; a 20%, 15% and 15% release is recommended for
lean, monsoon and intermediate period/season. These works out to be a minimum release of
19.02 cumec in lean, 34.48 cumec in monsoon and 26.81 cumec in intermediate period.
Emini HEP
Modeling output for Emini HEP is given in Table 8.13. Keeping in view the minimum depth
requirement, reduction in river width requirement and ensuring that a minimum of 20% of
average discharge in lean season is released; a 20%, 20% and 20% release is recommended for
lean, monsoon and intermediate period/season. These works out to be a minimum release of
22.73 cumec in lean, 54.96 cumec in monsoon and 42.73 cumec in intermediate period.
Emra I HEP
Modeling output for Emra I HEP is given in Table 8.14. Keeping in view the minimum depth
requirement for Mahseer Zone, reduction in river width requirement and ensuring that a
minimum of 20% of average discharge in lean season is released; a 20%, 25% and 20% release is
recommended for lean, monsoon and intermediate period/season. These works out to be a
minimum release of 14.83 cumec in lean, 48.95 cumec in monsoon and 21.95 cumec in
intermediate period.
Emra II HEP
Modeling output for Emra II HEP is given in Table 8.15. Keeping in view the minimum depth
requirement for Mahseer Zone, reduction in river width requirement and ensuring that a
minimum of 20% of average discharge in lean season is released; a 20%, 25% and 20% release is
recommended for lean, monsoon and intermediate period/season. These works out to be a
minimum release of 15.24 cumec in lean, 50.33 cumec in monsoon and 22.56 cumec in
intermediate period.
Ithun I HEP
Modeling output for Ithun I HEP is given in Table 8.16. Keeping in view the minimum depth
requirement for Mahseer Zone, reduction in river width requirement and ensuring that a
minimum of 20% of average discharge in lean season is released; a 20%, 20% and 20% release is
recommended for lean, monsoon and intermediate period/season. These works out to be a
minimum release of 7.02 cumec in lean, 18.82 cumec in monsoon and 10.53 cumec in
intermediate period.
Ithun II HEP
Modeling output for Ithun II HEP is given in Table 8.17. Keeping in view the minimum depth
requirement for Mahseer Zone, reduction in river width requirement and ensuring that a
minimum of 20% of average discharge in lean season is released; a 25%, 25% and 25% release is
recommended for lean, monsoon and intermediate period/season. These works out to be a
minimum release of 6.7 cumec in lean, 18.80 cumec in monsoon and 10.08 cumec in
intermediate period.
Sissiri HEP
Modeling output for Sissiri HEP is given in Table 8.18. The project is envisaged with dam toe
powerhouse and affected intermediate stretch will be about 500 m. Modeling results show that
almost 75% of the lean season discharge may need to be released to meet the habitat
requirement of 50 cm depth. Similarly in monsoon, 100% of release will give only 90 cm of the
depth. Therefore, Sissiri HEP environmental flow cannot be recommended based on the
modeling study using the present discharge series.
Therefore, CWC approved discharge series and power potential study as approved by CEA were
reviewed before making environmental flow recommendation for Sissiri HEP. Average monsoon
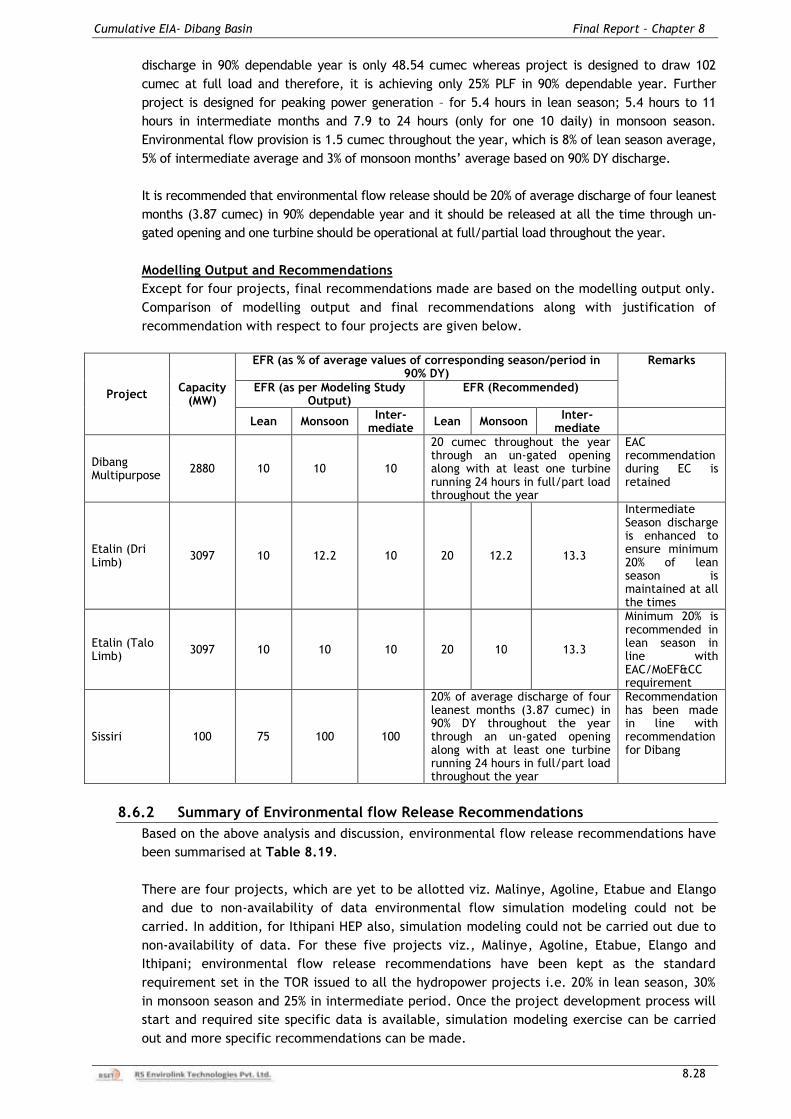
Cumulative EIA- Dibang Basin Final Report – Chapter 8
8.28
discharge in 90% dependable year is only 48.54 cumec whereas project is designed to draw 102
cumec at full load and therefore, it is achieving only 25% PLF in 90% dependable year. Further
project is designed for peaking power generation – for 5.4 hours in lean season; 5.4 hours to 11
hours in intermediate months and 7.9 to 24 hours (only for one 10 daily) in monsoon season.
Environmental flow provision is 1.5 cumec throughout the year, which is 8% of lean season average,
5% of intermediate average and 3% of monsoon months‟ average based on 90% DY discharge.
It is recommended that environmental flow release should be 20% of average discharge of four leanest
months (3.87 cumec) in 90% dependable year and it should be released at all the time through un-
gated opening and one turbine should be operational at full/partial load throughout the year.
Modelling Output and Recommendations
Except for four projects, final recommendations made are based on the modelling output only.
Comparison of modelling output and final recommendations along with justification of
recommendation with respect to four projects are given below.
Project Capacity
(MW)
EFR (as % of average values of corresponding season/period in 90% DY)
Remarks
EFR (as per Modeling Study Output)
EFR (Recommended)
Lean Monsoon Inter-
mediate Lean Monsoon
Inter-mediate
Dibang Multipurpose
2880 10 10 10
20 cumec throughout the year through an un-gated opening along with at least one turbine running 24 hours in full/part load throughout the year
EAC recommendation during EC is retained
Etalin (Dri Limb)
3097 10 12.2 10 20 12.2 13.3
Intermediate Season discharge is enhanced to ensure minimum 20% of lean season is maintained at all the times
Etalin (Talo Limb)
3097 10 10 10 20 10 13.3
Minimum 20% is recommended in lean season in line with EAC/MoEF&CC requirement
Sissiri 100 75 100 100
20% of average discharge of four leanest months (3.87 cumec) in 90% DY throughout the year through an un-gated opening along with at least one turbine running 24 hours in full/part load throughout the year
Recommendation has been made in line with recommendation for Dibang
8.6.2 Summary of Environmental flow Release Recommendations
Based on the above analysis and discussion, environmental flow release recommendations have
been summarised at Table 8.19.
There are four projects, which are yet to be allotted viz. Malinye, Agoline, Etabue and Elango
and due to non-availability of data environmental flow simulation modeling could not be
carried. In addition, for Ithipani HEP also, simulation modeling could not be carried out due to
non-availability of data. For these five projects viz., Malinye, Agoline, Etabue, Elango and
Ithipani; environmental flow release recommendations have been kept as the standard
requirement set in the TOR issued to all the hydropower projects i.e. 20% in lean season, 30%
in monsoon season and 25% in intermediate period. Once the project development process will
start and required site specific data is available, simulation modeling exercise can be carried
out and more specific recommendations can be made.
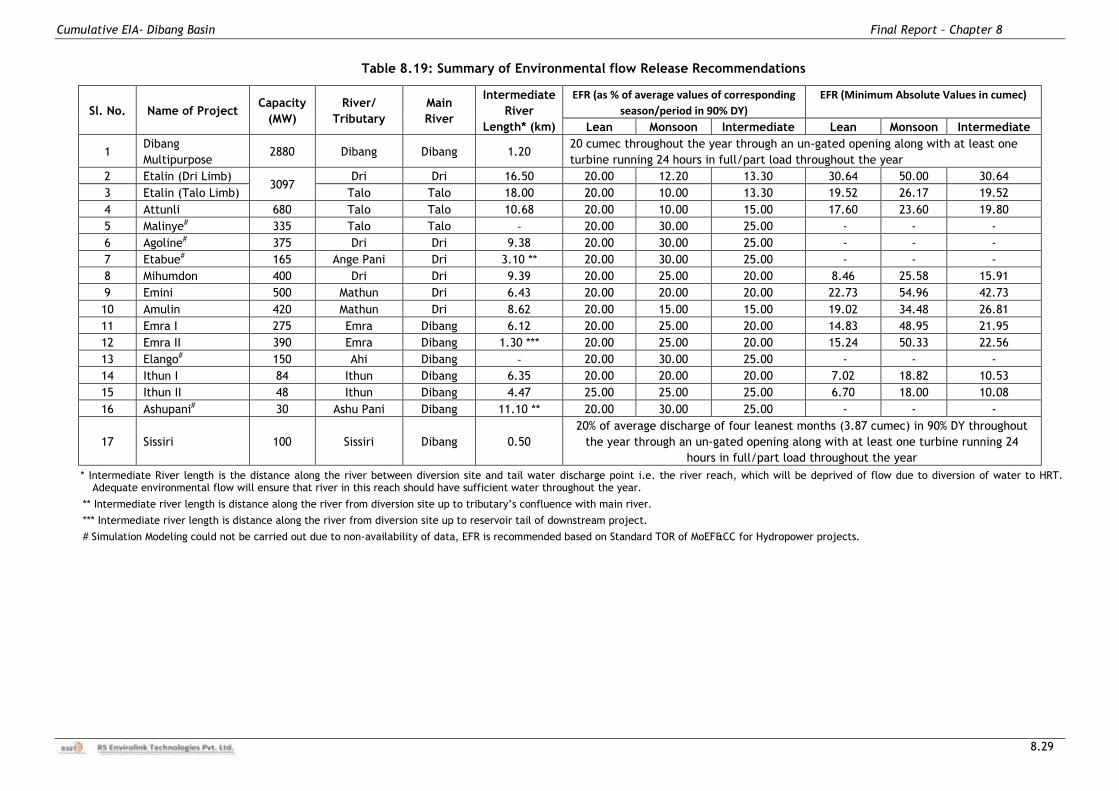
Cumulative EIA- Dibang Basin Final Report – Chapter 8
8.29
Table 8.19: Summary of Environmental flow Release Recommendations
Sl. No. Name of Project Capacity
(MW)
River/
Tributary
Main
River
Intermediate
River
Length* (km)
EFR (as % of average values of corresponding
season/period in 90% DY)
EFR (Minimum Absolute Values in cumec)
Lean Monsoon Intermediate Lean Monsoon Intermediate
1 Dibang
Multipurpose 2880 Dibang Dibang 1.20
20 cumec throughout the year through an un-gated opening along with at least one
turbine running 24 hours in full/part load throughout the year
2 Etalin (Dri Limb) 3097
Dri Dri 16.50 20.00 12.20 13.30 30.64 50.00 30.64
3 Etalin (Talo Limb) Talo Talo 18.00 20.00 10.00 13.30 19.52 26.17 19.52
4 Attunli 680 Talo Talo 10.68 20.00 10.00 15.00 17.60 23.60 19.80
5 Malinye# 335 Talo Talo - 20.00 30.00 25.00 - - -
6 Agoline# 375 Dri Dri 9.38 20.00 30.00 25.00 - - -
7 Etabue# 165 Ange Pani Dri 3.10 ** 20.00 30.00 25.00 - - -
8 Mihumdon 400 Dri Dri 9.39 20.00 25.00 20.00 8.46 25.58 15.91
9 Emini 500 Mathun Dri 6.43 20.00 20.00 20.00 22.73 54.96 42.73
10 Amulin 420 Mathun Dri 8.62 20.00 15.00 15.00 19.02 34.48 26.81
11 Emra I 275 Emra Dibang 6.12 20.00 25.00 20.00 14.83 48.95 21.95
12 Emra II 390 Emra Dibang 1.30 *** 20.00 25.00 20.00 15.24 50.33 22.56
13 Elango# 150 Ahi Dibang - 20.00 30.00 25.00 - - -
14 Ithun I 84 Ithun Dibang 6.35 20.00 20.00 20.00 7.02 18.82 10.53
15 Ithun II 48 Ithun Dibang 4.47 25.00 25.00 25.00 6.70 18.00 10.08
16 Ashupani# 30 Ashu Pani Dibang 11.10 ** 20.00 30.00 25.00 - - -
17 Sissiri 100 Sissiri Dibang 0.50
20% of average discharge of four leanest months (3.87 cumec) in 90% DY throughout
the year through an un-gated opening along with at least one turbine running 24
hours in full/part load throughout the year
* Intermediate River length is the distance along the river between diversion site and tail water discharge point i.e. the river reach, which will be deprived of flow due to diversion of water to HRT. Adequate environmental flow will ensure that river in this reach should have sufficient water throughout the year.
** Intermediate river length is distance along the river from diversion site up to tributary‟s confluence with main river.
*** Intermediate river length is distance along the river from diversion site up to reservoir tail of downstream project.
# Simulation Modeling could not be carried out due to non-availability of data, EFR is recommended based on Standard TOR of MoEF&CC for Hydropower projects.
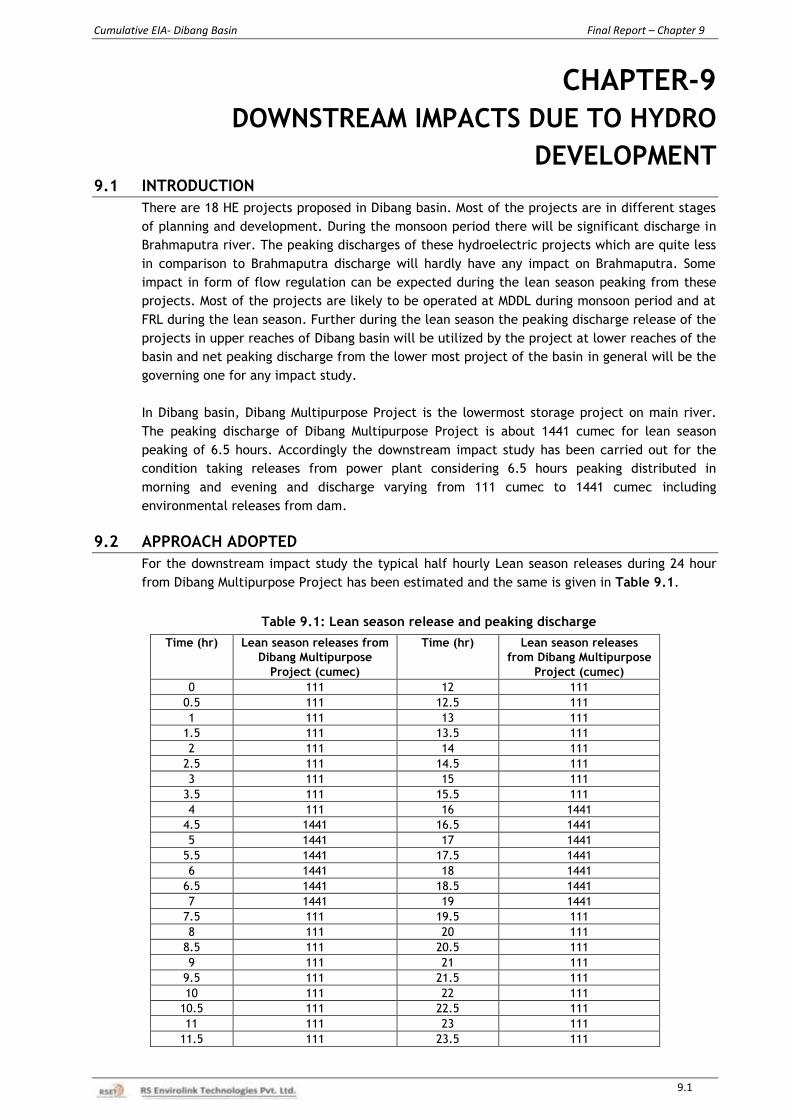
Cumulative EIA- Dibang Basin Final Report – Chapter 9
9.1
CHAPTER-9
DOWNSTREAM IMPACTS DUE TO HYDRO
DEVELOPMENT 9.1 INTRODUCTION
There are 18 HE projects proposed in Dibang basin. Most of the projects are in different stages
of planning and development. During the monsoon period there will be significant discharge in
Brahmaputra river. The peaking discharges of these hydroelectric projects which are quite less
in comparison to Brahmaputra discharge will hardly have any impact on Brahmaputra. Some
impact in form of flow regulation can be expected during the lean season peaking from these
projects. Most of the projects are likely to be operated at MDDL during monsoon period and at
FRL during the lean season. Further during the lean season the peaking discharge release of the
projects in upper reaches of Dibang basin will be utilized by the project at lower reaches of the
basin and net peaking discharge from the lower most project of the basin in general will be the
governing one for any impact study.
In Dibang basin, Dibang Multipurpose Project is the lowermost storage project on main river.
The peaking discharge of Dibang Multipurpose Project is about 1441 cumec for lean season
peaking of 6.5 hours. Accordingly the downstream impact study has been carried out for the
condition taking releases from power plant considering 6.5 hours peaking distributed in
morning and evening and discharge varying from 111 cumec to 1441 cumec including
environmental releases from dam.
9.2 APPROACH ADOPTED
For the downstream impact study the typical half hourly Lean season releases during 24 hour
from Dibang Multipurpose Project has been estimated and the same is given in Table 9.1.
Table 9.1: Lean season release and peaking discharge
Time (hr) Lean season releases from
Dibang Multipurpose
Project (cumec)
Time (hr) Lean season releases
from Dibang Multipurpose
Project (cumec)
0 111 12 111
0.5 111 12.5 111
1 111 13 111
1.5 111 13.5 111
2 111 14 111
2.5 111 14.5 111
3 111 15 111
3.5 111 15.5 111
4 111 16 1441
4.5 1441 16.5 1441
5 1441 17 1441
5.5 1441 17.5 1441
6 1441 18 1441
6.5 1441 18.5 1441
7 1441 19 1441
7.5 111 19.5 111
8 111 20 111
8.5 111 20.5 111
9 111 21 111
9.5 111 21.5 111
10 111 22 111
10.5 111 22.5 111
11 111 23 111
11.5 111 23.5 111
Cumulative EIA- Dibang Basin Final Report – Chapter 9
9.2
For the above estimated release, the study has been carried out for the above scenario and for
natural condition of river (without considering Dibang Multipurpose Project).
9.3 MIKE11 MODEL
MIKE11 is an integrated system of software, designed for interactive use in a multi-tasking
environment. The core of the MIKE 11 system consists of the HD (hydrodynamic) module, which
is capable of simulating steady, quasi-unsteady and unsteady flows in a network of open
channels. The results of a HD simulation consist of time series of water level and discharge.
MIKE 11 hydrodynamic module is an implicit, finite difference model for unsteady flow
computations. The model can describe sub-critical as well as supercritical flow conditions
through a numerical description, which is altered according to the local flow conditions in time
and space. Advanced computational modules are included for description of flow over hydraulic
structures, including possibilities to describe structure operation. The formulations can be
applied for looped networks and quasi two-dimensional flow simulation on flood plains. The
computational scheme is applicable for vertically homogeneous flow conditions extending from
steep river flows to tidal influenced tributaries.
The following three approaches simulate the flow in branches as well as looped systems.
i) Kinematic wave approach: The flow is calculated from the assumption of balance between
the friction and gravity forces. The simplification implies that the Kinematic wave
approach can not simulate backwater effects.
ii) Diffusive wave approach: In addition to the friction and gravity forces, the hydrostatic
gradient is included in this description. This allows the user to take downstream
boundaries into account, and thus, simulate backwater effects.
iii) Dynamic wave approach: Using the full momentum equation, including acceleration
forces, the user is able to simulate fast transients, tidal flows, etc., in the system.
Depending on the type of problem, the appropriate description can be chosen. The dynamic
and diffusive wave descriptions differ from kinematic wave description by being capable of
calculating backwater effects. For the present case, dynamic wave approach has been adopted
to have a better simulation of attenuation and translation pattern of flood wave.
The basic theory for dynamic routing in one dimensional analysis consists of two partial
differential equations of open channel flow originally derived by Barre De Saint Venant in 1871.
The equations are:
i. Conservation of mass (continuity) equation
(∂Q/∂X) + ∂(A + A0) / ∂t - q = 0
ii. Conservation of momentum equation
(∂Q/∂t) + { ∂(Q2/A)/∂X } + g A ((∂h/∂X ) + Sf + Sc) = 0
where Q = discharge;
A = active flow area;
A0 = inactive storage area;
h = water surface elevation;
q= lateral outflow;
x = distance along waterway;
t = time;
Sf = friction slope;
Sc = expansion contraction slope and
g = gravitational acceleration.
The boundary conditions in MIKE 11 are distinguished between external and internal boundary
conditions. Internal boundary conditions are (i) links at nodal points, (ii) structures and (iii)
internal inflows etc. External boundary conditions may consist of (i) constant values for h or Q,
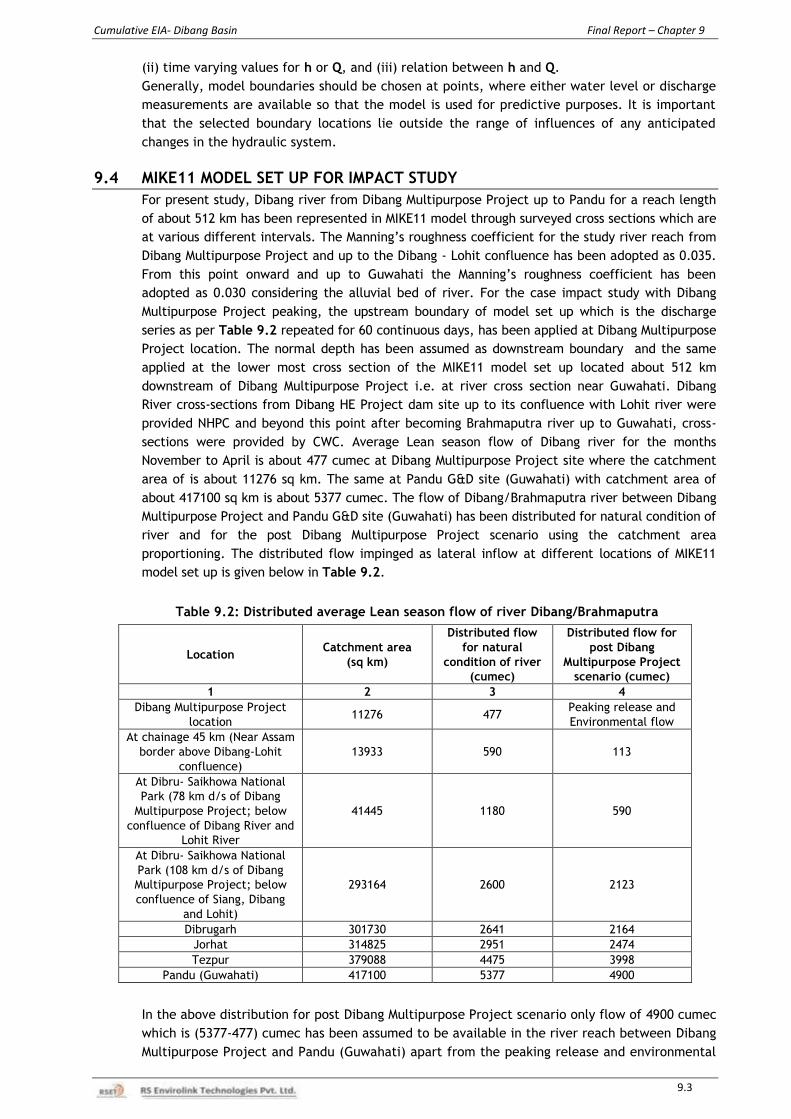
Cumulative EIA- Dibang Basin Final Report – Chapter 9
9.3
(ii) time varying values for h or Q, and (iii) relation between h and Q.
Generally, model boundaries should be chosen at points, where either water level or discharge
measurements are available so that the model is used for predictive purposes. It is important
that the selected boundary locations lie outside the range of influences of any anticipated
changes in the hydraulic system.
9.4 MIKE11 MODEL SET UP FOR IMPACT STUDY
For present study, Dibang river from Dibang Multipurpose Project up to Pandu for a reach length
of about 512 km has been represented in MIKE11 model through surveyed cross sections which are
at various different intervals. The Manning’s roughness coefficient for the study river reach from
Dibang Multipurpose Project and up to the Dibang - Lohit confluence has been adopted as 0.035.
From this point onward and up to Guwahati the Manning’s roughness coefficient has been
adopted as 0.030 considering the alluvial bed of river. For the case impact study with Dibang
Multipurpose Project peaking, the upstream boundary of model set up which is the discharge
series as per Table 9.2 repeated for 60 continuous days, has been applied at Dibang Multipurpose
Project location. The normal depth has been assumed as downstream boundary and the same
applied at the lower most cross section of the MIKE11 model set up located about 512 km
downstream of Dibang Multipurpose Project i.e. at river cross section near Guwahati. Dibang
River cross-sections from Dibang HE Project dam site up to its confluence with Lohit river were
provided NHPC and beyond this point after becoming Brahmaputra river up to Guwahati, cross-
sections were provided by CWC. Average Lean season flow of Dibang river for the months
November to April is about 477 cumec at Dibang Multipurpose Project site where the catchment
area of is about 11276 sq km. The same at Pandu G&D site (Guwahati) with catchment area of
about 417100 sq km is about 5377 cumec. The flow of Dibang/Brahmaputra river between Dibang
Multipurpose Project and Pandu G&D site (Guwahati) has been distributed for natural condition of
river and for the post Dibang Multipurpose Project scenario using the catchment area
proportioning. The distributed flow impinged as lateral inflow at different locations of MIKE11
model set up is given below in Table 9.2.
Table 9.2: Distributed average Lean season flow of river Dibang/Brahmaputra
Location Catchment area
(sq km)
Distributed flow
for natural
condition of river
(cumec)
Distributed flow for
post Dibang
Multipurpose Project
scenario (cumec)
1 2 3 4
Dibang Multipurpose Project
location 11276 477
Peaking release and
Environmental flow
At chainage 45 km (Near Assam
border above Dibang-Lohit
confluence)
13933 590 113
At Dibru- Saikhowa National
Park (78 km d/s of Dibang
Multipurpose Project; below
confluence of Dibang River and
Lohit River
41445 1180 590
At Dibru- Saikhowa National
Park (108 km d/s of Dibang
Multipurpose Project; below
confluence of Siang, Dibang
and Lohit)
293164 2600 2123
Dibrugarh 301730 2641 2164
Jorhat 314825 2951 2474
Tezpur 379088 4475 3998
Pandu (Guwahati) 417100 5377 4900
In the above distribution for post Dibang Multipurpose Project scenario only flow of 4900 cumec
which is (5377-477) cumec has been assumed to be available in the river reach between Dibang
Multipurpose Project and Pandu (Guwahati) apart from the peaking release and environmental
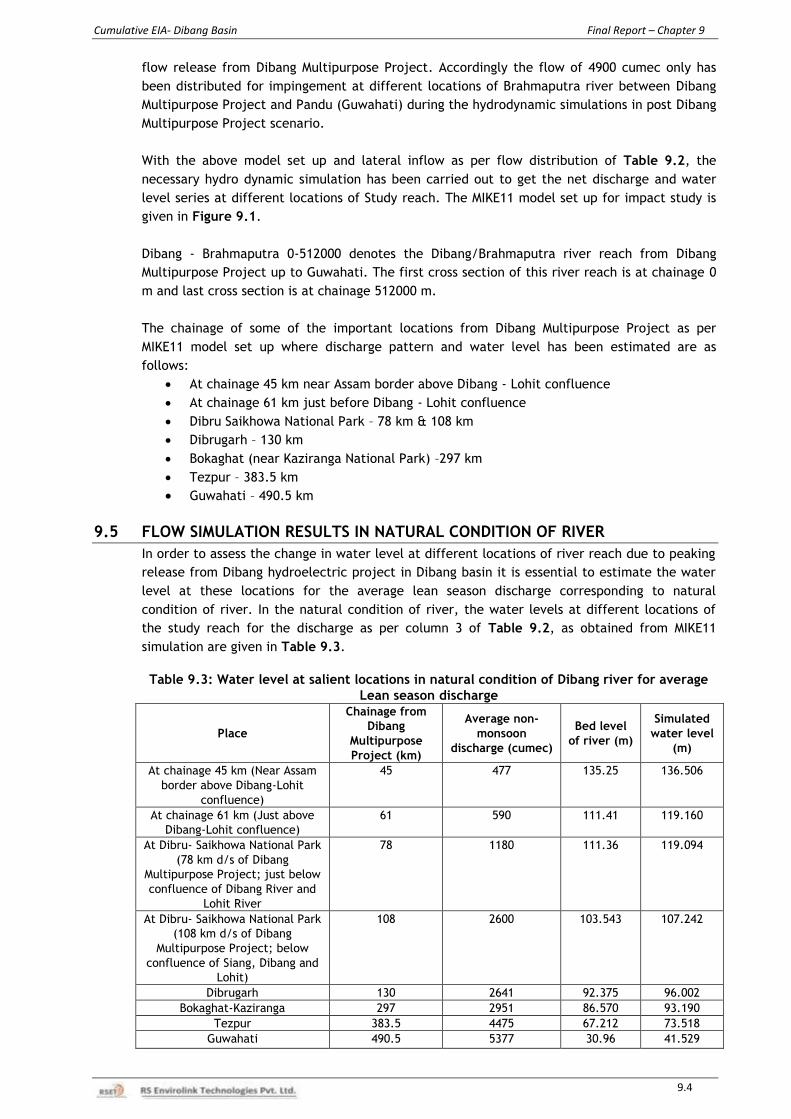
Cumulative EIA- Dibang Basin Final Report – Chapter 9
9.4
flow release from Dibang Multipurpose Project. Accordingly the flow of 4900 cumec only has
been distributed for impingement at different locations of Brahmaputra river between Dibang
Multipurpose Project and Pandu (Guwahati) during the hydrodynamic simulations in post Dibang
Multipurpose Project scenario.
With the above model set up and lateral inflow as per flow distribution of Table 9.2, the
necessary hydro dynamic simulation has been carried out to get the net discharge and water
level series at different locations of Study reach. The MIKE11 model set up for impact study is
given in Figure 9.1.
Dibang - Brahmaputra 0-512000 denotes the Dibang/Brahmaputra river reach from Dibang
Multipurpose Project up to Guwahati. The first cross section of this river reach is at chainage 0
m and last cross section is at chainage 512000 m.
The chainage of some of the important locations from Dibang Multipurpose Project as per
MIKE11 model set up where discharge pattern and water level has been estimated are as
follows:
At chainage 45 km near Assam border above Dibang - Lohit confluence
At chainage 61 km just before Dibang - Lohit confluence
Dibru Saikhowa National Park – 78 km & 108 km
Dibrugarh – 130 km
Bokaghat (near Kaziranga National Park) –297 km
Tezpur – 383.5 km
Guwahati – 490.5 km
9.5 FLOW SIMULATION RESULTS IN NATURAL CONDITION OF RIVER
In order to assess the change in water level at different locations of river reach due to peaking
release from Dibang hydroelectric project in Dibang basin it is essential to estimate the water
level at these locations for the average lean season discharge corresponding to natural
condition of river. In the natural condition of river, the water levels at different locations of
the study reach for the discharge as per column 3 of Table 9.2, as obtained from MIKE11
simulation are given in Table 9.3.
Table 9.3: Water level at salient locations in natural condition of Dibang river for average
Lean season discharge
Place
Chainage from
Dibang
Multipurpose
Project (km)
Average non-
monsoon
discharge (cumec)
Bed level
of river (m)
Simulated
water level
(m)
At chainage 45 km (Near Assam
border above Dibang-Lohit
confluence)
45 477 135.25 136.506
At chainage 61 km (Just above
Dibang-Lohit confluence)
61 590 111.41 119.160
At Dibru- Saikhowa National Park
(78 km d/s of Dibang
Multipurpose Project; just below
confluence of Dibang River and
Lohit River
78 1180 111.36
119.094
At Dibru- Saikhowa National Park
(108 km d/s of Dibang
Multipurpose Project; below
confluence of Siang, Dibang and
Lohit)
108 2600 103.543
107.242
Dibrugarh 130 2641 92.375 96.002
Bokaghat-Kaziranga 297 2951 86.570 93.190
Tezpur 383.5 4475 67.212 73.518
Guwahati 490.5 5377 30.96 41.529
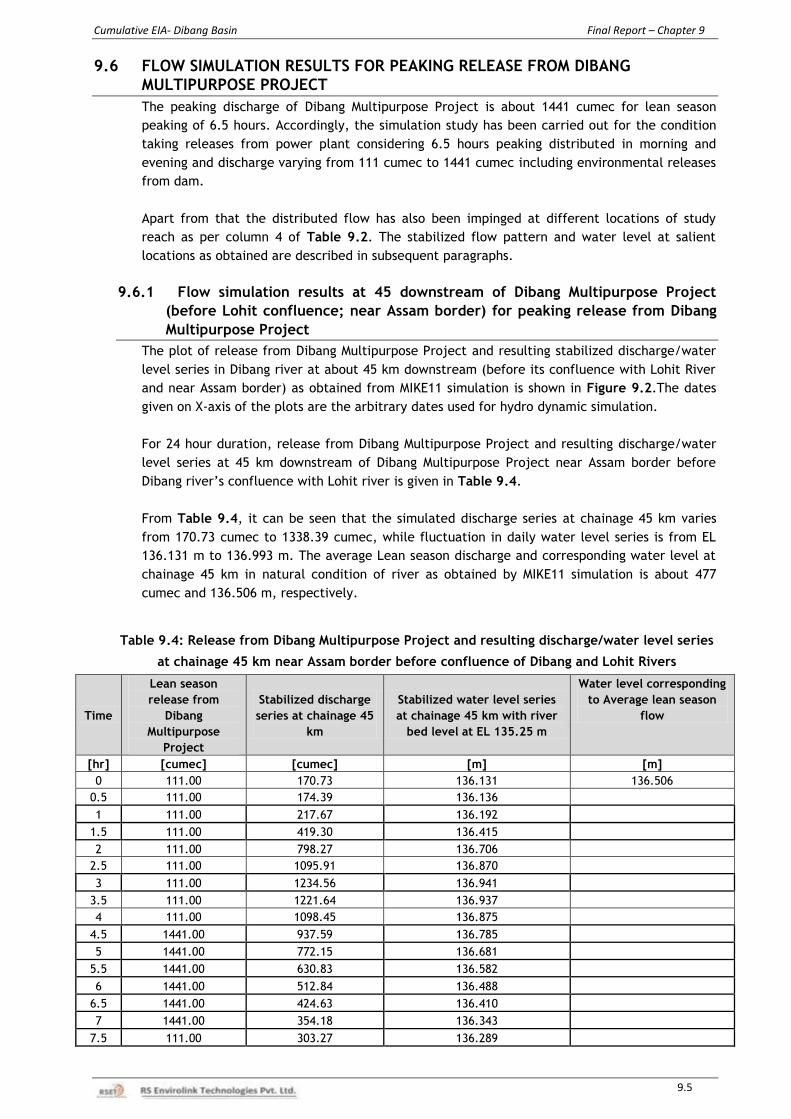
Cumulative EIA- Dibang Basin Final Report – Chapter 9
9.5
9.6 FLOW SIMULATION RESULTS FOR PEAKING RELEASE FROM DIBANG
MULTIPURPOSE PROJECT
The peaking discharge of Dibang Multipurpose Project is about 1441 cumec for lean season
peaking of 6.5 hours. Accordingly, the simulation study has been carried out for the condition
taking releases from power plant considering 6.5 hours peaking distributed in morning and
evening and discharge varying from 111 cumec to 1441 cumec including environmental releases
from dam.
Apart from that the distributed flow has also been impinged at different locations of study
reach as per column 4 of Table 9.2. The stabilized flow pattern and water level at salient
locations as obtained are described in subsequent paragraphs.
9.6.1 Flow simulation results at 45 downstream of Dibang Multipurpose Project
(before Lohit confluence; near Assam border) for peaking release from Dibang
Multipurpose Project
The plot of release from Dibang Multipurpose Project and resulting stabilized discharge/water
level series in Dibang river at about 45 km downstream (before its confluence with Lohit River
and near Assam border) as obtained from MIKE11 simulation is shown in Figure 9.2.The dates
given on X-axis of the plots are the arbitrary dates used for hydro dynamic simulation.
For 24 hour duration, release from Dibang Multipurpose Project and resulting discharge/water
level series at 45 km downstream of Dibang Multipurpose Project near Assam border before
Dibang river’s confluence with Lohit river is given in Table 9.4.
From Table 9.4, it can be seen that the simulated discharge series at chainage 45 km varies
from 170.73 cumec to 1338.39 cumec, while fluctuation in daily water level series is from EL
136.131 m to 136.993 m. The average Lean season discharge and corresponding water level at
chainage 45 km in natural condition of river as obtained by MIKE11 simulation is about 477
cumec and 136.506 m, respectively.
Table 9.4: Release from Dibang Multipurpose Project and resulting discharge/water level series
at chainage 45 km near Assam border before confluence of Dibang and Lohit Rivers
Time
Lean season
release from
Dibang
Multipurpose
Project
Stabilized discharge
series at chainage 45
km
Stabilized water level series
at chainage 45 km with river
bed level at EL 135.25 m
Water level corresponding
to Average lean season
flow
[hr] [cumec] [cumec] [m] [m]
0 111.00 170.73 136.131 136.506
0.5 111.00 174.39 136.136
1 111.00 217.67 136.192
1.5 111.00 419.30 136.415
2 111.00 798.27 136.706
2.5 111.00 1095.91 136.870
3 111.00 1234.56 136.941
3.5 111.00 1221.64 136.937
4 111.00 1098.45 136.875
4.5 1441.00 937.59 136.785
5 1441.00 772.15 136.681
5.5 1441.00 630.83 136.582
6 1441.00 512.84 136.488
6.5 1441.00 424.63 136.410
7 1441.00 354.18 136.343
7.5 111.00 303.27 136.289
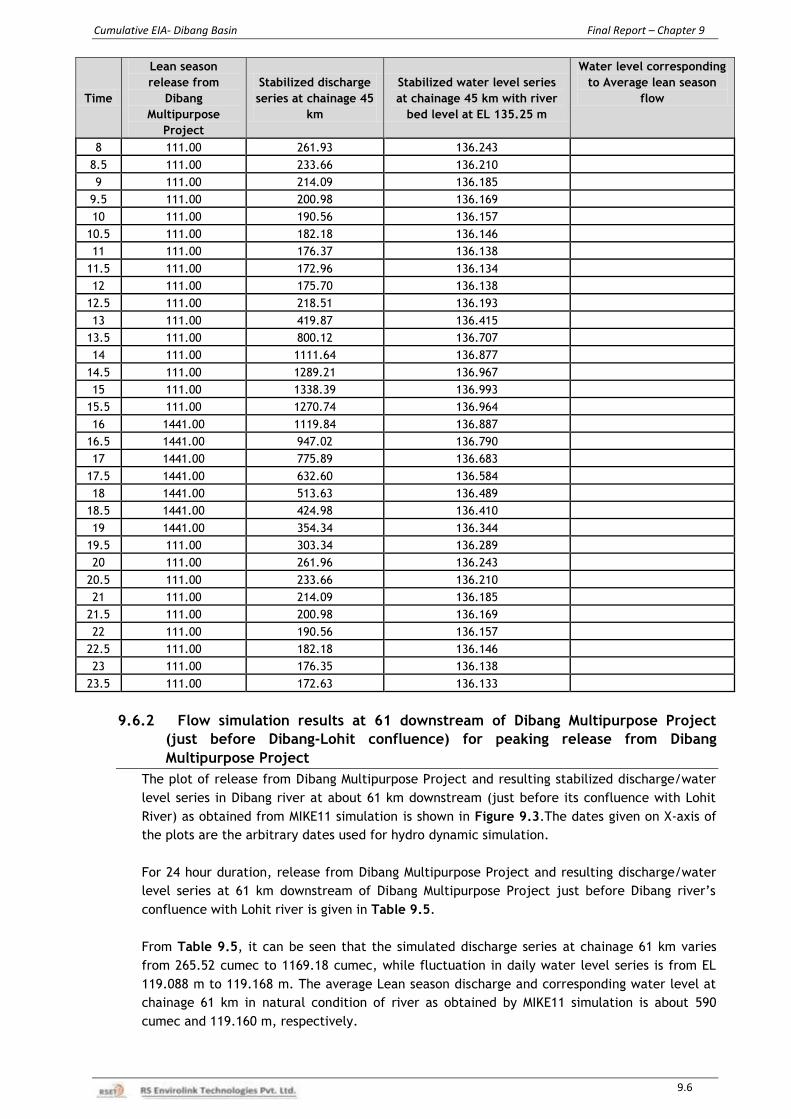
Cumulative EIA- Dibang Basin Final Report – Chapter 9
9.6
Time
Lean season
release from
Dibang
Multipurpose
Project
Stabilized discharge
series at chainage 45
km
Stabilized water level series
at chainage 45 km with river
bed level at EL 135.25 m
Water level corresponding
to Average lean season
flow
8 111.00 261.93 136.243
8.5 111.00 233.66 136.210
9 111.00 214.09 136.185
9.5 111.00 200.98 136.169
10 111.00 190.56 136.157
10.5 111.00 182.18 136.146
11 111.00 176.37 136.138
11.5 111.00 172.96 136.134
12 111.00 175.70 136.138
12.5 111.00 218.51 136.193
13 111.00 419.87 136.415
13.5 111.00 800.12 136.707
14 111.00 1111.64 136.877
14.5 111.00 1289.21 136.967
15 111.00 1338.39 136.993
15.5 111.00 1270.74 136.964
16 1441.00 1119.84 136.887
16.5 1441.00 947.02 136.790
17 1441.00 775.89 136.683
17.5 1441.00 632.60 136.584
18 1441.00 513.63 136.489
18.5 1441.00 424.98 136.410
19 1441.00 354.34 136.344
19.5 111.00 303.34 136.289
20 111.00 261.96 136.243
20.5 111.00 233.66 136.210
21 111.00 214.09 136.185
21.5 111.00 200.98 136.169
22 111.00 190.56 136.157
22.5 111.00 182.18 136.146
23 111.00 176.35 136.138
23.5 111.00 172.63 136.133
9.6.2 Flow simulation results at 61 downstream of Dibang Multipurpose Project
(just before Dibang-Lohit confluence) for peaking release from Dibang
Multipurpose Project
The plot of release from Dibang Multipurpose Project and resulting stabilized discharge/water
level series in Dibang river at about 61 km downstream (just before its confluence with Lohit
River) as obtained from MIKE11 simulation is shown in Figure 9.3.The dates given on X-axis of
the plots are the arbitrary dates used for hydro dynamic simulation.
For 24 hour duration, release from Dibang Multipurpose Project and resulting discharge/water
level series at 61 km downstream of Dibang Multipurpose Project just before Dibang river’s
confluence with Lohit river is given in Table 9.5.
From Table 9.5, it can be seen that the simulated discharge series at chainage 61 km varies
from 265.52 cumec to 1169.18 cumec, while fluctuation in daily water level series is from EL
119.088 m to 119.168 m. The average Lean season discharge and corresponding water level at
chainage 61 km in natural condition of river as obtained by MIKE11 simulation is about 590
cumec and 119.160 m, respectively.
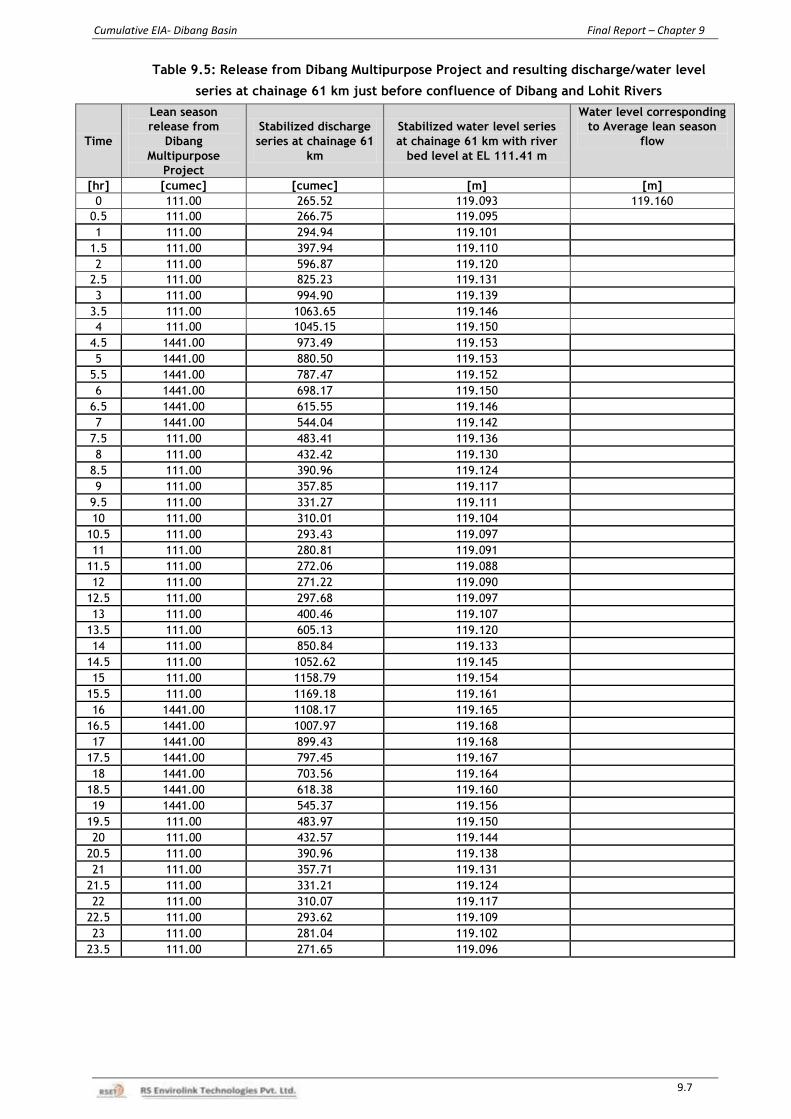
Cumulative EIA- Dibang Basin Final Report – Chapter 9
9.7
Table 9.5: Release from Dibang Multipurpose Project and resulting discharge/water level
series at chainage 61 km just before confluence of Dibang and Lohit Rivers
Time
Lean season
release from
Dibang
Multipurpose
Project
Stabilized discharge
series at chainage 61
km
Stabilized water level series
at chainage 61 km with river
bed level at EL 111.41 m
Water level corresponding
to Average lean season
flow
[hr] [cumec] [cumec] [m] [m]
0 111.00 265.52 119.093 119.160
0.5 111.00 266.75 119.095
1 111.00 294.94 119.101
1.5 111.00 397.94 119.110
2 111.00 596.87 119.120
2.5 111.00 825.23 119.131
3 111.00 994.90 119.139
3.5 111.00 1063.65 119.146
4 111.00 1045.15 119.150
4.5 1441.00 973.49 119.153
5 1441.00 880.50 119.153
5.5 1441.00 787.47 119.152
6 1441.00 698.17 119.150
6.5 1441.00 615.55 119.146
7 1441.00 544.04 119.142
7.5 111.00 483.41 119.136
8 111.00 432.42 119.130
8.5 111.00 390.96 119.124
9 111.00 357.85 119.117
9.5 111.00 331.27 119.111
10 111.00 310.01 119.104
10.5 111.00 293.43 119.097
11 111.00 280.81 119.091
11.5 111.00 272.06 119.088
12 111.00 271.22 119.090
12.5 111.00 297.68 119.097
13 111.00 400.46 119.107
13.5 111.00 605.13 119.120
14 111.00 850.84 119.133
14.5 111.00 1052.62 119.145
15 111.00 1158.79 119.154
15.5 111.00 1169.18 119.161
16 1441.00 1108.17 119.165
16.5 1441.00 1007.97 119.168
17 1441.00 899.43 119.168
17.5 1441.00 797.45 119.167
18 1441.00 703.56 119.164
18.5 1441.00 618.38 119.160
19 1441.00 545.37 119.156
19.5 111.00 483.97 119.150
20 111.00 432.57 119.144
20.5 111.00 390.96 119.138
21 111.00 357.71 119.131
21.5 111.00 331.21 119.124
22 111.00 310.07 119.117
22.5 111.00 293.62 119.109
23 111.00 281.04 119.102
23.5 111.00 271.65 119.096
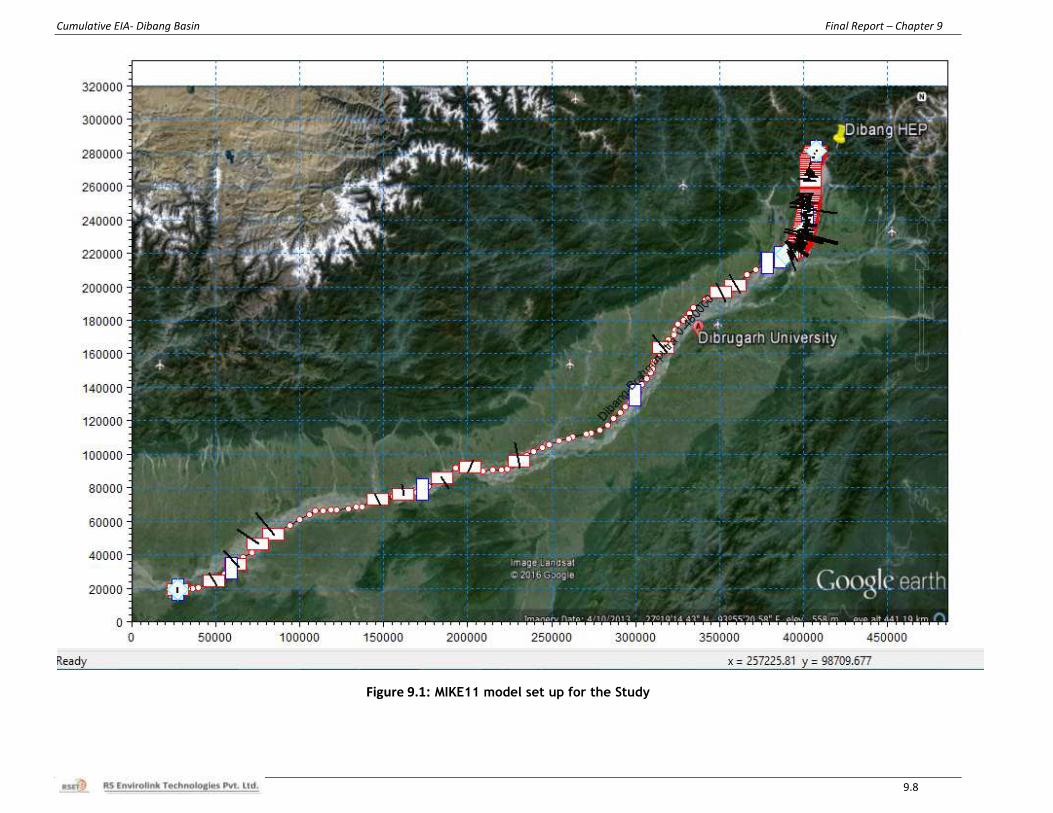
Cumulative EIA- Dibang Basin Final Report – Chapter 9
9.8
Figure 9.1: MIKE11 model set up for the Study
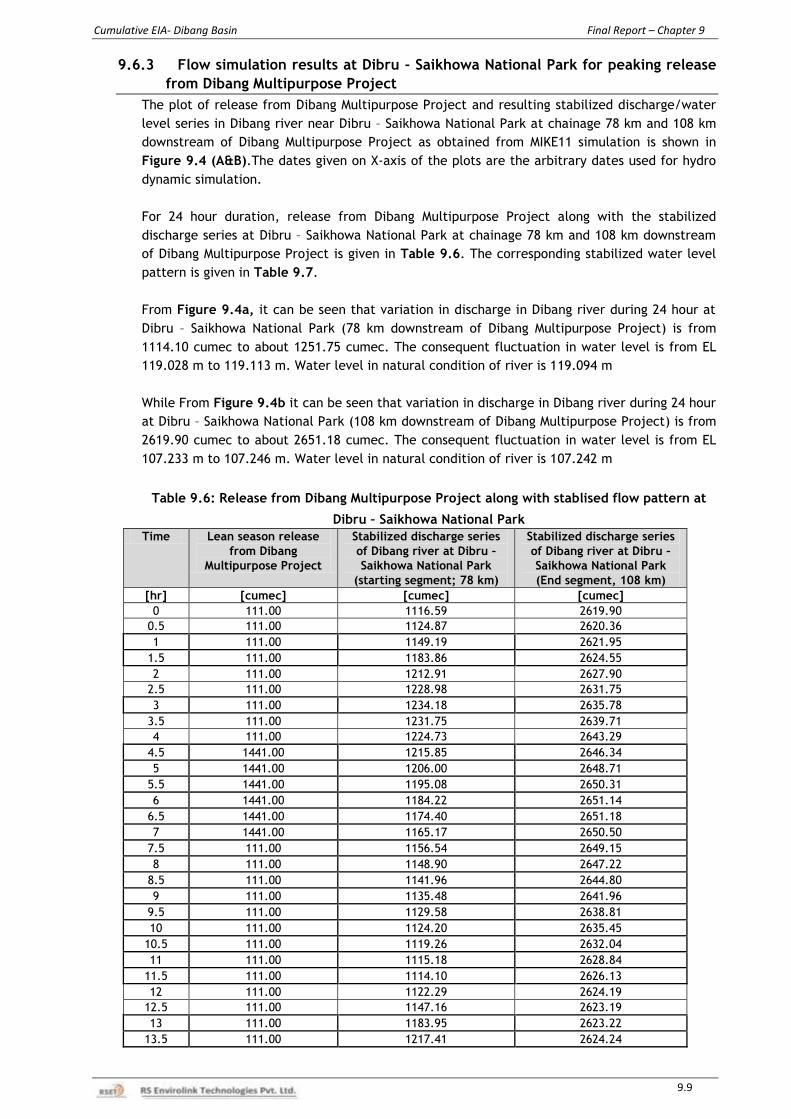
Cumulative EIA- Dibang Basin Final Report – Chapter 9
9.9
9.6.3 Flow simulation results at Dibru - Saikhowa National Park for peaking release
from Dibang Multipurpose Project
The plot of release from Dibang Multipurpose Project and resulting stabilized discharge/water
level series in Dibang river near Dibru – Saikhowa National Park at chainage 78 km and 108 km
downstream of Dibang Multipurpose Project as obtained from MIKE11 simulation is shown in
Figure 9.4 (A&B).The dates given on X-axis of the plots are the arbitrary dates used for hydro
dynamic simulation.
For 24 hour duration, release from Dibang Multipurpose Project along with the stabilized
discharge series at Dibru – Saikhowa National Park at chainage 78 km and 108 km downstream
of Dibang Multipurpose Project is given in Table 9.6. The corresponding stabilized water level
pattern is given in Table 9.7.
From Figure 9.4a, it can be seen that variation in discharge in Dibang river during 24 hour at
Dibru – Saikhowa National Park (78 km downstream of Dibang Multipurpose Project) is from
1114.10 cumec to about 1251.75 cumec. The consequent fluctuation in water level is from EL
119.028 m to 119.113 m. Water level in natural condition of river is 119.094 m
While From Figure 9.4b it can be seen that variation in discharge in Dibang river during 24 hour
at Dibru – Saikhowa National Park (108 km downstream of Dibang Multipurpose Project) is from
2619.90 cumec to about 2651.18 cumec. The consequent fluctuation in water level is from EL
107.233 m to 107.246 m. Water level in natural condition of river is 107.242 m
Table 9.6: Release from Dibang Multipurpose Project along with stablised flow pattern at
Dibru – Saikhowa National Park
Time Lean season release
from Dibang
Multipurpose Project
Stabilized discharge series
of Dibang river at Dibru –
Saikhowa National Park
(starting segment; 78 km)
Stabilized discharge series
of Dibang river at Dibru –
Saikhowa National Park
(End segment, 108 km)
[hr] [cumec] [cumec] [cumec]
0 111.00 1116.59 2619.90
0.5 111.00 1124.87 2620.36
1 111.00 1149.19 2621.95
1.5 111.00 1183.86 2624.55
2 111.00 1212.91 2627.90
2.5 111.00 1228.98 2631.75
3 111.00 1234.18 2635.78
3.5 111.00 1231.75 2639.71
4 111.00 1224.73 2643.29
4.5 1441.00 1215.85 2646.34
5 1441.00 1206.00 2648.71
5.5 1441.00 1195.08 2650.31
6 1441.00 1184.22 2651.14
6.5 1441.00 1174.40 2651.18
7 1441.00 1165.17 2650.50
7.5 111.00 1156.54 2649.15
8 111.00 1148.90 2647.22
8.5 111.00 1141.96 2644.80
9 111.00 1135.48 2641.96
9.5 111.00 1129.58 2638.81
10 111.00 1124.20 2635.45
10.5 111.00 1119.26 2632.04
11 111.00 1115.18 2628.84
11.5 111.00 1114.10 2626.13
12 111.00 1122.29 2624.19
12.5 111.00 1147.16 2623.19
13 111.00 1183.95 2623.22
13.5 111.00 1217.41 2624.24
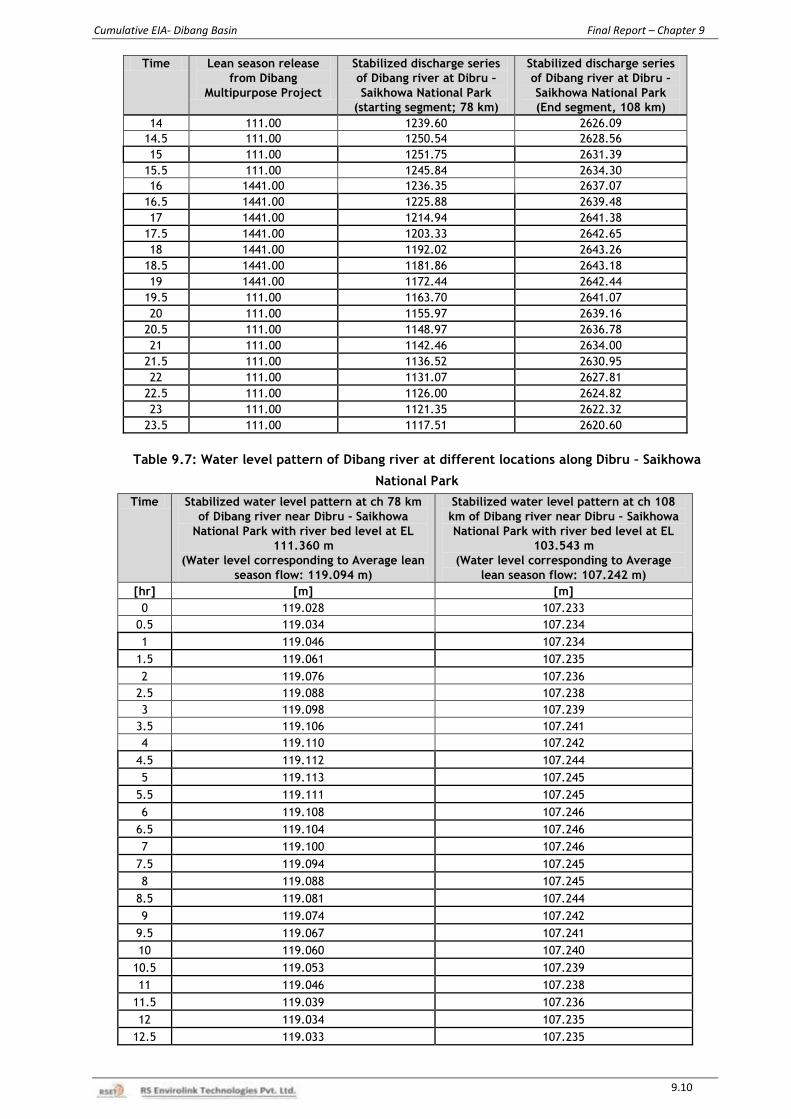
Cumulative EIA- Dibang Basin Final Report – Chapter 9
9.10
Time Lean season release
from Dibang
Multipurpose Project
Stabilized discharge series
of Dibang river at Dibru –
Saikhowa National Park
(starting segment; 78 km)
Stabilized discharge series
of Dibang river at Dibru –
Saikhowa National Park
(End segment, 108 km)
14 111.00 1239.60 2626.09
14.5 111.00 1250.54 2628.56
15 111.00 1251.75 2631.39
15.5 111.00 1245.84 2634.30
16 1441.00 1236.35 2637.07
16.5 1441.00 1225.88 2639.48
17 1441.00 1214.94 2641.38
17.5 1441.00 1203.33 2642.65
18 1441.00 1192.02 2643.26
18.5 1441.00 1181.86 2643.18
19 1441.00 1172.44 2642.44
19.5 111.00 1163.70 2641.07
20 111.00 1155.97 2639.16
20.5 111.00 1148.97 2636.78
21 111.00 1142.46 2634.00
21.5 111.00 1136.52 2630.95
22 111.00 1131.07 2627.81
22.5 111.00 1126.00 2624.82
23 111.00 1121.35 2622.32
23.5 111.00 1117.51 2620.60
Table 9.7: Water level pattern of Dibang river at different locations along Dibru – Saikhowa
National Park
Time Stabilized water level pattern at ch 78 km
of Dibang river near Dibru – Saikhowa
National Park with river bed level at EL
111.360 m
(Water level corresponding to Average lean
season flow: 119.094 m)
Stabilized water level pattern at ch 108
km of Dibang river near Dibru – Saikhowa
National Park with river bed level at EL
103.543 m
(Water level corresponding to Average
lean season flow: 107.242 m)
[hr] [m] [m]
0 119.028 107.233
0.5 119.034 107.234
1 119.046 107.234
1.5 119.061 107.235
2 119.076 107.236
2.5 119.088 107.238
3 119.098 107.239
3.5 119.106 107.241
4 119.110 107.242
4.5 119.112 107.244
5 119.113 107.245
5.5 119.111 107.245
6 119.108 107.246
6.5 119.104 107.246
7 119.100 107.246
7.5 119.094 107.245
8 119.088 107.245
8.5 119.081 107.244
9 119.074 107.242
9.5 119.067 107.241
10 119.060 107.240
10.5 119.053 107.239
11 119.046 107.238
11.5 119.039 107.236
12 119.034 107.235
12.5 119.033 107.235
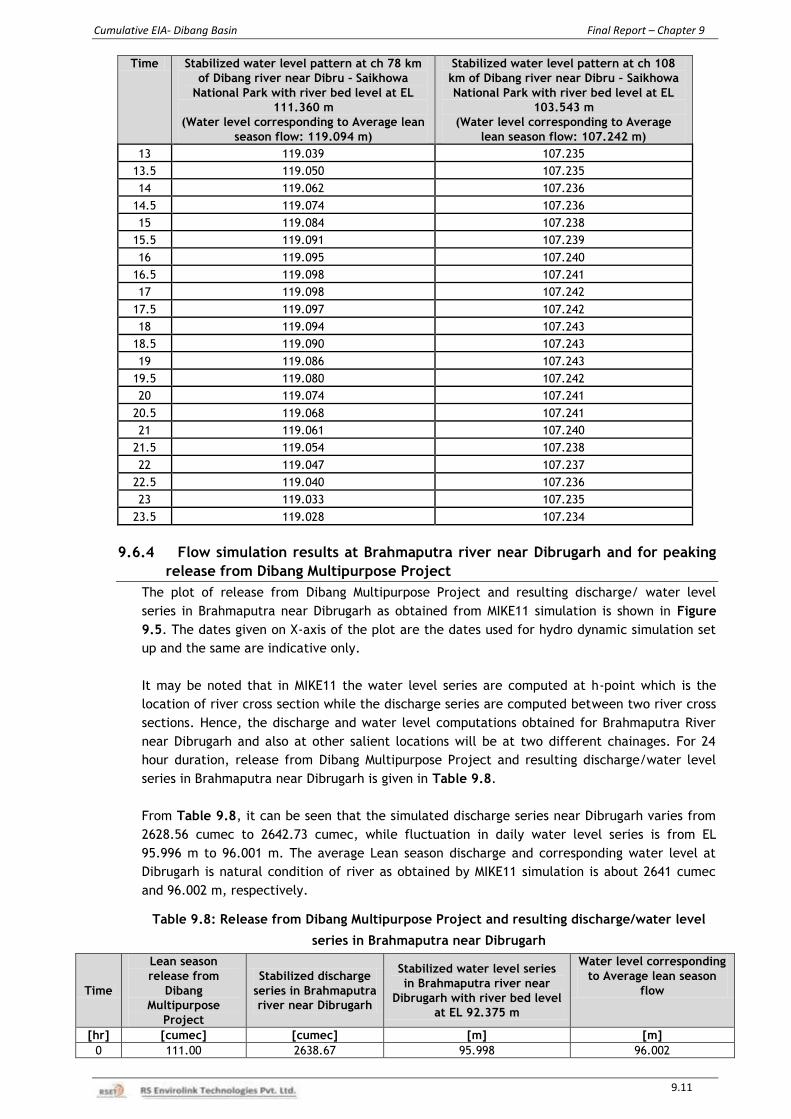
Cumulative EIA- Dibang Basin Final Report – Chapter 9
9.11
Time Stabilized water level pattern at ch 78 km
of Dibang river near Dibru – Saikhowa
National Park with river bed level at EL
111.360 m
(Water level corresponding to Average lean
season flow: 119.094 m)
Stabilized water level pattern at ch 108
km of Dibang river near Dibru – Saikhowa
National Park with river bed level at EL
103.543 m
(Water level corresponding to Average
lean season flow: 107.242 m)
13 119.039 107.235
13.5 119.050 107.235
14 119.062 107.236
14.5 119.074 107.236
15 119.084 107.238
15.5 119.091 107.239
16 119.095 107.240
16.5 119.098 107.241
17 119.098 107.242
17.5 119.097 107.242
18 119.094 107.243
18.5 119.090 107.243
19 119.086 107.243
19.5 119.080 107.242
20 119.074 107.241
20.5 119.068 107.241
21 119.061 107.240
21.5 119.054 107.238
22 119.047 107.237
22.5 119.040 107.236
23 119.033 107.235
23.5 119.028 107.234
9.6.4 Flow simulation results at Brahmaputra river near Dibrugarh and for peaking
release from Dibang Multipurpose Project
The plot of release from Dibang Multipurpose Project and resulting discharge/ water level
series in Brahmaputra near Dibrugarh as obtained from MIKE11 simulation is shown in Figure
9.5. The dates given on X-axis of the plot are the dates used for hydro dynamic simulation set
up and the same are indicative only.
It may be noted that in MIKE11 the water level series are computed at h-point which is the
location of river cross section while the discharge series are computed between two river cross
sections. Hence, the discharge and water level computations obtained for Brahmaputra River
near Dibrugarh and also at other salient locations will be at two different chainages. For 24
hour duration, release from Dibang Multipurpose Project and resulting discharge/water level
series in Brahmaputra near Dibrugarh is given in Table 9.8.
From Table 9.8, it can be seen that the simulated discharge series near Dibrugarh varies from
2628.56 cumec to 2642.73 cumec, while fluctuation in daily water level series is from EL
95.996 m to 96.001 m. The average Lean season discharge and corresponding water level at
Dibrugarh is natural condition of river as obtained by MIKE11 simulation is about 2641 cumec
and 96.002 m, respectively.
Table 9.8: Release from Dibang Multipurpose Project and resulting discharge/water level
series in Brahmaputra near Dibrugarh
Time
Lean season
release from
Dibang
Multipurpose
Project
Stabilized discharge
series in Brahmaputra
river near Dibrugarh
Stabilized water level series
in Brahmaputra river near
Dibrugarh with river bed level
at EL 92.375 m
Water level corresponding
to Average lean season
flow
[hr] [cumec] [cumec] [m] [m]
0 111.00 2638.67 95.998 96.002
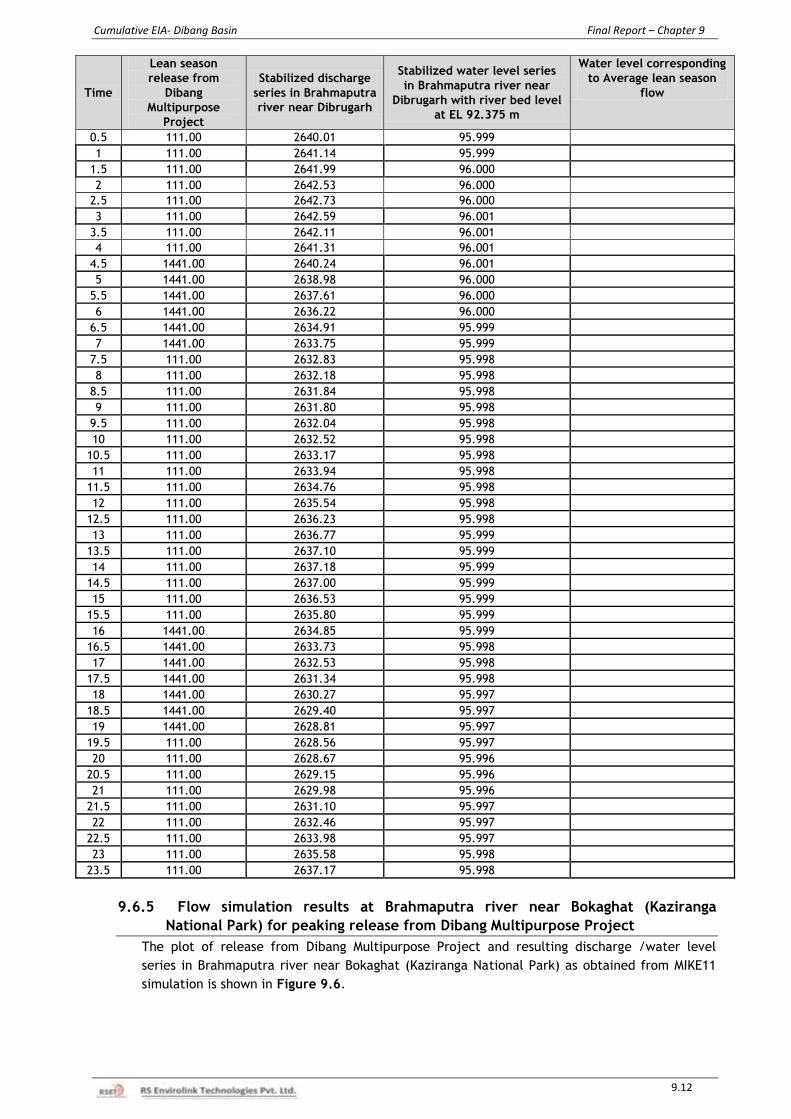
Cumulative EIA- Dibang Basin Final Report – Chapter 9
9.12
Time
Lean season
release from
Dibang
Multipurpose
Project
Stabilized discharge
series in Brahmaputra
river near Dibrugarh
Stabilized water level series
in Brahmaputra river near
Dibrugarh with river bed level
at EL 92.375 m
Water level corresponding
to Average lean season
flow
0.5 111.00 2640.01 95.999
1 111.00 2641.14 95.999
1.5 111.00 2641.99 96.000
2 111.00 2642.53 96.000
2.5 111.00 2642.73 96.000
3 111.00 2642.59 96.001
3.5 111.00 2642.11 96.001
4 111.00 2641.31 96.001
4.5 1441.00 2640.24 96.001
5 1441.00 2638.98 96.000
5.5 1441.00 2637.61 96.000
6 1441.00 2636.22 96.000
6.5 1441.00 2634.91 95.999
7 1441.00 2633.75 95.999
7.5 111.00 2632.83 95.998
8 111.00 2632.18 95.998
8.5 111.00 2631.84 95.998
9 111.00 2631.80 95.998
9.5 111.00 2632.04 95.998
10 111.00 2632.52 95.998
10.5 111.00 2633.17 95.998
11 111.00 2633.94 95.998
11.5 111.00 2634.76 95.998
12 111.00 2635.54 95.998
12.5 111.00 2636.23 95.998
13 111.00 2636.77 95.999
13.5 111.00 2637.10 95.999
14 111.00 2637.18 95.999
14.5 111.00 2637.00 95.999
15 111.00 2636.53 95.999
15.5 111.00 2635.80 95.999
16 1441.00 2634.85 95.999
16.5 1441.00 2633.73 95.998
17 1441.00 2632.53 95.998
17.5 1441.00 2631.34 95.998
18 1441.00 2630.27 95.997
18.5 1441.00 2629.40 95.997
19 1441.00 2628.81 95.997
19.5 111.00 2628.56 95.997
20 111.00 2628.67 95.996
20.5 111.00 2629.15 95.996
21 111.00 2629.98 95.996
21.5 111.00 2631.10 95.997
22 111.00 2632.46 95.997
22.5 111.00 2633.98 95.997
23 111.00 2635.58 95.998
23.5 111.00 2637.17 95.998
9.6.5 Flow simulation results at Brahmaputra river near Bokaghat (Kaziranga
National Park) for peaking release from Dibang Multipurpose Project
The plot of release from Dibang Multipurpose Project and resulting discharge /water level
series in Brahmaputra river near Bokaghat (Kaziranga National Park) as obtained from MIKE11
simulation is shown in Figure 9.6.
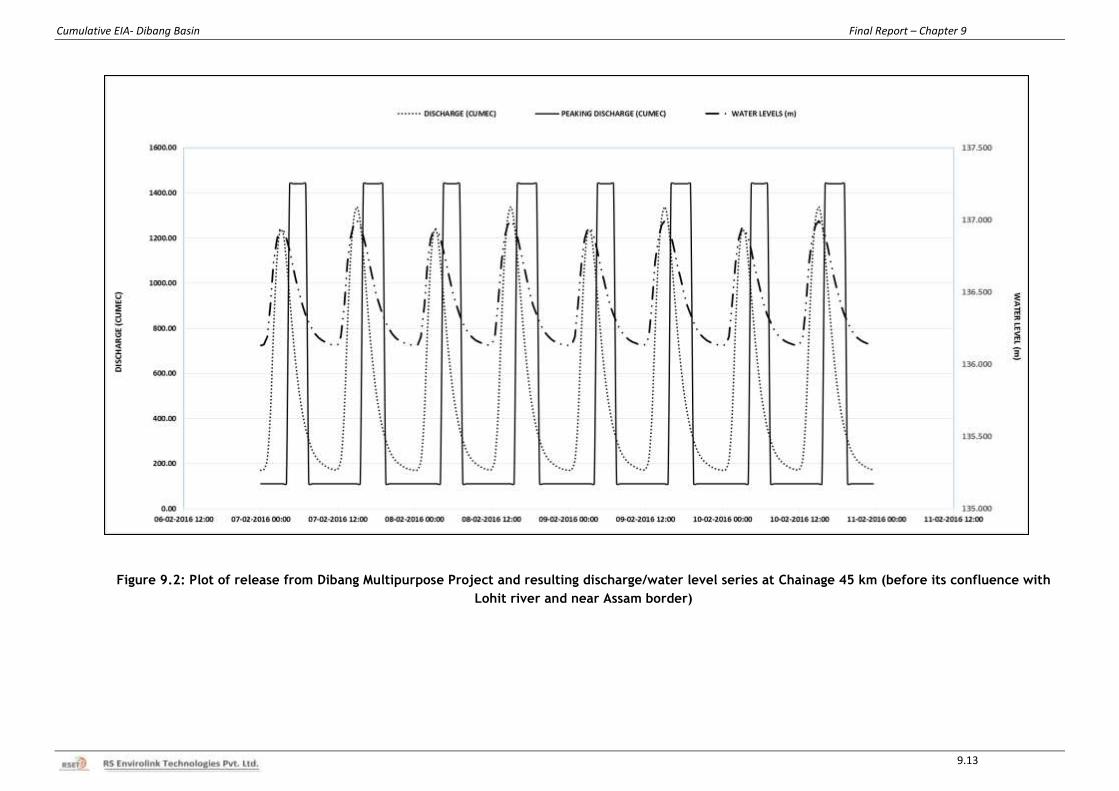
Cumulative EIA- Dibang Basin Final Report – Chapter 9
9.13
Figure 9.2: Plot of release from Dibang Multipurpose Project and resulting discharge/water level series at Chainage 45 km (before its confluence with
Lohit river and near Assam border)
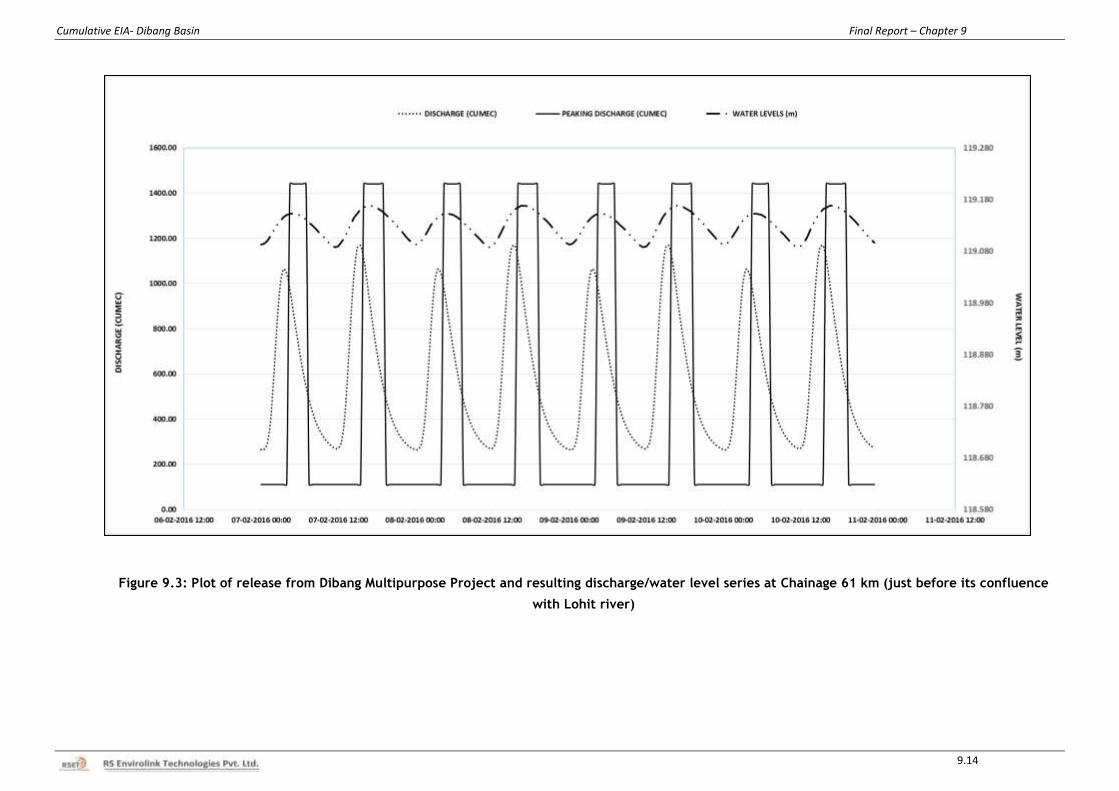
Cumulative EIA- Dibang Basin Final Report – Chapter 9
9.14
Figure 9.3: Plot of release from Dibang Multipurpose Project and resulting discharge/water level series at Chainage 61 km (just before its confluence
with Lohit river)
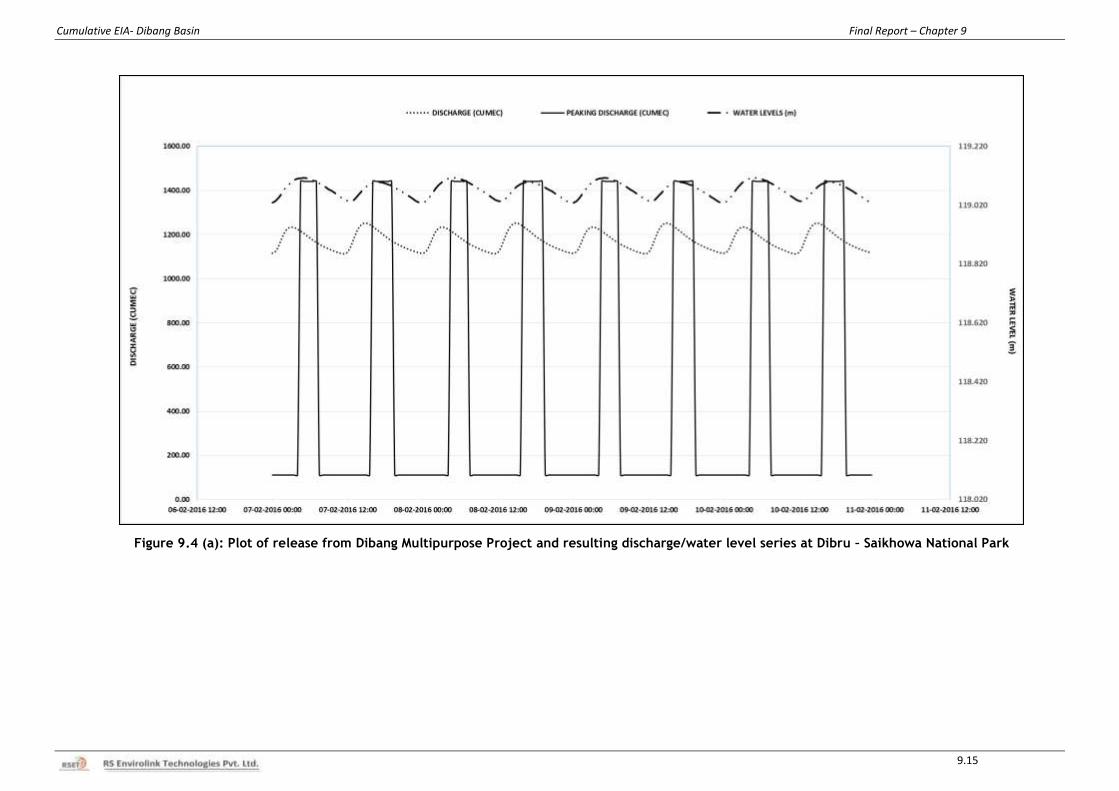
Cumulative EIA- Dibang Basin Final Report – Chapter 9
9.15
Figure 9.4 (a): Plot of release from Dibang Multipurpose Project and resulting discharge/water level series at Dibru – Saikhowa National Park
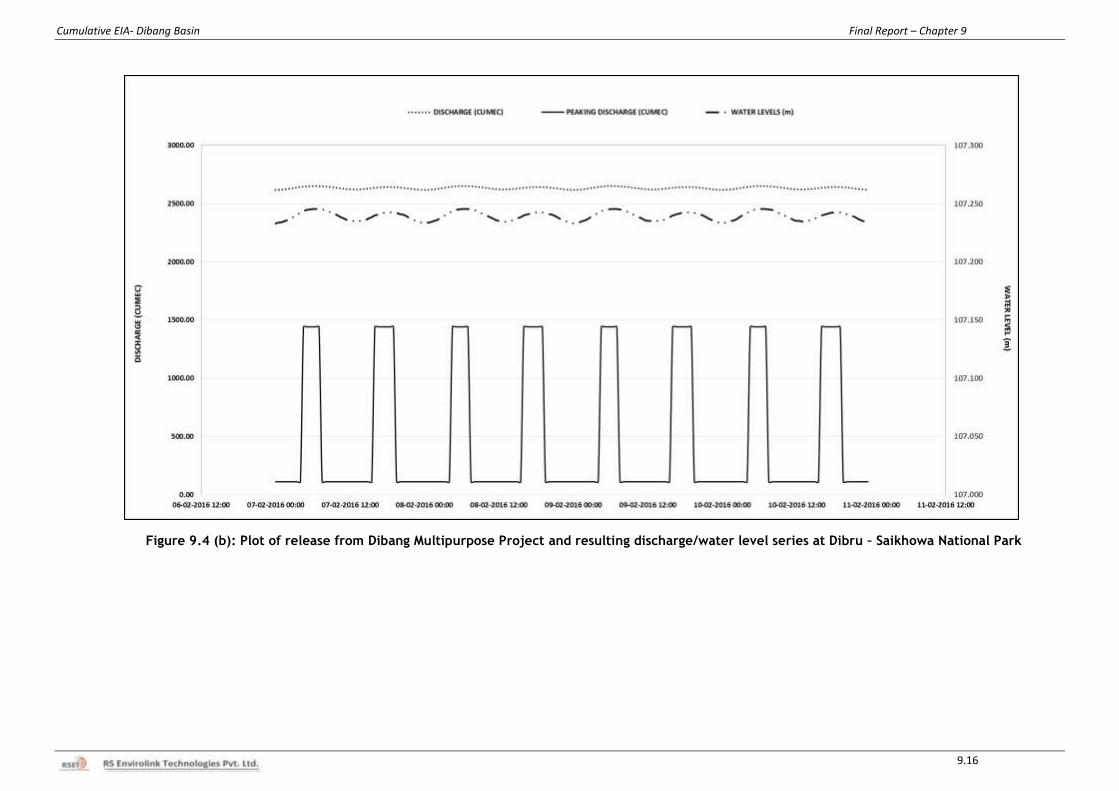
Cumulative EIA- Dibang Basin Final Report – Chapter 9
9.16
Figure 9.4 (b): Plot of release from Dibang Multipurpose Project and resulting discharge/water level series at Dibru – Saikhowa National Park
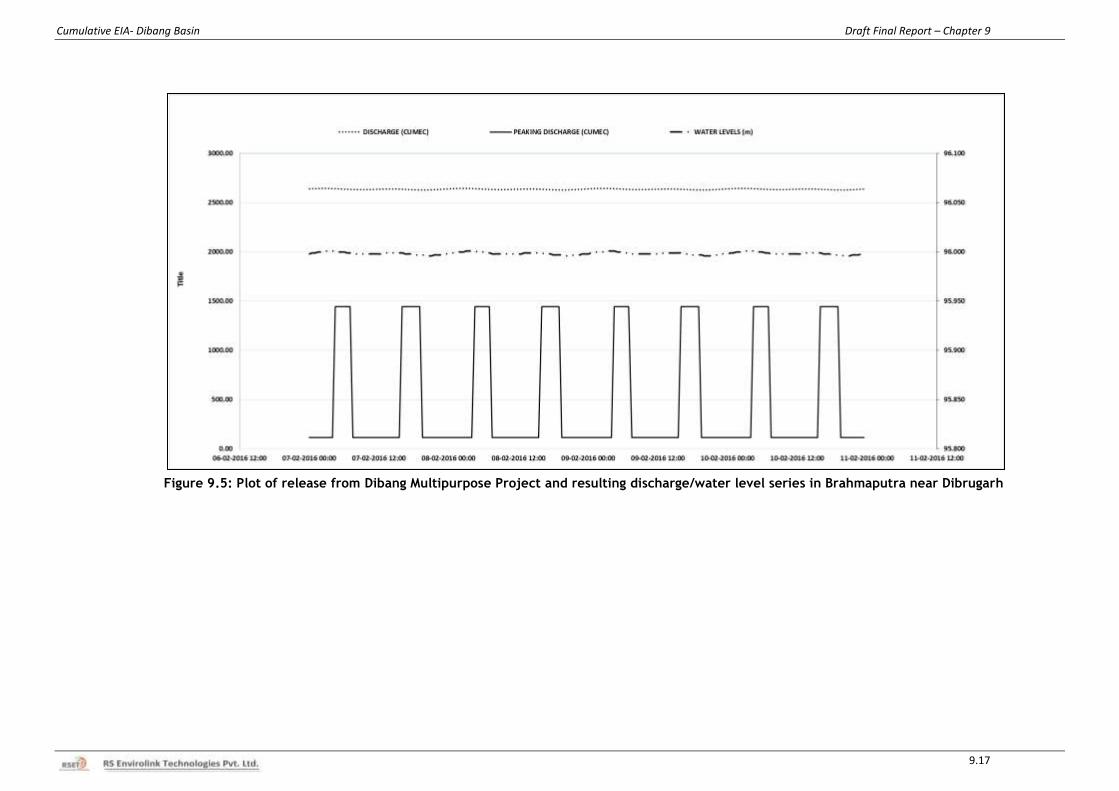
Cumulative EIA- Dibang Basin Draft Final Report – Chapter 9
9.17
Figure 9.5: Plot of release from Dibang Multipurpose Project and resulting discharge/water level series in Brahmaputra near Dibrugarh
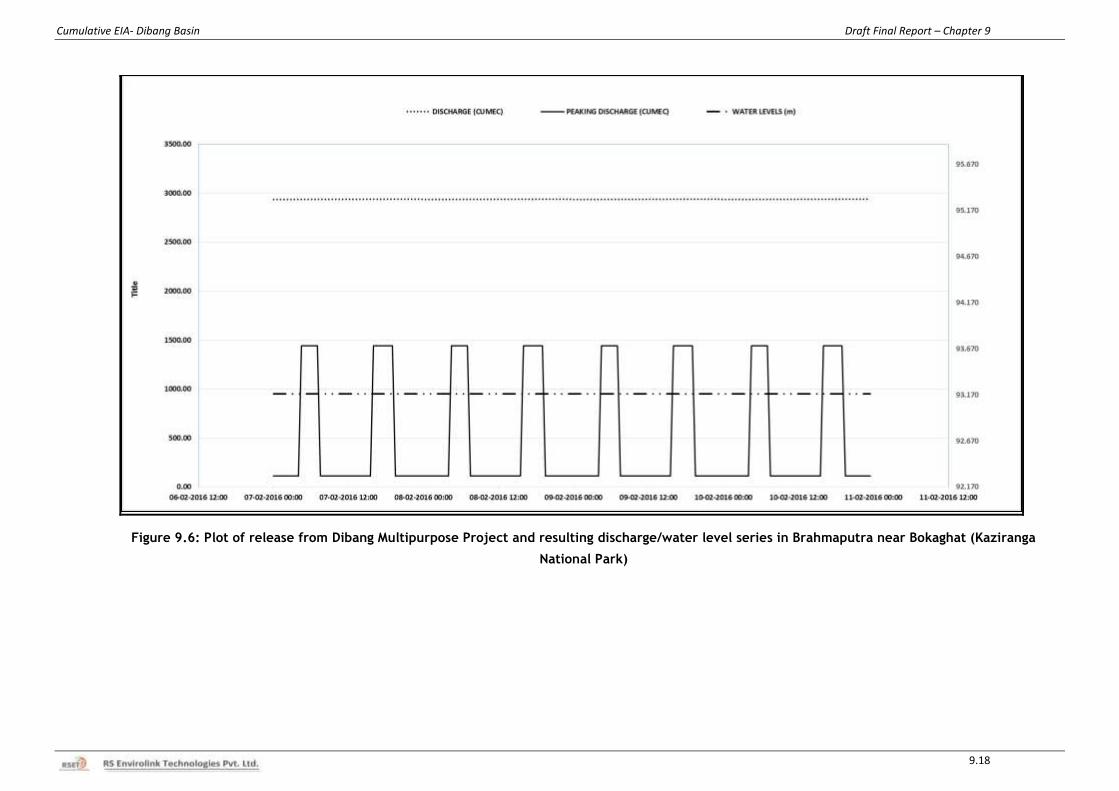
Cumulative EIA- Dibang Basin Draft Final Report – Chapter 9
9.18
Figure 9.6: Plot of release from Dibang Multipurpose Project and resulting discharge/water level series in Brahmaputra near Bokaghat (Kaziranga
National Park)
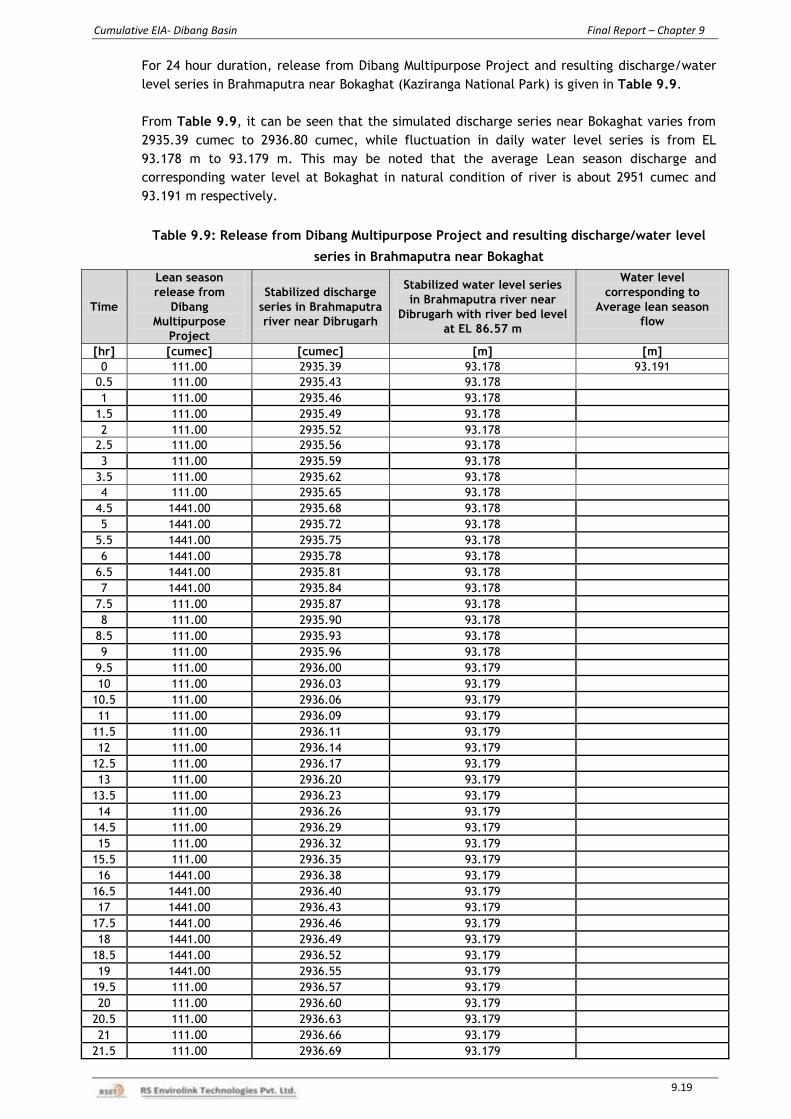
Cumulative EIA- Dibang Basin Final Report – Chapter 9
9.19
For 24 hour duration, release from Dibang Multipurpose Project and resulting discharge/water
level series in Brahmaputra near Bokaghat (Kaziranga National Park) is given in Table 9.9.
From Table 9.9, it can be seen that the simulated discharge series near Bokaghat varies from
2935.39 cumec to 2936.80 cumec, while fluctuation in daily water level series is from EL
93.178 m to 93.179 m. This may be noted that the average Lean season discharge and
corresponding water level at Bokaghat in natural condition of river is about 2951 cumec and
93.191 m respectively.
Table 9.9: Release from Dibang Multipurpose Project and resulting discharge/water level
series in Brahmaputra near Bokaghat
Time
Lean season
release from
Dibang
Multipurpose
Project
Stabilized discharge
series in Brahmaputra
river near Dibrugarh
Stabilized water level series
in Brahmaputra river near
Dibrugarh with river bed level
at EL 86.57 m
Water level
corresponding to
Average lean season
flow
[hr] [cumec] [cumec] [m] [m]
0 111.00 2935.39 93.178 93.191
0.5 111.00 2935.43 93.178
1 111.00 2935.46 93.178
1.5 111.00 2935.49 93.178
2 111.00 2935.52 93.178
2.5 111.00 2935.56 93.178
3 111.00 2935.59 93.178
3.5 111.00 2935.62 93.178
4 111.00 2935.65 93.178
4.5 1441.00 2935.68 93.178
5 1441.00 2935.72 93.178
5.5 1441.00 2935.75 93.178
6 1441.00 2935.78 93.178
6.5 1441.00 2935.81 93.178
7 1441.00 2935.84 93.178
7.5 111.00 2935.87 93.178
8 111.00 2935.90 93.178
8.5 111.00 2935.93 93.178
9 111.00 2935.96 93.178
9.5 111.00 2936.00 93.179
10 111.00 2936.03 93.179
10.5 111.00 2936.06 93.179
11 111.00 2936.09 93.179
11.5 111.00 2936.11 93.179
12 111.00 2936.14 93.179
12.5 111.00 2936.17 93.179
13 111.00 2936.20 93.179
13.5 111.00 2936.23 93.179
14 111.00 2936.26 93.179
14.5 111.00 2936.29 93.179
15 111.00 2936.32 93.179
15.5 111.00 2936.35 93.179
16 1441.00 2936.38 93.179
16.5 1441.00 2936.40 93.179
17 1441.00 2936.43 93.179
17.5 1441.00 2936.46 93.179
18 1441.00 2936.49 93.179
18.5 1441.00 2936.52 93.179
19 1441.00 2936.55 93.179
19.5 111.00 2936.57 93.179
20 111.00 2936.60 93.179
20.5 111.00 2936.63 93.179
21 111.00 2936.66 93.179
21.5 111.00 2936.69 93.179
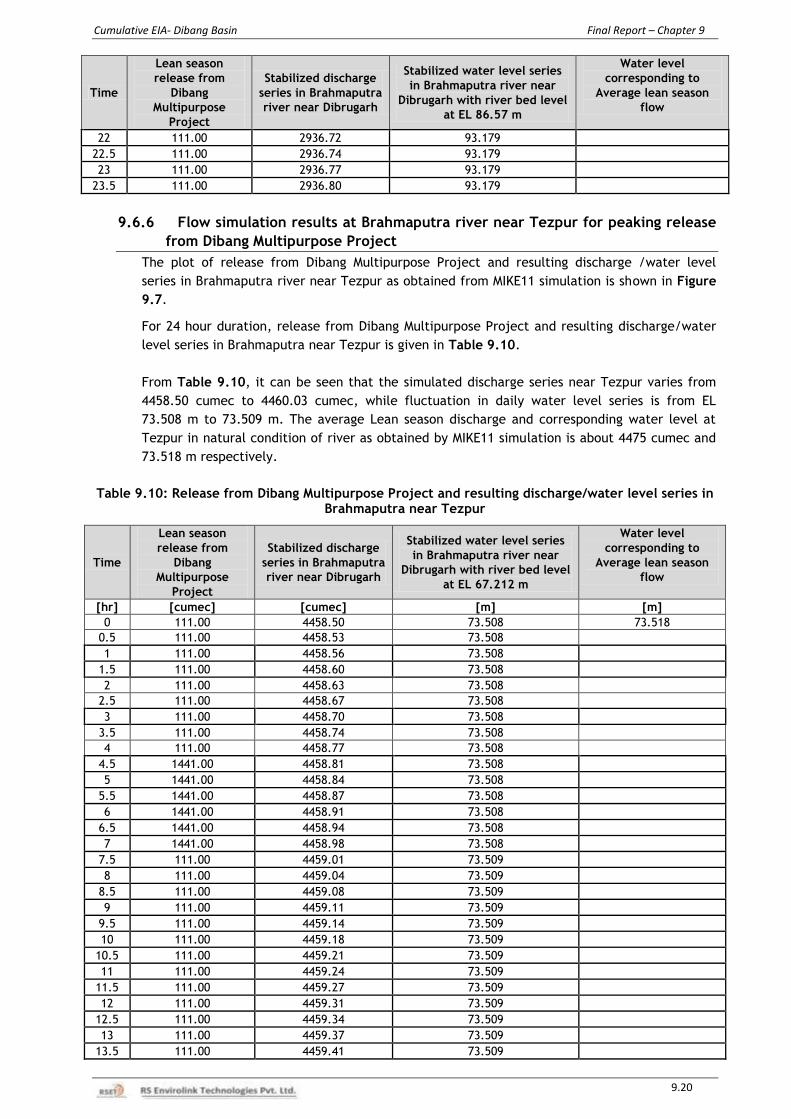
Cumulative EIA- Dibang Basin Final Report – Chapter 9
9.20
Time
Lean season
release from
Dibang
Multipurpose
Project
Stabilized discharge
series in Brahmaputra
river near Dibrugarh
Stabilized water level series
in Brahmaputra river near
Dibrugarh with river bed level
at EL 86.57 m
Water level
corresponding to
Average lean season
flow
22 111.00 2936.72 93.179
22.5 111.00 2936.74 93.179
23 111.00 2936.77 93.179
23.5 111.00 2936.80 93.179
9.6.6 Flow simulation results at Brahmaputra river near Tezpur for peaking release
from Dibang Multipurpose Project
The plot of release from Dibang Multipurpose Project and resulting discharge /water level
series in Brahmaputra river near Tezpur as obtained from MIKE11 simulation is shown in Figure
9.7.
For 24 hour duration, release from Dibang Multipurpose Project and resulting discharge/water
level series in Brahmaputra near Tezpur is given in Table 9.10.
From Table 9.10, it can be seen that the simulated discharge series near Tezpur varies from
4458.50 cumec to 4460.03 cumec, while fluctuation in daily water level series is from EL
73.508 m to 73.509 m. The average Lean season discharge and corresponding water level at
Tezpur in natural condition of river as obtained by MIKE11 simulation is about 4475 cumec and
73.518 m respectively.
Table 9.10: Release from Dibang Multipurpose Project and resulting discharge/water level series in
Brahmaputra near Tezpur
Time
Lean season
release from
Dibang
Multipurpose
Project
Stabilized discharge
series in Brahmaputra
river near Dibrugarh
Stabilized water level series
in Brahmaputra river near
Dibrugarh with river bed level
at EL 67.212 m
Water level
corresponding to
Average lean season
flow
[hr] [cumec] [cumec] [m] [m]
0 111.00 4458.50 73.508 73.518
0.5 111.00 4458.53 73.508
1 111.00 4458.56 73.508
1.5 111.00 4458.60 73.508
2 111.00 4458.63 73.508
2.5 111.00 4458.67 73.508
3 111.00 4458.70 73.508
3.5 111.00 4458.74 73.508
4 111.00 4458.77 73.508
4.5 1441.00 4458.81 73.508
5 1441.00 4458.84 73.508
5.5 1441.00 4458.87 73.508
6 1441.00 4458.91 73.508
6.5 1441.00 4458.94 73.508
7 1441.00 4458.98 73.508
7.5 111.00 4459.01 73.509
8 111.00 4459.04 73.509
8.5 111.00 4459.08 73.509
9 111.00 4459.11 73.509
9.5 111.00 4459.14 73.509
10 111.00 4459.18 73.509
10.5 111.00 4459.21 73.509
11 111.00 4459.24 73.509
11.5 111.00 4459.27 73.509
12 111.00 4459.31 73.509
12.5 111.00 4459.34 73.509
13 111.00 4459.37 73.509
13.5 111.00 4459.41 73.509
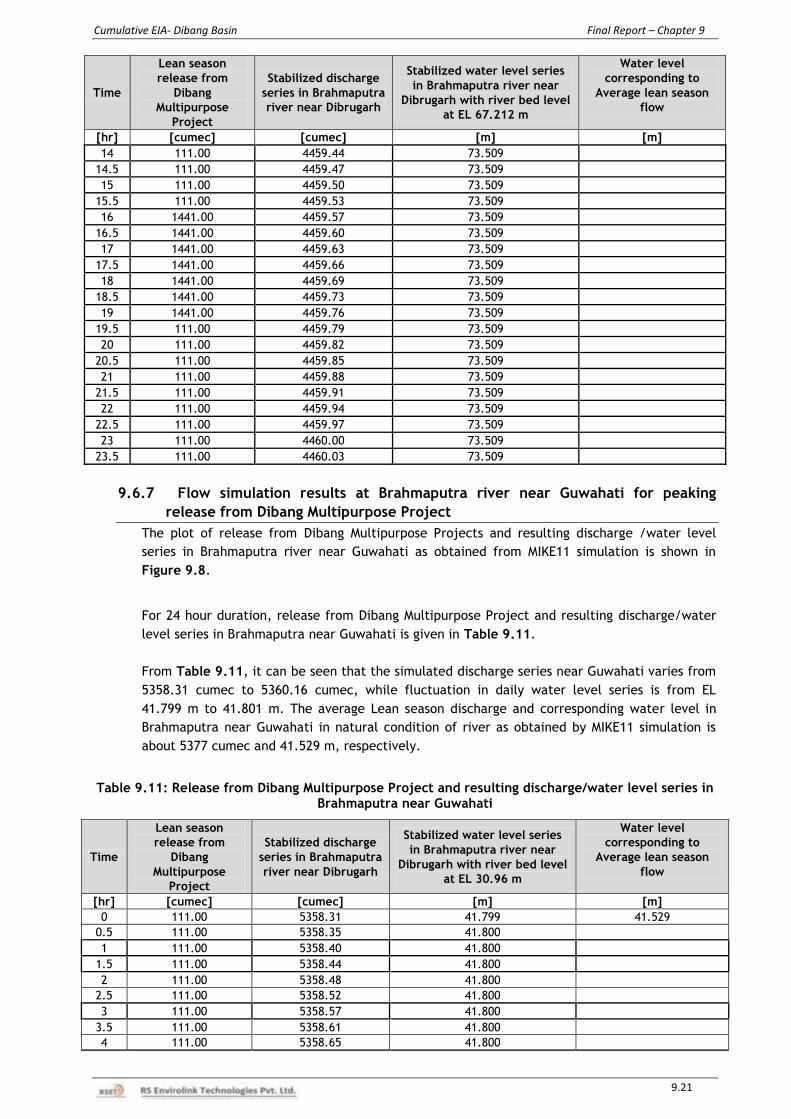
Cumulative EIA- Dibang Basin Final Report – Chapter 9
9.21
Time
Lean season
release from
Dibang
Multipurpose
Project
Stabilized discharge
series in Brahmaputra
river near Dibrugarh
Stabilized water level series
in Brahmaputra river near
Dibrugarh with river bed level
at EL 67.212 m
Water level
corresponding to
Average lean season
flow
[hr] [cumec] [cumec] [m] [m]
14 111.00 4459.44 73.509
14.5 111.00 4459.47 73.509
15 111.00 4459.50 73.509
15.5 111.00 4459.53 73.509
16 1441.00 4459.57 73.509
16.5 1441.00 4459.60 73.509
17 1441.00 4459.63 73.509
17.5 1441.00 4459.66 73.509
18 1441.00 4459.69 73.509
18.5 1441.00 4459.73 73.509
19 1441.00 4459.76 73.509
19.5 111.00 4459.79 73.509
20 111.00 4459.82 73.509
20.5 111.00 4459.85 73.509
21 111.00 4459.88 73.509
21.5 111.00 4459.91 73.509
22 111.00 4459.94 73.509
22.5 111.00 4459.97 73.509
23 111.00 4460.00 73.509
23.5 111.00 4460.03 73.509
9.6.7 Flow simulation results at Brahmaputra river near Guwahati for peaking
release from Dibang Multipurpose Project
The plot of release from Dibang Multipurpose Projects and resulting discharge /water level
series in Brahmaputra river near Guwahati as obtained from MIKE11 simulation is shown in
Figure 9.8.
For 24 hour duration, release from Dibang Multipurpose Project and resulting discharge/water
level series in Brahmaputra near Guwahati is given in Table 9.11.
From Table 9.11, it can be seen that the simulated discharge series near Guwahati varies from
5358.31 cumec to 5360.16 cumec, while fluctuation in daily water level series is from EL
41.799 m to 41.801 m. The average Lean season discharge and corresponding water level in
Brahmaputra near Guwahati in natural condition of river as obtained by MIKE11 simulation is
about 5377 cumec and 41.529 m, respectively.
Table 9.11: Release from Dibang Multipurpose Project and resulting discharge/water level series in Brahmaputra near Guwahati
Time
Lean season
release from
Dibang
Multipurpose
Project
Stabilized discharge
series in Brahmaputra
river near Dibrugarh
Stabilized water level series
in Brahmaputra river near
Dibrugarh with river bed level
at EL 30.96 m
Water level
corresponding to
Average lean season
flow
[hr] [cumec] [cumec] [m] [m]
0 111.00 5358.31 41.799 41.529
0.5 111.00 5358.35 41.800
1 111.00 5358.40 41.800
1.5 111.00 5358.44 41.800
2 111.00 5358.48 41.800
2.5 111.00 5358.52 41.800
3 111.00 5358.57 41.800
3.5 111.00 5358.61 41.800
4 111.00 5358.65 41.800
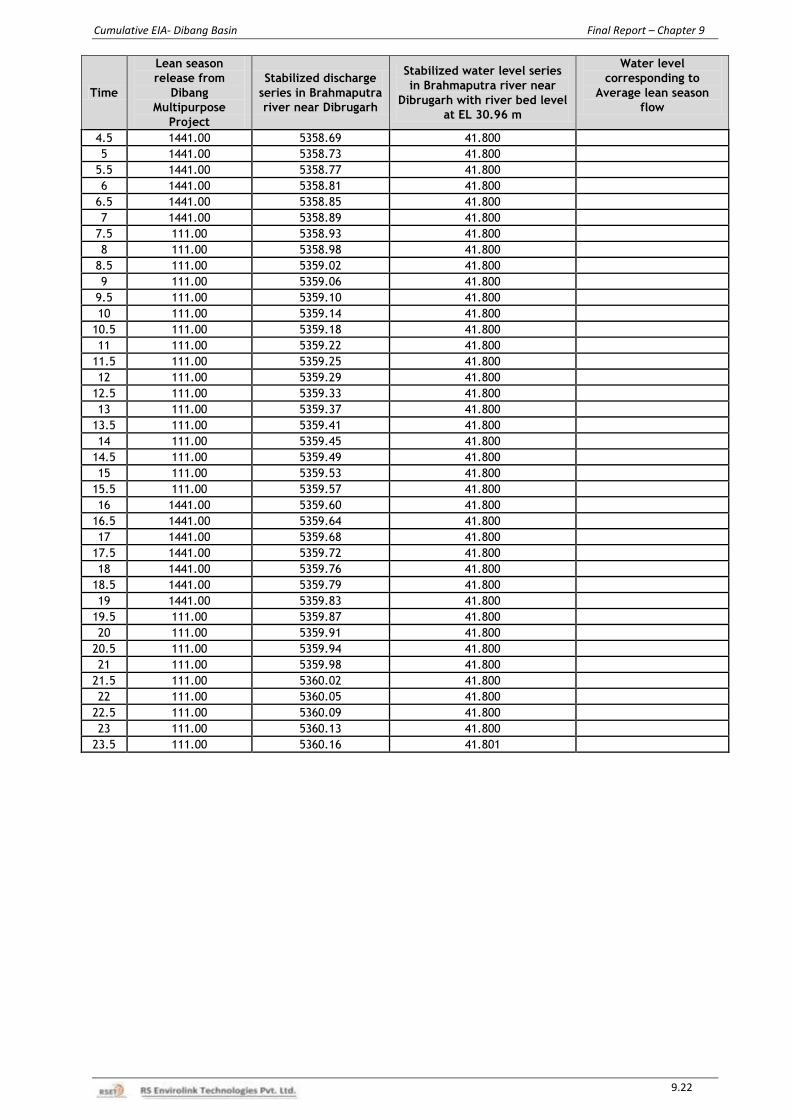
Cumulative EIA- Dibang Basin Final Report – Chapter 9
9.22
Time
Lean season
release from
Dibang
Multipurpose
Project
Stabilized discharge
series in Brahmaputra
river near Dibrugarh
Stabilized water level series
in Brahmaputra river near
Dibrugarh with river bed level
at EL 30.96 m
Water level
corresponding to
Average lean season
flow
4.5 1441.00 5358.69 41.800
5 1441.00 5358.73 41.800
5.5 1441.00 5358.77 41.800
6 1441.00 5358.81 41.800
6.5 1441.00 5358.85 41.800
7 1441.00 5358.89 41.800
7.5 111.00 5358.93 41.800
8 111.00 5358.98 41.800
8.5 111.00 5359.02 41.800
9 111.00 5359.06 41.800
9.5 111.00 5359.10 41.800
10 111.00 5359.14 41.800
10.5 111.00 5359.18 41.800
11 111.00 5359.22 41.800
11.5 111.00 5359.25 41.800
12 111.00 5359.29 41.800
12.5 111.00 5359.33 41.800
13 111.00 5359.37 41.800
13.5 111.00 5359.41 41.800
14 111.00 5359.45 41.800
14.5 111.00 5359.49 41.800
15 111.00 5359.53 41.800
15.5 111.00 5359.57 41.800
16 1441.00 5359.60 41.800
16.5 1441.00 5359.64 41.800
17 1441.00 5359.68 41.800
17.5 1441.00 5359.72 41.800
18 1441.00 5359.76 41.800
18.5 1441.00 5359.79 41.800
19 1441.00 5359.83 41.800
19.5 111.00 5359.87 41.800
20 111.00 5359.91 41.800
20.5 111.00 5359.94 41.800
21 111.00 5359.98 41.800
21.5 111.00 5360.02 41.800
22 111.00 5360.05 41.800
22.5 111.00 5360.09 41.800
23 111.00 5360.13 41.800
23.5 111.00 5360.16 41.801
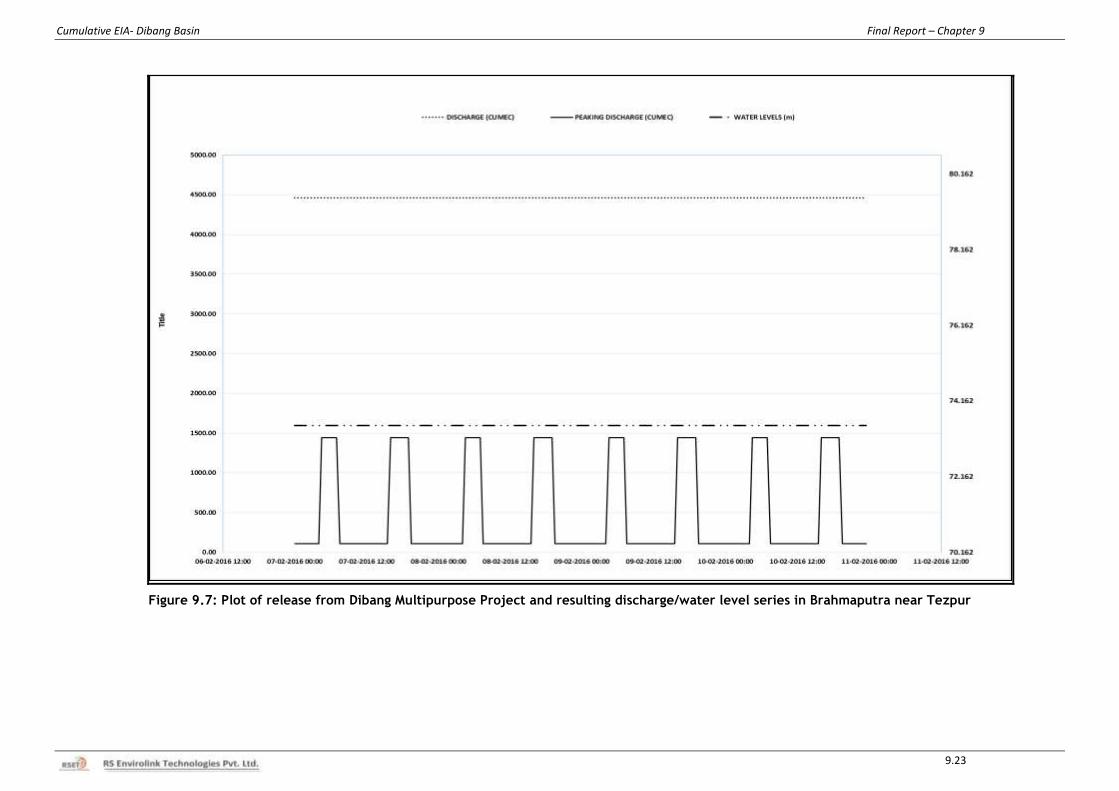
Cumulative EIA- Dibang Basin Final Report – Chapter 9
9.23
Figure 9.7: Plot of release from Dibang Multipurpose Project and resulting discharge/water level series in Brahmaputra near Tezpur
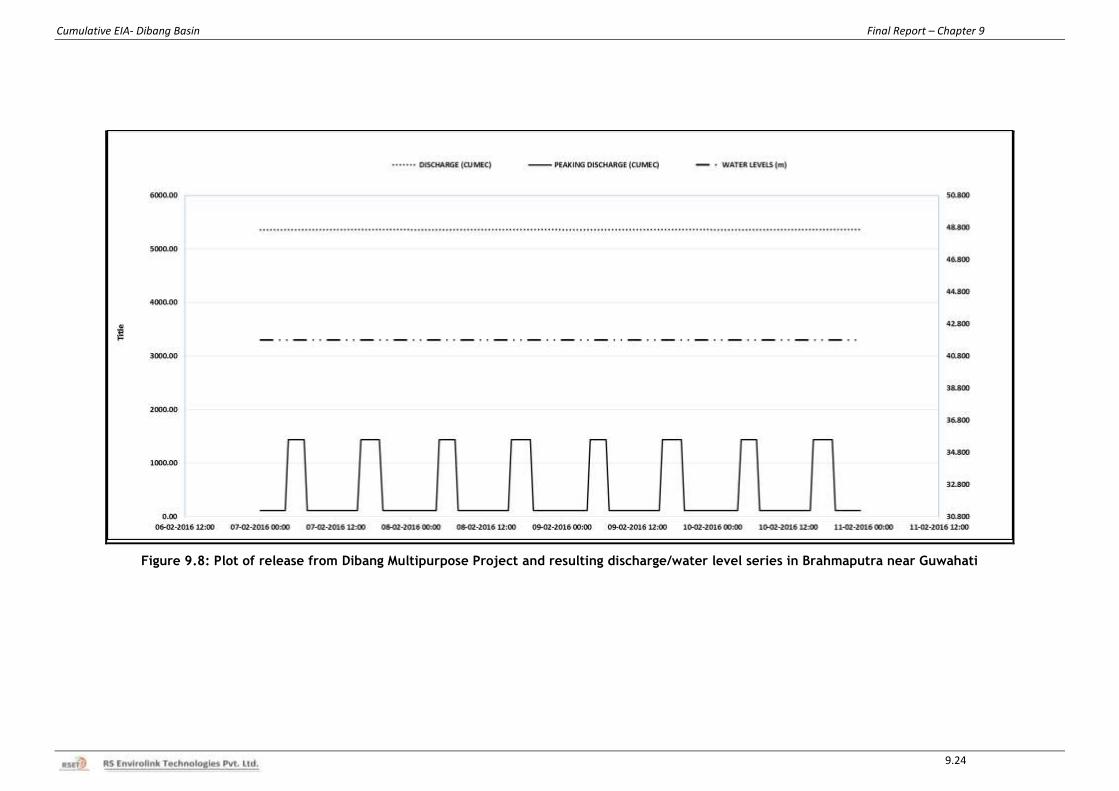
Cumulative EIA- Dibang Basin Final Report – Chapter 9
9.24
Figure 9.8: Plot of release from Dibang Multipurpose Project and resulting discharge/water level series in Brahmaputra near Guwahati
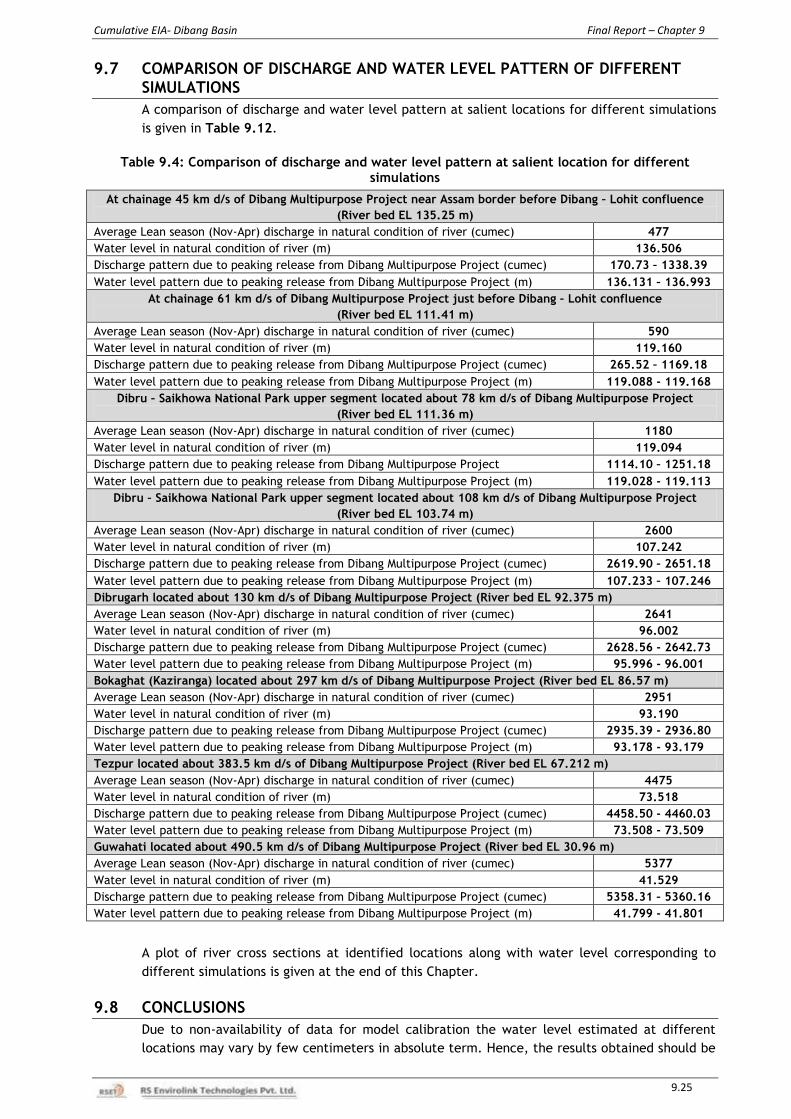
Cumulative EIA- Dibang Basin Final Report – Chapter 9
9.25
9.7 COMPARISON OF DISCHARGE AND WATER LEVEL PATTERN OF DIFFERENT
SIMULATIONS
A comparison of discharge and water level pattern at salient locations for different simulations
is given in Table 9.12.
Table 9.4: Comparison of discharge and water level pattern at salient location for different
simulations
At chainage 45 km d/s of Dibang Multipurpose Project near Assam border before Dibang – Lohit confluence
(River bed EL 135.25 m)
Average Lean season (Nov-Apr) discharge in natural condition of river (cumec) 477
Water level in natural condition of river (m) 136.506
Discharge pattern due to peaking release from Dibang Multipurpose Project (cumec) 170.73 – 1338.39
Water level pattern due to peaking release from Dibang Multipurpose Project (m) 136.131 – 136.993
At chainage 61 km d/s of Dibang Multipurpose Project just before Dibang – Lohit confluence
(River bed EL 111.41 m)
Average Lean season (Nov-Apr) discharge in natural condition of river (cumec) 590
Water level in natural condition of river (m) 119.160
Discharge pattern due to peaking release from Dibang Multipurpose Project (cumec) 265.52 – 1169.18
Water level pattern due to peaking release from Dibang Multipurpose Project (m) 119.088 - 119.168
Dibru – Saikhowa National Park upper segment located about 78 km d/s of Dibang Multipurpose Project
(River bed EL 111.36 m)
Average Lean season (Nov-Apr) discharge in natural condition of river (cumec) 1180
Water level in natural condition of river (m) 119.094
Discharge pattern due to peaking release from Dibang Multipurpose Project 1114.10 – 1251.18
Water level pattern due to peaking release from Dibang Multipurpose Project (m) 119.028 - 119.113
Dibru – Saikhowa National Park upper segment located about 108 km d/s of Dibang Multipurpose Project
(River bed EL 103.74 m)
Average Lean season (Nov-Apr) discharge in natural condition of river (cumec) 2600
Water level in natural condition of river (m) 107.242
Discharge pattern due to peaking release from Dibang Multipurpose Project (cumec) 2619.90 – 2651.18
Water level pattern due to peaking release from Dibang Multipurpose Project (m) 107.233 – 107.246
Dibrugarh located about 130 km d/s of Dibang Multipurpose Project (River bed EL 92.375 m)
Average Lean season (Nov-Apr) discharge in natural condition of river (cumec) 2641
Water level in natural condition of river (m) 96.002
Discharge pattern due to peaking release from Dibang Multipurpose Project (cumec) 2628.56 - 2642.73
Water level pattern due to peaking release from Dibang Multipurpose Project (m) 95.996 - 96.001
Bokaghat (Kaziranga) located about 297 km d/s of Dibang Multipurpose Project (River bed EL 86.57 m)
Average Lean season (Nov-Apr) discharge in natural condition of river (cumec) 2951
Water level in natural condition of river (m) 93.190
Discharge pattern due to peaking release from Dibang Multipurpose Project (cumec) 2935.39 - 2936.80
Water level pattern due to peaking release from Dibang Multipurpose Project (m) 93.178 - 93.179
Tezpur located about 383.5 km d/s of Dibang Multipurpose Project (River bed EL 67.212 m)
Average Lean season (Nov-Apr) discharge in natural condition of river (cumec) 4475
Water level in natural condition of river (m) 73.518
Discharge pattern due to peaking release from Dibang Multipurpose Project (cumec) 4458.50 - 4460.03
Water level pattern due to peaking release from Dibang Multipurpose Project (m) 73.508 - 73.509
Guwahati located about 490.5 km d/s of Dibang Multipurpose Project (River bed EL 30.96 m)
Average Lean season (Nov-Apr) discharge in natural condition of river (cumec) 5377
Water level in natural condition of river (m) 41.529
Discharge pattern due to peaking release from Dibang Multipurpose Project (cumec) 5358.31 – 5360.16
Water level pattern due to peaking release from Dibang Multipurpose Project (m) 41.799 - 41.801
A plot of river cross sections at identified locations along with water level corresponding to
different simulations is given at the end of this Chapter.
9.8 CONCLUSIONS
Due to non-availability of data for model calibration the water level estimated at different
locations may vary by few centimeters in absolute term. Hence, the results obtained should be
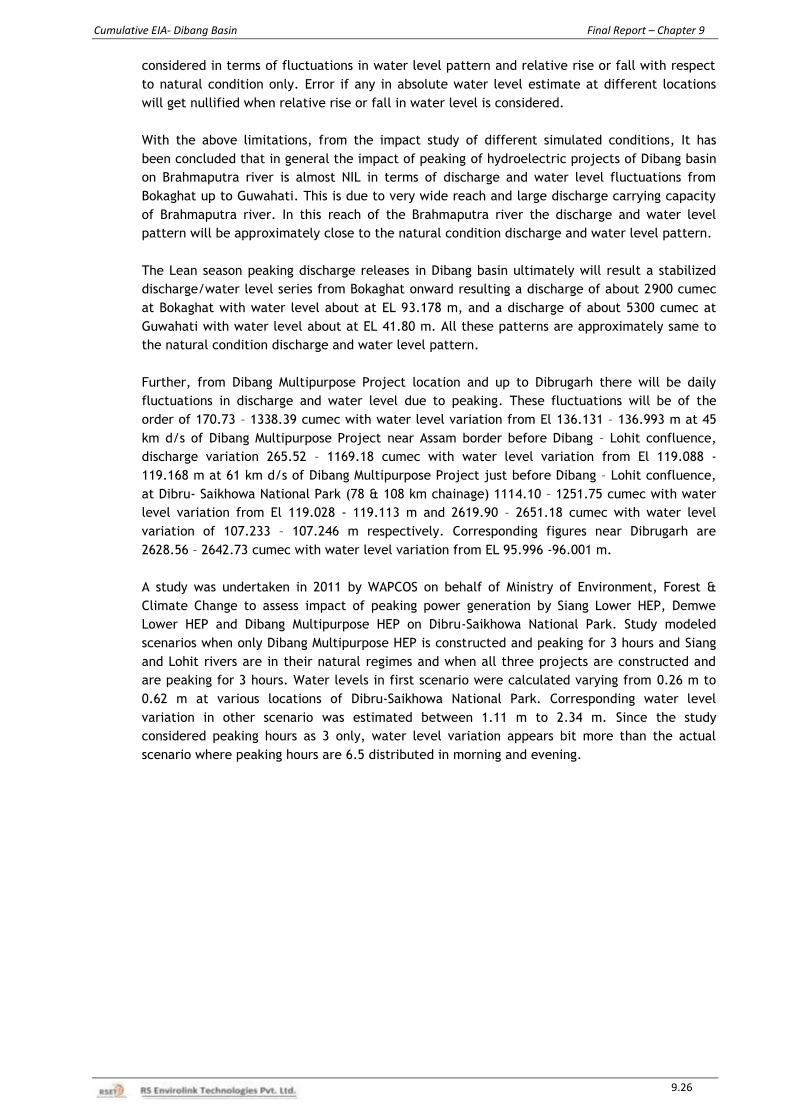
Cumulative EIA- Dibang Basin Final Report – Chapter 9
9.26
considered in terms of fluctuations in water level pattern and relative rise or fall with respect
to natural condition only. Error if any in absolute water level estimate at different locations
will get nullified when relative rise or fall in water level is considered.
With the above limitations, from the impact study of different simulated conditions, It has
been concluded that in general the impact of peaking of hydroelectric projects of Dibang basin
on Brahmaputra river is almost NIL in terms of discharge and water level fluctuations from
Bokaghat up to Guwahati. This is due to very wide reach and large discharge carrying capacity
of Brahmaputra river. In this reach of the Brahmaputra river the discharge and water level
pattern will be approximately close to the natural condition discharge and water level pattern.
The Lean season peaking discharge releases in Dibang basin ultimately will result a stabilized
discharge/water level series from Bokaghat onward resulting a discharge of about 2900 cumec
at Bokaghat with water level about at EL 93.178 m, and a discharge of about 5300 cumec at
Guwahati with water level about at EL 41.80 m. All these patterns are approximately same to
the natural condition discharge and water level pattern.
Further, from Dibang Multipurpose Project location and up to Dibrugarh there will be daily
fluctuations in discharge and water level due to peaking. These fluctuations will be of the
order of 170.73 – 1338.39 cumec with water level variation from El 136.131 – 136.993 m at 45
km d/s of Dibang Multipurpose Project near Assam border before Dibang – Lohit confluence,
discharge variation 265.52 – 1169.18 cumec with water level variation from El 119.088 -
119.168 m at 61 km d/s of Dibang Multipurpose Project just before Dibang – Lohit confluence,
at Dibru- Saikhowa National Park (78 & 108 km chainage) 1114.10 – 1251.75 cumec with water
level variation from El 119.028 - 119.113 m and 2619.90 – 2651.18 cumec with water level
variation of 107.233 – 107.246 m respectively. Corresponding figures near Dibrugarh are
2628.56 – 2642.73 cumec with water level variation from EL 95.996 -96.001 m.
A study was undertaken in 2011 by WAPCOS on behalf of Ministry of Environment, Forest &
Climate Change to assess impact of peaking power generation by Siang Lower HEP, Demwe
Lower HEP and Dibang Multipurpose HEP on Dibru-Saikhowa National Park. Study modeled
scenarios when only Dibang Multipurpose HEP is constructed and peaking for 3 hours and Siang
and Lohit rivers are in their natural regimes and when all three projects are constructed and
are peaking for 3 hours. Water levels in first scenario were calculated varying from 0.26 m to
0.62 m at various locations of Dibru-Saikhowa National Park. Corresponding water level
variation in other scenario was estimated between 1.11 m to 2.34 m. Since the study
considered peaking hours as 3 only, water level variation appears bit more than the actual
scenario where peaking hours are 6.5 distributed in morning and evening.
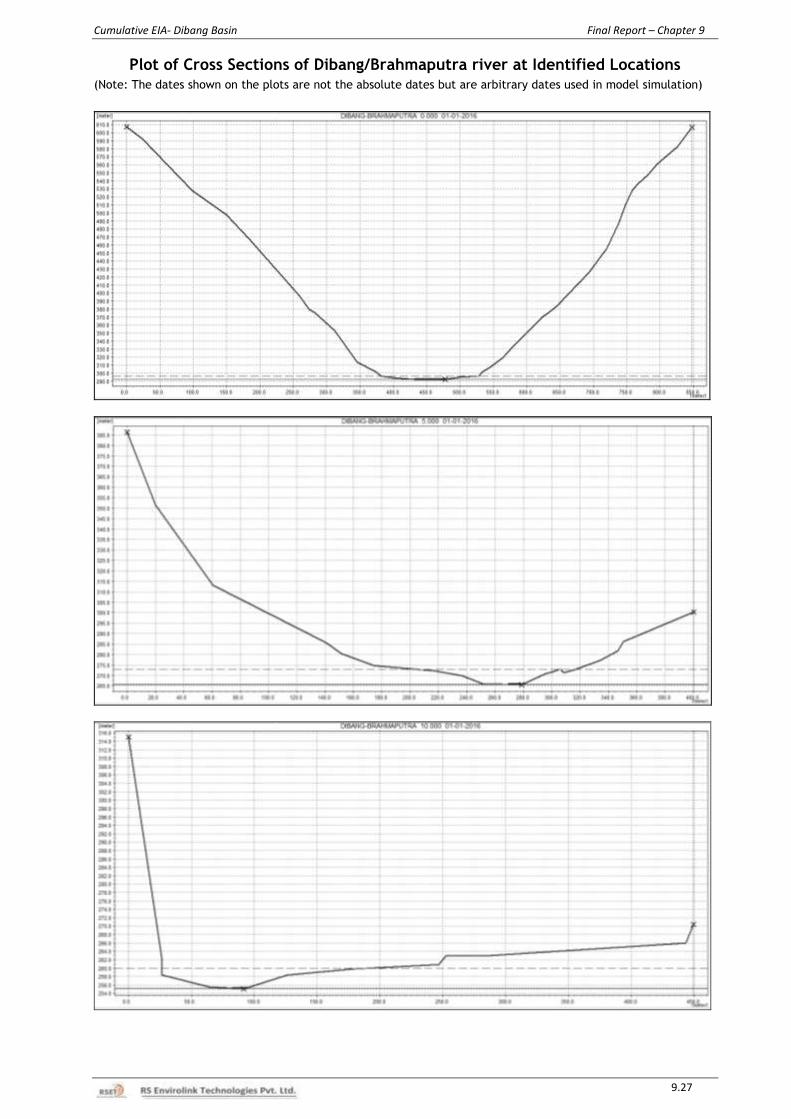
Cumulative EIA- Dibang Basin Final Report – Chapter 9
9.27
Plot of Cross Sections of Dibang/Brahmaputra river at Identified Locations (Note: The dates shown on the plots are not the absolute dates but are arbitrary dates used in model simulation)
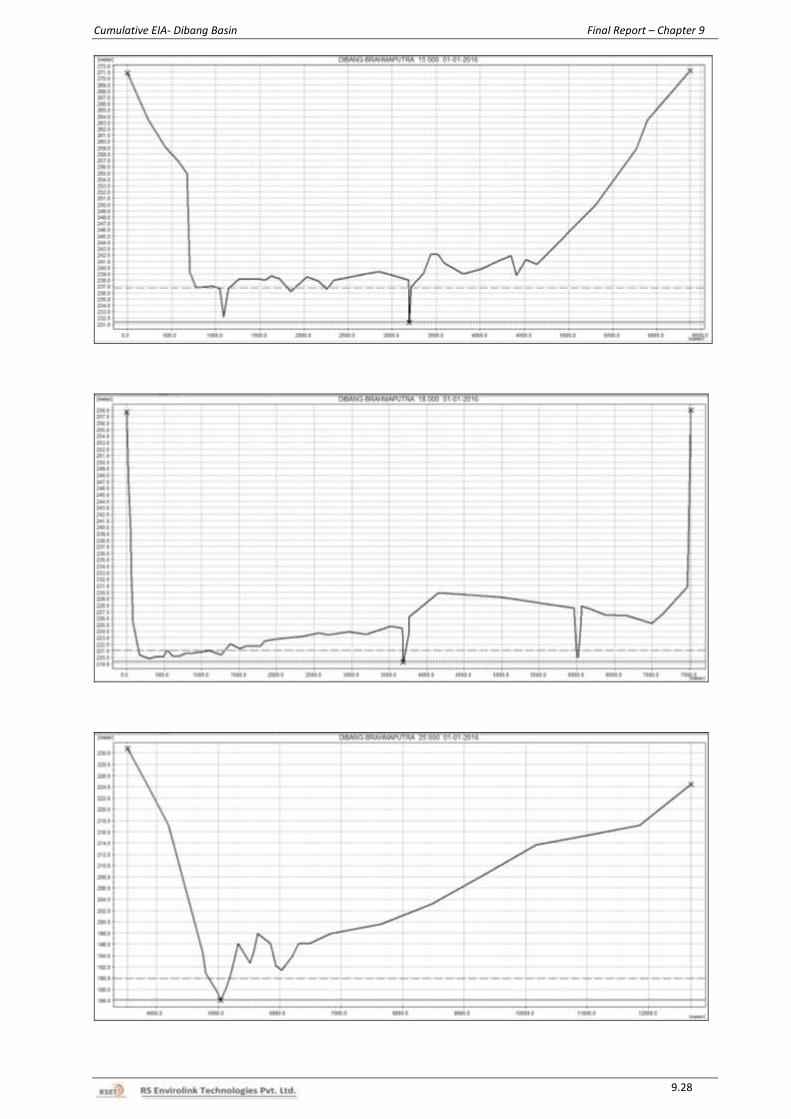
Cumulative EIA- Dibang Basin Final Report – Chapter 9
9.28
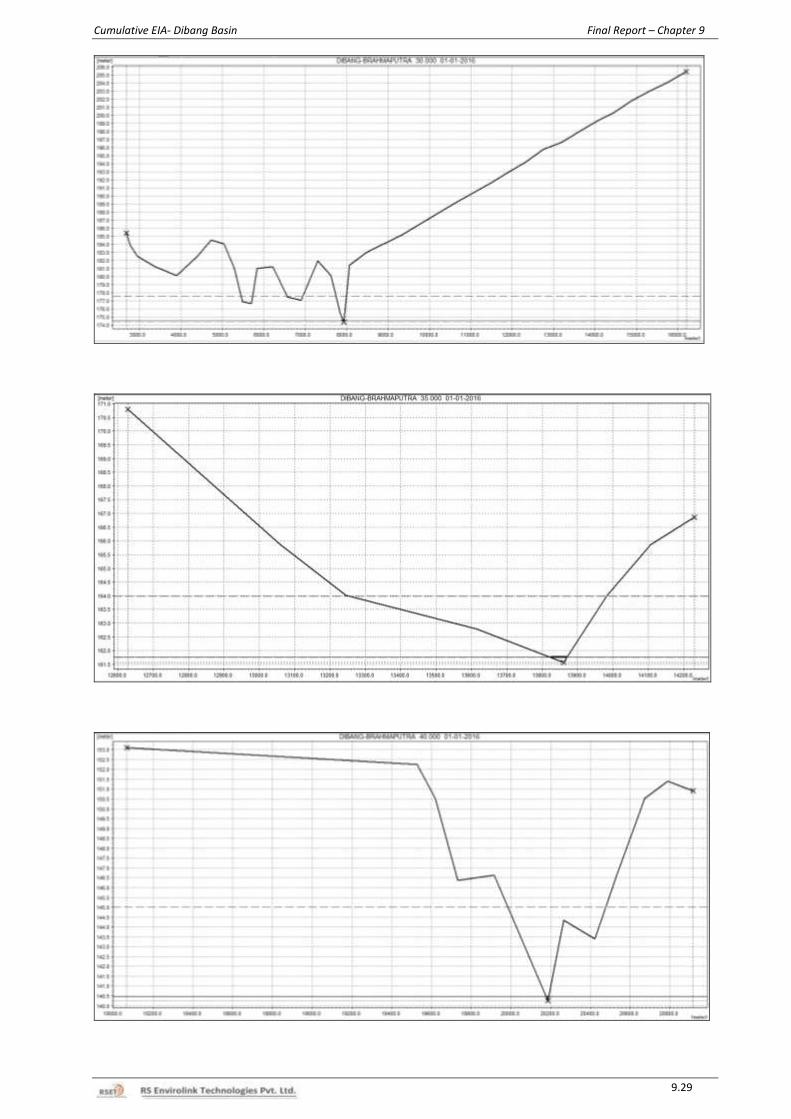
Cumulative EIA- Dibang Basin Final Report – Chapter 9
9.29
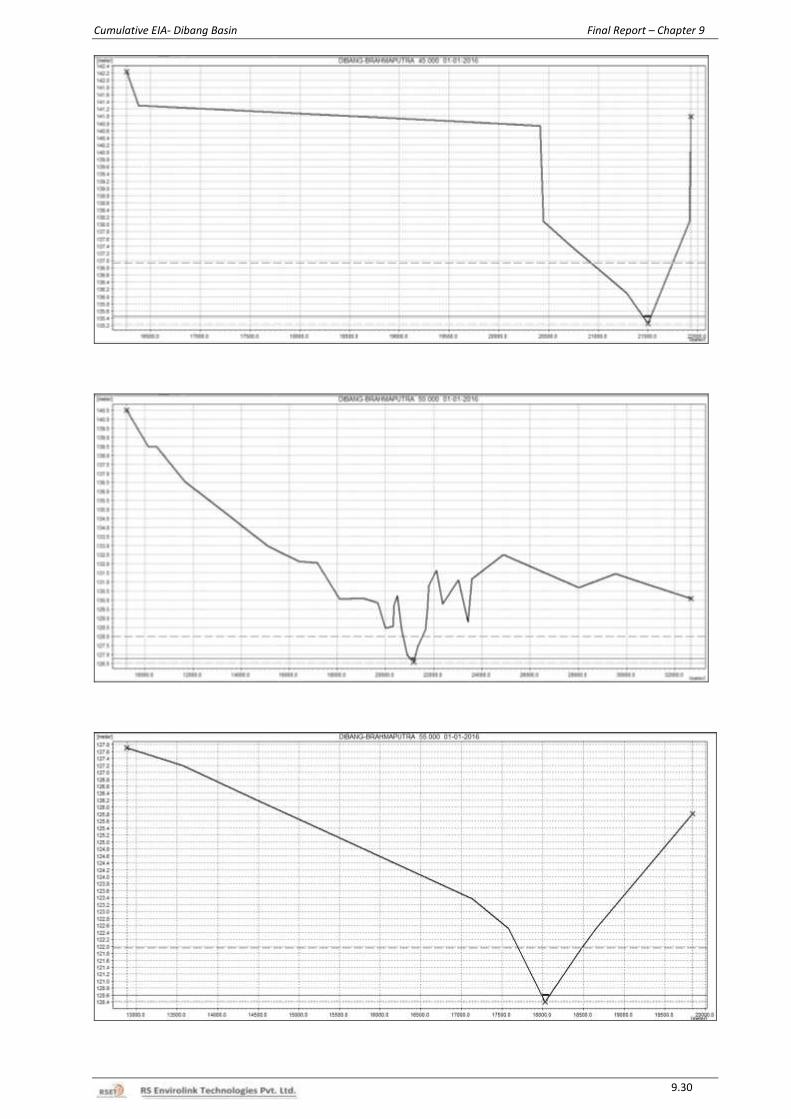
Cumulative EIA- Dibang Basin Final Report – Chapter 9
9.30
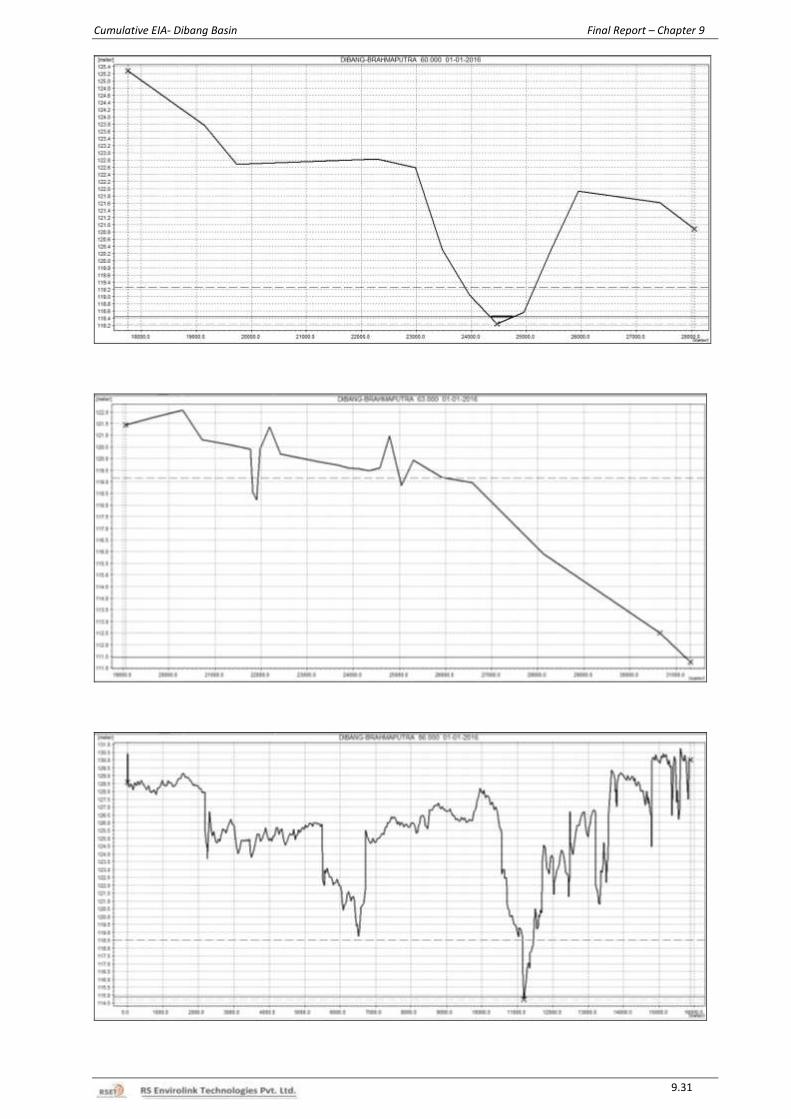
Cumulative EIA- Dibang Basin Final Report – Chapter 9
9.31
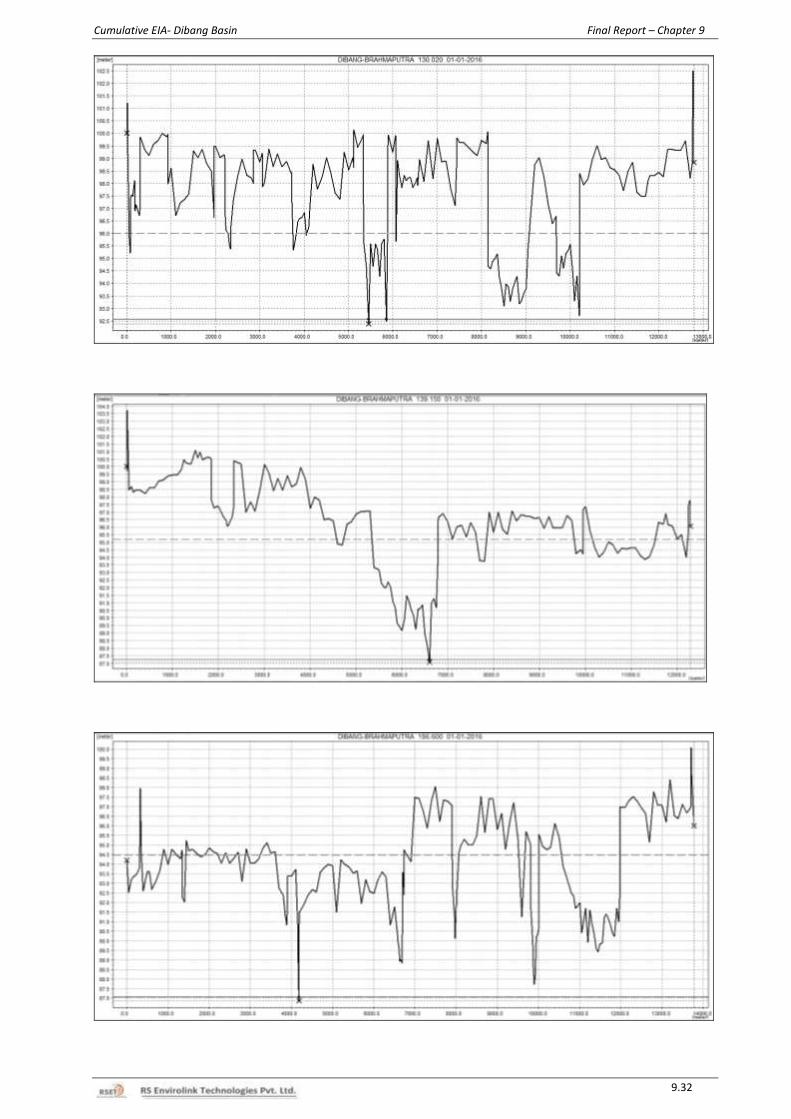
Cumulative EIA- Dibang Basin Final Report – Chapter 9
9.32
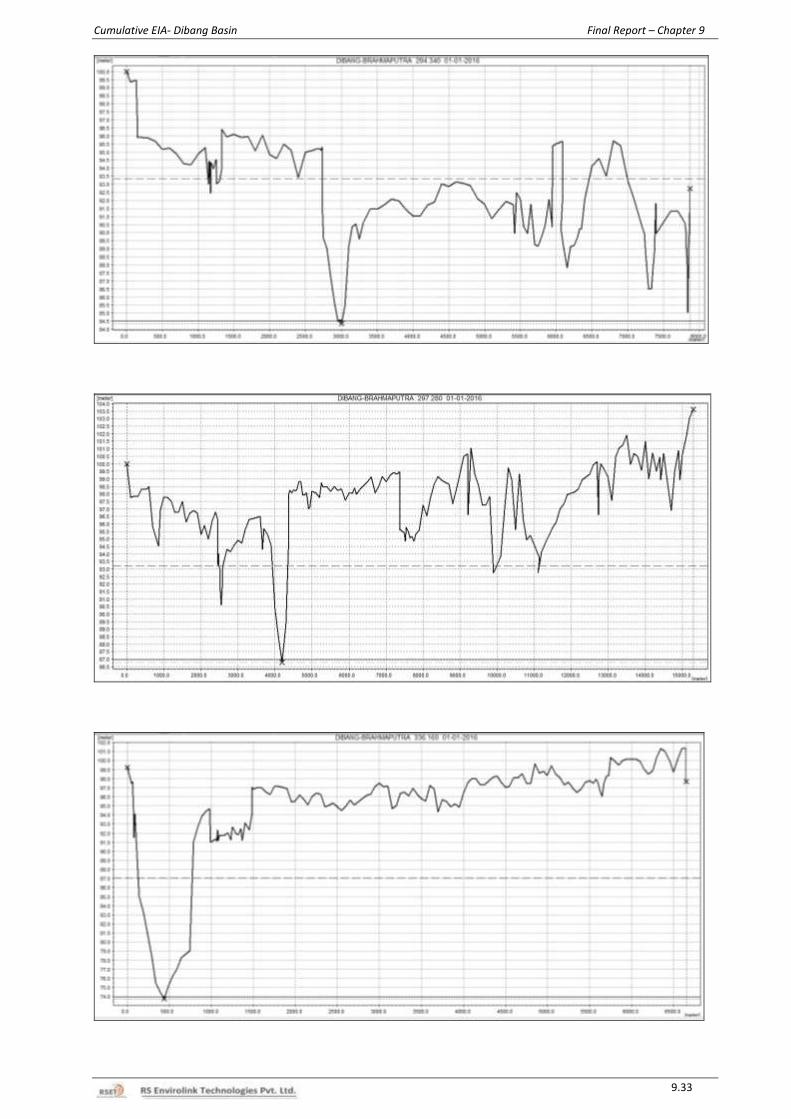
Cumulative EIA- Dibang Basin Final Report – Chapter 9
9.33
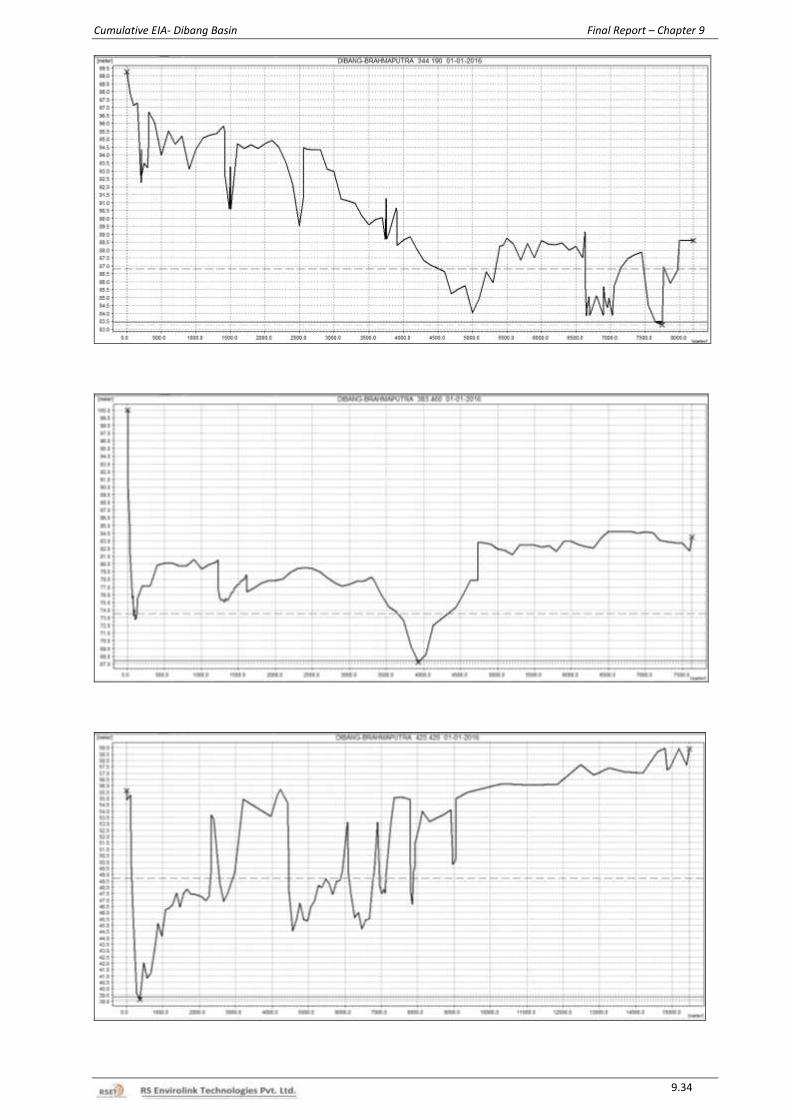
Cumulative EIA- Dibang Basin Final Report – Chapter 9
9.34
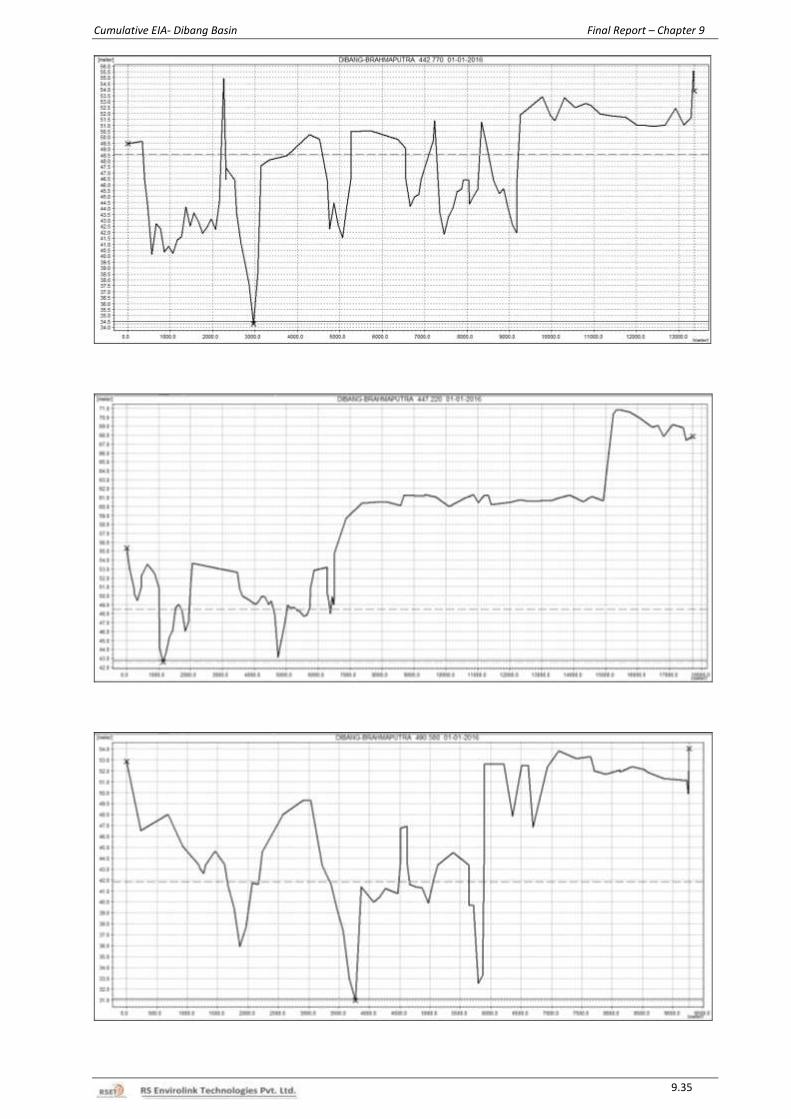
Cumulative EIA- Dibang Basin Final Report – Chapter 9
9.35
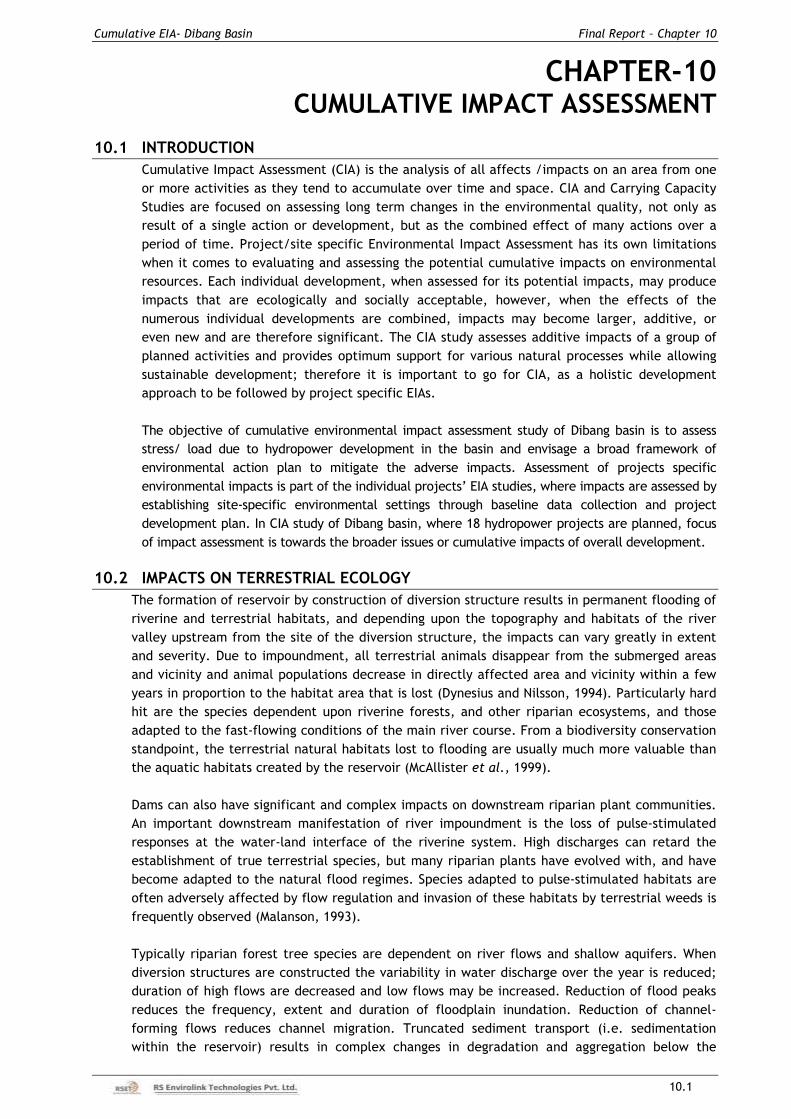
Cumulative EIA- Dibang Basin Final Report – Chapter 10
10.1
CHAPTER-10 CUMULATIVE IMPACT ASSESSMENT
10.1 INTRODUCTION
Cumulative Impact Assessment (CIA) is the analysis of all affects /impacts on an area from one
or more activities as they tend to accumulate over time and space. CIA and Carrying Capacity
Studies are focused on assessing long term changes in the environmental quality, not only as
result of a single action or development, but as the combined effect of many actions over a
period of time. Project/site specific Environmental Impact Assessment has its own limitations
when it comes to evaluating and assessing the potential cumulative impacts on environmental
resources. Each individual development, when assessed for its potential impacts, may produce
impacts that are ecologically and socially acceptable, however, when the effects of the
numerous individual developments are combined, impacts may become larger, additive, or
even new and are therefore significant. The CIA study assesses additive impacts of a group of
planned activities and provides optimum support for various natural processes while allowing
sustainable development; therefore it is important to go for CIA, as a holistic development
approach to be followed by project specific EIAs.
The objective of cumulative environmental impact assessment study of Dibang basin is to assess
stress/ load due to hydropower development in the basin and envisage a broad framework of
environmental action plan to mitigate the adverse impacts. Assessment of projects specific
environmental impacts is part of the individual projects’ EIA studies, where impacts are assessed by
establishing site‐specific environmental settings through baseline data collection and project
development plan. In CIA study of Dibang basin, where 18 hydropower projects are planned, focus
of impact assessment is towards the broader issues or cumulative impacts of overall development.
10.2 IMPACTS ON TERRESTRIAL ECOLOGY
The formation of reservoir by construction of diversion structure results in permanent flooding of
riverine and terrestrial habitats, and depending upon the topography and habitats of the river
valley upstream from the site of the diversion structure, the impacts can vary greatly in extent
and severity. Due to impoundment, all terrestrial animals disappear from the submerged areas
and vicinity and animal populations decrease in directly affected area and vicinity within a few
years in proportion to the habitat area that is lost (Dynesius and Nilsson, 1994). Particularly hard
hit are the species dependent upon riverine forests, and other riparian ecosystems, and those
adapted to the fast-flowing conditions of the main river course. From a biodiversity conservation
standpoint, the terrestrial natural habitats lost to flooding are usually much more valuable than
the aquatic habitats created by the reservoir (McAllister et al., 1999).
Dams can also have significant and complex impacts on downstream riparian plant communities.
An important downstream manifestation of river impoundment is the loss of pulse-stimulated
responses at the water-land interface of the riverine system. High discharges can retard the
establishment of true terrestrial species, but many riparian plants have evolved with, and have
become adapted to the natural flood regimes. Species adapted to pulse-stimulated habitats are
often adversely affected by flow regulation and invasion of these habitats by terrestrial weeds is
frequently observed (Malanson, 1993).
Typically riparian forest tree species are dependent on river flows and shallow aquifers. When
diversion structures are constructed the variability in water discharge over the year is reduced;
duration of high flows are decreased and low flows may be increased. Reduction of flood peaks
reduces the frequency, extent and duration of floodplain inundation. Reduction of channel-
forming flows reduces channel migration. Truncated sediment transport (i.e. sedimentation
within the reservoir) results in complex changes in degradation and aggregation below the
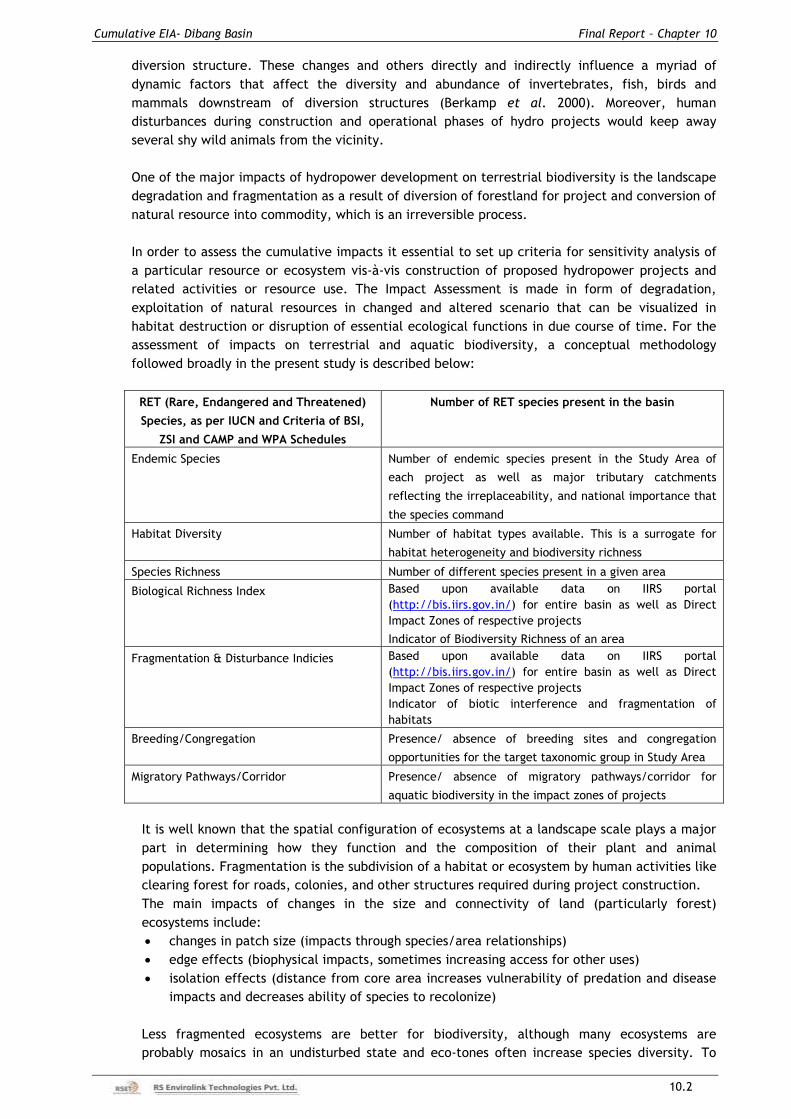
Cumulative EIA- Dibang Basin Final Report – Chapter 10
10.2
diversion structure. These changes and others directly and indirectly influence a myriad of
dynamic factors that affect the diversity and abundance of invertebrates, fish, birds and
mammals downstream of diversion structures (Berkamp et al. 2000). Moreover, human
disturbances during construction and operational phases of hydro projects would keep away
several shy wild animals from the vicinity.
One of the major impacts of hydropower development on terrestrial biodiversity is the landscape
degradation and fragmentation as a result of diversion of forestland for project and conversion of
natural resource into commodity, which is an irreversible process.
In order to assess the cumulative impacts it essential to set up criteria for sensitivity analysis of
a particular resource or ecosystem vis-à-vis construction of proposed hydropower projects and
related activities or resource use. The Impact Assessment is made in form of degradation,
exploitation of natural resources in changed and altered scenario that can be visualized in
habitat destruction or disruption of essential ecological functions in due course of time. For the
assessment of impacts on terrestrial and aquatic biodiversity, a conceptual methodology
followed broadly in the present study is described below:
RET (Rare, Endangered and Threatened)
Species, as per IUCN and Criteria of BSI,
ZSI and CAMP and WPA Schedules
Number of RET species present in the basin
Endemic Species Number of endemic species present in the Study Area of
each project as well as major tributary catchments
reflecting the irreplaceability, and national importance that
the species command
Habitat Diversity Number of habitat types available. This is a surrogate for
habitat heterogeneity and biodiversity richness
Species Richness Number of different species present in a given area
Biological Richness Index Based upon available data on IIRS portal
(http://bis.iirs.gov.in/) for entire basin as well as Direct
Impact Zones of respective projects
Indicator of Biodiversity Richness of an area
Fragmentation & Disturbance Indicies Based upon available data on IIRS portal
(http://bis.iirs.gov.in/) for entire basin as well as Direct
Impact Zones of respective projects
Indicator of biotic interference and fragmentation of
habitats
Breeding/Congregation Presence/ absence of breeding sites and congregation
opportunities for the target taxonomic group in Study Area
Migratory Pathways/Corridor Presence/ absence of migratory pathways/corridor for
aquatic biodiversity in the impact zones of projects
It is well known that the spatial configuration of ecosystems at a landscape scale plays a major
part in determining how they function and the composition of their plant and animal
populations. Fragmentation is the subdivision of a habitat or ecosystem by human activities like
clearing forest for roads, colonies, and other structures required during project construction.
The main impacts of changes in the size and connectivity of land (particularly forest)
ecosystems include:
changes in patch size (impacts through species/area relationships)
edge effects (biophysical impacts, sometimes increasing access for other uses)
isolation effects (distance from core area increases vulnerability of predation and disease
impacts and decreases ability of species to recolonize)
Less fragmented ecosystems are better for biodiversity, although many ecosystems are
probably mosaics in an undisturbed state and eco-tones often increase species diversity. To
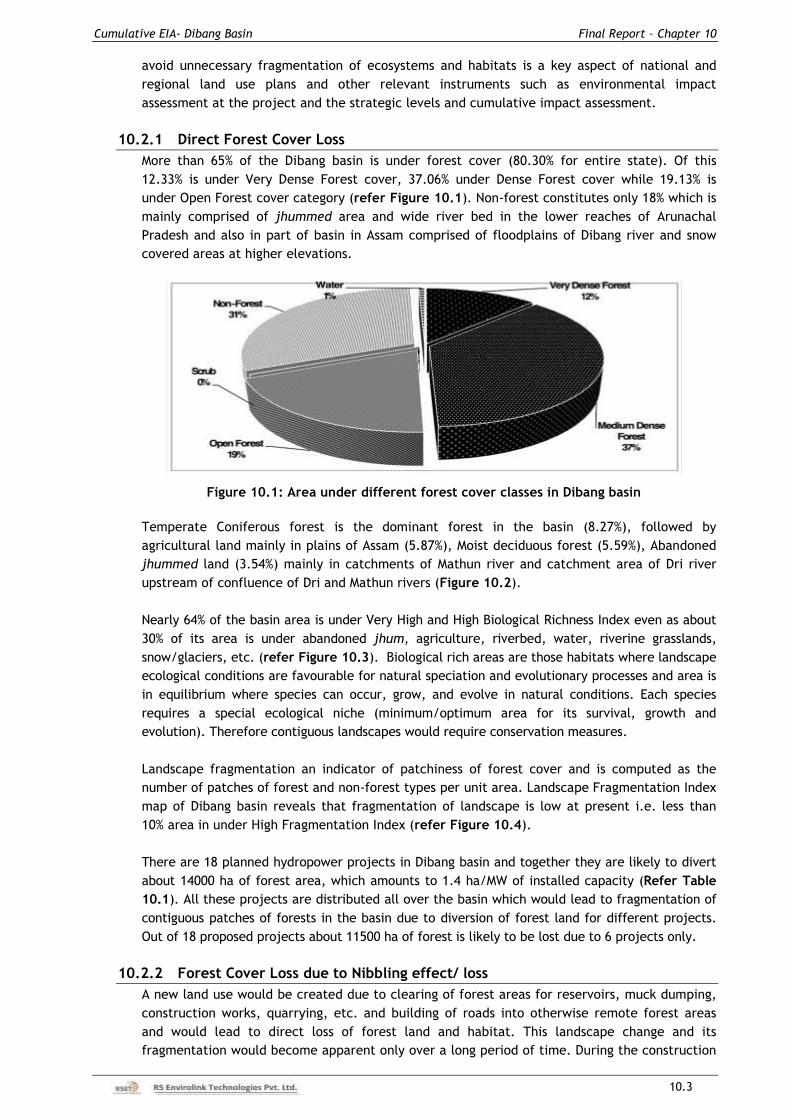
Cumulative EIA- Dibang Basin Final Report – Chapter 10
10.3
avoid unnecessary fragmentation of ecosystems and habitats is a key aspect of national and
regional land use plans and other relevant instruments such as environmental impact
assessment at the project and the strategic levels and cumulative impact assessment.
10.2.1 Direct Forest Cover Loss
More than 65% of the Dibang basin is under forest cover (80.30% for entire state). Of this
12.33% is under Very Dense Forest cover, 37.06% under Dense Forest cover while 19.13% is
under Open Forest cover category (refer Figure 10.1). Non-forest constitutes only 18% which is
mainly comprised of jhummed area and wide river bed in the lower reaches of Arunachal
Pradesh and also in part of basin in Assam comprised of floodplains of Dibang river and snow
covered areas at higher elevations.
Figure 10.1: Area under different forest cover classes in Dibang basin
Temperate Coniferous forest is the dominant forest in the basin (8.27%), followed by
agricultural land mainly in plains of Assam (5.87%), Moist deciduous forest (5.59%), Abandoned
jhummed land (3.54%) mainly in catchments of Mathun river and catchment area of Dri river
upstream of confluence of Dri and Mathun rivers (Figure 10.2).
Nearly 64% of the basin area is under Very High and High Biological Richness Index even as about
30% of its area is under abandoned jhum, agriculture, riverbed, water, riverine grasslands,
snow/glaciers, etc. (refer Figure 10.3). Biological rich areas are those habitats where landscape
ecological conditions are favourable for natural speciation and evolutionary processes and area is
in equilibrium where species can occur, grow, and evolve in natural conditions. Each species
requires a special ecological niche (minimum/optimum area for its survival, growth and
evolution). Therefore contiguous landscapes would require conservation measures.
Landscape fragmentation an indicator of patchiness of forest cover and is computed as the
number of patches of forest and non-forest types per unit area. Landscape Fragmentation Index
map of Dibang basin reveals that fragmentation of landscape is low at present i.e. less than
10% area in under High Fragmentation Index (refer Figure 10.4).
There are 18 planned hydropower projects in Dibang basin and together they are likely to divert
about 14000 ha of forest area, which amounts to 1.4 ha/MW of installed capacity (Refer Table
10.1). All these projects are distributed all over the basin which would lead to fragmentation of
contiguous patches of forests in the basin due to diversion of forest land for different projects.
Out of 18 proposed projects about 11500 ha of forest is likely to be lost due to 6 projects only.
10.2.2 Forest Cover Loss due to Nibbling effect/ loss
A new land use would be created due to clearing of forest areas for reservoirs, muck dumping,
construction works, quarrying, etc. and building of roads into otherwise remote forest areas
and would lead to direct loss of forest land and habitat. This landscape change and its
fragmentation would become apparent only over a long period of time. During the construction
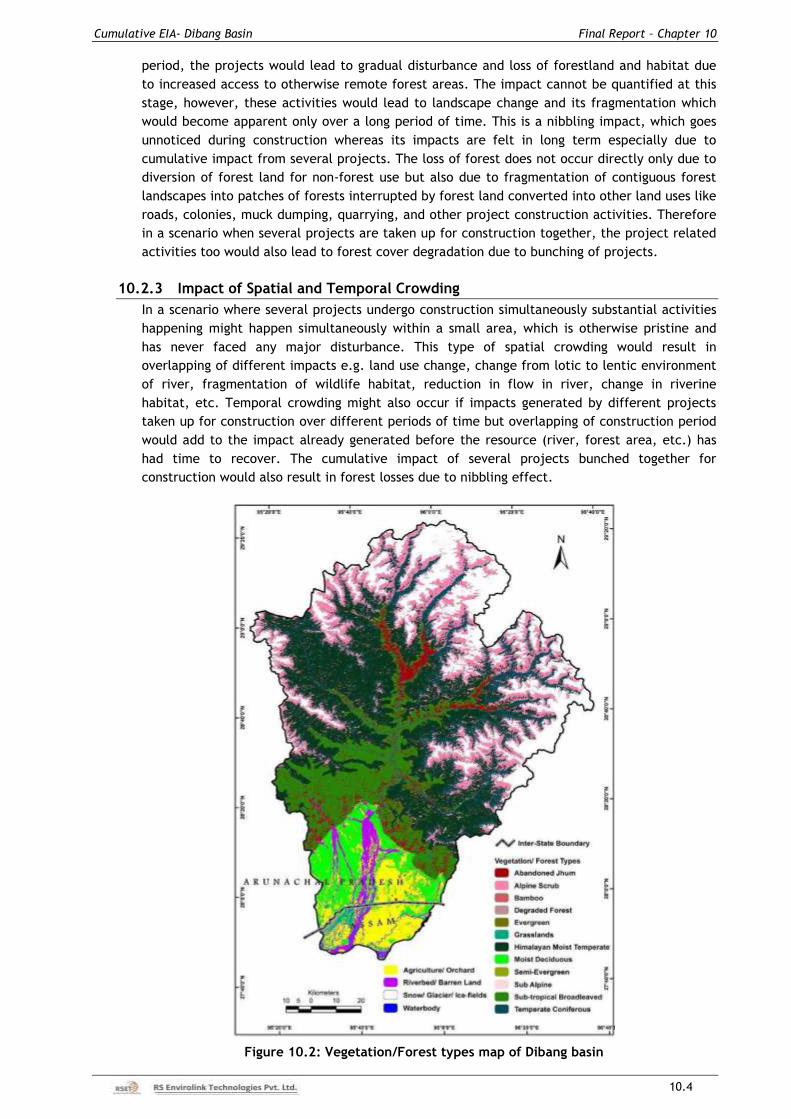
Cumulative EIA- Dibang Basin Final Report – Chapter 10
10.4
period, the projects would lead to gradual disturbance and loss of forestland and habitat due
to increased access to otherwise remote forest areas. The impact cannot be quantified at this
stage, however, these activities would lead to landscape change and its fragmentation which
would become apparent only over a long period of time. This is a nibbling impact, which goes
unnoticed during construction whereas its impacts are felt in long term especially due to
cumulative impact from several projects. The loss of forest does not occur directly only due to
diversion of forest land for non-forest use but also due to fragmentation of contiguous forest
landscapes into patches of forests interrupted by forest land converted into other land uses like
roads, colonies, muck dumping, quarrying, and other project construction activities. Therefore
in a scenario when several projects are taken up for construction together, the project related
activities too would also lead to forest cover degradation due to bunching of projects.
10.2.3 Impact of Spatial and Temporal Crowding
In a scenario where several projects undergo construction simultaneously substantial activities
happening might happen simultaneously within a small area, which is otherwise pristine and
has never faced any major disturbance. This type of spatial crowding would result in
overlapping of different impacts e.g. land use change, change from lotic to lentic environment
of river, fragmentation of wildlife habitat, reduction in flow in river, change in riverine
habitat, etc. Temporal crowding might also occur if impacts generated by different projects
taken up for construction over different periods of time but overlapping of construction period
would add to the impact already generated before the resource (river, forest area, etc.) has
had time to recover. The cumulative impact of several projects bunched together for
construction would also result in forest losses due to nibbling effect.
Figure 10.2: Vegetation/Forest types map of Dibang basin
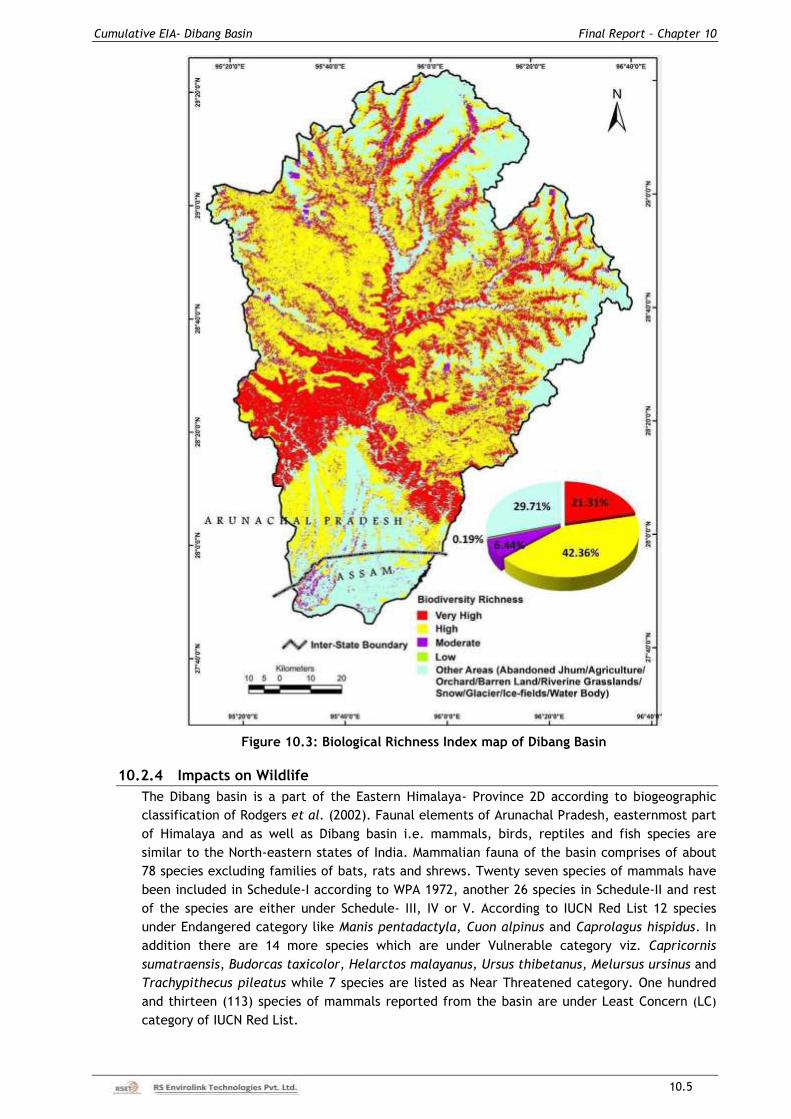
Cumulative EIA- Dibang Basin Final Report – Chapter 10
10.5
Figure 10.3: Biological Richness Index map of Dibang Basin
10.2.4 Impacts on Wildlife
The Dibang basin is a part of the Eastern Himalaya- Province 2D according to biogeographic
classification of Rodgers et al. (2002). Faunal elements of Arunachal Pradesh, easternmost part
of Himalaya and as well as Dibang basin i.e. mammals, birds, reptiles and fish species are
similar to the North-eastern states of India. Mammalian fauna of the basin comprises of about
78 species excluding families of bats, rats and shrews. Twenty seven species of mammals have
been included in Schedule-I according to WPA 1972, another 26 species in Schedule-II and rest
of the species are either under Schedule- III, IV or V. According to IUCN Red List 12 species
under Endangered category like Manis pentadactyla, Cuon alpinus and Caprolagus hispidus. In
addition there are 14 more species which are under Vulnerable category viz. Capricornis
sumatraensis, Budorcas taxicolor, Helarctos malayanus, Ursus thibetanus, Melursus ursinus and
Trachypithecus pileatus while 7 species are listed as Near Threatened category. One hundred
and thirteen (113) species of mammals reported from the basin are under Least Concern (LC)
category of IUCN Red List.
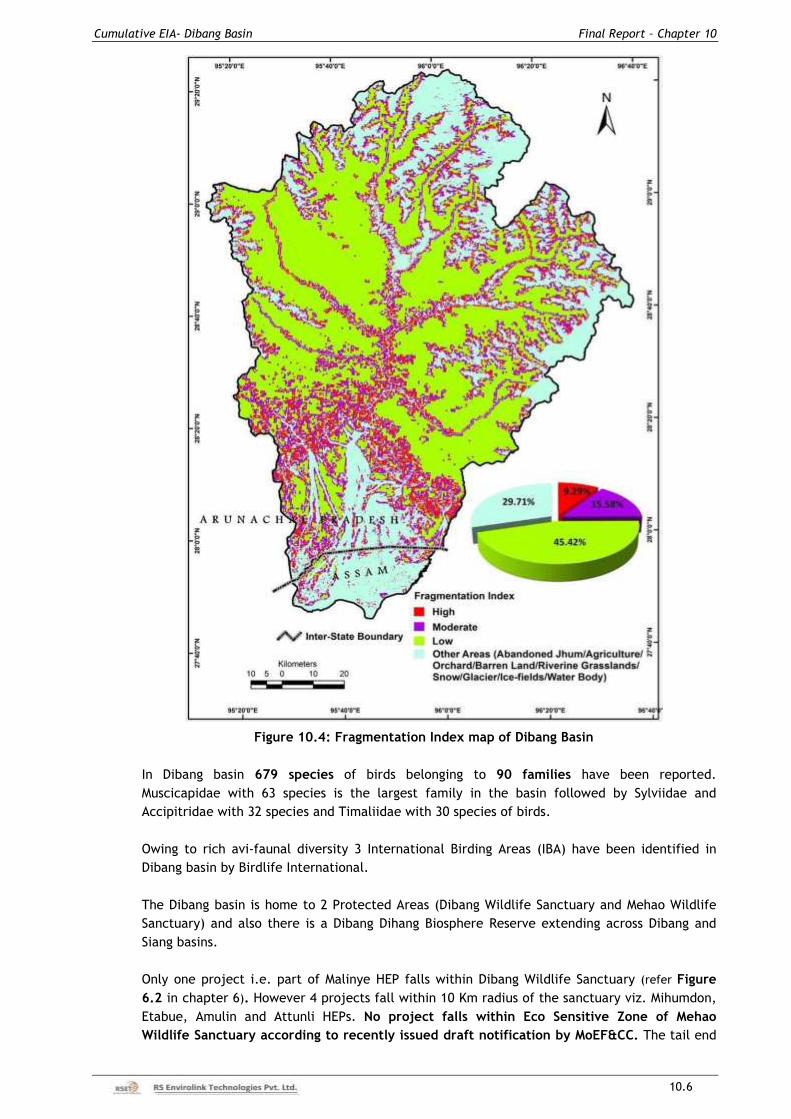
Cumulative EIA- Dibang Basin Final Report – Chapter 10
10.6
Figure 10.4: Fragmentation Index map of Dibang Basin
In Dibang basin 679 species of birds belonging to 90 families have been reported.
Muscicapidae with 63 species is the largest family in the basin followed by Sylviidae and
Accipitridae with 32 species and Timaliidae with 30 species of birds.
Owing to rich avi-faunal diversity 3 International Birding Areas (IBA) have been identified in
Dibang basin by Birdlife International.
The Dibang basin is home to 2 Protected Areas (Dibang Wildlife Sanctuary and Mehao Wildlife
Sanctuary) and also there is a Dibang Dihang Biosphere Reserve extending across Dibang and
Siang basins.
Only one project i.e. part of Malinye HEP falls within Dibang Wildlife Sanctuary (refer Figure
6.2 in chapter 6). However 4 projects fall within 10 Km radius of the sanctuary viz. Mihumdon,
Etabue, Amulin and Attunli HEPs. No project falls within Eco Sensitive Zone of Mehao
Wildlife Sanctuary according to recently issued draft notification by MoEF&CC. The tail end
Cumulative EIA- Dibang Basin Final Report – Chapter 10
10.7
of proposed reservoir of Ashupani HEP apparently encroaches into the Mehao WLS boundary
based upon the contour map derived from Survey of India (1:50000 toposheets) and salient
features and layout provided by the project developer which however requires ground
verification by the state forest department and the project developer.
10.2.5 Impact on RET & Endemic Species
The highest number of RET plant species (7 species) are found in study area of Emra-I HEP
followed by 6 species in study area of Emra-II and Mihumdon HEPs, out of 30 found in the entire
Dibang basin. Similarly, number of endemic plant species is highest in Emra-II study area (6)
followed by 5 each in study areas of Emra-I and Dibang Multipurpose project.
The number of mammalian species under RET (IUCN Red list) is maximum in study area of Dibang
Multipurpose Project i.e. 19 species out of 31 found in entire basin and 14-15 RET species in study
areas of Emra-II, Attunli, Mihumdon, Amulin, Emini and Emra-I HEPs. Similarly number of bird
species under RET (IUCN Redlist) is maximum in study area of Ashupani, Emra-I & Emra-II HEPs
i.e. 12, 11 and 10 species, respectively. Dibang Multipurpose Project study area harbours largest
number of fish species i.e. 60 species out of total 74 reported from the entire basin.
The direct forest loss due to diversion of forest land and degradation of forest cover in the
Direct Impact Zones of projects mentioned above will adversely affect the RET species
populations. The impacts of RET species occur due to loss of their habitat and their populations
sizes decrease due to gradual degradation and shrinkage of their habitats which ultimately
results in disappearance of their populations and which become known only over a longer
period of time. Such species rich areas need to be preserved in addition to the existing
protected areas in the basin.
The number of RET bird species is highest in Dibang Multipurpose project study area along with
highest number of fish species reported.
It has been noted that large number of endemic plant species have been reported from Emra
river catchment where Emra-I & Emra-II have been planned.
10.3 IMPACTS ON AQUATIC ECOLOGY
Freshwater ecosystems including rivers, lakes and wetlands are extremely rich in species, but
unfortunately, are also amongst the most altered and threatened ecosystems in the world. The
natural flow regime and the longitudinal and lateral connectivity of rivers, which are essential
to sustain the biophysical and ecological processes necessary for life in freshwaters, are
disrupted when dams and their reservoirs fragment the rivers. This fragmentation and the
consequent loss of ecosystem processes do not only affect ecosystems and species, but humans
as well. For example, the loss of floodplain inundation patterns affects both native ecosystems
and human communities dependent on floodplain fisheries and flood recession agriculture. In
freshwater habitats the main impacts of fragmentation from dam-building are:
changes in water flow/oxygenation rates/temperature regimes, and
effects of physical barriers obstructing migratory movements of species.
The impacts on aquatic ecology happen in following ways:
Reduced flows in downstream stretches
Altered flow regime in different seasons viz. lean, monsoon, pre- and post-monsoon
Discontinuity of river flow i.e. conversion of free flowing river into alternating small stretches
of free flowing lotic ecosystem to lentic ecosystems of reservoirs and deprived stretches of
river (run-of-the-river with long head race tunnels).
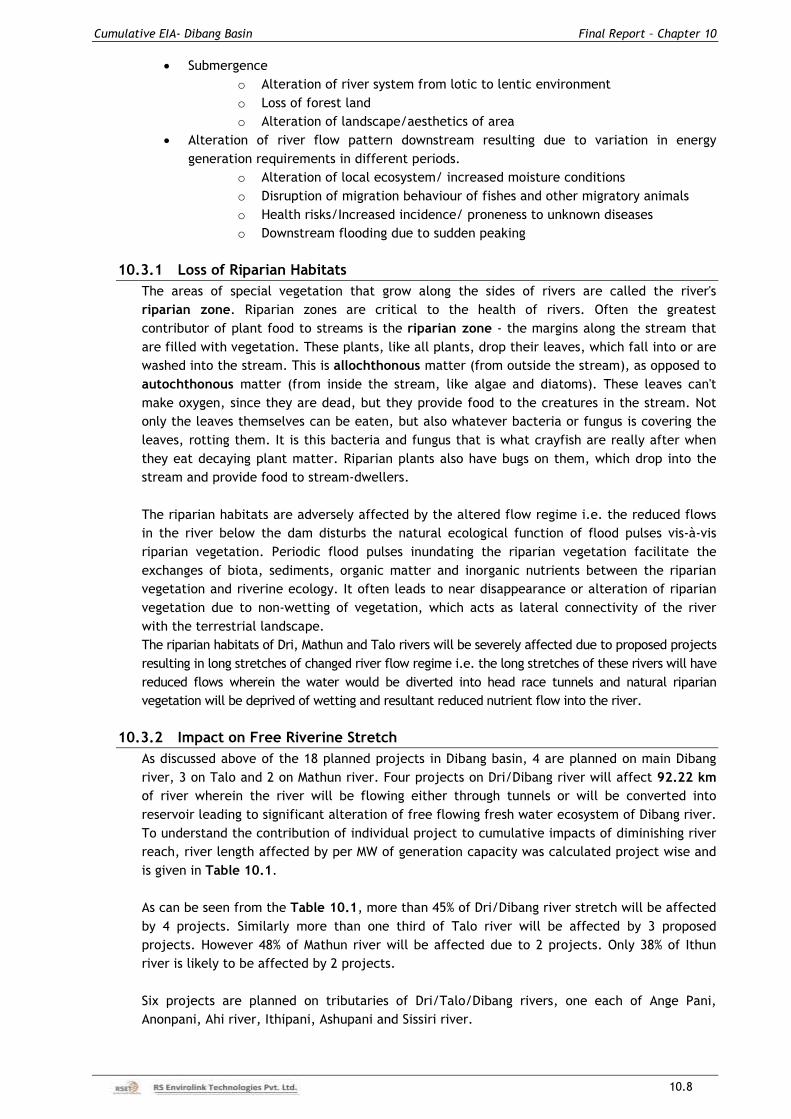
Cumulative EIA- Dibang Basin Final Report – Chapter 10
10.8
Submergence
o Alteration of river system from lotic to lentic environment
o Loss of forest land
o Alteration of landscape/aesthetics of area
Alteration of river flow pattern downstream resulting due to variation in energy
generation requirements in different periods.
o Alteration of local ecosystem/ increased moisture conditions
o Disruption of migration behaviour of fishes and other migratory animals
o Health risks/Increased incidence/ proneness to unknown diseases
o Downstream flooding due to sudden peaking
10.3.1 Loss of Riparian Habitats
The areas of special vegetation that grow along the sides of rivers are called the river's
riparian zone. Riparian zones are critical to the health of rivers. Often the greatest
contributor of plant food to streams is the riparian zone - the margins along the stream that
are filled with vegetation. These plants, like all plants, drop their leaves, which fall into or are
washed into the stream. This is allochthonous matter (from outside the stream), as opposed to
autochthonous matter (from inside the stream, like algae and diatoms). These leaves can't
make oxygen, since they are dead, but they provide food to the creatures in the stream. Not
only the leaves themselves can be eaten, but also whatever bacteria or fungus is covering the
leaves, rotting them. It is this bacteria and fungus that is what crayfish are really after when
they eat decaying plant matter. Riparian plants also have bugs on them, which drop into the
stream and provide food to stream-dwellers.
The riparian habitats are adversely affected by the altered flow regime i.e. the reduced flows
in the river below the dam disturbs the natural ecological function of flood pulses vis-à-vis
riparian vegetation. Periodic flood pulses inundating the riparian vegetation facilitate the
exchanges of biota, sediments, organic matter and inorganic nutrients between the riparian
vegetation and riverine ecology. It often leads to near disappearance or alteration of riparian
vegetation due to non-wetting of vegetation, which acts as lateral connectivity of the river
with the terrestrial landscape.
The riparian habitats of Dri, Mathun and Talo rivers will be severely affected due to proposed projects
resulting in long stretches of changed river flow regime i.e. the long stretches of these rivers will have
reduced flows wherein the water would be diverted into head race tunnels and natural riparian
vegetation will be deprived of wetting and resultant reduced nutrient flow into the river.
10.3.2 Impact on Free Riverine Stretch
As discussed above of the 18 planned projects in Dibang basin, 4 are planned on main Dibang
river, 3 on Talo and 2 on Mathun river. Four projects on Dri/Dibang river will affect 92.22 km
of river wherein the river will be flowing either through tunnels or will be converted into
reservoir leading to significant alteration of free flowing fresh water ecosystem of Dibang river.
To understand the contribution of individual project to cumulative impacts of diminishing river
reach, river length affected by per MW of generation capacity was calculated project wise and
is given in Table 10.1.
As can be seen from the Table 10.1, more than 45% of Dri/Dibang river stretch will be affected
by 4 projects. Similarly more than one third of Talo river will be affected by 3 proposed
projects. However 48% of Mathun river will be affected due to 2 projects. Only 38% of Ithun
river is likely to be affected by 2 projects.
Six projects are planned on tributaries of Dri/Talo/Dibang rivers, one each of Ange Pani,
Anonpani, Ahi river, Ithipani, Ashupani and Sissiri river.
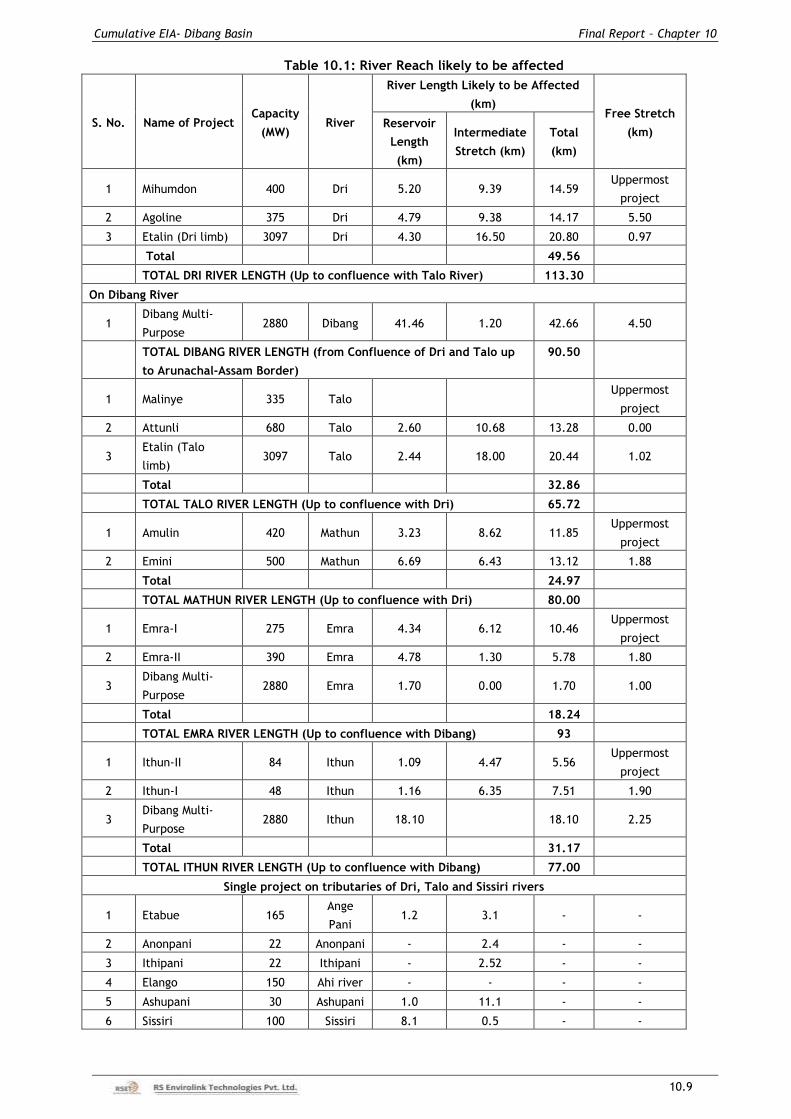
Cumulative EIA- Dibang Basin Final Report – Chapter 10
10.9
Table 10.1: River Reach likely to be affected
S. No. Name of Project Capacity
(MW) River
River Length Likely to be Affected
(km) Free Stretch
(km) Reservoir
Length
(km)
Intermediate
Stretch (km)
Total
(km)
1 Mihumdon 400 Dri 5.20 9.39 14.59 Uppermost
project
2 Agoline 375 Dri 4.79 9.38 14.17 5.50
3 Etalin (Dri limb) 3097 Dri 4.30 16.50 20.80 0.97
Total
49.56
TOTAL DRI RIVER LENGTH (Up to confluence with Talo River) 113.30
On Dibang River
1 Dibang Multi-
Purpose 2880 Dibang 41.46 1.20 42.66 4.50
TOTAL DIBANG RIVER LENGTH (from Confluence of Dri and Talo up
to Arunachal-Assam Border)
90.50
1 Malinye 335 Talo
Uppermost
project
2 Attunli 680 Talo 2.60 10.68 13.28 0.00
3 Etalin (Talo
limb) 3097 Talo 2.44 18.00 20.44 1.02
Total
32.86
TOTAL TALO RIVER LENGTH (Up to confluence with Dri) 65.72
1 Amulin 420 Mathun 3.23 8.62 11.85 Uppermost
project
2 Emini 500 Mathun 6.69 6.43 13.12 1.88
Total
24.97
TOTAL MATHUN RIVER LENGTH (Up to confluence with Dri) 80.00
1 Emra-I 275 Emra 4.34 6.12 10.46 Uppermost
project
2 Emra-II 390 Emra 4.78 1.30 5.78 1.80
3 Dibang Multi-
Purpose 2880 Emra 1.70 0.00 1.70 1.00
Total
18.24
TOTAL EMRA RIVER LENGTH (Up to confluence with Dibang) 93
1 Ithun-II 84 Ithun 1.09 4.47 5.56 Uppermost
project
2 Ithun-I 48 Ithun 1.16 6.35 7.51 1.90
3 Dibang Multi-
Purpose 2880 Ithun 18.10
18.10 2.25
Total
31.17
TOTAL ITHUN RIVER LENGTH (Up to confluence with Dibang) 77.00
Single project on tributaries of Dri, Talo and Sissiri rivers
1 Etabue 165 Ange
Pani 1.2 3.1 - -
2 Anonpani 22 Anonpani - 2.4 - -
3 Ithipani 22 Ithipani - 2.52 - -
4 Elango 150 Ahi river - - - -
5 Ashupani 30 Ashupani 1.0 11.1 - -
6 Sissiri 100 Sissiri 8.1 0.5 - -
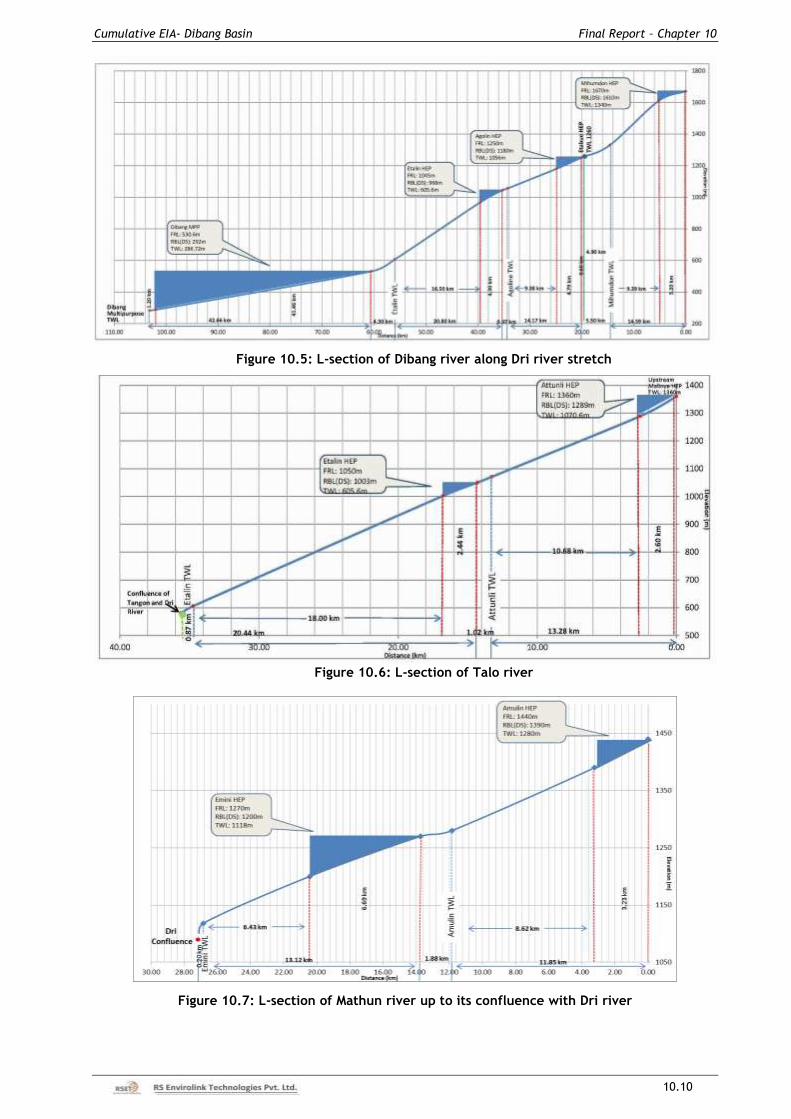
Cumulative EIA- Dibang Basin Final Report – Chapter 10
10.10
Figure 10.5: L-section of Dibang river along Dri river stretch
Figure 10.6: L-section of Talo river
Figure 10.7: L-section of Mathun river up to its confluence with Dri river
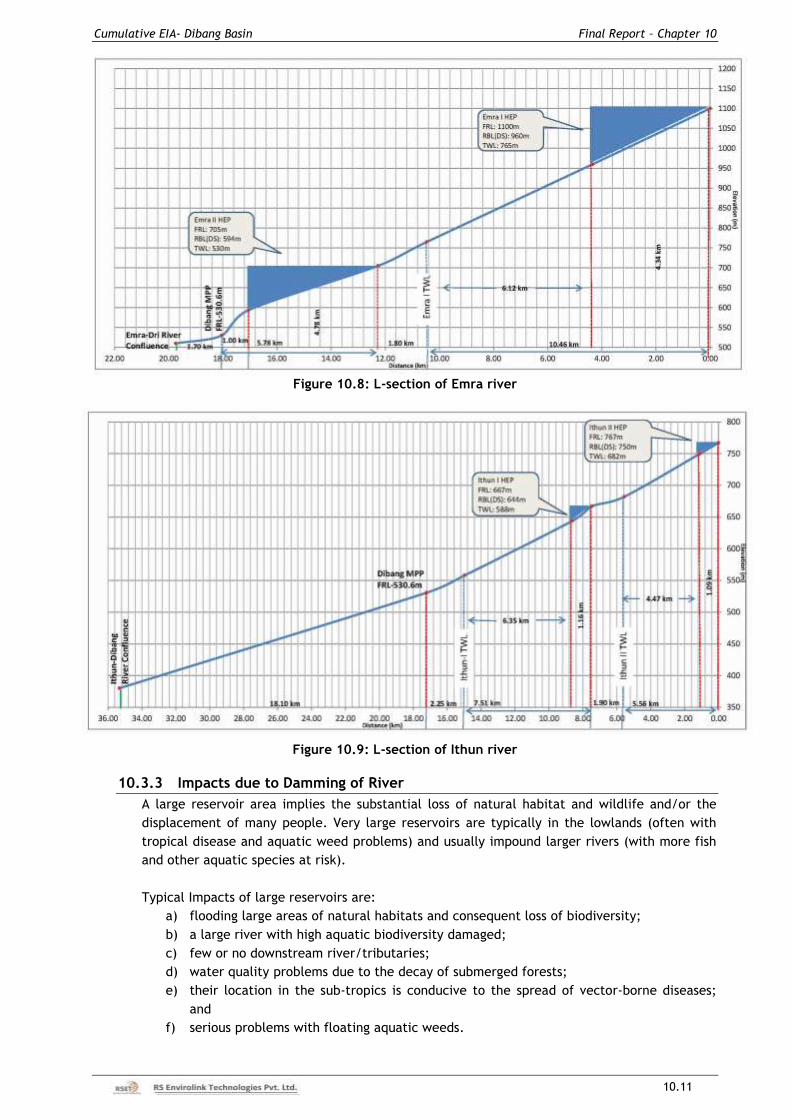
Cumulative EIA- Dibang Basin Final Report – Chapter 10
10.11
Figure 10.8: L-section of Emra river
Figure 10.9: L-section of Ithun river
10.3.3 Impacts due to Damming of River
A large reservoir area implies the substantial loss of natural habitat and wildlife and/or the
displacement of many people. Very large reservoirs are typically in the lowlands (often with
tropical disease and aquatic weed problems) and usually impound larger rivers (with more fish
and other aquatic species at risk).
Typical Impacts of large reservoirs are:
a) flooding large areas of natural habitats and consequent loss of biodiversity;
b) a large river with high aquatic biodiversity damaged;
c) few or no downstream river/tributaries;
d) water quality problems due to the decay of submerged forests;
e) their location in the sub-tropics is conducive to the spread of vector-borne diseases;
and
f) serious problems with floating aquatic weeds.
Cumulative EIA- Dibang Basin Final Report – Chapter 10
10.12
10.3.4 Direct Impacts of Reservoir based projects
• Barriers (high) severely restricts aquatic life migration
• Bottom layers are devoid of oxygen
• Changes river bottom profile
Direct impact of large reservoirs is the conversion of fast flowing river into stagnant reservoirs.
Its direct impact is on oxygen concentration in the water. In the large reservoirs oxygen
depletion results from eutrophication in which plant nutrients enter a river and phytoplankton
blooms are encouraged. While phytoplankton, through photosynthesis raise DO saturation
during daylight hours, the dense population of a bloom reduces DO saturation during the night
by respiration. When phytoplankton cells die, they sink towards the bottom and are
decomposed by bacteria, a process that further reduces DO in the water column. If oxygen
depletion progresses to hypoxia, fish kills can occur and invertebrates like worms and clams on
the bottom may be killed as well. Below 5 mg/L, most fish, especially the more desirable
species such as trout, do not survive. Actually, trouts need at least 8 mg/L during their
embryonic and larval stages and the first 30 days after hatching.
The consequence of river impoundment is the transformation of lotic environment to lentic
habitats. Independent of free passage problems, species which spawn in relatively fast flowing
reaches can be eliminated. From a study of the threatened fish of Oklahoma, Hubbs and Pigg
(1976) suggested that 55% of the man-induced species depletions had been caused by the loss
of free-flowing river habitat resulting from flooding by reservoirs, and a further 19% of the
depletion was caused by the construction of dams, acting as barriers to fish migration.
Projects such as Dibang Multipurpose Project and Sissiri HEP on Dibang river and Sissiri river,
respectively are dam toe projects with large reservoirs. In addition other run of the river large
projects such as Etalin, Attunli, Emini and Amulin will also submerge substantial forest area.
The creation of large reservoirs behind the proposed dams of Dibang Multipurpose Project and
Sissiri HEP would change free flowing character of Dibang and Sissiri rivers i.e. from lotic to
lentic - running water becomes still. This results in silt deposition and the formation stratified
bodies like reservoirs would change the temperature and oxygen conditions making it
unsuitable for existing riverine species. The projects would obstruct the migration of mahseer
and there is no other stream in which fish like mahseer can effectively migrate into for
breeding and spawning, which is part of natural life cycle of mahseer. The modified flow of the
river adversely affects the fish populations by obstructing the migration as well as changed
riverine profile.
10.3.5 Impact on Fish Populations
In Dibang river basin mahseer and trouts are the two key fish species. Mahseer is found up to the
confluence of Dri and Talo rivers i.e. up to elevation of about 750-800m in Dibang river and in
tributaries like Ithun, Ahi river and Emra rivers where they are reported for breeding and
spawning in monsoon. It could not be found in streams in upstream areas i.e. in Dri and Talo
rivers. In these streams trouts are dominant fish species especially snow trout (Schizothorax
richardsonii).
i) Mahseer Group fishes
The migratory phenomenon of the fish species is directly related to its life cycle as fish moves
from one habitat (stationary ground) to other (breeding ground) to spawn. The breeding
migration in fish may be of a few meters to many hundreds of kilometers. In the Himalayan rivers
Mahseer (Tor putitora and T. tor), important potamodromous fish species, ascend longest
distance for breeding purpose, which move from main stream to the tributaries. Other species
like Neolissochilus hexagonolepis, Labeo pangusia (all potamodromous fish) and Anguilla
Cumulative EIA- Dibang Basin Final Report – Chapter 10
10.13
bengalensis (catadromous) and snow trout species traverse relatively short distances. Mahseer
and Neolissochilus hexagonolepis start their migration during the onset of monsoon and perform
tri-phased migration. All ‘schizothoracines’ show migration variably. They descend in monsoon
towards warmer places and spawn in the main streams or tributaries. Labeo pangusia migrates
into the nearby tributaries for breeding.
The golden mahseer, Tor putitora is the most popular mahseer and the most popular game fish
in India. These fish like fast flowing, rocky waters, and are seen frequently around the
Himalayan foothills. Dibang Multipurpose project on Dibang river with large reservoir will stall
the migration of mahseer and in addition the projects on tributaries also would affect the
breeding grounds and shelters of mahseer during monsoon.
ii) Trout Group fishes
Trout thrive in cooler water than most other fish in temperatures that range from about 2–200C.
However, their optimum feeding range is about 10–180C. Cold mountain streams with good snow
melt provide those temperatures and are an ideal environment for trout.
Trouts are cold-blooded by nature so their food needs vary with the temperature of the water as
well as their body temperature. When the water is very cold, trout are almost dormant and
require very little food to survive. As the water warms, they need more food and will become
more aggressive in their feeding habits. In shallow mountain streams, the temperature can
change rather abruptly as the temperature in the air changes along with snow melt, rainfall and
direct sunlight on the water. Larger rivers provide a more stable water temperature due to the
sheer volume of water.
The water where trout lives can be either a few centimeters or 1-2 m deep depending on if
there is water close by that is deep enough (about 40-50cm) or if there is an overhanging
bank or downed log to protect them from overhead threats such as hawks and eagles. When
the snow melts there are usually good cold-water flow and just enough food to sustain the trout.
As the air temperature warms and the water warms a few degrees with a good flow, trout then
become very aggressive eaters. This is the time when the insects start hatching and provide the
trout with one of their favourite diets. Spring rains increase the water flow and enabling more
number of insects to hatch, which ensures that more food is available to them.
As the water flow slows down after November-December and the water level drops causing some
areas to dry up completely and due to slowing of current the water temperature gets warmer
and the water begins to form pools. The riffles become less prevalent and there is less oxygen
content in the water. With the continuation of this process, the fish generally start to become
sluggish, but they are still in their feeding cycle. If there is one available, the fish may move to
an area with better oxygen content (closer to a riffle or waterfall) and /or move to a cooler
water source such as a small colder stream in a shaded location. With the cooling of weather the
trout becomes aggressive again. They begin feeding and loading up on the abundant insects
gaining weight for the winter. When winter arrives, the water cools and the trout’s metabolism
slows so they don’t require as much food to keep them nourished. They then move to the deeper
holes even though they can still be enticed into taking an occasional offering.
Trout spends most of their lives in a small area of the stream and undertakes little movement
unless there is a shortage of food, changes in the water temperature changes and /or the oxygen
content gets too low. Since they live in such a small area of the stream, they are acutely aware
of their surroundings. They know where the current is ideal for feeding or resting and will move
to those positions as needed.
Schizotharax richardsonii (Snow trout), the predominant trout species is a column feeder and are
known to move relatively shorter distance as compared to mahseer. Schizothorax richardsonii
Cumulative EIA- Dibang Basin Final Report – Chapter 10
10.14
generally performs migration within same river. In order to cope with the low temperature in peak
winter season it starts to move downwards. It finds a tributary to spawn from May to September.
10.3.6 Impact on Fish Migration
The species Schizothorax richardsonii and Neolissochilus hexagonolepis migrate from lower
elevations to higher elevations in summer months and return to lower elevation in winter
months. These species were observed at various sampling locations. Construction of proposed
dams would hamper the upward and downward migratory movement of these fish species in
summer and winter seasons. Likewise, migration of fish species from tributaries to Dibang river
would be affected on account of creation of reservoir due to construction of proposed
hydroelectric projects. Thus, the projects will lead to adverse impact on migration of these fish
species. The fish migration would be restricted in the following stretches:
Upstream of dam site of Dibang Multipurpose Project and Sissiri HEPs
Upstream and Downstream of dam sites of Etalin and Attunli hydroelectric projects
Majority of the fish species found in the Dibang river and its tributaries prefer fast flowing,
rocky bottom waters. Mahseer is the main fish species of Dibang river and the main breeding
zone for mahseer is river Dibang and its tributaries like Ithun, Ahi and Emra rivers which offer
suitable habitats for its spawning and growth. Golden mahseer (Tor putitora) is an important
endangered migratory fish, which migrates longitudinally upstream during April-May in Dibang
river and then undertakes lateral migration in the tributaries of Dibang river for breeding,
feeding and as refuge location. Thereafter it migrates downstream via main channel during
post-monsoon period (September-October) to feed, thrive and grow in the main Dibang where
the temperature and oxygenation conditions in winters are conducive for its growth along with
availability of substratum in Dibang river. Chocolate mahseer (Neolissochilus hexagonolepis) is
another important migratory mahseer fish species found in Dibang river and its tributaries.
Construction of hydropower projects in stretch of Dibang river where mahseer is dominant
species, will severely affect its habitat. The projects like Dibang Multipurpose Project on
Dibang river would permanently block the movement of migratory mahseer species up and
down in Dibang river, causing extirpation (loss of populations from a part of the species range)
as these projects are planned in that part of river where mahseer is the key species. These
projects would also result in change in turbidity/sediment levels to which species/ecosystems
are adapted. The trapping of silt in reservoirs would deprive the downstream Dibang river
ecosystem of maintenance materials and nutrients that help in maintaining productivity of
Dibang river ecosystem.
Emra river is one of the rivers where fish species like mahseer (Tor putitora) migrates for spawning
and breeding. Labeo pangusia is another fish, which prefers waters of tributaries for spawning. In
addition snow trout (Schizothorax spp.) is important fish of the colder waters upstream. The
species like Labeo pangusia and Anguilla bengalensis ascend comparatively for short distance.
Among catfishes Aorichthys seenghala also migrates for breeding and spawning purposes.
The projects like Etalin and Attunli on Dri and Talo rivers, Amulin and Emini HEPs on Mathun
river and Emra-I & Emra-II HEPs on Emra river would affect the habitat of these fishes. Owing
to diversion of water for power generation there will be reduced flow of water downstream of
these projects up to the tailrace discharge of water from powerhouse. The reduced flows in
these stretches would affect the movement of trout leading to reduction in their population.
10.3.7 Major impact on Fishes
i) Loss of Habitat
The suppression of flood regime downstream from an impoundment by means of flow
regulation can deprive many fish species of spawning grounds and valuable food supply (Petts,
Cumulative EIA- Dibang Basin Final Report – Chapter 10
10.15
1988). This can lead to changes in species composition with loss of obligate floodplain
spawners. Dam construction for industrial uses within the Rio Mogi Guassu Brazil has resulted in
the progressive loss of flood plain wetlands (Godoy, 1975). The cumulative effect of diminished
peak discharges, stabilized water levels, reduced current velocities and water temperature
eliminated spawning grounds below the dams on the Qiantang and Han rivers: six migratory fish
and five species favouring torrential habitats declined severely (Zhong and Power, 1996). The
reaction of the fish communities of the Chari, Niger and Senegal rivers to flood failures
provoked by natural climatic variations illustrates the highly detrimental effect of suppressing
the flood (Welcomme, 1985). The construction of proposed dams on Dibang river would result
in loss of habitat of native fish species inhabiting the Dibang river and its tributaries.
ii) Impact on Fish Migration
One of the major effects of the construction of a dam on fish populations is the decline of
anadromous and potamodromous fish species. The dams prevent migration between feeding
and breeding zones. The effect can become severe, leading to the extinction of species, where
no spawning grounds are present in the river or its tributary downstream of the dam.
The concept of obstruction to migration is often associated with the height of the dam.
However, even low weirs can constitute a major obstruction to upstream migration. Whether
an obstacle can be passed or not depends on the hydraulic conditions over and at the foot of
the obstacle (velocity, depth of the water, aeration, turbulence, etc.) in relation to the
swimming and leaping capacities of the species concerned. The swimming and leaping
capacities depend on the species, the size of the individuals, their physiological condition and
water quality factors such as water temperature and dissolved oxygen. Certain catadromous
species (species of Anguilla) have a special ability to clear obstacles during their upstream
migration: in addition to speed of swimming, the young eels are able to climb through brush, or
over grassy slopes, provided they are kept thoroughly wet; some species (i.e. gobies) possess a
sucker and enlarged fins with which they can cling to the substrate and climb around the edge
of waterfalls and rapids (Mitchell, 1995).
For a migratory species, an obstruction may be total, i.e. permanently insurmountable for all
individuals. It may be partial, i.e. passable for certain individuals wherever the diversion
structures are not very high. It may be temporary, i.e. passable at certain times of the year
(under certain hydrological or temperature conditions). During low flow conditions diversion
dams may be insurmountable because the depth of water on the face is too shallow to permit
fish to swim. They may however become passable at a higher discharge rate, as water depth
increases and the fall at the structure generally decreases. The negative impact on fish caused
by temporary obstacles, which delay them during migration and which may cause them to stay
in unsuitable zones in the lower part of the river, or cause injury as a result of repeated,
fruitless attempts to pass, should not be underestimated.
iii) Modification of Discharge
The modification of downstream river flow characteristics (regime) by an impoundment can
have a variety of negative effects upon fish species: loss of cues/ stimuli for migration, loss of
migration routes and spawning grounds, decreased survival of eggs and juveniles, diminished
food production.
Regulation of stream flow during the migratory period can alter the seasonal and daily
dynamics of migration. Regulation of a river can lead to a sharp decrease in a migratory
population, or even to its complete elimination. Any reduction in river discharge during the
period of migratory activity can diminish the attractive potential of the river, hence the
numbers of spawners entering the river is reduced. Because of this, regulation of a river can
greatly influence the degree of migration to the non-regulated part of the river below the dam
site. This aspect will affect the migration behaviour of migratory fishes in Dibang river.
Cumulative EIA- Dibang Basin Final Report – Chapter 10
10.16
Modification of discharge will take place in all the projects and cumulatively this impact will
become serious as projects are planned in cascade in all the rivers and tributaries leading to
discharge modification in almost the entire basin. This impact cannot be eliminated, however
can be mitigated to certain extent by ensuring adequate environmental flow in the
intermediate stretch so that continuity with tributaries can be maintained; ensuring free
flowing river stretches for the river to recover and maintain continuity with the tributaries in
the free flowing river stretches, wherever tributaries are ensuring continuity of habitat with
the free flowing stretch and intermediate stretch, development should be restricted on such
tributaries.
iv) Water Temperature and Water Quality Changes
Dams can modify thermal and chemical characteristics of river water: the quality of dam-
releases is determined by the limnology of the impoundment, with surface-release reservoirs
acting as nutrient traps and heat exporters and deep-release reservoirs exporting nutrient and
cold-waters (Petts, 1988). This can affect fish species and populations downstream.
Water temperature changes have often been identified as a cause of reduction in native
species, particularly as a result of spawning success (Petts, 1988). Cold-water release from high
dams of the Colorado river has resulted in a decline in native fish abundance (Holden and
Stalnaker, 1975). The fact that Salmo spp. had replaced some twenty native species has been
attributed to the change from warm-water to cold-water.
Water-chemistry changes can also be significant for fish. Release of anoxic water from the
hypolimnion can cause fish mortality below dams (Bradka and Rehackova, 1964).
During high water periods, water which spills over the crest of the dam can become over-
saturated with atmospheric gases (oxygen and nitrogen) to a level which can be lethal for fish.
Mortality can result from prolonged exposure to such lethal concentrations downstream of the
spillways. Substantial mortalities of both adult and juvenile salmonids caused by high spillway
flows which produced high supersaturation (120-145%) have been observed below the John Day
dam on the Columbia river (Raymond, 1979). The Yacyreta dam on the Parana river generates
supersaturated levels of total dissolved gases that can affect the health condition of fish: in 1994,
massive fish mortality was observed in a 100 km reach below the dam (Bechara et al., 1996).
Therefore not only the migration behaviour is likely to change due the proposed projects but
changes in water temperature and quality also will have impact on fish populations and high
fish mortality.
v) Increased Exposure to Predation
Normal predation behaviour may become modified with the installation of a dam, and although
few data exist to date, it appears that migrating species suffer increased predation in the
vicinity of an installation, whether by other fish or birds. This may be due to the unnatural
concentration of fish above the dam in the forebay, or to fish becoming trapped in turbulence
or recirculating eddies below spillways, or to shocked, stressed and disoriented fish being more
vulnerable to predators after turbine passage. In some rivers or hydroelectric schemes,
predation may affect a substantial proportion of the fish population. On the Columbia river,
predator exposure associated to turbine passage was the major causes of salmon mortality.
Tests at the Kaplan turbines indicated a mean loss of 7% and studies showed that the indirect
mortality on juvenile coho salmon could reach 30% when indirect mortality from predation was
included (Ebel et al. 1979).
The proposed projects in Dibang basin will lead to increased exposure of fishes to predation
which will affect their mortality and populations.
Cumulative EIA- Dibang Basin Final Report – Chapter 10
10.17
10.3.8 Impacts on Tributaries
Ecosystems of small streams or tributaries of Dibang, Dri and Talo rivers if exploited for
hydropower generation would severely affect their role as natural resource replenishment
character as these streams are the main contributors of biological production of the main
rivers. These small streams act as hatcheries for biological production at the first and second
trophic levels.
The tributaries are a source of nutrients and energy by way of contributing dissolved organic
matter from falling litter, overland flow and subsurface movement into the main channel.
Their importance has been very well document by Wipfli et al. (2007). Therefore any
modification of tributary streams of large rivers like Dibang, Dri and Talo would impair their
capability to rejuvenate the main river channel by reduced resource flow. Their contribution
assumes more significance especially in the stretch downstream of projects which have been
affected by reduced flows by diversion of water for power generation. Therefore role of
tributaries to reduce the impact of projects on main river should be taken into account before
planning any project on tributaries.
Projects on tributaries like Ithun river, Ahi river, Anonpani, Ashupani and Ange Pani would
impair the capabilities of these tributaries to resource flow into the main channel Dibang river.
10.4 CUMULATIVE IMPACT ASSESSMENT
The approach followed in the present study is a combination of both the matrix as well as
overlay method. Such approach helps in identifying or "flagging", cumulative effects of bunch
of proposed projects planned in cascade. This method does not lends itself to measurement or
prediction, but it does allow for identification of potential cumulative effects. This technique
is derived from both the matrix and overlay methods and required a series of matrices for
either different levels of effects or for the cumulative effects of several activities. Once
individual matrices are completed, the composite that results from overlaying them highlights
areas for particular attention.
Since Dibang basin especially in Arunachal Pradesh is under forest cover of 71.54% and is
endowed with rich biodiversity the focus of CEIA is primarily in assessment of impacts of
proposed hydropower development in context of ecological attributes of the area that are
likely to be affected by the proposed projects. In order to make such assessment biodiversity
values were evaluated at landscape level which in turn was based upon vegetation /forest
types mapping of entire basin. In addition to assessment of impact of cascade of projects on a
particular tributary an assessment of biodiversity values were assessed incorporating
biodiversity related data in the respective immediate impact zones of the proposed projects
separately as well as bunching them together. For adopting Biodiversity Assessment & Mapping
Methodology (BAMM) Impact zones of proposed projects were delineated as 1 km buffer around
the main project components like dam complex, reservoir, powerhouse complex, construction
areas, colonies, etc. BAMM is frequently used by scientists around the world especially by
Department of Environment & Natural Resource Management, Queensland, Australia.
For this baseline data is used to assess ecological concepts such as rarity, diversity,
fragmentation, habitat condition, threats, etc. in a particular area/zone. This information is
used in Geographic Information System (GIS) and based upon expert’s knowledge/opinion
results of quantitative data is refined into qualitative estimates. Expert’s knowledge is used to
identify wildlife corridors, specialised habitats e.g. areas with special biodiversity value like
endemism. It also uses the data that is not uniformly available across the entire study area.
Landscape properties were analysed using various quantitative indices which measure the
heterogeneity of landscape within a specific distance (1 km buffer). Fragmentation increases
Cumulative EIA- Dibang Basin Final Report – Chapter 10
10.18
the vulnerability of patches to external disturbance with consequences for the survival of these
patches and of the supporting biodiversity (Nilsson & Grelsson, 1995).
The quantitative attributes like Impact area species richness – no. of plant species, RET species
based upon IUCN Redlist and BSI Red Data Book, Endemic species, medicinal plants with
conservation priorities identified by FRLHT, amongst faunal elements mammals and avi-fauna
along with their conservation status like RET species, WPA Schedule-I species, spatial
parameters like Forest Cover, Biological Richness Index, and Fragmentation Index. Though this
methodology is primarily focused on terrestrial values however it also accounts for aquatic
components like fishes and affected riverine stretch and reduced free flowing river stretches
between cascade of upstream and downstream projects.
Therefore in Biodiversity Assessment data was compiled on various attributes and a summary
list has been prepared for 14 allotted projects planned and allotted in Dibang Basin. Similar
details however could not be compiled for projects which are yet to be allotted as no
information is available about these projects except for PFR of Etabue HEP while no
information is available for Elango, Malinye and Agoline HEPs.
A table was compiled listing information on project capacity, location with respect to
river/tributary, total river reach affected by the project either in submergence or in the
intermediate stretch where river is bypassed in tunnel and forest area likely to be acquired for
the project. Information on forest area required for each project is not available for all the
projects, as investigation work has not yet started in 10 projects though ToR has been obtained
by 5 of them while 4 of them are yet to be allotted. For such projects, estimation is made
based on the information available from PFRs prepared under 50000 MW PM’s initiative on their
size and type of project in order to get a comprehensive picture and make basin level
assessment. The impacts have been studied for cascade of projects together on main river as
well its tributaries. On Dri river, main source river 4 projects are planned viz. Mihumdon,
Agoline, Etalin (Dri Limb) and Dibang Multipurpose HEP while one Etabue HEP is planned on
Ange Pani one of its tributaries. On Mathun 2 projects i.e. Amulin and Emini HEPs before it
confluences with Dri river upstream of Etalin (Dri Limb) HEP. Three projects ate planned on
Talo river i.e. Malinye, Attunli and Etalin (Talo Limb) HEP upstream of its confluence with Dri
to form Dibang river. One project Anonpani is planned on left bank tributary of Talo river
downstream of Etalin HEP. On Emra river right bank tributary of Dibang 2 projects are planned
i.e. Emra-I & Emra-II. On Ithun river two projects i.e. Ithun-I & Ithun-II HEPs are planned in
cascade while one is planned on its tributary Ithipani.
An assessment of major tributary catchments of Dibang river for their biodiversity
characterisation was made by mapping Biological Richness, Fragmentation and Disturbance
indicies. Biological Richness index as it is a cumulative property of an ecological habitat and its
surrounding environment while Fragmentation Index is a measure of patchiness of ecological
habitat. These indicies were also derived for Direct Impact Zones of each of the 18 proposed
projects also. In addition area under forest cover in Direct Impact Zones was also mapped.
Dri, Talo, Emra, Mathun and Ithun are the major tributary catchments of Dibang river where
projects have been planned. Among them forest cover is highest in catchments of Emra and
Ithun rivers i.e. 87% and 81%, respectively. Talo catchment has least area under forest cover
(58.19%). Area under Very High and High Biological Richness Index also is highest in these two
catchments. Landscape fragmentation is also low in these two catchment as less than 6% of
their area is under High Fragmentation Index category. Landscape fragmentation is more in
catchments of Talo and Mathun rivers. Overall fragmentation in entire Dibang basin is low
except for river flowing in plains where it is characterised by wide riverbed consisting of sandy
and grassland tracts.
Cumulative EIA- Dibang Basin Final Report – Chapter 10
10.19
Among all 15 projects in Dibang basin for which project details were available, area under
Direct Impact Zone (DIZ) is highest in Dibang Multipurpose project i.e. about 199 sq km area
will be affected directly due to project components (see Table 10.2) and more than 95% of it
is under forest cover. However highest percentage of Very Dense and Moderately Dense Forest
cover in DIZ area is in Attunli, Ithun-I, Anonpani and Ashupani HEPs where it is more than 70%
(see Table 10.2). Only in DIZ areas of Amulin and Mihumdon HEPs it is less than 50% i.e. 47.61
and 36.57%, respectively.
About 75% of its area is under High Biological Richness index an indicator of high species
richness, and biodiversity value. Fragmentation index is comparatively low i.e. it is around 36%
of landscape in Direct Impact Zone is fragmented. The project will require diversion of 5794 ha
of forest land. The diversion of large area of forest is would lead to fragmentation of
contiguous patches of forests into patches of forest thereby increased fragmentation index. In
comparison though only 8.26 sq km of area would be directly affected by Ithipani project
highest percent of forest cover (98%) is likely to be affected due to this project whereas among
large projects in the affected area (DIZ) more than 95% area in under forest cover in Ithun-I,
Emra-I, Emra-II and Dibang Multipurpose projects (see Table 10.2). Total Forest cover also as
already discussed in DIZ of Amulin and Mihumdon HEP is lowest among all projects.
Direct Impact Zones of projects on Ithun river are characterised by high percentage of their
areas under Very High and High Biological Richness Index (varying from 81% to 85%) (see Table
10.2). DIZs of Emini, Amulin and Mihumdon HEPs this area varies from 36-40%. Emini and
Amulin are planned on Mathun river while Mihumdon on Dri river. Landscape fragmentation
interestingly is lowest in DIZs of these projects. Landscape fragmentation is highest in DIZ of
Emra-II HEP where area under High Fragmentation Index is more than 45%. Similarly area under
High Fragmentation Index in DIZs of Emra-I, Anonpani and Dibang MPP is more than 33% (see
Table 10.2).
10.4.1 Impact on Biodiversity Values
The direct loss of nearly 14000 ha of Very Dense and Dense category forests in entire Dibang
basin will adversely affect the biodiversity contained in these forests. In addition to direct loss of
forest cover due to development of 18 projects, large tracts of forests would be indirectly
affected by construction activities which will lead to degradation of forests in the vicinity of
project sites and more forest areas will become accessible due to construction of roads resulting
in disturbance of habitats of many RET plant species reported from these areas. It assumes
importance in case of Dibang basin which is rich in floral diversity as Dibang basin falls in the
Eastern Himalayan biogeographic zone and owes its high floral and faunal diversity to its
strategic location being at the junction of three biogeographic realms viz. the Palaearctic, the
Indo-Malayan and the Indo-Chinese. According to the biogeographic classification, the area
resides in the Himalaya–East-Himalaya biogeographic region (Rodgers and Panwar, 1988).
In all 1548 higher plant species have been documented which include 1329 Angiosperms, 17
Gymnosperms and 202 Pteridophytes. Among the lower plants bryophytes are represented by 21
species and lichens are represented by 16 species. Amongst angiosperms orchids, bamboos, canes
and rhododendrons are the important plant groups that are predominantly found in the basin.
Orchidaceae is represented by 199 species, rhododendrons by 16 species and bamboos and canes
together are represented by 27 species.
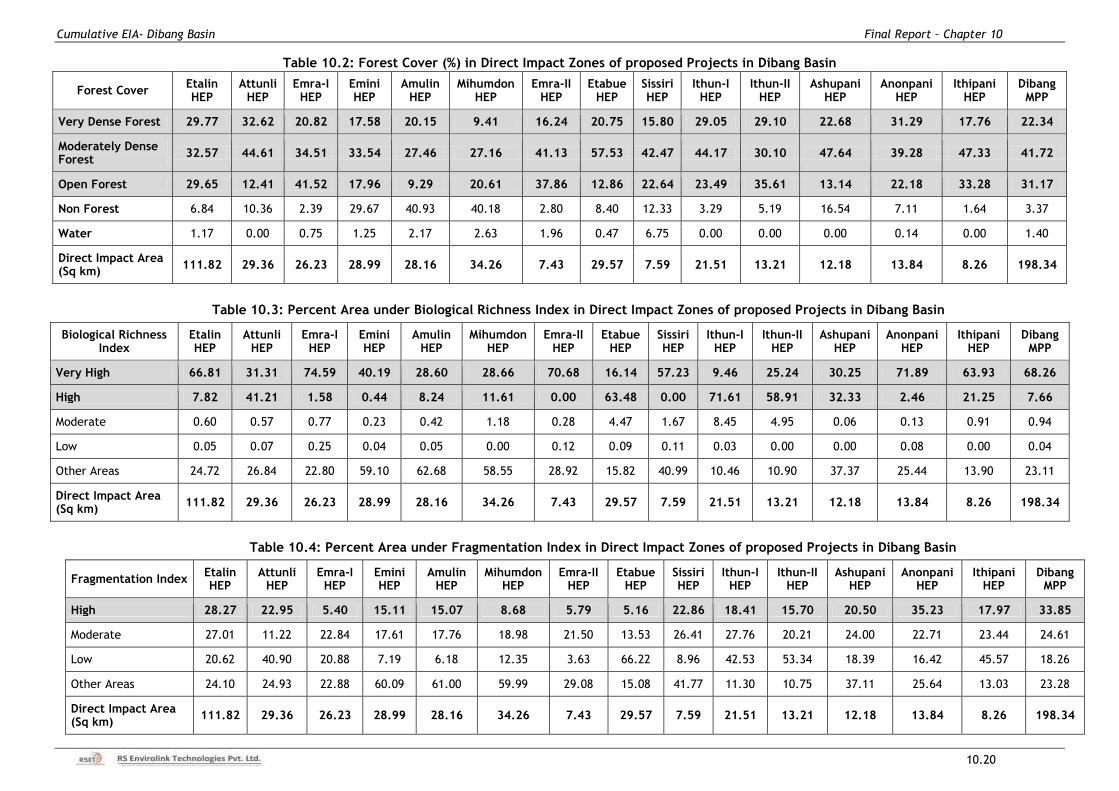
Cumulative EIA- Dibang Basin Final Report – Chapter 10
10.20
Table 10.2: Forest Cover (%) in Direct Impact Zones of proposed Projects in Dibang Basin
Forest Cover Etalin HEP
Attunli HEP
Emra-I HEP
Emini HEP
Amulin HEP
Mihumdon HEP
Emra-II HEP
Etabue HEP
Sissiri HEP
Ithun-I HEP
Ithun-II HEP
Ashupani HEP
Anonpani HEP
Ithipani HEP
Dibang MPP
Very Dense Forest 29.77 32.62 20.82 17.58 20.15 9.41 16.24 20.75 15.80 29.05 29.10 22.68 31.29 17.76 22.34
Moderately Dense Forest
32.57 44.61 34.51 33.54 27.46 27.16 41.13 57.53 42.47 44.17 30.10 47.64 39.28 47.33 41.72
Open Forest 29.65 12.41 41.52 17.96 9.29 20.61 37.86 12.86 22.64 23.49 35.61 13.14 22.18 33.28 31.17
Non Forest 6.84 10.36 2.39 29.67 40.93 40.18 2.80 8.40 12.33 3.29 5.19 16.54 7.11 1.64 3.37
Water 1.17 0.00 0.75 1.25 2.17 2.63 1.96 0.47 6.75 0.00 0.00 0.00 0.14 0.00 1.40
Direct Impact Area (Sq km)
111.82 29.36 26.23 28.99 28.16 34.26 7.43 29.57 7.59 21.51 13.21 12.18 13.84 8.26 198.34
Table 10.3: Percent Area under Biological Richness Index in Direct Impact Zones of proposed Projects in Dibang Basin
Biological Richness Index
Etalin HEP
Attunli HEP
Emra-I HEP
Emini HEP
Amulin HEP
Mihumdon HEP
Emra-II HEP
Etabue HEP
Sissiri HEP
Ithun-I HEP
Ithun-II HEP
Ashupani HEP
Anonpani HEP
Ithipani HEP
Dibang MPP
Very High 66.81 31.31 74.59 40.19 28.60 28.66 70.68 16.14 57.23 9.46 25.24 30.25 71.89 63.93 68.26
High 7.82 41.21 1.58 0.44 8.24 11.61 0.00 63.48 0.00 71.61 58.91 32.33 2.46 21.25 7.66
Moderate 0.60 0.57 0.77 0.23 0.42 1.18 0.28 4.47 1.67 8.45 4.95 0.06 0.13 0.91 0.94
Low 0.05 0.07 0.25 0.04 0.05 0.00 0.12 0.09 0.11 0.03 0.00 0.00 0.08 0.00 0.04
Other Areas 24.72 26.84 22.80 59.10 62.68 58.55 28.92 15.82 40.99 10.46 10.90 37.37 25.44 13.90 23.11
Direct Impact Area (Sq km)
111.82 29.36 26.23 28.99 28.16 34.26 7.43 29.57 7.59 21.51 13.21 12.18 13.84 8.26 198.34
Table 10.4: Percent Area under Fragmentation Index in Direct Impact Zones of proposed Projects in Dibang Basin
Fragmentation Index Etalin HEP
Attunli HEP
Emra-I HEP
Emini HEP
Amulin HEP
Mihumdon HEP
Emra-II HEP
Etabue HEP
Sissiri HEP
Ithun-I HEP
Ithun-II HEP
Ashupani HEP
Anonpani HEP
Ithipani HEP
Dibang MPP
High 28.27 22.95 5.40 15.11 15.07 8.68 5.79 5.16 22.86 18.41 15.70 20.50 35.23 17.97 33.85
Moderate 27.01 11.22 22.84 17.61 17.76 18.98 21.50 13.53 26.41 27.76 20.21 24.00 22.71 23.44 24.61
Low 20.62 40.90 20.88 7.19 6.18 12.35 3.63 66.22 8.96 42.53 53.34 18.39 16.42 45.57 18.26
Other Areas 24.10 24.93 22.88 60.09 61.00 59.99 29.08 15.08 41.77 11.30 10.75 37.11 25.64 13.03 23.28
Direct Impact Area (Sq km)
111.82 29.36 26.23 28.99 28.16 34.26 7.43 29.57 7.59 21.51 13.21 12.18 13.84 8.26 198.34
Cumulative EIA- Dibang Basin Final Report – Chapter 10
10.21
Fifty three (53) plant species that are endemic to Arunachal Pradesh have been reported from Dibang
basin (see Table 6.13 in Chapter 6). These belong to 28 families and 42 genera. These species
predominantly attributed to six plant families (i.e. Orchidaceae – 6 species; Gesneriaceae – 5 species,
Balsaminaceae - 4 species; and Ericaceae, Rubiaceae, Begoniaceae and Acanthaceae represented by
3 species each). Three of these species viz. Acer oblongum, Livistona jenkinsiana and Paphiopedilum
fairrieanum are under Endangered category according to BSI Red Data Book while Begonia scintillans
and Sapria himalayana are under Rare category. IUCN has placed Coptis teeta and Paphiopedilum
fairrieanum under Endangered and Critically Endangered categories.
In order to make an overall assessment of biodiversity values in study area (10 km radius) of
projects, data on different biodiversity components was compiled and the same is given at Table
10.5. This data then was used to make comparative assessment of different projects with
respect to their biodiversity values/ importance.
From the data compiled it can be seen that Dibang Multipurpose Project being the largest in
terms of affected area, harbours maximum number of plant species as well as mammals and bird
species in its study area. The formation of large reservoir shall submerge vast area of forest
which contains number of important plant species populations and would lead to conversion of
lotic system of Dibang river into lentic system which shall completely stall the migration of
mahseer fish species which is known for upstream and downstream migration in Dibang river and
its tributaries like Ahi, Ithun and Emra rivers especially. The resultant reservoir shall also
submerge riparian vegetation along Dibang river as well as Ahi river (12 km), Ithun river (18 km)
and Emra (1.7 km) rivers as reservoir will extend into these tributaries also.
Etalin HEP is the largest project in terms of Installed Capacity, total affected area is however is
much less (111 sq km) as compared to Dibang Multipurpose Project (199 sq km). In addition total
area under submergence is also quite low i.e. 119.44 ha only (covering both Dri and Talo Limbs).
Attunli, Amulin, Emini, Mihumdon and Emra-I HEPs are the other projects where submergence
area varies from 26 ha to 34 ha while in rest of the projects it is less than 20 ha. The projects
when assessed for their forest land requirement (including submergence area) vis-a-vis installed
capacity Ashupani HEP ranked highest with forest land ratio per MW i.e. 7.53 followed by Sissiri
and Emra-II HEPs with ratio of 4.03 and 3.57, respectively. Among large projects in Dibang
Multipurpose Project it is 2.01 while in Etalin and Attunli HEPs it is less than 0.37 only.
After assessing the project wise impacts; for understanding of Cumulative Impacts of on
sensitivity of Direct Impact Zones and Biodiversity values in Study area, a system of comparative
assessment was developed. Relative scoring of proposed HEPs in Dibang basin was carried out for
environmental sensitivity parameters like Very Dense and Moderately Dense forest cover, Forest
land to be diverted (direct forest cover loss), area under Very High and High Biological Richness
Index and High Fragmentation Index categories in Direct Impact Zones (highlighted rows in
Tables 10.2, 10.3 & 10.4) of the projects. Highest value was taken as 100 and other HEP values
were proportionately scored. The scores obtained by each project for all four above mentioned
parameters were then clubbed and averaged out.
Similar exercise was also undertaken for Valued Ecosystem Components (VECs) in the Study Area
both for terrestrial and aquatic ecosystems viz. Floristic Diversity (number of species, RET
species, Medicinal plants and Endemic species), Faunal diversity (Mammals and Birds - number of
species, RET species, Schedule-I species), and under aquatic ecosystem - Fish species. Scoring of
all the projects were done based upon the average scores obtained for sensitivity as well as
biodiversity richness values as follows and relative impact index generated.
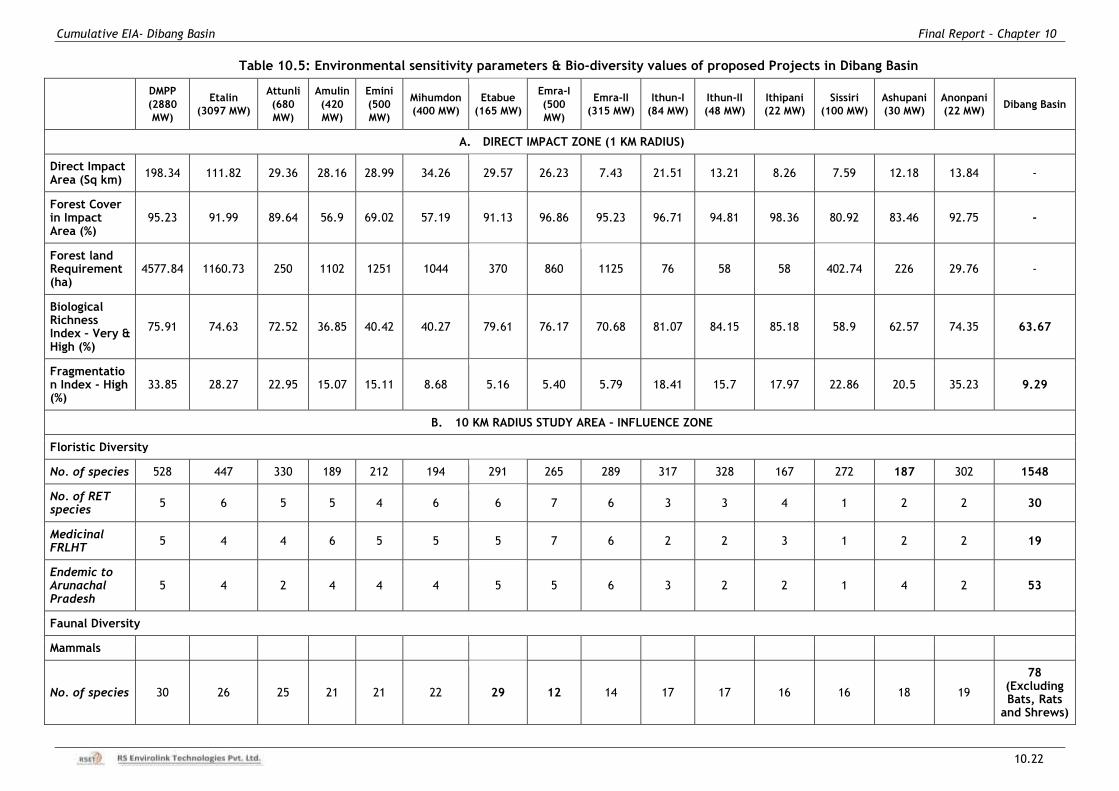
Cumulative EIA- Dibang Basin Final Report – Chapter 10
10.22
Table 10.5: Environmental sensitivity parameters & Bio-diversity values of proposed Projects in Dibang Basin
DMPP
(2880
MW)
Etalin
(3097 MW)
Attunli
(680
MW)
Amulin
(420
MW)
Emini
(500
MW)
Mihumdon
(400 MW)
Etabue
(165 MW)
Emra-I
(500
MW)
Emra-II
(315 MW)
Ithun-I
(84 MW)
Ithun-II
(48 MW)
Ithipani
(22 MW)
Sissiri
(100 MW)
Ashupani
(30 MW)
Anonpani
(22 MW) Dibang Basin
A. DIRECT IMPACT ZONE (1 KM RADIUS)
Direct Impact Area (Sq km)
198.34 111.82 29.36 28.16 28.99 34.26 29.57 26.23 7.43 21.51 13.21 8.26 7.59 12.18 13.84 -
Forest Cover in Impact Area (%)
95.23 91.99 89.64 56.9 69.02 57.19 91.13 96.86 95.23 96.71 94.81 98.36 80.92 83.46 92.75 -
Forest land Requirement (ha)
4577.84 1160.73 250 1102 1251 1044 370 860 1125 76 58 58 402.74 226 29.76 -
Biological Richness Index – Very & High (%)
75.91 74.63 72.52 36.85 40.42 40.27 79.61 76.17 70.68 81.07 84.15 85.18 58.9 62.57 74.35 63.67
Fragmentation Index - High (%)
33.85 28.27 22.95 15.07 15.11 8.68 5.16 5.40 5.79 18.41 15.7 17.97 22.86 20.5 35.23 9.29
B. 10 KM RADIUS STUDY AREA – INFLUENCE ZONE
Floristic Diversity
No. of species 528 447 330 189 212 194 291 265 289 317 328 167 272 187 302 1548
No. of RET species
5 6 5 5 4 6 6 7 6 3 3 4 1 2 2 30
Medicinal FRLHT
5 4 4 6 5 5 5 7 6 2 2 3 1 2 2 19
Endemic to Arunachal Pradesh
5 4 2 4 4 4 5 5 6 3 2 2 1 4 2 53
Faunal Diversity
Mammals
No. of species 30 26 25 21 21 22 29 12 14 17 17 16 16 18 19
78 (Excluding Bats, Rats
and Shrews)
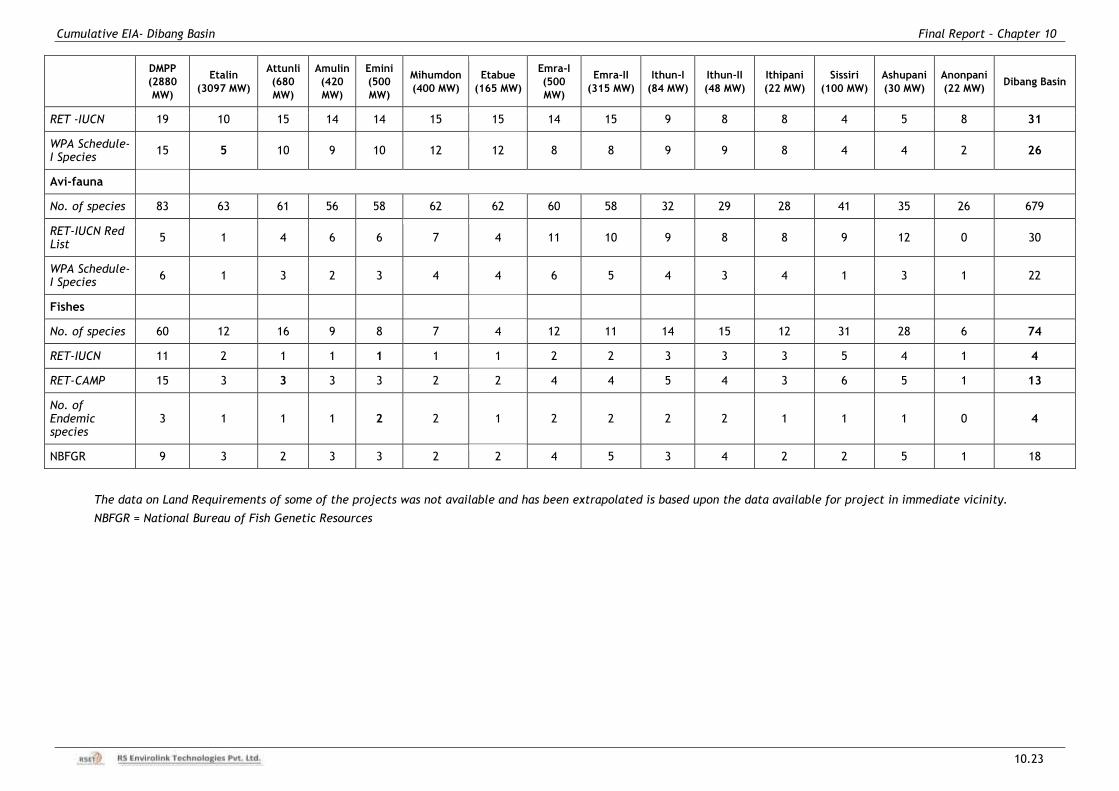
Cumulative EIA- Dibang Basin Final Report – Chapter 10
10.23
DMPP
(2880
MW)
Etalin
(3097 MW)
Attunli
(680
MW)
Amulin
(420
MW)
Emini
(500
MW)
Mihumdon
(400 MW)
Etabue
(165 MW)
Emra-I
(500
MW)
Emra-II
(315 MW)
Ithun-I
(84 MW)
Ithun-II
(48 MW)
Ithipani
(22 MW)
Sissiri
(100 MW)
Ashupani
(30 MW)
Anonpani
(22 MW) Dibang Basin
RET -IUCN 19 10 15 14 14 15 15 14 15 9 8 8 4 5 8 31
WPA Schedule-I Species
15 5 10 9 10 12 12 8 8 9 9 8 4 4 2 26
Avi-fauna
No. of species 83 63 61 56 58 62 62 60 58 32 29 28 41 35 26 679
RET-IUCN Red List
5 1 4 6 6 7 4 11 10 9 8 8 9 12 0 30
WPA Schedule-I Species
6 1 3 2 3 4 4 6 5 4 3 4 1 3 1 22
Fishes
No. of species 60 12 16 9 8 7 4 12 11 14 15 12 31 28 6 74
RET-IUCN 11 2 1 1 1 1 1 2 2 3 3 3 5 4 1 4
RET-CAMP 15 3 3 3 3 2 2 4 4 5 4 3 6 5 1 13
No. of Endemic species
3 1 1 1 2 2 1 2 2 2 2 1 1 1 0 4
NBFGR 9 3 2 3 3 2 2 4 5 3 4 2 2 5 1 18
The data on Land Requirements of some of the projects was not available and has been extrapolated is based upon the data available for project in immediate vicinity.
NBFGR = National Bureau of Fish Genetic Resources
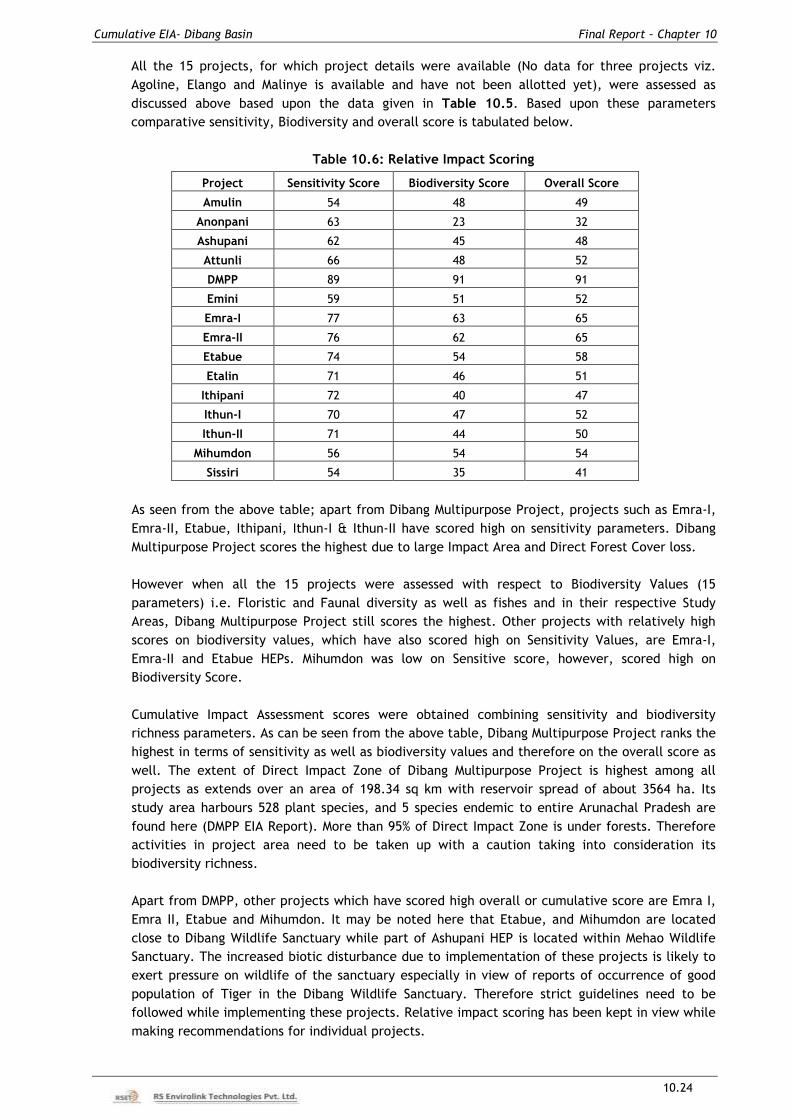
Cumulative EIA- Dibang Basin Final Report – Chapter 10
10.24
All the 15 projects, for which project details were available (No data for three projects viz.
Agoline, Elango and Malinye is available and have not been allotted yet), were assessed as
discussed above based upon the data given in Table 10.5. Based upon these parameters
comparative sensitivity, Biodiversity and overall score is tabulated below.
Table 10.6: Relative Impact Scoring
Project Sensitivity Score Biodiversity Score Overall Score
Amulin 54 48 49
Anonpani 63 23 32
Ashupani 62 45 48
Attunli 66 48 52
DMPP 89 91 91
Emini 59 51 52
Emra-I 77 63 65
Emra-II 76 62 65
Etabue 74 54 58
Etalin 71 46 51
Ithipani 72 40 47
Ithun-I 70 47 52
Ithun-II 71 44 50
Mihumdon 56 54 54
Sissiri 54 35 41
As seen from the above table; apart from Dibang Multipurpose Project, projects such as Emra-I,
Emra-II, Etabue, Ithipani, Ithun-I & Ithun-II have scored high on sensitivity parameters. Dibang
Multipurpose Project scores the highest due to large Impact Area and Direct Forest Cover loss.
However when all the 15 projects were assessed with respect to Biodiversity Values (15
parameters) i.e. Floristic and Faunal diversity as well as fishes and in their respective Study
Areas, Dibang Multipurpose Project still scores the highest. Other projects with relatively high
scores on biodiversity values, which have also scored high on Sensitivity Values, are Emra-I,
Emra-II and Etabue HEPs. Mihumdon was low on Sensitive score, however, scored high on
Biodiversity Score.
Cumulative Impact Assessment scores were obtained combining sensitivity and biodiversity
richness parameters. As can be seen from the above table, Dibang Multipurpose Project ranks the
highest in terms of sensitivity as well as biodiversity values and therefore on the overall score as
well. The extent of Direct Impact Zone of Dibang Multipurpose Project is highest among all
projects as extends over an area of 198.34 sq km with reservoir spread of about 3564 ha. Its
study area harbours 528 plant species, and 5 species endemic to entire Arunachal Pradesh are
found here (DMPP EIA Report). More than 95% of Direct Impact Zone is under forests. Therefore
activities in project area need to be taken up with a caution taking into consideration its
biodiversity richness.
Apart from DMPP, other projects which have scored high overall or cumulative score are Emra I,
Emra II, Etabue and Mihumdon. It may be noted here that Etabue, and Mihumdon are located
close to Dibang Wildlife Sanctuary while part of Ashupani HEP is located within Mehao Wildlife
Sanctuary. The increased biotic disturbance due to implementation of these projects is likely to
exert pressure on wildlife of the sanctuary especially in view of reports of occurrence of good
population of Tiger in the Dibang Wildlife Sanctuary. Therefore strict guidelines need to be
followed while implementing these projects. Relative impact scoring has been kept in view while
making recommendations for individual projects.
Cumulative EIA- Dibang Basin Final Report – Chapter 10
10.25
10.4.2 Impact due to Modification of Flow Regime
Whereas storage projects with large reservoir result into obstruction of migration paths of fishes,
and conversion of large sections of river from lotic to lentic ecosystems, the run-of-river (ROR)
affects the riverine ecosystem in a different way. In general impacts of ROR projects are:
• Dry stretches
• Barrier (even low) may affect migration of aquatic life
Main Dibang River has one large hydropower project planned on it. Three projects are planned
on Ithipani, its left bank tributary and two projects are planned on Emra river and one project
is planned on Ahi river its right bank tributaries.
Higher up before the confluence of Dri river with Talo river to Dibang river, three projects are
planned on Talo river, 4 projects on Dri river and two projects on Mathun which in turn is
tributary of Dri river.
Longitudinal profile of different of Dri, Talo, Mathun, Emra and Ithun rivers is given at Figures
10.5-10.9.
Total length of Dibang river likely to submerged by proposed Dibang Multipurpose project about
45 km i.e. lotic ecosystem will be converted into lentic ecosystem altering the entire Dibang
river aquatic system which will adversely impact the aquatic biodiversity and seriously
affecting fish populations and their migration behaviour.
In addition, the proposed dams on Dibang river will submerge large areas of forest land and
would store water to enable peaking power generation. As a result the Dibang river will have
relatively less water flow for few hours daily for generation of peaking power during lean
season. This storage period will result in drying up of the river, downstream of the Dibang
Lower dam site during winters. During this time the dry period will be followed by a wet or
flow period with uniform flow corresponding to the number of units/turbines generating
hydropower. Thus, the riverine ecology will be severely affected on account of modification in
flow regime. This change will have significant impact on the riverine fisheries affecting
physiological behaviour like migration and also affecting their growth cycle like maturation and
spawning periods.
Projects on Tributaries:
Tributaries draining into intermediate stretch/free flowing stretch are aso being exploited for
hydropower development, whereas they should be left undisturbed so that they can rejuvenate
the main river channel as they are the main contributors of biological production of the main
rivers.
Etabue, Elango, Ashupani and Anonpani projects have been planned on tributaries of Dibang,
Dri and Talo rivers.
Assessment of contribution of intermediate catchment needs to be assessed during individual
project EIA studies. Any major nallah/stream falling in intermediate catchment should be kept
free of hydropower development.
10.5 DOWNSTREAM AREAS
The area downstream of Dibang Multipurpose project is comprised of wide gently sloping
almost flat river bed of Dibang river up to Arunachal Pradesh –Assam border and also up to its
confluence with Lohit river in Assam. Dibang river here is as wide as 8 km at places with sandy
and grassy tracts. Most of the downstream area constitutes parts of Dibang Reserve Forest (RF),
Kerim RF and the whole of Sirkee RF (Choudhury, 1996) (refer Figure 10.10). Tall wet savanna
Cumulative EIA- Dibang Basin Final Report – Chapter 10
10.26
grassland occurs on the islets of the Dibang river, while the forest away from the river is mostly
Tropical Wet Evergreen. The main forested areas are between Dambuk-Bomjir and Bijari.
Dibang river habitat in this stretch is quite suitable for the wildlife in the region but the
population of mammalian fauna is quite low to moderate due to rampant hunting and
poaching. The major issue in this stretch is encroachment and presence of large number of
human settlements. Due to increased demand for flat land, there is tremendous pressure on
the area. Poaching, grazing of cattle and buffalos, collection of thatching and felling of trees
are other major issues. They kill the wild animals for meat, skin, trophy and traditionally use
for medicine and rituals for curing different diseases.
Among the major mammals are the Asian Elephant (Elephas maximus), Asiatic Wild Buffalo
(Bubalus arnee) and Hog Deer (Axis porcinus) (Choudhury 2003). The population of bird and
insects is also quite good in the region. These animals are found in the riverbed of Sissiri,
Dibang and Deopani rivers flowing through the plains. The habitat as already mentioned is
characterized typically with tall grasses up to 5 m high (Alpinia allughas) and large areas are
under agriculture which provides feeding and nesting grounds for the animals especially avi-
fauna. Accordingly Birdlife International has delineated Dibang Reserve Forest and adjacent
areas as IBA (see Chapter 6) with IBA criteria A1 and A2. This IBA is known for its rich
assemblage of threatened birds including the Lesser Adjutant (Leptoptilos javanicus), Swamp
Francolin (Francolinus gularis), Black-breasted Parrotbill (Paradoxornis flavirostris), Jerdon’s
Babbler (Chrysomma altirostre) and Marsh Babbler (Pellorneum palustre), White-winged Duck
(Cairina scutulata) and the Bengal Florican (Houbaropsis bengalensis). Spot-billed Pelican
(Pelecanus philippensis) was first time reported from Arunachal Pradesh from the northern
edge of this IBA by Choudhury (2000). It also constitutes an important staging area for
migratory birds and a new migration route of the Common Crane (Grus grus) (Choudhury 1994).
The predominant fish species are mahseer (Tor putitora and Neolissochilus hexagonolepis),
barils (Barilius bendelisis and B. teleo), and Glyptothorax (Glyptothorax spp.) especially in
streams like Deopani river.
Small sized fishes of species of Barilius, Danio, Neolissochilus, Garra, Puntius, Xenentodon,
Mystus and Chanda are also found in these areas. Barilius was most common in catch.
However, Danio spp. are the most dominant fishes followed by Barilius bendelisis, Barilius
teleo, Neolissochilus hexagonolepis and Garra sp. In this downstream section the quantity of
water gets divided into different channels and riffles hence, large size fishes get isolated in
deep pools.
Dattung river is formed by a branch of Dibang river and a channel of Sissiri river near the Bijari
village. The current velocity and discharge of water is comparatively higher in this river. The
species like Puntius conchonius and Barilius bendelisis, Xenentodon cancila, Chanda ranga,
Cyprinion semiplotus and Mystus sp. were landed in the catch from Dattung river. Chanda
ranga and Mystus sp. were also captured during the fishing.
Breeding/migration of fish
The fish fry of Barilius spp. were observed in a small pool habitats only (20-30 cm depth) at
left bank of the Sissiri river (refer Photographs), suggesting that the fish breeds in post
monsoon or early winter in the main river itself. The lean season (November to March) is most
productive period of the river and in this period fishes come back to the deep pools of main
river from the smaller channels and tributaries for feeding. They do not breed and migrate in
lean period; instead this is their feeding period.
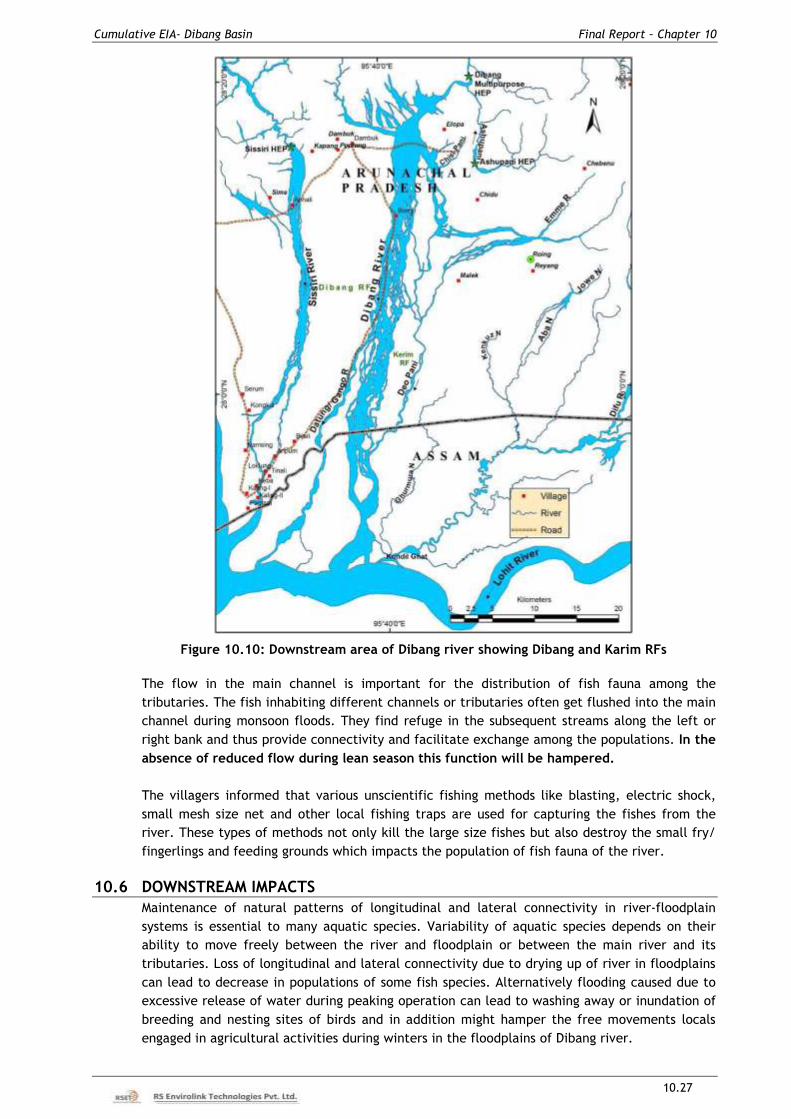
Cumulative EIA- Dibang Basin Final Report – Chapter 10
10.27
Figure 10.10: Downstream area of Dibang river showing Dibang and Karim RFs
The flow in the main channel is important for the distribution of fish fauna among the
tributaries. The fish inhabiting different channels or tributaries often get flushed into the main
channel during monsoon floods. They find refuge in the subsequent streams along the left or
right bank and thus provide connectivity and facilitate exchange among the populations. In the
absence of reduced flow during lean season this function will be hampered.
The villagers informed that various unscientific fishing methods like blasting, electric shock,
small mesh size net and other local fishing traps are used for capturing the fishes from the
river. These types of methods not only kill the large size fishes but also destroy the small fry/
fingerlings and feeding grounds which impacts the population of fish fauna of the river.
10.6 DOWNSTREAM IMPACTS
Maintenance of natural patterns of longitudinal and lateral connectivity in river-floodplain
systems is essential to many aquatic species. Variability of aquatic species depends on their
ability to move freely between the river and floodplain or between the main river and its
tributaries. Loss of longitudinal and lateral connectivity due to drying up of river in floodplains
can lead to decrease in populations of some fish species. Alternatively flooding caused due to
excessive release of water during peaking operation can lead to washing away or inundation of
breeding and nesting sites of birds and in addition might hamper the free movements locals
engaged in agricultural activities during winters in the floodplains of Dibang river.
Cumulative EIA- Dibang Basin Final Report – Chapter 10
10.28
A study was carried out to quantify the downstream impacts due to peaking power generation
by Dibang Multipurpose Project on Dibang River. Hydrodynamic routing was carried out using
MIKE 11 model, where different combinations of operations were simulated and flow variation
was studied in the extended downstream reach up to Guwahati. Impacts of modification of
flow regime in downstream reach due to peaking operations are discussed in ensuing
paragraphs.
The discharge control resulting from the damming of Dibang and Sissiri rivers will affect flow
variability downstream. It would lead to increase in flood peaks but the magnitude and timing
of flood peaks would change considerably. The effect of the project on individual flood flows
depends on the way the dams will be operated. Altered floodplain inundation and hydrology
downstream of these projects would reduce groundwater recharge in the riparian zone,
resulting in lowering of the groundwater table, with consequent impacts on riparian
vegetation.
Dibang Multipurpose Project has been planned as dam toe project with sufficient storage
capacity to generate peaking power. Peaking power generation in most part of monsoon is
generally of the order of 24 hours where plant runs at installed capacity round the clock
releasing water downstream which is equivalent to its design discharge. As the projects
operate as run-of-the-river projects, downstream releases are expected to be in tune with that
of normal monsoon discharge in the river. Water available in addition to that of design
discharge is released from the spillway and thereby variation in river flow is also reflected in
the downstream discharge. In non-monsoon season i.e. during 4 months of lean period and
other 4 months of pre-monsoon and post-monsoon season, discharge in river is not enough to do
24 hours peaking or run the plant at installed capacity, therefore, reservoir storage capacity is
used to store water to run the plant during the time of peak demand. During the storage period
only, minimum prescribed environment flow is released. This alternating dry and flooding is
likely to affect the downstream areas, the flood plains which is home to rich avian diversity.
However, provision of environment flow release will mitigate this impact to large extent.
Diurnal variation in river flows downstream of Dibang Multipurpose Project will be observed
during lean season due to peaking power generation from 6-8 hours and releasing environment
flow for rest of the day. The average winter (lean season) flow in the Dibang river in its
natural state is approximately 477 cumec (90% DY year discharge data). Both the ecology of the
downstream areas and people’s use of the riverine tracts in winter is adapted to this ‘lean’ but
relatively uniform flow of water on any particular day. After the implementation of the Dibang
Multipurpose Project; Dibang river flows, in winter in downstream reach up to its confluence
with Lohit River, will fluctuate on a daily basis. Fluctuation will be due to base discharge of
114 cumin for 16-18 hours to peaking discharge of 1282 cumec for 6-8 hours. The corresponding
fluctuation in water levels shall be of the order of 86 cm at 45 km downstream of Dibang dam,
which is significantly reduced at 61 Km downstream location to just about 8 cm. Therefore
there wouldn’t be any significant variation in water levels in the downstream reach. The
details these results have been given in Chapter 9 of this report.
10.6.1 Impact on Terrestrial Biodiversity
The reduced water flow also affects the ecology and biodiversity of terrestrial fauna in
downstream section. The species and materials may move laterally away from the river,
extending the effect of river changes to a band of varying width, parallel to the river. As long as
there is sufficient river flow below the dam, wildlife such as deer, antelope and elephants come
to the water, especially in the dry and hot season for drinking. Many birds fly in to drink. These
lateral movements can extend to several kilometers from the river. But the reduced flow or
partially drying condition of river trigger the large animals and birds migrate to nearby aquatic
body like Sibia river, Dattung river and Deopani river. But the small animals do not perform long
migration hence they will be worst affected fauna due to the construction of dams.
Cumulative EIA- Dibang Basin Final Report – Chapter 10
10.29
Diurnal variation in winter in the downstream reach of Dibang will have adverse impact on
Dibang river floodplain ecology, particularly for ground flora and fauna. Mammals, birds,
reptiles and amphibians that live on the ground of the islets that form in the winter season)
will be severely affected and some of them will either be drowned or obliterated. The eggs or
young ones of the breeding animals will suffer badly. These islets do experience seasonal
flooding due to change of river flow in monsoon during which most of the animals move away
to drier areas. In the dry lean winter season there is hardly any flooding of river for several
months and this is the time when most of these birds and animals come to inhabit these islets
and often breed there. Sudden releases of water flow even for a few hours in the lean season
will cause daily floods in large parts of these low-lying islets. The breeding behaviour of birds,
reptiles and mammals is not adapted to such levels of daily flooding in the breeding season.
The populations of highly threatened species like the Bengal Florican and Swamp Francolin
found in small pockets of suitable habitat for the survival of these species in these areas will
be lost.
The river is also carrying the mineral and nutrients for downstream floodplains during rainy
season. The river and floodplain ecosystems are closely adapted to the annual cycle of flooding
and drying. Many species depend on seasonal droughts or pulses of nutrients or water to give
the signals to start reproduction, hatching, migration or other important lifecycle stages. The
nutrients and minerals carried by river have also promoted the growth of grasses like Alpinia
allughas in river floodplain. The productive grasses that depend on the seasonal floods provide
the habitat for small animals like hare, rat and moles, snakes, and lizards. Some birds like
flycatchers, warblers, robins and bush chats used these grasses for their nesting material as
well as habitat.
The reduced water flow in downstream section will also affect the riparian vegetation
especially the stretch from below the dam. The riparian vegetation provides food and shelter
for riverside creatures and branches on which birds such as kingfishers can wait for their prey
to swim by. Furthermore, leaves and twigs falling into the river are an important source of
food for insects and other aquatic fauna. The plants and animals of the river bank and
floodplain also suffer when the area no longer floods or when the river is in spate at the wrong
time. The flow alterations on this scale have numerous ecological consequences. Rapid water
level fluctuations speed up erosion downstream and can wash away the trees, shrubs and
grasses along its banks.
Evergreen forests in and around Mehao WLS show medium elephant abundance, and has been
reported to be highly disturbed with a high degree of encroachment (especially in the Koronu
and Ippipaani areas) near the sanctuary. Elephants that use the Dibru-Deomali elephant
corridor sometimes visit this area (Sundaram et al., 2003).
Dibang river in plains of Assam comprised of Sadiya sub-division of Tinsukia district are highly
degraded due to number of habitations in the area and recurrent flooding during monsoon and
terrestrial biodiversity is very low and only scattered populations of Hoolock gibbon can be
seen (Chetry et al. 2012) restricted only to Reserved Forests.
10.6.2 Impact on Fish fauna
The impact of dams on natural flood regimes can drastically reduce fish populations in both
river channel and floodplain. Many floodplain fishes are stimulated by rising seasonal flood
flows to move into the floodplain to breed in the warm organically rich water. As the flood
subsides, fish move back to the river channel, and in many cases eventually to the small and
deoxygenated pools of largely dry river beds. If a dam reduces flood peaks fish fail to move or
breed, reducing the population size and the economic return to the fish catchers.
Cumulative EIA- Dibang Basin Final Report – Chapter 10
10.30
The low fluctuations would also affect the fish populations thriving in the transition zones in
the foothills. For example, in the winter, some species breed in the shallow waters (Barilius
species), while other species such as Channa spp. hibernate along the shorelines. Such massive
flow fluctuations will destroy these natural processes for many such species.
The reduced flow also affects the spawning and breeding of fishes in downstream section. The
pools and shallow banks having slow moving water, moderate temperature and good quantity
of feeding materials for young fishes will dry and water will remain in the central portion only
which ultimately hampers the breeding of fishes and ultimately reduce the fish stocks of
downstream section.
The aquatic species such as invertebrates and fishes require minimal flows in which to navigate
and feed. Such species may be affected by reduced flows including a reduction in the area of
habitat utilised. This may lead to smaller populations, reduced growth rates and, where
populations are already at risk, extirpation or extinction.
A certain level of downstream flow is needed to maintain a minimum volume and area of
habitat, oxygen concentration and other ‘desirable’ in-stream conditions and avoid lethal
temperatures. Normal seasonal flow patterns are a key to maintaining river biodiversity.
Balancing reservoirs may help avoid pulse discharges, delay peak discharges and reduce them
to an ecologically acceptable levels and guarantee a certain minimum discharge.
10.7 CONSTRUCTION PHASE IMPACTS
Construction phase impacts are generally dealt in detail during individual project EIA study
with respect to local environment setting. For cumulative environment impact assessment, it is
important to visualize the cumulative impacts of several projects under construction,
simultaneously. Total 18 hydropower projects are considered as part of this cumulative EIA
study of Dibang basin and none of the projects have started construction though EC & EC has
been granted to Dibang Multipurpose Project. Two projects Etalin and Attunli are at advanced
stages and remaining are still in preliminary stages without any investigation work on ground. It
is expected that it may take another few years before a medium to large size project will start
construction in the basin, followed by another and so on. Thereafter there will be a peak
period when several projects will be under construction at the same time. This construction
phase might last for 10-15 years before large part of construction work will be over in the basin
and many of the projects will be under operation.
Though environmental impacts attributed to construction phase of hydropower projects are
considered temporary in nature, lasting mainly during the construction phase and often do not
extend much beyond the construction period, their impacts however need to be minimised
during this phase. The construction phase of Hydroelectric Projects is fairly large; therefore
these impacts are required to be managed by strict implementation of pollution control and
environment management measures. As the limited project data is available at this stage,
quantification of construction phase impacts in detail is not possible. This is also not part of
the scope of the present study. Broad framework of major impacts is discussed with
recommendations/guidelines wherever possible.
10.7.1 Human Interference
Entire Arunachal Pradesh is scarcely populated. Average population density of two districts of
Dibang i.e. Lower Dibang Valley and Dibang Valley is 14 and 1 persons per sq km, respectively.
Construction of hydropower projects is labour intensive work and would lead to influx of
manpower. Type of manpower needed in terms of skill sets and number, locals can only meet a
small part of the total requirement and rest will come from outside the state. Project
construction being long-term activity and generally located in remote areas, establishment of
labour camps near construction sites is only practical solution. Labour requirement for a
Cumulative EIA- Dibang Basin Final Report – Chapter 10
10.31
project will depend upon size and type of project and construction management and planning
schedule. For a typical 1000 MW project, migrant population will be of the order of 2500-3000
persons including labours and their families, during peak construction period. With a few
projects under construction simultaneously on the same river in cascade, this number will be
multiplied and far exceeds the local population in that area. Such a large influx of people in
otherwise pristine tribal area, can lead to several impacts requiring careful management to
minimize their impacts. Major impacts include:
• Labour camps, in the absence of waste management system, can have serious impact on
water and land environment as disposal of sewage and solid waste, in otherwise pristine
and hilly terrain will seriously pollute land and water environment. Therefore, it is
important to ensure that Sewage Treatment and Solid Waste Management measures are
designed and implemented for the entire duration of the project. Pollution Control Board
needs to be strengthened to monitor implementation of such measures.
• Labour generally resort to tree cutting to source wood for cooking and space heating and
also hunting and poaching of wildlife in remote areas can become a common practice, if
not controlled strictly. Developers need to ensure that the provision of adequate fuel to
labour for cooking and space heating is made binding in contract for all the contractors.
Forest Department need to monitor and control such damages with penalties to offenders.
• Influx of large labour force will increase the load on local infrastructure such as schools,
hospitals, etc. Therefore, developers should plan as part of project budget to improve local
infrastructure with a view to provide adequate medical and other amenities to migrant
labour force as well as to local population.
• Influx of large labour force can also lead to introduction of new diseases in the area.
Developers have to ensure through contractors, that before introduction of labour, they
should undergo health check-up and persons with communicable disease should not be
given entry unless he/she is disease free. After initial screening regular health check-ups
should be organized and record maintained till the completion of the project. Local
medical officers need to be involved for certification.
10.7.2 Sourcing, Storing and Transportation of Construction Material
Out of main construction material viz. cement, steel, coarse aggregate and fine aggregate;
aggregate requirement is met locally. In addition, to use the muck generated from excavation,
some specific quarry sites are identified near the project site to quarry material for
construction. Opening of the quarries cause visual impacts because they remove a significant
part of the hills and with several projects coming under construction on the same river, large
quarry sites or several quarry sites can spoil the local land scape altogether, unless the impact
is adequately managed. Other impacts will be the noise generated during aggregate acquisition
through explosive and crushing, which could affect wildlife in the area, dust produced during
the crushing operation to get the aggregates to the appropriate size and transport of the
aggregates, and transport of materials.
Storage of large quantities of construction material near construction sites and temporary
storage of muck before disposal can spoil the local air quality with high levels of SPM and RPM.
Strict implementation of Pollution Control and Environment Management measures can only
mitigate such impacts. Regular monitoring, auditing and reporting to authorities should be
made part of the EMP and Pollution Control Board should be strengthened to supervise all the
construction activities to ensure that planned measures are implemented.
Transportation of construction material from outside the project area to the site will be a
regular activity, once a project becomes operational. This should be considered as one of the
Cumulative EIA- Dibang Basin Final Report – Chapter 10
10.32
major impact of hydropower project during construction phase. With several projects under
construction at the same time, such impact will multiply with the number of projects. Road
network is not designed to handle heavy traffic carrying raw material for construction; with
substantial increase of heavy traffic impact will be severe and long term. A detailed separate
study is needed at this stage where based on predicted traffic volume, infrastructure
improvement plan can be prepared and implemented.
10.7.3 Operation of Construction Plant and Machinery
Operation of construction plants, machines and equipment will lead to pollution generation in
various manifestations viz. air pollution, noise generation, wastewater generation, solid and
hazardous waste generation, etc. These construction plants set up locally near the project sites
are as good as industrial units generating pollution. Pollution generation should be controlled
by use of pollution control equipment such as silencers/mufflers for DG sets, waste water
treatment plants, etc. Pollution Control Board will play an important role in ensuring that
pollution control measures are taken and all the required emission limits are adhered to at all
the time.
10.7.4 Muck Disposal
The construction of hydropower involves generation large quantities of as a result of activities
like tunneling, road construction, etc. In a hilly terrain like Himalaya the disposal of muck
generated from excavation has been a matter of grave concern over the years. The biggest
obstacle in the way of dumping of muck and its rehabilitation is the non-availability of sites for
safe disposal as the hydropower project sites in Himalaya characterised by steep slopes and
fragile geology. It has invariably been seen that from designated areas for muck disposal, the
muck tends to fall into the river and contaminate its waters. These coupled with faulty disposal
practices and improper management further deteriorates the landscape and augment the
sediment load in the stream causing severe impact to the aquatic ecosystem as well as
increased sediment deposition, siltation etc.
As part of the engineering study an estimation of the muck quantities likely to be generated is
made. A part of it is considered for reuse in construction and balance for disposal after adding
swell factor. Several samples of muck should be tested for correct estimation of reusable
material and swell factor. Data, on quantum of muck generation, re-use and muck requiring
disposal including area required for muck disposal, is available only for some of the projects in
the basin. Based on this data, a broad estimation is made about the quantity of muck that
would be required to be disposed of due to implementation of 18 projects in Dibang basin and
this amounts to about 700 lakh cum. Disposal area requirement would depend upon
topography and terrain, however, a general estimation showed that about 800 ha of land would
be needed for muck disposal.
Cumulative EIA- Dibang Basin Final Report - Chapter 11
11.1
CHAPTER-11
CONCLUSIONS & RECOMMENDATIONS
11.1 INTRODUCTION
During the Cumulative Impact Assessment (CIA) study various issues and concerns relevant to
implementation of proposed 18 hydropower projects in Dibang basin were assessed. Baseline
data superimposed with the project parameters of proposed HEPs have been used to analyse
cumulative impacts of hydropower development in the basin. Recommendations have been
made for sustainable and optimal ways for hydropower development in the basin keeping in
view the environmental baseline characteristics of Dibang basin as well its major tributaries.
The recommendations have been made for Dibang river as well as its tributaries, wherever the
project development have been proposed. The recommendations are based upon the
cumulative impacts evaluated on biodiversity values, riverine ecosystem, riparian habitats,
lateral connectivity and environmental flow requirements vis-à-vis planned hydropower
projects.
11.2 PROJECTS STATUS
Progress status of projects in Dibang basin is summarised below:
Etalin, Attunli and Anonpani of Jindal Power and Dibang Multipurpose Project of NHPC; are
the only four projects in the basin which are making progress.
Dibang Multipurpose Project has got the environment and forest clearance in place and
is under the process of revising the DPR to accommodate the recommendations of EAC
and conditions imposed by MoEF&CC during environment clearance.
Etalin DPR has got CEA concurrence, however, environment and forest clearance is
pending for want of Dibang Basin study; EIA EMP reports have been discussed and
concluded in EAC.
Attunli is making progress with DPR preparation and interlinked sections of EIA EMP
reports.
Ithun I, Ithun II and Ithipani of JVKIL consortium has started the work on DPR preparation
and have obtained scoping clearances (for Ithun I and Ithun II only), however, for last
couple of years all work on the projects is suspended. Scoping clearances have also lapsed
for both the projects and have not been applied again for extension/re-issue.
Emini, Amulin and Mihumdon of Reliance Power; have not made any significant progress;
TOR obtained in 2010/11 have also expired and have not been revised /extended.
Sissiri HEP has prepared a draft DPR of 222 MW and submitted to CEA for appraisal and
approval. CEA has asked to furnish details/justification for proposed 222 MW installed
capacity including examining the possibility of reducing the IC/dam height. The developer
while submitting the justification have requested for consideration of 100 MW installed
capacity, which CEA has found to be in order subject to certain conditions and approvals.
(Refer CEA Letter dated July 01, 2011 enclosed as Annexure VII, Volume II). TOR obtained
for 222 MW installed capacity, which was never revised for 100 MW. No further information
was made available to us by developer, therefore status of preparation/updation of DPR
for 100 MW installed capacity is not clear.
Two projects have been planned on Emra river i.e. Emra-I (275 MW) & Emra-II (390 MW)
HEPs as per the data submitted by the State Government of Arunachal Pradesh. Developer
has submitted salient features for Emra I and Emra II for revised installed capacities of 600
Cumulative EIA- Dibang Basin Final Report - Chapter 11
11.2
MW and 315 MW for Emra I and Emra II HEPs. A communication dated May 09, 2016 from
the Department of Hydropower Development (Monitoring), Government of Arunachal
Pradesh has mentioned that, “these projects can be developed in one or more
schemes/stages of run-of-the-river and/or storage type to capture 275 MW (390 MW) or
more of the installed capacity to optimally explore the entire hydropower potential
available in the Emra Basin.” (copy of the letter is enclosed as Annexure VIII, Volume II).
Emra I and Emra II of Athena Energy, could not make any progress since the allotment of
the projects. Large part of Emra catchment is inaccessible, therefore no site investigation
has been initiated so far. The lower project i.e. Emra II was denied by EAC at MoEF&CC in
2010, when developer informed that entire basin is allotted to them and they need
permission to proceed with investigation. EAC recommended carrying out basin study and
then apply for fresh TOR, however, no progress is made till date.
Ashupani HEP has been allotted to Arti Power, however, no progress has been made till
date. Only available document is PFR prepared by NHPC under the 50,000 MW initiative.
Developer has not started any work till date. According to available layout of Ashupani HE
project tail end of its reservoir encroaches into Mehao Wildlife Sanctuary.
Agoline, Malinye, Etabue and Elango HEPs have not been allotted till to date. PFRs for
Agoline, Elango and Elango HEPs have never been prepared. PFR is available only for
Etabue HEP which was prepared under 50,000 MW initiative. Project location of Malinye
HEP, as provided by State government, show that it falls within Dibang Wildlife Sanctuary.
11.3 PROJECTS PLANNED ON DIBANG/DRI RIVER AND TRIBUTARIES
Dibang is the main river in the basin formed by confluence of Dri and Talo rivers. Four projects
have been planned on Dibang river including Dri stretch. Dibang Multipurpose Project is on Dibang
river; Etalin, Agoline and Mihumdon are on Dri River. Etabue HEP is proposed on Ange Pani, which
is tributary of Dri and Ashupani HEP is on Ashupani, which is tributary of Dibang river.
Area under Direct Impact Zone (DIZ) is highest in Dibang Multipurpose Project (2880 MW) i.e.
about 199 sq km area will be affected directly due to project components. Affected area is
much less in case of Etalin (Dri Limb) (3097 MW) i.e. only 111 sq km covering both the limbs
and less than 34 sq km in case of Etabue (165 MW) and Mihumdon (400 MW) HEPs. Collectively
these projects are likely to affect around 10000 ha of forest area. On an average about 65% of
entire area is under Very High and High Biological Richness index. In Etabue, Dibang
Multipurpose Project and Etalin HEPs together more than 75% area in Direct Impact Zone is
under Very High and High Biological Richness index. Fragmentation index is comparatively low
i.e. around 32% of landscape in Direct Impact Zone is fragmented. However in DIZ of Mihumdon
and Ashupani HEPs fragmentation is much lower as only about 8% area is under High
Fragmentation Index and in Etabue HEP it is as low as 5%.
Dibang Multipurpose and Etalin projects together will require nearly 5739 ha of forest land
(Dibang Multipurpose Project 4578 ha & Etalin HEP 1161 ha). The diversion of large area of
forest would lead to fragmentation of contiguous patches of forests into patches of forest
thereby increased forested landscape fragmentation.
According to assessment based upon total affected area (Direct Impact Zone), Forest land
requirement, Biological Richness Index and Fragmentation Index, Dibang Multipurpose Project
gets the highest environmental sensitivity score; followed by Etabue, Mihumdon, Etalin and
Ashupani in that order. Details were not available for Agoline except for its location, so no
analysis could be carried out.
Cumulative EIA- Dibang Basin Final Report - Chapter 11
11.3
Mahseer reportedly migrates from Dibang river into its waters of tributaries like Ithun, Ahi and
Emra rivers during monsoon for spawning and breeding. However after the implementation of
Dibang Multipurpose project, mahseer no longer will be able to visit these tributary streams as
upstream migration of mahseer is likely to be stopped completely due to high dam of Dibang
Multipurpose Project. Therefore life cycle of mahseer will completely restricted to downstream
of Dibang Multipurpose Project only. This will have severe impact on the populations of
mahseer and other migratory fish species in Dibang river.
11.4 PROJECTS ON TALO RIVER
Four projects are planned in Talo river catchment i.e. Etalin (Talo Limb), Attunli, and Malinye
HEPs on Talo river, while a small hydropower project Anonpani is on Anonpani which is a
tributary of Talo river downstream of Etalin (Talo Limb) project diversion site.
More than 58% of Talo river catchment is under forests and 67% of area in Direct Impact Zones of
planned projects is under Very High and High Biological Richness Index categories. As the area is
sparsely populated and accordingly fragmentation in catchment is low to moderate.
Etalin HEP has already been discussed in the previous section as it spread in both Dri and Talo
rivers. Attunli HEP is located within 10 km radius of Dibang Wildlife Sanctuary, however
according to sensitivity and biodiversity richness values this project falls in moderate
sensitivity category. Anonpani another small project on a tributary of Talo river falls in low
impact category. Malinye HEPs is the uppermost project on Talo river and part of it falls within
the sanctuary.
11.5 PROJECTS ON MATHUN RIVER
Two projects are planned in Mathun river catchment i.e. Amulin and Emini HEPs. They have
been planned immediately upstream of confluence of Mathun with Dri river. Forest cover in
Mathun river catchment is 64.30%. Area under Very High and High Biological Richness Index is
quite low as compared to Talo and Dri catchments. Large continuous patches of slopes can be
seen cleared of vegetation for jhum cultivation. Even then overall fragmentation of landscape is
not high. Forest cover in Direct Impact Zone of two projects on Mathun river is 56.90 and
69.08%. Overall score on sensitivity assessment show that both projects are in medium category,
however being situated close to Dibang Wildlife Sanctuary especially Amulin HEP which is only
few kilometres from the sanctuary boundary, wildlife conservation measures need to be stressed
upon during implementation these two projects.
11.6 PROJECTS ON EMRA RIVER
Emra river catchment as a whole is least disturbed of all tributary catchments of Dibang river
with almost no habitation and there are no approach roads also at present. The forest cover is
as high as 87.26% while area under Very High and High Biological Richness Index is nearly 81%,
the highest amongst all catchments. Fragmentation of landscape too is quite low (less than 6%
area is under High Fragmentation Index) as these is no habitation in the area.
Area under Very High and High Biological Richness index categories in Direct Impact Zones of
the Emra-I & Emra-II HEPs is 76.17 and 70.96%, respectively. Based upon forest cover and
Biological Richness Index, these two projects get High sensitivity Score.
Emra river is one of the tributaries where mahseer is known to migrate from Dibang river into
its waters during monsoon for breeding. As the high dam of Dibang Multipurpose Project will
completely check the upstream migration, mahseer no longer will be able to reach this river.
Cumulative EIA- Dibang Basin Final Report - Chapter 11
11.4
11.7 PROJECTS ON ITHUN RIVER
Three projects are planned on Ithun river with 2 on main Ithun river and one on its tributary
Ithipani. Ithun river catchment also constitutes one of the pristine areas of Dibang basin.
Though there are number of habitations in its catchment, forest cover is more than 81% and
area under Very High and High Biological Index is 80% and fragmentation is also low.
Forest cover in Direct Impact Zones of Ithun-I, Ithun-II and Ithipani HEPs is 96.71, 94.81 and
98.36%, respectively. However due to presence of number of settlements near the proposed
projects, fragmentation is higher than catchments of Emra, Mathun and Talo as area under
High Fragmentation Index category varies from 15.70 to 18.41% in all three projects.
Therefore, overall sensitivity score is not very significant.
Fishes form an important aquatic resource in this river. Fishes like Golden mahseer and
Chocolate mahseer migrate into this river for spawning and breeding from main Dibang river.
At higher altitudes river also harbours species of trouts. However as already discussed in
previous sections the migration of mahseer fish will be entirely stopped by Dibang Multipurpose
project.
11.8 SINGLE PROJECTS ON TRIBUTARIES
Sissiri HEP on Sissiri River
More than 86% of Sissiri river catchment is under forest. Based upon sensitivity and biodiversity
value assessment Sissiri HEP falls in Low impact category and is the only project on Sissiri river
which meets Dibang river only in plains.
Elango HEP on Ahi River
On Ahi river, only Elango HEP is planned, which is not yet allotted. Based upon the project
location (no other data is available), its catchment is in pristine condition and mahseer is
known to migrate from Dibang river for spawning and breeding.
Ashupani HEP on Ashupani River
Though Ashupani HEP has been allotted to M/s Arti Power & Ventures Pvt. Ltd. but no work has
been done till to date and developer has yet to apply for ToR. As per the present layout of the
project reservoir tail of the project falls within the boundary of Mehao Wildlife Sanctuary.
Anonpani HEP on Anonpani River
Anonpani small hydropower project is the only project on Anonpani, a left bank tributary of
Talo river. It falls in low sensitivity/impact category and has been planned as construction
power project for Etalin and Attunli HEPs by the project developer. The Forest Clearance also
has been recommended by Regional Empowered Committee, Shillong of MoEF&CC.
11.9 PROJECT SPECIFIC RECOMMENDATIONS
11.9.1 Dibang Multipurpose Project
The project is in most advanced stage in basin, with environment and forest clearance in DPR and
DPR is under revision due to changes proposed during environment clearance process. The
project has reduced the dam height by 10 m leading to change of installed capacity from 3000
MW to 2880 MW. Environmental flow provisions as finalised during the environment clearance
have been assessed by modeling study and are found to be adequate. Keeping this in view, no
additional modification or changes are recommended for this project.
Cumulative EIA- Dibang Basin Final Report - Chapter 11
11.5
11.9.2 Etalin and Attunli HEPs
In addition to Dibang Multipurpose Project, these two are the only projects which have made
substantial progress in terms of Survey and Investigation and preparation of environmental
impact assessment study reports. Etalin’s DPR has already been accorded TEC by Central
Electricity Authority; EIA & EMP studies have been completed along with public consultation
process and have been discussed in EAC, however, environment clearance is not recommended
because basin study was not complete at that time. Adequate free flow river stretch is
maintained with upstream and downstream projects in both the cases and with the provision of
environmental flow recommendations, impacts of reduced flow in de-watered stretch will also
be mitigated. Therefore, no changes are required for these two projects as well.
11.9.3 Emra I and Emra II HEPs
Emra I and Emra II projects have been allotted to M/s Athena Energy by GoAP vide MoA dated
02/02/2008 with the provision of developing Emra river in two or more schemes/stages. Survey
and investigation have not made any significant progress. Environment clearance process has
yet to start from scoping clearance stage. These two projects have been considered on the
basis of the desktop information provided by the developer; however, whether more projects
in the Emra basin can be sustainably develop cannot be assessed based on the limited
information. Therefore, it is recommended that development of Emra basin should remain
limited to two schemes in the present form. No more projects should be considered on Emra
River unless a detailed basin study establishes their sustainability.
11.9.4 Malinye, Elango, Agoline and Etabue HEPs
These four projects have not been allotted yet, and therefore, not much information is
available for a detailed assessment. Malinye HEP falls within Dibang Wildlife Sanctuary and
there is no possibility of shifting the project downstream in order to avoid falling within the
sanctuary and there is no free stretch between Malinye and Attunli HEPs according to the tail
water level of the project provided by the state government matches with the FRL of Attunli
HEP. Therefore based upon the location of Malinye HEP is recommended to be dropped.
Etabue HEPs diversion site is on Ange Pani and powerhouse is planned on left bank of Dri river
downstream of Mihumdon HEP powerhouse (on right bank) and upstream of Agoline HEP. Diversion
on Ange Pani will reduce the contribution of intermediate catchment downstream of Mihumdon
diversion. As the project features are not yet final, it is recommended that at least one kilometre
of free flow stretch should be maintained between FRL of Agoline and TWL of Etabue. As Agoline
HEP is also not allotted, based on limited available features, it TWL is approximately giving a 970m
free river stretch with Etalin FRL on Dri river. A minimum of one kilometer free flow stretch is
recommended to be maintained by Agoline from the FRL of Etalin HEP.
11.9.5 Mihumdon, Amulin, Emini, Ithun I and Ithun II HEPs
Mihumdon, Emini and Amulin HEPs are with Reliance Power and Ithun I and Ithun II are with
JVKIL consortium. All these five projects have taken scoping clearance which have lapsed and
have not been applied for revalidation/extension by developers. No significant progress is
made on DPR preparation as well. Projects have been considered and reviewed based on the
PFR information and scoping clearance issued by MoEF&CC. Environmental flows have been
assessed and recommended for individual project and should be incorporated in DPR during its
preparation and finalisation.
11.9.6 Anonpani and Ithipani HEPs
Anonpani and Ithipani are two small projects i.e. less than 25 MW installed capacity and
therefore are not covered under EIA notification. Anonpani is in advance stage and is making
progress whereas Ithipani is only at PFR stage. Projects are found to be sustainable based on
Cumulative EIA- Dibang Basin Final Report - Chapter 11
11.6
the present project features and environmental baseline setting, therefore, no specific
recommendations have been made.
11.9.7 Ashupani HEP
Ashupani is a 30 MW proposed project on Ashupani river and the features available as of date
are from PFR prepared by NHPC under 50,000 MW initiative. Project was allotted to Arti Power
& Ventures Pvt. Ltd. in 2013 and no progress is made till date. Reservoir tail appears to be
encroaching in the Mehao Wildlife Sanctuary. Detailed Project features are not available to
verify this fact. Project is planned as inter-basin transfer where water of Ashupani will be
diverted to a powerhouse on the bank of Digi Nala. This will make about 11 km of the Ashupani
river, downstream of dam up to confluence with Dibang, dry but for the environmental flow.
Catchment area at diversion site is only 67 sq km. It is recommended that project should be
planned keeping it completely outside the boundary of Mehao Wildlife Sanctuary.
Environmental flow provisions are very critical for this project where out of 28 km of the total
Ashupani river length, about 11 km will be left with environmental flow only. Therefore, the
environmental flow recommendations should be strictly implemented and provisions should be
made in the project design in DPR itself.
11.9.8 Sissiri HEP
Sissiri HEP’s installed capacity has already been reduced to from 222 MW to 100 MW and
revised DPR is under preparation. Scoping clearance obtained in 2009 has lapsed and never
applied again for re-issue/revalidation. Environmental flow provisions have been assessed and
same needs to be incorporated to make project environmentally sustainable. It is
recommended that environment flow provisions are incorporated in the DPR at this stage as it
may require some changes in terms of turbine configuration/features. It is further
recommended that developer should proceed with fresh scoping clearance and environment
study.
11.10 ENVIRONMENT FLOW RELEASE RECOMMENDATIONS
Detailed environmental flow assessment is done and discussed on Chapter 08. Following table
summarizes final recommendation on environmental flow releases.
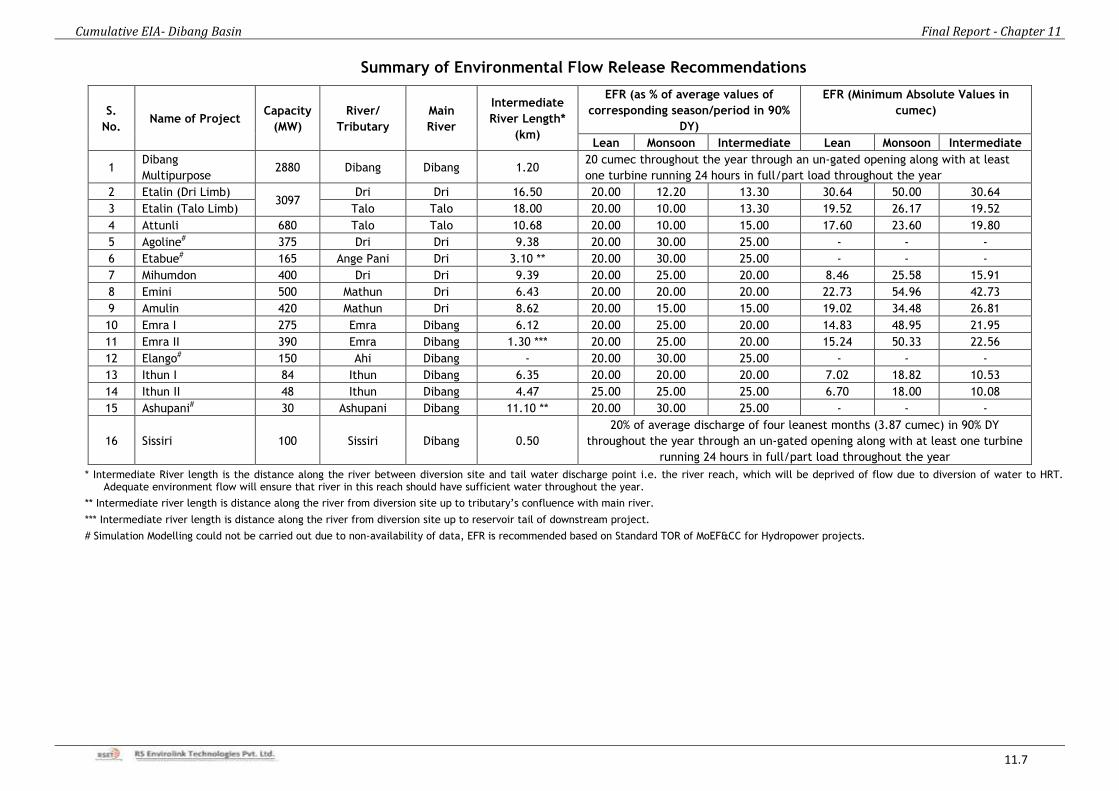
Cumulative EIA- Dibang Basin Final Report - Chapter 11
11.7
Summary of Environmental Flow Release Recommendations
S.
No. Name of Project
Capacity
(MW)
River/
Tributary
Main
River
Intermediate
River Length*
(km)
EFR (as % of average values of
corresponding season/period in 90%
DY)
EFR (Minimum Absolute Values in
cumec)
Lean Monsoon Intermediate Lean Monsoon Intermediate
1 Dibang
Multipurpose 2880 Dibang Dibang 1.20
20 cumec throughout the year through an un-gated opening along with at least
one turbine running 24 hours in full/part load throughout the year
2 Etalin (Dri Limb) 3097
Dri Dri 16.50 20.00 12.20 13.30 30.64 50.00 30.64
3 Etalin (Talo Limb) Talo Talo 18.00 20.00 10.00 13.30 19.52 26.17 19.52
4 Attunli 680 Talo Talo 10.68 20.00 10.00 15.00 17.60 23.60 19.80
5 Agoline# 375 Dri Dri 9.38 20.00 30.00 25.00 - - -
6 Etabue# 165 Ange Pani Dri 3.10 ** 20.00 30.00 25.00 - - -
7 Mihumdon 400 Dri Dri 9.39 20.00 25.00 20.00 8.46 25.58 15.91
8 Emini 500 Mathun Dri 6.43 20.00 20.00 20.00 22.73 54.96 42.73
9 Amulin 420 Mathun Dri 8.62 20.00 15.00 15.00 19.02 34.48 26.81
10 Emra I 275 Emra Dibang 6.12 20.00 25.00 20.00 14.83 48.95 21.95
11 Emra II 390 Emra Dibang 1.30 *** 20.00 25.00 20.00 15.24 50.33 22.56
12 Elango# 150 Ahi Dibang - 20.00 30.00 25.00 - - -
13 Ithun I 84 Ithun Dibang 6.35 20.00 20.00 20.00 7.02 18.82 10.53
14 Ithun II 48 Ithun Dibang 4.47 25.00 25.00 25.00 6.70 18.00 10.08
15 Ashupani# 30 Ashupani Dibang 11.10 ** 20.00 30.00 25.00 - - -
16 Sissiri 100 Sissiri Dibang 0.50
20% of average discharge of four leanest months (3.87 cumec) in 90% DY
throughout the year through an un-gated opening along with at least one turbine
running 24 hours in full/part load throughout the year
* Intermediate River length is the distance along the river between diversion site and tail water discharge point i.e. the river reach, which will be deprived of flow due to diversion of water to HRT. Adequate environment flow will ensure that river in this reach should have sufficient water throughout the year.
** Intermediate river length is distance along the river from diversion site up to tributary’s confluence with main river.
*** Intermediate river length is distance along the river from diversion site up to reservoir tail of downstream project.
# Simulation Modelling could not be carried out due to non-availability of data, EFR is recommended based on Standard TOR of MoEF&CC for Hydropower projects.
i
References
Acreman, M. and Dunbar M.J. (2004). Defining environmental river flow requirements: a
review. Hydrol Earth Syst Sci 8(5):861–876Aitchison, J.E.T. (1868). Flora of
Hushiarpur district of the Punjab. J. Linn. Soc. (Bot.) Vol. 11: pp. 17-22.
Adoni, A.D., Joshi, G., Gosh, K., Chaurasia,S.K., Vashya, A.K.,Yadav Manoj and Verma H. G.
(1985); Workbook on limnology. Pratibha Publishers C-10, Gour Nagar, Sagar-470003,
India.
Ali N. and Ghosh B. (2006). Ethnomedicinal Plants in Arunachal Pradesh: Some Tacit Prospects.
ENVIS Bulletin: Himalayan Ecology, Vol. 14(2), pp. 22-28.
Ali, S and Ripley, S.D. (1983). Handbook of the birds of India and Pakistan. Oxford (Delhi and
New York).
APHA (1992). Standard methods for the examination of water and wastewater, 18th ed.
Washington DC: American Public Health Association.
Arthington, A. H. and Pusey, B. J. (1993). In stream flow management in Australia: Methods,
Deficiencies and Future directions, Australia Biologist Vol. (6): 52-60.
Arthington, A.H. and Zalucki, J.M. (eds.) (1998). Comparative evaluation of environmental flow
assessment techniques: review of methods. Land and Water Resources Research and
Development Corporation Occasional Paper No. 27/98. Canberra, Australia. pp 141.
Arthington, A.H., King, J.M., O’Keeffe, J.H., Bunn, S.E., Day, J.A., Pusey, B.J., Blu¨hdorn,
D.R. and Tharme, R.E. (1992). Development of an holistic approach for assessing
environmental flow requirements of riverine ecosystems. In: Proceedings of an
International Seminar and Workshop on Water Allocation for the Environment, Pigram
JJ, Hooper BP (eds). The Centre for Water Policy Research, University of New England:
Armidale, Australia.
Bagra K., Kento K., Kongbrailatpan Nebeshwar-Sharma Boni A. L., Uttam U. S., Debangshu N.
D., (2009). Ichthyological survey and review of the checklist of fish fauna of Arunachal
Pradesh, India, Check List Vol 5(2): pp 330–350.
Baker, E. C. Stuart (1913). On a small collection of birds from the Mishmi Hills, N. E. frontier of
India. Records of the Indian Museum. Vol. 9: pp. 251–254.
Barre De Saint Venant in 1871
Barua, U., Hore, D.K., Rathi, R.S. and Das, G. (2006). Occurrence of Orchids in parts of Upper
Assam Districts and Lohit and Dibang Valley Districts of Arunachal Pradesh.
Environment & Ecology, Vol. 24 (4): pp. 736-742.
Battish, S.K. (1992). Fresh Water Zooplankton of India. Oxford and IBH Publishing Co. Pvt.
New Delhi.
Bechara, J.A, Domitrovic, H.A., Quintana, C.F., Roux, J.P., Jacobo, W.R. and Gavilan, G.
(1996). The effect of gas supersaturation on fish health below Yacyreta dam (Parana
River, Argentina). In: Second International Symposium on Habitat Hydraulics (eds M.
Leclerc, H. Capra, S. Valentin, A. Boudreault and Y. Cöté). Québec, Canada. INRS
Publisher.
Beecher, H. A. (1990). Standards for Instream Flows. Rivers, Vol. 1(2): pp 97-109.
Behera M.D., Kushwaha S.P.S. and P.S. Roy (2002). High plant endemism in an Indian hotspot –
eastern Himalaya. Biodiversity and Conservation Vol. 11: pp 669–682.
Ben-Menahem, A., Aboudi, E. and Schild, R. (1974). The source of the great Assam Earthquake:
An intraplate wedge motion. Physics of the Earth and Planetary Interiors. Vol. 16: pp.
109-131.
ii
Bergkamp, G., McCartney, M., Dugan. P., McNeely, J. and Acreman, M., (2000). Dams,
Ecosystem functions and Environmental Restoration. Thematic Review II.1, prepared as
an input to the World Commision on Dams, Cape Town, www.dams.org
Bhaumik, M. (2010). Contributions to the Orchid Flora Vis-À-Vis Forest Types of Dibang Valley
District Of Arunachal Pradesh (India). Bulletin of Arunachal Forest Research, Vol. 26
(1&2): pp. 58-64.
Bhaumik, M. and M.K. Pathak (2005). A new variety of Cheirostylis chinensis Rolfe var. glabra
(Orchidaceae) from Dibang valley, Arunachal Pradesh, India. Bull. Bot. Surv. India Vol.
47(1-4): pp. 183-184.
BirdLife International (2001) Threatened Birds of Asia: The BirdLife International Red Data
Book. BirdLife International, Cambridge, U.K.
Borah, M. M. (2004). A study on the Habitat Ecology and Diversity of Ambhibian fauna of
Arunachal Pradesh. Arunachal Forest News Journal, Vol. 20: pp 123-133.
Borang, A. (2001). Mammalian Fauna of Arunachal Pradesh (Checklist and Distribution in
Protected Areas). Arunachal Forest News, Biodiversity Special Issue. Vol.19 (1&2): pp
43-82.
Borang, A. (2002). Mammalian Fauna and Tribal Traditional Biodiveristy Conservation and
Management Sysytem in Dehang Dibang Biosphere Reserve Area in Eastern Himalaya.
Himalayan Biosphere Reserves Vol. 4 (1&2): pp. 55-74.
Borang, A. (2003). Checklist of Reptilian Fauna of in Dehang Dibang Biosphere Reserve in North
East India. Himalayan Biosphere Reserves Vol. 5 (1&2): pp. 61-68.
Borang, A. and Bhatt, B.B. (2001). Checklist of Reptils of Arunachal Pradesh (North east
India) Arunachal Forest News: Special Biodiversity Issue. 19 (1& 2): 132-148.
Borang, A., Bhatt, B.B., Tamuk, M., Borkotoki, A. and Kalita. J. (2008) Butterflies of Dihang
Dibang biosphere reserve of Arunachal Pradesh, Eastern Himalayas, India. Bulletin of
Arunachal Forest Research, Vol. 24: pp. 41-53.
Bovee, K.D. (1982). A guide to Stream Habitat Analysis Using the Instream Flow Incremental
Methodology. Information Paper No. 12. Washington DC: U.S. Fish and Wildlife Service
(FWS/OBS-82/26).
Bovee, K.D., Lamb, B.L., Bartholow, J.M., Stalnaker, C.B., Taylor, J. and Henriksen. J. (1998).
Stream habitat analysis using the instream flow incremental methodology. Information
and Technology Report 1998-0004. Fort Collins, CO: U.S. Geological Survey. 130 p.
Bradka. J. and Rehackova, V. (1964): Mass destruction of fish in the Slappy Reservoir in winter
1962.-63. In Vodni Hospodarstvi. Vol 15: pp 451-452.
Brown, C. A. and King, J. M. (1999). Task 2 Report Series. Introduction and description of the
workshop process. Consulting services for the establishment and monitoring of the
instream flow requirements for river courses downstream of the Lesotho Highland
Water Project dams. Lesotho Highlands Development Authority, Lesotho.
Brown, C. and King, J. (2000). Environmental flow assessments for rivers: A summary of the
DRIFT process. Information Report no. 01/00, Southern Waters’ Ecological Research
and Consulting Pty (Ltd): Mowbray, South Africa (www.southernwaters.co.za).
Brown, C.A., Sparks, A. and Howard, G. (2000). Proceedings of the IFR Workshop and
determination of associated dam yields. Palmiet River Instream Flow Assessment.
Unpublished Southern Waters Report to Client: Department of Water Affairs and
Forestry. Report No. G400-00-0499. 168 p.
iii
Bunn, S. E. and Arthington, A. H. (2002). Basic principles and consequences of altered
hydrological regimes for aquatic biodiversity. Environmental Management. Vol. 30(4):
492–507.
Bunn, S. E. and Arthington, A. H. (2002). Basic principles and ecological consequences of
altered flow regimes for aquatic biodiversity. Environ Manage Vol. 30: pp. 492–507.
Chakraborty, S. and Sen, A. K. (1991). Mammals of the Mehao Wildlife Sanctuary (Dibang Valley
District, Arunachal Pradesh) with remarks on their status. Rec. zool. Surv. India. Vol.
88 (3&4): pp. 263-285.
Champion H.G., Seth S.K., (1968). A revised survey of the forest types of India. Govt. of India
Press, Nasik.
Checklist of Endemic Plants of Arunachal Pradesh. ENVIS Centre on Floral Diversity. Botanical
survey of India, Ministry of Environment and Forests, Government of India.
indiabiodiversity.org/checklist/show/194.
Chetry, D. and Chetry, R. (2007) Current Status and Conservation of Primate in Dibang Wildlife
Sanctuary in the State of Arunachal Pradesh, India. Project Report. Supported By The
Rufford Small Grants Foundation (―RSGF‖).
Chetry, D., Chetry, R., Ghosh, K., and Chetry, D. (2007). Primate survey in Dri valley in Dibang
Valley Wildlife Sanctuary, Arunachal Pradesh, India. Tiger Paper. Vol. 34 (4): pp 23-26.
Chetry, R., Chetry, D. and Bhattacharjee, P.C. (2012). Status and conservation of Eastern
Hoolock Gibbon Hoolock leuconedys in Assam, India. Journal of Threatened Taxa Vol.
4(13): pp. 3183–3189.
Choudhary, R.K. (2008) A Preliminary Report On Floristic Diversity Of Dihang Dibang Biosphere
Reserve Of Arunachal Pradesh. Bulletin of Arunachal Forest Research, Vol. 24 (1&2): pp
29-34.
Choudhury A. (2010). Mammals and birds in Dihang-Dibang Biosphere Reserve, Arunachal
Pradesh. Tigerpaper Vol. 37 (4): pp. 1-4.
Choudhury, A. (2010). The Vanishing herds: the wild water buffalo, Guwahati: Gibbon Books &
Rhino Foundation (supported by COA,Taiwan and CEPF/ATREE).
Choudhury, A. U. (1994). A new Crane- migration route discovered. Asian Wetland News 7(1):18
p.
Choudhury, A. U. (1995) White-winged Wood Duck in Mehao and Pakhui Sanctuaries, Arunachal
Pradesh. IWRB TWRG Newsletter 7: 12.Choudhury, 2000 Spotbill Pelican
Choudhury, A. U. (1996) Survey of the White-winged Wood Duck and Bengal Florican in Tinsukia
district and adjacent areas of Assam and Arunachal Pradesh. The Rhino Foundation for
Nature in NE India. Guwahati. 82 p.
Choudhury, A. U. (2000) The Birds of Assam. Gibbon Books and WWF-India, NE Regional Office,
Guwahati.
Choudhury, A. U. (2003) The mammals of Arunachal Pradesh. Regency Publications, New Delhi.
Choudhury, A. U. (2010). Mammals and birds in Dehang-Debang Biosphere Reserve, India. LAP
Lambert Academic Pub., Saarbrücken, Germany, 104 p.
Choudhury, A., (2006). A pocket guide to the birds of Arunachal Pradesh. 1st ed. Pp. 1–109.
Guwahati: Gibbon Books & The Rhino Foundation for Nature in NE India
Chowdhery, H.J. (1998). Orchid Flora of Arunachal Pradesh. Bishen Singh Mahendrapal Singh,
Dehra Dun.
Conservation Assessment and Management Plan (CAMP) Workshops Report (2003). Medicinal
Plant species of conservation concern identified for Arunachal Pradesh (AR).
iv
http://envis.frlht.org– ENVIS Centre on Conservation of Medicinal Plants, FRLHT,
Bangalore.
Conservation Assessment and Management Plan (CAMP) Workshops Report (1998), Freshwater
Fishes of India, Hosted by National Bureau of Fish Genetic Resources (ICAR), Lucknow
22-26 September 1997. Edited by Sanjay Molur and Sally Walker. Published by Zoo
Outreach Organisation.
Curits, J. T., (1959). The vegetation of Wisconsin. Univ. Wisconsin Press, Madison.
Curtis, J. T. and McIntosh R. P.,(1950). The interre-lations of certain analytic and synthetic
photosocio- logical characters. Ecology. Vol. 31: pp.434-455.
Daniel Mize, Ripin Taba and Hirendra Nath Sarma (2014), Species Diversity of Birds in Dihang-
Dibang Biosphere Reserve, Arunachal Pradesh.
Dasgupta, S., Kumar, M and Chatterjee G., (1997). Report on the systematic mapping of
eastern Arunachal Pradesh, Dibang valley, Arunachal Pradesh, Unpub. Prog. Rep. F.S.
1996 – 97.
DWAF (1997). White paper on a National Water Policy for South Africa. Department of Water
Affairs and Forestry, Pretoria.
Dynesius, M. and Nilsson, C. (1994). Fragmentation and Flow Regulation of River Systems in the
Northern Third of the World. Science Vol. 266: pp. 753–762.
Ebel, W.J., Tanonaka,G.K., Monan, G.E., Raymond, H.L. and Park,D.L. (1979). The Snake River
Salmon and Steelhead Crisis: its Relation to Dams and the National Energy Shortage.
Northeast and Alaska Fisheries Center, National Marine Fisheries Service, Seatle,
Wasington, USA.
Edington, J. M. and Hildrew A. G. (1995). Caseless caddis larvae of the British Isles. A key with
ecological notes. Freshwater Biological Association Scientific Publication No. 53: 134 p.
Edmondson, W.T. (1959). Freshwater Biology. John Wiley & Sons, New York.
Environmental Impact Assessment of Dibang Multipurpose Project (3000MW), Arunachal
Pradesh. National Productivity Council, Guwahati. Prepared for National Hydro Power
Corporation Limited (NHPC Ltd.).
Fauna of Arunachal Pradesh, State Fauna Series (2006). Editor-Director, Published by the
Director, Zoological Survey of India, Kolkata. 13(Part-l) 1-396.
Fleming, R. L. 2006. Notes on some Butterflies and Natural History of the Siang Valley,
Arunachal Pradesh, India.
Gandhi, H. P. (1998). Freshwater diatoms of Central Gujarat – With a review and some others.
Bishen Singh Mahendra Pal, Dehradun.
Gaston, K. J. (1991). How large is a species geographic range? Oiko. Vol 61: pp 434-438.
Gibji, N., Ringu, N. and Oyi Dar, N. (2012) Ethnomedicinal Knowledge among the Adi tribes of
Lower Dibang Valley District of Arunachal Pradesh India. International Research Journal
of Pharmacy. Vol 3 (6). Pp 223-229.
Gibji, N., Ringu, N. and Oyi Dar, N. (2013) Phytogeographical Observations from the ADI Tribes
Inhabited Areas of Lower Dibang Valley District, Arunachal Pradesh (India). Science and
Culture. Vol 79 (9-10). Pp 396-402.
Gibji, N., Ringu, N., and Dai N. O. (2012). Ethnomedicinal knowledge among the Adi Tribes of
Lower Dibang Valley District of Arunachal Pradesh, India. International Reasearch
Journal of Pharmacy. Vol. 3 (6): pp. 223-229.
Gippel, C.J. and Stewardson, M.J. (1996). Use of wetted perimeter in defining minimum
environmental flows. In: Leclerc, M., Capra, H., Valentin, S., Boudreault, A. & Côté, Y.
v
(eds). Ecohydraulics 2000. Proceedings of the 2ndinternational symposium on habitat
hydraulics. Québec, June 1996. INRS-Eau, Quebec City, Canada.
Godoy, M.P., (1985). Aquicultura. Actividade multidisciplinar. Escadas o outras facilidades para
passagens de peixes. Estaçoes de piscicultura. Florianopolis, Brasil.
Gogoi, M.J. (2012). Butterflies (Lepidoptera) of Dibang Valley, Mishmi Hills, Arunachal Pradesh,
India. Journal of Threatened Taxa Vol. 4(12): pp. 3137–3160.
Grimmett, R., C. Inskipp and T. Inskipp. 1998. Birds of the Indian Subcontinent. London:
Oxford University Press. 384p.
Grimmett, R., C. Inskipp and T. Inskipp. 2011. Birds of the Indian Subcontinent. London: Oxford
University Press. 528p.
Groshens, T. P. and Orth, D. J. (1994). Transferability of habitat suitability criteria for small
mouth bass, Micropterus dolomieu. Rivers. Vol 4(3): pp. 194-212.
Growns, I. and Kotlash, A. (1994). Environmental Flow Allocations for the Hawkesbury-Nepean
River System: A Review of Information. (Australian Water Technologies EnSight:
Sydney.) Report No. 94/189. 55 p.
Holden, P.B. and Stalnaker, C.B. (1975). Distribution and abundance of mainstream fishes of
the middle and upper Colorado River basins, 1967-1973. In: Transactions of the
American Fisheries Society. Vol. 104: 217-231.
http://avibase.bsc-eoc.org/avibase.jsp. Avibase –a database system for managing and
organizing taxonomic concepts
http://www.algaebase.org/ AlgaeBase is a Global Species Database of information on all
groups of algae.
http://www.fishbase.org Fishbase: A Global Information System on Fishes.
http://www.nethan-valley.co.uk/insectgroups.doc
http://www.theplantlist.org. International Plant Names Index
Hubbs, C. and Pigg, J. (1976). The effects of impoundments on threatened fishes of Oklahoma.
Annals of the Oklahoma Academy of Science. Vol. 5: pp. 133-77.
Hustedt, F. (1943). Neue und wenig bekannte Diatomeen. Ber. Deutsch. Bot. ges. Vol. 61: pp
271-290.
Hustedt, F. and Jensen, N. G. (1985). The Pennate Diatoms. Koeltz Scientific Books,
Koenigstein. 918 p.
Indian State of Forest Report (2013). Forest Survey of India, Minsistry of Invironment and Forest
Govt. of India, Dehradun.
Indian State of Forest Report (2015). Forest Survey of India, Minsistry of Invironment and Forest
Govt. of India, Dehradun.
International Union for Conservation of Nature (IUCN) Red List of Threatened Species 2015.
http://www.iucnredlist.org/apps/redlist/search.
Jha, K. K., Chetri K., Ghosh T., and Jha V.C. (2014), Distribution of an endangered fish species,
Chaca chaca (Ham.- Buch.), in Arunachal Pradesh, India: A biodiversity hot spot.
International Journal of Biology and Biological Sciences Vol. 3(3), pp. 023-030, Vol.
3(3), pp. 23-30.
Jowett, I. G. (1997). Instream flow methods: a comparison of approaches. Regulated Rivers:
Research and Management 13: 115-127.
Karr, J.R., Fausch, K.D., Angermeier, P.L., Yant, P.R. and Schlosser, I.J.. (1986). Assessing
biological integrity in running waters: A method and its rationale. Illinois Natural
History Survey, Special Publication.
vi
Katti, M., Singh, P., Manjrekar, N., Sharma, D. and Mukherjee, S. (1992). An ornithological
survey in eastern Arunachal Pradesh. Forktail 7: 75–89.
King, J. M. (1996). Quantifying the amount of water required for aquatic ecosystems. Water
law review. Discussion document for policy development. Report for the Department of
Water Affairs and Forestry. August 1996. Freshwater Research Unit, University of Cape
Town, Cape Town. 31p.
King, J. M. and Louw, M. D. (1998). Instream flow assessments for regulated rivers in South
Africa using the Building Block Methodology. Aquatic Ecosystem Health and
Management Vol 1: pp 109–124.
King, J. M. and Tharme R. E. (1994). Assessment of the Instream Flow Incremental Methodology
and Initial Development of Alternative Instream Flow Methodologies for South Africa.
Water Research Commission Report No. 295/1/94. Water Research Commission:
Pretoria, South Africa.
Krammer, K. (2003). Diatoms of Europe. Volume 4: Cymbopleura, Delicata, Navicymbula,
Gomphocymbellopsis, Afrocymbella. 530 pp. A.R.G. Gantner Verlag K.G.
Krammer, K., Lange-Bertalot, H. (2000), Süßwasserflora von Mitteleuropa. Band 2/5.
Bacillariophyceae. Part 5. English and French Translation of the Keys. Gustav Fischer
Verlag, Stuttgart.
Krishna, M. C., Awadhesh Kumar, Ray, P. C., Sarma, K., Devi, A. and Khan, M.L. (2012), Impact
of road widening on wildlife in Namdapha National Park, Arunachal Pradesh, India: a
conservation issue. Asian Journal of Conservation Biology, Vol. 2 (1): pp. 76–78.
Lakra, W. S., Sarkar, U. K., Gopalkrishnan, A. and Kathirvelpandian, A. (2010), Threatened
Freshwater Fishes of India. Published by National Bureau of Fish Genetic Resources
(ICAR), Lucknow. 25 pp.
Lange-Bertalot, H., Cavacini, P., Tagliaventi, N. and Alfinito, S. (2003). Diatoms of Sardinia.
Rare and 76 new species in rock pools and other ephemeral waters. In: Iconographia
Diatomologica (H. Lange-Bertalot, ed.), 12, 1-438. Koeltz, Königstein.
Laskar B.A, Das D. N. and Tyagi B. C. (2009), Growth performance of the chocolate mahseer
Neolissocheilus hexagonolepis (Mc Clelland) in pond system in Arunachal Pradesh.
Indian J. Fish., Vol. 56(1): pp. 55-59.
Laskar, B.A, Roy S, Bagra, K & Das D. N. (2010), Mehao lake of Arunachal Pradesh: A biological
Treasure, Science & Culture: Vol. 76 (1/2): pp. 59-61.
Lightfoot, G. S. (1940). On the occurrence of Hume’s Wedge-billed Wren
(Sphenocichla humei Mandelli) in the Aka Hills, Assam. J. Bombay Nat. Hist. Soc. 41:
418-420.Macan, T. T. 1979. A key to the nymphs of the British species of
Ephemeroptera with notes on their ecology. Scient. Pubis Freshwat. biol. Ass. No. 20:
1-80.
Magurran, A. E. (2004). Measuring Biological Diversity. Oxford: Blackwell Science.
Mahanta P.C., Sarma D. and Dutta R. (2012), Ecological Status and Fishery Potential of
Deopani: a Coldwater Stream of Arunachal Pradesh. The Clarion, Vol 1(1): pp 37-45.
Maheswaran, G. (2012). Fauna of the Protected Areas of Arunachal Pradesh: 1-14. Published by
Director, ZSI, Kolkata.
Malanson, G.P., (1993). Riparian Landscapes, Cambridge University Press, United Kingdom, 296
p.
Management Plan of Mehao Wildlife Sanctuary 2011-12 to 2015-16. Mehao Wildlife Sanctuary
Division, Roing, Arunachal Pradesh.
vii
Mann, J. L. (2006). Instream flow methodologies: an evaluation of the Tennant method for
higher gradient streams in the national forest system lands in the western U.S. Master
of Science thesis. Colorado State University, Fort Collins.
Mao, A. A., Gogoi, R. and Apang, O. (2009). Study of Rhododendron species of Mayodiya, Lower
Dibang Vlaeey, Arunachal Pradesh, India. Bulletin of Arunachal Forest Research, Vol.
25 (1&2): pp 93-99.
Maran, S. (2007). Débits environnementaux et Gestion Intégrée des Ressources en Eau: étude
de cas du fleuve Vomano (Italie). Dans UICN-Med, 2007. Estimation et disposition des
debits environnementaux dans les cours d’eau méditerranéens. Concepts,
méthodologies et pratique émergente. Disponible sur Internet:
http://www.iucn.org/places/medoffice/cdflow/conten/2/pdf/2_2_Italie_MedEC.pdf.
McAllister, D.E., Hamilton, A.L., and Harvey, B. (1997) Global Freshwater Biodiversity: Striving
for the Integrity of Freshwater Ecosystemsî, in Special Edition of Sea Wind-Bulletin of
Ocean Voice International, 11(3): 1-140.
Metzeltin D., Lange–Bertalot H., Garcia–Rodriguez F. (2005). Diatoms of Uruguay compared
with other taxa from South America and elsewhere. – Iconographia Diatomologica Vol.
15: pp 1–736.
Milhous, R.T. (1982). Effect of sediment transport and flow regulation on the ecology of gravel
bed rivers. In. Hey, R. D., Bathurus, J.C. and Thorne, C.R. (eds.) Gravel bed Rivers.
John Wiley, Chichester.
Milhous, R.T. (1998). A review of the physical habitat simulation system. In Hydroecological
Modelling. Research, Practice, Legislation and Decision-making, Blazˇkova´ S ˇ,
Stalnaker C, Novicky´ O (eds). Report by US Geological Survey, Biological Research
Division and Water Research Institute, Fort Collins, and Water Research Institute,
Praha, Czech Republic. VUV: Praha; pp 7–8.
Milhous, R.T., Updike, M.A. and Schneider, D.M. (1989). Physical Habitat Simulation System
Reference Manual—Version 2. Instream Flow Information Paper 26. USDI Fish and
Wildlife Services, Biology Report Vol 89(16).
Misra, R. (1968). Ecology Work Book. Oxford & IBH Publication, New Delhi.
Mitchell, C., 1995. Fish Passage Problems in New Zealand. In: Proceedings of the International
Symposium on Fishways '95. Gifu, Japan.
Mize, D., Taba, R., and Sarma, H. N. (2014). Species Diversity of Birds in Dhiang-Dibang
Biosphere Reserve, Arunachal Pradesh. The Ecoscan. Vol. 8 (1&2): pp. 77-84.
Myers, N. (1988). Threatened biotas: 'hotspots' in tropical forests. Environmentalist. Vol. 8, pp.
187–208.
Nandy D.R. (1980). Tectonic patterns in north eastern India. Indian Journal of Earth Sci. Vol. 7:
pp. 103-107.
Nath, P. and Dey S.C. (2000), Fish and fisheries of North East India (Arunachal Pradesh).
Narendra Publishing House, Delhi. 217 p.
Nautiyal, P and Nautiyal, R. (2002). Altitudinal variations in the relative abundance of epilithic
diatoms in some glacier and spring-fed Himalayan tributaries of Ganga (Ganges) river
system in the Garhwal region. In Proceeding of the 15th International Diatom
Symposium, Tokyo, eds. J. John, Perth: ARG Gantner Verlag K.G. pp: 143-151.
Nautiyal, R. and Nautiyal, P. (1999). Altitudinal variations in the pennate diatom flora of the
Alaknanda-Ganga river system in the Himalayan stretch of Garhwal region. Pages 85-
100, In: Proceedings of Fourteenth International Diatom Symposium (S. Mayama, M.
Idei and I. Koizumi, eds.), Koeltz Scientific Books, Koenigstein.
viii
Nayar M.P. and Sastry A.R.K. (1987). Red Data Book of Indian Plants. Botanical Survey of India,
Calcutta. Vol.I.
Nayar M.P. and Sastry A.R.K. (1988). Red Data Book of Indian Plants. Botanical Survey of India,
Calcutta. Vol.II.
Nayar M.P. and Sastry A.R.K. (1990). Red Data Book of Indian Plants. Botanical Survey of India,
Calcutta. Vol.III.
Nilsson, C. and Grelsson, G. (1995). The Fragility of Ecosystems: A Review. Journal of Applied
Ecology, Vol. 32 (4): pp.677-692.
Pandit, M. K. and Babu, C. R. (1998). Biology and conservation of Coptis teeta Wall. – An
endemic and endangered medicinal herb of Eastern Himalaya. Environmental
Conservation. Vol. 25(3): pp. 262 – 272.
Paul, A., Khan, M. L. Arunachalam, A. and Arunachalm, K. (2005). Biodiversity and conservation
of rhododendrons in Arunachal Pradesh in the Indo-Burma biodiversity hotspot. Current
Science, VOL. 8 (4): pp 623-634.
Pawar, S. and Birand, A. (2001) A survey of amphibians, reptiles, and birds in Northeast India.
CERC Technical Report #6, Centre for Ecological Research and Conservation, Mysore.
Pennak, R. W. (1953). Freshwater Invertebrates of United States (2nd edition). John Willey &
Sons, New York.
Petts, G.E., (1988). Impounded rivers, Chichester,UK: John Wiley & Sons Ltd Publishers. 326p.
Poff, N. L., Allan, J.D., Bain, M.B., Karr, J.R., Prestegaard, K.L., Richter, B.D., Sparks, R.E.
and Stromberg, J.C. (1997). The natural flow regime. A paradigm for river conservation
and restoration. Bio Science Vol. 47: pp. 769–784.
Prasad, B. N. Misra, P. K. (1992). Freshwater Algal Flora of Andaman & Nicobar Islands. Bishen
Singh Mahendra Pal, Dehradun.
Prasad, S. N. (1996). A Rapid Assessment Of Bio-Diversity Using Remote Sensing/Geographic
Information System Techniques In Mehao Wildlife Sanctuary (Mishmi Hills) Arunachal
Pradesh. SACON report. www.sacon.in/pulication/reports.
Prater, S.H. (1980). The Book of Indian animals. Third ed. Bombay Natural History Society.
Bombay, 428 p.
Puckridge, J. T., Sheldone, F., Wlaker, K. F. and Boulton, A. J. (1998). Flow variability and
ecology of large rivers. Marine and Freshwater Research. Vol. 49: pp 55-72.
Rama Shankar, Singh VK & Rawat MS, (1993). Medicinal plants of Divang valley (AP) social
forestry and afforestation, Bull Medico Ethnobot Res, Vol. 14 (3&4): pp. 144-149.
Rangini, N., Lodhi, M. S., Samal, P.K., Sharma, S., Dhyani, P.P. (2013). Review of Fauna of
Dehang-Debang Biosphere Reserve, Arunachal Pradesh (India). Nature and Science. Vol
11 (9). pp 8-13.
Rao, A. N. (2010). Orchid Flora of Arunachal Pradesh - An Update. Bulletin of Arunachal Forest
Research Vol. 26 (1&2): pp. 82-110.
Rao, A. N. (2010). Orchid flora of Arunachal Pradesh- An update. Bulletin of Arunachal Forest
Research Vol 26 (1 & 2): pp. 82-110.
Rawat, V. K., Sahu, T.R, Dixit. R. D., (2005). A Preliminary account of the Pteridophytes from
Mehao Wildlife Sanctuary, Arunachal Pradesh, India. Jour. Econ. Tax. Bot. Vol. 29(4):
pp. 1-4.
Raymond, H.L., 1979. Effects on Dams and Impoundments on the Migration Rate of Juvenile
Chinook Salmon and Steelhead Trout from the Snake River, 1966-1975. In: Transactions
of the American Fisheries Society. Vol. 108 (6): 509-29.
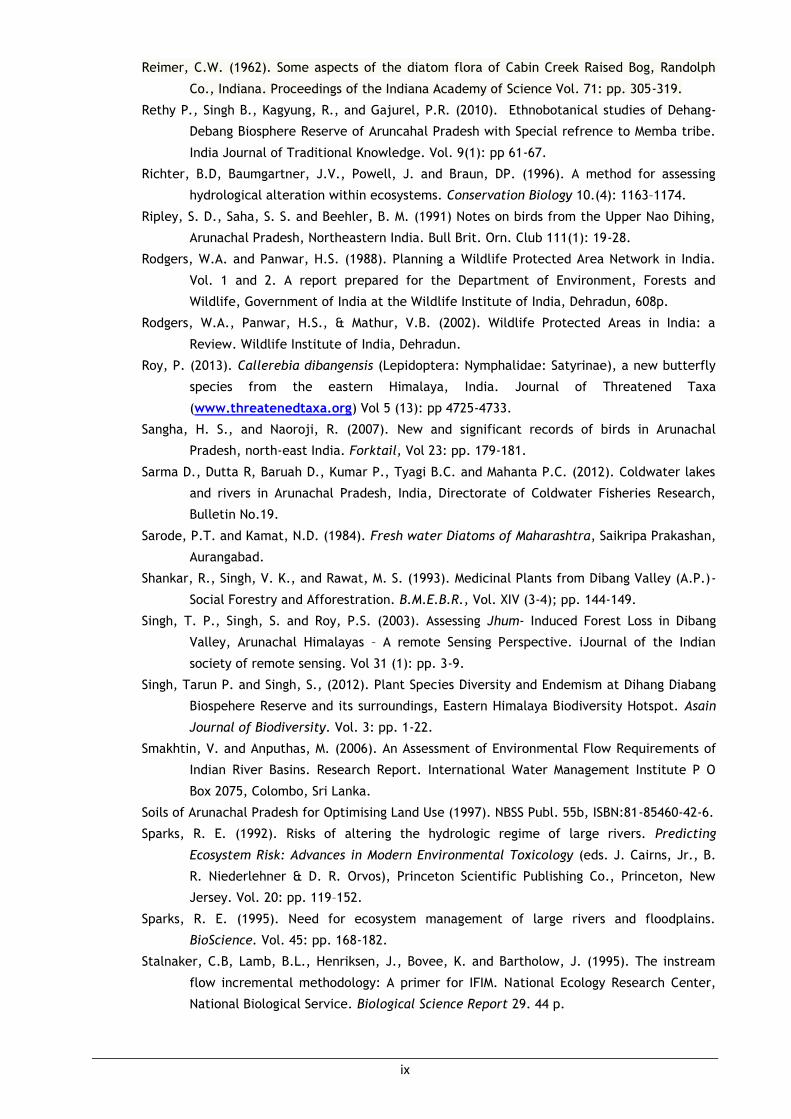
ix
Reimer, C.W. (1962). Some aspects of the diatom flora of Cabin Creek Raised Bog, Randolph
Co., Indiana. Proceedings of the Indiana Academy of Science Vol. 71: pp. 305-319.
Rethy P., Singh B., Kagyung, R., and Gajurel, P.R. (2010). Ethnobotanical studies of Dehang-
Debang Biosphere Reserve of Aruncahal Pradesh with Special refrence to Memba tribe.
India Journal of Traditional Knowledge. Vol. 9(1): pp 61-67.
Richter, B.D, Baumgartner, J.V., Powell, J. and Braun, DP. (1996). A method for assessing
hydrological alteration within ecosystems. Conservation Biology 10.(4): 1163–1174.
Ripley, S. D., Saha, S. S. and Beehler, B. M. (1991) Notes on birds from the Upper Nao Dihing,
Arunachal Pradesh, Northeastern India. Bull Brit. Orn. Club 111(1): 19-28.
Rodgers, W.A. and Panwar, H.S. (1988). Planning a Wildlife Protected Area Network in India.
Vol. 1 and 2. A report prepared for the Department of Environment, Forests and
Wildlife, Government of India at the Wildlife Institute of India, Dehradun, 608p.
Rodgers, W.A., Panwar, H.S., & Mathur, V.B. (2002). Wildlife Protected Areas in India: a
Review. Wildlife Institute of India, Dehradun.
Roy, P. (2013). Callerebia dibangensis (Lepidoptera: Nymphalidae: Satyrinae), a new butterfly
species from the eastern Himalaya, India. Journal of Threatened Taxa
(www.threatenedtaxa.org) Vol 5 (13): pp 4725-4733.
Sangha, H. S., and Naoroji, R. (2007). New and significant records of birds in Arunachal
Pradesh, north-east India. Forktail, Vol 23: pp. 179-181.
Sarma D., Dutta R, Baruah D., Kumar P., Tyagi B.C. and Mahanta P.C. (2012). Coldwater lakes
and rivers in Arunachal Pradesh, India, Directorate of Coldwater Fisheries Research,
Bulletin No.19.
Sarode, P.T. and Kamat, N.D. (1984). Fresh water Diatoms of Maharashtra, Saikripa Prakashan,
Aurangabad.
Shankar, R., Singh, V. K., and Rawat, M. S. (1993). Medicinal Plants from Dibang Valley (A.P.)-
Social Forestry and Afforestration. B.M.E.B.R., Vol. XIV (3-4); pp. 144-149.
Singh, T. P., Singh, S. and Roy, P.S. (2003). Assessing Jhum- Induced Forest Loss in Dibang
Valley, Arunachal Himalayas – A remote Sensing Perspective. iJournal of the Indian
society of remote sensing. Vol 31 (1): pp. 3-9.
Singh, Tarun P. and Singh, S., (2012). Plant Species Diversity and Endemism at Dihang Diabang
Biospehere Reserve and its surroundings, Eastern Himalaya Biodiversity Hotspot. Asain
Journal of Biodiversity. Vol. 3: pp. 1-22.
Smakhtin, V. and Anputhas, M. (2006). An Assessment of Environmental Flow Requirements of
Indian River Basins. Research Report. International Water Management Institute P O
Box 2075, Colombo, Sri Lanka.
Soils of Arunachal Pradesh for Optimising Land Use (1997). NBSS Publ. 55b, ISBN:81-85460-42-6.
Sparks, R. E. (1992). Risks of altering the hydrologic regime of large rivers. Predicting
Ecosystem Risk: Advances in Modern Environmental Toxicology (eds. J. Cairns, Jr., B.
R. Niederlehner & D. R. Orvos), Princeton Scientific Publishing Co., Princeton, New
Jersey. Vol. 20: pp. 119–152.
Sparks, R. E. (1995). Need for ecosystem management of large rivers and floodplains.
BioScience. Vol. 45: pp. 168-182.
Stalnaker, C.B, Lamb, B.L., Henriksen, J., Bovee, K. and Bartholow, J. (1995). The instream
flow incremental methodology: A primer for IFIM. National Ecology Research Center,
National Biological Service. Biological Science Report 29. 44 p.
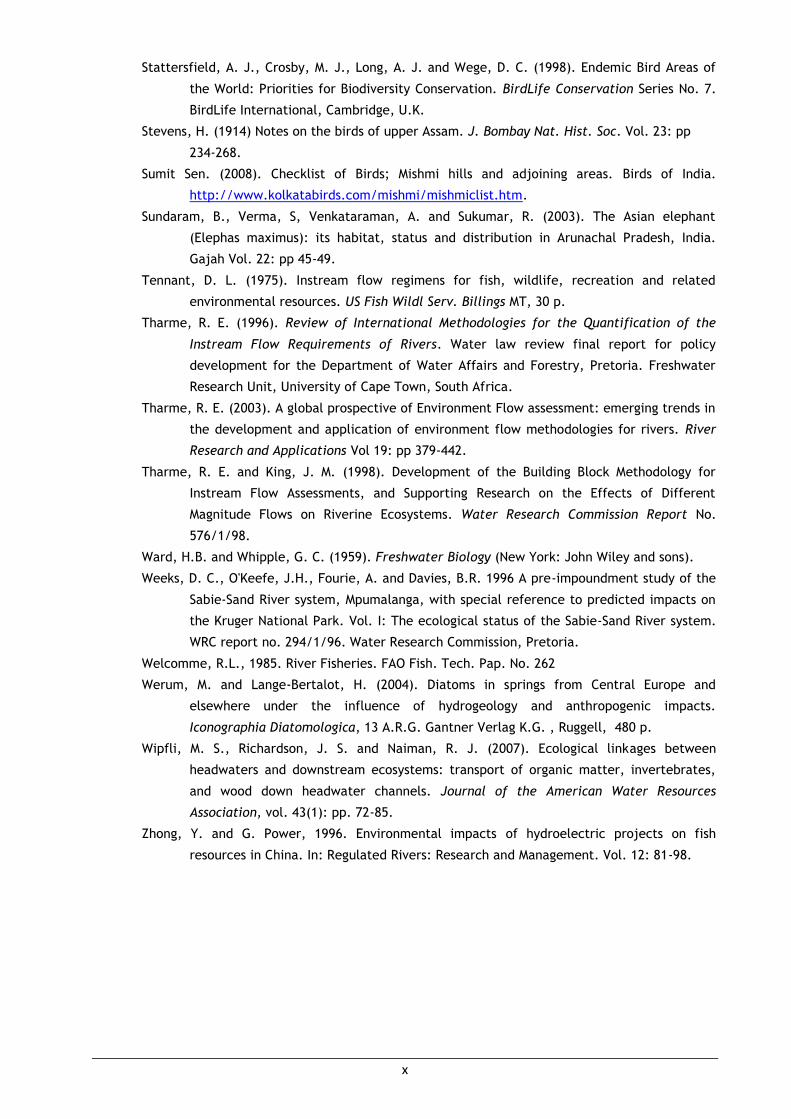
x
Stattersfield, A. J., Crosby, M. J., Long, A. J. and Wege, D. C. (1998). Endemic Bird Areas of
the World: Priorities for Biodiversity Conservation. BirdLife Conservation Series No. 7.
BirdLife International, Cambridge, U.K.
Stevens, H. (1914) Notes on the birds of upper Assam. J. Bombay Nat. Hist. Soc. Vol. 23: pp
234-268.
Sumit Sen. (2008). Checklist of Birds; Mishmi hills and adjoining areas. Birds of India.
http://www.kolkatabirds.com/mishmi/mishmiclist.htm.
Sundaram, B., Verma, S, Venkataraman, A. and Sukumar, R. (2003). The Asian elephant
(Elephas maximus): its habitat, status and distribution in Arunachal Pradesh, India.
Gajah Vol. 22: pp 45-49.
Tennant, D. L. (1975). Instream flow regimens for fish, wildlife, recreation and related
environmental resources. US Fish Wildl Serv. Billings MT, 30 p.
Tharme, R. E. (1996). Review of International Methodologies for the Quantification of the
Instream Flow Requirements of Rivers. Water law review final report for policy
development for the Department of Water Affairs and Forestry, Pretoria. Freshwater
Research Unit, University of Cape Town, South Africa.
Tharme, R. E. (2003). A global prospective of Environment Flow assessment: emerging trends in
the development and application of environment flow methodologies for rivers. River
Research and Applications Vol 19: pp 379-442.
Tharme, R. E. and King, J. M. (1998). Development of the Building Block Methodology for
Instream Flow Assessments, and Supporting Research on the Effects of Different
Magnitude Flows on Riverine Ecosystems. Water Research Commission Report No.
576/1/98.
Ward, H.B. and Whipple, G. C. (1959). Freshwater Biology (New York: John Wiley and sons).
Weeks, D. C., O'Keefe, J.H., Fourie, A. and Davies, B.R. 1996 A pre-impoundment study of the
Sabie-Sand River system, Mpumalanga, with special reference to predicted impacts on
the Kruger National Park. Vol. I: The ecological status of the Sabie-Sand River system.
WRC report no. 294/1/96. Water Research Commission, Pretoria.
Welcomme, R.L., 1985. River Fisheries. FAO Fish. Tech. Pap. No. 262
Werum, M. and Lange-Bertalot, H. (2004). Diatoms in springs from Central Europe and
elsewhere under the influence of hydrogeology and anthropogenic impacts.
Iconographia Diatomologica, 13 A.R.G. Gantner Verlag K.G. , Ruggell, 480 p.
Wipfli, M. S., Richardson, J. S. and Naiman, R. J. (2007). Ecological linkages between
headwaters and downstream ecosystems: transport of organic matter, invertebrates,
and wood down headwater channels. Journal of the American Water Resources
Association, vol. 43(1): pp. 72-85.
Zhong, Y. and G. Power, 1996. Environmental impacts of hydroelectric projects on fish
resources in China. In: Regulated Rivers: Research and Management. Vol. 12: 81-98.

PHOTO PLATES
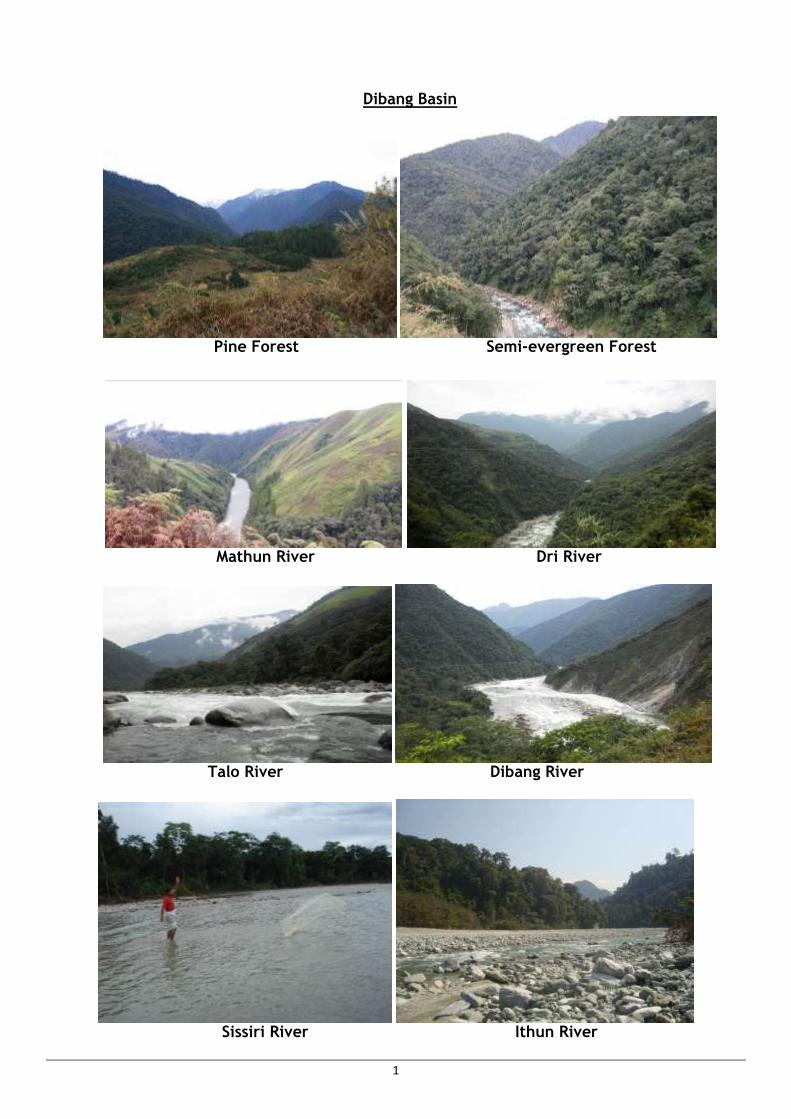
1
Dibang Basin
Pine Forest Semi-evergreen Forest
Mathun River Dri River
Talo River Dibang River
Sissiri River Ithun River
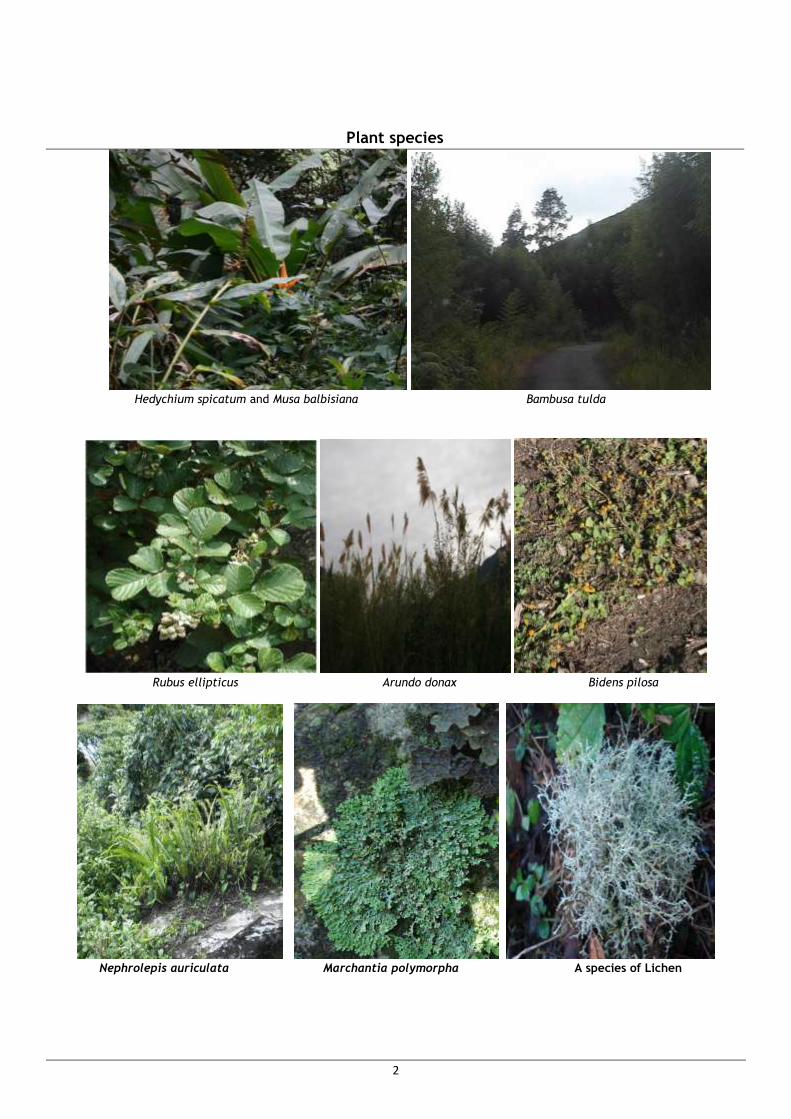
2
Plant species
Hedychium spicatum and Musa balbisiana Bambusa tulda
Rubus ellipticus Arundo donax Bidens pilosa
Nephrolepis auriculata Marchantia polymorpha A species of Lichen
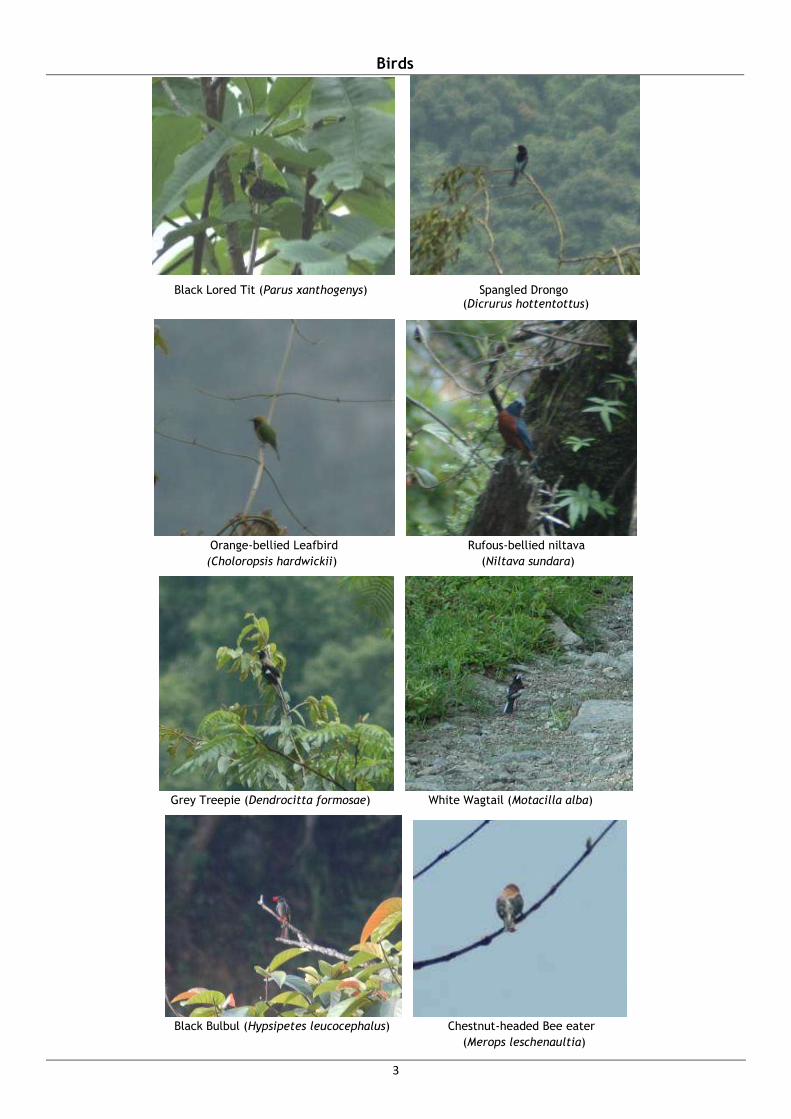
3
Birds
Black Lored Tit (Parus xanthogenys) Spangled Drongo (Dicrurus hottentottus)
Orange-bellied Leafbird Rufous-bellied niltava
(Choloropsis hardwickii) (Niltava sundara)
Grey Treepie (Dendrocitta formosae) White Wagtail (Motacilla alba)
Black Bulbul (Hypsipetes leucocephalus) Chestnut-headed Bee eater
(Merops leschenaultia)
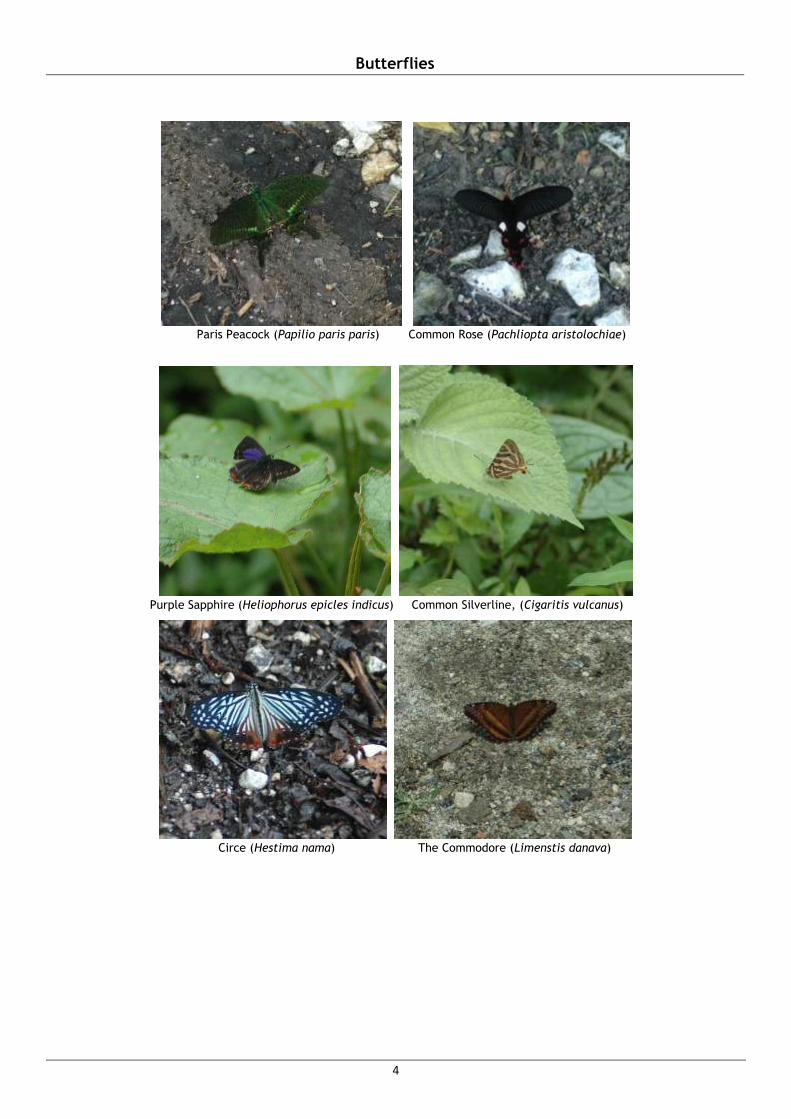
4
Butterflies
Paris Peacock (Papilio paris paris) Common Rose (Pachliopta aristolochiae)
Purple Sapphire (Heliophorus epicles indicus) Common Silverline, (Cigaritis vulcanus)
Circe (Hestima nama) The Commodore (Limenstis danava)
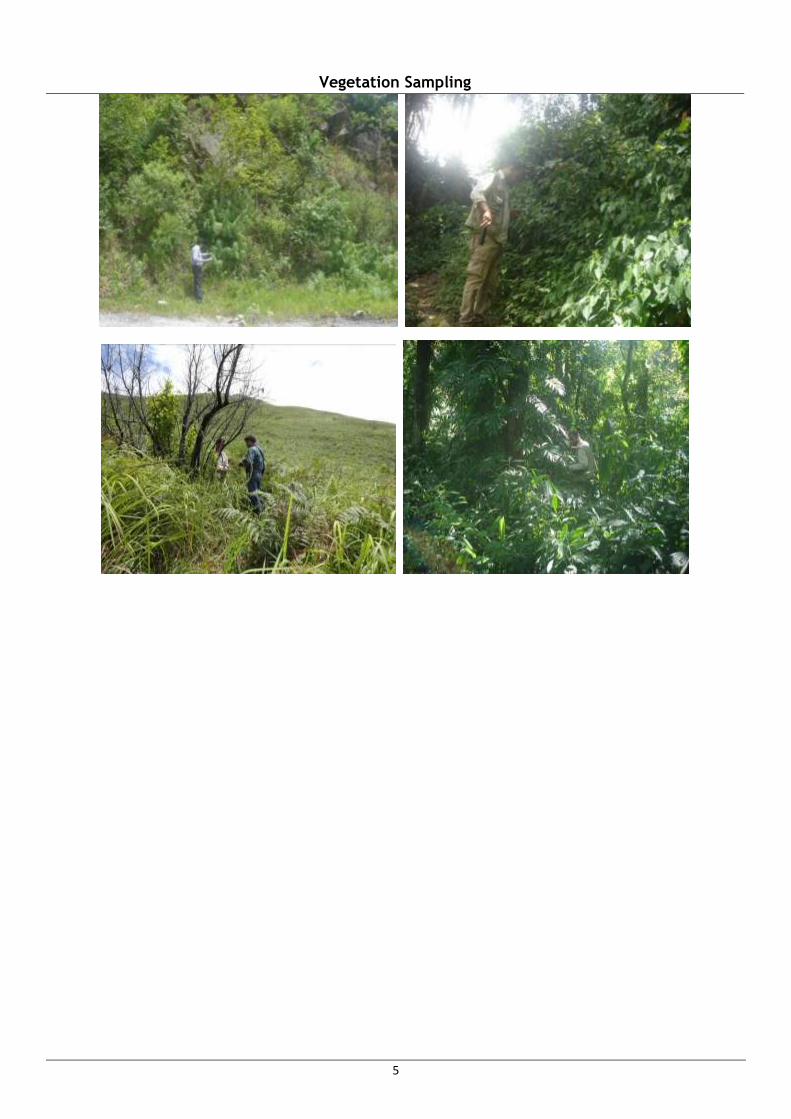
5
Vegetation Sampling
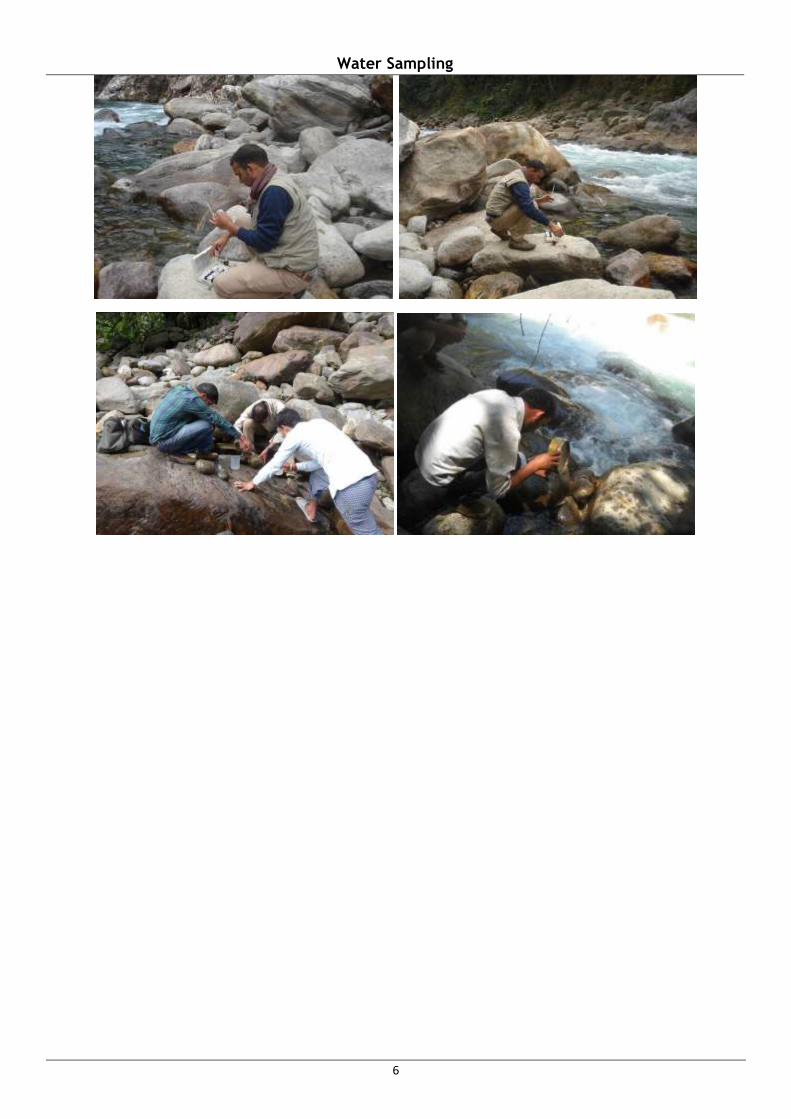
6
Water Sampling
Related Documents


