DRAFT Chronic Obstructive Pulmonary Disease (COPD): Consistent Estimates of Incidence, Prevalence, and Mortality by WHO Region Kenji Shibuya Colin D Mathers Alan D Lopez Global Programme on Evidence for Health Policy World Health Organization 30 November 2001

Welcome message from author
This document is posted to help you gain knowledge. Please leave a comment to let me know what you think about it! Share it to your friends and learn new things together.
Transcript

DRAFT
Chronic Obstructive Pulmonary Disease (COPD):
Consistent Estimates of Incidence, Prevalence,
and Mortality by WHO Region
Kenji Shibuya
Colin D Mathers
Alan D Lopez
Global Programme on Evidence for Health Policy
World Health Organization
30 November 2001

1
1. Introduction
Despite the fact that COPD is now prevalent in both developed and developing countries as the result of tobacco epidemic, precise figures on its prevalence is surprisingly scanty in many parts of the world (Chen and Mannnino 1999; Barnes 2000; Hurd 2000) There is now a consensus that COPD is characterised by airway obstruction with lung function levels of FEV1/FVC < 70% and presence of a post-bronchodilator FEV1<80% of the predicted value that is not fully reversible (Petty 1998; Pauwels et al 2001). However, population-based estimates of COPD prevalence by region has been problematic since the disease is progressive, measurement tools and definitions still vary among studies, and implementation of spirometry is often not feasible in developing regions (Rennard 1998).
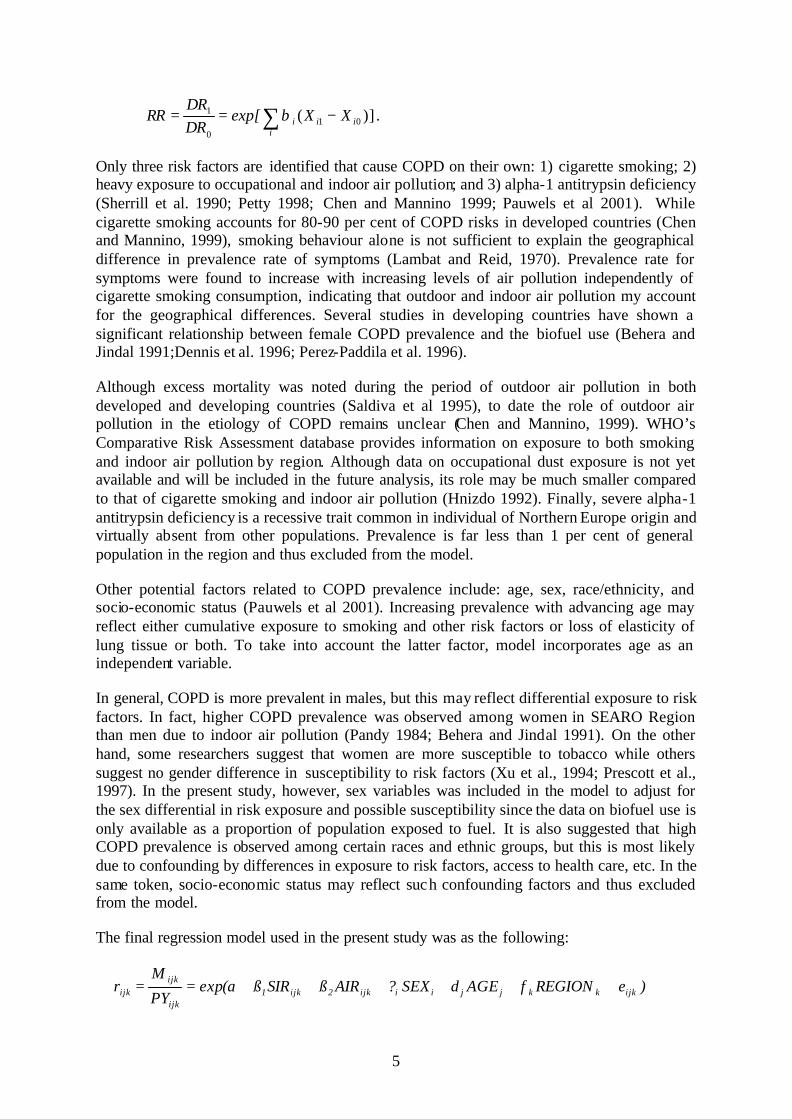
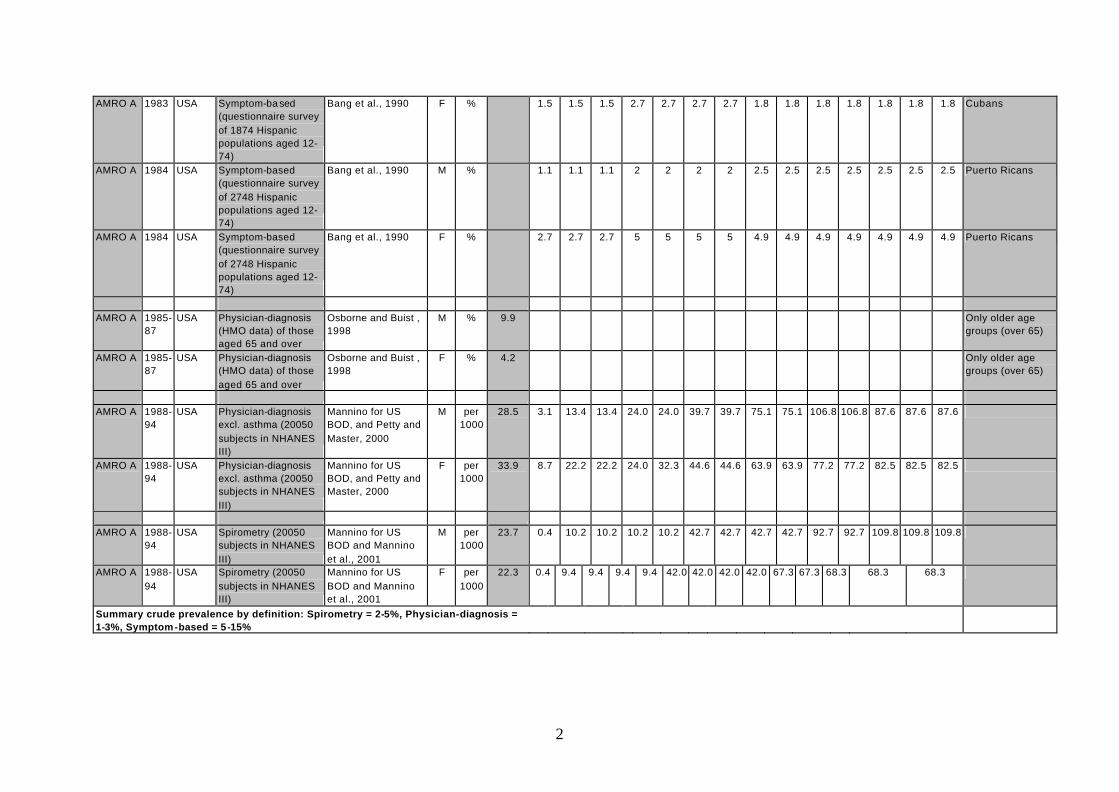
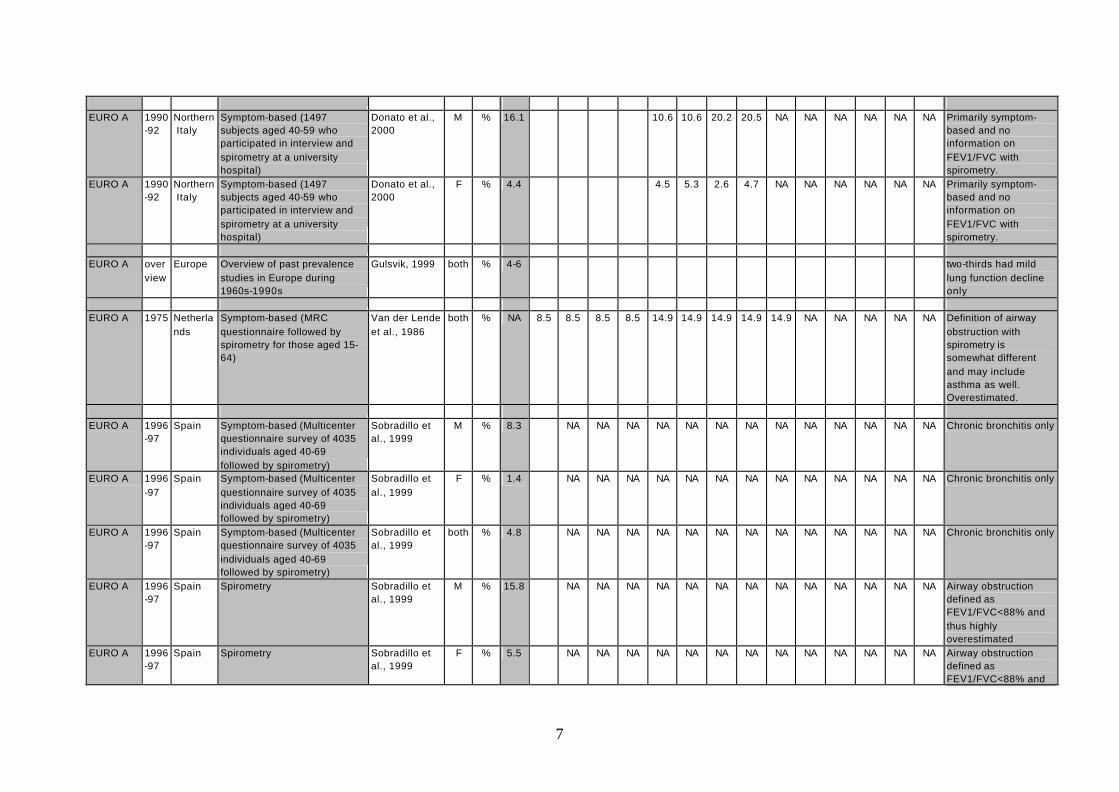
In such circumstances, the observed incidence and prevalence become highly dependent on factors other than the true occurrence of disease (Table 1). For example, prevalence based on self-reported symptoms (chronic cough, sputum, etc.) most likely overestimates true COPD prevalence due to misclassification of other possible respiratory diseases. In fact, it is suggested that only half of patients with symptoms of chronic bronchitis have actual COPD. On the other hand, physician-diagnosis usually underestimates true COPD prevalence. In the United States, for instance, approximately 60-70% of those with lower FEV1 have never had diagnosis of COPD (Mannino et al. 2000). Furthermore, there is a considerable variation among studies in terms of case definition, study design, sample size, and data analysis, which makes the comparison among studies more difficult (see Appendix 1).
Table 1 Difference in COPD prevalence by definition
(age groups 30 years and over)
Region Symptoms Physician-diagnosis Spirometry
AFRO D 1-3% - -
AFRO E - - -
AMRO A 5-15% 1-3% 2-5%
AMRO B 5-13% - -
AMRO D - - -
EMRO B 2-10% - 1-2%
EMRO D - - -
EURO A 10-20% 2-5% 3-7%
EURO B 10-20% - -
SEARO B - - -
SEARO D 2-7% - -
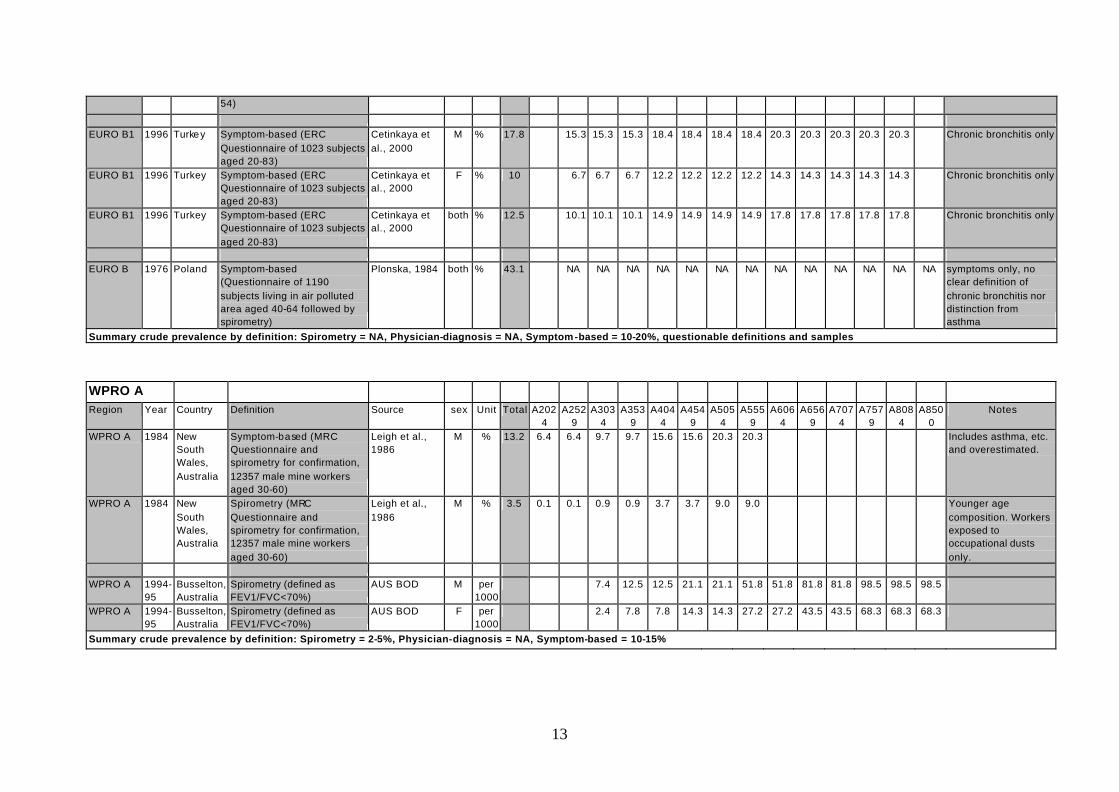
WPRO A 10-15% - 2-5%
WPRO B1 2-8% - 1-3%
(Source: Compilation of selected studies in Appendix 1)
Since precise prevalence figures are not available in many developing regions, the alternative approach is to infer the disease occurrence from mortality figures with the help of the mathematical constraints imposed on the consistent epidemiological relationships among prevalence/incidence, remission and mortality rates (Barendregt et al. 2000). Therefore, the

2
purpose of the present study is to derive consistent estimates of incidence, prevalence, and mortality of COPD from available data on mortality and to assess the plausibility of this approach by comparing the estimates with data from recent national burden of disease studies and other published data.
2. Methods
(1) DISMOD II
DISMOD II developed by the World Health Organization was used to back calculate the consistent estimates of COPD incidence/prevalence (Mathers et al. 2001). The main advantage of DIMOD is that incidence, prevalence and mortality figures are linked through the causal chain of a disease process and this chain limits the possible combinations of incidence, prevalence and mortality rates (Barendregt et al. 2001). Limits can be imposed since any prevalent case must have become incident at younger age, and any person died with a disease must have become incident previously and have been prevalent. Thus jointly estimated these rates are internally consistent (Murray and Lopez 1996).
Let dm , 1m , and 0m denote COPD-related death and total mortality rates of those with and without COPD. Using relative risk of death from COPD ( R ), the relationship between 1m and 0m is:
Rmm 01 = .
Then average population mortality m can be expressed as:
)1(01 pmpmm −+=
where p p is prevalence of COPD. Thus, COPD-related mortality rate in this population is:
ppRmRp
mmpM d −+−
=−=1
)1()( 01 .
Suppose we have data on dm , m , and R . We can now solve for prevalence p of the form:
))(1( d
d
mmRm
p−−
= .
Incidence rate can be easily derived from the above equation of the form:
t
dtdtt p
mpmpi
−+−−
= +
1)1(1
where tp and 1+tp are prevalence rates between age t and age (t+1) (Barendregt et al. 2000)
3
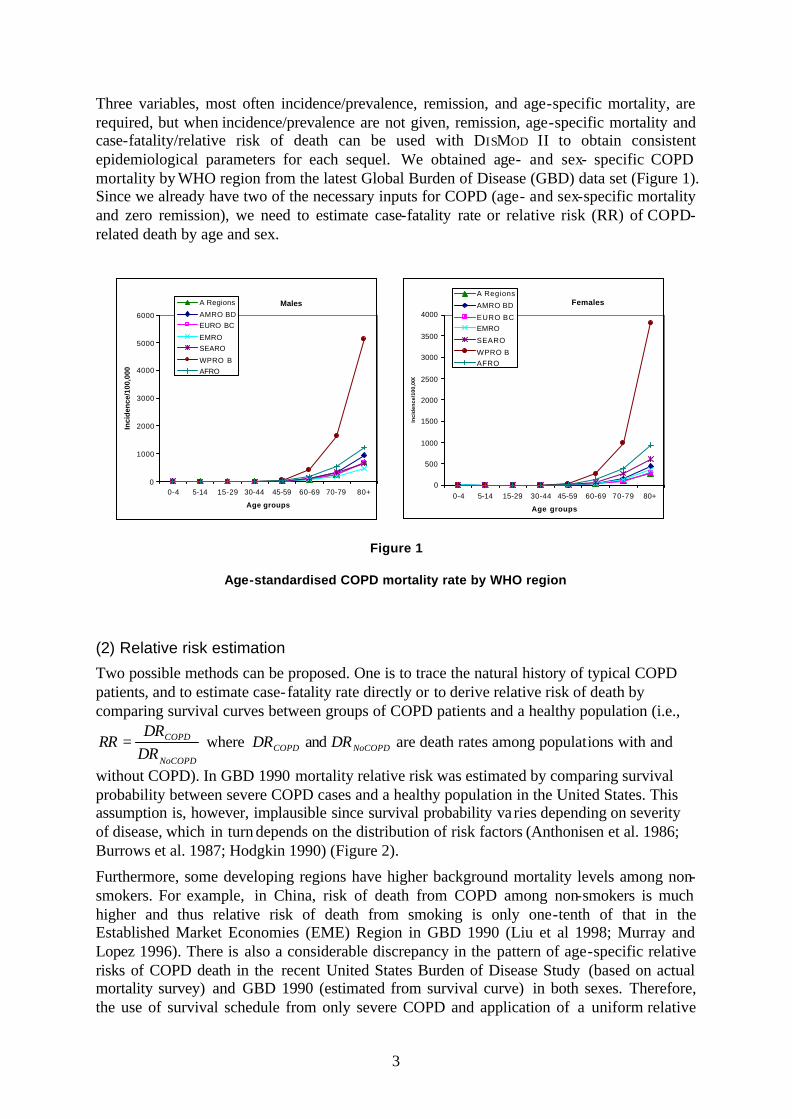
Three variables, most often incidence/prevalence, remission, and age-specific mortality, are required, but when incidence/prevalence are not given, remission, age-specific mortality and case-fatality/relative risk of death can be used with DISMOD II to obtain consistent epidemiological parameters for each sequel. We obtained age- and sex- specific COPD mortality by WHO region from the latest Global Burden of Disease (GBD) data set (Figure 1). Since we already have two of the necessary inputs for COPD (age- and sex-specific mortality and zero remission), we need to estimate case-fatality rate or relative risk (RR) of COPD-related death by age and sex.
Figure 1
Age-standardised COPD mortality rate by WHO region
(2) Relative risk estimation
Two possible methods can be proposed. One is to trace the natural history of typical COPD patients, and to estimate case-fatality rate directly or to derive relative risk of death by comparing survival curves between groups of COPD patients and a healthy population (i.e.,
NoCOPD
COPD
DRDR
RR = where COPDDR and NoCOPDDR are death rates among populations with and
without COPD). In GBD 1990 mortality relative risk was estimated by comparing survival probability between severe COPD cases and a healthy population in the United States. This assumption is, however, implausible since survival probability va ries depending on severity of disease, which in turn depends on the distribution of risk factors (Anthonisen et al. 1986; Burrows et al. 1987; Hodgkin 1990) (Figure 2).
Furthermore, some developing regions have higher background mortality levels among non-smokers. For example, in China, risk of death from COPD among non-smokers is much higher and thus relative risk of death from smoking is only one-tenth of that in the Established Market Economies (EME) Region in GBD 1990 (Liu et al 1998; Murray and Lopez 1996). There is also a considerable discrepancy in the pattern of age-specific relative risks of COPD death in the recent United States Burden of Disease Study (based on actual mortality survey) and GBD 1990 (estimated from survival curve) in both sexes. Therefore, the use of survival schedule from only severe COPD and application of a uniform relative
Males
0
1000
2000
3000
4000
5000
6000
0-4 5-14 15-29 30-44 45-59 60-69 70-79 80+
Age groups
Inci
den
ce/1
00,0
00
A Regions
AMRO BDEURO BC
EMROSEARO
WPRO BAFRO
Females
0
500
1000
1500
2000
2500
3000
3500
4000
0-4 5-14 15-29 30-44 45-59 60-69 70-79 80+
Age groups
Inci
den
ce/1
00,0
00
A Regions
AMRO BD
EURO BCEMRO
SEARO
WPRO BAFRO

4
risks across all regions in 1990 GBD exercise may have biased the results particularly in the regions where distribution of risk factors is considerably different from that in the United States.
Figure 2
(Source: Anthonisen et al., 1986, Hodgkin, 1990)
The alternative approach to approximating relative risk of COPD mortality by that of risk
factors associated with COPD (i.e., 0
1
DRDR
RR = where 1DR and 0DR are death rates in
exposed and unexposed groups). We modelled COPD mortality as a function of risk factors and other possible determinants along with regional fixed-effects of the form:
]ijjji
iiij
ijij REGIONXexp[
PY
Mr εφβα +++== ∑
where
ijr = age- and sex- specific COPD mortality rate,
ijM = number of death in each age group,
ijPY = person-years at risk approximated by mid-year population by age and sex
iX = risk factor variables
jREGION = regional fixed-effect.
Goodness-of-fit and deviation of errors were assessed to choose the best fit regression model. By modelling in this way, relative risk of death from COPD for each region can be approximated by relative risk of COPD risk factors:
Survival curve by levels of lung function
0.50.55
0.60.65
0.70.75
0.80.85
0.90.95
1
0 0.5 1 1.5 2 2.5 3
Year
Sur
viva
l pr
obab
ility
Normal
FEV1>50%
FEV= 40-49%FEV1=30-39%
FEV1<30%
5
])( 010
1 ∑ −==i
iii XXexp[DRDR
RR β .
Only three risk factors are identified that cause COPD on their own: 1) cigarette smoking; 2) heavy exposure to occupational and indoor air pollution; and 3) alpha-1 antitrypsin deficiency (Sherrill et al. 1990; Petty 1998; Chen and Mannino 1999; Pauwels et al 2001). While cigarette smoking accounts for 80-90 per cent of COPD risks in developed countries (Chen and Mannino, 1999), smoking behaviour alone is not sufficient to explain the geographical difference in prevalence rate of symptoms (Lambat and Reid, 1970). Prevalence rate for symptoms were found to increase with increasing levels of air pollution independently of cigarette smoking consumption, indicating that outdoor and indoor air pollution my account for the geographical differences. Several studies in developing countries have shown a significant relationship between female COPD prevalence and the biofuel use (Behera and Jindal 1991;Dennis et al. 1996; Perez-Paddila et al. 1996).
Although excess mortality was noted during the period of outdoor air pollution in both developed and developing countries (Saldiva et al 1995), to date the role of outdoor air pollution in the etiology of COPD remains unclear (Chen and Mannino, 1999). WHO’s Comparative Risk Assessment database provides information on exposure to both smoking and indoor air pollution by region. Although data on occupational dust exposure is not yet available and will be included in the future analysis, its role may be much smaller compared to that of cigarette smoking and indoor air pollution (Hnizdo 1992). Finally, severe alpha-1 antitrypsin deficiency is a recessive trait common in individual of Northern Europe origin and virtually absent from other populations. Prevalence is far less than 1 per cent of general population in the region and thus excluded from the model.
Other potential factors related to COPD prevalence include: age, sex, race/ethnicity, and socio-economic status (Pauwels et al 2001). Increasing prevalence with advancing age may reflect either cumulative exposure to smoking and other risk factors or loss of elasticity of lung tissue or both. To take into account the latter factor, model incorporates age as an independent variable.
In general, COPD is more prevalent in males, but this may reflect differential exposure to risk factors. In fact, higher COPD prevalence was observed among women in SEARO Region than men due to indoor air pollution (Pandy 1984; Behera and Jindal 1991). On the other hand, some researchers suggest that women are more susceptible to tobacco while others suggest no gender difference in susceptibility to risk factors (Xu et al., 1994; Prescott et al., 1997). In the present study, however, sex variables was included in the model to adjust for the sex differential in risk exposure and possible susceptibility since the data on biofuel use is only available as a proportion of population exposed to fuel. It is also suggested that high COPD prevalence is observed among certain races and ethnic groups, but this is most likely due to confounding by differences in exposure to risk factors, access to health care, etc. In the same token, socio-economic status may reflect such confounding factors and thus excluded from the model.
The final regression model used in the present study was as the following:
)eREGIONfAGEdSEX?AIRßSIRß(aexpPY
Mr ijkkkjji iijk2ijk1
ijk
ijkijk ++++++==

6
where SIR is the smoking impact ratio which approximates cumulative past exposure to smoking (Peto et al, 1994), AIR is a proportion of household using biofuel, and SEX and AGE are dummy variables for gender and age, respectively.
From this regression mode, relatives risks of COPD-related mortality can be approximated by:
)]()( 01010
1 AIRAIRSIRSIRexp[DRDR
RR 21 −+−== ββ
where 0SIR and 0AIR were set to zero in unexposed groups.
(3) Model validation
For the purpose of validating our model, we have compared the estimated relative risks for AMOR A and WPRO A with two recent burden of disease analyses in the United States and Australia, respectively. Population-based COPD prevalence measured by spirometry and mortality rates as well as corresponding DISMOD outputs are available in both studies.
Furthermore, DISMOD estimates of internally consistent prevalence rates were compared to published prevalence data based on spirometry measurement in each region where available (Table 2). When spirometry data are not available, prevalence based on symptoms was used as an upper bound of true COPD prevalence. If there is a discrepancy between DISMOD estimates and published literature, the inputs for DISMOD was calibrated after the careful review of the regional epidemiological pattern and the distribution of risk factors.
Table 2 Validation of model estimates
Comparison with published prevalence measured by spirometry where available and symptom-based prevalence as an upper-bound
Region Males Females
AFRO D <1% -
AMRO A 3-5% 2-4%
AMRO B - 2-4%
EMRO B 1-2% 1%
EMRO D - -
EURO A 3-7% 2-6%
EURO B 2-8% 2-5%
SEARO D <2% <1%
WPRO A 2-4% 2-3%
WPRO B1 >3% <3%
(Source: Compilation of selected studies in Appendix 1)
(4) Disability weights
Internal consistent estimates of COPD incidence by region were used to estimate years lived with disability (YLDs) by region. Together with mortality estimates converted into years of

7
life lost (YLLs), overall COPD burden was measured by disability-adjusted life years (DALYs), which are the sum of YLDs and YLLs due to COPD.
The traditional approach of caring COPD patients has been to rely on pulmonary function test to quantify severity and to assess response to therapy. However, patients with COPD seek medical care because of symptoms, in particular dyspnea and inability to function, which clearly impact on an individual’s HRQOL. Accordingly instruments have been developed to provide a standardized method to measure health status and levels of disability. One of the major reasons for measuring HRQOL is to detect how much HRQOL has changed in response to therapy (Mahler 2000).
It is suggested that when the FEV1 falls to about 50% of that predicted for a healthy population, the individual typically first experiences some activity limitation because of dyspnoea. When FEV1 reaches a level of 30-40% of predicted, there would be significant exercise limitations, which can be disabling (Fletcher and Peto 1977; Wise 1997).
For GBD estimation, we employ disability weights rather than disease-specific HRQOL scores. WHO is now undergoing a major revision of disability weights of each sequelae and the results of the population-based sampling survey on health status preferences are soon available. The original disability weights for untreated and treated COPD in GBD 1990 were 0.428 and 0.388, respectively (Murray and Lopez 1996). The recent national burden of disease studies in Australia and the United States employed an aggregated disability weight based on those from the Dutch disability weight exercise in which mild/moderate and severe COPD were assigned the weights of 0.17 and 0.53, respectively (Dutch exercise and Aus BOD).
In the present study, we decided that disability weights from these national burden of disease studies were employed in the major analysis and the future revision will be made when the final disability weights for GBD 2000 are available. For the purpose of comparison, YLDs based on current incidence estimates and GBD 1990 disability weights were calculated as well.
It has been suggested that treatments could improve quality of life among COPD patients but only smoking cessation can alter the prognosis and progression as confirmed in the large Lung Health Study (Anthonisen et al. 1994; Barnes 2000). Hence majority of current treatments for COPD are conservative and some improvement in QOL score has been observed (see, for example, Jones and Bosh 1997 for a bronchodilator; Lacasse et al 1996, Camp et al. 2000, and Finnety et al 2000 for lung rehabilitation; Jans et al. 2001 for treatment guidelines; Geddes et al 2000 for lung-volume-reduction surgery). Change in a generic HRQOL instrument (SF-36) score ranged from 14 per cent (rehabilitation) to 22 per cent (volume reduction surgery). For the assessment of treatment effect, we employed a conservative 14 per cent reduction in disability weight as a treatment effect, which is slightly larger than that in GBD 1990.
3. Results
(1) Risk factor analysis of COPD mortality by region

8
Table 3 shows the regression result of COPD mortality by region. Risk factor variables (i.e., smoking impact ratio and biofuel use), age, sex, and regional effects were all statistically significant. The final model achieved a considerably high goodness-of- fit with no systematic deviation among residuals. Predicted mortality was consistent with the GBD 2000 mortality data, except for females in EURO B3 and males in SEARO D where GBD 2000 estimates were lower than predicted values (Figure 4).
We used this model to estimate age- and sex- specific relative risks (RRs) of COPD-related mortality by region (Table 4). For the purpose of comparison, relative risks used in GBD 1990, current estimates, and the recent US national burden of disease study (unpublished) are graphically displayed in Figure 5. The patterns of age- and sex- specific RRs were consistent among studies except the GBD 1990 estimates.
Table 3
Poisson regression results of COPD mortality by region
Variable Coefficient SE p-value 95% Conf. Interval constant -5.445 0.012 0.000 -5.468 -5.421 Age30-44 1.664 0.012 0.000 1.641 1.687 Age45-59 3.694 0.011 0.000 3.672 3.715 Age60-69 5.662 0.011 0.000 5.640 5.683 Age70-79 6.922 0.011 0.000 6.901 6.943 Age80+ 8.068 0.011 0.000 8.047 8.089 Sex (female=1) -0.853 0.004 0.000 -0.861 -0.844 SIR 1.111 0.009 0.000 1.094 1.129 Bio-fuel use 2.108 0.016 0.000 2.077 2.138 AFRO E -0.059 0.006 0.000 -0.071 -0.048 AMRO A -0.073 0.012 0.000 0.049 0.097 AMRO B -0.060 0.008 0.000 -0.075 -0.044 AMRO D -0.705 0.014 0.000 -0.732 -0.678 EMRO B 0.093 0.013 0.000 0.068 0.117 EMRO D -0.734 0.011 0.000 -0.755 -0.713 EURO A -0.161 0.010 0.000 -0.181 -0.140 EURO B1 -0.796 0.007 0.000 -0.810 -0.781 EURO B2 -0.026 0.009 0.004 -0.044 -0.008 SEARO B -0.542 0.006 0.000 -0.553 -0.530 SEARO D -0.663 0.005 0.000 -0.673 -0.654 WPRO A -0.998 0.013 0.000 -1.023 -0.973 WPRO B2/B3 -1.795 0.005 0.000 -1.805 -1.784 WPRO B1 1.017 0.004 0.000 1.009 1.025 R2 0.942 Log-likelihood -47779

9
pr
edic
ted
num
ber
of e
vent
s
death6 318272
4.64777
291738
Figure 4
Original COPD mortality vs. predicated mortality
Table 4
Estimated relative risks of COPD-related death by age and sex
(1) Males
Region Age 15-29 Age 30-44 Age 45-59 Age 60-69 Age 70-79 Age 80+ AFRO D 2.34 2.49 2.56 2.55 2.53 2.53 AFRO E 2.65 3.19 3.13 3.05 2.98 2.97 AMRO A 1.02 1.85 1.89 2.06 1.94 1.88 AMRO B 1.33 2.02 1.85 1.78 1.71 1.72 AMRO D 1.85 1.88 1.96 1.97 1.95 1.94 EMRO B 1.07 1.46 1.44 1.46 1.41 1.43 EMRO D 1.87 2.30 2.31 2.29 2.23 2.24 EURO A 1.01 2.30 2.15 1.98 1.79 1.64 EURO B1 1.62 4.89 4.61 3.46 2.57 2.16 EURO B2 1.62 2.79 2.47 2.17 1.90 1.74 EURO B3 1.30 4.99 4.63 3.69 2.46 1.75 SEARO B 2.16 4.26 3.40 3.16 2.99 2.99 SEARO D 2.64 4.09 3.66 3.49 3.35 3.33 WPRO A 1.01 1.37 1.29 1.44 1.59 1.87 WPRB1 2.48 3.21 2.79 2.71 2.66 2.63 WPRB2 2.48 4.96 3.93 3.65 3.31 2.99
SEARO D, males
EURO B3, females

10
WPRB3 2.48 3.57 3.27 3.15 2.95 2.75

11
(2) Females
Region Age 15-29 Age 30-44 Age 45-59 Age 60-69 Age 70-79 Age 80+ AFRO D 3.76 3.81 3.83 3.81 3.80 3.79 AFRO E 4.57 4.92 4.88 4.82 4.74 4.76 AMRO A 1.03 1.56 1.81 2.25 2.34 2.00 AMRO B 1.56 1.82 1.81 1.77 1.70 1.67 AMRO D 2.61 2.61 2.67 2.68 2.63 2.62 EMRO B 1.12 1.42 1.21 1.18 1.15 1.12 EMRO D 2.64 2.96 2.79 2.75 2.69 2.64 EURO A 1.01 1.32 1.23 1.24 1.26 1.22 EURO B1 2.12 2.77 2.53 2.40 2.43 2.44 EURO B2 2.12 2.44 2.22 2.19 2.15 2.12 EURO B3 1.51 1.82 1.73 1.70 1.70 1.59 SEARO B 3.34 3.34 3.49 3.46 3.37 3.33 SEARO D 4.53 4.58 4.78 4.75 4.61 4.56 WPRO A 1.01 1.05 1.09 1.12 1.23 1.50 WPRB1 4.11 4.25 4.19 4.24 4.25 4.19 WPRB2 4.11 4.46 4.59 4.65 4.53 4.29 WPRB3 4.11 5.16 4.97 4.92 4.88 4.60
Figure 5
Comparison of relative risks of COPD-related mortality by age and sex
(2) Model validation
We compared the current estimates of COPD prevalence by region with both previous estimates based on GBD 1990 data and published prevalence figures during a past decade (Table 3). In general, the current model estimates were more consistent with the results of the published literature. In particular, the previous estimates highly underestimated COPD prevalence in AMRO A, EURO A and WPRO A in which prevalence of smoking was higher than in other regions. On the other hand, the current estimates yielded lower prevalence rates in AFRO D, AFRO E, and WPRO B1.
0.0
0.5
1.0
1.5
2.0
2.5
3.0
3.5
0-4 5-14 15-29
30-44
45-59
60-69
70-79
80+
US BOD (males)
GBD/EME (males)
Model estimates(males)
0.00.51.01.52.02.53.03.54.04.55.0
0-4 5-14 15-29
30-44
45-59
60-69
70-79
80+
US BOD (females)
GBD/EME (females)
Model estimates(males)

12
Table 5
Comparison of COPD prevalence (for age 30 years and over) by region
Region Current estimates (%) Preliminary estimates based on GBD 1990 data (%)
Published prevalence (%)
Males Females Males Females Males Females AFRO D 1.0 0.5 2.4 1.4 <1.0 - AFRO E 0.6 0.3 2.1 1.3 - - AMRO A 3.6 2.8 1.4 0.7 3.0-5.0 2.0-4.0 AMRO B 3.0 2.9 1.5 0.8 - 2.0-4.0 AMRO D 0.8 0.4 1.4 0.7 - - EMRO B 1.9 0.8 0.9 0.9 1.0-2.0 1.0 EMRO D 0.8 0.5 0.9 0.9 - - EURO A 2.8 2.8 1.7 0.9 3.0-7.0 2.0-6.0 EURO B1 1.3 1.2 1.7 0.9 3.0-8.0 2.0-5.0 EURO B2 1.9 1.9 1.0 1.1 2.0-8.0 2.0-5.0 EURO B3 2.0 1.9 1.5 1.1 - - SEARO B 1.3 0.9 1.2 0.6 - - SEARO D 0.7 0.6 1.7 1.3 <2.0 <1.0 WPRO A 2.5 2.3 1.9 1.0 2.0-4.0 2.0-3.0 WPRO B1 3.5* 1.5* 4.8* 4.5* >3.0 * <3.0 * WPRO B2 2.4 2.2 1.2 0.5 - - WPRO B3 1.2 0.4 1.0 0.4 - -
* Age 15 years and over
(3) Version 1 estimation of COPD burden by region
Consistent estimates of incidence from DISMOD outputs were use to calculate years lived with disability (YLDs). Combined with years of life lost (YLLs) derived from mortality estimates, disability-adjusted life years (DALYs) due to COPD were also estimated for each region. Table 6 represents the preliminary estimates of total YLDs, YLLs, and DALYs due to COPD by region in 2000. Detailed estimates of age- and sex- specific incidence, prevalence and mortality by region are shown in Appendix 2.
Among the estimated global total of COPD burden, WPRO B1 (including China) and SEARO D (including India) accounted for 52 per cent and 11 per cent of the global total in 2000, respectively. Despite a smaller prevalence in these regions than in other regions where risk factors are more prevalent, a large population in both regions contributed a larger total number of morbidity from COPD. They were followed by smoking-prevalent regions such as EURO A (5.8 per cent) and AMRO A (4.8 per cent). Male-to-female ratios of total YLDs and YLLs were 1.6 and 1.4, respectively. The ratios tended to be higher in AFRO, EMRO, and WPRO B regions where smoking prevalence among females is still small.
Overall, YLDs accounted for 44 per cent of total COPD burden, but YLDs exceeded YLLs in regions such as AMRO A, EURO A, and WPRO A. Based on a preliminary result of global burden of disease in 2000 (Mathers et al. 2001), the present study suggests that approximately 2.1 per cent of total global burden were due to COPD. If disability weights in GBD 1990 were employed to estimate YLDs by using current estimates of incidence, overall COPD burden from disabling states increased by 63 per cent and total COPD burden accounted for 2.7 per cent of global total disease burden (Table 7).

13
Table 6
Version 1 estimates of YLDs, YLLs, and DALYs due to COPD by region, 2000
Incidence Incidence YLD/100,000 YLD/100,000 YLL/100,000 YLL/100,000 Total YLD Total YLL Total DALYs
Males Females Males Females ('000) ('000) ('000)R01 AFRO D 47.1 21.9 174.4 153.6 115 547 662R02 AFRO E 41.9 14.1 187.2 146.5 94 563 657R03 AMRO A 317.9 230.7 223.9 183.2 847 629 1,476R04 AMRO B 183.9 211.4 151.0 90.5 875 533 1,408R05 AMRO D 43.8 26.4 361.1 335.3 25 248 273R06 EMRO B 97.6 42.9 78.0 66.4 99 101 200R07 EMRO D 57.4 34.6 185.6 171.9 64 247 311R08 EURO A 270.6 274.2 220.9 100.6 1,119 655 1,775R09 EURO B1 179.3 159.3 224.4 90.3 240 260 500R10 EURO B2 231.3 215.6 172.3 114.6 119 73 192R11 EURO B3 285.1 274.4 425.2 132.4 571 663 1,234R12 SEARO B 148.3 115.5 172.1 98.3 520 533 1,053R13 SEARO D 69.0 57.3 194.7 165.3 854 2,433 3,288R14 WPRO A 205.4 182.7 88.5 34.9 290 92 381R15 WPRO B1 726.7 299.8 719.1 579.6 7,050 8,844 15,895R16 WPRO B2 316.3 216.4 547.7 478.0 449 728 1,177R17 WPRO B3 139.6 52.2 225.5 138.6 7 13 19 Total 272.8 167.7 325.9 241.3 13,339 17,162 30,502
Table 7
COPD burden by region when GBD 1990 disability weights were employed
Incidence Incidence YLD/100,000 YLD/100,000 YLL/100,000 YLL/100,000 Total YLD Total YLL Total DALYs
Males Females Males Females ('000) ('000) ('000)R01 AFRO D 119.9 55.7 174.4 153.6 293 547 840R02 AFRO E 84.5 28.5 187.2 146.5 190 563 753R03 AMRO A 622.1 449.5 223.9 183.2 1,655 629 2,284R04 AMRO B 436.4 494.5 151.0 90.5 2,060 533 2,593R05 AMRO D 99.6 60.1 361.1 335.3 57 248 305R06 EMRO B 248.5 109.3 78.0 66.4 253 101 354R07 EMRO D 131.8 79.4 185.6 171.9 146 247 393R08 EURO A 461.9 440.9 220.9 100.6 1,854 655 2,509R09 EURO B1 188.6 215.8 224.4 90.3 336 260 596R10 EURO B2 308.9 311.8 172.3 114.6 158 73 231R11 EURO B3 242.9 411.1 425.2 132.4 816 663 1,479R12 SEARO B 213.2 163.3 172.1 98.3 743 533 1,276R13 SEARO D 127.9 106.5 194.7 165.3 1,585 2,433 4,018R14 WPRO A 404.2 360.2 88.5 34.9 571 92 662R15 WPRO B1 1083.8 447.1 719.1 579.6 10,514 8,844 19,359R16 WPRO B2 393.3 392.4 547.7 478.0 558 728 1,286R17 WPRO B3 173.4 64.5 225.5 138.6 8 13 21 Total 441.7 278.3 325.9 241.3 21,796 17,162 38,959
Figure 6 shows the comparison of YLDs per 100,000 populations by region in GBD 1990 and GBD 2000 version 1 estimates. Total burden of COPD was larger in the GBD 1990 estimate than the present estimate partly because GBD 1990 tended to underestimate the COPD incidence in smoking prevalent regions such as AMRO A, EURO A and WPRO A and underestimate in AFRO and WPRO B1 regions, and partly because GBD 1990 employed higher severity weights across the regions. It should be noted, however, that actual

14
epidemiological parameters such as mortality and prevalence rates increased considerably in 2000.
MALES - YLD per 1,000
0.00 2.00 4.00 6.00 8.00 10.00
EME - A regions
IND - SEARO D
OAI - SEARB+WPRB2/3
LAC - AMRO B+D
World
YLD/1000
GBD 2000
GBD 1990
FEMALES - YLD per 1,000
0.00 1.00 2.00 3.00 4.00 5.00 6.00 7.00 8.00 9.00
EME - A regions
IND - SEARO D
OAI - SEARB+WPRB2/3
LAC - AMRO B+D
World
YLD/1000
GBD 2000
GBD 1990
Figure 6
Comparison of YLDs per 100,000 in GBD 1990 and GBD 2000 version 1 estimates
4. Discussion
The present study has proposed an alternative approach to estimating COPD incidence, which was used for estimating years lived with disability (YLDs) in 2000. Compared to the previous

15
estimates in GBD 1990 (Murray and Lopez 1996), which employed uniform relative risks across the regions, the present method has an advantage of including regional variations in relative risks of COPD-related mortality. Several limitations should be noted, however.
First, estimated relative risks are not the true relative risks of COPD-related mortality, rather they are approximated by the two major risk factors of COPD: i.e., relative risks of joint effects of smoking and air pollution. On the other hand, since the goodness-of- fit of the regression model was considerably high, COPD-related mortality would be well represented by the risk factor analysis. Estimated prevalence rates were comparable to those published in the literature ensuring the validity of the present approach.
Second, COPD mortality estimated for GBD 2000 may be still underestimated. A recent study in Canada suggests that COPD mortality was much lower than that estimated by Mannino and colleagues from the US multiple causes of death data (Lacasse et al. 1999). In fact, a study by Mannino and colleagues suggested that mortality from COPD was highly underestimated when using vital statistics rather than multiple causes of death data (Mannino et al. 1997). If asthma was excluded as a cause of COPD death and cause of death was restricted to the primary cause, however, actual mortality figures in Canada and US were comparable since COPD often coexists with lung cancer and COPD may be often the secondary cause of death rather than the primary cause (Petty 1997). Therefore if the data on cause of death is restricted to the primary cause classified by ICD 9th or 10th revision as in GBD exercise, COPD mortality is at least comparable across the regions. Possibility of miscoding in COPD would be still smaller than other causes of death. Nevertheless the current estimate of COPD burden should be considered as a lower bound of true COPD burden.
Third, another problem of underestimated mortality would be overestimation of prevalence, particularly in SERAO D and EURO B3. Since a patient with a disease is selectively being removed from the population, its prevalence is lower than it would have been if the disease ran no excess mortality risk (Barendregt et al. 2000).
Finally, the main results from this study are estimates of COPD incidence rates, which are consistent with a corresponding set of prevalence and mortality rates and more importantly can be comparable to those in national burden of disease studies and published literature than the previous estimates. Although further population-based prevalence studies will be required to understand the true burden of COPD in the world and the proposed approach is not the solution to fill the gap between available data and true COPD burden, it can be used at least to assess the plausibility of current and future GBD estimates for COPD burden.

16
References
Anthonisen NR, Connett JE, Kiley JP, et al. Effects of smoking intervention and the use of an inhaled anticholinergic bronchodilator on the rate of decline of FEV1. The Lung Health Study. JAMA 1994;272.1497-1505.
Anthonisen NR, Wright EC, Hodgkin JE, et al. Prognosis in chronic obstructive pulmonary disease. American Review of Respiratory Disease 1986;33.14-20.
Barendregt JJ, Baan CA, Bonneux L. An indirect estimate of the incidence of non- insulin-dependent diabetes mellitus. Epidemiology 2000;11:274-9.
Barendregt JJ. DisMod version 1.0. Release note. Global Programme on Evidence for Health Policy, World Health Organization, 2001.
Barnes PJ. Chronic obstructive pulmonary disease. New England Journal of Medicine 2000;343.269-280.
Behera D, Jindal SK. Respiratory symptoms in India women using domestic cooking fuels. Chest 1991;100:385-388.
Burrows B, Bloom JW, Trayer GA, et al. The course and prognosis of different forms of chronic airway obstruction in a sample from the general population. New England Journal of Medicine 1987;317:1309-1314.
Burrows B. The course and prognosis of different types of chronic airflow limitation in a general population sample from Arizona. Comparison with the Chicago “COPD” series. American Review of Respiratory Disease 1989;49(suppl): S92-S94.
Chen JC, Mannino DM. Worldwide epidemiology of chronic obstructive pulmonary disease. Current Opinion in Pulmonary Medicine 1999;5.93-99.
Finnerty JP, Keeping I, Bullough I, et al. The effectiveness of outpatient pulmonary rehabilitation in chronic lung disease. A randomised trial. Chest 2001;119:1705-1710.
Fletcher C, Peto R. The natural history of chronic airflow obstruction. BMJ 1977;1:1645-1648.
Geddes D, Davies M, Koyama H, et al. Effect of lung-volume-reduction surgery in patients with severe emphysema. New England Journal of Medicine 2000;343:239-245.
Gorecka D, Gorzelak K, Sliwinski P, wt al. Effect of long term oxygen therapy on survival in patients with chronic obstructive pulmonary disease with moderate hypoxemia. Thorax 1997;52:674-679.
Hnizdo E. Health risks among white South African goldminers—dust, smoking, and chronic obstructive pulmonary disease. South African Medical Journal 1992;81:512-517.
Hodgkin JE. Prognosis in chronic obstructive pulmonary disease. Clinics in Chest Medicine 1990;1.555-569.

17
Hurd S. The impact of COPD on lung health worldwide. Chest 2000;117 (suppl):1S-4S.
Jans MP, Schellevis FG, Le Coq EM, et al. Health outcomes of asthma and COPD patients: the evaluation of a project to implement guidelines in general practice. International Journal for Quality in Health Care 2000;13:17-25.
Jones PW, Bosh TK. Quality of life changes in COPD patients treated with Salmeterol. American Journal of Respiratory and Critical Care Medicine 1997;155:1283-1289.
Lacasse Y, Wong E, Guyatt GH, et al. Meta-analysis of respiratory rehabilitation in chronic obstructive pulmonary disease. Lancet 1996;348:1115-1119.
Mahler DA. How should health-related quality of life be assessed in patients with COPD? Chest 2000,117(suppl):54S-57S.
Mannino DM, Brown C, Giovino GA. Obstructive lung disease deaths in the United States from 1979 through 1993. An analysis using multiple-cause mortality data. American Journal Respiratory Critical Care Medicine 1997;156(3 Pt 1):814-8.
Mannino DM, Gagnon RC, Petty TL, et al. Obstructive lung disease and low lung function in adults in the United States. Archives of Internal Medicine 2000;160:1683-1689.
Mathers C et al. Australian National Burden of Disease, 1999.
Mathers C, Murray CJL, Lopez AD, et al. The global burden of diseases 2000 project: objectives, methods, data sources and preliminary results. Global Programme on Evidence for Health Policy, World Health Organization, 2001.
Murray CJL, Lopez AD, eds. The global burden of disease. Cambridge, Harvard University Press, 1996.
Pandy MR. Prevalence of chronic bronchitis in a rural community of the hill region of Nepal. Thorax 1984;39:337-339.
Pauwels RA, Buist AS, Calverley PMA, et al. Global strategy for the diagnosis, management, and prevention of chronic obstructive pulmonary disease. NHLBI/WHO Global Initiative for Chronic Obstructive Lung Disease (GOLD) Workshop summary. American Journal of Respiratory and Critical Care Medicine 2001;163.1256-1276.
Petty TL. Definitions, causes, and prognosis of chronic obstructive pulmonary disease. Respiratory Care Clinics of North America 1998;4:345-358.
Petty TL. Lung cancer and chronic obstructive pulmonary disease. Hematology/Oncology Clinics of North America 1997,11:531-541.
Petty TL. Scope of the COPD problem in North America. Early studies of prevalence and NHANES III Data: basis for early identification and intervention. Chest 2000;117:326S-331S.
Rennard SI. COPD: overview of definitions, epidemiology, and factors influencing its development. Chest 1998;113:235S-241S.

18
Sherrill DL, Lebowitz MD, Burrows B. Epidemiology of Chronic obstructive pulmonary disease. Clinics in Chest Medicine 1990;11:375-387.
Tsukino M, Nishimura K, Ikeda A, et al. Physiologic factors tat determine the health-related quality of life in patients with COPD. Chest 1996;110:896-903.
Vestbo J, Sorensen T, Lange P, et al. Long-term effect of inhaled budesone in mild and moderate chronic obstructive pulmonary disease: a randomised control trial. Lancet 1999;353:1819-1823.
Wise RA. Changing smoking patterns and mortality from chronic obstructive pulmonary disease. Preventive Medicine 1997;26:418-421.

Appendix 1. Review of recent studies on COPD prevalence by WHO region
AFRO D
Region Year Country Definition Source sex unit Total A2529
A3034
A3539
A4044
A4549
A5054
A5559
A6064
A6569
A7074
A7579
A8084
A8500
Notes
AFRO D 1975 Nigeria Symptom-based (MRC Questionnaire, 1544 subjects aged 31-70)
Sofowora, 1977 M % 0.27 NA NA NA NA NA NA NA NA NA NA NA NA NA
AFRO D 1975 Nigeria Symptom-based (MRC Questionnaire, 1544 subjects aged 31-70)
Sofowora, 1977 F % 0.24 NA NA NA NA NA NA NA NA NA NA NA NA NA
AFRO D 1976 Zimbab
we Symptom-based (MRC Questionnaire, 4494 subjects aged 20 and over)
Cookson and Mataka, 1978
M % 1.2 NA NA NA NA NA NA NA NA NA NA NA NA NA
AFRO D 1976 Zimbabwe
Symptom-based (MRC Questionnaire, 4494 subjects aged 20 and over)
Cookson and Mataka, 1978
F % 2.8 NA NA NA NA NA NA NA NA NA NA NA NA NA
AFRO D 1991 Nigeria Symptom-based (MRC
Questionnaire, random sample of 804 male soldiers aged 15-60)
Harrs-Eze, 1993 M % 2.24 NA NA NA NA NA NA NA NA NA NA NA NA NA % smokers was 34%
Limited population groups (mostly occupational exposures) AFRO D 198? Morocco Questionnaire for 1829
industrial workers (aged 20-60)
El Meziane 1984 both % 6 NA NA NA NA NA NA NA NA NA NA NA NA NA
AFRO D 198? South Africa
Questionnaire among 582 exposed and 153 non-exposed workers.
Yach 1985 both % 25 NA NA NA NA NA NA NA NA NA NA NA NA NA exposed group
AFRO D 198? South Africa
Questionnaire among 582 exposed and 153 non-exposed workers.
Yach 1985 both % 11 NA NA NA NA NA NA NA NA NA NA NA NA NA unexposed group
Summary crude prevalence by definition: Spirometry = NA, Physician-diagnosis = NA, Symptom-based = 1 -3%
AMRO A
Region Year Country Definition Source sex Unit Total A2024
A2529
A3034
A3539
A4044
A4549
A5054
A5559
A6064
A6569
A7074
A7579
A8084
A8500
Notes
AMRO A 1994-95
Canada Symptom-based (questionnaire of
Chen et al., 2000 M % 1.8 1.8 1.5 1.5 5 5
1
7210 subjects aged 35-64)
AMRO A 1994-95
Canada Symptom-based (questionnaire of 7210 subjects aged 35-64)
Chen et al., 2000 F % 3.5 3.5 3.6 3.6 4.5 4.5
AMRO A 1994-
95 Canada Physician-diagnosis
(national survey) Lacasse et al., 1999 M % 6.3 5 5 6.6 6.6 9.1 9.1 9.1
AMRO A 1994-95
Canada Physician-diagnosis (national survey)
Lacasse et al., 1999 F % 5.2 4.5 4.5 4.4 4.4 7.8 7.8 7.8
AMRO A 1994-95
Canada Physician-diagnosis (national survey)
Lacasse et al., 1999 Both % 5.7 4.7 4.7 5.4 5.4 8.3 8.3 8.3
AMRO A 1983 USA Symptom-based
questionnaire of 674 males and 1237 females aged 20-60
Foxman et al., 1986 M % 12.2 11.5 10.8 10.8 12.3 12.3 13.9 13.9 16.6 16.6 16.6 Younger sample (20-69)
AMRO A 1983 USA Symptom-based questionnaire of 674 males and 1237 females aged 20-60
Foxman et al., 1986 F % 8.3 7.1 8.6 8.6 8.1 8.1 8.7 8.7 9.1 9.1 9.1 Younger sample (20-69)
AMRO A 1972-
85 USA symptom-based data
from the Tucson residents aged 20 years and over
Postma and Lebowitz, 1995
Both % 14.2
AMRO A 1982 USA Symptom-based
(questionnaire survey of 6868 Hispanic populations aged 12-74)
Bang et al., 1990 M % 0.9 0.9 0.9 1.5 1.5 1.5 1.5 3.6 3.6 3.6 3.6 3.6 3.6 3.6 Mexicans
AMRO A 1982 USA Symptom-based (questionnaire survey of 6868 Hispanic populations aged 12-74)
Bang et al., 1990 F % 0.9 0.9 0.9 2.5 2.5 2.5 2.5 3.1 3.1 3.1 3.1 3.6 3.6 3.6 Mexicans
AMRO A 1983 USA Symptom-based (questionnaire survey of 1874 Hispanic populations aged 12-74)
Bang et al., 1990 M % 3.5 3.5 3.5 3.5 2.3 2.3 2.3 2.3 2.3 2.3 2.3 Cubans
2
AMRO A 1983 USA Symptom-ba sed (questionnaire survey of 1874 Hispanic populations aged 12-74)
Bang et al., 1990 F % 1.5 1.5 1.5 2.7 2.7 2.7 2.7 1.8 1.8 1.8 1.8 1.8 1.8 1.8 Cubans
AMRO A 1984 USA Symptom-based (questionnaire survey of 2748 Hispanic populations aged 12-74)
Bang et al., 1990 M % 1.1 1.1 1.1 2 2 2 2 2.5 2.5 2.5 2.5 2.5 2.5 2.5 Puerto Ricans
AMRO A 1984 USA Symptom-based (questionnaire survey of 2748 Hispanic populations aged 12-74)
Bang et al., 1990 F % 2.7 2.7 2.7 5 5 5 5 4.9 4.9 4.9 4.9 4.9 4.9 4.9 Puerto Ricans
AMRO A 1985-
87 USA Physician-diagnosis
(HMO data) of those aged 65 and over
Osborne and Buist , 1998
M % 9.9 Only older age groups (over 65)
AMRO A 1985-87
USA Physician-diagnosis (HMO data) of those aged 65 and over
Osborne and Buist , 1998
F % 4.2 Only older age groups (over 65)
AMRO A 1988-
94 USA Physician-diagnosis
excl. asthma (20050 subjects in NHANES III)
Mannino for US BOD, and Petty and Master, 2000
M per 1000
28.5 3.1 13.4 13.4 24.0 24.0 39.7 39.7 75.1 75.1 106.8 106.8 87.6 87.6 87.6
AMRO A 1988-94
USA Physician-diagnosis excl. asthma (20050 subjects in NHANES III)
Mannino for US BOD, and Petty and Master, 2000
F per 1000
33.9 8.7 22.2 22.2 24.0 32.3 44.6 44.6 63.9 63.9 77.2 77.2 82.5 82.5 82.5
AMRO A 1988-
94 USA Spirometry (20050
subjects in NHANES III)
Mannino for US BOD and Mannino et al., 2001
M per 1000
23.7 0.4 10.2 10.2 10.2 10.2 42.7 42.7 42.7 42.7 92.7 92.7 109.8 109.8 109.8
AMRO A 1988-94
USA Spirometry (20050 subjects in NHANES III)
Mannino for US BOD and Mannino et al., 2001
F per 1000
22.3 0.4 9.4 9.4 9.4 9.4 42.0 42.0 42.0 42.0 67.3 67.3 68.3 68.3 68.3
Summary crude prevalence by definition: Spirometry = 2-5%, Physician-diagnosis = 1-3%, Symptom-based = 5 -15%

3
AMRO B
Region Year Country Definition Source sex Unit Total A2024
A2529
A3034
A3539
A4044
A4549
A5054
A5559
A6064
A6569
A7074
A7579
A8084
A8500
Notes
Only indoor air pollution studies in rural areas AMRO B 199? rural
Bolivia Symptom-based (MRC Questionnaire. Population-based cross-sectional study of 102 indoor and 139 outdoor cooking women.)
Albalak et al., 1999
F % 10 10 10 10 33 33 33 33 33 33 33 High chronic bronchitis prevalence among indoor cooking women, 10% in age 20-40 and 33% in age over 40
AMRO B 1990 Petros, Brazil
Symptom-based (ATS Questionnaire. Population-based cross-sectional study of 1053 individuals aged 40-75)
Menezes et al., 1994
both % 12.7 Lack of significance of some COPD risk factors may be due to high degree of multicollenearity.
Summary crude prevalence by definition: Spirometry = NA, Physician-diagnosis = NA, Symptom-based = 5 -13% among high risk groups only
EURO A
Region Year Country Definition Source sex Unit Total A2024
A2529
A3034
A3539
A4044
A4549
A5054
A5559
A6064
A6569
A7074
A7579
A8084
A8500
Notes
EURO A 1988-91
Italy Symptom-based (ERS Questionnaire, 2841 subjects aged 8-73)
Viegi et al., 2000
M % 10.8 10.8 10.8 10.8 10.8 14.5 14.5 14.5 14.5 14.5 14.5 Comparison of 3 different measures of COPD
EURO A 1988-91
Italy Spirometery (2841 subjects aged 8-73)
Viegi et al., 2000
M % 13.3 13.3 13.3 13.3 13.3 33.1 33.1 33.1 33.1 33.1 33.1 ERS has higher specificity and predictive value positive than ATS criterion.
EURO A 1988-91
Italy Symptom-based (ATS Questionnaire, 2841 subjects aged 8-73)
Viegi et al., 2000
M % 32 32 32 32 32 60.7 60.7 60.7 60.7 60.7 60.7
EURO A 1988-91
Italy Symptom-based (ERS Questionnaire, 2841 subjects aged 8-73)
Viegi et al., 2000
F % 11.7 11.7 11.7 11.7 11.7 12 12 12 12 12 12
EURO A 1988-91
Italy Spirometery (2841 subjects aged 8-73)
Viegi et al., 2000
F % 6.5 6.5 6.5 6.5 6.5 22.2 22.2 22.2 22.2 22.2 22.2
EURO A 1988-91
Italy Symptom-based (ATS Questionnaire, 2841 subjects aged 8-73)
Viegi et al., 2000
F % 22.2 22.2 22.2 22.2 22.2 53.4 53.4 53.4 53.4 53.4 53.4

4
EURO A 1993 Iceland Symptom-based (MRC Questionnaire, 1175 individuals aged 50 years and over)
Magnusson et al., 1998
both % 7.1 7.1 7.1 7.1 7.1 7.1 16.7 16.7 Chronic bronchitis only and thus underestimated.
EURO A 1988 South-
West France
Symptom-based (Questionnaire, 3777subjects over 65 years)
Nejjari et al, 1996
M % 20 65 years and over only 8 17 19 29 21 Chronic bronchitis only. Only aged 65 years and over.
EURO A 1988 South-West France
Symptom-based (Questionnaire, 3777subjects over 65 years)
Nejjari et al, 1996
F % 8 65 years and over only 6 8 10 10 7 Chronic bronchitis only. Only aged 65 years and over.
EURO A 1997 UK Physician-diagnosis Soriano et al.,
2000 M % 1.7 NA NA NA NA NA NA NA NA NA NA NA NA NA Only registered COPD
patients and thus underestimated.
EURO A 1997 UK Physician-diagnosis Soriano et al., 2000
F % 1.3 NA NA NA NA NA NA NA NA NA NA NA NA NA Only registered COPD patients and thus underestimated.
EURO A 1995 Sweden Symptom-based
(Questionnaire of 7104 individuals aged 20-69)
Lindstrom et al., 2001
both % 11 NA NA NA NA NA NA NA NA NA NA NA NA NA
EURO A 1995 Sweden Physician-diagnosis (Questionnaire of 7104 individuals aged 20-69)
Lindstrom et al., 2001
both % 3.1 NA NA NA NA NA NA NA NA NA NA NA NA NA
EURO A 1995 Finland Symptom-based
(Questionnaire of 6633 individuals aged 20-69)
Lindstrom et al., 2001
both % 7 NA NA NA NA NA NA NA NA NA NA NA NA NA
EURO A 1995 Finland Physician-diagnosis (Questionnaire of 6633 individuals aged 20-69)
Lindstrom et al., 2001
both % 3.8 NA NA NA NA NA NA NA NA NA NA NA NA NA
EURO A 1992
-94 UK Questionnaire and
confirmation with spirometry for chronic airways obstructions
Renwick and Connoly, 1996
both % 15.4 NA NA NA NA NA NA NA NA NA NA NA NA NA Not representative sample, includes asthma patients, and thus highly biased.
EURO A 198? UK Symptom-based
(Questionnaire, 1803 subjects aged 65 and over)
Horsely et al., 1991
both % NA NA NA NA NA NA NA NA 16.4 16.4 16.4 16.4 16.4 Only for older age groups (65 and over)
EURO A 198? UK Spirometry (selected 296
patients) Dow et al., 1992
both % 15.6 NA NA NA NA NA NA NA NA NA NA NA NA NA Selected patients and not representative

5
sample
EURO A 1992 Sweden Symptom-based (MRC
Questionnaire of 12071 subjects aged 20-59 years)
Montnemery et al., 1998
both % 4.6 NA NA NA NA NA NA NA NA NA NA NA NA Only younger age groups (20-59)
EURO A 1990
-91 Finland Spirometry (Questionnaire and
spirometry for confirmation, 488 males and 708 females aged over 65)
Isoaho et al., 1994
M % 12.5 65 years and over
NA NA NA NA NA NA NA 14 14 9.6 9.6 9.6 Older age groups only
EURO A 1990-91
Finland Spirometry (Questionnaire and spirometry for confirmation, 488 males and 708 females aged over 65)
Isoaho et al., 1994
F % 3 65 years and over
NA NA NA NA NA NA NA 3.6 3.6 2.1 2.1 2.1 Older age groups only
EURO A 1996
-97 Spain Spirometry (Questionnaire,
exclusion of asthma, and confirmation with spirometry, 4035 subjects aged 40-69)
Sobradillo et al., 2000
M % 14.3 NA NA NA NA NA NA NA NA NA NA NA NA NA COPD definition of FEV1/FVC<88%, less strict than the Gold definition of <70%, and thus overestimated prevalence figure.
EURO A 1996-97
Spain Spirometry (Questionnaire, exclusion of asthma, and confirmation with spirometry, 4035 subjects aged 40-69)
Sobradillo et al., 2000
F % 3.9 NA NA NA NA NA NA NA NA NA NA NA NA NA
EURO A 1985
-86 Denmark Spirometry (hospital-based
study: 1342 males and 1398 females aged 16 and over)
Hansen and Schmidt, 1991
M % 7 NA NA NA NA NA NA NA NA NA NA NA NA NA Hospital-based study of patients who attended the clinic with respiratory symptoms and thus overestimated prevalence figures.
EURO A 1985-86
Denmark Spirometry (hospital-based study: 1342 males and 1398 females aged 16 and over)
Hansen and Schmidt, 1991
F % 2 NA NA NA NA NA NA NA NA NA NA NA NA NA Hospital-based study of patients who attended the clinic with respiratory symptoms and thus overestimated prevalence figures.
EURO A 1995 Sweden Symptom-based (Two -stage
design of questionnaire followed by spirometry. 5949
Hasselgren et al., 2001
both % 4.3 NA NA NA NA NA NA NA NA NA NA NA NA NA chronic bronchitis with normal lung function?

6
respondents out of 184572 people aged 18-70.)
EURO A 1995 Sweden Spirometry (Only for selected patients screened by questionnaire.)
Hasselgren et al., 2001
both % 2.1 NA NA NA NA NA NA NA NA NA NA NA NA NA COPD defined as FEV1/FVC<70%
EURO A coho
rt study until 1992
Denmark Hospital admission rate (Cohort study of 13897 subjects for 6-17 years)
Prescott et al., 1997
both % 2.4 NA NA NA NA NA NA NA NA NA NA NA NA NA COPD hospitalization rate rather than actual prevalence (underestimated)
EURO A 198? Sweden Symptom-based
(Questionnaire, 6610 adults aged 35-66)
Lundback et al., 1994
both % 12 NA NA NA NA NA NA NA NA NA NA NA NA NA Chronic bronchitis only
EURO A 198? Sweden Symptoms and spirometry
(Questionnaire, 6610 adults aged 35-66 were interviewed and 1243 took spirometry.)
Lundback et al., 1993
M % 7.4 NA NA NA NA NA NA NA NA NA NA NA NA NA FEV1< 80% predicted was used to define airway obstruction. No data on FEV1/FVC and thus includes asthma.
EURO A 198? Sweden Symptoms and spirometry (Questionnaire, 6610 adults aged 35-66 were interviewed and 1243 took spirometry.)
Lundback et al., 1993
F % 4.3 NA NA NA NA NA NA NA NA NA NA NA NA NA FEV1< 80% predicted was used to define airway obstruction. No data on FEV1/FVC and thus includes asthma.
EURO A 198? Northern
Italy Symptom-based (Questionnaire, 2382 subjects aged 20-64)
Viegi et al., 1994
M % 23 NA NA NA NA NA NA NA NA NA NA NA NA NA Includes asthma and thus overestimated prevalence
EURO A 198? Northern Italy
Symptom-based (Questionnaire, 2382 subjects aged 20-64)
Viegi et al., 1994
F % 8 NA NA NA NA NA NA NA NA NA NA NA NA NA Includes asthma and thus overestimated prevalence
EURO A 198? Northern Italy
Spirometry (Questionnaire, 2382 subjects aged 20-64)
Viegi et al., 1994
M % 38 NA NA NA NA NA NA NA NA NA NA NA NA NA Definition is different, includes asthma, and thus overestimated prevalence
EURO A 198? Northern Italy
Spirometry (Questionnaire, 2382 subjects aged 20-64)
Viegi et al., 1994
F % 20 NA NA NA NA NA NA NA NA NA NA NA NA NA Definition is different, includes asthma, and thus overestimated prevalence
7
EURO A 1990
-92 Northern Italy
Symptom-based (1497 subjects aged 40-59 who participated in interview and spirometry at a university hospital)
Donato et al., 2000
M % 16.1 10.6 10.6 20.2 20.5 NA NA NA NA NA NA Primarily symptom-based and no information on FEV1/FVC with spirometry.
EURO A 1990-92
Northern Italy
Symptom-based (1497 subjects aged 40-59 who participated in interview and spirometry at a university hospital)
Donato et al., 2000
F % 4.4 4.5 5.3 2.6 4.7 NA NA NA NA NA NA Primarily symptom-based and no information on FEV1/FVC with spirometry.
EURO A over
view Europe Overview of past prevalence
studies in Europe during 1960s-1990s
Gulsvik, 1999 both % 4-6 two-thirds had mild lung function decline only
EURO A 1975 Netherla
nds Symptom-based (MRC questionnaire followed by spirometry for those aged 15-64)
Van der Lende et al., 1986
both % NA 8.5 8.5 8.5 8.5 14.9 14.9 14.9 14.9 14.9 NA NA NA NA NA Definition of airway obstruction with spirometry is somewhat different and may include asthma as well. Overestimated.
EURO A 1996
-97 Spain Symptom-based (Multicenter
questionnaire survey of 4035 individuals aged 40-69 followed by spirometry)
Sobradillo et al., 1999
M % 8.3 NA NA NA NA NA NA NA NA NA NA NA NA NA Chronic bronchitis only
EURO A 1996-97
Spain Symptom-based (Multicenter questionnaire survey of 4035 individuals aged 40-69 followed by spirometry)
Sobradillo et al., 1999
F % 1.4 NA NA NA NA NA NA NA NA NA NA NA NA NA Chronic bronchitis only
EURO A 1996-97
Spain Symptom-based (Multicenter questionnaire survey of 4035 individuals aged 40-69 followed by spirometry)
Sobradillo et al., 1999
both % 4.8 NA NA NA NA NA NA NA NA NA NA NA NA NA Chronic bronchitis only
EURO A 1996-97
Spain Spirometry Sobradillo et al., 1999
M % 15.8 NA NA NA NA NA NA NA NA NA NA NA NA NA Airway obstruction defined as FEV1/FVC<88% and thus highly overestimated
EURO A 1996-97
Spain Spirometry Sobradillo et al., 1999
F % 5.5 NA NA NA NA NA NA NA NA NA NA NA NA NA Airway obstruction defined as FEV1/FVC<88% and

8
thus highly overestimated
EURO A 1996-97
Spain Spirometry Sobradillo et al., 1999
both % 10.6 NA NA NA NA NA NA NA NA NA NA NA NA NA Airway obstruction defined as FEV1/FVC<88% and thus highly overestimated
EURO A 198? UK Symptom-based (MRC
Questionnaire survey 2387 patients aged 40-70 and registered to GPs)
Littlejohns et al., 1989
M % 16.7 NA NA NA NA NA NA NA NA NA NA NA NA NA Only 1444 responded. 256 underwent spirometry. MRC definition of chronic bronchitis only.
EURO A 198? UK Symptom-based (MRC Questionnaire survey 2387 patients aged 40-70 and registered to GPs)
Littlejohns et al., 1989
F % 7.1 NA NA NA NA NA NA NA NA NA NA NA NA NA Only 1444 responded. 256 underwent spirometry. MRC definition of chronic bronchitis only.
EURO A 198? UK Symptom-based (MRC Questionnaire survey 2387 patients aged 40-70 and registered to GPs)
Littlejohns et al., 1989
M % 5.4 NA NA NA NA NA NA NA NA NA NA NA NA NA MRC definition of chronic bronchitis + disability (difficulty walking on the level due to SOB--pretty severe disability). 30-40% were severe.
EURO A 198? UK Symptom-based (MRC Questionnaire survey 2387 patients aged 40-70 and registered to GPs)
Littlejohns et al., 1989
F % 2.9 NA NA NA NA NA NA NA NA NA NA NA NA NA MRC definition of chronic bronchitis + disability (difficulty walking on the level due to SOB--pretty severe disability). 30-40% were severe.
EURO A 198? UK Physician-diagnosis (MRC Questionnaire survey 2387 patients aged 40-70 and registered to GPs)
Littlejohns et al., 1989
M % 3.9 NA NA NA NA NA NA NA NA NA NA NA NA NA Physician- diagnosis
EURO A 198? UK Physician-diagnosis (MRC Questionnaire survey 2387 patients aged 40-70 and registered to GPs)
Littlejohns et al., 1989
F % 2.1 NA NA NA NA NA NA NA NA NA NA NA NA NA Physician- diagnosis
EURO A 1996 Finland Symptom-based (FinEsS
Questionnaire, random sample of 6062 individuals aged 20-
Pallasaho et al., 1999
M % 2.5 2.5 2.5 2.5 2.5 8 8 8 8 8

9
69)
EURO A 1996 Finland Symptom-based (FinEsS Questionnaire, random sample of 6062 individuals aged 20-69)
Pallasaho et al., 1999
F % 3 3 3 3 3 6.9 6.9 6.9 6.9 6.9
EURO A 1996 Finland Symptom-based (FinEsS Questionnaire, random sample of 6062 individuals aged 20-69)
Pallasaho et al., 1999
both % 4.8 S
EURO A 1996 Finland Physician-diagnosis (FinEsS Questionnaire, random sample of 6062 individuals aged 20-69)
Pallasaho et al., 1999
M % 2.2 2.2 2.2 2.2 2.2 6.7 6.7 6.7 6.7 6.7
EURO A 1996 Finland Physician-diagnosis (FinEsS Questionnaire, random sample of 6062 individuals aged 20-69)
Pallasaho et al., 1999
F % 2 2 2 2 2 5.5 5.5 5.5 5.5 5.5
EURO A 1996 Finland Physician-diagnosis (FinEsS Questionnaire, random sample of 6062 individuals aged 20-69)
Pallasaho et al., 1999
both % 3.7
EURO A 1992 UK Symptom-based
(Questionnaire of 723 individuals registered to GPs aged over 45)
Renwick and Connoly, 1996
both % NA 22.9 22.9 22.9 22.9 29.7 29.7 29.7 29.7 247 underwent spirometry, but overestimated since non-representative sample of registered patients
EURO A 1992 UK Symptom-based (Questionnaire of 723 individuals registered to GPs aged over 45)
Renwick and Connoly, 1996
both % 15.4 symptom-based NA NA NA NA NA NA NA NA
EURO A 1985
-86 Northern Sweden
Physician-diagnosis (MRC Questionnaire of 5698 subjects aged 35-66)
Lundback et al., 1991
M % 4.7 NA NA NA NA NA NA NA NA NA NA
EURO A 1985-86
Northern Sweden
Physician-diagnosis (MRC Questionnaire of 5698 subjects aged 35-66)
Lundback et al., 1991
F % 4 NA NA NA NA NA NA NA NA NA NA
EURO A 1993 Spain Questionnaire and
confirmation with spirometry of 2047 unemployed young adults aged 20-44.
Kogevinas et al., 1998
both % 2.7 NA NA NA NA NA Age-distribution of the sample was younger

10
EURO A 1983 Italy Symptoms (National health
survey of 34787 subjects aged 15 and over)
Vecchia et al., 1988
M (Non
-smokers)
% 4.1 Non-smokers (self-reported symptoms)
EURO A 1983 Italy Symptoms (National health survey of 34787 subjects aged 15 and over)
Vecchia et al., 1988
F (Non
-smokers)
% 3.5 Non-smokers (self-reported symptoms)
EURO A 1983 Italy Symptoms (National health survey of 34787 subjects aged 15 and over)
Vecchia et al., 1988
M (Smoker
s)
% 8.4 Smokers (self-reported symptoms)
EURO A 1983 Italy Symptoms (National health survey of 34787 subjects aged 15 and over)
Vecchia et al., 1988
F (Smoker
s)
% 4.1 Smokers (self-reported symptoms)
EURO A Spain Symptom-based
(Questionnaire of 483 subjects in a general population aged 6 years and over)
Bayego et al., 1994
M % 11.3 symptom-based
EURO A Spain Symptom-based (Questionnaire of 483 subjects in a general population aged 6 years and over)
Bayego et al., 1994
both % 9.2 symptom-based
EURO A Spain Physician-diagnosis (Questionnaire of 483 subjects in a general population aged 6 years and over)
Bayego et al., 1994
both % 4.1 physician-diagnosis
EURO A 197? Northern
Sweden Symptom-based (MRC Questionnaire of 1939 subjects aged 20-64, confirmed by spirometry)
Mikaelsson et al., 1982
M % 2.3 confirmed by spirometry relatively younger age-distribution
EURO A 197? Northern Sweden
Symptom-based (MRC Questionnaire of 1939 subjects aged 20-64, confirmed by spirometry)
Mikaelsson et al., 1982
F % 0.9 confirmed by spirometry relatively younger age-distribution
Summary crude prevalence by definition: Spirometry = 3-7%, Physician-diagnosis = 2 -5%, Symptom-based = 10-20%

11
EURO B
Region Year Country Definition Source sex Unit Total A2024
A2529
A3034
A3539
A4044
A4549
A5054
A5559
A6064
A6569
A7074
A7579
A8084
A8500
Notes
EURO B1 1968-81
Poland Spirometry FEV1<65% predicted (thus included asthma as well), cohort study of 731 males and 1038 females surveyed in 1968
Krzyzanowski et al. 1986
M % 8.5 2.4 2.4 6.1 6.1 6.1 11.7 11.7 17.3 17.3 8.8 8.8 8.8 Highly overestimated COPD prevalence since the figure includes asthma. Only 1864 out of 3047 persons were followed.
EURO B1 1968-81
Poland Spirometry FEV1<65% predicted (thus included asthma as well), cohort study of 731 males and 1038 females surveyed in 1968
Krzyzanowski et al. 1986
F % 4.9 0.7 0.7 3.9 3.9 3.9 6.8 6.8 7.6 7.6 14.8 14.8 14.8 Highly overestimated COPD prevalence since the figure includes asthma. Only 1864 out of 3047 persons were followed.
EURO B1 1968-81
Poland Spirometry FEV1<65% predicted (thus included asthma as well), cohort study of 731 males and 1038 females surveyed in 1968
Krzyzanowski et al. 1986
M (Smoker
s)
% 9.3 2.2 2.2 7.6 7.6 7.6 16 16 21.2 21.2 0 0 0 Highly overestimated COPD prevalence since the figure includes asthma. Only 1864 out of 3047 persons were followed.
EURO B1 1968-81
Poland Spirometry FEV1<65% predicted (thus included asthma as well), cohort study of 731 males and 1038 females surveyed in 1968
Krzyzanowski et al. 1986
F (Smoker
s)
% 6.6 0 0 3.3 3.3 3.3 16.3 16.3 16.7 16.7 0 0 0 Highly overestimated COPD prevalence since the figure includes asthma. Only 1864 out of 3047 persons were followed.
EURO B1 1968-81
Poland Spirometry FEV1<65% predicted (thus included asthma as well), cohort study of 731 males and 1038 females surveyed in 1968
Krzyzanowski et al. 1986
M (Non
-smokers)
% 3.6 0 0 2.3 2.3 2.3 8.7 8.7 7.7 7.7 0 0 0 Highly overestimated COPD prevalence since the figure includes asthma. Only 1864 out of 3047 persons were followed.
EURO B1 1968-81
Poland Spirometry FEV1<65% predicted (thus included asthma as well), cohort study of 731 males and 1038 females surveyed in 1968
Krzyzanowski et al. 1986
F (Non
-smokers)
% 4.8 0.7 0.7 3.8 3.8 3.8 4.5 4.5 5.9 5.9 17.6 17.6 17.6 Highly overestimated COPD prevalence since the figure includes asthma. Only 1864 out of 3047 persons were followed.
EURO B1 199? Poland Spirometry of self-selected
smokers over 39 years (mean 52 years) (subject to selection bias)
Zielinski et al. 2000
Both (smokers) 8.99 8.99 26.56
26.56
26.56
26.56
26.56
26.56
26.56
26.56
26.56
26.56
FEV1/FVE<85% (too high compared to conventional definition of 70% and thus

12
prevalence figures are highly overestimated)
EURO B1 199? Poland 8386 smokers and 1768 non-smokers, 60% were males
Zielinski et al. 2000
Both (non-smokers) 6.16 6.16 16.23
16.23
16.23
16.23
16.23
16.23
16.23
16.23
16.23
16.23
Questionable definitions of COPD since 30-50% of subjects show remission of their symptoms (Wojtyniak et al, 1989)
EURO B1 198? USSR Symptom-based
(Questionnaire on chronic cough, 1768 residents)
Davydova et al., 1991
Both 12.5 10.9 13.7 15.8
EURO B1 1990
? Poland Symptom-based (MRC
Questionnaire, 917 men exposed to occupational hazard)
Niepsuj et al., 1993
Male smokers
% 27.3 NA NA NA NA NA NA NA NA NA NA NA NA NA Occupational exposure group only
EURO B1 1990?
Poland Symptom-based (MRC Questionnaire, 917 men exposed to occupational hazard)
Niepsuj et al., 1993
Male non-smokers
% 11 NA NA NA NA NA NA NA NA NA NA NA NA NA Occupational exposure group only
EURO B1 198? Latvia Symptom-based
(Questionnaire survey of 10200 individuals aged 20-70)
Utkin and Tepanov, 1986
both % 11.6 NA NA NA NA NA NA NA NA NA NA NA NA Chronic bronchitis only
EURO B1 198? Lithuani
a Symptom-based (Questionnaire survey of 679 males and 733 females aged 25-59)
Shinipas and Lesatskaite, 1983
M 4.7 11.3 20.3 Younger age groups only
EURO B1 198? Lithuania
Symptom-based (Questionnaire survey of 679 males and 733 females aged 25-59)
Shinipas and Lesatskaite, 1983
F 3.8 6.1 12.3
EURO B1 197? Estonia Symptom-based
(Questionnaire survey of 3141 and 5831 individuals aged 35-54)
Yannus et al., 1977
both % 7.1 NA NA NA NA NA NA NA NA NA NA NA NA NA Younger age groups only
EURO B1 197? Estonia Symptom-based (Questionnaire survey of 3141 and 5831 individuals aged 35-
Yannus et al., 1977
both % 8 NA NA NA NA NA NA NA NA NA NA NA NA NA
13
54)
EURO B1 1996 Turkey Symptom-based (ERC
Questionnaire of 1023 subjects aged 20-83)
Cetinkaya et al., 2000
M % 17.8 15.3 15.3 15.3 18.4 18.4 18.4 18.4 20.3 20.3 20.3 20.3 20.3 Chronic bronchitis only
EURO B1 1996 Turkey Symptom-based (ERC Questionnaire of 1023 subjects aged 20-83)
Cetinkaya et al., 2000
F % 10 6.7 6.7 6.7 12.2 12.2 12.2 12.2 14.3 14.3 14.3 14.3 14.3 Chronic bronchitis only
EURO B1 1996 Turkey Symptom-based (ERC Questionnaire of 1023 subjects aged 20-83)
Cetinkaya et al., 2000
both % 12.5 10.1 10.1 10.1 14.9 14.9 14.9 14.9 17.8 17.8 17.8 17.8 17.8 Chronic bronchitis only
EURO B 1976 Poland Symptom-based
(Questionnaire of 1190 subjects living in air polluted area aged 40-64 followed by spirometry)
Plonska, 1984 both % 43.1 NA NA NA NA NA NA NA NA NA NA NA NA NA symptoms only, no clear definition of chronic bronchitis nor distinction from asthma
Summary crude prevalence by definition: Spirometry = NA, Physician-diagnosis = NA, Symptom-based = 10-20%, questionable definitions and samples
WPRO A
Region Year Country Definition Source sex Unit Total A2024
A2529
A3034
A3539
A4044
A4549
A5054
A5559
A6064
A6569
A7074
A7579
A8084
A8500
Notes
WPRO A 1984 New South Wales, Australia
Symptom-based (MRC Questionnaire and spirometry for confirmation, 12357 male mine workers aged 30-60)
Leigh et al., 1986
M % 13.2 6.4 6.4 9.7 9.7 15.6 15.6 20.3 20.3 Includes asthma, etc. and overestimated.
WPRO A 1984 New South Wales, Australia
Spirometry (MRC Questionnaire and spirometry for confirmation, 12357 male mine workers aged 30-60)
Leigh et al., 1986
M % 3.5 0.1 0.1 0.9 0.9 3.7 3.7 9.0 9.0 Younger age composition. Workers exposed to occupational dusts only.
WPRO A 1994-
95 Busselton, Australia
Spirometry (defined as FEV1/FVC<70%)
AUS BOD M per 1000
7.4 12.5 12.5 21.1 21.1 51.8 51.8 81.8 81.8 98.5 98.5 98.5
WPRO A 1994-95
Busselton, Australia
Spirometry (defined as FEV1/FVC<70%)
AUS BOD F per 1000
2.4 7.8 7.8 14.3 14.3 27.2 27.2 43.5 43.5 68.3 68.3 68.3
Summary crude prevalence by definition: Spirometry = 2-5%, Physician-diagnosis = NA, Symptom-based = 10-15%

14
WPRO B
Region Year Country Definition Source sex unit Total A2024
A2529
A3034
A3539
A4044
A4549
A5054
A5559
A6064
A6569
A7074
A7579
A8084
A8500
Notes
WPRO B 1972-79
China Symptom-based (Questionnaire, sample size varied from 1160 to 1884175)
Compiled by Yan, 1989
both (chroni
c bronch
itis)
% 4.1 NA NA NA NA NA NA NA NA NA NA NA NA NA NA Chronic bronchitis only
WPRO B 1972-79
China Symptom-based (Questionnaire, sample size varied from 1160 to 1884175)
Compiled by Yan, 1989
both (emphysema
)
% 1.2 NA NA NA NA NA NA NA NA NA NA NA NA NA NA Emphysema only
WPRO B 1991
-92 Hong Kong, China
Symptom-based (Questionnaire survey of 999 males and 1033 female HK residents aged 70 years and over)
Lai et al., 1995
both (chroni
c bronch
itis)
% 7 NA NA NA NA NA NA NA NA NA NA 7 7 7 7 Chronic bronchitis only. Only for very older groups (70 and over). Asthma prevalence was 5%
WPRO B 1991-92
Hong Kong, China
Symptom-based (Questionnaire survey of 999 males and 1033 female HK residents aged 70 years and over)
Lai et al., 1995
both (emphysema
)
% 2 NA NA NA NA NA NA NA NA NA NA 2 2 2 2 Emphysema only. Only for very older groups (70 and over).
WPRO B 1992 China Spirometry (Questionnaire
followed by spirometry, population-based study of 6536 people aged 15 and over)
Cheng and Zhang 1998
both (overal
l)
% 3.0 NA NA NA NA NA NA NA NA NA NA NA NA NA NA COPD was defines as FEV1/FVC<70% c/w Gold definition, but probably overestimated
WPRO B 1992 China Spirometry (Questionnaire followed by spirometry, population-based study of 6536 people aged 15 and over)
Cheng and Zhang 1998
both (smok
ers)
% 24.6 NA NA NA NA NA NA NA NA NA NA NA NA NA NA Smoking accounted for approximately 72% of COPD cases
Summary crude prevalence by definition: Spirometry = 1-3%, Physician-diagnosis = NA, Symptom-based = 2-8%
SEARO D
Region Year Country Definition Source sex unit Total A2024
A2529
A3034
A3539
A4044
A4549
A5054
A5559
A6064
A6569
A7074
A7579
A8084
A8500
Notes

15
SEARO D 199? rural Kashmir, India
Symptom-based (Questionnaire, 560 sample aged 25-55)
Qureshi, 1994
M % 7.6 4.8 3.9 3.9 16.2 16.2 19.6 NA NA NA NA NA NA NA Significant relationship between exposure to domestic pollution and COPD (no adjustment for confounding)
SEARO D 199? rural Kashmir, India
Symptom-based (Questionnaire, 560 sample aged 25-55)
Qureshi, 1994
F % 7.8 4.0 12.3 12.3 13.3 13.3 35.7 NA NA NA NA NA NA NA Exposure to domestic pollution was higher among females.
SEARO D 199? rural Kashmir, India
Spirometry for only 35 patients
Qureshi, 1994
both Normal
mild moderate
severe
11 43.0 29 17
SEARO D 198? Chnadigarh, India
Symptom-based (Questionnaire, 2180 females aged 20 and over)
Malik, 1985 F % 3.0 NA NA NA NA NA NA NA NA NA NA NA NA NA
SEARO D
1981-86
Tamil Nadu, India
Symptom-based (Questionnaire, 24,950 residents aged 30 and over)
Ray et al., 1995
M (smok
ers only)
per 1000
40.8 NA 20.6 20.6 33.1 33.1 59.4 59.4 71.6 71.6 62.3 62.3 NA NA Perhaps most reliable data
SEARO D 1981-86
Tamil Nadu, India
Symptom-based (Questionnaire, 24,950 residents aged 30 and over)
Ray et al., 1995
F per 1000
25.5 NA 19.1 19.1 23.5 23.5 44.2 44.2 28.9 28.9 10.7 10.7 NA NA 80-90% of cases were smokers.
SEARO D 1981-86
Tamil Nadu, India
Symptom-based (Questionnaire, 24,950 residents aged 30 and over)
Ray et al., 1995
both per 1000
33.0 NA 19.8 19.8 28.4 28.4 51.8 51.8 49.6 49.6 34.5 34.5 NA NA
SEARO D 199? urban
Kashmir, India
Symptom-based (Questionnaire, 1140 sample aged 35 and over)
Akhtar and Latif, 1999
M % 6.7 NA NA 2.8 5.2 5.2 6.9 6.9 9.9 9.9 17.3 NA NA NA
SEARO D 199? urban Kashmir, India
Symptom-based (Questionnaire, 1140 sample aged 35 and over)
Akhtar and Latif, 1999
F % 4.5 NA NA 2.2 2.8 2.8 6.9 6.9 7.6 7.6 9.9 NA NA NA
SEARO D 199? urban Kashmir, India
Symptom-based (Questionnaire, 1140 sample aged 35 and over)
Akhtar and Latif, 1999
both % 5.7 NA NA 2.5 3.8 3.8 6.9 6.9 9.7 9.7 14.1 NA NA NA
SEARO D 199? urban Kashmir, India
Spirometry for suspected 35 COPD patients
Akhtar and Latif, 1999
both Normal
mild moderate
severe
8.5 46.0 34 11
SEARO D 1990 Chnadigrah, India
Symptom-based (Questionnaire in a follow-up
Jindal, 1992 M % 5.0 NA NA NA NA NA NA NA NA NA NA NA NA NA

16
study of 1475 subjects (originally 4381) aged 15-70)
SEARO D 1990 Chnadigrah, India
Symptom-based (Questionnaire in a follow-up study of 1475 subjects (originally 4381) aged 15-70)
Jindal, 1992 F % 2.8 NA NA NA NA NA NA NA NA NA NA NA NA NA
SEARO D Multi
ple India Symptom-based
(Compilation of prevalence studies from 1970s)
Jindal et al, 2000
M % 5.0 NA NA NA NA NA NA NA NA NA NA NA NA NA
SEARO D Multiple
India Each prevalence study varied in terms of definitions, design and sample size.
Jindal et al, 2000
F % 2.7 NA NA NA NA NA NA NA NA NA NA NA NA NA
SEARO D 1975 Delhi (rural
and urban), India
Symptom-based (Questionnaire survey of 629 males and 511 females aged 30-70)
Bhattacharya et al., 1977
M % 6.7 NA NA NA NA NA NA NA NA NA NA NA NA NA
SEARO D 1975 Delhi (rural and urban), India
Symptom-based (Questionnaire survey of 629 males and 511 females aged 30-70)
Bhattacharya et al., 1977
F % 4.5 NA NA NA NA NA NA NA NA NA NA NA NA NA
SEARO D 1977 Madras,
India Symptom-based (Questionnaire survey of 408 males and 409 females aged 5-60)
Thiruvengadam et al., 1977
M % 1.9 NA NA NA NA NA NA NA NA NA NA NA NA NA
SEARO D 1977 Madras, India
Symptom-based (Questionnaire survey of 408 males and 409 females aged 5-60)
Thiruvengadam et al., 1977
F % 1.2 NA NA NA NA NA NA NA NA NA NA NA NA NA
SEARO D 1977 Rural
Punjab, India
Symptom-based (Questionnaire survey of 3894 males and 3238 females aged 16-73)
Charan, 1977
M % 2.3 NA NA NA NA NA NA NA NA NA NA NA NA NA
SEARO D 1977 Rural Punjab, India
Symptom-based (Questionnaire survey of 3894 males and 3238 females aged 16-73)
Charan, 1977
F % 1.6 NA NA NA NA NA NA NA NA NA NA NA NA NA
SEARO D 1977 North India
(rural and urban)
Symptom-based (Questionnaire survey of 1087 males and 1011
Radha et al., 1977
M % 8.1 NA NA NA NA NA NA NA NA NA NA NA NA NA

17
females aged 3-60)
SEARO D 1977 North India (rural and urban)
Symptom-based (Questionnaire survey of 1087 males and 1011 females aged 3-60)
Radha et al., 1977
F % 4.6 NA NA NA NA NA NA NA NA NA NA NA NA NA
SEARO D 1986 North India
(rural and urban)
Symptom-based (Quest ionnaire survey of 2121 males and 2251 females aged 15-65)
Malik, 1986 M % 9.4 (4.9 in
rural)
NA NA NA NA NA NA NA NA NA NA NA NA NA
SEARO D 1986 North India (rural and urban)
Symptom-based (Questionnaire survey of 2121 males and 2251 females aged 15-65)
Malik, 1986 F % 3.7 (1.6 in
rural)
NA NA NA NA NA NA NA NA NA NA NA NA NA
SEARO D North India
(industrial region)
Symptom-based (Questionnaire survey of 473 aged 17-64, followed by spirometry)
Joshi et al., 1975
both % 16.8 16.8 11.9 11.9 15.4 15.4 11.1 11.1 Chronic bronchitis only
SEARO D 1979 Rural
Nepal Symptom-based (MRC Questionnaire + follow-up spirometry for confirmation Dx. 2826 subjects and 383 were followed-up with spirometry)
Pandey, 1984
M % 17.6 2.2 14.2 14.2 19.1 19.1 29 29 41.1 41.1 39.1 39.1 39.1 39.1 Chronic bronchitis only but includes asthma
SEARO D 1979 Rural Nepal
Symptom-based (MRC Questionnaire + follow-up spirometry for confirmation Dx. 2826 subjects and 383 were followed-up with spirometry)
Pandey, 1984
F % 18.9 4.8 14.2 14.2 21.1 21.1 34.4 34.4 41.2 41.2 33.9 33.9 33.9 33.9 Chronic bronchitis only but includes asthma
SEARO D 1979 Rural Nepal
Symptom-based (MRC Questionnaire + follow-up spirometry for confirmation Dx. 2826 subjects and 383 were followed-up with spirometry)
Pandey, 1984
both % 3.1 NA NA NA NA NA NA NA NA NA NA NA NA NA Emphysema only
SEARO D 1979 Rural Nepal
Symptom-based (MRC Questionnaire + follow-up spirometry for confirmation Dx. 2826 subjects and 383 were followed-up with
Pandey, 1984
both % 1.5 NA NA NA NA NA NA NA NA NA NA NA NA NA Cor pulmonale only

18
spirometry)
Summary crude prevalence by definition: Spirometry = NA%, Physician-diagnosis = NA, Symptom-based = 2-7%
EMRO B
Region Year Country Definition Source sex unit Total A2529
A3034
A3539
A4044
A4549
A5054
A5559
A6064
A6569
A7074
A7579
A8084
A8500
Notes
EMRO 1990 Saudi Arabia
Spirometry (Case -control study of COPD patients (27 females and 23 males))
Dossing et al, 1994
M FEV1/FVC=57% (34-69%)
average FEV1 of 0.95 (38>% predicted), with a range of 12-69% predicted; 87% are smokers
hospital-based study and not representative
EMRO 1990 Saudi Arabia
Spirometry (Case -control study of COPD patients (27 females and 23 males))
Dossing et al, 1994
F FEV1/FVC=60% (43-69%)
average FEV1 of 0.6 (32% predicted), with a range of 15-65% predicted; mostly non-smokers (89%)
Strong association between indoor air pollution and COPD among females
EMRO 1998 Iran Symptom-based
(Questionnaire (4636) and spirometry for chronic bronchitis (216) among subjects aged 35 and over)
Golshan et al., 2001
both % 4.7 Chronic bronchitis Chronic bronchitis based on questionnaire
EMRO 1998 Iran Symptom-based (Questionnaire (4636) and spirometry for chronic bronchitis (216) among subjects aged 35 and over)
Golshan et al., 2001
both % 1.7 Confirmed by spirometry FEV1/FVC<65% and thus slightly strict criteria
EMRO B 198? Tunisia Symptom-based
(Questionnaire survey of 5005 subjects aged 20-60)
Maalej et al., 1986
M % 11.7 NA NA NA NA NA NA NA NA NA NA NA NA NA
EMRO B 198? Tunisia Symptom-based (Questionnaire survey of
Maalej et al., 1986
F % 10.4 NA NA NA NA NA NA NA NA NA NA NA NA NA
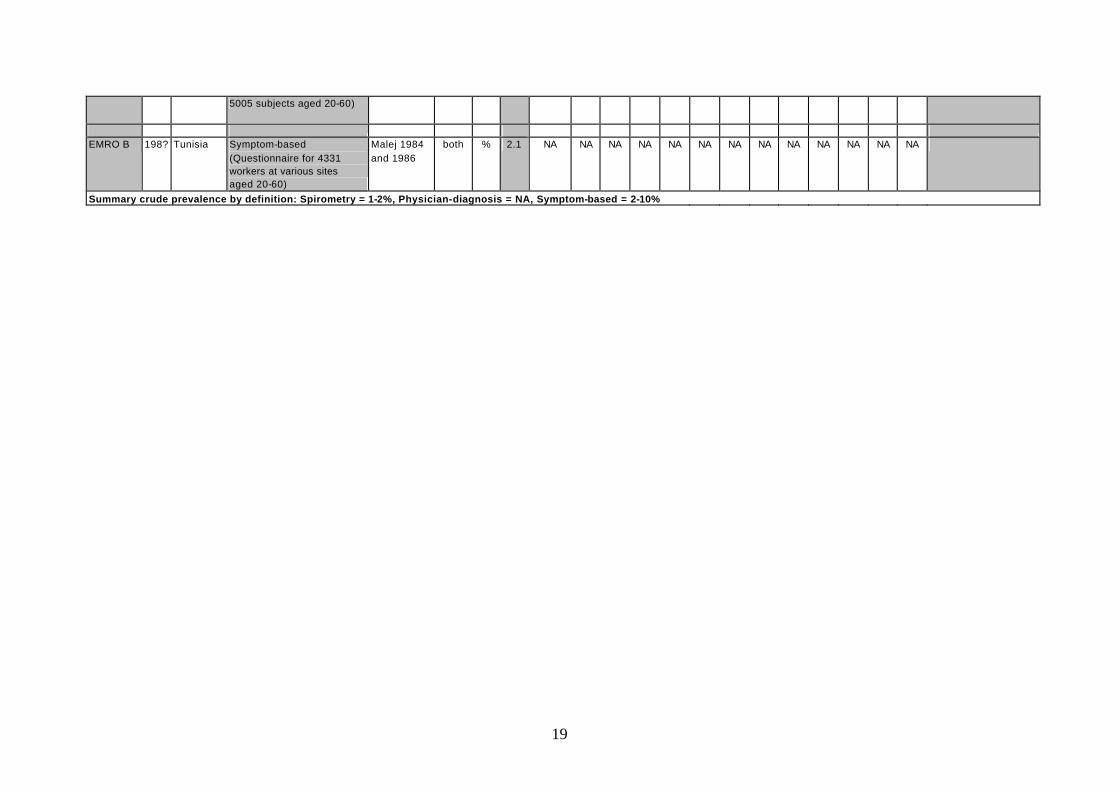
19
5005 subjects aged 20-60)
EMRO B 198? Tunisia Symptom-based
(Questionnaire for 4331 workers at various sites aged 20-60)
Malej 1984 and 1986
both % 2.1 NA NA NA NA NA NA NA NA NA NA NA NA NA
Summary crude prevalence by definition: Spirometry = 1-2%, Physician-diagnosis = NA, Symptom-based = 2-10%

20
Appendix 2. DISMOD outputs of consistent estimates of incidence and prevalence by WHO region
AFRO D Incidence Prevalence Average Average age Population Prevalence Validity Check
per 1000 per 1000 duration (yrs) at onset ('000) Aged 30 and over
Male
0-4 0 0 0 2.46 27,658 0
5-14 0 0 31.84 14.25 44,801 0
15-29 0.02 0.02 22.69 29.22 46,186 924
30-44 0.31 2.33 19.37 36.49 26,290 61,257
45-59 1.2 12.96 13.52 49.01 13,663 177,073
60-69 4.13 27.34 6.93 64.61 4,895 133,833
70-79 4.94 47.02 4.42 72.82 2,163 101,722
80+ 9 33.18 1.85 84.24 497 16,506
Total 0.37 2.96 9.80 58.99 166,154 491,313 1.0%
Female
0-4 0 0 0 2.44 27,157 0
5-14 0 0 24.31 14.25 44,261 0
15-29 0.01 0.01 17.03 29.17 46,089 461
30-44 0.15 0.92 14.85 37.39 26,792 24,649
45-59 0.7 6.34 10.86 49.27 14,548 92,231 60-69 2.08 12.35 5.03 63.61 5,589 69,025
70-79 3.4 12.41 2.35 74.37 2,630 32,642
80+ 8.76 13.2 1.16 84.39 668 8,813
Total 0.24 1.36 6.44 62.40 167,734 227,821 0.5%
AFOR E Incidence Prevalence Average Average age Population Prevalence Validity Check
per 1000 per 1000 duration (yrs) at onset ('000) Aged 30 and over
Male
0-4 0.00 0.00 0.00 2.46 28,798 0
5-14 0.02 0.01 22.24 14.25 46,760 566
15-29 0.08 0.98 19.97 17.24 46,561 45,653
30-44 0.11 0.93 10.06 42.89 25,954 24,013
45-59 1.09 7.27 8.76 50.56 12,913 93,849
60-69 4.14 24.14 5.49 63.28 4,393 106,043
70-79 5.69 26.40 2.80 74.28 1,936 51,114
80+ 12.73 28.76 1.55 83.94 417 12,004
Total 0.33 1.99 6.87 59.31 167,733 333,241 0.6%
Female
0-4 0.00 0.00 0.00 3.57 28,397 0
5-14 0.00 0.00 16.65 14.25 46,568 56
15-29 0.01 0.06 12.03 21.69 46,559 2,565
30-44 0.06 0.28 8.03 36.93 26,116 7,404
45-59 0.50 2.77 7.43 50.43 13,766 38,145 60-69 1.98 9.40 4.35 62.82 5,174 48,629
70-79 4.06 9.71 1.88 74.06 2,533 24,604
80+ 8.30 9.27 0.89 84.36 700 6,492
Total 0.21 0.75 3.91 65.66 169,814 127,894 0.3%

21
AMRO A Incidence Prevalence Average Average age Population Prevalence Validity Check
per 1000 per 1000 duration (yrs) at onset ('000) Aged 30 and over
Male
0-4 0 0 0 1.46 10,688 0
5-14 0 0 55.25 14.25 22,924 0
15-29 0.05 0.04 41.18 29.11 31,637 1,265
30-44 0.5 7.95 38.76 31.75 36,946 293,720
45-59 3.15 38.45 24.48 48.05 28,413 1,092,461
60-69 3.64 67.62 13.51 62.55 10,793 729,817
70-79 5.64 96 8.4 72.09 7,819 750,636
80+ 4.97 84.73 4.39 82.86 3,371 285,609
Total 1.37 20.67 18.82 57.02 152,590 3,153,509 3.6%
Female
0-4 0 0 71 3.54 10,181 0
5-14 0 0 61.73 12.96 21,877 0
15-29 0.05 0.13 47.64 27.39 30,557 3,972
30-44 0.43 3.55 36.88 38.73 36,300 128,863
45-59 2.5 20.52 23.59 53.62 29,070 596,515 60-69 3.41 60.66 15.34 64.52 11,948 724,738
70-79 1.9 73.99 9.43 74.68 10,292 761,491
80+ 2.21 64.91 5.27 84.95 6,690 434,227
Total 1.05 16.89 19.71 59.97 156,914 2,649,806 2.8%
AMRO B Incidence Prevalence Average Average age Population Prevalence Validity Check
per 1000 per 1000 duration (yrs) at onset ('000) Aged 30 and over
Male
0-4 0.00 0.00 0.00 4.25 23,215 0
5-14 0.00 0.00 50.10 14.25 45,921 138
15-29 0.04 0.13 38.56 27.43 62,171 8,169
30-44 0.44 5.58 34.99 31.76 45,580 254,472
45-59 2.96 31.17 22.26 48.52 26,106 813,768
60-69 6.39 79.09 13.20 62.18 9,457 747,966
70-79 6.81 114.04 8.20 72.31 5,057 576,722
80+ 9.93 129.77 4.73 82.04 1,579 204,953
Total 0.96 11.90 17.46 56.99 219,085 2,606,188 3.0%
Female
0-4 0.00 0.00 0.00 3.87 22,317 0
5-14 0.00 0.00 57.77 13.75 44,303 13
15-29 0.15 0.20 43.69 28.68 61,660 12,443
30-44 1.15 12.33 37.72 35.24 47,282 583,128
45-59 1.81 33.44 25.53 49.35 27,931 933,890 60-69 2.70 53.29 14.79 64.00 10,867 579,089
70-79 3.36 71.71 9.25 73.92 6,505 466,493
80+ 3.67 77.14 5.49 82.94 2,463 189,989
Total 0.78 12.38 25.44 51.10 223,328 2,765,046 2.9%

22
AMRO D Incidence Prevalence Average Average age Population Prevalence Validity Check
per 1000 per 1000 duration (yrs) at onset ('000) Aged 30 and over
Male
0-4 0.00 0.00 0.00 2.45 4,780 0
5-14 0.00 0.00 46.14 14.25 8,763 0
15-29 0.04 0.03 33.57 29.18 10,305 315
30-44 0.33 3.83 30.55 32.93 6,166 23,602
45-59 0.29 6.72 17.68 49.80 3,399 22,839
60-69 1.58 12.86 8.64 65.33 1,289 16,576
70-79 2.39 26.58 5.56 73.17 640 17,019
80+ 10.96 50.77 3.23 83.23 181 9,166
Total 0.25 2.52 13.92 60.09 35,523 89,517 0.8%
Female
0-4 0.00 0.00 0.00 2.15 4,601 0
5-14 0.00 0.01 47.27 13.05 8,483 49
15-29 0.06 0.14 34.18 28.10 10,206 1,380
30-44 0.14 2.16 28.75 34.80 6,465 13,979
45-59 0.21 4.32 17.15 49.68 3,616 15,609 60-69 0.47 6.67 8.75 63.04 1,415 9,438
70-79 1.20 7.27 3.80 76.23 759 5,519
80+ 6.35 20.69 2.34 84.12 251 5,193
Total 0.15 1.43 13.48 60.82 35,795 51,166 0.4%
EMRO B Incidence Prevalence Average Average age Population Prevalence Validity Check
per 1000 per 1000 duration (yrs) at onset ('000) Aged 30 and over
Male
0-4 0.00 0.00 0.00 2.47 8,392 0
5-14 0.00 0.01 55.27 12.65 18,052 135
15-29 0.04 0.13 40.82 27.73 20,945 2,635
30-44 0.37 4.09 33.95 35.07 13,483 55,202
45-59 2.43 20.85 19.12 51.71 7,263 151,404
60-69 3.42 56.54 10.06 64.31 2,520 142,475
70-79 4.44 73.02 4.61 76.42 1,285 93,827
80+ 7.30 104.87 2.99 82.97 333 34,886
Total 0.56 6.65 16.54 57.12 72,274 480,564 1.9%
Female
0-4 0.00 0.00 56.89 3.99 8,029 0
5-14 0.00 0.00 49.05 12.45 17,264 79
15-29 0.04 0.16 36.48 26.28 20,059 3,217
30-44 0.34 2.63 25.94 38.66 11,846 31,177
45-59 0.93 10.83 15.05 52.41 6,042 65,412 60-69 1.06 19.98 7.67 64.49 2,340 46,753
70-79 0.91 17.80 3.84 74.08 1,297 23,092
80+ 0.61 6.40 1.64 83.73 380 2,429
Total 0.21 2.56 17.02 51.31 67,258 172,159 0.8%

23
EMRO D Incidence Prevalence Average Average age Population Prevalence Validity Check
per 1000 per 1000 duration (yrs) at onset ('000) Aged 30 and over
Male
0-4 0.00 0.00 0.00 2.48 9,465 0
5-14 0.00 0.00 48.75 13.00 16,952 32
15-29 0.11 0.27 35.45 27.48 20,092 5,523
30-44 0.28 4.49 29.92 33.78 13,009 58,439
45-59 0.97 10.99 15.04 51.90 6,663 73,243
60-69 0.67 17.74 6.91 65.61 2,273 40,321
70-79 1.20 15.56 3.64 75.11 1,078 16,771
80+ 2.67 12.28 1.76 84.56 268 3,286
Total 0.23 2.83 19.03 48.97 69,799 197,616 0.8%
Female
0-4 0.00 0.00 56.10 3.99 9,052 0
5-14 0.00 0.00 48.02 12.71 16,261 59
15-29 0.08 0.24 35.15 26.86 18,986 4,462
30-44 0.17 2.85 29.13 33.82 12,502 35,637
45-59 0.50 6.20 14.33 51.94 7,052 43,738 60-69 0.63 8.42 5.83 66.27 2,676 22,523
70-79 0.80 6.56 3.10 74.70 1,361 8,932
80+ 2.05 5.06 1.33 85.27 359 1,817
Total 0.15 1.72 16.71 51.86 68,249 117,167 0.5%
EURO A Incidence Prevalence Average Average age Population Prevalence Validity Check
per 1000 per 1000 duration (yrs) at onset ('000) Aged 30 and over
Male
0-4 0.00 0.00 0.00 3.87 11,061 0
5-14 0.02 0.03 55.26 13.75 24,478 742
15-29 0.12 1.28 47.59 21.69 41,047 52,676
30-44 0.42 4.42 31.75 39.04 47,868 211,744
45-59 1.65 22.69 22.59 50.00 39,026 885,399
60-69 3.52 44.95 12.23 64.56 19,811 890,531
70-79 6.67 80.14 7.51 73.98 13,049 1,045,708
80+ 7.35 100.89 4.28 83.13 4,714 475,590
Total 1.40 17.72 14.25 63.76 201,054 3,562,390 2.8%
Female
0-4 0.00 0.00 0.00 3.99 10,475 0
5-14 0.00 0.00 65.02 12.84 23,198 32
15-29 0.16 0.27 49.80 28.32 39,092 10,621
30-44 0.89 11.30 43.82 34.50 46,739 528,142
45-59 1.12 23.00 27.16 52.34 39,273 903,465 60-69 1.42 38.50 17.32 64.09 21,947 845,005
70-79 1.81 43.98 8.44 77.81 18,563 816,420
80+ 3.52 68.72 6.17 82.98 10,512 722,417
Total 0.92 18.24 22.60 59.92 209,798 3,826,102 2.8%

24
EURO B1 Incidence Prevalence Average Average age Population Prevalence Validity Check
per 1000 per 1000 duration (yrs) at onset ('000) Aged 30 and over
Male
0-4 0.00 0.00 0.00 2.50 6,171 0
5-14 0.00 0.00 41.68 14.25 13,295 32
15-29 0.04 0.11 28.85 28.04 22,235 2,452
30-44 0.45 6.02 25.65 31.76 17,863 107,544
45-59 0.43 7.91 13.22 50.41 12,885 101,862
60-69 2.71 21.46 8.45 62.48 5,840 125,310
70-79 4.33 33.72 5.53 72.28 3,256 109,775
80+ 7.11 38.49 2.89 83.34 728 28,037
Total 0.60 5.77 10.75 60.46 82,272 475,012 1.3%
Female
0-4 0.00 0.00 0.00 0.00 5,913 0
5-14 0.00 0.00 53.94 14.06 12,713 0
15-29 0.07 0.05 40.27 29.19 21,261 1,137
30-44 0.50 6.19 36.15 34.03 17,492 108,224
45-59 0.64 13.78 24.66 47.85 13,304 183,369 60-69 1.09 18.64 11.84 65.35 6,873 128,116
70-79 1.12 26.96 8.22 71.46 4,733 127,627
80+ 1.23 15.23 2.22 87.21 1,451 22,089
Total 0.40 6.81 21.61 53.27 83,739 570,562 1.2%
EURO B2 Incidence Prevalence Average Average age Population Prevalence Validity Check
per 1000 per 1000 duration (yrs) at onset ('000) Aged 30 and over
Male
0-4 0.00 0.00 0.00 3.99 2,983 0
5-14 0.01 0.02 48.01 12.63 6,170 125
15-29 0.16 0.39 33.95 27.94 6,986 2,735
30-44 1.10 13.26 28.64 34.29 5,088 67,464
45-59 0.33 17.30 13.57 55.78 2,221 38,427
60-69 3.27 32.43 9.60 63.98 1,107 35,899
70-79 3.41 42.81 5.85 75.38 507 21,714
80+ 5.35 60.24 3.74 84.92 109 6,553
Total 0.53 6.87 19.17 50.37 25,171 172,917 1.9%
Female
0-4 0.00 0.00 62.18 4.50 2,879 0
5-14 0.01 0.03 54.58 12.50 5,970 175
15-29 0.13 0.41 40.73 27.61 6,837 2,784
30-44 0.74 8.91 34.09 35.36 5,306 47,271
45-59 1.48 24.32 24.22 47.34 2,375 57,763 60-69 1.58 30.99 11.54 65.25 1,312 40,673
70-79 1.87 43.83 8.34 71.39 784 34,372
80+ 1.11 23.68 2.24 90.03 282 6,672
Total 0.48 7.37 24.15 48.87 25,747 189,710 1.9%
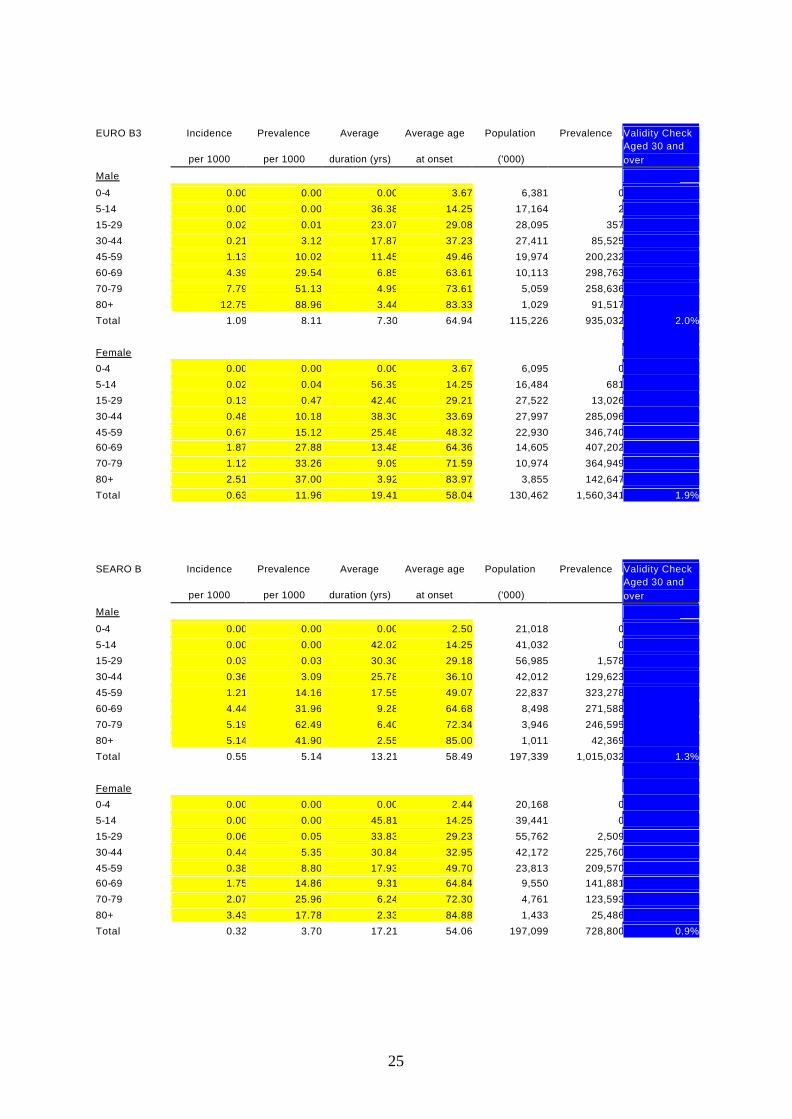
25
EURO B3 Incidence Prevalence Average Average age Population Prevalence Validity Check
per 1000 per 1000 duration (yrs) at onset ('000) Aged 30 and over
Male
0-4 0.00 0.00 0.00 3.67 6,381 0
5-14 0.00 0.00 36.38 14.25 17,164 2
15-29 0.02 0.01 23.07 29.08 28,095 357
30-44 0.21 3.12 17.87 37.23 27,411 85,525
45-59 1.13 10.02 11.45 49.46 19,974 200,232
60-69 4.39 29.54 6.85 63.61 10,113 298,763
70-79 7.79 51.13 4.99 73.61 5,059 258,636
80+ 12.75 88.96 3.44 83.33 1,029 91,517
Total 1.09 8.11 7.30 64.94 115,226 935,032 2.0%
Female
0-4 0.00 0.00 0.00 3.67 6,095 0
5-14 0.02 0.04 56.39 14.25 16,484 681
15-29 0.13 0.47 42.40 29.21 27,522 13,026
30-44 0.48 10.18 38.30 33.69 27,997 285,096
45-59 0.67 15.12 25.48 48.32 22,930 346,740 60-69 1.87 27.88 13.48 64.36 14,605 407,202
70-79 1.12 33.26 9.09 71.59 10,974 364,949
80+ 2.51 37.00 3.92 83.97 3,855 142,647
Total 0.63 11.96 19.41 58.04 130,462 1,560,341 1.9%
SEARO B Incidence Prevalence Average Average age Population Prevalence Validity Check
per 1000 per 1000 duration (yrs) at onset ('000) Aged 30 and over
Male
0-4 0.00 0.00 0.00 2.50 21,018 0
5-14 0.00 0.00 42.02 14.25 41,032 0
15-29 0.03 0.03 30.30 29.18 56,985 1,578
30-44 0.36 3.09 25.78 36.10 42,012 129,623
45-59 1.21 14.16 17.55 49.07 22,837 323,278
60-69 4.44 31.96 9.28 64.68 8,498 271,588
70-79 5.19 62.49 6.40 72.34 3,946 246,595
80+ 5.14 41.90 2.55 85.00 1,011 42,369
Total 0.55 5.14 13.21 58.49 197,339 1,015,032 1.3%
Female
0-4 0.00 0.00 0.00 2.44 20,168 0
5-14 0.00 0.00 45.81 14.25 39,441 0
15-29 0.06 0.05 33.83 29.23 55,762 2,509
30-44 0.44 5.35 30.84 32.95 42,172 225,760
45-59 0.38 8.80 17.93 49.70 23,813 209,570 60-69 1.75 14.86 9.31 64.84 9,550 141,881
70-79 2.07 25.96 6.24 72.30 4,761 123,593
80+ 3.43 17.78 2.33 84.88 1,433 25,486
Total 0.32 3.70 17.21 54.06 197,099 728,800 0.9%

26
SEARO D Incidence Prevalence Average Average age Population Prevalence Validity Check
per 1000 per 1000 duration (yrs) at onset ('000) Aged 30 and over
Male
0-4 0.00 0.00 0.00 2.43 83,439 0
5-14 0.00 0.00 38.28 14.25 158,454 0
15-29 0.06 0.05 25.81 29.22 193,336 8,951
30-44 0.45 5.55 23.55 32.34 136,548 757,662
45-59 0.27 6.21 10.15 53.70 77,761 483,014
60-69 2.26 14.71 5.92 63.32 28,680 421,746
70-79 3.14 16.16 3.08 74.26 13,415 216,734
80+ 5.89 15.55 1.69 84.31 3,433 53,379
Total 0.32 2.79 11.36 55.98 695,066 1,941,487 0.7%
Female
0-4 0.00 0.00 0.00 2.43 78,716 0
5-14 0.00 0.00 36.48 14.25 148,561 0
15-29 0.04 0.03 26.51 29.17 178,171 6,093
30-44 0.35 3.87 23.41 33.66 125,344 484,794
45-59 0.45 7.65 13.21 48.47 73,855 565,079 60-69 1.11 8.35 5.03 64.82 29,706 248,158
70-79 3.17 11.44 2.63 74.29 14,788 169,172
80+ 6.75 12.17 1.33 84.49 4,153 50,557
Total 0.29 2.33 10.35 58.69 653,295 1,523,853 0.6%
WPRO A Incidence Prevalence Average Average age Population Prevalence Validity Check
per 1000 per 1000 duration (yrs) at onset ('000) Aged 30 and over
Male
0-4 0 0 0 2.52 3,993 0
5-14 0.03 0.07 62.85 12.65 8,074 565
15-29 0.09 0.71 50.02 25.87 15,691 11,141
30-44 0.44 5.64 40.99 35.31 15,046 84,858
45-59 1.03 14.28 24.36 53.6 16,123 230,237
60-69 3.36 41.05 15.98 64.16 7,895 324,083
70-79 4.03 63.7 8.47 76.38 4,829 307,584
80+ 6.23 113.31 5.77 82.77 1,725 195,455
Total 1.11 15.73 17.31 64.22 73,376 1,153,922 2.5%
Female
0-4 0 0 0 3.87 3,786 0
5-14 0 0 68.26 13.75 7,684 0
15-29 0.12 0.25 54.1 28.13 15,047 3,762
30-44 0.66 7.62 47.02 35.38 14,820 112,931
45-59 0.81 20.04 33.85 49.23 16,241 325,474 60-69 0.92 27.44 19.95 65.01 8,555 234,745
70-79 2.14 41.47 13.01 74.13 6,404 265,566
80+ 2.3 58.84 7.79 82.96 3,548 208,772
Total 0.72 15.13 25.73 59.64 76,086 1,151,250 2.3%
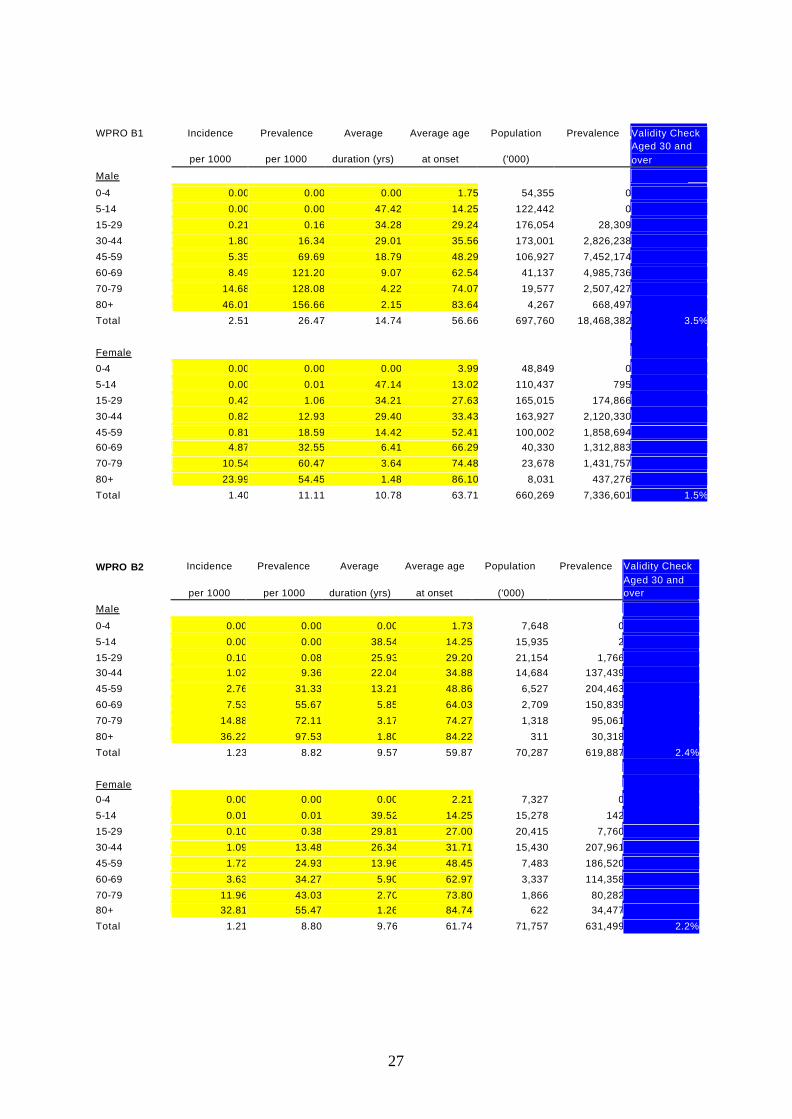
27
WPRO B1 Incidence Prevalence Average Average age Population Prevalence Validity Check
per 1000 per 1000 duration (yrs) at onset ('000) Aged 30 and over
Male
0-4 0.00 0.00 0.00 1.75 54,355 0
5-14 0.00 0.00 47.42 14.25 122,442 0
15-29 0.21 0.16 34.28 29.24 176,054 28,309
30-44 1.80 16.34 29.01 35.56 173,001 2,826,238
45-59 5.35 69.69 18.79 48.29 106,927 7,452,174
60-69 8.49 121.20 9.07 62.54 41,137 4,985,736
70-79 14.68 128.08 4.22 74.07 19,577 2,507,427
80+ 46.01 156.66 2.15 83.64 4,267 668,497
Total 2.51 26.47 14.74 56.66 697,760 18,468,382 3.5%
Female
0-4 0.00 0.00 0.00 3.99 48,849 0
5-14 0.00 0.01 47.14 13.02 110,437 795
15-29 0.42 1.06 34.21 27.63 165,015 174,866
30-44 0.82 12.93 29.40 33.43 163,927 2,120,330
45-59 0.81 18.59 14.42 52.41 100,002 1,858,694 60-69 4.87 32.55 6.41 66.29 40,330 1,312,883
70-79 10.54 60.47 3.64 74.48 23,678 1,431,757
80+ 23.99 54.45 1.48 86.10 8,031 437,276
Total 1.40 11.11 10.78 63.71 660,269 7,336,601 1.5%
WPRO B2 Incidence Prevalence Average Average age Population Prevalence Validity Check
per 1000 per 1000 duration (yrs) at onset ('000) Aged 30 and over
Male
0-4 0.00 0.00 0.00 1.73 7,648 0
5-14 0.00 0.00 38.54 14.25 15,935 2
15-29 0.10 0.08 25.93 29.20 21,154 1,766 30-44 1.02 9.36 22.04 34.88 14,684 137,439
45-59 2.76 31.33 13.21 48.86 6,527 204,463
60-69 7.53 55.67 5.85 64.03 2,709 150,839
70-79 14.88 72.11 3.17 74.27 1,318 95,061
80+ 36.22 97.53 1.80 84.22 311 30,318
Total 1.23 8.82 9.57 59.87 70,287 619,887 2.4%
Female 0-4 0.00 0.00 0.00 2.21 7,327 0
5-14 0.01 0.01 39.52 14.25 15,278 142
15-29 0.10 0.38 29.81 27.00 20,415 7,760
30-44 1.09 13.48 26.34 31.71 15,430 207,961
45-59 1.72 24.93 13.96 48.45 7,483 186,520
60-69 3.63 34.27 5.90 62.97 3,337 114,358
70-79 11.96 43.03 2.70 73.80 1,866 80,282 80+ 32.81 55.47 1.26 84.74 622 34,477
Total 1.21 8.80 9.76 61.74 71,757 631,499 2.2%

28
WPRO B3 Incidence Prevalence Average Average age Population Prevalence Validity Check
per 1000 per 1000 duration (yrs) at onset ('000) Aged 30 and over
Male
0-4 0.00 0.00 0.00 2.48 486 0
5-14 0.00 0.00 36.71 14.25 857 1
15-29 0.03 0.06 25.66 28.46 1,010 60 30-44 0.43 4.76 23.30 31.75 656 3,125
45-59 1.63 17.14 12.53 48.30 344 5,897
60-69 3.13 26.76 5.73 62.33 117 3,132
70-79 6.01 28.75 3.13 73.03 50 1,441
80+ 8.42 24.60 1.73 83.39 9 230
Total 0.46 3.93 10.86 54.50 3,531 13,886 1.2%
Female 0-4 0.00 0.00 0.00 2.48 457 0
5-14 0.00 0.00 35.60 12.99 812 1
15-29 0.08 0.21 24.05 27.47 947 194
30-44 0.21 3.02 19.94 33.51 586 1,770
45-59 0.27 3.92 8.22 52.41 341 1,335
60-69 1.00 4.59 3.38 65.88 123 563
70-79 2.24 6.19 1.90 74.62 58 360 80+ 3.76 5.46 1.04 84.33 12 64
Total 0.18 1.29 9.82 55.28 3,336 4,288 0.4%
Related Documents