CHRONIC LOW BACK PAIN, PHYSICAL ACTIVITY AND THE ROLE OF SHARED FAMILIAL FACTORS Joshua Robert Zadro, BAppSc(Phty)(Hons) A thesis submitted in fulfilment of the requirements for the degree of Doctor of Philosophy Faculty of Health Sciences The University of Sydney 2018

Welcome message from author
This document is posted to help you gain knowledge. Please leave a comment to let me know what you think about it! Share it to your friends and learn new things together.
Transcript
CHRONIC LOW BACK PAIN, PHYSICAL ACTIVITY AND THE ROLE OF SHARED FAMILIAL FACTORS
Joshua Robert Zadro, BAppSc(Phty)(Hons)
A thesis submitted in fulfilment of the requirements for the degree of
Doctor of Philosophy
Faculty of Health Sciences
The University of Sydney
2018
ii
TABLE OF CONTENTS
Acknowledgements …...... ......................................................................................... vii
Publications and Presentations ........ ……………………………………………….viii
Preface ….... ............................................................................................................... xii
Abstract …...... ........................................................................................................... xv
Thesis Overview ….................................................................................................. xvii
Chapter One: Introduction …………………………………………….......………1
1.1 Epidemiology of non-specific low back pain ………..……...……......…………..2
1.1.1 Introduction to non-specific low back pain ……………………...………...2
1.1.2 Burden and cost of low back pain …………………………………………3
1.1.3 Prevalence, incidence, and course of low back pain ...……………….……4
1.1.4 Chronic low back pain and older people ………….....……………….……6
1.2 Prevention and intervention strategies for low back pain …………………..…...7
1.2.1 Prevention ……………………………..….…………………….……….…7
1.2.2 Intervention ...………………………...…..……………………………......8
1.2.3 Research priorities for low back pain …………...…………………...….....9
1.3 Understanding risk factors and factors associated with low back pain and chronic
low back pain …..…………………………………………………………….......9
1.3.1 Physical activity ......................................................................................... 10
1.3.2 The built environment ……. ...................................................................... 12
1.3.3 Educational attainment ……. ..................................................................... 13
1.3.4 Heritability and shared familial factors ..................................................... 15
1.3.5 Twin study design to control for shared familial factors ........................... 17
1.4 Factors influencing the recovery and response to treatment for chronic low back
pain ...…………………………………………………………………………...18
1.4.1 Environmental influences on recovery ...................................................... 18
1.4.2 Shared familial factors and recovery ......................................................... 19
1.4.3 Environmental influences on the response to treatment ............................ 19
1.4.4 Shared familial factors and the response to increased physical activity .... 20
1.5 Physical activity interventions targeting pain self-efficacy for older people with
chronic low back pain ......................................................................................... 21
1.5.1 Importance of assessing pain self-efficacy ................................................ 21
1.5.2 Physical activity interventions for older people ........................................ 22
iii
1.5.3 Video-game exercises targeting pain self-efficacy .....................................24
1.6 Aims of thesis ..................................................................................................... 24
1.7 References ........................................................................................................... 26
Chapter Two: Are people with chronic low back pain meeting the physical
activity guidelines? A co-twin control study .......................................................... 49
Abstract .............................................................................................................. 50
Introduction ......................................................................................................... 51
Methods ............................................................................................................... 51
Results ................................................................................................................. 54
Discussion .......................................................................................................... 56
Conclusion ......................................................................................................... 58
References ........................................................................................................... 58
Chapter Three: Neighborhood walkability moderates the association between
low back pain and physical activity: a co-twin control study ............................. 60
Abstract .............................................................................................................. 61
Introduction ......................................................................................................... 61
Methods ............................................................................................................... 62
Results ................................................................................................................. 63
Discussion .......................................................................................................... 64
Conclusion ......................................................................................................... 66
References ........................................................................................................... 66
Supplementary material: Assessment of confounding variables . ....................... 68
Supplementary material: Association between educational attainment and Walk
Score® ............................................................................................................... 69
Chapter Four: Does educational attainment increase the risk of low back pain
when genetics is considered? A population-based study of Spanish twins ......... 70
Abstract .............................................................................................................. 71
Introduction ......................................................................................................... 72
Methods ............................................................................................................... 72
Results ................................................................................................................. 76
Discussion .......................................................................................................... 79

iv
Conclusion .......................................................................................................... 81
References .......................................................................................................... 81
Supplementary material: Sample size estimation ............................................... 84
Supplementary material: Identification of confounding variables ..................... 87
Supplementary material: Sample characteristics for discordant twin pairs in the
prevalence analysis ............................................................................................. 91
Supplementary material: Sample characteristics for discordant twin pairs in the
longitudinal analysis ........................................................................................... 93
Supplementary material: Association between educational attainment and work-
related physical activity ...................................................................................... 95
Chapter Five: Does familial aggregation of chronic low back pain impact on
recovery? A population-based twin study ............................................................ 96
Abstract .............................................................................................................. 97
Introduction ........................................................................................................ 97
Methods .............................................................................................................. 98
Results ................................................................................................................. 99
Discussion ........................................................................................................ 100
Conclusion ....................................................................................................... 102
References ........................................................................................................ 102
Chapter Six: The beneficial effects of physical activity: is it down to your genes?
A systematic review and meta-analysis of twin and family studies ................... 104
Abstract ............................................................................................................ 105
Background ...................................................................................................... 106
Methods ............................................................................................................ 106
Results .............................................................................................................. 108
Discussion ........................................................................................................ 114
Conclusions ...................................................................................................... 121
References ........................................................................................................ 122
Supplementary material: Search strategy ........................................................ 124
Supplementary material: Sensitivity analysis excluding one study at a time ... 132

v
Chapter Seven: Video-game based exercises for older people with chronic low
back pain: a protocol for a feasibility randomised controlled trial (the
GAMEBACK trial) ...…………………………………………………………….133
Abstract ............................................................................................................ 134
Introduction ....................................................................................................... 134
Methods ............................................................................................................. 135
Discussion ........................................................................................................ 139
References ......................................................................................................... 140
Supplementary material: CONSORT flowchart for the GAMEBACK Trial .... 142
Supplementary material: Participant information sheet/consent form ............ 143
Supplementary material: Participant Wii-Fit-U screening tool ...................... 155
Chapter Eight: Video-game based exercises for older people with chronic low
back pain: a pilot randomised controlled trial (GAMEBACK) …....................157
Title page .......................................................................................................... 158
Abstract ............................................................................................................ 159
Introduction ....................................................................................................... 161
Methods ............................................................................................................. 162
Results ............................................................................................................... 169
Discussion..........................................................................................................171
Conclusions ....................................................................................................... 176
References ......................................................................................................... 178
Table 1 .............................................................................................................. 187
Table 2 .............................................................................................................. 188
Table 3 .............................................................................................................. 190
Table 4 .............................................................................................................. 191
Table 5 .............................................................................................................. 192
Figure 1 ............................................................................................................ 194
Appendix A: Experience with the intervention questionnaire .......................... 195
Appendix B: Experience with the intervention results .....................................197
Chapter Nine: Conclusion .................................................................................... 198
9.1 Overview of findings.......................................................................................... 199
vi
9.1.1 Risk factors and factors associated with low back pain and chronic low
back pain ........................................................................................................... 199
9.1.2 Shared familial factors and the recovery from chronic low back pain .... 201
9.1.3 Shared familial factors and the response to physical activity .................. 202
9.1.4 Home-based video-game exercises for older people with chronic low back
pain………………………………………………………………………...........202
9.2 Clinical implications .......................................................................................... 205
9.3 Future directions ................................................................................................ 210
9.4 Concluding remarks ........................................................................................... 216
9.5 References .......................................................................................................... 218
Appendices .............................................................................................................. 221
Appendix 1: Media coverage of Chapter Two publication ..................................... 222
Appendix 2: Media coverage of Chapter Four publication ..................................... 223
Appendix 3: Media coverage of Chapter Six publication ....................................... 224

vii
Acknowledgements
I would like to extend my sincere thanks and appreciation to my supervisors, Dr Debra
Shirley and Dr Paulo Ferreira for their enthusiasm, encouragement and guidance throughout
my PhD. I would also like to thank my friends at the Arthritis and Musculoskeletal Research
Group for their guidance and support, and for sharing plenty of great memories with me.
Lastly, I would like to thank my friends outside the lab and my family for their patience and
support during this time.

viii
Publications and Presentations
Parts of the work presented in this thesis have been published and/or presented in the
following form:
Publications:
Zadro JR, Shirley D, Amorim A, Pérez-Riquelme F, Ordoñana, JR, Ferreira, PH. Are
people with chronic low back pain meeting the physical activity guidelines? A co-twin
control study. The Spine Journal. 2017;17(6):845-854.
Zadro JR, Shirley D, Pinheiro MB, Bauman A, Duncan GE, Ferreira PH. Neighborhood
walkability moderates the association between low back pain and physical activity: a co-twin
control study. Preventive Medicine. 2017;99:257-63.
Zadro JR, Shirley D, Pinheiro MB, Sánchez-Romera JF, Pérez-Riquelme F, Ordoñana JR,
Ferreira PH. Does educational attainment increase the risk of low back pain when genetics is
considered? A population-based study of Spanish twins. The Spine Journal. 2016;17(4):518-
30.
Zadro JR, Shirley D, Sánchez-Romera JF, Ordoñana JR, Ferreira PH. Does familial
aggregation of chronic low back pain impact on recovery? A population-based twin study.
Spine. 2017;42(17):1295-1301.
Zadro JR, Shirley D, Andrade TB, Scurrah KJ, Bauman A, Ferreira PH. The Beneficial
Effects of Physical Activity: Is It Down to Your Genes? A Systematic Review and Meta-
Analysis of Twin and Family Studies. Sports Medicine - Open. 2017;3(1):4.
ix
Zadro JR, Shirley D, Simic M, Mousavi SJ, Ceprnja D, Maka K, Ferreira PH. Video-game
based exercises for older people with chronic low back pain: a protocol for a feasibility
randomised controlled trial (the GAMEBACK trial). Physiotherapy. 2016;103(2):146-53.
Zadro JR, Shirley D, Simic M, Mousavi SJ, Ceprnja D, Maka K, Sung J, Ferreira PH.
Video-game based exercises for older people with chronic low back pain: a pilot randomised
controlled trial (GAMEBACK). Submitted to Physical Therapy (18th October 2017).
x
Oral presentations:
Zadro JR, Shirley D, Ferreira PH, Pinheiro M, Ordoñana JR. Does education impact the risk
of developing low back pain when genetics is considered? A population-based study of
Spanish twins. Australian Physiotherapy Association Conference October 2015.
Shirley D, Zadro JR, Pinheiro MB, Ferreira PH. How twin studies will advance
understanding of aetiology of musculoskeletal disorders and guide selection of optimal
treatment. Australian Physiotherapy Association Conference October 2015.
Zadro JR, Shirley D, Andrade T, Ferreira PH. Are genetics responsible for the beneficial
effects of physical activity? A systematic review and meta-analysis of twin studies.
International Federation of Orthopaedic Manipulative Physical Therapy (IFOMPT)
Conference 2016; Glasgow, Scotland.
Zadro JR, Shirley D, Simic M, Mousavi SJ, Cerpjna D, Maka K, Ferreira PH. Video-game
based exercises for older people with chronic low back pain: A protocol for a pilot
randomized controlled trial (the GAMEBACK Trial). Allied Health Research Symposium.
Westmead Hospital. August 2016.
Zadro JR, Shirley D, Simic M, Mousavi SJ, Cerpjna D, Maka K, Ferreira PH. Video-game
based exercises for older people with chronic low back pain: A pilot randomized controlled
trial (the GAMEBACK Trial). XV International Back and Neck Pain Forum 2017; Oslo,
Norway.
xi
Poster presentations:
Zadro JR, Shirley D, Simic M, Mousavi SJ, Cerpjna D, Maka K, Ferreira PH. Video-game
based exercises for older people with chronic low back pain: A protocol for a pilot
randomized controlled trial (the GAMEBACK Trial). XIV International Back and Neck Pain
Forum 2016; Buxton, Derbyshire, UK.
Zadro JR, Shirley D, Andrade T, Ferreira PH. The beneficial effects of physical activity: Is
it down to your genes? A systematic review and meta-analysis of twin studies. XIV
International Back and Neck Pain Forum 2016; Buxton, Derbyshire, UK.
Zadro JR, Shirley D, Sanchez-Romera JF, Ordonana JF, Ferreira PH. Does a family history
of low back pain impact recovery from low back pain? A population-based study of Spanish
Twins. XIV International Back and Neck Pain Forum 2016; Buxton, Derbyshire, UK.
Zadro JR, Shirley D, Amorim A, Pérez-Riquelme F, Ordoñana, JR, Ferreira, PH. Are
people with chronic low back pain meeting the physical activity guidelines? XV International
Back and Neck Pain Forum 2017; Oslo, Norway.
Zadro JR, Shirley D, Pinheiro MB, Bauman A, Duncan GE, Ferreira PH. The built
environment affects the association between low back pain and physical activity. XV
International Back and Neck Pain Forum 2017; Oslo, Norway.

xii
Preface
This thesis is organised into nine chapters, written so that each chapter can be read
independently. The University of Sydney allows published papers that arise from the
candidature to be included in the thesis. Chapters Two, Three, Four, Five, Six and Seven are
the PDF files of the published papers and Chapter Eight is in thesis format.
Chapter One is an introduction that provides relevant background information on the topics
that will be discussed in the remaining chapters of the thesis.
Chapter Two is a cross-sectional study that investigated the association between different
presentations of chronic low back pain and meeting the World Health Organisation’s Physical
Activity Guidelines. The paper is presented as published in The Spine Journal. A summary of
the media coverage this article generated is presented in Appendix 1.
Chapter Three is a cross-sectional study that investigated whether the built environment
moderated the relationship between low back pain and different forms of physical activity.
The paper is presented as published in Preventive Medicine.
Chapter Four is a longitudinal study that investigated whether educational attainment
increased the risk of chronic low back pain, and whether this association was different for
males and females. The paper is presented as published in The Spine Journal. A summary of
the media coverage this article generated is presented in Appendix 2.

xiii
Chapters Two, Three & Four utilised a co-twin design to control for genetics and shared
environmental factors. This contributed to a better understanding of the role of shared
familial factors in the development of low back pain.
Chapter Five is a longitudinal study that investigated whether the familial aggregation of
chronic low back pain impacted recovery. The paper is presented as published in Spine.
Chapter Six is a systematic review of twin and family studies that investigated how shared
familial factors influenced the response to regular physical activity. The paper is presented as
published in Sports Medicine Open. A summary of the media coverage this article generated
is presented in Appendix 3.
Chapters Five and Six contributed to a better understanding of the role of shared familial
factors in the recovery and management of chronic low back pain.
Chapter Seven describes a protocol for a randomised controlled trial that investigated the
feasibility and clinical effects of a home-based video-game exercise program for older people
with chronic low back pain. The paper is presented as published in Physiotherapy.
Chapter Eight is a randomised controlled trial that investigated a home-based video-game
exercise program for older people with chronic low back pain. The paper is presented in the
form it was submitted for publication in Physical Therapy.
Chapter Nine provides a discussion of the findings of the thesis, including implications for
clinicians and recommendations for future research.
xiv
Each chapter contains its own reference list. Appendices that were published as online
supplementary material are included at the end of the relevant chapter.
Ethical approval was obtained for the studies reported in Chapter Two, Chapter Three, and
Chapter Five from the Human Research Ethics Committee of the University of Murcia –
Spain, for the study reported in Chapter Four from the Washington State University
Institutional Review Board, and for the study reported in Chapter Seven and Chapter Eight
from the Human Research Ethics Committee of the Western Sydney Local Health District.

xv
Abstract
Low back pain (LBP) is the leading cause of global disability, with the majority of disease
burden accounted for by people with chronic LBP. Current intervention and prevention
strategies are failing to reduce the substantial burden of LBP and there are numerous topic
areas that warrant further investigation to increase our understanding of how to improve
outcomes for this population. The broad aims of this thesis were to investigate the role of
shared familial factors (including genetics) in the development, recovery and management of
chronic LBP; and to investigate the feasibility and clinical effects of a novel home-based
exercise program. Chapter Two showed that individuals with recent chronic LBP are less
likely to be active compared to those without chronic LBP, while Chapter Three showed that
the relationship between LBP and physical activity is moderated by the built environment.
Chapter Four identified that females with low educational attainment are at increased risk of
developing chronic LBP, but a co-twin control analysis suggested that these findings (like
the findings in Chapter Two) are confounded by shared familial factors. Chapters Five and
Six investigated factors influencing the recovery from chronic LBP and the response to
increased physical activity, and showed that shared familial factors are an important
contributor. Finally, Chapters Seven and Eight outlined the design and findings of a
randomised controlled trial investigating the feasibility and clinical effects of home-based
video-game exercises for older people with chronic LBP. High recruitment and response
rates, and adherence to the intervention showcased trial feasibility, while home-based video-
game exercises led to significant improvements in pain self-efficacy, pain and function
compared to usual care. Home-based video-game exercises are therefore a promising self-
management strategy for older people with chronic LBP that could improve outcomes and
reduce health-care costs.
xvi
Thesis Overview
Low back pain (LBP) is the most prevalent and disabling musculoskeletal condition
worldwide. The enormous costs resulting from health-care utilisation and lost work output
due to LBP are primarily accounted for by individuals who develop chronic symptoms,
particularly older people. Structured exercises programs (hereafter referred to as physical
activity interventions) are strongly recommended for the management of chronic LBP,
although only have modest effects for reducing pain and improving function. There is also
conflicting evidence regarding the effect physical activity interventions have on reducing the
risk of LBP, particularly chronic LBP. It is currently unclear why intervention and prevention
strategies (particularly physical activity interventions) are failing to reduce the substantial
disability and cost associated with chronic LBP. The aim of this thesis is to explore the
following topic areas to better explain the ongoing burden of LBP: i) risk factors and factors
associated with LBP and chronic LBP; ii) factors influencing the recovery and response to
treatment for chronic LBP; and iii) a novel physical activity intervention targeting
improvements in pain self-efficacy for older people with chronic LBP.
Chapters Two, Three and Four of this thesis explore the relationship between LBP, physical
activity, the built environment and educational attainment, with the aim of providing
guidance about management for populations with chronic LBP that would benefit from
increased physical activity and for those at risk of developing chronic LBP. Furthermore,
given the strong influence of genetics and shared environmental factors on the development
of chronic LBP, physical activity engagement, residential selection, and educational
attainment, it is important to adjust for these factors to minimise confounding and obtain
more precise estimates of association. The studies reported in Chapters Two, Three, and Four
employed a co-twin design to control for the confounding effects of genetics and shared
xvii
environmental factors (shared familial factors).
Evidence regarding physical activity levels in people with and without chronic LBP is
inconclusive. This may be explained by existing studies using different methods to assess
physical activity and recruiting samples with varying presentations of chronic LBP. The
conflicting evidence also highlights a lack of understanding of what types and dosages of
physical activity are the most beneficial for people with chronic LBP. Until the most
beneficial form of physical activity for people with chronic LBP is known, research should
determine whether people with chronic LBP are engaging in sufficient levels of physical
activity for promoting optimal health, while investigating how different presentations of
chronic LBP influence physical activity engagement. Chapter Two of this thesis presents the
findings of a cross-sectional study demonstrating that individuals with a recent episode of
chronic LBP are less likely to meet the World Health Organisation physical activity
guidelines compared to those with no history of chronic LBP. On the other hand, individuals
with persistent or previous chronic LBP are just as likely to meet these guidelines as
individuals with no history of chronic LBP. These findings highlight that clinicians should
incorporate specific strategies to encourage physical activity engagement into the
management of individuals with a recent episode of chronic LBP. However, the association
between recent chronic LBP and physical activity was no longer significant after controlling
for the influence of shared familial factors. This suggests common genetic or shared
environmental factors are influencing the development of both chronic LBP and physical
activity, consistent with confounding, although we cannot rule out that a reduction in the
sample size in the within-pair analysis was the reason these findings were no longer
significant.

xviii
Individuals with chronic LBP should continue to be active following a physical activity
intervention to ensure their symptoms continue to improve, or at least to maintain any
improvements resulting from the physical activity intervention. However, existing physical
activity interventions for people with chronic LBP only increase physical activity
engagement in the short-term. This may be due to a lack of consideration for how the built
environment influences physical activity engagement and long-term physical activity
behaviour change. Chapter Three presents the findings of a cross-sectional study
demonstrating that individuals with LBP are less likely to meet the physical activity
guidelines, or walk more than 150 minutes per week, compared to those free of LBP if they
live in an environment with short walkable distances to nearby amenities (high walkability).
Furthermore, the strength of this association increased in magnitude after controlling for
genetics and shared environmental factors. This increases our confidence in these findings as
controlling for a greater number of confounding factors suggests the relationship between
LBP and physical activity (for individuals living in an environment with high walkability) is
independent of shared familial factors. The sample size in this study was over four-times
greater compared to the study in Chapter Two so we can also be confident a reduction in the
sample size during the within-pair analyses did not influence these findings. The findings of
Chapter Three have important implications for targeting physical activity interventions
towards individuals with LBP living in a neighbourhood with high walkability, as their
environment could support long-term physical activity behaviour change. Future research
investigating the association between LBP and physical activity, or the effectiveness of a
physical activity intervention for people with LBP, must consider the influence of the built
environment to build on these findings and better understand the facilitators and barriers to
physical activity engagement in this population.
xix
Another potential risk factor that has received little attention is educational attainment. A
better understanding of how educational attainment increases the risk of developing chronic
LBP could inform on which populations are at risk of developing chronic LBP. Cross-
sectional studies have demonstrated a higher prevalence of chronic LBP in individuals with
low educational attainment, with numerous studies highlighting gender differences in this
relationship. Unfortunately, there are few longitudinal studies investigating educational
attainment as a risk factor for developing chronic LBP, while also considering the influence
of gender. Chapter Four presents the findings of a longitudinal study demonstrating a higher
risk of developing chronic LBP in females with low educational attainment, and a lower risk
in females with high educational attainment. There was no association between educational
attainment and the risk of chronic LBP in males. These findings highlight the importance of
targeting prevention strategies towards females with low educational attainment as they are at
high risk of developing chronic LBP. In addition, health literacy education might be a key
priority for females with chronic LBP as they are more likely to have lower educational
attainment compared to females without chronic LBP. Further research is needed to explore
the reason educational attainment affects the risk of chronic LBP in females but not in males.
One hypothesis that deserves consideration is that shared familial factors could be
confounding the positive association we found for females, since after controlling for
genetics and shared environmental factors, educational attainment did not affect the risk of
developing chronic LBP in females. Future studies exploring the relationship between
education and chronic LBP must consider the influence of gender and shared familial factors
to build on these results and inform on populations at risk of developing chronic LBP.
Chapters Five and Six of this thesis explore factors influencing the recovery and response to
treatment for chronic LBP, with the aim of improving clinicians’ ability to identify patients at

xx
risk of poor outcomes and predict their response to treatment. The role shared familial factors
play in the recovery from chronic LBP and in the response to increased physical activity
needs to be investigated if we are to better understand why some individuals have poor
outcomes or fail to respond to a physical activity intervention. Shared familial factors have a
strong influence on the development of chronic LBP, with the familial aggregation of chronic
LBP increasing the likelihood of developing chronic LBP. Despite this, no studies have
investigated the impact shared familial factors have on the recovery from chronic LBP.
Understanding how the familial aggregation of chronic LBP impacts on the recovery from
chronic LBP will help clinicians identify those at risk of poor outcomes and potentially
inform the direction of treatment. Chapter Five of this thesis presents the findings of a
longitudinal study demonstrating that the familial aggregation of chronic LBP significantly
impacts on the recovery from chronic LBP. The likelihood of non-recovery was highest in
identical twins with a family history of chronic LBP, suggesting that genetics play a strong
role in the recovery from chronic LBP. With this in mind, future studies investigating the
recovery from chronic LBP should control for shared familial factors (particularly genetics)
to get more precise estimates of association. From a clinical perspective, the presence of
chronic LBP within a family can inform clinicians on which patients are less likely to
recover, and have implications for treatment strategies. Clinicians that identify a patient with
negative beliefs and attitudes regarding their LBP that have further been reinforced amongst
family members could intervene and educate about these beliefs to potentially improve this
patient’s recovery.
There is substantial individual variation in the responsiveness to regular physical activity in
healthy adults and in people with chronic LBP. A better understanding of factors that
influence the response to increased physical activity is warranted and may explain the modest
xxi
effects of physical activity interventions for chronic LBP. Shared familial factors appear to
play a role in dictating how an individual will respond to increased physical activity. For
example, identical twin pairs completing a standardized physical activity intervention
demonstrate great variation for increases in maximal oxygen uptake between twin pairs, but
only a small amount of variation within twin pairs. Chapter Six presents the findings of a
systematic review demonstrating that genetics and shared environmental factors significantly
influence the response of body composition and cardiorespiratory fitness following a physical
activity intervention in healthy adults. Future studies should build on these results and
investigate the role of shared familial factors in the response to a physical activity
intervention for individuals with chronic conditions, such as LBP. If shared familial factors
influence the response to physical activity in people with chronic LBP, this could have
implications for adjusting modifiable intervention parameters (intensity, frequency, duration)
to achieve a desired response, or for selecting alternative management strategies in the case
of non-responders. Information about the response to physical activity could also be used by
clinicians to guide treatment choices, decrease health-care costs, and reduce patient
disappointment.
Chapters Seven and Eight of this thesis investigate the feasibility and clinical effects of a
novel physical activity intervention targeting improvements in pain self-efficacy for older
people with chronic LBP. A potential shortcoming of trials investigating physical activity
interventions for older people with chronic LBP is an overemphasis on outcomes related to
pain and function, while neglecting the important role of pain self-efficacy. Pain self-efficacy
is an individual’s ability to continue activities of daily living despite pain and is closely
linked to self-management. Older people with poor physical functioning often prefer an
exercise program that can be performed at home, reducing the need to travel to a clinic for
xxii
supervised exercise. However, poor adherence to home exercise highlights the need for an
interactive physical activity intervention aimed at improving self-management in older people
with chronic LBP. Chapter Seven outlines the protocol of a pilot randomised controlled trial
investigating the feasibility and clinical effects of a home-based video-game exercise
program in older people with chronic LBP. Chapter Eight details the results. Our trial had a
high response rate (51%), a high recruitment rate in community-dwelling older people (11
participants per month), and high adherence to the intervention. No adverse events were
reported. Participants completing video-game exercises demonstrated significantly higher
pain self-efficacy in the long-term and significantly greater improvements in pain and
function immediately post-intervention compared to a control group advised to maintain their
usual activities. In addition, participants completing video-game exercises were significantly
more likely to engage in flexibility exercises in the long-term, tended to be less likely to take
pain medication in the long-term, and tended to have lower fear of movement immediately
post-intervention. There were no significant between-group differences for the remaining
physical activity and care-seeking variables, nor disability or falls-efficacy at any time point.
The results of this pilot study support the feasibility and positive clinical effects of a home-
based video-game exercise program for older people with chronic LBP. Considering the
numerous benefits of physical activity for older people, a large randomised controlled trial is
needed to build on these results. If home-based video-game exercises are shown to be
effective, the intervention will be rolled out to community-dwelling older people and has the
potential to reduce long-term health-care expenditure for chronic LBP by promoting self-
management.
This thesis explored numerous issues not sufficiently addressed in the literature and will
contribute to a better understanding of why current intervention and prevention strategies for
xxiii
chronic LBP are failing to reduce the enormous personal and financial burden associated with
the condition. In summary, clinicians need to incorporate physical activity promotion into the
management of individuals with a recent episode of chronic LBP, and individuals with LBP
who live in an environment with good walkable access to nearby amenities. Clinicians should
also target prevention strategies towards females with low educational attainment, as these
individuals are at an increased risk of developing chronic LBP. On the other hand, the
relationships we found between chronic LBP and physical activity, and chronic LBP and
educational attainment need to be interpreted with caution, since genetics and shared
environmental factors appear to be confounding these associations. The co-twin study design
should continue to be utilised when investigating risk factors for chronic LBP to control for
the confounding effects of shared familial factors and obtain more precise estimates of
association.
The thesis also highlighted the important role of shared familial factors in the recovery from
chronic LBP, and in dictating the response to increased physical activity. Clinicians involved
in the management of an individual with chronic LBP should consider the presence of
chronic LBP within a family as a predictor of non-recovery, and use this information to better
understand a patient’s prognosis and guide treatment strategies. In addition, given the
substantial role of shared familial factors in the response of body composition and
cardiorespiratory fitness following a physical activity intervention, shared familial factors
may also play a role in how an individual with chronic LBP responds to a physical activity
intervention. Future studies should investigate the response to a standardised physical activity
intervention in a sample of identical twin pairs with chronic LBP. A higher concordance in
outcomes (e.g. pain and function) between identical twin pairs following the intervention
would highlight a strong role of shared familial factors in dictating the response to a physical

xxiv
activity intervention in people with chronic LBP. These findings would have implications for
changing modifiable training parameters or selecting an alternative intervention to achieve a
desired response, decrease treatment costs, and reduce patient disappointment.
Finally, this thesis highlighted the feasibility of a home-based video-game exercise program
in community-dwelling older people with chronic LBP, while demonstrating positive clinical
effects for pain self-efficacy, pain and function. Given the enormous benefits of increased
physical activity in older people with chronic LBP, home-based video-game exercises are an
innovative way to increase adherence to home exercise, support self-management, and reduce
health-care expenditure for chronic LBP. However, before video-game exercises are
recommended for older people with chronic LBP, an adequately powered randomised
controlled trial is needed to confirm the efficacy of this novel self-management strategy.

CHAPTER ONE
Introduction
1

1.1. Epidemiology of non-specific low back pain
1.1.1. Introduction to non-specific low back pain
Low back pain (LBP) is the most prevalent and disabling musculoskeletal condition
worldwide1. It is defined as pain which localises posteriorly within the region from the
inferior border of the twelfth rib to the lower gluteal folds2. The majority of LBP cases
presenting to primary care are classified as ‘non-specific’ (~85%)3, with the remaining cases
presenting with either spinal nerve or nerve root compression (~5-10%)4, 5, or a serious
pathology (e.g. malignancy, fractures, inflammatory conditions, cauda equina) (~1%)6, 7. This
thesis will only consider non-specific LBP from this point onwards.
Although there are numerous pain-sensitive (nociceptive) structures within the spine, such as
intervertebral discs, zygapophyseal joint capsules, synovia, muscles and spinal ligaments8,
classifying someone as having non-specific LBP reflects the complexity of determining
which structures are responsible for the pain. Health-care professionals routinely use clinical
examination findings to determine the source of nociception within the spine9, while
increasing rates of magnetic resonance imaging (MRI) for people with LBP likely reflect the
desire to confirm a structural diagnosis10. Unfortunately, there are numerous issues with these
approaches9, 11, and solely focusing on a patho-anatomical source of nociception may neglect
important psychological and social contributors to an individual’s symptoms12-14. Numerous
studies have investigated the diagnostic accuracy of clinical examination findings for
identifying patho-anatomical sources of LBP. However, the lack of accurate reference
standards limits our confidence in these findings9. For example, using medical imaging as a
reference standard for determining the diagnostic accuracy of clinical examination findings
has numerous issues. Structural abnormalities displayed on MRI, such as disc degeneration,
facet joint arthropathy, and disc bulges are common in individuals without LBP15, 16.
2
Furthermore, the prevalence of ‘abnormal’ findings (e.g. spondylolithesis) are often similar in
people with and without LBP17. The presence of ‘abnormal’ imaging findings for an
individual with LBP may also lead to pain catastrophising, increased health-care utilization18,
and worse outcomes compared to those who do not pursue medical imaging18-20, especially if
these individuals are not reassured that ‘abnormal’ findings are common in asymptomatic
individuals19. Medical imaging is also costly21, does not guide the choice of treatment22, and
does not predict treatment outcomes in individuals with LBP23. As a result, medical imaging
is limited in ability to identify which spinal structure is responsible for pain and should not be
routinely recommended for individuals with non-specific LBP18. Given the limited utility of
clinical examination findings and medical imaging to diagnose a patho-anatomical source of
LBP, a shift towards a biopsychosocial explanation of LBP – and away from the biomedical
disease model – has been recommended to guide treatment12. This shift is supported by
numerous studies identifying psychosocial factors in the development and prognosis of
LBP12-14 and highlights the importance of understanding how a variety of factors influence
the development of LBP, the recovery from LBP and the response to treatment. Since the
term non-specific LBP continues to be widely used in research and clinical practice –
reflecting that pain may have a nociceptive origin but there are other factors contributing to
the pain experience24 – non-specific LBP will be referred to as LBP throughout this thesis.
1.1.2. Burden and cost of low back pain
The most recent Global Burden of Disease Study has ranked LBP as the leading cause of
years lived with disability, in both developed and developing countries, ahead of other
conditions including major depressive disorder, diabetes, and neck pain1. Furthermore,
between 1990 and 2013, LBP rose from the twelfth leading cause of premature mortality and
3

non-fatal health loss (disability-adjusted life-years) to the fourth leading cause, only behind
heart disease, cerebrovascular disease, and lower respiratory infections25.
The economic cost of LBP is enormous across many countries26, 27, and can be divided into
the costs from direct or indirect sources. Direct costs refer to the utilisation of health services
for LBP and include the cost of visiting health professionals (e.g. doctors, physiotherapists,
and chiropractors), purchasing medications, or the costs of hospital admissions and surgical
procedures. Indirect costs consist of lost work output resulting from decreased productivity
and earnings, commonly accounting for the majority of the global economic burden of LBP27,
28. The costs of LBP also appear to be increasing. In 2001, the total yearly cost of LBP in
Australia was approximately AU$9 billion, with direct costs estimated at AU$1 billion28. In
2012, direct costs alone were estimated at AU$5 billion29. Furthermore, the total yearly cost
of LBP in 1998 was US$90 billion in the United States30, with this figure increasing
approximately 65% by 200531. The total yearly costs of LBP are also substantial across other
countries and have been estimated at ₤12 billion for the United Kingdom32, and up to €300
billion for the whole of Europe27.
1.1.3. Prevalence, incidence, and course of low back pain
The global point prevalence of LBP is estimated at 46.3%1, with estimates for the lifetime
prevalence being as high as 80% by 20 years of age33. These figures are typically higher in
females34-38. The 1-year incidence of a first-ever episode of LBP ranges from 6.3-15.4%, with
estimates for the 1-year incidence of any episode of LBP as high as 36%39. On average,
individuals with LBP demonstrate substantial reductions in pain and disability within the first
six weeks following an acute episode40. However, the rate of recurrence within the next year
is estimated at 33%41, and there is significant individual variation in the trajectory of
4
symptoms42. By examining individual data on pain intensity over time, a number of distinct
pain trajectories describing the course of LBP have been identified42. Persistent or fluctuating
pain can be used to describe an individual’s pain variability, while different rates of
improvement can describe how these symptoms change overtime42. The majority of people
with LBP experience either persistent or fluctuating symptoms of mild to moderate
intensity42, with cases of severe or chronic LBP less common43. Nevertheless, individuals
experiencing chronic LBP often have slower reductions in pain and disability40, and are at
greater risk of recurrence41. Individuals who go on to develop chronic LBP also account for
the majority of the disability and cost resulting from LBP26, 44, 45, with more than 75% of the
costs associated with LBP accounted for by the 5% of individuals who develop chronic
symptoms44, 46. Therefore, given that individuals with chronic LBP often fail to recover43,
research on these individuals is particularly important from a public health perspective and
will be the focus of a number of chapters in this thesis.
Chronic LBP is most commonly defined as LBP lasting for more than 3 months47. However,
there is inconsistency regarding this definition48, with some sources defining chronic LBP as
pain lasting for 6 months or longer, and others defining chronic LBP as the presence of pain
for more than half the days in a year39, 47, 49. Given that LBP does not follow a linear course
and individuals often have flare-ups and recurrent episodes39, 41, 42, there is currently no
consensus on which definition of chronic LBP is the most appropriate to use in research and
clinical practice2. Therefore, because more than one database was used for the studies
reported in this thesis, some studies define chronic LBP as symptoms lasting for at least 3
months, while others define chronic LBP as symptoms lasting for at least 6 months.
5
1.1.4. Chronic low back pain and older people
Chronic LBP has an enormous impact on older people, with older people commonly defined
as individuals over 65 years old50-52. The 1-month prevalence of chronic LBP is estimated at
23.2% in the general population53. However, the prevalence of chronic LBP increases with
age52-55, with estimates being as high as 40% in males and 35% in females by 80 years old 53.
Chronic LBP also becomes more severe52 and disabling with age56, with the prevalence of
disabling chronic LBP nearly three times higher in people over 90 years old (9.7%) compared
to people between 75-80 years old (3.8%)57, and the prevalence of severe chronic LBP nearly
three times higher in people over 80 years old compared to people less than 60 years old58.
The prevalence and financial burden of chronic LBP are increasing45, 59, and individuals
reporting high levels of disability and poor physical functioning spend up to five times more
on health-care services compared to people with less disabling symptoms45. Furthermore, the
likelihood of recovering from an episode of LBP decreases with age60. For example, older
people tend to report smaller improvements in pain and disability over time61, with older
people reporting chronic or severe symptoms even less likely to recover60.
Chronic LBP has a significant impact on physical functioning62 and physical activity
engagement in older people63. Older people with chronic LBP demonstrate significantly
slower gait speed, stair descent time, and repeated sit-to-stand time compared to older people
without LBP64, 65, with worse physical functioning observed in individuals with longer
duration of symptoms60. Older people with chronic LBP also demonstrate reduced overall
levels of physical activity compared to pain-free individuals63, with the duration of symptoms
strongly associated with decreased physical activity engagement66. Decreases in physical
functioning and physical activity engagement may explain why older people with severe LBP
frequently experience difficulty with simple activities of daily living67, are at high risk of
falling68, and have lower falls-related self-efficacy compared to older people without LBP69.
6

Furthermore, the significant impact chronic LBP has on older people is highlighted by the
fact that health-care costs associated with LBP increase with age and chronicity of
symptoms70. This is particularly problematic given the global population of people over 60
years old is expected to triple by 205071. However, despite the significant impact chronic
LBP has on older people, they are commonly excluded from randomised controlled trials
evaluating treatment options72. Therefore, chronic LBP in older people accounts for a
substantial portion of the disability and cost resulting from LBP, and given the rapidly aging
population51, 71, more research on older people with chronic LBP is needed. Chapters Seven
and Eight of this thesis will further explore this topic area.
1.2. Prevention and intervention strategies for low back pain
1.2.1. Prevention
Despite decades of research aimed at advancing our understanding of LBP, the prevalence
and disability associated with the condition has failed to reduce since 19901. This is likely
reflecting a lack of research investigating appropriate prevention strategies to reduce the risk
of developing LBP (particularly chronic LBP), and small effect sizes of current interventions
for chronic LBP. In terms of prevention strategies, combining education with a structured
exercise program can reduce the risk of developing a first-time episode of LBP by nearly
50%73, while structured exercise programs in isolation are only effective at reducing recurrent
episodes of LBP74, 75. Unfortunately, neither structured exercise programs nor education in
isolation are effective at reducing the risk of a first-time episode of LBP73, 76. The content of
structured exercise programs varies between studies but commonly includes one or more of
the following: abdominal and lumbar muscle activation, strengthening or endurance
exercises, lower limb muscle strengthening or stretching, or aerobic exercises73. Similarly,
education commonly involves information regarding one or more of the following areas:
7

basic anatomy and pathophysiology of LBP, evidence-based information, lifting posture,
ergonomic principles, or the benefits of increased physical activity73. Numerous other
prevention strategies including lumbar supports, ergonomic modifications, and shoe insoles,
are ineffective at reducing the risk of LBP75, 77-79, and there is limited research on the
prevention of chronic LBP. Graded activity80 and pain education81 are promising strategies
for reducing the likelihood that individuals experiencing acute LBP will develop chronic
symptoms, although more research in this area is needed before firm recommendations can be
made. The lack of supporting evidence for many prevention strategies is likely be explained
by a poor understanding of factors that increase the risk of developing LBP. This highlights
the importance of first identifying risk factors for LBP, then targeting preventions strategies
towards those at high risk. Identifying risk factors for LBP is a major component of this
thesis and will be further explored in Chapters Two, Three and Four.
1.2.2. Intervention
Most evidence-based clinical practice guidelines recommend structured exercise programs
for the management of chronic LBP82-84. These exercise programs are largely similar in
content to those recommended for the prevention of LBP, although some additional forms of
exercise have been recommended for the management of chronic LBP and include: yoga,
pilates, and motor control exercises. Structured exercises programs are effective as a stand-
alone intervention for chronic LBP85, or can delivered alongside interventions such as spinal
manipulative therapy86, cognitive behavioural therapy87, 88, education83, 89, advice to remain
active89, and advice regarding the most appropriate physical activities to undertake to
promote long-term self-management83. However, despite an abundance of research
investigating different types and doses of the above-mentioned interventions for people with
chronic LBP90-92, the analgesic effects are small93, 94. For example, structured exercise
8
programs only result in a small decrease in pain and increase in function91, 95, 96 and this is
regardless of the exercise modality investigated (e.g. abdominal or lumbar muscle
strengthening, aerobic exercise, pilates, etc.)85, 97, 98. Therefore, given the lack of evidence
supporting the superiority of one exercise modality over another for the management of
chronic LBP85, and that physical activity encompasses all forms of bodily movements that
result in energy expenditure99, structured exercise programs will be referred to as physical
activity interventions throughout this thesis.
1.2.3. Research priorities for low back pain
The ongoing disability and cost resulting from chronic LBP is a major concern1, 100 and
highlights that current intervention and prevention strategies are at best having a small impact
on the burden of LBP. A major problem in the field of LBP is that most intervention and
prevention strategies have been investigated without an adequate – let alone comprehensive –
understanding of the range of factors that could influence the development of chronic LBP,
the recovery from chronic LBP and the effects of treatment. Further, there is little-to-no
research on interventions that facilitate self-management; an approach that could improve an
individual’s ability to manage their pain independently, reduce their reliance on the health-
care system, and subsequently decrease the enormous burden of chronic LBP. These topic
areas warrant further attention and will be explored in depth in this thesis.
1.3. Understanding risk factors and factors associated with low back pain and chronic
low back pain
The majority of research on chronic LBP concerns therapy. However, a better understanding
of factors increasing the risk of developing LBP (particularly chronic LBP) is essential to
guide the design of more effective intervention and prevention strategies. A previous history
9
of LBP is the only strong and consistent risk factor for the development of LBP (including
chronic LBP)73, 101, 102. Other factors that have been consistently shown to increase the risk of
LBP only demonstrate small effects. For example, obesity103, work-related physical
activity104, poor general health105, 106, and low levels of job satisfaction105 are consistently
associated with a small increase in the risk of developing LBP, while high baseline pain
intensity102, low baseline function106, obesity103, poor general health106, depression107, and
maladaptive coping behaviours106, 107 are consistently associated with a small increase in the
risk of developing chronic LBP. Despite this, there are other potential risk factors that
demonstrate inconsistent effects (e.g. recreational physical activity104, 105), or that have not
been investigated adequately to make definite conclusions regarding their effect (e.g.
educational attainment, and the built environment). In addition, most studies investigating
risk factors for LBP are cross-sectional, limiting their ability to determine which factors
precede the development of LBP. Longitudinal studies overcome this limitation by
identifying those at risk of developing LBP and subsequently those who might benefit from
targeted prevention strategies. This thesis will aim to address some of the limitations and
literature gaps regarding the relationship between recreational physical activity, the built
environment, educational attainment and different presentations of LBP. A better
understanding of risk factors and factors associated with LBP, and chronic LBP, will have
implications for the future design of intervention and prevention strategies.
1.3.1. Physical activity
Physical activity is one of the most important factors for maintaining optimal health across
numerous body systems, including the cardiovascular108 and musculoskeletal system109.
Throughout this thesis the following physical activity domains will be predominately referred
to: i) recreational physical activity, which refers to any physical activity an individual
10

performs during their leisure time (e.g. sport, resistance training, flexibility exercises, etc.);
and ii) work-related physical activity, which refers to any physical activity an individual does
at work (e.g. lifting, bending, walking, etc.). Furthermore, structured exercise programs will
be referred to as physical activity interventions as previously outlined.
Physical activity interventions are commonly recommended for the management of chronic
LBP83, although they only provide modest improvements for pain and function93. A possible
explanation for these modest results could be that these interventions are implemented in
populations that already achieve adequate levels of physical activity63, 104. Despite an
abundance of research investigating physical activity levels in people with chronic LBP, it is
not clear whether individuals with chronic LBP have reduced physical activity levels
compared to those without chronic LBP63, 104, or that a lack of or excessive amount of
physical activity increases the risk of developing LBP or chronic LBP104, 110. Some studies
report that individuals with chronic LBP have reduced levels of recreational physical activity
(e.g. sports participation) compared to people without LBP111-113, while others report that
individuals with chronic LBP have either greater114, 115, or similar physical activity levels
compared to people without LBP116-118. These conflicting findings are likely explained by
different methods of assessing and defining chronic LBP and physical activity, and highlight
a lack of understanding of what types and dosages of physical activity are the most beneficial
for people with chronic LBP. With this in mind, it would be beneficial to assess physical
activity in light of promoting optimal health across a variety of body systems, and investigate
how different presentations of chronic LBP influence the engagement in sufficient levels of
physical activity. The 2010 World Health Organisation (WHO) Physical Activity Guidelines
recommends a minimum of either 150 minutes moderate-intensity physical activity, 75
minutes of vigorous-intensity physical activity, or a combined 150 minutes of moderate or
11

vigorous-intensity physical activity per week, accumulated in multiple bouts of at least 10
minutes50. Therefore, until it is clear what types and dosages of physical activity are the most
beneficial for people with chronic LBP, research should focus the prescription of physical
activity according to the WHO physical activity guidelines to ensure people with chronic
LBP are sufficiently active for improving or maintaining their overall health. In addition,
understanding the relationship between different presentations of chronic LBP (e.g. time
since last episode, persistence) and physical activity engagement will help clinicians and
policy makers better determine which populations with chronic LBP would benefit the most
from increased physical activity. The second chapter of this thesis presents the findings of a
cross-sectional study investigating what proportion of individuals with various presentations
of chronic LBP are meeting the physical activity guidelines, and whether there is an
association between various presentations of chronic LBP and meeting the WHO physical
activity guidelines.
1.3.2. The built environment
Physical activity interventions are commonly recommended for individuals with chronic LBP
to reduce pain and improve function83, and primarily consist of structured exercise programs
implemented over a certain timeframe74, 85. However, it is important that individuals with
chronic LBP continue to be physically active following the completion of a physical activity
intervention. This is to ensure their symptoms continue to improve, or that any improvements
resulting from the physical activity intervention are maintained. Despite this, current physical
activity interventions only increase physical activity engagement in the short-term119, 120, and
fail to result in long-term physical activity behaviour change121-124. Understanding factors that
influence long-term engagement in physical activity following a physical activity intervention
is important. A shortcoming of current physical activity interventions may be a lack of
12

consideration for the influence of external environmental or community-level factors, such as
the built environment. By incorporating information on environmental characteristics such as
the continuity of sidewalks, variety of land-uses in a neighbourhood (e.g. residential,
business, and entertainment), and walkable distance to nearby amenities (e.g. parks, shops,
restaurants, etc.), walkability can be used to objectively quantify the extent the built
environment in a neighbourhood promotes physical activity125-127. Walkability is high in
cities where residents are within walking distance of work, public transportation, and
shopping centres, but is generally lower in suburbs or rural areas where the distance to nearby
amenities is greater125. However, it is currently unclear how walkability impacts physical
activity levels in people with LBP. Individuals who live in a neighbourhood with low
walkability and experience LBP may be less likely to practice regular physical activity
compared to those free of LBP. On the other hand, those suffering LBP may be less likely to
engage in physical activity despite living in an environment which promotes it (high
walkability). A better understanding of the relationship between LBP, physical activity, and
walkability may serve to explain why current physical activity interventions fail to
demonstrate long-term physical activity behaviour change in people with LBP. The third
chapter of this thesis presents the findings of a cross-sectional study investigating whether
walkability moderates the association between LBP and physical activity.
1.3.3. Educational attainment
Despite conflicting evidence regarding levels of recreational physical activity in people with
and without chronic LBP63, the exposure to physically demanding work-related physical
activities, such as awkward or prolonged postures, and heavy lifting, is consistently more
common in people with LBP104, 128, 129 and chronic LBP130, 131, compared to those without
LBP. In addition, exposure to physically demanding work-related physical activities has been
13
associated with an increased risk of severe LBP132, and the development of chronic LBP130,
133. These work-related physical activities are primarily influenced by an individual’s
occupation, a common indicator of socioeconomic status, and may highlight the importance
of considering other socioeconomic risk factors for chronic LBP, such as educational
attainment. The prevalence of LBP39, 134, and chronic LBP131, 135 are higher in individuals
with low educational attainment, with these individuals experiencing greater severity136, 137
and frequency of symptoms138, longer symptom duration134, and a less favourable
prognosis134. Only a few studies have investigated educational attainment as a risk factor for
LBP, demonstrating that having a higher education reduces the risk of developing activity
limiting LBP139, 140, but no studies have investigated whether educational attainment increases
the risk of developing chronic LBP. Furthermore, a number of observational studies have
highlighted potential gender differences in the relationship between educational attainment
and LBP141-143, and chronic LBP135, although further research is needed to build on these
findings. People with low educational attainment might be at increased risk of developing
chronic LBP because they are more likely to engage in strenuous work-related physical
activity104 and have lower job satisfaction105. Further, gender differences in the relationship
between educational attainment and the development of chronic LBP might be explained by
occupational factors. For example, work-related physical activity appears to have a larger
influence on the risk of LBP-related disability in males140, while high emotional demands are
stronger predictors of LBP in females144. A better understanding of the relationship between
educational attainment and chronic LBP may assist clinicians more appropriately target
intervention strategies towards individuals at risk of developing chronic LBP. The fourth
chapter of this thesis presents the findings of a longitudinal study investigating how gender
influences the relationship between educational attainment and the prevalence and risk of
chronic LBP.
14
1.3.4. Heritability and shared familial factors
When investigating risk factors or factors associated with LBP (particularly chronic LBP) the
potential confounding effects of shared familial factors, including genetics, need to be
considered. Twin studies are frequently used to quantify the extent genetics and shared
environmental factors contribute to a particular trait (classical twin study), such as the
presence of LBP. It is known that non-identical twins (dizygotic – DZ) twins share
approximately 50% of their genes while identical twins (monozygotic – MZ) twins share
approximately 100%145. It is also assumed that both DZ and MZ twins were exposed to the
same environment when growing up145. If genetics influence a particular trait, MZ twin pairs
would demonstrate a greater concordance (or similarity) for the trait compared to DZ twin
pairs, and the heritability estimate would be high. If genetics were the only influence on a
trait, the ratio of concordance between MZ and DZ twin pairs would be 2:1, with a
heritability estimate of 100%. On the other hand, if concordance for a trait was similar
between MZ and DZ twin pairs, shared environmental factors would be an important
contributor to the trait. Examples of environmental exposures during childhood include
physical activity levels, educational development, socioeconomic status, and parental role
modelling. Genetics play a strong role in the development of LBP, with heritability estimates
as high as 67% for cases of chronic or disabling LBP146. Furthermore, genetics and shared
environmental factors substantially influence the engagement in physical activity147,
educational attainment148, and residential selection149. Therefore, when investigating risk
factors for LBP, it is important to account for genetics and shared environmental factors.
Twin studies provide a unique opportunity to control for the confounding effects of genetics
and shared environmental factors and over the past two decades there has been increasing
recognition of their utility in research investigating risk factors for LBP150-153. Leboeuf-Yde
15
and colleagues (1998) demonstrated that the association between smoking and LBP
disappeared after controlling for the confounding effects of genetics and shared
environmental factors153, while Hestbaek and colleagues (2006) found that controlling for
these factors didn’t influence the association between obesity and LBP150. More recently,
numerous publications from our research group have supported the utility of twin studies in
better understanding risk factors and factors associated with LBP154-156. For example, a
systematic review and meta-analysis by Dario and colleagues (2015) showed that the
association between obesity and LBP disappeared when pooling results from studies that had
adjusted for the confounding effects of genetics and shared environmental factors154. This
suggests common genetic and shared environmental factors may be responsible for the
presence of both obesity and LBP, and are confounding this relationship. In addition, another
study within our research group demonstrated that the association between physical activity
(recreational and work-related) and LBP increased in magnitude after adjusting for shared
familial factors155, suggesting a more direct relationship between physical activity and LBP.
The findings of twin studies have important implications for the design of intervention and
prevention strategies for LBP. For example, if genetics and shared environmental factors are
driving the relationship between obesity and LBP, this could explain why weight loss
interventions are ineffective for people with LBP157. Therefore, if researchers plan to use
knowledge of risk factors, and factors associated with LBP, to guide intervention and
prevention strategies, a robust method of adjusting for the confounding effects of genetics
and shared environmental factors is required to obtain more precise estimates of association.
Unfortunately, the majority of observational studies investigating risk factors or factors
associated with LBP have unknowingly neglected the potential confounding effects of shared
familial factors. This thesis builds on the body of evidence from within and outside our
research group by utilising the twin study design to investigate a few precise risk factors for
16

LBP. Overall, this work contributes to a larger body of twin research that aims to better
understand how shared familial factors influence the risk of developing LBP.
1.3.5. Twin study design to control for shared familial factors
There are numerous ways to control for shared familial factors when analysing twin data150-
152 but this thesis will predominately focus on the co-twin control design as this approach has
been utilised extensively in the field of LBP150, 154-156. Considering complete twin pairs
discordant for LBP (i.e. one twin reported LBP but the co-twin did not) allows researchers to
control for the effects of genetics and shared environmental factors, and can be achieved
through the following steps. First, considering only DZ twin pairs allows the researcher to
adjust for 50% of genetics, while considering only MZ twin pairs in the next step allows the
researcher to adjust for almost 100% of genetics. Since it can be assumed both DZ and MZ
twin pairs were exposed to similar environmental factors during childhood, both analyses are
adjusted for shared environmental factors. In theory, when the association between two
variables remains or increases in magnitude as we adjust for a greater proportion of genetics
(particularly in the analyses of MZ twins where the highest level of adjustment is achieved),
this is likely to be consistent with a more direct association between the two variables.
Conversely, if the magnitude of the association decreases, this is more likely consistent with
confounding158. Confounding would suggest that genetics and/or shared environmental
factors are driving the relationship between the two variables, or that common genetic and/or
shared environmental factors are responsible for the development of both traits (such as LBP
and physical activity engagement). Therefore, to get a clearer understanding on factors that
increase the risk, or that are associated with LBP, we need to control for the influence of
genetics and shared environmental factors. Chapters Two, Three, and Four present the
findings from three studies that utilised a co-twin control design to adjust for shared familial
17

factors. This allowed us to obtain more precise estimates of investigated risk factors
(educational attainment) and factors associated with LBP (physical activity and the built
environment). The findings presented in these chapters will likely inform on the design of
future prevention and intervention strategies.
1.4. Factors influencing the recovery and response to treatment for chronic low back pain
1.4.1. Environmental influences on recovery
Understanding a range of factors that influence recovery and the response to treatment for
chronic LBP may help to explain why current interventions are failing to reduce the
prevalence and disability resulting from the condition100. Numerous factors have been
investigated in the recovery from chronic LBP159, 160, with only a few demonstrating a
consistent negative impact, including recurrent episodes of LBP or longer symptom
duration161, 162, high initial pain intensity163, 164, longer work absence165, negative expectations
about recovery166, 167, pain catastrophising13, and symptoms of depression14, 164. Negative
expectations about recovery can increase the risk of persistent symptoms by approximately
2.5 times166, while pain catastrophising has been shown to negatively influence the prognosis
in all types of LBP (e.g. acute, sub-acute, and chronic)13. Furthermore, symptoms of
depression in people with chronic LBP appear to predict worse pain, disability, and a reduced
likelihood of returning to work14. Numerous other factors have been investigated in the
recovery from chronic LBP and include gender160, recreational physical activity168, fear-
avoidance beliefs169, and clinical examination findings (e.g. lumbar spine range of motion,
hip range of motion, pain provocation tests, lumbar muscle strength and lumbar muscle
endurance)159, although their effects are less consistent.
18

1.4.2. Shared familial factors and recovery
Although a number of the above-mentioned factors are important, they only consider the
individual, without consideration of external or familial factors. Genetics account for up to
67% of chronic and disabling LBP cases146, with the family environment accounting for up to
48% of LBP cases in children170, 171. Therefore, it may be important to extend our
understanding of factors impacting the recovery from chronic LBP beyond the individual and
into the family environment. Among familial factors that could influence recovery, the
familial aggregation of chronic LBP – where multiple family members report a history of
chronic LBP – is likely to be relevant. Familial aggregation of chronic LBP is associated with
the presence of chronic LBP172, while having family members suffering from chronic LBP
increases the likelihood of developing chronic LBP173, 174 or chronic LBP with high fear
avoidance beliefs175. Further, both children and adults are at increased risk of seeking care for
their LBP if they have family members seeking care for LBP176, 177. Despite this, familial
aggregation of chronic LBP is yet to be investigated in the recovery from chronic LBP. A
broader understanding of the factors associated with persistent pain and disability will assist
clinicians to identify those at risk of non-recovery and better target treatment. The fifth
chapter of this thesis presents the findings from a longitudinal study investigating the impact
familial aggregation of chronic LBP has on the recovery from chronic LBP, while gaining
insights into the influence of shared familial factors.
1.4.3. Environmental influences on the response to treatment
A better understanding of the factors that influence how an individual responds to an
intervention may explain the modest treatment effects of current interventions for chronic
LBP and guide a more tailored approach to therapy. Some research has focussed on
identifying factors that predict a favourable response to an intervention in people with
19

chronic LBP, such as lower baseline pain levels, younger age, and increased adherence178.
Alternatively, others have focused on identifying sub-groups of patients who demonstrate a
more favourable response to a particular intervention over another179-181. Numerous studies
have attempted to use a patient’s history and clinical examination findings182-184, or the
presence of impaired trunk movements185, 186, to guide the choice of treatment. However,
despite on-going enthusiasm for the use of treatment-based sub-grouping, strong evidence
supporting outcomes for individuals managed using these approaches is lacking187, 188. This is
partly due to the fact that conclusions from existing sub-group studies are not appropriate
given their poor methodological quality, and it is recommended that future studies be
conducted in a step-by-step and rigorous manner179, 189. In addition, existing sub-group
studies have only focused on how patient characteristics can be used to guide treatment,
neglecting the potentially important role of shared familial factors (including genetics).
1.4.4. Shared familial factors and the response to increased physical activity
Understanding how shared familial factors influence the response to treatment for individuals
with LBP, particularly chronic LBP, might explain why some individuals fail to respond to a
particular intervention and could even influence the direction of treatment. For example, if
shared familial factors dictate how individuals with chronic LBP respond to increased
physical activity this would have implications for changing modifiable training parameters
(e.g. frequency, intensity, duration) or for selecting alternative management strategies in
scenarios where an individual fails to respond. Using an individual’s response to treatment to
modify therapy accordingly could be considered a flexible approach to the management of
chronic LBP, and may be more beneficial than basing the management of an individual’s
LBP on a rigid treatment protocol. Currently, no research has investigated how shared
familial factors influence the response to treatment in people with chronic LBP, although
20

there is research suggesting the responsiveness to regular physical activity is partially
influenced by shared familial factors in healthy adults190. Identical female twin pairs
performing an identical physical activity program demonstrate great variation in the amount
of weight lost between twin pairs but only a small amount of variation within twin pairs191.
Similarly, individual differences in the response of maximal oxygen uptake following an
exercise program is more variable between families than within families192. These results
suggest that factors shared within families, including genes, play a role in the response to a
physical activity intervention. However, prior to investigating whether the response to
increased physical activity for individuals with chronic LBP is influenced by shared familial
factors, we plan to evaluate the available evidence on how shared familial factors influence
the response to a physical activity intervention in healthy individuals. The sixth chapter of
this thesis presents the findings of a systematic review investigating the role of shared
familial factors (including genetics) in the response of body composition and
cardiorespiratory fitness following a physical activity intervention.
1.5. Physical activity interventions targeting pain self-efficacy for older people with
chronic low back pain
1.5.1 Importance of assessing pain self-efficacy
A potential shortcoming of trials investigating physical activity interventions for chronic LBP
is an overemphasis on outcomes related to pain and function74, 85, 91, while neglecting the
important role of pain self-efficacy. Pain self-efficacy is defined as an individual’s ability to
continue activities of daily living despite pain193 and has been shown to significantly
influence treatment outcomes in people with chronic pain194. Pain self-efficacy is closely
related to an individual’s ability to self-manage their pain, and given the importance of self-
management for people with chronic LBP83, targeting improvements in pain self-efficacy is
21

an important consideration. Pain self-efficacy is also a strong mediator accounting for how
pain leads to disability in people with LBP195. Therefore, given that people experiencing high
levels of disability are more likely to seek care for their LBP196, identifying interventions that
improve pain self-efficacy has the potential to support self-management in people with
chronic LBP and reduce the enormous financial burden of the condition29, 197.
1.5.2. Physical activity interventions for older people
The health benefits of physical activity for older people are enormous, with regular moderate-
intensity physical activity reducing the risk of mortality, coronary heart disease, stroke, type 2
diabetes, and falls198. Physical activity also has positive effects on musculoskeletal and
psychosocial health, and can help to preserve independence and quality of life as people
age109. Despite this, older people with chronic LBP have lower levels of overall physical
activity and are less likely to engage in regular strengthening exercise compared to pain-free
older people63, 114. Therefore, in light of the importance of targeting physical activity
interventions towards this population, it is inappropriate that older people are commonly
excluded from randomised controlled trials evaluating treatment options for chronic LBP72.
This is despite a rapidly aging population and evidence that the prevalence and disability
resulting from chronic LBP are the greatest amongst older people52, 53, 56, 71.
Physical activity interventions can reduce pain and increase function in older people with
chronic LBP, particularly interventions involving strengthening exercises94, 199. However,
poor adherence to unsupervised exercise programs85 has increased the need for these
programs to be supervised94, 200, which presents its own issues. Supervised exercise programs
are superior to unsupervised home exercises for improving pain and function in people with
chronic LBP94. However, attending supervised exercise programs can be problematic for
22
older people with disabling chronic LBP, who prefer a home-based exercise program that
does not require transport201. In addition, the need for on-going supervision will increase the
already enormous health-care costs accounted for by older people suffering chronic LBP70.
As one might suspect, increased adherence to a physical activity intervention is associated
with a more favourable outcome in people with chronic LBP178, and may explain why
supervised exercise programs are superior to unsupervised home exercise programs for
improving pain and function94. However, there are numerous factors that can improve
adherence to an unsupervised home-based exercise program, and these factors need to be
considered when designing physical activity interventions targeting self-management in older
people with chronic LBP. Adherence to an unsupervised home-based exercise program can
be improved in people with chronic LBP if they have a better understanding of their
condition, and the potential beneficial effects of home exercise202-204. In addition, people with
chronic LBP prefer a home-based exercise program that is simple, time-efficient, and
provides motivation to engage in exercises through video or audio instructions, real-time
feedback, and feedback on overall exercise performance203, 205. Incorporating this information
into the design and implementation of a physical activity intervention for people with chronic
LBP (particularly older people) has the potential to increase the capacity of this population to
manage their condition independently, and ultimately increase their pain self-efficacy. Self-
management is an on-going health-care priority for the management of chronic diseases and
has the potential to reduce health-care utilisation in older people with chronic LBP206.
Therefore, more research is needed on physical activity interventions that aim to increase
adherence to an unsupervised exercise program and improve pain self-efficacy through self-
management.
23
1.5.3. Video-game exercises targeting pain self-efficacy
Video-game exercises have been shown to increase adherence to unsupervised home-based
physical activity interventions200, and are already widely utilised in the management of some
neurological and musculoskeletal disorders207-209. Increased adherence is likely due to
improvements in patients’ motivation levels to complete the video-game exercises, which
may be due to video and audio instructions, real-time feedback, or feedback on overall
exercise performance203, 205. In addition, the ability to perform video-game exercises at home
reduces the need to travel to clinics and is more time-efficient203. With this in mind, tailored
video-game exercises could be particularly useful for older people with chronic LBP as they
can be implemented at home and allow patients to more effectively self-manage their
condition. This has the potential to improve pain self-efficacy and reduce care seeking
behaviours in this population. The use of video-game exercises for the management of
chronic LBP is promising, with working-age adults demonstrating improvements in pain,
disability, fear avoidance, and quality of life following a video-game exercise program210, 211.
However, no randomised controlled trial has investigated changes in pain self-efficacy and
other clinical outcomes (e.g. pain and function) following an unsupervised video-game
exercise program in older people with chronic LBP. The seventh chapter of this thesis
outlines the protocol for a pilot randomised controlled trial investigating the feasibility of a
home-based video-game exercise program aimed at improving pain self-efficacy in older
people with chronic LBP. The eighth chapter of this thesis presents the results of this study.
1.6. Aims of thesis
The broad aims of this thesis are to investigate the role of shared familial factors in the
development of LBP, and in the recovery and management of chronic LBP; and to investigate
24
a novel home-based exercise program for older people with chronic LBP. The specific aims
of this thesis are to:
i) Investigate the relationship between LBP and educational attainment, physical
activity, and the built environment, while using a co-twin design to control for the
confounding effects of genetics and shared environmental factors
ii) Investigate the role of shared familial factors in the recovery from chronic LBP
iii) Investigate the role of shared familial factors in the response to increased physical
activity in healthy adults
iv) Investigate the feasibility and clinical effects of a home-based video-game
exercise program for older people with chronic LBP
25

1.7. References
1. Vos T, Abajobir AA, Abate KH, et al. Global, regional, and national incidence,
prevalence, and years lived with disability for 328 diseases and injuries for 195 countries,
1990–2016: a systematic analysis for the Global Burden of Disease Study 2016. Lancet.
2017;390(10100):1211-59.
2. Dionne CE, Dunn KM, Croft PR, et al. A consensus approach toward the
standardization of back pain definitions for use in prevalence studies. Spine. 2008;33(1):95-
103.
3. Brunner F, Weiser S, Schmid A, et al. Non-specific Low Back Pain. In: Boos N, Aebi
M, editors. Spinal Disorders: Fundamentals of Diagnosis and Treatment. Berlin, Heidelberg:
Springer Berlin Heidelberg; 2008. p. 585-601.
4. Koes BW, van Tulder MW, Peul WC. Diagnosis and treatment of sciatica. BMJ.
2007;334(7607):1313-7.
5. Deyo RA, Tsui-Wu YJ. Descriptive epidemiology of low-back pain and its related
medical care in the United States. Spine. 1987;12(3):264-8.
6. Henschke N, Maher CG, Refshauge KM, et al. Prevalence of and screening for
serious spinal pathology in patients presenting to primary care settings with acute low back
pain. Arthritis Rheum. 2009;60(10):3072-80.
7. Henschke N, Maher CG, Refshauge KM. Screening for malignancy in low back pain
patients: a systematic review. Eur Spine J. 2007;16(10):1673-9.
8. Sukthankar A, Nerlich AG, Paesold G. Age-Related Changes of the Spine. In: Boos
N, Aebi M, editors. Spinal Disorders: Fundamentals of Diagnosis and Treatment. Berlin,
Heidelberg: Springer Berlin Heidelberg; 2008. p. 91-122.
9. Petersen T, Laslett M, Juhl C. Clinical classification in low back pain: best-evidence
diagnostic rules based on systematic reviews. BMC Musculoskelet Disord. 2017;18(1):188.
26

10. Deyo RA, Mirza SK, Turner JA, et al. Overtreating chronic back pain: time to back
off? J Am Board Fam Med. 2009;22(1):62-8.
11. Jarvik JG, Hollingworth W, Heagerty PJ, et al. Three-year incidence of low back pain
in an initially asymptomatic cohort: clinical and imaging risk factors. Spine.
2005;30(13):1541-8; discussion 9.
12. Kamper SJ, Apeldoorn AT, Chiarotto A, et al. Multidisciplinary biopsychosocial
rehabilitation for chronic low back pain: Cochrane systematic review and meta-analysis.
BMJ. 2015;350:h444.
13. Wertli MM, Eugster R, Held U, et al. Catastrophizing-a prognostic factor for outcome
in patients with low back pain: a systematic review. Spine J. 2014;14(11):2639-57.
14. Pinheiro MB, Ferreira ML, Refshauge K, et al. Symptoms of Depression and Risk of
New Episodes of Low Back Pain: A Systematic Review and Meta-Analysis. Arthritis Care
Res. 2015;67(11):1591-603.
15. Brinjikji W, Luetmer PH, Comstock B, et al. Systematic literature review of imaging
features of spinal degeneration in asymptomatic populations. Am J Neuroradiol.
2015;36(4):811-6.
16. Savage RA, Whitehouse GH, Roberts N. The relationship between the magnetic
resonance imaging appearance of the lumbar spine and low back pain, age and occupation in
males. Eur Spine J. 1997;6(2):106-14.
17. Brinjikji W, Diehn FE, Jarvik JG, et al. MRI Findings of Disc Degeneration are More
Prevalent in Adults with Low Back Pain than in Asymptomatic Controls: A Systematic
Review and Meta-Analysis. Am J Neuroradiol. 2015;36(12):2394-9.
18. Flynn TW, Smith B, Chou R. Appropriate use of diagnostic imaging in low back pain:
a reminder that unnecessary imaging may do as much harm as good. J Orthop Sports Phys
Ther. 2011;41(11):838-46.
27
19. McCullough BJ, Johnson GR, Martin BI, et al. Lumbar MR Imaging and Reporting
Epidemiology: Do Epidemiologic Data in Reports Affect Clinical Management? Radiology.
2012;262(3):941-6.
20. Chou R, Qaseem A, Snow V, et al. Diagnosis and treatment of low back pain: a joint
clinical practice guideline from the American College of Physicians and the American Pain
Society. Ann Intern Med. 2007;147(7):478-91.
21. Srinivas SV, Deyo RA, Berger ZD. Application of "less is more" to low back pain.
Arch Intern Med. 2012;172(13):1016-20.
22. Wong AY, Parent EC, Funabashi M, et al. Do changes in transversus abdominis and
lumbar multifidus during conservative treatment explain changes in clinical outcomes related
to nonspecific low back pain? A systematic review. J Pain. 2014;15(4):377.e1-35.
23. Steffens D, Hancock MJ, Pereira LS, et al. Do MRI findings identify patients with
low back pain or sciatica who respond better to particular interventions? A systematic review.
Eur Spine J. 2016;25(4):1170-87.
24. Chou R, Qaseem A, Snow V, et al. Diagnosis and treatment of low back pain: A joint
clinical practice guideline from the american college of physicians and the american pain
society. Ann Intern Med. 2007;147(7):478-91.
25. Kassebaum NJ, Arora M, Barber RM, et al. Global, regional, and national disability-
adjusted life-years (DALYs) for 315 diseases and injuries and healthy life expectancy
(HALE), 1990-2015: a systematic analysis for the Global Burden of Disease Study 2015.
Lancet. 2016;388(10053):1603-1658.
26. Gore M, Sadosky A, Stacey BR, et al. The burden of chronic low back pain: clinical
comorbidities, treatment patterns, and health care costs in usual care settings. Spine.
2012;37(11):E668-77.
28
27. Wenig CM, Schmidt CO, Kohlmann T, et al. Costs of back pain in Germany. Eur J
Pain. 2009;13(3):280-6.
28. Walker BF, Muller R, Grant WD. Low Back Pain in Australian Adults: The
Economic Burden. Asia Pac J Public Health. 2003;15(2):79-87.
29. Arthritis and Osteoporosis Victoria. A problem worth solving. The rising cost of
musculoskeletal conditions in Australia. Melbourne: Arthritis and Osteoporosis Victoria with
Deloitte Access Economics: 2013.
30. Luo X, Pietrobon R, Sun SX, et al. Estimates and patterns of direct health care
expenditures among individuals with back pain in the United States. Spine. 2004;29(1):79-86.
31. Martin BI, Deyo RA, Mirza SK, et al. Expenditures and health status among adults
with back and neck problems. JAMA. 2008;299(6):656-64.
32. Maniadakis N, Gray A. The economic burden of back pain in the UK. Pain.
2000;84(1):95-103.
33. Jones GT, Macfarlane GJ. Epidemiology of low back pain in children and
adolescents. Arch Dis Child. 2005;90(3):312-6.
34. Biering-Sorensen F, Thomsen CE, Hilden J. Risk indicators for low back trouble.
Scand J Rehabil Med. 1989;21(3):151-7.
35. Bener A, Alwash R, Gaber T, et al. Obesity and low back pain. Coll Antropol.
2003;27(1):95-104.
36. Picavet HS, Schouten JS, Smit HA. Prevalence and consequences of low back
problems in The Netherlands, working vs non-working population, the MORGEN-Study.
Monitoring Project on Risk Factors for Chronic Disease. Public Health. 1999;113(2):73-7.
37. Picavet HS, Schouten JS. Musculoskeletal pain in the Netherlands: prevalences,
consequences and risk groups, the DMC(3)-study. Pain. 2003;102(1-2):167-78.
29
38. Santos-Eggimann B, Wietlisbach V, Rickenbach M, et al. One-year prevalence of low
back pain in two Swiss regions: estimates from the population participating in the 1992-1993
MONICA project. Spine. 2000;25(19):2473-9.
39. Hoy D, Brooks P, Blyth F, et al. The Epidemiology of low back pain. Best Pract Res
Clin Rheumatol. 2010;24(6):769-781.
40. Heuch I, Foss IS. Acute low back usually resolves quickly but persistent low back
pain often persists. J Physiother. 2013;59(2):127.
41. da Silva T, Mills K, Brown BT, et al. Risk of Recurrence of Low Back Pain: A
Systematic Review. J Orthop Sports Phys Ther. 2017;47(5):305-13.
42. Kongsted A, Kent P, Axen I, et al. What have we learned from ten years of trajectory
research in low back pain? BMC Musculoskelet Disord. 2016;17(1):220.
43. Dunn KM, Campbell P, Jordan KP. Long-term trajectories of back pain: cohort study
with 7-year follow-up. BMJ Open. 2013;3.
44. Frymoyer JW, Cats-Baril WL. An overview of the incidences and costs of low back
pain. Orthop Clin North Am. 1991;22(2):263-71.
45. Becker A, Held H, Redaelli M, et al. Low back pain in primary care: costs of care and
prediction of future health care utilization. Spine. 2010;35(18):1714-20.
46. Katz JN. Lumbar disc disorders and low-back pain: socioeconomic factors and
consequences. J Bone Joint Surg Am. 2006;88 Suppl 2:21-4.
47. Cedraschi C, Robert J, Goerg D, et al. Is chronic non-specific low back pain chronic?
Definitions of a problem and problems of a definition. Br J Gen Pract. 1999;49(442):358-
362.
48. Waddell G. The Back Pain Revolution. Edinburgh: Churchill Livingstone; 1998.
30
49. Künzel HE, Boos N. Pathways of Spinal Pain. In: Boos N, Aebi M, editors. Spinal
Disorders: Fundamentals of Diagnosis and Treatment. Berlin, Heidelberg: Springer Berlin
Heidelberg; 2008. p. 123-51.
50. Global recommendations on physical activity for health. Geneva: World Health
Organization; http://apps.who.int/iris/bitstream/10665/44399/1/9789241599979_eng.pdf.
Accessed 15th February 2016.
51. Australian Institute of Health and Welfare (AIHW). Older Austrlia at a glance. 2017.
http://www.aihw.gov.au/ageing/older-australia-at-a-glance/#toc. Accessed 5th May 2017.
52. Dionne CE, Dunn KM, Croft PR. Does back pain prevalence really decrease with
increasing age? A systematic review. Age Ageing. 2006;35(3):229-34.
53. Hoy D, March L, Brooks P, et al. The global burden of low back pain: estimates from
the Global Burden of Disease 2010 study. Ann Rheum Dis. 2014;73(6):968-74.
54. Lawrence RC, Helmick CG, Arnett FC, et al. Estimates of the prevalence of arthritis
and selected musculoskeletal disorders in the United States. Arthritis Rheum. 1998;41(5):778-
99.
55. Loney PL, Stratford PW. The prevalence of low back pain in adults: a methodological
review of the literature. Phys Ther. 1999;79(4):384-96.
56. Buchbinder R, Blyth FM, March LM, et al. Placing the global burden of low back
pain in context. Best Pract Res Clin Rheumatol. 2013;27(5):575-589.
57. Docking RE, Fleming J, Brayne C, et al. Epidemiology of back pain in older adults:
prevalence and risk factors for back pain onset. Rheumatol. 2011;50(9):1645-53.
58. Stewart Williams J, Ng N, Peltzer K, et al. Risk Factors and Disability Associated
with Low Back Pain in Older Adults in Low- and Middle-Income Countries. Results from the
WHO Study on Global AGEing and Adult Health (SAGE). PLoS One. 2015;10(6):e0127880.
31
59. Freburger JK, Holmes GM, Agans RP, et al. The Rising Prevalence of Chronic Low
Back Pain. Arch Intern Med. 2009;169(3):251-8.
60. Scheele J, Enthoven WT, Bierma-Zeinstra SM, et al. Course and prognosis of older
back pain patients in general practice: a prospective cohort study. Pain. 2013;154(6):951-7.
61. Deyo RA, Bryan M, Comstock BA, et al. Trajectories of symptoms and function in
older adults with low back disorders. Spine. 2015;40(17):1352-62.
62. Pereira LS, Sherrington C, Ferreira ML, et al. Self-reported chronic pain is associated
with physical performance in older people leaving aged care rehabilitation. Clin Interv Aging.
2014;9:259-265.
63. Griffin DW, Harmon DC, Kennedy NM. Do patients with chronic low back pain have
an altered level and/or pattern of physical activity compared to healthy individuals? A
systematic review of the literature. Physiotherapy. 2012;98(1):13-23.
64. Sions JM, Coyle PC, Velasco TO, et al. Multifidi Muscle Characteristics and Physical
Function Among Older Adults With and Without Chronic Low Back Pain. Arch Phys Med
Rehabil. 2017;98(1):51-7.
65. Coyle PC, Velasco T, Sions JM, et al. Lumbar Mobility and Performance-Based
Function: An Investigation in Older Adults with and without Chronic Low Back Pain. Pain
Med. 2017;18(1):161-8.
66. Hartvigsen J, Frederiksen H, Christensen K. Back and neck pain in seniors—
prevalence and impact. Eur Spine J. 2006;15(6):802-6.
67. Leveille SG, Guralnik JM, Hochberg M, et al. Low back pain and disability in older
women: independent association with difficulty but not inability to perform daily activities. J
Gerontol A Biol Sci Med Sci. 1999;54(10):M487-93.
32

68. Yagci N, Cavlak U, Aslan UB, et al. Relationship between balance performance and
musculoskeletal pain in lower body comparison healthy middle aged and older adults. Arch
Gerontol Geriatr. 2007;45(1):109-19.
69. Champagne A, Prince F, Bouffard V, et al. Balance, Falls-Related Self-Efficacy, and
Psychological Factors amongst Older Women with Chronic Low Back Pain: A Preliminary
Case-Control Study. Rehabil Res Pract. 2012;2012:430374.
70. Lazkani A, Delespierre T, Bauduceau B, et al. Healthcare costs associated with
elderly chronic pain patients in primary care. Eur J Clin Pharmacol. 2015;71(8):939-47.
71. Department of Economic and Social Affairs Population Division. World population
ageing 2009. New York: United Nations Publication; 2010.
72. Paeck T, Ferreira ML, Sun C, et al. Are older adults missing from low back pain
clinical trials? A systematic review and meta-analysis. Arthritis Care Res. 2014;66(8):1220-
6.
73. Steffens D, Maher CG, Pereira LS, et al. Prevention of Low Back Pain: A Systematic
Review and Meta-analysis. JAMA Intern Med. 2016;176(2):199-208.
74. Choi BK, Verbeek JH, Tam WW, et al. Exercises for prevention of recurrences of
low-back pain. Cochrane Database Syst Rev. 2010(1):CD006555.
75. Bigos SJ, Holland J, Holland C, et al. High-quality controlled trials on preventing
episodes of back problems: systematic literature review in working-age adults. Spine J.
2009;9(2):147-68.
76. Shorthouse FM, Roffi V, Tack C. Effectiveness of educational materials to prevent
occupational low back pain. Occup Med. 2016;66(8):623-9.
77. Driessen MT, Proper KI, Anema JR, et al. The effectiveness of participatory
ergonomics to prevent low-back and neck pain--results of a cluster randomized controlled
trial. Scand J Work Environ Health. 2011;37(5):383-93.
33
78. Linton SJ, van Tulder MW. Preventive interventions for back and neck pain
problems: what is the evidence? Spine. 2001;26(7):778-87.
79. Chuter V, Spink M, Searle A, et al. The effectiveness of shoe insoles for the
prevention and treatment of low back pain: a systematic review and meta-analysis of
randomised controlled trials. BMC Musculoskelet Disord. 2014;15:140.
80. Brunner E, De Herdt A, Minguet P, et al. Can cognitive behavioural therapy based
strategies be integrated into physiotherapy for the prevention of chronic low back pain? A
systematic review. Disabil Rehabil. 2013;35(1):1-10.
81. Traeger AC, Moseley GL, Hubscher M, et al. Pain education to prevent chronic low
back pain: a study protocol for a randomised controlled trial. BMJ Open. 2014;4(6):e005505.
82. Koes BW, van Tulder M, Lin C-WC, et al. An updated overview of clinical guidelines
for the management of non-specific low back pain in primary care. Eur Spine J.
2010;19(12):2075-94.
83. National Institute for Health and Care Excellence (NICE) Guidelines. Low back pain
and sciatica in over 16s: assessment and management. November 2016.
https://www.nice.org.uk/guidance/ng59. Accessed 5th December 2017.
84. Qaseem A, Wilt TJ, McLean RM, Forciea M, for the Clinical Guidelines Committee
of the American College of P. Noninvasive treatments for acute, subacute, and chronic low
back pain: A clinical practice guideline from the american college of physicians. Ann Intern
Med. 2017;166(7):514-30.
85. van Middelkoop M, Rubinstein SM, Verhagen AP, et al. Exercise therapy for chronic
nonspecific low-back pain. Best Pract Res Clin Rheumatol. 2010;24(2):193-204.
86. Bronfort G, Haas M, Evans RL, et al. Efficacy of spinal manipulation and
mobilization for low back pain and neck pain: a systematic review and best evidence
synthesis. Spine J. 2004;4(3):335-56.
34
87. Cherkin DC, Anderson ML, Sherman KJ, et al. Two-Year Follow-up of a
Randomized Clinical Trial of Mindfulness-Based Stress Reduction vs Cognitive Behavioral
Therapy or Usual Care for Chronic Low Back Pain. JAMA. 2017;317(6):642-4.
88. Khan M, Akhter S, Soomro RR, et al. The effectiveness of Cognitive Behavioral
Therapy (CBT) with general exercises versus general exercises alone in the management of
chronic low back pain. Pak J Pharm Sci. 2014;27(4 Suppl):1113-6.
89. Liddle SD, Gracey JH, Baxter GD. Advice for the management of low back pain: a
systematic review of randomised controlled trials. Man Ther. 2007;12(4):310-27.
90. Saragiotto BT, Maher CG, Yamato TP, et al. Motor Control Exercise for Nonspecific
Low Back Pain: A Cochrane Review. Spine. 2016;41(16):1284-95.
91. Ferreira ML, Ferreira PH, Latimer J, et al. Comparison of general exercise, motor
control exercise and spinal manipulative therapy for chronic low back pain: A randomized
trial. Pain. 2007;131(1-2):31-7.
92. Chou R, Deyo R, Friedly J, et al. AHRQ Comparative Effectiveness Reviews.
Noninvasive Treatments for Low Back Pain. Rockville (MD): Agency for Healthcare
Research and Quality (US); 2016.
93. Keller A, Hayden J, Bombardier C, et al. Effect sizes of non-surgical treatments of
non-specific low-back pain. Eur Spine J. 2007;16(11):1776-88.
94. Hayden JA, van Tulder MW, Tomlinson G. Systematic review: strategies for using
exercise therapy to improve outcomes in chronic low back pain. Ann Intern Med.
2005;142(9):776-85.
95. Vibe Fersum K, O'Sullivan P, Skouen JS, et al. Efficacy of classification-based
cognitive functional therapy in patients with non-specific chronic low back pain: a
randomized controlled trial. Eur J Pain. 2013;17(6):916-28.
35
96. Bystrom MG, Rasmussen-Barr E, Grooten WJ. Motor control exercises reduces pain
and disability in chronic and recurrent low back pain: a meta-analysis. Spine.
2013;38(6):E350-8.
97. Airaksinen O, Brox JI, Cedraschi C, et al. Chapter 4. European guidelines for the
management of chronic nonspecific low back pain. Eur Spine J. 2006;15 Suppl 2:S192-300.
98. Wells C, Kolt GS, Marshall P, et al. Effectiveness of Pilates exercise in treating
people with chronic low back pain: a systematic review of systematic reviews. BMC Med Res
Methodol. 2013;13:7.
99. Caspersen CJ, Powell KE, Christenson GM. Physical activity, exercise, and physical
fitness: definitions and distinctions for health-related research. Public Health Rep.
1985;100(2):126-31.
100. Vos T, Barber RM, Bell B, et al. Global, regional, and national incidence, prevalence,
and years lived with disability for 301 acute and chronic diseases and injuries in 188
countries, 1990-2013: a systematic analysis for the Global Burden of Disease Study 2013.
Lancet. 2015;386(9995):743-800.
101. Taylor JB, Goode AP, George SZ, et al. Incidence and risk factors for first-time
incident low back pain: a systematic review and meta-analysis. Spine J. 2014;14(10):2299-
319.
102. Sihawong R, Sitthipornvorakul E, Paksaichol A, et al. Predictors for chronic neck and
low back pain in office workers: a 1-year prospective cohort study. J Occup Health.
2016;58(1):16-24.
103. Shiri R, Karppinen J, Leino-Arjas P, et al. The association between obesity and low
back pain: a meta-analysis. Am J Epidemiol. 2010;171(2):135-54.
104. Heneweer H, Staes F, Aufdemkampe G, et al. Physical activity and low back pain: a
systematic review of recent literature. Eur Spine J. 2011;20(6):826-45.
36

105. Croft PR, Papageorgiou AC, Thomas E, et al. Short-term physical risk factors for new
episodes of low back pain. Prospective evidence from the South Manchester Back Pain
Study. Spine. 1999;24(15):1556-61.
106. Chou R, Shekelle P. Will this patient develop persistent disabling low back pain?
JAMA. 2010;303(13):1295-302.
107. Ramond A, Bouton C, Richard I, et al. Psychosocial risk factors for chronic low back
pain in primary care--a systematic review. Fam Pract. 2011;28(1):12-21.
108. Nelson ME, Rejeski WJ, Blair SN, et al. Physical activity and public health in older
adults: recommendation from the American College of Sports Medicine and the American
Heart Association. Med Sci Sports Exerc. 2007;39(8):1435-45.
109. Taylor AH, Cable NT, Faulkner G, et al. Physical activity and older adults: a review
of health benefits and the effectiveness of interventions. J Sports Sci. 2004;22(8):703-25.
110. Shiri R, Falah-Hassani K. Does leisure time physical activity protect against low back
pain? Systematic review and meta-analysis of 36 prospective cohort studies. Br J Sports Med.
2017;51(19):1410-8.
111. Cecchi F, Debolini P, Lova RM, et al. Epidemiology of back pain in a representative
cohort of Italian persons 65 years of age and older: the InCHIANTI study. Spine.
2006;31(10):1149-55.
112. Bjorck-van Dijken C, Fjellman-Wiklund A, Hildingsson C. Low back pain, lifestyle
factors and physical activity: a population based-study. J Rehabil Med. 2008;40(10):864-9.
113. Payne N, Gledhill N, Katzmarzyk PT, et al. Health-related fitness, physical activity,
and history of back pain. Can J Appl Physiol. 2000;25(4):236-49.
114. Kim W, Jin YS, Lee CS, et al. Relationship between the type and amount of physical
activity and low back pain in Koreans aged 50 years and older. PM&R. 2014;6(10):893-9.
37

115. Wright D, Barrow S, Fisher AD, et al. Influence of physical, psychological and
behavioural factors on consultations for back pain. Br J Rheumatol. 1995;34(2):156-61.
116. Junqueira DR, Ferreira ML, Refshauge K, et al. Heritability and lifestyle factors in
chronic low back pain: results of the Australian twin low back pain study (The AUTBACK
study). Eur J Pain. 2014;18(10):1410-8.
117. Shiri R, Solovieva S, Husgafvel-Pursiainen K, et al. The role of obesity and physical
activity in non-specific and radiating low back pain: the Young Finns study. Semin Arthritis
Rheum. 2013;42(6):640-50.
118. Andrusaitis SF, Oliveira RP, Barros Filho TE. Study of the prevalence and risk factors
for low back pain in truck drivers in the state of Sao Paulo, Brazil. Clinics (Sao Paulo,
Brazil). 2006;61(6):503-10.
119. Nassif H, Brosset N, Guillaume M, et al. Evaluation of a randomized controlled trial
in the management of chronic lower back pain in a French automotive industry: an
observational study. Arch Phys Med Rehabil. 2011;92(12):1927-36.e4.
120. Hagen EM, Odelien KH, Lie SA, et al. Adding a physical exercise programme to brief
intervention for low back pain patients did not increase return to work. Scand J Public
Health. 2010;38(7):731-8.
121. Kuukkanen T, Mälkiä E, Kautiainen H, et al. Effectiveness of a home exercise
programme in low back pain: a randomized five-year follow-up study. Physiother Res Int.
2007;12(4):213-24.
122. Sorensen PH, Bendix T, Manniche C, et al. An educational approach based on a non-
injury model compared with individual symptom-based physical training in chronic LBP. A
pragmatic, randomised trial with a one-year follow-up. BMC Musculoskelet Disord.
2010;11:212.
38

123. Bendix AE, Bendix T, Haestrup C, et al. A prospective, randomized 5-year follow-up
study of functional restoration in chronic low back pain patients. Eur Spine J. 1998;7(2):111-
9.
124. Schaller A, Dintsios CM, Icks A, et al. Promoting physical activity in low back pain
patients: six months follow-up of a randomised controlled trial comparing a multicomponent
intervention with a low intensity intervention. Clin Rehabil. 2016;30(9):865-77.
125. Frank LD, Schmid TL, Sallis JF, et al. Linking objectively measured physical activity
with objectively measured urban form: findings from SMARTRAQ. Am J Prev Med.
2005;28(2 Suppl 2):117-25.
126. Carr LJ, Dunsiger SI, Marcus BH. Validation of Walk Score for estimating access to
walkable amenities. Br J Sports Med. 2011;45(14):1144-8.
127. Carr LJ, Dunsiger SI, Marcus BH. Walk score as a global estimate of neighborhood
walkability. Am J Prev Med. 2010;39(5):460-3.
128. Hubscher M, Ferreira ML, Junqueira DR, et al. Heavy domestic, but not recreational,
physical activity is associated with low back pain: Australian Twin low BACK pain
(AUTBACK) study. Eur Spine J. 2014.
129. Matsui H, Maeda A, Tsuji H, et al. Risk indicators of low back pain among workers in
Japan. Association of familial and physical factors with low back pain. Spine.
1997;22(11):1242-7; discussion 8.
130. van Oostrom SH, Verschuren M, de Vet HC, et al. Longitudinal associations between
physical load and chronic low back pain in the general population: the Doetinchem Cohort
Study. Spine. 2012;37(9):788-96.
131. Liira JP, Shannon HS, Chambers LW, et al. Long-term back problems and physical
work exposures in the 1990 Ontario Health Survey. Am J Public Health. 1996;86(3):382-7.
39

132. Sterud T, Tynes T. Work-related psychosocial and mechanical risk factors for low
back pain: a 3-year follow-up study of the general working population in Norway. Occup
Environ Med. 2012;70(5):296-302.
133. Heuch I, Heuch I, Hagen K, et al. Physical activity level at work and risk of chronic
low back pain: A follow-up in the Nord-Trondelag Health Study. PLoS One.
2017;12(4):e0175086.
134. Dionne CE, Von Korff M, Koepsell TD, et al. Formal education and back pain: a
review. J Epidemiol Community Health. 2001;55(7):455-68.
135. Stronks K, van de Mheen H, van den Bos J, et al. The interrelationship between
income, health and employment status. Int J Epidemiol. 1997;26(3):592-600.
136. Schmidt CO, Raspe H, Pfingsten M, et al. Back pain in the German adult population:
prevalence, severity, and sociodemographic correlates in a multiregional survey. Spine.
2007;32(18):2005-11.
137. Latza U, Kohlmann T, Deck R, et al. Influence of occupational factors on the relation
between socioeconomic status and self-reported back pain in a population-based sample of
German adults with back pain. Spine. 2000;25(11):1390-7.
138. Stranjalis G, Tsamandouraki K, Sakas DE, et al. Low back pain in a representative
sample of Greek population: analysis according to personal and socioeconomic
characteristics. Spine. 2004;29(12):1355-60; discussion 61.
139. Thelin A, Holmberg S, Thelin N. Functioning in neck and low back pain from a 12-
year perspective: a prospective population-based study. J Rehabil Med. 2008;40(7):555-61.
140. Hagen KB, Tambs K, Bjerkedal T. What mediates the inverse association between
education and occupational disability from back pain?--A prospective cohort study from the
Nord-Trondelag health study in Norway. Soc Sci Med. 2006;63(5):1267-75.
40

141. Deyo RA, Tsui-Wu YJ. Functional disability due to back pain. A population-based
study indicating the importance of socioeconomic factors. Arthritis Rheum.
1987;30(11):1247-53.
142. Croft PR, Rigby AS. Socioeconomic influences on back problems in the community
in Britain. J Epidemiol Community Health. 1994;48(2):166-70.
143. Reisbord LS, Greenland S. Factors associated with self-reported back-pain
prevalence: a population-based study. J Chronic Dis. 1985;38(8):691-702.
144. Clausen T, Andersen LL, Holtermann A, et al. Do self-reported psychosocial working
conditions predict low back pain after adjustment for both physical work load and depressive
symptoms? A prospective study among female eldercare workers. Occup Environ Med.
2013;70(8):538-44.
145. Silventoinen K, Rokholm B, Kaprio J, et al. The genetic and environmental influences
on childhood obesity: a systematic review of twin and adoption studies. Int J Obes.
2010;34(1):29-40.
146. Ferreira PH, Beckenkamp P, Maher CG, et al. Nature or nurture in low back pain?
Results of a systematic review of studies based on twin samples. Eur J Pain. 2012;17(7):957-
71.
147. de Vilhena e Santos DM, Katzmarzyk PT, Seabra AF, et al. Genetics of physical
activity and physical inactivity in humans. Behav Genet. 2012;42(4):559-78.
148. Colodro-Conde L, Rijsdijk F, Tornero-Gómez MJ, Sánchez-Romera JF, et al.
Equality in Educational Policy and the Heritability of Educational Attainment. PLoS One.
2015;10(11):e0143796.
149. Duncan GE, Dansie EJ, Strachan E, et al. Genetic and environmental influences on
residential location in the US. Health & Place. 2012;18(3):515-9.
41
150. Hestbaek L, Leboeuf-Yde C, Kyvik KO. Are lifestyle-factors in adolescence
predictors for adult low back pain? A cross-sectional and prospective study of young twins.
BMC Musculoskelet Disord. 2006;7:27-.
151. Leboeuf-Yde C, Kyvik KO, Bruun NH. Low back pain and lifestyle. Part II--Obesity.
Information from a population-based sample of 29,424 twin subjects. Spine. 1999;24(8):779-
83; discussion 83-4.
152. MacGregor AJ, Andrew T, Sambrook PN, et al. Structural, psychological, and genetic
influences on low back and neck pain: A study of adult female twins. Arthritis Care Res.
2004;51(2):160-7.
153. Leboeuf-Yde C, Kyvik KO, Bruun NH. Low back pain and lifestyle. Part I: Smoking.
Information from a population-based sample of 29,424 twins. Spine. 1998;23(20):2207-13;
discussion 14.
154. Dario AB, Ferreira ML, Refshauge KM, et al. The relationship between obesity, low
back pain, and lumbar disc degeneration when genetics and the environment are considered: a
systematic review of twin studies. Spine J. 2015;15(5):1106-17.
155. Hubscher M, Ferreira ML, Junqueira DR, et al. Heavy domestic, but not recreational,
physical activity is associated with low back pain: Australian Twin low BACK pain
(AUTBACK) study. Eur Spine J. 2014;23(10):2083-9.
156. Pinheiro MB, Ferreira ML, Refshauge K, et al. Genetics and the environment affect
the relationship between depression and low back pain: a co-twin control study of Spanish
twins. Pain. 2015;156(3):496-503.
157. Burton AK, Balague F, Cardon G, et al. Chapter 2. European guidelines for
prevention in low back pain: November 2004. Eur Spine J. 2006;15 Suppl 2:S136-68.
42
158. Kujala UM, Kaprio J, Koskenvuo M. Modifiable risk factors as predictors of all-cause
mortality: the roles of genetics and childhood environment. Am J Epidemiol.
2002;156(11):985-93.
159. Hartvigsen L, Kongsted A, Hestbaek L. Clinical examination findings as prognostic
factors in low back pain: a systematic review of the literature. Chiropr Man Therap.
2015;23:13.
160. Verkerk K, Luijsterburg PA, Miedema HS, et al. Prognostic factors for recovery in
chronic nonspecific low back pain: a systematic review. Phys Ther. 2012;92(9):1093-108.
161. da CMCL, Maher CG, Hancock MJ, et al. The prognosis of acute and persistent low-
back pain: a meta-analysis. CMAJ. 2012;184(11):E613-24.
162. Gregg CD, McIntosh G, Hall H, et al. Prognostic factors associated with low back
pain outcomes. J Prim Health Care. 2014;6(1):23-30.
163. Heymans MW, van Buuren S, Knol DL, et al. The prognosis of chronic low back pain
is determined by changes in pain and disability in the initial period. Spine J.
2010;10(10):847-56.
164. da Silva T, Macaskill P, Mills K, et al. Predicting recovery in patients with acute low
back pain: A Clinical Prediction Model. Eur J Pain. 2017;21(4):716-26.
165. Verkerk K, Luijsterburg PA, Pool-Goudzwaard A, Heymans MW, et al. Prognosis
and course of work-participation in patients with chronic non-specific low back pain: a 12-
month follow-up cohort study. J Rehabil Med. 2015;47(9):854-9.
166. Hallegraeff JM, Krijnen WP, van der Schans CP, et al. Expectations about recovery
from acute non-specific low back pain predict absence from usual work due to chronic low
back pain: a systematic review. J Physiother. 2012;58(3):165-72.
167. Kuijer W, Groothoff JW, Brouwer S, et al. Prediction of sickness absence in patients
with chronic low back pain: a systematic review. J Occup Rehabil. 2006;16(3):439-67.
43

168. Hendrick P, Milosavljevic S, Hale L, et al. The relationship between physical activity
and low back pain outcomes: a systematic review of observational studies. Eur Spine J.
2011;20(3):464-74.
169. Wertli MM, Rasmussen-Barr E, Weiser S, Bachmann LM, et al. The role of fear
avoidance beliefs as a prognostic factor for outcome in patients with nonspecific low back
pain: a systematic review. Spine J. 2014;14(5):816-36.e4.
170. Hestbaek L, Iachine IA, Leboeuf-Yde C, et al. Heredity of low back pain in a young
population: a classical twin study. Twin Res. 2004;7(1):16-26.
171. El-Metwally A, Mikkelsson M, Stahl M, et al. Genetic and environmental influences
on non-specific low back pain in children: a twin study. Eur Spine J. 2008;17(4):502-8.
172. Karunanayake AL, Pathmeswaran A, Kasturiratne A, et al. Risk factors for chronic
low back pain in a sample of suburban Sri Lankan adult males. Int J Rheum Dis.
2013;16(2):203-10.
173. Matsudaira K, Konishi H, Miyoshi K, et al. Potential risk factors of persistent low
back pain developing from mild low back pain in urban Japanese workers. PLoS One.
2014;9(4):e93924.
174. Campbell P, Jordan KP, Smith BH, et al. Chronic pain in families: a cross-sectional
study of shared social, behavioural, and environmental influences. Pain. 2017 (Epub ahead of
print).
175. Fujii T, Matsudaira K, Oka H. Factors associated with fear-avoidance beliefs about
low back pain. J Orthop Sci. 2013;18(6):909-915.
176. Campbell P, Shraim M, Jordan KP, et al. In sickness and in health: A cross-sectional
analysis of concordance for musculoskeletal pain in 13,507 couples. Eur J Pain.
2016;20(3):438-46.
44
177. Shraim M, Blagojevic-Bucknall M, Mallen CD, et al. Repeated primary care
consultations for non-specific physical symptoms in children in UK: a cohort study. BMC
Fam Pract. 2014;15(1):195.
178. Cecchi F, Pasquini G, Paperini A, et al. Predictors of response to exercise therapy for
chronic low back pain: result of a prospective study with one year follow-up. Eur J Phys
Rehabil Med. 2014;50(2):143-51.
179. Kamper SJ, Maher CG, Hancock MJ, et al. Treatment-based subgroups of low back
pain: a guide to appraisal of research studies and a summary of current evidence. Best Pract
Res Clin Rheumatol. 2010;24(2):181-91.
180. Kent P, Keating J. Do primary-care clinicians think that nonspecific low back pain is
one condition? Spine. 2004;29(9):1022-31.
181. Beneciuk JM, Hill JC, Campbell P, et al. Identifying Treatment Effect Modifiers in
the STarT Back Trial: A Secondary Analysis. J Pain. 2017;18(1):54-65.
182. Stanton TR, Fritz JM, Hancock MJ, et al. Evaluation of a treatment-based
classification algorithm for low back pain: a cross-sectional study. Phys Ther.
2011;91(4):496-509.
183. Fritz JM, Cleland JA, Childs JD. Subgrouping patients with low back pain: evolution
of a classification approach to physical therapy. J Orthop Sports Phys Ther. 2007;37(6):290-
302.
184. Hicks GE, Fritz JM, Delitto A, et al. Preliminary development of a clinical prediction
rule for determining which patients with low back pain will respond to a stabilization exercise
program. Arch Phys Med Rehabil. 2005;86(9):1753-62.
185. Sahrmann S. Diagnosis and treatment of movement impairment syndromes: Elsevier
Health Sciences; 2002.
45

186. Karayannis NV, Jull GA, Hodges PW. Physiotherapy movement based classification
approaches to low back pain: comparison of subgroups through review and developer/expert
survey. BMC Musculoskelet Disord. 2012;13:24.
187. Henry SM, Van Dillen LR, Ouellette-Morton RH, et al. Outcomes are not different
for patient-matched versus nonmatched treatment in subjects with chronic recurrent low back
pain: a randomized clinical trial. Spine J. 2014;14(12):2799-810.
188. Haskins R, Osmotherly PG, Rivett DA. Diagnostic Clinical Prediction Rules for
Specific Subtypes of Low Back Pain: A Systematic Review. J Orthop Sports Phys Ther.
2015;45(2):61-76.
189. Saragiotto BT, Maher CG, Moseley AM, et al. A systematic review reveals that the
credibility of subgroup claims in low back pain trials was low. J Clin Epidemiol. 2016;79:3-9
190. Bouchard C, Rankinen T. Individual differences in response to regular physical
activity. Med Sci Sports Exerc. 2001;33(6 Suppl):S446-51; discussion S52-3.
191. Koenigstorfer J, Schmidt WF. Effects of exercise training and a hypocaloric diet on
female monozygotic twins in free-living conditions. Physiol Behav. 2011;104(5):838-44.
192. Bouchard C, An P, Rice T, et al. Familial aggregation of VO(2max) response to
exercise training: results from the HERITAGE Family Study. J Appl Physiol.
1999;87(3):1003-1008.
193. Nicholas MK. The pain self-efficacy questionnaire: Taking pain into account. Eur J
Pain. 2007;11(2):153-63.
194. Asghari A, Nicholas MK. Pain self-efficacy beliefs and pain behaviour. A prospective
study. Pain. 2001;94(1):85-100.
195. Lee H, Hubscher M, Moseley GL, et al. How does pain lead to disability? A
systematic review and meta-analysis of mediation studies in people with back and neck pain.
Pain. 2015.
46
196. Ferreira ML, Machado G, Latimer J, et al. Factors defining care-seeking in low back
pain--a meta-analysis of population based surveys. Eur J Pain. 2010;14(7):747.e1-7.
197. Carey TS, Evans A, Hadler N, et al. Care-seeking among individuals with chronic low
back pain. Spine. 1995;20(3):312-7.
198. Vogel T, Brechat PH, Leprêtre PM. Health benefits of physical activity in older
patients: a review. Int J Clin Pract. 2009;63.
199. Ishak NA, Zahari Z, Justine M. Effectiveness of Strengthening Exercises for the
Elderly with Low Back Pain to Improve Symptoms and Functions: A Systematic Review.
Scientifica. 2016;2016:10.
200. Beinart NA, Goodchild CE, Weinman JA, et al. Individual and intervention-related
factors associated with adherence to home exercise in chronic low back pain: a systematic
review. Spine J. 2013;13(12):1940-50.
201. Franco MR, Howard K, Sherrington C, et al. Eliciting older people's preferences for
exercise programs: a best-worst scaling choice experiment. J Physiother. 2015;61(1):34-41.
202. Escolar-Reina P, Medina-Mirapeix F, Gascon-Canovas JJ, et al. Self-management of
chronic neck and low back pain and relevance of information provided during clinical
encounters: an observational study. Arch Phys Med Rehabil. 2009;90(10):1734-9.
203. Escolar-Reina P, Medina-Mirapeix F, Gascon-Canovas JJ, et al. How do care-
provider and home exercise program characteristics affect patient adherence in chronic neck
and back pain: a qualitative study. BMC Health Serv Res. 2010;10:60.
204. Liddle SD, Baxter GD, Gracey JH. Chronic low back pain: patients' experiences,
opinions and expectations for clinical management. Disabil Rehabil. 2007;29(24):1899-909.
205. Jordan JL, Holden MA, Mason EE, et al. Interventions to improve adherence to
exercise for chronic musculoskeletal pain in adults. Cochrane Database Syst Rev.
2010(1):Cd005956.
47
206. Raven, M. PHCRIS Research Roundup: Patient-centred care and self-management
support in primary health care. 2015.
207. Betker AL, Desai A, Nett C, et al. Game-based exercises for dynamic short-sitting
balance rehabilitation of people with chronic spinal cord and traumatic brain injuries. Phys
Ther. 2007;87(10):1389-98.
208. Clark RA, Howells B, Feller J, et al. Clinic-based assessment of weight-bearing
asymmetry during squatting in people with anterior cruciate ligament reconstruction using
Nintendo Wii Balance Boards. Arch Phys Med Rehabil. 2014;95(6):1156-61.
209. Szturm T, Betker AL, Moussavi Z, et al. Effects of an interactive computer game
exercise regimen on balance impairment in frail community-dwelling older adults: a
randomized controlled trial. Phys Ther. 2011;91(10):1449-62.
210. Kim SS, Min WK, Kim JH, et al. The Effects of VR-based Wii Fit Yoga on Physical
Function in Middle-aged Female LBP Patients. J Phys Ther Sci. 2014;26(4):549-52.
211. Park JH, Lee SH, Ko DS. The Effects of the Nintendo Wii Exercise Program on
Chronic Work-related Low Back Pain in Industrial Workers. J Phys Ther Sci.
2013;25(8):985-8.
48
CHAPTER TWO
Are people with chronic low back pain meeting the physical activity
guidelines? A co-twin control study
Chapter Two has been published as:
Zadro JR, Shirley D, Amorim A, Pérez-Riquelme F, Ordoñana, JR, Ferreira, PH. Are people
with chronic low back pain meeting the physical activity guidelines? A co-twin control study.
The Spine Journal. 2017;17(6):845-854. Copyright © 2017 Elsevier Inc. All rights reserve.
Reprinted with permission from Elsevier.
49

Clinical Study
Are people with chronic low back pain meeting the physical activityguidelines? A co-twin control study
Joshua Robert Zadro, BAppSc (Phty) (Hons)a,*, Debra Shirley, PhDa,Anita Amorim, BPT (Hons)a, Francisco Pérez-Riquelme, MDb,c, Juan R. Ordoñana, PhDc,d,
Paulo H. Ferreira, PhDa
aDiscipline of Physiotherapy, Faculty of Health Sciences, The University of Sydney, 75 East St, Lidcombe, New South Wales, 2141, AustraliabMurcia Health Council, IMIB-Arrixaca, Ronda de Levante, 11, 30008, Murcia, Spain
cMurcia Institute for Biomedical Research, IMIB-Arrixaca, HCUVA Virgen de la Arrixaca, 30120, Murcia, SpaindMurcia Twin Registry, Department of Human Anatomy and Psychobiology, University of Murcia, Campus de Espinardo, 30100, Murcia, Spain
Received 17 August 2016; revised 20 December 2016; accepted 30 January 2017
Abstract BACKGROUND: Despite a large amount of research investigating physical activity (PA) levels inpeople with chronic low back pain (LBP), no study has investigated whether people with chronicLBP are meeting the World Health Organization (WHO) PA guidelines. Furthermore, with geneticsand the early shared environment substantially influencing the presence of LBP and PA engagement,these factors could confound the association between LBP and PA and need to be controlled for.PURPOSE: This study aimed to investigate the association between chronic LBP and meeting thePA guidelines, while controlling for the effects of genetics and early shared environment.DESIGN: This is a cross-sectional co-twin control study.PATIENT SAMPLE: A cross-sectional analysis was performed on 1,588 twins from the MurciaTwin Registry in Spain with available data on LBP and PA from the 2013 data collection wave.OUTCOME MEASURES: The exposure and outcome variables in our study were self-reported.Twins reporting a history of chronic LBP were asked follow-up questions to inform on the presenceof recent LBP (within the past 4 weeks), previous LBP (no pain within the past 4 weeks), and per-sistent LBP (no pain-free month in the last 6 months). These were our exposure variables. Our outcomevariable was meeting the WHO PA guidelines, which involved at least 75 minutes of vigorous-intensity PA, or at least 150 minutes of moderate-intensity PA per week.METHODS: To investigate the association between chronic LBP and meeting the PA guidelines,we first performed a multivariate logistic regression on the total sample of twins. Co-variables enteredthe model if the univariate association between the co-variable, and both the exposure and the outcomereached a significance of p<.2. Second, to adjust for the influence of genetics and early shared en-vironment, we performed a conditional multivariate logistic regression on complete twin pairs discordantfor LBP. The Murcia Twin Registry is supported by Fundación Séneca, Regional Agency for Scienceand Technology, Murcia, Spain (08633/PHCS/08 and 15302/PHCS/10) and the Ministry of Scienceand Innovation, Spain (PSI11560-2009). Funding for this project has also been received from FundaciónMAPFRE (2012). The authors declare that there are no conflicts of interest.RESULTS: There was a significant inverse association between recent LBP and meeting the PAguidelines (odds ratio [OR]=0.71, p=.034). When controlling for genetics and early shared environ-ment, this association disappeared. There was no association between previous (OR=0.95, p=.779)or persistent LBP (OR=0.78, p=.192) and meeting the PA guidelines.
FDA device/drug status: Not applicable.Author disclosures: JRZ: Nothing to disclose. DS: Nothing to dis-
close. AA: Nothing to disclose. FP-R: Nothing to disclose. JRO: Nothingto disclose. PHF: Nothing to disclose.
The Murcia Twin Registry is supported by Fundación Séneca, Region-al Agency for Science and Technology, Murcia, Spain (08633/PHCS/08 and
15302/PHCS/10) and the Ministry of Science and Innovation, Spain(PSI11560-2009). Funding for this project has also been received fromFundación MAPFRE (2012).
* Corresponding author. Faculty of Health Sciences, University ofSydney, PO Box 170, Lidcombe 1825 Australia. Tel.: 0449 906 121.
E-mail address: [email protected] (J.R. Zadro)
http://dx.doi.org/10.1016/j.spinee.2017.01.0151529-9430/© 2017 Elsevier Inc. All rights reserved.
The Spine Journal 17 (2017) 845–854
50
CONCLUSION: Twins with recent LBP are less likely to meet the PA guidelines than those withno history of chronic LBP, highlighting the importance of incorporating PA promotion in the treat-ment of these individuals. Genetics and early shared environment appear to be confounding theassociation between LBP and PA, although this needs to be further tested in larger twinsamples. © 2017 Elsevier Inc. All rights reserved.
Keywords: Early shared environment; Genetics; Low back pain; Murcia Twin Registry; Physical activity guidelines; Twinstudy
Introduction
Low back pain (LBP) is a worldwide problem, contrib-uting to the highest number of years lived with disabilityamong all musculoskeletal conditions [1]. LBP has a largefinancial impact, significantly burdening economies through-out the world [2,3], with the estimated cost being as high as€300 billion for Europe [2]. Physical activity (PA) is one ofthe most important aspects for maintaining optimal health [4–6]and is also recommended in evidence-based clinical guide-lines for the management of chronic LBP [7]. Recentguidelines outline PA recommendations to improve cardio-respiratory fitness and reduce the risk of non-communicablediseases (eg cardiovascular disease) [8]. These guidelines rec-ommend a minimum of 150 minutes of moderate-intensityPA, or 75 minutes of vigorous-intensity PA per week, accu-mulated in multiple bouts. However, an astonishing one infour adults worldwide are failing to meet these guidelines [8],with individuals experiencing chronic conditions, such as kneeand hip osteoarthritis, even less likely to meet the guide-lines [9]. Considering the high prevalence and associateddisability of chronic LBP [1], it is important to determine whatproportions of individuals with chronic LBP are meeting theseguidelines. This information will have important implica-tions for incorporating PA promotion into the treatment ofthese individuals.
Despite numerous studies investigating the relationshipbetween LBP and PA, no study to date has investigated whetherindividuals with chronic LBP are more or less likely to meetthe PA guidelines than the pain-free population [10]. Further-more, there appears to be a considerable amount of confusionin the literature regarding activity levels in individuals withchronic LBP. Some studies report that individuals with chronicLBP have reduced levels of PA (eg sports participation, rec-reational exercise) compared with the pain-free population[11–13], whereas others found that both groups have eithergreater [14,15] or similar levels of PA [16–18]. Taking intoaccount the different presentations of LBP is important and mayhelp to explain some of these inconsistencies (eg chronicity,time since last episode, persistence); however, it may also behelpful to use a well-recognized definition of sufficient levelsof activity (PA guidelines) to better understand whether indi-viduals with different presentations of chronic LBP aresufficiently active for the purpose of health promotion.
To get the clearest understanding of the relationship betweenchronic LBP and meeting the PA guidelines, it is importantto consider the effects of genetics and early shared environ-
ment. Genetics substantially contributes to the variance of LBPand PA, with heritability estimates being as high as 67% forthe presence of chronic and disabling LBP [19], and 85% forthe engagement in PA [20]. In addition, the importance of ad-justing for genetics and early shared environment has beenhighlighted in a previous study investigating the relation-ship between LBP and PA [16].
The aim of this cross-sectional study is to investigate whatproportion of individuals with various presentations of chronicLBP are meeting the PA guidelines, and to investigate the as-sociation between these variables using a co-twin controldesign to adjust for the effects of genetics and early sharedenvironment.
Methods
Participants and data collection
Data for this study were derived from a sample of adulttwins born between 1940 and 1966 from the Murcia TwinRegistry (MTR). The MTR has gathered information fromthe twins in three waves: 2007, 2009–2011, and 2013. De-tailed information regarding the data collection proceduresand registry characteristics can be found elsewhere [21]. Par-ticipants completed a health-related questionnaire via face-to-face or telephone interview, capturing information onanthropometrics, demographics, health history, and health be-haviors (eg PA, smoking).
Of the 2,148 adult twins registered in the MTR, there were1,613 twins who participated in the 2013 data collection wave,which included a detailed assessment of LBP and PA. Of thesetwins, 1,588 (98.5%) provided data on LBP and PA and wereincluded in our cross-sectional analyses. Assessors wereblinded to the exposures and outcome of this study, and theCommittee of Research Ethics of the University of Murciaapproved all registry and data collection procedures used inthe MTR.
Zygosity ascertainment
When DNA testing was not performed, twin zygosity wasascertained through a 12-item questionnaire focusing on thesimilarities between twins’ eye color, hair color, face color,and face form, as well as mistaken identity between twins.This questionnaire has demonstrated agreement with zygos-ity determined through DNA testing in nearly 96% of cases[21].
846 J.R. Zadro et al. / The Spine Journal 17 (2017) 845–854
51
Assessment of LBP
A comprehensive self-reported assessment of LBP was con-ducted in 2013 with questions regarding LBP derived fromstandardized definitions aimed to facilitate uniformity acrossobservational studies [22]. The presence of activity limitingchronic LBP was assessed by the following questions. First,participants were asked: “Have you ever suffered from chronicLBP?” Chronic LBP was described to participants as pain inthe lower back lasting for 6 months or longer, including sea-sonal and recurrent episodes. Participants responding “yes”were asked a follow-up question: “Was this pain bad enoughto limit your usual activities or change your daily routine formore than 1 day?” There were 442 twins who responded “yes”and 1,146 twins who responded “no” (total n=1,588). Par-ticipants responding “yes” were considered to have experiencedactivity limiting chronic LBP (hereafter referred to as chronicLBP), and were asked additional follow-up questions, formingthe LBP variables for this study.
Recent LBP“When was the last time you experienced LBP?” Partici-
pants selecting the response “within the past 4 weeks” wereconsidered to have recent LBP.
Previous LBPParticipants who did not experience LBP “within the past
4 weeks” were considered to have previous LBP.
Persistent LBP“How long has it been since you have had a whole month
pain free?” Participants selecting the response “7 months to3 years,” or “greater than 3 years” were considered to havepersistent LBP.
These variables were dichotomized with the comparisonbeing twins who had never experienced any chronic LBP(n=1,005).
Assessment of meeting the physical activity guidelines
The World Health Organization PA guidelines for adults aged18–64 (at the time data were collected for this study) recom-mend a minimum of either 150 minutes of moderate-intensityPA, 75 minutes of vigorous-intensity PA, or a combined 150minutes of moderate or vigorous-intensity PA per week, ac-cumulated in multiple bouts lasting at least 10 minutes [8]. Adetailed assessment of PA for this study was conducted in 2013,with questions adapted from the Active Australia Survey [23].Engagement in vigorous-intensity PA was determined by par-ticipants’ response to the following questions: “In the last week,how many times did you do any vigorous PA for at least 10minutes which made you breathe harder or puff and pant? (egrunning, cycling)” and “what do you estimate was the total timethat you spent doing this vigorous physical activity in the lastweek?” Engagement in moderate-intensity PA was deter-mined by participants’ response to the following set of questions:(1) “In the last week, how many times have you walked con-tinuously, for at least 10 minutes (to get to or from places, forrecreation or exercise)?” and “what do you estimate was thetotal time that you spent walking in this way in the last week?”;(2) “In the last week, how many times did you do any othermore moderate physical activities for at least 10 minutes thatyou have not already mentioned? (eg gentle swimming, socialtennis, golf)” and “what do you estimate was the total time thatyou spent doing these activities in the last week?” The orderin which participants were asked these questions indicates “mod-erate physical activities” would exclude walking, as this wasasked in a prior question. Because it is likely walking is acommon form of exercise in the Spanish population of this age,we included walking as a type of moderate-intensity PA despitebeing unable to assess intensity. Participants who engaged inat least 75 minutes of vigorous-intensity PA, or at least 150minutes of moderate-intensity PA, or at least 150 minutes ofcombined moderate and vigorous-intensity PA per week, onat least two separate occasions, were considered to have metthe PA guidelines.
Assessment of co-variables
We investigated potential confounding variables basedon previous studies in the field and data availability. The
ContextPhysical activity is recommended for persons with chroniclow back pain, yet the prevalence of engaging in recom-mended levels of activity overall and in comparison to pain-free populations is largely unknown.
ContributionThe authors analyzed data from Spain’s Murcia TwinRegistry to estimate crude and adjusted cross-sectional as-sociations between self-reported chronic low back pain andmeeting the World Health Organization’s physical activ-ity guidelines (150 minutes of moderate-intensity activityor 75 minutes of vigorous-intensity activity per week),finding similar guideline adherence for individuals withlow back pain histories but without current pain and thosewith no pain histories, but relatively less adherence forthose with chronic low back pain. This latter associationattenuated when adjusted for genetics and early sharedenvironment.
ImplicationsAlthough the findings suggest that genetics and sharedearly environment may be confounders of the back pain– physical activity association, the measures are self-reported, estimates imprecise, and the authors were not ableto consider pain intensity and many other factors likelyrelated to physical activity and pain.
847J.R. Zadro et al. / The Spine Journal 17 (2017) 845–854
52

co-variables included age, gender, zygosity, body mass index(BMI), smoking, and symptoms of depression or anxiety.Data on BMI were based on self-reported height and weight.Data on smoking were based on the Spanish National HealthSurvey Questionnaire [21] and was dichotomized as (1)ex-smoker or never smoked or (2) current smoker. Symp-toms of depression or anxiety were based on the depressionor anxiety domain of the EuroQol-5 dimension and wereassessed by participants selecting one of the following options:(1) I am not anxious or depressed; (2) I am moderatelyanxious or depressed; and (3) I am extremely anxious ordepressed. Responses were dichotomized as not depressedor anxious (1) and moderately or extremely depressed oranxious (2 and 3).
Analysis
We conducted descriptive analyses for all study vari-ables, describing continuous variables with means and standarddeviations (SD), and nominal variables with percentages. Theexposure variables were recent LBP, previous LBP, and per-sistent LBP, whereas the outcome variable was meeting thePA guidelines (Fig. 1).
Total sample analysis
We conducted univariate and multivariate logistic regres-sion analyses in the following sequence. First, we performedan unadjusted total sample analysis, including all complete andincomplete twin pairs, to explore the univariate associationsbetween LBP and meeting the PA guidelines. To determinewhich co-variables should be included in the adjusted totalsample analysis (multivariate model), we performed a univariatelogistic regression between the co-variables, and both the ex-posure and the outcomes. If the univariate association betweenco-variables, and both the exposure and the outcomes reacheda significance level of p<.2, these variables were adjusted forin the multivariate logistic regression models. This is a widelyused method to identify confounding variables for inclusionin the multivariate models [24–26]. Age and gender were forcedinto the multivariate models to facilitate comparison betweenthe total sample analysis and the within-pair case-control anal-ysis, in which age (all case-control analyses) and gender(analysis of identical twins only) are naturally adjusted for. Toaccount for the non-independence of twins, we used a robustsandwich estimator (cluster command in STATA), allowing usto control for observations that are independent across groups,but not necessarily within groups.
Fig. 1. STrengthening the Reporting of OBservational studies in Epidemiology (STROBE) flow diagram. LBP, low back pain; DZ, dizygotic; MZ, mono-zygotic; n, number of individual twins.
848 J.R. Zadro et al. / The Spine Journal 17 (2017) 845–854
53

Within-pair case-control analysis
If the association from the adjusted total sample analysisreached a significance level of <.2, we performed a within-pair case-control analysis to adjust for the influence of geneticsand early shared environment. The within-pair case-controlanalysis included complete twin pairs discordant for LBP status(ie one twin reported LBP but the co-twin did not). We ad-justed for potential confounding variables as described above,with gender forced into analyses including only dizygotic (DZ)twins. The adjustment for confounding variables deter-mined whether the analysis was univariate or multivariate.Because it is assumed twin pairs share similar environ-ments during childhood, all within-pair case-control analysesallow us to adjust for early shared environmental factors. First,we considered DZ and monozygotic (MZ) twin pairs in thesame analysis, to adjust for the influence of genetics and earlyshared environment. Second, to better understand the role ofgenetics, we stratified analyses by zygosity. DZ and MZ twinpairs share approximately 50% and 100% of their segregat-ing genes, respectively [27]. Therefore, considering only DZtwins allows us to adjust for 50% of genetics, whereas con-sidering only MZ twin pairs allows us to completely adjustfor genetic factors. In theory, when the association betweentwo variables (LBP and PA) maintains or increases in mag-nitude as we adjust for a greater proportion of genetics(particularly in MZ twins where the highest level of adjust-ment is implemented), this is likely consistent with a moredirect association between the two variables. Conversely, ifthe magnitude of the association decreases, this is more likelyconsistent with confounding. Analyses were conducted usingSTATA statistical software (StataCorp. 2013, Stata StatisticalSoftware: Release 13, Version 13.1, StataCorp LP, CollegeStation, TX, USA) with the significance level set at .05. Odds
ratios (OR) and 95% confidence intervals (CI) were calcu-lated from the regression models.
Results
There were 1,588 twins with data available on LBP and PAfrom the 2013 data collection wave. Of these twins, there were442 twins who reported chronic LBP at some point in their lifethat limited their daily activities for more than 1 day (27.8%),with 228 twins experiencing recent LBP (pain with the past 4weeks) and 209 twins reporting previous LBP (no pain withinthe past 4 weeks). Five twins failed to report when they ex-perienced their most recent episode of LBP. There were 155twins who reported having persistent LBP (no pain-free monthfor 7 months or longer). All of them had recent LBP. On theother hand, 73 twins experienced recent but not persistent LBP.The mean age (SD) of twins included in this study was 56.7(7.1), with 877 females (55.2%) and 554 MZ twins (34.9%).Further details regarding sample characteristics can be foundin Table 1. Zygosity was not adjusted for in any analysis as itwas not identified as a confounding variable using the methodspreviously described (see Assessment of co-variables section).
Meeting the PA guidelines
There were 962 twins (60.6%) who met the PA guide-lines, which is comparable with the estimate from the Spanishpopulation in 2011–2012 for adults aged between 18 and 69years (66.4%) [28]. There were 243 twins (55.0%) who re-ported a history of chronic LBP and met the PA guidelines(Table 2). When we considered the various phenotypes ofchronic LBP, there were 111 twins with recent LBP (48.7%),128 twins with previous LBP (61.2%), and 79 twins with per-sistent LBP (51.0%) who met the PA guidelines (Table 2).
Table 1Sample characteristics of twins who met the PA guidelines
Variables
Met the PA guidelines Did not meet the PA guidelines
Mean (SD) or n (%) Total Mean (SD) or n (%) Total
Confounding variablesAge (y) 56.9 (7.2) 961 56.4 (6.9) 627BMI 27.0 (4.0) 902 27.6 (4.7) 571Males 481 (49.9%) 961 231 (36.8%) 627Females 480 (50.1%) 961 396 (63.2%) 627Smoking* 305 (31.7%) 961 269 (42.9%) 627Depression† 203 (21.1%) 961 206 (32.9%) 627Outcome variables (percentages are based on twins with available data on each variable)Recent LBP‡ 111 (15.0%) 739 117 (23.7%) 494Previous LBP§ 128 (16.9%) 756 81 (17.7%) 458Persistent LBP‖ 79 (11.2%) 707 76 (16.8%) 453
LBP, low back pain; PA, physical activity; SD, standard deviation; MZ, monozygotic; DZ, dizygotic; n, number of individual twins; BMI, body massindex.
* Current smokers.†
Moderately or very depressed or anxious.‡
Those who have had symptoms of LBP within the past 4 weeks.§
Those who have a previous history of chronic activity limiting LBP without symptoms in the past 4 weeks.‖ Those who have not had a pain-free month in the last 6 months.
849J.R. Zadro et al. / The Spine Journal 17 (2017) 845–854
54
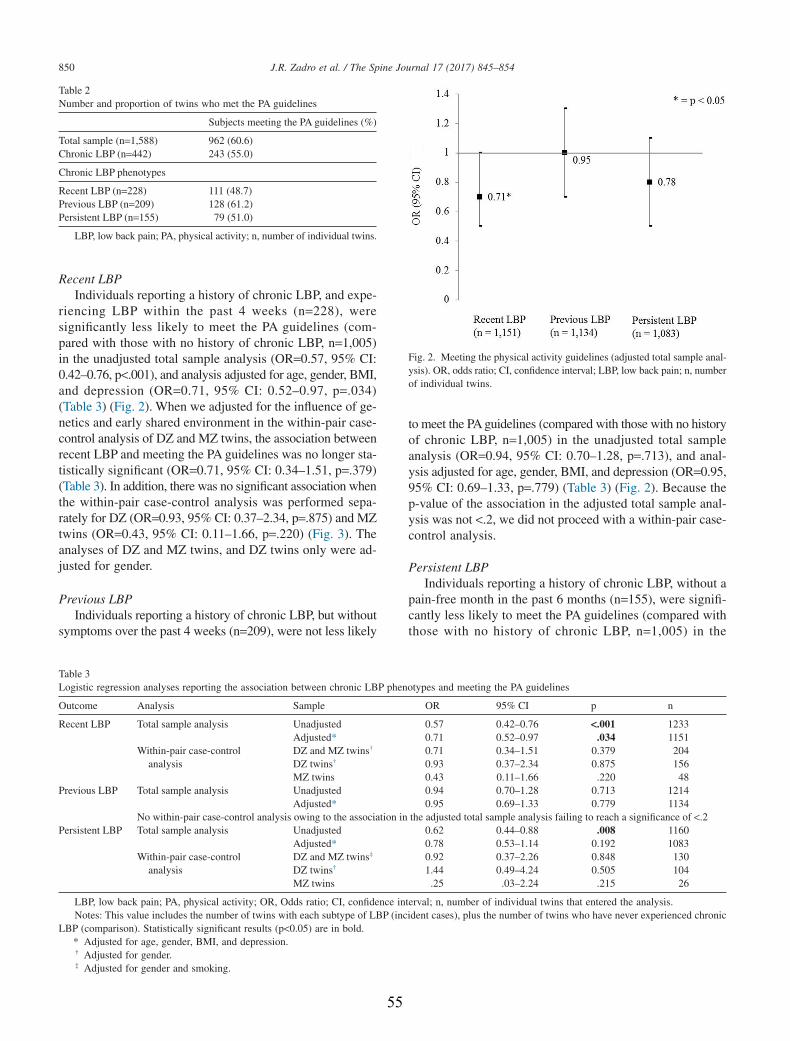
Recent LBPIndividuals reporting a history of chronic LBP, and expe-
riencing LBP within the past 4 weeks (n=228), weresignificantly less likely to meet the PA guidelines (com-pared with those with no history of chronic LBP, n=1,005)in the unadjusted total sample analysis (OR=0.57, 95% CI:0.42–0.76, p<.001), and analysis adjusted for age, gender, BMI,and depression (OR=0.71, 95% CI: 0.52–0.97, p=.034)(Table 3) (Fig. 2). When we adjusted for the influence of ge-netics and early shared environment in the within-pair case-control analysis of DZ and MZ twins, the association betweenrecent LBP and meeting the PA guidelines was no longer sta-tistically significant (OR=0.71, 95% CI: 0.34–1.51, p=.379)(Table 3). In addition, there was no significant association whenthe within-pair case-control analysis was performed sepa-rately for DZ (OR=0.93, 95% CI: 0.37–2.34, p=.875) and MZtwins (OR=0.43, 95% CI: 0.11–1.66, p=.220) (Fig. 3). Theanalyses of DZ and MZ twins, and DZ twins only were ad-justed for gender.
Previous LBPIndividuals reporting a history of chronic LBP, but without
symptoms over the past 4 weeks (n=209), were not less likely
to meet the PA guidelines (compared with those with no historyof chronic LBP, n=1,005) in the unadjusted total sampleanalysis (OR=0.94, 95% CI: 0.70–1.28, p=.713), and anal-ysis adjusted for age, gender, BMI, and depression (OR=0.95,95% CI: 0.69–1.33, p=.779) (Table 3) (Fig. 2). Because thep-value of the association in the adjusted total sample anal-ysis was not <.2, we did not proceed with a within-pair case-control analysis.
Persistent LBPIndividuals reporting a history of chronic LBP, without a
pain-free month in the past 6 months (n=155), were signifi-cantly less likely to meet the PA guidelines (compared withthose with no history of chronic LBP, n=1,005) in the
Table 2Number and proportion of twins who met the PA guidelines
Subjects meeting the PA guidelines (%)
Total sample (n=1,588) 962 (60.6)Chronic LBP (n=442) 243 (55.0)
Chronic LBP phenotypes
Recent LBP (n=228) 111 (48.7)Previous LBP (n=209) 128 (61.2)Persistent LBP (n=155) 79 (51.0)
LBP, low back pain; PA, physical activity; n, number of individual twins.
Table 3Logistic regression analyses reporting the association between chronic LBP phenotypes and meeting the PA guidelines
Outcome Analysis Sample OR 95% CI p n
Recent LBP Total sample analysis Unadjusted 0.57 0.42–0.76 <.001 1233Adjusted* 0.71 0.52–0.97 .034 1151
Within-pair case-controlanalysis
DZ and MZ twins† 0.71 0.34–1.51 0.379 204DZ twins† 0.93 0.37–2.34 0.875 156MZ twins 0.43 0.11–1.66 .220 48
Previous LBP Total sample analysis Unadjusted 0.94 0.70–1.28 0.713 1214Adjusted* 0.95 0.69–1.33 0.779 1134
No within-pair case-control analysis owing to the association in the adjusted total sample analysis failing to reach a significance of <.2Persistent LBP Total sample analysis Unadjusted 0.62 0.44–0.88 .008 1160
Adjusted* 0.78 0.53–1.14 0.192 1083Within-pair case-control
analysisDZ and MZ twins‡ 0.92 0.37–2.26 0.848 130DZ twins† 1.44 0.49–4.24 0.505 104MZ twins .25 .03–2.24 .215 26
LBP, low back pain; PA, physical activity; OR, Odds ratio; CI, confidence interval; n, number of individual twins that entered the analysis.Notes: This value includes the number of twins with each subtype of LBP (incident cases), plus the number of twins who have never experienced chronic
LBP (comparison). Statistically significant results (p<0.05) are in bold.* Adjusted for age, gender, BMI, and depression.† Adjusted for gender.‡ Adjusted for gender and smoking.
Fig. 2. Meeting the physical activity guidelines (adjusted total sample anal-ysis). OR, odds ratio; CI, confidence interval; LBP, low back pain; n, numberof individual twins.
850 J.R. Zadro et al. / The Spine Journal 17 (2017) 845–854
55

unadjusted total sample analysis (OR=0.62, 95% CI: 0.44–0.88, p=.008) (Table 3). The magnitude of this associationwas similar when adjusting for age, gender, BMI, and de-pression (OR=0.78, 95% CI: 0.53–1.14, p=.192) (Table 3)(Fig. 2), although not statistically significant. When we ad-justed for the influence of genetics and early sharedenvironment in the within-pair case-control analysis, there wereno statistically significant results (Table 2) (Fig. 4). The anal-yses of DZ and MZ twins, and DZ twins only were alsoadjusted for gender and smoking.
Discussion
Our results show that 55% of individuals with chronic LBPmet the PA guidelines, although this varies depending on thephenotype of chronic LBP assessed. Individuals with recentLBP were significantly less likely to meet the PA guidelinescompared with those with no history of chronic LBP. Afteradjusting for the influence of genetics and early shared en-vironment, the association between recent LBP and meetingthe PA guidelines was no longer statistically significant despiteremaining in the same direction. This suggests that the effects
of genetics and early shared environmental factors may beconfounding the association between LBP and PA.
Proportion of individuals with chronic LBP meeting thePA guidelines
The proportion of individuals who met the PA guidelinesin this study (60.6%) was similar to the estimate for adultsaged between 18 and 69 years old from the Spanish NationalHealth Survey (66.4%) [28]. Although the sample of twinsin our study was older (mean age [SD]: 56.7 [7.1]) comparedwith the overall Spanish population (median age: 41.8), it isunlikely age would significantly affect our estimate becauseapproximately 68% of the Spanish population between 60 and69 years old met the PA guidelines [28]. Questions regardingPAin our study were adapted from theActiveAustralia Survey,whereas data from the Spanish population were capturedthrough the International PhysicalActivity Questionnaire [29].These questionnaires capture very similar PA data so are un-likely to impact the comparison between estimates.
Our results showed that 55.0% of individuals with chronicLBP met the PA guidelines, which does not appear to be
Fig. 3. Total sample and within-pair case-control analysis for recent low back pain and meeting the physical activity guidelines. OR, odds ratio; CI, confi-dence interval; DZ, dizygotic; MZ, monozygotic; n, number of individual twins.
Fig. 4. Total sample and within-pair case-control analysis for persistent low back pain and meeting the physical activity guidelines. OR, odds ratio; CI, con-fidence interval; DZ, dizygotic; MZ, monozygotic; n, number of individual twins.
851J.R. Zadro et al. / The Spine Journal 17 (2017) 845–854
56

significantly lower than the total sample (60.6%). However,a lower proportion of individuals met the PA guidelines if theyreported recent LBP (48.7%) (Table 2). Furthermore, indi-viduals with recent LBP were significantly less likely to meetthe PA guidelines compared with those with no history ofchronic LBP (OR=0.71, p=.034), whereas there was no as-sociation between LBP and PA for those with persistent(OR=0.78, p=.192) or previous LBP (OR=0.95, p=.779). Thissuggests that once an individual recovers from a recent episodeof LBP, he or she is just as likely to meet the PA guidelinesas the pain-free population, highlighting the importance ofconsidering the presentation of an individual’s LBP when de-ciding how it may impact his or her PA engagement.
Comparison with previous literature
Despite an abundance of research investigating the rela-tionship between LBP and PA, different definitions of LBPand methods of assessing PA may be producing conflictingresults between studies. This highlights the need to consid-er a definition of PA, which has broader implications for healthpromotion when investigating LBP. Many studies have failedto find an association between LBP and PA [16–18], whereasothers show that individuals with LBP are more physicallyactive than pain-free individuals [14,15]. Our study is the firstto investigate the relationship between chronic LBP andmeeting the PA guidelines, showing that individuals with recentLBP are less likely to meet the PA guidelines compared withthose with no history of chronic LBP (OR=0.71, p=.034). Thisis consistent with research demonstrating that individuals withrecent LBP are less likely to engage in regular PA [30], sportingactivities [31], strength training [14], vigorous-intensity PA[32], or even more than 1 hour of PA per week [33]. There-fore, using the PA guidelines as a meaningful cutoff point forsufficient levels of PA has important implications for the pro-motion and maintenance of optimal health, and may help futurestudies obtain more consistent results.
Genetics and early shared environment
The results of our study highlight the importance of con-sidering the influence, and potentially confounding effects,of genetics and early shared environment. Genetics and earlyshared environment have been shown to substantially con-tribute to the variance of LBP [19], and the engagement inPA [20], with twin studies supporting the importance of ad-justing for these factors to better understand the relationshipbetween LBP and PA [34]. Twins are considered represen-tative of the non-twin population [35], with the sample of twinsin our study being comparable with reference populationsurveys [21]. The results from our within-pair case-controlanalyses showed no association between chronic LBP (recentor persistent) and meeting the PA guidelines, even when theadjusted total sample analysis demonstrated a strong asso-ciation for recent LBP (Fig. 3). This suggests that therelationship between LBP and meeting the PA guidelines may
be confounded by genetic or shared environmental factors thatinfluence both the presence of LBP and PA engagement.However, the findings from the within-pair case-control anal-ysis may have simply been the result of a reduction in power(sample size), limiting our ability to find statistically signif-icant results. Therefore, although genetics and early sharedenvironment may be confounding the association between LBPand PA, higher powered twin studies are needed before def-inite conclusions are reached.
Strengths and limitations
The present study demonstrated considerable strengths inits design. First, using a sample of twins allowed us to adjustfor the influence of genetics and early shared environment.Because these factors explain a significant amount of vari-ance for the presence of chronic LBP [19], and the engagementin PA [20], failure to adjust for these factors may be consid-ered a limitation of previous studies investigating therelationship between LBP and PA. Second, a comprehen-sive assessment of LBP allowed us to explore the associationbetween PA and various phenotypes of chronic LBP, a commonlimitation of previous observational studies [10]. This limi-tation is particularly relevant for existing twin studies that haveoften analyzed simplistic definitions of LBP (eg doctor di-agnosed, self-reported lifetime prevalence) because of the broaduse of twin registries for research [34].
This study also has some limitations that need to be con-sidered when interpreting the results. First, we includedwalking as a form of moderate-intensity PA, despite beingunable to determine whether it was a brisk walk, which no-ticeably increased the participant’s heart rate [36]. This mayhave overestimated the number of individuals meeting the PAguidelines. However, it is likely that walking is one of themost common forms of PA in the adult Spanish population,so excluding walking as a form of moderate-intensity PA ac-tivity may have resulted in a very small amount of individualswho met the PA guidelines through moderate-intensity PA (eggentle swimming, social tennis, golf). Furthermore, includ-ing walking as a means to meeting the PA guidelines wouldonly reduce the effect size of our results, because individu-als with LBP may be more likely to engage in low-intensityPA compared with the pain-free population. Second, we wereunable to investigate the relationship between pain-intensityand PA levels, an interesting area where more research isneeded [37,38]. In addition, questions regarding LBP and PAstatus were self-reported and would inevitably result in a degreeof recall bias. Third, the presence of different chronic LBPphenotypes was compared with individuals with no historyof chronic LBP, defined as the presence of pain in the lowerback lasting for 6 months or longer, including seasonal andrecurrent episodes. Therefore, it is possible that someindividuals with no history of chronic LBP had experiencedLBP of shorter duration (<6 months), although this would onlyserve to underestimate the results we obtained. Finally, weacknowledge there are numerous variables that could influence
852 J.R. Zadro et al. / The Spine Journal 17 (2017) 845–854
57

PA levels in individuals with LBP, such as the presence ofsciatica [39], previous spinal surgery [40], and occupation [41].However, because of the lack of available data, we were unableto control for these and many other factors. This is a commonlimitation in large observational studies as the burden of col-lecting an exhaustive list of variables from participants needsto be considered, and there are also many unknown factorslikely to influence PA levels in individuals with LBP. Despitethis, our within-pair case-control analysis allowed us to adjustfor several variables and, importantly, for the influence ofgenetic factors, as well as numerous known and unknownfactors shared within twin pairs.
Clinical implications
Because of the numerous health benefits associated withmeeting the PA guidelines, these results have significant im-plications for PA promotion in people with chronic LBP.Individuals with recent chronic LBP are less likely to meetthe PA guidelines compared with those who have never hadchronic LBP, and would benefit from incorporating PA pro-motion into their treatment. Furthermore, PA levels appearto normalize following a recent episode of chronic LBP. Thisinformation may be used to reassure patients with chronicLBP who are concerned they will not return to their previ-ous levels of PA. Our results appear to suggest genetic andearly shared environmental factors are driving the associa-tion between LBP and PA, as these associations disappearedafter adjusting for genetics and early shared environment.However, these results will need to be confirmed in a largersample of twins before definite conclusions are reached.
Conclusion
Individuals with recent LBP are less likely to meet the PAguidelines when compared with those with no history ofchronic LBP. However, a history of chronic LBP in individu-als who are currently pain free does not influence meetingthe PA guidelines. This highlights the importance of incor-porating PA promotion in the treatment of individuals witha recent episode of chronic LBP. Whether genetics and earlyshared environment could affect the association between recentLBP and meeting the PA guidelines should be further testedin larger samples of twins discordant for LBP.
Acknowledgment
The authors would like to acknowledge the support andcontribution of the Murcia Twin Registry for the implemen-tation of this study.
References
[1] Vos T, Barber RM, Bell B, et al. Global, regional, and nationalincidence, prevalence, and years lived with disability for 301 acute andchronic diseases and injuries in 188 countries, 1990–2013: a systematicanalysis for the Global Burden of Disease Study 2013. Lancet2015;386:743–800. doi:10.1016/s0140-6736(15)60692-4.
[2] Wenig CM, Schmidt CO, Kohlmann T, et al. Costs of back pain inGermany. Eur J Pain 2009;13:280–6.
[3] Gore M, Sadosky A, Stacey BR, et al. The burden of chronic low backpain: clinical comorbidities, treatment patterns, and health care costsin usual care settings. Spine 2012;37:E668–77.
[4] Vogel T, Brechat PH, Leprêtre PM, et al. Health benefits of physicalactivity in older patients: a review. Int J Clin Pract 2009;63:303–20.doi:10.1111/j.1742-1241.2008.01957.x.
[5] Sherrington C, Whitney JC, Lord SR, et al. Effective exercise for theprevention of falls: a systematic review and meta-analysis. J Am GeriatrSoc 2008;56:2234–43. doi:10.1111/j.1532-5415.2008.02014.x.
[6] Janssen I, Leblanc AG. Systematic review of the health benefits ofphysical activity and fitness in school-aged children and youth. Int JBehav Nutr Phys Act 2010;7:40. doi:10.1186/1479-5868-7-40.
[7] Choi BK, Verbeek JH, Tam WW, et al. Exercises for prevention ofrecurrences of low-back pain. Cochrane Database Syst Rev 2010;(1):CD006555. http://dx.doi.org/10.1002/14651858.CD006555.pub2.
[8] World Health Organization. Global recommendations on physicalactivity for health. Geneva: World Health Organization; 2010 Availableat: http://apps.who.int/iris/bitstream/10665/44399/1/9789241599979_eng.pdf. Accessed February 15, 2016.
[9] Wallis JA, Webster KE, Levinger P, et al. What proportion of peoplewith hip and knee osteoarthritis meet physical activity guidelines? Asystematic review and meta-analysis. Osteoarthritis Cartilage2013;21:1648–59.
[10] Sitthipornvorakul E, Janwantanakul P, Purepong N, et al. The associationbetween physical activity and neck and low back pain: a systematicreview. Eur Spine J 2011;20:677–89. doi:10.1007/s00586-010-1630-4.
[11] Cecchi F, Debolini P, Lova RM, et al. Epidemiology of back pain ina representative cohort of Italian persons 65 years of age and older:the InCHIANTI study. Spine 2006;31:1149–55. doi:10.1097/01.brs.0000216606.24142.e1.
[12] Bjorck-van Dijken C, Fjellman-Wiklund A, Hildingsson C. Low backpain, lifestyle factors and physical activity: a population based-study.J Rehabil Med 2008;40:864–9. doi:10.2340/16501977-0273.
[13] Payne N, Gledhill N, Katzmarzyk PT, et al. Health-related fitness,physical activity, and history of back pain. Can J Appl Physiol2000;25:236–49.
[14] Kim W, Jin YS, Lee CS, et al. Relationship between the typeand amount of physical activity and low back pain in Koreans aged50 years and older. PM R 2014;6:893–9. doi:10.1016/j.pmrj.2014.04.009.
[15] Wright D, Barrow S, Fisher AD, et al. Influence of physical,psychological and behavioural factors on consultations for back pain.Br J Rheumatol 1995;34:156–61.
[16] Junqueira DR, Ferreira ML, Refshauge K, et al. Heritability and lifestylefactors in chronic low back pain: results of the Australian twin low backpain study (The AUTBACK study). Eur J Pain 2014;18:1410–18.doi:10.1002/ejp.506.
[17] Shiri R, Solovieva S, Husgafvel-Pursiainen K, et al. The role of obesityand physical activity in non-specific and radiating low back pain: theYoung Finns study. Semin Arthritis Rheum 2013;42:640–50.doi:10.1016/j.semarthrit.2012.09.002.
[18] Andrusaitis SF, Oliveira RP, Barros Filho TE. Study of the prevalenceand risk factors for low back pain in truck drivers in the state of SaoPaulo, Brazil. Clinics 2006;61:503–10.
[19] Ferreira PH, Beckenkamp P, Maher CG, et al. Nature or nurture in lowback pain? Results of a systematic review of studies based on twinsamples. Eur J Pain 2012;17:957–71.
[20] de Vilhena e Santos DM, Katzmarzyk PT, Seabra AF, et al. Geneticsof physical activity and physical inactivity in humans. Behav Genet2012;42:559–78. doi:10.1007/s10519-012-9534-1.
[21] Ordoñana JR, Rebollo-Mesa I, Carrillo E, et al. The Murcia TwinRegistry: a population-based registry of adult multiples in Spain. TwinRes Hum Genet 2013;16:302–6.
[22] Dionne CE, Dunn KM, Croft PR, et al. A consensus approachtoward the standardization of back pain definitions for use in
853J.R. Zadro et al. / The Spine Journal 17 (2017) 845–854
58
prevalence studies. Spine 2008;33:95–103. doi:10.1097/BRS.0b013e31815e7f94.
[23] Brown W, Bauman A, Timperio A, et al. Measurement of adult physicalactivity: reliability, comparison and validity of self-report surveys forpopulation surveillance. Summary and recommendations. Unpublishedreport to the Department of Health and Ageing. 2002.
[24] Pinheiro MB, Ferreira ML, Refshauge K, et al. Genetics and theenvironment affect the relationship between depression and low backpain: a co-twin control study of Spanish twins. Pain 2015;156:496–503.doi:10.1097/01.j.pain.0000460330.56256.25.
[25] Dario AB, Ferreira ML, Refshauge K, et al. Are obesity and body fatdistribution associated with low back pain in women? A population-based study of 1128 Spanish twins. Eur Spine J 2016;25:1188–95.doi:10.1007/s00586-015-4055-2.
[26] Zadro JR, Shirley D, Pinheiro MB, et al. Does educational attainmentincrease the risk of low back pain when genetics is considered? Apopulation-based study of Spanish twins. Spine J 2016;doi:10.1016/j.spinee.2016.10.021. In press.
[27] Silventoinen K, Rokholm B, Kaprio J, et al. The genetic andenvironmental influences on childhood obesity: a systematic review oftwin and adoption studies. Int J Obes 2010;34:29–40.
[28] World Health Organization Europe. Spain physical activity fact sheet.Available at: http://www.euro.who.int/__data/assets/pdf_file/0008/288125/SPAIN-Physical-Activity-Factsheet.pdf. Accessed February 16,2016.
[29] Craig CL, Marshall AL, Sjostrom M, et al. International physicalactivity questionnaire: 12-country reliability and validity. Med Sci SportsExerc 2003;35:1381–95. doi:10.1249/01.mss.0000078924.61453.fb.
[30] Kwon MA, Shim WS, Kim MH, et al. A correlation between low backpain and associated factors: a study involving 772 patients who hadundergone general physical examination. J Korean Med Sci2006;21:1086–91.
[31] Jacob T, Baras M, Zeev A, et al. Physical activities and low back pain:a community-based study. Med Sci Sports Exerc 2004;36:9–15.doi:10.1249/01.mss.0000106166.94343.02.
[32] Heneweer H, Picavet HS, Staes F, et al. Physical fitness, rather thanself-reported physical activities, is more strongly associated with lowback pain: evidence from a working population. Eur Spine J2012;21:1265–72. doi:10.1007/s00586-011-2097-7.
[33] Katsavouni F, Bebetsos E, Antoniou P, et al. Work-related risk factorsfor low back pain in firefighters. Is exercise helpful? Sport Sci Health2014;10:17–22. doi:10.1007/s11332-013-0167-4.
[34] Hubscher M, Ferreira ML, Junqueira DR, et al. Heavy domestic, butnot recreational, physical activity is associated with low back pain:Australian Twin low BACK pain (AUTBACK) study. Eur Spine J2014;23:2083–9. doi:10.1007/s00586-014-3258-2.
[35] Barnes JC, Boutwell BB. A demonstration of the generalizability oftwin-based research on antisocial behavior. Behav Genet 2013;43:120–31. doi:10.1007/s10519-012-9580-8.
[36] Haskell WL, Lee IM, Pate RR, et al. Physical activity and public health:updated recommendation for adults from the American College of SportsMedicine and the American Heart Association. Med Sci Sports Exerc2007;39:1423–34. doi:10.1249/mss.0b013e3180616b27.
[37] van Abbema R, Lakke SE, Reneman MF, et al. Factors associated withfunctional capacity test results in patients with non-specific chronic lowback pain: a systematic review. J Occup Rehabil 2011;21:455–73.doi:10.1007/s10926-011-9306-4.
[38] Huijnen IP, Verbunt JA, Peters ML, et al. Do depression and painintensity interfere with physical activity in daily life in patients withchronic low back pain? Pain 2010;150:161–6. doi:10.1016/j.pain.2010.04.021.
[39] Shiri R, Falah-Hassani K, Viikari-Juntura E, et al. Leisure-time physicalactivity and sciatica: a systematic review and meta-analysis. Eur J Pain2016;20:1563–72. doi:10.1002/ejp.885.
[40] Mancuso CA, Duculan R, Girardi FP. Healthy physical activity levelsbelow recommended thresholds two years after lumbar spine surgery.Spine 2016;doi:10.1097/brs.0000000000001757.
[41] Xu Y, Bach E, Orhede E. Work environment and low back pain:the influence of occupational activities. Occup Environ Med 1997;54:741–5.
854 J.R. Zadro et al. / The Spine Journal 17 (2017) 845–854
59

CHAPTER THREE
Neighborhood walkability moderates the association between low back pain
and physical activity: a co-twin control study
Chapter Three has been published as:
Zadro JR, Shirley D, Pinheiro MB, Bauman A, Duncan GE, Ferreira PH. Neighborhood
walkability moderates the association between low back pain and physical activity: a co-twin
control study. Preventive Medicine. 2017;99:257-63. Copyright © 2017 Elsevier Inc. All rights
reserve. Reprinted with permission from Elsevier.
60
Preventive Medicine 99 (2017) 257–263
Contents lists available at ScienceDirect
Preventive Medicine
j ourna l homepage: www.e lsev ie r .com/ locate /ypmed
Neighborhood walkability moderates the association between low backpain and physical activity: A co-twin control study
J.R. Zadro a,⁎, D. Shirley a, M.B. Pinheiro a, A. Bauman b, G.E. Duncan c, P.H. Ferreira a
a Discipline of Physiotherapy, Faculty of Health Sciences, The University of Sydney, Sydney, Australiab School of Public Health and Charles Perkins Centre, The University of Sydney, Sydney, Australiac Elson S. Floyd College of Medicine, Nutrition & Exercise Physiology Program, Washington State University, Spokane, USA.
⁎ Corresponding author: Joshua Robert Zadro, Faculty ofof Sydney, 75 East Street, Lidcombe, Sydney NSW 2141, A
E-mail address: [email protected] (J.R. Zad
http://dx.doi.org/10.1016/j.ypmed.2017.03.0030091-7435/© 2017 Published by Elsevier Inc.
a b s t r a c t
a r t i c l e i n f oArticle history:Received 14 September 2016Received in revised form 2 March 2017Accepted 11 March 2017Available online 18 March 2017
The aim of this study was to investigate whether neighborhood walkability moderates the association betweenlow back pain (LBP) and physical activity (PA), using a co-twin design to control for genetics and shared environ-mental factors. A cross-sectional analysis was performed on 10,228 twins from the Washington State Twin Reg-istry with available data on LBP from recruitment surveys between 2009 and 2013. LBPwithin the past 3monthswas our exposure variable. Our outcome variables were sufficientmoderate or vigorous-intensity PA (MVPA, de-fined as at least 75 min of vigorous-intensity PA, or 150 min of moderate-intensity PA per week), and walking(≥150 min per week). Neighborhood walkability, estimated using the commercially available Walk Score®,was our moderator variable. After controlling for the influence of genetics and shared environment, individualsreporting LBP were significantly less likely to engage in sufficient MVPA if they lived in a neighborhood withhigh walkability (OR = 0.59, 95%CI: 0.36–0.96). There was no association between LBP and sufficient MVPAfor individuals living in a neighborhood with low walkability (OR = 1.27, 95%CI: 0.93–1.72), demonstratingthat walkability is a significant moderator of the association between LBP and PA (interaction p = 0.013).These findings were similar for the association between LBP and walking (high walkability OR = 0.42, 95%CI:0.22–0.78; low walkability OR = 0.71, 95%CI: 0.46–1.12), although the interaction was not significant (p =0.700). Neighborhood walkability moderates the association between LBP and PA. Our results highlight the im-portance of targeting interventions promoting PA towards individuals with LBP living in a neighborhood withgood walkable access to amenities.
© 2017 Published by Elsevier Inc.
Keywords:Low back painTwin studyPhysical activityWalkability
1. Introduction
Low back pain (LBP) is a global problem, resulting in disability(Murray et al., 2012) and an enormous financial burden across manycountries (Gore et al., 2012; Wenig et al., 2009). Physical activity (PA)is commonly recommended for the management (van Middelkoop etal., 2010) and prevention of LBP (Steffens et al., 2016), with the impor-tant additional health benefits of increasing cardiorespiratory fitnessand reducing the risk of non-communicable diseases (e.g. cardiovascu-lar disease) (Global Recommendations on Physical Activity for Health,n.d.). Among commonly prescribed interventions for LBP, structured ex-ercise programs appear to increase PA engagement in the short-term(Nassif et al., 2011; Hagen et al., 2010), but have failed to demonstratelong-term PA adoption (Kuukkanen et al., 2007; Sorensen et al., 2010;Bendix et al., 1998).
Health Sciences, TheUniversityustralia.ro).
61
Despite numerous interventions employing a biopsychosocial ap-proach, evidence appears to demonstrate limited benefits of these indi-vidual approaches on long-term adoption and maintenance of PA(Leonhardt et al., 2008). A shortcoming of these approaches may in-clude a lack of consideration for the influence of external environmentalfactors (e.g. the physical or “built” environment). Furthermore, inter-ventions for LBP on an individual level are costly, and may contributeto the substantial economic burden of LBP (Gore et al., 2012; Wenig etal., 2009). Therefore, a broader understanding of how environmentalfactors influence PA in people with LBP is warranted, and may aid themanagement of LBP at a population level.
Changes to the built environment to improve walkability is an ap-proach that holds promise for increasing PA engagement at the popula-tion level, with individuals living in a neighborhood with highwalkability more likely to engage in PA than individuals living in aneighborhood with low walkability (Global Advocacy for PhysicalActivity (GAPA) the Advocacy Council of the International Society forPhysical Activity and Health (ISPAH), 2012; Van Holle et al., 2012).Walkability is used to quantify the extent the built environment
258 J.R. Zadro et al. / Preventive Medicine 99 (2017) 257–263
surrounding the residence (neighborhood) promotes physical activity,most notably walking, for numerous purposes. Measures of neighbor-hood walkability incorporate information on environmental character-istics, for example the walkable distance to nearby amenities such asparks, shops, restaurants, fitness centres, etc. However, it is unclearhow walkability impacts PA levels in people with LBP. Individualsexperiencing LBP may be less likely to practice regular PA if they livein a neighborhood with low walkability. Conversely, they may be lesslikely to engage in PA despite living in an environment which promotesit. Therefore, to get a clearer understanding of the barriers to PA engage-ment in people with LBP, it is important to consider howwalkability in-fluences PA levels in this population.
Genetic and shared (familial) environmental factors have also beenshown to substantially contribute to the variance of chronic and dis-abling LBP (Ferreira et al., 2012), PA engagement (de Vilhena Santoset al., 2012), and play a role in influencing residential selection(Duncan et al., 2012). It is possible that an individual's genetics (or fam-ily environment) could be a confounder between LBP and PA, and recentresearch investigating risk factors for LBP has utilized twins as amethodof controlling for the effects of genetics and shared environment (Darioet al., 2015).
The aim of this study is to investigate whether walkability moder-ates the association between LBP and PA, using a cross-sectional co-twin design to control for the effects of genetics and sharedenvironment.
2. Methods
2.1. Participants and data collection
The sample for this cross-sectional studywas drawn from theWash-ington State Twin Registry (WSTR), a community-based registry ofadult twins. Information regarding characteristics and data collectionprocedures can be found elsewhere (Afari et al., 2006). Participantscompleted a recruitment survey containing items on demographics(age, sex, race, education,marital status), health conditions (self-report-ed and physician diagnosed), and health-behaviours (PA, sleep quality,smoking, alcohol intake). There were 10,228 twins with data on LBPfrom the recruitment surveys between 2009 and 2013, forming thebasis for this study. All recruitment and data collection procedureswere approved by the local Institutional Review Board.
2.2. Zygosity ascertainment
Questions regarding childhood similarities between twins, for ex-ample, “As children were you and your twin as alike as 2 peas in a podor of ordinary family resemblance?” were used to determine zygosity,with an agreement of 95–98% when compared to zygosity determinedby biological markers (Eisen et al., 1989).
2.3. Exposure variable
Data on the presence of LBP within the last 3 months was collectedin the recruitment survey and based on the following question: “In thepast 3months, have you had back pain that lasted for at least one day?”.
2.4. Moderator variable
Walkability served as our moderator variable and was assessed viaWalk Score®, a publically available web-resource (www.walkscore.com) with good validity and reliability for estimating walkable accessto nearby amenities (Carr et al., 2011). Walk Score® has been shownto significantly correlate with numerous objective (e.g. residential den-sity, street connectivity) and subjective measures (e.g. perceived accessto amenities) of the built environment (Carr et al., 2010). The WalkScore® algorithm calculates the walkable distance to 13 equally-
62
weighted categories of amenities including: grocery stores, coffeeshops, restaurants, bars, movie theatres, schools, parks, libraries, bookstores, fitness centres, pharmacies, hardware stores, and clothing ormusic stores. Participant's residential addresses were entered into theWalk Score® website; values from each category were summed andnormalized to yield a total Walk Score® from 0 to 100, where a higherscore (higher walkability) represents shorter walkable distances tonearby amenities. We categorized Walk Score® into tertiles, anddichotomised it at the highest tertile.
2.5. Outcome variables
Data on moderate or vigorous-intensity PA (MVPA) and total walk-ing time per week were collected in the recruitment survey and servedas our outcome variables.
2.5.1. Assessment of PAData on MVPA was used to determine whether individuals met the
World Health Organization PA guidelines for adults aged 18–64 (con-sidered sufficiently active) (Global Recommendations on PhysicalActivity for Health, n.d.). The PA guidelines recommend a minimum of75 min vigorous-intensity PA, 150 min moderate-intensity PA, or150 min combined MVPA per week, accumulated in multiple bouts(Global Recommendations on Physical Activity for Health, n.d.). Ques-tions regarding MVPA were adapted from a validated brief assessmenttool (Smith et al., 2005).Moderate-intensity PAwas assessed by the fol-lowing question: “Over the past 4 weeks, howmany days during a typ-ical week did you exercise moderately for at least 30 minutes?”.Moderate-intensity PA was described as exercise causing only lightsweating, or slight to moderate increases in breathing or heart rate, in-cluding brisk walking, bicycling for pleasure, golf, and dancing. Vigor-ous-intensity PA was assessed by a similar question: “Over the past 4weeks, howmany days during a typical week did you exercise vigorous-ly for at least 20 minutes?”. Vigorous-intensity PA was described as ex-ercise causing heavy sweating, or large increases in breathing or heartrate, including running, lap swimming, aerobics classes, and fast bicy-cling. Participants engaged in at least five days of moderate-intensityPA, or at least 4 days of vigorous-intensity PA, or engaged in a combina-tion ofmoderate and vigorous-intensity PA of at least 150min perweek(e.g. three days of moderate-intensity PA and three days of vigorous-in-tensity PA would give a total of at least 150 min), were considered suf-ficiently active (dichotomised variable).
In a sub-sample of 104 twins whowore accelerometers and GPS de-vices over a two-week period in an ongoing funded study, subjectiveMVPA correlated significantly with objectively measured MVPA (r =0.46, p b 0.01) (Duncan, G. Unpublished observations, 2016).
2.5.2. Assessment of walkingTotal walking time per week was assessed by the following ques-
tions: i) “How many days during a typical week do you walk for recre-ation, exercise, to get from place to place, or for any other reasons inyour neighborhood?”; and ii) “When you walk in your neighborhood,about how many minutes, on average, do you spend walking eachtime you walk?” For question ii) participants could select the followingoptions: “b15”, “15”, “30”, “45”, “60”, “75”, “90 or more”. To calculatetotal walking time we considered “b15” as 7.5 min, “90 or more” as90 min, and the rest of the values as outlined. Responses to questionsi) and ii) were multiplied and then dichotomised as ≥150 min andb150 min of walking per week. This cut-off was based on meeting thePA guidelines since walking is commonly considered a form of moder-ate-intensity PA (Haskell et al., 2007).
2.6. Assessment of confounding variables
Data on age, sex, body mass index (BMI), smoking, educational at-tainment, sleep quality, depression, and leisure sitting time were

259J.R. Zadro et al. / Preventive Medicine 99 (2017) 257–263
considered as possible confounding variables. BMI was calculated basedon self-reported height andweight. Details on how the other confound-ing variables were assessed can be found in Appendix A.
2.7. Analysis
Descriptive analyses were conducted for all study variables. We per-formedmultivariate logistic regression analyses to investigate the asso-ciation between LBP and PA, and to quantify the extent walkabilitymoderates this association (interaction analysis). Univariate logistic re-gression analyses were performed to identify confounders for inclusioninto the multivariate models. The selection of confounding variableswas based on data availability and previous studies examining risk fac-tors for LBP (Shiri et al., 2010; Dario et al., 2016; Zadro et al., 2016;Pinheiro et al., 2015a; Kelly et al., 2011; Chen et al., 2009). If the p-value of the association between the confounder, and both the exposureand outcome were b0.2 in the univariate logistic regression, these vari-ableswere included in themultivariatemodels (Dario et al., 2016; Zadroet al., 2016; Pinheiro et al., 2015b). Age and sex were forced into themultivariate logistic regression models to facilitate comparison to thewithin-pair analysis, where identical [monozygotic (MZ)] twins areanalysed in pairs, naturally resulting in the adjustment for age andsex. Each analysis was stratified by walkability with an interactionterm (‘PA’ × ‘walkability’) used to quantify the significance of the mod-eration effect. Analyseswere conducted using STATA statistical software(version 13.1) with odds ratios (OR) and 95% confidence intervals (CI)calculated from the regressionmodels, and significance level set at 0.05.
2.7.1. Total sample analysisWe performed a total sample analysis on all complete and incom-
plete twin pairs, regardless of LBP status, to investigate whetherwalkability moderates the association between LBP and PA. Becausetwins are treated as individuals in this analysis, we used a robust sand-wich estimator to account for the non-independence of twins. The var-iables that entered the adjusted total sample analysis were included inthe within-pair analysis of MZ twins to facilitate the comparison of ef-fect sizes.
2.7.1. Within-pair analysisTo control for the influence of genetics and shared environment we
performed a within-pair analysis on all complete MZ twin pairs discor-dant for LBP status, i.e. one twin reported LBP (case) while the co-twindid not (control). Controlling for these factors is important because anindividual's genetics (and family environment) may result in certaincharacteristics (e.g. the presence of LBP and low PA levels) that can in-fluence any associations found between exposure and outcomeamong all twin pairs (i.e. total sample analysis whereby twins are treat-ed as individuals). Twin pairs are usually exposed to a similar environ-ment when growing up, especially for twins reared together as wasthe case in our study, and MZ twins share close to 100% of their segre-gating genes while DZ twins share no N50%. Therefore, the analysis ofMZ twins allows us to control for genetics and shared environmentalfactors. In theory,when a significant relationship between two variables(LBP and PA) in the total sample analysis disappears in the within-pairanalysis ofMZ twins, it suggests genetics and shared environmental fac-tors are confounding the previously observed relationship.
3. Results
3.1. Descriptive statistics
Of the 10,228 twins included in this study, there were 3975 males(38.9%), 5331 MZ twins (52.1%), and 9824 twins with data availableon Walk Score® (96.1%). The mean age [standard deviation (SD)] ofparticipants was 42.1 (18.4). Twins in the highest education category(3: bachelor, graduate, or professional degree) were less likely to report
63
LBP (MZ twins: 37.2% vs. 43.2%; DZ twins: 35.1% vs. 42.8%), whiletwins in the lowest education category (1: up to high school completion)were more likely to report LBP (MZ twins: 24.8% vs. 22.5%; DZ twins:27.8% vs. 23.0%). Further details regarding the characteristics of thetotal sample according to LBP status and zygosity are shown in Table1. Levels of the various physical activity types by tertile of walkabilityand LBP status are shown in Table 2; differences in PA engagement be-tween those with and without LBP were more pronounced in highertertiles of Walk Score®.
3.1.1. Association between LBP and MVPAAssociations between LBP and MVPA (regardless of Walk Score®)
are shown in Table 3 (row ‘A’). Twins with LBP were significantly lesslikely to be sufficiently active in the unadjusted total sample analysis(OR = 0.82, 95%CI: 0.76–0.89, see row 1), although this failed to reachstatistical significance in the total sample analysis adjusted for age,sex, BMI, smoking, education, depression, sleep quality, and leisure sit-ting time (OR = 0.93, 95%CI: 0.85–1.01, see row 2). The magnitude ofthe association further decreased and was not statistically significantwhen controlling for genetics and shared environment in the within-pair analysis of MZ twins (OR = 1.01, 95%CI: 0.81–1.25, see row 3).
3.1.2. Association between LBP and MVPA (moderated by Walk Score®)Associations between LBP and MVPA for participants with their res-
idential address in the highest tertile ofWalk Score® are shown in Table3 (row ‘B’). In the unadjusted total sample analysis, twinswith LBPweresignificantly less likely to be sufficiently active if their residential ad-dress was in the highest tertile of Walk Score® (OR = 0.78, 95%CI:0.68–0.90, see row 1), although this was no longer statistically signifi-cant in the total sample analysis adjusted for age, sex, BMI, smoking, ed-ucation, depression, sleep quality, and leisure sitting time (OR = 0.91,95%CI: 0.78–1.05, see row 2). When controlling for genetics and sharedenvironment in thewithin-pair analysis ofMZ twins, the strength of thisassociation increased and was statistically significant (OR = 0.55,95%CI: 0.33–0.92, see row 3) (Table 3).
Associations between LBP and MVPA for participants with their res-idential address in the lower two tertiles of Walk Score® are shown inTable 3 (row ‘C’). In the unadjusted total sample analysis, twins withLBPwere significantly less likely to be sufficiently active if their residen-tial address was in the lowest tertiles of Walk Score® (OR = 0.84,95%CI: 0.76–0.93, see row 1), although this was no longer statisticallysignificant in the total sample analysis adjusted for age, sex, BMI,smoking, education, depression, sleep quality, and leisure sitting time(OR= 0.94, 95%CI: 0.84–1.04, see row 2). There was no association be-tween LBP and being sufficiently active in the within-pair analysis (OR= 1.23, 95%CI: 0.90–1.70, see row 3) (Table 3).
Walk Score®was a significantmoderator of the association betweenLBP and being sufficiently active in the within-pair analysis of MZ twins(p = 0.023, final row in Table 3).
3.1.3. Association between LBP and walkingAssociations between LBP and walking (regardless of Walk Score®)
are shown in Table 4 (row ‘A’). Twins with LBP were significantly lesslikely to walk 150 min or more per week in the unadjusted (OR =0.84, 95%CI: 0.76–0.93, see row1), and adjusted (age, sex, BMI, smoking,education, depression, and leisure sitting time) total sample analysis(OR= 0.89, 95%CI: 0.80–0.99, see row 2). Themagnitude of this associ-ation was similar in the within-pair analysis (OR = 0.86, 95%CI: 0.66–1.14, see row 3) (Table 4).
3.1.4. Association between LBP and walking (moderated by Walk Score®)Associations between LBP and walking for participants with their
residential address in the highest tertile of Walk Score® are shown inTable 4 (row ‘B’). In both the unadjusted and adjusted (age, sex, BMI,smoking, education, depression, and leisure sitting time) total sampleanalysis, twins with LBP were significantly less likely to walk 150 min

Table 1Sample characteristics of twin participants stratified according to zygosity and low back pain status.
MZ twins DZ twins
LBP No LBP LBP No LBP
Mean (SD) or n (%) Total Mean (SD) or n (%) Total Mean (SD) or n (%) Total Mean (SD) or n (%) Total
Outcome variablesWalkinga 24.6 (17.0) 2194 24.8 (17.3) 2830 24.6 (17.3) 2060 25.8 (17.3) 2598Vigorous PAb 42.7 (41.5) 2316 47.0 (41.6) 2971 41.1 (42.0) 2148 46.3 (43.4) 2705Moderate PAc 82.0 (63.8) 2302 85.0 (63.4) 2955 81.0 (64.5) 2114 89.4 (66.1) 2690MVPAd 123.3 (93.1) 2333 130.3 (91.7) 2998 120.1 (93.7) 2161 133.7 (95.7) 2736Sufficiently activee 1047 (45.0%) 2328 1464 (49.0%) 2988 951 (44.1%) 2155 1371 (50.2%) 2730Walkingf 408 (18.7%) 2183 558 (19.8%) 2819 380 (18.6%) 2049 601 (23.2%) 2589
Moderator variableWalk score® 36.0 (27.2) 2245 36.4 (27.7) 2888 34.7 (27.3) 2063 36.8 (27.8) 2628
Confounding variablesAge (years) 42.1 (17.2) 2333 40.4 (18.4) 2998 43.4 (18.3) 2161 43.0 (19.3) 2736BMI 26.5 (5.9) 2308 25.3 (5.2) 2960 26.7 (5.8) 2141 25.6 (5.3) 2703Males 788 (33.8%) 2333 1117 (37.3%) 2998 908 (42.0%) 2161 1162 (42.5%) 2736Females 1545 (66.2%) 2333 1881 (62.7%) 2998 1253 (58.0%) 2161 1574 (57.5%) 2736Current smoker 309 (13.4%) 2312 239 (8.1%) 2963 326 (15.3%) 2127 250 (9.3%) 2704
Education1: up to high school completion; 2: college or associates degree; 3: bachelor, graduate, or professional degree1 577 (24.8%) 2328 671 (22.5%) 2984 595 (27.8%) 2141 627 (23.0%) 27272 884 (38.0%) 2328 934 (31.3%) 2984 795 (37.1%) 2141 932 (34.2%) 27273 867 (37.2%) 2328 1379 (43.2%) 2984 751 (35.1%) 2141 1168 (42.8%) 2727Sleepg 707 (30.4%) 2327 532 (17.8%) 2990 652 (30.2%) 2157 510 (18.7%) 2732Depressionh 830 (36.0%) 2303 716 (24.1%) 2977 781 (36.6%) 2135 675 (24.9%) 2714Sedentaryi 1224 (52.7%) 2321 1501 (50.2%) 2989 1192 (55.4%) 2150 1415 (52.0%) 2723
LBP: low back pain, MZ:monozygotic, DZ: dizygotic, SD: standard deviation, BMI: bodymass index, PA: physical activity,MVPA:moderate or vigorous-intensity physical activity; n: num-ber of individual twins.
a Minutes of walking each day.b Minutes of vigorous-intensity physical activity per week.c Minutes of moderate-intensity physical activity per week.d Total moderate and vigorous-intensity physical activity per week.e At least 75 min of vigorous PA or at least 150 min of moderate PA per week, including a combination of either which totals N150 min.f Walking for N150 min per week.g Difficulty falling or staying asleep.h Bothered by symptoms of depression in the past 4 weeks.i Sitting for 3 or more hours during leisure time each day.
260 J.R. Zadro et al. / Preventive Medicine 99 (2017) 257–263
ormore perweek if their residential addresswas in the highest tertile ofWalk Score® (unadjusted OR= 0.79, 95%CI: 0.66–0.94; adjusted OR=0.83, 95%CI: 0.70–1.00).When controlling for genetics and shared envi-ronment in the within-pair analysis the strength of this association in-creased (OR = 0.48, 95%CI: 0.25–0.92).
Associations between LBP and walking for participants with theirresidential address in the lower two tertiles of Walk Score® areshown in Table 4 (row ‘C’). There was no association between LBP andwalking in the total sample (see row 1 and 2), or within-pair analysis(see row 3) for twins with a residential address in the lowest tertilesof Walk Score® (Table 4).
Walk Score® did not significantlymoderate the association betweenLBP andwalking in the total sample (unadjusted: p=0.163; adjusted:
Table 2Physical activity levels by tertile of Walk Score®.
Tertile 1* Tertile 2*
LBP No LBP Total LBP
Walkinga 25.0 (18.1) 25.1 (17.6) 25.0 (17.9) 25.0 (17.1)Vigorous PAb 41.4 (42.8) 45.9 (42.9) 43.8 (42.9) 42.7 (41.2)Moderate PAc 83.6 (65.5) 85.9 (65.5) 84.9 (65.5) 80.4 (63.0)MVPAd 123.2 (95.0) 130.2 (94.2) 127.1 (94.6) 121.6 (92.1)
Data reported as means (standard deviations).LBP: low back pain, PA: physical activity, MVPA:moderate or vigorous physical activity. *: eachvalues, 3 = highest 1/3 of Walk Score® values).
a Minutes of walking each day.b Minutes of vigorous-intensity physical activity per week.c Minutes of moderate-intensity physical activity per week.d Total moderate and vigorous-intensity physical activity per week.
64
p = 0.135) or within-pair analysis (p = 0.800) (see final 3 rows ofTable 4).
4. Discussion
Our results showed that individuals with LBP were significantly lesslikely to be sufficiently active, compared to those without LBP, if youconsidered those with a residential address in a neighborhood with ahigh Walk Score® (shorter walkable distance to nearby amenities).Thus, the findings of this study highlight the importance of consideringneighborhood walkability (as a measure of the built environment)when investigating the relationship between LBP and PA. To our knowl-edge, this is the first study to investigate how the built environment
Tertile 3*
No LBP Total LBP No LBP Total
25.0 (17.0) 25.0 (17.0) 24.4 (16.4) 25.7 (17.1) 25.1 (16.8)46.6 (42.2) 44.9 (41.8) 41.8 (40.8) 48.0 (42.2) 45.3 (41.7)86.1 (63.8) 83.6 (63.5) 81.3 (63.5) 89.0 (64.6) 85.7 (64.2)130.4 (92.2) 126.6 (92.2) 121.3 (92.2) 135.5 (94.4) 129.3 (93.7)
tertiles is ordered and contains a third of the total sample (1= lowest 1/3 ofWalk Score®

Table 3Total sample and within-pair analysis for the association between LBP and sufficient moderate to vigorous physical activity, moderated by Walk Score®.
Sample OR 95% CI n
A. Total sample(regardless of Walk Score®)
Total sample analysis Unadjusted 0.82 0.76–0.89 10,201Adjusteda 0.93 0.85–1.01 9796
Within-pair analysis MZ twinsa 1.01 0.81–1.25 1780
B. Highest tertile(Walk Score®)
Total sample analysis Unadjusted 0.78 0.68–0.90 3294Adjusteda 0.91 0.78–1.05 3170
Within-pair analysis MZ twinsa 0.55 0.33–0.92 346
C. Lower two tertiles(Walk Score®)
Total sample analysis Unadjusted 0.84 0.76–0.93 6505Adjusteda 0.94 0.84–1.04 6238
Within-pair analysis MZ twinsa 1.23 0.90–1.70 840
Interaction Total sample analysis Unadjusted p = 0.390Adjusteda p = 0.581
Within-pair analysis MZ twinsa p = 0.023
LBP: low back pain; PA: physical activity; MVPA: moderate-vigorous physical activity, defined as at least 75 min of vigorous PA or at least 150 min of moderate PA per week, including acombination of either which totals N150 min; OR: odds ratio (reference: no low back pain within the past 3 months); CI: confidence interval; n: number of individual twins.
a Adjusted for age, gender, body mass index, smoking, education, depression, sleep quality, and leisure sitting time.
261J.R. Zadro et al. / Preventive Medicine 99 (2017) 257–263
moderates the association between LBP and PA, andmay serve as an im-portant step towards future studies identifying external factors whichcould impact the effectiveness of interventions targeting long-term PAadoption. Our results highlight the importance of targeting interven-tions promoting PA towards individuals with LBP living in a neighbor-hood with good walkable access to amenities, since these individualsare less likely to practice regular PA despite living in an environmentthat promotes it. In addition, efforts to promote PA may be more effec-tive in this population compared to individuals with LBP living in an en-vironment that doesn't promote PA (lowWalk Score®). This is becausethe presence of LBP didn't appear to influence PA levels for individualsliving in a neighborhood with poor walkable access to amenities, andmay highlight that the built environment is a larger barrier to PA en-gagement than having LBP. However, another interpretation of our re-sults could be that individuals with LBP benefit less from living in aneighborhood with high walkability, highlighting the importance ofconsidering other (individual and environmental-level) factors to sup-port PA engagement, for example, education or social connectedness.
Socioeconomic factorsmay influence both an individual's residentialaddress and the likelihood of experiencing LBP, and thus need to be con-sidered when investigating how neighborhood walkability influencesthe relationship between LBP and PA. To explore this, we performed alogistic regression analysis and found a significant association betweenWalk Score® and higher educational attainment (a proxy for socioeco-nomic status) (Appendix B), suggesting that individuals with higher ed-ucational attainment are more likely to live in a neighborhood with
Table 4Total sample and within-pair analysis for the association between LBP and walking (N150 min
Sample
A. Total sample(regardless of Walk Score®)
Total sample analysis UnadAdju
Within-pair analysis MZ t
B. Highest tertile(Walk Score®)
Total sample analysis UnadAdju
Within-pair analysis MZ t
C. Lower two tertiles(Walk Score®)
Total sample analysis UnadAdju
Within-pair analysis MZ t
Interaction Total sample analysis UnadAdju
Within-pair analysis MZ t
LBP: low back pain; OR: odds ratio (reference: no low back pain within the past 3 months); CIa Adjusted for age, gender, body mass index, smoking, education, depression, and leisure sit
65
good walkable access to amenities (high Walk Score®). In addition,Table 1 demonstrated that twins in the highest education categorywere less likely to report LBP, while twins in the lowest education cate-goryweremore likely to report LBP. Thismay be explained by the expo-sure to heavy work-related PA in people with lower educationalattainment, a hypothesis that has been highlighted in other studies in-vestigating the relationship between educational attainment and LBP(Zadro et al., 2016). Therefore, given that educational attainment influ-ences LBP, PA, and neighborhoodwalkability, it was an important factorto control for in our study.
4.1. Comparison to previous literature
Conflicting findings across studies of LBP and PA are preventing def-inite conclusions about this relationship from being reached. An earlycross-sectional study (Wright et al., 1995) investigated LBP and PAlevels in over 30,000 people in the UK and showed that individualsexperiencing LBP within the past 12 months were more likely to be en-gaged in vigorous-intensity PA. In contrast, numerous studies havedemonstrated that individuals with LBP are less likely to engage insport (Cakmak et al., 2004), structured exercise (Eriksen et al., 1999;Kwon et al., 2006), or recreational PA (including walking) (Bjorck-vanDijken et al., 2008; Nilsen et al., 2011), while others have failed to findan association between LBP and PA (Cecchi et al., 2006; Croft et al.,1999; Schneider et al., 2005; Mortimer et al., 2001). Although variationin the methods used to assess LBP and PA may explain some of these
per week), moderated by Walk Score®.
OR 95% CI n
justed 0.84 0.76–0.93 9640steda 0.89 0.80–0.99 9290winsa 0.86 0.66–1.14 1606
justed 0.79 0.66–0.94 3155steda 0.83 0.70–1.00 3048winsa 0.48 0.25–0.92 322
justed 0.92 0.81–1.04 6103steda 0.97 0.84–1.10 5874winsa 0.72 0.45–1.14 744
justed p = 0.163steda p = 0.135winsa p = 0.800
: confidence interval; n: number of individual twins.ting time.
262 J.R. Zadro et al. / Preventive Medicine 99 (2017) 257–263
differences, there are additional factors that have not been investigatedthat may be influencing the relationship between LBP and PA, such asthe built environment.
The results of our study showed that the inverse association be-tween LBP and walking increased in magnitude when considering indi-viduals living in an environment with a high Walk Score®, even afteradjusting for genetics and shared environment. High levels of adjust-ment demonstrated in the within-pair analysis of MZ twins increaseour suspicion of a direct association between LBP and walking for indi-viduals living in an environment with a high Walk Score®, since con-founding factors, including genetics, have been accounted for. Inaddition, the results of within-pair analysis of DZ twins were similarto the results from the total sample analysis (data not presented), fur-ther supporting that shared environmental factors are not confoundingthemain findings of our study. These findings were similar for the asso-ciation between LBP andMVPA, and highlight that variation in the builtenvironment is potentially impacting the findings of previous LBP-PAstudies. For example, a study in which the majority of participantslived in a neighborhood with a low Walk Score® might fail to show adifference in PA levels between individuals with and without LBP, be-cause PA levels may have been limited by the built environment. Fur-thermore, previous studies investigating interventions aimed atincreasing long-termPA adoption in peoplewith LBP have unknowinglyneglected the influence of the built environment, a factor which couldexplain why these interventions have failed to demonstrate large ef-fects, despite having good behavioral theoretical underpinning(Leonhardt et al., 2008; Meng et al., 2011). Future intervention studiesmaywant to consider the influence of the built environment before con-clusions regarding effectiveness are made.
4.2. Strengths and limitations
This study has numerous strengths including analysing data from alarge sample of twins that not only allowed us to control for the influ-ence of genetics and shared environment, but increased our confidence(power) in these findings, since small sample sizes are a common limi-tation of twin studies in the field (Dario et al., 2015). The importance ofcontrolling for the potential confounding effects of genetics and sharedenvironment is highlighted by the substantial influence these factorshave on the variance of LBP (Ferreira et al., 2012), PA engagement (deVilhena Santos et al., 2012), and residential selection (Duncan et al.,2012). Furthermore, previous studies investigating walkability mea-sures have failed to adjust for genetics and shared environment, factorswhich could facilitate the self-selection bias of individuals who live in aneighborhood with high walkability (McCormack and Shiell, 2011).
This study also has a number of limitations. First, our assessment ofLBP was self-reported and did not consider pain intensity or disability.Moreover, the term ‘back pain’ may encompass thoracic spine symp-toms, potentially overestimating the prevalence of LBP in this sample.However, this is unlikely to significantly impact our results since theprevalence of isolated thoracic spine pain is low (Briggs et al., 2009)and individuals generally understand that ‘back pain’ refers to LBP (deVet et al., 2002). Furthermore, because data on walkability was basedon the residential address of participant's at survey completion it is im-portant to acknowledge the possibility (although small) that aparticipant's experience of LBP within the past 3 months was capturedat a previous residential address with different walkability. Second,self-reported data on PA will inevitably result in a degree of recall bias,with PA engagement potentially being overestimated. However, this isa common and somewhat unavoidable limitation in large observationalstudies, andwould be somewhat nullified in thewithin-pair analysis. Inaddition, ourwalking variable capturedwalking for numerous purposes(recreation, exercise, transport, etc.) and did not allow us to differenti-ate walking of varying intensities. Third, by using cross-sectional data,we were not able to investigate the direction of the relationship be-tween LBP and PA (the reverse causation problem). Finally, themeasure
66
ofwalkability used in this study (Walk Score®) only considers thewalk-able distance to nearby amenities from an individual's residential ad-dress, and does not take into account other commonly usedcommunity measures of how the built environment promotes PA (e.g.land-use mix, residential density, intersection density). However,Walk Score®has been shown to significantly correlatewith these objec-tivemeasures of the built environment (Carr et al., 2010) and is a valid-ity and reliable tool for estimating walkable distance to nearbyamenities (Carr et al., 2011).
5. Conclusion
Walkable distance to nearby amenities (Walk Score®) is a signifi-cant moderator of the association between LBP and being sufficientlyactive (even after adjusting for the influence of genetics and shared en-vironment). Our results highlight the importance of targeting interven-tions promoting PA towards individuals with LBP living in aneighborhood with good walkable access to amenities. Future studiesshould consider the influence of these factors to gain a better under-standing of the relationship between LBP and PA.
Supplementary data to this article can be found online at http://dx.doi.org/10.1016/j.ypmed.2017.03.003.
Funding sources
This research did not receive any specific grant from funding agen-cies in the public, commercial, or not-for-profit sectors.
Conflicts of interest
None.
Transparency document
The Transparency document associated with this article can befound, in online version.
Acknowledgments
The authors would like to acknowledge the support and contribu-tion of the Washington State Twin Registry for the implementation ofthis study.
References
Afari, N., Noonan, C., Goldberg, J., et al., 2006. University of Washington Twin Registry:construction and characteristics of a community-based twin registry. Twin Res.Hum. Genet. 9 (6):1023–1029. http://dx.doi.org/10.1375/183242706779462543.
Bendix, A.E., Bendix, T., Haestrup, C., Busch, E., 1998. A prospective, randomized 5-yearfollow-up study of functional restoration in chronic low back pain patients. Eur.Spine J. 7 (2), 111–119.
Bjorck-van Dijken, C., Fjellman-Wiklund, A., Hildingsson, C., 2008. Low back pain, lifestylefactors and physical activity: a population based-study. J. Rehabil. Med. 40 (10):864–869. http://dx.doi.org/10.2340/16501977-0273.
Briggs, A.M., Smith, A.J., Straker, L.M., Bragge, P., 2009. Thoracic spine pain in the generalpopulation: prevalence, incidence and associated factors in children, adolescents andadults. A systematic review. BMC Musculoskelet. Disord. 10:77. http://dx.doi.org/10.1186/1471-2474-10-77.
Cakmak, A., Yucel, B., Ozyalcn, S.N., et al., 2004. The frequency and associated factors oflow back pain among a younger population in Turkey. Spine 29 (14), 1567–1572.
Carr, L.J., Dunsiger, S.I., Marcus, B.H., 2010. Walk score as a global estimate of neighbor-hood walkability. Am. J. Prev. Med. 39 (5):460–463. http://dx.doi.org/10.1016/j.amepre.2010.07.007.
Carr, L.J., Dunsiger, S.I., Marcus, B.H., 2011. Validation of Walk Score for estimating accessto walkable amenities. Br. J. Sports Med. 45 (14):1144–1148. http://dx.doi.org/10.1136/bjsm.2009.069609.
Cecchi, F., Debolini, P., Lova, R.M., et al., 2006. Epidemiology of back pain in a representa-tive cohort of Italian persons 65 years of age and older: the InCHIANTI study. Spine 31(10):1149–1155. http://dx.doi.org/10.1097/01.brs.0000216606.24142.e1.
Chen, S.-M., Liu, M.-F., Cook, J., Bass, S., Lo, S.K., 2009. Sedentary lifestyle as a risk factor forlow back pain: a systematic review. Int. Arch. Occup. Environ. Health 82 (7):797–806.http://dx.doi.org/10.1007/s00420-009-0410-0.

263J.R. Zadro et al. / Preventive Medicine 99 (2017) 257–263
Croft, P.R., Papageorgiou, A.C., Thomas, E., Macfarlane, G.J., Silman, A.J., 1999. Short-termphysical risk factors for new episodes of low back pain. Prospective evidence fromthe South Manchester Back Pain Study. Spine 24 (15), 1556–1561.
Dario, A.B., Ferreira, M.L., Refshauge, K.M., et al., 2015. The relationship between obesity,low back pain, and lumbar disc degeneration when genetics and the environmentare considered: a systematic review of twin studies. Spine J. 15 (5):1106–1117.http://dx.doi.org/10.1016/j.spinee.2015.02.001.
Dario, A.B., Ferreira, M.L., Refshauge, K., et al., 2016. Are obesity and body fat distributionassociated with low back pain in women? A population-based study of 1128 Spanishtwins. Eur. Spine J. 25 (4):1188–1195. http://dx.doi.org/10.1007/s00586-015-4055-2.
Duncan, G.E., Dansie, E.J., Strachan, E., et al., 2012. Genetic and environmental influenceson residential location in the US. Health Place 18 (3):515–519. http://dx.doi.org/10.1016/j.healthplace.2012.02.003.
Eisen, S., Neuman, R., Goldberg, J., Rice, J., True, W., 1989. Determining zygosity in theVietnam Era Twin Registry: an approach using questionnaires. Clin. Genet. 35 (6),423–432.
Eriksen, W., Natvig, B., Bruusgaard, D., 1999. Smoking, heavy physical work and low backpain: a four-year prospective study. Occup. Med. 49 (3), 155–160.
Ferreira, P.H., Beckenkamp, P., Maher, C.G., Hopper, J.L., Ferreira, M.L., 2012. Nature or nur-ture in low back pain? Results of a systematic review of studies based on twin sam-ples. Eur. J. Pain 17 (7), 957–971.
Global Advocacy for Physical Activity (GAPA) the Advocacy Council of the InternationalSociety for Physical Activity and Health (ISPAH), 2012C. NCD prevention: invest-ments [corrected] that work for physical activity. Br. J. Sports Med. 46 (10):709–712. http://dx.doi.org/10.1136/bjsm.2012.091485.
Global Recommendations on Physical Activity for Health. Geneva: World Health Organi-zation, (accessed 15 February 2016) http://apps.who.int/iris/bitstream/10665/44399/1/9789241599979_eng.pdf
Gore, M., Sadosky, A., Stacey, B.R., Tai, K.S., Leslie, D., 2012. The burden of chronic low backpain: clinical comorbidities, treatment patterns, and health care costs in usual caresettings. Spine 37 (11), E668–E677.
Hagen, E.M., Odelien, K.H., Lie, S.A., Eriksen, H.R., 2010. Adding a physical exercise pro-gramme to brief intervention for low back pain patients did not increase return towork. Scand. J. Public Health 38 (7):731–738. http://dx.doi.org/10.1177/1403494810382472.
Haskell, W.L., Lee, I.M., Pate, R.R., et al., 2007. Physical activity and public health: updatedrecommendation for adults from the American College of Sports Medicine and theAmerican Heart Association. Med. Sci. Sports Exerc. 39 (8):1423–1434. http://dx.doi.org/10.1249/mss.0b013e3180616b27.
Kelly, G.A., Blake, C., Power, C.K., O'Keeffe, D., Fullen, B.M., 2011. The association betweenchronic low back pain and sleep: a systematic review. Clin. J. Pain 27 (2):169–181.http://dx.doi.org/10.1097/AJP.0b013e3181f3bdd5.
Kuukkanen, T., Malkia, E., Kautiainen, H., Pohjolainen, T., 2007. Effectiveness of a home ex-ercise programme in low back pain: a randomized five-year follow-up study.Physiother. Res. Int. 12 (4), 213–224.
Kwon, M.A., Shim, W.S., Kim, M.H., et al., 2006. A correlation between low back pain andassociated factors: a study involving 772 patients who had undergone general phys-ical examination. J. Korean Med. Sci. 21 (6), 1086–1091.
Leonhardt, C., Keller, S., Chenot, J.F., et al., 2008. TTM-based motivational counselling doesnot increase physical activity of low back pain patients in a primary care setting—acluster-randomized controlled trial. Patient Educ. Couns. 70 (1), 50–60.
McCormack, G.R., Shiell, A., 2011. In search of causality: a systematic review of the rela-tionship between the built environment and physical activity among adults. Int.J. Behav. Nutr. Phys. Act. 8:125. http://dx.doi.org/10.1186/1479-5868-8-125.
Meng, K., Seekatz, B., Roband, H., et al., 2011. Intermediate and long-term effects of a stan-dardized back school for inpatient orthopedic rehabilitation on illness knowledge andself-management behaviors: a randomized controlled trial. Clin. J. Pain 27 (3):248–257. http://dx.doi.org/10.1097/AJP.0b013e3181ffbfaf.
van Middelkoop, M., Rubinstein, S.M., Verhagen, A.P., et al., 2010. Exercise therapy forchronic nonspecific low-back pain. Best Pract. Res. Clin. Rheumatol. 24 (2):193–204. http://dx.doi.org/10.1016/j.berh.2010.01.002.
67
Mortimer, M., Wiktorin, C., Pernol, G., Svensson, H., Vingard, E., 2001. Sports activities,body weight and smoking in relation to low-back pain: a population-based case-ref-erent study. Scand. J. Med. Sci. Sports 11 (3), 178–184.
Murray, C.J., Vos, T., Lozano, R., et al., 2012. Disability-adjusted life years (DALYs) for 291diseases and injuries in 21 regions, 1990–2010: a systematic analysis for the GlobalBurden of Disease Study 2010. [Erratum appears in Lancet. 2013 Feb 23;381(9867):628 Note: AlMazroa, Mohammad A [added]; Memish, Ziad A [added]]. Lancet 380(9859), 2197–2223.
Nassif, H., Brosset, N., Guillaume, M., et al., 2011. Evaluation of a randomized controlledtrial in the management of chronic lower back pain in a French automotive industry:an observational study. Arch. Phys. Med. Rehabil. 92 (12):1927–1936, e1924. http://dx.doi.org/10.1016/j.apmr.2011.06.029.
Nilsen, T.I.L., Holtermann, A., Mork, P.J., 2011. Physical exercise, bodymass index, and riskof chronic pain in the low back and neck/shoulders: longitudinal data from the nord-trøndelag health study. Am. J. Epidemiol. 174 (3):267–273. http://dx.doi.org/10.1093/aje/kwr087.
Pinheiro, M.B., Ferreira, M.L., Refshauge, K., et al., 2015a. Symptoms of depression and riskof new episodes of low back pain: a systematic review and meta-analysis. ArthritisCare Res. 67 (11), 1591–1603.
Pinheiro, M.B., Ferreira, M.L., Refshauge, K., et al., 2015b. Genetics and the environment af-fect the relationship between depression and low back pain: a co-twin control studyof Spanish twins. Pain 156 (3):496–503. http://dx.doi.org/10.1097/01.j.pain.0000460330.56256.25.
Schneider, S., Schmitt, H., Zoller, S., Schiltenwolf, M., 2005. Workplace stress, lifestyle andsocial factors as correlates of back pain: a representative study of the German work-ing population. Int. Arch. Occup. Environ. Health 78 (4):253–269. http://dx.doi.org/10.1007/s00420-004-0576-4.
Shiri, R., Karppinen, J., Leino-Arjas, P., Solovieva, S., Viikari-Juntura, E., 2010. The associa-tion between smoking and low back pain: a meta-analysis. Am. J. Med. 123 (1):87,e87-35. http://dx.doi.org/10.1016/j.amjmed.2009.05.028.
Smith, B.J., Marshall, A.L., Huang, N., 2005. Screening for physical activity in family prac-tice: evaluation of two brief assessment tools. Am. J. Prev. Med. 29 (4):256–264.http://dx.doi.org/10.1016/j.amepre.2005.07.005.
Sorensen, P.H., Bendix, T., Manniche, C., et al., 2010. An educational approach based on anon-injury model compared with individual symptom-based physical training inchronic LBP. A pragmatic, randomised trial with a one-year follow-up. BMCMusculoskelet. Disord. 11:212. http://dx.doi.org/10.1186/1471-2474-11-212.
Steffens, D., Maher, C.G., Pereira, L.S., et al., 2016. Prevention of low back pain: a system-atic review andmeta-analysis. JAMA Intern. Med. 176 (2):199–208. http://dx.doi.org/10.1001/jamainternmed.2015.7431.
Van Holle, V., Deforche, B., Van Cauwenberg, J., et al., 2012. Relationship between thephysical environment and different domains of physical activity in European adults:a systematic review. BMC Public Health 12:807. http://dx.doi.org/10.1186/1471-2458-12-807.
de Vet, H.C., Heymans, M.W., Dunn, K.M., et al., 2002. Episodes of low back pain: a propos-al for uniform definitions to be used in research. Spine (Phila Pa 1976) 27 (21):2409–2416. http://dx.doi.org/10.1097/01.brs.0000030307.34002.be.
de Vilhena Santos, D.M., Katzmarzyk, P.T., Seabra, A.F., Maia, J.A., 2012. Genetics of phys-ical activity and physical inactivity in humans. Behav. Genet. 42 (4):559–578. http://dx.doi.org/10.1007/s10519-012-9534-1.
Wenig, C.M., Schmidt, C.O., Kohlmann, T., Schweikert, B., 2009. Costs of back pain in Ger-many. Eur. J. Pain 13 (3), 280–286.
Wright, D., Barrow, S., Fisher, A.D., Horsley, S.D., Jayson, M.I., 1995. Influence of physical,psychological and behavioural factors on consultations for back pain. Br.J. Rheumatol. 34 (2), 156–161.
Zadro, J.R., Shirley, D., Pinheiro, M.B., et al., 2016. Does educational attainment increasethe risk of low back pain when genetics is considered? A population based study ofSpanish twins. Spine J. http://dx.doi.org/10.1016/j.spinee.2016.10.021.

Supplementary material: Assessment of confounding variables.
Variable Question Response options
Smoking “Do you currently smoke?” i) Yes ii) No Educational attainment
“What is the highest level of education you have completed?”
i) never attended school or only attended kindergarten ii) grade 1-8 iii) grade 9-11 iv) grade12/high school graduated v) some college vi) associates degree vii) technical or vocational degree viii) bachelor degree ix) graduate or professional degree
Sleep quality “How often do you have difficulty
falling asleep or staying asleep?” i) never ii) sometimes iii) often iv) always
Depression “In the past 4 weeks, how often have
you been bothered by the following problems: feeling down, depressed, or hopeless?”
i) not at all ii) several days iii) more than half days iv) nearly every day
Leisure sitting time
“Over the past 4 weeks, how much time altogether did you spend on a typical day sitting and watching TV or videos or using a computer outside of work?”
i) 0 hours ii) 1-2 hours iii) 3-4 hours iv) 5 or more
68
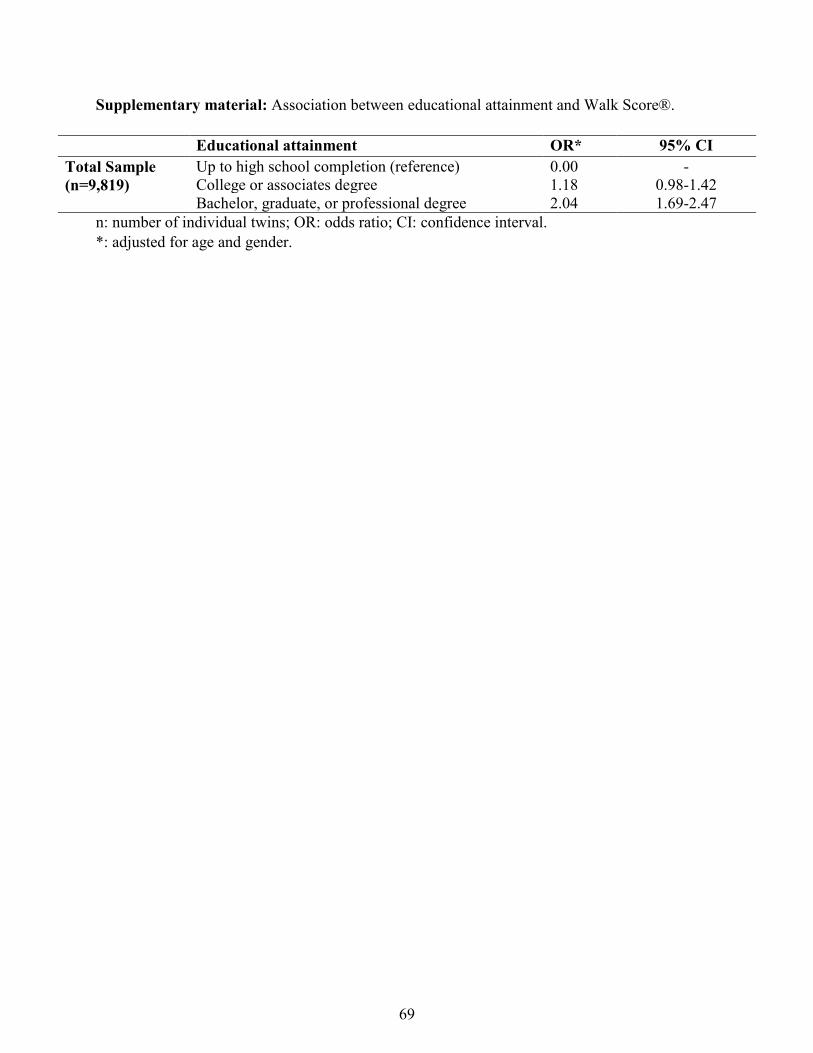
Supplementary material: Association between educational attainment and Walk Score®.
Educational attainment OR* 95% CI Total Sample (n=9,819)
Up to high school completion (reference) 0.00 - College or associates degree 1.18 0.98-1.42 Bachelor, graduate, or professional degree 2.04 1.69-2.47
n: number of individual twins; OR: odds ratio; CI: confidence interval. *: adjusted for age and gender.
69
CHAPTER FOUR
Does educational attainment increase the risk of low back pain when genetics
is considered? A population-based study of Spanish twins
Chapter Four has been published as:
Zadro JR, Shirley D, Pinheiro MB, Sánchez-Romera JF, Pérez-Riquelme F, Ordoñana JR,
Ferreira PH. Does educational attainment increase the risk of low back pain when genetics is
considered? A population-based study of Spanish twins. The Spine Journal. 2016;17(4):518-30.
Copyright © 2017 Elsevier Inc. All rights reserve. Reprinted with permission from Elsevier.
70

Clinical Study
Does educational attainment increase the risk of low back pain whengenetics are considered? A population-based study of Spanish twins
Joshua R. Zadro, BAppSc (Phty) (Hons)a,*, Debra Shirley, PhDa,Marina B. Pinheiro, BAppSc (Phty)a, Juan F. Sánchez-Romera, PhDb,c,
Francisco Pérez-Riquelme, MDc,d, Juan R. Ordoñana, PhDc,e, Paulo H. Ferreira, PhDa
aDiscipline of Physiotherapy, Faculty of Health Sciences, University of Sydney, 75 East St, Lidcombe, New South Wales, 2141, AustraliabDepartment of Educational and Developmental Psychology, University of Murcia, Campus de Espinardo, 30100, Murcia, Spain
cMurcia Institute for Biomedical Research, IMIB-Arrixaca, HCUVA Virgen de la Arrixaca, 30120, Murcia, SpaindMurcia Health Council, IMIB-Arrixaca, Ronda de Levante, 11, 30008, Murcia, Spain
eMurcia Twin Registry, Department of Human Anatomy and Psychobiology, University of Murcia, Campus de Espinardo, 30100, Murcia, Spain
Received 1 June 2016; revised 15 September 2016; accepted 25 October 2016
Abstract BACKGROUND CONTEXT: There is limited research investigating educational attainment as arisk factor for low back pain (LBP), with the influence of gender commonly being neglected. Fur-thermore, genetics and early shared environment explain a substantial proportion of LBP cases andneed to be controlled for when investigating risk factors for LBP.PURPOSE: To investigate whether educational attainment affects the prevalence and risk of LBPdifferently in men and women while controlling for the influence of genetics and early sharedenvironment.STUDY DESIGN: This is a cross-sectional and prospective twin case-control study.PATIENT SAMPLE: Adult monozygotic (MZ) and dizygotic (DZ) twins from the Murcia TwinRegistry, with available data on educational attainment, formed the base sample for this study. Theprevalence analysis considered twins with available data on LBP in 2013 (n=1,580). The longitudi-nal analysis considered twins free of LBP at baseline (2009–2011), with available data on LBP atfollow-up (2013) (n=1,077).OUTCOME MEASURES: Data on the lifetime prevalence of activity limiting LBP (outcome) andeducational attainment (risk factor) were self-reported.METHODS: The prevalence analysis investigated the cross-sectional association between educa-tional attainment and LBP, whereas the longitudinal analysis investigated whether educational attainmentincreased the risk of developing LBP. Both analyses were performed in the following sequence. First,a total sample analysis was performed on all twins (considering them as individuals), adjusting forconfounding variables selected by the data. Second, to control for the influence of genetics and earlyshared environment, a within-pair case-control analysis (stratified by zygosity) was performed oncomplete twin pairs discordant for LBP (ie, one twin had LBP, whereas the co-twin did not). Allanalyses were stratified for gender where possible, with an interaction term determining whether genderwas a significant moderator of the association between educational attainment and LBP.RESULTS: Women with either general secondary or university education were less likely to expe-rience (prevalence analysis) or to develop LBP (longitudinal analysis). Educational attainment did notaffect the risk of LBP in men. When controlling for the effects of genetics and early shared environ-ment, the relationship between educational status and LBPin women was no longer statistically significant.
FDA device/drug status: Not applicable.Author disclosures: JRZ: Nothing to disclose. DS: Nothing to
disclose. MBP: Nothing to disclose. JFS-R: Nothing to disclose.FP-R: Nothing to disclose. JRO: Nothing to disclose. PHF: Nothing to dis-close.
The disclosure key can be found on the Table of Contents and atwww.TheSpineJournalOnline.com.
Conflict of interest: None declared.
Funding sources: The Murcia Twin Registry is supported by FundaciónSénecea, Regional Agency for Science and Technology, Murcia, Spain (15302/PHCS/10 & 19479/PI/14) and the Ministry of Economy and Competitiveness(PSI2009-11560 & PSI2014-56680-R). Funding for this project has also beenreceived from Fundación Mapfre (2012).
* Corresponding author. Faculty of Health Sciences, University of Sydney,PO Box 170, Lidcombe, NSW, 2141, Australia. Tel.: (61) 449-906-121.
E-mail address: [email protected] (J.R. Zadro)
http://dx.doi.org/10.1016/j.spinee.2016.10.0211529-9430/© 2016 Elsevier Inc. All rights reserved.
The Spine Journal 17 (2017) 518–530
71
CONCLUSIONS: Educational attainment affects LBP differently in men and women, with higherlevels of education only decreasing the risk of developing LBP in women. After adjusting for ge-netics and early shared environment, the relationship between educational attainment and LBP inwomen disappears. This suggests that genetics and early shared environment are confounding therelationship between educational attainment and LBP in women. © 2016 Elsevier Inc. All rightsreserved.
Keywords: Education; Gender; Genetics; Low back pain; Murcia Twin Registry; Twin study
Introduction
Low back pain (LBP) is a global problem, resulting in dis-ability affecting people in many countries, regardless of income[1,2]. The most recent Global Burden of Disease Study hasranked LBP as the leading cause of global disability [3], withapproximately 23% of individuals experiencing activity lim-iting LBP in the past month [4], and up to 15% of individualsestimated to experience a first-ever episode of LBP withinthe next year [5]. As a result of the high prevalence of LBP,the financial burden is enormous and has been estimated atAU$4.8 billion in Australia [6]. In addition, the financialburden is significant across other countries [7,8], with esti-mates for the whole of Europe being as high as €300 billion[8]. To effectively reduce the burden of LBP, it is necessaryto identify risk factors for the condition so that effective pre-vention strategies can be properly designed.
Studies assessing risks for a first-time episode of LBP orLBP reoccurrence have failed to identify strong and consis-tent risk factors, with a previous history of LBP being theexception [9]. Although some commonly reported risk factorsinclude poor general health, low levels of job satisfaction [10],and physically demanding work-related factors [9], there arestill factors that are not well investigated, for example, edu-cational attainment. There is an inverse relationship betweeneducational attainment and the severity [11,12] and frequen-cy [13] of LBP; however, only a few studies have investigatededucational attainment as a risk factor for LBP. It appears thathaving a higher level of education reduces the risk of devel-oping activity limiting LBP [14,15], although there are additionalfactors that need to be considered before definite conclusionscan be made, including the influence of gender and genetics.
First, the impact gender has on the relationship betweeneducational attainment and LBP has only been considered ina few observational studies. Some studies have reported thatgender is important when considering the relationship betweeneducational attainment and LBP [16,17], whereas others havenot [11,12,15]. For example, Deyo and Tsui-Wu reported thatincreased educational attainment was associated with reducedfunctional limitations from LBP in men, but not in women[16], whereas increased educational attainment reduces therisk of disabling LBP irrespective of gender [15]. Before thedesign of effective intervention strategies, it is important toget a better understanding of the risk factors for LBP whileconsidering differences between men and women. Gender-related differences exist in the experience of musculoskeletalpain [18,19], with women being more likely to report chronic
pain [19] and LBP [20]. In addition, the outcome of inter-ventions for LBP may be dependent on gender [21,22].Therefore, to better understand whether educational attain-ment increases the risk of LBP, it is important to considerthe influence of gender. Second, genetic factors have beenshown to have a significant impact on educational attain-ment and LBP, accounting for between 34% and 67% of thevariance in educational attainment [23], and up to 67% of vari-ance in chronic and disabling LBP [24]. With geneticsresponsible for substantial variation in an individual’s edu-cational attainment and LBP, the confounding effects ofgenetics need to be considered if a direct relationship betweenthese variables is to be elucidated. Co-twin control studiesare being increasingly used to control for the effects of ge-netics and are producing interesting findings in the LBP field[25,26]. For example, a recent systematic review found thatthe strong association between obesity and LBP disappearsafter adjusting for genetic factors [25]. This finding sup-ports the importance of considering genetic factors wheninvestigating risk factors for LBP. Based on the results of pre-vious twin studies, and given the strong influence geneticshas over educational attainment and LBP, we hypothesize thatthe association between these variables may be confoundedby genetic factors. The aim of the present study is to inves-tigate how gender influences the relationship betweeneducational attainment and the prevalence and risk of LBPby using a co-twin controlled design to adjust for the influ-ence of genetics and early shared environment.
Methods
Participants and data collection
The sample for the present study was drawn from theMurcia Twin Registry (MTR). The MTR is a population-based registry of adult twins, born between 1940 and 1966,in the region of Murcia, southeast Spain. The Murcia HealthService identifies people who were born on the same day andshare the same surname, and contacts them via mail andtelephone to explain the purpose of the registry, request par-ticipation, and gather data. Participation in the MTR isvoluntary, subject to informed consent, and not remuner-ated. Twins are included in the MTR if they meet the inclusioncriteria: pairs with both members alive at the time of incor-poration, residence in the region of Murcia, and absence ofconditions or disability that may limit their voluntary par-ticipation. The global cooperation rate across data collection
519J.R. Zadro et al. / The Spine Journal 17 (2017) 518–530
72
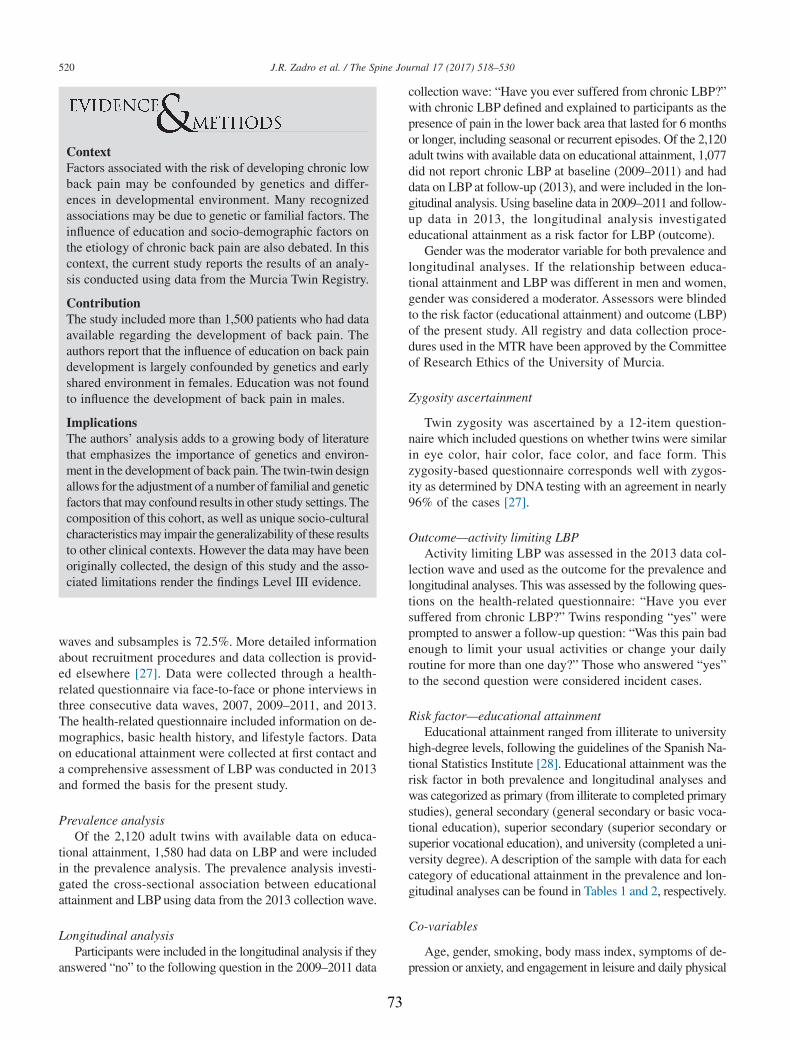
waves and subsamples is 72.5%. More detailed informationabout recruitment procedures and data collection is provid-ed elsewhere [27]. Data were collected through a health-related questionnaire via face-to-face or phone interviews inthree consecutive data waves, 2007, 2009–2011, and 2013.The health-related questionnaire included information on de-mographics, basic health history, and lifestyle factors. Dataon educational attainment were collected at first contact anda comprehensive assessment of LBP was conducted in 2013and formed the basis for the present study.
Prevalence analysisOf the 2,120 adult twins with available data on educa-
tional attainment, 1,580 had data on LBP and were includedin the prevalence analysis. The prevalence analysis investi-gated the cross-sectional association between educationalattainment and LBP using data from the 2013 collection wave.
Longitudinal analysisParticipants were included in the longitudinal analysis if they
answered “no” to the following question in the 2009–2011 data
collection wave: “Have you ever suffered from chronic LBP?”with chronic LBP defined and explained to participants as thepresence of pain in the lower back area that lasted for 6 monthsor longer, including seasonal or recurrent episodes. Of the 2,120adult twins with available data on educational attainment, 1,077did not report chronic LBP at baseline (2009–2011) and haddata on LBP at follow-up (2013), and were included in the lon-gitudinal analysis. Using baseline data in 2009–2011 and follow-up data in 2013, the longitudinal analysis investigatededucational attainment as a risk factor for LBP (outcome).
Gender was the moderator variable for both prevalence andlongitudinal analyses. If the relationship between educa-tional attainment and LBP was different in men and women,gender was considered a moderator. Assessors were blindedto the risk factor (educational attainment) and outcome (LBP)of the present study. All registry and data collection proce-dures used in the MTR have been approved by the Committeeof Research Ethics of the University of Murcia.
Zygosity ascertainment
Twin zygosity was ascertained by a 12-item question-naire which included questions on whether twins were similarin eye color, hair color, face color, and face form. Thiszygosity-based questionnaire corresponds well with zygos-ity as determined by DNA testing with an agreement in nearly96% of the cases [27].
Outcome—activity limiting LBPActivity limiting LBP was assessed in the 2013 data col-
lection wave and used as the outcome for the prevalence andlongitudinal analyses. This was assessed by the following ques-tions on the health-related questionnaire: “Have you eversuffered from chronic LBP?” Twins responding “yes” wereprompted to answer a follow-up question: “Was this pain badenough to limit your usual activities or change your dailyroutine for more than one day?” Those who answered “yes”to the second question were considered incident cases.
Risk factor—educational attainmentEducational attainment ranged from illiterate to university
high-degree levels, following the guidelines of the Spanish Na-tional Statistics Institute [28]. Educational attainment was therisk factor in both prevalence and longitudinal analyses andwas categorized as primary (from illiterate to completed primarystudies), general secondary (general secondary or basic voca-tional education), superior secondary (superior secondary orsuperior vocational education), and university (completed a uni-versity degree). A description of the sample with data for eachcategory of educational attainment in the prevalence and lon-gitudinal analyses can be found in Tables 1 and 2, respectively.
Co-variables
Age, gender, smoking, body mass index, symptoms of de-pression or anxiety, and engagement in leisure and daily physical
ContextFactors associated with the risk of developing chronic lowback pain may be confounded by genetics and differ-ences in developmental environment. Many recognizedassociations may be due to genetic or familial factors. Theinfluence of education and socio-demographic factors onthe etiology of chronic back pain are also debated. In thiscontext, the current study reports the results of an analy-sis conducted using data from the Murcia Twin Registry.
ContributionThe study included more than 1,500 patients who had dataavailable regarding the development of back pain. Theauthors report that the influence of education on back paindevelopment is largely confounded by genetics and earlyshared environment in females. Education was not foundto influence the development of back pain in males.
ImplicationsThe authors’ analysis adds to a growing body of literaturethat emphasizes the importance of genetics and environ-ment in the development of back pain. The twin-twin designallows for the adjustment of a number of familial and geneticfactors that may confound results in other study settings. Thecomposition of this cohort, as well as unique socio-culturalcharacteristics may impair the generalizability of these resultsto other clinical contexts. However the data may have beenoriginally collected, the design of this study and the asso-ciated limitations render the findings Level III evidence.
520 J.R. Zadro et al. / The Spine Journal 17 (2017) 518–530
73
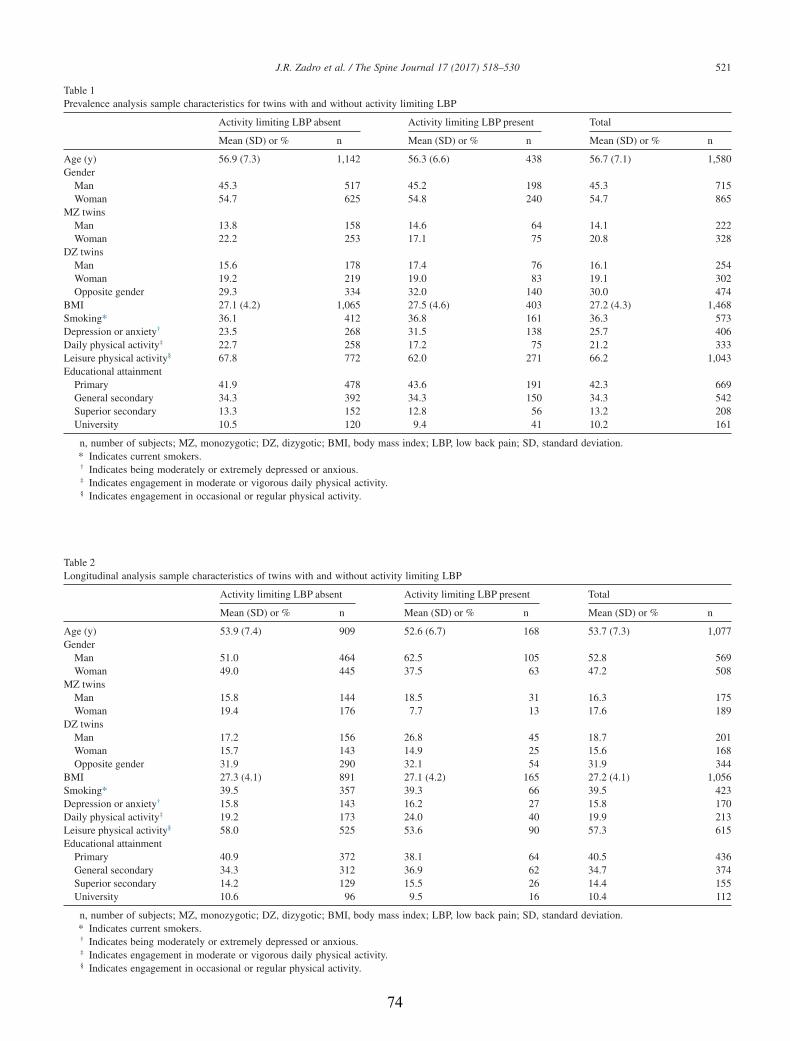
Table 1Prevalence analysis sample characteristics for twins with and without activity limiting LBP
Activity limiting LBP absent Activity limiting LBP present Total
Mean (SD) or % n Mean (SD) or % n Mean (SD) or % n
Age (y) 56.9 (7.3) 1,142 56.3 (6.6) 438 56.7 (7.1) 1,580Gender
Man 45.3 517 45.2 198 45.3 715Woman 54.7 625 54.8 240 54.7 865
MZ twinsMan 13.8 158 14.6 64 14.1 222Woman 22.2 253 17.1 75 20.8 328
DZ twinsMan 15.6 178 17.4 76 16.1 254Woman 19.2 219 19.0 83 19.1 302Opposite gender 29.3 334 32.0 140 30.0 474
BMI 27.1 (4.2) 1,065 27.5 (4.6) 403 27.2 (4.3) 1,468Smoking* 36.1 412 36.8 161 36.3 573Depression or anxiety† 23.5 268 31.5 138 25.7 406Daily physical activity‡ 22.7 258 17.2 75 21.2 333Leisure physical activity§ 67.8 772 62.0 271 66.2 1,043Educational attainment
Primary 41.9 478 43.6 191 42.3 669General secondary 34.3 392 34.3 150 34.3 542Superior secondary 13.3 152 12.8 56 13.2 208University 10.5 120 9.4 41 10.2 161
n, number of subjects; MZ, monozygotic; DZ, dizygotic; BMI, body mass index; LBP, low back pain; SD, standard deviation.* Indicates current smokers.† Indicates being moderately or extremely depressed or anxious.‡ Indicates engagement in moderate or vigorous daily physical activity.§ Indicates engagement in occasional or regular physical activity.
Table 2Longitudinal analysis sample characteristics of twins with and without activity limiting LBP
Activity limiting LBP absent Activity limiting LBP present Total
Mean (SD) or % n Mean (SD) or % n Mean (SD) or % n
Age (y) 53.9 (7.4) 909 52.6 (6.7) 168 53.7 (7.3) 1,077Gender
Man 51.0 464 62.5 105 52.8 569Woman 49.0 445 37.5 63 47.2 508
MZ twinsMan 15.8 144 18.5 31 16.3 175Woman 19.4 176 7.7 13 17.6 189
DZ twinsMan 17.2 156 26.8 45 18.7 201Woman 15.7 143 14.9 25 15.6 168Opposite gender 31.9 290 32.1 54 31.9 344
BMI 27.3 (4.1) 891 27.1 (4.2) 165 27.2 (4.1) 1,056Smoking* 39.5 357 39.3 66 39.5 423Depression or anxiety† 15.8 143 16.2 27 15.8 170Daily physical activity‡ 19.2 173 24.0 40 19.9 213Leisure physical activity§ 58.0 525 53.6 90 57.3 615Educational attainment
Primary 40.9 372 38.1 64 40.5 436General secondary 34.3 312 36.9 62 34.7 374Superior secondary 14.2 129 15.5 26 14.4 155University 10.6 96 9.5 16 10.4 112
n, number of subjects; MZ, monozygotic; DZ, dizygotic; BMI, body mass index; LBP, low back pain; SD, standard deviation.* Indicates current smokers.† Indicates being moderately or extremely depressed or anxious.‡ Indicates engagement in moderate or vigorous daily physical activity.§ Indicates engagement in occasional or regular physical activity.
521J.R. Zadro et al. / The Spine Journal 17 (2017) 518–530
74
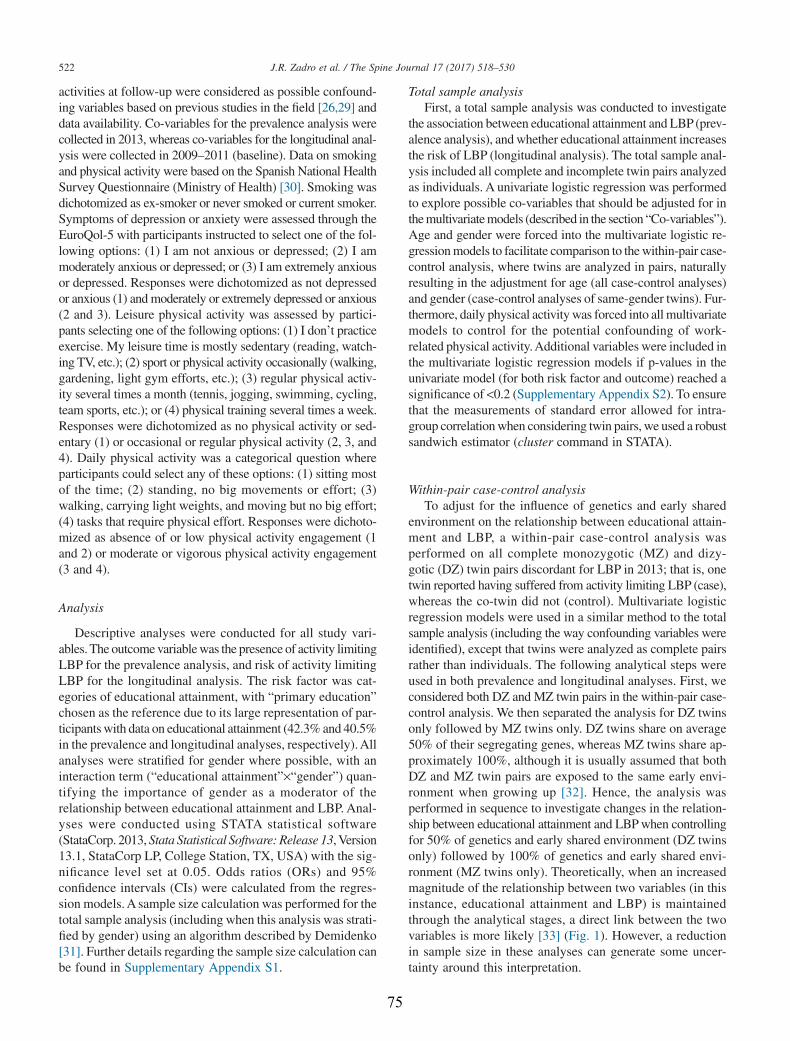
activities at follow-up were considered as possible confound-ing variables based on previous studies in the field [26,29] anddata availability. Co-variables for the prevalence analysis werecollected in 2013, whereas co-variables for the longitudinal anal-ysis were collected in 2009–2011 (baseline). Data on smokingand physical activity were based on the Spanish National HealthSurvey Questionnaire (Ministry of Health) [30]. Smoking wasdichotomized as ex-smoker or never smoked or current smoker.Symptoms of depression or anxiety were assessed through theEuroQol-5 with participants instructed to select one of the fol-lowing options: (1) I am not anxious or depressed; (2) I ammoderately anxious or depressed; or (3) I am extremely anxiousor depressed. Responses were dichotomized as not depressedor anxious (1) and moderately or extremely depressed or anxious(2 and 3). Leisure physical activity was assessed by partici-pants selecting one of the following options: (1) I don’t practiceexercise. My leisure time is mostly sedentary (reading, watch-ing TV, etc.); (2) sport or physical activity occasionally (walking,gardening, light gym efforts, etc.); (3) regular physical activ-ity several times a month (tennis, jogging, swimming, cycling,team sports, etc.); or (4) physical training several times a week.Responses were dichotomized as no physical activity or sed-entary (1) or occasional or regular physical activity (2, 3, and4). Daily physical activity was a categorical question whereparticipants could select any of these options: (1) sitting mostof the time; (2) standing, no big movements or effort; (3)walking, carrying light weights, and moving but no big effort;(4) tasks that require physical effort. Responses were dichoto-mized as absence of or low physical activity engagement (1and 2) or moderate or vigorous physical activity engagement(3 and 4).
Analysis
Descriptive analyses were conducted for all study vari-ables. The outcome variable was the presence of activity limitingLBP for the prevalence analysis, and risk of activity limitingLBP for the longitudinal analysis. The risk factor was cat-egories of educational attainment, with “primary education”chosen as the reference due to its large representation of par-ticipants with data on educational attainment (42.3% and 40.5%in the prevalence and longitudinal analyses, respectively). Allanalyses were stratified for gender where possible, with aninteraction term (“educational attainment”דgender”) quan-tifying the importance of gender as a moderator of therelationship between educational attainment and LBP. Anal-yses were conducted using STATA statistical software(StataCorp. 2013, Stata Statistical Software: Release 13, Version13.1, StataCorp LP, College Station, TX, USA) with the sig-nificance level set at 0.05. Odds ratios (ORs) and 95%confidence intervals (CIs) were calculated from the regres-sion models. A sample size calculation was performed for thetotal sample analysis (including when this analysis was strati-fied by gender) using an algorithm described by Demidenko[31]. Further details regarding the sample size calculation canbe found in Supplementary Appendix S1.
Total sample analysisFirst, a total sample analysis was conducted to investigate
the association between educational attainment and LBP (prev-alence analysis), and whether educational attainment increasesthe risk of LBP (longitudinal analysis). The total sample anal-ysis included all complete and incomplete twin pairs analyzedas individuals. A univariate logistic regression was performedto explore possible co-variables that should be adjusted for inthe multivariate models (described in the section “Co-variables”).Age and gender were forced into the multivariate logistic re-gression models to facilitate comparison to the within-pair case-control analysis, where twins are analyzed in pairs, naturallyresulting in the adjustment for age (all case-control analyses)and gender (case-control analyses of same-gender twins). Fur-thermore, daily physical activity was forced into all multivariatemodels to control for the potential confounding of work-related physical activity. Additional variables were included inthe multivariate logistic regression models if p-values in theunivariate model (for both risk factor and outcome) reached asignificance of <0.2 (Supplementary Appendix S2). To ensurethat the measurements of standard error allowed for intra-group correlation when considering twin pairs, we used a robustsandwich estimator (cluster command in STATA).
Within-pair case-control analysisTo adjust for the influence of genetics and early shared
environment on the relationship between educational attain-ment and LBP, a within-pair case-control analysis wasperformed on all complete monozygotic (MZ) and dizy-gotic (DZ) twin pairs discordant for LBP in 2013; that is, onetwin reported having suffered from activity limiting LBP (case),whereas the co-twin did not (control). Multivariate logisticregression models were used in a similar method to the totalsample analysis (including the way confounding variables wereidentified), except that twins were analyzed as complete pairsrather than individuals. The following analytical steps wereused in both prevalence and longitudinal analyses. First, weconsidered both DZ and MZ twin pairs in the within-pair case-control analysis. We then separated the analysis for DZ twinsonly followed by MZ twins only. DZ twins share on average50% of their segregating genes, whereas MZ twins share ap-proximately 100%, although it is usually assumed that bothDZ and MZ twin pairs are exposed to the same early envi-ronment when growing up [32]. Hence, the analysis wasperformed in sequence to investigate changes in the relation-ship between educational attainment and LBP when controllingfor 50% of genetics and early shared environment (DZ twinsonly) followed by 100% of genetics and early shared envi-ronment (MZ twins only). Theoretically, when an increasedmagnitude of the relationship between two variables (in thisinstance, educational attainment and LBP) is maintainedthrough the analytical stages, a direct link between the twovariables is more likely [33] (Fig. 1). However, a reductionin sample size in these analyses can generate some uncer-tainty around this interpretation.
522 J.R. Zadro et al. / The Spine Journal 17 (2017) 518–530
75
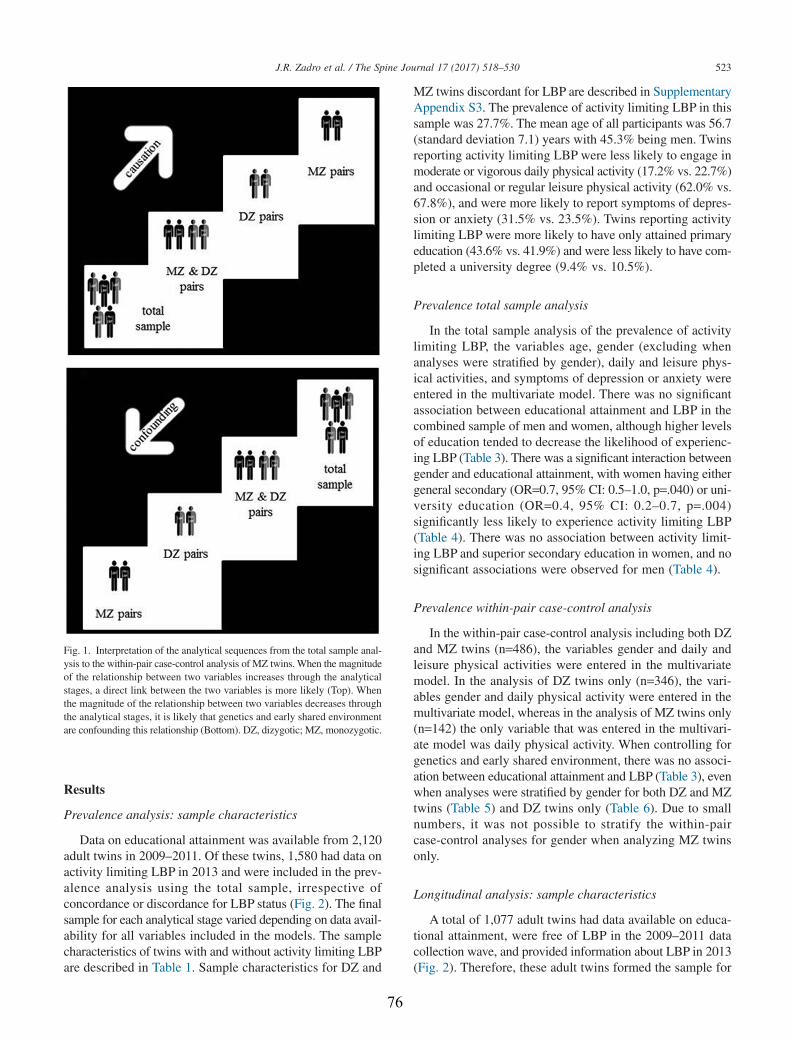
Results
Prevalence analysis: sample characteristics
Data on educational attainment was available from 2,120adult twins in 2009–2011. Of these twins, 1,580 had data onactivity limiting LBP in 2013 and were included in the prev-alence analysis using the total sample, irrespective ofconcordance or discordance for LBP status (Fig. 2). The finalsample for each analytical stage varied depending on data avail-ability for all variables included in the models. The samplecharacteristics of twins with and without activity limiting LBPare described in Table 1. Sample characteristics for DZ and
MZ twins discordant for LBP are described in SupplementaryAppendix S3. The prevalence of activity limiting LBP in thissample was 27.7%. The mean age of all participants was 56.7(standard deviation 7.1) years with 45.3% being men. Twinsreporting activity limiting LBP were less likely to engage inmoderate or vigorous daily physical activity (17.2% vs. 22.7%)and occasional or regular leisure physical activity (62.0% vs.67.8%), and were more likely to report symptoms of depres-sion or anxiety (31.5% vs. 23.5%). Twins reporting activitylimiting LBP were more likely to have only attained primaryeducation (43.6% vs. 41.9%) and were less likely to have com-pleted a university degree (9.4% vs. 10.5%).
Prevalence total sample analysis
In the total sample analysis of the prevalence of activitylimiting LBP, the variables age, gender (excluding whenanalyses were stratified by gender), daily and leisure phys-ical activities, and symptoms of depression or anxiety wereentered in the multivariate model. There was no significantassociation between educational attainment and LBP in thecombined sample of men and women, although higher levelsof education tended to decrease the likelihood of experienc-ing LBP (Table 3). There was a significant interaction betweengender and educational attainment, with women having eithergeneral secondary (OR=0.7, 95% CI: 0.5–1.0, p=.040) or uni-versity education (OR=0.4, 95% CI: 0.2–0.7, p=.004)significantly less likely to experience activity limiting LBP(Table 4). There was no association between activity limit-ing LBP and superior secondary education in women, and nosignificant associations were observed for men (Table 4).
Prevalence within-pair case-control analysis
In the within-pair case-control analysis including both DZand MZ twins (n=486), the variables gender and daily andleisure physical activities were entered in the multivariatemodel. In the analysis of DZ twins only (n=346), the vari-ables gender and daily physical activity were entered in themultivariate model, whereas in the analysis of MZ twins only(n=142) the only variable that was entered in the multivari-ate model was daily physical activity. When controlling forgenetics and early shared environment, there was no associ-ation between educational attainment and LBP (Table 3), evenwhen analyses were stratified by gender for both DZ and MZtwins (Table 5) and DZ twins only (Table 6). Due to smallnumbers, it was not possible to stratify the within-paircase-control analyses for gender when analyzing MZ twinsonly.
Longitudinal analysis: sample characteristics
A total of 1,077 adult twins had data available on educa-tional attainment, were free of LBP in the 2009–2011 datacollection wave, and provided information about LBP in 2013(Fig. 2). Therefore, these adult twins formed the sample for
Fig. 1. Interpretation of the analytical sequences from the total sample anal-ysis to the within-pair case-control analysis of MZ twins. When the magnitudeof the relationship between two variables increases through the analyticalstages, a direct link between the two variables is more likely (Top). Whenthe magnitude of the relationship between two variables decreases throughthe analytical stages, it is likely that genetics and early shared environmentare confounding this relationship (Bottom). DZ, dizygotic; MZ, monozygotic.
523J.R. Zadro et al. / The Spine Journal 17 (2017) 518–530
76

the longitudinal analysis, irrespective of concordance or dis-cordance for LBP status. The final sample for each analyticalstage varied depending on data availability for all variablesincluded in the models. The sample characteristics of twins
with and without activity limiting LBP are described in Table 2.The sample characteristics of DZ and MZ twins discordantfor LBP are described in Supplementary Appendix S4. Theincidence of activity limiting LBP in this sample was 15.6%.
Fig. 2. STrengthening the Reporting of OBservational studies in Epidemiology (STROBE) study flowchart. LBP, low back pain; DZ, dizygotic; MZ, monozygotic.
Table 3Prevalence total sample analysis and within-pair case-control analysis of activity limiting low back pain (multivariate model)
Educational attainment OR 95% CI p
Total sample (n=1,572)* Primary (reference) 1.0 — —General secondary 0.9 0.7–1.2 .348Superior secondary 0.8 0.6–1.2 .377University 0.8 0.5–1.2 .239
DZ and MZ (n=486)† Primary (reference) 1.0 — —General secondary 0.8 0.5–1.3 .389Superior secondary 1.3 0.5–3.0 .595University 1.3 0.5–3.6 .617
DZ (n=346)‡ Primary (reference) 1.0 — —General secondary 0.8 0.4–1.4 .401Superior secondary 1.0 0.4–2.6 .972University 1.2 0.4–3.7 .745
MZ (n=142)§ Primary (reference) 1.0 — —General secondary 0.8 0.3–1.9 .544Superior secondary 2.4 0.2–25.8 .467University 0.8 0.0–21.3 .896
n, number of individual twins; OR, odds ratio; CI, confidence interval; MZ, monozygotic; DZ, dizygotic.* Adjusted for age, gender, daily physical activity, symptoms of depression or anxiety, and leisure physical activity.† Adjusted for gender and daily and leisure physical activities.‡ Adjusted for gender and daily physical activity.§ Adjusted for daily physical activity.
524 J.R. Zadro et al. / The Spine Journal 17 (2017) 518–530
77
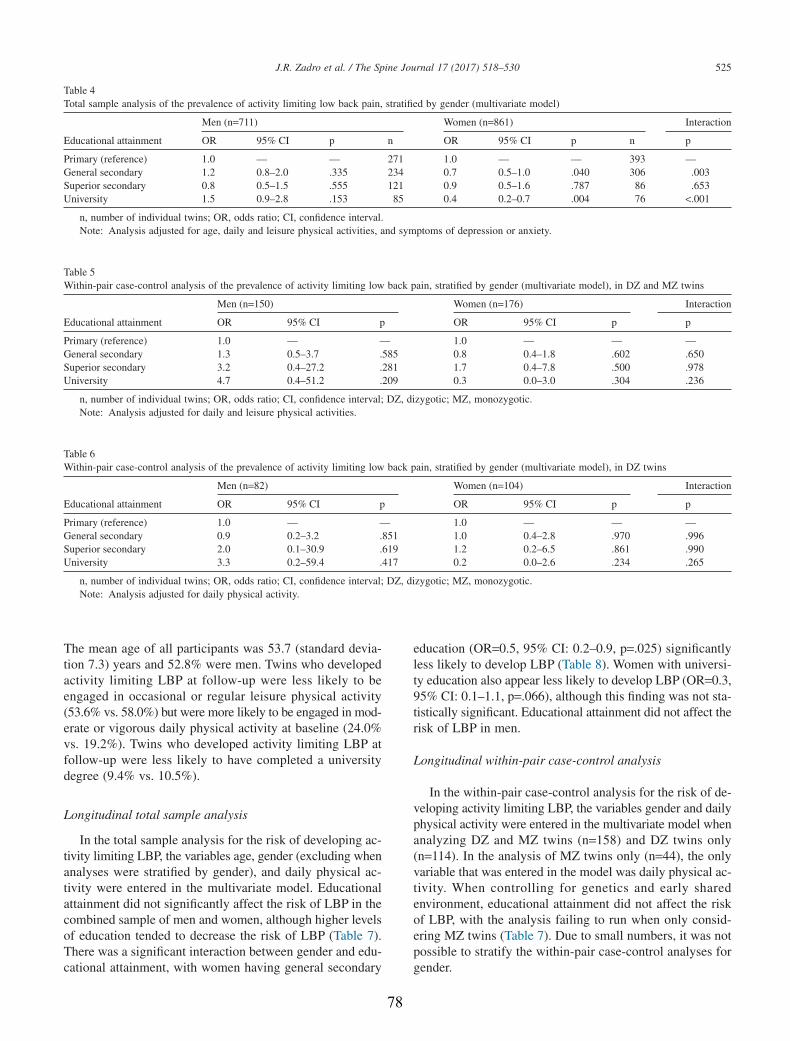
The mean age of all participants was 53.7 (standard devia-tion 7.3) years and 52.8% were men. Twins who developedactivity limiting LBP at follow-up were less likely to beengaged in occasional or regular leisure physical activity(53.6% vs. 58.0%) but were more likely to be engaged in mod-erate or vigorous daily physical activity at baseline (24.0%vs. 19.2%). Twins who developed activity limiting LBP atfollow-up were less likely to have completed a universitydegree (9.4% vs. 10.5%).
Longitudinal total sample analysis
In the total sample analysis for the risk of developing ac-tivity limiting LBP, the variables age, gender (excluding whenanalyses were stratified by gender), and daily physical ac-tivity were entered in the multivariate model. Educationalattainment did not significantly affect the risk of LBP in thecombined sample of men and women, although higher levelsof education tended to decrease the risk of LBP (Table 7).There was a significant interaction between gender and edu-cational attainment, with women having general secondary
education (OR=0.5, 95% CI: 0.2–0.9, p=.025) significantlyless likely to develop LBP (Table 8). Women with universi-ty education also appear less likely to develop LBP (OR=0.3,95% CI: 0.1–1.1, p=.066), although this finding was not sta-tistically significant. Educational attainment did not affect therisk of LBP in men.
Longitudinal within-pair case-control analysis
In the within-pair case-control analysis for the risk of de-veloping activity limiting LBP, the variables gender and dailyphysical activity were entered in the multivariate model whenanalyzing DZ and MZ twins (n=158) and DZ twins only(n=114). In the analysis of MZ twins only (n=44), the onlyvariable that was entered in the model was daily physical ac-tivity. When controlling for genetics and early sharedenvironment, educational attainment did not affect the riskof LBP, with the analysis failing to run when only consid-ering MZ twins (Table 7). Due to small numbers, it was notpossible to stratify the within-pair case-control analyses forgender.
Table 4Total sample analysis of the prevalence of activity limiting low back pain, stratified by gender (multivariate model)
Educational attainment
Men (n=711) Women (n=861) Interaction
OR 95% CI p n OR 95% CI p n p
Primary (reference) 1.0 — — 271 1.0 — — 393 —General secondary 1.2 0.8–2.0 .335 234 0.7 0.5–1.0 .040 306 .003Superior secondary 0.8 0.5–1.5 .555 121 0.9 0.5–1.6 .787 86 .653University 1.5 0.9–2.8 .153 85 0.4 0.2–0.7 .004 76 <.001
n, number of individual twins; OR, odds ratio; CI, confidence interval.Note: Analysis adjusted for age, daily and leisure physical activities, and symptoms of depression or anxiety.
Table 5Within-pair case-control analysis of the prevalence of activity limiting low back pain, stratified by gender (multivariate model), in DZ and MZ twins
Educational attainment
Men (n=150) Women (n=176) Interaction
OR 95% CI p OR 95% CI p p
Primary (reference) 1.0 — — 1.0 — — —General secondary 1.3 0.5–3.7 .585 0.8 0.4–1.8 .602 .650Superior secondary 3.2 0.4–27.2 .281 1.7 0.4–7.8 .500 .978University 4.7 0.4–51.2 .209 0.3 0.0–3.0 .304 .236
n, number of individual twins; OR, odds ratio; CI, confidence interval; DZ, dizygotic; MZ, monozygotic.Note: Analysis adjusted for daily and leisure physical activities.
Table 6Within-pair case-control analysis of the prevalence of activity limiting low back pain, stratified by gender (multivariate model), in DZ twins
Educational attainment
Men (n=82) Women (n=104) Interaction
OR 95% CI p OR 95% CI p p
Primary (reference) 1.0 — — 1.0 — — —General secondary 0.9 0.2–3.2 .851 1.0 0.4–2.8 .970 .996Superior secondary 2.0 0.1–30.9 .619 1.2 0.2–6.5 .861 .990University 3.3 0.2–59.4 .417 0.2 0.0–2.6 .234 .265
n, number of individual twins; OR, odds ratio; CI, confidence interval; DZ, dizygotic; MZ, monozygotic.Note: Analysis adjusted for daily physical activity.
525J.R. Zadro et al. / The Spine Journal 17 (2017) 518–530
78
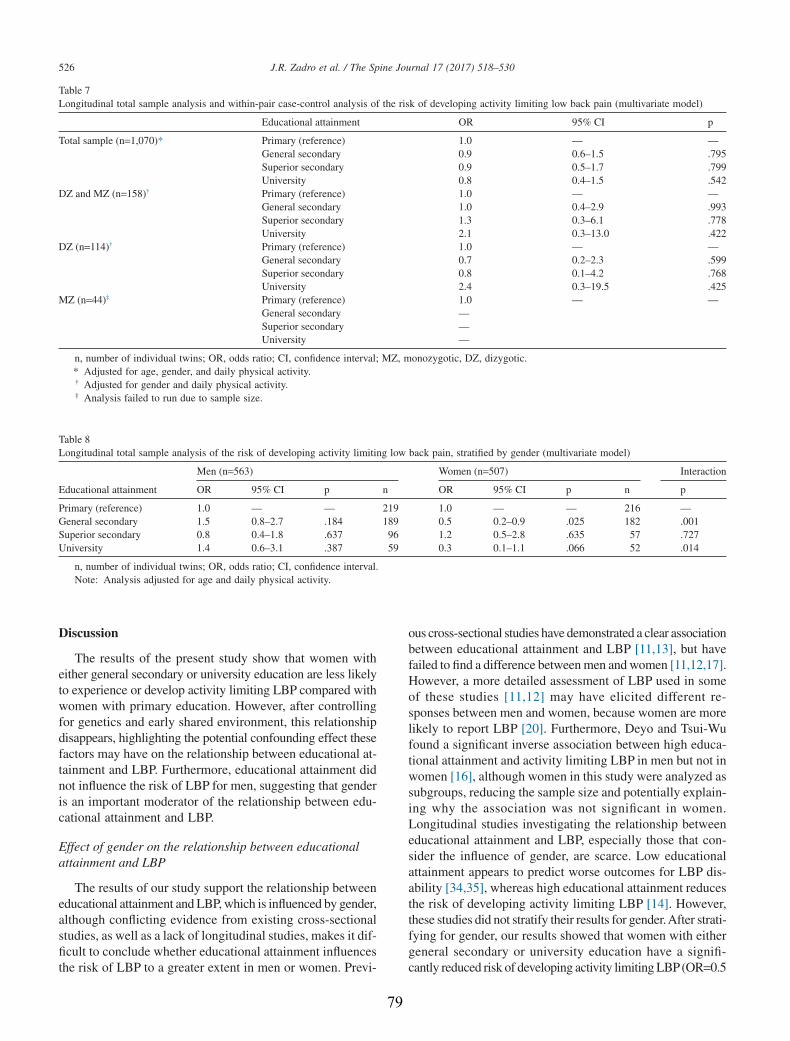
Discussion
The results of the present study show that women witheither general secondary or university education are less likelyto experience or develop activity limiting LBP compared withwomen with primary education. However, after controllingfor genetics and early shared environment, this relationshipdisappears, highlighting the potential confounding effect thesefactors may have on the relationship between educational at-tainment and LBP. Furthermore, educational attainment didnot influence the risk of LBP for men, suggesting that genderis an important moderator of the relationship between edu-cational attainment and LBP.
Effect of gender on the relationship between educationalattainment and LBP
The results of our study support the relationship betweeneducational attainment and LBP, which is influenced by gender,although conflicting evidence from existing cross-sectionalstudies, as well as a lack of longitudinal studies, makes it dif-ficult to conclude whether educational attainment influencesthe risk of LBP to a greater extent in men or women. Previ-
ous cross-sectional studies have demonstrated a clear associationbetween educational attainment and LBP [11,13], but havefailed to find a difference between men and women [11,12,17].However, a more detailed assessment of LBP used in someof these studies [11,12] may have elicited different re-sponses between men and women, because women are morelikely to report LBP [20]. Furthermore, Deyo and Tsui-Wufound a significant inverse association between high educa-tional attainment and activity limiting LBP in men but not inwomen [16], although women in this study were analyzed assubgroups, reducing the sample size and potentially explain-ing why the association was not significant in women.Longitudinal studies investigating the relationship betweeneducational attainment and LBP, especially those that con-sider the influence of gender, are scarce. Low educationalattainment appears to predict worse outcomes for LBP dis-ability [34,35], whereas high educational attainment reducesthe risk of developing activity limiting LBP [14]. However,these studies did not stratify their results for gender.After strati-fying for gender, our results showed that women with eithergeneral secondary or university education have a signifi-cantly reduced risk of developing activity limiting LBP(OR=0.5
Table 7Longitudinal total sample analysis and within-pair case-control analysis of the risk of developing activity limiting low back pain (multivariate model)
Educational attainment OR 95% CI p
Total sample (n=1,070)* Primary (reference) 1.0 — —General secondary 0.9 0.6–1.5 .795Superior secondary 0.9 0.5–1.7 .799University 0.8 0.4–1.5 .542
DZ and MZ (n=158)† Primary (reference) 1.0 — —General secondary 1.0 0.4–2.9 .993Superior secondary 1.3 0.3–6.1 .778University 2.1 0.3–13.0 .422
DZ (n=114)† Primary (reference) 1.0 — —General secondary 0.7 0.2–2.3 .599Superior secondary 0.8 0.1–4.2 .768University 2.4 0.3–19.5 .425
MZ (n=44)‡ Primary (reference) 1.0 — —General secondary —Superior secondary —University —
n, number of individual twins; OR, odds ratio; CI, confidence interval; MZ, monozygotic, DZ, dizygotic.* Adjusted for age, gender, and daily physical activity.† Adjusted for gender and daily physical activity.‡ Analysis failed to run due to sample size.
Table 8Longitudinal total sample analysis of the risk of developing activity limiting low back pain, stratified by gender (multivariate model)
Educational attainment
Men (n=563) Women (n=507) Interaction
OR 95% CI p n OR 95% CI p n p
Primary (reference) 1.0 — — 219 1.0 — — 216 —General secondary 1.5 0.8–2.7 .184 189 0.5 0.2–0.9 .025 182 .001Superior secondary 0.8 0.4–1.8 .637 96 1.2 0.5–2.8 .635 57 .727University 1.4 0.6–3.1 .387 59 0.3 0.1–1.1 .066 52 .014
n, number of individual twins; OR, odds ratio; CI, confidence interval.Note: Analysis adjusted for age and daily physical activity.
526 J.R. Zadro et al. / The Spine Journal 17 (2017) 518–530
79
and 0.3, respectively), although this was only statistically sig-nificant for general secondary education. No significant effectwas observed for men, suggesting gender is influencing edu-cational attainment as a risk factor for LBP in this sample. Incontrast, a longitudinal study by Hagen et al. reported thateach year of additional education reduced the risk of devel-oping activity limiting LBPin a similar way for men and women[15]. However, using educational attainment as a continuousvariable rather than as a categorical variable might not reflectchanges in work-related factors that are associated with peoplein different educational categories. Therefore, our study is oneof the very few longitudinal studies investigating educa-tional attainment as a risk factor for LBP and highlights theimportance of taking gender into account when decidingwhether an individual’s education will impact the risk of LBP.
The differences between men and women in the relation-ship between educational attainment and LBP might beexplained by sample specific issues, such as work-relatedfactors. Exposure to prolonged postures and lifting heavy loadshave been shown to account for the relationship between loweducational attainment and LBP [36]. However, we ad-justed all analyses for “daily physical activity” as a proxy forwork-related physical activity, suggesting other work-related factors that impact men and women differently mightexplain our results. Men appear to be impacted to a greaterextent by physical work-related factors compared with women[15], which might be explained by more men being exposedto physically demanding occupations. Nonetheless, womenin rural areas may be more likely to be subject to physicallydemanding tasks than those in urban areas, thereby increas-ing their likelihood of LBP. In contrast, women are usuallymore affected by non-physical work-related factors, such asjob insecurity [37] or high emotional demands [38], whichhave been shown to increase the risk of developing LBP andhaving time off work because of LBP [39]. These factors arenot a unique feature of physically demanding occupations andcan be present for any occupation, regardless of educationalattainment. Another hypothesis that deserves attention is thepotential for women to be experiencing external factors thatimpact their occupational load (eg, additional domestic duties,being pregnant, or going through menopause). It is sug-gested these factors impact the frequency [40] and severityof LBP [41,42]. Therefore, work-related factors may have dif-ferent effects on men and women, impacting the relationshipbetween educational attainment and LBP.
Women with general secondary or university education wereless likely to experience or develop LBP compared with womenwith primary education. However, this relationship was not foundfor women with superior secondary education. Although it islikely that a small sample of women with superior secondaryeducation in both prevalence and longitudinal total sample anal-yses (5.4% and 5.3%, respectively) is the reason for this finding,the influence of work-related factors cannot be ignored. Womenwho completed high school or received advanced vocationaltraining may be more likely to find themselves in occupationsthat involve long periods of sedentary behavior (eg, adminis-
trative jobs), or occupations that have low job security and highemotional demands. It is suggested that these factors have agreater influence on LBP in women [37,38,43] and may explainwhy superior secondary education failed to reduce the risk ofdeveloping LBP in our sample.
Although a sample of twins was used for the present study,the twins were considered representative of the populationfrom which they were drawn [27], and also the non-twin pop-ulation [44]. Twins have a similar mortality rate when comparedwith the general population [45] and demonstrate compara-ble prevalence for numerous diseases, including diabetesmellitus [46], asthma [47], and thyroid disease [48]. In ad-dition, the lifetime prevalence of activity limiting LBP in thissample of twins appears to be similar to global estimates (27.7%and 23%, respectively) [49]. Therefore, we consider the sampleused for the present study as representative of the general pop-ulation, making the results generalizable.
Effects of genetics on the relationship between educationalattainment and LBP
Identifying risk factors for LBP is integral to the designof prevention strategies. Controlling for genetics and earlyshared environment allow us to see if a direct relationshipexists between educational attainment and LBP, and repre-sent a considerable strength of the co-twin control design.Similar to the total sample analyses, there was no associa-tion between educational attainment and LBP in within-paircase-control analyses including men and women together.However, when the prevalence within-pair case-control anal-ysis was stratified for gender, the strong association betweeneducational attainment and LBP for women (observed in thetotal sample analysis) was no longer statistically signifi-cant. This suggests that the relationship between these variablesis likely to be confounded by genetics or early shared envi-ronment (Fig. 1). The absence of a direct relationship betweeneducational attainment and LBP, found after adjusting for thesefactors, may explain why existing education-based preven-tion strategies for LBP are ineffective in isolation [50,51].However, the possibility that a reduced sample size in thewithin-pair case-control analyses resulted in a lack of statis-tically significant findings cannot be ruled out.
Strength and limitations of the present study
Our study employed high levels of control, ensuring the re-lationship between educational attainment and LBP was notconfounded by other variables.Aco-twin control design allowedus to adjust for the potential confounding effects of geneticsand early shared environment. With genetics accounting for upto 67% of the variance in LBP [24] and educational attain-ment [23], not controlling for this is a potential limitation ofprevious studies. We adjusted for other potential confoundingvariables by exploring the relationship between individual co-variables and activity limiting LBP. Furthermore, we controlledour analyses for “daily physical activity” as a proxy for
527J.R. Zadro et al. / The Spine Journal 17 (2017) 518–530
80
work-related physical activity because there is a well-establishedassociation between educational attainment and work-relatedfactors [36] that was also found in our sample (SupplementaryAppendix S5). The measures of LBP and educational attain-ment used in the present study have been used widely, suggestingour results would be generalizable to an international audi-ence.Although data on LBPwere self-reported and will inevitablyresult in a degree of recall bias, the questions used in the presentstudy were based on standardized definitions, facilitating thecomparison of our results to other observational studies [2,52].The classification of educational attainment used in the presentstudy was based on guidelines from the Spanish National Sta-tistics Institute [28]. These guidelines are based on theInternational Standard Classification of Education (ISCED) andhave been developed to facilitate international comparison [53].For example, the ISCED is comparable to the Australian Stan-dard Classification of Education [54]. There is currently noconsensus regarding the best way to categorize educational at-tainment when investigating the risk of common healthconditions, although studies investigating the relationship betweeneducational attainment and LBP have commonly used cutoffpoints based on schooling and university milestones[11,12,14,16,17]. Therefore, to facilitate the comparison betweenour study and the existing literature, we categorized the orig-inal classification of education in a similar way. Finally, ourstudy was sufficiently powered in the prevalence and longi-tudinal total sample analyses, including when these analyseswere stratified by gender (Supplementary Appendix S1).
There are a few limitations that should be taken into accountwhen interpreting the results. First, we were unable to stratifythe longitudinal within-pair case-control analyses for genderdue to an insufficient sample size. This may have yielded in-teresting results due to the number of statistically significantresults we observed when separating the total sample analysesby gender, and because heritability for LBP has beenreportedly higher in women [55]. In addition, we do not knowwhether the confounding effects of genetics and early sharedenvironment demonstrated in the prevalence analyses are dem-onstrated in the longitudinal analyses, a question to be investigatedin future studies using a larger sample of twins. Based on oursample size calculations for the total sample analysis, the pos-sibility that our within-pair case-control analysis wasunderpowered cannot be ignored. However, due to high levelsof control demonstrated when analyzing twins as matched pairs,it is expected that the required sample size would be less thanthat in the analysis of the non-twin population [56,57]. Second,due to the inclusion of twins never having suffered from chronicLBP, there is a possibility that twins with LBP lasting less than6 months were included in our longitudinal analysis. This lim-itation may have impacted our results because a previous historyof LBP is a strong risk factor for future LBP [9].
Clinical implications
At first sight, our results appear to deny the presence ofa significant relationship between educational attainment and
LBP. In fact, none of the analyses including the whole samplereached significant levels of association, suggesting that nopreventive or intervention strategy taking into account edu-cational attainment can be generalized to the entire population.However, our results show that educational attainment mayaffect LBP differently in men and women. Compared withwomen with primary education, women with either generalsecondary or university education were less likely to expe-rience or develop LBP. This relationship was not found in men.Because women with increased education were signifi-cantly less likely to experience or develop LBP, there maybe a benefit of targeting intervention and prevention strate-gies toward education of back care and early managementof LBP in women with low education levels.
Our results highlight the importance of using twins forfuture research into LBP. The relationship between educa-tional attainment and LBP in women disappeared when wecontrolled for genetics and early shared environment. However,the possibility that this association disappeared due to a re-duction in sample size cannot be ruled out. Therefore, geneticsand early shared environment may play a role in the rela-tionship between educational attainment and LBP, althoughthis hypothesis needs to be confirmed in future twin studiesif we are to better understand those at greater risk of LBP.
Conclusions
Educational attainment affects the prevalence and risk ofLBP differently in men and women. Women with eithergeneral secondary or university education have a signifi-cantly reduced risk of developing activity limiting LBP. Afteradjusting for genetics and early shared environment, the as-sociation between educational attainment and LBP in womendisappears, although future studies using greater sample sizesare needed to confirm these results.
Acknowledgment
The authors acknowledge the support and contribution ofthe Murcia Twin Registry for the implementation to this study.
Supplementary material
Supplementary material related to this article can be foundat http://dx.doi.org/10.1016/j.spinee.2016.10.021.
References
[1] Murray CJ, Vos T, Lozano R, et al. Disability-adjusted life years(DALYs) for 291 diseases and injuries in 21 regions, 1990–2010:a systematic analysis for the Global Burden of Disease Study 2010.Lancet 2012;380:2197–223.
[2] Hoy D, March L, Brooks P, et al. Measuring the global burden of lowback pain. Best Pract Res Clin Rheumatol 2010;24:155–65.doi:10.1016/j.berh.2009.11.002.
[3] Vos T, Flaxman AD, Naghavi M, et al. Years lived with disability(YLDs) for 1160 sequelae of 289 diseases and injuries 1990–2010:a systematic analysis for the Global Burden of Disease Study 2010.Lancet 2012;380:2163–96.
528 J.R. Zadro et al. / The Spine Journal 17 (2017) 518–530
81

[4] Hoy D, March L, Brooks P, et al. The global burden of low backpain: estimates from the Global Burden of Disease 2010 study.Ann Rheum Dis 2014;73:968–74. doi:10.1136/annrheumdis-2013-204428.
[5] Hoy D, Brooks P, Blyth F, et al. The epidemiology of low back pain.Best Pract Res Clin Rheumatol 2010;24:769–81.
[6] Australian Institute of Health and Welfare. Health-care expenditure onarthritis and other musculoskeletal conditions 2008–09. Canberra:AIHW; 2014. Arthritis series no. 20, Cat. no. PHE 177.
[7] Gore M, Sadosky A, Stacey BR, et al. The burden of chronic low backpain: clinical comorbidities, treatment patterns, and health care costsin usual care settings. Spine 2012;37:E668–77.
[8] Wenig CM, Schmidt CO, Kohlmann T, et al. Costs of back pain inGermany. Eur J Pain 2009;13:280–6.
[9] Taylor JB, Goode AP, George SZ, et al. Incidence and risk factors forfirst-time incident low back pain: a systematic review and meta-analysis.Spine J 2014;14:2299–319. doi:10.1016/j.spinee.2014.01.026.
[10] Croft PR, Papageorgiou AC, Thomas E, et al. Short-term physicalrisk factors for new episodes of low back pain. Prospective evidencefrom the South Manchester Back Pain Study. Spine 1999;24:1556–61.
[11] Schmidt CO, Raspe H, Pfingsten M, et al. Back pain in the Germanadult population: prevalence, severity, and sociodemographic correlatesin a multiregional survey. Spine 2007;32:2005–11.
[12] Latza U, Kohlmann T, Deck R, et al. Influence of occupational factorson the relation between socioeconomic status and self-reported backpain in a population-based sample of German adults with back pain.Spine 2000;25:1390–7.
[13] Stranjalis G, Tsamandouraki K, Sakas DE, et al. Low back pain in arepresentative sample of Greek population: analysis according topersonal and socioeconomic characteristics. Spine 2004;29:1355–60,discussion 1361.
[14] Thelin A, Holmberg S, Thelin N. Functioning in neck and low backpain from a 12-year perspective: a prospective population-based study.J Rehabil Med 2008;40:555–61.
[15] Hagen KB, Tambs K, Bjerkedal T. What mediates the inverseassociation between education and occupational disability from backpain?—A prospective cohort study from the Nord-Trondelag healthstudy in Norway. Soc Sci Med 2006;63:1267–75. doi:10.1016/j.socscimed.2006.03.041.
[16] Deyo RA, Tsui-Wu YJ. Functional disability due to back pain. Apopulation-based study indicating the importance of socioeconomicfactors. Arthritis Rheum 1987;30:1247–53.
[17] Croft PR, Rigby AS. Socioeconomic influences on back problems inthe community in Britain. J Epidemiol Community Health1994;48:166–70.
[18] Jensen I, Nygren A, Gamberale F, et al. Coping with long-termmusculoskeletal pain and its consequences: is gender a factor? Pain1994;57:167–72.
[19] Fillingim RB, King CD, Ribeiro-Dasilva MC, et al. Sex, gender, andpain: a review of recent clinical and experimental findings. J Pain2009;10:447–85. doi:10.1016/j.jpain.2008.12.001.
[20] Leboeuf-Yde C, Nielsen J, Kyvik KO, et al. Pain in the lumbar, thoracicor cervical regions: do age and gender matter? A population-based studyof 34,902 Danish twins 20–71 years of age. BMC Musculoskelet Disord2009;10:39.
[21] Jensen IB, Bergstrom G, Ljungquist T, et al. A randomized controlledcomponent analysis of a behavioral medicine rehabilitation programfor chronic spinal pain: are the effects dependent on gender? Pain2001;91:65–78.
[22] George SZ, Fritz JM, Childs JD, et al. Sex differences in predictorsof outcome in selected physical therapy interventions for acute low backpain. J Orthop Sports Phys Ther 2006;36:354–63. doi:10.2519/jospt.2006.2270.
[23] Colodro-Conde L, Rijsdijk F, Tornero-Gómez MJ, et al. Equality ineducational policy and the heritability of educational attainment. PLoSONE 2015;10:e0143796. doi:10.1371/journal.pone.0143796.
[24] Ferreira PH, Beckenkamp P, Maher CG, et al. Nature or nurture in lowback pain? Results of a systematic review of studies based on twinsamples. Eur J Pain 2012;17:957–71.
[25] Dario AB, Ferreira ML, Refshauge KM, et al. The relationship betweenobesity, low back pain, and lumbar disc degeneration when geneticsand the environment are considered: a systematic review of twin studies.Spine J 2015;15:1106–17. doi:10.1016/j.spinee.2015.02.001.
[26] Pinheiro MB, Ferreira ML, Refshauge K, et al. Genetics and theenvironment affect the relationship between depression and low backpain: a co-twin control study of Spanish twins. Pain 2015;156:496–503.doi:10.1097/01.j.pain.0000460330.56256.25.
[27] Ordoñana JR, Rebollo-Mesa I, Carrillo E, et al. The Murcia TwinRegistry: a population-based registry of adult multiples in Spain. TwinRes Hum Genet 2013;16:302–6.
[28] Instituto Nacional de Estadistica. National classification of education,CNED-2014. 2015. Available at: http://www.ine.es/jaxi/menu.do?type=pcaxis&path=%2Ft40%2Fcned14%2F&file=inebase&L=1. AccessedJuly 31, 2015.
[29] Dario AB, Ferreira ML, Refshauge K, et al. Are obesity and body fatdistribution associated with low back pain in women? A population-based study of 1128 Spanish twins. Eur Spine J 2016;25:1188–95.doi:10.1007/s00586-015-4055-2.
[30] Ministry of Health. S.S.a.E. Encuesta Nacional de Salud de España[Spanish National Health Survey].
[31] Demidenko E. Sample size determination for logistic regressionrevisited. Stat Med 2007;26:3385–97. doi:10.1002/sim.2771.
[32] Silventoinen K, Rokholm B, Kaprio J, et al. The genetic andenvironmental influences on childhood obesity: a systematic review oftwin and adoption studies. Int J Obes 2010;34:29–40.
[33] Kujala UM, Kaprio J, Koskenvuo M. Modifiable risk factors aspredictors of all-cause mortality: the roles of genetics and childhoodenvironment. Am J Epidemiol 2002;156:985–93.
[34] Jarvik JG, Comstock BA, Heagerty PJ, et al. Back pain in seniors: theBack Pain Outcomes using Longitudinal Data (BOLD) cohort baselinedata. BMC Musculoskelet Disord 2014;15:134. doi:10.1186/1471-2474-15-134.
[35] Costa Lda C, Maher CG, McAuley JH, et al. Prognosis for patientswith chronic low back pain: inception cohort study. BMJ 2009;339:b3829. doi:10.1136/bmj.b3829.
[36] Leclerc A, Gourmelen J, Chastang JF, et al. Level of education andback pain in France: the role of demographic, lifestyle and physicalwork factors. Int Arch Occup Environ Health 2009;82:643–52.
[37] Leino PI, Hanninen V. Psychosocial factors at work in relation to backand limb disorders. Scand J Work Environ Health 1995;21:134–42.
[38] Clausen T, Andersen LL, Holtermann A, et al. Do self-reportedpsychosocial working conditions predict low back pain after adjustmentfor both physical work load and depressive symptoms? A prospectivestudy among female eldercare workers. Occup Environ Med2013;70:538–44. doi:10.1136/oemed-2012-101281.
[39] Hemingway H, Shipley MJ, Stansfeld S, et al. Sickness absence fromback pain, psychosocial work characteristics and employment gradeamong office workers. Scand J Work Environ Health 1997;23:121–9.
[40] Dugan SA, Powell LH, Kravitz HM, et al. Musculoskeletal pain andmenopausal status. Clin J Pain 2006;22:325–31. doi:10.1097/01.ajp.0000208249.07949.d5.
[41] Wang SM, Dezinno P, Maranets I, et al. Low back pain duringpregnancy: prevalence, risk factors, and outcomes. Obstet Gynecol2004;104:65–70. doi:10.1097/01.AOG.0000129403.54061.0e.
[42] Hartvigsen J, Kyvik KO, Leboeuf-Yde C, et al. Ambiguous relationbetween physical workload and low back pain: a twin control study.Occup Environ Med 2003;60:109–14.
[43] Thorbjornsson CB, Alfredsson L, Fredriksson K, et al. Physical andpsychosocial factors related to low back pain during a 24-year period.A nested case-control analysis. Spine 2000;25:369–74, discussion 375.
[44] Barnes JC, Boutwell BB. A demonstration of the generalizability oftwin-based research on antisocial behavior. Behav Genet 2013;43:120–31. doi:10.1007/s10519-012-9580-8.
529J.R. Zadro et al. / The Spine Journal 17 (2017) 518–530
82

[45] Christensen K, Vaupel JW, Holm NV, et al. Mortality among twinsafter age 6: fetal origins hypothesis versus twin method. BMJ1995;310:432–6.
[46] Kyvik KO, Green A, Beck-Nielsen H. Concordance rates of insulindependent diabetes mellitus: a population based study of young Danishtwins. BMJ 1995;311:913–17.
[47] Skadhauge LR, Christensen K, Kyvik KO, et al. Genetic andenvironmental influence on asthma: a population-based study of 11,688Danish twin pairs. Eur Respir J 1999;13:8–14.
[48] Brix TH, Hansen PS, Kyvik KO, et al. Cigarette smoking and risk ofclinically overt thyroid disease: a population-based twin case-controlstudy. Arch Intern Med 2000;160:661–6.
[49] Balague F, Mannion AF, Pellise F, et al. Non-specific lowback pain. Lancet 2012;379:482–91. doi:10.1016/s0140-6736(11)60610-7.
[50] Steffens D, Maher CG, Pereira LS, et al. Prevention of low backpain: a systematic review and meta-analysis. JAMA Intern Med2016;176:199–208. doi:10.1001/jamainternmed.2015.7431.
[51] Shorthouse FM, Roffi V, Tack C. Effectiveness of educational materialsto prevent occupational low back pain. Occup Med 2016;doi:10.1093/occmed/kqw072.
[52] Dionne CE, Dunn KM, Croft PR, et al. A consensus approach towardthe standardization of back pain definitions for use in prevalence studies.Spine 2008;33:95–103. doi:10.1097/BRS.0b013e31815e7f94.
[53] United Nations Educational, Scientific and Cultural Organisation(UNESCO) Institute for Statistics. International standard classificationof education ISCED 2011. 2012. Available at: http://www.uis.unesco.org/Education/Pages/international-standard-classification-of-education.aspx. Accessed January 13, 2016.
[54] Australian Bureau of Statistics. Australian standard classification ofeducation. 2006. Available at: http://www.abs.gov.au/ausstats/[email protected]/0/D68A94314A3C62CBCA256AAF001FCA4F?opendocument.Accessed January 13, 2016.
[55] Hartvigsen J, Nielsen J, Kyvik KO, et al. Heritability of spinal painand consequences of spinal pain: a comprehensive genetic epidemiologicanalysis using a population-based sample of 15,328 twins ages 20–71years. Arthritis Rheum 2009;61:1343–51.
[56] Dupont WD. Power calculations for matched case-control studies.Biometrics 1988;44:1157–68.
[57] Visscher PM, Gordon S, Neale MC. Power of the classical twin designrevisited: II detection of common environmental variance. Twin ResHum Genet 2008;11:48–54. doi:10.1375/twin.11.1.48.
530 J.R. Zadro et al. / The Spine Journal 17 (2017) 518–530
83

Supplementary material: Sample size estimation
A sample size calculation was performed for the total sample analysis (including when this
analysis was stratified by gender) using an algorithm described in “Demidenko E. (2007).
Sample size determination for logistic regression revisited. Statistics in Medicine 26:3385-3397”
[1]. Our calculations were based on the ability to detect a difference in OR between those with
primary education and university education of 0.3 (Table 17). This value was an estimate from
existing observational studies which found a similar effect size when investigating the
association between educational attainment and LBP [2-5], and was used for the stratified
analyses given the lack of research investigating whether gender influences this relationship. We
required 179 participants in the prevalence analysis and 344 participants in the longitudinal
analysis to provide us with 80% power and alpha set at 0.05. Our calculations were based on a
27.7% prevalence of chronic LBP and 43.6% prevalence of primary education in affected cases
(prevalence analysis), and a 15.6% incidence of chronic LBP and 38.1% prevalence of primary
education in incident cases (longitudinal analysis). For the analyses stratified by gender, we
required 166 females in the prevalence analysis (given a 27.7% prevalence of chronic LBP and
53.3% prevalence of primary education in affected cases) and 383 females in the longitudinal
analysis (given a 12.4% incidence of chronic LBP and 52.4% prevalence of primary education in
incident cases). We required 220 males in the prevalence analysis (given a 27.7% prevalence of
chronic LBP and 31.8% prevalence of primary education in affected cases) and 344 males in the
longitudinal analysis (given an 18.5% incidence of chronic LBP and 29.5% prevalence of
primary education in incident cases). Our total sample analysis stratified by gender included 861
females and 711 males in the prevalence analysis, and 507 females and 563 males in the
longitudinal analysis, thus was adequately powered. Based on these figures it would appear our
84

within-pair case-control analyses were underpowered. We acknowledge this possibility and have
highlighted this throughout the manuscript. However, due to high levels of control demonstrated
when analysing twins as matched pairs, it is expected the required sample size would be less than
an analysis of the non-twin population [6,7].
Table 9. Sample size calculation for the total sample analyses. Prevalence analysis* Longitudinal analysis*
Males and females
Prevalence of LBP 27.7% Incidence of LBP 15.6% Prevalence of primary education in affected cases
43.6% Prevalence of primary education in incident cases
38.1%
Required 179 Required 344 Analysed 1572 Analysed 1070
Males Prevalence of LBP 27.7% Incidence of LBP 18.5%
Prevalence of primary education in affected cases
31.8% Prevalence of primary education in incident cases
29.5%
Required 220 Required 344 Analysed 711 Analysed 563
Females Prevalence of LBP 27.7% Incidence of LBP 12.4%
Prevalence of primary education in affected cases
53.3% Prevalence of primary education in incident cases
52.4%
Required 166 Required 383 Analysed 861 Analysed 507
LBP: low back pain. *calculations were based on the ability to detect a difference in odds ratio between those with primary education and university education of 0.3, with 80% power and alpha set at 0.05.
References
1. Demidenko E Sample size determination for logistic regression revisited. Stat Med
2007;26(18):3385-3397. doi:10.1002/sim.2771
2. Stranjalis G, Tsamandouraki K, Sakas DE et al. Low back pain in a representative sample of
Greek population: analysis according to personal and socioeconomic characteristics. Spine (Phila
Pa 1976) 2004;29(12):1355-1360; discussion 1361
85

3. Thelin A, Holmberg S, Thelin N Functioning in neck and low back pain from a 12-year
perspective: a prospective population-based study. J Rehabil Med 2008;40(7):555-561
4. Hagen KB, Tambs K, Bjerkedal T What mediates the inverse association between education
and occupational disability from back pain?--A prospective cohort study from the Nord-
Trondelag health study in Norway. Soc Sci Med 2006;63(5):1267-1275.
doi:10.1016/j.socscimed.2006.03.041
5. Croft PR, Rigby AS Socioeconomic influences on back problems in the community in Britain.
J Epidemiol Community Health 1994;48(2):166-170
6. Dupont WD Power calculations for matched case-control studies. Biometrics
1988;44(4):1157-1168
7. Visscher PM, Gordon S, Neale MC Power of the classical twin design revisited: II detection of
common environmental variance. Twin Res Hum Genet 2008;11(1):48-54.
doi:10.1375/twin.11.1.48
86

Supplementary material: Identification of confounding variables. Table 10. Univariate analyses to identify confounding variables for inclusion in the multivariate models (prevalence analysis)*
Total sample analysis
Activity limiting LBP Educational attainment
Co-variables
OR 95%CI p n B 95%CI p n Decision
BMI 1.02 0.99-1.05
0.228 1468 -0.04 -0.05- -0.03
<0.001 1468 N
Smoking 1.03 0.82-1.30
0.790 1578 0.10 -0.00- 0.21
0.061 1578 N
Leisure PA 0.78 0.62-0.98
0.032 1576 0.19 0.09- 0.29
<0.001 1576 Y
Depression/ anxiety
1.50 1.17-1.92
0.001 1580 -0.22 -0.33- -0.11
<0.001 1580 Y
Within-pair case-control analysis (DZ & MZ twins)
Co-variables
OR 95%CI p n B 95%CI p n Decision
BMI 1.00 0.95-1.06
0.916 430 -0.03 -0.05- -0.01
0.005 464 N
Smoking 0.69 0.44-1.07
0.098 490 0.01 -0.17-0.19
0.888 499 N
Leisure PA 0.67 0.45-0.99
0.047 488 0.21 0.03-0.39
0.023 498 Y
Depression/ anxiety
1.12 0.74-1.68
0.600 490 -0.27 -0.45- -0.09
0.004 499 N
Within-pair case-control analysis (DZ & MZ twins)
Co-variables
OR 95%CI p n B 95%CI p n Decision
BMI 1.00 0.95-1.06
0.953 310 -0.03 -0.06- -0.01
0.008 332 N
Smoking 0.63 0.38-1.03
0.065 348 0.03 -0.19-0.25
0.772 355 N
Leisure PA 0.75 0.47-1.20
0.234 348 0.22 0.01-0.43
0.040 355 N
Depression/ anxiety
1.12 0.70-1.79
0.633 348 -0.32 -0.53- -0.10
0.004 355 N
87

Within-pair case-control analysis (DZ & MZ twins)
Co-variables
OR 95%CI p n B 95%CI p n Decision
BMI 1.01 0.88-1.16
0.892 120 -0.02 -0.06- 0.02
0.337 132 N
Smoking 1.0 0.38-2.66
1.000 142 -0.04 -0.37- 0.28
0.789 144 N
Leisure PA 0.50 0.23-1.07
0.074 140 0.19 -0.15-0.53
0.259 143 N
Depression/ anxiety
1.10 0.47-2.59
0.827 142 -0.11 -0.45-0.24
0.531 144 N
n: number of individual twins; OR: odds ratio; CI: confidence interval; B: beta coefficient; MZ: monozygotic, DZ: dizygotic. LBP: low back pain; BMI: body mass index; PA: physical activity; Y: included in the multivariate model; N: not included in the multivariate model. *: if the univariate association between the co-variable, and both activity limiting LBP and educational attainment reached a significance of p<0.2, the co-variable was included in the multivariate model.
88

Table 11. Univariate analyses to identify confounding variables for inclusion in the multivariate models (longitudinal analysis)*
Total sample analysis
Activity limiting LBP
Educational attainment
Co-variables
OR 95%CI p n B 95%CI p n Decision
BMI 0.99 0.95-1.03
0.610 1056 -0.05 -0.06- -0.03
<0.001 1056 N
Smoking 0.99 0.72-1.37
0.958 1072 0.16 0.04-0.29
0.012 1072 N
Leisure PA 0.84 0.60-1.16
0.281 1073 0.25 0.13-0.37
<0.001 1073 N
Depression/ anxiety
1.03 0.66-1.61
0.900 1073 -0.16 -0.32- -0.01
0.043 1073 N
Within-pair case-control analysis (DZ & MZ twins)
Co-variables
OR 95%CI p n B 95%CI p n Decision
BMI 0.95 0.86-1.04
0.255 154 -0.05 -0.08- -0.02
0.001 289 N
Smoking 0.92 0.40-2.08
0.835 160 0.06 -0.19-0.31
0.648 293 N
Leisure PA 0.67 0.32-1.39
0.277 160 0.33 0.10-0.57
0.005 293 N
Depression/ anxiety
1.56 0.67-3.59
0.301 158 -0.10 -0.40-0.20
0.501 292 N
Within-pair case-control analysis (DZ & MZ twins)
Co-variables
OR 95%CI p n B 95%CI p n Decision
BMI 0.94 0.85-1.04
0.207 112 -0.06 -0.09- -0.03
<0.001 207 N
Smoking 1.00 0.42-2.40
1.000 116 -0.02 -0.30-0.26
0.885 210 N
Leisure PA 0.79 0.36-1.73
0.549 116 0.43 0.19-0.67
0.001 210 N
Depression/ anxiety
1.63 0.67-3.92
0.280 114 -0.06 -0.39-0.27
0.720 209 N
Within-pair case-control analysis (MZ twins)
89
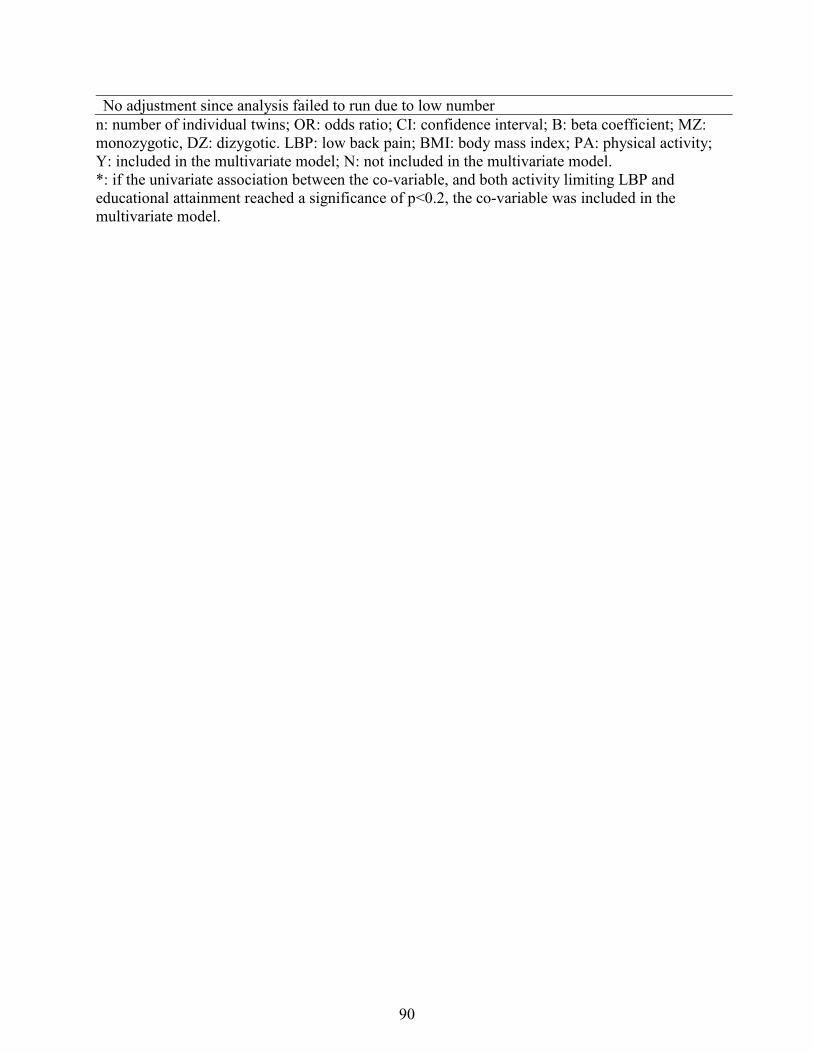
No adjustment since analysis failed to run due to low number n: number of individual twins; OR: odds ratio; CI: confidence interval; B: beta coefficient; MZ: monozygotic, DZ: dizygotic. LBP: low back pain; BMI: body mass index; PA: physical activity; Y: included in the multivariate model; N: not included in the multivariate model. *: if the univariate association between the co-variable, and both activity limiting LBP and educational attainment reached a significance of p<0.2, the co-variable was included in the multivariate model.
90

Supplementary material: Sample characteristics for discordant twin pairs in the prevalence analysis. Table 12. Prevalence analysis sample characteristics for DZ twins discordant for activity limiting low back pain (LBP).
Activity Limiting
LBP absent
Activity Limiting
LBP present
Total
Mean
(SD) or %
n Mean
(SD) or %
n Mean (SD)
or %
n
Age (years) 56.7 (6.6) 176 56.8 (6.7) 179 56.8 (6.7) 355
Gender (male) 56.9% 95 43.1% 72 47.0% 167
Gender (female) 43.1% 81 56.9% 107 53.0% 188
BMI 27.6 (4.0) 165 27.5 (4.5) 167 27.6 (4.2) 332
Smoking ¥ 44.9% 79 36.3% 65 40.6% 144
Depression/anxiety 29.6% 52 32.4% 58 31.0% 110
Daily Physical activity£ 24.6% 43 13.4% 24 18.9% 67
Leisure Physical activity€ 70.5% 124 63.7% 114 67.0% 238
Educational Attainment
Primary 39.2% 69 45.3% 81 42.3% 150
General Secondary 37.5% 66 30.2% 54 33.8% 120
Superior Secondary 13.6% 24 14.0% 25 13.8% 49
University 9.7% 17 10.6% 19 10.1% 36
n: number of subjects, MZ: monozygotic, DZ: dizygotic, BMI: body mass index. ¥: indicates current smokers; : indicates being moderately/extremely depressed or anxious; £: indicates the engagement in moderate/vigorous daily physical activity; €: indicates the engagement in occasional/regular physical activity.
91
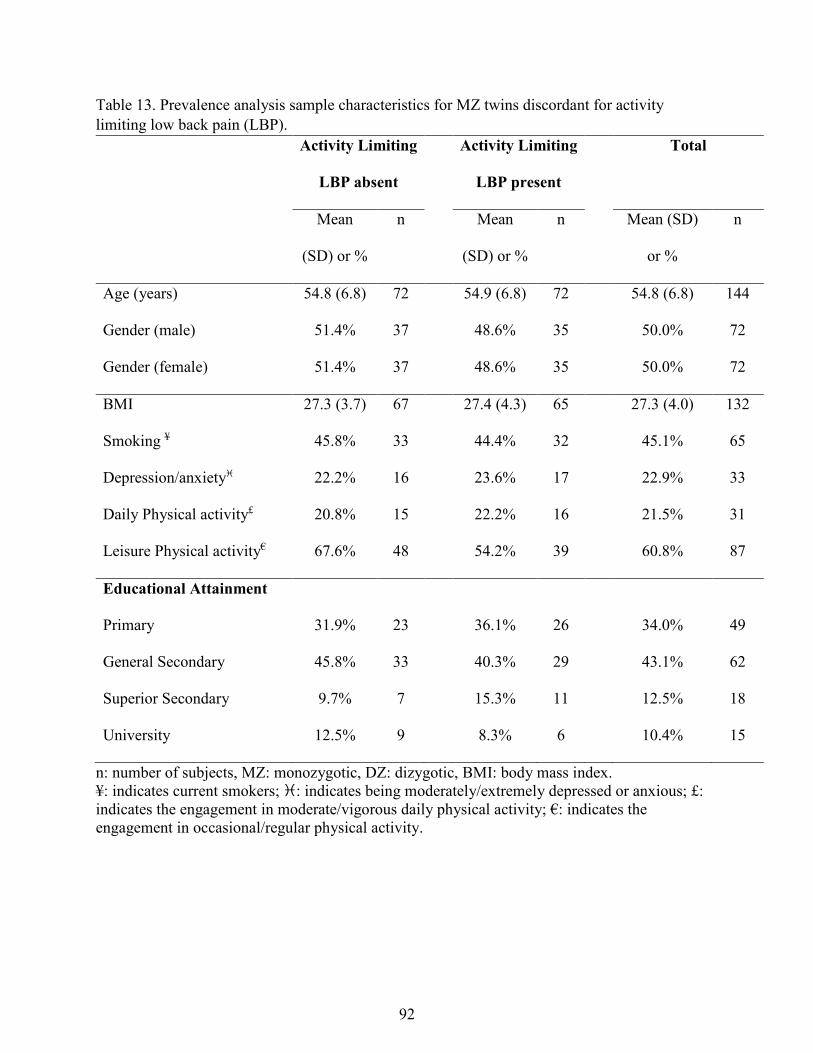
Table 13. Prevalence analysis sample characteristics for MZ twins discordant for activity limiting low back pain (LBP).
Activity Limiting
LBP absent
Activity Limiting
LBP present
Total
Mean
(SD) or %
n Mean
(SD) or %
n Mean (SD)
or %
n
Age (years) 54.8 (6.8) 72 54.9 (6.8) 72 54.8 (6.8) 144
Gender (male) 51.4% 37 48.6% 35 50.0% 72
Gender (female) 51.4% 37 48.6% 35 50.0% 72
BMI 27.3 (3.7) 67 27.4 (4.3) 65 27.3 (4.0) 132
Smoking ¥ 45.8% 33 44.4% 32 45.1% 65
Depression/anxiety 22.2% 16 23.6% 17 22.9% 33
Daily Physical activity£ 20.8% 15 22.2% 16 21.5% 31
Leisure Physical activity€ 67.6% 48 54.2% 39 60.8% 87
Educational Attainment
Primary 31.9% 23 36.1% 26 34.0% 49
General Secondary 45.8% 33 40.3% 29 43.1% 62
Superior Secondary 9.7% 7 15.3% 11 12.5% 18
University 12.5% 9 8.3% 6 10.4% 15
n: number of subjects, MZ: monozygotic, DZ: dizygotic, BMI: body mass index. ¥: indicates current smokers; : indicates being moderately/extremely depressed or anxious; £: indicates the engagement in moderate/vigorous daily physical activity; €: indicates the engagement in occasional/regular physical activity.
92

Supplementary material: Sample characteristics for discordant twin pairs in the longitudinal analysis. Table 14. Longitudinal analysis sample characteristics for DZ twins discordant for activity limiting low back pain (LBP).
Activity Limiting
LBP absent
Activity Limiting
LBP present
Total
Mean
(SD) or %
n Mean
(SD) or %
n Mean (SD)
or %
n
Age (years) 53.5 (6.4) 137 52.9 (6.9) 73 53.3 (6.6) 210
Gender (male) 66.7% 82 33.3% 41 58.6% 123
Gender (female) 63.2% 55 36.8% 32 41.4% 87
BMI 27.4 (4.1) 135 27.1 (4.0) 72 27.3 (4.0) 207
Smoking ¥ 40.9% 56 37.0% 27 39.5% 83
Depression/anxiety 19.7% 27 20.8% 15 20.1% 42
Daily Physical activity£ 19.7% 27 26.4% 19 22.0% 46
Leisure Physical activity€ 61.3% 84 53.4% 39 58.6% 123
Educational Attainment
Primary 34.3% 47 42.5% 31 37.1% 78
General Secondary 41.6% 57 31.5% 23 38.1% 80
Superior Secondary 14.6% 20 15.1% 11 14.8% 31
University 9.5% 13 11.0% 8 10.0% 21
n: number of subjects, MZ: monozygotic, DZ: dizygotic, BMI: body mass index. ¥: indicates current smokers; : indicates being moderately/extremely depressed or anxious; £: indicates the engagement in moderate/vigorous daily physical activity; €: indicates the engagement in occasional/regular physical activity.
93

Table 15. Longitudinal analysis sample characteristics for MZ twins discordant for activity limiting low back pain (LBP).
Activity Limiting
LBP absent
Activity Limiting
LBP present
Total
Mean
(SD) or %
n Mean
(SD) or %
n Mean (SD)
or %
n
Age (years) 51.6 (6.9) 55 51.6 (7.2) 28 51.6 (7.0) 83
Gender (male) 63.3% 31 36.7% 18 59.0% 49
Gender (female) 70.6% 24 29.4% 10 41.0% 34
BMI 27.2 (3.4) 55 26.6 (3.8) 27 27.0 (3.5) 82
Smoking ¥ 47.3% 26 53.6% 15 49.4% 41
Depression/anxiety 14.6% 8 7.1% 2 12.1% 10
Daily Physical activity£ 18.2% 10 10.7% 3 15.7% 13
Leisure Physical activity€ 63.6% 35 46.4% 13 57.8% 48
Educational Attainment
Primary 30.9% 17 32.1% 9 31.3% 26
General Secondary 45.5% 25 39.3% 11 43.4% 36
Superior Secondary 9.1% 5 14.3% 4 10.8% 9
University 14.6% 8 14.3% 4 14.5% 12
n: number of subjects, MZ: monozygotic, DZ: dizygotic, BMI: body mass index. ¥: indicates current smokers; : indicates being moderately/extremely depressed or anxious; £: indicates the engagement in moderate/vigorous daily physical activity; €: indicates the engagement in occasional/regular physical activity.
94

Supplementary material: Association between educational attainment and work-related physical activity. Table 16. Univariate association between educational attainment and moderate/vigorous daily physical activity for the total sample of twins (2013)
Educational Attainment OR 95% CI p
Total Sample
(n = 1574)
Primary (reference) 1.0 - -
General Secondary 0.8 0.6 – 1.1 0.117
Superior Secondary 0.7 0.4 – 1.0 0.038
University 0.2 0.1 – 0.4 <0.001
n: number of individual twins; OR: odds ratio; CI: confidence interval.
Table 17. Univariate association between educational attainment and moderate/vigorous daily physical activity for the total sample of twins (2009)
Educational Attainment OR 95% CI p
Total Sample
(n = 1571)
Primary (reference) 1.0 - -
General Secondary 1.0 0.8 – 1.4 0.827
Superior Secondary 0.6 0.4 – 0.9 0.015
University 0.3 0.1 – 0.5 <0.001
n: number of individual twins; OR: odds ratio; CI: confidence interval.
95

CHAPTER FIVE
Does familial aggregation of chronic low back pain impact on recovery? A
population-based twin study
Chapter Five has been published as:
Zadro JR, Shirley D, Sánchez-Romera JF, Ordoñana JR, Ferreira PH. Does familial aggregation
of chronic low back pain impact on recovery. A population-based twin study. Spine.
2017;42(17):1295-1301. Copyright © 2017 Wolters Kluwer Health, Inc. All rights reserved.
96

SPINE Volume 42, Number 17, pp 1295–1301
� 2017 Wolters Kluwer Health, Inc. All rights reserved.
EPIDEMIOLOGY
C
Does Familial Aggregation of Chronic Low BackPain Affect Recovery?
FromversityHumaand z
Spain.
Ackno2016.
The mdevice
The MAgenc1947911560receiv
No re
CorresSciencAustra
DOI:
Spine
opy
A Population-Based Twin Study
Joshua R. Zadro, BappSc (PT, Hons),� Debra Shirley, PhD,� Juan F. Sanchez-Romera, PhD,y,z
Juan R. Ordonana, PhD,y,z and Paulo H. Ferreira, PhD�
relative recurrence risk (l ) was 1.2 for the total sample, 1.5 for
Study Design. Longitudinal twin-cohort study.Objective. To investigate the effect familial aggregation of chroniclow back pain (LBP) has on the recovery from chronic LBP.Summary of Background Data. LBP is a worldwide problem,
with pain and disability often becoming chronic. Genetics and
familial behaviors could significantly affect the recovery from
chronic LBP but have not been extensively investigated.Methods. A total of 624 Spanish twins from the Murcia Twin
Registry reported experiencing chronic LBP within the past 2
years during the 2009/11 data collection wave and were
followed up in 2013. Familial aggregation of chronic LBP was
determined by the co-twin experiencing chronic LBP within the
past 2 years at baseline. Twins reporting LBP ‘‘within the past 4
weeks’’ at follow-up were considered to have not recovered.Results. There were 455 twins with available data on LBP at
follow-up and available data on LBP from their co-twin at
baseline. Twins with an affected co-twin at baseline were
significantly more likely to have not recovered from chronic LBP
at follow-up (odds ratio [OR]¼1.6, 95% confidence interval
[CI]: 1.0–2.4, P¼0.046). This relationship was stronger for
monozygotic twins (OR¼ 2.5, 95% CI: 1.3–4.8, P¼0.006)
(n¼172) but disappeared when considering only dizygotic twins
(OR¼1.1, 95% CI: 0.6–2.0, P¼0.668) (n¼283). Sibling-
the �Discipline of Physiotherapy, Faculty of Health Sciences, Uni-of Sydney, Sydney, Australia; yMurcia Twin Registry, Department of
n Anatomy and Psychobiology, University of Murcia, Murcia, Spain;Murcia Institute for Biomedical Research (IMIB-Arrixaca), Murcia,
wledgment date: July 22, 2016. First revision date: November 25,Acceptance date: December 12, 2016.
anuscript submitted does not contain information about medical(s)/drug(s).
urcia Twin Registry is supported by Fundacion Seneca, Regionaly for Science and Technology, Murcia, Spain (15302/PHCS/10 and/PI/14), and the Ministry of Science and Innovation, Spain (PSI2009-and PSI2014-56680-R). Funding for this project has also been
ed from Fundacion MAPFRE (2012).
levant financial activities outside the submitted work.
pondence to Joshua R. Zadro, BappSc (PT, Hons), Faculty of Healthes, University of Sydney, 75 East St, Lidcombe, Sydney NSW 2141,lia; E-mail: [email protected]
10.1097/BRS.0000000000002075
right © 2017 Wolters Kluwer Health, Inc. Unau97
s
monozygotic twins, and 1.1 for dizygotic twins.Conclusion. Having a sibling with chronic LBP at baseline
increased the likelihood of LBP at follow-up by 20%, with this
likelihood increasing to 50% if the sibling was an identical twin.
These results are novel and highlight the important influence
genetics have on people’s recovery from chronic LBP. Infor-
mation regarding the presence of chronic LBP within a family is
easy to obtain and has the potential to inform clinicians on
which patients are less likely to recover when treatment
implementation is not considered.Key words: chronic low back pain, dizygotic twins, familialaggregation, monozygotic twins, Murcia Twin Registry,prospective, recovery, relative recurrence risk, siblings, twinstudy.Level of Evidence: 3Spine 2017;42:1295–1301
Disability resulting from low back pain (LBP) is aworldwide problem.1 Although most peopleimprove within the first 6 weeks after an episode
of LBP, many fail to completely recover, with pain anddisability becoming chronic.2 Numerous factors have beeninvestigated in the recovery from chronic LBP3 with only afew demonstrating a consistent negative effect, including aprevious history of LBP2,4 and longer symptom duration.5
The effect of familial factors on the recovery from chronicLBP has, however, not been analyzed.
Genetics have been shown to account for up to 67% ofchronic LBP cases,6 with the family environment accountingfor up to 41% of chronic LBP cases in children.7 Therefore,among familial factors that could influence the recoveryfrom chronic LBP, familial aggregation of chronic LBP islikely to be relevant. Familial aggregation of chronic LBP isassociated with the presence of chronic LBP in adults,8
whereas having family members suffering from chronicLBP increases the likelihood of developing chronic LBP9
and displaying high fear avoidance beliefs about LBP.10
Despite this, familial aggregation of chronic LBP is yet tobe investigated in the recovery from chronic LBP.
www.spinejournal.com 1295
thorized reproduction of this article is prohibited.
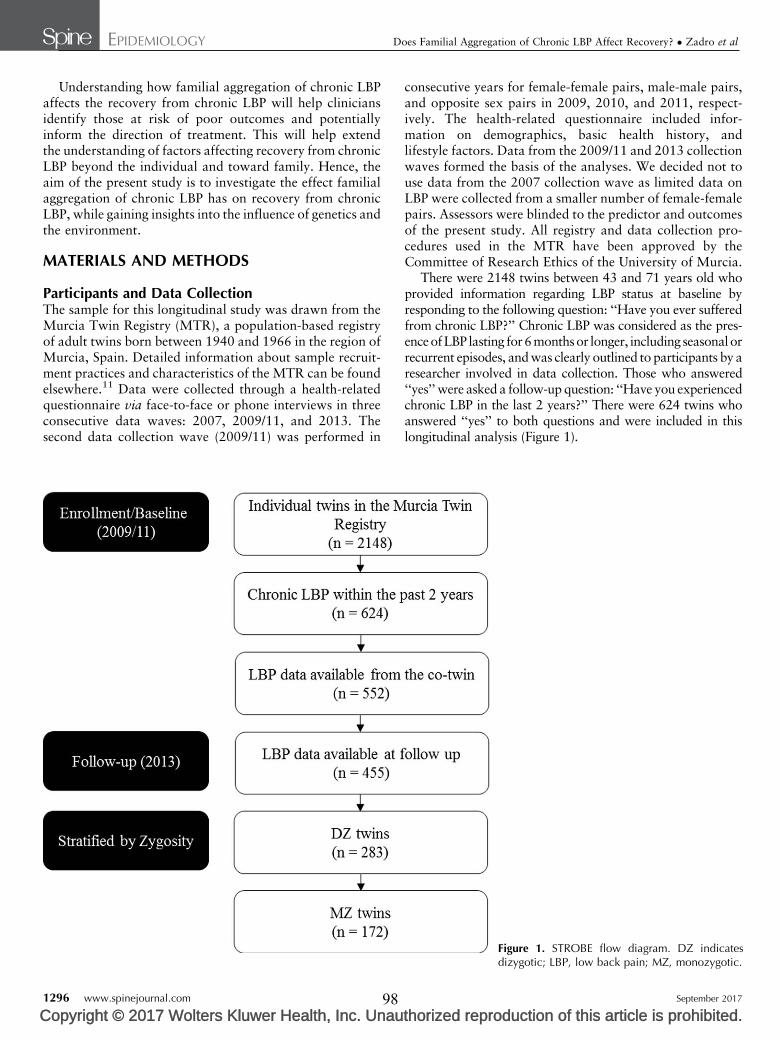
EPIDEMIOLOGY Does Familial Aggregation of Chronic LBP Affect Recovery? � Zadro et al
Understanding how familial aggregation of chronic LBPaffects the recovery from chronic LBP will help cliniciansidentify those at risk of poor outcomes and potentiallyinform the direction of treatment. This will help extendthe understanding of factors affecting recovery from chronicLBP beyond the individual and toward family. Hence, theaim of the present study is to investigate the effect familialaggregation of chronic LBP has on recovery from chronicLBP, while gaining insights into the influence of genetics andthe environment.
MATERIALS AND METHODS
Participants and Data CollectionThe sample for this longitudinal study was drawn from theMurcia Twin Registry (MTR), a population-based registryof adult twins born between 1940 and 1966 in the region ofMurcia, Spain. Detailed information about sample recruit-ment practices and characteristics of the MTR can be foundelsewhere.11 Data were collected through a health-relatedquestionnaire via face-to-face or phone interviews in threeconsecutive data waves: 2007, 2009/11, and 2013. Thesecond data collection wave (2009/11) was performed in
1296 www.spinejournal.com
Copyright © 2017 Wolters Kluwer Health, Inc. Unau98
consecutive years for female-female pairs, male-male pairs,and opposite sex pairs in 2009, 2010, and 2011, respect-ively. The health-related questionnaire included infor-mation on demographics, basic health history, andlifestyle factors. Data from the 2009/11 and 2013 collectionwaves formed the basis of the analyses. We decided not touse data from the 2007 collection wave as limited data onLBP were collected from a smaller number of female-femalepairs. Assessors were blinded to the predictor and outcomesof the present study. All registry and data collection pro-cedures used in the MTR have been approved by theCommittee of Research Ethics of the University of Murcia.
There were 2148 twins between 43 and 71 years old whoprovided information regarding LBP status at baseline byresponding to the following question: ‘‘Have you ever sufferedfrom chronic LBP?’’ Chronic LBP was considered as the pres-enceofLBP lasting for6monthsor longer, including seasonalorrecurrent episodes, and was clearly outlined to participants by aresearcher involved in data collection. Those who answered‘‘yes’’ were asked a follow-up question: ‘‘Have you experiencedchronic LBP in the last 2 years?’’ There were 624 twins whoanswered ‘‘yes’’ to both questions and were included in thislongitudinal analysis (Figure 1).
Figure 1. STROBE flow diagram. DZ indicatesdizygotic; LBP, low back pain; MZ, monozygotic.
September 2017
thorized reproduction of this article is prohibited.

EPIDEMIOLOGY Does Familial Aggregation of Chronic LBP Affect Recovery? � Zadro et al
C
Zygosity AscertainmentZygosity was ascertained by a 12-item questionnaire focus-ing on the degree of similarity and mistaken identitybetween twins. This questionnaire correlates with zygositydetermined by DNA in approximately 96% of the cases.11
Assessment of Recovery From Chronic LowBack PainQuestions regarding LBP status at follow-up were adaptedfrom standardized definitions developed to facilitate com-parison across epidemiological studies.12 Participants whohad experienced chronic LBP in the last 2 years were askedthe following question at follow-up: ‘‘When was the lasttime you experienced LBP?’’ Participants who selected‘‘within the past 4 weeks’’ were considered to have notrecovered from chronic LBP. This definition is based on thebest available evidence, suggesting being pain-free for theduration of a month is sufficient to infer recovery.13
Assessment of Familial Aggregation of Chronic LowBack PainFamilial aggregation of chronic LBP (predictor variable)was determined by the co-twin suffering from chronicLBP within the past 2 years at baseline.
Assessment of CovariablesWe selected potential confounders based on previous lit-erature and data availability including: age, sex, body massindex, smoking, sedentary behavior, symptoms of depres-sion/anxiety, and sleep quality. Data on body mass indexwere either self-reported (67.4%) or objectively measured(32.6%). Data on smoking and sedentary behavior werebased on the Spanish National Health Survey Question-naire.14 Smoking was dichotomized as ex-smoker/neversmoked or current smoker. Sedentary behavior was deter-mined by participants’ engagement in leisure and dailyphysical activities. Leisure physical activity was assessedby participants selecting one of the following options: (i) Ido not practice exercise. My leisure time is mostly seden-tary (reading, watching, TV, movies, etc.); (ii) sport orphysical activity occasionally (walking, gardening, softgym, light efforts, etc.); (iii) regular physical activity sev-eral times a month (tennis, jogging, swimming, cycling,team sports, etc.); (iv) physical training several times aweek. Responses were dichotomized as no physicalactivity/sedentary (i) or occasional/regular physical act-ivity (ii, iii, and iv). Daily physical activity was assessedby participants selecting one of the following options: (i)sitting most of the time; (ii) standing. No big movements oreffort; (iii) walking, carrying light weights, moving but nobig effort; (iv) tasks that require physical effort. Responseswere dichotomized as no/low physical activity engagement(i and ii) or moderate/vigorous physical activity engage-ment (iii and iv). Participants who had engaged in noleisure physical activity and no/low daily physical activitywere considered sedentary. Symptoms of depression/anxiety were assessed by participants selecting one of
Spine
opyright © 2017 Wolters Kluwer Health, Inc. Unau99
the following options based on the depression/anxietydomain of the EuroQol-5 dimension: (i) I am not anxiousor depressed; (ii) I am moderately anxious or depressed;(iii) I am extremely anxious or depressed. Responses weredichotomized as not depressed or anxious (i) or moder-ately/extremely depressed or anxious (ii and iii). Sleepquality was assessed by participants’ score on the Spanishversion of the Pittsburgh Sleep Quality Index. Responseswere dichotomized as poor sleep quality (score >5) orgood sleep quality (score �5).15
AnalysisFirst, we conducted analyses to identify whether familialaggregation of chronic LBP affected the recovery from LBP.Univariate logistic regressions were performed to identifypossible confounders that should enter the multivariate logisticregression models. Covariables were included in multivariatemodels if the P values from the univariate relationship betweenthe covariables, and both the predictor and outcome were<0.2. Because baseline data were collected between 2009/11we adjusted all analyses for follow-up length. Twin pairs wereconsidered as clusters to account for their nonindependence.To gain insights into the role of genetics as a familial predictorof recovery, we stratified analyses by zygosity. Dizygotic (DZ)twins shareonaverage50%of their segregatinggenes,whereasmonozygotic (MZ) twins share approximately 100% of theirsegregating genes.16 Therefore, if the association is similarbetween analyses regardless of zygosity, this is likely to suggestgenetics are less influential as a familial predictor of recovery. Ifthe magnitude of the association is, however, higher for MZtwins, this is likely to suggest genetics play an important role asa familialpredictorof recovery.AnalyseswereconductedusingSTATA statistical software (version 13.1) with the significancelevel set at.05. Odds ratios (ORs) and 95% confidence inter-vals (CIs) were calculated from the regression models.
Second, we calculated the sibling recurrence relative risk(ls). For our study, ls represents the risk of nonrecoveryfrom chronic LBP in the presence of an affected sibling(chronic LBP at baseline), compare to the risk of nonrecov-ery in the total sample (population prevalence). This is acommonly reported measure of familial aggregation, andhas been adapted to reduce the bias when consideringconditions with a high prevalence (e.g., LBP).17 We calcu-lated ls using the formula
ls ¼OR
1� PrevþORðPrevÞ
where ‘‘OR’’ is the odds of nonrecovery from chronic LBPgiven a co-twin with chronic LBP at baseline, and ‘‘Prev’’ isthe prevalence of nonrecovery at follow-up in the totalsample.
RESULTS
Sample CharacteristicsThere were 552 twins that experienced chronic LBP withinthe past 2 years at baseline and had available data from their
www.spinejournal.com 1297
thorized reproduction of this article is prohibited.
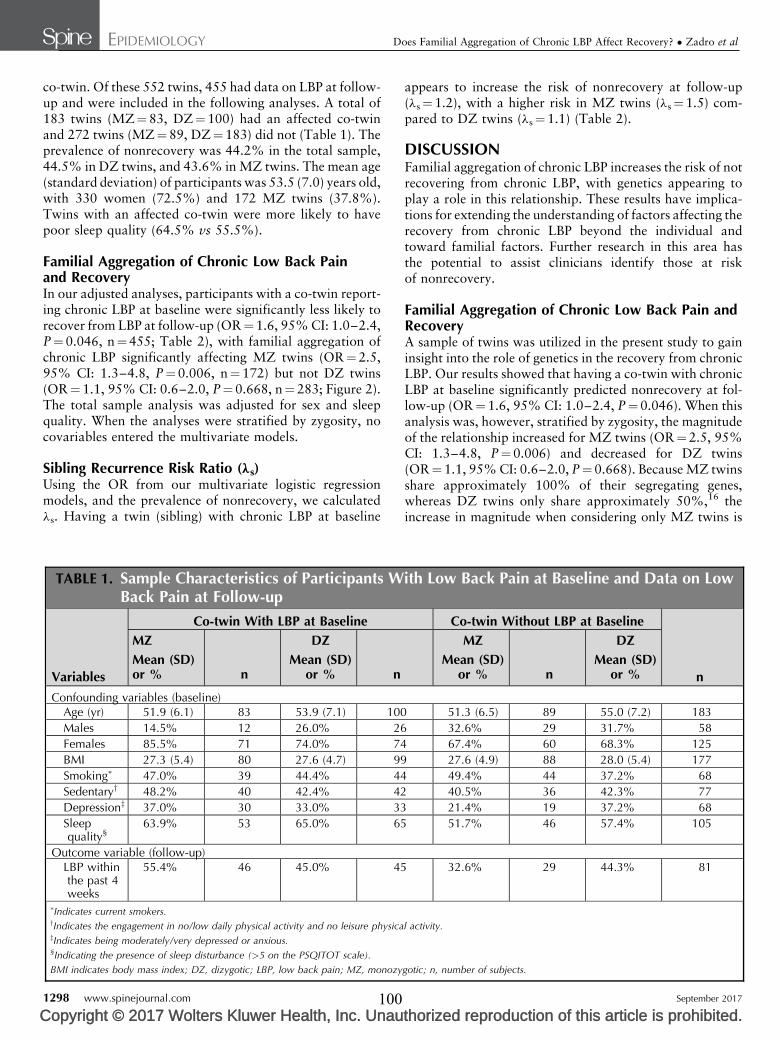
EPIDEMIOLOGY Does Familial Aggregation of Chronic LBP Affect Recovery? � Zadro et al
co-twin. Of these 552 twins, 455 had data on LBP at follow-up and were included in the following analyses. A total of183 twins (MZ¼83, DZ¼100) had an affected co-twinand 272 twins (MZ¼89, DZ¼183) did not (Table 1). Theprevalence of nonrecovery was 44.2% in the total sample,44.5% in DZ twins, and 43.6% in MZ twins. The mean age(standard deviation) of participants was 53.5 (7.0) years old,with 330 women (72.5%) and 172 MZ twins (37.8%).Twins with an affected co-twin were more likely to havepoor sleep quality (64.5% vs 55.5%).
Familial Aggregation of Chronic Low Back Painand RecoveryIn our adjusted analyses, participants with a co-twin report-ing chronic LBP at baseline were significantly less likely torecover from LBP at follow-up (OR¼1.6, 95% CI: 1.0–2.4,P¼0.046, n¼455; Table 2), with familial aggregation ofchronic LBP significantly affecting MZ twins (OR¼2.5,95% CI: 1.3–4.8, P¼0.006, n¼172) but not DZ twins(OR¼1.1, 95% CI: 0.6–2.0, P¼0.668, n¼283; Figure 2).The total sample analysis was adjusted for sex and sleepquality. When the analyses were stratified by zygosity, nocovariables entered the multivariate models.
Sibling Recurrence Risk Ratio (ls)Using the OR from our multivariate logistic regressionmodels, and the prevalence of nonrecovery, we calculatedls. Having a twin (sibling) with chronic LBP at baseline
TABLE 1. Sample Characteristics of Participants WBack Pain at Follow-up
Variables
Co-twin With LBP at Baseline
MZ DZ
Mean (SD)or % n
Mean (SD)or % n
Confounding variables (baseline)Age (yr) 51.9 (6.1) 83 53.9 (7.1) 100
Males 14.5% 12 26.0% 26
Females 85.5% 71 74.0% 74
BMI 27.3 (5.4) 80 27.6 (4.7) 99
Smoking� 47.0% 39 44.4% 44
Sedentaryy 48.2% 40 42.4% 42
Depressionz 37.0% 30 33.0% 33
Sleepquality§
63.9% 53 65.0% 65
Outcome variable (follow-up)LBP withinthe past 4weeks
55.4% 46 45.0% 45
�Indicates current smokers.yIndicates the engagement in no/low daily physical activity and no leisure physicazIndicates being moderately/very depressed or anxious.§Indicating the presence of sleep disturbance (>5 on the PSQITOT scale).
BMI indicates body mass index; DZ, dizygotic; LBP, low back pain; MZ, monozy
1298 www.spinejournal.com
Copyright © 2017 Wolters Kluwer Health, Inc. Unau100
appears to increase the risk of nonrecovery at follow-up(ls¼1.2), with a higher risk in MZ twins (ls¼1.5) com-pared to DZ twins (ls¼1.1) (Table 2).
DISCUSSIONFamilial aggregation of chronic LBP increases the risk of notrecovering from chronic LBP, with genetics appearing toplay a role in this relationship. These results have implica-tions for extending the understanding of factors affecting therecovery from chronic LBP beyond the individual andtoward familial factors. Further research in this area hasthe potential to assist clinicians identify those at riskof nonrecovery.
Familial Aggregation of Chronic Low Back Pain andRecoveryA sample of twins was utilized in the present study to gaininsight into the role of genetics in the recovery from chronicLBP. Our results showed that having a co-twin with chronicLBP at baseline significantly predicted nonrecovery at fol-low-up (OR¼1.6, 95% CI: 1.0–2.4, P¼0.046). When thisanalysis was, however, stratified by zygosity, the magnitudeof the relationship increased for MZ twins (OR¼2.5, 95%CI: 1.3–4.8, P¼0.006) and decreased for DZ twins(OR¼1.1, 95% CI: 0.6–2.0, P¼0.668). Because MZ twinsshare approximately 100% of their segregating genes,whereas DZ twins only share approximately 50%,16 theincrease in magnitude when considering only MZ twins is
ith Low Back Pain at Baseline and Data on Low
Co-twin Without LBP at Baseline
n
MZ DZ
Mean (SD)or % n
Mean (SD)or %
51.3 (6.5) 89 55.0 (7.2) 183
32.6% 29 31.7% 58
67.4% 60 68.3% 125
27.6 (4.9) 88 28.0 (5.4) 177
49.4% 44 37.2% 68
40.5% 36 42.3% 77
21.4% 19 37.2% 68
51.7% 46 57.4% 105
32.6% 29 44.3% 81
l activity.
gotic; n, number of subjects.
September 2017
thorized reproduction of this article is prohibited.

TABLE 2. The Effect of Familial Aggregation of Chronic Low Back Pain on Recovery and the SiblingRecurrence Relative Risk (ls)
OR 95% CI P ls
Total sample—unadjusted(n¼455)
1.5 1.0–2.2 0.064 1.2
Total sample (n¼455)� 1.6 1.0–2.4 0.046� 1.2
DZ (n¼ 283) 1.1 0.6–2.0 0.668 1.1
MZ (n¼172) 2.5 1.3–4.8 0.006� 1.5�Adjusted for sex and sleep quality. All analyses were adjusted for follow-up length unless reported as unadjusted.
CI indicates confidence interval; DZ, dizygotic; MZ, monozygotic; OR, odds ratio.
EPIDEMIOLOGY Does Familial Aggregation of Chronic LBP Affect Recovery? � Zadro et al
C
likely reflecting the role of genetics in the recovery fromchronic LBP. Furthermore, the results from our siblingrecurrence relative risk analysis demonstrated the risk ofnon-recovery increases 1.2 times in the presence of a siblingwho has suffered from chronic LBP. This risk was higher inMZ twins (ls¼1.5), but lower in DZ twins (ls¼1.1),consistent with an influence of genetics factors in the recov-ery from chronic LBP.
Our study did not intend to explain why familial aggre-gation of chronic LBP affects recovery, and althoughgenetics appear to be playing a role, additional hypothesesdeserve attention. Our results appear to be consistent withexisting research highlighting the negative impact havingfamily members suffering from chronic LBP have on theprevalence,8 and risk9 of chronic LBP. Therefore, onepossible explanation is that negative beliefs about chronicLBP, shown to be associated with greater pain and disabil-ity,18 may have been shared among twin pairs concordantfor chronic LBP, negatively affecting recovery.19 Twin pairsshare numerous environmental factors throughout theirchildhood,16 with a strong twin bond potentially influencingeach other’s beliefs. Furthermore, it has been suggested thatMZ twins share a stronger bond compared with DZ twins.20
The possibility of this bond increasing the influence of eachother’s beliefs and potentially explaining why familial
Figure 2. The effect of familial aggregation ofchronic LBP on recovery. CI indicates confidenceinterval; DZ, dizygotic; LBP, low back pain; MZ,monozygotic; OR, odds ratio.
Spine
opyright © 2017 Wolters Kluwer Health, Inc. Unau101
aggregation of chronic LBP had a greater effect on MZtwins cannot be ruled out. Finally, having an adult siblingwith LBP appears to have a larger effect on LBP outcomesthan having parents or children with LBP.21 Therefore,shared beliefs between adult siblings in our study mightexplain the strong effect familial aggregation of chronic LBPhas on recovery.
Strengths and LimitationsOur study has numerous strengths. First, we employed strictcriteria for the adjustment of confounding variables.Although it is not always necessary to adjust for confound-ers in prognostic cohort studies, adjusting for strong knownconfounders allows us to make these results more general-izable.22 Secondly, we were able to use subjective data fromco-twins to inform on the familial aggregation of chronicLBP. We believe this is more accurate than participantsreporting on behalf of their family members, which haspreviously been employed in studies investigating familialaggregation of LBP.8,9,23 Thirdly, stratifying the analyses byzygosity, while performing a sibling recurrence relative riskanalysis, provided insights on the contribution of genetics,which previous studies in the field have been unable toachieve. Finally, the sample of twins used in the presentstudy are representative of the general population from
www.spinejournal.com 1299
thorized reproduction of this article is prohibited.
EPIDEMIOLOGY Does Familial Aggregation of Chronic LBP Affect Recovery? � Zadro et al
which they were drawn and can be considered representa-tive of the nontwin population for the prevalence ofnumerous diseases, including LBP.24 Our study, however,pre- sented a few limitations which need to be considered.First, our assessment of chronic LBP at baseline was basedon the following question: ‘‘Have you experienced chronicLBP in the last 2 years?’’ As a result, participants at baselinedid not necessarily experience chronic LBP at study entry.Second, our outcome variable for the recovery from chronicLBP gives us an indication of whether the participantexperienced LBP within the past 4 weeks, but does notgive us information on LBP disability or pain intensity.Because these data were not collected from participantsspecifically for this episode of LBP, we were unable toinvestigate whether familial aggregation of chronic LBPaffects disability or pain intensity at follow-up. In addition,baseline data on care seeking and treatment would have beenvaluable to determine whether the effect familial aggregationof chronic LBP has on recovery is moderated by ongoingtreatment. Third, we did not have adequate data on LBP fromthe 2007 collection wave, and did not have data on LBPbetween assessment points. This information would havebeen valuable for analyzing the recurrence or persistence ofLBP symptoms over time. Finally, our definition of familialaggregation of chronic LBP only considered data from theco-twin, without considering characteristics of the wholefamily. This would, however, likely underestimate the trueeffect of familial aggregation, because both twins with, orwithout a co-twin with chronic LBP may have had otherfamily members with chronic LBP.
Clinical ImplicationsObtaining information from patients regarding familyhistory of chronic LBP has the potential to inform whichpatients are less likely to recover, and help clinicians makemore accurate prognosis. More importantly, an understand-ing of the mechanisms behind familial aggregation ofchronic LBP and nonrecovery (such as the relative contri-bution of genetics and environmental factors to LBP) mayhave the potential to inform the direction of treatment. Forexample, if negative beliefs about LBP have been passed onby family members with chronic LBP and are significantlyaffecting recovery, providing the appropriate reassuranceand education could be extremely valuable. In addition, theplausibly important role of genetics on the prognosis ofchronic LBP should lead to attempts to identify geneticvariants for these phenotypes. Therefore, further studieson quantitative and molecular genetics (e.g., genome-wideassociation studies) should investigate the pathwaysbetween familial aggregation of chronic LBP and nonrecov-ery to build on these results.
CONCLUSIONFamilial aggregation of chronic LBP significantly predictednonrecovery, with genetics playing a role in this relation-ship. Although previous research has considered familialfactors associated with LBP, the present study is the first to
1300 www.spinejournal.com
Copyright © 2017 Wolters Kluwer Health, Inc. Unau102
investigate how familial aggregation affects recovery.Future research should further explore familial aggregationin the recovery from LBP, and investigate the mechanismsbehind familial predictors of nonrecovery.
th
Key Points
ori
Familial aggregation of chronic LBP increases therisk of not recovering from chronic LBP.
Genetics appear to play a role in the recoveryfrom chronic LBP, with familial aggregation ofchronic LBP having a larger effect on nonrecoveryin identical twins than in fraternal twins.
The presence of chronic LBP within a family hasthe potential to inform clinicians on whichpatients are less likely to recover and may guidefuture management strategies.
ze
AcknowledgmentsThe authors would like to acknowledge the support andcontribution of the Murcia Twin Registry for the imple-mentation of this study.
References1. Vos T, Flaxman AD, Naghavi M, et al. Years lived with disability
(YLDs) for 1160 sequelae of 289 diseases and injuries 1990–2010:a systematic analysis for the Global Burden of Disease Study 2010.Erratum appears in Lancet 2013;381:628; Note: AlMazroa,Mohammad A [added]; Memish, Ziad A [added]]. Lancet2012;380(9859):2163-2196.
2. Heuch I, Foss IS. Acute low back usually resolves quickly butpersistent low back pain often persists. J Physiother 2013;59:127.
3. Verkerk K, Luijsterburg PA, Miedema HS, et al. Prognostic factorsfor recovery in chronic nonspecific low back pain: a systematicreview. Phys Ther 2012;92:1093–108.
4. Menezes Costa LC, Maher CG, Hancock MJ, et al. The prognosisof acute and persistent low-back pain: a meta-analysis. CMAJ2012;184:E613–24.
5. Gregg CD, McIntosh G, Hall H, et al. Prognostic factors associatedwith low back pain outcomes. J Prim Health Care 2014;6:23–30.
6. Ferreira PH, Beckenkamp P, Maher CG, et al. Nature or nurture inlow back pain? Results of a systematic review of studies based ontwin samples. Eur J Pain 2012;17:957–71.
7. El-Metwally A, Mikkelsson M, Stahl M, et al. Genetic andenvironmental influences on non-specific low back pain in chil-dren: a twin study. Eur Spine J 2008;17:502–8.
8. Karunanayake AL, Pathmeswaran A, Kasturiratne A, et al. Riskfactors for chronic low back pain in a sample of suburban SriLankan adult males. Int J Rheum Dis 2013;16:203–10.
9. Matsudaira K, Konishi H, Miyoshi K, et al. Potential risk factors ofpersistent low back pain developing from mild low back pain inurban Japanese workers. PLoS One 2014;9:e93924.
10. Fujii T, Matsudaira K, Oka H. Pain-Related Fear, Disability, andthe Fear-Avoidance Model of Chronic Pain. J Orthop Sci 2013;18:909–15.
11. Ordonana JR, Rebollo-Mesa I, Carrillo E, et al. The Murcia TwinRegistry: a population-based registry of adult multiples in Spain.Twin Res Hum Genet 2013;16:302–6.
12. Stanton TR, Latimer J, Maher CG, et al. Definitions of recurrenceof an episode of low back pain: a systematic review. Spine (Phila Pa1976) 2009;34:E316–22.
13. Dionne CE, Dunn KM, Croft PR, et al. A consensus approachtoward the standardization of back pain definitions for use inprevalence studies. Spine (Phila Pa 1976) 2008;33:95–103.
September 2017
d reproduction of this article is prohibited.

EPIDEMIOLOGY Does Familial Aggregation of Chronic LBP Affect Recovery? � Zadro et al
C
14. Ministerio de Sanidad Servicios Sociales e Igualdad. EncuestaNacional de Salud 2011-2012 [Spanish National Health Survey2011–2012]: Ministerio de Sanidad, Servicios Sociales e Igualdad,2012. Available at: http://www.msssi.gob.es/estadEstudios/estadisticas/encuestaNacional/encuesta2011.htm. Accessed January 17,2017.
15. Buysse DJ, Reynolds Iii CF, Monk TH, et al. The Pittsburgh sleepquality index: a new instrument for psychiatric practice andresearch. Psychiatry Res 1989;28:193–213.
16. Silventoinen K, Rokholm B, Kaprio J, et al. The genetic andenvironmental influences on childhood obesity: a systematicreview of twin and adoption studies. Int J Obes 2010;34:29–40.
17. Demeester K, Van Wieringen A, Hendrickx JJ, et al. Heritabilityof audiometric shape parameters and familial aggregation ofpresbycusis in an elderly Flemish population. Hear Res 2010;265:1–10.
18. Wertli MM, Rasmussen-Barr E, Held U, et al. Fear-avoidancebeliefs-a moderator of treatment efficacy in patients with low backpain: a systematic review. Spine J 2014;14:2658–78.
Spine
opyright © 2017 Wolters Kluwer Health, Inc. Unau103
19. Wertli MM, Rasmussen-Barr E, Weiser S, et al. The role of fearavoidance beliefs as a prognostic factor for outcome in patientswith nonspecific low back pain: a systematic review. Spine J2014;14:816–36.
20. Neyer FJ. Twin relationships in old age: a developmental perspect-ive. J Soc Pers Relat 2002;19:155–77.
21. Matsui H, Maeda A, Tsuji H, et al. Risk indicators of low backpain among workers in Japan. Association of familial and physicalfactors with low back pain. Spine (Phila Pa 1976) 1997;22:1242–1247; discussion 1248.
22. Herbert RD. Cohort studies of aetiology and prognosis: they’redifferent. J Physiother 2014;60:241–4.
23. Aggarwal N, Anand T, Kishore J, et al. Low back pain andassociated risk factors among undergraduate students of a medicalcollege in Delhi. Educ Health (Abingdon) 2013;26:103–8.
24. Ordonana JR, Sanchez Romera JF, Colodro-Conde L, et al.The Murcia Twin Registry. A resource for research on health-related behaviors [in Spanish]. Gaceta Sanitaria 2017; Mar 8.pii: S0213-9111(16)30259-X.
www.spinejournal.com 1301
thorized reproduction of this article is prohibited.

CHAPTER SIX
The Beneficial Effects of Physical Activity: Is It Down to Your Genes? A Systematic
Review and Meta-Analysis of Twin and Family Studies
Chapter Seven has been published open access as:
Zadro JR, Shirley D, Andrade TB, Scurrah KJ, Bauman A, Ferreira PH. The Beneficial Effects
of Physical Activity: Is It Down to Your Genes? A Systematic Review and Meta-Analysis of
Twin and Family Studies. Sports Medicine - Open. 2017;3(1):4. Copyright © Springer
International Publishing AG. Distributed under the terms of the Creative Commons Attribution
4.0 International License (http://creativecommons.org/licenses/by/4.0/).
104

SYSTEMATIC REVIEW Open Access
The Beneficial Effects of Physical Activity: IsIt Down to Your Genes? A SystematicReview and Meta-Analysis of Twin andFamily StudiesJ. R. Zadro1*, D. Shirley1, T. B. Andrade1, K. J Scurrah2, A. Bauman3 and P. H. Ferreira1
Abstract
Background: There is evidence for considerable heterogeneity in the responsiveness to regular physical activity(PA) which might reflect the influence of genetic factors. The aim of this systematic review was to assess whetherthe response to a PA intervention for measures of body composition and cardiorespiratory fitness is (i) correlatedwithin twin pairs and/or families and (ii) more correlated in monozygotic twins (MZ) compared to dizygotic twins(DZ), which would be consistent with genetic effects.
Methods: We performed electronic database searches, combining key words relating to “physical activity” and“genetics”, in MEDLINE, CINAHL, EMBASE, SPORTS Discuss, AMED, PsycINFO, WEB OF SCIENCE, and SCOPUS fromthe earliest records to March 2016.Twin and family studies were included if they assessed body composition and/or cardiorespiratory fitnessfollowing a PA intervention, and provided a heritability estimate, maximal heritability estimate, or within MZ twinpair correlation (rMZ).Data on heritability (twin studies), maximal heritability (family studies), and the rMZ were extracted from includedstudies, although heritability estimates were not reported as small sample sizes made them uninformative.
Results: After screening 224 full texts, nine twin and five family studies were included in this review. The pooledrMZ in response to PA was significant for body mass index (rMZ = 0.69, n = 58), fat mass (rMZ = 0.58, n = 48), bodyfat percentage (rMZ = 0.55, n = 72), waist circumference (rMZ = 0.50, n = 27), and VO2max (rMZ = 0.39, n = 48), where“n” represents the total number of twin pairs from all studies. Maximal heritability estimates ranged from 0–21%for measures of body composition, and 22–57% for cardiorespiratory fitness.Twin studies differed in sample age, baseline values, and PA intervention, although the exclusion of any onestudy did not affect the results.
Conclusions: Shared familial factors, including genetics, are likely to be a significant contributor to the responseof body composition and cardiorespiratory fitness following PA.Genetic factors may explain individual variation in the response to PA.
Trial Registrations: PROSPERO Registration No CRD42015020056.
Keywords: Genetics, Heritability, Familial aggregation, Physical activity, Body composition, Cardiorespiratoryfitness
* Correspondence: [email protected] of Physiotherapy, Faculty of Health Sciences, The University ofSydney, 75 East Street, Lidcombe, Sydney NSW 1825, AustraliaFull list of author information is available at the end of the article
© The Author(s). 2017 Open Access This article is distributed under the terms of the Creative Commons Attribution 4.0International License (http://creativecommons.org/licenses/by/4.0/), which permits unrestricted use, distribution, andreproduction in any medium, provided you give appropriate credit to the original author(s) and the source, provide a link tothe Creative Commons license, and indicate if changes were made.
Zadro et al. Sports Medicine - Open (2017) 3:4 DOI 10.1186/s40798-016-0073-9
105

Key points
� Shared familial factors, including genetics, are likelyto play a stronger role in the response of bodycomposition when compared to cardiorespiratoryfitness.
� The response of body mass index, fat mass, andbody fat percentage to PA appear to be moredependent on shared familial factors than measuressuch as waist-to-hip ratio.
� These results have implications for the managementof conditions which advocate increased levels of PA,since shared familial factors, including genetics,might serve as an explanation for why some peoplerespond more effectively than others in specificmeasures of PA.
BackgroundEngagement in regular physical activity (PA) is one ofthe most important aspects for maintaining optimalhealth and is recommended for reducing the risk ofnumerous diseases (including cardiovascular disease) inpeople of all ages [1–4]. In addition, PA is used as anon-pharmacological treatment option for coronaryheart disease [5], osteoporosis [6], rheumatoid arthritis[7], anxiety disorders [8], and a variety of musculoskel-etal conditions, including low back pain [9]. Althoughthe benefits of PA are numerous, their positive effectson cardiorespiratory fitness [e.g., maximal oxygen uptake(VO2max)] and measures of body composition [e.g.,body mass index (BMI)] [10] deserve special attention,due to their subsequent influence on cardiovascular dis-ease and mortality rates. Cardiorespiratory fitness is astrong and independent risk factor for cardiovasculardisease and all-cause mortality [11], with up to 7% ofdeaths being attributed to low cardiorespiratory fitness[12]. Similarly, high values of body composition measures,such as BMI and waist circumference, are significantlyassociated with greater all-cause [13] and CVD-relatedmortality [14].Although the benefits of PA are clear and substantial,
research has demonstrated that genetic factors have astrong influence on PA engagement [15], with the herit-ability of time-spent in moderate-to-vigorous intensity PAestimated at 47% [16]. In addition, not everyone engagedin PA will benefit to the same extent, with strong evidencefor considerable heterogeneity in the responsiveness toregular PA [17–19]. This variation might also reflect theinfluence of genetic factors.Twin and family studies are commonly used to investi-
gate the extent to which shared familial factors, includ-ing genetics, contribute to the variation of a phenotype.Monozygotic (MZ) twins share 100% of their segregatinggenes, while dizygotic (DZ) twins share 50% on average.
If genes influence a phenotype, we would expect to see agreater correlation for MZ twins than for DZ twins, andif genes are the only influence on a phenotype the ratioshould be 2:1, with a heritability estimate of 100%.Smaller differences between the correlations would indi-cate that shared environmental effects are involved, withthe shared environment referring to the exposure tosimilar environmental (non-genetic) factors within twinpairs (e.g., nutrition, physical activity, childhood experi-ences, parental beliefs and values, socioeconomic status,etc.). Family studies can estimate maximal heritabilityusing correlations between parent-offspring pairs andsiblings (sometimes adjusted for correlation betweenspouses) [19]. However, unlike heritability estimatesfrom twin studies, these studies are unable to tease apartthe contribution from genetic and shared environmentalfactors. This is because different proportions of geneticsharing are required to separate genetic and shared en-vironmental sources of variation, and in nuclear familiesparent-offspring pairs and sibling-pairs share equal pro-portions of their genes (50%). Although we can estimatespouse correlations, we cannot tell whether this correl-ation is due to shared genes (assortative mating) orshared environmental factors.The role of both genetic and environmental factors
shared within families in the response to a PA interventionhas been investigated in a number of studies. MZ twinpairs who completed a standardized PA interventiondemonstrated great variation in the amount of weightlost between twin pairs, but only a small amount of vari-ation within twin pairs [20]. In addition, individualdifferences in the response of VO2max following anexercise program were 2.5 times more variable betweenfamilies than within families [19]. These results suggestthat factors shared within families, including genes, playa role in the response to a PA intervention, althoughtheir exact contribution, across measures of body com-position and cardiorespiratory fitness, are not wellunderstood. A better understanding of the contributiongenetics and shared environmental effects make to peo-ple’s response to PA may help health practitionersunderstand the possible reasons behind individual vari-ation in response to a PA targeted intervention, and whysome patients demonstrate a more favorable response.The aim of this systematic review is to obtain quantita-
tive estimates of twin correlations (both MZ and DZ), her-itability (from twin studies), and maximal heritability (fromfamily studies), for measures of body composition and car-diorespiratory fitness in response to a PA intervention.
MethodsSearch StrategyWe conducted a systematic review and meta-analysisin accordance with the “Preferred reporting items for
Zadro et al. Sports Medicine - Open (2017) 3:4 Page 2 of 19
106
systematic reviews and meta-analyses” (PRISMA) state-ment [21]. The protocol for this systematic review hasbeen registered on PROSPERO (Registration No:CRD42015020056). We performed electronic databasesearches in MEDLINE, CINAHL, EMBASE, SPORTSDiscuss, AMED, PsycINFO, WEB OF SCIENCE, andSCOPUS from the earliest records to May 2015. Thesearch was then updated in March 2016. We used acomprehensive key word search strategy (Additionalfile 1) combining key words relating to PA (e.g., “phys-ical activi*” OR “exercise” OR “resistance training” etc.)and genetics (e.g., “genetic*” OR “herita*” OR “familyresemblance” etc.). The search strategy remained sensitiveto capture all outcomes related to body composition andcardiorespiratory fitness. To identify additional studieswe performed a hand search of the reference listsfrom included papers.
Study SelectionTwo reviewers (TA and JZ) independently performedthe selection of studies and consensus was used to re-solve any disagreement. Studies were included if theyinvestigated clinically relevant outcome measures ofbody composition or cardiorespiratory fitness followinga PA or exercise intervention (referred to hereafter asPA interventions) amongst twin pairs and/or familymembers. Studies investigating a PA intervention incombination with other interventions (e.g., diet) wereincluded. We included randomised controlled trials andcase series provided they reported a within MZ twinpair correlation (rMZ), heritability estimate (from a twinstudy), or maximal heritability estimate (from a familystudy). Heritability estimates and the rMZ for the re-sponse of an intervention (based on change scores) arecommonly reported in studies where twin pairs areconsidered as clusters, with the treatment effect as afixed variable [22]. To investigate the intra-pair resem-blance in the response to PA it is essential that twinpairs participate in an identical intervention. This issimilar to the methodology employed in family studiesto obtain a maximal heritability estimate (where thevariance explained by genetic and shared environmentalfactors cannot be teased apart). Therefore, we decidednot to use methodological quality as part of the inclu-sion/exclusion criteria as it is not practical to consideritems commonly assessed in systematic reviews ofrandomized controlled trials (such as allocation con-cealment, blinding, and intention-to-treat) [23] whenconsidering this study design. It is unlikely results fromtwin and family studies investigating heritability aresubject to publication bias, since the contribution ofgenetics and shared environment is relevant regardlessof whether the estimates are small or large. However,we acknowledge the possibility that individual studies
may only report results for traits that demonstrate ahigh heritability. To minimize the risk of reporting bias,we contacted authors when there was data available onbody composition and cardiorespiratory fitness butwithin twin pair correlations were not reported. Obser-vational studies or studies only assessing the heritabilityof PA engagement, without a PA intervention, were ex-cluded. There was no restriction on the age or genderof participants, nor the type of PA intervention investi-gated. We included published conference abstracts anddissertations provided they met the inclusion criteria.
Data ExtractionTwo reviewers (DS and JZ) independently performed theextraction of data. A standardized data extraction formwas used to collect data on participants’ characteristics(age, gender, and zygosity), sample size, prescribed PAintervention (frequency, intensity, duration, and type),co-prescription of other interventions (e.g., diet), out-comes assessed, loss to follow up, and study type.
Data AnalysisData on correlation (r), equality of variances (F), herit-ability (h2), and maximal heritability were extracted fromincluded studies. In family studies, “heritability” esti-mates were derived from the familial correlation modeland termed “maximal heritability”, since the model isunable to partition the variance explained by genetic andnon-genetic sources shared within families [24]. In twinstudies, heritability estimates were calculated from thefollowing formula: h2 = 2(rMZ–rDZ), where rDZ is thewithin DZ twin pair correlation. When h2 was greaterthan 1 we used rMZ as the heritability estimate, since itis not possible for genetics to contribute more than100% to the variance of a phenotype. In addition, if therewere no data available for DZ twins, we used rMZ as anestimate of the upper bound of heritability (includingvariance from genetic and shared environmental factors).In cases where the F-ratio was reported but the rMZ wasnot, we used the following formula to calculate rMZ asdescribed by Haggard: r = (F–1)/(F + 1) [25]. Authorswere contacted when required data were not published.When raw data were obtained from twin studies, weattempted to fit variance components models to changescores in order to estimate the rMZ and rDZ simultan-eously and formally compare models in which these twoparameters were forced to be equal with models inwhich they were allowed to differ. However, for manyphenotypes the models could not be fitted or failed toconverge due to small sample sizes (no results shownfrom these models). Instead, for all phenotypes, andseparately for MZ and DZ twin pairs, we performed aone-way (twin pair identifier) analysis of variance withchange score as the outcome (calculated from the pre
Zadro et al. Sports Medicine - Open (2017) 3:4 Page 3 of 19
107

and post-intervention raw data). Specifying changescore as a repeated measure within a twin pair in themodels enabled calculation of the within twin pair cor-relation. When possible and applicable, we adjusted theanalyses for age, gender, and baseline values [22]. Ifstudies were considered homogenous in terms of out-comes and PA interventions, we performed a meta-analysis using Comprehensive Meta-Analysis Version3.0. Additionally, if there were enough studies investi-gating PA interventions of varying durations, the co-prescription of other interventions (e.g., diet), or ana-lyzing data from males and females separately, we sub-grouped our meta-analyses accordingly. If pooling dataon heritability/maximal heritability was not possible(from either twin or family studies), we attempted topool data on the rMZ. Data on correlation and samplesize from each study with greater than or equal to fourtwin pairs (the minimum number of observationsallowed to be entered into the software) was used toprovide a pooled estimate of the rMZ, 95% confidenceinterval (CI), and p-value. Heterogeneity between stud-ies was assessed using the I2 statistic. An I2 value <25%indicates low heterogeneity between studies. We usedfixed-effects where I2 was <50% and random-effectswhen I2 was ≥50% (moderate heterogeneity). We didnot display pooled estimates where the I2 value indi-cated high heterogeneity (≥75%) [26].
ResultsDescription of StudiesThe comprehensive key word search yielded 27,830 re-sults, with one additional study retrieved from handsearching the reference lists of included studies. After re-moving duplicates and screening titles and abstracts therewere 224 full texts which were screened. A total of 14studies (nine twin and five family studies) were includedin this systematic review, with eight twin studies formingthe basis for our meta-analyses (Fig. 1). The nine twinstudies included data from a total of 83 complete MZ twinpairs, and 15 complete DZ twin pairs, with no twin pairsused in more than one study (as confirmed by authorsnamed in multiple included studies). The five family stud-ies were based off the same sample of 199 families (whichdid not include any twin pairs). Although there were nu-merous twin and family studies similar in design and out-comes, we were unable to pool heritability estimates forany outcomes for two main reasons. First, there were aninsufficient number of family studies deriving results fromindependent samples. Second, although we were able toobtain heritability estimates from three twin studies, theseestimates were uninformative since the 95% CI coveredthe whole range (0,1) (apart from Danis and colleagueswho estimated heritability without utilizing DZ twins inits design [27]), and differences between the rMZ and rDZwere not statistically significant (Table 1).Instead, we were
Fig. 1 PRISMA flow diagram
Zadro et al. Sports Medicine - Open (2017) 3:4 Page 4 of 19
108

able to pool the rMZ for selected outcomes, giving usquantitative estimates of the upper bound of heritability.Included studies that reported more than one outcomemeasure were used in multiple meta-analyses.The characteristics of the included twin and family
studies, including sample size, age, baseline PA status,and PA intervention are described in Tables 2 and 3.The mean age [standard deviation (SD)] of participantsranged from 13 (1) to 39 (2) in twin studies, and 17 to
65 years in family studies. At study entry, participantswere mostly sedentary or engaged in light PA but nothighly physically trained. Only two twin studies [20, 28]analysed data from twin pairs living apart at the time ofenrolment [mean age (SD) 30 (8) and 39 (2), respect-ively], while another reported that more than 50% of thetwin pairs were living together at this time [mean age(SD) 19 (2)] [29]. Every study recruited healthy individ-uals from the community, except Hainer and colleagues
Table 1 Within MZ and DZ twin pair correlations for the response of body composition and cardiorespiratory fitness following aphysical activity intervention in twin studies
Author (year) Sample Age[mean (SD)]
Baseline status[mean (SD)]
Within MZcorrelation(95% CI)
Within DZcorrelation(95% CI)
Between MZ andDZ correlationsignificanced
Body fat percentage (%)
Hopkins ND (2012)a 6 MZ (1 male and 5 female) and 6 DZ(2 male and 4 female) twin pairs
MZ: 13.5 (0.8)DZ: 13.4 (0.8)
MZ: 27.1 (6.9)DZ: 26.0 (11.3)
0.63(−0.37 to 0.95)
0.31(−0.67 to 0.90)
p = 0.606
Afman G (1988)b 18 MZ (2 males and 16 females) and9 DZ (3 males and 6 females) twin pairs
MZ: 19.0 (1.4)DZ: 19.4 (1.8)
MZ: 21.3 (9.0)DZ: 19.9 (7.2)
0.61(0.20 to 0.84)
0.50(−0.25 to 0.87)
p = 0.742
Danis A (2003) 9 MZ male twin pairs 11–14c E: 17.8 (4.1)C: 16.8 (2.8)
* * h2 = 69%**
BMI
Hopkins ND (2012)a 6 MZ (1 male and 5 female) and 6 DZ(2 male and 4 female) twin pairs
MZ: 13.5 (0.8)DZ: 13.4 (0.8)
MZ: 21.5 (3.5)DZ: 21.9 (3.5)
0.81(0.00 to 0.98)
0.57(−0.45 to 0.94)
p = 0.557
Afman G (1988)b 16 MZ (3 males and 13 females) and6 DZ (2 males and 4 females) twin pairs
MZ:18.6 (1.1)DZ: 19.3 (1.3)
MZ: 21.9 (1.9)DZ: 22.6 (3.7)
0.42(−0.10 to 0.76)
0.00(−0.81 to 0.81)
p = 0.485
Weight (kg)
Hopkins ND (2012)a 6 MZ (1 male and 5 female) and6 DZ (2 male and 4 female) twin pairs
MZ: 13.5 (0.8)DZ: 13.4 (0.8)
MZ: 59.0 (11.5)DZ: 58.9 (12.6)
0.89(0.28 to 0.99)
0.00(−0.81 to 0.81)
p = 0.091
Afman G (1988)b 19 MZ (3 males and 16 females) and9 DZ (3 males and 6 females) twin pairs
MZ: 18.7 (1.0)DZ: 19.4 (1.8)
MZ: 60.4 (10.6)DZ: 67.1 (13.4)
0.53(0.10 to 0.79)
0.13(−0.58 to 0.73)
p = 0.337
Fat free mass
Hopkins ND (2012)a 6 MZ (1 male and 5 female) and6 DZ (2 male and 4 female) twin pairs
MZ: 13.5 (0.8)DZ: 13.4 (0.8)
MZ: 69.9 (6.8)%DZ: 69.9 (6.8)%
0.52(−0.50 to 0.94)
0.34(−0.65 to 0.90)
p = 0.785
Afman G (1988)b 19 MZ (3 males and 16 females) and9 DZ (3 males and 6 females) twin pairs
MZ: 18.9 (1.4)DZ: 19.4 (1.8)
MZ: 48.2 (8.1) kgDZ: 53.2 (13.2) kg
0.40(−0.07 to 0.72)
0.18(−0.55 to 0.75)
p = 1.000
Relative VO2 max (mL.kg−1min−1)
Hopkins ND (2012)a 6 MZ (1 male and 5 female) and 6 DZ(2 male and 4 female) twin pairs
MZ: 13.5 (0.8)DZ: 13.4 (0.8)
MZ: 44.4 (8.1)DZ: 45.7 (8.1)
0.43(−0.59 to 0.92)
0.21(−0.73 to 0.87)
p = 0.763
Afman G (1988)b 19 MZ (3 males and 16 females) and9 DZ (3 males and 6 females) twin pairs
MZ: 18.9 (1.4)DZ: 19.4 (1.8)
MZ: 33.3 (7.3)DZ: 37.1 (8.0)
0.44(0.00 to 0.74)
0.00(−0.66 to 0.66)
p = 0.324
Danis A (2003) 9 MZ male twin pairs 11–14c E: 52.1 (3.6)C: 54.0 (3.9)
* * h2 = 44%**
Absolute VO2 max (L.min−1)
Afman G (1988)b 20 MZ (3 males and 16 females) and9 DZ (3 males and 6 females) twin pairs
MZ: 18.9 (1.4)DZ: 19.4 (1.8)
MZ: 2.0 (0.6)DZ: 2.5 (0.9)
0.44(0.00 to 0.74)
0.00(−0.66 to 0.66)
p = 0.320
Danis A (2003) 9 MZ male twin pairs 11–14c E: 2.1 (0.4)C: 2.1 (0.4)
* * h2 = 54%**
MZ monozygotic, DZ dizygotic, E experimental group, C control group, SD standard deviation, CI confidence interval, h2 heritability, VO2 max maximal oxygenuptake, BMI body mass index*No reported correlation due to a different method used to estimate heritability**Unable to calculate the standard error and thus present the 95% CIaWithin twin pair correlations (95% CI) extracted from the publicationbWithin twin pair correlations (95% CI) calculated from raw datacDid not report a mean age (SD)dUnable to calculate the within MZ and DZ twin pair correlations for Danis A (2003) due to methodology, so the h2 is presented instead
Zadro et al. Sports Medicine - Open (2017) 3:4 Page 5 of 19
109
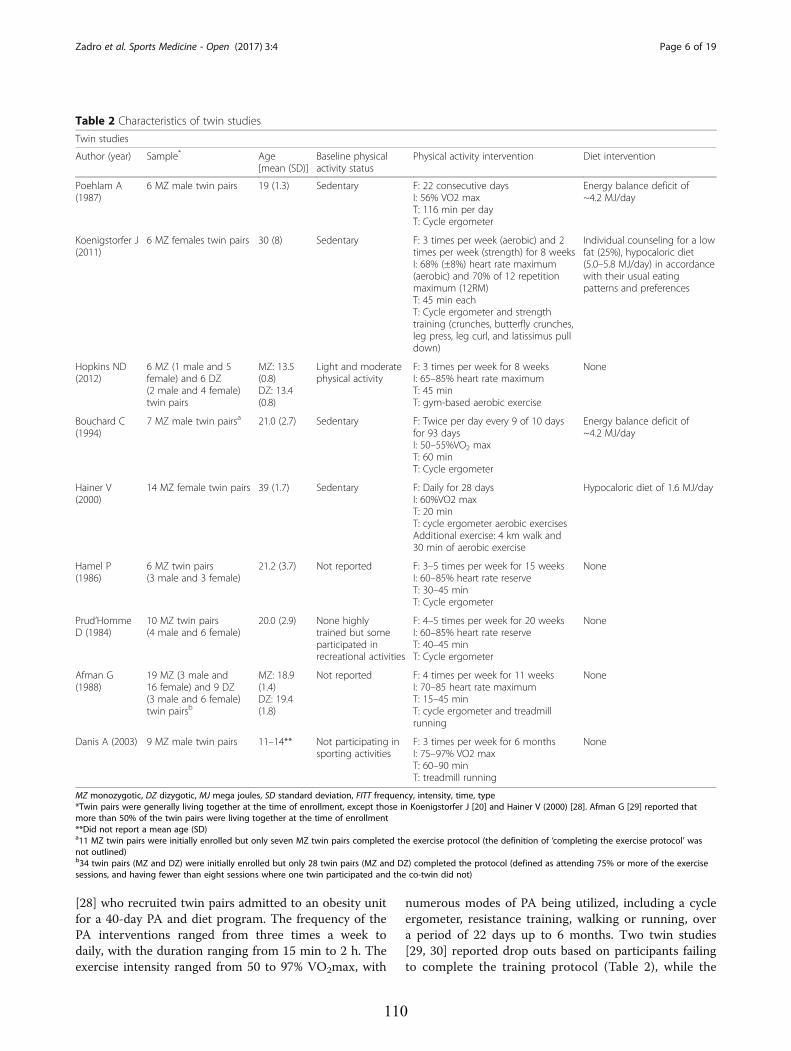
[28] who recruited twin pairs admitted to an obesity unitfor a 40-day PA and diet program. The frequency of thePA interventions ranged from three times a week todaily, with the duration ranging from 15 min to 2 h. Theexercise intensity ranged from 50 to 97% VO2max, with
numerous modes of PA being utilized, including a cycleergometer, resistance training, walking or running, overa period of 22 days up to 6 months. Two twin studies[29, 30] reported drop outs based on participants failingto complete the training protocol (Table 2), while the
Table 2 Characteristics of twin studies
Twin studies
Author (year) Sample* Age[mean (SD)]
Baseline physicalactivity status
Physical activity intervention Diet intervention
Poehlam A(1987)
6 MZ male twin pairs 19 (1.3) Sedentary F: 22 consecutive daysI: 56% VO2 maxT: 116 min per dayT: Cycle ergometer
Energy balance deficit of~4.2 MJ/day
Koenigstorfer J(2011)
6 MZ females twin pairs 30 (8) Sedentary F: 3 times per week (aerobic) and 2times per week (strength) for 8 weeksI: 68% (±8%) heart rate maximum(aerobic) and 70% of 12 repetitionmaximum (12RM)T: 45 min eachT: Cycle ergometer and strengthtraining (crunches, butterfly crunches,leg press, leg curl, and latissimus pulldown)
Individual counseling for a lowfat (25%), hypocaloric diet(5.0–5.8 MJ/day) in accordancewith their usual eatingpatterns and preferences
Hopkins ND(2012)
6 MZ (1 male and 5female) and 6 DZ(2 male and 4 female)twin pairs
MZ: 13.5(0.8)DZ: 13.4(0.8)
Light and moderatephysical activity
F: 3 times per week for 8 weeksI: 65–85% heart rate maximumT: 45 minT: gym-based aerobic exercise
None
Bouchard C(1994)
7 MZ male twin pairsa 21.0 (2.7) Sedentary F: Twice per day every 9 of 10 daysfor 93 daysI: 50–55%VO2 maxT: 60 minT: Cycle ergometer
Energy balance deficit of~4.2 MJ/day
Hainer V(2000)
14 MZ female twin pairs 39 (1.7) Sedentary F: Daily for 28 daysI: 60%VO2 maxT: 20 minT: cycle ergometer aerobic exercisesAdditional exercise: 4 km walk and30 min of aerobic exercise
Hypocaloric diet of 1.6 MJ/day
Hamel P(1986)
6 MZ twin pairs(3 male and 3 female)
21.2 (3.7) Not reported F: 3–5 times per week for 15 weeksI: 60–85% heart rate reserveT: 30–45 minT: Cycle ergometer
None
Prud’HommeD (1984)
10 MZ twin pairs(4 male and 6 female)
20.0 (2.9) None highlytrained but someparticipated inrecreational activities
F: 4–5 times per week for 20 weeksI: 60–85% heart rate reserveT: 40–45 minT: Cycle ergometer
None
Afman G(1988)
19 MZ (3 male and16 female) and 9 DZ(3 male and 6 female)twin pairsb
MZ: 18.9(1.4)DZ: 19.4(1.8)
Not reported F: 4 times per week for 11 weeksI: 70–85 heart rate maximumT: 15–45 minT: cycle ergometer and treadmillrunning
None
Danis A (2003) 9 MZ male twin pairs 11–14** Not participating insporting activities
F: 3 times per week for 6 monthsI: 75–97% VO2 maxT: 60–90 minT: treadmill running
None
MZ monozygotic, DZ dizygotic, MJ mega joules, SD standard deviation, FITT frequency, intensity, time, type*Twin pairs were generally living together at the time of enrollment, except those in Koenigstorfer J [20] and Hainer V (2000) [28]. Afman G [29] reported thatmore than 50% of the twin pairs were living together at the time of enrollment**Did not report a mean age (SD)a11 MZ twin pairs were initially enrolled but only seven MZ twin pairs completed the exercise protocol (the definition of ‘completing the exercise protocol’ wasnot outlined)b34 twin pairs (MZ and DZ) were initially enrolled but only 28 twin pairs (MZ and DZ) completed the protocol (defined as attending 75% or more of the exercisesessions, and having fewer than eight sessions where one twin participated and the co-twin did not)
Zadro et al. Sports Medicine - Open (2017) 3:4 Page 6 of 19
110

included family studies only analyzed data from partici-pants who completed 60 exercise sessions in 21 weeks[31] (Table 3).Due to significant between-study variation for the
intervention frequency and duration, we were unable tostratify meta-analyses in this way. Instead, we examinedthe correlations for each outcome to investigate if stud-ies with more frequent bouts of PA, or longer interven-tion durations reported higher rMZ, but, we were unableto identify any trends. We were able to stratify ourmeta-analyses by the co-prescription of a diet interven-tion, and by gender.
Outcomes of Body CompositionThere were 11 studies (nine twin studies [20, 27–30, 32–35] and two family studies [24, 36]) which investigatedbody composition measures and their response followinga PA intervention. Pooling of eight twin studies results(excluding Danis and colleagues [27] due to differentmethodology) suggest there is a significant rMZ across themajority of body composition measures (Table 4). Thepooled rMZ was highest for BMI (rMZ = 0.69, 95% CI:0.49–0.82, n = 58) and the ratio of fat mass to fat free mass(rMZ = 0.69, 95% CI: 0.42–0.85, n = 36) (Fig. 2), where “n”represents the total number of twin pairs from all studies.There were significant pooled rMZ for fat mass (rMZ =0.58, 95% CI: 0.13–0.83, n = 48), fat free mass (rMZ = 0.57,95% CI: 0.35–0.73, n = 73) (Fig. 3), body fat percentage(rMZ = 0.55, 95% CI: 0.32–0.72, n = 72), waist circumfer-ence (rMZ = 0.50, 95% CI: 0.09–0.77, n = 27) and hip cir-cumference (rMZ = 0.51, 95% CI: 0.11–0.77, n = 27)(Fig. 4). However, the pooled rMZ was lower and not statis-tically significantly different from 0 for waist-to-hip ratio(rMZ = 0.29, 95% CI: −0.16–0.64, n = 27) (Fig. 5).When we pooled data from twin studies that included
a combined PA and diet intervention (four studies [20,28, 30, 33], there was a trend for the rMZ to be higheracross all measures of body composition compared totwin studies that only involved a PA intervention (fourstudies [29, 32, 34, 35]) (Table 4). The rMZ for BMI was
higher when results were pooled for studies including acombined PA and diet intervention (rMZ = 0.79, 95% CI:0.54–0.91, n = 27), compared to studies only involving aPA intervention (rMZ = 0.58, 95% CI: 0.23–0.79, n = 31)(Fig. 6), although confidence intervals were wide. Meta-analyses for each outcome were stratified by gender.The rMZ was variable between males and females, de-pending on the outcome assessed (Table 5), with wideconfidence intervals observed for both males and fe-males. The pooled rMZ for the response of fat massfollowing PA was higher and statistically significant infemales (rMZ = 0.85, 95% CI: 0.63–0.94, n = 25) com-pared to males (rMZ = 0.40, 95% CI: −0.26–0.81, n = 17)(Fig. 7). However, the pooled rMZ for fat free mass washigher in males (rMZ = 0.80, 95% CI: 0.39–0.95, n = 17)compared to females (rMZ = 0.52, 95% CI: 0.19–0.75, n =38) (Fig. 8), both being statistically significantly differentfrom 0 but not from each other.We were able to extract heritability, and maximal her-
itability estimates for measures of body compositionfrom three twin studies [27, 29, 32] (with raw data usedto generate heritability estimates from one [29]), andtwo family studies, respectively [24, 36]. However, wedid not report the heritability estimates from two twinstudies [29, 32], as there were no statistically significantdifferences between the rMZ and rDZ, making the esti-mates uninformative (Table 1). Danis and colleagues[27] used different methodology to calculate heritabilityand we reported the estimates in Table 1. Maximal her-itability estimates ranged from 0–21% in family studies,with higher estimates for trunk and extremity skin foldscompared to measures of fat mass and waist circumfer-ence (Table 6).
Outcomes of Cardiorespiratory FitnessThere were nine studies (six twin studies [27, 29, 30,32, 34, 35] and three family studies [19, 37, 38]) whichinvestigated cardiorespiratory fitness measures andtheir response following a PA intervention. Pooling offive twin studies results (excluding Danis and colleagues
Table 3 Characteristics of family studies
Family Studies (all studies were based on the sample from “The HERITAGE Family Study”)
Author (year) Samplea Age Baselinephysicalactivity status
Physical activityintervention
Dietintervention
Rice T (1999) 98 Caucasian families (440 individuals) Parents were less than65 years old, whileoffspring rangedfrom 17–40 years old
Sedentary F: 3 times per weekfor 20 weeksI: 55–75% VO2 maxT: 30–50 minT: Cycle ergometer
None.
Bouchard C (1999) 98 Caucasian families (481 individuals)
Perusse L (2000) 99 Caucasian families (483 individuals)
Perusse L (2001) 99 Caucasian families (483 individuals)
Gaskill SE (2001) 100 Caucasian families (339 individuals) and99 African-American families (172 individuals)
FITT frequency, intensity, time, type, VO2 max maximal oxygen uptakeaParticipants needed to complete 60 exercise sessions within 21 weeks to satisfy the protocol and be included in the study
Zadro et al. Sports Medicine - Open (2017) 3:4 Page 7 of 19
111

Table 4 Pooled within monozygotic (MZ) twin pair correlations (95% confidence intervals)
Outcome All studies Studies including a combinedphysical activity and diet intervention
Studies only including aphysical activity intervention
Body fat percentage (%) 0.55 (0.32–0.72)***(n = 72)Poehlam A et al. (1987)Koenigstorfer J et al. (2011)Hopkins N et al. (2012) Bouchard C et al. (1994)Hainer V et al. (2000) Hamel P et al. (1986)Prud’Homme D et al. (1984)Afman G et al. (1988)
0.61 (0.28–0.82)**(n = 33)Poehlam A et al. (1987)Koenigstorfer J et al. (2011)Bouchard C et al. (1994)Hainer V et al. (2000)
0.49 (0.16–0.73)**(n = 39)Hopkins N et al. (2012)Hamel P et al. (1986)Prud’Homme D et al. (1984)Afman G et al. (1988)
BMI 0.69 (0.49–0.82)***(n = 58)Koenigstorfer J et al. (2011)Hopkins N et al. (2012)Bouchard C et al. (1994)Hainer V et al. (2000)Prud’Homme D et al. (1984)Afman G et al. (1988)
0.79 (0.54–0.91)***(n = 27)Koenigstorfer J et al. (2011)Bouchard C et al. (1994)Hainer V et al. (2000)
0.58 (0.23–0.79)**(n = 31)Hopkins N et al. (2012)Prud’Homme D et al. (1984)Afman G et al. (1988)
Fat free mass (kg) 0.57 (0.35–0.73)***(n = 73)Poehlam A et al. (1987)Koenigstorfer J et al. (2011)Hopkins N et al. (2012)Bouchard C et al. (1994)Hainer V et al. (2000)Hamel P et al. (1986)Prud’Homme D et al. (1984)Afman G et al. (1988)
0.71 (0.43–0.87)***(n = 33)Poehlam A et al. (1987)Koenigstorfer J et al. (2011)Bouchard C et al. (1994)Hainer V et al. (2000)
0.43 (0.09–0.68)*(n = 40)Hopkins N et al. (2012)Hamel P et al. (1986)Prud’Homme D et al. (1984)Afman G et al. (1988)
Fat mass (kg) 0.58 (0.13–0.83)*(n = 48)Poehlam A et al. (1987)Koenigstorfer J et al. (2011)Bouchard C et al. (1994)Hainer V et al. (2000)Hamel P et al. (1986)Prud’Homme D et al. (1984)
0.68 (0.16–0.90)*(n = 33)Poehlam A et al. (1987)Koenigstorfer J et al. (2011)Bouchard C et al. (1994)Hainer V et al. (2000)
0.27 (−0.36–0.73)(n = 15)Hamel P et al. (1986)Prud’Homme D et al. (1984)
Fat mass to fat freemass ratio
0.69 (0.42–0.85)***(n = 36)Bouchard C et al. (1994)Hainer V et al. (2000)Hamel P et al. (1986)Prud’Homme D et al. (1984)
0.82 (0.58–0.93)***(n = 21)Bouchard C et al. (1994)Hainer V et al. (2000)
0.30 (−0.33–0.75)(n = 15)Hamel P et al. (1986)Prud’Homme D et al. (1984)
Waist circumference (cm) 0.50 (0.09–0.77)*(n = 27)Koenigstorfer J et al. (2011)Bouchard C et al. (1994)Hainer V et al. (2000)
–
Hip circumference (cm) 0.51 (0.11–0.77)*(n = 27)Koenigstorfer J et al. (2011)Bouchard C et al. (1994)Hainer V et al. (2000)
–
Waist to hip ratio 0.29 (−0.16–0.64)(n = 27)Koenigstorfer J et al. (2011)Bouchard C et al. (1994)Hainer V et al. (2000)
–
Sum of skin folds (cm) 0.67 (0.37–0.85)***(n = 30)Bouchard C et al. (1994)Hainer V et al. (2000)Prud’Homme D et al. (1984)
0.73 (0.39–0.89)***(n = 21)Bouchard C et al. (1994)Hainer V et al. (2000)
0.49 (−0.26–0.87)(n = 9)Prud’Homme D et al. (1984)
Trunk fat 0.52 (0.12–0.78)*(n = 27)
0.56 (0.13–0.82)*(n = 21)
0.30 (−0.68–0.89)(n = 6)
Zadro et al. Sports Medicine - Open (2017) 3:4 Page 8 of 19
112
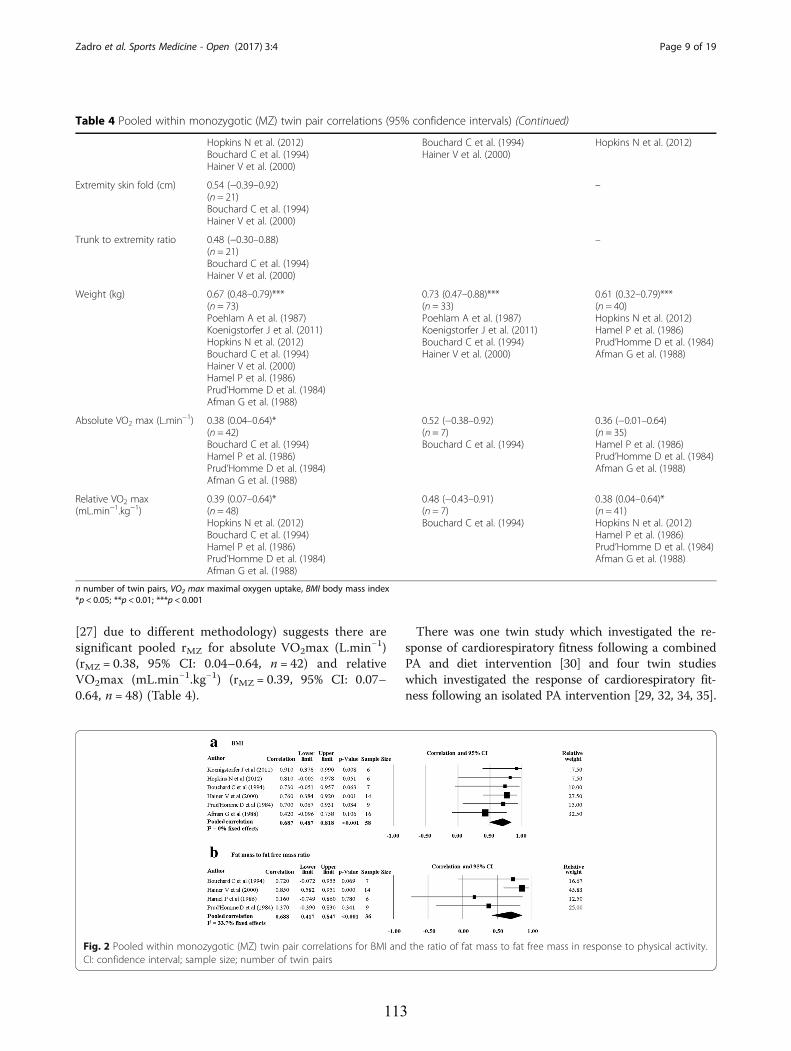
[27] due to different methodology) suggests there aresignificant pooled rMZ for absolute VO2max (L.min−1)(rMZ = 0.38, 95% CI: 0.04–0.64, n = 42) and relativeVO2max (mL.min−1.kg−1) (rMZ = 0.39, 95% CI: 0.07–0.64, n = 48) (Table 4).
There was one twin study which investigated the re-sponse of cardiorespiratory fitness following a combinedPA and diet intervention [30] and four twin studieswhich investigated the response of cardiorespiratory fit-ness following an isolated PA intervention [29, 32, 34, 35].
Table 4 Pooled within monozygotic (MZ) twin pair correlations (95% confidence intervals) (Continued)
Hopkins N et al. (2012)Bouchard C et al. (1994)Hainer V et al. (2000)
Bouchard C et al. (1994)Hainer V et al. (2000)
Hopkins N et al. (2012)
Extremity skin fold (cm) 0.54 (−0.39–0.92)(n = 21)Bouchard C et al. (1994)Hainer V et al. (2000)
–
Trunk to extremity ratio 0.48 (−0.30–0.88)(n = 21)Bouchard C et al. (1994)Hainer V et al. (2000)
–
Weight (kg) 0.67 (0.48–0.79)***(n = 73)Poehlam A et al. (1987)Koenigstorfer J et al. (2011)Hopkins N et al. (2012)Bouchard C et al. (1994)Hainer V et al. (2000)Hamel P et al. (1986)Prud’Homme D et al. (1984)Afman G et al. (1988)
0.73 (0.47–0.88)***(n = 33)Poehlam A et al. (1987)Koenigstorfer J et al. (2011)Bouchard C et al. (1994)Hainer V et al. (2000)
0.61 (0.32–0.79)***(n = 40)Hopkins N et al. (2012)Hamel P et al. (1986)Prud’Homme D et al. (1984)Afman G et al. (1988)
Absolute VO2 max (L.min−1) 0.38 (0.04–0.64)*(n = 42)Bouchard C et al. (1994)Hamel P et al. (1986)Prud’Homme D et al. (1984)Afman G et al. (1988)
0.52 (−0.38–0.92)(n = 7)Bouchard C et al. (1994)
0.36 (−0.01–0.64)(n = 35)Hamel P et al. (1986)Prud’Homme D et al. (1984)Afman G et al. (1988)
Relative VO2 max(mL.min−1.kg−1)
0.39 (0.07–0.64)*(n = 48)Hopkins N et al. (2012)Bouchard C et al. (1994)Hamel P et al. (1986)Prud’Homme D et al. (1984)Afman G et al. (1988)
0.48 (−0.43–0.91)(n = 7)Bouchard C et al. (1994)
0.38 (0.04–0.64)*(n = 41)Hopkins N et al. (2012)Hamel P et al. (1986)Prud’Homme D et al. (1984)Afman G et al. (1988)
n number of twin pairs, VO2 max maximal oxygen uptake, BMI body mass index*p < 0.05; **p < 0.01; ***p < 0.001
Fig. 2 Pooled within monozygotic (MZ) twin pair correlations for BMI and the ratio of fat mass to fat free mass in response to physical activity.CI: confidence interval; sample size; number of twin pairs
Zadro et al. Sports Medicine - Open (2017) 3:4 Page 9 of 19
113

The rMZ for absolute and relative VO2max in the study(n = 7) which combined PA with diet (rMZ = 0.52, 95%CI: −0.38–0.92, and rMZ = 0.48, 95% CI: −0.43–0.91, re-spectively) was higher than the pooled rMZ from thestudies which only investigated a PA intervention (rMZ
= 0.36, 95% CI: −0.01–0.64, n = 35, and rMZ = 0.38, 95%CI: 0.04–0.64, n = 41, respectively) (Fig. 9) although theconfidence intervals overlapped, and the rMZ from theindividual study was not statistically significantly dif-ferent from 0 (with 95% CIs generated from the meta-analysis software). Meta-analyses for absolute and rela-tive VO2max were stratified by gender, with the pooledrMZ being higher in females (Table 5). The pooled rMZ
for the response of absolute VO2max following PA was0.74 in females (n = 21) and 0.49 in males (n = 11), al-though neither were statistically significantly differentfrom 0 (Fig. 10).Heritability estimates for the response of VO2max
from two twin studies [29, 32] were not reported, asthere were no statistically significant differences be-tween the rMZ and rDZ (Table 1). Danis and colleagues[27] used different methodology to calculate heritabilityand we reported the estimates in Table 1 .Maximalheritability estimates from the three included familystudies [19, 37, 38] were variable, ranging from 22–57%depending on race and when VO2max was measured(e.g., ventilatory threshold, pre-determined power levels,etc.) (Table 6).
DiscussionOur results demonstrate consistent evidence that sharedfamilial factors (whether genetic or environmental) play
a role in the response of body composition and cardiore-spiratory fitness following PA, despite varying on theoutcome being assessed, particularly when results werestratified by gender. The pooled rMZ were generally >0.5,and the bulk of most CIs also exceeded 0.5. Sharedfamilial factors appear to play a larger role in theresponse of body composition when compared to car-diorespiratory fitness, and may have more influence onthe response for most outcomes when considering acombined PA and diet intervention.
Heritability Estimates and the Within MZ Twin PairCorrelationOnly a few studies included DZ twins (n = 2) [29, 32],so we pooled the rMZ to provide an estimate of theupper bound of heritability. Traditionally, twin andfamily studies investigating the heritability of a pheno-type (e.g., PA engagement [15, 16], BMI [39], andchronic pain [40]) have done so using a cross-sectionaldesign, with twin studies dividing the variance of aphenotype into components or proportions due toadditive genetic factors (heritability), shared environ-mental factors, and unique environmental factors. Ourpooled estimates represent the upper bound of herit-ability, including variance from additive genetic andshared environmental factors. However, our study in-vestigated how shared familial factors influence the re-sponse to PA, with the rMZ derived from the change inoutcome status following an intervention. Since inter-ventions were implemented over a specified timeframe,with training parameters controlled, it has been sug-gested that unique and shared environmental factors
Fig. 3 Pooled within monozygotic (MZ) twin pair correlations for fat mass and fat free mass in response to physical activity. CI: confidenceinterval; sample size; number of twin pairs
Zadro et al. Sports Medicine - Open (2017) 3:4 Page 10 of 19
114

would make minor contributions to the variance of theresponse to PA [22], resulting in a rMZ that would givea close estimate of heritability. However, family studiesincluded in this review found significant correlationsbetween spouses for the response of body composition[38] and cardiorespiratory fitness [19, 24] following aPA intervention. Although some suggest this indicatesa greater influence of shared environmental factors[19], this correlation may equally be due to shared
genes (assortative mating), so without making strongassumptions as to which is occurring in spouses, this isunlikely to indicate a greater influence of shared environ-mental factors.
Shared Familial Influence on Changes of Body CompositionFactors shared within MZ twin pairs appear to play astrong role in the response of BMI (pooled rMZ = 0.69)following a PA intervention (Fig. 2), although they
Fig. 4 Pooled within monozygotic (MZ) twin pair correlations for body fat percentage, waist circumference and hip circumference in response tophysical activity. CI: confidence interval; sample size; number of twin pairs
Fig. 5 Pooled within monozygotic (MZ) twin pair correlations for waist-to-hip ratio in response to physical activity. CI: confidence interval; samplesize; number of twin pairs
Zadro et al. Sports Medicine - Open (2017) 3:4 Page 11 of 19
115

appear to be less influential in the response of other out-comes (e.g., waist-to-hip ratio) (Fig. 5). Although we wereunable to pool heritability estimates, our pooled rMZ forthe response of BMI following PA appears to be withinthe range of previous studies reporting the cross-sectionalheritability of BMI (ranging from 47–90% in twins studies[39]). However, other cross-sectional studies have reportedheritability estimates for waist circumference (66%) andbody fat percentage (68%) [41] that appear to be slightlyhigher than our rMZ in response to exercise (pooled rMZ =0.50 and 0.55, respectively), especially considering our re-sults represent the upper bound of heritability. Therefore,by comparing our results to those of previous investiga-tions, it appears the genetic influences on an individual’sbody composition (cross-sectional association) might bedifferent, and perhaps higher, than the way their bodycomposition responds to PA.Previous cross-sectional twin studies have reported
gender differences for the heritability of body compos-ition, although they appear to vary depending on theoutcome of interest. A twin study by Schousboe andcolleagues [42] reported that males have higher herit-ability estimates compared to females for body fat per-centage (63 and 59%, respectively), sum of skin folds(65 and 61%, respectively), waist circumference (61 and48%, respectively) and waist-to-hip ratio (22 and 10%,respectively). However, other studies have reportedhigher heritability estimates in females across a varietyof body composition measures [43, 44]. The variabilitybetween genders for the heritability of body compos-ition has been supported in various twin studies,regardless of the sample size, methods of analyses orethnicity [43, 45–47]. Our results extend the under-standing that gender influences the role shared familialfactors, including genes, play in the variation of bodycomposition (cross-sectional association), and suggestsgender influences how shared familial factors influencethe response of body composition measures followingPA. In particular, shared familial factors appear to have
a greater influence on changes in fat mass for femalesengaged in PA (Fig. 7) and fat free mass for males en-gaged in PA (Fig. 8). Therefore, to better understandhow both genetics and shared environmental factorsimpact an individual’s response to PA, it may be importantto take into consideration the gender of the individual,and the outcome of interest.
Shared Familial Influence on Changes in CardiorespiratoryFitnessThe heritability of VO2max assessed in cross-sectionalstudies ranges from 40–71% in twin studies [41, 48] andhas been reported at 50% (maximal heritability) in theHERITAGE Family Study [49]. Our pooled rMZ were0.38 and 0.39 for absolute and relative VO2max, respect-ively, and appear to be smaller than heritability estimatesfor an individual’s pre-training VO2max, although theCIs for our results include the cross-sectional estimates.This suggests genetics may be more influential in deter-mining an individual’s cardiorespiratory fitness, com-pared to their fitness response following PA, althoughthe biological explanation for this is unclear.The point estimates of the rMZ for the response of
cardiorespiratory fitness following PA appear slightlygreater in females (Fig. 10), although the CIs for boththe male and female correlations cover almost all thepossible range of values due to small sample sizes in theoriginal studies. Similarly, existing studies investigatingthe heritability of cardiorespiratory fitness have beenlimited in their ability to analyze the effect of gender dueto small sample sizes [41], and single gender cohorts[48]. Therefore, our results should be viewed as prelimin-ary with this area deserving attention in future studies.
Strengths and LimitationsOur study demonstrated considerable strengths in its de-sign. First, previous studies have predominantly focussedon investigating the heritability of PA engagement(cross-sectional association) [15], without considering
Fig. 6 Pooled within monozygotic (MZ) twin pair correlations for BMI in response to physical activity combined with diet, and physical activitywithout a dietary component. CI: confidence interval; sample size; number of twin pairs
Zadro et al. Sports Medicine - Open (2017) 3:4 Page 12 of 19
116

Table 5 Pooled within monozygotic (MZ) twin pair correlations (95% confidence intervals)
Outcome All studies Females Males
Body fat percentage (%) 0.55 (0.32–0.72)***(n = 72)Poehlam A et al. (1987)Koenigstorfer J et al. (2011)Hopkins N et al. (2012)Bouchard C et al. (1994)Hainer V et al. (2000)Hamel P et al. (1986)Prud’Homme D et al. (1984)Afman G et al. (1988)
0.63 (0.36–0.80)***(n = 41)Koenigstorfer J et al. (2011)Hainer V et al. (2000)Prud’Homme D et al. (1984)Afman G et al. (1988)
0.58 (−0.04–0.87)(n = 17)Poehlam A et al. (1987)Bouchard C et al. (1994)Prud’Homme D et al. (1984)
BMI 0.69 (0.49–0.82)***(n = 58)Koenigstorfer J et al. (2011)Hopkins N et al. (2012)Bouchard C et al. (1994)Hainer V et al. (2000)Prud’Homme D et al. (1984)Afman G et al. (1988)
0.63 (0.36–0.80)***(n = 41)Koenigstorfer J et al. (2011)Hainer V et al. (2000)Prud’Homme D et al. (1984)Afman G et al. (1988)
0.63 (−0.13–0.93)(n = 11)Bouchard C et al. (1994)Prud’Homme D et al. (1984)
Fat free mass (kg) 0.57 (0.35–0.73)***(n = 73)Poehlam A et al. (1987)Koenigstorfer J et al. (2011)Hopkins N et al. (2012)Bouchard C et al. (1994)Hainer V et al. (2000)Hamel P et al. (1986)Prud’Homme D et al. (1984)Afman G et al. (1988)
0.52 (0.19–0.75)**(n = 38)Koenigstorfer J et al. (2011)Hainer V et al. (2000)Prud’Homme D et al. (1984)Afman G et al. (1988)
0.80 (0.39–0.95)**(n = 17)Poehlam A et al. (1987)Bouchard C et al. (1994)Prud’Homme D et al. (1984)
Fat mass (kg) 0.58 (0.13–0.83)*(n = 48)Poehlam A et al. (1987)Koenigstorfer J et al. (2011)Bouchard C et al. (1994)Hainer V et al. (2000)Hamel P et al. (1986)Prud’Homme D et al. (1984)
0.85 (0.63–0.94)***(n = 25)Koenigstorfer J et al. (2011)Hainer V et al. (2000)Prud’Homme D et al. (1984)
0.40 (−0.26–0.81)(n = 17)Poehlam A et al. (1987)Bouchard C et al. (1994)Prud’Homme D et al. (1984)
Fat mass to fat free mass ratio 0.69 (0.42–0.85)***(n = 36)Bouchard C et al. (1994)Hainer V et al. (2000)Hamel P et al. (1986)Prud’Homme D et al. (1984)
0.85 (0.61–0.95)***(n = 19)Hainer V et al. (2000)Prud’Homme D et al. (1984)
0.62 (−0.15–0.92)(n = 11)Bouchard C et al. (1994)Prud’Homme D et al. (1984)
Waist circumference (cm) 0.50 (0.09–0.77)*(n = 27)Koenigstorfer J et al. (2011)Bouchard C et al. (1994)Hainer V et al. (2000)
0.36 (−0.15–0.72)(n = 20)Koenigstorfer J et al. (2011)Hainer V et al. (2000)
0.83 (0.21–0.97)*(n = 7)Bouchard C et al. (1994)
Hip circumference (cm) 0.51 (0.11–0.77)*(n = 27)Koenigstorfer J et al. (2011)Bouchard C et al. (1994)Hainer V et al. (2000)
0.58 (0.13–0.83)*(n = 20)Koenigstorfer J et al. (2011)Hainer V et al. (2000)
0.25 (−0.62–0.84)(n = 7)Bouchard C et al. (1994)
Waist to hip ratio 0.29 (−0.16–0.64)(n = 27)Koenigstorfer J et al. (2011)Bouchard C et al. (1994)Hainer V et al. (2000)
0.27 (−0.24–0.66)(n = 20)Koenigstorfer J et al. (2011)Hainer V et al. (2000)
0.35 (−0.55–0.87)(n = 7)Bouchard C et al. (1994)
Sum of skin folds (cm) 0.67 (0.37–0.85)***(n = 30)Bouchard C et al. (1994)Hainer V et al. (2000)Prud’Homme D et al. (1984)
0.78 (0.46–0.92)***(n = 19)Hainer V et al. (2000)Prud’Homme D et al. (1984)
0.51 (−0.30–0.89)(n = 11)Bouchard C et al. (1994)Prud’Homme D et al. (1984)
Zadro et al. Sports Medicine - Open (2017) 3:4 Page 13 of 19
117

how genetics and shared environmental factors impactan individual’s response to PA. From a health-care per-spective, it may be more important to investigate howgenetics and environmental factors influence the re-sponse to PA. It is likely the response to PA would be
more dependent on unique environmental factors, suchas training parameters (frequency, intensity, duration,type), adherence, therapeutic alliance, and many more.However, neither training frequency nor duration ap-peared to influence the rMZ for either body composition
Table 5 Pooled within monozygotic (MZ) twin pair correlations (95% confidence intervals) (Continued)
Trunk fat 0.52 (0.12–0.78)*(n = 27)Hopkins N et al. (2012)Bouchard C et al. (1994)Hainer V et al. (2000)
0.67 (0.22–0.89)**(n = 14)Hainer V et al. (2000)
0.15 (−0.68–0.81)(n = 7)Bouchard C et al. (1994)
Extremity skin fold (cm) 0.54 (−0.39–0.92)(n = 21)Bouchard C et al. (1994)Hainer V et al. (2000)
0.78 (0.43–0.93)**(n = 14)Hainer V et al. (2000)
0.00 (−0.75–0.75)(n = 7)Bouchard C et al. (1994)
Trunk to extremity ratio 0.48 (−0.30–0.88)(n = 21)Bouchard C et al. (1994)Hainer V et al. (2000)
0.70 (0.27–0.90)**(n = 14)Hainer V et al. (2000)
0.00 (−0.75–0.75)(n = 7)Bouchard C et al. (1994)
Weight (kg) 0.67 (0.48–0.79)***(n = 73)Poehlam A et al. (1987)Koenigstorfer J et al. (2011)Hopkins N et al. (2012)Bouchard C et al. (1994)Hainer V et al. (2000)Hamel P et al. (1986)Prud’Homme D et al. (1984)Afman G et al. (1988)
0.70 (0.46–0.84)***(n = 41)Koenigstorfer J et al. (2011)Hainer V et al. (2000)Prud’Homme D et al. (1984)Afman G et al. (1988)
0.45 (−0.20–0.83)(n = 17)Poehlam A et al. (1987)Bouchard C et al. (1994)Prud’Homme D et al. (1984)
Absolute VO2 max (L.min−1) 0.38 (0.04–0.64)*(n = 42)Bouchard C et al. (1994)Hamel P et al. (1986)Prud’Homme D et al. (1984)Afman G et al. (1988)
0.74 (−0.18–0.97)(n = 21)Prud’Homme D et al. (1984)Afman G et al. (1988)
0.49 (−0.33–0.89)(n = 11)Bouchard C et al. (1994)Prud’Homme D et al. (1984)
Relative VO2 max (mL.min−1.kg−1) 0.39 (0.07–0.64)*(n = 48)Hopkins N et al. (2012)Bouchard C et al. (1994)Hamel P et al. (1986)Prud’Homme D et al. (1984)Afman G et al. (1988)
0.51 (0.06–0.79)*(n = 21)Prud’Homme D et al. (1984)Afman G et al. (1988)
0.40 (−0.43–0.86)(n = 11)Bouchard C et al. (1994)Prud’Homme D et al. (1984)
n number of twin pairs, VO2 max maximal oxygen uptake, BMI body mass index*p < 0.05; **p < 0.01; ***p < 0.001
Fig. 7 Pooled within monozygotic (MZ) twin pair correlations for fat mass in response to physical activity for females and males. CI: confidenceinterval; sample size; number of twin pairs
Zadro et al. Sports Medicine - Open (2017) 3:4 Page 14 of 19
118

or cardiorespiratory fitness, which may suggest the rolegenetics plays in response to PA is independent of theseparameters. Quantifying the influence of genetics andenvironmental factors on the response to PA may serveto explain why certain individuals do not respond as wellto a structured PA program across a variety of outcomes,with implications for how we can modify the trainingenvironment to achieve a positive response. Second,twin studies which have investigated how genetics influ-ence the response to PA have been limited in their abil-ity to draw firm conclusions due to small sample sizes.Small sample sizes of the included studies explain caseswhere our pooled CIs were wide, even though we wereable to pool results for up to 83 MZ twin pairs, improv-ing the precision around these estimates. To obtain 95%CIs of sufficiently small width to be informative (e.g., atotal width of 0.1), in studies that include only MZtwins, approximately 400 twin pairs are required if thecorrelation is moderately high (0.7), and greater than1000 twin pairs if the correlation is 0.4. For studies
including both MZ and DZ twins, 150 twin pairs of eachzygosity would be required to detect a significant differ-ence (p = 0.05) between rMZ = 0.7 and rDZ = 0.5, with 80%power. If both correlations are lower (e.g., rMZ = 0.5 andrDZ = 0.3), 275 twins pairs of each zygosity would be re-quired. Many of the studies which reported heritability ormaximal heritability also failed to report confidence inter-vals for their estimates, or provide sufficient informationto enable these to be estimated accurately (Tables 1 and6). Although point estimates are available, there is clearlya substantial information difference between a heritabilityof 47% with a 95% CI of 44–50% and the same heritabilitywith a 95% CI of 10–85%, and we expect that studies in-cluded in this review are more like to the second situation,limiting the utility of the reported estimates. Third, rawdata were used to re-analyse previously reported correla-tions in four twin studies [29, 30, 34, 35] and adjust forage, gender (if applicable), and baseline values. Thisprovided a more precise estimate for quantifying therole genetics plays in the response to PA.
Fig. 8 Pooled within monozygotic (MZ) twin pair correlations for fat free mass in response to physical activity for females and males. CI:confidence interval; sample size; number of twin pairs
Table 6 Maximal heritability estimates from family studies (includes variance explained by genetic and non-genetic sources sharedwithin families)
Outcome Author (year) Maximal heritability (95% CI)
Fat mass (kg) Rice T (1999) 0%a
Trunk skin folds (cm) Perusse L (2000) 21% (14 to 28%)
Extremity skin folds (cm) Perusse L (2000) 15% (5 to 25%)
Subcutaneous fat (sum of eight skin folds) (cm) Perusse L (2000) 15% (8 to 22%)
Trunk to extremity skin fold ratio (adjusted for subcutaneous fat) Perusse L (2000) 14% (10 to 18%)
Waist circumference (cm) (adjusted for BMI) Perusse L (2000) 0%a
Absolute VO2 max (L.min−1) Bouchard C (1999) 47%a
Absolute VO2 max at ventilatory threshold (L.min−1) Gaskill SE (2001) Caucasian: 22% (−2 to 46%)African-American: 51 (27% to 75%)
Relative VO2 max (mL.min−1.kg−1) Perusse L (2001) 50 W: 57%a
60% VO2 max: 23%a
80% VO2 max: 44%a
CI confidence interval, VO2 max maximal oxygen uptake, W watts, BMI body mass indexaUnable to calculate the standard error and thus present the 95% CI
Zadro et al. Sports Medicine - Open (2017) 3:4 Page 15 of 19
119

Our study has a few limitations which need to beconsidered when interpreting the results. First, samplesfrom included twin studies differed in their age, base-line values, PA interventions, and diet interventions.Furthermore, one study recruited twin pairs admittedto an obesity unit for a 40-day physical activity and dietprogram [28], a sample not representative of the gen-eral population. However, we conducted a number ofsensitivity analyses and the exclusion of any singlestudy did not significantly affect the results for any ofthe outcomes (Additional file 2). In addition, we per-formed separate meta-analyses for studies which in-cluded a diet intervention, to better understand howthe difference between interventions impacted our re-sults. Second, two twin studies [29, 30] reported dropouts on the basis of twin pairs failing to complete thetraining protocol (Table 2), while the family studiesonly analyzed data from participants who completedthe training protocol (Table 3). We acknowledge thatthis may limit the generalizability of the results, as par-ticipants who completed the training protocol are likelyto be more motivated to engage in PA than the generalpopulation. Third, although using a classical twin de-sign to estimate heritability is a widely reported methodto investigate how genetics contributes to the variationof a phenotype, it does have some limitations, and
together with the fact that individual twin studies hadsmall sample sizes, is the reason we did not focus ourresults on these estimates. The use of self-reported zy-gosity measures, based on the difficulty of being toldapart by parents, is often criticized. MZ twins who dif-fer in their height and weight can be mistakenly classi-fied as DZ twins when using self-reported measures,resulting in an underestimation of heritability [50].However, only one study included in this reviewassessed zygosity using only a self-reported question-naire [32], with another failing to describe how zygositywas assessed [20]. The remaining twin studies (n = 7)verified questionnaire-based zygosity through DNAmapping. In addition, not considering the genotype-environment interaction is a limitation of the classicaltwin design, since genetic factors can influence an indi-vidual’s choice/exposure to the environment. However,studies included in this review utilized a controlledtraining environment, reducing the likelihood that anindividual’s genetics would impact their environmentfor the experimental period. Furthermore, the use ofheritability as a measure, although widely reported, hassome limitations; it is dependent on the modeling ofthe mean, on the amount of variance and measurementerror (which may be larger in studies of changes in out-comes compared with cross-sectional studies of
Fig. 9 Pooled within monozygotic (MZ) twin pair correlations for absolute and relative maximal oxygen uptake (VO2 max) in response to physicalactivity without a dietary component. CI: confidence interval; sample size; number of twin pairs
Fig. 10 Pooled within monozygotic (MZ) twin pair correlations for absolute maximal oxygen uptake (VO2 max) in response to physical activity forfemales and males. CI: confidence interval; sample size; number of twin pairs
Zadro et al. Sports Medicine - Open (2017) 3:4 Page 16 of 19
120

outcomes [51]) and on the total variation within apopulation, which may differ between populations andbetween the same population measured at differenttimes [52]. Finally, when estimated from classic twinstudies, this estimate depends on the assumption thatenvironments are shared to the same extent by MZ andDZ pairs—an assumption that is rarely considered ortested in practice [53].
Clinical ImplicationsThe results of this current investigation are consistentwith a substantial influence of genes on the response ofbody composition and cardiorespiratory fitness followingPA. These results have implications for conditions whichutilize PA as a management strategy, for example, dia-betes, and low back pain. If an individual’s response to aPA intervention is partially dictated by genetic factorsthis could potentially explain why some individuals failto respond to increased PA. This has implications forchanging the modifiable training environment to achievea desired effect (e.g., increased intensity, frequency, orduration), or excluding people who demonstrate a poorresponse to reduce treatment costs and consumer disap-pointment. Furthermore, if genetic factors are involvedin the poor response to PA as an intervention, this hasimplications for the selection of alternative managementstrategies, or a modification to the outcome investigated,since individuals who show a low training response toone parameter (e.g., VO2max) might in fact respondpositively to another (e.g., BMI).Research linking genetic markers to a specific pheno-
type (quantitative trait locus analysis) have aided themechanistic understanding of how genetics influence theresponse of body composition and cardiorespiratory fit-ness following PA, although more genetic research needsto be done. A family study investigated over 300,000single-nucleotide polymorphisms (SNPs) and identified21 SNPs which accounted for 49% of the variance in theresponse of VO2max following a PA intervention, withone SNP (rs6552828) accounting for ~6% of the variance[54]. The variance explained by these 21 SNPs is similarto the maximal heritability of VO2max response fromthe family study included in this review (47%), althoughthis study observed significant spouse correlations whichsome consider consistent with shared environmental ef-fects, thereby reducing the variance explained by genet-ics [19]. Similarly, nine SNPs were found to explain 20%of the variance of submaximal heart rate in response toPA, with one SNP (rs2253206) accounting for ~5% ofthe variance [55]. Earlier studies have identified candi-date genes that are strongly linked to or associated withthe response of BMI, fat mass, fat-free mass, and bodyfat percentage following a PA intervention [56]. For ex-ample, the insulin-like growth factor-1 (IGF-1) gene
marker was strongly linked to response of fat-free massfollowing PA [57], with linkage also present for a poly-morphism in the S100A gene [56] (predominantly foundin slow-twitch skeletal and cardiac muscle fibers [58]).Research identifying genetic markers is promising andmay aid the prediction of how an individual’s bodycomposition and cardiorespiratory fitness will respondfollowing PA, although it is essential these results arereplicated in larger samples, and through a variety ofgenetic analyses before definite conclusions are reached[59, 60]. Furthermore, research investigating practicaland cost-effective methods to identify those who willrespond positively to a PA intervention would be ofsignificant interest from a public health and clinicalperspective. For example, information regarding howfamily members have previously responded to PA mayhelp to predict how an individual will respond to asimilar intervention, potentially reducing the need forcostly genetic testing.
ConclusionsShared familial factors, including genetics, are likely tobe significant contributors to the response of severalmarkers of body composition and cardiorespiratory fit-ness following PA. Shared familial factors may play astronger role in the response of body composition whencompared to cardiorespiratory fitness, and may be moreinfluential in dictating the response for measures ofBMI, fat mass, and body fat percentage, compared towaist-to-hip ratio. The influence shared familial factorshave on the response to PA may be different in malesand females, with such factors having a greater influenceon changes in fat mass for females, and fat-free massfor males. In addition, shared familial factors appear tobe more influential in dictating the response of bodycomposition and cardiorespiratory fitness when PA iscombined with diet.These results have implications for the management of
conditions which advocate increased levels of PA, sincegenetic factors might serve as an explanation for whysome people respond more effectively than others in spe-cific measures of PA. To further quantify the role geneticsand environmental factors play in the response to PA fu-ture research should focus on adequately powered studiesincluding both MZ and DZ twins, and the replication ofexisting genome-wide association studies to identify im-portant genetic markers for the response to PA.
Additional files
Additional file 1: Search strategy. (DOCX 18 kb)
Additional file 2: Sensitivity analysis excluding one study at a time.(JPG 363 kb)
Zadro et al. Sports Medicine - Open (2017) 3:4 Page 17 of 19
121
FundingThere was no funding for this study. KJS is funded in part by a Centre ofResearch Excellence Grant from the National Health and Medical ResearchCouncil of Australia.
Authors’ ContributionsAll authors critically revised the manuscript for important intellectual contentand approved the final manuscript. Please find below a detailed descriptionof the role of each author. JRZ contributed to the conception and design,acquisition, and assembly of data, analysis and interpretation of data, draftingand revision of the manuscript and final approval of the version to bepublished. DHS contributed to the conception and design, interpretation ofdata and results, drafting and revision of the manuscript, and final approvalof the version to be published. TBA contributed to the conception anddesign, acquisition and assembly of data, drafting and revision of themanuscript, and final approval of the version to be published. KS contributedto the conception and design, acquisition and assembly of data, revision ofthe manuscript, and final approval of the version to be published. ABcontributed to the conception and design, interpretation of data, draftingand revision of the manuscript, and final approval of the version to bepublished. PHF contributed to the conception and design, analysis andinterpretation of data, drafting and revision of the manuscript, and finalapproval of the version to be published. All authors read and approved thefinal manuscript.
Competing InterestsZadro JR, Shirley D, Andrade TB, Scurrah KJ, Bauman A, and Ferreira PHdeclare that they have no competing interests.
Author details1Discipline of Physiotherapy, Faculty of Health Sciences, The University ofSydney, 75 East Street, Lidcombe, Sydney NSW 1825, Australia. 2AustralianCentre for Excellence in Twin Research, Centre for Epidemiology andBiostatistics, Melbourne School of Population and Global Health, TheUniversity of Melbourne, Melbourne, Australia. 3School of Public Health andCharles Perkins Centre, University of Sydney, Sydney, Australia.
Received: 7 June 2016 Accepted: 21 December 2016
References1. Vogel T, Brechat PH, Leprêtre PM, et al. Health benefits of physical activity in
older patients: a review. Int J Clin Pract. 2009;63:303–20.2. Sherrington C, Whitney JC, Lord SR, et al. Effective exercise for the
prevention of falls: a systematic review and meta-analysis. J Am GeriatrSoc. 2008;56:2234–43.
3. Janssen I, Leblanc AG. Systematic review of the health benefits of physicalactivity and fitness in school-aged children and youth. Int J Behav Nutr PhysAct. 2010;7:40.
4. Nelson ME, Rejeski WJ, Blair SN, et al. Physical activity and public healthin older adults: recommendation from the American College of SportsMedicine and the American Heart Association. Med Sci Sports Exerc.2007;39:1435–45.
5. Taylor RS, Brown A, Ebrahim S, et al. Exercise-based rehabilitation forpatients with coronary heart disease: systematic review and meta-analysisof randomized controlled trials. Am J Med. 2004;116:682–92.
6. Nikander R, Sievanen H, Heinonen A, et al. Targeted exercise againstosteoporosis: a systematic review and meta-analysis for optimising bonestrength throughout life. BMC Med. 2010;8:47.
7. Metsios GS, Stavropoulos-Kalinoglou A, Veldhuijzen van Zanten JJCS, et al.Rheumatoid arthritis, cardiovascular disease and physical exercise: asystematic review. Rheumatol. 2008;47:239–48.
8. Herring MP, O’Connor PJ, Dishman RK. The effect of exercise training onanxiety symptoms among patients: a systematic review. Arch Intern Med.2010;170:321–31.
9. Heneweer H, Staes F, Aufdemkampe G, et al. Physical activity and low backpain: a systematic review of recent literature. Eur Spine J. 2011;20:826–45.
10. Goodpaster BH, Delany JP, Otto AD, et al. Effects of diet and physicalactivity interventions on weight loss and cardiometabolic risk factors inseverely obese adults: a randomized trial. JAMA. 2010;304:1795–802.
11. Wei M, Kampert JB, Barlow CE, et al. Relationship between lowcardiorespiratory fitness and mortality in normal-weight, overweight,and obese men. JAMA. 1999;282:1547–53.
12. Sui X, Li H, Zhang J, et al. Percentage of deaths attributable to poorcardiovascular health lifestyle factors: findings from the Aerobics CenterLongitudinal Study. Epidemiol Res Int. 2013;2013:9.
13. Flegal KM, Kit BK, Orpana H, et al. Association of all-cause mortality withoverweight and obesity using standard body mass index categories: asystematic review and meta-analysis. JAMA. 2013;309:71–82.
14. Flegal KM, Graubard BI, Williamson DF, et al. Cause-specific excess deathsassociated with underweight, overweight, and obesity. JAMA. 2007;298:2028–37.
15. De Vilhena e Santos DM, Katzmarzyk PT, Seabra AF, et al. Genetics of physicalactivity and physical inactivity in humans. Behav Genet. 2012;42:559–78.
16. den Hoed M, Brage S, Zhao JH, et al. Heritability of objectively assesseddaily physical activity and sedentary behavior. Am J Clin Nutr. 2013;98:1317–25.
17. Bouchard C, Rankinen T. Individual differences in response to regularphysical activity. Med Sci Sports Exerc. 2001;33:S446-51. discussion S52-3.
18. Lortie G, Simoneau JA, Hamel P, et al. Responses of maximal aerobic powerand capacity to aerobic training. Int J Sports Med. 1984;5:232–6.
19. Bouchard C, An P, Rice T, et al. Familial aggregation of VO(2max) responseto exercise training: results from the HERITAGE family study. J Appl Physiol.1999;87:1003–8.
20. Koenigstorfer J, Schmidt WFJ. Effects of exercise training and a hypocaloricdiet on female monozygotic twins in free-living conditions. Physiol Behav.2011;104:838–44.
21. Moher D, Liberati A, Tetzlaff J, et al. Preferred reporting items for systematicreviews and meta-analyses: the PRISMA statement. Ann Intern Med. 2009;151:264–9, w64.
22. Bouchard C, Perusse L, Leblanc C. Using MZ twins in experimental researchto test for the presence of a genotype-environment interaction effect. ActaGenet Med Gemellol. 1990;39:85–9.
23. Maher CG, Sherrington C, Herbert RD, et al. Reliability of the PEDro Scale forRating Quality of Randomized Controlled Trials. Phys Ther. 2003;83:713–21.
24. Perusse L, Rice T, Province MA, et al. Familial aggregation of amount anddistribution of subcutaneous fat and their responses to exercise trainingin the HERITAGE family study. Obes Res. 2000;8:140–50.
25. Haggard E. Intraclass correlation and the analysis of variance. New York:Dryden Press; 1958. p. 171.
26. Higgins JPT, Thompson SG, Deeks JJ, et al. Measuring inconsistency inmeta-analyses. BMJ. 2003;327:557–60.
27. Danis A, Kyriazis Y, Klissouras V. The effect of training in male prepubertaland pubertal monozygotic twins. Eur J Appl Physiol. 2003;89:309–18.
28. Hainer V, Stunkard AJ, Kunesova M, et al. Intrapair resemblance in very lowcalorie diet-induced weight loss in female obese identical twins. Int J ObesRelat Metab Disord. 2000;24:1051–7.
29. Afman G, Adams T, Fisher G, et al. Influence of genetics and exercisetraining on the heart: a 22-week study of monozygous and dizygoustwins [Manuscript of a Journal Article]: Brigham Young University. 1988.
30. Bouchard C, Tremblay A, Despres JP, et al. The response to exercise withconstant energy intake in identical twins. Obes Res. 1994;2:400–10.
31. Skinner JS, Wilmore KM, Krasnoff JB, et al. Adaptation to a standardizedtraining program and changes in fitness in a large, heterogeneouspopulation: the HERITAGE Family Study. Med Sci Sports Exerc. 2000;32:157–61.
32. Hopkins ND, Stratton G, Cable NT, et al. Impact of exercise training onendothelial function and body composition in young people: a study ofmono- and di-zygotic twins. Eur J Appl Physiol. 2012;112:421–7.
33. Poehlman ET, Tremblay A, Marcotte M, et al. Heredity and changes inbody composition and adipose tissue metabolism after short-termexercise-training. Eur J Appl Physiol Occup Physiol. 1987;56:398–402.
34. Hamel P, Simoneau J, Lortie G, et al. Heredity and muscle adaption toendurance training. Med Sci Sports Exerc. 1986;18:690–6.
35. Prud’Homme D, Bouchard C, Leblanc C. Sensitivity of maximal aerobic powerto training is genotype-dependent. Med Sci Sports Exerc. 1984;16:489–93.
36. Rice T, Hong Y, Perusse L, et al. Total body fat and abdominal visceral fatresponse to exercise training in the HERITAGE Family Study: Evidence formajor locus but no multifactorial effects. Metab Clin Exp. 1999;48:1278–86.
37. Gaskill SE, Rice T, Bouchard C, et al. Familial resemblance in ventilatorythreshold: The HERITAGE Family Study. Med Sci Sports Exerc. 2001;33:1832–40.
38. Perusse L, Gagnon J, Province MA, et al. Familial aggregation of submaximalaerobic performance in the heritage family study. Med Sci Sports Exerc.2001;33:597–604.
Zadro et al. Sports Medicine - Open (2017) 3:4 Page 18 of 19
122
39. Elks CE, den Hoed M, Zhao JH, et al. Variability in the heritability of bodymass index: a systematic review and meta-regression. Front Endocrinol.2012;3:29.
40. Hocking LJ, Morris AD, Dominiczak AF, et al. Heritability of chronic pain in2195 extended families. Eur J Pain. 2012;16:1053–63.
41. Mustelin L, Latvala A, Pietilainen KH, et al. Associations between sportsparticipation, cardiorespiratory fitness, and adiposity in young adult twins.J App Physiol (Bethesda, Md : 1985). 2011;110:681–6.
42. Schousboe K, Visscher PM, Erbas B, et al. Twin study of genetic andenvironmental influences on adult body size, shape, and composition.Int J Obes Relat Metab Disord. 2004;28:39–48.
43. Poulsen P, Vaag A, Kyvik K, et al. Genetic versus environmental aetiologyof the metabolic syndrome among male and female twins. Diabetologia.2001;44:537–43.
44. Zillikens MC, Yazdanpanah M, Pardo LM, et al. Sex-specific genetic effectsinfluence variation in body composition. Diabetologia. 2008;51:2233–41.
45. Korkeila M, Kaprio J, Rissanen A, et al. Effects of gender and age on theheritability of body mass index. Int J Obes. 1991;15:647–54.
46. Schousboe K, Willemsen G, Kyvik KO, et al. Sex differences in heritability ofBMI: a comparative study of results from twin studies in eight countries.Twin Res. 2003;6:409–21.
47. Korkeila M, Kaprio J, Rissanen A, et al. Consistency and change of bodymass index and weight. A study on 5967 adult Finnish twin pairs. Int JObes Relat Metab Disord. 1995;19:310–7.
48. Bouchard C, Lesage R, Lortie G. Aerobic performance in brothers, dizygoticand monozygotic twins. Med Sci Sports Exerc. 1986;18:639–46.
49. Bouchard C, Daw EW, Rice T, et al. Familial resemblance for VO2max inthe sedentary state: the HERITAGE family study. Med Sci Sports Exerc.1998;30:252–8.
50. Maes HH, Neale MC, Eaves LJ. Genetic and environmental factors in relativebody weight and human adiposity. Behav Genet. 1997;27:325–51.
51. Deeks JJ, Higgins JPT, Altman DG (editors). Chapter 9: Analysing data andundertaking meta-analyses. In: Higgins JPT, Green S (editors). CochraneHandbook for Systematic Reviews of Interventions Version 5.1.0(updated March 2011). The Cochrane Collaboration, 2011. Availablefrom www.handbook.cochrane.org.
52. Hopper JL. Variance components for statistical genetics: applications inmedical research to characteristics related to human diseases and health.Stat Methods Med Res. 1993;2:199–223.
53. Hopper JL. Why ‘common environmental effects’ are so uncommon in theliterature In: Spector T, Snieder H, MacGregor AJ, editors. Advances in Twinand Sib-pair Analysis 137 Euston Rd, London, NW1, 2AA: Greewich MedicalMedia Ltd.; 2000. p. 151–66.
54. Bouchard C, Sarzynski MA, Rice TK, et al. Genomic predictors of the maximalO(2) uptake response to standardized exercise training programs. J ApplPhysiol (1985). 2011;110:1160–70.
55. Rankinen T, Argyropoulos G, Rice T, et al. CREB1 is a strong genetic predictor ofthe variation in exercise heart rate response to regular exercise: the HERITAGEFamily Study. Circ Cardiovasc Genet. 2010;3:294–9.
56. Chagnon YC, Rice T, Perusse L, et al. Genomic scan for genes affectingbody composition before and after training in Caucasians from HERITAGE.J Appl Physiol (1985). 2001;90:1777–87.
57. Sun G, Gagnon J, Chagnon YC, et al. Association and linkage between aninsulin-like growth factor-1 gene polymorphism and fat free mass in theHERITAGE Family Study. Int J Obes Relat Metab Disord. 1999;23:929–35.
58. Haimoto H, Hosoda S, Kato K. Differential distribution of immunoreactiveS100-alpha and S100-beta proteins in normal nonnervous human tissues.Lab Invest. 1987;57:489–98.
59. Bouchard C, Antunes-Correa LM, Ashley EA, et al. Personalized preventivemedicine: genetics and the response to regular exercise in preventiveinterventions. Prog Cardiovasc Dis. 2015;57:337–46.
60. Kitsios G, Zintzaras E. Genomic convergence of genome-wide investigationsfor complex traits. Ann Hum Genet. 2009;73:514–9.
Submit your manuscript to a journal and benefi t from:
7 Convenient online submission
7 Rigorous peer review
7 Immediate publication on acceptance
7 Open access: articles freely available online
7 High visibility within the fi eld
7 Retaining the copyright to your article
Submit your next manuscript at 7 springeropen.com
Zadro et al. Sports Medicine - Open (2017) 3:4 Page 19 of 19
123

Supplementary material: Search Strategy. MEDLINE
Searches
Physical Activity
1. “physical activit*”.mp 2. exp Motor Activity/ 3. “plyometric exercise”.mp 4. exp Exercise Therapy/ 5. exp Physical Endurance/ 6. exp Exercise/ 7. exp “Physical Education and Training”/ 8. “physical fitness”.mp 9. “endurance training”.mp 10. “aerobic exercise”.mp 11. exp Physical Exertion/ 12. “resistance training”.mp 13. 1 or 2 or 3 or 4 or 5 or 6 or 7 or 8 or 9 or 10 or 11 or 12
Twin and Family studies
14. “twin*”.mp 15. exp Twins, Monozygotic/ 16. exp Twins, Dizygotic/ 17. exp Diseases in Twins/ 18. exp Genetics/ 19. exp Genetic Linkage/ 20. “twin stud*”.mp 21. “herita*”.mp 22. “identical twin*”.mp 23. “family resemblance”.mp 24. exp Family Characteristics/ 25. exp Family Relations/ 26. exp Phenotype/ 27. exp Genotype/ 28. 14 or 15 or 16 or 17 or 18 or 19 or 20 or 21 or 22 or 23 or 24
or 25 or 26 or 27
29. 13 and 28 30. Limit 29 to humans
124
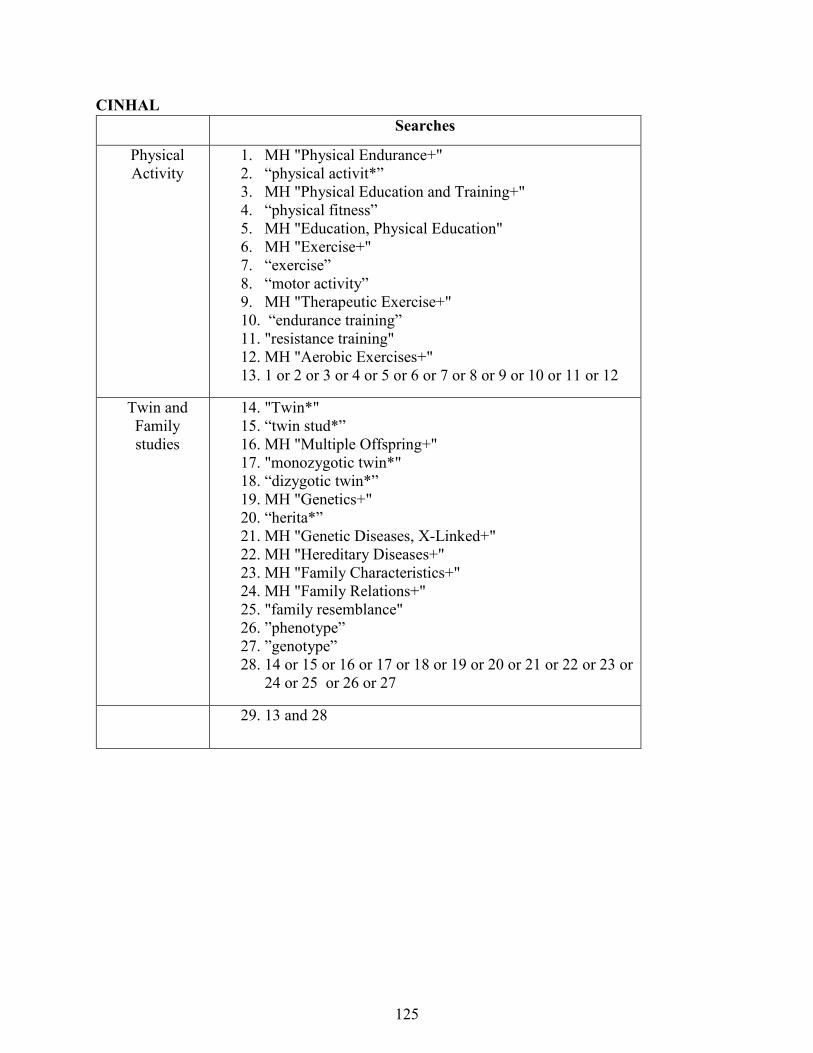
CINHAL Searches
Physical Activity
1. MH "Physical Endurance+" 2. “physical activit*” 3. MH "Physical Education and Training+" 4. “physical fitness” 5. MH "Education, Physical Education" 6. MH "Exercise+" 7. “exercise” 8. “motor activity” 9. MH "Therapeutic Exercise+" 10. “endurance training” 11. "resistance training" 12. MH "Aerobic Exercises+" 13. 1 or 2 or 3 or 4 or 5 or 6 or 7 or 8 or 9 or 10 or 11 or 12
Twin and Family studies
14. "Twin*" 15. “twin stud*” 16. MH "Multiple Offspring+" 17. "monozygotic twin*" 18. “dizygotic twin*” 19. MH "Genetics+" 20. “herita*” 21. MH "Genetic Diseases, X-Linked+" 22. MH "Hereditary Diseases+" 23. MH "Family Characteristics+" 24. MH "Family Relations+" 25. "family resemblance" 26. ”phenotype” 27. ”genotype” 28. 14 or 15 or 16 or 17 or 18 or 19 or 20 or 21 or 22 or 23 or
24 or 25 or 26 or 27
29. 13 and 28
125

EMBASE Searches
Physical Activity
1. 'physical activity' 2. 'physical exertion' 3. 'motor activity' 4. 'physical fitness' 5. ‘aerobic exercise’ 6. Exercise:de,ab,ti 7. 'endurance training' 8. 'exercise therapy' 9. 'physical education and training' 10. 'resistance training' 11. 1 or 2 or 3 or 4 or 5 or 6 or 7 or 8 or 9 or 10
Twin and Family studies
12. Heritage:de,ab,ti 13. 'monozygotic twins' 14. 'dizygotic twins' 15. ‘identical twins’ 16. 'genetic linkage' 17. 'family resemblance' 18. 'family relation' 19. 'family characteristics' 20. herita* 21. 'twin study' 22. Twin* 23. 'genetic variability' 24. 'genetic variation' 25. Genetics:de,ab,ti 26. 12 or 13 or 14 or 15 or 16 or 17 or 18 or 19 or 20 or 21 or
22 or 23 or 24 or 25
27. 11 and 26 28. Limit 27 to humans
126

Sports Discuss Searches
Physical Activity
1. "physical activi*" 2. “exercise" 3. “exercise therapy" 4. "physical fitness" 5. "endurance training" 6. "physical exertion" 7. "motor activity" 8. "physical endurance" 9. "physical education and training" 10. “resistance training” 11. “plyometric exercise” 12. “aerobic exercise” 13. 1 or 2 or 3 or 4 or 5 or 6 or 7 or 8 or 9 or 10 or 11 or 12
Twin and Family studies
14. "twin*" 15. "monozygotic twin*" 16. "dizygotic twin*" 17. "diseases in twins" 18. "genetic*" 19. "genetic linkage" 20. "twin stud*" 21. "herita*" 22. "family characteristics" 23. "family resemblance" 24. "family relations" 25. “identical twin*” 26. “genotype” 27. “phenotype” 28. 14 or 15 or16 or 17 or 18 or 19 or 20 or 21 or 22 or 23 or
24 or 25 or 26 or 27
29. 13 and 28
127

AMED Searches
Physical Activity
1. “physical activi*”.mp 2. “motor activity”.mp 3. exp Exercise/ 4. “aerobic exercise”.mp 5. “exercise therapy”.mp 6. exp Physical Endurance/ 7. “physical fitness”.mp 8. “endurance training”.mp 9. “physical exertion”.mp 10. “resistance training”.mp 11. 1 or 2 or 3 or 4 or 5 or 6 or 7 or 8 or 9 or 10
Twin and Family studies
12. “twin*”.mp 13. “monozygotic twin*”.mp 14. “dizygotic twin*”.mp 15. “genetic*”.mp 16. “twin stud*”.mp 17. “herita*”.mp 18. “identical twin*”.mp 19. exp Family Characteristics/ 20. exp Family Relations/ 21. “genotype”.mp 22. “phenotype”.mp 23. 13 or 14 or 15 or 16 or 17 or 18 or 19 or 20 or 21 or 22
24. 11 and 23
128

PsycINFO Searches
Physical Activity
1. “physical activi*”.mp 2. “motor activity”.mp 3. exp Exercise/ 4. “aerobic exercise”.mp 5. “exercise therapy”.mp 6. “physical endurance”.mp 7. “physical fitness”.mp 8. “endurance training”.mp 9. “physical exertion”.mp 10. “resistance training”.mp 11. 1 or 2 or 3 or 4 or 5 or 6 or 7 or 8 or 9 or 10
Twin and Family studies
12. “twin*”.mp 13. “monozygotic twin*”.mp 14. “dizygotic twin*”.mp 15. exp Heterozygotic Twins/ 16. exp Genetics/ 17. exp Genetic Linkage/ 18. “twin stud*”.mp 19. “herita*”.mp 20. “identical twin*”.mp 21. “family characteristics”.mp 22. exp Family Relations/ 23. “genotype”.mp 24. “phenotype”.mp 25. 13 or 14 or 15 or 16 or 17 or 18 or 19 or 20 or 21 or 22 or 23
or 24
26. 11 and 25 27. Limit 26 to humans
129
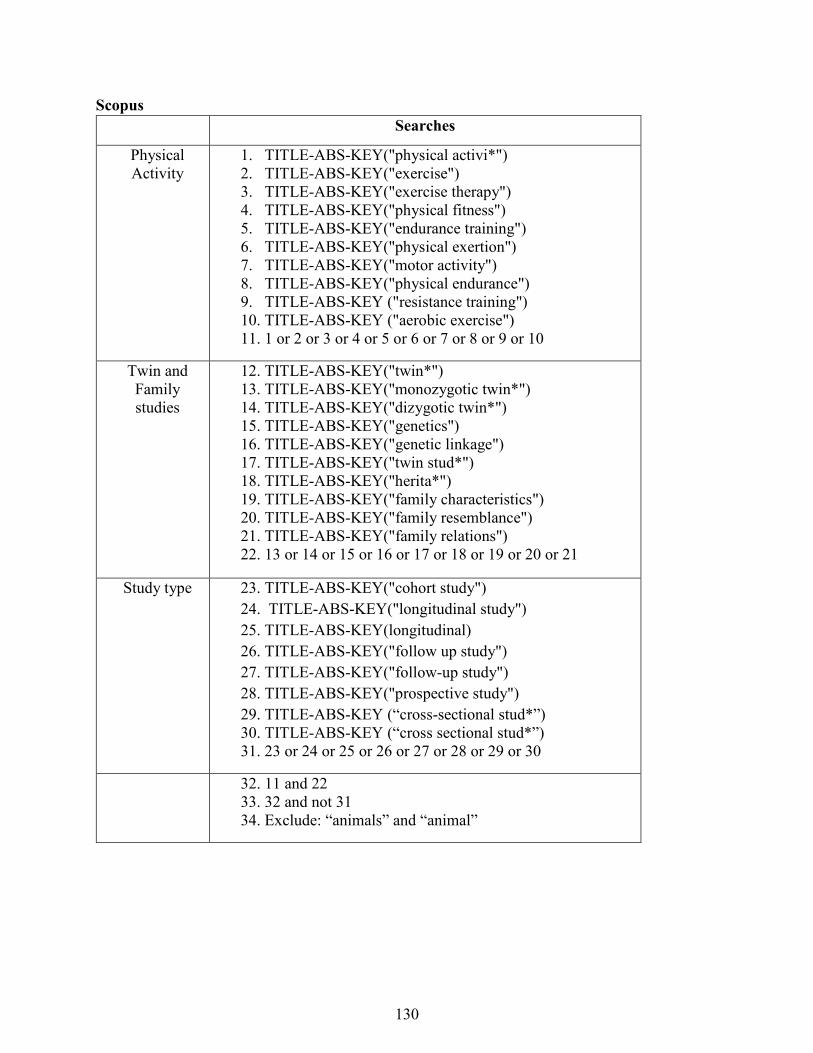
Scopus Searches
Physical Activity
1. TITLE-ABS-KEY("physical activi*") 2. TITLE-ABS-KEY("exercise") 3. TITLE-ABS-KEY("exercise therapy") 4. TITLE-ABS-KEY("physical fitness") 5. TITLE-ABS-KEY("endurance training") 6. TITLE-ABS-KEY("physical exertion") 7. TITLE-ABS-KEY("motor activity") 8. TITLE-ABS-KEY("physical endurance") 9. TITLE-ABS-KEY ("resistance training") 10. TITLE-ABS-KEY ("aerobic exercise") 11. 1 or 2 or 3 or 4 or 5 or 6 or 7 or 8 or 9 or 10
Twin and Family studies
12. TITLE-ABS-KEY("twin*") 13. TITLE-ABS-KEY("monozygotic twin*") 14. TITLE-ABS-KEY("dizygotic twin*") 15. TITLE-ABS-KEY("genetics") 16. TITLE-ABS-KEY("genetic linkage") 17. TITLE-ABS-KEY("twin stud*") 18. TITLE-ABS-KEY("herita*") 19. TITLE-ABS-KEY("family characteristics") 20. TITLE-ABS-KEY("family resemblance") 21. TITLE-ABS-KEY("family relations") 22. 13 or 14 or 15 or 16 or 17 or 18 or 19 or 20 or 21
Study type 23. TITLE-ABS-KEY("cohort study") 24. TITLE-ABS-KEY("longitudinal study") 25. TITLE-ABS-KEY(longitudinal) 26. TITLE-ABS-KEY("follow up study") 27. TITLE-ABS-KEY("follow-up study") 28. TITLE-ABS-KEY("prospective study") 29. TITLE-ABS-KEY (“cross-sectional stud*”) 30. TITLE-ABS-KEY (“cross sectional stud*”) 31. 23 or 24 or 25 or 26 or 27 or 28 or 29 or 30
32. 11 and 22 33. 32 and not 31 34. Exclude: “animals” and “animal”
130
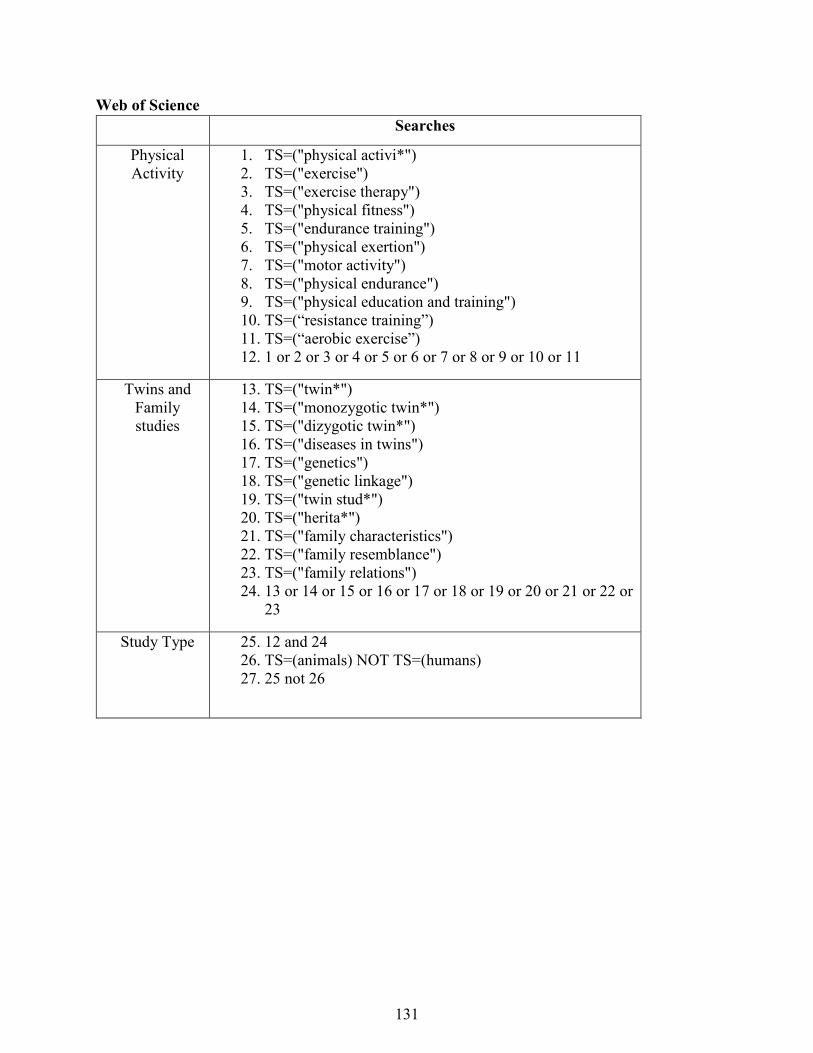
Web of Science Searches
Physical Activity
1. TS=("physical activi*") 2. TS=("exercise") 3. TS=("exercise therapy") 4. TS=("physical fitness") 5. TS=("endurance training") 6. TS=("physical exertion") 7. TS=("motor activity") 8. TS=("physical endurance") 9. TS=("physical education and training") 10. TS=(“resistance training”) 11. TS=(“aerobic exercise”) 12. 1 or 2 or 3 or 4 or 5 or 6 or 7 or 8 or 9 or 10 or 11
Twins and Family studies
13. TS=("twin*") 14. TS=("monozygotic twin*") 15. TS=("dizygotic twin*") 16. TS=("diseases in twins") 17. TS=("genetics") 18. TS=("genetic linkage") 19. TS=("twin stud*") 20. TS=("herita*") 21. TS=("family characteristics") 22. TS=("family resemblance") 23. TS=("family relations") 24. 13 or 14 or 15 or 16 or 17 or 18 or 19 or 20 or 21 or 22 or
23
Study Type 25. 12 and 24 26. TS=(animals) NOT TS=(humans) 27. 25 not 26
131
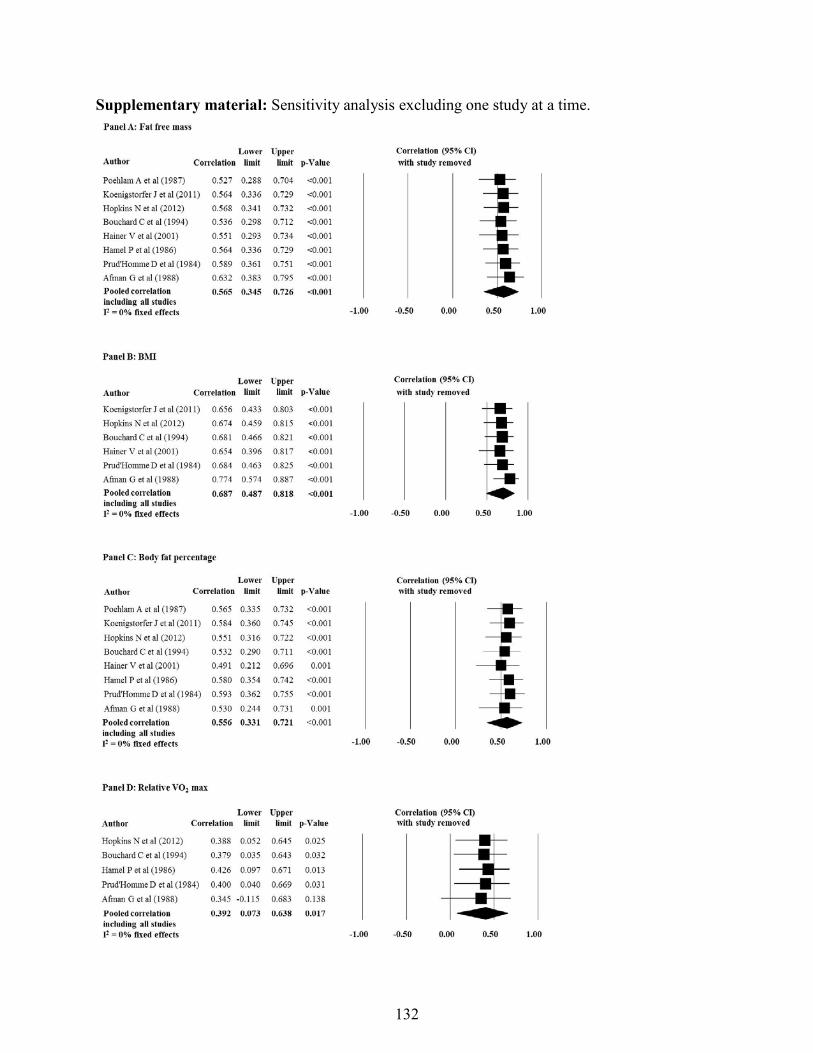
Supplementary material: Sensitivity analysis excluding one study at a time.
132

CHAPTER SEVEN
Video-game based exercises for older people with chronic low back pain: a
protocol for a feasibility randomised controlled trial (the GAMEBACK trial)
Chapter Seven has been published as:
Zadro JR, Shirley D, Simic M, Mousavi SJ, Ceprnja D, Maka K, Ferreira PH. Video-game
based exercises for older people with chronic low back pain: a protocol for a feasibility
randomised controlled trial (the GAMEBACK trial). Physiotherapy. 2016;103(2):146-53.
Copyright © 2016 Chartered Society of Physiotherapy. Published by Elsevier Ltd. All rights
reserved. Reprinted with permission from Elsevier.
133
J
A
O(DSPIwfpMtepRCpT©
K
I
htl
h0
Physiotherapy 103 (2017) 146–153
Protocol Paper
Video-game based exercises for older people with chroniclow back pain: a protocol for a feasibility randomised
controlled trial (the GAMEBACK trial)oshua Robert Zadro a,∗, Debra Shirley a, Milena Simic a, Seyed Javad Mousavi a,
Dragana Ceprnja b, Katherine Maka b, Paulo Ferreira a
a Discipline of Physiotherapy, Faculty of Health Sciences, The University of Sydney, 75 East St, Lidcombe, NSW 2141, Australiab Physiotherapy Department, Westmead Public Hospital, Western Sydney Local Health District, Cnr Hawkesbury Rd and Darcy
Rd, Westmead, NSW 2145, Australia
bstract
bjectives To investigate the feasibility of implementing a video-game exercise programme for older people with chronic low back painLBP).esign Single-centred single-blinded randomised controlled trial (RCT).etting Physiotherapy outpatient department in a public hospital in Western Sydney, Australia.articipants We will recruit 60 participants over 55 years old with chronic LBP from the waiting list.nterventions Participants will be randomised to receive video-game exercise (n = 30) or to remain on the waiting list (n = 30) for 8 weeks,ith follow up at 3 and 6 months. Participants engaging in video-game exercises will be unsupervised and will complete video-game exercise
or 60 minutes, 3 times per week. Participants allocated to remain on the waiting list will be encouraged to maintain their usual levels ofhysical activity.ain outcome measure The primary outcomes for this feasibility study will be study processes (recruitment and response rates, adherence
o and experience with the intervention, and incidence of adverse events) relevant to the future design of a large RCT. Estimates of treatmentfficacy (point estimates and 95% confidence intervals) on pain self-efficacy, care seeking, physical activity, fear of movement/re-injury, pain,hysical function, disability, falls-efficacy, strength, and walking speed, will be our secondary outcome measures.esults Recruitment for this trial began in November 2015.onclusion This study describes the rationale and processes of a feasibility study investigating a video-game exercise programme for oldereople with chronic LBP. Results from the feasibility study will inform on the design and sample required for a large multicentre RCT.
rial registration Australian New Zealand Clinical Trials Registry: ACTRN12615000703505.2016 Chartered Society of Physiotherapy. Published by Elsevier Ltd. All rights reserved.
eywords: Exercise therapy; Low back pain; Video-game technology; Wii
gw[
ntroduction
Low back pain (LBP) is a global problem [1] and the
ighest contributor to disability in Australia [2]. In 2012,he financial burden of LBP was estimated to be AU$4.8 bil-ion, with direct healthcare expenditure for LBP being the∗ Correspondence: Tel.: +61 2 9036 7435; fax: +61 2 9659 6849.E-mail address: [email protected] (J.R. Zadro).
tL[hop
ttp://dx.doi.org/10.1016/j.physio.2016.05.004031-9406/© 2016 Chartered Society of Physiotherapy. Published by Elsevier Ltd.
134
reatest amongst all musculoskeletal conditions [3]. Peopleho suffer from LBP have lower levels of physical activity
4], and lower cardiorespiratory fitness when compared tohe healthy population [5]. These factors might explain whyBP can have a significant impact on physical performance
6], particularly in older people [7]. Older people with LBPave reduced self-efficacy and mobility when compared tolder people without LBP [8]. However, despite the largeersonal impact of LBP in older people, they are commonly
All rights reserved.
otherap
em
pLaotspbpls[anfeTaba
drsgavMnf[phepcoit
iompett(ppcss
M
D
cmaaSdo[STZafriH
D
stitejmp
S
tsor
P
cgiT
R
Participants on the waiting list of the musculoskeletal out-patient department of ‘X’, who meet the inclusion criteria,will be contacted via mail and telephone. Recruitment fly-
J.R. Zadro et al. / Physi
xcluded from randomised controlled trials (RCT) evaluatinganagement of LBP [9].Exercise therapy as a self-management strategy has the
otential to improve outcomes in older people with chronicBP. Exercise therapy plays an important role in the man-gement of chronic LBP [10], however, current evidencenly demonstrates low-to-moderate improvements for func-ion and disability [11]. One proposed reason is that painelf-efficacy significantly influences treatment outcomes ineople with chronic pain [12], and is the strongest mediatoretween pain and disability in people with LBP [13]. Sinceeople with high levels of disability are eight times moreikely to seek care for their LBP [14], we need to consider painelf-efficacy if we are to reduce direct healthcare expenditure15] and waiting times for treatment of LBP. In addition, poordherence to exercise programmes [10] suggests an increasedeed for supervision [16]. However, this can be problematicor older people with disability, who prefer a home-basedxercise programme that does not require transport [17].herefore, these issues call for a new exercise managementpproach for older people with chronic LBP, involving home-ased exercise therapy, aimed at improving pain self-efficacynd reducing the need to travel to clinics for treatment.
Video-game technologies are among novel interventionsemonstrating clinical effectiveness for musculoskeletalehabilitation [18] and present a unique opportunity for theelf-management of chronic LBP in older people. Video-ame exercises have been shown to improve balance [19]nd falls-efficacy [20], with emerging evidence supportingideo-game based interventions in people with chronic LBP.iddle-aged women with chronic LBP demonstrated sig-
ificant improvements in pain, disability and fear avoidanceollowing a four week video-game exercise intervention21], while industrial workers with chronic LBP partici-ating in video-game exercises significantly improved theirealth-related quality of life [22]. Adherence to video-gamexercises is high [23], which is likely due to improvements inatients’ motivation levels to complete the video-game exer-ises [23]. Therefore, home-based video-game exercises forlder people with chronic LBP could be particularly useful atmproving pain self-efficacy and reducing the need to travelo clinics for treatment.
The aim of this pilot RCT is to investigate the feasibil-ty of implementing a video-game exercise programme forlder people with chronic low back pain (LBP). The pri-ary aim of this study is to investigate the following trial
rocesses: recruitment and response rates, adherence to andxperience with the video-game exercise programme, andhe incidence of adverse events. The secondary aim will beo evaluate the immediate, medium (3 months) and long term6 months) clinical effects of an 8 week video-game exerciserogramme on pain self-efficacy, care seeking behaviours,hysical activity levels, fear avoidance beliefs, pain, physi-al function, disability, falls-efficacy, strength, and walkingpeed. Findings from this study will inform on the design and
ample size required for a large multicentre RCT. e135
y 103 (2017) 146–153 147
ethods
esign
A single-centre single-blinded feasibility RCT will beonducted with participants allocated to one of two treat-ent groups: a home-based video-game exercise group or
control group that will remain on the waiting list of public hospital musculoskeletal outpatient department inydney, Australia (Supplementary Fig. 1). This trial has beenesigned according to the Standard Protocol Items: Rec-mmendations for Intervention Trials (SPIRIT) statement24] and will be reported according to the CONsolidatedtandards OF Reporting Trials (CONSORT) statement [25].his protocol has been registered at the Australian Newealand Clinical Trials Registry (ACTRN12615000703505)nd approved by the Human Research Ethics Committeerom the Western Sydney Local Health District (Local HRECeference (4266) AU RED HREC/15/WMEAD/143). Mod-fications to the trial protocol will be communicated to theREC from the Western Sydney Local Health District.
ata protection, storage and dissemination
The information collected from participants will be storedecurely and coded to be non-identifiable to staff involved inhe trial except the principal investigator. Data will be enterednto a secure server and all trial investigators will have accesso the final dataset. Information collected for, used in, or gen-rated by this project will be disseminated to the public viaournal publication or conference presentations. No infor-
ation about individual participants will be reported in theublications and dissemination of research results.
ample size estimation
A formal sample size calculation was not performed forhis feasibility study as one of the study aims is to provideample size estimation for a large RCT. Instead we decidedn recruiting 30 participants per group, recommended as aule of thumb for feasibility studies [26].
articipants
Sixty participants aged over 55 years and experiencinghronic LBP will be recruited and allocated to either a video-ame exercise group (n = 30) or control group (n = 30). Thenclusion/exclusion criteria for this study are outlined inable 1.
ecruitment method and screening procedures
rs throughout the hospital will serve as an additional form
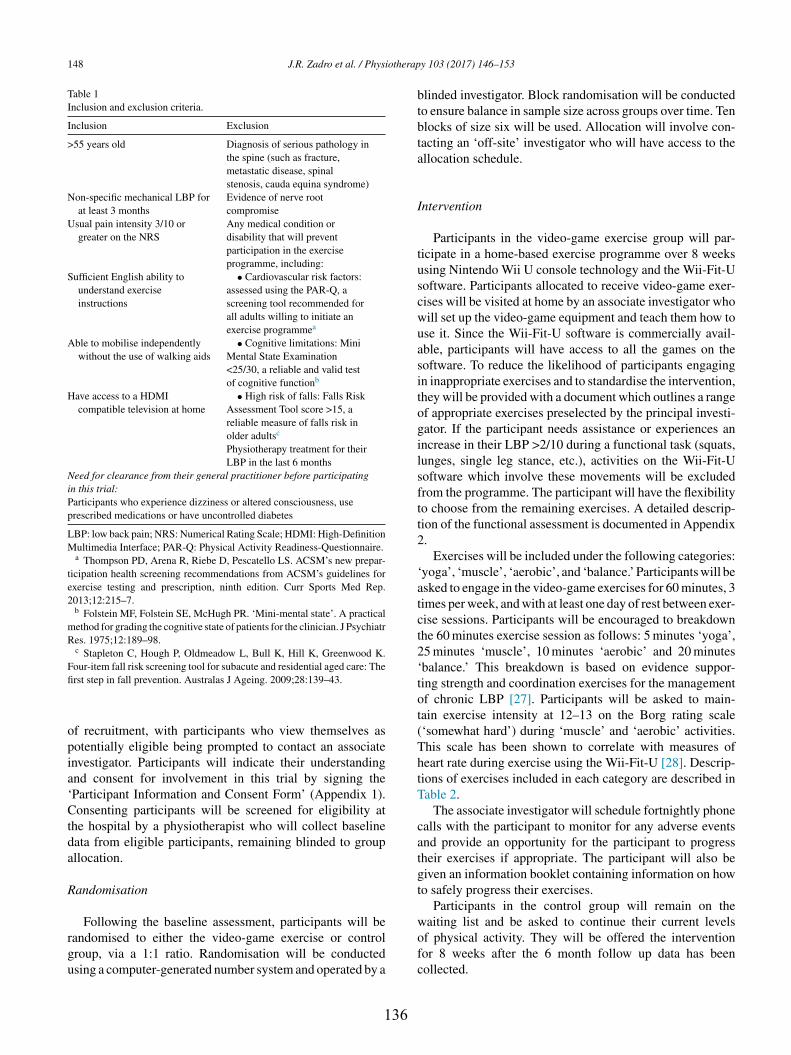
148 J.R. Zadro et al. / Physiotherap
Table 1Inclusion and exclusion criteria.
Inclusion Exclusion
>55 years old Diagnosis of serious pathology inthe spine (such as fracture,metastatic disease, spinalstenosis, cauda equina syndrome)
Non-specific mechanical LBP forat least 3 months
Evidence of nerve rootcompromise
Usual pain intensity 3/10 orgreater on the NRS
Any medical condition ordisability that will preventparticipation in the exerciseprogramme, including:
Sufficient English ability tounderstand exerciseinstructions
• Cardiovascular risk factors:assessed using the PAR-Q, ascreening tool recommended forall adults willing to initiate anexercise programmea
Able to mobilise independentlywithout the use of walking aids
• Cognitive limitations: MiniMental State Examination<25/30, a reliable and valid testof cognitive functionb
Have access to a HDMIcompatible television at home
• High risk of falls: Falls RiskAssessment Tool score >15, areliable measure of falls risk inolder adultsc
Physiotherapy treatment for theirLBP in the last 6 months
Need for clearance from their general practitioner before participatingin this trial:Participants who experience dizziness or altered consciousness, useprescribed medications or have uncontrolled diabetes
LBP: low back pain; NRS: Numerical Rating Scale; HDMI: High-DefinitionMultimedia Interface; PAR-Q: Physical Activity Readiness-Questionnaire.
a Thompson PD, Arena R, Riebe D, Pescatello LS. ACSM’s new prepar-ticipation health screening recommendations from ACSM’s guidelines forexercise testing and prescription, ninth edition. Curr Sports Med Rep.2013;12:215–7.
b Folstein MF, Folstein SE, McHugh PR. ‘Mini-mental state’. A practicalmethod for grading the cognitive state of patients for the clinician. J PsychiatrRes. 1975;12:189–98.
c Stapleton C, Hough P, Oldmeadow L, Bull K, Hill K, Greenwood K.Four-item fall risk screening tool for subacute and residential aged care: Thefi
opia‘Ctda
R
rgu
btbta
I
tuscwuasitogilsftt2
‘atct2‘tot(ThtT
catgt
rst step in fall prevention. Australas J Ageing. 2009;28:139–43.
f recruitment, with participants who view themselves asotentially eligible being prompted to contact an associatenvestigator. Participants will indicate their understandingnd consent for involvement in this trial by signing theParticipant Information and Consent Form’ (Appendix 1).onsenting participants will be screened for eligibility at
he hospital by a physiotherapist who will collect baselineata from eligible participants, remaining blinded to groupllocation.
andomisation
Following the baseline assessment, participants will beandomised to either the video-game exercise or controlroup, via a 1:1 ratio. Randomisation will be conductedsing a computer-generated number system and operated by a
wofc
136
y 103 (2017) 146–153
linded investigator. Block randomisation will be conductedo ensure balance in sample size across groups over time. Tenlocks of size six will be used. Allocation will involve con-acting an ‘off-site’ investigator who will have access to thellocation schedule.
ntervention
Participants in the video-game exercise group will par-icipate in a home-based exercise programme over 8 weekssing Nintendo Wii U console technology and the Wii-Fit-Uoftware. Participants allocated to receive video-game exer-ises will be visited at home by an associate investigator whoill set up the video-game equipment and teach them how tose it. Since the Wii-Fit-U software is commercially avail-ble, participants will have access to all the games on theoftware. To reduce the likelihood of participants engagingn inappropriate exercises and to standardise the intervention,hey will be provided with a document which outlines a rangef appropriate exercises preselected by the principal investi-ator. If the participant needs assistance or experiences anncrease in their LBP >2/10 during a functional task (squats,unges, single leg stance, etc.), activities on the Wii-Fit-Uoftware which involve these movements will be excludedrom the programme. The participant will have the flexibilityo choose from the remaining exercises. A detailed descrip-ion of the functional assessment is documented in Appendix.
Exercises will be included under the following categories:yoga’, ‘muscle’, ‘aerobic’, and ‘balance.’ Participants will besked to engage in the video-game exercises for 60 minutes, 3imes per week, and with at least one day of rest between exer-ise sessions. Participants will be encouraged to breakdownhe 60 minutes exercise session as follows: 5 minutes ‘yoga’,5 minutes ‘muscle’, 10 minutes ‘aerobic’ and 20 minutesbalance.’ This breakdown is based on evidence suppor-ing strength and coordination exercises for the managementf chronic LBP [27]. Participants will be asked to main-ain exercise intensity at 12–13 on the Borg rating scale‘somewhat hard’) during ‘muscle’ and ‘aerobic’ activities.his scale has been shown to correlate with measures ofeart rate during exercise using the Wii-Fit-U [28]. Descrip-ions of exercises included in each category are described inable 2.
The associate investigator will schedule fortnightly phonealls with the participant to monitor for any adverse eventsnd provide an opportunity for the participant to progressheir exercises if appropriate. The participant will also beiven an information booklet containing information on howo safely progress their exercises.
Participants in the control group will remain on the
aiting list and be asked to continue their current levelsf physical activity. They will be offered the interventionor 8 weeks after the 6 month follow up data has beenollected.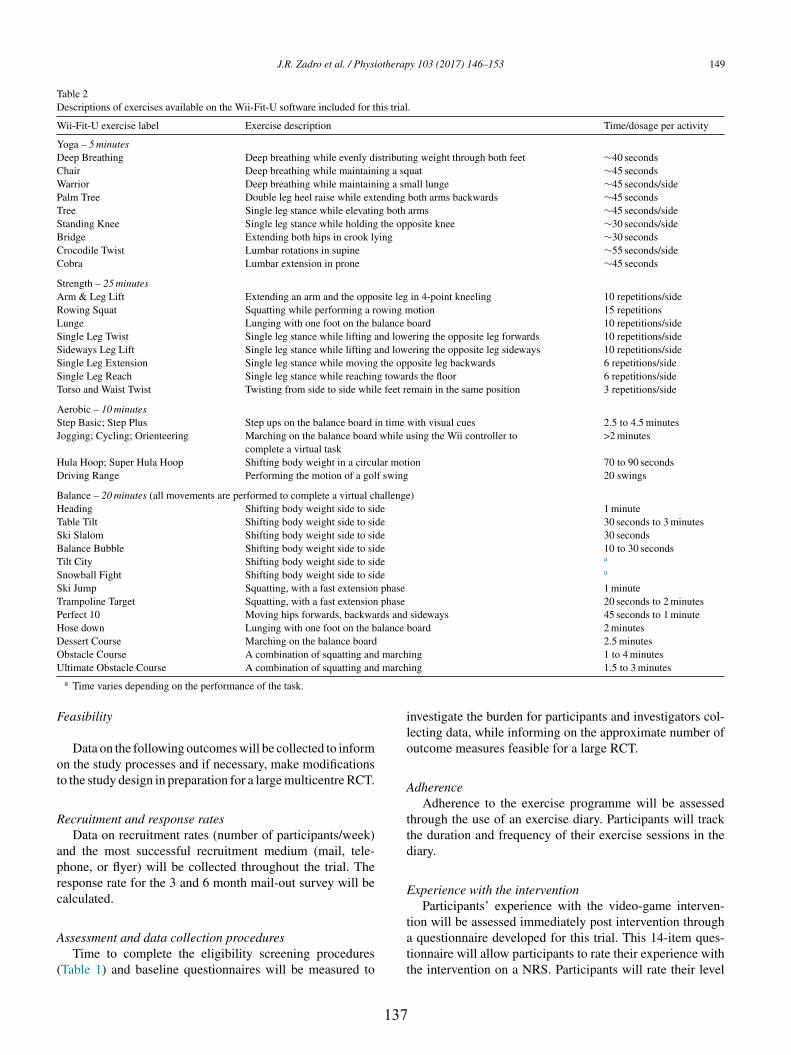
J.R. Zadro et al. / Physiotherapy 103 (2017) 146–153 149
Table 2Descriptions of exercises available on the Wii-Fit-U software included for this trial.
Wii-Fit-U exercise label Exercise description Time/dosage per activity
Yoga – 5 minutesDeep Breathing Deep breathing while evenly distributing weight through both feet ∼40 secondsChair Deep breathing while maintaining a squat ∼45 secondsWarrior Deep breathing while maintaining a small lunge ∼45 seconds/sidePalm Tree Double leg heel raise while extending both arms backwards ∼45 secondsTree Single leg stance while elevating both arms ∼45 seconds/sideStanding Knee Single leg stance while holding the opposite knee ∼30 seconds/sideBridge Extending both hips in crook lying ∼30 secondsCrocodile Twist Lumbar rotations in supine ∼55 seconds/sideCobra Lumbar extension in prone ∼45 seconds
Strength – 25 minutesArm & Leg Lift Extending an arm and the opposite leg in 4-point kneeling 10 repetitions/sideRowing Squat Squatting while performing a rowing motion 15 repetitionsLunge Lunging with one foot on the balance board 10 repetitions/sideSingle Leg Twist Single leg stance while lifting and lowering the opposite leg forwards 10 repetitions/sideSideways Leg Lift Single leg stance while lifting and lowering the opposite leg sideways 10 repetitions/sideSingle Leg Extension Single leg stance while moving the opposite leg backwards 6 repetitions/sideSingle Leg Reach Single leg stance while reaching towards the floor 6 repetitions/sideTorso and Waist Twist Twisting from side to side while feet remain in the same position 3 repetitions/side
Aerobic – 10 minutesStep Basic; Step Plus Step ups on the balance board in time with visual cues 2.5 to 4.5 minutesJogging; Cycling; Orienteering Marching on the balance board while using the Wii controller to
complete a virtual task>2 minutes
Hula Hoop; Super Hula Hoop Shifting body weight in a circular motion 70 to 90 secondsDriving Range Performing the motion of a golf swing 20 swings
Balance – 20 minutes (all movements are performed to complete a virtual challenge)Heading Shifting body weight side to side 1 minuteTable Tilt Shifting body weight side to side 30 seconds to 3 minutesSki Slalom Shifting body weight side to side 30 secondsBalance Bubble Shifting body weight side to side 10 to 30 secondsTilt City Shifting body weight side to side a
Snowball Fight Shifting body weight side to side a
Ski Jump Squatting, with a fast extension phase 1 minuteTrampoline Target Squatting, with a fast extension phase 20 seconds to 2 minutesPerfect 10 Moving hips forwards, backwards and sideways 45 seconds to 1 minuteHose down Lunging with one foot on the balance board 2 minutesDessert Course Marching on the balance board 2.5 minutesObstacle Course A combination of squatting and marching 1 to 4 minutesU march
F
ot
R
aprc
A
(
ilo
A
ttd
E
ltimate Obstacle Course A combination of squatting anda Time varies depending on the performance of the task.
easibility
Data on the following outcomes will be collected to informn the study processes and if necessary, make modificationso the study design in preparation for a large multicentre RCT.
ecruitment and response ratesData on recruitment rates (number of participants/week)
nd the most successful recruitment medium (mail, tele-hone, or flyer) will be collected throughout the trial. Theesponse rate for the 3 and 6 month mail-out survey will bealculated.
ssessment and data collection proceduresTime to complete the eligibility screening procedures
Table 1) and baseline questionnaires will be measured to
tatt
137
ing 1.5 to 3 minutes
nvestigate the burden for participants and investigators col-ecting data, while informing on the approximate number ofutcome measures feasible for a large RCT.
dherenceAdherence to the exercise programme will be assessed
hrough the use of an exercise diary. Participants will trackhe duration and frequency of their exercise sessions in theiary.
xperience with the interventionParticipants’ experience with the video-game interven-
ion will be assessed immediately post intervention through questionnaire developed for this trial. This 14-item ques-ionnaire will allow participants to rate their experience withhe intervention on a NRS. Participants will rate their level

1 otherap
oiipiac
C
twthcsfoeaawpbtwc
A
raadaUeo
C
palrs6aaitt
D
scffLtd
P
Ehct[ccsaws
C
nipab
P
Awdtaaam
btr
F
1
50 J.R. Zadro et al. / Physi
f satisfaction with the exercises and use of technology,nforming on the facilitators and barriers to the video-gamentervention. The questionnaire will be given to the partici-ant, along with a reply paid envelope, when the associatenvestigator collects the Nintendo Wii U equipment immedi-tely following the 8 week intervention. The participant willomplete the questionnaire and post it to ‘X’.
ost-effectivenessPrior to enrolment in the study, participants are informed
hat they will maintain their position on the waiting list butill be unable to receive outpatient physiotherapy during the
rial (except in the case of drop-outs). Therefore, costs to theealthcare system from general practitioner visits and medi-ation use will be derived from the Medical Benefits Schemetandard fees and the Pharmaceutical Benefits Scheme costor medications. Self-reported costs include the utlilisationf private non-medical health care services, miscellaneousxpenses (e.g. lumbar support, gym or pool attendance, etc.)nd absence from work (calculated as the number of daysbsent from work multiplied by the average wage; althoughe suspect our inclusion criteria will predominately captureeople retired from work). Effectiveness will be measuredy reported changes in pain self-efficacy, our most impor-ant clinical outcome. The between-group differences in costill be divided by the between-group differences in effect,
reating an incremental cost-effectiveness ratio.
dverse eventsAdverse events are defined as any undesirable outcome
elated to the intervention, such as falls, injury, discomfortnd increased LBP symptoms. Participants will be encour-ged to report any adverse events to the associate investigatoruring the fortnightly telephone call. These adverse eventsnd their possible connection with the use of the Wii-Fit-
will be monitored and documented. Participants will bencouraged to seek appropriate medical advice in the eventf a serious adverse event.
linical outcome measures
Clinical outcome measures will be collected from partici-ants at baseline, 8 weeks, 3 months and 6 months. Baselinend 8 week outcome measures will be collected at the muscu-oskeletal outpatient department of ‘X’. Participants will beequested to complete the follow up assessments even if theytop using the Wii-Fit-U software during the trial. The 3 and
month assessments consist of self-reported questionnairesnd will be mailed to participants home addresses (along with
reply paid envelope), where they will complete it and mail
t back to the hospital. Participants will be contacted prior tohe mail-out of the 3 and 6 month questionnaires to increasehe response rate.i4io
138
y 103 (2017) 146–153
emographic/descriptor variablesData on age, gender, body mass index (BMI), marital
tatus, ethnicity, alcohol consumption, smoking history, edu-ational attainment, employment status, comorbidities andamily characteristics will be collected at baseline. Data onamily characteristics will consider the presence and type ofBP, as well as the level of physical activity engagement, of
he participant’s immediate family members (parents, chil-ren and siblings).
ain self-efficacyPain self-efficacy will be assessed using the Pain Self-
fficacy Questionnaire (PSEQ) which has been shown toave good reliability (r = 0.79) and validity in patients withhronic pain [29]. The PSEQ assesses how confidently par-icipants can do a variety of daily activities despite their pain29]. Participants are instructed to score their confidence forompleting an activity on a scale from 0 to 6; where 0 = ‘notonfident at all’ and 6 = ‘completely confident.’ Data on painelf-efficacy will be collected at baseline, 8 weeks, 3 monthsnd 6 months, however, the data collected at 3 and 6 monthsill be considered the most important clinical outcome mea-
ure.
are seekingCare seeking will be assessed by a 3-item question-
aire developed for this trial. This questionnaire will collectnformation on current care seeking (e.g. GP visits, privatehysiotherapy, private chiropractic, etc.), future care seeking,nd medication use (e.g. type and dosage). Care seeking wille evaluated at baseline, 8 weeks, 3 months and 6 months.
hysical activityPhysical activity levels will be assessed by the Rapid
ssessment of Physical Activity (RAPA) questionnairehich has been validated for use among older adults andemonstrates good discrimination between active and inac-ive older adults [30]. The RAPA assesses the self-reportedmount and intensity of physical activity and is divided inton ‘aerobic’ and ‘strength and flexibility’ section. Physicalctivity levels will be collected at baseline, 8 weeks, 3onths and 6 months.
The following clinical outcomes will only be collected ataseline and 8 weeks to reduce to burden on participants forhe 3 and 6 month follow up survey and improve the responseate.
ear of movement/re-injuryFear of movement/re-injury will be assessed using the
1-item Tampa Scale of Kinesiophobia (TSK). Participants
ndicate their level of agreement with each statement on a-point scale, where 1 indicates ‘strongly disagree’ and 4ndicates ‘strongly agree.’ Higher scores reflect greater fearf movement/re-injury. The TSK is a valid, reliable and
otherap
rc
P
Sptoi[at
P
rNl
D
Dcipoi
F
cabceciha
S
Dadisrbp
W
uu
rftiio
D
cre(lmEtwatdaihso
P
pthwwu
D
aacmmfppppe
J.R. Zadro et al. / Physi
esponsive tool for assessing pain related fear in people withhronic LBP [31].
hysical functionPhysical function will be assessed using the Patient
pecific Functional Scale (PSFS). The PSFS instructs thearticipant to nominate three activities they currently haverouble with because of their LBP. Each activity is scoredn an 11-point scale from 0 (unable to perform the activ-ty) to 10 (able to perform the activity at pre-injury level)32]. The PSFS has demonstrated good reliability, validitynd responsiveness to detect change in people with LBP overime [32].
ainPain will be assessed using the NRS [33], an 11-point scale
anging from 0 (no pain) to 10 (worst pain imaginable). TheRS assesses the usual intensity of pain experienced in the
ast week.
isabilityDisability will be assessed using the Roland Morris
isability Questionnaire (RMDQ), a 24-item questionnaireontaining statements describing activities which might bempacted by the participants’ LBP. For each statement, thearticipant will answer ‘yes’ or ‘no,’ forming a total scoreut of 24. The RMDQ is a valid, reliable and sensitive tooln detecting change in patients with LBP over time [34].
alls-efficacyFalls-efficacy will be assessed using the Falls Effi-
acy Scale-International (FES-I), a 16-item questionnairessessing how concerned participants are about the possi-ility of falling during activities of daily living (cleaning,lothing, cooking, shopping, etc.). The participant will scoreach activity on a 4-point scale, where 1 indicates not beingoncerned at all and 4 indicates feeling very concerned, form-ng a total score out of 64. The FES-I has been shown toave good test retest reliability and internal reliability in olderdults [35].
trengthStrength will be indirectly assessed by the Timed Up and
own Stairs Test (TUDS). The TUDS will be performed on set of 9 stairs, each step being 14.5 cm high and 26 cmeep. Participants will stand 27 cm from the first step and benstructed to safely go up, turn around and come down thetairs as fast as they can without running. The test will beepeated three times to yield an average time. The TUDS haseen shown to be a clinically relevant measure of leg muscleower and mobility performance in older adults [36].
alking speedMaximal and preferred walking speed will be assessed
sing the 10 m Walk Test. Participants will be asked to walknassisted for 10 m, with the middle 6 m being timed to
ppbf
139
y 103 (2017) 146–153 151
educe the effects of acceleration and deceleration. The testsor maximal and preferred walking speed will be repeatedhree times to yield an average maximal and preferred walk-ng speed. Walking speed has shown good prognostic valuen identifying lower extremity limitations in well-functioninglder people [37].
ata analysis
The primary focus of the analysis will be on process out-omes, including the calculation of recruitment and responseates, adherence to the video-game intervention and experi-nce with the intervention. Estimates of treatment efficacymeans and 95% Confidence Intervals (CI)) will be calcu-ated using mixed-models to accommodate for the repeated
easures over time while adjusting for baseline outcomes.mphasis will be placed on effect sizes and 95%CI, rather
han hypothesis testing. The investigator analysing the dataill be blinded to the group identification code. To ensure all
nalyses are performed by intention-to-treat we will attempto follow up all participants, regardless of whether they with-raw from their allocation. When data is missing ‘completelyt random’ (e.g. administrative error) analyses will onlynclude complete cases. When it is plausible that missing dataas originated from non-random causes, we will perform sen-itivity analyses to investigate whether different assumptionsn the mechanism of missing data impact the results [38].
articipant withdrawal from study and/or from follow-upIf a participant decides to withdraw from the study, the
rincipal investigator will be notified by the associate inves-igator, and will contact the participant. If the participant isappy to give a reason for their withdrawal from the study, thisill be documented. The principal investigator will determinehether the participant wishes to be included in the followp assessments or withdraw completely.
iscussion
This manuscript describes the rationale and processes of pilot study investigating the feasibility of implementing video-game exercise programme for older people withhronic LBP. Although exercise therapy is the most recom-ended intervention for the management of chronic LBP,otivation to engage in an unsupervised exercise programme
or people with musculoskeletal conditions can often be aroblem [10]. This is particularly problematic for older peo-le with chronic LBP who are more likely to have impairedhysical performance [6] and prefer a home-based exerciserogramme that does not require transport [17]. Video-gamexercises present a unique opportunity to increase older peo-
le’s motivation to engage in an exercise programme [16] andotentially manage their chronic LBP. Results from the feasi-ility study will inform on the design and sample size requiredor a large multicentre RCT, which will aim to investigate the
1 otherap
lutfpLfe
A
t
Eate
C
A
fj
R
[
[
[
[
[
[
[
[
[
[
[
[
[
[
52 J.R. Zadro et al. / Physi
ong term effects of an innovative self-management strategy,tilising video-game technology, on older people’s capacityo self-manage their chronic LBP. If video-game exercises areound to be effective at improving self-management in oldereople with chronic LBP this could reduce care-seeking forBP in this population, resulting in reduced waiting times
or treatment in public hospitals, and decreased health-carexpenditure for chronic LBP.
cknowledgments
The authors would like to acknowledge the in-kind con-ribution of three Nintendo Wii U consoles from Nintendo.
thical approval: This protocol has been granted ethicspproval by the Human Research Ethics Committee fromhe Western Sydney Local Health District (Local HREC ref-rence (4266) AU RED HREC/15/WMEAD/143).
onflict of interest: None declared.
ppendix A. Supplementary data
Supplementary data associated with this article can beound, in the online version, at http://dx.doi.org/10.1016/.physio.2016.05.004.
eferences
[1] Murray CJ, Vos T, Lozano R, Naghavi M, Flaxman AD, MichaudC, et al. Disability-adjusted life years (DALYs) for 291 diseases andinjuries in 21 regions, 1990–2010: a systematic analysis for the GlobalBurden of Disease Study 2010. Lancet 2012;380:2197–223 [Erra-tum appears in Lancet. 2013 Feb 23;381(9867):628 Note: AlMazroa,Mohammad A [added]; Memish, Ziad A [added]].
[2] Vos T, Barber RM, Bell B, Bertozzi-Villa A, Biryukov S, Bol-liger I, et al. Global, regional, and national incidence, prevalence,and years lived with disability for 301 acute and chronic diseasesand injuries in 188 countries, 1990–2013: a systematic analy-sis for the Global Burden of Disease Study 2013. Lancet 2015,http://dx.doi.org/10.1016/s0140-6736(15)60692-4.
[3] Arthritis and Osteoporosis Victoria A problem worth solving. The risingcost of musculoskeletal conditions in Australia. Melbourne: Arthritisand Osteoarthritis Victoria with Deloitte Access Economic; 2013.
[4] Hartvigsen J, Nielsen J, Kyvik KO, Fejer R, Vach W, Iachine I,et al. Heritability of spinal pain and consequences of spinal pain:a comprehensive genetic epidemiologic analysis using a population-based sample of 15,328 twins ages 20–71 years. Arthritis Rheum2009;61:1343–51.
[5] Smeets RJ, Wittink H, Hidding A, Knottnerus JA. Do patients withchronic low back pain have a lower level of aerobic fitness than healthycontrols?: are pain, disability, fear of injury, working status, or levelof leisure time activity associated with the difference in aerobic fitnesslevel? Spine (Phila Pa 1976) 2006;31:90–7 [discussion 8].
[6] Pereira LS, Sherrington C, Ferreira ML, Tiedemann A, Ferreira PH,Blyth FM, et al. Self-reported chronic pain is associated with physi-cal performance in older people leaving aged care rehabilitation. ClinInterv Aging 2014;9:259–65, http://dx.doi.org/10.2147/cia.s51807.
[
140
y 103 (2017) 146–153
[7] Buchbinder R, Blyth FM, March LM, Brooks P, Woolf AD, Hoy DG.Placing the global burden of low back pain in context. Best Pract ResClin Rheumatol 2013;27:575–89.
[8] Champagne A, Prince F, Bouffard V, Lafond D. Balance, falls-relatedself-efficacy, and psychological factors amongst older women withchronic low back pain: a preliminary case–control study. Rehabil ResPract 2012;2012:430374, http://dx.doi.org/10.1155/2012/430374.
[9] Paeck T, Ferreira ML, Sun C, Lin CW, Tiedemann A, Maher CG.Are older adults missing from low back pain clinical trials? Asystematic review and meta-analysis. Arthritis Care Res (Hoboken)2014;66:1220–6, http://dx.doi.org/10.1002/acr.22261.
10] van Middelkoop M, Rubinstein SM, Verhagen AP, Ostelo RW,Koes BW, van Tulder MW. Exercise therapy for chronic nonspe-cific low-back pain. Best Pract Res Clin Rheumatol 2010;24:193–204,http://dx.doi.org/10.1016/j.berh.2010.01.002.
11] Ferreira ML, Ferreira PH, Latimer J, Herbert RD, Hodges PW, JenningsMD, et al. Comparison of general exercise, motor control exercise andspinal manipulative therapy for chronic low back pain: a randomizedtrial. Pain 2007;131:31–7.
12] Asghari A, Nicholas MK. Pain self-efficacy beliefs and pain behaviour.A prospective study. Pain 2001;94:85–100.
13] Lee H, Hubscher M, Moseley GL, Kamper SJ, Traeger AC, MansellG, et al. How does pain lead to disability? A systematic review andmeta-analysis of mediation studies in people with back and neck pain.Pain 2015, http://dx.doi.org/10.1097/j.pain.0000000000000146.
14] Ferreira ML, Machado G, Latimer J, Maher C, Ferreira PH, SmeetsRJ. Factors defining care-seeking in low back pain – a meta-analysis of population based surveys. Eur J Pain 2010;14(747):e1–7,http://dx.doi.org/10.1016/j.ejpain.2009.11.005.
15] Carey TS, Evans A, Hadler N, Kalsbeek W, McLaughlin C, Fryer J.Care-seeking among individuals with chronic low back pain. Spine1995;20:312–7.
16] Beinart NA, Goodchild CE, Weinman JA, Ayis S, Godfrey EL. Indi-vidual and intervention-related factors associated with adherence tohome exercise in chronic low back pain: a systematic review. Spine J2013;13:1940–50, http://dx.doi.org/10.1016/j.spinee.2013.08.027.
17] Franco MR, Howard K, Sherrington C, Ferreira PH, Rose J, GomesJL, et al. Eliciting older people’s preferences for exercise programs:a best-worst scaling choice experiment. J Physiother 2015;61:34–41,http://dx.doi.org/10.1016/j.jphys.2014.11.001.
18] Ravenek KE, Wolfe DL, Hitzig SL. A scoping review of videogaming in rehabilitation. Disabil Rehabil Assist Technol 2015;1:9,http://dx.doi.org/10.3109/17483107.2015.1029538.
19] Szturm T, Betker AL, Moussavi Z, Desai A, Goodman V. Effects of aninteractive computer game exercise regimen on balance impairment infrail community-dwelling older adults: a randomized controlled trial.Phys Ther 2011;91:1449–62, http://dx.doi.org/10.2522/ptj.20090205.
20] Jorgensen MG, Laessoe U, Hendriksen C, Nielsen OB, Aagaard P.Efficacy of Nintendo Wii training on mechanical leg muscle functionand postural balance in community-dwelling older adults: a random-ized controlled trial. J Gerontol A Biol Sci Med Sci 2013;68:845–52,http://dx.doi.org/10.1093/gerona/gls222.
21] Kim SS, Min WK, Kim JH, Lee BH. The effects of VR-based Wii Fityoga on physical function in middle-aged female LBP patients. J PhysTher Sci 2014;26:549–52, http://dx.doi.org/10.1589/jpts.26.549.
22] Park JH, Lee SH, Ko DS. The effects of the Nintendo Wii exerciseprogram on chronic work-related low back pain in industrial workers.J Phys Ther Sci 2013;25:985–8, http://dx.doi.org/10.1589/jpts.25.985.
23] Miller KJ, Adair BS, Pearce AJ, Said CM, Ozanne E, Morris MM.Effectiveness and feasibility of virtual reality and gaming system use athome by older adults for enabling physical activity to improve health-related domains: a systematic review. Age Ageing 2014;43:188–95,http://dx.doi.org/10.1093/ageing/aft194.
24] Chan AW, Tetzlaff JM, Altman DG, Laupacis A, Gotzsche PC,
Krleza-Jeric K, et al. SPIRIT 2013 statement: defining standardprotocol items for clinical trials. Ann Intern Med 2013;158:200–7,http://dx.doi.org/10.7326/0003-4819-158-3-201302050-00583.
otherap
[
[
[
[
[
[
[
[
[
[
[
[
[
J.R. Zadro et al. / Physi
25] Schulz KF, Altman DG, Moher D. CONSORT 2010 statement:updated guidelines for reporting parallel group randomised trials.J Pharmacol Pharmacother 2010;1:100–7, http://dx.doi.org/10.4103/0976-500x.72352.
26] Browne RH. On the use of a pilot sample for sample size determination.Stat Med 1995;14:1933–40.
27] Searle A, Spink M, Ho A, Chuter V. Exercise interventions forthe treatment of chronic low back pain: a systematic review andmeta-analysis of randomised controlled trials. Clin Rehabil 2015,http://dx.doi.org/10.1177/0269215515570379.
28] Pollock BS, Barkley JE, Potenzini N, Desalvo RM, Buser SL, Otter-stetter R, et al. Validity of Borg ratings of perceived exertion duringactive video game play. Int J Exerc Sci 2013;6:164–70.
29] Nicholas MK. The pain self-efficacy questionnaire: taking paininto account. Eur J Pain 2007;11:153–63, http://dx.doi.org/10.1016/j.ejpain.2005.12.008.
30] Topolski TD, LoGerfo J, Patrick DL, Williams B, Walwick J, PatrickMB. The rapid assessment of physical activity (RAPA) among olderadults. Prev Chronic Dis 2006;3:A118.
31] Woby SR, Roach NK, Urmston M, Watson PJ. Psychometricproperties of the TSK-11: a shortened version of the Tampa
Scale for Kinesiophobia. Pain 2005;117:137–44, http://dx.doi.org/10.1016/j.pain.2005.05.029.32] Stratford P, Gill C, Westaway M, Binkley J. Assessingdisability and change on individual patients: a report
[
Available online at www.s
ScienceD
141
y 103 (2017) 146–153 153
of a patient specific measure. Physiother Can 1995;47:258–63.
33] Von Korff M, Jensen MP, Karoly P. Assessing global pain severityby self-report in clinical and health services research. Spine (Phila Pa1976) 2000;25:3140–51.
34] Roland M, Morris R. A study of the natural history of back pain. PartI: Development of a reliable and sensitive measure of disability in low-back pain. Spine (Phila Pa 1976) 1983;8:141–4.
35] Hauer K, Yardley L, Beyer N, Kempen G, Dias N, Campbell M, et al.Validation of the Falls Efficacy Scale and Falls Efficacy Scale Inter-national in geriatric patients with and without cognitive impairment:results of self-report and interview-based questionnaires. Gerontology2010;56:190–9, http://dx.doi.org/10.1159/000236027.
36] Bean JF, Kiely DK, LaRose S, Alian J, Frontera WR. Is stairclimb power a clinically relevant measure of leg power impair-ments in at-risk older adults? Arch Phys Med Rehabil 2007;88:604–9,http://dx.doi.org/10.1016/j.apmr.2007.02.004.
37] Cesari M, Kritchevsky SB, Penninx BW, Nicklas BJ, SimonsickEM, Newman AB, et al. Prognostic value of usual gait speedin well-functioning older people – results from the Health, Agingand Body Composition Study. J Am Geriatr Soc 2005;53:1675–80,
http://dx.doi.org/10.1111/j.1532-5415.2005.53501.x.38] White IR, Horton NJ, Carpenter J, Pocock SJ. Strategy for intentionto treat analysis in randomised trials with missing outcome data. BMJ2011;34:2, http://dx.doi.org/10.1136/bmj.d40.
ciencedirect.com
irect
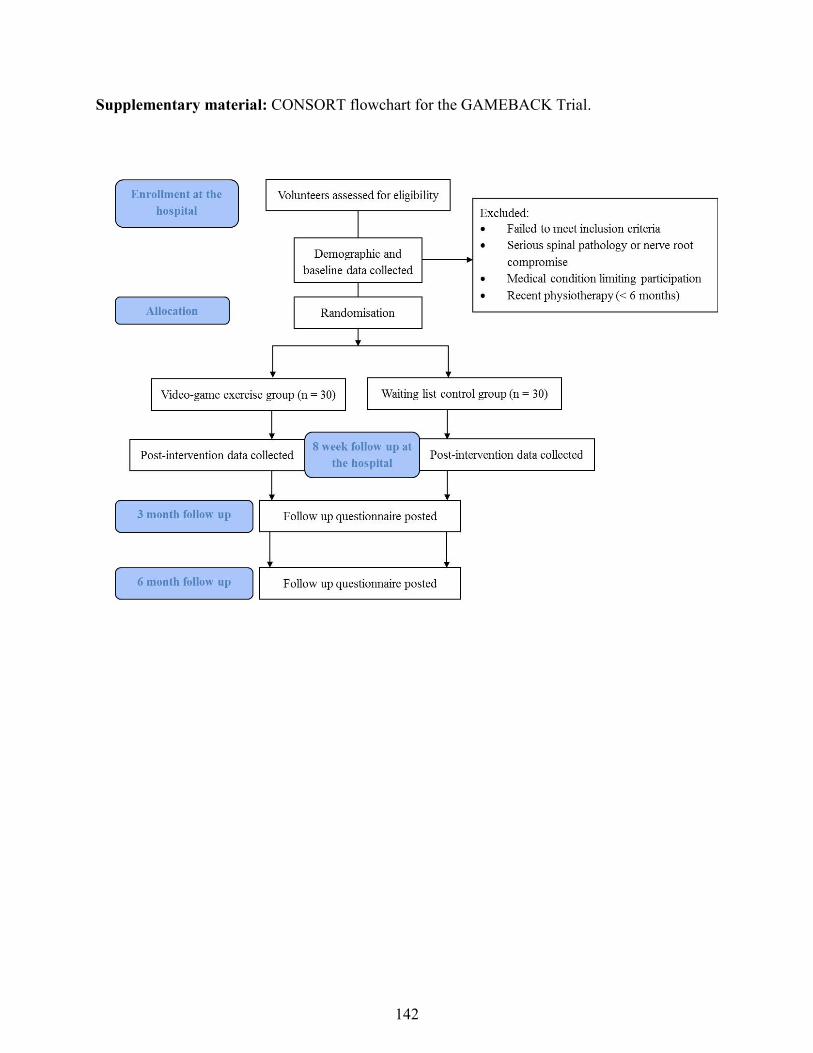
Supplementary material: CONSORT flowchart for the GAMEBACK Trial.
142
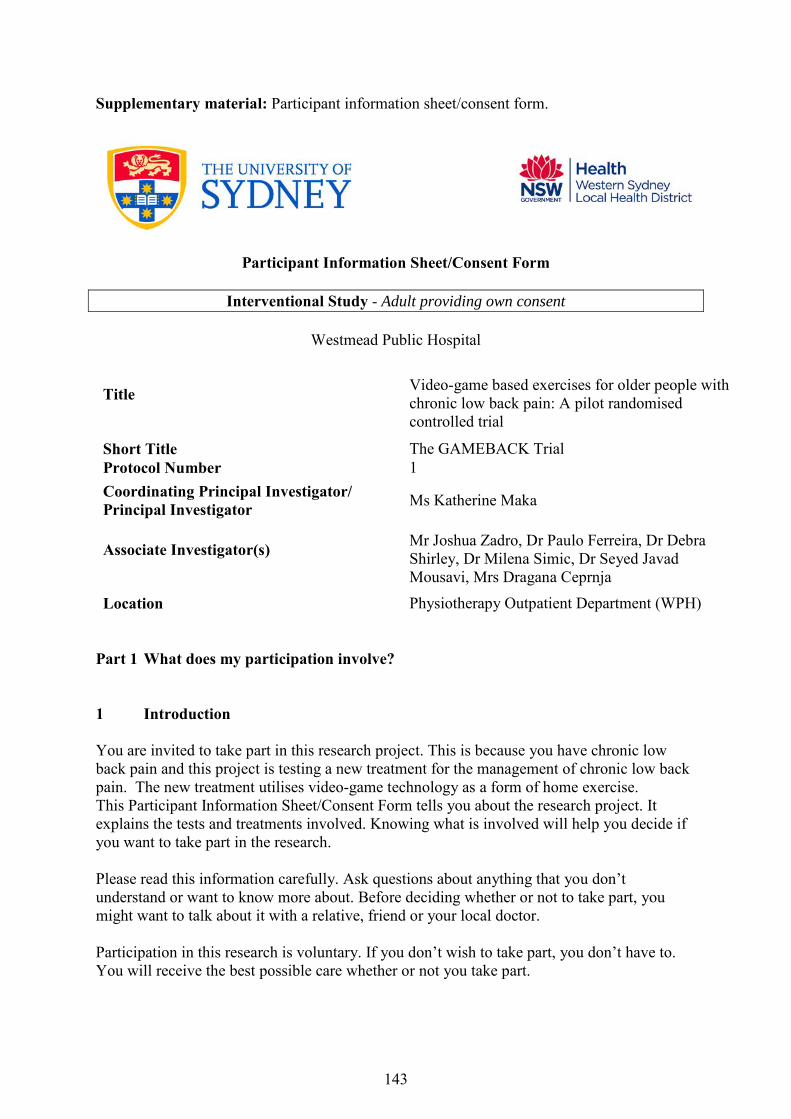
Supplementary material: Participant information sheet/consent form.
Participant Information Sheet/Consent Form
Interventional Study - Adult providing own consent
Westmead Public Hospital
Title
Video-game based exercises for older people with chronic low back pain: A pilot randomised controlled trial
Short Title The GAMEBACK Trial Protocol Number 1 Coordinating Principal Investigator/ Principal Investigator Ms Katherine Maka
Associate Investigator(s)
Mr Joshua Zadro, Dr Paulo Ferreira, Dr Debra Shirley, Dr Milena Simic, Dr Seyed Javad Mousavi, Mrs Dragana Ceprnja
Location Physiotherapy Outpatient Department (WPH) Part 1 What does my participation involve? 1 Introduction
You are invited to take part in this research project. This is because you have chronic low back pain and this project is testing a new treatment for the management of chronic low back pain. The new treatment utilises video-game technology as a form of home exercise. This Participant Information Sheet/Consent Form tells you about the research project. It explains the tests and treatments involved. Knowing what is involved will help you decide if you want to take part in the research. Please read this information carefully. Ask questions about anything that you don’t understand or want to know more about. Before deciding whether or not to take part, you might want to talk about it with a relative, friend or your local doctor.
Participation in this research is voluntary. If you don’t wish to take part, you don’t have to. You will receive the best possible care whether or not you take part.
143
If you decide you want to take part in the research project, you will be asked to sign the consent section. By signing it you are telling us that you:
• Understand what you have read
• Consent to take part in the research project
• Consent to have the tests and treatments that are described • Consent to the use of your personal and health information as described
You will be given a copy of this Participant Information and Consent Form to keep. 2 What is the purpose of this research? The aim of this study is to investigate how well people with low back pain can manage their symptoms following a video-game exercise program. We are specifically interested in people who are currently awaiting treatment for their back at the Physiotherapy Department of Westmead Hospital. Low back pain is the leading cause of disability in Australia and is more disabling in older people. Exercise programs are frequently used to treat low back pain and are known to offer moderate improvements for pain and function. However, usually exercise programs require supervision and the need for patients to travel to treatment sites, which can be problematic for older people with disability. Additionally, limited availability of health resources and an increasing number of people with chronic diseases means patients are often on long waiting lists for treatment. Video-game exercises for low back pain could be particularly useful in older people because they can be implemented at home and therefore reduce the need to travel to treatment sites. This has the potential to reduce the number of people waiting for treatment in public hospitals and reduce management costs of chronic low back pain. Video-game exercises are starting to be used to treat a variety of conditions and have been shown to increase motivation for completing a home-based exercise program. Therefore, this study will determine whether video-game exercises done in the home are effective in the management of low back pain. The results of this research will be used by the study investigator Joshua Zadro to obtain a Doctor of Philosophy (PhD). This research has been initiated by the principal study physiotherapist, Ms Katherine Maka. This research has been funded by the University of Sydney and additional funding may be sourced from the Physiotherapy Research Foundation if our funding application is successful. This research is being conducted by the University of Sydney at the Faculty of Health Sciences. 3 What does participation in this research involve? All assessment procedures will be conducted after you have; read all of this information carefully, asked any questions about anything that you don’t understand or want to know more about and you have signed the consent form. You will be participating in a randomised controlled research project. Sometimes we do not know which treatment is best for treating a condition. To find out we need to compare different treatments and put people into groups which receive different treatments. The results are compared to see if one is better. To try to make sure the groups are the same, each
144

participant is put into a group by chance (randomised). The groups we are comparing include a ‘video-game exercise’ group and a ‘remain on the waiting list’ group. On the following page is a table outlining the activities involved if you decide to participate in this study:
Stage Activity Estimated time to complete Week 1: Hospital Visit If eligible:
Lower back assessment & screening for eligibility
30-45 minutes
Baseline questionnaire 15-20 minutes
Weeks 1-8: you will be allocated to one of the groups
Video-game exercise group: - Remain on the waiting list - 3 x 60 min unsupervised
exercise sessions - Fill out weekly exercise
diary
~3 hours/week for 8 weeks
Control group: - Remain on the waiting list - Maintain usual activities
No time commitment
Week 9 : Hospital Visit
Follow up questionnaires 10-15 minutes
3 Months Complete questionnaires posted to you and return by mail
5-10 minutes
6 Months Complete questionnaires posted to you and return by mail
5-10 minutes
You will be eligible to participate in this study if: i) you are over 55 years old; ii) you have experienced low back pain for at least the last 3 months; iii) you have pain in your lower back which is greater than 3/10; iv) you have sufficient English ability; v) you can walk without anyone’s assistance or the assistance of any aids (e.g. walking
stick, walking frame, etc.); vi) your scheduled physiotherapy treatment at Westmead Hospital doesn’t fall within the
next 8 weeks; vii) you have a HDMI compatible television at home (this is a requirement to use the
video-game equipment). viii) You have not received physiotherapy treatment for your low back pain in the last 6
months You will be excluded from this study if: i) you have been diagnosed with a serious pathology in the spine (such as fracture,
metastatic disease, spinal stenosis, cauda equina syndrome). If you unsure about this statement, please ask the study researcher;
ii) you have any medical condition or disability that will prevent you from participating in an exercise program;
iii) if the physiotherapist determines that participating in this study wouldn’t be beneficial for you.
145
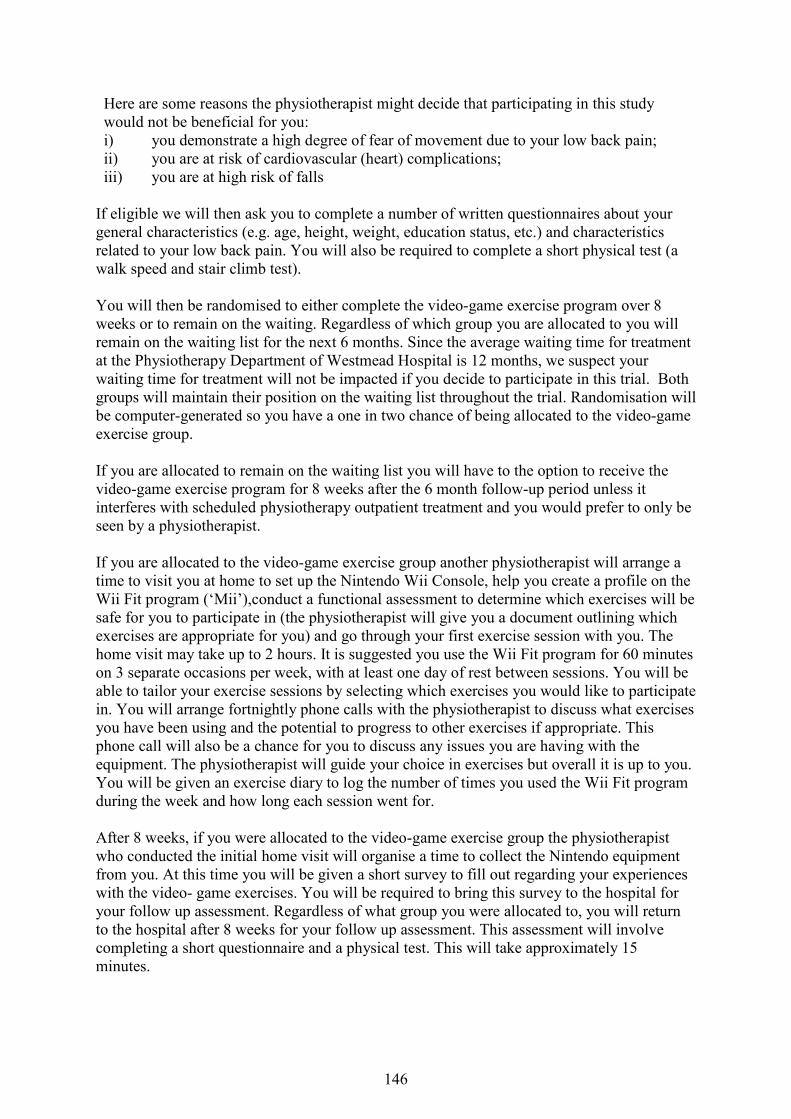
Here are some reasons the physiotherapist might decide that participating in this study would not be beneficial for you: i) you demonstrate a high degree of fear of movement due to your low back pain; ii) you are at risk of cardiovascular (heart) complications; iii) you are at high risk of falls
If eligible we will then ask you to complete a number of written questionnaires about your general characteristics (e.g. age, height, weight, education status, etc.) and characteristics related to your low back pain. You will also be required to complete a short physical test (a walk speed and stair climb test).
You will then be randomised to either complete the video-game exercise program over 8 weeks or to remain on the waiting. Regardless of which group you are allocated to you will remain on the waiting list for the next 6 months. Since the average waiting time for treatment at the Physiotherapy Department of Westmead Hospital is 12 months, we suspect your waiting time for treatment will not be impacted if you decide to participate in this trial. Both groups will maintain their position on the waiting list throughout the trial. Randomisation will be computer-generated so you have a one in two chance of being allocated to the video-game exercise group. If you are allocated to remain on the waiting list you will have to the option to receive the video-game exercise program for 8 weeks after the 6 month follow-up period unless it interferes with scheduled physiotherapy outpatient treatment and you would prefer to only be seen by a physiotherapist. If you are allocated to the video-game exercise group another physiotherapist will arrange a time to visit you at home to set up the Nintendo Wii Console, help you create a profile on the Wii Fit program (‘Mii’),conduct a functional assessment to determine which exercises will be safe for you to participate in (the physiotherapist will give you a document outlining which exercises are appropriate for you) and go through your first exercise session with you. The home visit may take up to 2 hours. It is suggested you use the Wii Fit program for 60 minutes on 3 separate occasions per week, with at least one day of rest between sessions. You will be able to tailor your exercise sessions by selecting which exercises you would like to participate in. You will arrange fortnightly phone calls with the physiotherapist to discuss what exercises you have been using and the potential to progress to other exercises if appropriate. This phone call will also be a chance for you to discuss any issues you are having with the equipment. The physiotherapist will guide your choice in exercises but overall it is up to you. You will be given an exercise diary to log the number of times you used the Wii Fit program during the week and how long each session went for. After 8 weeks, if you were allocated to the video-game exercise group the physiotherapist who conducted the initial home visit will organise a time to collect the Nintendo equipment from you. At this time you will be given a short survey to fill out regarding your experiences with the video- game exercises. You will be required to bring this survey to the hospital for your follow up assessment. Regardless of what group you were allocated to, you will return to the hospital after 8 weeks for your follow up assessment. This assessment will involve completing a short questionnaire and a physical test. This will take approximately 15 minutes.
146

At 3 months and 6 months we will mail out a short questionnaire on characteristics related to your back pain to assess how the exercise program has impacted you in the medium and long term. This research project has been designed to make sure the researchers interpret the results in a fair and appropriate way and avoids study physiotherapists or participants jumping to conclusions. There are no additional costs associated with participating in this research project, nor will you be paid. All video-game equipment required as part of the research project will be provided to you on loan, free of charge, and collected from you following the 8 week program period. There will be no reimbursement for any travel related costs for participating in this study. 4 What do I have to do? You will be required to complete three 60 minute sessions per week, with at least one day between sessions to rest. You will arrange a time for the physiotherapist to call you, once a fortnight, to progress exercises if appropriate. You will be given an exercise diary to log the number of times you used the Wii Fit program during the week and how long each session went for. 5 Other relevant information about the research project The study is being conducted at the Physiotherapy Department of Westmead Hospital, in collaboration with Dr Paulo Ferreira and his team of researchers from the Discipline of Physiotherapy, the University of Sydney. We aim to recruit sixty participants for this study, thirty to participate in the video-game exercise program and thirty to remain on the waiting list. 6 Do I have to take part in this research project? Participation in any research project is voluntary. If you do not wish to take part, you do not have to. If you decide to take part and later change your mind, you are free to withdraw from the project at any stage. If you do decide to take part, you will be given this Participant Information and Consent Form to sign and you will be given a copy to keep. Your decision whether to take part or not to take part, or to take part and then withdraw, will not affect your routine treatment, your relationship with those treating you or your relationship with The University of Sydney or Westmead Public Hospital.
147

7 What are the alternatives to participation? You do not have to take part in this research project to receive treatment at this hospital. Other options are available; these include continuing to remain on the waiting list until you receive outpatient physiotherapy treatment. Your study coordinator will discuss these options with you before you decide whether or not to take part in this research project. You can also discuss the options with your local doctor. 8 What are the possible benefits of taking part? We cannot guarantee or promise that you will receive any benefits from this research. However, possible benefits for those allocated to the video-game exercise program may include: an improvement in your ability to manage your lower back symptoms, a reduction in pain, disability, use of health care services or falls risk, an improvement in function, quality of life or physical activity levels. Findings from this study will determine whether home-based video-game exercises are effective in the management of low back pain. If video-game exercises are found to be effective, waiting lists for treatment in public hospitals and management costs of chronic low back pain could be reduced since video-game exercises potentially require less supervision than a traditional exercise program. 9 What are the possible risks and disadvantages of taking part? There may be side effects or adverse events that the researchers do not expect or do not know about and that may be serious. Tell your study physiotherapist immediately about any new or unusual symptoms that you get, or if something serious occurs. If you require emergency assistance, or you experience chest pain or excessive shortness of breath, call 000. There will be no risks or disadvantages if you are allocated to remain on the waiting list since you will have the option to receive the video-game intervention after 6 months. If you are allocated to the video game exercise program there may be some exercises which will challenge your strength, fitness, balance and coordination. You may feel soreness in your muscles one or even two days after participating in an exercise session, however, this is completely normal and somewhat expected. The risk for an injury or a fall is inherent to any exercise program. However, a physiotherapist will minimise the risk of this occurring by identifying which exercises you can safely choose to participate in. 10 What if new information arises during this research project? Sometimes during the course of a research project, new information becomes available about the treatment that is being studied. If this happens, your study physiotherapist will tell you about it and discuss with you whether you want to continue in the research project. If you decide to withdraw, your study physiotherapist will make arrangements for your regular health care to continue. If you decide to continue in the research project you will be asked to sign an updated consent form. Also, on receiving new information, your study physiotherapist might consider it to be in your best interests to withdraw you from the research project. If this happens, he/ she will explain the reasons and arrange for your regular health care to continue.
148

11 Can I have other treatments during this research project? Whilst you are participating in this research project, you will be encouraged not to undergo any other physiotherapy treatments. As this is an 8 week trial, we will make it clear if you are within 8 weeks of receiving outpatient physiotherapy treatment. If the waiting list suddenly becomes shorter during the trial and you wish to receive outpatient physiotherapy treatment, it is your choice to do so. 12 What if I withdraw from this research project? If you decide to withdraw from the project, please notify a member of the research team so they can take you off the phone call or email list, and also collect the Nintendo Wii equipment from your home if you were allocated to the video-game exercise group. If you do withdraw your consent during the research project, the study physiotherapist and relevant study staff will not collect additional personal information from you, although personal information already collected will be retained to ensure that the results of the research project can be measured properly and to comply with law. You should be aware that data collected by the physiotherapist up to the time you withdraw will form part of the research project results. If you do not want them to do this, you must tell them before you join the research project. 13 Could this research project be stopped unexpectedly? No. 14 What happens when the research project ends? Upon completion of the trial, if you were allocated to remain on the waiting list you will be given the option to receive the video-game exercise program or wait for your outpatient physiotherapy consult. If you participated in the video-game exercise program a research investigator will organise a time to collect the Nintendo equipment. Your results will be communicated to you at the end of the exercise program. The research assistant in charge of collecting assessment data will be responsible for communicating these results to you. The results of the research are intended for Journal publication, conference presentations and hospital in-service with allied health professionals. You may request a copy of the results.
149

Part 2 How is the research project being conducted? 15 What will happen to information about me? By signing the consent form you consent to the study physiotherapist and relevant research staff collecting and using personal information about you for the research project. Any information obtained in connection with this research project that can identify you will remain confidential. All questionnaires will be stored in a locked filing cabinet in the office of the senior physiotherapist in the Physiotherapy Department at Westmead Hospital. All collected data will be de-identified before leaving Western Sydney Local Health District. Data transported to the University of Sydney will be kept in a locked filing cabinet, accessible only by the researchers associated with the project. Data will be coded and stored on computer files on the University of Sydney Secure Server. Only the principal researchers will have access to the code. It is necessary to store this data as re-identifiable, because in accordance with Australian and NSW privacy and other relevant laws, you have the right to request access to your information collected and stored by the research team. You also have the right to request that any information with which you disagree be corrected. Please contact the study team member named at the end of this document if you would like to access your information. The data will be kept for a minimum of 7 years after which time the data may be disposed of in a secure manner. Your information will only be used for the purpose of this research project and it will only be disclosed with your permission, except as required by law. It is anticipated that the results of this research project will be published and/or presented in a variety of forums. In any publication and/or presentation, information will be provided in such a way that you cannot be identified, except with your permission. Data on your general characteristics and characteristics related to your back pain will be presented in the tables or results section without referring to your individual data. 16 Complaints and compensation If you suffer any serious injuries or complications as a result of this research project, you should contact the study team as soon as possible and you will be assisted with arranging appropriate medical treatment. If you are eligible for Medicare, you can receive any medical treatment required to treat the injury or complication, free of charge, as a public patient in any Australian public hospital. If your symptoms get worse as a result of this research project, let the study team know at the scheduled fortnightly follow up time and they will discuss appropriate options with you. 17 Who is organising and funding the research? This research project is being conducted by a team of researchers at Discipline of Physiotherapy, University of Sydney and Westmead Hospital, led by Dr Paulo Ferreira. The University of Sydney has supplied us with Nintendo® Wii equipment to conduct this trial.
150

Nintendo® may benefit financially from this research project if, for example, the project assists Nintendo® to sell more Nintendo Wii® consoles for the management of chronic low back pain. You will not benefit financially from your involvement in this research project. In addition, if knowledge acquired through this research leads to discoveries that are of commercial value to Nintendo®, the study physiotherapists or their institutions, there will be no financial benefit to you or your family from these discoveries. No member of the research team will receive a personal financial benefit from your involvement in this research project (other than their ordinary wages). 18 Who has reviewed the research project? All research in Australia involving humans is reviewed by an independent group of people called a Human Research Ethics Committee (HREC). The ethical aspects of this research project have been approved by the HREC of the Western Sydney Local Health District. This project will be carried out according to the National Statement on Ethical Conduct in Human Research (2007). This statement has been developed to protect the interests of people who agree to participate in human research studies. 19 Further information and who to contact The person you may need to contact will depend on the nature of your query. If you want any further information concerning this project or if you have any medical problems which may be related to your involvement in the project (for example, any side effects), you can contact the following people: Clinical contact person
For matters relating to research at the site at which you are participating, the details of the local site complaints person are:
Complaints contact person
If you have any complaints about any aspect of the project, the way it is being conducted or any questions about being a research participant in general, then you may contact:
Name Mr Joshua Zadro Position Associate Investigator Telephone 0449906121 Email [email protected]
Position Westmead Hospital Patient Representative Telephone 9845 7014
151

Reviewing HREC approving this research and HREC Executive Officer details
Local HREC Office contact (Single Site -Research Governance Officer)
Reviewing HREC name Western Sydney Local Health District HREC HREC Executive Officer Mrs Kellie Hansen Telephone 9845 8183 Email [email protected]
Name Mrs Margaret Piper Position Research Governance Officer Telephone 9845 9634 Email [email protected]
152

Consent Form - Adult providing own consent
Title
Video-game based exercises for older people with chronic low back pain: A pilot randomised controlled trial.
Short Title The GAMEBACK Trial Protocol Number 1 Coordinating Principal Investigator/
Ms Katherine Maka
Associate Investigator(s)
Mr Joshua Zadro, Dr Paulo Ferreira Dr Debra Shirley, Dr Milena Simic, Dr Seyed Javad Mousavi, Mrs Dragana Ceprnja
Location Physiotherapy Outpatient Department (WPH) Declaration by Participant I have read the Participant Information Sheet or someone has read it to me in a language that I understand. I understand the purposes, procedures and risks of the research described in the project. I give permission for my doctors, other health professionals, hospitals or laboratories outside this hospital to release information to The University of Sydney concerning my disease and treatment for the purposes of this project. I understand that such information will remain confidential. I have had an opportunity to ask questions and I am satisfied with the answers I have received. I freely agree to participate in this research project as described and understand that I am free to withdraw at any time during the study without affecting my future health care. I understand that I will be given a signed copy of this document to keep. Name of Participant (please
Signature Date Declaration by Study Physiotherapist/Senior Researcher†
I have given a verbal explanation of the research project, its procedures and risks and I believe that the participant has understood that explanation. Name of Study Physiotherapist/
Senior Researcher† (please print)
Signature Date † A senior member of the research team must provide the explanation of, and information concerning, the research project. Note: All parties signing the consent section must date their own signature. I understand that, if I decide to discontinue the study treatment, I may be asked to attend follow-up visits to allow collection of information regarding my health status. Alternatively, a member of the research team may request my permission to obtain access to my medical records for collection of follow-up information for the purposes of research and analysis.
Form for Withdrawal of Participation - Adult providing own consent
153

Title Video-game based exercises for older people with chronic low back pain: A pilot randomised controlled trial
Short Title The GAMEBACK Trial Protocol Number 1 Coordinating Principal Investigator/
Ms Katherine Maka
Associate Investigator(s)
Mr Joshua Zadro, Dr Paulo Ferreira, Dr Debra Shirley, Dr Milena Simic, Dr Seyed Javad Mousavi, Mrs Dragana Ceprnja
Location Physiotherapy Outpatient Department (WPH) Declaration by Participant I wish to withdraw from participation in the above research project and understand that such withdrawal will not affect my routine treatment, my relationship with those treating me or my relationship with The University of Sydney. Name of Participant (please
Signature Date Description of withdrawal circumstances (to be completed by the study physiotherapist)
Declaration by Study Physiotherapist/Senior Researcher†
I have given a verbal explanation of the implications of withdrawal from the research project and I believe that the participant has understood that explanation. Name of Study Physiotherapist/
Senior Researcher† (please print)
Signature Date † A senior member of the research team must provide the explanation of and information concerning withdrawal from the research project. Note: All parties signing the consent section must date their own signature.
154

Supplementary material: Participant Wii-Fit-U screening tool.
This document describes the range of movements involved in certain exercises on the Wii-Fit-U,
and will help determine which exercises are appropriate for each participant.
Tick the box next to each movement if the participant is able to perform the movement safely. If
the participant needs assistance, or experiences an increase in their low back pain > 2/10 on the
Numeric Pain Rating Scale (NRS), remove the indicated Wii-Fit-U exercises from their program.
Squat □
If box isn’t ticked remove: Chair, Rowing Squat, Ski Jump, Trampoline Target, Obstacle
Course and Ultimate Obstacle Course
Unsupported double leg heel raise □
If box isn’t ticked remove: Palm Tree
Single leg stance □
If box isn’t ticked remove: Tree, Standing Knee, Single Leg Extension, Single Leg Twist,
Sideways Leg Lift and Single Leg Reach.
Single leg reach towards the floor (drinking bird) □
If box isn’t ticked remove: Single Leg Reach
Lunge □
If box isn’t ticked remove: Lunge
155
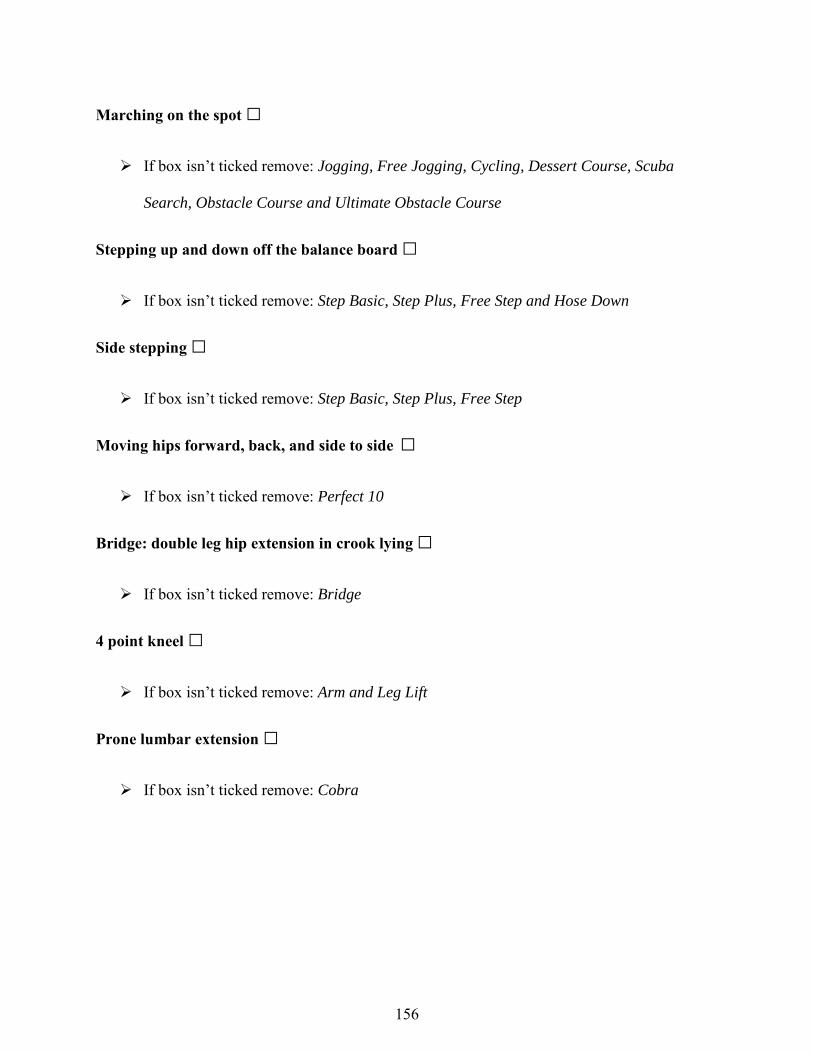
Marching on the spot □
If box isn’t ticked remove: Jogging, Free Jogging, Cycling, Dessert Course, Scuba
Search, Obstacle Course and Ultimate Obstacle Course
Stepping up and down off the balance board □
If box isn’t ticked remove: Step Basic, Step Plus, Free Step and Hose Down
Side stepping □
If box isn’t ticked remove: Step Basic, Step Plus, Free Step
Moving hips forward, back, and side to side □
If box isn’t ticked remove: Perfect 10
Bridge: double leg hip extension in crook lying □
If box isn’t ticked remove: Bridge
4 point kneel □
If box isn’t ticked remove: Arm and Leg Lift
Prone lumbar extension □
If box isn’t ticked remove: Cobra
156

CHAPTER EIGHT
Video-game based exercises for older people with chronic low back pain: a
pilot randomised controlled trial (GAMEBACK)
Chapter Eight has been submitted for publication as:
Zadro JR, Shirley D, Simic M, Mousavi SJ, Ceprnja D, Maka K, Sung J, Ferreira PH. Video-
game based exercises for older people with chronic low back pain: a pilot randomised controlled
trial (GAMEBACK). Submitted to Physical Therapy (18.10.17)
157
Video-game based exercises for older people with chronic low back pain: A pilot
randomised controlled trial (GAMEBACK).
Joshua Robert Zadroa*, Debra Shirleya, Milena Simica, Seyed Javad Mousavib, c, Dragana
Ceprnjad, Katherine Makad, Jennie Sungd, Paulo Ferreiraa.
aThe University of Sydney, Discipline of Physiotherapy, Faculty of Health Sciences, 75 East St,
Lidcombe, NSW 2141, Australia.
b Department of Orthopaedic Surgery, Harvard Medical School, 330 Brookline Ave, Boston, MA
02115, United States of America.
cCenter for Advanced Orthopaedic Studies, Beth Israel Deaconess Medical Center, 330
Brookline Ave, Boston, MA 02215, United States of America
dPhysiotherapy Department, Westmead Public Hospital, Western Sydney Local Health District,
Cnr Hawkesbury Rd and Darcy Rd, Westmead, NSW 2145, Australia.
*Corresponding author: Joshua R Zadro - Faculty of Health Sciences, The University of Sydney,
75 East St, Lidcombe, NSW 2141, Australia. Telephone: +61 2 9036 7435. Fax: +61 2 9659
6849. Email: [email protected]
158

Abstract
Background: Video-game technology can increase adherence to home-exercise and is a
promising self-management strategy for older people with chronic low back pain (LBP).
Objectives: To investigate the feasibility and efficacy of an 8 week home-based video-game
exercise program for older people with chronic LBP.
Design: Randomised controlled trial (RCT).
Setting: Community and outpatient rehabilitation waiting list.
Patients: Sixty participants over 55 years of age with chronic LBP were randomised to receive
Wii-Fit-U exercises (n=30) or instructed to continue their usual activities (n=30) for 8 weeks.
Intervention: Wii-Fit-U flexibility, strengthening and aerobic exercises at home for 60 minutes,
three times per week, with fortnightly follow-up calls from a physiotherapist.
Measurements: Recruitment and response rates, adherence, experience with the intervention,
incidence of adverse events, pain self-efficacy, care seeking, physical activity, pain, function,
disability, fear of movement/re-injury, and falls-efficacy.
Results: We screened 117 participants and included 60 (51.3%). The mean age (standard
deviation) was 67.8 (6.0) years old, and 93.3% of participants were recruited from the
community (recruitment rate =11.2 participants/month). Follow-up data was available from 57
participants at 6 months (95.0%). Average adherence to the total recommended exercise time
was 70.8% and no adverse events were reported. Participants completing Wii-Fit-U exercises
had significantly higher pain self-efficacy at 6 months, were more likely to engage in flexibility
exercises at 6 months, and demonstrated significantly greater improvements in pain and function
at 8 weeks compared to the control group. There were no significant between-group differences
159

for the remaining outcomes.
Limitations: Participants and the therapist delivering the intervention were not blinded.
Conclusion: Wii-Fit-U exercises are feasible and can improve pain self-efficacy, pain, and
function in older people with chronic LBP.
Keywords: Home exercise, Low back pain, Video-game, Nintendo Wii, Older people.
160
Introduction
Low back pain (LBP) is the most disabling and costly musculoskeletal condition worldwide1-3,
with the majority of this burden accounted for by older people who develop chronic symptoms4.
Chronic LBP becomes more severe5 and disabling with age6, and can have a significant impact
on physical functioning7. Despite this, older people with chronic LBP are commonly excluded
from randomised controlled trials (RCT) evaluating treatment options8, and given the global
population of people over 60 years old is expected to triple by 20509, more research on this
population should be a priority.
Structured exercise programs are recommended for the management of chronic LBP10, although
adherence to unsupervised home-exercise is poor10-13. Despite this, older people with poor
physical functioning prefer home-based exercises as travelling to treatment facilities can be
difficult and supervised exercise can be costly14. Poor adherence to home-exercise is likely
explained by a lack of motivation to perform exercises without supervision, but could also be the
result of low levels of pain self-efficacy15. Pain self-efficacy is the ability to continue daily
activities despite pain16 and has been shown to significantly influence treatment outcomes in
people with chronic pain13. Pain self-efficacy also accounts for how pain leads to disability17.
Therefore, given that disability is associated with greater health-care utilisation18, improving pain
self-efficacy should be a priority if older people with chronic LBP are to effectively self-manage
their condition and reduce their health-care utilisation19.
Video-game exercise programs are being increasingly used for musculoskeletal rehabilitation20,
and can improve balance21 and falls-efficacy22 in older people with poor physical function. In
addition, video-game exercises can improve pain, disability, fear avoidance, and quality of life in
161

adults with chronic LBP23,24, but have not been investigated as a self-management strategy for
older people with chronic LBP. Video-game exercises are interactive and may increase patients’
adherence to home-exercise25,26, mostly because of video and audio instructions, and feedback on
performance27,28. With this in mind, video-game exercises could be a unique solution to increase
older people’s motivation to self-manage their chronic LBP through home-exercise and improve
their pain self-efficacy. In addition, using video-game exercises as a self-management strategy
could have important implications for reducing health-care costs for chronic LBP in the long-
term.
The aim of this pilot RCT was to investigate the feasibility of an 8-week unsupervised home-
based video-game exercise program for older people with chronic LBP by evaluating the
recruitment and response rates, adherence to and experience with the intervention, and the
incidence of adverse events. The secondary aim was to investigate the immediate, short (3
months), and long term (6 months) clinical effects of an 8-week video-game exercise program on
pain self-efficacy, care seeking, physical activity, pain, function, disability, fear of movement/re-
injury, and falls-efficacy.
Methods
Design
We conducted a single-blinded feasibility RCT in people over 55 years of age with chronic LBP
and compared an unsupervised home-based video-game exercise program to a control group
instructed to maintain their usual activities (including care-seeking behaviours). This trial is
reported in accordance with the CONsolidated Standards OF Reporting Trials (CONSORT)
162
statement29 and the intervention has been documented according to the Template for Intervention
Description and Replication (TIDieR) checklist30. The study protocol was prospectively
registered with the Australian New Zealand Clinical Trials Registry (ACTRN12615000703505)
and has been published31. All recruitment and data collection procedures were approved by the
Human Research Ethics Committee from the Western Sydney Local Health District [Local
HREC reference: (4266) AU RED HREC/15/WMEAD/143] and participants gave informed
written consent.
Participants
Sixty participants over 55 years with chronic LBP were randomly allocated to a video-game
exercise (n=30) or control group (n=30). Given that the findings from this study will inform on
the sample size required for a large RCT we based our sample size on a rule of thumb for
feasibility studies32. The inclusion/exclusion criteria we specified in our protocol can be found in
Table 1. However, to increase the recruitment rate we didn’t exclude participants who received
physiotherapy for their LBP in the past 6 months.
Recruitment method and screening procedures
Participants were recruited from: i) the local community via advertisements in an online seniors’
newsletter; and ii) the waiting list of the Outpatient Physiotherapy Department at Westmead
Hospital, Sydney, Australia. People over 55 years on the waiting list with a referral for chronic
LBP treatment were contacted via mail or presented with information about the study during
routine telephone communication from their physiotherapist. Those interested in the trial
contacted a research investigator who clarified the inclusion/exclusion criteria over the phone,
163
sent them detailed information about the trial, and screened consenting and potentially eligible
participants. Eligible participants were guided through the baseline assessment by a qualified
physiotherapist who remained blind to group allocation. From November 2015 to August 2016
only four participants from the waiting list were interested and eligible for the trial, so we
modified our recruitment strategy to include participants from the general community to increase
the recruitment rate.
Randomisation
Following the baseline assessment, the assessing physiotherapist contacted a blinded “off-site”
investigator who used a computer-generated number system to determine group allocation.
Participants were randomised (1:1) to either the video-game exercise or control group, with
randomisation performed in ten blocks of six to ensure balance in sample size across groups over
time.
Intervention
Participants in the video-game exercise group engaged in an unsupervised home-based exercise
program for 8 weeks using a Nintendo Wii-U console with Wii-Fit-U software. These
participants were visited at home by a physiotherapist with three years clinical experience who
set up the video-game equipment and guided them through their first session. The Wii-Fit-U
exercises are commercially available and it was not possible to alter which exercises were
displayed to participants. Therefore, participants were given a booklet which outlined a range of
flexibility, body weight resistance, and aerobic exercises pre-selected by the research team to
standardize the intervention. Prior to instructing the participant how to perform Wii-Fit-U
164

exercises, the physiotherapist assessed their ability to perform several movements included in the
program. If the participant appeared unsafe while performing any of these movements or
reported at least a 2/10 increase in their pain that failed to subside when the movement stopped,
Wii-Fit-U exercises that involved these movements were removed from the exercise list. Further
details regarding the included Wii-Fit-U exercises and the movements assessed during the initial
visit can be found in our protocol31.Wii-Fit-U exercises included video and audio instructions,
gave participants feedback on their performance during and after exercises, and scored their
performance. For example, visual representation of the pressure participants were applying
through their foot while performing ‘lunges’ encouraged them to perform the movement with
more hip and knee flexion (and subsequently more pressure on the balance board). Once the
participant felt confident performing Wii-Fit-U exercises independently the physiotherapist
outlined the exercise protocol they were to follow over the next 8 weeks.
Participants were asked to perform Wii-Fit-U exercises for 60 minutes, 3 times per week31. They
were instructed to have at least one day of rest between exercise sessions and to use their
symptoms in the 24 hours post-exercise to guide whether they should increase or decrease the
duration and intensity of subsequent sessions. A physiotherapist contacted participants
fortnightly to encourage them to progress their exercises, if appropriate, while also monitoring
for any adverse events or equipment issues. Exercise progression was centred on increasing the
repetitions of an exercise or selecting more challenging exercises to maintain a perceived
exertion of 13 on the Borg rating scale. This was outlined to participants during the initial
session. On the other hand, participants were encouraged to modify exercises they found too
difficult by reducing the repetitions, range of movement, balance requirements, or the duration of
165
the exercise sessions to maintain a similar perceived exertion.
Feasibility outcomes
Adherence. Participants tracked the duration and frequency of their exercise sessions in a paper
exercise diary. Despite reporting issues associated with paper exercise diaries33 they are simple
and likely appropriate for an older population34. Adherence was based on the extent the
participants exercise behaviours corresponded to our recommendations15: i) total minutes,
expressed as a percentage of the total recommended exercise time (60 minutes x 3 x 8 weeks =
1,440 minutes); ii) number of weeks adherent to the protocol (≥180 minutes/week), expressed as
a percentage of 8 weeks; iii) total number of sessions ≥60 minutes; and iv) total number of
sessions, irrespective of duration. Both iii) and iv) were expressed as a percentage of the total
number of recommended sessions (n=24).
Experience with the intervention. Participants in the video-game exercise group completed a 12-
item questionnaire that allowed them to rate the following aspects of the intervention: i)
usability; ii) exercise variation; iii) ease of exercise progression; iv) the extent symptoms
interfered with the program; and v) overall experience (Appendix A).
Clinical outcomes
All baseline data was collected in-person at The University of Sydney (participants from the
community) or at the Outpatient Physiotherapy Department of Westmead Hospital (participants
on the waiting list). All remaining follow-up surveys (8 weeks, 3 and 6 months) were either sent
to participants’ email address via Research Electronic Data Capture (REDCap) or posted to their
166

residential address. Participants who did not adhere to the intervention were encouraged to
complete all follow-up assessments. All study data were collected and managed using REDCap
electronic data capture tools hosted at The University of Sydney35.
Pain self-efficacy was assessed using the 10-item Pain Self-Efficacy Questionnaire (PSEQ), a
valid and reliable tool for detecting changes in people with chronic pain over time16. Care
Seeking was assessed using a 3-item questionnaire developed for this trial which asked
participants to indicate whether they were: i) currently receiving treatment (e.g. GP visits, private
physiotherapy, etc.); ii) planning to start treatment in the coming months; or iii) currently taking
medication for their LBP. Engagement in physical activity was assessed by the RAPA
questionnaire, a valid tool for discriminating between active and inactive older adults36.
Participants selected the time and intensity of physical activity that best described how much
aerobic physical activity they usually do over the course of a week (e.g. “I do 30 minutes or more
per day of moderate physical activities 5 or more days per week”). Participants also indicated
whether they performed any ‘strength’ or ‘flexibility’ exercises at least once per week. The
American College of Sports Medicine (ACSM) recommends that all adults perform a weekly
minimum of 150 minutes moderate-intensity or 60 minutes vigorous-intensity physical activity37.
In light of these recommendations, we formed three categories of physical activity engagement
that has also been used in a previous study38: i) sedentary or only light physical activity (items 1-
3); ii) moderate or vigorous-intensity physical activity less than recommended by the ACSM
(items 4-5); and iii) physical activity that met the ACSM recommendations (items 6-7). Data on
pain self-efficacy, care-seeking, and engagement in physical activity levels were collected at
baseline, 8 weeks, 3 months, and 6 months.
167
The remaining outcomes were only collected at baseline and 8 weeks31. Usual pain intensity over
the last week was assessed using the 11-point NRS39. Function was assessed using the Patient
Specific Functional Scale (PSFS), a valid, reliable, and responsive tool for detecting changes in
function over time in people with LBP40. Disability was measured using the 24-item Roland
Morris Disability Questionnaire (RMDQ) which has demonstrated good validity, reliability and
sensitivity for detecting changes in disability over time in people with LBP41. Fear of
movement/re-injury was assessed using the 17-item Tampa Scale of Kinesiophobia (TSK) which
has demonstrated good validity, reliability and responsiveness for evaluating changes in pain-
related fear in people suffering chronic LBP42. Falls-efficacy was measured using the 16-item
Falls-Efficacy Scale-International (FES-I) questionnaire which assesses participants’ concerns
about the possibility of falling during a number of daily activities (e.g. walking upstairs)43.
Data Analysis
We reported data on feasibility outcomes using descriptive statistics [means, standard deviations
(SD), %]. We investigated the clinical effects of home-based video-game exercises using linear
regression for continuous outcome variables (e.g. pain, function) and logistic regression for
dichotomous outcome variables (e.g. care seeking). Estimates were adjusted for baseline
covariates and any variable that was significantly different between groups at baseline. STATA
statistical software (version 13.1) was used to conduct all analyses (StataCorp LP. 2013, College
Station, TX, USA). Coefficients (β) and 95% confidence intervals (CI) were calculated from
regression models, with significance level set at 0.05. We attempted to follow up all participants
regardless of whether they withdrew from their allocation.
168

Results
One hundred and seventeen individuals with chronic LBP interested in participating in this trial
were screened for eligibility between November 2015 and February 2017 (Fig 1). Sixty people
(51%) were eligible to participate and were randomised to the video-game exercise (n=30) or
control group (n=30), with 56 participants (93.3%) recruited from the community and four
participants (6.7%) recruited from the waiting list. The recruitment rates for the total sample,
participants on the waiting list, and participants from the community were 4.3, 0.4 and 11.2
participants per month, respectively. The mean age (SD) of participants was 67.8 (6.0) years old,
and there were 31 females (51.7%). At baseline, participants allocated to receive Wii-Fit-U
exercises had higher levels of function (PSFS) [5.3 (1.4) vs. 4.3 (2.1), p=0.04]. There were no
significant between-group differences for the remaining baseline characteristics (Table 2).
Of the 30 participants allocated to receive Wii-Fit-U exercises, four participants were not able to
start the program due to personal commitments. The remaining participants commenced the
program (n=26). All participants in the intervention group and 28 participants in the control
group (93.3%) completed the post-intervention follow-up questionnaire. Follow-up data was
available from 56 (93.3%) and 57 (95.0%) participants at 3 and 6 months respectively (Fig 1), as
one participant responded to the questionnaire at 6 months, but not at 3 months. During the
fortnightly calls, it was relatively common for participants to report some temporary soreness
during or after performing Wii-Fit-U exercises. However, no participant reported any soreness
that limited their participation in the program or any other adverse events related to Wii-Fit-U
exercises (e.g. fall, injury, etc.).
169

Adherence
The average adherence to the total recommended exercise time was 70.8%, with scores ranging
from 7.6% to 144.4%. The average number of sessions irrespective of duration was 20.4 (out of
24, 85.1%), while the average number of sessions ≥60 minutes was only 10.1 (42.0%). The
average number of weeks participants were adherent to the protocol was 2.6 (out of 8, 32.7%).
Furthermore, the average number of minutes and average number of sessions each week tended
to decrease throughout the 8 week program (Table 3).
Experience with the intervention
Overall, participants reported high usability (average scores ranged from 7.9-8.7/10), sufficient
exercise variety (8.2/10) and challenge (7.4/10), and a positive overall experience using the
program (7.3/10). Participants felt confident to progress their exercises throughout the program
with (7.6/10) or without (6.8/10) the physiotherapist’s guidance, rarely had symptoms that
stopped them from using the program (3.3/10), but occasionally experienced symptoms
following an exercise session (5.7/10). On average, participants indicated that a 50.8%
improvement in their LBP would make participating in the 8 week program worthwhile
(Appendix B).
Clinical outcomes
There were no between-group differences for PSEQ scores immediately post-intervention
(β=1.20, 95% CI: -3.23 to 5.64, p=0.59). However, participants completing Wii-Fit-U exercises
had significantly higher PSEQ scores at 6 months (β=5.17, 95% CI: 0.52 to 9.82, p=0.03) and
170
tended to have higher PSEQ scores at 3 months compared to the control group (β=4.33, 95% CI:
-0.24 to 8.80, p=0.06) (Table 4). Participants completing Wii-Fit-U exercises also demonstrated
significantly greater improvements in pain (β=-1.07, 95% CI: -2.11 to -0.03, p=0.04) and
function (β=1.21, 95% CI: 0.10 to 2.33, p=0.03), and tended to reduce their fear of movement/re-
injury more than the control group immediately post-intervention (β=-2.97, 95% CI: -6.14 to
0.21, p=0.07). There were no significant between-group differences for disability (β=-0.85, 95%
CI: -2.58 to 0.89, p=0.33) and falls-efficacy (β=-1.08, 95% CI: -3.08 to 0.92, p=0.28)
immediately post-intervention, or in any care seeking or physical activity behaviours at 8 weeks
and 3 months (Table 5). However, participants completing Wii-Fit-U exercises were
significantly more likely to engage in flexibility exercises at least once per week at 6 months
(OR=4.36, 95% CI: 1.06 to 17.93, p=0.04), and tended to be less likely to be on medication at 6
months compared to the control group (OR=0.24, 95% CI: 0.06 to 1.04, p=0.06) (Table 5).
Discussion
This trial demonstrated a high recruitment rate in community-dwelling older people, follow-up
data was available from 57 participants at 6 months (95.0%), and there were no reported adverse
events. Adherence to the intervention was high when considering the total time and total number
of sessions performed. However, as the average number of participants completing sessions ≥60
minutes or doing a weekly total of 180 minutes was low, it suggests the exercise protocol might
need to be revised for future trials in this population. Nevertheless, these features highlight the
feasibility of Wii-Fit-U exercises for older people with chronic LBP. Participants completing
Wii-Fit-U exercises also reported significantly better pain self-efficacy at 6 months, and
significantly greater improvements in pain and function immediately post-intervention compared
171
to the control group. In addition, participants completing Wii-Fit-U exercises were more likely to
be engaged in flexibility exercises at 6 months, tended to be less likely to be taking medication at
6 months, and tended to have less fear of movement/re-injury immediately post-intervention
compared to the control group. Given the feasibility and preliminary efficacy of Wii-Fit-U
exercises for older people with chronic LBP, a large RCT is needed to build on these results.
Our study showed that adherence to Wii-Fit-U exercises in older people with chronic LBP is
high, particularly when compared to studies where people with chronic LBP are instructed to
exercise without supervision11,12,15,44-46. For example, the adherence to an unsupervised exercise
program at local health clubs in people with chronic LBP by completing the number of
recommended sessions was only 33%46. This figure is similar across a number of other
studies12,44,45 and is considerably less than the corresponding value found in our study (85.1%).
High adherence to Wii-Fit-U exercises in our study could be due to a number of factors. First,
adherence was likely facilitated during the fortnightly follow-up calls where participants were
encouraged to progress their exercises. Second, Wii-Fit-U exercises provide video and audio
instructions, and feedback on performance, factors that promote adherence to home exercise in
people with chronic LBP27,28. Video-game technology also increases motivation to perform home
exercises25, and there is preliminary evidence supporting the use of supervised Wii-Fit-U
exercises for adults with chronic LBP23,24. However, given the lack of studies investigating
unsupervised Wii-Fit-U exercises for chronic LBP, additional studies investigating how Wii-Fit-
U exercises influence the adherence to home-exercise in older people with chronic LBP are
needed to build on the findings of this study.
172
Our study showed a high recruitment rate in community-dwelling older people (11.2 participants
per month), but a very low recruitment rate from the waiting list (0.4 participants per month).
This is despite reassuring people they would not lose their position on the waiting list. We
hypothesise these recruitment rate differences are due to the sample’s desire to self-manage their
condition through home-exercise, which is likely a reflection of their pain self-efficacy.
Participants in our trial had high baseline pain self-efficacy, with 56 participants recruited from
the community and four from the waiting list. With this in mind, high levels of pain-self efficacy
might be a trait of participants willing to engage in home-based Wii-Fit-U exercises and might
not be common in patients on a waiting list for treatment. In addition, older people managing
their chronic LBP in the community might be more willing to engage in Wii-Fit-U exercises than
patients on the waiting list. High baseline pain self-efficacy might also explain why there were
no between-group differences in pain self-efficacy immediately post-intervention, despite
significantly higher pain self-efficacy in the intervention group at 6 months. Previous studies
have demonstrated post-intervention improvements in pain self-efficacy for people with chronic
LBP when the sample had low baseline pain self-efficacy47-52, therefore, high baseline pain self-
efficacy likely reduces the scope for improvement. Nevertheless, the adjusted between-group
difference in pain self-efficacy scores at 6 months was 5.2, which is just below the minimal
important change (MIC) for people with chronic LBP (5.5)53. Therefore, a home-based video-
game exercise program may be even more beneficial for older people with chronic LBP and
lower levels of pain self-efficacy, and strategies to recruit these individuals should be considered
in future trials.
Given the enormous global cost of chronic LBP3,54, increasing an individual’s capacity to self-
173

manage their pain, while reducing the need for therapist supervision, should be a priority.
Numerous studies have investigated self-management approaches involving pain education and
exercise55, showing moderate effect sizes for pain and disability55. However, most of these
interventions involve extensive interactions with a therapist55,56. Despite this, the few studies that
investigated self-management strategies for chronic LBP with minimal supervision showed
promising results57-59. For example, a moderated email discussion group, combined with pain
education and exercise advice was more beneficial than usual care for reducing pain and
disability58. On the other hand, there has only been one study investigating a self-management
approach for older people with chronic LBP, and this involved extensive therapist supervision.
This study compared six weekly education seminars on the benefits of exercise, relaxation, and
goal setting, to a waiting list control group, but found no between-group differences in pain and
self-management attitudes60. A possible explanation for these findings could be poor adherence
to the seminars, with only 16% of participants attending every session. However, the possibility
that promoting self-management in older people with chronic LBP is more complex, cannot be
ruled out. This is highlighted by the findings of our trial, where pain and function significantly
improved following Wii-Fit-U exercises, but improvements in pain-self-efficacy and medication
usage were only greater than the control group at 6 months. Despite high adherence,
improvements in other outcomes may be more dependent on therapist supervision and may not
be adequately addressed during an unsupervised exercise program. In addition, the lack of
research on web-based or video-game self-management strategies in older people with chronic
LBP may reflect concerns with the familiarity and access to modern technology, but should
nonetheless be a consideration for future research.
174
Strengths and limitations
This study has numerous strengths. First, we ensured transparency by registering and publishing
our study protocol31. Second, Wii-Fit-U exercises are commercially available and of relative low
cost, making it suitable for use at home and direct implementation to the community if shown to
be effective in a large trial. In contrast, video-game interventions developed specifically for
research are rarely manufactured on a large scale, resulting in issues related to cost and
accessibility61-64. Third, consistency of the intervention was enhanced by only one
physiotherapist setting up the exercise program. Finally, we had a high response rate to the
questionnaires posted to participants at 3-months (93.3%) and 6-months (95.0%), which was
likely due to participants in the control group being offered Wii-Fit-U exercises following the
completion of the trial.
This study has limitations. First, we were unable to blind the participants and physiotherapist
administering the intervention. However, since Wii-Fit-U exercises were performed without
supervision this is unlikely to have a large impact on internal validity. Second, participants used
a paper exercise diary to track adherence, which may result in a degree of inaccuracy33.
However, unlike other studies in the field, we expressed adherence in numerous ways to get an
overall picture of how compliant the participants were to our recommendations34. Third, it was
not possible to extract exercise selection data from the software so there was no way to ensure
participants stuck to our recommendations, despite being reminded during fortnightly follow-up
calls. In addition, we did not ask participants to write down which exercises they performed each
session as this could have decreased motivation to use the program. However, since no single
175
type of exercise is superior for people with chronic LBP65-67, this information is unlikely to
influence the design of future trials.
Conclusion
This study provides preliminary evidence that an unsupervised home-based video-game exercise
program is feasible and can improve pain self-efficacy, pain, and function in older people with
chronic LBP. On the other hand, strategies to improve care-seeking behaviours, physical activity,
disability, fear of movement/re-injury, and falls-efficacy in this population need to be considered
in future trials. If the efficacy of video-game exercises is supported in a large trial, this will have
immediate implications for the self-management of LBP and is likely to reduce the management
costs of chronic LBP.
176
Acknowledgments
The authors would like to acknowledge the contribution of 12 Nintendo Wii-U consoles from
SJM, using funds from his International Postdoctoral Research Fellowship – The University of
Sydney. The authors would also like to acknowledge the in-kind contribution of three Nintendo
Wii U consoles from Nintendo, and the enormous contribution from numerous physiotherapy
and administrative Staff at Westmead Hospital, Sydney, Australia.
Funding
None received.
Conflict of Interest
None declared.
177

References
1. Vos T, Barber RM, Bell B, et al. Global, regional, and national incidence, prevalence,
and years lived with disability for 301 acute and chronic diseases and injuries in 188
countries, 1990-2013: a systematic analysis for the Global Burden of Disease Study 2013.
Lancet. 2015.
2. Walker BF, Muller R, Grant WD. Low Back Pain in Australian Adults: The Economic
Burden. Asia Pacific Journal of Public Health. 2003;15(2):79-87.
3. Wenig CM, Schmidt CO, Kohlmann T, Schweikert B. Costs of back pain in Germany.
Eur J Painn. 2009;13(3):280-286.
4. Frymoyer JW, Cats-Baril WL. An overview of the incidences and costs of low back pain.
Orthop Clin North Am. 1991;22(2):263-271.
5. Dionne CE, Dunn KM, Croft PR. Does back pain prevalence really decrease with
increasing age? A systematic review. Age Ageing. 2006;35(3):229-234.
6. Buchbinder R, Blyth FM, March LM, Brooks P, Woolf AD, Hoy DG. Placing the global
burden of low back pain in context. Best Pract Res Clin Rheumatol. 2013;27(5):575-589.
7. Pereira LS, Sherrington C, Ferreira ML, et al. Self-reported chronic pain is associated
with physical performance in older people leaving aged care rehabilitation. Clin Interv
Aging. 2014;9:259-265.
8. Paeck T, Ferreira ML, Sun C, Lin CW, Tiedemann A, Maher CG. Are older adults
missing from low back pain clinical trials? A systematic review and meta-analysis.
Arthritis Care Res (Hoboken). 2014;66(8):1220-1226.
9. Department of Economic and Social Affairs Population Division. World population
ageing 2009. New York: United Nations Publication; 2010.
178

10. van Middelkoop M, Rubinstein SM, Verhagen AP, Ostelo RW, Koes BW, van Tulder
MW. Exercise therapy for chronic nonspecific low-back pain. Best Pract Res Clin
Rheumatol. 2010;24(2):193-204.
11. Basler HD, Bertalanffy H, Quint S, Wilke A, Wolf U. TTM-based counselling in
physiotherapy does not contribute to an increase of adherence to activity
recommendations in older adults with chronic low back pain--a randomised controlled
trial. Eur J Pain. 2007;11(1):31-37.
12. Friedrich M, Gittler G, Halberstadt Y, Cermak T, Heiller I. Combined exercise and
motivation program: effect on the compliance and level of disability of patients with
chronic low back pain: a randomized controlled trial. Arch Phys Med Rehabil.
1998;79(5):475-487.
13. Asghari A, Nicholas MK. Pain self-efficacy beliefs and pain behaviour. A prospective
study. Pain. 2001;94(1):85-100.
14. Franco MR, Howard K, Sherrington C, et al. Eliciting older people's preferences for
exercise programs: a best-worst scaling choice experiment. J Physiother. 2015;61(1):34-
41.
15. Beinart NA, Goodchild CE, Weinman JA, Ayis S, Godfrey EL. Individual and
intervention-related factors associated with adherence to home exercise in chronic low
back pain: a systematic review. Spine J. 2013;13(12):1940-1950.
16. Nicholas MK. The pain self-efficacy questionnaire: Taking pain into account. Eur J Pain.
2007;11(2):153-163.
179

17. Lee H, Hubscher M, Moseley GL, et al. How does pain lead to disability? A systematic
review and meta-analysis of mediation studies in people with back and neck pain. Pain.
2015.
18. Ferreira ML, Machado G, Latimer J, Maher C, Ferreira PH, Smeets RJ. Factors defining
care-seeking in low back pain--a meta-analysis of population based surveys. Eur J Pain.
2010;14(7):747.e741-747.
19. Lazkani A, Delespierre T, Bauduceau B, et al. Healthcare costs associated with elderly
chronic pain patients in primary care. Eur J Clin Pharmacol. 2015;71(8):939-947.
20. Ravenek KE, Wolfe DL, Hitzig SL. A scoping review of video gaming in rehabilitation.
Disabil Rehabil Assist Technol. 2015:1-9.
21. Szturm T, Betker AL, Moussavi Z, Desai A, Goodman V. Effects of an interactive
computer game exercise regimen on balance impairment in frail community-dwelling
older adults: a randomized controlled trial. Phys Ther. 2011;91(10):1449-1462.
22. Jorgensen MG, Laessoe U, Hendriksen C, Nielsen OB, Aagaard P. Efficacy of Nintendo
Wii training on mechanical leg muscle function and postural balance in community-
dwelling older adults: a randomized controlled trial. J Gerontol A Biol Sci Med Sci.
2013;68(7):845-852.
23. Kim SS, Min WK, Kim JH, Lee BH. The Effects of VR-based Wii Fit Yoga on Physical
Function in Middle-aged Female LBP Patients. J Phys Ther Sci. 2014;26(4):549-552.
24. Park JH, Lee SH, Ko DS. The Effects of the Nintendo Wii Exercise Program on Chronic
Work-related Low Back Pain in Industrial Workers. J Phys Ther Sci. 2013;25(8):985-
988.
180

25. Miller KJ, Adair BS, Pearce AJ, Said CM, Ozanne E, Morris MM. Effectiveness and
feasibility of virtual reality and gaming system use at home by older adults for enabling
physical activity to improve health-related domains: a systematic review. Age Ageing.
2014;43(2):188-195.
26. Warburton DE, Bredin SS, Horita LT, et al. The health benefits of interactive video game
exercise. Appl Physiol Nutr Metab. 2007;32(4):655-663.
27. Jordan JL, Holden MA, Mason EE, Foster NE. Interventions to improve adherence to
exercise for chronic musculoskeletal pain in adults. Cochrane Database Syst Rev.
2010(1):Cd005956.
28. Escolar-Reina P, Medina-Mirapeix F, Gascon-Canovas JJ, et al. How do care-provider
and home exercise program characteristics affect patient adherence in chronic neck and
back pain: a qualitative study. BMC Health Serv Res. 2010;10:60.
29. Schulz KF, Altman DG, Moher D. CONSORT 2010 statement: Updated guidelines for
reporting parallel group randomised trials. J Pharmacol Pharmacother. 2010;1(2):100-
107.
30. Hoffmann TC, Glasziou PP, Boutron I, et al. Better reporting of interventions: template
for intervention description and replication (TIDieR) checklist and guide. BMJ.
2014;348.
31. Zadro JR, Shirley D, Simic M, et al. Video-game based exercises for older people with
chronic low back pain: a protocol for a feasibility randomised controlled trial (the
GAMEBACK trial). Physiotherapy. 2016;103(2):146-53.
32. Browne RH. On the use of a pilot sample for sample size determination. Stat Med.
1995;14(17):1933-1940.
181

33. Stone AA, Shiffman S, Schwartz JE, Broderick JE, Hufford MR. Patient compliance with
paper and electronic diaries. Control Clin Trials. 2003;24(2):182-199.
34. Nicolson PJ, Bennell KL, Dobson FL, Van Ginckel A, Holden MA, Hinman RS.
Interventions to increase adherence to therapeutic exercise in older adults with low back
pain and/or hip/knee osteoarthritis: a systematic review and meta-analysis. Br J Sports
Med. 2017.
35. Paul A. Harris, Robert Taylor, Robert Thielke, Jonathon Payne, Nathaniel Gonzalez, Jose
G. Conde, Research electronic data capture (REDCap) - A metadata-driven methodology
and workflow process for providing translational research informatics support. J Biomed
Inform. 2009 Apr;42(2):377-81.
36. Topolski TD, LoGerfo J, Patrick DL, Williams B, Walwick J, Patrick MB. The Rapid
Assessment of Physical Activity (RAPA) among older adults. Prev Chronic Dis.
2006;3(4):A118.
37. Garber CE, Blissmer B, Deschenes MR, et al. American College of Sports Medicine
position stand. Quantity and quality of exercise for developing and maintaining
cardiorespiratory, musculoskeletal, and neuromotor fitness in apparently healthy adults:
guidance for prescribing exercise. Med Sci Sports Exerc. 2011;43(7):1334-1359.
38. Adams SA, Wirth MD, Khan S, et al. The association of C-reactive protein and physical
activity among a church-based population of African Americans. Prev Med.
2015;77(Supplement C):137-140.
39. Von Korff M, Jensen MP, Karoly P. Assessing global pain severity by self-report in
clinical and health services research. Spine (Phila Pa 1976). 2000;25(24):3140-3151.
182

40. Stratford P, Gill C, Westaway M, Binkley J. Assessing disability and change on
individual patients: a report of a patient specific measure. Physiother Can. 1995;47:258-
263.
41. Roland M, Morris R. A study of the natural history of back pain. Part I: development of a
reliable and sensitive measure of disability in low-back pain. Spine (Phila Pa 1976).
1983;8(2):141-144.
42. Woby SR, Roach NK, Urmston M, Watson PJ. Psychometric properties of the TSK-11:
A shortened version of the Tampa Scale for Kinesiophobia. Pain. 2005;117(1–2):137-
144.
43. Hauer K, Yardley L, Beyer N, et al. Validation of the Falls Efficacy Scale and Falls
Efficacy Scale International in geriatric patients with and without cognitive impairment:
results of self-report and interview-based questionnaires. Gerontol. 2010;56(2):190-199.
44. Harkapaa K, Jarvikoski A, Mellin G, Hurri H. A controlled study on the outcome of
inpatient and outpatient treatment of low back pain. Part I. Pain, disability, compliance,
and reported treatment benefits three months after treatment. Scand J Rehabil Med.
1989;21(2):81-89.
45. Sluijs EM, Kok GJ, van der Zee J. Correlates of exercise compliance in physical therapy.
Phys Ther. 1993;73(11):771-782; discussion 783-776.
46. Reilly K, Lovejoy B, Williams R, Roth H. Differences between a supervised and
independent strength and conditioning program with chronic low back syndromes. J
Occup Med. 1989;31(6):547-550.
47. Vong SK, Cheing GL, Chan F, So EM, Chan CC. Motivational enhancement therapy in
addition to physical therapy improves motivational factors and treatment outcomes in
183

people with low back pain: a randomized controlled trial. Arch Phys Med Rehabil.
2011;92(2):176-183.
48. Wajswelner H, Metcalf B, Bennell K. Clinical pilates versus general exercise for chronic
low back pain: randomized trial. Med Sci Sports Exerc. 2012;44(7):1197-1205.
49. Tilbrook HE, Cox H, Hewitt CE, et al. Yoga for chronic low back pain: a randomized
trial. Ann Intern Med. 2011;155(9):569-578.
50. Lamb SE, Lall R, Hansen Z, et al. A multicentred randomised controlled trial of a
primary care-based cognitive behavioural programme for low back pain. The Back Skills
Training (BeST) trial. Health Technol Assess. 2010;14(41):1-253, iii-iv.
51. Woods MP, Asmundson GJ. Evaluating the efficacy of graded in vivo exposure for the
treatment of fear in patients with chronic back pain: a randomized controlled clinical trial.
Pain. 2008;136(3):271-280.
52. van Hooff ML, van der Merwe JD, O'Dowd J, et al. Daily functioning and self-
management in patients with chronic low back pain after an intensive cognitive
behavioral programme for pain management. Eur Spine J. 2010;19(9):1517-1526.
53. Chiarotto A, Vanti C, Cedraschi C, et al. Responsiveness and Minimal Important Change
of the Pain Self-Efficacy Questionnaire and Short Forms in Patients With Chronic Low
Back Pain. J Pain. 2016;17(6):707-718.
54. Gore M, Sadosky A, Stacey BR, Tai KS, Leslie D. The burden of chronic low back pain:
clinical comorbidities, treatment patterns, and health care costs in usual care settings.
Spine. 2012;37(11):E668-677.
55. Du S, Hu L, Dong J, et al. Self-management program for chronic low back pain: A
systematic review and meta-analysis. Patient Educ Couns. 2017;100(1):37-49.
184

56. Moessner M, Schiltenwolf M, Neubauer E. Internet-based aftercare for patients with back
pain-a pilot study. Telemed J E Health. 2012;18(6):413-419.
57. Carpenter KM, Stoner SA, Mundt JM, Stoelb B. An online self-help CBT intervention
for chronic lower back pain. Clin J Pain. 2012;28(1):14-22.
58. Lorig KR, Laurent DD, Deyo RA, Marnell ME, Minor MA, Ritter PL. Can a Back Pain
E-mail Discussion Group improve health status and lower health care costs?: A
randomized study. Arch Intern Med. 2002;162(7):792-796.
59. Irvine AB, Russell H, Manocchia M, et al. Mobile-Web app to self-manage low back
pain: randomized controlled trial. J Med Internet Res. 2015;17(1):e1.
60. Haas M, Groupp E, Muench J, et al. Chronic disease self-management program for low
back pain in the elderly. J Manipulative Physiol Ther. 2005;28(4):228-237.
61. Thomas JS, France CR, Applegate ME, Leitkam ST, Walkowski S. Feasibility and Safety
of a Virtual Reality Dodgeball Intervention for Chronic Low Back Pain: A Randomized
Clinical Trial. J Pain. 2016;17(12):1302-1317.
62. Chan EA, Chung JW, Wong TK, Lien AS, Yang JY. Application of a virtual reality
prototype for pain relief of pediatric burn in Taiwan. J Clin Nurs. 2007;16(4):786-793.
63. Sato K, Fukumori S, Matsusaki T, et al. Nonimmersive virtual reality mirror visual
feedback therapy and its application for the treatment of complex regional pain
syndrome: an open-label pilot study. Pain Med. 2010;11(4):622-629.
64. Botella C, Garcia-Palacios A, Vizcaino Y, Herrero R, Banos RM, Belmonte MA. Virtual
reality in the treatment of fibromyalgia: a pilot study. Cyberpsychol Behav Soc Netw.
2013;16(3):215-223.
185

65. Bystrom MG, Rasmussen-Barr E, Grooten WJ. Motor control exercises reduces pain and
disability in chronic and recurrent low back pain: a meta-analysis. Spine.
2013;38(6):E350-358.
66. Ferreira ML, Ferreira PH, Latimer J, et al. Comparison of general exercise, motor control
exercise and spinal manipulative therapy for chronic low back pain: A randomized trial.
Pain. 2007;131(1-2):31-37.
67. Wells C, Kolt GS, Marshall P, Hill B, Bialocerkowski A. Effectiveness of Pilates
exercise in treating people with chronic low back pain: a systematic review of systematic
reviews. BMC Med Res Methodol. 2013;13:7.
186

Table 1. Inclusion and exclusion criteria. 1
Inclusion Exclusion
> 55 years old
Non-specific mechanical LBP for at least 3 months
Usual pain intensity 3/10 or greater on the NRS
Sufficient English ability to understand exercise instructions
Able to mobilise independently without the use of walking aids
Have access to a HDMI compatible television at home
Diagnosis of serious pathology in the spine (such as fracture, metastatic disease, spinal stenosis, cauda equina syndrome)
Evidence of nerve root compromise
Any medical condition or disability that will prevent participation in the exercise program, including:
• Cardiovascular risk factors: assessed usingthe PAR-Q, a screening tool recommendedfor all adults willing to initiate an exerciseprograma
• Cognitive limitations: Mini Mental StateExamination <25/30, a reliable and valid testof cognitive functionb
• High risk of falls: Falls Risk AssessmentTool score >15, a reliable measure of fallsrisk in older adultsc
Physiotherapy treatment for their LBP in the last 6 months
Need for clearance from their general practitioner before participating in this trial:
Participants who experience dizziness or altered consciousness, use prescribed medications or have uncontrolled diabetes
LBP: low back pain; NRS: Numerical Rating Scale; HDMI: High-Definition Multimedia 2 Interface; PAR-Q: Physical Activity Readiness-Questionnaire. 3 aThompson PD, Arena R, Riebe D, Pescatello LS. ACSM's new preparticipation health screening 4 recommendations from ACSM's guidelines for exercise testing and prescription, ninth edition. 5 Curr Sports Med Rep. 2013;12:215-7. 6 bFolstein MF, Folstein SE, McHugh PR. "Mini-mental state". A practical method for grading the 7 cognitive state of patients for the clinician. J Psychiatr Res. 1975;12:189-98. 8 cStapleton C, Hough P, Oldmeadow L, Bull K, Hill K, Greenwood K. Four-item fall risk 9 screening tool for subacute and residential aged care: The first step in fall prevention. Australas J 10 Ageing. 2009;28:139-43. 11
12
187
Reprinted from Physiotherapy, 2016;103(2):146-53, Zadro JR, Shirley D, Simic M, Mousavi SJ, Ceprnja D, Maka K, Ferreira PH. Video-game based exercises for older people with chronic low back pain: a protocol for a feasibility randomised controlled trial (the GAMEBACK trial). Copyright © 2016, with permission from Elsevier.
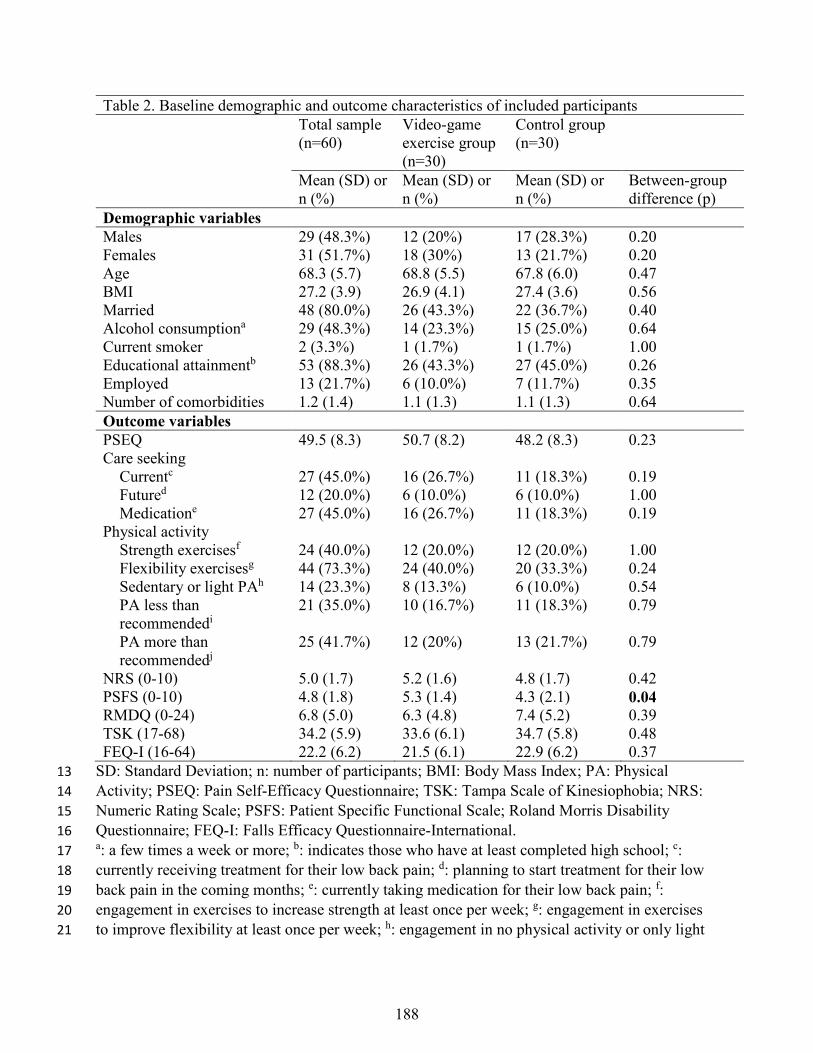
Table 2. Baseline demographic and outcome characteristics of included participants Total sample
(n=60) Video-game exercise group (n=30)
Control group (n=30)
Mean (SD) or n (%)
Mean (SD) or n (%)
Mean (SD) or n (%)
Between-group difference (p)
Demographic variables Males 29 (48.3%) 12 (20%) 17 (28.3%) 0.20 Females 31 (51.7%) 18 (30%) 13 (21.7%) 0.20 Age 68.3 (5.7) 68.8 (5.5) 67.8 (6.0) 0.47 BMI 27.2 (3.9) 26.9 (4.1) 27.4 (3.6) 0.56 Married 48 (80.0%) 26 (43.3%) 22 (36.7%) 0.40 Alcohol consumptiona 29 (48.3%) 14 (23.3%) 15 (25.0%) 0.64 Current smoker 2 (3.3%) 1 (1.7%) 1 (1.7%) 1.00 Educational attainmentb 53 (88.3%) 26 (43.3%) 27 (45.0%) 0.26 Employed 13 (21.7%) 6 (10.0%) 7 (11.7%) 0.35 Number of comorbidities 1.2 (1.4) 1.1 (1.3) 1.1 (1.3) 0.64 Outcome variables PSEQ 49.5 (8.3) 50.7 (8.2) 48.2 (8.3) 0.23 Care seeking Currentc 27 (45.0%) 16 (26.7%) 11 (18.3%) 0.19 Futured 12 (20.0%) 6 (10.0%) 6 (10.0%) 1.00 Medicatione 27 (45.0%) 16 (26.7%) 11 (18.3%) 0.19 Physical activity Strength exercisesf 24 (40.0%) 12 (20.0%) 12 (20.0%) 1.00 Flexibility exercisesg 44 (73.3%) 24 (40.0%) 20 (33.3%) 0.24 Sedentary or light PAh 14 (23.3%) 8 (13.3%) 6 (10.0%) 0.54 PA less than
recommendedi 21 (35.0%) 10 (16.7%) 11 (18.3%) 0.79
PA more than recommendedj
25 (41.7%) 12 (20%) 13 (21.7%) 0.79
NRS (0-10) 5.0 (1.7) 5.2 (1.6) 4.8 (1.7) 0.42 PSFS (0-10) 4.8 (1.8) 5.3 (1.4) 4.3 (2.1) 0.04 RMDQ (0-24) 6.8 (5.0) 6.3 (4.8) 7.4 (5.2) 0.39 TSK (17-68) 34.2 (5.9) 33.6 (6.1) 34.7 (5.8) 0.48 FEQ-I (16-64) 22.2 (6.2) 21.5 (6.1) 22.9 (6.2) 0.37
SD: Standard Deviation; n: number of participants; BMI: Body Mass Index; PA: Physical 13 Activity; PSEQ: Pain Self-Efficacy Questionnaire; TSK: Tampa Scale of Kinesiophobia; NRS: 14 Numeric Rating Scale; PSFS: Patient Specific Functional Scale; Roland Morris Disability 15 Questionnaire; FEQ-I: Falls Efficacy Questionnaire-International. 16 a: a few times a week or more; b: indicates those who have at least completed high school; c: 17 currently receiving treatment for their low back pain; d: planning to start treatment for their low 18 back pain in the coming months; e: currently taking medication for their low back pain; f: 19 engagement in exercises to increase strength at least once per week; g: engagement in exercises 20 to improve flexibility at least once per week; h: engagement in no physical activity or only light 21
188
physical activity each week; i: engagement in moderate or vigorous-intensity physical activity 22 each week that is less than recommended by the American College of Sports Medicine (ACSM); 23 j: engagement in physical activity that meets the ACSM recommendations. 24
25
189

Table 3. Adherence to Wii-Fit-U exercises Week 1 Week 2 Week 3 Week 4 Week 5 Week 6 Week 7 Week
8 Total
Average minutes (%)
169.3 (94.1)
146.4 (81.3)
131.7 (73.2)
126.8 (70.5)
126.7 (70.4)
124.2 (69.0)
107.3 (59.6)
93.7 (52.0)
1019.1 (70.8)
Average number of adherent sessions (%)
1.42 (47.4)
1.54 (51.3)
1.35 (44.9)
1.27 (42.3)
1.35 (44.9)
1.19 (39.7)
1.15 (38.5)
0.81 (26.9)
10.08 (42.0)
Average number of sessions (%)
3.46 (115.4)
2.92 (97.4)
2.77 (92.3)
2.46 (82.1)
2.42 (80.8)
2.38 (79.5)
2.08 (69.2)
1.92 (64.1)
20.42 (85.1)
26
190

Table 4. Effect of a video-game exercise program on pain self-efficacy, pain, function, disability, fear of movement/re-injury and falls efficacy Video-
game exercise group+
Control group++
Unadjusted between-group difference
Adjusted between-group difference
Mean (SD) Mean (SD) β 95% CI p β* 95% CI p PSEQ Baseline 50.7 (8.2) 48.2 (8.3) 8 weeks 47.8 (10.3) 44.6 (9.6) 3.20 -2.04 to 8.43 0.23 1.20 -3.23 to 5.64 0.59
3 months 49.2 (8.8) 43.1 (12.1) 6.06 0.43 to 11.69 0.04 4.33 -0.24 to 8.80 0.06 6 months 48.8 (10.5) 41.7 (11.2) 7.11 1.34 to 12.89 0.02 5.17 0.52 to 9.82 0.03 NRS Baseline 5.2 (1.6) 4.8 (1.7) 8 weeks 3.8 (2.4) 4.4 (2.3) -0.66 -1.90 to 0.58 0.29 -1.07 -2.11 to -0.03 0.04
PSFS Baseline 5.3 (1.4) 4.3 (2.1) 8 weeks 6.5 (2.1) 4.8 (2.5) 1.69 0.50 to 2.88 0.01 1.21 0.10 to 2.33 0.03
RMDQ Baseline 6.3 (4.8) 7.4 (5.2) 8 weeks 4.9 (4.5) 6.4 (4.4) -1.49 -3.85 to 0.86 0.21 -0.85 -2.58 to 0.89 0.33
TSK Baseline 33.6 (6.1) 34.7 (5.8) 8 weeks 32.3 (7.1) 35.9 (5.8) -3.52 -6.97 to -0.08 0.05 -2.97 -6.14 to 0.21 0.07
FEQ-I Baseline 21.5 (6.1) 22.9 (6.2) 8 weeks 21.1 (5.8) 23.4 (7.0) -2.30 -5.65 to 1.06 0.18 -1.08 -3.08 to 0.92 0.28 SD: Standard Deviation; n: number of participants; CI: confidence interval; PSEQ: Pain Self-27 Efficacy Questionnaire; TSK: Tampa Scale of Kinesiophobia; NRS: Numeric Rating Scale; 28 PSFS: Patient Specific Functional Scale; Roland Morris Disability Questionnaire; FEQ-I: Falls 29 Efficacy Questionnaire-International. 30 +: there were 30, 30, 29, and 29 participants with follow-up data at baseline, 8 weeks, 3 months, 31 and 6 months respectively; 32 ++: there were 30, 28, 27, and 28 participants with follow-up data at baseline, 8 weeks, 3 months, 33 and 6 months respectively. 34 *: adjusted for baseline values and function (baseline Patient Specific Functional Scale). 35 36
191
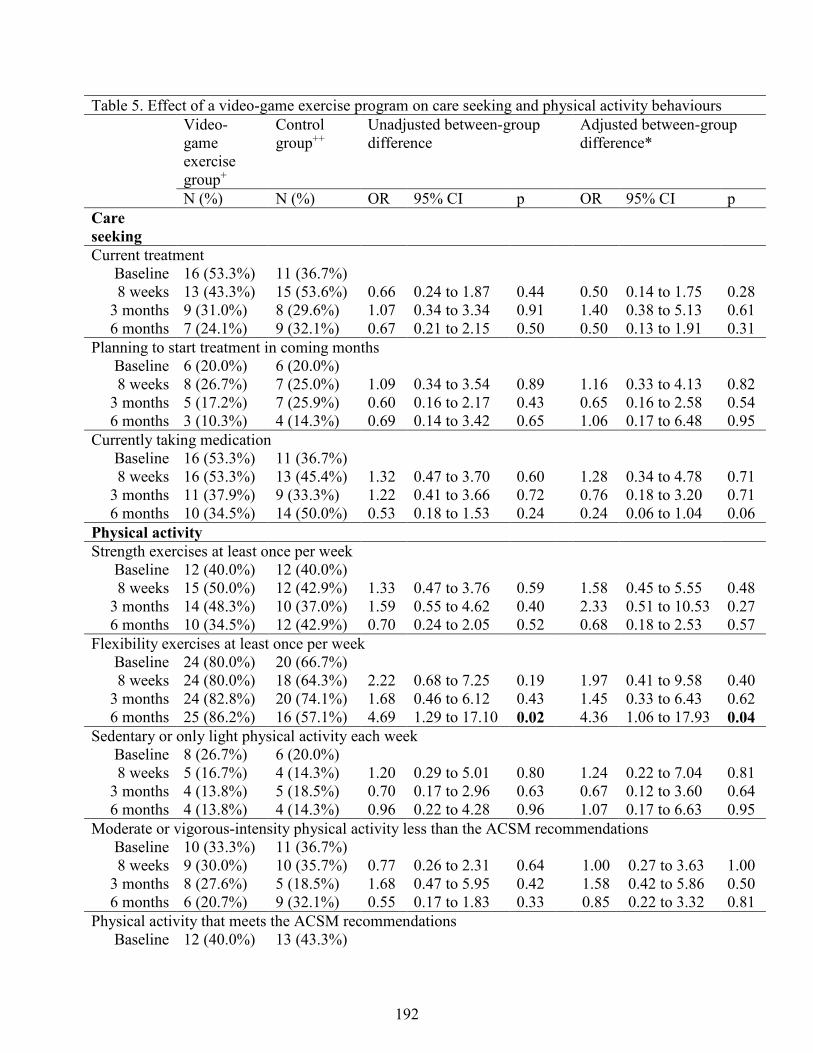
Table 5. Effect of a video-game exercise program on care seeking and physical activity behaviours Video-
game exercise group+
Control group++
Unadjusted between-group difference
Adjusted between-group difference*
N (%) N (%) OR 95% CI p OR 95% CI p Care seeking
Current treatment Baseline 16 (53.3%) 11 (36.7%) 8 weeks 13 (43.3%) 15 (53.6%) 0.66 0.24 to 1.87 0.44 0.50 0.14 to 1.75 0.28
3 months 9 (31.0%) 8 (29.6%) 1.07 0.34 to 3.34 0.91 1.40 0.38 to 5.13 0.61 6 months 7 (24.1%) 9 (32.1%) 0.67 0.21 to 2.15 0.50 0.50 0.13 to 1.91 0.31
Planning to start treatment in coming months Baseline 6 (20.0%) 6 (20.0%) 8 weeks 8 (26.7%) 7 (25.0%) 1.09 0.34 to 3.54 0.89 1.16 0.33 to 4.13 0.82
3 months 5 (17.2%) 7 (25.9%) 0.60 0.16 to 2.17 0.43 0.65 0.16 to 2.58 0.54 6 months 3 (10.3%) 4 (14.3%) 0.69 0.14 to 3.42 0.65 1.06 0.17 to 6.48 0.95
Currently taking medication Baseline 16 (53.3%) 11 (36.7%) 8 weeks 16 (53.3%) 13 (45.4%) 1.32 0.47 to 3.70 0.60 1.28 0.34 to 4.78 0.71
3 months 11 (37.9%) 9 (33.3%) 1.22 0.41 to 3.66 0.72 0.76 0.18 to 3.20 0.71 6 months 10 (34.5%) 14 (50.0%) 0.53 0.18 to 1.53 0.24 0.24 0.06 to 1.04 0.06
Physical activity Strength exercises at least once per week
Baseline 12 (40.0%) 12 (40.0%) 8 weeks 15 (50.0%) 12 (42.9%) 1.33 0.47 to 3.76 0.59 1.58 0.45 to 5.55 0.48
3 months 14 (48.3%) 10 (37.0%) 1.59 0.55 to 4.62 0.40 2.33 0.51 to 10.53 0.27 6 months 10 (34.5%) 12 (42.9%) 0.70 0.24 to 2.05 0.52 0.68 0.18 to 2.53 0.57
Flexibility exercises at least once per week Baseline 24 (80.0%) 20 (66.7%) 8 weeks 24 (80.0%) 18 (64.3%) 2.22 0.68 to 7.25 0.19 1.97 0.41 to 9.58 0.40
3 months 24 (82.8%) 20 (74.1%) 1.68 0.46 to 6.12 0.43 1.45 0.33 to 6.43 0.62 6 months 25 (86.2%) 16 (57.1%) 4.69 1.29 to 17.10 0.02 4.36 1.06 to 17.93 0.04
Sedentary or only light physical activity each week Baseline 8 (26.7%) 6 (20.0%) 8 weeks 5 (16.7%) 4 (14.3%) 1.20 0.29 to 5.01 0.80 1.24 0.22 to 7.04 0.81
3 months 4 (13.8%) 5 (18.5%) 0.70 0.17 to 2.96 0.63 0.67 0.12 to 3.60 0.64 6 months 4 (13.8%) 4 (14.3%) 0.96 0.22 to 4.28 0.96 1.07 0.17 to 6.63 0.95
Moderate or vigorous-intensity physical activity less than the ACSM recommendations Baseline 10 (33.3%) 11 (36.7%) 8 weeks 9 (30.0%) 10 (35.7%) 0.77 0.26 to 2.31 0.64 1.00 0.27 to 3.63 1.00
3 months 8 (27.6%) 5 (18.5%) 1.68 0.47 to 5.95 0.42 1.58 0.42 to 5.86 0.50 6 months 6 (20.7%) 9 (32.1%) 0.55 0.17 to 1.83 0.33 0.85 0.22 to 3.32 0.81
Physical activity that meets the ACSM recommendations Baseline 12 (40.0%) 13 (43.3%)
192
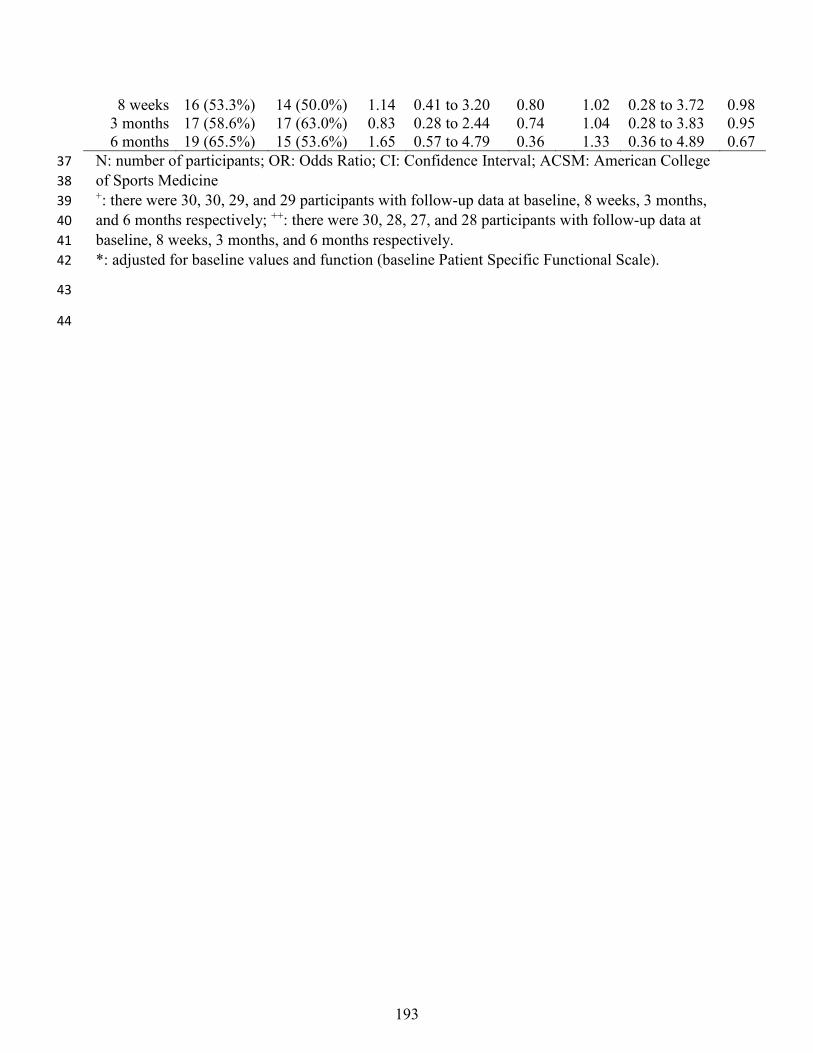
8 weeks 16 (53.3%) 14 (50.0%) 1.14 0.41 to 3.20 0.80 1.02 0.28 to 3.72 0.98 3 months 17 (58.6%) 17 (63.0%) 0.83 0.28 to 2.44 0.74 1.04 0.28 to 3.83 0.95 6 months 19 (65.5%) 15 (53.6%) 1.65 0.57 to 4.79 0.36 1.33 0.36 to 4.89 0.67
N: number of participants; OR: Odds Ratio; CI: Confidence Interval; ACSM: American College 37 of Sports Medicine 38 +: there were 30, 30, 29, and 29 participants with follow-up data at baseline, 8 weeks, 3 months, 39 and 6 months respectively; ++: there were 30, 28, 27, and 28 participants with follow-up data at 40 baseline, 8 weeks, 3 months, and 6 months respectively. 41 *: adjusted for baseline values and function (baseline Patient Specific Functional Scale). 42
43
44
193

Figure legend
Fig 1. CONSORT flowchart
194
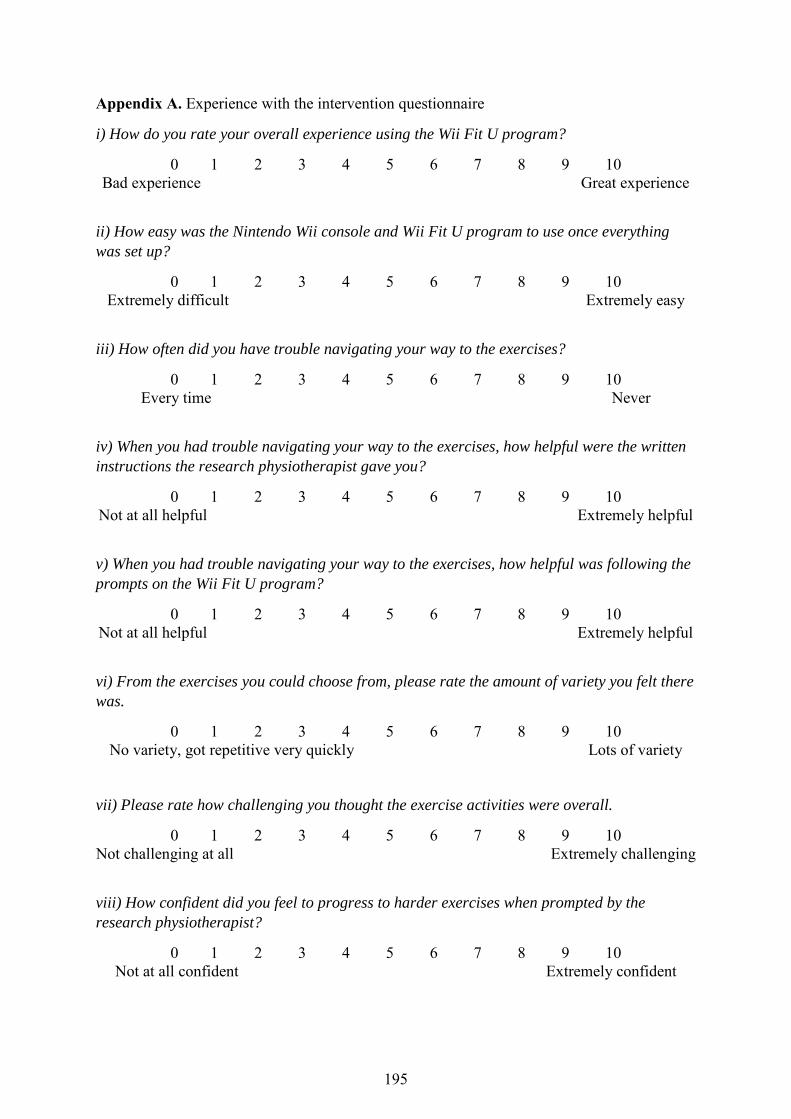
Appendix A. Experience with the intervention questionnaire
i) How do you rate your overall experience using the Wii Fit U program?
0 1 2 3 4 5 6 7 8 9 10 Bad experience Great experience
ii) How easy was the Nintendo Wii console and Wii Fit U program to use once everything was set up?
0 1 2 3 4 5 6 7 8 9 10 Extremely difficult Extremely easy
iii) How often did you have trouble navigating your way to the exercises?
0 1 2 3 4 5 6 7 8 9 10 Every time Never
iv) When you had trouble navigating your way to the exercises, how helpful were the written instructions the research physiotherapist gave you?
0 1 2 3 4 5 6 7 8 9 10 Not at all helpful Extremely helpful
v) When you had trouble navigating your way to the exercises, how helpful was following the prompts on the Wii Fit U program?
0 1 2 3 4 5 6 7 8 9 10 Not at all helpful Extremely helpful
vi) From the exercises you could choose from, please rate the amount of variety you felt there was.
0 1 2 3 4 5 6 7 8 9 10 No variety, got repetitive very quickly Lots of variety
vii) Please rate how challenging you thought the exercise activities were overall.
0 1 2 3 4 5 6 7 8 9 10 Not challenging at all Extremely challenging
viii) How confident did you feel to progress to harder exercises when prompted by the research physiotherapist?
0 1 2 3 4 5 6 7 8 9 10 Not at all confident Extremely confident
195
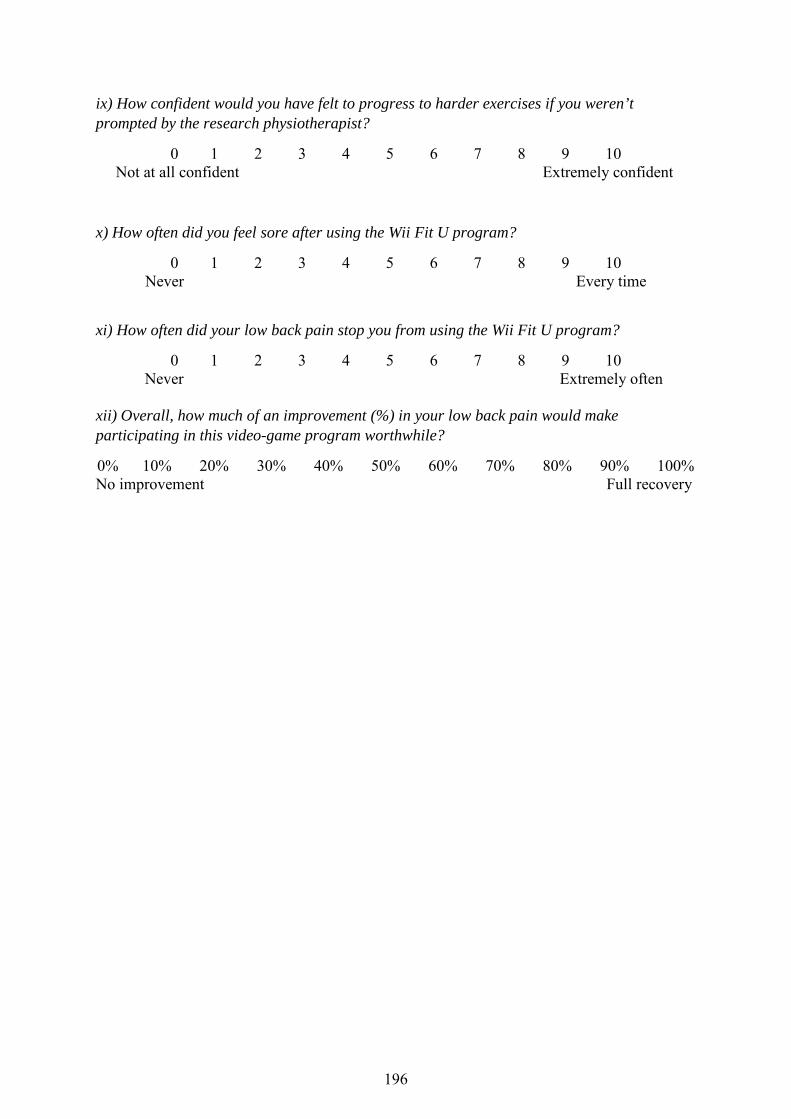
ix) How confident would you have felt to progress to harder exercises if you weren’t prompted by the research physiotherapist?
0 1 2 3 4 5 6 7 8 9 10 Not at all confident Extremely confident
x) How often did you feel sore after using the Wii Fit U program?
0 1 2 3 4 5 6 7 8 9 10 Never Every time
xi) How often did your low back pain stop you from using the Wii Fit U program?
0 1 2 3 4 5 6 7 8 9 10 Never Extremely often
xii) Overall, how much of an improvement (%) in your low back pain would make participating in this video-game program worthwhile?
0% 10% 20% 30% 40% 50% 60% 70% 80% 90% 100% No improvement Full recovery
196
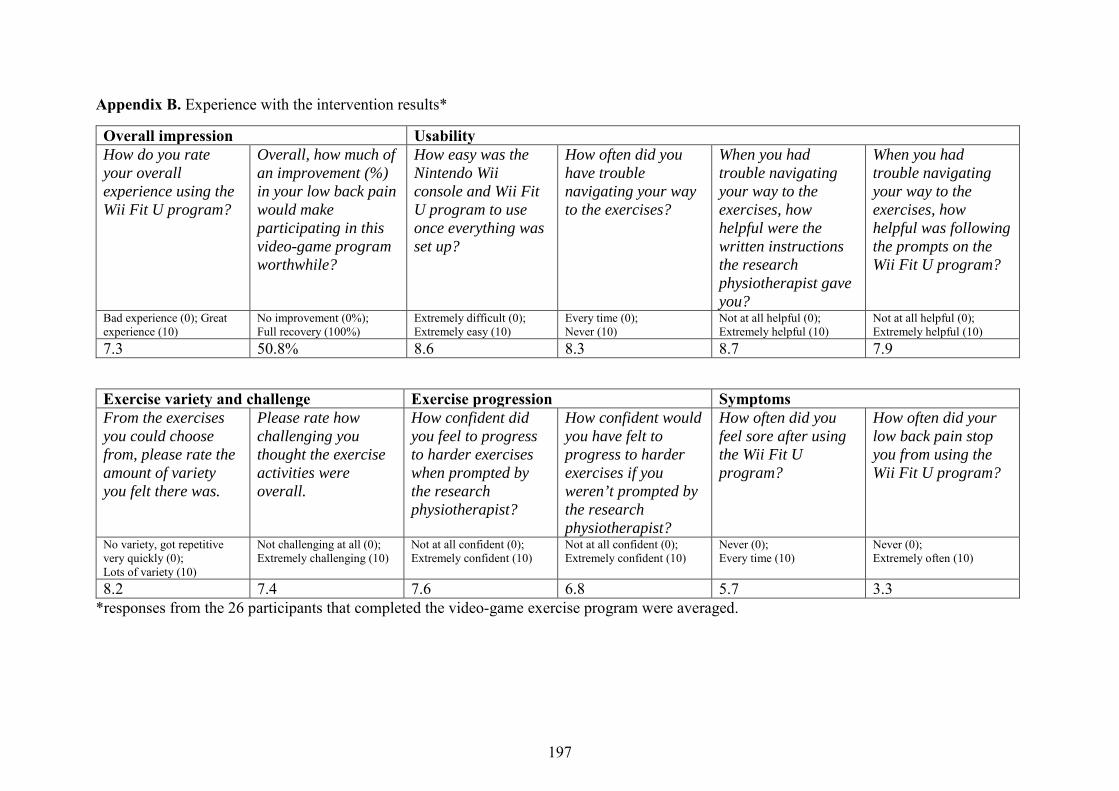
Appendix B. Experience with the intervention results*
Overall impression Usability How do you rate your overall experience using the Wii Fit U program?
Overall, how much of an improvement (%) in your low back pain would make participating in this video-game program worthwhile?
How easy was the Nintendo Wii console and Wii Fit U program to use once everything was set up?
How often did you have trouble navigating your way to the exercises?
When you had trouble navigating your way to the exercises, how helpful were the written instructions the research physiotherapist gave you?
When you had trouble navigating your way to the exercises, how helpful was following the prompts on the Wii Fit U program?
Bad experience (0); Great experience (10)
No improvement (0%); Full recovery (100%)
Extremely difficult (0); Extremely easy (10)
Every time (0); Never (10)
Not at all helpful (0); Extremely helpful (10)
Not at all helpful (0); Extremely helpful (10)
7.3 50.8% 8.6 8.3 8.7 7.9
Exercise variety and challenge Exercise progression Symptoms From the exercises you could choose from, please rate the amount of variety you felt there was.
Please rate how challenging you thought the exercise activities were overall.
How confident did you feel to progress to harder exercises when prompted by the research physiotherapist?
How confident would you have felt to progress to harder exercises if you weren’t prompted by the research physiotherapist?
How often did you feel sore after using the Wii Fit U program?
How often did your low back pain stop you from using the Wii Fit U program?
No variety, got repetitive very quickly (0); Lots of variety (10)
Not challenging at all (0); Extremely challenging (10)
Not at all confident (0); Extremely confident (10)
Not at all confident (0); Extremely confident (10)
Never (0); Every time (10)
Never (0); Extremely often (10)
8.2 7.4 7.6 6.8 5.7 3.3 *responses from the 26 participants that completed the video-game exercise program were averaged.
197

CHAPTER NINE
Conclusion
198
9.1. Overview of findings
The broad aims of this thesis were to investigate the role of shared familial factors in the
development of LBP, and in the recovery and management of chronic LBP; and to investigate
a novel home-based exercise program for older people with chronic LBP. More specifically
this thesis investigated : i) the relationship between chronic low back pain (LBP) and physical
activity, LBP and the built environment , and chronic LBP and educational attainment, while
using a co-twin design to control for the confounding effects of shared familial factors
(Chapters Two, Three and Four); ii) the role of shared familial factors in the recovery from
chronic LBP (Chapter Five); iii) the role of shared familial factors in the response to
increased physical activity in healthy adults (Chapter Six); and iv) the feasibility and clinical
effects of a home-based video-game exercise program for older people with chronic LBP
through a pilot randomized controlled trial (Chapters Seven and Eight).
9.1.1. Risk factors and factors associated with low back pain and chronic low back pain
A better understanding of risk factors and factors associated with LBP and chronic LBP will
help guide the development of future intervention and prevention strategies and was the main
focus of Chapters Two, Three and Four. Chapter Two presented the results of a cross-
sectional study investigating whether individuals with chronic LBP are meeting the World
Health Organisation physical activity guidelines. Our results showed that individuals with a
history of chronic LBP who experienced pain in the past 4 weeks were less likely to meet the
physical activity guidelines compared to those with no history of chronic LBP. Furthermore,
individuals who hadn’t experienced a pain free month in the last 6 months, and individuals
with a history of chronic LBP but without LBP in the past 4 weeks, had a similar likelihood
of meeting the physical activity guidelines compared to those with no history of chronic LBP.
These findings have important implications for the prescription of physical activity for
199

individuals with chronic LBP. However, the association between recent LBP and physical
activity in people with a history of chronic LBP disappeared after controlling for the
influence of genetics and shared environmental factors, highlighting that shared familial
factors are driving this relationship. To put it another way, the observed relationship between
recent chronic LBP and physical activity might be explained by the presence of genetic or
shared environmental factors common to the development of both traits, and should be
considered in future studies investigating the relationship between chronic LBP and physical
activity.
Chapter Three presented the results of a cross-sectional study that aimed to confirm the
findings of Chapter Two in a larger sample of twins, while investigating whether the built
environment moderated the relationship between LBP and physical activity. Our results
showed that individuals with LBP were less likely to meet the physical activity guidelines, or
walk more than 150 minutes per week, compared to those free of LBP if they lived in an
environment with a short walkable distance to nearby amenities (high walkability). Unlike
the results presented in Chapters Two, the magnitude of these findings strengthened when we
adjusted for the influence of genetics and shared environmental factors. This indicates the
presence of a direct relationship between LBP and physical activity for individuals living in
an environment with high walkability, or that this relationship exists independent of shared
familial factors. Furthermore, physical activity levels did not differ between individuals with
or without LBP living in an environment with low walkability, which may suggest the built
environment is a larger barrier to physical activity engagement than LBP.
Chapter Four built on the methodology used in Chapters Two and Three and applied it to a
longitudinal study design investigating educational attainment as a risk factor for chronic
200

LBP. The results showed that females with low educational attainment had an increased risk
of chronic LBP, while females with high educational attainment had a decreased the risk of
chronic LBP. However, similar to the findings in Chapter Two, genetics and shared
environmental factors are likely confounders of the relationship between educational
attainment and chronic LBP in females, since these associations disappeared when
controlling for genetics and shared environmental factors. We found no association between
educational attainment and the risk of chronic LBP in males. Taken together, these findings
highlight the importance of considering the role of gender and shared familial factors in the
relationship between educational attainment and chronic LBP.
Chapters Two, Three and Four investigated the role of shared familial factors in the
development of LBP and found that genetics and shared environmental factors appear to be
confounding the relationship between recent chronic LBP and physical activity, and chronic
LBP and educational attainment in females. However, the strong relationship observed
between LBP and physical activity for individuals living in an environment with high
walkability is independent of shared familial factors. These findings were novel and
prompted us to consider whether shared familial factors play a role in the recovery from
chronic LBP, and in the response to a physical activity intervention.
9.1.2. Shared familial factors and the recovery from chronic low back pain
Chapter Five presented the results of a longitudinal study investigating the influence of
familial aggregation of chronic LBP on the recovery from chronic LBP. People who had a
sibling with chronic LBP had a 20% increased likelihood of non-recovery from chronic LBP,
with this likelihood increasing to 50% if the sibling was an identical twin. These findings are
novel and suggest genetics influence the recovery from chronic LBP more so than shared
201

environmental factors. In other words, the presence of certain candidate genes or single-
nucleotide polymorphisms may influence the likelihood of recovering from chronic LBP.
Research aimed at identifying these genetic markers will help build on these findings. With
this in mind, we were also interested in investigating the role of shared familial factors in the
response to a commonly prescribed intervention for chronic LBP, physical activity.
9.1.3. Shared familial factors and the response to physical activity
Chapter Six presented the findings from a systematic review investigating the role of shared
familial factors in the response of body composition and cardiorespiratory fitness following a
physical activity intervention. At the time of this review, no study had investigated how
shared familial factors influence the response to a physical activity intervention in people
with LBP so we performed this review on healthy adults to provide background for future
studies. Our review showed that genetics and shared environmental factors significantly
influence the response of body composition and cardiorespiratory fitness following a physical
activity intervention. Furthermore, genetics and shared environmental factors appear to
influence the response of body composition to a greater extent compared to cardiorespiratory
fitness. Chapters Five and Six have laid the foundations for future research exploring the role
of shared familial factors in the recovery from chronic LBP, and in the response to a physical
activity intervention.
9.1.4. Home-based video-game exercises for older people with chronic low back pain
Chapters Seven and Eight explored the feasibility and clinical effects of a novel home-based
video-game exercise program for older people with chronic LBP, addressing the final aim of
this thesis. Physical activity is vital for promoting health and well-being1, and for preventing
chronic disease in older people2, 3. Physical activity interventions are also recommended for
202

the management of chronic LBP in older people4, 5 but strategies to facilitate self-
management in this population are largely missing from the literature. Chapter Seven
outlined the protocol for a randomised controlled trial investigating a home-based video-
game exercise program for older people with chronic LBP. Chapter Eight outlined the results.
The recruitment rate was high amongst older people suffering from chronic LBP in the
community (11 participants per month), but was low in older people waiting for
physiotherapy treatment in a public hospital (0.4 participants per month). On average,
participants had high baseline levels of pain self-efficacy, suggesting good pain self-efficacy
is a trait of individuals willing to participate in an unsupervised home-based video-game
exercise program. With this in mind, the difference in recruitment rates between older people
in the community compared to those on the waiting list could be reflecting different levels of
pain self-efficacy in these populations. Adherence to the intervention was high when
considering the total time engaged in video-game exercises (71%) and the total number of
sessions performed (85%), and no adverse events were reported. Finally, we had a high
response rate to the surveys at 3 months (93%) and 6 months (95%), which was likely due to
participants in the control group being offered the video-game exercise program following
the completion of the trial. These findings support the feasibility of conducting a large multi-
centre randomised controlled trial. In terms of clinical effects, participants engaged in video-
game exercises reported significantly higher pain self-efficacy in the long-term (6 months),
and demonstrated significantly greater improvements in pain and function immediately post-
intervention compared to the control group. The control group was instructed to maintain
their usual activities and care-seeking behaviors. Improvements in pain self-efficacy also
favored the video-game exercise group in the medium term (3 months) despite not being
statistically significant. However, high baseline levels of pain self-efficacy in both groups are
likely to explain why there was no between-group difference in pain self-efficacy scores
203

immediately post-intervention (8 weeks). Participants completing video-game exercises were
significantly more likely to regularly engage in flexibility exercises in the long-term, tended
to be less likely to take pain medication in the long-term, and tended to have less fear of
movement immediately post-intervention compared to the control group. On the other hand,
there were no between-group differences for the remaining physical activity and care-seeking
variables, nor disability or falls-efficacy at any time point. Given the feasibility and positive
preliminary effects of video-game exercises for improving pain self-efficacy, pain and
function in older people with chronic LBP, an adequately powered randomised controlled
trial is needed to build on these results.
204

9.2. Clinical implications
The results presented in this thesis have important implications for clinical practice and may
guide the selection of intervention and prevention strategies for people with chronic LBP.
First, we conducted three studies (Chapters Two, Three, and Four) to address the lack of
knowledge regarding risk factors and factors associated with LBP (particularly chronic LBP).
Primarily, we were interested in investigating the relationship between LBP, physical
activity, the built environment, and educational attainment. Individuals with a history of
chronic LBP and pain in the past 4 weeks (recent chronic LBP) are less likely to meet the
physical activity guidelines compared to those with no history of chronic LBP, while
individuals with a history of chronic LBP who are currently pain free are just as likely to
meet the physical activity guidelines compared to those with no history of chronic LBP. The
importance of physical activity for individuals with chronic LBP is clear. Physical activity
interventions are recommended in most evidence-based guidelines for the management of
chronic LBP6-8, and can reduce the risk of recurrent episodes9, 10. Based on our findings and
the well-established benefits of physical activity for people with chronic LBP, clinicians
could incorporate specific strategies to encourage individuals with a recent episode of chronic
LBP to gradually increase their physical activity. Specific strategies to encourage increased
physical activity may include: i) education regarding the benefits of physical activity; ii)
practical ways to increase physical activity (e.g. active transportation, sports participation);
iii) information on nearby facilities that could promote increased physical activity (e.g. parks,
gyms, cycle paths); and iv) guidance on how to gradually increase physical activity in the
presence of symptoms.
Understanding how the built environment influences the relationship between physical
activity and LBP could also help clinicians tailor strategies to facilitate increased physical
205

activity. Individuals with LBP are less likely to meet the physical activity guidelines, or walk
more than 150 minutes per week, compared to those free of LBP if they live in an
environment with a short walkable distance to nearby amenities (high walkability). These
findings have implications for targeting physical activity interventions towards individuals
with LBP living in an environment with high walkability, or for considering other individual
and social-level factors to support increased physical activity engagement, such as education
or social connectedness. Although individuals with LBP who live in an environment with a
short walkable distance to nearby amenities are less active than people without LBP, they are
in a perfect position to respond to interventions targeting increased physical activity because
of their environment. These individuals should be given education regarding the benefits of
increased physical activity for their LBP and overall health and well-being, as well as
information on nearby amenities that can promote physical activity (e.g. walking paths,
cycling paths, parks and gyms). Furthermore, clinicians could utilise a behaviour counselling
and cognitive behavioural therapy approach to identify and address barriers to increased
physical activity in this population (e.g. beliefs that physical activity is detrimental for the
spine).
To gain a broader understanding of risk factors for chronic LBP this thesis investigated the
relationship between educational attainment and the development of chronic LBP. Females
with low educational attainment are at increased risk of developing chronic LBP, while
females with high educational attainment are at decreased risk of developing chronic LBP.
These findings highlight a population at risk of developing chronic LBP that could benefit
from an effective prevention strategy to reduce this risk. Unfortunately, research on
interventions for reducing the risk of chronic LBP are largely missing from the literature,
with graded activity and pain education emerging as promising strategies11, 12. With this in
206

mind, clinicians may wish to implement a prevention strategy involving graded activity and
pain education in a population of females with low educational attainment, as these
individuals are at increased risk of developing chronic LBP. Overall, the findings presented
in Chapters Two, Three and Four highlighted populations at risk of chronic LBP or reduced
physical activity, and prompted us to investigate the role of shared familial factors in the
recovery from chronic LBP and in the response to a commonly prescribed intervention for
chronic LBP, physical activity (Chapters Five and Six).
The familial aggregation of chronic LBP significantly impacts on the recovery from chronic
LBP, highlighting the strong prognostic role of shared familial factors (particularly genetics).
From a clinical perspective, identifying the presence of chronic LBP in family members
(particularly siblings) has the potential to inform clinicians on which patients are less likely to
recover. A better understanding of factors influencing the recovery from chronic LBP may
have implications for targeting specific interventions towards individuals who present with
poor prognostic factors. If negative beliefs and experiences regarding LBP are shared among
family members, and are negatively impacting the recovery from chronic LBP, intervening
on these beliefs has the potential to improve outcomes for these individuals. Cognitive
behavioral therapy is commonly recommended for people with chronic LBP and often
involves addressing unhelpful beliefs and attitudes towards pain13, 14. People reporting a
family history of chronic LBP may respond positively to a cognitive behavioral therapy
approach that addresses unhelpful shared familial beliefs regarding pain, and involving
family members in this intervention may further reinforce positive beliefs and attitudes in the
family environment. Therefore, clinicians could consider the presence of chronic LBP within
a family as an indicator of poor recovery and use this information to guide treatment.
207

Shared familial factors (including genetics) also significantly influence the response of body
composition and cardiorespiratory fitness following a physical activity intervention in healthy
adults. Therefore, shared familial factors are likely to be a significant contributor to the large
individual variation seen in the response to increased physical activity. Shared familial
factors may explain why some individuals fail to respond to increased physical activity, while
others demonstrate a more favorable response. These findings have implications for changing
modifiable training parameters (intensity, frequency, duration) to achieve the desired
response, or for selecting an alternative management strategy in individuals who demonstrate
an ongoing poor response to physical activity despite these changes. Understanding the role
of shared familial factors in an individual’s response to increased physical activity could also
be important for individuals with chronic conditions where physical activity is strongly
recommended (such as chronic LBP). This information could guide a clinician’s choice of
intervention and has the potential to improve treatment effectiveness, reduce treatment costs,
and avoid patient disappointment.
Lastly, this thesis investigated a novel self-management strategy for older people with
chronic LBP and provided strong evidence supporting the feasibility and preliminary clinical
effects of a home-based video-game exercise program in this population (Chapters Seven and
Eight). The feasibility of this novel self-management strategy was highlighted by a high
recruitment rate of community-dwelling older people with chronic LBP, a high response rate,
high adherence to the intervention, and no reported adverse events. Furthermore, older people
with chronic LBP performing a home-based video-game exercise program reported
significant long-term improvements in pain self-efficacy, and significant reductions in pain
and increases in function following the intervention compared to a control group instructed to
maintain their usual activities and care-seeking behaviours. Considering the enormous
208

benefits of physical activity engagement for older people2, 15, the positive clinical effects of
home-based video-game exercises, and the high adherence to the intervention; clinicians
should recommend home-based video-game exercises as a self-management strategy for
older people with chronic LBP. If home-based video-game exercises are implemented to
community-dwelling older people with chronic LBP on a large scale, this could significantly
reduce health-care expenditure for LBP in the long-term.
209
9.3 Future directions
This thesis showcased novel and innovative approaches to better understand how shared
familial factors influence risk factors and factors associated with chronic LBP, the recovery
from chronic LBP, and the response to increased physical activity. Further, this thesis
investigated the feasibility and clinical effects of a novel physical activity intervention
targeting improvements in pain self-efficacy for older people with chronic LBP. The methods
and findings presented in this thesis will guide future research that aims to better understand
why current intervention and prevention strategies are failing to reduce the enormous
personal and financial burden associated with LBP.
The relationship between recent chronic LBP and physical activity disappeared after
controlling for genetics and shared environmental factors, suggesting that shared familial
factors are confounding this relationship. This brings into question whether shared familial
factors could also be confounding the association between LBP and physical activity reported
in existing studies and warrants further investigation. In the within-pair analyses which
controlled for shared familial factors, there was a substantial sample size reduction. This
could explain why the relationship between recent chronic LBP and physical activity was no
longer statistically significant. To overcome the limitation pertaining to a small sample size,
we investigated the association between LBP and physical activity in a larger sample of
twins, while also using this data to determine whether the built environment influenced the
association between LBP and physical activity.
The association between LBP and physical activity is moderated by the built environment,
with individuals suffering from LBP and living in an environment with high walkability less
likely to engage in sufficient physical activity compared to people without LBP. These
210
findings highlight the importance of considering external environmental factors when trying
to promote increased physical activity in people with LBP, since the built environment could
be a barrier or facilitator to physical activity engagement. Existing studies investigating
education or behaviour counselling approaches for increasing physical activity in people with
LBP have only demonstrated short-term physical activity behaviour change16, 17. However,
information regarding the built environment is missing from these trials and may explain why
some individuals fail to increase their physical activity in the long-term18-21. Future research
investigating physical activity interventions for LBP should consider the influence of the built
environment when discussing the efficacy of an intervention, or barriers and facilitators to
long-term physical activity behaviour change. In addition, shared familial factors need to be
considered in future studies investigating the relationship between LBP, physical activity, and
the built environment, since the association between LBP and physical activity for
individuals living in an environment with high walkability increased in magnitude after
controlling for genetics and shared environmental factors. This suggests the presence of a
direct relationship between LBP and physical activity for individuals living in an
environment with high walkability, independent of shared familial factors.
The methodology used in Chapters Two and Three was applied to a longitudinal study
investigating whether educational attainment increased the risk of developing chronic LBP.
Educational attainment significantly influenced the risk of developing chronic LBP in
females, but did not affect the risk of developing chronic LBP in males. Research must
therefore explore why gender moderates the relationship between educational attainment and
the risk of developing chronic LBP, since a better understanding of the interaction between
educational attainment and gender has the potential to guide the design of future prevention
strategies for chronic LBP. On the other hand, genetics and shared environmental factors
211
appear to be confounding the relationship between educational attainment and chronic LBP in
females, which was concluded on the basis that these findings were no longer statistically
significant in the within-pair analyses (despite negligible changes in effect sizes). A reduction
in the sample size when considering twin pairs discordant for chronic LBP in the within-pair
analyses might explain the non-significant findings and highlights the need for larger twin
samples – particularly when analysing longitudinal data. Nevertheless, our findings showcase
the promise of twin studies for investigating the relationship between educational attainment
and chronic LBP.
To further twin research worldwide and overcome limitations pertaining to small sample
sizes, an International Network of Twin Registries (INTR) has been established22. The INTR
aims to foster international multi-centre collaborations and expand the resources of existing
twin registries around the world. To achieve this, the INTR will support data harmonization
between existing twin registries, and create a web-based search engine to help researchers
identify registries that have appropriate data sources and research expertise to complete a
given project. This will no doubt strengthen the design of future twin studies and allow
researchers to get a clearer understanding of how shared familial factors influence various
conditions, such as LBP. Chapters Two, Three and Four of this thesis investigated risk
factors and factors associated with LBP (particularly chronic LBP) while utilising a co-twin
control design to adjust for the confounding effects of genetics and shared environmental
factors. The primary benefit of a co-twin design compared to non-twin population-based
studies is the ability to adjust for higher levels of confounding and obtain more precise
estimates of association. However, there still remain other sources of confounding that cannot
be controlled for when investigating identical twins discordant for a trait. One potentially
important source of confounding that cannot be controlled for when using a co-twin design
212

are epigenetic differences between identical twins23. Epigenetics is the study of how altered
gene expression, rather than changes in gene sequence, influence the presence of certain
diseases or traits. Altered gene expression commonly results from environmental exposures
throughout life and is more pronounced in identical twins who are older, have spent less time
together or who have different medical histories23. Therefore, although identical twins share
the same gene sequence, epigenetic differences may contribute to the discordance of a disease
or trait and act as residual confounding. This is a limitation of the discordant co-twin design
that we must acknowledge. Future studies investigating epigenetic differences in identical
twins will help identify changes in gene expression that could confound the results of studies
aimed at understanding the etiology of a condition, such as LBP. This information could be
incorporated into the design of future observational studies and allow researchers to obtain
higher levels of adjustment for confounding and more precise estimates of association.
Nevertheless, the findings presented in Chapters Two, Three and Four have highlighted the
importance of considering shared familial factors when investigating risk factors and factors
associated with LBP (particularly chronic LBP), and should be used to guide the design of
future studies on these topics.
The role shared familial factors play in the recovery from chronic LBP and in response to
increase physical activity have important implications for future research. Having a sibling
with chronic LBP significantly increased the risk of not recovering from chronic LBP,
particularly if this sibling was an identical twin. This highlights the strong role of genetics in
the recovery from chronic LBP and the need to consider the influence of shared familial
factors (particularly genetics) in future prognostic studies of chronic LBP. Furthermore, a
recent study demonstrated that two single-nucleotide polymorphisms which are known to
influence the development of persistent LBP, also influence the 5-year recovery from
213
persistent LBP24. This provides additional evidence supporting the strong role of genetics in
the recovery from persistent or chronic LBP. To build on these findings, future research
should continue to use quantitative genetic testing (e.g. genome-wide association or
epigenetic studies) to identify genetic polymorphisms predicting the recovery from chronic
LBP. This will further our understanding of the mechanisms between the familial aggregation
of chronic LBP and non-recovery and will have significant implications for the design of
future intervention strategies for individuals presenting with familial/genetic factors
negatively impacting recovery.
Shared familial factors (including genetics) also influenced the response of body composition
and cardiorespiratory fitness following a physical activity intervention in healthy adults. To
build on these findings, future twin and family studies should investigate the role of shared
familial factors in the response to a physical activity intervention for individuals with chronic
conditions, such as LBP. If shared familial factors strongly influence the response to a
physical activity intervention in people with chronic LBP, this would have significant
implications for changing the parameters of a physical activity intervention to achieve a
desired response (e.g. exercise modality, intensity, frequency), or for selecting a different
management strategy for non-responders. From a quantitative genetic perspective, future
research should focus on genome-wide association studies with large sample sizes to identify
candidate genes or single-nucleotide polymorphisms that can aid the prediction of how an
individual will respond to increased physical activity. However, until quantitative genetic
testing becomes affordable for clinicians, research should endeavor to identify practical and
cost-effective methods that can predict an individual’s response to increased physical activity
(e.g. previous responses or responses from family members). These findings have laid the
foundation for future research to explore the role of shared familial factors in response to a
214

physical activity intervention for people with chronic LBP, and to identify clinical tests that
can identify individuals likely to demonstrate a poor or favorable response.
In regards to the final aim of this thesis, our pilot randomised controlled trial demonstrated
the positive preliminary effects of home-based video-game exercises for older people with
chronic LBP, while also highlighting the feasibility of this novel self-management strategy.
These findings have implications for the design and sample size required for a large multi-
centre randomised controlled trial where the effectiveness of this intervention can be
established. Pain self-efficacy was the primary outcome for this pilot study, as we anticipated
a home-based video-game exercise program would be more effective at improving older
people’s ability to self-manage their chronic LBP compared to a control group instructed to
maintain their usual activities. Despite this, there was only a significant between-group
difference in pain self-efficacy at 6 months, which was the result of a decline in the control
group’s pain self-efficacy from baseline. This finding is likely explained by the high levels of
pain self-efficacy reported in both groups at baseline, since older people willing to participate
in an unsupervised home-based video-game exercise program already appear to have the
capacity to continue with their daily activities despite pain. These findings may also reflect
the need to recruit individuals with lower levels of pain self-efficacy in future trials.
Nevertheless, home-based video-game exercises significantly reduced pain and increased
function in older people with chronic LBP. This potentially highlights more appropriate
primary outcome measures for a large multi-centre randomized controlled trial, particularly
since the nature of the intervention lends itself to recruiting participants with high pain self-
efficacy.
215

9.4 Concluding remarks
Overall, this thesis has highlighted a number of populations at risk of poor outcomes from
chronic LBP and that would benefit from targeted intervention or prevention strategies.
Chapter Two demonstrated that individuals with a recent episode of chronic LBP are less
likely to be sufficiently active compared to people with no history of chronic LBP, and would
benefit from a physical activity intervention to prevent recurrent episodes and promote
increased physical activity for overall health and well-being. However, given the influence
the built environment has on physical activity levels in people with LBP, both individual and
environmental factors supporting physical activity engagement need to be taken into
consideration. People suffering from LBP are less likely to be physically active compared to
people without LBP when considering individuals living in an environment which promotes
physical activity (i.e. good walkable access to amenities - high walkability). With this in
mind, clinicians should consider other individual and social-level factors (such as education
and social connectedness) to promote increased physical activity in people with LBP living in
an environment with high walkability. Furthermore, females with low educational attainment
are at increased risk of developing chronic LBP. Therefore, effective prevention strategies
involving education, in addition to established evidence-based interventions such as physical
activity25, should be targeted toward this population.
This thesis demonstrated that the familial aggregation of chronic LBP is a strong predictor of
non-recovery from chronic LBP, particularly in identical twins. This highlights the important
role our genes play in the recovery from chronic LBP, but also the need to address shared
environmental factors that could potentially reduce the likelihood of recovery in these
populations (such as negative beliefs about pain). Finally, this thesis supported the feasibility
and preliminary effectiveness of home-based video-game exercises for improving pain self-
216
efficacy, pain, and function in older people with chronic LBP. However, Chapter Six
highlighted the strong role of shared familial factors in the response of body composition and
cardiorespiratory fitness following a physical activity intervention in healthy adults.
Therefore, the possibility that outcomes following a physical activity intervention for people
with chronic LBP are influenced by shared familial factors cannot be ruled out, and needs to
be investigated in future studies.
217

9.5 References
1. Global recommendations on physical activity for health. Geneva: World Health
Organization; http://apps.who.int/iris/bitstream/10665/44399/1/9789241599979_eng.pdf.
Accessed 15th February 2016.
2. Vogel T, Brechat PH, Leprêtre PM. Health benefits of physical activity in older
patients: a review. Int J Clin Pract. 2009;63.
3. Nelson ME, Rejeski WJ, Blair SN, et al. Physical activity and public health in older
adults: recommendation from the American College of Sports Medicine and the American
Heart Association. Med Sci Sports Exerc. 2007;39(8):1435-45.
4. Ishak NA, Zahari Z, Justine M. Effectiveness of Strengthening Exercises for the
Elderly with Low Back Pain to Improve Symptoms and Functions: A Systematic Review.
Scientifica. 2016;2016:10.
5. Hayden JA, van Tulder MW, Tomlinson G. Systematic review: strategies for using
exercise therapy to improve outcomes in chronic low back pain. Ann Intern Med.
2005;142(9):776-85.
6. Koes BW, van Tulder M, Lin C-WC, et al. An updated overview of clinical guidelines
for the management of non-specific low back pain in primary care. Eur Spine J.
2010;19(12):2075-94.
7. National Institute for Health and Care Excellence (NICE) Guidelines. Low back pain
and sciatica in over 16s: assessment and management. November 2016.
https://www.nice.org.uk/guidance/ng59. Accessed 5th December 2017.
8. van Middelkoop M, Rubinstein SM, Verhagen AP, et al. Exercise therapy for chronic
nonspecific low-back pain. Best Pract Res Clin Rheumatol. 2010;24(2):193-204.
9. Choi BK, Verbeek JH, Tam WW, et al. Exercises for prevention of recurrences of
low-back pain. Cochrane Database Syst Rev. 2010(1):CD006555.
218
10. Bigos SJ, Holland J, Holland C, et al. High-quality controlled trials on preventing
episodes of back problems: systematic literature review in working-age adults. Spine J.
2009;9(2):147-68.
11. Brunner E, De Herdt A, Minguet P, et al. Can cognitive behavioural therapy based
strategies be integrated into physiotherapy for the prevention of chronic low back pain? A
systematic review. Disabil Rehabil. 2013;35(1):1-10.
12. Traeger AC, Moseley GL, Hubscher M, et al. Pain education to prevent chronic low
back pain: a study protocol for a randomised controlled trial. BMJ Open. 2014;4(6):e005505.
13. Cherkin DC, Anderson ML, Sherman KJ, et al. Two-Year Follow-up of a
Randomized Clinical Trial of Mindfulness-Based Stress Reduction vs Cognitive Behavioral
Therapy or Usual Care for Chronic Low Back Pain. JAMA. 2017;317(6):642-4.
14. Khan M, Akhter S, Soomro RR, et al. The effectiveness of Cognitive Behavioral
Therapy (CBT) with general exercises versus general exercises alone in the management of
chronic low back pain. Pak J Pharm Sci. 2014;27(4 Suppl):1113-6.
15. Taylor AH, Cable NT, Faulkner G, et al. Physical activity and older adults: a review
of health benefits and the effectiveness of interventions. J Sports Sci. 2004;22(8):703-25.
16. Nassif H, Brosset N, Guillaume M, et al. Evaluation of a randomized controlled trial
in the management of chronic lower back pain in a French automotive industry: an
observational study. Arch Phys Med Rehabil. 2011;92(12):1927-36.e4.
17. Hagen EM, Odelien KH, Lie SA, et al. Adding a physical exercise programme to brief
intervention for low back pain patients did not increase return to work. Scand J Public
Health. 2010;38(7):731-8.
18. Kuukkanen T, Mälkiä E, Kautiainen H, et al. Effectiveness of a home exercise
programme in low back pain: a randomized five-year follow-up study. Physiother Res Int.
2007;12(4):213-24.
219

19. Sorensen PH, Bendix T, Manniche C, et al. An educational approach based on a non-
injury model compared with individual symptom-based physical training in chronic LBP. A
pragmatic, randomised trial with a one-year follow-up. BMC Musculoskelet Disord.
2010;11:212.
20. Bendix AE, Bendix T, Haestrup C, et al. A prospective, randomized 5-year follow-up
study of functional restoration in chronic low back pain patients. Eur Spine J. 1998;7(2):111-
9.
21. Schaller A, Dintsios CM, Icks A, et al. Promoting physical activity in low back pain
patients: six months follow-up of a randomised controlled trial comparing a multicomponent
intervention with a low intensity intervention. Clin Rehabil. 2016;30(9):865-77.
22. Buchwald D, Kaprio J, Hopper JL, et al. International network of twin registries
(INTR): building a platform for international collaboration. Twin Res Hum Genet.
2014;17(6):574-7.
23. Castillo-Fernandez JE, Spector TD, Bell JT. Epigenetics of discordant monozygotic
twins: implications for disease. Genome Med. 2014;6(7):60.
24. Bjorland S, Roe C, Moen A, et al. Genetic predictors of recovery in low back and
lumbar radicular pain. Pain. 2017;158(8):1456-60.
25. Steffens D, Maher CG, Pereira LS, et al. Prevention of Low Back Pain: A Systematic
Review and Meta-analysis. JAMA Intern Med. 2016;176(2):199-208.
220

APPENDICES
221

APPENDIX 1
Media coverage of Chapter Two publication
ONLINE NEWS ARTICLE
Twin study investigates recent low back pain and meeting physical activity guidelines
Healio Orthopedics Today - 11/05/2017
https://www.healio.com/orthopedics/spine/news/online/%7Ba37c0670-6d75-4a69-bb07-
d174e0b1e7a6%7D/twin-study-investigates-recent-low-back-pain-and-meeting-physical-
activity-guidelines.
ONLINE NEWS ARTICLE
Physical Activity Important In Low Back Pain
Broussard Clinic: Chiropractic, Acupuncture, Trigenics, Short Term Neck and Back Care -
15/06/2017
http://cajunchiro.net/2017/06/15/physical-activity-important-in-low-back-pain/.
222

APPENDIX 2
Media coverage of Chapter Four publication
ONLINE NEWS ARTICLE
Study highlights link between educational attainment, LBP and gender
Healio Spine Surgery Today - 28/11/2016
http://www.healio.com/spine-surgery/pain-management/news/online/%7B8c82467e-d8ab-
4afe-8c45-f832db6bd15a%7D/study-highlights-link-between-educational-attainment-lbp-
and-gender.
223

APPENDIX 3
Media coverage of Chapter Six publication
ONLINE NEWS ARTICLE
Exercise, genetics and the fat gene: New studies are showing why some people may
respond differently to exercise
The Irish Times – 23/05/2017
http://www.irishtimes.com/life-and-style/health-family/fitness/exercise-genetics-and-the-fat-
gene-1.3083671.
ONLINE NEWS ARTICLE
There's Diet and Exercise and There's Genetics
Genome Web - 23/05/2017
https://www.genomeweb.com/scan/theres-diet-and-exercise-and-theres-genetics.
ONLINE NEWS ARTICLE
Unzipping genes for the good of humanity: Genes Determine Our Weight Loss Ability
Front Line Genomics - 24/05/2017
http://www.frontlinegenomics.com/news/12145/genes-determine-weight-loss-ability/.
224
Related Documents