1 Chronic food shortage and seasonal modulations of daily torpor and locomotor activity in the grey mouse lemur (Microcebus murinus) Sylvain Giroud 1,2 , Stéphane Blanc 2* , Fabienne Aujard 1 , Frédéric Bertrand 3 , Caroline Gilbert 2 , Martine Perret 1 1 Mécanismes Adaptatifs et Evolution, UMR 7179 CNRS, Muséum National d’Histoire Naturelle ; 4 avenue du Petit Château 91800 Brunoy, France. 2 Institut Pluridisciplinaire Hubert Curien – Département d’Ecologie, Physiologie, Ethologie UMR 7178 CNRS, Université Louis Pasteur; 23 rue Becquerel 67087 Strasbourg, France. 3 Institut de Recherche en Mathématique Avancée, Université Louis Pasteur, 7 rue René Descartes 67084 Strasbourg Cedex, France. *Corresponding author: [email protected] Institut Pluridisciplinaire Hubert Curien – Département d’Ecologie, Physiologie, Ethologie UMR CNRS Université Louis Pasteur 7178; 23 rue Becquerel 67087 Strasbourg, France. Tel: +33 (0)3 88 10 69 42 Fax: +33 (0)3 88 10 69 06 Page 1 of 32 Articles in PresS. Am J Physiol Regul Integr Comp Physiol (April 23, 2008). doi:10.1152/ajpregu.00794.2007 Copyright © 2008 by the American Physiological Society.

Welcome message from author
This document is posted to help you gain knowledge. Please leave a comment to let me know what you think about it! Share it to your friends and learn new things together.
Transcript
1
Chronic food shortage and seasonal modulations of daily torpor and locomotor activity in
the grey mouse lemur (Microcebus murinus)
Sylvain Giroud1,2, Stéphane Blanc2*, Fabienne Aujard1, Frédéric Bertrand3, Caroline Gilbert2,
Martine Perret1
1Mécanismes Adaptatifs et Evolution, UMR 7179 CNRS, Muséum National d’Histoire
Naturelle ; 4 avenue du Petit Château 91800 Brunoy, France.
2Institut Pluridisciplinaire Hubert Curien – Département d’Ecologie, Physiologie, Ethologie
UMR 7178 CNRS, Université Louis Pasteur; 23 rue Becquerel 67087 Strasbourg, France.
3Institut de Recherche en Mathématique Avancée, Université Louis Pasteur, 7 rue René
Descartes 67084 Strasbourg Cedex, France.
*Corresponding author: [email protected]
Institut Pluridisciplinaire Hubert Curien – Département d’Ecologie, Physiologie, Ethologie
UMR CNRS Université Louis Pasteur 7178; 23 rue Becquerel 67087 Strasbourg, France.
Tel: +33 (0)3 88 10 69 42
Fax: +33 (0)3 88 10 69 06
Page 1 of 32Articles in PresS. Am J Physiol Regul Integr Comp Physiol (April 23, 2008). doi:10.1152/ajpregu.00794.2007
Copyright © 2008 by the American Physiological Society.

2
ABSTRACT
The extent to which seasonal plasticity in torpor displayed by one of the smallest
Malagasy primates (Microcebus murinus) will help survival in the context of ongoing global
change-induced chronic food shortage, is unknown. Body temperature (Tb) and locomotor
activity were measured by telemetry in short- (SD, winter-acclimated) and long-days (LD,
summer-acclimated) males (n = 24) during an experimental 35-day calorie restriction of 40 or
80%. Under SD exposure, regardless of calorie restriction intensity, mouse lemurs immediately
increased torpor depth and duration by 4.6-fold, and showed greater phase-advanced entry into
torpor (2.4-fold). Tb adjustments were efficient under 40% calorie restriction to maintain body
mass, whereas they did not prevent a 0.71 ± 0.11 g/day mass loss during 80% calorie
restriction. The 40% food-deprived LD animals combined an early shallow deepening of torpor
(1°C) and a late 18% decrease in locomotor activity, resulting in a moderate 6% mass loss.
After 15 days of 80% calorie restriction, LD animals exhibited a SD phenotype by increasing
their torpor duration and phase-advancing the entry of torpor (16 min/day). Those adjustments
had no impact on mass loss (0.93 ± 0.07 g/day) as locomotor activity increased 4-fold. Daily
torpor allows M. murinus to face moderate food shortage whatever the photoperiod, but poorly
mitigates energy imbalance during severe food deprivation, especially under LD exposure.
Although the behavioral thermoregulation role warrants further investigation in energy savings,
M. murinus survival would be impaired during long-term food shortage in summer.
Keywords: body temperature, daily rhythm, energy balance, photoperiod, climate change
Short title: Adaptive responses to food restriction in a primate
Page 2 of 32

3
INTRODUCTION
Global change triggers environmental modifications that seriously threaten biodiversity
and species survival, particularly those restricted in distribution to natural “habitat islands”
(29). In this context, Madagascar has emerged as a critical hotspot for biodiversity conservation
due to its high level of endemism (17), particularly in primate species.
The Madagascar climate juxtaposes a warm and wet summer with large food
availability to a cold and dry winter with drastic food shortage, to which endemic species have
adapted through efficient physiological and behavioral strategies of energy and water economy.
This is particularly the case for the primate members of the family Cheirogaleidae who show
strong seasonal variations in body mass and periods of hibernation or torpor, as reported in the
Cheirogaleus medius (10, 42) and Microcebus species (1, 9, 37, 42, 44, 46). Indeed, the grey
mouse lemur (Microcebus murinus), one of the smallest primates, shows marked biological
rhythms characterized by the succession of an active state during the summer breeding season
and, after an autumnal fattening, an optimization of their daily torpor during the winter resting
period. Previous works of our group aimed to study the short-term physiological adjustments of
these small primates confronted to food shortage both in short-days (winter-) and in long-days
(summer-) acclimated state. A 3-day food starvation (51) and 80% energy restriction over 8
days (14) revealed that short-term food restriction led to a significant increase in locomotor
activity and in the frequency of daily torpor in both seasons. A greater plasticity of the body
temperature (Tb) adjustments was, however, observed in animals under SD phenotype with
torpor depth and duration being respectively 1.5 and 2.4-fold higher than animals under LD
exposure (14). These results are consolidated by the observation that the grey mouse lemur in
the field enters torpor spontaneously during the dry season but not during the rainy period (49).
This seasonal difference in ability to display torpor suggests that adaptive mechanisms
developed by M. murinus would differ according to season, and the vulnerability of this
Page 3 of 32
4
primate species would mainly depend on seasonal modifications triggered by the ongoing
global changes.
One of the main reasons for Malagasy species disappearance is the fragmentation of
specific habitat due to anthropization (16). In addition to the human impact, global change
models predict that Madagascar’s climate will experience an increased intensity and frequency
of abnormal drought and/or precipitation as well as cyclone and storm occurrence throughout
the year (3, 20). Currently, the wetter conditions in Madagascar, and thus resource availabilities
were globally shown to coincide with El Niño phenomenon. More precisely, there is a strong
negative correlation between vegetation density indexes and El Niño southern Oscillation
(ENSO). During severe episodes of El Niño, certain regions of the island experience drought
conditions lasting up to several months even in the summer, as observed in 1982-1983 and
1994-1995 El Niño episodes (19), which results in unpredictable food shortage during the food
abundant season. Consequently, given its wide distribution on the west coast of the island, it is
likely that the grey mouse lemur uses efficient strategies to cope with both predictable and
unpredictable food shortages. The direct corollary is that the summer heterothermy used by
these primates may be more plastic than previously thought from short-term food deprivation
studies, or that it is used in combination with other efficient physiological or behavioural
strategies. Such strategies may involve modulation of locomotor activity pattern as
demonstrated from rodent studies (18) and suggested from the short-term food deprivation
studies on M. murinus (14).
Therefore, in the context of global change, the objective of the study was to determine
the nature and the limits of the seasonal adaptive strategies used by M. murinus to face a
chronic food shortage. Strategies were assessed through the thermo-modulation and locomotor
activity responses to moderate and severe experimental food scarcities of 35 days.
Page 4 of 32
5
MATERIAL AND METHODS
Animals
The 24 male grey mouse lemurs (Microcebus murinus, Cheirogaleidae, Primates) in this
study were adults (2 to 5 years old) and born in the laboratory-breeding colony of the National
Museum of Natural History (Brunoy, UMR7179 CNRS/MNHN, France; European Institutions
Agreement # 962773) from a stock originally caught in southern Madagascar 35 years ago.
Behavioural and physiological seasonal changes of mouse lemurs are dependent on
photoperiod and are easily reproduced in captivity (2, 15, 40, 41). None of the animals was
studied twice in the present experiment. In the breeding colony, animals were exposed to an
artificial photoperiodic regime consisting of alternating 6-month periods of Malagasy winter-
like short day-lengths (L:D 10:14) and of Malagasy summer-like long day-lengths (L:D 14:10).
To minimize social influences, animals were housed individually in cages (50x40x30cm)
visually separated from each other. Relative humidity was maintained at a constant 55%, and
individuals under LD and SD exposure were kept at ambient room temperature of 30 and 25°C
respectively. Indeed, monthly mean temperatures in Madagascar are 30-31°C at the mid-
summer (January) and 24-26°C at the mid-winter (July) (21).
Energy intake during the control period and calculation of calorie restriction
Before calorie restriction, individual energy requirement was measured during a 10-day
control period in order to determine food-restricted allotments. In ad libitum conditions,
animals were fed on fresh banana and a standardized homemade mixture containing baby
cereals, spice bread, egg, concentrated milk, white cheese, water and, vitamins and dietary
minerals (Vitapaulia/MR, Intervet, France and Toison d’orR, Clément Thékan, France) in
proportions of 0.10 and 0.03 % of the total mass of the mixture, respectively. All these
ingredients were blended together so that animals were not able to eat specifically some of
Page 5 of 32

6
them. The macronutrient composition of the mixture was 50% of carbohydrates, 20% of
proteins and 30% of lipids. Since isolated animals, and particularly those under SD exposure,
tend to overfeed and gain mass during the control period, energy intake was clamped to the
level required to stabilize their body masses. This procedure was required to avoid a significant
underestimation of the calorie restriction intensities. Each individual was initially fed ad-
libitum and progressively, daily energy intake was narrowed according to the body mass time-
course. Patterns of Tb and locomotor activity were not modified during the control period and
none of the animals lost weight.
Half of the animals in each photoperiod were then provided 60% (= 40% calorie
restriction) or 20% (= 80% calorie restriction) of these individually derived energy
requirements. Food-restricted individuals were fed daily with the reference mixture at the onset
of the dark phase to avoid disturbances of biological rhythms. Animals ate their food ration in
one go at the beginning of the night. Water was provided ad-libitum. During the control and
food-restricted periods, daily food intake was calculated from the difference between provided
and remaining food masses and was corrected for water evaporation, when necessary i.e. when
the animal did not eat all its food ration. Grams of food intake were converted to kJ using
equivalents of 3.7 kJ/g for the banana and 4.6 kJ/g for the mixture. During the 35-day food
restriction, the 40% calorie restriction received an energy allotment of 57 ± 2 kJ/day and
52 ± 6 kJ/day in the long (LD) and short (SD) days respectively (named LD40 and SD40).
Comparatively, the 80% calorie restriction corresponded to an energy allotment of 17 ± 0
kJ/day and 19 ± 2 kJ/day in LD80 and SD80 groups respectively.
Body mass
During the calorie restriction period, body mass of each animal was measured every two
days. For ethical reasons, special attention was paid to the body mass time-course of the LD80
group because of their leanness at inclusion. Animals were excluded from the study when body
Page 6 of 32

7
masses reached the lowest value (50 g) reported in the colony for this photoperiod (41).
Practically this affected only two animals: one was excluded on day 28 and a second on day 33
of calorie restriction.
Tb and locomotor activity recording
A telemetric transmitter (TA10TA-F20, 3.2 g, Data Science Co., Saint-Paul, Minnesota,
USA) was implanted into the abdominal cavity, under general anaesthesia (pre-anaesthesia:
Valium 10 mg, 2 mg/100g IM; anaesthesia: Ketamine Imalgene 500 mg, 10 mg/100g IM) as
routinely done in the laboratory (51). Animals started the experimental protocol one month
after surgery. Before being implanted in the animals, transmitters were calibrated individually
by the manufacturer in two points of temperature, 35 and 39°C. Moreover, the linearity of the
logger response was further calibrated in our laboratory, between 21 and 42°C, using a thermo-
stated water bath. The receiver board (RPC-1, Data Science Co., Minnesota, USA) was
positioned in front of the nest-box to collect the radio frequency signals. Tb was recorded for
10 sec every 5 min. Locomotor activity was recorded continuously and the sum of activity
counts, from the entire previous 5 min, was reported in arbitrary unit (a.u.). Activity counts are
recorded when the animal moved in 3 dimensions, the number of counts generated depending
on both distance and speed of movement. Data were analyzed using the Dataquest software
(LabPro Data Science Co., Saint-Paul, Minnesota, USA). After the study, the transmitters were
removed via surgery and the animals were returned to their breeding groups.
Data and statistical analyses
Due to unexpected transmitter failures, three individuals (one in SD40 and two in
LD80) were excluded from the data analysis.
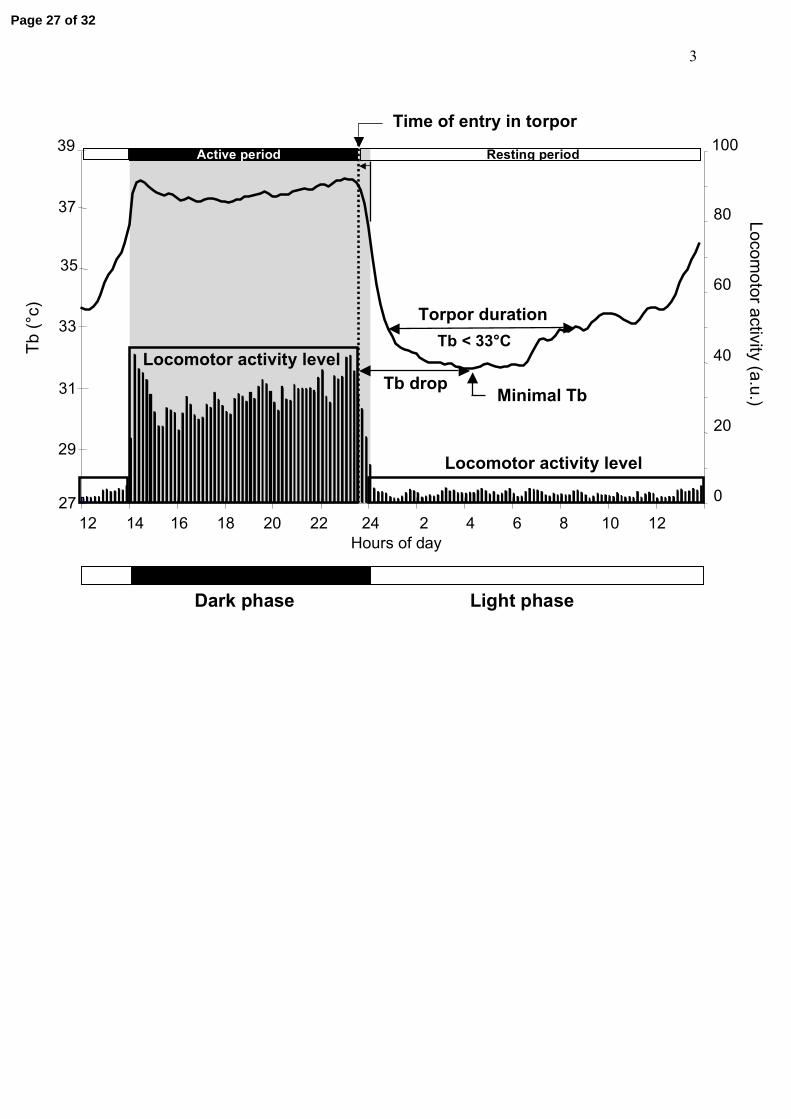
Parameters studied. For each individual, six parameters were calculated from the
locomotor activity and Tb records (Figure 1) in order to characterize the strategies used by
Page 7 of 32

8
mouse lemurs to face calorie restriction. The parameters were divided into two types: those
characterizing the active period and those relating to the resting period. The active period was
defined as the period lasted from the start of the dark phase to the time of entry in torpor, from
which started the resting period that finished at the onset of the following dark phase. The
locomotor activity level during the active period was calculated. The time of entry in torpor,
indicated by negative numbers (in minutes), represents the onset of a continuous Tb drop,
which goes below the average Tb of the active period, until the minimal Tb. Therefore, the
more negative the time of entry in torpor was, the more phase-advanced was the entry into
torpor. The other parameters of the resting period included the duration of the Tb drop from the
entry into torpor until the appearance of minimal Tb, the minimal Tb and the duration of the
torpor bout characterized by a Tb below 33°C. Therefore, the part of the Tb drop above 33°C
(shallow torpor) was not accounted in the calculation of the torpor duration. We also calculated
the locomotor activity level during the light phase. Locomotor activity levels during the active
period and light phase were expressed in arbitrary unit per hour of the active period or light
phase respectively, and were also represented every 10 minutes on a double plotted actogram,
using the Clocklab software (Actimetrics, USA) to highlight changes in patterns.
Data processing. Raw observation of the daily parameters showed non-linear trends in
the response to calorie restriction masked by day-to-day variability in the data. Trending was
revealed on individual data by a standard smoothing procedure using centrally weighted
moving averages (with weights being exponentially distributed from a given time point from 50
to 2.5% over 9 days) (59). Due to this smoothing procedure, the 31st to 35th day of calorie
restriction were then included in the moving average and the resulted smoothed data were
shortened to 30 days.
Main effects of the trend analysis. The variables were analyzed with the Generalized
Linear Model (GLZ), with a gamma error distribution and log-link function, as described by
Page 8 of 32

9
Geister and collaborators (13). The GLZ was used to analyze effects of photoperiod and calorie
restriction intensity on the non-linear time-courses of calorie restriction response for each
telemetry parameter. Thus, photoperiod (LD vs. SD), calorie restriction intensities (40% vs.
80%) and time were entered as main factors in the GLZ and therefore the time effect is taken
into account from a non-parametric point of view. The type of distribution followed by each
variable was analyzed by the Analysis of Processes module of Statistica (V7.1.515.0, Statsoft
France, Paris) and was accounted for in the GLZ procedure. None of the three-term interactions
were significant and are thus not reported. To ensure that the observed main effects were not a
product of the trending procedure, the GLZ was also performed on raw data. The statistical
outputs were similar (p not detailed). For clarity, only statistics from the trend analysis are
reported.
Complementary analysis. As within-group response of each parameter seemed to be
composed of piecewise linear of one or two segments, the time-course of each parameter was
examined by individual one or two-segment linear regressions. This procedure was realized
using the Regression Wizard module of SigmaPlot (V10.0.0.54) and allowed estimation of the
break-point (in the case of a two-segment linear regression) and the slope(s) of the linear part(s)
of each parameter response to calorie restriction across time, as described and already used in
other studies (5, 36). A break-point corresponded to the intercept of the two linear segments
that characterized the non-linear time-course of one parameter. When the slopes did not differ
from zero, average Tb or locomotor activity values were used. When appropriate, between and
within-group differences were compared by Mann and Whitney U-test and Wilcoxon test
respectively, both corrected by a Bonferroni p-value adjustment procedure.
Multiple regression analysis. The LD and SD grey mouse lemurs showed, respectively,
an early and a late response to food deprivation. Thus, to investigate the determinants of the
loss of body mass and of minimal Tb, multiple regression analyses were performed on both the
Page 9 of 32
10
7th and 25th day of calorie restriction, to highlight the early and the late responses, respectively.
In the model for body mass loss, the 24h locomotor activity level, minimal Tb, torpor duration
and the ingested energy were selected as explanatory variables, as presumably they were the
most important contributors to explain the model. In the model for minimal Tb, the duration of
the Tb drop, the Tb during the active phase and the ingested energy were selected as the
explanatory variables, as they seemed to be the main contributors to explain the model.
All reported values are means ± SEM and p<0.05 was considered significant. All the
statistical computations were performed by Statistica (V7.1.515.0, Statsoft France, Paris).
RESULTS
Baseline data during the control period
Baseline parameters are shown in the Table 1. As expected from previous work (15),
LD grey mouse lemurs had a 22% lower body mass than SD ones. No difference was reported
on food intake during the control period. During their active period, LD animals showed a 30%
greater locomotor activity level than SD animals. During their light phase, LD animals
displayed higher minimal Tb than SD animals, while their locomotor activity levels did not
differ between groups. In contrast to LD mouse lemurs that did not show Tb below 33°C, SD
animals displayed torpor bouts (Tb < 33°C) with a 3.8-fold earlier entrance in torpor state than
the LD ones.
Body mass
Both the LD80 and the SD80 animals lost weight at a similar rate of 0.8 ± 0.1 g/day
during calorie restriction (U = 7, nLD80 = 4, nSD80 = 6, p = 0.14; Figure 2). In contrast, the 40%
calorie restriction induced a different pattern of mass loss in LD and SD animals. Indeed,
during the first 11 ± 1 days, both LD40 and SD40 animals had a similar rate of mass loss of
Page 10 of 32

11
0.3 ± 0.1 g/day (U = 11, nLD40 = 5, nSD40 = 6, p = 0.54). Afterwards, whereas body mass
stabilized in the SD40 group at 101 ± 7 g, the LD40 animal’s mass further dropped at a rate of
0.20 ± 0.04 g/day. Overall, the 40% calorie restriction resulted in a cumulated mass loss of 7%
in LD animals and no body mass change in SD mouse lemurs whereas the 80% calorie
restriction induced a respective 20% and 31% reduction in SD and LD animals. This difference
was essentially explained by the initial body masses of each group and not by the rate of body
mass loss.
Levels and patterns of locomotor activity
Locomotor activity during the active phase. Under SD, calorie restriction had no effect
on locomotor activity levels during the active phase, independent of calorie restriction intensity
(Figure 3, top). The LD40 group, showed an 18% decrease in locomotor activity level by the
20th (± 3) day. Although the locomotor activity level in the LD80 group showed a trend to
increase, no significant modifications were reported due to the high inter-individual variability.
Nevertheless, the differences in locomotor activity level were maintained between
photoperiods.
Locomotor activity during the light phase. Locomotor activity levels gradually
decreased by 48% and 50% in SD40 and SD80 groups respectively (Figure 3, bottom). In
contrast, the LD40 animals displayed no change in their activity level whereas the LD80
animals showed a 4-fold increase from the 14th (± 4) day before reaching a plateau on the
24th day.
Locomotor activity patterns. The LD40 animals did not redistribute their locomotor
activity level over a nycthemere (Figure 4). Conversely, from day 15, the LD80 animals
decreased their locomotor activity level by 31% during the last four hours of the night and
increased it 5-fold in the four hours before dusk. Considering the SD40 and SD80 animals, we
observed a gradual concentration of the locomotor activity level in the first six hours of the
Page 11 of 32

12
active phase until the 15th day of calorie restriction, corresponding to an increase of 7 % and
34 %, respectively. These redistributions of locomotor activity in the LD80, SD40 and SD80
groups matched the increased phase-advance of the entry into torpor, as described later in the
text.
Effects of calorie restriction on torpor parameters
Time of entry in torpor. Both the SD40 and SD80 animals displayed, from the very
start of the calorie restriction, a significant -10 ± 3 min/day phase-advance of the entry into
torpor during 14 ± 1 days (Figure 5, top). Then, both groups stabilized the time of entry in
torpor at a value of -238 ± 35 min. In contrast, while no modifications of the time of entry in
torpor occurred in the LD40 group during the calorie restriction period, the LD80 animals
showed a significant phase-advance of the entry into torpor from the 16th (± 2) day, at a rate of
-16 ± 6 min/day.
Torpor bout duration. While LD40 mouse lemurs did not show any torpor bouts over
the 5-week food shortage, those facing an 80% calorie restriction significantly increased their
torpor duration at a rate of 9 ± 5 min/day during the first 25 ± 0 days of calorie restriction,
stabilizing it at a value of 253 ± 61 min (Figure 5, bottom). Conversely, both SD40 and SD80
animals increased their torpor duration at a rate of 30 ± 6 min/day during the first 14 ± 1 days
of calorie restriction. Then, SD animals stabilized their torpor duration at similar values of
409 ± 129 min for SD40 and 357 ± 128 min for SD80 (U = 14.0, nSD40 = 5, nSD80 = 6, p = 0.86).
Minimal Tb. Both SD40 and SD80 animals displayed a drop in minimal Tb of 6.2 °C
until the 12th (± 2) day (Figure 6). Thereafter, minimal Tb at the 12th and 13th day did not differ
from their final respective one (SD40: 27.6 ± 1.7°C vs. 27.6 ± 0.6°C, Z = 0.4, n = 5, p = 0.59;
SD80: 27.6 ± 0.7°C vs. 28.0 ± 1.0°C, Z = 0.5, n = 6, p = 0.60). The LD40 group displayed a
transient but significant drop in their minimal Tb of 1 °C during the first 8 ± 2 days of calorie
restriction. Then, the minimal Tb at the 8th day reached a stable value of 34.8 ± 0.3 °C until the
Page 12 of 32
13
end of the calorie restriction. The LD80 animals showed a decrease in minimal Tb over the first
24 ± 1 days and then stabilized at 32.9 ± 0.6 °C. During the early adaptation phase first (7th day
of calorie restriction), the model obtained from multiple regression analysis demonstrated no
significant determinants for the minimal Tb. Conversely during the late response (25th day of
calorie restriction) the only variable determining the minimal Tb in the LD mouse lemurs
appeared to be the energy intake (Table 2). In SD primates, whereas the duration of the Tb
drop (from the onset of the torpor until the occurrence time of the minimal Tb) appeared to be
the main explanatory variable of the minimal Tb at the 7th day of calorie restriction, no
determinants for the minimal Tb reach significance during the late response (25th day of calorie
restriction, Table 2).
Determinants of changes in body mass
Multiple regression analysis showed that energy intake was the only variable explaining
the loss of mass in the LD grey mouse lemurs for the entire calorie restriction period; 24-h
locomotor activity level, minimal Tb and torpor duration were all non-significant contributors
(Table 3). Although in SD animals energy intake remained the principal explanatory variable,
24-h locomotor activity level, minimal Tb and torpor duration appeared as significant
contributors to the initial (7th day of calorie restriction) loss of mass. During the late response
(25th day of calorie restriction), minimal Tb and torpor duration did not remain significant
contributors (Table 3).
DISCUSSION
From previous studies on M. murinus (14, 51), the onset of a short-term food restriction
induces a progressive increase in torpor depth. In addition, an 80% food deprivation during 8
days results in greater phase-advance of the entry into torpor and increased torpor bout duration
(14). In our study, the grey mouse lemurs acclimated to short-days responded immediately to
Page 13 of 32

14
food deprivation, by exhibiting a deeper (22% increased) and 2.4-fold more phase-advanced
entry into torpor under both moderate and severe food deprivations. The early adjustment of
daily Tb allows for immediate energy saving for the grey mouse lemur that enter into a
behavioral and sexual rest, optimizing a torpor bout after an autumnal fattening in order to face
seasonal food shortage (39). Moreover, seasonal Tb adjustments have been reported in the wild
mouse lemur, housed in outdoor enclosure for the measurements (37, 38, 44, 45), and all are
more significant when the ambient temperature (Ta) reaches extreme minimal values during the
torpor phase: around 15°C and down to 4°C during the night on Madagascar. This feature
allows mouse lemurs to display deeper torpor bouts, increasing energy savings in the wild
compared to our laboratory study. However, although the frequency of such extreme Ta (4°C)
on the island is too low to be of significance in terms of energy economy, an extreme average
minimal Ta of 15°C would have a much more substantial effect on energy metabolism, almost
twice than that observed under a Ta of 25°C. Like mouse lemurs, several small mammals show
seasonal heterothermy in order to conserve energy when faced with environmental stresses (24,
26, 57), as reported in food deprived free-ranging elephant shrew (Elephantulus myurus) (25,
32). In our study, M. murinus acclimated to short-days and facing a 40% food restriction
stabilized energy balance, but when faced with a severe 80% lowered food availability did not.
Although it was expected that no compensation would occur at 80% food restriction, this small
primate may use other strategies in their natural habitat to save energy during the winter period.
In contrast to our experimental design where each animal was kept alone in a cage, wild
mouse lemurs regroup themselves in tree holes during the night (27, 43, 48). This huddling
process may represent an important strategy to limit energetic costs during the diurnal sleeping
period due to social thermoregulation (22, 39, 43), notably allowing M. murinus to face more
efficiently a severe food shortage in winter. Another energy-saving mechanism corresponds to
the use of passive reheating during torpor arousal since considerable energy is required to
Page 14 of 32

15
arouse from a low Tb (34). During the cold and dry season in the Kirindy forest, M.murinus
and M. myoxinus arouse from torpor through a two-step process, consisting of an initial passive
climb in Tb in relation to Ta followed by an active rise of Tb to normothermic level (45, 47).
This was also observed in small captive marsupials (Sminthopsis macroura) and free-ranging
rock elephant shrew (Elephantulus myurus) (12).
In our experiment, the Ta of the summer-like long days animal’s room was kept at
30°C. This feature theoretically allowed mouse lemurs to display minimal Tb ~32°C, since
heterothermic mammals can generally show Tb 1-2°C above Ta during their torpor state (53,
54, 58). However, these animals did not display torpor bouts (Tb < 33°C) to increase energy
conservation during the food-restricted period. Since mouse lemurs display an active breeding
state during summer, this lack of torpor reported in food-restricted long-days animals can be
due to their high level of reproductive hormones, which influences thermoregulation and
torpor, as reported in pouched mice (33) and European hamsters (7). Furthermore, the low body
mass loss of these long-days acclimated mouse lemurs under moderate food shortage of 40%
might not be fully explained by torpor induced energy saving. Thus, M. murinus under long-
days exposure may combine other energy saving strategy in addition to their thermo-
modulation responses, to efficiently cope with a 40% food restriction. A possible mechanism
may reside in the strategy used by the golden spiny mouse (Acomys russatus) facing two weeks
of 50% energy restriction. This mouse “switches down” its resting metabolism, and is able to
survive and maintain its body mass indefinitely on a 50% limited ration. The reduction in
metabolism occurs without a decrease in Tb or in activity level (30) but may be explained by
the reduction, under food deprivation, in the activity of Na+/K+ pump that accounting for 23%
of the total resting energy expenditure in man (55). In heterotherms, this physiological
inhibitory mechanism, that occurs in addition to the temperature effect, must be involved in the
reduction of the metabolic rate, as pointed out by Geiser in his recent review (11). Therefore,
Page 15 of 32

16
the long-days acclimated grey mouse lemur may be able to decrease its metabolic rate to a step
below the one predicted by its Tb drop during the torpor, saving additional energy.
Alternatively, mouse lemur undergoes large reduction of body mass in summer, an observation
known as Dehnel effect (31), and notably, mouse lemurs under long-days exposure do not
show large amount of fat mass compared to short-days acclimated animals. Therefore, the
proportion of the fat-free mass loss would be higher in long-days animals compared to short-
days ones. Fat-free mass being the main determinants of resting metabolic rate, it is likely that
energy expenditure will also be decreased to a larger extent than in animals under short-days
acclimation. Similarly, the cost of activity per gram of body mass will also be decreased.
However, such season-related changes in body composition in response to calorie restriction
require further studies.
A previous study of 80% food deprivation during eight days on long-days acclimated
M. murinus showed that mouse lemurs displayed deeper and longer torpor bouts associated
with an increase in physical activity level (14). Conversely, animals in our study showed Tb
changes only from the 15th day of food restriction. In addition to these Tb modifications, these
primates greatly phase-advanced the dark phase, increasing their locomotor activity level by
3.6-fold four hours before dusk when food allotments became available. Therefore, it is likely
that the energy saved by Tb adjustments was compensated by increased absolute levels of
physical activity, resulting in an unmodified rate of body mass loss. Several studies reported
that the observed increase in physical activity levels in response to food scarcity might
represent an increase in foraging behavior (6, 8, 28, 52). The increased locomotor activity in
the 80% food-deprived mouse lemurs under long-days exposure likely correspond to a
programmed behavioural response for searching food that was exacerbated by our experimental
design, i.e. animals were spatially limited to their own cage and food was provided at the
beginning of the dark phase. Indeed, time meal feeding associated with calorie restriction, i.e.
Page 16 of 32

17
timed food restriction, is a powerful entraining agent as it phase-advances nocturnal component
of locomotor activity rhythm by 6h, in Wistar rats (4). Therefore, timed availability of food
allotment would act as a zeitgeber in the food anticipatory activity in long-days acclimated
mouse lemurs under an 80% food restriction. In spite of this synchronization role of timed food
restriction, in our study, the higher level of locomotor activity before food availability only
resulted in higher energy expenditure. In male Wistar rats, body mass must fall to some
relatively fixed critical level before activity substantially increases (23) and there is a
correlation between pre-deprivation body mass and the occurrence time of the day of the
activity peak (50). A trigger for the increased locomotor activity level may involve plasma
leptin level. It was found that in rats, leptin suppresses semi-starvation induced hyperactivity
(8). Therefore, it was suggested that hypoleptinemia, as a result of food restriction, may
represent the initial trigger for the increased activity levels in food restricted rats (8). This may
be a possible explanation for the 3.6-fold increase in locomotor activity level of the long-days
acclimated primates under an 80% calorie restriction. In addition, other hormones sensible to
energy homeostasis, named ‘gut hormones’, such as ghrelin, pancreatic polypeptide and
peptide YY (PYY), are positively correlated with behavioral activity level in mice (35).
Perspectives and Significance
Apart the fundamental approach in ecophysiology, calorie restriction received a great
deal of attention in homeothermic species because undernutrition without malnutrition is, so
far, the only paradigm that increases life span in all the species tested. Based on the strong
similitude that exists between the effects of calorie restriction in homeothermic species and the
processes of torpor/hibernation, Walford and Springler (56) suggested in 1997, that the life
extending properties of restriction in energy are part of a larger processes of energy saving
developed to face food shortage, that is conserved across evolution and thus, that can be seen
Page 17 of 32

18
solely as a laboratory artefact. It is evident that the responses to calorie restriction may vary
across animal species such as hyper or hypo locomotor activity, shallow or deep hypothermia;
those responses being probably selected according to environmental constraints. Similarly,
differences exist between the effects of food shortage and the deep hibernators, but the
convergence between the life-extending properties of calorie restriction and the mechanisms of
torpor, as seen in estivation or in the primate of the present study, are clearly worth of
investigation. As such comparative studies between the effects of moderate calorie restriction
in heterotherms and homeotherms may provide original information on the mechanisms by
which calorie restriction increases life span. This is currently tested in our laboratory where a
colony of Microcebus murinus is submitted to moderate calorie restriction since adulthood to
natural death. We hope that this longitudinal study, named RESTRIKAL, in a primate
heterotherm will open new area of research on the biology of aging.
ACKNOWLEDGEMENTS
S Giroud was financially supported by a fellowship of the French Ministry of Research. This
study was supported by an ATIP from the CNRS (S Blanc), the Bettencourt Schueller
Fondation (S Blanc), the GIS-Longévité (S Blanc) and the ANR Alimentation & Nutrition
Humaine (F Aujard, M Perret, S Blanc). We would like to thank Dr Susanne Votruba for the
English editing of this article.
Page 18 of 32

19
REFERENCES
1. Atsalis S. Seasonal fluctuations in body fat and activity levels in a rain-forest species of mouse lemurs, Microcebus rufus. Int J Primatol 20: 883-910, 1999.2. Aujard F, Perret M, Vannier G. Thermoregulatory responses to variations of photoperiod and ambient temperature in the male lesser mouse lemur: a primitive or an advanced adaptive character? J Comp Physiol B 168: 540-548, 1998.3. Cazelles B, Hales S. Infectious diseases, climate influences, and nonstationarity. PLoS Med 3: e328, 2006.4. Challet E, Pevet P, Vivien-Roels B, Malan A. Phase-advanced daily rhythms of melatonin, body temperature, and locomotor activity in food-restricted rats fed during daytime. J Biol Rhythms 12: 65-79, 1997.5. Corbel H, Morlon F, Groscolas R. Is fledging in king penguin chicks related to changes in metabolic or endocrinal status? Gen Comp Endocrinol 2008 (November 7, 2007). doi: 10.1016/j.ygcen.2007.11.006.6. Cornish ER, Mrosovsky N. Activity during food deprivation and satiation of six species of rodent. Anim Behav 13: 242-248, 1965.7. Darrow JM, Duncan MJ, Bartke A, Bona-Gallo A, Goldman BD. Influence of photoperiod and gonadal steroids on hibernation in the European hamster. J Comp Physiol A 163: 339-348, 1988.8. Exner C, Hebebrand J, Remschmidt H, Wewetzer C, Ziegler A, Herpertz S, Schweiger U, Blum WF, Preibisch G, Heldmaier G, Klingenspor M. Leptin suppresses semi-starvation induced hyperactivity in rats: implications for anorexia nervosa. Mol Psychiatry 5: 476-481, 2000.9. Fietz J. Body mass in wild M. murinus over the dry season. Folia primatol 69: 183-190, 1998.10. Fietz J, Ganzhorn JU. Feeding ecology of the hibernating primate Cheirogaleusmedius: How does it get so fat? Oecologia 121: 157-164, 1999.11. Geiser F. Metabolic rate and body temperature reduction during hibernation and daily torpor. Annu Rev Physiol 66: 239-274, 2004.12. Geiser F, Drury RL. Radiant heat affects thermoregulation and energy expenditure during rewarming from torpor. J Comp Physiol B 173: 55-60, 2003.13. Geister TL, Fischer K. Testing the beneficial acclimation hypothesis: temperature effects on mating success in a butterfly. Behav Ecol 18: 658-664, 2007.14. Genin F, Perret M. Daily hypothermia in captive grey mouse lemurs (Microcebus murinus): effects of photoperiod and food restriction. Comp Biochem Physiol B 136: 71-81, 2003.15. Genin F, Perret M. Photoperiod-induced changes in energy balance in gray mouse lemurs. Physiol Behav 71: 315-321, 2000.16. Goodman SM, Benstead JP. The Natural History of Madagascar. The University of Chicago Press, 2003.17. Goodman SM, Benstead JP. Updated estimates of biotic diversity and endemism for Madagascar. Oryx 39: 73-77, 2005.18. Gutman R, Yosha D, Choshniak I, Kronfeld-Schor N. Two strategies for coping with food shortage in desert golden spiny mice. Physiol Behav 90: 95-102, 2006.19. Ingram JC, Dawson TP. Climate change impacts and vegetation response on the island of Madagascar. Phil Trans R Soc A 363: 55-59, 2005.20. IPCC. Climate Change 2007: Fourth Assessment Report. Intergovernmental Panel on Climate Change, Geneva, Switzerland, 2007.
Page 19 of 32

20
21. Jury MR. The climate of Madagascar. In: The Natural History of Madagascar, edited by Goodman SM, Benstead JP, The University of Chicago Press, 2003, p. 75-87.22. Kappeler PM. Ecologie des microcèbes. Primatologie 3: 145-171, 2000.23. Koubi HE, Robin JP, Dewasmes G, Le Maho Y, Frutoso J, Minaire Y. Fasting-induced rise in locomotor activity in rats coincides with increased protein utilization. Physiol Behav 50: 337-343, 1991.24. Lovegrove BG. The low basal metabolic rates of marsupials: the influence of torpor and zoogeography. In: Adaptations to the cold: Tenth Hibernation Symposium edited by Geiser F, Hulbert AJ, Nicol SC. Armidale, Australia: University of New England Press, 1996, p. 141-151.25. Lovegrove BG, Raman J, Perrin MR. Daily torpor in elephant shrews (Macroscelidea: Elephantulus spp.) in response to food deprivation. J Comp Physiol B 171: 11-21, 2001.26. Lyman CP, Willis JS, Malan A, Wang LCH. Hibernation and torpor in mammals and birds. New York: Academic Press, 1982.27. Martin RD. A review of the behavior and ecology of the lesser mouse lemur (Microcebus murinus). In: Comparative ecology and behavior of primates, edited by Michael RP, Crooks JH. Academic Press, London, 1973, p. 1-68.28. Mather JG. Wheel-running activity: a new interpretation. Mammal Rev 11: 41-51, 1981.29. Mcdonald KA, Brown JH. Using montane mammals to model extinction due to global change. Conserv Biol 6: 409-415, 1992.30. Merkt JR, Taylor CR. "Metabolic switch" for desert survival. Proc Natl Acad Sci USA 91: 12313-12316, 1994.31. Mezhzherin SV. Dehnel’s phenomenon and its possible explanation. Acta Theriol 8: 95–114, 1964.32. Mzilikazi N, Lovegrove BG. Daily torpor in free-ranging rock elephant shrews, Elephantulus myurus: a year-long study. Physiol Biochem Zool 77: 285-296, 2004.33. Mzilikazi N, Lovegrove BG. Reproductive activity influences thermoregulation and torpor in pouched mice, Saccostomus campestris. J Comp Physiol B 172: 7-16, 2002.34. Mzilikazi N, Lovegrove BG, and Ribble DO. Exogenous passive heating during torpor arousal in free-ranging rock elephant shrews, Elephantulus myurus. Oecologia 133: 307-314, 2002.35. Nakajima M, Inui A, Teranishi A, Miura M, Hirosue Y, Okita M, Himori N, Baba S, Kasuga M. Effects of pancreatic polypeptide family peptides on feeding and learning behavior in mice. J Pharmacol Exp Ther 268: 1010-1014, 1993.36. Naumova EN, Must A, Laird NM. Tutorial in Biostatistics: Evaluating the impact of 'critical periods' in longitudinal studies of growth using piecewise mixed effects models. Int J Epidemiol 30: 1332-1341, 2001.37. Ortmann S, Heldmaier G, Schmid J, Ganzhorn JU. Spontaneous daily torpor in Malagasy mouse lemurs. Naturwissenschaften 84: 28-32, 1997.38. Ortmann S, Schmid J, Ganzhorn JU, Heldmaier G. Body temperature and torpor in a Malagasy small primate, the mouse lemur. In: Adaptations to the cold: Tenth Hibernation Symposium, edited by Geiser F., Hulbert A.J., Nicol S.C. Armidale, Australia: University of New England Press, 1996, p. 55-61.39. Perret M. Energetic advantage of nest-sharing in a solitary primate, the lesser mouse lemur (Microcebus murinus). J Mammal 79: 1095-1102, 1998.40. Perret M. Environmental and social determinants of sexual function in the male lesser mouse lemur (Microcebus murinus). Folia primatol 59: 1-25, 1992.
Page 20 of 32
21
41. Perret M, Aujard F, Vannier G. Influence of daylength on metabolic rate and daily water loss in the male prosimian primate Microcebus murinus. Comp Biochem Physiol A 119: 981-989, 1998.42. Petter-Rousseaux A. Seasonal activity rhythms, reproduction, and body weight variations in five sympatric nocturnal prosimians in simulated climatic conditions. In:Nocturnal Malagasy Primates: Ecology, Physiology and Behaviour, edited by Charles-Dominique P, Cooper HM, Hladik A, Pagès E, Pariente GF, Petter-Rousseaux A, Petter JJ, Schilling A, New York Academic, 1980.43. Radespiel U, Cepok S, Zietemann V, Zimmermann E. Sex-specific usage patterns of sleeping sites in grey mouse lemurs (Microcebus murinus) in northwestern Madagascar. Am J Primatol 46: 77-84, 1998.44. Schmid J. Daily torpor in the gray mouse lemur (Microcebus murinus) in Madagascar: energetic consequences and biological significance. Oecologica 123: 175-183, 2000.45. Schmid J. Oxygen consumption and torpor in mouse lemurs (Microcebus murinus and M. myoxinus): Preliminary results of a study in western Madagascar. In: Adaptations to the cold: Tenth Hibernation Symposium edited by Geiser F., Hulbert A.J., Nicol S.C. Armidale, Australia: University of New England Press, 1996, p. 47-54.46. Schmid J. Sex-specific differences in activity patterns and fattening in the gray mouse lemur (Microcebus murinus) in Madagascar. J Mammal 80: 749-757, 1999.47. Schmid J. Torpor in the tropics: the case of the gray mouse lemur (Microcebus murinus). Basic Appl Ecol 1: 133-139, 2000.48. Schmid J. Tree holes used for resting by gray mouse lemurs (Microcebus murinus) in Madagascar: insulation capacities and energetic consequences. Int J Primatol 19: 797-809, 1998.49. Schmid J, Speakman JR. Daily energy expenditure of the grey mouse lemur (Microcebus murinus): a small primate that uses torpor. J Comp Physiol B 170: 633-641, 2000.50. Sclafani A, Rendel A. Food deprivation-induced activity in normal and hypothalamic obese rats. Behav Biol 22: 244-255, 1978.51. Seguy M, Perret M. Factors affecting the daily rhythm of body temperature of captive mouse lemurs (Microcebus murinus). J Comp Physiol B 175: 107-115, 2005.52. Sherwin CM. Voluntary wheel running: a review and novel interpretation. Anim Behav 56: 11-27, 1998.53. Song X, Kortner G, Geiser F. Reduction of metabolic rate and thermoregulation during daily torpor. J Comp Physiol B 165: 291-297, 1995.54. Song X, Kortner G, Geiser F. Thermal relations of metabolic rate reduction in a hibernating marsupial. Am J Physiol Regul Integr Comp Physiol 273: R2097-R2104, 1997.55. Swaminathan R, Burrows G, McMurray J. Energy cost of sodium pump activity in man: an in vivo study of metabolic rate in human subjects given digoxin. IRCS Med Sci 10: 949, 1982.56. Walford RL, Spindler SR. The response to calorie restriction in mammals shows features also common to hibernation: a cross-adaptation hypothesis. J Gerontol A Biol Sci Med Sci 52: B179-B183, 1997.57. Weiner J. Metabolic constraints to mammalian energy budgets. Acta Theriol 34: 3-35, 1989.58. Wilz M, Heldmaier G. Comparison of hibernation, estivation and daily torpor in the edible dormouse, Glis glis. J Comp Physiol B 170: 511-521, 2000.59. Winner BJ, Brown DR, Michels KM. Statistical principles in experimental design. Mc Craw-Hill, New York, 1991.
Page 21 of 32

1
Parameters Long days (n=10) Short days (n=11) P
Body mass (g) 84 ± 1 108 ± 4 p < 0.01Energy intake (kJ/day) 90 ± 3 89 ± 7 NS
Act
ive
peri
od Locomotor activity level (a.u.) 2098 ± 150 1461 ± 137 p < 0.01
Lig
ht
phas
e
Locomotor activity level (a.u.) 302 ± 62 225 ± 38 NS
Minimal Tb (°C) 35.6 ± 0.2 34.1 ± 0.5 p < 0.01
Time of entry in torpor (min) -26 ± 4 -98 ± 11 p < 0.01
Res
ting
per
iod
Duration of torpor (min) 0 ± 0 83 ± 33 p < 0.05
Table 1: Body masses, energy intake and parameters of body temperature (Tb) and locomotor
activity of long days (summer) and short days (winter) animals during the control period
a.u. = arbitrary unit. Between-group differences were compared by a Mann-Whitney U-test and
p<0.05 was considered as significant.
Page 22 of 32

2
Day of calorie restriction
R2 Duration of the Tb drop (min)
Ingested energy (KJ/d)
7 0.50 p = 0.334
0.80 ± 0.33 p = 0.054
0.25 ± 0.33 p = 0.487
Lon
g D
ays
N=
10
25 0.70 p = 0.026
0.19 ± 0.32 p = 0.56
0.97 ± 0.32 p = 0.022
7 0.72 p = 0.006
-0.85 ± 0.19 p = 0.002
0.01 ± 0.19 p = 0.981
Shor
t Day
s N
=11
25 0.23 p = 0.033
-0.48 ± 0.32 p = 0.165
0.09 ± 0.32 p = 0.773
Table 2: Determinants of minimal body temperature (Tb)
Values for ß (regression coefficient) are means ± SE. ß represents the
relative contributions of the independent variables to the explanation of
the dependant variable: the minimal Tb. Bold characters represent
significant results.
Page 23 of 32

3
Day of calorie
restriction
R2 24h LA level (a.u)
Minimal Tb (°C)
Torpor bout duration (min)
Ingested energy (KJ/d)
70.95
p = 0.007
-0.02 ± 0.13
p = 0.862
-0.10 ± 0.18
p = 0.633
-0.06 ± 0.17
p = 0.741
0.94 ± 0.12
p = 0.001
Lon
g D
ays
N=
10
250.98
p = 0.002
-0.22 ± 0.12
p = 0.131
0.03 ± 0.15
p = 0.860
0.01 ± 0.12
p = 0.936
0.81 ± 0.15
p = 0.006
70.98
p < 0.001
-0.33 ± 0.08
p = 0.006
0.66 ± 0.16
p = 0.007
0.71 ± 0.16
p = 0.004
0.93 ± 0.06
p < 0.001
Shor
t Day
s N
=11
250.97
p < 0.001
-0.24 ± 0.08
p = 0.021
0.15 ± 0.10
p = 0.183
0.24 ± 0.10
p = 0.058
0.83 ± 0.08
p < 0.001
Table 3: Determinants of the changes in body mass
Tb = body temperature, 24h LA = Total locomotor activity. Values for ß (regression
coefficient) are means ± SE. ß represents the relative contributions of the independent
variables to the explanation of the dependant variable: the body mass loss. Bold characters
represent significant results.
Page 24 of 32

1
Figure 1: Typical example of body temperature (Tb) and locomotor activity of daily
pattern for a control animal under long days
Definition of the parameters used in this study.
a.u. = arbitrary unit
Figure 2: Body mass changes over 30 days of calorie restriction
Wald statistic, mentioned on the right side of the graph, show overall general effects of
photoperiod (P) and calorie restriction intensity (CRi) on the body mass changes during a 30-
day calorie restriction (time) in long days (LD) and short days (SD) animals under 40% or 80%
calorie restriction (LD40, n=6; LD80, n=4; SD40, n=5; SD80, n=6). When mentioned, symbol
# or * on a curve indicates the time of rupture in the time-course of body mass of the 40% or
80% food deprived group, respectively. Values are mean ±SEM.
Figure 3: Locomotor activity during the active and light phases
Wald statistic, mentioned on the right side of each graph, show overall general effects of
photoperiod (P) and calorie restriction intensity (CRi) on the evolution of locomotor activity
levels over a 30-day calorie restriction (time) in long days (LD) and short days (SD) animals
under 40% or 80% calorie restriction (LD40, n=6; LD80, n=4; SD40, n=5; SD80, n=6). When
mentioned, symbol # or * on a curve indicates the time of rupture in the time-course of
locomotor activity of the 40% or 80% food deprived group, respectively. Values are
mean ±SEM.
Figure 4: Double daily plots of locomotor activity
LD40 = Long Days animals under 40% calorie restriction, LD80 = Long Days animals under
80% calorie restriction, SD40 = Short Days animals under 40% calorie restriction, SD80 =
Page 25 of 32

2
Short Days animals under 80% calorie restriction. X-axis represents zeitgeber time and dark
bars indicate the dark phase. On the Y-axis, the 30 days of calorie restriction are indicated.
Values are means of locomotor activity levels for each of the animal groups. During the calorie
restriction, individual daily allotment was provided when the light switched off. Please note the
time-advance of the dark phase by the long days-acclimated mouse lemurs under an 80%
calorie restriction.
Figure 5: Onset and duration of torpor bout
Wald statistic, mentioned on the right side of each graph, show overall general effects of
photoperiod (P) and calorie restriction intensity (CRi) on changes of the initiation time and
duration of torpor bout over a 30-day calorie restriction (time) in long days (LD) and short days
(SD) animals under 40% or 80% calorie restriction (LD40, n=6; LD80, n=4; SD40, n=5; SD80,
n=6). When mentioned, symbol # or * on a curve indicates the time of rupture in the time-
course of onset or duration of torpor bout of the 40% or 80% food deprived group, respectively.
Values are mean ±SEM.
Figure 6: Minimal body temperature
Wald statistic, mentioned on the right side of each graph, show overall general effects of
photoperiod (P) and calorie restriction intensity (CRi) on evolutions of the minimal body
temperature over a 30-day calorie restriction (time) in long days (LD) and short days (SD)
animals under 40% or 80% calorie restriction (LD40, n=6; LD80, n=4; SD40, n=5; SD80,
n=6). When mentioned, symbol # or * on a curve indicates the time of rupture in the time-
course of minimal body temperature of the 40% or 80% food deprived group, respectively.
Values are mean ±SEM.
Page 26 of 32
3
12 14 16 18 20 22 24 2 4 6 8 10 12
Tb drop
27
29
33
37
0
20
40
60
80
100
Tb (°
c)
Locomotor activity (a.u.)
Time of entry in torpor
Minimal Tb
Dark phase Light phase
Hours of day
Resting period
Locomotor activity level
Locomotor activity level
Active period
Torpor duration
35
31
39
Tb < 33°C
Page 27 of 32

4
LD40
SD40
SD80
LD80
P p<0.01 CRi p<0.01 Time p<0.01 P*CRi p<0.01 P*Time NS CRi*Time p<0.01
0 5 10 15 20 25 30
Time (days)
50
60
70
80
90
100
110
120
Body
mas
s (g
) #
Page 28 of 32

5
Light phase
LD40 SD40 SD80 LD80
#
Active phase
P p<0,01 CRi p<0,05 Time NS P*CRi NS P*Time NS CRi*Time NS
0
100
200
300
400
500
Activ
ity le
vel (
a.u.
/h)
P p<0,01 CRi p<0,01 Time NS P*CRi p<0,01 P*Time NS CRi*Time NS
0 5 10 15 20 25 30 Time (days)
0
40
80
120
160
200
Activ
ity le
vel (
a.u.
/h)
*
Page 29 of 32

6
0 0
0 16
16 8
8
0
30
15 5
10
20
25
LD40
LD80
Time (days) Time (days)
0
30
15 5
10
20
25
SD40
SD80
0 0
0 16
16 8
8
Page 30 of 32

7
LD40 SD40 SD80 LD80
-300
-240
-180
-120
-60
Dur
atio
n (m
inut
es) P p<0.01
CRi p<0.01 Time p<0.01 P*CRi p<0.05 P*Time NS CRi*Time p<0.01
Time of entry in torpor
*
*
#
P p<0.01 CRi p<0.05 Time p<0.01 P*CRi p<0.05 P*Time p<0.01 CRi*Time NS
Torpor bout duration
0 5 10 15 20 25 30
Time (days)
0
120
240
360
480
600
Dur
atio
n (m
inut
es)
*
#
*
Page 31 of 32

8
Minimal Tb
LD40 SD40 SD80 LD80
26
28
30
32
34
36
Body
tem
pera
ture
(°C
)
P p<0.01 CRi NS Time p<0.01 P*CRi p<0.01 P*Time p<0.01 CRi*Time NS
0 5 10 15 20 25 30 Time (days)
#
*
* #
Page 32 of 32
Related Documents