RESEARCH ARTICLE Chronic Ethanol Exposure Produces Time- and Brain Region-Dependent Changes in Gene Coexpression Networks Elizabeth A. Osterndorff-Kahanek 1 , Howard C. Becker 3 , Marcelo F. Lopez 3 , Sean P. Farris 1 , Gayatri R. Tiwari 1 , Yury O. Nunez 2 , R. Adron Harris 1 , R. Dayne Mayfield 1 * 1 Waggoner Center for Alcohol and Addiction Research, The University of Texas at Austin, Austin, Texas, United States of America, 2 Pharmacotherapy Education and Research Center, College of Pharmacy, The University of Texas at Austin, Austin, Texas, United States of America, 3 Charleston Alcohol Research Center, Department of Psychiatry and Behavioral Sciences, Medical University of South Carolina, Charleston, South Carolina, United States of America * [email protected] Abstract Repeated ethanol exposure and withdrawal in mice increases voluntary drinking and repre- sents an animal model of physical dependence. We examined time- and brain region- dependent changes in gene coexpression networks in amygdala (AMY), nucleus accum- bens (NAC), prefrontal cortex (PFC), and liver after four weekly cycles of chronic intermittent ethanol (CIE) vapor exposure in C57BL/6J mice. Microarrays were used to compare gene expression profiles at 0-, 8-, and 120-hours following the last ethanol exposure. Each brain region exhibited a large number of differentially expressed genes (2,000-3,000) at the 0- and 8-hour time points, but fewer changes were detected at the 120-hour time point (400- 600). Within each region, there was little gene overlap across time (~20%). All brain regions were significantly enriched with differentially expressed immune-related genes at the 8-hour time point. Weighted gene correlation network analysis identified modules that were highly enriched with differentially expressed genes at the 0- and 8-hour time points with virtually no enrichment at 120 hours. Modules enriched for both ethanol-responsive and cell-specific genes were identified in each brain region. These results indicate that chronic alcohol expo- sure causes global ‘rewiring‘ of coexpression systems involving glial and immune signaling as well as neuronal genes. Introduction Long-term alcohol use and dependence alter brain function and are linked to persistent changes in gene expression [1–3]. Gene expression profiling in human alcoholics [4–6] and ro- dent models of binge drinking [7–9] and dependence [10–12] have provided insight into the changes in the brain transcriptional landscape resulting from different drinking paradigms; however, to date it is not clear whether transcriptome changes found in animal models of PLOS ONE | DOI:10.1371/journal.pone.0121522 March 24, 2015 1 / 17 OPEN ACCESS Citation: Osterndorff-Kahanek EA, Becker HC, Lopez MF, Farris SP, Tiwari GR, Nunez YO, et al. (2015) Chronic Ethanol Exposure Produces Time- and Brain Region-Dependent Changes in Gene Coexpression Networks. PLoS ONE 10(3): e0121522. doi:10.1371/journal.pone.0121522 Academic Editor: Barbara Bardoni, CNRS UMR7275, FRANCE Received: September 17, 2014 Accepted: February 2, 2015 Published: March 24, 2015 Copyright: © 2015 Osterndorff-Kahanek et al. This is an open access article distributed under the terms of the Creative Commons Attribution License, which permits unrestricted use, distribution, and reproduction in any medium, provided the original author and source are credited. Data Availability Statement: Microarray data have been submitted to the NCBI Gene Expression Omnibus (GEO) (http://www.ncbi.nlm.nih.gov/geo/) under accession number GSE60676. Funding: This work was supported by National Institute on Alcohol Abuse and Alcoholism (NIAAA) grants AA016648, AA012404, U01 AA014095, U01 AA020929, and P50 AA010761. The funders had no role in study design, data collection and analysis, decision to publish, or preparation of the manuscript.

Welcome message from author
This document is posted to help you gain knowledge. Please leave a comment to let me know what you think about it! Share it to your friends and learn new things together.
Transcript
RESEARCH ARTICLE
Chronic Ethanol Exposure Produces Time-and Brain Region-Dependent Changes inGene Coexpression NetworksElizabeth A. Osterndorff-Kahanek1, Howard C. Becker3, Marcelo F. Lopez3, SeanP. Farris1, Gayatri R. Tiwari1, Yury O. Nunez2, R. Adron Harris1, R. Dayne Mayfield1*
1 Waggoner Center for Alcohol and Addiction Research, The University of Texas at Austin, Austin, Texas,United States of America, 2 Pharmacotherapy Education and Research Center, College of Pharmacy, TheUniversity of Texas at Austin, Austin, Texas, United States of America, 3 Charleston Alcohol ResearchCenter, Department of Psychiatry and Behavioral Sciences, Medical University of South Carolina,Charleston, South Carolina, United States of America
AbstractRepeated ethanol exposure and withdrawal in mice increases voluntary drinking and repre-
sents an animal model of physical dependence. We examined time- and brain region-
dependent changes in gene coexpression networks in amygdala (AMY), nucleus accum-
bens (NAC), prefrontal cortex (PFC), and liver after four weekly cycles of chronic intermittent
ethanol (CIE) vapor exposure in C57BL/6J mice. Microarrays were used to compare gene
expression profiles at 0-, 8-, and 120-hours following the last ethanol exposure. Each brain
region exhibited a large number of differentially expressed genes (2,000-3,000) at the 0-
and 8-hour time points, but fewer changes were detected at the 120-hour time point (400-
600). Within each region, there was little gene overlap across time (~20%). All brain regions
were significantly enriched with differentially expressed immune-related genes at the 8-hour
time point. Weighted gene correlation network analysis identified modules that were highly
enriched with differentially expressed genes at the 0- and 8-hour time points with virtually no
enrichment at 120 hours. Modules enriched for both ethanol-responsive and cell-specific
genes were identified in each brain region. These results indicate that chronic alcohol expo-
sure causes global ‘rewiring‘ of coexpression systems involving glial and immune signaling
as well as neuronal genes.
IntroductionLong-term alcohol use and dependence alter brain function and are linked to persistentchanges in gene expression [1–3]. Gene expression profiling in human alcoholics [4–6] and ro-dent models of binge drinking [7–9] and dependence [10–12] have provided insight into thechanges in the brain transcriptional landscape resulting from different drinking paradigms;however, to date it is not clear whether transcriptome changes found in animal models of
PLOSONE | DOI:10.1371/journal.pone.0121522 March 24, 2015 1 / 17
OPEN ACCESS
Citation: Osterndorff-Kahanek EA, Becker HC,Lopez MF, Farris SP, Tiwari GR, Nunez YO, et al.(2015) Chronic Ethanol Exposure Produces Time-and Brain Region-Dependent Changes in GeneCoexpression Networks. PLoS ONE 10(3):e0121522. doi:10.1371/journal.pone.0121522
Academic Editor: Barbara Bardoni, CNRSUMR7275, FRANCE
Received: September 17, 2014
Accepted: February 2, 2015
Published: March 24, 2015
Copyright: © 2015 Osterndorff-Kahanek et al. This isan open access article distributed under the terms ofthe Creative Commons Attribution License, whichpermits unrestricted use, distribution, andreproduction in any medium, provided the originalauthor and source are credited.
Data Availability Statement: Microarray data havebeen submitted to the NCBI Gene ExpressionOmnibus (GEO) (http://www.ncbi.nlm.nih.gov/geo/)under accession number GSE60676.
Funding: This work was supported by NationalInstitute on Alcohol Abuse and Alcoholism (NIAAA)grants AA016648, AA012404, U01 AA014095, U01AA020929, and P50 AA010761. The funders had norole in study design, data collection and analysis,decision to publish, or preparation of the manuscript.
excessive alcohol consumption are consistent with changes found in human alcoholics. Consil-ience in gene expression would be a key step toward validating animal models by determiningcommonalities in molecular plasticity between human and rodent brain.
Genomic approaches have successfully identified alcohol-mediated changes in gene expres-sion in animal models of alcoholism [9,13,14]. These studies suggest that distinct patterns ofgene expression underlie specific alcohol-related phenotypes. Animal models of excessive con-sumption have been developed to investigate different stages of the alcohol abuse cycle that ul-timately lead to dependence, including continuous two-bottle choice [15,16], drinking in thedark (DID) [17–19] (a model of binge drinking), and chronic intermittent ethanol (CIE) expo-sure [12,20] (a model of dependence). In general, studies have focused on transcriptionalchanges at a single time point following alcohol treatment; thus, it is difficult to determine ifthe changes in expression patterns are transient or longer lasting. CIE vapor exposure can beused to achieve and maintain high blood ethanol concentrations (180–200 mg/dl) in C57BL/6Jmice, and it results in increased self-administration of ethanol [21–23]. Transcriptome profil-ing immediately following CIE exposure, rather than after subsequent bouts of voluntarydrinking, could reveal gene expression and gene network changes associated with induction ofethanol dependence and early withdrawal.
We defined global gene expression profiles in amygdala (AMY), nucleus accumbens (NAC),prefrontal cortex (PFC), and liver of C57BL/6J mice exposed to 4 cycles of intermittent ethanolvapor. Tissue was harvested at 3 time points following the last vapor treatment to assess time-dependent changes in gene expression. We identified time-dependent gene clusters in AMYand NAC that were enriched with astrocytes, microglia, and oligodendrocyte cell types. Thesesets of genes were primarily associated with inflammatory response function. In contrast, thePFC was enriched with neuronal genes and displayed a greater diversity in directional expres-sion changes, suggesting that the PFC is under greater transcriptional regulatory control thanthe AMY and NAC.
Materials and Methods
Ethics StatementAll procedures were approved by the Medical University of South Carolina Institutional Ani-mal Care and Use Committee and adhered to NIH Guidelines. The Medical University ofSouth Carolina animal facility is accredited by the Association for Assessment and Accredita-tion of Laboratory Animal Care.
Animals and Chronic Ethanol Inhalation ProcedureChronic intermittent ethanol vapor exposure (or air) was delivered in Plexiglas inhalationchambers, as previously described [21,22,24] to drug-naïve C57BL/6J (B6) male mice (8 treatedand 8 controls per group). B6 mice were utilized because they show significant escalation ofdrinking when given access to alcohol after vapor exposure [21–23]. Ethanol treatments wereperformed in the laboratory of Dr. H.C. Becker (Medical University of South Carolina,Charleston, SC, USA). Briefly, ethanol (95%) was volatilized, mixed with fresh air and deliveredto the chambers at a rate of 10 L/min to maintain consistent ethanol concentrations (15–20mg/L air) in the chamber. Before entry into the chambers for each 16-hour exposure period,mice were administered ethanol (1.6 g/kg; 8% w/v) and the alcohol dehydrogenase inhibitorpyrazole (1 mmol/kg; i.p.) in a volume of 20 ml/kg body weight. Control mice were handledsimilarly, but they received saline and pyrazole and were exposed to air rather than alcoholvapor. The housing conditions in the inhalation chambers were identical to those in the colonyroom. Chamber ethanol concentrations were monitored daily using a LifeLoc Breathalyzer and
Time-Dependent Changes in Gene Expression in Response to Ethanol Vapor
PLOS ONE | DOI:10.1371/journal.pone.0121522 March 24, 2015 2 / 17
Competing Interests: The authors have declaredthat no competing interests exist.
airflow was adjusted to maintain ethanol concentrations within the specified range (180–200mg/dl). The chamber exposure (16 hr/day) was administered in 4 weekly cycles alternated with1 week in between in which the mice were left undisturbed (mimicking drinking weeks). Ani-mals were sacrificed at 3 time points: 0-, 8- and 120-hours following the last ethanol vapor orair treatment. Brain and liver samples were snap frozen in liquid nitrogen and stored at −80°Cuntil being shipped (frozen) to the Mayfield/Harris lab at University of Texas at Austin.
Tissue Harvest and RNA IsolationFrozen brains were placed in a plastic mold containing Optimal Cutting Temperature com-pound (OCT) and maintained in a mixture of powdered dry-ice and isopentane. A MicromHM550 cryostat (Thermo Scientific, Ontario, CA) was used for sectioning at a thickness of300 μm. Micropunches were collected from amygdala (AMY; 1.25 mm; combined basolateraland central nucleus), nucleus accumbens (NAC; 1.25 mm; combined core and shell), and pre-frontal cortex (PFC; 2.0 mm). See S1 Fig for tissue punch details. Approximately 100 mg of tis-sue was obtained from the lower lobes of the liver. Total RNA was isolated according tomanufacturer’s instructions using the MagMAX-96 Total RNA Isolation Kit (Ambion, Austin,TX). Total RNAs were quantified on a NanoDrop 1000 spectrophotometer (Thermo FisherScientific Inc., Rockford, IL), assessed for quality on an Agilent 2200 TapeStation Instrument(Agilent Technologies, Santa Clara, CA), and amplified/biotin-labeled using the IlluminaTotalPrep RNA-96 Amplification kit (Ambion, Austin, TX).
Microarray AnalysisA web-based tool was used to determine the number of arrays required to detect meaningfulstatistical changes with a power of 0.8 (http://bioinformatics.mdanderson.org/MicroarraySampleSize/). Aliquots of labeled cRNA were sent to the Yale Center for GenomeAnalysis (West Haven, CT) where they were hybridized to Illumina MouseRef-8 v2 ExpressionBeadChips (Illumina, Inc., San Diego, CA) according to manufacturer protocols. Since eachBeadChip contains 8 independent arrays, samples were hybridized in a group counter-balancedformat to minimize batch effects. Each array was hybridized with material obtained from a sin-gle animal; thus, 192 arrays were included in the analysis (16 animals x 4 tissues x 3 timepoints). Each expression array contains approximately 25,600 transcripts representing over19,100 unique genes. Transcript abundance was measured by fluorescent intensity after scan-ning. Microarray data have been submitted to the NCBI Gene Expression Omnibus (GEO)(http://www.ncbi.nlm.nih.gov/geo/) under accession number GSE60676.
Statistics and BioinformaticsUnless otherwise noted, the data were analyzed using open source software packages from Bio-conductor (http://bioconductor.org) designed for the statistical language R (http://www.r-project.org) and Microsoft Excel. The data were first filtered to include only genes with a detec-tion p-value of�0.05 that were present on>80% of the arrays. Data pre-processing included avariance stabilization transformation [25] followed by a quantile normalization step [26] usingthe Bioconductor package lumi [27]. Expression value outliers were removed using Grubbs’test [28]. Differential expression analysis for each time point was conducted using empiricalBayes moderated t-statistics from the Bioconductor package limma [29] to compare treatedand control mice.
Weighted gene coexpression network analysis (WGCNA) was used to investigate the modu-lar structure of the data at a gene network level. The general framework of WGCNA has beendescribed in detail elsewhere [4,30]. This analysis was conducted as described previously [4]
Time-Dependent Changes in Gene Expression in Response to Ethanol Vapor
PLOS ONE | DOI:10.1371/journal.pone.0121522 March 24, 2015 3 / 17
with modifications outlined below. Briefly, we constructed a signed network by calculating Pear-son correlations for all pairs of genes (across all time points) and the signed similarity (Sij) ma-trix derived from Sij = (1+cor(xi,xj))/2, where gene expression profiles xi and xj consist of theexpression of genes across multiple microarray samples. Sij was then raised to the power β torepresent the connection strength. The goal of this step is to emphasize strong correlations andreduce the emphasis of weak correlations on an exponential scale. We chose a power of β = 8–9so that the resulting networks exhibited approximate scale-free topology (Soft.R.sq = 0.68–070).All genes were hierarchically clustered based on a dissimilarity measure of topological overlapwhich measures interconnectedness for a pair of genes [4]. The resulting gene dendrogram wasused for module detection using the dynamic tree cut method (minimummodule size = 100,cutting height = 0.99). Module preservation scores (z-scores based upon a module membershipsize of 100) were calculated using theWGCNA package and are shown in S1 Table.
Gene ontology terms were identified using the Database for Annotation, Visualization and In-tegrated Discovery (DAVID) [31,32], and Ingenuity Pathways Analysis (IPA Ingenuity Systems,www.ingenuity.com) was used to identify overrepresented functional pathways of known genenetworks and biological functions. Hypergeometric tests were used to evaluate modules and indi-vidual data sets for over-representation of cell type-specific genes. Datasets for neurons, astro-cytes, microglia, and oligodendrocytes were obtained from previously published work [33,34].The dataset used to identify enriched immune-related genes is included in S2 Table and was cu-rated from SA Biosciences (QIAGEN). We then used an effect-size based approach to determinethe direction and magnitude of ethanol-induced changes (adjusted p�0.05) for each coexpres-sion module. Mean t-values were calculated for each module, and this analysis was completed foreach time point. Mean t-values were based on unique gene symbols within a module.
The Bioconductor package maSigPro [35] was used to identify clusters of genes showing dif-ferent patterns of expression as a function of time. The method involves a two-step regression ap-proach. First, a global regression model was used to identify differentially expressed genes, andsecond, a variable selection strategy was applied to identify differences between groups and time-related expression profiles. Prior to running maSigPro, a set of genes was identified in whichgene expression was unchanged over time in control animals (AMY, n = 8098; NAC, n = 8323;PFC, n = 7246; Liver, n = 4157 genes). These genes were then used in the overall maSigPro analy-sis comparing gene expression in treated versus control animals. For data visualization, hierar-chical clustering (4 clusters) was used to identify genes with similar expression patterns.
Historically it has been standard practice to verify a subset of microarray-generated gene ex-pression changes using qRT- PCR. However, we did not include such confirmation in the pres-ent study because we have used the Illumina platform (including the particular array used inthis study) extensively and ‘‘validated” expression differences with independent qRT- PCR ex-periments in the past. The level of correspondence between the microarray and RT-PCR resultsexceeds 80% [4,36,37].
Results
Gene Expression ChangesTime- and brain region-dependent changes in gene expression were detected in response toCIE vapor exposure in mice. These procedures do not result in overt behavioral signs of with-drawal at the exposure levels used this study. A similar number of genes were detected in eachbrain region (9,026–9,185), but fewer genes were detected in liver (7,616). CIE vapor elicitedpronounced gene expression changes in all brain regions, as well as in liver (Fig. 1). However,after 120 hours, the transcriptional response to CIE had declined substantially in all tissueswhen compared with the 0- and 8-hour time points. Differential gene expression was not
Time-Dependent Changes in Gene Expression in Response to Ethanol Vapor
PLOS ONE | DOI:10.1371/journal.pone.0121522 March 24, 2015 4 / 17

detected in any of the tissues at the 120-hour time point after multiple comparison correction.The 0- and 8-hour time points showed the greatest overlap of differentially expressed genesacross tissues (Fig. 2; S3 Table; note that these data represent the top 500 differentially express-ed genes regardless of multiple comparison correction). This overlap was less than 21% foreach of the brain regions and about 50% for liver (data not shown). Differentially expressedgenes at 0-hour were mostly (60–80%) regulated in a similar direction at 8 hours; however, theconsistency of genes changing in the same direction at these time points was greatest for liverand least for PFC (Fig. 3).
WGCNA and Enrichment AnalysesFor all tissues, there was distinct clustering of gene networks at 120-hours compared to othertimes, and this time point had a greater effect than treatment on sample clustering due to thelack of expression changes (data not shown). WGCNA identified 34–45 modules in brain and24 modules in liver, with module sizes ranging from 78–1,412 transcripts. The Database forAnnotation, Visualization and Integrated Discovery (DAVID) was used for over-representa-tion analysis and to evaluate the biological function of each module.
These results were further substantiated by enrichment analysis using cell-specific and func-tional gene lists. Published cell-type gene lists (see Methods for details) were used to determinewhich cells might be disproportionately enriched with differentially expressed genes (adjustedp�0.05) in response to CIE vapor as a function of time. Enrichment of microglia-specific geneswas observed in all brain regions at the 8-hour time point while almost all brain regions andtime points were enriched with astrocyte-specific genes (Table 1). The NAC was the only brainregion enriched with oligodendrocyte-specific genes, and the PFC was the only region enriched
Fig 1. Gene expression changes in brain and liver at three time points following CIE vapor. Bars indicate the number of genes differentially expressed(p�0.05) in each tissue at 0-, 8-, and 120-hours following CIE vapor treatment. The horizontal lines represent the number of differentially expressed genesafter correcting for multiple comparisons (FDR�0.05).
doi:10.1371/journal.pone.0121522.g001
Time-Dependent Changes in Gene Expression in Response to Ethanol Vapor
PLOS ONE | DOI:10.1371/journal.pone.0121522 March 24, 2015 5 / 17
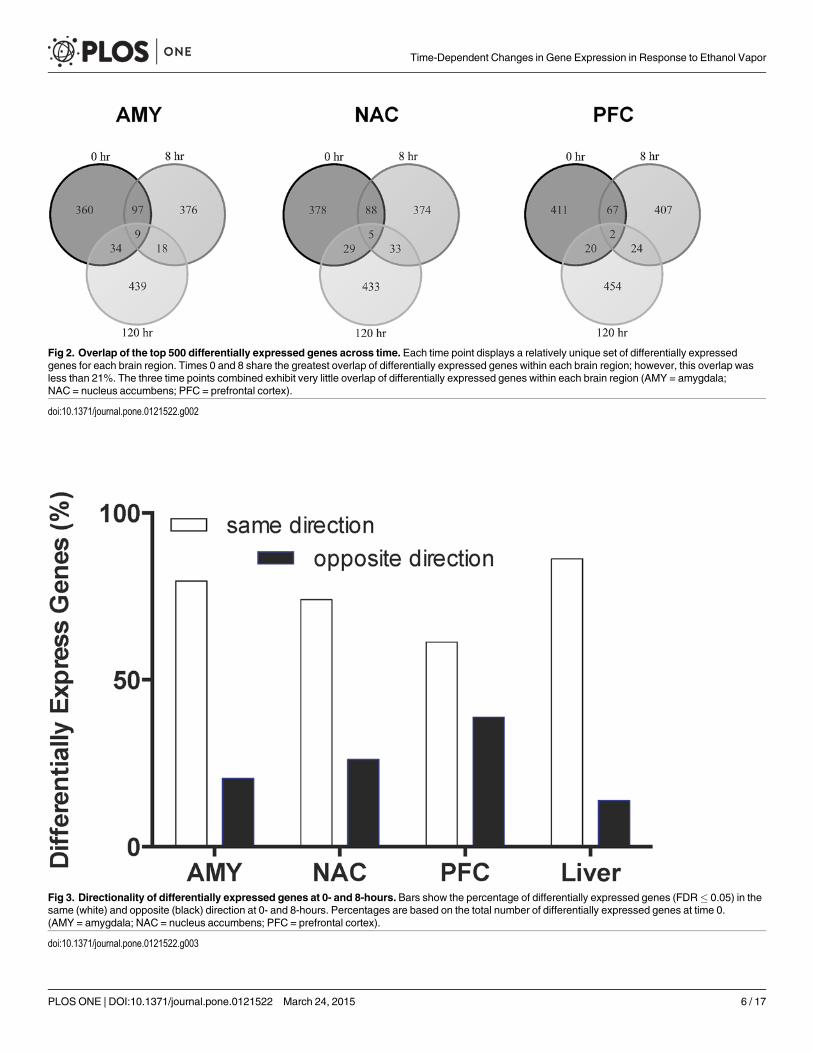
Fig 2. Overlap of the top 500 differentially expressed genes across time. Each time point displays a relatively unique set of differentially expressedgenes for each brain region. Times 0 and 8 share the greatest overlap of differentially expressed genes within each brain region; however, this overlap wasless than 21%. The three time points combined exhibit very little overlap of differentially expressed genes within each brain region (AMY = amygdala;NAC = nucleus accumbens; PFC = prefrontal cortex).
doi:10.1371/journal.pone.0121522.g002
Fig 3. Directionality of differentially expressed genes at 0- and 8-hours. Bars show the percentage of differentially expressed genes (FDR� 0.05) in thesame (white) and opposite (black) direction at 0- and 8-hours. Percentages are based on the total number of differentially expressed genes at time 0.(AMY = amygdala; NAC = nucleus accumbens; PFC = prefrontal cortex).
doi:10.1371/journal.pone.0121522.g003
Time-Dependent Changes in Gene Expression in Response to Ethanol Vapor
PLOS ONE | DOI:10.1371/journal.pone.0121522 March 24, 2015 6 / 17
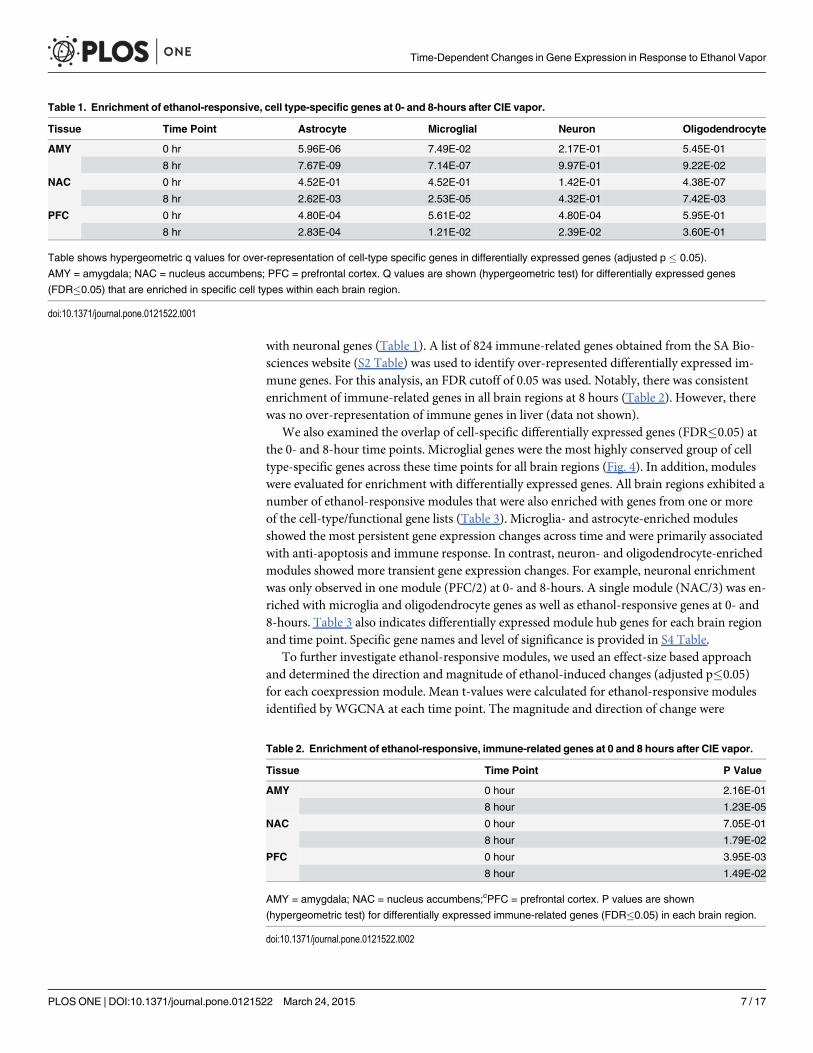
with neuronal genes (Table 1). A list of 824 immune-related genes obtained from the SA Bio-sciences website (S2 Table) was used to identify over-represented differentially expressed im-mune genes. For this analysis, an FDR cutoff of 0.05 was used. Notably, there was consistentenrichment of immune-related genes in all brain regions at 8 hours (Table 2). However, therewas no over-representation of immune genes in liver (data not shown).
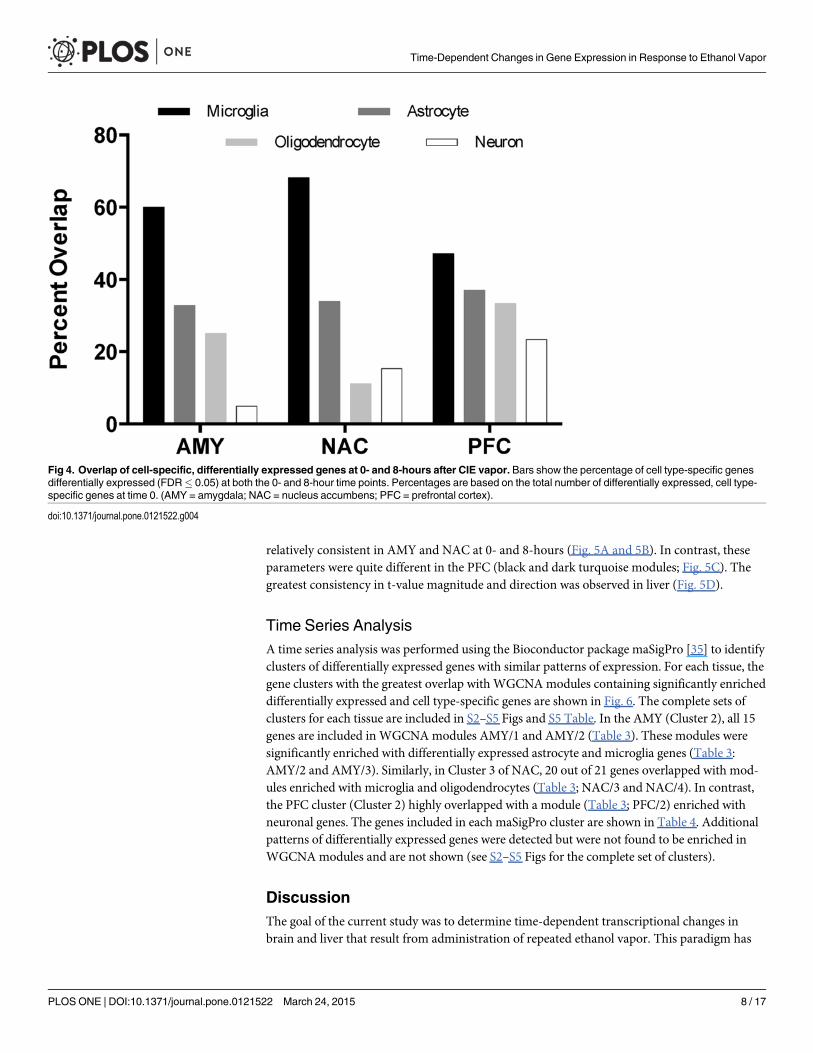
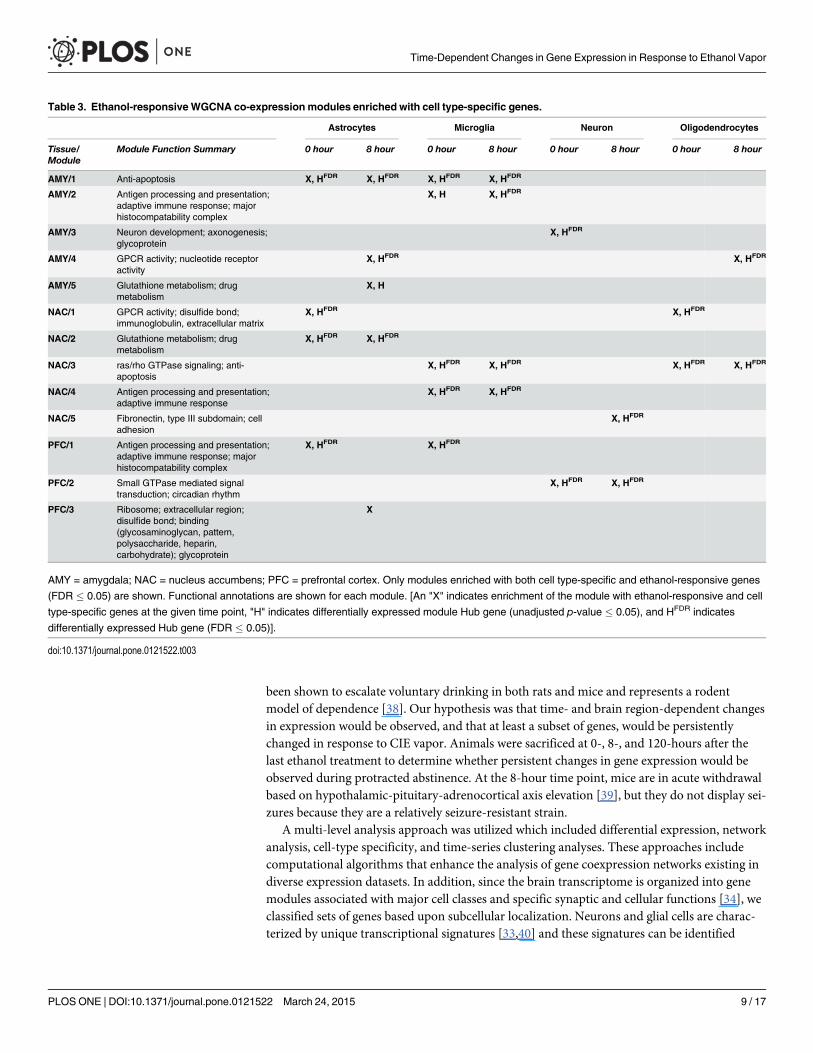
We also examined the overlap of cell-specific differentially expressed genes (FDR�0.05) atthe 0- and 8-hour time points. Microglial genes were the most highly conserved group of celltype-specific genes across these time points for all brain regions (Fig. 4). In addition, moduleswere evaluated for enrichment with differentially expressed genes. All brain regions exhibited anumber of ethanol-responsive modules that were also enriched with genes from one or moreof the cell-type/functional gene lists (Table 3). Microglia- and astrocyte-enriched modulesshowed the most persistent gene expression changes across time and were primarily associatedwith anti-apoptosis and immune response. In contrast, neuron- and oligodendrocyte-enrichedmodules showed more transient gene expression changes. For example, neuronal enrichmentwas only observed in one module (PFC/2) at 0- and 8-hours. A single module (NAC/3) was en-riched with microglia and oligodendrocyte genes as well as ethanol-responsive genes at 0- and8-hours. Table 3 also indicates differentially expressed module hub genes for each brain regionand time point. Specific gene names and level of significance is provided in S4 Table.
To further investigate ethanol-responsive modules, we used an effect-size based approachand determined the direction and magnitude of ethanol-induced changes (adjusted p�0.05)for each coexpression module. Mean t-values were calculated for ethanol-responsive modulesidentified by WGCNA at each time point. The magnitude and direction of change were
Table 1. Enrichment of ethanol-responsive, cell type-specific genes at 0- and 8-hours after CIE vapor.
Tissue Time Point Astrocyte Microglial Neuron Oligodendrocyte
AMY 0 hr 5.96E-06 7.49E-02 2.17E-01 5.45E-01
8 hr 7.67E-09 7.14E-07 9.97E-01 9.22E-02
NAC 0 hr 4.52E-01 4.52E-01 1.42E-01 4.38E-07
8 hr 2.62E-03 2.53E-05 4.32E-01 7.42E-03
PFC 0 hr 4.80E-04 5.61E-02 4.80E-04 5.95E-01
8 hr 2.83E-04 1.21E-02 2.39E-02 3.60E-01
Table shows hypergeometric q values for over-representation of cell-type specific genes in differentially expressed genes (adjusted p � 0.05).
AMY = amygdala; NAC = nucleus accumbens; PFC = prefrontal cortex. Q values are shown (hypergeometric test) for differentially expressed genes
(FDR�0.05) that are enriched in specific cell types within each brain region.
doi:10.1371/journal.pone.0121522.t001
Table 2. Enrichment of ethanol-responsive, immune-related genes at 0 and 8 hours after CIE vapor.
Tissue Time Point P Value
AMY 0 hour 2.16E-01
8 hour 1.23E-05
NAC 0 hour 7.05E-01
8 hour 1.79E-02
PFC 0 hour 3.95E-03
8 hour 1.49E-02
AMY = amygdala; NAC = nucleus accumbens;cPFC = prefrontal cortex. P values are shown
(hypergeometric test) for differentially expressed immune-related genes (FDR�0.05) in each brain region.
doi:10.1371/journal.pone.0121522.t002
Time-Dependent Changes in Gene Expression in Response to Ethanol Vapor
PLOS ONE | DOI:10.1371/journal.pone.0121522 March 24, 2015 7 / 17
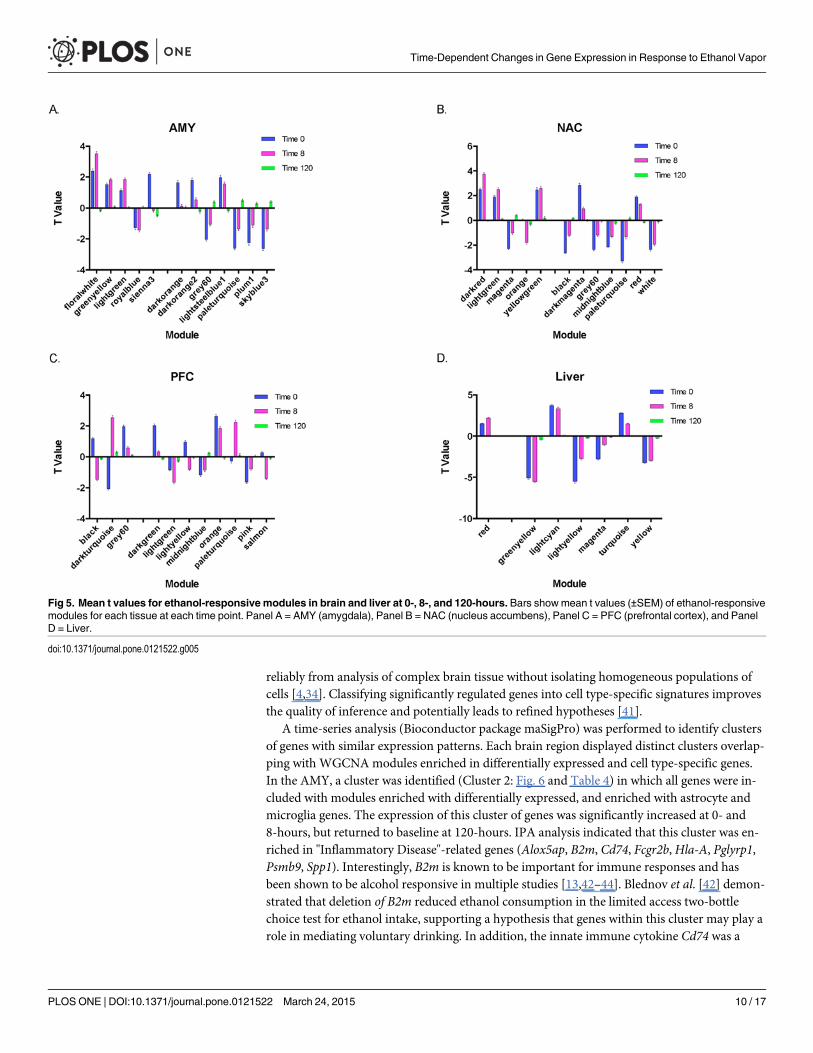
relatively consistent in AMY and NAC at 0- and 8-hours (Fig. 5A and 5B). In contrast, theseparameters were quite different in the PFC (black and dark turquoise modules; Fig. 5C). Thegreatest consistency in t-value magnitude and direction was observed in liver (Fig. 5D).
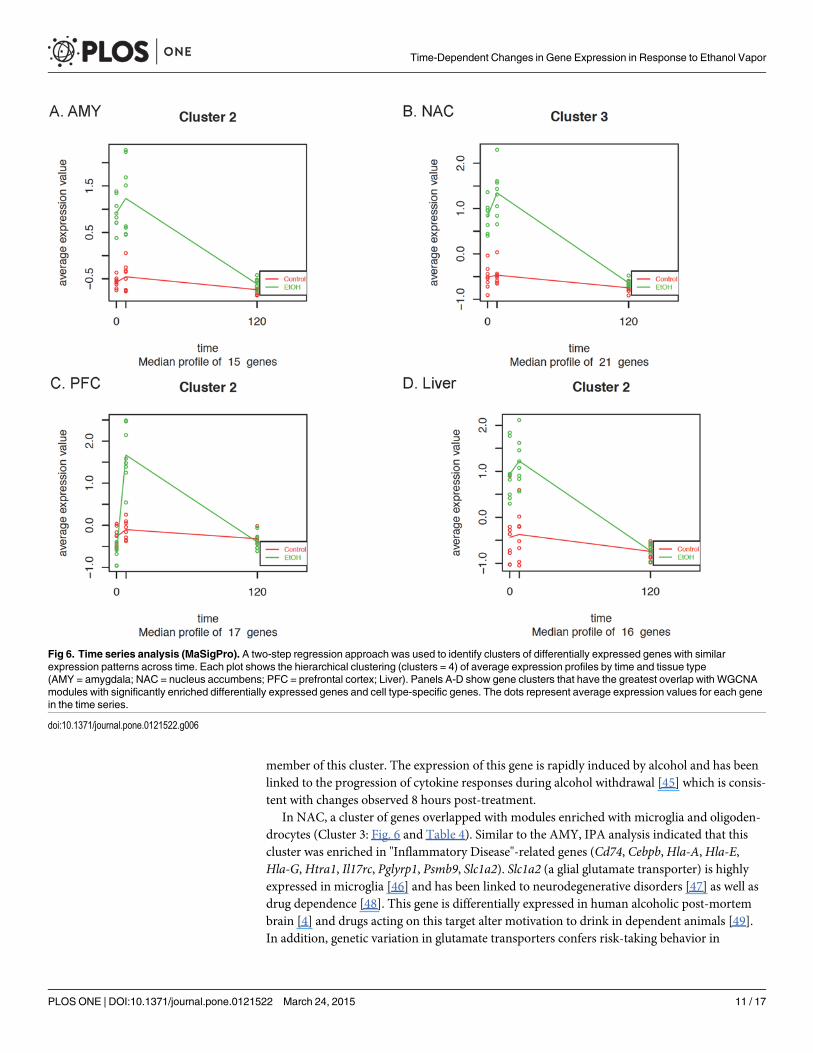
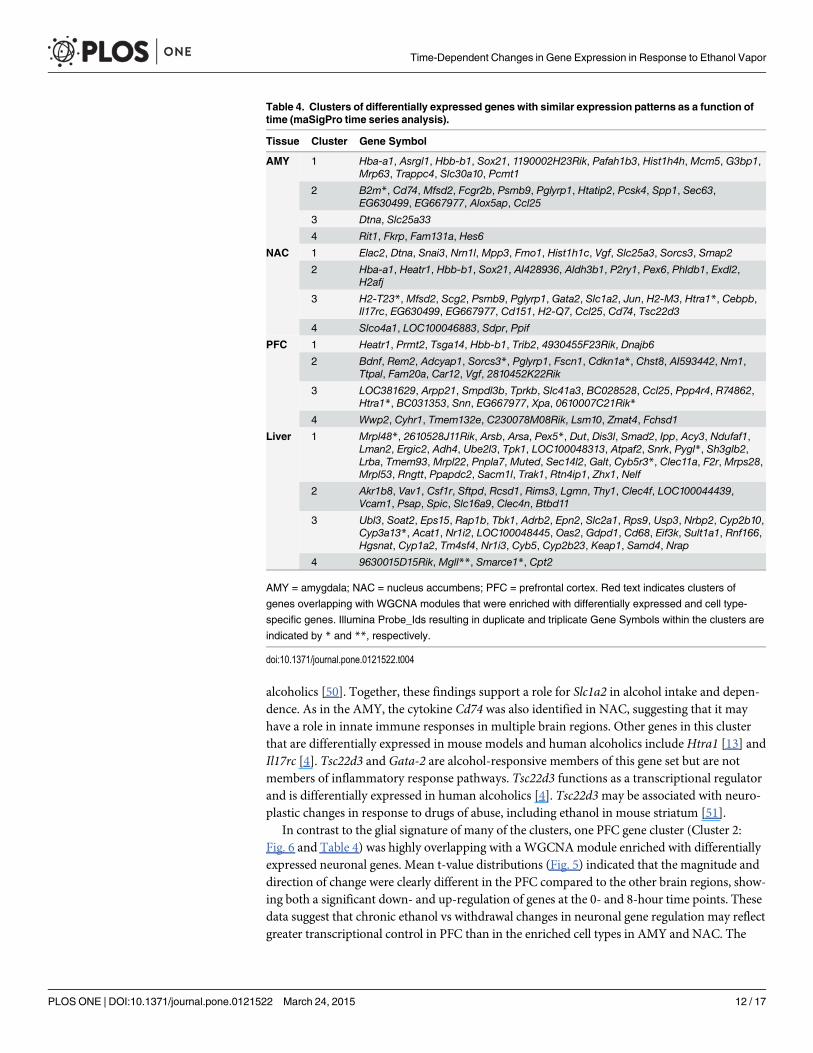
Time Series AnalysisA time series analysis was performed using the Bioconductor package maSigPro [35] to identifyclusters of differentially expressed genes with similar patterns of expression. For each tissue, thegene clusters with the greatest overlap with WGCNAmodules containing significantly enricheddifferentially expressed and cell type-specific genes are shown in Fig. 6. The complete sets ofclusters for each tissue are included in S2–S5 Figs and S5 Table. In the AMY (Cluster 2), all 15genes are included in WGCNAmodules AMY/1 and AMY/2 (Table 3). These modules weresignificantly enriched with differentially expressed astrocyte and microglia genes (Table 3:AMY/2 and AMY/3). Similarly, in Cluster 3 of NAC, 20 out of 21 genes overlapped with mod-ules enriched with microglia and oligodendrocytes (Table 3; NAC/3 and NAC/4). In contrast,the PFC cluster (Cluster 2) highly overlapped with a module (Table 3; PFC/2) enriched withneuronal genes. The genes included in each maSigPro cluster are shown in Table 4. Additionalpatterns of differentially expressed genes were detected but were not found to be enriched inWGCNAmodules and are not shown (see S2–S5 Figs for the complete set of clusters).
DiscussionThe goal of the current study was to determine time-dependent transcriptional changes inbrain and liver that result from administration of repeated ethanol vapor. This paradigm has
Fig 4. Overlap of cell-specific, differentially expressed genes at 0- and 8-hours after CIE vapor. Bars show the percentage of cell type-specific genesdifferentially expressed (FDR� 0.05) at both the 0- and 8-hour time points. Percentages are based on the total number of differentially expressed, cell type-specific genes at time 0. (AMY = amygdala; NAC = nucleus accumbens; PFC = prefrontal cortex).
doi:10.1371/journal.pone.0121522.g004
Time-Dependent Changes in Gene Expression in Response to Ethanol Vapor
PLOS ONE | DOI:10.1371/journal.pone.0121522 March 24, 2015 8 / 17
been shown to escalate voluntary drinking in both rats and mice and represents a rodentmodel of dependence [38]. Our hypothesis was that time- and brain region-dependent changesin expression would be observed, and that at least a subset of genes, would be persistentlychanged in response to CIE vapor. Animals were sacrificed at 0-, 8-, and 120-hours after thelast ethanol treatment to determine whether persistent changes in gene expression would beobserved during protracted abstinence. At the 8-hour time point, mice are in acute withdrawalbased on hypothalamic-pituitary-adrenocortical axis elevation [39], but they do not display sei-zures because they are a relatively seizure-resistant strain.
A multi-level analysis approach was utilized which included differential expression, networkanalysis, cell-type specificity, and time-series clustering analyses. These approaches includecomputational algorithms that enhance the analysis of gene coexpression networks existing indiverse expression datasets. In addition, since the brain transcriptome is organized into genemodules associated with major cell classes and specific synaptic and cellular functions [34], weclassified sets of genes based upon subcellular localization. Neurons and glial cells are charac-terized by unique transcriptional signatures [33,40] and these signatures can be identified
Table 3. Ethanol-responsiveWGCNA co-expression modules enriched with cell type-specific genes.
Astrocytes Microglia Neuron Oligodendrocytes
Tissue/Module
Module Function Summary 0 hour 8 hour 0 hour 8 hour 0 hour 8 hour 0 hour 8 hour
AMY/1 Anti-apoptosis X, HFDR X, HFDR X, HFDR X, HFDR
AMY/2 Antigen processing and presentation;adaptive immune response; majorhistocompatability complex
X, H X, HFDR
AMY/3 Neuron development; axonogenesis;glycoprotein
X, HFDR
AMY/4 GPCR activity; nucleotide receptoractivity
X, HFDR X, HFDR
AMY/5 Glutathione metabolism; drugmetabolism
X, H
NAC/1 GPCR activity; disulfide bond;immunoglobulin, extracellular matrix
X, HFDR X, HFDR
NAC/2 Glutathione metabolism; drugmetabolism
X, HFDR X, HFDR
NAC/3 ras/rho GTPase signaling; anti-apoptosis
X, HFDR X, HFDR X, HFDR X, HFDR
NAC/4 Antigen processing and presentation;adaptive immune response
X, HFDR X, HFDR
NAC/5 Fibronectin, type III subdomain; celladhesion
X, HFDR
PFC/1 Antigen processing and presentation;adaptive immune response; majorhistocompatability complex
X, HFDR X, HFDR
PFC/2 Small GTPase mediated signaltransduction; circadian rhythm
X, HFDR X, HFDR
PFC/3 Ribosome; extracellular region;disulfide bond; binding(glycosaminoglycan, pattern,polysaccharide, heparin,carbohydrate); glycoprotein
X
AMY = amygdala; NAC = nucleus accumbens; PFC = prefrontal cortex. Only modules enriched with both cell type-specific and ethanol-responsive genes
(FDR � 0.05) are shown. Functional annotations are shown for each module. [An "X" indicates enrichment of the module with ethanol-responsive and cell
type-specific genes at the given time point, "H" indicates differentially expressed module Hub gene (unadjusted p-value � 0.05), and HFDR indicates
differentially expressed Hub gene (FDR � 0.05)].
doi:10.1371/journal.pone.0121522.t003
Time-Dependent Changes in Gene Expression in Response to Ethanol Vapor
PLOS ONE | DOI:10.1371/journal.pone.0121522 March 24, 2015 9 / 17
reliably from analysis of complex brain tissue without isolating homogeneous populations ofcells [4,34]. Classifying significantly regulated genes into cell type-specific signatures improvesthe quality of inference and potentially leads to refined hypotheses [41].
A time-series analysis (Bioconductor package maSigPro) was performed to identify clustersof genes with similar expression patterns. Each brain region displayed distinct clusters overlap-ping with WGCNAmodules enriched in differentially expressed and cell type-specific genes.In the AMY, a cluster was identified (Cluster 2: Fig. 6 and Table 4) in which all genes were in-cluded with modules enriched with differentially expressed, and enriched with astrocyte andmicroglia genes. The expression of this cluster of genes was significantly increased at 0- and8-hours, but returned to baseline at 120-hours. IPA analysis indicated that this cluster was en-riched in "Inflammatory Disease"-related genes (Alox5ap, B2m, Cd74, Fcgr2b,Hla-A, Pglyrp1,Psmb9, Spp1). Interestingly, B2m is known to be important for immune responses and hasbeen shown to be alcohol responsive in multiple studies [13,42–44]. Blednov et al. [42] demon-strated that deletion of B2m reduced ethanol consumption in the limited access two-bottlechoice test for ethanol intake, supporting a hypothesis that genes within this cluster may play arole in mediating voluntary drinking. In addition, the innate immune cytokine Cd74 was a
Fig 5. Mean t values for ethanol-responsive modules in brain and liver at 0-, 8-, and 120-hours. Bars showmean t values (±SEM) of ethanol-responsivemodules for each tissue at each time point. Panel A = AMY (amygdala), Panel B = NAC (nucleus accumbens), Panel C = PFC (prefrontal cortex), and PanelD = Liver.
doi:10.1371/journal.pone.0121522.g005
Time-Dependent Changes in Gene Expression in Response to Ethanol Vapor
PLOS ONE | DOI:10.1371/journal.pone.0121522 March 24, 2015 10 / 17
member of this cluster. The expression of this gene is rapidly induced by alcohol and has beenlinked to the progression of cytokine responses during alcohol withdrawal [45] which is consis-tent with changes observed 8 hours post-treatment.
In NAC, a cluster of genes overlapped with modules enriched with microglia and oligoden-drocytes (Cluster 3: Fig. 6 and Table 4). Similar to the AMY, IPA analysis indicated that thiscluster was enriched in "Inflammatory Disease"-related genes (Cd74, Cebpb,Hla-A,Hla-E,Hla-G, Htra1, Il17rc, Pglyrp1, Psmb9, Slc1a2). Slc1a2 (a glial glutamate transporter) is highlyexpressed in microglia [46] and has been linked to neurodegenerative disorders [47] as well asdrug dependence [48]. This gene is differentially expressed in human alcoholic post-mortembrain [4] and drugs acting on this target alter motivation to drink in dependent animals [49].In addition, genetic variation in glutamate transporters confers risk-taking behavior in
Fig 6. Time series analysis (MaSigPro). A two-step regression approach was used to identify clusters of differentially expressed genes with similarexpression patterns across time. Each plot shows the hierarchical clustering (clusters = 4) of average expression profiles by time and tissue type(AMY = amygdala; NAC = nucleus accumbens; PFC = prefrontal cortex; Liver). Panels A-D show gene clusters that have the greatest overlap with WGCNAmodules with significantly enriched differentially expressed genes and cell type-specific genes. The dots represent average expression values for each genein the time series.
doi:10.1371/journal.pone.0121522.g006
Time-Dependent Changes in Gene Expression in Response to Ethanol Vapor
PLOS ONE | DOI:10.1371/journal.pone.0121522 March 24, 2015 11 / 17
alcoholics [50]. Together, these findings support a role for Slc1a2 in alcohol intake and depen-dence. As in the AMY, the cytokine Cd74 was also identified in NAC, suggesting that it mayhave a role in innate immune responses in multiple brain regions. Other genes in this clusterthat are differentially expressed in mouse models and human alcoholics includeHtra1 [13] andIl17rc [4]. Tsc22d3 and Gata-2 are alcohol-responsive members of this gene set but are notmembers of inflammatory response pathways. Tsc22d3 functions as a transcriptional regulatorand is differentially expressed in human alcoholics [4]. Tsc22d3may be associated with neuro-plastic changes in response to drugs of abuse, including ethanol in mouse striatum [51].
In contrast to the glial signature of many of the clusters, one PFC gene cluster (Cluster 2:Fig. 6 and Table 4) was highly overlapping with a WGCNAmodule enriched with differentiallyexpressed neuronal genes. Mean t-value distributions (Fig. 5) indicated that the magnitude anddirection of change were clearly different in the PFC compared to the other brain regions, show-ing both a significant down- and up-regulation of genes at the 0- and 8-hour time points. Thesedata suggest that chronic ethanol vs withdrawal changes in neuronal gene regulation may reflectgreater transcriptional control in PFC than in the enriched cell types in AMY and NAC. The
Table 4. Clusters of differentially expressed genes with similar expression patterns as a function oftime (maSigPro time series analysis).
Tissue Cluster Gene Symbol
AMY 1 Hba-a1, Asrgl1, Hbb-b1, Sox21, 1190002H23Rik, Pafah1b3, Hist1h4h, Mcm5, G3bp1,Mrp63, Trappc4, Slc30a10, Pcmt1
2 B2m*, Cd74, Mfsd2, Fcgr2b, Psmb9, Pglyrp1, Htatip2, Pcsk4, Spp1, Sec63,EG630499, EG667977, Alox5ap, Ccl25
3 Dtna, Slc25a33
4 Rit1, Fkrp, Fam131a, Hes6
NAC 1 Elac2, Dtna, Snai3, Nrn1l, Mpp3, Fmo1, Hist1h1c, Vgf, Slc25a3, Sorcs3, Smap2
2 Hba-a1, Heatr1, Hbb-b1, Sox21, AI428936, Aldh3b1, P2ry1, Pex6, Phldb1, Exdl2,H2afj
3 H2-T23*, Mfsd2, Scg2, Psmb9, Pglyrp1, Gata2, Slc1a2, Jun, H2-M3, Htra1*, Cebpb,Il17rc, EG630499, EG667977, Cd151, H2-Q7, Ccl25, Cd74, Tsc22d3
4 Slco4a1, LOC100046883, Sdpr, Ppif
PFC 1 Heatr1, Prmt2, Tsga14, Hbb-b1, Trib2, 4930455F23Rik, Dnajb6
2 Bdnf, Rem2, Adcyap1, Sorcs3*, Pglyrp1, Fscn1, Cdkn1a*, Chst8, AI593442, Nrn1,Ttpal, Fam20a, Car12, Vgf, 2810452K22Rik
3 LOC381629, Arpp21, Smpdl3b, Tprkb, Slc41a3, BC028528, Ccl25, Ppp4r4, R74862,Htra1*, BC031353, Snn, EG667977, Xpa, 0610007C21Rik*
4 Wwp2, Cyhr1, Tmem132e, C230078M08Rik, Lsm10, Zmat4, Fchsd1
Liver 1 Mrpl48*, 2610528J11Rik, Arsb, Arsa, Pex5*, Dut, Dis3l, Smad2, Ipp, Acy3, Ndufaf1,Lman2, Ergic2, Adh4, Ube2l3, Tpk1, LOC100048313, Atpaf2, Snrk, Pygl*, Sh3glb2,Lrba, Tmem93, Mrpl22, Pnpla7, Muted, Sec14l2, Galt, Cyb5r3*, Clec11a, F2r, Mrps28,Mrpl53, Rngtt, Ppapdc2, Sacm1l, Trak1, Rtn4ip1, Zhx1, Nelf
2 Akr1b8, Vav1, Csf1r, Sftpd, Rcsd1, Rims3, Lgmn, Thy1, Clec4f, LOC100044439,Vcam1, Psap, Spic, Slc16a9, Clec4n, Btbd11
3 Ubl3, Soat2, Eps15, Rap1b, Tbk1, Adrb2, Epn2, Slc2a1, Rps9, Usp3, Nrbp2, Cyp2b10,Cyp3a13*, Acat1, Nr1i2, LOC100048445, Oas2, Gdpd1, Cd68, Eif3k, Sult1a1, Rnf166,Hgsnat, Cyp1a2, Tm4sf4, Nr1i3, Cyb5, Cyp2b23, Keap1, Samd4, Nrap
4 9630015D15Rik, Mgll**, Smarce1*, Cpt2
AMY = amygdala; NAC = nucleus accumbens; PFC = prefrontal cortex. Red text indicates clusters of
genes overlapping with WGCNA modules that were enriched with differentially expressed and cell type-
specific genes. Illumina Probe_Ids resulting in duplicate and triplicate Gene Symbols within the clusters are
indicated by * and **, respectively.
doi:10.1371/journal.pone.0121522.t004
Time-Dependent Changes in Gene Expression in Response to Ethanol Vapor
PLOS ONE | DOI:10.1371/journal.pone.0121522 March 24, 2015 12 / 17
most prominent pathway identified by IPA analysis indicated that this cluster was enriched in"Neurological Disease"-related genes (Adcyap1, Bdnf, CA12, Cdkn1a, Vgf). Bdnf has a well-docu-mented role in synaptic plasticity [52,53] and addiction [54]. We recently demonstrated thatBdnf is significantly down-regulated in homogenized medial PFC tissue [11] as well as in puri-fied synaptoneurosome preparations [55]. Reductions of Bdnf levels [56,57] and knockdown ofBdnf expression increase ethanol-drinking behavior [58]. Together, these data support a role forBdnf in the modulation of ethanol intake. Alcohol consumption is known to be modulated bycircadian-related cellular function [59]. In the current study, the circadian gene Adcyap1 wasidentified as differentially expressed member of an enriched neuronal module and may repre-sent a regulatory mechanism involved in the time-dependent expression changes.
These marked changes in glial, and particularly microglial, genes at both the 0- and 8-hourtime points support an emerging concept of neuroimmune changes during alcohol dependence[60,61]. Alterations in neuroimmune gene expression are seen in human alcoholics and also inrodent models with intermittent administration of high doses of ethanol [5,62,63]. It is interest-ing to note that chronic voluntary alcohol consumption (resulting in lower blood levels com-pared to inhalation or injection of ethanol) did not produce pronounced changes in expressionof microglial or neuroimmune genes in a tissue homogenate [9], but such changes were moreprevalent in a synaptoneurosome preparation that enriches for synaptic elements, includingglia [55]. It will be interesting to examine in future studies whether voluntary alcohol consump-tion in this CIE model influences the gene expression profile reported in the present study.
The present study shows marked changes in gene expression between the 0- and 8-hourtime points in brain neuronal compartments, but fewer differences in non-neuronal clusters,and very few in liver. This is consistent with marked changes in neuronal excitability duringthe first 8 hours following withdrawal of alcohol and emphasizes the importance of comparingneuronal and glial gene expression patterns, as the glial changes are much more stable duringwithdrawal than the neuronal clusters.
In conclusion, gene modules and time-dependent gene clusters were identified in AMY andNAC that were enriched with astrocytes, microglia, and oligodendrocyte cell types. These setsof genes were primarily associated with inflammatory response function and the changes in ex-pression in this model of alcohol dependence is consistent with the proposed role of neuroim-mune signaling in promoting alcohol consumption [42,60]. In contrast, the PFC was enrichedwith neuronal genes and displayed a greater diversity in directional expression changes, sug-gesting that PFC is under greater transcriptional regulatory control. Importantly, of the manyexpression changes identified at 0- and 8-hours after ethanol vapor treatment, the majority ofchanges returned to baseline levels after 120-hours. These results suggest that although inter-mittent ethanol vapor treatment increases alcohol consumption 120 hours after the last treat-ment, it is difficult to detect changes in gene expression that might be responsible for signs ofprotracted abstinence. It is possible that some of the weak changes observed in our study after120 hours and by Tapocik et al. [10] after 3 weeks of abstinence are important but are dilutedby the cellular heterogeneity of the brain. Analysis of cell-specific transcriptomes, or use ofpreparations such as synaptoneurosomes [55], may be needed to detect persistent changes ingene expression produced by alcohol dependence.
Supporting InformationS1 Fig. Tissue Micropunches. Frozen brains were placed in a plastic mold containing OCTand maintained in a mixture of powdered dry-ice and isopentane. A Microm HM550 cryostat(Thermo Scientific, Ontario, CA) was used for sectioning at a thickness of 300 μm. Micro-punches were collected from amygdala (AMY; 1.25 mm; combined basolateral and central
Time-Dependent Changes in Gene Expression in Response to Ethanol Vapor
PLOS ONE | DOI:10.1371/journal.pone.0121522 March 24, 2015 13 / 17
nucleus), nucleus accumbens (NAC; 1.25 mm; combined core and shell), and prefrontal cortex(PFC; 2.0 mm).(PDF)
S2 Fig. Time series analysis (MaSigPro). A two-step regression approach was used to identifyclusters of differentially expressed genes with similar expression patterns across time. Each plotshows the hierarchical clustering (clusters = 4) of average expression profiles by time in theamygdala (AMY). The dots represent average expression values for each gene in the time series.(PDF)
S3 Fig. Time series analysis (MaSigPro). A two-step regression approach was used to identifyclusters of differentially expressed genes with similar expression patterns across time. Each plotshows the hierarchical clustering (clusters = 4) of average expression profiles by time in the nucleusaccumbens (NAC). The dots represent average expression values for each gene in the time series.(PDF)
S4 Fig. Time series analysis (MaSigPro). A two-step regression approach was used to identifyclusters of differentially expressed genes with similar expression patterns across time. Each plotshows the hierarchical clustering (clusters = 4) of average expression profiles by time in the pre-frontal cortex (PFC). The dots represent average expression values for each gene in the time series.(PDF)
S5 Fig. Time series analysis (MaSigPro). A two-step regression approach was used to identifyclusters of differentially expressed genes with similar expression patterns across time. Each plotshows the hierarchical clustering (clusters = 4) of average expression profiles by time in theLiver. The dots represent average expression values for each gene in the time series.(PDF)
S1 Table. WGCNAmodule preservation scores (z-scores based upon a module membershipsize of 100).(XLSX)
S2 Table. Immune-responsive gene list used in enrichment analysis.(XLSX)
S3 Table. Top 500 changed genes in AMY, NAC, and PFC.(XLSX)
S4 Table. Differentially expressed WGCNAmodule hub genes.(XLSX)
S5 Table. Gene information for maSigPro clusters shown in Fig. 6.(XLSX)
AcknowledgmentsThe authors would like to thank Dr. Jody Mayfield for thoughtful comments onthe manuscript.
Author ContributionsConceived and designed the experiments: RDM RAH HCB. Performed the experiments:EAOKMFL GRT YON. Analyzed the data: RDM EAOK GRT SPF. Contributed reagents/ma-terials/analysis tools: RDM RAH HCB. Wrote the paper: RDM EAOK.
Time-Dependent Changes in Gene Expression in Response to Ethanol Vapor
PLOS ONE | DOI:10.1371/journal.pone.0121522 March 24, 2015 14 / 17
References1. Farris SP, Wolen AR, Miles MF. Using expression genetics to study the neurobiology of ethanol and al-
coholism. Int Rev Neurobiol. 2010; 91: 95–128. doi: 10.1016/S0074-7742(10)91004-0 PMID:20813241
2. Nestler EJ. Genes and addiction. Nat Genet. 2000; 26: 277–81. PMID: 11062465
3. Robison AJ, Nestler EJ. Transcriptional and epigenetic mechanisms of addiction. Nat Rev Neurosci.2011; 12: 623–37. doi: 10.1038/nrn3111 PMID: 21989194
4. Ponomarev I, Wang S, Zhang L, Harris RA, Mayfield RD. Gene coexpression networks in human brainidentify epigenetic modifications in alcohol dependence. Journal of Neuroscience. 2012; 32: 1884–97.doi: 10.1523/JNEUROSCI.3136-11.2012 PMID: 22302827
5. Liu J, Lewohl JM, Harris RA, Iyer VR, Dodd PR, Randall PK, et al. Patterns of gene expression in thefrontal cortex discriminate alcoholic from nonalcoholic individuals. Neuropsychopharmacology. 2006;31: 1574–82. PMID: 16292326
6. Farris SP, Mayfield RD. RNA-Seq Reveals Novel Transcriptional Reorganization in Human AlcoholicBrain. Int Rev Neurobiol. 2014; 116: 275–300. doi: 10.1016/B978-0-12-801105-8.00011-4 PMID:25172479
7. Agrawal RG, Owen JA, Levin PS, Hewetson A, Berman AE, Franklin SR, et al. Bioinformatics analysesreveal age-specific neuroimmune modulation as a target for treatment of high ethanol drinking. AlcoholClin Exp Res. 2014; 38: 428–37. doi: 10.1111/acer.12288 PMID: 24125126
8. Iancu OD, Oberbeck D, Darakjian P, Metten P, McWeeney S, Hitzemann R. Selection for drinking inthe dark alters brain gene coexpression networks. Alcohol Clin Exp Res. 2013; 37: 1295–303. doi: 10.1111/acer.12100 PMID: 23550792
9. Osterndorff-Kahanek E, Ponomarev I, Harris RA. Gene expression in brain and liver produced by threedifferent regimens of alcohol consumption in mice: comparison with immune activation. PLoS ONE.2013; 8: e59870. doi: 10.1371/journal.pone.0059870 PMID: 23555817
10. Tapocik JD, Solomon M, Flanigan M, Meinhardt M, Barbier E, Schank JR, et al. Coordinated dysregula-tion of mRNAs and microRNAs in the rat medial prefrontal cortex following a history of alcohol depen-dence. The Pharmacogenomics Journal. 2013; 13: 286–96. doi: 10.1038/tpj.2012.17 PMID: 22614244
11. Melendez RI, McGinty JF, Kalivas PW. Brain region-specific gene expression changes after chronic in-termittent ethanol exposure and early withdrawal in C57BL/6J mice. Addict Biol. 2012; 17: 351–64. doi:10.1111/j.1369-1600.2011.00357.x PMID: 21812870
12. Lopez MF, Becker HC. Operant ethanol self-administration in ethanol dependent mice. Alcohol. 2014;48: 295–9. doi: 10.1016/j.alcohol.2014.02.002 PMID: 24721194
13. Mulligan MK, Ponomarev I, Hitzemann RJ, Belknap JK, Tabakoff B, Harris RA, et al. Toward under-standing the genetics of alcohol drinking through transcriptome meta-analysis. Proc Natl Acad SciUSA. 2006; 103: 6368–73. PMID: 16618939
14. Mayfield RD, Harris RA, Schuckit MA. Genetic factors influencing alcohol dependence. Br J Pharmacol.Blackwell Publishing Ltd; 2008; 154: 275–87. doi: 10.1038/bjp.2008.88 PMID: 18362899
15. Wahlsten D, Bachmanov A. Stability of inbred mouse strain differences in behavior and brain size be-tween laboratories and across decades. Proc Natl Acad Sci USA. 2006; 103: 16364–9. PMID:17053075
16. Hopf FW, Simms JA, Chang S-J, Seif T, Bartlett SE, Bonci A. Chlorzoxazone, an SK-Type PotassiumChannel Activator Used in Humans, Reduces Excessive Alcohol Intake in Rats. Biol Psychiatry. 2011;69: 618–24. doi: 10.1016/j.biopsych.2010.11.011 PMID: 21195386
17. Hopf FW, Lesscher HMB. Rodent models for compulsive alcohol intake. Alcohol. 2014; 48: 253–64.doi: 10.1016/j.alcohol.2014.03.001 PMID: 24731992
18. Thiele TE, Boehm SL II. “Drinking in the Dark (DID)”: A Simple Mouse Model of Binge-Like Alcohol In-take. Hoboken, NJ, USA: JohnWiley & Sons, Inc; 2001. doi: 10.1002/0471142301.ns0949s68 PMID:24984686
19. Barkley-Levenson AM. High Drinking in the Dark Mice: A genetic model of drinking to intoxication. Alco-hol. 2014; 48: 217–23. doi: 10.1016/j.alcohol.2013.10.007 PMID: 24360287
20. Becker HC. Animal models of excessive alcohol consumption in rodents. Curr Top Behav Neurosci.Berlin, Heidelberg: Springer Berlin Heidelberg; 2013; 13 (Chapter 203): 355–77.
21. Becker HC, Lopez MF. Increased ethanol drinking after repeated chronic ethanol exposure and with-drawal experience in C57BL/6 mice. Alcohol Clin Exp Res. 2004; 28: 1829–38. PMID: 15608599
22. Lopez MF, Becker HC. Effect of pattern and number of chronic ethanol exposures on subsequent vol-untary ethanol intake in C57BL/6J mice. Psychopharmacology. 2005; 18: 688–96.
Time-Dependent Changes in Gene Expression in Response to Ethanol Vapor
PLOS ONE | DOI:10.1371/journal.pone.0121522 March 24, 2015 15 / 17
23. Griffin WC III, Lopez MF, Becker HC. Intensity and duration of chronic ethanol exposure is critical forsubsequent escalation of voluntary ethanol drinking in mice. Alcohol Clin Exp Res. Blackwell PublishingLtd; 2009; 33: 1893–900. doi: 10.1111/j.1530-0277.2009.01027.x PMID: 19673744
24. Becker HC, Hale RL. Repeated episodes of ethanol withdrawal potentiate the severity of subsequentwithdrawal seizures: an animal model of alcohol withdrawal "kindling". Alcohol Clin Exp Res. 1993; 17:94–8. PMID: 8452212
25. Lin SM, Du P, Huber W, KibbeWA. Model-based variance-stabilizing transformation for Illumina micro-array data. Nucleic Acids Res. 2008; 36: e11–1. doi: 10.1093/nar/gkm1075 PMID: 18178591
26. Bolstad BM, Irizarry RA, Astrand M, Speed TP. A comparison of normalization methods for high densityoligonucleotide array data based on variance and bias. Bioinformatics. 2003; 19: 185–93. PMID:12538238
27. lumi: a pipeline for processing Illumina microarray. Oxford University Press; 2008; 24: 1547–8. doi: 10.1093/bioinformatics/btn224 PMID: 18467348
28. Sample Criteria for Testing Outlying Observations. Institute of Mathematical Statistics; 1950; 21: 27–58.
29. Smyth GK. Linear models and empirical bayes methods for assessing differential expression in micro-array experiments. 2004; 3: Article3. PMID: 16646809
30. Langfelder P, Horvath S. WGCNA: an R package for weighted correlation network analysis. BMC Bioin-formatics. 2008; 9: 559. doi: 10.1186/1471-2105-9-559 PMID: 19114008
31. Huang DW, Sherman BT, Lempicki RA. Systematic and integrative analysis of large gene lists usingDAVID bioinformatics resources. Nat Protoc. 2009; 4: 44–57. doi: 10.1038/nprot.2008.211 PMID:19131956
32. Huang DW, Sherman BT, Lempicki RA. Bioinformatics enrichment tools: paths toward the comprehen-sive functional analysis of large gene lists. Nucleic Acids Res. Oxford University Press; 2009; 37: 1–13.doi: 10.1093/nar/gkn923 PMID: 19033363
33. Cahoy JD, Ben Emery, Kaushal A, Foo LC, Zamanian JL, Christopherson KS, et al. A transcriptome da-tabase for astrocytes, neurons, and oligodendrocytes: a new resource for understanding brain develop-ment and function. Journal of Neuroscience. 2008; 28: 264–78. doi: 10.1523/JNEUROSCI.4178-07.2008 PMID: 18171944
34. OldhamMC, Konopka G, Iwamoto K, Langfelder P, Kato T, Horvath S, et al. Functional organization ofthe transcriptome in human brain. Nat Neurosci [Internet]. 2008; 11: 1271–82. Available: http://www.nature.com/doifinder/10.1038/nn.2207 doi: 10.1038/nn.2207 PMID: 18849986
35. Conesa A, Nueda MJ, Ferrer A, Talón M. maSigPro: a method to identify significantly differential ex-pression profiles in time-course microarray experiments. Bioinformatics. 2006; 22: 1096–102. PMID:16481333
36. Ponomarev I, Rau V, Eger EI, Harris RA, FanselowMS. Amygdala transcriptome and cellular mecha-nisms underlying stress-enhanced fear learning in a rat model of posttraumatic stress disorder. Neurop-sychopharmacology. 2010; 35: 1402–11. doi: 10.1038/npp.2010.10 PMID: 20147889
37. Harris RA, Osterndorff-Kahanek E, Ponomarev I, Homanics GE, Blednov YA. Testing the silence ofmutations: Transcriptomic and behavioral studies of GABA(A) receptor α1 and α2 subunit knock-inmice. Neurosci Lett. 2011; 488: 31–5. doi: 10.1016/j.neulet.2010.10.075 PMID: 21056629
38. Becker HC, Ron D. Animal models of excessive alcohol consumption: recent advances and future chal-lenges. Alcohol. 2014; 48: 205–8. doi: 10.1016/j.alcohol.2014.04.001 PMID: 24811154
39. Becker HC. Effects of alcohol dependence and withdrawal on stress responsiveness and alcohol con-sumption. Alcohol Res. 2012; 34(4):448–58. PMID: 23584111
40. Sugino K, Hempel CM, Miller MN, Hattox AM, Shapiro P, Wu C, et al. Molecular taxonomy of major neu-ronal classes in the adult mouse forebrain. Nat Neurosci. 2005; 9: 99–107. PMID: 16369481
41. Ponomarev I, Maiya R, Harnett MT, Schafer GL, Ryabinin AE, Morikawa H, et al. Transcriptional signa-tures of cellular plasticity in mice lacking the alpha1 subunit of GABAA receptors. Journal of Neurosci-ence. 2006; 26: 5673–83. PMID: 16723524
42. Ponomarev I, Geil C, Bergeson S, Harris RA. Neuroimmune regulation of alcohol consumption: behav-ioral validation of genes obtained from genomic studies. Addict Biol. 2012; 17: 108–20. doi: 10.1111/j.1369-1600.2010.00284.x PMID: 21309947
43. Mulligan MK, Rhodes JS, Crabbe JC, Mayfield RD, Harris RA, Ponomarev I. Molecular profiles of drink-ing alcohol to intoxication in C57BL/6J mice. Alcohol Clin Exp Res. 2011; 35: 659–70. doi: 10.1111/j.1530-0277.2010.01384.x PMID: 21223303
44. Kimpel MW, Strother WN, McClintick JN, Carr LG, Liang T, Edenberg HJ, et al. Functional gene expres-sion differences between inbred alcohol-preferring and -non-preferring rats in five brain regions. Alco-hol. 2007; 41: 95–132. PMID: 17517326
Time-Dependent Changes in Gene Expression in Response to Ethanol Vapor
PLOS ONE | DOI:10.1371/journal.pone.0121522 March 24, 2015 16 / 17
45. Freeman K, Brureau A, Vadigepalli R, Staehle MM, Brureau MM, Gonye GE, et al. Temporal changesin innate immune signals in a rat model of alcohol withdrawal in emotional and cardiorespiratory homeo-static nuclei. J Neuroinflammation. 2012; 9: 97. doi: 10.1186/1742-2094-9-97 PMID: 22626265
46. López-Redondo F, Nakajima K, Honda S, Kohsaka S. Glutamate transporter GLT-1 is highly expressedin activated microglia following facial nerve axotomy. Brain Res Mol Brain Res. 2000; 76: 429–35.PMID: 10762723
47. Thai DR. Excitatory amino acid transporter EAAT-2 in tangle-bearing neurons in Alzheimer's disease.Brain Pathol. 2002; 12: 405–11. PMID: 12408226
48. Nakagawa T, Satoh M. Involvement of glial glutamate transporters in morphine dependence. Ann N YAcad Sci. 2004; 1025: 383–8. PMID: 15542740
49. Griffin WC III, Haun HL, Hazelbaker CL, Ramachandra VS, Becker HC. Increased extracellular gluta-mate in the nucleus accumbens promotes excessive ethanol drinking in ethanol dependent mice. Neu-ropsychopharmacology. 2014; 39: 707–17. doi: 10.1038/npp.2013.256 PMID: 24067300
50. Sander T, Ostapowicz A, Samochowiec J, Smolka M, Winterer G, Schmidt LG. Genetic variation of theglutamate transporter EAAT2 gene and vulnerability to alcohol dependence. Psychiatr Genet. 2000;10: 103–7. PMID: 11204345
51. Piechota M, Korostynski M, Solecki W, Gieryk A, Slezak M, Bilecki W, et al. The dissection of transcrip-tional modules regulated by various drugs of abuse in the mouse striatum. Genome Biol. 2010; 11:R48. doi: 10.1186/gb-2010-11-5-r48 PMID: 20459597
52. Im H-I, Hollander JA, Bali P, Kenny PJ. MeCP2 controls BDNF expression and cocaine intake throughhomeostatic interactions with microRNA-212. Nat Neurosci. 2010; 13: 1120–7. doi: 10.1038/nn.2615PMID: 20711185
53. Schratt GM, Nigh EA, ChenWG, Hu L, Greenberg ME. BDNF regulates the translation of a selectgroup of mRNAs by a mammalian target of rapamycin-phosphatidylinositol 3-kinase-dependent path-way during neuronal development. Journal of Neuroscience. 2004; 24: 7366–77. PMID: 15317862
54. Lobo MK, Covington HE, Chaudhury D, Friedman AK, Sun H, Damez-Werno D, et al. Cell type-specificloss of BDNF signaling mimics optogenetic control of cocaine reward. Science. 2010; 330: 385–90. doi:10.1126/science.1188472 PMID: 20947769
55. Most D, Ferguson L, Blednov Y, Mayfield RD, Harris RA. The synaptoneurosome transcriptome: amodel for profiling the emolecular effects of alcohol. Pharmacogenomics J. 2014; doi: 10.1038/tpj.2014.43. [Epub ahead of print]
56. Hensler JG, Ladenheim EE, LyonsWE. Ethanol consumption and serotonin-1A (5-HT1A) receptorfunction in heterozygous BDNF (+/–) mice. J Neurochem. 2003; 85: 1139–47. PMID: 12753073
57. McGough NNH, He D-Y, Logrip ML, Jeanblanc J, Phamluong K, Luong K, et al. RACK1 and brain-de-rived neurotrophic factor: a homeostatic pathway that regulates alcohol addiction. Journal of Neurosci-ence. 2004; 24: 10542–52. PMID: 15548669
58. Jeanblanc J, He D-Y, Carnicella S, Kharazia V, Janak PH, Ron D. Endogenous BDNF in the dorsolater-al striatum gates alcohol drinking. Journal of Neuroscience. 2009; 29: 13494–502. doi: 10.1523/JNEUROSCI.2243-09.2009 PMID: 19864562
59. Spanagel R, Rosenwasser AM, Schumann G, Sarkar DK. Alcohol consumption and the body's biologi-cal clock. Alcohol Clin Exp Res. 2005; 29: 1550–7. PMID: 16156052
60. Mayfield J, Ferguson L, Harris RA. Neuroimmune signaling: a key component of alcohol abuse. CurrOpin Neurobiol. 2013; 23: 513–20. doi: 10.1016/j.conb.2013.01.024 PMID: 23434064
61. Crews FT. Immune function genes, genetics, and the neurobiology of addiction. Alcohol Res. 2012; 34:355–61. PMID: 23134052
62. Crews FT, Qin L, Sheedy D, Vetreno RP, Zou J. High mobility group box 1/Toll-like receptor danger sig-naling increases brain neuroimmune activation in alcohol dependence. Biol Psychiatry. 2013; 73: 602–12. doi: 10.1016/j.biopsych.2012.09.030 PMID: 23206318
63. Zou JY, Crews FT. Release of neuronal HMGB1 by Ethanol through decreased HDAC activity activatesbrain neuroimmune signaling. PLoS ONE. 2014; 9: e87915. doi: 10.1371/journal.pone.0087915 PMID:24551070
Time-Dependent Changes in Gene Expression in Response to Ethanol Vapor
PLOS ONE | DOI:10.1371/journal.pone.0121522 March 24, 2015 17 / 17
Related Documents
![Integrating Coexpression Networks with GWAS to Prioritize ... · LARGE-SCALE BIOLOGY ARTICLE Integrating Coexpression Networks with GWAS to Prioritize Causal Genes in Maize[OPEN]](https://static.cupdf.com/doc/110x72/5f51aba08bfbac6bef7784c2/integrating-coexpression-networks-with-gwas-to-prioritize-large-scale-biology.jpg)


![A Developmental Transcriptional Network for Maize Deines Coexpression Modules1[C]](https://static.cupdf.com/doc/110x72/61fb4f752e268c58cd5ca7f9/a-developmental-transcriptional-network-for-maize-deines-coexpression-modules1c.jpg)


