Welcome message from author
This document is posted to help you gain knowledge. Please leave a comment to let me know what you think about it! Share it to your friends and learn new things together.
Transcript
Chronic Diseases Journal
Editorial Team
CHAIRMAN Tayeb Ghadimi
Department of Surgery, Vice Deputy and General Manager, Deputy of Treatment,
Iran University of Medical Sciences, Tehran, Iran
EDITOR IN CHIEF Fariba Farhadifar
Social Determinates of Health Research Center AND Department of Obstetrics and
Gynecology, Kurdistan University of Medical Sciences, Sanandaj, Iran
JOURNAL ADMINISTRATOR Alireza Gharib
Deputy of Research and Technology, Kurdistan University of Medical Sciences,
Sanandaj, Iran
MANAGING EDITOR Samaneh Rouhi
Deputy of Research and Technology, Kurdistan University of Medical Sciences, Sanandaj, Iran
STATISTICAL ADVISERS Mohammad Aziz Rasouli
Department of Epidemiology and Biostatistics, Faculty of Medicine, Kurdistan University of Medical Sciences, Sanandaj, Iran
Saeedeh Jafari Social Determinants of Health Research Center,
Kurdistan University of Medical Sciences, Sanandaj, Iran
EDITORIAL BOARD Laleh Ardeshirpour, Department of Pediatrics, School of Medicine, Yale University, New Haven, CT, USA Ayyaz Ahmed, Department of Physiology, M. Islam Medical College Gujranwala, M. Islam Medical College, Riphah International University, Rawalpindi, Pakistan Fatemeh Alhani, Department of Nursing, Tarbiat Modares University, Tehran, Iran Shahriar Alian, Antimicrobial Resistance Research Center, Mazandaran University of Medical Sciences, Sari, Iran Saman Esmaeilnejad, Faculty of Medical Sciences, Tarbiat Modares University, Tehran, Iran Tanya Berry, Kinesiology, Sport, and Recreation, University of Alberta, Edmonton, Canada Nader Esmailnasab, Department of Epidemiology, Kurdistan University of Medical Sciences, Sanandaj, Iran Amir Faramarzi, Ophthalmology Department, Shahid Beheshti University of Medical Sciences, Tehran, Iran Mehdi Farhoudi, Neurosciences Research Center AND Department of Neurology and Neuroscience, Tabriz University of Medical Science, Tabriz, Iran Nahid Ghotbi, Department of Pediatrics, Kurdistan University of Medical Sciences, Sanandaj, Iran Fardin Fathi, Cellular and Molecular Research Center AND Department of Anatomy, Kurdistan University of Medical Sciences, Sanandaj, Iran Mohamad Esmail Ghaidari, Department of Cardiology, Shahid Beheshti University of Medical Sciences, Tehran, Iran Fariba Farhadifar, Social Determinants of Health Research Center AND Department of Obstetrics and Gynecology, Kurdistan university of Medical Sciences, Sanandaj, Iran Rashid Ramazanzadeh, Cellular and Molecular Research Center, Kurdistan University of Medical Sciences, Sanandaj, Iran Payam Khomand, Department of Neurology, Kurdistan University of Medical Sciences, Sanandaj, Iran Nastaran Khosravi, Department of Pediatric, Research Center of Pediatric Infectious Diseases, Tehran University of Medical Sciences, Tehran, Iran Ahmad Vahabi, Department of Medical Laboratory Sciences, Faculty of Paramedical, Kurdistan University of Medical Sciences, Sanandaj, Iran
Ghobad Moradi, Social Determinants of Health Research Center, Kurdistan University of Medical Sciences, Sanandaj, Iran Maziar Moradi-Lakeh, Institute for Health Metrics Evaluation (USA) AND Department of Community Medicine, School of Medicine, Iran University of Medical Sciences, Tehran, Iran Abolfazl Mozafari, Department of Internal Medicine, Qom Branch, Islamic Azad University, Qom, Iran Abolhassan Nadim, Institute of Health Research AND Department of Epidemiology and Biostatistics, School of Public Health, Tehran University of Medical Sciences, Tehran, Iran Samaneh Rouhi, Cellular and Molecular Research Center, Kurdistan University of Medical Sciences, Sanandaj, Iran Bahram Nikkhoo, Department of Pathology, Kurdistan University of Medical Sciences, Sanandaj, Iran Farokh Rad, Department of Dermatology, Kurdistan University of Medical Sciences, Sanandaj, Iran Ebrahim Ghaderi, Social Determinants of Health Research Center, Kurdistan University of Medical Sciences, Sanandaj, Iran Arash Rashidian, Deputy Director for Research, Center for Academic and Health Policy (CAHP), Tehran University of Medical Sciences, Tehran, Iran Vahid Ravaghi, Center for Health Sciences, Barts and the London, Queen Mary University of London, London, UK David Revalds Lubans, Faculty of Education and Arts, University of Newcastle, Callaghan, Australia Farzin Rezaie, Department of Psychology, Kurdistan University of Medical Sciences, Sanandaj, Iran Daem Roshani, Department of Epidemiology and Biostatistics, Faculty of Medicine, Kurdistan University of Medical Sciences, Sanandaj, Iran Aliakbar Sayyari, Pediatric Gastroenterology, Shahid Beheshti University of Medical Sciences, Tehran, Iran Shole Shahgheibi, Department of Obstetrics and Gynecology, Kurdistan University of Medical Sciences, Sanandaj, Iran Fatemeh Ahangarkani, Invasive Fungi Research Center, Mazandaran University of Medical Sciences, Sari, Iran Vahid Yousefinejad, Liver and Digestive Research Center, Kurdistan University of Medical Sciences, Sanandaj, Iran Yadollah Zarezadeh, Medical Education Development Center, Faculty of Medicine, Kurdistan University of Medical Sciences, Sanandaj, Iran
Publisher: Vesnu Publications Tel/fax: +98 31 32 22 43 35, +98 31 32 22 43 82
http://vesnupub.com Email: [email protected]
Address: Chronic Diseases Journal Office, Deputy of Research, Kurdistan University of Medical Sciences, Pasdaran Ave., Sanandaj, Iran Postal Code: 6617713446
Email: [email protected]/[email protected] Tel: +98 87 33 66 00 89 Interval: Quarterly
eISSN: 2345-2226, pISSN: 2588-7297
i
Chronic Diseases Journal
Information for Authors AIM AND SCOPE The Chronic Diseases Journal is a biannual peer-reviewed scientific journal published by Kurdistan University of Medical Sciences. The manuscripts on the topic of chronic and subacute medical and health conditions and diseases will be published in this journal. This contains all aspects of the chronic and subacute diseases such as control, planning, treatment, patient education, managing guides, policymaking, and biopsychosocial-spiritual factors.
Instruction to Authors MANUSCRIPTS Manuscripts containing original material are accepted for consideration if neither the article nor any part of its essential substance, tables, or figures has been or will be published or submitted elsewhere before appearing in the Chronic Diseases Journal. This restriction does not apply to abstracts or press reports published in connection with scientific meetings. Copies of any closely related manuscripts must be submitted along with the manuscript that is to be considered by the Chronic Diseases Journal. Authors of all types of articles should follow the general instructions given below.
STUDY DESIGN We strongly advise authors to design their clinical trial studies based on the appropriate guidelines. In randomized controlled trials, CONSORT guideline (link), in systematic reviews and meta-analyses, PRISMA (formally QUOROM) guideline (link), in meta-analyses of observational studies in epidemiology, MOOSE guideline (link), in studies of diagnostic accuracy, STARD guideline (link), and in observational studies in epidemiology, STROBE guideline (link) should be used. HUMAN AND ANIMAL RIGHTS The research involves human beings or animals must adhere to the principles of the Declaration of Helsinki (link , link).
Types of Articles
Original article which reports the results of an original scientific research should be less than 3000 words.
Review article which represents the researches and works on a particular topic.
Brief communication is a short research article and should be limited to 1500 words. This article contains all sections of an original article.
Case report is a detailed report of an individual patient that may represent a previously non-described condition and contains new information about different aspects of a disease. It should be less than 2000 words.
Letter to the Editor must be less than 400 words in all cases.
Other types of articles only could be submitted by Chronic Diseases Journal Editorial Board.
SUBMISSION
Only online submission is acceptable. Please
submit online at: http://cdjournal.muk.ac.ir
This manuscripts should be divided into the following sections: (1) Title page, (2) Abstract and Keywords, (3) Introduction, (4) Methods, (5) Results, (6) Discussion, (7) Acknowledgements, (8) References, (9) Figure legends, (10) Appendices, (11) Tables and (12) Figures (figures should be submitted in separate files).
Please supply a word count in title page.
Use normal page margins (2.5 cm), and double-space throughout.
Prepare your manuscript text using a Word processing package using times new roman 12 font, (save in .doc or .rtf format). Submissions of text in the form of PDF files are not permitted.
COVER LETTER A covering letter signed by all authors should identify the corresponding author (include the address, telephone number, fax number, and e-mail address). Please make clear that the final manuscript has been seen and approved by all authors, and that the authors accept full responsibility for the design and conduct of the study, had access to the data, and controlled the decision to publish.
AUTHORSHIP As stated in the Uniform Requirements for Manuscripts Submitted to Biomedical Journals (link), credit for authorship requires substantial contributions to: 1. Substantial contributions to the conception or design of the work; or the acquisition, analysis, or interpretation of data for the work; AND 2. Drafting the work or revising it critically for important intellectual content; AND 3.

ii
Final approval of the version to be published; AND 4. Agreement to be accountable for all aspects of the work in ensuring that questions related to the accuracy or integrity of any part of the work are appropriately investigated and resolved. Each author must sign authorship form attesting that he or she fulfills the authorship criteria. There should be a statement in manuscript explaining contribution of each author to the work. Acknowledgments will be limited to one page of Chronic Diseases Journal space, and those acknowledged will be listed only once. Any change in authorship after submission must be approved in writing by all authors.
ASSURANCES In appropriate places in the manuscript please provide the following items:
If applicable, a statement that the research protocol was approved by the relevant institutional review boards or ethics committees and that all human participants gave written informed consent
The source of funding for the study
The identity of those who analyzed the data
Financial disclosure, or a statement that none is necessary
TITLE PAGE With the manuscript, provide a page giving the title of the paper; titles should be concise and descriptive (not declarative). Title page should include an abbreviated running title of 40 characters, the names of the authors, including the complete first names and no more than two graduate degrees, the name of the department and institution in which the work was done, the institutional affiliation of each author. The name, post address, telephone number, fax number, and e-mail address of the corresponding author should be separately addressed. Any grant support that requires acknowledgment should be mentioned on this page. Word count of abstract and main text as well as number of tables and figures and references should be mentioned on title page. If the work was derived from a project or dissertation, its code should also be stated. Affiliation model: Academic Degree, Department,
Institute, City, Country.
Example: Associate Professor, Department of Radiology, School of Medicine, Kerman University of Medical Sciences, Kerman, Iran.
ABSTRACT Provide on a separate page an abstract of not more than 250 words. This abstract should consist of four paragraphs, labeled Background, Methods, Results, and Conclusions. They should briefly describe the problem being addressed in the study, how the study was performed, the salient results, and what the authors conclude from the results, respectively. Three to 10 keywords may be included. Keywords are preferred to be in accordance with MeSH (link) terms. CONFLICT OF INTEREST Authors of research articles should disclose at the time of submission any financial arrangement they may have with a company whose product is pertinent to the submitted manuscript or with a company making a competing product. Such information will be held in confidence while the paper is under review and will not influence the editorial decision, but if the article is accepted for publication, a disclosure will appear with the article. Because the essence of reviews and editorials is selection and interpretation of the literature, the Chronic Diseases Journal expects that authors of such articles will not have any significant financial interest in a company (or its competitor) that makes a product discussed in the article. REVIEW AND ACTION Submitted papers will be examined for the evidence of plagiarism using some automated plagiarism detection service. Manuscripts are examined by members of the editorial staff, and two thirds are sent to external reviewers. We encourage authors to suggest the names of possible reviewers, but we reserve the right of final selection. Communications about manuscripts will be sent after the review and editorial decision-making process is complete. After acceptance, editorial system makes a final language and scientific edition. No substantial change is permitted by authors after acceptance. It is the responsibility of corresponding author to answer probable questions and approve final version. COPYRIGHT Chronic Diseases Journal is the owner of all copyright to any original work published by the Chronic Diseases Journal. Authors agree to execute copyright transfer forms as requested with respect to their contributions accepted by the Journal. The Chronic Diseases Journal have the right to use, reproduce, transmit, derive works from, publish, and distribute the contribution, in the Journal or otherwise, in any form or medium. Authors will not use or authorize the use of the contribution without the Journal Office’ written consent

iii
JOURNAL STYLE Tables Double-space tables and provide a title for each. Figures Figures should be no larger than 125 (height) x 180 (width) mm (5 x 7 inches) and should be submitted in a separate file from that of the manuscript. The name of images or figures files should be the same as the order that was used in manuscript (fig1, fig2, etc.). Only JPEG, tif, gif and eps image formats are acceptable with CMYK model for colored image at a resolution of at least 300 dpi. Graphs must have the minimum quality: clear text, proportionate, not 3 dimensional and without disharmonic language. Electron photomicrographs should have internal scale markers. If photographs of patients are used, either the subjects should not be identifiable or the photographs should be accompanied by written permission to use them. Permission forms are available from the Editorial Office. Medical and scientific illustrations will be created or recreated in-house. If an outside illustrator creates the figure, the Chronic Diseases Journal reserves the right to modify or redraw it to meet our specifications for publication. The author must explicitly acquire all rights to the illustration from the artist in order for us to publish the illustration. Legends for figures should be an editable text as caption and should not appear on the figures. References The Vancouver style of referencing should be used. References must be double-spaced and numbered as superscripts consecutively as they are cited. References first cited in a table or figure legend should be numbered so that they will be in sequence with references cited in the text at the point where the table or figure is first mentioned. List all authors when there are six or fewer; when there are seven or more, list the first six, then “et al.” The following are sample references: 1. Perlman AI, Sabina A, Williams AL, Njike VY, Katz DL.
Massage therapy for osteoarthritis of the knee: a randomized controlled trial. Arch Intern Med 2006; 166(22): 2533-8. 2. Buckwalter JA, Marsh JL, Brown T, Amendola A, Martin JA. Articular cartilage injury. In: Robert L, Robert L, Joseph V, editors. Principles of Tissue Engineering. 3rd ed. Burlington, MA: Academic Press; 2007. p. 897-907. 3. Kuczmarski RJ, Ogden CL, Grammer-Strawn LM, Flegal KM, Guo SS, Wei R, et al. CDC growth charts: United States. Advance data from vital and health statistics. No. 314. Hyattsville, Md: National Center for Health Statistics, 2000. (DHHS publication no. (PHS) 2000-1250 0-0431) 4. World Health organization. Strategic directions for strengthening nursing and midwifery services [online]. Available from: URL:http://www.wpro.who.int/themesfocuses/theme3/focus2/nursingmidwifery.pdf2002
Units of Measurement Authors should express all measurements in conventional units, with Système International (SI) units given in parentheses throughout the text. Figures and tables should use conventional units, with conversion factors given in legends or footnotes. In accordance with the Uniform Requirements, however, manuscripts containing only SI units will not be returned for that reason. Abbreviations Except for units of measurement, abbreviations are discouraged. Consult Scientific Style and Format: The CBE Manual for Authors, Editors, and Publishers (Sixth edition. New York: Cambridge University Press, 1994) for lists of standard abbreviations. Except for units of measurement, the first time an abbreviation appears, it should be preceded by the words for which it stands. Drug Names Generic names should generally be used except for studies on comparative effects of different brands. When proprietary brands are used in research, include the brand name and the name of the manufacturer in parentheses in the Methods section.
For any more detail about the writing style for your manuscripts refer to:
http://cdjournal.muk.ac.ir

iv
Authorship Form
Title of the manuscript:
We, the undersigned, certify that we take responsibility for the conduct of this study and for the analysis
and interpretation of the data. We wrote this manuscript and are responsible for the decisions about it.
Each of us meets the definition of an author as stated by the International Committee of Medical Journal
Editors (see http://www.icmje.org/icmje-recommendations.pdf). We have seen and approved the final
manuscript. Neither the article nor any essential part of it, including tables and figures, will be published
or submitted elsewhere before appearing in the Chronic Diseases Journal. [All authors must sign this
form or an equivalent letter.]
Name of Author Signature
Please scan this form and upload it as a supplementary file in “Step 4” of submitting articles.

Table of Contents
Original Article(S) Analysis of the factors related to mortality in patients with primary brain and central nervous system tumors
Khaled Rahmani, Faramarz Allahdini, Namam Ali Azadi, Mohsen Sokunati, Abdorrahim Afkhamzadeh ……………..………….……………………………………………………………………………………………...……93-100
The effects of the health reform plan on the performance indicators of hospitals affiliated with Qazvin University of
Medical Sciences, Iran, 2014
Rohollah Kalhor, Soheyla Gholami, Shaghayegh Heidari, Nasrin Bakhtiari, Saeideh Moosavi, Abdollah Keshavarz, Mohammad Zakaria-Kiaei …………………………………………………………………….……………..………..101-107 Study of women's flourishing rate and some related factors, Sanandaj, Iran, 2016
Ahmad Vahabi, Boshra Vahabi, Sirvan Sayyad, Masoud Moradi, Mahnaz Sayyadi, Marzeyeh Fakhri ………………108-112 The prevalence of female genital mutilation and related factors among women in Kamyaran, Iran
Mitra Bahrami, Ebrahim Ghaderi, Erfan Farazi, Afshin Bahramy ………….………...…………………………...…113-119 A Survey of the prevalence of self-disclosure behavior in virtual social networks and related factors among the students
of Kurdistan University of Medical Sciences, Iran
Tahereh Pashaei, Razieh Javanmardi, Arezoo Fallahi …................................................................................120-126 Investigating the structural relationship between math anxiety, Gray’s biological model of personality, and test anxiety
through assessing the self-efficacy mediating role among junior girl students of Urmia City high schools, Iran
Jaleh Arji, Firozeh Sepehrian-Azar, Esmail Soleimani.………….................................................................…..127-135 Prevalence of depression and its relation to risky behaviors in students of Kurdistan University of Medical Sciences,
Iran, 2014
Abdorrahim Afkhamzadeh, Khaled Rahmani, Azizollah Mojahed, Sahar Molsaqi ……………………………...136-142 Comparing the effectiveness of music therapy and alpha-theta neuro-feedback training on anxiety and depression
among patients with chronic irritable bowel syndrome
Seyed Hamzeh Hosseini, Iradj Maleki, Samaneh Farnia, Shahideh Kazemi-Malekmahmoudi ……………….143-151 Spiritual intelligence and its related factors in the students of Sanandaj Universities, Iran, 2015
Ahmad Vahabi, Arezoo Vahabi, Boshra Vahabi, Daem Roshani, Mahnaz Sayyadi…………………………… 152-158

http://cdjournal.muk.ac.ir, 6 July
Chron Dis J, Vol. 6, No. 3, Summer 2018 93
DOI: 10.22122/cdj.v6i3.279 Published by Vesnu Publications
Analysis of the factors related to mortality in patients with primary brain and central nervous system tumors
Khaled Rahmani
1, Faramarz Allahdini
2, Namam Ali Azadi
3, Mohsen Sokunati
4,
Abdorrahim Afkhamzadeh1
1 Social Determinants of Health Research Center, Research Institute for Health Development, Kurdistan
University of Medical Sciences, Sanandaj, Iran
2 Department of Neurosurgery, Faculty of Medicine, Kurdistan University of Medical Sciences, Sanandaj, Iran
3 Department of Biostatistics, School of Medicine, Iran University of Medical Sciences, Tehran, Iran
4 Department of Urology, School of Medicine, Tehran University of Medical Sciences, Tehran, Iran
Abstract BACKGROUND: The present study aimed to assess the factors associated with the mortality of patints with brain
tumor surgery at Be’sat Hospital in Sanandaj, Kurdistan, Iran.
METHODS: In this prospectively cross-sectional study, 108 patients diagnosed with brain tumor and followed by a
surgery during April to December of 2014 were recruited. Eighteen cases were excluded from the study due to lack
of information about their treatment outcomes. Patients’ information including age, gender, tumor type, tumor
location, type of treatment, and extent of resection was collected by a checklist. Clinical outcome of the patients in
six months after surgery was determined through phone calling to patients. All analyses conducted in SPSS
software using logistic regression.
RESULTS: Forty-seven (52.2%) of the studied subjects were women. The age of cases ranged from 3 to 83 years
with total mean of 43.4 ± 21.9 years. In six months after treatment, 41 (45.6%) of the treated patients died.
After excluding 9 children from final analysis and modeling the data by logistic regression, st atistically significant
associations were observed between death from central nervous system (CNS) tumor and male gender [odds
ratio (OR): 5.25, 95% confidence interval (CI): 1.38–21.99], higher age (OR: 1.07, 95% CI: 1.02–1.13), partial
vs. total resection (OR: 20.24, 95% CI: 1.21–337.51), and high malignant potential tumors (OR: 14.77, 95% CI:
4.85–45.02).
CONCLUSION: The results showed that both demographic (advanced age and male gender) and clinical factors
(high malignant potential tumors and partial removal of tumor) related to the worse outcome in patients with
primary CNS tumors during six months after surgery.
KEYWORDS: Brain Neoplasms, Central Nervous System Neoplasms, Mortality, Risk Factors
Date of submission: 25 July 2017, Date of acceptance: 13 Sep. 2017
Citation: Rahmani K, Allahdini F, Azadi NA, Sokunati M, Afkhamzadeh A. Analysis of the factors related
to mortality in patients with primary brain and central nervous system tumors. Chron Dis J 2018; 6(3):
93-100.
Introduction1
Nearly a hundred histologically distinct types of primary central nervous system (CNS) tumors have been recognized, each of them having its own spectrum of clinical
Corresponding Author:
Abdorrahim Afkhamzadeh
Email: [email protected]
presentations, treatments, and outcomes. Primary brain tumors are divided into benign and malignant tumors that originate directly from the brain and its appendages.1,2 The incidence of brain tumors has increased in all age groups over the past two decades. According to the central brain tumor registry of the united states (CBTRUS), the incidence
Original Article

http://cdjournal.muk.ac.ir, 6 July
Risk factors of mortality in patients with CNS Rahmani et al.
94 Chron Dis J, Vol. 6, No. 3, Summer 2018
rate of all primary malignant and non-malignant brain and CNS tumors was 21.97 cases per 100000 for a total count of 356858 incident tumors diagnosed during 2015 in the United States of America (USA).3,4 The estimated number of new cases with brain and other nervous system tumors has been reported 23770 (7.3 per 100000) with 16050 deaths (fatality rate: 67.5%) in 2016.5
Although primary malignant CNS tumors are now registered in the national cancer registry (NCR) of Iran, there is no availability of nationwide CNS tumor epidemiologic data due to failure in surveillance system and incompleteness of collected data. Based on two previous review studies, the annual incidence of primary brain tumors in Iran is estimated to be 2.70 to 5.69 per 100000.6,7
Brain tumor can occur in both genders at any age, but its incidence and histology is different between age and sex groups. There is a modest rise before age 10 and a steady increase after age 15, with a maximum incidence between 75 and 84 years age group. Based on USA statistics, the incidence and mortality of brain and other nervous system tumors is higher in men. Furthermore, the incidence of all brain tumors, except meningioma, is higher in men.5 Surgery is important to remove a large tumor, but large tumor resection has more risk than small tumors. Although complementary treatments such as radiotherapy and chemotherapy are beneficial because of their high precision, they have some limitations.7,8
Albeit emergence of new diagnostic and therapeutic techniques led to improvement in treatment of brain tumors, high mortality after surgery or combination therapy is still a challenging issue for neurosurgeons that can be influenced by different factors. According to the exiting evidence, demographic variables, such as age and gender, and clinical factors such as tumor characteristics (type, size, grade, stage, and location), extent of surgical
resection, skills of surgeon, and also pre- and post-operative cares should be seriously considered.9-11
As mentioned earlier, the follow-up of patients with brain tumor after surgery to determine the outcome and assessing the potential related factors is essential. The aim of this study was to assess the potential risk factors related to the mortality in patients with brain and CNS tumors in six months after surgery.
Materials and Methods
In this prospectively cross-sectional study, all patients diagnosed with brain tumor during 2014 that underwent treatment (surgery) of tumor at Be'sat Hospital in Sanandaj, Iran, were investigated. The total number of patients included in the study was 108 individuals, primarily. Eighteen patients were excluded from the study due to lack of information about their treatment outcomes.
Data were collected using a checklist from patient medical records that was archived in the hospital. Patient information including age, gender, tumor type, tumor location, type of treatment, and extent of resection was extracted from patient’s medical records. Clinical outcome, and death or survival (relative/complete cure) of each patient was obtained in six months after surgery follow-up by phone calls to either the patient or her/his family. It should be noted that during fallow-up and calling to the patients, the aim of the research was explained and oral informed consent for data collection was taken from all individuals who entered in the study.
All analyses were conducted in SPSS software (version 20, IBM Corporation, Armonk, NY, USA). In analyzing the data, we first used independent sample t-test and chi square to assess the relation between studied variables, death, and studied outcome; then the values of odds ratio (OR), corresponding 95% confidence interval (CI) for OR, and significance values were calculated for each
http://cdjournal.muk.ac.ir, 6 July
Risk factors of mortality in patients with CNS Rahmani et al.
Chron Dis J, Vol. 6, No. 3, Summer 2018 95
factor using logistic regression method. It was noted that after the description of
patients’ characteristics and in order to determine the association between studied factors and mortality in six months after brain tumor surgery, 9 children aged < 15 years were excluded from the analysis due to the differences between children and adult brain tumors.
Results
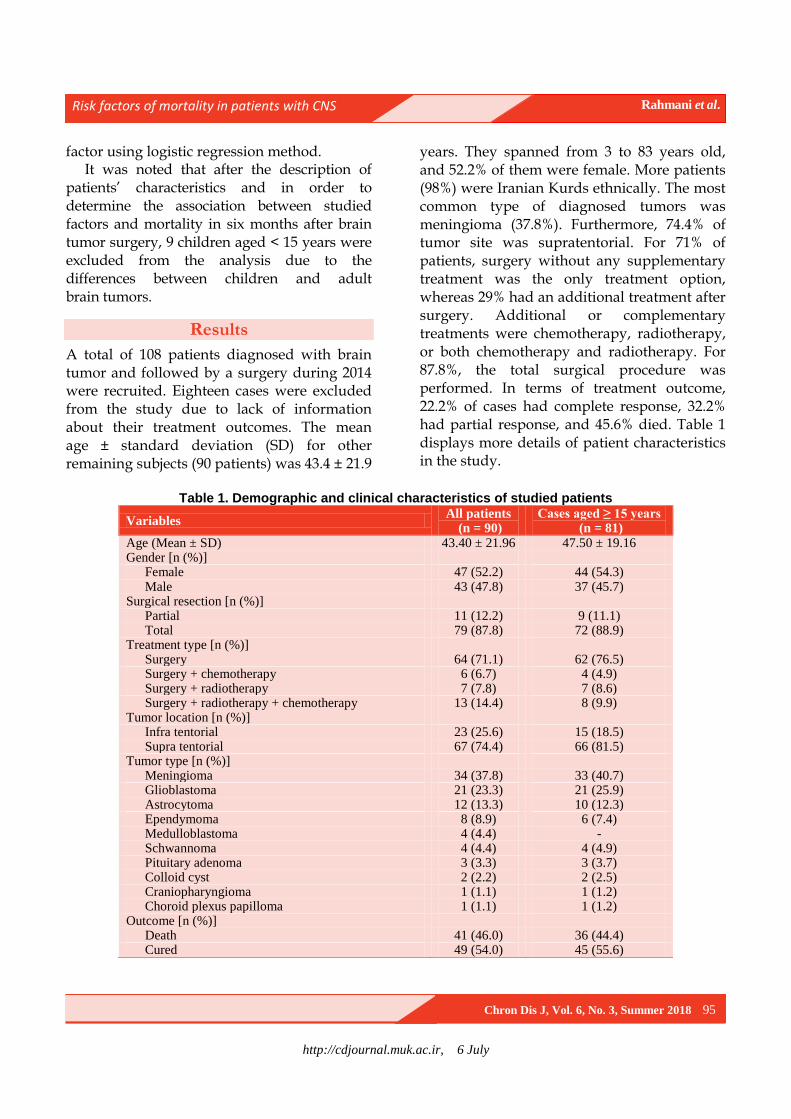
A total of 108 patients diagnosed with brain tumor and followed by a surgery during 2014 were recruited. Eighteen cases were excluded from the study due to lack of information about their treatment outcomes. The mean age ± standard deviation (SD) for other remaining subjects (90 patients) was 43.4 ± 21.9
years. They spanned from 3 to 83 years old, and 52.2% of them were female. More patients (98%) were Iranian Kurds ethnically. The most common type of diagnosed tumors was meningioma (37.8%). Furthermore, 74.4% of tumor site was supratentorial. For 71% of patients, surgery without any supplementary treatment was the only treatment option, whereas 29% had an additional treatment after surgery. Additional or complementary treatments were chemotherapy, radiotherapy, or both chemotherapy and radiotherapy. For 87.8%, the total surgical procedure was performed. In terms of treatment outcome, 22.2% of cases had complete response, 32.2% had partial response, and 45.6% died. Table 1 displays more details of patient characteristics in the study.
Table 1. Demographic and clinical characteristics of studied patients
Variables All patients
(n = 90) Cases aged ≥ 15 years
(n = 81)
Age (Mean ± SD) 43.40 ± 21.96 47.50 ± 19.16 Gender [n (%)]
Female 47 (52.2) 44 (54.3) Male 43 (47.8) 37 (45.7)
Surgical resection [n (%)] Partial 11 (12.2) 9 (11.1) Total 79 (87.8) 72 (88.9)
Treatment type [n (%)] Surgery 64 (71.1) 62 (76.5) Surgery + chemotherapy 6 (6.7) 4 (4.9) Surgery + radiotherapy 7 (7.8) 7 (8.6) Surgery + radiotherapy + chemotherapy 13 (14.4) 8 (9.9)
Tumor location [n (%)] Infra tentorial 23 (25.6) 15 (18.5) Supra tentorial 67 (74.4) 66 (81.5)
Tumor type [n (%)] Meningioma 34 (37.8) 33 (40.7) Glioblastoma 21 (23.3) 21 (25.9) Astrocytoma 12 (13.3) 10 (12.3) Ependymoma 8 (8.9) 6 (7.4) Medulloblastoma 4 (4.4) - Schwannoma 4 (4.4) 4 (4.9) Pituitary adenoma 3 (3.3) 3 (3.7) Colloid cyst 2 (2.2) 2 (2.5) Craniopharyngioma 1 (1.1) 1 (1.2) Choroid plexus papilloma 1 (1.1) 1 (1.2)
Outcome [n (%)] Death 41 (46.0) 36 (44.4) Cured 49 (54.0) 45 (55.6)
http://cdjournal.muk.ac.ir, 6 July
Risk factors of mortality in patients with CNS Rahmani et al.
96 Chron Dis J, Vol. 6, No. 3, Summer 2018
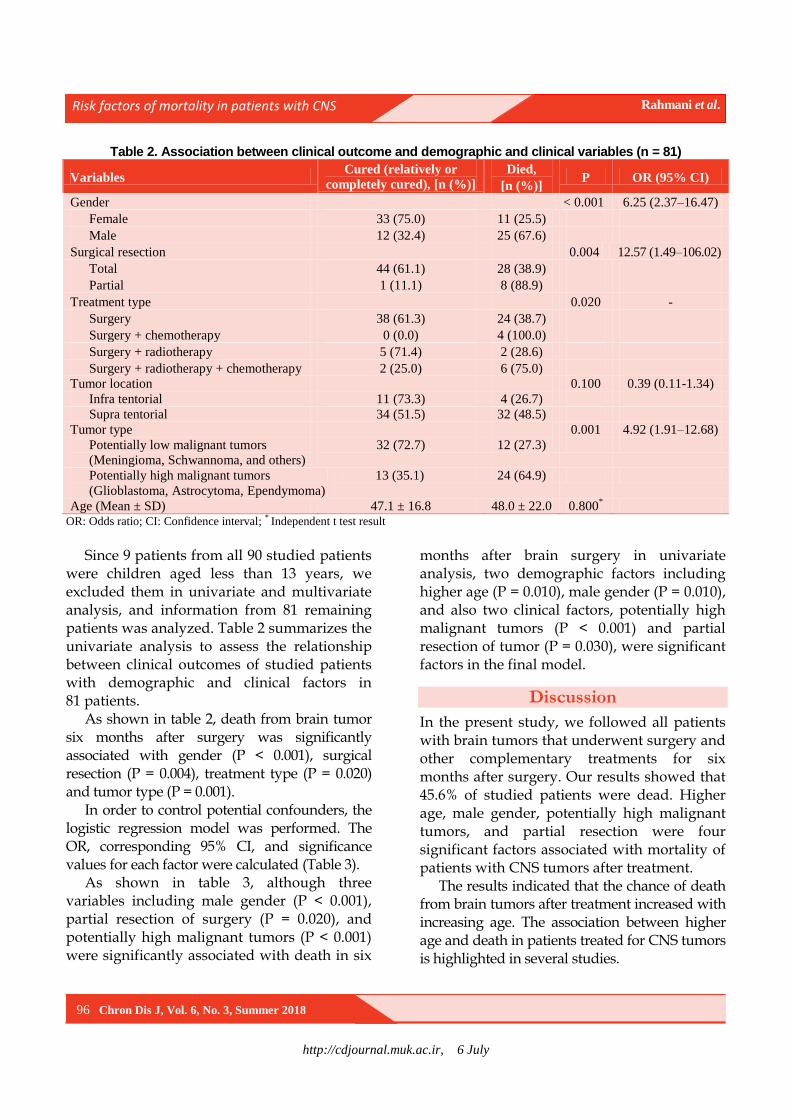
Table 2. Association between clinical outcome and demographic and clinical variables (n = 81)
Variables Cured (relatively or
completely cured), [n (%)]
Died,
[n (%)] P OR (95% CI)
Gender < 0.001 6.25 (2.37–16.47)
Female 33 (75.0) 11 (25.5)
Male 12 (32.4) 25 (67.6)
Surgical resection 0.004 12.57 (1.49–106.02)
Total 44 (61.1) 28 (38.9)
Partial 1 (11.1) 8 (88.9)
Treatment type 0.020 -
Surgery 38 (61.3) 24 (38.7)
Surgery + chemotherapy 0 (0.0) 4 (100.0)
Surgery + radiotherapy 5 (71.4) 2 (28.6)
Surgery + radiotherapy + chemotherapy 2 (25.0) 6 (75.0)
Tumor location 0.100 0.39 (0.11-1.34)
Infra tentorial 11 (73.3) 4 (26.7)
Supra tentorial 34 (51.5) 32 (48.5)
Tumor type 0.001 4.92 (1.91–12.68)
Potentially low malignant tumors
(Meningioma, Schwannoma, and others)
32 (72.7) 12 (27.3)
Potentially high malignant tumors
(Glioblastoma, Astrocytoma, Ependymoma)
13 (35.1) 24 (64.9)
Age (Mean ± SD) 47.1 ± 16.8 48.0 ± 22.0 0.800*
OR: Odds ratio; CI: Confidence interval; * Independent t test result
Since 9 patients from all 90 studied patients
were children aged less than 13 years, we excluded them in univariate and multivariate analysis, and information from 81 remaining patients was analyzed. Table 2 summarizes the univariate analysis to assess the relationship between clinical outcomes of studied patients with demographic and clinical factors in 81 patients.
As shown in table 2, death from brain tumor six months after surgery was significantly associated with gender (P < 0.001), surgical resection (P = 0.004), treatment type (P = 0.020) and tumor type (P = 0.001).
In order to control potential confounders, the logistic regression model was performed. The OR, corresponding 95% CI, and significance values for each factor were calculated (Table 3).
As shown in table 3, although three variables including male gender (P < 0.001), partial resection of surgery (P = 0.020), and potentially high malignant tumors (P < 0.001) were significantly associated with death in six
months after brain surgery in univariate analysis, two demographic factors including higher age (P = 0.010), male gender (P = 0.010), and also two clinical factors, potentially high malignant tumors (P < 0.001) and partial resection of tumor (P = 0.030), were significant factors in the final model.
Discussion
In the present study, we followed all patients with brain tumors that underwent surgery and other complementary treatments for six months after surgery. Our results showed that 45.6% of studied patients were dead. Higher age, male gender, potentially high malignant tumors, and partial resection were four significant factors associated with mortality of patients with CNS tumors after treatment.
The results indicated that the chance of death from brain tumors after treatment increased with increasing age. The association between higher age and death in patients treated for CNS tumors is highlighted in several studies.

http://cdjournal.muk.ac.ir, 6 July
Risk factors of mortality in patients with CNS Rahmani et al.
Chron Dis J, Vol. 6, No. 3, Summer 2018 97
Table 3. Logistic regression results for variables associated with mortality in patients with brain tumor
Variable Crude Adjusted
OR (95% CI) P OR (95% CI) P
Age 1.01 (0.98–1.03) 0.800 1.07 (1.02–1.13) 0.010
Gender
Female - - - -
Male 6.25 (2.37–16.47) < 0.001 5.52 (1.38–21.99) 0.010
Surgical resection
Total - - - -
Partial 12.57 (1.49–106.02) 0.020 20.24 (1.21–337.51) 0.030
Treatment type
Surgery - - - -
Surgery + chemotherapy 0.22 (0.04–1.16) 0.070 0.11 (0.01–1.05) 0.050
Surgery + radiotherapy 1.33 (0.09–20.12) 0.800 0.63 (0.01–30.05) 0.800
Surgery + radiotherapy + chemotherapy 0.13 (0.01-1.32) 0.080 0.07 (0.01–1.23) 0.070
Tumor location
Infra tentorial - - - -
Supra tentorial 2.59 (0.75–8.96) 0.100 0.77 (0.17–3.57) 0.700
Tumor type
Potentially low malignant tumors
(Menengioma, Schwannoma, and others)
- - - -
Potentially high malignant tumors
(Glioblastoma, Astrocytoma, Ependymoma)
4.92 (1.91–12.68) < 0.001 14.77 (4.85–45.02) < 0.001
OR: Odds ratio; CI: Confidence interval
Reihani Kermani reported higher mortality
rate for elderly patients.7 Similar findings have also been reported in some studies;12,13 for example, Tian et al. in a systematic review study indicated that higher age was a main risk factor for CNS cancers and its related death.14 Age was also significantly associated with survival of patients in Stark et al. study.15 Some studies have reported different results about the effect of patients’ age on CNS surgery outcome, so in previous studies conducted on patients with glioblastoma, higher age was a prognostic factor for patients undergoing biopsy while not an effective factor in patients undergoing resection.16,17
According to the results, male gender was another significant factor for death in patients with CNS tumors undergoing surgery. Some previous studies support this finding.1,3,18,19 In a study conducted by Villano et al., it was shown that male gender was a risk factor for death outcome from primary CNS lymphoma in patients with age less than 50 years. They also concluded that advanced age was only a
significant risk factor for survival of these patients in +50 age groups.20
In addition to above mentioned demographic variables, two clinical factors including having tumors with high malignant potential and partial surgical resection of tumor were recognized as main risk factors for patient mortality after treatment. There are several studies about surgical resection type, partial or total resection, as predictor factor for treatment outcome in treated patients with CNS tumors. Johnson et al. showed that total resection was a positive prognostic factor.21 Song et al. indicated that complete removal of tumor provided the best outcome. However, without complementary therapy, the outcome does not seem to be desirable.22 The same conclusion about the association of total resection and 5-year survival of pineocytoma has also been reported by Clark et al.23 In another study conducted by Chaichana et al., subtotal resections have been reported as independent risk factors for visual outcome and tumor recurrence in last follow-up of patients with
http://cdjournal.muk.ac.ir, 6 July
Risk factors of mortality in patients with CNS Rahmani et al.
98 Chron Dis J, Vol. 6, No. 3, Summer 2018
meningioma.24 Oszvald et al. recommended total resection plus adjuvant therapy in elderly patients with malignant brain tumor.25
There are several earlier supportive studies regarding another significant clinical risk factor, i.e. tumors with high malignant potential, that had highest association (OR = 14.77) with patients’ mortality in our study.26-28 Our results showed that the chance of death in patients with high malignant potential tumors was approximately 15 times higher than patients with low malignant potential tumors. Higher mortality resulting from malignant versus benign CNS tumors has been reported as an acceptable issue in many previous studies.29-31 Although, anatomical positions and specific conditions of the CNS tumors may lead to life threatening complications even in benign tumors,32,33 our findings demonstrated that tumor malignancy was the strongest risk factor for death in patients with CNS tumors after modeling the data and controlling the potential confounders.
Location of tumor (infra or supra tentorial) and type of treatment (surgery or combination of surgery plus radiotherapy or/and chemotherapy) had no statistical association with mortality in our study; whereas, there is some evidence about the effect of these factors in the literature that is incompatible with our results. Bagley et al. demonstrated that patients with supratentorial tumors had shorter survival time than those with infratentorial tumors.34 Two other studies advocated this finding.15,35 In Stark et al. study, prolonged survival was associated with patients undertaking several treatments (radiotherapy, chemotherapy, and combined radio-/chemotherapy with temozolomide).15 We did not observe any association between treatment type as a risk factor and mortality. The choice of the type of treatment by neurosurgeon depends on the clinical condition of the patient. Meeske and Nelson suggested combination treatment in patients
with partial resection to remove residual tumor or tumor recurrence treatment.10
The main limitation of the present study was lack of full access to information on socioeconomic status (SES), body mass index (BMI), life styles, and geographic location of patients; whereas, some past studies have shown that these factors can play a significant role on post-surgery survival in both adults and children. Other limitations of the study were small sample size, cross-sectional analysis, and non-generalizability of the results.
Conclusion
In this study, we investigated the clinical outcome of treated patients with CNS tumors in six months after surgery in Sanandaj. The results showed that two demographic (advancing age and male gender) and two clinical factors (high malignant potential tumors and partial removal of tumor) were associated with higher mortality.
Conflict of Interests
Authors have no conflict of interests.
Acknowledgments
We would like to thank all patients’ families who helped us in collecting the required data.
References
1. Ostrom QT, Gittleman H, Fulop J, Liu M, Blanda R,
Kromer C, et al. CBTRUS Statistical Report: Primary
Brain and Central Nervous System Tumors
Diagnosed in the United States in 2008-2012. Neuro
Oncol 2015; 17(Suppl 4): iv1-iv62.
2. Ostrom QT, Gittleman H, Liao P, Rouse C, Chen Y,
Dowling J, et al. CBTRUS statistical report: Primary
brain and central nervous system tumors diagnosed in
the United States in 2007-2011. Neuro Oncol 2014;
16(Suppl 4): iv1-63.
3. Louis ED, Mayer SA, Rowland LP. Merritt's
neurology. Philadelphia, PA: Lippincott Williams &
Wilkins; 2015.
4. Pessina F, Navarria P, Cozzi L, Ascolese AM, Maggi
G, Rossi M, et al. Role of surgical resection in
patients with single large brain metastases:
http://cdjournal.muk.ac.ir, 6 July
Risk factors of mortality in patients with CNS Rahmani et al.
Chron Dis J, Vol. 6, No. 3, Summer 2018 99
Feasibility, morbidity, and local control evaluation.
World Neurosurg 2016; 94: 6-12.
5. Siegel RL, Miller KD, Jemal A. Cancer statistics,
2016. CA Cancer J Clin 2016; 66(1): 7-30.
6. Jazayeri SB, Rahimi-Movaghar V, Shokraneh F,
Saadat S, Ramezani R. Epidemiology of primary
CNS tumors in Iran: A systematic review. Asian Pac
J Cancer Prev 2013; 14(6): 3979-85.
7. Reihani Kermani H. An epidemiologic survey on
brain tumors in Kerman from 1997 to 2001. Iran
South Med J 2004; 7(1): 47-53. [In Persian].
8. Meshkini A, Fakhrju A, Fathi A. Prevalence of central
nervous system tumors-a single center ten years study in
Tabriz Imam Khomeini Hospital. Med J Tabriz Univ
Med Sci 2010; 31(4): 76-86. [In Persian].
9. Duffner PK. Long-term effects of radiation therapy
on cognitive and endocrine function in children with
leukemia and brain tumors. Neurologist 2004; 10(6):
293-310.
10. Meeske KA, Nelson MB. The role of the long-term
follow-up clinic in discovering new emerging late
effects in adult survivors of childhood cancer. J
Pediatr Oncol Nurs 2008; 25(4): 213-9.
11. Tonning O, I, Perrin S, Lundgren J, Hjorth L,
Johanson A. Long-term cognitive sequelae after
pediatric brain tumor related to medical risk factors,
age, and sex. Pediatr Neurol 2014; 51(4): 515-21.
12. Moiyadi AV, Shetty PM. Perioperative outcomes
following surgery for brain tumors: Objective
assessment and risk factor evaluation. J Neurosci
Rural Pract 2012; 3(1): 28-35.
13. Allahdini F, Afkhamzadeh A, Amirjamshidi A,
Delpisheh A. Factors affecting the outcomes of
patient's suffering from chronic subdural hematoma
after surgery by burr-hole hole-drainage method; a
cross sectional survey. Iran J Surg 2010; 18(3): 19-
26. [In Persian].
14. Tian M, Zhu D, Chen D, Huo X, Ge J, Lu J, et al.
Prognostic value of age in neurological cancer: An
analysis of 22,393 cases from the SEER database.
Tumour Biol 2015; 36(11): 8341-8.
15. Stark AM, van de Bergh J, Hedderich J, Mehdorn
HM, Nabavi A. Glioblastoma: Clinical
characteristics, prognostic factors and survival in 492
patients. Clin Neurol Neurosurg 2012; 114(7): 840-5.
16. Assem M, Sibenaller Z, Agarwal S, Al-Keilani MS,
Alqudah MA, Ryken TC. Enhancing diagnosis,
prognosis, and therapeutic outcome prediction of
gliomas using genomics. OMICS 2012; 16(3): 113-22.
17. Gorlia T, Stupp R, Brandes AA, Rampling RR,
Fumoleau P, Dittrich C, et al. New prognostic factors
and calculators for outcome prediction in patients
with recurrent glioblastoma: A pooled analysis of
EORTC Brain Tumour Group phase I and II clinical
trials. Eur J Cancer 2012; 48(8): 1176-84.
18. Norden AD, Drappatz J, Wen PY, Claus EB.
Survival among patients with primary central nervous
system lymphoma, 1973-2004. J Neurooncol 2011;
101(3): 487-93.
19. Pulido JS, Vierkant RA, Olson JE, Abrey L, Schiff
D, O'Neill BP. Racial differences in primary central
nervous system lymphoma incidence and survival
rates. Neuro Oncol 2009; 11(3): 318-22.
20. Villano JL, Koshy M, Shaikh H, Dolecek TA,
McCarthy BJ. Age, gender, and racial differences in
incidence and survival in primary CNS lymphoma.
Br J Cancer 2011; 105(9): 1414-8.
21. Johnson DR, Sawyer AM, Meyers CA, O'Neill BP,
Wefel JS. Early measures of cognitive function
predict survival in patients with newly diagnosed
glioblastoma. Neuro Oncol 2012; 14(6): 808-16.
22. Song JY, Kim JH, Cho YH, Kim CJ, Lee EJ.
Treatment and outcomes for gangliogliomas: A
single-center review of 16 patients. Brain Tumor Res
Treat 2014; 2(2): 49-55.
23. Clark AJ, Sughrue ME, Ivan ME, Aranda D,
Rutkowski MJ, Kane AJ, et al. Factors influencing
overall survival rates for patients with pineocytoma. J
Neurooncol 2010; 100(2): 255-60.
24. Chaichana KL, Jackson C, Patel A, Miller NR,
Subramanian P, Lim M, et al. Predictors of visual
outcome following surgical resection of medial
sphenoid wing meningiomas. J Neurol Surg B Skull
Base 2012; 73(5): 321-6.
25. Oszvald A, Guresir E, Setzer M, Vatter H, Senft C,
Seifert V, et al. Glioblastoma therapy in the elderly
and the importance of the extent of resection
regardless of age. J Neurosurg 2012; 116(2): 357-64.
26. Davis FG, Freels S, Grutsch J, Barlas S, Brem S.
Survival rates in patients with primary malignant
brain tumors stratified by patient age and tumor
histological type: An analysis based on Surveillance,
Epidemiology, and End Results (SEER) data, 1973-
1991. J Neurosurg 1998; 88(1): 1-10.
27. Modan B, Wagener DK, Feldman JJ, Rosenberg HM,
Feinleib M. Increased mortality from brain tumors: A
combined outcome of diagnostic technology and
change of attitude toward the elderly. Am J
Epidemiol 1992; 135(12): 1349-57.
28. Surawicz TS, Davis F, Freels S, Laws ER Jr, Menck
HR. Brain tumor survival: Results from the National
Cancer Data Base. J Neurooncol 1998; 40(2): 151-60.
29. Gatta G, Peris-Bonet R, Visser O, Stiller C, Marcos-
Gragera R, Sanchez MJ, et al. Geographical
variability in survival of European children with
central nervous system tumours. Eur J Cancer 2017;
82: 137-48.
30. Patel S, Bhatnagar A, Wear C, Osiro S, Gabriel A,
http://cdjournal.muk.ac.ir, 6 July
Risk factors of mortality in patients with CNS Rahmani et al.
100 Chron Dis J, Vol. 6, No. 3, Summer 2018
Kimball D, et al. Are pediatric brain tumors on the
rise in the USA? Significant incidence and survival
findings from the SEER database analysis. Childs
Nerv Syst 2014; 30(1): 147-54.
31. Woehrer A, Hackl M, Waldhor T, Weis S, Pichler J,
Olschowski A, et al. Relative survival of patients
with non-malignant central nervous system tumours:
A descriptive study by the Austrian Brain Tumour
Registry. Br J Cancer 2014; 110(2): 286-96.
32. Bhat AR, Wani MA, Kirmani AR, Ramzan AU.
Histological-subtypes and anatomical location
correlated in meningeal brain tumors (meningiomas).
J Neurosci Rural Pract 2014; 5(3): 244-9.
33. Jagannathan J, Kanter AS, Sheehan JP, Jane JA Jr,
Laws ER Jr. Benign brain tumors: Sellar/parasellar
tumors. Neurol Clin 2007; 25(4): 1231-49, xi.
34. Bagley JH, Babu R, Friedman AH, Adamson C.
Improved survival in the largest national cohort of
adults with cerebellar versus supratentorial low-grade
astrocytomas. Neurosurg Focus 2013; 34(2): E7.
35. Tseng MY, Tseng JH, Merchant E. Comparison of
effects of socioeconomic and geographic variations
on survival for adults and children with glioma.
J Neurosurg 2006; 105(4 Suppl): 297-305.

http://cdjournal.muk.ac.ir, 06 July
Chron Dis J, Vol. 6, No. 3, Summer 2018 101
DOI: 10.22122/cdj.v6i3.280 Published by Vesnu Publications
The effects of the health reform plan on the performance indicators of hospitals affiliated with Qazvin University of Medical Sciences, Iran, 2014
Rohollah Kalhor1
, Soheyla Gholami2, Shaghayegh Heidari
3, Nasrin Bakhtiari
3, Saeideh Moosavi
4,
Abdollah Keshavarz5, Mohammad Zakaria-Kiaei
3
1 Social Determinants of Health Research Center, Qazvin University of Medical Sciences, Qazvin, Iran
2 Department of Health Care Management, Dezful University of Medical Sciences, Dezful, Iran
3 Department of Health Services Management, School of Public Health, Qazvin University of Medical Sciences,
Qazvin, Iran
4 Department of Occupational Health, School of Health, Qazvin University of Medical Sciences, Qazvin, Iran
5 Iranian Traditional Medicine Office, Vice Chancellor of Treatment Affairs, Qazvin University of Medical
Sciences, Qazvin, Iran
Abstract BACKGROUND: One of the significant goals of healthcare delivery organizations is to promote people’s health and
provide high quality care. In this regard, health reform plan was designed in Iran. Therefore, the present study
aimed to evaluate the performance of teaching hospitals after running of health system reform plan in Iran.
METHODS: This retrospective-descriptive study was carried out in 4 hospitals (Avicenna, Velayat, Rajaee, and Qhods)
affiliated with Qazvin University of Medical Sciences, Qazvin, Iran, in 2014. Data collection tool was the checklist of
standard indicators of Iranian Ministry of Health, because the checklist is standard to measure hospitals’
performance. In this study, 19 indicators (performance indicators, personnel indicators, and financial indicators) were
investigated. To fill out the indicators checklist, the statistics unit of Ministry of Health was used according to the
reports of two consecutive years of 2013 and 2014. The collected data were analyzed using Excel software.
RESULTS: In general, out of the 7 performance indicators that were investigated in the hospitals, increase was
observed in four, and decrease was seen in three items. Out of the six personnel indicators, all of the hospitals
experienced a rise; and out of the six financial indicators, four items increased and two decreased.
CONCLUSION: The results of this study indicated that after one year of implementing health reform plan, the
mentioned health care system experienced a remarkable progress in the hospitals. Providing the necessary
infrastructures can help better conduction of the plan and promotion of the mentioned indicators by removing or
decreasing the effect of some barriers.
KEYWORDS: Healthcare Systems, Outcomes Assessment, Indicators, Hospitals
Date of submission: 18 July 2017, Date of acceptance: 15 Sep. 2017
Citation: Kalhor R, Gholami S, Heidari S, Bakhtiari N, Moosavi S, Keshavarz A. et al. The effects of the
health reform plan on the performance indicators of hospitals affiliated with Qazvin University of
Medical Sciences, Iran, 2014. Chron Dis J 2018; 6(3): 101-7.
Introduction1
Despite rapid advances in sciences and technology in the world, one of the significant goals of healthcare delivery organizations is to promote people’s health and provide high-
Corresponding Author:
Mohammad Zakaria-Kiaei
Email: [email protected]
quality care,1 because low quality of health care services leads to an increase in costs, a decrease in profitability, and a drop in satisfaction and loyalty of patients.2 The first and the most important factor in improving health care quality is to investigate and measure the quality of the delivered services, an index of which is examining the rate of
Original Article

http://cdjournal.muk.ac.ir, 06 July
Effects of the Health Reform Plan Kalhor et al.
102 Chron Dis J, Vol. 6, No. 3, Summer 2018
efficiency and effectiveness.3,4 As main organizations that provide healthcare services, hospitals play a significant role in promoting the level of the society’s health and require special attention as the most important components of healthcare system. According to the study carried out by the World Bank, in developing countries, between 50% and 80% of health resources are allocated to hospitals.5 Hospital management mainly attempts to enhance effectiveness and efficiency and reduce medical expenses.6 However, poor management of hospital and failure to utilize the resources correctly lead to waste of resources such as money, human resources, buildings, and equipment. Such a waste means that creating a certain level of product or output is possible with a lower amount of resources. By preventing or reducing this waste, available resources can be utilized to deliver more services, develop access, and improve the quality of hospital services.7 Nowadays, health systems are faced with numerous complex challenges including reform processes, change in people’s health needs, increase in public expectations, lack of sufficient resources, an increase in healthcare expenses, necessity of paying attention to new financing resources, and necessity of utilizing more efficient available resources.8 These challenges are continually changing under the effect of economic, social, political, and environmental circumstances. On the other hand, diseases and health threatening factors are constantly changing, particularly in the present era, they are experiencing very rapid changes. Response to such changes is the most important reason why the health system should be changed and promoted.9-11 Over the recent years, there has been a remarkable development in reforms of health system. At all levels of economic development, most countries have sought better methods to organize and finance healthcare services with the purpose of justice development, public
coverage, efficiency, and effectiveness.8 In Iran, Ministry of Health and Medical Education started running HSR plan in April 2014 as the main stewardship of the country’s health with regard to the overall duties, missions, and upstream documents, particularly the Iran's 20-year vision plan, legal provisions related to health in the Fifth Development Plan, and the 11th government’s programs of HSR. It has followed three approaches of financial support of people, creation of fair access to health services, and improving the quality of health services on 7 main axes. Its main responsibility is to reduce the peoples’ share of out of pocket (OOP) up to 10%.12 After that the HSR plan was implemented and a significant decrease occurred in health care costs, the national hospitals experienced an unprecedented increase in patients’ referral to hospitals, and bed occupancy rate (BOR) rose.13 This trend may bring about changes in performance of hospitals and quality of services delivered to patients covered by this plan. Due to the importance of this issue, evaluating the performance of health system can provide the decision makers with timely information related to the performance of health system. Such information leads to the managers and policymakers’ awareness and provides circumstances in which progress toward national goals can be monitored and relevant policies can be evaluated. Timely monitoring and evaluation of reforms can provide evidence for redirection of the implementation of reforms.14
The purpose of this study was to evaluate the performance of teaching hospitals after implementation of the HSR plan.
Materials and Methods
This study was a descriptive study with a retrospective approach. The statistical population included 4 hospitals (Avicenna, Velayat, Rajaee, and Qhods) covered by HSR plan and affiliated with Qazvin University of
http://cdjournal.muk.ac.ir, 06 July
Effects of the Health Reform Plan Kalhor et al.
Chron Dis J, Vol. 6, No. 3, Summer 2018 103
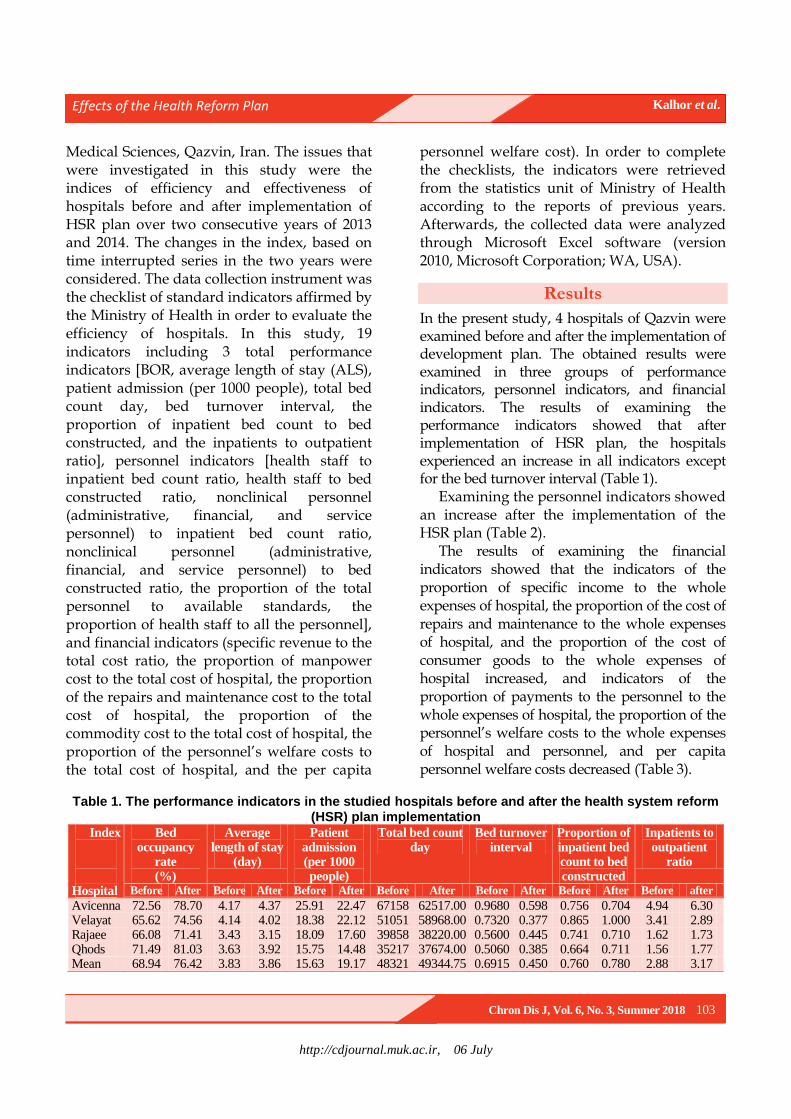
Medical Sciences, Qazvin, Iran. The issues that were investigated in this study were the indices of efficiency and effectiveness of hospitals before and after implementation of HSR plan over two consecutive years of 2013 and 2014. The changes in the index, based on time interrupted series in the two years were considered. The data collection instrument was the checklist of standard indicators affirmed by the Ministry of Health in order to evaluate the efficiency of hospitals. In this study, 19 indicators including 3 total performance indicators [BOR, average length of stay (ALS), patient admission (per 1000 people), total bed count day, bed turnover interval, the proportion of inpatient bed count to bed constructed, and the inpatients to outpatient ratio], personnel indicators [health staff to inpatient bed count ratio, health staff to bed constructed ratio, nonclinical personnel (administrative, financial, and service personnel) to inpatient bed count ratio, nonclinical personnel (administrative, financial, and service personnel) to bed constructed ratio, the proportion of the total personnel to available standards, the proportion of health staff to all the personnel], and financial indicators (specific revenue to the total cost ratio, the proportion of manpower cost to the total cost of hospital, the proportion of the repairs and maintenance cost to the total cost of hospital, the proportion of the commodity cost to the total cost of hospital, the proportion of the personnel’s welfare costs to the total cost of hospital, and the per capita
personnel welfare cost). In order to complete the checklists, the indicators were retrieved from the statistics unit of Ministry of Health according to the reports of previous years. Afterwards, the collected data were analyzed through Microsoft Excel software (version 2010, Microsoft Corporation; WA, USA).
Results
In the present study, 4 hospitals of Qazvin were examined before and after the implementation of development plan. The obtained results were examined in three groups of performance indicators, personnel indicators, and financial indicators. The results of examining the performance indicators showed that after implementation of HSR plan, the hospitals experienced an increase in all indicators except for the bed turnover interval (Table 1).
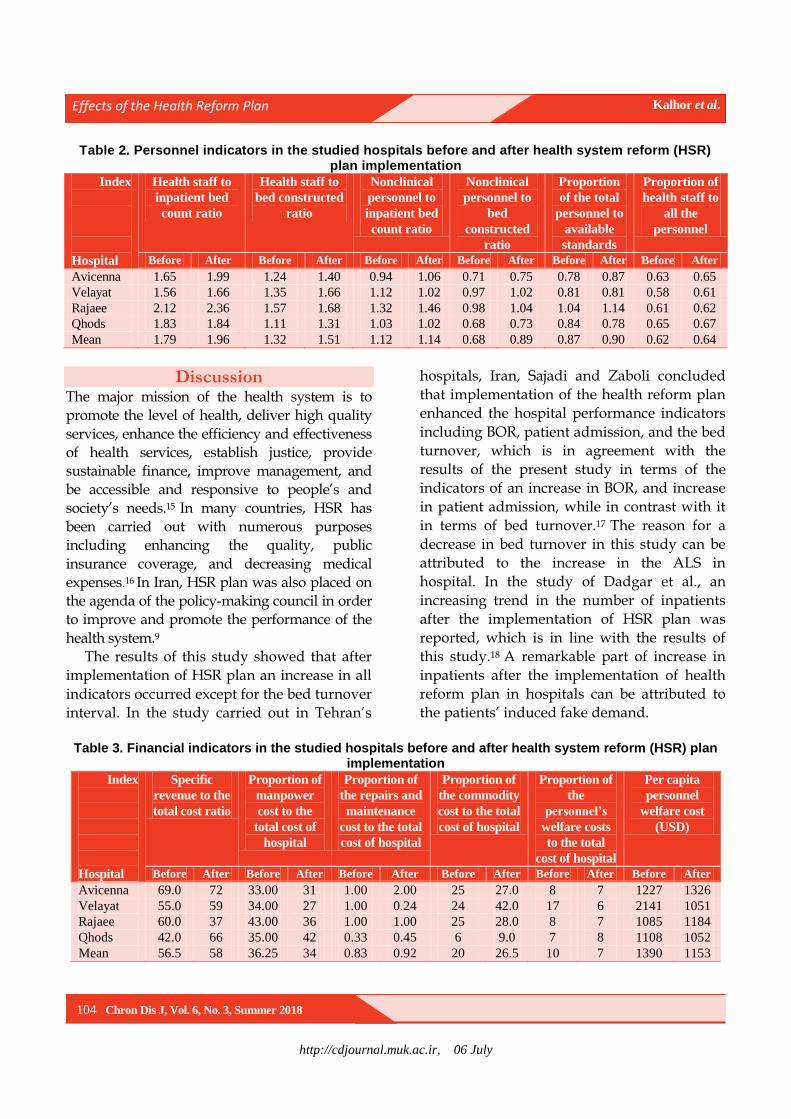
Examining the personnel indicators showed an increase after the implementation of the HSR plan (Table 2).
The results of examining the financial indicators showed that the indicators of the proportion of specific income to the whole expenses of hospital, the proportion of the cost of repairs and maintenance to the whole expenses of hospital, and the proportion of the cost of consumer goods to the whole expenses of hospital increased, and indicators of the proportion of payments to the personnel to the whole expenses of hospital, the proportion of the personnel’s welfare costs to the whole expenses of hospital and personnel, and per capita personnel welfare costs decreased (Table 3).
Table 1. The performance indicators in the studied hospitals before and after the health system reform (HSR) plan implementation
Index
Hospital
Bed occupancy
rate (%)
Average length of stay
(day)
Patient admission (per 1000 people)
Total bed count day
Bed turnover interval
Proportion of inpatient bed count to bed constructed
Inpatients to outpatient
ratio
Before After Before After Before After Before After Before After Before After Before after
Avicenna 72.56 78.70 4.17 4.37 25.91 22.47 67158 62517.00 0.9680 0.598 0.756 0.704 4.94 6.30 Velayat 65.62 74.56 4.14 4.02 18.38 22.12 51051 58968.00 0.7320 0.377 0.865 1.000 3.41 2.89 Rajaee 66.08 71.41 3.43 3.15 18.09 17.60 39858 38220.00 0.5600 0.445 0.741 0.710 1.62 1.73 Qhods 71.49 81.03 3.63 3.92 15.75 14.48 35217 37674.00 0.5060 0.385 0.664 0.711 1.56 1.77 Mean 68.94 76.42 3.83 3.86 15.63 19.17 48321 49344.75 0.6915 0.450 0.760 0.780 2.88 3.17
http://cdjournal.muk.ac.ir, 06 July
Effects of the Health Reform Plan Kalhor et al.
104 Chron Dis J, Vol. 6, No. 3, Summer 2018
Table 2. Personnel indicators in the studied hospitals before and after health system reform (HSR) plan implementation
Index
Hospital
Health staff to
inpatient bed
count ratio
Health staff to
bed constructed
ratio
Nonclinical
personnel to
inpatient bed
count ratio
Nonclinical
personnel to
bed
constructed
ratio
Proportion
of the total
personnel to
available
standards
Proportion of
health staff to
all the
personnel
Before After Before After Before After Before After Before After Before After
Avicenna 1.65 1.99 1.24 1.40 0.94 1.06 0.71 0.75 0.78 0.87 0.63 0.65
Velayat 1.56 1.66 1.35 1.66 1.12 1.02 0.97 1.02 0.81 0.81 0.58 0.61
Rajaee 2.12 2.36 1.57 1.68 1.32 1.46 0.98 1.04 1.04 1.14 0.61 0.62
Qhods 1.83 1.84 1.11 1.31 1.03 1.02 0.68 0.73 0.84 0.78 0.65 0.67
Mean 1.79 1.96 1.32 1.51 1.12 1.14 0.68 0.89 0.87 0.90 0.62 0.64
Discussion The major mission of the health system is to promote the level of health, deliver high quality
services, enhance the efficiency and effectiveness of health services, establish justice, provide sustainable finance, improve management, and be accessible and responsive to people’s and
society’s needs.15 In many countries, HSR has been carried out with numerous purposes including enhancing the quality, public
insurance coverage, and decreasing medical
expenses.16 In Iran, HSR plan was also placed on the agenda of the policy-making council in order to improve and promote the performance of the
health system.9 The results of this study showed that after
implementation of HSR plan an increase in all
indicators occurred except for the bed turnover
interval. In the study carried out in Tehran’s
hospitals, Iran, Sajadi and Zaboli concluded
that implementation of the health reform plan
enhanced the hospital performance indicators
including BOR, patient admission, and the bed
turnover, which is in agreement with the
results of the present study in terms of the
indicators of an increase in BOR, and increase
in patient admission, while in contrast with it
in terms of bed turnover.17 The reason for a
decrease in bed turnover in this study can be
attributed to the increase in the ALS in
hospital. In the study of Dadgar et al., an
increasing trend in the number of inpatients
after the implementation of HSR plan was
reported, which is in line with the results of
this study.18 A remarkable part of increase in
inpatients after the implementation of health
reform plan in hospitals can be attributed to
the patients’ induced fake demand.
Table 3. Financial indicators in the studied hospitals before and after health system reform (HSR) plan
implementation
Index
Hospital
Specific
revenue to the
total cost ratio
Proportion of
manpower
cost to the
total cost of
hospital
Proportion of
the repairs and
maintenance
cost to the total
cost of hospital
Proportion of
the commodity
cost to the total
cost of hospital
Proportion of
the
personnel’s
welfare costs
to the total
cost of hospital
Per capita
personnel
welfare cost
(USD)
Before After Before After Before After Before After Before After Before After
Avicenna 69.0 72 33.00 31 1.00 2.00 25 27.0 8 7 1227 1326
Velayat 55.0 59 34.00 27 1.00 0.24 24 42.0 17 6 2141 1051
Rajaee 60.0 37 43.00 36 1.00 1.00 25 28.0 8 7 1085 1184
Qhods 42.0 66 35.00 42 0.33 0.45 6 9.0 7 8 1108 1052
Mean 56.5 58 36.25 34 0.83 0.92 20 26.5 10 7 1390 1153
http://cdjournal.muk.ac.ir, 06 July
Effects of the Health Reform Plan Kalhor et al.
Chron Dis J, Vol. 6, No. 3, Summer 2018 105
In a study carried out in Massachusetts, United States, in order to investigate the effect of healthcare reforms on hospitals and preventive care, it was indicated that reforms were accompanied with a decrease in the ALS, the number of referred inpatients from the emergency ward, and avoidable admissions, which is not in agreement with this study.19
In this study, personnel indicators increased compared to previous years after the implementation of HSR plan, which was because of employing clinical and non-clinical work force during implementation of the plan; this work force entered the health system in order to deliver services.
While examining the financial indicators, an increase was observed in the indicators of the proportion of specific revenue to the total cost ratio, the proportion of the repairs and maintenance cost to the total cost of hospital, and proportion of the commodity cost to the total cost of hospital, and a decrease was observed in indicators of the proportion of the commodity cost to the total cost of hospital and the proportion of the personnel’s welfare costs to the total cost of hospital. Sajadi and Zaboli reported an increase in hospital revenues after the implementation of reform plan, which is in line with the present study.17 Moreover, in the study carried out in Taiwan, Shoujun reported similar results.20 This increase in revenue can be caused by patients’ referral from private hospitals to teaching hospitals and a rise in admission rate of teaching hospitals. In the study carried out by Yang et al. in China and the study conducted by Dunn and Shapiro in Turkey, it was concluded that implementation of reform plan resulted in an increase in personnel’s costs, particularly the doctors, which is not in agreement with the results of the present study.21,22
The results of this study indicated that implementation of health reform plan in healthcare sector had a positive effect on the performance of the studied hospitals. In a
study that was carried out in China’s hospitals over 2005-2011 in order to evaluate the performance of the hospitals after the implementation of reform plan, the results indicated that HSR had a positive effect on the hospitals’ performance, and decreased economic burden on the patients, which is in line with the results of the present study.23 The results of the study carried out by Anderson and Wakerman in Australian hospitals showed that reform had a positive effect on some areas of the hospitals’ performance, which is in agreement with the results of the present study.24 In addition, Dadgar et al. in their study concluded that implementation of the HSR plan had a remarkable effect on the increase in hospital’s performance indicators.18
Among the limitations of the present study one can refer to this point that since health reform plan has been recently implemented in Iran, no similar studies were found, and in most studies, satisfaction of the personnel and patients or an increase in the number of natural childbirth was measured while the hospitals’ performance was not focused on.
Limitations and suggestions: This study's limitation was short time after the implementation of health reform plan. However, more studies need to be conducted to verify that results in longer interval. Reform plan has reached a sufficient stability and adequacy to be used in short time in each development plan. In the same way, future studies could focus only on changes in the quantity of services based on the study of improving service quality, and patient and staff satisfaction before and after the plan. Moreover, with approximately one year of implementation of the health reform plan and fundamental changes, repetition of similar schemes could also show the effectiveness of the plan more realistically.
Conclusion
The results of this study indicated that one year

http://cdjournal.muk.ac.ir, 06 July
Effects of the Health Reform Plan Kalhor et al.
106 Chron Dis J, Vol. 6, No. 3, Summer 2018
after the implementation of HSR plan, in all the selected indicators (as a result of implementation of the new reform plan), it was observed that the plan had remarkable progress and a positive effect on the studied hospitals’ performance. However, the effects observed should be judged cautiously, considering the possible negative consequences such as induced demand and hospital workload increase in the long run. Providing the required infrastructures through removing or reducing some administrative barriers helps better implementation of the plan, promotes the mentioned indicators, increases the quality of the delivered services, enhances the personnel’s and the patients’ satisfaction, and finally improves the hospitals’ performance.
Conflict of Interests
Authors have no conflict of interests.
Acknowledgments
We extend our gratitude to the statistical experts of the studied hospitals in Qazvin for participating in this study and helping us acquire the data we needed.
References
1. Papanicolas I, Smith P. Health system performance
comparison: An agenda for policy, information and
research: An agenda for policy, information and
research. New York, NY: McGraw-Hill Education;
2013.
2. Yeilada F, Direktor E. Health care service quality: A
comparison of public and private hospitals. African
Journal of Business Management 2010; 4(6): 862-971.
3. Akter S, D'Ambra J, Ray P. Development and
validation of an instrument to measure user perceived
service quality of mHealth. Information &
Management 2013; 50(4): 181-95.
4. Jarrett-Pulliam C, Jenkins M. Building the foundation
of healthcare reform: Necessary elements for nurse
leaders. Nurse Leader 2014; 12(4): 80-3.
5. World Health Organization. Measuring hospital
performance to improve the quality of care in
Europe: A need for clarifying the concepts and
defining the main dimensions [Online]. [cited 2003];
Available from: URL:
wido.de/fileadmin/wido/downloads/pdf_krankenhaus
/wido_kra_who_1204.pdf
6. Martini G, Berta P, Mullahy J, Vittadini G. The
-off in health care: The
case of hospitals in Lombardy, Italy. Reg Sci Urban
Econ 2014; 49: 217-31.
7. Hatam N, Moslehi S, Askarian M, Shokrpour N,
Keshtkaran A, Abbasi M. The Efficiency of General
Public Hospitals in FarsProvince, Southern Iran. Iran
Red Crescent Med J 2010; 12(2): 138-44.
8. Rodin J, de Ferranti D. Universal health coverage:
The third global health transition? Lancet 2012;
380(9845): 861-2.
9. Akhondzade R. Health system transformation project,
an opportunity or a threat for doctors (Editorial).
J Anesth Pain 2014; 5(1): 1-2. [In Persian]. 10. Haghdoost AA, Mehrolhassani MH, Khajehkazemi
R, Fallah MS, Dehnavieh R. Monitoring indicators of Iranian health system reform plan. Hakim Health Sys Res 2013; 16(3): 171-81. [In Persian].
11. Regional Health Systems Observatory, World Health Organization. Health Systems Profile- Islamic Republic of Iran [Online]. [cited 2006]; Available from: URL: http://apps.who.int/medicinedocs/documents/s17294e/s17294e.pdf
12. Piroozi B, Moradi G, Nouri B, Mohamadi BA, Safari
H. Catastrophic health expenditure after the
implementation of health sector evolution plan: A
case study in the west of Iran. Int J Health Policy
Manag 2016; 5(7): 417-23. 13. Zarei E, Daneshkohan A, Pouragha B, Marzban S,
Arab M. An empirical study of the impact of service quality on patient satisfaction in private hospitals, Iran. Glob J Health Sci 2014; 7(1): 1-9.
14. Barry SP, Diarra-Nama AJ, Kirigia JM, Bakeera S,
Somanje H. Monitoring and evaluation of health
sector reforms in the WHO African Region. East Afr
Med J 2009; 86(1 Suppl): S25-S32.
15. Mastaneh Z, Mouseli L. Information position in new
reform of American health care system. Health Inf
Manage 2011; 8(1): 97-101. [In Persian].
16. McPake BI. Public autonomous hospitals in sub-
Saharan Africa: Trends and issues. Health Policy
1996; 35(2): 155-77.
17. Sajadi HS, Zaboli R. An assessment of the positive
effects of health reform plan implementation from the
perspective of hospital directors. Health Inf Manage
2016; 13(1): 55-60. [In Persian].
18. Dadgar R, Jahani M, Mahmoudi G. The impact of health
system reform plan on the hospital's performance
indicators of Lorestan University of Medical Sciences.
Yafteh 2017; 19(2): 93-102. [In Persian].
19. Kolstad JT, Kowalski AE. The impact of health care
reform on hospital and preventive care: Evidence

http://cdjournal.muk.ac.ir, 06 July
Effects of the Health Reform Plan Kalhor et al.
Chron Dis J, Vol. 6, No. 3, Summer 2018 107
from Massachusetts. J Public Econ 2012; 96(11-12):
909-29.
20. Shoujun Z. Analysis on medical service and universal coverage of health insurance system in Taiwan. Chinese Hospitals 2011; 15: 76-80. [In Chine].
21. Yang J, Hong Y, Ma S. Impact of the new health care
reform on hospital expenditure in China: A case
study from a pilot city. China Economic Review
2016; 39: 1-14.
22. Dunn A, Shapiro AH. Physician payments under
health care reform. J Health Econ 2015; 39: 89-105.
23. Shen JJ, Zhou S, Xu L, Chen J, Cochran CR, Fisher
ER, et al. Effects of the new health care reform on
hospital performance in china: A seven-year Trend
from 2005 to 2011. J Health Care Finance 2014;
41(1): 1-14.
24. Anderson I, Wakerman J. Aboriginal and Torres strait
islander primary health care and general practice.
General practice in Australia 2004. Canberra, Australia:
Australian Government, Department of Health and
Ageing, Canberra; 2005. p. 303-6.
http://cdjournal.muk.ac.ir, 06 July
108 Chron Dis J, Vol. 6, No. 3, Summer 2018
DOI: 10.22122/cdj.v6i3.281 Published by Vesnu Publications
Study of women's flourishing rate and some related factors, Sanandaj, Iran, 2016
Ahmad Vahabi1
, Boshra Vahabi2, Sirvan Sayyad
3, Masoud Moradi
4, Mahnaz Sayyadi
2, Marzeyeh Fakhri
2
1 Assistant Professor, Department of Medical Laboratory Sciences, Faculty of Paramedical, Kurdistan University
of Medical Sciences, Sanandaj, Iran
2 Student Research Committee, Kurdistan University of Medical Sciences, Sanandaj, Iran
3 Student Research Committee, Kermanshah University of Medical Sciences, Kermanshah, Iran
4 Vice Chancellor for Research & Technology, Kurdistan University of Medical Sciences, Sanandaj, Iran
Abstract BACKGROUND: Flourishing is a component of positive psychology. This refers to a type of life with permanent
optimism in human functions, and implicitly refers to goodness, growth, and flexibility. The present study was
carried out to evaluate women's flourishing rate and some related factors in Sanandaj, Iran, in 2016.
METHODS: This was a cross-sectional study on women aged between 18 to 64 years in Sanandaj City, Iran, that 400
of them were selected randomly. The data collection tool was flourishing questionnaire including 8 items. The
collected data were analyzed using SPSS software and chi-square, t, and analysis of variance (ANOVA) tests.
RESULTS: The highest average score (6.05 ± 1.19) referred to "I am deeply about the happiness of the others" and
the lowest average score (4.57 ± 1.89) referred to "I enjoy my daily activities". There was a statistically significant
difference between flourishing rate of subjects and their level of education (P = 0.04) as well as maternal
education (P = 0.001).
CONCLUSION: Considering the relation between the education and the flourishing rate, training classes in the field
of mental health and flourishing for women is suggested.
KEYWORDS: Positive Reinforcement, Educational Status, Happiness
Date of submission: 22 July 2017, Date of acceptance: 17 Sep. 2017
Citation: Vahabi A, Vahabi B, Sayyad S, Moradi M, Sayyadi M, Fakhri M. Study of women's flourishing
rate and some related factors, Sanandaj, Iran, 2016. Chron Dis J 2018; 6(3): 108-12.
Introduction1
In recent years, positive psychology focuses on the positive aspects of human spirit rather than focusing on the extent of their mental disorders and their effects on human health. In this kind of psychology, concepts of goodness, generosity, growth, resilience, and well-being represent the positive dimension of man.1,2 Flourishing is a constitutive part of positive psychology that refers to a kind of life associated with persistent optimism in human functions, and indirectly implies well-being,
Corresponding Author:
Mahnaz Sayyadi
Email: [email protected]
generosity, growth, and flexibility.3 The meaning of flourishing is in contradiction to the meaning of wilt and depression. Keyes did not accept mental health as not having mental illness, but he considered it as a distinct positive feeling and positive action.4 According to Keyes, flourishing is the mental life of adults who have high levels of emotional well-being. They are happy and satisfied, have a tendency to purposeful life, accept all their qualities, feel autonomy and independency, have internal control power, and decide on their destiny.5 In recent years, different theories have been made about flourishing; each of them considers varied variables as the basis of human well-
Original Article
http://cdjournal.muk.ac.ir, 06 July
Study of women's flourishing and related factors Vahabi et al.
Chron Dis J, Vol. 6, No. 3, Summer 2018 109
being and flourishing. Humanistic theories have argued that man has many universal psychological needs, including the need for merit, relationships, and self-sufficiency. These requirements are all measurable by the degree of individual flourishing.6-8
In addition, there are new discoveries about well-being. In this context, Putnam and Helliwell et al. considered the social network as the foundation of well-being.9,10 Some people also describe enthusiasm, interest in activities with enthusiasm, as well-known underpinnings of well-being as the basis for their friends' network.11 In recent years, extensive researches have been done in the field of welfare, and variables correlated with well-being have referred to different dimensions of flourishing and have considered purposefulness and meaningfulness as fundamental building blocks in human performance.6,7,12,13 Researchers believe that one of the reasons for the study of flourishing is getting aware of wilt and depression.14
Keyes says that 14 percent of adults become depressed annually, causing the destruction of social roles, absenteeism from work, reduced fertility, increased care costs, suicide, and more referral to the physician; but flourishing increases attention, sets thought-action, and guides the scope of insight and creativity in a useful direction.5,15 The various studies have shown that flourishing plays an important role in academic achievement, level of individuals' happiness, and their social competency.16-18 For example, in one of these studies, it was argued that flourishing had an effective role in relationship between social competency and psychological vulnerability.18 In another study, it was revealed that self-efficacy and self-esteem had an important role in spiritual health of the surveyed patients,19 and these factors can play an effective role in flourishing of the patients.
Given the important role of women in mental health of family and their important
role in development of children with complete physical, mental, and psychological well-being, and since there was not any study in this field in Iran, revealing the state of flourishing among women and considering the important role of flourishing in reducing depression, this study was designed and evaluated to determine the women's flourishing rate and some related factors in Sanandaj, Iran, in 2016.
Materials and Methods
This was a descriptive-analytical study. The population was women in Sanandaj with the age range of 18 to 64 years. The sample size was calculated as follows: given that there was no available information in this field, the following formula was used to estimate the sample size. To estimate the sample size, the values of p and d in the following formula were considered as 0.5 and 0.05, respectively. Thus, the minimum number of subjects to do this study was 384. Finally, 400 women were examined as the final sample.
N = (z2 × pq)/d2
The method of the study was a multi-stage cluster. In the first stage, Sanandaj city was divided into 5 parts: north, south, east, west, and center. Then, in each part, several neighborhoods were selected randomly, and finally in each neighborhood, some homes were selected randomly. Data were collected using a home-based interview.
In this study, the Persian version of flourishing questionnaire was used. This questionnaire was used by Moradi Siah Afshadi et al. Its validity and reliability were confirmed in that study and its Cronbach's alpha value was 0.82.16 In the present study, Cronbach's alpha was 0.79. The questionnaire had 8 items. The scoring was based on a 7-point Likert scale from 1, meaning totally disagree, to 7 meaning totally agree. Earning a higher score on the whole of the surveyed
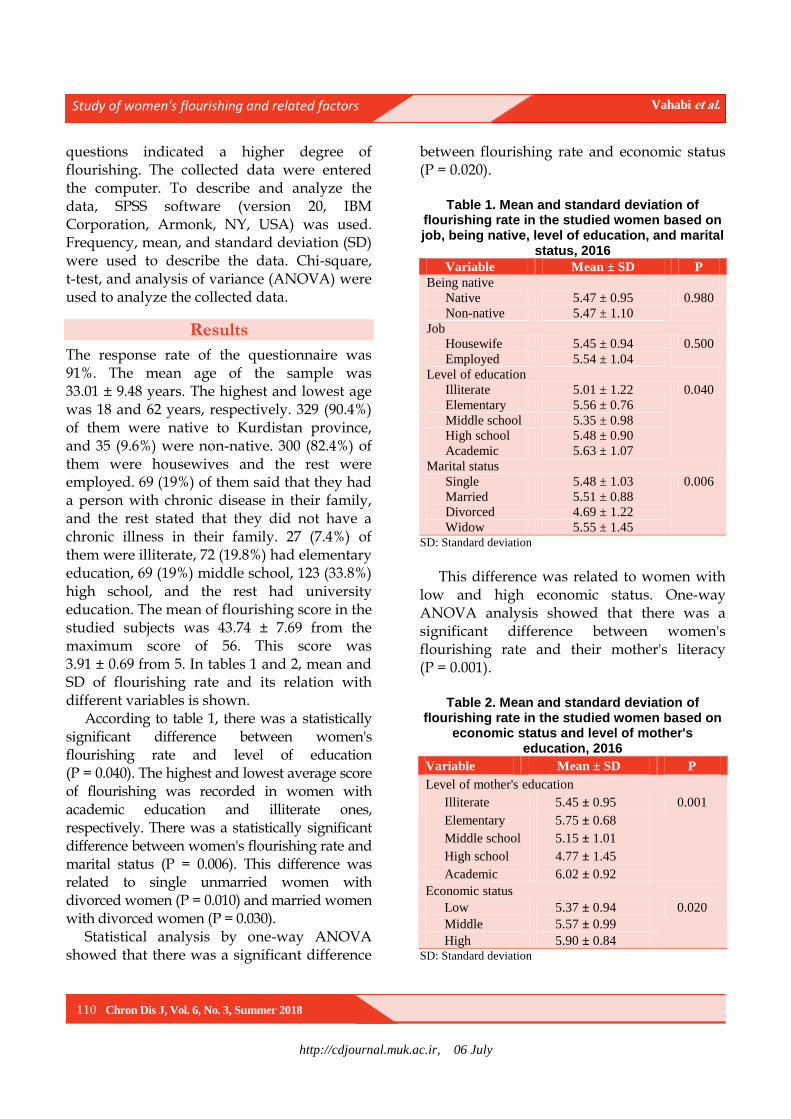
http://cdjournal.muk.ac.ir, 06 July
Study of women's flourishing and related factors Vahabi et al.
110 Chron Dis J, Vol. 6, No. 3, Summer 2018
questions indicated a higher degree of flourishing. The collected data were entered the computer. To describe and analyze the data, SPSS software (version 20, IBM Corporation, Armonk, NY, USA) was used. Frequency, mean, and standard deviation (SD) were used to describe the data. Chi-square, t-test, and analysis of variance (ANOVA) were used to analyze the collected data.
Results
The response rate of the questionnaire was 91%. The mean age of the sample was 33.01 ± 9.48 years. The highest and lowest age was 18 and 62 years, respectively. 329 (90.4%) of them were native to Kurdistan province, and 35 (9.6%) were non-native. 300 (82.4%) of them were housewives and the rest were employed. 69 (19%) of them said that they had a person with chronic disease in their family, and the rest stated that they did not have a chronic illness in their family. 27 (7.4%) of them were illiterate, 72 (19.8%) had elementary education, 69 (19%) middle school, 123 (33.8%) high school, and the rest had university education. The mean of flourishing score in the studied subjects was 43.74 ± 7.69 from the maximum score of 56. This score was 3.91 ± 0.69 from 5. In tables 1 and 2, mean and SD of flourishing rate and its relation with different variables is shown.
According to table 1, there was a statistically significant difference between women's flourishing rate and level of education (P = 0.040). The highest and lowest average score of flourishing was recorded in women with academic education and illiterate ones, respectively. There was a statistically significant difference between women's flourishing rate and marital status (P = 0.006). This difference was related to single unmarried women with divorced women (P = 0.010) and married women with divorced women (P = 0.030).
Statistical analysis by one-way ANOVA showed that there was a significant difference
between flourishing rate and economic status (P = 0.020).
Table 1. Mean and standard deviation of flourishing rate in the studied women based on job, being native, level of education, and marital
status, 2016
Variable Mean ± SD P
Being native
Native 5.47 ± 0.95 0.980
Non-native 5.47 ± 1.10
Job
Housewife 5.45 ± 0.94 0.500
Employed 5.54 ± 1.04
Level of education
Illiterate 5.01 ± 1.22 0.040
Elementary 5.56 ± 0.76
Middle school 5.35 ± 0.98
High school 5.48 ± 0.90
Academic 5.63 ± 1.07
Marital status
Single 5.48 ± 1.03 0.006
Married 5.51 ± 0.88
Divorced 4.69 ± 1.22
Widow 5.55 ± 1.45 SD: Standard deviation
This difference was related to women with
low and high economic status. One-way ANOVA analysis showed that there was a significant difference between women's flourishing rate and their mother's literacy (P = 0.001).
Table 2. Mean and standard deviation of
flourishing rate in the studied women based on economic status and level of mother's
education, 2016
Variable Mean ± SD P
Level of mother's education
Illiterate 5.45 ± 0.95 0.001
Elementary 5.75 ± 0.68
Middle school 5.15 ± 1.01
High school 4.77 ± 1.45
Academic 6.02 ± 0.92
Economic status
Low 5.37 ± 0.94 0.020
Middle 5.57 ± 0.99
High 5.90 ± 0.84 SD: Standard deviation
http://cdjournal.muk.ac.ir, 06 July
Study of women's flourishing and related factors Vahabi et al.
Chron Dis J, Vol. 6, No. 3, Summer 2018 111
This difference was significant among illiterate mothers and mothers with high school education (P = 0.020), elementary school with high school education (P = 0.001), and high school with academic education (P = 0.040). The highest and lowest average score of flourishing rate were showed in women whose mothers had university and high school education,, respectively.
Discussion
This research, which studied flourishing rate and some related factors among women in Sanandaj city, showed that the rate of flourishing was high. This finding is consistent with some studies and is not consistent with some others. In the study by Keyes, it was stated that people with high mental health had a good flourishing. The study found that people with lower mental health were six times more likely to have depression than those with high levels of flourishing. In that study, 17.2% of the subjects had a good flourishing, while 75.5% of the surveyed women in this research had a high degree of flourishing.4
It seems that there is a close relationship between flourishing and mental health. Given the high levels of flourishing among the subjects in this study, it is expected that their mental health will be high enough, and for proving it, we need to do more researches in this field. A study conducted in Malaysia showed that 50.1% of the participants in the study had a flourishing life, and there was a significant relationship between flourishing rate and gender, employment status, education level, having a child, and having a patient with chronic disease at home (P < 0.050), but there was no significant relationship between flourishing rate with age, marital status, living alone, and economic status.17 The results of the present study showed that 75.5% of the subjects had flourishing, that is consistent with the results of the Malaysian study.
In this study, there was a significant
difference between women's flourishing rate and educational level, marital status, type of residential home, economic status, and mother's education. However, there was no significant difference between the other variables studied. These results are consistent with some of the Malaysian study findings, and not fit with some others.
Keyes studies have shown that 14 percent of adults become depressed annually, and this is linked to the destruction of social roles, absence from work, reduced productivity, increased care costs, suicide, and more referral to the physician; while, flourishing increases attention in the people.4 A study done by Moradi Siah Afshadi et al. among students showed that their flourishing had a positive and significant relationship with academic achievement,16 which is indicative of the fact that flourishing is one of the important factors of a better life and progress and success in life. According to the findings of our study and other studies, it can be claimed that flourishing is one of the important factors in human success that can guarantee his/her mental health. In the present study, more than 50% of the subjects had flourishing, but in Keyes' study 17.2% of the subjects fit the criteria for flourishing.4 Therefore, this finding is not consistent with the finding of Keyes' study. In another study by Schotanus-Dijkstra et al., 37% of the subjects were flourishers, and some factors such as social support and positive life-events were significantly associated with flourishing.20 This finding is consistent with our findings.
One of the strengths of this research is that the study is conducted among women, who are the most important components of the family center, and it is important to know the state of their flourishing rate. The second strength of this study is that the participants were randomly selected. The third strong point is that it appears to be the first study on women's flourishing in Iran, which can be useful for further studies about flourishing.
http://cdjournal.muk.ac.ir, 06 July
Study of women's flourishing and related factors Vahabi et al.
112 Chron Dis J, Vol. 6, No. 3, Summer 2018
One of the disadvantages of this study is that the participants were a small group of community and some of them may have misplaced their views on the subject.
Conclusion
The high rate of flourishing of the subjects shows that women can play an important role in family calmness, and given the fact that flourishing has an inverse relationship with depression, mental health of community is expected to be well. Holding educational classes on the mental health of families and the role of flourishing in mental health of the community is one of the issues that health and cultural authorities need to pay special attention to it.
Conflict of Interests
Authors have no conflict of interests.
Acknowledgments
We would like to thank all women who participated in this research. We are also grateful to the Student Research Committee of Kurdistan University of Medical Sciences for their cooperation in approving this project and funding this research in the form of a student research project. This paper is the result of a research project with approval number 1395/21, supported by Vice Chancellor for Research and Technology in Kurdistan University of Medical Sciences.
References
1. Fredrickson BL, Losada MF. Positive affect and the complex dynamics of human flourishing. Am Psychol 2005; 60(7): 678-86.
2. Dunn DS, Dougherty SB. Flourishing: Mental health as living life well. J Soc Clin Psychol 2008; 27(3): 314.
3. Fredrickson BL. The broaden-and-build theory of positive emotions. Philos Trans R Soc Lond B Biol Sci 2004; 359(1449): 1367.
4. Keyes CL. The mental health continuum: From languishing to flourishing in life. J Health Soc Behav 2002; 43(2): 207-22.
5. Keyes CL. Toward a science of mental health. In: Lopez SJ, Snyder CR, Editors. The oxford handbook
of positive psychology. Oxford, UK: Oxford University Press; 2011.
6. Ryff CD. Happiness is everything, or is it? Explorations on the meaning of psychological well-being. J Pers Soc Psychol 1989; 57(6): 1069-81.
7. Ryff CD, Singer B. The contours of positive human health. Psychol Inq 1998; 9(1): 1-28.
8. Ryan RM, Deci EL. Self-determination theory and the facilitation of intrinsic motivation, social development, and well-being. Am Psychol 2000; 55(1): 68-78.
9. Putnam RD. Bowling alone: The collapse and revival of American community. New York, NY: Simon and Schuster; 2001.
10. Helliwell JF, Barrington-Leigh C, Harris A, Huang H. International evidence on the social context of well-being. In: Diener E, Kahneman D, Helliwell J, Editors. International Differences in Well-Being. Oxford, UK: Oxford University Press; 2010.
11. Csikszentmihalyi M. Flow: The psychology of optimal experience. New York, NY: HarperCollins; 209.
12. Seligman ME. Authentic happiness: Using the new positive psychology to realize your potential for lasting fulfillment. New York, NY: Simon and Schuster; 2004.
13. Steger MF, Kashdan TB, Sullivan BA, Lorentz D. Understanding the search for meaning in life: Personality, cognitive style, and the dynamic between seeking and experiencing meaning. J Pers 2008; 76(2): 199-228.
14. Horwitz AV. Outcomes in the sociology of mental health and illness: Where have we been and where are we going? J Health Soc Behav 2002; 43(2): 143-51.
15. Martin LL, Ward DW, Achee JW, Wyer RS. Mood as input: People have to interpret the motivational implications of their moods. J Pers Soc Psychol 1993; 64(3): 317-26.
16. Moradi Siah Afshadi M, Ghasemi N, Ghamarani A. Evaluating the validity and reliability of flourishing scale and determining the relation between flourishing and academic achievement in students of medicine school. Iran J Med Educ 2015; 15: 330-37.
17. Abolfathi Momtaz Y, Aizan Hamid T, Azizah Haron S, Fazdillah Bagat M. Flourishing in Later Life. Arch Gerontol Geriatr 2015; 63: 85-91.
18. Uysal R. Social competence and psychological vulnerability: The mediating role of flourishing. Psychol Rep 2015; 117(2): 554-65.
19. Mikaeili N, Samadifard H. The relationship between self-efficacy and self-esteem with spiritual health in patients with diabetes mellitus. Chron Dis J 2016; 4(2): 34-8.
20. Schotanus-Dijkstra M, Pieterse ME, Drossaert CH, Westerhof GJ, de Graaf R, ten Have M, et al. What factors are associated with flourishing? Results from a large representative national sample. J Happiness Stud 2016; 17(4): 1351-70.
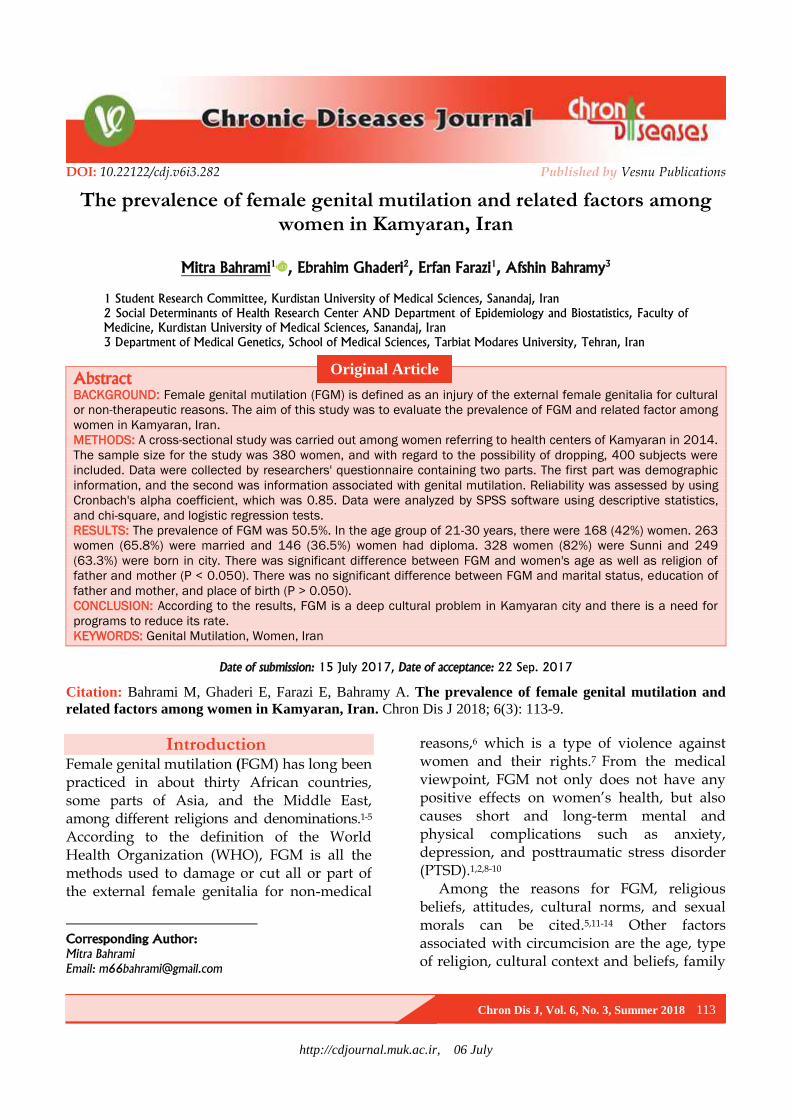
http://cdjournal.muk.ac.ir, 06 July
Chron Dis J, Vol. 6, No. 3, Summer 2018 113
DOI: 10.22122/cdj.v6i3.282 Published by Vesnu Publications
The prevalence of female genital mutilation and related factors among women in Kamyaran, Iran
Mitra Bahrami1
, Ebrahim Ghaderi2, Erfan Farazi
1, Afshin Bahramy
3
1 Student Research Committee, Kurdistan University of Medical Sciences, Sanandaj, Iran
2 Social Determinants of Health Research Center AND Department of Epidemiology and Biostatistics, Faculty of
Medicine, Kurdistan University of Medical Sciences, Sanandaj, Iran
3 Department of Medical Genetics, School of Medical Sciences, Tarbiat Modares University, Tehran, Iran
Abstract BACKGROUND: Female genital mutilation (FGM) is defined as an injury of the external female genitalia for cultural
or non-therapeutic reasons. The aim of this study was to evaluate the prevalence of FGM and related factor among
women in Kamyaran, Iran.
METHODS: A cross-sectional study was carried out among women referring to health centers of Kamyaran in 2014.
The sample size for the study was 380 women, and with regard to the possibility of dropping, 400 subjects were
included. Data were collected by researchers' questionnaire containing two parts. The first part was demographic
information, and the second was information associated with genital mutilation. Reliability was assessed by using
Cronbach's alpha coefficient, which was 0.85. Data were analyzed by SPSS software using descriptive statistics,
and chi-square, and logistic regression tests.
RESULTS: The prevalence of FGM was 50.5%. In the age group of 21-30 years, there were 168 (42%) women. 263
women (65.8%) were married and 146 (36.5%) women had diploma. 328 women (82%) were Sunni and 249
(63.3%) were born in city. There was significant difference between FGM and women's age as well as religion of
father and mother (P < 0.050). There was no significant difference between FGM and marital status, education of
father and mother, and place of birth (P > 0.050).
CONCLUSION: According to the results, FGM is a deep cultural problem in Kamyaran city and there is a need for
programs to reduce its rate.
KEYWORDS: Genital Mutilation, Women, Iran
Date of submission: 15 July 2017, Date of acceptance: 22 Sep. 2017
Citation: Bahrami M, Ghaderi E, Farazi E, Bahramy A. The prevalence of female genital mutilation and
related factors among women in Kamyaran, Iran. Chron Dis J 2018; 6(3): 113-9.
Introduction1
Female genital mutilation (FGM) has long been practiced in about thirty African countries, some parts of Asia, and the Middle East, among different religions and denominations.1-5 According to the definition of the World Health Organization (WHO), FGM is all the methods used to damage or cut all or part of the external female genitalia for non-medical
Corresponding Author:
Mitra Bahrami
Email: [email protected]
reasons,6 which is a type of violence against women and their rights.7 From the medical viewpoint, FGM not only does not have any positive effects on women’s health, but also causes short and long-term mental and physical complications such as anxiety, depression, and posttraumatic stress disorder (PTSD).1,2,8-10
Among the reasons for FGM, religious beliefs, attitudes, cultural norms, and sexual morals can be cited.5,11-14 Other factors associated with circumcision are the age, type of religion, cultural context and beliefs, family
Original Article
http://cdjournal.muk.ac.ir, 06 July
FGM and related factors Bahrami et al.
114 Chron Dis J, Vol. 6, No. 3, Summer 2018
level of education, parent's jobs, and the history of circumcision in other family members.5,11,14,15
Despite the great efforts to reduce FGM in recent years by WHO, government agencies, and other non-governmental organizations (NGOs), there are between 100 to 140 million women and girls circumcised in the world,1,2,5,16,17 and 3 million girls are exposed to be circumcised every year.2 This is usually done at a young age and up to 15 years of age.1,18 According to the studies conducted, FGM in Iran is still done in Azerbaijan, Kurdistan, Kermanshah, and Hormozgan.5,19,20 There is little information about the prevalence of FGM in Iran, and few studies have been conducted in this regard. Although the government has done a great deal to reduce it with education in high risk areas, studies have reported FGM to be from 32% to 70%.5,19,20 There is no statistical information in this regard in Kurdistan, Iran, but in a study on Kurdish women, Arasteh et al. reported that the prevalence of sexual dysfunction was about 77%,21 which might be indicative of problems in the sexual health in this province.
Kamyaran is one of the cities of Kurdistan province of Iran, with its specific traditional context and culture; in some areas of Kamyaran the girls are still being circumcised. Considering the importance of complications of circumcision on women's physical and psychological health and that so far no studies have been conducted on this issue in this city, the present study was conducted to determine the prevalence of circumcision and related factors among women in Kamyaran for using as evidence for intervention by health system.
Materials and Methods
This cross-sectional study was done in 2014 in Kamyaran (located in south of Iran's Kurdistan). Given the context of Kamyaran, there are few private clinics in this city, and most people refer to governmental health
centers for health care. Considering the similar studies conducted,19 (the prevalence of circumcision was 55.7%, accuracy 5%, and the type 1 error 5%), the sample size was calculated as 380. Given the probability of sample drop, 400 questionnaires were collected and completed. The study was approved by Kurdistan University of Medical Sciences Ethics Committee (REC.MUK.1393.142).
Kamyaran has 3 healthcare centers that according to the population covered by each center, the sample size was determined proportionate to those centers. Sampling method was convenient sampling from among women referring to health centers for any reason and from among all ages, which was started one day of the week. Moreover, the subjects entered the study until the sample size was complete. Prior to completing the questionnaires, while the purpose of the study was explained, the permission was obtained from participants or their mothers, and the circumcision status was enquired only by asking questions, and due to the sensitivity of the issue, the examination was avoided. Moreover, they were assured of the confidentiality of the information.
A researcher-made questionnaire containing two parts was used to collect information. The first part was demographic information, and the second part was information related to circumcision. The reliability of the questionnaire was obtained in two rural health centers using Cronbach's alpha coefficient (0.85). One researcher was trained in each center -with coordination established between them- to ask the question in the same way and complete the questionnaire. The data were then described using SPSS software (version 16, SPSS Inc., Chicago, IL, USA), and chi-square and logistic regression tests were used to analyze the data.
Results
Response rate in our study was 93.9%

http://cdjournal.muk.ac.ir, 06 July
FGM and related factors Bahrami et al.
Chron Dis J, Vol. 6, No. 3, Summer 2018 115
(400/426). The findings indicated that 263 subjects (65.8%) were married, 146 (36.5%) had high school diploma, 328 subjects (82%) were from Sunni religion, and the birthplace of 249 subjects (63.3%) was city. Moreover, 202 women (50.5%) participating in the study had been circumcised (Table 1). Table 1. Socio demographic distribution of the
study population
Variables n )%)
Age (years) 0-10 69 (17.2)
11-20 51 (12.8)
21-30 168 (42.0)
31-40 71 (17.8)
40 < 41 (10.2)
Marital status
Single 54 (13.5)
Married 263 (65.8)
Child 83 (20.7)
Education
Illiterate 39 (9.8)
Primary 99 (24.8)
High school 70 (17.5)
Diploma and above 146 (36.5)
Religion
Sunni 328 (82.0)
Shiite 72 (18.0)
Place of birth
City 249 (62.3)
Village 151 (37.8)
Father's job
Non-governmental 350 (87.5)
Governmental 50 (12.5)
Mother's job
Employed 93 (23.2)
Housewife 307 (76.7)
The state of circumcision
Yes 202 (50.5)
No 198 (49.5)
The highest prevalence of circumcision was
in the age group over 40 years with a prevalence of 68.3%, and the lowest was in the age group under 10 with a prevalence of 42%. 141 circumcised subjects (53.7%) were married and the rest 28 (51.7%) were single.
According to Table 2, the prevalence of circumcision was higher in older ages
(P = 0.006). FGM was somewhat lower with increasing parental education, but this difference was not statistically significant (P = 0.120). The prevalence of circumcision in Sunni religion mothers' children was 53.6% and in children whose mothers' were Shiite was 35.7%, that was statistically significant (P = 0.050). The prevalence of FGM did not have statistically significant correlation with parental job (P = 0.510). Regarding birthplace (city or village), the prevalence of circumcision was approximately equal with no statistically significant differences between the people with rural and urban place of birth (P = 0.520).
In multivariate analysis with controlling other factors, the prevalence of circumcision was higher in the age group over 40 compared to those under 10 (P = 0.031) [95% confidence interval (CI) = 1.107-8.366], with no significant differences among other age groups (Table 3). The level of mother's education, the birthplace of the child, and father's occupation did not have a significant relationship with circumcision, but the prevalence of circumcision in the Sunni religion was more than the Shiite (P = 0.015) (95% CI = 1.147-3.630).
Discussion
Given the findings of the study, the prevalence of FGM among participant women in the study was 50.5%. Although the prevalence of FGM was more common at age over 40, it was almost equal in other age groups and increased a little with age increase. Female circumcision was statistically significant in women with Sunni religion, but it was also common in the Shiite living in Kamyaran. There was no statistically significant relationship between female circumcision and mother and father's education.
The prevalence of women circumcision in the study of Pashaei et al. in Kermanshah, Iran, was 55.7%,22 in the study of Ahadi et al. in Hormozgan, Iran, 70%,20 in Yasin et al. study in Iraqi Kurdistan 70.3%,15 and in the study by Saleem et al. in Erbil, Iraq, 23%.23
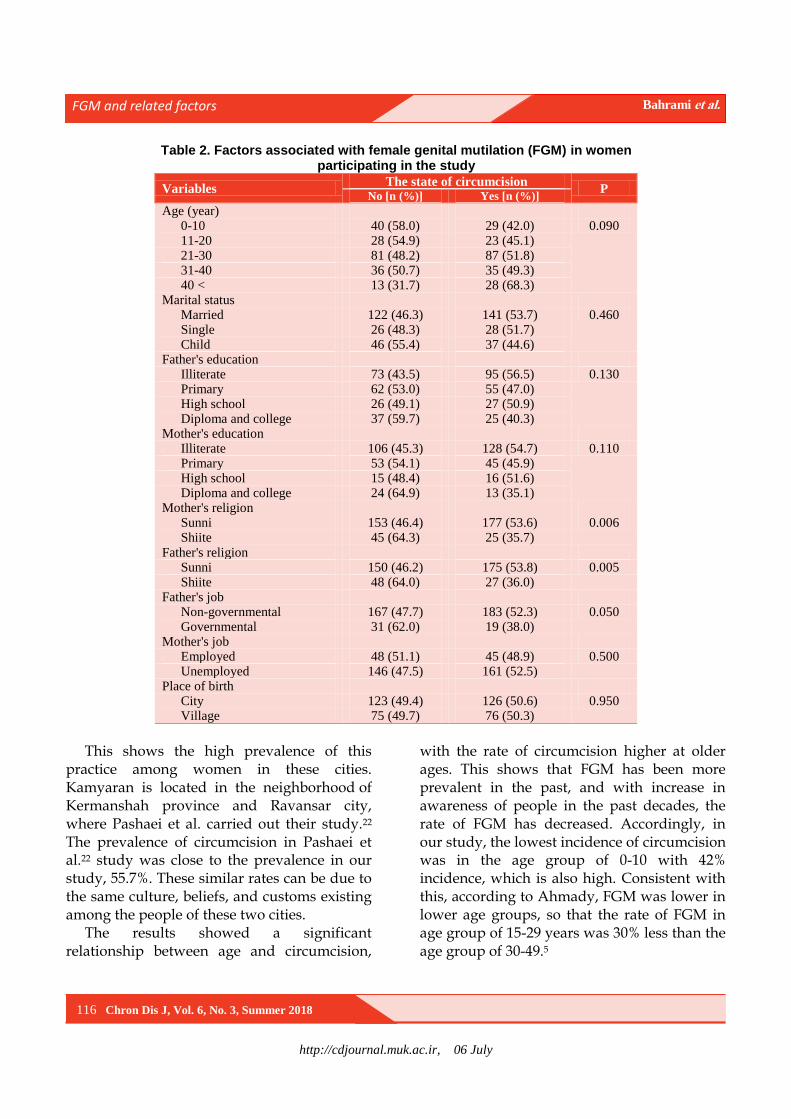
http://cdjournal.muk.ac.ir, 06 July
FGM and related factors Bahrami et al.
116 Chron Dis J, Vol. 6, No. 3, Summer 2018
Table 2. Factors associated with female genital mutilation (FGM) in women participating in the study
Variables The state of circumcision
P No [n (%)] Yes [n (%)]
Age (year) 0-10 40 (58.0) 29 (42.0) 0.090 11-20 28 (54.9) 23 (45.1) 21-30 81 (48.2) 87 (51.8) 31-40 36 (50.7) 35 (49.3) 40 < 13 (31.7) 28 (68.3)
Marital status Married 122 (46.3) 141 (53.7) 0.460 Single 26 (48.3) 28 (51.7) Child 46 (55.4) 37 (44.6)
Father's education Illiterate 73 (43.5) 95 (56.5) 0.130 Primary 62 (53.0) 55 (47.0) High school 26 (49.1) 27 (50.9) Diploma and college 37 (59.7) 25 (40.3)
Mother's education Illiterate 106 (45.3) 128 (54.7) 0.110 Primary 53 (54.1) 45 (45.9) High school 15 (48.4) 16 (51.6) Diploma and college 24 (64.9) 13 (35.1)
Mother's religion Sunni 153 (46.4) 177 (53.6) 0.006 Shiite 45 (64.3) 25 (35.7)
Father's religion Sunni 150 (46.2) 175 (53.8) 0.005 Shiite 48 (64.0) 27 (36.0)
Father's job Non-governmental 167 (47.7) 183 (52.3) 0.050 Governmental 31 (62.0) 19 (38.0)
Mother's job Employed 48 (51.1) 45 (48.9) 0.500 Unemployed 146 (47.5) 161 (52.5)
Place of birth City 123 (49.4) 126 (50.6) 0.950 Village 75 (49.7) 76 (50.3)
This shows the high prevalence of this
practice among women in these cities. Kamyaran is located in the neighborhood of Kermanshah province and Ravansar city, where Pashaei et al. carried out their study.22 The prevalence of circumcision in Pashaei et al.22 study was close to the prevalence in our study, 55.7%. These similar rates can be due to the same culture, beliefs, and customs existing among the people of these two cities.
The results showed a significant relationship between age and circumcision,
with the rate of circumcision higher at older ages. This shows that FGM has been more prevalent in the past, and with increase in awareness of people in the past decades, the rate of FGM has decreased. Accordingly, in our study, the lowest incidence of circumcision was in the age group of 0-10 with 42% incidence, which is also high. Consistent with this, according to Ahmady, FGM was lower in lower age groups, so that the rate of FGM in age group of 15-29 years was 30% less than the age group of 30-49.5

http://cdjournal.muk.ac.ir, 06 July
FGM and related factors Bahrami et al.
Chron Dis J, Vol. 6, No. 3, Summer 2018 117
Table 3. Relationship of female genital mutilation (FGM) with different variables by using logistic regression analysis
Variable
Beta Coefficient SE P OR 95% CI
Lower Upper
Age groups (year) 0-10 -
11-20 -0.023 0.412 0.955 0.977 0.436 2.189
21-30 0.301 0.368 0.413 1.352 0.658 2.778
31-40 0.240 0.431 0.578 1.271 0.546 2.957
40 < 1.113 0.516 0.031 3.043 1.107 8.366
Mother's education Diploma and college -
High school 0.554 0.515 0.282 1.740 0.634 4.777
Primary 0.394 0.457 0.388 1.483 0.606 3.631
Illiterate 0.616 0.482 0.201 1.852 0.720 4.763
Mother's religion Shiite -
Sunni 0.713 0.294 0.015 2.041 1.147 3.630
Place of birth Village -
City -0.428 0.260 0.099 0.652 0.392 1.084
Job of father Employed -
Unemployed 0.132 0.353 0.710 1.141 0.571 2.280 SE: Standard error; OR: Odds ratio; CI: Confidence interval
In theirs study, Al-Khulaidi et al. showed
that during the last decades, the rate of FGM has decreased from 61.9% in 1997 to 56.6% in 2003.12 One of the possible reasons for this can be that, as circumcised women have experienced unpleasant complications of it in their lives, and as health and well-being awareness has increased, they are not inclined to circumcise their daughters. In their study, Abolfotouh et al. showed that nearly half of the circumcised women did not intend to circumcise their daughters.24 In addition, raising public awareness has led to a decrease in this rate over the past years at younger ages.12 Given people's need to understand the correct health information and beliefs related to health, it is imperative to inform the community about the present generation and correct their attitudes toward solving this health problem. Moridi et al. study indicated that an appropriate training to women could promote their health.25 We did not expect such high prevalence in under 10 age group.
Considering parental education and FGM, our expectation was to see decrease in circumcision with an increase in the level of parent education, but the results did not
significantly differ. However, the overall prevalence of FGM was generally lower by increasing parents' literacy rates. One of the reasons for this can be that the people of this city mostly live in extended families with grandparents, who have a direct effect on the decision to have children circumcised, and FGM is a deep cultural problem. The results of Ahadi et al.,20 Pashaei et al.,26 Ahmady,5 Yasin et al.,15 and Saleem et al.23 have shown a relationship between the low level of parental education and the increased incidence of circumcision in girls. WHO has also declared illiteracy and low literacy as important factors for the persistence of FGM.2 Given the effective role of education in the practice of circumcision, more efforts should be made to raise the level of education of parents, especially mothers, and inform them; but in certain cultural conditions, one should not expect that with increase in knowledge, FGM could easily be reduced.
The results showed that religion was one of the factors affecting circumcision, with higher prevalence of it in Sunni women compared to the Shiite. There was also a relationship between father and mother's religion with
http://cdjournal.muk.ac.ir, 06 July
FGM and related factors Bahrami et al.
118 Chron Dis J, Vol. 6, No. 3, Summer 2018
FGM. Ahmady and Shabila et al. have also referred to the connection between Sunnis and circumcision.5,14 Given the fact that FGM exists in the teachings of Sunni religion but not in Shiite religion, FGM was expected to be low in the Shiite women, but the results showed that FGM was also performed by Shiites in Kamyaran. Cultural integration between Shiite and Sunni people in this city seems to be high. This has doubled the researchers' concerns over the high rate of female circumcision in women, because one can conclude that the roots of FGM in this region are inculcated very deeply in their culture, and even religion cannot completely eliminate it.
The parental occupation and birthplace of the person did not significantly correlate with the prevalence of circumcision; whereas employed and urban people were expected to have a much lower prevalence of circumcision. This issue and previous results of this study all indicate deep cultural and special beliefs in this region that even many influential factors on health promotion have not been able to reduce FGM; and studying this profound cultural belief needs conducting qualitative studies. However, this study had a limitation that was the lack of the possibility of examining women to determine the type of circumcision in this city; therefore, we could not examine the prevalence of different types of circumcision. Maybe educated and urban people have more superficial FGM than others, and the prevalence of deep FGM is less than this value.
Female circumcision has different degrees and is divided into 4 degrees, which varies from cutting and removing one part of the clitoris to the complete removal of large lobes.2,6 FGM can be one of the reasons for the high prevalence of sexual disorders such as “non-stimulation”.21 Removal of clitoris and other sensitive tissues reduces women's sexual satisfaction.8 Locals with no proper education usually do FGM in non-sterile and non-sanitary conditions with contaminated and
unsafe devices without the use of any local medication; therefore, usually people who are circumcised, in addition to the complications listed, are also exposed to the transmission of infection.1,5,27
According to the results, planning and the need for attention at high levels of managerial and inter-institutional coordination (the Ministry of Health with the Ministry of Education) are vital for developing strategies to increase the level of public health literacy and change their behavior. In their study, Bidarpoor et al. indicated that training through public classes and direct education by health personnel are effective in increasing awareness on healthy lifestyle.28
Furthermore, given the role of the traditions and religion of parents in the practice of FGM, the need is felt for cooperation and involvement of religious leaders of this city to reconcile their beliefs about the health and health consequences of circumcision in women. Moreover, their potential could be used to inform people of the harms of FGM and encourage them not to do FGM.
Conclusion
The prevalence of circumcision in Kamyaran was high in all ages and had no relation to the level of education of parents, place of residence, and occupation, but was higher in Sunni religion. According to the findings, female circumcision appears to be a profound cultural belief in the region, since factors such as literacy have not been able to reduce it.
Conflict of Interests
Authors have no conflict of interests.
Acknowledgments
We thank all those who helped us with this research. The Deputy of Research and Technology of Kurdistan University of Medical Sciences funded this project with the registration number 2013/11/20-1429914.
http://cdjournal.muk.ac.ir, 06 July
FGM and related factors Bahrami et al.
Chron Dis J, Vol. 6, No. 3, Summer 2018 119
References
1. UNICEF. Female Genital Mutilation/Cutting: A statistical overview and exploration of the dynamics of change. New York, NY: UNICEF Publications; 2013.
2. World Health Organization. Eliminating female genital mutilation: An interagency statement-OHCHR, UNAIDS, UNDP, UNECA, UNESCO, UNFPA, UNHCR, UNICEF, UNIFEM, WHO. Geneva, Switzerland: WHO; 2008.
3. Schiffman F, Mayo-Smith M, Burton M. Resident report: A conference with many uses. Rhode Island Medical Journal 1990; 73: 95-102.
4. Weberschock TB, Ginn TC, Reinhold J, Strametz R, Krug D, Bergold M, et al. Change in knowledge and skills of Year 3 undergraduates in evidence-based medicine seminars. Med Educ 2005; 39(7): 665-71.
5. Ahmady K, Prevalence of female genital mutilation/cutting in Iran. Swift Journal of Social Science and Humanity 2015; 1(3): 28-42.
6. World Health Organization. Female genital mutilation. Geneva, Switzerland: WHO; 1998.
7. General Recommendation No. 14, female circumcision: The committee on the Elimination of Discrimination against Women [Online]. [cited 1990]; Available from: URL: http://www.un.org/womenwatch/daw/cedaw/recommendations/recomm.htm
8. Kiragu K. Female genital mutilation: A reproductive health concern. Popul Rep J 1995; (41 Suppl): 1-4.
9. Mulongo P, Martin CH, McAndrew S. The psychological impact of Female Genital Mutilation/Cutting (FGM/C) on girls/women's mental health: A narrative literature review. J Reprod Infant Psychol 2018; 32(5): 469-85.
10. Vloeberghs E, van der Kwaak A, Knipscheer J, van den Muijsenbergh M. Coping and chronic psychosocial consequences of female genital mutilation in The Netherlands. Ethn Health 2012; 17(6): 677-95.
11. Berg RC, Denison E. A tradition in transition: Factors perpetuating and hindering the continuance of female genital mutilation/cutting (FGM/C) summarized in a systematic review. Health Care Women Int 2013; 34(10): 837-59.
12. Al-Khulaidi GA, Nakamura K, Seino K, Kizuki M. Decline of supportive attitudes among husbands toward female genital mutilation and its association to those practices in Yemen. PLoS One 2013; 8(12): e83140.
13. Ofor MC, Ofole NM. Female genital mutilation: The place of culture and the debilitating effects on the dignity of the female gender. Eur Sci J 2015; 11(14): 112-21.
14. Shabila NP, Saleh AM, Jawad RK. Women's perspectives of female genital cutting: Q-methodology. BMC Womens Health 2014; 14: 11.
15. Yasin BA, Al-Tawil NG, Shabila NP, Al-Hadithi TS.
Female genital mutilation among Iraqi Kurdish women: A cross-sectional study from Erbil city. BMC Public Health 2013; 13: 809.
16. World Health Organization. Sexual and reproductive health: Female genital mutilation programmes to date: What works and what doesn't. Geneva, Switzerland: WHO; 2011.
17. Marcusįn AK, Toledo SH, Puppo Avila NL. Manual for the management and prevention of female genital mutilation/cutting for health professionals the Gambia. Barcelona, Spain: Wassu-UAB Foundation; 2015.
18. What is Female Genital Mutilation (FGM) [Online]. [cited 2013]; Available from: URL: http://www.endfgm.eu/female-genital-mutilation/what-is-fgm
19. Pashaie T, Rahimi A, Ardalan A, Majlesi F. Prevalence of female genital mutilation and factors associated with it among women consulting health centers in Ravansar City, Iran. J Sch Public Health Inst Public Health Res 2012; 9(4): 57-68.
20. Ahadi H, Khadivzadeh T, Seyyedialavi G, Esmaili H. Women's circumcision in Minab: Prevalence, knowledge, attitude. J Qazvin Univ Med Sci 2003; 7(4): 14-20.
21. Arasteh M, Shams AN, Ghaderi E, Farhadifar F, Nabati R, Gharibi F. Survey of the prevalence of sexual dysfunctions in Kurdish women. J Sex Marital Ther 2014; 40(6): 503-11.
22. Pashaei T, Rahimi A, Ardalan A, Felah A, Majlessi F. Related factors of female genital mutilation (FGM) in Ravansar (Iran). J Women's Health Care 2012; 1: 108.
23. Saleem RA, Othman N, Fattah FH, Hazim L, Adnan B. Female genital mutilation in Iraqi Kurdistan: Description and associated factors. Women Health 2013; 53(6): 537-51.
24. Abolfotouh SM, Ebrahim AZ, Abolfotouh MA. Awareness and predictors of female genital mutilation/cutting among young health advocates. Int J Womens Health 2015; 7: 259-69.
25. Moridi G, Shahoei R, Khaldi S, Sayedolshohadaei F. Quality of life among Iranian postmenopausal women participating in a health educational program. Chron Dis J 2013; 1(2): 63-6.
26. Pashaei T, Ponnet K, Moeeni M, Khazaee-pool M, Majlessi F. Daughters at risk of female genital mutilation: Examining the determinants of mothers' intentions to allow their daughters to undergo female genital mutilation. PLoS One 2016; 11(3): e0151630.
27. Izet S, Tubia N. Female circumcision /Female genital mutilation. In: Goldman MB, Hatch M, Editors. Women and Health. Houston, TX: Gulf Professional Publishing; 2000. p. 404-18.
28. Bidarpoor F, Darabi F, Amani S. Evaluation of the effect of chain training methods on improvement of household awareness on and attitude toward healthy nutrition. Chron Dis J 2015; 3(1): 1-6.
http://cdjournal.muk.ac.ir, 06 July
120 Chron Dis J, Vol. 6, No. 3, Summer 2018
DOI: 10.22122/cdj.v6i3.283 Published by Vesnu Publications
A Survey of the prevalence of self-disclosure behavior in virtual social networks and related factors among the students of Kurdistan University
of Medical Sciences, Iran
Tahereh Pashaei1
, Razieh Javanmardi2
, Arezoo Fallahi1
1 Department of Public Health, Faculty of Health, Kurdistan University of Medical Sciences, Sanandaj, Iran
2 Student Research Committee, Kurdistan University of Medical Sciences, Sanandaj, Iran
Abstract BACKGROUND: The growing popularity of social networking sites (SNS) raises concerns about privacy and security,
especially among teenagers and young people, as they experience different types of unsafe behaviors on SNS. In
this regard, the problem of the consequences of using this communication tool has attracted the attention of
psychology and sociology researchers. The aim of this study was to evaluate self-disclosure behavior in virtual
social networks and its related factors.
METHODS: This descriptive-analytical study was conducted among 601 students of Kurdistan University of Medical
Sciences, Sanandaj, Iran. Data were collected by standard questionnaire and analyzed by SPSS software.
RESULTS: Effective factors such as presence in the virtual network, obscurity, and access to the Internet and
virtual networks were among the factors behind the self-disclosure behavior among students. The goal of attending
virtual networks was communicating and sharing personal information, getting rid of loneliness, using in free time,
accessing various information and updating information, getting to know friends and colleagues, feeling anonymity,
feeling united, and lacking confidence. The findings main reason for self-disclosure behavior was presence in
virtual social networks. There was a significant relationship between gender and the desire to obscurity.
CONCLUSION: The results of this study indicate that the tendency to self-disclosure behavior in virtual social
networks among young people, especially students, is increasing. It is essential for the cultural and social
authorities to pay attention and create effective grounds for raising awareness among the youth.
KEYWORDS: Internet, Self-Disclosure, Behavior, Social Networks
Date of submission: 22 July 2017, Date of acceptance: 16 Sep. 2017
Citation: Pashaei T, Javanmardi R, Fallahi A. A Survey of the prevalence of self-disclosure behavior in
virtual social networks and related factors among the students of Kurdistan University of Medical
Sciences, Iran. Chron Dis J 2018; 6(3): 120-6.
Introduction1
The current era is the era of the press, media, and communications. The current world is the field of competing mass media such as radio, television, satellite, cellular networks, and Internet.1,2 The Internet in the simplest definition is a set of interconnected computers that are connected throughout the world.3 One of the attractions of the Internet is the social
Corresponding Author:
Razieh Javanmardi
Email: [email protected]
networking sites (SNS) that have made most young people replace them with the interaction with peers and parents. The term social networks were first introduced by Barter in 1954.4
SNS are online services with a specific policy, which firstly provides participants with an identification profile including individual features and personal information. In the second step, users introduce themselves and openly open their relationships and share their personal information that is visible to others.
Original Article
http://cdjournal.muk.ac.ir, 06 July
Prevalence of self-disclosure behavior Pashaei et al.
Chron Dis J, Vol. 6, No. 3, Summer 2018 121
In the third step, they provide the ability to connect with others by connecting to the site.4,5 The social networking features include interactivity, simultaneous communication, accessibility across the board, lack of monitoring, lack of ownership of the network, multimedia, and high capacity for information and individualization.6
Among the topics to consider in the structure of social networks is the relationship between privacy and the online disclosure of information, which has turned it into an important discussion of the day in the psychological and social fields.7 Factors such as the lack of visual symptoms and anonymity provide a completely different way of face-to-face interaction; thus, it is likely that identities that are created successfully during social interactions are affected by online and virtual interaction. Some of these changes will be positive and some will be negative.4,5,8
Based on world-wide statistics, the number of Facebook users has risen to more than 1 billion in 2016, which is in the first position compared to the Google+ social network with 300 million users, LinkedIn with 347 million users, Instagram with 300 million users, and Twitter with 288 million users.9,10 According to the statistics published in 2016, about 30 million of Iranians are members of the social networks. Moreover, based on the latest statistics released by the cyberspace authorities, more than 40 million smartphone devices are available for Iranian users, which about 30 million of them use social networks.11
In recent studies, it was reported that 9% of European young people’s information has been abused in the past year.9 Therefore, one of the negative consequences of Internet communications and social networks is creating conditions for self-disclosure, intimacy, privacy violation, and self-supply. Self-disclosure in the broadest sense of the process is to disclose and provide personal information for others.
On the other hand, the people share their
own discovery, emotions, thoughts, experiences, and personal information with others. SNS, as a direct intermediary, persuade people to disclose themselves.12-14 Most vulnerable users are young people who suffer irreparable harm due to inappropriate use of cyberspace.15,16 User access to SNS, especially the youth and teenagers, is inevitable. Several factors such as trust, anonymity, social anxiety, internet access, and peers' presence in virtual networks are effective in self-disclosure behavior.6,17,18
As a result, the youth and teenagers should be guided in using these new tools and technologies as much as possible. The aim of this study was to determine the prevalence of self-disclosure behavior in virtual social networks and its related factors among the students of Kurdistan University of Medical Sciences, Sanandaj, Iran.
Materials and Methods
This descriptive-analytical study was conducted on the prevalence and related
factors of self-disclosure behavior in social networks among male and female students in
dental, medical, health, paramedical, nursing and midwifery faculties of Kurdistan University of Medical Sciences in
2017-2018. In addition, information of students was separated by faculty and gender (Table 1).
The participants were selected using clustered sampling method. First, according to the calculating formula for the sample size, a sample of 601 students from Kurdistan University of Medical Sciences (2392 people) was selected by cluster sampling. Then, this number was divided into five faculties in proportion to their number of students (dentistry: 33 girls and 29 boys, paramedical: 54 girls and 47 boys, medicine: 103 girls and 105 boys, nursing and midwifery: 92 girls and 48 boys, health: 64 girls and 26 boys) which were selected randomly.
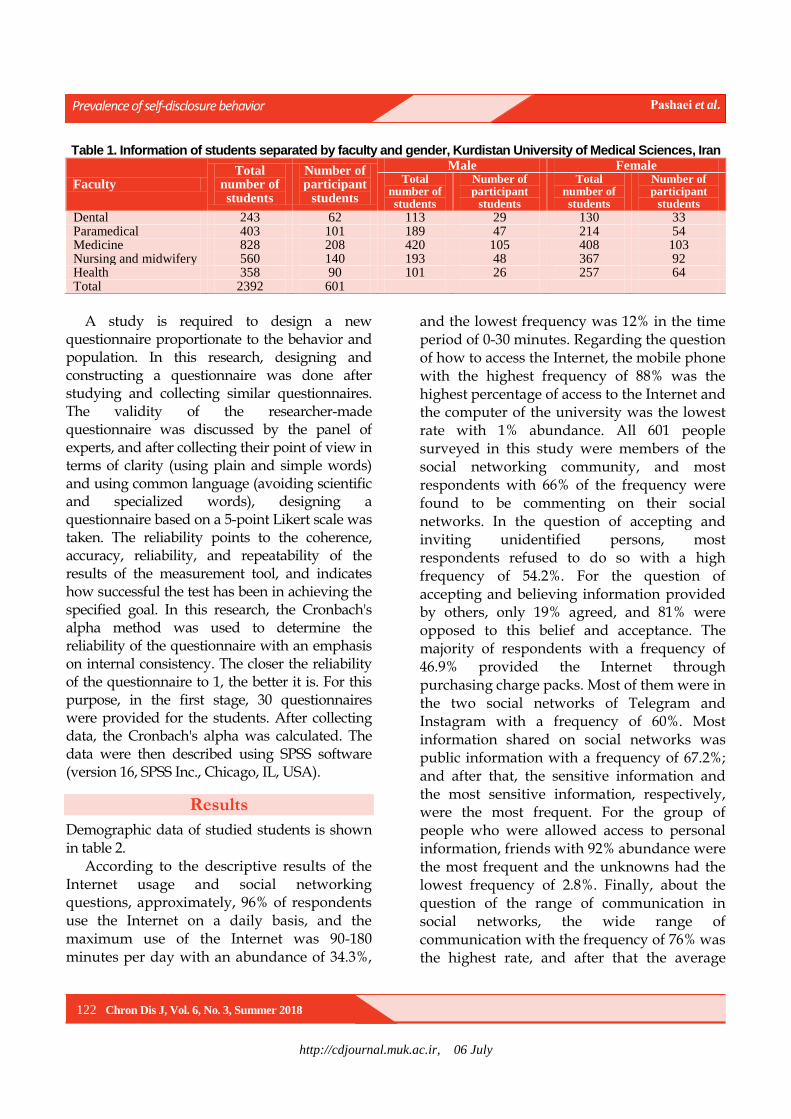
http://cdjournal.muk.ac.ir, 06 July
Prevalence of self-disclosure behavior Pashaei et al.
122 Chron Dis J, Vol. 6, No. 3, Summer 2018
Table 1. Information of students separated by faculty and gender, Kurdistan University of Medical Sciences, Iran
Faculty Total
number of students
Number of participant
students
Male Female Total
number of students
Number of participant
students
Total number of students
Number of participant
students
Dental 243 62 113 29 130 33 Paramedical 403 101 189 47 214 54 Medicine 828 208 420 105 408 103 Nursing and midwifery 560 140 193 48 367 92 Health 358 90 101 26 257 64 Total 2392 601
A study is required to design a new
questionnaire proportionate to the behavior and population. In this research, designing and constructing a questionnaire was done after studying and collecting similar questionnaires. The validity of the researcher-made questionnaire was discussed by the panel of experts, and after collecting their point of view in terms of clarity (using plain and simple words) and using common language (avoiding scientific and specialized words), designing a questionnaire based on a 5-point Likert scale was taken. The reliability points to the coherence, accuracy, reliability, and repeatability of the results of the measurement tool, and indicates how successful the test has been in achieving the specified goal. In this research, the Cronbach's alpha method was used to determine the reliability of the questionnaire with an emphasis on internal consistency. The closer the reliability of the questionnaire to 1, the better it is. For this purpose, in the first stage, 30 questionnaires were provided for the students. After collecting data, the Cronbach's alpha was calculated. The data were then described using SPSS software (version 16, SPSS Inc., Chicago, IL, USA).
Results
Demographic data of studied students is shown in table 2.
According to the descriptive results of the Internet usage and social networking questions, approximately, 96% of respondents use the Internet on a daily basis, and the maximum use of the Internet was 90-180 minutes per day with an abundance of 34.3%,
and the lowest frequency was 12% in the time period of 0-30 minutes. Regarding the question of how to access the Internet, the mobile phone with the highest frequency of 88% was the highest percentage of access to the Internet and the computer of the university was the lowest rate with 1% abundance. All 601 people surveyed in this study were members of the social networking community, and most respondents with 66% of the frequency were found to be commenting on their social networks. In the question of accepting and inviting unidentified persons, most respondents refused to do so with a high frequency of 54.2%. For the question of accepting and believing information provided by others, only 19% agreed, and 81% were opposed to this belief and acceptance. The majority of respondents with a frequency of 46.9% provided the Internet through purchasing charge packs. Most of them were in the two social networks of Telegram and Instagram with a frequency of 60%. Most information shared on social networks was public information with a frequency of 67.2%; and after that, the sensitive information and the most sensitive information, respectively, were the most frequent. For the group of people who were allowed access to personal information, friends with 92% abundance were the most frequent and the unknowns had the lowest frequency of 2.8%. Finally, about the question of the range of communication in social networks, the wide range of communication with the frequency of 76% was the highest rate, and after that the average
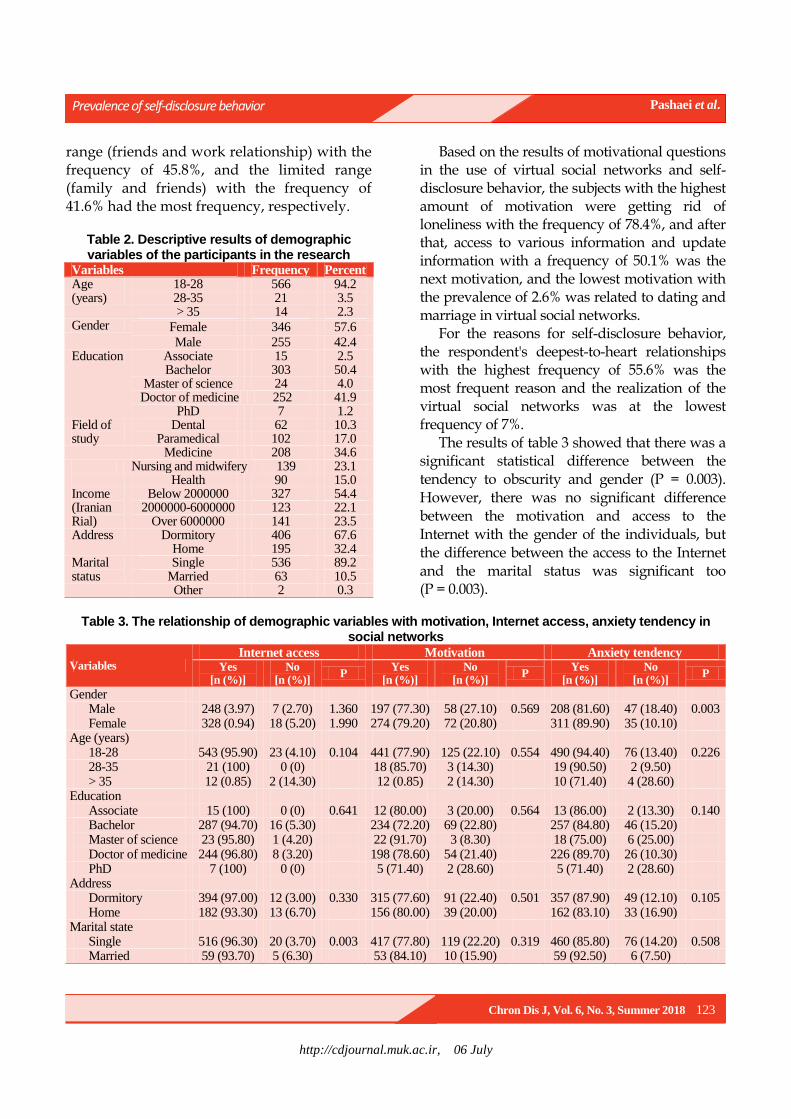
http://cdjournal.muk.ac.ir, 06 July
Prevalence of self-disclosure behavior Pashaei et al.
Chron Dis J, Vol. 6, No. 3, Summer 2018 123
range (friends and work relationship) with the frequency of 45.8%, and the limited range (family and friends) with the frequency of 41.6% had the most frequency, respectively.
Table 2. Descriptive results of demographic variables of the participants in the research
Variables Frequency Percent Age (years)
18-28 566 94.2 28-35 21 3.5 > 35 14 2.3
Gender Female 346 57.6
Male 255 42.4 Education Associate 15 2.5
Bachelor 303 50.4 Master of science 24 4.0 Doctor of medicine 252 41.9
PhD 7 1.2 Field of study
Dental 62 10.3 Paramedical 102 17.0
Medicine 208 34.6 Nursing and midwifery 139 23.1 Health 90 15.0 Income (Iranian Rial)
Below 2000000 327 54.4 2000000-6000000 123 22.1
Over 6000000 141 23.5 Address Dormitory 406 67.6
Home 195 32.4 Marital status
Single 536 89.2 Married 63 10.5 Other 2 0.3
Based on the results of motivational questions in the use of virtual social networks and self-disclosure behavior, the subjects with the highest amount of motivation were getting rid of loneliness with the frequency of 78.4%, and after that, access to various information and update information with a frequency of 50.1% was the next motivation, and the lowest motivation with the prevalence of 2.6% was related to dating and marriage in virtual social networks.
For the reasons for self-disclosure behavior, the respondent's deepest-to-heart relationships with the highest frequency of 55.6% was the most frequent reason and the realization of the virtual social networks was at the lowest frequency of 7%.
The results of table 3 showed that there was a significant statistical difference between the tendency to obscurity and gender (P = 0.003). However, there was no significant difference between the motivation and access to the Internet with the gender of the individuals, but the difference between the access to the Internet and the marital status was significant too (P = 0.003).
Table 3. The relationship of demographic variables with motivation, Internet access, anxiety tendency in
social networks
Variables Internet access Motivation Anxiety tendency
Yes [n (%)]
No [n (%)]
P Yes
[n (%)] No
[n (%)] P
Yes [n (%)]
No [n (%)]
P
Gender Male 248 (3.97) 7 (2.70) 1.360 197 (77.30) 58 (27.10) 0.569 208 (81.60) 47 (18.40) 0.003 Female 328 (0.94) 18 (5.20) 1.990 274 (79.20) 72 (20.80) 311 (89.90) 35 (10.10)
Age (years) 18-28 543 (95.90) 23 (4.10) 0.104 441 (77.90) 125 (22.10) 0.554 490 (94.40) 76 (13.40) 0.226 28-35 21 (100) 0 (0) 18 (85.70) 3 (14.30) 19 (90.50) 2 (9.50) > 35 12 (0.85) 2 (14.30) 12 (0.85) 2 (14.30) 10 (71.40) 4 (28.60)
Education Associate 15 (100) 0 (0) 0.641 12 (80.00) 3 (20.00) 0.564 13 (86.00) 2 (13.30) 0.140 Bachelor 287 (94.70) 16 (5.30) 234 (72.20) 69 (22.80) 257 (84.80) 46 (15.20) Master of science 23 (95.80) 1 (4.20) 22 (91.70) 3 (8.30) 18 (75.00) 6 (25.00) Doctor of medicine 244 (96.80) 8 (3.20) 198 (78.60) 54 (21.40) 226 (89.70) 26 (10.30) PhD 7 (100) 0 (0) 5 (71.40) 2 (28.60) 5 (71.40) 2 (28.60)
Address Dormitory 394 (97.00) 12 (3.00) 0.330 315 (77.60) 91 (22.40) 0.501 357 (87.90) 49 (12.10) 0.105 Home 182 (93.30) 13 (6.70) 156 (80.00) 39 (20.00) 162 (83.10) 33 (16.90)
Marital state Single 516 (96.30) 20 (3.70) 0.003 417 (77.80) 119 (22.20) 0.319 460 (85.80) 76 (14.20) 0.508 Married 59 (93.70) 5 (6.30) 53 (84.10) 10 (15.90) 59 (92.50) 6 (7.50)
http://cdjournal.muk.ac.ir, 06 July
Prevalence of self-disclosure behavior Pashaei et al.
124 Chron Dis J, Vol. 6, No. 3, Summer 2018
There was no significant difference between the motivation and the tendency to obscurity with marital status. There were no significant relationships among other variables.
Discussion
The purpose of this study was to investigate the prevalence of self-disclosure behavior in virtual social networks and its related factors among students of Kurdistan University of Medical Sciences. According to the descriptive results, Internet usage was more frequent at daily intervals with a frequency of 95.7%. Self-expression in virtual networks with a frequency of 1.66%, getting rid of loneliness with a frequency of 78.4%, access to various information and update information with a frequency of 50.1%, and deepest-to-heart relationships with others with a frequency of 55.6% had the highest percentage of factors related to self-disclosure behavior in virtual networks among the respondents. The prevalence of self-disclosure behavior and privacy statements is one of the important issues that can be considered consistent with the growth and spread of global social networks.19 In recent years, the proliferation of devices such as computers, mobile devices, and other smart devices has been accompanied by an increase in online self-disclosure behavior, especially among young people worldwide.20 Accessibility, how people are present in different social networks, and their various uses from the global Internet networks are all dimensions that can be discussed in the use of the Internet and its effects, such as self-disclosure. In fact, in self-disclosure, individuals share personal issues with other people who may not necessarily have previous acquaintance, and experience life like this.19 Youth, especially in the age range of 20 to 29 years, have the most sense of security in using virtual social networks. Social network users aged 20 to 29 are less likely to feel insecure due to their emotional spirit and
thoroughness. Therefore, they are more exposed to disclosure of their privacy.16 It is important to pay more attention to this age ranges. Based on the results obtained in the analytical section, there was a statistically significant difference between the tendency to obscurity and gender, so the gender variable in this study played a significant role in the appearance of self-disclosure behavior in virtual networks. Boyd and Ellison research showed that gender affected the participation of users in virtual social networks; women with higher age were more active on virtual social networks than men in higher age, because of obscurity,4 and women are more likely interested in using these networks to communicate with their friends than men. Regarding the gender impact, Larsen in his experimental study showed that interaction in virtual networks could help rebuild and maintain friendships,21 and women paid more attention to the received comments and their senders.22 Anonymity plays an important role in increasing self-esteem and independence of women. Without worrying about the way people look and feel, they talk about private life and personal aspects of their lives. Women and girls due to social pressures and problems that they experience in the community, use the opportunity that gives them the virtual space to present and produce content to express their feelings and emotions. They engage and discuss with similar people, and provide solutions to their problems. Indeed, the tendency to obscurity in relation to gender has increased with regard to the correlation of two disclosure variables, and the individuals have significantly discouraged disclosure of their private issues. In other words, the tendency to anonymity is the main factor in self-disclosure that is more effective than factors such as Internet access and other impacts mentioned in this article.19 Online anonymity, the lack of physical presence of others, and the lack of real communications allow users to control their
http://cdjournal.muk.ac.ir, 06 July
Prevalence of self-disclosure behavior Pashaei et al.
Chron Dis J, Vol. 6, No. 3, Summer 2018 125
social interaction. Enhanced Internet connectivity facilitates self-esteem and self-excitement, and provides an opportunity to improve social skills. This online facility, in combination with reducing social anxiety, allows individuals to submit themselves ideally and because of their anonymity, take any action.23 As a result, people show themselves in an unrealistic way in the cyberspace. Also, when one cannot identify an individual, their unethical behavior increases. Other findings suggested that there was a significant statistical difference between Internet access and marital status. Investigations by Adlipour et al.24 and Heirman et al.25 is in line with the results of this research. Considering the role of media influence on the society, especially on the younger generation and single individuals, they tend to be more likely attracted to social networks and the Internet, resulting in self-disclosure behavior. According to the results of these studies, adolescents, teenagers, and single adults have less resistance than married and elderly people in temptation to disclose personal information in a situation where they are motivated. The reason for this is because of the emotional spirit, the courage, and the sense of security that young people have, regardless of the outcome of self-disclosure behavior.
Conclusion
According to the potential harmfulness in inappropriate usage of Internet in teenagers and young people and how it relates to their disclosure behavior, it is necessary to pay close attention to the protection of young people in the regulatory area. The issue of self-disclosure on the Internet and virtual networks is one of the subjects that people talk about with caution and sometimes even reluctantly. The experience of this research suggests that in order to identify more dimensions of this issue, in addition to what used in this research, concepts and variables should be used that,
while not inducing respondent sensitivity, persuade them to make clear and precise views. The presence and use of the Internet and virtual networks today is an integral part of the life of the members of various communities, including our developing community, and the issue of self-disclosure and sharing of personal information is considered as one of the most important dimensions; thus, it is important to pay attention to this issue.
Conflict of Interests
Authors have no conflict of interests.
Acknowledgments
Hereby, we thank all of those who contributed to this study at Kurdistan University of Medical Science. This paper is the result of a research project with approval number 1396/187 supported by Vice Chancellor for Research and Technology of Kurdistan University of Medical Sciences.
References
1. Rezaei M, Babazadeh Moghadam H. Principles of codification for the laws and regulations of the internet with the emphasis on UNESCO and European council documents. Journal of Public Low 2015; 15(42): 43-82. [In Persian].
2. Ghahroodi M, Azari F. A review of internet's role in the promotion of women's social status. Women's Studies 2011; 1(2): 87-109. [In Persian].
3. Livingstone S. Internet literacy: Young people's negotiation of new online opportunities. In: Catherine JD, MacAr T, Editors. Digital youth, innovation, and the unexpected. Cambridge, MA: MIT Press; 2008. p. 101-22.
4. Boyd D, Ellison NB. Social network sites: Definition, history, and scholarship. J Comput Mediat Commun 2007; 13(1): 210-30.
5. Huang HY. Examining the beneficial effects of individual's self-disclosure on the social network site. Comput Human Behav 2016; 57: 122-32.
6. Green T, Wilhelmsen T, Wilmots E, Dodd B, Quinn
S. Social anxiety, attributes of online communication
and self-disclosure across private and public
Facebook communication. Comput Human Behav
2016; 58: 206-13.
http://cdjournal.muk.ac.ir, 06 July
Prevalence of self-disclosure behavior Pashaei et al.
126 Chron Dis J, Vol. 6, No. 3, Summer 2018
7. Hallam C, Zanella G. Online self-disclosure: The
privacy paradox explained as a temporally discounted
balance between concerns and rewards. Comput
Human Behav 2017; 68: 217-27.
8. Ellison NB, Steinfield C, Lampe C. The benefits of
Facebook friends: social capital and college students
use of online social network sites. J Comput Mediat
Commun 2007; 12(4): 1143-68.
9. Wang CM. Using Facebook for cross-cultural
collaboration: The experience of students from
Taiwan. Journal Educational Media International
2012; 49(1): 63-76.
10. Lin R, Utz S. Self-disclosure on SNS: Do disclosure
intimacy and narrativity influence interpersonal
closeness and social attraction? Comput Human
Behav 2017; 70: 426-36.
11. Razeghi N, Alizadeh M, Mohamadi Sangcheshmeh
S. A sociological analysis of youths' attitudes towards
marriage through cyberspace. Journal of Applied
Sociology 2017; 28(1): 67-86.
12. Chang CW, Heo J. Visiting theories that predict
college student’s self-disclosure on Facebook.
Comput Human Behav 2014; 30: 79-86.
13. Liu D, Brown BB. Self-disclosure on social
networking sites, positive feedback, and social capital
among Chinese college students. Comput Human
Behav 2014; 38: 213-9.
14. Sheldon P. "I'll poke you. You'll poke me!" Self-
disclosure, social attraction, predictability and trust as
important predictors of Facebook relationships.
Cyberpsychology 2009; 3(2).
15. Abdolahian H. Redefinition and typology of internet
pathological behaviors: Critical analysis of identity
changes in Iran. Cultural Studies & Communication
2005; 1(2-3): 135-54. [In Persian].
16. Huang YT, Su SF. Motives for instagram use and
topics of interest among young adults. Future
Internet 2018; 10(8): 77.
17. Wang L, Yan J, Lin J, Cui W. Let the users tell the
truth: Self-disclosure intention and self-disclosure
honesty in mobile social networking. Int J Inf
Manage 2017; 37(1, Part A): 1428-40.
18. Andrade EB, Kaltcheva V, Weitz B. Self-Disclosure
on the Web: The impact of privacy policy, reward,
and company reputation. Adv Consum Res 2002;
29(1): 650-353.
19. Tavassoli A, Jalalvand E. Using Internet and the
tendency to self-showing (Case Study of female
graduates of one university in Tehran). Women's
Studies Sociological and Psychological 2015; 13(4):
95-122. [In Persian].
20. Chen W, Xie XC, Ping F, Wang MZ. Personality
differences in online and offline self-disclosure
preference among adolescents: A person-oriented
approach. Pers Individ Dif 2017; 105: 175-8.
21. Girls are more preoccupied with photo comments than
boys [Online]. [cited 2009]; Available from: URL:
https://malenel.wordpress.com/2009/04/29/girls-are-
more-preoccupied-with-photo-comments-than-boys
22. Shahabi M, Bayat G. Purposes and motivations of
social networks' members (A study on youth from
Tehran). Journal of Culture-Communication Studies
2013; 13(20): 61-86. [In Persian].
23. Salimi AR, Joukar B, Nikpour R. Internet and
communication: Perceived social support and
loneliness as antecedent variables. Quarterly
Psychological Studies 2009; 5(3): 81-102.
[In Persian].
24. Adlipour S, Ghassemi V, Ghasabi R, Taheri N.
Investigating the Effect of using Facebook social
network on political trust and participation of the
youth. Culture-Communication Studies 2015; 15(28):
191-212. [In Persian].
25. Heirman W, Walrave M, Ponnet K. Predicting
adolescents' disclosure of personal information in
exchange for commercial incentives: An application
of an extended theory of planned behavior.
Cyberpsychol Behav Soc Netw 2013; 16(2): 81-7

http://cdjournal.muk.ac.ir, 06 July
Chron Dis J, Vol. 6 No. 3, Summer 2018 127
DOI: 10.22122/cdj.v6i3.284 Published by Vesnu Publications
Investigating the structural relationship between math anxiety, Gray’s biological model of personality, and test anxiety through assessing the
self-efficacy mediating role among junior girl students of Urmia City high schools, Iran
Jaleh Arji1
, Firozeh Sepehrian-Azar2
, Esmail Soleimani2
1 Department of Education Sciences, School of Literature and Humanities, Shiraz Branch, Islamic Azad
University, Shiraz,, Iran
2 Department of Psychology, School of Literature and Humanities, Urmia University, Urmia, Iran
Abstract BACKGROUND: Test anxiety as a common educational phenomenon is closely related to the academic
performance and achievement, and even the future performance of millions of students. Math anxiety is
considered as one of the possible contributing factors to test anxiety. The present study aimed to determine the
relationship between test anxiety, math anxiety, and Gray’s biological model of personality through assessing the
self-efficacy mediating role among girl students studying in junior year in Urmia City high schools, Iran.
METHODS: This was a descriptive-analytical study with structural equation modeling (SEM) as study design. The
statistical population included all girl students studying in the junior year of Urmia City high schools in the
academic year of 2016; out of which 315 were selected using multistage cluster sampling method. The data were
collected using Spielberger's test anxiety inventory (TAI), Chiu and Henry’s mathematics anxiety scale for children
(MASC), Sherer et al.’s general self-efficacy scale (SGSES), and behavioral inhibition/activation system (BIS/BAS)
scale. Linear structural relations (LISREL) software was used for data analysis.
RESULTS: Math anxiety affected test anxiety both directly (33%) and indirectly (7%), and had a direct effect on self-
efficacy (23%). BIS had an indirect effect on test anxiety (8%), while directly influenced self-efficacy (8%) and math
anxiety (25%); and BAS had an indirect effect on test anxiety (12%) (P < 0.01).
CONCLUSION: These results suggest that the performance of students can be improved by increasing their self-
efficacy and decreasing their test anxiety level. Accordingly, it is essential that educational authorities, and
particularly teachers, do their best to improve students' academic achievement by adopting appropriate strategies
and reducing their test anxiety.
KEYWORDS: Test Anxiety Scale, Mathematics, Self-Efficacy
Date of submission: 12 July 2017, Date of acceptance: 19 Sep. 2017
Citation: Arji J, Sepehrian-Azar F, Soleimani E. Investigating the structural relationship between math
anxiety, Gray’s biological model of personality, and test anxiety through assessing the self-efficacy
mediating role among junior girl students of Urmia high schools, Iran. Chron Dis J 2018; 6(3): 127-35.
Introduction1
Test anxiety as a common educational phenomenon is closely related to the academic performance and achievement and even the future performance of millions of students.1
Corresponding Author:
Firozeh Sepehrian-Azar
Email: [email protected]
Despite the fact that small amounts of anxiety regarding the school and doing homework assignments provoke responsibility, scheduling, and further study in the students, it is found that the main reason behind the academic failure of most of the students is not the learning disability or low IQ, but rather the high level of test anxiety which affects memory
Original Article
http://cdjournal.muk.ac.ir, 06 July
Math anxiety, biological model of personality, and test anxiety Arji et al.
128 Chron Dis J, Vol. 6 No. 3, Summer 2018
function and the ability to focus, and makes it difficult to recall relevant information, and does not allow the student's intelligence and educational competency to flourish perfectly.2 Test anxiety is a general term referring to some type of anxiety or specific social anxiety, which makes people call their abilities into question and makes them uncertain about their competencies, which results in a reduced ability to cope with conditions like a test in which individuals are assessed.3 Test anxiety is one of the most common and acute problems students encounter during educational course, which in many cases, hinders their proper assessment by teachers through interfering with students' academic performance.3 Spielberger et al. proposed worry and excitement as two components of test anxiety. Math anxiety is considered as one of the possible contributing factors to test anxiety.4
Math anxiety is defined as one’s inability to deal with quantitative situations, including those involving numbers, and in general mathematics.5 Anxiety, in general, and math anxiety, in particular, can increase the distraction and invasion of unrelated thoughts and distort individuals’ perceptions of mathematical phenomena and topics by disrupting mental structures and information processing procedures.6 Math fear creates emotional and mental barriers that make it difficult to achieve progress in mathematics in the future. Accordingly, the student chooses a fatalistic attitude and expects to get a poor grade on the math exam. This condition is gradually converts into a defective cycle and a pleasurable prediction, such that the mathematical performance is influenced by the math anxiety.7 The study conducted by Cargnelutti et al. on third grade students showed that math anxiety was significantly related to math performance.8
Another possible contributing factor to test anxiety is brain-behavioral systems that have received a lot of attention in the recent years.9
Gray has proposed a biological model of personality involving three brain-behavioral systems. According to Gray, these brain-behavioral systems are the basis of individual differences, and the activation of each of them calls for different emotional responses, such as fear and anxiety.10 The first system is the behavioral activation system (BAS) that responds to conditional stimuli of reward and signals of relief from punishment. The activity and increased sensitivity of this system triggers positive emotions, approach, and active avoidance.11 The second system is the behavioral inhibition system (BIS) which responds to conditional stimuli of punishment and signals of lack of award as well as novel stimuli and intrinsic fear stimuli. This system’s activity induces the emotional state of anxiety and behavioral inhibition, passive avoidance, silence, increased attention and arousal.11 The third system is the fight-flight system (FFS) that is structurally related to the amygdala and hypothalamus and is sensitive to irritant stimuli. Human studies have emphasized on the role of these systems in the onset of clinical problems. The results of these studies indicate that the high activity of the activation and inhibition systems contributes to the emergence of various disorders.12 BIS and BAS have been assessed in terms of several psychological components including self-regulation, interpersonal relationships, group performance, and pathological, psychological, and motivational factors.13 Slobodskaya believes that BIS and BAS are strong predictor variables for the anxiety problems of children and adolescents.14
Self-efficacy, which is the mediator variable in this study, is defined as one’s beliefs about his/her capabilities to accomplish planned levels of performance, and to progress and control events that have significant effects on his/her life.15,16 From Bandura’s point of view, self-efficacy is the most fundamental human mechanism for managing and controlling the events that influence one’s life.17 Bandura has
http://cdjournal.muk.ac.ir, 06 July
Math anxiety, biological model of personality, and test anxiety Arji et al.
Chron Dis J, Vol. 6 No. 3, Summer 2018 129
suggested four information sources for self-efficacy including 1) prior performance, 2) succession modeling, 3) verbal persuasion, and 4) emotional-physiological stimulation. These sources of self-efficacy affect one's behavior if this information is selected, interpreted, and eventually integrated into self-efficacy beliefs.18. The studies indicate that self-confidence, as one of the components of self-efficacy, is the most significant intrapersonal component that is related to test anxiety.19. There is a linear relationship between test anxiety and one’s performance at the exam which predicts that those with low anxiety benefit from the stressful conditions of the exam, while those with high anxiety profit from more relaxed exam situations. The results of a study carried out by Mirsamiei and Ebrahimi Ghavam revealed a negative and statistically significant relationship between students' self-efficacy and their test anxiety.20
Math anxiety, as some form of discomfort springing up in response to situations like math activities, is accompanied by threats to self-esteem, anxiety and panic, stress, helplessness, fear, distress and sadness, embarrassment, debility, and lack of concentration which implies the need for further research in this field. Thus, given the importance of the abovementioned items as well as the research background, the main subject of this study is whether test anxiety can be predicted by BIS/BAS and math anxiety with self-efficacy as an intermediate parameter.
Materials and Methods
The statistical population included all girl students (a total number of 1750 students) studying in junior year of high schools in Urmia, Iran, in the academic year of 2016, out of which 315 subjects were selected according to Krejcie and Morgan's table using multistage cluster sampling method. At first, 8 schools (2 northern, 2 southern, 2 eastern, and 2 western schools) were selected randomly from 18 girls’ high schools located in Urmia,
and afterwards 2 classes (each class with 20 students) were chosen from each high school and the questionnaires were distributed among students and filled out after obtaining informed consent from them. Pearson correlation and structural equations were employed to analyze the data using linear structural relations (LISREL) software.
Spielberger’s test anxiety inventory (TAI): This 32-item inventory was developed by Spielberger et al., in which each item is rated on a 3-point Likert scale (0 = very low, 1 = low, 2 = high, and 3 = very high). The total score of TAI varies between 0 and 96, with higher scores indicating more test anxiety.21 The reliability reported by Jadidi et al. for TAI was 0.86.22 In this study, the value of Cronbach's alpha used for reliability determination was 0.77.
Mathematics anxiety scale for children (MASC): This scale was developed by Chiu and Henry23 on the basis of the shortened version of Plake and Parker’s Mathematics Anxiety Rating Scale(S-MARS) which can be used for children in grades of 8-12.23. MASC consists of 22 short sentences rated on a 4-point Likert scale that specify math-related activities. The minimum and maximum scores on this scale are 22 and 88, respectively. To measure the validity of MASC, Chiu and Henry calculated its correlation using different tools. There was a high correlation (0.97) between this scale and MARS.23. In this study, the Cronbach's alpha of this scale was 0.76.
General self-efficacy scale (GSES): This questionnaire, developed by Sherer et al., is composed of 17 items which are rated by the respondent on a 5-point Likert scale (totally disagree to totally agree).24 GSES assesses three aspects of behavior including the willingness to initiate the behavior (1st, 4th, 14th, 15th items), willingness to make an effort to accomplish the assignment (3rd, 5th, 8th, 9th, 13th items) and persistence in the face of adversity and obstacles (2nd, 6th, 7th, 10th, 11th, 12th, 16th, 17th items). Asgharnejad et al. obtained a value of

http://cdjournal.muk.ac.ir, 06 July
Math anxiety, biological model of personality, and test anxiety Arji et al.
130 Chron Dis J, Vol. 6 No. 3, Summer 2018
0.88 for GSES reliability using the Cronbach's alpha coefficient.25 In this study, the reliability of this scale was equal to 0.891.
BIS/BAS scale: BIS/BAS scale is a 20-item self-report questionnaire introduced by Carver and White, which has 3 subscales including reward responsiveness, drive, and fun seeking. Respondents are asked to rate each item on a 4-point Likert scale, with high scores indicating more sensitivity.26 Mohammadi reported the values of 0.78, 0.69, 0.87, 0.74, and 0.65 for Cronbach's alpha coefficients related to total scale and subscales of BIS/BAS: reward responsiveness, drive, and fun seeking, respectively.27 In this study, Cronbach's alpha which was employed to determine the reliability was 0.82.
Results
Before addressing the theoretical model test and in order to examine the relationship between the variables, descriptive indexes and correlation matrix of the studied variables are presented in table 1.
According to table 1, the mean and standard deviation (SD) of BAS, BIS, math anxiety, self-efficacy, and test anxiety were 19.55 ± 3.07, 9.62 ± 1.72, 58.14 ± 18.29, 44.26 ± 11.52, and 50.15 ± 11.60, respectively. There was a statistically significant relationship between BAS and self-efficacy (0.31) (P < 0.010); but no significant relationship was observed between BAS and test anxiety (-0.10) and BAS and math anxiety (-0.060) (P > 0.010). In addition, BIS was significantly related to self-efficacy (-0.21) and test anxiety (0.15) (P < 0.010), but its relationship with math anxiety (0.19) was not statistically significant. Finally, statistically significant
relationships were found between math anxiety and self-efficacy (-0.21) and math anxiety and test anxiety (0.34), and self-efficacy was significantly correlated with test anxiety (-0.37) (P < 0.010).
In order to estimate students' test anxiety, the proposed conceptual model was examined by structural equation modeling (SEM) using maximum likelihood estimation (MLE) method. The MLE method requires not only the univariate normality, but also the multivariate normality. In this study, Mardia’s standardized kurtosis coefficient was used to assess the multivariate normality. This value was obtained to be 0.36, which is less than 35, the value calculated by the formula of p (p + 2). The fitness indices were used to evaluate the model's fitness.
The Goodness of Fit Index (GFI), Adjusted Goodness of Fit Index (AGFI), and Standardized Root Mean Squared Residual (SRMR) were considered as absolute fit indices; Comparative Fit Index (CFI), Normed Fit Index (NFI), and Non-Normed Fit Index (NNFI) were designated as relative fit indices, and chi-square to degree of freedom ratio (χ2/df), Parsimonious Normed Fit Index (PNFI), and Root Mean Square Error of Approximation (RMSEA) were considered as parsimonious fit indices. According to pour findings, the values of GFI, AGFI, CFI, NFI, NNFI indices which are 0.99, 0.98, 0.99, 0.98, and 0.99, respectively, all above 0.90.
The PNFI index value was 0.70, which was more than 0.60. The SRMR, RMSEA, and χ2/df indices were 0.01, 0.01, and 0.82, which were below the acceptable limits of 0.05, 0.08, and 3, respectively. Therefore, since all fit indices were favorable, it could be concluded that the tested model fitted the collected data well.
Table 1. Correlation matrix, mean, and the standard deviation of studied variables
Variable Mean ± standard deviation 1 2 3 4 5
Behavioral activation 19.55 ± 3.07 1.00 Behavioral inhibition 9.62 ± 1.72 -0.51
* 1.00
Math anxiety 58.14 ± 18.29 -0.06
0.11 1.00 Self-efficacy 44.26 ± 11.52 0.31
* -0.21
** -0.21
* 1.00
Test anxiety 50.15 ± 11.60 -0.10
0.15*
0.34*
0.37*
1 * P < 0.010
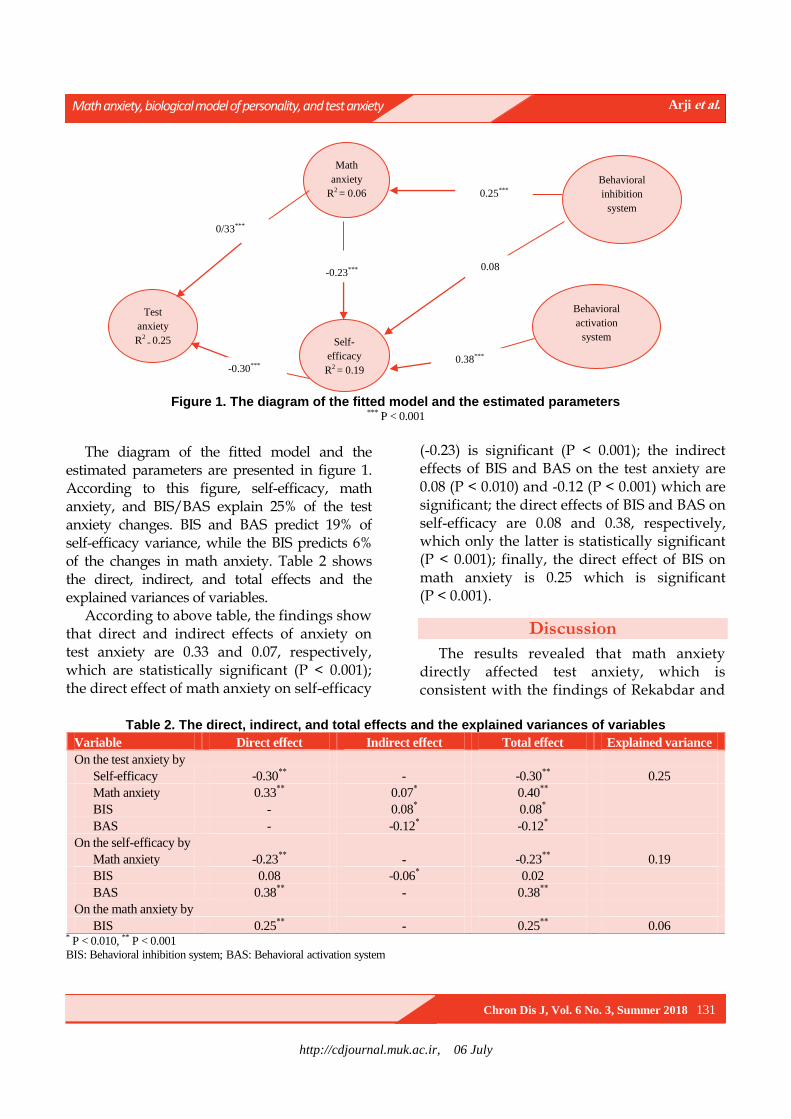
http://cdjournal.muk.ac.ir, 06 July
Math anxiety, biological model of personality, and test anxiety Arji et al.
Chron Dis J, Vol. 6 No. 3, Summer 2018 131
Figure 1. The diagram of the fitted model and the estimated parameters
*** P < 0.001
The diagram of the fitted model and the estimated parameters are presented in figure 1. According to this figure, self-efficacy, math anxiety, and BIS/BAS explain 25% of the test anxiety changes. BIS and BAS predict 19% of self-efficacy variance, while the BIS predicts 6% of the changes in math anxiety. Table 2 shows the direct, indirect, and total effects and the explained variances of variables.
According to above table, the findings show that direct and indirect effects of anxiety on test anxiety are 0.33 and 0.07, respectively, which are statistically significant (P < 0.001); the direct effect of math anxiety on self-efficacy
(-0.23) is significant (P < 0.001); the indirect effects of BIS and BAS on the test anxiety are 0.08 (P < 0.010) and -0.12 (P < 0.001) which are significant; the direct effects of BIS and BAS on self-efficacy are 0.08 and 0.38, respectively, which only the latter is statistically significant (P < 0.001); finally, the direct effect of BIS on math anxiety is 0.25 which is significant (P < 0.001).
Discussion
The results revealed that math anxiety directly affected test anxiety, which is consistent with the findings of Rekabdar and
Table 2. The direct, indirect, and total effects and the explained variances of variables
Variable Direct effect Indirect effect Total effect Explained variance
On the test anxiety by
Self-efficacy -0.30**
- -0.30**
0.25
Math anxiety 0.33**
0.07* 0.40
**
BIS - 0.08* 0.08
*
BAS - -0.12* -0.12
*
On the self-efficacy by
Math anxiety -0.23**
- -0.23**
0.19
BIS 0.08 -0.06* 0.02
BAS 0.38**
- 0.38**
On the math anxiety by
BIS 0.25**
- 0.25**
0.06 * P < 0.010, ** P < 0.001
BIS: Behavioral inhibition system; BAS: Behavioral activation system
Behavioral
activation
system
Behavioral
inhibition
system
Math
anxiety
R2 = 0.06
Self-
efficacy
R2 = 0.19
Test
anxiety
R2 = 0.25
0.25***
0.08
0.38***
-0.23***
-0.30***
0/33***
http://cdjournal.muk.ac.ir, 06 July
Math anxiety, biological model of personality, and test anxiety Arji et al.
132 Chron Dis J, Vol. 6 No. 3, Summer 2018
Soleymani.28 No discrepancy was found between the findings of this study and the results of the other studies. This finding can be explained by the fact that psychological pressures reduce one’s effective behavior in face of different realities, especially when the requested assignments need more attention and focus.
Students, who get anxious during a math activity, cannot think properly and organize their own knowledge; therefore, they often intentionally put more effort into their activities; even though their efforts do not result in the significant learning of mathematical concepts, which ultimately make them desperate and depressed.
The study also showed that math anxiety indirectly affected test anxiety, which is in line with the findings of Zaki29 and Ma and Xu.30 In addition, a direct relationship was found between math anxiety and self-efficacy. This finding is consistent with the results of the studies by Schunk and Pajares31 and Cheung and Sun.32 To explain this finding, it should be noted that since Bandura has recognized self-efficacy as a cognitive intermediate parameter influencing one’s thoughts and feelings,18 such an outcome is not unexpected; because once exposed to negative and stressful events, high self-efficacy helps individuals to manage those events and situations. An individual with test anxiety feels helpless and cannot take control of the exam. The results also demonstrated a negative relationship between test anxiety and self-efficacy. According to Mehrabizade et al.,33 Bandura,18 the social theoretician, believes that test anxiety develops in a social context. The modeling and observational learning in early childhood is a part of this mechanism that affects test anxiety. Those with test anxiety have generally lower levels of self-efficacy and feel more helpless and incapable. This finding is in line with the results of the study conducted by Mehrabizade et al., which indicated that test anxiety was negatively
correlated with self-efficacy and internal control place.33 Moreover, Mirsamiei and Ebrahimi Ghavam, showed that there was a negative significant relationship between students' self-efficacy and test anxiety.20. In fact, self-efficacy is very essential in improving one’s performance.34 The results also showed that BIS indirectly influenced test anxiety, which is consistent with the results of some other studies.35,36 Johnson et al., who investigated the relationship between brain behavioral systems and psychological disorders, emphasized on the contribution of inhibition system in the symptoms of anxiety and depression.37 In fact, the BIS responds to conditional stimuli of punishment and signals of lack of award as well as novel stimuli and intrinsic fear stimuli.10 This system’s activity triggers the emotional state of anxiety and behavioral inhibition, passive avoidance, silence, increased attention, and arousal. The neuroanatomical basis of BIS is its highly activation during the anxiety experience.10 Hasking's study on adolescents showed that BAS and BIS were associated with more problem-solving strategies and inappropriate problem-solving strategies, respectively.38
Based on the results, test anxiety is indirectly affected by the activation system. This finding can be explained by the fact that BAS is associated with the development of positive emotions and some dimensions of personality impulsivity, and an increase in its activity invokes positive emotions and attitude towards behavioral tendencies,10 which finally results in positive emotions like optimism and happiness. In Gray’s theory, BAS is introduced with positive emotions and behavioral tendencies, such as extraversion and impulsivity, while BIS is connected to negative emotions and behavioral inclinations like fear, passivity, introversion, despair, depression, and anxiety.39
Given the results, BIS directly influences self-efficacy which points to the fact that those
http://cdjournal.muk.ac.ir, 06 July
Math anxiety, biological model of personality, and test anxiety Arji et al.
Chron Dis J, Vol. 6 No. 3, Summer 2018 133
who are uncertain about their abilities evaluate themselves pessimistically and lose their ability to solve the problem, and their level of anxiety increases accordingly; and that is why many students are susceptible to depression.40 Bandura et al. believe that skills can easily be influenced by self-doubt, and hence even highly susceptible ones cannot use much of their abilities once they do not believe much in themselves. Therefore, self-efficacy enables individuals to do extraordinary works using their own skills when faced with obstacles.15 The study carried out by Lee in East Asian countries showed that subjects with low self-efficacy and self-concept had high anxiety during the math test; however, they eventually got high scores. On the other hand, subjects from Western European countries like Finland, Sweden, and the Netherlands reported high math performance and low anxiety.41
The results also indicated that inhibition system had a direct effect of 25% on math anxiety which is significant at 99% confidence interval (CI). This finding is consistent with the results of Johnson et al. and Carver and Harmon-Jones studies.37,42 Finally, the study showed that self-efficacy was directly affected by the activation system, which is in line with the findings of Van Beek et al., Rawlings, and Seyed Mousavi et al.43-45 In general, it can be said that people who are over-anxious are susceptible to the more diseases. Anxiety is one of the psychological disorders that affects all people, including the youth and adolescents. When an individual is worried about his/her mental ability and performance in a test, this feeling diminishes his/her performance, which jeopardizes his/her adaptations and makes the individual to put a lot of energy into reaching balance.20
Inaccessibility to boys’ high schools and restricting the study to Urmia high schools are among the study limitations which confine its generalizability. It is suggested that such studies be carried out in different cities in both
male and female students using different affective variables.
Conclusion
Researchers believe that some kind of moderate anxiety is necessary for various activities like mathematical behavior. Math cannot stimulate the students’ interest and motivate them to try their best as long as it is known as a boring and agonizing lesson. Therefore, this lesson should be taught not in a non-flexible and lecture-style form but by using various methods tailored to the students’ learning style. This requires a targeted effort from the educational system. It is suggested that teachers use methods leading to self-efficacy improvement in students, which in turn decrease the level of test anxiety caused by low self-efficacy. It is also important for teachers to give positive feedbacks to their students, and employ methods that develop the strong sense of competence in an attempt to reduce the level of test anxiety caused by low self-efficacy and significantly decrease the sense of incompetence.
Conflict of Interests
Authors have no conflict of interests.
Acknowledgments
Authors would like to thank all the patients who sincerely cooperated in this research.
References
1. Lotz C, Sparfeldt JR. Does test anxiety increase as
the exam draws near? Students' state test anxiety
recorded over the course of one semester. Pers
Individ Dif 2017; 104: 397-400.
2. Hagh-Shenas H, Bahredar MJ, Rahman-Setayesh Z.
A clinical trial for reduction of test anxiety in a group
of adolescents. Iran J Psychiatry Clin Psychol 2009;
15(1): 63-9. [In Persian].
3. Parks-Stamm EJ, Gollwitzer PM, Oettingen G.
Implementation intentions and test anxiety: Shielding
academic performance from distraction. Learn
Individ Differ 2010; 20(1): 30-3.
http://cdjournal.muk.ac.ir, 06 July
Math anxiety, biological model of personality, and test anxiety Arji et al.
134 Chron Dis J, Vol. 6 No. 3, Summer 2018
4. Spielberger CD, Gonzalez HP, Taylor CJ, Algaze B,
Anton WD. Examination stress and test anxiety.
Stress and Anxiety 1978; 5: 167-91.
5. Fuson JA. Study of the relationship between math's
Anxiety and selects demographics [PhD Thesis].
Minneapolis, MN: Capella University; 2007.
6. Ashcraft MH, Krause JA. Working memory, math
performance, and math anxiety. Psychon Bull Rev
2007; 14(2): 243-8.
7. Bonnstetter R. A follow-up study of mathematics
anxiety in middle grades students [PhD Thesis].
Vermillion, SD: University of South Dakota; 2007.
8. Cargnelutti E, Tomasetto C, Passolunghi MC. How is
anxiety related to math performance in young
students? A longitudinal study of Grade 2 to Grade 3
children. Cogn Emot 2017; 31(4): 755-64.
9. Carver CS, Sutton SK, Scheier MF. Action, emotion,
and personality: Emerging conceptual integration.
Pers Soc Psychol Bull 2000; 26(6): 741-51.
10. Gray JA. Framework for a taxonomy of psychiatric
disorder. In: van Goozen SH, Van de Poll NE,
Sergeant JA, Editors. Emotions: Essays on emotion
theory. Hillsdale, NJ: Lawrence Erlbaum Associates,
Inc.; 1994.
11. Lenze EJ, Wetherell JL. A lifespan view of anxiety
disorders. Dialogues Clin Neurosci 2011; 13(4): 381-99.
12. Bijttebier P, Beck I, Claes L, Vandereycken W.
Gray's Reinforcement Sensitivity Theory as a
framework for research on personality-
psychopathology associations. Clin Psychol Rev
2009; 29(5): 421-30.
13. Carver CS. Approach, Avoidance, and the Self-
Regulation of Affect and Action. Motivation and
Emotion 2006; 30(2): 105-10.
14. Slobodskaya HR. The associations among the Big
Five, Behavioural Inhibition and Behavioural
Approach systems and child and adolescent adjustment
in Russia. Pers Individ Dif 2007; 43(4): 913-24.
15. Bandura A, Freeman WH, Lightsey R. Self-efficacy:
The exercise of control. J Cogn Psychother 1999;
13(2): 158-66.
16. Yazdi-Ravandi S, Taslimi Z, Ahmadpanah M,
Ghaleiha A. Adjustment to Diabetes Among Diabetic
Patients: The Roles of Social Support and Self-
Efficacy. Avicenna J Neuro Psych Physio 2016; 3(1):
e37470.
17. Zimmerman BJ, Kitsantas A. Homework practices
and academic achievement: The mediating role of
self-efficacy and perceived responsibility beliefs.
Contemp Educ Psychol 2005; 30(4): 397-417.
18. Bandura A. Self-efficacy: The exercise of control.
New York, NY: W H Freeman; 1997.
19. Roick J, Ringeisen T. Self-efficacy, test anxiety, and
academic success: A longitudinal validation. Int J
Educ Res 2017; 83: 84-93.
20. Mirsamiei M, Ebrahimi Ghavam S. A study on the
relationship between self-efficiency, social support
and exam anxiety and the psychological health of the
men and women students in Allameh Tabatabaei
University. Educational Psychology: 2007; 7(2): 73-
91. [In Persian].
21. Spielberger CD, Gonzalez HP, Taylor CJ, Algaze B,
Anton WD. Examination stress and test anxiety. In:
Spielberger CD, Sarason IG, Editors. Stress and
anxiety. New York, NY: Hemisphere/Wiley; 1978.
22. Jadidi H, Behvarzi N, Shahni Yeylagh M, Hashemi
SE. Investigating the causal relationship between
optimism, test anxiety and math performance by
mediating adjectival coping strategies and exam
status in basic science students of Kurdistan
University. Journal oF Psychological Achievements
(Journal of Education & Psychology): 2015; 22(1):
269-90. [In Persian].
23. Chiu LH, Henry LL. Development and validation of
the Mathematics Anxiety Scale for Children. Meas
Eval Couns Dev 1990; 23(3): 121-7.
24. Sherer M, Maddux JE, Mercandante B, Prentice-dunn
S, Jacobs B, Rogers RW. The Self-efficacy Scale:
Construction and validation. Psychological Reports
1982; 51(2): 663-71.
25. Asgharnejad T, Ahmadi Dehghotboddini M, Farzad
V, Khodapanahi MR. Psychometric properties of
sherer's general self-efficacy scale. Journal of
Psychology: 2006; 10(3): 262-74. [In Persian].
26. Carver CS, White TL. Behavioral inhibition,
behavioral activation, and affective responses to
impending reward and punishment: The BIS/BAS
Scales. J Pers Soc Psychol 1994; 67(2): 319-33.
27. Mohammadi N. The Psychometric Properties of the
Behavioral Inhibition System (BIS) and Behavioral
Activation System (BAS) scales Among Students of
Shiraz University. Daneshvar Raftar 2008; 1(28): 61-
8. [In Persian].
28. Rekabdar GH, Soleymani B. To compare the
mathematics anxiety based on perfectionism typology
among Khoramshahr high school prep students.
Knowledge & Research in Applied Psychology 2008;
10(35-36): 33-52. [In Persian].
29. Zaki MA. Students' attitude toward mathematics and
relationship to exam anxiety (Case: Male and female
high school students of governmental high schools of
the city of Isfahan). Psychological Studies 2011;
7(3): 153-81. [In Persian].
30. Ma X, Xu J. The causal ordering of mathematics
anxiety and mathematics achievement: A longitudinal
panel analysis. J Adolesc 2004; 27(2): 165-79.
31. Schunk DH, Pajares F. The development of academic
self-efficacy. In: Wigfield A, Eccles JS, Editors.

http://cdjournal.muk.ac.ir, 06 July
Math anxiety, biological model of personality, and test anxiety Arji et al.
Chron Dis J, Vol. 6 No. 3, Summer 2018 135
Development of achievement motivation. San Diego,
CA: Academic Press; 2002.
32. Cheung SK, Sun SY. Effects of self-efficacy and
social support on the mental health conditions of
mutual-aid organization members. Soc Behav Pers
2000; 28(5): 413-22.
33. Mehrabizadeh Honarmand M, Najarian B,
Abolghasmi A, Shokrkon H. The epidemiology of
test anxiety, and its relation with self-efficacy and
control location with respect to intelligence variable.
Journal of Education and Psychology 2000; 7(1-2):
55-72. [In Persian].
34. Stoeber J, Corr PJ. Perfectionism, personality, and
future-directed thinking: Further insights from
revised Reinforcement Sensitivity Theory. Pers
Individ Dif 2017; 105: 78-83.
35. Yazdi-Ravandi S, Taslimi Z, Jamshidian N, Saberi H,
Shams J, Haghparast A. Prediction of quality of life
by self-efficacy, pain intensity and pain duration in
patient with pain disorders. Basic Clin Neurosci
2013; 4(2): 117-24.
36. Corr PJ. Reinforcement sensitivity theory of
personality questionnaires: Structural survey with
recommendations. Pers Individ Dif 2016; 89: 60-4.
37. Johnson SL, Turner RJ, Iwata N. BIS/BAS levels and
psychiatric disorder: An epidemiological study. J
Psychopathol Behav Assess 2003; 25(1): 25-36.
38. Hasking PA. Reinforcement sensitivity, coping, and
delinquent behaviour in adolescents. J Adolesc 2007;
30(5): 739-49.
39. Dumitrescu AL, Toma C, Lascu V. Self-liking, self-
competence, body investment and perfectionism:
Associations with oral health status and oral-health-
related behaviours. Oral Health Prev Dent 2009; 7(2):
191-200.
40. Rezaei T, Yazdi-Ravandi S, Ghaleiha A, Rabiei S,
Ali M. Depression among medical students of
Hamadan University of Medical Sciences in 2014:
The Role of demographic variables. Pajouhan
Scientific Journal 2015; 13(4): 1-8. [In Persian].
41. Lee J. Universals and specifics of math self-concept,
math self-efficacy, and math anxiety across 41 PISA
2003 participating countries. Pers Individ Dif 2009;
19(3): 355-65.
42. Carver CS, Harmon-Jones E. Anger is an approach-
related affect: Evidence and implications. Psychol
Bull 2009; 135(2): 183-204.
43. van Beek I, Kranenburg IC, Taris TW, Schaufeli WB.
BIS- and BAS-activation and study outcomes: A
mediation study. Pers Individ Dif 2013; 55(5): 474-9.
44. Rawlings AM. Effects of BIS/BAS on achievement
goal orientations [PhD Thesis]. Helsinki, Finland:
School of Behavioural Sciences, University of
Helsinki; 2014.
45. Seyed Mousavi P, Pouretemad HR, Fayazbakhsh
MR, Smaeilbeygi F, Farnoodian P. The relationship
between behavioral inhibition and activation systems
and behavioral and emotional problems in
adolescents. J Res Behav Sci 2011; 9(3): 155-63.
[In Persian].

http://cdjournal.muk.ac.ir, 06 July
136 Chron Dis J, Vol. 6, No. 3, Summer 2018
DOI: 10.22122/cdj.v6i3.285 Published by Vesnu Publications
Prevalence of depression and its relation to risky behaviors in students of Kurdistan University of Medical Sciences, Iran, 2014
Abdorrahim Afkhamzadeh1
, Khaled Rahmani1
, Azizollah Mojahed2, Sahar Molsaqi
3
1 Social Determinants of Health Research Center, Research Institute for Health Development, Kurdistan
University of Medical Sciences, Sanandaj, Iran
2 Health Promotion Research Center AND Department of Clinical Psychology, Zahedan University of Medical
Sciences, Zahedan, Iran
3 General Practitioner, Kurdistan University of Medical Sciences, Sanandaj, Iran
Abstract BACKGROUND: Students, particularly medical students, due to the special circumstances, are susceptible to loss
their mental health. The aim of this study was to investigate the prevalence of depression and its relation to risky
behaviors among students of Kurdistan University of Medical Sciences, Sanandaj, Iran, in 2014.
METHODS: This was a cross-sectional study conducted among 323 medical/paramedical students in Kurdistan
University of Medical Sciences. Data were collected through Beck Depression Inventory (BDI) and a checklist
including demographic information. Chi-square or Fisher's exact tests and logistic regression method were used to
determine the relationship between depression and investigated variables.
RESULTS: A total of 323 students, including 161 men (49.8%) and 162 women (50.2%) with mean age of
22.09 ± 1.67 years were investigated. From our series, 147 students (45.5%) had the symptoms of depression.
Although several variables including degree satisfaction, experiencing educational failure, alcohol consumption,
smoking, and having family problems increased the chance of depression in univariate analysis, degree
dissatisfaction was the only significant factor for depression occurrence in multivariate analysis by logistic regression.
CONCLUSION: Given the results, degree dissatisfaction was the most important factor related to the occurrence of
depression. This variable should be considered before entering to the university by students and their parents.
KEYWORDS: Depression, Risky Behavior, Students
Date of submission: 22 July 2017, Date of acceptance: 08 Sep. 2017
Citation: Afkhamzadeh A, Rahmani K, Mojahed A, Molsaqi S. Prevalence of depression and its relation to
risky behaviors in students of Kurdistan University of Medical Sciences, Iran, 2014. Chron Dis J 2018;
6(3): 136-42.
Introduction1
Depression is one of the most important causes of morbidity and disability throughout the world.1 This disease is also among the most common mental disorders and is prevalent as a major health problem in all nations and cultures.2 Lifetime prevalence estimates of major depression in general population vary among all countries in the world and range from 1.0%
Corresponding Author:
Khaled Rahmani
Email: [email protected]
(Czech) to 16.9% (USA). The prevalence per year also range from 0.3% (Czech) to 10.0% (USA).3 Depression among students is an important issue, because it reduces their success and academic achievements.4 Based on the existing evidence, long-time depression can lead to risky behaviors such as suicide and decline to the substance abuse.5
Students due to the special circumstances, including being away from family, entering into a new community, peer pressure, lack of sufficient income, long educational courses, and existence of educational competition are
Original Article
http://cdjournal.muk.ac.ir, 06 July
Depression and its relation to risky behaviors Afkhamzadeh et al.
Chron Dis J, Vol. 6, No. 3, Summer 2018 137
susceptible to loss of their mental health.5 It seems that medical and paramedical students have higher risk for depression occurrence than other students due to existence of several specific problems in their environment such as the close relationship with patients in different situations, sleep deprivation, long working hours, night working, challenging period in a professional medical students life, and responsibility for saving the life of patients.6-8 In a cross-sectional study conducted by Al-Busaidi et al. in Oman, the prevalence of depressive symptoms among university students has been reported 27.7%.9 In another study done in Kenya, the overall prevalence of moderate and severe depressive symptoms has been reported 35.7% (33.5% men and 39.0% women) and 5.6% (5.3% men and 5.1% women), respectively.10
Alcohol consumption, tobacco use, and also using different psychotropic drugs are dominant among young individuals as the most serious health problems in recent years, that have been correlated with demonstration of depression symptoms.6 In fact, drug abuse and its dependence is a chronic and recurrent phenomenon with serious physical, financial, familial, and social costs.4,8 In Iran, due to the legal and cultural constraints, there is not comprehensive and reliable information about alcohol and drug consumption in younger adults.11 A study on male medical students of two medical universities of Iran, in Isfahan and Kermanshah cities, showed that 19.4%, 3.9%, and 10.1% of the participants had history of cigarette smoking, drug use, and alcohol drinking, respectively, during the past three months.12
As mentioned earlier, there is strong evidence regarding simultaneous multi-drug dependence, depression, and personality disorders.13 Depression and mood disorders can be effective factors in tendency to addiction.14 Moreover, addiction can be related to the antisocial personality traits, depression, anxiety, irrational and pessimistic thoughts, emotional vulnerability, isolation and restlessness, and
dependent personality.15 Given the importance of depression and its consequences in medical students, the aim of this study was to investigate the prevalence of depression and its relation to drugs, psychotropic substances, alcohol, and sexual risky behaviors among the students of Kurdistan University of Medical Sciences, Sanandaj, Iran, in 2014.
Materials and Methods
The population of this cross-sectional study included students of Kurdistan University of Medical Sciences in the academic year of 2013-2014. The sample size based on the prevalence of depression in the previous surveys (0.3), 95% confidence interval (CI), and significance level of 5% using the formula of ratio estimation was obtained 323 individuals.
Subjects were randomly selected after stratifying the statistical community with respect to sex ratio and the share of each faculty, so that 32% of medicine, 26% of paramedical, 24% of nursing and midwifery, and 18% of health faculty were obtained.
Data were collected through Beck Depression Inventory (BDI) and a checklist including demographic information such as age, sex, faculty, educational level, marital status, location, father's occupation, income, and data related to the risky behaviors history such as risky sexual behavior, smoking, drug use, and alcohol consumption, without obtaining privacy personal details. BDI is an instrument that contains 21 questions and can be self-scored. Subjects with scores less than 20 and above 21 were considered normal and moderately/severely depressed, respectively.
After completing the questionnaire and check lists, the data were entered in the SPSS software (version 20, IBM Corporation, Armonk, NY, USA). Descriptive statistics including absolute and relative frequency, mean, and standard
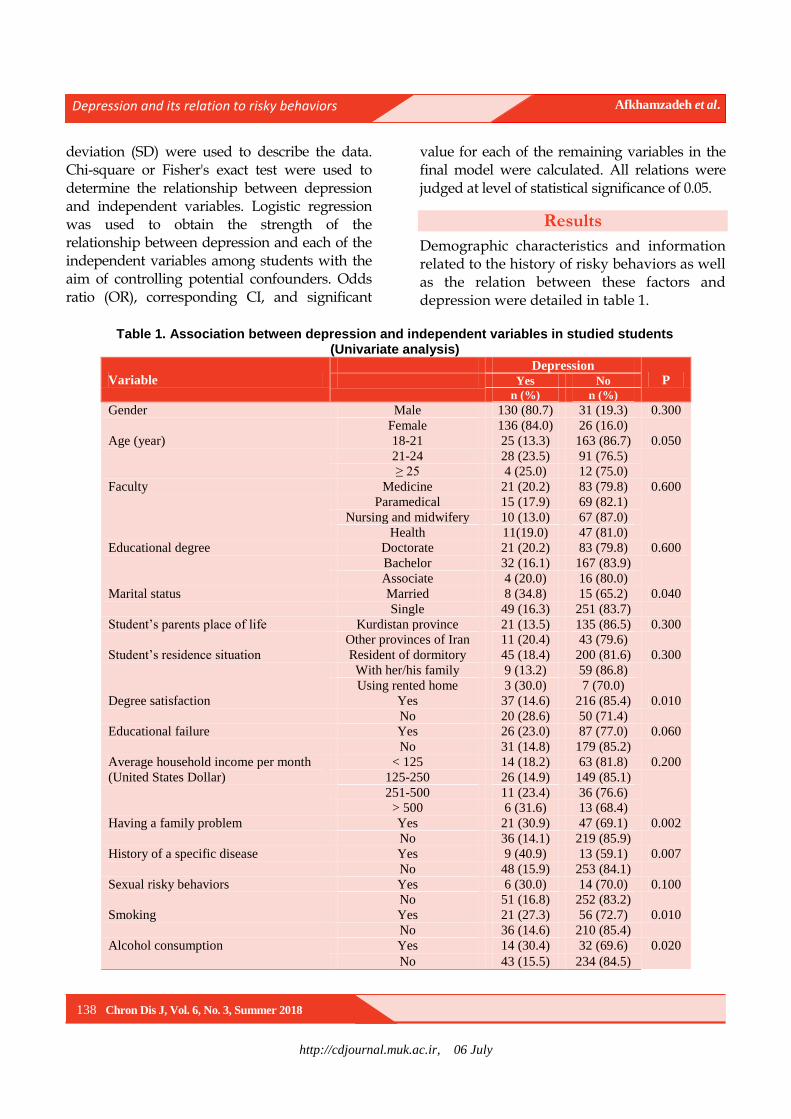
http://cdjournal.muk.ac.ir, 06 July
Depression and its relation to risky behaviors Afkhamzadeh et al.
138 Chron Dis J, Vol. 6, No. 3, Summer 2018
deviation (SD) were used to describe the data. Chi-square or Fisher's exact test were used to determine the relationship between depression and independent variables. Logistic regression was used to obtain the strength of the relationship between depression and each of the independent variables among students with the aim of controlling potential confounders. Odds ratio (OR), corresponding CI, and significant
value for each of the remaining variables in the final model were calculated. All relations were judged at level of statistical significance of 0.05.
Results
Demographic characteristics and information related to the history of risky behaviors as well as the relation between these factors and depression were detailed in table 1.
Table 1. Association between depression and independent variables in studied students
(Univariate analysis)
Variable Depression
P Yes No
n (%) n (%)
Gender Male 130 (80.7) 31 (19.3) 0.300
Female 136 (84.0) 26 (16.0)
Age (year) 18-21 25 (13.3) 163 (86.7) 0.050
21-24 28 (23.5) 91 (76.5)
≥ 25 4 (25.0) 12 (75.0)
Faculty Medicine 21 (20.2) 83 (79.8) 0.600
Paramedical 15 (17.9) 69 (82.1)
Nursing and midwifery 10 (13.0) 67 (87.0)
Health 11(19.0) 47 (81.0)
Educational degree Doctorate 21 (20.2) 83 (79.8) 0.600
Bachelor 32 (16.1) 167 (83.9)
Associate 4 (20.0) 16 (80.0)
Marital status Married 8 (34.8) 15 (65.2) 0.040
Single 49 (16.3) 251 (83.7)
Student’s parents place of life Kurdistan province 21 (13.5) 135 (86.5) 0.300
Other provinces of Iran 11 (20.4) 43 (79.6)
Student’s residence situation Resident of dormitory 45 (18.4) 200 (81.6) 0.300
With her/his family 9 (13.2) 59 (86.8)
Using rented home 3 (30.0) 7 (70.0)
Degree satisfaction Yes 37 (14.6) 216 (85.4) 0.010
No 20 (28.6) 50 (71.4)
Educational failure Yes 26 (23.0) 87 (77.0) 0.060
No 31 (14.8) 179 (85.2)
Average household income per month
(United States Dollar)
< 125 14 (18.2) 63 (81.8) 0.200
125-250 26 (14.9) 149 (85.1)
251-500 11 (23.4) 36 (76.6)
> 500 6 (31.6) 13 (68.4)
Having a family problem Yes 21 (30.9) 47 (69.1) 0.002
No 36 (14.1) 219 (85.9)
History of a specific disease Yes 9 (40.9) 13 (59.1) 0.007
No 48 (15.9) 253 (84.1)
Sexual risky behaviors Yes 6 (30.0) 14 (70.0) 0.100
No 51 (16.8) 252 (83.2)
Smoking Yes 21 (27.3) 56 (72.7) 0.010
No 36 (14.6) 210 (85.4)
Alcohol consumption Yes 14 (30.4) 32 (69.6) 0.020
No 43 (15.5) 234 (84.5)
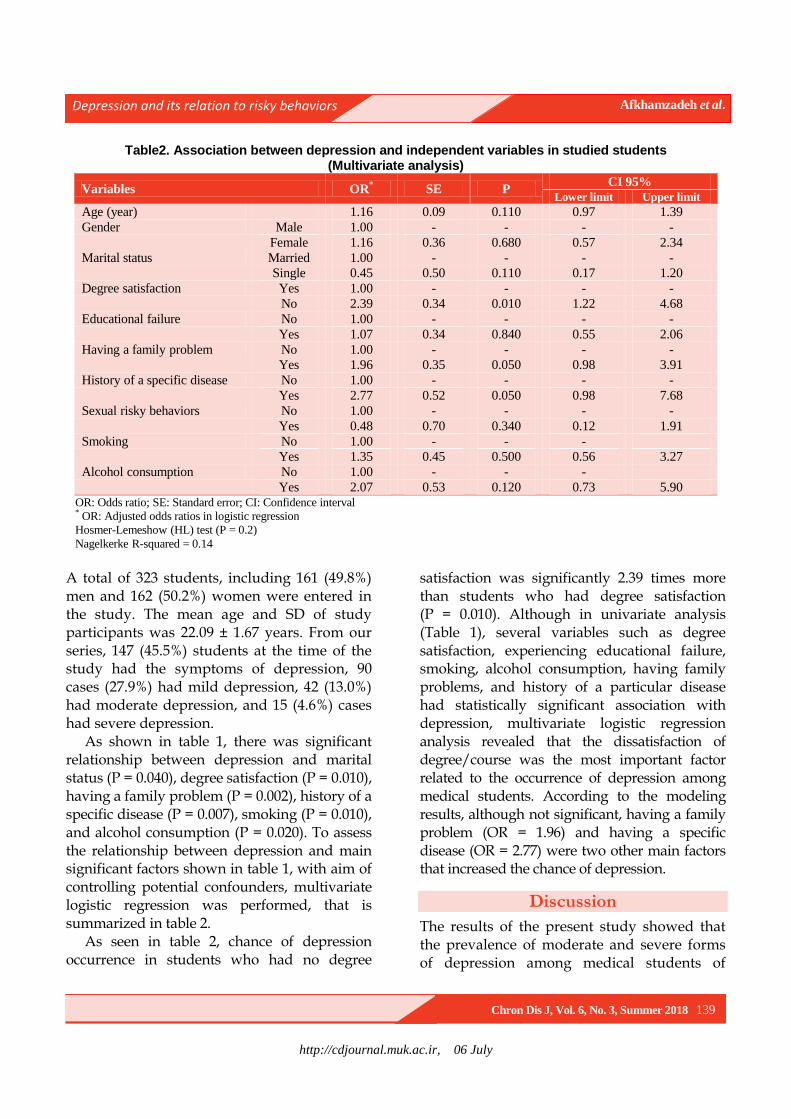
http://cdjournal.muk.ac.ir, 06 July
Depression and its relation to risky behaviors Afkhamzadeh et al.
Chron Dis J, Vol. 6, No. 3, Summer 2018 139
Table2. Association between depression and independent variables in studied students (Multivariate analysis)
Variables OR* SE P
CI 95%
Lower limit Upper limit
Age (year) 1.16 0.09 0.110 0.97 1.39
Gender Male 1.00 - - - -
Female 1.16 0.36 0.680 0.57 2.34
Marital status Married 1.00 - - - -
Single 0.45 0.50 0.110 0.17 1.20
Degree satisfaction Yes 1.00 - - - -
No 2.39 0.34 0.010 1.22 4.68
Educational failure No 1.00 - - - -
Yes 1.07 0.34 0.840 0.55 2.06
Having a family problem No 1.00 - - - -
Yes 1.96 0.35 0.050 0.98 3.91
History of a specific disease No 1.00 - - - -
Yes 2.77 0.52 0.050 0.98 7.68
Sexual risky behaviors No 1.00 - - - -
Yes 0.48 0.70 0.340 0.12 1.91
Smoking No 1.00 - - -
Yes 1.35 0.45 0.500 0.56 3.27
Alcohol consumption No 1.00 - - -
Yes 2.07 0.53 0.120 0.73 5.90 OR: Odds ratio; SE: Standard error; CI: Confidence interval * OR: Adjusted odds ratios in logistic regression
Hosmer-Lemeshow (HL) test (P = 0.2)
Nagelkerke R-squared = 0.14
A total of 323 students, including 161 (49.8%) men and 162 (50.2%) women were entered in the study. The mean age and SD of study participants was 22.09 ± 1.67 years. From our series, 147 (45.5%) students at the time of the study had the symptoms of depression, 90 cases (27.9%) had mild depression, 42 (13.0%) had moderate depression, and 15 (4.6%) cases had severe depression.
As shown in table 1, there was significant relationship between depression and marital status (P = 0.040), degree satisfaction (P = 0.010), having a family problem (P = 0.002), history of a specific disease (P = 0.007), smoking (P = 0.010), and alcohol consumption (P = 0.020). To assess the relationship between depression and main significant factors shown in table 1, with aim of controlling potential confounders, multivariate logistic regression was performed, that is summarized in table 2.
As seen in table 2, chance of depression occurrence in students who had no degree
satisfaction was significantly 2.39 times more than students who had degree satisfaction (P = 0.010). Although in univariate analysis (Table 1), several variables such as degree satisfaction, experiencing educational failure, smoking, alcohol consumption, having family problems, and history of a particular disease had statistically significant association with depression, multivariate logistic regression analysis revealed that the dissatisfaction of degree/course was the most important factor related to the occurrence of depression among medical students. According to the modeling results, although not significant, having a family problem (OR = 1.96) and having a specific disease (OR = 2.77) were two other main factors that increased the chance of depression.
Discussion
The results of the present study showed that the prevalence of moderate and severe forms of depression among medical students of
http://cdjournal.muk.ac.ir, 06 July
Depression and its relation to risky behaviors Afkhamzadeh et al.
140 Chron Dis J, Vol. 6, No. 3, Summer 2018
Kurdistan University of Medical Sciences was 19.2%. This result is inconsistent with other studies conducted in Iran. Although, like our results, Karami at the Kashan University of Medical Sciences, Iran, showed that 19.23% of medical students had depression,16 Aghakhani et al. in a study conducted among medical students of Urmia University of Medical Sciences, Iran, showed that 52.6% of the participants were depressed at different degrees.17 The prevalence of depression among medical students had various ranges in different studies in the world, so that the prevalence of depressive symptoms among medical students in studies of Dahlin et al. at the Karolinska Institute Medical University, Stockholm, Sweden,18 and Iqbal et al. at Bhubaneswar, Odisha, India,5 have been reported 12.9% and 51.3%, respectively. In a systematic review conducted in 2016 on 62728 medical students, the global prevalence of depression amongst medical students was reported 28.0% (95% CI: 24.2–32.1).19
According to the results, depression in students increased with increasing the age, so that prevalence of depression among medical students in final educational semesters was partly higher than others.
Although not significant, we observed gender difference in regard to depression; so that, frequency of depression in female students was four percent higher than male students. Some previous studies also reported gender difference regarding depression such as Dahlin et al.18, Peterlini et al.,20 and Schwenk et al.21
The data showed that the students of medicine and public health faculties had higher frequency of depression compared to the students of paramedical and nursing and midwifery faculties. It seems that concerns of public health students regarding future work and long duration of educational courses, and also burnout resulted from hospital work in students of medicine faculty can influence their depression.
As less is known about the income variable that might affect the depression, although our data showed that students with average household income per month more than 250$ had higher depression, the difference was not statistically significant. Inam et al. in a study conducted among medical students of private university also did not found any significant income difference for presence of depression.22 However, some studies revealed that parental income23 and social support24 as main variables may influence the mental status of medical students and their academic performance.
According to the results, the most important factor related to the occurrence of depression was the degree satisfaction. In our study, 21.7% of the students were not satisfied with their educational degree. Our result is similar to the findings of Becker et al. who reported a significant relationship between career satisfaction and depression in obstetrics and gynecology residents.25 In the present study, multivariate analysis also showed that the chance of depression in students who had no degree satisfaction was 2.4 times higher than others.
Having a family problem, history of a specific disease, smoking, and alcohol consumption were other significant variables which influence the frequency of depression in univariate analysis. These factors although increase the chance of depression in multivariate analyses, statistically are not significant.
This study has some advantages including estimation of depression prevalence by selecting adequate sample size randomly from medical students of Kurdistan University of Medical Sciences for the first time, and also quantifying the relationship between depression and different variables using logistic regression model. The potential weakness of the study was the methodological issue, so that the cross-sectional design that we used, could not demonstrate the real relation between outcomes and independent factors as
http://cdjournal.muk.ac.ir, 06 July
Depression and its relation to risky behaviors Afkhamzadeh et al.
Chron Dis J, Vol. 6, No. 3, Summer 2018 141
other analytical designs such as case-control or cohort studies could.
Conclusion
Based on the study results, degree dissatisfaction was the most important factor related to the occurrence of depression in studied students. This variable should be considered before entering to the university by students and their parents.
Conflict of Interests
Authors have no conflict of interests.
Acknowledgments
This work is a part of medical doctorate thesis funded by Vice Chancellor for Research and Technology in Kurdistan University of Medical Sciences.
References
1. Heim C, Plotsky PM, Nemeroff CB. Importance of
studying the contributions of early adverse
experience to neurobiological findings in depression.
Neuropsychopharmacology 2004; 29(4): 641-8.
2. Fernando S. Race and culture in psychiatry (Psychology
Revivals). London, UK: Routledge; 2014.
3. Kessler RC, Bromet EJ. The epidemiology of
depression across cultures. Annu Rev Public Health
2013; 34: 119-38.
4. Quiroga CV, Janosz M, Bisset S, Morin AJ. Early
adolescent depression symptoms and school dropout:
Mediating processes involving self-reported
academic competence and achievement. J Educ
Psychol 2013; 105(2): 552-60.
5. Iqbal S, Gupta S, Venkatarao E. Stress, anxiety and
depression among medical undergraduate students
and their socio-demographic correlates. Indian J Med
Res 2015; 141(3): 354-7.
6. Basnet B, Jaiswal M, Adhikari B, Shyangwa PM.
Depression among undergraduate medical students.
Kathmandu Univ Med J (KUMJ) 2012; 10(39): 56-9.
7. Haldorsen H, Bak NH, Dissing A, Petersson B. Stress
and symptoms of depression among medical students
at the University of Copenhagen. Scand J Public
Health 2014; 42(1): 89-95.
8. Ngasa SN, Sama CB, Dzekem BS, Nforchu KN,
Tindong M, Aroke D, et al. Prevalence and factors
associated with depression among medical students
in Cameroon: A cross-sectional study. BMC
Psychiatry 2017; 17(1): 216.
9. Al-Busaidi Z, Bhargava K, Al-Ismaily A, Al-Lawati
H, Al-Kindi R, Al-Shafaee M, et al. Prevalence of
depressive symptoms among university students in
Oman. Oman Med J 2011; 26(4): 235-9.
10. Othieno CJ, Okoth RO, Peltzer K, Pengpid S, Malla
LO. Depression among university students in Kenya:
prevalence and sociodemographic correlates. J Affect
Disord 2014; 165: 120-5.
11. Shamsipour M, Korani Bahador R,
Mohammadpoorasl A, Mansouri A. Smoking
prevalence and associated factors to quit among
Tabriz dormitory University Medical Students,
Tabriz, Iran. Qom Univ Med Sci J 2012; 6(1): 75-82.
[In Persian].
12. Jalilian F, Karami Matin B, Ahmadpanah M, Ataee
M, Ahmadi Jouybari T, Eslami AA, et al. Socio-
demographic characteristics associated with
cigarettes smoking, drug abuse and alcohol drinking
among male medical university students in Iran. J
Res Health Sci 2015; 15(1): 42-6.
13. Babaei Heydarabadi A, Ramezankhani A, Barekati
H, Tavassoli E, Gharli Pour Z. Knowledge and
attitude of dormitory students of Shahid Beheshti
University of Medical Sciences about substance
abuse in 2013. J Paramed Sci 2014; 5(3): 63-8.
14. Kozlov AA, Rokhlina ML. Dependence of the
formation of the addictive personality on the
predisposing factors. Zh Nevrol Psikhiatr Im S S
Korsakova 2001; 101(5): 16-20.
15. Klein DN, Kotov R, Bufferd SJ. Personality and
depression: Explanatory models and review of the
evidence. Annu Rev Clin Psychol 2011; 7:
269-95.
16. Karami M. The study of the rate of depression in
allied health faculty students of kashan university of
medical sciences in 2008. J Urmia Nurs Midwifery
Fac 2009; 7(3). [In Persian].
17. Aghakhani N, Sharif NH, Eghtedar S, Rahbar N,
Jasemi M, Mesgar Zadeh M. Prevalence of
depression among students of Urmia University of
Medical Sciences (Iran). Iran J Psychiatry Behav Sci
2011; 5(2): 131-5.
18. Dahlin M, Joneborg N, Runeson B. Stress and
depression among medical students: A cross-
sectional study. Med Educ 2005; 39(6): 594-604.
19. Puthran R, Zhang MW, Tam WW, Ho RC.
Prevalence of depression amongst medical students:
A meta-analysis. Med Educ 2016; 50(4): 456-68.
20. Peterlini M, Tiberio IF, Saadeh A, Pereira JC,
Martins MA. Anxiety and depression in the first year
of medical residency training. Med Educ 2002; 36(1):
66-72.
http://cdjournal.muk.ac.ir, 06 July
Depression and its relation to risky behaviors Afkhamzadeh et al.
142 Chron Dis J, Vol. 6, No. 3, Summer 2018
21. Schwenk TL, Davis L, Wimsatt LA. Depression,
stigma, and suicidal ideation in medical students.
JAMA 2010; 304(11): 1181-90.
22. Inam SN, Saqib A, Alam E. Prevalence of anxiety
and depression among medical students of private
university. J Pak Med Assoc 2003; 53(2): 44-7.
23. Fadem B, Schuchman M, Simring SS. The
relationship between parental income and academic
performance of medical students. Acad Med 1995;
70(12): 1142-4.
24. Rospenda KM, Halpert J, Richman JA. Effects of
social support on medical students' performances.
Acad Med 1994; 69(6): 496-500.
25. Becker JL, Milad MP, Klock SC. Burnout,
depression, and career satisfaction: Cross-sectional
study of obstetrics and gynecology residents. Am J
Obstet Gynecol 2006; 195(5): 1444-9.

http://cdjournal.muk.ac.ir, 06 July
Chron Dis J, Vol. 6, No. 3, Summer 2018 143
DOI: 10.22122/cdj.v6i3.286 Published by Vesnu Publications
Comparing the effectiveness of music therapy and alpha-theta neuro-feedback training on anxiety and depression among
patients with chronic irritable bowel syndrome
Seyed Hamzeh Hosseini1
, Iradj Maleki2, Samaneh Farnia
3, Shahideh Kazemi-Malekmahmoudi
1,
1 Psychiatry and Behavioral Sciences Research Center, Addiction Institute, Mazandaran University of Medical
Sciences, Sari, Iran
2 Gut and Liver Research Center, Mazandaran University of Medical Sciences, Sari, Iran
3 Child and Adolescent Psychiatrist, Psychiatry and Behavioral Sciences Research Center, Addiction Institute,
Mazandaran University of Medical Sciences, Sari, Iran
Abstract BACKGROUND: Non-pharmaceutical interventions are a promising area of research in psychiatry. Traditional
treatment of Irritable Bowel Syndrome (IBS) lacked notable efficacy. The aim of this study was to examine the
effectiveness of music therapy (MT) and alpha-theta neurofeedback training (NFT) on anxiety and depression
symptoms among patients with IBS.
METHODS: Patients with IBS, based on ROME III criteria, and high level of anxiety or depression symptoms were
randomly assigned into three groups: (A) music, (B) alpha-theta training, and (C) control. In intervention groups,
participants received ten 30-minute sessions of either music or alpha-theta NFT. The Hospital Anxiety and
Depression Scale (HADS) was administered for all patients before and after the training period. Thirty-three
patients completed the study. Data were analyzed using analysis of covariance (ANCOVA) to compare changes in
HADS scores among the three study groups.
RESULTS: There was a significant main effect of HADS scores (F1,18 = 17.79, P < 0.001) in the responses of MT
group. Significant decreases were observed in HADS scores from pre-intervention to post-intervention tests in MT
group comparing to control group. The MT accounted for 49 percent of variance in HADS scores. There was also a
significant main effect of HADS scores (F1,20 = 17.79, P < 0.010) in the responses of NFT group. HADS scores from
pre-intervention to post-intervention tests in alpha-theta NFT group comparing to control group showed significant
decreases, too. In addition, MT and alpha-theta NFT did not show any significant difference in somatic symptoms
scores between pretest and posttest among patients with IBS.
CONCLUSION: This study showed that MT and alpha-theta NFT significantly alleviated anxiety and depression level
among patients with IBS.
KEYWORDS: Anxiety, Depression, Irritable Bowel Syndrome, Music Therapy, Neurofeedback, EEG Feedback,
Brainwave Feedback
Date of submission: 22 July 2017, Date of acceptance: 14 Sep. 2017
Citation: Hosseini SH, Maleki I, Farnia S, Kazemi-Malekmahmoudi S. Comparing the effectiveness of music
therapy and alpha-theta neuro-feedback training on anxiety and depression among patients with chronic
irritable bowel syndrome. Chron Dis J 2018; 6(3): 143-51.
Introduction1
Irritable bowel syndrome (IBS) as the most common functional gastrointestinal (GI) tract
Corresponding Author:
Samaneh Farnia
Email: [email protected]
disorder is a cluster of symptoms that is accompanied by recurrent abdominal pain or discomfort and bowel dysfunction.1 It is estimated that 10% to 20% of the general population are affected.2
It has been shown that patients with the
Original Article
http://cdjournal.muk.ac.ir, 06 July
The effect of music and neurofeedback training on IBS Hosseini et al.
144 Chron Dis J, Vol. 6, No. 3, Summer 2018
most intensive symptoms have the worst quality of life, and the morbidity of IBS is equal to severe organic GI diseases. IBS is the second cause of absence from work after the common cold. In a survey of 8 European countries, a randomized cluster sampling of 41984 individuals, patients with IBS, were identified. After psychiatric evaluation, 78 percent of them believed that IBS had some effects on their health state and quality of life. Several studies have evaluated the relationship between IBS and psychiatric disorders.3 It has been reported that neurosis, anxiety, depression, and dysfunctional cognition are more prevalent in patients with IBS.4
Quality of life is often drastically devastated by IBS. Several factors may act to develop IBS, especially brain-gut interactions and psychosocial conditions; moreover, psychiatric disorders have a more important role in IBS than what had been assumed previously.5 Several studies have mentioned a complex interaction between IBS and stressful life events that affects psychiatric morbidity,6 but the nature of the relationship is not clear.7 Anxiety as an emotional condition is associated with stress and nervousness, and influences how the individuals with IBS cope with illness.8 It has also been supported by the fact that psychiatric disorders specially anxiety and depressive disorders are more prevalent in individuals with IBS than healthy individuals,9 and even individuals with gastro-esophageal reflux disease (GERD).10 It is estimated that 40% to 90% of individuals with IBS suffer from psychiatric disorders.11
For many sufferers of chronic diseases, an oversensitive or sluggish central nervous system (CNS) may be a cause or contributing factor to symptoms such as pain, anxiety, panic, depression, inattention, tremor, and even seizures.12 In addition to intestinal problems on the rise, the increase in anxiety and depression is striking.13
In the other investigation, it has been stated
that emotions are identified as one of the most meaningful effective factors on the IBS.14 Emotional stress makes people be more vulnerable to suffering from problems such as gastritis, heartburn, colitis, IBS, ulcers, constipation or diarrhea.15
Although various alternative interventions as well as drug administration have proven to be effective, some studies have argued that traditional therapeutic programs for IBS lacked meaningful efficacy.16 Drug administration may be associated with significant improvements in global symptoms and limited by the potential risks of serious adverse effects instead of interfering with adherence to therapeutic regimen in individuals with IBS.17 Therefore, the significant role of alternative interventions has been emphasized by several studies, especially to reduce anxiety and other psychiatric symptoms.18 They have strongly suggested that treatment of anxiety in individuals with IBS may require inclusive consideration as a supplement to medical management for promoting coping skills; thus, further studies on the issue are demanded.19
Music therapy (MT) has been extensively studied on clinical medicine and is now considered to be a supplement to medical management. Music is used to achieve therapeutic effects.20 The American Music Therapy Association (AMTA) defines music therapy as “the clinical and
evidence-based use of experimental music to accomplish individualized goals in a therapeutic relationship”.21 MT decreases sympathetic nervous system activity, so it produces the relaxation responses in patients.22 MT has a positive effect on decreasing anxiety in patients with Alzheimer disease,16 coronary heart disease (CHD),23 traumatic brain injury,24 breast cancer surgery,25 varicose vein surgery,26
daily burn care,27 organ transplantation,28 and early phase of laboring as well.
Neurofeedback [electroencephalography (EEG) biofeedback] mechanism supplies real-
http://cdjournal.muk.ac.ir, 06 July
The effect of music and neurofeedback training on IBS Hosseini et al.
Chron Dis J, Vol. 6, No. 3, Summer 2018 145
time information to participants about brain functions. It is based on operant conditioning principle in which the participants learn to lead their brainwaves. During training sessions, patients try to enhance desired brain waves amplitude based on positive feedback.29
Neurofeedback training (NFT) is one of the treatments of stress which enables the subject to train himself to control his brain activity during stress and anxiety.30 NFT trains the subject with functional disability to control his/her brainwaves, also in the case of stress and emotional distress.28 Mostly, audio is used as content for NFT to increase alpha power in right−prefrontal lobe. NFT is also used to decrease the high−beta using the game as content.31
The mechanism of NFT in this way has been clarified by detail. Alpha brainwave is between 7 to 12 Hz which is associated with a relaxed and effortless alertness, and individuals with active alpha brainwave experience a sense of floating, lightness, and tranquility.32 Theta brainwave ranges from 4 to 8 Hz, which is particularly connected to deep meditation.33 Alpha and theta brainwaves contribute to relaxation.30,32 Alpha-theta NFT protocol using auditory feedback has been used successfully in treatment of alcoholism and post-traumatic stress disorder (PTSD).34
The National Institutes of Health (NIH) reports that anxiety and depression affect 38 million Americans each year, and this number doubles in relation to those who are predicted to suffer from anxiety or depression during some point in their lives. It is estimated that the cost of treating these two mental health problems is more than $80 billion each year which is more than half of the nation’s total mental health cost.34
It has been found that the effectiveness of MT and NFT on anxiety and depression of patients suffering from IBS need to be evaluated out of clinical efficacy of these interventions. Therefore, the current study was
performed on the basis of the hypothesis that listening to music and performing NFT simultaneously decreases the stress among patients with IBS. In other words, the main goal of this paper was to investigate the effectiveness of MT and alpha-theta NFT on anxiety and depression among patients with chronic IBS.
Materials and Methods
This study was a randomized clinical trial that was registered in Iranian Registry of Clinical Trials and allocated a unique code
(IRCT2015050711885N6). Recruitment period was from November 2014 to July 2015. The study was approved by the Research Ethics Committee of Mazandaran University of Medical Sciences, Sari, Iran.
The patients (aged 20 to 40 years) attending gastroenterology clinic of Imam Khomeini Hospital, Sari, were screened by a gastroenterologist for IBS diagnosis based on Rome III criteria.34 The Persian version of Rome III criteria for IBS diagnosis has been used in Iran.35 All patients with IBS diagnosis were assessed by Hospital Anxiety and Depression Scale (HADS). HADS is a self-assessment scale that was developed by Zigmond and Snaith.36 It is commonly used for detecting states of anxiety and depression in the hospital,37 and outpatient clinic.36 Scale and subscales are reliable instruments of emotional distress and acceptable psychometric properties in Iran.35-38 It is a 14-item scale that its items are equally related to anxiety and depression. It takes less than 5 minutes to complete it, and individuals respond to the questions in relation to how they feel. Each item has a 4-point response level (0-3); thus, possible scores for each disorder are up to 21. The analysis of responses reveals the severity of both anxiety and depression. Scores of 0-7 indicate normal levels of anxiety and depression, scores of 8-10 suggest the anxiety and depression, and

http://cdjournal.muk.ac.ir, 06 July
The effect of music and neurofeedback training on IBS Hosseini et al.
146 Chron Dis J, Vol. 6, No. 3, Summer 2018
score of 11 or higher indicates the presence of the emotional disorders.36,39
The patients who referred for further psychiatric evaluation did not receive any medication for treatment of IBS if their HADS scores were higher than 11. They were interviewed by a psychiatrist using the Structured Clinical Interview based on diagnostic and statistical manual of mental disorders (DSM)-IV-TR (SCID) to rule out major psychiatric diagnoses (any psychotic disorder, suicidal ideation or plan, substance use disorder). The patients were excluded if pharmacotherapy was essential for treatment of anxiety and depressive symptoms. Those who were unable to take part fully in all treatment sessions and those who had hearing impairment or patients with nervous system diseases like seizure were also excluded. Informed consent was obtained from all
recruited patients after explaining adequate information about the study (Figure 1). The HADS was administered to all participants directly before (first day) and after the training period (20th day). HADS scores were assessed by a trained psychologist who was blind to participants’ assignment.
In order to determine the sample size, we used table for determining small sample size from a given population. Thirty four patients with IBS and high score of the HADS were eligible to join the study. They were randomly assigned into three groups: two experimental groups including A (music) and B (NFT), and one control group (Figure 1).
In order to deal with confounding variables, the randomization procedure randomly assigned patients to an experimental group and to a control group. Randomization helped prevent selection bias by the clinicians of this paper.
Figure 1. Flow chart of study design
IBS: Irritable bowel syndrome; HADS: Hospital anxiety and depression scale; DSM: Diagnostic and statistical manual of mental disorders
Patients with IBS symptoms
Invitation letter
Informed consent
Did not reply to letter or refuse to participate
Inclusion criteria:
IBS based on Rome III criteria
HADS score ≥ 11
Healthy auditory condition
Structured clinical interview based on
DSM-IV-TR
Exclusion criteria:
Unable to take part vin all sessions
Other psychiatric disorders (psychotic disorder, suicidal ideation
or plan, substance use disorder, …)
Known neurological diseases
(seizure, …) Randomization (n = 34)
Music therapy
(n = 10)
Neurofeedback training
(n = 12)
Control
(n = 12)
HADS (20th day)
Analyzed (n = 33)
Lost to follow up
(n = 1)
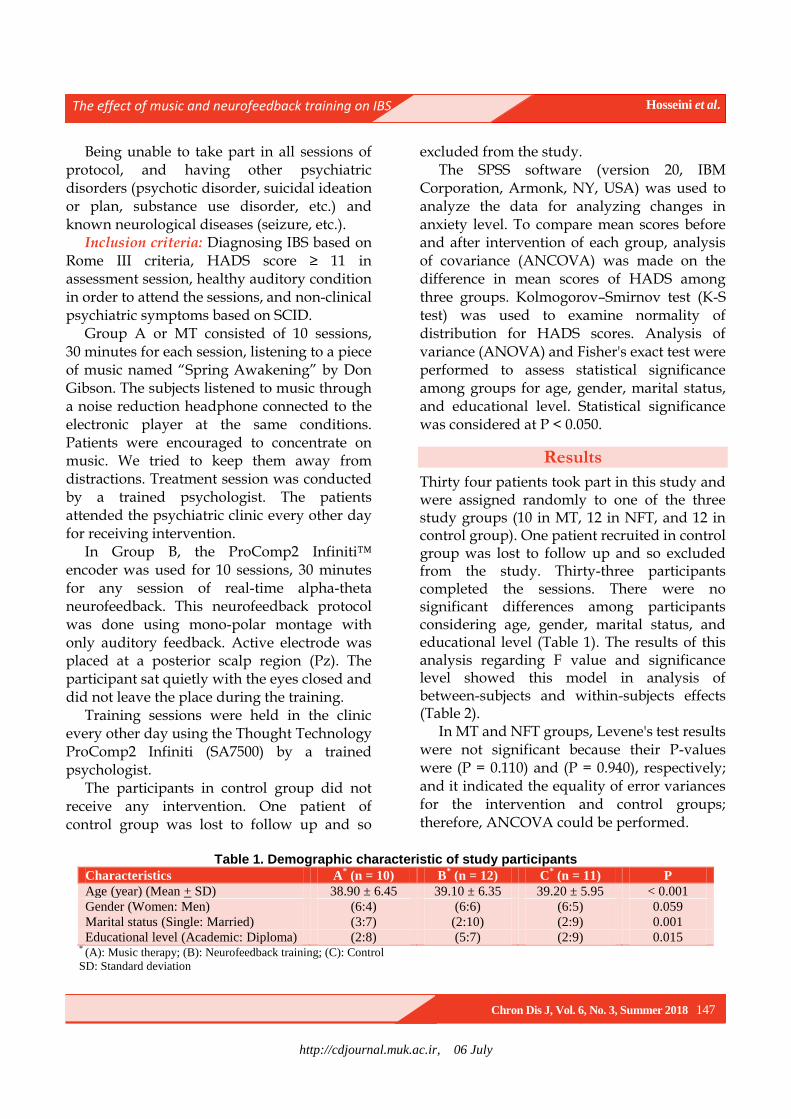
http://cdjournal.muk.ac.ir, 06 July
The effect of music and neurofeedback training on IBS Hosseini et al.
Chron Dis J, Vol. 6, No. 3, Summer 2018 147
Being unable to take part in all sessions of protocol, and having other psychiatric disorders (psychotic disorder, suicidal ideation or plan, substance use disorder, etc.) and known neurological diseases (seizure, etc.).
Inclusion criteria: Diagnosing IBS based on Rome III criteria, HADS score ≥ 11 in assessment session, healthy auditory condition in order to attend the sessions, and non-clinical psychiatric symptoms based on SCID.
Group A or MT consisted of 10 sessions, 30 minutes for each session, listening to a piece of music named “Spring Awakening” by Don Gibson. The subjects listened to music through a noise reduction headphone connected to the electronic player at the same conditions. Patients were encouraged to concentrate on music. We tried to keep them away from distractions. Treatment session was conducted by a trained psychologist. The patients attended the psychiatric clinic every other day for receiving intervention.
In Group B, the ProComp2 Infiniti™ encoder was used for 10 sessions, 30 minutes for any session of real-time alpha-theta neurofeedback. This neurofeedback protocol was done using mono-polar montage with only auditory feedback. Active electrode was placed at a posterior scalp region (Pz). The participant sat quietly with the eyes closed and did not leave the place during the training.
Training sessions were held in the clinic every other day using the Thought Technology ProComp2 Infiniti (SA7500) by a trained psychologist.
The participants in control group did not receive any intervention. One patient of control group was lost to follow up and so
excluded from the study. The SPSS software (version 20, IBM
Corporation, Armonk, NY, USA) was used to analyze the data for analyzing changes in anxiety level. To compare mean scores before and after intervention of each group, analysis of covariance (ANCOVA) was made on the difference in mean scores of HADS among three groups. Kolmogorov–Smirnov test (K-S test) was used to examine normality of distribution for HADS scores. Analysis of variance (ANOVA) and Fisher's exact test were performed to assess statistical significance among groups for age, gender, marital status, and educational level. Statistical significance was considered at P < 0.050.
Results
Thirty four patients took part in this study and were assigned randomly to one of the three study groups (10 in MT, 12 in NFT, and 12 in control group). One patient recruited in control group was lost to follow up and so excluded from the study. Thirty-three participants completed the sessions. There were no significant differences among participants considering age, gender, marital status, and educational level (Table 1). The results of this analysis regarding F value and significance level showed this model in analysis of between-subjects and within-subjects effects (Table 2).
In MT and NFT groups, Levene's test results were not significant because their P-values were (P = 0.110) and (P = 0.940), respectively; and it indicated the equality of error variances for the intervention and control groups; therefore, ANCOVA could be performed.
Table 1. Demographic characteristic of study participants
Characteristics A* (n = 10) B
* (n = 12) C
* (n = 11) P
Age (year) (Mean + SD) 38.90 ± 6.45 39.10 ± 6.35 39.20 ± 5.95 < 0.001
Gender (Women: Men) (6:4) (6:6) (6:5) 0.059
Marital status (Single: Married) (3:7) (2:10) (2:9) 0.001
Educational level (Academic: Diploma) (2:8) (5:7) (2:9) 0.015 * (A): Music therapy; (B): Neurofeedback training; (C): Control
SD: Standard deviation

http://cdjournal.muk.ac.ir, 06 July
The effect of music and neurofeedback training on IBS Hosseini et al.
148 Chron Dis J, Vol. 6, No. 3, Summer 2018
Table 2. Multivariate testes on the between-subject effects
(I) Group (J) Group Mean difference (I-J) SE P
Music therapy Neuro-feedback -0.067 1.588 0.999
control -5.582 1.621 0.007
Neuro-feedback Music therapy 0.067 1.588 0.999
control -5.515 1.548 0.005
Control Music therapy 5.582 1.621 0.007
Neuro-feedback 5.515 1.548 0.005 SE: Standard error
There was a significant main effect of HADS
scores (P < 0.001) in the responses of MT group. Significant decreases were observed in HADS scores from pre-intervention to post-intervention tests in MT group comparing to control group. The MT accounted for 49 percent of variance in HADS scores. There was also a significant main effect of HADS scores (P < 0.010) in the responses of NFT group. HADS scores from pre-intervention to post-intervention tests in NFT group comparing to control group showed significant decreases too (Figure 2). In addition, MT and NFT groups did not show any significant difference in somatic symptoms scores between pretest and posttest among patients with IBS.
Figure 2. Mean (standard deviation) of the
hospital anxiety and depression scale scores among three groups
Discussion
MT and NFT contributed to anxiety. In our study, MT and NFT groups showed significant improvement in diminishing anxiety. This was remarkable among patients with IBS, since our two protocols have not been conducted
previously. Brain-gut interactions has been documented in pathophysiology of IBS, so these results can state this hypothesis that psychological factors play a much more important role than previous assumptions.2
The first protocol (A) indicated that anxiety level has been improved after the MT sessions. While no study has been performed to investigate the impact of MT on anxiety among patients with IBS, several studies have focused on MT to lessen anxiety level among other patients with traumatic brain injury, dementia, cancer, heart disease, and burn.16-22,38 Although some studies have shown that stress-related signs as well as subjective anxiety could be diminished by MT, this study could not show a reduction in somatic symptoms of patients with IBS, and it may be related to limited period of interventions. Thus, further research designed with long-term intervention as well as longer follow-up to assess long-term psychiatric outcome is recommended.1,22,38,40
Beneficial effects of MT have been recognized previously.18,22,39,40 Music has positive psychological and physiological effects; it has alleviated anxiety and has improved tolerance among patients with IBS.41 Most of the investigations with common object have stated that MT can alleviate irritability and nervousness generally.10,18,19 Other studies have pointed that patients with IBS who were included in group with MT, showed meaningful decrease in taking and requesting sedative and tranquilizer medications.42 It may be argued that the results of alleviation in emotions after listening therapeutic music are affected by patients suggestibility, but it has
0
2
4
6
8
10
12
14
Musictherapy Neuro fedback Control
Before After
http://cdjournal.muk.ac.ir, 06 July
The effect of music and neurofeedback training on IBS Hosseini et al.
Chron Dis J, Vol. 6, No. 3, Summer 2018 149
been shown that MT can decrease the rate of emotions more than placebo.17,42 Learned helplessness effect may happen among participants who are allocated to sham treatment in control group, so this study did not implement sham treatment for control group. Learned helplessness effect happens while participants learn that what they did had nothing to do with outcome, so it may bring about passive behavior as well as low scores.42 With regard to this point, in our investigation, we assessed and worked up anxiety and depressive mood among patients with IBS and compared the results with a technologic therapeutic procedure named NFT.
We only used headphone to provide MT or so-called “music medicine” for patients with IBS, and this was one of the limitations of the current study. Music medicine is defined as passive listening to pre-recorded music.41 Listening to music through headphone may increase concentration on music comparing to public broadcasting. We did not use live performance by trained music therapists that might have greater impact on anxiety level.43 Other studies may include live performance in MT, especially by a music therapist.
The second protocol (B) has also shown that anxiety has been alleviated by NFT. A few studies has supported this idea that alpha-theta module has great impact on anxiety.42,44,45
It has been argued that the effects of alpha-theta NFT are more than alleviating anxiety; and furthermore, they are associated with creative process and well-being. Alpha-theta NFT may interact with limbic and long-distance circuitry in the brain which is notably accounted for the mood conditions.31,40,44 It can be concluded that when alpha-theta training leads to diminished frontal beta activity, it can reduce anxiety in patients.42
Neuroscience research has revealed that the intestinal tract and the brain are intimately related in terms of hormonal activity and autonomic nervous system connections.1,2,10,32
This is referred to as the "Gut-Brain Connection". Individuals with IBS frequently present evidence of abnormal high frequency brainwave activity in the frontal lobes where emotional regulation occurs.32,46 There has been a review revealing positive effects of NFT on IBS symptoms in adult patients with IBS. However, the paper has stated that these results should be interpreted with caution due to the small number of studies examined and the associated methodological problems.46,47
While patients with IBS have significantly higher levels of anxiety and depression than healthy population, few studies have addressed alternative medical therapies to alleviate anxiety and depression among patients with IBS.10 In this way, our present investigation has focused on emotions such as anxiety and depressive mood with applying NFT, and has shown that NFT, equally with MT, can decrease anxiety and depression, and this alleviation was meaningfully more than patients included in waiting list.
Conclusion
It is worth mentioning that non-pharmaceutical interventions give patients more choice over managing chronic disease; therefore, it may improve the quality of their life as well as self-care. With regard to literature, it was shown that IBS is strongly affected by multiple biopsychosocial factors. In this study, we have shown that other novel types of treatment like MT and NFT can alleviate clinical symptoms of patients with IBS. Future studies should address long-term interventions and monitoring physiologic indices of anxiety.
This study showed that MT as well as NFT significantly alleviated anxiety and depression level among patients with IBS.
One of the pitfalls among most of the recent investigations with same object is lack of attention to long-term effects of NFT on IBS;31-33 therefore, further studies are needed to ascertain
http://cdjournal.muk.ac.ir, 06 July
The effect of music and neurofeedback training on IBS Hosseini et al.
150 Chron Dis J, Vol. 6, No. 3, Summer 2018
the long-term effects of NFT and the underlying psychosocial mechanisms leading to anxiety reduction and improved quality of life.41
Conflict of Interests
Authors have no conflict of interests.
Acknowledgments
This study was a randomized clinical trial that was registered in Iranian Registry of Clinical Trials and allocated a unique code (IRCT2015050711885N6). Recruitment period was from November 2014 to July 2015. The study was approved by the Research Ethics Committee of Mazandaran University of Medical Sciences and allocated a unique code (Ir.Mazums.REC.95-A103). Finally, we thank the patients who took part in the study.
References
1. Spiegel DR, Kolb R. Treatment of irritable bowel syndrome with comorbid anxiety symptoms with mirtazapine. Clin Neuropharmacol 2011; 34(1): 36-8.
2. Chey WD, Kurlander J, Eswaran S. Irritable bowel syndrome: A clinical review. JAMA 2015; 313(9): 949-58.
3. Zhang MM, Liu SB, Chen T, Koga K, Zhang T, Li YQ, et al. Effects of NB001 and gabapentin on irritable bowel syndrome-induced behavioral anxiety and spontaneous pain. Mol Brain 2014; 7: 47.
4. Tyrer P. Against the stream: Generalised anxiety disorder (GAD)-a redundant diagnosis. BJPsych Bull 2018; 42(2): 69-71.
5. Tosic-Golubovic S, Miljkovic S, Nagorni A, Lazarevic D, Nikolic G. Irritable bowel syndrome, anxiety, depression and personality characteristics. Psychiatr Danub 2010; 22(3): 418-24.
6. Lydiard RB. Irritable bowel syndrome, anxiety, and depression: What are the links? J Clin Psychiatry 2001; 62 (Suppl 8): 38-45.
7. Pinto C, Lele MV, Joglekar AS, Panwar VS, Dhavale HS. Stressful life-events, anxiety, Depression and coping in patients of irritable bowel syndrome. J Assoc Physicians India 2000; 48(6): 589-93.
8. Lydiard RB. Anxiety and the irritable bowel syndrome: Psychiatric, medical, or both? J Clin Psychiatry 1997; 58(Suppl 3): 51-8.
9. Janssens KA, Zijlema WL, Joustra ML, Rosmalen
JG. Mood and anxiety disorders in chronic fatigue
syndrome, fibromyalgia, and irritable bowel
syndrome: Results from the lifelines cohort study.
Psychosom Med 2015; 77(4): 449-57.
10. Fond G, Loundou A, Hamdani N, Boukouaci W,
Dargel A, Oliveira J, et al. Anxiety and depression
comorbidities in irritable bowel syndrome (IBS): A
systematic review and meta-analysis. Eur Arch
Psychiatry Clin Neurosci 2014; 264(8): 651-60.
11. Kovacs Z, Kovacs F. Depressive and anxiety
symptoms, dysfunctional attitudes and social aspects
in irritable bowel syndrome and inflammatory bowel
disease. Int J Psychiatry Med 2007; 37(3): 245-55.
12. Deechakawan W, Heitkemper MM, Cain KC, Burr
RL, Jarrett ME. Anxiety, depression, and
catecholamine levels after self-management
intervention in irritable bowel syndrome.
Gastroenterol Nurs 2014; 37(1): 24-32.
13. Muscatello MR, Bruno A, Pandolfo G, Mico U, Stilo
S, Scaffidi M, et al. Depression, anxiety and anger in
subtypes of irritable bowel syndrome patients. J Clin
Psychol Med Settings 2010; 17(1): 64-70.
14. Gilkin RJ Jr. The spectrum of irritable bowel
syndrome: A clinical review. Clin Ther 2005; 27(11):
1696-709.
15. Li XM, Yan H, Zhou KN, Dang SN, Wang DL,
Zhang YP. Effects of music therapy on pain among
female breast cancer patients after radical
mastectomy: Results from a randomized controlled
trial. Breast Cancer Res Treat 2011; 128(2): 411-9.
16. Guetin S, Portet F, Picot MC, Pommie C, Messaoudi
M, Djabelkir L, et al. Effect of music therapy on
anxiety and depression in patients with Alzheimer's
type dementia: Randomised, controlled study.
Dement Geriatr Cogn Disord 2009; 28(1): 36-46. 17. Bradt J, Dileo C. Music for stress and anxiety
reduction in coronary heart disease patients. Cochrane Database Syst Rev 2009; (2): CD006577.
18. Guetin S, Soua B, Voiriot G, Picot MC, Herisson C. The effect of music therapy on mood and anxiety-depression: An observational study in institutionalised patients with traumatic brain injury. Ann Phys Rehabil Med 2009; 52(1): 30-40.
19. Zhou K, Li X, Li J, Liu M, Dang S, Wang D, et al. A clinical randomized controlled trial of music therapy and progressive muscle relaxation training in female breast cancer patients after radical mastectomy: Results on depression, anxiety and length of hospital stay. Eur J Oncol Nurs 2015; 19(1): 54-9.
20. Jimenez-Jimenez M, Garcia-Escalona A, Martin-
Lopez A, De Vera-Vera R, De Haro J. Intraoperative
stress and anxiety reduction with music therapy: A
controlled randomized clinical trial of efficacy and
safety. J Vasc Nurs 2013; 31(3): 101-6.
21. Tan X, Yowler CJ, Super DM, Fratianne RB. The
efficacy of music therapy protocols for decreasing
http://cdjournal.muk.ac.ir, 06 July
The effect of music and neurofeedback training on IBS Hosseini et al.
Chron Dis J, Vol. 6, No. 3, Summer 2018 151
pain, anxiety, and muscle tension levels during burn
dressing changes: A prospective randomized
crossover trial. J Burn Care Res 2010; 31(4): 590-7.
22. Madson AT, Silverman MJ. The effect of music
therapy on relaxation, anxiety, pain perception, and
nausea in adult solid organ transplant patients. J
Music Ther 2010; 47(3): 220-32.
23. Liu YH, Chang MY, Chen CH. Effects of music
therapy on labour pain and anxiety in Taiwanese first-
time mothers. J Clin Nurs 2010; 19(7-8): 1065-72.
24. Wang JR, Hsieh S. Neurofeedback training improves
attention and working memory performance. Clin
Neurophysiol 2013; 124(12): 2406-20.
25. Rasey H, Lubar JF, McIntyre A, Zoffuto A, Abbott
PL. EEG biofeedback for the enhancement of
attentional processing in normal college students. J
Neur 1995; 1(3): 15-21.
26. Cheon EJ, Koo BH, Seo WS, Lee JY, Choi JH, Song
SH. Effects of neurofeedback on adult patients with
psychiatric disorders in a naturalistic setting. Appl
Psychophysiol Biofeedback 2015; 40(1): 17-24.
27. Ghosh T, Jahan M, Singh AR. The efficacy of
electroencephalogram neurofeedback training in
cognition, anxiety, and depression in alcohol
dependence syndrome: A case study. Ind Psychiatry J
2014; 23(2): 166-70.
28. Schoenberg PL, David AS. Biofeedback for
psychiatric disorders: A systematic review. Appl
Psychophysiol Biofeedback 2014; 39(2): 109-35.
29. Chan SY. Neurofeedback: Challenges, applications, and
opportunities for education [MSc Thesis]. Burnaby,
Canada: Simon Fraser University; 2015.
30. Schnyer DM, Beevers CG, deBettencourt MT,
Sherman SM, Cohen JD, Norman KA, et al.
Neurocognitive therapeutics: From concept to
application in the treatment of negative attention bias.
Biol Mood Anxiety Disord 2015; 5: 1.
31. Gruzelier J. A theory of alpha/theta neurofeedback,
creative performance enhancement, long distance
functional connectivity and psychological integration.
Cogn Process 2009; 10(Suppl 1): S101-S109.
32. Gruzelier JH, Thompson T, Redding E, Brandt R,
Steffert T. Application of alpha/theta neurofeedback
and heart rate variability training to young
contemporary dancers: State anxiety and creativity.
Int J Psychophysiol 2014; 93(1): 105-11.
33. Saxby E, Peniston EG. Alpha-theta brainwave
neurofeedback training: An effective treatment for
male and female alcoholics with depressive
symptoms. J Clin Psychol 1995; 51(5): 685-93.
34. Peniston EG, Kulkosky PJ. Alpha-theta brainwave
neuro-feedback therapy for Vietnam veterans with
combat-related post-traumatic stress disorder.
Medical Psychotherapy 1991; 4: 47-60.
35. Drossman DA, Dumitrascu DL. Rome III: New
standard for functional gastrointestinal disorders.
J Gastrointestin Liver Dis 2006; 15(3): 237-41.
36. Zigmond AS, Snaith RP. The hospital anxiety and
depression scale. Acta Psychiatr Scand 1983; 67(6):
361-70.
37. McDowell I. Measuring Health: A Guide to rating
scales and questionnaires. Oxford, UK: Oxford
University Press; 2006.
38. Kaviani H, Seyfourian H, Sharifi V, Ebrahimkhani N.
Reliability and validity of Anxiety and Depression
Hospital Scales (HADS): Iranian patients with
anxiety and depression disorders. Tehran Univ Med J
2009; 67(2): 379-85. [In Persian].
39. Bjelland I, Dahl AA, Haug TT, Neckelmann D. The
validity of the hospital anxiety and depression scale.
an updated literature review. J Psychosom Res 2002;
52(2): 69-77.
40. Lehrer PM, Woolfolk RL, Sime WE. Principles and
practice of stress management. New York, NY:
Guilford Press; 2007.
41. Raymond J, Varney C, Parkinson LA, Gruzelier JH.
The effects of alpha/theta neurofeedback on
personality and mood. Brain Res Cogn Brain Res
2005; 23(2-3): 287-92.
42. Egner T, Zech TF, Gruzelier JH. The effects of
neurofeedback training on the spectral topography of
the electroencephalogram. Clin Neurophysiol 2004;
115(11): 2452-60.
43. Bahrami N, Soleimani MA, Sharifnia H, Shaigan H,
Sheikhi MR, Mohammad-Rezaei Z. Effects of
anxiety reduction training on physiological indices
and serum cortisol levels before elective surgery. Iran
J Nurs Midwifery Res 2013; 18(5): 416-20.
44. Chen LC, Wang TF, Shih YN, Wu LJ. Fifteen-
minute music intervention reduces pre-radiotherapy
anxiety in oncology patients. Eur J Oncol Nurs 2013;
17(4): 436-41.
45. Masuy I, Van Oudenhove L, Tack J, Biesiekierski
JR. Effect of intragastric FODMAP infusion on upper
gastrointestinal motility, gastrointestinal, and
psychological symptoms in irritable bowel syndrome
vs healthy controls. Neurogastroenterol Motil 2018;
30(1).
46. Fadgyas-Stanculete M, Buga AM, Popa-Wagner A,
Dumitrascu DL. The relationship between irritable
bowel syndrome and psychiatric disorders: From
molecular changes to clinical manifestations. J Mol
Psychiatry 2014; 2(1): 4.
47. Murad MH, Sharma V, Prokop LJ, Sood A.
Psychological therapies in patients with irritable
bowel syndrome: A systematic review and meta-
analysis of randomized controlled trials.
Gastroenterol Res Pract 2015; 2015: 549308.

http://cdjournal.muk.ac.ir, 06 July
152 Chron Dis J, Vol. 6, No. 3, Summer 2018
DOI: 10.22122/cdj.v6i3.332 Published by Vesnu Publications
Spiritual intelligence and its related factors in the students of Sanandaj Universities, Iran, 2015
Ahmad Vahabi1
, Arezoo Vahabi2, Boshra Vahabi
2, Daem Roshani
3, Mahnaz Sayyadi
4
1 Assistant Professor, Department of Medical Laboratory Sciences, Faculty of Paramedical, Kurdistan University
of Medical Sciences, Sanandaj, Iran
2 Student of Medicine, Student Research Committee, Kurdistan University of Medical Sciences, Sanandaj, Iran
3 Social Determinants of Health Research Center, Research Institute for Health Development, Kurdistan
University of Medical Sciences, Sanandaj, Iran
4 Ghods Hospital of Paveh, Kermanshah University of Medical Sciences, Kermanshah, Iran
Abstract BACKGROUND: Spiritual intelligence is the capacity of human to ask final questions about the meaning of life and
the unified relationship between us and the universe. The present study was done to determine spiritual
intelligence and its related factors among the students of the universities of Sanandaj, Iran, in 2015.
METHODS: This study was a cross-sectional research. The study population included students of Kurdistan
University, Islamic Azad University of Sanandaj, and Kurdistan University of Medical Sciences. 902 students were
selected using cluster sampling method. A two-part questionnaire including demographic characteristics and 29
questions about spiritual intelligence was used. The data were analyzed using SPSS software.
RESULTS: The mean total score of spiritual intelligence was 116.43 ± 15.65. 453 (50.6%) subjects had high spiritual
intelligence. There was a positive correlation between age and spiritual intelligence of the students (r = 0.02, P = 0.61).
Moreover, there was a significant statistical difference between spiritual intelligence and university (P < 0.001).
CONCLUSION: The results showed that the spiritual intelligence of the most students was satisfactory and good.
Considering the high spiritual intelligence score of the studied students, it is expected that most of them have a
good performance, especially in the field of education.
KEYWORDS: Intelligence, Spirituality, Students, Universities
Date of submission: 09 July 2017, Date of acceptance: 12 Sep. 2017
Citation: Vahabi A, Vahabi A, Vahabi B, Roshani D, Sayyadi M. Spiritual intelligence and its related
factors in the students of Sanandaj Universities, Iran, 2015. Chron Dis J 2018; 6(3): 152-8.
Introduction1
Intelligence is the problem-solving ability, which has a more cognitive aspect and was raised by Alfred Binet in the early of twentieth century.1,2 In the late of 20th century, in addition to intelligence quotient (IQ) and emotional intelligence (EI), there was also a third-generation intelligence called spiritual intelligence.3,4 Experts believe that spiritual intelligence is specific to human beings and it
Corresponding Author:
Boshra Vahabi
Email: [email protected]
is the basis of individual beliefs that affect its effectiveness and enhance flexibility against stresses and problems.2,5,6 Spiritual intelligence can be considered as something we believe in, and it embraces the role of beliefs, norms, and values in the activities we take. The intelligence through which we focus on questions about fundamental issues and the life as a whole that makes changes in our lives is called spiritual intelligence. By using this intelligence, we are able to solve life problems and we can give meaning to our activities.7,8
Amram believes that there is no coherent and systematic research in identifying and
Original Article

http://cdjournal.muk.ac.ir, 06 July
Spiritual intelligence and its related factors Vahabi et al.
Chron Dis J, Vol. 6, No. 3, Summer 2018 153
exploring the characteristics of spiritual intelligence.9 It seems that the nature of the components and the way of expressing spiritual intelligence is influenced by cultural factors, and the difference in personality characteristics of individuals will make a difference in the amount of spiritual interests, areas, and practices as well as skills and capacities associated with spiritual intelligence. Although spiritual intelligence is seen as an obvious global phenomenon, the meaning and way of expressing it differ among different groups.10 According to Sohrabi, because spiritual intelligence is influenced by different cultural factors and value systems, research in this field is valuable in different cultures and nationalities of the country, and in this way we can take longer scientific steps.11
New neurological studies have shown that
some brain actions are associated with spiritual experiences, so that spirituality affects some parts of the brain. One of these episodes
is the temporal lobe that neuropsychologists called it the "God" region, because its artificial stimulation emerges spiritual issues such as
meeting God, religious dialogue, selflessness,
sacrifice, humanity, and the like; therefore, we can believe in the existence of spiritual intelligence in human.12-14 Studies have shown
that people with higher spiritual intelligence have better general health and they are better than others in different fields.1,2,5,6,15-19
Considering the student's views on various
subjects in the universities of Sanandaj, Iran,20-29
no study was found on the status of students' spiritual intelligence in Sanandaj universities,
and considering the importance of spiritual
intelligence in the students' success in providing services to patients and society, we decided to carry out this study aimed to
determine spiritual intelligence and its related factors among university students in Sanandaj.
Materials and Methods
This was a cross sectional research. The study population included the students of Kurdistan
University, Islamic Azad University of Sanandaj, and Kurdistan University of Medical Sciences in Sanandaj city. The population of the present study was about 12000 students. Using a standard deviation (SD) of 5.5 from a similar study,5 and using the following sampling formula, the subjects required to complete this study were calculated as 920. In this formula, Z1-a/2 = 1.96, ZB = 1.28, , d = 0.83, and the design effect (DEEF) = 2 were determined.
⁄
A cluster sampling method was used for this study. Each university was considered a cluster. In each university 2-3 faculties and in each faculty a number of classes were selected; in each class, all students in the class who were willing to cooperate in the study, were examined. All students of all ages and all disciplines from the three universities could be included in the study. The exclusion criterion was students' unwillingness to participate in the study. For data collection, the used questionnaire by Heravi-Karimooi et al.5 was used. The questionnaire had two parts. The first part included the demographic characteristics and the second part had 29 questions about spiritual intelligence. Grading questions in this section was based on a 5-point Likert scale of totally disagree with the score of 1 to totally agree with the score of 5. Before the data collection, the necessary explanations were provided about the importance of the study to the students, and it was emphasized that the participation in this study was entirely optional and the students did not need to write their name. They also were assured that all personal information would remain completely confidential. The study was approved by the Ethics Committee of Kurdistan University of Medical Sciences (No. 94/110) prior to the study and was conducted in coordination with the universities. The collected data were analyzed by SPSS software (version 20, IBM Corporation, Armonk, NY, USA).
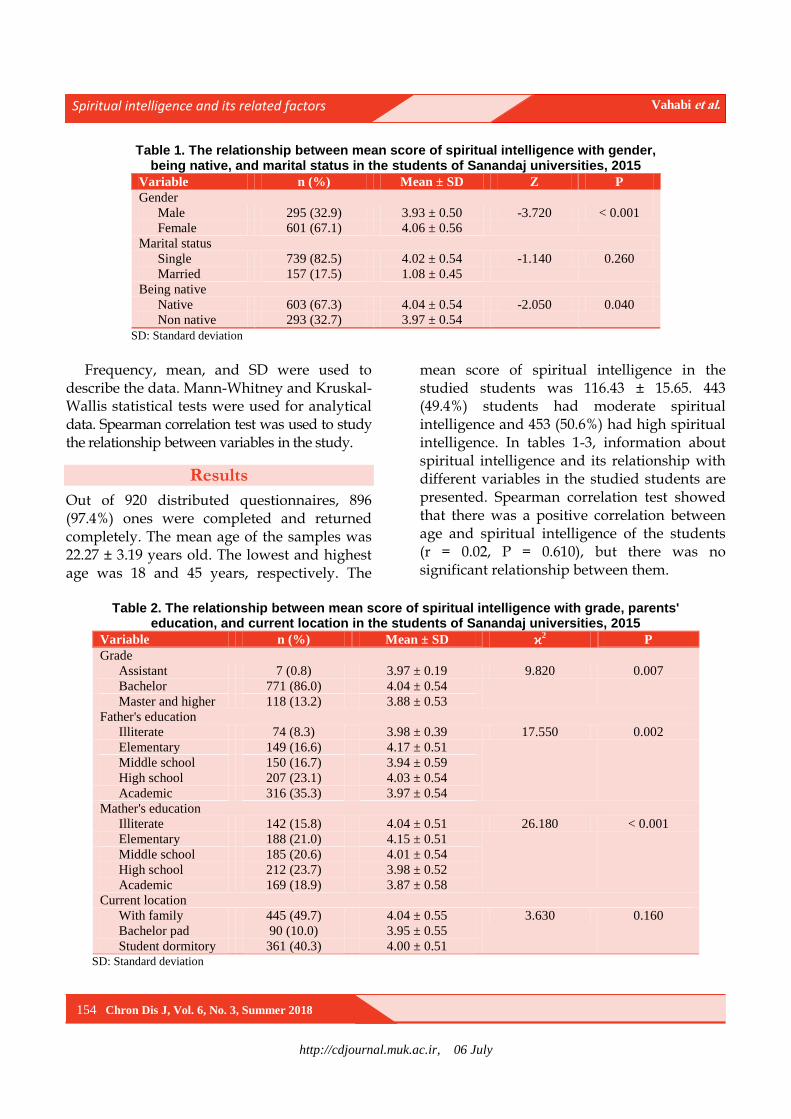
http://cdjournal.muk.ac.ir, 06 July
Spiritual intelligence and its related factors Vahabi et al.
154 Chron Dis J, Vol. 6, No. 3, Summer 2018
Table 1. The relationship between mean score of spiritual intelligence with gender, being native, and marital status in the students of Sanandaj universities, 2015
Variable n (%) Mean ± SD Z P
Gender
Male 295 (32.9) 3.93 ± 0.50 -3.720 < 0.001
Female 601 (67.1) 4.06 ± 0.56
Marital status
Single 739 (82.5) 4.02 ± 0.54 -1.140 0.260
Married 157 (17.5) 1.08 ± 0.45
Being native
Native 603 (67.3) 4.04 ± 0.54 -2.050 0.040
Non native 293 (32.7) 3.97 ± 0.54
SD: Standard deviation
Frequency, mean, and SD were used to
describe the data. Mann-Whitney and Kruskal-Wallis statistical tests were used for analytical data. Spearman correlation test was used to study the relationship between variables in the study.
Results
Out of 920 distributed questionnaires, 896 (97.4%) ones were completed and returned completely. The mean age of the samples was 22.27 ± 3.19 years old. The lowest and highest age was 18 and 45 years, respectively. The
mean score of spiritual intelligence in the studied students was 116.43 ± 15.65. 443 (49.4%) students had moderate spiritual intelligence and 453 (50.6%) had high spiritual intelligence. In tables 1-3, information about spiritual intelligence and its relationship with different variables in the studied students are presented. Spearman correlation test showed that there was a positive correlation between age and spiritual intelligence of the students (r = 0.02, P = 0.610), but there was no significant relationship between them.
Table 2. The relationship between mean score of spiritual intelligence with grade, parents'
education, and current location in the students of Sanandaj universities, 2015
Variable n (%) Mean ± SD ϰ2 P
Grade
Assistant 7 (0.8) 3.97 ± 0.19 9.820 0.007
Bachelor 771 (86.0) 4.04 ± 0.54
Master and higher 118 (13.2) 3.88 ± 0.53
Father's education
Illiterate 74 (8.3) 3.98 ± 0.39 17.550 0.002
Elementary 149 (16.6) 4.17 ± 0.51
Middle school 150 (16.7) 3.94 ± 0.59
High school 207 (23.1) 4.03 ± 0.54
Academic 316 (35.3) 3.97 ± 0.54
Mather's education
Illiterate 142 (15.8) 4.04 ± 0.51 26.180 < 0.001
Elementary 188 (21.0) 4.15 ± 0.51
Middle school 185 (20.6) 4.01 ± 0.54
High school 212 (23.7) 3.98 ± 0.52
Academic 169 (18.9) 3.87 ± 0.58
Current location
With family 445 (49.7) 4.04 ± 0.55 3.630 0.160
Bachelor pad 90 (10.0) 3.95 ± 0.55
Student dormitory 361 (40.3) 4.00 ± 0.51 SD: Standard deviation
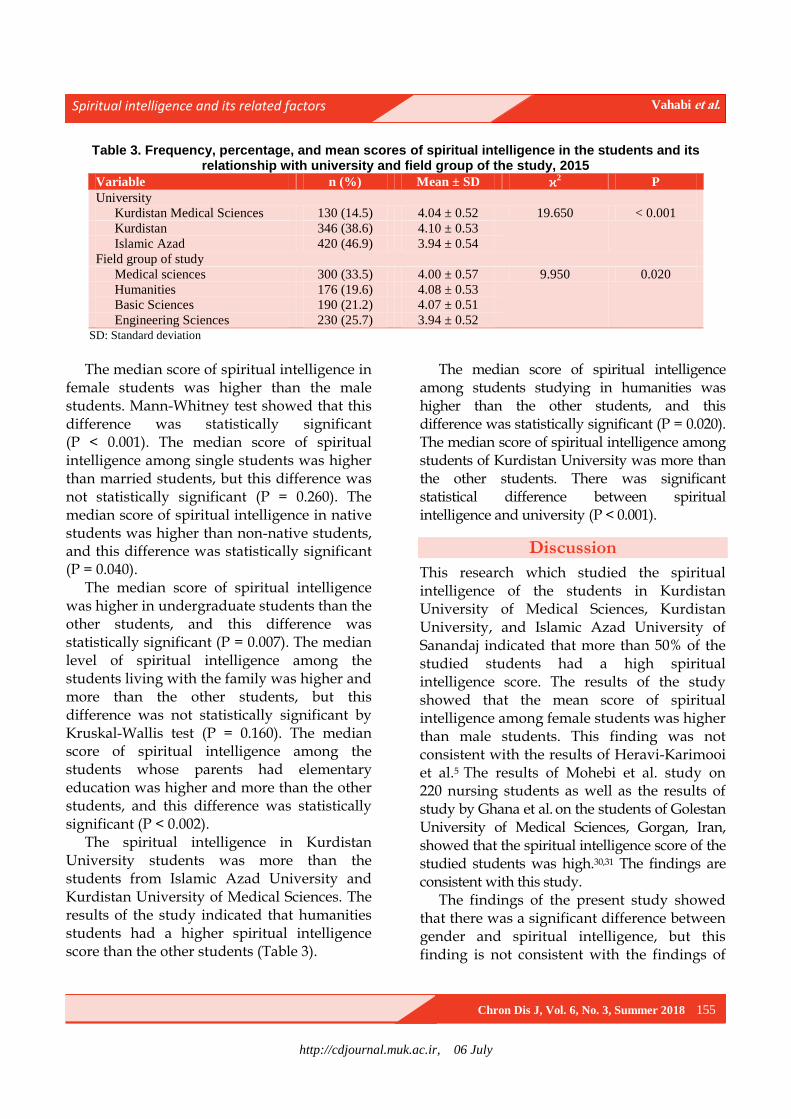
http://cdjournal.muk.ac.ir, 06 July
Spiritual intelligence and its related factors Vahabi et al.
Chron Dis J, Vol. 6, No. 3, Summer 2018 155
Table 3. Frequency, percentage, and mean scores of spiritual intelligence in the students and its relationship with university and field group of the study, 2015
Variable n (%) Mean ± SD ϰ2 P
University
Kurdistan Medical Sciences 130 (14.5) 4.04 ± 0.52 19.650 < 0.001
Kurdistan 346 (38.6) 4.10 ± 0.53
Islamic Azad 420 (46.9) 3.94 ± 0.54
Field group of study
Medical sciences 300 (33.5) 4.00 ± 0.57 9.950 0.020
Humanities 176 (19.6) 4.08 ± 0.53
Basic Sciences 190 (21.2) 4.07 ± 0.51
Engineering Sciences 230 (25.7) 3.94 ± 0.52 SD: Standard deviation
The median score of spiritual intelligence in
female students was higher than the male students. Mann-Whitney test showed that this difference was statistically significant (P < 0.001). The median score of spiritual intelligence among single students was higher than married students, but this difference was not statistically significant (P = 0.260). The median score of spiritual intelligence in native students was higher than non-native students, and this difference was statistically significant (P = 0.040).
The median score of spiritual intelligence was higher in undergraduate students than the other students, and this difference was statistically significant (P = 0.007). The median level of spiritual intelligence among the students living with the family was higher and more than the other students, but this difference was not statistically significant by Kruskal-Wallis test (P = 0.160). The median score of spiritual intelligence among the students whose parents had elementary education was higher and more than the other students, and this difference was statistically significant (P < 0.002).
The spiritual intelligence in Kurdistan University students was more than the students from Islamic Azad University and Kurdistan University of Medical Sciences. The results of the study indicated that humanities students had a higher spiritual intelligence score than the other students (Table 3).
The median score of spiritual intelligence among students studying in humanities was higher than the other students, and this difference was statistically significant (P = 0.020). The median score of spiritual intelligence among students of Kurdistan University was more than the other students. There was significant statistical difference between spiritual intelligence and university (P < 0.001).
Discussion
This research which studied the spiritual intelligence of the students in Kurdistan University of Medical Sciences, Kurdistan University, and Islamic Azad University of Sanandaj indicated that more than 50% of the studied students had a high spiritual intelligence score. The results of the study showed that the mean score of spiritual intelligence among female students was higher than male students. This finding was not consistent with the results of Heravi-Karimooi et al.5 The results of Mohebi et al. study on 220 nursing students as well as the results of study by Ghana et al. on the students of Golestan University of Medical Sciences, Gorgan, Iran, showed that the spiritual intelligence score of the studied students was high.30,31 The findings are consistent with this study.
The findings of the present study showed that there was a significant difference between gender and spiritual intelligence, but this finding is not consistent with the findings of
http://cdjournal.muk.ac.ir, 06 July
Spiritual intelligence and its related factors Vahabi et al.
156 Chron Dis J, Vol. 6, No. 3, Summer 2018
Hamidi and Sedaghat,32 Ghana et al.,31
Khorshidi and Ebadi,33 Ebrahimi et al.,34
Hosseinchari and Zakeri,35 and Raghib et al.,36 who stated that there was no relation between gender and spiritual intelligence. In the findings of George, it was also found that there was a statistically significant difference between the spiritual intelligence of boys and girls,37 which is consistent with the findings of this study. The findings of the present study indicated that most of the studied students had a high score of spiritual intelligence. This finding indicates that spirituality is very important for the surveyed students, which is consistent with the results of the other studies.31-37
The results of this research showed that there was a significant difference between the students' age and their spiritual intelligence. This finding is not consistent with the results of the studies by Heravi-Karimooi et al.,5 Ghana et al.,31 and Bagheri et al.;18 but there was a significant statistical difference between age and spiritual intelligence in the findings of Raqib and Siyadat,38 that is consistent with the findings of the present study.
The results of the present study showed that the score of spiritual intelligence of the students living with family was higher and better than the other students. This finding can also indicate the important role of families in creating and institutionalizing spirituality in the community. This group of the students can have higher spirituality for the sake of family support and companionship; in other groups, there may be no support and consequently a feeling of spiritual disability may develop in the students. One of the interesting findings of this research is that the score of spiritual intelligence among students of humanities department was higher and better than the other students, and this difference was statistically significant. This finding reflects the fact that, given that humanities students are more closely involved with spiritual topics that
may be in some of the disciplines of this group, there are many units in the field of spirituality and communication with God and the world. This group of the students is expected to enjoy a high level of spirituality. This expectation is somewhat satisfied in this study.
Conclusion
Considering the results of the study and the high score of spiritual intelligence in most of the studied students, it seems that paying attention to the humanistic and spiritual capacities of the students as a strong point can make the future of their professional career more successful and desirable.
Conflict of Interests
Authors have no conflict of interests.
Acknowledgments
We would like to thank all the students who
helped us with this project and also the Student Research Committee of Kurdistan
University of Medical Sciences for their
cooperation in approving this project and financing the research in the form of student research project No. 94/110 supported by Vice Chancellor for Research and Technology,
Kurdistan University of Medical Sciences.
References
1. Noohi E, Rahimi N, Nakhaee N. Study spiritual
intelligence nursing and midwife students of Kerman
University of Medical Sciences in 2012. Medical
History 2014; 5(17): 63-78. [In Persian].
2. Emamgholian F, Mostafaie M, Hoseinabadi M,
Keshavarz M. Spiritual Intelligence and its
influencing factors in nursing students: A cross-
sectional study. Islam and Health Journal 2015; 2(2):
16-22.
3. Samadi P. Spiritual intelligence. New Thoughts on
Education 2007; 2(3-4): 99-114. [In Persian].
4. Semyari H, Heravi Krimooi M, Nasiri M, Arabi F.
Spiritual intelligence in the dental students of Tehran
Universities 2013-2014. Journal of Nursing
Education 2015; 3(4): 48-57. [In Persian].
http://cdjournal.muk.ac.ir, 06 July
Spiritual intelligence and its related factors Vahabi et al.
Chron Dis J, Vol. 6, No. 3, Summer 2018 157
5. Heravi-Karimooi M, Rejeh N, Sharif Nia H. The
relationship between nursing students' spiritual
intelligence and their general health in Tehran, 2012.
Iran J Med Educ 2018; 14(1): 1-14. [In Persian].
6. Nouhi E, Nakhaee N, Rahimi N. Spiritual
intelligence and attitude towards spirituality and
spiritual care in nursing and midwifery students. Iran
J Nurs 2014; 27(90-91): 150-9. [In Persian].
7. Hamid N, Keikhosravani M, Babamiri M, Dehghani
M. The relationship between mental health, spiritual
intelligence with resiliency in student of Kermanshah
University of Medical Sciences. Jentashapir 2012;
3(2): 331-8. [In Persian].
8. Yaghoobi A. The study of relation between spiritual
intelligence and rate of happiness in booali university
students. Journal of Research in Educational Systems
2010; 4(9): 85-95. [In Persian].
9. Amram JY. The contribution of emotional and
spiritual intelligences to effective business leadership
[PhD Thesis]. Palo Alto, CA: Institute of
Transpersonal Psychology; 2009.
10. Hosseinpoor Mh, Younesian A, Khosravi A, Sabbagh
Y, Kolahdozan S. relationship between general health
with emotional intelligence and spiritual intelligence
in students. Knowledge Health 2015; 10(2): 11-7.
[In Persian].
11. Sohrabi F. Fundamental of spiritual intelligence. Journal
of Mental Health 2008; 1(1): 14-8. [In Persian].
12. Chiu L. Spiritual resources of Chinese immigrants
with breast cancer in the USA. Int J Nurs Stud 2001;
38(2): 175-84.
13. Narayanasamy A, Owens J. A critical incident study
of nurses' responses to the spiritual needs of their
patients. J Adv Nurs 2001; 33(4): 446-55.
14. Zare H, Pedram A, Shirvanian E. Prediction of
student's spiritual intelligence by their personality
characteristics. J Res Behav Sci 2012; 10(1): 59-68.
[In Persian].
15. Miri K, Kshavarz A, Shirdelzadeh S, Parsa M. The
relationship between nurses' spiritual intelligence and
quality of nursing care based on nurses' & patients'
viewpoints. J Urmia Nurs Midwifery Fac 2015;
13(6): 518-24. [In Persian].
16. Tasharrofi Z, Hatami HR, Asgharnejad AA. The
study of relationship between spiritual intelligence,
resilience and spiritual well-being with occupational
burnout in nurses. Euro J Exp Bio 2013; 3(6): 410-4.
17. Faribors B, Fatemeh A, Hamidreza H. The
relationship between nurse’s spiritual intelligence and
happiness in Iran. Procedia Soc Behav Sci 2010; 5:
1556-61.
18. Bagheri F, Akbarizadeh F, Hatami H. The
relationship between spiritual intelligence and
happiness on the nurse staffs of the Fatemeh Zahra
hospital and Bentolhoda institute of Boushehr city.
Iran South Med J 2011; 14(4): 256-63. [In Persian].
19. Karimi-Moonaghi H, Gazerani A, Vaghee S,
Gholami H, Salehmoghaddam AR, Gharibnavaz R.
Relation between spiritual intelligence and clinical
competency of nurses in Iran. Iran J Nurs Midwifery
Res 2015; 20(6): 665-9. [In Persian].
20. Vahabi A, Nadrian H, Sayyadi M, Iranpour A,
Bahmanpour K, Moradzadeh R, et al. A Quantitative
Study of Determinant Factors of Effective Teaching
in Kurdistan University of Medical Sciences: Non-
Clinical Teachers' Viewpoints. Iran J Med Educ
2012; 12(1): 46-54. [In Persian].
21. Vahabi A, Sayadi M, Shahsavari S, Khadem MB,
Veisi A, Pouladi A. Features of a good teacher from
viewpoints of Kurdistan University of Medical
Sciences. Proceedings of the 12th
congress of Medical
Education; 2011 Apr. 30-May 2; Mashhad, Iran.
[In Persian].
22. Salavati S, Vahabi A, Sayyadi M, Zandi S, Vahabi B.
Students' mental health status and its related factors
in Sanandaj City Universities, Iran, 2016. Chron Dis
J 2018; 6(1): 10-7.
23. Vahabi A, Vahabi A, Sayyad S, Kashefi H, Vahabi
B. The relationship between the student stressor
factors and academic burnout among the students in
Kurdistan University of Medical Sciences, Iran, in
year 2016. Chron Dis J 2018; 6(2): 45-52.
24. Vahabi A, Vahabi B, Rajabi N, Taifuri S, Ahmadian
M. Evaluation of internet addiction and its related
factors in the students of Kurdistan University of
Medical Sciences, 2015. J Med Educ Dev 2015;
8(19): 99-110. [In Persian].
25. Vahabi A. The characteristics of a good teacher from
the viewpoint of students of Sanandaj University of
applied Sciences, 2013. J Med Educ Dev 2014;
7(13): 82-90. [In Persian].
26. Vahabi A, Rahmani S, Rostami S, Vahabi B,
Hosseini M. Factors affecting teacher evaluation
scores: The students` viewpoints of Kurdistan
University of Medical Sciences. Iran J Med Educ
2015; 15(16): 111-21. [In Persian].
27. Ghasri H, Khatibi R, Vahabi A, Rahmani K, Ahmadi K,
Pakravan M, et al. Determination of importance rate of
evaluation questions from teachers' viewpoints of
Kurdistan University of Medical Sciences. Proceedings
of the 8th National Congress on Medical Education;
2007 Mar. 6-8; Kerman, Iran. [In Persian].
28. Khatibi R, Saedpanah M, Vahabi A, Mehrabi S,
Yazdanpanah K, Roostaei H. Determination of match
rate of teachers' evaluation results from students'
viewpoints and teachers in the University. Proceedings
of the 8th National Congress on Medical Education;
2007 Mar. 6-8; Kerman, Iran. [In Persian].
http://cdjournal.muk.ac.ir, 06 July
Spiritual intelligence and its related factors Vahabi et al.
158 Chron Dis J, Vol. 6, No. 3, Summer 2018
29. Vahabi B, Vahabi A, Sayyadi M, Roshani D. A study
of interpersonal communication skills and its
associated factors among students of Kurdistan
University of Medical Sciences, 2015. J Med Educ
Dev 2017; 9(24): 102-12. [In Persian].
30. Mohebi P, Rastegari L, Jaafari E, Sepehrinia M.
Spiritual Intelligence in Zanjan Nursing and Midwifery
Students and its Related Factors. Nursing & Midwifery
Care Journal 2013; 2(2): 49-56. [In Persian].
31. Ghana S, Jouybari L, Sharif Nia S, Hekmatafshar M,
Sanagoo A, Chehregosha M. Correlation of spiritual
intelligence with some of demographic and
educational factors among the students of Golestan
University of Medical Sciences. J Health Promot
Manag 2013; 2(1): 17-23. [In Persian].
32. Hamidi F, Sedaghat H. Comparison of spiritual
intelligence between high school students according to
their genders and grades. Woman in Culture and Art
(Women's Research) 2013; 4(4): 75-88. [In Persian].
33. Khorshidi A, Ebadi MG. Relationship between
spiritual intelligence and job satisfaction. Journal of
Applied Environmental and Biological Sciences
2012; 2(3): 131-3. [In Persian].
34. Ebrahimi A, Keykhosrovani M, Dehghani M, Javdan
M. Investigating the Relationship between
Resiliency, Spiritual Intelligence and Mental Health
of a group of undergraduate Students. Life Sci J
2012; 9(1): 67-70. [In Persian].
35. Hosseinchari M, Zakeri HR. The effect of studying
university majors, religious and art sciences on
spiritual intelligence: A trial for validation and
measuring reliability of spiritual intelligence scale.
Training Measurement 2010; 1(1): 73-91.
[In Persian].
36. Raghib MS, Ahmadi J, Siadat SA. Analysis of
amount of spiritual intelligence among students at
university of Isfahan and its relation to demographic
traits. Journal of Educational Psychology Studies
2008; 5(8): 39-56. [In Persian].
37. George M. Practical application of spiritual
intelligence in the workplace. Human Resource
Management International Digest 2006; 14(5):
3-5.
38. Raqib M, Siyadat S. An analysis of spiritual
intelligence of department heads at Isfahan
University and its relation to demographic traits.
Studies Islam and Psychology 2012; 5(9): 131-43.
[In Persian].
Related Documents