470 http://journals.tubitak.gov.tr/zoology/ Turkish Journal of Zoology Turk J Zool (2013) 37: 470-487 © TÜBİTAK doi:10.3906/zoo-1208-25 Chromosomal evolution of the genus Nannospalax (Palmer 1903) (Rodentia, Muridae) from western Turkey Ferhat MATUR*, Faruk ÇOLAK, Tuğçe CEYLAN, Murat SEVİNDİK, Mustafa SÖZEN Department of Biology, Faculty of Arts and Sciences, Bülent Ecevit University, Zonguldak, Turkey * Correspondence: [email protected] 1. Introduction e genus Nannospalax includes blind rodents that have adapted to living underground. Currently more than 30 chromosomal races have been determined in Turkish blind mole rats but there is still doubt about the taxonomy of this taxon (Nevo et al., 1994; Sözen et al., 1998a, 1998b, 1999, 2000a, 2000b, 2006a, 2006b, 2011; Sözen, 2004; Matur and Sözen, 2005; Kankiliç et al., 2007; Ivanitskaya et al., 2008; Arslan et al., 2011). Kandemir et al. (2012) discussed the taxonomic name problem of blind mole rats and so here we will follow Kandemir et al. (2012). Ivanitskaya and Nevo (1998) analyzed Jordanian blind mole rats using C-, G-, and AgNOR-banding techniques and compared these data with previous results obtained in Turkish and Israeli blind mole rats. ey found that NF values were useful for differentiation due to pericentric inversions and centromeric shiſts. So far, only a few banding studies of Turkish N. nehringi have been performed. ese were conducted in populations from Malatya (Ivanitskaya et al., 1997) and Kastamonu and Çankırı provinces (Ivanitskaya et al., 2008). Additionally, a banding study was performed by Ivanitskaya et al. (1997) with southeastern Anatolian blind mole rats (N. ehrenbergi) using G-, C-, and AgNOR-banding techniques. Ivanitskaya et al. (2008) assigned the 2n = 60 populations in Turkey to 2 chromosomal races as 2n = 60W and 2n = 60R, based on G-bands, C-bands, AgNOR staining, fluorochrome staining, and FISH of telomeric and rDNA probes. ey assumed that ancestral karyotype diverged into the 2n = 60W and R chromosomal races, and independent translocations of short arms of some chromosomes caused this differentiation. Arslan et al. (2011) studied variation of C- and AgNOR-banding of 3 chromosomal races (2n = 40, 58, and 60) of N. xanthodon from southern Anatolia. ey found differentiation among the chromosomal races. Matur et al. (2011) banded 4 chromosomal races with 2n = 50 from different localities in Anatolia. ese 4 chromosomal races had the same diploid numbers but their G-banding patterns were different. e complements of all these chromosomal races included 2 identical metacentric autosomes and the sex chromosomes were also always the same. e studied chromosomal races should have their own evolutionary pathway but they have a common ancestor. Dobigny et al. (2004) indicated that chromosomal data have been underutilized in phylogenetic research, and chromosomal changes could be used as a character. We set out to identify chromosomal characters that could be used to reconstruct the evolutionary history of these blind mole rats. e aim of the present study was to compare 9 chromosomal races of N. xanthodon and a chromosomal race from N. leucodon by determining which Robertsonian translocations are prevailing (fissions vs. fusions). By finding the main chromosomal changing mechanism, we may explain chromosomal evolution of the genus Nannospalax in western Turkey. Abstract: We used 33 blind mole rats belonging to 10 different chromosomal races from 10 localities in western Turkey. We applied G- and C-banding techniques to compare chromosomal races as well as clarifying relationships between them. We discussed cytogenetic similarities and differences between chromosomal races. We concluded that 2n = 60C is the ancestor of the other chromosomal races. However, as a result of ongoing evolution processes 2n = 38 and 2n = 60K have become ancestors to chromosomal races on their peripherals. We discovered which rearrangements contribute to the evolution of such a complex chromosomal race system in a genus. With this study we provide a comprehensive comparison of the 10 chromosomal races and perform a cladistic analysis using chromosomal rearrangement character states. According to our tree, chromosomal races with a low diploid number formed a monophyletic group. Key words: Blind mole rat, comparative cytogenetic, G- and C-banding, chromosome differentiation, phylogeny, Anatolia Received: 29.08.2012 Accepted: 17.02.2013 Published Online: 24.06.2013 Printed: 24.07.2013 Research Article

Welcome message from author
This document is posted to help you gain knowledge. Please leave a comment to let me know what you think about it! Share it to your friends and learn new things together.
Transcript
470
http://journals.tubitak.gov.tr/zoology/
Turkish Journal of Zoology Turk J Zool(2013) 37: 470-487© TÜBİTAKdoi:10.3906/zoo-1208-25
Chromosomal evolution of the genus Nannospalax (Palmer 1903) (Rodentia, Muridae) from western Turkey
Ferhat MATUR*, Faruk ÇOLAK, Tuğçe CEYLAN, Murat SEVİNDİK, Mustafa SÖZENDepartment of Biology, Faculty of Arts and Sciences, Bülent Ecevit University, Zonguldak, Turkey
* Correspondence: [email protected]
1. IntroductionThe genus Nannospalax includes blind rodents that have adapted to living underground. Currently more than 30 chromosomal races have been determined in Turkish blind mole rats but there is still doubt about the taxonomy of this taxon (Nevo et al., 1994; Sözen et al., 1998a, 1998b, 1999, 2000a, 2000b, 2006a, 2006b, 2011; Sözen, 2004; Matur and Sözen, 2005; Kankiliç et al., 2007; Ivanitskaya et al., 2008; Arslan et al., 2011). Kandemir et al. (2012) discussed the taxonomic name problem of blind mole rats and so here we will follow Kandemir et al. (2012).
Ivanitskaya and Nevo (1998) analyzed Jordanian blind mole rats using C-, G-, and AgNOR-banding techniques and compared these data with previous results obtained in Turkish and Israeli blind mole rats. They found that NF values were useful for differentiation due to pericentric inversions and centromeric shifts. So far, only a few banding studies of Turkish N. nehringi have been performed. These were conducted in populations from Malatya (Ivanitskaya et al., 1997) and Kastamonu and Çankırı provinces (Ivanitskaya et al., 2008). Additionally, a banding study was performed by Ivanitskaya et al. (1997) with southeastern Anatolian blind mole rats (N. ehrenbergi) using G-, C-, and AgNOR-banding techniques. Ivanitskaya et al. (2008) assigned the 2n = 60 populations in Turkey to 2 chromosomal races as 2n = 60W and 2n = 60R, based on G-bands, C-bands, AgNOR staining, fluorochrome staining, and FISH of telomeric and rDNA probes. They
assumed that ancestral karyotype diverged into the 2n = 60W and R chromosomal races, and independent translocations of short arms of some chromosomes caused this differentiation. Arslan et al. (2011) studied variation of C- and AgNOR-banding of 3 chromosomal races (2n = 40, 58, and 60) of N. xanthodon from southern Anatolia. They found differentiation among the chromosomal races. Matur et al. (2011) banded 4 chromosomal races with 2n = 50 from different localities in Anatolia. These 4 chromosomal races had the same diploid numbers but their G-banding patterns were different. The complements of all these chromosomal races included 2 identical metacentric autosomes and the sex chromosomes were also always the same. The studied chromosomal races should have their own evolutionary pathway but they have a common ancestor.
Dobigny et al. (2004) indicated that chromosomal data have been underutilized in phylogenetic research, and chromosomal changes could be used as a character. We set out to identify chromosomal characters that could be used to reconstruct the evolutionary history of these blind mole rats. The aim of the present study was to compare 9 chromosomal races of N. xanthodon and a chromosomal race from N. leucodon by determining which Robertsonian translocations are prevailing (fissions vs. fusions). By finding the main chromosomal changing mechanism, we may explain chromosomal evolution of the genus Nannospalax in western Turkey.
Abstract: We used 33 blind mole rats belonging to 10 different chromosomal races from 10 localities in western Turkey. We applied G- and C-banding techniques to compare chromosomal races as well as clarifying relationships between them. We discussed cytogenetic similarities and differences between chromosomal races. We concluded that 2n = 60C is the ancestor of the other chromosomal races. However, as a result of ongoing evolution processes 2n = 38 and 2n = 60K have become ancestors to chromosomal races on their peripherals. We discovered which rearrangements contribute to the evolution of such a complex chromosomal race system in a genus. With this study we provide a comprehensive comparison of the 10 chromosomal races and perform a cladistic analysis using chromosomal rearrangement character states. According to our tree, chromosomal races with a low diploid number formed a monophyletic group.
Key words: Blind mole rat, comparative cytogenetic, G- and C-banding, chromosome differentiation, phylogeny, Anatolia
Received: 29.08.2012 Accepted: 17.02.2013 Published Online: 24.06.2013 Printed: 24.07.2013
Research Article
MATUR et al. / Turk J Zool
471
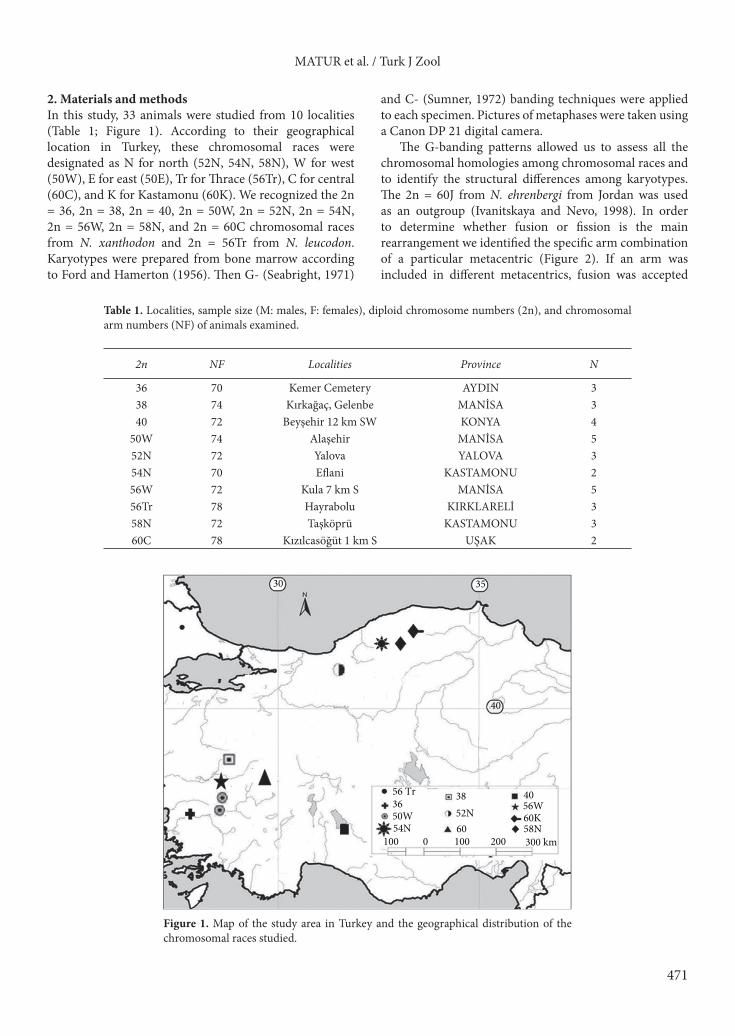
2. Materials and methodsIn this study, 33 animals were studied from 10 localities (Table 1; Figure 1). According to their geographical location in Turkey, these chromosomal races were designated as N for north (52N, 54N, 58N), W for west (50W), E for east (50E), Tr for Thrace (56Tr), C for central (60C), and K for Kastamonu (60K). We recognized the 2n = 36, 2n = 38, 2n = 40, 2n = 50W, 2n = 52N, 2n = 54N, 2n = 56W, 2n = 58N, and 2n = 60C chromosomal races from N. xanthodon and 2n = 56Tr from N. leucodon. Karyotypes were prepared from bone marrow according to Ford and Hamerton (1956). Then G- (Seabright, 1971)
and C- (Sumner, 1972) banding techniques were applied to each specimen. Pictures of metaphases were taken using a Canon DP 21 digital camera.
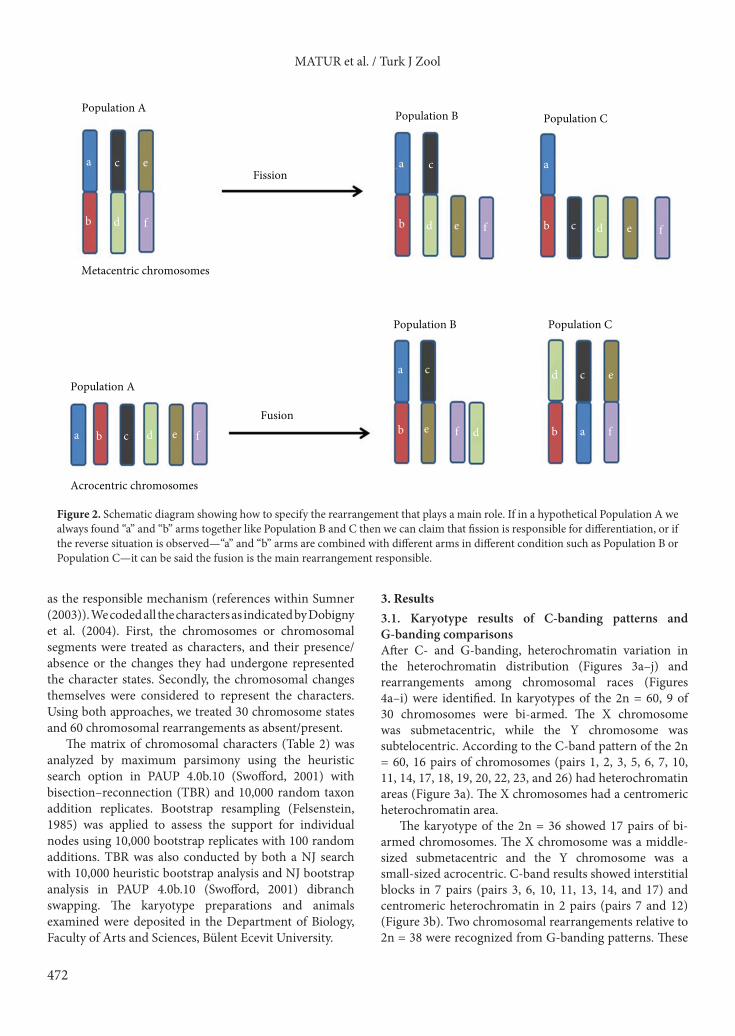
The G-banding patterns allowed us to assess all the chromosomal homologies among chromosomal races and to identify the structural differences among karyotypes. The 2n = 60J from N. ehrenbergi from Jordan was used as an outgroup (Ivanitskaya and Nevo, 1998). In order to determine whether fusion or fission is the main rearrangement we identified the specific arm combination of a particular metacentric (Figure 2). If an arm was included in different metacentrics, fusion was accepted
Table 1. Localities, sample size (M: males, F: females), diploid chromosome numbers (2n), and chromosomal arm numbers (NF) of animals examined.
2n NF Localities Province N
36 70 Kemer Cemetery AYDIN 338 74 Kırkağaç, Gelenbe MANİSA 340 72 Beyşehir 12 km SW KONYA 4
50W 74 Alaşehir MANİSA 552N 72 Yalova YALOVA 354N 70 Eflani KASTAMONU 256W 72 Kula 7 km S MANİSA 556Tr 78 Hayrabolu KIRKLARELİ 358N 72 Taşköprü KASTAMONU 360C 78 Kızılcasöğüt 1 km S UŞAK 2
30 35
40
56 Tr 36 50W 54N
38 52N 60
40 56W 60K 58N
100 0 100 200 300 km
Figure 1. Map of the study area in Turkey and the geographical distribution of the chromosomal races studied.
MATUR et al. / Turk J Zool
472
as the responsible mechanism (references within Sumner (2003)). We coded all the characters as indicated by Dobigny et al. (2004). First, the chromosomes or chromosomal segments were treated as characters, and their presence/absence or the changes they had undergone represented the character states. Secondly, the chromosomal changes themselves were considered to represent the characters. Using both approaches, we treated 30 chromosome states and 60 chromosomal rearrangements as absent/present.
The matrix of chromosomal characters (Table 2) was analyzed by maximum parsimony using the heuristic search option in PAUP 4.0b.10 (Swofford, 2001) with bisection–reconnection (TBR) and 10,000 random taxon addition replicates. Bootstrap resampling (Felsenstein, 1985) was applied to assess the support for individual nodes using 10,000 bootstrap replicates with 100 random additions. TBR was also conducted by both a NJ search with 10,000 heuristic bootstrap analysis and NJ bootstrap analysis in PAUP 4.0b.10 (Swofford, 2001) dibranch swapping. The karyotype preparations and animals examined were deposited in the Department of Biology, Faculty of Arts and Sciences, Bülent Ecevit University.
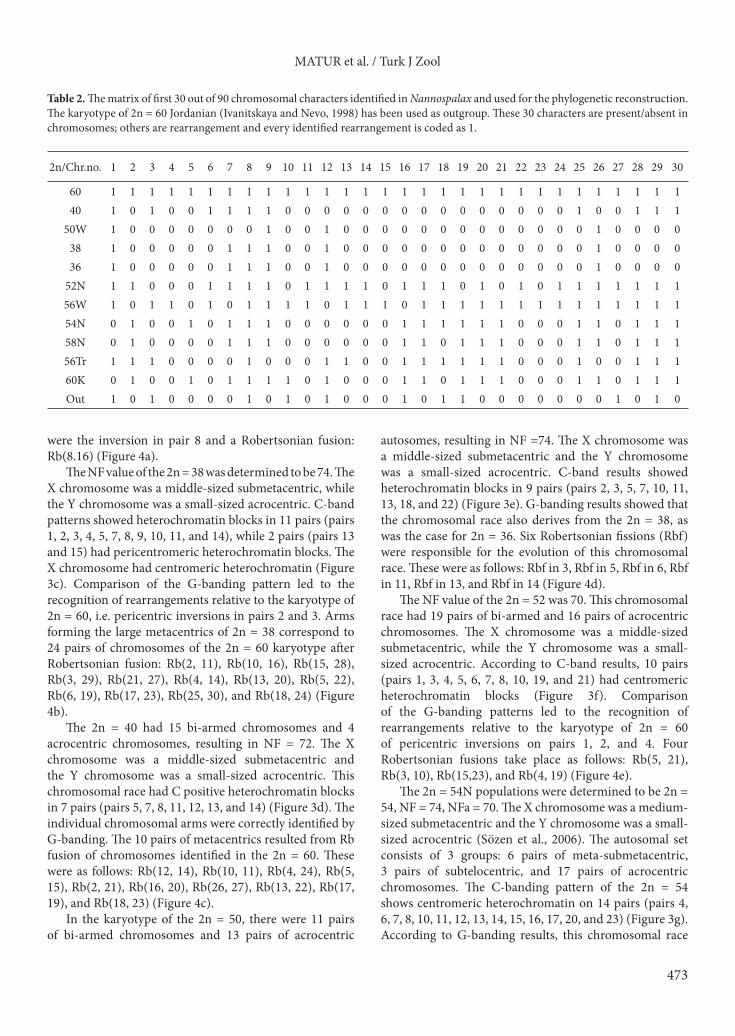
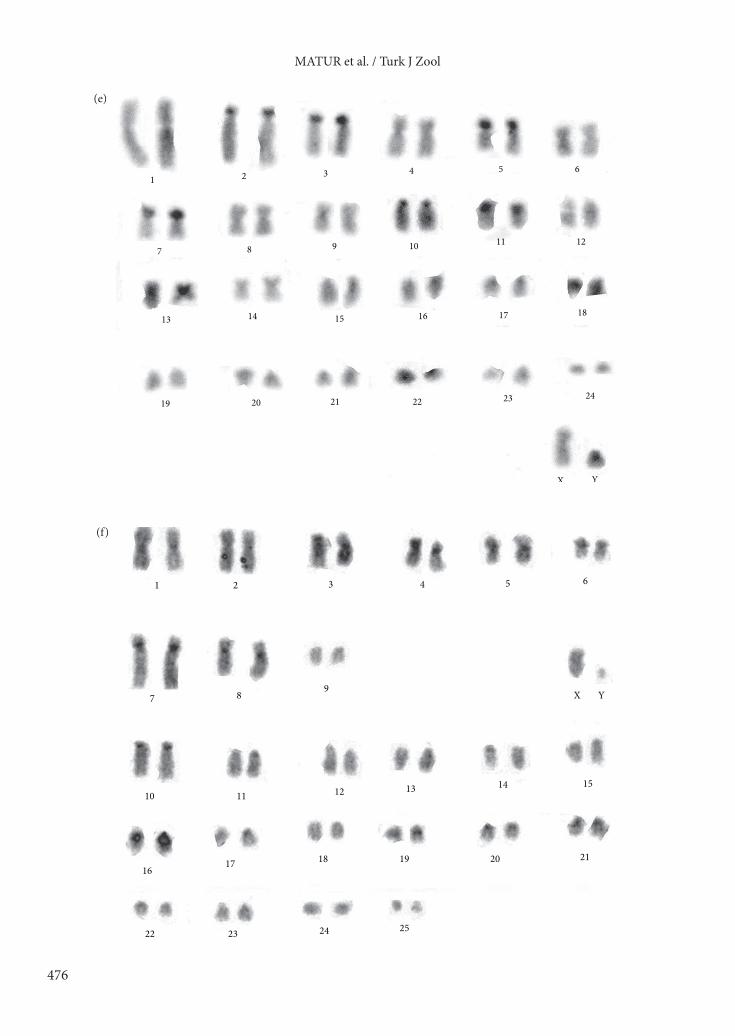
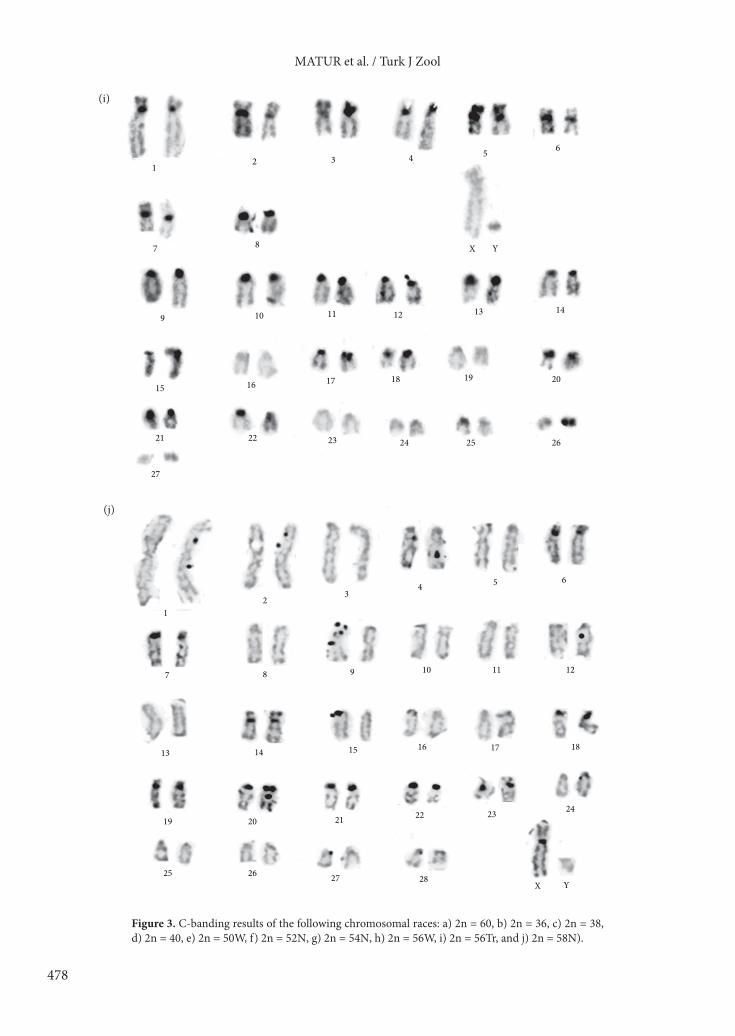
3. Results3.1. Karyotype results of C-banding patterns and G-banding comparisonsAfter C- and G-banding, heterochromatin variation in the heterochromatin distribution (Figures 3a–j) and rearrangements among chromosomal races (Figures 4a–i) were identified. In karyotypes of the 2n = 60, 9 of 30 chromosomes were bi-armed. The X chromosome was submetacentric, while the Y chromosome was subtelocentric. According to the C-band pattern of the 2n = 60, 16 pairs of chromosomes (pairs 1, 2, 3, 5, 6, 7, 10, 11, 14, 17, 18, 19, 20, 22, 23, and 26) had heterochromatin areas (Figure 3a). The X chromosomes had a centromeric heterochromatin area.
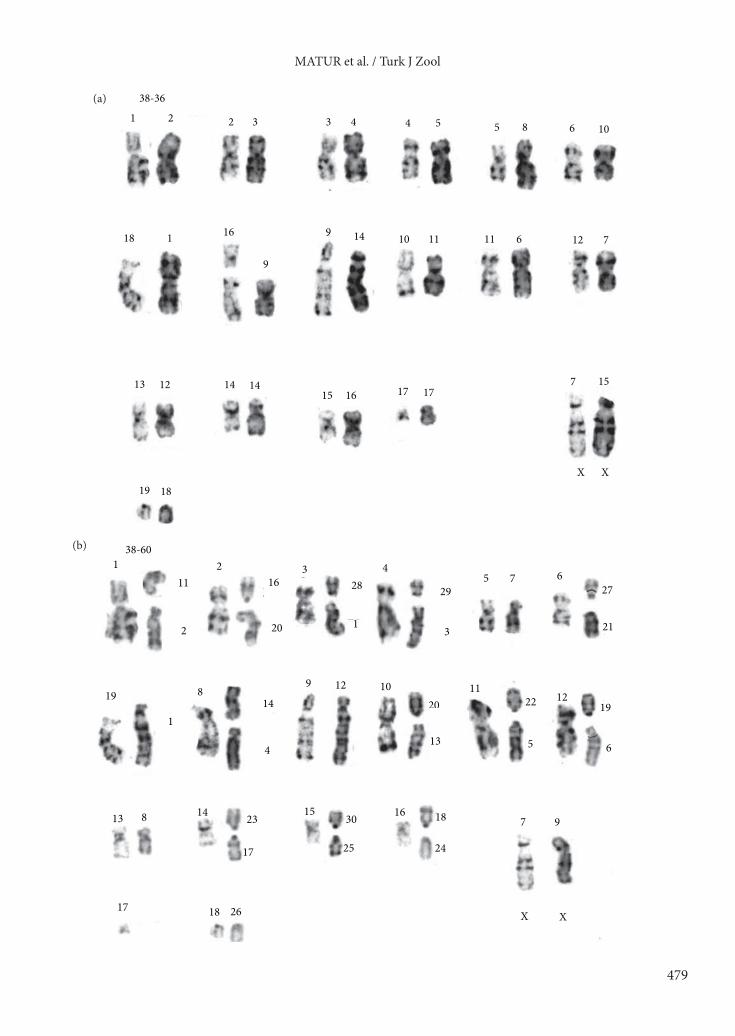
The karyotype of the 2n = 36 showed 17 pairs of bi-armed chromosomes. The X chromosome was a middle-sized submetacentric and the Y chromosome was a small-sized acrocentric. C-band results showed interstitial blocks in 7 pairs (pairs 3, 6, 10, 11, 13, 14, and 17) and centromeric heterochromatin in 2 pairs (pairs 7 and 12) (Figure 3b). Two chromosomal rearrangements relative to 2n = 38 were recognized from G-banding patterns. These
a
b
c
d
e
f
a b c d e f
a c
b d e f
a
b
c
d e f
a
b c d e f
a b
d c e
f
Population A
Metacentric chromosomes
Fission
Population A
Acrocentric chromosomes
Fusion
Population B Population C
Population B Population C
Figure 2. Schematic diagram showing how to specify the rearrangement that plays a main role. If in a hypothetical Population A we always found “a” and “b” arms together like Population B and C then we can claim that fission is responsible for differentiation, or if the reverse situation is observed—“a” and “b” arms are combined with different arms in different condition such as Population B or Population C—it can be said the fusion is the main rearrangement responsible.
MATUR et al. / Turk J Zool
473
were the inversion in pair 8 and a Robertsonian fusion: Rb(8.16) (Figure 4a).
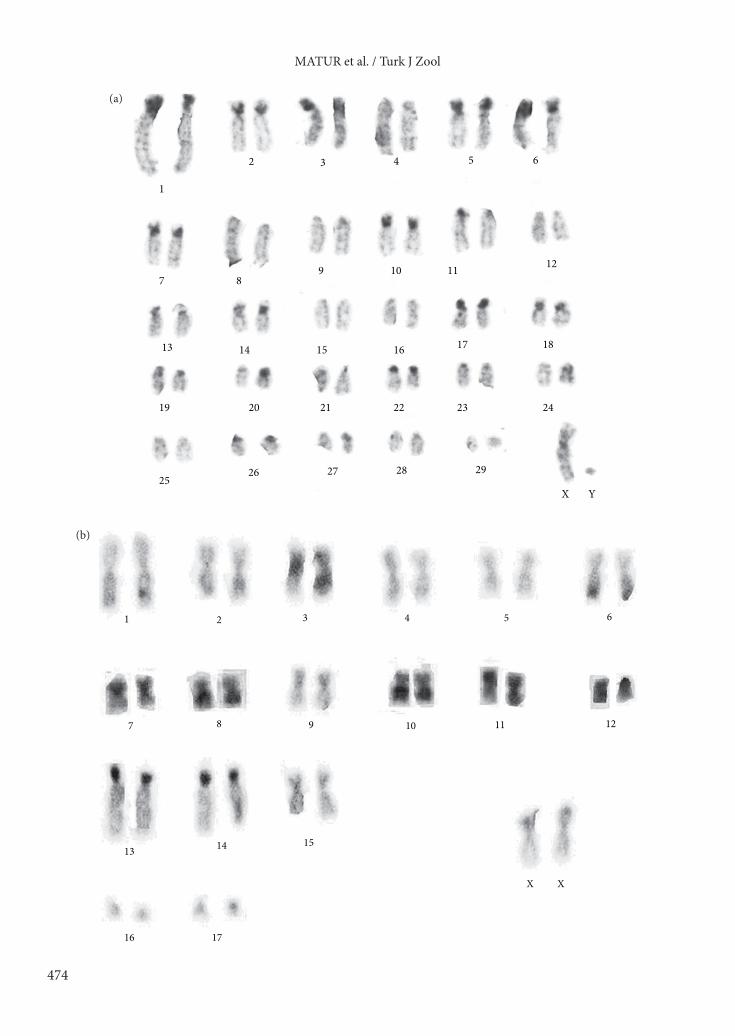
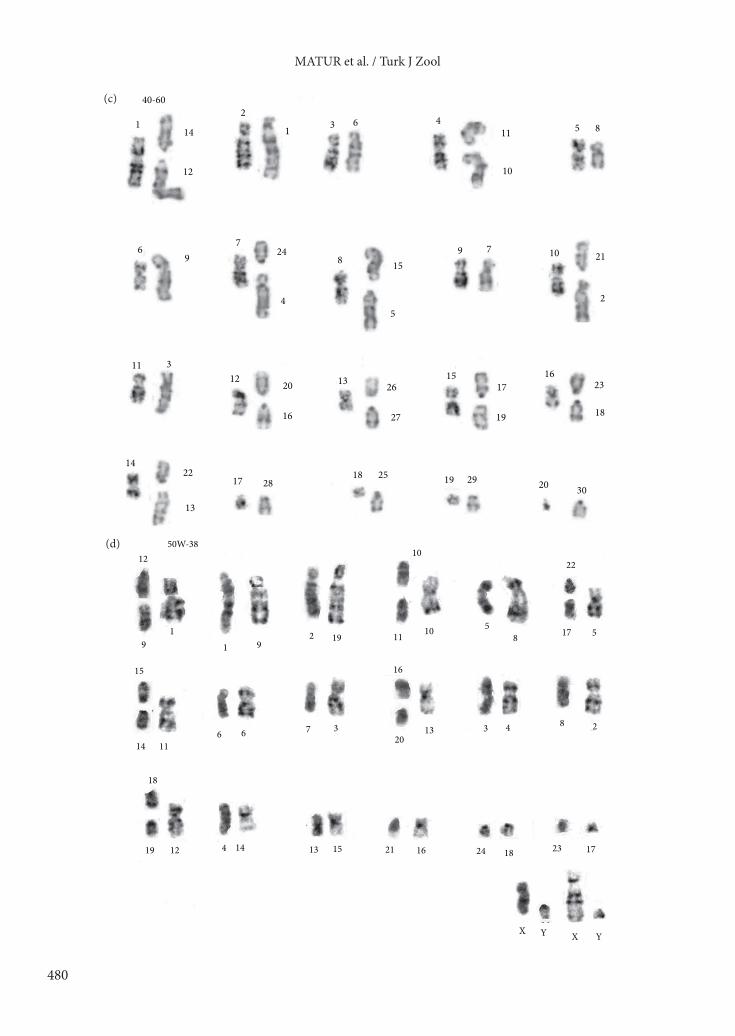
The NF value of the 2n = 38 was determined to be 74. The X chromosome was a middle-sized submetacentric, while the Y chromosome was a small-sized acrocentric. C-band patterns showed heterochromatin blocks in 11 pairs (pairs 1, 2, 3, 4, 5, 7, 8, 9, 10, 11, and 14), while 2 pairs (pairs 13 and 15) had pericentromeric heterochromatin blocks. The X chromosome had centromeric heterochromatin (Figure 3c). Comparison of the G-banding pattern led to the recognition of rearrangements relative to the karyotype of 2n = 60, i.e. pericentric inversions in pairs 2 and 3. Arms forming the large metacentrics of 2n = 38 correspond to 24 pairs of chromosomes of the 2n = 60 karyotype after Robertsonian fusion: Rb(2, 11), Rb(10, 16), Rb(15, 28), Rb(3, 29), Rb(21, 27), Rb(4, 14), Rb(13, 20), Rb(5, 22), Rb(6, 19), Rb(17, 23), Rb(25, 30), and Rb(18, 24) (Figure 4b).
The 2n = 40 had 15 bi-armed chromosomes and 4 acrocentric chromosomes, resulting in NF = 72. The X chromosome was a middle-sized submetacentric and the Y chromosome was a small-sized acrocentric. This chromosomal race had C positive heterochromatin blocks in 7 pairs (pairs 5, 7, 8, 11, 12, 13, and 14) (Figure 3d). The individual chromosomal arms were correctly identified by G-banding. The 10 pairs of metacentrics resulted from Rb fusion of chromosomes identified in the 2n = 60. These were as follows: Rb(12, 14), Rb(10, 11), Rb(4, 24), Rb(5, 15), Rb(2, 21), Rb(16, 20), Rb(26, 27), Rb(13, 22), Rb(17, 19), and Rb(18, 23) (Figure 4c).
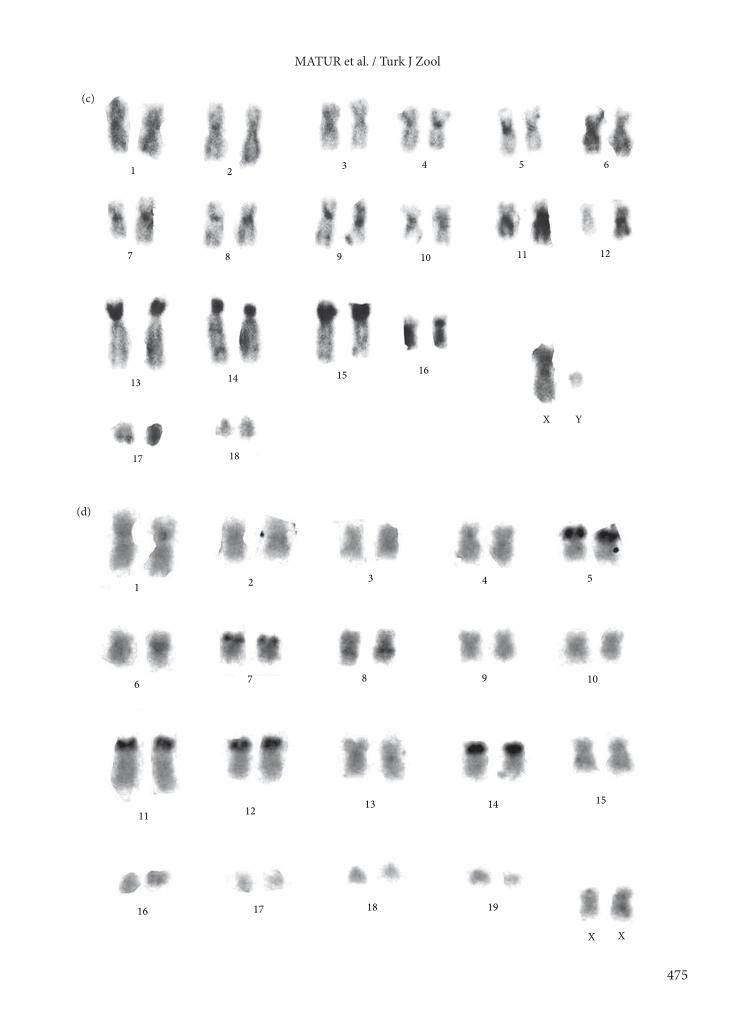
In the karyotype of the 2n = 50, there were 11 pairs of bi-armed chromosomes and 13 pairs of acrocentric
autosomes, resulting in NF =74. The X chromosome was a middle-sized submetacentric and the Y chromosome was a small-sized acrocentric. C-band results showed heterochromatin blocks in 9 pairs (pairs 2, 3, 5, 7, 10, 11, 13, 18, and 22) (Figure 3e). G-banding results showed that the chromosomal race also derives from the 2n = 38, as was the case for 2n = 36. Six Robertsonian fissions (Rbf) were responsible for the evolution of this chromosomal race. These were as follows: Rbf in 3, Rbf in 5, Rbf in 6, Rbf in 11, Rbf in 13, and Rbf in 14 (Figure 4d).
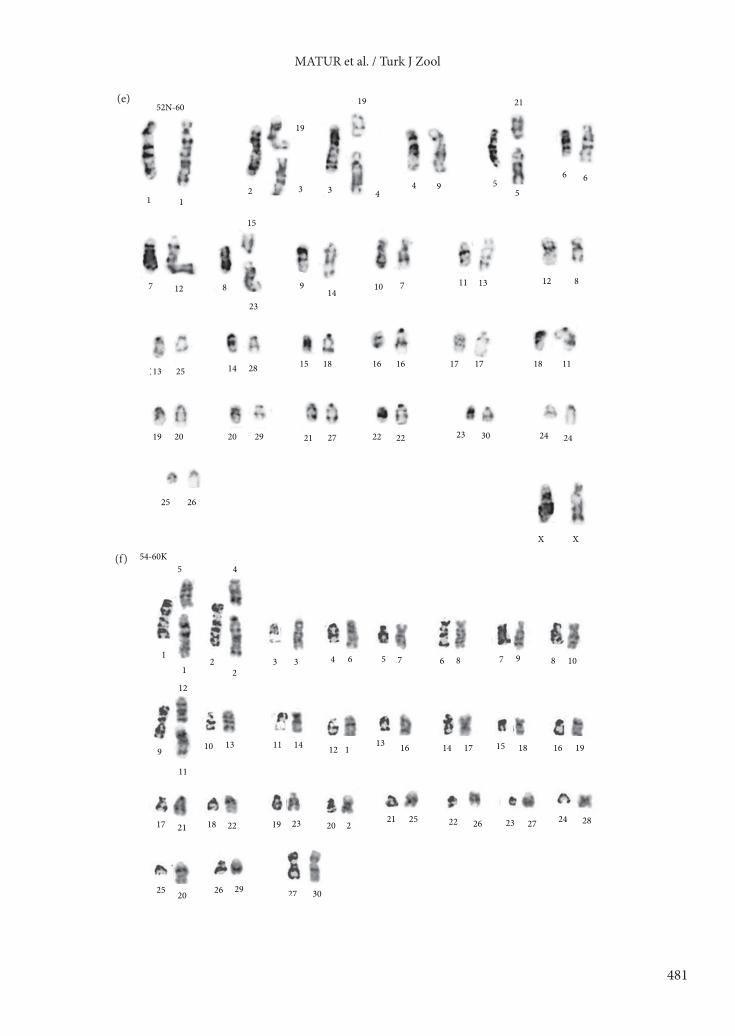
The NF value of the 2n = 52 was 70. This chromosomal race had 19 pairs of bi-armed and 16 pairs of acrocentric chromosomes. The X chromosome was a middle-sized submetacentric, while the Y chromosome was a small-sized acrocentric. According to C-band results, 10 pairs (pairs 1, 3, 4, 5, 6, 7, 8, 10, 19, and 21) had centromeric heterochromatin blocks (Figure 3f). Comparison of the G-banding patterns led to the recognition of rearrangements relative to the karyotype of 2n = 60 of pericentric inversions on pairs 1, 2, and 4. Four Robertsonian fusions take place as follows: Rb(5, 21), Rb(3, 10), Rb(15,23), and Rb(4, 19) (Figure 4e).
The 2n = 54N populations were determined to be 2n = 54, NF = 74, NFa = 70. The X chromosome was a medium-sized submetacentric and the Y chromosome was a small-sized acrocentric (Sözen et al., 2006). The autosomal set consists of 3 groups: 6 pairs of meta-submetacentric, 3 pairs of subtelocentric, and 17 pairs of acrocentric chromosomes. The C-banding pattern of the 2n = 54 shows centromeric heterochromatin on 14 pairs (pairs 4, 6, 7, 8, 10, 11, 12, 13, 14, 15, 16, 17, 20, and 23) (Figure 3g). According to G-banding results, this chromosomal race
Table 2. The matrix of first 30 out of 90 chromosomal characters identified in Nannospalax and used for the phylogenetic reconstruction. The karyotype of 2n = 60 Jordanian (Ivanitskaya and Nevo, 1998) has been used as outgroup. These 30 characters are present/absent in chromosomes; others are rearrangement and every identified rearrangement is coded as 1.
2n/Chr.no. 1 2 3 4 5 6 7 8 9 10 11 12 13 14 15 16 17 18 19 20 21 22 23 24 25 26 27 28 29 30
60 1 1 1 1 1 1 1 1 1 1 1 1 1 1 1 1 1 1 1 1 1 1 1 1 1 1 1 1 1 140 1 0 1 0 0 1 1 1 1 0 0 0 0 0 0 0 0 0 0 0 0 0 0 0 1 0 0 1 1 1
50W 1 0 0 0 0 0 0 0 1 0 0 1 0 0 0 0 0 0 0 0 0 0 0 0 0 1 0 0 0 038 1 0 0 0 0 0 1 1 1 0 0 1 0 0 0 0 0 0 0 0 0 0 0 0 0 1 0 0 0 036 1 0 0 0 0 0 1 1 1 0 0 1 0 0 0 0 0 0 0 0 0 0 0 0 0 1 0 0 0 0
52N 1 1 0 0 0 1 1 1 1 0 1 1 1 1 0 1 1 1 0 1 0 1 0 1 1 1 1 1 1 156W 1 0 1 1 0 1 0 1 1 1 1 0 1 1 1 0 1 1 1 1 1 1 1 1 1 1 1 1 1 154N 0 1 0 0 1 0 1 1 1 0 0 0 0 0 0 1 1 1 1 1 1 0 0 0 1 1 0 1 1 158N 0 1 0 0 0 0 1 1 1 0 0 0 0 0 0 1 1 0 1 1 1 0 0 0 1 1 0 1 1 156Tr 1 1 1 0 0 0 0 1 0 0 0 1 1 0 0 1 1 1 1 1 1 0 0 0 1 0 0 1 1 160K 0 1 0 0 1 0 1 1 1 1 0 1 0 0 0 1 1 0 1 1 1 0 0 0 1 1 0 1 1 1Out 1 0 1 0 0 0 0 1 0 1 0 1 0 0 0 1 0 1 1 0 0 0 0 0 0 0 1 0 1 0
MATUR et al. / Turk J Zool
474
1
2 3 4 5 6
7
28
9
27
11 12
29
14 15 16 17
X Y
18
19 20
25
21 22 23 24
26
8 10
13
1 2 3 4 5 6
7 8 9 10 11 12
13 14 15
16 17
X X
(a)
(b)
MATUR et al. / Turk J Zool
475
1 2 3 4 5 6
7 8 9 10 11 12
13 14 15 16
17 18
X Y
1 2 3 4 5
6 7 8 9 10
11 13 12 14 15
16 17 19 18
X X
(c)
(d)
MATUR et al. / Turk J Zool
476
1 2 3 4 5 6
7 8 9 10 11 12
14 15 17 13 16 18
19 20 22 21 23 24
Y X
1 2 3 4 5 6
X Y 8 7 9
10 11 12 13
16 17
14 15
18 19 20
22
21
25 24 23
(e)
(f)
MATUR et al. / Turk J Zool
477
1 2 3 4 6 5
7
X X
8 9 10 11
12 13 14 15 16 17
18 20 19
1 2 3 4
X Y
5 6 7
8 9 10 11 12 13
14 15 16 17
20
19 18
21 23 22 24 25
26 27
(g)
(h)
MATUR et al. / Turk J Zool
478
Y X
3
1 2
5 4
7
6
8 9 10 11 12
14 13 15 16 17 18
19 20 21 22 23 24
25 26 27 28
Y X
2 1
3 4 5 6
8 7
9 10 12 11 13 14
16 15 18 17 19 20
21 24 23 22 26 25
27
(i)
(j)
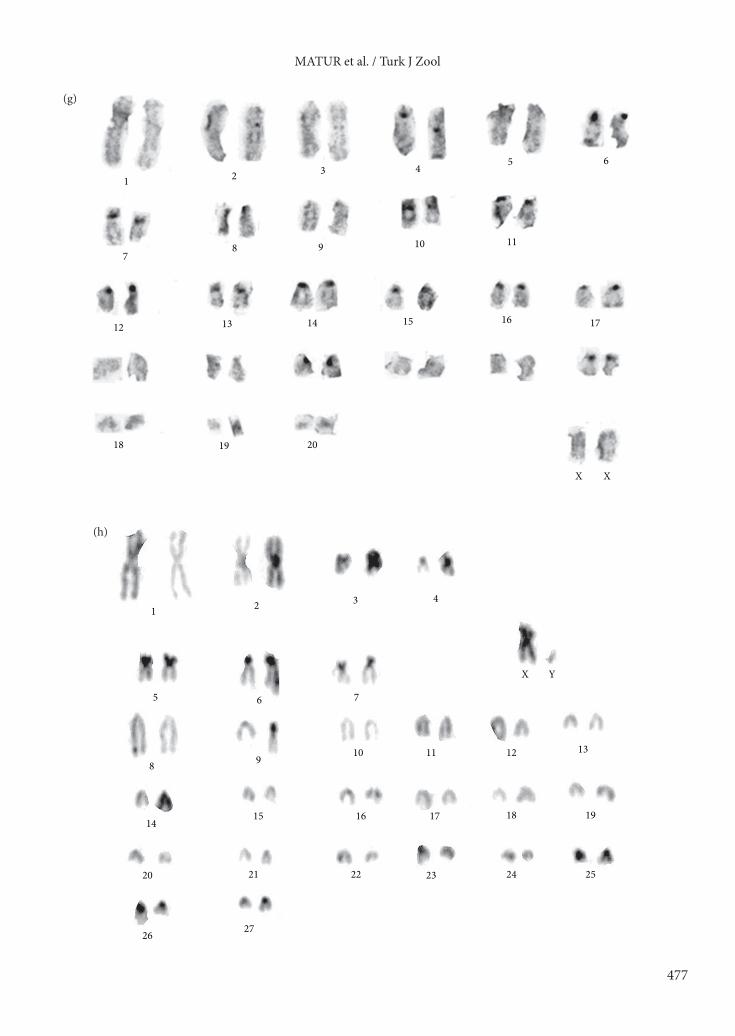
Figure 3. C-banding results of the following chromosomal races: a) 2n = 60, b) 2n = 36, c) 2n = 38, d) 2n = 40, e) 2n = 50W, f) 2n = 52N, g) 2n = 54N, h) 2n = 56W, i) 2n = 56Tr, and j) 2n = 58N).
MATUR et al. / Turk J Zool
479
1 11
2
2 16
20
3 28
1
4
29
3
5 7 6
27
21
19
1
8 14
4
9 12 10 22 20
13
11
5
12 19
6
13 8 14 23
17
15 30
25
16 18
24
7 9
18 X X 17 26
38-60
2 1 2 3 3 4 5 4 5 8 6 10
1 18 16
9
9 14 10 11 11 6 12 7
13 12 14 14 15 16 17 17
19 18
7 15
X X
38-36(a)
(b)
MATUR et al. / Turk J Zool
480
1 14
12
2
1 3 6 4 11
10
5 8
6 9
7 24
4
8 15
5
9 7 10 21
2
11 3 12
20
16
13 26
27
15 17
19
16 23
18
14 22
13
17 28 18 25 19 29 20 30
40-60
12
1 9 1 9
2 19
10
11 10 5 8
22
17 5
15
14 11 6 6 7 3
16
20 13 3 4 8 2
18
12 19 4 14 13 15 21 16 24 18 23 17
X X Y Y
50W-38
(c)
(d)
MATUR et al. / Turk J Zool
481
1 1 2
19
3 3
19
4 4 9 5
21
5
6 6
7 12 8
15
23
9 14
10 7 11 13 12 8
13 25 28 14 18 15 16 16 17 17 11 18
19 20 29 20 21 27 22 22 23 30 24 24
25 26
X X
52N-60
1 1
5
3 2 2
4
3 4 6
5
7 6 8 7 9 8 10
9
12
10
11
13 11 14 12 113 16 14
17 15 18
24 23
16
22
19
17 21 18
19 23 20 221 25 22 26
27
28
25 20 26
29 27
30
54-60K
(e)
(f)
MATUR et al. / Turk J Zool
482
8
60K -58N
1 1 2 2 3 3 4 16 5
2
6
6 4
11
7 9
5
9 10 14 10 12 12 8 13 14
21
7 15 1 16 2 17 17
18 13 19 1 2 20
1 22 21 23
28
2 2 11 2 24
26 25 27 2 27 29 30 29
X X
1
7
5 2 2 3 4 3 4
5 11
10
6 8
7
8
16
12 9 11 6 10
X X
1 1 9
12 27 13 19
30
14 13 1 15 16 24
18 21 1 22 20 25 21 18 22 23 17 1
23 17 24 20 25 26 26 28 27 29 28
56W-60(g)
(h)
MATUR et al. / Turk J Zool
483
evolved from the 2n = 60K with 3 Robertsonian fusions, namely Rb(5, 1), Rb(4, 2), and Rb(12, 11) (Figure 4f).
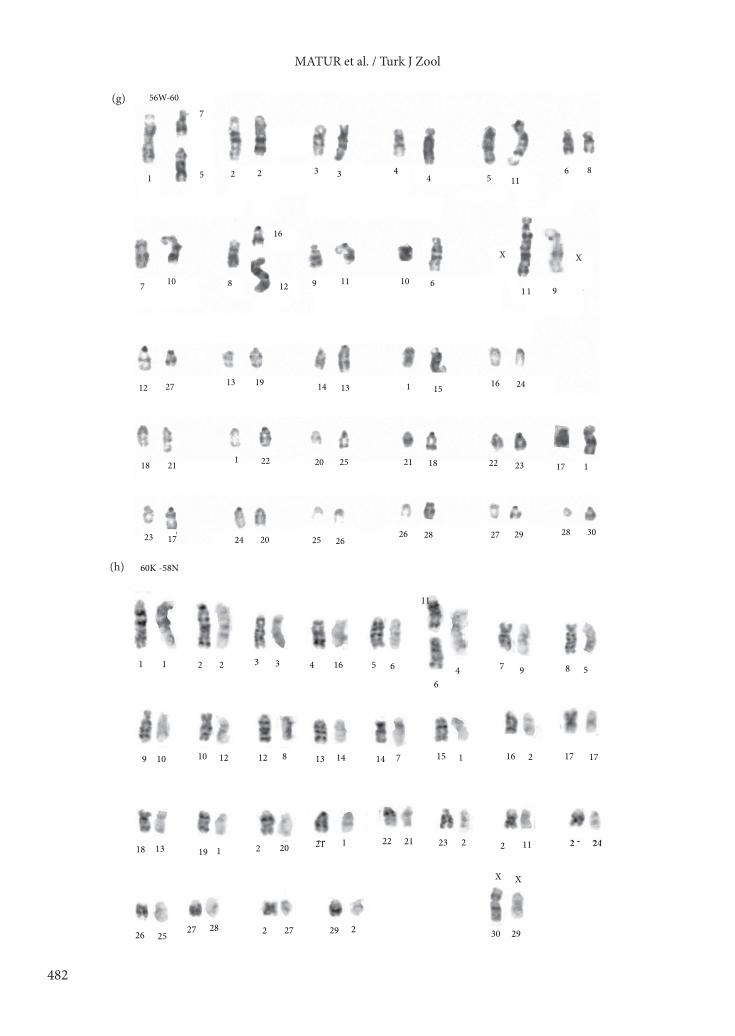
Results from the karyotype of the 2n = 56W populations showed that this chromosomal race had 7 pairs of biarmed chromosomes and 21 pairs of acrocentric chromosomes. The NF value was 72. The X chromosome was a middle-sized submetacentric and the Y chromosome was a small-sized acrocentric. Blocks of C heterochromatin occur on 8 pairs (pairs 2, 4, 6, 7, 9, 14, 16, and 19) (Figure 3h). Arms forming the metacentric of the 2n = 56 correspond to 4 pairs of chromosomes of the karyotype of the 2n = 60C after Robertsonian fusion, namely Rb(5, 7) and Rb(12, 16), and an inversion in 7 (Figure 4g).
In the 2n = 56Tr, the NF = 78 and NFa = 74. The X chromosome was a submetacentric and the Y chromosome was a small-sized acrocentric. The autosomal set contains 10 pairs of bi-armed and 17 pairs of acrocentric chromosomes. The C-banding patterns of the 2n = 56Tr chromosomal race showed positive staining in the centromeric region in 22 pairs (pairs 1, 2, 3, 4, 5, 6, 7, 8, 9, 10, 11, 12, 13, 14, 15, 17, 18, 20, 21, 22, 25, and 26) (Figure
3i). Both the X and Y chromosomes were negative for heterochromatin.
In the 2n = 58N, the NF = 74 and the NFa = 70. The X chromosome was a submetacentric and the Y chromosome was a small subtelocentric. The autosomal set contains a pair of metacentric, 6 pairs of submetacentric, and 20 pairs of acrocentric chromosomes. Eight pairs (pairs 6, 7, 18, 19, 20, 21, 22, and 23) had centromeric C-positive heterochromatin blocks (Figure 3j). While the Y chromosome was negative, the X chromosome was C-positive. According to the G-banding results, the 2n = 58N evolved from the 2n = 60K by a Robertsonian fusion of 2 acrocentrics at Rb(6, 11) (Figure 4h).
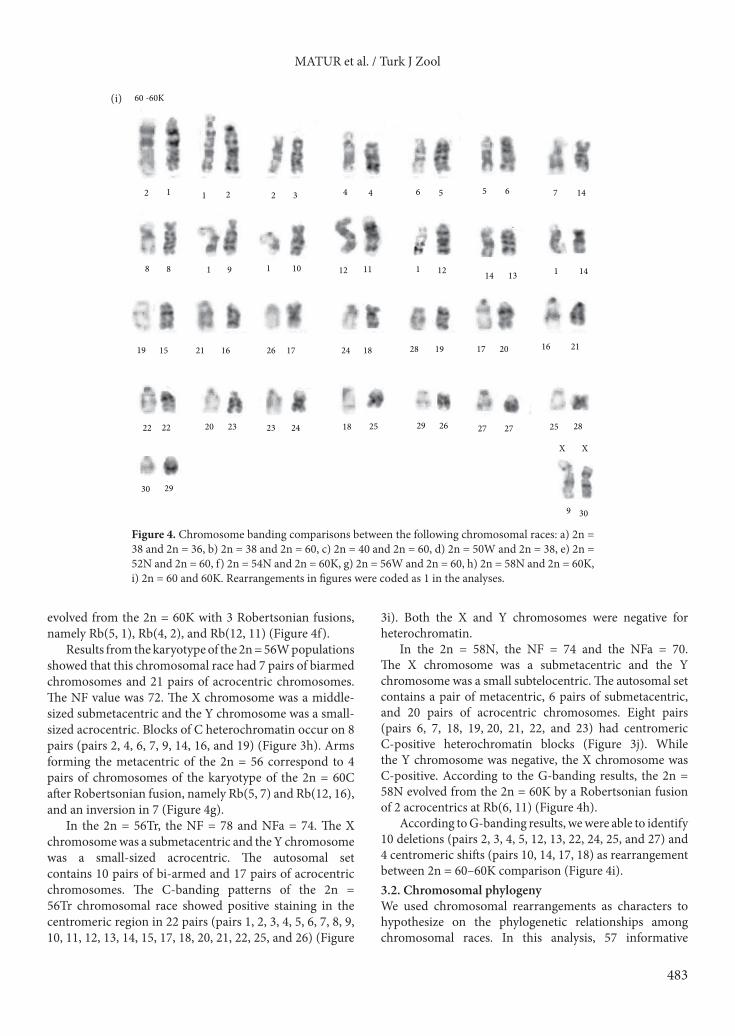
According to G-banding results, we were able to identify 10 deletions (pairs 2, 3, 4, 5, 12, 13, 22, 24, 25, and 27) and 4 centromeric shifts (pairs 10, 14, 17, 18) as rearrangement between 2n = 60–60K comparison (Figure 4i).3.2. Chromosomal phylogenyWe used chromosomal rearrangements as characters to hypothesize on the phylogenetic relationships among chromosomal races. In this analysis, 57 informative
60 -60K
2
23
1 1 2 2 3 4 4 6 5 5 6 7
14
14 113 14 8 8 1 9 1 10 12
11 1 12
19 28 15 21 16 26 17 24 18
19 17 20 16 21
25 22 22 20 23 24 18 25 29 26 27 27 28
X X
9 30
30 29
(i)
Figure 4. Chromosome banding comparisons between the following chromosomal races: a) 2n = 38 and 2n = 36, b) 2n = 38 and 2n = 60, c) 2n = 40 and 2n = 60, d) 2n = 50W and 2n = 38, e) 2n = 52N and 2n = 60, f) 2n = 54N and 2n = 60K, g) 2n = 56W and 2n = 60, h) 2n = 58N and 2n = 60K, i) 2n = 60 and 60K. Rearrangements in figures were coded as 1 in the analyses.
MATUR et al. / Turk J Zool
484
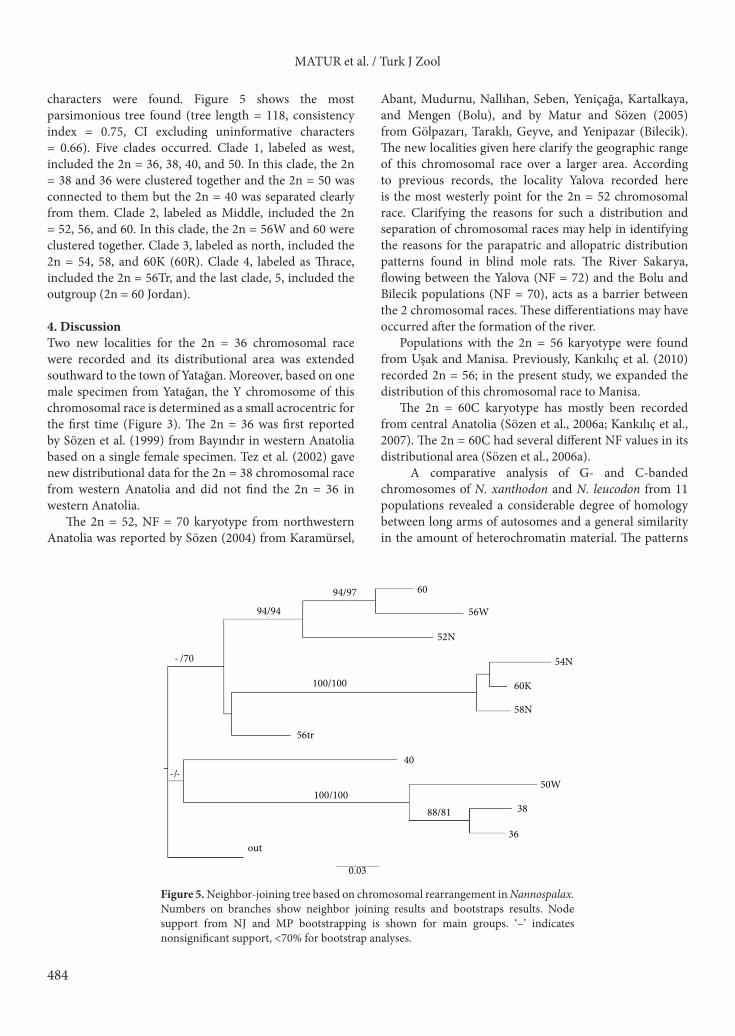
characters were found. Figure 5 shows the most parsimonious tree found (tree length = 118, consistency index = 0.75, CI excluding uninformative characters = 0.66). Five clades occurred. Clade 1, labeled as west, included the 2n = 36, 38, 40, and 50. In this clade, the 2n = 38 and 36 were clustered together and the 2n = 50 was connected to them but the 2n = 40 was separated clearly from them. Clade 2, labeled as Middle, included the 2n = 52, 56, and 60. In this clade, the 2n = 56W and 60 were clustered together. Clade 3, labeled as north, included the 2n = 54, 58, and 60K (60R). Clade 4, labeled as Thrace, included the 2n = 56Tr, and the last clade, 5, included the outgroup (2n = 60 Jordan).
4. DiscussionTwo new localities for the 2n = 36 chromosomal race were recorded and its distributional area was extended southward to the town of Yatağan. Moreover, based on one male specimen from Yatağan, the Y chromosome of this chromosomal race is determined as a small acrocentric for the first time (Figure 3). The 2n = 36 was first reported by Sözen et al. (1999) from Bayındır in western Anatolia based on a single female specimen. Tez et al. (2002) gave new distributional data for the 2n = 38 chromosomal race from western Anatolia and did not find the 2n = 36 in western Anatolia.
The 2n = 52, NF = 70 karyotype from northwestern Anatolia was reported by Sözen (2004) from Karamürsel,
Abant, Mudurnu, Nallıhan, Seben, Yeniçağa, Kartalkaya, and Mengen (Bolu), and by Matur and Sözen (2005) from Gölpazarı, Taraklı, Geyve, and Yenipazar (Bilecik). The new localities given here clarify the geographic range of this chromosomal race over a larger area. According to previous records, the locality Yalova recorded here is the most westerly point for the 2n = 52 chromosomal race. Clarifying the reasons for such a distribution and separation of chromosomal races may help in identifying the reasons for the parapatric and allopatric distribution patterns found in blind mole rats. The River Sakarya, flowing between the Yalova (NF = 72) and the Bolu and Bilecik populations (NF = 70), acts as a barrier between the 2 chromosomal races. These differentiations may have occurred after the formation of the river.
Populations with the 2n = 56 karyotype were found from Uşak and Manisa. Previously, Kankılıç et al. (2010) recorded 2n = 56; in the present study, we expanded the distribution of this chromosomal race to Manisa.
The 2n = 60C karyotype has mostly been recorded from central Anatolia (Sözen et al., 2006a; Kankılıç et al., 2007). The 2n = 60C had several different NF values in its distributional area (Sözen et al., 2006a).
A comparative analysis of G- and C-banded chromosomes of N. xanthodon and N. leucodon from 11 populations revealed a considerable degree of homology between long arms of autosomes and a general similarity in the amount of heterochromatin material. The patterns
60
60K
56tr
40
38
36 out
0.03
94/97
94/94
- /70
100/100
-/-
100/100 88/81
56W
52N
50W
54N
58N
Figure 5. Neighbor-joining tree based on chromosomal rearrangement in Nannospalax. Numbers on branches show neighbor joining results and bootstraps results. Node support from NJ and MP bootstrapping is shown for main groups. ‘–’ indicates nonsignificant support, <70% for bootstrap analyses.
MATUR et al. / Turk J Zool
485
of rearrangements and, consequently, C-heterochromatin block locations were found to be important for discriminating between chromosomal races.
In Turkey, geographic features may act as an isolation mechanism and thus separate chromosomal races (Matur and Sözen, 2005). Most chromosomal races are, however, differentiated without a barrier. Although chromosomal races are close together geographically in Turkey, hybridization does not occur (Nevo et al., 1994; Coşkun, 2003; Sözen, 2004; Matur and Sözen, 2005; Sözen et al., 2006a, 2006b; Kankılıç et al., 2007; Ivanitskaya et al., 2008). We neither recorded any hybrid specimens in the study area nor found polymorphism in G- and C-banding patterns. Each individual from each of the respective chromosomal races was identical. This means that all the chromosomal races have been isolated from each other and fixation or selection pressure is a strong evolutionary force on the evolution of new chromosomal races.
Previous banding studies (Ivanitskaya et al., 1997, 2008) suggested a high level of chromosomal divergence, which means that it is possible to consider these chromosomal races as having well-differentiated chromosomal lineage within the xanthodon group. Our phylogenetic tree indicates that each group (west, north, middle, and Thrace) is well differentiated (Figure 5). These groups should include one or more undescribed species when
studied further.Ivanitskaya et al. (1997) analyzed the chromosomal
races of N. xanthodon and N. ehrenbergi from southern Anatolia. They found that heterochromatin addition was the main process along with pericentric inversions and Robertsonian rearrangements. In Israel, the 2n = 52 is the ancestor of other chromosomal races of N. ehrenbergi due to Robertsonian fissions, which turn chromosomal races into new ones (Nevo et al., 2001). Assuming that the 2n = 60C is the ancestor of others, our results revealed that the Robertsonian fusion is the main mechanism responsible for chromosomal evolution in blind mole rats in the western part of Turkey. Furthermore, the Robertsonian fission, deletion, and inversion have a minor effect on chromosomal evolution in blind mole rats.4.1. Chromosomal evolution pathwaysThe 2n = 60C had the largest area of distribution (Figure 6). Because of its distribution, this chromosomal race is considered to be the ancestral chromosomal race to the others. It gave rise to new races, and then chromosomal differentiation might have acted as a postmating isolation mechanism. New chromosomal races may reach fixation and then differentiate as separate species. This supports the process of peripatric speciation, which is considered to be the common means of speciation for blind mole rats in Turkey (Nevo, 1991; Sözen, 2004). With this assumption,
56Tr
38
36
50W 56 40
60
60
52 N 58
54 C
58 N 56 N
60 K 54 N
56 N 50 N
58 S
52 S 56 S
56W
56Ehr
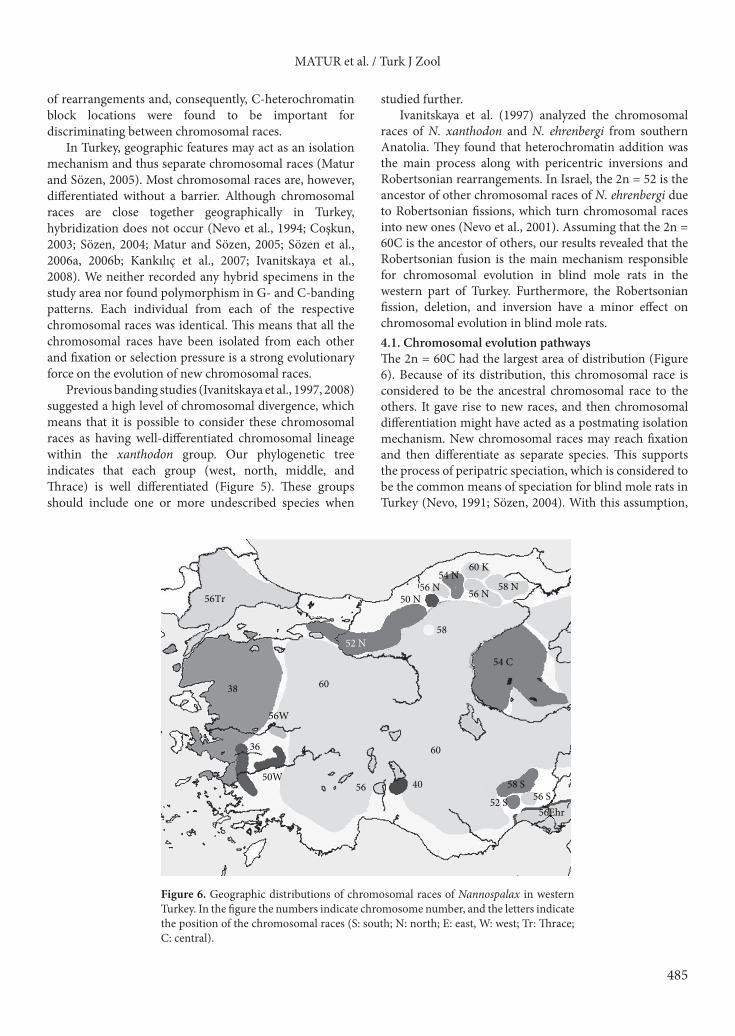
Figure 6. Geographic distributions of chromosomal races of Nannospalax in western Turkey. In the figure the numbers indicate chromosome number, and the letters indicate the position of the chromosomal races (S: south; N: north; E: east, W: west; Tr: Thrace; C: central).
MATUR et al. / Turk J Zool
486
we evaluated G- and C-banding results to develop scenarios for chromosomal evolution in blind mole rats. We discuss possible scenarios for the general evolution of blind mole rats in west and north populations in Turkey in detail below.
The 2n = 60K and 38 may have originated independently from 2n = 60C as peripheral populations at different times. While the main mechanism of the 2n = 38 race differentiation was Robertsonian fusion, for the 2n = 60K it was deletion. However, deletions hardly play an important role in chromosomal evolution; we think that additional forces (i.e. isolation from main population and selection pressure on small population) also caused the differentiation. Then those 2 chromosomal races reached fixation. Later peripheral populations of the 2n = 60K and 38 started to adaptively be distributed through new empty areas when they reached the place where other chromosomal races were derived. The 2n = 36 and 50W may have been derived from the 2n = 38. While the 2n = 36 was derived by Robertsonian fusions (Figure 4a), the 2n = 50W resulted from 6 fissions (Figure 4d). The 2n = 40 was derived from the 2n = 60C but this race includes the west group (Figure 5). However, the reason why they occurred in the west group as a paraphyletic group is still a mystery. In the north group, the 2n = 60K became the ancestral chromosomal race of the 2n = 54N and 58N after Robertsonian fusions. The north group evolved as a monophyletic group. Sözen (2004) indicated that the 2n = 50N, 54N, 56N, and 58N from northern Turkey had identical chromosomal morphology. According to our parsimony tree results, N. xanthodon grouped polyphyletically, because the 2n = 56Tr (N. leucodon) grouped together with an Anatolian sample (N. xanthodon). Kandemir et al. (2012) investigated the phylogeny of Turkish blind mole rats using molecular tools. They found similar tree topology. Chromosomal races with small diploid numbers were grouped together,
and leucodon was closer to xanthodon rather than to ehrenbergi. Hadid et al. (2012) also used molecular tools to draw a maximum likelihood tree of blind mole rats from 3 different species. In their results, Aydın (2n = 36) and Beyşehir (2n = 40) grouped together.
5. ConclusionThis study presents the first detailed banding results on blind mole rats in Turkey. Useful data for chromosomal evolution of blind mole rats in Turkey were collected. Banding results indicated that the 2n = 60C is the ancestral chromosomal race and the 2n = 38 and 2n = 60K are the secondary ancestral chromosomal races. Moreover, we agreed with Ivanitskaya et al. (1997) that Robertsonian fusions are the main mechanism responsible for chromosomal evolution of blind mole rats in Turkey. Additionally, we showed that Robertsonian fissions and pericentric inversions, and deletion are minor forces in the chromosomal evolution of blind mole rats in Turkey. Which factor causes these rearrangements is still not conclusively known. On the other hand, recently published molecular studies (Krystufek et al., 2011; Hadid et al., 2012; Kandemir et al., 2012) showed that differentiation of chromosomal races of blind mole rats in Anatolia was already done and each chromosomal race might be a good candidate to be a separate species. However, more detailed molecular studies using techniques such as genome analysis and mtDNA are still required.
AcknowledgmentsThis study was supported financially by TÜBİTAK (TBAG HD–164–101T225) and Bülent Ecevit University (Nr: 2008–13–06–01) grants. We also thank the 3 anonymous reviewers for their contribution during the evaluating process. This study is a part of the karyological and cytogenetical results presented in the PhD thesis of Ferhat Matur (2009).
References
Arslan, A., Akan, Ş. and Zima, J. 2011. Variation in C-heterochromatin and NOR distribution among chromosomal races of mole rats (Spalacidae) from Central Anatolia, Turkey. Mamm. Biol. 76: 28–35.
Coşkun, Y. 2003. A study on the morphology and karyology of Nannospalax nehringi (Satunin, 1898) (Rodentia: Spalacidae) from North-eastern Anatolia, Turkey. Turk. J. Zool. 27: 171–176.
Dobigny, G., Ducroz, J.F., Robinson, T.J. and Volobouev, V. 2004. Cytogenetics and cladistics. Syst. Biol. 53: 470–484.
Felsenstein, J. 1985. Confidence limits on phylogenies: an approach using the bootstrap. Evolution 39: 783–791.
Ford, C. and Hamerton, J. 1956. A colchicine hypotonic citrate, squash sequence for mammalian chromosomes. Stain Tech. 31: 247–251.
Hadid, Y., Németh, A., Snir, S., Pavlíček, T., Csorba, G., Kázmér, M., Major, Á., Mezhzherin, S., Rusin, M., Coşkun, Y., Nevo, E. 2012. Is evolution of blind mole rats determined by climate oscillations? PLoS One 7(1): 30043.
Ivanitskaya, E., Coskun, Y. and Nevo, E. 1997. Banded karyotypes of mole rats (Spalax, Spalacidae, Rodentia) from Turkey: a comparative analysis. J. Zool. Sys. Evol. Res. 35: 171–177.
Ivanitskaya, E. and Nevo, E. 1998. Cytogenetics of mole rats of the Spalax ehrenbergi superspecies from Jordan (Spalacidae, Rodentia). Z. Saeuget. 63: 336–346.
Ivanitskaya, E., Sozen, M., Rashkovetsky, L., Matur, F. and Nevo E 2008. Discrimination of 2n = 60 Spalax leucodon cytotypes (Spalacidae, Rodentia) in Turkey by means of classical and molecular cytogenetic techniques. Cytogenet. Genome Res. 122: 139–149.
MATUR et al. / Turk J Zool
487
Kankilic, T., Kankilic, T., Colak, R., Colak, E. and Karatas, A. 2007. Karyological comparison of populations of the Spalax leucodon Nordmann, 1840 superspecies (Rodentia: Spalacidae) in Turkey. Zool. Middle East 42: 15–24.
Kankılıç, T., Kankılıç, T., Seker, P.S., Çolak, R., Selvi, E. and Çolak E. 2010. Contributions to the karyology and distribution areas of cytotypes of Nannospalax leucodon (Rodentia: Spalacidae) in Western Anatolia. Acta Zool. Bulg. 62: 161–167.
Kandemir, İ., Sözen, M., Matur, F., Martinkova, N., Kankılıç, T., Çolak, F., Özkurt, Ş.Ö., and Çolak, E. 2012. Phylogeny of species and cytotypes of mole rats (Spalacidae) in Turkey inferred from mitochondrial cytochrome b gene sequences. Folia Zool. 61(1): 25–33.
Kryštufek, B., Ivanitskaya, E., Arslan, A., Arslan, E. and Bužan, E.V. 2011. Evolutionary history of mole rats (genus Nannospalax) inferred from mitochondrial cytochrome b sequence. Biol. J. Linnean Soc. 105(2): 446–455.
Matur, F. and Sozen, M. 2005. A karyological study on subterrranean mole rats of the Spalax leucodon Nordmann, 1840 (Mammalia: Rodentia) superspecies in northwestern Turkey. Zool. Middle East 36: 5–10.
Matur, F., Colak, F., Sevindik, M. and Sozen, M. 2011. Chromosome differentiation of four 2n = 50 chromosomal forms of Turkish mole rat, Nannospalax nehringi. Zool. Sci. 28: 61–67.
Nevo, E. 1991. Evolutionary theory and processes of active speciation and adaptive radiation in subterranean mole rats, Spalax ehrenbergi superspecies, in Israel. Evol. Biol. 25: 1–125.
Nevo, E., Filippucci, M.G., Redi, C., Korol, A. and Beiles, A. 1994. Chromosomal speciation and adaptive radiation of mole-rats in Asia Minor correlated with increased ecological stress. Proc. Natl. Acad. Sci. USA 91: 8160–8164.
Nevo, E., Ivanitskaya, E. and Beiles, A. 2001. Adaptive radiation of blind subterranean mole rats: naming and revisiting the four sibling species of the Spalax ehrenbergi superspecies in Israel: Spalax galili (2n = 52), S. golani (2n = 54), S. carmeli (2n = 58) and S. judaei (2n = 60). Bachkhuys Publishers, Leiden, The Netherlands.
Seabright, M. 1971. A rapid banding technique for human-chromosomes. Lancet 2: 971–972.
Sozen, M. 2004. A karyological study on subterranean mole rats of the Spalax leucodon Nordmann, 1840 superspecies in Turkey. Mamm. Biol. 69: 420–429.
Sozen, M. and Kivanc, E. 1998a. Two new karyotypic forms of Spalax leucodon (Nordmann, 1840) (Mammalia: Rodentia) from Turkey. Z Saugetierkd. -Mamm. Biol. 63: 307–310.
Sozen, M. and Kivanc, E. 1998b. A new karyotype of Spalax leucodon cilicicus Mehely, 1909 (Mammalia: Rodentia) from the type locality in Turkey. Israel J. Zool. 44: 53–55.
Sozen, M., Colak, E., Yigit, N., Ozkurt, S. and Verimli, R. 1999. Contributions to the karyology and taxonomy of the genus Spalax Guldenstaedt, 1770 (Mammalia: Rodentia) in Turkey. Z. Sauget. 64: 210–219.
Sozen, M., Colak, E. and Yigit, N. 2000a. Contributions to the karyology and taxonomy of Spalax leucodon nehringi Satunin, 1898 and Spalax leucodon armeniacus Mehely, 1909 (Mammalia: Rodentia) in Turkey. Z. Sauget. 65: 309–312.
Sözen, M., Yiğit, N. and Çolak, E. 2000b. A study on karyotypic evolution of the genus Spalax Guldenstaedt, 1770 (Mammalia: Rodentia) in Turkey. Israel J. Zool. 46: 239–242.
Sozen, M., Sevindik, M. and Matur, F. 2006a. Karyological and some morphological characteristics of Spalax leucodon Nordmann, 1840 (Mammalia: Rodentia) superspecies around Kastamonu province, Turkey. Turk. J. Zool. 30: 205–219.
Sozen, M., Matur, F., Colak, E., Ozkurt, S. and Karatas, A. 2006b. Some karyological records and a new chromosomal form for Spalax (Mammalia: Rodentia) in Turkey. Folia Zool. 55: 247–256.
Sözen, M., Çataklı, K., Eroğlu, F., Matur, F. and Sevindik, M. 2011. Distribution of chromosomal forms of Nannospalax nehringi (Satunin, 1898) (Rodentia: Spalacidae) in Çankırı and Çorum provinces, Turkey. Turk. J. Zool. 35(3): 367–374.
Sumner, A. 1972. A simple technique for demonstrating centromeric heterochromatin. Exp. Cell. Res. 75: 304–306.
Sumner, A. 2003. Chromosomes: Organization and Function. Blackwell Publishing, Oxford, UK.
Swofford, D. 1999. PAUP*. Phylogenetic Analysis Using Parsimony (* and other Methods). In. Sunderland, MA: Sinauer Associates.
Tez, C., Gunduz, I. and Kefelioglu, H. 2002. Note: New data on the distribution of 2n = 38 Spalax leucodon (Nordmann, 1840) cytotype in Turkey. Isr. J. Zool. 48: 155–159.
Related Documents