Volume 3 • Issue 5 • 1000138 J Chromat Separation Techniq ISSN:2157-7064 JCGST, an open access journal Research Article Open Access Ahir et al., J Chromat Separation Techniq 2012, 3:5 http://dx.doi.org/10.4172/2157-7064.1000138 Research Article Open Access Chromatography Separation Techniques Development of a Validated Stability- Indicating HPTLC Method for Nitazoxanide in Pharmaceutical Formulation Keyur B.Ahir, Emanuel M. Patelia* and Falgun A.Mehta Department of Pharmaceutical Chemistry and Analysis, Indukaka Ipcowala College of Pharmacy, New Vallabh Vidyanagar – 388121, Gujarat, India *Corresponding author: Emanuel M. Patelia, Department of Pharmaceutical Chemistry and Analysis, Indukaka Ipcowala College of Pharmacy, New Vallabh Vidyanagar – 388121, Gujarat, India, E-mail: [email protected] Received August 02, 2012; Accepted September 10, 2012; Published September 15, 2012 Citation: Ahir KB, Patelia EM, Mehta FA (2012) Development of a Validated Stability- Indicating HPTLC Method for Nitazoxanide in Pharmaceutical Formulation. J Chromat Separation Techniq 3:138. doi:10.4172/2157-7064.1000138 Copyright: © 2012 Ahir KB, et al. This is an open-access article distributed under the terms of the Creative Commons Attribution License, which permits unrestricted use, distribution, and reproduction in any medium, provided the original author and source are credited. Abstract The present paper describes stability indicating high-performance thin-layer chromatography (HPTLC) assay method for nitazoxanide in bulk drugs. The method employed TLC aluminium plates precoated with silica gel 60F-254 as the stationary phase. The solvent system consisted of carbon tetra chloride: ethyl acetate (7:3 v/v). The system was found to give compact spot for nitazoxanide (R f value of ± 0.02). Densitometric analysis of nitazoxanide was carried out in the absorbance mode at 345 nm. The linear regression analysis data for the calibration plots showed good linear relationship with r 2 = 0.9992 ± 0.0001 with respect to peak area in the concentration range 200 - 1200 ng spot -1 . The mean value ± S.D. of slope and intercept were 9.3726 ± 0.023 and 3795.46 ± 13.940 with respect to peak area. The developed HPTLC method was validated with respect to accuracy, precision, recovery and robustness. Also to determine related substance and assay determination of nitazoxanide that can be used to evaluate the quality of regular production samples. The developed method can also be conveniently used for the assay determination of nitazoxanide in pharmaceutical formulations. The limits of detection and quantitation were 17.12 and 51.88 ng spot -1 , respectively. Nitazoxanide was subjected to acid and alkali hydrolysis, oxidation, photochemical and thermal degradation. The drug undergoes degradation under acidic, basic, oxidation and heat conditions. This indicates that the drug is susceptible to acid, base hydrolysis, oxidation and heat. Statistical analysis proves that the method is repeatable, selective and accurate for the estimation of said drug. The proposed developed HPTLC method can be applied for identification and quantitative determination of nitazoxanide in bulk drug and tablet formulation. Keywords: Nitazoxanide; High performance thin-layer chromatography; Validation; Stability-indicating; Degradation Introduction e chemical designation of nitazoxanide is [2- [(5-nitro-1, 3-thiazol-2-yl) carbamoyl] phenyl] ethanoate and used as antiprotozoal and anthelmintic agent (Figure 1) [1]. Nitazoxanide is antiparasitic which is effective against a wide variety of protozoa, helminthes and gram-negative organisms [2]. Nitazoxanide is effective in a broad range of parasitic and protozoal infections including Giardia lamblia, Entamoeba histolytica, Cryptosporidium spp., Ascaris lumbricoides, Hymenolepis nana and Taenia solium/ saginata [3]. In literature, spectrophotometric methods for determination of nitazoxanide in pharmaceutical formulation were reported [4-6]. Validated stability indicating HPLC method for separation of nitazoxanide from its impurities was published [7]. e parent drug stability test guidelines (Q1A) issued by International Conference on Harmonisation (ICH) requires that analytical test procedures for stability samples should be fully validated and the assays should be stability indicating [8-13]. e main intention of the work is to build up a stability indicating high-performance thin- layer chromatography for determination of nitazoxanide. is paper mainly deals with the forced degradation of nitazoxanide under stress conditions like acid hydrolysis, base hydrolysis, peroxide hydrolysis, heat and light. Materials Nitazoxanide was supplied by Shreya Life Sciences, India as a giſt sample. All the reagents used were of HPLC grade. HPTLC instrumentation e samples were spotted in the form of bands of width 6 mm with Camag microlitre syringe on precoated silica gel aluminium Plate 60F- 254 (20 cm × 10 cm with 0.2 mm thickness E. Merck, Germany) using Camag Linomat V (Switzerland). A constant application rate of 150 nL sec -1 was employed and space between two bands was 15 mm. e slit dimension was kept 6 mm × 0.45 mm micro. e mobile phase consisted of carbon tetra chloride: ethyl acetate 7: 3 (v/v). Linear ascending development was carried out in twin trough glass chamber saturated with mobile phase. e optimized chamber saturation time for mobile phase was 15 min at room temp (25 ° C ± 2) and relative humidity 60% ± 5. e length of chromatogram run was approximately 80 mm. Forced degradation of nitazoxanide 0 20 40 60 80 100 120 1M HCl 1N NaOH 10%H2O2 Heat Photo Condition Applied % of Drug drug degraded Figure 1: Chemical structure of nitazoxanide.

Welcome message from author
This document is posted to help you gain knowledge. Please leave a comment to let me know what you think about it! Share it to your friends and learn new things together.
Transcript
Volume 3 • Issue 5 • 1000138J Chromat Separation TechniqISSN:2157-7064 JCGST, an open access journal
Research Article Open Access
Ahir et al., J Chromat Separation Techniq 2012, 3:5http://dx.doi.org/10.4172/2157-7064.1000138
Research Article Open Access
Chromatography Separation Techniques
Development of a Validated Stability- Indicating HPTLC Method for Nitazoxanide in Pharmaceutical FormulationKeyur B.Ahir, Emanuel M. Patelia* and Falgun A.Mehta
Department of Pharmaceutical Chemistry and Analysis, Indukaka Ipcowala College of Pharmacy, New Vallabh Vidyanagar – 388121, Gujarat, India
*Corresponding author: Emanuel M. Patelia, Department of Pharmaceutical Chemistry and Analysis, Indukaka Ipcowala College of Pharmacy, New Vallabh Vidyanagar – 388121, Gujarat, India, E-mail: [email protected]
Received August 02, 2012; Accepted September 10, 2012; Published September 15, 2012
Citation: Ahir KB, Patelia EM, Mehta FA (2012) Development of a Validated Stability- Indicating HPTLC Method for Nitazoxanide in Pharmaceutical Formulation. J Chromat Separation Techniq 3:138. doi:10.4172/2157-7064.1000138
Copyright: © 2012 Ahir KB, et al. This is an open-access article distributed under the terms of the Creative Commons Attribution License, which permits unrestricted use, distribution, and reproduction in any medium, provided the original author and source are credited.
AbstractThe present paper describes stability indicating high-performance thin-layer chromatography (HPTLC) assay
method for nitazoxanide in bulk drugs. The method employed TLC aluminium plates precoated with silica gel 60F-254 as the stationary phase. The solvent system consisted of carbon tetra chloride: ethyl acetate (7:3 v/v). The system was found to give compact spot for nitazoxanide (Rf value of ± 0.02). Densitometric analysis of nitazoxanide was carried out in the absorbance mode at 345 nm. The linear regression analysis data for the calibration plots showed good linear relationship with r2 = 0.9992 ± 0.0001 with respect to peak area in the concentration range 200 - 1200 ng spot-1. The mean value ± S.D. of slope and intercept were 9.3726 ± 0.023 and 3795.46 ± 13.940 with respect to peak area. The developed HPTLC method was validated with respect to accuracy, precision, recovery and robustness. Also to determine related substance and assay determination of nitazoxanide that can be used to evaluate the quality of regular production samples. The developed method can also be conveniently used for the assay determination of nitazoxanide in pharmaceutical formulations. The limits of detection and quantitation were 17.12 and 51.88 ng spot-1, respectively. Nitazoxanide was subjected to acid and alkali hydrolysis, oxidation, photochemical and thermal degradation. The drug undergoes degradation under acidic, basic, oxidation and heat conditions. This indicates that the drug is susceptible to acid, base hydrolysis, oxidation and heat. Statistical analysis proves that the method is repeatable, selective and accurate for the estimation of said drug. The proposed developed HPTLC method can be applied for identification and quantitative determination of nitazoxanide in bulk drug and tablet formulation.
Keywords: Nitazoxanide; High performance thin-layer chromatography; Validation; Stability-indicating; Degradation
IntroductionThe chemical designation of nitazoxanide is [2- [(5-nitro-1,
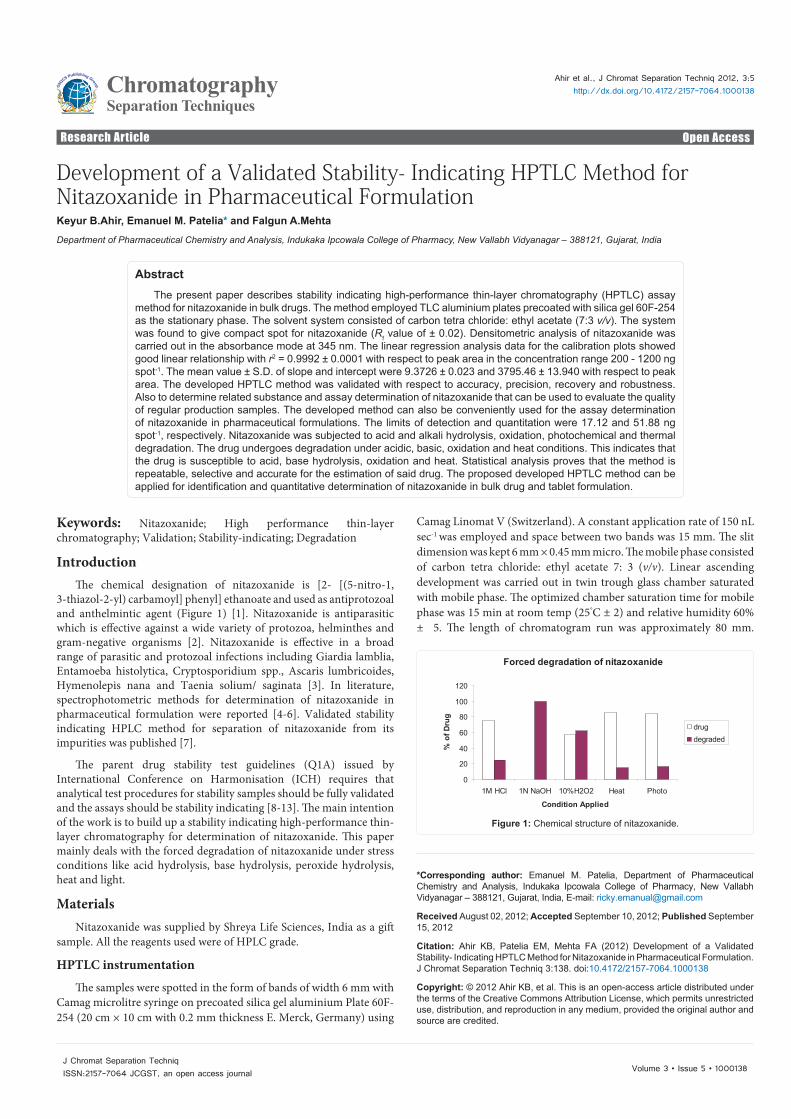
3-thiazol-2-yl) carbamoyl] phenyl] ethanoate and used as antiprotozoal and anthelmintic agent (Figure 1) [1]. Nitazoxanide is antiparasitic which is effective against a wide variety of protozoa, helminthes and gram-negative organisms [2]. Nitazoxanide is effective in a broad range of parasitic and protozoal infections including Giardia lamblia, Entamoeba histolytica, Cryptosporidium spp., Ascaris lumbricoides, Hymenolepis nana and Taenia solium/ saginata [3]. In literature, spectrophotometric methods for determination of nitazoxanide in pharmaceutical formulation were reported [4-6]. Validated stability indicating HPLC method for separation of nitazoxanide from its impurities was published [7].
The parent drug stability test guidelines (Q1A) issued by International Conference on Harmonisation (ICH) requires that analytical test procedures for stability samples should be fully validated and the assays should be stability indicating [8-13]. The main intention of the work is to build up a stability indicating high-performance thin-layer chromatography for determination of nitazoxanide. This paper mainly deals with the forced degradation of nitazoxanide under stress conditions like acid hydrolysis, base hydrolysis, peroxide hydrolysis, heat and light.
MaterialsNitazoxanide was supplied by Shreya Life Sciences, India as a gift
sample. All the reagents used were of HPLC grade.
HPTLC instrumentation
The samples were spotted in the form of bands of width 6 mm with Camag microlitre syringe on precoated silica gel aluminium Plate 60F-254 (20 cm × 10 cm with 0.2 mm thickness E. Merck, Germany) using
Camag Linomat V (Switzerland). A constant application rate of 150 nL sec-1 was employed and space between two bands was 15 mm. The slit dimension was kept 6 mm × 0.45 mm micro. The mobile phase consisted of carbon tetra chloride: ethyl acetate 7: 3 (v/v). Linear ascending development was carried out in twin trough glass chamber saturated with mobile phase. The optimized chamber saturation time for mobile phase was 15 min at room temp (25°C ± 2) and relative humidity 60% ± 5. The length of chromatogram run was approximately 80 mm.
Forced degradation of nitazoxanide
0
20
40
60
80
100
120
1M HCl 1N NaOH 10%H2O2 Heat Photo
Condition Applied
% o
f Dru
g
drugdegraded
Figure 1: Chemical structure of nitazoxanide.
Citation: Ahir KB, Patelia EM, Mehta FA (2012) Development of a Validated Stability- Indicating HPTLC Method for Nitazoxanide in Pharmaceutical Formulation. J Chromat Separation Techniq 3:138. doi:10.4172/2157-7064.1000138
Page 2 of 5
Volume 3 • Issue 5 • 1000138J Chromat Separation TechniqISSN:2157-7064 JCGST, an open access journal
Subsequent to the development; TLC plates were dried in current of air with the help of an air dryer. Densitometric scanning was performed using Camag TLC scanner III in the absorbance mode at 345 nm. The source of radiation utilized was deuterium lamp emitting a continuous UV spectrum in the range of 190 - 400 nm.
Calibration curve of nitazoxanide
A stock solution containing 1000 ng μL-1 of nitazoxanide was prepared in methanol. Calibration spots were applied on TLC plate using the stock solution, to enable application of 200 to 1200 ng spot-
1 for nitazoxanide. The plate was developed on previously described mobile phase. The peak areas were plotted against corresponding concentrations to obtain the calibration graphs.
Method ValidationPrecision
Repeatability of sample application and measurement of peak area were carried out using six replicates of same concentration (800 ng spot-1 of nitazoxanide). The intra-day and inter-day variation for the determination of nitazoxanide was carried out at three different concentration levels of 600, 800 and 1000 ng spot-1.
Robustness of the method
By introducing various changes in the previous chromatographic conditions the effects on the results were examined.
Limit of detection and limit of quantification
In order to determine detection and quantification limit, concentrations in the lower part of the linear range of the calibration curve were used. Stock solution of nitazoxanide (1000 µg mL-1) was prepared and different volume of stock solution in the range 200 to 400 ng were spotted in triplicate. The amount of nitazoxanide by spot versus average response (peak area) was graphed and the equation for this was determined. The standard deviations (S.D.) of responses were calculated. The average of standard deviations was calculated (A.S.D.). Detection limit was calculated by (3.3 × A.S.D.)/b and quantification limit was calculated by (10 × A.S.D.)/b, where “b” corresponds to the slope obtained in the linearity study of method.
Specificity
The specificity of the method was ascertained by analyzing standard drug and sample. The spot for nitazoxanide in sample was confirmed by comparing the Rf values and spectra of the spot with that of standard. The peak purity of nitazoxanide was accessed by comparing the spectra at three different levels, i.e., peak start (S), peak apex (M) and peak end (E) positions of the spot.
Recovery studies
The analyzed samples were spiked with extra 50, 100 and 150% of the standard nitazoxanide and the mixtures were reanalyzed by the proposed method. The experiment was conducted in triplicate. This was done to check for the recovery of the drug at different levels in formulations.
Analysis of the marketed formulation
To determine the content of nitazoxanide in conventional tablets; twenty tablets were weighed and powdered in a glass mortar. An amount of powder equivalent to 10 mg nitazoxanide was transferred to 25 mL volumetric flask, extracted with methanol, sonicated for 20
min and diluted to mark with same solvent. The resulting solution was filtered, using 0.45 μm filter (Millifilter, Milford, MA). The solution (2 μL, 800 ng of nitazoxanide) was spotted for assay of nitazoxanide. The spots at Rf is 0.52 for nitazoxanide were observed in the densitogram extracted from tablets. There were no interferences from the excipients commonly present in the tablets.
Forced degradation of standard nitazoxanide
In all degradation studies the average peak area of nitazoxanide after application (1000 ng spot -1) of seven replicates was obtained. The plate was developed and scanned in above established chromatographic conditions. Peak area was recorded for each concentration of degraded drug.
Acid and base induced degradation
The 10 mg of nitazoxanide was separately dissolved in 10 mL of methanolic solution of 1M HCl and 1M NaOH. These solutions were kept for 8 h at room temperature in the dark in order to exclude the possible degradative effect of light. The 1 ml of above solutions was taken and neutralized, then diluted up to 10 mL with methanol. The resultant solutions were applied on TLC plate in triplicate (10 μL each, i.e. 1000 ng spot-1). The chromatograms were run as described in HPTLC Instrumentation.
Hydrogen peroxide-induced degradation
The 10 mg of nitazoxanide was separately dissolved in 10 mL of methanolic solution of hydrogen peroxide (10%, v/v). The solution was kept for 8 h at room temperature in the dark in order to exclude the possible degradative effect of light. The 1 mL of above solution was taken and diluted up to 10 mL with methanol. The resultant solution was applied on TLC plate in triplicate (10 μL each, i.e. 1000 ng spot-1). The chromatograms were run as described in HPTLC Instrumentation.
Dry heat degradation product
The powdered drug was stored at 55°C for 3 h under dry heat condition showed significant degradation. The degraded product was resolved from the standard. In all degradation studies, the average peak areas of nitazoxanide after application (1000 ng spot-1) of three replicates were obtained.
Photochemical degradation product
The 10 mg nitazoxanide was dissolved in 10 mL of methanol. The solution was kept in the sun light for 8 h. The resultant solution was applied on TLC plate in triplicate (1 μL each, i.e. 1000 ng spot-1) [4-6].
Results and DiscussionHPTLC method development and validation
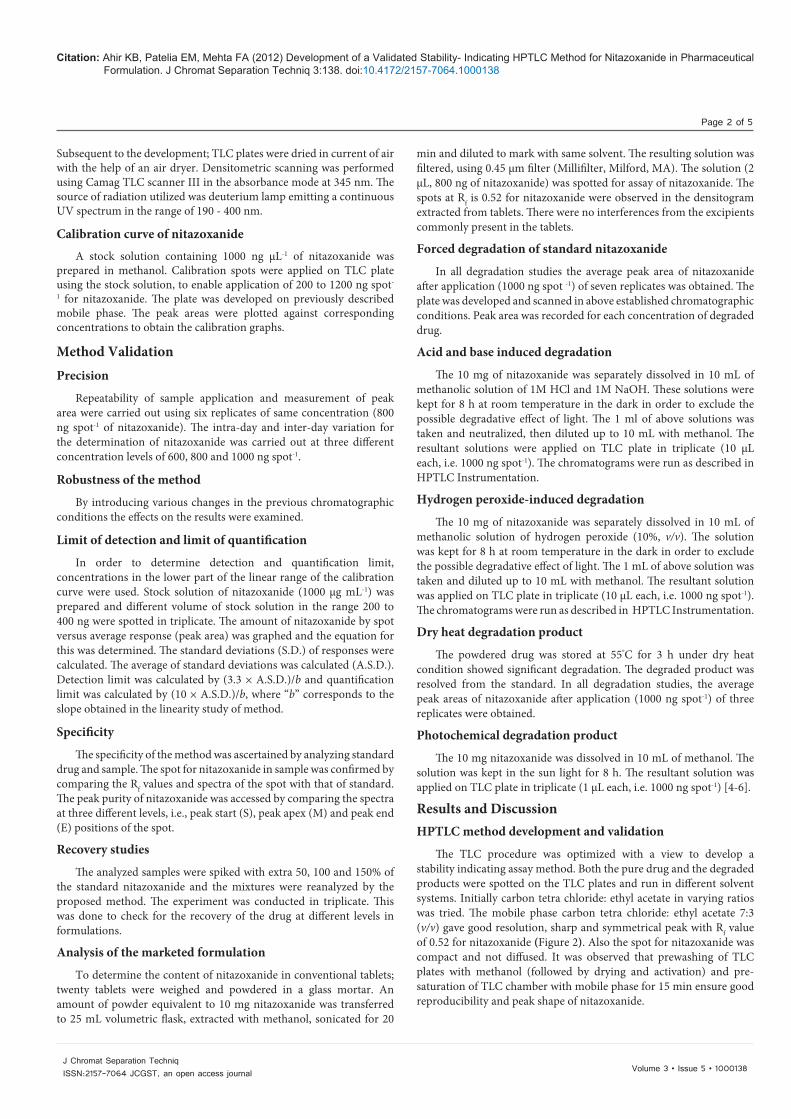
The TLC procedure was optimized with a view to develop a stability indicating assay method. Both the pure drug and the degraded products were spotted on the TLC plates and run in different solvent systems. Initially carbon tetra chloride: ethyl acetate in varying ratios was tried. The mobile phase carbon tetra chloride: ethyl acetate 7:3 (v/v) gave good resolution, sharp and symmetrical peak with Rf value of 0.52 for nitazoxanide (Figure 2). Also the spot for nitazoxanide was compact and not diffused. It was observed that prewashing of TLC plates with methanol (followed by drying and activation) and pre-saturation of TLC chamber with mobile phase for 15 min ensure good reproducibility and peak shape of nitazoxanide.
Citation: Ahir KB, Patelia EM, Mehta FA (2012) Development of a Validated Stability- Indicating HPTLC Method for Nitazoxanide in Pharmaceutical Formulation. J Chromat Separation Techniq 3:138. doi:10.4172/2157-7064.1000138
Page 3 of 5
Volume 3 • Issue 5 • 1000138J Chromat Separation TechniqISSN:2157-7064 JCGST, an open access journal
Validation
Linearity: The linear regression data for the calibration curves showed good linear relationship over the concentration range of 200- 1200 ng (co-relation co-efficient, r2 = 0.9992). No significant difference was observed in the slopes of standard curves. The results are shown in table 1.
Precision: The precision of the developed HPTLC method was expressed in terms of % relative standard deviation (% R.S.D.). The results depicted revealed high precision of the method is presented in table 2.
Robustness of the method: The standard deviation of peak areas was calculated for each parameter and %R.S.D. was found to be less than 2%. The low % R.S.D. values as shown in table 3 indicated robustness of the method.
Recovery: The proposed method when used for extraction and subsequent estimation of nitazoxanide from pharmaceutical dosage forms after spiking with 50, 100 and 150% of additional drug afforded recovery of 98 -102% as listed in table 4.
Ruggedness of the method: Ruggedness of the method was performed by applying 800 ng for nitazoxanide, by two different analyst keeping same experimental and environmental conditions. The results are presented in table 5.
Limit of detection and limit of quantification: Detection limit and quantification limit was calculated by the method as described in section 5.3 and found 17.12 and 51.88 ng, respectively. This indicates that adequate sensitivity of the method.
Assay of marketed formulation: A single spot at Rf of 0.52 was observed in the chromatogram of the drug samples extracted from conventional tablets. There was no interference from the excipients commonly present in the conventional tablets. The drug content was found to be 101.98 with a % R.S.D. of 0.24. It may, therefore, be inferred that degradation of nitazoxanide had not occurred in the marketed formulations that were analysed by this method. The low values of % R.S.D. indicated the suitability of this method for routine analysis of nitazoxanide in pharmaceutical dosage forms [7-14].
Accelerated degradation
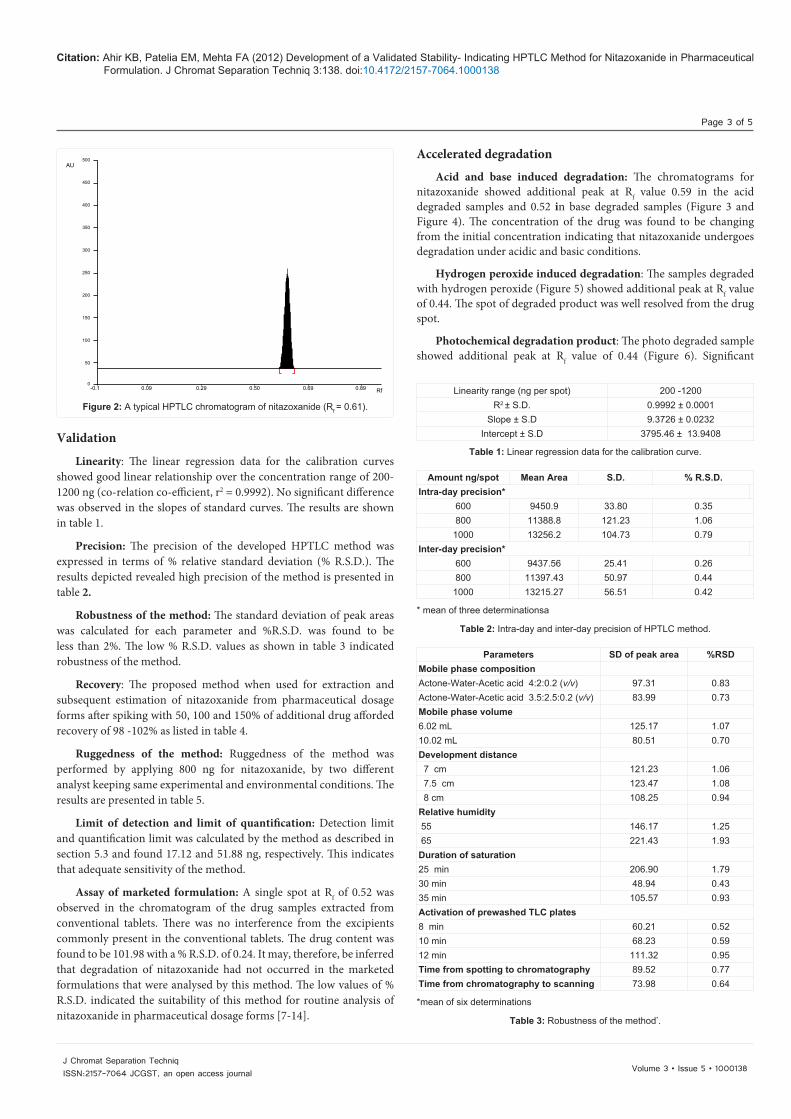
Acid and base induced degradation: The chromatograms for nitazoxanide showed additional peak at Rf value 0.59 in the acid degraded samples and 0.52 in base degraded samples (Figure 3 and Figure 4). The concentration of the drug was found to be changing from the initial concentration indicating that nitazoxanide undergoes degradation under acidic and basic conditions.
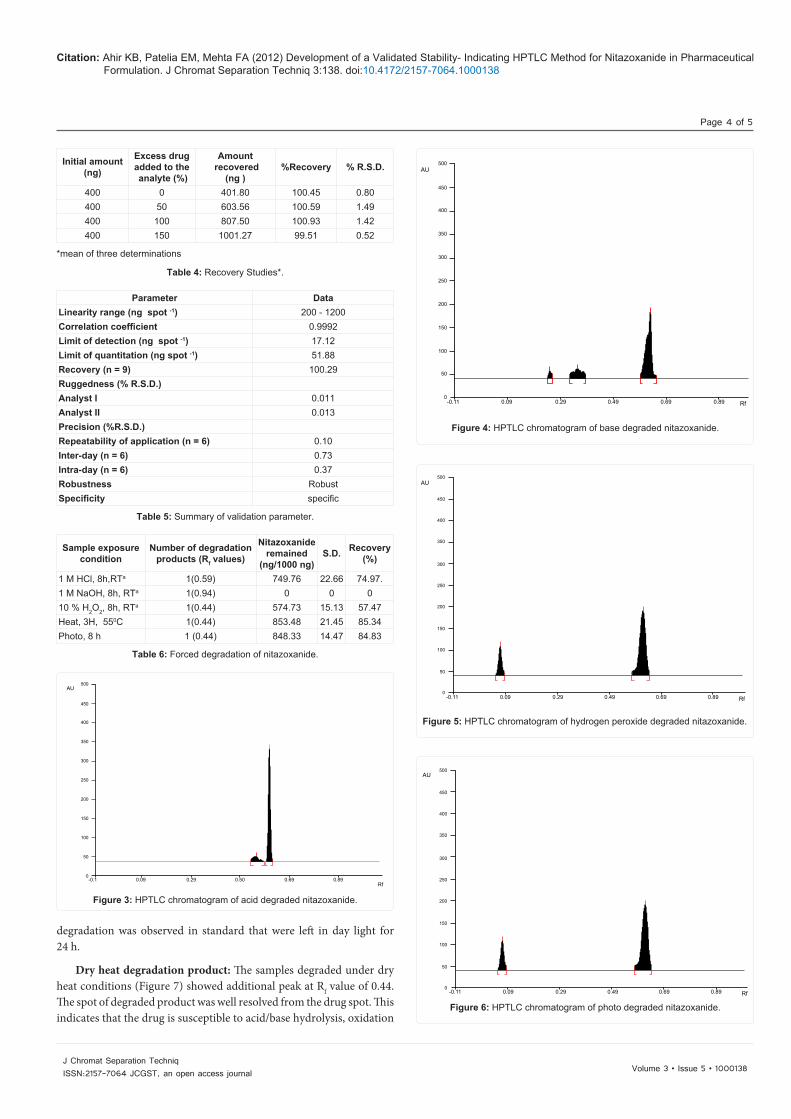
Hydrogen peroxide induced degradation: The samples degraded with hydrogen peroxide (Figure 5) showed additional peak at Rf value of 0.44. The spot of degraded product was well resolved from the drug spot.
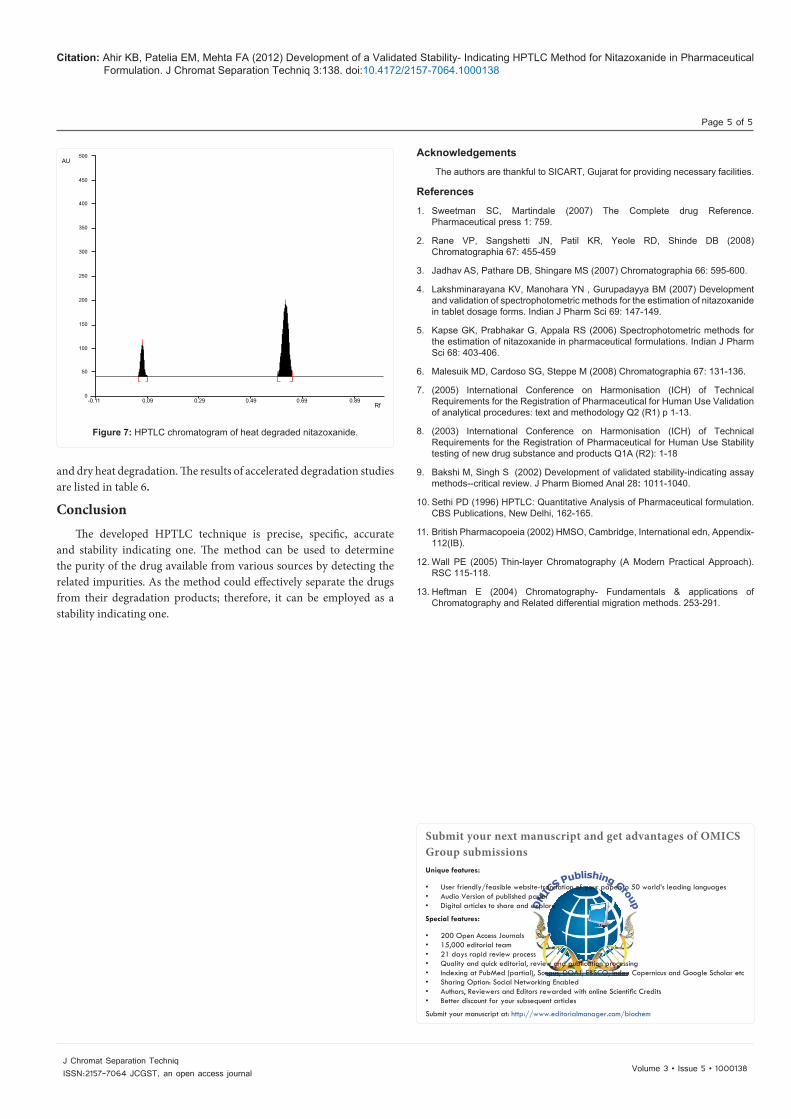
Photochemical degradation product: The photo degraded sample showed additional peak at Rf value of 0.44 (Figure 6). Significant
-0.1 0.09 0.29 0.50 0.69 0.89 Rf
AU500
450
400
350
300
250
200
150
100
50
0
Figure 2: A typical HPTLC chromatogram of nitazoxanide (Rf = 0.61).
Linearity range (ng per spot) 200 -1200R2 ± S.D. 0.9992 ± 0.0001
Slope ± S.D 9.3726 ± 0.0232Intercept ± S.D 3795.46 ± 13.9408
Table 1: Linear regression data for the calibration curve.
Amount ng/spot Mean Area S.D. % R.S.D.Intra-day precision*
600 9450.9 33.80 0.35800 11388.8 121.23 1.06
1000 13256.2 104.73 0.79Inter-day precision*
600 9437.56 25.41 0.26800 11397.43 50.97 0.44
1000 13215.27 56.51 0.42
* mean of three determinationsa
Table 2: Intra-day and inter-day precision of HPTLC method.
Parameters SD of peak area %RSDMobile phase composition Actone-Water-Acetic acid 4:2:0.2 (v/v) 97.31 0.83Actone-Water-Acetic acid 3.5:2.5:0.2 (v/v) 83.99 0.73Mobile phase volume6.02 mL 125.17 1.0710.02 mL 80.51 0.70Development distance 7 cm 121.23 1.06 7.5 cm 123.47 1.08 8 cm 108.25 0.94Relative humidity 55 146.17 1.25 65 221.43 1.93Duration of saturation 25 min 206.90 1.7930 min 48.94 0.4335 min 105.57 0.93Activation of prewashed TLC plates 8 min 60.21 0.5210 min 68.23 0.5912 min 111.32 0.95Time from spotting to chromatography 89.52 0.77Time from chromatography to scanning 73.98 0.64
*mean of six determinations
Table 3: Robustness of the method*.
Citation: Ahir KB, Patelia EM, Mehta FA (2012) Development of a Validated Stability- Indicating HPTLC Method for Nitazoxanide in Pharmaceutical Formulation. J Chromat Separation Techniq 3:138. doi:10.4172/2157-7064.1000138
Page 4 of 5
Volume 3 • Issue 5 • 1000138J Chromat Separation TechniqISSN:2157-7064 JCGST, an open access journal
degradation was observed in standard that were left in day light for 24 h.
Dry heat degradation product: The samples degraded under dry heat conditions (Figure 7) showed additional peak at Rf value of 0.44. The spot of degraded product was well resolved from the drug spot. This indicates that the drug is susceptible to acid/base hydrolysis, oxidation
Initial amount (ng)
Excess drug added to the analyte (%)
Amount recovered
(ng )%Recovery % R.S.D.
400 0 401.80 100.45 0.80400 50 603.56 100.59 1.49400 100 807.50 100.93 1.42400 150 1001.27 99.51 0.52
*mean of three determinations
Table 4: Recovery Studies*.
Parameter DataLinearity range (ng spot -1) 200 - 1200Correlation coefficient 0.9992Limit of detection (ng spot -1) 17.12Limit of quantitation (ng spot -1) 51.88Recovery (n = 9) 100.29Ruggedness (% R.S.D.)Analyst I 0.011Analyst II 0.013Precision (%R.S.D.)Repeatability of application (n = 6) 0.10Inter-day (n = 6) 0.73Intra-day (n = 6) 0.37Robustness RobustSpecificity specific
Table 5: Summary of validation parameter.
Sample exposure condition
Number of degradation products (Rf values)
Nitazoxanide remained
(ng/1000 ng)S.D. Recovery
(%)
1 M HCl, 8h,RTa 1(0.59) 749.76 22.66 74.97.1 M NaOH, 8h, RTa 1(0.94) 0 0 010 % H2O2, 8h, RTa 1(0.44) 574.73 15.13 57.47Heat, 3H, 550C 1(0.44) 853.48 21.45 85.34Photo, 8 h 1 (0.44) 848.33 14.47 84.83
Table 6: Forced degradation of nitazoxanide.
AU500
450
400
350
300
250
200
150
100
50
0-0.1 0.09 0.29 0.50 0.69 0.89
Rf
Figure 3: HPTLC chromatogram of acid degraded nitazoxanide.
AU500
450
400
350
300
250
200
150
100
50
0-0.11 0.09 0.29 0.49 0.69 0.89 Rf
Figure 4: HPTLC chromatogram of base degraded nitazoxanide.
-0.11 0.09 0.29 0.49 0.69 0.89 Rf
AU500
450
400
350
300
250
200
150
100
50
0
Figure 5: HPTLC chromatogram of hydrogen peroxide degraded nitazoxanide.
-0.11 0.09 0.29 0.49 0.69 0.89 Rf
AU500
450
400
350
300
250
200
150
100
50
0
Figure 6: HPTLC chromatogram of photo degraded nitazoxanide.
Citation: Ahir KB, Patelia EM, Mehta FA (2012) Development of a Validated Stability- Indicating HPTLC Method for Nitazoxanide in Pharmaceutical Formulation. J Chromat Separation Techniq 3:138. doi:10.4172/2157-7064.1000138
Page 5 of 5
Volume 3 • Issue 5 • 1000138J Chromat Separation TechniqISSN:2157-7064 JCGST, an open access journal
and dry heat degradation. The results of accelerated degradation studies are listed in table 6.
ConclusionThe developed HPTLC technique is precise, specific, accurate
and stability indicating one. The method can be used to determine the purity of the drug available from various sources by detecting the related impurities. As the method could effectively separate the drugs from their degradation products; therefore, it can be employed as a stability indicating one.
-0.11 0.09 0.29 0.49 0.69 0.89Rf
AU500
450
400
350
300
250
200
150
100
50
0
Figure 7: HPTLC chromatogram of heat degraded nitazoxanide.
Acknowledgements
The authors are thankful to SICART, Gujarat for providing necessary facilities.
References
1. Sweetman SC, Martindale (2007) The Complete drug Reference. Pharmaceutical press 1: 759.
2. Rane VP, Sangshetti JN, Patil KR, Yeole RD, Shinde DB (2008) Chromatographia 67: 455-459
3. Jadhav AS, Pathare DB, Shingare MS (2007) Chromatographia 66: 595-600.
4. Lakshminarayana KV, Manohara YN , Gurupadayya BM (2007) Development and validation of spectrophotometric methods for the estimation of nitazoxanide in tablet dosage forms. Indian J Pharm Sci 69: 147-149.
5. Kapse GK, Prabhakar G, Appala RS (2006) Spectrophotometric methods for the estimation of nitazoxanide in pharmaceutical formulations. Indian J Pharm Sci 68: 403-406.
6. Malesuik MD, Cardoso SG, Steppe M (2008) Chromatographia 67: 131-136.
7. (2005) International Conference on Harmonisation (ICH) of Technical Requirements for the Registration of Pharmaceutical for Human Use Validation of analytical procedures: text and methodology Q2 (R1) p 1-13.
8. (2003) International Conference on Harmonisation (ICH) of Technical Requirements for the Registration of Pharmaceutical for Human Use Stability testing of new drug substance and products Q1A (R2): 1-18
9. Bakshi M, Singh S (2002) Development of validated stability-indicating assay methods--critical review. J Pharm Biomed Anal 28: 1011-1040.
10. Sethi PD (1996) HPTLC: Quantitative Analysis of Pharmaceutical formulation. CBS Publications, New Delhi, 162-165.
11. British Pharmacopoeia (2002) HMSO, Cambridge, International edn, Appendix-112(IB).
12. Wall PE (2005) Thin-layer Chromatography (A Modern Practical Approach). RSC 115-118.
13. Heftman E (2004) Chromatography- Fundamentals & applications of Chromatography and Related differential migration methods. 253-291.
Submit your next manuscript and get advantages of OMICS Group submissionsUnique features:
• Userfriendly/feasiblewebsite-translationofyourpaperto50world’sleadinglanguages• AudioVersionofpublishedpaper• Digitalarticlestoshareandexplore
Special features:
• 200OpenAccessJournals• 15,000editorialteam• 21daysrapidreviewprocess• Qualityandquickeditorial,reviewandpublicationprocessing• IndexingatPubMed(partial),Scopus,DOAJ,EBSCO,IndexCopernicusandGoogleScholaretc• SharingOption:SocialNetworkingEnabled• Authors,ReviewersandEditorsrewardedwithonlineScientificCredits• Betterdiscountforyoursubsequentarticles
Submityourmanuscriptat:http://www.editorialmanager.com/biochem
http://www.scielo.br/scielo.php?script=sci_nlinks&ref=000148&pid=S0100-4042201000050002800024&lng=pt
http://www.scielo.br/scielo.php?script=sci_nlinks&ref=000148&pid=S0100-4042201000050002800024&lng=pt
Related Documents